2013 Reference Document - Kering Brand Portal
346
REFERENCE DOCUMENT 2013
-
Upload
khangminh22 -
Category
Documents
-
view
0 -
download
0
Transcript of 2013 Reference Document - Kering Brand Portal
R e f e R e n c e d o c u m e n t 2 0 1 3

12013 Reference Document ~ Kering
TABLE OF CONTENTS
CHAPTER 1
Kering in 2013 3
CHAPTER 2
Our activities 15
CHAPTER 3
Sustainability 55
CHAPTER 4
Corporate governance 115
CHAPTER 5
Financial Information 155
CHAPTER 6
Share capital and ownership structure 309
CHAPTER 7
Additional information 323
This is a free translation into English of the 2013 Reference Document issued in French and is provided solely for the convenience of English speaking users.
01_VA_V6 14/04/14 11:33 Page1

2 Kering ~ 2013 Reference Document
01_VA_V6 14/04/14 11:33 Page2

32013 Reference Document ~ Kering
CHAPter 1
Kering in 2013
1. History 4
2. Key consolidated figures 6
3. Kering Empowering Imagination 8
4. Kering Group Simplified Organisational Chart as of December 31, 2013 13
01_VA_V6 14/04/14 11:33 Page3
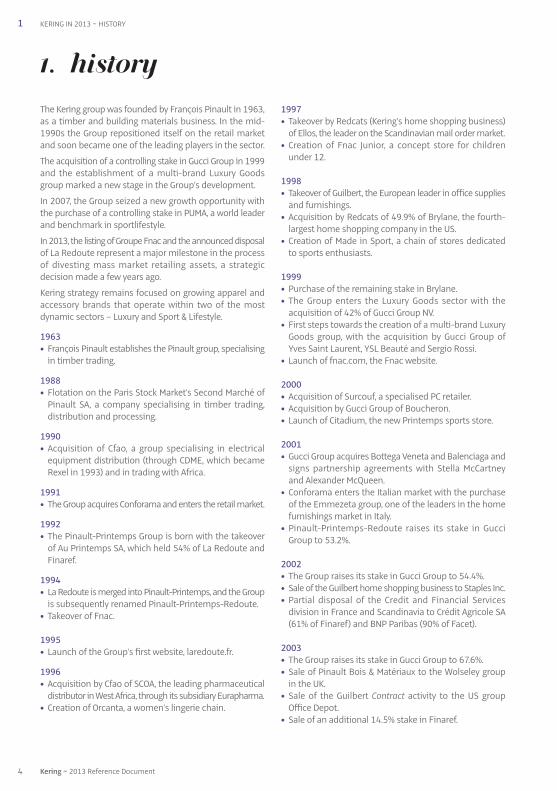
The Kering group was founded by François Pinault in 1963,as a timber and building materials business. In the mid-1990s the Group repositioned itself on the retail marketand soon became one of the leading players in the sector.
The acquisition of a controlling stake in Gucci Group in 1999and the establishment of a multi-brand Luxury Goodsgroup marked a new stage in the Group’s development.
In 2007, the Group seized a new growth opportunity withthe purchase of a controlling stake in PUMA, a world leaderand benchmark in sportlifestyle.
In 2013, the listing of Groupe Fnac and the announced disposalof La Redoute represent a major milestone in the processof divesting mass market retailing assets, a strategicdecision made a few years ago.
Kering strategy remains focused on growing apparel andaccessory brands that operate within two of the mostdynamic sectors – Luxury and Sport & Lifestyle.
1963
• François Pinault establishes the Pinault group, specialisingin timber trading.
1988
• Flotation on the Paris Stock Market’s Second Marché ofPinault SA, a company specialising in timber trading,distribution and processing.
1990
• Acquisition of Cfao, a group specialising in electricalequipment distribution (through CDME, which becameRexel in 1993) and in trading with Africa.
1991
• The Group acquires Conforama and enters the retail market.
1992
• The Pinault-Printemps Group is born with the takeoverof Au Printemps SA, which held 54% of La Redoute andFinaref.
1994
• La Redoute is merged into Pinault-Printemps, and the Groupis subsequently renamed Pinault-Printemps-Redoute.
• Takeover of Fnac.
1995
• Launch of the Group’s first website, laredoute.fr.
1996
• Acquisition by Cfao of SCOA, the leading pharmaceuticaldistributor in West Africa, through its subsidiary Eurapharma.
• Creation of Orcanta, a women’s lingerie chain.
1997
• Takeover by Redcats (Kering’s home shopping business)of Ellos, the leader on the Scandinavian mail order market.
• Creation of Fnac Junior, a concept store for childrenunder 12.
1998
• Takeover of Guilbert, the European leader in office suppliesand furnishings.
• Acquisition by Redcats of 49.9% of Brylane, the fourth-largest home shopping company in the US.
• Creation of Made in Sport, a chain of stores dedicatedto sports enthusiasts.
1999
• Purchase of the remaining stake in Brylane.• The Group enters the Luxury Goods sector with the
acquisition of 42% of Gucci Group NV.• First steps towards the creation of a multi-brand Luxury
Goods group, with the acquisition by Gucci Group ofYves Saint Laurent, YSL Beauté and Sergio Rossi.
• Launch of fnac.com, the Fnac website.
2000
• Acquisition of Surcouf, a specialised PC retailer.• Acquisition by Gucci Group of Boucheron.• Launch of Citadium, the new Printemps sports store.
2001
• Gucci Group acquires Bottega Veneta and Balenciaga andsigns partnership agreements with Stella McCartneyand Alexander McQueen.
• Conforama enters the Italian market with the purchaseof the Emmezeta group, one of the leaders in the homefurnishings market in Italy.
• Pinault-Printemps-Redoute raises its stake in GucciGroup to 53.2%.
2002
• The Group raises its stake in Gucci Group to 54.4%.• Sale of the Guilbert home shopping business to Staples Inc.• Partial disposal of the Credit and Financial Services
division in France and Scandinavia to Crédit Agricole SA(61% of Finaref) and BNP Paribas (90% of Facet).
2003
• The Group raises its stake in Gucci Group to 67.6%.• Sale of Pinault Bois & Matériaux to the Wolseley group
in the UK.• Sale of the Guilbert Contract activity to the US group
Office Depot.• Sale of an additional 14.5% stake in Finaref.
1. HISTORy
4 Kering ~ 2013 Reference Document
1 KERING IN 2013 ~ HISTORY
01_VA_V6 14/04/14 11:33 Page4
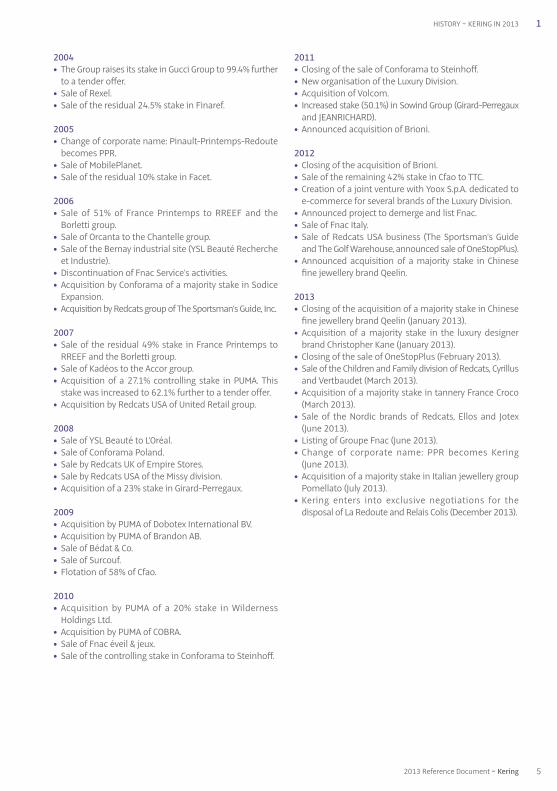
2004
• The Group raises its stake in Gucci Group to 99.4% furtherto a tender offer.
• Sale of Rexel.• Sale of the residual 24.5% stake in Finaref.
2005
• Change of corporate name: Pinault-Printemps-Redoutebecomes PPR.
• Sale of MobilePlanet.• Sale of the residual 10% stake in Facet.
2006
• Sale of 51% of France Printemps to RREEF and theBorletti group.
• Sale of Orcanta to the Chantelle group.• Sale of the Bernay industrial site (YSL Beauté Recherche
et Industrie).• Discontinuation of Fnac Service’s activities.• Acquisition by Conforama of a majority stake in Sodice
Expansion.• Acquisition by Redcats group of The Sportsman’s Guide, Inc.
2007
• Sale of the residual 49% stake in France Printemps toRREEF and the Borletti group.
• Sale of Kadéos to the Accor group.• Acquisition of a 27.1% controlling stake in PUMA. This
stake was increased to 62.1% further to a tender offer.• Acquisition by Redcats USA of United Retail group.
2008
• Sale of YSL Beauté to L’Oréal.• Sale of Conforama Poland.• Sale by Redcats UK of Empire Stores.• Sale by Redcats USA of the Missy division.• Acquisition of a 23% stake in Girard-Perregaux.
2009
• Acquisition by PUMA of Dobotex International BV.• Acquisition by PUMA of Brandon AB.• Sale of Bédat & Co.• Sale of Surcouf.• Flotation of 58% of Cfao.
2010
• Acquisition by PUMA of a 20% stake in WildernessHoldings Ltd.
• Acquisition by PUMA of COBRA.• Sale of Fnac éveil & jeux.• Sale of the controlling stake in Conforama to Steinhoff.
2011
• Closing of the sale of Conforama to Steinhoff.• New organisation of the Luxury Division.• Acquisition of Volcom.• Increased stake (50.1%) in Sowind Group (Girard-Perregaux
and JEANRICHARD).• Announced acquisition of Brioni.
2012
• Closing of the acquisition of Brioni.• Sale of the remaining 42% stake in Cfao to TTC.• Creation of a joint venture with Yoox S.p.A. dedicated to
e-commerce for several brands of the Luxury Division.• Announced project to demerge and list Fnac.• Sale of Fnac Italy.• Sale of Redcats USA business (The Sportsman’s Guide
and The Golf Warehouse, announced sale of OneStopPlus).• Announced acquisition of a majority stake in Chinese
fine jewellery brand Qeelin.
2013
• Closing of the acquisition of a majority stake in Chinesefine jewellery brand Qeelin (January 2013).
• Acquisition of a majority stake in the luxury designerbrand Christopher Kane (January 2013).
• Closing of the sale of OneStopPlus (February 2013).• Sale of the Children and Family division of Redcats, Cyrillus
and Vertbaudet (March 2013).• Acquisition of a majority stake in tannery France Croco
(March 2013).• Sale of the Nordic brands of Redcats, Ellos and Jotex
(June 2013).• Listing of Groupe Fnac (June 2013).• Change of corporate name: PPR becomes Kering
(June 2013).• Acquisition of a majority stake in Italian jewellery group
Pomellato (July 2013).• Kering enters into exclusive negotiations for the
disposal of La Redoute and Relais Colis (December 2013).
5
1
2013 Reference Document ~ Kering
HISTORY ~ KERING IN 2013
01_VA_V6 14/04/14 11:33 Page5
6 Kering ~ 2013 Reference Document
1 KERING IN 2013 ~ KEY CONSOLIDATED FIGURES
2. Key consolidated figures
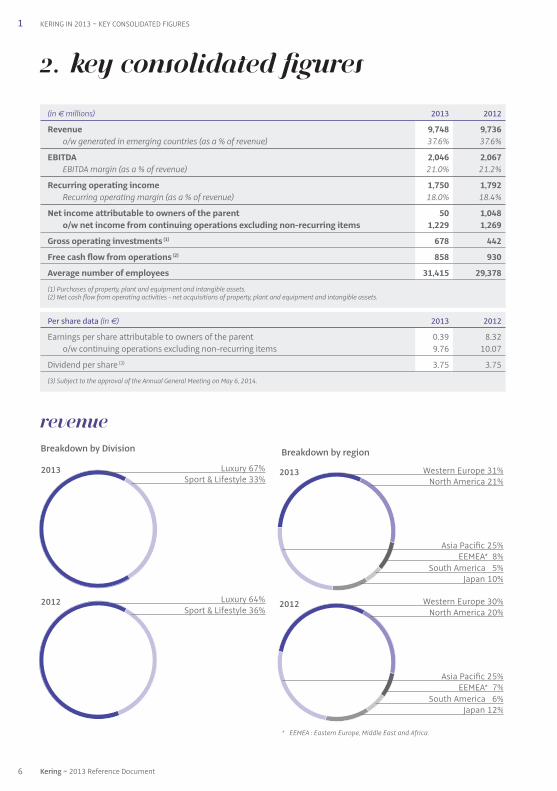
(in € millions) 2013 2012
Revenue 9,748 9,736o/w generated in emerging countries (as a % of revenue) 37.6% 37.6%
EBITDA 2,046 2,067EBITDA margin (as a % of revenue) 21.0% 21.2%
Recurring operating income 1,750 1,792Recurring operating margin (as a % of revenue) 18.0% 18.4%
Net income attributable to owners of the parent 50 1,048o/w net income from continuing operations excluding non-recurring items 1,229 1,269
Gross operating investments (1) 678 442
Free cash flow from operations (2) 858 930
Average number of employees 31,415 29,378
(1) Purchases of property, plant and equipment and intangible assets.(2) Net cash flow from operating activities - net acquisitions of property, plant and equipment and intangible assets.
Per share data (in €) 2013 2012
Earnings per share attributable to owners of the parent 0.39 8.32o/w continuing operations excluding non-recurring items 9.76 10.07
Dividend per share (3) 3.75 3.75
(3) Subject to the approval of the Annual General Meeting on May 6, 2014.
Breakdown by regionBreakdown by Division
Luxury 67%2013
2012
Sport & Lifestyle 33%
Luxury 64%Sport & Lifestyle 36%
Revenue
* EEMEA : Eastern Europe, Middle East and Africa.
2013
2012 Western Europe 30%
Western Europe 31%North America 21%
Asia Pacific 25%EEMEA* 8%
South America 5%Japan 10%
North America 20%
Asia Pacific 25%EEMEA* 7%
South America 6%Japan 12%
01_VA_V6 14/04/14 11:33 Page6

7
1
2013 Reference Document ~ Kering
KEY CONSOLIDATED FIGURES ~ KERING IN 2013
Undrawn confirmedcredit lines
(in € millions)
Maturity schedule of net debt(1)
(€3,443 million)
2014*
310
4,126
2015**
815
2016**
61
2017**
360
2018**
505
Beyond**
1,392
* Gross borrowings after deduction of cash equivalents and financing of customer loans.** Gross borrowings.
Liquidity
Breakdown by Division *
Luxury 89%2013
2012
Sport & Lifestyle 11%
Luxury 84%Sport & Lifestyle 16%
* Excluding Corporate.
Recurring operatingincome
Equity (in € millions)
Solvency ratio (ND/EBITDA)
2011 2012
11,750
2013
2011 2012 2013
2011(2) 2012 2013
(2) Published, not restated.
Net debt as a percentage of consolidated equity
28.9%
30.8%
20.6%
1.78 1.21 1.68
Net debt(1) (ND) (in € millions)
3,396 2,492 3,443
12,11911,196
Financial position debt-to-equity ratio
(1) Net debt defined in page 156.
01_VA_V6 14/04/14 11:33 Page7

The Kering of today and tomorrow is an integrated groupwith a coherent business mix. We concentrate exclusivelyon the design, manufacture and distribution of appareland accessories in two major segments: Luxury andSport & Lifestyle.
The Luxury and Sport & Lifestyle sectors are fuelled by soliddemographic and social trends, notably in emergingregions. To capture this growth, we have built up a uniqueensemble of complementary brands. The considerableorganic growth potential each one of them enjoys is basedon powerful brand equity, leading market positions,global recognition, huge consumer appeal and significantpricing power.
The success of our strategy rests on three main pillars.
First, our brands are in the step with major societal trends:people wish to enjoy and express themselves throughwhat they wear, and to look and feel good.
Second, a well-balanced geographical spread is core to thestrength of our brands: we carefully manage their growth
locations and ensure maximum flexibility to keep pacewith changing market conditions.
And third, the markets we are tapping are forecast torecord unprecedented growth in the coming years. In thepast 50 years, 800 million consumers in the USA, WesternEurope and Japan have generated most of the world’sgrowth. Over the next 50 years, China, India, Brazil,Indonesia and Mexico, with a combined population ofmore than three billion, will drive global economicexpansion(1). Furthermore, the younger generations inthese countries continue to enjoy increasing levels ofdisposable income.
Because of the inherent dynamics of our markets, ourgrowth strategy relies on the development of our existingbrands, which can take one or several forms:
• we nurture the international development of ourbrands by selectively entering new countries. Forexample, Brioni, which remains primarily Europe andNorth America driven, enjoys huge growth potential
Kering’S StrATEGY IS TO CREATE VALUE BY LIBERAtiNG THE ORGANIC GROWTH POTENtiAL OF ITS BRANDS
Kering’s ambition is to be the world leader in apparel andaccessories by concentrating on the two fastest-growingsegments: Luxury and Sport & Lifestyle.
Our mission is to offer products that enable ourcustomers to express their personality and to fulfil theirdreams. To achieve this, we empower an ensemble ofrobust, complementary brands to reach their potential byconstantly pushing them against the limits, in the mostimaginative and sustainable manner.
Since its inception in 1963, Kering has continuouslytransformed itself, constantly seeking growth andcreating value with the same entrepreneurial spirit. Withthe acquisition of Gucci in 1999, Kering initiated a majorstrategic move, amplified in 2007 with the takeover ofPUMA. These two milestones have enabled Kering tobenefit from the changes in the global economy andcapture the growth of emerging markets.
Since 2005 the Group has been evolving from a diverseconglomerate into a cohesive international group. In 2013,as we reached the final stage of our transformation weexited our remaining, legacy mass-retail businesses. Thechange in the name of the Group, approved by the AnnualGeneral Meeting on 18 June 2013, from PPR to Kering,therefore reflects this new identity.
Kering can be pronounced and understood as “ caring ”.The new name stands for more than a change in scope oractivity. It portrays the way we take care of our businesses,people, customers and stakeholders – as well as theenvironment.
We have a long-term entrepreneurial vision and a cleargrowth strategy to capitalise on consumer trends. We putsustainability at the core of everything we do. We embracee-business and any means of dialogue with our customersaround the world. Kering’s role is to release the full potentialof our brands while ensuring they stay true to their valuesand identity – that is what we call “ empowering imagination ”.
OWNER OF SOME OF THE WORLD’S MOST DESIRABLE LUXURYAND Sport & Lifestyle BRANDS, Kering IS WELL POSItiONEDFOR SUSTAINABLE, PROfiTABLE GROWTH
8 Kering ~ 2013 Reference Document
1 KERING IN 2013 ~ KERING EMPOWERING IMAGINATION
3. Kering Empowering Imagination
(1) Source : The $10 Trillion Prize, Harvard Business Review Press, 2012.
01_VA_V6 14/04/14 11:33 Page8

outside its home market, with plenty of room tobroaden its international presence of directly-operatedstores. A similar opportunity exists for two of our Britishluxury designer brands, Alexander McQueen and StellaMcCartney, both of which have recently embarked onmore ambitious expansion plans outside the UK andNorth American markets.
• we strengthen our distribution channels. In Luxury, weare constantly adjusting and consolidating our networkof directly-operated stores to optimise the sales mix; inSport and Lifestyle, we build relationships with third-party retailers who enjoy robust positions in theirrespective markets.
• we expand into new product categories. For example, atVolcom, which was acquired in 2011, we have launchedthe first closed-toe footwear styles this year, and a brandlike Bottega Veneta is clearly looking to further expandits men’s category, which is a promising source ofgrowth for the future.
• we aim at exploiting the huge potential of e-commerce.Our joint-venture set up in 2012 with Yoox, a leader inonline premium consumer goods shopping, willaccelerate the growth of e-commerce at most of ourLuxury brands.
Kering has employed an original approach and strategy indeveloping its portfolio of businesses. We have focused ontwo segments, Luxury and Sport & Lifestyle, with a multi-brand approach within both divisions. Each brand has itsown specific positioning, complementary with the others.There is therefore no direct competition between thebrands. This is how we have built the Luxury Division,while generating substantial synergies between thebrands and, since 2007, the Sport & Lifestyle Division.
Although organic growth remains the Group’s underlyingfocus, we have made acquisitions of small- to medium-sized brands in order to strengthen and complement theexisting brand portfolio, and therefore contribute to anincrease in revenue and earnings. While they may not alwaysbe central to Kering’s immediate value creation, they actas a catalyst for Group enlargement and internationaldevelopment.
We rely on the same strict acquisition criteria to consolidateour positions, as follows:
• we seek brands that have a truly distinctive identity: wellrooted values and a sought-after legacy; a unique scopeof expression through lasting codes and language; anability to broaden their territories independently orthrough alliances; an aptitude to gradually expand theirmarkets beyond their current borders.
• the Group only considers targets that offer genuinepotential to significantly improve financial performance,which it can identify and exploit in the long term, andwhich will go beyond the potential that the assets hadbefore being brought into the Group.
• external growth may be achieved through acquisitionsthat change or even reshape the Group – in which casethe investment will be made directly by Kering SA or aholding company from among its subsidiaries – orthrough targeted, tactical acquisitions aimed atbolstering an existing brand within a product categoryor in its operations – in which case the investment willbe made directly by the brand in question.
Our ambition for the two divisions can be characterisedas follows:
• for its Luxury brands, Kering aims at expanding themwhile striking the right balance between growth andeach brand’s exclusivity. The Group plans to continue todevelop its Luxury brands along defined paths, such asexpanding selectively their networks of directly-operated stores, launching new product categories, andimproving their long-term top-line performance,notably through ever-more efficient merchandising,effective communications, operational store excellenceand deeper customer knowledge.
• for its Sport & Lifestyle brands, Kering’s strategy is basedon expanding into new markets while bolstering growthin the most mature ones, developing distribution,launching new products that are consistent with eachbrand’s distinctive characteristics, and continuing to identifyand foster synergies between the brands, particularly insourcing, logistics and knowledge-sharing in the areasof product development, distribution and marketing.
Consistent with this strategy, in December 2012 (thetransaction was finalised in January 2013) Kering acquireda majority stake in Qeelin, a Chinese fine jewellery makerbased in Hong Kong. Kering thus increased its portfolio inthe hard luxury segment and its presence in the Chinesemarket. Qeelin has tremendous intrinsic growth potentialand Kering will enable it to accelerate its expansion, notablythrough store openings in mainland China and Hong Kong.
Similarly, in January 2013 Kering acquired a 51% interestin luxury designer brand Christopher Kane in order todevelop the business in partnership with its eponymousScottish creator and designer. By doing so, Kering is fulfillingits mission to empower new creative talent, while furtherstrengthening its portfolio of luxury brands. The Grouphas a strong track record of backing rising designers andhas enjoyed great success with brands such as AlexanderMcQueen and Stella McCartney. Kering will enable the brandto accelerate its expansion by providing the support itneeds to grow to the next level.
In July 2013, Kering acquired a majority stake in Pomellato,one of Europe’s major jewellery groups. It has two brands:Pomellato and Dodo, the former positioned in the finejewellery segment and the latter in accessible jewellery.Kering is thus extending and reinforcing its portfolio ofluxury brands in the high-growth jewellery market and willsupport the development and international expansion ofthe Pomellato group.
9
1
2013 Reference Document ~ Kering
KERING EMPOWERING IMAGINATION ~ KERING IN 2013
01_VA_V6 14/04/14 11:33 Page9

Each of our brands enjoys the high degree of autonomyand responsibility it requires to preserve its creativefreedom, its product and sourcing strategy, and itsdistinctive image and positioning towards its customers.
At the same time, at the Group level, we set out the guidelinesunder which our individual brands operate. We provide allthe “ behind-the-scene ” services that are more efficiently andeconomically carried out at a shared level. And we ensureconsistency across all our operations, notably when itcomes to financial management. We describe the way wemanage our operations as “ freedom within a framework ”.
This approach is consistent with our mission of “empoweringimagination”, which means giving our brands the autonomyand encouraging the creativity and market agility requiredto move beyond their natural limits. We nourish our brandsin terms of financial and managerial support, but we alsochallenge them on their strategy. We push them to go beyondtheir limits by developing new business, and also to sharetalent, expertise and best practice amongst themselves.
Empowering imagination also means providing ourbrands’ executives and Creative Directors with the visionto achieve ambitious targets, to develop talent and tofulfil their potential.
Organisational improvement
Regarding governance, the Kering Executive Committeereflects the integrated nature of the Group. Thus, theprincipal operational officers, the CEOs of Gucci, BottegaVeneta and PUMA, are all members.
In order to meet the needs of the brands more effectively,we have strengthened a number of functions, includingreal estate, e-business, indirect purchasing, intellectualproperty (IP), strategic marketing and media management.
Because our people are the force behind our transformation,we are developing a more ambitious, more integrated,worldwide human resources policy, based on increasedmobility across the brands. The idea behind the HR strategyis for our brands to flourish through accessing and sharing,among other things: a talent pool, expertise, standards,information systems and best practice. Kering is alreadymaking this new HR policy happen, which will largelyaffect our top 200 managers.
To further empower our brands as they expandinternationally, we have established Kering Americas andKering Asia Pacific (effected in 2011). Based respectivelyin New York and Hong Kong, these entities are staffed bylocal functional specialists (audit, HR, taxation, real estate,legal), which provide support to the brands’ operationsand facilitate their geographic expansion.
In addition, in 2013 we adapted the governance of Groupshared services, in particular management informationsystems and transactional finance, to improve theireffectiveness in our three most important regions:Europe, Americas and Asia Pacific.
Digital approach
Kering has embraced the digital revolution. It is speedingup the brands’ e-business projects and increasing digitaluse in an integrated programme across all Group-wideactivities, including HR, merchandising, distribution andsales. For example, the Kering Digital Academy facilitatesbest-practice exchange, expertise and professionaldevelopment in this field. We have also created a Group-wide dashboard and an internal web watch communityto share internal and external benchmarking.
THE Kering EffECT – BRINGING GROUP POWER TO THE SERVICE OF EACH OF OUR BRANDS
In September 2013, Kering became a minority shareholderof the New York-based Altuzarra luxury fashion brand.This investment marks the beginning of a relationship inwhich Kering will contribute to the growth of the brand,which was founded in 2008 by young Franco-Americandesigner Joseph Altuzarra.
In November 2013, Kering and Tomas Maier entered intoa joint venture to develop the business of the TomasMaier brand in partnership. Tomas Maier will continue tobe Creative Director of Bottega Veneta, a position he hasheld since 2001.
As part of the repositioning process, Kering carried outmany disposals of retail assets in 2013, as follows:
• in February, Kering finalised the sale of the Redcatsbusiness in the US, with the disposal of OneStopPlusGroup, its plus-size business, having already completed
the disposal of The Sportsman’s Guide and The GolfWarehouse in December 2012.
• in March, Kering completed the disposal of Cyrillus andVertBaudet, its children and family brands belonging tothe Group’s Redcats division, and in June, it completedthe sale of Ellos and Jotex, its Nordic brands.
• also in June, the demerger and flotation of Fnac,through the distribution of Fnac shares to theshareholders of Kering was achieved.
• in December, the Board of Directors entered intoexclusive negotiations with the chairman and CEO of LaRedoute and the Chief administrative officer of Redcatsto acquire La Redoute and Relais Colis (in the bestinterests of the company, its employees and the regionwhere it is based). The sale is expected to be concludedin the first half of 2014.
10 Kering ~ 2013 Reference Document
1 KERING IN 2013 ~ KERING EMPOWERING IMAGINATION
01_VA_V6 14/04/14 11:33 Page10

Kering believes sustainable business is smart business. Itgives us an opportunity to create value while helping to makea better world – economically, socially and environmentally.
The same vision that drives the Group’s business strategy(empowering an ensemble of brands to reach their potentialin the most imaginative and sustainable manner) also drivesour commitment to environmental and social sustainability.
It is our wish to give meaning to our business. Ourapproach to sustainability is therefore at the heart of thestrategy that guides the Group, our brands and all itsconstituent parts. Further, we believe sustainability isinherent in quality. Because quality is the quintessence ofour brands, the challenge of sustainability stimulates usto create products that are more imaginative, longerlasting and more desirable.
We believe our approach to sustainability representslong-term differentiation and competitive advantage byoffering new business development opportunities,stimulating innovation and in many cases helping reducecosts. It is also a motivating factor for our employees,helping us attract and retain the best.
Every employee has a part to play in making sustainabilitya reality. It is built into our structure, from the sustainabilitycommittee of the Kering Board of Directors to thecommitment of the CEO of every brand, and in the everydaydecisions and actions of our teams. A variable part of theremuneration of the CEOs of Kering brands is now partlybased on the degree to which they meet sustainabilityobjectives. Our Chief Sustainability Officer sits on theExecutive Committee, which ensures decision-making onsustainability is consistent and integrated across the Group.
The Kering sustainability department acts as a platformof resources to complement the brands’ own activities. Itprovides support in the form of 15 in-house experts insustainable sourcing, alternative materials, biodiversity,
energy, supply chain performance and change management,as well as social aspects. The sustainability departmentfacilitates change by providing knowledge and guidance,operational synergies and economies of scale that helpthe brands develop more sustainable practices. A networkof sustainability leads in each brand facilitates this process.
In 2013 Kering set up the sustainability technical advisorygroup (STAG) with the objective of providing technicaladvice and guidance to Kering’s board-level SustainableDevelopment Committee. Composed of external technicaland business environmental experts and internal businessleaders, STAG is helping the Group advance its overallsustainability strategy.
Kering has defined a number of quantifiable targets forits brands to reach ambitious environmental and socialmeasures for 2016. These relate to raw materials sourcing,including alternatives; paper and packaging; water use,waste and carbon emissions and hazardous chemicals; whileoffsetting our remaining CO2 emissions and supportingsuppliers in their progress. These targets highlight ourattention to sustainability at two intertwined levels:process and product.
By 2016, we will have rolled out a Group EnvironmentalProfit & Loss (EP&L) account across all of our brands. Firstlyit will measure the environmental impact across our ownoperations and entire supply chain, from sourcing rawmaterials to selling our products. Secondly, it will providea monetary valuation of the impact: the profit and loss forthe environment. It serves as a tool for deeper understandingand better decision-making. This is the first time that aglobal Group of companies has undertaken such an analysis.Pioneered by PUMA, the EP&L will lead us to new businessmodels and solutions that take nature into account.
Our social responsibility goes beyond compliance. Wework with our suppliers through our social audits and
SUSTAINABILIty IS AT THE HEART OF Kering group AND BRAND StrATEGY
E-business is a strategic priority for Kering. This is notonly for the business we conduct online but also becauseit influences demand across all sales channels, with moreand more shoppers affected by digital, regardless of wherethey purchase. Also, since our brands are global, we needonline flagship stores to be accessible all over the world.
In Luxury, Gucci has the size, resources and expertise to havedeveloped its own platform and is, in fact, a pioneer inluxury e-commerce. This was less the case for the otherLuxury brands in our portfolio, which is the reason whywe created (in August 2012) a joint venture with Yoox, toestablish a series of single-brand e-commerce websitesfor a number of our brands. Called E_lite, the Yoox partnerbrings its technology and worldwide logistics expertise
in this field. The joint venture is improving existing e-commerce sites, accelerating e-commerce developmentof their global digital presence and offering exclusiveonline shopping to customers.
By year-end 2013, all of the Group’s Luxury brands (BottegaVeneta, Saint Laurent, Sergio Rossi, Stella McCartney,Brioni, Balenciaga and Alexander McQueen) had theirown e-commerce sites, marking the first milestone of theprogramme. Some of these sites will be redesigned in 2014.Each brand remains in control of its brand image andmerchandising, whilst Yoox brings superior designknowledge, web business intelligence and performancemarketing.
11
1
2013 Reference Document ~ Kering
KERING EMPOWERING IMAGINATION ~ KERING IN 2013
01_VA_V6 14/04/14 11:33 Page11

In a context of slowing GDP trends, particularly in some keyemerging markets such as China, and in the absence of astrong rebound in Europe and the United States, growthin the global economy has remained muted throughout2013. Only Japan has seen a material pick-up in consumption,fuelled by a more accommodating monetary policy.
Against this uncertain and volatile back drop, Kering hasdemonstrated the pertinence of its multi-brand portfolio inLuxury. While Gucci has carried on making major investmentsaimed at further reinforcing its high-end positioning, Kering’sother luxury brands have acted as incremental drivers,allowing the Group to look to the future with confidence,thanks to its solid fundamentals. In Sport & Lifestyle, thearrival of a new management team at PUMA will provide anew impetus to the brand, as it rejuvenates its product rangeand refocuses its overall positioning. Such a far-reachingturnaround process should provide long-lasting benefitsand establish a more solid foundation for PUMA to growits sales and profits in the mid-term.
Kering enjoys healthy growth prospects. Its activities are alignedwith today’s consumer trends and aspirations, which willenable Kering to benefit from distinctive growth trends.At the same time, the Group’s Luxury brands are expected
to consolidate their store network expansion, selectivelyextending their footprint in those regions and for thosebrands where potential has been identified. By constantlystriving to make the products of each of its brands moreattractive and streamline operations, Kering should continueits long-term trend of improving sales and margins.
In addition, Kering is supporting the digital strategies ofits brands by systemising the fostering of inter-brandsynergies, co-ordinating e-business projects and encouragingknowledge sharing. Kering has thus pooled expertise insupport of its brands, to identify and share best digitalpractices, encourage innovation, improve the technicalcapacities and customer functionalities of websites, andincrease Internet penetration for the Group’s activities.
In 2014, Kering intends to pursue its policies to attractnew talent, promote skills and career development, andencourage fruitful exchanges within the Group. Wecontinue to devote energy to corporate environmentaland social sustainability, including people diversity, all ofwhich are crucial to our business objectives and to ourlong-term performance.
IN A StiLL UNSEttLED ECONOMIC ENVIRONMENT, Kering IS CONfiDENT IN ITS OUTLOOK FOR 2014
help them reach the standards laid out in our Code ofethics. We consider diversity, which is endorsed in our HRprocedures, to be a source for creativity and innovation.Social sustainability encompasses attention to workingconditions, which includes third-party workshops, andthe need to preserve artisanal businesses. Which is whyKering brands support a network of highly skilled craftworkers, providing training schemes and foundingtechnical schools.
In 2013, for its first year of participation in the review,Kering was added to the Dow Jones Sustainability Indices(DJSI) World and Europe. These indices track the best-in-class sustainability performers amongst the 2,500 largestcompanies in the Dow Jones Global Total Stock Market Index.Each year, applicant companies are rated against anindustry-specific questionnaire. Only the top ten per centof leading performers in terms of sustainability assessedagainst predefined criteria are listed in the DJSI.
At the same time, Kering leads the 2013 Carbon DisclosureProject (CDP) survey in the Luxury and Apparel Industry. Keringis also listed in the ethical rating indices FTSE4GOOD, Aspiand Ethibel Excellence. In addition, Kering’s sustainabilityreporting complies with Level A+ of the Global ReportingInitiative (GRI).
The Kering Corporate Foundation is dedicated to combatingviolence against women. The Kering Foundation is a separatelegal entity with its own slogan: Stop violence. Improve
women’s lives. Since its inception in 2009, it has supported47 NGOs and social entrepreneurs and benefited morethan 140,000 women.
Integrated in the Kering sustainability department, theFoundation embodies the social commitment of the Group.For example, in November 2013 Kering and the KeringFoundation signed a Charter with the Italian NGO Donnein Rete contro la violenza (D.i.Re). The Charter aims to raisethe awareness of all 6,000 employees of the Group in Italyregarding domestic violence and help them comprehendthis issue that affects all social classes. This partnershipechoes a similar one signed in France in 2010 with theNGO Fédération Nationale Solidarité Femmes (FNSF).There are plans to expand this action to other regions ofthe world where the Group operates.
In addition, many of our brands have been running theirown social-support programmes for some time. Forinstance, in February 2013 Gucci, with the support of theKering Foundation, launched Chime for Change, a globalcampaign to raise funds and awareness for girls’ andwomen’s empowerment with a focus on education,health and justice.
In line with the Group’s new identity, the Foundation hasrefocused its action on three geographic areas and willprioritise one cause in each: sexual violence in the Americas,harmful traditional practices in Western Europe anddomestic violence in Asia.
12 Kering ~ 2013 Reference Document
1 KERING IN 2013 ~ KERING EMPOWERING IMAGINATION
01_VA_V6 14/04/14 11:33 Page12
13
1
2013 Reference Document ~ Kering
KERING GROUP SIMPLIFIED ORGANISATIONAL CHART AS OF DECEMBER 31, 2013 ~ KERING IN 2013
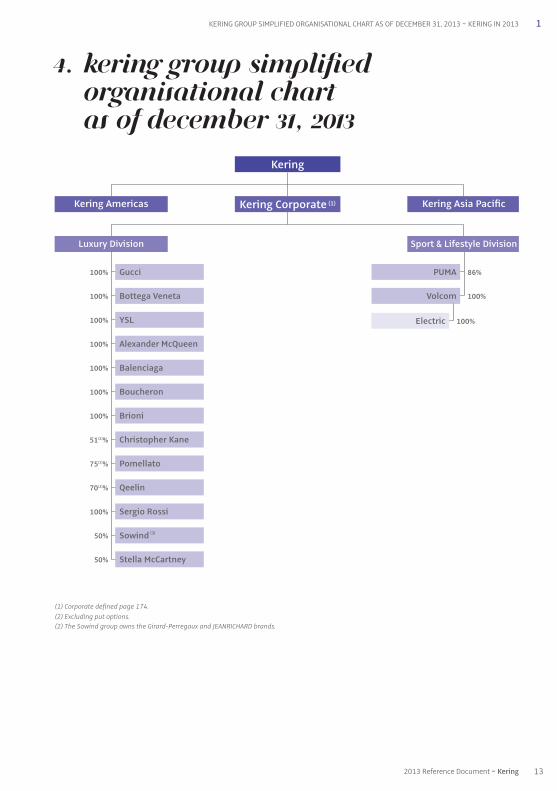
4. Kering Group SimplifiedOrganisational Chart as of December 31, 2013
Luxury Division
Gucci100%
Sport & Lifestyle Division
Kering
Kering Americas Kering Asia Pacific
Bottega Veneta100%
PUMA 86%
Volcom 100%
Electric 100%YSL100%
Alexander McQueen100%
Balenciaga100%
Boucheron100%
Brioni100%
51(2)% Christopher Kane
Pomellato
Qeelin
75(2)%
70(2)%
100% Sergio Rossi
Sowind (3)
(1) Corporate defined page 174.
(2) Excluding put options.
(2) The Sowind group owns the Girard-Perregaux and JEANRICHARD brands.
Stella McCartney
50%
50%
Kering Corporate (1)
01_VA_V6 14/04/14 11:33 Page13

14 Kering ~ 2013 Reference Document
01_VA_V6 14/04/14 11:33 Page14

CHAPTer 2
Our activities
1. Worldwide personal Luxury Goods market overview 16
2. Luxury Division 20Gucci 22Bottega Veneta 25Saint Laurent 28Other brands 31
3. Worldwide Sport & Lifestyle market overview 42
4. Sport & Lifestyle Division 46PUMA 48Other brands 51
152013 Reference Document ~ Kering
02_VA_V7 14/04/14 11:33 Page15

2 OUR ACTIVITIES ~ WORLDWIDE PERSONAL LUXURY GOODS MARKET OVERVIEW
MARKET OVERVIEW: SIZE, trENDS AND MAINGROWTH DRIVERS
The global personal Luxury Goods market has enjoyedsignificant growth over the past few years. In 2013, theglobal personal Luxury Goods market generatedestimated revenue of €217 billion, up 2% on 2012 asreported and up 6% at comparable exchange rates afterthree consecutive years of double-digit growth.
Worldwide personal Luxury Goods market trend (2006-2013e, in € billions, reported exchange rates).
Although the personal Luxury Goods market has seen stronggrowth since 2010, outpacing the global economy, it ishowever tied to changes in worldwide GDP, as evidencedby the fall in 2009.
In addition to economic factors, structural influences are alsoimpacting demand and growth on the personal Luxury Goodsmarket, including:
• positive demographic trends, especially in emerging markets;
• the emerging middle class in these countries, where theaverage disposable income and purchasing power ofconsumers has continued to grow;
• growth in the global population of high-net-worthindividuals (“HNWIs”)(1). Although the majority of HNWIslive in developed countries, the number of HNWIs in high-growth countries has increased rapidly in recent years.In 2012, the HNWI population rose 9.2% to 12 million.At the same time, the wealth of HNWIs grew 10% to arecord USD 46.2 trillion in 2012(Source: Capgemini/RBC 2013 World Wealth Report);
• increased tourism and the growing relevance of touristspending on Luxury Goods: according to the latest datafrom Global Blue, tourist spending was up 10% in 2013,driven by Chinese and Russian tourists, with countrieslike France, Italy and the United Kingdom among theleading destinations for shopping abroad.
Nevertheless, some factors could weigh down personal LuxuryGoods market development in the short term, such as:
• high import taxes on Luxury Goods in some emergingcountries;
• new, more restrictive regulations on travel and theacquisition of luxury goods.
COMPEtitiVE ENVIRONMENT
The global personal Luxury Goods market is highly fragmentedand is characterised by the presence of a few large globalplayers, often part of so called “multibrand groups”, and alarge number of smaller independent players. These playerscompete in different segments both in terms of productcategory and geographic location. Kering operates within theglobal personal Luxury Goods market alongside some of themost global groups, prominent among which are LVMH,Hermès, Prada, Burberry, Chanel and Richemont. A numberof brands with more accessible prices have appeared,which could compete with recognised Luxury brands.
This section contains information derived from studies conducted by organisations, such as Altagamma andBain & Company. Unless otherwise indicated, all historical and forecast statistical information, including trends, sales,market shares and growth levels, comes from the Bain Luxury Study – Altagamma Worldwide Market Monitor, published inDecember 2013. Luxury Goods industry segments and product categories correspond to the definitions used in the BainLuxury Study – Altagamma Worldwide Market Monitor.
In this document the global personal Luxury Goods market includes the following categories: apparel, acces sories, watchesand jewellery, and perfumes and cosmetics.
WORLDWIDE pERSONALLUXURY GOODS MARKETOVERVIEW
06
159
07
170
08
167
09
153
10
173
11
192
12
212
13e
217(+2%)(+10%)
(+11%)(+13%)
(%): annual change at reported exchange rates
(1) HNWIs are defined as those having assets of USD 1 million or more, excluding primary residence, collectibles, consumables, and consumer durables.
16 Kering ~ 2013 Reference Document
02_VA_V7 14/04/14 11:33 Page16

2WORLDWIDE PERSONAL LUXURY GOODS MARKET OVERVIEW ~ OUR ACTIVITIES
Accessories
This category includes shoes, leather goods (includinghandbags and wallets, and other leather products), eyewearand textile accessories.
In 2013, this category represented 28% of the total personalLuxury Goods market with total sales of €61 billion. It recordedthe fastest overall year-on-year growth in 2013 at 4%.
The two biggest sub-categories were:
a) Leather goods, with estimated revenue of €36 billionin 2013. Leather goods were the fastest growing sub-category between 2012 and 2013 with 5% growth,driven by outperformance in men’s products. Keringoperates in this product category mainly through theGucci brand, but also through Bottega Veneta, SaintLaurent and Balenciaga.
b) Shoes, with estimated 2013 revenue of €13 billion.The shoes sub-category grew at a rate of 4% between2012 and 2013. Kering operates in this productcategory mainly with Sergio Rossi, the shoe specialistbrand, with most of the larger brands, includingGucci, Bottega Veneta, Saint Laurent and Balenciagaalso offering shoes.
Apparel
This category includes ready-to-wear for both women andmen. It represented 25% of the total personal Luxury Goodsmarket in 2013 and was worth an estimated €55 billion.The market is evenly spread between men’s and women’sproducts, with a recent outperformance of the high-endsegment of menswear driven by made-to-measure andhigh demand in emerging countries.
All Kering brands operate in this product category especiallyStella McCartney, Alexander McQueen, Christopher Kaneand Saint Laurent, in addition to Brioni for menswear.
Watches and jewellery
The watches and jewellery category generated revenue of €48 billion in 2013, representing 23% of the totalpersonal Luxury Goods market, and grew by 2% between2012 and 2013.
Kering operates in this category across different price pointswith Gucci Timepieces, Girard-Perregaux and JEANRICHARDfor luxury watches, Boucheron, Pomellato and Qeelin forluxury jewellery.
Perfume and cosmetics
The perfume and cosmetics category represented 20% ofthe total personal Luxury Goods market in 2013 and wasworth an estimated €43 billion. Kering operates in thisproduct category through royalty licencing agreementsbetween its main brands and leading industry playerssuch as L’Oréal, Procter & Gamble, Coty and Interparfumsto develop and sell fragrances and cosmetics.
PRODUCT CATEGORIES
The global personal Luxury Goods market can be evenly spread into four product categories as shown below.
Worldwide personal Luxury Goods market: breakdown by category (2013)
Market value 2013 YoY change at reported 2013(in € billions) exchange rates market share
Accessories 61 +4% 28%Apparel 55 +1% 25%Watches and jewellery 48 +2% 23%Perfume and cosmetics 43 +2% 20%Other 10 +0% 4%
Total 217 +2% -
172013 Reference Document ~ Kering
02_VA_V7 14/04/14 11:33 Page17

18 Kering ~ 2013 Reference Document
2 OUR ACTIVITIES ~ WORLDWIDE PERSONAL LUXURY GOODS MARKET OVERVIEW
REGIONAL OVERVIEW
Worldwide personal Luxury Goods market: breakdown by region (2013e)
Size Reported YoY YoY change at comparable 2013(in € billions) change exchange rates market share
Europe 74 +2% +3% 34%Americas 69 +4% +7% 32%Japan 17 -12 % + 9% 8%Asia Pacific 46 + 4% +5% 21%Rest of the world 11 + 6% +8% 5%
The ten largest countries in terms of global personal Luxury Goods revenue in 2013 are as follows:
2013 Country Size Reported YoY YoY change at comparable Rank (in € billions) change exchange rates
1 United States 62.5 +4% +7%2 Japan 17.2 -12% +8%3 Italy 16.1 -2% -2%4 China 15.3 +2.5% +3.5%5 France 15.1 +4% +4%6 United Kingdom 12.1 +4% +9%7 Germany 9.9 +3% +3%8 South Korea 8.3 +1% +0%9 Hong Kong 7.7 +10% +13%10 Russia 5.8 +5% +10%
DIStrIBUtiON CHANNELS
Worldwide personal Luxury Goods market: breakdown by distribution channel (2011-2013e)
Retail channel
A strong directly-operated store network is important forthe success of a luxury brand as it allows greater controlover the consumer shopping experience and overproduct assortment, merchandising and customer service.In 2013 the retail channel accounts for sales amountingto 31% of the total global personal Luxury Goods market.
Wholesale channel
The wholesale channel typically includes departmentstores, independent high-end multi-brand stores andfranchise stores, and accounted for approximately 69% ofthe total global personal Luxury Goods market in 2013.
E-commerce
Online sales of Luxury Goods reached a record of around€10 billion (65% wholesale and 35% retail) in 2013 (up 28%versus 2012), representing about 5% of total globalpersonal Luxury Goods sales.
For Kering’s Luxury Division, the retail channel is predominant(68% of sales at the end of 2013), in particular for Gucci,Bottega Veneta, Saint Laurent, Balenciaga and Boucheron,while other luxury brands are generally distributedthrough wholesale channels. All Kering brands arepresent online with e-commerce websites, either operatedinternally, as is the case for Gucci, or managed by a jointventure signed with Yoox, E_Lite.
Retail
Wholesale2011 2012 2013e
€192 bn
€212 bn
€217 bn
29%
71%
31%
69%
28%
72%
02_VA_V7 14/04/14 11:33 Page18

19
2
2013 Reference Document ~ Kering
WORLDWIDE PERSONAL LUXURY GOODS MARKET OVERVIEW ~ OUR ACTIVITIES
Europe is the leading Luxury market with 2013 revenueup 3% on 2012 at comparable exchange rates. Growthwas fuelled by rising global tourism, as “travellingconsumers”, particularly from China, made significantpurchases in Paris, London and Milan.
The Americas is the second largest geographical region,with the United States accounting for the vast majority of revenue. The Americas accelerated to 7% growth atcomparable exchange rates thanks to greater consumerconfidence, strong momentum from tourism in majorcities and brand expansion in cities such as Miami, LasVegas and Los Angeles.
The Asia Pacific region, excluding Japan, was up 5% atcomparable exchange rates, and represented 21% of theglobal personal Luxury Goods market. Within the AsiaPacific region, Greater China, which encompasses MainlandChina, Hong Kong, Macau and Taiwan according to theaforementioned study, is the largest personal Luxury Goodsmarket in terms of sales, accounting for approximately €28billion in revenue in 2013, up 4% compared to 2012, butdown from the 19% growth figure reported in 2012.
Japan represented 8% of the global personal Luxury Goodsmarket in 2013. Japan is the second largest country in termsof personal Luxury Goods consumption after the UnitedStates. Since the beginning of 2013, the depreciation ofthe Japanese yen has redirected consumption locally. Atcomparable exchange rates, the market registered verypositive trends, driven by strong internal consumption,while Japanese tourist spending abroad declined.
The rest of the world represented 5% of the personalLuxury Goods market, with €11 billion in revenue in2013. The rest of the world mainly comprises the MiddleEast and Northern African markets.
MARKET OUTLOOK
Bain and Altagamma forecast that the global personalLuxury Goods market will reach between €245 billionand €255 billion by the end of 2016, representing 3% to5% average growth at comparable exchange rates overthe next three years.
Growth is expected to be driven by:
• new emerging countries: according to Bain andAltagamma, in addition to China, the Middle East, Brazil,Australia, Africa and India are key to the growth of theglobal personal Luxury Goods market. Within the Asiaregion, Indonesia, Malaysia, Vietnam and Thailand arethe new drivers of luxury growth;
• the continued expansion of tourism;
• development of new distribution channels such as e-commerce;
• increase in high-spending consumer classes such ashigh-net-worth individuals (HNWIs):
- the HNWI population is forecast to grow by 6.5% peryear to USD 55.8 trillion by 2015, driven mainly bygrowth in Asia Pacific HNWI wealth (Source: Capgemini/RBC 2013 World Wealth Report),
• the development of new high-end products and services;
• the robustness of the American market.
02_VA_V7 14/04/14 11:33 Page19

20 Kering ~ 2013 Reference Document
2 OUR ACTIVITIES ~ LUXURY DIVISION
Gucci 22Bottega Veneta 25Saint Laurent 28Other brands 31
Alexander McQueenBalenciagaBoucheronBrioniChristopher KaneGirard-Perregaux and JEANRICHARDPomellato and DodoQeelinSergio RossiStella McCartney
Luxury division
02_VA_V7 14/04/14 11:33 Page20

2LUXURY DIVISION ~ OUR ACTIVITIES
Breakdown by brand
Revenue and recurringoperating income
€6,470 millionin revenue
19,050average number of employees
1,149directly-operated stores
€1,683 millionin recurring operating income
Breakdown by brand
Breakdown by product category
Breakdown by region
Gucci 55%Bottega Veneta 16%
Saint Laurent 8%Other brands 21%
Leather goods 54%Shoes 13%
Ready-to-wear 16%
Watches 4%Jewellery 5%
Other 8%
Western Europe 33%North America 19%
Japan 10%Asia Pacific 31%
Other countries 7%
2013 key figures
Gucci 67%Bottega Veneta 20%
Saint Laurent 5%Other brands 8%
Revenue (in € millions)
Recurring operating income (in € millions)2012 2013
6,470
1,683
6,212
1,612
Total 2012: 958
Total 2013: 1,149WesternEurope
NorthAmerica
Japan
237249
161197
245
304
Emergingcountries
315
399
212013 Reference Document ~ Kering
02_VA_V7 14/04/14 11:33 Page21

2
2013 key figures
€3,561 millionin revenue
€1,132 millionin recurring operating income
9,415average number of employees
474directly-operated stores
Breakdown of 2013 revenueby product category
Breakdown of 2013 revenueby region
Leather goods 58%Shoes 14%
Ready-to-wear 11%Watches 5%Jewellery 2%
Other 10%
Western Europe 28%
North America 20%
Other countries 6%
Japan 10%
Asia Pacific 36%
BUSINESS CONCEPT
Founded in Florence in 1921, Gucci is one of the world’sleading luxury fashion brands.
Gucci’s legacy began more than 90 years ago with thefounder, Florentine artisan Guccio Gucci. Initially, theproduct was primarily focused on handcrafted leatherluggage, then expanded into all kinds of leather goodsand accessories. In a time before marketing and brandpositioning existed, Guccio Gucci set the tone for thebrand and what it would represent: a combination oftradition and modernity, craftsmanship and innovation.
From its foundation in the 1920s through the late 1970sthe brand stayed loyal to its values of superior Italiancraftsmanship and innovation, and Gucci became theexpression of Italian-made luxury for the international jetset. The following decades were the years of the brand’sinternational expansion, first in the US, then in Japan andAsia, while, in the 1990s, the brand became recognized asone of the most influential of its time.
Since Frida Giannini took over as Creative Director in2006, the brand has turned full circle to restore the visionof Guccio Gucci and find the right balance betweenfashion and heritage.
Gucci today designs, manufactures and distributes highlydesirable products for men and women, including leathergoods (handbags, small leather goods and luggage),shoes, ready-to-wear, silks, timepieces and fine jewellery.Eyewear and fragrances are manufactured and distributedunder license by global industry leaders in these twosectors. Gucci products are sold exclusively through anetwork of 474 directly-operated boutiques (77% of totalGucci revenues), a directly-operated e-commerce website(with more than 3,000 products available to customers)and a limited number of franchisees, as well as selecteddepartment and specialty stores.
COMPEtitiVE ENVIRONMENT
Gucci is one of the few luxury brands with truly worldwideoperations alongside Hermès, Chanel and Louis Vuitton.In a challenging environment Gucci is maintaining itsposition as one of the world’s largest Luxury Goodsbrands in terms of both revenue and profitability.
OUR ACTIVITIES ~ LUXURY DIVISION ~ GUCCI
22 Kering ~ 2013 Reference Document
02_VA_V7 14/04/14 11:33 Page22

2
StrATEGY
The luxury sector has grown strongly in the last few years,despite a challenging macroeconomic climate. In eachmarket, customers are at different stages in theirappreciation of luxury, yet most are adopting much moreprudent and thoughtful spending behaviours. They arelooking to be discreet, and they are seeking authenticvalues and an individual approach, accompanied by aunique brand experience.
Anticipating this shift in demand, over the last five yearsthe team led by Patrizio di Marco, Gucci President and CEO,and Frida Giannini, Gucci’s Creative Director, has continuedto move the brand towards a higher positioning, with afocus on products with a higher average value (driving higherprofitability), encapsulating Gucci’s quality, creativity,innovation and Italian craftsmanship. The long-term goal isto recapture the mid-high end of the market, re-attractingthe most sophisticated and exclusive luxury consumers witha more balanced product offer and a series of tacticalactions on communication and distribution.
Looking at distribution, a key element of the strategyworldwide has been the implementation of ongoingactions to reduce the proportion of indirect distribution,taking direct control wherever possible of the brand’sstore network and further enhancing the consistency ofthe consumer’s experience across different markets.
In this environment, Gucci intends to continue achievingbest-in-class profitability and long-term sustainablegrowth across product categories and geographic regions,while always maintaining high standards of socialresponsibility.
GUCCI ~ LUXURY DIVISION ~ OUR ACTIVITIES
2013 HIGHLIGHTS AND OUTLOOK FOR 2014
Gucci’s fashion authority – a fundamental part of thebrand’s DNA – was again on full display in 2013. Duringthe year Gucci introduced a series of new, iconic andsuccessful products, including the very sophisticated nologo leather handbags, the Lady Lock and BambooShopper, which both contain signature details such asthe bamboo handle. Launched in the Fall/Winter 2013-14 collections, the Lady Lock and Bamboo Shopperquickly joined the top-selling bags in most regions. 2013was also the sixtieth anniversary of Gucci’s legendaryhorsebit loafer, which was celebrated with thereinterpretation of the classic loafer for both women andmen, in seasonal colors and fine materials, supported byan innovative 360-degree communication effort.
Across most regions, the effective implementation ofGucci’s strategy was confirmed by the solid top-linegrowth posted by the retail business in most of theworld’s regions. In some countries – notably China – thisstrategy is currently being implemented and thereforerequires further time to be reflected in the sales trend.However, as already seen in regions where this strategywas first implemented, such as the US, Japan andWestern Europe, it should bring tangible benefits to thesales trend over time.
During the year, Gucci’s distribution strategy has beendriven by the goal to ensure coverage in untapped markets,such as Brazil, while also bolstering its presence in keyWestern European countries such as France. This cametogether with the effective roll-out of an ambitiousrefurbishment plan, in order to bring the store network tothe same high standard as Gucci’s products and to createa consistent brand image across regions.
Gucci also continued its buyback strategy across differentmarkets. In North America the process has been completedin many department stores, while in others there is stillroom to convert its presence into directly-operated stores.As of today, the most recent and evident achievements ofGucci’s wholesale conversion strategy are in NorthAmerica (with the completed buyback of SAKS and HoltRenfrew doors this year).
To meet the growing customer appetite for specificproduct categories, 2013 saw an increased number ofnew stores dedicated to the Children’s Collections andMen’s World. Specifically, in June Gucci opened its firstmen’s flagship in Europe, in Milan’s historic Brera district.The store was also the first to offer the capsule Made to
232013 Reference Document ~ Kering
02_VA_V7 14/04/14 11:33 Page23

2 OUR ACTIVITIES ~ LUXURY DIVISION ~ GUCCI
Measure collection designed by Creative Director FridaGiannini and Lapo Elkann, a contemporary statement ofclassic tailoring conceived as “Lapo’s Wardrobe”.
Respect for the House’s heritage and traditions goeshand-in-hand with the desire to keep the brand relevantand vibrant for new generations of customers. In thisregard, Gucci has indeed been successful in reaching newcustomers thanks to the attention paid to the internet inthe last ten years. Through the various and diversifieddigital channels, Gucci is able today to reach a broadaudience – more than 25 million of people – in a verydirect and content-rich way. As of today, Gucci operates e-commerce in 28 countries.
In 2013, Gucci again introduced several productinnovations as both a continuation of Gucci’s leadershipin social responsibility and a way to satisfy the modernconsumer’s desire for ethically-produced, sustainablefashion products. In July, Gucci also announced that ithad developed an innovative methodology to reduce theenvironmental impact of the leather tanning process.
Indicative of the company’s attention to its Florentineroots and in line with its strategy of showcasing theexcellence of Italian-manufactured products all over theworld, in April 2013 Gucci finalised the acquisition ofRichard Ginori 1735, the leading Italian brand in finechina tableware. The goal of the acquisition is to re-launch in the medium and long-term the historicFlorentine brand – which has always been synonymouswith quality, craftsmanship and made in Italy, the samevalues that lie at the heart of the Gucci brand’s success.
In February, Gucci announced the foundation of CHIMEFOR CHANGE, a global campaign to raise funds andawareness for girls’ and women’s empowerment. OnJune 1, the London concert “THE SOUND OF CHANGE LIVE”attended by more than 50,000 people and broadcast inover 150 countries – gathered together some of theworld’s most talented artists and renowned activists togive a voice to girls’ and women’s empowerment issuesworldwide, and in doing so raised almost USD 4 million inticket sales for around 210 projects in over 70 countriesaround the world.
In 2014, Gucci’s management team will continueinvesting to consolidate the uniqueness of the brandpositioning to build its brand equity and drive long-termsustainable growth, enhance its commitment tocustomers, and focus on nurturing further its higher-endproduct offering, both through novelties and carry-overs.
Gucci will also continue to enhance its retail excellence,both through selective store openings and by pursuing
retail excellence, either through wholesale conversions inEastern Europe and South-East Asia, or through retailstore refurbishments in key cities.
Revenue and recurringoperating income
Revenue (in € millions)
Recurring operating income (in € millions)2012 2013
3,561
1,132
3,639
1,126
Number of directly-operated stores by region
Total 2012: 429
Total 2013: 474WesternEurope
NorthAmerica
Japan
66 66
100116
97109
Emergingcountries
166183
24 Kering ~ 2013 Reference Document
02_VA_V7 14/04/14 11:33 Page24
2BOTTEGA VENETA ~ LUXURY DIVISION ~ OUR ACTIVITIES
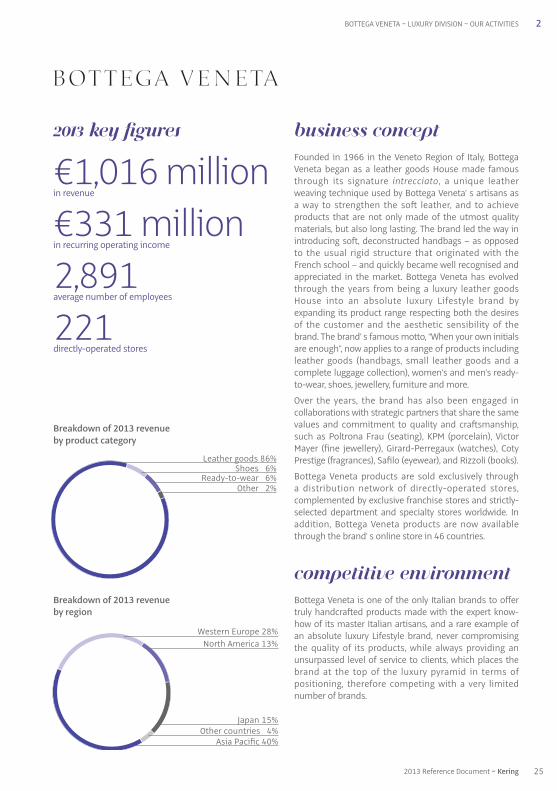
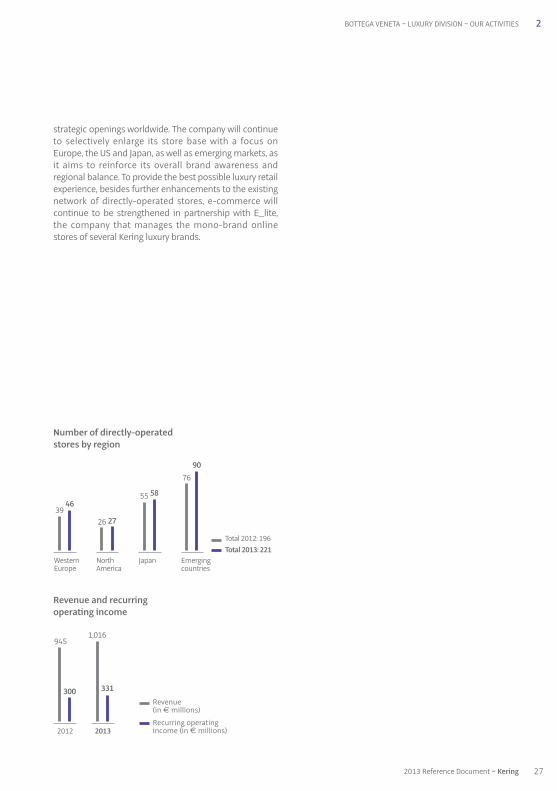
2013 key figures
€1,016 millionin revenue
€331 millionin recurring operating income
2,891average number of employees
221directly-operated stores
Breakdown of 2013 revenueby product category
Breakdown of 2013 revenueby region
Leather goods 86%Shoes 6%
Ready-to-wear 6%Other 2%
Western Europe 28%
North America 13%
Asia Pacific 40%
Japan 15%Other countries 4%
BUSINESS CONCEPT
Founded in 1966 in the Veneto Region of Italy, BottegaVeneta began as a leather goods House made famousthrough its signature intrecciato, a unique leatherweaving technique used by Bottega Veneta’ s artisans asa way to strengthen the soft leather, and to achieveproducts that are not only made of the utmost qualitymaterials, but also long lasting. The brand led the way inintroducing soft, deconstructed handbags – as opposedto the usual rigid structure that originated with theFrench school – and quickly became well recognised andappreciated in the market. Bottega Veneta has evolvedthrough the years from being a luxury leather goodsHouse into an absolute luxury Lifestyle brand byexpanding its product range respecting both the desiresof the customer and the aesthetic sensibility of thebrand. The brand’ s famous motto, “When your own initialsare enough”, now applies to a range of products includingleather goods (handbags, small leather goods and acomplete luggage collection), women’s and men’s ready-to-wear, shoes, jewellery, furniture and more.
Over the years, the brand has also been engaged incollaborations with strategic partners that share the samevalues and commitment to quality and craftsmanship,such as Poltrona Frau (seating), KPM (porcelain), VictorMayer (fine jewellery), Girard-Perregaux (watches), CotyPrestige (fragrances), Safilo (eyewear), and Rizzoli (books).
Bottega Veneta products are sold exclusively through a distribution network of directly-operated stores,complemented by exclusive franchise stores and strictly-selected department and specialty stores worldwide. Inaddition, Bottega Veneta products are now availablethrough the brand’ s online store in 46 countries.
COMPEtitiVE ENVIRONMENT
Bottega Veneta is one of the only Italian brands to offertruly handcrafted products made with the expert know-how of its master Italian artisans, and a rare example ofan absolute luxury Lifestyle brand, never compromisingthe quality of its products, while always providing anunsurpassed level of service to clients, which places thebrand at the top of the luxury pyramid in terms ofpositioning, therefore competing with a very limitednumber of brands.
252013 Reference Document ~ Kering
02_VA_V7 14/04/14 11:33 Page25
StrATEGY
Bottega Veneta’ s strategy, implemented under the creativedirection of Tomas Maier and the leadership of Presidentand CEO Marco Bizzarri, aims to position Bottega Venetaas a high-end and exclusive luxury Lifestyle brand, forwhich consistency and continuity are the key elements tomaintaining differentiation in the industry.
The core of the business historically lies in the leather goodsproduct categories, characterised by the attention todetails and the use of the highest quality of materials,progressively integrating a wider range of productsappealing to a sophisticated clientele of women and men,through contemporary functionality and timeless design.
The predominant trait of exclusivity has been transferredto the distribution network; through a significantworldwide expansion, Bottega Veneta consolidated itspresence in the emerging markets, without compromisingthe investments in the mature markets, especially Europe,origin of Bottega Veneta’ s tradition and craftsmanship.
Always focused on nurturing core values, the brandoperates mainly through directly-operated stores, while asmall part of the business is covered by a distinctiveselection of franchise boutiques and department andspecialty stores.
2013 HIGHLIGHTS AND OUTLOOK FOR 2014
In 2013, the careful execution of the internationaldevelopment strategy, consistent with the exclusivepositioning of the brand, resulted in growth recorded inall geographic areas, of which mature markets accountfor 56% of total sales, and for both retail and wholesalechannels, which respectively account for 81% and 19% oftotal sales. Leather goods continue to be the core for thebrand, constituting 86% of total sales.
Iconic leather goods products, also in new seasonalvariations, continued to represent a very important part ofthe business in 2013, while men’ s categories performedexceptionally well, underlining Bottega Veneta’ s strategiceffort to expand in this clientele segment.
Consequent to the successful 2011 introduction of itssignature women’s fragrance, in June 2013 BottegaVeneta launched its first fragrance for men, BottegaVeneta Pour Homme, further leveraging the BottegaVeneta brand and expanding its brand awareness.
Bottega Veneta opened the new Atelier in MontebelloVicentino in 2013, marking a new milestone for thedevelopment of the brand. The new site, a 55,000 squaremetre park with a historical villa, includes the ScuolaDella Pelletteria Bottega Veneta, where young artisans aretrained and taught Bottega Veneta’s exceptionalcraftsmanship capabilities. In this way the company willsecure the presence of the tradition and know-how foryears to come.
In 2013, Bottega Veneta enhanced its retail network withselective store openings worldwide, in both emerging andmature markets, reaching 221 compared to 196 at theend of 2012. The new stores were equally distributed inemerging and mature markets (14 new stores in APACand 11 new stores among Europe, Japan and America).
As a further step in the implementation of its absolute brandpositioning strategy, Bottega Veneta opened the brand’sfirst Maison in the world in September 2013. Located inthe prestigious Milan location of Via Sant’Andrea 15, thedesign and approach to the customer renders the brand’slargest store in the world unique among the entire retailnetwork, and represents an addition to the historicflagship located at Via Montenapoleone 5. The Maisonshowcases the entire Bottega Veneta product range, whilemaintaining the level of intimacy and utmost quality ofservice that characterises the brand.
In addition, in 2013 Bottega Veneta opened a gallery-likeboutique in Los Angeles on Melrose Place. The boutique,measuring 2,727 square feet, illustrates the retailevolution of the brand, and is part of Bottega Veneta’sapproach to the shopping experience for cities in whichthe brand is already established. This concept has beentailored to meet proclivities and tastes of the clientele inthose specific local areas.
During the year, following the success of a similar initiativeorganised at the Shanghai Yfeng Galleria Flagship store inthe previous year, Bottega Veneta brought artisans fromits Italian atelier to Japan for the first time, in order tospread the knowledge of its unique craftsmanship in oneof its key mature markets. The occasion was the BottegaVeneta World Exclusive for the Japanese departmentstore Isetan, a two-week event that kicked off in May 2013,during which an extensive presentation of the brand’sproduct range was exclusively displayed throughout theShinjuku flagship location and in all 15 windows,ultimately becoming for Isetan and the brand the firstinstallation of this scale.
In 2014, Bottega Veneta will continue to build on itsaccomplishments and positioning, supported by further
26 Kering ~ 2013 Reference Document
2 OUR ACTIVITIES ~ LUXURY DIVISION ~ BOTTEGA VENETA
02_VA_V7 14/04/14 11:33 Page26
strategic openings worldwide. The company will continueto selectively enlarge its store base with a focus onEurope, the US and Japan, as well as emerging markets, asit aims to reinforce its overall brand awareness andregional balance. To provide the best possible luxury retailexperience, besides further enhancements to the existingnetwork of directly-operated stores, e-commerce willcontinue to be strengthened in partnership with E_lite,the company that manages the mono-brand onlinestores of several Kering luxury brands.
27
2
2013 Reference Document ~ Kering
BOTTEGA VENETA ~ LUXURY DIVISION ~ OUR ACTIVITIES
Revenue and recurringoperating income
Revenue (in € millions)
Recurring operating income (in € millions)2012 2013
1,016
331
945
300
Number of directly-operated stores by region
Total 2012: 196
Total 2013: 221WesternEurope
NorthAmerica
Japan
55 58
26 2739
46
Emergingcountries
76
90
02_VA_V7 14/04/14 11:33 Page27

2 OUR ACTIVITIES ~ LUXURY DIVISION ~ SAINT LAURENT
2013 key figures
€557 millionin revenue
€77 millionin recurring operating income
1,445average number of employees
115directly-operated stores
Breakdown of 2013 revenueby product category
Breakdown of 2013 revenueby region
Leather goods 44%Shoes 22%
Ready-to-wear 24%Other 10%
Western Europe 42%
North America 22%
Asia Pacific 20%
Japan 8%Other countries 8%
BUSINESS CONCEPT
Founded in 1961, Yves Saint Laurent is one of the mostprominent fashion houses of the 20th century. Originallyan haute couture House, in 1966 Yves Saint Laurentrevolutionised modern fashion through the introductionof luxury ready-to-wear under the name Saint LaurentRive Gauche.
Saint Laurent designs and markets a broad range ofmen’s and women’s ready-to-wear, handbags, shoes,small leather goods, jewellery, scarves, ties and eyewear.Production is divided between Italy and France, where anhistoric workshop manufactures ready-to-wear garments.Under worldwide licence agreements, the House alsoproduces and distributes eyewear through Safilo as wellas fragances and cosmetics with L’Oréal.
In March 2012, the House of Yves Saint Laurent announcedthe appointment of Hedi Slimane as Creative Director.Leading Yves Saint Laurent into a new era, Hedi Slimanerecaptured the impulses of ‘youth, freedom and modernity’that inspired the founder to launch Saint Laurent RiveGauche ready-to-wear in 1966.
As of December 31, 2013, Saint Laurent retail networkconsists of 115 directly-operated boutiques which togethergenerated 56% of total revenue for the year and includeflagships in Paris, London, New York, Hong Kong, Shanghai,Beijing and Los Angeles. the house is also represented inselect multi-brand boutiques and department storesaround the world.
At the end of 2013, the Saint Laurent business was verywell balanced in terms of both geographic markets andproduct categories, with leather goods and shoesaccounting for 66% of business and ready-to-wearposting the fastest growth at 51% compared to last year.
28 Kering ~ 2013 Reference Document
02_VA_V7 14/04/14 11:33 Page28

29
2
2013 Reference Document ~ Kering
SAINT LAURENT ~ LUXURY DIVISION ~ OUR ACTIVITIES
COMPEtitiVE ENVIRONMENT
Since its inception, Yves Saint Laurent has held enormousinfluence within and outside the fashion industry.Through the years, its founder, the couturier Yves SaintLaurent, secured a reputation as one of the 20th century’sforemost designers and personalities.
Saint Laurent now competes globally with other Frenchhigh-end exclusive luxury brands and occupies a leadingposition in ready-to-wear, fashion and leather goodssectors.
StrATEGY
Saint Laurent’s primary objective is to create and markethighly desirable products, which embody the core valuesof the brand through innovation and unparalleled qualityand design.
Since his arrival, Hedi Slimane has entirely redefined themen’s and women’s collections and worked on new linesfor all categories. The collections for men and womenhave been repositioned and made even in terms of depthof the offer and product ranges. This repositioning isaccompanied by a rejuvenation of the style, in line withYves Saint Laurent’s original message of 1966. Ready-to-wear is therefore once again becoming a strong componentof Saint Laurent’s overall product offer, across bothgenders. At the same time Saint Laurent aims to furthernurture the development of its leather goods, shoes andother accessories offering.
2013 HIGHLIGHTS AND OUTLOOK FOR 2014
Under the leadership of Hedi Slimane and FrancescaBellettini, appointed CEO in September of last year, 2013has been a very rich year for Saint Laurent, with aparticular focus on new product launches, across all themain categories.
During the year, the brand’s sales were fuelled by theextremely strong growth figures posted by ready-to-wearin both retail and wholesale channels. Accessories andshoes transitioned smoothly into the new brandaesthetic, driven by the success of new styles, such as theSac de Jour handbag and Paris shoes. Notable success andcritical acclaim were also achieved for Saint Laurentfashion collections during 2013, which received significantexposure through editorials and global celebrities.
Saint Laurent also marked a year of investment in 2013,enhancing its retail network with selective store openingsworldwide, in both emerging and mature markets, andkey refurbishments and relocations.
In May 2013, the opening of the Avenue Montaigne flagshipin Paris was a significant step in the evolution of SaintLaurent under Hedi Slimane. Being located in one of themost prestigious districts for luxury shopping, it was animportant move for Yves Saint Laurent as a couture Housethat is deeply rooted in Paris. In June 2013, SaintLaurent – which operates an Uptown store on New York’sEast 57th Street – opened a store in Soho.
The establishment of the new ysl.com website has alsoplayed a key role – redesigned at the end of 2012, it featuresrich content and is a dynamic e-commerce platform thatalso forms part of the overall cross channel retail strategy.From June 2013, ysl.com added 30 additional countries,and now offers e-commerce to 60 countries around theworld. Furthermore, ysl.com moved onto the Yooxplatform as part of E_lite, the joint venture between Keringand Yoox signed in 2012, whereby the latter provides theinfrastructure for managing operations while SaintLaurent remains in full control of the image, productassortment, editorial content and art direction of the site.
Social media initiatives were met with extraordinarysuccess as social platforms were fully integrated intoglobal communications practices and strategies. As ofDecember 2013, Yves Saint Laurent had nearly 1.8 millionfans on Facebook and was one of the most popularluxury brands on Twitter with over 1.7 million followers.
02_VA_V7 14/04/14 11:33 Page29

Continuing a tradition of close relationships between theHouse and rock icons from its earliest days, the interplaybetween music, art and fashion is important to the SaintLaurent vocabulary, where collaborations are instinctive.In March 2013, Saint Laurent announced its ongoingMusic Project, a growing portraiture campaign of rock starsand artists such as Courtney Love, Daft Punk and legendarymusicians such as Chuck Berry, styling themselves iniconic and permanent pieces of the Saint Laurentcollection. Those initiatives contribute to conveying aholistic universe around the Saint Laurent brand, whilegenerating a positive marketing halo from fashion showsdown to press editorials, as well as contributing to furtherbolstering the House’s awareness globally.
In terms of distribution, the company pursues anambitious expansion of its retail network, which startedin 2012 with the initial launch of its new store concept. In2014 and going forward, the focus will not only be onemerging markets, such as Middle East, China or SouthEast Asia, but also on further development in the US,Japan and Europe, with openings in key international cities.Existing stores will also be progressively refurbished withthe new concept globally.
30 Kering ~ 2013 Reference Document
2 OUR ACTIVITIES ~ LUXURY DIVISION ~ SAINT LAURENT
Revenue and recurringoperating income
Revenue (in € millions)
Recurring operating income (in € millions)2012 2013
557
77
473
65
Number of directly-operated stores by region
Total 2012: 89
Total 2013: 115WesternEurope
NorthAmerica
Japan
22 21
10
17
2631
Emergingcountries
31
46
02_VA_V7 14/04/14 11:33 Page30
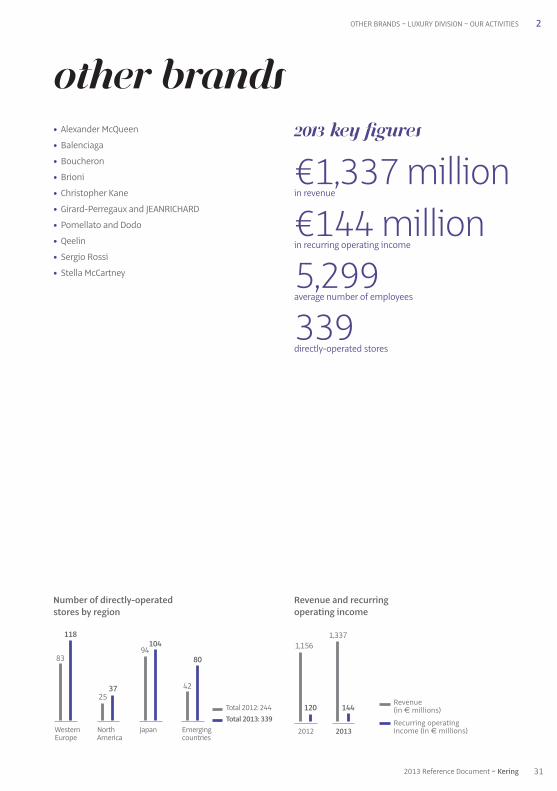
31
2
2013 Reference Document ~ Kering
OTHER BRANDS ~ LUXURY DIVISION ~ OUR ACTIVITIES
Revenue and recurringoperating income
Revenue (in € millions)
Recurring operatingincome (in € millions)2012 2013
1,337
144
1,156
120
Number of directly-operated stores by region
Total 2012: 244
Total 2013: 339WesternEurope
NorthAmerica
Japan
94104
2537
83
118
Emergingcountries
42
80
Other brands2013 key figures
€1,337 millionin revenue
€144 millionin recurring operating income
5,299average number of employees
339directly-operated stores
• Alexander McQueen
• Balenciaga
• Boucheron
• Brioni
• Christopher Kane
• Girard-Perregaux and JEANRICHARD
• Pomellato and Dodo
• Qeelin
• Sergio Rossi
• Stella McCartney
02_VA_V7 14/04/14 11:33 Page31

Founded in 1992 by Lee Alexander McQueen the brandquickly gained a reputation for conceptual design and astrong brand identity which led to a partnership withKering in 2001. The brand is now fully owned by Keringsince the passing of Lee Alexander McQueen in 2010.
Renowned for its unbridled creativity, Alexander McQueen –under the leadership of the CEO, Jonathan Akeroyd andthe vision of Sarah Burton, Creative Director since 2010 –has strongly developed its business internationallythrough both wholesale and retail channels over the pastdecade with wholesale being a key driver of growth. Inrecent years there has been an escalation of retailopenings which has enabled the brand to strengthen itsposition in the luxury arena.
Alexander McQueen currently has a total network of 24 directly-operated stores across all regions. This yearfive new stores were opened in Tokyo, Dallas, Shanghai,Hong Kong and San Francisco. In September 2013, thebrand relocated its New York flagship to Madison Avenue.Its London flagship was refurbished to complement a newstore concept that has helped to communicate a moreluxurious positioning for the brand. All collections arealso sold online in most countries, through the jointventure established with Yoox.
On the distribution side, the brand is sold in over 50 countriesand across more than 450 doors. Key partners are Saksand Neiman Marcus in the US, Harrods and Selfridges inthe UK and Lane Crawford in Asia. In all of these doorsAlexander McQueen is considered a successful brand.This has enabled the brand to open numerous shop-in-shops over recent years which has helped establish astronger brand image and business.
Franchises are also an important part of the distributionchannel and there are today 10 franchise boutiques,most of which are concentrated in the Middle East andEastern Europe.
Main product categories are women’s ready-to-wear andleather goods, although another strength of the brand isthat it has a good spread across all categories which givesit the opportunity to develop business further in manyareas. Silks and menswear have both developed stronglyin recent years and two men’s only stores were opened in2012 to help this category to develop further. There is also aneyewear licence with Safilo and a fragrance licence wassigned in 2013 with Procter & Gamble which will give thebrand an important platform to build on in coming years.
The company has also successfully developed McQ, anadditional brand which started as a licence in 2006 andwas re-launched as an in-house brand in 2011. The McQbrand has quickly established itself in the popularcontemporary market and is not only an importantcontributor to the overall Alexander McQueen businessbut also an important player in the contemporary sector.
McQ is distributed at a broader level and is sold primarilyas a wholesale business internationally with a total of more than 500 doors. Franchises are an important partof the business with nine openings in 2013 includingShanghai, Beijing and Seoul, leading to a total of 11franchise stores mainly in Asia and the Middle East. Afreestanding directly-operated store was opened in DoverStreet London in 2012 to help support the positioning ofthe brand to the market.
The development of McQ will enable the brand to pushfurther in the growing contemporary market and also enablethe Alexander McQueen brand to remain very exclusive.
In 2014 both brands will continue to develop further witha continued focus on product development especially inthe accessories categories. There will also be further retailopenings for Alexander McQueen. Marketing activities willalso be strengthened to build on the current momentumand improve brand awareness following on from thehugely successful brand exhibition “Savage Beauty” thatwas held at the Metropolitan Museum in New York andwhich will be shown in London in 2015.
32 Kering ~ 2013 Reference Document
2 OUR ACTIVITIES ~ LUXURY DIVISION~ OTHER BRANDS
02_VA_V7 14/04/14 11:33 Page32

Founded in 1919 by Cristóbal Balenciaga and establishedin Paris in 1936, the brand defined many of the greatestmovements in fashion from the 1930s to the 1960s. Themastery of techniques and cut, together with constantinnovation in fabrics, marked out a special place for Balenciagain the hearts and minds of its customers and followers.
In the 1990s and early 2000s, the brand experienced a re-birth,which saw an extension of its product universe onto abroader range of products, with particular focus on iconichandbag launches, together with increased focus onfashion shoes as well as accessories, without compromisingthe core ready-to-wear segment. The brand also witnesseda significant expansion of its retail network, furthercontributing to bolstering its brand awareness around theglobe. Reflecting this, Balenciaga is now equally distributedthrough directly-operated stores and e-commerce, as wellas through franchisees and leading multi-brand stores.
While the brand’s identity is firmly anchored on its highlysymbolic ready-to-wear collections, its bag and shoelines have also enjoyed phenomenal worldwide success.The women’s and men’s ready-to-wear collections span awide price range, from the most emblematic items tomore universal products, thus opening Balenciaga’s styleto a wider public.
In fragrance, the brand has established a solid licensepartnership with Coty and has released some successfulperfumes: Balenciaga Paris, L’Essence and Florabotanica.More recently, a similar partnership with Marcolin has beenbuilt up in eyewear with a first promising collection launchedat the end of 2013.
With his proven talent and cosmopolitan vision of design,Alexander Wang – appointed Creative Director inDecember 2012 – has embraced the heritage of thisfashion House.
Over the past years, under CEO Isabelle Guichot’s leadership,Balenciaga has been developing a project aimed atconsolidating a directly-operated store network worldwide.Today Balenciaga has a retail network of 81 stores welldeveloped in both mature markets (Western Europe, US and Japan) and Asia (Greater China and South Korea).In addition, Balenciaga e-commerce currently covers 91 countries and since May 2013 has been operated throughthe E_lite platform, under a new joint venture created byKering and Yoox.
2013 has been another milestone in Balenciaga’s retailstrategy, with the setup of direct operations in SouthKorea (seven directly-operated stores) and the opening inNovember of two new flagships (one dedicated toWomen and the other to Men) in New York’s Soho District,giving complete access to Balenciaga’s entire range ofproducts for the first time in such a premium retaillocation and unveiling the first version of its new retailconcept under Alexander Wang’s vision.
Balenciaga also continued to strengthen its position inmainland China, with two net store openings in additionto the twelve stores already existing in the country. Duringthe year the brand also extended its retail presence inupscale department stores with the opening of threeshop-in-shops in Paris, London and Tokyo.
In 2014, the brand will continue to leverage the impetusprovided by new product launches, together with a focuson further developing its retail concepts around theworld. Franchise and selective distribution remain keycontributors to the brand activity, but retail and e-commerce development will continue to be a priority forthe brand in 2014 and going forward, with new storeopenings planned in strategic locations in maturemarkets and in Asia.
33
2
2013 Reference Document ~ Kering
OTHER BRANDS ~ LUXURY DIVISION ~ OUR ACTIVITIES
02_VA_V7 14/04/14 11:33 Page33

Founded in Paris in 1858 by Frédéric Boucheron, theeponymous Maison grew up under four generations ofthe founder’s direct descendants and soon acquiredfame as an expert in precious stones and as a master ofsavoir-faire in creating innovative jewellery and watches.The jeweller, which decided to move to Place Vendôme in1893, was the first of the current neighbours to open aboutique on the square. For more than 150 years Boucheronhas embodied excellence in Jewellery, High Jewellery andWatchmaking.
Today, Boucheron creates and markets jewellery (bijoux,jewellery as well as high jewellery) and watches through37 directly-operated stores across the world, includingthe flagship Place Vendôme store, franchise boutiques,department stores and exclusive multi-brand boutiques.
For the Maison, 2013 marked the launch of a new boutiqueconcept, enhancing its high-end values of excellence andFrench know-how. By the end of the year, ten stores hadbeen refurbished in line with the new concept. TheFaubourg Saint-Honoré boutique in Paris, and the Harrodsshop-in-shop in London were the first stores offering thenew image of the Maison.
After the opening in 2012 of its first directly-operated storein Hong Kong, in 2013 Boucheron expanded its networkin the APAC region with a second DOS in Hong Kong andthe renovation of the Taipei boutique. In addition, twonew franchise stores were opened in Shanghai and AbuDhabi. The recent establishment of a Boucheron officeand local team in Hong Kong has also strengthened theMaison’s retail presence in this key area.
With the relaunch of iconic jewellery collections such asQuatre and Serpent Bohème in 2013, Boucheron experiencedsolid growth during the year. The second High Jewelrycollection designed by Claire Choisne enjoyed strong successwith both media and clients, giving the Maison a greatplatform to leverage for the years to come. In 2013, in orderto build brand awareness outside the home country,Boucheron strengthened its exposure to the luxury andcultural scenes, promoting two exhibitions with two majorJapanese artists, Makoto Azuma and Hiroshi Sugimoto.
In 2014 and in the following years Boucheron will continueto reinforce its retail network worldwide. The presentationof the collections during the renowned 2014 Biennale desAntiquaires in Paris should also help to consolidate Boucheron’spresence among the best international jewellers.
34 Kering ~ 2013 Reference Document
2 OUR ACTIVITIES ~ LUXURY DIVISION~ OTHER BRANDS
02_VA_V7 14/04/14 11:33 Page34

Brioni was founded in 1945 by two representatives ofItalian excellence, Nazareno Fonticoli, a tailor from Abruzzo,and an entrepreneur, Gaetano Savini, whose vision was toset a new reference in tailoring. Shortly after its creation,Brioni embodied the Dolce Vita spirit in menswear andbecame the first ambassador for Italian men’s fashion aroundthe world. Over the years Brioni developed a very stronginternational appeal, becoming one of the world’s mostfamous men’s tailoring houses and the symbol of masculineand contemporary elegance. Illustrating this, in 2007 andagain in 2011, the Luxury Institute of New York named Brionias the most prestigious men’s luxury fashion brand in America.
In January 2012, Brioni became part of the Kering group andin July of the same year, Brendan Mullane was appointedas Creative Director, to reinforce and achieve the company’sgrowth ambitions and to re-affirm its undisputed leadershipin the high-end menswear market. Beyond its coreformalwear offer, Brioni’s product range currently coversall categories of men’s attire, including casual ready-to-wear, leather goods, shoes and other accessories such aseyewear, launched in 2012.
Today, under the leadership of CEO Francesco Pesci, theHouse stands as much for the “Made in Brioni” promise,which goes even further than “Made in Italy” craftsmanship,as it does for its iconic and recognisable products. Mostof the production is carefully crafted in Brioni’s ateliers inPenne (Abruzzo), where its artisans apply a combinationof unique savoir-faire:
• the art of tailoring: a grand tradition combining highlyskilled master tailors and its own tailoring school toperpetuate know-how;
• a customised approach: a Brioni garment must reflectthe wearer’s personality and inner style. That is whyBrioni’s bespoke expertise is applied to both made-to-measure and to ready-to-wear, offering customers thehighest level of personalisation;
• a daring use of colour to stand out from the crowd. Brioniwas the only sartorial brand to use colour at a timewhen British codes stood for the conventional shadesof grey, blue and black.
While wholesale still represents Brioni’s major distributionchannel, in recent years the brand has developed a retailnetwork through both new store openings as well as thebuy-back of franchise stores.
At the end of 2013, Brioni had 45 directly-operated stores,mainly located in Western Europe, North America and Japan.During the year, Brioni expanded its retail network in NorthAmerica, Asia and Western Europe with 10 net openings,including three stores in the United States (Chicago, CostaMesa and Palm Beach), five franchise stores that have beenbought back in Mainland China and two stores in WesternEurope (Vienna and Frankfurt). Management’s goal for2014 and for the medium to long-term is to further expandthe retail network and to strengthen the company’spresence in Asia and onto other emerging markets.
35
2
2013 Reference Document ~ Kering
OTHER BRANDS ~ LUXURY DIVISION ~ OUR ACTIVITIES
02_VA_V7 14/04/14 11:33 Page35

Incepted in 2006 by eponymous designer, Christopher Kaneis a brand which is now widely acknowledged to havespearheaded a revival of British high fashion, through thelaunch of innovative ready-to-wear styles. After havingcompleted his Master of Arts (MA) in Fashion design at CentralSaint Martins College, Christopher Kane realised his ambitionto start his own label, in partnership with his older sister,Tammy Kane.
Today, the brand, driven by aesthetics, attitude and spiritof collections that are immediately recognisable, designsdistinctly identifiable high-end women’s and men’sready-to-wear pieces.
In January 2013 Kering announced the purchase of a 51%share of the company. In September, Christopher Kane andKering announced the appointment of Alexandre de Brettesas CEO of the brand, this announcement forms part of thecompany’s global development strategy. Finally, in DecemberChristopher Kane was awarded with the prestigious 2013Womenswear Designer of the Year by the British Fashion
Council (BFC). The award, which is given to a designer whohas been instrumental in enhancing women’s fashion,recognises a triumphant year for the London-based brand.The increased brand awareness in 2013 has resulted instrong growth across all product categories in thewholesale channel.
On the distribution side, Christopher Kane’s collectionsare now distributed in over 30 countries across more than150 wholesale accounts. The primary product category is women’s ready-to-wear. The menswear category wasadded in Spring 2011. The company also produces shoesto accompany these collections, which will be expandedover the next few years.
In 2014 the brand will open its first flagship store inLondon, which will be situated on Mount Street, Mayfair.Further growth is also planned in the wholesale channel,which will be assisted by the launch of the brand’s firstleather goods collection.
36 Kering ~ 2013 Reference Document
2 OUR ACTIVITIES ~ LUXURY DIVISION~ OTHER BRANDS
02_VA_V7 14/04/14 11:33 Page36
Based in La-Chaux-de-Fonds, Girard-Perregaux is a high-end Swiss watch manufacturer tracing its origins back to1791. The history of the brand is marked by watches thatcombine sharp design with innovative technology such asthe renowned Tourbillon with three Gold Bridges presentedby Constant Girard-Perregaux in 1889 at the ParisUniversal exhibition where he was awarded a gold medal.
Devoted to the creation of state-of-the-art Haute Horlogerie,Girard-Perregaux is one of the very few watchmakers tocombine all the skills of design and in-house manufacture,including the forging of the movements.
Since 2011, when Kering took a majority stake in SowindGroup, owner of Girard-Perregaux, the brand hasimplemented a new strategy aimed at creating a bridgebetween its rich past and its future. The collections werestreamlined while the launch of two new concepts in2013 (Hawk and Traveller) aimed at strengthening Girard-Perregaux’s position in Western markets and the Middle-East. In the high-end segment, the presentation of the“ Constant Force escapement ” at Baselworld 2013 wasacclaimed by the industry. As the result of more than eightyears of research and development, this groundbreakingconcept was awarded this year’s Aiguille d’or at the GrandPrix de Genève (GPHG), the most prestigious award withinthe global watch industry.
Mainly driven by wholesale business, Girard-Perregaux is nowpresent in over 70 countries across some 450 wholesaleaccounts (including prestigious department stores and specialties shops) as well as 17 mono brand stores(16 franchise stores and one directly-operated store)located in Asia, Europe and the United States. Newdistribution partners were added to drive the brand’sfuture growth in South America, in Europe and in theMiddle-East.
Based also in La Chaux-de-Fonds, JEANRICHARD was namedafter Daniel JEANRICHARD, who pioneered the Swisswatchmaking industry during the 17th century and inventedseveral machines and tools that are still crucial formanufacturing timepieces. This visionary and pioneeringspirit, which has been cultivated by his successors eversince, remains the soul of JEANRICHARD.
In 2012, JEANRICHARD launched its new identity andstrategic development based on the communicationpillars of traditional watchmaking, land, water and air. Inthis occasion, the overall positioning of JEANRICHARD hasbeen reviewed, in order to better anchor the brand at theforefront of the accessible luxury segment.
The collection – based on a common complex andinnovative “chassis” industrial platform case – embodiesthese four pillars with the “1681” (a contemporary re-interpretation of a traditional look, using the JR1000manufacture movement with automatic winding,created in 2004, conceived and built entirely in itsworkshops), the “Terrascope”, the “Aquascope” and the“Aeroscope”. For each of these environments, JEANRICHARDtells stories of people whose passions have driven themto do extraordinary things.
Today, JEANRICHARD is available in most regions of theworld through more than 150 points of sale with keyindependent retailers and high-end watch chains. Itsmost relevant presence today is in North America and LatinAmerica and the roll-out of the distribution network isexpected to continue in 2014 – particularly in Europe andAsia, where the brand already has a good presence in GreaterChina – and aims to reach 250-300 points of sale worldwide.
Sowind Haute Horlogerie Group, besides owning Girard-Perregaux and JEANRICHARD brands, incorporates amanufacturing activity that develops and produces acomplete portfolio of high-end watch movements andmechanical watches for its two brands and third parties,including Kering brands such as Gucci, Bottega Venetaand Boucheron.
37
2
2013 Reference Document ~ Kering
OTHER BRANDS ~ LUXURY DIVISION ~ OUR ACTIVITIES
02_VA_V7 14/04/14 11:33 Page37

2 OUR ACTIVITIES ~ LUXURY DIVISION~ OTHER BRANDS
38 Kering ~ 2013 Reference Document
Synonymous with creativity and character in theinternational jewellery scene, Pomellato was establishedin Milan in 1967, thanks to the intuition of its founder,Pino Rabolini, who was the first to introduce the prêt-à-porter philosophy into the world of jewellery. The brand’sstrong and distinctive identity enabled Pomellato torapidly gain ground in the Italian market and subsequentlyin the rest of the world.
Pomellato creations – unique in their blend of colourful stones,stone cutting and setting methods – are immediatelyrecognisable and have built a consistent, iconic style overtime. Jewels are crafted by the expert hands of goldsmiths,transforming the spirit of the brand into gold.
Dodo was created in 1995, the first jewellery line tocombine a decorative function with the idea of conveyinga message. With a unisex and multi-generational allure,Dodo became an independent brand in 2001.
To celebrate its 40th anniversary, in 2007 Pomellato madeits debut into high-end jewellery with the Pom Pom collection.Every ring is created around stones that are unique intheir rarity, large size or irregular shape. This results insophisticated, excessive, contemporary jewels, whosehigh value combines culture with an unconventional flair.
2012 was the debut year for Pomellato 67, with the brandreinterpreting the rock and transgressive spirit of the late60s in a stunning collection, translating the style codes ofthe Milanese Maison into solid silver.
In 2013 Pomellato created Rouge Passion, a capsulecollection dedicated to a woman’s most “sensual” side.Three intense red synthetic stones, backed with mother-of-pearl, epitomize the prêt-à-porter philosophy and theinnovative spirit of Pomellato.
The Pomellato group (which today includes the Pomellatoand Dodo brands) currently employs 590 people, 100 ofwhom are highly qualified goldsmiths, working in theheadquarters of the Milanese Maison. Today the companyis one of the leading European jewellery players in theinternational scene.
Thanks to an intensive programme of opening mono-brand stores, the two corporate brands – Pomellato andDodo – are currently present, with 55 directly-operated stores(35 for Pomellato and 20 for Dodo) and 30 franchiseboutiques (18 for Pomellato and 12 for Dodo), in the maincapital cities of Europe, the Middle East, Asia and theUnited States.
The group also relies upon a carefully selected distributionnetwork, through 600 wholesale partners worldwide.
In 2014 the group is planning to open several directly-operated stores worldwide, both in Europe and Asia Pacific.
In 2014 Pomellato group also plans to enter the femininewatch sector with two different collections, one forPomellato 67 and one for Dodo.
02_VA_V7 14/04/14 11:33 Page38

2OTHER BRANDS ~ LUXURY DIVISION ~ OUR ACTIVITIES
392013 Reference Document ~ Kering
Incepted in 2004 by Dennis Chan, Creative Director, andGuillaume Brochard, a French entrepreneur, and inspiredby a millennium-long Chinese cultural history, Qeelin turnsmythical and superstitious Chinese symbols into timeless,meaningful and state-of-the-art contemporary jewels.
Since its launch, Qeelin has been creatively blending traditionand modernity, embracing both the mythical essence ofChina’s cultural heritage and the excellence of Frenchcraftsmanship to design contemporary fine jewellery.
The brand’s name reflects its identity as it refers to the“Qilin”, an auspicious Chinese mythical animal and rootedsymbol of love, understanding and protection. The brand’siconic Wulu collection revisits the legendary Chinesegourd filled with auspicious associations. Qeelin is alsowell known for its Bo Bo collection, featuring an articulatedand playful diamond panda bear, China’s treasurednational hero.
The recent acquisition by Kering in December 2012 hasenabled Qeelin to accelerate its development, notablythrough an increase in marketing investments. Illustratingthis, Qeelin released its first advertising campaign inGreater China in fourth quarter 2013 to increase brandawareness. It has also continued to expand its storepresence with the opening of five new boutiques in 2013in Hong Kong and Shanghai, to reach a total of 19 boutiquesworldwide by the end of the year (11 directly-operatedboutiques and 8 franchise boutiques). This networkexpansion has been supported by the reinforcement ofthe access jewellery product offering with the successfullaunch of the Petite collection in May 2013, as well as thepromising launch of a new High Jewellery collection inOctober: the King & Queen.
This expansion strategy will be continued in 2014.
02_VA_V7 14/04/14 11:33 Page39
Since its establishment in Italy in the late sixties, SergioRossi has become a world reference in women’s luxuryfootwear. The brand has always been synonymous withstyle and timeless elegance, acclaimed for its creativityand perfect fit.
Today the brand- under the direction of its CEO, ChristopheMélard, and the newly appointed Collection and DesignDirector, Angelo Ruggeri- creates shapes and silhouetteswith well-recognised Italian know-how and a propericonic brand signature.
The brand operates a workshop in San Mauro Pascoli, locatedin Emilia Romagna, in the heartland of artisan Italy, wherethe brand’s tradition is perpetuated, while also contributingto nurturing the brand’s modernity. Illustrating this, SergioRossi recently created a capsule collection, as a tribute tothe famous Italian designer Gabriella Crespi, which will alsoinspire the Spring Summer 2014 collection. In addition toits core women’s shoes category, Sergio Rossi has successfullystrengthened the men’s shoes category and, more recentlyhas launched an accessories line featuring handbags.
Over the years, from a mainly domestic wholesale-drivenbusiness, Sergio Rossi has developed a global retail presence.Today Sergio Rossi footwear and accessories are equally soldthrough the worldwide directly-operated stores network,as well as through franchise boutiques and selecteddepartment and specialty stores. Moreover, thanks to thecollaboration with Yoox, the Sergio Rossi online store isnow accessible in all key countries.
At the end of 2013, Sergio Rossi had 53 directly-operatedstores, mainly in Japan, Europe and Greater China. In 2013,Sergio Rossi opened another directly-operated store inHong Kong to reinforce its presence in the Asia region. Thebrand also opened a directly-operated store in Las Vegasduring the year. The new store concept launched in 2010in the Rome flagship store has now been rolled out in over30 stores worldwide as part of its global refurbishment plan.
In 2014, Sergio Rossi aims to expand growth through its retailnetwork, particularly in emerging markets, while continuingto strengthen its worldwide wholesale business, especiallythrough long-term franchise partnerships and key third-party distribution.
40 Kering ~ 2013 Reference Document
2 OUR ACTIVITIES ~ LUXURY DIVISION~ OTHER BRANDS
02_VA_V7 14/04/14 11:33 Page40

Stella McCartney is an eponymous luxury Lifestyle brandwhich was launched under the designer’s name inpartnership with Kering in 2001.
Since the brand’s foundation, women’s ready-to-wearhas been the core business, but during the past years thebrand has been successfully extending its portfolio,adding other product categories such as handbags, withthe iconic Falabella bag, shoes, and very promisingdiversification in Kids.
Product diversification has also been fuelled by long-lasting successful collaborations, such as the design ofsportswear apparel with Adidas or lingerie with Bendon.The brand also developed eyewear and fragrances throughlicense agreements, as well as initiated several one-offcollaborations, all have allowed the company to increasebrand awareness as well as sales.
A lifelong vegetarian, Stella, since the early days of thebrand, has been committed to reflecting her ethical valuesin the collections, contributing to the brand’s ongoing success.2013 has been a particularly successful year in buildingbrand awareness with a persistent and strong exposureto the fashion scene. The year culminated with Stellareceiving an OBE (Order of the British Empire) from theQueen of England for her services to the fashion industry.
Initially started as a primarily wholesale business, thebrand now has more than 650 doors worldwide in over50 countries, but most recently it has focused its strategyon the expansion of its retail channel.
After doubling its directly-operated store network in2012, the brand added a four further net openings in 2013,mainly in the Asian market (Shanghai, Beijing and Tokyo),bringing the total store count to 25 stores, and whichremains one of the key strategic priorities for further growth.2013 also saw the launch of the joint venture betweenYoox and Kering to develop the e-commerce businessand to support market penetration, both in terms ofimage and revenue.
During the year, Stella McCartney also added six franchiseboutiques to its franchise network, which now consists ofa total of 16 stores worldwide and continues to representan important part of the distribution network.
In 2014, the brand will focus on consolidating the latestopenings as well as exploiting its historical locations inboth the retail and wholesale distribution channels, anddeveloping strong synergies between the off-line and on-line shopping experience.
41
2
2013 Reference Document ~ Kering
OTHER BRANDS ~ LUXURY DIVISION ~ OUR ACTIVITIES
02_VA_V7 14/04/14 11:33 Page41

2 OUR ACTIVITIES ~ WORLDWIDE SPORT & LIFESTYLE MARKET OVERVIEW
MARKET OVERVIEW: SIZE, trENDS and MAINGROWTH DRIVERS
According to NPD, the global Sport & Lifestyle marketgenerated revenue of €273 billion in 2012, representinga 5% increase compared with 2011, marking the thirdconsecutive year of positive growth. From 2006 to 2012,the Sport & Lifestyle market grew at a compound annualgrowth rate of 3%.
Worldwide Sport & Lifestyle market trend (2006-2012, in € billions)
Demand in the Sport & Lifestyle market is driven by fourmain factors:
• demographic trends and an increase in world GDP;
• increase in leisure time and increased awareness amongthe population of the positive effect of sport on health;
• globalisation and convergence of consumer habits assport promotes universal values;
• increase in purchasing power and urbanisation inemerging countries.
Meanwhile, industry players have developed theirproduct offering and extended their global reach through:
• innovation: sector players are quick to adopt newtechnologies and materials that help them stay ahead ofthe competition and to segment their offering;
• geographical expansion: Sporting Goods companies arefocusing on consolidating or growing their market sharesin mature markets, while investing in high-growth marketswhere they have more potential to grow market penetrationand brand awareness;
• retail expansion: while wholesale distribution remainsthe most important distribution channel for SportingGoods, industry players have also worked on developingtheir network of directly-operated stores.
COMPEtitiVE ENVIRONMENT
The Sport & Lifestyle market is a mass, global market. PUMAis currently one of the leading Sporting Goods brand afterNike and Adidas. In addition to these three major players,there are several smaller players that are often specialisedin one specific category.
In Kering’s Sport & Lifestyle Division, the “Other brands”,Volcom and Electric, address more niche markets, and theyare inspired by the world of Action sports and Outdoor,competing with brands such as Quiksilver and Vans.
This section contains information which is derived from the “2012 Global Sport Market Report” conducted by NPD, anindependent organisation, and published in June 2013. The scope of the study includes sales of footwear, apparel andequipment intended for all types of sport usage.
The following data, including trends, market sizes and growth levels, are based on NPD estimates. Please note that allgrowth rates are expressed in reported terms.
WORLDWIDE SPORT & LIFEStyLE MARKET OVERVIEW
(%): annual change, reported data
06
230
07
241
08
241
09
236
10
246
11
259
12
273(+5%)(+5%)(+4%)(-2%)(+0%)(+4%)
42 Kering ~ 2013 Reference Document
02_VA_V7 14/04/14 11:33 Page42

2WORLDWIDE SPORT & LIFESTYLE MARKET OVERVIEW ~ OUR ACTIVITIES
DIStrIBUtiON CHANNELS
The Sport & Lifestyle industry is mainly a wholesale business.Key distributors of Sporting Goods brands include retailerssuch as Foot Locker and Finish Line in the United Statesand Intersport and Decathlon in Europe. In the UnitedStates, Action sports & Outdoor brands can be distributedin Pacsun, Zumiez and Tilly’s.
Along with wholesale distribution, industry playersincreasingly tend to develop more controlled retail spacesuch as directly-operated stores, shop-in-shops or jointventures with retailers. E-commerce is also gainingmomentum, yet still accounts for a fraction of total sales.
In 2012, five main sports represented almost 50% of the Sport & Lifestyle market:
Sport 2012 value Reported(in € billions) YoY change
Cycling 39 +2 %Fitness 29 + 8%Walking / Hiking 24 +5%Running 20 +10%Football/Soccer 12 +8%
When assessing industry trends in 2012, all categories grewwith footwear posting the highest growth (up 7%) followedby apparel (up 6%). More specifically, within the footwear
category, the lightweight/technical running, casual/skateand premium basketball trainer segments performed well.
PRODUCT CATEGORIES
According to NPD, the global Sporting Goods industry can be broken down into three main product categories – footwear,apparel and equipment (excluding the market for bicycles and accessories) – which correspond to the key productareas in which Kering Sport & Lifestyle brands operate.
Worldwide Sport & Lifestyle market: breakdown by category (2012)
Market value Reported YoY 2012 (in € billions) change market share
Footwear 73 +7 % 27%Apparel 91 +6% 33%Equipment 72 +4% 26%Bicycle and accessories 37 +2% 14%
Total 273 +5% -
432013 Reference Document ~ Kering
02_VA_V7 14/04/14 11:33 Page43

2 OUR ACTIVITIES ~ WORLDWIDE SPORT & LIFESTYLE MARKET OVERVIEW
REGIONAL OVERVIEW
Worldwide Sport & Lifestyle market: breakdown by region (2012)
The ten largest countries in terms of global revenue in 2012are as follows:
2012 rank Country
1 United States2 China3 Japan4 Germany5 Brazil6 France7 United Kingdom8 Russia9 Canada10 Italy
At industry level in 2012, the Americas were the leadingregion in terms of market share (39% of the totalSport & Lifestyle market, stable year-on-year), followed byEurope (29%, down one percentage point year-on-year, infavour of the Middle East & Africa).
By country, the United States are by far the largest market,representing 27% of the global Sport & Lifestyle market,followed by China, surpassing Japan in terms of marketshare for the first time.
In terms of growth, sales in Western Europe posted a modestincrease (up 2% in 2012), under pressure from macro-economic headwinds. However, results were mixed aspositive trends in Northern Europe (Germany and the UnitedKingdom) offset weaknesses in Southern Europe.
Emerging markets enjoyed the highest growth rates, asinternational brands saw rapid growth. Latin America led theway (up 16%), followed by Central & Eastern Europe (up 8%)and Middle East & Africa (up 7%). The top emerging countrieswere Brazil, South Africa and India.
MARKET OUTLOOK
In the medium term, NPD forecasts a compound annualgrowth rate of 3% for 2013-2016, in line with the periodfrom 2006 to 2012. The Sport & Lifestyle market shouldtherefore reach €308 billion by 2016, underpinned by a positive global GDP growth assumption. Indeed, Sport &Lifestyle market growth is evolving broadly in line withconsumer spending.
However, the top 5 sports -cycling, fitness, walking/hiking,running and football- should outperform overall Sport &Lifestyle market growth. For example, NPD forecasts annualgrowth rates of 6% for running, 4% for football and 4% forfitness by 2016.
Americas 39%
Asia 26%
Europe 29%
Middle East & Africa 6%
44 Kering ~ 2013 Reference Document
02_VA_V7 14/04/14 11:33 Page44

2WORLDWIDE SPORT & LIFESTYLE MARKET OVERVIEW ~ OUR ACTIVITIES
452013 Reference Document ~ Kering
02_VA_V7 14/04/14 11:33 Page45

46 Kering ~ 2013 Reference Document
2 OUR ACTIVITIES ~ SPORT & LIFESTYLE DIVISION
PUMA 48Other brands 51
VolcomElectric
sport & lifestyle Division
02_VA_V7 14/04/14 11:33 Page46

47
2
2013 Reference Document ~ Kering
SPORT & LIFESTYLE DIVISION ~ OUR ACTIVITIES
Breakdown by brand
Revenue and recurringoperating income
€3,247 millionin revenue
€200 millionin recurring operating income
Breakdown by brand
Breakdown by product category
Breakdown by region
PUMA 92%Other brands 8%
Footwear 43%Apparel 39%
Accessories 18%
Western Europe 30%North America 25%
Japan 10%
Other countries 22%
Asia Pacific 13%
2013 key figures
PUMA 96%Other brands 4%
Revenue (in € millions)
Recurring operating income (in € millions)2012 2013
3,247
200
3,532
305
02_VA_V7 14/04/14 11:33 Page47

48 Kering ~ 2013 Reference Document
2 OUR ACTIVITIES ~ SPORT & LIFESTYLE DIVISION ~ PUMA
2013 key figures
€3,002 millionin revenue
€192 millionin recurring operating income
10,750average number of employees
Breakdown of 2013 revenueby product category
Breakdown of 2013 revenueby region
Footwear 46%Apparel 35%
Accessories 19%
Western Europe 30%North America 22%
Japan 10%Other countries 24%
Asia Pacific 14%
BUSINESS CONCEPT
PUMA is one of the world’s leading Sports Brands,designing, developing, selling and marketing footwear,apparel and accessories. For over 65 years, PUMA hasestablished a history of making fast products designedfor the fastest athletes on the planet.
PUMA offers performance and sport-inspired Lifestyleproducts in categories such as Football, Running, Trainingand Fitness, Golf, and Motorsports. It engages in excitingcollaborations with renowned design brands such asAlexander McQueen and Mihara Yasuhiro in an effort tobring innovative and fast designs to the sports world. ThePUMA Group owns the brands PUMA, COBRA Golf, Tretorn,Dobotex and Brandon. The company distributes itsproducts in more than 120 countries, employs more than10,000 people worldwide, and is headquartered inHerzogenaurach in Germany.
PUMA is committed to financial, social and environmentalsustainability. The company aims to reduce itsenvironmental footprint, improve social and workingconditions at its supplier factories, and acceleratepositive change in the industry.
COMPEtitiVE ENVIRONMENT
Competition in the Sporting Goods industry continues tobe fierce. Not only are the Industry leaders, Nike andAdidas, pursuing expansion plans, there are also manymore nimble participants with ambitious goals. Verticalretailers have also begun to cross over into the sportscategory within their product assortments.
The weakness of various currencies, particularly theJapanese yen and those of certain emerging markets,caused profitability fluctuations in 2013. In addition,although raw materials prices remained relatively stablethroughout the year, they stabilized at high levels, and wageinflation in Far Eastern production centers continues toput pressure on margins.
02_VA_V7 14/04/14 11:33 Page48

49
2
2013 Reference Document ~ Kering
PUMA ~ SPORT & LIFESTYLE DIVISION ~ OUR ACTIVITIES
StrATEGY
In 2013, PUMA created a newly unified Brand Platformthat is rooted in the Sports DNA of the company, andwhich reconciles the Performance and Lifestyle segmentsof the PUMA brand. With this significant milestone, PUMAis moving away from its approach of pursuing twodistinctive visions for each part of the business, whichhas led to confusion and a lack of clarity for employees,business partners, and consumers.
Going forward, PUMA will be the Fastest Sports Brand inthe World. This simplified mission will result in a singlebrand positioning, a single brand purpose, and a singleconsumer message. PUMA will be: “Forever Faster”. Thisstatement, a new tag line which will be launched toconsumers in 2014, reflects the 65 year history of makingfast product designs for the fastest athletes on the planet.
But “Forever” references more than just the brand’s history,and a commitment to classic products. It representsrecognition of the endless pursuit of whatever is next – inperformance innovations, in cultural trends and in styleand fashion. Forever also emphasizes PUMA’s long-termresponsibilities and underlines the importance ofsustainability to the brand. Of course the word “Faster”represents more than simply delivering the rationalbenefit of speed to athletes. PUMA will have a singleminded purpose of celebrating faster design in everysense of the word – lighter products, better fit for greateragility, enhanced flexibility and stability in the precisemeasure to allow for point to point speed, and any otherpossible way the brand can deliver the fastest products forthe fastest performers. The phrase simultaneously referencesthe emotional benefit of owning speed – the thrill, thefun, and the swagger of Usain Bolt himself, the man whobest personifies this new strategy and ambition.
Forever Faster will be a part of a long term effort to clearlyre-establish the brand in the minds of the customers. Inthe third quarter of 2014, PUMA will unleash this newbrand strategy in the market with a significant consumer-facing media campaign.
PUMA’s products are the ultimate embodiment of thenew brand strategy and the desire to produce the fastestproducts for the fastest athletes. Innovation efforts aredeveloping lighter, more agile products with better fit andimprovements in adaptation to the body in motion – bothextending training times and delivering faster resultswhen it counts. In addition to the “Forever Faster” innovationfocus, the product priorities are delivering commerciality,beauty in design, and overall product responsiveness.PUMA will focus on improving the commerciality of its
product range to meet the consumer’s price and valueexpectations. For PUMA, “Commerciality” means theconsumer is at the center of the design process, ensuringthat it delivers the performance, quality and aestheticscritical for success at the right price point.
Another key priority for PUMA is to focus on desirablewholesale distribution, shifting the balance from lower tohigher-tier wholesale channels. The quality of wholesaledistribution will be improved by focusing on and workingclosely together with key accounts on joint productprograms. Supported by significant marketing activities,this approach will lead to improved sell-through, drivingincreases in shelf-space at key wholesale accounts.
In the Direct-to-Consumer business, PUMA’s focus is tocapitalize on its Retail doors. While PUMA will finish closingthe loss-making stores earmarked in the TransformationProgram, it will also increase the number of outlet storesin currently under-penetrated markets – mainly in theAsia/Pacific region. In growth countries, selective full pricestores will continue to be opened in desirable locations. A key driver of growth in the direct-to-consumer businesswill be e-commerce. By going live with a completelyrefreshed site design in 2014, PUMA will integrate themarketing and commercial aspects of its digital strategyto drive growth and retention with compelling, “shoppable”content.
2013 HIGHLIGHTS AND OUTLOOK FOR 2014
2013 has been a transition year at PUMA with manyhighlights: a new management team is on board, a newbrand manifesto has been launched, progress was madewith the ongoing Transformation Program, and manyproduct and marketing successes were achieved.
As of summer 2013, PUMA has a new management teamin place that will shape the future of the company andmake PUMA the fastest Sports Brand in the world. At theBoard level, Bjoern Gulden joined as CEO and AndyKoehler came on-board as COO. Product teams werestrengthened at the senior level with the addition ofKevin Tolchard as Global Director of Merchandising andTorsten Hochstetter as Global Creative Director.
PUMA continues to execute its Transformation Programas announced in 2012. Key transformation achievementsin 2013 focused on complexity reduction. The successfulimplementation of a new European regional businessmodel created a regional layer and consolidated
02_VA_V7 14/04/14 11:33 Page49

23 countries into seven areas. Through year-end, PUMAclosed six warehouses in Europe, achieving significantmovement in its warehouse consolidation project.Alongside complexity reduction in terms of organizationand warehouses, meaningful progress was also achievedin reducing PUMA’s article count by more than 10% in 2013.Further measures are underway to achieve the articlereduction target of 30% by 2015. Finally, PUMA has alreadyclosed 73 of the announced 91 unprofitable stores withthe remaining 18 stores to be closed in 2014/15.
On the product side, PUMA celebrated successes of itsproduct launches underlining PUMA’s ambition to buildthe fastest products for the fastest athletes: PUMA’s top-selling adaptive running shoe, Mobium, won multipleawards across the globe, including Most Innovative(Competitor Magazine, US), Best New Technology (GoMulti, South Africa) and Best Debut (Runner’s World,China). PUMA also successfully introduced its ISPO –International Sporting Goods Trade Fair – award-winningPUMA ACTV and RCVR performance apparel, which is aproprietary technology fusing compression with built-inathletic taping.
2013 also provided further proof that PUMA equips thefastest athletes on the planet. The World Track and FieldChampionships in Moscow were once again dominatedby PUMA icon Usain Bolt, who took home another threegold medals to make him the fastest athlete of all time.With Usain Bolt, the Jamaican team achieved the thirdplace in the medals table, with six golds in total. Thisremarkable performance was accompanied by twofurther great achievements in PUMA’s core sports: PUMA -partnered football club Borussia Dortmund reached theChampions League Final and PUMA athlete Lexi Thompsonwon two LPGA tournaments in 2013, cementing herstatus as one of the world’s top female golfers.
Looking ahead to 2014, PUMA will focus on three key priorities:repositioning itself as the fastest Sports Brand in theWorld, elevating the product engine to new standards, andimproving the revenue quality. PUMA is excited to launchits new brand vision, Forever Faster, with a large scale mediacampaign globally in the Autumn/Winter season 2014.This brand relaunch is accompanied by the extension ofthe partnership with the fastest athlete on the planet,Usain Bolt, through the 2016 Olympic Games in Rio deJaneiro and beyond.
2014 will be the year of football for PUMA, at the WorldCup in Brazil, 25% of all participating teams will be PUMApartners. PUMA is proud that the teams of Italy,Switzerland, Chile, Uruguay, Algeria, Cameroon, Ghana,and the Ivory Coast will all be sporting the brand on the
world’s greatest football stage. The presence in football isfurther enhanced by new partnerships with two globalbrand properties – Arsenal Football Club and MarioBalotelli. Starting season 2014/15, PUMA will combine itssports performance expertise and proud heritage in thegame with Arsenal’s traditions, honors and global appeal.The partnership with Arsenal is a major milestone inPUMA’s history. It is the first time in modern history thatthe brand is associated with a truly international footballclub property including an extensive global fan base. ComeJuly 1st, PUMA will be the official kit supplier to Arsenal F.C.including the new playing kit, training line, fanwear andaccessories. The signing of Italian striker Mario Balotellihas two critical aspects to it. Firstly, PUMA is adding a primeand globally recognized striker to boost the footballfootwear business of the brand next to Sergio Aguero, CescFabregas, Marco Reus and Radamel Falcao. Secondly, theaddition of Mario Balotelli to the stable of talent adds atrue brand icon which fits perfectly with the PUMApersonality that will be rolled out under Forever Faster.
50 Kering ~ 2013 Reference Document
2 OUR ACTIVITIES ~ SPORT & LIFESTYLE DIVISION ~ PUMA
Revenue and recurringoperating income
Revenue (in € millions)
Recurring operating income (in € millions)2012 2013
3,002
192
3,271
290
02_VA_V7 14/04/14 11:33 Page50

51
2
2013 Reference Document ~ Kering
OUR ACTIVITIES ~ SPORT & LIFESTYLE DIVISION ~ OUR ACTIVITIES
Revenue and recurringoperating income
Revenue (in € millions)
Recurring operating income (in € millions)2012 2013
245
9
261
15
other brands2013 key figures
€245 millionin revenue
€9 millionin recurring operating income
771average number of employees
• Volcom
• Electric
02_VA_V7 14/04/14 11:33 Page51
52 Kering ~ 2013 Reference Document
2 OUR ACTIVITIES ~ SPORT & LIFESTYLE DIVISION ~ OTHER BRANDS
Founded in the early 1990’s, Volcom is a board sports-based modern Lifestyle brand that embodies the creativespirit of youth culture. The company was built onliberation, innovation and experimentation, and its goal isto provide sustainable lifestyle-enhancing apparel,outerwear, accessories and footwear to people who sharetheir passion for art, music, film and board sports. It is theonly company in its category founded on all three boardsports: skate, surf and snow. Volcom reinforces its brandimage through the sponsorship of world-class athletes,targeted grassroots marketing events, distinctiveadvertising and the production of board Sport and youthLifestyle related films, art and music.
With a broad array of products for men, women and boys,and key categories in denim, boardshorts, swim, outerwear,and footwear, Volcom aims to become one of the world’spremiere brands in the action Sport & Lifestyle market.The Volcom brand is constantly evolving and bringing theboard sports Lifestyle to an increasing number of peopleworldwide.
The action sports industry has been facing a strongeconomic downturn, pushing major competitors to reviewthe strategy and organisation in an effort to relaunchgrowth. 2013 was a productive year for Volcom as itaccomplished many significant initiatives. Volcomcontinued to strengthen the foundation of its business todrive operational excellence at every level. It added top talentto its teams and established a global organizationalstructure, particularly around marketing, merchandisingand design, sourcing, supply chain, logistics, retail andfinance. This new structure will help drive efficienciesaround product, planning, gross margin and expense
management. In addition, Volcom successfully deliveredits first closed-toe footwear line, which was well received bycustomers. In October, Volcom re-launched its Volcom.comwebsite, which combines the brand, athlete, product andcommunity into a single unified experience.
Branded retail was a key focus for Volcom, with four netstore openings particularly in France, Australia, the UnitedStates and Hong Kong during the year.
Volcom made significant investments in resources, marketingand operations in the Asia Pacific and Latin America regions,which are key markets for the Volcom brand and providepotential growth opportunities. These investments havebegun to yield results on some markets.
Volcom also hosted the World of Volcom Stone, a skate eventheld in Paris, celebrating the brand and its core values.The event was highlighted by the premiere of Volcom’snew movie “True to This”, a feature film which defines thebrand’s philosophy and captures the energy and artistryof board-riding in its purest forms.
The Volcom brand is well positioned for growth in 2014.Volcom will make further investments in resources,marketing and operations in the Asia Pacific and LatinAmerica regions, as Volcom looks to take advantage of itsrecent momentum.
It will also continue to enlarge its retail network in 2014.
With the recent re-launch of the Volcom website, Volcomwill expand the reach of its e-commerce platform toadditional regions with a focus on social media andenhanced content management.
02_VA_V7 14/04/14 11:33 Page52

53
2
2013 Reference Document ~ Kering
OUR ACTIVITIES ~ SPORT & LIFESTYLE DIVISION ~ OUR ACTIVITIES
Founded in 2000, Electric is a premium Lifestyle brandrooted in southern California’s action sports, music, artand customisation culture. It designs and marketssunglasses, snow goggles, backpacks, luggage, watchesand accessories through the Americas, Europe, Japan,China and Australasia. Electric sells in Lifestyle boutiques,department stores, sports shops and online, including itsown e-commerce website.
Competition in the action sports eyewear market ischaracterised by two main ideas. First, both young andestablished action Sport endemic competitors are vyingfor a decreasing retail footprint of core shops along withnon-endemic global brands. Second, many of the brandsthat are entering the market target lower margins andprice points.
The Lifestyle streetwear and department store channelsare also seeing a greater number of new brands,migrating from action sports, licensed from establishedfashion brands and original emerging brands. Many lackthe heritage, quality and authenticity to challenge themarket leaders.
Electric plans to leverage its newly expanded productportfolio, merchandising strategies, and re-organizedsales structure to challenge the leadership positions oflarger brands in the market. Geographic expansion willcontinue to play a key role in Electric’s growth strategy,while much focus will be placed on increased service toexisting distribution and expansion of retail footprintwithin the channel. Electric will manage its distributionexpansion through an increased focus on product linesegmentation. Electric’s newly launched premium collectionof eyewear, watches and small leather goods will bemarketed to premium Lifestyle boutique and departmentstore channels, while its technical and Sport driven productswill be targeted towards its existing action sports,premium Sporting Goods and outdoor channels.
Expansion in Europe, a currently under-penetrated market,from a central office in France will continue as the first phaseof an expanded international presence. The second phaseof Electric’s International expansion strategy will focus onbrand recognition and leadership in key cities.
2013 marked the completion of the Electric brand’scomplete reset. In March, Eric Crane was appointed CEOand continued to oversee the brand’s restructuring andgrowth initiatives.
In 2013, Electric began distribution of its newly rebrandedbags and accessories and successfully launched itsinaugural watch line to key existing retail partners. Electricalso successfully launched its e-commerce platform in theUS, and introduced a new global retail fixture program,driving gains in same store sales.
In 2014, Electric will release a new patent pending “quickchange” lens technology in snow goggles developed byco-founder and Chief Design Officer, Kip Arnette. Thetechnology will debut in the EG3 goggle, an update to itsbest selling EG2 goggle platform. A new outrigger-typegoggle will also be released, targeting helmet wearers inboth snowboarding and ski markets.
Electric will expand its watch product line offering, and openits distribution to all current retail partners and select newaccounts. A new line of luggage, helmets and accessories willbe launched in 2014, together with a restructured sunglassesoffering including capsule collections developed with keyambassadors and athletes, limited edition premiumItalian acetate styles and a new style featuring Electric’s firstmould injected hinge, all of which will feature Electric’ssignature melanin-injected lens technology.
02_VA_V7 14/04/14 11:33 Page53

54 Kering ~ 2013 Reference Document
02_VA_V7 14/04/14 11:33 Page54

552013 Reference Document ~ Kering
CHAPTer 3
Sustainability
1. Sustainability at Kering 561.1. A long-standing commitment 561.2. Vision and strategic challenges 571.3. Reporting, recognition and SRI ratings 601.4. 2013 highlights 611.5. Key figures 62
2. Supporting our employees 632.1. The Group’s human resources profile 632.2. Promotion and respect of ethics within the Group 662.3. Enhancement of skills and talent 672.4. Promotion of diversity 702.5. Quality of professional life, health and safety 722.6. Social dialogue 73
3. Reducing our environmental impact 753.1. Environmental management 753.2. Environmental Profit & Loss account (EP&L) 783.3. Measurement and reduction of our carbon footprint 813.4. Sustainable use of resources 883.5. Waste management 913.6. Protection of biodiversity 93
4. Supporting community development 964.1. Community impact 964.2. Stakeholder dialogue 974.3. Relationships with suppliers 984.4. Risk management and development of responsible products 1024.5. Initiatives carried out by the Kering foundation and sponsorship programmes 104
5. Cross-reference tablePursuant to articles R.225-104 and R.225-105 of the French Commercial Code (Code de commerce) 107
6. Cross-reference table: Global Compact 109
7. Report of the Statutory Auditors 110
03_VA_V6 14/04/14 11:33 Page55

For more than 15 years, Kering has pursued and improvedon its sustainability strategy, with the following keymilestones:
1996• Group’s first Ethics Charter.
2001• Creation of the SolidarCité association, promoting
solidarity-based initiatives among employees.
• First employee opinion survey.
2003• Creation of a Group Sustainability Department.
• Establishment of an environmental reporting platform.
2004• Signature of the Diversity Charter by PPR’s Chairman and
creation of the Diversity Committee and the MissionHandicap project.
2005• Signature of a partnership agreement with Agefiph, a
French association promoting job placement andvocational training for the disabled.
• Deployment of the Code of Business Practices andcreation of the Ethics and Corporate Social ResponsibilityCommittee (ECSRC).
• Creation of the Télémaque Institute.
2006• Definition of the Group’s CSR commitments.
2007• Creation of a Group Corporate Social Responsibility
Department, represented on the Executive Committeeand reporting directly to the Chairman.
• Definition of the seven strategic priorities for the Groupwith respect to CSR for 2008-2010.
• Signature of a second agreement with Agefiph tosupport the employment of people with disabilities.
2008• Membership of the Global Compact.
• Creation of the PPR Corporate Foundation for Women’sDignity and Rights.
2009• Worldwide release of Yann Arthus-Bertrand’s documentary
HOME, coproduced by EuropaCorp and Elzévir Films,and financed primarily by PPR.
• Dissemination of the updated Code of Business Practicesto all Group employees.
• Signature of a third agreement with Agefiph.
2010• Launch of PPR’s Innovation and Sustainability Awards.
• Sustainability criteria included in performance evaluationsof PPR group leaders.
• Adoption of the Charter of Commitments on the qualityof life at work and the prevention of work-related stressfor employees of the PPR group in Europe.
2011• Launch of PPR HOME, the new initiative and organisation
dedicated to sustainability.
• Publication of the first Environmental Profit & Loss Account(EP&L) by PUMA.
• Formalisation of the strategic “Gender Equality inLeadership” programme.
2012• Formalisation and publication of a set of ambitious
and key sustainability targets to be achieved by theGroup’s brands by 2016.
• Creation of a Sustainability Committee within the Boardof Directors.
• Launch of a mentoring programme as part of thestrategic “Gender Equality in Leadership” programme.
• Third edition of the Foundation’s Social EntrepreneursAwards.
After defining Kering’s sustainability targets andconsolidating sustainability governance, 2013 marked thecelebration of the ten-year anniversary of the SustainabilityDepartment and was devoted to accelerating thetransformation through three key projects: (i) stepping upthe EP&L approach and the publication of its results atGroup level in 2016 (at end-2013, 75% of Kering’s revenuewas already covered), (ii) the creation of Kering’s MaterialsInnovation Lab (MIL) tasked with researching anddeveloping sustainable and innovative textile fibres for
1. Sustainability at Kering
1.1. A long-standing commitment
3 SUSTAINABILITY ~ SUSTAINABILITY AT KERING
56 Kering ~ 2013 Reference Document
03_VA_V6 14/04/14 11:33 Page56
Vision
Kering’s commitment to sustainability is taken to thehighest level by the Chairman and Chief Executive Officerand it draws on the same impetus that drives the Group’sstrategy: “empowering imagination”, going beyond thelimits of imagination to release each brand’s full potential.
Kering encourages its brands to innovate by developingprocesses and products that improve social andenvironmental impacts while maintaining their identityand values.
For Kering, sustainability plays a fundamental andinherent role in product quality while creating value and:
• differentiates Kering from its competitors and offers along-term competitive advantage;
• provides the Company with business developmentopportunities;
• spurs innovation;
• offers the potential to improve efficiency;
• attracts and retains talent.
Kering does not limit itself to the traditional approach whichis based on compliance and reducing negative impacts.For Kering, sustainability is above all an opportunity, in linewith its entrepreneurial spirit, to commit to responsiblegrowth and its capacity to strengthen creativity, all ofwhich make the Group a leader in creating value.
Targets
Kering offers its brands considerable freedom within theshared framework defined at the Group level. The Grouppledged to achieve the following ambitious targets by 2016:
• the implementation of the EP&L in all the Group’sLuxury and Sport & Lifestyle brands;
• evaluating our strategic suppliers at least every twoyears, mainly to monitor their application of the Group’sCode of ethics;
• reducing our carbon emissions, waste and water usageresulting from the production of products and services by25%, while accounting for the growth of our business;
• all remaining CO2 emissions from Scope 1 and Scope 2of the Greenhouse Gas Protocol will be offset thanks toprogrammes that contribute to the welfare of thecommunity and the conservation of biodiversity in theGroup’s regions of operations;
• 100% of paper and packaging for Kering will be sourcedfrom certified sustainably managed forests with aminimum of 50% recycled content;
• all our collections will be PVC-free;
• ensuring all hazardous chemicals have been graduallyphased out and eliminated from our production by 2020;
• 100% of gold and diamonds in Kering’s products will besourced from verified operations that do not have aharmful impact on local communities, wildlife or theecosystems which support them;
• 100% of leather from domestic livestock within Kering’sproducts will be from responsible and verified sourcesthat do not result in converting sensitive ecosystems intograzing lands or agricultural lands for food productionfor livestock;
1.2. Vision and strategic challenges
the Group’s brands, and (iii) the definition, formalisation,dissemination and explanation of policies and guidelines forenvironmental management (energy, water, waste, etc.) andthe sourcing of the Group’s key raw materials (leather, cotton,precious skins, gold, etc.) to all employees. Each brand nowuses its own sustainability roadmap, a specific managementtool that describes ongoing and future projects and the brand’scontribution to the Group’s targets. In addition, the Groupdefends and promotes ethics worldwide through a revisedand enhanced Code of ethics disseminated to employees,Ethics Committees at Group and regional level, a global hotlineavailable in 73 countries for the Group’s employees and, inearly 2014, an online ethics training programme covering the
Code of ethics for Kering’s 35,786 employees. The enhancementof skills and talents, a keystone of the Group’s HR strategy,has been expanded to include improved Group and brandtraining and the launch of the new platform devoted tointernal mobility allowing all Group employees to take anactive role in the development of their careers. The KeringCorporate Foundation’s mandate has been renewed for thenext five years (2013 to 2017) with a new manifesto “Stopviolence. Improve women’s lives”, which upholds the Group’scommitment to the prevention of violence against women.Kering’s sustainability policy, as well as the integration of thispolicy in the Group’s strategy, led to Kering’s listing on the2013 Dow Jones World and Europe Sustainability Indices.
3SUSTAINABILITY AT KERING ~ SUSTAINABILITY
572013 Reference Document ~ Kering
03_VA_V6 14/04/14 11:33 Page57

MATERIALITY MATRIX
• 100% of precious skins and furs in Kering’s productswill come from verified captive breeding operations orfrom wild, sustainably managed populations. Additionallysuppliers will employ accepted animal welfare practicesand humane treatment in sourcing.
Materiality
Kering follows the materiality principle as defined by theGlobal Reporting Initiative (GRI) guidelines which definemateriality as the incorporation of economic, environmentaland social impacts likely to influence evaluations anddecisions of the Company’s stakeholders. Kering thereforedecided to set out its approach to its stakeholdersformally in a materiality matrix. The methodology used toestablish this matrix is described in section 4.2. Stakeholderdialogue. Sustainability targets for 2016, as described inthis section, are a direct result of this materiality analysisof social and environmental aspects.
3 SUSTAINABILITY ~ SUSTAINABILITY AT KERING
Significant
Sig
nifi
can
t
Important
Imp
ort
an
t
Sign
ifica
nce
for s
take
hold
ers
Significance for Kering
Veryimportant
Ve
ryim
po
rta
nt
Environmental
Wasteproduction
Packaging
Waterconsumption
Biodiversity
Chemical discharges/Water quality Greenhouse gas
and air pollution
Supply ofraw materials
Social
Communitydevelopment
Social dialogue
Quality of professional life, health and safety
Empowermentof women
Enhancement of talents and skills
Workingconditionsand humanrights
Economic
Technologicalchanges
Responsibleproducts
Preservationof skills
Financialtargets Organic growth
and acquisitions
Creativity& design
Customersatisfaction
Brand image
Product quality
58 Kering ~ 2013 Reference Document
03_VA_V6 14/04/14 11:33 Page58

Governance and organisation
Kering’s Sustainability Department operates as a resourceplatform to guide and complete the initiatives implementedby each brand. More than 15 specialists, who answerdirectly to the Group’s Chief Sustainability Officer, amember of the Executive Committee, assist the brandswith the implementation of the Group’s sustainabilitystrategy through operational synergies and economies ofscale, when possible. To reach these targets and moreefficiently deploy these initiatives, each brand now has atleast one sustainability Director, or for the larger brands,entire sustainability teams. As a result, there are morethan 50 people working on sustainability at Kering.
As concerns governance, a Sustainability Committee,established in 2012 at Board level, provides advice on andguides the Group’s sustainability strategy. The Committeeis chaired by Jochen Zeitz and is composed of GroupDirectors, including François-Henri Pinault, Jean-FrançoisPalus, Patricia Barbizet and Luca Cordero di Montezemolo.
The Sustainability Technical Advisory Group (STAG)provides the Committee with technical expertise on thechallenges faced by Kering in its sustainability initiatives.This group is composed of members of Kering (Jean-François Palus, Group Managing Director, Jochen Zeitz,Director and Chairman of the Sustainability Committee,Marie-Claire Daveu, Chief Sustainability Officer and Headof International Institutional Affairs and member of theExecutive Committee, Patrizio di Marco, Chairman and ChiefExecutive Officer of Gucci) as well as external advisors (HollyDublin, expert in sustainable international trade, suppliersof raw materials, conservation and community development,John Elkington, co-founder of Volans, SustainAbility andEnvironmental Data Services; visiting professor at Cranfield,Imperial College, University College London and MichaelWells, expert in the conservation of natural resources andpolitics, consultant for international and EU agencies, andexpert in performance monitoring and assessmentprogrammes in the field of sustainability).
3SUSTAINABILITY AT KERING ~ SUSTAINABILITY
Code of Ethics
Ethics Committee
SustainabilityCommittee
RemunerationCommittee
AppointmentsCommittee
AuditCommittee
Strategy andDevelopmentCommittee
FRANÇOIS-HENRI PINAULTCHAIRMAN AND CHIEF EXECUTIVE OFFICER
JEAN-FRANÇOIS PALUSDEPUTY CHIEF EXECUTIVE OFFICER
SustainabilityHuman
Resources Communication Finance
15 people
LuxuryDivision
Sport & LifestyleDivision
BOARD OF DIRECTORS
BRANDSTeams committed to sustainability within each brand35 people
EXECUTIVE COMMITTEE
SustainabilitySustainabilitySustainabilitySustainability
Sustainability TechnicalAdvisory Group
592013 Reference Document ~ Kering
03_VA_V6 14/04/14 11:33 Page59

In recognition of its sustainability strategy, Kering receivedseveral distinctions given by NGOs and extra-financial ratingagencies in 2013:
• DJSI (Dow Jones Sustainability Indices): In 2013, Keringwas listed on the DJSI World and Europe. The DJSI is aglobally recognised index that rates the best performingcompanies in terms of sustainability out of the top2,500 stocks by market capitalisation of the Dow JonesGlobal Total Stock Market Index.
• CDP (Carbon Disclosure Project): Kering was the toprated luxury and apparel company in the 2013 CDPranking and was therefore included in the ClimateDisclosure Leadership Index (CDLI) for France. The CDPranking takes into account all aspects of climate changewhen assessing company policies. More than 5,000businesses, including more than 80% of the top 500global stocks by market capitalisation, were invited to fillout a CDP questionnaire and to publicly disclose theircarbon footprint.
• GRI (Global Reporting Initiative): For the second yearrunning, Kering’s Reference Document earned an A+rating, the highest rating awarded by the GRI guidelineswhich define a methodology for the disclosure of data ongovernance and a company’s performance on economic,environmental and social indicators as well as responsiblepractice as regards human rights, products and society.
• Fast Company: In 2013, Kering’s commitment to innovationand sustainability was recognised by the magazine FastCompany, which included the Group in the “World’s 50most innovative companies”, for all sectors combined,mainly due to Kering’s EP&L.
• Other SRI indices: Kering has been included in themain benchmark indices: FTSE4Good, Euronext VigeoEurozone 120 Ethibel Sustainability Index Excellenceand STOXX Global ESG Leaders indices.
1.3. Reporting, recognition and SRI (1) ratings
Environmental Profit & Loss Account (EP&L)
The rollout of the Group’s sustainability strategy is chieflybased on EP&L, which is the cornerstone to the Group’stargets and allows the Group to assess the impacts ofmanufacturing and distribution of products throughoutthe supply chain, including raw materials. It also assigns amonetary value to these impacts so as to more effectivelyassess environmental issues in financial terms, therebyguiding Kering to better business decisions. Kering is thefirst group of its size to undertake such an analysis, whichwill enable Kering to define new business models andinnovative solutions taking ecosystem services into account.
Commitment to women’s initiatives
Kering is committed to the prevention of violence againstwomen through the initiatives of its Foundation. Bypursuing one of the eight millennium development goalsset by the UN, “To promote gender equality and empowerwomen”, the Foundation commits Kering to a key issuethat ties in with its activities and customers and an areain which the Group can play a key role by assistinggovernments and communities.
3 SUSTAINABILITY ~ SUSTAINABILITY AT KERING
(1) SRI: Socially Responsible Investing .
60 Kering ~ 2013 Reference Document
03_VA_V6 14/04/14 11:33 Page60

Kering was listed on the DJSI World and Europe and qualified for the CDLI in France
Kering was listed on the DJSI World and Europe within thefirst year of our application. The DJSI is an index that ratesthe best performing companies in terms of sustainabledevelopment out of the world’s top 2,500 stocks by marketcapitalisation of the Dow Jones Global Total Stock MarketIndex. Each year, participating companies are assessedbased on a specific questionnaire for each business sector.Only the top 10%, in terms of sustainability performanceaccording to defined criteria, are listed in the ranking. ForKering’s business sector, only 12 out of 89 companiesassessed were included in the DJSI World and only 4 out of11 companies were listed in the DJSI Europe.
In addition, with a score of 90B, Kering is the top performingluxury and apparel company in the 2013 CDP ranking. TheCDP ranking takes into account all aspects of climate changewhen assessing company policies. With 722 institutionalinvestors representing USD 87,000 billion in assets, CDP aimsto improve the assessment of the risk linked to climatechange in its investment portfolios through its study. As partof its 2013 study, more than 5,000 businesses, includingmore than 80% of the top 500 global stocks by marketcapitalisation, were invited to fill out a CDP questionnaireand to publicly disclose their carbon footprint.
Launch of a new Group platform devoted tointernal mobility and career management
As an essential part of the enhancement of skills andtalent, a cornerstone of Kering’s HR policy, mobility withinthe Group requires, above all, an in-depth knowledge in realtime of professional opportunities offered by the differentbrands. With this in mind, in 2013 Kering launched itsfirst platform devoted to internal mobility allowing Groupemployees to be active players in their professionaldevelopment by providing an application that publishesbrands’ hiring needs and allows employees to present theirskills, submit a CV and their plans for career development.The platform also provides brands with access to a sharedpool of talent. Just six months after its launch, the platformcontains 190 internal vacancies.
Creation of the Materials Innovation Lab (MIL)
This innovative laboratory is tasked with encouraging thebrands to incorporate more sustainably produced rawmaterials into their apparel collections. Its members workclosely with the Sustainability department and the Group’s
key strategic suppliers to identify and source such materialsprior to the collections’ development. The MIL has compiledand proposed a catalogue of alternative fabrics and fibres tothe creative teams. New sustainable materials are constantlybeing added to this catalogue with every research programme.
Strengthening the Group’s ethics organisationand updating the Code of ethics
After its first draft in 2005, Kering’s Code of ethics wasrewritten in 2009 and then updated and disseminated toall Kering employees worldwide in 2013. This new versionincludes three main changes: (i) making the Group’s SupplierCharter part of the Code of ethics, (ii) adopting a pro-activeapproach to protecting the environment, (iii) presentingthe new organisation of ethics within the Group. There arenow three Ethics Committees (at the Group level, in theAsia-Pacific region and the Americas) that monitorcompliance with the principles of the Code and answeremployee requests or demands. Assistance is providedby an ethics hotline created in 2013 and made availableto all employees in 73 countries and territories. In early2014, this service will be finalised with the creation of anonline training programme on ethics and the Code for allGroup employees.
PPR Corporate Foundation for Women’s Dignity and Rights becomes the Kering Corporate Foundation, with the slogan “Stop violence. Improve women’s lives.”
Kering Corporate Foundation’s mandate has been extendedfor five more years (2013 to 2018) and the Foundationstrengthened its initiatives for the prevention of violenceagainst women and renewed its programme adoptingthe slogan “Stop violence. Improve women’s lives.”
In line with the Group’s new identity and to increase its globalimpact, the Foundation is refocusing its initiatives onthree regions: the Americas, Western Europe and Asia. Ineach region, the Foundation will prioritise a cause (sexualviolence, harmful traditional practices and domesticviolence, respectively) and selected partnerships with NGOsand social entrepreneurs. Thanks to the extent of the Group’soperations and employee participation, the Foundation’sefforts will be bolstered, increasing awareness of andpreventing violence against women.
In August 2013, the Kering Corporate Foundation completedits first five-year term with a series of initiatives in partnershipwith 47 NGOs helping more than 140,000 women worldwide.
1.4. 2013 highlights
3SUSTAINABILITY AT KERING ~ SUSTAINABILITY
612013 Reference Document ~ Kering
03_VA_V6 14/04/14 11:33 Page61

• 35,786 employees as of December 31, 2013, 58.3% of whom are women;
• 89.5% of employees on permanent contracts;
• 50.1% of Group managers are women;
• 13.6% of permanent employees work part time;
• 34.5 years is the average age of permanent employees;
• 5.5 years is the average length of service of permanentemployees;
• 326 workers with disabilities;
• 322,452 hours of training, or 17,967 employees trained;
• 11,209 permanent employees hired;
• more than 140,000 women received assistance fromthe Kering Corporate Foundation during its first five-yearterm through its projects developed in partnership with47 NGOs worldwide;
• 73% of Group revenue was covered by an EP&L in 2013(six brands);
• 2,722 social audits carried out among the Group’ssuppliers, including those carried out as part of SA 8000certification procedures;
• 268,256 tonnes of CO2 emitted by the Group in 2013attributable to energy consumption and transport;
• the share of electricity purchased from renewable sourcesreached 15.4% in 2013, compared with 7% in 2012;
• energy-related CO2 emissions fell 5.2% year on yearbased on proforma data.
1.5. Key figures
3 SUSTAINABILITY ~ SUSTAINABILITY AT KERING
62 Kering ~ 2013 Reference Document
03_VA_V6 14/04/14 11:33 Page62

Change in the regional breakdown of the workforce as of December 31, 2013 and December 31, 2012 (non-proforma data)
2.1. The Group’s human resources profile(1)
2.1.1. Breakdown of the workforce
The total workforce as of December 31, 2013 was 35,786, up by 2,347. Changes related primarily to the development ofbusiness in various countries and to the integration of new companies.
Breakdown of the workforce as of December 31, 2013 (men / women managers, men / women non-managers)by region (2)
Managers Non-Managers
Women Men Women Men
2013 2012 2013 2012 2013 2012 2013 2012
Africa 26 28 38 39 79 65 49 52Asia & Middle East 911 780 780 674 6,457 6,155 2,946 2,551Eastern Europe 83 108 68 70 522 584 461 378France 531 428 317 307 821 767 492 414North America 565 496 550 500 2,559 2,447 2,430 2,334Oceania 31 36 33 33 232 253 159 159South America 112 101 214 217 650 652 1,282 1,339Western Europe 773 661 1,019 940 6,485 5,890 4,111 3,981
TOTAL 3,032 2,638 3,019 2,780 17,805 16,813 11,930 11,208
Our human resources policy, a core part of the Group’ssocial and environmental responsibility, is aimed atKering’s first stakeholders – our employees.
In today’s world of fast-changing markets, competitionand customer needs, finding and retaining the best talentis a strategic issue.
Our human resources policy continues to cultivate humanand cultural diversity to offer the Group an economic andcompetitive advantage.
It is designed to offer employees opportunities for personaland professional development, so they can be part of thestrategic changes within the Group. In this respect, eachbrand is independent so as to be able to implement themeans that are suited to its own issues.
2. Supporting our employees
3SUPPORTING OUR EMPLOYEES ~ SUSTAINABILITY
2013 2012Asia / Middle East 31.0%
Eastern Europe 3.2%Africa 0.5%
France 6.0%
North America 17.1%Oceania 1.3%
South America 6.3%
Western Europe 34.6%
Asia / Middle East 30.4%
Eastern Europe 3.4%Africa 0.6%
France 5.7%
North America 17.3%Oceania 1.4%
South America 6.9%
Western Europe 34.3%
(1) As no entities were deconsolidated in 2013, 2012 data correspond to data provided in 2012 in the Reference Document. Furthermore, the rate of coverage calculatedas a % of the Group's workforce as of December 31, 2013 is 100% for all indicators, with the exception of the number of workers with disabilities, which is 80.7 %(excluding the United Kingdom and the United States).
(2) The table by region includes the following countries and territories: Africa: South Africa; Asia & Middle East: United Arab Emirates, China, Guam, Hong Kong, India, Japan,Korea, Israel, Kuwait, Macao, Malaysia, Qatar, Singapore, Turkey, Taiwan, Vietnam, Bangladesh, Thailand, Pakistan; Eastern Europe: Bulgaria, Czech Republic, Estonia,Croatia, Hungary, Lithuania, Poland, Romania, Russia, Serbia, Slovakia, Ukraine; France; North America: Canada, United States; Oceania: Australia, New Zealand; SouthAmerica: Aruba, Argentina, Brazil, Chile, Mexico, Peru, Uruguay; Western Europe: Austria, Belgium, Switzerland, Germany, Cyprus, Denmark, Spain, Finland, UnitedKingdom, Greece, Ireland, Italy, Monaco, Malta, Netherlands, Norway, Portugal, Sweden, Luxembourg.
632013 Reference Document ~ Kering
03_VA_V6 14/04/14 11:33 Page63

BREAKDOWN OF FIXED-TERM AND PERMANENT CONTRACTS AMONG NEW HIRES
2.1.2. Hires
In 2013, Kering continued to attract new talent. In the 63 countries in which the Group operates, 11,209 employeeswere hired on permanent contracts and 4,359 on fixed-term contracts.
Of the 15,568 employees hired in 2013, 56.5% were womenand 89.9% were non-managers.
In addition, the Kering group had a monthly average of1,293 temporary employees across all of its brands in 2013.
Kering strengthened its partnerships in 2013 with first-classuniversities worldwide (HEC and ESSEC in France, Tsinghuain Beijing, Bocconi in Italy, Parsons in New York, etc.) inorder to hire the best talent in all key areas: marketing,communications, merchandising, design, management,human resources, etc. For example, Kering sponsors theHEC Luxury Research Chair, through which it gave ongoingsupport to 55 students in 2013; the Bocconi and JobsAbroad programme in Shanghai allowed students from theschool to meet representatives of the Group’s brands.
The brands also continue to develop their own programmes.For example, Gucci is pursuing the Gucci ScholarshipProgramme that was launched in April 2012 in partnershipwith a South Korean student organisation.
These initiatives also involve a large number of trainingprogrammes. Courses of three to six months are oftenheld at the brands’ head offices and many vacancies arethen filled by trainees who have developed their expertiseand demonstrated their potential. Some 25% to 30% ofthe brands’ corporate vacancies are filled this way for theLuxury Division brands.
The Empower Talent Project is another example of the Group’ssupport for creative young talent in 2013. Conducted withthe magazine Vogue Italy, this project was launched inOctober 2013 and called on the Luxury brands based inItaly and the Timepieces / Jewellery brands to offer traineeprogrammes in all key areas for the Luxury Division. To date,over 3,000 applications have been received and the finalselection was made in February 2014.
AGE STRUCTURE OF THE PERMANENT WORKFORCE IN 2013: MANAGERS & NON-MANAGERS
3 SUSTAINABILITY ~ SUPPORTING OUR EMPLOYEES
2013 2012Permanent contracts 72.0%Fixed-term contracts 28.0%
Permanent contracts 69.6%Fixed-term contracts 30.4%
50% 40 30 20 10 00 10 20 30 40 50 %
< 25 0.3%
2.6%
8.1%
5.5%
1.1%
0.6%
0.2%
13.5%
23.7%
26.4%
12.1%
3.4%
1.8%
0.7%
25-30
31-40
41-50
56-60
51-55
> 60
< 25
25-30
31-40
41-50
56-60
51-55
> 60Age
Non-ManagersManagers
64 Kering ~ 2013 Reference Document
03_VA_V6 14/04/14 11:33 Page64
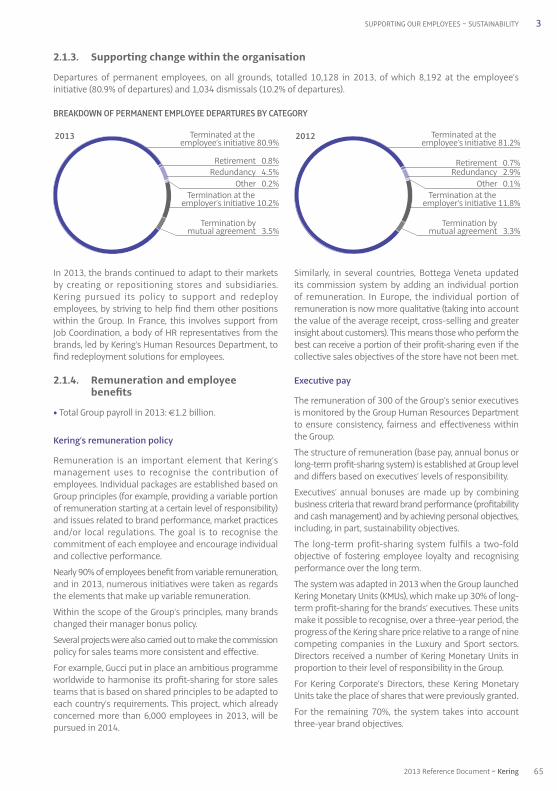
In 2013, the brands continued to adapt to their marketsby creating or repositioning stores and subsidiaries.Kering pursued its policy to support and redeployemployees, by striving to help find them other positionswithin the Group. In France, this involves support fromJob Coordination, a body of HR representatives from thebrands, led by Kering’s Human Resources Department, tofind redeployment solutions for employees.
2.1.4. Remuneration and employee benefits
• Total Group payroll in 2013: €1.2 billion.
Kering’s remuneration policy
Remuneration is an important element that Kering’smanagement uses to recognise the contribution ofemployees. Individual packages are established based onGroup principles (for example, providing a variable portionof remuneration starting at a certain level of responsibility)and issues related to brand performance, market practicesand / or local regulations. The goal is to recognise thecommitment of each employee and encourage individualand collective performance.
Nearly 90% of employees benefit from variable remuneration,and in 2013, numerous initiatives were taken as regardsthe elements that make up variable remuneration.
Within the scope of the Group’s principles, many brandschanged their manager bonus policy.
Several projects were also carried out to make the commissionpolicy for sales teams more consistent and effective.
For example, Gucci put in place an ambitious programmeworldwide to harmonise its profit-sharing for store salesteams that is based on shared principles to be adapted toeach country’s requirements. This project, which alreadyconcerned more than 6,000 employees in 2013, will bepursued in 2014.
Similarly, in several countries, Bottega Veneta updated its commission system by adding an individual portion of remuneration. In Europe, the individual portion ofremuneration is now more qualitative (taking into accountthe value of the average receipt, cross-selling and greaterinsight about customers). This means those who perform thebest can receive a portion of their profit-sharing even if thecollective sales objectives of the store have not been met.
Executive pay
The remuneration of 300 of the Group’s senior executivesis monitored by the Group Human Resources Departmentto ensure consistency, fairness and effectiveness withinthe Group.
The structure of remuneration (base pay, annual bonus orlong-term profit-sharing system) is established at Group leveland differs based on executives’ levels of responsibility.
Executives’ annual bonuses are made up by combiningbusiness criteria that reward brand performance (profitabilityand cash management) and by achieving personal objectives,including, in part, sustainability objectives.
The long-term profit-sharing system fulfils a two-foldobjective of fostering employee loyalty and recognisingperformance over the long term.
The system was adapted in 2013 when the Group launchedKering Monetary Units (KMUs), which make up 30% of long-term profit-sharing for the brands’ executives. These unitsmake it possible to recognise, over a three-year period, theprogress of the Kering share price relative to a range of ninecompeting companies in the Luxury and Sport sectors.Directors received a number of Kering Monetary Units inproportion to their level of responsibility in the Group.
For Kering Corporate’s Directors, these Kering MonetaryUnits take the place of shares that were previously granted.
For the remaining 70%, the system takes into accountthree-year brand objectives.
2.1.3. Supporting change within the organisation
Departures of permanent employees, on all grounds, totalled 10,128 in 2013, of which 8,192 at the employee’sinitiative (80.9% of departures) and 1,034 dismissals (10.2% of departures).
BREAKDOWN OF PERMANENT EMPLOYEE DEPARTURES BY CATEGORY
3SUPPORTING OUR EMPLOYEES ~ SUSTAINABILITY
2013 2012Terminated at the 80,8%employee’s initiative 80.9%
Termination at the 80,8%employer’s initiative 10.2%
Termination by 3,5%mutual agreement 3.5%
Redundancy 4.5%Retirement 0.8%
Other 0.2%
Terminated at the 80,8%employee’s initiative 81.2%
Termination at the 80,8%employer’s initiative 11.8%
Termination by 3,5%mutual agreement 3.3%
Redundancy 2.9%Retirement 0.7%
Other 0.1%
652013 Reference Document ~ Kering
03_VA_V6 14/04/14 11:33 Page65
A new expanded version of the Code of ethics provided to all
Sustainability for Kering is not attainable without businessethics and proper conduct by all within the Group, regardlessof their level of responsibility, position held or location.
Set out since 1996 in the Group’s first Ethics Charter, Kering’sethical principles apply to absolutely everyone within theGroup and reflect the Group’s strong convictions aboutbusiness practices. Kering’s Code of ethics, which wasestablished in 2005 and first updated in 2009, wasoverhauled again in 2013: organised by stakeholder(colleagues and employees, customers and consumers,the environment, civil society, shareholders and financialmarkets, business partners and competitors) and fitting infirmly with the major international reference texts (UnitedNations Universal Declaration of Human Rights, EuropeanConvention on Human Rights, the main conventions of theInternational Labour Organisation, OECD Guidelines forMultinational Enterprises, United Nations Convention onthe Rights of the Child, United Nations Global Compact). Itdemonstrates how the Group continually strengthens itscommitments and the systems in place to ensure compliance.It is used as the sole set of standards implemented throughoutthe entire Group. The new 2013 version made it possible inparticular to enhance the Code of ethics in three key areas:
• adopting a proactive approach to protecting theenvironment;
• making the Group’s Supplier Charter part of the Code ofethics. This Charter sets out the absolute minimum tobe applied throughout the Group and its brands in
supplier relations, particularly the crucial issues relatingto combating child labour and forced labour;
• the presentation of the organisation of ethics wasconsiderably improved in 2013.
The Code was translated into the 12 most widely spokenlanguages within the Group (French, English, Italian,German, Dutch, Spanish, Portuguese, Russian, simplifiedChinese, traditional Chinese, Japanese and Korean) and isavailable for all employees on the new “ 360° ” Groupintranet, as well as external readers on Kering’s website.
Organisation to strengthen and expandmeasures to monitor and promote ethics
From a single committee (ECSRC – Ethics and CorporateSocial Responsibility Committee, set up in 2005), the ethicsorganisation now draws on three Ethics Committees setup in 2013: a Group committee and two regional Committees(Asia Pacific and the Americas), which are involved in thepolicy to delegate responsibility applicable within theGroup that makes it possible to have bodies that are ableto act effectively in light of actual operating conditions.
Employees are able to call on the Committee of theirchoice to request clarification or ask a question regardingthe interpretation of the Code, if they are unsure how tobehave in a specific situation or how to address a complaintsent to the Committee for alleged non-compliance withone of the principles of the Code.
A Group-wide ethics hotline was also set up for the firsttime in 2013 for all Group employees in their country or
2.2. Promotion and respect of ethics within the Group
Employee benefits within the Group
In addition to monetary remuneration, the Kering group hasalways valued the social benefits offered to its employeesthrough healthcare, disability / life and pension benefits.Therefore, virtually all employees have supplementaryinsurance coverage in addition to coverage provided bylaw through the various Group schemes.
In light of the steady decrease in benefits provided bygovernment schemes in Europe, new initiatives wereimplemented in 2013 in addition to those put in place in 2012.Some of these programmes go beyond healthcare anddisability / life benefits, and are designed more generallyto help to improve the quality and balance of life at work.
Gucci, for example, started its Corporate Welfare Plan inJuly 2013. The plan, which was shared with trade unionsin Italy, finances social benefits for employees, includingretired employees, and their children for mobility, transport,
education, etc. This scheme is used by 1,500 people andwill be extended to another 700 people in 2014.
Bottega Veneta also put in place a programme for itsemployees in Italy in July 2013 called Bottega Veneta “ForMe”. Each employee can benefit, for an annual amount ofup to €500 net, from different services – private tuition,childcare, gym membership and spa treatments – or caneven pay the amount into their pensions.
Profit-sharing, incentive and employee savings agreements
In accordance with legal provisions in France, nearly100% of the Group’s French employees receive a share ofthe profit of their business under profit-sharing andincentive agreements. These mechanisms are governedby agreements specific to each legal entity.
3 SUSTAINABILITY ~ SUPPORTING OUR EMPLOYEES
66 Kering ~ 2013 Reference Document
03_VA_V6 14/04/14 11:33 Page66

Developing skills and talent is a key part of Kering’s humanresources policy, which is based on strong career developmentopportunities within the Group and structured training.
Group training (Kering University and Kering Digital Academy)seeks to train and develop talent, offer training suited to seniorexecutives and respond to the Group’s strategic challenges.In addition, training offered by the brands responds to theirchallenges: integrating new talent, supporting the developmentof managers and providing the best technical training foreach business.
In 2013, the Kering group devoted a budget of €15.7 millionto employee training, corresponding to 1.3% of the total Grouppayroll. On this basis, 322,452 hours of training (excludingsafety training) were provided across the Kering group brands,and 17,967 employees took at least one training coursein 2013. Women accounted for 58.9% of the workforcetrained in 2013 (excluding safety training). Furthermore,80.4% of employees trained in 2013 were non-managers.
2.3.1. Professional development and mobility
For many years, Kering has demonstrated its commitmentto helping its employees develop by constantly expandingtheir career prospects and strengthening their skillsthrough opportunities for growth and possibilities to boosttheir career. Senior managers were able to take advantageof a 360° feedback programme and personalised support.
Identifying and developing talent
Throughout the Group, the brands have put in place measuresto identify and develop talent and strengthen the rolloutof the performance management process.
The measures implemented in 2012 were pursued in 2013.For example, Gucci strengthened its Human Capital PlanningProcess. Its objectives are the management of human capital,the retention of the best talent, development, diversity and
inclusion. The process resulted in talent mapping of the uppertwo echelons of the organisation and all stores worldwide.
PUMA continued to roll out the People@PUMA managementsystem put in place in 2012 to provide a solid process foridentifying talent in all regions.
New Internal Mobility platform
Professional mobility has always been encouraged within theGroup and considered a major way to help to develop talent.
An Internal Mobility platform was set up in 2013. Thisambitious inter-country and inter-brand project allowsemployees to see the job opportunities in the differentbrands, as each brand posts its vacancies. This makes itpossible to offer the Group’s brands a shared pool oftalent and expertise, and to promote synergy and thesharing of best practices.
This platform allows employees to be active players in theirprofessional development by writing and posting their CV,sharing their career projects and promoting their skills.
This platform also helps HR professionals to be moreproactive and closer to managers in order to manage talentand job mobility.
In the first phase of rollout, the platform can be used to postcorporate and retail (store management) vacancies. Lessthan six months after the platform was launched, nearly190 positions were available.
The 360° feedback project: developing leaders
The work undertaken in 2012 with leaders on 360° feedbackwas continued in 2013 to help support their development.The Gucci, Saint Laurent, Balenciaga, Alexander McQueen,Stella McCartney, Sergio Rossi and Volcom managementteams benefited from 360° feedback. 360° feedback is aprocess aimed at gathering information on the perception of
2.3. Enhancement of skills and talent
area of operation. The hotline assists the Ethics Committeesin reporting information, questions and complaints fromemployees and can be called by anyone in the Group whoprefers this system over contacting one of the threeCommittees directly.
A training programme for all Group employees on ethics and the Code
In line with the significant changes in regards to themeasures for the promotion and respect of ethics withinthe Group, an online training programme was also set up
for the Group’s employees worldwide on ethics andcomplying with the Code. The programme presents casestudies that help employees ask themselves the rightquestions and set out the fundamentals of ethics at Kering.It will be updated annually and cover all the major ethicsprinciples upheld by the Group’s Code of ethics. The topicscovered for the first year of the programme will includecorruption, fraud, conflicts of interest and informationconfidentiality on social media. The programme, launchedin 2014, offers a 45-minute online training course for allin nine languages.
3SUPPORTING OUR EMPLOYEES ~ SUSTAINABILITY
672013 Reference Document ~ Kering
03_VA_V6 14/04/14 11:33 Page67

a person’s skills from several sources (supervisors, colleagues,employees, customers, etc.), with a view to enhancingand developing them. At the end of the process, eachleader has a one-on-one coaching session to analyse theresults of the feedback and define an action plan forpersonal and professional development.
2.3.2. Group training
For over ten years, Kering has offered training programmesat the Kering University for the senior executives, seniormanagers and future leaders of the Group and organisestraining at the Kering Digital Academy to bolster the Group’sdigital strategy. Performance culture, internationalisation,innovation, digitisation and entrepreneurship are centralto these programmes every year. Each year, hundreds ofsenior executives and managers within the Group benefitfrom the “Kering effect” and Group synergies.
Kering University
Pursuing the initiatives undertaken in 2012, KeringUniversity focused its activities on developing Kering’stalent and fast-track senior managers. The University alsoorganises training for senior managers to support theGroup’s transformation.
For several years, international Talent DevelopmentProgramme seminars have allowed the Company’stalented staff to bolster their strengths and develop theirskills. Each session begins with 360° feedback and aquestionnaire allowing participants to better understandhow they are perceived by their colleagues. The seminarcontinues with role plays and the drafting of a personaldevelopment plan. In 2013, the programme was regionalisedto promote better understanding and better monitoringof talent in the regions. Three sessions were held in 2013 –two in Europe and one in Asia – for a total of 34 peoplefrom all brands. A US session is planned for early 2014.
In 2013, Kering University also pursued its programmesfor the Group’s fast-track employees (LeadershipDevelopment Program). The two classes in 2013 wereattended by some 30 participants from Sport & Lifestyleand Luxury brands, representing the Group’s various keyfunctions in nine different countries.
The programme, which takes place over 18 months, includesa Learning Expedition, for the two classes in Singapore / Jakartaand Shanghai / Hong Kong – emerging markets and keygrowth targets of the Group’s brands. Participants thenattended leadership development seminars at ColumbiaUniversity in New York and IMD in Lausanne. The two 2013classes will complete their programme with a concrete projecton a community, social or environmental theme. This projectwill be carried out under timed conditions in an unfamiliarenvironment and will provide support for a communityentrepreneur, NGO or international non-profit.
The University is also supporting the Group’s transformationand has developed Leading Business Across Cultures
training to grasp multicultural differences and worktogether better internationally by taking them intoaccount. The seminars were led by INSEAD, as Keringcontinued to forge ties with prestigious internationalschools, and were offered to 37 senior managers beforethey were rolled out to their teams.
Kering Digital Academy
2013 marked the second year of the Kering DigitalAcademy programme. The Digital Academy is part of Kering’sdigital strategy. It is a programme for managers of theLuxury and Sport & Lifestyle brands aimed at:
• promoting a digital culture at Kering;
• developing the activity of the brands and innovation,and supporting the Group’s transformation strategy;
• raising managers’ awareness of digital issues andenhancing the expertise of digital teams;
• uniting the Group’s employees within an internationaldigital community.
In 2013, the Kering Digital Academy held 34 training sessions(104 days of training) for 450 senior executives and keyfigures within the Group: the Kering Executive Committee,the brand CEOs and their senior management teams (allfunctions combined), as well as e-business / digital managersand digital experts. They were held in nine cities on threecontinents: Paris, London, Florence, Milan, New York, SanFrancisco, Boston, Tokyo and Hong Kong.
In addition to these sessions, a Learning Expedition wasorganised for human resources managers of the brandsin Silicon Valley. During this expedition, the HR managersbenefited from testimonials and best HR practices fromover 14 innovative companies and senior experts indigital HR.
2.3.3. Training by the brands
Training for the Group’s brands revolves around three keyissues.
Integrating and developing new talent
In order to improve the induction and loyalty of newemployees, the brands have put in place training andprogrammes to help them integrate. This involvesoffering training on the values and heritage of the brandsand initial development training.
For example, Gucci put together the G.U.C.C.I Experienceabout sales basics primarily for new hires, but also forstore employees. The training, using both classroom ande-learning sessions, provides insight into the DNA andvalues of the brand and the history of Gucci’s signatureproducts and craftsmanship to offer better support for thesales process. The pilot group in early 2013 was attendedby 60 employees in Brazil and was followed by greatercoverage of employees in the United States and Canada
3 SUSTAINABILITY ~ SUPPORTING OUR EMPLOYEES
68 Kering ~ 2013 Reference Document
03_VA_V6 14/04/14 11:33 Page68

in the third quarter. The programme was stepped up atthe end of 2013, with e-learning launched by 21 storesand workshops in Japan, Singapore and Malaysia.
Saint Laurent offers induction programs for all newemployees in France and in all countries so they can gaina better understanding of the brand.
Bottega Veneta put in place its CORE programme to trainand integrate future retail managers. CORE, which is forboth employees and business students, is an internationalprogramme designed to promote development throughdiverse approaches. The second session took place in 2013.A total of 32 people received training and five were hired.Of the people who took part in the programme in 2012,60% moved into a new role and were promoted.
Developing the managerial skills of teams and store managers
In addition to the Group’s training sessions put in placefor talented employees and senior managers, the brandsorganise training for retail and / or corporate managerswithin the regions. The goal is to train these managers sothey can be better integrated and to enable them tomove ahead, and thus support the growth of the brandsin the markets.
Bottega Veneta launched a leadership programme knownas “GoAll” to forge a culture of leadership and feedbackamong current managers, and create an environment thatfosters employee commitment. The goal is to strengthenmanagement knowledge and practices adapted for thechallenges of the brand. To date, 130 managers have receivedcorporate and industry-specific training. A session in Asiawas attended by 15 managers from entities in China, Korea,Hong Kong, Taiwan and Singapore. In November 2013, 10managers in the United States took the course. Follow-upsessions were set up to monitor progress, in particularthrough the 360° intranet for 39 managers in Europe.
PUMA, as part of its People@PUMA programme, set up anInternational Leadership Programme (ILP) in 2012 to offerleadership training and monitor fast-tracked employees.This programme aims to develop leadership skills to support
the business strategy, both globally and regionally. Theprogramme also encourages employees to adopt a fair,honest, positive and creative attitude, in line with theGroup’s values. The goal is to convey a shared vision andprepare managers for current and future changes.
The Group supports these initiatives in the regions, particularlyto foster the growth of brands that do not yet have criticalmass in terms of employees in a region. Kering Asia Pacificset up a regional training programme, for each level ofmanagement, so teams can develop managerial skills, andnew hires with the Group can benefit from the “Kering effect”.
Strengthening business skills
The brands also implement training with a view to continuingto develop technical skills and knowledge to supportbusinesses and specific issues.
For example, Bottega Veneta continues to support the nextgeneration of designers and craftsmen with the ScuolaDella Pelletteria school, created in 2006. The goal is to supportthe next generation of designers and craftsmen with thebrand’s skills. In 2013, a new space was created withinBottega Veneta’s new atelier in Montebello Vicentino nearVicenza. Some 200 people (employees and students) tookpart in the school’s various projects in 2013.
After its support in 2011 and 2012 for Spiraux training,Girard-Perregaux has pursued its work to help young peoplestruggling at school by supporting a vocational trainingcourse (Attestation Fédérale Professionnelle) for watchmakingtechnicians that offers a two-year programme for a sought-after qualification in the sector. This training is sufficientto become a watchmaking technician, and additionalcertification (Certificat Fédéral de Capacité) can also beobtained to be able to work as a watchmaker. An apprenticestarted at Girard-Perregaux in August 2013, and a secondwill start at the beginning of 2014.
In 2013, the brands also pursued training to improveproduct knowledge. PUMA adapted the training sessionsorganised for 2013 to keep retail staff up to date withproducts and improve the customer’s buying experience.Specific methodology is used for these training sessions.
3SUPPORTING OUR EMPLOYEES ~ SUSTAINABILITY
692013 Reference Document ~ Kering
03_VA_V6 14/04/14 11:33 Page69

Kering has long been committed to diversity and wasamong the first to sign up to the French Corporate DiversityCharter in 2004. Equivalent charters were also signed in2010 by PUMA in Germany and in 2011 by Gucci in Italy.
This commitment goes beyond social responsibility andcompliance, and the Group believes that diversity is asource of creativity and innovation, and as such of economicperformance. The Code of ethics, implemented in 2005 andupdated and made available to all in 2013, demonstratesthe Group’s commitment to ethics.
2.4.1. Promoting equal opportunities for women and men
While Kering addresses the issue of diversity in all its aspects,particular emphasis has been placed on equal opportunities.In 2010, the Group was one of the first companies in Franceto sign the Women’s Empowerment Principles, drafted byUN Women and the United Nations Global Compact.These Principles offer guidance to companies on how toempower women in the workplace and the community.
Kering believes that gender equality is a major driver of theGroup’s overall performance and is committed to achievinga better balance between men and women at all levels. Inaddition to the representation of women in the Keringworkforce (women account for 56.5% of new hires, 50.1%of managers, 58.5% of employees trained, excluding safetytraining), the Group strives to attain an exemplary level ofgender equality for its senior managers and decision-making bodies. Consequently, François-Henri Pinault hasset ambitious objectives for 2015: women to represent 50%of senior managers, 40% of the Management Committeesand 40% of the Board of Directors. In 2010, Kering launchedthe Gender Equality in Leadership programme, the aim of which is to stem the loss of female talent at all levels ofauthority, establishing a culture of equality within theGroup. The goal is to increase the presence of women onall its governing bodies by 2015.
In 2013, with 30% women on its Executive Committee and33% on its Board of Directors, Kering is poised this yearagain as one of the CAC 40 companies with the highest levelof women (these bodies are respectively in first and eighthpositions in the ranking from the eighth annual Capitalcomsurvey on gender equality).
Success of the first mentoring group within the scopeof the Gender Equality in Leadership programme
The Gender Equality in Leadership programme continuedin 2013, in particular with inter-brand and inter-businessmentoring that connects fast-tracked women with seniorexecutives (women and men). The first group completedthe mentoring programme in 2013.
The aim of the year-long programme is to provide supportfor the professional and personal development of the Group’sfemale talent and to involve both women and men in thepromotion of diversity, and ultimately to help bring morewomen to the Group’s governing bodies.
After working with a coach to prepare them to take on theirroles in the programme, the 19 mentors and 19 menteesin the first group interacted for 12 months to address theissues and objectives identified by the mentees at thebeginning of the programme. At the end of the process, theparticipants answered a questionnaire: 100% found thementoring programme to be a positive experience, 93% ofthe mentees and 87% of the mentors said that they had metthe objectives set together at the beginning of the programme.
The last quarter was dedicated to analysing the pilot group,the goal being to organise new sessions in France and expandthe mentoring programme abroad.
Other initiatives to promote equal opportunities
The link between work life and family life is one of the otherkey parts of the Gender Equality in Leadership programme,with major initiatives implemented within the Group’s brands.
Over the last two years, as part of its PUMA Well-beingProgramme, PUMA has worked to promote the well-being ofemployees by helping parents who work at the head officein Herzogenaurach: providing reserved places in nearbydaycare centres, two special areas (with children’s furnitureand nursery equipment, as well as IT equipment for parents)at PUMA’s offices for employees and their children in theevent of a temporary childcare problem, and access to anexternal company that helps parents to find childcare.
In the United Kingdom, Stella McCartney and AlexanderMcQueen offer female employees greater opportunity totake parental leave than provided by law, by maintainingtheir full salary for up to six months of leave. Both brandshelp young parents and employees with dependentparents balance work and family life through a partnershipwith My Family Care, which offers support and advice.
In the United States, Bottega Veneta also introduced a newfamily and sick leave policy, which is much more advantageousin light of practices in the North American market. Employeescan (if they have at least one year of service) take twelveweeks of paid leave for the arrival of a child (birth oradoption), to take care of a sick family member or if a spousein the National Guard is called to duty.
Kering Corporate, signatory of the Parenthood Charter,organised a fourth “open day for the entrepreneurs oftomorrow” attended by 44 children of employees, aged 5to 12. This day gives employees the opportunity to showtheir children where they work and let them discover theGroup’s activities. Time was the theme for the 2013 event,
2.4. Promotion of diversity
3 SUSTAINABILITY ~ SUPPORTING OUR EMPLOYEES
70 Kering ~ 2013 Reference Document
03_VA_V6 14/04/14 11:33 Page70
with theatre and design workshops featuring the brands’creations (fine watchmaking, ready-to-wear, SportingGoods, etc.)
In France, the Group regularly invites female talent to takepart in events promoting gender equality (Printemps desFemmes, Jump Forum, Women’s Forum) in order to supporttheir personal development through assertiveness andleadership training, seminars and networking opportunities.
Similarly, PUMA continued to offer “Succeeding as a FemaleManager” training to its women managers, with nine employees(from Germany, Italy, and the UK) benefiting in 2013.
2.4.2. Promoting the integration of people with disabilities
Disability has always been another part of the Group’sDiversity policy. The Mission Handicap project was formedin 2004. As of December 31, 2013, the Kering groupemployed 326 workers with disabilities (rate of coverage:80.7% – excluding the UK and the United States). Since2005, in France, the Kering group has expressed itsongoing commitment to the integration of people withdisabilities by conducting an internal communicationcampaign marking the national week for the employmentof people with disabilities. This year, Kering made animpact by launching its “ Disability Campaign: Share andEngage ”, an exclusive news channel dedicated to the topicof disability that is hosted on the Group’s 360° digitalplatform for the 16,900 employees connected worldwideand is supplemented by a poster campaign in France.
During each day of disability week, Kering offered a programthat was educational, entertaining and interactive:profiles and testimonials to help go beyond appearancesand discover the realities of disability in the corporateworld and in society. Employees were also able tocontribute by sharing their experience and theirinitiatives to integrate people with disabilities and byproposing new ideas on the special in-house forums thathave been created.
The brands supported this Group campaign with specialdisability events: Boucheron organised an event with anautistic art photographer whose work was displayed for aweek at the brand’s head office in Paris. Balenciaga madeit possible for employees from its head office to discussthe brand’s disability policy with a blind journalist, whileKering Corporate hosted nearly 80 people for a conference / show on dyslexia and a Handi Ping Pong challenge whereemployees were able to test their skills against medalwinners from the Beijing Paralympics.
In 2013, Gucci also confirmed its commitment to helpingpeople with disabilities, by promoting disability awarenessamong not only its employees but also its suppliers. The brandorganised awareness modules for 800 supplier employees.
The Group’s brands in France continue to employdisadvantaged individuals, for services such as catering,preparing mailshots, printing, data entry, etc. KeringCorporate outsources to the protected sector negativereplies to unsolicited job applications (nearly 400 lettersper year) as well as paper / cardboard recycling (15.2 tonnesin 2013).
2.4.3. Supporting young people from disadvantaged backgroundsand those struggling at school
Kering also supports schemes for young people fromdisadvantaged backgrounds and those struggling at school.In France, the Group is a founding partner of TélémaqueInstitute which, through a dual programme of academicand business tutoring, helps talented and motivated youngpeople from underprivileged backgrounds complete theirsecondary schooling.
For several years, Kering has also taken part in the programmeUne Grande École, pourquoi pas moi ? (A prestigiousuniversity, why not me?) to help high-potential youngpeople from modest backgrounds access ambitiousuniversity programmes. In 2013, Kering Corporate,Boucheron and Saint Laurent sponsored eight secondarystudents from modest backgrounds who had promisingschool results and showed strong motivation. Thisprogramme allows them think about concrete careerprospects for the future and more clearly develop a planto decide on a career.
In Italy, Brioni offers training as tailors of made-to-measuremen’s suits, aimed at young people under 18 at risk ofdropping out of education. The course, which runs for threeyears and emphasises the practical approach and workexperience, is entirely funded by Brioni. After completingthe course, trainees perfect their skills during apprenticeshipsat Brioni’s production workshops and stores in Italy andin Europe. In September 2013, a new group of 18 students(including 7 girls) was selected to start the course, which isdesigned to train young international technicians seekingto contribute to Brioni’s strong growth.
3SUPPORTING OUR EMPLOYEES ~ SUSTAINABILITY
712013 Reference Document ~ Kering
03_VA_V6 14/04/14 11:33 Page71

The total figure for absenteeism due to illness includessick-leave, work-related illness, work-related accidentsand commute-related accidents. The overall absenteeismrate includes absenteeism due to illness and every otherkind of absence (maternity leave, paternity leave, unjustifiedabsences, etc.), calculated from the first day of absence.
Across all of the Group’s brands, 30 employees were recognisedas suffering from a work-related illness in 2013.
2.5.2. Organisation of work
Kering strives to put in place an organised and sharedstructure, methods and know-how that allow employeesto work together, in the interest of the organisation andbased on set objectives.
The average working time of the Group’s full-time employeeswas 39.8 hours per week, and this figure is stable comparedwith the data published in 2012.
In 2013, 4,354 employees had contractual weekly workinghours below the standard number in effect within theircompany. Staff working part time accounted for 13.6% ofpermanent employees and were located mainly in theUnited States and Western Europe. Contractual working
hours are spread out on the basis of the specific businessand organisation of each brand, either over certain daysof the week, or over small slots on all working days.
The organisation of working time in the Group’s brandsvaries according to the countries, sites and populationsconcerned. In France, work is most commonly organisedon the basis of a fixed number of hours or days, withannualised working time and the possibility of flexitime.
In 2013, 19,469 overtime hours were recorded in France.
2.5.3. Concrete initiatives promoting the quality of professional life for all employees
The brands put in place consistent and structuredprogrammes so employees are informed about theproposed action plans.
The PUMA Well-being programme does not only seek toestablish initiatives to promote equal opportunities forwomen and men. It also promotes collaboration betweenemployees and the brand’s appeal as an employer. Theprogramme covers physical health (sport), mental health(stress prevention training), social benefits (medical
Frequency rate and severity of work-related accidents in 2013 and 2012
2013 2012
Frequency of work-related accidents (Number of accidents per million hours worked) 4.97% 4.66%Severity rate of work-related accidents (Number of days lost per thousand hours worked) 0.08% 0.06%
Overall lost time and sick leave (%)
2013 2012
Overall absenteeism rate 4.46% 3.88%Rate of absenteeism due to illness 2.06% 1.93%
3 SUSTAINABILITY ~ SUPPORTING OUR EMPLOYEES
Providing its employees with a quality of life ensuring thehealth and physical safety and mental well-being of all is afundamental duty performed by all of Kering’s brands. Inkeeping with this commitment, and as part of thecommitments negotiated under Kering’s 2010 EuropeanWorks Council Charter on the quality of life at work andthe prevention of work-related stress, the brands haveushered in procedures and programmes aimed at identifying,assessing, mitigating and preventing the main risks arisingfrom their activities. To do this, they implement various toolsand mechanisms aimed at achieving a better balancebetween professional and personal lives (e.g., the ParenthoodCharter signed by Kering and the agreement signedbetween trade unions and Gucci, aimed at improving theskills and well-being of its employees). In 2014, the socialclimate survey conducted at the end of 2013 with all Group
employees will be used to establish action plans to promotethe involvement of all.
2.5.1. Health and safety in the workplace, a Group priority
The brands pursued their security initiatives in the retailsector and production. In terms of risk prevention, 37,259hours of safety training were provided to 11,953 Groupemployees in 2013.
In 2013, 297 lost-time accidents were recorded across allGroup brands, compared with 260 in 2012.
Accident frequency trended upwards, but the severityrate remained close to 2012.
2.5. Quality of professional life, health and safety
72 Kering ~ 2013 Reference Document
03_VA_V6 14/04/14 11:33 Page72

The Kering group strives to ensure ongoing socialdialogue specific to each of its bodies, while seeking theoptimal link for the various modes of representationwithin the Group and its two Luxury and Sport & LifestyleDivisions. 2013 saw a change in membership of Kering’ssocial dialogue bodies. The members of the European WorksCouncil and the Kering group Works Council were changed(for Luxury and Sport & Lifestyle for the European Council).
2.6.1. Listen to and engage with employees
By promoting free expression within the Group andongoing social dialogue with employee representatives,Kering has long made clear its determination to forgesustainable and constructive relationships with all of itsemployees and their representatives.
The commitment has also been adopted within eachGroup brand. In 2013, 87 collective bargaining agreementswere concluded within the Group, chiefly in Western Europe,Asia and France. These agreements mainly concerned payand benefits (salary, variable remuneration, profit-sharingand incentives, etc..), working hours and the organisationof working time, and, in France, generational agreements.
In addition, the number of working hours of industrial actiontotalled 1,841 in 2013, compared with 2,317 in 2012. Strikesmainly took place in Western Europe in response tonationwide calls for action.
Within the scope of the sale of the companies of the RedcatsGroup in France (La Redoute, Relais Colis), Kering chosethe buyout offer that corresponded to prerequisites setout by the Group: a long-term industrial project to ensurethe sustainability of the companies involved and aresponsible project in terms of job management andrespect for the territory. Kering also made a commitmentto financing measures to provide support for exemplarytransformations, and starting in June 2013, to engage inregular, transparent social dialogue with La Redoute’semployee representatives in France.
In Italy, Gucci acquired Richard Ginori in March 2013 aspart its overall strategy to develop the excellence of "Madein Italy". This acquisition saved 230 jobs and Gucci tookthe necessary measures to redeploy 43 employees whocould not join the new entity. These employees wereredeployed to companies in the same industry.
2.6.2. The Group’s forums for dialogue
The Kering European Works Council
Created pursuant to the agreement of September 27, 2000,the Kering European Works Council (EWC) provides a Europe-wide forum for information, consultation, the exchangeof views and dialogue.
2.6. Social dialogue
insurance for employees who travel, discount pricing) andsocial interaction (social events, induction of new hires).
Bottega Veneta was selected as a Great Place to Work in Italy – the only fashion company selected among the12 winners. The American research and consultinginstitute that made this ranking, helps organisations toidentify, create and strengthen working environments thatinspire confidence and employee involvement. Thisdistinction rewards significant initiatives to improve theworking environment and transparently promote careerdevelopment and internal mobility for the brand’semployees.
This prize was awarded at the same time that BottegaVeneta inaugurated in September 2013 its new MontebelloVicentino atelier which offers employees an outstandingworking environment – light, access, integrated into thenatural environment, etc. In order to help with thechange to this new location, Bottega Veneta worked withunion representatives and was then able to put in place afree shuttle service for employees.
After an initial trial in 2012, Girard-Perregaux andJEANRICHARD maintained their flexitime programme thatallows employees to use public transport and avoid rushhour and heavy traffic.
2.5.4. Safety and crisis management
The Traveller Safety Policy set out by the Safety Departmentwhich reports to the Group Managing Director seeks toprovide Group employees with more information aboutthe risks related to business travel, including theclassification of countries based on several levels of riskand safety recommendations. Daily “country monitoring”is also used to avert certain serious events that couldaffect employee safety or disrupt business continuity.
A Group-wide project is being put in place to roll out softwareto locate travellers based on their travel reservations. Thiswill make it possible to react more quickly in the event ofa major crisis by alerting travellers, making sure they arein a safe place or even bringing them home.
The Safety Department organises the safety measures for alltravel of delegations and travel in areas that are particularlyrisky. It also offers support for certain sensitive trips,coordinating safety measures on the ground. The Head ofSafety is part of the Risk Committee, whose other membersinclude the Legal and Internal Audit Directors, and theGroup Managing Director as Chairman. The Risk Committeemeets once every quarter.
3SUPPORTING OUR EMPLOYEES ~ SUSTAINABILITY
732013 Reference Document ~ Kering
03_VA_V6 14/04/14 11:33 Page73

The EWC is a true cross-border institution and operatesalongside existing national employee representativebodies in accordance with specific prerogatives. Themembership of Kering’s EWC was renewed in November 2013.
The EWC ordinarily holds two three-day plenary sessionsper year, at which it is informed and, where applicable,consulted on cross-border issues affecting the Group’semployees in a manner defined in precise terms by theagreement governing implementation.
The EWC also has a select Committee composed of fivemembers, elected by their peers, who meet at least five timesa year to prepare and analyse the two annual plenarysessions and to discuss various issues with Groupmanagement.
The September 3, 2008 agreement governing the EWC’sfunctions has been the subject of several addenda. The last,signed on March 27, 2013, followed the meetings of the2012 working group, taking into account the significantchange observed in the Group’s scope of consolidation(sale of Fnac and Redcats) and refocusing more than 50%of the Group’s European workforce from France to Italy.
The EWC’s ordinary plenary meetings took place in Paris,France, on June 25 and November 28, 2013. The main itemsof information provided to its members concerned theGroup’s economic and financial situation, social indicators,the activity of the brands, the Group’s outlook andstrategy, sustainability initiatives (sourcing), the new Codeof ethics and follow-up on the divestment of La Redoute.
The Kering group Works Council
Created in 1993 and renewed most recently in 2013, theKering group Works Council represents workers in Franceand operates under French law. Its members, who meetin plenary sessions twice a year, are kept informed of andexchange views on the Group’s strategies, economic andfinancial imperatives, and human resources managementinitiatives. The senior executives of the Group and thebrands work directly with the Group Works Council on anas-needed basis. Each plenary session is preceded by twopreparatory meetings of members, one of which is heldon the eve of the plenary session.
In 2013, the Group Works Council’s plenary meetings tookplace on May 16 and October 17. The topics addressed werethose presented at the European Works Council. In addition,a full update was provided on the divestment of La Redoute.
The Kering Luxury Works Council
Successor of the European Committee of the former GucciGroup, this re-established body now known as the KeringLuxury Works Council held its annual meeting in September2013 in Florence. This committee does not take the placeof the European and Group bodies. The Luxury Works Councilis a forum for information, dialogue and exchanges withthe unions in Kering’s Luxury Division in Italy and France.
All of the Group’s representative bodies were renewed in 2013,and agreements bearing on their functions renegotiated.
2.6.3. In-house opinion survey: “What’s the weather like where you are?”
In 2001, Kering introduced a bi-yearly in-house opinionsurvey, “What’s the weather like where you are?” for allemployees of the Group’s brands to gather, on aninternational scale, employees’ perceptions on life atwork (working relationships, training and personaldevelopment, organisation and operational efficiency,management, etc.).
The survey was conducted for the seventh time inOctober 2013 among all Group employees in collaborationwith the consulting firm Hay Group. With a participationrate of 71%, (up 11 percentage points like-for-like), over22,000 employees responded to the survey. The Kering groupand its brands have a solid base for analysis that will allowthem to identify the various key drivers for increasingemployee commitment and improving conditions forsuccess. Initial analysis of the results shows that majortopics involving the human resources policy such asperformance evaluations, internal communications, andinformation about career opportunities in the Group haveimproved overall after actions plans were implementedat Group level (new processes, 360° platform, etc.) and atbrand level (for example, creating a new internalcommunications function for Boucheron).
Kering ensures that answers are completely anonymousand reports the results to the employee representatives,at Group and local levels, and to the employees. Keringand the brands will also work on putting in place actionplans based on the analysis of the results. The actionplans will be implemented in a global or a decentralisedmanner in order to meet the expectations expressedstarting from the first quarter of the 2014.
3 SUSTAINABILITY ~ SUPPORTING OUR EMPLOYEES
74 Kering ~ 2013 Reference Document
03_VA_V6 14/04/14 11:33 Page74
Strategy and objectives
In April 2012, Kering announced a set of ambitiousenvironmental targets for 2016 for its Luxury and Sport &Lifestyle brands focusing primarily on the following areas:reducing CO2 emissions, waste and water consumption; thesupply of raw materials; phasing out hazardous chemicals;paper and packaging consumption; and social compliance.
In 2013 the Group worked on roadmaps with each of itsbrands to track their progress relative to each target and itis using this ongoing, collaborative process to prepare aninventory of all projects currently in progress and identifytheir contribution to objectives. The progress of thebrands in relation to the roadmaps is measured againstmilestones at regular intervals by the Group’s ChiefSustainability Officer and the brand CEOs.
Internal organisation for environmental management
The Kering Sustainability Department comprises around15 specialists tasked with devising Group environmentalpolicy and helping the brands to identify priority focusesand to implement the action plans necessary for achievingthe targets set by the Group for 2016. In addition tocentralised tools created and managed by Kering andmade available to the brands, the Group has developed a setof policies and practical guidelines that provide a frameworkand methodologies to help the brands manage theirenvironmental impact. This is the case, for example, forenergy consumption and raw material supplies.
Group-brand coordination is ensured through a networkof managers dedicated to sustainability issues and since2012, each brand has been allocated a SustainabilityLead to spearhead the drive toward sustainability. TheSustainability Leads and the Kering SustainabilityDepartment meet regularly to coordinate deployment ofthe sustainability strategy and to share any best practicesdeveloped at brand level. In addition to sharing experiences,
these meetings enable participants to draw up actionplans to deal with cross-company issues within the Group,as well as more specific issues affecting individual brands.
This structure is a catalyst for the Group’s sustainabledevelopment and illustrates the “Kering effect”. In all, over50 people work on implementing sustainability policy atboth Group and brand level.
The brands have also set up in-house structures – knownas Green Teams – to coordinate their sustainability policyand work towards achieving their targets. PUMA, Gucci, SaintLaurent, Sergio Rossi, Boucheron, Brioni, Girard-Perregauxand JEANRICHARD each have their own Green Team.
In 2013, several brands expanded or consolidated theirsustainability networks:
• Saint Laurent has set up a network of sustainabledevelopment contacts comprising about 20 key peopleworking in the Group’s main functions (studio, production,logistics, HR, marketing, etc..) and regions (Americas, Asia,Japan, Middle East and Europe). It meets every three monthsto review progress in implementing the sustainabilityaction plan. Performance management indicators havebeen devised and the network reports to the ExecutiveCommittee on a regular basis. Part of the variableremuneration of Executive Committee members isactually tied to sustainability criteria;
• Sergio Rossi devised its own specific sustainabilitytargets tied directly to the variable remuneration of thecompany’s 65 employees;
• Bottega Veneta also stepped up its efforts byappointing seven Sustainability Ambassadors fromamong key people in the brand network and they all gottogether at the Worldwide Sustainability AmbassadorWorkshop in Milan. Training was provided in environmentalreporting and sustainable development in general andthere was a presentation of ongoing Group initiatives inthis area;
3.1. Environmental management
Every year, the Kering group and its brands renew theirefforts to encourage green practices across all the Group’sbusinesses with proactive measures to control and reducedirect and indirect impacts on the environment. Concrete
examples of this commitment include the decision to publisha consolidated EP&L by 2016, the adoption of ambitious,quantified targets, and new sourcing scenarios with agreater focus on sustainable resource management.
3. Reducing our environmental impact
3REDUCING OUR ENVIRONMENTAL IMPACT ~ SUSTAINABILITY
752013 Reference Document ~ Kering
03_VA_V6 14/04/14 11:33 Page75

• the Green Team at Girard-Perregaux and JEANRICHARDgrew from four to six people in 2013 and its membersare now drawn from the Industrial Division, Productionand Methods, Human Resources, General Services, Supply-Chain management, and Marketing and Communication.A progress report is submitted to Executive Managementafter each monthly Green Team Meeting.
Environmental reporting now mobilises a network ofmore than 400 contributors worldwide across the Group’sbrands – up from 200 in 2012 – providing even moreaccuracy and information that enables the Group tomonitor its environmental impacts and performanceever more closely.
Informing and raising awareness among employees
As part of Kering’s policy of rallying all employees aroundits sustainability policies and making it part of theGroup’s corporate culture, Kering regularly organisesawareness-related initiatives and training.
The sustainability team gathers news on sustainabilitywithin the Group and circulates it through a variety of media.A new communication application, Intranet 360°, waslaunched in 2013 containing a dedicated sustainability spacewhere employees of all brands can exchange informationon multi-brand initiatives like EP&L or individual brandroadmaps.
Two sustainability newsletters are also issued twice a month: Sustainability Watch, sent in English to over1,000 employees, and Regulatory Watch, available in English,French and Italian to a more limited readership since it focuses more on regulatory issues. The organisation of one-off events also helps foster employee awareness andtraining is provided both by the Group and the brands.
Four webinars were organised this year by the Keringteam to train and inform almost 200 people through adetailed presentation of Group-wide environmentalreporting objectives, guidelines and applications.
The brands also use a wide range of activities to rallyemployees around sustainability initiatives. Boucheron sharedkey 2012 sustainability reporting data with employees tohighlight progress made and encourage green practicesin everyday situations. Sergio Rossi set up a dedicatedSustainable Development page on the intranet whereemployees can learn about ongoing initiatives. It alsoorganised a private showing for employees of Rafea SolarMama, a documentary supported by the Kering Foundation.Saint Laurent issues a bi-monthly sustainability newsletterto keep employees abreast of the latest initiatives and togive enhanced recognition to those involved in theprojects. Meanwhile, the Sustainability@Saint Laurentcommunity on the Group intranet, which was set up inJune 2013 to share information, ideas and good practices
now has 955 members, or 70% of all employees. InSeptember 2013, Saint Laurent organised an exchangeforum with Tristan Lecomte, the founder of the Alter ecoand Pur projet initiatives, who was designated 2013Social Entrepreneur of the Year by the SchwabFoundation and the Davos World Economic Forum. Hegave a presentation to about 100 employees on hiscareer as a fair trade pioneer and provided tips on how todeploy a corporate sustainable development strategy.
Gucci’s Sustainability Department organised five three-hour sessions for approximately 100 employees fromother departments in 2013 to train and raise awarenesson sustainability and Gucci’s efforts in the field.
Volcom used the Earth Day 2013 campaign to showemployees HOME by Yann Arthus-Bertrand, The LastOrang-utans by Mark Samuels, and Volcom Pipe Pro 2013:Sustainable by Design by Nathan Peracciny, which wasfilmed behind the scenes at the competition. Bestpractices workshops on cutting paper consumption andsorting office waste were held regularly and employeeswere encouraged to share their sustainability ideas andexperiences on the New Future Facebook page. They canalso be interviewed on the blog of the same name. Thecampaign wound up with an online dialogue with Volcom’sSustainability Lead and a presentation of the Group’s EP&Lobjectives and an overview of its sustainability actions andstrategy. Specialist training in selecting supplies andmaterials was also provided to the product developmentteam and a workshop highlighted the potential ofmaterial vetting procedures pending specific targets forcutting the Group’s greenhouse gas emissions and waterand energy consumption. Alternative sustainable materialswere also presented.
Alexander McQueen organised a one-day workshop presentedby the brand CEO that brought together employees fromstores, retail and CRM as well as architects and artists. Theaudience, comprising people from inside and outside thecompany, was assisted throughout the day with brainstormingtechniques to generate innovative brand and product ideasfor inclusion in the Alexander McQueen 2014 roadmap, asummary of the brand’s objectives and action plans.
Kering’s Innovation and Sustainability Awards are also anideal way of raising awareness and since 2010, they haveallowed Group employees to showcase their leadership,creativity and values. Held in September 2013, the fourthedition of the Awards – complete with a dedicated websitefor the second year running – allowed the Group’s employeesto submit and to vote for projects in the followingcategories: product innovation; efficiency enhancement;and communication with stakeholders, individuals andcommunities. The third edition of the Awards in 2012-2013generated innovative projects including Stella McCartney’s“Sustainable Wool” which won first prize. This involvessourcing sustainable wool fibres certified by Ovis XXI and
3 SUSTAINABILITY ~ REDUCING OUR ENVIRONMENTAL IMPACT
76 Kering ~ 2013 Reference Document
03_VA_V6 14/04/14 11:33 Page76

Reporting process and indicators
To accurately track the environmental footprint of itsactivities, Kering has undertaken environmental reportingbased on around a hundred indicators every year since2004. Representative of the environmental imperativesof the Group’s brands, these indicators fall into eightcategories: use of raw materials, waste production,energy consumption, water consumption, product policy,environmental management and management ofenvironmental risks, goods transport and business travel.
Following the introduction of new indicators in the 2012campaign, this year was used to consolidate reportingprocedures at the industrial sites to provide better qualityinformation on processes, materials used and environmentalmanagement, as well as more specific quantitative dataon water and air pollution.
In order to track its actual environmental performance asclosely as possible, Kering’s environmental reporting systemis designed to cover all the Group’s businesses, with theaim of collecting actual data from the 1,500 sites locatedaround the globe. The methodology set out in the reportingprotocol, however, allows the Group to estimate some data.
Kering works each year to increase the number of sitesincluded in its environmental reporting, extending theprocess to 290 new sites in 2013, mainly belonging to theBrioni, Gucci, Pomellato, Bottega Veneta and AlexanderMcQueen brands.
These efforts helped extend the environmental reportingscope in 2013 to cover 100% of the Group’s 2013 revenueand employees as of December 31, 2013.
A methodological note provides all necessary informationregarding the environmental reporting protocol, emissionfactors and rules for using estimated / extrapolated data. Itis available on Kering’s website, under “Sustainability”.
Brand Site name Activity Year of ISO 14001
certification
Gucci LGL platform (Bioggio and Stabio) Distribution 2006 Accessories Warehouse Florence Distribution 2010 Casellina Warehouse Distribution 2010 Casellina head office Offices 2010 Caravel Tanning 2011 Blutonic Tanning 2011
Florence head office Offices 2013
Bottega Veneta Altavilla Vicentina Distribution 2010 New Montebello Vicentino Atelier Production 2013
Nature Conservancy from Patagonia. The farmers whoproduce the wool are part of a vast programme to protect andrestore endangered Patagonian prairies. One millionhectares of prairie have already been certified for theirsustainable practices and the project aims to certifysix million hectares by 2016. Because wool is such anessential material for Stella McCartney and other brands,the entire Group may begin to use this source in 2014thanks in particular to MIL, the first collection to use thesefibres, scheduled for release in autumn 2014. This projectencapsulates what the Group’s environmental strategy isall about: engaging as far upstream as possible andreducing environmental footprint in the sourcing phasewhile simultaneously generating a positive local impact
through restoring endangered ecosystems.
Certification
The prevalence of retail activities within the Group limitsthe number of sites for which ISO 14001 certification isrelevant, so the process is primarily considered for siteswith the most significant environmental impacts, such aslarge logistics centres and tanneries. ISO 14001 certificationdemonstrates the implementation of a system to manageenvironmental impact. In 2013, Bottega Veneta renewedcertification for its Altavilla site and obtained certificationfor its new Montebello Vicentino atelier which replacesthe atelier in Vicenza.
3REDUCING OUR ENVIRONMENTAL IMPACT ~ SUSTAINABILITY
772013 Reference Document ~ Kering
03_VA_V6 14/04/14 11:33 Page77
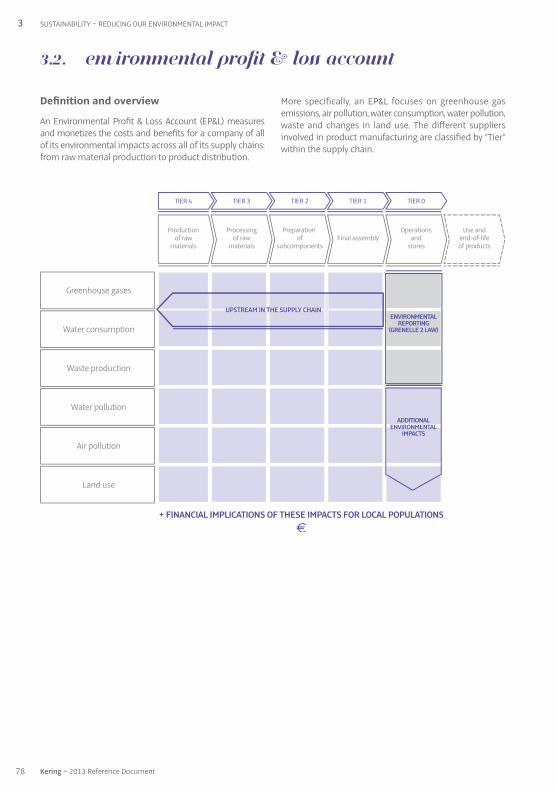
Definition and overview
An Environmental Profit & Loss Account (EP&L) measuresand monetizes the costs and benefits for a company of allof its environmental impacts across all of its supply chains:from raw material production to product distribution.
More specifically, an EP&L focuses on greenhouse gasemissions, air pollution, water consumption, water pollution,waste and changes in land use. The different suppliersinvolved in product manufacturing are classified by “Tier”within the supply chain.
3.2. Environmental Profit & Loss account (EP&L)
3 SUSTAINABILITY ~ REDUCING OUR ENVIRONMENTAL IMPACT
TIER 4
Productionof raw
materials
Greenhouse gases
Water consumption
Waste production
Water pollution
Air pollution
Land use
Processingof raw
materials
Preparation of
subcomponentsFinal assembly
Operationsand
stores
Use andend-of-lifeof products
TIER 3 TIER 2 TIER 1 TIER 0
UPSTREAM IN THE SUPPLY CHAIN
+ FINANCIAL IMPLICATIONS OF THESE IMPACTS FOR LOCAL POPULATIONS€
ENVIRONMENTALREPORTING
(GRENELLE 2 LAW)
ADDITIONALENVIRONMENTAL
IMPACTS
78 Kering ~ 2013 Reference Document
03_VA_V6 14/04/14 11:33 Page78

The two major innovations of this method involve:
• factoring in the total impact of activities, i.e., including thesupply chains and raw materials. This approach goesbeyond the traditional boundaries of the company andfactors in the environmental impacts developed inScope 3 of the GHG Protocol;
• allocating a monetary value to these impacts whiletaking account of their location by measuring thechange in natural capital use. Exchange rate fluctuationsare taken into account when monetary valuationcoefficients are updated.
EP&L is one of the first major approaches that allows acompany with global supply chains to quantify theenvironmental impacts of all of its production, transportand sales processes and to accurately map all of theimpacts across the different phases involved in producingand distributing its products.
Assigning monetary values to these environmental impactson local populations also considerably enriches this hugebody of data. It helps decision making by drawing upon ascientific, documented methodology that comparesdifferent environmental impacts in absolute terms and interms of their location.
For example, Kering has been able to use this approach tocompare the impact of drawing one cubic metre of waterfrom a high water stress zone or from a region with abundantaccess to freshwater. The Group can also choose the besttrade-off in terms of environmental benefits betweencutting waste production or water consumption on aproject-by-project basis.
The wealth of knowledge contained in this data booststhe effectiveness of Kering’s environmental strategy. TheEP&L approach highlights areas where the Group candeploy solutions that are likely to reduce the impact of itsexisting sourcing and manufacturing processes in asignificant manner and innovate using new materials,technologies and sourcing solutions.
Consequently, in view of the Group’s stated goal of boostingits eco-friendly product offering, the EP&L has become akey component in Kering’s strategic decision-makingarsenal. It is also being used to measure and guide theGroup’s sustainability targets through 2016.
History of involving and working with stakeholders
The EP&L was first developed at PUMA and is currently beingdeployed across all Kering brands. The Group has committedto publishing its first consolidated EP&L in 2016. Whiledeployment is being spearheaded by the Group, the “Keringeffect” is being leveraged to drive a shared approach toimplementation at individual brand level.
Given the innovative and complex nature of this approach,Kering was willing to share its methodological findingswith world-renowned specialists and PUMA’s first EP&L
was thoroughly reviewed by a panel of independentexperts comprising economists, and specialists inecosystem services and environmental reporting. Theresulting recommendations – which can be accessed viathe Group’s website – were used to refine the methodologyused in subsequent EP&Ls and the Group decided toinclude water pollution as an additional environmentalimpact.
Aside from the expert review, the Group also intends toshare its findings and assume a leadership role in thisfield by contributing its experience and participating in theflourishing debate around the whole question of assigninga financial value to services performed by ecosystemsand their deterioration. Kering has been invited to shareits experiences by peer groups including WBCSD, EpE, theWorld Forum on Natural Capital and The Economics ofEcosystems and Biodiversity (TEEB) inter alia.
The Group has presented its work to prestigious bodies thatwish to keep abreast of the latest private sector innovationsin sustainability, including the European Commission, theHouse of Commons (UK), the German Bundestag and ADEME.Kering also regularly participates in conventions andpresentations organised by other big companies.
The EP&L as a decision-making tool
Kering uses information provided by the EP&L to guide itsinvestment policy and to appraise its sustainabilityprojects by simulating the potential EP&L value andassessing the related financial impacts. For example,based on the analysis of the EP&Ls of several brands,Kering has looked into the possibility of changing thecountries in which it sources raw materials or actuallychanging the raw materials used in some components.Working with suppliers to limit their environmental impacthas also been identified as a possible area for unlockingsignificant potential environmental gains. The Group nowsees the EP&L as a key component in its strategy ofadapting to climate change.
The EP&L also allows the different functions – Supply Chainmanagement, Production, Communication, Purchasing,Finance, etc. – to get a fresh perspective on the specific issuesthat concern them. Mapping the industrial processes and thesuppliers involved in manufacturing products refines theanalysis of the different transformation processes in theupstream portion of the supply chain (breakdown andcharacteristics of suppliers, risk mapping, identification ofsynergies, etc.). This whole approach can strengthen therelationship that the brands have with their suppliers bygiving them a role in an innovative, unifying and non-competitive project.
2013: standardisation of methodology and large-scale deployment
Kering drew on the pioneering work of PUMA and theproduction of the first complete EP&L by another brand
3REDUCING OUR ENVIRONMENTAL IMPACT ~ SUSTAINABILITY
792013 Reference Document ~ Kering
03_VA_V6 14/04/14 11:33 Page79

in 2012 to standardise its own approach to deployment.By drawing up and documenting a clear methodologythat may be easily replicated across the Group’s differentbrands, Kering has moved the EP&L out of the experimentalphase and turned it into a fully-fledged decision-making tool.
An EP&L is deployed in four successive phases:
1. mapping processes and suppliers through to rawmaterials;
2. gathering as much environmental data as possible;
3. estimating / extrapolating the impacts not coveredby the environmental data gathering phase;
4. allocating a monetary value to the cost of theseimpacts while taking account of their location.
As well as partnering the brands throughout the process,Kering has devised a series of support mechanisms (mappingmodels, data gathering files, supplier guidelines, etc.) togive the brands greater autonomy when they replicatethe process.
In 2013 the EP&L approach was deployed in six Groupbrands accounting for 73% of consolidated revenue. In2013 alone, nearly 900 suppliers (manufacturers, tanneries,producers of components, subcontractors, dyeing andweaving firms, etc.) replied to Kering’s environmentalquestionnaire, providing invaluable data on the Group’senvironmental impact.
Breakdown of EP&L results (analysis carriedout in 2013 on six brands accounting for 73%of 2012 consolidated revenue)
ANALYSIS OF IMPACTS BY TIER AND BY TYPE OF IMPACT:
ANALYSIS OF IMPACTS BY TYPE OF MATERIAL (1):
(1) Analysis by type of material is only possible for the impacts of Tier 3 andTier 4.
The initial findings of the EP&L approach conducted in 2013on six Group brands (on 2012 data) clearly highlight:
• the greater environmental impacts of the supply chainsover that of the Group’s own activities (over 90%);
• the proportionate weight of Tier 4 related mainly toagricultural activities (cotton and other textile fibres, cattleand sheep farming, etc.) which accounts for 39% of theGroup’s impact;
• the significant contribution of transformation industries(production of synthetic and natural fibres, leathertanning and precious metal refining), which account for24% of the Group’s impact;
• as regards type of environmental impact, GHG emissionsand land use represent 39% and 26%, respectively, ofthe Group’s impact.
These findings validate the Group’s sustainability strategy,underpinned by a focus on responsible sourcing practicesand efficient material vetting and transformation processestogether with a quest for optimal management of the directoperations.
Stepping up deployment over the coming years
With a view to publishing the first consolidated EP&L in 2016,Kering has decided to test EP&L deployment to all brandsin 2014. This accelerated deployment will go hand inhand with a comprehensive analysis of available EP&Lfindings in the six brands already covered in order tocome up with effective action plans for reducing theenvironmental footprint.
3 SUSTAINABILITY ~ REDUCING OUR ENVIRONMENTAL IMPACT
Leather Metal
1%
44%
Preciousmetals
2%
Textilessynthetics
12%
Textile -animalfibres
5%
Textile -vegetalfibres
25%
Othermaterials(natural
and synthetic rubber, glass,
wood, etc.)
11%
Greenhousegases
Airpollution
Waterconsumption
Waterpollution
Wasteproduction
Change inland use
TIER 4 TIER 3 TIER 2 TIER 1 TIER 0
80 Kering ~ 2013 Reference Document
03_VA_V6 14/04/14 11:33 Page80

The Kering group helps address the impacts of climatechange in two ways: by directly reducing the carbonfootprint associated with its energy consumption and thetransport of people and goods, but also, from a longer-term perspective, by evaluating and reducing emissionsof greenhouse gases in its supply chain, especially byusing the EP&L analysis implemented by the Group for all itsbrands. This approach has become a key component inKering’s climate change strategy. In addition, Kering nowhas access via an external service provider to an applicationfor mapping and analysing its global risks according toseven broad categories that include:
• human rights;
• climate change;
• the environment;
• environmental regulatory changes.
Energy consumption and the transport of goods and peopleare the two main sources of the Group’s CO2 emissions(excluding emissions related to the supply chain). Totalemissions for 2013 came in at 268,256 tonnes of CO2.
A major review of the Group’s emission factors was carriedout in 2013 for the purpose of:
• ensuring consistency between the methodologies forcalculating the carbon footprint used for the EP&L and forthe Group’s annual environmental reporting; and
• getting a broader perspective of the Group’s impacts aspart of a Life Cycle Assessment (LCA) approach that factorsin the indirect impacts of emissions related to energyconsumption and transport.
In addition to those included from the combustion phase,the Group’s emission factors now also include those fromupstream extraction phases (petrol, uranium), line lossesand the treatment of nuclear waste, all of which are nowincluded in Scope 3 of our environmental reporting. In orderto facilitate year-on-year comparability, 2012 data hasbeen restated to include these new emission factors.
Details of the emission factors used are available in themethodological note to Kering’s 2013 environmentalreporting on the Group’s website.
A detailed account of these emissions, the main changesthat took place between 2012 and 2013, and the initiativesput in place to reduce the Group’s carbon footprint arepresented below.
BREAKDOWN OF TOTAL TRANSPORT- AND ENERGY-RELATEDCO2 EMISSIONS IN 2013
Total: 268,256 tonnes of CO2
The increase in energy-related over transport-relatedemissions (54.4% in 2013 versus 49.8% in 2012) is due tothe integration of new industrial sites and stores togetherwith the application of new emission factors that includeScope 3.
Energy consumption and related CO2 emissions
The energy-consumption indicators below enable theGroup to assess its energy use, together with the relatedgreenhouse gas emissions, both direct (Scope 1 of theGHG Protocol: burning of natural gas, heating oil and LPG)and indirect (Scopes 2 and 3 of the GHG Protocol: electricityand steam production, line losses, upstream productionphase of energy fuels and the treatment of nuclear waste).
3.3. Measurement and reduction of our carbon footprint
3REDUCING OUR ENVIRONMENTAL IMPACT ~ SUSTAINABILITY
Energy 54.4%Transport 45.6%
812013 Reference Document ~ Kering
03_VA_V6 14/04/14 11:33 Page81

On a proforma basis, the Group’s energy consumptionrose from 254 GWh in 2012 to 261 GWh in 2013, anincrease of 2.6%. This was attributable chiefly to anincrease in natural gas consumption following a changein the method of calculating natural gas consumption inUS stores based on measurements taken by a serviceprovider across a sample of stores.
The sharp increase in heating oil consumption correspondsto a change from stream-to an oil-based heating systemat a warehouse in Italy.
The share of CO2 emissions related to energy consumptionfell by 5.2% thanks to an increase in the share of renewableenergy in the energy mix which explains the decrease in
CO2 emissions despite the slight increase in overallenergy consumption.
Measures to improve the energy efficiency of stores and infrastructure
Kering has produced a handbook entitled the SmartSustainable Store, setting out good environmentalpractices to be applied in the Group’s stores. It is availablein six languages (English, French, Italian, Japanese andboth simplified and traditional Chinese) and covers themanagement of energy, waste, paper and water as well asother consumed resources such as packaging anddeliveries and store upkeep and maintenance. A more
Proforma year-on-year change in energy consumption (MWh) and in related CO2 emissions (tonnes)
2012-2013 proforma scope Year-on-year2013 2012 change
Electricity 210,529 207,792 +1.3%Natural gas 40,489 37,131 +9.0%Heating oil 1,528 715 +113.8%Steam 8,213 8,547 -3.9%LPG 160 164 -2.3%Total energy 260,919 254,350 +2.6%
Direct emissions (Scope 1) 8,218 7,361 +11.7%Indirect emissions (Scope 2 and 3) 120,485 128,454 -6.2%
Total energy-related emissions 128,703 135,815 -5.2%
BREAKDOWN OF ENERGY-RELATED CO2 EMISSIONS IN 2013 (%)
Total: 145,853 tonnes of CO2
The Kering group’s energy consumption relates mainly tothe heating, lighting and air conditioning of stores,warehouses and offices. In 2013, it amounted to almost295 GWh. Electricity is the Group’s main source of power,representing 80% of total energy consumption.
CO2 emissions related to the Group’s energy consumptionin 2013 totalled 145,853 tonnes of CO2 90.5% stemmedfrom the generation of electricity and were thereforeindirect emissions relating to the amount of electricityconsumed, but also to its mode of generation (coal,hydrocarbon, nuclear, renewable, etc.).
Energy consumption and related CO2 emissions in 2013
Energy Related CO2 consumption emissions (MWh) (tonnes)
Electricity 235,488 131,965Natural gas 47,856 11,015Heating oil 3,208 953Steam 8,277 1,870LPG 160 50
Total energy 294,989 145,853
3 SUSTAINABILITY ~ REDUCING OUR ENVIRONMENTAL IMPACT
Electricity 90.5%
Natural gas + LPG 7.6%
Heating oil 0.7%Steam 1.3%
82 Kering ~ 2013 Reference Document
03_VA_V6 14/04/14 11:33 Page82

detailed version is also available that focuses on the lifecycle of the store and its fittings.
In 2011, the Indirect Purchasing Department and theSustainability Department – in partnership with NUSConsulting – launched a major energy managementproject intended for all Group brands. In 2012, a systemfor closer monitoring of energy consumption wasintroduced and 381 sites in Europe and the US have nowsigned up to the project. It focuses on streamlining theenergy procurement process by pooling and consolidatingenergy consumption, increasing the use of renewableenergy and centralising energy procurement management.The project has generated tangible energy savings andcost reductions for the Group. For example, in 2013 morethan 25 GWh of COFER-certified energy (Certificates ofOrigin for Renewable Energy Power Plants) was purchasedin Italy and there are plans to expand the initiative to newregions in 2014. A module that trains people how to use thisenergy management tool has been deployed in most ofthe brands and is set to become mandatory for all of thebrand’s facility managers.
Taking things even further, a pilot scheme has been launchedto gain a better understanding of how consumption breaksdown at various points of sale. Sub-metering of differenttypes of consumption (lighting, air conditioning, etc.) istaking place in six Parisian pilot stores in partnership withSchneider Electric. Some of the Group’s most iconic Parisianstores have been selected, including Saint Laurent on AvenueMontaigne, Boucheron on Place Vendôme and PUMA onBoulevard Sébastopol. Tracking energy consumption atpoints of sale in real time should highlight the most energy-intensive captions and allow the Group to come up withoptimal energy performance solutions. If the pilot deliverson its promises, it will be rolled out to other stores. In theLuxury Division, LEED certification (Leadership in Energy andEnvironmental Design) for new buildings and majorrenovation work is a concrete example of what is being doneto cut energy consumption. The certification programmeis based on six evaluation criteria of which energy is themost important (optimising energy performance, usingrenewable energies, etc.). Gucci has obtained certificationfor its Brera, Shanghai IAPM and Hong Kong IFC stores andother stores have been earmarked for certification in 2014.Stella McCartney and Brioni obtained LEED certification fortheir stores in Dallas and the new building in Milan,respectively, and the 40,000 sq.m extension to Kering’sinternational distribution and logistics platform for itsluxury brands has also been certified.
The Group’s brands are working to come up withenvironmental performance solutions that actually gobeyond certification processes. For example, in 2013,Volcom finished renovating a building that incorporateseffective lighting, natural lighting and presence sensorsthat combine to create a system that is 20% more energyefficient than the California Energy Commission’s ownTitle-24 standard. PUMA received the OutstandingMerit – Tenant Improvement Award from Chain Store Age
and the A.R.E Sustainability Award for its Ontario Millsstore in California. Designing stores using the principle of“design by subtraction” has enabled the Group to cut itscarbon and energy footprints by 25% and 30%,respectively, and to use less materials. Store end of lifehas also been factored in with the use of 100% recyclablematerials and separable modules that can either berecycled or used at another store.
The stores of the various brands continue to be equippedwith LED (light emitting diodes) lighting to reduce energyconsumption: five Boucheron stores in Paris, London,Taiwan and Hong Kong are now 100% LED-lit, generatingsavings of 30% on average in each store – i.e., a total of 20 MWh in 2013 – and reducing the brand’s carbonfootprint by 15 tonnes. Sergio Rossi integrated LEDlighting into the design concept for its flagship Florenceand Milan stores, generating savings of around 20 MWh ayear and avoiding 9 tonnes of CO2 emissions. If theaesthetic effect produces the desired results, LED lightingwill be installed in other retail stores in 2014 and 2015.Saint Laurent is following the same approach for the newHedi Slimane store concept and all newly-opened orrenovated stores will be LED-lit cutting energyconsumption by 30% on average. At end-2013, around20% of Saint Laurent’s directly owned stores were 100%LED-lit. Gucci also continued to roll out its LED lightingprogramme equipping 22 stores in 2013 and the brandwill pursue its efforts in this field in 2014. Other brandssuch as Stella McCartney, PUMA and Volcom also haveplans to install LED lighting and PUMA in particular hasalready replaced lighting in 42 stores out of 79 in Hungary,Mexico, Australia, Argentina and New Zealand.
The gradual shift towards renewable energy
The proportion of renewable electricity used by the Groupis growing thanks to numerous changes in supply withinthe brands. It amounted to 15.4% in 2013, comparedwith 7% in 2012.
Numerous initiatives are afoot to boost the Group’s useof renewable energy including the renewable electricityproject being developed in partnership with NUS consultingdescribed previously. With the support of Kering, SaintLaurent is gradually switching all of its French energycontracts over to green electricity. Brioni is also leveragingthe partnership with NUS Consulting in its negotiationswith renewable energy suppliers as is Bottega Venetawhich now gets nearly 20% of its electricity requirementsfor all of its sites from renewable sources purchased byKering, and in Italy the proportion has now risen to 85%.
In 2013, the proportion of green electricity used byGirard-Perregaux and JEANRICHARD rose to 77% of totalrequirements. The figure is 60% for Stella McCartney and100% at its London-based sites. Sergio Rossi gets 40% of itselectricity requirements from green sources. 17% of Gucci’selectricity needs come from this source thanks to thebrand’s almost exclusive use of green electricity in Italy.
3REDUCING OUR ENVIRONMENTAL IMPACT ~ SUSTAINABILITY
832013 Reference Document ~ Kering
03_VA_V6 14/04/14 11:33 Page83

Emissions related to transport and travel
Transport and business travel-related CO2 emissions in 2013 (in tonnes of CO2)
2013
B to B transport 87,688B to C transport 5,956Business travel 28,759
Total 122,403
In 2013, the Group’s transport- and business travel-related CO2 emissions totalled 122,403 tonnes. B to B transportaccounted for 72% of these emissions.
In 2013, the share of electricity derived from renewablesources reached 15% of PUMA’s total electricity consumption,thanks to initiatives in Germany, the United Kingdom, Australia,Austria and the Benelux countries, and more recently, inVietnam.
Aside from suppliers, the brands have also been boostingtheir reliance on renewable energies by installing photovoltaicpanels. Some brands have already installed panels on theroofs of certain buildings such as PUMA’s head office inGermany, a warehouse operated by the Luxury Division inthe US, the Headquarters of Bottega Veneta (providing 45 kW), Sergio Rossi’s head office and its developmentand production site in San Mauro Pascoli which has beenproviding 540 MWh annually since 2012. These facilitieshave exceeded target estimates by more than 8MW,generating cumulative savings of €203,000 and 384tonnes of CO2 emissions.
Bottega Veneta has completed its solar power arsenalwith 16.5 kW of power on the roof of its second buildingin Milan and 57.1 kW at its new site in Montebello Vicentino,which takes its total generating power to 120 kW for all ofthe brand’s buildings.
Transport-related impacts and emissions
Methodology
Data on transport are divided into three main categories:
• B to B transport: this includes all transport of goods paidfor by the brands between the suppliers and the logisticsplatforms or industrial sites, and between the logisticscentres and the points of sale. The transport of goodsbetween logistics centres also falls into this category; B to B transport includes road freight, rail freight, shippingand air freight;
• B to C transport: this covers all deliveries of finishedproducts between logistics platforms or points of saleand customers. These deliveries can be carried out eitherby the brands’ own fleets or by subcontractors’ vehicles.Note that express delivery is included under B to C transport.As with B to B, only transport which is paid for by thebrands is taken into account. B to C transport includesroad freight and air freight;
• business travel: this covers business air travel and the useof company cars.
All the emission factors used in the reporting process arederived from public information sources, i.e., academicestablishments or internationally recognised institutions.Details of the methodology used are available in themethodological note to Kering’s environmental reportingon the Group’s website.
3 SUSTAINABILITY ~ REDUCING OUR ENVIRONMENTAL IMPACT
84 Kering ~ 2013 Reference Document
03_VA_V6 14/04/14 11:33 Page84

CO2 emissions from B to C transport totalled 5,956 tonnesin 2013, of which 98% was attributable to express transport,which involves shipping small quantities of goods quicklyand is used primarily by the Luxury Division. On a proformabasis, B to C transport emissions remained fairly stableyear on year.
Optimising logistics flows and switching to alternative means of transport
Goods transport has a significant impact on the Group’s CO2emissions, and the brands have been working to reducethe distances covered during the supply and delivery ofgoods, to improve truck load factors and the performanceof truck fleets, and even to develop alternative means oftransport.
In 2013, Kering launched a review of all modes of transportand flows of goods throughout the Group in order to analysethe current situation and compile best practices being usedby the brands. It was conducted worldwide and involvedPUMA, Volcom, LGI (Luxury Goods International, the LuxuryDivision’s logistics platform), Gucci, Bottega Veneta, SaintLaurent and Stella McCartney. Over 100 best practices wereidentified together with the main obstacles to implementingenvironmental impact reduction projects. Proposedimprovements include optimising packaging and deliveriesand changing the mode of transport whenever and whereverthis is possible, especially when there is no real timepressure. This applies particularly to non-retail products(e.g., point-of-sale advertising, packaging, merchandisingitems, etc.) and the focus is on switching from air transportto shipping and optimising the outbound port or – if airtransport has to be used – favouring direct flights.
B to C transport-related CO2 emissions in 2013 and proforma year-to-year change (in tonnes of CO2)
Related CO2 2012-2013 proforma scope Year-on-yearemissions (in tonnes) 2013 2012 change
B to C – own vehicle fleets 7.2 5.8 7.5 -22.7%
B to C – subcontractors’ vehicles Classic 121 95 138 -31.2% Express delivery (air and road) 5,828 5,620 5,572 +0.9%
Total 5,956 5,721 5,718 +0.1%
The Group’s proforma B to B transport emissions increasedby 2% due mainly to a slight increase in air and road transport(2012 air transport data was partly restated to reflect theenhanced methodology used to calculate 2013 data).
The increase in the number of road transport tonne-kilometresis mainly attributable to the inclusion by PUMA of additionaltransport flows previously handled by suppliers as well as tohigher levels of business for the Luxury Division brands.
Proforma year-to-year change in B to B transport volumes
2012-2013 proforma scope Year-on-year2013 2012 change
Road freight (t / km) 74,788,164 73,235,755 +2.1%Shipping (teu / km) 309,642,166 314,449,949 -1.5%Air freight (t / km) 73,292,975 70,841,337 +3.5%Rail freight (t / km) 18,141,203 17,966,251 +1.0%
Total CO2 emissions (tonnes) 87,562 85,847 +2.0%
Within the Group, the most frequently used means oftransport for goods in volume terms is shipping. Air transportis also frequently used to move goods manufactured in Europe
to faraway destinations quickly. It accounts for 56% of CO2emissions from B to B transport.
B to B transport volumes in 2013 and related CO2 emissions
Total 2013 Related CO2emissions
(tonnes)
Road freight (t / km) 74,872,291 11,507Shipping (teu / km) 309,642,166 26,345Air freight (t / km) 73,531,795 49,301Rail freight (t / km) 18,141,203 535
Total CO2 emissions (tonnes) 87,688
3REDUCING OUR ENVIRONMENTAL IMPACT ~ SUSTAINABILITY
852013 Reference Document ~ Kering
03_VA_V6 14/04/14 11:33 Page85

CO2 emissions associated with employee business travelamounted to 28,760 tonnes in 2013. On a proforma basis,emissions increased slightly by 0.8%. The increase in emissionsfrom company car fleets can be attributed essentially tomore exhaustive reporting of petrol consumption.
As part of its environmental reporting process, since 2008Kering has calculated CO2 emissions for the majority ofemployees who take business flights. Each year, the scopeof this coverage is broadened, and in 2013, it covered flightstaken by employees based in 17 different countries (upfrom 12 different countries in 2012). Moreover, in 2013, CO2emissions of company vehicles averaged 139.7 g / km.
Some brands took the Group’s policy even further by factoringenvironmental criteria into the selection of company vehicles:Bottega Veneta, for example, continued the renewal of itsfleet with the inclusion of 34 new hybrid vehicles out of itstotal fleet of 109 and Stella McCartney only uses companiesoffering hybrid vehicles for taxi journeys in Britain.
Aside from company vehicles, the Group seeks to raise itsemployees’ awareness about alternative means of transportthrough the promotion by the brands of public transport
for their employees’ commutes. For instance, LGI, theinternational logistics platform of Kering’s luxury brands,offers a free shuttle between the local railway station andthe site, which are two kilometres apart. The Group has setup partnerships with public transport services to negotiateschedules and secure reductions in the cost of travel passes.After the successful experiment conducted in 2012, Girard-Perregaux and JEANRICHARD have continued to encouragetheir employees to take public transport and avoid peakhours by offering more flexible working arrangements. Volcomhas also introduced flexible arrangements and a monthlydraw is organised for all employees who commit tocutting their commute-related emissions by carpooling,taking public transport, biking, walking or skateboarding.
Gucci came away with several Italy Fleet Awards this year: itsparticularly innovative approach to fleet management wasrewarded with the Fleet Manager of the Year award, itsperformance in healthcare, security and the environmentwere recognised by the Fleet Italy SQE (Safety QualityEnvironment) award while its overall mobility policy wasrewarded with the Italy Fleet Mobility prize.
Business travel
CO2 emissions from business travel in 2013 and proforma year-to-year change (in tonnes of CO2)
Related CO2 2012-2013 proforma scope Year-on-yearemissions (in tonnes) 2013 2012 change
Business air travel 19,286 18,376 19,448 -5.5%Company cars 9,474 8,525 7,233 +17.9%
Total 28,760 26,901 26,681 +0.8%
Gucci continued its “High Street Fashion” partnership withTNT and ND logistics to deploy sustainable deliverystrategies in major European shopping districts usingelectric cars. This partnership has been up and running inAmsterdam, Milan, Florence and the entire Swiss retailnetwork since 2012 and in 2013 it was extended to Catania,Nice, Forte dei Marmi, Bologna, Mendrisio, Lugano and Bicester.
In 2014 it will be deployed in Paris, London, Rome and Naples,before taking in Madrid, Berlin, Barcelona and Munich.Gucci also worked on optimising transport loads whichhelped avoid 85 truck deliveries between Florence andBioggio, or 3% of the total number of trips.
The average load factor of the trucks stood at 75% in 2013.
3 SUSTAINABILITY ~ REDUCING OUR ENVIRONMENTAL IMPACT
86 Kering ~ 2013 Reference Document
03_VA_V6 14/04/14 11:33 Page86

On a proforma basis, the Group recorded a 2.0% decreasein total emissions over the year due mainly to an increaseduse of renewable electricity and a drop in business flightstaken by employees.
Details of the calculations used can be found in theenvironmental reporting methodology note, which isavailable on Kering’s website, under “Sustainability”.
The carbon-offset programme
Aligned with its targets announced in spring 2012, Keringoffsets its residual greenhouse gas emissions annually.Consequently, in early 2013, it offset the 115,000 tonnesof CO2 corresponding to the remaining 2012 emissions ofthe Luxury and Sport & Lifestyle Divisions and its registeredoffice, thus achieving the carbon neutrality target set inScopes 1 and 2 of the Greenhouse Gas Protocol. To do this,Kering acquired carbon credits from Wildlife Works, of
Proforma year-on-year change in CO2 emissions (in tonnes)
2012-2013 proforma scope Year-on-year2013 2012 change
Total 248,888 254,063 -2.0%
In 2013, nearly 93% of the CO2 emissions measured by theKering group were not under its direct control. Reducingelectricity consumption, switching to renewable energy
sources, optimising transport and opting for alternativeforms of transport that emit less CO2 all constituteeffective ways of reducing the Group’s carbon footprint.
BREAKDOWN OF CO2 EMISSIONS IN 2013 (%)
Total 268,256 tonnes of CO2
The GHG Protocol defines three operational scopes inrespect to greenhouse gas emissions. To facilitatereadability, Kering publishes its emissions as follows:
• Scope 1 refers to direct emissions attributable to on-site fuel usage and to the fuel burnt by Kering group’sdirectly owned B to C vehicle and company car fleets;
• Scope 2 refers to indirect emissions resulting fromelectricity and steam production;
• Scope 3 refers to emissions resulting from goodstransported by subcontractors (all B to B deliveries andnearly all B to C deliveries) and from most employee airtravel, the production of energy fuels (upstream energy+ petrol) and line losses. Emissions attributable to theproduction of raw materials by suppliers and to employeebusiness travel other than by air (by car, train, etc.) arenot taken into account.
Emissions testing in accordance with Scopes 1, 2 and 3
CO2 emissions by scope as per the GHG protocol in 2013 (in tonnes of CO2)
2013
Scope 1 18,682Scope 2 104,706Scope 3 144,868
Total 268,256
3REDUCING OUR ENVIRONMENTAL IMPACT ~ SUSTAINABILITY
Scope 2: 39%Electricity and
steam prodution
Scope 1: 7%On-site fuel usage 4%
Directly owned B to C transport 4%and company car fleets 3%
Scope 3: 54%Air travel 7%
Subcontracted B to C transport 2%
B to B transport 33%
Upstream energy + petrol 12%
872013 Reference Document ~ Kering
03_VA_V6 14/04/14 11:33 Page87

As the global leader in apparel and accessories, Keringand its brands have developed numerous products forthe Luxury and Sport & Lifestyle markets. Manufacturingleather articles and textiles represent an important partof the Group’s activity. The main raw materials used areleather, rubber, precious skins, cotton and wool. The Groupalso uses gold and precious stones and although thequantities involved are much smaller, their productionhas a significant potential impact on the environment. TheGroup is committed to reducing its environmental footprintin the pre-operations phase, starting with the productionof its raw materials. This involves assessing environmentalimpacts using techniques such as EP&L, focusing on productdesign and materials used as well as impacting the supplyside to enhance practices and identifying opportunitiesto reduce the environmental impacts of products.
In 2013, the Sustainability Department launched “SmartSourcing” to encourage the brands to incorporate sustainablyproduced raw materials in their product design andmanufacturing processes. This project involves experts insupply-chain management, R&D and sustainabilityworking closely together to come up with responsiblesourcing solutions tailored to the specific needs of thedifferent brands.
Consequently,a new internal policy has been drawn up settingout the underlying principles of responsible sourcingpractices in line with the Group’s overall sustainabilitypolicy, objectives and existing best practices. Theseadditional guidelines have been drawn up for each typeof raw material – including precious skins, cotton, rubber,wool, leather, fur, gold, precious stones, paper and wood – toguide the brands in their quest for new solutions. All ofthese policies and guidelines have been circulated to thebrands together with comprehensive explanations.
Consumption of cotton, wool and precious skins
As part of the Smart Sourcing programme, in 2013 Kering setup a new structure – Materials Innovation Lab (MIL) – to assistthe brands. MIL is based in Northern Italy and tasked with
encouraging the brands to incorporate more sustainablyproduced raw materials into their textile collections. Itsmembers work closely with the Sustainability Departmentand the Group’s key strategic suppliers to identify andsource such materials and it has compiled a catalogue ofalternative fabrics and fibres. Many other initiatives havealso been launched across the brands. Gucci is trying toreplace some of its traditional materials with organicallyproduced materials such as the wool used in suits, cottonpoplin in t-shirts or the silk used in women’s collections.
In 2013, Stella McCartney began using wool produced inPatagonia (Argentina) as part of the Ovis XXI certificationprogramme. The producers work closely with NatureConservancy and have committed to sustainable farmingpractices that protect and restore endangered Patagonianprairies. The programme currently covers one million hectaresand the brand uses this certified wool to make wovenwoollen garments and knitwear. The first collection touse these fibres is scheduled for release in autumn 2014.
Other initiatives focusing on the use of organic cotton havebeen implemented or ramped up: 53% of all cotton usedby Stella McCartney’s collections is produced organicallyand Volcom has continued to use organic cotton in itsV.Co-Logical Series and has even started using it in otherranges. Volcom also produces mixed-fabrics from organiccotton and recycled PET.
Bottega Veneta is making big efforts to source eco-fabricsthat comply with GOTS (Global Organic Textile Standard),recognised as the world reference in this domain, and aproduction trial using GOTS-certified fabric is already upand running. The brand is also reviewing the environmentalimpact of its leather tanning in a bid to come up withcleaner processes. In 2013, Bottega Veneta came up witha tanning process that is free from heavy metals and thefirst phase of experimental production of leather bags usingthe process is already in progress. In July 2013, Gucci launchedan enhanced tanning process that is free from the metalstraditionally used in tanning and reduces the environmentalimpact of leather production by cutting water and energyproduction by 30% and 20% respectively.
3.4. Sustainable use of resources
which the Group has been a shareholder since spring 2012.Wildlife Works supports a leading REDD (ReducingEmissions from Deforestation and forest Degradation)offset project in Kenya, the first such programme to beapproved and verified in accordance with the VoluntaryCarbon Standard (VCS). In September 2013, Kering also tookpart in events to mark the fifth anniversary of the UN-REEDin New York as part of the 67th General Assembly of the UnitedNations in its role as a leading corporate stakeholder inthis high value added project to combat climate change.
The brands also develop their own carbon-offset initiatives.Two major events organised by Volcom in 2013 in Hawaiiand the Fiji Islands were certified Deep Blue Surf Events™.Emissions at all events covered by this label – which hasthe backing of the NGO Sustainable Surf – are offset infull. Bottega Veneta also offsets all of the GHG emissionsfrom its Milan head office, i.e., 886 tonnes of which 428were offset by Kering and 458 by the brand. All of thecorresponding carbon credits were acquired fromWildlife Works.
3 SUSTAINABILITY ~ REDUCING OUR ENVIRONMENTAL IMPACT
88 Kering ~ 2013 Reference Document
03_VA_V6 14/04/14 11:33 Page88

Between 2012 and 2013, the Group’s paper consumptiondropped slightly by 0.6%. The sharp 10.2% decline in officepaper consumption reflects the Group’s efforts in thisarea and its drive to develop paperless alternatives. Groupemployees are encouraged to use the double-sided printoption, to favour paperless alternatives (e-mails, press reviews,scanned documents, etc.) and to reuse the reverse side ofprinted sheets. Direct purchases of paper (catalogues,envelopes, etc.) have grown by 12%, mostly due brandrepositioning in the Luxury Division.
In 2013, the portion of certified (FSC or PEFC) or recycledpaper was 77% across the Group, breaking down as 59%certified paper and 19% recycled paper. The proportionexceeds 90% in several Kering brands, including BottegaVeneta, Saint Laurent, Stella McCartney, Boucheron, Girard-Perregaux and JEANRICHARD.
A number of additional initiatives were also deployed bythe brands during the year. All Volcom’s B to B catalogueswere printed on FSC-certified paper and all of the paperused by Boucheron in-house is now certified FSC or PEFC,
Paper consumption in 2013 and proforma year-to-year change (tonnes)
Consumption 2013-2012 proforma scope Year-on-yearin 2013 2013 2012 change
Paper – indirect purchases 936 875 781 12%Office paper 1,068 920 1,025 -10.2%
Total paper 2,004 1,795 1,806 -0.6%
PUMA is also striving to reduce the environmental footprintof its leather production by leveraging the findings of itsEP&L. It encourages its footwear suppliers to work withtanneries that belong to the Leather Working Group whichbrings together a wide range of stakeholders committedto improving the environmental stewardship of the leathergoods industry. The Leather Working Group has devised asystem of traceability and certification – tanneries can berated Gold, Silver or Bronze. Worldwide, more than 90% ofleather used by PUMA comes from certified tanneries. In2013, for PUMA suppliers that are members of the workinggroup, 66% of leather came from Gold-rated tanneries while30% and 4%, respectively came from Silver- and Bronze-rated tanneries.
Gucci is currently looking at a number of ways of using recycledmetals such as incorporating recycled copper and zincinto the brass used to produce its watches and jewellery.It is carrying out studies to identify alternative metals thatit could use to make handbags and finding new ways ofusing led-free zamak to manufacture men’s and women’saccessories in addition to its existing use in manufacturingchildren’s accessories.
Stella McCartney does not use either leather or fur in herproducts and she has selected an alternative bio-plasticleather with a coating created from over 50% non-ediblevegetable oil to produce her shoes, bags and accessories.
Gold and Diamonds
Illicit or unregulated mining for diamonds leads todevastating social conflict and corruption, and poses aserious threat to local biodiversity. This is why Keringcommitted in 2012 to use gold and diamonds sourced
from verified operations that do not have a harmfulimpact on local communities, wildlife or the ecosystemswhich support them.
Boucheron, Gucci and Bottega Veneta strive to ensure thetraceability of the diamonds they use and to guaranteetheir origin. To meet this objective, they comply with theKimberley process, which aims to certify the source ofdiamonds sold on the international market to ensure thatthey do not serve to finance armed conflict. Since 2006,2009 and 2010 respectively, the brands have also beenmembers of the RJC (Responsible Jewellery Council), anorganisation that promotes responsible and transparentsocial and environmental practices throughout thejewellery sector, from the mine to the point of sale. In 2012,Bottega Veneta, Girard-Perregaux and JEANRICHARD obtainedRJC certification for their gold and diamonds, followingGucci and Boucheron in 2011.
Paper consumption
Group consumption
Paper consumed by the Kering group and its subsidiariescomes from two main sources:
• indirect purchases of paper ordered by service providersoutside the Group (printers, processing companies andagencies) for printing communication media such asreports, posters, mail-shots and point-of-sale advertising;
• office paper.
In 2013, Kering’s overall paper consumption totalled2,004 tonnes. A breakdown by category is presented below.
3REDUCING OUR ENVIRONMENTAL IMPACT ~ SUSTAINABILITY
892013 Reference Document ~ Kering
03_VA_V6 14/04/14 11:33 Page89

On a proforma basis, the Group’s total packagingconsumption increased by almost 8% due mainly tohigher consumption of cardboard and plastic packagingin certain Luxury Division warehouses driven by higherlevels of business.
Since Gucci launched its “No box” campaign in 2010 tosave on resources by replacing cardboard boxes andplastic bags with cornstarch bags, the brand has cut itsconsumption of cardboard and polyethylene by 1,082tonnes and 103 tonnes, respectively.
Following an extensive review aimed at overhauling itsentire range of product packaging (shopping bags, boxes,pouches), Sergio Rossi has deployed a new packaging
concept in all its stores for the autumn-winter collectionssince early 2012. The new range is composed entirely ofFSC-certified paper, and no longer includes plastic film,thereby minimising the use of chemicals. Total weighthas also been reduced.
At the same time, the success of its “Bring Your Own Bag“campaign, which aims to encourage customers to bringtheir own bags or buy a reusable one, prompted Volcomto renew the exercise in 2013, purchasing an additional7,800 bags in the United States.
In 2012, Gucci began replacing wooden hangers used forstoring and transporting its products with recycled plastichangers and this initiative was continued into 2013.
Packaging consumption in 2013 and proforma year-to-year change (tonnes)
Consumption 2013-2012 proforma scope Year-on-yearin 2013 2013 2012 change
Plastic bags 204 139 163 -15%Paper bags and gift-wrapping paper 2,184 2,114 2,411 -12%Total bags and gift-wrapping paper 2,388 2,253 2,574 -12.5%
Plastic packaging 960 890 623 +43%Cardboard 9,435 8,668 7,773 +11.5%Paper for packaging 146 51 60 -14%Flannel bags 148 70 47 +47%Total non-bag packaging 10,689 9,679 8,503 +14%
Total packaging 13,077 11,932 11,077 +8%
including the paper used in its in-house publications.Gucci’s corporate and retail entities also use FSC-certifiedor recycled paper. Stella McCartney ensures that the emblematicherringbone parquet flooring fitted in all of her stores issourced from FSC-certified wood and Bottega Veneta usesdouble-A certified Khan-na paper in its Chinese stores.
These efforts have culminated in Kering being named asthe sixth best French company in the PAP50 organised byWWF and Riposte Verte.
TYPE OF PAPER USED IN 2013 (%)
Plastic
A working group known as “Idea Lab on AlternativePlastics” was set up in March 2013 to help the brandspool their research and share their needs in terms of“sustainable” plastics. Nine of the Group’s brands took partin three meetings organised during the year, the last of whichwas held at the 2013 Düsseldorf International Trade Fairfor Plastics and Rubber (K-Fair). The brands used thisoccasion to meet with major players in the plasticsindustry and discover their latest innovations. MeanwhileKering, in partnership with the Fraunhofer Institute,developed an innovative method of comparing plasticsusing sustainability criteria that will enable the brands toselect the most environmentally-friendly plastics.
Packaging consumption
The Group still uses significant volumes of cardboard andplastic for the protection and transport of goods sold in storesor by mail order. For reporting purposes, plastic bags andpaper bags are distinguished from other types of packaging.
In 2013, Kering consumed approximately 13,077 tonnesof packaging, over 72% of which was cardboard and 17% paperbags. Paper bag consumption is more than ten timeshigher than plastic bag consumption, as the brands ofthe Luxury Division almost exclusively use this type ofbag. Also, some brands have introduced reusable bags.
3 SUSTAINABILITY ~ REDUCING OUR ENVIRONMENTAL IMPACT
Certified paper 58.7%
Recycled paper 18.7%
Other paper 22.6%
90 Kering ~ 2013 Reference Document
03_VA_V6 14/04/14 11:33 Page90

Total waste produced in 2013 and proforma year-on-year change (tonnes)
Production 2013-2012 proforma scope Year-on-yearin 2013 2013 2012 change
Non-hazardous waste 12,086 10,281 9,702 6%Hazardous waste (1) 354 83 105 -21%
Total waste 12,440 10,364 9,807 6%
Hazardous and non-hazardous waste
As is the case for consumption of packaging, productionof waste in the operations of Kering group stems mainlyfrom the extent of its retail activities. The repackaging ofgoods and the use of pallets for transport mainly generate
non-hazardous waste. Kering mainly generates packagingwaste and small quantities of hazardous waste, correspondingto specific items of waste on production sites and otherwaste produced mainly in stores and offices (lighting, inkcartridges, etc.).
Water consumption in 2013 and proforma year-on-year change (cu.m)
Consumption 2013-2012 proforma scope Year-on-yearin 2013 2013 2012 change
Industrial water 210,328 171,487 168,762 1.6%Non-industrial water 504,680 437,563 445,962 -1.9%
Total water 715,008 609,050 614,724 -0.9%
In 2013, Kering group’s water consumption amounted to approximately 715,000 cu.m. On a proforma basis, it wasdown by 1% because less water was used for sanitation purposes.
3.5. Waste management
The brand also launched lower volume packaging for itseyewear in 2012: more batches now fit into each truck sofewer trucks are needed. All of these initiatives combinedto reduce the CO2 emissions from transporting eyewearby 60% in 2013.
As part of its wish to pool expertise and contribute toGroup initiatives, Brioni joined the LGI platform in 2013which allowed it to considerably reduce the quantities ofpackaging it uses.
Saint Laurent used the decision to change its packagingto make a commitment to the environment: all boxes andbags are now made from paper that uses 100% recyclable,chlorine-free FSC or PEFC-certified pulp.
As part of a major product initiative, Girard-Perregaux andJEANRICHARD sought to raise awareness about using FSC-certified wood and paper among suppliers of jewelleryboxes and point-of-sale advertising media.
The liners in bags given out by the Stella McCartney brandare made from polyester produced from recycled plastic.
Finally, in late 2013, the Group and the Luxury Division’slogistics platform launched a major global review for thepurpose of reducing the volume of packaging used totransport goods.
Water consumption
Given the nature of the Group’s operations, the bulk of itsindustrial water consumption concerns tanneries whichare not located in water-stressed zones. Nevertheless, thebrands are tirelessly working to come up with innovativetanning processes that cut out heavy metals and use lesswater.
Across the Group, more than 70% of water consumed bythe Group is used for sanitation (store cleaning, lavatories,air conditioning, etc.). Consequently, the direct environmentalimpact of the Group’s water consumption is low.
Kering is, however, using its groundbreaking EP&L approachto conduct a review of responsible water managementacross its entire production chain. Indirect water consumptionlinked to the use of agricultural raw materials like cottonconstitutes an environmental issue that Kering is strivingto quantify and address.
3REDUCING OUR ENVIRONMENTAL IMPACT ~ SUSTAINABILITY
(1) Hazardous waste includes neon lights, batteries, waste electrical and electronic equipment, used oil, paint, aerosols, soiled packaging and ink cartridges.
912013 Reference Document ~ Kering
03_VA_V6 14/04/14 11:33 Page91

Changes in the amount of recycled waste highlight thesuccess of awareness-building campaigns targetingGroup employees and the emphasis on identifying recyclingproviders. The Kering group recycled or reused as a sourceof energy 14% of its hazardous waste and 58.8% of its non-hazardous waste in 2013, giving an overall recycling rate of57.6%. The acquisition of two tanneries by the Group pushedup the total volume of non-recycled hazardous waste.
In collaboration with the I: CO group, PUMA launched aninnovative recycling operation in its German stores in 2012.This programme, known as “Bring Me Back “, allows consumersto deposit their old clothes, shoes and accessories, whateverthe brand, in dedicated recycling bins to be reused orrecycled, depending on their state of wear. In late 2013, itwas already up and running in about half of the brand’sstores worldwide and will be expanded in 2014. Volcomhas had the same type of recycling system in some of itspoints of sale since 2011 and it collected and recycled42kg of clothing and 133kg of used footwear in 2013.
At the beginning of 2011, Balenciaga adopted an originalapproach to sorting waste at its main sites in Paris. Thebrand works with Greenwishes, a company specialising inthe recovery and recycling of conventional office waste(paper, envelopes, flyers, etc.), as well as cardboard, plastic,cans, and above all fabric. Every month, Greenwishes sendsBalenciaga a set of indicators allowing it to monitor theeffectiveness of measures implemented and to communicatewith staff in an instructive manner on the benefits of dailysorting. Since the launch of the operation, 6 tonnes ofpaper, 26 tonnes of cardboard, 3.2 tonnes of plastic and2.6 tonnes of fabric have been recycled.
Alexander McQueen and Stella McCartney pursued theirefforts to recycle fabric in 2013. Through the establishmentof a partnership with Soex in 2012, textile cuttings producedat Stella McCartney’s London head office are collected,recycled and processed into insulation or plastic.
In April 2013, Bottega Veneta entered into an innovativepartnership arrangement with the ILSA corporation totransform leather cuttings into organic fertiliser. ILSAcollects waste leather from the brand’s workshops and
applies a specific process that breaks it down into a newbiodegradable product. Since the arrangement began,the four Bottega Veneta sites participating in this projecthave generated almost 120 tonnes of leather cuttings, twothirds of which have been transformed into organic fertiliser.
As part of the Fertiland campaign launched in the leatherindustry hub of Santa Croce in Tuscany, Gucci set up a similarprogramme in 2012 to turn leather cuttings into organicfertiliser – the cuttings are collected, shredded and thenprocessed by a specialised company. In 2013, 115 tonnesof fertiliser were produced from 230 tonnes of Gucci leathercuttings. The brand is also testing a process that reusescrocodile skin cuttings left over from bags to make footwear:1,825 pairs of shoes were made from cuttings in 2013.
As part of its rebranding process, Saint Laurent rolled outthe Second Life project in 2013 to give a new lease of life toproducts and materials – mannequins, visual merchandisingmedia, hangers, etc. – that can no longer be used. All regionshelped to reuse, resell, donate or recycle these productsthrough appropriate local channels resulting in:
• recycling / reuse of several tonnes of old packaging;
• resale of over 580 kilos of recyclable metal objects;
• donations to charities (Oxfam, Le Relais Emmaüs) or saleof over 850 kilos of old uniforms worn in Saint Laurentstores;
• resale or donation of almost 100 mannequins to design / fashion institutes or artists’ collectives.
Saint Laurent’s Règles d’Or – its ten golden rules for goodenvironmental practice throughout its stores – also havea waste management focus: managers must ensure that allwaste paper, cardboard packaging, glass, plastic bottles, tinsand ink cartridges are sorted and then recycled. Moreover,through pooling arrangements with Bottega Veneta, Gucciand Stella McCartney, Saint Laurent recycles all wastecardboard from its Parisian stores.
It has also deployed a proactive waste managementpolicy outside its stores and waste paper is separatedboth at its head office and all head offices worldwide.
Waste recycling
Rate of recycling and reuse of waste as energy in 2013 (%)
Production in 2013
Non-hazardous waste 58.8%Hazardous waste 14.0%
Total waste 57.6%
In 2013, the Kering group’s total waste productionamounted to around 12,440 tonnes, 97% of which wasnon-hazardous.
On a proforma basis, production of non-hazardous wasteincreased by nearly 6%, in line with the Luxury Division’scontinued business growth in 2013. The production ofhazardous waste declined by 21%.
3 SUSTAINABILITY ~ REDUCING OUR ENVIRONMENTAL IMPACT
92 Kering ~ 2013 Reference Document
03_VA_V6 14/04/14 11:33 Page92

Biodiversity is one of the key priorities for the Group. Keringstrives to protect and respect it in two major ways: byunderstanding the origin and assuring traceability of rawmaterials, and by promoting nature-conservation andawareness-raising initiatives among its employees andconsumers.
Use of precious skins, leather and fur
Kering works on the traceability of raw materials, with anemphasis on production of leather, precious skins and furs.It is essential that our products including those made withleather, precious skins and furs come from responsiblesuppliers.
The Group also developed a comprehensive policy and a setof recommendations covering all its purchases of theseitems, with a view to achieving its targets by 2016. Throughthis policy, Kering aims to work with suppliers to avoidconversion of sensitive ecosystems into grazing lands oragricultural lands for food production for livestock. TheGroup also requires that precious skins and furs comefrom verified captive breeding operations or from wild,sustainably managed populations. Suppliers shouldemploy accepted animal welfare practices and humane
treatment in sourcing. Additionally, all precious skins ofspecies listed by CITES and used by the Group must beaccompanied by a certificate of legal origin issued by theCITES management authority of the exporting country, inorder to ensure that the species is not endangered.
In addition to these internal guidelines, Kering works withinternational stakeholders to combat illegal trade inprecious skins. The Group contributed to the UnitedNations report of the International Trade Centre (ITC) ontrade in python skins in South-East Asia by providingtechnical advice in the project’s design phase. In 2013,both Kering and the ITC worked with the InternationalUnion for Conservation of Nature (experts on boas andpythons from the IUCN / SSC) on the launch of the PythonConservation Partnership to help move the sectortowards more sustainable practices. The goal of thistriennial research programme is to devise recommendationson compliance with sustainable practices, transparency,animal welfare and the resources of local populationsinvolved in the trade in python skins. The Partnerships’findings and recommendations will be made available toall stakeholders in the form of scientific peer-reviewedarticles that aim to grow the trade in python skins in asustainable manner.
3.6. Protection of biodiversity
Water discharge and odour pollution
Water discharge does not represent a significant directimpact for Kering. The brands concerned havenonetheless introduced specific measures that go furtherthan regulatory requirements.
Having obtained ISO 14001 certification for its twotanneries in Italy, Gucci plans to start a new initiative to reducethe use of chromium in its transformation processes andto optimise water consumption. Both tanneries also havemodern equipment to ensure that they do not emit anyunpleasant odours.
In 2011, PUMA publicly committed to removing allhazardous chemicals from its entire production chain by2020, under the Detox campaign launched by Greenpeace,an NGO. Two major events have seen the brand joinforces with big names in the textile industry to developcorrective measures aimed at achieving this goal:
• the creation of the Zero Discharge of Hazardous Chemicals(ZDHC) group committed to communicating regularlyand publicly on the progress of its member brands.
The standout event of 2013 was the publication of aJoint Roadmap Version 2 by ZDHC which elaborated onprevious versions and set out clear and precise targetsto be achieved by 2020.
The ZDHC Benchmarking Report, a comparative study ofchemical product use and water discharge managementamong 20 PUMA suppliers, was also finalised andpublished in summer 2013. Drawing on its findings, theproject team began preparing a tailored environmentalaudit tool that should allow PUMA to begin auditing itskey suppliers from the end of 2013.
Water discharge is also recorded in the EP&L given thesignificant related impact in the processing of textilesand leather and in mining. This issue is also dealt with ina detailed questionnaire during the data gathering phase.
• the launch by the Sustainable Apparel Coalition (SAC) ofthe HIGG index, a new tool to measure the environmentalimpact of textile products. In 2012, PUMA tested 13 of itsproducts against the Higgs Index and contributed to theprojects, benchmarking and studies of the ZDHC group.
As a member of the SAC, Kering actively participated inthe consultation processes designed to produce standardmethods for constructing the HIGG Index and the EP&L.
3REDUCING OUR ENVIRONMENTAL IMPACT ~ SUSTAINABILITY
932013 Reference Document ~ Kering
03_VA_V6 14/04/14 11:33 Page93

Kering’s brands have also joined forces with the LuxuryGoods working group, Business for Social Responsibility(BSR), to work on the issue of traceability.
The Luxury Division brands mainly use cowhide sourcedfrom Europe, principally from France. In March 2013,Gucci got together with Green Carpet Challenge and theNational Wildlife Federation to launch a limited edition ofleather bags in Amazonian leather with “zero deforestation”certification. Each article in the collection is producedusing leather from farms certified by the Rainforest Alliance,guaranteeing compliance with strict standards thatprotect the environment, farmers and their communitiesand animal welfare. The bags are sold with individual GreenCarpet Challenge passports explaining their sustainabilityand traceability credentials.
In 2011, Gucci launched its Made-By project to developand deploy a cowhide traceability procedure from thecountry / region in which the animal is slaughtered to thecowhide that comes out of its Blutonic tannery. The ITapplication for the traceability and monitoring of leatherwas tested in 2013 and should be operational in 2014.
Guaranteeing the origin of skins used is also a key issuefor PUMA. In 2012, the brand accordingly adopted a specificand restrictive policy on the use of leather, skins, furs,feathers and wool. In this document, PUMA asserts that itdoes not use any raw material derived from endangeredspecies within the meaning given by the International Unionfor Conservation of Nature (IUCN). This policy also prohibitsthe use of feathers, leather and skins obtained from abusedanimals, whether they are farmed or not. Finally, somespecies such as crocodiles and snakes, and certain practicessuch as mulesing in merino sheep are prohibited. Moreover,since 2010, the brand has been working alongside othercompanies and several NGOs within the Leather WorkingGroup (LWG), a platform that brings together representativesof the leather industry, with the aim of drawing up andpromoting a protocol of sustainable and responsiblepractices for the sector. While the main tanneries withwhich PUMA works have been certified by the LWG, thebrand now wants to go a step further by guaranteeing thetraceability of raw materials back to the farm itself.
Although the amount of fur used by the Luxury Divisionbrands is minimal, Kering is working closely with itssuppliers and with BSR experts to develop a programmethat guarantees the traceability of any fur used and ensuresanimal welfare throughout its supply chains. Gucci alsocontinues to work with the Humane Society and Lega AntiVivisezione (LAV), two NGOs, to draft a Charter to regulatefur use. Some brands, including Stella McCartney, havedecided to exclude it totally from their collections.
Gucci and other Group brands including Stella McCartneyalso maintain regular dialogue with numerous associationsand NGOs involved in animal welfare and the protection ofthe environment, such as the World Wildlife Fund (WWF),the Anti-Vivisection Society, the Humane Society, theNational Wildlife Federation, the Rainforest Alliance, the
Eco Age Green Carpet Challenge, Natural Ressources DefenseCouncil (NRDC), The Nature Conservancy and Greenpeace.
In 2013, Gucci became very involved in the Skin Fare initiativeto improve animal welfare on Italian farms launched inpartnership with the Italian Ministry for Agriculture,Institut Zooprofilattico, Blutonic tannery, Quinto Valoreslaughterhouse and a pharmaceutical brand. Gucci hopes toleverage this project to source more of its supplies in Italy.
Nature conservation
Aside from ensuring the traceability of raw materials, Keringand its brands are committed to preserving biodiversity bydeveloping initiatives to conserve the natural environmentand raise awareness among employees and consumers.
For instance, in connection with the United NationsConferences on Trade and Development, Kering is involvedin the UN’s Responsible Ecosystems Sourcing Platforminitiative.
Meanwhile, Volcom strives to promote clean beachesthrough public awareness and clean-up campaigns. Forthe past five years, the brand has partnered the Keepersof the Coast NGO and its Day After initiative to clean upFlorida’s beaches after the Fourth of July festivities. Volcomhas also been involved in the Summer Daze Beach Clean-Up Series for the past three years and the efforts to cleanbeaches that have been impacted by increased tourism.On top of its financial support for these operations,Volcom offers products and posters to the mostcommitted volunteers.
Since 2012, Stella McCartney has been partnering theBioPlanet USA and Million Trees Miami NGOs to supportthe planting of 1 million trees by 2020 in the forests ofMiami-Dade County in the United States.
Lastly, in 2012, Kering acquired a 5% stake in Wildlife WorksCarbon, LLC. This has bolstered the Group’s support for aleading REDD offset project in Kenya, the aim of which isto prevent destruction of forests in the Kasigau corridor,threatened by slash-and-burn subsistence farming practisedby migrant and local communities. The project focuseson the development of economic alternatives to this fairlyunproductive form of agriculture and the promotion ofsecure land tenure. Halting deforestation will helpmaintain the wealth of biodiversity in the area, which ishome to the following iconic species: African elephant,African wild dog, cheetah, lion and Grévy’s zebra.
In 2013, Volcom stepped up its campaign to raiseawareness of endangered species with a special focus onsea turtles. The brand is using the 1% for the Planetprogramme and the sale of products evoking theseanimals to foster customer awareness and promote theSea Turtle Restoration Project.
3 SUSTAINABILITY ~ REDUCING OUR ENVIRONMENTAL IMPACT
94 Kering ~ 2013 Reference Document
03_VA_V6 14/04/14 11:33 Page94
A wide range of other nature conservation initiatives werealso funded in 2013 out of Volcom’s 1% for the Planetprogramme, including:
• the protection of natural landscape and cultural heritagein Hawaii through support for North Shore CommunityLand Trust;
• the preservation of Alaskan land and waters via the AlaskaWilderness League NGO;
• coastal protection, especially surfing areas throughoutthe world by supporting Save the Waves, an NGO;
• the purchase of carbon credits from Wildlife Works.
In July 2013, Girard-Perregaux and JEANRICHARD launchedan urban bee-keeping initiative and placed three beehivesin the gardens of Villa Marguerite in the centre of Chauxde Fonds. Five workshops were organised so that thefirm’s employees could take part in the project. The goalis to harvest 100 kg of honey from the hives in 2014 to begiven to employees, suppliers and selected customers.
3REDUCING OUR ENVIRONMENTAL IMPACT ~ SUSTAINABILITY
952013 Reference Document ~ Kering
03_VA_V6 14/04/14 11:33 Page95

The Group and its brands endeavour to enrich the socialand economic fabric of the regions in which they operate.More specifically, by favouring Italian, French and Swissmanufacturers, the Luxury Division brands preserve traditionalknow-how and contribute to the economic developmentof these countries.
The brands also develop local partnerships to support trainingin traditional artisanal skills:
• Gucci, with the Made in Italy Tuscany Academy (MATI) andthe Alta Scuola di Pelletteria Italiana which sent numeroustrainees into employment in 2013;
• Bottega Veneta, with the Giovanni Fontana leather-crafttraining centre;
• Boucheron, with the Paris-based École de la Joailleriejewellery school; and
• Stella McCartney, with three scholarship places at CentralSaint Martins College of Art and Design (provided studentscommit to an ethical policy of not using fur or leather).
Beyond supporting these specialised training programmesand the students that graduate from them, some brandshave even set up their own schools to help preserve bothtraditional know-how and local employment:
• Brioni offers training to 16 young people per year (on athree-year course) at its tailoring school and then providesthem with work at its own workshops;
• Bottega Veneta provides young technicians with the highlyspecialised leather-working skills needed to produce thebrand’s products at its Scuola della Pelletteria.
The Group’s brands take decisive action to have a positiveimpact on the economic well-being of their local suppliers.Gucci created and established the Filiera Valore managementtraining initiative for its suppliers. The scheme supportspublicly financed entrepreneurs and provides training for235 employees at 63 of the brand’s leather goods, footwear,jewellery, metalware and ready-to-wear suppliers. Additionally,in January 2013, an innovative partnership was set upbetween Gucci and CR Firenze, to provide direct and indirectsuppliers of Gucci’s leather goods with access to bank loans,thanks to a shared evaluation system between the brand andthe bank. This programme helps more than 7,000 entrepreneursin the Italian manufacturing sector. Meanwhile, Bottega Venetacontinued to offer finance and support to two community
craft cooperatives, the Comunità Femminile Montana andCooperative Femminile Pedemonte, launched in early 2011in Alto Astico, an Italian valley with high unemploymentamong women. Trained in intreccio infilato, a traditionalweaving technique used in the production of Bottega Veneta’sproducts, 52 women are now able to run their ateliersindependently and have therefore become direct suppliersto the brand.
As part of its commitment to developing local talent,Alexander McQueen continued to support Kids Company,supporting vulnerable inner-city children in London: inaddition to donating clothing and holding charity sales,the brand’s design team has been offering training to theseyoung people since 2012. In 2010 Balenciaga formed astrong partnership with Sakina M’Sa (winner of the KeringFoundation social entrepreneurship award) by providingher ready-to-wear business with know-how and supplyingleftover fabrics (5,000 metres of fabric donated in 2013,enabling the business to produce 3,000 pieces). Locatedin the Goutte d’Or district of Paris, Sakina M’sa has built aresponsible business model based on social inclusivity,cultural mediation and a reduced environmental footprint.Gucci also supports a local association in Tuscany, LaRonda della Caritá, that enables homeless people to createhand-sewn bags from its remnants.
Volcom has committed to minimising the local environmentalimpacts of its events while raising awareness amongparticipants. The two major surfing competitions it organises(Fiji Pro and Hawaii Pipe Pro) have been certified DeepBlue Surfing Events™ thanks to exemplary environmentalmanagement practices and projects carried out inpartnership with local NGOs.
The Group’s brands generally help to enhance the localeconomic fabric by setting up partnerships with suppliersthat aim to improve performance and sustainability.
At the Group level, Kering is encouraging social mobility, notablyas a founding partner of the Télémaque Institute, which sendscorporate mentors to help young people from modestbackgrounds complete their secondary schooling. More than145 young people have received mentoring since the institutewas founded in 2005, of which 61 were supported by Keringemployees.
4. Supporting communitydevelopment
4.1. Community impact
3 SUSTAINABILITY ~ SUPPORTING COMMUNITY DEVELOPMENT
96 Kering ~ 2013 Reference Document
03_VA_V6 14/04/14 11:33 Page96

In an increasingly interconnected world, the private sectorneeds to pay attention to, and maintain relationships with their partners and stakeholders. Kering therefore aims toestablish quality relationships built on trust with all itspartners, regardless of location, with a view to gaining afull appreciation of their concerns and expectations and, asfar as possible, incorporating these aspects into its strategy.To achieve these goals, Kering has adopted a dual approach:
• defining a policy for consultation and analysis of stakeholderexpectations at the Group level;
• encouraging brands to develop their own stakeholderdialogue procedures at a more operational level.
Group approach – materiality
To ensure stakeholder expectations are appropriately takeninto account in its sustainability approach, Kering haschosen to adopt the materiality principle laid out in theGlobal Reporting Initiative (GRI) sustainability reportingguidelines. These guidelines define materiality as “thereflection of the organization’s significant economic,environmental, and social impacts that may influencethe assessments and decisions of stakeholders.”
Kering therefore decided to set out its approach to itsstakeholders formally in a materiality matrix. The matrix wasdrawn up with the aid of specific tools used by differentdepartments within the Group (risk analysis, customersatisfaction monitoring, Group brand image tracking, internalopinion survey tools, etc.) and draws on dialogue led byKering at the numerous international forums in which ittakes part (see below). Subsequently, various sessions wereorganised internally to draw on the experience of the HR,Communications, Marketing, Internal Control, Environmentand Finance teams with a view to refining the analysis andfinalising the matrix.
The themes listed in the materiality matrix presented atthe beginning of this section indicate the priorities on whichKering has decided to concentrate and their relativeimportance in relation to the business. The themes coveraspects with an economic, environmental or socialdimension. In this context, the term “stakeholder” refers toemployees, customers, suppliers, local communities,investors, NGOs, authorities, specific communities, competitorsand students. Sustainability targets for 2016, as described in this section, are also a direct result of this materialityanalysis of social and environmental aspects.
Taking part in international dialogue
In order to remain constantly attentive to the key issuesaffecting its stakeholders, Kering participates in a numberof international initiatives.
• WBCSD: In 2011, Kering joined the World BusinessCouncil for Sustainable Development, a multi-sectorplatform of 200 global companies that aims to promotethe role of the business community in achievingsustainability based on economic growth, ecologicalequilibrium and social progress.
• SAC: In 2012 Kering became a member of the SustainableApparel Coalition, which brings together more than 80 majorplayers (brands, retailers, suppliers, NGOs, etc.) in thetextile, footwear and accessories sector, who work togetherto reduce the negative environmental and social impactscaused by the industry worldwide. The Group and its brandsmade a substantial contribution to the establishmentof the HIGG Index, a tool that tracks the environmentaland social impacts of the textile, footwear and accessoriessector, notably at the supply chain level;
• Textile Exchange: Kering is a member of Textile ExchangeEurope and sits on the Board of Directors of this organisationwhich is committed to promoting the production and useof more sustainable textiles throughout the clothing industry;
• Python Conservation Partnership: In 2013, Kering, theInternational Trade Centre (ITC) and the InternationalUnion for Conservation of Nature (IUCN) launched apartnership with the aim of improving sustainability ofthe python trade and facilitating industry-wide change.This three-year research programme aims to analyseand make recommendations on transparency, animalwelfare and the livelihoods of local populations thatparticipate in the python trade. The data and findingsof the research will contribute to the Convention onInternational Trade in Endangered Species of Wild Faunaand Flora (CITES) process. The results and recommendationsof the Python Conservation Partnership will be madeavailable to stakeholders in the form of public reportsand peer-reviewed scientific articles;
• EPE: In 2012 Kering joined Entreprise pour l’Environnement,an association of approximately 40 French and internationalcompanies committed to working together to giveenvironmental considerations more weight in theirstrategies;
• BSR (Business for Social Responsibility): Within thisinternational network which unites more than 300companies, Kering is a member of the Sustainable
4.2. Stakeholder dialogue
Finally, the numerous sponsorship programmes set up bythe Kering Foundation and at the initiative of the brands
enable the Group and its brands to establish constructivelinks with local stakeholders.
3SUPPORTING COMMUNITY DEVELOPMENT ~ SUSTAINABILITY
972013 Reference Document ~ Kering
03_VA_V6 14/04/14 11:33 Page97

Choosing suppliers and maintaining good relationshipswith them is essential to Kering in order to secure supplyand therefore conduct business. Additionally, the resultsof the EP&L carried out in 2013 indicated that 90% of theenvironmental impacts generated by the Group’s activitiesoccur at the supply chain level (73% of the Group’s activitieswere covered by the EP&L analysis in 2013 which was carriedout on the basis of 2012 data). Furthermore, the activitiesand locations of the suppliers in the supply chain can raisematerial ethical issues. This is why suppliers are keystakeholders for the Group. To help its suppliers adopt andadhere to the highest environmental and social standards,the Group and its brands have set up an ambitious programmeof responsible buying and CSR criteria (through compliancewith the Supplier Charter of the Group’s Code of BusinessPractices) and sustainability training. Among its objectives,the Group aims to evaluate its strategic suppliers andtheir adherence to the Supplier Charter every two years atleast. Suppliers can be considered strategic in variousways; through the proportion of goods they supply to oneof the brands, the specific nature of their expertise orbecause they operate in a high-risk sector and / or countryin terms of social or environmental compliance.
Incorporation of social and environmentalissues in purchasing policies
As part of its responsible buying strategy, the Groupdistinguishes materials purchases from indirect purchases,such as services, fees, transport, etc., while devotingconsiderable resources to the ethical management of itssupply chains.
In 2012 Kering announced ambitious sourcing targets tobe met by all Group brands by 2016. The leather fromdomestic livestock used in the Group’s products will befrom responsible and verified sources that do not resultin converting sensitive ecosystems into pasture oragricultural land used to produce food for livestock.Similarly, the gold and diamonds used in the Group’sproducts will be sourced from verified operations that donot have a harmful impact on local communities, wildlifeor ecosystems. Finally, precious skins and furs will comefrom verified captive breeding operations or from wildpopulations managed sustainably in line with animalwelfare policies.
To achieve these targets, Kering has laid out guidelines forthe sourcing of raw materials, which are presented underpoint 3.4 of this section.
For non-retail (indirect) purchases, the Group’s IndirectPurchasing Department remains committed to responsiblebuying based on a reciprocal undertaking with suppliersto respect the Kering Code of ethics. It also has specificcommitments tailored to each category of purchase, withbuyers identifying the most relevant sustainability criteriafor each category (products, services, best practice,reporting, etc.).
For example, Saint Laurent has included specific clausesin most of the terms and conditions it sets for productionpurchases, but also for indirect purchases in France.Environmental criteria were also taken into account in theselection of dry cleaners used by the brand’s Paris andNew York stores (the brand selected those that do notuse tetrachloroethylene) and in the selection of service
4.3. Relationships with suppliers
Luxury working group which promotes transparencyand cooperation between Luxury Goods companies,particularly with regard to supply chains;
• TEEB Coalition for Business: Kering participates withand supports the initiatives of The Economics ofEcosystems and Biodiversity (TEEB) coalition, particularlyin relation to accounting for natural capital and enablingits reporting in business.
Brands’ sector initiatives
In 2013 the Group’s brands stepped up efforts to factor theconcerns of their stakeholders into their sustainabilitystrategies.
For example, with the support of BSR PUMA conducted asurvey of the major organisations that represent itsstakeholders worldwide. This exercise allowed the brand
to build a materiality matrix which enabled it to refine itsstrategy. In parallel, it organised the 11th annual Talks atBanz event attended by more than 60 participants (suppliers,industry and government representatives, NGOs, sustainabledevelopment experts, etc.) to address the theme of “How tolet consumers live and support sustainability?”.
In response to their specific issues, the Group’s brandsalso established partnerships with numerous NGOs. Forexample, Gucci regularly engages with Greenpeace, the Anti-Vivisection Organization, Human Society, the Clean ClothesCampaign, WWF, Solidaridad, the National Wildlife Federationand the Rainforest Alliance. Meanwhile, Stella McCartneycontinued to support the Ethical Trading Initiative, an allianceof companies, unions and NGOs that are striving to improveworking conditions for vulnerable workers across the globe.
Training is also a good way of maintaining dialogue withsuppliers, as described below.
3 SUSTAINABILITY ~ SUPPORTING COMMUNITY DEVELOPMENT
98 Kering ~ 2013 Reference Document
03_VA_V6 14/04/14 11:33 Page98
providers called on to carry out store construction andrenovation work (90% of the waste generated by therenovation of the Rodeo Drive store in Los Angeles wasrecycled).
Training, supporting and educating suppliersabout sustainability
To bring about change, it is essential to raise awarenessamong suppliers and provide training on the sustainabilityissues that are relevant to their activities.
Volcom invited all its direct suppliers to its head office inCalifornia for three days to learn about the brand’s views onsustainability. Participants attended workshops on themessuch as environmental reporting, regulatory complianceand quality. More than 100 people from five differentcountries were able to discuss these subjects directly withmembers of Volcom’s teams. For Gucci, training also representsan important way of supporting its suppliers: over 350 directsuppliers, or more than 700 people received training onsustainability and environmental footprint in 2013.
In May 2013 Saint Laurent held two half-day workshopsfor suppliers of its footwear and leather goods productionsites in Italy, to present its supply chain environmental reportinginitiative (EP&L). Around a hundred suppliers took part. Afterthese workshops, a selection of around 50 strategic supplierssubmitted detailed information on their environmentalperformance to a dedicated internet platform.
Finally, having talked to 50 of its strategic suppliers aboutsustainability challenges in 2012, Sowind carried out itsfirst environmental evaluations on 11 suppliers in 2013.
In the Sport & Lifestyle Division, PUMA.Safe provided PUMAsuppliers in Bangladesh, China, Cambodia and Indonesiawith technical expertise to help them reduce theirenvironmental footprints. This public-private partnershipbetween PUMA, H&M and DEG, the German entrepreneurialdevelopment cooperation, will span the 2013-2015 period.
Additionally, to tackle what is one of the most sensitivesubjects in the sector, PUMA launched a very ambitiousprogramme in 2012; the Better Wage programme, whichaims to put in place fair wages at a number of its suppliersby 2015. The first part of this ambitious programmeincludes a research project, the Compensation Ladderresearch, which aims to evaluate suppliers’ regional wagepolicies and compare them with benchmarks, such asAsian Floor Wage. The evaluation methodology used forpay scales was refined in 2013.
Three operational projects round out this first part of theprogramme. The training programme for the Human ResourceManagement System (HRMS) was set up at several suppliersin 2012 and 2013. The programme is currently run by the ILOand the Better Work initiative in Vietnam and Cambodia.Through the second project, union representatives atPUMA’s pilot suppliers in Vietnam were also given individualtraining to improve their leadership skills. Finally, the goal
of the third Fair Wage Network Remediation project is to draw up and implement roadmaps to improve workercompensation. Since 2012 roadmaps have gradually beenrolled out to the pilot supplier companies. Three Indonesiansuppliers have already applied them, and the project willcome to an end in 2014.
PUMA’s commitment to the Zero Discharge of HazardousChemicals group (ZDHC) provides another good example ofengagement and collaboration with suppliers. In 2011 PUMApublicly committed to remove all toxic residues from itsentire production chain by 2020, as part of the Detox campaignlaunched by Greenpeace. PUMA is an active member ofZDHC which published a roadmap in 2013, clearly presentingthe goals, expected results and key stages of the projectto be completed by 2020. The ZDHC Benchmarking Reporton the use of chemicals and the associated wastewaterproduced by 20 suppliers in Asia, was completed andpublished during summer 2013. The findings of thereport helped ZDHC members to create an appropriatelydefined environmental audit tool which enabled PUMA tostart auditing its strategic suppliers at the end of the year.
Finally, Stella McCartney is partner to Clean by Design, a National Resource Defence Council (NRDC) programmethat aims to reduce the environmental impact of textileproducers. The brand used NRDC methodology to pilot aproject in Italy involving four weaving, printing and dyingbusinesses, thus becoming the first company to implementthe approach in Italy. Detailed audits carried out at thefour sites focused on energy and water consumption,identifying potential annual savings of more than 140 MWhper site per annum.
Protecting human rights, combating corruption and ensuring social compliance
Kering follows the principles set out in its Code of ethicsand the UN Global Compact. These documents are basedon international reference texts, such as the UniversalDeclaration of Human Rights, the OECD Guidelines forMultinational Enterprises, the United Nations Conventionon the Rights of the Child and the core conventions of theInternational Labour Organization. The Group is alsocommitted to the respect of fundamental rights forwomen through its Foundation. It is essential for the Groupto ensure that its suppliers respect its standards, and it hastherefore included its supplier Charter in the new versionof its Code of ethics.
As regards corruption, Kering prohibits any political, tradeunion, cultural or charitable financing from being carriedout with a view to obtaining direct or indirect material,commercial or personal advantages. The Group respectsall national and international regulations relating to thefight against direct or indirect corruption; the Group’sEthics Committees ensure respect for the Code of ethicsand can be contacted by any employee over questionsrelating to corruption.
3SUPPORTING COMMUNITY DEVELOPMENT ~ SUSTAINABILITY
992013 Reference Document ~ Kering
03_VA_V6 14/04/14 11:33 Page99

In order to make sure their commitments are reflected bytheir operations, the brands take specific steps to ensurerespect for human rights. PUMA issued its first Code ofConduct in 1993. Since 2005 the brand has also issuedPUMA.Safe pocket guides for its employees and suppliers.These guides present PUMA’s social, environmental andhealth and safety standards. A Social Handbook is alsoavailable, with contact details to enable factory employeesto reach the PUMA.Safe team directly in case of breachesof the PUMA Code of Conduct. PUMA’s membership in theFLA (Fair Labor Association) means that third parties arealso entitled to file official complaints with the FLA if theyfeel that there has been a breach of the Code. The brand hasalso signed up to the Protocol on Freedom of Association(FOA) in Indonesia, which helps to encourage its suppliersto respect the rights of unions, especially their capacity tonegotiate collective bargaining agreements. These measuresenabled it to receive 135 complaints directly from workersrelating to breaches of the PUMA.Safe code. By workingwith its suppliers, PUMA’s teams were able to resolve 77%of these complaints.
As regards social compliance within the supply chain,PUMA has operated an ambitious policy for many yearsand, as part of the PUMA.Safe programme, has a specificReference Document known as the Social Handbook,which was first issued in 1999. The brand has also, since2004, been working with the FLA (Fair Labor Association),an association dedicated to monitoring and implementingthe required standards of working conditions at suppliers.PUMA.Safe has been certified by the Fair Labor Associationsince 2007. Additionally, as part of its commitments, PUMAhas published updated lists of its suppliers since 2005.
2013 was also marked by the tragedy of the Rana Plazagarment factory collapse in Bangladesh. Although noneof its direct or indirect suppliers were implicated in theevent, PUMA was the first Sport & Lifestyle brand to sign upto the Bangladesh Accord, a multi-party initiative which aimsto improve health and safety in the country’s clothingand footwear industry. The brand also responded bylaunching a full safety review of the buildings used by itsAsian suppliers and adding a specific section on buildingsafety to its Health and Safety Handbook.
Meanwhile, in 2007 and 2009, respectively, Gucci andBottega Veneta embarked on the process of obtaining SA 8000 (Social Accountability 8000) certification. Thisglobal standard takes into account not only the companyitself, but also the companies in its production chain. Itrequires the certified company and its suppliers to respectnine corporate responsibility requirements relating tochild labour, forced labour, health and safety, freedom ofassociation and collective bargaining, discrimination,disciplinary practices, working hours, remuneration andmanagement systems, and to set up a specific managementsystem for this purpose. Certification is awarded by SocialAccountability International (SAI) and Gucci has been amember of SAI’s Consultative Committee since 2009. In 2013, all of Gucci’s businesses (shoes, ready-to-wear,
silk, leather goods, jewellery and stores), Bottega Veneta’smain businesses (ready-to-wear, jewellery, fine jewellery,shoes, leather goods and furniture) and Kering’s internationallogistics platform for its Luxury brands (Luxury GoodsInternational), had obtained SA 8000 certification.
Gucci also continued in 2013 to roll out an integratedmanagement system to incorporate and track all itsinitiatives. Based on the standards for which it has gainedcertification (SA 8000, ISO 14001, OHSAS 18001), the systemwill enable the brand to monitor improvements it has madein terms of social responsibility, environmental performanceand worker health and safety. Within this managementsystem, six Committees reporting to Gucci’s SustainableDevelopment Committee meet to discuss specific themes:SA 8000 certification, HSE, equality of opportunity andwell-being, supply chain policies, consultative committeeon sustainable development and sponsorship initiatives.
Meanwhile, Volcom has focused on its vendor Code ofConduct. This document is signed every year by all directsuppliers, and sets out a zero tolerance approach to childlabour and forced labour, and also covers working conditions,freedom of association, wages and management cooperationwith Volcom and its auditors. The audits conducted byVolcom also verify compliance with C-TPAT guidelines.
Brand supplier evaluation systems
The supplier evaluation systems put in place by PUMA, Gucci,Bottega Veneta and Volcom are based on specific approaches:PUMA’s audits are performed by the PUMA.Safe team (SocialAccountability and Fundamental Environmental Standards,a team of twelve internal auditors dedicated to these systems),whereas Gucci and Bottega Veneta rely on an external,independent audit firm. Volcom uses its own teams to carryout audits, but also calls on external firms and sometimesuses the results of audits carried out by other sector leaders.
PUMA.Safe ensures that its suppliers meet the strictrequirements set by the PUMA Social Handbook. In 2013,24 sites were removed from PUMA’s supplier lists becausethey had failed to achieve a sufficient level of compliance.In addition to carrying out social audits which focus onthe deficiencies of its suppliers, PUMA also works withother brands to identify concrete solutions to enablethem to set up more responsible practices. The PUMA.Safeteam conducted 411 audits in 2013, of which 349 relatedto direct suppliers, mainly in China (31.3%), but also inVietnam (21.6%), Cambodia (11%), Indonesia (10.2%) andBangladesh (7.6%). Overall, 56% of the suppliers auditedobtained A or B+ ratings, while 14% failed the audit byobtaining a C or a D. More than 65% of the companies auditedimproved their rating in relation to their previous audit,thanks notably to the support provided by PUMA. The threemain reasons for non-compliance related to health andsafety, wages and freedom of association.
In 2013, an instance of the use of child labour was revealed bya PUMA audit of a site in China: PUMA’s audit teams discoveredthat 78 of the 96 participants of a work placement scheme
3 SUSTAINABILITY ~ SUPPORTING COMMUNITY DEVELOPMENT
100 Kering ~ 2013 Reference Document
03_VA_V6 14/04/14 11:33 Page100

Number of audits performed by Kering in 2013 and 2012
2013 2012 Change 2013 / 2012
Gucci 1,517 2,356 -36%Bottega Veneta 731 686 +7%PUMA 411 422 -3%Volcom 63 (1) N / A -
Total number of social audits 2,722 3,464 -21%
(1) 10 audits were performed directly by the brand; 53 were conducted by partners.
organised at the site by the local school were under 16.The school had also failed to take adequate considerationof the educational objectives of the students, who wereunderpaid and housed in dangerous accommodation.Under PUMA’s child labour protocol the PUMA.Safe teamwas able to take swift action to resolve the situation withsite management. The work placement scheme wasimmediately terminated; the young workers were paid inaccordance with the site’s wage scales and also grantedscholarships. The company then took financial responsibilityfor the students’ food and education and adopted proceduresto prevent any recurrence.
Gucci also runs an intense programme of social audits,carried out by external experts, who frequently operateon an unannounced basis. Audits are conducted for bothdirect suppliers and tier 2 suppliers. In order to roll outthis strategy, Gucci has developed a global risk matrix andvarious evaluation tools, to provide good visibility interms of production conditions. Of the 1,517 social auditsconducted in 2013, 562 took into account social andenvironmental issues, which represents a 40% increase onthe previous year. The number of suppliers audited remainedstable, at 1,218 in 2013. After the years of commitmentto its suppliers, the long-standing partnerships it has builtwith them and the stability of its supply chains, Gucci was
able to reduce the number of audits it carried out in 2013while keeping the number of suppliers audited at the samelevel. The maturity of these supplier partnerships allowedGucci to reduce the frequency of its social audits and devotemore time to assisting its suppliers with sustainabilityissues, such as by expanding audits to include environmentalthemes and by working together on EP&L implementation.
Bottega Veneta continued to pursue its ambitious socialaudit policy. The total number of audits performed in 2013came to 731, which is significant given that the brand has406 active suppliers. For each case of non-compliance,the supplier has to set up an action plan which dependson the seriousness of the problem: serious violationsmust be resolved within a month, non-serious issueswithin three months and minor issues within six months.In December 2013, 544 cases of non-compliance (including375 minor issues and non-serious violations) were thusin the process of being resolved. The vast majority relatedto health and safety.
Volcom’s social audit programme covered 63 of its directsuppliers (or 84%) in 2013. These audits led to one outrightdelisting, while another site is to receive no further ordersunless the follow-up audit results in an acceptable rating.
3SUPPORTING COMMUNITY DEVELOPMENT ~ SUSTAINABILITY
1012013 Reference Document ~ Kering
03_VA_V6 14/04/14 11:33 Page101
Kering’s responsibility towards society extends across thevalue chain, and the Group is keen to help raise awarenessof sustainability issues among consumers, while ensuringthat its products respect their health and the environment.
Consumer health and safety
To ensure the safety of the products they sell to theircustomers, the Group’s brands have put in place qualitycontrol procedures that comply with the strictestinternational consumer health and safety and environmentalstandards, such as REACH, US CPSIA, China SAC GBStandards, Japan Industrial Standards (JISL), etc.
In accordance with its Handbook for EnvironmentalStandards, PUMA has banned the use of dozens ofchemical substances deemed detrimental to human healthand the environment and exceeds the current regulatoryrequirements. Substances such as certain heavy metals,phthalates, organic compounds, azodyes, chlorobenzenes,etc., are listed in its Restricted Substances List (RSL). Thedocument also sets out the test procedures that need tobe carried out to ensure RSL compliance and, whereapplicable, the maximum authorised levels for certainsubstances. The PUMA Handbook for EnvironmentalStandards is distributed to the brand’s suppliers whomust in turn agree to respect the principles defined in the document.
Additionally, PUMA continued to participate in the ZDHC(Zero Discharge of Hazardous Chemicals) campaignlaunched in 2011, an initiative that aims to eliminate allhazardous chemical waste from production processes inthe textile industry by 2020. ZDHC posts regular updateson the progress made with this programme on its website.
Similar steps have been taken by the Group’s LuxuryDivision and these efforts are to be stepped up in 2014 withthe introduction of a Group-level product complianceplatform, which will define a common framework for allthe luxury brands in order to strengthen the processesthat verify product compliance with the regulations inforce around the world. The aim will also be to ensure thatmaterials (leather, fabrics, metal, etc.) and compoundsused in products respect the RSL, end products complywith physical and mechanical testing requirements, andcustomer communication (composition, usage, maintenance,etc.) is of a high standard.
Developing responsible products: a long-term strategy
Overall, Kering’s sustainability strategy seeks to influencethe way in which products are designed as far up thesupply chain as possible. This is due to two key factors:
• the findings of the first EP&Ls carried out by the Groupclearly indicate that the biggest environmental concernsare located far upstream at the raw materials end ofthe value chain (farming, cultivation and mining), ratherthan at the Group’s own operations and sites;
• designing more environmentally friendly products ischallenging without sustainable materials and processes.In terms of sustainability, the most important advancesare likely to be achieved in sourcing and by focusing onthe processing technologies used in the supply chain.
In 2013, therefore, the brands in part concentrated theirefforts on gradually upgrading sourcing and processes. Giventhe time it takes to effect such a major transformation,the portion of the Group’s production represented bymore sustainable products is still growing. Nevertheless,the Group’s brands strive each year to create new lines ofsustainable products, as pilot ranges to test a desiredresult, or as consumer awareness-raising to cultivate themarket’s appetite for sustainable products, or with a viewto sharing the results of their labours with charities orassociations with which they wish to collaborate.
With leather accounting for a significant portion of thematerials used by the Group and having major environmentalimpact, notably through the tanning process, in 2013Bottega Veneta and Gucci experimented with innovativetanning techniques that require no heavy metals and savealmost 30% of water. The first handbags produced fromleather processed using this new technique are to go onsale in 2014.
Among the other noteworthy initiatives involving leather,Gucci launched its first “zero deforestation” handbagcollection in 2013, in partnership with EcoAge. Havingintroduced traceability along the entire length of its valuechain, Gucci was able to certify that the Brazilian farmsthat raise the livestock that produces the leather fromwhich its bags are produced do not contribute to thedeforestation of the Amazon rainforest. This represents agood way of adressing the destruction of rare ecosystemswhile supporting Brazilian farmers.
At the same time, the metals used in footwear, leather goodsand ready-to-wear have come under close examination:Gucci, for example, is using an increasing amount of zamak(a family of alloys consisting of zinc, aluminium, magnesiumand sometimes copper) as a substitute for brass. This new
4.4. Risk management and development of responsible products
3 SUSTAINABILITY ~ SUPPORTING COMMUNITY DEVELOPMENT
102 Kering ~ 2013 Reference Document
03_VA_V6 14/04/14 11:33 Page102

material is already used to make all the accessories in thechildren’s collections, and is now being tested for introductioninto the women’s and men’s shoe collections. Additionally,all Gucci’s children’s ready-to-wear collections are now nickel-free, in line with EU Standard EN 1811. Finally, in 2013 thebrand joined forces with its main suppliers to analyse thepossibility of introducing recycled metals into its collectionsand to investigate the traceability of these materials.
Another particularly important resource for the Group,cotton, is also the subject of a large number of initiatives.In 2013, 53% of the cotton used by Stella McCartney wasorganic. Organic cotton was also chosen by Volcom for itsV.Co-Logical collections. Bottega Veneta is consideringintroducing organic cotton for several products in 2014,and in particular GOTS-certified fabrics (Global OrganicTextile Standard).
Meanwhile, 38% of the volume of cotton used by PUMA in2013 was organic. Since India is a major supplier of organiccotton, PUMA has joined forces with the Textile ExchangeNGO and the firm PE International to conduct the firstresearch into the lifecycle of organic cotton. The brand wasthen able to contribute to the exchange of knowledgeand data and streamline discussions on the subject byproviding clear, quantified data (organic cotton is 40% lesswater-intensive and 80% less energy-intensive than non-organic cotton).
In order to meet the Group’s PVC elimination targets, thebrands are developing pilot products to test the use ofbio-plastics in their collections. Sergio Rossi is currentlytesting a new bio-plastic to replace the PVC used in itsCléo sandals collection. Meanwhile, Gucci has opted toreplace PVC with polyurethane to coat the fabrics used inits handbags and footwear, and Bottega Veneta has takenthe same route for its Marco Polo handbag which now usespolyurethane. Bottega Veneta also uses Apinat bio-plasticfor the soles of its sports shoes. These initiatives are theresult of research carried out a long way upstream by theIdea Lab on Alternative Plastics set up by Kering, which isnow benefiting all the Group’s brands. Nine of Kering’sbrands were present at three meetings held in 2013, thelast of which took place in October at Düsseldorf’sinternational trade fair for plastics (K-fair), where the teamsmet major players in the plastics industry and discoveredtheir latest innovations. At the same time, Kering teamedup with the Fraunhofer Institute to develop an innovativemethod for comparing plastics based on sustainabilitycriteria that now enables the brands to select the mostappropriate plastics.
Having won Kering’s 2012 / 13 sustainability award forinnovation and sustainability with its Sustainable Woolproject, Stella McCartney spent 2013 setting up supplierlistings and sourcing for this new sustainable fabric whichoriginates from Patagonia in Argentina and is certified by OvisXXI and Nature Conservancy. The first ready-to-wear pieces inthis fabric will be showcased in the autumn 2014 collection.
With the aim of taking on board environmental considerationsas far upstream as possible in the product design process,in October 2013 Volcom set up a working group made upof its product development team and led by Textile Exchange,to focus on developing more sustainable garments. This“lifecycle” approach also adopted by PUMA led the brandto receive recognition from the Cradle-to-Cradle Institutein its annual awards, when PUMA was named 2013Innovator of the Year for its InCycle collection.
To capitalise on these initial successes and to systematiseresearch into ecological alternatives for each product, theGroup’s brands are able to draw on the support of theMaterials Innovation Lab (MIL) developed by Kering. Theobjective of this laboratory based in northern Italy is to offera range of sustainable materials to assist the developmentof their collections. Working with the SustainabilityDepartment, the MIL team shares its expertise with thebrands and works with strategic suppliers to identifymaterials that are better for the environment.
Beyond the products themselves, the brands also striveto reduce the environmental footprint of their packaging.At Gucci and Bottega Veneta all packaging and printedcommunications are already FSC-certified, and Volcomstarted following suit in 2013 by using only recycledmaterials for its main product packaging and catalogues.Also in 2013, Yves Saint Laurent switched all its cardboardboxes and paper carrier bags to 100% FSC- or PEFC-certified card, which is fully recyclable and derived fromECF pulp (elemental chlorine free) last year.
In terms of awareness-raising, Volcom continued toeducate and involve its markets and customers. For manyyears, Volcom has organised surfing events that qualifyfor Deep Blue Surfing Event certification, which involvesplanning all aspects of the entire event with sustainabilityin mind: reducing emissions at source, collecting andsorting waste, offering only recycled goods and organic,locally farmed, seasonal foods, calculating and offsettingcarbon emissions linked to participant and spectatortravel to the event, selling charity products to raise moneyfor local Hawaiian initiatives, involving local schools inthe preparation of the events, cleaning up the beaches inpartnership with local NGOs, etc. In addition to wanting tomake these events as eco-conscious as possible, theinitiatives provide Volcom with a powerful way of educatingpeople and raising awareness of sustainability challenges.
Under Volcom’s I: CO programme, recycling bins have beenplaced in certain stores to collect clothes that its customersno longer wear.
Similarly, PUMA established its Bring Me Back programmein 2013 which provides collection points in all its storesand points of sale to allow customers to send unwantedclothing, footwear and accessories for recycling.
3SUPPORTING COMMUNITY DEVELOPMENT ~ SUSTAINABILITY
1032013 Reference Document ~ Kering
03_VA_V6 14/04/14 11:33 Page103
Kering Corporate Foundation: Five yearscampaigning on behalf of women
Established in 2008, the Kering Foundation – formerly PPRCorporate Foundation for Women’s Dignity and Rights –has two objectives: to combat violence against women andto support initiatives to empower women. By pursuing oneof the eight millennium development goals set out by the UN,“To promote gender equality and empower women”, theFoundation commits Kering to a key issue that ties in withits activities and customers and an area in which the Groupcan play a key role alongside governments and communities.
In August 2013 the Kering Foundation completed its firstfive-year mandate having carried out an initial cycle ofinitiatives that helped more than 140,000 women, inpartnership with 47 NGOs worldwide.
An Activity Report published in the summer of 2013 andavailable on the Group’s website looks back at five years ofaction and highlights a number of key long-term partnerships.The report provides facts and figures on violence againstwomen and the progress made so far, alongside testimonialsfrom employees, experts, associations and beneficiariesexplaining the impact of these projects.
At its meeting on June 26, 2013, the Board of Directors extendedthe mandate of the Kering Foundation for a further fiveyears (2013-2018). To mark the occasion, the Foundation isstrengthening its actions to combat violence against womenunder a new programme with a new tagline: “Stop violence.Improve women’s lives”.
To be consistent with the Group’s new identity and to increaseits global impact, the Foundation is refocusing its initiativeson three regions: the Americas, Western Europe and Asia.In each of these regions the Foundation will focus on a maincause (sexual violence, harmful traditional practices anddomestic violence, respectively) and on targeted partnershipswith NGOs and social entrepreneurs. The Group’s localpositioning and the involvement of its staff strengthen theFoundation’s influence, leading to stronger awareness andmore effective prevention of violence against women.
• Working alongside NGOs
The Foundation supports projects run by local and internationalorganisations that aim to stamp out violence againstwomen. In 2013 it also enabled 21 employees to participatein community projects for two weeks as part of their paidleave, so that they could contribute their time and skillsto partner associations.
The Foundation has formed strong relationships with itspartners to secure the future of their projects and theirimpacts. In 2013 the Foundation continued to supportfour projects under partnerships set up in 2009 and 2011.
For example, the Kering Foundation Board of Directorsrenewed the partnership that began in 2009 with AFESIP inCambodia, which favours a broad approach to combatingviolence through a prevention programme for traffickedwomen and offering shelter and training to help them tofind a permanent way out of prostitution.
Renewed support for the Enda el Alto association, whichoffers shelter, care and training for homeless girls in Bolivia,allowed one Kering employee to boost the skills of theteam of social workers there and help them expand theirworkshop by organising the production line, calculatingcosts and optimising management.
The Foundation also decided in 2013 to support a researchproject led by Human Rights Watch into violence committedagainst women fleeing the Syrian conflict.
• Partnering social entrepreneurs acting for the benefit of women
Combining economic efficiency with social objectives,social entrepreneurs are key players in the developmentof innovative solutions. The Foundation helps them togrow their projects by providing €15,000 in financialassistance as well as the skills of the Group’s employees.
In 2013 the Foundation continued to support the threeprizewinners of the 2012 Social Entrepreneur Awards:
• AFRIPads, a business that encourages the educationaland vocational integration of girls in Uganda by producingwashable sanitary pads. In addition to receiving guidanceon human resources procedures, the managers receivedtraining during a four-day assignment at the site in theautumn of 2013;
• Filles du Facteur, which supports the empowerment ofwomen producing crocheted accessories from recycledplastic bags, and is supported by a Kering staff member.In addition to providing guidance on brand positioningand distribution strategy throughout the year, the employeewent to Burkina Faso in November 2013 to give a trainingcourse to the women that produce the accessories;
• Relmu Witral, a cooperative preserving the ancestral expertiseof the Mapuche women weavers in Chile, and is supportedby a Volcom employee. His help with the redefinition ofthe product offering and marketing strategy gave rise tothe “Give Back Series”, a collection of 1,200 hats thatwent on sale at Volcom stores around the world.
Over the summer, moreover, after the Kering Foundationput it into contact with Coup de Pouce, an associationthat organises community projects, the cooperativereceived 36 volunteers, including five Kering employees,to build workshops for six weavers and improve theirworking conditions.
4.5. Initiatives carried out by the Kering foundationand sponsorship programmes
3 SUSTAINABILITY ~ SUPPORTING COMMUNITY DEVELOPMENT
104 Kering ~ 2013 Reference Document
03_VA_V6 14/04/14 11:33 Page104
• Raising awareness among staff and the public in association with the Group’s brands
To combat violence against women it is necessary to buildawareness with a view to changing social representationsand behaviour: the Kering Foundation has made raisingawareness among its employees and the general public akey part of its programme.
When François-Henri Pinault joined forces with FédérationNationale Solidarité Femmes (FNSF) in 2010 to sign a Charter toprevent and combat domestic violence, the Group pledgedto inform and raise awareness of the issue among its employeesin France: since 2010, 120 employees been trained in how toput potential victims into contact with the right organisations.
In 2013, the Kering Foundation extended this commitmentto Italy and selected the Donne in Rete contro la violenza(D.i.Re) association as its national partner. After receivinginstruction from FNSF’s internal trainer, representatives fromD. i.Re were sent to Gucci as part of a pilot scheme whichin turn saw 80 employees receive training. The success ofthis scheme led François-Henri Pinault to sign the “Carta sullaprevenzione e la lotta contro le violenze alle donne” domesticviolence Charter on November 14, 2013. This Charter will nowbe distributed to more than 6,000 employees based in Italy.
To mark International Women’s Day on March 8, the KeringFoundation supported “À Travers Elles”, a photographyexhibition by Carole Mathieu, in partnership with Fnac. Theexhibition featured portraits of French actresses portrayingthe emotions of victims of domestic violence.
On November 25, International Day for the elimination ofviolence against women, the Foundation carried out a numberof awareness-raising events in partnership with the brands:
• for the second year running, Stella McCartney designeda White Ribbon for Women badge in partnership with theKering Foundation. On November 22-30, a limited editionmetal badge was given to every customer who made apurchase in one of Kering’s luxury brands’ 60 stores inEurope. Internet users were able to share the badge virtuallyusing social media. In total, the campaign reached55 million people, including 16 million in China, via socialnetworks like Twitter, Facebook, LinkedIn and Sina Weibo;
• the Kering Foundation also supported and broadcast thenew FNSF campaign in France entitled “The Phone”, a shortfilm against domestic violence made by Ivan Pierens.
For the third year running, the Kering Foundation joinedthe Gucci Tribeca Documentary Fund to present threeSpotlighting Women Documentary Awards. The winningfilm projects were chosen to highlight the extraordinaryfates and contributions of women around the world:
• Democrazy, by Andreas Dalsgaard, Nicolas Servide andViviana Gomez, which follows the leader of a corruptiontask force working within the Colombian Congress;
• Disruption, by Pamela Yates, about a group of activistsin Latin America fighting poverty through the economicemancipation of women;
• What Tomorrow Brings, by Beth Murphy, which tells thestory of the creation of the first girls’ school in a remoteAfghan village.
The three winners collectively received the total sum ofUSD 50,000 and support from the Tribeca Film Instituteto finalise and promote their films.
The issues that motivate our brands to take action
The support of the brands provides real leverage topartnership projects set up in the local community, by givingthem access to professional skills and expertise. Althoughall the Group’s brands develop their own communityinitiatives to tie in with their activities and their locations,the Kering Foundation encourages the sharing of bestpractice and offers support for the brands in developinginitiatives for women.
• Kering’s Luxury Division supports women’s empowerment projects, including education, healthcare and culture
The Luxury Division brands have shown their attachmentto projects supporting women in various ways.
In February 2013 Gucci launched the Chime For Changemovement to support access to education, healthcare andjustice for girls and women around the world. On June 1, aconcert presenting artists like Beyoncé, Jennifer Lopez andMadonna was held with the aim of raising awareness andcollecting funds. It raised USD 4.4 million via Catapult, thefirst crowd-funding platform dedicated to helping women.So far the movement has worked with 87 non-profitorganisations and helped to support 260 projects locatedin 81 countries. Gucci also raised USD 19,600 for EqualityNow, an organisation that campaigns against genderdiscrimination worldwide. Meanwhile, Boucheron donated€35,000 to the National Society for the Prevention of Crueltyto Children (NSPCC) in the United Kingdom in 2013, whichnotably launched the country’s first helpline for victims ofgenital mutilation.
The Group’s brands also supported medical research,especially into cancer and AIDS. These two themes wereactively supported by Bottega Veneta and Sergio Rossi, whichdonated more than €30,000 to various organisations,including the Italian association Lega Italiana per la Lottacontro i Tumori (LILT), which conducts research into breastcancer. Children’s health was also a strong focus for thebrands. Gucci donated USD 273,000 to China Childrenand Teenagers’ Foundation (CCTF) to help disadvantagedchildren suffering from amblyopia, a condition that leads toimpaired vision. Stella McCartney also raised funds in supportof medical research, notably to help children, by donatingmore than USD 15,000 in total. Saint Laurent and Bottega Venetaattended a charity dinner organised by the association UnAvenir pour les Enfants du Monde (AEM): a total of €16,690was contributed by the two brands to support access tohealthcare for hundreds of children in Rwanda.
3SUPPORTING COMMUNITY DEVELOPMENT ~ SUSTAINABILITY
1052013 Reference Document ~ Kering
03_VA_V6 14/04/14 11:33 Page105

Child protection and education also remain a priority forLuxury Division brands. Gucci continued its partnership withUNICEF, having donated a total of USD 18 million since2005, including USD 1.5 million this year, notably for theSchools for Africa and Schools for Asia programmes. 2013marks Gucci’s ninth year of support for these programmeswhich help to provide access to education for children inSub-Saharan Africa and Asia. Meanwhile, after seven yearsof commitment to Artists for Peace and Justice, Brioni donateda further €50,000 to this association which aims toprovide education for children living in the poorest areasof Haiti. Alexander McQueen gave a total of USD 115,000in support of children’s health and education thanks toan auction organised by Save the Children and the CrystalCharity lunch and fashion show. The Girard-Perregaux andJEANRICHARD brands also contributed €36,800 to children’scharities. Specifically, Girard-Perregaux supported theCanadian Steve Nash Foundation, which helps disadvantagedchildren, while JEANRICHARD continued the partnership itbegan in 2012 with the Kind Surf Foundation, which organisessurfing programmes for underprivileged children.
The Luxury Division brands demonstrated a strong commitmentto cultural initiatives in 2013. Boucheron, which becamea patron of the arts by partnering the Comédie Françaisein 2011, donated €30,000 to the Paris theatre and contributed€90,000 towards the organisation of its fourth ball. At theinternational level, Boucheron also donated €300,000 tosupport the work of Japanese photographer Hiroshi Sugimoto,who also produced a play using the traditional art of puppetryknown as bunraku, which is now on UNESCO’s IntangibleCultural Heritage list. The University of Los Angeles’ HammerMuseum has received €4,000 in sponsorship from StellaMcCartney for its Kids’ Art Museum Project (KAMP), as wellas €157,200 from Bottega Veneta. In addition, BottegaVeneta supported photographer Alex Prager, by providing€31,450 in sponsorship to enable him to present his firstexhibition at the Corcoran Gallery in Washington. Guccicontinued its commitment to cinema for the ninthconsecutive year, by donating USD 250,000 to the FilmFoundation which supports the restoration of old filmarchives, as well as USD 117,900 to the Tribeca Film Institute,
through the Gucci Tribeca Documentary Fund, whichsupports film-makers that make documentaries highlightingsocial themes and promotes film-making. The Group’sbrands also supported the art of fashion: Brioni reaffirmedits connection to the Abruzzo region of Italy by contributing€25,000 to the Museum of Fashion Foundation in Penne,while Saint Laurent showed its commitment to youngdesigners by supporting the Association Nationale pour leDéveloppement des Arts de la Mode (ANDAM), by providing€40,000 in funding. Finally, Saint Laurent, Stella McCartneyand Kering donated nearly USD 170,000 to the MetropolitanMuseum Costume Institute Ball.
• Kering Sport & Lifestyle: health, sport and solidarity
Volcom continued its “Let the Kids Ride Free” campaignlaunched 12 years ago, offering children and teenagersopportunities to take part in surf, snowboard andskateboard competitions for free. The sports brandinvested USD 685,000 in the campaign in 2013 andreached 7,000 young people. Young people aged betweennine and 16 can also take part in the Summer Soul SurfCamp to experience surfing and learn about water sportssafety. The brand also supported numerous environmentalinitiatives, including the “1% for the Planet “organisationwhich it has supported since 2008, by donating USD 35,000 this year. Finally, 135 women weavers fromthe Relmu Witral association in Chile benefited from theguidance of a Volcom employee for one year as part ofthe mentoring programme organised by the KeringFoundation. This partnership also led to the creation of the“Give Back Series”, a collection of 1,200 hats made by theMapuche women, which were “Fair Trade” certified anddistributed in Volcom stores all over the world.
In 2013, PUMA reran Project Pink, its breast cancer awareness-raising campaign. The brand paid all profits from the saleof Project Pink garments to the Dr Susan Love ResearchFoundation – selected by online voters – amounting to atotal contribution of USD 50,000. PUMA also continued tosupport victims of natural disasters through its CharityCat organisation. This year, PUMA paid out €25,000 to victimsof flooding in Germany and the typhoon in the Philippines.
3 SUSTAINABILITY ~ SUPPORTING COMMUNITY DEVELOPMENT
106 Kering ~ 2013 Reference Document
03_VA_V6 14/04/14 11:33 Page106
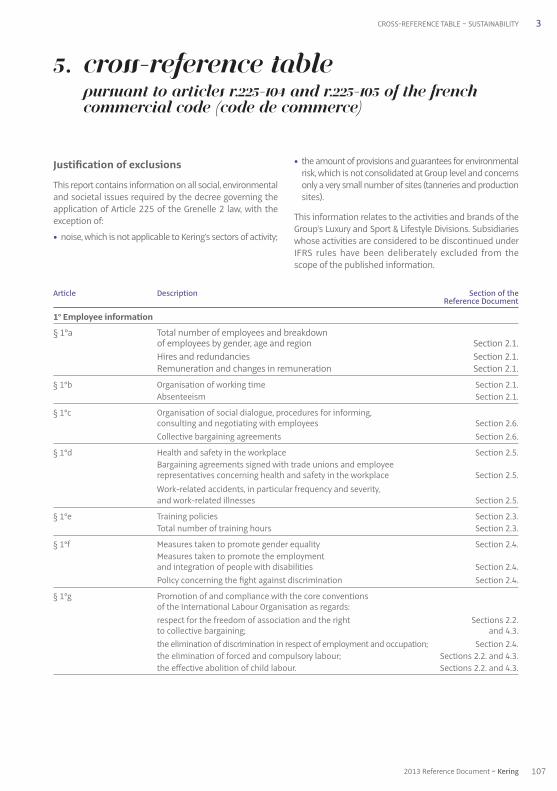
Article Description Section of the Reference Document
1° Employee information
§ 1°a Total number of employees and breakdown of employees by gender, age and region Section 2.1. Hires and redundancies Section 2.1. Remuneration and changes in remuneration Section 2.1.
§ 1°b Organisation of working time Section 2.1. Absenteeism Section 2.1.
§ 1°c Organisation of social dialogue, procedures for informing, consulting and negotiating with employees Section 2.6. Collective bargaining agreements Section 2.6.
§ 1°d Health and safety in the workplace Section 2.5. Bargaining agreements signed with trade unions and employee representatives concerning health and safety in the workplace Section 2.5. Work-related accidents, in particular frequency and severity, and work-related illnesses Section 2.5.
§ 1°e Training policies Section 2.3. Total number of training hours Section 2.3.
§ 1°f Measures taken to promote gender equality Section 2.4. Measures taken to promote the employment and integration of people with disabilities Section 2.4. Policy concerning the fight against discrimination Section 2.4.
§ 1°g Promotion of and compliance with the core conventions of the International Labour Organisation as regards: respect for the freedom of association and the right Sections 2.2. to collective bargaining; and 4.3. the elimination of discrimination in respect of employment and occupation; Section 2.4. the elimination of forced and compulsory labour; Sections 2.2. and 4.3. the effective abolition of child labour. Sections 2.2. and 4.3.
Justification of exclusions
This report contains information on all social, environmentaland societal issues required by the decree governing theapplication of Article 225 of the Grenelle 2 law, with theexception of:
• noise, which is not applicable to Kering’s sectors of activity;
• the amount of provisions and guarantees for environmentalrisk, which is not consolidated at Group level and concernsonly a very small number of sites (tanneries and productionsites).
This information relates to the activities and brands of theGroup’s Luxury and Sport & Lifestyle Divisions. Subsidiarieswhose activities are considered to be discontinued underIFRS rules have been deliberately excluded from thescope of the published information.
5. Cross-reference tablePursuant to articles R.225-104 and R.225-105 of the FrenchCommercial Code (Code de commerce)
3CROSS-REFERENCE TABLE ~ SUSTAINABILITY
1072013 Reference Document ~ Kering
03_VA_V6 14/04/14 11:33 Page107

Article Description Section of the Reference Document
SUSTAINABILITY ~ CROSS-REFERENCE TABLE3
2° Environmental information
§ 2°a Organisation of steps taken to address environmental issues and environmental assessment and certification procedures Sections 1.2. and 3.1. Initiatives taken to train and raise awareness among employees on environmental protection Sections 3.1. and 4.3. Resources assigned to the prevention Data not available. of environmental risks and pollution See “Justification of exclusions” section above. Amount of provisions and guarantees covering Data not available. environmental risks See “Justification of exclusions” section above.
§ 2°b Measures taken to prevent, reduce and rectify emissions into air, water and soil that have a significant impact on the environment Sections 3.3 to 3.6. Measures taken to prevent, recycle and eliminate waste Section 3.5. Steps taken to address noise and any other form Data not available. of pollution relating to a specific activity See “Justification of exclusions” section above.
§ 2°c Water consumption and supply of water in accordance with local regulations Section 3.4. Raw materials consumption and measures taken to promote more efficient use Section 3.4. Energy consumption and measures taken to improve energy efficiency and use of renewable energy Section 3.3. Land use Section 3.4.
§ 2°d Greenhouse gas emissions Section 3.3. Adapting to the consequences of climate change Section 3.3.
§ 2°e Measures taken to protect and develop biodiversity Section 3.6.
3° Employee information
§ 3°a Community, economic and social impact with respect to employment and regional development Section 4.1. Community, economic and social impact on local residents Section 4.1.
§ 3°b Dialogue with stakeholders Sections 4.2. and 4.3. Partnership and sponsorship initiatives Section 4.5.
§ 3°c Incorporating social and environmental issues in the purchasing policy Sections 4.3. and 4.4. Scale of outsourcing and steps taken to raise awareness among suppliers and subcontractors with respect to corporate social responsibility Section 4.3.
§ 3°d Steps taken to fight against corruption Sections 2.2. and 4.3. Measures taken to promote consumer health and safety Section 4.4.
§ 3°e Steps taken for the protection of human rights Sections 2.2. and 4.3.
Kering ~ 2013 Reference Document108
03_VA_V6 14/04/14 11:33 Page108

Principe Description Section of the Reference Document
Human rights
1 Supporting and respecting Section 2.2. the protection of internationally Section 2.4. proclaimed human rights Section 4.3.
2 Ensuring that Kering is not complicit in human rights abuses Section 2.2. Section 2.4. Section 4.3.
Labour
3 Upholding the freedom of association and the effective Section 2.2. recognition of the right to collective bargaining Section 2.6. Section 4.3.
4 Eliminating all forms of forced and compulsory labour Section 2.2. Section 4.3.
5 Ensuring the effective abolition of child labour Section 2.2. Section 4.3.
6 Eliminating discrimination in respect of employment and occupation Sections 2.4 and 4.3.
Environment
7 Supporting a precautionary approach Section 2.2. to environmental challenges Section 3.1. Section 3.2.
8 Undertaking initiatives to promote greater environmental responsibility Sections 3. and 4.
9 Encouraging the development and diffusion Section 3. of environmentally friendly technologies Section 4.4.
Anti-corruption
10 Working against corruption in all its forms, Section 2.2. including extortion and bribery Section 4.3.
CROSS-REFERENCE TABLE: GLOBAL COMPACT ~ SUSTAINABILITY 3
6. Cross-reference table: Global Compact
2013 Reference Document ~ Kering 109
03_VA_V6 14/04/14 11:33 Page109

This is a free translation into English of the original report issued in French and is provided solely for the convenience ofEnglish speaking readers. This report should be read in conjunction with, and construed in accordance with, French lawand professional auditing standards applicable in France.
To the Shareholders,
In our capacity as Statutory Auditors of Kering, and appointed as independent third-parties, for whom the applicationrequest for accreditation request has been approved by the French National Accreditation Body (COFRAC) on September 12, 2013 for Deloitte & Associés and on October 28, 2013 for KPMG, we hereby present you with our report on the social, environmental and societal information prepared for the year ended December 31, 2013 presented in the Management Report included in the Reference Document (hereinafter the “CSR Information”), pursuant to Article L.225-102-1 of the French Commercial Code.
Responsibility of the company
The Board of Directors of Kering is responsible for preparing a Management Report including CSR Information inaccordance with the provisions of Article R. 225-105-1 of the French Commercial Code, prepared in accordance withthe reporting protocols used by the company (hereafter the “Reporting Protocols”), which are available on request fromthe company’s Sustainability and Human Resources Departments and for which a summary is presented on the Groupinternet site (www.kering.com).
Independence and quality control
Our independence is defined by regulatory texts, the profession’s Code of ethics as well as by the provisions set forth inArticle L. 822-11 of the French Commercial Code. Furthermore, we have set up a quality control system that includesthe documented policies and procedures designed to ensure compliance with rules of ethics, professional auditingstandards and the applicable legal texts and regulations.
Responsibility of the Statutory Auditors
Based on our work, our responsibility is:
• to attest that the required CSR Information is presented in the Management Report or, in the event of omission, isexplained pursuant to the third paragraph of Article R. 225-105 of the French Commercial Code (Statement ofcompleteness of the CSR information);
• to express limited assurance on the fact that, taken as a whole, the CSR Information is presented fairly, in all materialaspects, in accordance with the adopted Reporting Protocols (Formed conclusion on the fair presentation of the CSRInformation).
Our work was carried out by a team of nine people between December 2013 and March 2014. To assist us in conductingour work, we referred to our corporate responsibility experts.
We conducted the following procedures in accordance with professional auditing standards applicable in France, withthe order of May 13, 2013 determining the methodology according to which the independent third party entityconducts its assignment and, with regard to the formed conclusion on the fair presentation of the Information, with theISAE (International Standard on Assurance Engagements) 3000(1).
7. Report of the Statutory Auditors,appointed as independent third-parties, on theconsolidated environmental, social and societalinformation published in the Management Report
3 SUSTAINABILITY ~ REPORT OF THE STATUTORY AUDITORS
(1) ISAE 3000 – Assurance engagements other than audits or reviews of historical financial information.
110 Kering ~ 2013 Reference Document
03_VA_V6 14/04/14 11:33 Page110

1. Statement of completeness of the CSR Information
Based on interviews with management, we familiarized ourselves with the Group’s sustainable development strategy,with regard to the social and environmental impacts of the company’s business and its societal commitments and,where appropriate, any resulting actions or programs.
We have compared the CSR Information presented in the Management Report with the list set forth in Article R. 225-105-1of the French Commercial Code.
In the event of omission of certain consolidated information, we have verified that explanations were provided inaccordance with the third paragraph of the Article R. 225-105 of the French Commercial Code.
We have verified that the CSR Information covered the consolidated scope, i.e., the company and its subsidiaries withinthe meaning of Article L. 233-1 of the French Commercial Code and the companies that it controls within the meaningof Article L. 233-3 of the French Commercial Code, subject to the limits set forth in section 5 of the Chapter 3 of the 2013Reference Document and in the environmental and social methodological summaries, available on the Kering Internetsite (www.kering.com).
Based on these procedures and considering the limitations mentioned above, we attest that the required CSR Informationis presented in the Management Report.
2. Limited assurance on the fair presentation of the CSR Information
Nature and scope of procedures
We conducted around twenty interviews with thirty people responsible for preparing the CSR Information in thedepartments in charge of the CSR Information collection process and, when appropriate, those responsible for internalcontrol and risk management procedures, in order to:
• assess the suitability of the Reporting Protocols with respect to their relevance, completeness, reliability, neutralityand understandability, taking into consideration, when relevant, the sector’s best practices;
• verify that a data-collection, compilation, processing and control procedure has been implemented to ensure the completenessand consistency of the CSR Information and review the internal control and risk management procedures used to preparethe CSR Information.
We determined the nature and scope of the tests and controls according to the nature and significance of the CSRInformation with regard to the company’s characteristics, the social and environmental challenges of its activities, itssustainable development strategies and the sector’s best practices.
Concerning the CSR Information that we have considered to be most important(1):
• for the consolidating entity, we consulted the documentary sources and conducted interviews to corroborate thequalitative information (organization, policies, actions), we performed analytical procedures on the quantitativeinformation and verified, using sampling techniques, the calculations and the data consolidation, and we verifiedtheir consistency with the other information presented in the Management Report;
• for a representative sample of entities that we have selected(2) according to their activity, their contribution to theconsolidated indicators, their location and a risk analysis, we held interviews to verify the correct application of theprocedures and performed substantive tests using sampling techniques, consisting in verifying the calculations madeand reconciling the data with supporting evidence. The selected sample represented 29% of the Group headcountand between 23% and 100% of the environmental quantitative information.
3REPORT OF THE STATUTORY AUDITORS ~ SUSTAINABILITY
(1) The relevant quantitative and qualitative information is presented in Appendix.(2) Puma Germany, Puma USA, Puma Argentina, Gucci Italy, Luxury Goods International (Gucci), Gucci USA, Bottega Veneta Italy, Saint Laurent France, Kering
Foundation, Volcom, Boucheron.
1112013 Reference Document ~ Kering
03_VA_V6 14/04/14 11:33 Page111

Regarding the other consolidated CSR Information, we have assessed its consistency in relation to our understanding ofthe Group.
Finally, we have assessed the relevance of the explanations relating to, where necessary, the total or partial omission ofcertain information.
We believe that the sampling methods and sizes of the samples we have used in exercising our professional judgmentenable us to express limited assurance; a higher level of assurance would have required more in-depth verifications.Due to the use of sampling techniques and the other limits inherent to the operations of any information and internalcontrol system, the risk that a material anomaly be identified in the CSR Information cannot be totally eliminated.
Conclusion
Based on our work, we did not identify any material anomalies likely to call into question the fact that the CSRInformation, taken as a whole, is presented fairly, in accordance with the Reporting Protocols.
Paris La Défense and Neuilly-sur-Seine, 31 March 2014
French original signed by:
KPMG Audit Deloitte & AssociésDépartement de KPMG SA
Hervé Chopin Philippe Arnaud Antoine de RiedmattenPartner Partner Partner
Climate Change &Sustainability Services
3 SUSTAINABILITY ~ REPORT OF THE STATUTORY AUDITORS
112 Kering ~ 2013 Reference Document
03_VA_V6 14/04/14 11:33 Page112
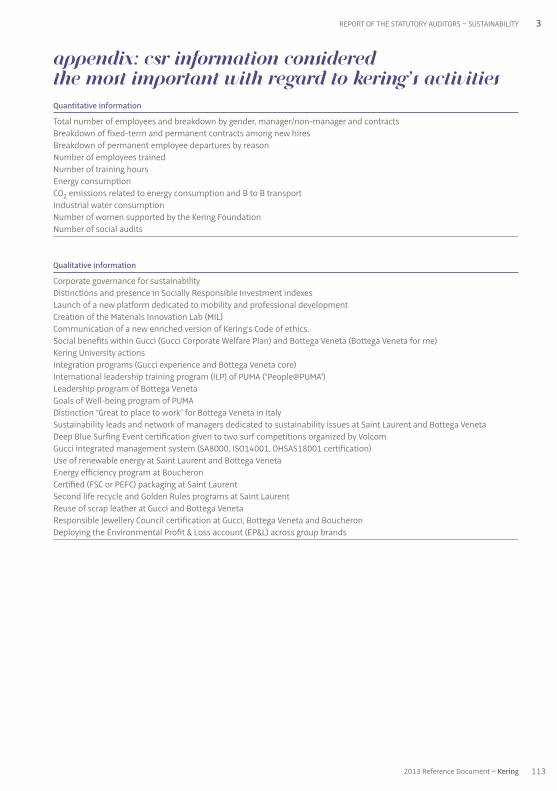
Appendix: CSR Information considered the most important with regard to Kering’s activities
Quantitative information
Total number of employees and breakdown by gender, manager / non-manager and contractsBreakdown of fixed-term and permanent contracts among new hiresBreakdown of permanent employee departures by reasonNumber of employees trainedNumber of training hoursEnergy consumptionCO2 emissions related to energy consumption and B to B transportIndustrial water consumptionNumber of women supported by the Kering FoundationNumber of social audits
Qualitative information
Corporate governance for sustainabilityDistinctions and presence in Socially Responsible Investment indexesLaunch of a new platform dedicated to mobility and professional developmentCreation of the Materials Innovation Lab (MIL)Communication of a new enriched version of Kering’s Code of ethics.Social benefits within Gucci (Gucci Corporate Welfare Plan) and Bottega Veneta (Bottega Veneta for me)Kering University actionsIntegration programs (Gucci experience and Bottega Veneta core)International leadership training program (ILP) of PUMA (“People@PUMA”)Leadership program of Bottega VenetaGoals of Well-being program of PUMADistinction “Great to place to work” for Bottega Veneta in ItalySustainability leads and network of managers dedicated to sustainability issues at Saint Laurent and Bottega VenetaDeep Blue Surfing Event certification given to two surf competitions organized by VolcomGucci integrated management system (SA8000, ISO14001, OHSAS18001 certification)Use of renewable energy at Saint Laurent and Bottega VenetaEnergy efficiency program at BoucheronCertified (FSC or PEFC) packaging at Saint LaurentSecond life recycle and Golden Rules programs at Saint LaurentReuse of scrap leather at Gucci and Bottega VenetaResponsible Jewellery Council certification at Gucci, Bottega Veneta and BoucheronDeploying the Environmental Profit & Loss account (EP&L) across group brands
3REPORT OF THE STATUTORY AUDITORS ~ SUSTAINABILITY
1132013 Reference Document ~ Kering
03_VA_V6 14/04/14 11:33 Page113

114 Kering ~ 2013 Reference Document
03_VA_V6 14/04/14 11:33 Page114
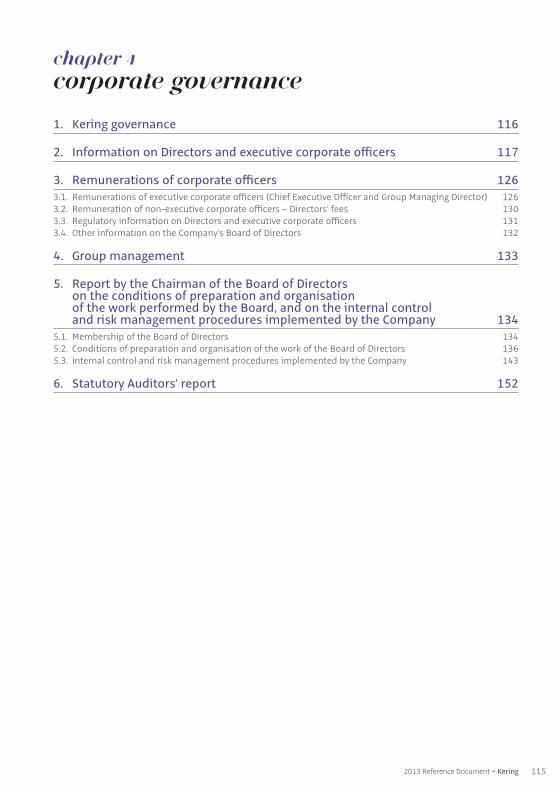
1152013 Reference Document ~ Kering
CHAPTer 4
Corporate governance
1. Kering governance 116
2. Information on Directors and executive corporate officers 117
3. Remunerations of corporate officers 1263.1. Remunerations of executive corporate officers (Chief Executive Officer and Group Managing Director) 1263.2. Remuneration of non-executive corporate officers – Directors’ fees 1303.3. Regulatory information on Directors and executive corporate officers 1313.4. Other information on the Company’s Board of Directors 132
4. Group management 133
5. Report by the Chairman of the Board of Directorson the conditions of preparation and organisation of the work performed by the Board, and on the internal control and risk management procedures implemented by the Company 134
5.1. Membership of the Board of Directors 1345.2. Conditions of preparation and organisation of the work of the Board of Directors 1365.3. Internal control and risk management procedures implemented by the Company 143
6. Statutory Auditors’ report 152
04_VA_V6 14/04/14 11:45 Page115

At the Combined General Meeting on May 19, 2005, the shareholders adopted the new Articles of Association of PPR(since renamed Kering) establishing a system of management with a Board of Directors instead of a Supervisory Boardand an Executive Board. François-Henri Pinault is Chairman of the Board of Directors and Chief Executive Officer of theCompany.
The Board opted to combine the roles of Chairman of the Board and Chief Executive Officer and retained this optionfollowing the renewal by the Combined General Meeting on June 18, 2013 of the directorship of François-Henri Pinault,who is both related to the controlling shareholder and very involved in conducting the business of the Group of whichhe has very strong in-depth knowledge and experience.
The Combined General Meeting on June 18, 2013 renewed the term of office of Jean-François Palus, Group ManagingDirector of the Kering group, as a Director for four years.
The Company refers to the Corporate Governance Code of Listed Corporations resulting from the consolidation of theOctober 2003 AFEP and MEDEF report, the January 2007 and October 2008 AFEP and MEDEF recommendations on theremuneration of Directors and executive corporate officers and the April 2010 AFEP-MEDEF recommendation onboosting the representation of women in the boardroom, which was revised in June 2013 (the revised AFEP-MEDEFCode). The Board of Directors has members from around the world with eleven members of French, German and Italiannationalities. Four Directors are women. In 2013, five of the eleven Directors were independent with regard to thecriteria presented in the revised AFEP-MEDEF Code.
Mr. François Pinault is Honorary Chairman but is not a Director.
The operating rules and procedures of the Board of Directors are defined by law, the Company’s Articles of Association,the internal rules of the Board and the specialised Committees provided for in those rules (see Chairman’s report, page 134).
The provisions of the Company’s Articles of Association regarding Directors do not in general deviate from the basiclegal standards. There are special provisions for the term of office of Directors (four years, renewable), the age limit (nomore than two-thirds of the Directors may be over 70) and the minimum number of shares that each Director mustown (500).
In order to avoid having to reappoint all Board members at the same time and to streamline the reappointmentprocess, the Combined General Meeting on May 7, 2009 amended the Company’s Articles of Association in order toimplement a staggered renewal of the Board of Directors.
The Directors’ duties and individual remuneration are described below.
1. Kering governance
116 Kering ~ 2013 Reference Document
4 CORPORATE GOVERNANCE ~ KERING GOVERNANCE
04_VA_V6 14/04/14 11:45 Page116

As of December 31, 2013, the Board of Directors was composed of eleven members, five of whom were independentDirectors with regards to the criteria presented in the revised AFEP-MEDEF Code.
There are no employee-elected Directors.
List of members of the Board of Directors with information on their positions in other companies
The following information is presented separately for each Director:
• professional experience and expertise in the area of business management;
• directorships and positions held in 2013;
• other directorships and positions held in the last five years.
Among Kering’s Directors and executive corporate officers, only François-Henri Pinault, Jean-François Palus, PatriciaBarbizet and Jochen Zeitz hold or have held legal representative or corporate executive functions in the Group’s mainsubsidiaries.
2. Information on Directors and executive corporate officers
117
4
2013 Reference Document ~ Kering
INFORMATION ON DIRECTORS AND EXECUTIVE CORPORATE OFFICERS ~ CORPORATE GOVERNANCE
04_VA_V6 14/04/14 11:45 Page117
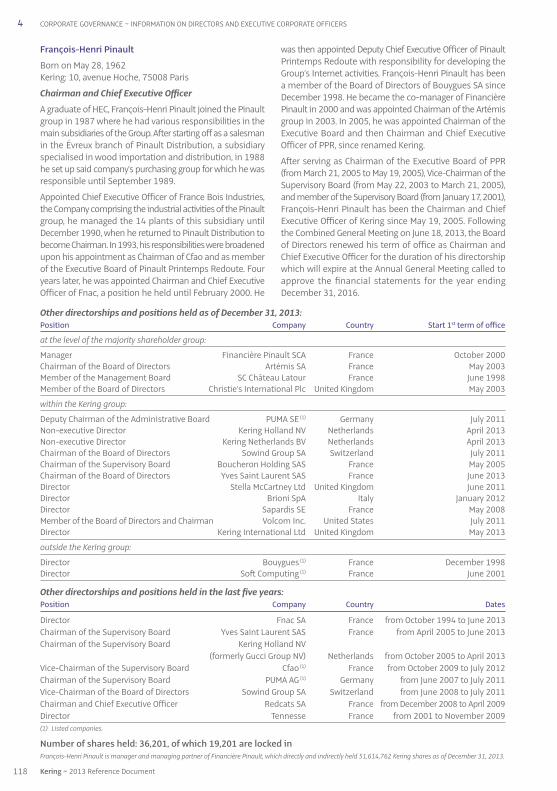
Other directorships and positions held as of December 31, 2013:Position Company Country Start 1st term of office
at the level of the majority shareholder group:
Manager Financière Pinault SCA France October 2000Chairman of the Board of Directors Artémis SA France May 2003Member of the Management Board SC Château Latour France June 1998Member of the Board of Directors Christie’s International Plc United Kingdom May 2003
within the Kering group:
Deputy Chairman of the Administrative Board PUMA SE (1) Germany July 2011Non-executive Director Kering Holland NV Netherlands April 2013Non-executive Director Kering Netherlands BV Netherlands April 2013Chairman of the Board of Directors Sowind Group SA Switzerland July 2011Chairman of the Supervisory Board Boucheron Holding SAS France May 2005Chairman of the Board of Directors Yves Saint Laurent SAS France June 2013Director Stella McCartney Ltd United Kingdom June 2011Director Brioni SpA Italy January 2012Director Sapardis SE France May 2008Member of the Board of Directors and Chairman Volcom Inc. United States July 2011Director Kering International Ltd United Kingdom May 2013
outside the Kering group:
Director Bouygues (1) France December 1998Director Soft Computing (1) France June 2001
Other directorships and positions held in the last five years:Position Company Country Dates
Director Fnac SA France from October 1994 to June 2013Chairman of the Supervisory Board Yves Saint Laurent SAS France from April 2005 to June 2013Chairman of the Supervisory Board Kering Holland NV (formerly Gucci Group NV) Netherlands from October 2005 to April 2013
Vice-Chairman of the Supervisory Board Cfao (1) France from October 2009 to July 2012Chairman of the Supervisory Board PUMA AG (1) Germany from June 2007 to July 2011Vice-Chairman of the Board of Directors Sowind Group SA Switzerland from June 2008 to July 2011Chairman and Chief Executive Officer Redcats SA France from December 2008 to April 2009Director Tennesse France from 2001 to November 2009(1) Listed companies.
Number of shares held: 36,201, of which 19,201 are locked inFrançois-Henri Pinault is manager and managing partner of Financière Pinault, which directly and indirectly held 51,614,762 Kering shares as of December 31, 2013.
François-Henri Pinault
Born on May 28, 1962Kering: 10, avenue Hoche, 75008 Paris
Chairman and Chief Executive Officer
A graduate of HEC, François-Henri Pinault joined the Pinaultgroup in 1987 where he had various responsibilities in themain subsidiaries of the Group. After starting off as a salesmanin the Évreux branch of Pinault Distribution, a subsidiaryspecialised in wood importation and distribution, in 1988he set up said company’s purchasing group for which he wasresponsible until September 1989.
Appointed Chief Executive Officer of France Bois Industries,the Company comprising the industrial activities of the Pinaultgroup, he managed the 14 plants of this subsidiary untilDecember 1990, when he returned to Pinault Distribution tobecome Chairman. In 1993, his responsibilities were broadenedupon his appointment as Chairman of Cfao and as memberof the Executive Board of Pinault Printemps Redoute. Fouryears later, he was appointed Chairman and Chief ExecutiveOfficer of Fnac, a position he held until February 2000. He
was then appointed Deputy Chief Executive Officer of PinaultPrintemps Redoute with responsibility for developing theGroup’s Internet activities. François-Henri Pinault has beena member of the Board of Directors of Bouygues SA sinceDecember 1998. He became the co-manager of FinancièrePinault in 2000 and was appointed Chairman of the Artémisgroup in 2003. In 2005, he was appointed Chairman of theExecutive Board and then Chairman and Chief ExecutiveOfficer of PPR, since renamed Kering.
After serving as Chairman of the Executive Board of PPR(from March 21, 2005 to May 19, 2005), Vice-Chairman of theSupervisory Board (from May 22, 2003 to March 21, 2005),and member of the Supervisory Board (from January 17, 2001),François-Henri Pinault has been the Chairman and ChiefExecutive Officer of Kering since May 19, 2005. Followingthe Combined General Meeting on June 18, 2013, the Boardof Directors renewed his term of office as Chairman andChief Executive Officer for the duration of his directorshipwhich will expire at the Annual General Meeting called toapprove the financial statements for the year endingDecember 31, 2016.
4 CORPORATE GOVERNANCE ~ INFORMATION ON DIRECTORS AND EXECUTIVE CORPORATE OFFICERS
118 Kering ~ 2013 Reference Document
04_VA_V6 14/04/14 11:45 Page118

Other directorships and positions held as of December 31, 2013:
Position Company Country Start 1st term of office
at the level of the majority shareholder group, mainly:
Chief Executive Officer and Director Artémis SA France 1992Chairman of the Board of Directors Christie’s International Plc United Kingdom March 2003Chief Executive Officer, non-corporate officer Financière Pinault SCA France June 2004Member of the Supervisory Board Financière Pinault SCA France January 2001Managing Director Palazzo Grassi Italy September 2005Director Société Nouvelle du Théâtre Marigny France February 2000Member of the Management Board SC Château Latour France July 1993Permanent representative of Artémis on the Board of Directors Agefi France July 2000Permanent representative of Artémis on the Board of Directors Sebdo Le Point France July 1997
within the Kering group:
Non-executive Director Kering Holland NV Netherlands April 2013Member of the Board of Directors Yves Saint Laurent SAS France June 2013
outside the Kering group:
Director Total (1) France May 2008Director Groupe Fnac (1) France June 2013Member of the Supervisory Board Peugeot SA (1) France April 2013Director Air France-KLM (1) France January 2003
Other directorships and positions held in the last five years:
Position Company Country Dates
Director TF1 (1) France from July 2000 to April 2013Director Bouygues (1) France from December 1998 to April 2013Director Fonds Stratégique d’Investissement France from December 2008 to July 2013Member of the Supervisory Board Kering Holland NV (formerly Gucci Group NV) Netherlands from July 1999 to April 2013
Member of the Supervisory Board Yves Saint Laurent SAS France from June 2003 to June 2013Director Tawa Plc (1) United Kingdom from April 2011 to June 2012Deputy Chief Executive Officer Société Nouvelle du Théâtre Marigny France from April 2010 to January 2012Director Piasa France from April 2007 to January 2009Director Fnac SA France from October 1994 to May 2011
(1) Listed companies.
Number of shares held: 1,040
Patricia Barbizet
Born on April 17, 1955Artémis: 12, rue François 1er, 75008 Paris
Vice-Chair of the Board of Directors
A graduate of the École Supérieure de Commerce de Paris,Patricia Barbizet began her career with the Renault groupas treasurer of Renault Véhicules Industriels then as ChiefFinancial Officer of Renault Crédit International. She joinedthe Pinault group in 1989 as Chief Financial Officer.
In 1992, she became Chief Executive Officer of Artémisand in 2004 Chief Executive Officer of Financière Pinault.She is also a Director of Total, Air France-KLM and GroupeFnac, and member of the Supervisory Board of Peugeot SA.
After serving as Chair of the Supervisory Board of PPR(from December 2001 to May 2005) and member of theSupervisory Board of PPR (from December 1992), PatriciaBarbizet has been Vice-Chair of the Board of Directors ofKering since May 19, 2005. Her term of office was renewedby the Combined General Meeting on June 18, 2013 and will expire at the Annual General Meeting called toapprove the financial statements for the year endingDecember 31, 2016.
4INFORMATION ON DIRECTORS AND EXECUTIVE CORPORATE OFFICERS ~ CORPORATE GOVERNANCE
1192013 Reference Document ~ Kering
04_VA_V6 14/04/14 11:45 Page119

Other directorships and positions held as of December 31, 2013:
Position Company Country Start 1st term of office
within the Kering group:
Chairman of the Administrative Board PUMA SE (1) Germany December 2012Director Pomellato SpA Italy July 2013Director Sowind Group SA Switzerland December 2013Director Brioni SpA Italy January 2012Director Kering Luxembourg SA Luxembourg May 2011Member of the Board of Directors Volcom Inc. United States July 2011Member of the Board of Directors Kering Americas Inc. United States June 2011Chairman of the Board of Directors LGI SA Switzerland April 2011Director Volcom Luxembourg Holding SA Luxembourg October 2012Director Kering Tokyo Investment Japan November 2013
Other directorships and positions held in the last five years:
Position Company Country Dates
Director Fnac SA France from November 2007 to June 2013Director Groupe Fnac France from September 2012 to June 2013Chairman and Chief Executive Officer Sapardis SE France from March 2007 to June 2013Member of the Supervisory Board Kering Holland NV Netherlands from May 2006 to April 2013 (formerly Gucci Group NV) Member of the Supervisory Board Yves Saint Laurent SAS France from March 2011 to March 2013Permanent representative Redcats SA France from April 2006 to February 2013of Kering on the Board of DirectorsMember of the Supervisory Board Cfao (1) France from October 2009 to July 2012Director Caumartin Participations SAS France from June 2008 to September 2012Director Conforama Holding SA France from April 2006 to March 2011Member of the Supervisory Board PUMA AG (1) Germany from June 2007 to July 2011Chairman and Chief Executive Officer PPR Club de Développement France from June 2006 to 2009Chairman Redcats International France from December 2008 to April 2009Director PPR Luxembourg Luxembourg from April 2006 to 2010Representative of Saprodis on SC Zinnia France from February 2008 the Management Board to December 2009Representative of Sapardis on SC Zinnia France from December 2009 the Management Board to June 2013
(1) Listed companies.
Number of shares held: 56,550, of which 25,420 are locked in
Jean-François Palus
Born on October 28, 1961Kering: 10, avenue Hoche, 75008 Paris
Director and Group Managing Director
A graduate of HEC (class of 1984), Jean-François Palus beganhis career in 1985 with Arthur Andersen where he carriedout audit and financial advisory duties.
Before joining Artémis in 2001 as corporate officer andDirector, he spent ten years within the PPR group, holdingsuccessively the positions of Deputy Chief Financial Officerof the wood industry branch of Pinault SA (from 1991 to1993), Group Financial Control Director (from 1993 to 1997),then Store Manager at Fnac (from 1997 to 1998) and lastlyCorporate Secretary and member of the Executive Boardof Conforama (from 1998 to 2001).
Since March 2005, Jean-François Palus has been in chargeof mergers and acquisitions at PPR, reporting to François-
Henri Pinault, Chairman and Chief Executive Officer of the Group.
He was Chief Financial Officer of the PPR group fromDecember 2005 to January 2012 and he has been GroupManaging Director (Directeur Général délégué) of PPR(since renamed Kering) since February 26, 2008. Followingthe Combined General Meeting on June 18, 2013, theBoard of Directors renewed his term of office as GroupManaging Director for a term of four years.
Since October 2012, Jean-François Palus has headed Kering’sSport & Lifestyle Division with the assistance of Todd Hymelin his capacity as the Division’s Chief Operating Officer. Jean-François Palus has also held the position of Chairman of theAdministrative Board of PUMA SE since December 1, 2012.
Jean-François Palus has been a Director of Kering since May 7,2009. His term of office will expire at the Annual GeneralMeeting called to approve the financial statements for theyear ending December 31, 2016
120 Kering ~ 2013 Reference Document
4 CORPORATE GOVERNANCE ~ INFORMATION ON DIRECTORS AND EXECUTIVE CORPORATE OFFICERS
04_VA_V6 14/04/14 11:45 Page120

Other directorships and positions held as of December 31, 2013:
Position Company Country Start 1st term of office
Chairman Ferrari SpA Italy 1991Chairman Montezemolo & Partners SGR Italy 2007Chairman Charme Management Srl Italy May 2007Vice-Chairman Unicredit SpA (1) Italy October 2012Director Nuovo Trasporto Viaggiatori SpA Italy October 2008Director Fiat SpA (1) Italy 2004Director Telethon Italy January 2009Director Editrice La Stampa Italy 2002Director Poltrona Frau SpA (1) Italy December 2003Director Tod’s SpA (1) Italy April 2001Director Delta Topco Ltd United Kingdom March 2012Director Octo Telematics SpA Italy 2010
Other directorships and positions held in the last five years:
Position Company Country Dates
Chairman Fiat SpA (1) Italy from 2004 to 2010Director Le Monde France from 2005 to 2009Director Citigroup (1) United States from 2004 to 2012(1) Listed companies.
Number of shares held: 500
Luca Cordero di Montezemolo
Born on August 31, 1947Ferrari: Via Abetone Inferiore 4, 41053 Maranello– Modena, Italy
Independent Director (until December 2013)
A graduate of the law faculty of the University of Romeand of Columbia University in New York, Luca Cordero diMontezemolo began his career in 1973 as an assistant tothe Chairman of Ferrari and manager of the Formula 1team that won the world championships in 1975 and1977. He was then appointed Director of Public Relationsof Fiat in 1977, then in 1981 Chairman and Chief ExecutiveOfficer of ITEDI, which manages the press activities of theFiat group, including the daily newspaper, La Stampa.
In 1984, he was appointed Chairman and Chief ExecutiveOfficer of Cinzano SpA in charge of the Azzurra Organisation,Italy’s first involvement in the America’s Cup. From 1985to 1990, he was the manager of the Italia 90 FootballWorld Cup organisation committee. Since 1991, he hasbeen Chairman of Ferrari SpA, of which he was also theChief Executive Officer until 2006. He is a Commander ofthe Legion of Honour.
Luca Cordero di Montezemolo has been a Director ofKering since May 19, 2005, after having served as amember of the Supervisory Board (from December 19,2001 to May 19, 2005). His term of office was renewed bythe Combined General Meeting on April 27, 2012 and willexpire at the Annual General Meeting called to approve thefinancial statements for the year ending December 31, 2015.
Laurence Boone
Born on May 15, 1969Bank of America – Merrill Lynch: 2 King Edward Street,London EC1A 1HQ, United Kingdom
Independent Director
Laurence Boone is a graduate of the Faculty of Economicsof Paris-X Nanterre University and has a PhD in economicsfrom the London Business School.
She began her career as an analyst at Merrill Lynch AssetManagement from 1995 to 1996. She then became aresearcher at the Centre d’Études Prospective et d’Informa -tions Internationales (CEPII) (France’s leading institute forresearch on the international economy) before joiningthe OECD as an economist in 1998. She successivelybecame Director of Barclays Capital France in 2004 and
Managing Director and Chief Economist in 2010. She hasbeen Managing Director, European Economic Research atBank of America Merrill Lynch since July 2011.
The author of numerous articles, she taught at the ÉcolePolytechnique, ENSAE (the National School of Statistics)and the École Normale Supérieure and is currently anassociate professor at the Institut de Sciences politiques ofParis. She is a member of the Circle of Economists and acorresponding member of France’s Council of EconomicAnalysis. She is a Knight of the Legion of Honour.
Laurence Boone has been a Director of Kering since May 19,2010. Her term of office will expire at the Annual GeneralMeeting called to approve the financial statements forthe year ended December 31, 2013.
Number of shares held: 500
121
4
2013 Reference Document ~ Kering
INFORMATION ON DIRECTORS AND EXECUTIVE CORPORATE OFFICERS ~ CORPORATE GOVERNANCE
04_VA_V6 14/04/14 11:45 Page121

Other directorships and positions held as of December 31, 2013:
Position Company Country
Chairman Fédération du Crédit Mutuel de Bretagne FranceChairman Crédit Mutuel Arkéa FranceChairman Arkéa Capital Partenaire FranceDirector Caisse de Crédit Mutuel de Cap Sizun FranceDirector Altrad FranceChairman of the Board of Directors Château Calon-Ségur SAS FranceDirector Soprol FranceDirector Paprec FranceDirector and General Treasurer French professional football league (association) France
Jean-Pierre Denis
Born on July 12, 1960Arkéa group: 29808 Brest Cedex 09
Independent Director
Jean-Pierre Denis is a Finance Inspector (inspecteur desfinances) and a graduate of HEC and ENA. He served asChairman and Chief Executive Officer of the Oséo group from2005 to 2007, and member of the Executive Board of VivendiEnvironnement which became Veolia Environnement(from 2000 to 2003), Chairman of Dalkia (Vivendi group
then Veolia Environnement) (from 1999 to 2003), Advisorto the Chair of CGE which became Vivendi (from 1997 to1999) and Deputy General Secretary of the French President’scabinet (from 1995 to 1997). He is currently Chairman ofCrédit Mutuel Arkéa and Crédit Mutuel de Bretagne.
Jean-Pierre Denis has been a Director of Kering since June 9,2008. His term of office was renewed by the CombinedGeneral Meeting on April 27, 2012 and will expire at theAnnual General Meeting called to approve the financialstatements for the year ending December 31, 2015.
Other directorships and positions held as of December 31, 2013:
Position Company Country Start 1st term of office
Chair and Chief Executive Officer 1000mercis SA (1) France October 2000Chair of the Supervisory Board Ocito SAS (1000mercis group) France 2010Member of the Supervisory Board Numergy France 2012Member of the Supervisory Board Vivendi (1) France April 2013Director SEB group (1) France May 2013
Other directorships and positions held in the last five years:
Position Company Country Dates
Member of the Supervisory Board Made in Presse SAS France from 2010 to 2012(1) Listed companies.
Number of shares held: 500
Yseulys Costes
Born on December 5, 19721000mercis: 28, rue de Châteaudun, 75009 Paris
Independent Director
Yseulys Costes holds a Masters degree in ManagementSciences from Paris I-Panthéon University, a postgraduatedegree in marketing and strategy from Paris IX-DauphineUniversity and an MBA from Robert O. Anderson School(USA).
Author of a number of works and articles on the topics ofonline marketing and databases, she was also thecoordinator of IAB France (Interactive Advertising Bureau)for two years before founding 1000mercis.com inFebruary 2000, of which she is now the Chair and ChiefExecutive Officer. The 1000mercis group, present in Paris
and in London, and listed on the Alternext market ofNYSE Euronext Paris since January 2006, offers innovativesolutions to companies seeking to optimise theiradvertising and marketing campaign on interactive media(Internet, mobile phones, etc.). The 1000mercis groupcurrently has 250 employees and posted consolidatedrevenues of €40.3 million in 2013.
A researcher in interactive marketing, Yseulys Costes wasreceived as a guest researcher at Harvard BusinessSchool and is a lecturer in interactive marketing at severalprestigious French higher education establishments(HEC, ESSEC, Paris IX Dauphine University).
Yseulys Costes has been a Director of Kering since May 19,2010. Her term of office will expire at the Annual GeneralMeeting called to approve the financial statements forthe year ended December 31, 2013.
122 Kering ~ 2013 Reference Document
4 CORPORATE GOVERNANCE ~ INFORMATION ON DIRECTORS AND EXECUTIVE CORPORATE OFFICERS
04_VA_V6 14/04/14 11:46 Page122
Other directorships and positions held as of December 31, 2013:
Position Company Country Start 1st term of office
Senior Advisor Barclays France March 2011Chairman Fondation de France France October 2010Director Fondation de France France 2009Chairman Institut des Hautes Etudes Scientifiques France November 1994Chairman Fondation de coopération scientifique France November 2008 pour la recherche sur la maladie d’Alzheimer Director Fimalac (1) France May 2003Director Renault SA (1) France May 2007
Other directorships and positions held in the last five years:
Position Company Country Dates
Vice-Chairman in EMEA JP Morgan France from September 2008 to January 2010
Managing Director and Chairman JP Morgan Chase Bank France from 1998 to 2008of the Paris Management CommitteeChairman and Chief Executive Officer JP Morgan et Cie SA France from July 1998 to August 2008Chairman French American Foundation France from 2003 to 2010
(1) Listed companies.
Number of shares held: 500
Philippe Lagayette
Born on June 16, 1943Fondation de France: 40, avenue Hoche, 75008 Paris
Independent Director
A graduate of the École Polytechnique and ENA, PhilippeLagayette managed the activities of JP Morgan in Francefrom July 1998 to August 2008. He was then Vice-Chairmanof JP Morgan in EMEA from September 2008 to January2010. He began his career within the French Ministry ofFinance in 1970. In 1974, he joined the Treasury Departmentof the French Ministry of Economy and Finance and wasappointed Deputy Director of that Department in 1980.He became Cabinet Director of the Minister of Economyand Finance in 1981, then joined the Bank of France in1984 as Deputy Governor. Appointed Chief ExecutiveOfficer of Caisse des dépôts et consignations in 1992, heheld this position until December 1997. Philippe Lagayette
is also Chairman of the Institut des Hautes ÉtudesScientifiques, where he researches in mathematics andtheoretical physics, Chairman of the Fondation de Franceand Chairman of the Fondation de coopération scientifiquepour la recherche sur la maladie d’Alzheimer, specialised inresearch into Alzheimer’s disease. He was Chairman ofthe French American Foundation from 2003 to 2010 and isa Commander of the Legion of Honour and a Commanderof the National Order of Merit. He was appointed SeniorAdvisor for France at Barclays in March 2011 and isChairman of PL Conseils.
Philippe Lagayette has been a Director of Kering sinceMay 19, 2005, after having served as a member of theSupervisory Board (from January 20, 1999 to May 19,2005). His term of office was renewed by the CombinedGeneral Meeting on April 27, 2012 and will expire at theAnnual General Meeting called to approve the financialstatements for the year ending December 31, 2015.
Other directorships and positions held in the last five years:
Member of the Supervisory Board of Oséo Bretagne.
Representative of Crédit Mutuel Arkéa on the Board ofDirectors of Crédit Foncier et Communal d’Alsace et de
Lorraine (CFCAL Banque) and of CFCAL SCF (until May 2011).
Director of Glon Sanders (until 2013)
Number of shares held: 500
123
4
2013 Reference Document ~ Kering
INFORMATION ON DIRECTORS AND EXECUTIVE CORPORATE OFFICERS ~ CORPORATE GOVERNANCE
04_VA_V6 14/04/14 11:46 Page123

Caroline Puel
Born on October 12, 1963Ji Qing Li Building 2 Room 1204, Chaoyang District, 100020Beijing, China
Director
Caroline Puel is a graduate of the Institut d’Études Politiques(Sciences-Po) of Paris, a graduate in Chinese of the InstitutFrançais des Langues Orientales and a former student ofthe Institute of Diplomacy of Beijing.
She began her career as a Press Attaché at the FrenchEmbassy in China (1984 then 1987-1988). In 1989, shejoined Radio France International (RFI) as a reporter, thenwar correspondent (India, Pakistan, first Gulf War,Yugoslavia,etc.). In 1992, she joined the French dailynewspaper Libération in Paris. From 1993 to 1997, shewas based in Hong Kong, as Asia correspondent forLibération and Le Point magazine. In 1995, she set uptheir offices in China and coordinated special editions onChina. She left Libération in 2000 in order to remain in Chinaand has since managed the office of Le Point in Asia,
based in Beijing, covering China and its area of influence,including North Korea, Mongolia and Southeast Asia. From2003 to 2007, she served as China correspondent for theRadio Suisse Romande and Radio France (France Info,France Inter and France Culture). An art critic and a writer,author of 15 or so books about Chinese contemporaryartists, Caroline Puel received the Albert Londres Prize in1997 for her coverage of China.
Ms. Puel, who has observed the evolution in China overthe last 25 years, often comes back to Europe for lectures.She taught at Sciences-Po in Paris from 2004 to 2010. Shewas a member of the Steering Committee of the Women’sForum Asia from 2006 to 2010. In January 2011, shepublished her book on the 30 years that changed China(Les trente ans qui ont changé la Chine 1980-2010).
Caroline Puel has been a Director of Kering since May 19,2010. Her term of office will expire at the Annual GeneralMeeting called to approve the financial statements forthe year ended December 31, 2013.
Number of shares held: 500
Other directorships and positions held as of December 31, 2013:
Position Company Country Start 1st term of office
Chairman of the Board of Directors BNP Paribas SA (1) France December 2011Director Lafarge SA (1) France May 2011Director Veolia Environnement SA (1) France April 2003Director Erbe SA Belgium June 2004Director Pargesa Holding SA Switzerland May 2004
Other directorships and positions held in the last five years:
Position Company Country Dates
Director and Chief Executive Officer BNP Paribas SA (1) France from May 2003 to December 2011Director Accor SA (1) France from January 2006 to February 2009Director BNL SpA Italy from February 2007 to September 2008
(1) Listed companies.
Number of shares held: 600
Baudouin Prot
Born on May 24, 1951BNP Paribas: 3, rue d’Antin, 75002 Paris
Director
After graduating from HEC in 1972 and from ENA in 1976,Baudouin Prot joined the French Ministry of Finance wherehe spent four years before serving as Deputy Director ofEnergy and Raw Materials at the French Ministry of Industryfor three years. He joined BNP in 1983 as Deputy Directorof Banque Nationale de Paris Intercontinentale, beforebecoming the Director for Europe in 1985. He joined theCentral Networks Department in 1987 and was promotedto Central Director in 1990 then Deputy Chief Executive
Officer of BNP in charge of networks in 1992. He becameChief Executive Officer of BNP in 1996 and Deputy ChiefExecutive Officer of BNP Paribas in 1999. In March 2000, hewas appointed Director and Deputy Chief Executive Officerof BNP Paribas then Director and Chief Executive Officer ofBNP Paribas in May 2003. He is an Officer of the NationalOrder of Merit and a Knight of the Legion of Honour.
Baudouin Prot has been a Director of Kering since May 19,2005, after having served as a member of the SupervisoryBoard (from March 11, 1998 to May 19, 2005). His term ofoffice was renewed by the Combined General Meeting onJune 18, 2013 and will expire at the Annual GeneralMeeting called to approve the financial statements forthe year ending December 31, 2016.
124 Kering ~ 2013 Reference Document
4 CORPORATE GOVERNANCE ~ INFORMATION ON DIRECTORS AND EXECUTIVE CORPORATE OFFICERS
04_VA_V6 14/04/14 11:46 Page124

Other directorships and positions held as of December 31, 2013:
Position Company Country Start 1st term of office
Director Harley Davidson Inc. (1) United States August 2007Director Wilderness Holdings Ltd. (1) Botswana 2010
Other directorships and positions held in the last five years:
Position Company Country Dates
Chairman and CEO PUMA AG (1) Germany from 1993 to July 2011 Chairman of the Administrative Board PUMA SE (1) Germany from July 2011 to November 2012(1) Listed companies.
Number of shares held: 500
Jochen Zeitz
Born on April 6, 19636 ruelle du Four, 1147 Montriches, Switzerland
Director
Jochen Zeitz graduated in International Marketing andFinance from the European Business School in 1986 afterhaving studied in Germany, France and the United States.He began his professional career with Colgate-Palmolivein New York and Hamburg. After joining PUMA in 1990, hewas appointed Chairman and CEO of PUMA in 1993,becoming the youngest Chairman in German history tohead a listed European company at the age of 30. JochenZeitz spearheaded the restructuring of PUMA, which wasin financial difficulties. He transformed PUMA into a leadingSport & Lifestyle company and one of the top three brandsin footwear, apparel and accessories by sticking to a long-term development plan that he introduced in 1993.
He previously held the positions of CEO of theSport & Lifestyle Division of PPR (renamed Kering) andChief Sustainability Officer of PPR and was Chairman of theAdministrative Board of PUMA SE until November 2012.
He has received numerous awards during his professionalcareer, including “2001 Entrepreneur of the Year”, “Strategistof the Year” for three years in a row by the Financial Times,“Trendsetter of the Year” and “Best of European BusinessAward 2006”. In 2004, the German Federal Presidentawarded him with the Federal Cross of Merit of the Republicof Germany.
Jochen Zeitz has been a Director of Kering since April 27,2012. His term of office will expire at the Annual GeneralMeeting called to approve the financial statements forthe year ending December 31, 2015.
125
4
2013 Reference Document ~ Kering
INFORMATION ON DIRECTORS AND EXECUTIVE CORPORATE OFFICERS ~ CORPORATE GOVERNANCE
04_VA_V6 14/04/14 11:46 Page125

Annual variable remunerations payable for 2012 werepaid during the first quarter of 2013 and those payablefor 2013 were paid during the first quarter of 2014. Feespayable to Directors in respect of their duties as members
of the Board of Directors of Kering for 2012 were paid in February 2013 and those payable for 2013 were paid inFebruary 2014.
Gross amounts (in euros) 2013 2012François-Henri Pinault Amounts Amounts Amounts AmountsChairman and Chief Executive Officer payable paid during payable paid during
for the year the year for the year the year
Fixed remuneration 1,099,996 1,099,996 1,099,996 1,099,996Annual variable remuneration 1,239,480 1,478,400 1,478,400 1,815,000(1)
Multi-annual variable remuneration 0 0 NA NAExceptional remuneration 0 0 0 0Directors’ fees (Kering) 64,951 61,080 61,080 43,235(1)
Directors’ fees (subsidiaries) 112,500 112,500 88,125 78,125Benefits in kind 18,866 18,866 19,784 19,784
TOTAL 2,535,793 2,770,842 2,747,385 3,056,140
Total employer contributions borne by the Group 1,060,000(2) 1,205,034 1,200,000(2) 1,181,128
Total cost for the Group 3,595,793 3,975,876 3,947,385 4,237,268
Gross amounts (in euros) 2013 2012Jean-François Palus Amounts Amounts Amounts AmountsGroup Managing Director payable paid during payable paid during
for the year the year for the year the year
Fixed remuneration 1,003,965 1,003,965 999,333 999,333Annual variable remuneration 939,000 1,120,000 1,120,000 1,100,000(1)
Multi-annual variable remuneration 0 0 NA NAExceptional remuneration 0 0 0 0Directors’ fees (Kering) 55,663 52,869 52,869 43,235(1)
Directors’ fees (subsidiaries) 86,333 86,333 81,250 71,250Benefits in kind 538,301 538,301 13,888 13,888
TOTAL 2,623,262 2,801,468 2,267,340 2,227,706
Total employer contributions borne by the Group 409,000(2) 582,600 792,000(2) 790,754
Total cost for the Group 3,032,262 3,384,068 3,059,340 3,018,460
(1) For 2011.(2) Current estimates.
The remunerations of executive corporate officersinclude a fixed portion and a variable portion. The Boardof Directors establishes the rules for setting suchremuneration each year based on the recommendationsissued by the Remuneration Committee.
The amounts payable, which are shown in the two tablesbelow, correspond to remunerations granted to the
executive corporate officer during each of the fiscal yearsshown, regardless of the actual payment date.
The amounts shown as paid correspond to all remunerationreceived by the executive corporate officer during each ofthe fiscal years shown.
3. Remunerations of corporate officers
3.1. Remunerations of executive corporate officers(Chief Executive Officer and Group ManagingDirector)
126 Kering ~ 2013 Reference Document
4 CORPORATE GOVERNANCE ~ REMUNERATIONS OF CORPORATE OFFICERS
04_VA_V6 14/04/14 11:46 Page126

For 2013, the Board of Directors set the remuneration ofthe Chairman and Chief Executive Officer and of the GroupManaging Director on the basis of the recommendationsof the Remuneration Committee. The structure ofremuneration – amount of the fixed portion and the rateof the variable portion – is decided based on an analysisof market practices observed for senior executives of CAC 40 companies.
Fixed remuneration
The Board of Directors, acting on the recommendation of theRemuneration Committee, resolved to maintain unchangedthe fixed remuneration for the Chairman and Chief ExecutiveOfficer and the Group Managing Director for 2013.
At its meeting on June 18, 2013, the Board of Directors noted,on the recommendation of the Remuneration Committeeand, in the context of the deployment of the Group’sinternational activities, the location of part of the GroupManaging Director’s activities in London. Consequently, theBoard decided to implement for the Group Managing Directorwith effect from July 1, 2013, an Employment Agreementwith Kering Netherlands BV, a Group subsidiary governedby Dutch law, as well as a Service Agreement (similar to anemployment agreement) with Kering International Ltd, aGroup subsidiary governed by English law. Under the termsof these two agreements, which correspond to themanagement of the Group’s Divisions and the coordinationof the Group’s international support functions respectively,these two companies will each pay half of his fixed annualremuneration (€500,000 for Kering Netherlands BV andGBP 425,000 for Kering International Ltd), of his variableremuneration and, where appropriate, of the amounts duein respect of his multi-annual remuneration, the finalallotment of which is decided by the Board of Directors.
These two employment agreements are related to and willremain in force during the Group Managing Director’sterm of office and will lapse on the termination thereof.
Annual variable remuneration
The variable remuneration of the Chairman and ChiefExecutive Officer is based on the achievement of preciselydefined targets, assessed on the basis of the Group’sresults after the closing of the relevant fiscal year. For2012 and 2013, the variable portion is equal to 120% ofthe fixed portion when targets are exactly met, and up to180% of the fixed portion when they are exceeded. In 2012and 2013, there were two targets, each accounting for 50%of the variable portion of remuneration, i.e., the Group’srecurring operating income and the Group’s free cash flowfrom operations. The rate of achievement of each of thesetargets must be at least 90% for variable remuneration tobe paid.
In view of the fact that these two targets for 2012 wereexceeded, the rate of variable remuneration was 112% ofthe amount of variable remuneration when targets are
exactly met, i.e., the Chairman and Chief Executive Officer’svariable remuneration amounted to €1,478,400. Inrespect of 2013, the rate of achievement of the targets forrecurring operating income and free operating cash flowwas 90.8% and 103.3%, respectively, leading to a combinedrate of variable remuneration of 93.9% of the target amountwhen targets are exactly met, i.e., the variable remunerationamounted to €1,239,480.
As in 2012, the Group Managing Director’s variable remunerationfor 2013 can be as much as 100% of the fixed portion ofremuneration when targets are exactly met, and up to150% of the fixed portion when they are exceeded, on thebasis of the same quantitative criteria, in the sameproportions and with the same minimum achievementrate as those applied to the variable remuneration of theChairman and Chief Executive Officer. As for the Chairmanand Chief Executive Officer, in view of the rate ofachievement of the targets for 2012 and 2013, the GroupManaging Director’s variable remuneration amounted to€1,120,000 for 2012 and €939,000 for 2013.
Multi-annual variable remuneration
While performance share plans currently in progress willbe allowed to run their course, a new long-term incentivesystem has been launched with effect from 2013. Thescheme is based on Kering monetary units (and no longer onperformance shares) known as "KMUs", whose initial valueof €152 is indexed to changes in the Kering share pricerelative to a basket of nine Luxury and Sport & Lifestylesecurities. These KMUs have a vesting period of threeyears as from January 1, 2013 of the years in which theyare granted, after which they may be cashed by thebeneficiaries over a two-year period (during two "windows"each year), when the beneficiaries may receive the cashequivalent of their KMUs based on the last assessed value.
At its meeting on June 18, 2013, the Kering Board of Directors,acting on the recommendation of the RemunerationCommittee, decided to award a long-term performancebonus to the Chairman and Chief Executive Officer and to the Group Managing Director. The grant value of this remuneration is equal to 70% of their total annualcash-based remuneration (fixed remuneration plusvariable remuneration in respect of the previous year).
In this context, and in accordance with the decision of theBoard of Directors’ meeting on June 18, 2013, 11,874 and9,763 KMUs were granted to the Chairman and Chief ExecutiveOfficer and to the Group Managing Director, respectively,corresponding to a value of €1,804,000 and €1,484,000.
For the Chairman and Chief Executive Officer and GroupManaging Director, final vesting of the KMUs is subject tothe condition of a minimum 5% average increase in earningsper Kering share from continuing operations attributable toowners over the vesting period (i.e., three years). The valueof the fully vested KMUs will be reduced in proportion toany under-performance of the Kering share and to theminimum average increase in earnings per Kering share
127
4
2013 Reference Document ~ Kering
REMUNERATIONS OF CORPORATE OFFICERS ~ CORPORATE GOVERNANCE
04_VA_V6 14/04/14 11:46 Page127
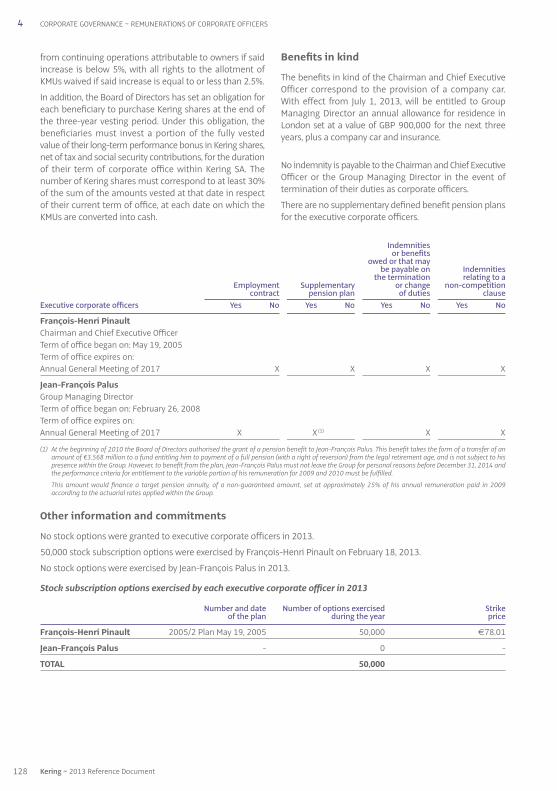
Indemnitiesor benefits
owed or that maybe payable on Indemnities
the termination relating to aEmployment Supplementary or change non-competition
contract pension plan of duties clauseExecutive corporate officers Yes No Yes No Yes No Yes No
François-Henri PinaultChairman and Chief Executive OfficerTerm of office began on: May 19, 2005Term of office expires on: Annual General Meeting of 2017 X X X X
Jean-François PalusGroup Managing DirectorTerm of office began on: February 26, 2008Term of office expires on: Annual General Meeting of 2017 X X (1) X X
(1) At the beginning of 2010 the Board of Directors authorised the grant of a pension benefit to Jean-François Palus. This benefit takes the form of a transfer of anamount of €3.568 million to a fund entitling him to payment of a full pension (with a right of reversion) from the legal retirement age, and is not subject to hispresence within the Group. However, to benefit from the plan, Jean-François Palus must not leave the Group for personal reasons before December 31, 2014 andthe performance criteria for entitlement to the variable portion of his remuneration for 2009 and 2010 must be fulfilled.
This amount would finance a target pension annuity, of a non-guaranteed amount, set at approximately 25% of his annual remuneration paid in 2009according to the actuarial rates applied within the Group.
Other information and commitments
No stock options were granted to executive corporate officers in 2013.
50,000 stock subscription options were exercised by François-Henri Pinault on February 18, 2013.
No stock options were exercised by Jean-François Palus in 2013.
Stock subscription options exercised by each executive corporate officer in 2013
Number and date Number of options exercised Strike of the plan during the year price
François-Henri Pinault 2005 / 2 Plan May 19, 2005 50,000 €78.01
Jean-François Palus - 0 -
TOTAL 50,000
from continuing operations attributable to owners if saidincrease is below 5%, with all rights to the allotment ofKMUs waived if said increase is equal to or less than 2.5%.
In addition, the Board of Directors has set an obligation foreach beneficiary to purchase Kering shares at the end ofthe three-year vesting period. Under this obligation, thebeneficiaries must invest a portion of the fully vestedvalue of their long-term performance bonus in Kering shares,net of tax and social security contributions, for the durationof their term of corporate office within Kering SA. Thenumber of Kering shares must correspond to at least 30%of the sum of the amounts vested at that date in respectof their current term of office, at each date on which theKMUs are converted into cash.
Benefits in kind
The benefits in kind of the Chairman and Chief ExecutiveOfficer correspond to the provision of a company car.With effect from July 1, 2013, will be entitled to GroupManaging Director an annual allowance for residence inLondon set at a value of GBP 900,000 for the next threeyears, plus a company car and insurance.
No indemnity is payable to the Chairman and Chief ExecutiveOfficer or the Group Managing Director in the event oftermination of their duties as corporate officers.
There are no supplementary defined benefit pension plansfor the executive corporate officers.
128 Kering ~ 2013 Reference Document
4 CORPORATE GOVERNANCE ~ REMUNERATIONS OF CORPORATE OFFICERS
04_VA_V6 14/04/14 11:46 Page128

4REMUNERATIONS OF CORPORATE OFFICERS ~ CORPORATE GOVERNANCE
Performance shares that became available during 2013 for each executive corporate officer
Number and date Number of shares that became Purchase of the plan available during the year conditions
Francois-Henri Pinault 2009-I Plan May 7, 2009 0 Francois-Henri Pinault waived his right to performance shares
granted on May 7, 2009
Jean-François Palus 2009-I Plan May 7, 2009 6,030 10% of the number of shares originally granted (6,030) are
to be purchased upon availability
TOTAL 6,030
In 2013, a total of 9,211 and 13,581 performance shares vested for François-Henri Pinault and Jean-François Palus,respectively, under the 2011-I Plan of May 19, 2011. The shares will be available as from May 19, 2015.
Details of the stock options previously granted toFrançois-Henri Pinault and Jean-François Palus are shownon pages 314 to 315.
The executive corporate officers have formally undertakennot to use hedges on their stock options or performanceshares, and no such hedges are currently in place.
Performance shares granted to each executive corporate officer in 2013
Further to the implementation of a new long-term incentivesystem based on monetary instruments, no performanceshares were granted to executive corporate officers in 2013.
Performance shares granted to each executive corporate officer in prior years
Details of the performance shares previously granted toFrançois-Henri Pinault and Jean-François Palus are shownon page 315.
At its meeting on April 27, 2012 held prior to the AnnualGeneral Meeting, the Board of Directors decided, uponthe recommendations of the Remuneration Committee, togrant 11,682 performance shares to François-Henri Pinaultand 8,416 performance shares to Jean-François Palus. Theseshares will vest on April 27, 2014, subject to an additionalcondition of a minimum average increase in (i) earnings perKering share attributable to the owners of the parent forthe Chairman and Chief Executive Officer, and (ii) earningsper Kering share from continuing operations attributable toowners of the parent during the vesting period for the GroupManaging Director.
The percentage of shares granted to François-Henri Pinaultand Jean-François Palus therefore represents 0.009% and0.007%, respectively, of the share capital, and 10.71% and7.72%, respectively, of the total number of shares grantedto all of the beneficiaries on April 27, 2012.
The Board of Directors decided that at least 30% of theamount, after tax and social security deductions (at thestandard rate, as if the shares were sold immediately), of theacquisition gain resulting from the sale of performance sharesmust be kept by François-Henri Pinault and Jean-FrançoisPalus, in the form of an equivalent number of shares thusgranted (valued at the date of sale) up to the terminationof their duties as executive corporate officers of Kering, unlessthe Board of Directors decides otherwise, thus releasing themfrom this restriction within the limit that it would then set.
The Board of Directors also decided, in accordance withthe recommendations of the AFEP-MEDEF Code, to set thepurchase obligation, when the performance shares becomeavailable, at 10% of the initial number of performance sharesgranted to François-Henri Pinault and Jean-François Palus.
At its meeting of March 18, 2014, the Board of Directorsnoted that François-Henri Pinault had not fulfilled theadditional performance condition relating to the minimumaverage increase in earnings per Kering share attributableto owners of the parent. As a result, none of theperformance shares granted to him will vest on April 27, 2014.
1292013 Reference Document ~ Kering

The Annual General Meeting on May 19, 2010 increasedthe total amount of Directors’ fees to be allocated to themembers of the Board of Directors for 2010 from €660,000to €809,000, due to the appointment of three additionalDirectors. This amount remained unchanged for 2013.
At its meeting on January 16, 2014, the Board of Directorsdecided, upon the recommendations of the RemunerationCommittee, to allocate Directors’ fees based on the actualpresence of members at meetings of the Board and ofspecialised Committees held in 2013.
Out of the total amount set by the Annual General Meeting,the rule followed by the Board is to allocate €114,000 asa special portion to the Vice-Chair (€45,000) and to theChairmen of the Audit, Remuneration and Appointments
Committees, respectively (€23,000 each), the balancebeing divided into two potentially equal portions:
a) a fixed portion, allocated with a coefficient of 1 byBoard membership, increased by 0.5 per committee;
b) a variable portion, allocated with a coefficient of 1 perpresence at each meeting of the Board and 0.5 foreach attendance of a committee meeting.
For 2013, a total amount of €680,488 was paid to thenon-executive Directors, allocated as follows:
• €114,000 for the special portion;
• €284,318 for the fixed portion;
• €282,170 for the variable portion.
130 Kering ~ 2013 Reference Document
4 CORPORATE GOVERNANCE ~ REMUNERATIONS OF CORPORATE OFFICERS
3.2. Remuneration of non-executive corporateofficers – Directors’ fees
Summary of remuneration, options and performance shares granted to each executive corporate officer
Gross amounts (in euros)François-Henri Pinault Amounts AmountsChairman and Chief Executive Officer for 2013 for 2012
Remuneration payable 2,535,793 2,747,385Value of multi-annual variable remuneration granted during the year (1) 1,472,732 Value of options granted during the year (1) Value of performance shares granted during the year (1) 1,036,544
TOTAL 4,008,525 3,783,929
(1) This value corresponds to the value of the options and financial instruments at the grant date as determined in accordance with IFRS 2 after taking intoaccount, in particular, any discount related to performance criteria and probability of presence in the Company at the end of the vesting period, but prior to thespreading of the expense over the vesting period in accordance with IFRS 2.
Gross amounts (in euros)Jean-François Palus Amounts AmountsGroup Managing Director for 2013 for 2012
Remuneration payable 2,623,262 2,267,340Value of multi-annual variable remuneration granted during the year (1) 1,210,905 Value of options granted during the year (1) Value of performance shares granted during the year (1) 746,752
TOTAL 3,834,167 3,014,092
(1) This value corresponds to the value of the options and financial instruments at the grant date as determined in accordance with IFRS 2 after taking intoaccount, in particular, any discount related to performance criteria and probability of presence in the Company at the end of the vesting period, but prior to thespreading of the expense over the vesting period in accordance with IFRS 2.
04_VA_V6 14/04/14 11:46 Page130

To the Company’s knowledge:
• none of the Directors or executive corporate officershave been convicted for fraud in the last five years;
• none of the Directors or executive corporate officershave been associated in the last five years withbankruptcy, receivership or liquidation proceedings as amember of an administrative, management orsupervisory body or as Chief Executive Officer;
• no court order has been entered over the last five yearsagainst any of the Directors or executive corporateofficers that prohibits them from acting as a memberof an administrative, management or supervisory bodyof an issuer or from intervening in the management orrunning of the business of an issuer;
• no incrimination and / or official public penalty hasbeen entered against any of the Directors or executivecorporate officers by statutory or regulatory authorities(including designated professional bodies);
• none of the Directors or executive corporate officers havebeen given a commitment by the Company or any of itssubsidiaries corresponding to items of remuneration,indemnities or benefits payable or potentially payableon account of the commencement, termination of orchange in his or her duties or subsequent thereto;
• none of the Directors or executive corporate officers haveindicated the existence of an agreement with a mainshareholder, customer or supplier of the Company pursuantto which he or she was designated as Director or executivecorporate officer.
3.3. Regulatory information on Directors and executive corporate officers
Neither the Company, nor any company that it controls, hasmade any commitment vis-à-vis its Directors or executivecorporate officers on account of the commencement,termination of or change in their duties or subsequent thereto.
No Director or executive corporate officer benefits fromany particular benefit or specific pension plan. There isno conditional or deferred remuneration.
Other than the remuneration set out above, neither theCompany, nor Artémis or Financière Pinault which controlit, has paid any remuneration or granted any benefits,directly or indirectly, to its Directors or executive corporateofficers in connection with their term of office, duties orassignments performed in or on behalf of the Company,and any company that it controls.
131
4
2013 Reference Document ~ Kering
REMUNERATIONS OF CORPORATE OFFICERS ~ CORPORATE GOVERNANCE
(1) Directors’ fees paid by Kering and Kering Holland NV.(2) The terms of office of Pierre Bellon and Allan Chapin expired on May 19, 2011.(3) The term of office of Aditya Mittal expired on June 18, 2013.(4) The term of office of Jean-Philippe Thierry expired on April 27, 2012.(5) Directors’ fees received in respect of his duties as Chairman of the Administrative Board of PUMA SE. Jochen Zeitz’s remuneration also comprised his salary of
€675,621 covering the period between April 27, 2012, the date on which he was appointed Director of Kering, and October 7, 2012 when he left his operationalrole within the Group.In addition, on April 30, 2012 PUMA SE granted him 70,516 stock options, the value of which amounted to 3,145,014 as of the grant date.
The table below shows Directors’ fees paid in 2012 and 2013 for fiscal years 2011 and 2012:
Members of the Board of Directors other Director’s fees paidthan the Chief Executive Officer during the year (in euros)and Group Managing Director 2013 2012
Patricia Barbizet 224,628 (1) 226,997 (1)
Pierre Bellon (2) - 31,037Laurence Boone 58,763 48,969Allan Chapin (2) - 31,037Luca Cordero di Montezemolo 58,032 39,272Yseulys Costes 75,551 54,877Jean-Pierre Denis 85,410 76,773Philippe Lagayette 89,974 90,076Aditya Mittal (3) 16,423 17,375Baudoin Prot 47,904 30,911Caroline Puel 47,449 52,202Jean-Philippe Thierry (4) 18,981 83,004Jochen Zeitz 31,937 25,000 (5)
TOTAL 755,051 807,530
04_VA_V6 14/04/14 11:46 Page131
Honorary Chairman of the Board of Directors
In accordance with the possibility provided for under theCompany’s Articles of Association, in its meeting onJune 18, 2013, which followed the Combined GeneralMeeting, the Board of Directors decided to confirm Mr. François Pinault, founder of the PPR group, sincerenamed Kering, as Honorary Chairman of the Board ofDirectors. In this capacity, Mr. François Pinault is invited toparticipate in the meetings of the Board of Directors andof the Strategy and Development Committee on aconsultative basis.
Vice-Chair of the Board of Directors
In accordance with the possibility provided for under theCompany’s Articles of Association, in its meeting onJune 18, 2013, which followed the Combined GeneralMeeting, the Board of Directors renewed Patricia Barbizet’sterm of office as Vice-Chair of the Board of Directors forthe same duration as her term of office as Director. In thiscapacity, Patricia Barbizet prepares and coordinates thework of the Board of Directors and may chair Boardmeetings when the Chairman is absent.
Non-voting Directors
• Alexis Babeau, Deputy Chief Executive Officer of Kering’sLuxury Division (appointed by the Board of Directors atits meeting on January 20, 2012);
• Patrizio di Marco, Chairman and Chief Executive Officerof Gucci (appointed by the Board of Directors at itsmeeting on February 14, 2013);
• Marco Bizzarri, Chairman and Chief Executive Officer ofBottega Veneta (appointed by the Board of Directors atits meeting on February 14, 2013);
• Björn Gulden, Chief Executive Officer of PUMA (appointedby the Board of Directors at its meeting on October 24, 2013).
The main role of non-voting Directors is to attend Strategyand Development Committee meetings and, as required,Board of Directors’ meetings, to provide the necessaryinformation, expertise and knowledge of the Group’s variousbusinesses. They serve on a consultative basis. In May 2007,the Annual General Meeting deemed appropriate that theBoard be allowed to decide on the number of non-votingDirectors and amended Article 18 of Kering’s Articles ofAssociation accordingly.
3.4. Other information on the Company’s Board of Directors
Moreover, no service contract providing for the grantingof benefits binds the Directors with the Kering group.
No assets belonging directly or indirectly to the Company’ssenior executives are used in Group operations.
In general, to the Company’s knowledge, none of the Directorsor executive corporate officers are in a position of potentialconflict of interest between their duties with regards tothe Company and their private interests or other duties orhave existing family ties with another Director or executivecorporate officer of the Company.
132 Kering ~ 2013 Reference Document
4 CORPORATE GOVERNANCE ~ REMUNERATIONS OF CORPORATE OFFICERS
04_VA_V6 14/04/14 11:46 Page132

Group management is composed of the Group ExecutiveCommittee headed by François-Henri Pinault, Chairmanand Chief Executive Officer, and Jean-François Palus,Group Managing Director.
The Executive Committee
The Executive Committee meets regularly, with the CEOsof the Group’s major brands and Kering’s main operatingofficers. The ten-member Executive Committee is theGroup’s key operational body and reflects Kering’stransformation into a more streamlined, group. It affordsthe CEOs of its major brands the opportunity to be moreclosely involved in the Group’s key strategic decision-makingprocesses, alongside Kering’s main operating officers.
Members of the Executive Committee
• François-Henri Pinault (since March 2005), Chairmanand Chief Executive Officer, Kering;
• Jean-François Palus (since December 2005), GroupManaging Director, Kering;
• Alexis Babeau (since March 2011), Deputy ChiefExecutive Officer, Luxury Division, Kering;
• Louise Beveridge (since March 2011), Senior Vice-President, Communications, Kering;
• Marco Bizzarri (since February 2012), Chairman andChief Executive Officer, Bottega Veneta;
• Patrizio di Marco (since February 2012), Chairman andChief Executive Officer, Gucci;
• Jean-Marc Duplaix (since February 2012), Group ChiefFinancial Officer, Kering;
• Belén Essioux-Trujillo (since May 2012), Senior Vice-President, Group Human Resources, Kering;
• Marie-Claire Daveu (since September 2012), GroupChief Sustainability Officer and Head of InternationalAffairs, Kering;
• Björn Gulden (since July 2013), Chief Executive Officer,PUMA.
Monthly activity and budget review meetings
The Executive Management of Kering, and the CEOs of themajor brands of the Divisions, hold monthly meetings toassess developments in the activities. This assessment isbased on operational and financial factors.
Insider Good Practices Committee
Composed of the Group Managing Director and the Headof the Legal Department, the Insider Good PracticesCommittee draws up the timetable of black-out periodsfor trading in Kering securities, lists of insiders, letters ofinformation and monitoring in relation to rules on insiderdealing, which are sent to the relevant managers andsenior executives of the Group as well as to occasionaland permanent insiders, in accordance with the GeneralRegulations of the French financial markets authority(Autorité des marchés financiers – AMF). The members ofthe Group’s Executive Committee are required to consultthe Insider Good Practices Committee before trading inCompany shares or similar financial instruments.
Pursuant to the provisions of Article 223-26 of the AMF’sGeneral Regulations, to the Company’s knowledge, notransactions were carried out by the individuals referredto in Article L. 621-18-2 of the French Monetary andFinancial Code (Code monétaire et financier) on Kering’sfinancial instruments during 2013, with the exception ofthe following transaction.
On February 18, 2013, François-Henri Pinault exercised50,000 subscription options at a strike price of €78.01and sold 48,500 shares resulting from the exercise of thesesubscription options at a price of €164.50 per share.
Ethics Committee
Kering’s Ethics Committee was set up in 2005, and is nowsupported by two regional Ethics Committees: the Asia-PacificEthics Committee and the Americas Ethics Committeeand an international hotline available for all Group staff.The Ethics Committees are composed of representativesof the Group’s brands and Kering staff. Their regionalorganisation reflects the Group’s policy of delegatingresponsibility, which results in better quality responses toqueries. Operating on a “last resort” basis under the authorityof the Group Ethics Committee to which they report,these Committees ensure that Group’s ethical principlesare applied consistently.
4. Group management
133
4
2013 Reference Document ~ Kering
GROUP MANAGEMENT ~ CORPORATE GOVERNANCE
04_VA_V6 14/04/14 11:46 Page133

5.1.1. Current membership of the Board
The Board is composed of Directors with wide anddiversified experience, in particular, in relation to corporatestrategy, finance, insurance, economics, the retail sector,industry, accounting, management and supervision ofcommercial and financial corporations. The Articles ofAssociation provide for a renewable four-year term ofoffice for Directors.
In order to avoid reappointing the entire Board simultaneouslyand to favour the smooth renewal of Directors, the CombinedGeneral Meeting on May 7, 2009 adopted an amendmentto Article 10 of the Company’s Articles of Association in orderto implement a staggered renewal of the Board of Directors.
The Board is currently made up of eleven Directors:
5.1. Membership of the Board of Directors
Pursuant to Article L. 225-37, paragraph 6 of the FrenchCommercial Code (Code de commerce) amended by ActNo. 2008-649 of July 3, 2008, the conditions of preparationand organisation of the work performed by the Board ofDirectors and the internal control and risk managementprocedures implemented by the Company are reportedhereinafter. This report specifies, in particular, theprocedures relating to the preparation and processing offinancial and accounting information for the consolidated
financial statements and the parent company financialstatements; the first part of this report was presented tothe Appointments Committee on February 17, 2014 andthe second part was the subject of deliberations by theCompany’s Audit Committee on January 18, 2014.
The Board of Directors approved the entire report at itsmeeting on February 20, 2014 in accordance with the provisionsof Article L. 225-37 of the French Commercial Code.
5. Report by the Chairman of the Board of Directorson the conditions of preparation and organisation of the work performed by the Board, and on the internalcontrol and risk management procedures implemented by the Company
134 Kering ~ 2013 Reference Document
4 CORPORATE GOVERNANCE ~ REPORT BY THE CHAIRMAN OF THE BOARD OF DIRECTORS
04_VA_V6 14/04/14 11:46 Page134

Four non-voting Directors appointed by the Board ofDirectors for a term of four years pursuant to Article 18 ofthe Company’s Articles of Association attend meetings of theBoard of Directors, as required, on a consultative basis.
The Board has set up five Committees responsible forassisting it in performing its task: the Audit Committee, theRemuneration Committee, the Appointments Committee,the Strategy and Development Committee and theSustainability Committee.
A detailed list of the Directors and the non-voting Directorsis set out in a previous section of the Reference Document,on pages 118 to 125, and 132.
5.1.2. Changes in the membership of the Board of Directors
The Combined General Meeting on June 18, 2013 renewedthe terms of office of François-Henri Pinault, Jean-FrançoisPalus, Baudouin Prot and Patricia Barbizet for four-yearterms as provided for in the Articles of Association. AdityaMittal’s term of office expired at the close of the Meeting.
In accordance with the provisions of the French lawdated January 27, 2011 on professional equality and thebalanced representation of women and men on boardsof Directors and supervisory boards, amending inparticular Article L. 225-37 of the French CommercialCode, pursuant to which this report has been drawn up,the principle of balanced representation of women andmen will be taken into consideration for the Board inaccordance with the law. Women currently represent 36%of the Board of Directors’ members, exceeding the requiredminimum proportion of 20% to be met by the date of theAnnual General Meeting which is due to take place in 2014.
Participation on a committee End of Indepen- Start 1st current dent Remune- Appoin- Strat. & Sustain- term of term ofName Position Age Director (1) Audit ration tments Dev. ability office office Nationality
François-Henri Chairman 51 ✓ ✓ 2005 2017 FrenchPinault and Chief Executive Officer
Patricia Barbizet Vice-Chair 58 ✓ ✓ ✓ ✓ ✓ 2001 2017 French
Jean-François Group 52 ✓ 2009 2017 FrenchPalus Managing Director
Laurence Boone Director 44 ✓ ✓ 2010 2014 French
Yseulys Costes Director 41 ✓ ✓ ✓ ✓ 2010 2014 French
Luca Cordero di Director 66 ✓ (2) ✓ ✓ 2001 2016 ItalianMontezemolo
Jean-Pierre Denis Director 53 ✓ ✓ ✓ 2008 2016 French
Philippe Lagayette Director 70 ✓ ✓ ✓ 1999 2016 French
Baudouin Prot Director 62 ✓ 1998 2017 French
Caroline Puel Director 50 2010 2014 French
Jochen Zeitz Director 50 ✓ 2012 2016 German
(1) According to the criteria of the AFEP-MEDEF Consolidated Code set out in section 5.2.5 below.(2) Independant Director until December 2013.
135
4
2013 Reference Document ~ Kering
REPORT BY THE CHAIRMAN OF THE BOARD OF DIRECTORS ~ CORPORATE GOVERNANCE
04_VA_V6 14/04/14 11:46 Page135

5.2.1. Internal rules of the Board
The Board of Directors performs the duties and exercisesthe powers granted to it by law and the Articles ofAssociation.
It determines and assesses the strategy, objectives andperformance of the Company and ensures theirimplementation. Subject to the powers expressly grantedto Annual General Meetings and within the limit of thecorporate purpose, it is called upon to handle any questionrelating to the smooth running of the Company andhandles all matters concerning the Company through itsdecisions.
The Board carries out the controls and verifications itdeems appropriate.
The conditions of preparation and organisation of the workof the Board of Directors are defined by law, the Company’sArticles of Association, the internal rules of the Board andthe work of its specialised Committees. The Board hasestablished internal rules for each committee.
Pursuant to its internal rules and the law, the Board of Directorsmeets at least four times a year. To enable Directors to preparein the best possible way for the topics to be examined duringthe meeting, a complete file is sent to them in due timeahead of the meeting; it includes, per topic addressed, thenecessary information on all items on the agenda.
In line with the relevant regulatory requirements, theinternal rules, which were amended to take into accountthe new recommendations of the AMF regarding theprevention of insider trading practices by seniorexecutives, also set the rules applicable to Directors inrelation to restrictions on trading in the securities of theCompany, or more generally the Group, by establishing“black-out periods”:
• the Directors must refrain from trading directly or indirectlyin the listed securities and financial instruments of theCompany and the Group for a period of 30 calendar dayspreceding each of the periodic publications relating tothe annual and half-year consolidated financial statementsand 15 calendar days preceding each of the quarterlypublications relating to consolidated revenue andending at the close of the trading day following thepublication of the relevant official press release. In noway does this black-out period replace the legal andregulatory provisions regarding insider trading with whicheach member of the Board must comply at the timehe / she decides to trade, no matter when this mightoccur outside the defined black-out periods;
• the same obligations apply to each Director insofar asthe Director has knowledge of insider informationrelating to any financial instrument listed on a regulatedmarket, where the issuer of those financial instrumentshas an insider relationship with the Group. Consequently,the internal rules require the reporting of all dealings inthese securities.
The internal rules set the frequency and conditions ofBoard meetings and provide for meeting participation byvideoconference and / or conference call.
They also establish the principle of regular assessment ofthe functioning of the Board and set the terms andconditions by which Directors’ fees are allocated.
According to the internal rules, Directors are required toinform the Chairman of the Board of any conflicts ofinterest, or of any possible conflicts, between their dutiestowards the Company and their private interests and / orother duties, and they may not vote on any matters thatconcern them directly or indirectly.
The Chairman of the Board of Directors may ask theDirectors at any time for a written statement confirmingthat they are not involved in any conflicts of interest.
In order to reinforce its methods of functioning and inthe interest of good governance, the internal rules of theBoard of Directors set forth and formally lay down therules governing the organisation and operating methodsof the Board as well as the missions of its five Committees:the Audit Committee, the Remuneration Committee, theAppointments Committee, the Strategy and DevelopmentCommittee and the Sustainability Committee.
Executive Management may in all circumstances beheard within said Committees.
5.2.2. Executive Management
After the Combined General Meeting on May 19, 2005adopted the new Articles of Association of Kering (thenPPR), introducing governance by a Board of Directors, theBoard of Directors opted to have the duties of Chairmanand Chief Executive Officer held by one person, andmaintained this option in May 2009. This choice hasproven to be an efficient corporate governance factor inlight of the organisation of the Kering group: François-Henri Pinault is the Chairman and Chief Executive Officerof Kering, the Group’s parent company. He is related to thecontrolling shareholder, is closely involved in conductingthe Group’s business and has in-depth knowledge andexperience of this business. The management of the Luxuryand Sport & Lifestyle Divisions is entrusted to the Chairmanand Chief Executive Officer and to the Group Managing
5.2. Conditions of preparation and organisation of the work of the Board of Directors
136 Kering ~ 2013 Reference Document
4 CORPORATE GOVERNANCE ~ REPORT BY THE CHAIRMAN OF THE BOARD OF DIRECTORS
04_VA_V6 14/04/14 11:46 Page136

Director, respectively. The Chairmen and Chief ExecutiveOfficers of the main brands (Gucci, Bottega Veneta andPUMA), as well as the Deputy Chief Executive Officer of theLuxury Division are members of the Executive Committeeand attend Board of Directors’ meetings as non-votingDirectors. They are all thus able to provide, at those Boardmeetings, which they are invited to attend, their viewsand information concerning the Group’s Divisions andbrands so that the non-executive Directors and moregenerally the Board may be well-informed.
On the proposal of the Chairman and Chief ExecutiveOfficer, the Board of Directors’ meeting on February 22,2008 appointed a Group Managing Director (DirecteurGénéral délégué) whose term of office was renewed onJune 18, 2013 and who has the same powers with regardto third parties as the Chief Executive Officer. The GroupManaging Director was appointed as Director by theCombined General Meeting on May 7, 2009 for a four-yearterm, renewed on June 18, 2013, for another four-year term.
The Chairman and Chief Executive Officer and the GroupManaging Director both take part, on an equal level, in thework of the Board of Directors, 45% of which consists ofindependent Directors and which operates smoothlythanks to frequent meetings, the regular attendance ofits members and the assistance of its specialisedCommittees, as described below.
5.2.3. Limitations by the Board of Directors of the powers of the Chief ExecutiveOfficer and Group Managing Director
In connection with the Board of Directors’ statutory roleof determining the business orientation of the Companyand ensuring its implementation, and without prejudiceto the legal provisions governing the authorisationsrequired to be granted by the Board (related-partyagreements, endorsements, suretyships and guarantees,divestments of shareholdings or sale of real property, etc.),the Company’s Articles of Association provide that certaindecisions of the Chief Executive Officer and Group ManagingDirector, by virtue of their nature or significance, requirethe prior approval of the Board of Directors:
a) matters and transactions that have a substantive effecton the strategy of the Group, its financial structure orits scope of business activity;
b) except in the event of a decision by the Annual GeneralMeeting, issues of securities, regardless of the naturethereof, that are liable to cause a change in the sharecapital;
c) the following transactions by the Company or any entitycontrolled by the Group, insofar as they each exceedan amount set annually by the Board of Directors(which was €500 million in 2013):
- all investments or divestments, including the acquisition,sale or exchange of holdings in all existing or futurebusinesses,
- all purchases or sales of Company real property.
These transactions are regularly submitted to the Boardof Directors, which examines them carefully.
5.2.4. Compliance with a Code of Corporate Governance
On October 22, 2008, the Board of Directors announcedthat it had examined and adopted, as a reference corporategovernance framework, the AFEP-MEDEF recommendationsof October 6, 2008 on the remuneration of executivecorporate officers of listed companies and deemed thatthe corporate governance policies already implementedby the Company complied with all the aforementionedrecommendations.
Accordingly, the Company now refers to the CorporateGovernance Code of Listed Corporations resulting from theconsolidation of the October 2003 AFEP and MEDEF report,the aforementioned January 2007 and October 2008AFEP-MEDEF recommendations and the April 2010AFEP-MEDEF recommendation on higher representationof women in the boardroom, as revised in June 2013 (“therevised AFEP-MEDEF Code”), and has done so, in particular,for the preparation of this report. The revised AFEP-MEDEFCode is available in French on the MEDEF’s website at:www.medef.com.
137
4
2013 Reference Document ~ Kering
REPORT BY THE CHAIRMAN OF THE BOARD OF DIRECTORS ~ CORPORATE GOVERNANCE
04_VA_V6 14/04/14 11:46 Page137

5.2.5. Independence of Directors
In order to assess the independence of a Director and toavoid possible risks of conflicts of interest, the Boardapplied the criteria defined in the revised AFEP-MEDEFCode, whereby a Director cannot:
• be an employee or executive corporate officer of theCompany, an employee or Director of its parent or acompany that the latter consolidates and not havebeen in such position in the past five years;
• be a Director or executive corporate officer of a companyin which the Company holds a directorship, directly orindirectly, or in which an employee appointed as suchor a Director or executive corporate officer of the Company(currently in office or having held office for less than fiveyears) is a Director;
• be a significant customer, supplier, investment banker,or commercial banker of the Company or the Group, orfor which the Company or the Group represents asignificant portion of the activity;
• have any close family ties with a Director or executivecorporate officer;
• have been the auditor of the Company within the pastfive years;
• have been a Director of the Company for over twelve years.
Upon analysing the situation of each Director with regardto these criteria and following a review by the AppointmentsCommittee on February 17, 2014, the Board of Directorsclassified as independent Directors, without prejudgingthe independence of the other Directors, the followingmembers: Laurence Boone, Yseulys Costes, Jean-PierreDenis and Philippe Lagayette.
Two provisions of the revised AFEP-MEDEF Code were not adopted:
AFEP-MEDEF recommendations Kering practice and explanations
Director independence criteria (section 9-4 of the Code) – In the case of Philippe Lagayette, the Board of DirectorsOne of the criteria to be reviewed in order for a Director decided not to apply the independence criterion limiting to qualify as independent is not to have been a Director a Director’s term of office to twelve years.of the company for more than twelve years.
On the recommendation of the Appointments Committee,the Board of Directors noted that Philippe Lagayette(appointed to the Board in January 1999), has had noresponsibilities in the banking sector since early 2010.The Board was unanimous in agreeing that his first-classexpertise, his other duties outside the Group (includingdirectorships in prestigious companies that also requireindependent representation) and his acknowledgedmoral authority show that such length of service on theBoard has a positive impact on his knowledge of theGroup, its background and its activities, and generates acontinuous and outstanding contribution to the work of theBoard, all of which overwhelmingly rebuts the presumptionof the revised AFEP-MEDEF Code. This belief is furthersupported by Philippe Lagayette’s role, both at Kering andon the Boards of Directors of other listed companies, aschairman of these specialised advisory committees.
Composition of the Appointments Committee The Committee is composed of three Directors: Patricia(section 17.1 of the Code) – the Committee should have Barbizet, chair, Luca Cordero di Montezemolo and a majority of independent Directors. Baudouin Prot.
The Company does not comply with the AFEP-MEDEFrecommendations regarding the proportion of independentmembers within the Appointments Committee. Thecomposition of the Committees of the Board of Directors,and particularly that of the Appointments Committee, isunder examination, as part of discussions on possible changesin the composition of the Board itself, which will beproposed to the Annual General Meeting of May 6, 2014.
138 Kering ~ 2013 Reference Document
4 CORPORATE GOVERNANCE ~ REPORT BY THE CHAIRMAN OF THE BOARD OF DIRECTORS
04_VA_V6 14/04/14 11:46 Page138

The Board of Directors noted that as of December 2013,Luca Cordero di Montezemolo had been a Director ofKering for more than 12 years and, having verified that hefulfils the personal independence criteria, acknowledgesthat he cannot however qualify as independent with regardto the criteria presented in the revised AFEP-MEDEF Codeunder the same conditions as Philippe Lagayette.
Regarding Baudouin Prot, the Board noted that althoughthe Kering group maintains ordinary and arms’ lengthrelationships with the BNP Paribas group, BNP Paribasgroup declared that his activities for the Kering group didnot engender a conflict of interest with regards to Kering.
Regarding Caroline Puel, the Committee noted that althoughthe Kering group maintains arms’ length relationshipswith certain journalists of Le Point, Caroline Puel declaredthat the nature of her professional activities did not engendera conflict of interest with regard to Kering.
Accordingly, four Directors out of the eleven Directors onthe Board are classified as independent Directors, it beingnoted that the revised AFEP-MEDEF Code recommendsthat those companies with a controlling shareholder, whichis the case of Kering, comply with the rule that at leastone-third of the Board members should be independentDirectors.
5.2.6. Activity of the Board of Directors and its specialised Committees
Activity of the Board of Directors in 2013 and up to February 20, 2014
Activity of the Board of Directors in 2013
During 2013, the Board met eleven times with an averageattendance rate of 89.0%; the Chairman of the Boardchaired all Board meetings.Dates Directors present (attendance rate)
January 18 10 / 12 (83.3%)February 14 11 / 12 (91.7%)March 19 10 / 12 (83.3%)April 17 10 / 12 (83.3%)June 18 (before the Combined General Meeting) 10 / 12 (83.3%)June 18 (after the Combined General Meeting) 10 / 11 (90.9%)July 25 9 / 11 (81.8%)October 24 11 / 11 (100%)November 13 11 / 11 (100%)December 4 9 / 11 (81.8%)December 20 11 / 11 (100%)
The work of the Board of Directors mainly involvedreviewing the annual and interim financial statements,the Group’s business activity and strategic issues.
During its meeting on January 18, 2013, the Board reviewedthe work of the Audit Committee on key focus points forthe closing of the 2012 financial statements and theGroup’s Internal Audit activity and heard a presentationon business activity in 2012 and PUMA’s current situation.
The Board granted and allocated the Directors’ fees for2012 in accordance with the terms and conditions of itsinternal rules.
On February 14, 2013, following a review by the AuditCommittee, which met two days before, the Board ofDirectors adopted the 2012 financial statements andreports in view of the Annual General Meeting. It adoptedthe draft Management Report of the Board of Directors tothe Annual General Meeting and approved the Chairman’sreport on corporate governance, internal control and riskmanagement.
On March 19, 2013, the Board met to deliberate on theGroup’s 2013 budget. The Board heard a presentation onthe work of the Remuneration Committee concerning theproposed policy for 2013 with regard to the long-termremuneration of the Group’s senior executives and, onthe recommendation of the same Committee, determinedthe variable components of the remuneration of theChairman and Chief Executive Officer and the GroupManaging Director for 2013.
The Board met on April 17, 2013 to discuss the distributionof Groupe Fnac shares to Kering’s shareholders and thelisting of these shares on Euronext Paris, following which itconvened the Combined General Meeting of June 18, 2013.
On June 18, 2013, the Board met prior to the Annual GeneralMeeting held on the same day. On the recommendationof the Remuneration Committee, it decided to award along-term performance bonus to the Chairman and ChiefExecutive Officer and to the Group Managing Director inrecognition of their performance in the 2012 fiscal year.The plan decided upon for the two executive corporateofficers is based on synthetic monetary instruments (andno longer on performance shares), whose initial value isindexed to the performance of the Kering share relativeto a basket of nine Luxury and Sport & Lifestyle securities.In accordance with the AFEP-MEDEF recommendations,the Board made these grants subject to an additionalperformance condition and to an obligation to purchaseKering shares at the end of the vesting period. Lastly, theacquisition of a controlling interest in Pomellato SpA waspresented to the Board of Directors.
After the Annual General Meeting on June 18, 2013, thenew Board of Directors met to renew the terms of officeof the Chairman and Chief Executive Officer, the Vice-Chairof the Board, the Group Managing Director and HonoraryChairman and to appoint the non-voting Directors. It alsorenewed the remuneration of the Chairman and ChiefExecutive Officer and Group Managing Director decided atthe meeting of the Board on March 19, 2013 stipulatingthat, since it corresponds to separate duties, the fullpackage of the Group Managing Director, excluding Directors’fees, will be paid equally, starting from July 1, 2013, by aDutch subsidiary of the Group and a British subsidiaryunder the terms of the Employment Agreement signedwith the former, and the Service Agreement signed with thelatter. It also authorised an annual allowance for residence
139
4
2013 Reference Document ~ Kering
REPORT BY THE CHAIRMAN OF THE BOARD OF DIRECTORS ~ CORPORATE GOVERNANCE
04_VA_V6 14/04/14 11:46 Page139

in London of a value of GBP 900,000, excluding a companycar and insurance for the Group Managing Director. TheBoard set at €500 million the amount of the authorisationgiven to the Chief Executive Officer, with the possibility tosub-delegate such authorisation, to carry out certaintransactions, in particular those referred to in Article 15-IIof the Company’s Articles of Association, and approvedthe implementation of the share buy-back programmeauthorised by the Annual General Meeting on the same day.
On July 25, 2013, the Board reviewed the work of theAudit Committee, which had met two days before, heardthe Statutory Auditors and a report on business activityfor the first half of 2013, and adopted the interim financialstatements and reports. It heard the report on its self-assessment carried out in conjunction with an external firmand discussed the improvement proposals mentioned below.
During the meeting on October 24, 2013, a report waspresented to the Board on the Group’s business activities,and its strategic content was the main subject of thisdiscussion. It appointed Björn Gulden, Chief ExecutiveOfficer of PUMA as a new non-voting Director.
The meeting of November 13, 2013 focused on theexamination of the offers received for La Redoute. Afterthe meeting, the Board issued a press release expressingits wish to continue evaluating the options available andstressed that the one-off expenses announced by PUMAon November 8, 2013 would affect Kering’s consolidatednet income, Group share.
The Board of Directors met again on December 4, 2013,to examine the four offers received for La Redoute andRelais Colis. After examining the takeover offers, Kering’sExecutive Management decided to enter into exclusivenegotiations with Nathalie Balla – the current Chairmanand CEO of La Redoute – and Eric Courteille – ChiefFinancial Officer of Redcats – who presented a takeoverplan for La Redoute and Relais Colis supported by a teamof managers from the two companies.
On December 20, 2013, the Board decided to pay aninterim dividend for 2013 as from January 24, 2014.
Activity of the Board of Directors in 2014 up to February 20, 2014
Between January 1, 2014 and February 20, 2014, the Boardof Directors met twice.
During its meeting on January 16, 2014, the Board reviewedthe work of the Audit Committee on key focus points forthe closing of the 2013 financial statements and theGroup’s Internal Audit activity and heard a presentationon business activity in 2013. The Board granted andallocated the Directors’ fees for 2013 in accordance withthe terms and conditions of its internal rules.
On February 20, 2014, the Board of Directors met toadopt the 2013 annual financial statements and reportsto be submitted to the Annual General Meeting as well asto approve this report.
Assessment of the Board of Directors
In accordance with its internal rules, since 2004 the Boardof Directors carries out an annual self-assessment. Atleast once every three years, an independent Director orthird-party expert appointed by the Board assesses andreports on its members and activity. The last assessmentwas carried out by a specialised firm which reported tothe Board on July 25, 2013.
This operational assessment of the Board of Directorswas conducted in February and March 2013 by means ofindividual interviews with each member.
From a general perspective, the Board of Directors appearsto run satisfactorily, and the Audit, Appointments andRemuneration Committees provide excellent support.
All Directors considered that the Board put the skills of the individual members to good use.
The Directors were unanimous in voicing their completeconfidence in the Executive Management.
A suggestion was made to boost the internationaldimension and the length of service of the Board, in orderto bring in new skills, particularly in those industries onwhich the Group has chosen to focus its organisation,and to diversify its age range.
Meetings of the Board were considered to be open andfrank, allowing members to discuss matters freely in afriendly and respectful manner. Some Directors, however,highlighted the dominance of financial issues, and wouldlike to see the Board spend more time on strategy.
There was a general consensus in favour of more discussionson the organisation, succession plans for senior executivesand key figures within the Group.
Some Directors also felt that they would like to have moretime alone with Executive Management during Boardmeetings.
Audit Committee
Set up in December 2002, the main assignment of the AuditCommittee, within the limit of the duties of the Board ofDirectors, is to review the annual and interim financialstatements, to verify the relevance, continuity and reliabilityof accounting methods applied within the Company andthe main subsidiaries and the implementation of internalcontrol and risk management procedures in the Group, tobe familiar with the policies implemented within theGroup in relation to sustainability and respect for theenvironment, and to listen to and question the StatutoryAuditors. The Committee is notified of the main problemsidentified by the Kering group’s Internal AuditDepartment.
The Audit Committee reports to the Board on a regular basisand provides it with its opinions or recommendations onall matters within its scope of duties. Meetings of the AuditCommittee give rise to a written and approved report.
140 Kering ~ 2013 Reference Document
4 CORPORATE GOVERNANCE ~ REPORT BY THE CHAIRMAN OF THE BOARD OF DIRECTORS
04_VA_V6 14/04/14 11:46 Page140

The Committee may call on external experts and hear any person.
Each year it reviews the fees charged by the Company’sStatutory Auditors and assesses their independence. TheAudit Committee also considers potential StatutoryAuditors for appointment.
The Committee is currently made up of three Directors:Jean-Pierre Denis, Chairman, and Yseulys Costes, both ofwhom are independent Directors, and Patricia Barbizet.
The Audit Committee members all have recognisedfinancial or accounting skills, combining their expertise ingeneral and operational management of banks andbusinesses as confirmed by their professional careers(see pages 119 and 122 of the Reference Document).
In accordance with the AFEP-MEDEF Consolidated Code,two-thirds of the members of the Committee areindependent Directors.
Activities of the Audit Committee in 2013 and up to February 20, 2014
In 2013, the Committee met four times, with an attendancerate of 100%.
During the 2013 financial year, the Chief Financial Officerand Group Internal Audit Director were frequently invitedto present their work to and answer questions at meetingsof the Committee.
On January 15, 2013, the Head of the Internal AuditDepartment reported to the Committee on the InternalAudit activities within the Group in 2012 (audit assignmentsand monitoring of action plans); the Committee reviewedthe accounting options for the annual financial statementsand the scope of the Statutory Auditors’ assignment aswell as their independence and general programme foraudit work in order to make its recommendations to theBoard of Directors.
On February 12, 2013, the Committee met before themeeting of the Board held to adopt the 2012 financialstatements, a topic to which it devoted most of its work,and heard the Statutory Auditors in relation to theirreports on the financial statements. It also reviewed theservices provided by Artémis in 2012.
On June 7, 2013, the Internal Audit missions for the Groupwere presented to the Committee.
With a view to the meeting of the Board on July 25, 2013to adopt the interim financial statements, the Committeemet two days before to review the financial statements.
Since the beginning of 2014, the Audit Committee hasmet twice, with all of its members present.
On January 15, 2014, the Head of the Internal Audit Departmentreported to the Committee on the Internal Audit activitieswithin the Group in 2013; the Committee reviewed theaccounting options for the annual financial statementsand the scope of the Statutory Auditors’ assignment aswell as their independence and general programme foraudit work in order to make its recommendations to theBoard of Directors. The Committee also heard a report onthe performance of the Kering share.
On February 18, 2014, the Committee met before themeeting of the Board to adopt the 2013 financial statements,a topic to which it devoted most of its work, and heardthe Statutory Auditors in relation to their reports on thefinancial statements. It also reviewed the services providedby Artémis in 2013, and issued a favourable opinion on theproposal to renew the term of Office of Deloitte & Associésas Statutory Auditors.
On February 20, 2014, the Committee informed the Boardof its work and recommendations.
Remuneration Committee
The Remuneration Committee’s role is to review andmake proposals to the Board of Directors on all items andterms of remuneration of the Chairman and Chief ExecutiveOfficer and the Group Managing Director (as explainedabove in the section “Remuneration of executive corporateofficers”) and the method of allocating Directors’ feesgranted to the Board by the Annual General Meeting. Itreviews and assesses the remuneration policy for seniorexecutives as well as the remuneration and benefitsreceived or deferred, stock options, free share grantsand / or similar benefits including retirement benefits andany other benefits granted to members of the Keringgroup Executive Committee.
The Remuneration Committee is composed of five Directors:Philippe Lagayette, Chairman of the Committee, LaurenceBoone, Yseulys Costes and Jean-Pierre Denis, all four ofwhom are independent Directors, and Patricia Barbizet.Accordingly, with regard to the criteria of the revisedAFEP-MEDEF Code, independent Directors representedthe majority of the Remuneration Committee’s members.
Activities of the Remuneration Committee in 2013 and up to February 20, 2014
In 2013, the Committee met twice, with an attendancerate of 100%.
In particular, on February 13, 2013, it met on the subjectof the variable remuneration of the Chairman and ChiefExecutive Officer, the Group Managing Director and themembers of the Executive Committee for 2012 and fixedremuneration for the coming fiscal years.
The Committee met in March 2013 to discuss the Group’slong-term performance pay policy and suggested changesto this policy, specifically the substitution of performanceshares by monetary units whose value is indexed to theperformance of the Kering share price relative to a basket of
141
4
2013 Reference Document ~ Kering
REPORT BY THE CHAIRMAN OF THE BOARD OF DIRECTORS ~ CORPORATE GOVERNANCE
04_VA_V6 14/04/14 11:46 Page141
nine Luxury and Sport & Lifestyle securities, for designatedGroup employees and executive corporate officers. TheCommittee gave its opinion on the proposed grant policy,as regards the Chairman and Chief Executive Officer and theGroup Managing Director, recommending an additionalperformance condition as well as a purchase obligation inaccordance with the recommendations of the revisedAFEP-MEDEF Code. The Committee also reviewed thecriteria for determining the variable remuneration of theChairman and Chief Executive Officer and the GroupManaging Director for 2013.
On February 12, 2014, four members of the Committee metto review the variable remuneration for 2013 and the fixedremuneration of the Executive Committee, the Chairmanand Chief Executive Officer and the Group Managing Director.
The Remuneration Committee reported on its work andrecommendations to the Board of Directors.
Appointments Committee
Set up in March 2003, the Appointments Committee reviewsthe proposed appointment of Directors as well as theirsituation with regard to the independence criteria definedby the Board. This review must be carried out prior to eachappointment and at any time deemed appropriate by theCommittee. It provides its opinions and recommendationsin these matters to the Board.
The Committee is composed of three Directors: PatriciaBarbizet, Chair, Luca Cordero di Montezemolo, independentDirector (until December 2013), and Baudouin Prot.
Activities of the Appointments Committee in 2013 and up to February 20, 2014
In 2013, the Appointments Committee met once withtwo thirds of its members present.
On February 11, 2013, the Committee met to discuss thesuccession plan for the Group’s senior executives, theassessment of the independence of Directors, thecomposition of the Board and of its Committees.
On February 17, 2014, the Committee met in the presenceof all its members to discuss the succession plan for theGroup’s senior executives, the assessment of the independenceof Directors, and the self-assessment and membership ofthe Board and its Committees. In addition, it reviewed adraft of the section of this report dealing with corporategovernance.
The Appointments Committee reported on its work andmade its recommendations to the Board of Directors.
Strategy and Development Committee
Within the limits of the duties of the Board of Directors,the Strategy and Development Committee’s role is toidentify, analyse and support the Kering group’s strategicdevelopment initiatives.
The Committee is composed of four Directors: PatriciaBarbizet, Chair, François-Henri Pinault, and Yseulys Costesand Philippe Lagayette, who are both independent Directors.
Activities of the Strategy and Development Committee in 2013 and up to February 20, 2014
On March 15, 2013, the Committee met with all membersin attendance to examine the profitability of the Group’sequity, and the Group and brand strategy.
The Committee did not meet in early 2014.
Sustainability Committee
The Sustainability Committee’s role is to support theCompany and the Group in establishing, implementingand monitoring good corporate governance, taking intoaccount the aim of the Board and Executive Managementto maintain a high level of sustainable development intheir economic, social and environmental context, theGroup’s clear ambitions in terms of ethics and the socialresponsibility policies and practices upheld by the Group,its senior executives and employees.
The Committee is composed of five Directors: Jochen Zeitz,Chairman of the Committee, François-Henri Pinault, PatriciaBarbizet, Jean-François Palus and Luca Cordero di Montezemolo,an independent Director (until December 2013).
Activities of the Sustainability Committee in 2013 and up to February 20, 2014
The Committee’s first meeting took place on March 19,2013, to approve the terms of its mission and to discussthe Group’s sustainability strategy and objectives. It hearda presentation on the role and organisation of thevarious players responsible for governing sustainabledevelopment within the Group.
The Committee did not meet in early 2014.
5.2.7. Shareholder participation
All shareholders are entitled to attend Annual GeneralMeetings in accordance with the conditions provided forby law. The terms and conditions of said attendance arespecified in the provisions of Article 20 of the Articles ofAssociation and are set out again on page 325 of theReference Document.
5.2.8. Information likely to have an impact in the event of a public offer
No information other than that related to (i) the currentshareholding structure (Artémis being the majorityshareholder, with 40.9% of the capital and 57.5% of votingrights of Kering), (ii) the double voting right provided forunder the Articles of Association, (iii) the share buy-backprogramme, and (iv) the authorisations given by theAnnual General Meeting to increase the capital, as expresslydescribed in the Reference Document, is liable to have animpact in the event of a public offer or can have the effectof delaying, deferring or preventing a change of control.
To the Company’s knowledge, there are no agreementsbetween shareholders that could restrict the transfer ofshares or the exercise of voting rights.
142 Kering ~ 2013 Reference Document
4 CORPORATE GOVERNANCE ~ REPORT BY THE CHAIRMAN OF THE BOARD OF DIRECTORS
04_VA_V6 14/04/14 11:46 Page142

This part of the Report by the Chairman of the Board ofDirectors on the risk management and internal controlsystem within the Group is based on the AMF’s referenceframework published in July 2010. This framework takesinto account the legislative and regulatory changes sincethe framework was first published in 2007, including theAct of July 3, 2008 and the Ordinance of December 8, 2008,which transposed EU Directive 2006 / 46 / EC into French lawand also supplemented the Financial Security Act ofAugust 1, 2003.
The AMF’s framework is based not only on the aforementionedFrench and EU legislation and regulations, but also oninternal control and risk management good practices andinternational standards, in particular ISO 31000 and COSO II.The COSO II standard was analysed in depth when the riskmanagement policy was drafted. This policy is set out inthe section “The components of risk management”.
5.3.1. Scope and principles of organisation
Kering is the parent company of the Kering group, whosemain entities are the Luxury Division and the Sport &Lifestyle Division. The following report aims to describe theinternal control procedures in the Group, in particular, theprocedures relating to the preparation and processing offinancial and accounting information. The scope of theGroup covered by the report includes all fully-consolidatedsubsidiaries, i.e., the companies in which the Group directlyor indirectly exercises exclusive control.
As a holding company, Kering’s own activity consists indefining and implementing its strategy, organising andmanaging its holdings, stimulating the development ofits Divisions, coordinating the financing of their activities,providing support and communication functions, anddefining and implementing the insurance cover policy.
5.3. Internal control and risk managementprocedures implemented by the Company
5.2.9. Remuneration policy with regard to Directors and executive corporateofficers
Directors’ fees paid to the members of the Board of Directors
The Annual General Meeting determines the total amountof Directors’ fees allocated to members of the Board ofDirectors.
On the basis of the recommendations of the RemunerationCommittee, the Board of Directors allocates Directors’fees on the basis of the actual presence of members atmeetings of the Board and of specialised Committeesheld during the relevant fiscal year.
Out of the total amount set by the Annual General Meeting,the rule followed by the Board is to allocate €114,000 asa special portion to the Vice-Chair (€45,000) and to theChairmen of the Audit, Remuneration and AppointmentsCommittees, respectively (€23,000 each), the balancebeing divided into two potentially equal portions:
a) a fixed portion, allocated with a coefficient of 1 byBoard membership, increased by 0.5 per committee;
b) a variable portion, allocated with a coefficient of 1 perpresence at each meeting of the Board and 0.5 foreach attendance of a Committee meeting.
In respect to 2013, Kering paid the members of its Boardof Directors €801,102 in Directors’ fees.
Other remuneration
The remuneration and benefits granted to executivecorporate officers primarily depend on the level ofresponsibilities attached to their functions, the Group’sresults and achievement of the targets pursued. They alsotake into account the remuneration paid by companiesthat are comparable in terms of size, business sector andinternational presence.
The variable portion of the remuneration paid to executivecorporate officers is exclusively based on the achievementof financial targets. The Board of Directors adopted twofinancial criteria for 2013, which are based on Groupperformance indicators in terms of free cash flow andrecurring operating income generation, each of theseitems accounting for one half. When targets are exactlymet, the variable portion is equal to 120% of the fixedremuneration of the Chairman and Chief Executive Officerand at 100% of that of the Group Managing Director.
None of Kering’s executive corporate officers benefit fromprovisions granting them a specific indemnity in theevent they leave the Group.
The individual remuneration of the Directors and executivecorporate officers of Kering is detailed on pages 126 to131 of the Reference Document.
143
4
2013 Reference Document ~ Kering
REPORT BY THE CHAIRMAN OF THE BOARD OF DIRECTORS ~ CORPORATE GOVERNANCE
04_VA_V6 14/04/14 11:46 Page143

The internal control function follows the general organisationof the Group. It is both:
• decentralised at the level of the Divisions: ExecutiveManagement of the operational and legal entities isresponsible for managing and coordinating the internalcontrol process;
• unified around a common methodology and a singleset of standards. The Kering holding company coordinatesits deployment across the Group, supported by teamsat Kering APAC and Kering Americas.
The section devoted to internal control procedures coversthe Luxury Division. PUMA AG, listed on the Germanmarket, is subject to regulatory obligations applicable tointernal control and risk reporting, which are described inthe company’s annual report and which may be consultedto supplement this report. It should be noted that theKering group’s best practices in this area have beenadopted by the PUMA group. PUMA SE’s Audit Committeekeeps the Kering Audit Committee regularly informed.
5.3.2. General principles of risk management
According to the definition of the AMF, risks represent thepossibility that an event may occur and could have animpact on people, assets, the environment, the company’sobjectives and its reputation.
Risk management covers areas that are much wider thanjust financial risks: for example, strategic, operational,reputational and compliance risk. Risk management is akey management tool that helps:
• create and preserve the value, assets and reputation of the Company;
• make the Company’s decision-making and processesmore secure to make it easier to achieve objectives;
• ensure that initiatives are consistent with the Company’svalues;
• bring Company employees together to develop a sharedview of the main risks.
5.3.3. The components of risk management
The Group constantly strives to make its operations moresecure and to improve its methodology to identify anddeal with risks. In 2013, the Group pressed ahead withchanges to its risk management methodology initiated in2011 and the means used for its risk management system.The Group’s risk management system provides anorganisational framework, a three-step risk managementprocess and continuous monitoring of the system.
5.3.3.1. An organisational framework
This organisational framework includes:
• an organisation that sets out the roles and responsibilitiesof the various persons involved and sets out procedures,as well as consistent and clear standards, for the system;
• a risk management policy that sets out the objectivesof the system in line with the Company’s culture, theshared language used, and the process to identify,analyse and deal with risks;
• an IT system that makes it possible to share informationabout risks internally.
Risk Committee
Within the scope of the Group’s risk management policyand in accordance with Kering’s corporate governance,Kering’s Executive Management created a “Kering groupRisk Committee” in 2011. This Committee is composed ofthe Group Managing Director, the Head of the LegalDepartment, the Head of the Internal Audit Departmentand the Head of the Security Department. As the Group’soperations and activities expand, and become morecomplex and more international, the Risk Committeehelps identify and manage strategic, operational, reportingand compliance risks that could have an impact on theGroup’s business operations. Internal rules establish therules for the Committee and how it operates.
The Risk Committee reviews (i) the validation andmonitoring process for the Group’s risk managementpolicy, (ii) the monitoring of the topicality and relevanceof the analysis of strategic, operational, reporting andcompliance risks, (iii) the analysis summaries of generaland specific risks, and (iv) the validation and monitoringof the rolling-out of action plans aimed at bettercontrolling identified risks.
The Risk Committee’s work may be brought to the attentionof the Audit Committee, which is informed of theCommittee’s internal rules and has access to the reportsfrom its meetings.
Risk manager
The risk manager function was also created within theCompany to coordinate this reinforced risk managementsystem, ensure that the Executive Management teams of the Divisions analyse the main risks within their scope ofbusiness, and provide the members of the Risk Committee,prior to each meeting, with the information and documentsnecessary for their work and their discussions.
Risk management policy
After reviewing in particular the COSO II standard, theGroup implemented a risk management policy that wassent to the Internal Control Departments of the Divisions.This document describes the methods used by the Groupfor the risk analysis work that it conducts every two years.
144 Kering ~ 2013 Reference Document
4 CORPORATE GOVERNANCE ~ REPORT BY THE CHAIRMAN OF THE BOARD OF DIRECTORS
04_VA_V6 14/04/14 11:46 Page144
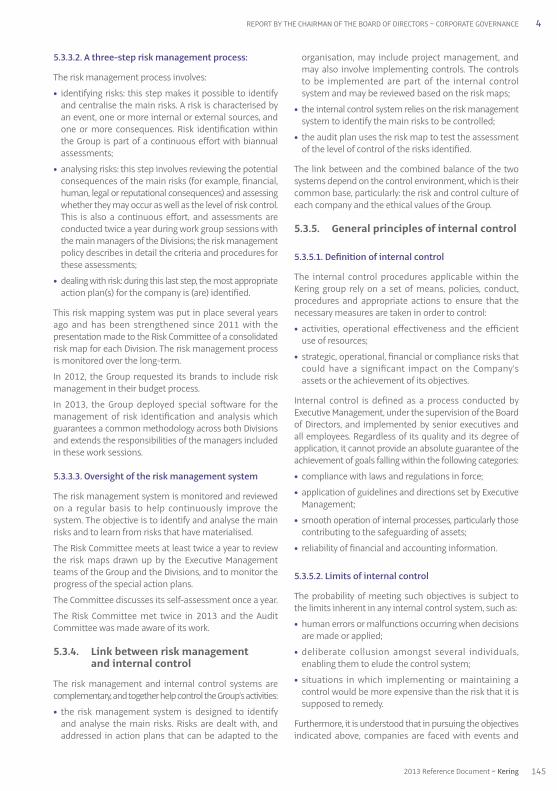
5.3.3.2. A three-step risk management process:
The risk management process involves:
• identifying risks: this step makes it possible to identifyand centralise the main risks. A risk is characterised byan event, one or more internal or external sources, andone or more consequences. Risk identification withinthe Group is part of a continuous effort with biannualassessments;
• analysing risks: this step involves reviewing the potentialconsequences of the main risks (for example, financial,human, legal or reputational consequences) and assessingwhether they may occur as well as the level of risk control.This is also a continuous effort, and assessments areconducted twice a year during work group sessions withthe main managers of the Divisions; the risk managementpolicy describes in detail the criteria and procedures forthese assessments;
• dealing with risk: during this last step, the most appropriateaction plan(s) for the company is (are) identified.
This risk mapping system was put in place several yearsago and has been strengthened since 2011 with thepresentation made to the Risk Committee of a consolidatedrisk map for each Division. The risk management processis monitored over the long-term.
In 2012, the Group requested its brands to include riskmanagement in their budget process.
In 2013, the Group deployed special software for themanagement of risk identification and analysis whichguarantees a common methodology across both Divisionsand extends the responsibilities of the managers includedin these work sessions.
5.3.3.3. Oversight of the risk management system
The risk management system is monitored and reviewedon a regular basis to help continuously improve thesystem. The objective is to identify and analyse the mainrisks and to learn from risks that have materialised.
The Risk Committee meets at least twice a year to reviewthe risk maps drawn up by the Executive Managementteams of the Group and the Divisions, and to monitor theprogress of the special action plans.
The Committee discusses its self-assessment once a year.
The Risk Committee met twice in 2013 and the AuditCommittee was made aware of its work.
5.3.4. Link between risk management and internal control
The risk management and internal control systems arecomplementary, and together help control the Group’s activities:
• the risk management system is designed to identifyand analyse the main risks. Risks are dealt with, andaddressed in action plans that can be adapted to the
organisation, may include project management, andmay also involve implementing controls. The controlsto be implemented are part of the internal controlsystem and may be reviewed based on the risk maps;
• the internal control system relies on the risk managementsystem to identify the main risks to be controlled;
• the audit plan uses the risk map to test the assessmentof the level of control of the risks identified.
The link between and the combined balance of the twosystems depend on the control environment, which is theircommon base, particularly: the risk and control culture ofeach company and the ethical values of the Group.
5.3.5. General principles of internal control
5.3.5.1. Definition of internal control
The internal control procedures applicable within theKering group rely on a set of means, policies, conduct,procedures and appropriate actions to ensure that thenecessary measures are taken in order to control:
• activities, operational effectiveness and the efficientuse of resources;
• strategic, operational, financial or compliance risks thatcould have a significant impact on the Company’sassets or the achievement of its objectives.
Internal control is defined as a process conducted byExecutive Management, under the supervision of the Boardof Directors, and implemented by senior executives andall employees. Regardless of its quality and its degree ofapplication, it cannot provide an absolute guarantee of theachievement of goals falling within the following categories:
• compliance with laws and regulations in force;
• application of guidelines and directions set by ExecutiveManagement;
• smooth operation of internal processes, particularly thosecontributing to the safeguarding of assets;
• reliability of financial and accounting information.
5.3.5.2. Limits of internal control
The probability of meeting such objectives is subject tothe limits inherent in any internal control system, such as:
• human errors or malfunctions occurring when decisionsare made or applied;
• deliberate collusion amongst several individuals,enabling them to elude the control system;
• situations in which implementing or maintaining acontrol would be more expensive than the risk that it issupposed to remedy.
Furthermore, it is understood that in pursuing the objectivesindicated above, companies are faced with events and
145
4
2013 Reference Document ~ Kering
REPORT BY THE CHAIRMAN OF THE BOARD OF DIRECTORS ~ CORPORATE GOVERNANCE
04_VA_V6 14/04/14 11:46 Page145

uncertainties beyond their control (unexpected changesin the markets, competitive environment or geopoliticalsituation, or error in forecasting or assessing the effectsof such changes on the organisation, etc.).
5.3.6. Components of internal control
The quality of the internal control system is based on thefollowing components:
• the control environment based on rules of conduct andintegrity supported by Management and communicatedto all employees;
• an organisation that clearly defines responsibilities andhas adequate resources and skills;
• a system to identify, analyse and manage the main risks;
• ongoing oversight of the internal control system andregular review of the functioning of the system.
5.3.6.1. Internal control environment
The Group’s internal control system is based on a decentralisedorganisation that clearly defines responsibilities throughthe Group Charter. It includes principles and values governingthe conduct and ethics of all its employees, presented inthe Code of Business Practices. It also includes an InternalControl Charter. Moreover, it relies on human resourcesmanagement that ensures the competency, ethical conductand involvement of its employees.
The Group Charter
The Kering group adopted a Group Charter several yearsago which was updated in 2012 and provides theframework for the decentralisation of the organisationand the responsibility of senior executives. The Charterdefines the guiding principles governing the relationsbetween Kering and the Divisions. It also defines, withineach functional area, (i) the matters that fall within thedelegated responsibility of the Divisions, (ii) those thatmust be communicated to Kering within sufficienttimeframes, and (iii) those requiring the prior authorisationof Kering.
Group principles and values
The ethical principles of the Kering group are set out in theCode of ethics, first circulated in 2005 and then recirculatedin 2009 and 2013 to all Kering group’s employees.
The third edition of the Code of ethics included a Suppliers’Charter and the adoption of the precautionary principle,especially in environmental protection. It also presentsnew developments in the Group’s ethics organisation andthe steps to take in cases of suspected non-compliancewith key Kering commitments.
The Code sets out the Group’s commitments and rules ofconduct towards its main stakeholders:
• employees;• customers and consumers;• business partners and competitors;• the environment;• civil society;• shareholders and financial markets.
This intensification of promotion and respect for ethicswithin the Group has also seen the implementation of anonline training programme in ethics and code compliancefor all Kering employees worldwide. It is based on casestudies that show ethics in the light of daily professionallife, and will be updated annually.
In addition to the first circulation of its code of ethics in2005, Kering has also set up a Group Ethics Committee.This Committee is now supported by two regional EthicsCommittees: the Asia-Pacific (APAC) Ethics Committeeand the Americas Ethics Committee. A global hotline is alsoavailable to all staff in all twelve of the Code’s languages.
The Ethics Committees are composed of representativesof the Group’s brands and Kering staff (Corporate, KeringAPAC and Kering Americas). This entire structure ismanaged by Kering’s Chief Sustainability Officer and Headof International Affairs.
The Ethics Committees have three main functions:
• supervising the circulation and application of the Codeof ethics and the principles that it defends;
• responding to any issues raised by a Group employee,be it a simple request for clarification or a question relatingto the interpretation of the Code and its application, ora claim submitted to the Committee due to alleged non-compliance with one of the Group’s ethical principles;
• generating initiatives for developing the Group’ssustainable development policy and activities.
The changes made to the Code and the organisation ofethics within the Group are examined in detail in section 3“Sustainability”.
The Divisions may in addition set up their own specificadditional procedures and guidelines, such as suppliergift charters.
Moreover, the Insider Good Practices Committee, madeup of the Group Managing Director and the Head of theLegal Department, implements preventive measures toprotect against insider trading activities (e.g., a calendarof black-out periods, a list of permanent and occasionalinsiders, newsletters, etc.).
The Internal Control Charter
The Kering group adopted an Internal Control Charter in2010 that was circulated throughout the Group. The Charterdefines internal control and sets out its objectives as
146 Kering ~ 2013 Reference Document
4 CORPORATE GOVERNANCE ~ REPORT BY THE CHAIRMAN OF THE BOARD OF DIRECTORS
04_VA_V6 14/04/14 11:46 Page146

presented in the AMF’s reference framework. It alsospecifies the limits of internal control, which cannotunder any circumstances provide an absolute guaranteethat the Company’s objectives will be achieved. TheCharter specifies that the holding company serves tounite the various entities. It also sets out the responsibilitiesof each Division in implementing an internal controlsystem that is adapted to their types of activities.
The Charter defines the role of each person involved inthe internal control system and the bodies responsiblefor oversight and assessment.
Furthermore, the Charter establishes the tools in place toassess internal control and risks: self-assessment ofinternal control and mapping of major risks.
Human resources policy
Quality of human resources and cohesion of managementare key success factors of the Group. Kering makes surethat the various Divisions apply human resources policiesthat are adapted to their context and the challenges theyface, while meeting the highest local standards. The principleof autonomy and empowerment of the Divisions is alsoapplied, but the Group guarantees the consistency of thepolicies implemented and their alignment with Kering’svalues and actions defined centrally.
With regard to social policy, the Divisions apply highstandards of dialogue and participation of employees inthe Company, while the Group engages in dialogue at thelevel of the Group’s employee representative bodies, theGroup Works Council and the European Works Council. In2010, the European Works Council and Kering’s Groupmanagement adopted a “Framework of Commitment onthe quality of life at work and the prevention of work-related stress”. Kering has also set up an employee opinionsurvey conducted every two years, which also concernsthe Divisions. The survey was conducted again in 2013.The Group develops cross-functional training programmesand carries out people reviews every year of the Divisions’managerial resources: Kering thus ensures that there is a good match both now and in future between the managerial resources and the challenges facing theDivisions. Furthermore, the Group maintains an activemarket monitoring policy for all key positions for which theinternal succession plan does not appear sufficiently strong.
5.3.6.2. Organisation and resources
The organisation of internal control depends on actively-involved persons at every level of the chain of responsibility,from Executive Management to all employees, as well asthe bodies responsible for oversight and assessment: theBoard of Directors, the Audit Committees, the InternalAudit and Risk Departments and the Statutory Auditors.
The Executive Committee
The Kering group Executive Committee, which is anExecutive Management body, is composed of the Chairmanand Chief Executive Officer, the Group Managing Director,the Deputy Chief Executive Officer of the Luxury Division,the Chief Executive Officer of PUMA SE, the Chairmen andChief Executive Officers of Gucci and Bottega Veneta, andthe Kering functional Directors (Human Resources,Finance, Sustainability, International Institutional Affairsand Communications).
The Executive Committee meets regularly, frequently, andwhenever required, in accordance with the policies of theStrategy and Development Committee, in order to:
• draw up and coordinate the Group’s operating strategy;
• define the priorities through objectives assigned to theDivisions and the main functional projects;
• develop synergies between the Divisions;
• propose acquisitions and disposals to the Board ofDirectors;
• ensure proper implementation of the policies andprojects defined within the framework of KeringSustainability.
Kering group strategies and goals are discussed each yearvia the medium-term plans and the budgets of thebusiness units of each of the Divisions.
Executive Management teams
The Executive Management teams define, coordinate andoversee the Group’s internal control system. They are alsoin charge of initiating the necessary corrective measures.The Executive Management teams’ involvement is of keyimportance to the internal control system, given theKering group’s organisation.
Oversight of the system results in an annual report oninternal control prepared by the Chief Executive Officer of PUMA.
Management and employees
Management is the operational actor of internal control;it relies on internal control to perform its duties and reachits objectives. In this respect, management implementsthe internal control operations related to its area ofresponsibility and ensures that the internal control systemis adapted to its activities.
Employees must have the knowledge and informationnecessary to set up, operate and oversee the internal controlsystem, with regard to the assigned objectives. In theirday-to-day activities, they must follow the principles andrules of control and may suggest ways to improve and detectmalfunctions.
147
4
2013 Reference Document ~ Kering
REPORT BY THE CHAIRMAN OF THE BOARD OF DIRECTORS ~ CORPORATE GOVERNANCE
04_VA_V6 14/04/14 11:46 Page147

The bodies responsible for oversight and assessment are:
The Board of Directors
The Board of Directors contributes to the overall controlenvironment through the skills of its members. TheBoard is regularly informed about the methodologiesused for internal control and the management of majorrisks, which it presents in its Board report.
Audit Committees
Under the responsibility of the Board of Directors, towhich it regularly reports on these matters, the KeringAudit Committee, comprising three members, two ofwhom are independent, is in charge of monitoring:
• the procedures for preparing financial information;
• the effectiveness of internal control and risk managementsystems;
• the statutory audits of annual financial statements and,if need be, consolidated financial statements performedby the Statutory Auditors;
• the independence of the Statutory Auditors.
The Kering Audit Committee also carries out the followingactions:
• verifies that the Group has Internal Audit Departmentsthat are structured and adapted to the tasks of identifying,detecting and preventing risks, anomalies or irregularitiesin the management of the Group’s affairs;
• assesses the relevance and quality of the methods andprocedures used;
• reviews the Internal Audit reports, and the recommendationsissued;
• approves the annual Internal Audit plan;
• reviews the work conducted by the Risk Committee andhas access to the minutes of its meetings.
Kering’s Audit Committee meets at least four times a year.Similarly, there is an Audit Committee within the LuxuryDivision and PUMA, whose methods of operating andactions are identical to those of Kering’s Audit Committee;they meet prior to the meeting of Kering’s Audit Committee.
Internal Audit and Risk Management Departments
PUMA, as a company listed in Germany, is required tohave an Internal Audit Department. This Departmentworks with the Kering group’s Internal Audit Departmentto provide full coverage of the Group to the audit teams.
Through their work, the Internal Audit and Risk ManagementDepartments help assess the internal control system; theymake recommendations to improve how the system operates.The Internal Audit and Risk Management Departments arealso in charge of coordinating risk management, in particularthrough risk mapping, and monitoring the action plans. TheHeads of the Internal Audit Departments report the main
results of their assessments to Executive Managementand the Audit Committee.
At the level of Kering, the Group Internal Audit Department,which reports to the Chairman, coordinates, harmonisesand optimises the working methods and tools. It also offersits services (regulatory intelligence, expertise, resources,etc.) and conducts cross-functional operational missionsin specific fields.
The Group Internal Audit Department centrally administersand analyses internal control pursuant to the FinancialSecurity Act and the new AMF reference frameworkdescribed in more detail in the section below entitled“Oversight of the system”.
The Group Internal Audit Department also carries out anactive watch with regard to best internal control practices.
The Internal Audit Departments check the controlprocedures implemented by other Departments andconduct operational and financial audits within their remit.During 2013, the Internal Audit teams taken togetherconducted around sixty audit assignments, includingspecial assignments.
The Internal Audit Departments draw up the audit plans,relying, in particular, on the Group’s process guidelines andbased on the major risks identified for the brands. Theytake account of special requests from senior managementand other operational departments. These projects arediscussed with the main persons in charge. The AuditCommittees review and approve the audit plans thusdrawn up.
The main issues identified by the Internal AuditDepartments have been reported to the Audit Committees.The Audit Committees were informed of the issuesidentified and the action plans set up by the entitiesconcerned.
Apart from these assignments, all of the Internal Auditresources in the Kering group are dedicated to promotinginternal control on all business processes and activities,whether operational or financial, whether they relate tostores, warehouses or headquarters, distribution ormanufacturing activities.
At the end of 2013, the Internal Audit Department of theKering group consisted of 17 employees, down from 21in 2012, when the figure included the internal auditors ofFnac and Redcats. Their rules of conduct are described inthe Audit Charter to which they refer. In general, the AuditCharter stipulates that:
• at the end of each audit, the findings and recommendationsare presented to the managers of the area or areasconcerned;
• any agreements or disagreements made known by the audited parties concerning the proposedrecommendations are included in the final report thatspecifies any action plan, responsibilities and thedeadlines for implementation;
148 Kering ~ 2013 Reference Document
4 CORPORATE GOVERNANCE ~ REPORT BY THE CHAIRMAN OF THE BOARD OF DIRECTORS
04_VA_V6 14/04/14 11:46 Page148

• the operational staff members concerned are responsiblefor implementing recommendations;
• the Internal Audit Department is in charge of verifyingtheir implementation.
The Internal Audit activities performed are consistentwith the work of the Audit Committees and the results ofthe work performed by the Statutory Auditors.
The Internal Audit Departments update their AuditCommittee on progress made on the audit plan and thefollow-up of their action plans at least twice a year.
In 2013, Kering’s Internal Audit Department published itsfoundation documents that establish the methodologyshared by both Divisions: the audit manual and the twoaudit approach documents. The development of the two audit approaches reflects the differences betweenthe Divisions.
The Statutory Auditors
The Statutory Auditors review the internal control systemsin order to certify the financial statements, by identifyingthe strengths and weaknesses, by assessing the risk ofmaterial misstatement, and where applicable, by makingrecommendations. Under no circumstances do theStatutory Auditors take the place of the company inimplementing the internal control system.
The role of the Statutory Auditors is to annually certify thecompleteness, accuracy and fair presentation of the parentcompany and consolidated financial statements andissue a review report on the Group’s interim consolidatedfinancial statements.
The audit assignments are allocated between twoStatutory Auditors: Deloitte and KPMG.
The main issues covered by the Auditors are as follows:
• identification of the risk areas and performance of testsby sampling in order to validate the completeness, accuracyand fair presentation of the financial statements withregard to their company or consolidated materiality level;
• validation of the main accounting treatments and optionsthroughout the year, in coordination with the managementof the Divisions and Kering;
• application of the accounting standards defined byKering for the Divisions;
• preparation of an audit report for each Division, in orderto certify the Kering consolidated financial statements,including any comments on internal control;
• presentation of a general overview for the Kering grouppresented to Kering’s Management and to the AuditCommittee;
• preparation of Statutory Auditors’ reports for Kering’sshareholders. These reports appear in the ReferenceDocument on pages 110, 152, 281, 303 and 305.
5.3.6.3. Risk management
The risk management system is described in the section“Risk management” (see pages 187 to 193).
5.3.6.4. Oversight of the system
Three types of work are used for the ongoing oversight of internal control and regular review of the functioningof the system: work performed by Internal Audit, theremarks made by the Statutory Auditors and the annualself-assessments.
Within each Division, and for each process identified, themanagers in charge are asked to assess the level ofinternal control using key controls for the smooth runningof their activities, in order to identify any weaknesses withintheir activities and implement corrective measures.
Self-assessment is not simply a reporting tool intendedfor the Internal Audit Departments or the Audit Committees;it is also a system that allows the Executive Managementteams of each Division to obtain reasonable assuranceregarding the strength of the internal control system.Self-assessment makes it possible to strengthen the levelof internal control through operational action plans.
The internal control analysis methodology is based onthe following principles:
• a self-assessment, using questionnaires, conducted withthe key operational staff members in each of the Divisionsfollowing the breakdown of activities into key processes.An overhaul of the self-assessment questionnaires wasinitiated in 2011 and continued in 2012 in order to makethe questionnaires more efficient and tailored to businessoperations; in 2013 the self-assessment campaign was extended significantly to cover almost 89% of theidentified activities at the Divisions and Kering;
• these questionnaires serve as a supplemental indicatorfor these operational staff members in terms ofassessing the quality of the internal control proceduresof which they are in charge. They make it possible toharmonise the level of internal control applied throughoutthe Group and for all activities to benefit from bestpractices, in particular within newly-acquired entities.They allow action plans for improvements to be launchedbased on the results of these self-assessments;
• the questionnaire regarding the finance, accountingand management process is circulated each year. Ittakes into account the AMF’s reference framework and, inparticular, its application guide. This questionnaireincludes 50 or so questions on the mandatory keycontrols for the Group. It is circulated among the largestsubsidiaries in the Luxury and Sport & LifestyleDivisions. As regards the other processes, following theimplementation of a dedicated application, in 2013 therewas a significant increase in the number of processescovered and the number of subsidiaries included in theself-assessment campaigns for each of these processes.
149
4
2013 Reference Document ~ Kering
REPORT BY THE CHAIRMAN OF THE BOARD OF DIRECTORS ~ CORPORATE GOVERNANCE

The self-assessment of internal control is now performedannually, not only for the finance process but for allprocesses.
In 2013, the Group’s Internal Audit Department beganto extend its self-assessment procedures to directly-owned stores throughout the Luxury Division. Thesequarterly self-assessments give the sales networkmanagers an idea of the effectiveness of their internalcontrol and a teaching tool that helps store managersto meet their internal control obligations.
This approach was presented and approved by the KeringAudit Committee.
5.3.7. Description of internal control procedures relating to the preparationof financial and accounting information
Organisation of the accounting and managementfunction
Financial and accounting information is prepared by theFinance Department. At the level of Kering, thisdepartment supervises the Financial Control Department,the Financing and Treasury Department, the InsuranceDepartment, the Tax Department as well as the FinancialCommunications Department.
The production and analysis of financial information is basedon a set of financial management procedures including:
• medium-term plans, which measure the consequencesof strategic decisions of the Group’s key financial andmanagement indicators. They are also used for theannual assessment by the Group of values in use ofassets relating to the various cash-generating units;
• budgets, drawn up on the basis of discussions betweenthe operating Departments and the members of theGroup’s Executive Management, and broken down intotwo phases: a budget describing the main financialindicators and operating action plans is defined in thefourth quarter of the fiscal year and definitively approvedin the first quarter of the following year, taking intoaccount significant events that have occurred in themeantime, where applicable;
• monthly reporting monitors the performance of the Luxuryand Sport & Lifestyle Divisions throughout the fiscalyear via specific indicators whose consistency andreliability are reviewed by the Financial Control Department.This Department also oversees the consistency of theaccounting treatment applied by the Divisions with Grouprules and carries out, in collaboration with the financialcontrollers of the Divisions, an analytical review bycomparison with the budget and the previous year;
• the Executive Management of Kering and the seniorexecutives of the Group’s Divisions hold monthly meetingsto assess changes in activities on the basis of financialand operational data communicated by each of them;
• the Group regularly monitors changes in the off-balancesheet commitments of the Group’s Divisions. This checkis carried out, in particular, as part of the statutoryconsolidation process given that the Divisions arerequired to provide an exhaustive list of their commercialor financial commitments along with a follow-up fromyear to year.
Organisation of the consolidation function
The statutory consolidation of the financial statements iscarried out at the end of June and December using theGroup consolidation tool that allows the transfer offinancial information from the Divisions after a completeprocess of approval of the consolidation reportingpackages by their Statutory Auditors and by the ChiefExecutive Officers and Chief Financial Officers of thebrands who then commit themselves via a signedrepresentation letter, thus confirming the quality of thefinancial information transferred.
There are consolidation levels within the Divisions thatguarantee a first level of control and consistency.
Kering’s Financial Control Department coordinates the processand is in charge of producing the Group’s consolidatedfinancial statements. For this purpose, the departmentsends instructions to the Divisions specifying the list ofreports to be sent, the common assumptions to be usedas well as the specific points to be taken into account.
Financial Communications
The purpose of the Financial Communications Departmentis to provide continuous information, to convey a consistentand clear message as well as to respect the principle ofequality between shareholders in relation to information.
Financial communication is meant for a diversifiedpublic composed mainly of institutional investors,individuals and employees. Executive Management, theFinance Department and the Financial CommunicationsDepartment are the contacts for analysts and institutionalinvestors. The Human Resources Department managesthe information provided to employees alongside theFinancial Communications Department.
Financial information is provided by the following means:Annual General Meetings, periodic publications, pressreleases, etc., and on all media: press, Internet, directtelephone contact, individual meetings, etc.
Financing and Treasury Department
The Financing and Treasury Department manages liquidity,counterparty, foreign exchange and interest rate financialrisks and moreover coordinates the Group’s cash management.It manages the Group’s banking policy, gives instructionsin terms of the allocation of activity by bank and coordinatesGroup invitations for bids. It ensures the consistencybetween published financial information and policiesgoverning interest rate, foreign exchange and liquidity riskmanagement. Almost all of the financing is set up by
150 Kering ~ 2013 Reference Document
4 CORPORATE GOVERNANCE ~ REPORT BY THE CHAIRMAN OF THE BOARD OF DIRECTORS
04_VA_V6 14/04/14 11:46 Page150

Kering or Kering Finance. Exceptions are analysed on acase-by-case basis according to specific opportunities orconstraints and require Kering’s agreement.
Internal control is strengthened by the centralisation of certain functions within Kering:
The Legal Department
The Legal Department, apart from its specific function atCompany level, assists the entire Group with importantlegal affairs and coordinates analyses or studies commonto the Divisions or of significant interest for the Group. Italso formulates Group policy and oversees its application.It provides the Divisions with a methodology for identifyingstandard risks enabling them to anticipate such risks andinform the Legal Department.
The Tax Department
The Tax Department coordinates the Group’s tax policy,advises and assists the Divisions on all issues related to taxlaw as well as in the implementation of tax consolidationin France.
The Insurance Department
The Insurance Department sets up and manages theGroup’s insurance policy. It carries out assignments toidentify, quantify and deal with risks (prevention, self-insurance or transfer to insurers or reinsurers).
The Communications Department
The Communications Department is involved in theGroup’s development by enhancing its trade image andreputation internally and externally.
The Information Systems Department
The Information Systems Department ensures optimaloperational performance, control of IT risk and advancedinformation systems.
This report on internal control, resulting from the contributionof the various internal control players mentioned in thefirst section of this document, was presented in its draftversion to Kering’s Audit Committee for its opinion and wasapproved by Kering’s Board of Directors on February 20, 2014.
Chairman of the Board of Directors
151
4
2013 Reference Document ~ Kering
REPORT BY THE CHAIRMAN OF THE BOARD OF DIRECTORS ~ CORPORATE GOVERNANCE
04_VA_V6 14/04/14 11:46 Page151
6. Statutory Auditors’ reportprepared in accordance with Article L. 225-235 of the French Commercial Code (Code de commerce) on the Report of the Chairman of the Board of DirectorsYear ended December 31, 2013
This is a free translation into English of the Statutory Auditors’ report issued in French prepared in accordance withArticle L. 225-235 of the French Commercial Code on the report prepared by the Chairman of the Board of Directors ofKering S.A. on the internal control and risk management procedures relating to the preparation and processing ofaccounting and financial information issued in French and is provided solely for the convenience of English speakingusers. This report should be read in conjunction and construed in accordance with French law and the relevantprofessional standards applicable in France.
To the Shareholders,
In our capacity as Statutory Auditors of Kering S.A. and in accordance with Article L. 225-235 of the French CommercialCode (Code de commerce), we hereby report to you on the report prepared by the Chairman of your Company inaccordance with Article L. 225-37 of the French Commercial Code for the year ended December 31, 2013.
It is the Chairman’s responsibility to prepare, and submit to the Board of Directors for approval, a report on the internalcontrol and risk management procedures implemented by the Company and containing the other disclosures requiredby Article L. 225-37 of the French Commercial Code, particularly in terms of corporate governance.
It is our responsibility:
• to report to you on the information contained in the Chairman’s report in respect of the internal control and riskmanagement procedures relating to the preparation and processing of accounting and financial information, and
• to attest that this report contains the other disclosures required by Article L. 225-37 of the French Commercial Code,it being specified that we are not responsible for verifying the fairness of these disclosures.
We conducted our work in accordance with professional standards applicable in France
152 Kering ~ 2013 Reference Document
4 CORPORATE GOVERNANCE ~ STATUTORY AUDITORS’ REPORT
04_VA_V6 14/04/14 11:46 Page152

Information on the internal control and risk management procedures relating to the preparation and processingof accounting and financial information
The professional standards require that we perform the necessary procedures to assess the fairness of the informationprovided in the Chairman’s report in respect of the internal control and risk management procedures relating to thepreparation and processing of accounting and financial information. These procedures mainly consisted in:
• obtaining an understanding of the internal control and risk management procedures relating to the preparation andprocessing of accounting and financial information on which the information presented in the Chairman’s report isbased and the existing documentation;
• obtaining an understanding of the work involved in the preparation of this information and the existingdocumentation;
• determining whether any significant weaknesses in the internal control procedures relating to the preparation andprocessing of accounting and financial information that we would have noted in the course of our engagement areproperly disclosed in the Chairman’s report.
On the basis of our procedures, we have nothing to report on the information on the Company’s internal control andrisk management procedures relating to the preparation and processing of accounting and financial informationcontained in the report prepared by the Chairman of the Board of Directors in accordance with Article L. 225-37 of theFrench Commercial Code.
Other disclosures
We hereby attest that the Report of the Chairman of the Board of Directors includes the other disclosures required byArticle L. 225-37 of the French Commercial Code.
Paris La Défense and Neuilly-sur-Seine, March 31, 2014
The Statutory Auditors
KPMG Audit Deloitte & AssociésDépartement de KPMG SA
Hervé Chopin Antoine de Riedmatten
153
4
2013 Reference Document ~ Kering
STATUTORY AUDITORS’ REPORT ~ CORPORATE GOVERNANCE
04_VA_V6 14/04/14 11:46 Page153

154 Kering ~ 2013 Reference Document
04_VA_V6 14/04/14 11:46 Page154

1552013 Reference Document ~ Kering
CHAPTer 5
financial Information
1. Activity report 1561.1. Foreword – Definitions 1561.2. 2013 highlights 1571.3. 2013 business review 1591.4. Analysis of operating performances by brand 1641.5. Comments on the Group’s financial position 1741.6. Net income and dividend of the parent company 1811.7. Transactions with related parties 1821.8. Subsequent events 1821.9. Outlook 182
2. Investment policy 1832.1. Financial investments 1832.2. Operating investments 185
3. Risk management 1873.1. Financial risks 1873.2. Strategic and operational risks 1893.3. Compliance risks 1923.4. Risk management 192
4. Consolidated financial statements 1954.1. Consolidated income statement 1954.2. Consolidated statement of comprehensive income 1964.3. Consolidated statement of financial position 1974.4. Consolidated statement of cash flows 1984.5. Consolidated statement of changes in equity 199
Notes to the consolidated financial statements for the year ended December 31, 2013 200
5. Statutory Auditors’ report on the consolidated financial statements 281
6. Parent Company financial statements 2846.1. Balance sheet 2846.2. Balance sheet – shareholders’ equity and liabilities 2856.3. Income statement 2866.4. Statement of cash flows 2866.5. Statement of changes in shareholders’ equity 2876.6. Notes to the parent company financial statements 2876.7. Five-year financial summary 302
7. Statutory Auditors’ Report on the Financial statements 303
8. Statutory Auditors’ special report on regulated agreements and commitments with third parties 305
9. Fees paid by the Group to the Statutory Auditors and members of their networks in 2013 308
05_A_VA_V6 14/04/14 11:32 Page155

IFRS 5 – Non-current assets held for sale and discontinued operations
In accordance with IFRS 5 – Non-current assets held for saleand discontinued operations, the Group has presentedcertain activities as “Non-current assets held for sale orfor distribution and discontinued operations”. The netincome or loss from these activities is shown on aseparate line of the income statement, “Net income (loss)from discontinued operations”, and is restated in thestatement of cash flows and income statement for allreported periods.
Assets and liabilities relating to assets held for sale or fordistribution and discontinued operations are presentedon separate lines in the Group’s statement of financialposition, without restatement for previous periods.
As stated in Note 12 to the consolidated financial statements,Groupe Fnac and Redcats are classified as “Non-currentassets held for sale or for distribution and discontinuedoperations”. As of January 1, 2013, Redcats Asia is no longerpresented under “Non-current assets held for sale or fordistribution and discontinued operations” following theGroup’s decision to retain this activity.
Definition of “reported” and “comparable” revenue
The Group’s “reported” revenue corresponds to publishedrevenue. The Group also uses “comparable” data to measureorganic growth. “Comparable” revenue is 2012 revenuerestated for the impact of changes in Group structure in2012 or 2013, and for translation differences relating toforeign subsidiaries’ revenue in 2012.
Definition of recurring operating income
The Group’s total operating income includes all revenuesand expenses directly related to Group activities, whetherthese revenues and expenses are recurring or arise fromnon-recurring decisions or transactions.
“Other non-recurring operating income and expenses”consists of unusual items, notably as concerns the natureor frequency, that could distort the assessment of Groupentities’ economic performance, as defined by Frenchnational accounting board (Conseil National de laComptabilité – CNC) recommendation No. 2009-R.03 of July 2, 2009.
Consequently, Kering monitors its operating performanceusing “Recurring operating income”, defined as thedifference between total operating income and othernon-recurring operating income and expenses (see Notes8 and 9 to the consolidated financial statements).
Recurring operating income is an intermediate line itemintended to facilitate the understanding of the entity’soperating performance and which can be used as a wayto estimate recurring performance. This indicator ispresented in a manner that is consistent and stable overthe long-term in order to ensure the continuity andrelevance of financial information.
Definition of EBITDA
The Group uses EBITDA to monitor its operating performance.This financial indicator corresponds to recurring operatingincome plus net charges to depreciation, amortisationand provisions on non-current operating assets recognisedin recurring operating income.
Definition of free cash flow from operations and available cash flow
The Group also uses an intermediate line item, “Free cashflow from operations”, to monitor its financial performance.This financial indicator measures net operating cash flow lessnet operating investments (defined as purchases and salesof property, plant and equipment and intangible assets).
“Available cash flow” corresponds to free cash flow fromoperations plus interest and dividends received lessinterest paid and equivalent.
Definition of net debt
As defined by CNC recommendation No. 2009-R.03, net debtcomprises gross borrowings, including accrued interest,less net cash.
Net debt includes fair value hedging instruments recordedin the statement of financial position relating to bankborrowings and bonds whose interest rate risk is fully orpartly hedged as part of a fair value relationship (see Note31 to the consolidated financial statements).
The financing of customer loans by fully-consolidatedconsumer credit businesses is presented in borrowings.Group net debt excludes the financing of customer loansby consumer credit businesses.
156 Kering ~ 2013 Reference Document
5 FINANCIAL INFORMATION ~ 2013 ACTIVITY REPORT
1. Activity report
1.1. Foreword – Definitions
05_A_VA_V6 14/04/14 11:32 Page156

PPR becomes Kering
Having completed its transformation into a global leader inapparel and accessories operating in the Luxury and Sport &Lifestyle markets, on March 22, 2013 the Group announcedits decision to change its name to “Kering” to better reflectits new identity. This name change was approved at theAnnual General Meeting held on June 18, 2013.
Distribution of Groupe Fnac shares to Keringshareholders and listing of Groupe Fnacshares on NYSE Euronext Paris
In line with the principle announced on October 9, 2012,at its April 17, 2013 meeting Kering’s Board of Directorsunanimously approved the listing of Groupe Fnac sharesthrough a distribution of Groupe Fnac shares to Keringshareholders. This listing had previously been approvedby the employee representative bodies of both GroupeFnac and Kering SA.
At the Annual General Meeting of June 18, 2013, Kering’sshareholders authorised the payment of an additionalcash dividend of €2.25 per share (following an interim cashdividend of €1.50 paid on January 24, 2013), and an additionaldividend in the form of Groupe Fnac shares at a ratio of oneGroupe Fnac share for every eight Kering shares held.
On June 20, 2013 prior to the start of market trading:
• the rights to the balance of the cash dividend for 2012 weredetached from the Kering shares and the dividend was paid;
• the rights to the allotment of Groupe Fnac shares weredetached from the Kering shares and the deliveries ofGroupe Fnac shares began.
Consequently, the Groupe Fnac share allotment rights begantrading on Euronext Paris on June 20, 2013.
Kering distributed a total of 15,672,034 shares representingjust under 95% of Groupe Fnac’s capital as of the ex-dividenddate, in view of the fact that a 5% stake in the companyhad already been sold in the first half of 2013 to KernicMet BV (a company indirectly held by Kering), which in turnhad transferred title to the 830,907 shares concerned aspart of a financial forward contract.
In accordance with IFRIC 17, as of June 20, 2013 – the dateon which the Groupe Fnac shares were delivered to theirshareholders and first listed – the Groupe Fnac shares werederecognised by Kering based on a fair value of €314 millionfor 95% of the shares (15,672,034 shares x €20.03).
The derecognition led to a €256 million post-tax disposalloss in 2013, taking into account the costs of the distributionand Groupe Fnac’s net income in the first half of the year.
This disposal loss was recorded in “Net income (loss)from discontinued operations”.
Kering continues its divestment of Redcatsand finalises the Group’s transformation
On January 3, 2013, Kering announced that it had receiveda firm offer from Alpha Private Equity Fund 6 (“APEF 6”) toacquire Redcats’ Children and Family division – comprisingthe Cyrillus and Vertbaudet brands – for an enterprisevalue of €119 million. The transaction was completed onMarch 28, 2013.
On February 5, 2013, Kering announced the closing of thesale of OneStopPlus to Charlesbank Capital Partners andWebster Capital in accordance with the terms of the definitivesale agreement announced on December 5, 2012. Thistransaction marked the final step in the sale of all ofRedcats USA’s operations.
On February 25, 2013, Kering announced that Redcats hadentered into an agreement to sell its Nordic activities,Ellos and Jotex to Nordic Capital Fund VII for an enterprisevalue of €275 million. The transaction was completed onJune 3, 2013.
During the second half of 2013, Kering continued the processfor its planned sale of La Redoute and Relais Colis. OnDecember 4, 2013, after examining the four takeover offers,Kering’s Board of Directors decided to enter into exclusivenegotiations with Nathalie Balla – the current Chairman andCEO of La Redoute – and Eric Courteille – Chief AdministrativeOfficer of Redcats – who presented a takeover plan supportedby a team of managers from the two companies. In linewith the undertakings it gave in relation to the takeover,Kering will recapitalise La Redoute and Relais Colis at thesame time as the sale is carried out. This recapitalisationwill ensure that both companies enjoy a healthy financialposition backed by a significant cash surplus and that thenew owners will be able to fund their transformation andmodernisation measures.
Nathalie Balla and Eric Courteille presented the details oftheir business plan to the relevant employee representativebodies in January 2014 in accordance with the standardinformation and consultation procedure required underFrench law, and they are currently pursuing negotiationswith La Redoute’s trade unions.
The results of Redcats’ businesses during the year amountedto a €562 million loss and were recorded under “Net income(loss) from discontinued operations”. This amount includesKering’s €315 million recapitalisation undertaking inrelation to La Redoute, the impairment losses recordedagainst Redcats’ residual assets and the disposal gainsand losses on activities sold during the period. It does notinclude the cost of financing the social guarantees to begranted to the employees concerned by the modernisationmeasures at La Redoute and Relais Colis. The total cost ofthis financing, which cannot as yet be reliably estimated,
1.2. 2013 highlights
157
5
2013 Reference Document ~ Kering
2013 ACTIVITY REPORT ~ FINANCIAL INFORMATION
05_A_VA_V6 14/04/14 11:32 Page157

will lead Kering to set up a trust guaranteeing the applicationof the employee measures approved in a majority collectiveagreement with trade unions. The associated costs willbe recognised in 2014.
Kering strengthens its portfolio of luxury brands
In early January 2013, Kering completed its acquisition ofa majority stake in the Chinese fine jewellery brand Qeelin.Launched in 2004, Qeelin is the first Chinese luxury jewellerto have developed an international network of stores in themost prestigious shopping districts worldwide. At the timeof acquisition, it operated 14 stores (seven in MainlandChina, four in Hong Kong and three in Europe) and is soldin a number of multi-brand stores such as Colette in Parisand Restir in Tokyo.
On January 15, 2013, Kering acquired a majority stake inthe luxury designer brand Christopher Kane with a view todeveloping the brand’s business in close partnership withits eponymous creator, the Scottish designer ChristopherKane. Founded in 2006, Christopher Kane is a distinctiveand exciting brand with a unique DNA.
Qeelin and Christopher Kane have been fully consolidatedin Kering’s financial statements since January 1, 2013. Asof December 31, 2013, Kering valued the Qeelin brand at€20 million on a provisional basis following the initialpurchase price allocation process, which will be completedduring 2014.
On March 25, 2013, Kering announced that it had acquireda majority stake in France Croco and Tannerie de Périers.Founded in 1974, France Croco is a leading independenttannery located in Normandy and specialised in thesourcing, tanning and processing of crocodile skins.
This acquisition will allow Kering’s brands to further securea sustainable supply of high quality crocodile skins andFrance Croco’s activities are highly complementary tothose of Caravel, another tannery owned by Kering whichspecialises in sourcing and tanning precious skins. FranceCroco and Tannerie de Périers have been consolidated inKering’s financial statements since the second quarter of2013. The purchase price allocation process for thisacquisition was still in progress at end-December 2013.
On April 22, 2013 Gucci further demonstrated its commitmentto the excellence of “Made in Italy” and to Tuscany byannouncing that it had acquired the Italian porcelain maker,Richard Ginori, as part of its plans to expand into thetableware market. Richard Ginori was not consolidated bythe Group at end-December 2013.
On April 24, 2013, Kering announced that it had signed anagreement with RA.MO SpA to acquire a majority stake in
the Italian jewellery group Pomellato. The Pomellatogroup has two brands: Pomellato, which is positioned inthe fine jewellery segment and Dodo, positioned in theaccessible jewellery segment. Through this acquisitionKering has extended and strengthened its portfolio ofluxury brands in the high-growth jewellery segment. Thetransaction was completed on July 5, 2013, followingclearance by the competition authorities. In view of thedate on which Kering took over control of the group,Pomellato has been consolidated since July 1, 2013. As ofDecember 31, 2013, Kering valued the Pomellato andDodo brands at €210 million on a provisional basisfollowing the initial purchase price allocation process,which will be completed during 2014.
On September 6, 2013, Kering announced that it wasacquiring a minority shareholding in the New York basedfashion brand Altuzarra, founded by the Franco-American designer Joseph Altuzarra in 2008. Thisinvestment marks the beginning of a partnership whichwill enable Kering to accompany Altuzarra in the nextstage of its growth. Altuzarra was not consolidated inKering’s financial statements at December 31 2013.
On November 19, 2013, Kering and Tomas Maier announcedthat they had entered into a joint venture to develop thebusiness of the Tomas Maier brand in partnership. TomasMaier will continue to be Creative Director of BottegaVeneta, a position he has held since 2001. The jointventure was not consolidated in Kering’s financialstatements at December 31, 2013.
Other highlights
On April 18, 2013, PUMA SE announced that it had appointedBjörn Gulden as Chief Executive Officer effective July 1,2013. Mr. Gulden – who is a member of Kering’s ExecutiveCommittee – brings to PUMA solid internationalexperience of nearly 20 years in the Sporting Goods andfootwear industry where he has held a variety ofmanagement positions, notably with Adidas, Helly Hansenand Deichman.
In the first half of 2013, Kering redeemed both the€600 million worth of bonds issued in 2005, includingthe additional bonds issued in 2006, and the second€200 million tranche of the bonds indexed to the Keringshare price that were issued in May 2008. To extend thematurity of its debt, Kering carried out a first bond issueon July 15, 2013, involving €500 million worth of seven-year bonds with a fixed-rate coupon of 2.5%, and asecond – which also represented €500 million – onOctober 8, 2013, involving five-year bonds with a 1.875%fixed-rate coupon.
158 Kering ~ 2013 Reference Document
5 FINANCIAL INFORMATION ~ 2013 ACTIVITY REPORT
05_A_VA_V6 14/04/14 11:32 Page158

Consolidated revenue from continuing operations amountedto €9,748 million in 2013, up 0.1% on 2012 as reportedand 4.0% based on a comparable Group structure andexchange rates.
Revenue for the Luxury Division rose 4.2% as reportedand 7.2% based on comparable data, with sustainedgrowth posted for all geographic areas.
Revenue generated by the Sport & Lifestyle Division contracted8.1% as reported and 2.8% based on comparable data.
The year-on-year increase in reported consolidatedrevenue includes a positive impact of close to €107 millionfrom changes in Group structure in 2013 (primarily dueto the Pomellato acquisition).
Exchange rate fluctuations had a negative €467 millioneffect on revenue, of which €246 million was attributableto the depreciation of the yen against the euro and€69 million was due to the depreciation of the US dollar.
1.3. 2013 business review
The main financial indicators taken from Kering’s consolidated financial statements for 2013 are presented below:
(in € millions) 2013 2012 Change
Revenue 9,748.4 9,736.3 +0.1%Recurring operating income 1,750.1 1,791.5 -2.3%
as a % of revenue 18.0% 18.4% -0.4 ptsEBITDA 2,045.9 2,066.6 -1.0%
as a % of revenue 21.0% 21.2% -0.2 ptsNet income attributable to owners of the parent 49.6 1,048.2 -95.3%
o/w continuing operations excluding non-recurring items 1,229.3 1,268.8 -3.1%
Gross operating investments (677.7) (441.9) +53.4%Free cash flow from operations 857.5 930.2 -7.8%
Total equity 11,195.9 12,118.7 -7.6%o/w attributable to owners of the parent 10,586.6 11,413.8 -7.2%
Net debt 3,442.9 2,491.7 +38.2%
Revenue
(in € millions) 2013 2012 Reported Comparable change change (1)
Luxury Division 6,470.2 6,212.3 +4.2% +7.2%Sport & Lifestyle Division 3,247.0 3,531.9 -8.1% -2.8%Eliminations 31.2 (7.9) - -
Total revenue 9,748.4 9,736.3 +0.1% +4.0%
(1) On a comparable Group structure and exchange rate basis.
159
5
2013 Reference Document ~ Kering
2013 ACTIVITY REPORT ~ FINANCIAL INFORMATION
05_A_VA_V6 14/04/14 11:32 Page159

Quarterly information
(in € millions) First Second Third Fourth Total quarter quarter quarter quarter 2013
Gucci 865.9 888.9 864.8 941.2 3,560.8Bottega Veneta 229.0 236.6 259.3 290.9 1,015.8Yves Saint Laurent 127.2 128.1 139.3 162.3 556.9Other Luxury brands 301.3 301.4 353.7 380.3 1,336.7
Luxury Division 1,523.4 1,555.0 1,617.1 1,774.7 6,470.2
PUMA 781.6 692.3 824.8 703.2 3,001.9Other Sport & Lifestyle brands 61.1 51.9 71.4 60.7 245.1
Sport & Lifestyle Division 842.7 744.2 896.2 763.9 3,247.0
Corporate 4.3 8.8 9.7 8.4 31.2
Kering total 2,370.4 2,308.0 2,523.0 2,547.0 9,748.4
(in € millions) First Second Third Fourth Total quarter quarter quarter quarter 2012
Gucci 847.9 879.9 914.6 996.4 3,638.8Bottega Veneta 218.0 211.5 241.6 274.0 945.1Yves Saint Laurent 108.8 114.7 130.0 119.3 472.8Other Luxury brands 283.2 260.5 306.7 305.2 1,155.6
Luxury Division 1,457.9 1,466.6 1,592.9 1,694.9 6,212.3
PUMA 820.9 752.9 892.2 804.7 3,270.7Other Sport & Lifestyle brands 65.6 54.6 77.5 63.5 261.2
Sport & Lifestyle Division 886.5 807.5 969.7 868.2 3,531.9
Corporate (2.5) (2.3) (2.2) (0.9) (7.9)
Kering total 2,341.9 2,271.8 2,560.4 2,562.2 9,736.3
The Group’s balance in terms of geographic presence andsales formats makes it more resilient to changes in theeconomic environment despite the volatility in the globaleconomy over the last several quarters. Revenuegenerated outside the eurozone climbed 5.8% in 2013(based on comparable data) and accounted for 79% ofthe Group total.
Growth in mature markets was sustained at 4.3% (basedon comparable data), driven by Japan and North America.Emerging markets were up 3.4% on a comparable basis,and now account for 38% of sales with 25.3% of thisamount generated in the Asia-Pacific region (excludingJapan).
Revenue by geographic area
(in € millions) 2013 2012 Reported Comparable change change (1)
Western Europe 3,057.9 2,937.5 +4.1% +2.7%North America 2,038.3 1,978.9 +3.0% +5.7%Japan 982.8 1,158.3 -15.2% +6.7%
Sub-total – mature markets 6,079.0 6,074.7 +0.1% +4.3%
Eastern Europe, Middle East and Africa 723.6 685.2 +5.6% +9.3%South America 476.0 536.7 -11.3% -3.7%Asia-Pacific (excluding Japan) 2,469.8 2,439.7 +1.2% +3.2%
Sub-total – emerging markets 3,669.4 3,661.6 +0.2% +3.4%
Total revenue 9,748.4 9,736.3 +0.1% +4.0%
(1) On a comparable Group structure and exchange rate basis.
160 Kering ~ 2013 Reference Document
5 FINANCIAL INFORMATION ~ 2013 ACTIVITY REPORT
05_A_VA_V6 14/04/14 11:32 Page160

EBITDA
At €2,046 million, EBITDA was 1.0% lower than in 2012, and the EBITDA margin edged back 0.2 basis points to 21.0%from 21.2%.
(in € millions) 2013 2012 Change
Luxury Division 1,913.3 1,815.3 +5.4%Sport & Lifestyle Division 258.3 370.8 -30.3%Corporate (125.7) (119.5) -5.2%
EBITDA 2,045.9 2,066.6 -1.0%
The Group’s gross margin for 2013 amounted to€6,091 million, up €131 million or 2.2% on the previousyear as reported. Over the same period, operating
expenses increased by 4.1% as reported, including a 2.8%rise in payroll expenses. The Group’s average headcount was31,415 in 2013, representing a 6.9% increase on 2012.
(comparable change) First Second Third Fourth Full-year quarter quarter quarter quarter 2013
Gucci +4.0% +4.1% +0.6% +0.2% +2.2%Bottega Veneta +8.8% +17.2% +15.8% +13.4% +13.8%Yves Saint Laurent +18.7% +14.4% +12.0% +42.0% +21.6%Other Luxury brands +6.9% +18.7% +9.4% +11.4% +11.3%
Luxury Division +6.4% +9.4% +5.6% +7.4% +7.2%
PUMA -2.3% -4.0% -0.8% -4.5% -2.8%Other Sport & Lifestyle brands -5.7% -2.4% -2.3% +1.5% -2.3%
Sport & Lifestyle Division -2.5% -3.9% -0.9% -4.1% -2.8%
Corporate - - - - -
Kering total +3.3% +5.2% +3.4% +4.0% +4.0%
Recurring operating income
Kering’s recurring operating income came to €1,750 million in 2013, down 2.3% on 2012 on a reported basis. The recurringoperating margin was 18.0% for the year, with the Luxury Division reporting an improved margin, at 26.0%. The recurringoperating margin for the Sport & Lifestyle Division narrowed, down to 6.2%.
(in € millions) 2013 2012 Change
Luxury Division 1,682.6 1,611.6 +4.4%Sport & Lifestyle Division 200.4 304.8 -34.3%Corporate (132.9) (124.9) -6.4%
Recurring operating income 1,750.1 1,791.5 -2.3%
161
5
2013 Reference Document ~ Kering
2013 ACTIVITY REPORT ~ FINANCIAL INFORMATION
05_A_VA_V6 14/04/14 11:32 Page161
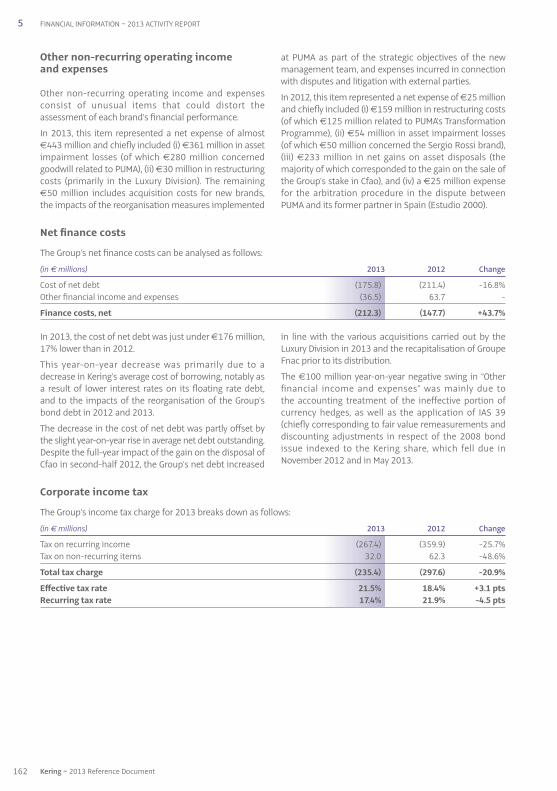
Corporate income tax
The Group’s income tax charge for 2013 breaks down as follows:
(in € millions) 2013 2012 Change
Tax on recurring income (267.4) (359.9) -25.7%Tax on non-recurring items 32.0 62.3 -48.6%
Total tax charge (235.4) (297.6) -20.9%
Effective tax rate 21.5% 18.4% +3.1 ptsRecurring tax rate 17.4% 21.9% -4.5 pts
In 2013, the cost of net debt was just under €176 million,17% lower than in 2012.
This year-on-year decrease was primarily due to adecrease in Kering’s average cost of borrowing, notably asa result of lower interest rates on its floating rate debt,and to the impacts of the reorganisation of the Group’sbond debt in 2012 and 2013.
The decrease in the cost of net debt was partly offset bythe slight year-on-year rise in average net debt outstanding.Despite the full-year impact of the gain on the disposal ofCfao in second-half 2012, the Group’s net debt increased
in line with the various acquisitions carried out by theLuxury Division in 2013 and the recapitalisation of GroupeFnac prior to its distribution.
The €100 million year-on-year negative swing in “ Otherfinancial income and expenses ” was mainly due to the accounting treatment of the ineffective portion ofcurrency hedges, as well as the application of IAS 39(chiefly corresponding to fair value remeasurements anddiscounting adjustments in respect of the 2008 bondissue indexed to the Kering share, which fell due inNovember 2012 and in May 2013.
Net finance costs
The Group’s net finance costs can be analysed as follows:
(in € millions) 2013 2012 Change
Cost of net debt (175.8) (211.4) -16.8%Other financial income and expenses (36.5) 63.7 -
Finance costs, net (212.3) (147.7) +43.7%
Other non-recurring operating income and expenses
Other non-recurring operating income and expensesconsist of unusual items that could distort theassessment of each brand’s financial performance.
In 2013, this item represented a net expense of almost€443 million and chiefly included (i) €361 million in assetimpairment losses (of which €280 million concernedgoodwill related to PUMA), (ii) €30 million in restructuringcosts (primarily in the Luxury Division). The remaining€50 million includes acquisition costs for new brands,the impacts of the reorganisation measures implemented
at PUMA as part of the strategic objectives of the newmanagement team, and expenses incurred in connectionwith disputes and litigation with external parties.
In 2012, this item represented a net expense of €25 millionand chiefly included (i) €159 million in restructuring costs(of which €125 million related to PUMA’s TransformationProgramme), (ii) €54 million in asset impairment losses(of which €50 million concerned the Sergio Rossi brand),(iii) €233 million in net gains on asset disposals (themajority of which corresponded to the gain on the sale ofthe Group’s stake in Cfao), and (iv) a €25 million expensefor the arbitration procedure in the dispute betweenPUMA and its former partner in Spain (Estudio 2000).
162 Kering ~ 2013 Reference Document
5 FINANCIAL INFORMATION ~ 2013 ACTIVITY REPORT
05_A_VA_V6 14/04/14 11:32 Page162

Kering’s effective tax rate rose sharply in 2013 due to thefact that there were a number of non-recurring factorswhich generated operating expenses without anycorresponding tax benefit.
Adjusted for the effect of non-recurring items and the relatedtaxes, the recurring tax rate contracted by 4.5 percentagepoints to 17.4%. This improvement is chiefly attributableto the increased weighting of Luxury brands withinconsolidated income and the utilisation of previouslyunrecognised tax losses.
Share in earnings of associates
The Group’s share in earnings of associates totalled€1.6 million in 2013, compared with €37 million in 2012.
The 2013 total corresponds to the contribution of Wilderness.The 2012 total primarily corresponded to the contributionof Cfao, which was accounted for by the equity method asfrom December 2009 based on Kering’s residual interestin the company (42% as of June 30, 2012). Kering soldthis residual stake during the second half of 2012.
Net income from continuing operations
Consolidated net income from continuing operationscame to €862 million in 2013 versus €1,358 million forthe previous year.
Attributable net income from continuing operationsamounted to €869 million compared with €1,324 millionin 2012.
Net income (loss) from discontinued operations
This item includes the income statement contributionsfrom all assets (or groups of assets) accounted for inaccordance with IFRS 5 – Non-current assets held for saleand discontinued operations (see Note 12 to theconsolidated financial statements).
For the year ended December 31, 2013, the Groupreported a net loss of €822 million under this item, mainlycorresponding to the €256 million net loss recognisedon the disposal of Groupe Fnac shares, after tax anddistribution costs and the contribution of Groupe Fnac tofirst-half earnings, and a net €562 million expense recognisedin relation to Redcats. The net expense for Redcats primarilyincludes disposal losses on the businesses sold during theyear, as well as impairment losses recorded against Redcats’residual assets, and the undertaking given by Kering to recapitalise La Redoute in an amount of €315 millionto cover future losses and the cost of enhancing La Redoute’sproduction base. It does not include the cost of financing thesocial guarantees to be granted to the employees concernedby the modernisation measures at La Redoute and RelaisColis. The total cost of this financing, which cannot as yetbe reliably estimated, will lead Kering to set up a trustguaranteeing the application of the employee measures
approved in a majority collective agreement with tradeunions. The associated costs will be recognised in 2014.
For the year ended December 31, 2012, the Group reporteda net loss of almost €276 million under “Net income(loss) from discontinued operations”.
Non-controlling interests
Net income attributable to non-controlling interestsrepresented a negative amount of approximately€10 million in 2013 versus a positive €34 million in 2012.
Non-controlling interests in PUMA’s net incomedecreased during the year due to the combined effects ofthe Group’s purchases of additional PUMA shares during2013, which raised Kering’s interest in PUMA to nearly86% at December 31, 2013 from almost 83% one yearearlier, and the decline in PUMA’s net income, which waspartly due to the recognition of non-recurring expenses.
This impact was significantly offset by an increase in thenet income generated by operations carried out by the Groupalongside non-controlling partners (including Sowind,Gucci in the Middle East, and Janed and Wheat at PUMA).
Net income attributable to owners of the parent
Adjusted for non-recurring items net of tax, attributablenet income from continuing operations edged back 3.1%,coming in at €1,229 million versus €1,269 million in 2012.Adjusted for non-recurring items and excluding the impactof the May 2008 indexed bond issue, attributable net incomefor 2013 came in 4.6% higher than one year earlier.
Net income attributable to owners of the parent totalledclose to €50 million, affected by significant non-recurringexpenses and heavy net losses on discontinued operations.In 2012, net income attributable to owners amounted to€1,048 million.
Earnings per share
The weighted average number of Kering shares used tocalculate earnings per share was 126.0 million in 2013,virtually unchanged from the number used for 2012.
Earnings per share from continuing operations came to€6.91, compared with €10.51 for the previous year.
Earnings per share stood at €0.39 in 2013 versus €8.32for the previous year.
Excluding non-recurring items, earnings per share fromcontinuing operations amounted to €9.76, down 3.1% onthe 2012 figure. Adjusted for non-recurring items andexcluding the impact of the May 2008 indexed bondissue, earnings per share for 2013 came in 4.6% higherthan one year earlier.
The impact of dilutive instruments on the calculation ofearnings per share was almost neutral in 2013.
163
5
2013 Reference Document ~ Kering
2013 ACTIVITY REPORT ~ FINANCIAL INFORMATION
05_A_VA_V6 14/04/14 11:32 Page163
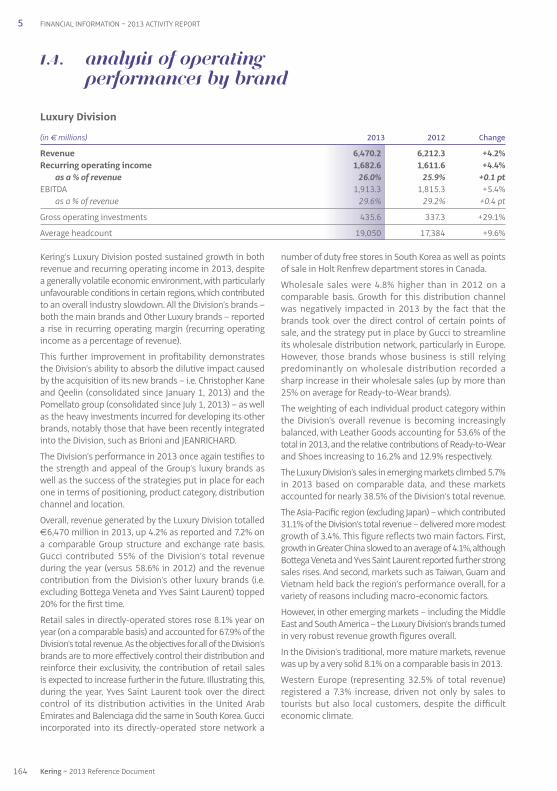
Kering’s Luxury Division posted sustained growth in bothrevenue and recurring operating income in 2013, despitea generally volatile economic environment, with particularlyunfavourable conditions in certain regions, which contributedto an overall industry slowdown. All the Division’s brands –both the main brands and Other Luxury brands – reporteda rise in recurring operating margin (recurring operatingincome as a percentage of revenue).
This further improvement in profitability demonstratesthe Division’s ability to absorb the dilutive impact causedby the acquisition of its new brands – i.e. Christopher Kaneand Qeelin (consolidated since January 1, 2013) and thePomellato group (consolidated since July 1, 2013) – as wellas the heavy investments incurred for developing its otherbrands, notably those that have been recently integratedinto the Division, such as Brioni and JEANRICHARD.
The Division’s performance in 2013 once again testifies tothe strength and appeal of the Group’s luxury brands aswell as the success of the strategies put in place for eachone in terms of positioning, product category, distributionchannel and location.
Overall, revenue generated by the Luxury Division totalled€6,470 million in 2013, up 4.2% as reported and 7.2% ona comparable Group structure and exchange rate basis.Gucci contributed 55% of the Division’s total revenueduring the year (versus 58.6% in 2012) and the revenuecontribution from the Division’s other luxury brands (i.e.excluding Bottega Veneta and Yves Saint Laurent) topped20% for the first time.
Retail sales in directly-operated stores rose 8.1% year onyear (on a comparable basis) and accounted for 67.9% of theDivision’s total revenue. As the objectives for all of the Division’sbrands are to more effectively control their distribution andreinforce their exclusivity, the contribution of retail salesis expected to increase further in the future. Illustrating this,during the year, Yves Saint Laurent took over the directcontrol of its distribution activities in the United ArabEmirates and Balenciaga did the same in South Korea. Gucciincorporated into its directly-operated store network a
number of duty free stores in South Korea as well as pointsof sale in Holt Renfrew department stores in Canada.
Wholesale sales were 4.8% higher than in 2012 on acomparable basis. Growth for this distribution channelwas negatively impacted in 2013 by the fact that thebrands took over the direct control of certain points ofsale, and the strategy put in place by Gucci to streamlineits wholesale distribution network, particularly in Europe.However, those brands whose business is still relyingpredominantly on wholesale distribution recorded asharp increase in their wholesale sales (up by more than25% on average for Ready-to-Wear brands).
The weighting of each individual product category withinthe Division’s overall revenue is becoming increasinglybalanced, with Leather Goods accounting for 53.6% of thetotal in 2013, and the relative contributions of Ready-to-Wearand Shoes increasing to 16.2% and 12.9% respectively.
The Luxury Division’s sales in emerging markets climbed 5.7%in 2013 based on comparable data, and these marketsaccounted for nearly 38.5% of the Division’s total revenue.
The Asia-Pacific region (excluding Japan) – which contributed31.1% of the Division’s total revenue – delivered more modestgrowth of 3.4%. This figure reflects two main factors. First,growth in Greater China slowed to an average of 4.1%, althoughBottega Veneta and Yves Saint Laurent reported further strongsales rises. And second, markets such as Taiwan, Guam andVietnam held back the region’s performance overall, for avariety of reasons including macro-economic factors.
However, in other emerging markets – including the MiddleEast and South America – the Luxury Division’s brands turnedin very robust revenue growth figures overall.
In the Division’s traditional, more mature markets, revenuewas up by a very solid 8.1% on a comparable basis in 2013.
Western Europe (representing 32.5% of total revenue)registered a 7.3% increase, driven not only by sales totourists but also local customers, despite the difficulteconomic climate.
1.4. Analysis of operating performances by brand
Luxury Division
(in € millions) 2013 2012 Change
Revenue 6,470.2 6,212.3 +4.2%Recurring operating income 1,682.6 1,611.6 +4.4%
as a % of revenue 26.0% 25.9% +0.1 ptEBITDA 1,913.3 1,815.3 +5.4%
as a % of revenue 29.6% 29.2% +0.4 pt
Gross operating investments 435.6 337.3 +29.1%
Average headcount 19,050 17,384 +9.6%
164 Kering ~ 2013 Reference Document
5 FINANCIAL INFORMATION ~ 2013 ACTIVITY REPORT
05_A_VA_V6 14/04/14 11:32 Page164

Gucci posted close to €3,561 million in revenue in 2013,down 2.1% year-on-year as reported but up 2.2% atcomparable exchange rates.
Two of the key components of the strategy put in place by Gucci to reposition its brand and further enhance its exclusivity include the strengthening of its directly-operated store network and the achieving in-storeoperational excellence. In line with this, retail salesgenerated in directly-operated stores accounted for76.8% of the brand’s total sales in 2013, representing a140 basis-point increase on 2012. Growth for thisdistribution channel came in at a very solid 4.8% overall atconstant exchange rates, with an extremely balancedbreakdown between mature markets (which reported a4.7% sales rise) and emerging markets (where the increasewas 4.8%). In the brand’s mature markets, the main growthdrivers were North America – where sales were buoyed byfavourable market conditions – and Japan. Gucci’s brandperception in North America and Japan is growing
constantly, illustrating the success of the repositioningstrategy implemented over the past few years.
Wholesale sales contracted 7.2% on a comparableexchange-rate basis, chiefly as a result of Gucci’s deliberatedecision to (i) limit the increase in sales of Ready-to-Wearand leather goods to certain distributors (notably in Italyand especially in the first half of the year), (ii) reduce thenumber of points of sale by bringing certain operationsback under direct management (notably in Canada), and(iii) incorporate 11 duty free points of sale in South Koreainto the directly-operated store network.
For Leather Goods – which represented approximately58% of the brand’s total sales – handbag sales postedsolid increases in sales, but luggage and small leathergoods saw declines. The positive effects of the measuresput in place over the last few seasons to fine-tune theoffering and focus on ever-more sophisticated productslargely benefited the overall performance of the handbagsrange in 2013. In 2013, this same repositioning effort
Gucci
(in € millions) 2013 2012 Change
Revenue 3,560.8 3,638.8 -2.1%Recurring operating income 1,131.8 1,126.4 +0.5%
as a % of revenue 31.8% 31.0% +0.8 ptEBITDA 1,275.8 1,260.3 +1.2%
as a % of revenue 35.8% 34.6% +1.2 pt
Gross operating investments 214.6 203.9 +5.2%
Average headcount 9,415 9,337 +0.8%
In North America (which accounted for 18.8% of the Division’ssales), revenue rose 7.6% year on year, led in particular by Gucciwhich is reaping the benefits of the measures undertakenover the past several years to more effectively control itsdistribution channels and enhance its brand perception.
Sales momentum was especially brisk in the Japanesemarket, where the Luxury Division’s brands posted 11.9%comparable-basis growth, propelled by the upswing inconsumer spending in Japan which began in late 2012, aswell as by an increase in purchases in the domesticmarket triggered by the weakening of the yen in 2013.
The Luxury Division’s recurring operating income rose 4.4%year on year to just under €1,683 million. At 26.0%, recurringoperating margin was up 10 basis points as reported,reflecting profitability gains achieved by the ensemble ofall brands. Currency hedges had a favourable impact duringthe year but were not the only reason for the rise inrecurring operating margin as the vast majority of thebrands also recorded an increase in gross margin atconstant exchange rates.
EBITDA rose 5.4% in 2013 to €1,913 million, which fuelleda 40 basis point increase in the EBITDA margin to 29.6%.
The Luxury Division’s gross operating investmentsamounted to €436 million in 2013, up 29.1% on 2012.This increase stemmed from store openings, expansionsand refurbishments (accounting for around 60% of thetotal) as well as significant investments in infrastructures,systems and the supply chain. It also reflects the Group’sobjective of allocating the resources required for developingthe brands’ businesses in line with their strategic plans. 2013was a key year for stepping up the pace of Yves Saint Laurent’sgrowth and integrating Brioni, with around two-thirds ofthe year-on-year increase in operating investments relatedto these two brands.
As of December 31, 2013 the Luxury Division had a networkof 1,149 directly-operated stores, including 750 in maturemarkets and 399 in emerging markets (201 in Greater China).Net store additions during the year totalled 191. However,when adjusted for transfers of existing points of salepreviously operated by third-party distributors (Yves SaintLaurent in the United Arab Emirates, Gucci and Balenciagain South Korea, Brioni in China and Gucci in Canada) andthe Qeelin store network as of January 1, 2013 and thePomellato/Dodo network as of July 1, 2013, the number ofnet store additions amounted to 94. Out of these additions,50 stores are in mature markets and 44 in emerging markets.
165
5
2013 Reference Document ~ Kering
2013 ACTIVITY REPORT ~ FINANCIAL INFORMATION
05_A_VA_V6 14/04/14 11:32 Page165

was stepped up in 2013 for luggage and small leathergoods, leading to a reduction in the distribution of certainentry price products. Within Leather Goods, theproportion of “ no logo ” products and products in pureleather and precious skins increased again during the year.For example, no-logo handbags accounted for almost halfthe product category’s overall revenue, versus 37% in 2012.
The brand’s other main product categories (shoes andReady-to-Wear, which together accounted for 25% ofGucci’s total revenue in 2013) recorded a rise in sales, buoyedby the commercial success of the Men’s shoe collections.
More generally, revenue generated from sales of Men’scollections increased sharply in 2013, as it had donealready in 2012.
The product categories that Gucci has launched orrevamped more recently – such as the children’s line andsilk products (scarves, ties, etc.) – have proved to be solidgrowth drivers and positively contributed to traffic intothe brand’s stores. In 2013 these categories all postedsignificant revenue increases.
Gucci’s sales in emerging markets were 0.4% higher thanin 2012 based on comparable data. A number of markets,such as the Middle East, Latin America and Eastern Europe,saw sustained growth but sales in the Asia-Pacific regionwere down slightly. The contraction in the Asia-Pacificregion was due to tougher macro-economic conditions andoperational reasons specific to the brand, with certainAsian markets such as Taiwan, Singapore and Vietnamweighing on performance during the year. In Mainland China,where the brand operated 61 stores as of December 31,2013, Gucci reported a moderate sales decline against abackdrop of consolidation, refurbishment of the existingstore network, and repositioning of the brand’s offering.
Revenue generated by Gucci in its mature markets rose 3.5%on a comparable basis. In Western Europe, revenue growthwas 1.0% in view of the difficult economic situation in theeurozone and despite the brand deliberately limitingsales to third-party distributors in the region, notably in thefirst half of the year. In North America, Gucci posted a solidincrease in sales, up 5.3%, driven by the brand’s successfulmarket repositioning in the region. This performance wasachieved despite a reduction in the number of Japanese
tourists as a result of the weaker yen, whose adverse effectswere notably felt in Hawaii. The Japanese domestic marketwas particularly buoyant in 2013, however, fuelling a 7.0%rise, at comparable exchange rates, in Gucci’s revenue inthat country.
Gucci’s recurring operating income for 2013 edged up 0.5%on a reported basis year on year, coming in at €1,132 million.This led to an 80 basis-point increase in recurringoperating margin to 31.8%, which represents a recordhigh for the brand. Although the year-on-year increasewas in part due to the positive impact of currency hedges,it also clearly reflects the underlying improvement ingross margin (at constant exchange rates) achieved as aresult of the brand’s effective product mix. At the sametime it demonstrates the results of Gucci’s strategy ofpositioning itself as a leading global brand in the Luxurymarket by further enhancing its exclusivity and increasingthe proportion of revenue generated in the highest-pricesegments. The rise in gross margin also helped offset theimpact of the increase in operating expenses during theyear, which primarily stemmed from the higher storerunning costs incurred in connection with the brand’sobjective of continually improving its store network.
EBITDA for 2013 totalled €1,276 million, up 1.2% as reported,and the EBITDA margin stood at 35.8%.
As of December 31, 2013, Gucci operated 474 stores directly,including 183 in emerging markets, of which 76 in GreaterChina. Excluding the incorporation into the directly-operatedstore network of 11 points of sale in South Korea and 8boutiques in Holt Renfrew department stores in Canada,Gucci added a net 26 new stores in 2013 (compared with53 net additions in 2012), of which 20 in mature markets.
Gucci’s gross operating investments amounted to€215 million in 2013, up 5.2% on 2012, when they rose byaround 83%. 2013 therefore marked the first stage towarda stabilisation of the brand’s investment spending. Store-related investments accounted for over half of the brand’stotal gross operating investments in 2013, with priority givento refurbishments in order to enhance both the network’sproductivity and customers’ shopping experience and to provide a retail environment aligned with the brand’songoing repositioning.
166 Kering ~ 2013 Reference Document
5 FINANCIAL INFORMATION ~ 2013 ACTIVITY REPORT
05_A_VA_V6 14/04/14 11:32 Page166

Bottega Veneta’s revenue topped €1 billion in 2013,coming in at just under €1,016 million, up 7.5% on areported basis and 13.8% at comparable exchange rates.Between 2011 and 2013, the brand’s revenue rose byalmost 50% based on comparable data, representing oneof the strongest growth rates among the luxury industry’shigh-end players.
With a view to preserving its high-end positioning andexclusivity, Bottega Veneta’s preferred distributionchannel is the brand’s directly-operated stores. In 2013, retailsales in directly-operated stores increased by 15.2% on acomparable basis and this distribution channel accountedfor 81.3% of the brand’s total sales (versus 80.6% in 2012).In line with its aim of continually differentiating andenhancing its store network, in September 2013 the brandopened its first Maison concept store, on Via Sant’ Andreain Milan.
Wholesale sales rose 7.9% in 2013, with momentum pickingup in the second half compared with the first six monthswhich were affected by the fact that Cruise collectiondeliveries had been anticipated in late 2012. Throughout thecourse of the year, Bottega Veneta continued to apply itsstrategy of streamlining its distributor network in order tostrengthen the brand’s exclusivity, particularly in Europe.
Leather Goods remained the brand’s core business,representing 85.6% of Bottega Veneta’s total sales. The salesperformance for this product category was extremelysolid during the year, propelled by an offering made up ofsignature collections enriched by new seasonal designsfeaturing different forms, colours and functions. Thebrand’s other product categories also saw sustained salesgrowth in 2013. For example, sales for the Men’s shoesand Ready-to-Wear collections advanced by some 25%year on year. Against this very favourable backdrop, thebrand launched its first Men’s fragrance.
Bottega Veneta’s sales growth in 2013 was evenly balancedbetween its traditional and emerging markets, whichrecorded respective revenue rises of 12.5% and 15.5% atcomparable exchange rates. These figures are consistentwith the brand’s expansion strategy which is aimed atstrengthening Bottega Veneta’s positioning in all theregions where it is present.
Emerging markets accounted for 44.0% of the brand’stotal sales in 2013, with the Asia-Pacific region (excludingJapan) making up a significant portion of this contribution.Bottega Veneta’s brand appeal is particularly high inMainland China, where its sales rose 26.6% year on yearon a comparable basis.
In its traditional markets, Bottega Veneta delivered anothervery solid showing despite the more complex macro-economic environment in Western Europe. Sales in thisregion – which represented 27.9% of the brand’s total –advanced 12.6% on a comparable basis, led by demandfrom both local customers and tourists (excluding Japanesetourists). In Japan – which made up 14.6% of total sales –business was extremely buoyant during the year, withcomparable-basis growth of 18.8% (down 5.8% on areported basis), powered both by the brand’s appeal andthe weak yen which boosted momentum in the domesticmarket. In North America the year-on-year sales increasewas 6.0% based on comparable data. Adjusted for thenegative trends in Hawaii resulting from the lowernumbers of Japanese tourists, sales in North Americaclimbed by almost 10%.
Bottega Veneta posted recurring operating income of closeto €331 million for 2013, with a record recurring operatingmargin of 32.5%, which represents a year-on-year increaseof 70 basis points as reported. The positive effects arisingfrom the brand’s currency hedges as well as better absorptionof fixed operating costs more than offset the initial dilutiveeffect on profitability caused by the store openings incurredin 2012 and 2013 and the launch of new product categories.
EBITDA totalled just under €355 million and the EBITDAmargin climbed to 34.9%, up 100 basis points as reported.
Bottega Veneta’s network of directly-operated storestotalled 221 as of December 31, 2013, including 90 inemerging markets. There were 25 net store additionsduring the year, versus 26 in 2012. In addition, the brandextended, refurbished or relocated or a total of 16 stores.
Bottega Veneta’s gross operating investments rose byaround 50% year on year to €62.0 million. Almost twothirds of these investments related to the store networkand the remainder included financing for a new atelierand offices at Montebello Vicentino.
Bottega Veneta
(in € millions) 2013 2012 Change
Revenue 1,015.8 945.1 +7.5%Recurring operating income 330.6 300.1 +10.2%
as a % of revenue 32.5% 31.8% +0.7 ptEBITDA 354.8 320.6 +10.7%
as a % of revenue 34.9% 33.9% +1.0 pt
Gross operating investments 62.0 41.3 +50.1%
Average headcount 2,891 2,339 +23.6%
167
5
2013 Reference Document ~ Kering
2013 ACTIVITY REPORT ~ FINANCIAL INFORMATION
05_A_VA_V6 14/04/14 11:32 Page167

Following on from 2012, which saw the appointment ofHedi Slimane as Creative Director with total responsibilityfor the brand’s image, 2013 marked a year of investmentfor Yves Saint Laurent, particularly in terms of opening newstores and strengthening the brand’s exclusivity, on-linedistribution and communications.
Against this backdrop of deep-seated change and aftertwo years of strong growth, Yves Saint Laurent’s revenuerose again in 2013, up 17.8% year on year as reported and21.6% based on comparable exchange rates. Total salestopped the €500 million mark, coming in at €557 million.
Wholesale sales jumped 42.6% on a comparable basis.While this performance was partly due to the brand’sdecision to postpone to the first quarter of 2013 certaindeliveries initially planned for 2012, it above all reflectsthe success of the brand’s new creative vision as well asthe depth and consistency of its product offering that leddistributors to increase their orders.
Retail sales in directly-operated stores – which accountedfor around 56% of the brand’s total sales – rose by a verysolid 14% on a comparable basis, with trends improvingconsistently quarter after quarter following on from atransition phase at the beginning of the year that wasrequired in order to adapt production and merchandisingprocesses and introduce the brand’s new store concept.To illustrate this, during the fourth quarter of the yearcomparable-basis growth in retail sales in directly-operated stores had reached 30.7%.
Revenue from royalties, however – primarily from L’Oréal forfragrances and cosmetics – were barely on a par with 2012.
All of Yves Saint Laurent’s main product categories registeredsharp sales growth during the period. Revenue fromReady-to-Wear surged by more than 50% on a comparablebasis and represented almost a quarter of the brand’s totalsales, proving that this category is regaining its essentialplace in the product offering. Leather Goods and Shoesdelivered a robust sales showing, driven by both new stylesand the brand’s signature products which have beenrevisited by Hedi Slimane.
Yves Saint Laurent posted increases in sales across allregions in 2013.
Sales growth in emerging markets came in at 19.4%, withthese markets accounting for 28.4% of the brand’s revenue.Yves Saint Laurent’s best-performing regions were theMiddle East – where it now directly manages distributionin the United Arab Emirates as part of a joint venture –and Greater China which saw a revenue jump of 23.1%,demonstrating the brand’s growing recognition anddesirability in that region.
In Yves Saint Laurent’s traditional markets, sales advancedby 22.5% on a comparable basis, reflecting the brand’srenewed appeal with local customers. Business wasparticularly buoyant in Japan, where sales jumped 29.6%at constant exchange rates, fuelled by customers’ verypositive reaction to the brand’s repositioning andrejuvenation. Sales in Western Europe and North Americawere also up sharply, with comparable-basis growthcoming in at 25.9% and 14.5% respectively.
Yves Saint Laurent ended 2013 with recurring operatingincome of close to €77 million, representing a year-on-year increase of 17.8%, and recurring operating margin stoodat 13.8%, up 10 basis points as reported. The positiveimpact of currency hedges was not significant in 2013.Although the costs incurred for expanding the business(extending the store network and putting in place a pro-active brand communication strategy) were much higherthan in 2012, the brand was able to maintain its operatingprofitability thanks primarily to its wider gross marginand capacity to tightly control other operating expenses.
Given the growing weight of depreciation and amortisation,EBITDA rose at a faster pace than recurring operatingincome, coming in at €93 million. The EBITDA margin was16.7%, up 70 basis points on 2012.
As of December 31, 2013, the Yves Saint Laurent branddirectly operated 115 stores, including 46 in emergingmarkets. In line with the brand’s aim of stepping up thepace of business expansion in 2013 by investing in thedistribution network, there were 20 net store additionsduring the year and the brand brought back under directmanagement another six points of sale in the UnitedArab Emirates.
As a result, gross operating investments increased three-fold in 2013 to €65 million, with nearly 80% of thisamount related to opening new stores and adaptingexisting stores to the new store concept.
Yves Saint Laurent
(in € millions) 2013 2012 Change
Revenue 556.9 472.8 +17.8%Recurring operating income 76.6 65.0 +17.8%
as a % of revenue 13.8% 13.7% +0.1 ptEBITDA 93.0 75.8 +22.7%
as a % of revenue 16.7% 16.0% +0.7 pt
Gross operating investments 65.3 21.8 +199.5%
Average headcount 1,445 1,208 +19.6%
168 Kering ~ 2013 Reference Document
5 FINANCIAL INFORMATION ~ 2013 ACTIVITY REPORT
05_A_VA_V6 14/04/14 11:32 Page168

Other Luxury brands have included Christopher Kane andQeelin since January 1, 2013 and the Pomellato and Dodobrands (the Pomellato group) since July 1, 2013.
Total revenue generated by Other Luxury brands amountedto €1,337 million in 2013, up 15.7% year on year as reportedand 11.3% on a comparable Group structure and exchangerate basis. Other Luxury brands contributed nearly 21% ofthe Luxury Division’s total revenue during the year.
Wholesale sales rose 10.2% on a comparable basis. Ready-to-Wear brands (Balenciaga and the three UK brands) sawtheir wholesale sales increase by around 20%, but overallperformance for this distribution channel was adverselyaffected by the reorganisation of Girard-Perregaux’sdistribution structure in Asia (which is still in progress), andthe streamlining measures put in place for Sergio Rossi’sdistributors’ network.
Retail sales in directly-operated stores advanced 12.8%on a comparable basis, and accounted for 39.0% of totalrevenue generated by Other Luxury brands in 2013.Developing an exclusive distribution network remains anobjective for all brands but has to be adapted in line witheach brand’s maturity and positioning in its traditionalmarkets as well as the depth and scope of its product offering.
All product categories of the Group’s Other Luxury brandsposted revenue increases for 2013. Ready-to-Wear wasthe best-selling category, representing 34.2% of totalrevenue generated by these brands, and recorded asignificant 17.3% sales rise on a comparable basis.Leather Goods (21.7% of revenue) and Shoes (12.3%) alsoreported buoyant sales growth. Although the Timepiecesand Jewellery category was penalised in the short term bythe reorganisation of Girard-Perregaux’s distribution in Asia,it nevertheless recorded a very solid increase in sales, partlythanks to a particularly strong showing from Boucheron.
Sales growth for Other Luxury brands was fairly balancedbetween mature markets and emerging markets, withrespective rises of 10.7% and 13.0% based on comparable data.
Mature markets, which are the traditional markets of theGroup’s Other Luxury brands, again made up 72.4% of thesebrands’ total revenue. Growth in these markets was led bylocal clienteles, especially in Japan and North America.
Overall, business in emerging markets was hampered in2013 by weaker spending on luxury products in China aswell as by a generally lacklustre market for timepieces in
the Asia-Pacific region at the beginning of the year. However,despite these unfavourable effects, the Group’s OtherLuxury brands reported sales growth of 8.8% in GreaterChina and well over 10% in their other emerging markets,notably the Middle East. These performances not onlyreflect the brands’ capacity to attract new customers butalso demonstrate the fact that emerging markets are stilla major growth vector.
Recurring operating income from Other Luxury brandsclimbed 19.6% to almost €144 million. Recurring operatingmargin rose by 30 basis points to 10.7% on a reported basisand was also up year on year based on constant exchangerates. These increases reflect the Group’s portfolio strategywhich targets a profitable growth model, while taking intoaccount the investments required to develop the businessof all of its brands and integrate newly-acquired brands.
EBITDA came in at just under €190 million, up 19.6% on2012 as reported.
The network of directly-operated stores owned by OtherLuxury brands totalled 339 stores as of December 31, 2013,including 55 in Greater China and 25 in other emergingmarkets. A total of 259 stores are located in these brands’traditional markets, mainly concentrated in Western Europeand Japan (118 and 104 stores respectively). There were 95net store additions during the year, reflecting the combinedimpacts of integrating Qeelin and Pomellato (60 storeadditions), transferring or purchasing points of sale that werepreviously operated by third parties (12 additions), openingnew stores (41 additions), and closing 18 existing stores.
The Group’s commitment to developing the business of itsOther Luxury brands is evidenced by the 33.3% increase intheir gross operating investments in 2013 to €94 million,the majority of which were related to store openings.
For Alexander McQueen and McQ, 2013 was another year ofstrong growth, with very solid sales rises across all regions,product categories and distribution channels. AlexanderMcQueen pursued the controlled expansion of its directly-operated store network, adding a net three new stores duringthe year. Against this backdrop of sustained growth in bothrevenue and gross margin, the brands’ operating incomeposted a significant increase.
For Balenciaga, 2013 was a transition year following AlexanderWang’s appointment as Creative Director in December 2012.The brand posted a robust increase in sales, with growth
Other Luxury brands
(in € millions) 2013 2012 Change
Revenue 1,336.7 1,155.6 +15.7%Recurring operating income 143.6 120.1 +19.6%
as a % of revenue 10.7% 10.4% +0.3 ptEBITDA 189.7 158.6 +19.6%
as a % of revenue 14.2% 13.7% +0.5 pt
Gross operating investments 93.7 70.3 +33.3%
Average headcount 5,299 4,500 +17.8%
169
5
2013 Reference Document ~ Kering
2013 ACTIVITY REPORT ~ FINANCIAL INFORMATION
05_A_VA_V6 14/04/14 11:32 Page169

picking up in the second half as the new collections graduallymade their mark. One of the best-performing categoriesduring the year was Women’s Ready-to-Wear, which is atthe heart of the brand’s identity and history. Balenciaga’soperating margin held firm, despite the investmentexpenditure required for the brand’s expansion.
Boucheron successfully pursued the expansion of its Bijouxand Jewellery lines in 2013, especially its signature line,Quatre, but also its Serpent Bohème line. At the sametime, following its successful return to the Biennale desAntiquaires event in Paris in late 2012, the brand postedstrong growth in High Jewellery sales. Also during the year,Boucheron strengthened its presence in Asia, opening anew store in Hong Kong and delivering a particularly solidperformance in Japan. It ended the year with a sharpincrease in recurring operating income, thanks to both itsrevenue growth and tight control over operating expenses.
For Brioni, 2013 was the first year in which the brand beganto reap the benefits of both its integration into the Group’sLuxury Division and the vision of its Creative Director, BrendanMullane. Brioni’s new collections were warmly acclaimed,and synergies with the Group were reinforced when thebrand joined the Luxury Division’s logistics platform inthe last quarter of the year. Against this backdrop, and inview of the expansion of the brand’s directly-operatedstore network (10 net additions in 2013, including thebuy-back of franchised stores in China), Brioni registeredsolid revenue growth for the year as well as an increase inoperating income.
Business for the Christopher Kane brand (which wasintegrated in Kering’s Luxury Division on January 1, 2013)developed considerably during the year. The brand iscurrently distributed in 30 countries through a network of150 points of sale operated by third parties, and its firststore is scheduled to open in 2014. Christopher Kane, theeponymous founder, was named Womenswear Designer ofthe Year at the 2013 British Fashion Awards in recognitionof his innovative design talent. This award will contribute toreinforce the brand awareness.
Sowind – which operates the Girard-Perregaux andJEANRICHARD brands – delivered a mixed performance in2013. Girard-Perregaux continued to streamline itsoffering and optimise its manufacturing capacity, and its
ground-breaking new high-end timepiece with arevolutionary “ Constant Force ” escapement was presentedto great acclaim at the 2013 Baselworld Watch andJewellery Show. JEANRICHARD began to market its newcollections having overhauled its range and launched itsnew brand identity. Sales momentum was good for bothbrands but Girard-Perregaux was hampered by thereorganisation of its distribution channels in Asia whichwill continue into the first half of 2014. Despite this,Sowind made a positive contribution to the Group’soperating income.
Pomellato and Dodo – which were integrated in Kering’sLuxury Division since July 1, 2013 – felt the benefits of theGroup’s support from the second half of the year, in termsof commercial property, brand marketing and corporatefunctions. The two brands pursued their respectivestrategies in 2013, with Pomellato focusing on targetedregional expansion and the introduction of new lines and collections, and Dodo aiming to consolidate itsmarket share.
Qeelin – which has been integrated since January 1, 2013 –stepped up the pace of its expansion during the year, openingnew stores in Hong Kong and Mainland China and increasingits marketing investments. Consequently, the brand wasable to deliver solid year-on-year growth despite lessfavourable conditions in the jewellery market in Asia.
Sergio Rossi posted revenue growth in 2013, particularlyin its directly-operated stores network. The brand is indeedpursuing its efforts to streamline and improve the qualityof its distributors network. At the same time, the sales inits directly-operated stores, which account for more thanhalf of total sales, have posted a solid increase.
2013 was another year of growth and expansion for StellaMcCartney. The brand recorded a surge in sales, buoyedby growing recognition and a well-balanced offeringbetween ready-to-wear, leather goods and the children’sline. The contribution of emerging markets is rising, and theyaccounted for over 20% of the brand’s total sales for the firsttime. A total of five new directly-operated stores were openedduring the year and one store was closed. Stella McCartneyalso reported robust growth in operating income.
170 Kering ~ 2013 Reference Document
5 FINANCIAL INFORMATION ~ 2013 ACTIVITY REPORT
05_A_VA_V6 14/04/14 11:32 Page170
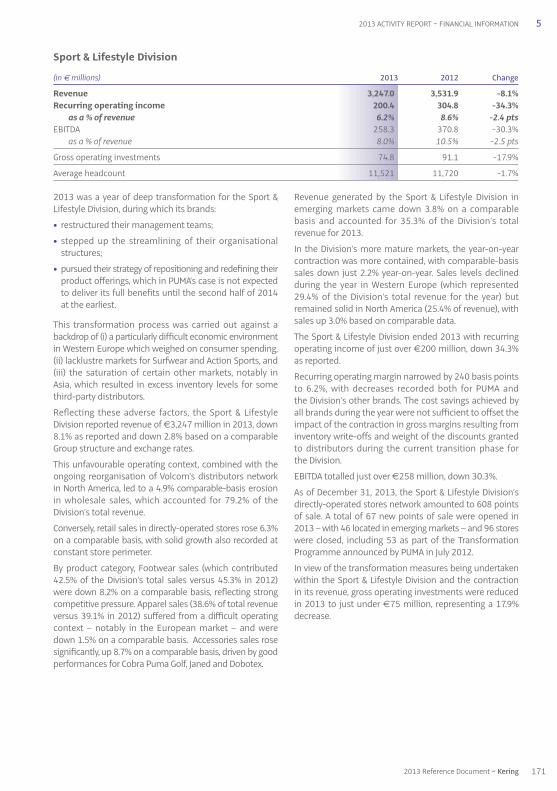
2013 was a year of deep transformation for the Sport &Lifestyle Division, during which its brands:
• restructured their management teams;
• stepped up the streamlining of their organisationalstructures;
• pursued their strategy of repositioning and redefining theirproduct offerings, which in PUMA’s case is not expectedto deliver its full benefits until the second half of 2014at the earliest.
This transformation process was carried out against abackdrop of (i) a particularly difficult economic environmentin Western Europe which weighed on consumer spending,(ii) lacklustre markets for Surfwear and Action Sports, and(iii) the saturation of certain other markets, notably inAsia, which resulted in excess inventory levels for somethird-party distributors.
Reflecting these adverse factors, the Sport & LifestyleDivision reported revenue of €3,247 million in 2013, down8.1% as reported and down 2.8% based on a comparableGroup structure and exchange rates.
This unfavourable operating context, combined with theongoing reorganisation of Volcom’s distributors networkin North America, led to a 4.9% comparable-basis erosionin wholesale sales, which accounted for 79.2% of theDivision’s total revenue.
Conversely, retail sales in directly-operated stores rose 6.3%on a comparable basis, with solid growth also recorded atconstant store perimeter.
By product category, Footwear sales (which contributed42.5% of the Division’s total sales versus 45.3% in 2012)were down 8.2% on a comparable basis, reflecting strongcompetitive pressure. Apparel sales (38.6% of total revenueversus 39.1% in 2012) suffered from a difficult operatingcontext – notably in the European market – and weredown 1.5% on a comparable basis. Accessories sales rosesignificantly, up 8.7% on a comparable basis, driven by goodperformances for Cobra Puma Golf, Janed and Dobotex.
Revenue generated by the Sport & Lifestyle Division inemerging markets came down 3.8% on a comparablebasis and accounted for 35.3% of the Division’s totalrevenue for 2013.
In the Division’s more mature markets, the year-on-yearcontraction was more contained, with comparable-basissales down just 2.2% year-on-year. Sales levels declinedduring the year in Western Europe (which represented29.4% of the Division’s total revenue for the year) butremained solid in North America (25.4% of revenue), withsales up 3.0% based on comparable data.
The Sport & Lifestyle Division ended 2013 with recurringoperating income of just over €200 million, down 34.3%as reported.
Recurring operating margin narrowed by 240 basis pointsto 6.2%, with decreases recorded both for PUMA and the Division’s other brands. The cost savings achieved byall brands during the year were not sufficient to offset theimpact of the contraction in gross margins resulting frominventory write-offs and weight of the discounts grantedto distributors during the current transition phase for the Division.
EBITDA totalled just over €258 million, down 30.3%.
As of December 31, 2013, the Sport & Lifestyle Division’sdirectly-operated stores network amounted to 608 pointsof sale. A total of 67 new points of sale were opened in2013 – with 46 located in emerging markets – and 96 storeswere closed, including 53 as part of the TransformationProgramme announced by PUMA in July 2012.
In view of the transformation measures being undertakenwithin the Sport & Lifestyle Division and the contractionin its revenue, gross operating investments were reducedin 2013 to just under €75 million, representing a 17.9%decrease.
Sport & Lifestyle Division
(in € millions) 2013 2012 Change
Revenue 3,247.0 3,531.9 -8.1%Recurring operating income 200.4 304.8 -34.3%
as a % of revenue 6.2% 8.6% -2.4 ptsEBITDA 258.3 370.8 -30.3%
as a % of revenue 8.0% 10.5% -2.5 pts
Gross operating investments 74.8 91.1 -17.9%
Average headcount 11,521 11,720 -1.7%
171
5
2013 Reference Document ~ Kering
2013 ACTIVITY REPORT ~ FINANCIAL INFORMATION
05_A_VA_V6 14/04/14 11:32 Page171

PUMA’s revenue reached around €3,002 million in 2013,down 8.2% on a reported basis and 2.8% based on acomparable basis.
This revenue contraction is in line with PUMA’s forecasts,as announced on May 14, 2013, which called for a revenuedecrease in the full year. The decrease was partly attributableto external factors, namely an unfavourable consumerspending environment (particularly in Western Europe)and inventory saturation in certain emerging markets. Italso reflected some issues specific to PUMA, such as thediscontinuation of certain businesses, the closure ofunprofitable stores, and the measures currently underwayto streamline the brand’s product offering, especially in Footwear.
In that context, wholesale sales decreased 5.0% year-on-year on a comparable basis, with around 40% of the declineattributable to Western Europe where distributorsreduced their orders. PUMA also recorded lower wholesalesales in most of its emerging markets, due to the highinventory levels previously built up by distributors andthe unsettled economic environment in certain SouthAmerican countries. In North America, however, wholesalesales were up slightly year on year.
Revenue posted by PUMA’s directly-operated stores rose5.8% in 2013 on a comparable basis. Western Europe wasthe only underperforming region for this channel, but thisis partly due to the fact that the number of stores in thisregion has been significantly reduced in 2013 (19% fewerstores compared to last year).
By product categories, Footwear once again accounted forthe highest proportion of sales, representing 45.6% (versus48.8% in 2012), although revenue for this categorycontracted 8.5% year on year on a comparable basis. Positiveperformances from several footwear lines – including theMobium Elite – in the key segments of Running, Training& Fitness and Lifestyle were not sufficient to offset the downward trends experienced by the brand’sFootwear distributors in almost all regions, particularly inWestern Europe.
Apparel sales (35.4% of PUMA’s total revenue versus 35.2% in2012) posted a limited decline in sales, down just 1.1% on acomparable basis. The trends observed in the first six monthsof the year continued into the second half, with negativetrends in European markets but growth in North America.
Conversely, Accessories sales and other revenue were up10.0% on a comparable basis. Sales growth was particularlystrong in mature markets (especially North America), ledby robust performances by COBRA PUMA GOLF but alsoDobotex and Janed.
PUMA generated 37.1% of its total 2013 sales in emergingmarkets, where the brand reported a 3.8% comparable-basis revenue contraction for the year.
In Western Europe, PUMA’s revenue dropped 6.1%, withparticularly negative trends in France and Italy. However,business was up sharply in the United Kingdom, which isone of the brand’s three largest markets in the region.
In Japan, sales declined 3.2%, while they were up 3.9% in North America, fuelled by growth in the Apparel andAccessories categories.
PUMA’s contribution to the Group’s recurring operatingincome amounted to €192 million in 2013 (down 33.8% on2012) and the brand’s recurring operating margin retreatedby 250 basis points to 6.4%. EBITDA totalled €246 million,down 29.7% year-on-year.
This decrease in operating profitability is in line with theguidance issued by PUMA in its quarterly releases concerningits profitability for the full year.
The main reason for PUMA’s lower profitability levels was the190 basis-point narrowing of its gross margin comparedwith 2012, which was primarily due to adverse currencyeffects, the impact of discounts granted to third-partydistributors, and inventory clearance measures. At the sametime, purchasing conditions did not significantly improve.
Operating expenses fell by 6.6% on a reported basis. Thisreduction in the brand’s cost base is one of the initialeffects of the Transformation Programme announced inJuly 2012 and implemented since then, which hasenabled PUMA to limit the contraction in its recurringoperating margin.
However, the full effects of the Programme – notably anupswing in sales – are not expected to be felt until themedium term, i.e. after 2014. In order to implement themeasures related to product development, marketing andcommunications, some operating expense items mayincrease while others will be generally contained or reduced.
PUMA
(in € millions) 2013 2012 Change
Revenue 3,001.9 3,270.7 -8.2%Recurring operating income 191.9 290.0 -33.8%
as a % of revenue 6.4% 8.9% -2.5 ptsEBITDA 246.4 350.3 -29.7%
as a % of revenue 8.2% 10.7% -2.5 pts
Gross operating investments 67.7 81.2 -16.6%
Average headcount 10,750 10,935 -1.7%
172 Kering ~ 2013 Reference Document
5 FINANCIAL INFORMATION ~ 2013 ACTIVITY REPORT
05_A_VA_V6 14/04/14 11:32 Page172
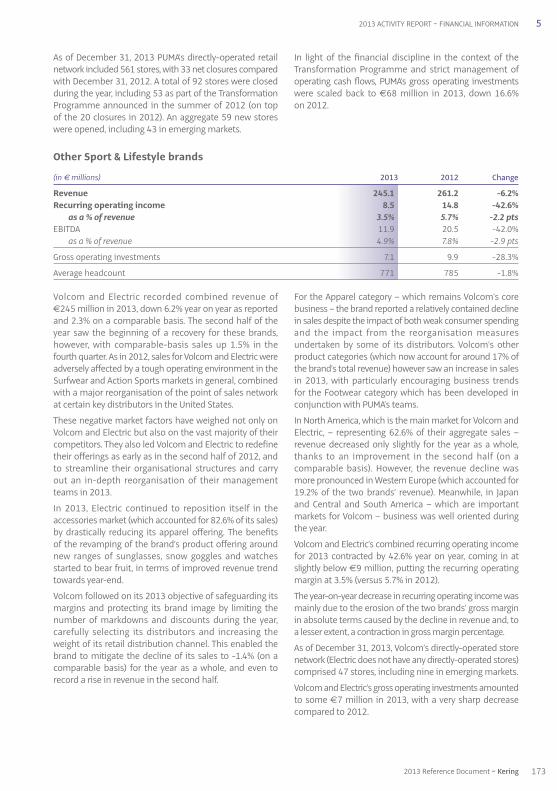
Volcom and Electric recorded combined revenue of €245 million in 2013, down 6.2% year on year as reportedand 2.3% on a comparable basis. The second half of theyear saw the beginning of a recovery for these brands,however, with comparable-basis sales up 1.5% in thefourth quarter. As in 2012, sales for Volcom and Electric wereadversely affected by a tough operating environment in theSurfwear and Action Sports markets in general, combinedwith a major reorganisation of the point of sales networkat certain key distributors in the United States.
These negative market factors have weighed not only onVolcom and Electric but also on the vast majority of theircompetitors. They also led Volcom and Electric to redefinetheir offerings as early as in the second half of 2012, andto streamline their organisational structures and carryout an in-depth reorganisation of their managementteams in 2013.
In 2013, Electric continued to reposition itself in theaccessories market (which accounted for 82.6% of its sales)by drastically reducing its apparel offering. The benefitsof the revamping of the brand’s product offering aroundnew ranges of sunglasses, snow goggles and watchesstarted to bear fruit, in terms of improved revenue trendtowards year-end.
Volcom followed on its 2013 objective of safeguarding itsmargins and protecting its brand image by limiting thenumber of markdowns and discounts during the year,carefully selecting its distributors and increasing theweight of its retail distribution channel. This enabled thebrand to mitigate the decline of its sales to -1.4% (on acomparable basis) for the year as a whole, and even torecord a rise in revenue in the second half.
For the Apparel category – which remains Volcom’s corebusiness – the brand reported a relatively contained declinein sales despite the impact of both weak consumer spendingand the impact from the reorganisation measuresundertaken by some of its distributors. Volcom’s otherproduct categories (which now account for around 17% ofthe brand’s total revenue) however saw an increase in salesin 2013, with particularly encouraging business trends for the Footwear category which has been developed inconjunction with PUMA’s teams.
In North America, which is the main market for Volcom andElectric, – representing 62.6% of their aggregate sales –revenue decreased only slightly for the year as a whole,thanks to an improvement in the second half (on acomparable basis). However, the revenue decline wasmore pronounced in Western Europe (which accounted for19.2% of the two brands’ revenue). Meanwhile, in Japanand Central and South America – which are importantmarkets for Volcom – business was well oriented duringthe year.
Volcom and Electric’s combined recurring operating incomefor 2013 contracted by 42.6% year on year, coming in atslightly below €9 million, putting the recurring operatingmargin at 3.5% (versus 5.7% in 2012).
The year-on-year decrease in recurring operating income wasmainly due to the erosion of the two brands’ gross marginin absolute terms caused by the decline in revenue and, toa lesser extent, a contraction in gross margin percentage.
As of December 31, 2013, Volcom’s directly-operated storenetwork (Electric does not have any directly-operated stores)comprised 47 stores, including nine in emerging markets.
Volcom and Electric’s gross operating investments amountedto some €7 million in 2013, with a very sharp decreasecompared to 2012.
Other Sport & Lifestyle brands
(in € millions) 2013 2012 Change
Revenue 245.1 261.2 -6.2%Recurring operating income 8.5 14.8 -42.6%
as a % of revenue 3.5% 5.7% -2.2 ptsEBITDA 11.9 20.5 -42.0%
as a % of revenue 4.9% 7.8% -2.9 pts
Gross operating investments 7.1 9.9 -28.3%
Average headcount 771 785 -1.8%
As of December 31, 2013 PUMA’s directly-operated retailnetwork included 561 stores, with 33 net closures comparedwith December 31, 2012. A total of 92 stores were closedduring the year, including 53 as part of the TransformationProgramme announced in the summer of 2012 (on topof the 20 closures in 2012). An aggregate 59 new storeswere opened, including 43 in emerging markets.
In light of the financial discipline in the context of theTransformation Programme and strict management ofoperating cash flows, PUMA’s gross operating investmentswere scaled back to €68 million in 2013, down 16.6% on 2012.
173
5
2013 Reference Document ~ Kering
2013 ACTIVITY REPORT ~ FINANCIAL INFORMATION
05_A_VA_V6 14/04/14 11:32 Page173

Capital employed
As of December 31, 2013, capital employed was €538 millionhigher than at the previous year-end.
Goodwill, brands and other intangible assets, net
As of December 31, 2013, “Goodwill, brands and otherintangible assets, net” represented 63% of total assets(versus 57% as of December 31, 2012) and mainlycomprised:
• goodwill amounting to €3,770 million, of which€2,523 million related to the Luxury Division and€1,247 million to the Sport & Lifestyle Division. This
overall goodwill figure was lower than the end-2012total due to the €280 million impairment loss recordedagainst PUMA’s goodwill, although the impact of thiswritedown was partially offset by the effect of theacquisitions carried out during the year;
• brands valued at €10,470 million, of which €6,629 millionfor the Luxury Division and €3,841 million for the Sport &Lifestyle Division. The year-on-year increase in this figurewas primarily due to the acquisition of Pomellato.
Net of deferred tax liabilities relating to brands (which arerecorded under “Other non-current assets (liabilities),net”, as shown below), this item came to €11,738 millionas of December 31, 2013.
1.5. Comments on the Group’s financial position
(in € millions) 2013 2012 Change
Goodwill, brands and other intangible assets, net 14,472.9 14,360.9 +112.0Other non-current assets (liabilities), net (119.9) (467.4) +347.5Current assets, net 836.2 756.7 +79.5Provisions (365.9) (364.8) -1.1
Capital employed 14,823.3 14,285.4 +537.9
Net assets held for sale (184.5) 325.0 -509.5
Total equity 11,195.9 12,118.7 -922.8
Net debt 3,442.9 2,491.7 +951.2
The Corporate segment
The Corporate segment comprises (i) Kering’s corporatedepartments and headquarters teams, (ii) SharedServices, which provide services to the brands, and (iii)the Kering Sustainability Department which is responsiblefor the sustainability initiative launched by Kering in 2011.
Since January 1, 2013 this segment has also included Kering’snew Sourcing Department based on Redcats Asia –
Redcats’ sourcing business that the Group decided to retain.
Costs recorded by the Corporate segment for 2013totalled close to €133 million, up 6.4% year on year.
This increase reflects the cross-business assignments andprojects taken on by the Corporate segment on behalf ofthe Group’s brands, as well as the launch of new shared-services centres, notably in the Asia-Pacific region.
174 Kering ~ 2013 Reference Document
5 FINANCIAL INFORMATION ~ 2013 ACTIVITY REPORT
05_A_VA_V6 14/04/14 11:32 Page174

As of December 31, 2013, Kering’s net current asset figurewas almost €80 million higher than at the previous year-end. After stripping out the impact of fluctuations in exchange rates and changes in Group structure, changesin working capital requirement led to a cash outflow of€75 million.
Changes in inventories resulted in a cash outflow of€93 million during 2013. This mainly reflects the expansionof the Luxury Division’s store network (Gucci and Yves SaintLaurent), partially offset by the effect of inventoryoptimisation measures put in place during the year,particularly at Bottega Veneta.
Adjusted for the effect of fluctuations in exchange ratesand changes in Group structure, the year-on-year increasein trade receivables led to a €7 million cash requirementin 2013. The increase in trade payables resulted in anoverall cash inflow of €69 million, primarily attributableto the business growth reported by the Luxury Division.
The decrease in the net liability recorded under “Othercurrent assets and liabilities” gave rise to a €44 million cashoutflow in 2013, notably at PUMA due to the expenditureincurred in connection with the brand’s TransformationProgramme.
Current assets, net
As of December 31, 2013, net current assets totalled €836 million, versus €757 million as of December 31, 2012. Thisitem breaks down as follows:
(in € millions) 2013 2012 Change
Inventories 1,805.5 1,736.5 +69.0Trade receivables 949.9 985.3 -35.4Trade payables (766.1) (684.5) -81.6Current tax receivables/payables (191.0) (242.7) +51.7Other current assets and liabilities (962.1) (1,037.9) +75.8
Current assets, net 836.2 756.7 +79.5
Deferred taxes primarily correspond to deferred taxliabilities relating to brands recognised on businesscombinations (notably Gucci and PUMA).
As of December 31, 2013, investments in associatescomprised Wilderness shares. The year-on-year increasein non-current financial assets in 2013 was chiefly due tothe acquisition of shares in non-consolidated companies.
The Group’s operating infrastructure breaks down as follows:
Owned Finance Operating 2013 2012 outright leases leases
Sales outlets Luxury Division 21 4 994 1,019 958 Sport & Lifestyle Division 4 604 608 637
Logistics units Luxury Division 19 1 68 88 64 Sport & Lifestyle Division 5 39 44 43
Production units Luxury Division 3 1 18 22 55& other Sport & Lifestyle Division 3 4 7 7
“Property, plant and equipment, net” rose slightly in 2013,due to the impact of increases in the scope of consolidation,
recurring transactions (acquisitions/disposals anddepreciation) and exchange rate fluctuations.
Other non-current assets, net
(in € millions) 2013 2012 Change
Property, plant and equipment, net 1,676.9 1,376.3 +300.6Net deferred tax liabilities (2,160.3) (2,172.1) +11.8Investments in associates 17.3 25.8 -8.5Non-current financial assets 316.1 273.7 +42.4Other non-current assets 30.1 28.9 +1.2
Other non-current assets (liabilities), net (119.9) (467.4) +347.5
175
5
2013 Reference Document ~ Kering
2013 ACTIVITY REPORT ~ FINANCIAL INFORMATION
05_A_VA_V6 14/04/14 11:32 Page175

As of December 31, 2013, Kering’s total equity was lowerthan at the previous year-end, with equity attributable toowners of the parent down €827 million, mainly due tothe impact of:
• €50 million in net income attributable to owners of theparent;
• €471 million in dividends and interim dividends paidby Kering;
• a €314 million stock dividend paid by Kering in theform of Groupe Fnac shares;
• a €28 million negative effect from changes in treasuryshares;
• a €91 million negative effect from currency translationadjustments.
During the year, Kering carried out the following treasuryshare transactions:
• purchases and sales of shares under the liquidityagreement (1,585,556 shares purchased and 1,585,556shares sold);
• the purchase of 106,000 shares and the allotment of102,491 shares to employees in connection with the2009 and 2011 free share plans and 450 shares underthe 2008 and 2009 free share plans;
• the purchase of 130,000 shares and the sale of 103,037shares to employee beneficiaries under stock optionplans, notably the 2006 and 2007 plans;
• the purchase of 720,000 shares and the remittance of714,514 shares in connection with an external growthtransaction and the allocation of the balance of sharesacquired (5,486 shares) to be allotted to employeesunder stock option plans.
As of December 31, 2013, Kering’s share capital was madeup of 126,226,761 shares with a par value of €4 each. Atthat date Kering held no treasury shares in connectionwith the liquidity agreement. Excluding the liquidityagreement, Kering held 60,581 shares in treasury as ofDecember 31, 2013, compared with 25,073 as ofDecember 31, 2012.
As of December 31, 2013, equity attributable to non-controlling interests mainly related to PUMA, for a total of€533 million (versus €665 million the previous year),and the Luxury Division’s brands, for €101 million(€40 million as of December 31, 2012).
The year-on-year change in the amount of equityattributable to non-controlling interests primarilyincludes the impact of (i) acquisitions of additional PUMAshares which raised Kering’s interest in PUMA to almost86% as of December 31, 2013 from 83% one year earlier;and (ii) the first-time consolidation of the Pomellatogroup and Christopher Kane in 2013.
(in € millions) 2013 2012 Change
Provisions for pensions and other post-employment benefits 100.0 104.8 -4.8Other provisions for contingencies and losses 265.9 260.0 +5.9
Provisions 365.9 364.8 +1.1
Net assets held for sale
This item results from applying IFRS 5 to operations that were discontinued or sold during the period, or were in theprocess of being sold. As of December 31, 2013 these operations corresponded to the residual assets of Redcats.
Equity
(in € millions) 2013 2012 Change
Equity attributable to owners of the parent 10,586.6 11,413.8 -827.2Equity attributable to non-controlling interests 609.3 704.9 -95.6
Total equity 11,195.9 12,118.7 -922.8
Provisions
As of December 31, 2013, the portion of provisions forpensions and other post-employment benefits that will notgive rise to cash outflows in the coming 12 months (recordedunder non-current liabilities) amounted to €93 million,slightly lower than the December 31, 2012 figure as a resultof changes in the actuarial assumptions used.
Other provisions for contingencies and losses edged up in2013, mainly due to the combined impacts of (i) thepartial utilisation of the provisions set aside for the PUMATransformation Programme and (ii) the reclassification of provisions for tax disputes in various countries and the recognition of provisions for new disputes withexternal parties.
176 Kering ~ 2013 Reference Document
5 FINANCIAL INFORMATION ~ 2013 ACTIVITY REPORT
05_A_VA_V6 14/04/14 11:32 Page176

In the first half of 2013, Kering redeemed both the€600 million worth of bonds issued in 2005, includingthe additional bonds issued in 2006, and the second€200 million tranche of the bonds indexed to the Keringshare price that were issued in May 2008. To extend thematurity of its debt, Kering carried out a first bond issueon July 13, 2013, involving €500 million of seven-yearbonds with a fixed-rate coupon of 2.5%, and a second –which also represented €500 million – on October 8, 2013,involving five-year bonds with a 1.875% fixed-rate coupon.
As of December 31, 2013, the Group’s gross borrowingsincluded €324 million concerning put options granted tominority shareholders (€215 million as of December 31,2012). The year-on-year increase notably stemmed fromthe recognition of the liability related to the non-controllinginterests in the Pomellato group.
In accordance with the Group’s interest rate managementpolicy, fixed-rate borrowings accounted for 59.3% of theGroup’s total gross borrowings as of December 31, 2013(including hedges), compared with 60.4% one year earlier.
As of December 31, 2013, the Group’s gross borrowingsmainly comprised euro-denominated borrowings. Theproportion denominated in Japanese yen represented 6.8%of total gross borrowings (8.9% as of December 31, 2012)and the proportion denominated in other currenciesstood at 7.2% (7.5% as of December 31, 2012).
Kering minimises its exposure to concentration risk bydiversifying its sources of financing. Therefore, non-bankingdebt accounted for 74.9% of gross borrowings as ofDecember 31, 2013, versus 76.3% as of December 31, 2012.Kering’s credit facilities are taken out with a diversifiedpool of top-tier French and non-French banks. As ofDecember 31, 2013, 78.8% of the confirmed credit facilitiesgranted to Kering were provided by a total of ten banks.The Group’s three leading banking partners represented40% of the total and no single bank accounted for morethan 20% of the aggregate amount of confirmed creditfacilities available to the Group.
Kering only carries out borrowing and investmenttransactions with investment grade financial institutionsand it spreads these transactions amongst the variousinstitutions concerned.
Net debt
The Group’s net debt totalled €3,443 million as of December 31, 2013, representing an increase of €951 million or38.2% compared with the previous year-end. As of December 31, 2013, Kering’s net debt broke down as follows:
(in € millions) 2013 2012 Change
Bonds 3,290.5 3,048.3 +242.2Bank borrowings 454.2 566.4 -112.2Commercial paper 358.0 449.0 -91.0Other borrowings 767.1 520.3 +246.8
Gross borrowings(1) 4,869.8 4,584.0 285.8
Fair value hedges (interest rate) (7.7) (11.3) +3.6Cash and cash equivalents (1,419.2) (2,081.0) +661.8
Net debt 3,442.9 2,491.7 +951.2
(1) Excluding the financing of customer loans.
177
5
2013 Reference Document ~ Kering
2013 ACTIVITY REPORT ~ FINANCIAL INFORMATION
05_A_VA_V6 14/04/14 11:32 Page177

Kering’s bank borrowing facilities are subject to just onefinancial covenant which provides that the solvency ratio(net debt to EBITDA, calculated annually on a proformabasis at the year-end) must not exceed 3.75.
In March 2012 Standard & Poor’s upgraded Kering’s long-term rating from BBB- to BBB with a stable outlook.
GEARING SOLVENCY
• its gearing ratio (net debt to equity) came out at 30.8% as of December 31, 2013 versus 20.6% as ofDecember 31, 2012.
• its solvency ratio (net debt to EBITDA) stood at 1.68 asof December 31, 2013 versus 1.21 as of December 31,2012.
Solvency
At December 31, 2013, Kering had a very sound financialstructure:
178 Kering ~ 2013 Reference Document
5 FINANCIAL INFORMATION ~ 2013 ACTIVITY REPORT
2009* 2010*
32.4%
39.9%
2011*
28.9%
2012
20.6%
2013
30.8%
* Reported data, not restated.
2009* 2010*
3,781
4,367
2011*
3,396
2012
2,492
2013
3,443
* Reported data, not restated.
Net debt (1) (ND)(in € millions)
Solvency ratio (ND/EBITDA)
2.44
2.031.78
1.21
1.68
(1) Net debt defined page 156.
05_A_VA_V6 14/04/14 11:32 Page178
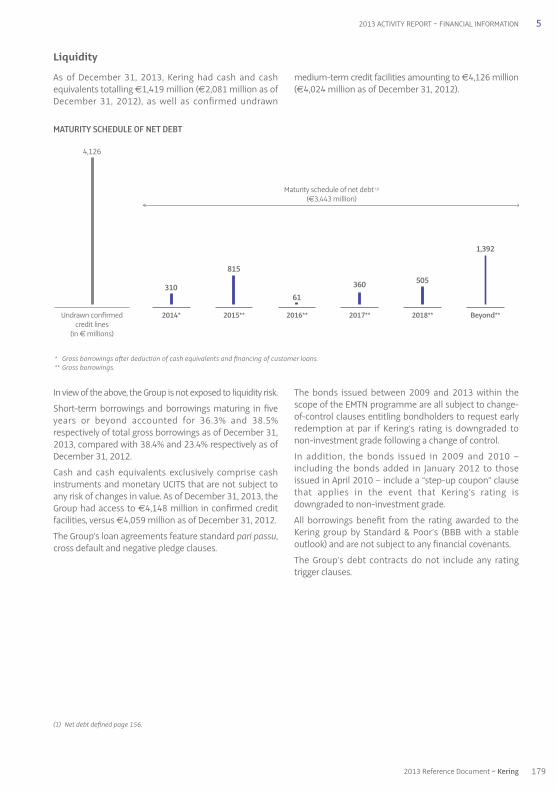
MATURITY SCHEDULE OF NET DEBT
In view of the above, the Group is not exposed to liquidity risk.
Short-term borrowings and borrowings maturing in fiveyears or beyond accounted for 36.3% and 38.5%respectively of total gross borrowings as of December 31,2013, compared with 38.4% and 23.4% respectively as ofDecember 31, 2012.
Cash and cash equivalents exclusively comprise cashinstruments and monetary UCITS that are not subject toany risk of changes in value. As of December 31, 2013, theGroup had access to €4,148 million in confirmed creditfacilities, versus €4,059 million as of December 31, 2012.
The Group’s loan agreements feature standard pari passu,cross default and negative pledge clauses.
The bonds issued between 2009 and 2013 within thescope of the EMTN programme are all subject to change-of-control clauses entitling bondholders to request earlyredemption at par if Kering’s rating is downgraded tonon-investment grade following a change of control.
In addition, the bonds issued in 2009 and 2010 –including the bonds added in January 2012 to thoseissued in April 2010 – include a “step-up coupon” clausethat applies in the event that Kering’s rating isdowngraded to non-investment grade.
All borrowings benefit from the rating awarded to theKering group by Standard & Poor’s (BBB with a stableoutlook) and are not subject to any financial covenants.
The Group’s debt contracts do not include any ratingtrigger clauses.
As of December 31, 2013, Kering had cash and cashequivalents totalling €1,419 million (€2,081 million as ofDecember 31, 2012), as well as confirmed undrawn
medium-term credit facilities amounting to €4,126 million(€4,024 million as of December 31, 2012).
Liquidity
179
5
2013 Reference Document ~ Kering
2013 ACTIVITY REPORT ~ FINANCIAL INFORMATION
Undrawn confirmedcredit lines
(in € millions)
Maturity schedule of net debt (1)
(€3,443 million)
2014*
310
4,126
2015**
815
2016**
61
2017**
360
2018**
505
Beyond**
1,392
* Gross borrowings after deduction of cash equivalents and financing of customer loans.** Gross borrowings.
(1) Net debt defined page 156.
05_A_VA_V6 14/04/14 11:32 Page179

Gross operating investments amounted to €678 million, up 53% year on year and breaking down as follows:
(in € millions) 2013 2012 Change
Luxury Division 435.6 337.3 +29.1%Sport & Lifestyle Division 74.8 91.1 -17.9%Corporate 167.3 13.5 +1,139.3%
Gross operating investments 677.7 441.9 +53.4%
Cash flow from operating activities before tax, dividendsand interest edged down slightly by €18 million (or 0.9%)compared with 2012, due to an erosion in PUMA’s recurringoperating income that was partially offset by the increasein profitability within the Luxury Division.
Changes in working capital requirement gave rise to a netcash outflow of €75 million in 2013 compared with a netcash outflow of €273 million in 2012.
This €198 million year-on-year decrease reflects thefollowing factors:
• a favourable impact of around €10 million resultingfrom an improved inventories management within theLuxury Division;
• a positive €24 million impact from a decrease in tradereceivables compared with the previous year, notablyfor PUMA;
• a positive impact of around €156 million due to the returnto a normal level of trade payables, which had decreasedsharply in 2012 mainly due to the significant scalingback of purchasing programmes at PUMA.
Corporate income tax paid was up slightly on 2012.
Net cash outflows relating to net operating investmentsrose by €232 million in 2013 compared with 2012. The 2013figure includes €10 million in proceeds from disposals ofproperty, plant and equipment and intangible assets(versus €6 million in 2012).
Changes in net debt
Changes in net debt during 2013 and 2012 can be analysed as follows:
(in € millions) 2013 2012
Net debt as of January 1 2,491.7 3,395.5
Free cash flow from operations (857.5) (930.2)Net interest paid and dividends received 117.1 162.3Dividends paid 497.2 473.3Acquisition of Kering shares 39.0 14.9Acquisition of PUMA shares 99.6 119.6Other acquisitions and disposals 1,154.7 (652.6)Other movements (98.9) (91.1)
Net debt as of December 31 3,442.9 2,491.7
Free cash flow from operations
The generation of free cash flow from operations is a key financial objective for all of the Group’s brands. In 2013, theGroup’s free cash flow from operations came to just under €858 million.
(in € millions) 2013 2012 Change
Cash flow from operating activities before tax, dividends and interest 1,983.1 2,000.7 -0.9%
Change in working capital requirement (excluding tax) (74.5) (272.5) -72.7%Corporate income tax paid (383.7) (362.2) +5.9%
Net cash from operating activities 1,524.9 1,366.0 +11.6%
Net operating investments (667.4) (435.8) +53.1%
Free cash flow from operations 857.5 930.2 -7.8%
180 Kering ~ 2013 Reference Document
5 FINANCIAL INFORMATION ~ 2013 ACTIVITY REPORT
05_A_VA_V6 14/04/14 11:33 Page180

The parent company ended 2013 with net income of€833 million, compared with €506 million in 2012. The2013 total includes €2,188 million in dividends receivedfrom subsidiaries (€876 million in 2012).
At its February 20, 2014 meeting, the Board decided thatat the Annual General Meeting to be held to approve thefinancial statements for the year ended December 31,2013 it will propose shareholders to approve a cashpayment for the 2013 dividend, corresponding to €3.75per share.
An interim dividend of €1.50 per share was paid onJanuary 24, 2014 pursuant to a decision by the Board ofDirectors on December 20, 2013.
If the final dividend is approved, the total dividend cashpayout in 2014 will amount to €473 million.
This recommended dividend reflects Kering’s goal ofmaintaining well-balanced payout ratios bearing in mind,on the one hand, changes in net income from continuingoperations (excluding non-recurring items) attributable toowners of the parent and, on the other hand, the amountof available cash flow. Kering’s payout ratios for 2013 areas follows:
• 38.5% of net income from continuing operations (excludingnon-recurring items) attributable to owners of theparent, versus 37.3% on a reported basis in 2012;
• 64% of available cash flow, compared with 61.6% on areported basis in 2012.
1.6. Net income and dividend of the parent company
In 2013, 46% of the Group’s gross operating investmentsconcerned store opening programmes, and around 19%related to store conversions and/or renovations (versus36% and 18% respectively in 2012).
The Luxury Division accounted for €98 million of theoverall increase in gross operating investments, reflectingstore openings and investments in the supply chain. Grossoperating investments for the Corporate segment includedKering’s acquisition of a building in the prestigiousOmotesandō district of Tokyo, which will be used toshowcase some of the Luxury Division brands.
Available cash flow
In 2013, net cash outflows relating to net finance costsincluded €70 million in interest and dividends received(versus €69 million in 2012). Out of this total, €62 millioncorresponded to the proceeds received following theredemption at 69.1% of par of the second tranche of thebonds indexed to Kering shares, which matured in May 2013.
Available cash flow for the year amounted to €740 millioncompared with €768 million in 2012.
Dividends paid
Dividends paid in 2013 were 5% higher than in 2012. The 2013 figure included €26 million paid to minorityshareholders of consolidated subsidiaries (€33 million in2012), of which almost €15 million related to PUMA andits subsidiaries (€23 million in 2012). The cash dividendpaid by Kering to its own shareholders in 2013 amountedto €471 million (including the interim dividend paid onJanuary 24, 2013), representing a slight increase comparedto 2012.
Acquisitions and disposals
In 2013, Kering purchased almost €100 million worth ofPUMA shares, increasing its interest in the company to85.81% at year-end 2013, from 82.99% at year-end 2012.
“ Acquisitions of Kering shares ” for an overall amount ofalmost €39 million relate to the purchase of 236,000shares in connection with the Group’s stock option andfree share plans.
The impact of other acquisitions and disposals of securitiesduring 2013 mainly concerned (i) the acquisitions carriedout during the period (including the Pomellato group,Richard Ginori, Christopher Kane and France Croco), (ii)€656 million in financial cash flows related to discontinuedoperations (primarily the recapitalisation of Groupe Fnacand collection of the sale price for assets disposed of inthe period, net of the financing provided for Redcats’operations).
In 2012, acquisitions and disposals of securities chieflyconcerned the acquisition of Brioni and the sale of Cfao,as well as cash flows related to operations that werediscontinued, sold or in the process of being sold duringthe year, notably corresponding to the proceeds from thesale of The Sportsman’s Guide and The Golf Warehouse.
Other movements
This item mainly includes the impact of (i) fluctuations inexchange rates, and (ii) fair value remeasurements offinancial instruments in accordance with IAS 32 and 39.
181
5
2013 Reference Document ~ Kering
2013 ACTIVITY REPORT ~ FINANCIAL INFORMATION
05_A_VA_V6 14/04/14 11:33 Page181

182 Kering ~ 2013 Reference Document
5 FINANCIAL INFORMATION ~ 2013 ACTIVITY REPORT
DIVIDEND PER SHARE (IN €)
PAYOUT RATIOS
2009 2010
3.503.30
2011
3.50
2012
3.75
2013*
3.75
* Subject to approval at the Annual General Meeting.
2009** 2010** 2011** 2012 2013*
* Subject to approval at the Annual General Meeting.** Reported data, not retstated.
% of attributable recurring net income, from continuing operations
% of free cash flow
58.6%
48.3%47.6%
52.9%
41.8%
59.8%
37.3% 38.5%
61.6%64.0%
Having completed its transformation, Kering has extremelysolid fundamentals which enable the Group to approach2014 with confidence.
Drawing on its positioning in structurally high-growthmarkets and its portfolio of powerful brands with strongpotential, Kering will continue to implement its strategyof rigorously managing and allocating its resources.
2014 will be marked by an ambitious relaunch plan forPUMA and by dedicated action plans for each of theLuxury Division’s brands, focusing on achieving profitableorganic growth.
In this context, Kering is forecasting growth for both itsrevenue and recurring operating income in 2014.
1.9. Outlook
The exclusive negotiations concerning the sale of LaRedoute and Relais Colis are still under way betweenKering and the executives concerned, who presented
their business plan to the relevant employee representativebodies in January 2014 as part of the standard informationand consultation procedure required under French law.
1.7. Transactions with related parties
Transactions with related parties are described in Note 34 to the consolidated financial statements.
1.8. Subsequent events
05_A_VA_V6 14/04/14 11:33 Page182

2013
Financial investments represented net cash outflows of €320.3 million for 2013, with acquisitions exceedingdisposals of financial assets, taking into accountrecapitalisations and refinancing, asset disposals anddiscontinued operations.
The cash flow relating to businesses sold that were restatedin accordance with IFRS 5 (Fnac and the Redcats group) isshown on the line “Net cash from discontinued operations”.
Kering strengthens its portfolio of luxury brands
In early January 2013, Kering completed its acquisition ofa majority stake in the Chinese fine jewellery brand Qeelin.Launched in 2004, Qeelin is the first Chinese luxury jewellerto have developed an international network of stores inthe most prestigious shopping districts worldwide. At thetime of acquisition, it operated 14 stores (seven inMainland China, four in Hong Kong and three in Europe)and is sold in a number of multi-brand stores such asColette in Paris and Restir in Tokyo.
On January 15, 2013, Kering acquired a majority stake inthe luxury designer brand Christopher Kane with a view todeveloping the brand’s business in close partnership withits eponymous creator, the Scottish designer ChristopherKane. Founded in 2006, Christopher Kane is a distinctiveand exciting brand with a unique DNA.
On March 25, 2013, Kering announced that it had acquireda majority stake in France Croco / Tannerie de Périers.Founded in 1974, France Croco is a leading independenttannery located in Normandy and specialised in thesourcing, tanning and processing of crocodile skins.
On April 22, 2013 Gucci further demonstrated itscommitment to the excellence of “Made in Italy” and toTuscany by announcing that it had acquired the Italian
porcelain maker, Richard Ginori, as part of its plans toexpand into the tableware market.
On April 24, 2013, Kering announced that it had signed anagreement with RA.MO SpA to acquire a majority stake inthe Italian jewellery group Pomellato. The Pomellatogroup has two brands: Pomellato, which is positioned inthe fine jewellery segment and Dodo, positioned in theaccessible jewellery segment. Through this acquisitionKering has extended and strengthened its portfolio ofluxury brands in the high-growth jewellery segment. Thetransaction was completed on July 5, 2013, followingclearance by the competition authorities. In view of thedate on which Kering took over control of the Group,Pomellato has been consolidated since July 1, 2013.
On September 6, 2013, Kering announced that it wasacquiring a minority shareholding in the New York-basedfashion brand, Altuzarra, founded by the Franco-Americandesigner Joseph Altuzarra in 2008. This investment marksthe beginning of a partnership which will enable Kering toaccompany Altuzarra in the next stage of its growth.
On November 19, 2013, Kering and Tomas Maier announcedthat they had entered into a joint venture to develop thebusiness of the Tomas Maier brand in partnership. TomasMaier will continue to be Creative Director of BottegaVeneta, a position he has held since 2001.
Distribution of Groupe Fnac shares, Kering continuesits divestment of the Redcats group and finalises theGroup’s transformation
In line with the principle announced on October 9, 2012,at its April 17, 2013 meeting Kering’s Board of Directorsunanimously approved the listing of Groupe Fnac sharesthrough a distribution of Groupe Fnac shares to Keringshareholders. At the Annual General Meeting on June 18,2013, Kering’s shareholders authorised the payment of
2.1. Financial investments
In 2013, Kering pressed ahead with its strategy ofreinforcing profitable high-growth activities. This strategyemphasises organic growth and international expansion, andis founded on renowned global brands. It is implementedin the Luxury and Sport & Lifestyle markets alike.
The objective is to ensure the success of each Group entityand leverage its organic growth potential. To bolster itspositions, Kering may make tactical acquisitions so as to
round out its resources, brand and product portfolios.
This vision also provides scope for strategic acquisitions,which are an effective means of accelerating the Group’sdevelopment and improving its growth and profitabilityprofile.
2. Investment policy
1832013 Reference Document ~ Kering
5INVESTMENT POLICY ~ FINANCIAL INFORMATION
05_B_VA_V6 14/04/14 11:32 Page183

an additional cash dividend and an additional dividend inthe form of Groupe Fnac shares. On June 20, 2013 prior tothe start of market trading, the rights to the balance ofthe cash dividend for 2012 were detached from theKering shares and the dividend was paid. The rights to the allotment of Groupe Fnac shares were also detachedfrom the Kering shares and the deliveries of Groupe Fnacshares began. Consequently, the Groupe Fnac shareallotment rights began trading on Euronext Paris on thesame day.
In 2013, Kering continued the divestment of the Redcatsgroup and finalised the Group’s transformation.
• on January 3, 2013, Kering announced that it hadreceived a firm offer from Alpha Private Equity Fund 6(“APEF 6”) to acquire Redcats’ Children and Familydivision – comprising the Cyrillus and Vertbaudet brands– for an enterprise value of €119 million. The transactionwas completed on March 28, 2013;
• on February 5, 2013, Kering announced the closing ofthe sale of OneStopPlus to Charlesbank Capital Partnersand Webster Capital in accordance with the terms ofthe definitive sale agreement announced onDecember 5, 2012. This transaction marked the finalstep in the sale of all of Redcats USA’s operations;
• on February 25, 2013, Kering announced that Redcatshad entered into an agreement to sell its Nordicactivities, Ellos and Jotex to Nordic Capital Fund VII foran enterprise value of €275 million. The transaction wascompleted on June 3, 2013;
• during the second half of 2013, Kering continued theprocess for its planned sale of La Redoute and RelaisColis. On December 4, 2013, after examining the fourtakeover offers, Kering’s Board of Directors decided toenter into exclusive negotiations with Nathalie Balla– the current chairman and CEO of La Redoute – andEric Courteille – Chief Administrative Officer of Redcats.This process has continued during the first half of 2014.
Other changes
In 2013, Kering purchased a total of 422,500 PUMA shareson the market for an aggregate €99.6 million. This raisedKering’s stake in PUMA to 85.81% as of December 31,2013 from nearly 83% one year earlier.
2012
Financial investments represented net cash inflows of€697 million for 2012, with disposals well exceedingacquisitions of financial assets. The cash flow relating tobusinesses sold that were restated in accordance withIFRS 5 (Fnac and the Redcats group) is shown on the line“Net cash from discontinued operations”.
Acquisition of Brioni
On November 8, 2011, Kering announced that it was toacquire 100% of Brioni’s share capital.
The acquisition was finalised on January 11, 2012, on theapproval of the competition authorities. Brioni is one ofthe world’s most reputable men’s fashion houses, owingto its exceptional sartorial expertise. It is a profitable andgrowing business with its own tailoring workshops, thelargest of which is located in Penne in the Abruzzo regionof Italy. As of December 31, 2012, the company had 1,800employees and was distributed in 35 directly-ownedstores, as well as through an extensive network of points-of-sale around the world. Brioni was consolidated inPPR’s financial statements as from January 1, 2012.
Sale of PPR’s remaining stake in Cfao
Following a share purchase agreement signed on July 26,2012 between Kering and the Japanese group ToyotaTsusho Corporation (“TTC”), in early August 2012 TTCacquired from Kering 29.8% of the share capital of Cfao ata price of €37.50 per share, making it Cfao’s mainshareholder. Subsequently, in December 2012 Keringtendered its residual 12.2% stake in Cfao to the voluntarypublic offer launched by TTC in October 2012 for Cfao’sremaining capital. The tender price was the same as thatapplied when TTC purchased its 29.8% interest, i.e.,€37.50 per share.
Plan to demerge and float Fnac and disposal of Fnac Italy
In 2012, Kering continued its strategic refocusing anddecided on a plan to demerge and float Fnac. The principleof this plan was unanimously approved by Kering’s Boardof Directors on October 9, 2012.
The sale of Fnac Italy initiated in the second half of 2011was finalised in the second half of 2012. An agreementwas entered into in November 2012 to sell Fnac Italy tothe investment fund Orlando Italy. The transaction wascompleted in January 2013.
Continued divestment of the Redcats group
The process begun by Kering in second-half 2011 to sellthe Redcats group was continued in 2012.
On November 8, 2012, Kering announced that anagreement had been signed between Redcats andNorthern Tool + Equipment (NTE) to sell the Sports& Leisure activities of Redcats USA, including TheSportsman’s Guide and The Golf Warehouse, for anenterprise value of USD 215 million. The sale wascompleted on December 17, 2012 and the sale price wascollected in accordance with the terms agreed.
5 FINANCIAL INFORMATION ~ INVESTMENT POLICY
184 Kering ~ 2013 Reference Document
05_B_VA_V6 14/04/14 11:32 Page184
The Group conducts a targeted investment policy designedto reinforce both its image and the unique positioning ofits brands, as well as to increase its return on capitalemployed.
The Group’s investment policy is focused on thedevelopment of its store network, the conversion andrenovation of its existing points of sale, the establishmentand maintenance of manufacturing units in the Luxurysector, and the development of IT systems.
Gross operating investments amounted to €678 million,up 53% year-on-year, or up 22% when adjusted for theone-off investment of more than €140 million for thepurchase of a building in Japan.
In 2013, 46% of the Group’s gross operating investmentsconcerned store opening programmes, and around 19% related to store conversions and / or renovations.Investments in France accounted for around 4% of thetotal in 2013. In 2012, 36% of the Group’s gross operatinginvestments concerned store opening programmes, andaround 18% related to store conversions and / orrenovations.
The Luxury Division accounted for most of the overallincrease in gross operating investments, with 191 netstore additions and renovations.
In 2013, net operating investments included €10 millionin proceeds from disposals of property, plant andequipment and intangible assets (€6 million in 2012).
Luxury Division
The Luxury Division’s gross operating investmentsamounted to €436 million in 2013, up 29.1% on 2012.This increase stemmed from store openings, expansionsand refurbishments (accounting for around 60% of thetotal) as well as significant investments in infrastructures,systems and the supply chain. It also reflects the Group’sobjective of allocating the resources required for developingthe brands’ businesses in line with their strategic plans.2013 was a key year for stepping up the pace of Yves SaintLaurent’s growth and integrating Brioni, with around two-thirds of the year-on-year increase in operating investmentsrelated to these two brands.
As of December 31, 2013 the Luxury Division had a networkof 1,149 directly-operated stores, including 750 in maturemarkets and 399 in emerging markets (201 in GreaterChina). Net store additions during the year totalled 191.However, when adjusted for transfers of existing points ofsale previously operated by third-party distributors (YvesSaint Laurent in the United Arab Emirates, Gucci andBalenciaga in South Korea, Brioni in China and Gucci inCanada) and the Qeelin store network as of January 1,2013 and the Pomellato / Dodo network as of July 1, 2013,the number of net store additions amounted to 94. Outof these additions, 50 stores are in mature markets and44 in emerging markets.
Gucci
Gucci’s gross operating investments amounted to€215 million in 2013, up 5.2% on 2012, when they rose byaround 83%. 2013 therefore marked the first stage towarda stabilisation of the brand’s investment spending. Store-related investments accounted for over half of the brand’stotal gross operating investments in 2013, with prioritygiven to refurbishments in order to enhance both thenetwork’s productivity and customers’ shopping experienceand to a retail environment aligned with the brand’songoing repositioning.
As of December 31, 2013, Gucci operated 474 storesdirectly, including 183 in emerging markets, of which 76in Greater China. Excluding the incorporation into thedirectly-operated store network of 11 points of sale inSouth Korea and 8 boutiques in Holt Renfrew departmentstores in Canada, Gucci added a net 26 new stores in2013 (compared with 53 net additions in 2012), of which20 in mature markets.
Bottega Veneta
Bottega Veneta’s gross operating investments rose byaround 50% year on year to €62.0 million. Almost two-thirds of these investments related to the store networkand the remainder included financing for a new atelierand offices at Montebello Vicentino.
2.2. Operating investments
On December 5, 2012, Kering announced that Redcats hadentered into an agreement to sell OneStopPlus, its plus-size business in the United States, to Charlesbank CapitalPartners and Webster Capital for an enterprise value of USD 525 million. This transaction – which was contingenton the customary closing conditions and approval by the US antitrust authorities – was finalised on February 5, 2013.
Other changes
In 2012, Kering and PUMA purchased a total of 465,314PUMA shares on the market for an aggregate €120 million.This raised Kering’s stake in PUMA from 79.9% as ofDecember 31, 2011, to 83% as of December 31, 2012.
5INVESTMENT POLICY ~ FINANCIAL INFORMATION
1852013 Reference Document ~ Kering
05_B_VA_V6 14/04/14 11:32 Page185
Bottega Veneta’s network of directly-operated storestotalled 221 as of December 31, 2013, including 90 inemerging markets. There were 25 net store additionsduring the year, versus 26 in 2012. In addition, the brandextended, relocated or refurbished a total of 16 stores.
Yves Saint Laurent
Gross operating investments increased three-fold in 2013to €65 million, with nearly 80% of this amount related toopening new stores and adapting existing stores to thenew store concept.
As of December 31, 2013, the Yves Saint Laurent branddirectly operated 115 stores, including 46 in emergingmarkets. In line with the brand’s aim of stepping up thepace of business expansion in 2013 by investing in thedistribution network, there were 20 net store additionsduring the year and the brand brought back under directmanagement six points of sale in the United Arab Emirates.
Other Luxury brands
The network of directly-operated stores owned by OtherLuxury brands totalled 339 stores as of December 31, 2013,including 55 in Greater China and 25 in other emergingmarkets. A total of 259 stores are located in these brands’traditional markets, mainly concentrated in Western Europeand Japan (118 and 104 stores respectively). There were95 net store additions during the year, reflecting thecombined impacts of integrating Qeelin and Pomellato(60 store additions), transferring or purchasing points ofsale that were previously operated by third parties (12additions), opening new stores (41 additions), and closing18 existing stores.
The Group’s commitment to developing the business ofits Other Luxury brands is evidenced by the 33.3% increasein their gross operating investments in 2013 to €94 million,the majority of which related to store openings.
Sport & Lifestyle Division
In view of the transformation measures being undertakenwithin the Sport & Lifestyle Division and the contractionin its revenue, gross operating investments reduced in 2013to just under €75 million, representing a 17.9% decrease.
As of December 31, 2013, the Sport & Lifestyle Divisiondirectly-operated store network amounted to 608 pointsof sale. A total of 67 new points of sale were opened in2013 – with 46 located in emerging markets – and 96 storeswere closed, including 53 as part of the TransformationProgramme announced by PUMA in July 2012.
PUMA
In light of the financial discipline in the context of theTransformation Programme and strict management ofoperating cash flows, PUMA’s gross operating investmentswere scaled back to €68 million in 2013, down 16.6% on 2012.
As of December 31, 2013 PUMA’s directly-operated retailnetwork included 561 stores, with 33 net closures comparedwith December 31, 2012. A total of 92 stores were closedduring the year, including 53 as part of the TransformationProgramme announced in the summer of 2012 (on topof the 20 closures in 2012). An aggregate 59 new storeswere opened, including 43 in emerging markets.
Other Sport & Lifestyle brands
Volcom and Electric’s gross operating investmentsamounted to some €7 million in 2013, with a very sharpdecrease compared to 2012.
As of December 31, 2013, Volcom’s directly-operated storenetwork (Electric does not have any directly-operated stores)comprised 47 stores, including nine in emerging markets.There were four net store openings during the year.
5 FINANCIAL INFORMATION ~ INVESTMENT POLICY
186 Kering ~ 2013 Reference Document
05_B_VA_V6 14/04/14 11:32 Page186
The Kering group has established a centralised structurefor the management of liquidity, exchange rate and interestrate risks. The Group’s Financing and Treasury Department,which reports to the Finance Department, is responsible forthis organisation and has the necessary expertise, resources(particularly technical) and information systems to carryout its tasks. It executes transactions in various financialmarkets with optimum efficiency and security via KeringFinance SNC, which is dedicated to cash managementand financing. The Financing and Treasury Departmentalso coordinates cash management for the subsidiariesand sets out the Group’s banking policy.
The financial risks identified by the Group aresummarised below:
Counterparty risk
Kering minimises its exposure to counterparty risk bydealing only with investment grade companies and byspreading its exposure among its various counterparties,up to their respective exposure and maturity limits.Counterparties to derivative transactions are included inthe Group’s counterparty risk management procedures.Each of these transactions requires approval and isgoverned by limits and maturities that are reviewed on aregular basis. Counterparties are assessed using aninternal classification system based on the rating theyhave received from rating agencies. Counterparties must be rated at least “BBB” by Standard & Poor’s and theequivalent by Moody’s.
Equity risk
In the normal course of its business, the Group enters intotransactions involving shares in consolidated companies orshares issued by Kering. The Group trades in its own securitieseither directly or through derivatives as part of its sharebuy-back programme and in accordance with applicableregulations. Kering has also signed an agreement with afinancial broker in order to improve the liquidity of theGroup’s shares and ensure share price stability. Thisagreement complies with the Professional Code ofConduct drawn up by the French association of financialand investment firms (Association française des marchésfinanciers - AMAFI) and approved by the French financialmarkets authority (Autorité des marchés financiers – AMF).
Shares held in connection with non-consolidatedinvestments represent a low exposure risk for the Groupand are not hedged.
When Kering sets up financial investments in the form ofopen-ended investment funds (Sicav), UCITS or equivalentfunds, it systematically uses liquid monetary instrumentswith maturities of less than three months in order tomitigate risk. Consequently, the price risk borne by Keringis deemed not to be material.
In May 2008, Kering issued a €400 million bond indexedto the price of its own shares, in two equal tranches of€200 million, the first of which matured in November2012 and the other in May 2013. The redemption price ofthese bonds was indexed to changes in the price of theKering share within the limit of a specified maximum andminimum price.
Additional information on equity risk is provided in Note 29.3 to the annual consolidated financial statements.
Foreign exchange risk
The Group uses hedging instruments to reduce its exposureto currency risk based on the specific requirements ofeach Division.
These instruments are used either to hedge foreign currencytrade receivables and payables, or to hedge highly probableforecast exposures and / or firm commitments. Eachentity hedges the risk generated by using a currency otherthan its functional currency in its commercial dealings.
Companies in the Sport & Lifestyle Division primarily hedgethe foreign exchange risk generated by firm purchasecommitments in foreign currencies and highly probablepurchase flows. Periods depend on the activity specific toeach company. Hedging flows may be generated by inter-company flows through purchasing offices.
Foreign exchange risk hedging by the Luxury Division’sentities mainly covers sales made to their retailsubsidiaries, and to a lesser extent purchase flows. Theseare essentially inter-company flows.
Future foreign exchange exposures are determined usinga regularly updated budget procedure.
Hedging periods are adapted to each brand’s business cycleand only marginally exceed one year at each reporting date.
3. Risk management
3.1. Financial risks
1872013 Reference Document ~ Kering
5RISK MANAGEMENT ~ FINANCIAL INFORMATION
05_C_VA_V6 14/04/14 11:34 Page187

Foreign exchange policies and procedures are set out byeach company’s Executive Committee and are validatedby Kering.
Each brand hedges its own foreign exchange risks inaccordance with policies and procedures reflecting itsspecific requirements.
These procedures incorporate Group policies as definedby Kering:
• Kering Finance SNC is the sole counterparty in currencytransactions, except where specific regulatory oroperating constraints rule this out;
• the amounts and maturities of all currency hedgingtransactions are backed by an economic underlying to prevent any speculative dealing;
• all highly probable exposures are at least 85%-hedgedwhere they concern forecast amounts, or fully-hedgedin the case of firm commitments;
• Kering has strictly limited the type of financialinstruments that may be used for hedging purposes;
• each brand implements its own internal control systemand conducts audits on a regular basis.
Kering ensures that each brand’s risk management policy is consistent with its underlying foreign exchangeexposure, notably through a monthly currency reportingprocedure. Kering also conducts periodic audits atGroup level.
The Group also hedges foreign exchange risk on financialassets and liabilities issued in foreign currencies by usingcurrency swaps for refinancing purposes or by investingcash in euros or local currency.
Note 29.2 to the annual consolidated financial statementssets out the nature of the hedging instruments held bythe Group and its exposure to foreign exchange risk (seepage 255, “ Exposure to foreign exchange risk ”).
Kering Finance SNC processes, controls and providesadministrative support for foreign exchange transactionson behalf of Group companies. Front-office, middle-office, back-office and accounting tasks are separated forsecurity reasons, as well as to ensure that derivativescontracted internally are unwound on the market. KeringFinance SNC uses market-standard techniques andinformation systems to price currency instruments.
Interest rate risk
Interest rate risk policy falls within Kering’s remit, and ismanaged on a consolidated basis by Kering Finance SNC.Kering has set a 70% – fixed / 30% – floating target ratemix for Group consolidated net debt.
Interest rate risk is measured based on current andprojected consolidated net debt, the schedule of hedgingpositions and fixed-rate / floating-rate debt issuances.This enables interest-rate hedging in accordance with
the Group’s target fixed / floating rate mix. Appropriatehedging products are set up through Kering Finance SNC,in close liaison with Kering’s Executive Management.Kering mainly uses interest rate swaps to convert all or aportion of its fixed-rate bonds and caps and collars to afloating rate in order to protect floating-rate financingagainst rises in interest rates.
Kering Finance SNC processes, controls and providesadministrative support for interest rate transactions onbehalf of Group companies. Front-office, middle-office,back-office and accounting tasks are separated for securityreasons. Kering Finance SNC uses market-standard techniquesand information systems to price interest rate instruments.
Note 29.1 to the annual consolidated financial statementssets out the nature of the hedging instruments held by theGroup and its exposure to interest rate risk (see page 252,“ Exposure to interest rate risk ”).
Liquidity risk
Liquidity risk management for the Group and each of its subsidiaries is closely monitored and periodicallyassessed by Kering, based on Group – and brand – levelfinancial reporting procedures.
In order to manage liquidity risk that may arise when its financial liabilities fall due, the Group’s financing policy is geared towards optimising its maturity scheduleand avoiding the concentration of redemptions andrepayments.
The Group’s active risk management policy also seeks to diversify sources of funding and limit reliance onindividual lenders.
The Group had undrawn confirmed lines of credit totalling€4,125.9 million as of December 31, 2013 compared to€4,023.6 million as of December 31, 2012.
Kering has a Euro Medium Term Notes (EMTN) programmein Luxembourg for its bond issuances, representing €5 billion. As of December 31, 2013, €3,300.1 million ofthis amount had been used. The EMTN programme wasextended on December 3, 2013 for a further one-yearperiod. Kering’s short-term debt is rated “A2” byStandard & Poor’s, while its long-term debt is rated “BBB”with a stable outlook.
The Group’s bonds and bank lines of credit are governed bythe standard commitment and default clauses customarilyincluded in this type of agreement: pari passu ranking, anegative-pledge clause that limits the security that can begranted to other lenders, and a cross-default obligation.The bonds issued between 2009 and 2013 within thescope of the EMTN programme are all subject to change-of-control clauses entitling bondholders to request earlyredemption at par if Kering’s rating is downgraded to non-investment grade following a change of control.
5 FINANCIAL INFORMATION ~ RISK MANAGEMENT
188 Kering ~ 2013 Reference Document
05_C_VA_V6 14/04/14 11:34 Page188

In accordance with the AMF’s recommendations, thissection deals only with risks identified by the Group ashaving a potentially significant impact.
Macroeconomic instability
The global economic slowdown continued through 2013,due, in particular, to the financial crisis in Europe andflatter growth in Asia.
The balanced geographical coverage of its Luxury andSport & Lifestyle Divisions limits the Kering group’s exposureto the impact of local recessions and enables it to benefitfrom growth in emerging countries.
The diversity of the Group’s product offering reduces itsdependence on a specific range. The distribution networkalso benefits from a balanced geographical footprint,with Luxury Division sales made through over 1,100directly-operated stores in 39 countries.
Raw materials and strategic skills
To meet its customers’ expectations, the Luxury Divisionneeds unhindered availability of raw materials thatcomply with its quality criteria, and sustained skill levelsacross its production teams. To these purposes, the Keringgroup has forged special partnerships with key suppliers,and pursues a policy of actively seeking new partners. Inaddition, it develops vertical integration throughout theproduction chain by means of a programme of acquisitionsand strategic business combinations.
To uphold know-how in its Luxury Division businesses,Kering runs personnel training and skills preservationoperations, and internalises a number of functions thatwere previously subcontracted.
Fluctuation in raw materials prices
The rising price of raw materials used by the KeringLuxury Division correlates with high demand for leather,skins and precious stones. Rising prices of the raw materialsused by the Sport & Lifestyle Division stem from variationsin the prices of rubber, cotton and polyester, partiallydependent on the price of oil. In the bulk of cases, rises inraw material prices can be wholly or partially offset bycorresponding rises in the sale prices of finished products.
Kering pays careful attention to the traceability ofsupplies, and insists that suppliers and subcontractorscomply with legislation and the Group’s Code of ethics.The Luxury Division is especially attentive to ensuring thatsupplies comply with international standards on miningconditions for gold, diamonds and precious stones. Thesefactors tend to restrict the scope of alternative sourcingoptions for certain materials. The Group is neverthelessorganised to regularly seek new suppliers capable ofmeeting its requirements on these issues.
Commercial appeal and brand value
Kering’s base activities are underpinned by powerfulglobal brands in the Group’s Luxury and Sport & LifestyleDivisions. One of the Group’s main operational risks thereforeconcerns the loss of commercial appeal and brand valuethat could arise from poor consideration of consumerexpectations, market changes, loss of key partnerships,problems with product quality, or failure to comply withthe Group’s Corporate Social Responsibility principles. Theaccounting impacts of impairment losses are describedin Note 18 to the consolidated financial statements forthe year ended December 31, 2013 on page 236.
3.2. Strategic and operational risks
In addition, the bonds issued in 2009 and 2010 – includingthe bonds added in January 2012 to those issued inApril 2010 – include a “step-up coupon” clause that appliesin the event that Kering’s rating is downgraded to non-investment grade (see Notes 28.4 and 28.5 to the annualconsolidated financial statements).
Kering and Kering Finance SNC confirmed lines of creditinclude a default clause (early repayment) in the event offailure to comply with the following financial covenant:consolidated net debt / EBITDA less than or equal to 3.75(see Note 28.5.3 to the annual consolidated financialstatements). This ratio is calculated based on pro formadata. As of December 31, 2013, Kering and Kering FinanceSNC had not drawn down any of the confirmed lines ofcredit subject to this covenant.
Euro bond issues are not subject to any financial ratiocovenants.
The Group was in compliance with all these covenants as of December 31, 2013 and there is no foreseeable risk of breach.
Information relating to liquidity risk is presented in Note 28 to the annual consolidated financial statements,including the breakdown of Group debt by maturity and currency, and in Note 29.6 to the annual consolidatedfinancial statements, which describes liquidity risk inaccordance with IFRS 7.39.
5RISK MANAGEMENT ~ FINANCIAL INFORMATION
1892013 Reference Document ~ Kering
05_C_VA_V6 14/04/14 11:34 Page189

Consumer expectations
The brands’ creative leadership, success and, as result,the commercial appeal of collections are managed byCreative Departments and their world-renowned designers,and by remaining true to the identity and fundamentalvalues of the brand. Kering’s Sport & Lifestyle brands alsoplay a major role as trend setters for consumers, byinvesting in R&D and offering new products and services.
The inability to anticipate changes in consumer expectationsrepresents a major risk to Kering’s business development.To counter this risk, Kering endeavours to streamline thesupply cycle, cutting lead times between product designand launch phases.
Kering also encourages its Divisions to stay ahead ofconsumer trends by keeping a constant watch overmarket shifts (attending trade fairs, working with trendforecasting agencies, running consumer surveys, etc.).
The Luxury Division brands are therefore broadeningtheir offerings, increasing the number of collections anddeveloping new partnerships with renowned designers.
Loss of key partnerships
Partnerships with celebrities, athletes, sports teams andother brands make a significant contribution to enhancingthe Group’s image. The risk of losing strategic partnershipsis mitigated by renewing major contracts in advance,extending the partnership portfolio, and paying carefulattention to the quality of relationships with figureheadsand brand representatives.
Product quality, health and safety risks
Ensuring the quality of goods and compliance withstringent safety standards are among the Group’s mainpriorities.
In order to bring high-quality products to market that arecompliant with these standards, the Group implementsquality control processes covering all of the stages in theproduct lifecycle, from design through to marketing.Products are classified using quality and safety standards,while suppliers are referenced on the basis of technicalaudits and adherence to the Group Suppliers’ Charter inthe Code of ethics. Product quality and safety controls arecarried out at all stages of the production process byquality engineers and accredited laboratories.
Procedures relating to product control are explained in greater depth in Chapter 3 “Sustainability” of theReference Document, pages 102 to 103.
All Kering Divisions have a “product” crisis managementunit. In the event of known risk, they follow proceduresensuring that immediate and transparent information is provided to the public, and that defective products are recalled.
The Group has also taken out civil liability insurance tocover bodily harm or property damage to third partiescaused by products considered defective (see “Mainexisting insurance programmes” page 193).
Image and reputation, respect for ethical rulesand integrity
The Group carefully safeguards its image and reputationalassets, and consequently seeks to ensure that no incidentarises due to unethical behaviour on the part of entitiesor individuals under its control, or those with which it isinvolved in business relations.
All Kering Divisions have a crisis management policy andunit that liaises with Kering headquarters.
The Group also monitors adherence by personnel to theKering group Charter and Code of ethics (the third editionof which was circulated to all of the Group’s employees in 2013) and regularly examines ways to adapt thesedocuments for new organisations, while ensuring theyare distributed to all of the Group’s employees. Suppliercontracts are conditional on adherence to the GroupSuppliers’ Charter, which suppliers are also required topromote within their production units, failing which theircontracts are terminated. Compliance with the GroupSuppliers’ Charter is monitored by means of social auditsat production sites (see Chapter 3 “Sustainability” of theReference Document, pages 98 to 101).
The Luxury Division is especially attentive to supplier andsubcontractor observance of the SA 8000 socialresponsibility standard. It includes ethics clauses in itscontracts with third parties, and audits of suppliers andsubcontractors on compliance with SA 8000 requirements.
The Sport & Lifestyle Division also monitors supplierobservance of its Social Accountability and FundamentalEnvironmental (SAFE) standards, which forbid child labour,unethical employment conditions, environmental damageand any business relationships with criminal organisations.
Counterfeiting and parallel distribution networks
Kering owns a large array of brands, models, copyrights,patents, designs and know-how, largely through itsLuxury and Sport & Lifestyle Divisions. This portfolioconstitutes intellectual property and a strategic asset forthe Group.
The Group’s legal departments manage the brand portfolioand other intellectual property rights, and implement activeand diversified policies to counter breaches of these rights.Kering actively opposes parallel distribution networksand illicit networks that sell counterfeit or copied goods, inparticular by working to increase the traceability of its goods.
5 FINANCIAL INFORMATION ~ RISK MANAGEMENT
190 Kering ~ 2013 Reference Document
05_C_VA_V6 14/04/14 11:34 Page190
Protection of the Group’s intellectual property takes manyforms, from upstream practices of our brand portfolios, todownstream practices, including anti-counterfeitingcustom or police raids or legal action. The costs ofmonitoring markets and tackling counterfeiting, withinthe brands and at the Group’s head office, are dividedbetween legal and security functions, or measures put inplace inside the stores. These costs are however relativelyinsignificant at the Group level.
Kering also participates in bodies that represent theleading Luxury industry players. The Group prevents sales ofits products by parallel distribution networks by workingto increase the traceability of its goods, prohibiting directsales to these networks and implementing specificmeasures to tighten control over its distribution channels.
Dependence on patents, licences and supplycontracts
The Group is not significantly dependent on any patents,licences or third-party supply sources.
The Group owns or has license rights to the trademarks,patents and intellectual property rights that it exploits,free of any restrictions as to right of priority or use (and ofrights likely to restrict such exploitation) in all relevantmarkets. The same applies to the corporate names anddomain names of the subsidiaries or entities, to thenames of the Group’s stores and points of sale and to thetrademarks and signs of the goods and productsmanufactured and marketed by the various Groupentities. This situation does not preclude any of thetrademarks belonging to the Group being licensed tothird parties for the sale of goods or services under itstrademark enhancement policy, as has been the case inperfumes and cosmetics. In all cases, such licensingagreements have been entered into under fair commercialand financial terms and conditions, and have no impact onthe ownership of the trademarks and signs belonging to theGroup. Further information on contractual obligations andother commitments is provided in Notes 33.2.1 and 33.2.4to the 2013 consolidated financial statements on pages268 and 269.
Litigation
Group companies are involved or are likely to be involvedin a number of lawsuits or disputes arising in the normalcourse of business, including litigation with tax, socialsecurity and customs authorities, as well as variousgovernmental and competition authorities. Provisions havebeen set aside by the companies for the probable costs,as estimated by the entities and their experts. Accordingto the Group entities’ experts, no litigation currently inprogress concerning Group companies presents a risk forthe normal operations of the Group, or for its future
development. Provisions have been set aside in theGroup’s 2013 consolidated financial statements to coverall of the abovementioned legal risks, including the impactof commitments given on the disposal of controllinginterests. None of these risks have been qualified as arisingoutside the scope of normal business for Group companies.
The Group considers that the effective procedures andprocesses for identifying and managing its industrial andenvironmental risks within each of the entities concerned,which rely chiefly on the advice of duly authorised externalorganisations and advisors, meet, in relevance and proportion,customary technical and professional standards underthe prevailing regulatory framework. An active preventionand safety policy is an integral part of these proceduresand processes.
Furthermore, the Group has granted various sellers’representations and warranties in connection withdisposals of controlling interests in subsidiaries madeover the last nine years (see Note 33.1. to the 2013consolidated financial statements, on page 267).
As regards the laws and regulations applicable to theGroup’s activities, Kering’s businesses are subject to thesame constraints and obligations as those directlyapplicable to its competitors on its different markets.None of its businesses are subject to specific rules orexemptions in any of the relevant territories.
The Company is not aware of any foreseeable regulatoryor legislative changes in contradiction with the foregoing.
To the Company’s knowledge, during the last 12 months(at least), there have been no governmental, legal orarbitration proceedings (including any pending orthreatened proceedings of which the issuer is aware) thathave had in the recent past or are likely to have in thefuture, a significant impact on the financial position orearnings of the Company or the Group.
Talent management
The Group recognises that the talent and creativity of itsemployees are one of the keys to its success. Its capacityto identify, attract and retain staff and nurture their skillsis critical for the Group.
Kering’s human resources policy therefore seeks topromote a stimulating and rewarding working environment,and to foster attachment to the Group and its values. This isdone by means of training programmes and profit-sharing.Kering also aims to boost its employees’ employability, toencourage internal mobility and to open up prospects forprofessional and personal development (see section 3“Sustainability” of the Reference Document, pages 63 to 66).
Special attention is given to Creative Directors and theirteams, to develop powerful, lasting brand identities.
5RISK MANAGEMENT ~ FINANCIAL INFORMATION
1912013 Reference Document ~ Kering
05_C_VA_V6 14/04/14 11:34 Page191
The Kering risk management policy is based on the ongoingidentification and evaluation of risks (see section “Internalcontrol and risk management procedures” in the Chairman’sreport, page 143 of the Reference Document), risk prevention,protection of people and property, and safety and businesscontinuity plans.
The risk management policy also includes the transfer ofrisks to insurance companies.
Insurance against risks
The Group’s policy of transferring significant risks toinsurance companies is determined based on:
• achieving the best economic balance between riskcoverage, premiums and self-insurance; and,
• availability of insurance capacities, insurance marketconstraints and local regulations.
5 FINANCIAL INFORMATION ~ RISK MANAGEMENT
192 Kering ~ 2013 Reference Document
3.4. Risk management
Kering’s international presence exposes it to risks regardingnon-compliance with legislation and national regulations,owing to the complexity and changing nature of regulationschiefly arising from corporate and tax law, customs dutiesand import restrictions applied by certain countries. To guard
against risks of non-compliance due to a lack of awarenessof legislative change, Kering provides its Divisions andretail businesses with a regulatory watch service, throughhead office and support centres in the regions in whichthe Group operates.
3.3. Compliance risks
Information systems
Most of the Group’s production and transaction processesrely on information systems. The maturity of the informationsystems in use across the Group, as regards suitability,security, rollout and functionality, is fairly heterogeneous.The Group runs an ongoing investment programme onthe adaptation, improvement, security and durability ofits information systems. Business continuity and recoveryplans are regularly updated, and their efficacy closelymonitored.
With the support of the Divisions’ brand security departments,the Group is introducing data protection and businesscontinuity plans.
Credit risk
Because of the nature of its businesses, a large proportionof Kering sales are not exposed to customer paymentrisks. This is true of direct customer sales by the LuxuryDivision and Kering retail businesses. For sales throughwholesalers, there is no strong dependency whereby loss of particular customers might have a significantimpact on business or income.
The Sport & Lifestyle Division is more exposed to paymentdefault risks because a significant portion of its productsis distributed through wholesalers. It manages these risksby constant monitoring of amounts outstanding.
As applicable, provisions are set aside against the value ofthe Division’s assets. Credit risk is also minimised byappropriate insurance coverage.
Seasonality of sales
Following the disposals of retail businesses in 2012 and2013, paving the way for the Group’s repositioning in theLuxury and Sport & Lifestyle sectors, the seasonality ofthe Group’s activities decreased and, as a result, is nolonger considered a significant risk.
However, for the Group’s Luxury brands, the fourth quarteris the most important in terms of revenue due to year-endholiday purchases in western countries, although fourth-quarter revenue does not significantly exceed revenuegenerated during the first three quarters of the year. Inaddition, the activity of the Luxury and Sport & LifestyleDivisions generally revolves around the twice yearly natureof their collections and changes in delivery dates towholesalers can lead to shift in sales from one givenquarter to the next one.
Exceptional factors likely to have major consequences onthe political or macroeconomic environment of one or moreof the Group’s main markets can impact the Group’sactivities and quarterly results and consequently changethe usual seasonality pattern in a given fiscal year.
05_C_VA_V6 14/04/14 11:34 Page192

Coverage is based on the “All risks except” approach,determined by assessing the financial consequences forthe company of a possible claim, especially in the areas of:
• civil liability: bodily harm or property damage to thirdparties caused by products, fittings and equipment;
• fire, explosions, water damage, etc.;
• operating losses following direct damage.
Insurance coverage is purchased based on an assessmentby site and company of the level of coverage necessary toface reasonably estimated potential occurrences ofdiverse risks (liability, damage and retailer counterparty).This assessment takes account of the analyses of theinsurers underwriting the Group’s risks.
The insurance schemes now in force in the Group, whichcentralises most purchases of insurance policies such asproperty and casualty risks for subsidiaries, were takenout with the assistance of internationally recognisedinsurance brokers specialised in covering major risks,with reputable insurers in the industrial risk insurancesector.
Main existing insurance programmes:
• property damage from fire, explosion, floods, machinebreakage, natural disasters to its own property: property,furnishings, equipment, merchandise, IT installations,and to property for which it is responsible, as well asany resulting operating losses, for any period deemednecessary for normal business activities to resume;
• damage and loss of equipment, merchandise and / orgoods in transport;
• damage resulting from theft, fraud, embezzlement, oracts of malice to valuable assets, data and / or property;
• bodily harm or property damage following constructionwork carried out as project owner (new buildings,renovations, restorations, etc.);
• liability for bodily or property damage to third parties bymotorised vehicles belonging to the different companies;
• responsibility under general and environmental civilliability for the “operating risk”, “post-delivery risk” and“risk after services rendered”, due to damages caused to third parties in the course of the Group’s business;
• non-payment of receivables by third-party distributors,particularly in the event of default or insolvency.
Other insurance contracts are taken out by Group companiesto cover specific risks or to comply with local regulations.
Uninsured risks are exposures for which there is noinsurance coverage offered on the insurance market, or forwhich the cost of available insurance is disproportionatecompared to the potential benefits of the coverage.
The Kering group handles known and manageable risksgiven the current scientific and medical understanding, ina manner consistent with other French and internationalindustrial groups with similar types of exposures. This isone of the reasons why the Group is able to place its riskswith insurers ready to deal with the unforeseeable anduncertain consequences of accidents.
The levels of coverage in place for the main potentialrisks facing the Group as a whole as of January 1, 2013,were as follows:
• fire, explosions or water damage and the ensuingoperating losses: €300 million;
• civil liability: €145 million;
• damage to or loss of goods in transport: €20 million;
• fraud and acts of malice to goods and valuables:€20 million.
In order to diversify the sources of its policies and securelasting coverage for highly volatile risks such as theearthquake in Japan, the Group has taken out insurancewith investors against natural disasters, which is bothindemnity-based and parametric.
The total risk financing cost for Kering includes threemain items (in addition to “physical” protection andprevention expenditure):
• cost of deductibles and non-insured losses retained orself-insured by the subsidiaries in 2013: €1.3 million;
• claims covered by the Group itself through itsreinsurance companies, in 2013: €2.5 million.
At the end of 2012, the Group acquired an excessreinsurance company in order to strengthen its self-coverage. Taking out self-insurance through the Group’sreinsurance subsidiaries reduces insurance costs andenhances performance because frequently occurringrisks are pooled within the Group and insured for anamount that is capped annually.
Since July 1, 2013, the Group’s reinsurance companieshave covered damage and operating losses of up to€5 million per claim, capped at €6.5 million per annum(for the period from July 1 to June 30):
• insurance premiums and management fees includingengineering visits and brokers fees, etc. (final 2013expenses): €16.9 million.
Specific additional policies may also be taken out bycertain subsidiaries or businesses or by virtue of localspecificities in certain countries (occupational accidents,contributions to natural disaster funds, etc.). These aremanaged at the level of each company and / or country.
5RISK MANAGEMENT ~ FINANCIAL INFORMATION
1932013 Reference Document ~ Kering
05_C_VA_V6 14/04/14 11:34 Page193

194 Kering ~ 2013 Reference Document
05_C_VA_V6 14/04/14 11:34 Page194

4. Consolidated financial statements as of December 31, 2013
4.1. Consolidated income statement For the years ended December 31, 2013 and 2012
(in € millions) Notes 2013 2012
CONTINUING OPERATIONS
Revenue 5 9,748.4 9,736.3Cost of sales (3,657.9) (3,776.2)
Gross margin 6,090.5 5,960.1
Payroll expenses 6-7 (1,534.7) (1,493.6)Other recurring operating income and expenses (2,805.7) (2,675.0)
Recurring operating income 8 1,750.1 1,791.5
Other non-recurring operating income and expenses 9 (442.5) (25.2)
Operating income 1,307.6 1,766.3
Finance costs, net 10 (212.3) (147.7)
Income before tax 1,095.3 1,618.6
Corporate income tax 11 (235.4) (297.6)Share in earnings of associates 1.6 36.9
Net income from continuing operations 861.5 1,357.9
o/w attributable to owners of the parent 869.4 1,323.7o/w attributable to non-controlling interests (7.9) 34.2
DISCONTINUED OPERATIONS
Net income (loss) from discontinued operations 12 (821.5) (275.5)
o/w attributable to owners of the parent (819.8) (275.5)o/w attributable to non-controlling interests (1.7)
Net income of consolidated companies 40.0 1,082.4
Net income attributable to owners of the parent 49.6 1,048.2Net income attributable to non-controlling interests (9.6) 34.2
Net income attributable to owners of the parent 49.6 1,048.2Earnings per share (in €) 13.1 0.39 8.32Fully diluted earnings per share (in €) 13.1 0.39 8.31
Net income from continuing operations attributable to owners of the parent 869.4 1,323.7
Earnings per share (in €) 13.1 6.91 10.51Fully diluted earnings per share (in €) 13.1 6.90 10.50
Net income from continuing operations (excluding non-recurring items) attributable to owners of the parent 1,229.3 1,268.8
Earnings per share (in €) 13.2 9.76 10.07Fully diluted earnings per share (in €) 13.2 9.75 10.06
195
5
2013 Reference Document ~ Kering
CONSOLIDATED FINANCIAL STATEMENTS AS OF DECEMBER 31, 2013 ~ FINANCIAL INFORMATION
05_D_VA_V6 14/04/14 11:29 Page195

4.2. Consolidated statement of comprehensive incomefor the years ended December 31, 2013 and 2012
(in € millions) Notes 2013 2012
Net income 40.0 1,082.4
Actuarial gains and losses (1) 1.8 (16.1)Unrecognised surplus of pension plan assets 7.1 (4.0)
Total items not reclassified to income 8.9 (20.1)
Foreign exchange gains and losses (111.4) (19.5)Cash flow hedges (1) 29.7 97.2Available-for-sale financial assets (1) 3.1 (0.1)Share in other comprehensive income (expense) of associates 0.0 8.7
Total items to be reclassified to income (78.6) 86.3
Other comprehensive income (expense), net of tax 14 (69.7) 66.2
Total comprehensive income (expense) (29.7) 1,148.6
o/w attributable to owners of the parent (3.1) 1,125.5o/w attributable to non-controlling interests (26.6) 23.1
(1) Net of tax.
196 Kering ~ 2013 Reference Document
5 FINANCIAL INFORMATION ~ CONSOLIDATED FINANCIAL STATEMENTS AS OF DECEMBER 31, 2013
05_D_VA_V6 14/04/14 11:29 Page196

4.3. Consolidated statement of financial position as of December 31, 2013 and 2012
Assets(in € millions) Notes Dec. 31, 2013 Dec. 31, 2012
Goodwill 15 3,770.1 3,871.0Brands and other intangible assets 16 10,702.8 10,489.9Property, plant and equipment 17 1,676.9 1,376.3Investments in associates 19 17.3 25.8Non-current financial assets 20 316.8 273.7Deferred tax assets 11.2 649.9 600.2Other non-current assets 30.1 28.9
Non-current assets 17,163.9 16,665.8
Inventories 21 1,805.5 1,736.5Trade receivables 22 949.9 985.3Current tax receivables 11.2 119.1 75.7Other current financial assets 23 107.7 87.0Other current assets 23 523.4 494.7Cash and cash equivalents 27 1,419.2 2,081.0
Current assets 4,924.8 5,460.2
Assets classified as held for sale or for distribution to owners 12 722.1 3,130.5
TOTAL ASSETS 22,810.8 25,256.5
Equity and liabilities(in € millions) Notes Dec. 31, 2013 Dec. 31, 2012
Share capital 24 504.9 504.5Capital reserves 2,424.3 2,416.1Treasury shares (10.4) (3.3)Translation adjustments (115.3) (24.2)Remeasurement of financial instruments 69.8 41.4Other reserves 7,713.3 8,479.3
Equity attributable to owners of the parent 24 10,586.6 11,413.8
Non-controlling interests 609.3 704.9
Total equity 24 11,195.9 12,118.7
Non-current borrowings 28 3,132.4 2,988.9Other non-current financial assets 29 0.7 Provisions for pensions and other post-employment benefits 25 92.8 98.2Other provisions 26 113.2 92.3Deferred tax liabilities 11.2 2,810.2 2,772.3
Non-current liabilities 6,149.3 5,951.7
Current borrowings 28 1,737.4 1,595.1Other current financial liabilities 23-29 213.2 207.9Trade payables 23 766.1 684.5Provisions for pensions and other post-employment benefits 25 7.2 6.6Other provisions 26 152.7 167.7Current tax liabilities 11.2 310.1 318.4Other current liabilities 23 1,372.3 1,400.4
Current liabilities 4,559.0 4,380.6
Liabilities associated with assets classified as held for sale or for distribution to owners 12 906.6 2,805.5
TOTAL EQUITY AND LIABILITIES 22,810.8 25,256.5
197
5
2013 Reference Document ~ Kering
CONSOLIDATED FINANCIAL STATEMENTS AS OF DECEMBER 31, 2013 ~ FINANCIAL INFORMATION
05_D_VA_V6 14/04/14 11:29 Page197

4.4. Consolidated statement of cash flows for the years ended December 31, 2013 and 2012
(in € millions) Notes 2013 2012
Net income from continuing operations 861.5 1,357.9Net recurring charges to depreciation, amortisation and provisions on non-current operating assets 295.8 275.1Other non-cash income and expenses 389.9 (156.4)
Cash flow from operating activities 32.1 1,547.2 1,476.6
Interest paid/received 120.5 163.2Dividends received (0.3) (0.1)Net income tax payable 11.1 315.7 361.0
Cash flow from operating activities before tax, dividends and interest 1,983.1 2,000.7
Change in working capital requirement 23 (74.5) (272.5)Corporate income tax paid 11.2.1 (383.7) (362.2)
Net cash from operating activities 1,524.9 1,366.0
Purchases of property, plant and equipment and intangible assets 32.2 (677.7) (441.9)Proceeds from disposals of property, plant and equipment and intangible assets 10.3 6.1Purchases of subsidiaries, net of cash acquired 32.3 (345.0) (219.3)Proceeds from disposals of subsidiaries and associates, net of cash transferred 32.3 24.7 916.5Purchases of other financial assets (57.9) (92.5)Proceeds from sales of other financial assets 5.1 21.2Interest and dividends received 70.0 68.9
Net cash from (used in) investing activities (970.5) 259.0
Increase/decrease in share capital and other transactions with owners 32.4 (85.4) (204.9)Treasury share transactions 32.5 (39.0) (14.9)Dividends paid to owners of the parent company (471.2) (440.7)Dividends paid to non-controlling interests (26.0) (32.6)Bond issues 28-32.6 938.9 676.5Bond redemptions 28-32.6 (740.0) (138.7)Increase/decrease in other borrowings 28-32.6 (309.9) (565.9)Interest paid and equivalent (187.1) (231.1)
Net cash used in financing activities (919.7) (952.3)
Net cash from (used in) discontinued operations 12 (437.5) 97.1Impact of exchange rate variations 65.3 3.0
Net increase (decrease) in cash and cash equivalents (737.5) 772.8
Cash and cash equivalents at beginning of year 32 1,975.1 1,202.3Cash and cash equivalents at end of year 32 1,237.6 1,975.1
198 Kering ~ 2013 Reference Document
5 FINANCIAL INFORMATION ~ CONSOLIDATED FINANCIAL STATEMENTS AS OF DECEMBER 31, 2013
05_D_VA_V6 14/04/14 11:29 Page198

4.5. Consolidated statement of changes in equity
(Before appropriation Number Share Capital Treasury Translation Remeasu- Other Equityof net income) of shares capital reserves shares adjustments rement of reserves Owners Non- Totaloutstanding (1) financial and net of the controlling equity
instruments income parent interests attributable to owners of
(in € millions) the parent
As of January 1, 2012 125,939,537 508.0 2,511.3 (114.6) (11.0) (60.2) 8,091.5 10,925.0 824.5 11,749.5
Total comprehensive income (13.2) 101.6 1,037.1 1,125.5 23.1 1,148.6
Increase/decreasein share capital (884,187) (3.5) (95.2) (98.7) (98.7)
Treasury shares (2) 1,036,279 111.3 (10.1) 101.2 101.2
Valuation of share-based payment 8.9 8.9 0.6 9.5
Dividends paid (629.8) (629.8) (32.7) (662.5)
Changes in Group structure (18.3) (18.3) (110.6) (128.9)
As of December 31, 2012 126,091,629 504.5 2,416.1 (3.3) (24.2) 41.4 8,479.3 11,413.8 704.9 12,118.7
Total comprehensive income (91.1) 28.4 59.6 (3.1) (26.6) (29.7)
Increase/decreasein share capital 110,059 0.4 8.2 8.6 8.6
Treasury shares (2) (35,508) (7.1) (20.9) (28.0) (28.0)
Valuation of share-based payment 8.2 8.2 (0.3) 7.9
Dividends paid
and interim dividends (785.3) (785.3) (26.0) (811.3)
Changes in Group structure (27.6) (27.6) (42.7) (70.3)
As of December 31, 2013 (3) 126,166,180 504.9 2,424.3 (10.4) (115.3) 69.8 7,713.3 10,586.6 609.3 11,195.9
(1) Shares with a par value of €4 each.(2) Net of tax.(3) Number of shares outstanding as of December 31, 2013: 126,226,761.
199
5
2013 Reference Document ~ Kering
CONSOLIDATED FINANCIAL STATEMENTS AS OF DECEMBER 31, 2013 ~ FINANCIAL INFORMATION
05_D_VA_V6 14/04/14 11:29 Page199

Notes to the consolidated financial statements for the year ended December 31, 2013
Note 1 Introduction 201
Note 2 Accounting policies and methods 201
Note 3 Highlights 212
Note 4 Operating segments 214
Note 5 Revenue 217
Note 6 Payroll expenses 218
Note 7 Share-based payment 219
Note 8 Recurring operating income 223
Note 9 Other non-recurring operating income and expenses 223
Note 10 Finance costs (net) 224
Note 11 Income taxes 224
Note 12 Non-current assets held for sale or for distribution and discontinued operations 227
Note 13 Earnings per share 229
Note 14 Other comprehensive income 230
Note 15 Goodwill 231
Note 16 Brands and other intangible assets 232
Note 17 Property, plant and equipment 234
Note 18 Impairment tests on non-financial assets 236
Note 19 Investments in associates 237
Note 20 Non-current financial assets 237
Note 21 Inventories 238
Note 22 Trade receivables 238
Note 23 Other current assets and liabilities 239
Note 24 Equity 239
Note 25 Employee benefits 240
Note 26 Provisions 244
Note 27 Cash and cash equivalents 245
Note 28 Borrowings 246
Note 29 Exposure to interest rate, foreign exchange and equity risk 252
Note 30 Accounting classification and market value of financial instruments 262
Note 31 Net debt 265
Note 32 Statement of cash flows 265
Note 33 Contingent liabilities, contractual commitments not recognised and other contingencies 267
Note 34 Transactions with related parties 270
Note 35 Subsequent events 271
Note 36 List of consolidated subsidiaries as of December 31, 2013 272
200 Kering ~ 2013 Reference Document
5 FINANCIAL INFORMATION ~ CONSOLIDATED FINANCIAL STATEMENTS AS OF DECEMBER 31, 2013
05_D_VA_V6 14/04/14 11:29 Page200

2.1. General principles and statement of compliance
Pursuant to European Regulation No. 1606/2002 ofJuly 19, 2002, the consolidated financial statements ofthe Kering group for the year ended December 31, 2013were prepared in accordance with applicable internationalaccounting standards published and adopted by theEuropean Union and mandatorily applicable as of that date.
These international standards comprise International FinancialReporting Standards (IFRS), International Accounting Standards(IAS) and the interpretations of the International FinancialReporting Interpretations Committee (IFRIC).
The financial statements presented do not reflect the draftstandards and interpretations that were at the exposuredraft stage with the International Accounting StandardsBoard (IASB) and the IFRIC on the date these financialstatements were prepared.
All accounting standards and guidance adopted by the European Union may be consulted on the EuropeanCommission’s website: http://ec.europa.eu/internal_market/accounting/ias_en.htm.
2.2. IFRS basis adopted
2.2.1. Standards, amendments and interpretationseffective as of January 1, 2013
The Group’s consolidated financial statements comply withthe following amendments to published standards andinterpretations which came into effect on January 1, 2013and have been adopted by the European Union:
• the amendments contained in the Annual Improvementsto IFRSs published in May 2012;
• IFRS 13 – Fair Value Measurement;
• the amended version of IAS 19 – Employee Benefits;
• amendment to IFRS 7 – Financial Instruments: Disclosures –Offsetting Financial Assets and Financial Liabilities;
• amendment to IAS 1 – Presentation of Items of OtherComprehensive Income which the Group elected to earlyadopt as of January 1, 2012.
IFRS 13 provides a single IFRS framework for the measurementof fair value and the related disclosures. It also defines fairvalue and sets out the disclosures required in terms ofmeasurement methods, including the fair value hierarchycurrently included in IFRS 7.
The prospective application of this standard did not have animpact on the Group’s consolidated financial statements.
The impacts for the Group of the application of IAS 19 arelimited: since the Group already recognises all actuarial gainsand losses in other comprehensive income, the discontinuationof the “corridor method” provided for by the revised standarddoes not have any impact on the consolidated financialstatements. The other impacts of the amended version ofIAS 19 on plan assets and the treatment of past servicecosts, are not material for the Group.
The following standards and amendments are either notapplicable to the Group or did not have a material impacton the consolidated financial statements:
• amendment to IFRS 1 – First-time Adoption of InternationalFinancial Reporting Standards – Severe hyper-inflationand removal of fixed dates for first-time adopters;
• amendment to IAS 12 – Income Taxes – Deferred Tax –Recovery of Underlying Assets;
• IFRIC 20 – Stripping Costs in the Production Phase of aSurface Mine.
Note 2 – Accounting policies and methods
Kering, the Group’s parent company, is a société anonyme(French joint stock company) with a Board of Directors,incorporated under French law, whose registered office islocated at 10 avenue Hoche, 75008 Paris, France. It is registeredwith the Paris Trade and Companies Registry under reference552 075 020 RCS Paris, and is listed on the Paris Euronextstock exchange.
The consolidated financial statements for the year endedDecember 31, 2013 reflect the accounting position of Keringand its subsidiaries, together with its interests in associatesand joint ventures.
The Board of Directors approved the consolidated financialstatements for the year ended December 31, 2013 andauthorised their publication on February 20, 2014. Theseconsolidated financial statements will only be consideredas final after their adoption by the Annual General Meeting.
Note 1 – Introduction
201
5
2013 Reference Document ~ Kering
CONSOLIDATED FINANCIAL STATEMENTS AS OF DECEMBER 31, 2013 ~ FINANCIAL INFORMATION
05_D_VA_V6 14/04/14 11:29 Page201
2.2.2. Standards, amendments and interpretations not mandatorily applicable as of January 1, 2013
The Group has elected not to early adopt the standardsand amendments whose application is not mandatory forfinancial periods beginning on or after January 1, 2013.
The Group expects the impact of the application of IFRS 10,IFRS 11, IFRS 12 as well as the amendments to the revisedIAS 28, which are applicable to financial periods beginningon or after January 1, 2014 and were adopted by the EuropeanUnion at the end of December 2012, to be limited.
The Group is currently assessing the impacts of IFRIC 21 onthe levies imposed by governments. This interpretation,which specifies the date on which provisions must be setaside for taxes imposed by governments, has not beenadopted by the European Union.
2.2.3. Summary of options used on the first-time adoption of IFRS
On its transition to International Financial ReportingStandards in 2005, the Group applied the IFRS adopted bythe European Union and effective as of December 31, 2005with retroactive effect from January 1, 2004 in accordancewith IFRS 1, with the exception of the followingexemptions provided by the standards:
• business combinations: in accordance with IFRS 3,the Group elected to restate business combinationsretroactively to January 1, 1999;
• employee benefits: the Group adopted the IFRS 1option of recognising all actuarial gains and losses atthe transition date, offset against opening equity;
• cumulative translation differences: the Group decidedto use the optional exemption allowing the eliminationof cumulative translation differences at the transition datethrough an offsetting entry in consolidated reserves;
• assets and liabilities of subsidiaries, associates andjoint venture partners: IFRS 1 states that if the parentcompany of a group adopts IFRS for the first time in itsconsolidated financial statements after a subsidiary, theparent company must, in its opening IFRS consolidatedbalance sheet, value the assets and liabilities at the samecarrying amount as that appearing in the subsidiary’sfinancial statements, taking into account any consolidationadjustments. Since Gucci was already preparing itsfinancial statements in accordance with IFRS before thetransition date, the Group complied with this treatmentwhen preparing its opening balance sheet;
• share-based payment: in accordance with the optionallowed by IFRS 2 for equity-settled plans, the Groupdecided to apply this standard solely to plans issuedafter November 7, 2002 which had not vested as ofJanuary 1, 2005.
In addition, subsequent to the choice offered by theregulator as to the date of adoption of IAS 32 and IAS 39on financial instruments, the Group opted to apply thesestandards as from January 1, 2005. Accordingly:
• for the liability component of a hybrid instrument thatis no longer outstanding at the date of transition to IAS 32and IAS 39, the Group opted not to separate the equityportion relating to the cumulative interest accreted on theliability component from the initial equity component;
• financial assets and liabilities recorded prior to thetransition date were designated at fair value through theincome statement or as available for sale on the transitiondate (January 1, 2005).
2.3. Basis of preparation of the consolidated financial statements
2.3.1. Basis of measurement
The consolidated financial statements are prepared inaccordance with the historical cost convention, with theexception of:
• certain financial assets and liabilities measured at fair value;
• interests retained in a subsidiary or associate, which aremeasured at fair value at the date control or significantinfluence is lost;
• non-current assets held for sale, which are measured andrecognised at the lower of net carrying amount and fairvalue less costs to sell as soon as their sale is consideredhighly probable. These assets are no longer depreciatedfrom the time they qualify as assets (or disposal groups)held for sale.
2.3.2. Use of estimates and judgement
The preparation of consolidated financial statements requiresGroup management to make estimates and assumptionsthat can affect the carrying amounts of certain assets andliabilities, income and expenses, and the disclosures in theaccompanying notes. Group management reviews theseestimates and assumptions on a regular basis to ensure theirpertinence with respect to past experience and the currenteconomic situation. Items in future financial statementsmay differ from current estimates as a result of changes inthese assumptions. The impact of changes in accountingestimates is recognised during the period in which thechange occurs and all affected future periods.
The main estimates made by management in the preparationof the financial statements concern the valuations and usefullives of operating assets, property, plant and equipment,intangible assets and goodwill, the amount of contingencyprovisions and other provisions relating to operations, andassumptions underlying the calculation of obligations relatingto employee benefits, share-based payment, deferred tax
202 Kering ~ 2013 Reference Document
5 FINANCIAL INFORMATION ~ CONSOLIDATED FINANCIAL STATEMENTS AS OF DECEMBER 31, 2013
05_D_VA_V6 14/04/14 11:29 Page202

balances and derivatives. The Group notably uses discountrate assumptions based on market data to estimate thevalue of long-term assets and liabilities.
The main assumptions made by the Group are detailed inspecific sections of the notes to the consolidated financialstatements, and in particular:
• Note 7 – Share-based payment;
• Note 11 – Income taxes;
• Note 18 – Impairment tests on non-financial assets;
• Note 25 – Employee benefits;
• Note 26 – Provisions;
• Note 29 – Exposure to interest rate, foreign exchangeand equity risk;
• Note 30 – Accounting classification and market value offinancial instruments.
In addition to the use of estimates, Group managementuses judgement to determine the appropriate accountingtreatment for certain transactions, pending the clarificationof certain IFRS or where prevailing standards do not coverthe issue at hand. This is notably the case for put optionsgranted to non-controlling interests.
Put options granted to non-controlling interests
The Group has undertaken to repurchase the non-controllinginterests of shareholders of certain subsidiaries. The strikeprice of these put options may be set or determinedaccording to a predefined calculation formula, and theoptions may be exercised at any time or on a specific date.
The revised IAS 27 – applied by the Group in its consolidatedfinancial statements as of January 1, 2009 – prescribes theappropriate accounting treatment for acquisitions ofadditional shares in a subsidiary after control is obtained.As permitted by the French financial markets authority(Autorité des marchés financiers – AMF), the Group has decidedto apply two different accounting methods to these putoptions, depending on whether they were granted before orafter the date the revised standard first came into effect.
Put options granted before January 1, 2009: existing goodwill method retained
The Group records a financial liability in respect of the putoptions granted to holders of non-controlling interests inthe entities concerned. The corresponding non-controllinginterests are reclassified and included in this financialliability. The difference between the debt representingthe commitment to repurchase the non-controllinginterests and the carrying amount of reclassified non-controlling interests is recorded as goodwill.
This liability is initially recognised at its present value.Subsequent changes in the value of the commitment arerecorded by an adjustment to goodwill.
Put options granted after January 1, 2009
The revised IAS 27 states that all equity transactions withnon-controlling interests that do not result in a loss of controlare to be recognised within equity. The Group records afinancial liability at its present value in respect of the putoptions granted to holders of non-controlling interests inthe entities concerned. Subsequent changes in the valueof the commitment are recorded by an adjustment to equity.
The offsetting entry for this financial liability will differdepending on whether the non-controlling interests havemaintained access at present to the economic benefits ofthe entity.
In the first case (access at present to the economic benefits),non-controlling interests are maintained in the statementof financial position and the liability is recognised againstequity attributable to owners of the parent. In the secondcase, the corresponding non-controlling interests arederecognised. The difference between the debt representingthe commitment to repurchase the non-controlling interestsand the carrying amount of reclassified non-controllinginterests is recorded as a deduction from equity attributableto owners of the parent.
2.3.3. Statement of cash flows
The Group’s statement of cash flows is prepared in accordancewith IAS 7 – Statement of Cash Flows. The Group preparesits statement of cash flows using the indirect method.
2.4. Consolidation principles
The consolidated financial statements include the financialstatements of companies acquired as from the acquisitiondate and companies sold up until the date of disposal.
2.4.1. Subsidiaries
Subsidiaries are all entities (including special-purposeentities) over which the Group exercises control. Controlis defined as the ability to govern, directly or indirectly,the financial and operating policies of an entity so as toobtain economic benefit from its activities. This situationgenerally implies directly or indirectly holding more than50% of the voting rights. The existence and effect ofpotential voting rights that are exercisable or convertibleare taken into account in the assessment of control.
Subsidiaries are consolidated from the effective date of control.
Inter-company assets and liabilities and transactionsbetween fully consolidated companies are eliminated.Gains and losses on internal transactions with controlledcompanies are fully eliminated.
Accounting policies and methods are modified wherenecessary to ensure consistency of accounting treatmentat Group level.
203
5
2013 Reference Document ~ Kering
CONSOLIDATED FINANCIAL STATEMENTS AS OF DECEMBER 31, 2013 ~ FINANCIAL INFORMATION
05_D_VA_V6 14/04/14 11:29 Page203

2.4.2. Associates
Associates are all entities in which the Group exercises asignificant influence over the entity’s management andfinancial policy, without exercising control, and generallyimplies holding 20% to 50% of the voting rights.
Associates are recognised using the equity method andinitially measured at cost, except when the associateswere previously controlled by the Group, in which casethey are measured at fair value through the incomestatement as of the date control is lost.
Subsequently, the share in profits or losses of the associateattributable to owners of the parent is recognised in“Share in earnings of associates”, and the share in othercomprehensive income of associates is carried on aseparate line of the statement of comprehensive income.If the Group’s share in the losses of an associate equals orexceeds its investment in that associate, the Group nolonger recognises its share of losses, unless it has legal orconstructive obligations to make payments on behalf ofthe associate.
Goodwill related to an associate is included in the carryingamount of the investment, presented separately within“Investments in associates” in the statement of financialposition.
Gains or losses on internal transactions with equity-accounted associates are eliminated in the amount ofthe Group’s investment in these companies.
The accounting policies and methods of associates aremodified where necessary to ensure consistency ofaccounting treatment at Group level.
2.4.3. Joint ventures
In the event of joint control, which exists pursuant to thecontractually agreed sharing of control over an economicactivity, and when the strategic, financial and operatingdecisions relating to the activity require the unanimousconsent of the parties sharing control, the Group’s stake inthe joint venture is recognised using the equity method.
2.4.4. Business combinations
Business combinations, where the Group acquires controlof one or more other activities, are recognised using theacquisition method.
Business combinations carried out after January 1, 2009 arerecognised and measured in accordance with the provisionsof the revised IFRS 3. Accordingly, the considerationtransferred (acquisition cost) is measured at the fair valueof the assets transferred, equity interests issued andliabilities incurred by the acquirer at the date ofexchange. Identifiable assets and liabilities are measuredat their fair value on the acquisition date. Costs directlyattributable to the business combination are recognisedin expenses.
The excess of the consideration transferred over theGroup’s interest in the net fair value of the identifiableassets and liabilities of the acquired entity is recognisedas goodwill. The Group may choose to measure any non-controlling interests resulting from a business combinationat fair value. In this case, goodwill is recognised on all of theidentifiable assets and liabilities (full goodwill method).
Goodwill is determined at the date control over theacquired entity is obtained and may not be adjusted afterthe measurement period. No additional goodwill isrecognised on any subsequent acquisition of non-controllinginterests. Acquisitions and disposals of non-controllinginterests are recognised directly in consolidated equity.
If the consideration transferred is less than the Group’s interestin the net assets of the subsidiary acquired measured atfair value, the difference is recognised directly in netincome for the period.
The accounting for a business combination must be completedwithin 12 months of the acquisition date. This applies tothe measurement of identifiable assets and liabilities,consideration transferred and non-controlling interests.
2.5. Foreign currency translation
2.5.1. Functional and presentation currency
Items included in the financial statements of each Groupentity are valued using the currency of the primary economicenvironment in which the entity operates (functionalcurrency). The Group’s consolidated financial statements arepresented in euros, which serves as the presentation currency.
2.5.2. Foreign currency transactions
Transactions denominated in foreign currencies arerecognised in the entity’s functional currency at theexchange rate prevailing on the transaction date.
Monetary items in foreign currencies are translated at the endof each reporting period using the closing rate. Translationadjustments arising from the settlement of these itemsare recognised in income or expenses for the period.
Non-monetary items in foreign currencies valued athistorical cost are translated at the rate prevailing on thetransaction date, and non-monetary items in foreigncurrencies measured at fair value are translated at the rateprevailing on the date the fair value is determined. Whena gain or loss on a non-monetary item is recognised directlyin other comprehensive income, the foreign exchangecomponent is also recognised in other comprehensiveincome. Otherwise, the component is recognised inincome or expenses for the period.
The treatment of foreign exchange rate hedges in the formof derivatives is described in the section on derivativeinstruments in Note 2.11 – Financial assets and liabilities.
204 Kering ~ 2013 Reference Document
5 FINANCIAL INFORMATION ~ CONSOLIDATED FINANCIAL STATEMENTS AS OF DECEMBER 31, 2013
05_D_VA_V6 14/04/14 11:29 Page204

2.5.3. Translation of the financial statements of foreign subsidiaries
The results and financial statements of Group entities witha functional currency that differs from the presentationcurrency are translated into euros as follows:
• items recorded in the statement of financial positionother than equity are translated at the exchange rate atthe end of the reporting period;
• income and cash flow statement items are translatedat the average rate for the period, corresponding to anapproximate value for the rate at the transaction datein the absence of significant fluctuations;
• foreign exchange differences are recognised as translationadjustments in the statement of comprehensive incomeunder other comprehensive income. These include gainsand losses on foreign currency borrowings used to hedgeforeign currency investments and on permanent advancesto foreign subsidiaries.
Goodwill and fair value adjustments arising from a businesscombination with a foreign activity are recognised in thefunctional currency of the entity acquired. They aresubsequently translated at the closing exchange rate intothe Group’s presentation currency, and any resultingdifferences transferred to other comprehensive incomewithin the statement of comprehensive income.
2.5.4. Net investment in a foreign subsidiary
Foreign exchange gains or losses arising on the translationof a net investment in a foreign subsidiary are recognisedin the consolidated financial statements as a separatecomponent within the statement of comprehensiveincome, and in income on disposal of the net investment.
Foreign exchange gains or losses in respect of foreign currencyborrowings hedging foreign currency investments orpermanent advances to foreign subsidiaries are alsorecognised in other comprehensive income (to the extent thatthe hedge is effective), within the statement of comprehensiveincome, and in income on disposal of the net investment.
2.6. Goodwill
Goodwill is determined as indicated in Note 2.4.4.
Goodwill represents the excess of the considerationtransferred in a business combination over the acquirer’sinterest in the net fair value of the identifiable assets andliabilities on the acquisition date. If the Group chooses tomeasure non-controlling interests in a given businesscombination at fair value, goodwill is calculated on allidentifiable assets and liabilities.
Goodwill is allocated as of the acquisition date to cash-generating units (CGUs) or groups of CGUs defined by theGroup based on the characteristics of the core business,market or geographical segment of each brand. The CGUsor groups of CGUs to which goodwill has been allocated
are tested for impairment during the second half of eachfiscal year or whenever events or circumstances indicatethat an impairment loss is likely.
Any impairment losses are recorded in “Other non-recurringoperating income and expenses” in the consolidatedincome statement as part of operating income.
2.7. Brands and other intangible assets
Intangible assets acquired as part of a businesscombination, which are controlled by the Group and areseparable or arise from contractual or other legal rights,are recognised separately from goodwill. These assets, inthe same way as intangible assets acquired separately,are amortised over their useful life where this is finite andwritten down if their recoverable amount is less thantheir net carrying amount. Intangible assets withindefinite useful lives are not amortised but are tested forimpairment at least annually or more frequently whenthere is an indication that an impairment loss is likely.
Any impairment losses recognised at the time of impairmenttests are recorded in the consolidated income statementunder “Other non-recurring operating income and expenses”as part of operating income.
Brands representing a predominant category of theGroup’s intangible assets are recognised separately fromgoodwill when they meet the criteria set out in IAS 38.Recognition and durability criteria are then taken intoaccount to assess the useful life of the brand.
A brand representing an intangible asset with an indefiniteuseful life is not amortised but is tested for impairmentat least annually or more frequently when there is anindication that an impairment loss is likely. In addition tothe projected future cash flows method, the Group appliesthe royalties method, which consists of determining thevalue of a brand based on future royalty revenue receivablewhere it is assumed that the brand will be operatedunder licence by a third party.
Software acquired as part of recurring operations is usuallyamortised over a period not exceeding 12 months.
Software developed in-house by the Group and meeting allthe criteria set out in IAS 38 is capitalised and amortisedon a straight-line basis over its useful life, which isgenerally between three and ten years.
2.8. Property, plant and equipment
Property, plant and equipment are recognised at cost lessaccumulated depreciation and impairment losses withthe exception of land, which is presented at cost lessimpairment losses. The various components of property,plant and equipment are recognised separately whentheir estimated useful life and therefore theirdepreciation periods are significantly different. The costof an asset includes the expenses that are directlyattributable to its acquisition.
205
5
2013 Reference Document ~ Kering
CONSOLIDATED FINANCIAL STATEMENTS AS OF DECEMBER 31, 2013 ~ FINANCIAL INFORMATION
05_D_VA_V6 14/04/14 11:29 Page205

Subsequent costs are included in the carrying amount ofthe asset or recognised as a separate component, wherenecessary, if it is probable that future economic benefits willflow to the Group and the cost of the asset can be reliablymeasured. All other routine repair and maintenancecosts are expensed in the year they are incurred.
Depreciation is calculated using the straight-line method,based on the purchase or production cost, less any residualvalue which is reviewed annually if considered material,over a period corresponding to the useful life of each assetcategory, i.e., 10 to 40 years for buildings and improvementsto land and buildings, and 3 to 10 years for equipment.
Property, plant and equipment are tested for impairmentwhen an indication of impairment loss exists, such as ascheduled closure, a redundancy plan or a downwardrevision of market forecasts. When the asset’s recoverableamount is less than its net carrying amount, an impairmentloss is recognised. Where the recoverable amount of anindividual asset cannot be determined precisely, theGroup determines the recoverable amount of the CGU orgroup of CGUs to which the asset belongs.
Lease contracts
Agreements whose fulfilment depends on the use of oneor more specific assets and which transfer the right touse the asset are classified as lease contracts.
Lease contracts which transfer to the Group substantiallyall the risks and rewards incidental to ownership of anasset are classified as finance leases.
Assets acquired under finance leases are recognised inproperty, plant and equipment against the correspondingdebt recognised in borrowings for the same amount, atthe lower of the fair value of the asset and the presentvalue of minimum lease payments. The correspondingassets are depreciated over a useful life identical to thatof property, plant and equipment acquired outright, orover the term of the lease, whichever is shorter.
Lease contracts that do not transfer substantially all therisks and rewards incidental to ownership are classifiedas operating leases. Payments made under operatingleases are recognised in recurring operating expenses ona straight-line basis over the term of the lease.
Capital gains on the sale and leaseback of assets arerecognised in full in income at the time of disposal when thelease qualifies as an operating lease and the transactionis performed at fair value.
The same accounting treatment is applied to agreementsthat, while not presenting the legal form of a lease contract,confer on the Group the right to use a specific asset inexchange for a payment or series of payments.
2.9. Inventories
Inventories are valued at the lower of cost and netrealisable value. Net realisable value is the estimated sale
price in the normal course of operations, net of costs tobe incurred to complete the sale.
The same method for determining costs is adopted forinventories of a similar nature and use within the sameentity. Inventories are valued using the retail, first-in-first-out (FIFO) or weighted average cost method, dependingon the Group activity.
Interest expenses are excluded from inventories andexpensed as finance costs in the year they are incurred.
The Group may recognise an inventory allowance based onexpected turnover, if inventory items are damaged, havebecome wholly or partially obsolete, the selling price hasdeclined, or if the estimated costs to completion or to beincurred to make the sale have increased.
2.10. Asset impairment
Goodwill and intangible assets with an indefinite life,such as certain brands, and CGUs or groups of CGUscontaining these items, are tested for impairment at leastannually during the second half of each reporting period.
An impairment test is also performed when events orcircumstances indicate that goodwill, other intangibleassets, property, plant and equipment, and CGUs or groupsof CGUs may be impaired. Such events or circumstancesconcern material unfavourable changes of a permanentnature affecting either the economic environment or theassumptions or objectives used on the acquisition date.
Impairment tests seek to determine whether the recoverableamount of an asset, a CGU or a group of CGUs is less thanits net carrying amount.
The recoverable amount of an asset, a CGU or a group ofCGUs is the higher of its fair value less costs to sell and itsvalue in use.
The value in use is determined with respect to future cashflow projections, taking into account the time value ofmoney and the specific risks attributable to the asset orCGU or group of CGUs.
Future cash flow projections are based on medium-termbudgets and plans. These plans are drawn up for a periodof four years with the exception of certain CGUs or groups ofCGUs undergoing strategic repositioning, for which a longerperiod may be applied. To calculate value in use, a terminalvalue equal to the perpetual capitalisation of a normativeannual cash flow is added to the estimated future cash flows.
Fair value less costs to sell is the amount obtainable fromthe sale of an asset or group of assets in an arm’s lengthtransaction between knowledgeable, willing parties, lessthe costs of disposal. These values are determined based onmarket data (comparison with similar listed companies, valuesadopted in recent transactions and stock market prices).
When the recoverable amount of an asset, CGU or group ofCGUs is less than its net carrying amount, an impairment lossis recognised in respect of the asset or group of assets.
206 Kering ~ 2013 Reference Document
5 FINANCIAL INFORMATION ~ CONSOLIDATED FINANCIAL STATEMENTS AS OF DECEMBER 31, 2013
05_D_VA_V6 14/04/14 11:29 Page206

For a CGU or group of CGUs, impairment is charged first togoodwill where appropriate, and recognised under “Othernon-recurring operating income and expenses” in theincome statement.
Impairment losses recognised in respect of property,plant and equipment and other intangible assets may bereversed at a later date up to the amount of the lossesinitially recognised, when the recoverable amount onceagain exceeds the net carrying amount. Impairmentlosses in respect of goodwill may not be reversed.
Goodwill relating to the partial disposal of a CGU ismeasured on a proportionate basis, except where analternative method is more appropriate.
2.11. Financial assets and liabilities
Derivative instruments are recognised in the statement offinancial position at fair value, in assets (positive fairvalue) or liabilities (negative fair value).
2.11.1. Financial assets
Pursuant to IAS 39, financial assets are classified withinone of the following four categories:
• financial assets at fair value through the incomestatement;
• loans and receivables;
• held-to-maturity investments;
• available-for-sale financial assets.
The classification determines the accounting treatmentfor the instrument. It is defined by the Group on the initialrecognition date, based on the objective behind the asset’spurchase. Purchases and sales of financial assets arerecognised on the trade date, which is the date the Groupis committed to the purchase or sale of the asset. A financialasset is derecognised if the contractual rights to the cashflows from the financial asset expire or the asset istransferred.
1. Financial assets at fair value through the income statement
These are financial assets held by the Group for short-term profit, or assets voluntarily classified in this category.
These assets are measured at fair value, with changes infair value recognised in income.
The instruments primarily comprise eligible mutual orsimilar funds, and are classified as current assets undercash equivalents.
2. Loans and receivables
Loans and receivables are non-derivative financial assetswith fixed or determinable payments that are not listed inan active market and are not held for trading purposes orclassified as available for sale.
These assets are initially recognised at fair value andsubsequently at amortised cost using the effectiveinterest method. Short-term receivables without a statedinterest rate are valued at the amount of the originalinvoice unless the effective interest rate has a material impact.
These assets are subject to impairment tests when thereis an indication of impairment loss. An impairment loss isrecognised if the carrying amount exceeds the estimatedrecoverable amount.
Loans and receivables due from non-consolidatedinvestments, other loans and receivables and tradereceivables are included in this category and arepresented in non-current financial assets, tradereceivables and other non-current financial assets.
3. Held-to-maturity investments
Held-to-maturity investments are non-derivative financialassets, other than loans or receivables, with fixed ordeterminable payments and fixed maturity that theGroup has the positive intention and ability to hold tomaturity. These assets are initially recognised at fair valueand subsequently at amortised cost using the effectiveinterest method.
These assets are subject to impairment tests when thereis an indication of impairment loss. An impairment loss isrecognised if the carrying amount exceeds the estimatedrecoverable amount.
Held-to-maturity investments are presented in non-currentfinancial assets.
4. Available-for-sale financial assets
Available-for-sale financial assets are non-derivativefinancial assets that are not included in the aforementionedcategories. They are recognised at fair value. Unrealisedcapital gains or losses are recognised in other comprehensiveincome until the disposal of the assets. However, wherethere is an objective indication of loss in value of anavailable-for-sale financial asset, the accumulated loss isrecognised in income. Impairment losses recognised inrespect of variable-income securities cannot be reversedthrough the income statement at the end of a subsequentreporting period.
For listed securities, fair value corresponds to a market price.For unlisted securities, fair value is determined by referenceto recent transactions or using valuation techniquesbased on reliable and objective indicators. However, whenthe fair value of a security cannot be reasonably estimated,it is recorded at historical cost. These assets are subjectto impairment tests in order to assess whether they arerecoverable.
This category mainly comprises non-consolidatedinvestments and marketable securities that do not meetother financial asset definitions. They are presented innon-current financial assets.
207
5
2013 Reference Document ~ Kering
CONSOLIDATED FINANCIAL STATEMENTS AS OF DECEMBER 31, 2013 ~ FINANCIAL INFORMATION
05_D_VA_V6 14/04/14 11:29 Page207
2.11.2. Financial liabilities
The measurement of financial liabilities depends on theirIAS 39 classification. Excluding put options granted tonon-controlling interests, derivative liabilities andfinancial liabilities accounted for under the fair valueoption, the Group recognises all financial liabilities andparticularly borrowings, trade payables and otherliabilities initially at fair value less transaction costs andsubsequently at amortised cost, using the effectiveinterest method.
The effective interest rate is determined for each transactionand corresponds to the rate that would provide the netcarrying amount of the financial liability by discountingits estimated future cash flows until maturity or the nearestdate the price is reset to the market rate. The calculationincludes transaction costs and any premiums and/ordiscounts. Transaction costs correspond to the costs directlyattributable to the acquisition or issue of a financial liability.
The net carrying amount of financial liabilities that qualifyas hedged items as part of a fair value hedging relationshipand are valued at amortised cost, is adjusted with respectto the hedged risk.
Hedging relationships are described in the section onderivative instruments.
Financial liabilities accounted for under the fair value option,other than derivative liabilities, are carried at fair value.Changes in fair value are taken to the income statement.Transaction costs incurred in setting up these financialliabilities are recognised immediately in expenses.
2.11.3. Hybrid instruments
Certain financial instruments have both a standard debtcomponent and an equity component.
For the Group, this concerns in particular OCEANE bonds(bonds convertible or exchangeable into new or existingshares).
Under IAS 32, convertible bonds are considered hybridinstruments insofar as the conversion option provides forthe repayment of the instrument against a fixed numberof equity instruments. There are several components:
• a financial liability (corresponding to the contractualcommitment to pay cash), representing the bondcomponent;
• the option converting the bonds into a fixed number ofordinary shares, offered to the subscriber, similar to a calloption written by the issuer, representing an equityinstrument;
• potentially one or more embedded derivatives.
The accounting policies applicable to each of thesecomponents, at the issue date and at the end of eachsubsequent reporting period, are as follows:
• debt component: the amount initially recognised asdebt corresponds to the present value of the future
cash flows arising from interest and principal paymentsat the market rate for a similar bond with no conversionoption. If the convertible bond contains embeddedderivatives closely related to the borrowing within themeaning of IAS 39, the value of these components isallocated to the debt in order to determine the value ofthe equity component. The debt component issubsequently recognised at amortised cost;
• embedded derivatives not closely related to the debtare recognised at fair value with changes in fair valuerecognised in income;
• equity component: the value of the conversion optionis determined by deducting the value of any embeddedderivatives from the amount of the issue less the carryingamount of the debt component. The conversion optioncontinues to be recorded in equity at its initial value.Changes in value are not recognised;
• transaction costs are allocated pro rata to eachcomponent.
2.11.4. Derivative instruments
The Group uses various financial instruments to reduceits exposure to foreign exchange, interest rate and equityrisk. These instruments are listed on organised marketsor traded over the counter with leading counterparties.
All derivatives are recognised in the statement offinancial position under other current or non-currentassets and liabilities depending on their maturity andaccounting classification, and are valued at fair value asof the trade date. Changes in the fair value of derivativesare always recorded in income except in the case of cashflow and net investment hedges.
Derivatives designated as hedging instruments areclassified by category of hedge based on the nature of therisks being hedged:
• a cash flow hedge is used to hedge the risk of changesin cash flow from recognised assets or liabilities or ahighly probable transaction that would impactconsolidated net income;
• a fair value hedge is used to hedge the risk of changesin the fair value of recognised assets or liabilities or a firmcommitment not yet recognised that would impactconsolidated net income;
• a net investment hedge is used to hedge the foreignexchange risk arising on foreign activities.
Hedge accounting can only be applied if all the followingconditions are met:
• there is a clearly identified, formalised and documentedhedging relationship as of the date of inception;
• the effectiveness of the hedging relationship can bedemonstrated on a prospective and retrospective basis.The results obtained must attain a confidence level ofbetween 80% and 125%.
208 Kering ~ 2013 Reference Document
5 FINANCIAL INFORMATION ~ CONSOLIDATED FINANCIAL STATEMENTS AS OF DECEMBER 31, 2013
05_D_VA_V6 14/04/14 11:29 Page208
The accounting treatment of financial instruments qualifiedas hedging instruments, and their impact on the incomestatement and the statement of financial position,depends on the type of hedging relationship:
• cash flow and net investment hedges:- the effective portion of fair value gains and losses on
the hedging instrument is recognised directly in othercomprehensive income. These amounts are releasedto the income statement to match the recognition ofthe hedged items, mainly in gross profit for tradingtransaction hedges and in net finance costs forfinancial transaction hedges,
- the ineffective portion of the hedge is recognised inthe income statement,
• for fair value hedges, the hedged component of theseitems is measured on the statement of financial positionat fair value. Fair value gains and losses are recorded inthe income statement and offset, to the extent effective,by matching fair value gains and losses on the hedginginstrument.
2.11.5. Cash and cash equivalents
The “Cash and cash equivalents” line item recorded onthe assets side of the consolidated statement of financialposition comprises cash, mutual or similar funds, short-term investments and other highly liquid instrumentsthat are readily convertible to known amounts of cash,subject to an insignificant risk of changes in value, andhave a maximum maturity of three months as of thepurchase date.
Investments with a maturity exceeding three months,and blocked or pledged bank accounts, are excluded fromcash. Bank overdrafts are presented in borrowings on theliabilities side of the statement of financial position.
In the statement of cash flows, cash and cash equivalentsinclude accrued interest receivable on assets presented incash and cash equivalents and bank overdrafts. A schedulereconciling cash per the statement of cash flows and perthe statement of financial position is provided in Note 32.
2.11.6. Definition of Group consolidated net debt
The concept of net debt used by Group companies comprisesgross debt including accrued interest receivable less netcash as defined by French national accounting board(Conseil National de la Comptabilité – CNC) recommendationNo. 2009-R.03. Net debt includes fair value hedginginstruments recorded in the statement of financial positionrelating to bank borrowings and bonds whose interestrate risk is fully or partly hedged as part of a fair valuehedging relationship.
The financing of customer loans by fully-consolidatedconsumer credit businesses is presented in borrowings.Group net debt excludes the financing of customer loansby consumer credit businesses.
2.12. Treasury shares
Treasury shares, whether specifically allocated for grantto employees or allocated to the liquidity agreement or inany other case, as well as directly related transaction costs,are deducted from consolidated equity. On disposal, theconsideration received for these shares, net of transactioncosts and the related tax impacts, is recognised in equity.
2.13. Treasury share options
Treasury share options are treated according to theircharacteristics as derivative instruments, equityinstruments or financial liabilities.
Options classified as derivatives are recorded at fair valuethrough the income statement. Options classified asequity instruments are recorded in equity for their initialamount. Changes in value are not recognised. The accountingtreatment of financial liabilities is described in Note 2.11.
2.14. Share-based payment
Free share plans, stock purchase plans and stocksubscription plans are awarded by the Group and settled inshares. In accordance with IFRS 2 – Share-based Payment,the fair value of these plans, determined by reference tothe fair value of services rendered by the beneficiaries, isassessed at the grant date. The mathematical modelsused in these calculations are described in Note 7.
During the rights vesting period, the fair value of optionsand free shares calculated as described above is amortisedin proportion to the vesting of rights. This expense isrecorded in payroll expenses with an offsetting increasein equity.
Share appreciation rights (SARs) granted by the Groupalso result in the recognition of payroll expenses spreadover the rights vesting period and a matching liabilitywhich is measured at fair value through income at theend of each reporting period.
2.15. Income taxes
The income tax charge for the period comprises the currentand deferred tax charge.
Deferred tax is calculated using the liability method on alltemporary differences between the carrying amountrecorded in the consolidated statement of financialposition and the tax value of assets and liabilities, exceptfor goodwill that is not deductible for tax purposes. Thevaluation of deferred tax balances depends on the way inwhich the Group intends to recover or settle the carryingamount of assets and liabilities, using tax rates that havebeen enacted or substantively enacted at the end of thereporting period.
Deferred tax assets and liabilities are not discounted andare classified in the statement of financial position withinnon-current assets and liabilities.
209
5
2013 Reference Document ~ Kering
CONSOLIDATED FINANCIAL STATEMENTS AS OF DECEMBER 31, 2013 ~ FINANCIAL INFORMATION
05_D_VA_V6 14/04/14 11:29 Page209

A deferred tax asset is recognised on deductible temporarydifferences and for tax loss carry-forwards and tax creditsto the extent that their future offset is probable.
A deferred tax liability is recognised on taxable temporarydifferences relating to investments in subsidiaries,associates and joint ventures unless the Group is able tocontrol the timing of the reversal of the temporarydifference, and it is probable that the temporarydifference will not reverse in the foreseeable future.
2.16. Provisions
Provisions for litigation and disputes, and miscellaneouscontingencies and losses are recognised as soon as a presentobligation arises from past events, which is likely to resultin an outflow of resources embodying economic benefits,and the amount of which can be reliably estimated.
Provisions maturing in more than one year are valued at thediscounted amount representing the best estimate of theexpense necessary to extinguish the current obligation atthe end of the reporting period. The discount rate usedreflects current assessments of the time value of moneyand specific risks related to the liability.
A restructuring provision is recognised when there is aformal and detailed restructuring plan and the plan hasbegun to be implemented or its main features have beenannounced before the end of the reporting period.Restructuring costs for which a provision is made essentiallyrepresent employee costs (severance pay, early retirementplans, payment in lieu of notice, etc.), work stoppages andcompensation for breaches of contract with third parties.
2.17. Post-employment benefits and otherlong-term employee benefits
Based on the laws and practices of each country, theGroup recognises various types of employee benefits.
Under defined contribution plans, the Group is notobliged to make additional payments over and abovecontributions already made to a fund, if the fund doesnot have sufficient assets to cover the benefitscorresponding to services rendered by personnel duringthe current period and prior periods. Contributions paidinto these plans are expensed as incurred.
Under defined benefit plans, obligations are valued usingthe projected unit credit method based on agreements ineffect in each company. Under this method, each period ofservice gives rise to an additional unit of benefit entitlementand each unit is measured separately to build up the finalobligation. The obligation is then discounted. The actuarialassumptions used to determine the obligations varyaccording to the economic conditions of the countrywhere the plan is established. These plans are valued by
independent actuaries on an annual basis for the mostsignificant plans and at regular intervals for the otherplans. The valuations take into account the level of futurecompensation, the probable active life of employees, lifeexpectancy and staff turnover.
Actuarial gains and losses are primarily due to changes inassumptions and the difference between estimatedresults based on actuarial assumptions and actual results.All actuarial differences in respect of defined benefitplans are recognised in other comprehensive income.
The past service cost designating the increase in anobligation following the introduction of a new plan orchanges to an existing plan, is expensed immediatelywhether the benefit entitlement has already vested or isstill vesting.
Expenses relating to this type of plan are recognised inrecurring operating income (service cost) and net financecosts (interest cost and net interest on the net definedbenefit liability or asset). Curtailments, settlements and pastservice costs are recognised in recurring operatingincome. The provision recognised in the statement offinancial position corresponds to the present value of theobligations calculated as described above, less the fairvalue of plan assets.
2.18. Non-current assets (and disposalgroups) held for sale to owners
The Group applies IFRS 5 – Non-current Assets Held for Saleand Discontinued Operations. This requires the separaterecognition and presentation of non-current assets (ordisposal groups) held for sale and discontinued operations.
Non-current assets, or groups of assets and liabilities directlyassociated with those assets, are considered as held forsale if it is highly probable that their carrying amount willbe recovered principally through a sale rather than throughcontinuing use. Non-current assets (or disposal groups)held for sale are measured and recognised at the lower oftheir net carrying amount and their fair value less the costsof disposal. These assets are no longer depreciated fromthe time they qualify as assets (or disposal groups) held forsale. They are presented on separate lines in the consolidatedstatement of financial position, without restatement forprevious periods.
A discontinued operation is defined as a component of anentity that generates cash flows that can be clearlydistinguished from the rest of the entity and represents aseparate major line of business or geographical area ofoperations. For all periods presented, the net income(loss) from these activities is shown on a separate line ofthe income statement (“Discontinued operations”), and isrestated in the statement of cash flows.
210 Kering ~ 2013 Reference Document
5 FINANCIAL INFORMATION ~ CONSOLIDATED FINANCIAL STATEMENTS AS OF DECEMBER 31, 2013
05_D_VA_V6 14/04/14 11:29 Page210

2.19. Revenue recognition
Revenue mainly comprises sales of goods for resale, consumergoods and Luxury Goods, together with income fromsales-related services, royalties and operating licences.
Revenue is valued at the fair value of the considerationreceived for goods and services sold, royalties and licences,excluding taxes, net of rebates and discounts and afterelimination of inter-company sales.
In the event of deferred payment beyond the usual creditterms that is not assumed by a financing institution, therevenue from the sale is equal to the discounted price, withthe difference between the discounted price and the cashpayment recognised in financial income over the life ofthe deferred payment if the transaction is material.
Sales of goods are recognised when a Group entity hastransferred the risks and rewards incidental to ownershipto the buyer (generally on delivery), when revenue can bereliably measured and when recovery is reasonably assured.
Following the sale of goods, and depending on thecontractual clauses attached to these sales, provisionsmay be deducted from revenue to cover potential returnslikely to occur after the end of the reporting period.
Services such as warranty extensions or services directlyrelated to the sale of goods are recognised over the periodin which such services are rendered or, if the Group companyacts as an intermediary in the sale of these services, as of thedate the contractual agreement is signed by the customer.
2.20. Operating income
Operating income includes all revenue and expensesdirectly related to Group activities, whether these revenueand expenses are recurring or arise from non-recurringdecisions or transactions.
Recurring operating income is an analytical balanceintended to facilitate the understanding of the entity’soperating performance.
Other non-recurring operating income and expensesexcluded from recurring operating income as defined byCNC recommendation No. 2009-R.03, include:
• non-recurring items corresponding to revenue andexpenses that are unusual due to their frequency,nature or amount;
• impairment of goodwill and other intangible assets;
• gains or losses on disposals of property, plant andequipment and intangible assets, operating assets orinvestments;
• restructuring costs and costs relating to employeeretraining measures.
2.21. Earnings per share
Earnings per share is calculated by dividing net incomeattributable to owners of the parent by the weightedaverage number of outstanding shares during the year,after deduction of the weighted average number oftreasury shares held by consolidated companies.
Fully diluted earnings per share is calculated by adjustingnet income attributable to owners of the parent and thenumber of outstanding shares for all instruments grantingdeferred access to the share capital of the Company, whetherissued by Kering or one of its subsidiaries. Dilution isdetermined separately for each instrument based on thefollowing conditions:
• when the proceeds corresponding to potential futureshare issues are received at the time dilutive securities areissued (e.g., convertible bonds), the numerator is equal tonet income before dilution plus the interest expense thatwould be saved in the event of conversion, net of tax;
• when the proceeds are received at the time the rights areexercised (e.g., stock subscription options), the dilutionattached to the options is determined using the treasuryshares method (theoretical number of shares purchasedat market price [average over the period] based on theproceeds received at the time the rights are exercised).
In the case of material non-recurring items, earnings pershare excluding non-recurring items is calculated by adjustingnet income attributable to owners of the parent for non-recurring items net of taxes and non-controlling interests.Non-recurring items taken into account for this calculationcorrespond to all the items included under “Other non-recurring operating income and expenses” in the incomestatement.
2.22. Operating segments
In accordance with IFRS 8 – Operating Segments, segmentinformation is reported on the same basis as used internallyby the Chairman and Chief Executive Officer and DeputyCEO – the Group’s chief operating decision makers – inorder to allocate resources to segments and assess theirperformance.
An operating segment is a component of the Group thatengages in business activities from which it may earn revenuesand incur expenses, whose operating results are regularlyreviewed by the entity’s chief operating decision maker,and for which discrete financial information is available.
Each operating segment is monitored separately forinternal reporting purposes, according to performanceindicators common to all of the Group’s segments.
The segments presented are operating segments or groupsof similar operating segments.
211
5
2013 Reference Document ~ Kering
CONSOLIDATED FINANCIAL STATEMENTS AS OF DECEMBER 31, 2013 ~ FINANCIAL INFORMATION
05_D_VA_V6 14/04/14 11:29 Page211

The Kering group consolidated financial statements forthe year ended December 31, 2013 include the financialstatements of the companies listed in Note 36.
3.1. PPR becomes Kering
Having completed its transformation into a global leaderin apparel and accessories operating in the Luxury andSport & Lifestyle markets, on March 22, 2013 the Groupannounced its decision to change its name to “Kering” tobetter reflect its new identity. This name change was approvedat the Annual General Meeting held on June 18, 2013.
3.2. Changes in Group structure
3.2.1. Distribution of Groupe Fnac shares to Keringshareholders and listing of Groupe Fnacshares on NYSE Euronext Paris
In line with the principle announced on October 9, 2012,at its April 17, 2013 meeting Kering’s Board of Directorsunanimously approved the listing of Groupe Fnac sharesthrough a distribution of Groupe Fnac shares to Keringshareholders. This listing had previously been approvedby the employee representative bodies of both GroupeFnac and Kering SA.
At the Annual General Meeting of June 18, 2013, Kering’sshareholders authorised the payment of an additional cashdividend of €2.25 per share (following an interim cashdividend of €1.50 paid on January 24, 2013), and an additional dividend in the form of Groupe Fnac sharesat a ratio of one Groupe Fnac share for every eight Keringshares held.
On June 20, 2013 prior to the start of market trading:
• the rights to the balance of the cash dividend for 2012were detached from the Kering shares and the dividendwas paid;
• the rights to the allotment of Groupe Fnac shares weredetached from the Kering shares and the deliveries ofGroupe Fnac shares began.
Consequently, the Groupe Fnac share allotment rightsbegan trading on Euronext Paris on June 20, 2013.
Kering distributed a total of 15,672,034 shares representingjust under 95% of Groupe Fnac’s capital as of the ex-dividend date, in view of the fact that a 5% stake in thecompany had already been sold in the first half of 2013to Kernic Met BV (a company indirectly held by Kering),which in turn had transferred title to the 830,907 sharesconcerned as part of a financial forward contract.
In accordance with IFRIC 17, as of June 20, 2013 – the dateon which the Groupe Fnac shares were delivered to their
shareholders and first listed – the Groupe Fnac shares werederecognised by Kering based on a fair value of €314 millionfor 95% of the shares (15,672,034 shares x €20.03).
The derecognition led to a €256 million post-tax disposalloss in 2013, taking into account the costs of the distributionand Groupe Fnac’s net income in the first half of the year.
This disposal loss was recorded in “Net income (loss)from discontinued operations”.
3.2.2. Kering continues its divestment of Redcatsand finalises the Group’s transformation
On January 3, 2013, Kering announced that it hadreceived a firm offer from Alpha Private Equity Fund 6(“APEF 6”) to acquire Redcats’ Children and Familydivision – comprising the Cyrillus and Vertbaudet brands –for an enterprise value of €119 million. The transactionwas completed on March 28, 2013.
On February 5, 2013, Kering announced the closing of thesale of OneStopPlus to Charlesbank Capital Partners andWebster Capital in accordance with the terms of thedefinitive sale agreement announced on December 5, 2012.This transaction marked the final step in the sale of all ofRedcats USA’s operations.
On February 25, 2013, Kering announced that Redcatshad entered into an agreement to sell its Nordic activities,Ellos and Jotex to Nordic Capital Fund VII for an enterprisevalue of €275 million. The transaction was completed onJune 3, 2013.
During the second half of 2013, Kering continued the processfor its planned sale of La Redoute and Relais Colis. OnDecember 4, 2013, after examining the four takeover offers,Kering’s Board of Directors decided to enter into exclusivenegotiations with Nathalie Balla – the current chairman andCEO of La Redoute – and Eric Courteille – Chief AdministrativeOfficer of Redcats – who presented a takeover plan for LaRedoute and Relais Colis, supported by a team of managersfrom the two companies. In line with the undertakings it gave in relation to the takeover, Kering will recapitaliseLa Redoute and Relais Colis at the same time as the saleis carried out. This recapitalisation will ensure that bothcompanies enjoy a healthy financial position backed by asignificant cash surplus and that the new owners will be ableto fund their transformation and modernisation measures.
Nathalie Balla and Eric Courteille presented the details oftheir business plan to the relevant employee representativebodies in January 2014 in accordance with the standardinformation and consultation procedure required underFrench law, and they are currently pursuing negotiationswith La Redoute’s trade unions.
Note 3 – Highlights
212 Kering ~ 2013 Reference Document
5 FINANCIAL INFORMATION ~ CONSOLIDATED FINANCIAL STATEMENTS AS OF DECEMBER 31, 2013
05_D_VA_V6 14/04/14 11:29 Page212
The results of Redcats’ businesses during the yearamounted to €562 million and were recorded under “Netincome (loss) from discontinued operations”. This amountincludes Kering’s €315 million recapitalisation undertakingin relation to La Redoute, the impairment losses recordedagainst Redcats’ residual assets and the disposal gainsand losses on activities sold during the period. It does notinclude the cost of financing the social guarantees to begranted to the employees concerned by the modernisationmeasures at La Redoute and Relais Colis. The total cost ofthis financing, which cannot as yet be reliably estimated, willlead Kering to set up a trust guaranteeing the applicationof the employee measures approved in a majority collectiveagreement with trade unions. The associated costs willbe recognised in 2014.
3.2.3. Kering strengthens its portfolio of luxury brands
In early January 2013, Kering completed its acquisition ofa majority stake in the Chinese fine jewellery brand Qeelin.Launched in 2004, Qeelin is the first Chinese luxury jewellerto have developed an international network of stores in themost prestigious shopping districts worldwide. At the timeof acquisition, it operated 14 stores (seven in Mainland China,four in Hong Kong and three in Europe) and is sold in anumber of multi-brand stores such as Colette in Paris andRestir in Tokyo.
On January 15, 2013, Kering acquired a majority stake inthe luxury designer brand Christopher Kane with a view todeveloping the brand’s business in close partnership withits eponymous creator, the Scottish designer ChristopherKane. Founded in 2006, Christopher Kane is a distinctiveand exciting brand with a unique DNA.
Qeelin and Christopher Kane have been fully consolidatedin Kering’s financial statements since January 1, 2013. As of December 31, 2013, Kering valued the Qeelin brandat €20 million on a provisional basis following the initialpurchase price allocation process, which will be completedduring 2014.
On March 25, 2013, Kering announced that it had acquireda majority stake in France Croco and Tannerie de Périers.Founded in 1974, France Croco is a leading independenttannery located in Normandy and specialised in thesourcing, tanning and processing of crocodile skins.
This acquisition will allow Kering’s brands to further securea sustainable supply of high quality crocodile skins andtheir activities are highly complementary to those ofCaravel, another tannery owned by Kering which specialisesin sourcing and tanning precious skins. France Croco andTannerie de Périers have been consolidated in Kering’sfinancial statements since the second quarter of 2013.The purchase price allocation process for this acquisitionwas still in progress at end-December 2013.
On April 22, 2013 Gucci further demonstrated its commitmentto the excellence of “Made in Italy” and to Tuscany by
announcing that it had acquired the Italian porcelain maker,Richard Ginori, as part of its plans to expand into thetableware market. Richard Ginori was not consolidated bythe Group at end-December 2013.
On April 24, 2013, Kering announced that it had signed anagreement with RA.MO SpA to acquire a majority stake inthe Italian jewellery group Pomellato. The Pomellatogroup has two brands: Pomellato, which is positioned inthe fine jewellery segment and Dodo, positioned in theaccessible jewellery segment. Through this acquisitionKering has extended and strengthened its portfolio ofluxury brands in the high-growth jewellery segment. Thetransaction was completed on July 5, 2013, followingclearance by the competition authorities. In view of thedate on which Kering took over control of the Group,Pomellato has been consolidated since July 1, 2013. As ofDecember 31, 2013, Kering valued the Pomellato and Dodobrands at €210 million on a provisional basis followingthe initial purchase price allocation process, which will becompleted during 2014.
On September 6, 2013, Kering announced that it wasacquiring a minority shareholding in the New York basedfashion brand, Altuzarra, founded by the Franco-Americandesigner Joseph Altuzarra in 2008. This investment marksthe beginning of a partnership which will enable Kering toaccompany Altuzarra in the next stage of its growth.Altuzarra was not consolidated in Kering’s financialstatements at December 31, 2013.
On November 19, 2013, Kering and Tomas Maier announcedthat they had entered into a joint venture to develop thebusiness of the Tomas Maier brand in partnership. TomasMaier will continue to be Creative Director of BottegaVeneta, a position he has held since 2001. The jointventure was not consolidated in Kering’s financialstatements at December 31, 2013.
3.3. Other highlights
On April 18, 2013, PUMA SE announced that it hadappointed Björn Gulden as Chief Executive Officereffective July 1, 2013. Mr Gulden – who is a member ofKering’s Executive Committee – brings to PUMA solidinternational experience of nearly 20 years in the SportingGoods and footwear industry where he has held a varietyof management positions, notably with Adidas, HellyHansen and Deichman.
In the first half of 2013, Kering redeemed both the€600 million worth of bonds issued in 2005, includingthe additional bonds issued in 2006, and the second€200 million tranche of the bonds indexed to the Keringshare price that were issued in May 2008. To extend thematurity of its debt, Kering carried out a first bond issueon July 15, 2013 involving €500 million worth of seven-year bonds with a fixed-rate coupon of 2.5%, and asecond – which also represented €500 million – onOctober 8, involving five-year bonds with a 1.875% fixed-rate coupon.
213
5
2013 Reference Document ~ Kering
CONSOLIDATED FINANCIAL STATEMENTS AS OF DECEMBER 31, 2013 ~ FINANCIAL INFORMATION
05_D_VA_V6 14/04/14 11:29 Page213
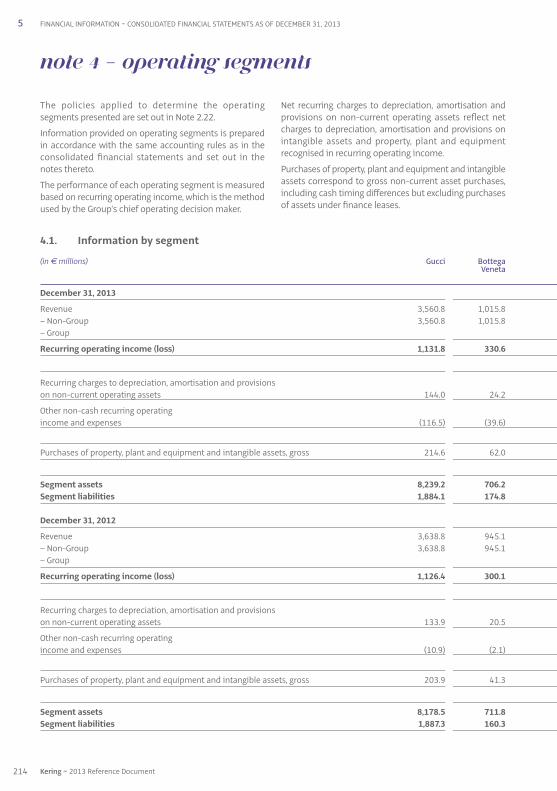
4.1. Information by segment
(in € millions) Gucci Bottega Veneta
December 31, 2013
Revenue 3,560.8 1,015.8 – Non-Group 3,560.8 1,015.8 – Group
Recurring operating income (loss) 1,131.8 330.6
Recurring charges to depreciation, amortisation and provisions on non-current operating assets 144.0 24.2
Other non-cash recurring operating income and expenses (116.5) (39.6)
Purchases of property, plant and equipment and intangible assets, gross 214.6 62.0
Segment assets 8,239.2 706.2 Segment liabilities 1,884.1 174.8
December 31, 2012
Revenue 3,638.8 945.1 – Non-Group 3,638.8 945.1 – Group
Recurring operating income (loss) 1,126.4 300.1
Recurring charges to depreciation, amortisation and provisions on non-current operating assets 133.9 20.5
Other non-cash recurring operating income and expenses (10.9) (2.1)
Purchases of property, plant and equipment and intangible assets, gross 203.9 41.3
Segment assets 8,178.5 711.8 Segment liabilities 1,887.3 160.3
The policies applied to determine the operatingsegments presented are set out in Note 2.22.
Information provided on operating segments is preparedin accordance with the same accounting rules as in theconsolidated financial statements and set out in thenotes thereto.
The performance of each operating segment is measuredbased on recurring operating income, which is the methodused by the Group’s chief operating decision maker.
Net recurring charges to depreciation, amortisation andprovisions on non-current operating assets reflect netcharges to depreciation, amortisation and provisions onintangible assets and property, plant and equipmentrecognised in recurring operating income.
Purchases of property, plant and equipment and intangibleassets correspond to gross non-current asset purchases,including cash timing differences but excluding purchasesof assets under finance leases.
Note 4 – Operating segments
5 FINANCIAL INFORMATION ~ CONSOLIDATED FINANCIAL STATEMENTS AS OF DECEMBER 31, 2013
214 Kering ~ 2013 Reference Document
05_D_VA_V6 14/04/14 11:29 Page214

5CONSOLIDATED FINANCIAL STATEMENTS AS OF DECEMBER 31, 2013 ~ FINANCIAL INFORMATION
Non-current segment assets comprise goodwill, brandsand other intangible assets, property, plant and equipmentand other non-current assets.
Segment assets comprise non-current segment assets,inventories, trade receivables and other current assets.
Segment liabilities comprise deferred tax liabilities onbrands, trade payables and other current liabilities.
Yves Saint Other Luxury PUMA Other Sport & Corporate Total Laurent brands Division brands Lifestyle Division
556.9 1,336.7 6,470.2 3,001.9 245.1 3,247.0 31.2 9,748.4 556.9 1,336.7 6,470.2 3,001.9 245.1 3,247.0 31.2 9,748.4
76.6 143.6 1,682.6 191.9 8.5 200.4 (132.9) 1,750.1
16.4 46.1 230.7 54.5 3.4 57.9 7.2 295.8
(16.0) (27.7) (199.8) (5.6) (2.7) (8.3) 105.4 (102.7)
65.3 93.7 435.6 67.7 7.1 74.8 167.3 677.7
1,246.3 2,522.8 12,714.5 5,960.8 546.5 6,507.3 236.9 19,458.7 241.6 587.6 2,888.1 1,625.8 128.8 1,754.6 230.3 4,873.0
472.8 1,155.6 6,212.3 3,270.7 261.2 3,531.9 (7.9) 9,736.3 472.8 1,155.1 6,211.8 3,263.3 261.2 3,524.5 9,736.3 0.5 0.5 7.4 7.4 (7.9)
65.0 120.1 1,611.6 290.0 14.8 304.8 (124.9) 1,791.5
10.8 38.5 203.7 60.3 5.7 66.0 5.4 275.1
(0.6) (0.5) (14.1) (4.2) 0.2 (4.0) 1.6 (16.5)
21.8 70.3 337.3 81.2 9.9 91.1 13.5 441.9
1,132.9 1,844.9 11,868.1 6,436.1 556.0 6,992.1 122.4 18,982.6 228.2 472.2 2,748.0 1,675.3 126.1 1,801.4 168.1 4,717.5
2152013 Reference Document ~ Kering
05_D_VA_V6 14/04/14 11:29 Page215

(in € millions) 2013 2012
Western Europe 3,057.9 2,937.5North America 2,038.3 1,978.9Japan 982.8 1,158.3
Sub-total – mature markets 6,079.0 6,074.7
Eastern Europe, Middle East and Africa 723.6 685.2South America 476.0 536.7Asia-Pacific (excluding Japan) 2,469.8 2,439.7
Sub-total – emerging markets 3,669.4 3,661.6
Total revenue 9,748.4 9,736.3
4.3. Reconciliation of segment assets and liabilities
The reconciliation of total segment assets and non-current segment assets with total Group assets is as follows:
(in € millions) 2013 2012
Goodwill 3,770.1 3,871.0Brands and other intangible assets 10,702.8 10,489.9Property, plant and equipment 1,676.9 1,376.3Other non-current assets 30.1 28.9
Non-current segment assets 16,179.9 15,766.1
Inventories 1,805.5 1,736.5Trade receivables 949.9 985.3Other current assets 523.4 494.7
Segment assets 19,458.7 18,982.6
Investments in associates 17.3 25.8Non-current financial assets 316.8 273.7Deferred tax assets 649.9 600.2Current tax receivables 119.1 75.7Other current financial assets 107.7 87.0Cash and cash equivalents 1,419.2 2,081.0Assets classified as held for sale or for distribution to owners 722.1 3,130.5
Total assets 22,810.8 25,256.5
4.2. Information by geographic area
The presentation of revenue by geographic area is basedon the geographic location of customers. Non-currentsegment assets are not broken down by geographic area
since a significant portion of these assets consists ofgoodwill and brands, which are to be analysed based onthe revenue they generate in each region, and not basedon their geographic location.
216 Kering ~ 2013 Reference Document
5 FINANCIAL INFORMATION ~ CONSOLIDATED FINANCIAL STATEMENTS AS OF DECEMBER 31, 2013
05_D_VA_V6 14/04/14 11:29 Page216

The reconciliation of total segment liabilities with total Group equity and liabilities is as follows:
(in € millions) 2013 2012
Deferred tax liabilities on brands 2,734.6 2,632.6Trade payables 766.1 684.5Other current liabilities 1,372.3 1,400.4
Segment liabilities 4,873.0 4,717.5
Total equity 11,195.9 12,118.7Non-current borrowings 3,132.4 2,988.9Other non-current financial assets 0.7 Non-current provisions for pensions and other post-employment benefits 92.8 98.2Other non-current provisions 113.2 92.3Other deferred tax liabilities 75.6 139.7Current borrowings 1,737.4 1,595.1Other current financial liabilities 213.2 207.9Current provisions for pensions and other post-employment benefits 7.2 6.6Other current provisions 152.7 167.7Current tax liabilities 310.1 318.4Liabilities associated with assets classified as held for sale or for distribution to owners 906.6 2,805.5
Total equity and liabilities 22,810.8 25,256.5
Note 5 – Revenue
(in € millions) 2013 2012
Net sales of goods 9,571.7 9,583.4Net sales of services 2.4 7.2Revenue from concessions and licences 168.4 145.2Other revenue 5.9 0.5
Total 9,748.4 9,736.3
217
5
2013 Reference Document ~ Kering
CONSOLIDATED FINANCIAL STATEMENTS AS OF DECEMBER 31, 2013 ~ FINANCIAL INFORMATION
05_D_VA_V6 14/04/14 11:30 Page217

(in € millions) 2013 2012
Luxury Division (985.5) (943.0)Sport & Lifestyle Division (452.4) (483.1)Corporate (96.8) (67.5)
Total (1,534.7) (1,493.6)
In 2013, payroll expenses recorded under “Corporate” include a €3.1 million charge (€4.0 million in 2012) relating tothe application of IFRS 2 to all transactions based on Kering shares (see Note 7.1).
The average headcount of continuing operations, on a full-time equivalent basis, breaks down as follows:
2013 2012
Luxury Division 19,050 17,384Sport & Lifestyle Division 11,521 11,720Corporate 844 274
Total 31,415 29,378
The total headcount of continuing operations is as follows:
2013 2012
Luxury Division 20,959 18,905Sport & Lifestyle Division 13,921 14,235Corporate 906 299
Total 35,786 33,439
Payroll expenses primarily include fixed and variableremuneration, social security charges, charges relating toemployee profit-sharing and other incentives, training
costs, share-based payment expenses (see Note 7) andexpenses relating to employee benefits recognised inrecurring operating income (see Note 25).
Note 6 – Payroll expenses
218 Kering ~ 2013 Reference Document
5 FINANCIAL INFORMATION ~ CONSOLIDATED FINANCIAL STATEMENTS AS OF DECEMBER 31, 2013
05_D_VA_V6 14/04/14 11:30 Page218
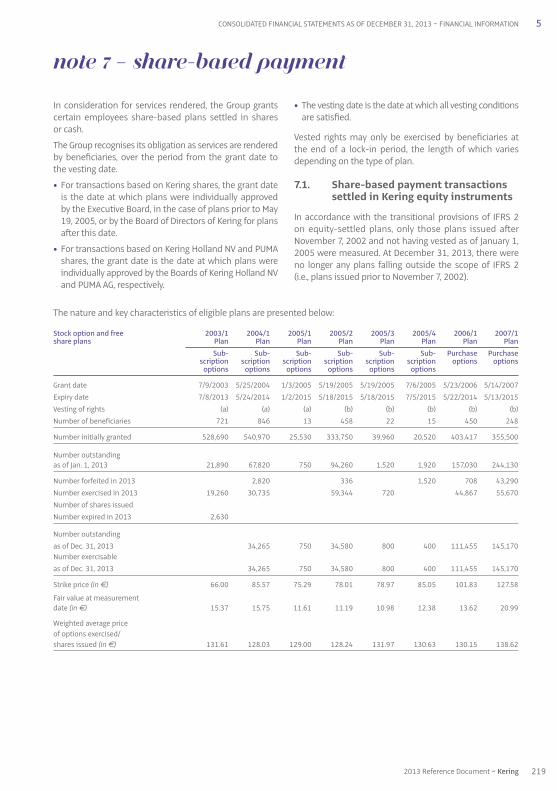
The nature and key characteristics of eligible plans are presented below:
Stock option and free 2003/1 2004/1 2005/1 2005/2 2005/3 2005/4 2006/1 2007/1share plans Plan Plan Plan Plan Plan Plan Plan Plan Sub- Sub- Sub- Sub- Sub- Sub- Purchase Purchase scription scription scription scription scription scription options options options options options options options options
Grant date 7/9/2003 5/25/2004 1/3/2005 5/19/2005 5/19/2005 7/6/2005 5/23/2006 5/14/2007Expiry date 7/8/2013 5/24/2014 1/2/2015 5/18/2015 5/18/2015 7/5/2015 5/22/2014 5/13/2015Vesting of rights (a) (a) (a) (b) (b) (b) (b) (b)Number of beneficiaries 721 846 13 458 22 15 450 248
Number initially granted 528,690 540,970 25,530 333,750 39,960 20,520 403,417 355,500
Number outstanding as of Jan. 1, 2013 21,890 67,820 750 94,260 1,520 1,920 157,030 244,130
Number forfeited in 2013 2,820 336 1,520 708 43,290Number exercised in 2013 19,260 30,735 59,344 720 44,867 55,670Number of shares issued Number expired in 2013 2,630
Number outstanding as of Dec. 31, 2013 34,265 750 34,580 800 400 111,455 145,170Number exercisable as of Dec. 31, 2013 34,265 750 34,580 800 400 111,455 145,170
Strike price (in €) 66.00 85.57 75.29 78.01 78.97 85.05 101.83 127.58
Fair value at measurement date (in €) 15.37 15.75 11.61 11.19 10.98 12.38 13.62 20.99
Weighted average price of options exercised/shares issued (in €) 131.61 128.03 129.00 128.24 131.97 130.63 130.15 138.62
In consideration for services rendered, the Group grantscertain employees share-based plans settled in shares or cash.
The Group recognises its obligation as services are renderedby beneficiaries, over the period from the grant date tothe vesting date.
• For transactions based on Kering shares, the grant dateis the date at which plans were individually approvedby the Executive Board, in the case of plans prior to May19, 2005, or by the Board of Directors of Kering for plansafter this date.
• For transactions based on Kering Holland NV and PUMAshares, the grant date is the date at which plans wereindividually approved by the Boards of Kering Holland NVand PUMA AG, respectively.
• The vesting date is the date at which all vesting conditionsare satisfied.
Vested rights may only be exercised by beneficiaries atthe end of a lock-in period, the length of which variesdepending on the type of plan.
7.1. Share-based payment transactionssettled in Kering equity instruments
In accordance with the transitional provisions of IFRS 2on equity-settled plans, only those plans issued afterNovember 7, 2002 and not having vested as of January 1,2005 were measured. At December 31, 2013, there wereno longer any plans falling outside the scope of IFRS 2(i.e., plans issued prior to November 7, 2002).
Note 7 – Share-based payment
219
5
2013 Reference Document ~ Kering
CONSOLIDATED FINANCIAL STATEMENTS AS OF DECEMBER 31, 2013 ~ FINANCIAL INFORMATION
05_D_VA_V6 14/04/14 11:30 Page219

No new shares are issued on the exercise of stock purchaseoptions or free share grants.
Under all these plans, shares are subject to a four-yearlock-in period, commencing on the grant date.
(a) Options vest at a rate of 25% per full year of presencewithin the Group, except in the event of retirement(when rights vest in full). If a beneficiary is dismissedfor gross negligence or misconduct, all rights are lost,including after the lock-in period.
(b) Options vest at a rate of 25% per full year of presencewithin the Group, except in the event of retirement(when rights vest in full) or resignation (when allrights are lost). If a beneficiary is dismissed for grossnegligence or misconduct, all rights are lost, includingafter the lock-in period.
(c) Shares vest two years after being granted, except in theevent of resignation or dismissal for gross negligenceor misconduct (when all rights are lost). The totalnumber of shares granted is subject to stock marketperformance conditions. The vesting period isfollowed by a two-year non-transferability period.
(d) Shares vest four years after being granted, except inthe event of resignation or dismissal for grossnegligence or misconduct (when all rights are lost).The total number of shares granted is subject tostock market performance conditions. These sharesare not subject to a non-transferability period.
The value of services rendered by beneficiaries isdetermined on the grant date of the plans:
• for stock purchase and stock subscription plans, by usinga Black & Scholes model with a trinomial algorithm andexercise thresholds, which takes into account thenumber of potentially exercisable options at the end ofthe vesting period;
• for free share plans, by using a Black & Scholes modelwith a Monte Carlo algorithm and two underlyings.
The exercise thresholds and probability assumptionsused for the stock subscription and stock purchaseoption plans are as follows:
Threshold as a % of the strike price Probability of exercise
125% 15%
150% 20%
175% 20%
200% 20%
Based on these assumptions, 25% of beneficiaries do notelect to exercise their options prior to the expiry date.
Stock option and free 2007 / 2 2009 / 2 2010/2 2011/1 2011/2 2012/1 2012/2share plans Plan Plan Plan Plan Plan Plan Plan Purchase Free Free Free Free Free Free options shares shares shares shares shares shares
Grant date 9/17/2007 5/7/2009 5/19/2010 5/19/2011 5/19/2011 4/27/2012 4/27/2012Expiry date 9/16/2015 N/A N/A N/A N/A N/A N/AVesting of rights (b) (d) (d) (c) (d) (c) (d)Number of beneficiaries 14 161 108 184 76 198 88
Number initially granted 51,300 46,505 25,035 67,379 9,455 69,399 39,640
Number outstanding as of Jan. 1, 2013 41,400 40,225 23,625 65,524 8,870 67,564 38,675
Number forfeited in 2013 220 325 3,038 585 2,467 370Number exercised in 2013 2,500 Number of shares issued 40,005 62,486 Number expired in 2013
Number outstanding as of Dec. 31, 2013 38,900 23,300 8,285 65,097 38,305Number exercisable as of Dec. 31, 2013 38,900
Strike price (in €) 127.58 N/A N/A N/A N/A N/A N/A
Fair value at measurement date (in €) 24.74 32.21 60.62 83.53 69.91 88.73 74.62
Weighted average price of options exercised/shares issued (in €) 131.58
220 Kering ~ 2013 Reference Document
5 FINANCIAL INFORMATION ~ CONSOLIDATED FINANCIAL STATEMENTS AS OF DECEMBER 31, 2013
05_D_VA_V6 14/04/14 11:30 Page220
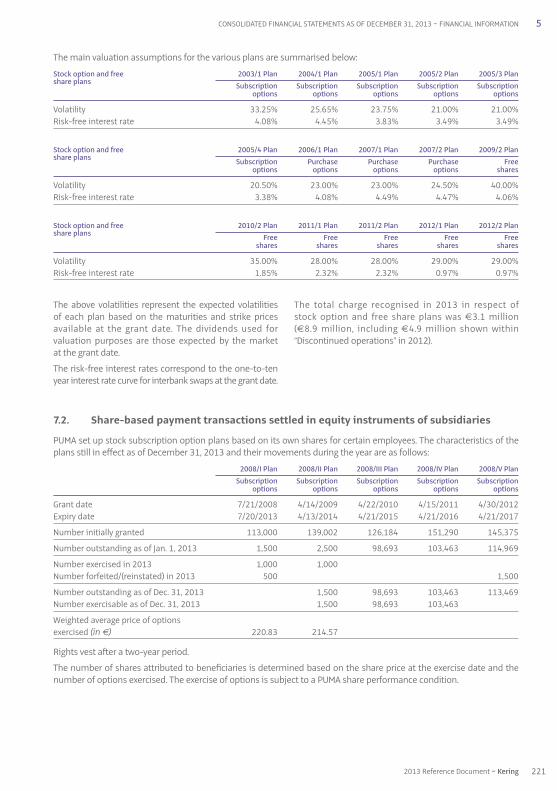
7.2. Share-based payment transactions settled in equity instruments of subsidiaries
PUMA set up stock subscription option plans based on its own shares for certain employees. The characteristics of theplans still in effect as of December 31, 2013 and their movements during the year are as follows:
2008/I Plan 2008/II Plan 2008/III Plan 2008/IV Plan 2008 / V Plan Subscription Subscription Subscription Subscription Subscription options options options options options
Grant date 7/21/2008 4/14/2009 4/22/2010 4/15/2011 4/30/2012Expiry date 7/20/2013 4/13/2014 4/21/2015 4/21/2016 4/21/2017
Number initially granted 113,000 139,002 126,184 151,290 145,375
Number outstanding as of Jan. 1, 2013 1,500 2,500 98,693 103,463 114,969
Number exercised in 2013 1,000 1,000 Number forfeited/(reinstated) in 2013 500 1,500
Number outstanding as of Dec. 31, 2013 1,500 98,693 103,463 113,469Number exercisable as of Dec. 31, 2013 1,500 98,693 103,463
Weighted average price of options exercised (in €) 220.83 214.57
Rights vest after a two-year period.
The number of shares attributed to beneficiaries is determined based on the share price at the exercise date and thenumber of options exercised. The exercise of options is subject to a PUMA share performance condition.
The above volatilities represent the expected volatilitiesof each plan based on the maturities and strike pricesavailable at the grant date. The dividends used forvaluation purposes are those expected by the market at the grant date.
The risk-free interest rates correspond to the one-to-tenyear interest rate curve for interbank swaps at the grant date.
The total charge recognised in 2013 in respect of stock option and free share plans was €3.1 million(€8.9 million, including €4.9 million shown within“Discontinued operations” in 2012).
The main valuation assumptions for the various plans are summarised below:
Stock option and free 2003/1 Plan 2004/1 Plan 2005/1 Plan 2005/2 Plan 2005 / 3 Planshare plans Subscription Subscription Subscription Subscription Subscription options options options options options
Volatility 33.25% 25.65% 23.75% 21.00% 21.00%Risk-free interest rate 4.08% 4.45% 3.83% 3.49% 3.49%
Stock option and free 2005/4 Plan 2006/1 Plan 2007/1 Plan 2007/2 Plan 2009 / 2 Planshare plans Subscription Purchase Purchase Purchase Free options options options options shares
Volatility 20.50% 23.00% 23.00% 24.50% 40.00%Risk-free interest rate 3.38% 4.08% 4.49% 4.47% 4.06%
Stock option and free 2010/2 Plan 2011/1 Plan 2011/2 Plan 2012/1 Plan 2012 / 2 Planshare plans Free Free Free Free Free shares shares shares shares shares
Volatility 35.00% 28.00% 28.00% 29.00% 29.00%Risk-free interest rate 1.85% 2.32% 2.32% 0.97% 0.97%
221
5
2013 Reference Document ~ Kering
CONSOLIDATED FINANCIAL STATEMENTS AS OF DECEMBER 31, 2013 ~ FINANCIAL INFORMATION
05_D_VA_V6 14/04/14 11:30 Page221

7.3.2. Characteristics of KMUs granted by Kering SA
Since 2013, the Group has granted Kering Monetary Units(KMUs) instead of free shares.
The unit value of the KMUs awarded (and any changes inthat value) is determined based on the intrinsic value ofthe Kering share price in comparison with the averageincrease in a basket of stocks from the Luxury and Sportsindustries. On July 21, 2013, 124,126 KMUs were granted,with a unit value of €152.
Subject to the beneficiaries’ continued presence withinthe Group, the KMUs granted will be settled in cash at theend of the three-year vesting period. The vesting period willbe followed by a two-year period (January to December)during which beneficiaries may opt, in April or October, tocash out some or all of their KMUs, at their discretion,based on the most recently determined value.
The value of services rendered by beneficiaries is recalculatedby an independent expert at the end of each reporting period.
In 2013, the Group recognised a €5.1 million expense inrespect of KMUs within recurring operating income.
Plan movements 2013 2012
SARs outstanding as of January 1 17,204 44,204Weighted average strike price (in €) 79.94 84.59
SARs granted during the year Weighted average strike price (in €)
SARs exercised during the year 200 27,000Weighted average strike price (in €) 82.26 87.55
SARs forfeited during the year Weighted average strike price (in €)
SARs outstanding as of December 31 17,004 17,204Weighted average strike price (in €) 79.91 79.94
SARs exercisable as of December 31 12,000 2,200Weighted average strike price (in €) 79.84 45.32
7.3. Cash-settled share-based payment transactions
The Group (Kering Holland NV and Kering SA) also grantscertain employees Share Appreciation Rights (SARs) and,since 2013, Kering Monetary Units (KMUs) that constitutecash-settled share-based plans.
7.3.1. Characteristics of SARs granted by Kering Holland NV
SAR plans have a term of six to ten years from their grant date.
SARs vest at a rate of 20% per full year of presence in theGroup, except in the event of dismissal (excluding dismissalfor gross negligence or misconduct) when all rights vestimmediately. If an employee is dismissed for grossnegligence or misconduct, all rights are lost.
The SAR strike price is determined by applying financialratios for a basket of comparable companies to the resultsof the Luxury Division.
The value of services rendered by beneficiaries isrecalculated at the end of each reporting period by anindependent expert using an option pricing modelcorresponding to the intrinsic value, to which a timevalue is added.
In 2013, Kering Holland NV recognised a €0.9 millionexpense in respect of SARs within recurring operatingincome (€1.6 million in 2012).
The strike price of SARs outstanding as of December 31, 2013is between €40.18 and €94.85 and the weighted averageremaining contractual term is 1.3 years (2.3 years as ofend-2012).
The carrying amount of the liability relating to these SARswas €3.1 million as of December 31, 2013, with an intrinsicvalue of €2.3 million (€2.3 million and €1.8 million,respectively, as of December 31, 2012).
The value of services rendered by beneficiaries at the grant date is primarily determined on the basis of the following assumptions:
2008 / I Plan 2008 / II Plan 2008 / III Plan 2008 / IV Plan 2008 / V Plan
Volatility 29.10% 47.70% 34.50% 29.20% 26.80%Risk-free interest rate 4.60% 1.97% 1.60% 2.40% 0.30%
In 2013, PUMA recognised an expense of €1.1 million (€2.8 million in 2012).
222 Kering ~ 2013 Reference Document
5 FINANCIAL INFORMATION ~ CONSOLIDATED FINANCIAL STATEMENTS AS OF DECEMBER 31, 2013
05_D_VA_V6 14/04/14 11:30 Page222

The Group’s other non-recurring operating income andexpenses consist of unusual items that could distort theassessment of each brand’s economic performance. The netbalance of this caption was an expense of €442.5 millionin 2013 and included the following items:
• restructuring costs of €29.7 million, mainly concerningthe Luxury Division;
• asset impairment totalling €361.2 million, including€280.1 million charged against PUMA goodwill;
• net capital losses of €1.2 million on asset disposals;
• other income and expenses relating primarily to newbrand acquisition fees, the impacts of the restructuringmeasures put in place at PUMA as part of the newmanagement’s strategy, and litigation and disputeswith third parties (Note 26).
The net balance of this caption was an expense of€25.2 million in 2012 and included the following items:
• restructuring costs of €158.5 million (chiefly relating toPUMA’s restructuring programme);
• asset impairment totalling €53.6 million, including€50.0 million for the Sergio Rossi brand ;
• net capital gains of €232.9 million on asset disposals,chiefly relating to the capital gains from the sale of theresidual interest in Cfao;
• other income and expenses primarily relating to claimsand litigation in relation to third parties.
Note 9 – Other non-recurring operating incomeand expenses
(in € millions) 2013 2012
Non-recurring operating expenses 444.0 (261.3)
Restructuring costs (29.7) (158.5)Asset impairment (361.2) (53.6)Capital losses on disposals (2.7) (0.5)Other (50.4) (48.7)
Non-recurring operating income 1.5 236.1
Capital gains on disposals 1.5 233.4Other 2.7
Total (442.5) (25.2)
Charges to depreciation, amortisation and provisions onnon-current operating assets included in recurringoperating income amounted to €295.8 million in 2013
(€275.1 million in 2012). Other net non-cash operatingincome amounted to €102.7 million in 2013(€16.5 million in 2012).
Note 8 – Recurring operating income
Recurring operating income is the primary indicator of the Group’s operating performance, and breaks down as follows:
(in € millions) 2013 2012
Luxury Division 1,682.6 1,611.6Sport & Lifestyle Division 200.4 304.8Corporate (132.9) (124.9)
Total 1,750.1 1,791.5
223
5
2013 Reference Document ~ Kering
CONSOLIDATED FINANCIAL STATEMENTS AS OF DECEMBER 31, 2013 ~ FINANCIAL INFORMATION
05_D_VA_V6 14/04/14 11:30 Page223

Note 10 – Finance costs (net)
This caption breaks down as follows:
(in € millions) 2013 2012
Cost of net debt (175.8) (211.4)
Income from cash and cash equivalents 9.3 6.7Finance costs at amortised cost (183.3) (196.2)Finance costs on financial liabilities at fair value through income (4.8) (24.3)Gains and losses on borrowings hedged by fair value hedges 2.8 0.3Gains and losses on fair value hedging derivatives 0.2 2.1
Other financial income and expenses (36.5) 63.7
Net losses on available-for-sale financial assets (7.6) (1.0)Gains and losses on financial liabilities at fair value through income 11.5 104.7Foreign exchange gains and losses (17.5) (3.2)Ineffective portion of cash flow hedges (11.3) (26.0)Gains and losses on derivative instruments not qualifying for hedge accounting (foreign exchange and interest rate hedges) 0.5 (2.0)Impact of discounting assets and liabilities (9.0) (6.3)Other finance costs (3.1) (2.5)
Total (212.3) (147.7)
Note 11 – Income taxes
11.1. Analysis of the income tax expense in respect of continuing operations
11.1.1. Income tax expense
(in € millions) 2013 2012
Income before tax 1,095.3 1,618.6
Taxes paid out of operating income (315.7) (361.0)Other taxes payable not impacting operating cash flow (9.0) (5.2)
Income tax payable (324.7) (366.2)Deferred tax income/(expense) 89.3 68.6
Total tax charge (235.4) (297.6)
Effective tax rate 21.49% 18.39%
Income tax expense on dividends was recognised in an amount of €23.6 million in 2013 (€5.7 million in 2012).
224 Kering ~ 2013 Reference Document
5 FINANCIAL INFORMATION ~ CONSOLIDATED FINANCIAL STATEMENTS AS OF DECEMBER 31, 2013
05_D_VA_V6 14/04/14 11:30 Page224
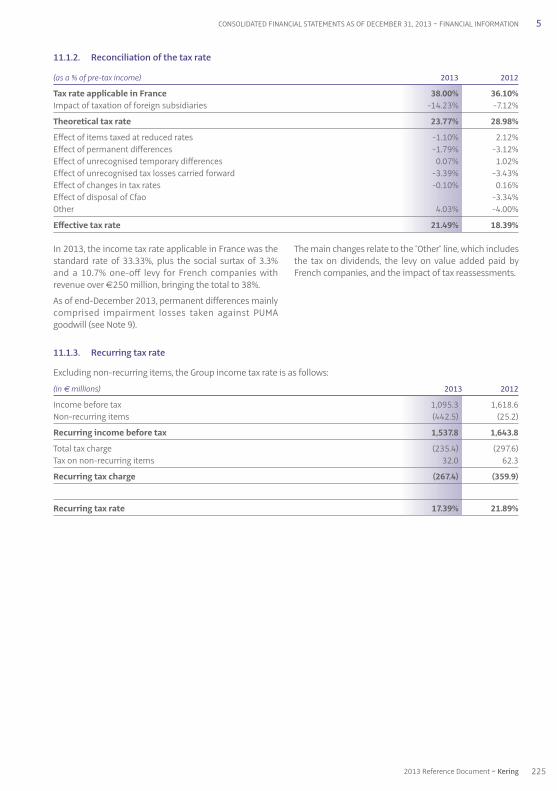
11.1.3. Recurring tax rate
Excluding non-recurring items, the Group income tax rate is as follows:
(in € millions) 2013 2012
Income before tax 1,095.3 1,618.6Non-recurring items (442.5) (25.2)
Recurring income before tax 1,537.8 1,643.8
Total tax charge (235.4) (297.6)Tax on non-recurring items 32.0 62.3
Recurring tax charge (267.4) (359.9)
Recurring tax rate 17.39% 21.89%
In 2013, the income tax rate applicable in France was thestandard rate of 33.33%, plus the social surtax of 3.3%and a 10.7% one-off levy for French companies withrevenue over €250 million, bringing the total to 38%.
As of end-December 2013, permanent differences mainlycomprised impairment losses taken against PUMAgoodwill (see Note 9).
The main changes relate to the "Other" line, which includesthe tax on dividends, the levy on value added paid byFrench companies, and the impact of tax reassessments.
11.1.2. Reconciliation of the tax rate
(as a % of pre-tax income) 2013 2012
Tax rate applicable in France 38.00% 36.10%Impact of taxation of foreign subsidiaries -14.23% -7.12%
Theoretical tax rate 23.77% 28.98%
Effect of items taxed at reduced rates -1.10% 2.12%Effect of permanent differences -1.79% -3.12%Effect of unrecognised temporary differences 0.07% 1.02%Effect of unrecognised tax losses carried forward -3.39% -3.43%Effect of changes in tax rates -0.10% 0.16%Effect of disposal of Cfao -3.34%Other 4.03% -4.00%
Effective tax rate 21.49% 18.39%
225
5
2013 Reference Document ~ Kering
CONSOLIDATED FINANCIAL STATEMENTS AS OF DECEMBER 31, 2013 ~ FINANCIAL INFORMATION
05_D_VA_V6 14/04/14 11:30 Page225

11.2. Movement in statement of financial position headings
11.2.1. Net current tax liabilities
Cash Cash outflows outflows Other Other relating to relating to changes items Net operating investing in Group recognised (in € millions) 2012 income activities activities structure in equity 2013
Current tax receivables 75.7 119.1Current tax liabilities (318.4) (310.1)
Net current tax liabilities (242.7) (315.7) 383.7 - (11.9) (4.4) (191.0)
11.2.2. Deferred tax
Other Other
changes items Net in Group recognised (in € millions) 2012 income structure in equity 2013
Deferred tax assets 600.2 649.9Deferred tax liabilities (2,772.3) (2,810.2)
Deferred tax (2,172.1) 89.3 (74.2) (3.3) (2,160.3)
Other Other
changes items Net in Group recognised (in € millions) 2012 income structure in equity 2013
Intangible assets (2,593.8) 7.0 (52.4) (2,639.2)Property, plant and equipment 15.3 (3.2) (3.1) 9.0Other non-current assets (5.7) (3.6) (3.7) (0.3) (13.3)Other current assets 276.4 44.7 (15.0) 306.1Total equity 10.2 0.7 10.9Borrowings (20.2) (0.5) (20.7)Provisions for pensions and other post-employment benefits 45.1 6.4 1.2 (1.0) 51.7Other provisions 25.1 (7.7) (0.8) 16.6Other current liabilities 65.5 27.0 7.7 (2.0) 98.2Recognised tax losses and tax credits 10.0 18.5 (8.1) 20.4
Net deferred tax assets (liabilities) (2,172.1) 89.3 (74.2) (3.3) (2,160.3)
Deferred tax assets 600.2 649.9Deferred tax liabilities (2,772.3) (2,810.2)
Deferred tax (2,172.1) 89.3 (74.2) (3.3) (2,160.3)
226 Kering ~ 2013 Reference Document
5 FINANCIAL INFORMATION ~ CONSOLIDATED FINANCIAL STATEMENTS AS OF DECEMBER 31, 2013
05_D_VA_V6 14/04/14 11:30 Page226

Kering continued to realign its strategy in 2013. In thefirst half of the year, it finalised the sale of the Childrenand Family, OneStopPlus and Nordic Divisions of Redcats.At the Annual General Meeting of June 18, 2013, Kering’sshareholders authorised the payment of an additionalcash dividend of €2.25 per share (following an interimcash dividend of €1.50 paid on January 24, 2013), and anadditional dividend in the form of Groupe Fnac shares ata ratio of one Groupe Fnac share for every eight Keringshares held.
The Group made a strategic decision not to sell RedcatsAsia, which is now Kering’s new Sourcing division (renamedKGS and presented within the “Corporate” segment).Accordingly, as of January 1, 2013, the results, assets andliabilities of Redcats Asia are no longer presented on separatelines in the Group’s consolidated financial statements.
For all periods presented, assets held for sale or fordistribution and discontinued operations mainly compriseRedcats, Groupe Fnac, Fnac Italy and YSL Beauty.
In accordance with IFRS 5, the Group measured thesedisposal groups and the related assets at the lower of theircarrying amount and recoverable amount. Recoverableamount is defined as value in use or fair value less costs to sell.
For all periods presented, the net income or loss fromthese activities is shown separately on the face of theincome statement within “Discontinued operations”, andis restated in the statement of cash flows.
Assets and liabilities relating to assets held for sale arepresented on separate lines in the Group’s statement offinancial position, without restatement for previous periods.
Assets and liabilities relating to discontinued operationsare not presented on separate lines in the Group’s statementof financial position.
11.3. Unrecognised deferred tax
Tax losses and tax credits not recognised as deferred tax assets amounted to €2,234.1 million as of December 31, 2013(€2,260.3 million as of December 31, 2012).
Changes in unused tax losses and tax credits and the associated expiry schedule are set out below:
(in € millions)
As of January 1, 2012 2,337.2
Losses generated during the year 18.6Losses utilised and time barred during the year (83.8)Effect of changes in Group structure and exchange rate adjustments (11.7)
As of December 31, 2012 2,260.3
Losses generated during the year 170.0Losses utilised and time barred during the year (68.4)Effect of changes in Group structure and exchange rate adjustments (127.8)
As of December 31, 2013 2,234.1
Ordinary tax loss carry-forwards 373.9Expiring in less than five years 206.3Expiring in more than five years 167.6
Indefinite tax loss carry-forwards 1,860.2
Total 2,234.1
There were no unrecognised deferred taxes in respect of temporary differences relating to investments in subsidiaries,associates and joint ventures as of December 31, 2013.
Note 12 – Non-current assets held for sale or for distribution and discontinued operations
227
5
2013 Reference Document ~ Kering
CONSOLIDATED FINANCIAL STATEMENTS AS OF DECEMBER 31, 2013 ~ FINANCIAL INFORMATION
05_D_VA_V6 14/04/14 11:30 Page227

The impact of assets held for sale and discontinued operations on the Group’s consolidated statement of financial positionwas as follows:
(in € millions) 2013 2012
Assets classified as held for sale 722.1 3,130.5Liabilities associated with assets classified as held for sale 906.6 2,805.5
Cash flows related to discontinued operations result from therecapitalisation of Groupe Fnac and the collection of the sale
price for assets disposed of in the period, net of the financingprovided for Redcats' operations.
(in € millions) 2013 2012
Net cash from operating activities (154.5) 135.9Net cash from investing activities 517.0 18.6Net cash from financing activities (690.0) 54.1Impact of exchange rate variations 11.5 (1.4)
Net change in cash and cash equivalents (316.0) 207.2
Opening cash and changes in intra-Group cash flows (121.5) (110.1)
Net cash from discontinued operations (1) (437.5) 97.1
(1) Line item in the consolidated statement of cash flows.
In 2013, the Fnac and Redcats groups were the maincontributors to the net loss arising on “Non-current assetsheld for sale or for distribution and discontinued operations”.
In 2013, this item mainly corresponds to the net capital lossof €256 million after the tax effect, share distributioncosts and net loss for the first half of the year recognisedfollowing the distribution of Groupe Fnac shares, as wellas a €562 million net expense in respect of Redcats. Thisamount includes Kering's €315 million recapitalisationundertaking in relation to La Redoute, as well as the
impairment losses recorded against Redcats' residualassets and the disposal gains and losses on activities soldduring the period. It does not include the cost of financingthe social guarantees to be granted to the employeesconcerned by the modernisation measures at La Redouteand Relais Colis. The total cost of this financing, which cannotas yet be reliably estimated, will lead Kering to set up a trustguaranteeing the application of the employee measuresapproved in a majority collective agreement with tradeunions. The associated costs will be recognised in 2014.
Impact on the financial statements
The income statement and statement of cash flows for non-current assets held for sale or for distribution and discontinuedoperations are as follows:
(in € millions) 2013 2012
Revenue 3,083.3 7,077.3Cost of sales (1,782.5) (4,168.5)
Gross margin 1,300.8 2,908.8
Payroll expenses (520.0) (1,066.6)Other recurring operating income and expenses (842.9) (1,655.2)
Recurring operating income (62.1) 187.0
Other non-recurring operating income and expenses (708.4) (437.0)
Operating income (770.5) (250.0)
Finance costs, net (13.6) (35.9)
Income before tax (784.1) (285.9)
Corporate income tax (31.1) (33.0)Share in earnings of associates 0.9 1.5Net income (loss) on disposal of discontinued operations (7.2) 41.9
Net income (821.5) (275.5)o/w attributable to owners of the parent (819.8) (275.5)o/w attributable to non-controlling interests (1.7)
228 Kering ~ 2013 Reference Document
5 FINANCIAL INFORMATION ~ CONSOLIDATED FINANCIAL STATEMENTS AS OF DECEMBER 31, 2013
05_D_VA_V6 14/04/14 11:30 Page228

13.1. Earnings per share
Earnings per share as of December 31, 2013
(in € millions) Consolidated Continuing Discontinued Group operations operations
Net income attributable to ordinary shareholders 49.6 869.4 (819.8)
Weighted average number of ordinary shares outstanding 126,245,102 126,245,102 126,245,102Weighted average number of treasury shares (332,896) (332,896) (332,896)Weighted average number of ordinary shares 125,912,206 125,912,206 125,912,206
Basic earnings per share (in €) 0.39 6.91 (6.52)
Net income attributable to ordinary shareholders 49.6 869.4 (819.8)
Convertible and exchangeable instruments
Diluted net income attributable to owners of the parent 49.6 869.4 (819.8)
Weighted average number of ordinary shares 125,912,206 125,912,206 125,912,206Potentially dilutive ordinary shares 114,760 114,760 114,760Weighted average number of diluted ordinary shares 126,026,966 126,026,966 126,026,966
Fully diluted earnings per share (in €) 0.39 6.90 (6.51)
Earnings per share as of December 31, 2012
(in € millions) Consolidated Continuing Discontinued Group operations operations
Net income attributable to ordinary shareholders 1,048.2 1,323.7 (275.5)
Weighted average number of ordinary shares outstanding 126,174,343 126,174,343 126,174,343Weighted average number of treasury shares (188,871) (188,871) (188,871)Weighted average number of ordinary shares 125,985,472 125,985,472 125,985,472
Basic earnings per share (in €) 8.32 10.51 (2.19)
Net income attributable to ordinary shareholders 1,048.2 1,323.7 (275.5)
Convertible and exchangeable instruments
Diluted net income attributable to owners of the parent 1,048.2 1,323.7 (275.5)
Weighted average number of ordinary shares 125,985,472 125,985,472 125,985,472Potentially dilutive ordinary shares 97,738 97,738 97,738Weighted average number of diluted ordinary shares 126,083,210 126,083,210 126,083,210
Fully diluted earnings per share (in €) 8.31 10.50 (2.19)
Basic earnings per share are calculated on the basis ofthe weighted average number of shares outstanding, afterdeduction of the weighted average number of sharesheld by consolidated companies.
Fully diluted earnings per share are based on the weightedaverage number of shares as defined above for thecalculation of basic earnings per share, plus the weighted
average number of potentially dilutive ordinary shares.Potentially dilutive shares correspond to shares grantedto employees as part of equity-settled share-basedpayment plans (see Note 7).
Earnings are adjusted for the theoretical interest charge,net of tax, on convertible and exchangeable instruments.
Note 13 – Earnings per share
229
5
2013 Reference Document ~ Kering
CONSOLIDATED FINANCIAL STATEMENTS AS OF DECEMBER 31, 2013 ~ FINANCIAL INFORMATION
05_D_VA_V6 14/04/14 11:30 Page229

The amounts of these components before and after the related tax effects, together with reclassification adjustmentstaken to income, are shown in the table below:
(in € millions) Gross Income tax Net
Foreign exchange gains and losses (19.5) (19.5)Cash flow hedges 84.7 12.5 97.2
– change in fair value 44.7 – gains and losses reclassified to income 40.0
Available-for-sale assets (0.1) (0.1)– change in fair value (0.1) – gains and losses reclassified to income
Unrecognised surplus of pension plan assets (4.0) (4.0)Actuarial gains and losses (20.4) 4.3 (16.1)Share in other comprehensive income (expense) of associates 8.7 8.7
Other comprehensive income as of December 31, 2012 49.4 16.8 66.2
The components of other comprehensive income include:
• gains and losses arising from translating the financialstatements of foreign operations ;
• the effective portion of gains and losses on cash flowhedging instruments ;
• gains and losses on remeasuring available-for-salefinancial assets and other financial instruments ;
• components relating to the measurement of employeebenefit obligations: unrecognised surplus of pensionplan assets and actuarial gains and losses on definedbenefit plans.
13.2. Earnings per share from continuing operations excluding non-recurring items
Non-recurring items consist of the income statement line “Other non-recurring operating income and expenses”reported net of tax and non-controlling interests.
(in € millions) 2013 2012
Net income attributable to ordinary shareholders 869.4 1,323.7
Other non-recurring operating income and expenses (442.5) (25.2)Income tax on other non-recurring operating income and expenses 32.0 62.3Non-controlling interests in other non-recurring operating income and expenses 50.6 17.8
Net income excluding non-recurring items 1,229.3 1,268.8
Weighted average number of ordinary shares outstanding 126,245,102 126,174,343Weighted average number of treasury shares (332,896) (188,871)Weighted average number of ordinary shares 125,912,206 125,985,472
Basic earnings per share excluding non-recurring items (in €) 9.76 10.07
Net income excluding non-recurring items 1,229.3 1,268.8
Convertible and exchangeable instruments
Diluted net income attributable to owners of the parent 1,229.3 1,268.8
Weighted average number of ordinary shares 125,912,206 125,985,472Potentially dilutive ordinary shares 114,760 97,738Weighted average number of diluted ordinary shares 126,026,966 126,083,210
Fully diluted earnings per share (in €) 9.75 10.06
Note 14 – Other comprehensive income
230 Kering ~ 2013 Reference Document
5 FINANCIAL INFORMATION ~ CONSOLIDATED FINANCIAL STATEMENTS AS OF DECEMBER 31, 2013
05_D_VA_V6 14/04/14 11:30 Page230

Note 15 – Goodwill
(in € millions) Gross Impairment Net losses
Goodwill as of January 1, 2012 4,302.9 (88.0) 4,214.9
Acquisitions 117.6 117.6Non-current assets held for sale or for distribution and discontinued operations (433.2) 29.5 (403.7)Impairment losses Put options granted to non-controlling shareholders (47.0) (47.0)Translation adjustments (10.8) (10.8)Other movements (0.3) 0.3
Goodwill as of December 31, 2012 3,929.2 (58.2) 3,871.0
Acquisitions 172.2 172.2Non-current assets held for sale or for distribution and discontinued operations Impairment losses (see Note 18) (280.1) (280.1)Put options granted to non-controlling shareholders 38.4 38.4Translation adjustments (30.9) 1.0 (29.9)Other movements (1.5) (1.5)
Goodwill as of December 31, 2013 4,107.4 (337.3) 3,770.1
All goodwill recognised in 2013 was allocated to CGUs at year-end.
The breakdown of the net amount of goodwill by activity and brand is as follows:
(in € millions) 2013 2012
Luxury Division 2,523.4 2,319.5Sport & Lifestyle Division 1,246.7 1,551.5
Total 3,770.1 3,871.0
A negative amount on the “Gains and losses reclassifiedto income” line item corresponds to a gain recognised inthe income statement.
Gains and losses on cash flow hedging instrumentsreclassified to income are recognised under gross margin.
Gains and losses on available-for-sale financial assetsreclassified to income are recognised under net finance costs.
(in € millions) Gross Income tax Net
Foreign exchange gains and losses (111.4) (111.4)Cash flow hedges 34.0 (4.3) 29.7
– change in fair value 129.2 – gains and losses reclassified to income (95.2)
Available-for-sale assets 4.7 (1.6) 3.1– change in fair value 4.7 – gains and losses reclassified to income
Unrecognised surplus of pension plan assets 7.1 7.1Actuarial gains and losses 2.7 (0.9) 1.8Share in other comprehensive income (expense) of associates
Other comprehensive income as of December 31, 2013 (62.9) (6.8) (69.7)
231
5
2013 Reference Document ~ Kering
CONSOLIDATED FINANCIAL STATEMENTS AS OF DECEMBER 31, 2013 ~ FINANCIAL INFORMATION
05_D_VA_V6 14/04/14 11:30 Page231

Note 16 – Brands and other intangible assets
(in € millions) Brands Other Total intangible assets
Gross amount as of December 31, 2012 10,341.3 611.3 10,952.6
Changes in Group structure 230.0 9.6 239.6Acquisitions 0.4 82.6 83.0Other disposals (11.0) (11.0)Translation adjustments (16.6) (6.4) (23.0)Other movements 0.9 (26.4) (25.5)
Gross amount as of December 31, 2013 10,556.0 659.7 11,215.7
Accumulated amortisation and impairment as of December 31, 2012 (85.3) (377.4) (462.7)
Changes in Group structure (6.3) (6.3)Other disposals 9.7 9.7Amortisation (83.2) (83.2)Impairment losses (see Note 18) Translation adjustments 2.6 2.6Other movements (0.7) 27.7 27.0
Accumulated amortisation and impairment as of December 31, 2013 (86.0) (426.9) (512.9)
Carrying amount as of December 31, 2012 10,256.0 233.9 10,489.9
Changes in Group structure 230.0 3.3 233.3Acquisitions 0.4 82.6 83.0Other disposals (1.3) (1.3)Amortisation (83.2) (83.2)Impairment losses (see Note 18) Translation adjustments (16.6) (3.8) (20.4)Other movements 0.2 1.3 1.5
Carrying amount as of December 31, 2013 10,470.0 232.8 10,702.8
232 Kering ~ 2013 Reference Document
5 FINANCIAL INFORMATION ~ CONSOLIDATED FINANCIAL STATEMENTS AS OF DECEMBER 31, 2013
05_D_VA_V6 14/04/14 11:30 Page232

(in € millions) Brands Other Total intangible assets
Gross amount as of December 31, 2011 10,083.0 836.0 10,919.0
Changes in Group structure 264.8 30.3 295.1Acquisitions 67.5 67.5Assets classified as held for sale or for distribution to owners and discontinued operations (311.3) (311.3)Other disposals (17.8) (17.8)Translation adjustments (6.5) (0.6) (7.1)Other movements 7.2 7.2
Gross amount as of December 31, 2012 10,341.3 611.3 10,952.6
Accumulated amortisation and impairment as of December 31, 2011 (35.3) (552.6) (587.9)
Changes in Group structure (24.0) (24.0)Assets classified as held for sale or for distribution to owners and discontinued operations 237.2 237.2Other disposals 15.9 15.9Amortisation (49.5) (49.5)Impairment losses (50.0) (50.0)Translation adjustments Other movements (4.4) (4.4)
Accumulated amortisation and impairment as of December 31, 2012 (85.3) (377.4) (462.7)
Carrying amount as of December 31, 2011 10,047.7 283.4 10,331.1
Changes in Group structure 264.8 6.3 271.1Acquisitions 67.5 67.5Assets classified as held for sale or for distribution to owners and discontinued operations (74.1) (74.1)Other disposals (1.9) (1.9)Amortisation (49.5) (49.5)Impairment losses (50.0) (50.0)Translation adjustments (6.5) (0.6) (7.1)Other movements 2.8 2.8
Carrying amount as of December 31, 2012 10,256.0 233.9 10,489.9
The breakdown of net brand value by activity is as follows:
(in € millions) 2013 2012
Luxury Division 6,629.0 6,399.6Sport & Lifestyle Division 3,841.0 3,856.4
Total 10,470.0 10,256.0
233
5
2013 Reference Document ~ Kering
CONSOLIDATED FINANCIAL STATEMENTS AS OF DECEMBER 31, 2013 ~ FINANCIAL INFORMATION
05_D_VA_V6 14/04/14 11:30 Page233

Note 17 – Property, plant and equipment
(in € millions) Land and Plant and Other Total buildings equipment PP&E
Gross amount as of December 31, 2012 752.8 1,700.7 275.3 2,728.8
Changes in Group structure 17.1 41.0 (0.2) 57.9Acquisitions 207.7 325.8 50.9 584.4Assets classified as held for sale to owners and discontinued operations 0.7 8.3 9.0Disposals (97.3) (19.7) (117.0)Translation adjustments (27.0) (79.2) (14.3) (120.5)Other movements 16.6 51.4 (52.0) 16.0
Gross amount as of December 31, 2013 967.2 1,943.1 248.3 3,158.6
Accumulated depreciation and impairment as of December 31, 2012 (188.1) (1,027.6) (136.8) (1,352.5)
Changes in Group structure (7.2) (22.8) (30.0)Assets classified as held for sale to owners and discontinued operations 0.2 0.2Disposals 89.5 19.9 109.4Depreciation (26.1) (208.5) (21.1) (255.7)Impairment losses (see Note 18) Translation adjustments 4.2 46.5 7.2 57.9Other movements (0.3) (14.1) 3.4 (11.0)
Accumulated depreciation and impairment as of December 31, 2013 (217.5) (1,136.8) (127.4) (1,481.7)
Carrying amount as of December 31, 2012 564.7 673.1 138.5 1,376.3
Changes in Group structure 9.9 18.2 (0.2) 27.9Acquisitions 207.7 325.8 50.9 584.4Assets classified as held for sale to owners and discontinued operations 0.9 8.3 9.2Disposals (7.8) 0.2 (7.6)Depreciation (26.1) (208.5) (21.1) (255.7)Impairment losses (see Note 18) Translation adjustments (22.8) (32.7) (7.1) (62.6)Other movements 16.3 37.3 (48.6) 5.0
Carrying amount as of December 31, 2013 749.7 806.3 120.9 1,676.9
o/w assets owned outright 691.1 806.3 120.2 1,617.6o/w assets held under finance leases 58.6 0.7 59.3
234 Kering ~ 2013 Reference Document
5 FINANCIAL INFORMATION ~ CONSOLIDATED FINANCIAL STATEMENTS AS OF DECEMBER 31, 2013
05_D_VA_V6 14/04/14 11:30 Page234
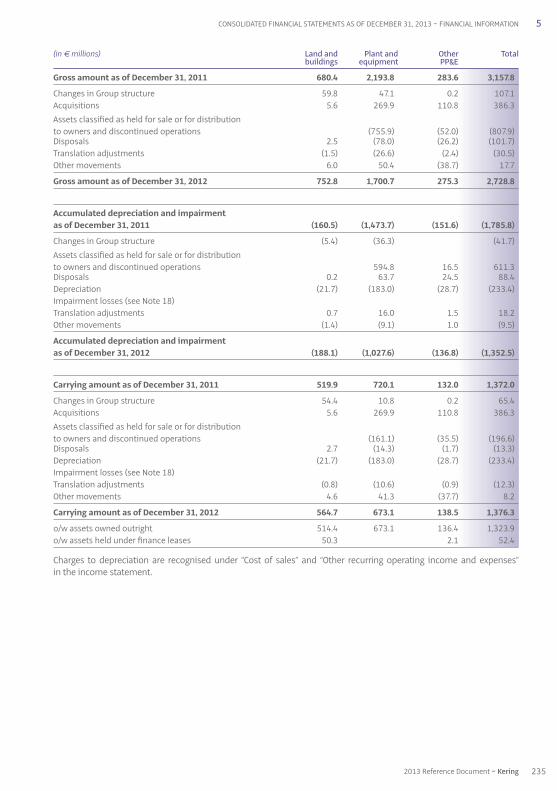
(in € millions) Land and Plant and Other Total buildings equipment PP&E
Gross amount as of December 31, 2011 680.4 2,193.8 283.6 3,157.8
Changes in Group structure 59.8 47.1 0.2 107.1Acquisitions 5.6 269.9 110.8 386.3Assets classified as held for sale or for distribution to owners and discontinued operations (755.9) (52.0) (807.9)Disposals 2.5 (78.0) (26.2) (101.7)Translation adjustments (1.5) (26.6) (2.4) (30.5)Other movements 6.0 50.4 (38.7) 17.7
Gross amount as of December 31, 2012 752.8 1,700.7 275.3 2,728.8
Accumulated depreciation and impairment as of December 31, 2011 (160.5) (1,473.7) (151.6) (1,785.8)
Changes in Group structure (5.4) (36.3) (41.7)Assets classified as held for sale or for distribution to owners and discontinued operations 594.8 16.5 611.3Disposals 0.2 63.7 24.5 88.4Depreciation (21.7) (183.0) (28.7) (233.4)Impairment losses (see Note 18) Translation adjustments 0.7 16.0 1.5 18.2Other movements (1.4) (9.1) 1.0 (9.5)
Accumulated depreciation and impairment as of December 31, 2012 (188.1) (1,027.6) (136.8) (1,352.5)
Carrying amount as of December 31, 2011 519.9 720.1 132.0 1,372.0
Changes in Group structure 54.4 10.8 0.2 65.4Acquisitions 5.6 269.9 110.8 386.3Assets classified as held for sale or for distribution to owners and discontinued operations (161.1) (35.5) (196.6)Disposals 2.7 (14.3) (1.7) (13.3)Depreciation (21.7) (183.0) (28.7) (233.4)Impairment losses (see Note 18) Translation adjustments (0.8) (10.6) (0.9) (12.3)Other movements 4.6 41.3 (37.7) 8.2
Carrying amount as of December 31, 2012 564.7 673.1 138.5 1,376.3
o/w assets owned outright 514.4 673.1 136.4 1,323.9o/w assets held under finance leases 50.3 2.1 52.4
Charges to depreciation are recognised under “Cost of sales” and “Other recurring operating income and expenses” in the income statement.
235
5
2013 Reference Document ~ Kering
CONSOLIDATED FINANCIAL STATEMENTS AS OF DECEMBER 31, 2013 ~ FINANCIAL INFORMATION
05_D_VA_V6 14/04/14 11:31 Page235

18.2. Impairment tests on major items
In the case of the Gucci CGU, which accounts for a significantportion of the goodwill in the Luxury Division, the CGU’srecoverable amount was determined on the basis of itsvalue in use. Value in use is determined with respect toprojected future cash flows, taking into account the timevalue and specific risks associated with the CGU. Futurecash flow projections were prepared during the secondhalf of the year on the basis of budgets and medium-term plans with a four-year timescale. To calculate value inuse, a terminal value equal to the perpetual capitalisationof a normative annual cash flow is added to the estimatedfuture cash flows.
The growth rate used to extrapolate projected cash flowsto perpetuity is 3.5%.
The pre-tax discount rate applied to projected cash flowsis 8.9%.
In the case of the Gucci brand, which is the highest-valued brand in the Luxury Division, the value based onfuture royalty revenue receivable on the assumption thatthe brand will be operated under licence by a third partywas calculated using a royalty rate of 15.0%, a 3.5% perpetualgrowth rate and a 9.2% pre-tax discount rate.
In the case of the PUMA CGU, which accounts for asignificant portion of the goodwill in the Sport & LifestyleDivision, the CGU’s recoverable amount was determinedon the basis of its value in use. Value in use is determinedwith respect to projected future cash flows, taking intoaccount the time value and specific risks associated withthe CGU. Future cash flow projections were prepared
during the second half of the year on the basis of budgetsand medium-term plans with a four-year timescale. Tocalculate value in use, a terminal value equal to theperpetual capitalisation of a normative annual cash flowis added to the estimated future cash flows.
The growth rate used to extrapolate projected cash flowsto perpetuity is 2.5%.
The pre-tax discount rate applied to projected cash flowsis 10.2%.
For information purposes, PUMA’s market capitalisationwas €3.5 billion as of December 31, 2013. This valuationdoes not represent a relevant indication of impairment giventhe limited free float and resulting lack of liquidity of thePUMA share. As of December 31, 2013, Kering holds an85.81% controlling interest in PUMA.
In the case of the PUMA brand, which is the highest-valuedbrand in the Sport & Lifestyle Division, the value based onfuture royalty revenue receivable on the assumption thatthe brand will be operated under licence by a third partywas calculated using a royalty rate of 8.0%, a 2.5% perpetualgrowth rate and a 10.1% pre-tax discount rate.
The impairment tests carried out by the Group in 2013gave rise to the recognition of an impairment loss againstPUMA goodwill amounting to €280.1 million (see Note18.3). Besides the PUMA goodwill impairment loss, theGroup considers that, based on events that are foreseeablewithin reason, any changes impacting the key assumptionsdescribed below would not give rise to the recognition ofimpairment against other CGUs.
18.1. Assumptions underlying impairment tests
The pre-tax discount and perpetual growth rates applied to expected cash flows in connection with the economicassumptions and forecast operating conditions retained by the Group are as follows:
Discount rate Perpetual growth rate2013 2012 2013 2012
Luxury Division 8.9%-10.4% 9.5%-12.5% 3.5% 3.5%Sport & Lifestyle Division 10.1%-12.2% 10.9%-13.2% 2.5% 2.5%
The growth rates are appropriate in view of the country mix (the Group now operates in regions whose markets areenjoying faster-paced growth than in Europe), the rise in the cost of raw materials and inflation.
As discussed in Note 2.10, the business plans for certain CGUs are drawn up over longer periods of 10 years. These CGUscurrently being repositioned are Boucheron, Sergio Rossi, Volcom, Brioni and Sowind.
The principles governing the impairment of non-financialassets are set out in Note 2.10.
The main items of goodwill, brands and other intangibleassets are broken down by activity in Notes 15 and 16.
Note 18 – Impairment tests on non-financial assets
236 Kering ~ 2013 Reference Document
5 FINANCIAL INFORMATION ~ CONSOLIDATED FINANCIAL STATEMENTS AS OF DECEMBER 31, 2013
05_D_VA_V6 14/04/14 11:31 Page236

Note 20 – Non-current financial assets
Non-current financial assets break down as follows:
(in € millions) 2013 2012
Non-consolidated investments 74.7 53.9Derivative financial instruments (see Note 29) 0.4 12.4Available-for-sale financial assets 74.7 10.3Loans and receivables due from non-consolidated investments 21.6 34.5Deposits and guarantees 116.1 110.5Other 29.3 52.1
Total 316.8 273.7
As of December 31, 2013, investments in associatesmainly comprised the investments in Wilderness furtherto the sale during second-half 2012 of the entire residualinterest in Cfao (i.e., 42%).
The market value of the Group’s interest in Wildernessamounts to €17.3 million. Wilderness’ consolidatedfinancial statements are available on its website, athttp://www.wilderness-holdings.com.
Note 19 – Investments in associates
(in € millions) 2013 2012
Investments in associates 17.3 25.8
Sensitivity to a rise of 10 basis points in the post-taxdiscount rate and a decrease of 10 basis points in theperpetual growth rate and in the normative cash flowsconcerns the PUMA CGU only.
18.3. Impairment losses recognised during the period
The impairment tests carried out by the Group in 2013 ledto the recognition of an impairment loss against PUMAgoodwill totalling €280.1 million.
This loss reflects the difference between the carryingamount of the PUMA CGU and its recoverable amount andis recognised in the income statement under “Other non-recurring operating income and expenses” (see Note 9).
The impairment tests carried out by the Group in 2012led to the recognition of an impairment loss on the brandSergio Rossi totalling €50.0 million. Historic goodwill waswritten down in full in 2010.
The sensitivity to changes in key assumptions is shown below:
(in € millions) Impairment loss due to: Value of intangible net 10 basis point 10 basis point 10 basis point assets concerned at increase in post-tax decrease in perpetual decrease in normative Dec. 31, 2013 discount rate growth rate cash flows
Luxury CGU 9,354 - - -
Sport & Lifestyle CGU 5,102 87 71 40
Gucci brand 4,800 - - -
PUMA brand 3,500 - - -
237
5
2013 Reference Document ~ Kering
CONSOLIDATED FINANCIAL STATEMENTS AS OF DECEMBER 31, 2013 ~ FINANCIAL INFORMATION
05_D_VA_V6 14/04/14 11:31 Page237
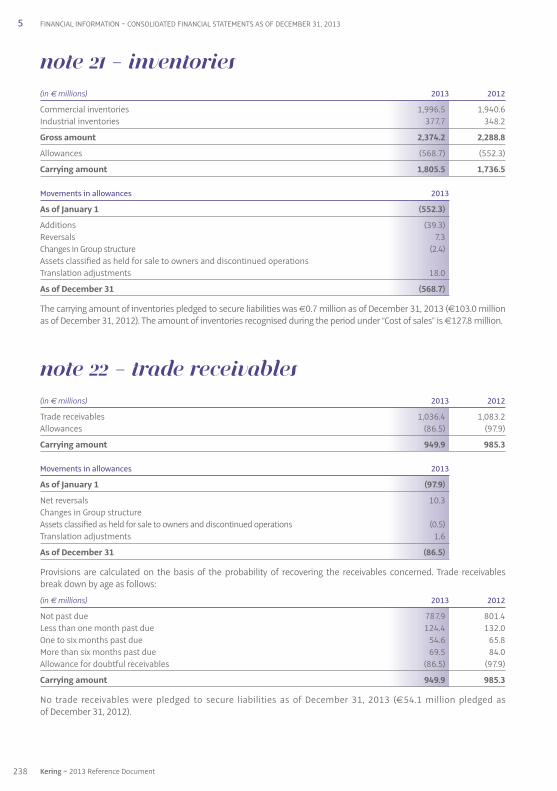
Note 21 – Inventories
(in € millions) 2013 2012
Commercial inventories 1,996.5 1,940.6Industrial inventories 377.7 348.2
Gross amount 2,374.2 2,288.8
Allowances (568.7) (552.3)
Carrying amount 1,805.5 1,736.5
Movements in allowances 2013
As of January 1 (552.3)
Additions (39.3)Reversals 7.3Changes in Group structure (2.4)Assets classified as held for sale to owners and discontinued operationsTranslation adjustments 18.0
As of December 31 (568.7)
The carrying amount of inventories pledged to secure liabilities was €0.7 million as of December 31, 2013 (€103.0 millionas of December 31, 2012). The amount of inventories recognised during the period under “ Cost of sales ” is €127.8 million.
Note 22 – Trade receivables
(in € millions) 2013 2012
Trade receivables 1,036.4 1,083.2Allowances (86.5) (97.9)
Carrying amount 949.9 985.3
Movements in allowances 2013
As of January 1 (97.9)
Net reversals 10.3Changes in Group structureAssets classified as held for sale to owners and discontinued operations (0.5)Translation adjustments 1.6
As of December 31 (86.5)
Provisions are calculated on the basis of the probability of recovering the receivables concerned. Trade receivablesbreak down by age as follows:
(in € millions) 2013 2012
Not past due 787.9 801.4Less than one month past due 124.4 132.0One to six months past due 54.6 65.8More than six months past due 69.5 84.0Allowance for doubtful receivables (86.5) (97.9)
Carrying amount 949.9 985.3
No trade receivables were pledged to secure liabilities as of December 31, 2013 (€54.1 million pledged as of December 31, 2012).
238 Kering ~ 2013 Reference Document
5 FINANCIAL INFORMATION ~ CONSOLIDATED FINANCIAL STATEMENTS AS OF DECEMBER 31, 2013
05_D_VA_V6 14/04/14 11:31 Page238

As of December 31, 2013, the share capital amounted to€504,907,044, comprising 126,226,761 fully paid-upshares with a par value of €4 each (126,116,702 shareswith a par value of €4 each as of December 31, 2012).
24.1. Kering treasury shares and optionson Kering shares
In 2013, treasury shares increased by 35,508 as a resultof the following transactions:
• the acquisition of 1,585,556 shares under the liquidityagreement ;
• the disposal of 1,585,556 shares under the liquidityagreement ;
• the acquisition of 106,000 Kering shares to be allottedto employees under 2009 and 2011 free share plans ;
• the allotment of 102,491 shares to employees underthe May 2009 and May 2011 free share plans maturingin May 2013 and 450 shares under the 2008 and 2009free share plans ;
• the acquisition of 130,000 Kering shares to be allottedto employees under the 2006 and 2007 stock purchaseoption plans ;
• the disposal of 103,037 shares to employees under the2006 and 2007 stock purchase option plans ;
• the acquisition of 720,000 shares as part of an externalgrowth transaction ;
• the tender of 714,514 shares as part of an externalgrowth transaction and the allocation of the remaining5,486 shares acquired to be allotted under stock purchaseoption plans.
As a result of the various stock subscription options exercisedin 2013, the share capital increased by 110,059 shares.
As of December 31, 2013, Kering’s share capital thereforecomprises 126,226,761 shares with a par value of €4 each.
On May 26, 2004, Kering signed an agreement with afinancial broker in order to improve the liquidity of theGroup’s shares and ensure share price stability. Thisagreement complies with the Professional Code ofConduct drawn up by the French Association of Financialand Investment Firms (Association française des marchésfinanciers – AMAFI) and approved by the French financialmarkets authority (Autorité des Marchés Financiers – AMF).The agreement was initially endowed with €40 million, halfof which was provided in cash and half in Kering shares.An additional €20 million in cash was allocated to theagreement on September 3, 2004, and a further€30 million on December 18, 2007.
As of December 31, 2013, Kering did not hold any treasuryshares in connection with the liquidity agreement (notreasury shares were held under the agreement as ofDecember 31, 2012). Outside the scope of the liquidityagreement, Kering held 60,581 treasury shares (25,073treasury shares held as of December 31, 2012).
Note 24 – Equity
Other current financial assets and liabilities primarilycomprise derivative financial instruments (see Note 29).
Given the nature of its activities, the Group’s exposure tocustomer default would not have a material impact on itsbusiness, financial position or net assets.
Note 23 – Other current assets and liabilities
Working Changes in Translation capital Other Group adjustments (in € millions) 2012 cash flows cash flows structure and other 2013
Inventories 1,736.5 92.9 85.4 (109.3) 1,805.5Trade receivables 985.3 6.8 24.3 (66.5) 949.9Other current financial assets and liabilities (120.9) (9.1) 24.5 (105.5)Current tax receivables/payables (242.7) 68.0 (11.9) (4.4) (191.0)Trade payables (684.5) (69.3) (20.6) 8.3 (766.1)Other (905.7) 44.1 4.9 (7.2) 15.0 (848.9)
Other current assets and liabilities 768.0 74.5 63.8 70.0 (132.4) 843.9
239
5
2013 Reference Document ~ Kering
CONSOLIDATED FINANCIAL STATEMENTS AS OF DECEMBER 31, 2013 ~ FINANCIAL INFORMATION
05_D_VA_V6 14/04/14 11:31 Page239
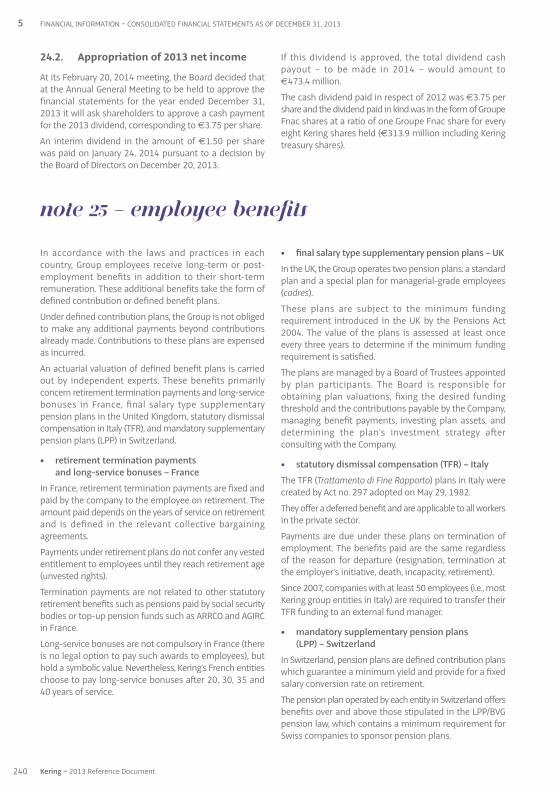
In accordance with the laws and practices in eachcountry, Group employees receive long-term or post-employment benefits in addition to their short-termremuneration. These additional benefits take the form ofdefined contribution or defined benefit plans.
Under defined contribution plans, the Group is not obligedto make any additional payments beyond contributionsalready made. Contributions to these plans are expensedas incurred.
An actuarial valuation of defined benefit plans is carriedout by independent experts. These benefits primarilyconcern retirement termination payments and long-servicebonuses in France, final salary type supplementarypension plans in the United Kingdom, statutory dismissalcompensation in Italy (TFR), and mandatory supplementarypension plans (LPP) in Switzerland.
• retirement termination payments and long-service bonuses – France
In France, retirement termination payments are fixed andpaid by the company to the employee on retirement. Theamount paid depends on the years of service on retirementand is defined in the relevant collective bargainingagreements.
Payments under retirement plans do not confer any vestedentitlement to employees until they reach retirement age(unvested rights).
Termination payments are not related to other statutoryretirement benefits such as pensions paid by social securitybodies or top-up pension funds such as ARRCO and AGIRCin France.
Long-service bonuses are not compulsory in France (thereis no legal option to pay such awards to employees), buthold a symbolic value. Nevertheless, Kering’s French entitieschoose to pay long-service bonuses after 20, 30, 35 and40 years of service.
• final salary type supplementary pension plans – UK
In the UK, the Group operates two pension plans: a standardplan and a special plan for managerial-grade employees(cadres).
These plans are subject to the minimum fundingrequirement introduced in the UK by the Pensions Act2004. The value of the plans is assessed at least onceevery three years to determine if the minimum fundingrequirement is satisfied.
The plans are managed by a Board of Trustees appointedby plan participants. The Board is responsible forobtaining plan valuations, fixing the desired fundingthreshold and the contributions payable by the Company,managing benefit payments, investing plan assets, anddetermining the plan’s investment strategy afterconsulting with the Company.
• statutory dismissal compensation (TFR) – Italy
The TFR (Trattamento di Fine Rapporto) plans in Italy werecreated by Act no. 297 adopted on May 29, 1982.
They offer a deferred benefit and are applicable to all workersin the private sector.
Payments are due under these plans on termination ofemployment. The benefits paid are the same regardlessof the reason for departure (resignation, termination atthe employer’s initiative, death, incapacity, retirement).
Since 2007, companies with at least 50 employees (i.e., mostKering group entities in Italy) are required to transfer theirTFR funding to an external fund manager.
• mandatory supplementary pension plans(LPP) – Switzerland
In Switzerland, pension plans are defined contribution planswhich guarantee a minimum yield and provide for a fixedsalary conversion rate on retirement.
The pension plan operated by each entity in Switzerland offersbenefits over and above those stipulated in the LPP/BVGpension law, which contains a minimum requirement forSwiss companies to sponsor pension plans.
Note 25 – Employee benefits
24.2. Appropriation of 2013 net income
At its February 20, 2014 meeting, the Board decided thatat the Annual General Meeting to be held to approve thefinancial statements for the year ended December 31,2013 it will ask shareholders to approve a cash paymentfor the 2013 dividend, corresponding to €3.75 per share.
An interim dividend in the amount of €1.50 per sharewas paid on January 24, 2014 pursuant to a decision bythe Board of Directors on December 20, 2013.
If this dividend is approved, the total dividend cashpayout – to be made in 2014 – would amount to€473.4 million.
The cash dividend paid in respect of 2012 was €3.75 pershare and the dividend paid in kind was in the form of GroupeFnac shares at a ratio of one Groupe Fnac share for everyeight Kering shares held (€313.9 million including Keringtreasury shares).
240 Kering ~ 2013 Reference Document
5 FINANCIAL INFORMATION ~ CONSOLIDATED FINANCIAL STATEMENTS AS OF DECEMBER 31, 2013
05_D_VA_V6 14/04/14 11:31 Page240
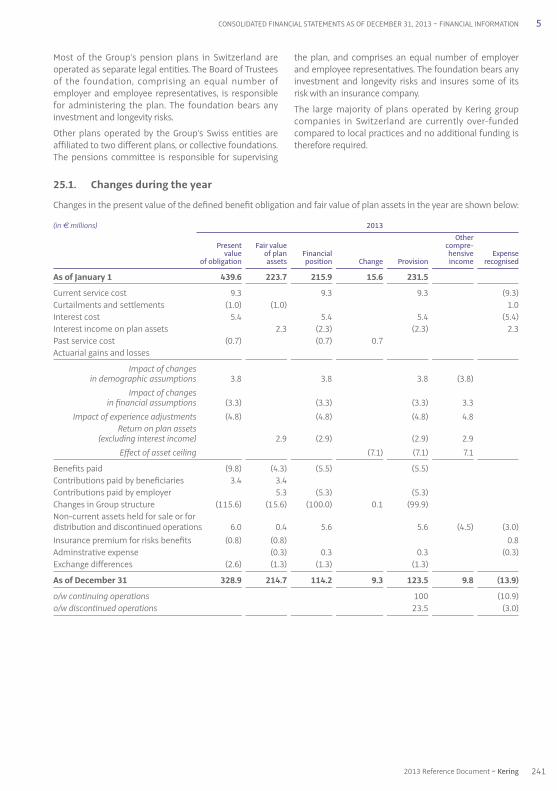
25.1. Changes during the year
Changes in the present value of the defined benefit obligation and fair value of plan assets in the year are shown below:
(in € millions) 2013 Other Present Fair value compre- value of plan Financial hensive Expense of obligation assets position Change Provision income recognised
As of January 1 439.6 223.7 215.9 15.6 231.5
Current service cost 9.3 9.3 9.3 (9.3)Curtailments and settlements (1.0) (1.0) 1.0Interest cost 5.4 5.4 5.4 (5.4)Interest income on plan assets 2.3 (2.3) (2.3) 2.3Past service cost (0.7) (0.7) 0.7 Actuarial gains and losses
Impact of changes in demographic assumptions 3.8 3.8 3.8 (3.8) Impact of changes in financial assumptions (3.3) (3.3) (3.3) 3.3 Impact of experience adjustments (4.8) (4.8) (4.8) 4.8 Return on plan assets
(excluding interest income) 2.9 (2.9) (2.9) 2.9 Effect of asset ceiling (7.1) (7.1) 7.1
Benefits paid (9.8) (4.3) (5.5) (5.5) Contributions paid by beneficiaries 3.4 3.4 Contributions paid by employer 5.3 (5.3) (5.3) Changes in Group structure (115.6) (15.6) (100.0) 0.1 (99.9) Non-current assets held for sale or fordistribution and discontinued operations 6.0 0.4 5.6 5.6 (4.5) (3.0)Insurance premium for risks benefits (0.8) (0.8) 0.8Adminstrative expense (0.3) 0.3 0.3 (0.3)Exchange differences (2.6) (1.3) (1.3) (1.3)
As of December 31 328.9 214.7 114.2 9.3 123.5 9.8 (13.9)
o/w continuing operations 100 (10.9)o/w discontinued operations 23.5 (3.0)
Most of the Group’s pension plans in Switzerland areoperated as separate legal entities. The Board of Trusteesof the foundation, comprising an equal number ofemployer and employee representatives, is responsiblefor administering the plan. The foundation bears anyinvestment and longevity risks.
Other plans operated by the Group’s Swiss entities areaffiliated to two different plans, or collective foundations.The pensions committee is responsible for supervising
the plan, and comprises an equal number of employerand employee representatives. The foundation bears anyinvestment and longevity risks and insures some of itsrisk with an insurance company.
The large majority of plans operated by Kering groupcompanies in Switzerland are currently over-fundedcompared to local practices and no additional funding istherefore required.
241
5
2013 Reference Document ~ Kering
CONSOLIDATED FINANCIAL STATEMENTS AS OF DECEMBER 31, 2013 ~ FINANCIAL INFORMATION
05_D_VA_V6 14/04/14 11:31 Page241
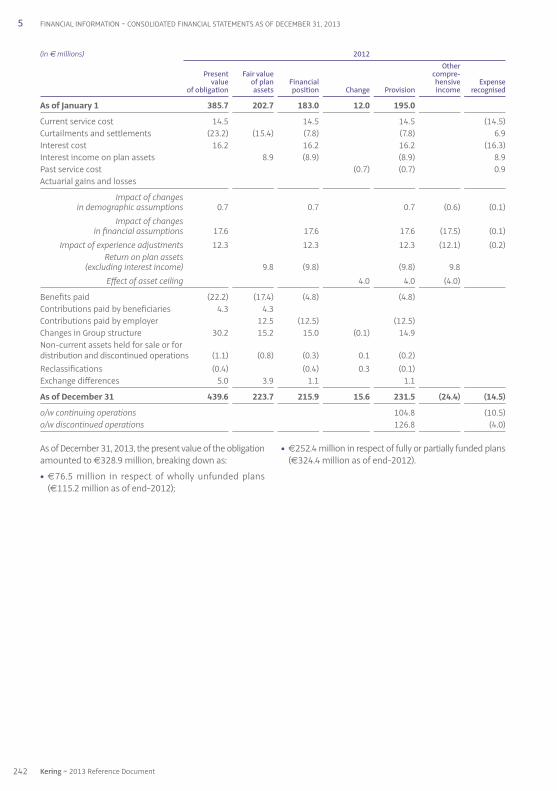
As of December 31, 2013, the present value of the obligationamounted to €328.9 million, breaking down as:
• €76.5 million in respect of wholly unfunded plans(€115.2 million as of end-2012);
• €252.4 million in respect of fully or partially funded plans(€324.4 million as of end-2012).
(in € millions) 2012 Other Present Fair value compre- value of plan Financial hensive Expense
of obligation assets position Change Provision income recognised
As of January 1 385.7 202.7 183.0 12.0 195.0
Current service cost 14.5 14.5 14.5 (14.5)Curtailments and settlements (23.2) (15.4) (7.8) (7.8) 6.9Interest cost 16.2 16.2 16.2 (16.3)Interest income on plan assets 8.9 (8.9) (8.9) 8.9Past service cost (0.7) (0.7) 0.9Actuarial gains and losses Impact of changes
in demographic assumptions 0.7 0.7 0.7 (0.6) (0.1) Impact of changes in financial assumptions 17.6 17.6 17.6 (17.5) (0.1) Impact of experience adjustments 12.3 12.3 12.3 (12.1) (0.2) Return on plan assets
(excluding interest income) 9.8 (9.8) (9.8) 9.8 Effect of asset ceiling 4.0 4.0 (4.0)
Benefits paid (22.2) (17.4) (4.8) (4.8) Contributions paid by beneficiaries 4.3 4.3 Contributions paid by employer 12.5 (12.5) (12.5) Changes in Group structure 30.2 15.2 15.0 (0.1) 14.9 Non-current assets held for sale or for distribution and discontinued operations (1.1) (0.8) (0.3) 0.1 (0.2) Reclassifications (0.4) (0.4) 0.3 (0.1) Exchange differences 5.0 3.9 1.1 1.1
As of December 31 439.6 223.7 215.9 15.6 231.5 (24.4) (14.5)
o/w continuing operations 104.8 (10.5)o/w discontinued operations 126.8 (4.0)
242 Kering ~ 2013 Reference Document
5 FINANCIAL INFORMATION ~ CONSOLIDATED FINANCIAL STATEMENTS AS OF DECEMBER 31, 2013
05_D_VA_V6 14/04/14 11:31 Page242

Based on the actuarial assumptions in the table above,the sensitivity tests carried out show that the impact of a50 basis-point increase or decrease in the discount ratewould not be material and would represent less than0.2% of consolidated equity.
The Group’s discount rate is determined by reference tothe yield on corporate bonds rated AA with a maturitysimilar to the plans in question.
25.2. Actuarial assumptions
The main actuarial assumptions used to estimate the Group’s obligations are as follows:
France Switzerland Italy UK2013 2012 2013 2012 2013 2012 2013 2012
Average maturity of plans 11.1 11.1 18.3 18.3 14.6 14.6 15.3 15.3Discount rate 3.25% 3.50% 2.30% 2.00% 3.25% 3.50% 4.08% 4.35%Expected rate of increase in salaries 2.90% 2.95% 1.90% 1.85% 3.00% 2.00% 4.30% (1) 4.00% (1)
Inflation rate 2.00% 2.00% 0.60% 0.60% 2.00% 2.00% 3.20% 3.00%
(1) Only applicable to current employees.
Funded defined benefit plan assets break down as follows :
• debt instruments account for 51.2%, or €109.8 million(57.8%, or €129.4 million at end-2012);
• equity instruments account for 26.0%, or €55.9 million(22.7%, or €50.9 million at end-2012);
• insurance policies account for 6.1%, or €13.0 million, andinvestment funds 7.3%, or €15.5 million (15% of the totalfair value of plan assets, or €33.5 million, at end-2012);
• real estate accounts for 4.8%, or €10.4 million ;
• other assets account for 4.6%, or €10.3 million (4.5%,or €9.9 million at end-2012).
In accordance with the option provided under IAS 19 asrevised in December 2004 and the obligation set out inIAS 19R effective as of January 1, 2013, the Grouprecognises actuarial gains and losses on defined benefitplans in other comprehensive income for the period.
In 2013, actuarial losses were recognised for a total of€2.7 million (see Note 14).
Cumulative actuarial gains and losses recognised in othercomprehensive income since January 1, 2004 amountedto €102.9 million as of December 31, 2013.
The breakdown in the present value of the obligation by type of plan and country as of December 31, 2013 was as follows:
(in € millions) 2013 2012
Retirement gratuities – France 43.1 96.1Long-service awards – France 0.3 2.5Statutory termination indemnities (TFR) – Italy 31.3 29.9Supplementary plans – United Kingdom 141.9 132.7Supplementary plans (LPP) – Switzerland 77.6 91.7Other 34.7 86.7
Present value of obligation as of December 31 328.9 439.6
The Group expects to pay an estimated €8.5 million in contributions in 2014.
(in € millions) Total 2013 France Switzerland Italy UK Other
Employer contributions in respect of 2014 8.5 0.5 3.7 1.6 0.7 2.0
Benefits
2014 11.8 0.5 3.3 1.6 4.9 1.52015 11.8 0.9 2.9 1.5 5.3 1.22016 12.4 1.8 2.8 1.4 5.2 1.22017 13.4 2.2 3 1.5 5.4 1.32018 14.8 2.7 3 1.5 6.2 1.42019/2023 81.6 19.7 12.4 9.4 33.1 7.0
243
5
2013 Reference Document ~ Kering
CONSOLIDATED FINANCIAL STATEMENTS AS OF DECEMBER 31, 2013 ~ FINANCIAL INFORMATION
05_D_VA_V6 14/04/14 11:31 Page243

Provisions for claims and litigation mainly relate to claimsbrought by third parties and litigation with tax authoritiesin various countries. Provisions for restructuring costschiefly reflect additions recognised and write-backsutilised during the year in connection with PUMA’s
Transformation Programme. Other provisions chiefly coverthe impact of restructuring measures implemented at PUMAas part of the new management’s strategy (see Note 9)and risks relating to vendor warranties (see Note 33.1).
Note 26 – ProvisionsReversal Reversal(utilised (surplus Translation
(in € millions) 2012 Charge provision) provision) adjustments Other 2013
Provisions for restructuring costs
Provisionsfor claims and litigation 17.4 2.1 (5.6) (1.3) (0.1) 1.9 14.4
Other non-current provisions 74.9 4.3 (2.7) (3.1) (1.5) 26.9 98.8
Other non-current provisions 92.3 6.4 (8.3) (4.4) (1.6) 28.8 113.2
Provisions for restructuring costs 95.2 16.6 (59.7) (8.9) (1.9) (7.6) 33.7
Provisions for claims and litigation 36.0 20.9 (3.0) 0.1 (0.2) 2.4 56.2
Other current provisions 36.5 39.8 (14.6) (6.9) (0.4) 8.4 62.8
Current provisions 167.7 77.3 (77.3) (15.7) (2.5) 3.2 152.7
Total 260.0 83.7 (85.6) (20.1) (4.1) 32.0 265.9
Impact on income (163.4) (83.7) 20.1 (63.6)
– on recurring operating income (7.8) (19.8) 4.4 (15.4)
– on other non-recurring operating income and expenses (135.5) (60.3) 15.7 (44.6)
– on net finance costs
– on income taxes
– on income (loss) fromdiscontinued operations (20.1) (3.6) (3.6)
244 Kering ~ 2013 Reference Document
5 FINANCIAL INFORMATION ~ CONSOLIDATED FINANCIAL STATEMENTS AS OF DECEMBER 31, 2013
05_D_VA_V6 14/04/14 11:31 Page244

27.2. Breakdown by currency
(in € millions) 2013 % 2012 %
EUR 868.4 61.2% 1,495.7 71.9%USD 165.9 11.7% 180.7 8.7%HKD 52.4 3.7% 42.9 2.0%JPY 37.2 2.6% 27.5 1.3%CHF 35.8 2.5% 38.4 1.9%CNY 35.2 2.5% 44.4 2.1%GBP 32.0 2.3% 45.7 2.2%Other currencies 192.3 13.5% 205.7 9.9%
Total 1,419.2 2,081.0
As of December 31, 2013, cash equivalents include UCITS,certificates of deposit and term deposits with a maturityof less than three months.
The items classified by the Group as cash and cashequivalents strictly comply with the AMF’s positionpublished in 2008 and updated in 2011. In particular,
cash investments are reviewed on a regular basis inaccordance with Group procedures and in strictcompliance with the eligibility criteria set out in IAS 7 andthe AMF’s recommendations. As of December 31, 2013, noreclassifications were made as a result of these reviews.
Note 27 – Cash and cash equivalents
27.1. Breakdown by category
Cash and cash equivalents break down as follows:
(in € millions) 2013 2012
Cash 1,161.6 1,232.5Cash equivalents 257.6 848.5
Total 1,419.2 2,081.0
245
5
2013 Reference Document ~ Kering
CONSOLIDATED FINANCIAL STATEMENTS AS OF DECEMBER 31, 2013 ~ FINANCIAL INFORMATION
05_D_VA_V6 14/04/14 11:31 Page245

All gross borrowings as of December 31, 2013 are recognisedat amortised cost based on an effective interest ratedetermined after taking into account any identified issuecosts and redemption or issue premiums relating to eachliability. However, the May 2008 bond issues indexed tochanges in the Kering share price were recognised at fairvalue through income.
As of December 31, 2013, a fair value adjustment of€1.4 million (€4.3 million as of December 31, 2012) wasrecognised in respect of borrowings – mainly bond issues –partially or fully hedged in a fair value hedging relationship.
Bond issues represented 66.9% of gross borrowings as ofDecember 31, 2013 and 62.8% as of end-2012.
Borrowings with a maturity of more than one year represented63.7% of total gross borrowings as of December 31, 2013and 61.6% as of December 31, 2012.
Note 28 – Borrowings
28.1. Breakdown of borrowings by maturity
(in € millions) 2013 Y+1 Y+2 Y+3 Y+4 Y+5 Beyond
Non-current borrowings 3,132.4 814.7 61.0 359.6 504.6 1,392.5
Bonds 2,589.6 750.6 349.0 497.0 993.0Confirmed lines of credit Other bank borrowings 152.1 58.0 57.0 6.6 3.7 26.8Obligations under finance leases 67.0 4.0 4.0 4.0 3.9 51.1Other borrowings 323.7 2.1 321.6
Current borrowings 1,788.8 1,788.8
Bonds 700.9 700.9 Confirmed lines of credit Drawdowns on unconfirmed lines of credit 152.8 152.8 Other bank borrowings 302.1 302.1 Obligations under finance leases 4.1 4.1 Bank overdrafts 181.6 181.6 Commercial paper 358.0 358.0 Other borrowings 89.3 89.3
Total 4,921.2 1,788.8 814.7 61.0 359.6 504.6 1,392.5% 36.3% 16.6% 1.2% 7.3% 10.3% 28.3%
(in € millions) 2012 Y+1 Y+2 Y+3 Y+4 Y+5 Beyond
Non-current borrowings 2,988.9 1,003.6 822.1 25.5 360.3 777.4
Bonds 2,298.9 704.2 751.3 348.8 494.6Confirmed lines of credit Other bank borrowings 419.1 294.7 64.3 21.6 7.6 30.9Obligations under finance leases 58.6 4.0 3.9 3.9 3.9 42.9Other borrowings 212.3 0.7 2.6 209.0
Current borrowings 1,864.9 1,864.9
Bonds 749.4 749.4 Confirmed lines of credit Drawdowns on unconfirmed lines of credit 295.2 295.2 Other bank borrowings 147.4 147.4 Obligations under finance leases 4.1 4.1 Bank overdrafts 105.9 105.9 Commercial paper 449.0 449.0 Other borrowings 113.9 113.9
Total 4,853.8 1,864.9 1,003.6 822.1 25.5 360.3 777.4% 38.4% 20.7% 16.9% 0.6% 7.4% 16.0%
246 Kering ~ 2013 Reference Document
5 FINANCIAL INFORMATION ~ CONSOLIDATED FINANCIAL STATEMENTS AS OF DECEMBER 31, 2013
05_D_VA_V6 14/04/14 11:31 Page246
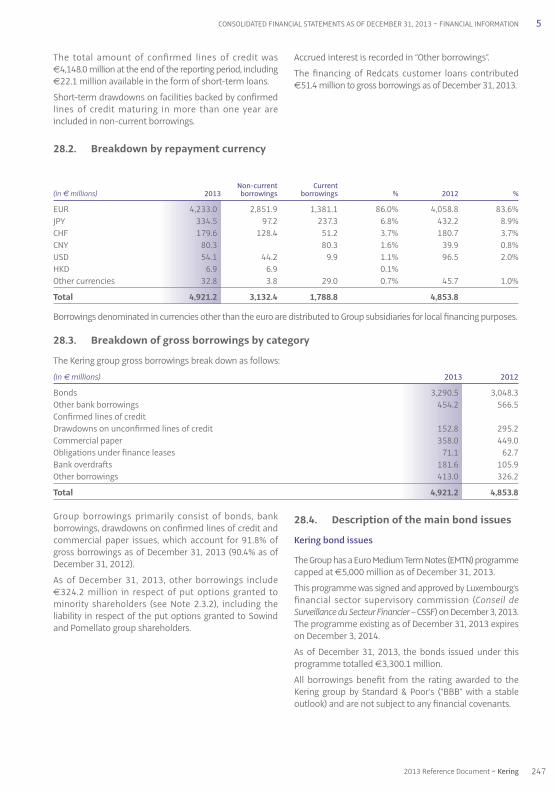
Group borrowings primarily consist of bonds, bankborrowings, drawdowns on confirmed lines of credit andcommercial paper issues, which account for 91.8% ofgross borrowings as of December 31, 2013 (90.4% as ofDecember 31, 2012).
As of December 31, 2013, other borrowings include€324.2 million in respect of put options granted tominority shareholders (see Note 2.3.2), including theliability in respect of the put options granted to Sowindand Pomellato group shareholders.
28.4. Description of the main bond issues
Kering bond issues
The Group has a Euro Medium Term Notes (EMTN) programmecapped at €5,000 million as of December 31, 2013.
This programme was signed and approved by Luxembourg’sfinancial sector supervisory commission (Conseil deSurveillance du Secteur Financier – CSSF) on December 3, 2013.The programme existing as of December 31, 2013 expireson December 3, 2014.
As of December 31, 2013, the bonds issued under thisprogramme totalled €3,300.1 million.
All borrowings benefit from the rating awarded to theKering group by Standard & Poor’s (“BBB” with a stableoutlook) and are not subject to any financial covenants.
28.2. Breakdown by repayment currency
Non-current Current(in € millions) 2013 borrowings borrowings % 2012 %
EUR 4,233.0 2,851.9 1,381.1 86.0% 4,058.8 83.6%JPY 334.5 97.2 237.3 6.8% 432.2 8.9%CHF 179.6 128.4 51.2 3.7% 180.7 3.7%CNY 80.3 80.3 1.6% 39.9 0.8%USD 54.1 44.2 9.9 1.1% 96.5 2.0%HKD 6.9 6.9 0.1% Other currencies 32.8 3.8 29.0 0.7% 45.7 1.0%
Total 4,921.2 3,132.4 1,788.8 4,853.8
Borrowings denominated in currencies other than the euro are distributed to Group subsidiaries for local financing purposes.
28.3. Breakdown of gross borrowings by category
The Kering group gross borrowings break down as follows:
(in € millions) 2013 2012
Bonds 3,290.5 3,048.3Other bank borrowings 454.2 566.5Confirmed lines of credit Drawdowns on unconfirmed lines of credit 152.8 295.2Commercial paper 358.0 449.0Obligations under finance leases 71.1 62.7Bank overdrafts 181.6 105.9Other borrowings 413.0 326.2
Total 4,921.2 4,853.8
The total amount of confirmed lines of credit was€4,148.0 million at the end of the reporting period, including€22.1 million available in the form of short-term loans.
Short-term drawdowns on facilities backed by confirmedlines of credit maturing in more than one year areincluded in non-current borrowings.
Accrued interest is recorded in “Other borrowings”.
The financing of Redcats customer loans contributed€51.4 million to gross borrowings as of December 31, 2013.
247
5
2013 Reference Document ~ Kering
CONSOLIDATED FINANCIAL STATEMENTS AS OF DECEMBER 31, 2013 ~ FINANCIAL INFORMATION
05_D_VA_V6 14/04/14 11:31 Page247
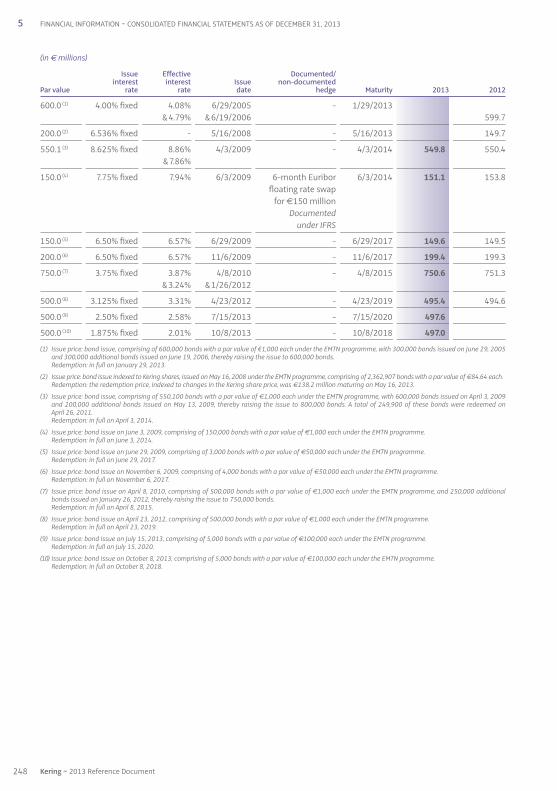
(in € millions)
Issue Effective Documented/interest interest Issue non-documented
Par value rate rate date hedge Maturity 2013 2012
600.0 (1) 4.00% fixed 4.08% 6/29/2005 - 1/29/2013& 4.79% &6/19/2006 599.7
200.0 (2) 6.536% fixed - 5/16/2008 - 5/16/2013 149.7
550.1 (3) 8.625% fixed 8.86% 4/3/2009 - 4/3/2014 549.8 550.4& 7.86%
150.0 (4) 7.75% fixed 7.94% 6/3/2009 6-month Euribor 6/3/2014 151.1 153.8floating rate swap
for €150 millionDocumented
under IFRS
150.0 (5) 6.50% fixed 6.57% 6/29/2009 - 6/29/2017 149.6 149.5
200.0 (6) 6.50% fixed 6.57% 11/6/2009 - 11/6/2017 199.4 199.3
750.0 (7) 3.75% fixed 3.87% 4/8/2010 - 4/8/2015 750.6 751.3& 3.24% & 1/26/2012
500.0 (8) 3.125% fixed 3.31% 4/23/2012 - 4/23/2019 495.4 494.6
500.0 (9) 2.50% fixed 2.58% 7/15/2013 - 7/15/2020 497.6
500.0 (10) 1.875% fixed 2.01% 10/8/2013 - 10/8/2018 497.0
(1) Issue price: bond issue, comprising of 600,000 bonds with a par value of €1,000 each under the EMTN programme, with 300,000 bonds issued on June 29, 2005and 300,000 additional bonds issued on June 19, 2006, thereby raising the issue to 600,000 bonds.Redemption: in full on January 29, 2013.
(2) Issue price: bond issue indexed to Kering shares, issued on May 16, 2008 under the EMTN programme, comprising of 2,362,907 bonds with a par value of €84.64 each.Redemption: the redemption price, indexed to changes in the Kering share price, was €138.2 million maturing on May 16, 2013.
(3) Issue price: bond issue, comprising of 550,100 bonds with a par value of €1,000 each under the EMTN programme, with 600,000 bonds issued on April 3, 2009and 200,000 additional bonds issued on May 13, 2009, thereby raising the issue to 800,000 bonds. A total of 249,900 of these bonds were redeemed onApril 26, 2011.Redemption: in full on April 3, 2014.
(4) Issue price: bond issue on June 3, 2009, comprising of 150,000 bonds with a par value of €1,000 each under the EMTN programme.Redemption: in full on June 3, 2014.
(5) Issue price: bond issue on June 29, 2009, comprising of 3,000 bonds with a par value of €50,000 each under the EMTN programme.Redemption: in full on June 29, 2017.
(6) Issue price: bond issue on November 6, 2009, comprising of 4,000 bonds with a par value of €50,000 each under the EMTN programme.Redemption: in full on November 6, 2017.
(7) Issue price: bond issue on April 8, 2010, comprising of 500,000 bonds with a par value of €1,000 each under the EMTN programme, and 250,000 additionalbonds issued on January 26, 2012, thereby raising the issue to 750,000 bonds.Redemption: in full on April 8, 2015.
(8) Issue price: bond issue on April 23, 2012, comprising of 500,000 bonds with a par value of €1,000 each under the EMTN programme.Redemption: in full on April 23, 2019.
(9) Issue price: bond issue on July 15, 2013, comprising of 5,000 bonds with a par value of €100,000 each under the EMTN programme.Redemption: in full on July 15, 2020.
(10) Issue price: bond issue on October 8, 2013, comprising of 5,000 bonds with a par value of €100,000 each under the EMTN programme.Redemption: in full on October 8, 2018.
248 Kering ~ 2013 Reference Document
5 FINANCIAL INFORMATION ~ CONSOLIDATED FINANCIAL STATEMENTS AS OF DECEMBER 31, 2013
05_D_VA_V6 14/04/14 11:31 Page248
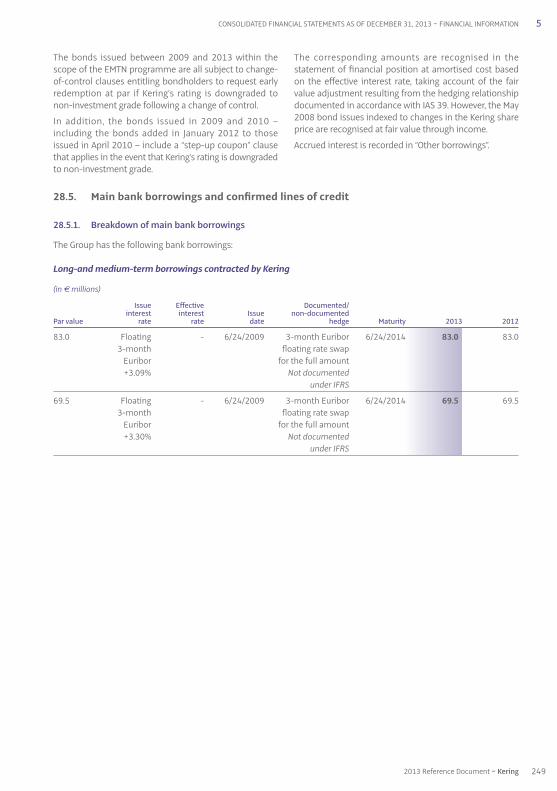
28.5. Main bank borrowings and confirmed lines of credit
28.5.1. Breakdown of main bank borrowings
The Group has the following bank borrowings:
Long-and medium-term borrowings contracted by Kering
(in € millions)
Issue Effective Documented/ interest interest Issue non-documented Par value rate rate date hedge Maturity 2013 2012
83.0 Floating - 6/24/2009 3-month Euribor 6/24/2014 83.0 83.0 3-month floating rate swap Euribor for the full amount +3.09% Not documented under IFRS
69.5 Floating - 6/24/2009 3-month Euribor 6/24/2014 69.5 69.5 3-month floating rate swap Euribor for the full amount +3.30% Not documented under IFRS
The bonds issued between 2009 and 2013 within thescope of the EMTN programme are all subject to change-of-control clauses entitling bondholders to request earlyredemption at par if Kering’s rating is downgraded tonon-investment grade following a change of control.
In addition, the bonds issued in 2009 and 2010 –including the bonds added in January 2012 to thoseissued in April 2010 – include a “step-up coupon” clausethat applies in the event that Kering’s rating is downgradedto non-investment grade.
The corresponding amounts are recognised in thestatement of financial position at amortised cost basedon the effective interest rate, taking account of the fairvalue adjustment resulting from the hedging relationshipdocumented in accordance with IAS 39. However, the May2008 bond issues indexed to changes in the Kering shareprice are recognised at fair value through income.
Accrued interest is recorded in “Other borrowings”.
249
5
2013 Reference Document ~ Kering
CONSOLIDATED FINANCIAL STATEMENTS AS OF DECEMBER 31, 2013 ~ FINANCIAL INFORMATION
05_D_VA_V6 14/04/14 11:31 Page249
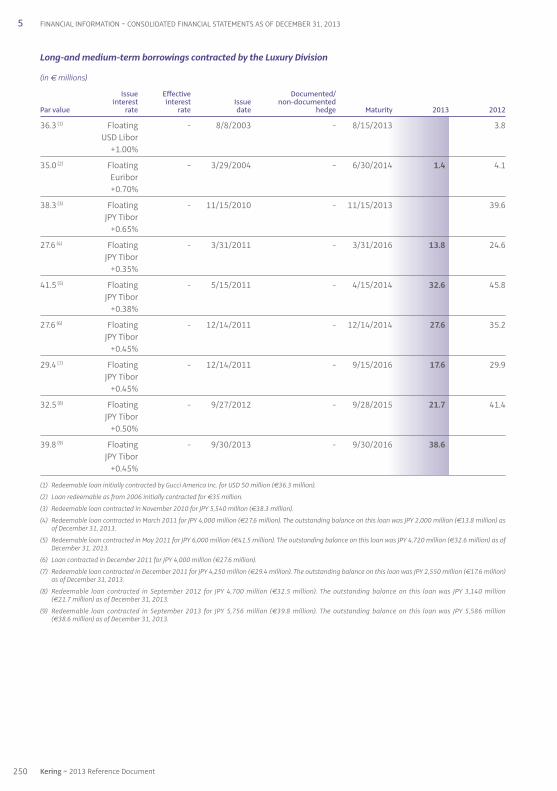
Long-and medium-term borrowings contracted by the Luxury Division
(in € millions)
Issue Effective Documented/ interest interest Issue non-documented Par value rate rate date hedge Maturity 2013 2012
36.3 (1) Floating - 8/8/2003 - 8/15/2013 3.8USD Libor
+1.00%
35.0 (2) Floating - 3/29/2004 - 6/30/2014 1.4 4.1 Euribor +0.70%
38.3 (3) Floating - 11/15/2010 - 11/15/2013 39.6JPY Tibor
+0.65%
27.6 (4) Floating - 3/31/2011 - 3/31/2016 13.8 24.6JPY Tibor
+0.35%
41.5 (5) Floating - 5/15/2011 - 4/15/2014 32.6 45.8JPY Tibor
+0.38%
27.6 (6) Floating - 12/14/2011 - 12/14/2014 27.6 35.2JPY Tibor
+0.45%
29.4 (7) Floating - 12/14/2011 - 9/15/2016 17.6 29.9JPY Tibor
+0.45%
32.5 (8) Floating - 9/27/2012 - 9/28/2015 21.7 41.4JPY Tibor
+0.50%
39.8 (9) Floating - 9/30/2013 - 9/30/2016 38.6JPY Tibor
+0.45%
(1) Redeemable loan initially contracted by Gucci America Inc. for USD 50 million (€36.3 million).
(2) Loan redeemable as from 2006 initially contracted for €35 million.
(3) Redeemable loan contracted in November 2010 for JPY 5,540 million (€38.3 million).
(4) Redeemable loan contracted in March 2011 for JPY 4,000 million (€27.6 million). The outstanding balance on this loan was JPY 2,000 million (€13.8 million) asof December 31, 2013.
(5) Redeemable loan contracted in May 2011 for JPY 6,000 million (€41.5 million). The outstanding balance on this loan was JPY 4,720 million (€32.6 million) as ofDecember 31, 2013.
(6) Loan contracted in December 2011 for JPY 4,000 million (€27.6 million).
(7) Redeemable loan contracted in December 2011 for JPY 4,250 million (€29.4 million). The outstanding balance on this loan was JPY 2,550 million (€17.6 million)as of December 31, 2013.
(8) Redeemable loan contracted in September 2012 for JPY 4,700 million (€32.5 million). The outstanding balance on this loan was JPY 3,140 million(€21.7 million) as of December 31, 2013.
(9) Redeemable loan contracted in September 2013 for JPY 5,756 million (€39.8 million). The outstanding balance on this loan was JPY 5,586 million(€38.6 million) as of December 31, 2013.
250 Kering ~ 2013 Reference Document
5 FINANCIAL INFORMATION ~ CONSOLIDATED FINANCIAL STATEMENTS AS OF DECEMBER 31, 2013
05_D_VA_V6 14/04/14 11:31 Page250

The Group’s confirmed bank lines of credit are governedby the standard commitment and default clausescustomarily included in this type of agreement: paripassu ranking, a negative-pledge clause that limits thesecurity that can be granted to other lenders, and a cross-default obligation.
Kering and Kering Finance SNC confirmed lines of creditinclude a default clause (early repayment) in the event offailure to comply with the following financial covenant:Consolidated net debt/Consolidated EBITDA less than or equal to 3.75. This ratio is calculated based on proforma data.
As of December 31, 2013, Kering and Kering Finance SNChad not drawn down any of the €3,901.0 million availableunder confirmed lines of credit subject to this covenant.
The Group was in compliance with all these covenants as of December 31, 2013 and there is no foreseeable riskof breach.
The undrawn balance on these confirmed lines of credit asof December 31, 2013 was €4,125.9 million (€4,023.6 millionas of December 31, 2012).
The undrawn confirmed lines of credit guarantee theGroup’s liquidity and back the commercial paper issueprogramme, on which a total of €358.0 million remainedoutstanding as of December 31, 2013 (€449.0 million asof December 31, 2012).
Other confirmed lines of credit: €247.0 million breaking down by maturity as follows:
(in € millions) 20 13 Less than One to More than 20 12 one year five years five years
Redcats 372.7PUMA (1) 247.0 247.0 247.9
247.0 247.0 620.6
(1) PUMA: including €22.1 million drawn down in the form of bank borrowings as of the end of December 2013.
The confirmed lines of credit include a syndicated line for€2.5 billion set up on January 14, 2011 and maturing inJanuary 2016.
As of December 31, 2013, no amounts had been drawndown under the January 2011 syndicated facility.
Total confirmed undrawn credit lines available to Keringand Kering Finance SNC as of December 31, 2013amounted to €3,901.0 million.
28.5.2. Confirmed lines of credit available to the Group
As of December 31, 2013, the Group had access to €4,148.0 million in confirmed lines of credit (versus€4,431.6 million as of December 31, 2012).
28.5.3. Breakdown of confirmed lines of credit
Kering and Kering Finance SNC: €3,901.0 million breaking down by maturity as follows:
(in € millions) 20 13 Less than One to More than 20 12 one year five years five years
Confirmed lines of credit 3,901.0 3,901.0 3,811.0
251
5
2013 Reference Document ~ Kering
CONSOLIDATED FINANCIAL STATEMENTS AS OF DECEMBER 31, 2013 ~ FINANCIAL INFORMATION
05_D_VA_V6 14/04/14 11:31 Page251

These interest rate derivatives are recognised in thestatement of financial position at their market value atthe end of the reporting period.
The accounting treatment of fair value movementsdepends on the purpose of the derivative instrument andthe resulting accounting classification.
In the case of interest rate derivatives designated as fairvalue hedges, fair value movements are recognised in netincome for the period, fully or partly offsetting symmetricalchanges in the fair value of the hedged debt. The ineffectiveportion impacts net finance costs for the period.
As of December 31, 2013, fair value hedges concerned fixed-rate bonds issued by the Group in June 2009, hedged byinterest rate swaps for a nominal amount of €150 million.
In the case of interest rate derivatives designated as cashflow hedges, the effective portion of changes in fair valueis initially recognised in other comprehensive income andsubsequently taken to income when the hedged positionitself affects income. The ineffective portion impacts netfinance costs for the period.
Movements in the fair value of non-documented derivativeinstruments are recognised directly in income, with animpact on net finance costs for the period.
As of December 31, 2013, derivative instruments that did notqualify for hedge accounting under IAS 39 primarilycomprised options in the form of interest rate swaps intendedto hedge revolving financing issued at fixed rates.
As of December 31, 2013, documented and non-documented financial instruments can be analysed as follows:
(in € millions) 2013 Fair value Cash flow Non-documented hedges hedges hedges
Swaps: fixed-rate lender 650.0 150.0 500.0Swaps: fixed-rate borrower 14.3 14.3Other interest rate instruments 252.5 252.5
Total 916.8 150.0 14.3 752.5
As part of the Group’s interest rate hedging strategy, theseinstruments are primarily designed to:
• convert fixed-rate bonds into floating-rate debt: the Grouphas entered into interest rate swaps as a fixed-rate lenderin an amount of €150 million to hedge Kering bond issues;
• convert fixed-rate negotiable debt securities, borrowingsand credit-line drawdowns into floating-rate debt: theGroup has entered into interest rate swaps as a fixed-rate lender in an amount of €600 million.
In accordance with IAS 39, these financial instrumentswere analysed with respect to hedge accounting eligibilitycriteria.
Note 29 – Exposure to interest rate, foreignexchange and equity risk
The Group uses derivative financial instruments to manage its exposure to market risks.
Derivatives used by the Group as of December 31, 2013 are described below.
29.1. Exposure to interest rate risk
To manage interest rate risk on its financial assets and liabilities, and particularly on its borrowings, the Kering groupuses instruments with the following outstanding notional amounts:
(in € millions) 20 13 Y+1 Y+2 Y+3 Y+4 Y+5 Beyond 20 12
Swaps: fixed-rate lender 650.0 550.0 100.0 431.9Swaps: fixed-rate borrower 14.3 14.3 Other interest rate instruments (1) 252.5 152.5 100.0 152.5
Total 916.8 702.5 100.0 100.0 14.3 584.4
(1) Including floating/floating rate swaps.
252 Kering ~ 2013 Reference Document
5 FINANCIAL INFORMATION ~ CONSOLIDATED FINANCIAL STATEMENTS AS OF DECEMBER 31, 2013
05_D_VA_V6 14/04/14 11:31 Page252

The Group’s exposure to interest rate risk before the impact of hedging is presented below, with a distinction made between:
• fixed-rate financial assets and liabilities, exposed to a price risk before hedging:
2013 maturities(in € millions) 2013 Less than One to More than 2012
one year five years five years
Fixed-rate financial assets 79.0 67.4 10.8 0.8 252.3
Bonds 3,290.5 700.9 1,596.6 993.0 3,048.3Commercial paper 358.0 358.0 312.0Other borrowings 4.4 0.6 2.4 1.4 8.1
Fixed-rate financial liabilities 3,652.9 1,059.5 1,599.0 994.4 3,368.4
• floating-rate financial assets and liabilities, exposed to a cash flow risk before hedging:
2013 maturities(in € millions) 2013 Less than One to More than 2012
one year five years five years
Floating-rate financial assets 1,397.2 1,381.3 15.9 1,924.5
Bonds Commercial paper 137.0Other borrowings 1,268.3 729.3 140.9 398.1 1,348.4
Floating-rate financial liabilities 1,268.3 729.3 140.9 398.1 1,485.4
The Group’s exposure to interest rate risk after the impact of hedging is presented below, with a distinction made between:
• fixed-rate financial assets and liabilities, exposed to a price risk after hedging:
2013 maturities(in € millions) 2013 Less than One to More than 2012
one year five years five years
Fixed-rate financial assets 79.0 67.4 10.8 0.8 252.3
Bonds 2,897.4 507.8 1,396.6 993.0 2,894.5Commercial paper 30.1Other borrowings 18.7 1.8 7.6 9.3 8.1
Fixed-rate financial liabilities 2,916.1 509.6 1,404.2 1,002.3 2,932.7
• floating-rate financial assets and liabilities, exposed to a cash flow risk after hedging:
2013 maturities(in € millions) 2013 Less than One to More than 2012
one year five years five years
Floating-rate financial assets 1,397.2 1,381.3 15.9 1,924.5
Bonds 393.1 193.1 200.0 153.7Commercial paper 358.0 358.0 419.0Other borrowings 1,254.0 728.1 135.7 390.2 1,348.4
Floating-rate financial liabilities 2,005.1 1,279.2 335.7 390.2 1,921.1
Financial assets and liabilities consist of interest-bearing items recorded in the statement of financial position.
253
5
2013 Reference Document ~ Kering
CONSOLIDATED FINANCIAL STATEMENTS AS OF DECEMBER 31, 2013 ~ FINANCIAL INFORMATION
05_D_VA_V6 14/04/14 11:31 Page253

All other market variables were assumed to remainunchanged for the purpose of the sensitivity analysis.
The impact on equity is generated by interest rateinstruments eligible for cash flow hedge accounting andwas not material as of December 31, 2013.
The impact on net finance costs arises from interest rateinstruments not eligible for hedge accounting and fromfinancial liabilities carried at fair value through income.
These amounts are shown before tax.
(in € millions) Impact Impact on reserves on income
As of December 31, 2013
Increase of 50 basis points 1.6Decrease of 50 basis points (2.0)
As of December 31, 2012
Increase of 50 basis points 0.4Decrease of 50 basis points (0.5)
Analysis of sensitivity to interest rate risk
Based on the fixed/floating rate mix after hedging, asudden 50 basis point increase or decrease in interestrates would have a full-year impact of €4.9 million onpre-tax consolidated net income. As of December 31,2012, the impact of a sudden 50 basis point increase ordecrease in interest rates was estimated at €2.7 million(assumption consistent with relative interest rate levelsobserved at year-end).
Based on market data at the end of the reporting period,and the particularly low benchmark interest rates for theGroup, the impact of interest rate derivatives and financialliabilities carried at fair value through income wasdetermined assuming a sudden increase or decrease of 50basis points in the euro yield curve as of December 31, 2013.
The breakdown of gross borrowings by type of interest rate before and after hedging transactions is as follows:
(in € millions) 2013 Before hedging After hedgingFixed-rate Floating-rate Fixed-rate Floating-rate
Gross borrowings 4,921.2 3,652.9 1,268.3 2,916.1 2,005.1
% 74.2% 25.8% 59.3% 40.7%
(in € millions) 2012 Before hedging After hedgingFixed-rate Floating-rate Fixed-rate Floating-rate
Gross borrowings 4,853.8 3,368.4 1,485.4 2,932.7 1,921.1
% 69.4% 30.6% 60.4% 39.6%
254 Kering ~ 2013 Reference Document
5 FINANCIAL INFORMATION ~ CONSOLIDATED FINANCIAL STATEMENTS AS OF DECEMBER 31, 2013
05_D_VA_V6 14/04/14 11:31 Page254
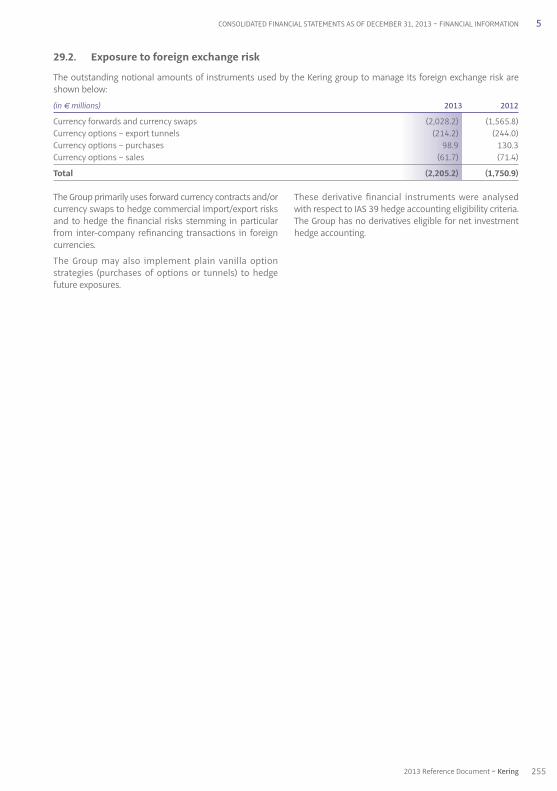
The Group primarily uses forward currency contracts and/orcurrency swaps to hedge commercial import/export risksand to hedge the financial risks stemming in particularfrom inter-company refinancing transactions in foreigncurrencies.
The Group may also implement plain vanilla optionstrategies (purchases of options or tunnels) to hedgefuture exposures.
These derivative financial instruments were analysedwith respect to IAS 39 hedge accounting eligibility criteria.The Group has no derivatives eligible for net investmenthedge accounting.
29.2. Exposure to foreign exchange risk
The outstanding notional amounts of instruments used by the Kering group to manage its foreign exchange risk areshown below:
(in € millions) 2013 2012
Currency forwards and currency swaps (2,028.2) (1,565.8)Currency options – export tunnels (214.2) (244.0)Currency options – purchases 98.9 130.3Currency options – sales (61.7) (71.4)
Total (2,205.2) (1,750.9)
255
5
2013 Reference Document ~ Kering
CONSOLIDATED FINANCIAL STATEMENTS AS OF DECEMBER 31, 2013 ~ FINANCIAL INFORMATION
05_D_VA_V6 14/04/14 11:31 Page255

Foreign exchange derivatives are recognised in thestatement of financial position at their market value atthe end of the reporting period.
Derivatives qualifying as cash flow hedges are used to hedgehighly probable future cash flows (not yet recognised)based on a budget for the current budget period (seasonor catalogue, quarter, half-year, etc.) or certain future cashflows not yet recognised (firm orders).
As of December 31, 2013, the majority of foreign exchangederivatives qualifying as cash flow hedges had a residualmaturity of less than one year and are used to hedgecash flows expected to be realised and recorded in theaccounts in the coming reporting period.
Derivatives qualifying as fair value hedges are used tohedge items recognised in the consolidated statement offinancial position at the end of the reporting period, orcertain future cash flows not yet recognised (firm orders).Hedges of items recognised in the statement of financialposition chiefly concern brands in the Luxury Division.
Certain foreign exchange derivatives treated as hedges formanagement purposes are not documented in accordancewith IAS 39 hedge accounting and are therefore recordedas derivatives, with any changes in their fair value impactingnet finance costs.
These derivatives mainly hedge items recorded in thestatement of financial position and future cash flows whichdo not satisfy the ’highly probable’ criteria required by IAS 39.
(in € millions) 20 13 EUR USD JPY
Cash flow hedges
Forward purchases and forward purchase swaps 787.8 0.1 778.7 Forward sales and forward sale swaps (1,597.0) (692.5) Currency options – purchases of export tunnels (214.2) (214.2)
Fair value hedges
Forward purchases and forward purchase swaps 232.8 4.2 90.7 33.4 Forward sales and forward sale swaps (763.0) (23.1) (144.7) (55.8)
Not documented
Forward purchases and forward purchase swaps 304.8 17.5 129.1 21.1 Forward sales and forward sale swaps (993.6) (17.3) (777.2) (95.2) Currency options – purchases 98.9 6.6 81.9 Currency options – sales (61.7) (6.6) (25.9)
Maturity
Less than one year
Forward purchases and forward purchase swaps 1,267.5 21.8 940.6 54.5 Forward sales and forward sale swaps (3,332.2) (40.4) (1,614.4) (151.0) Currency options – purchases of export tunnels (206.3) (206.3) Currency options – purchases 98.9 6.6 81.9 Currency options – sales (61.7) (6.6) (25.9)
More than one year
Forward purchases and forward purchase swaps 57.9 57.9 Forward sales and forward sale swaps (21.4) Currency options – purchases of export tunnels (7.9) (7.9) Currency options – purchases Currency options – sales
As of December 31, 2013, documented and non-documented derivative instruments were as follows:
256 Kering ~ 2013 Reference Document
5 FINANCIAL INFORMATION ~ CONSOLIDATED FINANCIAL STATEMENTS AS OF DECEMBER 31, 2013
05_D_VA_V6 14/04/14 11:31 Page256
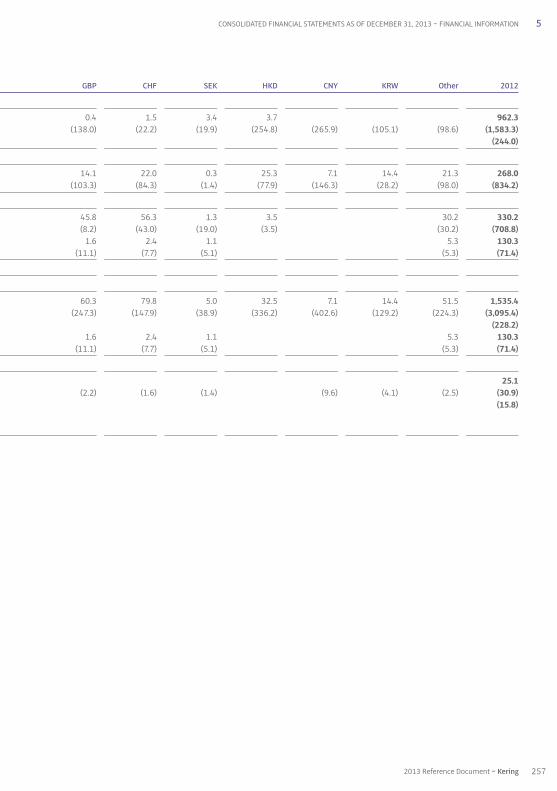
257
5
2013 Reference Document ~ Kering
CONSOLIDATED FINANCIAL STATEMENTS AS OF DECEMBER 31, 2013 ~ FINANCIAL INFORMATION
GBP CHF SEK HKD CNY KRW Other 20 12
0.4 1.5 3.4 3.7 962.3 (138.0) (22.2) (19.9) (254.8) (265.9) (105.1) (98.6) (1,583.3) (244.0)
14.1 22.0 0.3 25.3 7.1 14.4 21.3 268.0 (103.3) (84.3) (1.4) (77.9) (146.3) (28.2) (98.0) (834.2)
45.8 56.3 1.3 3.5 30.2 330.2 (8.2) (43.0) (19.0) (3.5) (30.2) (708.8) 1.6 2.4 1.1 5.3 130.3 (11.1) (7.7) (5.1) (5.3) (71.4)
60.3 79.8 5.0 32.5 7.1 14.4 51.5 1,535.4 (247.3) (147.9) (38.9) (336.2) (402.6) (129.2) (224.3) (3,095.4) (228.2) 1.6 2.4 1.1 5.3 130.3 (11.1) (7.7) (5.1) (5.3) (71.4)
25.1 (2.2) (1.6) (1.4) (9.6) (4.1) (2.5) (30.9) (15.8)
05_D_VA_V6 14/04/14 11:31 Page257

All other market variables were assumed to remainunchanged for the purpose of the sensitivity analysis.
The impact on equity is generated by foreign exchangeinstruments qualifying for cash flow hedge accounting.
The impact on net finance costs arises from foreignexchange instruments not qualifying for cash flow hedgeaccounting and from the change in the ineffective portionof cash flow hedges.
These amounts are shown before tax.
29.3. Exposure to equity risk
In the normal course of its business, the Group entersinto transactions involving shares in consolidatedcompanies or shares issued by Kering.
Shares held in connection with non-consolidatedinvestments represent a low exposure risk for the Groupand are not hedged.
As of December 31, 2013, no equity risk hedging transactionhad been recognised as a derivative instrument inaccordance with IAS 39.
As of December 31, 2013 Impact on reserves Impact on income(in € millions) +10% increase -10% decrease +10% increase -10% decrease
USD (7.4) 12.3 2.7JPY 9.5 (8.7) (0.1) (0.1)CNY 24.2 (29.5) (0.3) 0.3
As of December 31, 2012 Impact on reserves Impact on income(in € millions) +10% increase -10% decrease +10% increase -10% decrease
USD (33.6) 41.0 (1.7) 8.4JPY 22.2 (26.6) (0.2) (0.1)CNY 22.4 (27.4) (0.4) 0.4
Monetary assets comprise loans and receivables, bankbalances, investments and cash equivalents maturingwithin three months of the acquisition date.
Monetary liabilities comprise borrowings, operatingpayables and other payables.
Most of these monetary items are denominated in thefunctional currency in which the subsidiary operates orare converted into the Group’s functional currency usingforeign exchange derivatives in accordance withapplicable procedures.
Analysis of sensitivity to foreign exchange risk
This analysis excludes the impact of translating thefinancial statements of each Group entity into thepresentation currency (euro) and the measurement ofthe foreign exchange position of the statement offinancial position, not considered material as of the endof the reporting period.
Based on market data as of December 31, 2013, the impactof foreign exchange derivative instruments in the event of asudden 10% increase or decrease in the euro exchange rateagainst the principal currencies to which the Group is exposedin terms of commercial appeal (USD, JPY and CNY) wouldbe as follows:
As of December 31, 2013, the exposure to foreign exchange risk on the statement of financial position was as follows:
(in € millions) 20 13 EUR USD JPY
Monetary assets 2,364.2 23.9 1,026.9 220.7 Monetary liabilities 1,092.1 25.9 290.5 341.0
Gross exposure in the statement of financial position 1,272.1 (2.0) 736.4 (120.3)
Forecast gross exposure 1,051.6 (55.4) 214.2
Gross exposure before hedging 2,323.7 (2.0) 681.0 93.9
Hedging instruments (2,200.0) (18.8) (559.8) (310.7)
Gross exposure after hedging 123.7 (20.8) 121.2 (216.8)
258 Kering ~ 2013 Reference Document
5 FINANCIAL INFORMATION ~ CONSOLIDATED FINANCIAL STATEMENTS AS OF DECEMBER 31, 2013
05_D_VA_V6 14/04/14 11:31 Page258

(in € millions) 2013 Interest Foreign Other 2012 rate risk exchange risk market risks
Derivative assets 101.5 8.5 93.0 89.6
Non-current 0.4 0.4 12.4At fair value through income 0.4 0.4 1.1Cash flow hedges Fair value hedges 11.3
Current 101.1 8.1 93.0 77.2At fair value through income 14.7 0.4 14.3 5.5Cash flow hedges 78.6 78.6 66.2Fair value hedges 7.8 7.7 0.1 5.5
Derivative liabilities 26.3 0.7 25.6 18.7
Non-current 0.7 0.7 At fair value through income Cash flow hedges 0.7 0.7 Fair value hedges
Current 25.6 25.6 18.7At fair value through income 5.3 5.3 2.4Cash flow hedges 19.9 19.9 16.3Fair value hedges 0.4 0.4
TOTAL 75.2 7.8 67.4 70.9
29.4. Other market risks – Credit risk
The Group uses derivative instruments solely to reduceits overall exposure to foreign exchange, interest rate andequity risk arising in the normal course of business. Alltransactions involving derivatives are carried out onorganised markets or over-the-counter with leading firms.
All bonds issued in 2009 and 2010 within the scope ofthe EMTN programme, including the additional bondsissued in January 2012 for the April 2010 bond issue, aresubject to a “step-up coupon” clause in the event thatKering’s rating is downgraded to non-investment grade.This would increase the coupon payable on each issue by1.25%, and could lead to an increase of €22.5 million infinance costs over a full year.
The Group has a large number of customers in a widerange of business segments and is therefore not exposedto any concentration of credit risk on its receivables.Generally, the Group considers that it is not exposed toany specific credit risk on these financial assets.
29.5. Derivative instruments at market value
As of December 31, 2013, and in accordance with IAS 39,the market value of derivative financial instruments isrecognised in assets under the headings “Non-currentfinancial assets” and “Other current financial assets”, andin liabilities under the headings “Other non-currentfinancial liabilities” and “Other current financial liabilities”.
The fair value of derivatives hedging interest rate risk isrecognised in non-current or current assets or liabilitiesdepending on the maturity of the underlying debt.
The fair value of foreign exchange derivatives isrecognised in other current financial assets or liabilities.
259
5
2013 Reference Document ~ Kering
CONSOLIDATED FINANCIAL STATEMENTS AS OF DECEMBER 31, 2013 ~ FINANCIAL INFORMATION
GBP CHF SEK HKD CNY KRW Other 20 12
128.0 142.5 35.3 99.4 191.8 37.7 458.0 2,340.6 42.0 230.4 3.0 15.1 89.4 1.4 53.4 1,225.2
86.0 (87.9) 32.3 84.3 102.4 36.3 404.6 1,115.4
137.9 20.0 15.6 251.1 265.9 105.1 97.2 831.5
223.9 (67.9) 47.9 335.4 368.3 141.4 501.8 1,946.9
(198.7) (83.2) (25.8) (303.7) (405.1) (118.9) (175.3) (1,835.3)
25.2 (151.1) 22.1 31.7 (36.8) 22.5 326.5 111.6
05_D_VA_V6 14/04/14 11:32 Page259

Derivatives qualifying for fair value hedge accountingmainly hedge debt in the form of bonds. They are presentedin assets for an amount of €7.7 million as of December 31,2013 and €11.3 million as of December 31, 2012.
The effective portion of derivatives hedging future cashflows is recorded against equity.
Changes in the cash flow hedging reserve in 2013 arepresented in Note 14.
In accordance with IFRS 13, derivatives were measured asof December 31, 2013 taking into account credit and debitvalue adjustments (CVA/DVA). The probability of default usedis based on market data where this is available for thecounterparty. The impact of this revised measurementwas not material for the Group as of the end of thereporting period and is recognised in net finance costs.
29.6. Liquidity risk
Liquidity risk management for the Group and each of itssubsidiaries is closely monitored and periodically assessedby Kering within the scope of Group financial reportingprocedures.
In order to guarantee its liquidity, the Group holds confirmedlines of credit totalling €4,148.0 million. As of December 31,2013, this includes an amount of €4,125.9 million notyet drawn and available cash of €1,419.2 million.
The table below shows contractual commitments relatingto borrowings and trade payables. It includes accruedinterest payable and excludes the impact of nettingagreements. The table also includes Group commitmentsrelating to derivative instruments recorded in assets or liabilities.
Forecast cash flows relating to interest payable areincluded in “Other borrowings” and calculated up to thecontractual maturity of the borrowings to which theyrelate. Future floating-rate interest is set based on thelast coupon for the current period, based on fixingsapplicable at the end of the reporting period for flowsassociated with subsequent maturities.
The future cash flows presented have not been discounted.
Based on data available as of the end of the reportingperiod, the Group does not expect that the cash flowsindicated will materialise before the scheduled date orthat the amounts concerned will differ significantly fromthose set out in the maturity schedule.
This analysis excludes non-derivative financial assets inthe statement of financial position and in particular, thecash and cash equivalents and trade receivables captions,which amounted to €1,419.2 million and €949.9 million,respectively, as of December 31, 2013.
260 Kering ~ 2013 Reference Document
5 FINANCIAL INFORMATION ~ CONSOLIDATED FINANCIAL STATEMENTS AS OF DECEMBER 31, 2013
05_D_VA_V6 14/04/14 11:32 Page260

(in € millions) 2013 Carrying Cash flow Less than One to More thanamount one year five years five years
Non-derivative financial instruments
Bonds 3,290.5 (3,300.1) (700.1) (1,600.0) (1,000.0)Commercial paper 358.0 (358.0) (358.0) Other borrowings 1,272.7 (1,656.5) (803.9) (412.9) (439.7)Trade payables 766.1 (766.1) (766.1)
Other non-derivative financial instruments associated with assets classified as heldfor sale or for distribution 259.1 (259.1) (252.1) (7.0)
Derivative financial instruments
Interest rate hedges (7.8)
Interest rate swaps 8.2 8.4 0.2 (0.4)Other interest rate instruments
Foreign exchange hedges (67.4)
Currency forwards and currency swaps Outflows (4,056.7) (3,991.7) (65.0) Inflows 4,085.3 4,020.8 64.5 Other foreign exchange instruments Outflows (235.7) (227.8) (7.9) Inflows 262.7 254.1 8.6
Total 5,871.2 (6,276.0) (2,816.4) (2,019.5) (1,440.1)
(in € millions) 2012 Carrying Cash flow Less than One to More thanamount one year five years five years
Non-derivative financial instruments
Bonds 3,048.3 (3,038.3) (738.2) (1,800.1) (500.0)Commercial paper 449.0 (449.0) (449.0) Other borrowings 1,356.5 (1,753.2) (730.3) (697.3) (325.6)Trade payables 684.5 (684.5) (684.5) Other non-derivative financial instruments associated with assets classified as held for sale or for distribution 1,484.8 (1,493.7) (1,393.6) (100.1)
Derivative financial instruments
Interest rate hedges (12.4)
Interest rate swaps 12.6 4.5 8.1 Other interest rate instruments
Foreign exchange hedges (58.5)
Currency forwards and currency swaps Outflows (3,990.2) (3,953.4) (36.8) Inflows 4,004.5 3,968.8 35.7 Other foreign exchange instruments Outflows (320.1) (304.3) (15.8) Inflows 349.2 331.6 17.6
Total 6,952.2 (7,362.7) (3,948.4) (2,588.7) (825.6)
261
5
2013 Reference Document ~ Kering
CONSOLIDATED FINANCIAL STATEMENTS AS OF DECEMBER 31, 2013 ~ FINANCIAL INFORMATION
05_D_VA_V6 14/04/14 11:32 Page261

Note 30 – Accounting classification and marketvalue of financial instruments
The basis of measurement for financial instruments and the market value of these instruments as of December 31,2013 are presented below:
(in € millions) 2013 Breakdown by accounting classificationCarrying Market Fair Available- Loans Amortised Derivatives Derivativesamount value value for-sale and cost qualifying not qualifying
through assets receivables for hedge for hedgeincome accounting accounting
Non-current assets Non-current financial assets 316.8 316.8 149.4 167.0 0.4Current assets Trade receivables 949.9 949.9 949.9 Other current financial assets 107.7 107.7 6.6 86.4 14.7Cash and cash equivalents 1,419.2 1,419.2 257.6 1,161.6
Non-current liabilities Non-current borrowings 3,132.4 3,260.6 3,132.4 Other non-current financial assets 0.7 0.7 0.7Current liabilities Current borrowings 1,788.8 1,802.7 1,788.8 Other current financial liabilities 213.2 213.2 187.6 20.3 5.3Trade payables 766.1 766.1 766.1
262 Kering ~ 2013 Reference Document
5 FINANCIAL INFORMATION ~ CONSOLIDATED FINANCIAL STATEMENTS AS OF DECEMBER 31, 2013
05_D_VA_V6 14/04/14 11:32 Page262
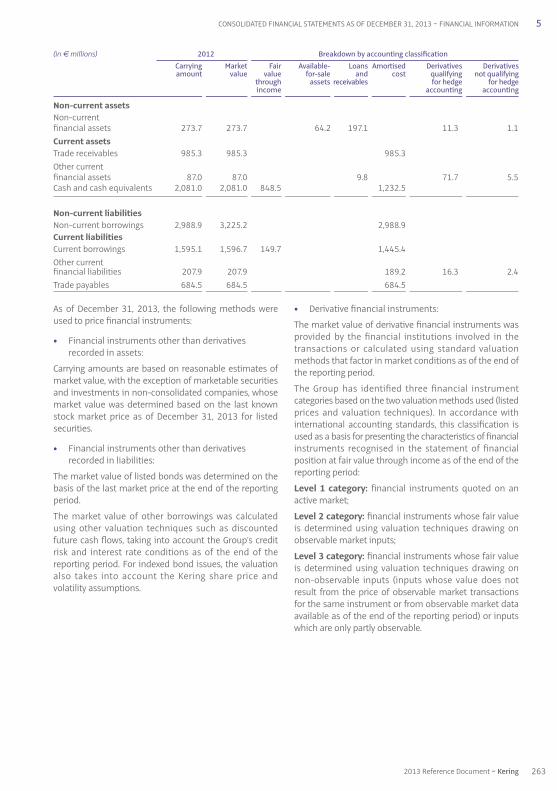
As of December 31, 2013, the following methods wereused to price financial instruments:
• Financial instruments other than derivatives recorded in assets:
Carrying amounts are based on reasonable estimates ofmarket value, with the exception of marketable securitiesand investments in non-consolidated companies, whosemarket value was determined based on the last knownstock market price as of December 31, 2013 for listedsecurities.
• Financial instruments other than derivatives recorded in liabilities:
The market value of listed bonds was determined on thebasis of the last market price at the end of the reportingperiod.
The market value of other borrowings was calculatedusing other valuation techniques such as discountedfuture cash flows, taking into account the Group’s creditrisk and interest rate conditions as of the end of thereporting period. For indexed bond issues, the valuationalso takes into account the Kering share price andvolatility assumptions.
• Derivative financial instruments:
The market value of derivative financial instruments wasprovided by the financial institutions involved in thetransactions or calculated using standard valuationmethods that factor in market conditions as of the end ofthe reporting period.
The Group has identified three financial instrumentcategories based on the two valuation methods used (listedprices and valuation techniques). In accordance withinternational accounting standards, this classification isused as a basis for presenting the characteristics of financialinstruments recognised in the statement of financialposition at fair value through income as of the end of thereporting period:
Level 1 category: financial instruments quoted on anactive market ;
Level 2 category: financial instruments whose fair valueis determined using valuation techniques drawing onobservable market inputs ;
Level 3 category: financial instruments whose fair valueis determined using valuation techniques drawing onnon-observable inputs (inputs whose value does notresult from the price of observable market transactionsfor the same instrument or from observable market dataavailable as of the end of the reporting period) or inputswhich are only partly observable.
(in € millions) 2012 Breakdown by accounting classificationCarrying Market Fair Available- Loans Amortised Derivatives Derivativesamount value value for-sale and cost qualifying not qualifying
through assets receivables for hedge for hedgeincome accounting accounting
Non-current assets Non-current financial assets 273.7 273.7 64.2 197.1 11.3 1.1Current assets Trade receivables 985.3 985.3 985.3 Other current financial assets 87.0 87.0 9.8 71.7 5.5Cash and cash equivalents 2,081.0 2,081.0 848.5 1,232.5
Non-current liabilities Non-current borrowings 2,988.9 3,225.2 2,988.9 Current liabilities Current borrowings 1,595.1 1,596.7 149.7 1,445.4 Other current financial liabilities 207.9 207.9 189.2 16.3 2.4Trade payables 684.5 684.5 684.5
263
5
2013 Reference Document ~ Kering
CONSOLIDATED FINANCIAL STATEMENTS AS OF DECEMBER 31, 2013 ~ FINANCIAL INFORMATION
05_D_VA_V6 14/04/14 11:32 Page263

The table below shows the fair value hierarchy by financial instrument category as of December 31, 2013:
(in € millions) Fair value hierarchy 2013Market price = Models based Models based
Level 1 on observable on non-observable inputs = Level 2 inputs = Level 3
Non-current assetsNon-current financial assets 74.7 0.4 241.7 316.8Current assetsTrade receivables 949.9 949.9Other current financial assets 101.1 6.6 107.7Cash and cash equivalents 205.8 51.8 1,161.6 1,419.2
Non-current liabilitiesNon-current borrowings 3,132.4 3,132.4Other non-current financial liabilities 0.7 0.7Current liabilitiesCurrent borrowings 1,788.8 1,788.8Other current financial liabilities 25.6 187.6 213.2Trade payables 766.1 766.1
(in € millions) Fair value hierarchy 2012 Market price = Models based Models based Level 1 on observable on non-observable inputs = Level 2 inputs = Level 3
Non-current assets Non-current financial assets 10.3 12.4 251.0 273.7Current assets Trade receivables 985.3 985.3Other current financial assets 77.2 9.8 87.0Cash and cash equivalents 619.4 229.1 1,232.5 2,081.0
Non-current liabilities Non-current borrowings 2,988.9 2,988.9Current liabilities Current borrowings 149.7 1,445.4 1,595.1Other current financial liabilities 18.7 189.2 207.9Trade payables 684.5 684.5
264 Kering ~ 2013 Reference Document
5 FINANCIAL INFORMATION ~ CONSOLIDATED FINANCIAL STATEMENTS AS OF DECEMBER 31, 2013
05_D_VA_V6 14/04/14 11:32 Page264

Note 31 – Net debt
Group net debt breaks down as follows:
(in € millions) 2013 2012
Gross borrowings excluding the financing of customer loans 4,869.8 4,584.0Fair value hedges (interest rate) (7.7) (11.3)Cash and cash equivalents (1,419.2) (2,081.0)
Net debt 3,442.9 2,491.7
Note 32 – Statement of cash flows
Cash and cash equivalents net of bank overdrafts amounted to €1,237.6 million as of December 31, 2013, reflectingtotal cash and cash equivalents presented in the statement of cash flows.
(in € millions) 2013 2012
Cash and cash equivalents as reported in the statement of financial position 1,419.2 2,081.0
Bank overdrafts (181.6) (105.9)
Cash and cash equivalents as reported in the statement of cash flows 1,237.6 1,975.1
32.1. Cash flow from operating activities
Cash flow from operating activities breaks down as follows:
(in € millions) 2013 2012
Net income from continuing operations 861.5 1,357.9Net recurring charges to depreciation, amortisationand provisions on non-current operating assets 295.8 275.1Expenses relating to share-based payment (4.8) 7.5Impairment losses on non-current operating assets 361.2 53.6Gains/(losses) on asset disposals, net of tax 1.2 (233.4)Income/(expenses) in respect of fair value movements 8.0 (51.2)Deferred tax (89.3) (68.6)Share in earnings of associates (1.6) (36.9)Dividends received from associates - 22.6Other non-cash income and expenses 115.2 150.0
Cash flow from operating activities 1,547.2 1,476.6
32.2. Purchases of property, plant and equipment and intangible assets
Purchases of property, plant and equipment and intangible assets totalled €677.7 million in 2013 and €441.9 millionin 2012 (see section 1.5. of the activity report).
32.3. Acquisitions and disposals of subsidiaries
(in € millions) 2013 2012
Acquisitions of subsidiaries, net of cash acquired (345.0) (219.3)Proceeds from disposals of subsidiaries and associates, net of cash transferred 24.7 916.5
Total (320.3) 697.2
In 2013, acquisitions of subsidiaries mainly concerned Pomellato group, Christopher Kane, Qeelin, France Croco andTannerie de Périers (see Note 3.2.3).
265
5
2013 Reference Document ~ Kering
CONSOLIDATED FINANCIAL STATEMENTS AS OF DECEMBER 31, 2013 ~ FINANCIAL INFORMATION
05_D_VA_V6 14/04/14 11:32 Page265
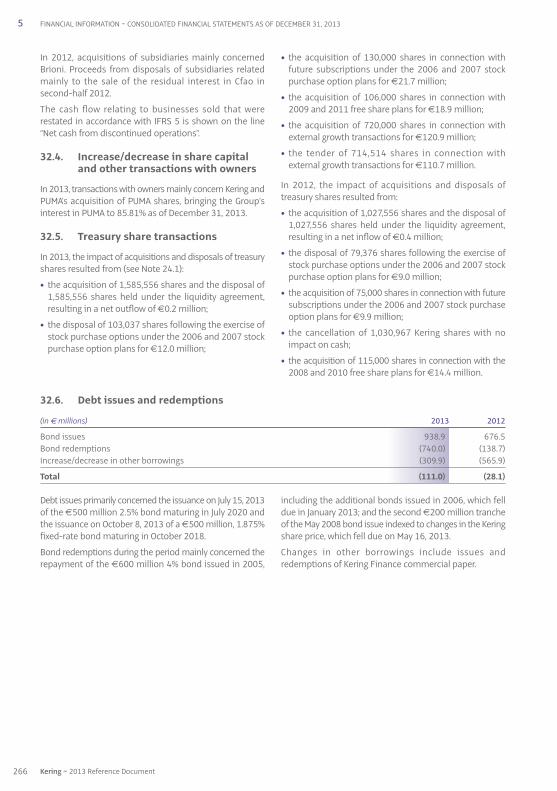
Debt issues primarily concerned the issuance on July 15, 2013of the €500 million 2.5% bond maturing in July 2020 andthe issuance on October 8, 2013 of a €500 million, 1.875%fixed-rate bond maturing in October 2018.
Bond redemptions during the period mainly concerned therepayment of the €600 million 4% bond issued in 2005,
including the additional bonds issued in 2006, which felldue in January 2013; and the second €200 million trancheof the May 2008 bond issue indexed to changes in the Keringshare price, which fell due on May 16, 2013.
Changes in other borrowings include issues andredemptions of Kering Finance commercial paper.
32.6. Debt issues and redemptions
(in € millions) 2013 2012
Bond issues 938.9 676.5Bond redemptions (740.0) (138.7)Increase/decrease in other borrowings (309.9) (565.9)
Total (111.0) (28.1)
In 2012, acquisitions of subsidiaries mainly concernedBrioni. Proceeds from disposals of subsidiaries relatedmainly to the sale of the residual interest in Cfao insecond-half 2012.
The cash flow relating to businesses sold that wererestated in accordance with IFRS 5 is shown on the line“Net cash from discontinued operations”.
32.4. Increase/decrease in share capitaland other transactions with owners
In 2013, transactions with owners mainly concern Kering andPUMA’s acquisition of PUMA shares, bringing the Group’sinterest in PUMA to 85.81% as of December 31, 2013.
32.5. Treasury share transactions
In 2013, the impact of acquisitions and disposals of treasuryshares resulted from (see Note 24.1):
• the acquisition of 1,585,556 shares and the disposal of1,585,556 shares held under the liquidity agreement,resulting in a net outflow of €0.2 million ;
• the disposal of 103,037 shares following the exercise ofstock purchase options under the 2006 and 2007 stockpurchase option plans for €12.0 million ;
• the acquisition of 130,000 shares in connection withfuture subscriptions under the 2006 and 2007 stockpurchase option plans for €21.7 million ;
• the acquisition of 106,000 shares in connection with2009 and 2011 free share plans for €18.9 million ;
• the acquisition of 720,000 shares in connection withexternal growth transactions for €120.9 million ;
• the tender of 714,514 shares in connection withexternal growth transactions for €110.7 million.
In 2012, the impact of acquisitions and disposals oftreasury shares resulted from:
• the acquisition of 1,027,556 shares and the disposal of1,027,556 shares held under the liquidity agreement,resulting in a net inflow of €0.4 million ;
• the disposal of 79,376 shares following the exercise ofstock purchase options under the 2006 and 2007 stockpurchase option plans for €9.0 million ;
• the acquisition of 75,000 shares in connection with futuresubscriptions under the 2006 and 2007 stock purchaseoption plans for €9.9 million ;
• the cancellation of 1,030,967 Kering shares with noimpact on cash ;
• the acquisition of 115,000 shares in connection with the2008 and 2010 free share plans for €14.4 million.
266 Kering ~ 2013 Reference Document
5 FINANCIAL INFORMATION ~ CONSOLIDATED FINANCIAL STATEMENTS AS OF DECEMBER 31, 2013
05_D_VA_V6 14/04/14 11:32 Page266
Note 33 – Contingent liabilities, contractualcommitments not recognised and other contingencies
33.1. Commitments given and received following asset disposals
Vendor warranties given by the Group on the sale of companies are summarised below:
Disposals Vendor warranties
May 2003 Sale of Guilbert Contract to Office Depot Vendor tax warranties covering periods not yet time barred.
June 2003 Sale of Pinault Bois & Matériaux The vendor warranty granted by Saprodis is limited to a specific warranty for certainto Wolseley damages relating to health, safety and the environment. This warranty expires on July 7, 2014 and is capped at €50 million.
December 2010 Sale of Conforama Vendor warranties covering tax-related or similar claims expiring when the period
becomes time-barred, capped at €120 million. This disposal is related to thecommitment by Kering to continue commercial relations between Conforama andthe BNP Paribas group as regards customer loans.
December 2012 Sale of The Sportsman’s Guide Vendor warranties covering (i) tax-related or similar claims which expire when the and The Golf Warehouse period becomes time-barred, (ii) certain fundamental representations (including with
respect to organisation, capitalisation and authority) which survive indefinitely and(iii) representations with respect to employment and benefit plans which terminatesix months after the applicable statute of limitations. The warranty is capped at USD 21.5 million.
February 2013 Sale of OneStopPlus Customary vendor warranty expiring at the earliest of April 30, 2014 and five days
after the publication of the 2013 financial statements, except for (i) tax-related orsimilar claims which expire when the period becomes time-barred; (ii) certainfundamental representations (including with respect to organisation, capitalisationand authority), which survive indefinitely; and (iii) certain environmental obligations.The warranty is capped at USD 52.5 million.
March 2013 Sale of Redcats’ Children Customary vendor warranty expiring after June 30, 2014, except for (i) tax-relatedand Family division or similar claims which expire when the period becomes time-barred; and
(ii) representations with respect to employment and benefit plans, trademark andtitle ownership, which expire five years after the sale transaction date. Thewarranty is capped at €10 million.
June 2013 Sale of Ellos Customary vendor warranty expiring after December 31, 2014, except for certain
fundamental representations (including with respect to organisation, capitalisationand authority), which survive indefinitely. The warranty is capped at €29 million.
Specific vendor warranty covering tax-related or similar claims which expires onJune 2, 2019 and is capped at €40 million.
This was accompanied by a commitment received as regards the continuation of commercial relations with Finaref, covered by a €70 million bank guaranteeexpiring in 2023.
267
5
2013 Reference Document ~ Kering
CONSOLIDATED FINANCIAL STATEMENTS AS OF DECEMBER 31, 2013 ~ FINANCIAL INFORMATION
05_D_VA_V6 14/04/14 11:32 Page267
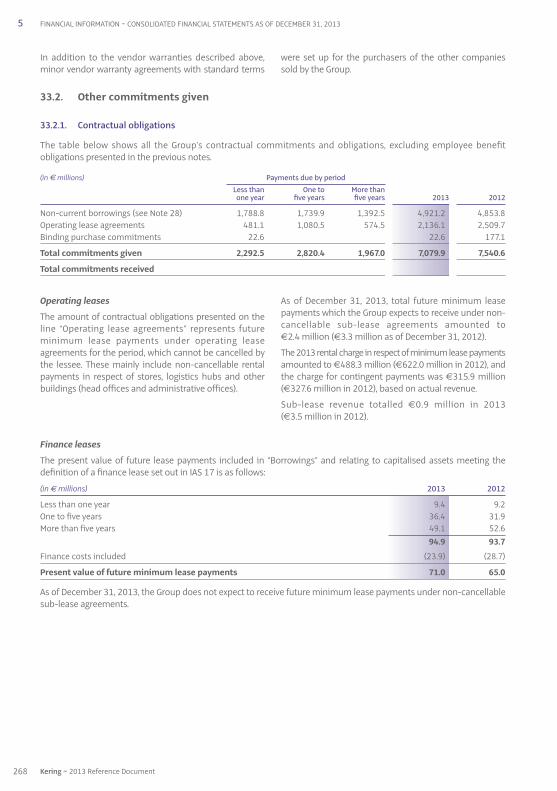
Finance leases
The present value of future lease payments included in “Borrowings” and relating to capitalised assets meeting thedefinition of a finance lease set out in IAS 17 is as follows:
(in € millions) 2013 2012
Less than one year 9.4 9.2One to five years 36.4 31.9More than five years 49.1 52.6 94.9 93.7
Finance costs included (23.9) (28.7)
Present value of future minimum lease payments 71.0 65.0
As of December 31, 2013, the Group does not expect to receive future minimum lease payments under non-cancellablesub-lease agreements.
Operating leases
The amount of contractual obligations presented on theline “Operating lease agreements” represents futureminimum lease payments under operating leaseagreements for the period, which cannot be cancelled bythe lessee. These mainly include non-cancellable rentalpayments in respect of stores, logistics hubs and otherbuildings (head offices and administrative offices).
As of December 31, 2013, total future minimum leasepayments which the Group expects to receive under non-cancellable sub-lease agreements amounted to€2.4 million (€3.3 million as of December 31, 2012).
The 2013 rental charge in respect of minimum lease paymentsamounted to €488.3 million (€622.0 million in 2012), andthe charge for contingent payments was €315.9 million(€327.6 million in 2012), based on actual revenue.
Sub-lease revenue totalled €0.9 million in 2013(€3.5 million in 2012).
33.2. Other commitments given
33.2.1. Contractual obligations
The table below shows all the Group’s contractual commitments and obligations, excluding employee benefitobligations presented in the previous notes.
(in € millions) Payments due by periodLess than One to More thanone year five years five years 2013 2012
Non-current borrowings (see Note 28) 1,788.8 1,739.9 1,392.5 4,921.2 4,853.8Operating lease agreements 481.1 1,080.5 574.5 2,136.1 2,509.7Binding purchase commitments 22.6 22.6 177.1
Total commitments given 2,292.5 2,820.4 1,967.0 7,079.9 7,540.6
Total commitments received
In addition to the vendor warranties described above,minor vendor warranty agreements with standard terms
were set up for the purchasers of the other companiessold by the Group.
268 Kering ~ 2013 Reference Document
5 FINANCIAL INFORMATION ~ CONSOLIDATED FINANCIAL STATEMENTS AS OF DECEMBER 31, 2013
05_D_VA_V6 14/04/14 11:32 Page268

Other commitments given primarily include customswarranties and operating guarantees.
To the best of the Group’s knowledge, there are no othersignificant commitments given or contingent liabilities.
33.3. Dependence on patents, licences and supply contracts
The Group is not significantly dependent on any patents,licences or supply contracts.
33.4. Litigation
Group companies are involved in a number of lawsuits ordisputes arising in the normal course of business,including litigation with tax, social security and customsauthorities. Provisions have been set aside for the
probable costs, as estimated by the Group’s entities andtheir counsel.
According to the Group’s legal counsel, no litigation currentlyin progress is likely to have a material impact on normalor foreseeable operations or the planned development ofthe Group or any of its subsidiaries.
The Group believes there is no known litigation likely to havea potential material impact on its net assets, earnings orfinancial position that is not adequately covered byprovisions recorded at the end of the reporting period. Noindividual claim is material to the Company or the Group.
The Group is not aware of any other dispute or arbitration,which has had in the recent past, or is likely to have in thefuture, a significant impact on the financial position, activityor earnings of the Company or Group.
33.2.4. Other commitments
Other commitments break down as follows:
(in € millions) Payments due by periodLess than One to More thanone year five years five years 2013 2012
Confirmed lines of credit (see Note 28) 247.0 3,901.0 4,148.0 4,431.6Letters of credit 20.0 20.0 15.1Other guarantees received 10.3 7.6 1.1 19.0 45.7
Total commitments received 277.3 3,908.6 1.1 4,187.0 4,492.4
Guarantees given to banks responsible for cash pooling arrangements 1.3 0.2 18.9 20.4 23.6Rent guarantees, property guarantees 3.5 1.2 1.3 6.0 52.5Sponsoring and advertising commitments 117.2 364.2 55.3 536.7 324.3Other commitments 27.3 20.9 1.8 50.0 140.8
Total commitments given 149.3 386.5 77.3 613.1 541.2
33.2.3. Individual training entitlement
Pursuant to French Law No. 2004-391 of May 4, 2004 onvocational training, all employees of the Group’s Frenchcompanies receive a 20-hour training credit each year,which can be accumulated over six years and is capped at120 hours. Any training courses followed within the
framework of this training entitlement are deducted fromthe number of training hours accumulated.
The total unused cumulative training entitlement accruedby employees represented 0.4 million training hours as of December 31, 2013 and 1.6 million hours as ofDecember 31, 2012.
33.2.2. Guarantees and other collateral
Guarantees and other collateral granted by the Group break down as follows:
(in € millions) StatementAmount of financial Amount
of assets position total of assetsPledge Pledge pledged as of (carrying Corresponding pledged as of
start date expiry date Dec. 31, 2013 amount) % Dec. 31, 2012
Intangible assets 10,702.8 Property, plant and equipment 7/11/2004 6/25/2018 222.9 1,676.9 13.3% 307.2Non-current financial assets 0.1 316.8
Total non-current assets pledged as collateral 223.0 12,696.5 1.8% 307.2
269
5
2013 Reference Document ~ Kering
CONSOLIDATED FINANCIAL STATEMENTS AS OF DECEMBER 31, 2013 ~ FINANCIAL INFORMATION
05_D_VA_V6 14/04/14 11:32 Page269

Short-term benefits, long-term benefits and terminationbenefits correspond to amounts paid during the year;post-employment benefits and share-based paymentcorrespond to the amounts recognised as expenses.
A list of the members of the Board of Directors and ExecutiveCommittee is provided in the “ Corporate Governance ”section of the Reference Document.
34.2. Associates
In the normal course of business, the Group enters into transactions with associates on an arm’s length basis.
The main transactions with associates are summarised in the following table:
(in € millions) 2013 2012
Trade receivables - 1.6Sales of goods and services - 17.9
34.3. Senior executive remuneration
The table below shows remuneration paid to members of the Board of Directors and the Group’s Executive Committee:
(in € millions) 2013 2012
Short-term benefits 20.0 24.7Payroll taxes 4.3 6.1High income tax 2.0 -Post-employment benefits 0.9 0.6Other long-term benefits 2.0 1.0Termination indemnities - 4.3Share-based payment 3.7 6.5
Total 32.9 43.2
34.1. Related party controlling the Group
Kering is controlled by Artémis, which in turn is wholly ownedby Société Financière Pinault. As of December 31, 2013,the Artémis group held 40.9% of Kering’s share capitaland 57.5% of its voting rights.
The main transactions carried out between Kering’sconsolidated companies and Artémis in 2013 aredescribed below:
• payment of an interim dividend in respect of 2013totalling €77.4 million in January 2014 ;
• balancing payment of the cash dividend for 2012 of €116.1 million, further to the payment of an interimdividend of €77.4 million in January 2013 (€180.7 millionin 2011) and a complementary in-kind dividend settledin Groupe Fnac shares for €129.2 million;
• recognition of fees totalling €1.0 million (€2.2 millionin 2012) for (i) business development consulting servicesand complex transaction support, and (ii) the supply ofdevelopment opportunities, new business and costreduction solutions. These fees are governed by anagreement reviewed by the Audit Committee andapproved by the Board of Directors.
Note 34 – Transactions with related parties
270 Kering ~ 2013 Reference Document
5 FINANCIAL INFORMATION ~ CONSOLIDATED FINANCIAL STATEMENTS AS OF DECEMBER 31, 2013
05_D_VA_V6 14/04/14 11:32 Page270

Exclusive negotiations for the disposal of La Redoute andRelais Colis continued between Kering and the Directors,who presented the details of the methods and
procedures of their business plan to the staffrepresentative bodies as part of the normal information-consultation process prior to the transfer in January 2014.
Note 35 – Subsequent events
271
5
2013 Reference Document ~ Kering
CONSOLIDATED FINANCIAL STATEMENTS AS OF DECEMBER 31, 2013 ~ FINANCIAL INFORMATION
05_D_VA_V6 14/04/14 11:32 Page271

Kering Parent company
LUXURY DIVISION
France
ARCADES PONTHIEU F 95.00 F 95.00
BALENCIAGA SA F 100.00 F 100.00
BOTTEGA VENETA France SAS F 100.00 F 100.00
BOUCHERON HOLDING SAS F 100.00 F 100.00
BOUCHERON PARFUM SAS F 100.00 F 100.00
BOUCHERON SAS F 100.00 F 100.00
BRIONI France SA F 100.00 F 100.00
C. MENDES SAS F 100.00 F 100.00
DODO PARIS SAS F 81.00 Acquisition
France CROCO SAS F 85.00 Acquisition
TANNERIE DE PERIERS SAS F 85.00 Acquisition
GG FRANCE 11 SAS F 100.00 F 100.00
GG FRANCE HOLDING SAS F 100.00 F 100.00
GG FRANCE SERVICES SAS F 100.00 F 100.00
GPO HOLDING SAS F 100.00 Creation
GUCCI FRANCE SAS F 100.00 F 100.00
GUCCI GROUP WATCHES France SAS F 100.00 F 100.00
LES BOUTIQUES BOUCHERON SAS F 100.00 F 100.00
POMELLATO PARIS SA F 81.00 Acquisition
QEELIN France SARL F 100.00 Acquisition
SOWIND France SAS(1) F 50.00 F 50.00
STELLA MCCARTNEY France SAS F 50.00 F 50.00
YSL VENTES PRIVEES France SAS F 100.00 F 100.00
YVES SAINT LAURENT BOUTIQUE France SAS F 100.00 F 100.00
YVES SAINT LAURENT PARFUMS SAS F 100.00 F 100.00
YVES SAINT LAURENT SAS(1) F 100.00 F 100.00
Germany
BOTTEGA VENETA GERMANY GmbH F 100.00 F 100.00
DODO DEUTSCHLAND GmbH F 81.00 Acquisition
GG LUXURY GOODS GmbH F 100.00 F 100.00
POMELLATO DEUTSCHLAND GmbH F 81.00 Acquisition
TRADEMA GmbH(1) F 50.00 F 50.00
YVES SAINT LAURENT GERMANY GmbH F 100.00 F 100.00
Austria
BOTTEGA VENETA AUSTRIA GmbH F 100.00 Creation
GUCCI AUSTRIA GmbH F 100.00 F 100.00
YVES SAINT LAURENT AUSTRIA GmbH F 100.00 F 100.00
Belgium
GUCCI BELGIUM SA Liquidation F 100.00
LA MERIDIANA FASHION SA F 100.00 F 100.00
SERGIO ROSSI BELGIUM SPRL F 100.00 F 100.00
Spain
BOTTEGA VENETA ESPANA SL F 100.00 F 100.00
BRIONI RETAIL SPAGNA SRL F 100.00 F 100.00
DODO SPAIN SA F 81.00 Acquisition
LUXURY GOODS SPAIN SL F 100.00 F 100.00
LUXURY TIMEPIECES ESPAÑA SL F 100.00 F 100.00
NOGA LUXE SL F 100.00 F 100.00
SERGIO ROSSI ESPANA SL F 100.00 F 100.00
STELLA MCCARTNEY SPAIN SL F 50.00 F 50.00
YVES SAINT LAURENT SPAIN SA F 100.00 F 100.00
United Kingdom
ALEXANDER MCQUEEN TRADING Ltd F 100.00 F 100.00
AUTUMNPAPER Limited F 100.00 F 100.00
BALENCIAGA UK Ltd F 100.00 F 100.00
BIRDSWAN SOLUTIONS Ltd F 100.00 F 100.00
BOTTEGA VENETA UK CO. Limited F 100.00 F 100.00
BOUCHERON UK Ltd F 100.00 F 100.00
BRIONI UK Ltd F 100.00 F 100.00
CHRISTOPHER KANE Ltd(1) F 80.00 Acquisition
DODO UK Ltd F 81.00 Acquisition
GUCCI Limited F 100.00 F 100.00
LUXURY TIMEPIECES (UK) Ltd F 100.00 F 100.00
PAINTGATE Limited F 100.00 F 100.00
POMELLATO UK Ltd F 81.00 Acquisition
QEELIN UK Ltd F 100.00 Acquisition
Company % interestDec. 31, 2013 Dec. 31, 2012
Company % interestDec. 31, 2013 Dec. 31, 2012
Note 36 – List of consolidated subsidiaries as of December 31, 2013
Details of Group subsidiaries are provided below.
Consolidation method: Full consolidation : F
Equity method : E
272 Kering ~ 2013 Reference Document
5 FINANCIAL INFORMATION ~ CONSOLIDATED FINANCIAL STATEMENTS AS OF DECEMBER 31, 2013
05_D_VA_V6 14/04/14 11:32 Page272
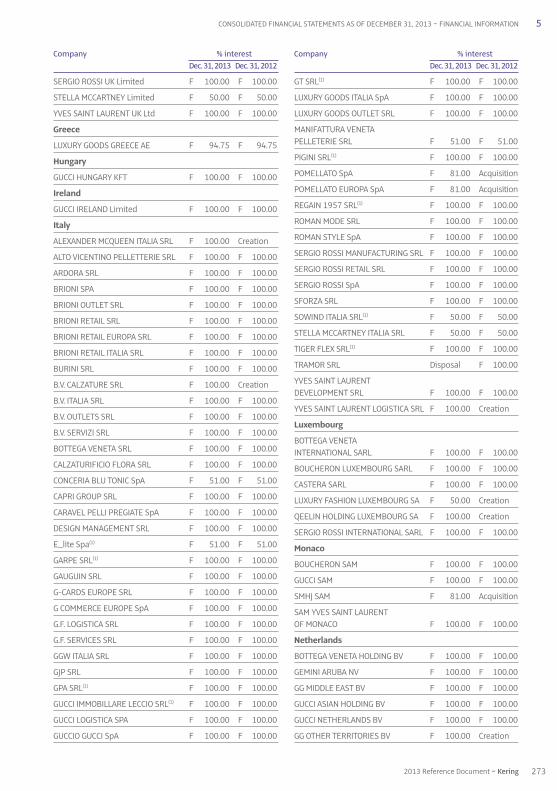
SERGIO ROSSI UK Limited F 100.00 F 100.00
STELLA MCCARTNEY Limited F 50.00 F 50.00
YVES SAINT LAURENT UK Ltd F 100.00 F 100.00
Greece
LUXURY GOODS GREECE AE F 94.75 F 94.75
Hungary
GUCCI HUNGARY KFT F 100.00 F 100.00
Ireland
GUCCI IRELAND Limited F 100.00 F 100.00
Italy
ALEXANDER MCQUEEN ITALIA SRL F 100.00 Creation
ALTO VICENTINO PELLETTERIE SRL F 100.00 F 100.00
ARDORA SRL F 100.00 F 100.00
BRIONI SPA F 100.00 F 100.00
BRIONI OUTLET SRL F 100.00 F 100.00
BRIONI RETAIL SRL F 100.00 F 100.00
BRIONI RETAIL EUROPA SRL F 100.00 F 100.00
BRIONI RETAIL ITALIA SRL F 100.00 F 100.00
BURINI SRL F 100.00 F 100.00
B.V. CALZATURE SRL F 100.00 Creation
B.V. ITALIA SRL F 100.00 F 100.00
B.V. OUTLETS SRL F 100.00 F 100.00
B.V. SERVIZI SRL F 100.00 F 100.00
BOTTEGA VENETA SRL F 100.00 F 100.00
CALZATURIFICIO FLORA SRL F 100.00 F 100.00
CONCERIA BLU TONIC SpA F 51.00 F 51.00
CAPRI GROUP SRL F 100.00 F 100.00
CARAVEL PELLI PREGIATE SpA F 100.00 F 100.00
DESIGN MANAGEMENT SRL F 100.00 F 100.00
E_lite Spa(1) F 51.00 F 51.00
GARPE SRL(1) F 100.00 F 100.00
GAUGUIN SRL F 100.00 F 100.00
G-CARDS EUROPE SRL F 100.00 F 100.00
G COMMERCE EUROPE SpA F 100.00 F 100.00
G.F. LOGISTICA SRL F 100.00 F 100.00
G.F. SERVICES SRL F 100.00 F 100.00
GGW ITALIA SRL F 100.00 F 100.00
GJP SRL F 100.00 F 100.00
GPA SRL(1) F 100.00 F 100.00
GUCCI IMMOBILLARE LECCIO SRL(1) F 100.00 F 100.00
GUCCI LOGISTICA SPA F 100.00 F 100.00
GUCCIO GUCCI SpA F 100.00 F 100.00
GT SRL(1) F 100.00 F 100.00
LUXURY GOODS ITALIA SpA F 100.00 F 100.00
LUXURY GOODS OUTLET SRL F 100.00 F 100.00
MANIFATTURA VENETA PELLETERIE SRL F 51.00 F 51.00
PIGINI SRL(1) F 100.00 F 100.00
POMELLATO SpA F 81.00 Acquisition
POMELLATO EUROPA SpA F 81.00 Acquisition
REGAIN 1957 SRL(1) F 100.00 F 100.00
ROMAN MODE SRL F 100.00 F 100.00
ROMAN STYLE SpA F 100.00 F 100.00
SERGIO ROSSI MANUFACTURING SRL F 100.00 F 100.00
SERGIO ROSSI RETAIL SRL F 100.00 F 100.00
SERGIO ROSSI SpA F 100.00 F 100.00
SFORZA SRL F 100.00 F 100.00
SOWIND ITALIA SRL(1) F 50.00 F 50.00
STELLA MCCARTNEY ITALIA SRL F 50.00 F 50.00
TIGER FLEX SRL(1) F 100.00 F 100.00
TRAMOR SRL Disposal F 100.00
YVES SAINT LAURENT DEVELOPMENT SRL F 100.00 F 100.00
YVES SAINT LAURENT LOGISTICA SRL F 100.00 Creation
Luxembourg
BOTTEGA VENETA INTERNATIONAL SARL F 100.00 F 100.00
BOUCHERON LUXEMBOURG SARL F 100.00 F 100.00
CASTERA SARL F 100.00 F 100.00
LUXURY FASHION LUXEMBOURG SA F 50.00 Creation
QEELIN HOLDING LUXEMBOURG SA F 100.00 Creation
SERGIO ROSSI INTERNATIONAL SARL F 100.00 F 100.00
Monaco
BOUCHERON SAM F 100.00 F 100.00
GUCCI SAM F 100.00 F 100.00
SMHJ SAM F 81.00 Acquisition
SAM YVES SAINT LAURENTOF MONACO F 100.00 F 100.00
Netherlands
BOTTEGA VENETA HOLDING BV F 100.00 F 100.00
GEMINI ARUBA NV F 100.00 F 100.00
GG MIDDLE EAST BV F 100.00 F 100.00
GUCCI ASIAN HOLDING BV F 100.00 F 100.00
GUCCI NETHERLANDS BV F 100.00 F 100.00
GG OTHER TERRITORIES BV F 100.00 Creation
273
5
2013 Reference Document ~ Kering
CONSOLIDATED FINANCIAL STATEMENTS AS OF DECEMBER 31, 2013 ~ FINANCIAL INFORMATION
Company % interestDec. 31, 2013 Dec. 31, 2012
Company % interestDec. 31, 2013 Dec. 31, 2012
05_D_VA_V6 14/04/14 11:32 Page273
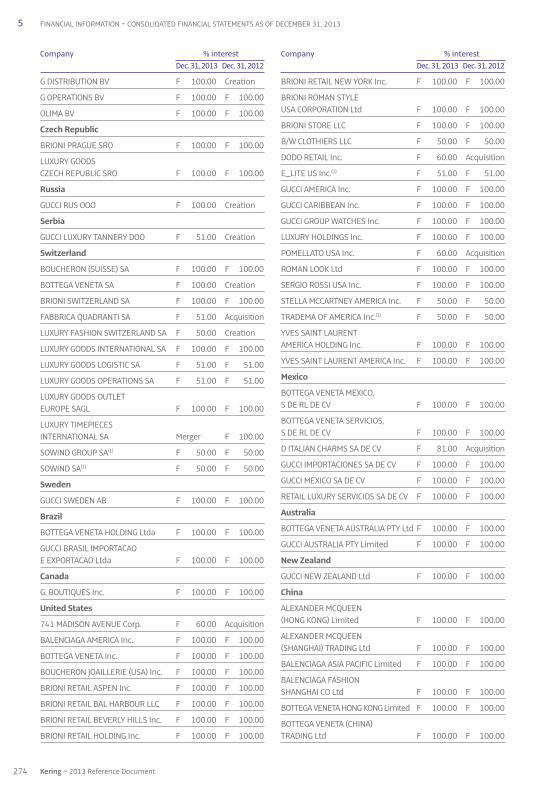
G DISTRIBUTION BV F 100.00 Creation
G OPERATIONS BV F 100.00 F 100.00
OLIMA BV F 100.00 F 100.00
Czech Republic
BRIONI PRAGUE SRO F 100.00 F 100.00
LUXURY GOODS CZECH REPUBLIC SRO F 100.00 F 100.00
Russia
GUCCI RUS OOO F 100.00 Creation
Serbia
GUCCI LUXURY TANNERY DOO F 51.00 Creation
Switzerland
BOUCHERON (SUISSE) SA F 100.00 F 100.00
BOTTEGA VENETA SA F 100.00 Creation
BRIONI SWITZERLAND SA F 100.00 F 100.00
FABBRICA QUADRANTI SA F 51.00 Acquisition
LUXURY FASHION SWITZERLAND SA F 50.00 Creation
LUXURY GOODS INTERNATIONAL SA F 100.00 F 100.00
LUXURY GOODS LOGISTIC SA F 51.00 F 51.00
LUXURY GOODS OPERATIONS SA F 51.00 F 51.00
LUXURY GOODS OUTLET EUROPE SAGL F 100.00 F 100.00
LUXURY TIMEPIECES INTERNATIONAL SA Merger F 100.00
SOWIND GROUP SA(1) F 50.00 F 50.00
SOWIND SA(1) F 50.00 F 50.00
Sweden
GUCCI SWEDEN AB F 100.00 F 100.00
Brazil
BOTTEGA VENETA HOLDING Ltda F 100.00 F 100.00
GUCCI BRASIL IMPORTACAO E EXPORTACAO Ltda F 100.00 F 100.00
Canada
G. BOUTIQUES Inc. F 100.00 F 100.00
United States
741 MADISON AVENUE Corp. F 60.00 Acquisition
BALENCIAGA AMERICA Inc. F 100.00 F 100.00
BOTTEGA VENETA Inc. F 100.00 F 100.00
BOUCHERON JOAILLERIE (USA) Inc. F 100.00 F 100.00
BRIONI RETAIL ASPEN Inc. F 100.00 F 100.00
BRIONI RETAIL BAL HARBOUR LLC F 100.00 F 100.00
BRIONI RETAIL BEVERLY HILLS Inc. F 100.00 F 100.00
BRIONI RETAIL HOLDING Inc. F 100.00 F 100.00
BRIONI RETAIL NEW YORK Inc. F 100.00 F 100.00
BRIONI ROMAN STYLE USA CORPORATION Ltd F 100.00 F 100.00
BRIONI STORE LLC F 100.00 F 100.00
B/W CLOTHIERS LLC F 50.00 F 50.00
DODO RETAIL Inc. F 60.00 Acquisition
E_LITE US Inc.(1) F 51.00 F 51.00
GUCCI AMERICA Inc. F 100.00 F 100.00
GUCCI CARIBBEAN Inc. F 100.00 F 100.00
GUCCI GROUP WATCHES Inc. F 100.00 F 100.00
LUXURY HOLDINGS Inc. F 100.00 F 100.00
POMELLATO USA Inc. F 60.00 Acquisition
ROMAN LOOK Ltd F 100.00 F 100.00
SERGIO ROSSI USA Inc. F 100.00 F 100.00
STELLA MCCARTNEY AMERICA Inc. F 50.00 F 50.00
TRADEMA OF AMERICA Inc.(1) F 50.00 F 50.00
YVES SAINT LAURENT AMERICA HOLDING Inc. F 100.00 F 100.00
YVES SAINT LAURENT AMERICA Inc. F 100.00 F 100.00
Mexico
BOTTEGA VENETA MEXICO, S DE RL DE CV F 100.00 F 100.00
BOTTEGA VENETA SERVICIOS, S DE RL DE CV F 100.00 F 100.00
D ITALIAN CHARMS SA DE CV F 81.00 Acquisition
GUCCI IMPORTACIONES SA DE CV F 100.00 F 100.00
GUCCI MEXICO SA DE CV F 100.00 F 100.00
RETAIL LUXURY SERVICIOS SA DE CV F 100.00 F 100.00
Australia
BOTTEGA VENETA AUSTRALIA PTY Ltd F 100.00 F 100.00
GUCCI AUSTRALIA PTY Limited F 100.00 F 100.00
New Zealand
GUCCI NEW ZEALAND Ltd F 100.00 F 100.00
China
ALEXANDER MCQUEEN (HONG KONG) Limited F 100.00 F 100.00
ALEXANDER MCQUEEN (SHANGHAI) TRADING Ltd F 100.00 F 100.00
BALENCIAGA ASIA PACIFIC Limited F 100.00 F 100.00
BALENCIAGA FASHION SHANGHAI CO Ltd F 100.00 F 100.00
BOTTEGA VENETA HONG KONG Limited F 100.00 F 100.00
BOTTEGA VENETA (CHINA) TRADING Ltd F 100.00 F 100.00
274 Kering ~ 2013 Reference Document
5 FINANCIAL INFORMATION ~ CONSOLIDATED FINANCIAL STATEMENTS AS OF DECEMBER 31, 2013
Company % interestDec. 31, 2013 Dec. 31, 2012
Company % interestDec. 31, 2013 Dec. 31, 2012
05_D_VA_V6 14/04/14 11:32 Page274

BOTTEGA VENETA MACAU Ltd F 100.00 F 100.00
BRIONI (SHANGHAI) TRADING Ltd F 100.00 F 100.00
BOUCHERON HONG KONG Limited F 100.00 F 100.00
GUCCI (CHINA) TRADING Ltd F 100.00 F 100.00
GUCCI ASIA COMPANY Ltd F 100.00 Creation
GUCCI GROUP (HONG KONG) Limited F 100.00 F 100.00
GUCCI MACAU Limited F 100.00 F 100.00
LGI (SHANGHAI) ENTERPRISE MANAGEMENT Ltd F 100.00 F 100.00
GUCCI WATCHES MARKETING CONSULTING (SHANGHAI) Ltd F 100.00 F 100.00
LUXURY TIMEPIECES (HONG KONG) Limited F 100.00 F 100.00
POMELLATO CHINA Ltd F 49.00 Acquisition
POMELLATO SHANGHAI Co. Ltd F 49.00 Acquisition
POMELLATO PACIFIC Ltd F 61.00 Acquisition
QEELIN Limited F 100.00 Acquisition
QEELIN TRADING (SHANGHAI) Co. Limited F 100.00 Acquisition
SERGIO ROSSI (SHANGHAI) TRADING Ltd F 100.00 F 100.00
SERGIO ROSSI MACAU Ltd F 100.00 F 100.00
STELLA MCCARTNEY (SHANGHAI) TRADING Ltd F 50.00 F 50.00
SOWIND ASIA Ltd(1) F 50.00 F 50.00
YVES SAINT LAURENT MACAU Limited F 100.00 F 100.00
YVES SAINT LAURENT (SHANGHAI) TRADING Limited F 100.00 F 100.00
Korea
BALENCIAGA KOREA Ltd F 100.00 F 100.00
BOTTEGA VENETA KOREA Ltd F 100.00 F 100.00
BOUCHERON KOREA Ltd F 100.00 Creation
GUCCI GROUP KOREA Ltd F 100.00 F 100.00
Guam
BOTTEGA VENETA GUAM Inc. F 100.00 F 100.00
GUCCI GROUP GUAM Inc. F 100.00 F 100.00
India
GUCCI INDIA PRIVATE Ltd(1) F 100.00 F 100.00
LUXURY GOODS RETAIL PRIVATE LGR F 51.00 F 51.00
Japan
BALENCIAGA JAPAN Ltd F 100.00 F 100.00
BOTTEGA VENETA JAPAN Limited F 100.00 F 100.00
BRIONI JAPAN & CO. Limited F 100.00 F 100.00
E_LITE JAPAN Ltd(1) F 51.00 Creation
GUCCI YUGEN KAISHA F 100.00 F 100.00
LUXURY TIMEPIECES JAPAN Limited F 100.00 F 100.00
POMELLATO JAPAN Co Ltd F 61.00 Acquisition
STELLA MCCARTNEY JAPAN Limited F 50.00 F 50.00
SOWIND JAPAN KK(1) F 50.00 F 50.00
Bahrain
FLORENCE 1921 WLL F 49.00 Creation
United Arab Emirates
LUXURY GOODS GULF LLC F 49.00 F 49.00
LUXURY FASHION GULF LLC F 49.00 Creation
Kuwait
LUXURY GOODS KUWAIT Wll F 49.00 F 49.00
Qatar
LUXURY GOODS QATAR LLC F 49.00 F 49.00
Malaysia
BOTTEGA VENETA MALAYSIA Sdn Bhd F 100.00 F 100.00
GUCCI (MALAYSIA) Sdn Bhd F 100.00 F 100.00
Singapore
BOTTEGA VENETA SINGAPORE PRIVATE Limited F 100.00 F 100.00
GUCCI SINGAPORE PTE Limited F 100.00 F 100.00
Taiwan
BOUCHERON TAIWAN CO Ltd(1) F 100.00 F 100.00
GUCCI GROUP WATCHES TAIWAN Limited F 100.00 F 100.00
Turkey
POMELLATO MUCEVHERAT VE AKSESUAR DAGITIM VE TIKARET Limited SIRKETI F 81.00 Acquisition
Thailand
GUCCI THAILAND CO Ltd F 100.00 F 100.00
G-OPERATIONS FRASEC Ltd F 49.00 Acquisition
CLOSED-CYCLE BREEDING INTERNATIONAL Ltd F 48.00 Acquisition
FNAC
GROUPE FNAC Disposal F 100.00
France
FNAC SA Disposal F 100.00
ALIZE – SFL Disposal F 100.00
ATTITUDE Disposal F 100.00
CODIREP Disposal F 100.00
FRANCE BILLET Disposal F 100.00
275
5
2013 Reference Document ~ Kering
CONSOLIDATED FINANCIAL STATEMENTS AS OF DECEMBER 31, 2013 ~ FINANCIAL INFORMATION
Company % interestDec. 31, 2013 Dec. 31, 2012
Company % interestDec. 31, 2013 Dec. 31, 2012
05_D_VA_V6 14/04/14 11:32 Page275

FNAC APPRO GROUPE Disposal F 100.00
FNAC DIRECT Disposal F 100.00
FNAC GLOBAL SERVICES Disposal F 100.00
FNAC LOGISTIQUE Disposal F 100.00
FNAC PARIS Disposal F 100.00
FNAC PERIPHERIE Disposal F 100.00
FNAC SERVICE Disposal F 100.00
FNAC SPECTACLES Disposal F 100.00
FNAC TOURISME Disposal F 100.00
FORM@HOME Disposal F 100.00
KYRO CONCEPT Disposal F 100.00
LYSIANE THOMAS DIFFUSION Disposal F 100.00
MSS Disposal F 100.00
RELAIS FNAC Disposal F 100.00
Belgium
FNAC BELGIUM Disposal F 100.00
Spain
GRANDES ALMACENES FNAC ESPANA Disposal F 100.00
Monaco
FNAC MONACO Disposal F 100.00
Portugal
FNAC PORTUGAL Disposal F 100.00
Switzerland
FNAC SUISSE SA Disposal F 100.00
Brazil
FNAC BRASIL Disposal F 100.00
REDCATS
REDCATS F 100.00 F 100.00
France
CYRILLUS Disposal F 100.00
DIAM F 100.00 F 100.00
LA REDOUTE F 100.00 F 100.00
LES AUBAINES MAGASINS F 100.00 F 100.00
LES DEFIS DE VERTBAUDET Disposal F 100.00
MOVITEX F 100.00 F 100.00
REDCATS INTERNATIONAL F 100.00 F 100.00
REDCATS INTERNATIONAL HOLDING F 100.00 F 100.00
REDCATS MANAGEMENT SERVICES F 100.00 F 100.00
LA REDOUTE MAG F 100.00 F 100.00
REF BRESIL F 100.00 F 100.00
SADAS Disposal F 100.00
LES TROUVAILLES F 100.00 F 100.00
RELAIS COLIS F 100.00 F 100.00
SOMEWHERE STOCK Disposal F 100.00
THOMAS INDUSTRIES Disposal F 100.00
VBMAG Disposal F 100.00
AWS F 100.00 F 100.00
GIORNICA F 100.00 F 100.00
REDCATS BUSINESS DEVELOPMENT F 100.00 F 100.00
Germany
CYRILLUS GmbH Disposal F 100.00
VERTBAUDET VERWALTUNGS GmbH Disposal E 50.00
Austria
REDCATS BETEILIGUNG Gmbh F 100.00 F 100.00
REDOUTE VERSAND GmbH F 100.00 F 100.00
Belgium
CYRILLUS BENELUX Disposal F 100.00
REDOUTE CATALOGUE BENELUX F 100.00 F 100.00
Denmark
ELLOS AS Disposal F 100.00
Spain
REDCATS ESPANA F 100.00 F 100.00
Estonia
ELLOS EESTI OU Disposal F 100.00
Finland
ELLOS TILI OY Disposal F 100.00
REDCATS OY Disposal F 100.00
United Kingdom
CYRILLUS UK Disposal F 100.00
HOLDSWORTH COLLECTION Limited F 100.00 F 100.00
MOVITEX UK Limited F 100.00 F 100.00
REDCATS (BRANDS) Limited F 100.00 F 100.00
REDCATS FINANCE Limited F 100.00 F 100.00
REDCATS UK PLC F 100.00 F 100.00
REDOUTE UK F 100.00 F 100.00
VERTBAUDET UK Disposal F 100.00
Greece
REDOUTE HELLAS F 100.00 F 100.00
Italy
REDCATS ITALY F 100.00 F 100.00
Norway
ELLOS HOLDING AS Disposal F 100.00
REDCATS AS Disposal F 100.00
276 Kering ~ 2013 Reference Document
5 FINANCIAL INFORMATION ~ CONSOLIDATED FINANCIAL STATEMENTS AS OF DECEMBER 31, 2013
Company % interestDec. 31, 2013 Dec. 31, 2012
Company % interestDec. 31, 2013 Dec. 31, 2012
05_D_VA_V6 14/04/14 11:32 Page276

REDOUTE NORWAY AS F 100.00 F 100.00
Portugal
REDCATS PORTUGAL F 100.00 F 100.00
Russia
LA REDOUTE RUS F 100.00 F 100.00
Sweden
ELLOS AB Disposal F 100.00
JOTEX AB Disposal F 100.00
REDCATS NORDIC AB Disposal F 100.00
REDCATS FINANS AB Disposal F 100.00
REDOUTE SVERIGE AB F 100.00 F 100.00
Switzerland
CYRILLUS SUISSE Disposal F 100.00
REDCATS SUISSE F 100.00 F 100.00
Brazil
REDCATS DO BRASIL F 100.00 F 100.00
Canada
REDCATS USA CANADA HOLDING Inc. Disposal F 100.00
United States
AVENUE GIFT CARDS, Inc. Disposal F 100.00
BNY SERVICE CORPORATION Disposal F 100.00
JESSICA LONDON Inc. Disposal F 100.00
REDCATS USA DROP SHIP Disposal F 100.00
REDCATS USA GIFT CARDS Disposal F 100.00
REDCATS USA LLC Disposal F 100.00
REDCATS USA LP Disposal F 100.00
REDCATS USA MANAGEMENT SERVICES LP Disposal F 100.00
REDCATS USA, Inc. Disposal F 100.00
SPS INVESTMENT LLC Disposal F 100.00
VLP CORPORATION Disposal F 100.00
RUSA TEXAS LLC Disposal F 100.00
Hong Kong
REDCATS ASIA F 100.00 F 100.00
REDCATS MANAGEMENT CONSULTING (SHANGHAI) F 100.00 F 100.00
India
REDCATS INDIA PRIVATE Limited F 100.00 F 100.00
Japan
CYRILLUS JAPON Disposal F 100.00
Turkey
REDCATS TEKSTIL ITHALAT VE IHRACAT TICARET F 100.00 F 100.00
China
REDCATS COMMERCE ET TRADING F 100.00 F 100.00
PUMA
PUMA SE (GERMANY) F 85.81 F 82.99
France
DOBOTEX FRANCE SAS(1) F 100.00 F 100.00
PUMA FRANCE SAS F 100.00 F 100.00
PUMA SPEEDCAT SAS F 100.00 F 100.00
Germany
DOBOTEX DEUTSCHLAND GmbH(1) F 100.00 F 100.00
BRANDON GERMANY GmbH F 100.00 F 100.00
PUMA AVANTI GmbH Merger F 100.00
PUMA MOSTRO GmbH F 100.00 F 100.00
PUMA SPRINT GmbH F 100.00 F 100.00
PUMA VERTRIEB GmbH F 100.00 F 100.00
Austria
AUSTRIA PUMA DASSLER GmbH F 100.00 F 100.00
DOBOTEX ÖSTERREICH GmbH(1) F 100.00 F 100.00
Bulgaria
PUMA BULGARIA EOOD F 100.00 F 100.00
Cyprus
PUMA CYPRUS Ltd(1) F 100.00 F 100.00
Croatia
PUMA Sport HRVATSKA DOO F 100.00 F 100.00
Denmark
PUMA DENMARK A/S F 100.00 F 100.00
Spain
PUMA IBERIA SLU F 100.00 F 100.00
DOBOTEX SPAIN SL(1) F 100.00 F 100.00
Estonia
PUMA ESTONIA OU F 100.00 F 100.00
Finland
BRANDON OY F 100.00 F 100.00
PUMA FINLAND OY F 100.00 F 100.00
TRETORN FINLAND OY F 100.00 F 100.00
United Kingdom
DOBOTEX UK Ltd(1) F 100.00 F 100.00
BRANDON MERCHANDISE UK Ltd F 100.00 F 100.00
277
5
2013 Reference Document ~ Kering
CONSOLIDATED FINANCIAL STATEMENTS AS OF DECEMBER 31, 2013 ~ FINANCIAL INFORMATION
Company % interestDec. 31, 2013 Dec. 31, 2012
Company % interestDec. 31, 2013 Dec. 31, 2012
05_D_VA_V6 14/04/14 11:32 Page277
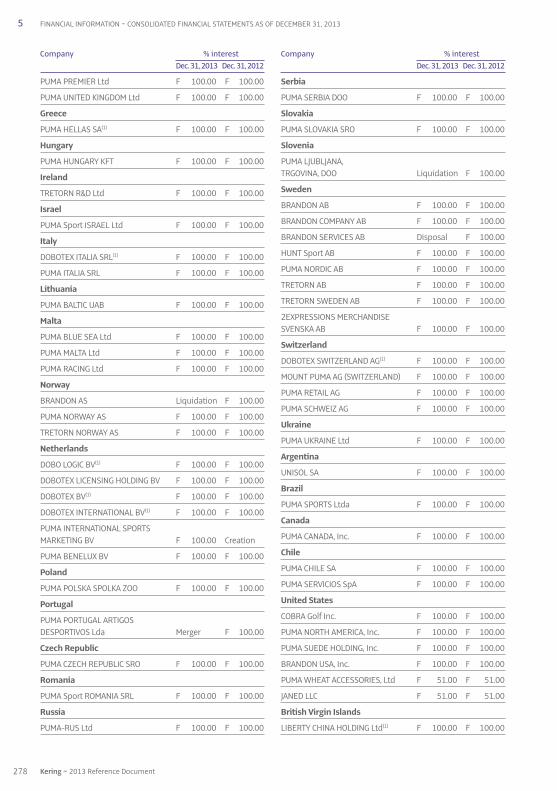
PUMA PREMIER Ltd F 100.00 F 100.00
PUMA UNITED KINGDOM Ltd F 100.00 F 100.00
Greece
PUMA HELLAS SA(1) F 100.00 F 100.00
Hungary
PUMA HUNGARY KFT F 100.00 F 100.00
Ireland
TRETORN R&D Ltd F 100.00 F 100.00
Israel
PUMA Sport ISRAEL Ltd F 100.00 F 100.00
Italy
DOBOTEX ITALIA SRL(1) F 100.00 F 100.00
PUMA ITALIA SRL F 100.00 F 100.00
Lithuania
PUMA BALTIC UAB F 100.00 F 100.00
Malta
PUMA BLUE SEA Ltd F 100.00 F 100.00
PUMA MALTA Ltd F 100.00 F 100.00
PUMA RACING Ltd F 100.00 F 100.00
Norway
BRANDON AS Liquidation F 100.00
PUMA NORWAY AS F 100.00 F 100.00
TRETORN NORWAY AS F 100.00 F 100.00
Netherlands
DOBO LOGIC BV(1) F 100.00 F 100.00
DOBOTEX LICENSING HOLDING BV F 100.00 F 100.00
DOBOTEX BV(1) F 100.00 F 100.00
DOBOTEX INTERNATIONAL BV(1) F 100.00 F 100.00
PUMA INTERNATIONAL SPORTS MARKETING BV F 100.00 Creation
PUMA BENELUX BV F 100.00 F 100.00
Poland
PUMA POLSKA SPOLKA ZOO F 100.00 F 100.00
Portugal
PUMA PORTUGAL ARTIGOS DESPORTIVOS Lda Merger F 100.00
Czech Republic
PUMA CZECH REPUBLIC SRO F 100.00 F 100.00
Romania
PUMA Sport ROMANIA SRL F 100.00 F 100.00
Russia
PUMA-RUS Ltd F 100.00 F 100.00
Serbia
PUMA SERBIA DOO F 100.00 F 100.00
Slovakia
PUMA SLOVAKIA SRO F 100.00 F 100.00
Slovenia
PUMA LJUBLJANA, TRGOVINA, DOO Liquidation F 100.00
Sweden
BRANDON AB F 100.00 F 100.00
BRANDON COMPANY AB F 100.00 F 100.00
BRANDON SERVICES AB Disposal F 100.00
HUNT Sport AB F 100.00 F 100.00
PUMA NORDIC AB F 100.00 F 100.00
TRETORN AB F 100.00 F 100.00
TRETORN SWEDEN AB F 100.00 F 100.00
2EXPRESSIONS MERCHANDISE SVENSKA AB F 100.00 F 100.00
Switzerland
DOBOTEX SWITZERLAND AG(1) F 100.00 F 100.00
MOUNT PUMA AG (SWITZERLAND) F 100.00 F 100.00
PUMA RETAIL AG F 100.00 F 100.00
PUMA SCHWEIZ AG F 100.00 F 100.00
Ukraine
PUMA UKRAINE Ltd F 100.00 F 100.00
Argentina
UNISOL SA F 100.00 F 100.00
Brazil
PUMA SPORTS Ltda F 100.00 F 100.00
Canada
PUMA CANADA, Inc. F 100.00 F 100.00
Chile
PUMA CHILE SA F 100.00 F 100.00
PUMA SERVICIOS SpA F 100.00 F 100.00
United States
COBRA Golf Inc. F 100.00 F 100.00
PUMA NORTH AMERICA, Inc. F 100.00 F 100.00
PUMA SUEDE HOLDING, Inc. F 100.00 F 100.00
BRANDON USA, Inc. F 100.00 F 100.00
PUMA WHEAT ACCESSORIES, Ltd F 51.00 F 51.00
JANED LLC F 51.00 F 51.00
British Virgin Islands
LIBERTY CHINA HOLDING Ltd(1) F 100.00 F 100.00
278 Kering ~ 2013 Reference Document
5 FINANCIAL INFORMATION ~ CONSOLIDATED FINANCIAL STATEMENTS AS OF DECEMBER 31, 2013
Company % interestDec. 31, 2013 Dec. 31, 2012
Company % interestDec. 31, 2013 Dec. 31, 2012
05_D_VA_V6 14/04/14 11:32 Page278

Mexico
DOBOTEX DE MEXICO SA DE CV F 100.00 F 100.00
IMPORTACIONES RDS SA DE CV F 100.00 F 100.00
PUMA MEXICO SPORT SA DE CV F 100.00 F 100.00
SERVICIOS PROFESIONALES RDS SA DE CV F 100.00 F 100.00
Peru
DISTRUIBUIDORA DEPORTIVA PUMA SAC F 100.00 F 100.00
DISTRUIBUIDORA DEPORTIVA PUMA TACNA SAC F 100.00 F 100.00
PUMA RETAIL PERU SAC F 100.00 F 100.00
Uruguay
PUMA SPORTS LA SA F 100.00 F 100.00
Botswana
WILDERNESS HOLDINGS Ltd E 25.10 E 25.10
South Africa
PUMA SPORTS DISTRIBUTORS (PTY) Ltd F 100.00 F 100.00
PUMA SPORTS SA F 100.00 F 100.00
Australia
KALOLA PTY Ltd F 100.00 F 100.00
PUMA AUSTRALIA PTY Ltd F 100.00 F 100.00
WHITE DIAMOND AUSTRALIA PTY Ltd F 100.00 F 100.00
WHITE DIAMOND PROPERTIES F 100.00 F 100.00
New Zealand
PUMA NEW ZEALAND Ltd F 100.00 F 100.00
United Arab Emirates
PUMA MIDDLE EAST FZ LLC F 100.00 F 100.00
PUMA UAE LLC(1) F 100.00 F 100.00
Turkey
PUMA SPOR GIYIM SANANYI VE TICARET AS F 100.00 F 100.00
China
BRANDON TRADING (SHANGHAI) Ltd F 100.00 Creation
DOBOTEX CHINA Ltd(1) F 100.00 F 100.00
PUMA CHINA Ltd F 100.00 F 100.00
GUANGZHOU WORLD CAT INFORMATION CONSULTING SERVICES CO. Ltd F 100.00 F 100.00
Hong Kong
BRANDON HONG KONG Ltd F 100.00 F 100.00
DEVELOPMENT SERVICES Ltd F 100.00 F 100.00
DOBOTEX Ltd(1) F 100.00 F 100.00
PUMA ASIA PACIFIC Ltd F 100.00 F 100.00
PUMA HONG KONG Ltd F 100.00 F 100.00
WORLD CAT Ltd F 100.00 F 100.00
India
PUMA SPORTS INDIA PVT Ltd F 100.00 F 100.00
PUMA INDIA RETAIL PVT Ltd(1) F 100.00 F 100.00
WORLD CAT SOURCING INDIA Ltd F 100.00 F 100.00
Japan
PUMA JAPAN KK F 100.00 F 100.00
Korea
PUMA KOREA Ltd F 100.00 F 100.00
DOBOTEX KOREA Ltd(1) F 100.00 F 100.00
Malaysia
PUMA SPORTS GOODS SDN BHD F 100.00 F 100.00
Singapore
PUMA SPORTS SINGAPORE PTE Ltd F 100.00 F 100.00
Taiwan
PUMA TAIWAN SPORTS Ltd(1) F 100.00 F 100.00
Vietnam
WORLD CAT VIETNAM CO. Ltd F 100.00 F 100.00
WORLD CAT VIETNAM SOURCING & DEVELOPMENT SERVICES CO. Ltd F 100.00 F 100.00
VOLCOM
VOLCOM Inc. F 100.00 F 100.00
United States
VOLCOM RETAIL Inc. F 100.00 F 100.00
VOLCOM ENTERTAINMENT Inc. F 100.00 F 100.00
LS&S RETAIL Inc. F 100.00 F 100.00
VOLCOM OUTLET Inc. F 100.00 F 100.00
ELECTRIC VISUAL EVOLUTION LLC F 100.00 F 100.00
Luxembourg
VOLCOM LUXEMBOURG HOLDING SA F 100.00 F 100.00
Switzerland
VOLCOM INTERNATIONAL SARL F 100.00 F 100.00
WELCOM DISTRIBUTION SARL F 100.00 F 100.00
Spain
VOLCOM DISTRIBUTION SPAIN SL F 100.00 F 100.00
ELECTRIC VISUAL EVOLUTION SPAIN F 100.00 F 100.00
279
5
2013 Reference Document ~ Kering
CONSOLIDATED FINANCIAL STATEMENTS AS OF DECEMBER 31, 2013 ~ FINANCIAL INFORMATION
Company % interestDec. 31, 2013 Dec. 31, 2012
Company % interestDec. 31, 2013 Dec. 31, 2012
05_D_VA_V6 14/04/14 11:32 Page279

France
VOLCOM SAS F 100.00 F 100.00
VOLCOM RETAIL FRANCE F 100.00 F 100.00
SARL ELECTRIC EUROPE F 100.00 F 100.00
United Kingdom
VOLCOM DISTRIBUTION (UK) Limited F 100.00 F 100.00
VOLCOM RETAIL (UK) Limited F 100.00 F 100.00
Australia
VOLCOM AUSTRALIA HOLDING COMPANY PTY Ltd F 100.00 F 100.00
VOLCOM AUSTRALIA PTY Ltd F 100.00 F 100.00
ELECTRIC VISUAL EVOLUTION AUSTRALIA PTY Ltd F 100.00 F 100.00
New Zealand
VOLCOM NEW ZEALAND Limited F 100.00 F 100.00
ELECTRIC VISUAL EVOLUTION NEW ZEALAND Limited Liquidation F 100.00
Japan
VOLCOM JAPAN GODOGAISHIYA F 100.00 F 100.00
China
VOLCOM HONG KONG F 100.00 Creation
HOLDING COMPANIES AND OTHER
France
CONSEIL ET ASSISTANCE F 100.00 F 100.00
DISCODIS F 100.00 F 100.00
FINANCIERE MAROTHI Merger F 100.00
KERING FINANCE F 100.00 F 100.00
SAPARDIS F 100.00 F 100.00
GG FRANCE 13 SAS F 100.00 F 100.00
GG FRANCE 14 F 100.00 Creation
SAPRODIS SERVICES SAS F 100.00 F 100.00
YSL BEAUTE CONSULTING - - F 100.00
GG France 10 - - F 100.00
United Kingdom
KERING INTERNATIONAL Limited F 100.00 Creation
KERING UK SERVICES Limited F 100.00 F 100.00
Germany
SAPARDIS DEUTSCHLAND SE F 100.00 F 100.00
Italy
KERING ITALIA SpA F 100.00 F 100.00
KERING SERVICE ITALIA SpA F 100.00 F 100.00
REXCOURTA SpA F 100.00 F 100.00
Luxembourg
ABBEY REINSURANCE F 100.00 Acquisition
E-KERING LUX SA F 100.00 F 100.00
FI HOLDING LUX SA Disposal F 100.00
PPR DISTRI LUX SA F 100.00 F 100.00
PPR INTERNATIONAL F 100.00 F 100.00
PRINTEMPS REASSURANCE F 100.00 F 100.00
KERING LUXEMBOURG SA F 100.00 F 100.00
Netherlands
KERING HOLLAND NV F 100.00 F 100.00
GUCCI INTERNATIONAL NV F 100.00 F 100.00
GUCCI PARTICIPATION BV F 100.00 F 100.00
KERING NETHERLANDS BV F 100.00 F 100.00
Switzerland
LUXURY GOODS SERVICES SA F 100.00 F 100.00
Hong Kong
KGS F 100.00 F 100.00
China
KERING ASIA PACIFIC Ltd F 100.00 F 100.00
KERING (CHINA) ENTERPRISE MANAGEMENT Ltd F 100.00 Creation
PPR HOLDING Limited F 100.00 F 100.00
Korea
KERING KOREA Limited F 100.00 Creation
Japan
KERING JAPAN Limited F 100.00 F 100.00
KERING TOKYO INVESTMENTS F 100.00 Creation
United States
KERING AMERICAS F 100.00 F 100.00
(1) Income of these consolidated companies is consolidated based on theGroup’s contractual share in their operations which may differ from theGroup’s share in capital.
280 Kering ~ 2013 Reference Document
5 FINANCIAL INFORMATION ~ CONSOLIDATED FINANCIAL STATEMENTS AS OF DECEMBER 31, 2013
Company % interestDec. 31, 2013 Dec. 31, 2012
Company % interestDec. 31, 2013 Dec. 31, 2012
05_D_VA_V6 14/04/14 11:32 Page280
5. Statutory Auditors’ report on theconsolidated financial statementsYear ended December 31, 2013
This is a free translation into English of the Statutory Auditors’ report issued in French and is provided solely for theconvenience of English speaking readers. The Statutory Auditors’ report includes information specifically required by Frenchlaw in such reports, whether modified or not. This information is presented below the opinion on the consolidated financialstatements and includes an explanatory paragraph discussing the Auditors’ assessments of certain significant accountingand auditing matters. These assessments were considered for the purpose of issuing an audit opinion on the consolidatedfinancial statements taken as a whole and not to provide separate assurance on individual account captions or oninformation taken outside of the consolidated financial statements. This report should be read in conjunction with, andconstrued in accordance with, French law and professional auditing standards applicable in France.
To the Shareholders,
In accordance with our appointment as Statutory Auditors at your Annual General Meetings, we hereby report to you forthe year ended December 31, 2013 on:
• the audit of the accompanying consolidated financial statements of Kering S.A.;
• the justification of our assessments;
• the specific verification required by law.
These consolidated financial statements have been approved by the Board of Directors. Our role is to express anopinion on these consolidated financial statements based on our audit.
1. Opinion on the consolidated financial statements
We conducted our audit in accordance with professional standards applicable in France. These standards require that weplan and perform the audit to obtain reasonable assurance about whether the consolidated financial statements arefree of material misstatement. An audit includes examining, using sample testing techniques or other selection methods,evidence supporting the amounts and disclosures in the consolidated financial statements. An audit also includesassessing the accounting principles used and significant estimates made, as well as evaluating the overall financialstatement presentation. We believe that the audit evidence we have obtained is sufficient and appropriate to provide areasonable basis for our opinion.In our opinion, the consolidated financial statements give a true and fair view of the financial position and assets andliabilities of the Group as of December 31, 2013 and of the results of its operations for the year then ended in accordancewith International Financial Reporting Standards as adopted by the European Union.
2. Justification of our assessments
Pursuant to Article L. 823-9 of the French Commercial Code (Code de commerce) governing the justification of ourassessments, we hereby report on the following:
• During the second half of the year, your Company systematically tests goodwill and assets with an indefinite usefullife for impairment, and also assesses whether there is indication of impairment of long-term assets, in accordancewith the methods described in Note 2.10 to the consolidated financial statements. We examined the methods usedto implement these impairment tests, the cash flow forecasts and assumptions used and verified that Note 18 to theconsolidated financial statements provides the appropriate disclosure.
• Your Company recognizes provisions, as described in Note 2.16 to the consolidated financial statements. Ourprocedures mainly consisted in assessing the data and assumptions underlying such estimates, verifying, on a testbasis, the Company’s calculations and examining the Management approval procedures for these estimates. We haveassessed the reasonableness of those estimates based on this work.
281
5
2013 Reference Document ~ Kering
STATUTORY AUDITORS’ SPECIAL REPORT ON THE CONSOLIDATED FINANCIAL STATEMENTS ~ FINANCIAL INFOMATION
05_D_VA_V6 14/04/14 11:32 Page281
• Note 2.17 to the consolidated financial statements sets out the methods used to measure post-employment andother long-term employee benefit obligations. These obligations were measured by independent actuaries. Ourprocedures consisted in examining the data used, assessing the underlying assumptions and verifying that Note 25 tothe consolidated financial statements provides the appropriate disclosures.
These assessments were performed as part of our audit approach for the consolidated financial statements taken as awhole and therefore contributed to the expression of our opinion in the first part of this report.
3. Specific verification
We have also performed the other procedures required by law on the information relating to the Group given in theManagement Report, in accordance with professional standards applicable in France.
We have no matters to report as to its fair presentation and its consistency with the consolidated financial statements.
Paris La Défense and Neuilly-sur-Seine, March 31, 2014The Statutory Auditors
KPMG Audit Deloitte & AssociésDépartement de KPMG SA
Hervé Chopin Antoine de Riedmatten
282 Kering ~ 2013 Reference Document
5 FINANCIAL INFORMATION ~ CONSOLIDATED FINANCIAL STATEMENTS AS OF DECEMBER 31, 2013
05_D_VA_V6 14/04/14 11:32 Page282

2832013 Reference Document ~ Kering
05_D_VA_V6 14/04/14 11:32 Page283
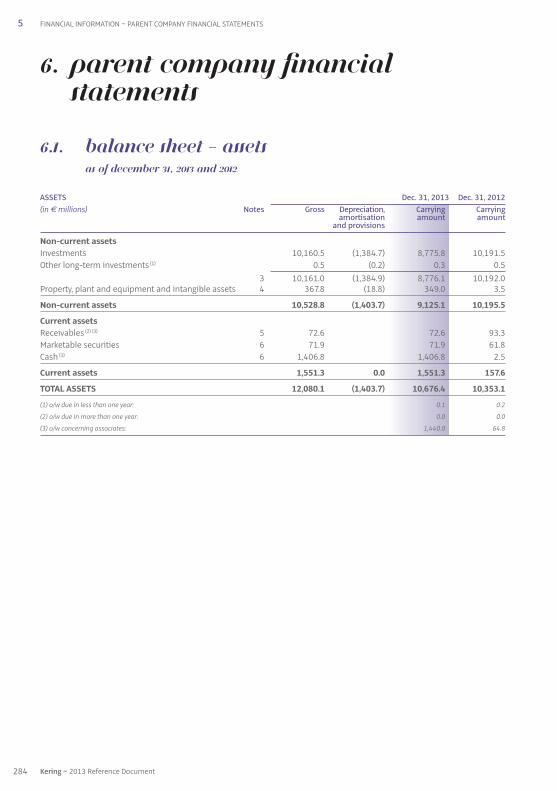
6. Parent Company financial statements
6.1. Balance sheet – assets as of December 31, 2013 and 2012
ASSETS Dec. 31, 2013 Dec. 31, 2012(in € millions) Notes Gross Depreciation, Carrying Carrying amortisation amount amount
and provisions
Non-current assets Investments 10,160.5 (1,384.7) 8,775.8 10,191.5Other long-term investments (1) 0.5 (0.2) 0.3 0.5 3 10,161.0 (1,384.9) 8,776.1 10,192.0Property, plant and equipment and intangible assets 4 367.8 (18.8) 349.0 3.5
Non-current assets 10,528.8 (1,403.7) 9,125.1 10,195.5
Current assets Receivables (2) (3) 5 72.6 72.6 93.3Marketable securities 6 71.9 71.9 61.8Cash (3) 6 1,406.8 1,406.8 2.5
Current assets 1,551.3 0.0 1,551.3 157.6
TOTAL ASSETS 12,080.1 (1,403.7) 10,676.4 10,353.1
(1) o / w due in less than one year: 0.1 0.2
(2) o / w due in more than one year: 0.0 0.0
(3) o / w concerning associates: 1,440.0 64.8
284 Kering ~ 2013 Reference Document
5 FINANCIAL INFORMATION ~ PARENT COMPANY FINANCIAL STATEMENTS
05_E_VA_V6 14/04/14 11:28 Page284

6.2. Balance sheet – shareholders’ equity and liabilities as of December 31, 2013 and 2012
SHAREHOLDERS’ EQUITY AND LIABILITIES Notes Dec. 31, 2013 Dec. 31, 2012(in € millions)
Shareholders’ equity Share capital 504.9 504.5Additional paid-in capital 2,048.3 2,040.1Reserves 7 1,587.9 1,588.7Retained earnings 1,426.3 1,706.1Net income for the year 832.9 505.6
Shareholders’ equity 6,400.3 6,345.0
Provisions 8 463.0 50.8Liabilities
Bonds (1) 9.1 3,300.1 3,100.1Other borrowings (1) (3) 9.1 241.7 594.5Other liabilities (2) (3) 10 271.3 262.7
3,813.1 3,957.3
TOTAL SHAREHOLDERS’ EQUITY AND LIABILITIES 10,676.4 10,353.1
(1) o / w due in more than one year: 2,600.0 2,452.6
(2) o / w due in more than one year: 0.0 0.0
(3) o / w concerning associates: 30.4 354.6
285
5
2013 Reference Document ~ Kering
PARENT COMPANY FINANCIAL STATEMENTS ~ FINANCIAL INFORMATION
05_E_VA_V6 14/04/14 11:28 Page285

6.3. Income statement
For the years ended December 31, 2013 and 2012
(in € millions) Notes 2013 2012
Operating income 117.5 100.8Operating expenses (133.7) (117.3)
Net operating loss 12 (16.2) (16.5)
Dividends 2,188.2 876.1Other financial income and expenses (96.7) (129.4)
Net financial income 13 2,091.5 746.7
Recurring income before tax 2,075.3 730.2
Net non-recurring expense 14 (1,259.2) (364.7)Employee profit-sharing (3.3) (2.0)Income tax 15 20.1 142.1
Net income for the year 832.9 505.6
6.4. Statement of cash flows
For the years ended December 31, 2013 and 2012
(in € millions) 2013 2012
Dividends received 2,188.2 876.1Interest on borrowings (145.5) (174.8)Income tax received 42.2 111.6Other (28.9) (11.4)
Change in cash resulting from operating activities 2,056.0 801.5
(Acquisitions) / disposals of operating assets (3.9) (1.8)Change in long-term investments (87.5) (574.9)
Change in cash resulting from investing activities (91.4) (576.7)
Net change in borrowings (155.0) 206.5Share capital increases 8.6 12.1Dividends paid by Kering (471.2) (440.6)
Change in cash resulting from financing activities (617.6) (222.0)
Changes in Group structure following the merger of Financière Marothi 67.4 -
Change in cash and cash equivalents 1,414.4 2.8
Cash and cash equivalents at beginning of year 64.3 61.5
Cash and cash equivalents at end of year 1,478.7 64.3
286 Kering ~ 2013 Reference Document
5 FINANCIAL INFORMATION ~ PARENT COMPANY FINANCIAL STATEMENTS
05_E_VA_V6 14/04/14 11:28 Page286
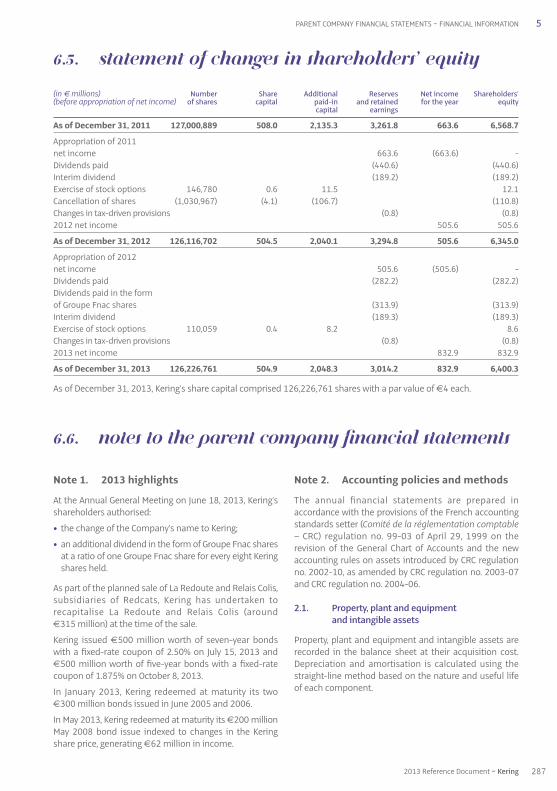
Note 1. 2013 highlights
At the Annual General Meeting on June 18, 2013, Kering’sshareholders authorised:
• the change of the Company’s name to Kering;
• an additional dividend in the form of Groupe Fnac sharesat a ratio of one Groupe Fnac share for every eight Keringshares held.
As part of the planned sale of La Redoute and Relais Colis,subsidiaries of Redcats, Kering has undertaken torecapitalise La Redoute and Relais Colis (around€315 million) at the time of the sale.
Kering issued €500 million worth of seven-year bondswith a fixed-rate coupon of 2.50% on July 15, 2013 and€500 million worth of five-year bonds with a fixed-ratecoupon of 1.875% on October 8, 2013.
In January 2013, Kering redeemed at maturity its two€300 million bonds issued in June 2005 and 2006.
In May 2013, Kering redeemed at maturity its €200 millionMay 2008 bond issue indexed to changes in the Keringshare price, generating €62 million in income.
Note 2. Accounting policies and methods
The annual financial statements are prepared inaccordance with the provisions of the French accountingstandards setter (Comité de la réglementation comptable– CRC) regulation no. 99-03 of April 29, 1999 on therevision of the General Chart of Accounts and the newaccounting rules on assets introduced by CRC regulationno. 2002-10, as amended by CRC regulation no. 2003-07and CRC regulation no. 2004-06.
2.1. Property, plant and equipment and intangible assets
Property, plant and equipment and intangible assets arerecorded in the balance sheet at their acquisition cost.Depreciation and amortisation is calculated using thestraight-line method based on the nature and useful lifeof each component.
6.5. Statement of changes in shareholders’ equity
(in € millions) Number Share Additional Reserves Net income Shareholders’(before appropriation of net income) of shares capital paid-in and retained for the year equity
capital earnings
As of December 31, 2011 127,000,889 508.0 2,135.3 3,261.8 663.6 6,568.7
Appropriation of 2011 net income 663.6 (663.6) -Dividends paid (440.6) (440.6)Interim dividend (189.2) (189.2)Exercise of stock options 146,780 0.6 11.5 12.1Cancellation of shares (1,030,967) (4.1) (106.7) (110.8)Changes in tax-driven provisions (0.8) (0.8)2012 net income 505.6 505.6
As of December 31, 2012 126,116,702 504.5 2,040.1 3,294.8 505.6 6,345.0
Appropriation of 2012 net income 505.6 (505.6) -Dividends paid (282.2) (282.2)Dividends paid in the form of Groupe Fnac shares (313.9) (313.9)Interim dividend (189.3) (189.3)Exercise of stock options 110,059 0.4 8.2 8.6Changes in tax-driven provisions (0.8) (0.8)2013 net income 832.9 832.9
As of December 31, 2013 126,226,761 504.9 2,048.3 3,014.2 832.9 6,400.3
As of December 31, 2013, Kering’s share capital comprised 126,226,761 shares with a par value of €4 each.
6.6. Notes to the parent company financial statements
287
5
2013 Reference Document ~ Kering
PARENT COMPANY FINANCIAL STATEMENTS ~ FINANCIAL INFORMATION
05_E_VA_V6 14/04/14 11:28 Page287
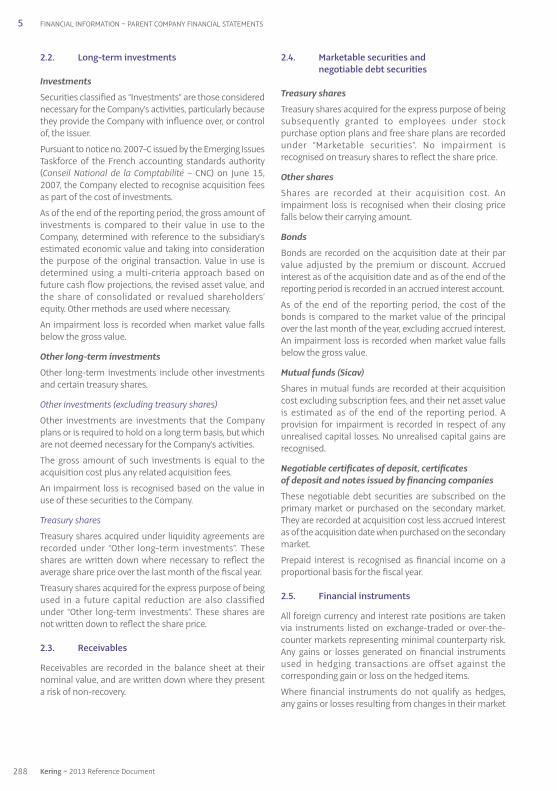
2.2. Long-term investments
Investments
Securities classified as “Investments” are those considerednecessary for the Company’s activities, particularly becausethey provide the Company with influence over, or controlof, the issuer.
Pursuant to notice no. 2007-C issued by the Emerging IssuesTaskforce of the French accounting standards authority(Conseil National de la Comptabilité – CNC) on June 15,2007, the Company elected to recognise acquisition feesas part of the cost of investments.
As of the end of the reporting period, the gross amount ofinvestments is compared to their value in use to theCompany, determined with reference to the subsidiary’sestimated economic value and taking into considerationthe purpose of the original transaction. Value in use isdetermined using a multi-criteria approach based onfuture cash flow projections, the revised asset value, andthe share of consolidated or revalued shareholders’equity. Other methods are used where necessary.
An impairment loss is recorded when market value fallsbelow the gross value.
Other long-term investments
Other long-term investments include other investmentsand certain treasury shares.
Other investments (excluding treasury shares)
Other investments are investments that the Companyplans or is required to hold on a long term basis, but whichare not deemed necessary for the Company’s activities.
The gross amount of such investments is equal to theacquisition cost plus any related acquisition fees.
An impairment loss is recognised based on the value inuse of these securities to the Company.
Treasury shares
Treasury shares acquired under liquidity agreements arerecorded under “Other long-term investments”. Theseshares are written down where necessary to reflect theaverage share price over the last month of the fiscal year.
Treasury shares acquired for the express purpose of beingused in a future capital reduction are also classifiedunder “Other long-term investments”. These shares arenot written down to reflect the share price.
2.3. Receivables
Receivables are recorded in the balance sheet at theirnominal value, and are written down where they presenta risk of non-recovery.
2.4. Marketable securities and negotiable debt securities
Treasury shares
Treasury shares acquired for the express purpose of beingsubsequently granted to employees under stockpurchase option plans and free share plans are recordedunder “Marketable securities”. No impairment isrecognised on treasury shares to reflect the share price.
Other shares
Shares are recorded at their acquisition cost. Animpairment loss is recognised when their closing pricefalls below their carrying amount.
Bonds
Bonds are recorded on the acquisition date at their parvalue adjusted by the premium or discount. Accruedinterest as of the acquisition date and as of the end of thereporting period is recorded in an accrued interest account.
As of the end of the reporting period, the cost of thebonds is compared to the market value of the principalover the last month of the year, excluding accrued interest.An impairment loss is recorded when market value fallsbelow the gross value.
Mutual funds (Sicav)
Shares in mutual funds are recorded at their acquisitioncost excluding subscription fees, and their net asset valueis estimated as of the end of the reporting period. Aprovision for impairment is recorded in respect of anyunrealised capital losses. No unrealised capital gains arerecognised.
Negotiable certificates of deposit, certificates of deposit and notes issued by financing companies
These negotiable debt securities are subscribed on theprimary market or purchased on the secondary market.They are recorded at acquisition cost less accrued interestas of the acquisition date when purchased on the secondarymarket.
Prepaid interest is recognised as financial income on aproportional basis for the fiscal year.
2.5. Financial instruments
All foreign currency and interest rate positions are takenvia instruments listed on exchange-traded or over-the-counter markets representing minimal counterparty risk.Any gains or losses generated on financial instrumentsused in hedging transactions are offset against thecorresponding gain or loss on the hedged items.
Where financial instruments do not qualify as hedges,any gains or losses resulting from changes in their market
288 Kering ~ 2013 Reference Document
5 FINANCIAL INFORMATION ~ PARENT COMPANY FINANCIAL STATEMENTS
05_E_VA_V6 14/04/14 11:28 Page288
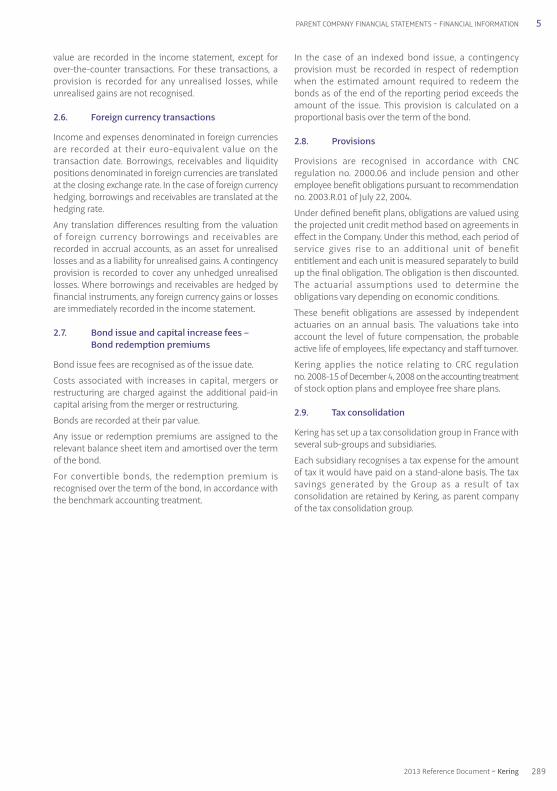
value are recorded in the income statement, except forover-the-counter transactions. For these transactions, aprovision is recorded for any unrealised losses, whileunrealised gains are not recognised.
2.6. Foreign currency transactions
Income and expenses denominated in foreign currenciesare recorded at their euro-equivalent value on thetransaction date. Borrowings, receivables and liquiditypositions denominated in foreign currencies are translatedat the closing exchange rate. In the case of foreign currencyhedging, borrowings and receivables are translated at thehedging rate.
Any translation differences resulting from the valuationof foreign currency borrowings and receivables arerecorded in accrual accounts, as an asset for unrealisedlosses and as a liability for unrealised gains. A contingencyprovision is recorded to cover any unhedged unrealisedlosses. Where borrowings and receivables are hedged byfinancial instruments, any foreign currency gains or lossesare immediately recorded in the income statement.
2.7. Bond issue and capital increase fees – Bond redemption premiums
Bond issue fees are recognised as of the issue date.
Costs associated with increases in capital, mergers orrestructuring are charged against the additional paid-incapital arising from the merger or restructuring.
Bonds are recorded at their par value.
Any issue or redemption premiums are assigned to therelevant balance sheet item and amortised over the termof the bond.
For convertible bonds, the redemption premium isrecognised over the term of the bond, in accordance withthe benchmark accounting treatment.
In the case of an indexed bond issue, a contingencyprovision must be recorded in respect of redemptionwhen the estimated amount required to redeem thebonds as of the end of the reporting period exceeds theamount of the issue. This provision is calculated on aproportional basis over the term of the bond.
2.8. Provisions
Provisions are recognised in accordance with CNC regulation no. 2000.06 and include pension and otheremployee benefit obligations pursuant to recommendationno. 2003.R.01 of July 22, 2004.
Under defined benefit plans, obligations are valued usingthe projected unit credit method based on agreements ineffect in the Company. Under this method, each period ofservice gives rise to an additional unit of benefitentitlement and each unit is measured separately to buildup the final obligation. The obligation is then discounted.The actuarial assumptions used to determine theobligations vary depending on economic conditions.
These benefit obligations are assessed by independentactuaries on an annual basis. The valuations take intoaccount the level of future compensation, the probableactive life of employees, life expectancy and staff turnover.
Kering applies the notice relating to CRC regulation no. 2008-15 of December 4, 2008 on the accounting treatmentof stock option plans and employee free share plans.
2.9. Tax consolidation
Kering has set up a tax consolidation group in France withseveral sub-groups and subsidiaries.
Each subsidiary recognises a tax expense for the amountof tax it would have paid on a stand-alone basis. The taxsavings generated by the Group as a result of taxconsolidation are retained by Kering, as parent companyof the tax consolidation group.
289
5
2013 Reference Document ~ Kering
PARENT COMPANY FINANCIAL STATEMENTS ~ FINANCIAL INFORMATION
05_E_VA_V6 14/04/14 11:28 Page289

Treasury share transactions
In 2013, the Group made a net acquisition of 35,508treasury shares, resulting from the following transactions:
• the acquisition of 1,585,556 shares under the liquidityagreement;
• the disposal of 1,585,556 shares under the liquidityagreement;
• the acquisition of 106,000 shares in connection withfree share plans;
• the allotment to employees of 40,005 shares under the2009 free share plans which mature in May 2013,62,486 shares under the 2011 free share plan whichmatures in May 2013, and 450 shares under the 2008and 2009 free share plans;
• the acquisition of 130,000 shares to be allotted toemployees under stock purchase option plans;
• the disposal of 44,867 shares to employees under theMay 2006 stock purchase option plan, 55,670 sharesunder the May 2007 stock purchase option plan, and2,500 shares under the September 2007 stock purchaseoption plan;
• the acquisition of 720,000 shares to be tendered aspart of an external growth transaction;
• the tender of 714,514 shares as part of an externalgrowth transaction and the allocation of the remaining5,486 shares acquired to be allotted under stockpurchase option plans.
As a result of the various stock subscription optionsexercised in 2013, the share capital increased by 110,059shares.
As of December 31, 2013, the Group held no call optionson its own shares to cover stock purchase and stocksubscription option plans.
On May 26, 2004, Kering signed an agreement with afinancial broker in order to improve the liquidity of theGroup’s shares and ensure share price stability. Thisagreement complies with the Professional Code ofConduct drawn up by the French association of financialand investment firms (Association française des marchésfinanciers – AMAFI) and approved by the French financialmarkets authority (Autorité des marchés financiers – AMF).
The agreement was initially endowed with €40 million,half of which was provided in cash and half in Keringshares. An additional €20 million in cash was allocatedto the agreement on September 3, 2004, and a further€30 million on December 18, 2007.
Note 3. Net long-term investments
(in € millions) As of Increase Decrease As of Dec. 31, 2012 Dec. 31, 2013
Gross value Investments 11,166.7 4,331.4 (5,337.6) 10,160.5
Kering Netherlands BV (Financière Marothi merger) 4,237.2 4,237.2Kering Holland NV 2,566.9 2,566.9Redcats 1,171.6 1,171.6Groupe Fnac (formerly Caumartin Participations) 622.0 66.5 (688.5) Financière Marothi 4,648.1 0.7 (4,648.8) Sapardis 1,804.0 1,804.0Discodis 299.7 299.7Other 54.4 27.0 (0.3) 81.1
Other long-term investments 0.5 264.2 (264.2) 0.5Treasury shares (liquidity agreement) (1) 264.1 (264.1) Loans 0.3 (0.1) 0.2Deposits and guarantees 0.2 0.1 0.3
Gross value 11,167.2 4,595.6 (5,601.8) 10,161.0
Impairment losses Investments (975.2) (592.7) 183.2 (1,384.7)
Redcats (780.5) (391.1) (1,171.6)Groupe Fnac (formerly Caumartin Participations) (182.0) 182.0 Sapardis (200.0) (200.0)Other (12.7) (1.6) 1.2 (13.1)
Other long-term investments (0.2) (0.2)
Impairment losses (975.2) (592.9) 183.2 (1,384.9)
CARRYING AMOUNT 10,192.0 8,776.1
(1) The amount corresponding to treasury shares is unavailable and recognised in tax-driven reserves.
290 Kering ~ 2013 Reference Document
5 FINANCIAL INFORMATION ~ PARENT COMPANY FINANCIAL STATEMENTS
05_E_VA_V6 14/04/14 11:28 Page290

Note 4. Property, plant and equipment and intangible assets
Movements in property, plant and equipment and intangible assets are presented below:
(in € millions) Land and Plant and Other Total buildings equipment
Gross value
December 31, 2012 2.9 0.4 16.7 20.0
Acquisitions 3.9 3.9Financière Marothi merger deficit 344.1 344.1Disposals (0.2) (0.2)
December 31, 2013 2.9 0.4 364.5 367.8
Depreciation, amortisation and provisions
December 31, 2012 (2.4) (0.3) (13.8) (16.5)
Additions (0.3) (0.1) (2.1) (2.5)Reversals on disposals 0.2 0.2
December 31, 2013 (2.7) (0.4) (15.7) (18.8)
Carrying amount
December 31, 2012 0.5 0.1 2.9 3.5
December 31, 2013 0.2 0.0 348.8 349.0
Other non-current assets mainly include the Financière Marothi merger deficit, improvements, head office equipmentand furniture, and other intangible assets (software).
Note 5. Receivables
These line items break down as follows: (in € millions) Dec. 31, 2013 Dec. 31, 2012
Tax consolidation current accounts 15.9 50.7Interest rate swap and forex suspense account 6.2 6.1Kadéos account 9.4 9.4Income tax benefit 12.0 8.4Group customers 17.5 14.1Bond issue premiums 3.1 (0.5)Other 6.4 4.0Prepaid expenses 2.1 1.1
TOTAL 72.6 93.3
o / w concerning associates 33.8 64.8
As of December 31, 2013, Kering held no treasury sharesin connection with the liquidity agreement.
Outside the scope of the liquidity agreement, Keringholds 4,275 treasury shares to be granted to employeesunder the 2012 free share plans which mature in 2014,
and 56,306 treasury shares in connection with stockpurchase option plans.
As of December 31, 2012, 25,073 treasury shares wereheld by the Company outside the scope of saidagreement.
291
5
2013 Reference Document ~ Kering
PARENT COMPANY FINANCIAL STATEMENTS ~ FINANCIAL INFORMATION
05_E_VA_V6 14/04/14 11:28 Page291

Contingency provisions for subsidiaries mainly correspondto Kering’s €315 million recapitalisation commitment inrelation to La Redoute and Relais Colis as well as theirlosses for 2013.
The main actuarial assumptions used to determinepensions and other employee benefit obligations are:
• discount rate of 3.25% versus 3.50% in 2012;
• salary increase rate of 3.00% as in 2012.
Note 6. Marketable securities and cash
These line items break down as follows:
(in € millions) Dec. 31, 2013 Dec. 31, 2012
Treasury shares pending employee grants 0.8 0.1Treasury shares pending allocation to stock purchase option plans 9.6 3.2Listed securities 61.5 61.6Impairment of listed securities - (3.1)
Marketable securities 71.9 61.8
Bank deposits and fund transfers 0.6 2.5Cash current accounts 1,405.9 -Interest on cash current accounts 0.3 -
Cash 1,406.8 2.5
CASH AND CASH EQUIVALENTS 1,478.7 64.3
o / w concerning associates 1,406.2 -
Listed securities mainly comprise mutual funds (Sicav) for €55.7 million (€55.8 million as of December 31, 2012).
Note 7. Reserves
The Company’s reserves before the appropriation of net income break down as follows:
(in € millions) Dec. 31, 2013 Dec. 31, 2012
Legal reserve 51.4 51.4Tax-driven reserves 1,293.6 1,293.6Other reserves 240.3 240.3
Reserves 1,585.3 1,585.3
Tax-driven provisions 2.6 3.4
TOTAL 1,587.9 1,588.7
Note 8. Provisions
(in € millions) Dec. 31, 2012 Additions Reversals Reversals Reclassification Dec. 31, 2013 (utilised (surplus provisions) provisions)
Disputes 28.4 0.6 8.2 0.5 21.3Risks relating to subsidiaries 420.0 420.0Pensions and other employee benefit obligations 6.3 0.3 0.1 6.5Other contingencies 16.1 0.2 0.6 (0.5) 15.2
TOTAL 50.8 421.1 8.2 0.7 463.0
o / w: operating items 0.1 financing items 0.4 non-recurring items 420.6 8.2 0.7
292 Kering ~ 2013 Reference Document
5 FINANCIAL INFORMATION ~ PARENT COMPANY FINANCIAL STATEMENTS
05_E_VA_V6 14/04/14 11:28 Page292

The bonds issued between 2009 and 2013 within thescope of the EMTN programme are all subject to change-of-control clauses entitling bondholders to request earlyredemption at par if Kering’s rating is downgraded tonon-investment grade following a change of control.
In addition, the bonds issued in 2009 and 2010 – includingthe bonds added in January 2012 to those issued inApril 2010 – include a “step-up coupon” clause thatapplies in the event that Kering’s rating is downgraded tonon-investment grade.
Note 9. Borrowings
Bond issues
(in € millions) Interest rate Issue date Hedge Maturity Dec. 31, 2013 Dec. 31, 2012
Bond issue (1) 4.00% fixed 06 / 29 / 2005 & - 01 / 29 / 2013 600.0 06 / 19 / 2006
Bond issue (2) 6.536% fixed 05 / 16 / 2008 - 05 / 16 / 2013 200.0
Bond issue (3) 8.625% fixed 04 / 03 / 2009 - 04 / 03 / 2014 550.1 550.1
Bond issue (4) 7.75% fixed 06 / 03 / 2009 6-month Euribor 06 / 03 / 2014 150.0 150.0 floating rate swap for €150 million
Bond issue (5) 6.50% fixed 06 / 29 / 2009 - 06 / 29 / 2017 150.0 150.0
Bond issue (6) 6.50% fixed 11 / 06 / 2009 - 11 / 06 / 2017 200.0 200.0
Bond issue (7) 3.75% fixed 04 / 08 / 2010 & - 04 / 08 / 2015 750.0 750.0 01 / 26 / 2012
Bond issue (8) 3.125% fixed 04 / 23 / 2012 - 04 / 23 / 2019 500.0 500.0
Bond issue (9) 2.50% fixed 07 / 15 / 2013 - 07 / 15 / 2020 500.0
Bond issue (10) 1.875% fixed 10 / 08 / 2013 - 10 / 08 / 2018 500.0
(1) Issue price: bond issue, comprising 600,000 bonds with a par value of €1,000 each under the EMTN programme, with 300,000 bonds issued on June 29, 2005and 300,000 additional bonds issued on June 19, 2006, thereby raising the issue to 600,000 bonds.Redemption: in full on January 29, 2013.
(2) Issue price: bond issue indexed to Kering shares, issued on May 16, 2008 under the EMTN programme, comprising 2,362,907 bonds with a par value of €84.64 each.Redemption: the redemption price, indexed to changes in the Kering share price, was €138.2 million maturing on May 16, 2013.
(3) Issue price: bond issue, comprising 550,100 bonds with a par value of €1,000 each under the EMTN programme, with 600,000 bonds issued on April 3, 2009and 200,000 additional bonds issued on May 13, 2009, thereby raising the issue to 800,000 bonds. A total of 249,900 of these bonds were redeemed onApril 26, 2011.Redemption: in full on April 3, 2014.
(4) Issue price: bond issue on June 3, 2009, comprising 150,000 bonds with a par value of €1,000 each under the EMTN programme.Redemption: in full on June 3, 2014.
(5) Issue price: bond issue on June 29, 2009, comprising 3,000 bonds with a par value of €50,000 each under the EMTN programme.Redemption: in full on June 29, 2017.
(6) Issue price: bond issue on November 6, 2009, comprising 4,000 bonds with a par value of €50,000 each under the EMTN programme.Redemption: in full on November 6, 2017.
(7) Issue price: bond issue on April 8, 2010, comprising 500,000 bonds with a par value of €1,000 each under the EMTN programme, and 250,000 additional bondsissued on January 26, 2012, thereby raising the issue to 750,000 bonds.Redemption: in full on April 8, 2015.
(8) Issue price: bond issue on April 23, 2012, comprising 500,000 bonds with a par value of €1,000 each under the EMTN programme.Redemption: in full on April 23, 2019.
(9) Issue price: bond issue on July 15, 2013, comprising 5,000 bonds with a par value of €100,000 each under the EMTN programme.Redemption: in full on July 15, 2020.
(10) Issue price: bond issue on October 8, 2013, comprising 5,000 bonds with a par value of €100,000 each under the EMTN programme.Redemption: in full on October 8, 2018.
293
5
2013 Reference Document ~ Kering
PARENT COMPANY FINANCIAL STATEMENTS ~ FINANCIAL INFORMATION
05_E_VA_V6 14/04/14 11:28 Page293

9.1. Breakdown by type
(in € millions) Dec. 31, 2013 Dec. 31, 2012
Bonds 3,300.1 3,100.1Interest on bond issues 88.7 111.1Long- and medium-term borrowings 152.5 152.5Interest on long- and medium-term borrowings 0.1 0.1Outstanding bank overdrafts 0.1 -Cash current accounts 0.3 330.7Interest on cash current accounts - 0.1Other borrowings 241.7 594.5
TOTAL 3,541.8 3,694.6
o / w concerning associates 0.3 330.8
As of December 31, 2013 and 2012, no borrowings were secured by collateral.
9.2. Breakdown by maturity
(in € millions) Dec. 31, 2013 Dec. 31, 2012
Less than one year 941.8 1,242.0One to five years 1,600.0 1,952.6More than five years 1,000.0 500.0
TOTAL 3,541.8 3,694.6
9.3. Net debt
(in € millions) Dec. 31, 2013 Dec. 31, 2012
Borrowings 3,541.8 3,694.6Marketable securities (71.9) (61.8)Cash (1,406.8) (2.5)
TOTAL 2,063.1 3,630.3
9.4. Information on interest rates
Dec. 31, 2013 Dec. 31, 2012
Average interest rate over the year 4.06% 4.81%% average debt at fixed rates 71.00% 80.00%% average debt at floating rates 29.00% 20.00%
Note 10. Other liabilities
These line items break down as follows:
(in € millions) Dec. 31, 2013 Dec. 31, 2012
Tax consolidation current accounts 8.2 16.5Dividends to be paid 189.3 189.2Tax and employee-related liabilities 23.5 20.9Other 50.3 36.1
TOTAL 271.3 262.7
o / w concerning associates 30.1 23.8
294 Kering ~ 2013 Reference Document
5 FINANCIAL INFORMATION ~ PARENT COMPANY FINANCIAL STATEMENTS
05_E_VA_V6 14/04/14 11:28 Page294

11.2. Stock option plans and free share plans
The nature and main characteristics of the plans are indicated in the tables below:
Stock option and free share plans 2003 / 1 Plan 2004 / 1 Plan 2005 / 1 Plan 2005 / 2 Plan 2005 / 3 Plan
Subscription Subscription Subscription Subscription Subscription options options options options options
Grant date 07 / 09 / 2003 05 / 25 / 2004 01 /03 / 2005 05 / 19/ 2005 05/ 19 / 2005Expiry date 07 / 08 / 2013 05 / 24 / 2014 01 /02 / 2015 05/ 18 / 2015 05 / 18 / 2015Vesting of rights (a) (a) (a) (b) (b)Number of beneficiaries 721 846 13 458 22
Number initially granted 528,690 540,970 25,530 333,750 39,960
Number outstanding as of Jan. 1, 2013 21,890 67,820 750 94,260 1,520
Number forfeited in 2013 2,820 336 Number exercised in 2013 19,260 30,735 59,344 720Number of shares issued (AGM) Number expired in 2013 2,630
Number outstanding as of Dec. 31, 2013 34,265 750 34,580 800Number exercisable as of Dec. 31, 2013 34,265 750 34,580 800
Strike price (in €) 66.00 85.57 75.29 78.01 78.97
As part of the Group’s policy of hedging interest rate risk,Kering sets up interest rate swaps in connection withcertain fixed-rate bond issues.
As of December 31, 2013, these transactions concernedthe bond issue maturing in June 2014, which was swappedin full against 6-month Euribor for €150 million.
Kering has also entered into floating-for-floating rateswaps on a nominal amount of €152.5 million maturingin June 2014.
Note 11. Off-balance sheet commitments
11.1. Interest rate hedges
(in € millions) Dec. 31, 2013 Y+1 Y+2 Y+3 Y+4 Y+5 >Y+5 Dec. 31, 2012
Swaps: fixed-rate lender 150.0 150.0 150.0Other interest rate instruments (1) 152.5 152.5 152.5
(1) Including floating-for-floating rate swaps.
295
5
2013 Reference Document ~ Kering
PARENT COMPANY FINANCIAL STATEMENTS ~ FINANCIAL INFORMATION
05_E_VA_V6 14/04/14 11:28 Page295
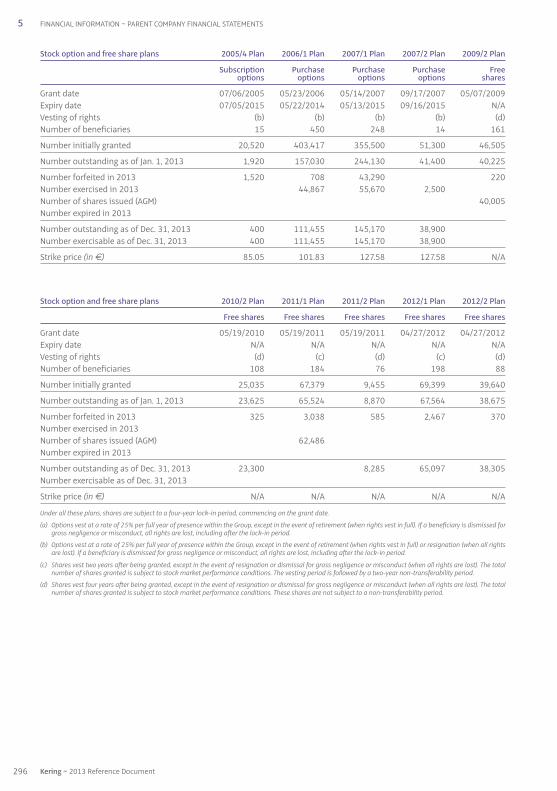
Stock option and free share plans 2005 / 4 Plan 2006 / 1 Plan 2007 / 1 Plan 2007 / 2 Plan 2009 / 2 Plan
Subscription Purchase Purchase Purchase Free options options options options shares
Grant date 07 /06 / 2005 05 / 23/ 2006 05 /14 / 2007 09/ 17 / 2007 05/ 07/ 2009Expiry date 07 / 05 / 2015 05 / 22/ 2014 05 / 13 / 2015 09 / 16/ 2015 N / AVesting of rights (b) (b) (b) (b) (d)Number of beneficiaries 15 450 248 14 161
Number initially granted 20,520 403,417 355,500 51,300 46,505
Number outstanding as of Jan. 1, 2013 1,920 157,030 244,130 41,400 40,225
Number forfeited in 2013 1,520 708 43,290 220Number exercised in 2013 44,867 55,670 2,500 Number of shares issued (AGM) 40,005Number expired in 2013
Number outstanding as of Dec. 31, 2013 400 111,455 145,170 38,900 Number exercisable as of Dec. 31, 2013 400 111,455 145,170 38,900
Strike price (in €) 85.05 101.83 127.58 127.58 N / A
Stock option and free share plans 2010 / 2 Plan 2011 / 1 Plan 2011 / 2 Plan 2012 / 1 Plan 2012 / 2 Plan
Free shares Free shares Free shares Free shares Free shares
Grant date 05 /19 / 2010 05 /19 / 2011 05 / 19 / 2011 04 / 27 / 2012 04 / 27 / 2012Expiry date N / A N / A N / A N / A N / AVesting of rights (d) (c) (d) (c) (d)Number of beneficiaries 108 184 76 198 88
Number initially granted 25,035 67,379 9,455 69,399 39,640
Number outstanding as of Jan. 1, 2013 23,625 65,524 8,870 67,564 38,675
Number forfeited in 2013 325 3,038 585 2,467 370Number exercised in 2013 Number of shares issued (AGM) 62,486 Number expired in 2013
Number outstanding as of Dec. 31, 2013 23,300 8,285 65,097 38,305Number exercisable as of Dec. 31, 2013
Strike price (in €) N / A N / A N / A N / A N / A
Under all these plans, shares are subject to a four-year lock-in period, commencing on the grant date.
(a) Options vest at a rate of 25% per full year of presence within the Group, except in the event of retirement (when rights vest in full). If a beneficiary is dismissed forgross negligence or misconduct, all rights are lost, including after the lock-in period.
(b) Options vest at a rate of 25% per full year of presence within the Group, except in the event of retirement (when rights vest in full) or resignation (when all rightsare lost). If a beneficiary is dismissed for gross negligence or misconduct, all rights are lost, including after the lock-in period.
(c) Shares vest two years after being granted, except in the event of resignation or dismissal for gross negligence or misconduct (when all rights are lost). The totalnumber of shares granted is subject to stock market performance conditions. The vesting period is followed by a two-year non-transferability period.
(d) Shares vest four years after being granted, except in the event of resignation or dismissal for gross negligence or misconduct (when all rights are lost). The totalnumber of shares granted is subject to stock market performance conditions. These shares are not subject to a non-transferability period.
296 Kering ~ 2013 Reference Document
5 FINANCIAL INFORMATION ~ PARENT COMPANY FINANCIAL STATEMENTS
05_E_VA_V6 14/04/14 11:28 Page296

11.3. Other off-balance sheet commitments
(in € millions) Dec. 31, 2013 Dec. 31, 2012
Endorsements and guarantees in favour of: associates - -third parties outside the Group 3.7 0.9
Endorsements and guarantees 3.7 0.9
Collateral: in favour of subsidiaries - -in favour of third parties - -
Note 12. Net operating loss
Net operating loss breaks down as follows:
(in € millions) 2013 2012
Group management fees 88.8 73.6Property rental income 0.1 0.2Payroll expenses (31.8) (28.6)External purchases and expenses, taxes (80.4) (67.7)Depreciation, amortisation and provisions (2.6) (2.5)Other income and expenses 9.7 8.5
TOTAL (16.2) (16.5)
Note 13. Net financial income
Net financial income breaks down as follows:
(in € millions) 2013 2012
Net interest expense (96.7) (129.4)Expenses and interest on non-Group debt (149.4) (186.5)Indexed bond redemption benefit 61.8 63.0Interest on Group current accounts (9.1) (5.9)
Dividends 2,188.2 876.1Kering Netherlands BV 1,850.0 -Kering Holland NV 301.8 268.3Discodis - 21.4Discodis (interim dividend) - 550.3Groupe Fnac - 20.5Kering Finance 36.4 15.6
TOTAL 2,091.5 746.7
o / w concerning associates: Interest on inter-company current accounts (9.1) (5.9)Dividends 2,188.2 876.1
297
5
2013 Reference Document ~ Kering
PARENT COMPANY FINANCIAL STATEMENTS ~ FINANCIAL INFORMATION
05_E_VA_V6 14/04/14 11:28 Page297
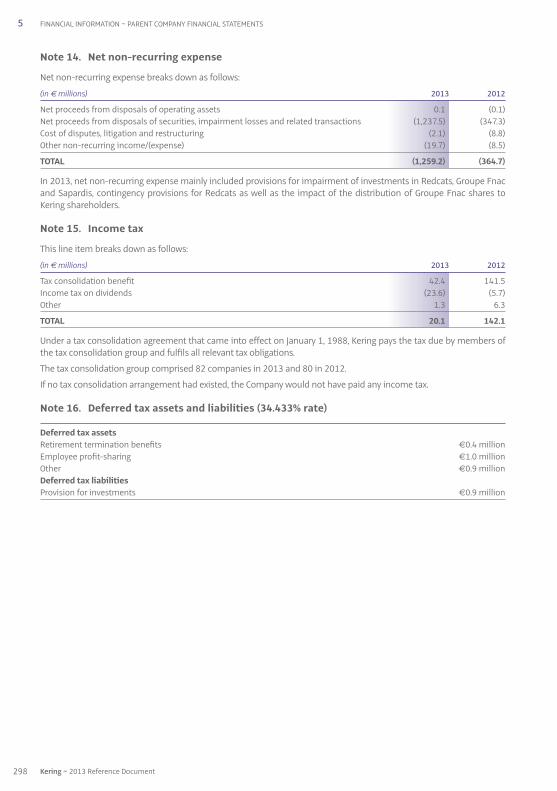
Note 14. Net non-recurring expense
Net non-recurring expense breaks down as follows:
(in € millions) 2013 2012
Net proceeds from disposals of operating assets 0.1 (0.1)Net proceeds from disposals of securities, impairment losses and related transactions (1,237.5) (347.3)Cost of disputes, litigation and restructuring (2.1) (8.8)Other non-recurring income / (expense) (19.7) (8.5)
TOTAL (1,259.2) (364.7)
In 2013, net non-recurring expense mainly included provisions for impairment of investments in Redcats, Groupe Fnacand Sapardis, contingency provisions for Redcats as well as the impact of the distribution of Groupe Fnac shares toKering shareholders.
Note 15. Income tax
This line item breaks down as follows:
(in € millions) 2013 2012
Tax consolidation benefit 42.4 141.5Income tax on dividends (23.6) (5.7)Other 1.3 6.3
TOTAL 20.1 142.1
Under a tax consolidation agreement that came into effect on January 1, 1988, Kering pays the tax due by members ofthe tax consolidation group and fulfils all relevant tax obligations.
The tax consolidation group comprised 82 companies in 2013 and 80 in 2012.
If no tax consolidation arrangement had existed, the Company would not have paid any income tax.
Note 16. Deferred tax assets and liabilities (34.433% rate)
Deferred tax assets Retirement termination benefits €0.4 millionEmployee profit-sharing €1.0 millionOther €0.9 millionDeferred tax liabilities Provision for investments €0.9 million
298 Kering ~ 2013 Reference Document
5 FINANCIAL INFORMATION ~ PARENT COMPANY FINANCIAL STATEMENTS
05_E_VA_V6 14/04/14 11:28 Page298
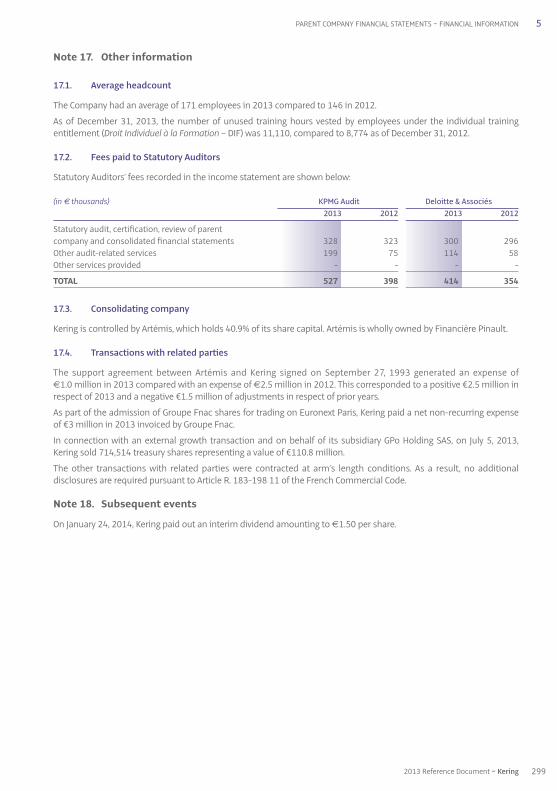
Note 17. Other information
17.1. Average headcount
The Company had an average of 171 employees in 2013 compared to 146 in 2012.
As of December 31, 2013, the number of unused training hours vested by employees under the individual trainingentitlement (Droit Individuel à la Formation – DIF) was 11,110, compared to 8,774 as of December 31, 2012.
17.2. Fees paid to Statutory Auditors
Statutory Auditors’ fees recorded in the income statement are shown below:
(in € thousands) KPMG Audit Deloitte & Associés2013 2012 2013 2012
Statutory audit, certification, review of parent company and consolidated financial statements 328 323 300 296Other audit-related services 199 75 114 58Other services provided - - - -
TOTAL 527 398 414 354
17.3. Consolidating company
Kering is controlled by Artémis, which holds 40.9% of its share capital. Artémis is wholly owned by Financière Pinault.
17.4. Transactions with related parties
The support agreement between Artémis and Kering signed on September 27, 1993 generated an expense of€1.0 million in 2013 compared with an expense of €2.5 million in 2012. This corresponded to a positive €2.5 million inrespect of 2013 and a negative €1.5 million of adjustments in respect of prior years.
As part of the admission of Groupe Fnac shares for trading on Euronext Paris, Kering paid a net non-recurring expenseof €3 million in 2013 invoiced by Groupe Fnac.
In connection with an external growth transaction and on behalf of its subsidiary GPo Holding SAS, on July 5, 2013,Kering sold 714,514 treasury shares representing a value of €110.8 million.
The other transactions with related parties were contracted at arm’s length conditions. As a result, no additionaldisclosures are required pursuant to Article R. 183-198 11 of the French Commercial Code.
Note 18. Subsequent events
On January 24, 2014, Kering paid out an interim dividend amounting to €1.50 per share.
299
5
2013 Reference Document ~ Kering
PARENT COMPANY FINANCIAL STATEMENTS ~ FINANCIAL INFORMATION
05_E_VA_V6 14/04/14 11:28 Page299
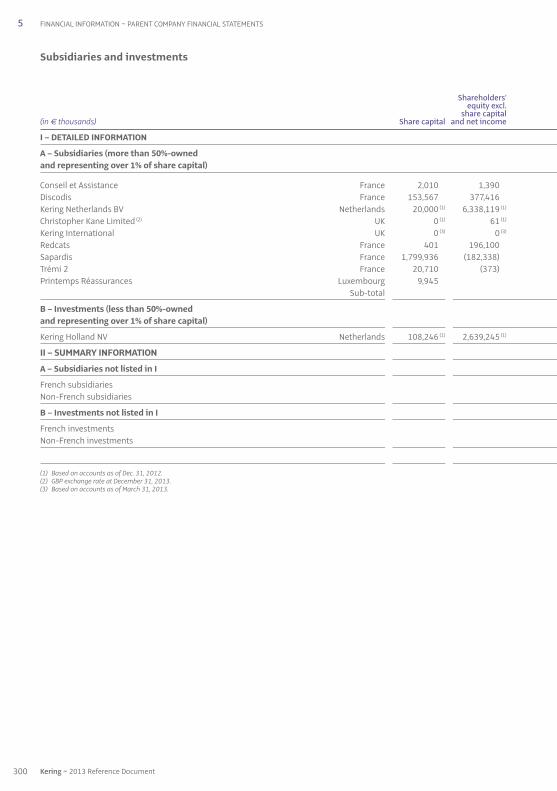
Subsidiaries and investments
Shareholders’ equity excl. share capital
(in € thousands) Share capital and net income
I – DETAILED INFORMATION
A – Subsidiaries (more than 50%-ownedand representing over 1% of share capital)
Conseil et Assistance France 2,010 1,390 Discodis France 153,567 377,416 Kering Netherlands BV Netherlands 20,000 (1) 6,338,119 (1) Christopher Kane Limited (2) UK 0 (1) 61 (1) Kering International UK 0 (3) 0 (3) Redcats France 401 196,100 Sapardis France 1,799,936 (182,338) Trémi 2 France 20,710 (373) Printemps Réassurances Luxembourg 9,945 Sub-total
B – Investments (less than 50%-owned and representing over 1% of share capital)
Kering Holland NV Netherlands 108,246 (1) 2,639,245 (1)
II – SUMMARY INFORMATION
A – Subsidiaries not listed in I
French subsidiaries Non-French subsidiaries
B – Investments not listed in I
French investments Non-French investments
(1) Based on accounts as of Dec. 31, 2012.(2) GBP exchange rate at December 31, 2013.(3) Based on accounts as of March 31, 2013.
300 Kering ~ 2013 Reference Document
5 FINANCIAL INFORMATION ~ PARENT COMPANY FINANCIAL STATEMENTS
05_E_VA_V6 14/04/14 11:29 Page300

301
5
2013 Reference Document ~ Kering
PARENT COMPANY FINANCIAL STATEMENTS ~ FINANCIAL INFORMATION
Carrying amountof shares Outstanding Endorsements Last Last Dividends
loans granted and guarantees published published received by % of by the given by the revenue net income the Company capital held Gross Net Company Company excl. VAT (loss) during the year
90.00 7,724 2,089 (1,080) 99.99 299,736 299,736 (15,448) 100.00 4,237,240 4,237,240 537,034 (1) 1,850,000 51.00 12,174 12,174 3,396 (1) (1,550) (1) 100.00 14,773 14,773 0 (3) 0 (3) 99.99 1,171,636 0 14,330 (616,420) 100.00 1,804,008 1,604,008 (36,545) 100.00 20,475 19,683 (654) 100.00 10,188 10,188 7,577,954 6,199,891
33.53 2,566,912 2,566,912 94,377 (1) 942,810 (1) 301,777
6,817 2,096 2,004 31
0 0 3,517 3,517
10,157,204 8,772,447
05_E_VA_V6 14/04/14 11:29 Page301
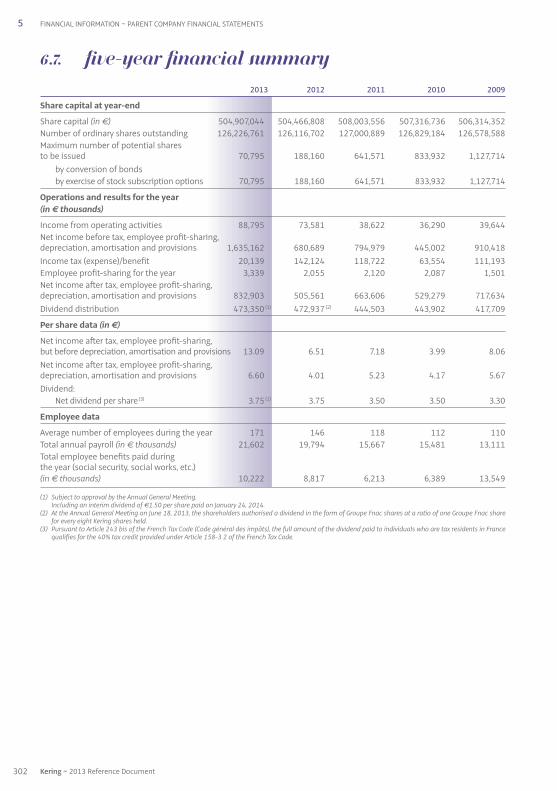
FINANCIAL INFORMATION ~ PARENT COMPANY FINANCIAL STATEMENTS5
Kering ~ 2013 Reference Document302
6.7. Five-year financial summary
20 13 20 12 20 11 20 10 20 09
Share capital at year-end
Share capital (in €) 504,907,044 504,466,808 508,003,556 507,316,736 506,314,352Number of ordinary shares outstanding 126,226,761 126,116,702 127,000,889 126,829,184 126,578,588Maximum number of potential shares to be issued 70,795 188,160 641,571 833,932 1,127,714
by conversion of bonds by exercise of stock subscription options 70,795 188,160 641,571 833,932 1,127,714
Operations and results for the year (in € thousands)
Income from operating activities 88,795 73,581 38,622 36,290 39,644Net income before tax, employee profit-sharing, depreciation, amortisation and provisions 1,635,162 680,689 794,979 445,002 910,418Income tax (expense) / benefit 20,139 142,124 118,722 63,554 111,193Employee profit-sharing for the year 3,339 2,055 2,120 2,087 1,501Net income after tax, employee profit-sharing, depreciation, amortisation and provisions 832,903 505,561 663,606 529,279 717,634Dividend distribution 473,350 (1) 472,937 (2) 444,503 443,902 417,709
Per share data (in €)
Net income after tax, employee profit-sharing, but before depreciation, amortisation and provisions 13.09 6.51 7.18 3.99 8.06Net income after tax, employee profit-sharing, depreciation, amortisation and provisions 6.60 4.01 5.23 4.17 5.67Dividend:
Net dividend per share(3) 3.75(1) 3.75 3.50 3.50 3.30
Employee data
Average number of employees during the year 171 146 118 112 110Total annual payroll (in € thousands) 21,602 19,794 15,667 15,481 13,111Total employee benefits paid during the year (social security, social works, etc.) (in € thousands) 10,222 8,817 6,213 6,389 13,549
(1) Subject to approval by the Annual General Meeting.Including an interim dividend of €1.50 per share paid on January 24, 2014.
(2) At the Annual General Meeting on June 18, 2013, the shareholders authorised a dividend in the form of Groupe Fnac shares at a ratio of one Groupe Fnac sharefor every eight Kering shares held.
(3) Pursuant to Article 243 bis of the French Tax Code (Code général des impôts), the full amount of the dividend paid to individuals who are tax residents in Francequalifies for the 40% tax credit provided under Article 158-3 2 of the French Tax Code.
05_E_VA_V6 14/04/14 11:29 Page302

This is a free translation into English of the Statutory Auditors’ report issued in French and is provided solely for theconvenience of English speaking users. The Statutory Auditors’ report includes information specifically required byFrench law in such reports, whether modified or not. This information is presented below the opinion on the Companyfinancial statements and includes an explanatory paragraph discussing the auditors’ assessments of certain significantaccounting and auditing matters. These assessments were considered for the purpose of issuing an audit opinion onthe Company financial statements taken as a whole and not to provide separate assurance on individual accountcaptions or on information taken outside of the Company financial statements. This report should be read inconjunction and construed in accordance with French law and professional auditing standards applicable in France.
To the Shareholders,
In accordance with our appointment as Statutory Auditors at your Annual General Meetings, we hereby report to you forthe year ended December 31, 2013 on:
• the audit of the accompanying financial statements of Kering S.A.;
• the justification of our assessments;
• the specific procedures and disclosures required by law.
The financial statements have been approved by the Board of Directors. Our role is to express an opinion on thesefinancial statements, based on our audit.
1. Opinion on the financial statements
We conducted our audit in accordance with professional standards applicable in France. These standards require that weplan and perform the audit to obtain reasonable assurance about whether the financial statements are free of materialmisstatement. An audit includes examining, using sample testing techniques or other selection methods, evidence supportingthe amounts and disclosures in the financial statements. An audit also includes assessing the accounting principlesused and significant estimates made, as well as evaluating the overall financial statement presentation. We believe thatthe audit evidence we have obtained is sufficient and appropriate to provide a reasonable basis for our opinion.
In our opinion, the financial statements give a true and fair view of the financial position and the assets and liabilities ofthe Company as of December 31, 2013 and the results of its operations for the year then ended in accordance withaccounting principles generally accepted in France.
2. Justification of our assessments
Pursuant to Article L. 823-9 of the French Commercial Code (Code de commerce) governing the justification of our assessments,we hereby report on the following:
Note 2.2 to the financial statements describes the accounting policies relating to the measurement of long-term investments.
As part of our assessment of the accounting policies implemented by your Company, we have verified theappropriateness of the above-mentioned accounting methods and their proper application.
These assessments were performed as part of our audit approach for the financial statements taken as a whole andtherefore contributed to the expression of our opinion in the first part of this report.
7. Statutory Auditors’ Report on the Financial statementsYear ended December 31, 2013
303
5
2013 Reference Document ~ Kering
STATUTORY AUDITORS’ REPORT ON THE FINANCIAL STATEMENTS ~ FINANCIAL INFORMATION
05_E_VA_V6 14/04/14 11:29 Page303

3. Specific procedures and disclosures
We have also performed the other procedures required by law, in accordance with professional standards applicable in France.
We have no matters to report regarding the fair presentation and consistency with the financial statements of the informationgiven in the Management Report of the Board of Directors and in the documents addressed to the shareholders inrespect of the financial position and the financial statements.
Concerning the information given in accordance with the requirements of Article L. 225-102-1 of the French CommercialCode relating to remunerations and benefits received by the corporate officers and any other commitments made intheir favor, we have verified its consistency with the financial statements, or with the underlying information used toprepare these financial statements and, where applicable, with the information obtained by your company fromcompanies controlling your company or controlled by it.
Based on these procedures, we have the following comment on the accuracy and fair presentation of this information: Asindicated in the Board of Directors’ Management Report, this information represents the remunerations and benefits paidby the Kering group and the companies controlling it to the corporate officers concerned with respect to the mandates,duties or tasks carried out within or on behalf of the Kering group. The information does not include the remunerationsand benefits paid with respect to mandates, duties or tasks other than those carried out within or on behalf of theKering group.
Pursuant to the law, we have verified that the Management Report contains the appropriate disclosures as to theidentity of and voting rights held by shareholders.
Paris La Défense and Neuilly-sur-Seine, March 31, 2014
The Statutory Auditors
KPMG Audit Deloitte & AssociésDivision of KPMG S.A.
Hervé Chopin Antoine de Riedmatten
304 Kering ~ 2013 Reference Document
5 FINANCIAL INFORMATION ~STATUTORY AUDITORS’ REPORT ON THE FINANCIAL STATEMENTS
05_E_VA_V6 14/04/14 11:29 Page304

8. Statutory Auditors’ special reporton regulated agreements and commitments with third partiesShareholders’ Meeting held to approve the financial statementsfor the year ended December 31, 2013
This is a free translation into English of the Statutory Auditors’ special report on regulated agreements and commitmentswith third parties that is issued in the French language and is provided solely for the convenience of English speakingreaders. This report on regulated agreements and commitments should be read in conjunction and construed inaccordance with French law and professional auditing standards applicable in France. It should be understood that theagreements reported on are only those provided by the French Commercial Code (Code de commerce) and that thereport does not apply to those related party transactions described in IAS 24 or other equivalent accounting standards.
To the Shareholders,
In our capacity as Statutory Auditors of your Company, we hereby report to you on regulated agreements and commitmentswith third parties.
The terms of our engagement require us to communicate to you, based on information provided to us, the principal termsand conditions of those agreements and commitments brought to our attention or which we may have discovered duringthe course of our audit, without expressing an opinion on their usefulness and appropriateness or identifying such otheragreements, if any. It is your responsibility, pursuant to Article R. 225-31 of the French Commercial Code (Code de commerce),to assess the interest involved in respect of the conclusion of these agreements for the purpose of approving them.
Our role is also to provide you with the information provided for in Article R. 225-31 of the French Commercial Code in respectof the performance of the agreements and commitments, already authorized by the Shareholders’ Meeting and havingcontinuing effect during the year, if any.
We conducted the procedures we deemed necessary in accordance with the professional guidelines of the French NationalInstitute of Statutory Auditors (Compagnie Nationale des Commissaires aux Comptes) relating to this engagement. Theseprocedures consisted in agreeing the information provided to us with the relevant source documents.
Agreements and commitments submitted to the approval of the shareholders’ meetingAgreements and commitments authorized during the year
Pursuant to Article L. 225-40 of the French Commercial Code, we were advised of the following agreements and commitmentspreviously authorized by the Board of Directors.
• Payment of exceptional expenses relating to the admission of Groupe Fnac S.A. shares for trading
Following the decision of the Kering S.A. shareholders’ meeting of June 18, 2013 to allocate Groupe Fnac S.A. shares toKering S.A. shareholders, the said shares were admitted for trading on the Euronext Paris market on June 20, 2013.
Accordingly, exceptional expenses were incurred by Kering S.A. and Groupe Fnac S.A. These expenses were subject to anallocation agreement signed by both companies in fiscal 2013. This agreement was previously authorized by the Boardof Directors on July 25, 2013.
Under this agreement, Groupe Fnac S.A. invoiced a net amount of €3,005,876.88, excluding tax, to Kering S.A. in fiscal 2013.
Person involved: Mrs. Patricia Barbizet, Director of Kering S.A. and Groupe Fnac S.A.
305
5
2013 Reference Document ~ Kering
STATUTORY AUDITORS’ SPECIAL REPORT ON REGULATED AGREEMENTS AND COMMITMENTS WITH THIRD PARTIES ~ FINANCIAL INFORMATION
05_E_VA_V6 14/04/14 11:29 Page305
• Assignment by Kering S.A. of its treasury shares on behalf of a subsidiary
On June 18, 2013, as part of an external growth transaction, the Board of Directors authorized that this acquisition bepartially settled in Kering shares to be submitted by Kering S.A. on behalf of its subsidiary, GPo Holding S.A.S.
On July 5, 2013, Kering S.A. therefore transferred 714,514 treasury shares amounting to €110,749,697.50 to the assignees,on behalf of its subsidiary GPo Holding S.A.S., a company controlled by Kering Holland N.V., itself controlled by Kering S.A.
Persons involved: Mrs. Patricia Barbizet and Mr. François-Henri Pinault, Directors of Kering S.A. and Kering Holland N.V.
Agreements and commitments previously approved by the shareholders’ meeting
a) Agreements and commitments authorized in previous years and having continuing effect during the year
Pursuant to Article R. 225-30 of the French Commercial Code, we have been advised that the following agreements andcommitments authorized in previous years have had continuing effect during the year.
• Support agreement for services provided by Artémis S.A.
Pursuant to the terms of a support agreement between Kering S.A. and Artémis S.A. signed on September 27, 1993,Artémis S.A. carries out research and advisory work for Kering S.A. in the following areas:
• strategy and development of the Kering group and support in carrying out complex legal, tax, financial and real estate transactions;
• sourcing of business development opportunities in France and abroad or cost-cutting measures.
At its March 10, 1999 meeting, the Kering S.A. Supervisory Board authorized payment for these services amounting to0.037% of consolidated net revenue (excluding VAT).
In line with the appropriate modifications to Kering S.A.’s corporate governance rules, your Board of Directors resolvedon July 6, 2005, without amending the agreement in force since September 27, 1993, that the Kering S.A. Audit Committeewould perform, in addition to the usual annual review of the substance of the support provided by Artemis S.A. to Kering S.A.,an annual assessment of the services and their fair price given the facilities provided and the cost savings realized inthe common interest.
The methods for assessing the contractually-agreed amount were reviewed by the Audit Committee which, at itsmeeting of February 18, 2014, noted that Kering S.A. had continued to benefit, during 2013, from the advice and assistanceof Artemis S.A. on recurring issues including communications, public and institutional relations, as well as the developmentstrategy and its implementation.
At its February 20, 2014 meeting, your Board of Directors duly noted the payment of €2,496,000 (excluding VAT) underthis agreement in respect of 2013, it being specified that the revenue of the PUMA group was excluded from thecalculation of this fee, as was the case in previous years, together with revenue from discontinued operations.
Persons involved: Mrs. Patricia Barbizet and Mr. François-Henri Pinault, members of the Board of Directors of Artémis S.A., aKering S.A. shareholder with more than 10% of voting rights.
b) Agreements and commitments authorized in previous years and without continuing effect during the year
Furthermore, we were advised of the following agreements and commitments previously approved by the Shareholders’Meeting in prior years which remained in force but had no continuing effect during the year.
306 Kering ~ 2013 Reference Document
5 FINANCIAL INFORMATION ~ STATUTORY AUDITORS’ SPECIAL REPORT ON REGULATED AGREEMENTS AND COMMITMENTS WITH THIRD PARTIES
05_E_VA_V6 14/04/14 11:29 Page306

• Retirement commitment in favor of Mr. Jean-François Palus, Deputy CEO of Kering S.A.
On January 22 and April 8, 2010, the Board of Directors authorized Kering S.A. and the companies controlled by it within themeaning of Article L. 233-16 of the French Commercial Code to grant specific retirement benefits to Mr. Jean-François Palus,Deputy CEO of Kering S.A., due to his exceptional contribution to the business development of the Luxury Goods Division.This authorization resulted in the allocation of €3,568,000 (this capital being either managed by Kering S.A. or a companycontrolled by it, or invested in a top-tier asset management company) to fund his retirement benefits (with reversion rightsto his beneficiaries in the event of death) payable as from the legal retirement age. His presence in the Kering group isnot a requirement at that date, provided that he has not left the Group before December 31, 2014 for personal reasons.
To receive these retirement benefits, Mr. Jean-François Palus must satisfy the performance conditions attached to hisvariable compensation, for fiscal years 2009 and 2010, in his capacity as Deputy CEO of Kering S.A. On April 8, 2010 andFebruary 16, 2011, your Board of Directors duly noted that the performance conditions were met for fiscal years 2009and 2010, respectively.
Pursuant to these Board of Directors’ authorizations, the Supervisory Board of Gucci Group NV (now Kering Holland N.V.),wholly-owned directly and indirectly by Kering S.A., decided, on December 10, 2010, to grant Mr. Jean-François Palus, inhis capacity at that date as a member of the Supervisory Board of Gucci Group NV since May 30, 2006, an irrevocablepension right in respect of retirement benefits, in accordance with the terms and conditions provided for in your Boardof Directors’ authorization, based on a capital of €3,568,000, in so much as Kering S.A. acknowledges, at the given time,that this right is no longer subject to the fulfillment of any conditions.
Paris La Défense and Neuilly-sur-Seine, March 31, 2014
The Statutory Auditors
KPMG Audit Deloitte & AssociésDépartement de KPMG SA
Hervé Chopin Antoine de Riedmatten
307
5
2013 Reference Document ~ Kering
STATUTORY AUDITORS’ SPECIAL REPORT ON REGULATED AGREEMENTS AND COMMITMENTS WITH THIRD PARTIES ~ FINANCIAL INFORMATION
05_E_VA_V6 14/04/14 11:29 Page307

9. Fees paid by the Group to the Statutory Auditors and members of their networks in 2013
(in € thousands) KPMG AUDIT DELOITTE & ASSOCIÉS TOTAL FEESAMOUNT % AMOUNT % AMOUNT %
(EXCL. TAXES) (EXCL. TAXES) (EXCL. TAXES) 2013 2012 2013 2012 2013 2012 2013 2012 2013 2012 Change
Audit Statutory audit, certification,review of parent company and consolidated financial statements 4,175.1 3,737.0 77% 83% 3,263.9 4,112.0 82% 64% 7,439.0 7,849.0 -5.2%
Issuer 327.8 324.5 6% 7% 309.3 302.8 8% 5% 637.1 627.3 1.6%Fully-consolidated subsidiaries 3,847.3 3,412.5 71% 76% 2,954.6 3,809.2 74% 60% 6,801.9 7,221.7 -5.8%
Other audit-related services 598.5 348.0 11% 8% 155.0 1,600.4 4% 25% 753.5 1,948.4 -61.3%Issuer 486.5 205.0 9% 5% 114.0 121.0 3% 2% 600.5 326.0 84.2%Fully-consolidated subsidiaries 112.0 143.0 2% 3% 41.0 1,479.4 1% 23% 153.0 1,622.4 -90.6%
Sub-total 4,773.6 4,085.0 88% 91% 3,418.9 5,712.4 86% 89% 8,192.5 9,797.4 -16.4%
Other services provided by the networks to fully-consolidated subsidiaries
Legal, tax and employment-related services 160.0 327.0 3% 7% 382.9 593.0 10% 9% 542.9 920.0 -41.0%Other 513.0 101.0 9% 2% 182.6 86.0 5% 1% 695.6 187.0 272.0%
Sub-total 673.0 428.0 12% 9% 565.5 679.0 14% 11% 1,238.5 1,107.0 11.9%
TOTAL 5,446.6 4,513.0 100% 100% 3,984.3 6,391.4 100% 100% 9,431.0 10,904.4 -13.5%
Data for 2012 have been restated on a pro forma basis to exclude Groupe Fnac.
308 Kering ~ 2013 Reference Document
5 FINANCIAL INFORMATION ~ FEES PAID BY THE GROUP TO THE STATUTORY AUDITORS
05_E_VA_V6 14/04/14 11:29 Page308
3092013 Reference Document ~ Kering
CHAPTer 6
Share capital and ownership structure
1. Share capital 3101.1. Share capital 3101.2. Treasury shares held by the Company and its subsidiaries 3101.3. Authorisations to issue securities giving access to the share capital 3121.4. Employee share ownership 3151.5. Appropriation of net income – Dividends paid by the Company 3161.6. Share pledges 3171.7. Arrangements and agreements 317
2. Share ownership structure 318
06_VA_V6 14/04/14 11:33 Page309
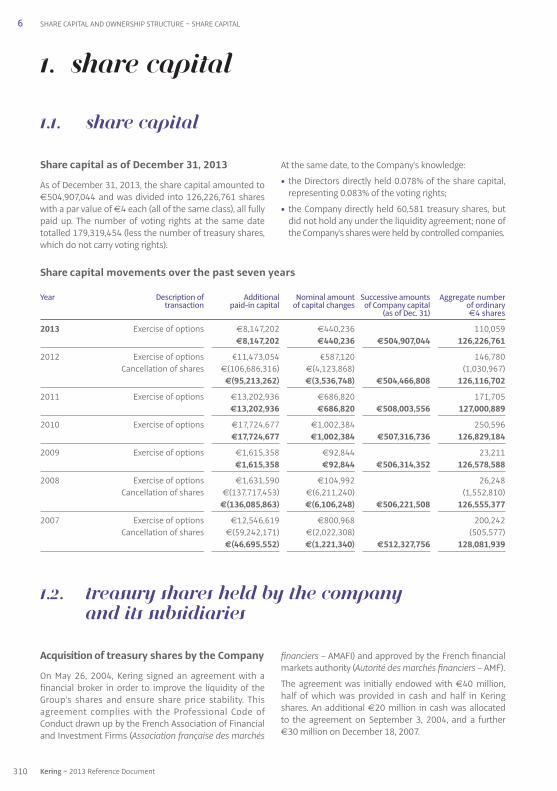
Acquisition of treasury shares by the Company
On May 26, 2004, Kering signed an agreement with afinancial broker in order to improve the liquidity of theGroup’s shares and ensure share price stability. Thisagreement complies with the Professional Code ofConduct drawn up by the French Association of Financialand Investment Firms (Association française des marchés
financiers – AMAFI) and approved by the French financialmarkets authority (Autorité des marchés financiers – AMF).
The agreement was initially endowed with €40 million,half of which was provided in cash and half in Keringshares. An additional €20 million in cash was allocatedto the agreement on September 3, 2004, and a further€30 million on December 18, 2007.
Share capital movements over the past seven years
Year Description of Additional Nominal amount Successive amounts Aggregate number transaction paid-in capital of capital changes of Company capital of ordinary (as of Dec. 31) €4 shares
2013 Exercise of options €8,147,202 €440,236 110,059 €8,147,202 €440,236 €504,907,044 126,226,761
2012 Exercise of options €11,473,054 €587,120 146,780 Cancellation of shares €(106,686,316) €(4,123,868) (1,030,967) €(95,213,262) €(3,536,748) €504,466,808 126,116,702
2011 Exercise of options €13,202,936 €686,820 171,705 €13,202,936 €686,820 €508,003,556 127,000,889
2010 Exercise of options €17,724,677 €1,002,384 250,596 €17,724,677 €1,002,384 €507,316,736 126,829,184
2009 Exercise of options €1,615,358 €92,844 23,211 €1,615,358 €92,844 €506,314,352 126,578,588
2008 Exercise of options €1,631,590 €104,992 26,248 Cancellation of shares €(137,717,453) €(6,211,240) (1,552,810) €(136,085,863) €(6,106,248) €506,221,508 126,555,377
2007 Exercise of options €12,546,619 €800,968 200,242 Cancellation of shares €(59,242,171) €(2,022,308) (505,577) €(46,695,552) €(1,221,340) €512,327,756 128,081,939
1.2. Treasury shares held by the Company and its subsidiaries
Share capital as of December 31, 2013
As of December 31, 2013, the share capital amounted to€504,907,044 and was divided into 126,226,761 shareswith a par value of €4 each (all of the same class), all fullypaid up. The number of voting rights at the same datetotalled 179,319,454 (less the number of treasury shares,which do not carry voting rights).
At the same date, to the Company’s knowledge:
• the Directors directly held 0.078% of the share capital,representing 0.083% of the voting rights;
• the Company directly held 60,581 treasury shares, butdid not hold any under the liquidity agreement; none ofthe Company’s shares were held by controlled companies.
1. Share capital
1.1. Share capital
310 Kering ~ 2013 Reference Document
6 SHARE CAPITAL AND OWNERSHIP STRUCTURE ~ SHARE CAPITAL
06_VA_V6 14/04/14 11:33 Page310

The Annual General Meeting on April 27, 2012 authorisedthe Board of Directors to trade in Company shares for aperiod of 18 months in accordance with the goals andterms of the share buy-back programme filed with the AMF.This programme specifies a maximum purchase price of€180 per share and states that the number of sharespurchased may not exceed 10% of the share capital.
The Annual General Meeting on June 18, 2013 authorisedthe Board of Directors to trade in Company shares for aperiod of 18 months, under the same terms and conditions,with a maximum purchase price of €220 per share.
On May 6, 2014, the Annual General Meeting will be askedto approve an authorisation to trade in Company sharesunder a new buy-back programme.
Buy-backs and sales of shares during 2013– Trading costs – Number of treasury shares held as of December 31, 2013
Share buy-backs
• 1,535,246 shares were bought back pursuant to theauthorisation given by the Annual General Meeting onApril 27, 2012, at an average price of €168.94;
• 1,006,310 shares were bought back by the Companypursuant to the authorisation given by the AnnualGeneral Meeting on June 18, 2013, at an average priceof €165.25.
In 2013, Kering therefore bought back a total of 2,541,556shares at an average price of €167.48 for the followingpurposes:
• 106,000 shares to be granted to employees under the2009 and 2011 free share plans;
• 130,000 shares to be granted under stock option plans,in particular the 2006 and 2007 plans;
• 1,585,556 shares purchased under the liquidityagreement;
• the acquisition of 720,000 shares as part of an externalgrowth transaction.
Sales of treasury shares
In 2013, Kering sold 1,585,556 shares at an average priceof €166.44, under the aforementioned liquidity agreement.
103,037 shares were sold to employees under the 2006and 2007 stock purchase option plans.
An additional 102,491 shares were granted to employeesunder the 2009 and 2011 free share plans, maturing inMay 2013, and 450 shares were granted under the 2008and 2009 free share plans.
714,514 shares were issued as part of an external growthtransaction and the remaining 5,486 shares (out of the720,000 acquired) were allocated to be allotted understock purchase option plans.
Trading costs
Total share trading costs amounted to €0.5 million in 2013.
Share cancellations in 2013
No shares were cancelled during the year.
As of the end of the reporting period, the Company didnot hold any treasury shares under the liquidity agreement.It directly held 60,581 shares with a par value of €4 eachand a carrying amount of €10,392,807.12 representing0.048% of the share capital.
Buy-backs and sales of Kering shares carried out bet-ween January 1 and March 15, 2014
Since January 1, 2014, the Company has acquired 510,250shares at an average price of €147.75 and has sold 435,250shares at an average price of €148.47, in connection withthe liquidity agreement.
As of March 15, 2014, the Company held 75,000 sharesunder the liquidity agreement.
Excluding the liquidity agreement, a total of 4,466 purchaseoptions were exercised under the 2006 and 2007 plans.An additional 360 shares were granted to employeesunder the 2009 free share plan.
The number of treasury shares held by Kering as of March 15,2014 therefore totals 130,755 shares with a par value of€4 per share and a carrying amount of €20,220,150.90.
Share cancellations in 2014
No shares were cancelled between January 1 andMarch 15, 2014.
Use of derivatives in 2013
Kering did not buy any call options on its own shares in 2013.
The call options which expired in 2013 were not exercised.
As of December 31, 2013, Kering did not hold any call optionson its own shares.
311
6
2013 Reference Document ~ Kering
SHARE CAPITAL ~ SHARE CAPITAL AND OWNERSHIP STRUCTURE
06_VA_V6 14/04/14 11:33 Page311
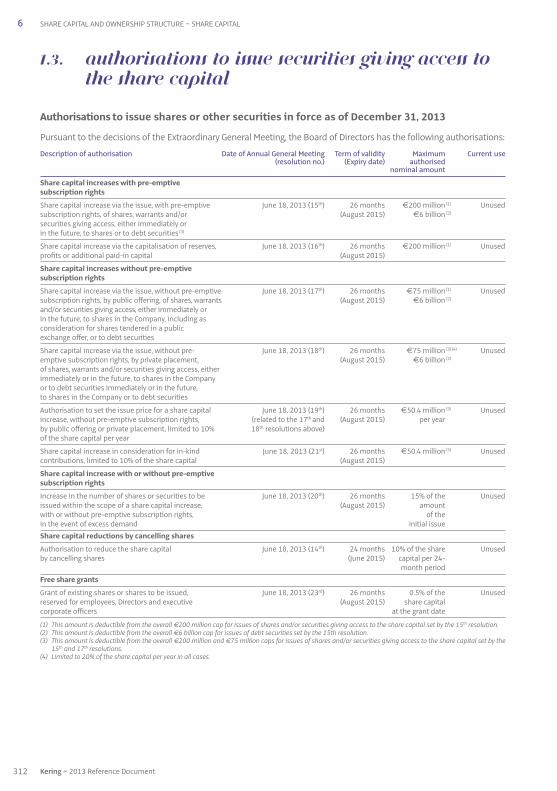
1.3. Authorisations to issue securities giving access tothe share capital
Authorisations to issue shares or other securities in force as of December 31, 2013
Pursuant to the decisions of the Extraordinary General Meeting, the Board of Directors has the following authorisations:
Description of authorisation Date of Annual General Meeting Term of validity Maximum Current use (resolution no.) (Expiry date) authorised nominal amount
Share capital increases with pre-emptive subscription rights
Share capital increase via the issue, with pre-emptive June 18, 2013 (15th) 26 months €200 million (1) Unusedsubscription rights, of shares, warrants and / or (August 2015) €6 billion (2) securities giving access, either immediately or in the future, to shares or to debt securities (3)
Share capital increase via the capitalisation of reserves, June 18, 2013 (16th) 26 months €200 million (1) Unusedprofits or additional paid-in capital (August 2015)
Share capital increases without pre-emptive subscription rights
Share capital increase via the issue, without pre-emptive June 18, 2013 (17th) 26 months €75 million (1) Unusedsubscription rights, by public offering, of shares, warrants (August 2015) €6 billion (2)
and / or securities giving access, either immediately or in the future, to shares in the Company, including as consideration for shares tendered in a public exchange offer, or to debt securities
Share capital increase via the issue, without pre- June 18, 2013 (18th) 26 months €75 million (3) (4) Unusedemptive subscription rights, by private placement, (August 2015) €6 billion (2) of shares, warrants and / or securities giving access, either immediately or in the future, to shares in the Company or to debt securities immediately or in the future, to shares in the Company or to debt securities
Authorisation to set the issue price for a share capital June 18, 2013 (19th) 26 months €50.4 million (3) Unusedincrease, without pre-emptive subscription rights, (related to the 17th and (August 2015) per year by public offering or private placement, limited to 10% 18th resolutions above)of the share capital per year
Share capital increase in consideration for in-kind June 18, 2013 (21st) 26 months €50.4 million (3) Unusedcontributions, limited to 10% of the share capital (August 2015)
Share capital increase with or without pre-emptive subscription rights
Increase in the number of shares or securities to be June 18, 2013 (20th) 26 months 15% of the Unusedissued within the scope of a share capital increase, (August 2015) amountwith or without pre-emptive subscription rights, of the in the event of excess demand initial issue Share capital reductions by cancelling shares
Authorisation to reduce the share capital June 18, 2013 (14th) 24 months 10% of the share Unusedby cancelling shares (June 2015) capital per 24- month period
Free share grants
Grant of existing shares or shares to be issued, June 18, 2013 (23rd) 26 months 0.5% of the Unusedreserved for employees, Directors and executive (August 2015) share capitalcorporate officers at the grant date
(1) This amount is deductible from the overall €200 million cap for issues of shares and / or securities giving access to the share capital set by the 15th resolution.(2) This amount is deductible from the overall €6 billion cap for issues of debt securities set by the 15th resolution.(3) This amount is deductible from the overall €200 million and €75 million caps for issues of shares and / or securities giving access to the share capital set by the
15th and 17th resolutions.(4) Limited to 20% of the share capital per year in all cases.
312 Kering ~ 2013 Reference Document
6 SHARE CAPITAL AND OWNERSHIP STRUCTURE ~ SHARE CAPITAL
06_VA_V6 14/04/14 11:33 Page312
As indicated in the above table, the Extraordinary GeneralMeeting on June 18, 2013 authorised the Board of Directorsto issue, with or without pre-emptive subscription rights,securities giving access to the Company’s share capital,either immediately or in the future, to increase the sharecapital by capitalising reserves, profits or additional paid-in capital and to grant free shares.
These delegations of authority were not used during the year.
Other securities giving access to the share capital
Special report on stock subscription and purchase options and free share grants
The policy governing stock subscription and purchaseoptions and free share grants forms part of the Group’shuman resources policy and is determined each year bythe Board of Directors based on preparatory work andproposals from the Remuneration Committee.
Overall, this programme aims to recognise the contributionof employees to Kering’s past and future results, toencourage long-term commitment to the Group andenable Kering group employees to benefit from increasesin Kering’s stock market value. Stock options are designedto foster employee loyalty, while free share grants seek torecognise an employee’s contribution to Kering’s results.
Eligible employees include managers holding key positionsand with major responsibilities within the Group who,selected at the suggestion of each brand, play a key partin the development and implementation of the Group’sstrategy.
Grants are made on the basis of general and specific criteriaand are not cumulative with other salary-related bonuses.In 2012, grants only concerned free shares recognised asperformance shares, allocated to 286 employees (seepage 315).
No free shares were granted in 2013.
François-Henri Pinault, Chairman and Chief ExecutiveOfficer, and Jean-François Palus, Group Managing Director,were granted performance shares in 2012. Further detailson the granting of performance shares are providedbelow on page 315.
Stock option plans
Grants are, in principle, made annually. However, no stocksubscription and purchase option plans have been set upsince 2007.
The plans set up in 2006 and 2007 have terms of eightyears (compared to terms of ten years for previous plans)and the options granted are purchase options. As theyhave no impact on the number of shares comprising theshare capital, they are not dilutive.
Since 2001, stock options have been granted without anydiscount with regard to the price and with a four-yearlock-in period.
Employees, Directors and executive corporate officerswho leave the Group before exercising their options losepart of their entitlement, determined on the basis of theirlength of service with the Group since the grant date andthe nature of their departure.
Twenty-five percent of options are vested per full year ofservice. All rights vest upon retirement. Since 2005, if abeneficiary resigns, he or she loses all rights vested subjectto exceptions made by the Company. If a beneficiary isdismissed for gross negligence or misconduct, all rightsare lost, including after the lock-in period.
As of December 31, 2013, the number of options outstandingwas 366,320 including 70,795 stock subscription optionsand 295,525 stock purchase options.
313
6
2013 Reference Document ~ Kering
SHARE CAPITAL ~ SHARE CAPITAL AND OWNERSHIP STRUCTURE
06_VA_V6 14/04/14 11:33 Page313
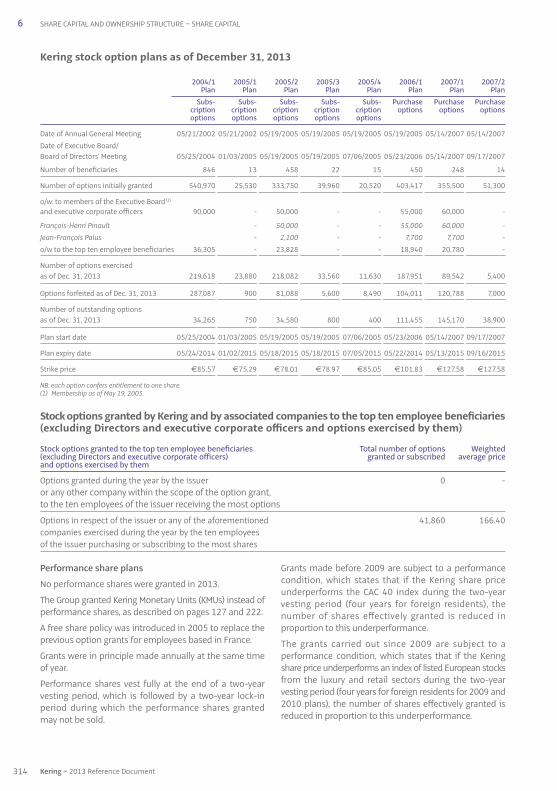
Performance share plans
No performance shares were granted in 2013.
The Group granted Kering Monetary Units (KMUs) instead ofperformance shares, as described on pages 127 and 222.
A free share policy was introduced in 2005 to replace theprevious option grants for employees based in France.
Grants were in principle made annually at the same timeof year.
Performance shares vest fully at the end of a two-yearvesting period, which is followed by a two-year lock-inperiod during which the performance shares grantedmay not be sold.
Grants made before 2009 are subject to a performancecondition, which states that if the Kering share priceunderperforms the CAC 40 index during the two-yearvesting period (four years for foreign residents), thenumber of shares effectively granted is reduced inproportion to this underperformance.
The grants carried out since 2009 are subject to aperformance condition, which states that if the Keringshare price underperforms an index of listed European stocksfrom the luxury and retail sectors during the two-yearvesting period (four years for foreign residents for 2009 and2010 plans), the number of shares effectively granted isreduced in proportion to this underperformance.
Kering stock option plans as of December 31, 2013
2004 / 1 2005 / 1 2005 / 2 2005 / 3 2005 / 4 2006 / 1 2007 / 1 2007 / 2 Plan Plan Plan Plan Plan Plan Plan Plan Subs- Subs- Subs- Subs- Subs- Purchase Purchase Purchase cription cription cription cription cription options options options options options options options options
Date of Annual General Meeting 05 / 21 / 2002 05 / 21 / 2002 05 / 19 / 2005 05 / 19 / 2005 05 / 19 / 2005 05 / 19 / 2005 05 / 14 / 2007 05 / 14 / 2007Date of Executive Board / Board of Directors’ Meeting 05 / 25 / 2004 01 / 03 / 2005 05 / 19 / 2005 05 / 19 / 2005 07 / 06 / 2005 05 / 23 / 2006 05 / 14 / 2007 09 / 17 / 2007
Number of beneficiaries 846 13 458 22 15 450 248 14
Number of options initially granted 540,970 25,530 333,750 39,960 20,520 403,417 355,500 51,300
o / w: to members of the Executive Board (1)
and executive corporate officers 90,000 - 50,000 - - 55,000 60,000 -
François-Henri Pinault - 50,000 - - 55,000 60,000 -Jean-François Palus - 2,100 - - 7,700 7,700 -o / w to the top ten employee beneficiaries 36,305 - 23,828 - - 18,940 20,780 -
Number of options exercised as of Dec. 31, 2013 219,618 23,880 218,082 33,560 11,630 187,951 89,542 5,400
Options forfeited as of Dec. 31, 2013 287,087 900 81,088 5,600 8,490 104,011 120,788 7,000
Number of outstanding options as of Dec. 31, 2013 34,265 750 34,580 800 400 111,455 145,170 38,900
Plan start date 05 / 25 / 2004 01 / 03 / 2005 05 / 19 / 2005 05 / 19 / 2005 07 / 06 / 2005 05 / 23 / 2006 05 / 14 / 2007 09 / 17 / 2007
Plan expiry date 05 / 24 / 2014 01 / 02 / 2015 05 / 18 / 2015 05 / 18 / 2015 07 / 05 / 2015 05 / 22 / 2014 05 / 13 / 2015 09 / 16 / 2015
Strike price €85.57 €75.29 €78.01 €78.97 €85.05 €101.83 €127.58 €127.58
NB: each option confers entitlement to one share.(1) Membership as of May 19, 2005.
Stock options granted by Kering and by associated companies to the top ten employee beneficiaries(excluding Directors and executive corporate officers and options exercised by them)
Stock options granted to the top ten employee beneficiaries Total number of options Weighted (excluding Directors and executive corporate officers) granted or subscribed average priceand options exercised by them
Options granted during the year by the issuer 0 -or any other company within the scope of the option grant,to the ten employees of the issuer receiving the most options
Options in respect of the issuer or any of the aforementioned 41,860 166.40companies exercised during the year by the ten employees of the issuer purchasing or subscribing to the most shares
314 Kering ~ 2013 Reference Document
6 SHARE CAPITAL AND OWNERSHIP STRUCTURE ~ SHARE CAPITAL
06_VA_V6 14/04/14 11:33 Page314
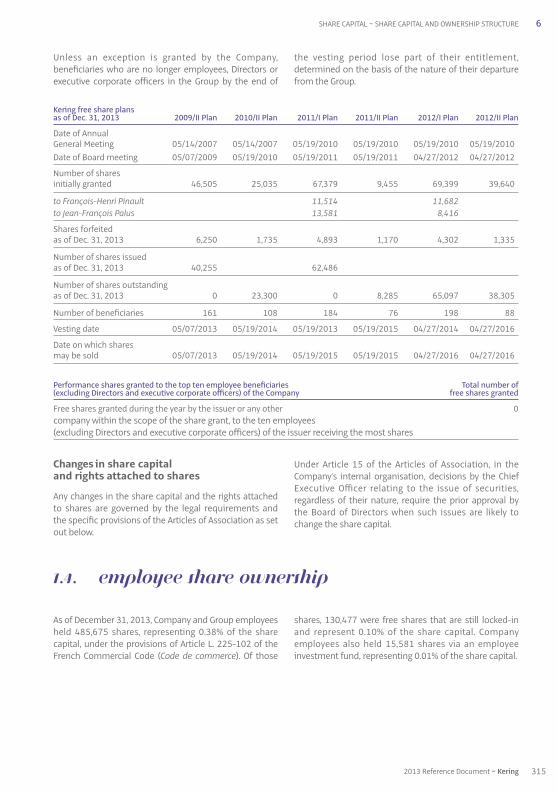
As of December 31, 2013, Company and Group employeesheld 485,675 shares, representing 0.38% of the sharecapital, under the provisions of Article L. 225-102 of theFrench Commercial Code (Code de commerce). Of those
shares, 130,477 were free shares that are still locked-inand represent 0.10% of the share capital. Companyemployees also held 15,581 shares via an employeeinvestment fund, representing 0.01% of the share capital.
1.4. Employee share ownership
Changes in share capital and rights attached to shares
Any changes in the share capital and the rights attachedto shares are governed by the legal requirements and the specific provisions of the Articles of Association as set out below.
Under Article 15 of the Articles of Association, in theCompany’s internal organisation, decisions by the ChiefExecutive Officer relating to the issue of securities,regardless of their nature, require the prior approval bythe Board of Directors when such issues are likely tochange the share capital.
Kering free share plans as of Dec. 31, 2013 2009 / II Plan 2010 / II Plan 2011 / I Plan 2011 / II Plan 2012 / I Plan 2012 / II Plan
Date of Annual General Meeting 05 / 14 / 2007 05 / 14 / 2007 05 / 19 / 2010 05/ 19 / 2010 05 / 19 / 2010 05 / 19 / 2010Date of Board meeting 05 / 07 / 2009 05 / 19 / 2010 05 / 19 / 2011 05 / 19 / 2011 04 / 27 / 2012 04 / 27 / 2012
Number of shares initially granted 46,505 25,035 67,379 9,455 69,399 39,640
to François-Henri Pinault 11,514 11,682 to Jean-François Palus 13,581 8,416
Shares forfeited as of Dec. 31, 2013 6,250 1,735 4,893 1,170 4,302 1,335
Number of shares issued as of Dec. 31, 2013 40,255 62,486
Number of shares outstanding as of Dec. 31, 2013 0 23,300 0 8,285 65,097 38,305
Number of beneficiaries 161 108 184 76 198 88
Vesting date 05 / 07 / 2013 05 / 19 / 2014 05 / 19 / 2013 05 / 19 / 2015 04 / 27 / 2014 04 / 27 / 2016
Date on which shares may be sold 05 / 07 / 2013 05 / 19 / 2014 05 / 19 / 2015 05 / 19 / 2015 04 / 27 / 2016 04 / 27 / 2016
Performance shares granted to the top ten employee beneficiaries Total number of (excluding Directors and executive corporate officers) of the Company free shares granted
Free shares granted during the year by the issuer or any other 0company within the scope of the share grant, to the ten employees(excluding Directors and executive corporate officers) of the issuer receiving the most shares
Unless an exception is granted by the Company,beneficiaries who are no longer employees, Directors orexecutive corporate officers in the Group by the end of
the vesting period lose part of their entitlement,determined on the basis of the nature of their departurefrom the Group.
315
6
2013 Reference Document ~ Kering
SHARE CAPITAL ~ SHARE CAPITAL AND OWNERSHIP STRUCTURE
06_VA_V6 14/04/14 11:34 Page315

Dividends paid out over the past three fiscal years
Year of payment Net dividend Qualifying for a tax allowance of
2013 €3.75 (1) 40%2012 €3.50 40%2011 €3.30 40%
(1) Plus an in-kind dividend in the form of a right to the allotment of Groupe Fnac shares (one Groupe Fnac share for every eight Kering shares held) based on avalue of €20.03 per Groupe Fnac share as of June 20, 2013, the day the shares were first listed.
The Board of Directors will propose to the Annual GeneralMeeting on May 6, 2014 the payment of a dividend of€3.75 per share eligible for dividends as of January 1, 2013
An interim dividend in the amount of €1.50 per sharewas paid on January 24, 2014 pursuant to a decision bythe Board of Directors on December 20, 2013.
If this dividend is approved, the balance of €2.25 pershare will have an ex-dividend date of May 8, 2014 andwill be payable as from May 13, 2014.
1.5. Appropriation of net income – Dividends paid by the Company
Appropriation of net income
At its meeting on February 20, 2014, the Board of Directors acknowledged and proposed the following net incomeappropriation to the Annual General Meeting:
(in €)
Source
Retained earnings 1,615,655,077.29Net income for the year 832,902,513.76Total for appropriation 2,448,557,591.05
Appropriation
Legal reserve (1) Dividend (2) 473,350,353.75Retained earnings 1,975,207,237.30Total 2,448,557,591.05
(1) No further charge to the legal reserve is proposed since the reserve stood at €51,354,910 as of December 31, 2013, i.e., above the minimum amount requiredby law (10% of the share capital).
(2) Representing a dividend of €3.75 per share qualifying for the 40% tax allowance, payable on May 13, 2014. This amount corresponds to the interim dividendpaid on January 24, 2014 (€189,340,141.50) plus an additional dividend of €284,010,212.25, equal to €2.25 per share, calculated on the basis of themaximum number of shares carrying dividend rights.
316 Kering ~ 2013 Reference Document
6 SHARE CAPITAL AND OWNERSHIP STRUCTURE ~ SHARE CAPITAL
06_VA_V6 14/04/14 11:34 Page316

To the Company’s knowledge, there are no contractualprovisions involving shares or voting rights of the Company
that should have been disclosed to the AMF pursuant toArticle L. 233-11 of the French Commercial Code.
1.7. Arrangements and agreements
In September 2010, the Artémis group issued €690 millionworth of bonds exchangeable for existing Kering shares.The exchangeable bonds were issued by Misarte, a 99.6%-owned subsidiary of Artémis.
This issue was carried out as part of the Artémis group’sstrategy to optimise its financial structure and diversifyits sources of financing. Holders of exchangeable bondsmay request to exchange their bonds for Kering shares,subject to any subsequent adjustments and Misarte’sright, instead of delivering the Kering shares, to pay all orpart of their exchange value in cash.
In order to facilitate the exchange or redemption of bondsfor Kering shares, 4,932,094 Kering shares to be deliveredto bond-holders were placed in escrow at the time of the issue.
Following the distribution of Groupe Fnac shares byKering on June 20, 2013, the exchange parity of the bondsissued by Misarte was adjusted, as was the number ofshares placed in escrow. The new exchange parity is 1.015Kering shares for one bond and the number of Keringshares placed in escrow as of December 31, 2013 was5,005,963.
The bonds, which were admitted for trading on the EuroMTF market of the Luxembourg stock exchange, will befully redeemed (with the exception of those redeemed inadvance) on January 1, 2016.
To the Company’s knowledge, any previous issues ofexchangeable bonds carried out by the Artémis grouphave not led to any changes in its shareholding structure.
1.6. Share pledges
As of December 31, 2013, 7,925,000 registered shares were pledged by the Artémis group.
Beneficiary Pledge Pledge Terms Number of % of theName of registered start date expiry date of release issuer shares issuer’s capitalshareholder of the pledges pledged pledged(2)
Artémis CA CIB 03 / 01 / 2007 Unspecified (1) 1,700,000 1.35%Artémis CA CIB 11 / 02 / 2011 Unspecified (1) 900,000 0.71%Artémis CA CIB 07 / 26 / 2012 Unspecified (1) 825,000 0.65%Artémis CA CIB 09 / 28 / 2012 Unspecified (1) 4,500,000 3.57%
(1) Full reimbursement or payment of the receivable.(2) Based on the share capital as of December 31, 2013, comprising 126,226,761 shares with a par value of €4 each.
317
6
2013 Reference Document ~ Kering
SHARE CAPITAL ~ SHARE CAPITAL AND OWNERSHIP STRUCTURE
06_VA_V6 14/04/14 11:34 Page317

Artémis is wholly owned by Financière Pinault, itselfcontrolled by the Pinault family. Artémis holds 57.5% ofthe Company’s voting rights and as such has de jurecontrol of the Company within the meaning of ArticleL. 233-3-I of the French Commercial Code.
On January 17, 2014, Harris Associates L.P. (4), based inChicago (the USA) and acting on behalf of funds andclients for whom it provides asset management services,reported that it had crossed above the 5% threshold ofKering’s share capital on January 14, 2014 and that itheld, on behalf of said funds and clients, 6,323,756shares representing an equal number of voting rights, i.e.,5.01% of the share capital and 3.53% of the Company’svoting rights. This threshold was crossed as a result of apurchase of Kering shares on the open market.
To the Company’s knowledge, no other shareholderdirectly, indirectly, or jointly holds 5% or more of theshare capital of voting rights.
Regarding the majority shareholder’s control of theCompany, the organisation and operating rules of theBoard and of its specialised Committees, the number ofindependent Directors – representing (i) more than athird of the Board members (who oversee the preventionof conflicts of interests and regularly carry out its self-assessment), (ii) two-thirds of the Audit Committee, and(iii) the majority of the Remuneration Committee, it beingspecified that no executive corporate officer is a memberof these Committees – general compliance with currentrules, internal rules and good governance practices allcontribute to maintaining a balanced control (seeChapter 4 “Corporate governance”).
Change in share ownership and voting rights as of December 31, 2013
2013 2012
Number % of Number % of Number % of Number % of of share of voting voting of share of voting voting shares capital rights rights(1) shares capital rights rights(1)
Artémis group 51,614,762 40.9% 103,155,543 57.5% 51,614,762 40.9% 98,988,548 56.5%Baillie Gifford see Note (2) below 6,399,935 5.1% 6,399,935 3.6%Kering 60,581 0.0% 60,581(3) 0.0% 25,073 0.0% 25,073(3) 0.0%Employees 501,256 0.4% 800,417 0.5% 451,932 0.4% 669,850 0.4%Free float 74,050,162 58.7% 75,302,913 42.0% 67,625,000 53.6% 69,143,852 39.5%
Total 126,226,761 100.0% 179,319,454 100.0% 126,116,702 100.0% 175,227,258 100.0%
2011
Number % of Number % of of share of voting voting shares capital rights rights(1)
Artémis group 51,614,762 40.6% 93,645,175 55.1%Baillie Gifford 6,399,935 5.0% 6,399,935 3.8%Kering 1,061,352 0.8 % 1,061,352(3) 0.6%Employees 407,324 0.3% 575,890 0.3%Free float 67,517,516 53.3% 68,316,550 40.2%
Total 127,000,889 100.0% 169,998,902 100.0 %
(1) Shares held for more than two years in a registered account in the name of the same shareholder carry double voting rights (see the section entitled “Generalinformation on the Company – Annual General Meetings” on page 325).
(2) On May 2, 2013, Baillie Gifford & Co, parent company of an investment management group based in Edinburgh (UK), acting on behalf of funds and clients underan asset management agreement, reported that, on April 30, 2013, it had crossed below the 5% threshold of Kering’s share capital and that it held, on behalf ofsaid funds and clients, 6,287,063 Kering shares representing an equal number of voting rights, i.e., 4.98% of the share capital and 3.56% of the Company’svoting rights.
(3) Theoretical voting rights, in the Annual General Meeting these shares lose their voting rights.
2. Share ownership structure
6 SHARE CAPITAL AND OWNERSHIP STRUCTURE ~ SHARE OWNERSHIP STRUCTURE
(4) Controlled by Natixis Global Asset Management, L.P., itself controlled by Natixis. Harris Associates L.P. claims to act independently of the person controlling it, underthe conditions laid down in Articles L. 233-9 II of the French Commercial Code and Articles 223-12 and 223-12-1 of the AMF’s General Regulations.
318 Kering ~ 2013 Reference Document
06_VA_V6 14/04/14 11:34 Page318

Change in the price of the Kering share compared to the CAC 40 index since January 1, 2013
Market price and trading volume of the Kering share
2013 2012 2011 2010 2009
High (in €) 184.5 144.5 132.2 128.3 93.3Low (in €) 140.3 106.4 90.5 81 36.3Price as of December 31 (in €) 153.7 140.9 110.7 119.0 84.2Market capitalisation as of December 31 (in € millions) 19,395 17,764 14,034 15,093 10,663Daily average volume (in number of shares) 254,343 317,960 385,265 453,415 701,105
Number of shares as of December 31 126,226,761 126,116,702 127,000,889 126,829,184 126,578,588
Source: Euronext.
BREAKDOWN OF SHARE CAPITAL AS OF DECEMBER 31, 2013
Source: Identifiable Bearer Security (Titre au Porteur Identifiable) as ofDecember 31, 2013.
As of December 31, 2013, private individual shareholdersheld 5.9% of the Group’s share capital. Institutionalinvestors owned 52.8% of the share capital, with 10.2%held by French companies and 42.6% by investorsresiding outside France.
Among the international institutional investors, NorthAmerican-based and UK-based shareholders held 15.3%and 13.8% of the share capital, respectively. ContinentalEuropean investors (excluding France) held 6.9% of theshare capital, including notably Norway (1.7%), theNetherlands (1.4%) and Switzerland (1.6%). Shareholdersbased in the Asia-Pacific region represent 2.9% of theshare capital.
Stock market information
Kering share
Place of listing NYSE Euronext Paris
Market Eurolist A
Benchmark index CAC 40
Initial public offering October 25, 1988 on the Second Market February 9, 1995 on the CAC 40
Number of shares 126,226,761 as of December 31, 2013
Tickers ISIN code: FR 0000121485Reuters: KER.PA
Bloomberg: KERFP
319
6
2013 Reference Document ~ Kering
SHARE OWNERSHIP STRUCTURE ~ SHARE CAPITAL AND OWNERSHIP STRUCTURE
Artémis group 40.9%Treasury shares 0.0%
Private individual 5.9%shareholders 5.9%
Employee 42,6%shareholders 0.4%
International 42,6%institutional investors 42.6%
French 42,6%institutional investors 10.2%
201301 02 03 04 05 06 07 08 09 10 11 12 01 02
2014
135
145
155
125
165
175
185
In €
CAC 40Kering
06_VA_V6 14/04/14 11:34 Page319

Listed securities of the Group as of December 31, 2013
Securities listed on the Paris Stock Exchange (SRD) ISIN code
EquitiesKering FR 00 00 121 485
Securities listed on the Luxembourg Stock Exchange ISIN code
BondsKering 8.625% April 2014 FR 00 10 744 987Kering 7.75% June 2014 FR 00 10 754 531Kering 6.50% November 2017 FR 00 10 784 082Kering 3.75% April 2015 FR 00 10 878 991Kering 1.875% October 2018 FR 00 11 584 929Kering 3.125% April 2019 FR 00 11 236 983Kering 2.50% July 2020 FR 00 11 535 764
Stock market data
Kering share
2012 Share price (in €) VolumeShares traded
Monthly Average NumberAverage High Low change daily €m of shares
January 117.2 123.1 110.7 +8.7% 264,634 681 5,821,943February 124.4 128.5 119.1 +6.1% 260,349 678 5,467,331March 131.2 136.9 124.1 +1.1% 327,917 941 7,214,172April 124.0 131.7 114.1 -2.1% 574,564 1,341 10,916,723May 120.6 127.0 114.1 -9.0% 427,367 1,145 9,402,063June 112.3 118.1 108.2 -2.4% 411,801 974 8,647,812July 112.6 123.8 106.4 +8.7% 425,207 1,059 9,354,558August 126.4 129.0 121.3 +1.8% 209,462 605 4,817,617September 124.0 128.9 118.9 -3.9% 330,633 816 6,612,658October 129.6 137.3 119.2 +13.6% 397,784 1,184 9,149,023November 137.4 144.2 132.5 +5.7% 240,834 725 5,298,354December 141.6 144.5 139.4 -1.8% 231,506 610 4,398,611
2013 Share price (in €) VolumeShares traded
Monthly Average NumberAverage High Low change daily €m of shares
January 149.2 159.9 142.0 +12.5% 298,194 989 6,560,258February 162.8 175.1 156.1 +8.4% 346,778 1,155 6,935,556March 172.3 179.5 168.7 -0.2% 294,733 1,034 5,894,656April 166.1 179.8 161.9 -2.5% 299,701 1,063 6,293,719May 169.3 177.2 166.5 +0.7% 241,112 912 5,304,460June 156.9 165.2 147.0 -4.2% 405,928 1,269 8,118,558July 168.3 178.6 155.7 +10.2% 269,147 1,042 6,190,374August 178.8 185.2 170.9 -0.7% 164,487 646 3,618,723September 171.5 177.7 163.6 -3.1% 230,052 824 4,831,088October 167.5 175.6 160.3 +1.0% 218,123 839 5,016,824November 164.5 169.0 161.1 -2.4% 170,815 589 3,587,114December 152.1 163.6 148.1 -5.9% 262,583 797 5,251,660
320 Kering ~ 2013 Reference Document
6 SHARE CAPITAL AND OWNERSHIP STRUCTURE ~ SHARE OWNERSHIP STRUCTURE
06_VA_V6 14/04/14 11:34 Page320

2014 shareholders’ agenda
April 24, 2014 2014 first-quarter revenue
May 6, 2014 Combined General Meeting
July 2014 2014 half-year results
October 2014 2014 third-quarter revenue
Financial communications policy
Kering’s financial communications policy endeavours todisseminate accurate and reliable information. Its actions aretargeted and customised to offer different audiences, privateindividual shareholders and the financial community,messages suited to their respective expectations whilecomplying with the principle of equal access to information.
Towards individual shareholders
Private individual shareholders have access to numerousmedia and tools to keep themselves informed on theGroup and on the life of the security. These include thetwice-yearly Letter to Shareholders, the shareholders’hotline in France (+33 1 45 64 65 64), the email address([email protected]), the financial notices in thepress and on the Internet, and the annual report.
Towards the financial community
The Group maintains close relationships with the Frenchand international financial community. A number ofinitiatives are designed to keep the financial communityinformed about its businesses, strategy and outlook.Kering has expanded its communication by organisingconference calls upon the release of quarterly revenueand half-year results, and meetings to present its annualresults. Kering also participates in industry conferences
held by major banks. All of the presentation material isavailable on the Group’s website. Kering also meets withinvestors during roadshows held in the major financialcentres around the world. In addition, the Group meetswith individual investors and analysts upon request andmaintains proactive relationships in terms of reporting tothe AMF (Autorité des marchés financiers).
Procedures for communicating regulatory information
Pursuant to obligations – applicable since January 20, 2007 –to disclose regulatory information resulting from theimplementation of the Transparency Directive in the AMF’sGeneral Regulations, Kering’s Financial CommunicationsDepartment oversees the proper and full disclosure ofregulatory information. This information is filed with the AMFat the time of its disclosure and stored on the Kering website.
Full and effective communication is carried out electronicallyin compliance with the criteria defined by the AMF’sGeneral Regulations which require communication to awide audience within the European Union and accordingto terms and conditions guaranteeing the security of thecommunication and information. Accordingly, Kering’sFinancial Communications Department has chosen tocall on a professional communications agency satisfying thecommunication criteria set by the General Regulations andfeatured on the list published by the AMF, thus benefitingfrom a presumption of full and effective communication.
2014 Share price (in €) VolumeShares traded
Monthly Average NumberAverage High Low change daily €m of shares
January 149.2 154.8 143.0 +3.6% 271,137 886 5,965,013February 150.9 157.5 145.6 +0.4% 263,507 795 5,270,132
Source: Euronext.
321
6
2013 Reference Document ~ Kering
SHARE OWNERSHIP STRUCTURE ~ SHARE CAPITAL AND OWNERSHIP STRUCTURE
06_VA_V6 14/04/14 11:34 Page321

322 Kering ~ 2013 Reference Document
06_VA_V6 14/04/14 11:34 Page322
3232013 Reference Document ~ Kering
CHAPTer 7
additional information
1. Additional information 3241.1. General information 3241.2. Information on trade payables – payment terms 326
2. Person responsible for the Reference Document 3272.1. Declaration by the person responsible for the Reference Document
and for the Annual Financial Report 327
3. Statutory Auditors 3283.1. Principal Statutory Auditors 3283.2. Substitute Statutory Auditors 328
4. Documents incorporated by reference 329
5. Cross-reference table to the disclosure requirements set out in Annex I of European Regulation No. 809 / 2004 330
6. Cross-reference table for the Management Report 333
7. Cross-reference table for the Annual Financial Report 335
8. Index 336
07_VA_V6 14/04/14 11:34 Page323
Company name and registered office
Company name: Kering
Registered office: 10, avenue Hoche, 75008 Paris, France
Legal form
A French joint stock company (société anonyme)
Applicable law
French law
Date of incorporation and term
The Company was incorporated on June 24, 1881 for aterm of 99 years. The term was extended to May 26, 2066by the Extraordinary General Meeting on May 26, 1967,except in the case of an early dissolution or of an extensionapproved by the Extraordinary General Meeting.
Corporate purpose
• the purchase, retail sale or wholesale, either directly orindirectly, by all means and using all existing or futuretechniques, of all goods, products, commodities or services;
• the creation, acquisition, leasing, operating or sale,either directly or indirectly, of all establishments, storesor warehouses, by all means and using all existing orfuture techniques, for the retail sale or wholesale of allgoods, products, commodities or services;
• the direct or indirect manufacture of all goods, productsor commodities that are useful for corporate operations;
• the direct or indirect supply of all services;
• the purchase, operation and sale of all buildings thatare useful for corporate operations;
• the creation of all commercial, non-trading, industrial andfinancial concerns, whether in moveable or real property,service or other businesses, the acquisition of participatinginterests by all means, subscription, acquisition, contribution,merger or otherwise in, to or of such concerns and businessesand the management of its participating interests;
• and, in general, all commercial, non-trading, industrial andfinancial operations, whether in moveable or real property,service or other businesses that can be directly or indirectlyconnected to the purposes specified above or to all similar,complementary or related purposes or purposes that areliable to favour the creation or development thereof.
(Article 5 of the Articles of Association)
Trade and Companies Registry
552 075 020 RCS Paris
APE code: 741 J
Consultation of legal documents
The Articles of Association, the minutes of Annual General Meetings and other corporate documents may be consulted at the registered office under the conditionsprovided for by law.
Fiscal year
The Company’s fiscal year begins on January 1 and endson December 31 of the same year.
Appropriation of earnings
From the profit for the fiscal year, less deferred losses whereapplicable, a minimum withdrawal of one-twentieth ismade and paid into a reserve fund known as the “legalreserve”. Said withdrawal ceases to be mandatory oncesaid reserve reaches one-tenth of the share capital.
From the distributable profit, which is made up of theprofit for the fiscal year less the deferred losses and thewithdrawal referred to above, as well as the amounts tobe paid into the reserves in accordance with the law, plus deferred profits, the Annual General Meeting, pursuantto a proposal by the Board of Directors, may withdraw allamounts it deems appropriate, either to be deferred tothe subsequent fiscal year, or to be entered into one ormore extraordinary, general or special reserve funds, theallocation and use of which is determined by the AnnualGeneral Meeting.
The balance, if any, is allocated among the shareholders.
The Annual General Meeting that votes on the financialstatements for the fiscal year has the option of grantingeach shareholder, for all or part of the dividend or interimdividend distributed, an option between the payment ofthe dividend or the interim dividend in cash, in kind or inshares. The Annual General Meeting may also decide, forall or part of the dividend, interim dividends, reserves, orpremiums distributed, or for any capital reduction, thatthe distribution of dividends, reserves or premiums or thecapital reduction will be made in kind in the form ofcorporate assets, including securities.(Article 22 of the Articles of Association)
1. Additional information
1.1. General information
324 Kering ~ 2013 Reference Document
7 ADDITIONAL INFORMATION ~ ADDITIONAL INFORMATION
07_VA_V6 14/04/14 11:34 Page324
Dividends not claimed after five years are paid to the State.
Dividends paid over the last three fiscal years arepresented in the Management Report.
Administrative and management bodies
Information regarding administrative and managementbodies is presented in the “Corporate governance” chapter.
Annual General Meetings – Double voting rights
Annual General Meetings are convened by the Board of Directors and deliberate on their agenda under theconditions provided for by the law and the regulations.
Meetings are held at the registered office or in any other place specified in the convening notice.
All shareholders may attend meetings, either in person orvia a proxy, under the conditions laid down by law, subjectto providing proof of their identity and of the title to theirsecurities, by the recognition of said securities in theaccounts in their name within the regulatory timeframes,either in the accounts of registered securities held by theCompany, or in the accounts of bearer securities held by anaccredited intermediary. Proof of the capacity of a shareholdercan be provided electronically, under the conditions setby the regulations in force. Pursuant to a decision of theBoard of Directors, shareholders may participate in meetingsvia video-conference or via telecommunications means thatmake it possible to identify them under the conditionslaid down by the regulations in force. All shareholders mayvote by correspondence using a form filled out and sentto the Company under the conditions laid down by theregulations in force, including electronically, pursuant to adecision by the Board of Directors. This form must reachthe Company in accordance with the regulatory conditionsin order to be taken into account. The Board of Directorsmay reduce said timeframe for the benefit of all shareholders.The owners of securities who are not resident on Frenchterritory may be represented by an intermediary who isregistered in accordance with the conditions laid downby the regulations in force.
Meetings are chaired by the Chairman of the Board ofDirectors or, in his / her absence, by the member of the Boardwho is specifically appointed for this purpose by theBoard. Failing this, the meeting elects its own chair.
Meeting minutes are prepared and copies thereof arecertified and issued in accordance with the law.
In all Annual General Meetings, a voting right that is doublethat conferred on the other shares is granted to all sharesthat are paid up in full and for which proof is providedthat they have been held in registered form for at leasttwo years in the name of the same shareholder. This doublevoting right, which existed in the Articles of Association ofPinault SA prior to its merger with Printemps SA, wasrestated at the time of their 1992 merger.
This double voting right may be withdrawn outright at anytime pursuant to a decision of the Extraordinary GeneralMeeting and after ratification by a special meeting of thebeneficiary shareholders.(Article 20 of the Articles of Association)
The double voting right existed in Pinault SA andPrintemps SA prior to their 1992 merger. The Company’sArticles of Association do not provide that, in the event of a free allocation of registered shares to a shareholder inrespect of old shares for which he / she / it had a doublevoting right, the new shares are also entitled to a doublevoting right.
Pursuant to the relevant legislation, double voting rights arecancelled for any share converted to a bearer share or in theevent of a transfer of ownership except in the case of a transferfollowing inheritance, liquidation of joint property betweenspouses, or donation between living family members (spouseor relative) with legal inheritance rights.
Voting rights are not limited under the Articles of Association.
The legal and regulatory provisions relating to the crossing ofthresholds by shareholders apply. The Company’s Articles ofAssociation do not include any special provision in this regard.
There are no shares that are non-representative of capital.
The steps required to amend shareholder rights are thoseprovided for by law.
Share capital
The Company is authorised to use the provisions of thelaw and regulations regarding the identification of theholders of securities that grant immediate or deferredaccess to voting rights at its own Annual General Meetings.(Article 7 of the Articles of Association)
In addition to the voting right that is granted to eachshare by the law and by the specific provisions of Article 20below, each share confers the right to a percentage,which is proportional to the number and par value of theexisting shares, of the corporate assets, profits afterdeduction of the withdrawals provided for by law and the Articles of Association, and liquidating dividend.
In order for all the shares to receive the same net amount,without distinction, and to be listed on the same line, theCompany shall, unless prohibited by law, pay the amountof any proportional tax that may be owed on certain sharesonly, in particular upon a winding up of the Company orcapital reduction; however, the Company will not make thispayment when the tax applies under the same conditionsto all the shares in the same class, if there are severalclasses of shares to which different rights are attached.
Each time it is necessary to possess more than one sharein order to exercise a right, it is the responsibility of the ownerswho do not possess such number to make arrangementsto regroup the required number of shares.(Article 8 of the Articles of Association)
325
7
2013 Reference Document ~ Kering
ADDITIONAL INFORMATION ~ ADDITIONAL INFORMATION
07_VA_V6 14/04/14 11:34 Page325
1.2. Information on trade payables – payment terms
Kering’s trade payables, amounting to €5.6 million as of December 31, 2013 (€5.1 million as of December 31, 2012), fall due in less than 60 days.
In the event of liquidation of the Company, the remainingshareholders’ equity after repayment of the par value ofthe shares will be allocated among the shareholders inthe same proportions as their holdings in the capital.(Article 24 of the Articles of Association)
Any changes in the share capital or the rights attached tosecurities comprised in the share capital are governed by the legal requirements and the specific provisions of the Articles of Association as set out below.
Under Article 15 of the Articles of Association, in theCompany’s internal organisation, decisions by the ChiefExecutive Officer relating to the issue of securities,regardless of their nature, require the prior approval bythe Board of Directors when such issues are likely tochange the share capital.
326 Kering ~ 2013 Reference Document
7 ADDITIONAL INFORMATION ~ ADDITIONAL INFORMATION
07_VA_V6 14/04/14 11:34 Page326

2. Person responsible for the Reference Document
Jean-François Palus
Group Managing Director
2.1. Declaration by the person responsible for the Reference Document and for the Annual Financial Report
Having taken all reasonable measures to that effect, I hereby attest that the information in this Reference Document is,to my knowledge, in accordance with the facts and contains no omission likely to affect its import.
I certify that, to my knowledge, the financial statements have been prepared in accordance with applicable accountingstandards and give a true and fair view of the assets, liabilities, financial position and results of the Company and theundertakings included in the consolidation, and that the Management Report (the cross-reference table for which isshown on page 333) includes a fair review of the development of the business, the results of operations and the financialposition of the Company and of all the undertakings included in the consolidation and also describes the main risksand uncertainties to which they are exposed.
I have obtained a statement from the Statutory Auditors, KPMG Audit and Deloitte & Associés, confirming that they haveaudited the information contained in this document relating to the financial position and the financial statementscontained herein, and that they have read this document in its entirety.
The annual consolidated and parent company financial statements of Kering SA shown in the Reference Document are subject to reports by the Statutory Auditors on pages 281-282 and 303-304 respectively of said document. TheStatutory Auditors’ report on the parent company financial statements contains an emphasis of matter regarding theinformation presented in the Management Report on remuneration paid and benefits granted to corporate officers.
Paris, April 9, 2014
Jean-François Palus
Group Managing Director (Directeur Général délégué)
327
7
2013 Reference Document ~ Kering
PERSON RESPONSIBLE FOR THE REFERENCE DOCUMENT ~ ADDITIONAL INFORMATION
07_VA_V6 14/04/14 11:34 Page327
328 Kering ~ 2013 Reference Document
7 ADDITIONAL INFORMATION ~ STATUTORY AUDITORS
3. Statutory Auditors
3.1. Principal Statutory Auditors
KPMG Audit, a department of KPMG SA
1, cours Valmy, 92923 Paris-La Défense Cedex
Hervé Chopin
Date of first appointment: Annual General Meeting on June 18, 1992.
Term and expiry: from May 19, 2010 until the Annual General Meeting called to approve the 2015 financial statements.
Deloitte & Associés
185, avenue Charles de Gaulle, 92524 Neuilly-sur-Seine Cedex
Antoine de Riedmatten
Date of first appointment: Annual General Meeting on May 18, 1994.
Term and expiry: from June 9, 2008 until the Annual General Meeting called to approve the 2013 financial statements.
3.2. Substitute Statutory Auditors
KPMG Audit IS
3, cours du Triangle, Puteaux, 92939 Paris-La Défense Cedex
Date of first appointment: Annual General Meeting on May 19, 2010.
Term and expiry: from May 19, 2010 until the Annual General Meeting called to approve the 2015 financial statements.
BEAS
7-9, Villa Houssay, 92524 Neuilly-sur-Seine Cedex
Date of first appointment: Annual General Meeting on May 19, 2005.
Term and expiry: from June 9, 2008 until the Annual General Meeting called to approve the 2013 financial statements.
07_VA_V6 14/04/14 11:34 Page328

329
7
2013 Reference Document ~ Kering
DOCUMENTS INCORPORATED BY REFERENCE ~ ADDITIONAL INFORMATION
In compliance with Article 28 of European Regulation no. 809 / 2004 dated April 29, 2004, this ReferenceDocument incorporates by reference the followinginformation, to which the reader is invited to refer:
• for the fiscal year ended on December 31, 2012: key figures,activities of the Group, activity report, investment policy,consolidated financial statements, parent companyfinancial statements and the related Statutory Auditors’reports, set out on pages 6-7, 16-42, 157-160, 169-260,264-282, 261-262 and 283-284 respectively of theReference Document filed on April 18, 2013 with the AMF;
• for the fiscal year ended on December 31, 2011: keyfigures, activities of the Group, activity report, investmentpolicy, consolidated financial statements, parentcompany financial statements and the related StatutoryAuditors’ reports, set out on pages 6-7, 15-57, 136-162,163-165, 173-262, 266-284, 263-264 and 285-286respectively of the Reference Document filed onMarch 21, 2012 with the AMF.
Information included in these two Reference Documentsother than that listed above is, where relevant, replaced orupdated by the information included in this ReferenceDocument. These two Reference Documents are availableat the Group’s registered office and on its website:www.kering.com, under the Finance section.
4. Documents incorporated by reference
07_VA_V6 14/04/14 11:34 Page329

5. Cross-reference table to the disclosure requirements set out in Annex 1 of European Regulation No. 809 / 2004
1. Person responsible
1.1. Name and position of the person responsible 3271.2. Declaration by the person responsible 327
2. Statutory Auditors
2.1. Names and addresses of the Statutory Auditors 3282.2. Resigned, removed or not reappointed N / A
3. Selected financial information and key figures 6-7
3.1. Selected historical financial information 6-73.2. Selected financial information for interim periods N / A
4. Risk factors 187-193, 252-261
5. Information about the Company
5.1. The Company’s history and development5.1.1. The Company’s legal and commercial name 3245.1.2. Place of registration and registration number 3245.1.3. Date of incorporation and term 3245.1.4. Registered office and legal form 3245.1.5. Important events in the development of the business 4-5, 157-158, 212-213
5.2. Investments5.2.1. Principal investments made by the Company for each fiscal year
for the period covered by the historical financial information 15-53, 183-1865.2.2. Principal investments in progress, the geographic distribution
of these investments (France and abroad) and the method of financing (internal or external) 214-216, 265-266
5.2.3. Information concerning the issuer’s principal future investments to which its management bodies are already firmly committed N / A
6. Business overview
6.1. Principal activities6.1.1. Nature of operations and principal activities 15-536.1.2. Significant new products and / or services introduced 29, 36-37, 39, 41, 50, 53
6.2. Principal markets 15-536.3. Exceptional factors 4-56.4. Any dependencies N / A6.5. The basis for any statements made by the Company regarding its competitive position 16-19, 22, 25, 29, 42, 48
7. Organisational structure
7.1. Brief description of the Group 8-137.2. List of the Company’s significant subsidiaries 13
8. Property, plant and equipment
8.1. Existing or planned material property, plant and equipment 175, 234-235, 2658.2. Environmental issues that may affect the utilisation of property, plant and equipment 75-95
330 Kering ~ 2013 Reference Document
7 ADDITIONAL INFORMATION ~ CROSS-REFERENCE TABLE
07_VA_V6 14/04/14 11:34 Page330

9. Operating and financial review
9.1. Financial position 156-1829.2. Operating results
9.2.1. Significant factors 1569.2.2. Material changes in revenue 159-1619.2.3. Any policy or factor that could affect the Company’s operations 8-13
10. Capital resources
10.1. Information concerning the Company’s capital resources (both short and long term) 174-176, 199, 23910.2. Sources and amounts of the Company’s cash flows 180-181, 198, 26510.3. Information on the borrowing terms and the funding structure of the Company 7, 177-179, 24510.4. Information regarding any restrictions on the use of capital resources that have
materially affected, or could materially affect, directly or indirectly, the Company’s operations 25210.5. Information regarding the anticipated sources of funds 246-251
11. Research and development, patents and licences N / A (1)
12. Trend information 182
13. Profit forecasts and estimates N / A (2)
14. Administrative, management and supervisory bodies and Executive Management
14.1. Administrative, management and supervisory bodies 117-125, 132-13314.2. Administrative, management and supervisory bodies
and Executive Management conflicts of interest 131-132
15. Remuneration and benefits
15.1. Remuneration of Directors and executive corporate officers 126-13115.2. Total amounts set aside or accrued to provide pension, retirement or similar benefits 240-243
16. Board practices
16.1. Expiry date of the current terms of office 118-12516.2. Members of the administrative, management or supervisory bodies’ service contracts 12616.3. Information on the Company’s Audit Committee and Remuneration Committee 140-14216.4. Statement of compliance with corporate governance rules in force in France 137
17. Employees
17.1. Number of employees 63-6417.2. Shareholdings and stock options 65-66, 313-31517.3. Arrangements for involving the employees in the capital of the Company 313
18. Major shareholders
18.1. Shareholders owning more than 5% of the share capital or voting rights 31818.2. Existence of different voting rights 318, 32518.3. Control of the Company 31818.4. Any arrangements, known to the Company, the operation
of which may at a subsequent date result in a change in its control N / A
19. Related-party transactions 270, 299
20. Financial information concerning the issuer’s assets and liabilities, financial position and profits and losses
20.1. Historical financial information 195-280, 284-30220.2. Proforma financial information N/A20.3. Financial statements 195-280, 284-30220.4. Auditing of historical annual financial information
20.4.1. Statement that the historical financial information has been audited 281-282, 303-30420.4.2. Other information audited by the Statutory Auditors 110-113, 152-153, 305-30720.4.3. Source of financial data not extracted from the issuer’s audited financial statements N / A
331
7
2013 Reference Document ~ Kering
CROSS-REFERENCE TABLE ~ ADDITIONAL INFORMATION
(1) Not significant given the Group’s business.(2) This Reference Document does not include any profit forecasts.
07_VA_V6 14/04/14 11:34 Page331
20.5. Date of latest financial information 195, 28420.6. Interim and other financial information N / A (3)
20.7. Dividend distribution policy 181, 31620.7.1. Amount of dividend per share adjusted, where the number
of shares in the issuer has changed, to make it comparable N / A
20.8. Legal and arbitration proceedings 19120.9. Significant change in the financial or trading position 157, 182
21. Additional information
21.1. Share capital21.1.1. Amount of issued capital 31021.1.2. Shares not representing capital N / A21.1.3. Shares held by the Company, on its behalf or by subsidiaries 310-31121.1.4. Amount of any convertible securities, exchangeable securities or securities with warrants N / A21.1.5. Information about the terms of any acquisition rights and / or any obligations
over capital issued but not paid-up or an undertaking to increase the capital N / A21.1.6. Information about the capital of any member of the Group which is under option
or agreed conditionally or unconditionally to be put under option N / A21.1.7. History of share capital 310
21.2. Memorandum and Articles of Association21.2.1. Corporate purpose 32421.2.2. Provisions with respect to the members of the Company’s administrative bodies 134-14321.2.3 Rights, preferences and restrictions attaching to each class of existing shares 324-32521.2.4. Action necessary to change the shareholders’ rights N / A21.2.5. Conditions governing the manner in which Annual General Meetings are called 32521.2.6. Provisions that would have an effect of delaying, deferring or preventing a change in control 14221.2.7. Provision governing the ownership threshold above which holdings must be disclosed 32521.2.8. Conditions, articles or Charter governing changes in the capital 325
22. Material contracts N / A (4)
23. Third party information and statements by experts and declarations of any interest N / A
24. Documents on display 321, 324, 329
25. Information on holdings 272-280, 300-301
7 ADDITIONAL INFORMATION ~ CROSS-REFERENCE TABLE
(3) No quarterly financial statements have been published between the closing of the annual financial statements and the publication of the Reference Document.(4) Not material.
332 Kering ~ 2013 Reference Document
07_VA_V6 14/04/14 11:34 Page332

6. Cross-reference table for the Management Report(Articles L. 225-100 et sEQ. of the French Commercial Code)
Position of the Company and activity over the past fiscal year 156-182
Results of operations of the Company, its subsidiaries and companies under their control 156-174
Key financial performance indicators 6-7
Review of the business, results of operations and financial position 156-182
Trade payables – Payment terms 326
Progress achieved and problems encountered 157, 177-181
Description of main risks and uncertainties 187-193, 252-261
Notes on the use of financial instruments: the Company’s financial risk management policies and objectives 252-261
Information on market risks (interest rate, foreign exchange and equity) 252-261
Information on country risks N / A
Significant events that have occurred between the end of the reporting period and the date of the Management Report 182
Planned development of the Company and of entities within the scope of the consolidation and outlook 182
List of positions held and duties performed by each Director (or equivalent) and executive corporate officer in all companies 118-125
Total remuneration and benefits in kind paid to each Director and executive corporate officer during the year (including the principles and rules used to determine the remuneration and benefits allocated to them) 126-131
Commitments of any kind entered into by the Company in favour of its Directors and executive corporate officers 126-131
Transactions by management, Directors and executive corporate officers in the Company’s securities 133
Key environmental and social indicators 62
Employee information 63-74
Employee share-ownership 315, 319
Environmental information 75-95
Information on the risk-reduction policy for technological accidents N / A
Significant shareholdings in companies with registered offices in France 158, 213
Changes in the presentation of the annual parent company or consolidated financial statements 156
Major shareholders, share ownership structure and voting rights as of December 31, 2013 318
Information on factors likely to have an impact in the event of a public offering 142
Company’s management structure 136-137
Special report on stock options and free share grants 313-315
Information on the share buy-back programme – transactions carried out by the Company in its own shares (number and average exchange price of purchases and sales, reasons for acquisitions and proportion of the capital they represent, etc..) 310-311
7CROSS-REFERENCE TABLE FOR THE MANAGEMENT REPORT ~ ADDITIONAL INFORMATION
3332013 Reference Document ~ Kering
07_VA_V6 14/04/14 11:34 Page333
Summary table showing the authorisations currently in force to increase the share capital 312
Five-year financial summary 302
Net income for the year and proposed appropriation of net income 316
Dividends paid during the last three fiscal years 316
Information on related-party agreements 299, 305
Information on the renewal of the terms of office of the Statutory Auditors 141
Research and development activity N / A
Works Council’s observations on the economic and employment situation N / A
Expenses that are not deductible for tax purposes N/A
334 Kering ~ 2013 Reference Document
7 ADDITIONAL INFORMATION ~ CROSS-REFERENCE TABLE FOR THE ANNUAL FINANCIAL REPORT
07_VA_V6 14/04/14 11:34 Page334

7. Cross-reference table for the Annual Financial Report(Article 222-3 of the amf’s general regulations)
Kering SA parent company financial statements 284-302
Kering group consolidated financial statements 195-280
Management Report refer to the cross-reference table for the Management Report
Statement by the person responsible for the Annual Financial Report 327
Statutory Auditors’ report on the financial statements 303-304
Statutory Auditors’ report on the consolidated financial statements 281-282
Fees paid to Statutory Auditors 308
Report by the Chairman of the Board of Directors on the conditions of preparation and organisation of the work performed by the Board, and on the internal control and risk management procedures implemented by the Company 134-151
Statutory Auditors’ report prepared in accordance with Article L. 225-235 of the French Commercial Code on the report prepared by the Chairman of the Board of Directors 152-153
335
7
2013 Reference Document ~ Kering
CROSS-REFERENCE TABLE FOR THE ANNUAL FINANCIAL REPORT ~ ADDITIONAL INFORMATION
07_VA_V6 14/04/14 11:34 Page335

8. Index
AAccounting methods and principles 140, 201, 279, 299
Activities
Consumer (see Fnac and Redcats)Luxury 4-13, 16-20, 22-23, 25-29, 32, 34-35, 37, 40-41, 57, 59-61, 64-65, 68, 73-75,
83-92, 94, 96, 98, 100, 102, 105-106, 111, 127, 132-133, 136-137, 139, 142-144,147-150, 157-167, 169-170, 174-176, 180-183, 185-187, 189-192, 211-213,
215, 218, 222-223, 231, 233, 236-237, 250, 256, 272-275, 280, 307, 314Sport & Lifestyle 4, 6-9, 12-13, 42-44, 46, 52, 57, 59, 68, 73, 75, 87-88, 99-100, 106,
120, 125, 127, 136, 139, 142-143, 149-150, 157, 159-161, 171, 173-175,180, 183, 186-187, 189-190, 192, 212, 218, 223, 231, 233, 236-237
AFEP-MEDEF Code 116-117, 129, 137-139, 141-142
Alexander McQueen 4, 9, 11, 13, 17, 20, 31-32, 48, 67, 70, 76-77, 92, 96, 106, 169, 272-274
Annual General Meeting 6, 8, 118-125, 128-130, 132, 135, 137-143, 157, 181-183, 201,212, 227, 240, 287, 302, 311-312, 314-316, 318, 324, 328
APE code (French activity code) 324
Arrangements and agreements 317
Artémis 118-120, 131, 141-142, 270, 299, 306, 317-319
Audit
internal 73, 139-141, 144, 147-150 social 11, 62, 100-101, 113, 190
BBalenciaga 4, 11, 13, 17-18, 20, 31, 33, 67, 71, 92, 96, 164-165, 169, 185, 272, 274-275
Black-out periods 133, 136, 146
Board of Directors
Composition of the Board of Directors 134Internal rules of the Board of Directors 136Work of the Board of Directors 132, 135-139
Bottega Veneta 4, 9-11, 13, 17-18, 20-21, 25-26, 37, 65-66, 69-70, 73, 75, 77, 83-86,88-90, 92, 96, 100-103, 105-106, 111, 113, 132-133, 137, 147,
158, 160-161, 164, 167, 175, 183, 185, 213-214, 272-275
Boucheron 4, 13, 17-18, 20, 31, 34, 37, 71, 74-76, 83, 89, 96,105, 106, 111, 113, 118, 169-170, 236, 272-275
Brioni 5, 8, 11, 13, 17, 20, 31, 35, 71, 75, 77, 83, 91, 96, 106, 118,120, 164-165, 170, 181, 184-185, 236, 266, 272-275
CCfao 4, 5, 118, 120, 162-163, 181, 184, 223, 225, 237, 266
Christopher Kane 5, 9, 13, 17, 20, 31, 36, 158, 164, 169-170, 176, 181, 183, 213, 265, 272, 300
COBRA 5, 48, 171-172, 278
Code of Business Practices 56, 98, 146
Code of ethics 12, 57, 59, 61, 66-67, 70, 74, 98-99, 110, 113, 146, 189, 190
336 Kering ~ 2013 Reference Document
7 ADDITIONAL INFORMATION ~ INDEX
07_VA_V6 14/04/14 11:34 Page336
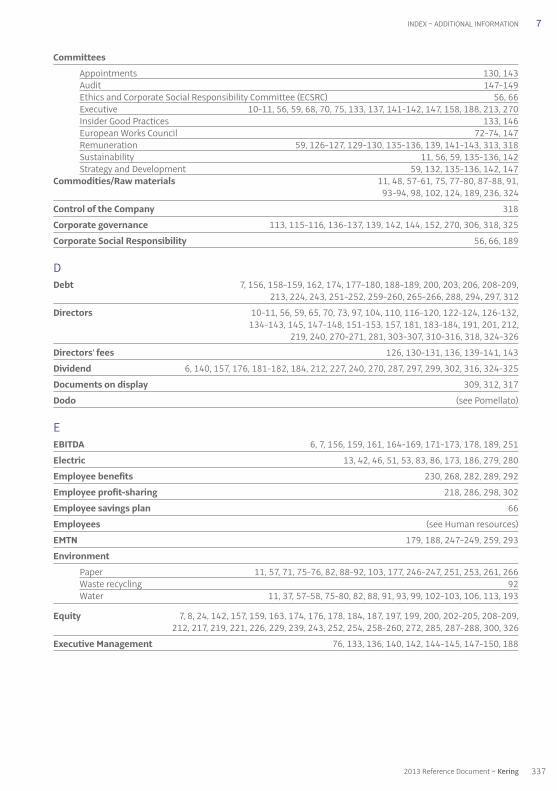
Committees
Appointments 130, 143Audit 147-149Ethics and Corporate Social Responsibility Committee (ECSRC) 56, 66Executive 10-11, 56, 59, 68, 70, 75, 133, 137, 141-142, 147, 158, 188, 213, 270 Insider Good Practices 133, 146European Works Council 72-74, 147Remuneration 59, 126-127, 129-130, 135-136, 139, 141-143, 313, 318Sustainability 11, 56, 59, 135-136, 142Strategy and Development 59, 132, 135-136, 142, 147
Commodities / Raw materials 11, 48, 57-61, 75, 77-80, 87-88, 91,93-94, 98, 102, 124, 189, 236, 324
Control of the Company 318
Corporate governance 113, 115-116, 136-137, 139, 142, 144, 152, 270, 306, 318, 325
Corporate Social Responsibility 56, 66, 189
DDebt 7, 156, 158-159, 162, 174, 177-180, 188-189, 200, 203, 206, 208-209,
213, 224, 243, 251-252, 259-260, 265-266, 288, 294, 297, 312
Directors 10-11, 56, 59, 65, 70, 73, 97, 104, 110, 116-120, 122-124, 126-132, 134-143, 145, 147-148, 151-153, 157, 181, 183-184, 191, 201, 212,
219, 240, 270-271, 281, 303-307, 310-316, 318, 324-326
Directors’ fees 126, 130-131, 136, 139-141, 143
Dividend 6, 140, 157, 176, 181-182, 184, 212, 227, 240, 270, 287, 297, 299, 302, 316, 324-325
Documents on display 309, 312, 317
Dodo (see Pomellato)
EEBITDA 6, 7, 156, 159, 161, 164-169, 171-173, 178, 189, 251
Electric 13, 42, 46, 51, 53, 83, 86, 173, 186, 279, 280
Employee benefits 230, 268, 282, 289, 292
Employee profit-sharing 218, 286, 298, 302
Employee savings plan 66
Employees (see Human resources)
EMTN 179, 188, 247-249, 259, 293
Environment
Paper 11, 57, 71, 75-76, 82, 88-92, 103, 177, 246-247, 251, 253, 261, 266Waste recycling 92Water 11, 37, 57-58, 75-80, 82, 88, 91, 93, 99, 102-103, 106, 113, 193
Equity 7, 8, 24, 142, 157, 159, 163, 174, 176, 178, 184, 187, 197, 199, 200, 202-205, 208-209,212, 217, 219, 221, 226, 229, 239, 243, 252, 254, 258-260, 272, 285, 287-288, 300, 326
Executive Management 76, 133, 136, 140, 142, 144-145, 147-150, 188
337
7
2013 Reference Document ~ Kering
INDEX ~ ADDITIONAL INFORMATION
07_VA_V6 14/04/14 11:34 Page337

FFair trade 76, 106
Financial and accounting information 134, 143, 145, 150
Financial communications 150, 321
Financial statementsconsolidated 134, 136, 148-150, 156, 159, 163, 182, 187-189, 191, 195,
200-205, 212, 214, 227, 237, 281-282, 299, 308, 329parent company 134, 284, 287, 327, 329, 335
Five-year financial summary 302
Fnac 4, 5, 10, 74, 105, 118-120, 139, 148, 156-157, 162-163, 176, 181, 183-184,212, 227-228, 240, 270, 275-276, 287, 290, 297-299, 302, 305, 308, 316-317
Free share grants 141, 220, 312-313
GGeneral information 318, 324
Girard-Perregaux 5, 13, 17, 20, 25, 31, 37, 69, 73, 75-76, 83, 86, 89, 91, 95, 106, 170
Gucci 8, 10-13, 17-18, 20-24, 37, 59, 64-68, 70-75, 77, 83,85-86, 88-90, 92-94, 96, 98-103, 105-106, 111, 113, 118-120, 132-133, 137, 147,
158, 160-161, 163-166, 175, 183, 185, 202, 213-214, 236-237, 250, 272-275, 280, 307
Gucci Group 4, 5, 74, 118-120, 272, 274-275, 307
HHighlights 23, 26, 29, 49, 61, 79, 104, 157-158, 200, 212-213, 287
History 4, 37, 39, 48-50, 68, 79, 125, 170
HOME the film 56, 76
Human resources 10, 59, 63-65, 67-68, 74, 76, 104, 110, 133, 146-147, 150, 191, 313
IIFRS 130, 156, 163, 176, 183-184, 189, 201-204, 209-211,
218-219, 227, 248-249, 260, 266
Insurance 66, 73, 128, 134, 140, 143, 150-151, 190, 192-193, 241, 243
Internal control
Internal control procedures 143-145, 149-150, 153Chairman’s report (section on internal control) 116, 139, 152-153, 192
Internal rules 116, 136, 139-140, 144, 318
Investment policy 79, 183, 185, 329
JJEANRICHARD 5, 13, 17, 20, 31, 37, 73, 75-76, 83, 86, 89, 91, 95, 106, 164, 170
338 Kering ~ 2013 Reference Document
7 ADDITIONAL INFORMATION ~ INDEX
07_VA_V6 14/04/14 11:34 Page338

KKering Foundation 12, 76, 96-97, 104-106, 111, 113
Kering share
Pledges 317Share performance 221Stock market prices 206Treasury shares 176, 197, 199, 209, 211, 229-230, 239-240, 266, 288, 290-292, 299, 306, 310-311, 319
Key figures 21-22, 25, 28, 31, 47-48, 51, 62, 68, 140, 329
LLa Redoute 4, 5, 10, 73-74, 140, 157, 163, 182, 184, 212-213, 228, 271, 276-277, 287, 292
Luxury (see Activities)
MMcQ (see Alexander McQueen)
NNon-controlling interests 163, 176-177, 195-198, 203-205, 208, 211, 228, 230
Non-voting Directors 132, 135, 137, 139
OOCEANE bonds 208
Organisational structure of the Group 13
Ownership structure 309, 318
PPension plan 128, 131, 196, 230-231, 240
Pomellato 5, 9, 13, 17, 20, 31, 38, 77, 120, 139, 158-159, 164-165, 169-170,174, 176-177, 181, 183, 185-186, 213, 247, 265, 272-275
Public offer (impact) 142, 184
PUMA 4-5, 8, 10-13, 42, 46-50, 56, 67, 69, 70-72, 75, 79, 83, 85, 89, 92-94, 98-103, 106, 111, 113,118, 120, 125, 131, 132-133, 137, 140, 144, 147-148, 158, 160-163, 171-172, 175-176,180-182, 184-186, 213, 215, 219, 221-223, 225, 236-237, 244, 251, 266, 277-279, 306
QQeelin 5, 9, 13, 17, 20, 31, 39, 158, 164-165, 169-170, 183, 185-186, 213, 265, 272-273, 275
RRedcats 4-5, 10, 73-74, 118, 120, 140, 148, 156-157, 163, 174, 176, 181, 183-185, 212-213,
227-228, 247, 251, 267, 276-277, 287, 290, 298, 300
Remuneration
paid to executive corporate officers 143paid to other corporate officers (see Directors’ fees)
339
7
2013 Reference Document ~ Kering
INDEX ~ ADDITIONAL INFORMATION
07_VA_V6 14/04/14 11:34 Page339

Reports
business review 8, 159Chairman’s report 116, 139, 152-153, 192parent company Management Report 329Statutory Auditors’ report (see Statutory Auditors)
Risk
credit 192, 259, 263equity 187, 200, 203, 208, 252, 258-259financialforeign exchange 187-188, 208, 255, 258 insurance 192interest rate 156, 188, 209, 252-254, 259, 295legal 191operational 189prevention (see Risk prevention)
Risk prevention 72, 192
SSaint Laurent (voir Yves Saint Laurent)
Securities market 318, 319
Seller’s warranties 175-176, 246, 267
Sergio Rossi 4, 11, 13, 17, 20, 31, 40, 67, 75-76, 83, 90, 103, 105, 162, 170, 223, 236-237, 272-275
Share buy-back (programme) 140, 142, 187, 311
Share capital 129, 137, 176, 184, 197-199, 211, 239, 266, 270, 285-287, 290, 299-300, 302, 309-313, 315-319, 324-326
Share capital transactions 310Share capital structure 318
Sport & Lifestyle (see Activities)
Staff 68-69, 72, 92, 104-105, 133, 146, 149, 191, 210, 271, 289
Statutory Auditors 110, 140-141, 147-150, 152-153, 281-282, 299, 303-305, 307-308, 327-329
Engagement 99, 153, 305Fees 98, 126, 130-131, 136, 139-141, 143, 193, 223, 270, 288-289, 297, 299, 308Reports
by the Chairman 152-153on related-party agreements and commitments 305, 306 on sustainability 110on the consolidated financial statements 281on the financial statements 141
Stella McCartney 4, 9, 11, 13, 17, 20, 31, 41, 67, 70, 77, 83, 85-86, 88-92, 94, 96, 98-99, 103,105-106, 118, 170, 272-275
Stock options (see Stock subscription and purchase options)
Stock-market prices 206
Stock subscription and purchase options 313
Strategy 4, 8-11, 23-24, 26, 29, 33, 36-37, 39, 41, 49, 52-53, 56-57, 59-60, 68-69, 73-77,79-81, 97-98, 101-102, 104, 111, 122, 132, 134-137, 140, 142-143,
147, 164-169, 171, 182-183, 223, 227, 240, 244, 252, 306, 313, 317, 321
Subsidiaries and investments 300
Suppliers 11, 57-59, 61-62, 71, 78-80, 83-85, 87-89, 91, 93-103, 146, 189-190
340 Kering ~ 2013 Reference Document
7 ADDITIONAL INFORMATION ~ INDEX
07_VA_V6 14/04/14 11:34 Page340

TTrade and Companies Registry 201, 324
Thresholds 220, 325
Tretorn 48, 277-278
VVolcom 5, 9, 13, 42, 46, 51-52, 67, 76, 83, 85-86, 88, 90, 92, 94, 96, 99, 100-101, 103-104,
106, 111, 113, 118, 120, 173, 186, 236, 279-280
Voting rights 142, 203-204, 270, 304, 306, 310, 317-318, 325
YYves Saint Laurent 4, 28-29, 103, 118-120, 160-161, 164-165, 168, 175, 185-186, 272-275
341
7
2013 Reference Document ~ Kering
INDEX ~ ADDITIONAL INFORMATION
07_VA_V6 14/04/14 11:34 Page341

Kering
Société anonyme (a French corporation) with a share capital of €504,907,044Registered office: 10 avenue Hoche – 75381 Paris Cedex 08
552 075 020 RCS Paris
Tel.: +33 1 45 64 61 00 – Fax: +33 1 45 64 60 00kering.com
This document was produced by an “Imprim’Vert” eco-responsible printer on PEFC certified paper from sustainably managed forests.
Design and Production: Agence Marc Praquin