Extending stratified datalog to capture complexity classes ranging from ${\cal P} to {\cal QH}$
Upload
khangminh22Category
view
0download
0
2015 HEDIS® Aggregate Report for Medi-Cal Managed Care
Managed Care Quality and Monitoring Division California Department of Health Care Services
January 2016 (Revised March 2016)

2015 HEDIS Aggregate Report
—Draft Copy for Review— 2015 HEDIS Aggregate Report Page i California Department of Health Care Services Health Services Advisory Group, Inc.
TABLE OF CONTENTS
COMMONLY USED ABBREVIATIONS AND ACRONYMS iii
1. EXECUTIVE SUMMARY 1
2. INTRODUCTION 4
CMS and State Requirements 4 Medi-Cal Managed Care Overview 5 Medi-Cal Managed Care Delivery System 8 How DHCS Uses Performance Measures 9
3. READER’S GUIDE AND METHODOLOGY 15
About HEDIS 15 How HEDIS Results Are Calculated and Displayed 15 How to Interpret Results 22
4. VALIDATING EXTERNAL ACCOUNTABILITY SET PERFORMANCE MEASURES 26
About Performance Measure Validation 26 HEDIS Audit Results 26 HEDIS Reporting Capabilities 27
5. FULL-SCOPE MANAGED CARE HEALTH PLANS’ PERFORMANCE MEASURE RESULTS 30
Medi-Cal Managed Care Weighted Averages 30 All-Cause Readmissions 32 Annual Monitoring for Patients on Persistent Medications 38 Avoidance of Antibiotic Treatment in Adults With Acute Bronchitis 51 Cervical Cancer Screening 57 Childhood Immunization Status—Combination 3 62 Children and Adolescents’ Access to Primary Care Practitioners 67 Comprehensive Diabetes Care—Blood Pressure Control (<140/90 mm Hg) 82 Comprehensive Diabetes Care—Eye Exam (Retinal) Performed 87 Comprehensive Diabetes Care—HbA1c Testing 92 Comprehensive Diabetes Care—HbA1c Control (<8.0 Percent) 95 Comprehensive Diabetes Care—Medical Attention for Nephropathy 100 Comprehensive Diabetes Care—HbA1c Poor Control (>9.0 Percent) 104 Controlling High Blood Pressure 109 Immunizations for Adolescents—Combination 1 115 Medication Management for People with Asthma 121 Prenatal and Postpartum Care—Postpartum Care 131 Prenatal and Postpartum Care—Timeliness of Prenatal Care 138 Use of Imaging Studies for Low Back Pain 144

TABLE OF CONTENTS
2015 HEDIS Aggregate Report Page ii California Department of Health Care Services Health Services Advisory Group, Inc.
Weight Assessment and Counseling for Nutrition and Physical Activity for Children/Adolescents 150
Well-Child Visits in the Third, Fourth, Fifth, and Sixth Years of Life 162
6. SPECIALTY MCP PERFORMANCE MEASURE RESULTS 168
AIDS Healthcare Foundation 168 Family Mosaic Project 173 SCAN Health Plan 176
7. AMBULATORY CARE USE OF SERVICES MEASURE RESULTS 179
Ambulatory Care 179
8. SENIORS AND PERSONS WITH DISABILITIES POPULATION 186
Performance Measure Results 186
9. FINDINGS, CONCLUSIONS, AND RECOMMENDATIONS 210
Background 210 Performance Measure HEDIS Compliance Audit—Key Findings 211 Comparisons to National Benchmarks 211 Conclusions and Recommendations 219
APPENDIX A. TREND TABLES A-1
APPENDIX B. SPD TREND TABLES B-1
APPENDIX C. NON-SPD TREND TABLES C-1
APPENDIX D. MEDI-CAL MANAGED CARE HEDIS 2015 AT-A-GLANCE PERFORMANCE SUMMARY D-1
—Draft Copy for Review— 2015 HEDIS Aggregate Report Page iii California Department of Health Care Services Health Services Advisory Group, Inc.
COMMONLY USED ABBREVIATIONS AND ACRONYMS
Following is a list of abbreviations and acronyms used throughout this report.
AHRQ—Agency for Healthcare Research and Quality
CDC—Centers for Disease Control and Prevention
CMS—Centers for Medicare & Medicaid Services
COHS—County-Organized Health System
CP—commercial plan
DHCS—California Department of Health Care Services
EAS—External Accountability Set
EQR—external quality review
EQRO—external quality review organization
ESRD—end-stage renal disease
FFS—fee-for-service
GMC—Geographic Managed Care
HEDIS®—Healthcare Effectiveness Data and Information Set1
HPL—high performance level
HSAG—Health Services Advisory Group, Inc.
IHI— Institute for Healthcare Improvement
IS—information systems
LI—local initiative
MCMC—Medi-Cal Managed Care
MCP—Medi-Cal managed care health plan
MHPA— Medicaid Health Plans of America
MPL—minimum performance level
MY—measurement year
NA—an audit result denoting Small Denominator, meaning that although an MCP may have complied with all applicable specifications, the MCP’s denominator is too small to report (less than 30)
NCQA—National Committee for Quality Assurance
1 HEDIS® is a registered trademark of the National Committee for Quality Assurance (NCQA).

COMMONLY USED ABBREVIATIONS AND ACRONYMS
2015 HEDIS Aggregate Report Page iv California Department of Health Care Services Health Services Advisory Group, Inc.
Non-SPD—Non-Seniors and Persons with Disabilities
PCP—primary care provider
QIP—quality improvement project
RY—reporting year
SPD—Seniors and Persons with Disabilities
TPM—Two-Plan Model
WIC—Women, Infants, and Children

2015 HEDIS Aggregate Report Page 1 California Department of Health Care Services Health Services Advisory Group, Inc.
2015 HEDIS Aggregate Report
1. EXECUTIVE SUMMARY
The Centers for Medicare & Medicaid Services (CMS) requires that states, through their contracts with managed care health plans (MCPs), measure and report on performance to assess the quality and appropriateness of care and services provided to beneficiaries. In response, the California Department of Health Care Services (DHCS) implemented a monitoring system to provide an objective, comparative review of the Medi-Cal Managed Care (MCMC) MCPs’ quality-of-care outcomes and performance measures called the External Accountability Set (EAS). DHCS designates performance measures annually and requires MCPs to report on them.
During the 2014 calendar year, DHCS held contracts with 23 full-scope MCPs and three specialty MCPs. The DHCS reporting year (RY) 2015 EAS for the full-scope MCPs included 14 Healthcare Effectiveness Data and Information Set (HEDIS®) measures developed by the National Committee for Quality Assurance (NCQA) and one measure developed by DHCS and the MCPs, with guidance from the external quality review organization (EQRO), to be used for the statewide collaborative quality improvement project (QIP). Several of the HEDIS measures include more than one indicator, bringing the total measure rates required for MCP reporting to 30. In addition to reporting the EAS in 2015, full-scope MCPs were required to report separate rates for their Seniors and Persons with Disabilities (SPD) and non-SPD populations for a selected group of measures.
Due to the small size of specialty MCP populations, DHCS established different performance measure requirements for the specialty MCPs. Instead of requiring a specialty MCP to annually report the full list of performance measure rates as full-scope MCPs do, DHCS requires specialty MCPs to report only two performance measures. In collaboration with DHCS, a specialty MCP may select HEDIS measures or develop measures that are appropriate to the MCP’s Medi-Cal population. The measures put forth by the specialty MCP are subject to DHCS approval.
The full-scope MCP performance measure results for RY 2015, which represent calendar year 2014 data, indicate overall improvement across the State. DHCS held 43 MCP reporting units accountable to meet the minimum performance levels (MPLs) in RY 2015 and 44 MCP reporting units accountable in RY 2014, for 22 measures each year. In RY 2015, 81 percent of the reporting unit rates for which comparisons could be made to the MPLs were above the MPLs as compared to RY 2014, where 80 percent of the reporting unit rates were above the MPLs. Further, in RY 2015, 11 percent of the reporting unit rates were above the high performance levels (HPLs). While this is an improvement over the prior year, variability in MCP performance continues.
MCPs’ performance was best for the following measures:
Use of Imaging Studies for Low Back Pain

EXECUTIVE SUMMARY
2015 HEDIS Aggregate Report Page 2 California Department of Health Care Services Health Services Advisory Group, Inc.
Weight Assessment and Counseling for Nutrition and Physical Activity for Children/Adolescents—BMI Assessment: Total, Nutrition Counseling: Total, and Physical Activity: Total
Although there are many opportunities for improvement, HSAG identified several measures for DHCS to consider as priority areas for improvement based on declining performance and the number of rates below the DHCS-established MPLs, which are the national Medicaid 25th percentiles. While some of the rates below the MPLs were for counties/regions reporting rates for the first time, all MCPs with rates below the MPLs should be striving to improve rates to above the MPLs. HSAG identified the following measures as having the most opportunities for improvement:
All-Cause Readmissions (Note that since this measure is not a HEDIS measure, no MPL or HPL is established. The recommendation for improvement is based on MCPs’ declining performance for this measure from RY 2014 to RY 2015.)
Annual Monitoring for Patients on Persistent Medications—ACE Inhibitors or ARBs and Diuretics Children and Adolescents’ Access to Primary Care Practitioners—12 to 24 Months, 25 Months to 6 Years, 7
to 11 Years, and 12 to 19 Years (Note that while MPLs and HPLs for these measures exist, due to the small range of variation between the MPL and HPL thresholds for these measures, DHCS did not hold the MCPs accountable to meet the MPLs. HSAG recommends that MCPs strive to improve and perform above the MPLs.)
Cervical Cancer Screening Medication Management for People with Asthma—Medication Compliance 50% (Total) and Medication
Compliance 75% (Total) Prenatal and Postpartum Care—Postpartum Care and Timeliness of Prenatal Care Child Immunization Status—Combination 3 Comprehensive Diabetes Care—Eye Exam (Retinal) Performed
As in RY 2013 and RY 2014, most MCP counties had SPD rates that were significantly higher than the non-SPD rates for the Annual Monitoring for Patients on Persistent Medications—ACE Inhibitors or ARBs and Diuretics measures. The higher rates for these measures may be attributed to SPD beneficiaries having more health care needs, resulting in them being seen more regularly by providers and leading to better monitoring of care. For the third consecutive year, the SPD population had a significantly higher rate of hospital readmissions than the non-SPD population, which is also expected based on the greater and often more complicated health needs of these beneficiaries. For several MCP counties/regions, SPD rates were significantly lower than the non-SPD rates. The lower SPD rates for these measures may be attributed to beneficiaries in the SPD population relying on specialist providers as their care sources, based on complicated health care needs, rather than accessing care from PCPs, as well as the SPD population potentially having poorer health than the general Medi-Cal population.

EXECUTIVE SUMMARY
2015 HEDIS Aggregate Report Page 3 California Department of Health Care Services Health Services Advisory Group, Inc.
The three specialty MCPs had mixed results. Notable results include:
AIDS Healthcare Foundation’s (AHF’s) rate for the Colorectal Cancer Screening measure improved significantly from RY 2014 to RY 2015, resulting in the rate moving from below the MPL in RY 2014 to above the MPL in RY 2015 and to above the Healthy People 2020 goal. The MPL for this measure is based on the national commercial 25th percentile since there are no Medicaid benchmarks for this measure.
SCAN Health Plan’s rate for the Breast Cancer Screening measure improved significantly from RY 2014 to RY 2015 and remained above the national Medicaid 90th percentile (HPL) for the third consecutive year.

2015 HEDIS Aggregate Report Page 4 California Department of Health Care Services Health Services Advisory Group, Inc.
2. INTRODUCTION
CMS and State Requirements
CMS requires that states, through their contracts with MCPs, measure and report on performance to assess the quality and appropriateness of care and services provided to beneficiaries. In response, DHCS implemented a monitoring system to provide an objective, comparative review of MCMC MCPs’ quality-of-care outcomes and performance measures. DHCS designates a set of performance measures called the EAS annually and requires MCPs to report on them.
During the 2014 calendar year, DHCS held contracts with 23 full-scope MCPs and three specialty MCPs to provide health care services to almost 9 million beneficiaries enrolled in MCMC.2
The DHCS RY 2015 EAS for the full-scope MCPs consisted of 14 HEDIS measures developed by NCQA and one measure developed by DHCS and the MCPs, with guidance from the EQRO, to be used for the statewide collaborative QIP. The HEDIS data set is a nationally recognized and standardized set of performance measures used by consumers, employers, government agencies, legislators, advocates, and potential purchasers to assess the quality of care provided within an MCP’s Medicare, Medicaid, and commercial lines of business.
Several of the 14 HEDIS measures include more than one indicator, bringing the total performance measures required for full-scope MCPs to 30. In this report, “performance measure” or “measure” (rather than indicator) is used to describe the required EAS measures. The required measures provide information on access to care for women, adolescents, and children; use of imaging studies for low back pain; screening for diseases such as cervical cancer; weight assessment and counseling for nutrition and physical activity for children and adolescents; care provided to beneficiaries with chronic diseases such as diabetes; hospital readmissions rates; and utilization of outpatient and emergency department care.
In addition to reporting the EAS in 2015, full-scope MCPs were required to report separate rates for their Seniors and Persons with Disabilities (SPD) and non-SPD populations for a selected group of measures using DHCS-identified aid codes.
DHCS established different performance measure requirements for the specialty MCPs because of the unique population characteristics of their membership and relatively small overall population size. Instead of requiring a specialty MCP to annually report the full list of performance measure rates as full-scope MCPs do, DHCS requires specialty MCPs to report only two performance
2 Medi-Cal Managed Care Enrollment Report, December 2014. Available at:
http://www.dhcs.ca.gov/dataandstats/reports/Pages/MMCDMonthlyEnrollment.aspx. Accessed on: September 13, 2015.

INTRODUCTION
2015 HEDIS Aggregate Report Page 5 California Department of Health Care Services Health Services Advisory Group, Inc.
measures. In collaboration with DHCS, a specialty MCP may select HEDIS measures or develop measures that are appropriate to the MCP’s population. The measures put forth by the specialty MCP are subject to DHCS approval. Furthermore, the specialty MCP must report performance measure results specific to the MCP’s MCMC beneficiaries, not for the MCP’s entire population.
As part of the EAS, DHCS requires MCPs to undergo an NCQA HEDIS Compliance Audit™3 conducted by an EQRO. The EQRO assesses the MCPs’ information systems (IS) capabilities and compliance with HEDIS specifications to ensure standardized reporting of performance measure results. For MCPs reporting non-HEDIS measures, the EQRO uses the CMS protocol for validating performance measures.4 DHCS contracted with Health Services Advisory Group, Inc. (HSAG), to perform these on-site compliance audits in 2015, analyze MCMC HEDIS and non-HEDIS rates objectively, and evaluate each MCP’s current performance level relative to local and national thresholds and benchmarks.
This report presents MCMC HEDIS 2015 results for the 2014 measurement year (MY) of January 1, 2014, through December 31, 2014, for all MCPs reporting rates for the MY, except Family Mosaic Project. The RY 2015 results for Family Mosaic Project are for non-HEDIS measures, but are for the same 2014 MY as the other MCPs. Additionally, results are presented for the All-Cause Readmissions measure, which was developed for the statewide collaborative QIP and is not a HEDIS measure. Full-scope MCP results are included in Section 5 of this report, and specialty MCP results are included in Section 6.
Medi-Cal Managed Care Overview
In the State of California, DHCS administers the Medicaid Program (Medi-Cal) through its fee-for-service (FFS) and managed care delivery systems.
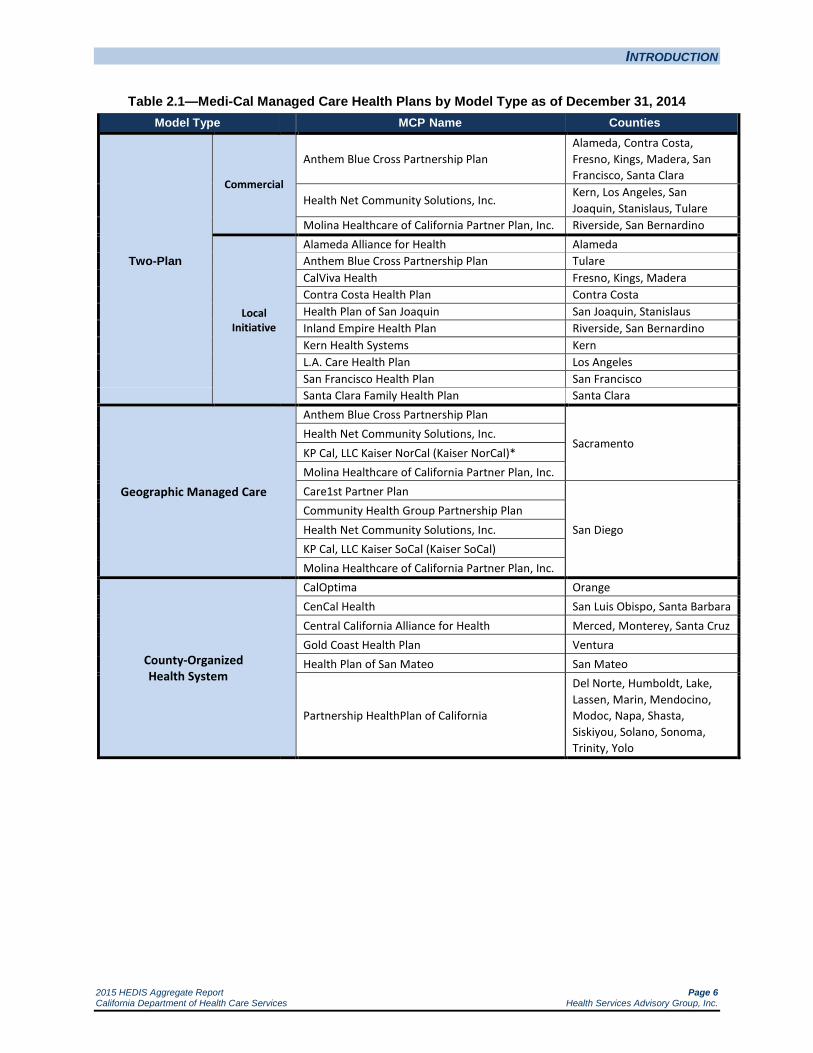
During MY 2014, DHCS contracted with 23 full-scope MCPs and three specialty MCPs to provide health care services throughout California in all 58 counties. DHCS operates MCMC through a service delivery system that encompasses six models of managed care for its full-scope services: the Two-Plan Model (TPM)—both local initiative (LI) and commercial plan (CP), the Geographic Managed Care (GMC) model, the County Organized Health System (COHS) model, the Regional Model (RM), the Imperial model, and the San Benito model. DHCS monitors MCP performance across model types. Table 2.1 shows participating MCPs by model type.
3 NCQA HEDIS Compliance AuditTM is a trademark of NCQA. 4 Department of Health and Human Services, Centers for Medicare & Medicaid Services. EQR Protocol 2: Validation of
Performance Measures Reported by the MCO: A Mandatory Protocol for External Quality Review (EQR), Version 2.0, September 2012. Available at: http://www.medicaid.gov/Medicaid-CHIP-Program-Information/By-Topics/Quality-of-Care/Quality-of-Care-External-Quality-Review.html. Accessed on: September 13, 2015.
INTRODUCTION
2015 HEDIS Aggregate Report Page 6 California Department of Health Care Services Health Services Advisory Group, Inc.
Table 2.1—Medi-Cal Managed Care Health Plans by Model Type as of December 31, 2014 Model Type MCP Name Counties
Two-Plan
Commercial
Anthem Blue Cross Partnership Plan Alameda, Contra Costa, Fresno, Kings, Madera, San Francisco, Santa Clara
Health Net Community Solutions, Inc. Kern, Los Angeles, San Joaquin, Stanislaus, Tulare
Molina Healthcare of California Partner Plan, Inc. Riverside, San Bernardino
Local Initiative
Alameda Alliance for Health Alameda Anthem Blue Cross Partnership Plan Tulare CalViva Health Fresno, Kings, Madera Contra Costa Health Plan Contra Costa Health Plan of San Joaquin San Joaquin, Stanislaus Inland Empire Health Plan Riverside, San Bernardino Kern Health Systems Kern L.A. Care Health Plan Los Angeles San Francisco Health Plan San Francisco
Santa Clara Family Health Plan Santa Clara
Geographic Managed Care
Anthem Blue Cross Partnership Plan
Sacramento Health Net Community Solutions, Inc. KP Cal, LLC Kaiser NorCal (Kaiser NorCal)* Molina Healthcare of California Partner Plan, Inc. Care1st Partner Plan
San Diego Community Health Group Partnership Plan Health Net Community Solutions, Inc. KP Cal, LLC Kaiser SoCal (Kaiser SoCal) Molina Healthcare of California Partner Plan, Inc.
County-Organized Health System
CalOptima Orange CenCal Health San Luis Obispo, Santa Barbara Central California Alliance for Health Merced, Monterey, Santa Cruz Gold Coast Health Plan Ventura Health Plan of San Mateo San Mateo
Partnership HealthPlan of California
Del Norte, Humboldt, Lake, Lassen, Marin, Mendocino, Modoc, Napa, Shasta, Siskiyou, Solano, Sonoma, Trinity, Yolo
INTRODUCTION
2015 HEDIS Aggregate Report Page 7 California Department of Health Care Services Health Services Advisory Group, Inc.
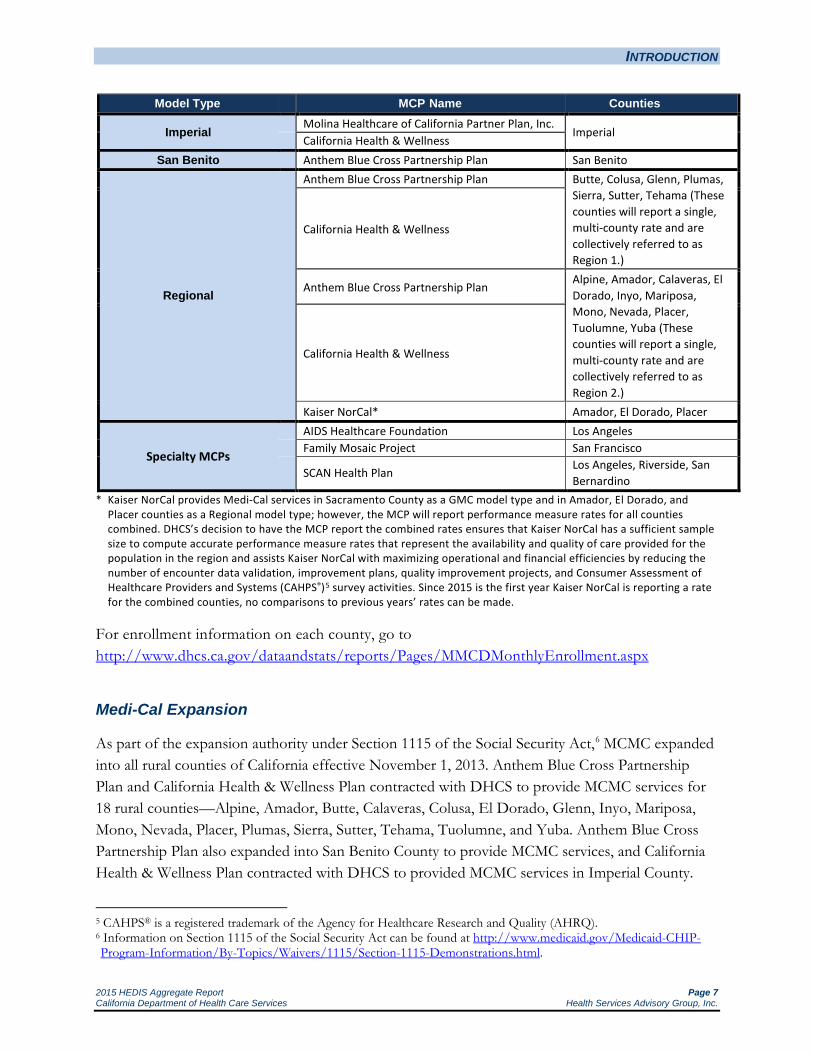
Model Type MCP Name Counties
Imperial Molina Healthcare of California Partner Plan, Inc.
Imperial California Health & Wellness San Benito Anthem Blue Cross Partnership Plan San Benito
Regional
Anthem Blue Cross Partnership Plan Butte, Colusa, Glenn, Plumas, Sierra, Sutter, Tehama (These counties will report a single, multi-county rate and are collectively referred to as Region 1.)
California Health & Wellness
Anthem Blue Cross Partnership Plan Alpine, Amador, Calaveras, El Dorado, Inyo, Mariposa, Mono, Nevada, Placer, Tuolumne, Yuba (These counties will report a single, multi-county rate and are collectively referred to as Region 2.)
California Health & Wellness
Kaiser NorCal* Amador, El Dorado, Placer
Specialty MCPs
AIDS Healthcare Foundation Los Angeles Family Mosaic Project San Francisco
SCAN Health Plan Los Angeles, Riverside, San Bernardino
* Kaiser NorCal provides Medi-Cal services in Sacramento County as a GMC model type and in Amador, El Dorado, and Placer counties as a Regional model type; however, the MCP will report performance measure rates for all counties combined. DHCS’s decision to have the MCP report the combined rates ensures that Kaiser NorCal has a sufficient sample size to compute accurate performance measure rates that represent the availability and quality of care provided for the population in the region and assists Kaiser NorCal with maximizing operational and financial efficiencies by reducing the number of encounter data validation, improvement plans, quality improvement projects, and Consumer Assessment of Healthcare Providers and Systems (CAHPS®)5 survey activities. Since 2015 is the first year Kaiser NorCal is reporting a rate for the combined counties, no comparisons to previous years’ rates can be made.
For enrollment information on each county, go to http://www.dhcs.ca.gov/dataandstats/reports/Pages/MMCDMonthlyEnrollment.aspx
Medi-Cal Expansion
As part of the expansion authority under Section 1115 of the Social Security Act,6 MCMC expanded into all rural counties of California effective November 1, 2013. Anthem Blue Cross Partnership Plan and California Health & Wellness Plan contracted with DHCS to provide MCMC services for 18 rural counties—Alpine, Amador, Butte, Calaveras, Colusa, El Dorado, Glenn, Inyo, Mariposa, Mono, Nevada, Placer, Plumas, Sierra, Sutter, Tehama, Tuolumne, and Yuba. Anthem Blue Cross Partnership Plan also expanded into San Benito County to provide MCMC services, and California Health & Wellness Plan contracted with DHCS to provided MCMC services in Imperial County.
5 CAHPS® is a registered trademark of the Agency for Healthcare Research and Quality (AHRQ). 6 Information on Section 1115 of the Social Security Act can be found at http://www.medicaid.gov/Medicaid-CHIP-Program-Information/By-Topics/Waivers/1115/Section-1115-Demonstrations.html.
INTRODUCTION
2015 HEDIS Aggregate Report Page 8 California Department of Health Care Services Health Services Advisory Group, Inc.
Also as part of the expansion authority, Kaiser NorCal contracted with DHCS to provide MCMC services in Amador, El Dorado, and Placer counties beginning November 1, 2013; Molina Healthcare of California Partner Plan, Inc., contracted with DHCS to provide MCMC services in Imperial County beginning September 1, 2013; and Partnership HealthPlan of California contracted with DHCS to provided MCMC services in Del Norte, Humboldt, Lake, Lassen, Modoc, Shasta, Siskiyou, and Trinity counties beginning September 1, 2013.
In order to report HEDIS measure rates, MCPs must first have beneficiaries meet continuous enrollment requirements for each measure being reported, which typically means beneficiaries need to be enrolled in the MCP for 11 of 12 months during the measurement year. None of the expansion county Medi-Cal beneficiaries had continuous enrollment during MY 2013. Consequently, DHCS did not require MCPs operating in these expansion counties to report rates for HEDIS 2014, and HSAG did not include any of the expansion counties in the 2014 NCQA HEDIS Compliance Audits conducted with Anthem Blue Cross Partnership Plan, Kaiser NorCal, Molina Healthcare of California Partner Plan, Inc., and Partnership HealthPlan of California. Additionally, HSAG did not conduct an NCQA HEDIS Compliance Audit with California Health & Wellness Plan in 2014 since the MCP began Medi-Cal operations on November 1, 2013.
HSAG included all expansion counties and California Health & Wellness Plan in the 2015 NCQA HEDIS Compliance Audit process, and rates for California Health & Wellness Plan and the expansion counties are therefore included in the 2015 HEDIS Aggregate Report. Please note that previously, Kaiser NorCal reported Sacramento County as a single-county rate; however, starting in RY 2015, Kaiser NorCal combined the expansion counties (Amador, El Dorado, and Placer) with Sacramento County to report a single, multi-county rate.
Medi-Cal Managed Care Delivery System
Following are the descriptions of the six MCP model types and the specialty MCPs.
County-Organized Health System
A COHS is a nonprofit, independent public agency that contracts with DHCS to administer Medi-Cal benefits through a wide network of health care providers. Each COHS MCP is established by the County Board of Supervisors and governed by an independent commission. A COHS has been implemented in 22 counties.

INTRODUCTION
2015 HEDIS Aggregate Report Page 9 California Department of Health Care Services Health Services Advisory Group, Inc.
Geographic Managed Care
In the GMC model, DHCS allows MCMC beneficiaries to select from several MCPs within a specified geographic area (county). The GMC model currently operates in the counties of San Diego and Sacramento.
Imperial
In the Imperial model, DHCS contracts with two CPs to provide MCMC services in Imperial County.
Regional
In RM counties, DHCS contracts with two CPs to provide MCMC services. The RM currently operates in 21 counties.
San Benito
In the San Benito model, there is one CP, and DHCS contracts with the plan. In a San Benito model county, MCMC beneficiaries can choose the MCP or regular (FFS) Medi-Cal.
Two-Plan
In TPM counties, MCMC beneficiaries may choose between two MCPs; typically, one MCP is an LI and the other a CP. DHCS contracts with both plans. The LI is established under authority of the local government with input from State and federal agencies, local community groups, and health care providers to meet the needs and concerns of the community. The CP is a private insurance plan that also provides care for Medi-Cal beneficiaries. The TPM has been implemented in 14 counties.
Specialty Managed Care Health Plans
Specialty MCPs provide health care services to specialized populations. During MY 2014, DHCS held contracts with three specialty MCPs.
How DHCS Uses Performance Measures
DHCS’s overall goal is to preserve and improve the health status of all Californians. MCMC provides comprehensive health care services to a large population of low-income adults, children and families, as well as high-need populations (e.g., SPDs, those requiring long-term care supports

INTRODUCTION
2015 HEDIS Aggregate Report Page 10 California Department of Health Care Services Health Services Advisory Group, Inc.
and services). Since MCMC serves some of California’s most vulnerable populations, evaluating and monitoring the quality of health care has remained a key objective for supporting DHCS in meeting its overall goal.
One mechanism established to monitor accountability for quality health care is DHCS’s implementation of the EAS. DHCS selects performance measures annually and requires its contracted MCPs to report rates at the county level unless otherwise specified.
DHCS expects its MCPs to implement effective quality improvement systems to monitor, evaluate, and improve performance. These systems include health care claims systems, membership and provider files, and hardware/software management tools that facilitate accurate and reliable reporting of HEDIS measures.
Federal requirements mandate the validation of performance measures. DHCS satisfies this federal requirement by contracting with HSAG, an EQRO, to conduct performance measure validation. HSAG follows the CMS protocol for validating performance measures by conducting NCQA HEDIS Compliance Audits for HEDIS measures or using the CMS protocol for validating performance measures for non-HEDIS measures, ensuring that MCPs report accurate and complete information.
DHCS shares MCP-specific and aggregate HEDIS results with the MCPs and CMS, and releases the results publicly. DHCS also incorporates these results into its consumer guides for new beneficiaries and uses the data as part of its annual performance assessment of MCPs and MCMC as a whole.
Minimum Performance Levels and High Performance Levels
DHCS annually establishes an MPL and HPL for each required HEDIS performance measure; however, DHCS does not hold the MCPs accountable to meet the MPLs for utilization measures, first-year measures, measures that had significant specification changes impacting comparability, or if DHCS decides to prioritize efforts in other areas of poor performance. In instances where DHCS holds the MCPs accountable to meet the MPLs, MCPs with rates below the MPLs must submit an improvement plan to DHCS outlining the steps they will take to improve care. MCP performance in relation to the MPL and HPL for each measure becomes public record with the release of this report. In some instances where MPLs are established but DHCS does not hold the MCPs accountable to meet the MPLs, HSAG provides information in this report on MCPs’ performance related to the MPLs and HPLs to assist DHCS and the MCPs in assessing MCPs’ overall performance related to established benchmarks.
To establish the MPLs and HPLs for the RY 2015 rates, DHCS used the HEDIS 2014 Audit Means, Percentiles, and Ratios, which reflect the previous year’s benchmarks (CY 2013). The MPLs
INTRODUCTION
2015 HEDIS Aggregate Report Page 11 California Department of Health Care Services Health Services Advisory Group, Inc.
for the RY 2015 rates were based on the Medicaid national 25th percentiles, and the HPLs were based on the national Medicaid 90th percentiles. MCPs are contractually required to perform at or above the established MPLs. For the Comprehensive Diabetes Care—HbA1c Poor Control (>9.0 Percent) measure, the 10th percentile (rather than the 90th percentile) is used for the HPL, and the 75th percentile (rather than the 25th percentile) is used for the MPL because for this measure, a lower rate indicates better performance. DHCS establishes no MPL or HPL for the All-Cause Readmissions measure since this measure was developed by DHCS and no national benchmarks exist for comparison.
The Colorectal Cancer Screening measure (reported by AHF) and the Osteoporosis Management in Women Who Had a Fracture measure (reported by SCAN Health Plan) do not have established national percentiles for the Medicaid population. For comparison purposes, HSAG and DHCS use the established commercial 25th and 90th percentiles for the Colorectal Cancer Screening measure and the established Medicare 25th and 90th percentiles for the Osteoporosis Management in Women Who Had a Fracture measure.
Auto-Assignment Program
For RY 2015, five performance measures selected from the EAS, were part of DHCS’s auto-assignment program, along with two measures related to MCP use of safety net providers. DHCS awards more default enrollment (i.e., assignment of beneficiaries who do not choose an MCP) to TPM and GMC model MCPs that perform high on selected measures and that achieve improvement over time. The auto-assignment program encourages MCPs to improve and/or maintain quality of care and services provided to their Medi-Cal beneficiaries.
The following five performance measures, selected from the EAS were part of DHCS’s auto-assignment program during RY 2015:
Cervical Cancer Screening
Childhood Immunization Status—Combo 3
Prenatal and Postpartum Care—Timeliness of Prenatal Care
Well-Child Visits in the Third, Fourth, Fifth, and Sixth Years of Life
Comprehensive Diabetes Care—HbA1c Testing
In addition to the performance measures selected from the EAS, the following two measures related to MCP use of safety net providers were used in the auto-assignment program:
Percentage of hospital discharges at Disproportionate Share Hospital facilities for beneficiaries residing within the county (based on the Office of Statewide Health Planning & Development hospital discharge data)

INTRODUCTION
2015 HEDIS Aggregate Report Page 12 California Department of Health Care Services Health Services Advisory Group, Inc.
Percentage of beneficiaries assigned to PCPs who are safety net providers (based on rates provided by the MCPs after safety net provider lists have been validated by Medi-Cal managed care and validation of a sample of screen prints verifying PCP assignments)
After auto-assignment rates are determined using the EAS and safety net measures, rates are shifted by 5 percent within counties from the higher-cost MCP to the lower-cost MCP. This 5 percent cost factor is determined through a comparison of MCP capitated rates for non-SPD MCP beneficiaries.
Medi-Cal Managed Care’s RY 2015 Performance Measures
DHCS’s RY 2015 EAS for full-scope MCPs, which used MY 2014 data, included the following measures:
All-Cause Readmissions (originally developed for the Statewide Collaborative QIP)
Ambulatory Care
Emergency Department Visits
Outpatient Visits
Annual Monitoring for Patients on Persistent Medications
ACE Inhibitors or ARBs
Digoxin—DHCS did not hold the MCPs accountable to meet the MPL for this measure
Diuretics
Avoidance of Antibiotic Treatment in Adults With Acute Bronchitis
Cervical Cancer Screening
Childhood Immunization Status—Combination 3
Children and Adolescents’ Access to Primary Care Practitioners—DHCS did not hold the MCPs accountable to meet the MPLs for these measures
12 to 24 Months
25 Months to 6 Years
7 to 11 Years
12 to 19 Years
Comprehensive Diabetes Care Blood Pressure Control (<140/90 mm Hg) Eye Exam (Retinal) Performed HbA1c Testing HbA1c Control (<8.0 Percent)

INTRODUCTION
2015 HEDIS Aggregate Report Page 13 California Department of Health Care Services Health Services Advisory Group, Inc.
HbA1c Poor Control (>9.0 Percent) Medical Attention for Nephropathy
Controlling High Blood Pressure
Immunizations for Adolescents—Combination 1
Medication Management for People with Asthma Medication Compliance 50% Total Medication Compliance 75% Total
Prenatal and Postpartum Care Postpartum Care Timeliness of Prenatal Care
Use of Imaging Studies for Low Back Pain
Weight Assessment and Counseling for Nutrition and Physical Activity for Children/Adolescents BMI Assessment: Total Nutrition Counseling: Total Physical Activity Counseling: Total
Well-Child Visits in the Third, Fourth, Fifth, and Sixth Years of Life
Full-scope MCPs were required to report SPD and non-SPD rates for the following measures:
All-Cause Readmissions—originally developed for the Statewide Collaborative QIP
Ambulatory Care—Outpatient Visits
Ambulatory Care—Emergency Department Visits
Annual Monitoring for Patients on Persistent Medications—ACE Inhibitors or ARBs
Annual Monitoring for Patients on Persistent Medications—Digoxin
Annual Monitoring for Patients on Persistent Medications—Diuretics
Children and Adolescents’ Access to Primary Care Practitioners—12 to 24 Months
Children and Adolescents’ Access to Primary Care Practitioners—25 Months to 6 Years
Children and Adolescents’ Access to Primary Care Practitioners—7 to 11 Years
Children and Adolescents’ Access to Primary Care Practitioners—12 to 19 Years

INTRODUCTION
2015 HEDIS Aggregate Report Page 14 California Department of Health Care Services Health Services Advisory Group, Inc.
Measures for the specialty MCPs included the following:
AIDS Healthcare Foundation
Colorectal Cancer Screening
Controlling High Blood Pressure
Family Mosaic Project (non-HEDIS measures)
School Attendance
Out-of-Home Placements
SCAN Health Plan
Breast Cancer Screening
Osteoporosis Management in Women Who Had a Fracture

2015 HEDIS Aggregate Report Page 15 California Department of Health Care Services Health Services Advisory Group, Inc.
3. READER’S GUIDE AND METHODOLOGY
About HEDIS
HEDIS, developed by NCQA, is a standardized set of performance measures used to provide health care purchasers, consumers, and others with a reliable comparison among health plans. HEDIS data are often used to produce health plan “report cards,” analyze quality improvement activities, and benchmark performance. NCQA classifies the broad range of HEDIS measures across five domains of care:
Effectiveness of Care
Access/Availability of Care
Experience of Care
Utilization and Relative Resource Use
Health Plan Descriptive Information
Performance measures within these domains provide information about a health plan’s performance in such areas as providing timely access to preventive services, management of beneficiaries with chronic disease, and appropriate treatment for beneficiaries with select conditions.
While HEDIS data provide an opportunity to compare health plans based on some aspects of health care delivered to beneficiaries, the intent of the data is not to provide an overall, comprehensive assessment of health care quality for a health plan.
DHCS uses HEDIS data as one component of its overall quality monitoring strategy. DHCS and MCPs use MCP-specific data, aggregate data, and comparisons to State and national benchmarks to identify opportunities for improvement, analyze performance, and assess whether previously implemented interventions were effective.
How HEDIS Results Are Calculated and Displayed
NCQA developed specific HEDIS methodology to ensure that health plans collect data and calculate and report results consistently to allow for health plan comparison.
Methodology
To assist health plans in standardized reporting, NCQA develops and makes available technical specifications that provide information on how to collect data for each measure, with general

READER’S GUIDE AND METHODOLOGY
2015 HEDIS Aggregate Report Page 16 California Department of Health Care Services Health Services Advisory Group, Inc.
guidelines for sampling and calculating rates. DHCS’s EAS requirements for RY 2015 indicate that MCPs are responsible for adhering to the HEDIS 2015 Technical Specifications, Volume 2.
To ensure that MCPs calculate and report performance measures consistent with HEDIS specifications and that the results can be compared to other MCPs’ HEDIS results, the MCPs must undergo an independent audit. NCQA publishes HEDIS Compliance Audit™: Standards, Policies, and Procedures, Volume 5, which outlines the accepted approach for auditors to use when conducting an IS capabilities assessment and an evaluation of compliance with HEDIS specifications for a health plan. DHCS requires that MCPs undergo an annual compliance audit conducted by HSAG, DHCS’s contracted EQRO.
The HEDIS process begins well in advance of the MCPs reporting their rates. MCPs typically calculated their RY 2015 HEDIS rates with measurement data from January 1, 2014, to December 31, 2014, with the exception of some measures that deviate slightly from this measurement period. Performance measure calculation and reporting typically involves three phases: Off-site, On-site, and Post-on-site.7
Off-site Activity (October through March)
MCPs prepare for data collection and the on-site audit. MCPs complete the HEDIS Record of Administration, Data Management, and Processes
(Roadmap), a tool used by MCPs to communicate information to the auditor about the MCPs’ systems for collecting and processing data for HEDIS.
The EQRO conducts kick-off calls with MCPs to provide guidance on HEDIS audit processes and to ensure MCPs are aware of important deadlines.
The EQRO reviews the MCPs’ completed Roadmaps to assess compliance with the audit standards and provides MCPs with an IS standard tracking report that lists outstanding items and areas that require additional clarification.
The EQRO reviews the MCPs’ source code used for calculating the EAS measures to ensure compliance with the technical specifications, unless the MCPs use a vendor whose measures are certified by NCQA.
The MCPs prepare for medical record review validation for EAS measures that require the hybrid method for data collection.
The EQRO conducts supplemental data validation for all supplemental data sources the MCPs intend to use for reporting.
The EQRO conducts preliminary rate review to assess the MCPs’ data completeness and accuracy early in the audit process.
7 Department of Health and Human Services, Centers for Medicare & Medicaid Services. EQR Protocol 2: Validation of
Performance Measures Reported by the MCO: A Mandatory Protocol for External Quality Review (EQR), Version 2.0, September 2012. Available at: http://www.medicaid.gov/Medicaid-CHIP-Program-Information/By-Topics/Quality-of-Care/Quality-of-Care-External-Quality-Review.html. Accessed on: September 13, 2015.

READER’S GUIDE AND METHODOLOGY
2015 HEDIS Aggregate Report Page 17 California Department of Health Care Services Health Services Advisory Group, Inc.
On-site Activity (January through April)
MCPs conduct data capture and data collection. The EQRO conducts on-site audits to assess the MCPs’ capabilities to collect and integrate data
from internal and external sources. The EQRO provides preliminary audit findings to the MCPs and DHCS.
Post-on-site Activity (May through October)
MCPs submit final audited rates to DHCS (June). The EQRO provides final audit reports to the MCPs and DHCS (July). The EQRO analyzes data and generates the HEDIS aggregate report in coordination with
DHCS.
Data Collection Methodology
NCQA specifies two methods for data capture: the administrative method and the hybrid method.
Administrative Method
The administrative method requires health plans to identify the eligible population (i.e., the denominator) using administrative data such as enrollment, claims, and encounters. In addition, health plans derive the numerator(s), or services provided to beneficiaries in the eligible population, from administrative data sources and auditor-approved supplemental data sources. Health plans cannot use medical records to retrieve information. When using the administrative method, the entire eligible population is used as the denominator because NCQA does not allow sampling.
Following are the DHCS-selected EAS measures for which NCQA methodology requires the administrative method to derive rates: All-Cause Readmissions (statewide collaborative QIP measure) Ambulatory Care Annual Monitoring for Patients on Persistent Medications Avoidance of Antibiotic Treatment in Adults With Acute Bronchitis Breast Cancer Screening* Children and Adolescents' Access to Primary Care Practitioners Medication Management for People with Asthma Osteoporosis Management in Women Who Had a Fracture* Use of Imaging Studies for Low Back Pain
*A specialty MCP measure
READER’S GUIDE AND METHODOLOGY
2015 HEDIS Aggregate Report Page 18 California Department of Health Care Services Health Services Advisory Group, Inc.
The administrative method is cost-efficient, but it can produce lower rates due to incomplete data submission (often by capitated providers), as well as data that are typically not submitted as part of a claims or encounter submission such as Current Procedural Terminology (CPT) II codes, or as a result of global billing practices.
Hybrid Method
The hybrid method requires health plans to identify the eligible population using administrative data and then extract a systematic sample of beneficiaries from the eligible population, which becomes the denominator. Health plans use administrative data to identify services provided to those Medi-Cal beneficiaries. When administrative data do not show evidence that a service was provided, health plans then review medical records for those beneficiaries.
The hybrid method generally produces higher rates but is considerably more labor-intensive. For example, a health plan that has 10,000 beneficiaries who qualify for the Prenatal and Postpartum Care measure may use the hybrid method. After randomly selecting 411 eligible beneficiaries, the health plan finds that 161 beneficiaries have evidence of a postpartum visit using administrative data. The health plan then obtains and reviews medical records for the 250 beneficiaries who do not have evidence of a postpartum visit using administrative data. Of those 250 beneficiaries, the health plan finds 54 additional beneficiaries who have a postpartum visit recorded in the medical record. The final rate for this measure, using the hybrid method, would be (161 + 54)/411, or 52 percent.
In contrast, using the administrative method, if the health plan finds that 4,000 of the 10,000 beneficiaries had evidence of a postpartum visit using only administrative data, the final rate for this measure would be 4,000/10,000, or 40 percent.
Following are the DHCS-selected EAS measures for which NCQA methodology allows hybrid data collection:
Cervical Cancer Screening Childhood Immunization Status—Combination 3 Colorectal Cancer Screening* Comprehensive Diabetes Care Controlling High Blood Pressure** Immunizations for Adolescents—Combination 1 Prenatal and Postpartum Care Weight Assessment and Counseling for Nutrition and Physical Activity for Children and Adolescents Well-Child Visits in the Third, Fourth, Fifth, and Sixth Years of Life
* A specialty MCP measure
** A full-scope MCP and specialty MCP measure

READER’S GUIDE AND METHODOLOGY
2015 HEDIS Aggregate Report Page 19 California Department of Health Care Services Health Services Advisory Group, Inc.
MCPs that have complete and robust administrative data may choose to report measures using only the administrative method and avoid labor-intensive medical record review; however, currently only two of the MCMC-contracted MCPs report rates in this manner, Kaiser NorCal and Kaiser SoCal. The Kaiser MCPs have IS capabilities, primarily due to their closed-system model and electronic medical records that support administrative-only reporting because medical record review does not generally yield additional data beyond what the MCP had already captured administratively.
Inclusion of Dual Eligible Population
Following are the guidelines for MCPs regarding inclusion of dual eligible beneficiaries in their Medi-Cal performance measure rates:
If an MCP does not have the Medicare product, then the MCP would not have dual eligible beneficiaries to include in its rates.
If the member has both Medicare and Medicaid benefits through the MCP, then the beneficiary is included in the Medi-Cal rates.
If the beneficiary has Medicare FFS or Medicare through another MCP, then the beneficiary can be excluded from the Medi-Cal rates.
HEDIS Aggregate Report Data Displays
This report displays 2015 HEDIS results relative to both local and national performance thresholds and benchmarks to compare the quality of services provided to MCMC beneficiaries. A comparison of performance gives both DHCS and the MCPs a framework to identify opportunities to improve care.
While the specific rates are not included in this report, comparisons are made to the 2014 national Medicaid and national commercial averages as reported by NCQA. The objectives and goals of the federal Healthy People 2020 program provide another source of national benchmarks for comparison within this report, as available.8 Local benchmarks include prior-year MCMC weighted averages. MCPs’ submission of HEDIS data provides rates calculated to the sixth decimal place. Unless otherwise noted, results in this report are rounded to the second decimal place to be consistent with the display of comparative local and national benchmarks. Some rounded rates may appear the same; however, the more precise rates are not identical.
8 Healthy People 2020 is managed by the U.S. Department of Health and Human Services’ Office of Prevention and
Health Promotion. Healthy People 2020 provides a framework for prevention for the nation by establishing national health objectives and setting national goals to reduce threats. Available at http://www.healthypeople.gov/2020/default.aspx. Accessed on: September 13, 2015.

READER’S GUIDE AND METHODOLOGY
2015 HEDIS Aggregate Report Page 20 California Department of Health Care Services Health Services Advisory Group, Inc.
Medi-Cal Managed Care Weighted Averages
The principal measure of overall MCMC performance on a given measure is the weighted average rate. This use of a weighted average, based on each MCP’s eligible population for that measure, provides the most representative rate for the overall MCMC population. Weighting the MCMC average by each MCP’s eligible population size ensures that the rate for an MCP with 125,000 beneficiaries, for example, has a greater impact on the overall MCMC weighted average than the rate for an MCP with only 10,000 beneficiaries.
HSAG computed the RY 2015 MCMC weighted average for each measure using MCP-reported rates and weighted these by each MCP’s reported eligible population size for the measure. Rates that were given an audit result of Not Reportable were not included in the calculation of these averages. A weighted average is a better estimate of care for all MCMC beneficiaries than a straight average of MCMC MCPs’ performance.
Significance Testing
HSAG used a Chi-square test to determine if MCP-specific differences between RY 2014 and RY 2015 rates were statistically significant. The Chi-square test was used to judge how likely it is that the difference is real and not the result of chance.
To determine significance for this report, HSAG used the traditionally accepted risk level of 0.05 (i.e., probability of a Type I error). At this risk level, the probability of finding a statistically significant difference between the RY 2014 and RY 2015 rates when a true difference does not exist is not more than 5 percent.
Understanding Sampling Error and Effect Size
Correct interpretation of results for measures collected using the HEDIS hybrid methodology requires an understanding of sampling error. It is rarely possible or feasible, logistically or financially, to conduct medical record reviews of the entire eligible population for a given measure. Measures collected using the HEDIS hybrid method include only a sample from the eligible population, and statistical techniques are used to maximize the probability that the sample results reflect the experience of the entire eligible population.
For results to be generalized to the entire eligible population, the process of sample selection must be such that everyone in the eligible population has an equal chance of being selected. The HEDIS hybrid method prescribes a systematic sampling process of selecting at least 411 beneficiaries from the eligible population. Health plans may use a 5 percent, 10 percent, 15 percent, or 20 percent oversample to replace invalid cases (e.g., a male selected for Postpartum Care).

READER’S GUIDE AND METHODOLOGY
2015 HEDIS Aggregate Report Page 21 California Department of Health Care Services Health Services Advisory Group, Inc.
Figure 3.1 shows that if 411 health plan beneficiaries are included in a measure, the margin of error is approximately ± 4.9 percentage points. Note that the data in this figure are based on the assumption that the size of the eligible population is greater than 2,000. The smaller the sample included in the measure, the larger the sampling error.
Figure 3.1—Relationship of Sample Size to Sample Error
Effect Size
The difference between two measured rates may not be statistically significant, but may, nevertheless, be important. The judgment of the reviewer is always a requisite for meaningful data interpretation. As Figure 3.1 shows, sample error gets smaller as the sample size gets larger. Consequently, when sample sizes are very large and sampling errors are very small, almost any difference is statistically significant. This does not mean that all such differences are important.
Effect sizes can be somewhat arbitrary and controversial, but are often used to determine the sample size needed to detect the difference that is desired.
The general guidelines to determine effect size are:
A “small” difference between means is equal to one-fifth the standard deviation.
A “medium” effect size is equal to one-half the standard deviation.
A “large” effect is equal to 0.8 times the standard deviation.
READER’S GUIDE AND METHODOLOGY
2015 HEDIS Aggregate Report Page 22 California Department of Health Care Services Health Services Advisory Group, Inc.
The HEDIS sample sizes have already considered the effect size. The sampling formula used by HEDIS is sufficient to detect a difference of 10 percentage points. According to the HEDIS 2015 Technical Specifications, Volume 2, “This was chosen because it is a big enough difference to be actionable, it is not a burden for data collection and it is not so small as to be ‘swamped’ by nonsampling error.” Sample size is calculated using a two-tailed test of significance between two proportions (alpha = 0.5, 80 percent power) and a normal approximation to the binomial with a continuity correction factor also employed.
HEDIS results are intended to be used for decision making based on expected future performance. In this manner, the results of the sample are generalized to the population, and the plan’s entire population is considered a “sample” of future populations. When there is no interest in generalizing the results to the population (e.g., there is only interest in the results for the sample), there is no need for significance testing. In these situations, effect sizes are sufficient and suitable.
How to Interpret Results
HEDIS results can differ among plans and even across measures for the same plan. The following questions generally arise when examining these data:
Considerations for Data Interpretation
1. How accurate are the results?
2. How do MCMC rates compare to national percentiles?
3. How are MCMC MCPs performing overall?
Results Accuracy
DHCS requires all MCMC MCPs to have their HEDIS results confirmed by an NCQA HEDIS Compliance Audit. As a result, HSAG verified all rates in this report as an unbiased estimate of the measure. NCQA designed the HEDIS protocol with its hybrid method, which produces results with a sampling error of ± 5 percent at a 95 percent confidence level.
Sampling error can affect the accuracy of results. Suppose a plan uses the hybrid method to derive a Prenatal and Postpartum Care rate of 52 percent. Because of sampling error, the true rate is actually ± 5 percent of this rate—somewhere between 47 percent and 57 percent at a 95 percent confidence level. If the target is a rate of 55 percent, it is uncertain whether the true rate, which is between 47 percent and 57 percent, meets the target level.
To prevent such ambiguity, this report uses a standardized methodology that requires the reported rate to be at or above the threshold level to be considered as meeting the target. For internal

READER’S GUIDE AND METHODOLOGY
2015 HEDIS Aggregate Report Page 23 California Department of Health Care Services Health Services Advisory Group, Inc.
purposes, MCPs should understand and consider the issue of sampling error when implementing interventions.
Comparing Medi-Cal Managed Care Rates to National Benchmarks
This report displays the MCMC weighted average for each measure and compares it to the following national benchmarks:
National Medicaid 25th Percentile—all measures except the All-Cause Readmissions and HbA1c Poor Control (>9.0 Percent). The All-Cause Readmissions measure is not compared to national benchmarks because it is a measure initially developed for a statewide collaborative QIP and is not a HEDIS measure and the HbA1c Poor Control (>9.0 Percent) measure is compared to the national Medicaid 75th percentile because a higher rate indicates worse performance for this measure.
National Medicaid 90th Percentile—all measures except the All-Cause Readmissions and HbA1c Poor Control (>9.0 Percent). The All-Cause Readmissions measure is not compared to national benchmarks because it is a measure initially developed for a statewide collaborative QIP and is not a HEDIS measure and the HbA1c Poor Control (>9.0 Percent) measure is compared to the national Medicaid 10th percentile because a lower rate indicates better performance for this measure.
National Medicaid Average—all measures except the All-Cause Readmissions measure because it is a measure initially developed for a statewide collaborative QIP and is not a HEDIS measure.
National Commercial Average— all measures except the All-Cause Readmissions measure because it is a measure initially developed for a statewide collaborative QIP and is not a HEDIS measure.
Healthy People 2020—for measures with a comparable Healthy People 2020 goal.
Note: The MCMC weighted averages presented for each HEDIS reporting year are compared to benchmarks developed using prior year’s rates. For example, MCMC weighted averages reported for HEDIS 2015, representing calendar year 2014 data, are compared to the national HEDIS 2014 benchmarks, representing calendar year 2013 data.
Medi-Cal Managed Care Health Plans’ Overall Performance
As indicated in the Introduction section, DHCS establishes performance thresholds annually for minimum performance and high performance except for utilization measures, first-year measures, measures that had significant specification changes impacting comparability, or if DHCS decides to prioritize efforts in other areas of poor performance. This report displays each MCP’s rate relative to the established MPL and HPL for each measure (except for the All-Cause Readmissions measure since no MPL or HPL is established for this measure). The highest threshold or rate is at the top of the chart, continuing in descending order to the lowest threshold or rate for all measures except the All-Cause Readmissions and HbA1c Poor Control (>9.0 Percent) measures. For the

READER’S GUIDE AND METHODOLOGY
2015 HEDIS Aggregate Report Page 24 California Department of Health Care Services Health Services Advisory Group, Inc.
All-Cause Readmissions and HbA1c Poor Control (>9.0 Percent) measures, the lowest threshold or rate is at the top of the chart, continuing in ascending order to the highest threshold or rate since for these two measures, a lower rate means better performance.
Using NCQA’s HEDIS 2014 Audit Means, Percentiles, and Ratios, DHCS established MPLs and HPLs for its HEDIS 2015 EAS. DHCS based the MPLs on the 2014 Medicaid national 25th percentile and the HPLs on the 2014 Medicaid national 90th percentile, which represent the most recent data available from NCQA at the time this report was prepared.
Also as indicated in the Introduction section, for most measures in this report, the national Medicaid 90th percentile indicates the HPLs and the 25th national Medicaid percentile represents the MPLs. This means that Medi-Cal MCPs with reported rates above the 90th percentile (HPL) rank in the top 10 percent of all Medicaid plans nationwide. Similarly, MCPs reporting rates below the 25th percentile (MPL) rank in the bottom 25 percent nationwide for that measure. This differs for one measure, Comprehensive Diabetes Care—HbA1c Poor Control (>9.0 Percent), where lower rates of poor control indicate better care. For this measure, the 10th percentile (rather than the 90th percentile) represents the HPL, and the 75th percentile (rather than the 25th percentile) represents the MPL because a lower rate indicates better performance.
The Colorectal Cancer Screening measure (reported by AIDS Healthcare Foundation) and the Osteoporosis Management in Women Who Had a Fracture measure (reported by SCAN Health Plan) do not have established national percentiles for the Medicaid population. For comparison purposes, HSAG and DHCS use the established commercial 25th and 90th percentiles for the Colorectal Cancer Screening measure and the established Medicare 25th and 90th percentiles for the Osteoporosis Management in Women Who Had a Fracture measure.
Performance Trend Analysis
In Appendix A, the “RY 2014–15 Rate Difference” column shows, by measure, a comparison between the HEDIS 2014 results and the HEDIS 2015 results for each MCP. HSAG used a Chi-square test to calculate the statistical significance between MCP rates in RY 2014 and RY 2015. The following symbols are used to show statistically significant changes:
Rates in RY 2015 were significantly higher than they were in RY 2014. Rates in RY 2015 were significantly lower than they were in RY 2014. ↔ Rates in RY 2015 were not significantly different than they were in RY 2014.
Different symbols () are used to indicate a performance change for All-Cause Readmissions and Comprehensive Diabetes Care—HbA1c Poor Control (>9.0 Percent), where a decrease in the rate indicates better performance. A downward triangle () denotes a significant decline in performance, as denoted by a significant increase in the RY 2015 rate from the RY 2014 rate. An upward triangle

READER’S GUIDE AND METHODOLOGY
2015 HEDIS Aggregate Report Page 25 California Department of Health Care Services Health Services Advisory Group, Inc.
() denotes significant improvement in performance, as indicated by a significant decrease of the RY 2015 rate from the RY 2014 rate.
Not comparable = A RYs 2014–15 rate difference could not be made because data were not available for both years, or there were significant methodology changes between years that did not allow for comparison.
S = The MCP’s measure is publicly reported based on NCQA HEDIS Compliance Audit results; however, since there are fewer than 11 cases in the numerator of this measure, DHCS suppresses displaying the rate in this report to satisfy the Health Insurance Portability and Accountability Act of 1996 Privacy Rule’s de-identification standard.
2015 HEDIS Aggregate Report Page 26 California Department of Health Care Services Health Services Advisory Group, Inc.
4. VALIDATING EXTERNAL ACCOUNTABILITY SET PERFORMANCE MEASURES
About Performance Measure Validation
CMS requires that states conduct performance measure validation of their contracted health plans to ensure that plans calculate performance measure rates according to state specifications. CMS also requires that states assess the extent to which the plans’ information systems (IS) provide accurate and complete information.
To comply with this requirement, DHCS contracted with HSAG to conduct validation of the selected EAS performance measures. HSAG conducted audits in accordance with the 2015 NCQA HEDIS Compliance Audit: Standards, Policies, and Procedures, Volume 5. NCQA specifies IS standards that detail the minimum requirements that health plans must meet, including the criteria for any manual processes used to report HEDIS information. When a Medi-Cal MCP did not meet a particular IS standard, the audit team evaluated the impact on HEDIS reporting capabilities. MCPs not fully compliant with all of the IS standards could still report measures as long as the final reported rates were not significantly biased.
The IS standards include:
IS 1.0—Medical Services Data—Sound Coding Methods and Data Capture, Transfer, and Entry. IS 2.0—Enrollment Data—Data Capture, Transfer, and Entry. IS 3.0—Practitioner Data—Data Capture, Transfer, and Entry. IS 4.0—Medical Record Review Processes—Training, Sampling, Abstraction, and Oversight. IS 5.0—Supplemental Data—Capture, Transfer, and Entry. IS 6.0—Member Call Center Data—Capture, Transfer, and Entry. (This standard is not covered
under the scope of the MCMC audit.) IS 7.0—Data Integration—Accurate Reporting, Control Procedures That Support HEDIS or
Measure Reporting Integrity.
HEDIS Audit Results
Through the audit process, HSAG assigns each measure one of the four audit results. A numeric result, usually accompanied with an “R” (Reportable), indicates that the MCP complied with all HEDIS specifications to produce an unbiased, reportable rate or rates that can be released for public reporting. Although an MCP may have complied with all applicable specifications, if the MCP’s denominator is too small to report (less than 30), the audit result is “NA,” denoting Small Denominator. An audit result of “NR” (Not Reportable) indicates that the rate should not be publicly reported because the measure deviated from HEDIS specifications enough to bias the reported
VALIDATING EXTERNAL ACCOUNTABILITY SET PERFORMANCE MEASURES
2015 HEDIS Aggregate Report Page 27 California Department of Health Care Services Health Services Advisory Group, Inc.
rate significantly or that the MCP chose not to report the measure. An “NB” (Benefit Not Offered) audit result indicates that the MCP did not offer the benefit required to report the measure.
HEDIS Reporting Capabilities
Key Findings
A total of twenty-six contracted MCPs underwent performance measure validation. Twenty-five of the MCPs had an NCQA HEDIS Compliance Audit. Family Mosaic Project, a specialty MCP, reported non-HEDIS measures; therefore, it underwent a performance measure validation audit consistent with the CMS protocol for conducting performance measure validation. All audits, regardless of which audit methodology/protocol was followed, were conducted by an NCQA certified HEDIS compliance auditor.
For the HEDIS 2015 reporting year, 23 of the 26 audited MCPs used vendors to calculate and produce rates, and all of these vendors achieved full measure certification status by NCQA for the reported HEDIS measures. For Family Mosaic Project and the two MCPs that developed source code internally for measure calculation, HSAG reviewed and approved the source code. Since All-Cause Readmissions was a DHCS-defined measure, HSAG also reviewed and approved the source code for adherence to DHCS’s measure specifications.
Strengths
All MCPs followed NCQA’s specifications in calculating their rates for the DHCS-required measures. The MCPs had sufficient transactional systems and processes that captured the required data elements for producing valid rates.
Despite notable increases in the number of Medicaid memberships as a result of the Affordable Care Act during the measurement year, most MCPs experienced no significant backlogs in processing membership or enrollment data and claims data that would impact HEDIS reporting.
The MCPs continued using more standard supplemental data sources to supplement their rates. The majority of MCPs are capturing a large volume of data electronically, which reduces the burden of medical record abstraction.
With a few exceptions, HSAG found MCPs fully compliant with the applicable IS standards. For the seven MCPs that did not achieve full compliance with all IS standards, the auditors determined that the issues occurred in ensuring complete and accurate claims/encounters data from service partners and in integrating data for measure calculation. Nonetheless, these deficiencies were resolved before the rates were reported.

VALIDATING EXTERNAL ACCOUNTABILITY SET PERFORMANCE MEASURES
2015 HEDIS Aggregate Report Page 28 California Department of Health Care Services Health Services Advisory Group, Inc.
Challenges
Most of the challenges and opportunities were MCP-specific, and few challenges were applicable to all or most of the MCPs. HSAG identified several challenges experienced by the MCPs while reporting for HEDIS 2015.
Several MCPs sub-contracted with one MCP to provide services for Medi-Cal beneficiaries. In late 2014, this full-service partner suggested a new data format as an alternative to the monthly encounter files submitted to these MCPs for HEDIS reporting. The MCPs encountered several challenges in processing the new service data files. Although the issues were eventually resolved for most of the MCPs, the late introduction of this change by the full-service partner hindered the MCPs’ ability to assess data completeness and accuracy, and to properly monitor this partner’s performance.
A few MCPs also encountered some issues in processing their claims internally. One MCP changed its claims system during 2014 and found significant claims processing backlogs with its providers. The MCP had to revert back to using its original system, and the auditor did not note any concerns regarding this change. Nonetheless, due to multiple data challenges, the MCP had to request an extension in submitting its hybrid rates to DHCS.
Several MCPs had challenges in providing complete and accurate responses in their Roadmap. A few identified their supplemental data sources after the initial Roadmap submission deadline, and they submitted the corresponding Section 5 portions of the Roadmap late. As the MCPs are exploring the use of additional supplemental databases, it is critical to ensure that adequate coordination, oversight, and validation are implemented in a timely manner before these databases are considered for reporting.
Recommendations
Based on the results of the audit findings, HSAG provides the following recommendations for improved reporting capabilities by the MCPs:
Closely monitor timelines, milestones, and deliverables of contracted providers and software vendors. MCPs should consider implementing sanctions for vendors that do not meet contractual requirements. MCPs should also strengthen oversight of their vendor’s data extraction and submission activities when the vendor has a major change in its data submission routines.
When a new data system is used for processing data used for HEDIS reporting, the MCP should ensure that sufficient resources are delegated to oversee and monitor the data for completeness and accuracy.
VALIDATING EXTERNAL ACCOUNTABILITY SET PERFORMANCE MEASURES
2015 HEDIS Aggregate Report Page 29 California Department of Health Care Services Health Services Advisory Group, Inc.
Work with providers to increase electronic claims/encounter submission and more automatic data load. Document in detail any changes in software, vendor, or any testing or implementation process.
When an opportunity to obtain data from integrated systems is available, explore the ability to obtain standard encounter files to expedite the data integration process.
Implement a stronger internal validation process to ensure all supplemental data sources are accurate across providers who enter the information.
Improve reporting accountability by formalizing and clearly documenting the internal data audit or reconciliation processes.
Coordinate the HEDIS quality assurance process for data integration and rate review with the vendors early in the audit process to ensure sufficient time to assess data completeness and reasonableness as well as rate accuracy.
Maintain and implement formal policies, procedures, and timelines to ensure the HEDIS measure production process remains as smooth as possible during any staff transition or turnover.
Review Roadmap responses provided by the vendor as well as the MCP’s Roadmap for completeness and accuracy before submitting to the auditors.
2015 HEDIS Aggregate Report Page 30 California Department of Health Care Services Health Services Advisory Group, Inc.
5. FULL-SCOPE MANAGED CARE HEALTH PLANS’ PERFORMANCE MEASURE RESULTS
Medi-Cal Managed Care Weighted Averages
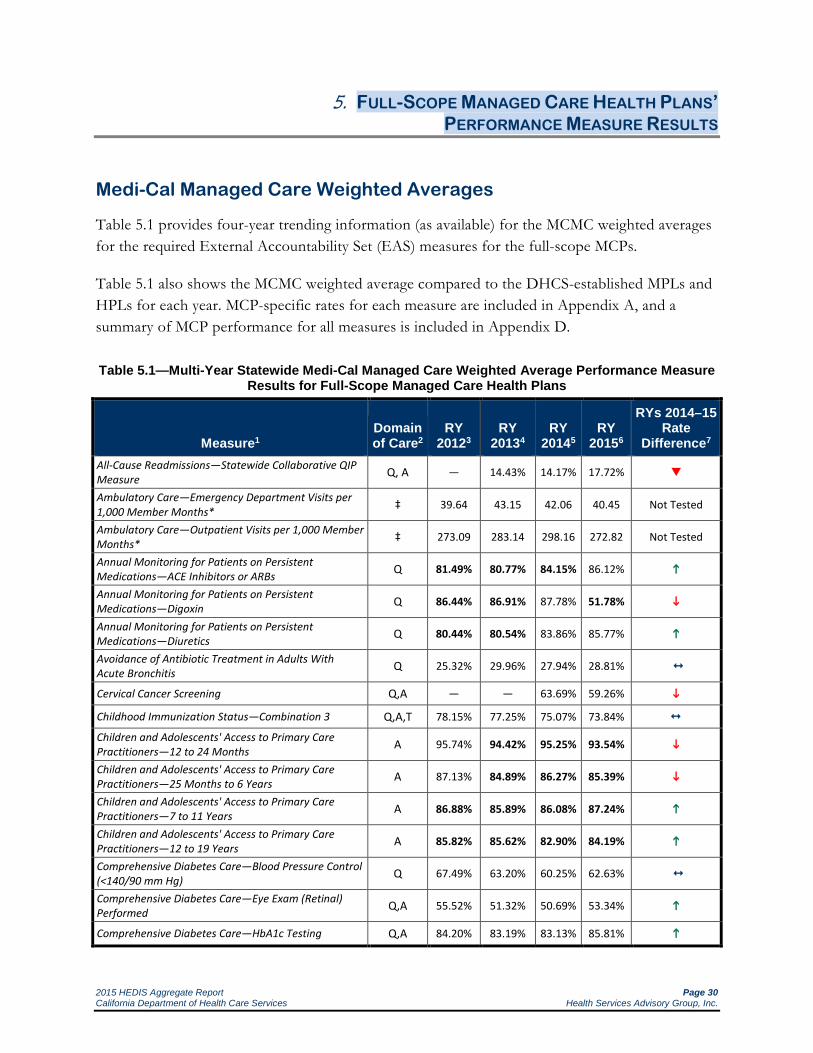
Table 5.1 provides four-year trending information (as available) for the MCMC weighted averages for the required External Accountability Set (EAS) measures for the full-scope MCPs.
Table 5.1 also shows the MCMC weighted average compared to the DHCS-established MPLs and HPLs for each year. MCP-specific rates for each measure are included in Appendix A, and a summary of MCP performance for all measures is included in Appendix D.
Table 5.1—Multi-Year Statewide Medi-Cal Managed Care Weighted Average Performance Measure
Results for Full-Scope Managed Care Health Plans
Measure1 Domain of Care2
RY 20123
RY 20134
RY 20145
RY 20156
RYs 2014–15 Rate
Difference7
All-Cause Readmissions—Statewide Collaborative QIP Measure Q, A — 14.43% 14.17% 17.72%
Ambulatory Care—Emergency Department Visits per 1,000 Member Months* ‡ 39.64 43.15 42.06 40.45 Not Tested
Ambulatory Care—Outpatient Visits per 1,000 Member Months* ‡ 273.09 283.14 298.16 272.82 Not Tested
Annual Monitoring for Patients on Persistent Medications—ACE Inhibitors or ARBs Q 81.49% 80.77% 84.15% 86.12%
Annual Monitoring for Patients on Persistent Medications—Digoxin Q 86.44% 86.91% 87.78% 51.78%
Annual Monitoring for Patients on Persistent Medications—Diuretics Q 80.44% 80.54% 83.86% 85.77%
Avoidance of Antibiotic Treatment in Adults With Acute Bronchitis Q 25.32% 29.96% 27.94% 28.81%
Cervical Cancer Screening Q,A — — 63.69% 59.26%
Childhood Immunization Status—Combination 3 Q,A,T 78.15% 77.25% 75.07% 73.84%
Children and Adolescents' Access to Primary Care Practitioners—12 to 24 Months A 95.74% 94.42% 95.25% 93.54%
Children and Adolescents' Access to Primary Care Practitioners—25 Months to 6 Years A 87.13% 84.89% 86.27% 85.39%
Children and Adolescents' Access to Primary Care Practitioners—7 to 11 Years A 86.88% 85.89% 86.08% 87.24%
Children and Adolescents' Access to Primary Care Practitioners—12 to 19 Years A 85.82% 85.62% 82.90% 84.19%
Comprehensive Diabetes Care—Blood Pressure Control (<140/90 mm Hg) Q 67.49% 63.20% 60.25% 62.63%
Comprehensive Diabetes Care—Eye Exam (Retinal) Performed Q,A 55.52% 51.32% 50.69% 53.34%
Comprehensive Diabetes Care—HbA1c Testing Q,A 84.20% 83.19% 83.13% 85.81%

FULL-SCOPE MANAGED CARE HEALTH PLANS’ PERFORMANCE MEASURE RESULTS
2015 HEDIS Aggregate Report Page 31 California Department of Health Care Services Health Services Advisory Group, Inc.
Measure1 Domain of Care2
RY 20123
RY 20134
RY 20145
RY 20156
RYs 2014–15 Rate
Difference7
Comprehensive Diabetes Care—HbA1c Control (<8.0 Percent) Q 50.79% 49.35% 46.64% 49.08%
Comprehensive Diabetes Care—Medical Attention for Nephropathy Q,A 81.90% 81.80% 82.65% 84.45%
Comprehensive Diabetes Care—HbA1c Poor Control (>9.0 Percent) Q 38.04% 40.35% 43.73% 39.35%
Controlling High Blood Pressure Q — 58.30% 56.34% 61.22%
Immunizations for Adolescents—Combination 1 Q,A,T 62.99% 72.66% 74.44% 73.51%
Medication Management for People with Asthma—Medication Compliance 50% Total Q — 58.85% 53.48% 49.08%
Medication Management for People with Asthma—Medication Compliance 75% Total Q — 36.52% 32.23% 26.99%
Prenatal and Postpartum Care—Postpartum Care Q,A,T 61.74% 58.61% 56.99% 59.35%
Prenatal and Postpartum Care—Timeliness of Prenatal Care Q,A,T 83.77% 83.17% 81.33% 81.80%
Use of Imaging Studies for Low Back Pain Q 81.03% 80.84% 80.35% 79.54% Weight Assessment and Counseling for Nutrition and Physical Activity for Children/Adolescents—BMI Assessment: Total
Q 68.33% 71.55% 71.17% 77.47%
Weight Assessment and Counseling for Nutrition and Physical Activity for Children/Adolescents—Nutrition Counseling: Total
Q 72.08% 72.53% 71.37% 73.42%
Weight Assessment and Counseling for Nutrition and Physical Activity for Children/Adolescents—Physical Activity Counseling: Total
Q 56.04% 58.28% 59.53% 63.64%
Well-Child Visits in the Third, Fourth, Fifth, and Sixth Years of Life Q,A,T 76.77% 74.50% 73.29% 72.78%
1 DHCS-selected HEDIS performance measures developed by the National Committee for Quality Assurance (NCQA), with the exception of the All-Cause Readmissions measure, which was originally developed by DHCS for the statewide collaborative QIP.
2 HSAG’s assignment of performance measures to the domains of care for quality (Q), access (A), and timeliness (T). 3 RY 2012 rates reflect MY data from January 1, 2011, through December 31, 2011. 4 RY 2013 rates reflect MY data from January 1, 2012, through December 31, 2012. 5 RY 2014 rates reflect MY data from January 1, 2013, through December 31, 2013. 6 RY 2015 rates reflect MY data from January 1, 2014, through December 31, 2014.
7 Performance comparisons are based on comparing the 95-percent confidence levels associated with RY 2014 and RY 2015 rates. * Member months are a member's "contribution" to the total yearly membership. ‡ This is a utilization measure, which is not assigned a domain of care. — Indicates the rate is not available. = Statistically significant decline. = No statistically significant change. = Statistically significant improvement. are used to indicate performance differences for the All-Cause Readmissions and Comprehensive Diabetes Care—HbA1c Poor Control (>9.0%) measures, where a decrease in the rate indicates better performance. A downward triangle () denotes a significant decline in performance, as denoted by a significant increase in the RY 2015 rate from the RY 2014 rate. An upward triangle () denotes significant improvement in performance, as indicated by a significant decrease of the RY 2015 rate from the RY 2014 rate. For most measures, the reported rate is bolded if the rate is below the national Medicaid 25th percentile (i.e., the minimum performance level [MPL]), and is shaded if the rate is above the 90th percentile (i.e., the high performance level [HPL]) for that year. For the Comprehensive Diabetes Care—HbA1c Poor Control measure, the reported rate is bolded if the rate is above the 75th percentile and is shaded if the rate is below the 10th percentile, since a lower rate indicates better performance.
FULL-SCOPE MANAGED CARE HEALTH PLANS’ PERFORMANCE MEASURE RESULTS
2015 HEDIS Aggregate Report Page 32 California Department of Health Care Services Health Services Advisory Group, Inc.
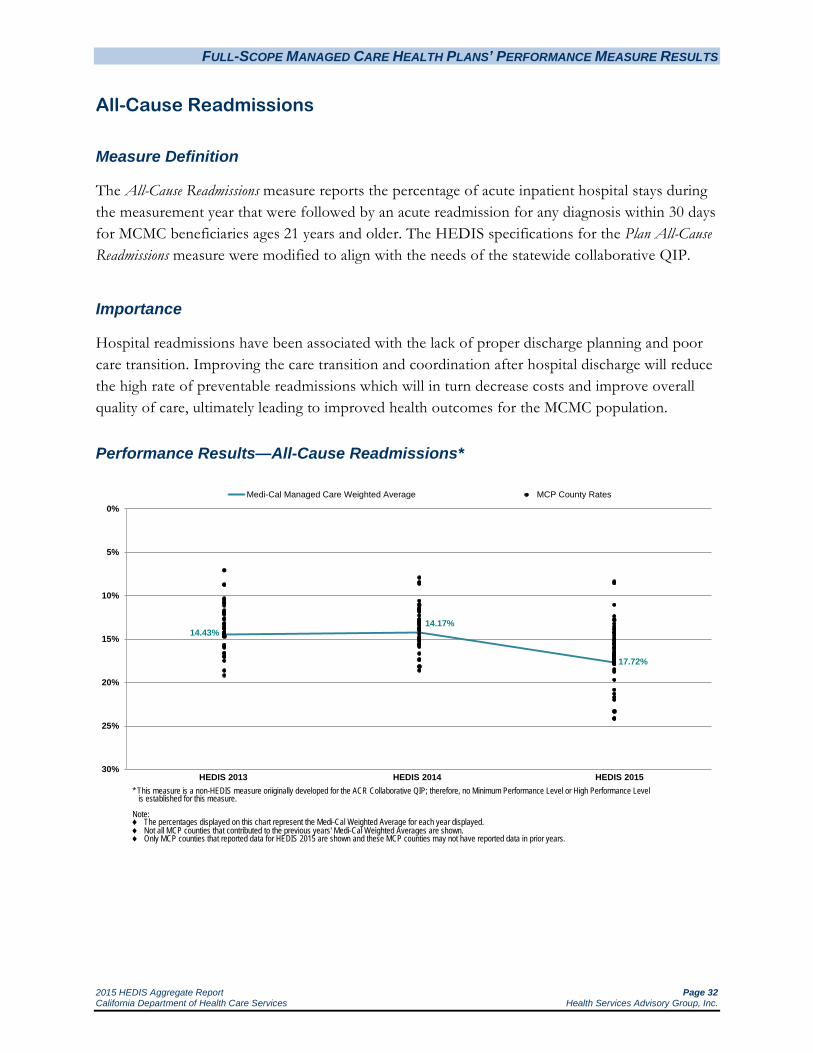
All-Cause Readmissions
Measure Definition
The All-Cause Readmissions measure reports the percentage of acute inpatient hospital stays during the measurement year that were followed by an acute readmission for any diagnosis within 30 days for MCMC beneficiaries ages 21 years and older. The HEDIS specifications for the Plan All-Cause Readmissions measure were modified to align with the needs of the statewide collaborative QIP.
Importance
Hospital readmissions have been associated with the lack of proper discharge planning and poor care transition. Improving the care transition and coordination after hospital discharge will reduce the high rate of preventable readmissions which will in turn decrease costs and improve overall quality of care, ultimately leading to improved health outcomes for the MCMC population.
Performance Results—All-Cause Readmissions*
14.43%14.17%
17.72%
0%
5%
10%
15%
20%
25%
30%
Medi-Cal Managed Care Weighted Average MCP County Rates
* This measure is a non-HEDIS measure oriiginally developed for the ACR Collaborative QIP; therefore, no Minimum Performance Level or High Performance Level is established for this measure.
Note:♦ The percentages displayed on this chart represent the Medi-Cal Weighted Average for each year displayed.♦ Not all MCP counties that contributed to the previous years' Medi-Cal Weighted Averages are shown.♦ Only MCP counties that reported data for HEDIS 2015 are shown and these MCP counties may not have reported data in prior years.
HEDIS 2013 HEDIS 2015HEDIS 2014

FULL-SCOPE MANAGED CARE HEALTH PLANS’ PERFORMANCE MEASURE RESULTS
2015 HEDIS Aggregate Report Page 33 California Department of Health Care Services Health Services Advisory Group, Inc.
Medi-Cal Managed Care HEDIS 2015 All-Cause Readmissions
NA S S
8.3911.04
12.3612.7512.7813.2213.5613.8013.9414.2414.2914.3014.5514.8415.0715.1515.3715.5115.5915.6315.9416.0116.1416.4416.5816.7616.7716.8916.9216.9917.1917.1917.2917.3517.4317.6017.6517.7117.7217.8717.8918.4918.7619.7120.8321.3021.6721.98
23.3124.1224.15
0 10 20 30 40 50 60 70 80 90 100
Rate (%)
Anthem Blue Cross Partnership Plan - San Benito California Health & Wellness Plan - Imperial
Molina Healthcare of CA - Imperial
Anthem Blue Cross Partnership Plan - Region 2 Anthem Blue Cross Partnership Plan - Region 1
CenCal Health - San Luis Obispo Health Net Community Solutions, Inc. - Tulare
Health Plan of San Joaquin - San Joaquin
This measure is a non-HEDIS measure originally developed for the ACR Collaborative QIP; therefore, no Minimum Performance Level or High Performance Level is established for this measure.
NA = A Not Applicable audit finding because the MCP’s denominator was too small (i.e., less than 30).
S = The measure is publicly reported based on audit results; however, since the MCP’s numerator was less than 11, DHCS suppresses displaying the rate to satisfy the HIPAA Privacy Rule’s de-identification standard.
Partnership HealthPlan of CA - Northwest
California Health & Wellness Plan - Region 1 CenCal Health - Santa Barbara
CalViva Health - Kings
Partnership HealthPlan of CA - Southwest Health Plan of San Joaquin - Stanislaus
Central CA Alliance for Health - Monterey/Santa Cruz
Partnership HealthPlan of CA - Northeast KP Cal LLC (Kaiser NorCal) - KP North
Partnership HealthPlan of CA - Southeast Molina Healthcare of CA - Sacramento
CalViva Health - Madera Molina Healthcare of CA - Riverside/San Bernardino
Anthem Blue Cross Partnership Plan - Kings
Health Net Community Solutions, Inc. - Kern Molina Healthcare of CA - San Diego
KP Cal LLC (Kaiser SoCal) - San Diego Alameda Alliance for Health - Alameda
Anthem Blue Cross Partnership Plan - Tulare Anthem Blue Cross Partnership Plan - Sacramento
Health Net Community Solutions, Inc. - Stanislaus
Anthem Blue Cross Partnership Plan - Contra Costa Care 1st Partner Plan, LLC - San Diego
Santa Clara Family Health Plan - Santa Clara
Health Plan of San Mateo - San Mateo Anthem Blue Cross Partnership Plan - Santa Clara
Health Net Community Solutions, Inc. - Sacramento
Health Net Community Solutions, Inc. - Los Angeles Contra Costa Health Plan - Contra Costa
CalViva Health - Fresno CalOptima - Orange
California Health & Wellness Plan - Region 2
Kern Health Systems - Kern 2015 Medi-Cal Managed Care Weighted Average
Gold Coast Health Plan - Ventura Inland Empire Health Plan - Riverside/San Bernardino
Central CA Alliance for Health - Merced Community Health Group Partnership Plan - San Diego
San Francisco Health Plan - San Francisco L.A. Care Health Plan - Los Angeles
Anthem Blue Cross Partnership Plan - Fresno Health Net Community Solutions, Inc. - San Joaquin
Anthem Blue Cross Partnership Plan - Madera Anthem Blue Cross Partnership Plan - Alameda
Health Net Community Solutions, Inc. - San Diego
Anthem Blue Cross Partnership Plan - San Francisco

FULL-SCOPE MANAGED CARE HEALTH PLANS’ PERFORMANCE MEASURE RESULTS
2015 HEDIS Aggregate Report Page 34 California Department of Health Care Services Health Services Advisory Group, Inc.
Summary of Results—All-Cause Readmissions
DHCS did not establish an MPL or HPL for the All-Cause Readmissions measure, so no comparisons to an MPL or HPL have been made.
For the All-Cause Readmissions measure, a lower rate indicates better performance. The MCMC weighted average was significantly higher in RY 2015 when compared to RY 2014, meaning that statewide, there were more beneficiaries (ages 21 years and older) who were readmitted within 30 days of an inpatient discharge in RY 2015 than in RY 2014.
High and Low Performers
No MCP counties had All-Cause Readmissions rates that improved significantly from RY 2014 to RY 2015, and the readmissions rates for 25 MCP counties increased significantly from RY 2014 to RY 2015 compared to six MCP counties from RY 2013 to RY 2014 These results could be attributed to the influx of newly eligible beneficiaries resulting from the Medicaid expansion effective January 1, 2014.
Note:
The rates for California Health & Wellness Plan—Imperial County and Molina Healthcare of California Partner Plan, Inc.—Imperial County for this measure were reportable based on performance measure validation audit results; however, since there are fewer than 11 cases in the numerators of this measure for these MCP counties, DHCS suppresses displaying the rates in this report to satisfy the Health Insurance Portability and Accountability Act of 1996 Privacy Rule’s de-identification standard.
Anthem Blue Cross Partnership Plan—San Benito County had an audit result of “NA” for this measure, meaning that although the MCP complied with all applicable specifications, it had a denominator less than 30 for the measure, resulting in the “NA” audit result.
Best and Emerging Practices—All-Cause Readmissions
In order to reduce the number of hospital readmissions, interventions should address discharge planning, transitions of care processes, care coordination, education, and self-management. The Institute for Healthcare Improvement (IHI) provides information on 15 promising interventions. Following are descriptions of four interventions that have strong evidence of reducing hospital readmissions based on randomized controlled trials or program evaluations:9
9 Institute for Healthcare Improvement. Effective Interventions to Reduce Rehospitalizations: A Compendium of 15
Promising Interventions. March 2009. Available at: http://ah.cms-plus.com/files/STAAR_A_Compendium_of_Promising_Interventions.pdf. Accessed on: July 2, 2015.

FULL-SCOPE MANAGED CARE HEALTH PLANS’ PERFORMANCE MEASURE RESULTS
2015 HEDIS Aggregate Report Page 35 California Department of Health Care Services Health Services Advisory Group, Inc.
Transitional Care Model10,11
The University of Pennsylvania School of Nursing created and tested the Transitional Care Model, which uses advanced practice nurses to provide pre- and post-discharge coordination of care for high-risk, elderly patients with chronic illness. Some Medi-Cal MCPs are implementing this intervention to reduce readmissions. The core components of the program include:
Consistency of providers across the entire episode of care, with the transitional care nurse as the primary coordinator of care.
In-hospital assessment and development of an evidence-based plan of care.
Regular home visits with the provision of ongoing telephone support (24 hours per day, seven days per week) for an average follow-up period of two months post-discharge.
Comprehensive, holistic focus on each patient’s needs, including the reason for the primary hospitalization and other complicating or coexisting events.
Emphasis on early identification and response to health care risks and symptoms, and avoidance of adverse events that lead to readmissions.
Active engagement of patients, their families, and informal caregivers, including providing education and support.
Communication to, between, and among the patient, family, informal caregivers, and health care providers and professionals.
Two randomized controlled trials showed that the use of the Transitional Care Model results in fewer rehospitalizations, lower overall health care costs, and improved patient satisfaction.
10 Naylor MD, Brooten DA, Campbell RL, Maislin G, McCauley KM, Schwartz JS. Transitional care of older adults
hospitalized with heart failure: a randomized, controlled trial. J Am Geriatr Soc. 2004;52:675-684. Quoted by: Institute for Healthcare Improvement. Effective Interventions to Reduce Rehospitalizations: A Compendium of 15 Promising Interventions. March 2009. Available at: http://ah.cms-plus.com/files/STAAR_A_Compendium_of_Promising_Interventions.pdf. Page 4. Accessed on: July 2, 2015.
11 Naylor MD, Brooten D, Campbell R, et al. Comprehensive discharge planning and home follow-up of hospitalized elders: a randomized clinical trial. JAMA. 1999; 281:613-620. Quoted by: Institute for Healthcare Improvement. Effective Interventions to Reduce Rehospitalizations: A Compendium of 15 Promising Interventions. March 2009. Available at: http://ah.cms-plus.com/files/STAAR_A_Compendium_of_Promising_Interventions.pdf. Page 4. Accessed on: July 2, 2015.

FULL-SCOPE MANAGED CARE HEALTH PLANS’ PERFORMANCE MEASURE RESULTS
2015 HEDIS Aggregate Report Page 36 California Department of Health Care Services Health Services Advisory Group, Inc.
Care Transitions Program12,13
Eric Coleman, MD, MPH, developed the Care Transitions Program, a four-week intervention focusing on improving care transitions by fostering improved self-management skills. Several Medi-Cal MCPs are implementing this program to reduce hospital readmissions. The four main components of the Care Transitions Program are:
Medication self-management.
Patient-centered medical record.
Follow-up with a physician.
Knowledge of “red flags” or warning signs/symptoms and how to respond.
The Care Transitions Program is designed for community-dwelling patients ages 65 and older and centers on the use of a transition coach who is a nurse or nurse practitioner. The transition coach conducts a home visit within 72 hours of discharge and speaks with the patient by telephone two, seven, and 14 days post-discharge. During the telephone calls, the transition coach prepares the patient for upcoming provider visits, helps the patient reconcile or identify discrepancies in medications, encourages follow-up, and serves as a single point of contact.
One evaluation of the program found that patients who participated in the Care Transitions Program were significantly less likely to be rehospitalized than patients who did not participate in the intervention, at 30, 90, and 180 days after discharge. Additionally, the time to rehospitalization was significantly longer for those participating in the Care Transitions Program.
Evercare Care Model14
Evercare is one of the nation’s largest health care coordination programs for people who have long-term or advanced illness, who are older, or have disabilities. The core elements of the intervention are:
Enhanced primary care and care coordination by nurse practitioners or care managers.
12 Coleman EA, Smith JD, Frank JC, Min S, Parry C, Kramer AM. Preparing patients and caregivers to participate in
care delivered across settings: the care transitions intervention. J Am Geriatr Soc. 2004;52(11):1817-1825. Quoted by: Institute for Healthcare Improvement. Effective Interventions to Reduce Rehospitalizations: A Compendium of 15 Promising Interventions. March 2009. Available at: http://ah.cms-plus.com/files/STAAR_A_Compendium_of_Promising_Interventions.pdf. Page 5. Accessed on: July 2, 2015.
13 Coleman EA. CMS Learning Session: The Care Transitions Intervention. December 20, 2007 [presentation]. Quoted by: Institute for Healthcare Improvement. Effective Interventions to Reduce Rehospitalizations: A Compendium of 15 Promising Interventions. March 2009. Available at: http://ah.cms-plus.com/files/STAAR_A_Compendium_of_Promising_Interventions.pdf. Page 5. Accessed on: July 2, 2015.
14 Kane RL, Keckhafer G, Flood S, Bershadsky B, Siadaty MS. The effect of Evercare on hospital use. J Am Geriatr Soc. 2003 Oct;51(10):1427-34. Quoted by: Institute for Healthcare Improvement. Effective Interventions to Reduce Rehospitalizations: A Compendium of 15 Promising Interventions. March 2009. Available at: http://ah.cms-plus.com/files/STAAR_A_Compendium_of_Promising_Interventions.pdf. Page 6. Accessed on: September 13, 2015.
FULL-SCOPE MANAGED CARE HEALTH PLANS’ PERFORMANCE MEASURE RESULTS
2015 HEDIS Aggregate Report Page 37 California Department of Health Care Services Health Services Advisory Group, Inc.
Nurse practitioner care in the nursing home setting.
Development and coordination of personalized care plans with all health care providers.
Evercare’s services are triaged according to four levels of care intensity based on patients’ health and functional status. Results showed that hospitalizations were reduced by 45 percent, emergency room visits were reduced by 50 percent, and cost savings were realized.

FULL-SCOPE MANAGED CARE HEALTH PLANS’ PERFORMANCE MEASURE RESULTS
2015 HEDIS Aggregate Report Page 38 California Department of Health Care Services Health Services Advisory Group, Inc.
Annual Monitoring for Patients on Persistent Medications
Measure Definition
The Annual Monitoring for Patients on Persistent Medications measure assesses the percentage of members 18 years of age and older who received at least 180 treatment days of ambulatory medication therapy for a select therapeutic agent during the measurement year and at least one therapeutic monitoring event for the therapeutic agent in the measurement year. For each product line, rates are reported separately and as a total rate.
Annual monitoring for members on angiotensin converting enzyme (ACE) inhibitors or angiotensin receptor blockers (ARBs).
Annual monitoring for members on digoxin.
Annual monitoring for members on diuretics.
Total rate (the sum of the three numerators divided by the sum of the three denominators).
Importance
Patient safety is highly important, especially for patients at increased risk of adverse medication events from long-term medication use. Persistent use of these medications warrants monitoring and follow-up by the prescribing provider to assess for side-effects and adjust medication dosage accordingly. The medications included in this measure also have more detrimental effects in the elderly.
The costs of annual monitoring are offset by the reduction in health care costs associated with complications arising from lack of monitoring and follow-up of patients on long-term medications. According to the Agency for Healthcare Research and Quality, total costs of medication-related problems due to misuse of medications in the ambulatory setting has been estimated to exceed $76 billion annually.15
Appropriate monitoring of medication therapy remains a significant issue to guide therapeutic decision making and provides largely unmet opportunities for improvement in care for patients on persistent medications.
15 Johnson JA, Bootman JL, Arch Intern Med. 1995 Oct 9;155(18):1949-56.

FULL-SCOPE MANAGED CARE HEALTH PLANS’ PERFORMANCE MEASURE RESULTS
2015 HEDIS Aggregate Report Page 39 California Department of Health Care Services Health Services Advisory Group, Inc.
Performance Results—Annual Monitoring for Patients on Persistent Medications—ACE Inhibitors or ARBs
81.49%80.77%
84.15%86.12%
50%
55%
60%
65%
70%
75%
80%
85%
90%
95%
100%
HEDIS 2012 HEDIS 2013 HEDIS 2014 HEDIS 2015
National Medicaid 25th Percentile (MPL) National Medicaid 90th Percentile (HPL) Medi-Cal Managed Care Weighted AverageNational Medicaid Average National Commercial Average MCP County Rates
Note:♦ The percentages displayed on this chart represent the Medi-Cal Weighted Average for each year displayed.♦ Not all MCP counties that contributed to the previous years' Medi-Cal Weighted Averages are shown.♦ Only MCP counties that reported data for HEDIS 2015 are shown and these MCP counties may not have reported data in prior years.

FULL-SCOPE MANAGED CARE HEALTH PLANS’ PERFORMANCE MEASURE RESULTS
2015 HEDIS Aggregate Report Page 40 California Department of Health Care Services Health Services Advisory Group, Inc.
Medi-Cal Managed Care HEDIS 2015 Annual Monitoring for Patients on Persistent Medications—ACE Inhibitors or ARBs
95.3893.7393.60
90.0790.0589.51
88.7888.2688.1687.8587.7487.7487.32
86.5586.4786.4386.1786.1486.1285.88
85.5585.4785.3785.1084.8884.8784.6284.4184.3784.3684.3483.9983.9583.4683.2083.1583.1283.04
82.1482.1182.0281.5981.4381.1680.9180.7480.5180.4180.2280.1779.88
77.4274.48
NA
0 10 20 30 40 50 60 70 80 90 100
Rate (%)
KP Cal LLC (Kaiser NorCal) - KP North KP Cal LLC (Kaiser SoCal) - San Diego
California Health & Wellness Plan - Imperial High Performance Level 1
CalOptima - Orange Molina Healthcare of CA - Imperial
Health Plan of San Mateo - San Mateo
Kern Health Systems - Kern
1 High Performance Level is HEDIS 2014 national Medicaid 90th Percentile.2 Minimum Performance Level is HEDIS 2014 national Medicaid 25th Percentile.
NA = A Not Applicable audit finding because the MCP’s denominator was too small (i.e., less than 30).
Note: HEDIS 2015 rates reflect 2014 measurement year data.
Partnership HealthPlan of CA - Southeast Central CA Alliance for Health - Monterey/Santa Cruz
Inland Empire Health Plan - Riverside/San Bernardino Health Net Community Solutions, Inc. - Kern Santa Clara Family Health Plan - Santa Clara
Central CA Alliance for Health - Merced L.A. Care Health Plan - Los Angeles
San Francisco Health Plan - San Francisco CenCal Health - Santa Barbara
Anthem Blue Cross Partnership Plan - Santa Clara CalViva Health - Madera
Health Plan of San Joaquin - Stanislaus Minimum Performance Level 2
Contra Costa Health Plan - Contra Costa Care 1st Partner Plan, LLC - San Diego
Anthem Blue Cross Partnership Plan - Sacramento Molina Healthcare of CA - Riverside/San Bernardino
CalViva Health - Fresno Anthem Blue Cross Partnership Plan - Alameda
Health Net Community Solutions, Inc. - Los Angeles
2015 Medi-Cal Managed Care Weighted Average
Molina Healthcare of CA - San Diego Community Health Group Partnership Plan - San Diego
Anthem Blue Cross Partnership Plan - Region 1 Health Net Community Solutions, Inc. - Tulare
CenCal Health - San Luis Obispo Molina Healthcare of CA - Sacramento
Health Net Community Solutions, Inc. - San Diego Partnership HealthPlan of CA - Southwest
Anthem Blue Cross Partnership Plan - Fresno Alameda Alliance for Health - Alameda
Anthem Blue Cross Partnership Plan - Tulare Gold Coast Health Plan - Ventura
Partnership HealthPlan of CA - Northeast Anthem Blue Cross Partnership Plan - Madera
California Health & Wellness Plan - Region 1 California Health & Wellness Plan - Region 2 Anthem Blue Cross Partnership Plan - Kings
Anthem Blue Cross Partnership Plan - San Francisco Health Net Community Solutions, Inc. - Stanislaus
Health Plan of San Joaquin - San Joaquin Partnership HealthPlan of CA - Northwest
Anthem Blue Cross Partnership Plan - Contra Costa CalViva Health - Kings
Health Net Community Solutions, Inc. - Sacramento Anthem Blue Cross Partnership Plan - Region 2
Health Net Community Solutions, Inc. - San Joaquin Anthem Blue Cross Partnership Plan - San Benito

FULL-SCOPE MANAGED CARE HEALTH PLANS’ PERFORMANCE MEASURE RESULTS
2015 HEDIS Aggregate Report Page 41 California Department of Health Care Services Health Services Advisory Group, Inc.
Summary of Results—Annual Monitoring for Patients on Persistent Medications—ACE Inhibitors or ARBs
The MCMC weighted average for the Annual Monitoring for Patients on Persistent Medications—ACE Inhibitors or ARBs measure improved significantly from RY 2014 to RY 2015, moving the rate from below the national Medicaid 25th percentile (MPL) in RY 2014 to above the MPL in RY 2015. The rate remained above the national commercial average in RY 2015. For the fourth consecutive year, however, the rate was below the national Medicaid average for this measure.
High and Low Performers
Since being required to report this measure in RY 2012, Kaiser SoCal—San Diego County’s rate for this measure has been above the national Medicaid 90th percentile (HPL) for this measure. The rates for California Health & Wellness Plan—Imperial County and Kaiser NorCal—KP North also were above the HPL in RY 2015.
The rates for the following MCP counties improved significantly from RY 2014 to RY 2015:
Anthem Blue Cross Partnership Plan—Sacramento County; however, the rate remained below the MPL
Health Net Community Solutions, Inc.—Kern County, Los Angeles County, and Sacramento County. The rates for Los Angeles County and Sacramento County remained below the MPL.
Inland Empire Health Plan—Riverside/San Bernardino counties
L.A. Care Health Plan—Los Angeles County
Molina Healthcare of California Partner Plan, Inc.—Sacramento County; however, the rate remained below MPL
The improvement for Health Net Community Solutions, Inc.—Kern County and L.A. Care Health Plan—Los Angeles County resulted in the rates moving from below the MPL in RY 2014 to above the MPL in RY 2015.
The rate for CalViva Health—Madera County improved from RY 2014 to RY 2015. Although the improvement was not statistically significant, the change resulted in the rate moving from below the MPL in RY 2014 to above the MPL in RY 2015.
Thirty-three MCP county/regional rates were below the MPL in RY 2015 compared with 21 in RY 2014. The rates for 12 MCP counties have been below the MPL for three or more consecutive years. The rates for the following MCP counties/regions are included in the 33 rates below the MPL; however, RY 2015 was the first year the MCP counties/regions reported rates for this measure and DHCS therefore did not hold the MCPs accountable to meet the MPL (i.e., the

FULL-SCOPE MANAGED CARE HEALTH PLANS’ PERFORMANCE MEASURE RESULTS
2015 HEDIS Aggregate Report Page 42 California Department of Health Care Services Health Services Advisory Group, Inc.
MCPs were not required to submit an improvement plan if their rates for the measure were below the MPL):
Anthem Blue Cross Partnership Plan—Region 1 and Region 2
California Health & Wellness Plan—Region 1 and Region 2
Partnership HealthPlan of California—Northeast, Northwest, and Southwest
The following MCP counties/regions had rates that declined significantly from RY 2014 to RY 2015:
CalViva Health—Kings County, resulting in the rate moving from above the MPL in RY 2014 to below the MPL in RY 2015
Community Health Group Partnership Plan—San Diego County, resulting in the rate moving from above the MPL in RY 2014 to below the MPL in RY 2015
Gold Coast Health Plan—Ventura County, resulting in the rate moving from above the MPL in RY 2014 to below the MPL in RY 2015
Health Net Community Solutions, Inc.—San Diego County, resulting in the rate moving from above the MPL in RY 2014 to below the MPL in RY 2015
Health Plan of San Joaquin—San Joaquin County
Health Plan of San Mateo—San Mateo County
Molina Healthcare of California Partner Plan, Inc.—Riverside/San Bernardino counties, resulting in the rate moving from above the MPL in RY 2014 to below the MPL in RY 2015
Partnership HealthPlan of California—Southeast
The rates for the following MCP counties declined from RY 2014 to RY 2015, and although the decline was not statistically significant, the change resulted in the rates moving from above the MPL in RY 2014 to below the MPL in RY 2015:
Anthem Blue Cross Partnership Plan—Tulare County
CalViva Health—Fresno County
Contra Costa Health Plan—Contra Costa County
Health Net Community Solutions, Inc.—Tulare County
Molina Healthcare of California Partner Plan, Inc.—San Diego County
Anthem Blue Cross Partnership Plan—San Benito County had an audit result of “NA” for this measure, meaning that although the MCP complied with all applicable specifications, it had a denominator less than 30 for the measure, resulting in the “NA” audit result.

FULL-SCOPE MANAGED CARE HEALTH PLANS’ PERFORMANCE MEASURE RESULTS
2015 HEDIS Aggregate Report Page 43 California Department of Health Care Services Health Services Advisory Group, Inc.
Performance Results—Annual Monitoring for Patients on Persistent Medications—Digoxin
86.44%86.91% 87.78%
51.78%
30%
40%
50%
60%
70%
80%
90%
100%
HEDIS 2012 HEDIS 2013 HEDIS 2014 HEDIS 2015
National Medicaid 25th Percentile (MPL) National Medicaid 90th Percentile (HPL) Medi-Cal Managed Care Weighted AverageNational Medicaid Average National Commercial Average MCP County Rates
Note:♦ The percentages displayed on this chart represent the Medi-Cal Weighted Average for each year displayed.♦ Not all MCP counties that contributed to the previous years' Medi-Cal Weighted Averages are shown.♦ Only MCP counties that reported data for HEDIS 2015 are shown and these MCP counties may not have reported data in prior years.

FULL-SCOPE MANAGED CARE HEALTH PLANS’ PERFORMANCE MEASURE RESULTS
2015 HEDIS Aggregate Report Page 44 California Department of Health Care Services Health Services Advisory Group, Inc.
Medi-Cal Managed Care HEDIS 2015 Annual Monitoring for Patients on Persistent Medications—Digoxin
77.1172.73
62.5060.8760.42
59.3858.6458.16
56.9456.3856.25
52.7852.3651.78
51.0250.0050.0050.0049.3549.17
48.2348.0847.4347.37
44.2342.11
38.18NA NA NA NA NA NA NA NA NA NA NA NA NA NA NA NA NA NA NA NA NA NA NA NA NA NA NA
0 10 20 30 40 50 60 70 80 90 100
Rate (%)
High Performance Level 1
Minimum Performance Level 2
Contra Costa Health Plan - Contra Costa KP Cal LLC (Kaiser NorCal) - KP North Care 1st Partner Plan, LLC - San Diego
Community Health Group Partnership Plan - San Diego Partnership HealthPlan of CA - Northeast
Molina Healthcare of CA - Riverside/San Bernardino
1 High Performance Level is HEDIS 2014 national Medicaid 90th Percentile.2 Minimum Performance Level is HEDIS 2014 national Medicaid 25th Percentile.
NA = A Not Applicable audit finding because the MCP’s denominator was too small (i.e., less than 30).
Note: HEDIS 2015 rates reflect 2014 measurement year data.
Partnership HealthPlan of CA - Southeast Santa Clara Family Health Plan - Santa Clara
Molina Healthcare of CA - San Diego Partnership HealthPlan of CA - Southwest
Gold Coast Health Plan - Ventura CalOptima - Orange
Inland Empire Health Plan - Riverside/San Bernardino 2015 Medi-Cal Managed Care Weighted Average
San Francisco Health Plan - San Francisco Central CA Alliance for Health - Monterey/Santa Cruz
Health Net Community Solutions, Inc. - Stanislaus
Health Plan of San Mateo - San Mateo Alameda Alliance for Health - Alameda
Health Net Community Solutions, Inc. - Los Angeles Kern Health Systems - Kern
L.A. Care Health Plan - Los Angeles CalViva Health - Fresno
Health Plan of San Joaquin - San Joaquin Health Net Community Solutions, Inc. - Tulare
Health Net Community Solutions, Inc. - Sacramento
Molina Healthcare of CA - Sacramento
Anthem Blue Cross Partnership Plan - Alameda Anthem Blue Cross Partnership Plan - Contra Costa
Anthem Blue Cross Partnership Plan - Fresno Anthem Blue Cross Partnership Plan - Kings
Anthem Blue Cross Partnership Plan - Madera Anthem Blue Cross Partnership Plan - Region 1 Anthem Blue Cross Partnership Plan - Region 2
Anthem Blue Cross Partnership Plan - Sacramento Anthem Blue Cross Partnership Plan - San Benito
Anthem Blue Cross Partnership Plan - San Francisco Anthem Blue Cross Partnership Plan - Santa Clara
Anthem Blue Cross Partnership Plan - Tulare CalViva Health - Kings
CalViva Health - Madera California Health & Wellness Plan - Imperial
California Health & Wellness Plan - Region 1 California Health & Wellness Plan - Region 2
CenCal Health - San Luis Obispo CenCal Health - Santa Barbara
Central CA Alliance for Health - Merced Health Net Community Solutions, Inc. - Kern
Health Net Community Solutions, Inc. - San Diego Health Net Community Solutions, Inc. - San Joaquin
Health Plan of San Joaquin - Stanislaus KP Cal LLC (Kaiser SoCal) - San Diego
Molina Healthcare of CA - Imperial Partnership HealthPlan of CA - Northwest

FULL-SCOPE MANAGED CARE HEALTH PLANS’ PERFORMANCE MEASURE RESULTS
2015 HEDIS Aggregate Report Page 45 California Department of Health Care Services Health Services Advisory Group, Inc.
Summary of Results— Annual Monitoring for Patients on Persistent Medications—Digoxin
For HEDIS 2015 DHCS did not hold the MCPs accountable to meet the MPL for the Annual Monitoring for Patients on Persistent Medications—Digoxin measure. Denominators are small for this indicator, and each individual counted toward the denominator would be expected to be counted toward the ACE Inhibitors or ARBs and Diuretics denominators since these patients generally receive all three medications. Furthermore, serum digoxin concentration measurement as part of routine monitoring is not evidence-based and is not recommended by the American College of Cardiology or American Heart Association (see http://circ.ahajournals.org/content/113/21/2556.full.pdf+html). While DHCS did not hold the MCPs accountable to meet the national Medicaid 25th percentile (MPL) for this measure (i.e., the MCPs were not required to submit an improvement plan if their rates for the measure were below the MPL), HSAG shows the MCPs’ performance relative to the established MPL and national Medicaid 90th percentile (HPL) to provide DHCS and the MCPs an assessment of overall MCP performance relative to the established benchmarks.
Note: NCQA made several changes to the Annual Monitoring for Patients on Persistent Medications—Digoxin measure specifications for HEDIS 2015. The specifications no longer allow a blood urea nitrogen therapeutic monitoring test to count as evidence of annual monitoring. In addition, the specifications added monitoring of serum digoxin level to meet the numerator criteria. The additional requirement is more restrictive, and may be directly related to the statistically significant rate declines for this measure.
Despite the specification changes, NCQA did not consider the Annual Monitoring for Patients on Persistent Medications—Digoxin measure to be a first-year measure in RY 2015. For the following reasons, HSAG recommends that no conclusions be drawn from the comparative analysis on this measure for RY 2015:
For all 26 MCP counties/regions able to report a rate for this measure, all rates were below the MPL.
All 21 MCP counties/regions with rates to compare to the previous year showed significant decline in their rates from RY 2014 to RY 2015.
The MCMC weighted average being below all national benchmarks.
Twenty-seven MCP counties/regions had an audit result of “NA” for this measure, meaning that although the MCP complied with all applicable specifications, it had a denominator less than 30 for the measure, resulting in the “NA” audit result.
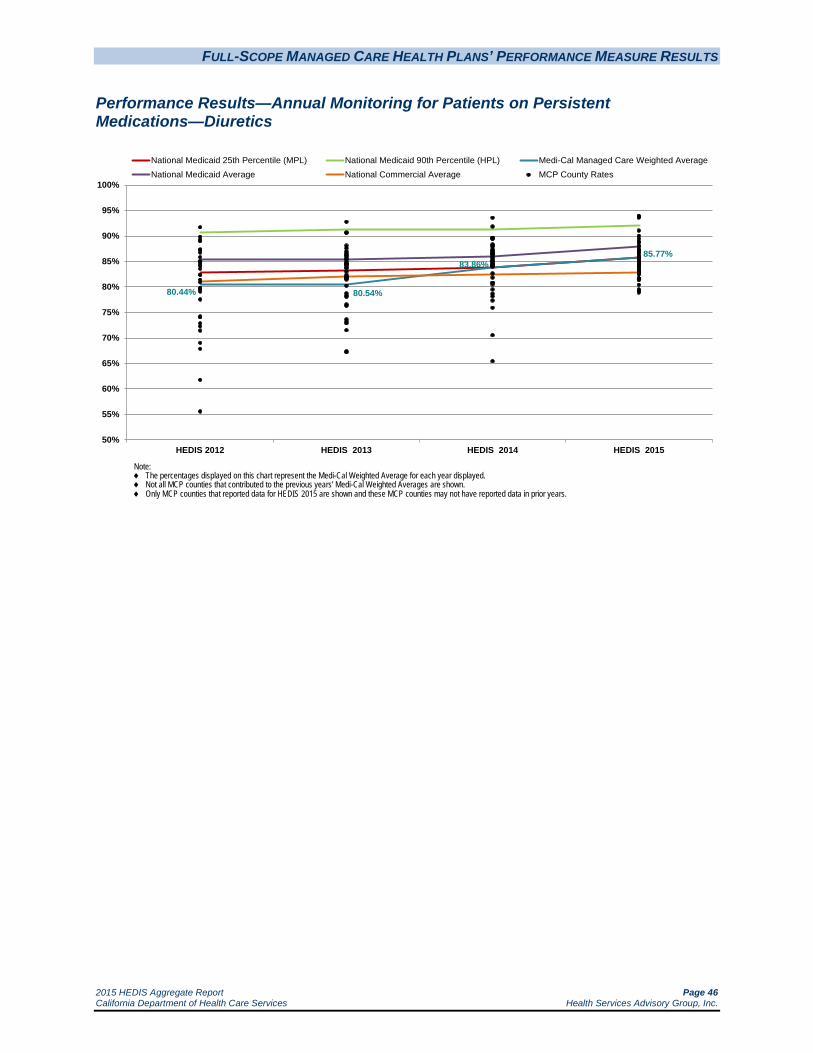
FULL-SCOPE MANAGED CARE HEALTH PLANS’ PERFORMANCE MEASURE RESULTS
2015 HEDIS Aggregate Report Page 46 California Department of Health Care Services Health Services Advisory Group, Inc.
Performance Results—Annual Monitoring for Patients on Persistent Medications—Diuretics
80.44% 80.54%
83.86%85.77%
50%
55%
60%
65%
70%
75%
80%
85%
90%
95%
100%
HEDIS 2012 HEDIS 2013 HEDIS 2014 HEDIS 2015
National Medicaid 25th Percentile (MPL) National Medicaid 90th Percentile (HPL) Medi-Cal Managed Care Weighted AverageNational Medicaid Average National Commercial Average MCP County Rates
Note:♦ The percentages displayed on this chart represent the Medi-Cal Weighted Average for each year displayed.♦ Not all MCP counties that contributed to the previous years' Medi-Cal Weighted Averages are shown.♦ Only MCP counties that reported data for HEDIS 2015 are shown and these MCP counties may not have reported data in prior years.
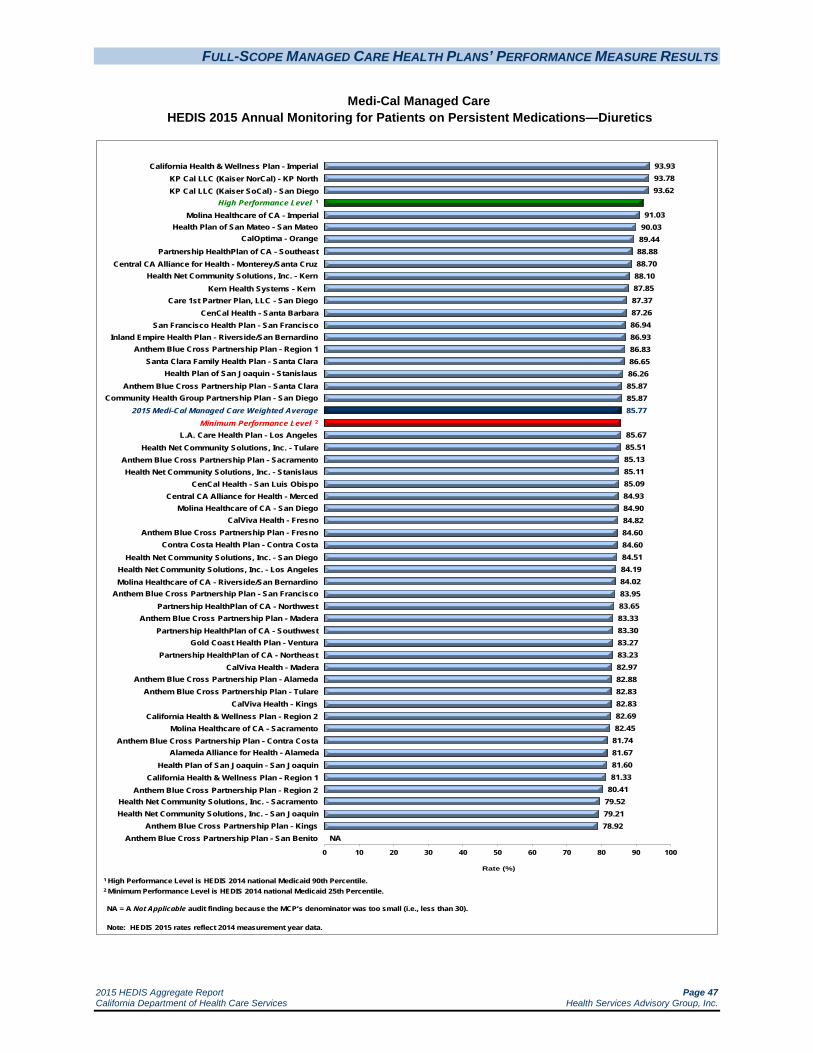
FULL-SCOPE MANAGED CARE HEALTH PLANS’ PERFORMANCE MEASURE RESULTS
2015 HEDIS Aggregate Report Page 47 California Department of Health Care Services Health Services Advisory Group, Inc.
Medi-Cal Managed Care HEDIS 2015 Annual Monitoring for Patients on Persistent Medications—Diuretics
93.9393.7893.62
91.0390.0389.4488.8888.7088.1087.8587.3787.2686.9486.9386.8386.6586.2685.8785.8785.77
85.6785.5185.1385.1185.0984.9384.9084.8284.6084.6084.5184.1984.0283.9583.6583.3383.3083.2783.2382.9782.8882.8382.8382.6982.45
81.7481.6781.6081.33
80.4179.5279.2178.92
NA
0 10 20 30 40 50 60 70 80 90 100
Rate (%)
California Health & Wellness Plan - Imperial KP Cal LLC (Kaiser NorCal) - KP North KP Cal LLC (Kaiser SoCal) - San Diego
High Performance Level 1
Molina Healthcare of CA - Imperial Health Plan of San Mateo - San Mateo
CalOptima - Orange
Partnership HealthPlan of CA - Southeast
1 High Performance Level is HEDIS 2014 national Medicaid 90th Percentile.2 Minimum Performance Level is HEDIS 2014 national Medicaid 25th Percentile.
NA = A Not Applicable audit finding because the MCP’s denominator was too small (i.e., less than 30).
Note: HEDIS 2015 rates reflect 2014 measurement year data.
Central CA Alliance for Health - Monterey/Santa Cruz Health Net Community Solutions, Inc. - Kern
Kern Health Systems - Kern Care 1st Partner Plan, LLC - San Diego
CenCal Health - Santa Barbara San Francisco Health Plan - San Francisco
Inland Empire Health Plan - Riverside/San Bernardino Anthem Blue Cross Partnership Plan - Region 1
Santa Clara Family Health Plan - Santa Clara Health Plan of San Joaquin - Stanislaus
Anthem Blue Cross Partnership Plan - Santa Clara
2015 Medi-Cal Managed Care Weighted Average Minimum Performance Level 2
L.A. Care Health Plan - Los Angeles Health Net Community Solutions, Inc. - Tulare
Anthem Blue Cross Partnership Plan - Sacramento Health Net Community Solutions, Inc. - Stanislaus
CenCal Health - San Luis Obispo Central CA Alliance for Health - Merced
Molina Healthcare of CA - San Diego
Community Health Group Partnership Plan - San Diego
CalViva Health - Fresno Anthem Blue Cross Partnership Plan - Fresno
Contra Costa Health Plan - Contra Costa Health Net Community Solutions, Inc. - San Diego
Health Net Community Solutions, Inc. - Los Angeles Molina Healthcare of CA - Riverside/San Bernardino
Anthem Blue Cross Partnership Plan - San Francisco Partnership HealthPlan of CA - Northwest
Anthem Blue Cross Partnership Plan - Madera Partnership HealthPlan of CA - Southwest
Gold Coast Health Plan - Ventura Partnership HealthPlan of CA - Northeast
CalViva Health - Madera Anthem Blue Cross Partnership Plan - Alameda
Anthem Blue Cross Partnership Plan - Tulare CalViva Health - Kings
California Health & Wellness Plan - Region 2 Molina Healthcare of CA - Sacramento
Anthem Blue Cross Partnership Plan - Contra Costa Alameda Alliance for Health - Alameda
Health Plan of San Joaquin - San Joaquin California Health & Wellness Plan - Region 1
Anthem Blue Cross Partnership Plan - Region 2 Health Net Community Solutions, Inc. - Sacramento Health Net Community Solutions, Inc. - San Joaquin
Anthem Blue Cross Partnership Plan - Kings Anthem Blue Cross Partnership Plan - San Benito

FULL-SCOPE MANAGED CARE HEALTH PLANS’ PERFORMANCE MEASURE RESULTS
2015 HEDIS Aggregate Report Page 48 California Department of Health Care Services Health Services Advisory Group, Inc.
Summary of Results—Annual Monitoring for Patients on Persistent Medications—Diuretics
The MCMC weighted average for the Annual Monitoring for Patients on Persistent Medications—Diuretics measure improved significantly from RY 2014 to RY 2015 and remained above the national Medicaid 25th percentile (MPL) and the national commercial average for this measure. Despite the significant improvement, the rate remained below the national Medicaid average for this measure for the fourth consecutive year.
High and Low Performers
Since being required to report this measure in RY 2012, Kaiser SoCal—San Diego County’s rate has been above the national Medicaid 90th percentile (HPL) for this measure. Additionally, the rates for California Health & Wellness Plan—Imperial County and Kaiser NorCal—KP North were above the HPL in RY 2015.
The rates for the following MCP counties improved significantly from RY 2014 to RY 2015:
Anthem Blue Cross Partnership Plan—Sacramento County; however, the rate remained below the MPL
Care1st Partner Plan—San Diego County
Health Net Community Solutions, Inc.—Kern County, Los Angeles County, Sacramento County, and San Joaquin County, resulting in the rate for Kern County moving from below the MPL in RY 2014 to above the MPL in RY 2015. The rates for Los Angeles County, Sacramento County, and San Joaquin County remained below the MPL. (Note: RY 2014 was the first year Health Net Community Solutions, Inc., reported a rate for San Joaquin County, so DHCS did not hold the MCP accountable to meet the MPL for this county in RY 2014.)
Inland Empire Health Plan—Riverside/San Bernardino counties
L.A. Care Health Plan—Los Angeles County; however, the rate remained below the MPL
Molina Healthcare of California Partner Plan, Inc.—Sacramento County; however, the rate remained below the MPL
The rates for 33 MCP counties/regions were below the MPL for this measure in RY 2015 compared to 13 in RY 2014. The rates for nine MCP counties have been below the MPL for three or more consecutive years. The rates for the following MCP counties/regions are included in the 33 rates below the MPL; however, RY 2015 was the first year the MCP counties/regions reported rates for this measure and DHCS therefore did not hold the MCPs accountable to meet the MPL (i.e., the MCPs were not required to submit an improvement plan if their rates for the measure were below the MPL):

FULL-SCOPE MANAGED CARE HEALTH PLANS’ PERFORMANCE MEASURE RESULTS
2015 HEDIS Aggregate Report Page 49 California Department of Health Care Services Health Services Advisory Group, Inc.
Anthem Blue Cross Partnership Plan—Region 2
California Health & Wellness Plan—Region 1 and Region 2
Partnership HealthPlan of California—Northeast, Northwest, and Southwest
The rates for the following MCP counties declined significantly from RY 2014 to RY 2015:
Alameda Alliance for Health—Alameda County, resulting in the rate moving from above the MPL in RY 2014 to below the MPL in RY 2015.
Community Health Group Partnership Plan—San Diego County
Gold Coast Health Plan—Ventura County, resulting in the rate moving from above the MPL in RY 2014 to below the MPL in RY 2015
Health Plan of San Joaquin—San Joaquin County, resulting in the rate moving from above the MPL in RY 2014 to below the MPL in RY 2015 (Note: RY 2014 was the first year Health Plan of San Joaquin reported a rate for Stanislaus County, so DHCS did not hold the MCP accountable to meet the MPL for this county in RY 2014)
Health Plan of San Mateo—San Mateo County
Molina Healthcare of California Partner Plan, Inc.—Riverside/San Bernardino counties and San Diego County, resulting in the rates moving from above the MPL in RY 2014 to below the MPL in RY 2015
The rates for 11 additional MCP counties declined from RY 2014 to RY 2015. Although the decline was not statistically significant, the change resulted in the rates moving from above the MPL in RY 2014 to below the MPL in RY 2015.
Anthem Blue Cross Partnership Plan—San Benito County had an audit result of “NA” for this measure, meaning that although the MCP complied with all applicable specifications, it had a denominator less than 30 for the measure, resulting in the “NA” audit result.
Best and Emerging Practices—Annual Monitoring for Patients on Persistent Medications
Provider Education
Patients who take medications for chronic conditions may be at increased risk for adverse drug effects or problems relating to nonadherence. While yearly testing for patients on medications such as angiotensin-converting enzyme inhibitors (ACE inhibitors), statins, and anticonvulsants to monitor blood levels and organ functioning is essential, blood tests cannot replace good communication between providers and beneficiaries. Educational interventions for providers should include prescribing products that simplify the medication regimen or the practice of

FULL-SCOPE MANAGED CARE HEALTH PLANS’ PERFORMANCE MEASURE RESULTS
2015 HEDIS Aggregate Report Page 50 California Department of Health Care Services Health Services Advisory Group, Inc.
sending refill reminders. Although these interventions are less effective than direct patient contact, they are often more cost-effective.16
Computerized Methods to Detect Adverse Drug Events
Use of computerized data to identify adverse drug events (ADEs) is one strategy to monitor the effects prescribed medications are having on patients. The Food and Drug Administration and The Joint Commission emphasize the need for reporting ADEs as important markers of the quality of medical care. Additionally, the American Society for Health-Systems Pharmacists recommends that all health care systems develop ongoing ADE reporting programs. Compared with manual chart review, use of electronic medical records to estimate the rate of ADEs is faster and much less expensive.17
16 A. A. Petrilla, J. S. Benner, D. S. Battleman, et al. Evidence-based interventions to improve patient compliance with
antihypertensive and lipid-lowering medications. 2005. International Journal of Clinical Practice. 59:12; 1141–1451. 17 Honigman B, Lee J, Rothschild J, et al. Using Computerized Data to Identify Adverse Drug Events in Outpatients. J
Am Med Inform Assoc. 2001 May–Jun; 8(3): 254–266.

FULL-SCOPE MANAGED CARE HEALTH PLANS’ PERFORMANCE MEASURE RESULTS
2015 HEDIS Aggregate Report Page 51 California Department of Health Care Services Health Services Advisory Group, Inc.
Avoidance of Antibiotic Treatment in Adults With Acute Bronchitis
Measure Definition
The Avoidance of Antibiotic Treatment in Adults With Acute Bronchitis measure assesses the percentage of members 18 to 64 years of age with a primary diagnosis of acute bronchitis who were not dispensed an antibiotic prescription.
Importance
While only about 5 percent of adults report an episode of acute bronchitis each year, 90 percent seek treatment.18 Acute bronchitis consistently ranks among the top 10 conditions that account for the most ambulatory office visits to U.S. physicians. The majority of acute bronchitis cases (more than 90 percent) have a nonbacterial cause (i.e., are viral in origin) making the prescribing of antibiotics for the treatment of acute bronchitis inappropriate.
Although prescribing antibiotics for acute bronchitis is inappropriate, between 1996 and 2010, antibiotic prescribing for acute bronchitis was 71 percent and the prescribing rate increased during the time period.19 The prescribing of antibiotics for smokers with acute bronchitis is even greater. More than 90 percent of smokers with acute bronchitis receive antibiotics; however, there is no evidence that smokers are in greater need of antibiotics than nonsmokers.20
When the treatment of acute bronchitis was compared between patients who received an antibiotic and patients who received a placebo, it was found that there were few benefits in terms of reducing impairments such as coughing, sore throat, sputum build-up, and fever. Antibiotic use did, however, show a significantly higher level of adverse medication side effects such as nausea, vomiting, headaches, and rash.21 Use of unnecessary antibiotics can lead to unwanted side effects and antibiotic resistance.22 Although hospitals have seen a reduction in the misuse of antibiotics, doctors in the community continue to overprescribe antibiotics at the request of their patients. By prescribing unnecessary antibiotics, physicians are adding to the creation of “superbugs” and the public health threat that “superbugs” create.23
18 National Committee for Quality Assurance. The State of Health Care Quality 2013. Washington, D.C: NCQA 2013. 19 Barnett, Michael L., MD and Linder, Jeffrey A., MD, MPH, Antibiotic Prescribing for Adults With Acute Bronchitis
in the United States, 1996–2010, JAMA, May 21, 2014, Volume 311, Number 19. 20 Braman SS. Chronic Cough Due to Acute Bronchitis: ACCP Evidence-Based Clinical Practice Guidelines. Chest. 2006;
129; 95S–103S. 21 Chandran R. Should We Prescribe Antibiotics for Acute Bronchitis? American Family Physician. 2001. 22 Get Smart: Know When Antibiotics Work. Centers for Disease Control. Available at
http://www.cdc.gov/getsmart/antibiotic-use/uri/bronchitis.html. Accessed on July 9, 2015. 23 Antibiotics Drastically Overprescribed for Sore Throats, Bronchitis. October 4, 2013. Science Daily. Available at
http://www.sciencedaily.com/releases/2013/10/131004105256.htm. Accessed on July 9, 2015.
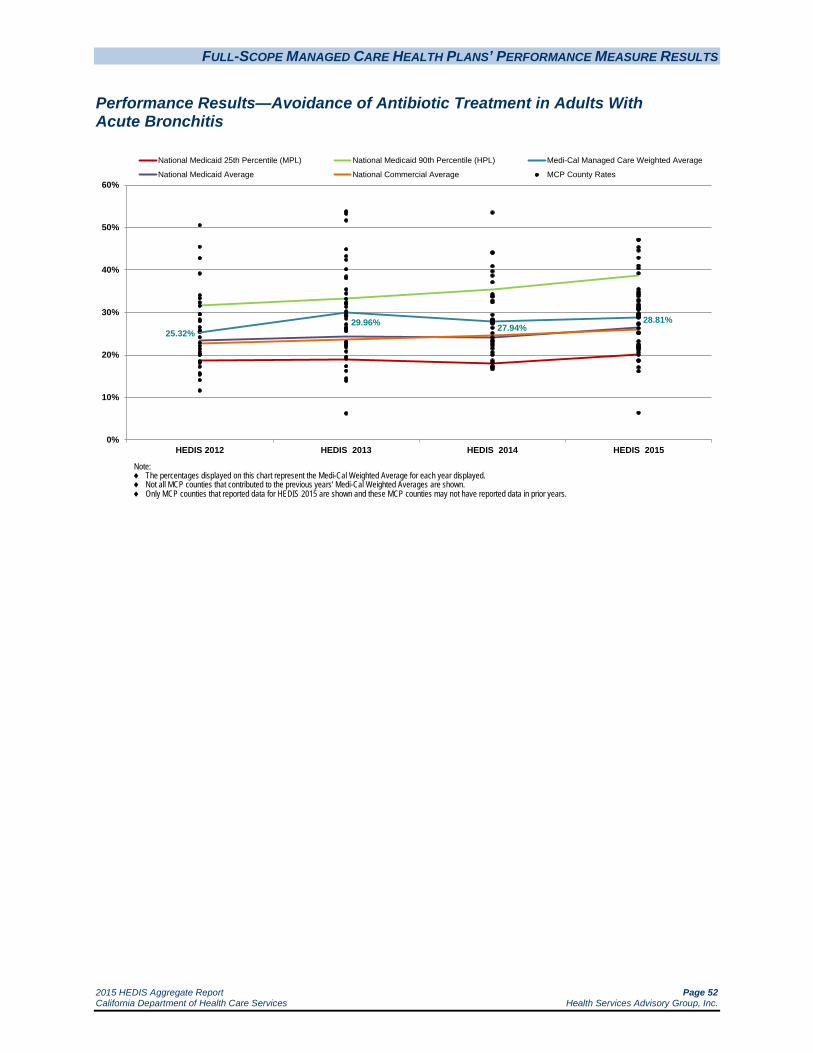
FULL-SCOPE MANAGED CARE HEALTH PLANS’ PERFORMANCE MEASURE RESULTS
2015 HEDIS Aggregate Report Page 52 California Department of Health Care Services Health Services Advisory Group, Inc.
Performance Results—Avoidance of Antibiotic Treatment in Adults With Acute Bronchitis
25.32%29.96% 27.94%
28.81%
0%
10%
20%
30%
40%
50%
60%
HEDIS 2012 HEDIS 2013 HEDIS 2014 HEDIS 2015
National Medicaid 25th Percentile (MPL) National Medicaid 90th Percentile (HPL) Medi-Cal Managed Care Weighted Average
National Medicaid Average National Commercial Average MCP County Rates
Note:♦ The percentages displayed on this chart represent the Medi-Cal Weighted Average for each year displayed.♦ Not all MCP counties that contributed to the previous years' Medi-Cal Weighted Averages are shown.♦ Only MCP counties that reported data for HEDIS 2015 are shown and these MCP counties may not have reported data in prior years.

FULL-SCOPE MANAGED CARE HEALTH PLANS’ PERFORMANCE MEASURE RESULTS
2015 HEDIS Aggregate Report Page 53 California Department of Health Care Services Health Services Advisory Group, Inc.
Medi-Cal Managed Care HEDIS 2015 Avoidance of Antibiotic Treatment in Adults With Acute Bronchitis
47.0647.06
45.3444.60
42.8640.9740.38
39.22
35.5034.8334.4834.2033.82
32.9232.65
31.8231.6831.3230.9630.9430.69
29.7329.4929.4629.3528.9328.9028.8528.81
27.3727.23
26.3225.2425.2025.14
23.2522.5022.3122.0021.7721.7521.5421.1520.65
20.0018.6518.60
17.0816.15
6.35NA NA NA NA
0 10 20 30 40 50 60 70 80 90 100
Rate (%)
Anthem Blue Cross Partnership Plan - San Francisco Contra Costa Health Plan - Contra Costa
San Francisco Health Plan - San Francisco Community Health Group Partnership Plan - San Diego
KP Cal LLC (Kaiser NorCal) - KP North Partnership HealthPlan of CA - Southwest
CalViva Health - Fresno
California Health & Wellness Plan - Imperial
1 High Performance Level is HEDIS 2014 national Medicaid 90th Percentile.2 Minimum Performance Level is HEDIS 2014 national Medicaid 25th Percentile.
NA = A Not Applicable audit finding because the MCP’s denominator was too small (i.e., less than 30).
Note: HEDIS 2015 rates reflect 2014 measurement year data.
High Performance Level 1
Health Plan of San Mateo - San Mateo Partnership HealthPlan of CA - Southeast
Alameda Alliance for Health - Alameda Anthem Blue Cross Partnership Plan - Fresno
Health Net Community Solutions, Inc. - San Diego Anthem Blue Cross Partnership Plan - Sacramento
Anthem Blue Cross Partnership Plan - Alameda Anthem Blue Cross Partnership Plan - Kings
Molina Healthcare of CA - Riverside/San Bernardino Health Net Community Solutions, Inc. - Los Angeles
Santa Clara Family Health Plan - Santa Clara Health Net Community Solutions, Inc. - Stanislaus
L.A. Care Health Plan - Los Angeles Anthem Blue Cross Partnership Plan - Santa Clara
Health Plan of San Joaquin - San Joaquin Partnership HealthPlan of CA - Northwest
CenCal Health - Santa Barbara Molina Healthcare of CA - San Diego
CenCal Health - San Luis Obispo
Health Net Community Solutions, Inc. - Sacramento
2015 Medi-Cal Managed Care Weighted Average CalViva Health - Kings
Molina Healthcare of CA - Sacramento Health Net Community Solutions, Inc. - San Joaquin Central CA Alliance for Health - Monterey/Santa Cruz
Care 1st Partner Plan, LLC - San Diego Central CA Alliance for Health - Merced
Health Net Community Solutions, Inc. - Tulare Anthem Blue Cross Partnership Plan - Region 2
Partnership HealthPlan of CA - Northeast CalOptima - Orange
Health Net Community Solutions, Inc. - Kern Inland Empire Health Plan - Riverside/San Bernardino
Kern Health Systems - Kern Gold Coast Health Plan - Ventura
CalViva Health - Madera Minimum Performance Level 2
Anthem Blue Cross Partnership Plan - Region 1 Health Plan of San Joaquin - Stanislaus
California Health & Wellness Plan - Region 2 Anthem Blue Cross Partnership Plan - Tulare California Health & Wellness Plan - Region 1
Anthem Blue Cross Partnership Plan - Madera Anthem Blue Cross Partnership Plan - Contra Costa
Anthem Blue Cross Partnership Plan - San Benito KP Cal LLC (Kaiser SoCal) - San Diego
Molina Healthcare of CA - Imperial

FULL-SCOPE MANAGED CARE HEALTH PLANS’ PERFORMANCE MEASURE RESULTS
2015 HEDIS Aggregate Report Page 54 California Department of Health Care Services Health Services Advisory Group, Inc.
Summary of Results—Avoidance of Antibiotic Treatment in Adults With Acute Bronchitis
The MCMC weighted average for the Avoidance of Antibiotic Treatment in Adults With Acute Bronchitis measure was higher than the national Medicaid 25th percentile (MPL) and the national Medicaid and commercial averages for the fourth consecutive year. The rate remained below the national Medicaid 90th percentile (HPL).
High and Low Performers
The rates for the following MCP counties/regions exceeded the HPL in RY 2015:
Anthem Blue Cross Partnership Plan—San Francisco County (for the fifth consecutive year)
California Health & Wellness Plan—Imperial County
CalViva Health—Fresno County (for the third consecutive year)
Community Health Group Partnership Plan—San Diego County
Contra Costa Health Plan—Contra Costa County
Kaiser NorCal—KP North
Partnership HealthPlan of California—Southwest
San Francisco Health Plan—San Francisco County (for the fifth consecutive year)
The rates for the following MCP counties improved significantly from RY 2014 to RY 2015:
CenCal Health—San Luis Obispo County, resulting in the rate moving from below the MPL in RY 2014 to above the MPL in RY 2015.
Central California Alliance for Health—Merced County
Health Net Community Solutions, Inc.—Los Angeles County and Stanislaus County
Health Plan of San Joaquin—San Joaquin County
The rates for CalViva Health—Kings County and Madera County also improved from RY 2014 to RY 2015. Although the improvement was not statistically significant, the change resulted in the rates moving from below the MPL in RY 2014 to above the MPL in RY 2015.
The rates for the following MCP counties/regions were below the MPL in RY 2015:
Anthem Blue Cross Partnership Plan—Region 1, Madera County, and Tulare County
California Health & Wellness Plan—Region 1 and Region 2
Health Plan of San Joaquin—Stanislaus County

FULL-SCOPE MANAGED CARE HEALTH PLANS’ PERFORMANCE MEASURE RESULTS
2015 HEDIS Aggregate Report Page 55 California Department of Health Care Services Health Services Advisory Group, Inc.
Note: RY 2015 was the first year Anthem Blue Cross Partnership Plan—Region 1 and California Health & Wellness Plan—Region 1 and Region 2 reported rates for this measure and DHCS therefore did not hold the MCPs accountable to meet the MPL (i.e., the MCPs were not required to submit an improvement plan if their rates for the measure were below the MPL).
The rates for the following MCP counties declined significantly from RY 2014 to RY 2015:
Alameda Alliance for Health—Alameda County
Anthem Blue Cross Partnership Plan—Madera County and Tulare County, resulting in the rates for both counties moving from above the MPL in RY 2014 to below the MPL in RY 2015.
Kern Health Systems—Kern County
Four MCP counties had an audit result of “NA” for this measure, meaning that although the MCPs complied with all applicable specifications, they had a denominator less than 30 for the measure, resulting in the “NA” audit result.
Best and Emerging Practices—Avoidance of Antibiotic Treatment in Adults With Acute Bronchitis
The overuse of antibiotics has created “superbugs.” In order to prevent the further development of these “superbugs,” antibiotics should not be used to treat acute bronchitis. It has been shown that providing education directly to the patient at the time of the visit is more effective than educational efforts involving pamphlets or newsletters.24 MCPs and other organizations are developing interventions to help educate both the patient and the provider.
In order to help providers determine when it is appropriate to provide antibiotics for acute bronchitis, the University of Pennsylvania, the University of California at San Francisco, and the Geisinger Health System developed an algorithm. The algorithm utilizes a patient’s vital signs and chest examination to determine if the patient is a low, intermediate, or high probability case in need of antibiotics. Once the patient has been categorized, specific treatment strategies are implemented in order to treat the patient.25
The Get Smart Campaign, developed by Centers for Disease Control and Prevention (CDC), helps educate patients and providers on the appropriate use of antibiotics. CDC provides printed,
24 Ranji, S.R., Steinman, M.A., Shojania, K.G., et al. Closing the Quality Gap: A Critical Analysis of Quality
Improvement Strategies. Volume 4—Antibiotic Prescribing Behavior. Technical Review 9.4 2006. AHRQ Publication No. 04(06)-0051-4. Available at: http://www.ncbi.nlm.nih.gov/books/NBK43956/. Accessed on: July 9, 2015.
25 National Committee for Quality Assurance. An Algorithm to Improve Appropriate Antibiotic Use for Patients with Acute Bronchitis. April 2011. Available at: http://www.ncqa.org/portals/0/Education/An_Algorithm_To_Improve_Appriopriate_Antibiotic_Use_for_Bronchitis_Archived_Manual.pdf. Accessed on: July 9, 2015.

FULL-SCOPE MANAGED CARE HEALTH PLANS’ PERFORMANCE MEASURE RESULTS
2015 HEDIS Aggregate Report Page 56 California Department of Health Care Services Health Services Advisory Group, Inc.
online, and radio/television materials for patients and providers in both English and Spanish.26 In 2008, CDC established Get Smart About Antibiotics Week, which is an annual effort to coordinate the work of the Get Smart Campaign, state-based appropriate antibiotic use campaigns, non-profit partners, and for-profit partners during a one-week observance of antibiotic resistance and the importance of appropriate antibiotic use.27
26 Get Smart: Know When Antibiotics Work. Centers for Disease Control and Prevention. Available at:
http://www.cdc.gov/getsmart/community/index.html. Accessed on: July 9, 2015. 27 Get Smart: Know When Antibiotics Work. Centers for Disease Control and Prevention. Available at:
http://www.cdc.gov/getsmart/community/index.html. Accessed on: July 9, 2015.

FULL-SCOPE MANAGED CARE HEALTH PLANS’ PERFORMANCE MEASURE RESULTS
2015 HEDIS Aggregate Report Page 57 California Department of Health Care Services Health Services Advisory Group, Inc.
Cervical Cancer Screening
Measure Definition
The Cervical Cancer Screening measure reports the percentage of women 21 through 64 years of age who were screened for cervical cancer using either of the following criteria:
Women age 21–64 who had cervical cytology performed every 3 years.
Women age 30–64 who had cervical cytology/human papillomavirus (HPV) co-testing performed every 5 years.
Importance
In the United States during 2012, the American Cancer Society estimated 12,170 new cases of invasive cervical cancer and 4,220 deaths resulting from cervical cancer.28 In the United States, Hispanic women are most likely to get cervical cancer, followed by African-Americans, Asians and Pacific Islanders, and Whites.29
A well-proven way to prevent cervical cancer is to have testing (screening) to find pre-cancers before they can turn into invasive cancer. The Pap test (or Pap smear) is the most common way to do this. If a pre-cancer is found it can be treated, stopping cervical cancer before it starts. The five-year relative survival rate for early stages of invasive cervical cancer is 93 percent.30
In March 2012, the U.S. Preventive Services Task Force (USPSTF) updated the screening guidelines for cervical cancer.31 Consistent with prior recommendations, the 2012 updated guidelines recommend that women ages 21–65 who have a cervix have a Pap smear every three years. The new recommendations provide the alternative of having a combination of Pap smear and HPV testing every five years for women ages 30–65 who want to be screened less frequently. USPSTF did not change its recommendation against cervical cancer screening using HPV testing, alone or with cytology, in women younger than 30.
28 American Cancer Society. Cancer Facts and Figures 2012. Available at:
http://www.cancer.org/acs/groups/content/@epidemiologysurveilance/documents/document/acspc-031941.pdf Accessed on: July 9, 2015.
29 American Cancer Society. Detailed Guide: Cervical Cancer. Updated 2012. Available at: http://www.cancer.org/acs/groups/cid/documents/webcontent/003094-pdf.pdf. Accessed on: July 9, 2015.
30 Ibid. 31 Screening for Cervical Cancer, Topic Page. April 2012. U.S. Preventive Services Task Force. Available at:
http://www.uspreventiveservicestaskforce.org/uspstf/uspscerv.htm. Accessed on: July 9, 2015.

FULL-SCOPE MANAGED CARE HEALTH PLANS’ PERFORMANCE MEASURE RESULTS
2015 HEDIS Aggregate Report Page 58 California Department of Health Care Services Health Services Advisory Group, Inc.
Performance Results—Cervical Cancer Screening
63.69%59.26%
20%
30%
40%
50%
60%
70%
80%
90%
100%
HEDIS 2014 HEDIS 2015
National Medicaid 25th Percentile (MPL) National Medicaid 90th Percentile (HPL) Medi-Cal Managed Care Weighted AverageNational Medicaid Average National Commercial Average MCP County Rates
Healthy People 2020 goal: 93.00%
Note:♦ The percentages displayed on this chart represent the Medi-Cal Weighted Average for each year displayed.♦ Not all MCP counties that contributed to the previous years' Medi-Cal Weighted Averages are shown.♦ Only MCP counties that reported data for HEDIS 2015 are shown and these MCP counties may not have reported data in prior years.

FULL-SCOPE MANAGED CARE HEALTH PLANS’ PERFORMANCE MEASURE RESULTS
2015 HEDIS Aggregate Report Page 59 California Department of Health Care Services Health Services Advisory Group, Inc.
Medi-Cal Managed Care HEDIS 2015 Cervical Cancer Screening
85.8679.66
74.0070.40
68.0065.4565.3564.9664.7464.32
63.3262.78
61.7961.7761.3461.3160.79
59.3759.2658.6858.5358.1957.9157.2757.1857.1856.8856.5156.20
55.4755.1055.1054.99
53.5352.79
51.5351.3451.1251.02
50.1249.7649.6449.6449.64
48.3848.24
45.9944.53
43.0641.1240.88
40.2239.86
36.25
0 10 20 30 40 50 60 70 80 90 100
Rate (%)
KP Cal LLC (Kaiser SoCal) - San Diego KP Cal LLC (Kaiser NorCal) - KP North
High Performance Level 1
San Francisco Health Plan - San Francisco CenCal Health - Santa Barbara
Inland Empire Health Plan - Riverside/San Bernardino Central CA Alliance for Health - Monterey/Santa Cruz
Anthem Blue Cross Partnership Plan - Santa Clara
1 High Performance Level is HEDIS 2014 national Medicaid 90th Percentile.2 Minimum Performance Level is HEDIS 2014 national Medicaid 25th Percentile.
Note: HEDIS 2015 rates reflect 2014 measurement year data.
Central CA Alliance for Health - Merced CalViva Health - Fresno
Anthem Blue Cross Partnership Plan - San Francisco Health Net Community Solutions, Inc. - Tulare
CalOptima - Orange L.A. Care Health Plan - Los Angeles
Gold Coast Health Plan - Ventura CenCal Health - San Luis Obispo
Anthem Blue Cross Partnership Plan - Madera Anthem Blue Cross Partnership Plan - Tulare
Community Health Group Partnership Plan - San Diego
CalViva Health - Madera Molina Healthcare of CA - Riverside/San Bernardino
Partnership HealthPlan of CA - Southeast Kern Health Systems - Kern
Molina Healthcare of CA - Sacramento Health Plan of San Joaquin - San Joaquin
Santa Clara Family Health Plan - Santa Clara Anthem Blue Cross Partnership Plan - Alameda
Anthem Blue Cross Partnership Plan - Sacramento
2015 Medi-Cal Managed Care Weighted Average
Partnership HealthPlan of CA - Southwest Contra Costa Health Plan - Contra Costa
California Health & Wellness Plan - Imperial Health Plan of San Mateo - San Mateo
Health Net Community Solutions, Inc. - Stanislaus Minimum Performance Level 2
Alameda Alliance for Health - Alameda Anthem Blue Cross Partnership Plan - Fresno
Health Net Community Solutions, Inc. - Los Angeles Health Net Community Solutions, Inc. - Sacramento
CalViva Health - Kings Molina Healthcare of CA - San Diego
Health Plan of San Joaquin - Stanislaus Anthem Blue Cross Partnership Plan - Kings
Care 1st Partner Plan, LLC - San Diego Health Net Community Solutions, Inc. - Kern
Partnership HealthPlan of CA - Northwest Anthem Blue Cross Partnership Plan - Contra Costa
Anthem Blue Cross Partnership Plan - Region 2 Partnership HealthPlan of CA - Northeast
California Health & Wellness Plan - Region 1 Anthem Blue Cross Partnership Plan - San Benito Health Net Community Solutions, Inc. - San Diego
California Health & Wellness Plan - Region 2 Molina Healthcare of CA - Imperial
Anthem Blue Cross Partnership Plan - Region 1 Health Net Community Solutions, Inc. - San Joaquin
FULL-SCOPE MANAGED CARE HEALTH PLANS’ PERFORMANCE MEASURE RESULTS
2015 HEDIS Aggregate Report Page 60 California Department of Health Care Services Health Services Advisory Group, Inc.
Summary of Results—Cervical Cancer Screening
Note: NCQA’s HEDIS 2014 specification for the Cervical Cancer Screening measure changed to reflect new cervical cancer screening guidelines. Although the Cervical Cancer Screening measure was considered to be a first-year measure in RY 2014, the benchmarks displayed for RY 2015 were slightly lower than those for RY 2014. The reader should be aware that these differences resulted from the specification change.
The RY 2015 Medi-Cal weighted average for the Cervical Cancer Screening measure was higher than the national Medicaid 25th percentile (MPL) but lower than the national Medicaid and commercial averages, the national Medicaid 90th percentile (HPL), and the Healthy People 2020 goal of 93 percent.
High and Low Performers
The rates for Kaiser NorCal—KP North and Kaiser SoCal—San Diego County were above the national Medicaid 90th percentile (HPL), and the rates for 21 MCP counties were below the MPL in RY 2015. Since in RY 2014 the measure was considered to be a first-year measure, RY 2015 is the first year DHCS held the MCPs accountable to meet the MPL.
Best and Emerging Practices—Cervical Cancer Screening
In order to prevent cervical cancer, women must be screened; however, many health plans find that beneficiaries are not compliant with being screened. The Community Preventive Services Task Force found that client reminders, providing videos or printed materials, and one-on-one education were the most effective interventions for increasing cervical cancer screening.32
Medicaid Health Plans of America’s Center for Best Practices provides information on efforts that have resulted in an increase in adherence to recommended care. Following are two examples of initiatives that may help MCPs improve cervical cancer screening rates.33
OmniCare Health Plan
Studies find that African-American women are more likely to be diagnosed with and die from cervical cancer than are White women. To address this issue, OmniCare Health Plan in Michigan implemented multiple interventions to engage African-American women and educate them about the benefits of regular Pap screenings. Since breast cancer is the second most common cause of cancer death among African-American women, the health plan’s interventions also included 32 The Community Guide: Cancer Prevention and Control: Client-Oriented Interventions to Increase Breast, Cervical,
and Colorectal Cancer Screening. Available at http://www.thecommunityguide.org/cancer/screening/client-oriented/index.html. Accessed on: July 9, 2015.
33 Medicaid Health Plans of America: Centers for Best Practices. Treatment Adherence: Best Practices Compendium. Available at: http://www.mhpa.org/_upload/adherenceCompendiumWeb2.pdf. Accessed on: July 9, 2015.
FULL-SCOPE MANAGED CARE HEALTH PLANS’ PERFORMANCE MEASURE RESULTS
2015 HEDIS Aggregate Report Page 61 California Department of Health Care Services Health Services Advisory Group, Inc.
education about the benefits of regular mammogram screening. Interventions with focus on improving cervical cancer screening rates included:
Sending targeted mailings and placing follow-up telephone calls to chronically noncompliant beneficiaries.
Implementing a direct messaging campaign (mail and telephone calls) identifying women who were missing both their mammogram and Pap screenings.
Partnering with a physician’s group/radiology facility and an OB/PCP site for scheduled appointments at each site on the same day.
Transportation was arranged and OmniCare Health Plan coordinated beneficiaries being shuttled between the two locations.
Providing PCPs with real-time electronic listings of noncompliant beneficiaries that they can access from their offices 24 hour a day, 7 days a week.
Providing an on-screen pop-up to health plan customer service department representatives to indicate when an incoming call is from a noncompliant beneficiary. The representative can then discuss needed screenings with the beneficiary.
As a result of the various interventions, OmniCare saw continuous improvement in the cervical cancer screening rate from 2008 to 2010.
Amerigroup
In order to support patients and help them gain access to needed services, Amerigroup implemented the TXT2Care intervention in its Maryland and Texas (Houston area) health plans. The health plans explored using two-way text messaging as a tool to improve utilization of preventive services. The program resulted in approximately 71 percent of beneficiaries who responded “yes” to the text getting their care access needs met. Additionally, the program made the care management process more productive and efficient. While the health plan did not specifically report on how the TXT2Care intervention impacted cervical cancer screening rates, the positive results suggest that it could be an effective approach for improving adherence to cervical cancer screening.
FULL-SCOPE MANAGED CARE HEALTH PLANS’ PERFORMANCE MEASURE RESULTS
2015 HEDIS Aggregate Report Page 62 California Department of Health Care Services Health Services Advisory Group, Inc.
Childhood Immunization Status—Combination 3
Measure Definition
The Childhood Immunization Status—Combination 3 measure calculates the percentage of children 2 years of age who had four diphtheria, tetanus, and acellular pertussis (DTaP); three polio (IPV); one measles, mumps, and rubella (MMR); three Haemophilus influenza type B (HiB); three hepatitis B (HepB); one chicken pox (VZV); four pneumococcal conjugate (PCV); one hepatitis A (HepA); two or three rotavirus (RV); and two influenza (flu) vaccines by their second birthday. The measure calculates a rate for each vaccine and nine separate combination rates.
Importance
Disease prevention is the key to public health, and one of the most basic methods for the prevention of diseases is immunization. Immunizations are the safest and most effective tools for protecting children from various potentially serious childhood diseases. Vaccines are proven to help children stay healthy and avoid the harmful effects of diseases such as diphtheria, tetanus, hepatitis, polio, measles, mumps, and rubella. Vaccines also help stop the spread of an infectious disease to others in the community. While the rates of vaccine-preventable diseases are very low in the United States, the only eradicated disease is smallpox. All other viruses and bacteria that cause these infectious diseases still exist. In 2013, there were multiple measles outbreaks throughout the country, specifically among groups with low vaccine rates. If national vaccine rates drop, the spread of once preventable diseases may become commonplace and return to pre-vaccine levels.34 Additionally, the National Committee for Quality Assurance (NCQA) estimates that 14 million cases of infectious diseases are prevented directly due to vaccines, and health care costs are reduced by $9.9 billion in direct costs and $33.4 billion in indirect costs.35
Despite the established guidelines and documented benefits and risks associated with childhood immunization, a gap in coverage still exists. Previous evidence showed that the population at greatest risk for under-immunization was minority children from low-income families or children that live in inner-city or rural areas.36 In 2013, more than 90 percent of kindergarten-aged children had all or the majority of recommended vaccinations. Currently, parents are refusing or delaying vaccinations due to concerns over a potential harmful side effect.37 For these reasons, leading health care organizations and professionals widely agree that the need to focus on increasing childhood immunization rates in the United States still remains crucial.
34 Centers for Disease Control and Prevention. What Would Happen If We Stopped Vaccinations? Updated May 2014.
Available at: http://www.cdc.gov/vaccines/vac-gen/whatifstop.htm Accessed on: July 9, 2015. 35 National Committee for Quality Assurance. The State of Health Care Quality in 2013. Washington, D.C.: NCQA; 2009. 36 American Academy of Pediatrics, Committee on Practice and Ambulatory Medicine and Council on Community
Pediatrics. “Increasing Immunization Coverage.” Pediatrics. 2003; 112(4): 993–996. 37 Institute of Medicine. January 2013. The Childhood Immunization Schedule and Safety: Stakeholder Concerns,
Scientific Evidence, and Future Studies. Available at http://iom.edu/~/media/Files/Report%20files/2013/ Childhood-Immunization-Schedule/ChildhoodImmunizationScheduleandSafety_RB.pdf. Accessed on: July 9, 2015.

FULL-SCOPE MANAGED CARE HEALTH PLANS’ PERFORMANCE MEASURE RESULTS
2015 HEDIS Aggregate Report Page 63 California Department of Health Care Services Health Services Advisory Group, Inc.
Performance Results—Childhood Immunization Status—Combination 3
78.15% 77.25%
75.07% 73.84%
30%
40%
50%
60%
70%
80%
90%
HEDIS 2012 HEDIS 2013 HEDIS 2014 HEDIS 2015
National Medicaid 25th Percentile (MPL) National Medicaid 90th Percentile (HPL) Medi-Cal Managed Care Weighted AverageNational Medicaid Average National Commercial Average MCP County Rates
Note:♦ The percentages displayed on this chart represent the Medi-Cal Weighted Average for each year displayed.♦ Not all MCP counties that contributed to the previous years' Medi-Cal Weighted Averages are shown.♦ Only MCP counties that reported data for HEDIS 2015 are shown and these MCP counties may not have reported data in prior years.

FULL-SCOPE MANAGED CARE HEALTH PLANS’ PERFORMANCE MEASURE RESULTS
2015 HEDIS Aggregate Report Page 64 California Department of Health Care Services Health Services Advisory Group, Inc.
Medi-Cal Managed Care HEDIS 2015 Childhood Immunization Status—Combination 3
86.7582.9682.87
81.6081.25
79.7378.94
77.8677.6577.62
75.9175.9175.7675.7475.46
74.6174.4474.3273.8473.72
71.5371.00
69.9769.5969.5469.3869.3469.2168.6668.2968.2167.8867.8267.2967.0466.9666.67
66.3166.20
65.5263.94
62.3161.90
60.5860.10
59.2958.6458.3357.7657.59
56.1352.08
50.8234.04
0 10 20 30 40 50 60 70 80 90 100
Rate (%)
KP Cal LLC (Kaiser SoCal) - San Diego KP Cal LLC (Kaiser NorCal) - KP North
San Francisco Health Plan - San Francisco Health Plan of San Mateo - San Mateo
CenCal Health - Santa Barbara High Performance Level 1
CenCal Health - San Luis Obispo
CalOptima - Orange
1 High Performance Level is HEDIS 2014 national Medicaid 90th Percentile.2 Minimum Performance Level is HEDIS 2014 national Medicaid 25th Percentile.
Note: HEDIS 2015 rates reflect 2014 measurement year data.
Contra Costa Health Plan - Contra Costa L.A. Care Health Plan - Los Angeles
Central CA Alliance for Health - Monterey/Santa Cruz Alameda Alliance for Health - Alameda
Community Health Group Partnership Plan - San Diego Anthem Blue Cross Partnership Plan - San Francisco Health Net Community Solutions, Inc. - Los Angeles
Inland Empire Health Plan - Riverside/San Bernardino Molina Healthcare of CA - San Diego
Health Net Community Solutions, Inc. - Tulare Health Net Community Solutions, Inc. - San Diego
Partnership HealthPlan of CA - Southwest Santa Clara Family Health Plan - Santa Clara
Anthem Blue Cross Partnership Plan - Alameda Gold Coast Health Plan - Ventura
Health Plan of San Joaquin - San Joaquin CalViva Health - Madera
Anthem Blue Cross Partnership Plan - Madera Care 1st Partner Plan, LLC - San Diego
Anthem Blue Cross Partnership Plan - Santa Clara
2015 Medi-Cal Managed Care Weighted Average
Partnership HealthPlan of CA - Southeast Anthem Blue Cross Partnership Plan - Contra Costa Molina Healthcare of CA - Riverside/San Bernardino
Central CA Alliance for Health - Merced Anthem Blue Cross Partnership Plan - Fresno
Health Net Community Solutions, Inc. - Kern Anthem Blue Cross Partnership Plan - Region 1
CalViva Health - Fresno Anthem Blue Cross Partnership Plan - Tulare
Minimum Performance Level 2
Anthem Blue Cross Partnership Plan - Kings Anthem Blue Cross Partnership Plan - Sacramento Health Net Community Solutions, Inc. - Stanislaus
California Health & Wellness Plan - Region 1 Health Net Community Solutions, Inc. - Sacramento
California Health & Wellness Plan - Imperial Health Plan of San Joaquin - Stanislaus
Kern Health Systems - Kern Molina Healthcare of CA - Sacramento
Partnership HealthPlan of CA - Northeast Anthem Blue Cross Partnership Plan - San Benito
CalViva Health - Kings Health Net Community Solutions, Inc. - San Joaquin
Partnership HealthPlan of CA - Northwest California Health & Wellness Plan - Region 2
Anthem Blue Cross Partnership Plan - Region 2 Molina Healthcare of CA - Imperial

FULL-SCOPE MANAGED CARE HEALTH PLANS’ PERFORMANCE MEASURE RESULTS
2015 HEDIS Aggregate Report Page 65 California Department of Health Care Services Health Services Advisory Group, Inc.
Summary of Results—Child Immunization Status—Combination 3
For the fifth consecutive year, the MCMC weighted average for the Childhood Immunization Status—Combination 3 measure was better than the national Medicaid 25th percentile (MPL) and national Medicaid average for this measure. The rate remained below the national commercial average and national Medicaid 90th percentile (HPL).
High and Low Performers
The rates for five MCP counties/regions were above the HPL in RY 2015:
CenCal Health—Santa Barbara County (for the fifth consecutive year) Health Plan of San Mateo—San Mateo County Kaiser NorCal—KP North Kaiser SoCal—San Diego County (for the fifth consecutive year) San Francisco Health Plan—San Francisco County (for the fifth consecutive year)
The rates for the following counties improved significantly from RY 2014 to RY 2015:
Alameda Alliance for Health—Alameda County Anthem Blue Cross Partnership Plan—Sacramento County; however, the rate remained below
the MPL Health Net Community Solutions, Inc.—San Diego County
The rates for the following MCP counties improved from RY 2014 to RY 2015, and although the improvement was not statistically significant, the change resulted in the rates moving from below the MPL in RY 2014 to above the MPL in RY 2015:
Anthem Blue Cross Partnership Plan—Madera County Care1st Partner Plan—San Diego County Health Net Community Solutions, Inc.—Kern County
The rates for 17 MCP counties/regions were below the MPL in RY 2015. The rates for Anthem Blue Cross Partnership Plan—Sacramento County and Molina Healthcare of California Partner Plan, Inc.—Sacramento County were below the MPL for the fifth consecutive year. The rates for the following MCP counties/regions are included in the 17 rates below the MPL; however, RY 2015 was the first year the MCP counties/regions reported rates for this measure and DHCS therefore did not hold the MCPs accountable to meet the MPL (i.e., the MCPs were not required to submit an improvement plan if their rates for the measure were below the MPL):
Anthem Blue Cross Partnership Plan—Region 2 and San Benito County California Health & Wellness Plan—Imperial County, Region 1, and Region 2
FULL-SCOPE MANAGED CARE HEALTH PLANS’ PERFORMANCE MEASURE RESULTS
2015 HEDIS Aggregate Report Page 66 California Department of Health Care Services Health Services Advisory Group, Inc.
Molina Healthcare of California Partner Plan, Inc.—Imperial County Partnership HealthPlan of California—Northeast and Northwest
The rates for the following six MCP counties declined significantly from RY 2014 to RY 2015:
Anthem Blue Cross Partnership Plan—Contra Costa County CalViva Health—Kings County, resulting in the rate moving from above the MPL in RY 2014
to below the MPL in RY 2015 Health Plan of San Joaquin—San Joaquin County
The rates for the following MCP counties declined from RY 2014 to RY 2015, and although the decline was not statistically significant, the change resulted in the rates moving from above the MPL in RY 2014 to below the MPL in RY 2015:
Anthem Blue Cross Partnership Plan—Kings County Health Net Community Solutions, Inc.—Stanislaus County Kern Health Systems—Kern County
Best and Emerging Practices—Childhood Immunization Status—Combination 3
Vaccines are a vital part of stopping the spread of diseases. The following types of interventions and strategies recommended by the Community Preventive Services Task Force have been shown to increase the vaccination rates among a wide range of the population:38
Home visits Reducing client out-of-pocket costs Vaccination programs in schools and child care centers Vaccination programs in the Women, Infants, and Children (WIC) Program Beneficiary incentives Beneficiary reminder systems Community-based interventions Vaccination requirements for child care and schools Immunization information systems Provider assessment and feedback Provider reminders Standing orders
38 The Community Guide: Increasing Appropriate Vaccination. Available at:
http://www.thecommunityguide.org/vaccines/index.html. Accessed on: July 9, 2015.

FULL-SCOPE MANAGED CARE HEALTH PLANS’ PERFORMANCE MEASURE RESULTS
2015 HEDIS Aggregate Report Page 67 California Department of Health Care Services Health Services Advisory Group, Inc.
Children and Adolescents’ Access to Primary Care Practitioners
Measure Definition
This measure is used to assess the percentage of members 12 months through 19 years of age who had a visit with a primary care practitioner (PCP). The organization reports four separate percentages for each product line.
Children 12 through 24 months and 25 months through 6 years who had a visit with a PCP during the measurement year.
Children 7 years through 11 years and adolescents 12 years through 19 years who had a visit with a PCP during the measurement year or the year prior to the measurement year.
Importance
A child’s health and wellness is connected to his or her ability to access primary care. In 2011, NCQA indicated that nationally the medical needs of 2.5 million children were not met and 2 million children were considered in “fair to poor” health. Evidence has shown that primary care services can significantly reduce the amount of non-urgent emergency room (ER) visits for children 18 years of age and younger. By strengthening primary care services, health outcomes improve and health care costs are reduced.39
39 National Committee for Quality Assurance. The State of Health Care Quality in 2013. Washington, D.C.: NCQA;
2009.
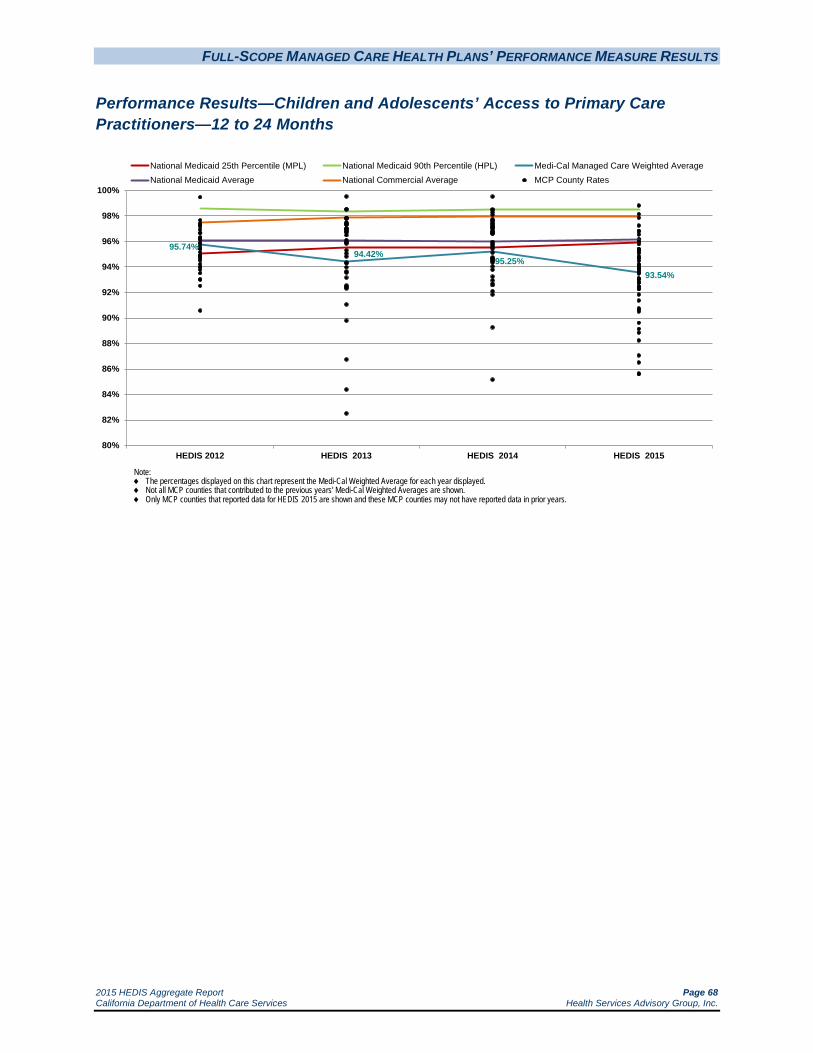
FULL-SCOPE MANAGED CARE HEALTH PLANS’ PERFORMANCE MEASURE RESULTS
2015 HEDIS Aggregate Report Page 68 California Department of Health Care Services Health Services Advisory Group, Inc.
Performance Results—Children and Adolescents’ Access to Primary Care Practitioners—12 to 24 Months
95.74%94.42%
95.25%93.54%
80%
82%
84%
86%
88%
90%
92%
94%
96%
98%
100%
HEDIS 2012 HEDIS 2013 HEDIS 2014 HEDIS 2015
National Medicaid 25th Percentile (MPL) National Medicaid 90th Percentile (HPL) Medi-Cal Managed Care Weighted AverageNational Medicaid Average National Commercial Average MCP County Rates
Note:♦ The percentages displayed on this chart represent the Medi-Cal Weighted Average for each year displayed.♦ Not all MCP counties that contributed to the previous years' Medi-Cal Weighted Averages are shown.♦ Only MCP counties that reported data for HEDIS 2015 are shown and these MCP counties may not have reported data in prior years.
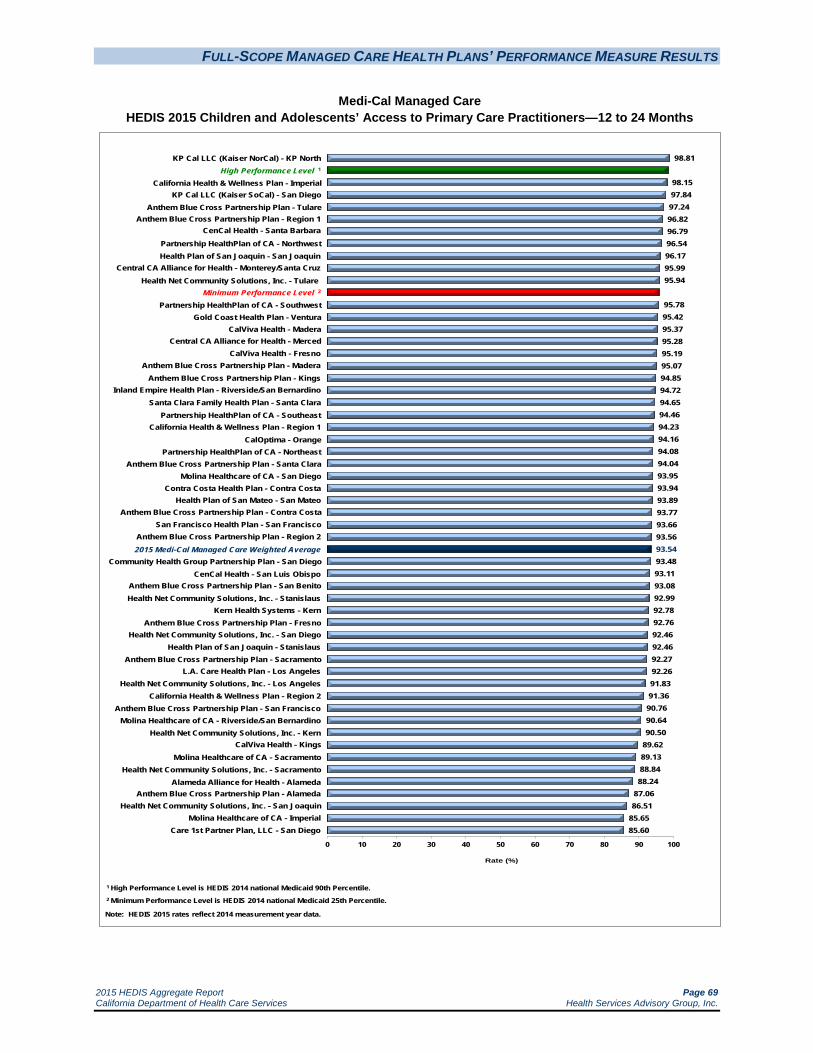
FULL-SCOPE MANAGED CARE HEALTH PLANS’ PERFORMANCE MEASURE RESULTS
2015 HEDIS Aggregate Report Page 69 California Department of Health Care Services Health Services Advisory Group, Inc.
Medi-Cal Managed Care HEDIS 2015 Children and Adolescents’ Access to Primary Care Practitioners—12 to 24 Months
98.81
98.1597.8497.2496.8296.7996.5496.1795.9995.94
95.7895.4295.3795.2895.1995.0794.8594.7294.6594.4694.2394.1694.0894.0493.9593.9493.8993.7793.6693.5693.5493.4893.1193.0892.9992.7892.7692.4692.4692.2792.2691.8391.3690.7690.6490.50
89.6289.1388.8488.24
87.0686.51
85.6585.60
0 10 20 30 40 50 60 70 80 90 100
Rate (%)
KP Cal LLC (Kaiser NorCal) - KP North High Performance Level 1
California Health & Wellness Plan - Imperial KP Cal LLC (Kaiser SoCal) - San Diego
Anthem Blue Cross Partnership Plan - Tulare Anthem Blue Cross Partnership Plan - Region 1
CenCal Health - Santa Barbara
Partnership HealthPlan of CA - Northwest
1 High Performance Level is HEDIS 2014 national Medicaid 90th Percentile.2 Minimum Performance Level is HEDIS 2014 national Medicaid 25th Percentile.
Note: HEDIS 2015 rates reflect 2014 measurement year data.
Health Plan of San Joaquin - San Joaquin Central CA Alliance for Health - Monterey/Santa Cruz
Health Net Community Solutions, Inc. - Tulare Minimum Performance Level 2
Partnership HealthPlan of CA - Southwest Gold Coast Health Plan - Ventura
CalViva Health - Madera Central CA Alliance for Health - Merced
CalViva Health - Fresno Anthem Blue Cross Partnership Plan - Madera
Anthem Blue Cross Partnership Plan - Kings
Santa Clara Family Health Plan - Santa Clara Partnership HealthPlan of CA - Southeast
California Health & Wellness Plan - Region 1 CalOptima - Orange
Partnership HealthPlan of CA - Northeast Anthem Blue Cross Partnership Plan - Santa Clara
Molina Healthcare of CA - San Diego Contra Costa Health Plan - Contra Costa
Health Plan of San Mateo - San Mateo
Inland Empire Health Plan - Riverside/San Bernardino
Anthem Blue Cross Partnership Plan - Contra Costa San Francisco Health Plan - San Francisco
Anthem Blue Cross Partnership Plan - Region 2 2015 Medi-Cal Managed Care Weighted Average
Community Health Group Partnership Plan - San Diego CenCal Health - San Luis Obispo
Anthem Blue Cross Partnership Plan - San Benito Health Net Community Solutions, Inc. - Stanislaus
Kern Health Systems - Kern Anthem Blue Cross Partnership Plan - Fresno
Health Net Community Solutions, Inc. - San Diego Health Plan of San Joaquin - Stanislaus
Anthem Blue Cross Partnership Plan - Sacramento L.A. Care Health Plan - Los Angeles
Health Net Community Solutions, Inc. - Los Angeles California Health & Wellness Plan - Region 2
Anthem Blue Cross Partnership Plan - San Francisco Molina Healthcare of CA - Riverside/San Bernardino
Health Net Community Solutions, Inc. - Kern CalViva Health - Kings
Molina Healthcare of CA - Sacramento Health Net Community Solutions, Inc. - Sacramento
Alameda Alliance for Health - Alameda Anthem Blue Cross Partnership Plan - Alameda
Health Net Community Solutions, Inc. - San Joaquin Molina Healthcare of CA - Imperial
Care 1st Partner Plan, LLC - San Diego

FULL-SCOPE MANAGED CARE HEALTH PLANS’ PERFORMANCE MEASURE RESULTS
2015 HEDIS Aggregate Report Page 70 California Department of Health Care Services Health Services Advisory Group, Inc.
Summary of Results—Children and Adolescents’ Access to Primary Care Practitioners—12 to 24 Months
Note: For HEDIS 2015 DHCS did not hold the MCPs accountable to meet the MPL for the Children and Adolescents’ Access to Primary Care Practitioners—12 to 24 Months measure due to the small range of variation between the MPL and HPL threshold for the measure. While DHCS did not hold the MCPs accountable to meet the MPL for this measure (i.e., the MCPs were not required to submit an improvement plan if their rates for the measure were below the MPL), HSAG shows the MCPs’ performance relative to the established MPL and HPL to provide DHCS and the MCPs an assessment of overall MCP performance relative to the established benchmarks.
The MCMC weighted average for Children and Adolescents’ Access to Primary Care Practitioners—12 to 24 Months measure declined significantly from RY 2014 to RY 2015 and was below the national Medicaid 25th percentile (MPL) for the third consecutive year. Additionally, the rate was below the national Medicaid and commercial averages for the fourth consecutive year.
High and Low Performers
Kaiser NorCal—KP North was the only MCP county/region with a rate above the HPL in RY 2015. The rate for L.A. Care Health Plan—Los Angeles County improved significantly from RY 2014 to RY 2015; however, the rate remained below the MPL for the third consecutive year.
The rates for 43 MCP counties/regions were below the MPL in RY 2015 compared to 18 in RY 2014; however, since DHCS did not hold MCPs accountable to meet the MPL for this measure, no MCP was required to submit an IP for this measure.
The rates for 32 MCP counties/regions declined significantly from RY 2014 to RY 2015, resulting in the rates for 18 of these counties/regions moving from above the MPL in RY 2014 to below the MPL in RY 2015. The rates for six MCP counties were below the MPL for the third consecutive year, and the rates for eight MCP counties were below the MPL for the fourth consecutive year.
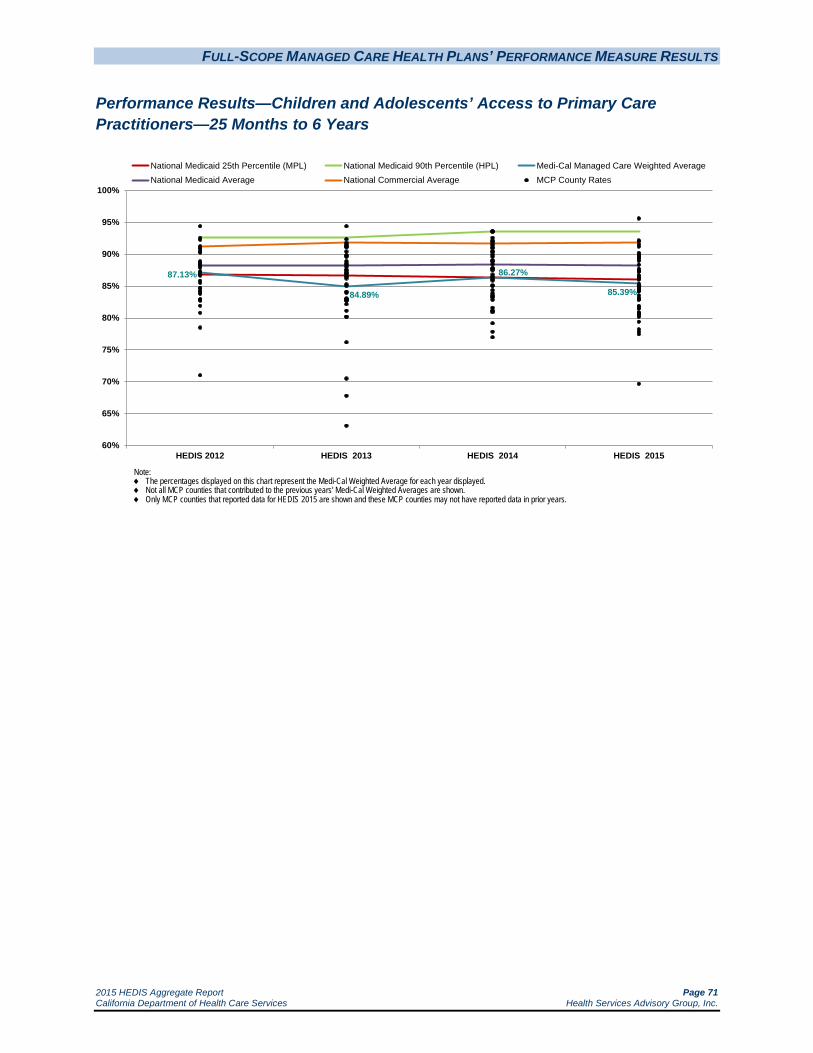
FULL-SCOPE MANAGED CARE HEALTH PLANS’ PERFORMANCE MEASURE RESULTS
2015 HEDIS Aggregate Report Page 71 California Department of Health Care Services Health Services Advisory Group, Inc.
Performance Results—Children and Adolescents’ Access to Primary Care Practitioners—25 Months to 6 Years
87.13%
84.89%
86.27%
85.39%
60%
65%
70%
75%
80%
85%
90%
95%
100%
HEDIS 2012 HEDIS 2013 HEDIS 2014 HEDIS 2015
National Medicaid 25th Percentile (MPL) National Medicaid 90th Percentile (HPL) Medi-Cal Managed Care Weighted AverageNational Medicaid Average National Commercial Average MCP County Rates
Note:♦ The percentages displayed on this chart represent the Medi-Cal Weighted Average for each year displayed.♦ Not all MCP counties that contributed to the previous years' Medi-Cal Weighted Averages are shown.♦ Only MCP counties that reported data for HEDIS 2015 are shown and these MCP counties may not have reported data in prior years.
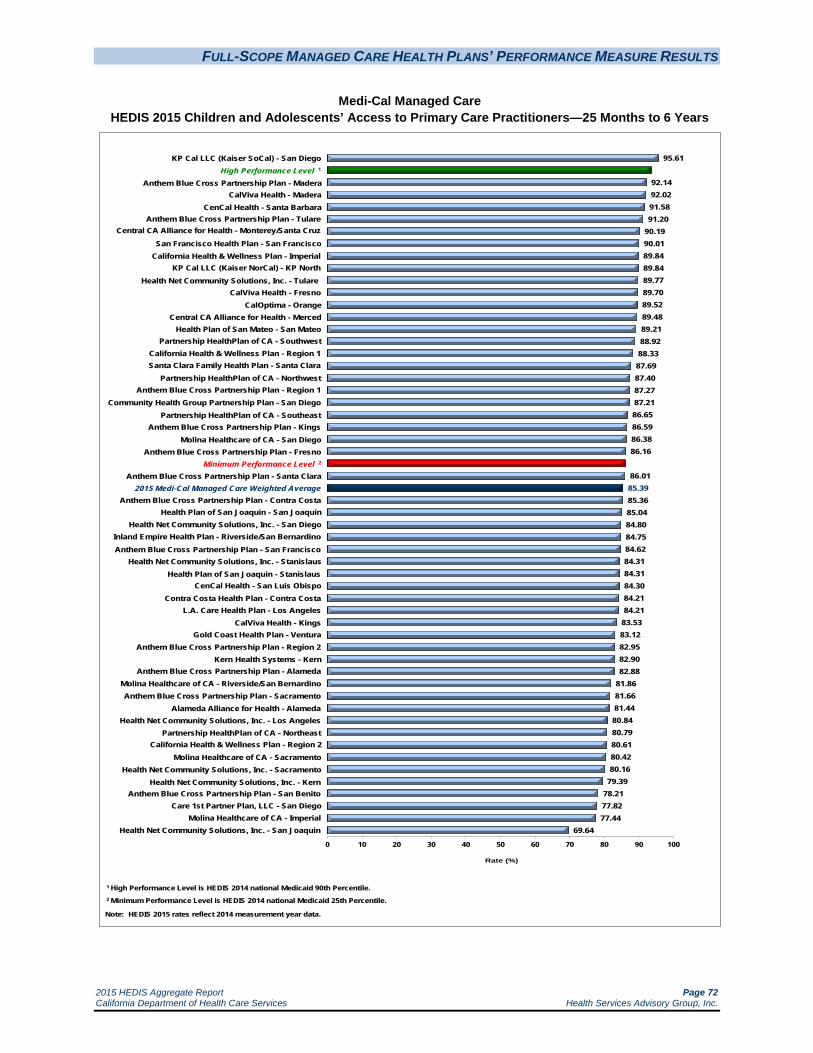
FULL-SCOPE MANAGED CARE HEALTH PLANS’ PERFORMANCE MEASURE RESULTS
2015 HEDIS Aggregate Report Page 72 California Department of Health Care Services Health Services Advisory Group, Inc.
Medi-Cal Managed Care HEDIS 2015 Children and Adolescents’ Access to Primary Care Practitioners—25 Months to 6 Years
95.61
92.1492.0291.5891.20
90.1990.0189.8489.8489.7789.7089.5289.4889.2188.9288.3387.6987.4087.2787.2186.6586.5986.3886.16
86.0185.3985.3685.0484.8084.7584.6284.3184.3184.3084.2184.21
83.5383.1282.9582.9082.88
81.8681.6681.4480.8480.7980.6180.4280.16
79.3978.2177.8277.44
69.64
0 10 20 30 40 50 60 70 80 90 100
Rate (%)
KP Cal LLC (Kaiser SoCal) - San Diego High Performance Level 1
Anthem Blue Cross Partnership Plan - Madera CalViva Health - Madera
CenCal Health - Santa Barbara Anthem Blue Cross Partnership Plan - Tulare
Central CA Alliance for Health - Monterey/Santa Cruz
San Francisco Health Plan - San Francisco
1 High Performance Level is HEDIS 2014 national Medicaid 90th Percentile.2 Minimum Performance Level is HEDIS 2014 national Medicaid 25th Percentile.
Note: HEDIS 2015 rates reflect 2014 measurement year data.
California Health & Wellness Plan - Imperial KP Cal LLC (Kaiser NorCal) - KP North
Health Net Community Solutions, Inc. - Tulare CalViva Health - Fresno
CalOptima - Orange Central CA Alliance for Health - Merced
Health Plan of San Mateo - San Mateo Partnership HealthPlan of CA - Southwest
California Health & Wellness Plan - Region 1 Santa Clara Family Health Plan - Santa Clara
Partnership HealthPlan of CA - Northwest
Community Health Group Partnership Plan - San Diego Partnership HealthPlan of CA - Southeast
Anthem Blue Cross Partnership Plan - Kings Molina Healthcare of CA - San Diego
Anthem Blue Cross Partnership Plan - Fresno Minimum Performance Level 2
Anthem Blue Cross Partnership Plan - Santa Clara 2015 Medi-Cal Managed Care Weighted Average
Anthem Blue Cross Partnership Plan - Contra Costa
Anthem Blue Cross Partnership Plan - Region 1
Health Plan of San Joaquin - San Joaquin Health Net Community Solutions, Inc. - San Diego
Inland Empire Health Plan - Riverside/San Bernardino Anthem Blue Cross Partnership Plan - San Francisco
Health Net Community Solutions, Inc. - Stanislaus Health Plan of San Joaquin - Stanislaus
CenCal Health - San Luis Obispo Contra Costa Health Plan - Contra Costa
L.A. Care Health Plan - Los Angeles CalViva Health - Kings
Gold Coast Health Plan - Ventura Anthem Blue Cross Partnership Plan - Region 2
Kern Health Systems - Kern Anthem Blue Cross Partnership Plan - Alameda
Molina Healthcare of CA - Riverside/San Bernardino Anthem Blue Cross Partnership Plan - Sacramento
Alameda Alliance for Health - Alameda Health Net Community Solutions, Inc. - Los Angeles
Partnership HealthPlan of CA - Northeast California Health & Wellness Plan - Region 2
Molina Healthcare of CA - Sacramento Health Net Community Solutions, Inc. - Sacramento
Health Net Community Solutions, Inc. - Kern Anthem Blue Cross Partnership Plan - San Benito
Care 1st Partner Plan, LLC - San Diego Molina Healthcare of CA - Imperial
Health Net Community Solutions, Inc. - San Joaquin

FULL-SCOPE MANAGED CARE HEALTH PLANS’ PERFORMANCE MEASURE RESULTS
2015 HEDIS Aggregate Report Page 73 California Department of Health Care Services Health Services Advisory Group, Inc.
Summary of Results—Children and Adolescents’ Access to Primary Care Practitioners—25 Months to 6 Years
Note: For HEDIS 2015 DHCS did not hold the MCPs accountable to meet the MPL for the Children and Adolescents’ Access to Primary Care Practitioners—25 Months to 6 Years measure due to the small range of variation between the MPL and HPL threshold for the measure. While DHCS did not hold the MCPs accountable to meet the MPL for this measure (i.e., the MCPs were not required to submit an improvement plan if their rates for the measure were below the MPL), HSAG shows the MCPs’ performance relative to the established MPL and HPL to provide DHCS and the MCPs an assessment of overall MCP performance relative to the established benchmarks.
The MCMC weighted average for Children and Adolescents’ Access to Primary Care Practitioners—25 Months to 6 Years measure declined significantly from RY 2014 to RY 2015 and was below the national Medicaid 25th percentile (MPL) for the third consecutive year. Additionally, the rate was below the national Medicaid and commercial averages for the fourth consecutive year.
High and Low Performers
Kaiser SoCal—San Diego County’s rate was above the HPL for the fourth consecutive year.
The rates for six MCP counties improved significantly from RY 2014 to RY 2015 compared to 22 MCP counties from RY 2013 to RY 2014. The MCP counties with rates that improved significantly were:
Anthem Blue Cross Partnership Plan—Alameda County, Fresno County, Kings County, and Tulare County, resulting in the rates for Fresno County and Kings County moving from below the MPL in RY 2014 to above the MPL in RY 2015. The rate for Alameda County remained below the MPL.
Kaiser SoCal—San Diego County L.A. Care Health Plan—Los Angeles County; however, the rate remained below the MPL
Twenty-nine MCP county/regional rates were below the MPL in RY 2015 compared to 18 in RY 2014; however, since DHCS did not hold MCPs accountable to meet the MPL for this measure, no MCP was required to submit an IP for this measure.
The rates for 29 MCP counties/regions declined significantly from RY 2014 to RY 2015 compared to five MCP counties from RY 2013 to RY 2014. The significant decline resulted in the rates for seven MCP counties moving from above the MPL in RY 2014 to below the MPL in RY 2015. The rate for Anthem Blue Cross Partnership Plan—Contra Costa County declined from RY 2014 to RY 2015, and although the decline was not statistically significant, the change resulted in the rate moving from above the MPL in RY 2014 to below the MPL in RY 2015.
The rates for three MCP counties were below the MPL for the third consecutive year, and the rates for 10 MCP counties were below the MPL for the fourth consecutive year.

FULL-SCOPE MANAGED CARE HEALTH PLANS’ PERFORMANCE MEASURE RESULTS
2015 HEDIS Aggregate Report Page 74 California Department of Health Care Services Health Services Advisory Group, Inc.
Performance Results—Children and Adolescents’ Access to Primary Care Practitioners—7 to 11 Years
86.88% 85.89% 86.08% 87.24%
60%
65%
70%
75%
80%
85%
90%
95%
100%
HEDIS 2012 HEDIS 2013 HEDIS 2014 HEDIS 2015
National Medicaid 25th Percentile (MPL) National Medicaid 90th Percentile (HPL) Medi-Cal Managed Care Weighted AverageNational Medicaid Average National Commercial Average MCP County Rates
Note:♦ The percentages displayed on this chart represent the Medi-Cal Weighted Average for each year displayed.♦ Not all MCP counties that contributed to the previous years' Medi-Cal Weighted Averages are shown.♦ Only MCP counties that reported data for HEDIS 2015 are shown and these MCP counties may not have reported data in prior years.

FULL-SCOPE MANAGED CARE HEALTH PLANS’ PERFORMANCE MEASURE RESULTS
2015 HEDIS Aggregate Report Page 75 California Department of Health Care Services Health Services Advisory Group, Inc.
Medi-Cal Managed Care HEDIS 2015 Children and Adolescents’ Access to Primary Care Practitioners—7 to 11 Years
94.1193.7393.0992.7792.7192.6892.5492.44
91.4991.4791.2891.2090.8090.4990.3590.1990.1589.8489.8189.7789.4988.8688.50
87.5987.5287.24
86.5686.4986.3886.2786.2585.9885.49
84.7784.4984.3684.3384.2983.9883.4983.31
82.5980.9780.7380.44
77.4072.20
NA NA NA NA NA NA NA
0 10 20 30 40 50 60 70 80 90 100
Rate (%)
High Performance Level 1
San Francisco Health Plan - San Francisco CenCal Health - Santa Barbara
KP Cal LLC (Kaiser SoCal) - San Diego Anthem Blue Cross Partnership Plan - Region 2
CalViva Health - Madera CalOptima - Orange
Anthem Blue Cross Partnership Plan - Region 1
1 High Performance Level is HEDIS 2014 national Medicaid 90th Percentile.2 Minimum Performance Level is HEDIS 2014 national Medicaid 25th Percentile.
NA = A Not Applicable audit finding because the MCP’s denominator was too small (i.e., less than 30).
Note: HEDIS 2015 rates reflect 2014 measurement year data.
Central CA Alliance for Health - Monterey/Santa Cruz Health Plan of San Mateo - San Mateo
CalViva Health - Fresno Anthem Blue Cross Partnership Plan - Tulare
Anthem Blue Cross Partnership Plan - San Francisco Central CA Alliance for Health - Merced
Anthem Blue Cross Partnership Plan - Madera Health Net Community Solutions, Inc. - Tulare
Community Health Group Partnership Plan - San Diego Santa Clara Family Health Plan - Santa Clara
CenCal Health - San Luis Obispo
Partnership HealthPlan of CA - Southwest KP Cal LLC (Kaiser NorCal) - KP North
Anthem Blue Cross Partnership Plan - Santa Clara Anthem Blue Cross Partnership Plan - Contra Costa
Minimum Performance Level 2
Health Plan of San Joaquin - Stanislaus Health Net Community Solutions, Inc. - San Diego
2015 Medi-Cal Managed Care Weighted Average Contra Costa Health Plan - Contra Costa
Molina Healthcare of CA - San Diego
L.A. Care Health Plan - Los Angeles Health Net Community Solutions, Inc. - Stanislaus
Health Plan of San Joaquin - San Joaquin CalViva Health - Kings
Partnership HealthPlan of CA - Southeast Anthem Blue Cross Partnership Plan - Fresno
Alameda Alliance for Health - Alameda Anthem Blue Cross Partnership Plan - Alameda
Inland Empire Health Plan - Riverside/San Bernardino Health Net Community Solutions, Inc. - Los Angeles Molina Healthcare of CA - Riverside/San Bernardino
Anthem Blue Cross Partnership Plan - Kings Anthem Blue Cross Partnership Plan - Sacramento
Gold Coast Health Plan - Ventura Kern Health Systems - Kern
Health Net Community Solutions, Inc. - Sacramento Care 1st Partner Plan, LLC - San Diego Molina Healthcare of CA - Sacramento
Health Net Community Solutions, Inc. - San Joaquin Health Net Community Solutions, Inc. - Kern
Anthem Blue Cross Partnership Plan - San Benito California Health & Wellness Plan - Imperial
California Health & Wellness Plan - Region 1 California Health & Wellness Plan - Region 2
Molina Healthcare of CA - Imperial Partnership HealthPlan of CA - Northeast Partnership HealthPlan of CA - Northwest

FULL-SCOPE MANAGED CARE HEALTH PLANS’ PERFORMANCE MEASURE RESULTS
2015 HEDIS Aggregate Report Page 76 California Department of Health Care Services Health Services Advisory Group, Inc.
Summary of Results—Children and Adolescents’ Access to Primary Care Practitioners—7 to 11 Years
Note: For HEDIS 2015 DHCS did not hold the MCPs accountable to meet the MPL for the Children and Adolescents’ Access to Primary Care Practitioners—7 to 11 Years measure due to the small range of variation between the MPL and HPL threshold for the measure. While DHCS did not hold the MCPs accountable to meet the MPL for this measure (i.e., the MCPs were not required to submit an improvement plan if their rates for the measure were below the MPL), HSAG shows the MCPs’ performance relative to the established MPL and HPL to provide DHCS and the MCPs an assessment of overall MCP performance relative to the established benchmarks.
The MCMC weighted average for Children and Adolescents’ Access to Primary Care Practitioners—7 to 11 Years measure improved significantly from RY 2014 to RY 2015; however, the rate remained below the national Medicaid 25th percentile (MPL) and national Medicaid and commercial averages for the fourth consecutive year.
High and Low Performers
The rates for 15 MCP counties improved significantly from RY 2014 to RY 2015. Nine of these MCP counties had rates below the MPL in 2014 and although they experienced significant improvement, the change was not enough to bring the rates above the MPL.
The rates for 23 MCP counties/regions were below the MPL in RY 2015, which is similar to RY 2014 in which 24 MCP counties had rates below the MPL; however, since DHCS did not hold MCPs accountable to meet the MPL for this measure, no MCP was required to submit an IP for this measure.
The rates for the following MCPs declined significantly from RY 2014 to RY 2015:
Alameda Alliance for Health—Alameda County
Central California Alliance for Health—Monterey/Santa Cruz counties
Molina Healthcare of California Partner Plan, Inc.—Sacramento County
The rate for Health Plan of San Joaquin—Stanislaus County declined from RY 2014 to RY 2015, and although the decline was not statistically significant, the change resulted in the rate moving from above the MPL in RY 2014 to below the MPL in RY 2015.
The rates for four MCP counties were below the MPL for the third consecutive year, and the rates for 14 MCP counties/regions were below the MPL for the fourth consecutive year.
Seven MCP counties/regions had an audit result of “NA” for this measure, meaning that although the MCPs complied with all applicable specifications, they had a denominator less than 30 for the measure, resulting in the “NA” audit result.
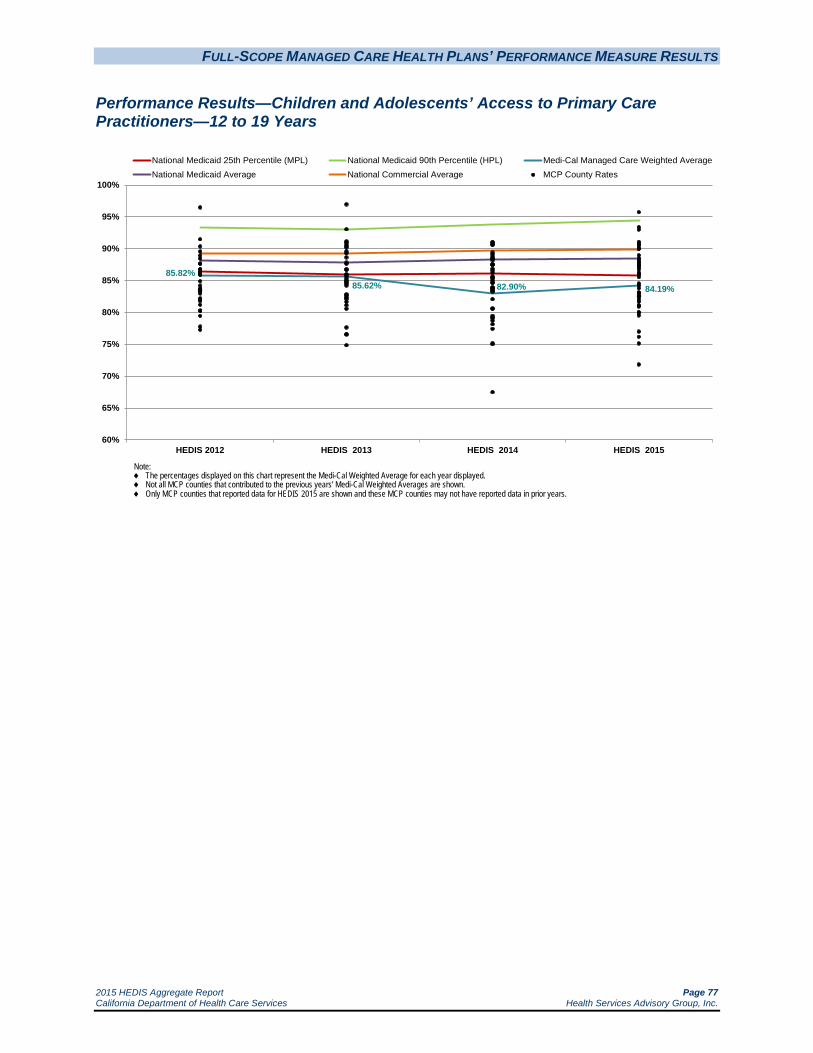
FULL-SCOPE MANAGED CARE HEALTH PLANS’ PERFORMANCE MEASURE RESULTS
2015 HEDIS Aggregate Report Page 77 California Department of Health Care Services Health Services Advisory Group, Inc.
Performance Results—Children and Adolescents’ Access to Primary Care Practitioners—12 to 19 Years
85.82%85.62% 82.90% 84.19%
60%
65%
70%
75%
80%
85%
90%
95%
100%
HEDIS 2012 HEDIS 2013 HEDIS 2014 HEDIS 2015
National Medicaid 25th Percentile (MPL) National Medicaid 90th Percentile (HPL) Medi-Cal Managed Care Weighted AverageNational Medicaid Average National Commercial Average MCP County Rates
Note:♦ The percentages displayed on this chart represent the Medi-Cal Weighted Average for each year displayed.♦ Not all MCP counties that contributed to the previous years' Medi-Cal Weighted Averages are shown.♦ Only MCP counties that reported data for HEDIS 2015 are shown and these MCP counties may not have reported data in prior years.

FULL-SCOPE MANAGED CARE HEALTH PLANS’ PERFORMANCE MEASURE RESULTS
2015 HEDIS Aggregate Report Page 78 California Department of Health Care Services Health Services Advisory Group, Inc.
Medi-Cal Managed Care HEDIS 2015 Children and Adolescents’ Access to Primary Care Practitioners—12 to 19 Years
95.74
93.4093.00
91.0590.8190.6290.5990.4890.0789.9689.95
88.9888.5388.3388.0487.8687.6087.3687.3187.0386.7786.2485.9885.92
85.5584.5484.1984.1983.8083.1883.0683.0082.6082.5682.3982.0181.6581.1081.0180.93
80.0279.9979.54
76.9776.16
75.1271.83
NA NA NA NA NA NA NA
0 10 20 30 40 50 60 70 80 90 100
Rate (%)
Anthem Blue Cross Partnership Plan - Region 1 High Performance Level 1
Anthem Blue Cross Partnership Plan - Region 2 KP Cal LLC (Kaiser SoCal) - San Diego
San Francisco Health Plan - San Francisco KP Cal LLC (Kaiser NorCal) - KP North
Anthem Blue Cross Partnership Plan - Tulare
CenCal Health - Santa Barbara
1 High Performance Level is HEDIS 2014 national Medicaid 90th Percentile.2 Minimum Performance Level is HEDIS 2014 national Medicaid 25th Percentile.
NA = A Not Applicable audit finding because the MCP’s denominator was too small (i.e., less than 30).
Note: HEDIS 2015 rates reflect 2014 measurement year data.
CalViva Health - Madera Anthem Blue Cross Partnership Plan - Madera
CalOptima - Orange Central CA Alliance for Health - Monterey/Santa Cruz
Central CA Alliance for Health - Merced Health Net Community Solutions, Inc. - Tulare
CenCal Health - San Luis Obispo CalViva Health - Fresno
Partnership HealthPlan of CA - Southwest Anthem Blue Cross Partnership Plan - San Francisco
Health Plan of San Mateo - San Mateo
Molina Healthcare of CA - San Diego Santa Clara Family Health Plan - Santa Clara
Anthem Blue Cross Partnership Plan - Santa Clara Anthem Blue Cross Partnership Plan - Kings
Community Health Group Partnership Plan - San Diego Minimum Performance Level 2
CalViva Health - Kings Health Plan of San Joaquin - Stanislaus
Partnership HealthPlan of CA - Southeast
Anthem Blue Cross Partnership Plan - Contra Costa
2015 Medi-Cal Managed Care Weighted Average Contra Costa Health Plan - Contra Costa
Molina Healthcare of CA - Riverside/San Bernardino Inland Empire Health Plan - Riverside/San Bernardino
Anthem Blue Cross Partnership Plan - Fresno Health Net Community Solutions, Inc. - Stanislaus
Health Plan of San Joaquin - San Joaquin L.A. Care Health Plan - Los Angeles
Gold Coast Health Plan - Ventura Alameda Alliance for Health - Alameda
Kern Health Systems - Kern Health Net Community Solutions, Inc. - San Diego
Anthem Blue Cross Partnership Plan - Sacramento Anthem Blue Cross Partnership Plan - Alameda
Molina Healthcare of CA - Sacramento Health Net Community Solutions, Inc. - Los Angeles Health Net Community Solutions, Inc. - Sacramento
Care 1st Partner Plan, LLC - San Diego Health Net Community Solutions, Inc. - San Joaquin
Health Net Community Solutions, Inc. - Kern Anthem Blue Cross Partnership Plan - San Benito
California Health & Wellness Plan - Imperial California Health & Wellness Plan - Region 1 California Health & Wellness Plan - Region 2
Molina Healthcare of CA - Imperial Partnership HealthPlan of CA - Northeast Partnership HealthPlan of CA - Northwest
FULL-SCOPE MANAGED CARE HEALTH PLANS’ PERFORMANCE MEASURE RESULTS
2015 HEDIS Aggregate Report Page 79 California Department of Health Care Services Health Services Advisory Group, Inc.
Summary of Results—Children and Adolescents’ Access to Primary Care Practitioners—12 to 19 Years
Note: For HEDIS 2015 DHCS did not hold the MCPs accountable to meet the MPL for the Children and Adolescents’ Access to Primary Care Practitioners—12 to 19 Years measure due to the small range of variation between the MPL and HPL threshold for the measure. While DHCS did not hold the MCPs accountable to meet the MPL for this measure (i.e., the MCPs were not required to submit an improvement plan if their rates for the measure were below the MPL), HSAG shows the MCPs’ performance relative to the established MPL and HPL to provide DHCS and the MCPs an assessment of overall MCP performance relative to the established benchmarks.
The MCMC weighted average for Children and Adolescents’ Access to Primary Care Practitioners—12 to 19 Years measure improved significantly from RY 2014 to RY 2015; however, the rate remained below the national Medicaid 25th percentile (MPL) and national Medicaid and commercial averages for this measure for the fourth consecutive year.
High and Low Performers
The rate for Anthem Blue Cross Partnership Plan—Region 1 was above the HPL in RY 2015.
The rates for 14 MCP counties improved significantly from RY 2014 to RY 2015. The improvement for Anthem Blue Cross Partnership Plan—Contra Costa County and Health Plan of San Mateo—San Mateo County resulted in their rates moving from below the MPL in RY 2014 to above the MPL in RY 2015. Eight of these MCP counties had rates below the MPL in RY 2014 and although they experienced significant improvement, the change was not enough to bring the rates above the MPL. The rates for the following MCP counties improved from RY 2014 to RY 2015, and although the improvement was not statistically significant, the change resulted in the rates moving from below the MPL in RY 2014 to above the MPL in RY 2015:
Anthem Blue Cross Partnership Plan—Kings County and Santa Clara County
Community Health Group Partnership Plan—San Diego County
The rates for 22 MCP counties/regions were below the MPL in RY 2015 compared to 27 in RY 2014; however, since DHCS did not hold MCPs accountable to meet the MPL for this measure, no MCP was required to submit an IP for this measure.
The rates for the following MCP declined significantly from RY 2014 to RY 2015:
Alameda Alliance for Health—Alameda County
Care1st Partner Plan—San Diego County
Central California Alliance for Health—Monterey/Santa Cruz counties

FULL-SCOPE MANAGED CARE HEALTH PLANS’ PERFORMANCE MEASURE RESULTS
2015 HEDIS Aggregate Report Page 80 California Department of Health Care Services Health Services Advisory Group, Inc.
Health Plan of San Joaquin—San Joaquin County, resulting in the rate moving from above the MPL in RY 2014 to below the MPL in RY 2015
Inland Empire Health Plan—Riverside/San Bernardino counties
Santa Clara Family Health Plan—Santa Clara County
The rate for Anthem Blue Cross Partnership Plan—Fresno County was below the MPL for the third consecutive year, and the rates for 16 MCP counties/regions were below the MPL for the fourth consecutive year.
Seven MCP counties/regions had an audit result of “NA” for this measure, meaning that although the MCPs complied with all applicable specifications, they had a denominator less than 30 for the measure, resulting in the “NA” audit result.
Best and Emerging Practices—Children and Adolescents’ Access to Primary Care Practitioners
Having access to primary care practitioners can help ensure the health and wellness of children and adolescents. The following types of interventions can result in improved access, resulting in better health for children and adolescents.
United Healthcare Community & State
United Healthcare Community & State’s Baby Blocks program engages expectant and new mothers with a mobile-optimized game board that reminds them of upcoming prenatal, postpartum, and well-child appointments through 15 months of age. The online and mobile engagement tool aligns with the demographic and ethnographic profiles of its beneficiaries, and pregnant beneficiaries are enrolled through direct mail, outreach calls, and provider marketing. The health plan continuously communicates with enrolled beneficiaries through email or text reminders about appointments and tips for healthy living. The pilot phase showed promising results, and at the time of the report, the program had the potential to reach nearly 50,000 pregnant women.40 Note that this intervention could be implemented to improve beneficiary access to prenatal and postpartum care visits as well.
Amerigroup Maryland
Amerigroup Maryland developed the Adolescent Well Care Outreach Initiative in 2010. The health plan assembled a multidisciplinary team to develop interventions and monitor utilization of wellness services for adolescent beneficiaries ages 12 to 20 years old. The multidisciplinary team addresses barriers to adolescent beneficiaries receiving routine well care visits and provides
40 Medicaid Health Plans of America: Centers for Best Practices. 2012–2013 Best Practices Compendium. Available at:
https://www.mhpa.org/_upload/2012Compendium.pdf. Accessed on: July 9, 2015.
FULL-SCOPE MANAGED CARE HEALTH PLANS’ PERFORMANCE MEASURE RESULTS
2015 HEDIS Aggregate Report Page 81 California Department of Health Care Services Health Services Advisory Group, Inc.
incentives to high-volume providers to bring beneficiaries into care. Amerigroup also partners with high-volume PCP offices to host wellness clinics during various school breaks and conducts outbound calls to beneficiaries to coordinate appointments and to assist with transportation. Beneficiaries attending a wellness visit are provided incentives such as gift cards, school supplies, and a chance to win an iPod. In 2011, the health plan began remote appointment scheduling with participating providers using the MyHealthDirect software program. MyHealthDirect also gives beneficiaries a choice of how they wish to receive appointment reminders—via text or email. Amerigroup Maryland reported a 10.9 percentage point increase in adolescent well-care visits from 2010 to 2011.41
Department of Health & Human Services
States and other stakeholders are implementing a variety of approaches to increase adolescent well-care visit rates and awareness of preventive services.42 The Department of Health & Human Services recommends the following six strategies help to promote adolescent use of preventive services:
Adopting current Bright Futures guidelines for adolescents.
Incentivizing providers, adolescents, and adolescents’ parents to encourage preventive care.
Encouraging teen-centered care.
Leveraging missed opportunities to increase adolescent well-care visits (i.e., using episodic, acute care, and sport-required visits to increase preventive care, immunizations, and health education).
Using social media to increase well-care visits.
Developing partnerships with key community stakeholders to increase accessibility (i.e., making appointments available in accessible community locations or schools, providing evening and weekend appointments).
41 Medicaid Health Plans of America: Centers for Best Practices. 2012–2013 Best Practices Compendium. Available at:
https://www.mhpa.org/_upload/2012Compendium.pdf. Accessed on: July 9, 2015. 42 Department of Health & Human Services. Paving the Road to Good Health. Strategies for Increasing Medicaid Adolescent Well-
Care Visits. Available at http://www.medicaid.gov/Medicaid-CHIP-Program-Information/By-Topics/Benefits/Downloads/Paving-the-Road-to-Good-Health.pdf. Accessed on July 9, 2015.

FULL-SCOPE MANAGED CARE HEALTH PLANS’ PERFORMANCE MEASURE RESULTS
2015 HEDIS Aggregate Report Page 82 California Department of Health Care Services Health Services Advisory Group, Inc.
Comprehensive Diabetes Care—Blood Pressure Control (<140/90 mm Hg)
Measure Definition
The Comprehensive Diabetes Care—Blood Pressure Control (<140/90 mm Hg) measure is intended to assess whether the blood pressure of patients with diabetes is being monitored. It reports the percentage of members 18 through 75 years of age with diabetes (Type 1 and Type 2) who had a blood pressure reading of <140/90 mm Hg.
Importance
Nearly one in three American adults has high blood pressure (hypertension), and two in three people with diabetes report having high blood pressure or take prescription medications to lower their blood pressure.43 Beneficiaries with diabetes are at an increased risk for developing hypertension and other cardiovascular problems because diabetes adversely affects the arteries which can increase the risk of heart attack, heart failure, kidney failure, and stroke.44 Other complications from high blood pressure include:
Enlargement of the heart which may lead to heart failure.
Formation of aneurysms in blood vessels throughout the body (e.g., heart, brain, legs, intestines, and spleen).
Narrowing of the blood vessels in the kidney which may lead to kidney failure.
Hardening of the arteries throughout the body (e.g., heart, brain, kidneys, and legs) which may lead to heart attack, stroke, kidney failure, or amputation.
Bursting or bleeding of blood vessels in the eyes, which may cause vision changes and can ultimately result in blindness.
Controlled blood pressure has been strongly related to decreased microvascular complications, including retinopathy, nephropathy, and neuropathy. Several clinical trials have demonstrated the importance of blood pressure control among patients with diabetes.45
43 American Diabetes Association. High Blood Pressure (Hypertension). Available at: http://www.diabetes.org/living-with-
diabetes/complications/high-blood-pressure-hypertension.html. Accessed on: July 10, 2015. 44 WebMD. Hypertension/high blood pressure guide. Available at: http://www.webmd.boots.com/hypertension-high-blood-
pressure/guide/diabetes-bp. Accessed on: July 10, 2015. 45 American Diabetes Association. Blood Pressure Management in Patients With Diabetes. Available at:
http://clinical.diabetesjournals.org/content/28/3/107.full. Accessed on July 10, 2015.

FULL-SCOPE MANAGED CARE HEALTH PLANS’ PERFORMANCE MEASURE RESULTS
2015 HEDIS Aggregate Report Page 83 California Department of Health Care Services Health Services Advisory Group, Inc.
Performance Results—Comprehensive Diabetes Care—Blood Pressure Control (140/90 mm Hg)
67.49%
63.20%60.25% 62.63%
30%
40%
50%
60%
70%
80%
90%
HEDIS 2012 HEDIS 2013 HEDIS 2014 HEDIS 2015
National Medicaid 25th Percentile (MPL) National Medicaid 90th Percentile (HPL) Medi-Cal Managed Care Weighted AverageNational Medicaid Average National Commercial Average MCP County Rates
Healthy People 2020 Goal: 57.00%
Note:♦ The percentages displayed on this chart represent the Medi-Cal Weighted Average for each year displayed.♦ Not all MCP counties that contributed to the previous years' Medi-Cal Weighted Averages are shown.♦ Only MCP counties that reported data for HEDIS 2015 are shown and these MCP counties may not have reported data in prior years.

FULL-SCOPE MANAGED CARE HEALTH PLANS’ PERFORMANCE MEASURE RESULTS
2015 HEDIS Aggregate Report Page 84 California Department of Health Care Services Health Services Advisory Group, Inc.
Medi-Cal Managed Care HEDIS 2015 Comprehensive Diabetes Care—Blood Pressure Control (<140/90 mm Hg)
86.3483.19
75.41
74.0772.6172.26
70.6070.6070.56
68.3367.4067.40
66.1865.88
65.1364.5864.4864.3563.7563.7563.7463.4162.8662.6862.63
61.9561.8061.2060.5860.5860.4460.4260.1059.85
59.1258.7258.3957.91
57.1856.6956.4556.39
55.7254.7554.3954.2954.1753.64
52.3049.88
48.6646.93
45.5840.39
0 10 20 30 40 50 60 70 80 90 100
Rate (%)
KP Cal LLC (Kaiser SoCal) - San Diego KP Cal LLC (Kaiser NorCal) - KP North
San Francisco Health Plan - San Francisco High Performance Level 1
CalOptima - Orange California Health & Wellness Plan - Imperial
Health Plan of San Joaquin - Stanislaus
California Health & Wellness Plan - Region 1
1 High Performance Level is HEDIS 2014 national Medicaid 90th Percentile.2 Minimum Performance Level is HEDIS 2014 national Medicaid 25th Percentile.
Note: HEDIS 2015 rates reflect 2014 measurement year data.
CenCal Health - Santa Barbara Health Plan of San Joaquin - San Joaquin
CenCal Health - San Luis Obispo CalViva Health - Madera
Central CA Alliance for Health - Monterey/Santa Cruz Central CA Alliance for Health - Merced
Kern Health Systems - Kern L.A. Care Health Plan - Los Angeles
Anthem Blue Cross Partnership Plan - Tulare Partnership HealthPlan of CA - Southwest
Inland Empire Health Plan - Riverside/San Bernardino
Health Net Community Solutions, Inc. - Stanislaus Anthem Blue Cross Partnership Plan - Region 1 Anthem Blue Cross Partnership Plan - Region 2
Anthem Blue Cross Partnership Plan - San Benito Anthem Blue Cross Partnership Plan - Madera
2015 Medi-Cal Managed Care Weighted Average Partnership HealthPlan of CA - Southeast
Health Net Community Solutions, Inc. - Tulare California Health & Wellness Plan - Region 2
Gold Coast Health Plan - Ventura
CalViva Health - Fresno Santa Clara Family Health Plan - Santa Clara
Contra Costa Health Plan - Contra Costa Anthem Blue Cross Partnership Plan - San Francisco
Health Plan of San Mateo - San Mateo Health Net Community Solutions, Inc. - Los Angeles Health Net Community Solutions, Inc. - Sacramento
Molina Healthcare of CA - San Diego Partnership HealthPlan of CA - Northwest
Health Net Community Solutions, Inc. - San Diego CalViva Health - Kings
Partnership HealthPlan of CA - Northeast Community Health Group Partnership Plan - San Diego
Anthem Blue Cross Partnership Plan - Kings Health Net Community Solutions, Inc. - Kern
Molina Healthcare of CA - Riverside/San Bernardino Health Net Community Solutions, Inc. - San Joaquin
Anthem Blue Cross Partnership Plan - Santa Clara Anthem Blue Cross Partnership Plan - Fresno
Molina Healthcare of CA - Sacramento Minimum Performance Level 2
Anthem Blue Cross Partnership Plan - Contra Costa Anthem Blue Cross Partnership Plan - Sacramento
Care 1st Partner Plan, LLC - San Diego Molina Healthcare of CA - Imperial
Anthem Blue Cross Partnership Plan - Alameda Alameda Alliance for Health - Alameda

FULL-SCOPE MANAGED CARE HEALTH PLANS’ PERFORMANCE MEASURE RESULTS
2015 HEDIS Aggregate Report Page 85 California Department of Health Care Services Health Services Advisory Group, Inc.
Summary of Results—Comprehensive Diabetes Care—Blood Pressure Control (<140/90 mm Hg)
The MCMC weighted average for the Comprehensive Diabetes Care—Blood Pressure Control (<140/90 mm Hg) exceeded the Healthy People 2020 goal, the national Medicaid 25th percentile (MPL), and the national Medicaid average for the fifth consecutive year. The rate has been below the national commercial average for three consecutive years and below the national Medicaid 90th percentile (HPL) for the fifth consecutive year.
High and Low Performers
For the fifth consecutive year, the rate for Kaiser SoCal—San Diego County was above the HPL. Additionally, the rates for the following MCP counties/regions also were above the HPL in RY 2015:
Kaiser NorCal—KP North
San Francisco Health Plan—San Francisco County
The rates for the following MCP counties improved significantly from RY 2014 to RY 2015:
Anthem Blue Cross Partnership Plan—Alameda County, Santa Clara County, and Tulare County, resulting in the rate for Santa Clara County moving from below the MPL in RY 2014 to above the MPL in RY 2015
CalViva Health—Kings County, resulting in the rate moving from below the MPL in RY 2014 to above the MPL in RY 2015
Community Health Group Partnership Plan—San Diego County, resulting in the rate moving from below the MPL in RY 2014 to above the MPL in RY 2015
Health Net Community Solutions, Inc.—Sacramento County, San Diego County, and San Joaquin County, resulting in the rates moving from below the MPL in RY 2014 to above the MPL in RY 2015 (Note: RY 2014 was the first year Health Net Community Solutions, Inc., reported a rate for San Joaquin County, so DHCS did not hold the MCP accountable to meet the MPL for this county in RY 2014)
Health Plan of San Mateo—San Mateo County, resulting in the rate moving from below the MPL in RY 2014 to above the MPL in RY 2015
The rates for the following MCP counties improved from RY 2014 to RY 2015, and although the improvement was not statistically significant, the change resulted in the rates moving from below the MPL in RY 2014 to above the MPL in RY 2015:
Anthem Blue Cross Partnership Plan—Fresno County
Health Net Community Solutions, Inc.—Kern County
Molina Healthcare of California Partner Plan, Inc.—Sacramento County

FULL-SCOPE MANAGED CARE HEALTH PLANS’ PERFORMANCE MEASURE RESULTS
2015 HEDIS Aggregate Report Page 86 California Department of Health Care Services Health Services Advisory Group, Inc.
The rates for six MCP counties/regions were below the MPL in RY 2015 compared to 14 in RY 2014. The rate for Molina Healthcare of California Partner Plan, Inc.—Imperial County is included in the six rates below the MPL; however, RY 2015 was the first year the MCP reported a rate for this county for this measure and DHCS therefore did not hold the MCP accountable to meet the MPL (i.e., the MCP was not required to submit an improvement plan if its rate for the measure was below the MPL).
The rate for Anthem Blue Cross Partnership Plan—Contra Costa County was below the MPL for the fourth consecutive year. Although the rate for Anthem Blue Cross Partnership Plan—Alameda County improved significantly from RY 2014 to RY 2015, the rate remained below the MPL for the fifth consecutive year.
The following MCP county rates declined significantly from RY 2014 to RY 2015:
Alameda Alliance for Health—Alameda County, resulting in the rate moving from above the MPL in RY 2014 to below the MPL in RY 2015
Central California Alliance for Health—Monterey/Santa Cruz counties
Kern Health Systems—Kern County

FULL-SCOPE MANAGED CARE HEALTH PLANS’ PERFORMANCE MEASURE RESULTS
2015 HEDIS Aggregate Report Page 87 California Department of Health Care Services Health Services Advisory Group, Inc.
Comprehensive Diabetes Care—Eye Exam (Retinal) Performed
Measure Definition
The Comprehensive Diabetes Care—Eye Exam (Retinal) Performed measure reports the percentage of members 18 through 75 years of age with diabetes (Type 1 and Type 2) who received a retinal or dilated eye exam during the measurement year or a negative retinal or dilated eye exam in the year prior to the measurement year.
Importance
High blood sugar levels increase diabetics’ risk of eye complications. The three most common eye complications in diabetics are retinopathy, cataracts, and glaucoma. Because diabetes is the leading cause of blindness in adults ages 20 to 74, it is important that people with diabetes receive an eye exam each year.46 Detecting and treating diabetics with an eye disease can reduce the development of severe vision loss and blindness.
46 WebMD. Eye Problems and Diabetes. Available at: http://diabetes.webmd.com/eye-problems Accessed July 10, 2015.
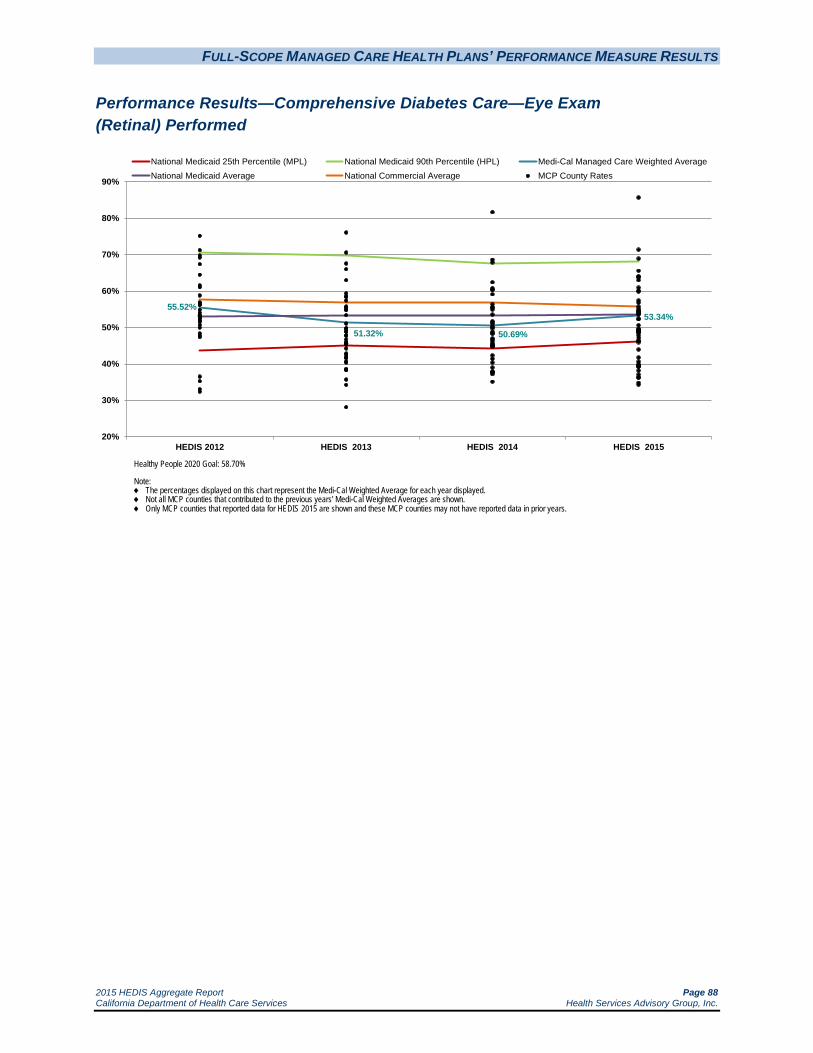
FULL-SCOPE MANAGED CARE HEALTH PLANS’ PERFORMANCE MEASURE RESULTS
2015 HEDIS Aggregate Report Page 88 California Department of Health Care Services Health Services Advisory Group, Inc.
Performance Results—Comprehensive Diabetes Care—Eye Exam (Retinal) Performed
55.52%
51.32% 50.69%
53.34%
20%
30%
40%
50%
60%
70%
80%
90%
HEDIS 2012 HEDIS 2013 HEDIS 2014 HEDIS 2015
National Medicaid 25th Percentile (MPL) National Medicaid 90th Percentile (HPL) Medi-Cal Managed Care Weighted AverageNational Medicaid Average National Commercial Average MCP County Rates
Healthy People 2020 Goal: 58.70%
Note:♦ The percentages displayed on this chart represent the Medi-Cal Weighted Average for each year displayed.♦ Not all MCP counties that contributed to the previous years' Medi-Cal Weighted Averages are shown.♦ Only MCP counties that reported data for HEDIS 2015 are shown and these MCP counties may not have reported data in prior years.

FULL-SCOPE MANAGED CARE HEALTH PLANS’ PERFORMANCE MEASURE RESULTS
2015 HEDIS Aggregate Report Page 89 California Department of Health Care Services Health Services Advisory Group, Inc.
Medi-Cal Managed Care HEDIS 2015 Comprehensive Diabetes Care—Eye Exam (Retinal) Performed
85.7071.36
68.91
65.5964.1363.8963.75
63.0260.93
60.1059.85
57.4156.79
55.7255.1054.7454.5154.3554.1553.8253.7753.5353.34
52.4452.31
50.6149.6549.4549.1549.1549.1548.7948.6648.61
47.9347.20
46.4746.30
46.2345.94
43.9341.76
40.6039.9039.5839.5339.2039.17
38.1437.05
36.2836.25
34.7934.29
0 10 20 30 40 50 60 70 80 90 100
Rate (%)
KP Cal LLC (Kaiser SoCal) - San Diego CenCal Health - Santa Barbara
San Francisco Health Plan - San Francisco High Performance Level 1
CenCal Health - San Luis Obispo KP Cal LLC (Kaiser NorCal) - KP North
CalOptima - Orange
Health Plan of San Mateo - San Mateo
1 High Performance Level is HEDIS 2014 national Medicaid 90th Percentile.2 Minimum Performance Level is HEDIS 2014 national Medicaid 25th Percentile.
Note: HEDIS 2015 rates reflect 2014 measurement year data.
CalViva Health - Madera Molina Healthcare of CA - San Diego
Gold Coast Health Plan - Ventura Central CA Alliance for Health - Monterey/Santa Cruz
Inland Empire Health Plan - Riverside/San Bernardino California Health & Wellness Plan - Imperial
Health Net Community Solutions, Inc. - Los Angeles Contra Costa Health Plan - Contra Costa
Community Health Group Partnership Plan - San Diego Molina Healthcare of CA - Imperial
Anthem Blue Cross Partnership Plan - Madera
Health Net Community Solutions, Inc. - San Joaquin CalViva Health - Fresno
Care 1st Partner Plan, LLC - San Diego 2015 Medi-Cal Managed Care Weighted Average
Anthem Blue Cross Partnership Plan - Santa Clara Central CA Alliance for Health - Merced
Health Net Community Solutions, Inc. - Tulare L.A. Care Health Plan - Los Angeles
Kern Health Systems - Kern
Partnership HealthPlan of CA - Southeast
CalViva Health - Kings Health Net Community Solutions, Inc. - San Diego
Partnership HealthPlan of CA - Southwest Molina Healthcare of CA - Sacramento
Santa Clara Family Health Plan - Santa Clara Anthem Blue Cross Partnership Plan - San Francisco
Health Net Community Solutions, Inc. - Kern Health Plan of San Joaquin - San Joaquin
Health Net Community Solutions, Inc. - Stanislaus Anthem Blue Cross Partnership Plan - Tulare
Minimum Performance Level 2
Alameda Alliance for Health - Alameda Anthem Blue Cross Partnership Plan - Contra Costa Molina Healthcare of CA - Riverside/San Bernardino
Anthem Blue Cross Partnership Plan - Region 1 Anthem Blue Cross Partnership Plan - Sacramento
Health Net Community Solutions, Inc. - Sacramento Anthem Blue Cross Partnership Plan - Fresno
Anthem Blue Cross Partnership Plan - Alameda California Health & Wellness Plan - Region 1
Partnership HealthPlan of CA - Northwest California Health & Wellness Plan - Region 2 Anthem Blue Cross Partnership Plan - Kings
Anthem Blue Cross Partnership Plan - Region 2 Health Plan of San Joaquin - Stanislaus
Partnership HealthPlan of CA - Northeast Anthem Blue Cross Partnership Plan - San Benito

FULL-SCOPE MANAGED CARE HEALTH PLANS’ PERFORMANCE MEASURE RESULTS
2015 HEDIS Aggregate Report Page 90 California Department of Health Care Services Health Services Advisory Group, Inc.
Summary of Results—Comprehensive Diabetes Care—Eye Exam (Retinal) Performed
The MCMC weighted average for the Comprehensive Diabetes Care—Eye Exam (Retinal) measure improved significantly from RY 2014 to RY 2015 and was above the national Medicaid 25th percentile (MPL) for the fifth consecutive year. Despite the significant improvement, the rate remained below the national commercial average and Healthy People 2020 goal for the fifth consecutive year and below the national Medicaid average for the third consecutive year.
High and Low Performers
For the fifth consecutive year, the rates for Kaiser SoCal—San Diego County and CenCal Health—Santa Barbara County were above the national Medicaid 90th percentile (HPL). The rate for San Francisco Health Plan—San Francisco County also was above the HPL in RY 2015.
The rates for the following MCP counties improved significantly from RY 2014 to RY 2015:
Anthem Blue Cross Partnership Plan—Contra Costa County and Santa Clara County; however, the rate for Contra Costa County remained below the MPL
Care1st Partner Plan—San Diego County, resulting in the rate moving from below the MPL in RY 2014 to above the MPL in RY 2015
Gold Coast Health Plan—Ventura County
Health Net Community Solutions, Inc.—San Joaquin County, resulting in the rate moving from below the MPL in RY 2014 to above the MPL in RY 2015 (Note: RY 2014 was the first year Health Net Community Solutions, Inc., reported a rate for San Joaquin County, so DHCS did not hold the MCP accountable to meet the MPL for this county in RY 2014)
Kaiser SoCal—San Diego County
San Francisco Health Plan—San Francisco County, resulting in the rate moving to above the HPL
The rates for Health Net Community Solutions, Inc.—Kern County and Stanislaus County improved from RY 2014 to RY 2015, and although the improvement was not statistically significant, the change resulted in the rates moving from below the MPL in RY 2014 to above the MPL in RY 2015.
The rates for 16 MCP counties/regions were below the MPL in RY 2015 compared to 11 in RY 2014. The rates for the following MCP counties/regions are included in the 16 rates below the MPL; however, RY 2015 was the first year the MCP counties/regions reported rates for this measure and DHCS therefore did not hold the MCPs accountable to meet the MPL (i.e., the MCPs were not required to submit an improvement plan if their rates for the measure were below the MPL):

FULL-SCOPE MANAGED CARE HEALTH PLANS’ PERFORMANCE MEASURE RESULTS
2015 HEDIS Aggregate Report Page 91 California Department of Health Care Services Health Services Advisory Group, Inc.
Anthem Blue Cross Partnership Plan—Region 1, Region 2, and San Benito County
California Health & Wellness Plan—Region 1 and Region 2
Partnership HealthPlan of California—Northeast and Northwest
The rate for Molina Healthcare of California Partner Plan, Inc.—Riverside/San Bernardino counties declined significantly from RY 2014 to RY 2015, resulting in the rate moving from above the MPL in RY 2014 to below the MPL in RY 2015.
The rates for the following MCP counties declined from RY 2014 to RY 2015, and although the decline was not statistically significant, the change resulted in the rates moving from above the MPL in RY 2014 to below the MPL in RY 2015:
Alameda Alliance for Health—Alameda County
Anthem Blue Cross Partnership Plan—Fresno County
The rates for Anthem Blue Cross Partnership Plan—Kings County and Health Net Community Solutions, Inc.—Sacramento County were below the MPL for the third consecutive year. The rates for Anthem Blue Cross Partnership Plan—Alameda County, Contra Costa County, and Sacramento County were below the MPL for the fifth consecutive year.

FULL-SCOPE MANAGED CARE HEALTH PLANS’ PERFORMANCE MEASURE RESULTS
2015 HEDIS Aggregate Report Page 92 California Department of Health Care Services Health Services Advisory Group, Inc.
Comprehensive Diabetes Care—HbA1c Testing
Measure Definition
The Comprehensive Diabetes Care—HbA1c Testing measure reports the percentage of members 18 through 75 years of age with diabetes (Type 1 and Type 2) who had an HbA1c test during the measurement year.
Importance
Blood tests to measure HbA1c (A1c) levels (glycosylated hemoglobin levels) are critical for diabetics since diabetics with a high A1c level are at an increased risk of:47
Eye disease.
Heart disease.
Kidney disease.
Nerve damage.
Stroke.
Performance Results—Comprehensive Diabetes Care—HbA1c Testing
47 National Institute of Health. Available at: http://www.nlm.nih.gov/medlineplus/ency/article/003640.htm Accessed
on: July 10, 2015.
84.20% 83.19% 83.13%85.81%
60%
65%
70%
75%
80%
85%
90%
95%
100%
HEDIS 2012 HEDIS 2013 HEDIS 2014 HEDIS 2015
National Medicaid 25th Percentile (MPL) National Medicaid 90th Percentile (HPL) Medi-Cal Managed Care Weighted AverageNational Medicaid Average National Commercial Average MCP County Rates
Note:♦ The percentages displayed on this chart represent the Medi-Cal Weighted Average for each year displayed.♦ Not all MCP counties that contributed to the previous years' Medi-Cal Weighted Averages are shown.♦ Only MCP counties that reported data for HEDIS 2015 are shown and these MCP counties may not have reported data in prior years.

FULL-SCOPE MANAGED CARE HEALTH PLANS’ PERFORMANCE MEASURE RESULTS
2015 HEDIS Aggregate Report Page 93 California Department of Health Care Services Health Services Advisory Group, Inc.
Medi-Cal Managed Care HEDIS 2015 Comprehensive Diabetes Care—HbA1c Testing
95.7294.97
92.21
91.4891.4291.0090.9590.5190.2089.8589.8189.29
88.3288.0587.8387.8087.5987.3587.1087.1086.6486.5486.3786.3786.1185.81
84.6984.6784.6384.2984.1884.0683.9883.6083.5683.2183.1483.1083.0383.0282.87
81.8781.6881.2780.7880.29
79.3279.0878.59
77.6277.1477.0476.80
74.43
0 10 20 30 40 50 60 70 80 90 100
Rate (%)
KP Cal LLC (Kaiser SoCal) - San Diego KP Cal LLC (Kaiser NorCal) - KP North
Partnership HealthPlan of CA - Northwest High Performance Level 1
Santa Clara Family Health Plan - Santa Clara San Francisco Health Plan - San Francisco
Community Health Group Partnership Plan - San Diego
CenCal Health - Santa Barbara
1 High Performance Level is HEDIS 2014 national Medicaid 90th Percentile.2 Minimum Performance Level is HEDIS 2014 national Medicaid 25th Percentile.
Note: HEDIS 2015 rates reflect 2014 measurement year data.
Gold Coast Health Plan - Ventura California Health & Wellness Plan - Imperial
Molina Healthcare of CA - San Diego CalOptima - Orange
Health Plan of San Mateo - San Mateo CalViva Health - Madera
Partnership HealthPlan of CA - Southeast Central CA Alliance for Health - Monterey/Santa Cruz
California Health & Wellness Plan - Region 2 Care 1st Partner Plan, LLC - San Diego
Partnership HealthPlan of CA - Northeast
Partnership HealthPlan of CA - Southwest Molina Healthcare of CA - Imperial
Anthem Blue Cross Partnership Plan - Region 1 Central CA Alliance for Health - Merced
Health Net Community Solutions, Inc. - Los Angeles Inland Empire Health Plan - Riverside/San Bernardino
2015 Medi-Cal Managed Care Weighted Average Anthem Blue Cross Partnership Plan - Santa Clara
CalViva Health - Fresno
Alameda Alliance for Health - Alameda
California Health & Wellness Plan - Region 1 CenCal Health - San Luis Obispo
Health Net Community Solutions, Inc. - Tulare Anthem Blue Cross Partnership Plan - Madera
Contra Costa Health Plan - Contra Costa Anthem Blue Cross Partnership Plan - Region 2
Anthem Blue Cross Partnership Plan - San Francisco Health Net Community Solutions, Inc. - Kern
L.A. Care Health Plan - Los Angeles Anthem Blue Cross Partnership Plan - Fresno
Kern Health Systems - Kern Anthem Blue Cross Partnership Plan - Alameda
Anthem Blue Cross Partnership Plan - Tulare Health Net Community Solutions, Inc. - San Joaquin Molina Healthcare of CA - Riverside/San Bernardino Anthem Blue Cross Partnership Plan - Contra Costa
Health Plan of San Joaquin - Stanislaus Health Net Community Solutions, Inc. - Stanislaus
Minimum Performance Level 2
Health Plan of San Joaquin - San Joaquin CalViva Health - Kings
Health Net Community Solutions, Inc. - Sacramento Health Net Community Solutions, Inc. - San Diego Anthem Blue Cross Partnership Plan - San Benito
Molina Healthcare of CA - Sacramento Anthem Blue Cross Partnership Plan - Sacramento
Anthem Blue Cross Partnership Plan - Kings

FULL-SCOPE MANAGED CARE HEALTH PLANS’ PERFORMANCE MEASURE RESULTS
2015 HEDIS Aggregate Report Page 94 California Department of Health Care Services Health Services Advisory Group, Inc.
Summary of Results—Comprehensive Diabetes Care—HbA1c Testing
The MCMC weighted average for the Comprehensive Diabetes Care—HbA1c Testing measure improved significantly from 2014 to 2015, moving the rate from below the national Medicaid average in RY 2014 to above the national Medicaid average in RY 2015. For the fifth consecutive year, the MCMC weighted average remained above the national Medicaid 25th percentile (MPL) and below the national commercial average and national Medicaid 90th percentile (HPL).
High and Low Performers
For the fifth consecutive year, Kaiser SoCal—San Diego County had a rate above the national Medicaid 90th percentile (HPL). The rates for Kaiser NorCal—KP North and Partnership HealthPlan of California—Northwest also were above the HPL in RY 2015.
The rates for 12 MCP counties/regions improved significantly from RY 2014 to RY 2015. The improvement for the following MCP counties resulted in the rates moving from below the MPL in RY 2014 to above the MPL in RY 2015:
Anthem Blue Cross Partnership Plan—Alameda County Health Net Community Solutions, Inc.—Kern County and San Joaquin County (Note: RY 2014
was the first year Health Net Community Solutions, Inc., reported a rate for San Joaquin County, so DHCS did not hold the MCP accountable to meet the MPL for this county in RY 2014)
The rate for Anthem Blue Cross Partnership Plan—Contra Costa County also improved from RY 2014 to RY 2015, and although the improvement was not statistically significant, the change resulted in the rate moving from below the MPL in RY 2014 to above the MPL in RY 2015.
The rates for eight MCP counties were below the MPL in RY 2015, which is similar to RY 2014 in which 10 MCP counties had rates below the MPL. The rate for Anthem Blue Cross Partnership Plan—San Benito County is included in the eight rates below the MPL; however, RY 2015 was the first year Anthem Blue Cross Partnership Plan reported a rate for this measure in San Benito County and DHCS therefore did not hold the MCP accountable to meet the MPL (i.e., the MCP was not required to submit an improvement plan if its rate for the measure was below the MPL)
The rate for Health Net Community Solutions, Inc.—Stanislaus County declined significantly from RY 2014 to RY 2015. Additionally, the rate for Molina Healthcare of California Partner Plan, Inc.—Sacramento County declined from RY 2014 to RY 2015, and although the decline was not statistically significant, the change resulted in the rate moving from above the MPL in RY 2014 to below the MPL in RY 2015.
The rates for Anthem Blue Cross Partnership Plan—Kings County and Health Net Community Solutions, Inc.—Sacramento County were below the MPL for the third consecutive year, and the rate for Anthem Blue Cross Partnership Plan—Sacramento County was below the MPL for the fourth consecutive year.

FULL-SCOPE MANAGED CARE HEALTH PLANS’ PERFORMANCE MEASURE RESULTS
2015 HEDIS Aggregate Report Page 95 California Department of Health Care Services Health Services Advisory Group, Inc.
Comprehensive Diabetes Care—HbA1c Control (<8.0 Percent)
Measure Definition
The Comprehensive Diabetes Care—HbA1c Control (<8.0 Percent) measure reports the percentage of members 18 through 75 years of age with diabetes (Type 1 and Type 2) whose most recent HbA1c test conducted during the year showed an HbA1c level of less than 8 percent.
Importance
HbA1c control improves quality of life, increases work productivity, and decreases health care utilization. Controlling the HbA1c level also lowers the risk of diabetes-related death. In addition, controlling blood glucose levels in people with diabetes significantly reduces the risk of blindness, end-stage renal disease (ESRD), and lower extremity amputation.48
48 National Committee for Quality Assurance. The State of Health Care Quality 2009. Washington, D.C.: NCQA; 2009.

FULL-SCOPE MANAGED CARE HEALTH PLANS’ PERFORMANCE MEASURE RESULTS
2015 HEDIS Aggregate Report Page 96 California Department of Health Care Services Health Services Advisory Group, Inc.
Performance Results—Comprehensive Diabetes Care—HbA1c Control (<8.0 Percent)
50.79% 49.35%46.64% 49.08%
20%
30%
40%
50%
60%
70%
80%
HEDIS 2012 HEDIS 2013 HEDIS 2014 HEDIS 2015
National Medicaid 25th Percentile (MPL) National Medicaid 90th Percentile (HPL) Medi-Cal Managed Care Weighted AverageNational Medicaid Average National Commercial Average MCP County Rates
Note:♦ The percentages displayed on this chart represent the Medi-Cal Weighted Average for each year displayed.♦ Not all MCP counties that contributed to the previous years' Medi-Cal Weighted Averages are shown.♦ Only MCP counties that reported data for HEDIS 2015 are shown and these MCP counties may not have reported data in prior years.

FULL-SCOPE MANAGED CARE HEALTH PLANS’ PERFORMANCE MEASURE RESULTS
2015 HEDIS Aggregate Report Page 97 California Department of Health Care Services Health Services Advisory Group, Inc.
Medi-Cal Managed Care HEDIS 2015 Comprehensive Diabetes Care—HbA1c Control (<8.0 Percent)
65.8562.41
61.5761.06
58.1557.9157.87
56.6156.20
55.1954.9954.6154.2653.66
51.8250.2350.12
49.3949.0848.9148.42
47.6947.6947.2047.2046.9646.7246.7246.6446.3046.1745.9945.9645.7445.3344.8144.2844.17
42.8242.3942.1342.1341.85
40.9340.3140.1339.8439.7839.43
37.7534.75
32.2925.27
S
0 10 20 30 40 50 60 70 80 90 100
Rate (%)
KP Cal LLC (Kaiser SoCal) - San Diego San Francisco Health Plan - San Francisco
CalOptima - Orange CenCal Health - Santa Barbara
High Performance Level 1
Santa Clara Family Health Plan - Santa Clara Gold Coast Health Plan - Ventura
KP Cal LLC (Kaiser NorCal) - KP North
1 High Performance Level is HEDIS 2014 national Medicaid 90th Percentile.2 Minimum Performance Level is HEDIS 2014 national Medicaid 25th Percentile.
S = The measure is publicly reported based on audit results; however, since the MCP’s numerator was less than 11, DHCS suppresses displaying the rate to satisfy the HIPAA Privacy Rule’s de-identification standard.
Note: HEDIS 2015 rates reflect 2014 measurement year data.
Anthem Blue Cross Partnership Plan - Santa Clara Partnership HealthPlan of CA - Northwest
Molina Healthcare of CA - San Diego Health Plan of San Mateo - San Mateo
CenCal Health - San Luis Obispo Community Health Group Partnership Plan - San Diego
Partnership HealthPlan of CA - Southeast Health Plan of San Joaquin - Stanislaus
Inland Empire Health Plan - Riverside/San Bernardino CalViva Health - Madera
Health Net Community Solutions, Inc. - Tulare
Partnership HealthPlan of CA - Northeast Care 1st Partner Plan, LLC - San Diego
CalViva Health - Fresno Health Net Community Solutions, Inc. - Sacramento
Health Net Community Solutions, Inc. - San Diego Health Net Community Solutions, Inc. - Stanislaus
Central CA Alliance for Health - Monterey/Santa Cruz Health Plan of San Joaquin - San Joaquin Partnership HealthPlan of CA - Southwest
2015 Medi-Cal Managed Care Weighted Average
Anthem Blue Cross Partnership Plan - Contra Costa Anthem Blue Cross Partnership Plan - San Francisco
Anthem Blue Cross Partnership Plan - Sacramento Central CA Alliance for Health - Merced
L.A. Care Health Plan - Los Angeles Health Net Community Solutions, Inc. - Los Angeles Health Net Community Solutions, Inc. - San Joaquin
Molina Healthcare of CA - Sacramento CalViva Health - Kings
Contra Costa Health Plan - Contra Costa Health Net Community Solutions, Inc. - Kern
Anthem Blue Cross Partnership Plan - Madera Anthem Blue Cross Partnership Plan - Fresno Anthem Blue Cross Partnership Plan - Tulare
Alameda Alliance for Health - Alameda Anthem Blue Cross Partnership Plan - Alameda
California Health & Wellness Plan - Region 1 California Health & Wellness Plan - Region 2
Anthem Blue Cross Partnership Plan - Region 1 Kern Health Systems - Kern
Anthem Blue Cross Partnership Plan - Region 2 Minimum Performance Level 2
Molina Healthcare of CA - Riverside/San Bernardino Anthem Blue Cross Partnership Plan - Kings
California Health & Wellness Plan - Imperial Molina Healthcare of CA - Imperial
Anthem Blue Cross Partnership Plan - San Benito

FULL-SCOPE MANAGED CARE HEALTH PLANS’ PERFORMANCE MEASURE RESULTS
2015 HEDIS Aggregate Report Page 98 California Department of Health Care Services Health Services Advisory Group, Inc.
Summary of Results—Comprehensive Diabetes Care—HbA1c Control (<8.0 Percent)
The MCMC weighted average for the Comprehensive Diabetes Care—HbA1c Control measure remained above the national Medicaid 25th percentile (MPL) and national Medicaid average for this measure for the fifth consecutive year. The rate remained below the national Medicaid 90th percentile (HPL) and national commercial average for the fifth consecutive year.
High and Low Performers
For the fifth consecutive year, the following MCP county rates were above the HPL:
CenCal Health—Santa Barbara County
Kaiser SoCal—San Diego County
San Francisco Health Plan—San Francisco County
The rate for CalOptima—Orange County was also above the HPL in RY 2015.
The rates for 11 MCP counties improved significantly from RY 2014 to RY 2015. The improvement resulted in the following rates moving from below the MPL in RY 2014 to above the MPL in RY 2015:
Anthem Blue Cross Partnership Plan—Alameda County and Contra Costa County
CalViva Health—Fresno County
Health Net Community Solutions, Inc.—Kern County, San Diego County, and San Joaquin County (Note: RY 2014 was the first year Health Net Community Solutions, Inc., reported a rate for San Joaquin County, so DHCS did not hold the MCP accountable to meet the MPL for this county in RY 2014)
The rates for Anthem Blue Cross Partnership Plan—Fresno County and CalViva Health—Kings County improved from RY 2014 to RY 2015, and although the improvement was not statistically significant, the change resulted in the rates moving from below the MPL in RY 2014 to above the MPL in RY 2015.
The rates for five MCP counties/regions were below the MPL in RY 2015 compared to 10 in RY 2014. The rates for the following MCP counties/regions are included in the five rates below the MPL; however, RY 2015 was the first year the MCP counties/regions reported rates for this measure and DHCS therefore did not hold the MCPs accountable to meet the MPL (i.e., the MCPs were not required to submit an improvement plan if their rates for the measure were below the MPL):

FULL-SCOPE MANAGED CARE HEALTH PLANS’ PERFORMANCE MEASURE RESULTS
2015 HEDIS Aggregate Report Page 99 California Department of Health Care Services Health Services Advisory Group, Inc.
Anthem Blue Cross Partnership Plan—San Benito County (Note: The rate for this measure was reportable based on performance measure validation audit results; however, since there are fewer than 11 cases in the numerator of this measure, DHCS suppresses displaying the rate in this report to satisfy the Health Insurance Portability and Accountability Act of 1996 Privacy Rule’s de-identification standard.)
California Health & Wellness Plan—Imperial County
Molina Healthcare of California Partner Plan, Inc.—Imperial County
FULL-SCOPE MANAGED CARE HEALTH PLANS’ PERFORMANCE MEASURE RESULTS
2015 HEDIS Aggregate Report Page 100 California Department of Health Care Services Health Services Advisory Group, Inc.
Comprehensive Diabetes Care—Medical Attention for Nephropathy
Measure Definition
The Comprehensive Diabetes Care—Medical Attention for Nephropathy measure is intended to assess whether diabetic patients are being monitored for nephropathy (kidney disease). It reports the percentage of members 18 through 75 years of age with diabetes (Type 1 and Type 2) who received a screening test or had evidence of nephropathy during the measurement year.
Importance
Nephropathy refers to damage or disease of the kidney. Diabetes has been shown to be a leading cause of kidney failure and ESRD, and 20 to 30 percent of diabetics will develop evidence of nephropathy.49 In 2011, 44 percent of all new kidney failure cases were due to diabetes. There were also 228,924 patients either receiving continuous dialysis treatments or who had a kidney transplant.50 While there are still large numbers of diabetic patients suffering from kidney disease, current research shows a decline in the number of diabetes-related ESRD cases across all ethnicities, genders, and ages; however, the Hispanic population did not see as much of a decline as other ethnicities.51
Nephropathy is also associated with increased risk for hypertension and high cholesterol. Blood sugar control reduces the risk of microalbuminuria (having small amounts of protein in the urine) by one-third and reduces the risk of microalbuminuria progressing by 50 percent. It has also been shown that tight control of blood sugar may even reverse microalbuminuria.52
49 Butt, Saud, Phillip Hall, and Saul Nurko. Diabetic Nephropathy. Cleveland Clinic: Center for Continuing Education. 2010.
Available at: http://www.clevelandclinicmeded.com/medicalpubs/diseasemanagement/nephrology/diabetic-nephropathy/ Accessed on: July 10, 2015.
50 American Diabetes Association. Statistics About Diabetes. Overall Numbers, Diabetes and Prediabetes. 2014. Available at: http://www.diabetes.org/diabetes-basics/statistics/. Accessed on: July 10, 2015.
51 Burrow, Nilka Rios, Yanfeng Li, and Linda S. Geiss. Epidemiology/Health Services Research. Incidence of Treatment for End-Stage Renal Disease Among Individuals With Diabetes in the U.S. Continues to Decline. 2010. Available at: http://care.diabetesjournals.org/content/33/1/73.full.pdf+html. Accessed on: July 10, 2015.
52 National Kidney and Urologic Diseases Information Clearinghouse. IgA Nephropathy, Available at: http://kidney.niddk.nih.gov/kudiseases/pubs/iganephropathy/. Updated September 2010. Accessed on: July 10, 2015.

FULL-SCOPE MANAGED CARE HEALTH PLANS’ PERFORMANCE MEASURE RESULTS
2015 HEDIS Aggregate Report Page 101 California Department of Health Care Services Health Services Advisory Group, Inc.
Performance Results—Comprehensive Diabetes Care—Medical Attention for Nephropathy
81.90% 81.80% 82.65%84.45%
50%
55%
60%
65%
70%
75%
80%
85%
90%
95%
100%
HEDIS 2012 HEDIS 2013 HEDIS 2014 HEDIS 2015
National Medicaid 25th Percentile (MPL) National Medicaid 90th Percentile (HPL) Medi-Cal Managed Care Weighted Average
National Medicaid Average National Commercial Average MCP County Rates
Note:♦ The percentages displayed on this chart represent the Medi-Cal Weighted Average for each year displayed.♦ Not all MCP counties that contributed to the previous years' Medi-Cal Weighted Averages are shown.♦ Only MCP counties that reported data for HEDIS 2015 are shown and these MCP counties may not have reported data in prior years.

FULL-SCOPE MANAGED CARE HEALTH PLANS’ PERFORMANCE MEASURE RESULTS
2015 HEDIS Aggregate Report Page 102 California Department of Health Care Services Health Services Advisory Group, Inc.
Medi-Cal Managed Care HEDIS 2015 Comprehensive Diabetes Care—Medical Attention for Nephropathy
92.9692.71
90.5189.29
87.9487.8387.42
86.6186.3186.1386.1385.89
85.1884.9584.9184.8884.7884.7084.6784.4984.4584.1883.9983.9483.7083.4583.3783.2982.6482.5282.2482.0082.0081.9781.7581.6781.5981.5781.0280.6280.5780.5480.05
79.1578.2477.6777.1376.6476.1776.1676.10
75.4373.19
54.29
0 10 20 30 40 50 60 70 80 90 100
Rate (%)
KP Cal LLC (Kaiser NorCal) - KP North KP Cal LLC (Kaiser SoCal) - San Diego
Santa Clara Family Health Plan - Santa Clara Community Health Group Partnership Plan - San Diego
San Francisco Health Plan - San Francisco Health Net Community Solutions, Inc. - Tulare
Molina Healthcare of CA - San Diego
High Performance Level 1
1 High Performance Level is HEDIS 2014 national Medicaid 90th Percentile.2 Minimum Performance Level is HEDIS 2014 national Medicaid 25th Percentile.
Note: HEDIS 2015 rates reflect 2014 measurement year data.
L.A. Care Health Plan - Los Angeles Molina Healthcare of CA - Riverside/San Bernardino
Health Net Community Solutions, Inc. - Kern Health Net Community Solutions, Inc. - Los Angeles
Partnership HealthPlan of CA - Northwest CenCal Health - Santa Barbara
Anthem Blue Cross Partnership Plan - San Francisco Central CA Alliance for Health - Merced
Partnership HealthPlan of CA - Southeast Anthem Blue Cross Partnership Plan - Madera
Health Net Community Solutions, Inc. - San Joaquin
Inland Empire Health Plan - Riverside/San Bernardino 2015 Medi-Cal Managed Care Weighted Average
Care 1st Partner Plan, LLC - San Diego Anthem Blue Cross Partnership Plan - Santa Clara
Health Plan of San Mateo - San Mateo Gold Coast Health Plan - Ventura
CalViva Health - Madera California Health & Wellness Plan - Region 2
CenCal Health - San Luis Obispo
Health Net Community Solutions, Inc. - Sacramento
CalOptima - Orange Contra Costa Health Plan - Contra Costa
CalViva Health - Kings CalViva Health - Fresno
Central CA Alliance for Health - Monterey/Santa Cruz Anthem Blue Cross Partnership Plan - Kings
Health Plan of San Joaquin - San Joaquin Anthem Blue Cross Partnership Plan - Sacramento
Molina Healthcare of CA - Imperial Kern Health Systems - Kern
Anthem Blue Cross Partnership Plan - Fresno California Health & Wellness Plan - Imperial
Molina Healthcare of CA - Sacramento Health Net Community Solutions, Inc. - San Diego
Alameda Alliance for Health - Alameda Anthem Blue Cross Partnership Plan - Contra Costa
Anthem Blue Cross Partnership Plan - Tulare Anthem Blue Cross Partnership Plan - Alameda
Health Plan of San Joaquin - Stanislaus Partnership HealthPlan of CA - Southwest
California Health & Wellness Plan - Region 1 Partnership HealthPlan of CA - Northeast
Anthem Blue Cross Partnership Plan - Region 1 Minimum Performance Level 2
Health Net Community Solutions, Inc. - Stanislaus Anthem Blue Cross Partnership Plan - Region 2
Anthem Blue Cross Partnership Plan - San Benito
FULL-SCOPE MANAGED CARE HEALTH PLANS’ PERFORMANCE MEASURE RESULTS
2015 HEDIS Aggregate Report Page 103 California Department of Health Care Services Health Services Advisory Group, Inc.
Summary of Results—Comprehensive Diabetes Care—Medical Attention for Nephropathy
The MCMC weighted average for the Comprehensive Diabetes Care—Medical Attention for Nephropathy measure was above the national Medicaid 25th percentile (MPL) and national Medicaid average for the fifth consecutive year. The rate remained below the national commercial average and national Medicaid 90th percentile (HPL).
High and Low Performers
For the fifth consecutive year, the rate for Kaiser SoCal—San Diego County was above the HPL. The rates for the following MCP counties/regions also were above the HPL in RY 2015:
Community Health Group Partnership Plan—San Diego County Health Net Community Solutions, Inc.—Tulare County Kaiser NorCal—KP North Molina Healthcare of California Partner Plan, Inc.—San Diego County San Francisco Health Plan—San Francisco County (for the third consecutive year) Santa Clara Family Health Plan—Santa Clara County
The rates for the following MCP counties improved significantly from RY 2014 to RY 2015:
Community Health Group Partnership Plan—San Diego County Gold Coast Health Plan—Ventura County Health Net Community Solutions, Inc.—Kern County and Tulare County Santa Clara Family Health Plan—Santa Clara County
The rate for Anthem Blue Cross Partnership Plan—Alameda County improved from RY 2014 to RY 2015, and although the improvement was not statistically significant, the change resulted in the rate moving from below the MPL in RY 2014 to above the MPL in RY 2015.
The rate for Health Net Community Solutions, Inc.—Stanislaus County declined from RY 2014 to RY 2015, and although the decline was not statistically significant, the change resulted in the rate moving from above the MPL in RY 2014 to below the MPL in RY 2015.
The rates for Anthem Blue Cross Partnership Plan—Region 2 and San Benito County also were below the MPL in RY 2015. (Note: RY 2015 was the first year Anthem Blue Cross Partnership Plan reported rates in Region 2 and San Benito County for this measure and DHCS therefore did not hold the MCP accountable to meet the MPL [i.e., the MCP was not required to submit an improvement plan if its rate for the measure was below the MPL].)
The rate for Health Plan of San Mateo—San Mateo County declined significantly from RY 2014 to RY 2015.

FULL-SCOPE MANAGED CARE HEALTH PLANS’ PERFORMANCE MEASURE RESULTS
2015 HEDIS Aggregate Report Page 104 California Department of Health Care Services Health Services Advisory Group, Inc.
Comprehensive Diabetes Care—HbA1c Poor Control (>9.0 Percent)
Measure Definition
The Comprehensive Diabetes Care—HbA1c Poor Control (>9.0 Percent) measure reports the percentage of members 18 through 75 years of age with diabetes (Type 1 and Type 2) whose most recent HbA1c test conducted during the measurement year showed a greater than 9 percent HbA1c level, was missing a result, or if an HbA1c test was not done during the measurement period.
Importance
The United States lost approximately $245 billion on diabetes medical costs and lost productivity.53 HbA1c control improves quality of life, increases work productivity, and decreases health care utilization. Decreasing the HbA1c level lowers the risk of diabetes-related death. Controlling blood glucose levels in people with diabetes significantly reduces the risk for blindness, heart disease, ESRD, stroke, nerve damage, and lower extremity amputation.54
53 National Committee for Quality Assurance. The State of Health Care Quality 2013. Washington, D.C.: NCQA; 2013. 54 National Committee for Quality Assurance. The State of Health Care Quality 2009. Washington, D.C.: NCQA; 2009.

FULL-SCOPE MANAGED CARE HEALTH PLANS’ PERFORMANCE MEASURE RESULTS
2015 HEDIS Aggregate Report Page 105 California Department of Health Care Services Health Services Advisory Group, Inc.
Performance Results—Comprehensive Diabetes Care—HbA1c Poor Control (>9.0 Percent)
38.04%40.35%
43.73%39.35%
10%
20%
30%
40%
50%
60%
70%
National Medicaid 75th Percentile (MPL) National Medicaid 10th Percentile (HPL) Medi-Cal Managed Care Weighted AverageNational Medicaid Average National Commercial Average MCP County Rates
Healthy People 2020 Goal: 16.10%
Note:♦ The percentages displayed on this chart represent the Medi-Cal Weighted Average for each year displayed.♦ Not all MCP counties that contributed to the previous years' Medi-Cal Weighted Averages are shown.♦ Only MCP counties that reported data for HEDIS 2015 are shown and these MCP counties may not have reported data in prior years.
HEDIS 2012 HEDIS 2013 HEDIS 2014 HEDIS 2015

FULL-SCOPE MANAGED CARE HEALTH PLANS’ PERFORMANCE MEASURE RESULTS
2015 HEDIS Aggregate Report Page 106 California Department of Health Care Services Health Services Advisory Group, Inc.
Medi-Cal Managed Care HEDIS 2015 Comprehensive Diabetes Care—HbA1c Poor Control (>9.0 Percent)
21.0425.06
27.7827.9629.1529.68
31.1432.8533.4134.4434.6635.3736.0136.57
38.2038.2038.4439.3539.4239.9040.1540.8841.0841.2641.3641.8042.0942.4042.5843.3143.3143.3143.8043.8043.8543.9344.9945.7446.3046.72
48.1248.38
50.2350.5550.7951.0951.3951.4351.6451.81
56.3557.05
62.8667.15
0 10 20 30 40 50 60 70 80 90 100
Rate (%)
KP Cal LLC (Kaiser SoCal) - San Diego San Francisco Health Plan - San Francisco
CalOptima - Orange KP Cal LLC (Kaiser NorCal) - KP North
CenCal Health - Santa Barbara Santa Clara Family Health Plan - Santa Clara
High Performance Level 1
Partnership HealthPlan of CA - Northwest
1 High Performance Level is HEDIS 2014 national Medicaid 10th Percentile.2 Minimum Performance Level is HEDIS 2014 national Medicaid 75th Percentile.
Note: HEDIS 2015 rates reflect 2014 measurement year data.
Gold Coast Health Plan - Ventura Anthem Blue Cross Partnership Plan - Santa Clara
Molina Healthcare of CA - San Diego CenCal Health - San Luis Obispo
Partnership HealthPlan of CA - Southeast Community Health Group Partnership Plan - San Diego
Inland Empire Health Plan - Riverside/San Bernardino Health Net Community Solutions, Inc. - Los Angeles
Health Plan of San Mateo - San Mateo CalViva Health - Madera
2015 Medi-Cal Managed Care Weighted Average
Health Plan of San Joaquin - Stanislaus Health Net Community Solutions, Inc. - Sacramento
Health Net Community Solutions, Inc. - Tulare Health Net Community Solutions, Inc. - San Joaquin
Contra Costa Health Plan - Contra Costa Health Net Community Solutions, Inc. - Stanislaus
L.A. Care Health Plan - Los Angeles Health Plan of San Joaquin - San Joaquin
Anthem Blue Cross Partnership Plan - Contra Costa
Care 1st Partner Plan, LLC - San Diego
Partnership HealthPlan of CA - Northeast CalViva Health - Fresno
Health Net Community Solutions, Inc. - San Diego Partnership HealthPlan of CA - Southwest
Central CA Alliance for Health - Merced Central CA Alliance for Health - Monterey/Santa Cruz
Anthem Blue Cross Partnership Plan - Sacramento Molina Healthcare of CA - Sacramento
California Health & Wellness Plan - Region 1 Health Net Community Solutions, Inc. - Kern
Anthem Blue Cross Partnership Plan - San Francisco CalViva Health - Kings
California Health & Wellness Plan - Region 2 Anthem Blue Cross Partnership Plan - Tulare
Anthem Blue Cross Partnership Plan - Alameda Anthem Blue Cross Partnership Plan - Region 1 Anthem Blue Cross Partnership Plan - Region 2
Alameda Alliance for Health - Alameda Anthem Blue Cross Partnership Plan - Fresno
Molina Healthcare of CA - Riverside/San Bernardino Kern Health Systems - Kern
Anthem Blue Cross Partnership Plan - Madera Minimum Performance Level 2
California Health & Wellness Plan - Imperial Anthem Blue Cross Partnership Plan - Kings
Anthem Blue Cross Partnership Plan - San Benito Molina Healthcare of CA - Imperial

FULL-SCOPE MANAGED CARE HEALTH PLANS’ PERFORMANCE MEASURE RESULTS
2015 HEDIS Aggregate Report Page 107 California Department of Health Care Services Health Services Advisory Group, Inc.
Summary of Results—Comprehensive Diabetes Care—HbA1c Poor Control (>9.0 Percent)
For the HbA1c Poor Control (>9.0 Percent) measure, a lower rate indicates better performance. The MCMC weighted average improved significantly from RY 2014 to RY 2015. For the fifth consecutive year, the MCMC weighted average was better (i.e., lower) than the national Medicaid 75th percentile (MPL) and national Medicaid average for this measure and worse (i.e., higher) than the national Medicaid 10th percentile (HPL), national commercial average, and Healthy People 2020 goal.
High and Low Performers
For the fifth consecutive year, the rates for the following MCP counties were better than the HPL:
Kaiser SoCal—San Diego County
San Francisco Health Plan—San Francisco County
The rates for the following MCP counties/regions also were better than the HPL in RY 2015:
CalOptima—Orange County
CenCal Health—Santa Barbara County
Kaiser NorCal—KP North
Santa Clara Family Health Plan—Santa Clara County
The rate for 13 MCP counties improved significantly from RY 2014 to RY 2015. The improvement for the following MCP counties resulted in the rates moving from higher than the MPL (i.e., worse) to lower than the MPL (i.e., better):
Anthem Blue Cross Partnership Plan—Alameda County and Contra Costa County
CalViva Health—Fresno County
Health Net Community Solutions, Inc.—Kern County, San Diego County, and San Joaquin County (Note: RY 2014 was the first year Health Net Community Solutions, Inc., reported a rate for San Joaquin County, so DHCS did not hold the MCP accountable to meet the MPL for this county in RY 2014)
Anthem Blue Cross Partnership Plan—Kings County was one of the counties with a rate that improved significantly; however, despite the improvement, the rate in this county remained higher than the MPL (i.e., worse) for the third consecutive year. The following MCP counties also had rates higher than the MPL; however, RY 2015 was the first year these MCP counties reported rates for this measure and DHCS therefore did not hold the MCPs accountable to meet the MPL
FULL-SCOPE MANAGED CARE HEALTH PLANS’ PERFORMANCE MEASURE RESULTS
2015 HEDIS Aggregate Report Page 108 California Department of Health Care Services Health Services Advisory Group, Inc.
for this measure (i.e., the MCPs were not required to submit an improvement plan if their rates for the measure were below the MPL):
Anthem Blue Cross Partnership Plan—San Benito County
California Health & Wellness Plan—Imperial County
Molina Healthcare of California Partner Plan, Inc.—Imperial County
Best and Emerging Practices—Comprehensive Diabetes Care
MHPA’s Center for Best Practices provides information on best practices in the clinical and operations areas of Medicaid health plans. MHPA’s Diabetes Care Best Practices Compendium provides examples on interventions that have been successful at improving the care provided to Medicaid beneficiaries with diabetes. MHPA indicates that health plans are using the following approaches to improve diabetes care:55
Measuring the quality of care provided to beneficiaries with diabetes and developing focused efforts to increase evidence-based care.
Using care management programs to educate and support patients in making lifestyle choices that prevent and manage diabetes.
Engaging beneficiaries with diabetes or those at risk for diabetes with prevention, treatment, and health education programs.
Connecting with beneficiaries on health education through interactive websites that offer health information, health risk assessments, and games.
Offering diabetes disease management directly to patients in need of additional support and education.
Contracting with high-quality physicians and increasing patient awareness of high-quality diabetes providers such as those recognized in diabetes care by NCQA.
Partnering with physicians and other practitioners to help them understand opportunities to improve diabetes care.
Using incentives to encourage beneficiaries to use high-quality providers and to participate in diabetes management programs.
Collaborating with communities and community organizations such as schools, health departments, and fitness organizations to develop prevention and wellness programs.
Partnering with states to carry out payment incentive demonstration programs to reward providers for better quality care.
55 Medicaid Health Plans of America: Centers for Best Practices. Best Practices Compendium on Diabetes Care. 2013.
Available at: https://www.mhpa.org/_upload/Diabetes%20Compendium%20Final%20Web.pdf. Accessed on: July 9, 2015.

FULL-SCOPE MANAGED CARE HEALTH PLANS’ PERFORMANCE MEASURE RESULTS
2015 HEDIS Aggregate Report Page 109 California Department of Health Care Services Health Services Advisory Group, Inc.
Controlling High Blood Pressure
Measure Definition
The Controlling High Blood Pressure measure is used to assess the percentage of members 18 to 85 years of age who had a diagnosis of hypertension and whose blood pressure (BP) was adequately controlled during the measurement year based on the following criteria:
Members 18 through 59 years of age whose BP was <140/90 mm Hg.
Members 60 through 85 years of age with a diagnosis of diabetes whose BP was <140/90 mm Hg.
Members 60 through 85 years of age without a diagnosis of diabetes whose BP was <150/90 mm Hg.
Note: A single rate is reported and is the sum of all three groups.
Importance
Although hypertension does not have symptoms, it can lead to increased risk for heart disease and stroke. NCQA has estimated that by 2015, hypertension will cost America $118.6 billion in both direct and indirect costs. One in three Americans currently has hypertension, but fewer than 50 percent have their disease under control.56 Research has shown that by controlling hypertension, mortality from both strokes and coronary heart disease is reduced by 42 percent and 14 to 20 percent respectively. By reducing sodium intake and making lifestyle changes, a person with hypertension can reduce his or her risk of cardiovascular disease and have an overall healthier life.57
56 National Committee for Quality Assurance. The State of Health Care Quality 2013. Washington, D.C: NCQA 2013. 57 Agency for Healthcare Research and Quality. National Quality Measures Clearinghouse. Available at:
http://www.qualitymeasures.ahrq.gov/content.aspx?id=38869. Accessed on: July 9, 2015.

FULL-SCOPE MANAGED CARE HEALTH PLANS’ PERFORMANCE MEASURE RESULTS
2015 HEDIS Aggregate Report Page 110 California Department of Health Care Services Health Services Advisory Group, Inc.
Performance Results—Controlling High Blood Pressure
58.30% 56.34%61.22%
20%
30%
40%
50%
60%
70%
80%
90%
HEDIS 2013 HEDIS 2014 HEDIS 2015
National Medicaid 25th Percentile (MPL) National Medicaid 90th Percentile (HPL) Medi-Cal Managed Care Weighted AverageNational Medicaid Average National Commercial Average MCP County Rates
Healthy People 2020 Goal: 61.20%
Note:♦ The percentages displayed on this chart represent the Medi-Cal Weighted Average for each year displayed.♦ Not all MCP counties that contributed to the previous years' Medi-Cal Weighted Averages are shown.♦ Only MCP counties that reported data for HEDIS 2015 are shown and these MCP counties may not have reported data in prior years.
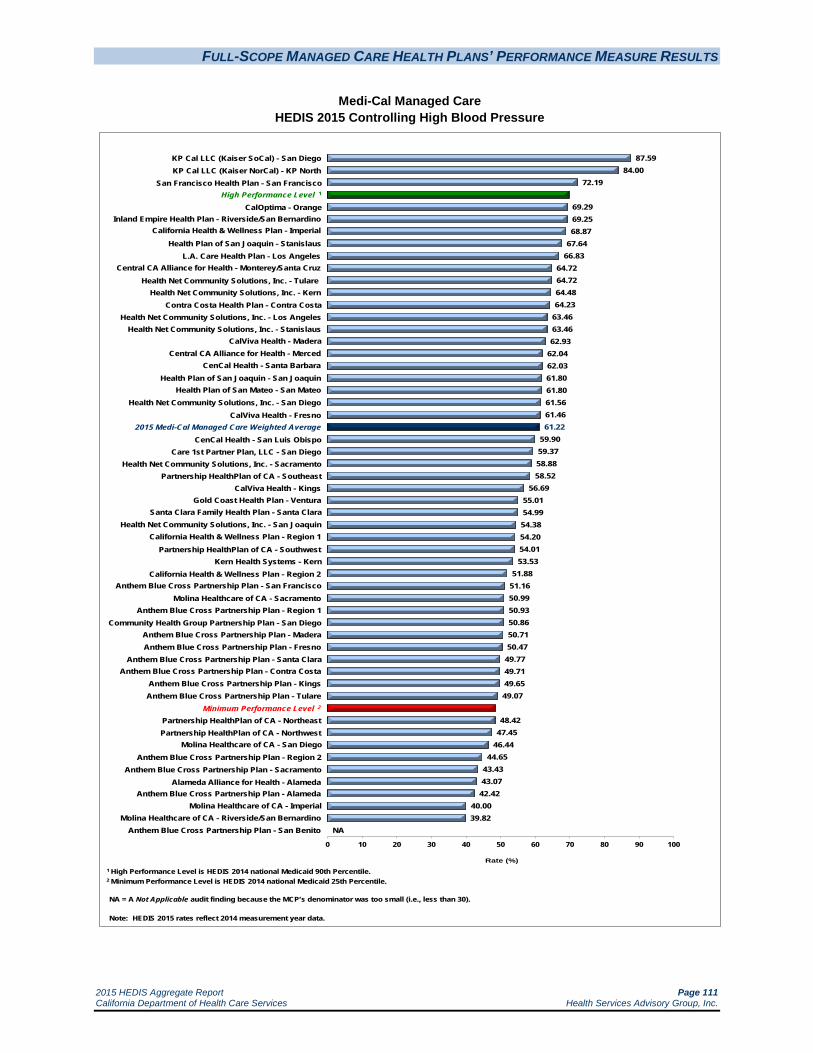
FULL-SCOPE MANAGED CARE HEALTH PLANS’ PERFORMANCE MEASURE RESULTS
2015 HEDIS Aggregate Report Page 111 California Department of Health Care Services Health Services Advisory Group, Inc.
Medi-Cal Managed Care HEDIS 2015 Controlling High Blood Pressure
87.5984.00
72.19
69.2969.2568.87
67.6466.83
64.7264.7264.4864.23
63.4663.4662.93
62.0462.0361.8061.8061.5661.4661.22
59.9059.3758.8858.52
56.6955.0154.9954.3854.2054.0153.53
51.8851.1650.9950.9350.8650.7150.47
49.7749.7149.6549.07
48.4247.45
46.4444.65
43.4343.0742.42
40.0039.82
NA
0 10 20 30 40 50 60 70 80 90 100
Rate (%)
KP Cal LLC (Kaiser SoCal) - San Diego KP Cal LLC (Kaiser NorCal) - KP North
San Francisco Health Plan - San Francisco High Performance Level 1
CalOptima - Orange Inland Empire Health Plan - Riverside/San Bernardino
California Health & Wellness Plan - Imperial
Health Plan of San Joaquin - Stanislaus
1 High Performance Level is HEDIS 2014 national Medicaid 90th Percentile.2 Minimum Performance Level is HEDIS 2014 national Medicaid 25th Percentile.
NA = A Not Applicable audit finding because the MCP’s denominator was too small (i.e., less than 30).
Note: HEDIS 2015 rates reflect 2014 measurement year data.
L.A. Care Health Plan - Los Angeles Central CA Alliance for Health - Monterey/Santa Cruz
Health Net Community Solutions, Inc. - Tulare Health Net Community Solutions, Inc. - Kern
Contra Costa Health Plan - Contra Costa Health Net Community Solutions, Inc. - Los Angeles
Health Net Community Solutions, Inc. - Stanislaus CalViva Health - Madera
Central CA Alliance for Health - Merced CenCal Health - Santa Barbara
Health Plan of San Joaquin - San Joaquin
Health Net Community Solutions, Inc. - San Diego CalViva Health - Fresno
2015 Medi-Cal Managed Care Weighted Average CenCal Health - San Luis Obispo
Care 1st Partner Plan, LLC - San Diego Health Net Community Solutions, Inc. - Sacramento
Partnership HealthPlan of CA - Southeast CalViva Health - Kings
Gold Coast Health Plan - Ventura
Health Plan of San Mateo - San Mateo
Santa Clara Family Health Plan - Santa Clara Health Net Community Solutions, Inc. - San Joaquin
California Health & Wellness Plan - Region 1 Partnership HealthPlan of CA - Southwest
Kern Health Systems - Kern California Health & Wellness Plan - Region 2
Anthem Blue Cross Partnership Plan - San Francisco Molina Healthcare of CA - Sacramento
Anthem Blue Cross Partnership Plan - Region 1 Community Health Group Partnership Plan - San Diego
Anthem Blue Cross Partnership Plan - Madera Anthem Blue Cross Partnership Plan - Fresno
Anthem Blue Cross Partnership Plan - Santa Clara Anthem Blue Cross Partnership Plan - Contra Costa
Anthem Blue Cross Partnership Plan - Kings Anthem Blue Cross Partnership Plan - Tulare
Minimum Performance Level 2
Partnership HealthPlan of CA - Northeast Partnership HealthPlan of CA - Northwest
Molina Healthcare of CA - San Diego Anthem Blue Cross Partnership Plan - Region 2
Anthem Blue Cross Partnership Plan - Sacramento Alameda Alliance for Health - Alameda
Anthem Blue Cross Partnership Plan - Alameda Molina Healthcare of CA - Imperial
Molina Healthcare of CA - Riverside/San Bernardino Anthem Blue Cross Partnership Plan - San Benito
FULL-SCOPE MANAGED CARE HEALTH PLANS’ PERFORMANCE MEASURE RESULTS
2015 HEDIS Aggregate Report Page 112 California Department of Health Care Services Health Services Advisory Group, Inc.
Summary of Results—Controlling High Blood Pressure
For the third consecutive year, the MCMC weighted average for the Controlling High Blood Pressure measure was above the national Medicaid 25th percentile (MPL) and national Medicaid average and below the national commercial average and national Medicaid 90th percentile (HPL). The weighted average improved significantly from RY 2014 to RY 2015, resulting in the rate moving from below the Healthy People 2020 goal in RY 2014 to just above the Healthy People 2020 goal in RY 2015.
High and Low Performers
The rates for the following MCP counties/regions were above the HPL in RY 2015:
Kaiser NorCal—KP North
Kaiser SoCal—San Diego County (for the third consecutive year)
San Francisco Health Plan—San Francisco County
The rates for 19 MCP counties improved significantly from RY 2014 to RY 2015, resulting in the rates for the following MCP counties moving from below the MPL in RY 2014 to above the MPL in RY 2015:
Anthem Blue Cross Partnership Plan—Santa Clara County
CalViva Health—Kings County
Care1st Partner Plan—San Diego County
Health Net Community Solutions, Inc.—Kern County, Sacramento County, San Diego County, San Joaquin County, and Tulare County (Note: RY 2014 was the first year Health Net Community Solutions, Inc., reported a rate for San Joaquin County, so DHCS did not hold the MCP accountable to meet the MPL for this county in RY 2014)
Health Plan of San Mateo—San Mateo County
Although the rate for Anthem Blue Cross Partnership Plan—Alameda County improved significantly from RY 2014 to RY 2015, the rate remained below the MPL.
The rates for Anthem Blue Cross Partnership Plan—Contra Costa County, Kings County, and San Francisco County, and Molina Healthcare of California Health Plan, Inc.—Sacramento County also improved from RY 2014 to RY 2015, and although the improvement was not statistically significant, the change resulted in the rates moving from below the MPL in RY 2014 to above the MPL in RY 2015.

FULL-SCOPE MANAGED CARE HEALTH PLANS’ PERFORMANCE MEASURE RESULTS
2015 HEDIS Aggregate Report Page 113 California Department of Health Care Services Health Services Advisory Group, Inc.
The rates for the following MCP counties were below the MPL in RY 2015:
Alameda Alliance for Health—Alameda County
Anthem Blue Cross Partnership Plan—Alameda County and Sacramento County(for the third consecutive year)
Molina Healthcare of California Partner Plan, Inc.—Riverside/San Bernardino counties and San Diego County
The rates for the following MCP counties/regions also were below the MPL; however, RY 2015 was the first year the MCP counties/regions reported rates for this measure and DHCS therefore did not hold the MCPs accountable to meet the MPL (i.e., the MCPs were not required to submit an improvement plan if their rates for the measure were below the MPL):
Anthem Blue Cross Partnership Plan—Region 2
Molina Healthcare of California Partner Plan, Inc.—Imperial County
Partnership HealthPlan of California—Northeast and Northwest
The rates for the following MCP counties declined significantly from RY 2014 to RY 2015:
Kern Health Systems—Kern County
Molina Healthcare of California Partner Plan, Inc.—Riverside/San Bernardino counties and San Diego County, resulting in the rate for San Diego County moving from above the MPL in RY 2014 to below the MPL in RY 2015.
Anthem Blue Cross Partnership Plan—San Benito County had an audit result of “NA” for this measure, meaning that although the MCP complied with all applicable specifications, it had a denominator less than 30 for the measure, resulting in the “NA” audit result.
Best and Emerging Practices—Controlling High Blood Pressure
The Community Preventive Services Task Force found strong scientific evidence that lowering out-of-pocket medication costs for patients with high blood pressure and high cholesterol can help control both conditions.58 The Task Force recommends combining the reduction in out-of-patient costs with additional interventions aimed at improving patient-provider interaction and patient knowledge. The recommendation is based on strong evidence that this approach improves medication adherence and blood pressure and cholesterol outcomes.
58 Community Preventive Services Task Force. Community Guide News. Available at:
http://www.thecommunityguide.org/news/2013/CVD-ROPC.html. Accessed on July 9, 2015.

FULL-SCOPE MANAGED CARE HEALTH PLANS’ PERFORMANCE MEASURE RESULTS
2015 HEDIS Aggregate Report Page 114 California Department of Health Care Services Health Services Advisory Group, Inc.
The Community Preventive Services Task Force also recommends a team-based care approach to improving blood pressure control.59 The intervention is a health systems-level, organizational approach that incorporates a multidisciplinary team to improve the quality of hypertension care for patients. Each team includes the patient, the patient’s PCP, and other professionals such as nurses, pharmacists, dieticians, social workers, and community health workers. Team beneficiaries provide support and share the responsibilities of the hypertension care to complement the activities of the PCP. The responsibilities include medication management, patient follow-up, and adherence and self-management support. The recommendation is based on strong evidence of effectiveness in improving the proportion of patients with controlled blood pressure in reducing systolic and diastolic blood pressure. Additionally, the evidence indicates that team-based care is cost effective.
59 Community Preventive Services Task Force. Cardiovascular Disease Prevention and Control: Team-Based Care to Improve
Blood Pressure Control. Available at: http://www.thecommunityguide.org/cvd/teambasedcare.html. Accessed on July 9, 2015.
FULL-SCOPE MANAGED CARE HEALTH PLANS’ PERFORMANCE MEASURE RESULTS
2015 HEDIS Aggregate Report Page 115 California Department of Health Care Services Health Services Advisory Group, Inc.
Immunizations for Adolescents—Combination 1
Measure Definition
The Immunizations for Adolescents—Combination 1 measure assesses the percentage of adolescents 13 years of age who had one dose of meningococcal vaccine and one tetanus, diphtheria toxoids and acellular pertussis vaccine (Tdap) or one tetanus, diphtheria toxoids vaccine (Td) by their 13th birthday. The measure calculates a rate for each vaccine and one combination rate.
Importance
As children grow into adolescents, they will need to update the vaccinations they received as children with booster shots and receive new vaccines targeted specifically to adolescents. By not continuing with recommended vaccinations, adolescents have the potential to cause outbreaks of preventable diseases and establish reservoirs of disease in adolescents that can affect other populations, including infants, the elderly, and individuals with chronic conditions. In 2012, a pertussis outbreak resulted in 32,000 cases and 16 deaths nationwide.60 The CDC indicated that in 2012, adolescents ages 13–15 years old received the meningococcal and Tdap vaccine at a rate of 73.8 percent and 85.3 percent, respectively.61 Although progress has been made, many adolescents still lack the life-saving coverage vaccines provide.
This measure follows the CDC and Advisory Committee on Immunization Practices guidelines for immunizations.
60 National Committee for Quality Assurance. The State of Health Care Quality 2013. Washington, D.C: NCQA 2013. 61 Centers for Disease Control and Prevention. National and State Vaccination Coverage Among Adolescents Aged 13–17
Years—United States, 2012. Available at: http://www.cdc.gov/mmwr/preview/mmwrhtml/mm6234a1.htm. Accessed on: July 10, 2015.

FULL-SCOPE MANAGED CARE HEALTH PLANS’ PERFORMANCE MEASURE RESULTS
2015 HEDIS Aggregate Report Page 116 California Department of Health Care Services Health Services Advisory Group, Inc.
Performance Results—Immunizations for Adolescents—Combination 1
62.99%
72.66%74.44%
73.51%
30%
40%
50%
60%
70%
80%
90%
HEDIS 2012 HEDIS 2013 HEDIS 2014 HEDIS 2015
National Medicaid 25th Percentile (MPL) National Medicaid 90th Percentile (HPL) Medi-Cal Managed Care Weighted AverageNational Medicaid Average National Commercial Average MCP County Rates
Note:♦ The percentages displayed on this chart represent the Medi-Cal Weighted Average for each year displayed.♦ Not all MCP counties that contributed to the previous years' Medi-Cal Weighted Averages are shown.♦ Only MCP counties that reported data for HEDIS 2015 are shown and these MCP counties may not have reported data in prior years.
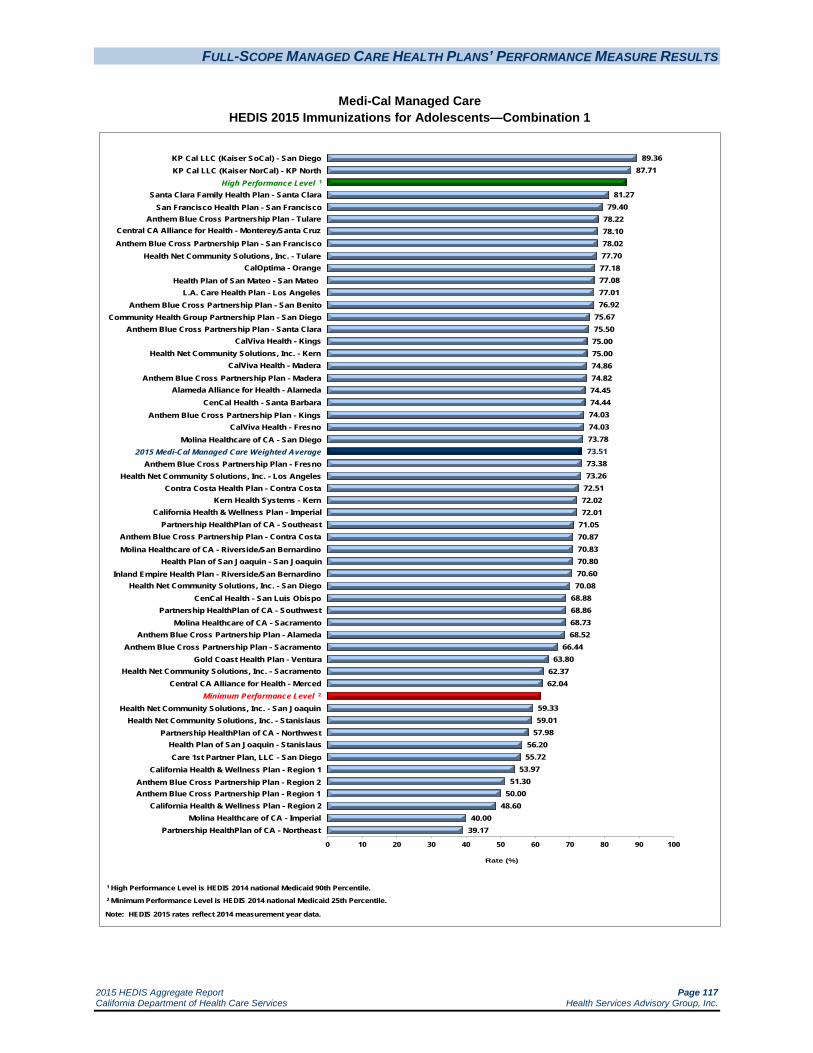
FULL-SCOPE MANAGED CARE HEALTH PLANS’ PERFORMANCE MEASURE RESULTS
2015 HEDIS Aggregate Report Page 117 California Department of Health Care Services Health Services Advisory Group, Inc.
Medi-Cal Managed Care HEDIS 2015 Immunizations for Adolescents—Combination 1
89.3687.71
81.2779.40
78.2278.1078.0277.7077.1877.0877.0176.92
75.6775.5075.0075.0074.8674.8274.4574.4474.0374.0373.7873.5173.3873.26
72.5172.0272.01
71.0570.8770.8370.8070.6070.08
68.8868.8668.7368.52
66.4463.80
62.3762.04
59.3359.01
57.9856.2055.72
53.9751.30
50.0048.60
40.0039.17
0 10 20 30 40 50 60 70 80 90 100
Rate (%)
KP Cal LLC (Kaiser SoCal) - San Diego KP Cal LLC (Kaiser NorCal) - KP North
High Performance Level 1
Santa Clara Family Health Plan - Santa Clara San Francisco Health Plan - San Francisco
Anthem Blue Cross Partnership Plan - Tulare Central CA Alliance for Health - Monterey/Santa Cruz
Anthem Blue Cross Partnership Plan - San Francisco
1 High Performance Level is HEDIS 2014 national Medicaid 90th Percentile.2 Minimum Performance Level is HEDIS 2014 national Medicaid 25th Percentile.
Note: HEDIS 2015 rates reflect 2014 measurement year data.
Health Net Community Solutions, Inc. - Tulare CalOptima - Orange
Health Plan of San Mateo - San Mateo L.A. Care Health Plan - Los Angeles
Anthem Blue Cross Partnership Plan - San Benito Community Health Group Partnership Plan - San Diego
Anthem Blue Cross Partnership Plan - Santa Clara CalViva Health - Kings
Health Net Community Solutions, Inc. - Kern CalViva Health - Madera
Anthem Blue Cross Partnership Plan - Madera
CenCal Health - Santa Barbara Anthem Blue Cross Partnership Plan - Kings
CalViva Health - Fresno Molina Healthcare of CA - San Diego
2015 Medi-Cal Managed Care Weighted Average Anthem Blue Cross Partnership Plan - Fresno
Health Net Community Solutions, Inc. - Los Angeles Contra Costa Health Plan - Contra Costa
Kern Health Systems - Kern
Alameda Alliance for Health - Alameda
California Health & Wellness Plan - Imperial Partnership HealthPlan of CA - Southeast
Anthem Blue Cross Partnership Plan - Contra Costa Molina Healthcare of CA - Riverside/San Bernardino
Health Plan of San Joaquin - San Joaquin Inland Empire Health Plan - Riverside/San Bernardino
Health Net Community Solutions, Inc. - San Diego CenCal Health - San Luis Obispo
Partnership HealthPlan of CA - Southwest Molina Healthcare of CA - Sacramento
Anthem Blue Cross Partnership Plan - Alameda Anthem Blue Cross Partnership Plan - Sacramento
Gold Coast Health Plan - Ventura Health Net Community Solutions, Inc. - Sacramento
Central CA Alliance for Health - Merced Minimum Performance Level 2
Health Net Community Solutions, Inc. - San Joaquin Health Net Community Solutions, Inc. - Stanislaus
Partnership HealthPlan of CA - Northwest Health Plan of San Joaquin - Stanislaus Care 1st Partner Plan, LLC - San Diego
California Health & Wellness Plan - Region 1 Anthem Blue Cross Partnership Plan - Region 2 Anthem Blue Cross Partnership Plan - Region 1
California Health & Wellness Plan - Region 2 Molina Healthcare of CA - Imperial
Partnership HealthPlan of CA - Northeast

FULL-SCOPE MANAGED CARE HEALTH PLANS’ PERFORMANCE MEASURE RESULTS
2015 HEDIS Aggregate Report Page 118 California Department of Health Care Services Health Services Advisory Group, Inc.
Summary of Results—Immunizations for Adolescents—Combination 1
For the fourth consecutive year, the MCMC weighted average for the Immunizations for Adolescents—Combination 1 measure was above the national Medicaid 25th percentile (MPL) and national Medicaid and commercial averages for the measure. The rate remained below the national Medicaid 90th percentile (HPL).
High and Low Performers
The rates for Kaiser NorCal—KP North and Kaiser SoCal—San Diego County were above the HPL. The rates for the following MCP counties/regions improved significantly from RY 2014 to RY 2015:
Kaiser SoCal—San Diego County
Partnership HealthPlan of California—Southeast
Santa Clara Family Health Plan—Santa Clara County
The rates for 11 MCP counties/regions were below the MPL. The rates for the following MCP counties/regions are included in the 11 rates below the MPL; however, RY 2015 was the first year the MCP counties/regions reported rates for this measure and DHCS therefore did not hold the MCPs accountable to meet the MPL (i.e., the MCPs were not required to submit an improvement plan if their rates for the measure were below the MPL):
Anthem Blue Cross Partnership Plan—Region 1 and Region 2
California Health & Wellness Plan—Region 1 and Region 2
Molina Healthcare of California Partner Plan, Inc.—Imperial County
Partnership HealthPlan of California—Northeast and Northwest
The rates for the following counties declined significantly from RY 2014 to RY 2015:
CalOptima—Orange County
Care1st Partner Plan—San Diego County, resulting in the rate moving from above the MPL in RY 2014 to below the MPL in RY 2015
Kern Health Systems—Kern County
Molina Healthcare of California Partner Plan, Inc.—San Diego County
Additionally, the rate for Health Plan of San Joaquin—Stanislaus County declined from RY 2014 to RY 2015, and although the decline was not statistically significant, the change resulted in the rate moving from above the MPL in RY 2014 to below the MPL in RY 2015.

FULL-SCOPE MANAGED CARE HEALTH PLANS’ PERFORMANCE MEASURE RESULTS
2015 HEDIS Aggregate Report Page 119 California Department of Health Care Services Health Services Advisory Group, Inc.
Best and Emerging Practices—Immunizations for Adolescents—Combination 1
As indicated in the Childhood Immunization Status—Combination 3 section, the following types of interventions and strategies recommended by the Community Preventive Services Task Force have been shown to increase the vaccination rates among a wide range of the population:62
Home visits
Reducing client out-of-pocket costs
Vaccination programs in schools and child care centers
Vaccination programs in the WIC Program
Beneficiary incentives
Beneficiary reminder systems
Community-based interventions
Vaccination requirements for child care and schools
Immunization information systems
Provider assessment and feedback
Provider reminders
Standing orders
The American Academy of Pediatrics recommends the following strategies for pediatricians for increasing adolescent immunization rates:63
Implementing patient reminder-recall systems.
Implementing provider prompts through electronic health records or notes in charts or standing orders for immunizations.
Making strong recommendations to parents for all vaccines on the schedule rather than just mentioning that the vaccines are available.
Including all recommended vaccinations at every visit.
Developing a process to assess the immunization rate for the provider practice and compare the rate to national, state, or local data from the National Immunization Survey.
Identifying an immunization champion in the provider practice who can serve as a steward and advocate of immunizations in the practice.
62 The Community Guide: Increasing Appropriate Vaccination. Available at
http://www.thecommunityguide.org/vaccines/index.html Accessed on: July 10, 2015. 63 American Academy of Pediatrics. AAP Immunization Resources, Adolescent Immunizations: Strategies for Increasing Coverage
Rates. Available at: AAP Immunization Resources/Adolescent Immunizations/Strategies for Increasing Coverage Rates. Accessed on: July 10, 2015.

FULL-SCOPE MANAGED CARE HEALTH PLANS’ PERFORMANCE MEASURE RESULTS
2015 HEDIS Aggregate Report Page 120 California Department of Health Care Services Health Services Advisory Group, Inc.
Educating patients and their parents about each recommended vaccine and the disease it prevents.
Discussing the costs associated with the recommended vaccines and providing information about payment options, if needed.
Holding vaccine clinics at hours that are convenient for families (i.e., evenings or Saturdays.)
FULL-SCOPE MANAGED CARE HEALTH PLANS’ PERFORMANCE MEASURE RESULTS
2015 HEDIS Aggregate Report Page 121 California Department of Health Care Services Health Services Advisory Group, Inc.
Medication Management for People with Asthma
Measure Definition
The Medication Management for People with Asthma measure is used to assess the percentage of members 5 to 64 years of age during the measurement year who were identified as having persistent asthma and who were dispensed appropriate medications that they remained on during the treatment period. Two rates are reported:
The percentage of members who remained on an asthma controller medication for at least 50 percent of their treatment period.
The percentage of members who remained on an asthma controller medication for at least 75 percent of their treatment period.
Importance
Effective asthma management depends not only on the availability of prescribed medications, but also on their acceptance and regular use by patients. Current adherence rates to controller medications are extremely low. Only a third (33.5 percent) of patients who require a prescription for inhaled corticosteroids have such a prescription, and only a minority of patients use their preventive medication as directed. 64 According to NCQA, 70 percent of adults and children who display asthma symptoms are considered "not well controlled" or "very poorly controlled" as defined by clinical practice guidelines.65
The United States spends approximately $56 billion per year in direct and indirect medical costs due to asthma-related illness, and approximately 80 percent of this amount is spent on hospitalizations and emergency department visits.66 Appropriate medication adherence can decrease the severity of many asthma-related symptoms. Medication management is used to prevent and control asthma symptoms, improve quality of life, reduce the frequency and severity of asthma exacerbations, and reverse airflow obstruction.
64 Centers for Disease Control and Prevention, National Center for Health Statistics. Vital Signs: Asthma
Prevalence, Disease Characteristics, and Self-Management Education – United States, 2001–2009. 2011. 65 National Committee for Quality Assurance. The State of Health Care Quality 2013. Washington, D.C:
NCQA. 2013. 66 Ibid.

FULL-SCOPE MANAGED CARE HEALTH PLANS’ PERFORMANCE MEASURE RESULTS
2015 HEDIS Aggregate Report Page 122 California Department of Health Care Services Health Services Advisory Group, Inc.
Performance Results—Medication Management for People with Asthma—Medication Compliance 50% (Total)
58.85% 53.48%
49.08%
20%
30%
40%
50%
60%
70%
80%
90%
HEDIS 2013 HEDIS 2014 HEDIS 2015
National Medicaid 25th Percentile (MPL) National Medicaid 90th Percentile (HPL) Medi-Cal Managed Care Weighted AverageNational Medicaid Average National Commercial Average MCP County Rates
Note:♦ The percentages displayed on this chart represent the Medi-Cal Weighted Average for each year displayed.♦ Not all MCP counties that contributed to the previous years' Medi-Cal Weighted Averages are shown.♦ Only MCP counties that reported data for HEDIS 2015 are shown and these MCP counties may not have reported data in prior years.

FULL-SCOPE MANAGED CARE HEALTH PLANS’ PERFORMANCE MEASURE RESULTS
2015 HEDIS Aggregate Report Page 123 California Department of Health Care Services Health Services Advisory Group, Inc.
Medi-Cal Managed Care HEDIS 2015 Medication Management for People with Asthma—Medication Compliance 50% (Total)
73.9368.90
59.9459.3959.1058.96
56.9556.63
55.9755.69
54.4954.4454.16
53.5052.5552.1251.6851.3851.0150.7650.53
49.7849.08
47.0947.0046.7346.69
45.3645.2645.1044.7144.5844.4444.21
43.4343.13
42.2542.07
41.0441.0140.38
38.3038.30
35.20NA NA NA NA NA NA NA NA NA NA
0 10 20 30 40 50 60 70 80 90 100
Rate (%)
KP Cal LLC (Kaiser SoCal) - San Diego KP Cal LLC (Kaiser NorCal) - KP North
High Performance Level 1
Santa Clara Family Health Plan - Santa Clara Partnership HealthPlan of CA - Southwest
Contra Costa Health Plan - Contra Costa Partnership HealthPlan of CA - Southeast
Anthem Blue Cross Partnership Plan - San Francisco
1 High Performance Level is HEDIS 2014 national Medicaid 90th Percentile.2 Minimum Performance Level is HEDIS 2014 national Medicaid 25th Percentile.
NA = A Not Applicable audit finding because the MCP’s denominator was too small (i.e., less than 30).
Note: HEDIS 2015 rates reflect 2014 measurement year data.
CalViva Health - Kings Health Net Community Solutions, Inc. - Sacramento
San Francisco Health Plan - San Francisco Central CA Alliance for Health - Monterey/Santa Cruz
Health Net Community Solutions, Inc. - San Diego Gold Coast Health Plan - Ventura
Anthem Blue Cross Partnership Plan - Santa Clara CalOptima - Orange
Inland Empire Health Plan - Riverside/San Bernardino Health Net Community Solutions, Inc. - Stanislaus
Anthem Blue Cross Partnership Plan - Contra Costa
Health Net Community Solutions, Inc. - Kern Central CA Alliance for Health - Merced Health Plan of San Joaquin - Stanislaus
2015 Medi-Cal Managed Care Weighted Average Minimum Performance Level 2
Health Plan of San Mateo - San Mateo Community Health Group Partnership Plan - San Diego
Molina Healthcare of CA - San Diego L.A. Care Health Plan - Los Angeles
Health Net Community Solutions, Inc. - Los Angeles
Anthem Blue Cross Partnership Plan - Alameda CenCal Health - Santa Barbara
Alameda Alliance for Health - Alameda Molina Healthcare of CA - Riverside/San Bernardino
Kern Health Systems - Kern Anthem Blue Cross Partnership Plan - Madera
Anthem Blue Cross Partnership Plan - Tulare Molina Healthcare of CA - Sacramento
Health Net Community Solutions, Inc. - Tulare Anthem Blue Cross Partnership Plan - Sacramento
Care 1st Partner Plan, LLC - San Diego CenCal Health - San Luis Obispo
CalViva Health - Madera Health Plan of San Joaquin - San Joaquin
Anthem Blue Cross Partnership Plan - Kings CalViva Health - Fresno
Anthem Blue Cross Partnership Plan - Fresno Anthem Blue Cross Partnership Plan - Region 1 Anthem Blue Cross Partnership Plan - Region 2
Anthem Blue Cross Partnership Plan - San Benito California Health & Wellness Plan - Imperial
California Health & Wellness Plan - Region 1 California Health & Wellness Plan - Region 2
Health Net Community Solutions, Inc. - San Joaquin Molina Healthcare of CA - Imperial
Partnership HealthPlan of CA - Northeast Partnership HealthPlan of CA - Northwest
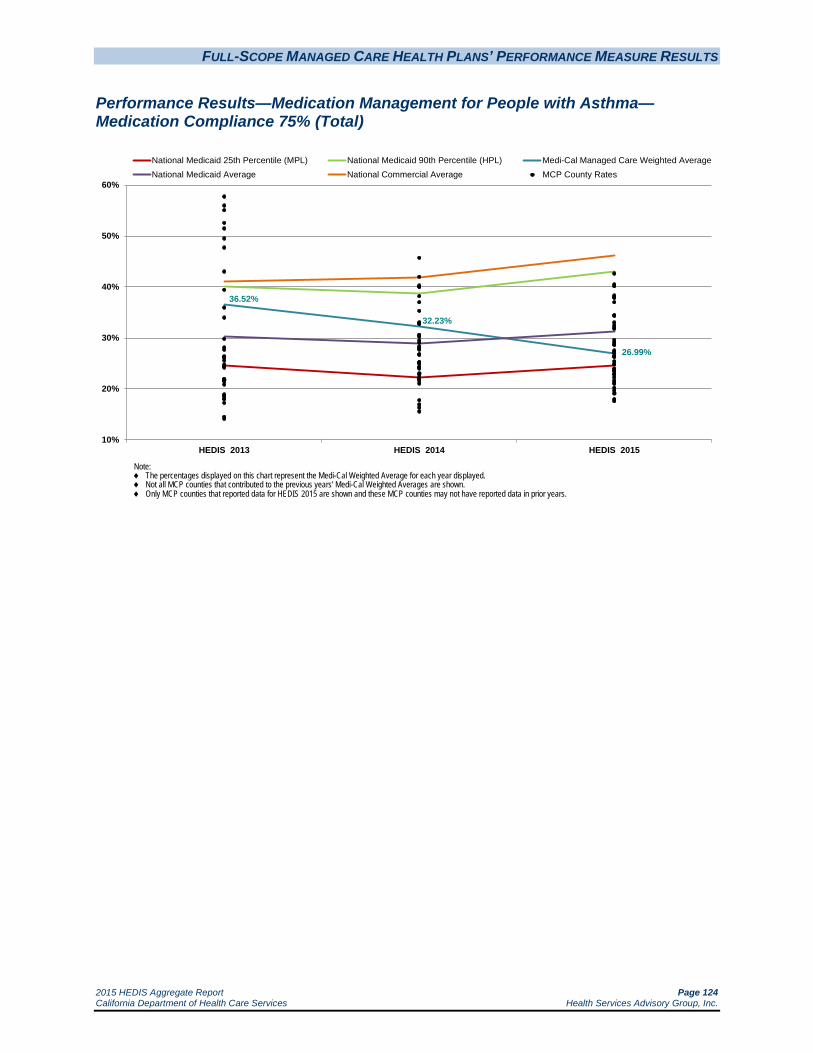
FULL-SCOPE MANAGED CARE HEALTH PLANS’ PERFORMANCE MEASURE RESULTS
2015 HEDIS Aggregate Report Page 124 California Department of Health Care Services Health Services Advisory Group, Inc.
Performance Results—Medication Management for People with Asthma—Medication Compliance 75% (Total)
36.52%
32.23%
26.99%
10%
20%
30%
40%
50%
60%
HEDIS 2013 HEDIS 2014 HEDIS 2015
National Medicaid 25th Percentile (MPL) National Medicaid 90th Percentile (HPL) Medi-Cal Managed Care Weighted AverageNational Medicaid Average National Commercial Average MCP County Rates
Note:♦ The percentages displayed on this chart represent the Medi-Cal Weighted Average for each year displayed.♦ Not all MCP counties that contributed to the previous years' Medi-Cal Weighted Averages are shown.♦ Only MCP counties that reported data for HEDIS 2015 are shown and these MCP counties may not have reported data in prior years.

FULL-SCOPE MANAGED CARE HEALTH PLANS’ PERFORMANCE MEASURE RESULTS
2015 HEDIS Aggregate Report Page 125 California Department of Health Care Services Health Services Advisory Group, Inc.
Medi-Cal Managed Care HEDIS 2015 Medication Management for People with Asthma—Medication Compliance 75% (Total)
42.6440.4840.13
38.2737.9437.92
37.0134.4434.36
33.0232.4331.9631.79
29.5929.1928.7328.62
27.5327.1827.1326.9926.9826.4226.3826.26
25.4024.8524.83
23.9823.8723.6823.6123.4322.9022.8222.2721.6321.2720.98
20.2119.7019.12
17.9817.59
NA NA NA NA NA NA NA NA NA NA
0 10 20 30 40 50 60 70 80 90 100
Rate (%)
High Performance Level 1
KP Cal LLC (Kaiser SoCal) - San Diego KP Cal LLC (Kaiser NorCal) - KP North
Partnership HealthPlan of CA - Southeast Anthem Blue Cross Partnership Plan - Santa Clara
Partnership HealthPlan of CA - Southwest Contra Costa Health Plan - Contra Costa
Santa Clara Family Health Plan - Santa Clara
1 High Performance Level is HEDIS 2014 national Medicaid 90th Percentile.2 Minimum Performance Level is HEDIS 2014 national Medicaid 25th Percentile.
NA = A Not Applicable audit finding because the MCP’s denominator was too small (i.e., less than 30).
Note: HEDIS 2015 rates reflect 2014 measurement year data.
Anthem Blue Cross Partnership Plan - San Francisco Health Net Community Solutions, Inc. - San Diego
Health Net Community Solutions, Inc. - Stanislaus San Francisco Health Plan - San Francisco
Health Net Community Solutions, Inc. - Sacramento Gold Coast Health Plan - Ventura
CalViva Health - Kings Health Net Community Solutions, Inc. - Los Angeles Anthem Blue Cross Partnership Plan - Contra Costa
CalOptima - Orange Central CA Alliance for Health - Monterey/Santa Cruz
Alameda Alliance for Health - Alameda 2015 Medi-Cal Managed Care Weighted Average
Central CA Alliance for Health - Merced Molina Healthcare of CA - San Diego
Health Plan of San Mateo - San Mateo Community Health Group Partnership Plan - San Diego
Anthem Blue Cross Partnership Plan - Madera L.A. Care Health Plan - Los Angeles
Care 1st Partner Plan, LLC - San Diego
Inland Empire Health Plan - Riverside/San Bernardino
Minimum Performance Level 2
Anthem Blue Cross Partnership Plan - Tulare Anthem Blue Cross Partnership Plan - Alameda
Health Plan of San Joaquin - Stanislaus Anthem Blue Cross Partnership Plan - Sacramento
CenCal Health - Santa Barbara Health Net Community Solutions, Inc. - Kern
Molina Healthcare of CA - Riverside/San Bernardino Health Net Community Solutions, Inc. - Tulare
CalViva Health - Madera CenCal Health - San Luis Obispo
Kern Health Systems - Kern Anthem Blue Cross Partnership Plan - Kings
Molina Healthcare of CA - Sacramento Health Plan of San Joaquin - San Joaquin
Anthem Blue Cross Partnership Plan - Fresno CalViva Health - Fresno
Anthem Blue Cross Partnership Plan - Region 1 Anthem Blue Cross Partnership Plan - Region 2
Anthem Blue Cross Partnership Plan - San Benito California Health & Wellness Plan - Imperial
California Health & Wellness Plan - Region 1 California Health & Wellness Plan - Region 2
Health Net Community Solutions, Inc. - San Joaquin Molina Healthcare of CA - Imperial
Partnership HealthPlan of CA - Northeast Partnership HealthPlan of CA - Northwest

FULL-SCOPE MANAGED CARE HEALTH PLANS’ PERFORMANCE MEASURE RESULTS
2015 HEDIS Aggregate Report Page 126 California Department of Health Care Services Health Services Advisory Group, Inc.
Summary of Results—Medication Management for People with Asthma
The MCMC weighted averages for the Medication Compliance 50% (Total) and Medication Compliance 75% (Total) measures declined significantly from RY 2014 to RY 2015. Despite the decline, the rates remained above the national Medicaid 25th percentiles (MPLs) for the measures; however, the decline resulted in the rates moving from above the Medicaid averages for the measures in RY 2014 to below the national Medicaid averages in RY 2015. For the third consecutive year, both rates were below the national Medicaid 90th percentiles (HPLs) and national commercial averages for the measures.
High and Low Performers
Medication Compliance 50% (Total)
The rates for Kaiser NorCal—KP North and Kaiser SoCal—San Diego County were above the HPL. The rates for the following MCP counties improved significantly from RY 2014 to RY 2015:
Alameda Alliance for Health—Alameda County; however, the rate remained below the MPL for the third consecutive year
Anthem Blue Cross Partnership Plan—Contra Costa County, Madera County, San Francisco County, and Santa Clara County, resulting in the rates for Contra Costa County, San Francisco County, and Santa Clara County moving from below the MPL in RY 2014 to above the MPL in RY 2015. The rate for Madera County remained below the MPL.
Contra Costa Health Plan—Contra Costa County, resulting in the rate moving from below the MPL in RY 2014 to above the MPL in RY 2015
Kaiser SoCal—San Diego County
The rates for 21 MCP counties were below the MPL in RY 2015 compared to 15 in RY 2014, and the rates for the following MCP counties declined significantly from RY 2014 to RY 2015:
Anthem Blue Cross Partnership Plan—Sacramento County, resulting in the rate moving from above the MPL in RY 2014 to below the MPL in RY 2015
CalViva Health—Fresno County
Care1st Partner Plan—San Diego County, resulting in the rate moving from above the MPL in RY 2014 to below the MPL in RY 2015
Health Net Community Solutions, Inc.—Los Angeles County and Tulare County, resulting in the rate for Tulare County moving from above the MPL in RY 2014 to below the MPL in RY 2015
Kern Health Systems—Kern County, resulting in the rate moving from above the MPL in RY 2014 to below the MPL in RY 2015
FULL-SCOPE MANAGED CARE HEALTH PLANS’ PERFORMANCE MEASURE RESULTS
2015 HEDIS Aggregate Report Page 127 California Department of Health Care Services Health Services Advisory Group, Inc.
L.A. Care Health Plan—Los Angeles County, resulting in the rate moving from above the HPL in RY 2014 to below the MPL in RY 2015
Additionally, the rates for the following MCPs declined from RY 2014 to RY 2015, and although the decline was not statistically significant, the change resulted in the rates moving from above the MPL in RY 2014 to below the MPL in RY 2015:
CenCal Health—San Luis Obispo County and Santa Barbara County
Community Health Group Partnership Plan—San Diego County
Health Plan of San Mateo—San Mateo County
Molina Healthcare of California Partner Plan, Inc.—Sacramento County and San Diego County
The rates for the following MCPs were below the MPL for the third consecutive year:
Alameda Alliance for Health—Alameda County
Anthem Blue Cross Partnership Plan—Alameda County, Fresno County, and Tulare County
Health Plan of San Joaquin—San Joaquin County
Molina Healthcare of California Partner Plan, Inc.—Riverside/San Bernardino counties
Ten MCP counties/regions had an audit result of “NA” for this measure, meaning that although the MCPs complied with all applicable specifications, they had a denominator less than 30 for the measure, resulting in the “NA” audit result.
Medication Compliance 75% (Total)
The rates for the following MCP counties improved significantly from RY 2014 to RY 2015:
Alameda Alliance for Health—Alameda County, resulting in the rate moving from below the MPL in RY 2014 to above the MPL in RY 2015
Anthem Blue Cross Partnership Plan—Santa Clara County
Contra Costa Health Plan—Contra Costa County
Kaiser SoCal—San Diego County
The rates for Anthem Blue Cross Partnership Plan—Contra Costa County and Madera County improved from RY 2014 to RY 2015, and although the improvement was not statistically significant, the change resulted in the rates moving from below the MPL in RY 2014 to above the MPL in RY 2015.

FULL-SCOPE MANAGED CARE HEALTH PLANS’ PERFORMANCE MEASURE RESULTS
2015 HEDIS Aggregate Report Page 128 California Department of Health Care Services Health Services Advisory Group, Inc.
The rates for 16 MCP counties were below the MPL in RY 2015 compared to eight in RY 2014. The rates for 11 MCP counties declined significantly, resulting in the rates for the following counties moving from above the MPL in RY 2014 to below the MPL in RY 2015:
Anthem Blue Cross Partnership Plan—Sacramento County
CalViva Health—Fresno County
Health Net Community Solutions, Inc.—Kern County and Tulare County
Health Plan of San Joaquin—San Joaquin County
The rates for the following MCP counties also declined from RY 2014 to RY 2015, and although the decline was not statistically significant, the change resulted in the rates moving from above the MPL in RY 2014 to below the MPL in RY 2015:
CalViva Health—Madera County
CenCal Health—San Luis Obispo County and Santa Barbara County
Kern Health Systems—Kern County
Molina Healthcare of California Partner Plan, Inc.—Riverside/San Bernardino counties and Sacramento County
The rates for Anthem Blue Cross Partnership Plan—Alameda County, Fresno County, and Tulare County were below the MPL for the third consecutive year.
Ten MCP counties/regions had an audit result of “NA” for this measure, meaning that although the MCPs complied with all applicable specifications, they had a denominator less than 30 for the measure, resulting in the “NA” audit result.
Best and Emerging Practices—Medication Management for People with Asthma
MHPA’s Childhood Asthma Care Best Practices Compendium provides examples of initiatives being implemented by health plans to improve the care being provided to beneficiaries with asthma. Following are examples of two initiatives targeting beneficiaries with asthma that include efforts to increase appropriate treatment for asthma and improve adherence to asthma medication.67
67 Medicaid Health Plans of America: Centers for Best Practices. Childhood Asthma Care Best Practices Compendium. 2011.
Available at: http://www.mhpa.org/_upload/Asthma%20CompendiumFINAL.pdf. Accessed on: July 10, 2015.

FULL-SCOPE MANAGED CARE HEALTH PLANS’ PERFORMANCE MEASURE RESULTS
2015 HEDIS Aggregate Report Page 129 California Department of Health Care Services Health Services Advisory Group, Inc.
HealthCare USA, a Coventry Health Care Plan
HealthCare USA implemented a patient-centered asthma disease management program in Missouri for adults and pediatric beneficiaries with asthma to reduce asthma-related morbidity and negative lifestyle impact. The program includes multiple initiatives, including:
Early identification of and outreach to beneficiaries with asthma.
Education on environmental triggers.
Efforts to reduce emergency room visits.
Review of medication refill history.
Beneficiary and provider incentive programs.
From June 2007 to August 2010, the health plan saw an increase in adherence to asthma medications—from a baseline of 17 percent to 30 percent. As a result of the improved medication adherence, asthma-related emergency room visit rates were lower for beneficiaries enrolled in the disease management program when compared to beneficiaries not enrolled in the program.
WellCare
In 2010, WellCare Health Plans, Inc., developed initiatives for its health plans, providers, and beneficiaries to enhance the overall quality and effectiveness of asthma care. One aspect of the initiative in Georgia was to target and reduce disparities in access to care, which were resulting in higher use of emergency department visits by non-Hispanic Blacks than by other beneficiaries. The initiative involved redesigning beneficiary fulfillment materials and educational mailings with culturally appropriate messaging. Additionally, the case management nurses, who managed Georgia’s beneficiaries, were given priority for cultural competency training.
WellCare’s pharmacy department developed a pilot program to notify PCPs of gaps in asthma care. Pharmacy claims for excessive use of short-acting beta-agonist rescue inhalers are identified and alert letters are sent to the prescribing providers. The letters include beneficiary-specific claims information along with a recommendation to add maintenance inhaled corticosteroid therapy, increase the dose of inhaled corticosteroids, or add a long-acting beta-agonist, as appropriate, for better symptomatic control.
WellCare’s member initiative focuses on improving care coordination and community outreach to high-risk beneficiaries with asthma. The outreach focuses on beneficiaries with increased emergency department visits, overutilization of short-acting rescue medications, or documented noncompliance or missing claims data for inhaled corticosteroids for persistent asthma. The community outreach initiative includes telephonic assessments and education, home visits with environmental survey, and care coordination to support appointment scheduling and reminders.

FULL-SCOPE MANAGED CARE HEALTH PLANS’ PERFORMANCE MEASURE RESULTS
2015 HEDIS Aggregate Report Page 130 California Department of Health Care Services Health Services Advisory Group, Inc.
The pharmacy-driven provider notification pilot program resulted in 99 of 648 Medicaid beneficiaries who had overutilized short-acting beta-agonists being prescribed maintenance inhaled corticosteroids. Additionally, the initiative resulted in a 46.4 percent decrease in use of short-acting medications for 262 of 565 Medicaid beneficiaries who were previously on an inhaled corticosteroid and had also overutilized a short-acting beta-agonist.

FULL-SCOPE MANAGED CARE HEALTH PLANS’ PERFORMANCE MEASURE RESULTS
2015 HEDIS Aggregate Report Page 131 California Department of Health Care Services Health Services Advisory Group, Inc.
Prenatal and Postpartum Care—Postpartum Care
Measure Definition
The Prenatal and Postpartum Care—Postpartum Care measure reports the percentage of women who delivered a live birth who completed a postpartum visit on or between 21 days and 56 days after delivery.
Importance
Postpartum care is an important determinant of quality health care outcomes for women giving birth. Since medical complications can occur after a woman has given birth, postpartum visits can address any adverse effects that giving birth had on a woman’s body, such as persistent bleeding, inadequate iron levels, elevated blood pressure, pain, emotional changes, and infections. For example, heavy bleeding can be an indicator of a retained placenta, uterine atony, lacerations, hematoma, or coagulation disorders. However, socioeconomic factors that present barriers to consistent care are common in the Medicaid population. In 2010, almost 81 percent of beneficiaries enrolled in commercial health plans received timely postpartum care; however, only 64 percent of Medicaid beneficiaries received timely postpartum care.68
Postpartum depression is one of the most prevalent complications that can occur after delivery. Approximately 85 percent of women experience some form of mood changes during the postpartum phase. An estimated 10 to 15 percent of these women suffer from a more persistent form of depression, while 0.1 to 0.2 percent of women have postpartum psychosis. Untreated postpartum depression can lead to long-term effects on the mother-child relationship and the child’s development and behavior.69 Receiving appropriate postpartum care can address these emotional issues.
In addition to emotional issues, there are physical issues associated with pregnancy that should be closely monitored during the postpartum period. The most common issues include postpartum infections in the uterus, bladder, or kidney; excessive bleeding; perineal area pain; vaginal discharge; breast pain including swollen breasts, infection, and clogged ducts; hemorrhoids, constipation; and hair loss.70 Women can be treated for these issues during the postpartum period. Postpartum visits also provide an opportunity for women to be instructed on certain health care guidelines, such as contraceptive use.
68 Women’s Health USA 2012. Quality of Women’s Health Care. Available at
http://www.mchb.hrsa.gov/whusa12/hsu/pages/qwhc.html. Accessed on: July 10, 2015. 69 Medscape. Postpartum Depression. Updated April 17, 2014. Available at:
http://reference.medscape.com/article/271662-overview. Accessed on July 10, 2015. 70 MedicineNet.com. Postpartum Problems. Available at
http://www.medicinenet.com/script/main/art.asp?articlekey=51744. Accessed on July 10, 2015.

FULL-SCOPE MANAGED CARE HEALTH PLANS’ PERFORMANCE MEASURE RESULTS
2015 HEDIS Aggregate Report Page 132 California Department of Health Care Services Health Services Advisory Group, Inc.
Performance Results—Prenatal and Postpartum Care—Postpartum Care
61.74%
58.61%56.99%
59.35%
20%
30%
40%
50%
60%
70%
80%
90%
HEDIS 2012 HEDIS 2013 HEDIS 2014 HEDIS 2015
National Medicaid 25th Percentile (MPL) National Medicaid 90th Percentile (HPL) Medi-Cal Managed Care Weighted AverageNational Medicaid Average National Commercial Average MCP County Rates
Note:♦ The percentages displayed on this chart represent the Medi-Cal Weighted Average for each year displayed.♦ Not all MCP counties that contributed to the previous years' Medi-Cal Weighted Averages are shown.♦ Only MCP counties that reported data for HEDIS 2015 are shown and these MCP counties may not have reported data in prior years.

FULL-SCOPE MANAGED CARE HEALTH PLANS’ PERFORMANCE MEASURE RESULTS
2015 HEDIS Aggregate Report Page 133 California Department of Health Care Services Health Services Advisory Group, Inc.
Medi-Cal Managed Care HEDIS 2015 Prenatal and Postpartum Care—Postpartum Care
79.3174.10
73.9570.5970.07
69.1768.3767.82
67.1566.67
64.9664.1564.1263.5063.0763.0362.81
61.0761.0360.4660.1560.1059.6359.6159.3559.2658.7258.1557.9157.6657.3757.1857.0456.8456.7456.25
55.4755.37
54.2053.2852.8252.8052.59
51.8951.82
50.4650.36
49.1248.15
45.4144.1243.7043.68
39.96
0 10 20 30 40 50 60 70 80 90 100
Rate (%)
KP Cal LLC (Kaiser SoCal) - San Diego CenCal Health - Santa Barbara
High Performance Level 1
KP Cal LLC (Kaiser NorCal) - KP North San Francisco Health Plan - San Francisco
Central CA Alliance for Health - Monterey/Santa Cruz Partnership HealthPlan of CA - Southeast
Partnership HealthPlan of CA - Southwest
1 High Performance Level is HEDIS 2014 national Medicaid 90th Percentile.2 Minimum Performance Level is HEDIS 2014 national Medicaid 25th Percentile.
Note: HEDIS 2015 rates reflect 2014 measurement year data.
CenCal Health - San Luis Obispo Contra Costa Health Plan - Contra Costa
CalViva Health - Madera Care 1st Partner Plan, LLC - San Diego
CalOptima - Orange Anthem Blue Cross Partnership Plan - Region 1
California Health & Wellness Plan - Region 1 Health Plan of San Mateo - San Mateo
Health Net Community Solutions, Inc. - Tulare Gold Coast Health Plan - Ventura
Santa Clara Family Health Plan - Santa Clara
CalViva Health - Fresno Health Net Community Solutions, Inc. - Kern
Kern Health Systems - Kern Anthem Blue Cross Partnership Plan - Region 2
Health Plan of San Joaquin - San Joaquin 2015 Medi-Cal Managed Care Weighted Average
Anthem Blue Cross Partnership Plan - Tulare Health Net Community Solutions, Inc. - Stanislaus
Health Net Community Solutions, Inc. - Sacramento
Inland Empire Health Plan - Riverside/San Bernardino
Central CA Alliance for Health - Merced Community Health Group Partnership Plan - San Diego
Anthem Blue Cross Partnership Plan - Madera Health Plan of San Joaquin - Stanislaus
L.A. Care Health Plan - Los Angeles Anthem Blue Cross Partnership Plan - Santa Clara
Anthem Blue Cross Partnership Plan - Fresno Anthem Blue Cross Partnership Plan - Sacramento
Minimum Performance Level 2
Alameda Alliance for Health - Alameda California Health & Wellness Plan - Imperial
Molina Healthcare of CA - San Diego California Health & Wellness Plan - Region 2
CalViva Health - Kings Partnership HealthPlan of CA - Northeast
Anthem Blue Cross Partnership Plan - San Francisco Molina Healthcare of CA - Imperial
Health Net Community Solutions, Inc. - Los Angeles Anthem Blue Cross Partnership Plan - Alameda
Partnership HealthPlan of CA - Northwest Health Net Community Solutions, Inc. - San Joaquin
Anthem Blue Cross Partnership Plan - San Benito Anthem Blue Cross Partnership Plan - Kings
Health Net Community Solutions, Inc. - San Diego Anthem Blue Cross Partnership Plan - Contra Costa Molina Healthcare of CA - Riverside/San Bernardino
Molina Healthcare of CA - Sacramento

FULL-SCOPE MANAGED CARE HEALTH PLANS’ PERFORMANCE MEASURE RESULTS
2015 HEDIS Aggregate Report Page 134 California Department of Health Care Services Health Services Advisory Group, Inc.
Summary of Results—Prenatal and Postpartum Care—Postpartum Care
The MCMC weighted average for the Prenatal and Postpartum Care—Postpartum Care measure improved from RY 2014 to RY 2015, and although the improvement was not statistically significant, the change resulted in the rate moving from below the national Medicaid 25th percentile (MPL) in RY 2014 to above the MPL in RY 2015. The rate was below the national Medicaid and commercial averages for the fifth consecutive year.
High and Low Performers
The rates for Kaiser SoCal—San Diego County and CenCal Health—Santa Barbara County were above the HPL. The rates for the following MCP counties improved significantly from RY 2014 to RY 2015:
CalViva Health—Madera County, resulting in the rate moving from below the MPL in RY 2014 to above the MPL in RY 2015
Contra Costa Health Plan—Contra Costa County
Health Net Community Solutions, Inc.—Sacramento County, resulting in the rate moving from below the MPL in RY 2014 to above the MPL in RY 2015
Kaiser SoCal—San Diego County
The rates for the following MCP counties improved from RY 2014 to RY 2015, and although the improvement was not statistically significant, the change resulted in the rates moving from below the MPL in RY 2014 to above the MPL in RY 2015:
Anthem Blue Cross Partnership Plan—Fresno County and Sacramento County
Health Net Community Solutions, Inc.—Kern County and Stanislaus County
Health Plan of San Joaquin—Stanislaus County (Note: RY 2014 was the first year Health Plan of San Joaquin reported a rate for Stanislaus County, so DHCS did not hold the MCP accountable to meet the MPL for this county in RY 2014)
L.A. Care Health Plan—Los Angeles County
The rates for 18 MCP counties/regions were below the MPL in RY 2015, which is similar to RY 2014 in which 19 rates were below the MPL. The rates for the following MCP counties/regions are included in the 18 rates below the MPL; however, RY 2015 was the first year the MCP counties/regions reported rates for this measure and DHCS therefore did not hold the MCPs accountable to meet the MPL (i.e., the MCPs were not required to submit an improvement plan if their rates for the measure were below the MPL):
Anthem Blue Cross Partnership Plan—San Benito County

FULL-SCOPE MANAGED CARE HEALTH PLANS’ PERFORMANCE MEASURE RESULTS
2015 HEDIS Aggregate Report Page 135 California Department of Health Care Services Health Services Advisory Group, Inc.
California Health & Wellness Plan—Imperial County and Region 2
Molina Healthcare of California Partner Plan, Inc.—Imperial County
Partnership HealthPlan of California—Northeast and Northwest
The rate for Molina Healthcare of California Partner Plan, Inc.—San Diego County declined significantly from RY 2014 to RY 2015, resulting in the rate moving from above the MPL in RY 2014 to below the MPL in RY 2015.
The following MCP counties had rates below the MPLs for three or more consecutive years:
Alameda Alliance for Health—Alameda County—three consecutive years
Anthem Blue Cross Partnership Plan—Alameda County (four consecutive years), Contra Costa County (five consecutive years), and Kings County (three consecutive years)
CalViva Health—Kings County—three consecutive years
Health Net Community Solutions, Inc.—Los Angeles County (five consecutive years) and San Diego County (four consecutive years)
Molina Healthcare of California Partner Plan, Inc.—Riverside/San Bernardino counties and Sacramento County(four consecutive years)
Best and Emerging Practices—Prenatal and Postpartum Care—Postpartum Care
MHPA’s Center for Best Practices provides information on best practices in the clinical and operations areas of Medicaid health plans. Following are three examples of efforts that resulted in improvements in the timeliness of postpartum care.71
CareNet Southern Health Services, Inc., a Coventry Health Care Plan
CareNet enhanced its perinatal program in 2008 to better identify at-risk mothers. The plan developed more comprehensive initiatives to improve outreach to at-risk mothers and in 2010, added a neonatal intensive care unit component and increased case management and social worker face-to-face visits to beneficiaries. The elements of the postpartum program include:
Educational mailings to beneficiaries.
Communications to providers.
Transportation services.
Home visits.
71 Medicaid Health Plans of America: Centers for Best Practices. 2012–2013 Best Practices Compendium. Available at:
https://www.mhpa.org/_upload/2012Compendium.pdf Accessed on: July 10, 2015.

FULL-SCOPE MANAGED CARE HEALTH PLANS’ PERFORMANCE MEASURE RESULTS
2015 HEDIS Aggregate Report Page 136 California Department of Health Care Services Health Services Advisory Group, Inc.
Beneficiary incentives for making and keeping the postpartum appointment.
High-risk OB case management.
Postpartum telephone calls.
Postpartum depression information and assessments.
Wraparound mental health services.
CareNet’s Postpartum Care rate improved significantly from 2009 to 2011, and the rate moved from the national Medicaid 10th percentile to the 75th percentile, which the plan attributes to the positive effects of the comprehensive perinatal program.
MDwise, Inc.
MDwise, Inc.’s Bluebelle Beginnings program aims to assist MDwise beneficiaries who are pregnant to have healthy pregnancies and, ultimately, healthy babies. The program involves multiple initiatives including Bluebelle Baby Showers, which focus on providing expectant and new moms with the information they need to provide healthier outcomes for themselves and their babies. In addition to holding the baby showers, program initiatives include:
Mailing a prenatal booklet to pregnant beneficiaries as soon as the plan becomes aware of the pregnancy through the claims process.
Distributing throughout provider offices an educational brochure highlighting the importance of prenatal care throughout a pregnancy and describing how beneficiaries may accumulate points through the MDwise Rewards program.
Shortly after sending the prenatal booklet, sending to pregnant beneficiaries a direct mail postcard highlighting prenatal care.
Once per year, mailing all pregnant beneficiaries letters containing a link to online pregnancy educational materials.
Once per year, making agentless calls to pregnant beneficiaries about the importance of prenatal doctor visits.
Case managers calling high-risk beneficiaries.
Promoting the Text4baby program on the MDwise website and in outreach and educational materials. The Text4baby program provides relevant prenatal, postpartum, and parenting information.
The direct mailings and educational materials reach more than 19,000 pregnant MDwise beneficiaries per year, and the Bluebelle Baby Showers have reached more than 1,400 pregnant women across Indiana. The program has resulted in an improvement in prenatal and postpartum care scores.
FULL-SCOPE MANAGED CARE HEALTH PLANS’ PERFORMANCE MEASURE RESULTS
2015 HEDIS Aggregate Report Page 137 California Department of Health Care Services Health Services Advisory Group, Inc.
Amerigroup Maryland
Beginning in 2010, Amerigroup Maryland made changes to its service delivery for pregnant beneficiaries with a focus on postpartum care. The initiative consisted of several interventions, including case management, prenatal assessments, mailings, outbound calls, appointment coordination, and incentives for beneficiaries and providers to schedule and keep the postpartum care appointment within 56 days following delivery. The combined interventions resulted in Amerigroup achieving a 3.9 percentage point improvement in its HEDIS postpartum visit rate from 2010 to 2012.

FULL-SCOPE MANAGED CARE HEALTH PLANS’ PERFORMANCE MEASURE RESULTS
2015 HEDIS Aggregate Report Page 138 California Department of Health Care Services Health Services Advisory Group, Inc.
Prenatal and Postpartum Care—Timeliness of Prenatal Care
Measure Definition
The Prenatal and Postpartum Care—Timeliness of Prenatal Care measure calculates the percentage of women who delivered a live birth who received a prenatal care visit as a member of the plan in the first trimester or within 42 days of enrollment in the plan.
Importance
Effective prenatal care aids in the identification of high-risk pregnancies and provides educational opportunities to prevent subsequent poor birth outcomes. According to the National Committee for Quality Assurance, the United States spent more than $26 billion on preterm births in 2011. Timely and frequent prenatal care visits allow health problems to be detected early such as preeclampsia, ectopic pregnancy, gestational diabetes, and hypertension.72 A lack of timely prenatal care may indicate weak therapeutic alliances, lack of peer support, hesitation regarding health plans, and residential instability throughout the gestational period. Studies reveal that women in the U.S. who are at risk for inadequate prenatal care are more likely to be non-Caucasian, not a high school graduate, enrolled in Medicaid, unmarried, a smoker, a drug user, and under 20 years of age.73 Socioeconomic status is a determinant of health outcomes, including poor birth outcomes.74 Socioeconomic factors that present barriers to consistent care are common in the Medicaid populations. Due to this lack of care, poor birth outcomes are particularly high among these populations.75 Studies revealed that receiving timely prenatal care is associated with the timing of Medicaid coverage.76 In 2008, only 82 percent of Medicaid beneficiaries received timely prenatal care, compared to approximately 92 percent for beneficiaries in commercial plans.77
72 National Committee for Quality Assurance. The State of Health Care Quality 2013. Washington DC: NCQA, 2013. 73 Tough, S., Siever, J., Johnson, D. “Retaining Women in a Prenatal care Randomized Controlled Trial in Canada:
Implications for Program Planning.” BMC Public Health 2007, 7: 148. 74 Zeka, Ariana, Melly, Steve, Schwartz. “The Effects of Socioeconomic Status and Indices of Physical Environment on
Reduced Birth Weight and Preterm Births in Eastern Massachusetts.” 75 Shulman, Shanna. “Poor Preventive Care Achievement and Program Retention Among Low Birth Weight Infant
Medicaid Enrollees.” Pediatrics. Nov 2006. 118(5): e1509-e1515. Available at: http://pediatrics.aappublications.org/cgi/reprint/118/5/e1509 Accessed on: July 10, 2015.
76 Gavin, N., Adams, K., Manning, W., et al. 2007 August. “The Impact of Welfare Reform on Insurance Coverage before Pregnancy and the Timing of Prenatal Care Initiation.” Health Services Research 42(4): 1564–1588.
77 National Committee for Quality Assurance. The State of Health Care Quality 2009. Washington DC: NCQA, 2009.

FULL-SCOPE MANAGED CARE HEALTH PLANS’ PERFORMANCE MEASURE RESULTS
2015 HEDIS Aggregate Report Page 139 California Department of Health Care Services Health Services Advisory Group, Inc.
Performance Results—Prenatal and Postpartum Care—Timeliness of Prenatal Care
83.77% 83.17%
81.33% 81.80%
60%
65%
70%
75%
80%
85%
90%
95%
100%
HEDIS 2012 HEDIS 2013 HEDIS 2014 HEDIS 2015
National Medicaid 25th Percentile (MPL) National Medicaid 90th Percentile (HPL) Medi-Cal Managed Care Weighted AverageNational Medicaid Average National Commercial Average MCP County Rates
Healhty People 2020 Goal: 77.90%
Note:♦ The percentages displayed on this chart represent the Medi-Cal Weighted Average for each year displayed.♦ Not all MCP counties that contributed to the previous years' Medi-Cal Weighted Averages are shown.♦ Only MCP counties that reported data for HEDIS 2015 are shown and these MCP counties may not have reported data in prior years.

FULL-SCOPE MANAGED CARE HEALTH PLANS’ PERFORMANCE MEASURE RESULTS
2015 HEDIS Aggregate Report Page 140 California Department of Health Care Services Health Services Advisory Group, Inc.
Medi-Cal Managed Care HEDIS 2015 Prenatal and Postpartum Care—Timeliness of Prenatal Care
93.2893.10
90.1288.7988.34
87.5087.10
86.3886.2286.1386.1385.8985.6885.1584.92
84.2083.7883.4583.3883.2182.9782.8782.2482.1682.0081.8081.2580.9780.78
79.8679.8179.8179.4779.0878.9578.83
77.8977.86
77.7877.0876.9876.5376.4076.22
73.9772.9972.5572.2772.1371.85
69.5468.96
66.6760.29
0 10 20 30 40 50 60 70 80 90 100
Rate (%)
KP Cal LLC (Kaiser NorCal) - KP North KP Cal LLC (Kaiser SoCal) - San Diego
High Performance Level 1
San Francisco Health Plan - San Francisco CenCal Health - San Luis Obispo
Health Net Community Solutions, Inc. - Tulare Partnership HealthPlan of CA - Southeast
CalViva Health - Madera
1 High Performance Level is HEDIS 2014 national Medicaid 90th Percentile.2 Minimum Performance Level is HEDIS 2014 national Medicaid 25th Percentile.
Note: HEDIS 2015 rates reflect 2014 measurement year data.
Inland Empire Health Plan - Riverside/San Bernardino CalViva Health - Fresno
Central CA Alliance for Health - Monterey/Santa Cruz Partnership HealthPlan of CA - Southwest
Contra Costa Health Plan - Contra Costa Gold Coast Health Plan - Ventura
Anthem Blue Cross Partnership Plan - Region 2 CenCal Health - Santa Barbara
CalOptima - Orange Health Net Community Solutions, Inc. - Stanislaus
Central CA Alliance for Health - Merced
Molina Healthcare of CA - San Diego Partnership HealthPlan of CA - Northwest
Anthem Blue Cross Partnership Plan - Region 1 Santa Clara Family Health Plan - Santa Clara
L.A. Care Health Plan - Los Angeles Health Net Community Solutions, Inc. - Sacramento
2015 Medi-Cal Managed Care Weighted Average Anthem Blue Cross Partnership Plan - Tulare
Anthem Blue Cross Partnership Plan - Santa Clara
CalViva Health - Kings
Health Plan of San Joaquin - San Joaquin Anthem Blue Cross Partnership Plan - Sacramento
Health Plan of San Joaquin - Stanislaus Kern Health Systems - Kern
Anthem Blue Cross Partnership Plan - Madera Care 1st Partner Plan, LLC - San Diego
Health Net Community Solutions, Inc. - San Joaquin Partnership HealthPlan of CA - Northeast
Health Plan of San Mateo - San Mateo Community Health Group Partnership Plan - San Diego
Minimum Performance Level 2
Anthem Blue Cross Partnership Plan - San Benito Anthem Blue Cross Partnership Plan - Alameda
Anthem Blue Cross Partnership Plan - Fresno Anthem Blue Cross Partnership Plan - Kings California Health & Wellness Plan - Region 1
Molina Healthcare of CA - Imperial Health Net Community Solutions, Inc. - Los Angeles
California Health & Wellness Plan - Region 2 California Health & Wellness Plan - Imperial
Anthem Blue Cross Partnership Plan - Contra Costa Health Net Community Solutions, Inc. - Kern
Anthem Blue Cross Partnership Plan - San Francisco Molina Healthcare of CA - Sacramento
Molina Healthcare of CA - Riverside/San Bernardino Alameda Alliance for Health - Alameda
Health Net Community Solutions, Inc. - San Diego

FULL-SCOPE MANAGED CARE HEALTH PLANS’ PERFORMANCE MEASURE RESULTS
2015 HEDIS Aggregate Report Page 141 California Department of Health Care Services Health Services Advisory Group, Inc.
Summary of Results—Prenatal and Postpartum Care—Timeliness of Prenatal Care
The MCMC weighted average for the Prenatal and Postpartum Care—Timeliness of Prenatal Care measure was above the national Medicaid 25th percentile (MPL) and Healthy People 2020 goal for the fifth consecutive year. The rate remained below the national Medicaid average. Additionally, for the fifth consecutive year, the MCMC weighted average was below the national Medicaid 90th percentile (HPL) and national commercial average.
High and Low Performers
The rates for Kaiser NorCal—KP North and Kaiser SoCal—San Diego County were above the HPL. The rates for the following MCP counties/regions improved significantly from RY 2014 to RY 2015:
Anthem Blue Cross Partnership Plan—Sacramento County, resulting in the rate moving from below the MPL in RY 2014 to above the MPL in RY 2015
CalViva Health—Madera County
Health Plan of San Joaquin—Stanislaus County, resulting in the rate moving from below the MPL in RY 2014 to above the MPL in RY 2015 (Note: RY 2014 was the first year Health Plan of San Joaquin reported a rate for Stanislaus County, so DHCS did not hold the MCP accountable to meet the MPL for this county in RY 2014)
Partnership HealthPlan of California—Southeast
The rates for the following MCP counties improved from RY 2014 to RY 2015, and although the improvement was not statistically significant, the change resulted in the rates moving from below the MPL in RY 2014 to above the MPL in RY 2015:
Anthem Blue Cross Partnership Plan—Madera County
Health Net Community Solution, Inc.—Sacramento County and San Joaquin County (Note: RY 2014 was the first year Health Net Community Solutions, Inc., reported a rate for San Joaquin County, so DHCS did not hold the MCP accountable to meet the MPL for this county in RY 2014)
The rates for 16 MCP counties/regions were below the MPL in RY 2015, which is similar to RY 2014 in which the rates for 15 MCP counties were below the MPL. The rates for the following MCP counties/regions are included in the 16 rates below the MPL; however, RY 2015 was the first year the MCP counties/regions reported rates for this measure and DHCS therefore did not hold the MCPs accountable to meet the MPL (i.e., the MCPs were not required to submit an improvement plan if their rates for the measure were below the MPL):
FULL-SCOPE MANAGED CARE HEALTH PLANS’ PERFORMANCE MEASURE RESULTS
2015 HEDIS Aggregate Report Page 142 California Department of Health Care Services Health Services Advisory Group, Inc.
Anthem Blue Cross Partnership Plan—San Benito County
California Health & Wellness Plan—Imperial County, Region 1, and Region 2
Molina Healthcare of California Partner Plan, Inc.—Imperial County
The rates for the following MCP counties declined significantly from RY 2014 to RY 2015:
Alameda Alliance for Health—Alameda County
Central California Alliance for Health—Monterey/Santa Cruz counties
The rate for Anthem Blue Cross Partnership Plan—Kings County declined from RY 2014 to RY 2015, and although the decline was not statistically significant, the change resulted in the rates moving from above the MPL in RY 2014 to below the MPL in RY 2015.
The rates for the following MCP counties were below the MPL for at least three consecutive years:
Anthem Blue Cross Partnership Plan—Alameda County and Contra Costa County (four consecutive years) and Fresno County (three consecutive years)
Health Net Community Solutions, Inc.—Kern County, Los Angeles County, and San Diego County (three consecutive years)
Molina Healthcare of California Partner Plan, Inc.—Riverside/San Bernardino counties (four consecutive years) and Sacramento County (three consecutive years)
Best and Emerging Practices—Prenatal and Postpartum Care—Timeliness of Prenatal Care
MHPA’s Center for Best Practices provides information on best practices in the clinical and operations areas of Medicaid health plans. Following are three examples of efforts that resulted in improvements in the timeliness of prenatal care. 78
AmeriHealth Mercy Health Plan and Keystone Mercy Health Plan
AmeriHealth Mercy Health Plan and Keystone Mercy Health Plan developed and implemented a pregnancy identification algorithm to facilitate early identification of pregnant beneficiaries. The early identification of pregnant beneficiaries is performed by data mining of medical, behavioral health, pharmacy claims, and Logical Observation Identifiers Names and Codes utilization; new beneficiary assessments and obstetrical needs assessment form; provider referrals; beneficiary requests; and health plan activity. The health plans prepare a weekly report to send to their
78 Medicaid Health Plans of America: Centers for Best Practices. 2012–2013 Best Practices Compendium. Available at:
https://www.mhpa.org/_upload/2012Compendium.pdf. Accessed on: July 10, 2015.
FULL-SCOPE MANAGED CARE HEALTH PLANS’ PERFORMANCE MEASURE RESULTS
2015 HEDIS Aggregate Report Page 143 California Department of Health Care Services Health Services Advisory Group, Inc.
maternity teams that identifies beneficiaries requiring outreach and follow-up. A care manager contacts the beneficiaries to enroll them in maternity care management and completes a risk assessment. Beneficiaries assessed as low-risk receive information via mail, care reminders, and on-demand access to a care manager. Beneficiaries identified as having a medium- or high-risk pregnancy are aggressively managed by the health plan, with a team of care managers and care connectors through the plans’ Integrated Care Management Program. Both health plans saw improvement in their Frequency of Ongoing Prenatal Care and Timeliness of Prenatal Care measures from 2010 to 2011, with the improvement for Keystone Mercy Health Plan’s Frequency of Ongoing Prenatal Care measure being statistically significant.
United Healthcare Community & State
As described in the Children and Adolescents’ Access to Primary Care Practitioners measure section, United Healthcare Community & State’s Baby Blocks program engages expectant and new mothers with a mobile-optimized game board that reminds them of upcoming prenatal, postpartum, and well-child appointments through 15 months of age. Also as indicated in the Children and Adolescents’ Access to Primary Care Practitioners measure section, the pilot phase showed promising results, and at the time of the report, the program had the potential to reach nearly 50,000 pregnant women.
MDwise, Inc.
As described in the Prenatal and Postpartum Care—Postpartum Care measure section of this report, MDwise, Inc.’s Bluebelle Beginnings program aims to assist MDwise beneficiaries who are pregnant to have healthy pregnancies and, ultimately, healthy babies. As indicated in the Postpartum Care measure section, in addition to improvements in the postpartum care score, the program’s efforts resulted in improvement in the prenatal care score.

FULL-SCOPE MANAGED CARE HEALTH PLANS’ PERFORMANCE MEASURE RESULTS
2015 HEDIS Aggregate Report Page 144 California Department of Health Care Services Health Services Advisory Group, Inc.
Use of Imaging Studies for Low Back Pain
Measure Definition
The Use of Imaging Studies for Low Back Pain measure assesses the percentage of members with a primary diagnosis of low back pain who did not have an imaging study (plain X-ray, magnetic resonance imaging [MRI], computed topography [CT] scan) within 28 days of the diagnosis.
Importance
Low back pain is a common and expensive cause of lost productivity and work days in the United States. According to NCQA, 75 to 85 percent of Americans will, at one point, experience back pain.79 Frequently, low back pain is also the cause for patients’ calls and visits to a primary care clinician. For most patients, acute low back pain is non-specific. A history and physical examination can provide clues to the rare but potentially serious causes of low back pain. While imaging may be appropriate for patients at risk for more serious conditions, the majority of patients experience low back pain that is non-specific and with no identifiable cause. According to the American College of Radiology, acute low back pain without complications is usually benign and self-limiting, and does not necessitate early imaging studies, such as X-rays, MRIs, or CT scans. Most patients return to their usual activities within a month.
Studies have shown that complications from unnecessary surgery potentially increase the duration of low back pain. In 2008, the Agency for Healthcare Research and Quality (AHRQ) determined 18,000 patients were treated for back pain at a cost of $35 billion.80 Furthermore, despite this evidence, imaging studies are commonly overused in the evaluation of patients with acute low back pain. Less than 1 percent of radiographs find the cause of low back pain.81 Abnormalities found when imaging patients with and without back pain had similar prevalence. Other than patient satisfaction, most patients given standard low back care experienced no difference in health outcomes compared to those given lower back radiographs.
79 National Committee for Quality Assurance. The State of Health Care Quality 2009. Washington DC: NCQA, 2013. 80 Agency for Healthcare Research and Quality. National Quality Measures Clearinghouse. Available at:
http://www.qualitymeasures.ahrq.gov/content.aspx?id=48635. Accessed on: July 10, 2015. 81 National Committee for Quality Assurance. The State of Health Care Quality 2009. Washington DC: NCQA, 2013.

FULL-SCOPE MANAGED CARE HEALTH PLANS’ PERFORMANCE MEASURE RESULTS
2015 HEDIS Aggregate Report Page 145 California Department of Health Care Services Health Services Advisory Group, Inc.
Performance Results—Use of Imaging Studies for Low Back Pain
81.03%80.84% 80.35% 79.54%
50%
55%
60%
65%
70%
75%
80%
85%
90%
95%
100%
HEDIS 2012 HEDIS 2013 HEDIS 2014 HEDIS 2015
National Medicaid 25th Percentile (MPL) National Medicaid 90th Percentile (HPL) Medi-Cal Managed Care Weighted AverageNational Medicaid Average National Commercial Average MCP County Rates
Note:♦ The percentages displayed on this chart represent the Medi-Cal Weighted Average for each year displayed.♦ Not all MCP counties that contributed to the previous years' Medi-Cal Weighted Averages are shown.♦ Only MCP counties that reported data for HEDIS 2015 are shown and these MCP counties may not have reported data in prior years.
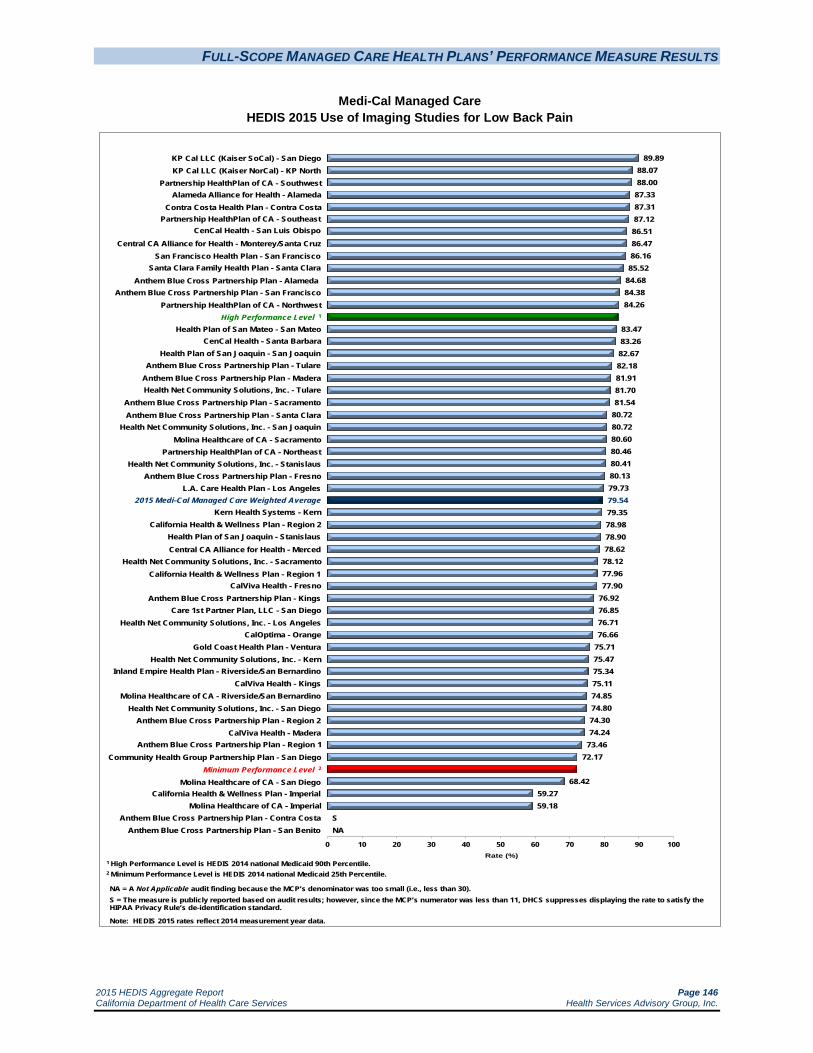
FULL-SCOPE MANAGED CARE HEALTH PLANS’ PERFORMANCE MEASURE RESULTS
2015 HEDIS Aggregate Report Page 146 California Department of Health Care Services Health Services Advisory Group, Inc.
Medi-Cal Managed Care HEDIS 2015 Use of Imaging Studies for Low Back Pain
89.8988.0788.00
87.3387.3187.1286.5186.4786.1685.52
84.6884.3884.26
83.4783.2682.6782.1881.9181.7081.54
80.7280.7280.6080.4680.4180.1379.7379.5479.3578.9878.9078.6278.1277.9677.90
76.9276.8576.7176.66
75.7175.4775.3475.1174.8574.8074.3074.24
73.4672.17
68.4259.2759.18
S NA
0 10 20 30 40 50 60 70 80 90 100Rate (%)
KP Cal LLC (Kaiser SoCal) - San Diego KP Cal LLC (Kaiser NorCal) - KP North
Partnership HealthPlan of CA - Southwest Alameda Alliance for Health - Alameda
Contra Costa Health Plan - Contra Costa Partnership HealthPlan of CA - Southeast
CenCal Health - San Luis Obispo
Central CA Alliance for Health - Monterey/Santa Cruz
1 High Performance Level is HEDIS 2014 national Medicaid 90th Percentile.2 Minimum Performance Level is HEDIS 2014 national Medicaid 25th Percentile.
NA = A Not Applicable audit finding because the MCP’s denominator was too small (i.e., less than 30).S = The measure is publicly reported based on audit results; however, since the MCP’s numerator was less than 11, DHCS suppresses displaying the rate to satisfy the HIPAA Privacy Rule’s de-identification standard.
Note: HEDIS 2015 rates reflect 2014 measurement year data.
San Francisco Health Plan - San Francisco Santa Clara Family Health Plan - Santa Clara
Anthem Blue Cross Partnership Plan - Alameda Anthem Blue Cross Partnership Plan - San Francisco
Partnership HealthPlan of CA - Northwest High Performance Level 1
Health Plan of San Mateo - San Mateo CenCal Health - Santa Barbara
Health Plan of San Joaquin - San Joaquin Anthem Blue Cross Partnership Plan - Tulare
Anthem Blue Cross Partnership Plan - Madera
Anthem Blue Cross Partnership Plan - Sacramento Anthem Blue Cross Partnership Plan - Santa Clara
Health Net Community Solutions, Inc. - San Joaquin Molina Healthcare of CA - Sacramento
Partnership HealthPlan of CA - Northeast Health Net Community Solutions, Inc. - Stanislaus
Anthem Blue Cross Partnership Plan - Fresno L.A. Care Health Plan - Los Angeles
2015 Medi-Cal Managed Care Weighted Average
Health Net Community Solutions, Inc. - Tulare
Kern Health Systems - Kern California Health & Wellness Plan - Region 2
Health Plan of San Joaquin - Stanislaus Central CA Alliance for Health - Merced
Health Net Community Solutions, Inc. - Sacramento California Health & Wellness Plan - Region 1
CalViva Health - Fresno Anthem Blue Cross Partnership Plan - Kings
Care 1st Partner Plan, LLC - San Diego Health Net Community Solutions, Inc. - Los Angeles
CalOptima - Orange Gold Coast Health Plan - Ventura
Health Net Community Solutions, Inc. - Kern Inland Empire Health Plan - Riverside/San Bernardino
CalViva Health - Kings Molina Healthcare of CA - Riverside/San Bernardino
Health Net Community Solutions, Inc. - San Diego Anthem Blue Cross Partnership Plan - Region 2
CalViva Health - Madera Anthem Blue Cross Partnership Plan - Region 1
Community Health Group Partnership Plan - San Diego Minimum Performance Level 2
Molina Healthcare of CA - San Diego California Health & Wellness Plan - Imperial
Molina Healthcare of CA - Imperial Anthem Blue Cross Partnership Plan - Contra Costa
Anthem Blue Cross Partnership Plan - San Benito

FULL-SCOPE MANAGED CARE HEALTH PLANS’ PERFORMANCE MEASURE RESULTS
2015 HEDIS Aggregate Report Page 147 California Department of Health Care Services Health Services Advisory Group, Inc.
Summary of Results—Use of Imaging Studies for Low Back Pain
The MCMC weighted average for the Use of Imaging Studies for Low Back Pain measure declined significantly from RY 2014 to RY 2015; however, for the fifth consecutive year, the rate exceeded the national Medicaid 25th percentile (MPL) and national Medicaid and commercial averages for this measure. The rate remained below the national Medicaid 90th percentile (HPL).
High and Low Performers
The rates for 14 MCP counties/regions were above the HPL in RY 2015 compared to 23 in RY 2014. (Note: The rate for Anthem Blue Cross Partnership Plan—Contra Costa County is one of the 14 rates above the HPL in RY 2015. Anthem Blue Cross Partnership Plan—Contra Costa County’s rate for this measure was reportable based on performance measure validation audit results; however, since there are fewer than 11 cases in the numerator of this measure, DHCS suppresses displaying the rate in this report to satisfy the Health Insurance Portability and Accountability Act of 1996 Privacy Rule’s de-identification standard.)
The rates for the following MCP counties/regions were above the HPL for at least three consecutive years:
Alameda Alliance for Health—Alameda County (four consecutive years)
Anthem Blue Cross Partnership Plan—Alameda County (four consecutive years) and San Francisco County (three consecutive years)
Central California Alliance for Health—Monterey/Santa Cruz counties (four consecutive years)
Kaiser SoCal—San Diego County (three consecutive years)
Partnership HealthPlan of California—Southeast (four consecutive years)
San Francisco Health Plan—San Francisco County (four consecutive years)
Santa Clara Family Health Plan—Santa Clara County (three consecutive years)
The rate for Kern Health Systems—Kern County improved significantly from RY 2014 to RY 2015. The rates for CalViva Health—Madera County and Health Net Community Solutions, Inc.—San Diego County improved from RY 2014 to RY 2015, and although the improvement was not statistically significant, the change resulted in the rates moving from below the MPL in RY 2014 to above the MPL in RY 2015.
The rate for Molina Healthcare of California Partner Plan, Inc.—San Diego County was below the MPL for the fourth consecutive year. The rates for California Health & Wellness Plan—Imperial County and Molina Healthcare of California Partner Plan, Inc.—Imperial County also were below the MPL; however, RY 2015 was the first year the two MCP counties/regions reported rates for this measure and DHCS therefore did not hold the MCPs accountable to meet the MPL (i.e., the

FULL-SCOPE MANAGED CARE HEALTH PLANS’ PERFORMANCE MEASURE RESULTS
2015 HEDIS Aggregate Report Page 148 California Department of Health Care Services Health Services Advisory Group, Inc.
MCPs were not required to submit an improvement plan if their rates for the measure were below the MPL.)
The rates for the following MCP counties declined significantly from RY 2014 to RY 2015:
Anthem Blue Cross Partnership Plan—Tulare County
Central California Alliance for Health—Merced County
Community Health Group Partnership Plan—San Diego County
Health Net Community Solutions, Inc.—Sacramento County
Anthem Blue Cross Partnership Plan—San Benito County had an audit result of “NA” for this measure, meaning that although the MCP complied with all applicable specifications, it had a denominator less than 30 for the measure, resulting in the “NA” audit result.
Best and Emerging Practices—Use of Imaging Studies for Low Back Pain
Focus on Identifying Red Flag Indicators
During the initial assessment of patients with low back pain, clinical guidelines recommend focusing on obtaining a complete medical history and physical examination.82 The history and physical examination will generally provide “red flag” indicators to rare but potentially serious causes of low back pain and identify if a patient is at risk for chronic disabling back pain. When these red flag indicators are not present, the patient is considered to have non-specific low back pain. Clinical guidelines recommend that clinicians should be restrictive in referral for imaging in patients with non-specific low back pain. Only in cases with red flag conditions should imaging be indicated.83
Patient Education
Information about why an imaging test is not indicated is generally sufficient for most patients.84 Providing patients with evidence-based information on low back pain, including the natural history of low back pain (i.e., its expected course), advising them to remain active, and providing them with information about effective self-care options and how to prevent future episodes can help ensure the patient’s expectations are met.
82 Agency for Health Care Quality and Research. “Diagnosis and treatment of low back pain: a joint clinical practice
guideline from the American College of Physicians and the American Pain Society.” 2007. Annals of Internal Medicine. Available at: http://www.ncbi.nlm.nih.gov/pubmed/17909209. Accessed on: July 10, 2015.
83 Ibid. 84 Atlas SJ, Deyo RA. Evaluating and Managing Acute Low Back Pain in the Primary Care Setting. Journal of General
Internal Medicine. 2001; 16: 120–131.

FULL-SCOPE MANAGED CARE HEALTH PLANS’ PERFORMANCE MEASURE RESULTS
2015 HEDIS Aggregate Report Page 149 California Department of Health Care Services Health Services Advisory Group, Inc.
Alternative Therapy
For patients who do not improve with self-care options, clinicians should consider recommending nonpharmacologic therapy with proven benefits. For patients with chronic or subacute low back pain, this might include intensive interdisciplinary rehabilitation, exercise therapy, acupuncture, massage therapy, spinal manipulation, yoga, cognitive-behavioral therapy, or progressive relaxation.

FULL-SCOPE MANAGED CARE HEALTH PLANS’ PERFORMANCE MEASURE RESULTS
2015 HEDIS Aggregate Report Page 150 California Department of Health Care Services Health Services Advisory Group, Inc.
Weight Assessment and Counseling for Nutrition and Physical Activity for Children/Adolescents
Measure Definition
The Weight Assessment and Counseling for Nutrition and Physical Activity for Children/Adolescents measure calculates the percentage of members 3 through 17 years of age who had an outpatient visit with a PCP or OB/GYN and who had evidence of body mass index (BMI) percentile documentation, counseling for nutrition, and counseling for physical activity during the measurement year.
Importance
The emergence of obesity in children and adolescents has been one of the most important developments in pediatrics, and its rapidly increasing prevalence is one of the most challenging dilemmas pediatricians face today in the United States. In 1980, it was estimated that 7 percent of children ages 6 to 11 and 5 percent of adolescents ages 12 to 19 were obese. However, in the past 30 years the prevalence of obesity among children and adolescents has increased sharply to 18 percent and 21 percent respectively. Also of great concern are children who are overweight and at risk for becoming obese. Overweight children and adolescents are more likely to become obese as adults.85
According to NCQA, 23 percent of children ages 9 to 13 do not engage in any free-time physical activity. For young people in grades 9 through 12, the level of physical activity decreases drastically. More than 70 percent of young people in grades 9 through 12 do not meet the recommended levels of physical activity.86
For these reasons, it is essential that children and adolescents in the United States receive adequate weight assessment and counseling for nutrition and physical activity. The first step involves screening for overweight and obesity in the physician’s office with the calculation of BMI. With this tool, physicians can estimate a child’s BMI percentile for age and gender. In addition, it has been found that BMI is a useful screening tool for assessing and tracking the degree of obesity among adolescents. To address the lack of physical activity and nutritional education among children and adolescents in the United States today, health care providers should promote regular exercise activity and healthy eating and assist parents in creating an environment that supports these healthy habits.
85 Centers for Disease Control and Prevention. Adolescent and School Health: Childhood Obesity Facts. Available at:
http://www.cdc.gov/healthyyouth/obesity/facts.htm. Accessed on: July 10, 2015. 86 National Committee for Quality Assurance. The State of Health Care Quality 2013. Washington DC: NCQA, 2013.

FULL-SCOPE MANAGED CARE HEALTH PLANS’ PERFORMANCE MEASURE RESULTS
2015 HEDIS Aggregate Report Page 151 California Department of Health Care Services Health Services Advisory Group, Inc.
Performance Results—Weight Assessment and Counseling for Nutrition and Physical Activity for Children/Adolescents—BMI Assessment: Total
68.33%
71.55%
71.17%
77.47%
10%
20%
30%
40%
50%
60%
70%
80%
90%
100%
HEDIS 2012 HEDIS 2013 HEDIS 2014 HEDIS 2015
National Medicaid 25th Percentile (MPL) National Medicaid 90th Percentile (HPL) Medi-Cal Managed Care Weighted AverageNational Medicaid Average National Commercial Average MCP County Rates
Healthy People 2020 Goal: 54.70%
Note:♦ The percentages displayed on this chart represent the Medi-Cal Weighted Average for each year displayed.♦ Not all MCP counties that contributed to the previous years' Medi-Cal Weighted Averages are shown.♦ Only MCP counties that reported data for HEDIS 2015 are shown and these MCP counties may not have reported data in prior years.

FULL-SCOPE MANAGED CARE HEALTH PLANS’ PERFORMANCE MEASURE RESULTS
2015 HEDIS Aggregate Report Page 152 California Department of Health Care Services Health Services Advisory Group, Inc.
Medi-Cal Managed Care HEDIS 2015 Weight Assessment and Counseling for Nutrition and Physical Activity
for Children/Adolescents—BMI Assessment: Total
99.6094.42
90.9586.8686.6286.3186.1386.13
85.4085.3885.1984.6784.6784.1883.62
80.6780.5780.4680.1580.0579.8179.35
78.0478.0177.4777.0276.6476.6476.5176.4076.2376.1675.67
73.9773.9673.6673.3272.82
71.7671.76
69.3468.8068.75
68.0668.06
66.9164.12
62.2761.80
58.3357.21
55.3250.72
42.34
0 10 20 30 40 50 60 70 80 90 100
Rate (%)
KP Cal LLC (Kaiser SoCal) - San Diego KP Cal LLC (Kaiser NorCal) - KP North
CalViva Health - Madera Central CA Alliance for Health - Monterey/Santa Cruz
Partnership HealthPlan of CA - Southwest Molina Healthcare of CA - San Diego
Health Net Community Solutions, Inc. - Tulare
Partnership HealthPlan of CA - Northeast
1 High Performance Level is HEDIS 2014 national Medicaid 90th Percentile.2 Minimum Performance Level is HEDIS 2014 national Medicaid 25th Percentile.
Note: HEDIS 2015 rates reflect 2014 measurement year data.
Central CA Alliance for Health - Merced Anthem Blue Cross Partnership Plan - Madera
San Francisco Health Plan - San Francisco CenCal Health - San Luis Obispo
Molina Healthcare of CA - Sacramento Community Health Group Partnership Plan - San Diego
CenCal Health - Santa Barbara High Performance Level 1
Health Net Community Solutions, Inc. - Stanislaus Molina Healthcare of CA - Imperial
Health Net Community Solutions, Inc. - San Diego
Gold Coast Health Plan - Ventura Anthem Blue Cross Partnership Plan - Tulare
CalOptima - Orange Health Net Community Solutions, Inc. - Kern
Inland Empire Health Plan - Riverside/San Bernardino 2015 Medi-Cal Managed Care Weighted Average
Partnership HealthPlan of CA - Southeast Health Plan of San Joaquin - San Joaquin
Santa Clara Family Health Plan - Santa Clara
L.A. Care Health Plan - Los Angeles
Molina Healthcare of CA - Riverside/San Bernardino CalViva Health - Kings
Health Net Community Solutions, Inc. - Los Angeles Anthem Blue Cross Partnership Plan - San Francisco
Care 1st Partner Plan, LLC - San Diego Kern Health Systems - Kern
Health Plan of San Mateo - San Mateo CalViva Health - Fresno
California Health & Wellness Plan - Imperial Health Net Community Solutions, Inc. - Sacramento
Anthem Blue Cross Partnership Plan - Fresno Anthem Blue Cross Partnership Plan - San Benito
Contra Costa Health Plan - Contra Costa Health Net Community Solutions, Inc. - San Joaquin
Anthem Blue Cross Partnership Plan - Santa Clara Anthem Blue Cross Partnership Plan - Kings
Anthem Blue Cross Partnership Plan - Sacramento Partnership HealthPlan of CA - Northwest
Anthem Blue Cross Partnership Plan - Region 1 Anthem Blue Cross Partnership Plan - Region 2
Health Plan of San Joaquin - Stanislaus Anthem Blue Cross Partnership Plan - Alameda
California Health & Wellness Plan - Region 2 Anthem Blue Cross Partnership Plan - Contra Costa
California Health & Wellness Plan - Region 1 Alameda Alliance for Health - Alameda
Minimum Performance Level 2

FULL-SCOPE MANAGED CARE HEALTH PLANS’ PERFORMANCE MEASURE RESULTS
2015 HEDIS Aggregate Report Page 153 California Department of Health Care Services Health Services Advisory Group, Inc.
Summary of Results—Weight Assessment and Counseling for Nutrition and Physical Activity for Children/Adolescents—BMI Assessment: Total
For the fifth consecutive year, the MCMC weighted average for the Weight Assessment and Counseling for Nutrition and Physical Activity for Children/Adolescents—BMI Assessment: Total measure was higher than the national Medicaid 25th percentile (MPL), national Medicaid and commercial averages, and Healthy People 2020 goal for this measure. Although the rate increased significantly from RY 2014 to RY 2015, the rate remained below the national Medicaid 90th percentile (HPL).
High and Low Performers
The rates for 15 MCP counties/regions were above the HPL in RY 2015 compared to eight MCP counties in RY 2014. The rates for the following MCP counties were above the HPL for three or more consecutive years:
Central California Alliance for Health— Merced County (three consecutive years) and Monterey/Santa Cruz counties (five consecutive years)
Community Health Group Partnership Plan—San Diego County (five consecutive years)
Kaiser SoCal—San Diego County (five consecutive years)
San Francisco Health Plan—San Francisco County (four consecutive years)
The rates for 29 MCP counties/regions improved significantly from RY 2014 to RY 2015 compared to eight in RY 2014, and the improvement for CalViva Health—Kings County resulted in the rate moving from below the MPL in RY 2014 to above the MPL in RY 2015.
The rate for one MCP county (Alameda Alliance for Health—Alameda County) declined significantly from RY 2014 to RY 2015 compared to 11 MCP counties from RY 2013 to RY 2014. No MCP county/regional rates were below the MPL in RY 2015.

FULL-SCOPE MANAGED CARE HEALTH PLANS’ PERFORMANCE MEASURE RESULTS
2015 HEDIS Aggregate Report Page 154 California Department of Health Care Services Health Services Advisory Group, Inc.
Performance Results—Weight Assessment and Counseling for Nutrition and Physical Activity for Children/Adolescents—Nutrition Counseling: Total
72.08%72.53% 71.37% 73.42%
30%
40%
50%
60%
70%
80%
90%
100%
HEDIS 2012 HEDIS 2013 HEDIS 2014 HEDIS 2015
National Medicaid 25th Percentile (MPL) National Medicaid 90th Percentile (HPL) Medi-Cal Managed Care Weighted AverageNational Medicaid Average National Commercial Average MCP County Rates
Healthy People 2020 goal: 22.90%
Note:♦ The percentages displayed on this chart represent the Medi-Cal Weighted Average for each year displayed.♦ Not all MCP counties that contributed to the previous years' Medi-Cal Weighted Averages are shown.♦ Only MCP counties that reported data for HEDIS 2015 are shown and these MCP counties may not have reported data in prior years.

FULL-SCOPE MANAGED CARE HEALTH PLANS’ PERFORMANCE MEASURE RESULTS
2015 HEDIS Aggregate Report Page 155 California Department of Health Care Services Health Services Advisory Group, Inc.
Medi-Cal Managed Care HEDIS 2015 Weight Assessment and Counseling for Nutrition and Physical Activity
for Children/Adolescents—Nutrition Counseling: Total
96.1693.57
87.4483.2982.83
81.4881.42
80.1579.33
78.3577.92
76.3975.6775.67
75.0074.9474.8674.6374.14
73.4273.2273.11
72.4170.5670.3269.9169.3569.34
68.2167.6467.5366.91
64.7264.58
63.7563.2662.9662.77
61.8159.26
57.4256.5156.4556.2556.0155.9655.79
54.2653.13
50.46
46.9946.47
45.1439.90
0 10 20 30 40 50 60 70 80 90 100
Rate (%)
KP Cal LLC (Kaiser SoCal) - San Diego KP Cal LLC (Kaiser NorCal) - KP North
CalViva Health - Madera CalOptima - Orange
Anthem Blue Cross Partnership Plan - Madera San Francisco Health Plan - San Francisco
Health Net Community Solutions, Inc. - Kern
L.A. Care Health Plan - Los Angeles
1 High Performance Level is HEDIS 2014 national Medicaid 90th Percentile.2 Minimum Performance Level is HEDIS 2014 national Medicaid 25th Percentile.
Note: HEDIS 2015 rates reflect 2014 measurement year data.
Molina Healthcare of CA - Sacramento Central CA Alliance for Health - Monterey/Santa Cruz
CenCal Health - Santa Barbara High Performance Level 1
Inland Empire Health Plan - Riverside/San Bernardino Care 1st Partner Plan, LLC - San Diego
Health Net Community Solutions, Inc. - Tulare Health Plan of San Mateo - San Mateo
Santa Clara Family Health Plan - Santa Clara Health Net Community Solutions, Inc. - Los Angeles
CalViva Health - Fresno
2015 Medi-Cal Managed Care Weighted Average Health Net Community Solutions, Inc. - San Joaquin
Partnership HealthPlan of CA - Southeast Molina Healthcare of CA - San Diego
Health Plan of San Joaquin - San Joaquin Health Net Community Solutions, Inc. - Sacramento
Anthem Blue Cross Partnership Plan - San Francisco Molina Healthcare of CA - Riverside/San Bernardino
Community Health Group Partnership Plan - San Diego
Health Net Community Solutions, Inc. - San Diego
Anthem Blue Cross Partnership Plan - Tulare Contra Costa Health Plan - Contra Costa
Health Net Community Solutions, Inc. - Stanislaus Central CA Alliance for Health - Merced
Kern Health Systems - Kern Anthem Blue Cross Partnership Plan - Santa Clara
CenCal Health - San Luis Obispo CalViva Health - Kings
Anthem Blue Cross Partnership Plan - Sacramento Partnership HealthPlan of CA - Southwest
Anthem Blue Cross Partnership Plan - Alameda Anthem Blue Cross Partnership Plan - Fresno
Alameda Alliance for Health - Alameda Molina Healthcare of CA - Imperial
Health Plan of San Joaquin - Stanislaus Anthem Blue Cross Partnership Plan - Kings California Health & Wellness Plan - Imperial
Partnership HealthPlan of CA - Northeast Anthem Blue Cross Partnership Plan - Contra Costa
Gold Coast Health Plan - Ventura California Health & Wellness Plan - Region 2
Anthem Blue Cross Partnership Plan - San Benito Minimum Performance Level 2
Anthem Blue Cross Partnership Plan - Region 1 Partnership HealthPlan of CA - Northwest
Anthem Blue Cross Partnership Plan - Region 2 California Health & Wellness Plan - Region 1

FULL-SCOPE MANAGED CARE HEALTH PLANS’ PERFORMANCE MEASURE RESULTS
2015 HEDIS Aggregate Report Page 156 California Department of Health Care Services Health Services Advisory Group, Inc.
Summary of Results—Weight Assessment and Counseling for Nutrition and Physical Activity for Children/Adolescents—Nutrition Counseling: Total
For the fifth consecutive year, the MCMC weighted average for the Weight Assessment and Counseling for Nutrition and Physical Activity for Children/Adolescents—Nutrition Counseling: Total measure was higher than the national Medicaid 25th percentile (MPL), national Medicaid and commercial averages, and Healthy People 2020 goal for this measure. The rate was below the national Medicaid 90th percentile (HPL) for the third consecutive year.
High and Low Performers
The rates for 11 MCP counties/regions were above the HPL in RY 2015.
The rates for the following MCP counties were above the HPL for three or more consecutive years:
CalOptima—Orange County (five consecutive years)
Central California Alliance for Health—Monterey/Santa Cruz counties (five consecutive years)
Health Net Community Solutions, Inc.—Kern County (three consecutive years)
Kaiser SoCal—San Diego County (three consecutive years)
San Francisco Health Plan—San Francisco County (five consecutive years)
The rates for 18 MCP counties/regions improved significantly from RY 2014 to RY 2015. The improvement for the following MCP counties/regions resulted in the rates moving from below the MPL in RY 2014 to above the MPL in RY 2015:
Anthem Blue Cross Partnership Plan—Alameda County, Kings County, and Santa Clara County
CalViva Health—Kings County
Gold Coast Health Plan—Ventura County
Health Plan of San Joaquin—Stanislaus County (Note: RY 2014 was the first year Health Plan of San Joaquin reported a rate for Stanislaus County, so DHCS did not hold the MCP accountable to meet the MPL for this county in RY 2014)
The rates for the following MCP regions were below the MPL. (Note: RY 2015 was the first year the MCPs reported rates for these regions and DHCS therefore did not hold the MCPs accountable to meet the MPL [i.e., the MCPs were not required to submit an improvement plan if their rates for the measure were below the MPL]):
Anthem Blue Cross Partnership Plan—Region 1 and Region 2
California Health & Wellness Plan—Region 1
Partnership HealthPlan of California—Northwest

FULL-SCOPE MANAGED CARE HEALTH PLANS’ PERFORMANCE MEASURE RESULTS
2015 HEDIS Aggregate Report Page 157 California Department of Health Care Services Health Services Advisory Group, Inc.
The rates for the following MCP counties declined significantly from RY 2014 to RY 2015:
Alameda Alliance for Health—Alameda County
Health Net Community Solutions, Inc.—Kern County; however, the rate remained above the HPL

FULL-SCOPE MANAGED CARE HEALTH PLANS’ PERFORMANCE MEASURE RESULTS
2015 HEDIS Aggregate Report Page 158 California Department of Health Care Services Health Services Advisory Group, Inc.
Performance Results—Weight Assessment and Counseling for Nutrition and Physical Activity for Children/Adolescent—Physical Activity Counseling: Total
56.04% 58.28% 59.53%
63.64%
20%
30%
40%
50%
60%
70%
80%
90%
100%
HEDIS 2012 HEDIS 2013 HEDIS 2014 HEDIS 2015
National Medicaid 25th Percentile (MPL) National Medicaid 90th Percentile (HPL) Medi-Cal Managed Care Weighted AverageNational Medicaid Average National Commercial Average MCP County Rates
Healthy People 2020 goal: 22.90%
Note:♦ The percentages displayed on this chart represent the Medi-Cal Weighted Average for each year displayed.♦ Not all MCP counties that contributed to the previous years' Medi-Cal Weighted Averages are shown.♦ Only MCP counties that reported data for HEDIS 2015 are shown and these MCP counties may not have reported data in prior years.

FULL-SCOPE MANAGED CARE HEALTH PLANS’ PERFORMANCE MEASURE RESULTS
2015 HEDIS Aggregate Report Page 159 California Department of Health Care Services Health Services Advisory Group, Inc.
Medi-Cal Managed Care HEDIS 2015 Weight Assessment and Counseling for Nutrition and Physical Activity
for Children/Adolescents—Physical Activity Counseling: Total
97.5193.52
80.4077.78
76.1073.5672.97
71.3169.84
69.3569.10
67.9767.4967.0166.6766.42
65.2165.0564.96
63.8463.6463.39
61.9861.8061.5761.31
57.8056.5156.45
55.1153.77
52.8052.7852.13
49.7749.5449.19
48.4247.2046.9946.6346.30
45.2644.7744.37
42.3141.85
40.3936.3436.25
35.4231.71
29.3323.84
0 10 20 30 40 50 60 70 80 90 100
Rate (%)
KP Cal LLC (Kaiser SoCal) - San Diego KP Cal LLC (Kaiser NorCal) - KP North
CalViva Health - Madera San Francisco Health Plan - San Francisco
CalOptima - Orange Health Net Community Solutions, Inc. - San Diego
Health Net Community Solutions, Inc. - Kern
Health Net Community Solutions, Inc. - Los Angeles
1 High Performance Level is HEDIS 2014 national Medicaid 90th Percentile.2 Minimum Performance Level is HEDIS 2014 national Medicaid 25th Percentile.
Note: HEDIS 2015 rates reflect 2014 measurement year data.
Anthem Blue Cross Partnership Plan - Madera High Performance Level 1
L.A. Care Health Plan - Los Angeles Health Net Community Solutions, Inc. - Tulare
Partnership HealthPlan of CA - Southeast CenCal Health - Santa Barbara
Health Net Community Solutions, Inc. - Stanislaus Contra Costa Health Plan - Contra Costa
Community Health Group Partnership Plan - San Diego Central CA Alliance for Health - Monterey/Santa Cruz
Inland Empire Health Plan - Riverside/San Bernardino
Health Net Community Solutions, Inc. - Sacramento 2015 Medi-Cal Managed Care Weighted Average
Health Net Community Solutions, Inc. - San Joaquin Health Plan of San Mateo - San Mateo
Santa Clara Family Health Plan - Santa Clara Anthem Blue Cross Partnership Plan - San Francisco
Health Plan of San Joaquin - San Joaquin CalViva Health - Fresno
Molina Healthcare of CA - San Diego
Care 1st Partner Plan, LLC - San Diego
CenCal Health - San Luis Obispo Molina Healthcare of CA - Sacramento
Partnership HealthPlan of CA - Southwest Kern Health Systems - Kern
Anthem Blue Cross Partnership Plan - Santa Clara Molina Healthcare of CA - Riverside/San Bernardino
Anthem Blue Cross Partnership Plan - Alameda Anthem Blue Cross Partnership Plan - Sacramento
Anthem Blue Cross Partnership Plan - Tulare Alameda Alliance for Health - Alameda
Central CA Alliance for Health - Merced Anthem Blue Cross Partnership Plan - Contra Costa
California Health & Wellness Plan - Imperial Anthem Blue Cross Partnership Plan - Fresno
CalViva Health - Kings Health Plan of San Joaquin - Stanislaus
Molina Healthcare of CA - Imperial California Health & Wellness Plan - Region 2
Gold Coast Health Plan - Ventura Minimum Performance Level 2
Partnership HealthPlan of CA - Northeast Anthem Blue Cross Partnership Plan - Kings
Partnership HealthPlan of CA - Northwest Anthem Blue Cross Partnership Plan - Region 2 Anthem Blue Cross Partnership Plan - Region 1
California Health & Wellness Plan - Region 1 Anthem Blue Cross Partnership Plan - San Benito

FULL-SCOPE MANAGED CARE HEALTH PLANS’ PERFORMANCE MEASURE RESULTS
2015 HEDIS Aggregate Report Page 160 California Department of Health Care Services Health Services Advisory Group, Inc.
Summary of Results—Weight Assessment and Counseling for Nutrition and Physical Activity for Children/Adolescents—Physical Activity Counseling: Total
For the fifth consecutive year, the MCMC weighted average for the Weight Assessment and Counseling for Nutrition and Physical Activity for Children/Adolescents—Physical Activity Counseling: Total measure was higher than the national Medicaid 25th percentile (MPL), national Medicaid and commercial averages, and Healthy People 2020 goal for this measure. Although the rate increased significantly from RY 2014 to RY 2015, the rate remained below the national Medicaid 90th percentile (HPL).
High and Low Performers
The rates for nine MCP counties/regions were above the HPL in RY 2015. The rates for the following MCP counties were above the HPL for three or more consecutive years:
CalOptima—Orange County (five consecutive years)
Health Net Community Solutions, Inc.—Los Angeles County (four consecutive years)
Kaiser SoCal—San Diego County (five consecutive years)
San Francisco Health Plan—San Francisco County (five consecutive years)
The rates for 16 MCP counties improved significantly from RY 2014 to RY 2015, and the improvement for Anthem Blue Cross Partnership Plan—Santa Clara County and Gold Coast Health Plan—Ventura County resulted in the rates moving from below the MPL in RY 2014 to above the MPL in RY 2015.
The rates for Anthem Blue Cross Partnership Plan—Kings County declined from RY 2014 to RY 2015, and although the decline was not statistically significant, the change resulted in the rate moving from above the MPL in RY 2014 to below the MPL in RY 2015. The rates for the following MCP counties/regions also were below the MPL in RY 2015; however, RY 2015 was the first year the MCP counties/regions reported rates for this measure and DHCS therefore did not hold the MCPs accountable to meet the MPL (i.e., the MCPs were not required to submit an improvement plan if their rates for the measure were below the MPL):
Anthem Blue Cross Partnership Plan—Region 1, Region 2, and San Benito County
California Health & Wellness Plan—Region 1
Partnership HealthPlan of California—Northeast and Northwest
The rates for Alameda Alliance for Health—Alameda County and Anthem Blue Cross Partnership Plan—San Francisco County declined significantly from RY 2014 to RY 2015.

FULL-SCOPE MANAGED CARE HEALTH PLANS’ PERFORMANCE MEASURE RESULTS
2015 HEDIS Aggregate Report Page 161 California Department of Health Care Services Health Services Advisory Group, Inc.
Best and Emerging Practices—Weight Assessment and Counseling for Nutrition and Physical Activity for Children/Adolescents
Educating health care professionals and providing them with the tools, skills, and knowledge necessary to identify and screen children and adolescents for overweight and obesity in a primary care setting is crucial. Physician visits offer health care providers and other clinicians the opportunity to provide preventive services, such as BMI assessments, dietary counseling, and related weight management and nutrition services. Studies indicate that adolescents view their physicians as a trustworthy source of health information and that parents want clinicians to provide these services.87 Following is an example of two health plans that partnered to develop an initiative to provide education to providers that resulted in an improvement in their rates for the Weight Assessment and Counseling for Nutrition and Physical Activity for Children/Adolescents measures.
AmeriHealth Mercy Health Plan and Keystone Mercy Health Plan88
In 2011, AmeriHealth Mercy Health Plan and Keystone Mercy Health Plan provided information and support to beneficiaries and providers to improve the quality of services and care to their pediatric population struggling with being overweight/obese. The initiatives included a care management component focused on beneficiaries who meet specific criteria related to obesity and a provider education component. The provider component included the provision of instruction to PCPs regarding documentation of BMI and the proper coding of nutritional and physical activity counseling services. Additionally, providers were given packets that included:
A BMI percentile wheel.
An American Academy of Pediatricians clinical decision support flipchart.
A summary of HEDIS coding guidelines.
A provider tip sheet for effective communication with obese beneficiaries.
A BMI screening-by-category chart.
The plans reported that the most impactful intervention was the provider education component. More than 250 packets were distributed to providers, and both plans saw improvement in their three Weight Assessment and Counseling for Nutrition and Physical Activity for Children/Adolescents measures.
87 Park MJ, Macdonald TM, Ozer EM, et al. Investing in Clinical Preventive Health Services for Adolescents.
University of California, San Francisco, Policy Information and Analysis Center for Middle Childhood and Adolescence, and National Adolescent Health Information Center. 2001. Available at: http://nahic.ucsf.edu/downloads/CPHS.pdf. Accessed on: July 10, 2015.
88 Medicaid Health Plans of America: Centers for Best Practices. 2012–2013 Best Practices Compendium. Available at: https://www.mhpa.org/_upload/2012Compendium.pdf Accessed on: July 10, 2015.
FULL-SCOPE MANAGED CARE HEALTH PLANS’ PERFORMANCE MEASURE RESULTS
2015 HEDIS Aggregate Report Page 162 California Department of Health Care Services Health Services Advisory Group, Inc.
Well-Child Visits in the Third, Fourth, Fifth, and Sixth Years of Life
Measure Definition
The Well-Child Visits in the Third, Fourth, Fifth, and Sixth Years of Life measure calculates the percentage of members three-to-six years of age who had one or more well-child visits with a PCP during the measurement year.
Importance
Children in preschool and early school years benefit from well-child visits to obtain early detection of vision, speech, or language problems. These visits are also important for:
Assessing school readiness.
Completing preschool immunization.
Reinforcing accident and injury prevention.
Educating about appropriate weight.89
In addition to performing preventive services, well-child visits foster communication between parents and doctors; however, between 2011 and 2012, 11 million children 0 to 17 years of age did not have a well-visit during the year. Regular well-visits allow doctors to offer guidance and counseling on a variety of health care topics, including safety, nutrition, normal development, and general health care, which can decrease health care costs and improve a child’s health and wellness throughout life.90
89 Medicaid Managed Care Services. Components of Well Child Screenings. Available at:
http://mmcs.afmc.org/HealthCareProfessionals/ProviderRelations/WellChildEPSDT/ComponentsofWellChildScreenings.aspx. Accessed on: July 10, 2015.
90 National Committee for Quality Assurance. The State of Health Care Quality 2009. Washington DC: NCQA, 2013.
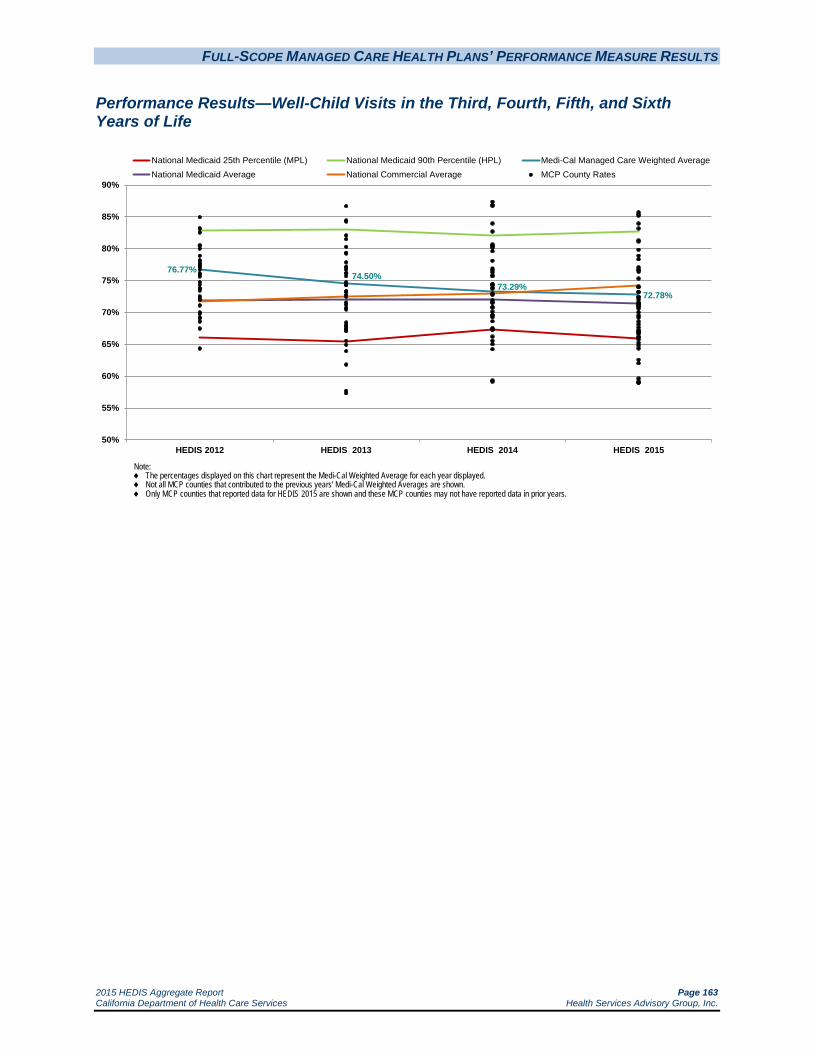
FULL-SCOPE MANAGED CARE HEALTH PLANS’ PERFORMANCE MEASURE RESULTS
2015 HEDIS Aggregate Report Page 163 California Department of Health Care Services Health Services Advisory Group, Inc.
Performance Results—Well-Child Visits in the Third, Fourth, Fifth, and Sixth Years of Life
76.77%74.50%
73.29%72.78%
50%
55%
60%
65%
70%
75%
80%
85%
90%
HEDIS 2012 HEDIS 2013 HEDIS 2014 HEDIS 2015
National Medicaid 25th Percentile (MPL) National Medicaid 90th Percentile (HPL) Medi-Cal Managed Care Weighted AverageNational Medicaid Average National Commercial Average MCP County Rates
Note:♦ The percentages displayed on this chart represent the Medi-Cal Weighted Average for each year displayed.♦ Not all MCP counties that contributed to the previous years' Medi-Cal Weighted Averages are shown.♦ Only MCP counties that reported data for HEDIS 2015 are shown and these MCP counties may not have reported data in prior years.

FULL-SCOPE MANAGED CARE HEALTH PLANS’ PERFORMANCE MEASURE RESULTS
2015 HEDIS Aggregate Report Page 164 California Department of Health Care Services Health Services Advisory Group, Inc.
Medi-Cal Managed Care HEDIS 2015 Well-Child Visits in the Third, Fourth, Fifth, and Sixth Years of Life
85.7185.4285.19
83.9483.16
81.2781.15
79.8178.8978.35
77.0876.8076.6276.40
75.3074.0773.97
73.2473.1672.7872.4572.4172.0271.5371.4671.3971.2671.0670.9770.9070.6070.0669.5269.1868.5868.1367.6467.2167.1166.8766.8766.6766.1866.08
65.7465.2164.8264.35
62.5362.04
59.6259.1358.9458.93
0 10 20 30 40 50 60 70 80 90 100
Rate (%)
CalOptima - Orange San Francisco Health Plan - San Francisco
Anthem Blue Cross Partnership Plan - Madera KP Cal LLC (Kaiser SoCal) - San Diego
CalViva Health - Madera High Performance Level 1
Central CA Alliance for Health - Monterey/Santa Cruz
KP Cal LLC (Kaiser NorCal) - KP North
1 High Performance Level is HEDIS 2014 national Medicaid 90th Percentile.2 Minimum Performance Level is HEDIS 2014 national Medicaid 25th Percentile.
Note: HEDIS 2015 rates reflect 2014 measurement year data.
Contra Costa Health Plan - Contra Costa Health Net Community Solutions, Inc. - Tulare Santa Clara Family Health Plan - Santa Clara
Anthem Blue Cross Partnership Plan - Santa Clara CalViva Health - Fresno
Anthem Blue Cross Partnership Plan - Fresno Health Plan of San Joaquin - San Joaquin Partnership HealthPlan of CA - Southeast
CenCal Health - Santa Barbara Central CA Alliance for Health - Merced
Community Health Group Partnership Plan - San Diego
2015 Medi-Cal Managed Care Weighted Average Anthem Blue Cross Partnership Plan - Tulare
Anthem Blue Cross Partnership Plan - Alameda Partnership HealthPlan of CA - Southwest
Alameda Alliance for Health - Alameda Anthem Blue Cross Partnership Plan - San Francisco
California Health & Wellness Plan - Imperial Health Net Community Solutions, Inc. - Stanislaus
Inland Empire Health Plan - Riverside/San Bernardino
Health Plan of San Mateo - San Mateo
Molina Healthcare of CA - Sacramento Health Net Community Solutions, Inc. - Los Angeles
Anthem Blue Cross Partnership Plan - Kings Molina Healthcare of CA - San Diego L.A. Care Health Plan - Los Angeles
Health Net Community Solutions, Inc. - San Diego Health Net Community Solutions, Inc. - Sacramento
Health Net Community Solutions, Inc. - Kern Kern Health Systems - Kern
Anthem Blue Cross Partnership Plan - Sacramento Gold Coast Health Plan - Ventura
Anthem Blue Cross Partnership Plan - Contra Costa CenCal Health - San Luis Obispo
Molina Healthcare of CA - Riverside/San Bernardino Care 1st Partner Plan, LLC - San Diego
Health Net Community Solutions, Inc. - San Joaquin Minimum Performance Level 2
Anthem Blue Cross Partnership Plan - San Benito Health Plan of San Joaquin - Stanislaus
CalViva Health - Kings Anthem Blue Cross Partnership Plan - Region 1
Partnership HealthPlan of CA - Northwest Partnership HealthPlan of CA - Northeast
California Health & Wellness Plan - Region 1 California Health & Wellness Plan - Region 2
Molina Healthcare of CA - Imperial Anthem Blue Cross Partnership Plan - Region 2

FULL-SCOPE MANAGED CARE HEALTH PLANS’ PERFORMANCE MEASURE RESULTS
2015 HEDIS Aggregate Report Page 165 California Department of Health Care Services Health Services Advisory Group, Inc.
Summary of Results—Well-Child Visits in the Third, Fourth, Fifth, and Sixth Years of Life
For the fifth consecutive year, the MCMC weighted average for the Well-Child Visits in the Third, Fourth, Fifth, and Sixth Years of Life measure was higher than the national Medicaid 25th percentile (MPL) and national Medicaid average for this measure. The rate declined by less than 1 percentage point from RY 2014 to RY 2015, and the slight decline resulted in the rate moving from above the national commercial average for this measure in RY 2014 to below the national commercial average in RY 2015. The rate remained below the national Medicaid 90th percentile (HPL).
High and Low Performers
The rates for the following MCP counties were above the HPL in RY 2015:
Anthem Blue Cross Partnership Plan—Madera County
CalOptima—Orange County (for the third consecutive year)
CalViva Health—Madera County (for the third consecutive year)
Kaiser SoCal—San Diego County
San Francisco Health Plan—San Francisco County (for the fifth consecutive year)
The rates for the following MCP counties improved significantly from RY 2014 to RY 2015:
Anthem Blue Cross Partnership Plan—Alameda County, resulting in the rate moving from below the MPL in RY 2014 to above the MPL in RY 2015
Health Net Community Solutions, Inc.—San Joaquin County, resulting in the rate moving from below the MPL in RY 2014 to above the MPL in RY 2015 (Note: RY 2014 was the first year Health Net Community Solutions, Inc., reported a rate for San Joaquin County, so DHCS did not hold the MCP accountable to meet the MPL for this county in RY 2014)
Kaiser SoCal—San Diego County
Santa Clara Family Health Plan—Santa Clara County
The rates for the following MCP counties improved from RY 2014 to RY 2015, and although the improvement was not statistically significant, the change resulted in the rates moving from below the MPL in RY 2014 to above the MPL in RY 2015:
Anthem Blue Cross Partnership Plan—Kings County
Care1st Partner Plan—San Diego County
Gold Coast Health Plan—Ventura County
Kern Health Centers—Kern County
Molina Healthcare of California Partner Plan, Inc.—Sacramento County
FULL-SCOPE MANAGED CARE HEALTH PLANS’ PERFORMANCE MEASURE RESULTS
2015 HEDIS Aggregate Report Page 166 California Department of Health Care Services Health Services Advisory Group, Inc.
The rates for CalViva Health—Kings County and Health Plan of San Joaquin—Stanislaus County were below the MPL in RY 2015. Additionally, the rates for the following MCP counties/regions were below the MPL; however, RY 2015 was the first year the MCP counties/regions reported rates for this measure and DHCS therefore did not hold the MCPs accountable to meet the MPL (i.e., the MCPs were not required to submit an improvement plan if their rates for the measure were below the MPL):
Anthem Blue Cross Partnership Plan—Region 1, Region 2, and San Benito County
California Health & Wellness Plan—Region 1 and Region 2
Molina Healthcare of California Partner Plan, Inc.—Imperial County
Partnership HealthPlan of California—Northeast and Northwest
The rates for the following MCP counties declined significantly from RY 2014 to RY 2015:
Anthem Blue Cross Partnership Plan—Contra Costa County and San Francisco County
Health Net Community Solutions, Inc.—San Diego County
Best and Emerging Practices—Well-Child Visits in the Third, Fourth, Fifth, and Sixth Years of Life
University of Oklahoma Health Sciences Center91
Members of the Department of Family and Preventive Medicine at the University of Oklahoma Health Sciences Center contracted to help provider practices improve the rates and quality of well-child visits within the Oklahoma Medicaid Program. Sixteen pediatric and family medicine practices in three Oklahoma counties participated in the initiative. Performance feedback was given to the providers on the rate and quality of well-child visits that occurred during the previous twelve months. Additionally, the providers were given a copy of the practice guidelines, the Oklahoma Medicaid requirements, and tips from exemplary practices. In two of the counties, a case manager helped the practices with challenging patients. Practice enhancement assistants then helped providers implement a variety of strategies to increase the well-child visit rates and improve the quality of early and periodic screening, diagnosis, and treatment visits. When needed, information technology support was provided. The average rates of well-child visits for all counties combined increased. Visit rates increased more in the younger age groups (birth to two years). There also was significant improvement in quality of visits.
91 Smith KD, Merchen E, Turner CD, Vaught C, Fritz T, Mold J. Improving the Rate and Quality of Well Child Care
Exams in Primary Care Practices. The Journal of the Oklahoma State Medical Association. 2010: Jul;103(7):248-53.

FULL-SCOPE MANAGED CARE HEALTH PLANS’ PERFORMANCE MEASURE RESULTS
2015 HEDIS Aggregate Report Page 167 California Department of Health Care Services Health Services Advisory Group, Inc.
Children’s Preventive Healthcare Initiative92
IHI provides information about the Children’s Preventive Healthcare Initiative, which aimed to increase well-child visits and immunization rates for children enrolled in the Washington Medicaid program by 10 percentage points. Of the 11 clinics that participated in the initiative, nine completed at least one quality improvement project using the Model for Improvement, which is the framework IHI uses to guide improvement work. Changes designed and implemented to improve well-child visits included:
Developing postcard and telephone outreach to parents of infants and children overdue for a well-child visit.
Offering incentives to parents for making and keeping the well-child visit appointment.
Developing a process for physicians and nurses to remind the parent, during sick visits, to schedule a well-child visit.
Developing bilingual reminder postcards.
Adopting the State well-child visit charting tool.
Developing a system to identify the children overdue for a well-child visit using clinic billing data or managed care health plan data.
The initiative established a unique cooperative effort between state policymakers, health plan representatives, and frontline clinic staff to improve health care for Washington’s Medicaid children. A key component was that the exchange of information was fluid and productive across participants. Additionally, the clinics helped each other on their individual quality improvement projects.
92 Institute for Healthcare Improvement. Improvement Stories. Children’s Preventive Healthcare Initiative. Available
at: http://www.ihi.org/resources/Pages/ImprovementStories/ChildrensPreventiveHealthcareInitiative.aspx. Accessed on: July 10, 2015.
2015 HEDIS Aggregate Report Page 168 California Department of Health Care Services Health Services Advisory Group, Inc.
6. SPECIALTY MCP PERFORMANCE MEASURE RESULTS
DHCS contracts with three specialty MCPs. These MCPs are required to report two performance measures annually. In collaboration with DHCS, a specialty MCP may select measures from HEDIS or design a measure that is appropriate to the MCP’s population. The measures put forth by the specialty MCPs are subject to approval by DHCS. Furthermore, specialty MCPs must report performance measure results specific to MCMC beneficiaries. This section includes results from the specialty MCPs’ RY 2015 performance measures, which reflect data from January 1, 2014, to December 31, 2014.
Note that specialty MCPs serve a very small percentage of the Medi-Cal population; therefore, the performance measure rates for specialty MCPs are not representative of the Medicaid population.
AIDS Healthcare Foundation
AIDS Healthcare Foundation is a specialty Medi-Cal MCP operating in Los Angeles County that provides services primarily to beneficiaries living with human immunodeficiency virus (HIV) or acquired immunodeficiency syndrome (AIDS). Some of the MCP’s beneficiaries are dual eligible (covered by both Medicare and Medi-Cal). The MCP has been previously referred to as AIDS Healthcare Centers, AHF Healthcare Centers, or Positive Healthcare.
AHF’s RY 2015 performance measures were the HEDIS measures Controlling High Blood Pressure and Colorectal Cancer Screening.
Controlling High Blood Pressure
Measure Definition
The Controlling High Blood Pressure measure is used to assess the percentage of members 18 to 85 years of age who had a diagnosis of hypertension and whose blood pressure (BP) was adequately controlled during the measurement year based on the following criteria:
Members 18 through 59 years of age whose BP was <140/90 mm Hg.
Members 60 through 85 years of age with a diagnosis of diabetes whose BP was <140/90 mm Hg.
Members 60 through 85 years of age without a diagnosis of diabetes whose BP was <150/90 mm Hg.
Note: A single rate is reported and is the sum of all three groups.
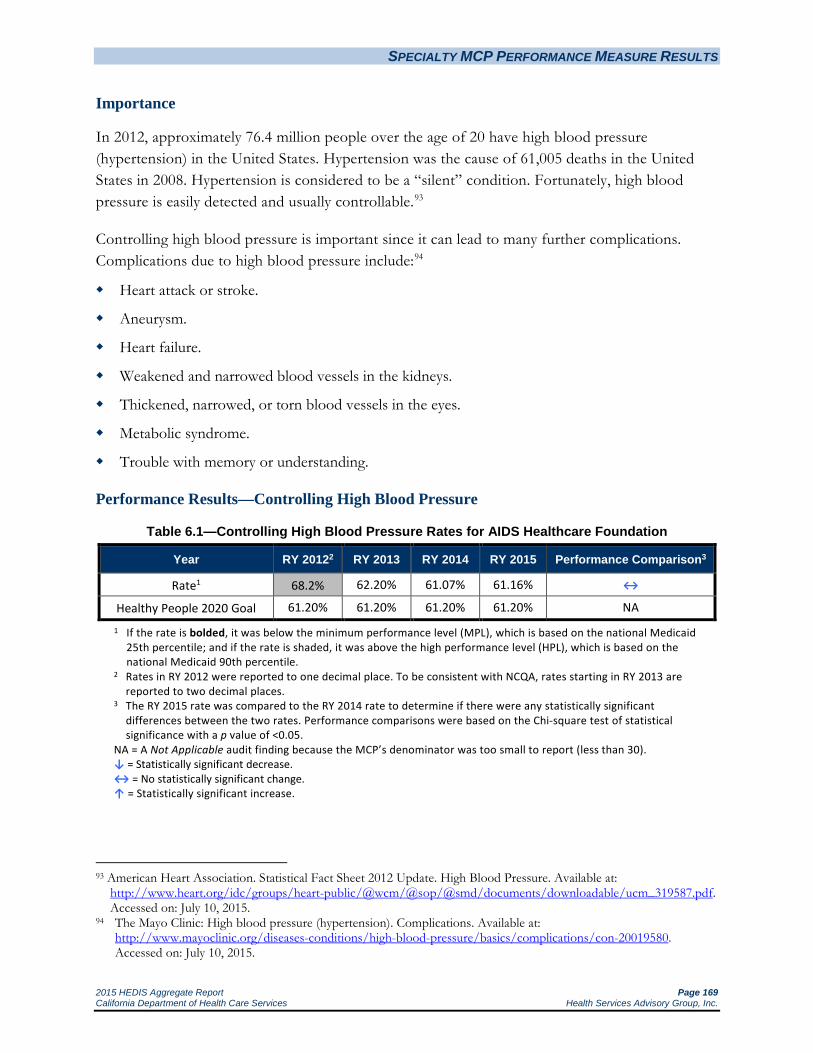
SPECIALTY MCP PERFORMANCE MEASURE RESULTS
2015 HEDIS Aggregate Report Page 169 California Department of Health Care Services Health Services Advisory Group, Inc.
Importance
In 2012, approximately 76.4 million people over the age of 20 have high blood pressure (hypertension) in the United States. Hypertension was the cause of 61,005 deaths in the United States in 2008. Hypertension is considered to be a “silent” condition. Fortunately, high blood pressure is easily detected and usually controllable.93
Controlling high blood pressure is important since it can lead to many further complications. Complications due to high blood pressure include:94
Heart attack or stroke.
Aneurysm.
Heart failure.
Weakened and narrowed blood vessels in the kidneys.
Thickened, narrowed, or torn blood vessels in the eyes.
Metabolic syndrome.
Trouble with memory or understanding.
Performance Results—Controlling High Blood Pressure
Table 6.1—Controlling High Blood Pressure Rates for AIDS Healthcare Foundation
Year RY 20122 RY 2013 RY 2014 RY 2015 Performance Comparison3
Rate1 68.2% 62.20% 61.07% 61.16% ↔
Healthy People 2020 Goal 61.20% 61.20% 61.20% 61.20% NA
1 If the rate is bolded, it was below the minimum performance level (MPL), which is based on the national Medicaid 25th percentile; and if the rate is shaded, it was above the high performance level (HPL), which is based on the national Medicaid 90th percentile.
2 Rates in RY 2012 were reported to one decimal place. To be consistent with NCQA, rates starting in RY 2013 are reported to two decimal places.
3 The RY 2015 rate was compared to the RY 2014 rate to determine if there were any statistically significant differences between the two rates. Performance comparisons were based on the Chi-square test of statistical significance with a p value of <0.05.
NA = A Not Applicable audit finding because the MCP’s denominator was too small to report (less than 30). ↓ = Statistically significant decrease. ↔ = No statistically significant change. ↑ = Statistically significant increase.
93 American Heart Association. Statistical Fact Sheet 2012 Update. High Blood Pressure. Available at:
http://www.heart.org/idc/groups/heart-public/@wcm/@sop/@smd/documents/downloadable/ucm_319587.pdf. Accessed on: July 10, 2015.
94 The Mayo Clinic: High blood pressure (hypertension). Complications. Available at: http://www.mayoclinic.org/diseases-conditions/high-blood-pressure/basics/complications/con-20019580. Accessed on: July 10, 2015.

SPECIALTY MCP PERFORMANCE MEASURE RESULTS
2015 HEDIS Aggregate Report Page 170 California Department of Health Care Services Health Services Advisory Group, Inc.
Summary of Results—Controlling High Blood Pressure
AIDS Healthcare Foundation’s rate for the Controlling High Blood Pressure measure showed no statistically significant change from RY 2014 to RY 2015. The rate continued to be just under the Healthy People 2020 goal.

SPECIALTY MCP PERFORMANCE MEASURE RESULTS
2015 HEDIS Aggregate Report Page 171 California Department of Health Care Services Health Services Advisory Group, Inc.
Colorectal Cancer Screening
Measure Definition
The Colorectal Cancer Screening measure calculates the percentage of members 50 to 75 years of age who had appropriate screening for colorectal cancer.
Importance95
Not counting skin cancers, colorectal cancer is the third most common cancer found in men and women in the United States. Overall, the lifetime risk of developing colorectal cancer is about 1 in 20. Colorectal cancer is the third leading cause of cancer-related deaths in the United States when men and women are considered separately, and the second leading cause of death when both sexes are combined. The death rate from colorectal cancer has been declining for more than 20 years. One reason is that there are fewer cases, and with preventive colorectal cancer screening, polyps can be found and removed before they become cancerous.
The American Cancer Society’s most recent estimates for colorectal cancer in the United States are for 2014:
About 96,830 new cases of colon cancer.
About 40,000 new cases of rectal cancer.
About 50,310 deaths from colorectal cancer.
Colorectal cancer screening saves lives. Screening can find precancerous polyps—abnormal growths in the colon or rectum—so that they can be removed before turning into cancer. Screening also helps find colorectal cancer at an early stage, when treatment often leads to a cure.
95 American Cancer Society. What are the key statistics about colorectal cancer? Available at:
http://www.cancer.org/cancer/colonandrectumcancer/detailedguide/colorectal-cancer-key-statistics. Accessed on: July 10, 2015.
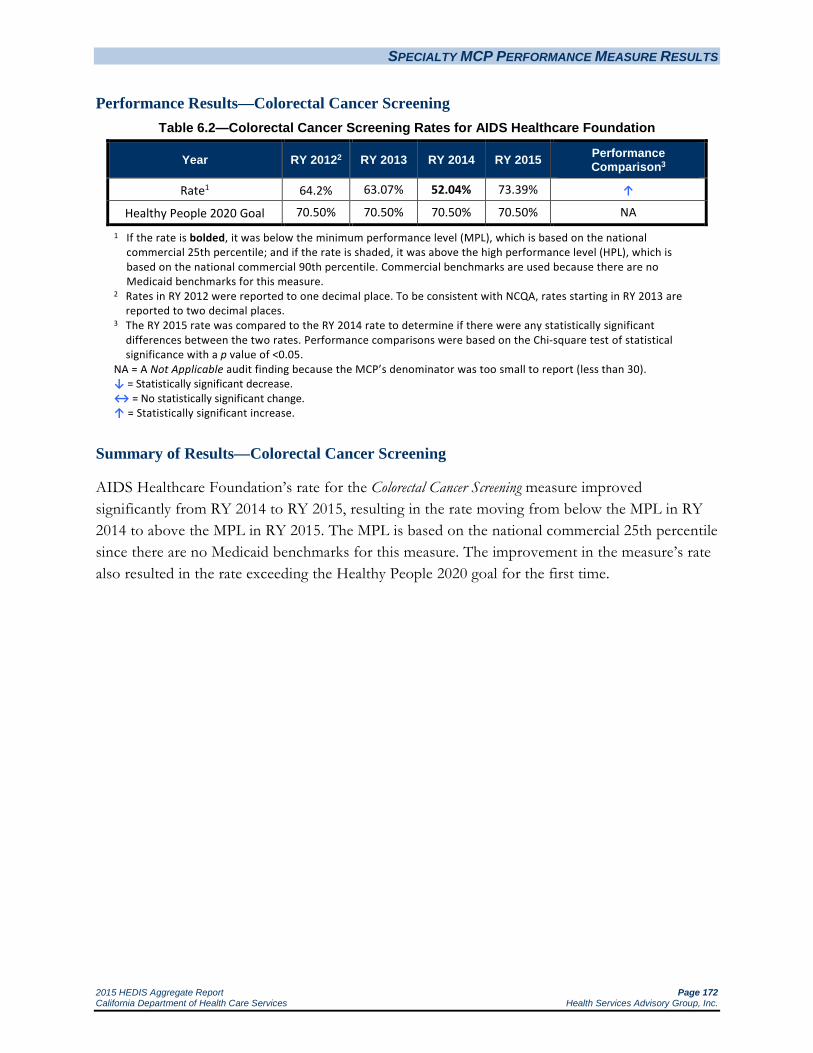
SPECIALTY MCP PERFORMANCE MEASURE RESULTS
2015 HEDIS Aggregate Report Page 172 California Department of Health Care Services Health Services Advisory Group, Inc.
Performance Results—Colorectal Cancer Screening Table 6.2—Colorectal Cancer Screening Rates for AIDS Healthcare Foundation
Year RY 20122 RY 2013 RY 2014 RY 2015 Performance Comparison3
Rate1 64.2% 63.07% 52.04% 73.39% ↑
Healthy People 2020 Goal 70.50% 70.50% 70.50% 70.50% NA
1 If the rate is bolded, it was below the minimum performance level (MPL), which is based on the national commercial 25th percentile; and if the rate is shaded, it was above the high performance level (HPL), which is based on the national commercial 90th percentile. Commercial benchmarks are used because there are no Medicaid benchmarks for this measure.
2 Rates in RY 2012 were reported to one decimal place. To be consistent with NCQA, rates starting in RY 2013 are reported to two decimal places.
3 The RY 2015 rate was compared to the RY 2014 rate to determine if there were any statistically significant differences between the two rates. Performance comparisons were based on the Chi-square test of statistical significance with a p value of <0.05.
NA = A Not Applicable audit finding because the MCP’s denominator was too small to report (less than 30). ↓ = Statistically significant decrease. ↔ = No statistically significant change. ↑ = Statistically significant increase.
Summary of Results—Colorectal Cancer Screening
AIDS Healthcare Foundation’s rate for the Colorectal Cancer Screening measure improved significantly from RY 2014 to RY 2015, resulting in the rate moving from below the MPL in RY 2014 to above the MPL in RY 2015. The MPL is based on the national commercial 25th percentile since there are no Medicaid benchmarks for this measure. The improvement in the measure’s rate also resulted in the rate exceeding the Healthy People 2020 goal for the first time.

SPECIALTY MCP PERFORMANCE MEASURE RESULTS
2015 HEDIS Aggregate Report Page 173 California Department of Health Care Services Health Services Advisory Group, Inc.
Family Mosaic Project
Family Mosaic Project, operated by the City and County of San Francisco Department of Public Health, is a specialty MCP in San Francisco County. Family Mosaic Project became operational with MCMC in February 1993.
Family Mosaic Project is part of the Child, Youth & Family System of Care operated by the City and County of San Francisco Department of Public Health, Community Behavioral Health Services. The MCP provides MCMC services to children and adolescents at risk for out-of-home placement with intensive case management and wraparound services through a capitation agreement. To receive MCMC services, the MCP’s member must meet specific enrollment criteria, including being a San Francisco resident between 3 and 18 years of age, having serious mental health care needs, and being at imminent risk of out-of-home placement or already in an out-of-home placement. Family Mosaic Project submits appropriate clients to DHCS for approval to be enrolled in Family Mosaic Project MCMC services. Once a client is approved and under Family Mosaic Project’s contract with DHCS, the MCP receives a per-member, per-month capitated rate to provide mental health and related wraparound services to these beneficiaries.
Due to the unique services Family Mosaic Project provides, standardized HEDIS measures are not appropriate. For RY 2015, the MCP reported on the Out-of-Home Placements measure for the fourth consecutive year and on the School Attendance measure for the second consecutive year. Both measures were developed in consultation with HSAG and approved by DHCS.
Reduce Rate of Out-of-Home Placements
Measure Definition
The percentage of members enrolled in Family Mosaic Project who were discharged to an out-of-home placement (foster care, group home, or residential treatment facility) during the measurement period.
Importance
Research has shown adverse effects on the health and well-being of children and adolescents who were placed out-of-home in foster care, group home, and residential treatment facilities, as well as community treatment facilities.96 Out-of-home placements can be overly restrictive and contribute to behavioral health deterioration. Ensuring that beneficiaries are maintained in a home-like setting is one goal of Family Mosaic Project.
96 Family Mosaic Project. Quality Improvement Project, Reducing the Rate of Out-of-Home Placements, 2010 submission.

SPECIALTY MCP PERFORMANCE MEASURE RESULTS
2015 HEDIS Aggregate Report Page 174 California Department of Health Care Services Health Services Advisory Group, Inc.
Performance Results—Out-of-Home Placements Table 6.3—Out-of-Home Placements Rates* for Family Mosaic Project
Year RY 2012 RY 2013 RY 2014 RY 2015 Performance Comparison2
Rate1 6.3% 4.1% S S ↔
* There is no MPL or HPL for this measure. 1 The rate for this measure was reported to one decimal place in RY 2012 and RY 2013; however, in RY 2014, the
rate was reported to two decimal places. 2 The RY 2015 rate was compared to the RY 2014 rate to determine if there were any statistically significant
differences between the two rates. Performance comparisons were based on the Chi-square test of statistical significance with a p value of <0.05.
S = The MCP’s measure was reportable based on performance measure validation audit results; however, since there are fewer than 11 cases in the numerator of this measure, DHCS suppresses displaying the rate in this report to satisfy the Health Insurance Portability and Accountability Act of 1996 Privacy Rule’s de-identification standard.
↓ = Statistically significant decrease. ↔ = No statistically significant change. ↑ = Statistically significant increase.
Summary of Results—Out-of-Home Placements
The rate of Out-of-Home Placements showed no statistically significant change from RY 2014 to RY 2015.
School Attendance
Measure Definition
The School Attendance measure indicates the number of capitated Medi-Cal managed care beneficiaries enrolled into Family Mosaic Project with a 2 or 3 in school attendance on the initial Child and Adolescent Needs and Strengths (CANS) outcome/assessment tool and a 2 or 3 in school attendance on the most recent closing CANS during the measurement period.
0 = Child/youth attends school regularly.
1 = Child/youth has some problems attending school but generally goes to school. May miss up to one day per week on average OR may have moderate to severe problem in the past six months but has been attending school regularly in the past month.
2 = Child/youth is having problems with school attendance. He/she is missing at least two days per week.
3 = Child/youth is generally truant or refusing to go to school/mental health admission to an inpatient hospital facility during the measurement period.

SPECIALTY MCP PERFORMANCE MEASURE RESULTS
2015 HEDIS Aggregate Report Page 175 California Department of Health Care Services Health Services Advisory Group, Inc.
Importance
Family Mosaic Project’s data showed that school attendance is a marked problem for children and youth within the MCP. In response, Family Mosaic Project focused on increasing the rate of school attendance for its beneficiaries ages 6 to 18 years. Using the CANS outcome/assessment tool, the MCP aimed to reduce the percentage of beneficiaries identified in the tool as having missed school at least two days per week on average, were generally truant, or refused to go to school.
Performance Results—School Attendance
Table 6.4—School Attendance* for Family Mosaic Project
Year RY 2014 RY 2015 Performance Comparison1
Rate S S ↔
* There is no MPL or HPL for this measure. 1 The RY 2015 rate was compared to the RY 2014 rate to determine if there were any
statistically significant differences between the two rates. Performance comparisons were based on the Chi-square test of statistical significance with a p value of <0.05.
S = The MCP’s measure was reportable based on performance measure validation audit results; however, since there are fewer than 11 cases in the numerator of this measure, DHCS suppresses displaying the rate in this report to satisfy the Health Insurance Portability and Accountability Act of 1996 Privacy Rule’s de-identification standard.
↓ = Statistically significant decrease. ↔ = No statistically significant change. ↑ = Statistically significant increase.
Summary of Results—School Attendance
The rate for the School Attendance measure showed no statistically significant change from RY 2014 to RY 2015.

SPECIALTY MCP PERFORMANCE MEASURE RESULTS
2015 HEDIS Aggregate Report Page 176 California Department of Health Care Services Health Services Advisory Group, Inc.
SCAN Health Plan
SCAN Health Plan is a Fully-Integrated Dual-Eligible Special Needs Plan (FIDE-SNP) that contracts with DHCS as a specialty MCP for elderly beneficiaries who reside in Los Angeles, Riverside, and San Bernardino counties and who are dually eligible under both the Medicare and Medi-Cal programs.
SCAN Health Plan provides a full range of health care services for elderly beneficiaries who are dually eligible, including comprehensive medical coverage, prescription benefits, and support services specifically designed to enhance the ability of its beneficiaries to manage their health and remain independent. SCAN became operational in Los Angeles County with MCMC in 1985 and expanded into Riverside and San Bernardino counties in 1997.
SCAN Health Plan’s RY 2015 performance measures were the Breast Cancer Screening and Osteoporosis Management in Women Who Had a Fracture HEDIS measures.
Breast Cancer Screening
Measure Definition
The Breast Cancer Screening measure is reported using only the administrative method. This measure calculates the percentage of women 50 through 74 years of age who had a mammogram to screen for breast cancer.
Importance
Breast cancer is one of the most prevalent cancers and is the second leading cause of cancer deaths among women. There is a one-in-eight lifetime risk that a woman in the United States will develop breast cancer.97 The risk factors and mortality rate vary across age and racial/ethnic groups. Although breast cancer rates are higher among Caucasian women, the breast cancer mortality rate is higher in African American women. Older women are more at risk for breast cancer than younger women. Women ages 50 years and older have an 80 percent chance of developing breast cancer. Since there is no cure, early detection is the key in fighting breast cancer.98
Since breast cancer is not preventable, screening tests that allow for the detection of cancer in the early stages is the preeminent method to reduce mortality.99 Screenings typically detect tumors at 97 National Committee for Quality Assurance. The State of Health Care Quality 2013: NCQA; 2013. 98 Susan G. Komen Foundation. About Breast Cancer. Available at: http://www.komenmiaftl.org/understanding-breast-
cancer/about-breast-cancer/. Accessed on: July 10, 2015. 99 USPSTF. Screening for breast cancer: U.S. Preventive Services Task Force Recommendation Statement. Annals of
Internal Medicine. 2009; 151(10): 716–726, W-236.

SPECIALTY MCP PERFORMANCE MEASURE RESULTS
2015 HEDIS Aggregate Report Page 177 California Department of Health Care Services Health Services Advisory Group, Inc.
an earlier stage of development (i.e., Stage I) than those found outside of screening and can detect cancer in women without symptoms.100,101 For women 50 to 69 years of age, mammogram screenings decrease breast cancer mortality by up to 35 percent.102
In addition to the personal loss, breast cancer accounts for substantial costs to the U.S. health care system. It is estimated that breast cancer in the United States costs $7 billion per year, and a significant portion is spent on late-stage treatment. Treatment for breast cancer detected in earlier stages costs significantly less than treatment for more advanced stages.103
Performance Results—Breast Cancer Screening
Table 6.5—Breast Cancer Screening Rates for SCAN Health Plan
Year RY 20122 RY 2013 RY 2014 RY 2015 Performance Comparison3
Rate1 79.9% 81.42% 74.90% 80.30% ↑
Healthy People 2020 Goal 81.10% 81.10% 81.10% 81.10% NA 1 If the rate is bolded, it was below the minimum performance level (MPL), which is based on the national Medicaid
25th percentile; and if the rate is shaded, it was above the high performance level (HPL), which is based on the national Medicaid 90th percentile.
2 Rates in RY 2012 were reported to one decimal place. To be consistent with NCQA, rates starting in RY 2013 are reported to two decimal places.
3 The RY 2015 rate was compared to the RY 2014 rate to determine if there were any statistically significant differences between the two rates. Performance comparisons were based on the Chi-square test of statistical significance with a p value of <0.05.
NA = A Not Applicable audit finding because the MCP’s denominator was too small to report (less than 30). ↓ = Statistically significant decrease. ↔ = No statistically significant change. ↑ = Statistically significant increase.
Summary of Results—Breast Cancer Screening
The rate for the Breast Cancer Screening measure improved significantly from RY 2014 to RY 2015 and remained above the national Medicaid 90th percentile (HPL) for the third consecutive year. While the rate improved significantly from RY 2014 to RY 2015, it remained below the Healthy People 2020 goal.
100 National Committee for Quality Assurance. The State of Health Care Quality 2009: NCQA; 2009. 101 Redondo, Maximino, Funez, Rafael, Medina-Cano, Francisco, et al. Detection Methods Predict Differences in
Biology and survival in Breast Cancer Patients. BMC Cancer. 2012; 12(604). Available at: http://www.biomedcentral.com/1471-2407/12/604. Accessed on September 13, 2015.
102 National Committee for Quality Assurance. The State of Health Care Quality 2009: NCQA; 2009. 103 National Committee for Quality Assurance. The State of Health Care Quality 2013: NCQA; 2013.

SPECIALTY MCP PERFORMANCE MEASURE RESULTS
2015 HEDIS Aggregate Report Page 178 California Department of Health Care Services Health Services Advisory Group, Inc.
Osteoporosis Management in Women Who Had a Fracture
Measure Definition
This measure is used to assess the percentage of women 67 to 85 years of age who suffered a fracture and who had either a bone mineral density (BMD) test or prescription for a drug to treat osteoporosis in the six months after the fracture.
Importance
Osteoporosis is a skeletal disorder characterized by compromised bone strength that puts a person at increased risk for fractures. Morbidity and mortality related to osteoporotic fractures are major health issues. Nine million Americans have osteoporosis, and another 48 million are at risk for osteoporosis due to low bone mass. Eighty percent of people with osteoporosis are women. Approximately 1.5 million fractures annually can be linked to osteoporosis.104
Treatment of osteoporosis and fractures is estimated at $17–22 billion annually in the United States. It is estimated that there will be a 50 percent increase in the number of fractures and costs associated with those fractures by 2025.105 The aging United States population is likely to increase the future financial cost of osteoporosis care.
Performance Results—Osteoporosis Management in Women Who Had a Fracture
Table 6.6—Osteoporosis Management in Women Who Had a Fracture Rates for SCAN Health Plan
Year RY 20122 RY 2013 RY 2014 RY 2015 Performance Comparison3
Rate1 27.7% 28.40% 41.14% 51.95% ↔
1 If the rate is bolded, it was below the minimum performance level (MPL), which is based on the national Medicare 25th percentile; and if the rate is shaded, it was above the high performance level (HPL), which is based on the national Medicare 90th percentile.
2 Rates in RY 2012 were reported to one decimal place. To be consistent with NCQA, rates starting in RY 2013 are reported to two decimal places.
3 The RY 2015 rate was compared to the RY 2014 rate to determine if there were any statistically significant differences between the two rates. Performance comparisons were based on the Chi-square test of statistical significance with a p value of <0.05.
↓ = Statistically significant decrease. ↔ = No statistically significant change. ↑ = Statistically significant increase.
Summary of Results—Osteoporosis Management in Women Who Had a Fracture
SCAN Health Plan’s rate for the Osteoporosis Management in Women Who Had a Fracture measure showed no statistically significant change from RY 2014 to RY 2015.
104 Ibid. 105 National Committee for Quality Assurance. The State of Health Care Quality 2013: NCQA; 2013.
2015 HEDIS Aggregate Report Page 179 California Department of Health Care Services Health Services Advisory Group, Inc.
7. AMBULATORY CARE USE OF SERVICES MEASURE RESULTS
Utilization information can be helpful to MCPs in reviewing patterns of suspected under- and overutilization of services; however, data should be used with caution as high and low rates do not necessarily indicate better or worse performance. For this reason, DHCS does not establish performance thresholds for these measures, and HSAG does not provide comparative analysis.
Ambulatory Care
Measure Definition
This measure summarizes utilization of ambulatory care in the following categories:
Outpatient visits
Emergency department (ED) visits
Outpatient visits include office visits or routine visits to hospital outpatient departments. Emergency rooms often deliver nonemergency care.106
Importance
Use of services measures provide information about how MCPs manage the provision of care to their beneficiaries as well as how those MCPs use and manage resources. However, use of services measures are not totally controlled by the MCPs and are affected by many beneficiary characteristics which can vary greatly among MCPs and include age and sex, current medical condition, socioeconomic status, and regional practice patterns. The results of these measures should be considered informational and a starting point for discussion about how resources are used, the extent of care, and possible inappropriate care.107
106 National Quality Measures Clearinghouse. Measure Summary, Ambulatory care: summary of utilization of ambulatory care in
the following categories: outpatient visits and emergency department visits. AHRQ. 2010. Available at: http://www.qualitymeasures.ahrq.gov/content.aspx?id=48733&search=ambulatory+care+outpatient. .Accessed on:
July 10, 2015. 107 Ibid.

AMBULATORY CARE USE OF SERVICES MEASURE RESULTS
2015 HEDIS Aggregate Report Page 180 California Department of Health Care Services Health Services Advisory Group, Inc.
Performance Results—Ambulatory Care—Outpatient Visits
273.09283.14 298.16
272.82
100
150
200
250
300
350
400
450
500
550
600
HEDIS 2012 HEDIS 2013 HEDIS 2014 HEDIS 2015
Visit
s per
1,00
0 Mem
ber M
onths
*
Medi-Cal Managed Care Weighted Average MCP County Rates
*Member months are a member's "contribution" to the total yearly membership.
Note:♦ The percentages displayed on this chart represent the Medi-Cal Weighted Average for each year displayed.♦ Not all MCP counties that contributed to the previous years' Medi-Cal Weighted Averages are shown.♦ Only MCP counties that reported data for HEDIS 2015 are shown and these MCP counties may not have reported data in prior years.

AMBULATORY CARE USE OF SERVICES MEASURE RESULTS
2015 HEDIS Aggregate Report Page 181 California Department of Health Care Services Health Services Advisory Group, Inc.
Medi-Cal Managed Care HEDIS 2015 Ambulatory Care—Outpatient Visits
143.82170.14172.89
191.03198.90201.00
207.58209.28209.85212.47
229.06230.36232.63233.52234.71
241.84244.43248.98251.63253.37256.82257.12257.36
272.48272.82274.08275.87280.75
288.23288.72289.58290.72292.88297.12298.94299.04301.62302.48
311.82317.42
327.12331.00331.93333.19
341.47354.46
366.29369.40
438.97443.05446.79447.02
454.21469.28
0 50 100 150 200 250 300 350 400 450 500
Visits per 1,000 Member Months*
Health Net Community Solutions, Inc. - San Joaquin Health Net Community Solutions, Inc. - Los Angeles Health Net Community Solutions, Inc. - Sacramento
Anthem Blue Cross Partnership Plan - Alameda Anthem Blue Cross Partnership Plan - Sacramento
Anthem Blue Cross Partnership Plan - Contra Costa Health Net Community Solutions, Inc. - San Diego
Gold Coast Health Plan - Ventura
DHCS did not require a Minimum Performance Level and High Performance Level for this measure because high and low rates do not necessarily indicate better or worse performance.
*Member months are a member's "contribution" to the total yearly membership.
Note: HEDIS 2015 rates reflect 2014 measurement year data.
Anthem Blue Cross Partnership Plan - Santa Clara
Anthem Blue Cross Partnership Plan - Region 2 Health Net Community Solutions, Inc. - Kern
Health Net Community Solutions, Inc. - Stanislaus
Anthem Blue Cross Partnership Plan - Fresno Santa Clara Family Health Plan - Santa Clara
Anthem Blue Cross Partnership Plan - San Benito Health Plan of San Joaquin - San Joaquin
Inland Empire Health Plan - Riverside/San Bernardino Partnership HealthPlan of CA - Northeast Partnership HealthPlan of CA - Northwest
CalOptima - Orange Contra Costa Health Plan - Contra Costa
California Health & Wellness Plan - Region 2 Kern Health Systems - Kern
2015 Medi-Cal Managed Care Weighted Average Health Plan of San Joaquin - Stanislaus
Alameda Alliance for Health - Alameda Anthem Blue Cross Partnership Plan - Kings
Community Health Group Partnership Plan - San Diego
Anthem Blue Cross Partnership Plan - San Francisco
Anthem Blue Cross Partnership Plan - Madera CalViva Health - Kings
Central CA Alliance for Health - Monterey/Santa Cruz Anthem Blue Cross Partnership Plan - Region 1
Central CA Alliance for Health - Merced CalViva Health - Fresno
California Health & Wellness Plan - Imperial L.A. Care Health Plan - Los Angeles
CenCal Health - Santa Barbara Health Net Community Solutions, Inc. - Tulare Anthem Blue Cross Partnership Plan - Tulare
CalViva Health - Madera Partnership HealthPlan of CA - Southeast
California Health & Wellness Plan - Region 1 Partnership HealthPlan of CA - Southwest
CenCal Health - San Luis Obispo Molina Healthcare of CA - Riverside/San Bernardino
Care 1st Partner Plan, LLC - San Diego San Francisco Health Plan - San Francisco
Health Plan of San Mateo - San Mateo Molina Healthcare of CA - San Diego
Molina Healthcare of CA - Imperial KP Cal LLC (Kaiser NorCal) - KP North Molina Healthcare of CA - Sacramento KP Cal LLC (Kaiser SoCal) - San Diego

AMBULATORY CARE USE OF SERVICES MEASURE RESULTS
2015 HEDIS Aggregate Report Page 182 California Department of Health Care Services Health Services Advisory Group, Inc.
Performance Results—Ambulatory Care—Emergency Department Visits
39.64
43.1542.06
40.45
20
30
40
50
60
70
80
HEDIS 2012 HEDIS 2013 HEDIS 2014 HEDIS 2015
Visit
s per
1,00
0 Mem
ber M
onths
*
Medi-Cal Managed Care Weighted Average MCP County Rates
*Member months are a member's "contribution" to the total yearly membership.
Note:♦ The percentages displayed on this chart represent the Medi-Cal Weighted Average for each year displayed.♦ Not all MCP counties that contributed to the previous years' Medi-Cal Weighted Averages are shown.♦ Only MCP counties that reported data for HEDIS 2015 are shown and these MCP counties may not have reported data in prior years.

AMBULATORY CARE USE OF SERVICES MEASURE RESULTS
2015 HEDIS Aggregate Report Page 183 California Department of Health Care Services Health Services Advisory Group, Inc.
Medi-Cal Managed Care HEDIS 2015 Ambulatory Care—Emergency Department Visits
22.5225.76
27.1330.0930.9131.0131.7633.0033.9934.3234.9835.1735.8836.06
39.2139.8540.2940.4541.1441.47
43.2045.1745.3945.8246.2246.3947.61
49.6549.7349.8350.0150.0450.5850.6550.7651.03
53.4854.2154.9955.7456.1356.2156.7856.8157.3958.0158.8359.5759.9060.36
61.7461.92
64.2268.85
0 10 20 30 40 50 60 70 80 90 100
Visits per 1,000 Member Months*
Health Net Community Solutions, Inc. - Los Angeles Health Net Community Solutions, Inc. - San Diego
Health Net Community Solutions, Inc. - Tulare
Health Net Community Solutions, Inc. - Sacramento CalViva Health - Madera
Health Net Community Solutions, Inc. - San Joaquin CalViva Health - Fresno
KP Cal LLC (Kaiser SoCal) - San Diego
DHCS did not require a Minimum Performance Level and High Performance Level for this measure because high and low rates do not necessarily indicate better or worse performance.
*Member months are a member's "contribution" to the total yearly membership.
Note: HEDIS 2015 rates reflect 2014 measurement year data.
L.A. Care Health Plan - Los Angeles
San Francisco Health Plan - San Francisco Santa Clara Family Health Plan - Santa Clara
CalOptima - Orange
Alameda Alliance for Health - Alameda Health Net Community Solutions, Inc. - Kern
Gold Coast Health Plan - Ventura
Molina Healthcare of CA - Riverside/San Bernardino CalViva Health - Kings
2015 Medi-Cal Managed Care Weighted Average Health Net Community Solutions, Inc. - Stanislaus
Anthem Blue Cross Partnership Plan - Tulare Central CA Alliance for Health - Monterey/Santa Cruz
Anthem Blue Cross Partnership Plan - Santa Clara Health Plan of San Joaquin - San Joaquin
Community Health Group Partnership Plan - San Diego Anthem Blue Cross Partnership Plan - Region 1
California Health & Wellness Plan - Region 1
KP Cal LLC (Kaiser NorCal) - KP North Health Plan of San Mateo - San Mateo
Molina Healthcare of CA - San Diego
Inland Empire Health Plan - Riverside/San Bernardino Partnership HealthPlan of CA - Southwest
Anthem Blue Cross Partnership Plan - Fresno
Central CA Alliance for Health - Merced Kern Health Systems - Kern
Anthem Blue Cross Partnership Plan - San Benito
CenCal Health - Santa Barbara Care 1st Partner Plan, LLC - San Diego
Anthem Blue Cross Partnership Plan - Region 2 Anthem Blue Cross Partnership Plan - Sacramento
Partnership HealthPlan of CA - Northwest Anthem Blue Cross Partnership Plan - Madera
Contra Costa Health Plan - Contra Costa Anthem Blue Cross Partnership Plan - San Francisco
Molina Healthcare of CA - Imperial CenCal Health - San Luis Obispo
Partnership HealthPlan of CA - Southeast
Molina Healthcare of CA - Sacramento California Health & Wellness Plan - Region 2
Anthem Blue Cross Partnership Plan - Contra Costa Health Plan of San Joaquin - Stanislaus
Anthem Blue Cross Partnership Plan - Alameda California Health & Wellness Plan - Imperial
Anthem Blue Cross Partnership Plan - Kings
Partnership HealthPlan of CA - Northeast
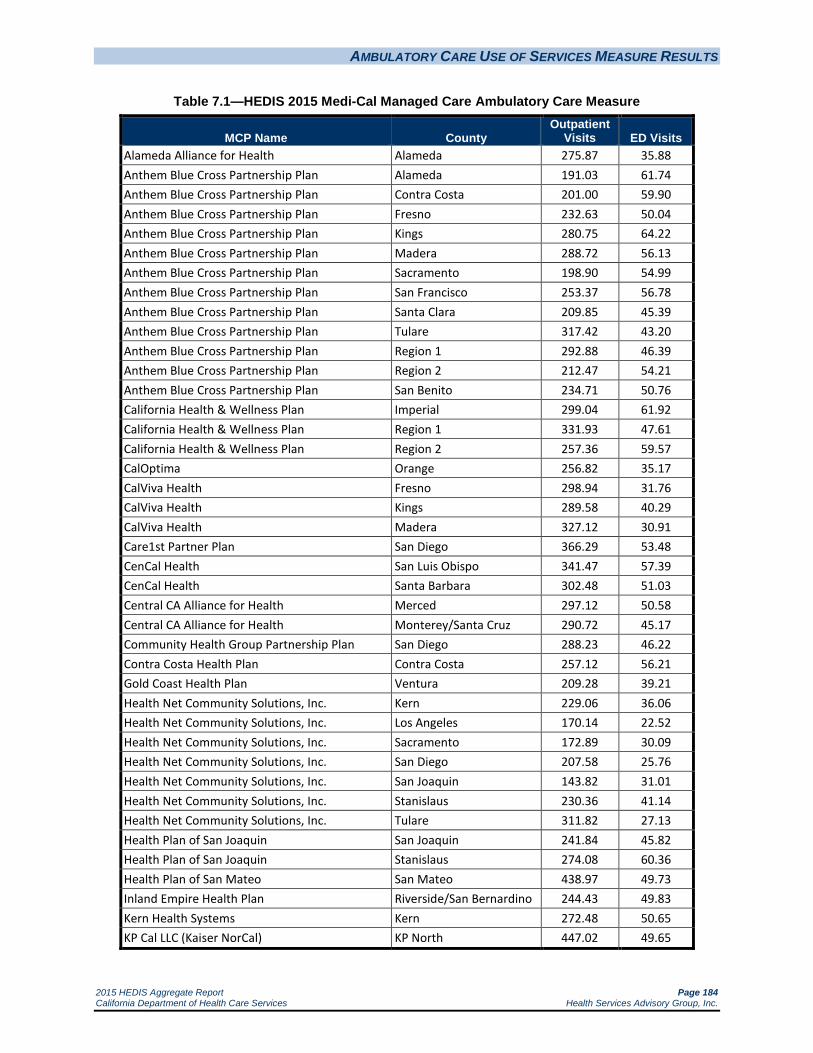
AMBULATORY CARE USE OF SERVICES MEASURE RESULTS
2015 HEDIS Aggregate Report Page 184 California Department of Health Care Services Health Services Advisory Group, Inc.
Table 7.1—HEDIS 2015 Medi-Cal Managed Care Ambulatory Care Measure
MCP Name County Outpatient
Visits ED Visits Alameda Alliance for Health Alameda 275.87 35.88 Anthem Blue Cross Partnership Plan Alameda 191.03 61.74 Anthem Blue Cross Partnership Plan Contra Costa 201.00 59.90 Anthem Blue Cross Partnership Plan Fresno 232.63 50.04 Anthem Blue Cross Partnership Plan Kings 280.75 64.22 Anthem Blue Cross Partnership Plan Madera 288.72 56.13 Anthem Blue Cross Partnership Plan Sacramento 198.90 54.99 Anthem Blue Cross Partnership Plan San Francisco 253.37 56.78 Anthem Blue Cross Partnership Plan Santa Clara 209.85 45.39 Anthem Blue Cross Partnership Plan Tulare 317.42 43.20 Anthem Blue Cross Partnership Plan Region 1 292.88 46.39 Anthem Blue Cross Partnership Plan Region 2 212.47 54.21 Anthem Blue Cross Partnership Plan San Benito 234.71 50.76 California Health & Wellness Plan Imperial 299.04 61.92 California Health & Wellness Plan Region 1 331.93 47.61 California Health & Wellness Plan Region 2 257.36 59.57 CalOptima Orange 256.82 35.17 CalViva Health Fresno 298.94 31.76 CalViva Health Kings 289.58 40.29 CalViva Health Madera 327.12 30.91 Care1st Partner Plan San Diego 366.29 53.48 CenCal Health San Luis Obispo 341.47 57.39 CenCal Health Santa Barbara 302.48 51.03 Central CA Alliance for Health Merced 297.12 50.58 Central CA Alliance for Health Monterey/Santa Cruz 290.72 45.17 Community Health Group Partnership Plan San Diego 288.23 46.22 Contra Costa Health Plan Contra Costa 257.12 56.21 Gold Coast Health Plan Ventura 209.28 39.21 Health Net Community Solutions, Inc. Kern 229.06 36.06 Health Net Community Solutions, Inc. Los Angeles 170.14 22.52 Health Net Community Solutions, Inc. Sacramento 172.89 30.09 Health Net Community Solutions, Inc. San Diego 207.58 25.76 Health Net Community Solutions, Inc. San Joaquin 143.82 31.01 Health Net Community Solutions, Inc. Stanislaus 230.36 41.14 Health Net Community Solutions, Inc. Tulare 311.82 27.13 Health Plan of San Joaquin San Joaquin 241.84 45.82 Health Plan of San Joaquin Stanislaus 274.08 60.36 Health Plan of San Mateo San Mateo 438.97 49.73 Inland Empire Health Plan Riverside/San Bernardino 244.43 49.83 Kern Health Systems Kern 272.48 50.65 KP Cal LLC (Kaiser NorCal) KP North 447.02 49.65

AMBULATORY CARE USE OF SERVICES MEASURE RESULTS
2015 HEDIS Aggregate Report Page 185 California Department of Health Care Services Health Services Advisory Group, Inc.
MCP Name County Outpatient
Visits ED Visits KP Cal LLC (Kaiser SoCal) San Diego 469.28 33.00 L.A. Care Health Plan Los Angeles 301.62 33.99 Molina Healthcare of California Partner Plan, Inc. Riverside/San Bernardino 354.46 39.85 Molina Healthcare of California Partner Plan, Inc. Sacramento 454.21 58.83 Molina Healthcare of California Partner Plan, Inc. San Diego 443.05 41.47 Molina Healthcare of California Partner Plan, Inc. Imperial 446.79 56.81 Partnership HealthPlan of California Southwest 333.19 50.01 Partnership HealthPlan of California Southeast 331.00 58.01 Partnership HealthPlan of California Northwest 251.63 55.74 Partnership HealthPlan of California Northeast 248.98 68.85 San Francisco Health Plan San Francisco 369.40 34.32 Santa Clara Family Health Plan Santa Clara 233.52 34.98

2015 HEDIS Aggregate Report Page 186 California Department of Health Care Services Health Services Advisory Group, Inc.
8. SENIORS AND PERSONS WITH DISABILITIES POPULATION
In addition to reporting the External Accountability Set (EAS) in RY 2015, full-scope MCPs were required to report a separate rate for their Seniors and Persons with Disabilities (SPD) population for a selected group of measures. MCPs reported the rates for the SPD population separately via a Microsoft Excel reporting template. The SPD rates were compared to the non-SPD rates to identify statistically significant differences between the two populations.
For RY 2015, DHCS made the following changes to the SPD stratification requirements:
DHCS no longer required the MCPs to stratify for the SPD population for the: Comprehensive Diabetes Care—LDL-C Control (<100 mg/dL) and LDL-C Screening indicators
because NCQA removed these indicators from the HEDIS measures.
Comprehensive Diabetes Care—Blood Pressure Control (<140/90 mm Hg) indicator based on the difference between the stratified populations being small and feedback from the MCPs that the stratification results were minimally beneficial for the MCPs’ quality improvement efforts.
Comprehensive Diabetes Care—HbA1c Control (<8.0 Percent) and Comprehensive Diabetes Care—HbA1c Poor Control (>9.0 Percent) indicators based on DHCS’s research that found the rate for the Comprehensive Diabetes Care—HbA1c Testing indicator is highly correlated with HbA1c control/poor control.
DHCS calculated the SPD rates using encounter data for the following indicators and will report the rates to CMS: Comprehensive Diabetes Care— Eye Exam (Retinal) Performed
Comprehensive Diabetes Care—HbA1c Testing
Comprehensive Diabetes Care—Medical Attention for Nephropathy
In addition to the comparison in this section of the report, Appendix B provides a comparison of RY 2015 SPD rates to the RY 2014 SPD rates, and Appendix C provides a comparison of the RY 2015 Non-SPD rates to the RY 2014 Non-SPD rates.
Performance Measure Results
HSAG conducted statistical significance testing between the SPD and non-SPD rates for each measure using a Chi-square test and displayed this information within the “SPD Compared to Non-SPD” column of the SPD versus non-SPD tables. The following symbols are used to show statistically significant changes:

SENIORS AND PERSONS WITH DISABILITIES POPULATION
2015 HEDIS Aggregate Report Page 187 California Department of Health Care Services Health Services Advisory Group, Inc.
= SPD rates in RY 2015 were significantly higher than the non-SPD rates.
= SPD rates in RY 2015 were significantly lower than the non-SPD rates.
↔ = SPD rates in RY 2015 were not significantly different than the non-SPD rates.
Different symbols () are used to indicate performance differences for All-Cause Readmissions and Comprehensive Diabetes Care—HbA1c Poor Control where a decrease in the rate indicates better performance. A downward triangle () denotes significantly lower performance, as denoted by a
significantly higher SPD rate than the non-SPD rate. An upward triangle () denotes significantly higher performance, as indicated by a significantly lower SPD rate than the non-SPD rate.
Not comparable = A rate comparison could not be made because data were not available for both populations.
NA = A Not Applicable audit finding, meaning that although an MCP may have complied with all applicable specifications, the MCP’s denominator is too small to report (less than 30).
S = The MCP’s measure is publicly reported based on NCQA HEDIS Compliance Audit results; however, since there are fewer than 11 cases in the numerator of this measure, DHCS suppresses displaying the rate in this report to satisfy the Health Insurance Portability and Accountability Act of 1996 Privacy Rule’s de-identification standard.
All-Cause Readmissions
Summary of Results
The SPD population had significantly higher readmissions rates than the non-SPD population for 41 of the 46 reported rates, which represented lower performance. No MCPs demonstrated a statistically significant lower readmission rate for the SPD population when compared to the non-SPD population.
Comparison of RY 2015 SPD Rates to RY 2014 SPD Rates
The SPD rates for 28 MCP counties were significantly higher in RY 2015 when compared to RY 2014, representing lower performance in RY 2015, compared to only three MCP counties having significantly higher SPD rates in RY 2014 when compared to RY 2013.
Comparison of RY 2015 Non-SPD Rates to RY 2014 Non-SPD Rates
The non-SPD rates for 13 MCP counties were significantly higher in RY 2015 when compared to RY 2014, representing lower performance in RY 2015, compared to only two MCP counties having significantly higher non-SPD rates in RY 2014 when compared to RY 2013.

SENIORS AND PERSONS WITH DISABILITIES POPULATION
2015 HEDIS Aggregate Report Page 188 California Department of Health Care Services Health Services Advisory Group, Inc.
Table 8.1—Medi-Cal Managed Care All-Cause Readmissions (Non-HEDIS Measure) SPD versus Non-SPD
HEDIS 2015
MCP Name County Non-SPD Rate
SPD Rate
SPD Compared to
Non-SPD
Total Rate (Non-SPD and SPD)
Alameda Alliance for Health Alameda 13.50% 19.60% 16.44%
Anthem Blue Cross Partnership Plan Alameda 13.26% 25.07% 23.31%
Anthem Blue Cross Partnership Plan Contra Costa 13.75% 17.74% 16.77%
Anthem Blue Cross Partnership Plan Fresno 9.90% 26.58% 21.30%
Anthem Blue Cross Partnership Plan Kings S 17.11% 15.63%
Anthem Blue Cross Partnership Plan Madera 17.35% 25.37% 21.98%
Anthem Blue Cross Partnership Plan Sacramento 7.09% 20.29% 16.76%
Anthem Blue Cross Partnership Plan San Francisco S 25.49% 24.15%
Anthem Blue Cross Partnership Plan Santa Clara 11.06% 19.38% 17.19%
Anthem Blue Cross Partnership Plan Tulare 9.45% 21.19% 16.58%
Anthem Blue Cross Partnership Plan Region 1 11.04% NA Not Comparable 11.04%
Anthem Blue Cross Partnership Plan Region 2 8.39% NA Not Comparable 8.39%
Anthem Blue Cross Partnership Plan San Benito NA NA Not Comparable NA
California Health & Wellness Plan Imperial S NA Not Comparable S
California Health & Wellness Plan Region 1 12.38% NA Not Comparable 13.56%
California Health & Wellness Plan Region 2 S NA Not Comparable 17.65%
CalOptima Orange 14.49% 19.97% 17.60%
CalViva Health Fresno 11.20% 20.99% 17.43%
CalViva Health Kings 9.13% 18.91% 13.94%
CalViva Health Madera 9.80% 20.61% 15.51%
Care1st Partner Plan San Diego 13.92% 19.22% 16.89%
CenCal Health San Luis Obispo 12.06% 12.70% 12.36%
CenCal Health Santa Barbara 9.81% 17.34% 13.80%
Central CA Alliance for Health Merced 14.39% 22.57% 18.49%
Central CA Alliance for Health Monterey/Santa Cruz 11.32% 17.51% 14.30%
Community Health Group Partnership Plan San Diego 15.62% 22.31% 18.76%
Contra Costa Health Plan Contra Costa 10.62% 23.03% 17.35%
Gold Coast Health Plan Ventura 12.80% 22.83% 17.87%
Health Net Community Solutions, Inc. Kern 13.78% 17.40% 15.94%
Health Net Community Solutions, Inc. Los Angeles 12.52% 20.98% 17.29%
Health Net Community Solutions, Inc. Sacramento 12.34% 19.25% 17.19%
Health Net Community Solutions, Inc. San Diego 13.39% 26.64% 24.12%
Health Net Community Solutions, Inc. San Joaquin 15.96% 27.18% 21.67%
Health Net Community Solutions, Inc. Stanislaus 12.35% 17.13% 15.37%

SENIORS AND PERSONS WITH DISABILITIES POPULATION
2015 HEDIS Aggregate Report Page 189 California Department of Health Care Services Health Services Advisory Group, Inc.
MCP Name County Non-SPD Rate
SPD Rate
SPD Compared to
Non-SPD
Total Rate (Non-SPD and SPD)
Health Net Community Solutions, Inc. Tulare 10.34% 14.81% 12.75%
Health Plan of San Joaquin San Joaquin 7.91% 16.82% 12.78%
Health Plan of San Joaquin Stanislaus 8.95% 20.55% 14.29%
Health Plan of San Mateo San Mateo 11.64% 20.91% 16.99%
Inland Empire Health Plan Riverside/San Bernardino 13.43% 21.77% 17.89%
Kern Health Systems Kern 13.32% 23.45% 17.71%
KP Cal LLC (Kaiser NorCal) KP North 14.47% 15.01% 14.84%
KP Cal LLC (Kaiser SoCal) San Diego 9.91% 19.04% 16.14%
L.A. Care Health Plan Los Angeles 13.55% 25.53% 20.83%
Molina Healthcare of California Partner Plan, Inc.
Riverside/San Bernardino 10.87% 19.55% 15.59%
Molina Healthcare of California Partner Plan, Inc.
Sacramento 10.98% 16.14% 15.15%
Molina Healthcare of California Partner Plan, Inc.
San Diego 14.02% 18.01% 16.01%
Molina Healthcare of California Partner Plan, Inc.
Imperial S NA Not Comparable S
Partnership HealthPlan of California Southwest 11.99% 16.07% 14.24%
Partnership HealthPlan of California Southeast 10.71% 16.32% 15.07%
Partnership HealthPlan of California Northwest 10.44% 14.92% 13.22%
Partnership HealthPlan of California Northeast 11.25% 16.60% 14.55%
San Francisco Health Plan San Francisco 9.81% 25.15% 19.71%
Santa Clara Family Health Plan Santa Clara 11.91% 21.25% 16.92%

SENIORS AND PERSONS WITH DISABILITIES POPULATION
2015 HEDIS Aggregate Report Page 190 California Department of Health Care Services Health Services Advisory Group, Inc.
Annual Monitoring for Patients on Persistent Medications
Summary of Results
As in RY 2013 and RY 2014, across all MCPs, the SPD rates were significantly higher than the non-SPD rates for both the Annual Monitoring for Patients on Persistent Medications—ACE Inhibitors or ARBs and Annual Monitoring for Patients on Persistent Medications—Diuretics measures, representing better performance. Also as in previous years, for most MCP counties, HSAG was not able to calculate if there was a statistically significant difference between the SPD and non-SPD rates for the Annual Monitoring for Patients on Persistent Medications—Digoxin measure because many MCP counties had an audit result of “NA” for one or both populations for this measure, meaning that although the MCP complied with all applicable specifications, it had a denominator less than 30 for the measure, resulting in the “NA” audit result.
Annual Monitoring for Patients on Persistent Medications—ACE Inhibitors or ARBs
Twenty-seven MCP counties had SPD rates that were significantly higher than the non-SPD rates in RY 2015.
The SPD rates for seven MCP counties improved significant from RY 2014 to RY 2015 compared to 12 MCP counties from RY 2013 to RY 2014. From RY 2013 to RY 2014, no MCP counties had SPD rates that declined significantly; however, the SPD rates for seven MCP counties declined significantly from RY 2014 to RY 2015.
The non-SPD rates for 11 MCP counties improved significantly from RY 2014 to RY 2015 compared to 13 MCP counties from RY 2013 to RY 2014, and Gold Coast Health Plan—Ventura County was the only MCP county with a non-SPD rate that declined significantly from RY 2014 to RY 2015.
Annual Monitoring for Patients on Persistent Medications—Digoxin
As indicated above, HSAG could not calculate if there was a statistically significant difference between the SPD and non-SPD rates for most MCP counties for the Annual Monitoring for Patients on Persistent Medications—Digoxin measure. For MCP counties where a comparison could be made, there was no statistically significant difference between the SPD and non-SPD rates.
Comparison of RY 2015 SPD rates to RY 2014 SPD rates could only be done for 17 MCP counties, and the rates for all 17 MCP counties declined significantly from RY 2014 to RY 2015.
Comparison of RY 2015 non-SPD rates to RY 2014 non-SPD rates could only be done for three MCP counties, and the rates for all three declined significantly from RY 2014 to RY 2015:
Health Net Community Solutions, Inc.—Los Angeles County

SENIORS AND PERSONS WITH DISABILITIES POPULATION
2015 HEDIS Aggregate Report Page 191 California Department of Health Care Services Health Services Advisory Group, Inc.
Inland Empire Health Plan—Riverside/San Bernardino counties
L.A. Care Health Plan—Los Angeles County
Annual Monitoring for Patients on Persistent Medications—Diuretics
Thirty-two MCP counties had SPD rates that were significantly higher than the non-SPD rates in RY 2015, representing better performance, and no MCP counties had SPD rates that were significantly lower than the non-SPD rates.
The SPD rates for seven MCP counties improved significantly from RY 2014 to RY 2015 compared to 11 MCP counties from RY 2013 to RY 2014. The following MCP counties had SPD rates that declined significantly from RY 2014 to RY 2015:
Central California Alliance for Health—Merced County
Molina Healthcare of California Partner Plan, Inc.—Riverside/San Bernardino counties
The non-SPD rates for 10 MCP counties improved significantly from RY 2014 to RY 2015 compared to 11 counties from RY 2013 to RY 2014. The rate for Gold Coast Health Plan—Ventura County declined significantly from RY 2014 to RY 2015.

SENIORS AND PERSONS WITH DISABILITIES POPULATION
2015 HEDIS Aggregate Report Page 192 California Department of Health Care Services Health Services Advisory Group, Inc.
Table 8.2—Medi-Cal Managed Care Annual Monitoring for Patients on Persistent Medications SPD versus Non-SPD
HEDIS 2015
MCP Name Measure Non-SPD Rate
SPD Rate
SPD Compared to
Non-SPD
Total Rate (Non-SPD and SPD)
Alameda Alliance for Health—Alameda ACE Inhibitors or ARBs 81.83% 85.09% 83.12%
Digoxin 41.77% 54.90% 49.17%
Diuretics 79.71% 84.74% 81.67%
Anthem Blue Cross Partnership Plan—Alameda ACE Inhibitors or ARBs 84.44% 84.97% 84.87%
Digoxin NA NA Not Comparable NA
Diuretics 74.66% 84.52% 82.88%
Anthem Blue Cross Partnership Plan—Contra Costa ACE Inhibitors or ARBs 79.17% 80.60% 80.22%
Digoxin NA NA Not Comparable NA
Diuretics 76.47% 83.95% 81.74%
Anthem Blue Cross Partnership Plan—Fresno ACE Inhibitors or ARBs 80.12% 85.24% 83.15%
Digoxin NA NA Not Comparable NA
Diuretics 80.36% 87.22% 84.60%
Anthem Blue Cross Partnership Plan—Kings ACE Inhibitors or ARBs 82.84% 79.75% 81.16%
Digoxin NA NA Not Comparable NA
Diuretics 73.97% 82.14% 78.92%
Anthem Blue Cross Partnership Plan—Madera ACE Inhibitors or ARBs 75.24% 87.80% 82.02%
Digoxin NA NA Not Comparable NA
Diuretics 79.55% 85.53% 83.33%
Anthem Blue Cross Partnership Plan—Sacramento ACE Inhibitors or ARBs 79.35% 87.82% 85.37%
Digoxin NA NA Not Comparable NA
Diuretics 77.75% 87.67% 85.13%
Anthem Blue Cross Partnership Plan—San Francisco ACE Inhibitors or ARBs 77.98% 81.41% 80.91%
Digoxin NA NA Not Comparable NA
Diuretics 89.13% 83.44% 83.95%
Anthem Blue Cross Partnership Plan—Santa Clara ACE Inhibitors or ARBs 87.56% 85.50% 86.17%
Digoxin NA NA Not Comparable NA
Diuretics 87.01% 85.44% 85.87%
Anthem Blue Cross Partnership Plan—Tulare ACE Inhibitors or ARBs 81.37% 85.03% 83.04%
Digoxin NA NA Not Comparable NA
Diuretics 79.21% 86.70% 82.83%

SENIORS AND PERSONS WITH DISABILITIES POPULATION
2015 HEDIS Aggregate Report Page 193 California Department of Health Care Services Health Services Advisory Group, Inc.
MCP Name Measure Non-SPD Rate
SPD Rate
SPD Compared to
Non-SPD
Total Rate (Non-SPD and SPD)
Anthem Blue Cross Partnership Plan—Region 1 ACE Inhibitors or ARBs 84.36% NA Not Comparable 84.36%
Digoxin NA NA Not Comparable NA
Diuretics 86.83% NA Not Comparable 86.83%
Anthem Blue Cross Partnership Plan—Region 2 ACE Inhibitors or ARBs 77.42% NA Not Comparable 77.42%
Digoxin NA NA Not Comparable NA
Diuretics 80.41% NA Not Comparable 80.41%
Anthem Blue Cross Partnership Plan—San Benito ACE Inhibitors or ARBs NA NA Not Comparable NA
Digoxin NA NA Not Comparable NA
Diuretics NA NA Not Comparable NA
California Health & Wellness Plan—Imperial ACE Inhibitors or ARBs 93.25% 97.40% 93.60%
Digoxin NA NA Not Comparable NA
Diuretics 93.32% 100.0% 93.93%
California Health & Wellness Plan—Region 1 ACE Inhibitors or ARBs 81.51% 82.81% 81.59%
Digoxin NA NA Not Comparable NA
Diuretics 80.84% 87.50% 81.33%
California Health & Wellness Plan—Region 2 ACE Inhibitors or ARBs 81.31% 83.33% 81.43%
Digoxin NA NA Not Comparable NA
Diuretics 82.15% 88.89% 82.69%
CalOptima—Orange ACE Inhibitors or ARBs 88.91% 91.07% 90.07%
Digoxin 46.90% 55.00% 52.78%
Diuretics 87.62% 91.12% 89.44%
CalViva Health—Fresno ACE Inhibitors or ARBs 82.74% 86.47% 84.88%
Digoxin NA 51.11% Not Comparable 47.37%
Diuretics 81.37% 87.20% 84.82%
CalViva Health—Kings ACE Inhibitors or ARBs 77.15% 85.09% 80.17%
Digoxin NA NA Not Comparable NA
Diuretics 78.54% 90.30% 82.83%
CalViva Health—Madera ACE Inhibitors or ARBs 84.62% 88.84% 86.14%
Digoxin NA NA Not Comparable NA
Diuretics 81.77% 85.00% 82.97%
Care1st Partner Plan—San Diego ACE Inhibitors or ARBs 84.75% 85.97% 85.47%
Digoxin NA NA Not Comparable 62.50%
Diuretics 87.75% 87.10% 87.37%

SENIORS AND PERSONS WITH DISABILITIES POPULATION
2015 HEDIS Aggregate Report Page 194 California Department of Health Care Services Health Services Advisory Group, Inc.
MCP Name Measure Non-SPD Rate
SPD Rate
SPD Compared to
Non-SPD
Total Rate (Non-SPD and SPD)
CenCal Health—San Luis Obispo ACE Inhibitors or ARBs 83.10% 84.97% 83.99%
Digoxin NA NA Not Comparable NA
Diuretics 84.36% 85.96% 85.09%
CenCal Health—Santa Barbara ACE Inhibitors or ARBs 83.97% 88.66% 86.43%
Digoxin NA NA Not Comparable NA
Diuretics 83.57% 90.32% 87.26%
Central CA Alliance for Health—Merced ACE Inhibitors or ARBs 86.14% 88.89% 87.32%
Digoxin NA NA Not Comparable NA
Diuretics 83.73% 86.44% 84.93%
Central CA Alliance for Health—Monterey/Santa Cruz ACE Inhibitors or ARBs 85.21% 91.91% 88.16%
Digoxin NA 45.71% Not Comparable 50.00%
Diuretics 85.83% 91.83% 88.70%
Community Health Group Partnership Plan—San Diego ACE Inhibitors or ARBs 82.85% 86.30% 84.37%
Digoxin 64.52% 59.02% 60.87%
Diuretics 83.57% 88.70% 85.87%
Contra Costa Health Plan—Contra Costa ACE Inhibitors or ARBs 83.66% 87.44% 85.55%
Digoxin 77.14% 77.08% 77.11%
Diuretics 82.04% 87.23% 84.60%
Gold Coast Health Plan—Ventura ACE Inhibitors or ARBs 79.63% 86.29% 82.14%
Digoxin NA NA Not Comparable 56.25%
Diuretics 80.29% 88.34% 83.27%
Health Net Community Solutions, Inc.—Kern ACE Inhibitors or ARBs 87.59% 87.92% 87.74%
Digoxin NA NA Not Comparable NA
Diuretics 86.56% 89.45% 88.10%
Health Net Community Solutions, Inc.—Los Angeles ACE Inhibitors or ARBs 84.53% 84.74% 84.62%
Digoxin 43.75% 50.23% 48.23%
Diuretics 83.58% 84.98% 84.19%
Health Net Community Solutions, Inc.—Sacramento ACE Inhibitors or ARBs 76.78% 81.51% 79.88%
Digoxin NA 37.25% Not Comparable 38.18%
Diuretics 74.42% 82.32% 79.52%
Health Net Community Solutions, Inc.—San Diego ACE Inhibitors or ARBs 74.66% 86.09% 83.46%
Digoxin NA NA Not Comparable NA
Diuretics 77.67% 86.53% 84.51%

SENIORS AND PERSONS WITH DISABILITIES POPULATION
2015 HEDIS Aggregate Report Page 195 California Department of Health Care Services Health Services Advisory Group, Inc.
MCP Name Measure Non-SPD Rate
SPD Rate
SPD Compared to
Non-SPD
Total Rate (Non-SPD and SPD)
Health Net Community Solutions, Inc.—San Joaquin ACE Inhibitors or ARBs 74.48% 74.47% 74.48%
Digoxin NA NA Not Comparable NA
Diuretics 78.23% 81.48% 79.21%
Health Net Community Solutions, Inc.—Stanislaus ACE Inhibitors or ARBs 78.65% 82.29% 80.74%
Digoxin NA NA Not Comparable 50.00%
Diuretics 83.29% 86.23% 85.11%
Health Net Community Solutions, Inc.—Tulare ACE Inhibitors or ARBs 83.43% 85.33% 84.34%
Digoxin NA NA Not Comparable 42.11%
Diuretics 83.07% 87.97% 85.51%
Health Plan of San Joaquin—San Joaquin ACE Inhibitors or ARBs 79.93% 81.04% 80.51%
Digoxin NA 50.00% Not Comparable 44.23%
Diuretics 78.50% 84.20% 81.60%
Health Plan of San Joaquin—Stanislaus ACE Inhibitors or ARBs 82.84% 89.02% 85.88%
Digoxin NA NA Not Comparable NA
Diuretics 83.86% 88.44% 86.26%
Health Plan of San Mateo—San Mateo ACE Inhibitors or ARBs 86.99% 90.60% 89.51%
Digoxin 56.67% 47.58% 49.35%
Diuretics 86.47% 91.55% 90.03%
Inland Empire Health Plan—Riverside/San Bernardino ACE Inhibitors or ARBs 86.53% 89.54% 87.85%
Digoxin 50.35% 53.23% 52.36%
Diuretics 85.29% 88.93% 86.93%
Kern Health Systems—Kern ACE Inhibitors or ARBs 88.39% 89.60% 88.78%
Digoxin NA 56.67% Not Comparable 48.08%
Diuretics 87.18% 89.09% 87.85%
KP Cal LLC (Kaiser NorCal)—KP North ACE Inhibitors or ARBs 93.34% 96.81% 95.38%
Digoxin NA NA Not Comparable 72.73%
Diuretics 91.06% 95.86% 93.78%
KP Cal LLC (Kaiser SoCal)—San Diego ACE Inhibitors or ARBs 91.89% 95.32% 93.73%
Digoxin NA NA Not Comparable NA
Diuretics 91.36% 95.71% 93.62%
L.A. Care Health Plan—Los Angeles ACE Inhibitors or ARBs 85.50% 87.63% 86.55%
Digoxin 40.65% 49.29% 47.43%
Diuretics 83.81% 87.55% 85.67%
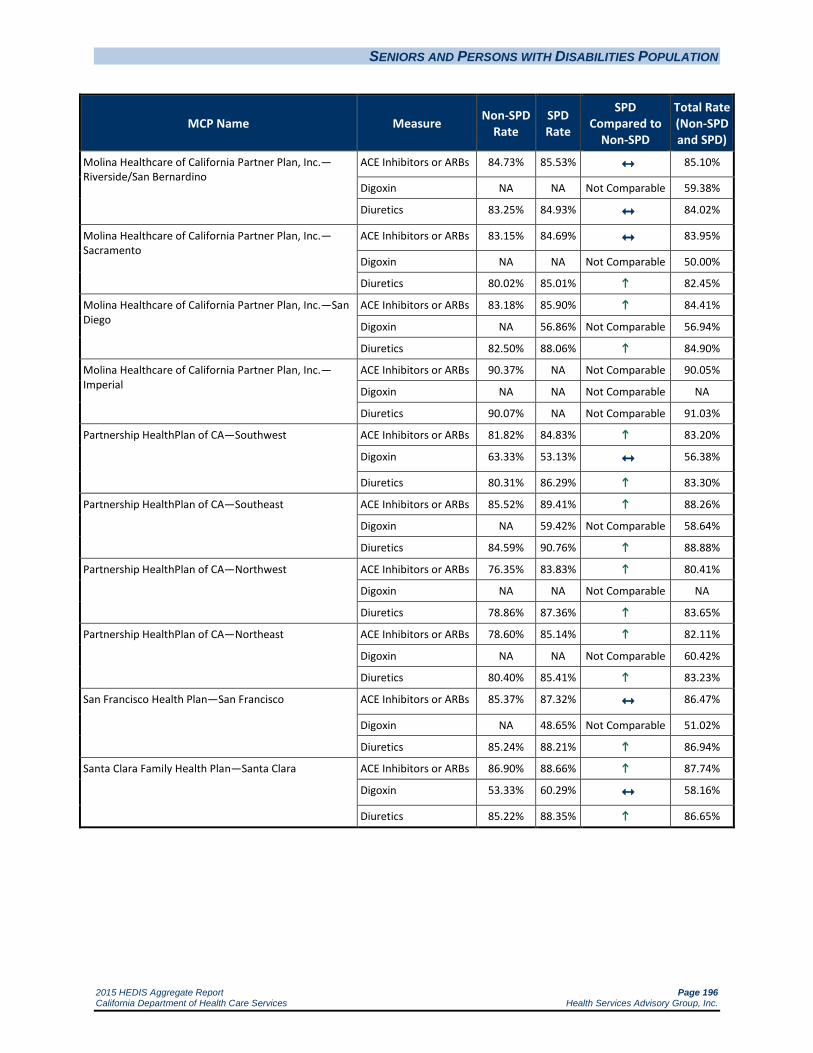
SENIORS AND PERSONS WITH DISABILITIES POPULATION
2015 HEDIS Aggregate Report Page 196 California Department of Health Care Services Health Services Advisory Group, Inc.
MCP Name Measure Non-SPD Rate
SPD Rate
SPD Compared to
Non-SPD
Total Rate (Non-SPD and SPD)
Molina Healthcare of California Partner Plan, Inc.—Riverside/San Bernardino
ACE Inhibitors or ARBs 84.73% 85.53% 85.10%
Digoxin NA NA Not Comparable 59.38%
Diuretics 83.25% 84.93% 84.02%
Molina Healthcare of California Partner Plan, Inc.—Sacramento
ACE Inhibitors or ARBs 83.15% 84.69% 83.95%
Digoxin NA NA Not Comparable 50.00%
Diuretics 80.02% 85.01% 82.45%
Molina Healthcare of California Partner Plan, Inc.—San Diego
ACE Inhibitors or ARBs 83.18% 85.90% 84.41%
Digoxin NA 56.86% Not Comparable 56.94%
Diuretics 82.50% 88.06% 84.90%
Molina Healthcare of California Partner Plan, Inc.—Imperial
ACE Inhibitors or ARBs 90.37% NA Not Comparable 90.05%
Digoxin NA NA Not Comparable NA
Diuretics 90.07% NA Not Comparable 91.03%
Partnership HealthPlan of CA—Southwest ACE Inhibitors or ARBs 81.82% 84.83% 83.20%
Digoxin 63.33% 53.13% 56.38%
Diuretics 80.31% 86.29% 83.30%
Partnership HealthPlan of CA—Southeast ACE Inhibitors or ARBs 85.52% 89.41% 88.26%
Digoxin NA 59.42% Not Comparable 58.64%
Diuretics 84.59% 90.76% 88.88%
Partnership HealthPlan of CA—Northwest ACE Inhibitors or ARBs 76.35% 83.83% 80.41%
Digoxin NA NA Not Comparable NA
Diuretics 78.86% 87.36% 83.65%
Partnership HealthPlan of CA—Northeast ACE Inhibitors or ARBs 78.60% 85.14% 82.11%
Digoxin NA NA Not Comparable 60.42%
Diuretics 80.40% 85.41% 83.23%
San Francisco Health Plan—San Francisco ACE Inhibitors or ARBs 85.37% 87.32% 86.47%
Digoxin NA 48.65% Not Comparable 51.02%
Diuretics 85.24% 88.21% 86.94%
Santa Clara Family Health Plan—Santa Clara ACE Inhibitors or ARBs 86.90% 88.66% 87.74%
Digoxin 53.33% 60.29% 58.16%
Diuretics 85.22% 88.35% 86.65%

SENIORS AND PERSONS WITH DISABILITIES POPULATION
2015 HEDIS Aggregate Report Page 197 California Department of Health Care Services Health Services Advisory Group, Inc.
Children and Adolescents’ Access to Primary Care Practitioners
Summary of Results
Children and Adolescents’ Access to Primary Care Practitioners—12 to 24 Months
For most MCP counties, HSAG was not able to calculate if there was a statistically significant difference between the SPD and non-SPD rates for the Children and Adolescents’ Access to Primary Care Practitioners—12 to 24 Months measure because many MCP counties had an audit result of “NA” for one or both populations for this measure, meaning that although the MCP complied with all applicable specifications, it had a denominator less than 30 for the measure, resulting in the “NA” audit result. As in RY 2014, in RY 2015 no MCP counties had SPD rates that were significantly higher than the non-SPD rates. The SPD rates for the following MCP counties were significantly lower than the non-SPD rates, demonstrating lower performance:
CalOptima—Orange County
CalViva Health—Fresno County
Central California Alliance for Health—Monterey/Santa Cruz counties
Gold Coast Health Plan—Ventura County
Health Net Community Solutions, Inc.—Los Angeles County and Sacramento County
L.A. Care Health Plan—Los Angeles County
Santa Clara Family Health Plan—Santa Clara County
For most MCP counties, HSAG was not able to calculate if there was statistically significant difference between the RY 2014 SPD rate and the RY 2015 SPD rate. For the MCP counties where comparison could be made, the SPD rates for the following MCP counties declined significantly from RY 2014 to RY 2015:
CalOptima—Orange County
CalViva Health—Fresno County
Health Net Community Solutions, Inc.—Sacramento County
The non-SPD rates for 32 MCP counties/regions declined significantly from RY 2014 to RY 2015.

SENIORS AND PERSONS WITH DISABILITIES POPULATION
2015 HEDIS Aggregate Report Page 198 California Department of Health Care Services Health Services Advisory Group, Inc.
Children and Adolescents’ Access to Primary Care Practitioners—25 Months to 6 Years
The SPD rates for the following MCP counties/regions were significantly higher than the non-SPD rates in RY 2015, demonstrating better performance:
Alameda Alliance for Health—Alameda County
Anthem Blue Cross Partnership Plan—Kings County
Central California Alliance for Health—Monterey/Santa Cruz counties
Inland Empire Health Plan—Riverside/San Bernardino counties
Kaiser NorCal—KP North
Partnership HealthPlan of California—Northeast
The SPD rates for the following MCP counties were significantly lower than the non-SPD rates in RY 2015, demonstrating lower performance:
Anthem Blue Cross Partnership Plan—San Francisco County and Santa Clara County
CalOptima—Orange County
Care1st Partner Plan—San Diego County
Health Net Community Solutions, Inc.—Los Angeles County and San Diego County
Health Plan of San Mateo—San Mateo County
San Francisco Health Plan—San Francisco County
Santa Clara Family Health Plan—Santa Clara County
The SPD rates for Anthem Blue Cross Partnership Plan—Kings County and L.A. Care Health Plan—Los Angeles County improved significantly from RY 2014 to RY 2015.
The SPD rates for Health Plan of San Joaquin—Stanislaus County and Santa Clara Family Health Plan—Santa Clara County declined significantly from RY 2014 to RY 2015.
The non-SPD rates for six MCP counties improved significantly from RY 2014 to RY 2015 compared to 22 MCP counties from RY 2013 to RY 2014:
Anthem Blue Cross Partnership Plan—Alameda County, Fresno County, Kings County, and Tulare County
Kaiser SoCal—San Diego County
L.A. Care Health Plan—Los Angeles County

SENIORS AND PERSONS WITH DISABILITIES POPULATION
2015 HEDIS Aggregate Report Page 199 California Department of Health Care Services Health Services Advisory Group, Inc.
The non-SPD rates for 29 MCP counties declined significantly from RY 2014 to RY 2015 compared to five MCP counties from RY 2013 to RY 2014.
Children and Adolescents’ Access to Primary Care Practitioners—7 to 11 Years
The SPD rates for the following MCP counties/regions were significantly higher than the non-SPD rates in RY 2015, demonstrating better performance:
CalViva Health—Fresno County
Gold Coast Health Plan—Ventura County
Inland Empire Health Plan—Riverside/San Bernardino County
Kaiser NorCal—KP North
The SPD rates for the following MCP counties were significantly lower than the non-SPD rates in RY 2015, demonstrating lower performance:
CalOptima—Orange County
Care1st Partner Plan—San Diego County
CenCal Health—San Luis Obispo County
Community Health Group Partnership Plan—San Diego County
Health Net Community Solutions, Inc.—Los Angeles County and San Diego County
Health Plan of San Mateo—San Mateo County
San Francisco Health Plan—San Francisco County
Santa Clara Family Health Plan—Santa Clara County
No SPD rates declined significantly from RY 2014 to RY 2015, and the SPD rates for the following MCP counties improved significantly from RY 2014 to RY 2015:
CalOptima—Orange County
Gold Coast Health Plan—Ventura County
L.A. Care Health Plan—Los Angeles County
The non-SPD rates for 13 MCP counties improved significantly from RY 2014 to RY 2015, and the non-SPD rates for the following MCP counties declined significantly from RY 2014 to RY 2015:
Alameda Alliance for Health—Alameda County
Central California Alliance for Health—Monterey/Santa Cruz counties
Molina Healthcare of California Partner Plan, Inc.—Sacramento County

SENIORS AND PERSONS WITH DISABILITIES POPULATION
2015 HEDIS Aggregate Report Page 200 California Department of Health Care Services Health Services Advisory Group, Inc.
Children and Adolescents’ Access to Primary Care Practitioners—12 to 19 Years
The SPD rates for the following MCP counties/regions were significantly higher than the non-SPD rates in RY 2015, demonstrating better performance:
Health Plan of San Joaquin—Stanislaus County
Kaiser NorCal—KP North
Seventeen MCP counties/regions had SPD rates that were significantly lower than the non-SPD rates in RY 2015.
The SPD rates for the following MCP counties improved significantly from RY 2014 to RY 2015:
Anthem Blue Cross Partnership Plan—Alameda County and Fresno County
CalOptima—Orange County
Gold Coast Health Plan—Ventura County
Health Net Community Solutions, Inc.—Los Angeles County
L.A. Care Health Plan—Los Angeles County
The SPD rates for Care1st Partner Plan—San Diego County and Santa Clara Family Health Plan—Santa Clara County declined significantly from RY 2014 to RY 2015.
The non-SPD rates for 13 MCP counties improved significantly from RY 2014 to RY 2015 compared to five MCP counties from RY 2013 to RY 2014. The non-SPD rates for four MCP counties declined significantly from RY 2014 to RY 2015 compared to 20 MCP counties from RY 2013 to RY 2014:
Alameda Alliance for Health—Alameda County
Central California Alliance for Health—Monterey/Santa Cruz counties
Health Plan of San Joaquin—Stanislaus County
Inland Empire Health Plan—Riverside/San Bernardino counties

SENIORS AND PERSONS WITH DISABILITIES POPULATION
2015 HEDIS Aggregate Report Page 201 California Department of Health Care Services Health Services Advisory Group, Inc.
Table 8.3—Medi-Cal Managed Care Children and Adolescents' Access to Primary Care Practitioners SPD versus Non-SPD
HEDIS 2015
MCP Name Measure Non-SPD Rate
SPD Rate
SPD Compared to
Non-SPD
Total Rate (Non-SPD and SPD)
Alameda Alliance for Health—Alameda 12 to 24 months 88.22% 90.91% 88.24%
25 months to 6 years 81.35% 84.62% 81.44%
7 to 11 years 84.78% 84.47% 84.77%
12 to 19 years 81.92% 77.91% 81.65%
Anthem Blue Cross Partnership Plan—Alameda 12 to 24 months 87.00% NA Not Comparable 87.06%
25 months to 6 years 82.86% 83.43% 82.88%
7 to 11 years 84.81% 80.49% 84.49%
12 to 19 years 80.28% 77.83% 80.02%
Anthem Blue Cross Partnership Plan—Contra Costa 12 to 24 months 93.82% NA Not Comparable 93.77%
25 months to 6 years 85.36% 85.29% 85.36%
7 to 11 years 88.73% 85.92% 88.50%
12 to 19 years 87.49% 86.15% 87.31%
Anthem Blue Cross Partnership Plan—Fresno 12 to 24 months 92.83% NA Not Comparable 92.76%
25 months to 6 years 86.11% 88.03% 86.16%
7 to 11 years 85.47% 85.97% 85.49%
12 to 19 years 82.88% 84.57% 83.00%
Anthem Blue Cross Partnership Plan—Kings 12 to 24 months 94.74% NA Not Comparable 94.85%
25 months to 6 years 86.28% 96.30% 86.59%
7 to 11 years 83.64% 88.89% 83.98%
12 to 19 years 86.26% 83.33% 85.98%
Anthem Blue Cross Partnership Plan—Madera 12 to 24 months 95.06% NA Not Comparable 95.07%
25 months to 6 years 92.04% 97.44% 92.14%
7 to 11 years 90.19% 96.67% 90.49%
12 to 19 years 90.21% 88.17% 90.07%
Anthem Blue Cross Partnership Plan—Sacramento 12 to 24 months 92.23% NA Not Comparable 92.27%
25 months to 6 years 81.71% 80.35% 81.66%
7 to 11 years 83.42% 84.38% 83.49%
12 to 19 years 80.99% 80.38% 80.93%

SENIORS AND PERSONS WITH DISABILITIES POPULATION
2015 HEDIS Aggregate Report Page 202 California Department of Health Care Services Health Services Advisory Group, Inc.
MCP Name Measure Non-SPD Rate
SPD Rate
SPD Compared to
Non-SPD
Total Rate (Non-SPD and SPD)
Anthem Blue Cross Partnership Plan—San Francisco 12 to 24 months 90.64% NA Not Comparable 90.76%
25 months to 6 years 85.13% 68.42% 84.62%
7 to 11 years 91.52% 85.42% 91.20%
12 to 19 years 88.26% 81.30% 87.60%
Anthem Blue Cross Partnership Plan—Santa Clara 12 to 24 months 94.31% NA Not Comparable 94.04%
25 months to 6 years 86.22% 74.68% 86.01%
7 to 11 years 89.02% 84.87% 88.86%
12 to 19 years 86.46% 80.27% 86.24%
Anthem Blue Cross Partnership Plan—Tulare 12 to 24 months 97.22% NA Not Comparable 97.24%
25 months to 6 years 91.15% 93.26% 91.20%
7 to 11 years 91.36% 89.50% 91.28%
12 to 19 years 90.64% 90.29% 90.62%
Anthem Blue Cross Partnership Plan—Region 1 12 to 24 months 96.82% NA Not Comparable 96.82%
25 months to 6 years 87.27% NA Not Comparable 87.27%
7 to 11 years 92.54% NA Not Comparable 92.54%
12 to 19 years 95.74% NA Not Comparable 95.74%
Anthem Blue Cross Partnership Plan—Region 2 12 to 24 months 93.56% NA Not Comparable 93.56%
25 months to 6 years 82.95% NA Not Comparable 82.95%
7 to 11 years 92.77% NA Not Comparable 92.77%
12 to 19 years 93.40% NA Not Comparable 93.40%
Anthem Blue Cross Partnership Plan—San Benito 12 to 24 months 93.08% NA Not Comparable 93.08%
25 months to 6 years 78.23% NA Not Comparable 78.21%
7 to 11 years NA NA Not Comparable NA
12 to 19 years NA NA Not Comparable NA
California Health & Wellness Plan—Imperial 12 to 24 months 98.25% NA Not Comparable 98.15%
25 months to 6 years 89.77% 97.78% 89.84%
7 to 11 years NA NA Not Comparable NA
12 to 19 years NA NA Not Comparable NA
California Health & Wellness Plan—Region 1 12 to 24 months 94.20% NA Not Comparable 94.23%
25 months to 6 years 88.29% 93.10% 88.33%
7 to 11 years NA NA Not Comparable NA
12 to 19 years NA NA Not Comparable NA

SENIORS AND PERSONS WITH DISABILITIES POPULATION
2015 HEDIS Aggregate Report Page 203 California Department of Health Care Services Health Services Advisory Group, Inc.
MCP Name Measure Non-SPD Rate
SPD Rate
SPD Compared to
Non-SPD
Total Rate (Non-SPD and SPD)
California Health & Wellness Plan—Region 2 12 to 24 months 91.35% NA Not Comparable 91.36%
25 months to 6 years 80.58% NA Not Comparable 80.61%
7 to 11 years NA NA Not Comparable NA
12 to 19 years NA NA Not Comparable NA
CalOptima—Orange 12 to 24 months 94.33% 75.19% 94.16%
25 months to 6 years 89.59% 87.18% 89.52%
7 to 11 years 92.88% 88.65% 92.68%
12 to 19 years 90.27% 83.86% 89.96%
CalViva Health—Fresno 12 to 24 months 95.28% 80.95% 95.19%
25 months to 6 years 89.69% 89.91% 89.70%
7 to 11 years 91.36% 93.95% 91.47%
12 to 19 years 87.98% 89.10% 88.04%
CalViva Health—Kings 12 to 24 months 89.65% NA Not Comparable 89.62%
25 months to 6 years 83.59% 81.82% 83.53%
7 to 11 years 86.01% 91.11% 86.25%
12 to 19 years 85.35% 88.24% 85.55%
CalViva Health—Madera 12 to 24 months 95.30% NA Not Comparable 95.37%
25 months to 6 years 91.95% 94.64% 92.02%
7 to 11 years 92.69% 93.33% 92.71%
12 to 19 years 90.64% 87.07% 90.48%
Care1st Partner Plan—San Diego 12 to 24 months 86.15% NA Not Comparable 85.60%
25 months to 6 years 78.31% 59.63% 77.82%
7 to 11 years 81.66% 64.66% 80.73%
12 to 19 years 77.52% 58.79% 76.16%
CenCal Health—San Luis Obispo 12 to 24 months 93.18% NA Not Comparable 93.11%
25 months to 6 years 84.43% 78.76% 84.30%
7 to 11 years 90.17% 83.87% 89.84%
12 to 19 years 89.19% 77.16% 88.33%
CenCal Health—Santa Barbara 12 to 24 months 96.80% NA Not Comparable 96.79%
25 months to 6 years 91.56% 92.95% 91.58%
7 to 11 years 93.82% 91.17% 93.73%
12 to 19 years 90.60% 90.43% 90.59%

SENIORS AND PERSONS WITH DISABILITIES POPULATION
2015 HEDIS Aggregate Report Page 204 California Department of Health Care Services Health Services Advisory Group, Inc.
MCP Name Measure Non-SPD Rate
SPD Rate
SPD Compared to
Non-SPD
Total Rate (Non-SPD and SPD)
Central CA Alliance for Health—Merced 12 to 24 months 95.35% NA Not Comparable 95.28%
25 months to 6 years 89.46% 90.30% 89.48%
7 to 11 years 90.67% 93.41% 90.80%
12 to 19 years 89.23% 84.97% 88.98%
Central CA Alliance for Health—Monterey/Santa Cruz 12 to 24 months 96.05% 84.38% 95.99%
25 months to 6 years 90.14% 93.44% 90.19%
7 to 11 years 92.42% 93.24% 92.44%
12 to 19 years 89.98% 89.19% 89.95%
Community Health Group Partnership Plan—San Diego 12 to 24 months 93.46% NA Not Comparable 93.48%
25 months to 6 years 87.21% 87.44% 87.21%
7 to 11 years 90.27% 88.08% 90.19%
12 to 19 years 85.99% 84.25% 85.92%
Contra Costa Health Plan—Contra Costa 12 to 24 months 94.03% NA Not Comparable 93.94%
25 months to 6 years 84.22% 83.71% 84.21%
7 to 11 years 86.51% 87.52% 86.56%
12 to 19 years 83.96% 81.82% 83.80%
Gold Coast Health Plan—Ventura 12 to 24 months 95.54% 84.21% 95.42%
25 months to 6 years 83.04% 86.37% 83.12%
7 to 11 years 83.01% 89.29% 83.31%
12 to 19 years 81.92% 83.31% 82.01%
Health Net Community Solutions, Inc.—Kern 12 to 24 months 90.57% NA Not Comparable 90.50%
25 months to 6 years 79.49% 75.34% 79.39%
7 to 11 years 71.93% 76.60% 72.20%
12 to 19 years 72.05% 69.12% 71.83%
Health Net Community Solutions, Inc.—Los Angeles 12 to 24 months 92.03% 69.34% 91.83%
25 months to 6 years 80.93% 77.43% 80.84%
7 to 11 years 84.42% 82.75% 84.33%
12 to 19 years 79.84% 75.34% 79.54%
Health Net Community Solutions, Inc.—Sacramento 12 to 24 months 89.13% 73.17% 88.84%
25 months to 6 years 80.12% 81.67% 80.16%
7 to 11 years 80.76% 84.02% 80.97%
12 to 19 years 76.93% 77.37% 76.97%

SENIORS AND PERSONS WITH DISABILITIES POPULATION
2015 HEDIS Aggregate Report Page 205 California Department of Health Care Services Health Services Advisory Group, Inc.
MCP Name Measure Non-SPD Rate
SPD Rate
SPD Compared to
Non-SPD
Total Rate (Non-SPD and SPD)
Health Net Community Solutions, Inc.—San Diego 12 to 24 months 92.45% NA Not Comparable 92.46%
25 months to 6 years 85.13% 75.36% 84.80%
7 to 11 years 88.08% 80.08% 87.52%
12 to 19 years 81.69% 75.00% 81.01%
Health Net Community Solutions, Inc.—San Joaquin 12 to 24 months 86.67% NA Not Comparable 86.51%
25 months to 6 years 69.42% NA Not Comparable 69.64%
7 to 11 years 76.98% NA Not Comparable 77.40%
12 to 19 years 75.17% NA Not Comparable 75.12%
Health Net Community Solutions, Inc.—Stanislaus 12 to 24 months 93.01% NA Not Comparable 92.99%
25 months to 6 years 84.22% 86.89% 84.31%
7 to 11 years 86.31% 87.26% 86.38%
12 to 19 years 82.44% 84.42% 82.60%
Health Net Community Solutions, Inc.—Tulare 12 to 24 months 95.95% NA Not Comparable 95.94%
25 months to 6 years 89.74% 90.75% 89.77%
7 to 11 years 90.28% 91.46% 90.35%
12 to 19 years 88.49% 88.97% 88.53%
Health Plan of San Joaquin—San Joaquin 12 to 24 months 96.14% 100.0% 96.17%
25 months to 6 years 85.08% 83.28% 85.04%
7 to 11 years 86.21% 87.42% 86.27%
12 to 19 years 82.44% 84.27% 82.56%
Health Plan of San Joaquin—Stanislaus 12 to 24 months 92.42% NA Not Comparable 92.46%
25 months to 6 years 84.35% 82.25% 84.31%
7 to 11 years 87.48% 92.06% 87.59%
12 to 19 years 84.41% 89.64% 84.54%
Health Plan of San Mateo—San Mateo 12 to 24 months 93.94% NA Not Comparable 93.89%
25 months to 6 years 89.51% 77.54% 89.21%
7 to 11 years 92.37% 72.75% 91.49%
12 to 19 years 88.43% 69.49% 87.36%
Inland Empire Health Plan—Riverside/San Bernardino 12 to 24 months 94.73% 93.81% 94.72%
25 months to 6 years 84.71% 86.10% 84.75%
7 to 11 years 84.26% 86.29% 84.36%
12 to 19 years 83.10% 82.37% 83.06%

SENIORS AND PERSONS WITH DISABILITIES POPULATION
2015 HEDIS Aggregate Report Page 206 California Department of Health Care Services Health Services Advisory Group, Inc.
MCP Name Measure Non-SPD Rate
SPD Rate
SPD Compared to
Non-SPD
Total Rate (Non-SPD and SPD)
Kern Health Systems—Kern 12 to 24 months 92.75% 95.92% 92.78%
25 months to 6 years 82.85% 85.39% 82.90%
7 to 11 years 82.61% 81.69% 82.59%
12 to 19 years 81.14% 79.74% 81.10%
KP Cal LLC (Kaiser NorCal)—KP North 12 to 24 months 98.80% NA Not Comparable 98.81%
25 months to 6 years 89.69% 94.78% 89.84%
7 to 11 years 89.15% 96.67% 89.49%
12 to 19 years 90.57% 94.39% 90.81%
KP Cal LLC (Kaiser SoCal)—San Diego 12 to 24 months 97.83% NA Not Comparable 97.84%
25 months to 6 years 95.54% 98.89% 95.61%
7 to 11 years 93.01% 95.28% 93.09%
12 to 19 years 92.89% 96.34% 93.00%
L.A. Care Health Plan—Los Angeles 12 to 24 months 92.33% 83.56% 92.26%
25 months to 6 years 84.21% 84.22% 84.21%
7 to 11 years 86.47% 86.87% 86.49%
12 to 19 years 82.42% 81.92% 82.39%
Molina Healthcare of California Partner Plan, Inc.—Riverside/San Bernardino
12 to 24 months 90.92% NA Not Comparable 90.64%
25 months to 6 years 81.89% 80.74% 81.86%
7 to 11 years 84.31% 83.99% 84.29%
12 to 19 years 83.65% 75.52% 83.18%
Molina Healthcare of California Partner Plan, Inc.—Sacramento
12 to 24 months 89.21% NA Not Comparable 89.13%
25 months to 6 years 80.54% 75.00% 80.42%
7 to 11 years 80.57% 77.42% 80.44%
12 to 19 years 80.93% 70.32% 79.99%
Molina Healthcare of California Partner Plan, Inc.—San Diego
12 to 24 months 93.94% NA Not Comparable 93.95%
25 months to 6 years 86.40% 85.64% 86.38%
7 to 11 years 89.86% 88.47% 89.81%
12 to 19 years 87.20% 83.53% 87.03%
Molina Healthcare of California Partner Plan, Inc.—Imperial
12 to 24 months 85.65% NA Not Comparable 85.65%
25 months to 6 years 77.36% NA Not Comparable 77.44%
7 to 11 years NA NA Not Comparable NA
12 to 19 years NA NA Not Comparable NA
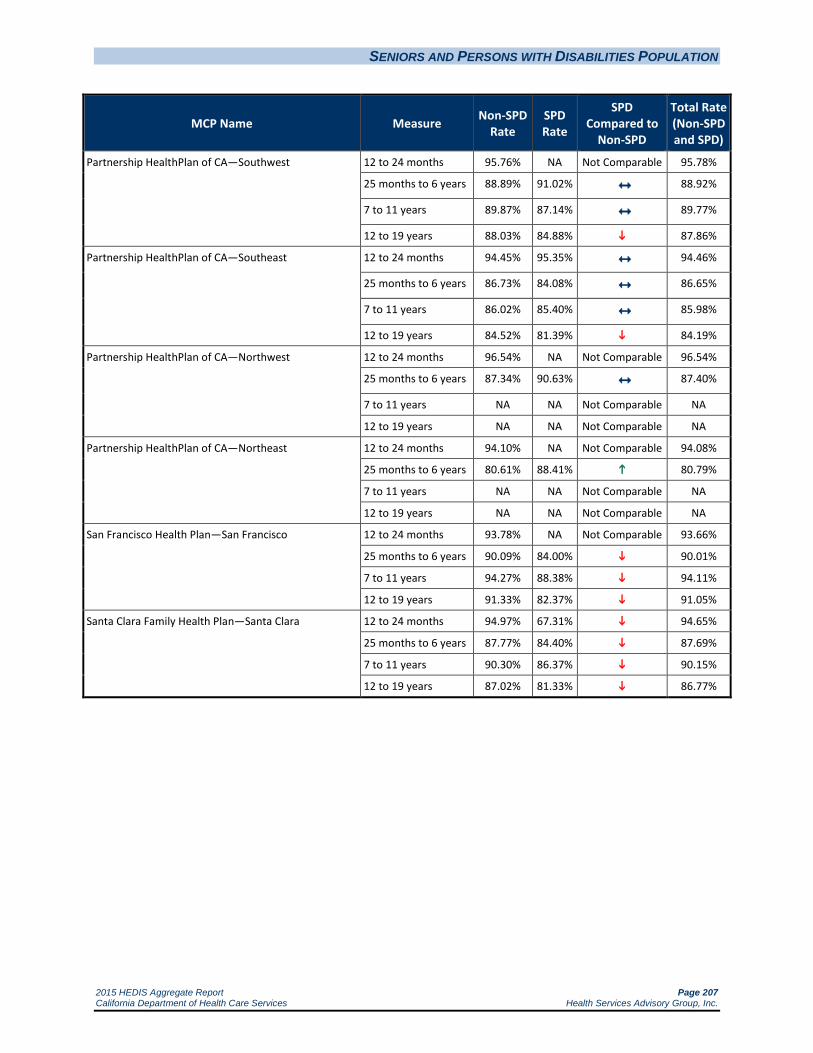
SENIORS AND PERSONS WITH DISABILITIES POPULATION
2015 HEDIS Aggregate Report Page 207 California Department of Health Care Services Health Services Advisory Group, Inc.
MCP Name Measure Non-SPD Rate
SPD Rate
SPD Compared to
Non-SPD
Total Rate (Non-SPD and SPD)
Partnership HealthPlan of CA—Southwest 12 to 24 months 95.76% NA Not Comparable 95.78%
25 months to 6 years 88.89% 91.02% 88.92%
7 to 11 years 89.87% 87.14% 89.77%
12 to 19 years 88.03% 84.88% 87.86%
Partnership HealthPlan of CA—Southeast 12 to 24 months 94.45% 95.35% 94.46%
25 months to 6 years 86.73% 84.08% 86.65%
7 to 11 years 86.02% 85.40% 85.98%
12 to 19 years 84.52% 81.39% 84.19%
Partnership HealthPlan of CA—Northwest 12 to 24 months 96.54% NA Not Comparable 96.54%
25 months to 6 years 87.34% 90.63% 87.40%
7 to 11 years NA NA Not Comparable NA
12 to 19 years NA NA Not Comparable NA
Partnership HealthPlan of CA—Northeast 12 to 24 months 94.10% NA Not Comparable 94.08%
25 months to 6 years 80.61% 88.41% 80.79%
7 to 11 years NA NA Not Comparable NA
12 to 19 years NA NA Not Comparable NA
San Francisco Health Plan—San Francisco 12 to 24 months 93.78% NA Not Comparable 93.66%
25 months to 6 years 90.09% 84.00% 90.01%
7 to 11 years 94.27% 88.38% 94.11%
12 to 19 years 91.33% 82.37% 91.05%
Santa Clara Family Health Plan—Santa Clara 12 to 24 months 94.97% 67.31% 94.65%
25 months to 6 years 87.77% 84.40% 87.69%
7 to 11 years 90.30% 86.37% 90.15%
12 to 19 years 87.02% 81.33% 86.77%

SENIORS AND PERSONS WITH DISABILITIES POPULATION
2015 HEDIS Aggregate Report Page 208 California Department of Health Care Services Health Services Advisory Group, Inc.
Ambulatory Care
Utilization information can be helpful to MCPs in reviewing patterns of suspected under- and overutilization of services; however, data should be used with caution as high and low rates do not necessarily indicate better or worse performance. For this reason, DHCS does not establish performance thresholds for these measures, and HSAG does not provide comparative analysis.
Table 8.4—Medi-Cal Managed Care Ambulatory Care Measure SPD versus Non-SPD
HEDIS 2015
Non-SPD
Visits/1,000 Member Months
SPD Visits/1,000 Member Months
MCP Name County Outpatient Visits
ED Visits
Outpatient Visits
ED Visits
Alameda Alliance for Health Alameda 253.99 32.31 422.12 59.71
Anthem Blue Cross Partnership Plan Alameda 168.72 49.70 279.57 109.49
Anthem Blue Cross Partnership Plan Contra Costa 191.29 53.97 263.60 98.09
Anthem Blue Cross Partnership Plan Fresno 214.46 46.64 380.66 77.75
Anthem Blue Cross Partnership Plan Kings 255.64 58.16 499.29 117.00
Anthem Blue Cross Partnership Plan Madera 267.13 53.49 536.73 86.42
Anthem Blue Cross Partnership Plan Sacramento 174.75 49.78 340.85 85.62
Anthem Blue Cross Partnership Plan San Francisco 207.43 37.25 336.25 92.01
Anthem Blue Cross Partnership Plan Santa Clara 190.87 41.49 311.19 66.24
Anthem Blue Cross Partnership Plan Tulare 296.37 39.08 571.12 92.92
Anthem Blue Cross Partnership Plan Region 1 292.88 46.39 0.00 0.00
Anthem Blue Cross Partnership Plan Region 2 212.47 54.21 0.00 0.00
Anthem Blue Cross Partnership Plan San Benito 234.43 50.77 308.82 49.02
California Health & Wellness Plan Imperial 294.65 61.43 585.22 94.32
California Health & Wellness Plan Region 1 325.44 46.76 608.59 83.85
California Health & Wellness Plan Region 2 253.23 59.01 454.03 86.17
CalOptima Orange 227.07 33.33 536.97 52.48
CalViva Health Fresno 294.85 30.78 336.48 40.72
CalViva Health Kings 278.19 38.54 399.51 57.15
CalViva Health Madera 320.60 30.13 406.08 40.34
Care1st Partner Plan San Diego 345.87 49.57 478.22 74.91
CenCal Health San Luis Obispo 313.29 53.41 646.84 100.46
CenCal Health Santa Barbara 280.68 47.04 595.81 104.75
Central CA Alliance for Health Merced 280.19 48.28 509.74 79.54
Central CA Alliance for Health Monterey/Santa Cruz 275.69 43.18 520.95 75.65
Community Health Group Partnership Plan San Diego 265.64 44.00 488.98 65.87

SENIORS AND PERSONS WITH DISABILITIES POPULATION
2015 HEDIS Aggregate Report Page 209 California Department of Health Care Services Health Services Advisory Group, Inc.
Non-SPD
Visits/1,000 Member Months
SPD Visits/1,000 Member Months
MCP Name County Outpatient Visits
ED Visits
Outpatient Visits
ED Visits
Contra Costa Health Plan Contra Costa 242.58 52.20 338.92 78.73
Gold Coast Health Plan Ventura 196.26 37.05 397.29 70.45
Health Net Community Solutions, Inc. Kern 226.19 33.30 248.74 55.00
Health Net Community Solutions, Inc. Los Angeles 173.02 21.65 150.49 28.53
Health Net Community Solutions, Inc. Sacramento 169.33 28.31 191.02 39.16
Health Net Community Solutions, Inc. San Diego 218.65 24.93 155.22 29.69
Health Net Community Solutions, Inc. San Joaquin 142.99 29.20 153.04 51.30
Health Net Community Solutions, Inc. Stanislaus 225.96 38.34 261.19 60.78
Health Net Community Solutions, Inc. Tulare 305.08 25.50 375.32 42.48
Health Plan of San Joaquin San Joaquin 225.18 43.63 401.82 70.82
Health Plan of San Joaquin Stanislaus 254.18 56.92 535.60 105.69
Health Plan of San Mateo San Mateo 351.81 47.21 803.65 60.26
Inland Empire Health Plan Riverside/San Bernardino
225.61 46.76 452.07 83.70
Kern Health Systems Kern 259.98 47.95 488.71 97.43
KP Cal LLC (Kaiser NorCal) KP North 383.06 44.28 899.26 87.64
KP Cal LLC (Kaiser SoCal) San Diego 408.75 29.60 972.64 61.23
L.A. Care Health Plan Los Angeles 284.50 31.16 450.94 58.66
Molina Healthcare of California Partner Plan, Inc.
Riverside/San Bernardino
335.56 37.13 571.37 71.10
Molina Healthcare of California Partner Plan, Inc.
Sacramento 384.77 54.54 799.21 80.14
Molina Healthcare of California Partner Plan, Inc.
San Diego 398.66 38.26 913.25 75.48
Molina Healthcare of California Partner Plan, Inc.
Imperial 440.92 55.82 899.94 132.65
Partnership HealthPlan of California Southwest 306.70 45.75 590.09 91.33
Partnership HealthPlan of California Southeast 276.89 51.68 602.57 89.77
Partnership HealthPlan of California Northwest 224.69 48.98 420.22 98.05
Partnership HealthPlan of California Northeast 221.32 62.01 413.55 109.59
San Francisco Health Plan San Francisco 331.26 27.68 621.71 78.27
Santa Clara Family Health Plan Santa Clara 216.50 33.98 399.37 44.71
2015 HEDIS Aggregate Report Page 210 California Department of Health Care Services Health Services Advisory Group, Inc.
9. FINDINGS, CONCLUSIONS, AND RECOMMENDATIONS
This report displays 2015 HEDIS results. When applicable, the results are compared to DHCS-established minimum and high performance levels and national benchmarks and MCP-specific results are displayed in order of performance. A comparison of performance gives both DHCS and MCPs a framework in which to identify opportunities to improve care. This section provides a summary of the findings and conclusions for full-scope MCPs and recommendations for DHCS related to full-scope and specialty MCPs.
Background
In order to ensure understanding of the findings included in this section, the reader should note the following:
Full-scope MCPs are required to report to DHCS the rates for 30 measures. All are HEDIS measures except the All-Cause Readmissions measure.
HSAG calculated RY 2015 MCMC weighted averages for all measures using MCP-reported rates and weighting them according to each MCP’s reported eligible population size for the measure. A weighted average is a better estimate of care for all beneficiaries than is a straight average of the MCPs’ performance.
DHCS does not establish MPLs and HPLs for the following measures:
All-Cause Readmissions—initially developed for the statewide collaborative QIP.
Ambulatory Care—Outpatient Visits and Emergency Department Visits because they are utilization measures, and high and low rates do not necessarily indicate better or worse performance.
Although MPLs and HPLs were established for the following measures, DHCS did not hold the MCPs accountable to meet the MPLs for these measures for RY 2015 (i.e., the MCPs were not required to submit an improvement plan if their rates for the measure were below the MPLs):
All four Children and Adolescents’ Access to Primary Care Practitioners measures—due to the small range of variation between the MPL and HPL threshold for each measure.
Annual Monitoring for Patients on Persistent Medications—Digoxin—Denominators are small for this indicator, and each individual counted toward the denominator would be expected to be counted toward the ACE Inhibitors or ARBs and Diuretics denominators since these patients generally receive all three medications. Furthermore, serum digoxin concentration measurement as part of routine monitoring is not evidence-based and is not recommended by the American College of Cardiology or American Heart Association (see http://circ.ahajournals.org/content/113/21/2556.full.pdf+html).

FINDINGS, CONCLUSIONS, AND RECOMMENDATIONS
2015 HEDIS Aggregate Report Page 211 California Department of Health Care Services Health Services Advisory Group, Inc.
HSAG compares results of 26 measures to the following benchmarks. (Note that of the 30 required measures, the All-Cause Readmissions, Ambulatory Care, and Annual Monitoring for Patients on Persistent Medications—Digoxin measures are excluded from the comparisons in this section of the report.)
National Medicaid 25th percentile (i.e., MPL) as reported by NCQA for all measures except Comprehensive Diabetes Care—HbA1c Poor Control (>9.0 Percent), which is compared to the national Medicaid 90th percentile because a higher rate indicates worse performance for this measure.
National Medicaid 90th percentile (i.e., HPL) as reported by NCQA for all measures except Comprehensive Diabetes Care—HbA1c Poor Control (>9.0 Percent), which is compared to the national Medicaid 10th percentile because a lower rate indicates better performance for this measure.
National Medicaid average.
National commercial average.
Healthy People 2020 (for measures with a comparable Healthy People 2020 goal).
Note: Based on the availability of the benchmark data, the data used for comparisons are from the prior year’s rates. For example, the MCMC weighted averages reported for HEDIS 2015, representing calendar year 2014 data, are compared to the national HEDIS 2014 benchmarks, which represent calendar year 2013 data.
Performance Measure HEDIS Compliance Audit—Key Findings
HSAG conducted performance measure validation of all Medi-Cal MCPs. All MCPs were able to report valid rates for their DHCS-required measures, and all MCPs were compliant with the information systems standards.
Comparisons to National Benchmarks
Below is a summary of the RY 2015 MCMC weighted averages compared to the MPLs, national Medicaid averages, national commercial averages, and Healthy People 2020 goals (as applicable) for the 26 measures compared to the benchmarks for the analyses.
Comparison to the Minimum Performance Levels and Changes from RY 2014 to RY 2015
The weighted averages for 22 of 26 measures were better than the MPLs in RY 2015 compared to 21 of 26 measures in RY 2014.

FINDINGS, CONCLUSIONS, AND RECOMMENDATIONS
2015 HEDIS Aggregate Report Page 212 California Department of Health Care Services Health Services Advisory Group, Inc.
The weighted averages for the following measures improved significantly from RY 2014 to RY 2015:
Annual Monitoring for Patients on Persistent Medications—ACE or ARBs and Diuretics, resulting in the rate for the ACE or ARBs measure moving from below the MPL in RY 2014 to above the MPL in RY 2015
Children and Adolescents’ Access to Primary Care Practitioners—7 to 11 Years and 12 to 19 Years
Comprehensive Diabetes Care—Eye Exam (Retinal) Performed, HbA1c Testing, and HbA1c Poor Control (>9.0 Percent)
Controlling High Blood Pressure
Weight Assessment and Counseling for Nutrition and Physical Activity for Children/Adolescents—BMI Assessment: Total and Physical Activity Counseling: Total
The weighted average for the Prenatal and Postpartum Care—Postpartum Care measure also improved from RY 2014 to RY 2015, and although the improvement was not statistically significant, the change resulted in the rate moving from below the MPL in RY 2014 to above the MPL in RY 2015.
The weighted averages for the following measures were below DHCS’s established MPLs:
Annual Monitoring for Patients on Persistent Medications—Digoxin
All four Children and Adolescents’ Access to Primary Care Practitioners measures.
o 12 to 24 Months and 25 Months to 6 Years (for the third consecutive year)
o 7 to 11 Years and 12 to 19 Years (for the fourth consecutive year)
Comparison to National Medicaid Averages
The weighted averages for 14 of 26 measures were better than the national Medicaid averages for the measures, with 13 of the rates better than the national Medicaid averages for three or more consecutive years.
The weighted averages for 12 of 26 measures were below the national Medicaid averages for the measures, with eight of the rates below the national Medicaid averages for three or more consecutive years.
Comparison to National Commercial Averages
The weighted averages for eight of 26 measures were above the national commercial averages for the measures, with six of the rates better than the national commercial averages for three or more consecutive years.
The weighted averages for 18 of 26 measures were lower than the national commercial averages for the measures, with 15 of the rates falling short of the national commercial averages for three or more consecutive years.

FINDINGS, CONCLUSIONS, AND RECOMMENDATIONS
2015 HEDIS Aggregate Report Page 213 California Department of Health Care Services Health Services Advisory Group, Inc.
Comparison to Healthy People 2020 Goals
The weighted average for the Controlling High Blood Pressure measure exceeded the Healthy People 2020 goal for the first time; and for the fifth consecutive year, the weighted averages for the following measures have exceeded the Healthy People 2020 goals for the measures:
Comprehensive Diabetes Care—Blood Pressure Control (<140/90 mm Hg)
Prenatal and Postpartum Care—Timeliness of Prenatal Care
All three Weight Assessment and Counseling for Nutrition and Physical Activity for Children/Adolescents measures
The weighted averages for the following measures fell short of the Healthy People 2020 goals for the measures:
Cervical Cancer Screening
Comprehensive Diabetes Care—Eye Exam (Retinal) Performed and HbA1c Poor Control (>9.0 Percent) (for five consecutive years)
High and Low Managed Care Health Plan County Performance
Three MCP counties/regions demonstrated high performance across the EAS, exceeding the HPLs for 13 or more of 26 measures:
Kaiser SoCal—San Diego County: 21 measures with rates above the HPLs, and no measures with rates below the MPLs.
Kaiser NorCal—KP North: 18 measures with rates above the HPLs, and one measure with a rate below the MPL.
San Francisco Health Plan—San Francisco County: 13 measures with rates above the HPLs, and two measures with rates below the MPLs.
Twenty-two MCP counties/regions showed the greatest opportunity for improvement by having 10 or more measures below the DHCS-established MPLs:
Alameda Alliance for Health—Alameda County (13 measures)
Anthem Blue Cross Partnership Plan—Alameda County (13 measures), Fresno County (10 measures), Kings County (15 measures), Region 2 (13 measures), Sacramento County (13 measures), and San Benito (13 counties). (Note: RY 2015 was the first year Anthem Blue Cross Partnership Plan reported rates for Region 2 and San Benito County. Therefore, DHCS did not require the MCP to submit improvement plans for rates below the MPLs for the region/county.)

FINDINGS, CONCLUSIONS, AND RECOMMENDATIONS
2015 HEDIS Aggregate Report Page 214 California Department of Health Care Services Health Services Advisory Group, Inc.
California Health & Wellness Plan—Region 1 (12 measures) and Region 2 (12 measures) (Note: RY 2015 was the first year California Health & Wellness Plan reported rates for Region 1 and Region 2. Therefore, DHCS did not hold the MCP accountable to meet the MPLs for these regions [i.e., the MCP was not required to submit improvement plans for rates below the MPLs for the regions])
Cal Viva Health—Kings County (11 measures)
Care1st Partner Plan—San Diego County (10 measures)
Health Net Community Solutions, Inc.—Los Angeles County (10 measures), Sacramento County (11 measures) San Diego County (10 measures), San Joaquin County (10 measures), and Stanislaus county (10 measures)
Health Plan of San Joaquin—Stanislaus County (11 measures)
Molina Healthcare of California Partner Plan, Inc.—Riverside/San Bernardino counties (14 measures), Sacramento County (13 measures), and Imperial County (13 measures) (Note: RY 2015 was the first year Molina Healthcare of California Partner Plan, Inc., reported rates for Imperial County. Therefore, DHCS did not hold the MCP accountable to meet the MPLs for this county [i.e., the MCP was not required to submit improvement plans for rates below the MPLs for the county])
Partnership HealthPlan of California—Northwest (11 measures) and Northeast (13 measures) (Note: RY 2015 was the first year Partnership HealthPlan of California reported rates for these two regions. Therefore, DHCS did not hold the MCP accountable to meet the MPLs for these regions [i.e., the MCP was not required to submit improvement plans for rates below the MPLs for the regions])
Notable Performance Measures
The performance measure results were mixed in that some rates improved from RY 2014 to RY 2015, some declined, and some remained relatively stable. The MCPs performed the best on the following measures:
Use of Imaging Studies for Low Back Pain
For the fifth consecutive year, the MCMC weighted average for this measure exceeded the national Medicaid 25th percentile (MPL) and national Medicaid and commercial averages for the measure.
Of the 53 MCP counties/regions with reportable rates in RY 2015, 14 MCP counties/regions had rates above the HPL. The rates for eight MCP counties/regions have been above the HPL for three or more consecutive years.
Of the 41 MCP counties/regions for which comparisons can be made, the rate for one MCP county improved significantly from RY 2014 to RY 2015. Additionally, the rates for two

FINDINGS, CONCLUSIONS, AND RECOMMENDATIONS
2015 HEDIS Aggregate Report Page 215 California Department of Health Care Services Health Services Advisory Group, Inc.
other MCP counties improved, and although the improvement was not statistically significant, the change resulted in the rates moving from below the MPL in RY 2014 to above the MPL in RY 2015.
Three MCP counties/regions had rates below the MPL for this measure, and four rates declined significantly from RY 2014 to RY 2015. (Note: The rates for two of the MCP counties below the MPL in RY 2015 were first-year reported rates and DHCS therefore did not hold the MCPs accountable to meet the MPL for these counties [i.e., the MCPs were not required to submit an improvement plan if their rates for the measure were below the MPL].)
Weight Assessment and Counseling for Nutrition and Physical Activity for Children/Adolescents—BMI Assessment: Total
For the fifth consecutive year, the MCMC weighted average was higher than the national Medicaid 25th percentile (MPL), national Medicaid and commercial averages, and Healthy People 2020 goal for this measure.
All 53 MCP reporting units had reportable rates for this measure in RY 2015. The rates for 15 MCP counties/regions were above the HPL, and no MCP county/regional rates were below the MPL. The rates for five MCP counties have been above the HPL for three or more consecutive years.
Of the 42 MCP counties/regions for which comparisons can be made, the rates for 29 MCP counties/regions improved significantly from RY 2014 to RY 2015.
Of the 42 MCP counties/regions for which comparisons can be made, the rate for one MCP county declined significantly from RY 2014 to RY 2015 compared to 11 MCP counties’ rates declining from RY 2013 to RY 2014.
Weight Assessment and Counseling for Nutrition and Physical Activity for Children/Adolescents—Nutrition Counseling: Total
For the fifth consecutive year, the MCMC weighted average for this measure exceeded the national Medicaid 25th percentile (MPL) national Medicaid and commercial averages, and Healthy People 2020 goal for this measure.
All 53 MCP reporting units had reportable rates for this measure in RY 2015. The rates for 11 MCP counties/regions were above the HPL for this measure. The rates for five MCP counties have been above the HPL for three or more consecutive years.
Of the 42 MCP counties/regions for which comparisons can be made, the rates for 18 MCP counties/regions improved significantly from RY 2014 to RY 2015, resulting in the rates for six MCP counties/regions improving from below the MPL in RY 2014 to above the MPL in RY 2015.
Of the 53 MCP reporting units with reportable rates in RY 2015, the rates for four regions were below the MPL; however, RY 2015 was the first year the MCPs reported rates for the

FINDINGS, CONCLUSIONS, AND RECOMMENDATIONS
2015 HEDIS Aggregate Report Page 216 California Department of Health Care Services Health Services Advisory Group, Inc.
regions and DHCS therefore did not hold the MCPs accountable to meet the MPL for these regions (i.e., the MCPs were not required to submit an improvement plan if their rates for the measure were below the MPL.)
Weight Assessment and Counseling for Nutrition and Physical Activity for Children/Adolescents—Physical Activity: Total
For the fifth consecutive year, the MCMC weighted average for this measure was above the national Medicaid 25th percentile, national Medicaid and commercial averages, and Healthy People 2020 goal for the measure.
All 53 MCP reporting units had reportable rates for this measure in RY 2015. The rates for nine MCP counties/regions were above the HPL for this measure. The rates for five MCP counties have been above the HPL for three or more consecutive years.
Of the 42 MCP counties/regions for which comparisons can be made, the rates for 16 MCP counties/regions improved significantly from RY 2014 to RY 2015, resulting in the rates for two MCP counties moving from below the MPL in RY 2014 to above the MPL in RY 2015.
Of the 42 MCP counties/regions for which comparisons can be made, the rates for two MCP counties declined significantly. The rate for one other MCP county declined, and although the decline was not statistically significant, the change resulted in the rate moving from above the MPL in RY 2014 to below the MPL in RY 2015. The rates for six MCP regions were below the MPL; however, RY 2015 was the first year the MCPs reported rates for these regions and DHCS therefore did not hold the MCPs accountable to meet the MPL for these regions (i.e., the MCPs were not required to submit an improvement plan if their rates for the measure were below the MPL.)
In addition to the measures noted above, the rates for multiple MCP counties/regions improved significantly from RY 2014 to RY 2015 for the following measures:
Children and Adolescents’ Access to Primary Care Practitioners—7 to 11 Years (15 of 41 MCP counties/regions for which comparisons can be made between RY 2014 and RY 2015)
Children and Adolescents’ Access to Primary Care Practitioners—12 to 19 Years (14 of 41 MCP counties/regions for which comparisons can be made between RY 2014 and RY 2015)
Comprehensive Diabetes Control—HbA1c Testing (12 of 42 MCP counties/regions for which comparisons can be made between RY 2014 and RY 2015)
Comprehensive Diabetes Control—HbA1c Control (<8.0 Percent) (11 of 42 MCP counties/regions for which comparisons can be made between RY 2014 and RY 2015)
Comprehensive Diabetes Control—HbA1c Poor Control (>9.0 Percent) (13 of 42 MCP counties/regions for which comparisons can be made between RY 2014 and RY 2015)
Controlling High Blood Pressure (19 of 42 MCP counties/regions for which comparisons can be made between RY 2014 and RY 2015)

FINDINGS, CONCLUSIONS, AND RECOMMENDATIONS
2015 HEDIS Aggregate Report Page 217 California Department of Health Care Services Health Services Advisory Group, Inc.
Opportunities for Improvement
Although there are many opportunities for improvement, HSAG identified several measures for DHCS to consider as priority areas for improvement based on the number of rates below the DHCS-established MPLs. While some of the rates below the MPLs were for counties/regions reporting rates for the first time, all MCPs with rates below the MPLs should be striving to improve rates to above the MPLs. HSAG identified the following measures as having the most opportunities for improvement:
All-Cause Readmissions measure
Of the 42 MCP counties/regions for which comparisons can be made, the readmissions rates for 25 MCP counties/regions increased significantly from RY 2014 to RY 2015.
Annual Monitoring for Patients on Persistent Medications—ACE Inhibitors or ARBs and Diuretics measures
While the weighted averages for both measures improved significantly from RY 2014 to RY 2015, of the 53 MCP counties/regions with reportable rates in RY 2015, the rates for 33 MCP counties/regions were below the MPL for each measure. Given the significant improvement made from RY 2014 to RY 2015, DHCS should encourage MCPs to continue successful improvement strategies to move the weighted average for these measures to above the national Medicaid averages for the measures.
Note:
Twenty-seven of the 53 MCP counties/regions with a reportable rate for the Digoxin measure in RY 2015 received a Not Applicable audit finding due to the denominator being too small, and all 26 MCP counties/regions with sufficient denominators for the measure had rates below the MPL. Based on NCQA specification changes and the measure results as described in the Summary of Results section for the measure, HSAG makes no recommendations regarding the Digoxin measure.
Cervical Cancer Screening measure
Of the 53 MCP counties/regions with reportable rates in RY 2015, the rates for 21 MCP counties/regions were below the MPL.
All four Children and Adolescents’ Access to Primary Care Practitioners measures
The weighted averages for all four measures have been below the DHCS-established MPLs for at least three consecutive years.
The weighted averages for the 12 to 24 Months and 25 Months to 6 Years measures declined significantly from RY 2014 to RY 2015, whereas the rates for the 7 to 11 Years and 12 to 19 Years measures improved significantly. This suggests that MCPs’ improvement strategies for the older age groups are showing promise; however, improvement strategies for the younger age groups may need to be increased or modified.

FINDINGS, CONCLUSIONS, AND RECOMMENDATIONS
2015 HEDIS Aggregate Report Page 218 California Department of Health Care Services Health Services Advisory Group, Inc.
Note: Although DHCS does not hold the MCPs accountable to meet the MPLs for these measures (i.e., the MCPs are not required to submit an improvement plan if their rates for the measures are below the MPLs), since DHCS establishes minimum performance levels for the measures, HSAG recommends that DHCS encourage continued improvement on the measures for MCPs with rates below the established MPLs.
Both Medication Management for People with Asthma measures
The MCMC weighted averages for both measures declined significantly from RY 2014 to RY 2015.
Forty-three MCP counties/regions had reportable rates for the Medication Management for People with Asthma measures in RY 2015. The rates for 21 MCP counties/regions were below the MPL for the Medication Compliance 50% (Total) measure, and 16 rates were below the MPL for the Medication Compliance 75% (Total) measure.
Both Prenatal and Postpartum Care measures
All 53 MCP reporting units had reportable rates for the Prenatal and Postpartum Care measures in RY 2015. The rates for MCP counties/regions were below the MPL for the Postpartum Care measure, and the rates were below the MPL for 16 MCP counties/regions for the Timeliness of Prenatal Care measure.
Child Immunization Status—Combination 3 measure.
All 53 MCP reporting units had reportable rates for the Child Immunization Status—Combination 3 measure in RY 2015. The rates for 17 MCP counties/regions were below the MPL.
Comprehensive Diabetes Care—Eye Exam (Retinal) Performed measure.
All 53 MCP reporting units had reportable rates for the Comprehensive Diabetes Care—Eye Exam (Retinal) Performed measure in RY 2015. The rates for 16 MCP counties/regions were below the MPL.
Seniors and Persons with Disabilities
As in RY 2013 and RY 2014, most MCP counties had SPD rates that were significantly higher than the non-SPD rates for the Annual Monitoring for Patients on Persistent Medications—ACE Inhibitors or ARBs and Diuretics measures. The better rates for these measures may be attributed to SPD beneficiaries having more health care needs, resulting in them being seen more regularly by providers and leading to better monitoring of care.
For the third consecutive year, the SPD population had a significantly higher rate of hospital readmissions than the non-SPD population, which is also expected based on the greater and often more complicated health needs of these beneficiaries. For most of the Children and Adolescents’ Access to Primary Care Practitioners measures where a comparison between the SPD and non-SPD rates could be calculated, there was no statistically significant difference between the SPD and
FINDINGS, CONCLUSIONS, AND RECOMMENDATIONS
2015 HEDIS Aggregate Report Page 219 California Department of Health Care Services Health Services Advisory Group, Inc.
non-SPD rates. For several MCP counties, SPD rates were significantly lower than the non-SPD rates. The lower SPD rates for these measures may be attributed to children and adolescents in the SPD population relying on specialist providers as their care source, based on complicated health care needs, rather than accessing care from a PCP.
Specialty Managed Care Health Plan Notable Performance
The three specialty MCPs had mixed results. Notable results include:
AHF’s rate for the Colorectal Cancer Screening measure improved significantly from RY 2014 to RY 2015, resulting in the rate moving from below the MPL in RY 2014 to above the MPL in RY 2015 and to above the Healthy People 2020 goal. The MPL for this measure is based on the national commercial 25th percentile since there are no Medicaid benchmarks for this measure.
SCAN Health Plan’s rate for the Breast Cancer Screening measure improved significantly from RY 2014 to RY 2015 and remained above the national Medicaid 90th percentile (HPL) for the third consecutive year.
Conclusions and Recommendations
DHCS’s External Accountability Set (EAS) includes measures that cut across all domains of care (i.e., quality access, and timeliness), which provides DHCS with the opportunity to assess and monitor the quality, accessibility, and timeliness of care being delivered to MCMC beneficiaries. The DHCS-established MPLs make DHCS’s performance expectations clear for the MCPs and provide a framework for prioritizing improvement efforts.
DHCS continued to support the MCPs in their quality improvement efforts, including providing technical assistance in tandem with HSAG on the implementation of rapid-cycle improvement strategies for measures with rates below the DHCS-established MPLs. DHCS also supported MCPs in selecting performance measures for formal quality improvement projects to help structure improvement efforts to increase the likelihood of positive outcomes. For MCPs with multiple years of poor performance on several measures, DHCS provided more intensive oversight and required more frequent reporting on progress and outcomes. Lastly, DHCS’s auto-assignment program continues to offer increased incentive for TPM and GMC model MCPs to perform well by rewarding higher-performing MCPs with increased default membership.
Based on the review of the 2015 HEDIS results, HSAG provides the following recommendations to DHCS to support the MCPs in their continued efforts to improve performance on measures:
Continue to engage in intensive oversight of MCPs with poor performance on measures over consecutive years.
For MCPs with multiple measures with rates below the MPLs, assist the MCPs with prioritizing quality improvement activities and interventions to improve the likelihood of positive outcomes.
Identify State-level barriers and develop strategies for addressing the barriers.

2015 HEDIS Aggregate Report Page A-1 California Department of Health Care Services Health Services Advisory Group, Inc.
Appendix A. TREND TABLES
Tables A.1 through A.53 provide four-year trending information for each MCP across the reported measures. The following audit findings are provided within the table:
— = A year that data were not collected. NA = A Not Applicable audit finding, meaning that although an MCP may have complied with all applicable specifications, the MCP’s denominator is too small to report (less than 30).
HSAG calculated statistical significance testing between the reporting year (RY) 2014 and RY 2015 rates for each measure using a Chi-square test and displayed this information within the “RYs 2014–15 Rate Difference” column in Tables A.1 through A.53. The following symbols are used to show statistically significant changes:
= Rates in RY 2015 were significantly higher than they were in RY 2014.
= Rates in RY 2015 were significantly lower than they were in RY 2014.
↔ = Rates in RY 2015 were not significantly different than they were in RY 2014.
Different symbols () are used to indicate a performance change for the All-Cause Readmissions and Comprehensive Diabetes Care—HbA1c Poor Control measures where a decrease in the rate indicates better performance. A downward triangle () denotes a significant decline in performance, as denoted by a significant increase in the RY 2015 rate from the RY 2014 rate. An upward triangle () denotes significant improvement in performance, as indicated by a significant decrease of the RY 2015 rate from the RY 2014 rate.
Not Comparable = A RY 2014–15 rate difference could not be calculated because data were not available for both years, or there were significant methodology changes between years that did not allow for comparison.
Not Tested = No comparison was made because high and low rates do not necessarily indicate better or worse performance.
S = The MCP’s measure was reportable based on performance measure validation audit results; however, since there are fewer than 11 cases in the numerator of this measure, DHCS suppresses displaying the rate in this report to satisfy the Health Insurance Portability and Accountability Act of 1996 Privacy Rule’s de-identification standard.
For most measures, the reported rate will be bolded if it is below the national Medicaid 25th percentile (i.e., the minimum performance level [MPL]) and will be shaded if it is above the 90th

TREND TABLES
2015 HEDIS Aggregate Report Page A-2 California Department of Health Care Services Health Services Advisory Group, Inc.
percentile (i.e., the high performance level [HPL] for that year). For the Comprehensive Diabetes Care—HbA1c Poor Control measure, the reported rate will be bolded if it is above the 75th percentile [i.e., the MPL] and will be shaded if it is below the 10th percentile [i.e., the HPL], since a lower rate indicates better performance.
Note:
RY 2012 rates reflect measurement year (MY) data from January 1, 2011, through December 31, 2011.
RY 2013 rates reflect MY data from January 1, 2012, through December 31, 2012.
RY 2014 rates reflect MY data from January 1, 2013, through December 31, 2013.
RY 2015 rates reflect MY data from January 1, 2014, through December 31, 2014.
No MPL or HPL is established for the All-Cause Readmissions and Ambulatory Care measures; therefore, there is no bolding or shading of these measures’ rates.
Although the trend tables reflect if rates are below the MPL and above the HPL for all years included in the tables, MCPs are not held to the MPLs in the following cases: (1) for first-year measures, (2) for measures that had significant specification changes impacting comparability, or (3) if DHCS decided to prioritize efforts in other areas of poor performance. HSAG’s analysis in this report accounts for years in which the MCPs were not held to the MPLs.

TREND TABLES
2015 HEDIS Aggregate Report Page A-3 California Department of Health Care Services Health Services Advisory Group, Inc.
Table A.1—HEDIS 2015 Trend Table for Alameda Alliance for Health—Alameda County
Measure RY
2012 RY
2013 RY
2014 RY
2015 RYs 2014–15
Rate Difference All-Cause Readmissions—Statewide Collaborative QIP measure — 14.66% 17.42% 16.44% Ambulatory Care—Emergency Department Visits per 1,000 Member Months* 42.02 47.24 29.28 35.88 Not Tested
Ambulatory Care—Outpatient Visits per 1,000 Member Months* 315.03 297.17 240.12 275.87 Not Tested
Annual Monitoring for Patients on Persistent Medications—ACE Inhibitors or ARBs 87.05% 84.40% 83.78% 83.12%
Annual Monitoring for Patients on Persistent Medications—Digoxin 86.41% 94.08% 93.43% 49.17% Annual Monitoring for Patients on Persistent Medications—Diuretics 84.78% 81.92% 84.34% 81.67%
Avoidance of Antibiotic Treatment in Adults With Acute Bronchitis 31.53% 38.09% 40.90% 34.48% Cervical Cancer Screening — — 59.85% 53.53% Childhood Immunization Status—Combination 3 78.10% 79.08% 67.40% 75.91%
Children and Adolescents' Access to Primary Care Practitioners—12 to 24 Months 94.63% 92.32% 94.34% 88.24%
Children and Adolescents' Access to Primary Care Practitioners—25 Months to 6 Years 85.48% 83.91% 85.10% 81.44%
Children and Adolescents' Access to Primary Care Practitioners—7 to 11 Years 85.61% 85.06% 87.07% 84.77%
Children and Adolescents' Access to Primary Care Practitioners—12 to 19 Years 82.03% 84.64% 83.24% 81.65%
Comprehensive Diabetes Care—Blood Pressure Control (<140/90 mm Hg) 59.85% 59.61% 57.66% 40.39% Comprehensive Diabetes Care—Eye Exam (Retinal) Performed 52.55% 48.91% 45.26% 46.23% Comprehensive Diabetes Care—HbA1c Testing 83.21% 83.45% 81.75% 87.10% Comprehensive Diabetes Care—HbA1c Control (<8.0 Percent) 58.88% 51.58% 48.18% 41.85% Comprehensive Diabetes Care—Medical Attention for Nephropathy 82.97% 82.97% 80.05% 80.05% Comprehensive Diabetes Care—HbA1c Poor Control (>9.0 Percent) 28.47% 37.47% 51.82% 51.09% Controlling High Blood Pressure — 53.53% 45.99% 43.07% Immunizations for Adolescents—Combination 1 66.67% 76.40% 79.08% 74.45% Medication Management for People with Asthma—Medication Compliance 50% Total — 43.88% 41.69% 45.10%
Medication Management for People with Asthma—Medication Compliance 75% Total — 24.23% 17.80% 27.13%
Prenatal and Postpartum Care—Postpartum Care 61.07% 57.18% 49.39% 55.47% Prenatal and Postpartum Care—Timeliness of Prenatal Care 88.56% 80.54% 79.56% 66.67% Use of Imaging Studies for Low Back Pain 84.76% 87.07% 88.58% 87.33% Weight Assessment and Counseling for Nutrition and Physical Activity for Children/Adolescents—BMI Assessment: Total 55.23% 55.23% 59.61% 42.34%
Weight Assessment and Counseling for Nutrition and Physical Activity for Children/Adolescents—Nutrition Counseling: Total 58.64% 64.72% 71.29% 57.42%
Weight Assessment and Counseling for Nutrition and Physical Activity for Children/Adolescents—Physical Activity Counseling: Total 41.61% 46.23% 61.31% 48.42%
Well-Child Visits in the Third, Fourth, Fifth, and Sixth Years of Life 77.62% 71.53% 70.80% 71.53% *Member months are a member’s “contribution” to the total yearly membership.

TREND TABLES
2015 HEDIS Aggregate Report Page A-4 California Department of Health Care Services Health Services Advisory Group, Inc.
Table A.2—HEDIS 2015 Trend Table for Anthem Blue Cross Partnership Plan—Alameda County
Measure RY
2012 RY
2013 RY
2014 RY
2015 RYs 2014–15
Rate Difference All-Cause Readmissions—Statewide Collaborative QIP measure — 14.67% 18.16% 23.31% Ambulatory Care—Emergency Department Visits per 1,000 Member Months* 55.63 68.25 67.55 61.74 Not Tested Ambulatory Care—Outpatient Visits per 1,000 Member Months* 215.86 154.77 212.17 191.03 Not Tested Annual Monitoring for Patients on Persistent Medications—ACE Inhibitors or ARBs 79.35% 77.02% 81.73% 84.87% Annual Monitoring for Patients on Persistent Medications—Digoxin NA NA NA NA Not Comparable
Annual Monitoring for Patients on Persistent Medications—Diuretics 72.88% 73.14% 80.81% 82.88% Avoidance of Antibiotic Treatment in Adults With Acute Bronchitis 39.13% 42.36% 33.83% 32.65% Cervical Cancer Screening — — 49.18% 56.88%
Childhood Immunization Status—Combination 3 70.56% 71.29% 71.30% 71.00% Children and Adolescents' Access to Primary Care Practitioners—12 to 24 Months 93.51% 84.39% 85.16% 87.06% Children and Adolescents' Access to Primary Care Practitioners—25 Months to 6 Years 82.89% 67.77% 77.82% 82.88%
Children and Adolescents' Access to Primary Care Practitioners—7 to 11 Years 84.12% 79.12% 78.58% 84.49% Children and Adolescents' Access to Primary Care Practitioners—12 to 19 Years 79.44% 77.65% 75.18% 80.02% Comprehensive Diabetes Care—Blood Pressure Control (<140/90 mm Hg) 47.45% 35.92% 38.41% 45.58% Comprehensive Diabetes Care—Eye Exam (Retinal) Performed 35.28% 34.22% 35.10% 39.53% Comprehensive Diabetes Care—HbA1c Testing 73.48% 63.83% 75.94% 83.02% Comprehensive Diabetes Care—HbA1c Control (<8.0 Percent) 32.36% 30.58% 26.05% 40.93% Comprehensive Diabetes Care—Medical Attention for Nephropathy 68.86% 71.36% 73.95% 77.67% Comprehensive Diabetes Care—HbA1c Poor Control (>9.0 Percent) 60.58% 63.35% 67.55% 50.23% Controlling High Blood Pressure — 30.66% 34.15% 42.42% Immunizations for Adolescents—Combination 1 64.96% 73.16% 73.04% 68.52% Medication Management for People with Asthma—Medication Compliance 50% Total — 42.61% 44.30% 45.36% Medication Management for People with Asthma—Medication Compliance 75% Total — 20.87% 21.94% 23.87%
Prenatal and Postpartum Care—Postpartum Care 50.61% 36.74% 50.23% 50.46% Prenatal and Postpartum Care—Timeliness of Prenatal Care 72.99% 75.18% 73.95% 77.08% Use of Imaging Studies for Low Back Pain 91.46% 90.20% 88.04% 84.68% Weight Assessment and Counseling for Nutrition and Physical Activity for Children/Adolescents—BMI Assessment: Total 44.04% 62.29% 46.17% 58.33%
Weight Assessment and Counseling for Nutrition and Physical Activity for Children/Adolescents—Nutrition Counseling: Total 62.04% 61.07% 47.33% 61.81%
Weight Assessment and Counseling for Nutrition and Physical Activity for Children/Adolescents—Physical Activity Counseling: Total 31.14% 37.47% 40.84% 49.77%
Well-Child Visits in the Third, Fourth, Fifth, and Sixth Years of Life 73.71% 57.32% 65.51% 72.41%
*Member months are a member’s “contribution” to the total yearly membership.

TREND TABLES
2015 HEDIS Aggregate Report Page A-5 California Department of Health Care Services Health Services Advisory Group, Inc.
Table A.3—HEDIS 2015 Trend Table for Anthem Blue Cross Partnership Plan—Contra Costa County
Measure RY
2012 RY
2013 RY
2014 RY
2015 RYs 2014–15
Rate Difference All-Cause Readmissions—Statewide Collaborative QIP measure — 18.62% 17.30% 16.77% Ambulatory Care—Emergency Department Visits per 1,000 Member Months* 52.20 61.62 62.60 59.90 Not Tested Ambulatory Care—Outpatient Visits per 1,000 Member Months* 213.84 202.66 234.67 201.00 Not Tested Annual Monitoring for Patients on Persistent Medications—ACE Inhibitors or ARBs 76.67% 77.90% 80.33% 80.22% Annual Monitoring for Patients on Persistent Medications—Digoxin NA NA NA NA Not Comparable
Annual Monitoring for Patients on Persistent Medications—Diuretics 67.86% 71.53% 75.90% 81.74% Avoidance of Antibiotic Treatment in Adults With Acute Bronchitis NA 54.29% 42.42% NA Not Comparable Cervical Cancer Screening — — 53.94% 48.38% Childhood Immunization Status—Combination 3 68.37% 76.16% 75.46% 68.29% Children and Adolescents' Access to Primary Care Practitioners—12 to 24 Months 93.04% 96.93% 95.12% 93.77% Children and Adolescents' Access to Primary Care Practitioners—25 Months to 6 Years 82.73% 85.01% 86.44% 85.36%
Children and Adolescents' Access to Primary Care Practitioners—7 to 11 Years 80.01% 85.18% 88.29% 88.50% Children and Adolescents' Access to Primary Care Practitioners—12 to 19 Years 80.28% 82.76% 84.96% 87.31% Comprehensive Diabetes Care—Blood Pressure Control (<140/90 mm Hg) 46.72% 50.99% 46.13% 52.30% Comprehensive Diabetes Care—Eye Exam (Retinal) Performed 36.50% 38.61% 37.64% 45.94% Comprehensive Diabetes Care—HbA1c Testing 67.15% 69.31% 75.28% 81.27% Comprehensive Diabetes Care—HbA1c Control (<8.0 Percent) 29.20% 39.60% 36.16% 46.64% Comprehensive Diabetes Care—Medical Attention for Nephropathy 64.96% 67.33% 78.60% 79.15% Comprehensive Diabetes Care—HbA1c Poor Control (>9.0 Percent) 65.69% 52.97% 56.83% 42.40% Controlling High Blood Pressure — 46.15% 43.88% 49.71% Immunizations for Adolescents—Combination 1 65.02% 68.35% 65.30% 70.87% Medication Management for People with Asthma—Medication Compliance 50% Total — 40.34% 40.74% 51.38%
Medication Management for People with Asthma—Medication Compliance 75% Total — 18.18% 21.60% 28.73%
Prenatal and Postpartum Care—Postpartum Care 48.15% 44.64% 44.26% 43.70% Prenatal and Postpartum Care—Timeliness of Prenatal Care 76.30% 79.46% 72.95% 72.27% Use of Imaging Studies for Low Back Pain 92.59% 81.48% S S Weight Assessment and Counseling for Nutrition and Physical Activity for Children/Adolescents—BMI Assessment: Total 42.58% 57.66% 50.00% 55.32% Weight Assessment and Counseling for Nutrition and Physical Activity for Children/Adolescents—Nutrition Counseling: Total 53.77% 52.31% 55.09% 55.79% Weight Assessment and Counseling for Nutrition and Physical Activity for Children/Adolescents—Physical Activity Counseling: Total 25.55% 36.74% 47.92% 46.99% Well-Child Visits in the Third, Fourth, Fifth, and Sixth Years of Life 67.45% 63.93% 75.83% 66.87%
*Member months are a member’s “contribution” to the total yearly membership.

TREND TABLES
2015 HEDIS Aggregate Report Page A-6 California Department of Health Care Services Health Services Advisory Group, Inc.
Table A.4—HEDIS 2015 Trend Table for Anthem Blue Cross Partnership Plan—Fresno County
Measure RY
2012 RY
2013 RY
2014 RY
2015 RYs 2014–15
Rate Difference All-Cause Readmissions—Statewide Collaborative QIP measure — 13.83% 14.38% 21.30% Ambulatory Care—Emergency Department Visits per 1,000 Member Months* — 43.10 48.83 50.04 Not Tested Ambulatory Care—Outpatient Visits per 1,000 Member Months* — 247.54 236.16 232.63 Not Tested Annual Monitoring for Patients on Persistent Medications—ACE Inhibitors or ARBs — 80.77% 82.80% 83.15% Annual Monitoring for Patients on Persistent Medications—Digoxin — NA NA NA Not Comparable
Annual Monitoring for Patients on Persistent Medications—Diuretics — 81.48% 82.63% 84.60% Avoidance of Antibiotic Treatment in Adults With Acute Bronchitis — 29.65% 33.76% 34.20% Cervical Cancer Screening — — 50.93% 52.79%
Childhood Immunization Status—Combination 3 — 70.80% 67.36% 67.82% Children and Adolescents' Access to Primary Care Practitioners—12 to 24 Months — 94.35% 93.76% 92.76% Children and Adolescents' Access to Primary Care Practitioners—25 Months to 6 Years — 82.85% 83.38% 86.16%
Children and Adolescents' Access to Primary Care Practitioners—7 to 11 Years — 80.34% 83.51% 85.49% Children and Adolescents' Access to Primary Care Practitioners—12 to 19 Years — 76.54% 79.14% 83.00%
Comprehensive Diabetes Care—Blood Pressure Control (<140/90 mm Hg) — 58.74% 52.44% 54.17% Comprehensive Diabetes Care—Eye Exam (Retinal) Performed — 38.35% 44.89% 39.58% Comprehensive Diabetes Care—HbA1c Testing — 77.18% 79.33% 83.10% Comprehensive Diabetes Care—HbA1c Control (<8.0 Percent) — 41.99% 36.22% 42.13% Comprehensive Diabetes Care—Medical Attention for Nephropathy — 77.43% 80.22% 81.02% Comprehensive Diabetes Care—HbA1c Poor Control (>9.0 Percent) — 50.24% 50.00% 51.39% Controlling High Blood Pressure — 50.85% 53.32% 50.47% Immunizations for Adolescents—Combination 1 — 70.80% 68.22% 73.38% Medication Management for People with Asthma—Medication Compliance 50% Total — 35.29% 33.16% 35.20% Medication Management for People with Asthma—Medication Compliance 75% Total — 14.10% 15.57% 17.98%
Prenatal and Postpartum Care—Postpartum Care — 54.74% 52.90% 56.74% Prenatal and Postpartum Care—Timeliness of Prenatal Care — 79.56% 74.94% 76.98% Use of Imaging Studies for Low Back Pain — 84.06% 82.85% 80.13% Weight Assessment and Counseling for Nutrition and Physical Activity for Children/Adolescents—BMI Assessment: Total — 58.88% 54.29% 71.76%
Weight Assessment and Counseling for Nutrition and Physical Activity for Children/Adolescents—Nutrition Counseling: Total — 63.02% 59.86% 59.26%
Weight Assessment and Counseling for Nutrition and Physical Activity for Children/Adolescents—Physical Activity Counseling: Total — 46.23% 49.65% 46.30%
Well-Child Visits in the Third, Fourth, Fifth, and Sixth Years of Life — 67.88% 79.63% 76.62% *Member months are a member’s “contribution” to the total yearly membership.

TREND TABLES
2015 HEDIS Aggregate Report Page A-7 California Department of Health Care Services Health Services Advisory Group, Inc.
Table A.5—HEDIS 2015 Trend Table for Anthem Blue Cross Partnership Plan—Kings County
Measure RY
2012 RY
2013 RY
2014 RY
2015 RYs 2014–15
Rate Difference All-Cause Readmissions—Statewide Collaborative QIP measure — 16.58% 8.43% 15.63% Ambulatory Care—Emergency Department Visits per 1,000 Member Months* — 68.85 68.06 64.22 Not Tested Ambulatory Care—Outpatient Visits per 1,000 Member Months* — 368.80 320.37 280.75 Not Tested Annual Monitoring for Patients on Persistent Medications—ACE Inhibitors or ARBs — 85.71% 81.64% 81.16% Annual Monitoring for Patients on Persistent Medications—Digoxin — NA NA NA Not Comparable
Annual Monitoring for Patients on Persistent Medications—Diuretics — 84.56% 77.36% 78.92% Avoidance of Antibiotic Treatment in Adults With Acute Bronchitis — 28.57% 32.69% 31.82% Cervical Cancer Screening — — 56.05% 49.76%
Childhood Immunization Status—Combination 3 — 66.77% 68.51% 66.31% Children and Adolescents' Access to Primary Care Practitioners—12 to 24 Months — 95.06% 94.74% 94.85% Children and Adolescents' Access to Primary Care Practitioners—25 Months to 6 Years — 86.53% 83.25% 86.59%
Children and Adolescents' Access to Primary Care Practitioners—7 to 11 Years — NA 84.78% 83.98%
Children and Adolescents' Access to Primary Care Practitioners—12 to 19 Years — NA 84.64% 85.98%
Comprehensive Diabetes Care—Blood Pressure Control (<140/90 mm Hg) — 58.44% 54.39% 56.39% Comprehensive Diabetes Care—Eye Exam (Retinal) Performed — 38.31% 40.35% 37.05% Comprehensive Diabetes Care—HbA1c Testing — 75.00% 72.51% 74.43% Comprehensive Diabetes Care—HbA1c Control (<8.0 Percent) — 38.64% 25.73% 34.75%
Comprehensive Diabetes Care—Medical Attention for Nephropathy — 73.38% 77.19% 81.97% Comprehensive Diabetes Care—HbA1c Poor Control (>9.0 Percent) — 55.19% 64.91% 57.05%
Controlling High Blood Pressure — 43.55% 43.30% 49.65% Immunizations for Adolescents—Combination 1 — 56.12% 69.66% 74.03% Medication Management for People with Asthma—Medication Compliance 50% Total — NA 40.22% 38.30%
Medication Management for People with Asthma—Medication Compliance 75% Total — NA 16.30% 20.21%
Prenatal and Postpartum Care—Postpartum Care — 54.37% 45.70% 45.41% Prenatal and Postpartum Care—Timeliness of Prenatal Care — 86.11% 80.08% 76.53% Use of Imaging Studies for Low Back Pain — 76.03% 84.30% 76.92% Weight Assessment and Counseling for Nutrition and Physical Activity for Children/Adolescents—BMI Assessment: Total — 46.47% 40.74% 68.06%
Weight Assessment and Counseling for Nutrition and Physical Activity for Children/Adolescents—Nutrition Counseling: Total — 44.04% 43.29% 56.25%
Weight Assessment and Counseling for Nutrition and Physical Activity for Children/Adolescents—Physical Activity Counseling: Total — 31.39% 38.66% 36.34%
Well-Child Visits in the Third, Fourth, Fifth, and Sixth Years of Life — 57.66% 65.05% 70.60% *Member months are a member’s “contribution” to the total yearly membership.

TREND TABLES
2015 HEDIS Aggregate Report Page A-8 California Department of Health Care Services Health Services Advisory Group, Inc.
Table A.6—HEDIS 2015 Trend Table for Anthem Blue Cross Partnership Plan—Madera County
Measure RY
2012 RY
2013 RY
2014 RY
2015 RYs 2014–15
Rate Difference All-Cause Readmissions—Statewide Collaborative QIP measure — 10.87% 8.63% 21.98% Ambulatory Care—Emergency Department Visits per 1,000 Member Months* — 59.71 58.44 56.13 Not Tested Ambulatory Care—Outpatient Visits per 1,000 Member Months* — 313.66 293.80 288.72 Not Tested Annual Monitoring for Patients on Persistent Medications—ACE Inhibitors or ARBs — 76.60% 84.36% 82.02% Annual Monitoring for Patients on Persistent Medications—Digoxin — NA NA NA Not Comparable
Annual Monitoring for Patients on Persistent Medications—Diuretics — 78.26% 78.64% 83.33% Avoidance of Antibiotic Treatment in Adults With Acute Bronchitis — 6.25% 20.00% 6.35% Cervical Cancer Screening — — 60.19% 61.31% Childhood Immunization Status—Combination 3 — 76.40% 63.78% 69.38% Children and Adolescents' Access to Primary Care Practitioners—12 to 24 Months — 97.83% 98.47% 95.07% Children and Adolescents' Access to Primary Care Practitioners—25 Months to 6 Years — 88.53% 90.94% 92.14%
Children and Adolescents' Access to Primary Care Practitioners—7 to 11 Years — NA 90.80% 90.49%
Children and Adolescents' Access to Primary Care Practitioners—12 to 19 Years — NA 88.72% 90.07%
Comprehensive Diabetes Care—Blood Pressure Control (<140/90 mm Hg) — 66.81% 61.09% 62.68% Comprehensive Diabetes Care—Eye Exam (Retinal) Performed — 55.02% 54.91% 54.35% Comprehensive Diabetes Care—HbA1c Testing — 84.72% 84.36% 84.06% Comprehensive Diabetes Care—HbA1c Control (<8.0 Percent) — 51.97% 43.27% 42.39% Comprehensive Diabetes Care—Medical Attention for Nephropathy — 79.04% 80.73% 84.78% Comprehensive Diabetes Care—HbA1c Poor Control (>9.0 Percent) — 36.24% 47.64% 51.81% Controlling High Blood Pressure — 53.36% 53.36% 50.71% Immunizations for Adolescents—Combination 1 — 67.29% 72.62% 74.82% Medication Management for People with Asthma—Medication Compliance 50% Total — NA 29.66% 44.44%
Medication Management for People with Asthma—Medication Compliance 75% Total — NA 16.95% 25.40%
Prenatal and Postpartum Care—Postpartum Care — 51.57% 59.89% 57.37% Prenatal and Postpartum Care—Timeliness of Prenatal Care — 76.10% 77.47% 79.47% Use of Imaging Studies for Low Back Pain — 70.10% 83.54% 81.91% Weight Assessment and Counseling for Nutrition and Physical Activity for Children/Adolescents—BMI Assessment: Total — 77.62% 56.94% 85.38%
Weight Assessment and Counseling for Nutrition and Physical Activity for Children/Adolescents—Nutrition Counseling: Total — 70.07% 61.81% 82.83%
Weight Assessment and Counseling for Nutrition and Physical Activity for Children/Adolescents—Physical Activity Counseling: Total — 48.66% 52.55% 69.84%
Well-Child Visits in the Third, Fourth, Fifth, and Sixth Years of Life — 80.29% 86.81% 85.19% *Member months are a member’s “contribution” to the total yearly membership.

TREND TABLES
2015 HEDIS Aggregate Report Page A-9 California Department of Health Care Services Health Services Advisory Group, Inc.
Table A.7—HEDIS 2015 Trend Table for Anthem Blue Cross Partnership Plan—Region 1 (Butte, Colusa, Glenn, Plumas, Sierra, Sutter, and Tehama Counties)
Measure RY
2012 RY
2013 RY
2014 RY
2015 RYs 2014–15
Rate Difference All-Cause Readmissions—Statewide Collaborative QIP measure — — — 11.04% Not Comparable Ambulatory Care—Emergency Department Visits per 1,000 Member Months* — — — 46.39 Not Tested Ambulatory Care—Outpatient Visits per 1,000 Member Months* — — — 292.88 Not Tested Annual Monitoring for Patients on Persistent Medications—ACE Inhibitors or ARBs — — — 84.36% Not Comparable
Annual Monitoring for Patients on Persistent Medications—Digoxin — — — NA Not Comparable Annual Monitoring for Patients on Persistent Medications—Diuretics — — — 86.83% Not Comparable Avoidance of Antibiotic Treatment in Adults With Acute Bronchitis — — — 20.00% Not Comparable Cervical Cancer Screening — — — 39.86% Not Comparable Childhood Immunization Status—Combination 3 — — — 67.04% Not Comparable Children and Adolescents' Access to Primary Care Practitioners—12 to 24 Months — — — 96.82% Not Comparable Children and Adolescents' Access to Primary Care Practitioners—25 Months to 6 Years — — — 87.27% Not Comparable
Children and Adolescents' Access to Primary Care Practitioners—7 to 11 Years — — — 92.54% Not Comparable Children and Adolescents' Access to Primary Care Practitioners—12 to 19 Years — — — 95.74% Not Comparable Comprehensive Diabetes Care—Blood Pressure Control (<140/90 mm Hg) — — — 63.74% Not Comparable Comprehensive Diabetes Care—Eye Exam (Retinal) Performed — — — 41.76% Not Comparable Comprehensive Diabetes Care—HbA1c Testing — — — 86.54% Not Comparable Comprehensive Diabetes Care—HbA1c Control (<8.0 Percent) — — — 39.84% Not Comparable Comprehensive Diabetes Care—Medical Attention for Nephropathy — — — 76.10% Not Comparable Comprehensive Diabetes Care—HbA1c Poor Control (>9.0 Percent) — — — 50.55% Not Comparable Controlling High Blood Pressure — — — 50.93% Not Comparable Immunizations for Adolescents—Combination 1 — — — 50.00% Not Comparable Medication Management for People with Asthma—Medication Compliance 50% Total — — — NA Not Comparable
Medication Management for People with Asthma—Medication Compliance 75% Total — — — NA Not Comparable
Prenatal and Postpartum Care—Postpartum Care — — — 64.12% Not Comparable Prenatal and Postpartum Care—Timeliness of Prenatal Care — — — 82.87% Not Comparable Use of Imaging Studies for Low Back Pain — — — 73.46% Not Comparable Weight Assessment and Counseling for Nutrition and Physical Activity for Children/Adolescents—BMI Assessment: Total — — — 64.12% Not Comparable
Weight Assessment and Counseling for Nutrition and Physical Activity for Children/Adolescents—Nutrition Counseling: Total — — — 46.99% Not Comparable
Weight Assessment and Counseling for Nutrition and Physical Activity for Children/Adolescents—Physical Activity Counseling: Total — — — 31.71% Not Comparable
Well-Child Visits in the Third, Fourth, Fifth, and Sixth Years of Life — — — 64.35% Not Comparable
*Member months are a member’s “contribution” to the total yearly membership.

TREND TABLES
2015 HEDIS Aggregate Report Page A-10 California Department of Health Care Services Health Services Advisory Group, Inc.
Table A.8—HEDIS 2015 Trend Table for Anthem Blue Cross Partnership Plan—Region 2 (Alpine, Amador, Calaveras, El Dorado, Inyo, Mariposa, Mono, Nevada, Placer, Tuolumne, and Yuba Counties)
Measure RY
2012 RY
2013 RY
2014 RY
2015 RYs 2014–15
Rate Difference All-Cause Readmissions—Statewide Collaborative QIP measure — — — 8.39% Not Comparable Ambulatory Care—Emergency Department Visits per 1,000 Member Months* — — — 54.21 Not Tested Ambulatory Care—Outpatient Visits per 1,000 Member Months* — — — 212.47 Not Tested Annual Monitoring for Patients on Persistent Medications—ACE Inhibitors or ARBs — — — 77.42% Not Comparable
Annual Monitoring for Patients on Persistent Medications—Digoxin — — — NA Not Comparable Annual Monitoring for Patients on Persistent Medications—Diuretics — — — 80.41% Not Comparable Avoidance of Antibiotic Treatment in Adults With Acute Bronchitis — — — 22.50% Not Comparable Cervical Cancer Screening — — — 48.24% Not Comparable Childhood Immunization Status—Combination 3 — — — 50.82% Not Comparable Children and Adolescents' Access to Primary Care Practitioners—12 to 24 Months — — — 93.56% Not Comparable Children and Adolescents' Access to Primary Care Practitioners—25 Months to 6 Years — — — 82.95% Not Comparable
Children and Adolescents' Access to Primary Care Practitioners—7 to 11 Years — — — 92.77% Not Comparable Children and Adolescents' Access to Primary Care Practitioners—12 to 19 Years — — — 93.40% Not Comparable Comprehensive Diabetes Care—Blood Pressure Control (<140/90 mm Hg) — — — 63.41% Not Comparable Comprehensive Diabetes Care—Eye Exam (Retinal) Performed — — — 36.28% Not Comparable Comprehensive Diabetes Care—HbA1c Testing — — — 83.60% Not Comparable Comprehensive Diabetes Care—HbA1c Control (<8.0 Percent) — — — 39.43% Not Comparable Comprehensive Diabetes Care—Medical Attention for Nephropathy — — — 73.19% Not Comparable Comprehensive Diabetes Care—HbA1c Poor Control (>9.0 Percent) — — — 50.79% Not Comparable Controlling High Blood Pressure — — — 44.65% Not Comparable Immunizations for Adolescents—Combination 1 — — — 51.30% Not Comparable Medication Management for People with Asthma—Medication Compliance 50% Total — — — NA Not Comparable
Medication Management for People with Asthma—Medication Compliance 75% Total — — — NA Not Comparable
Prenatal and Postpartum Care—Postpartum Care — — — 59.63% Not Comparable Prenatal and Postpartum Care—Timeliness of Prenatal Care — — — 85.15% Not Comparable Use of Imaging Studies for Low Back Pain — — — 74.30% Not Comparable Weight Assessment and Counseling for Nutrition and Physical Activity for Children/Adolescents—BMI Assessment: Total — — — 62.27% Not Comparable
Weight Assessment and Counseling for Nutrition and Physical Activity for Children/Adolescents—Nutrition Counseling: Total — — — 45.14% Not Comparable
Weight Assessment and Counseling for Nutrition and Physical Activity for Children/Adolescents—Physical Activity Counseling: Total — — — 35.42% Not Comparable
Well-Child Visits in the Third, Fourth, Fifth, and Sixth Years of Life — — — 58.93% Not Comparable
*Member months are a member’s “contribution” to the total yearly membership.

TREND TABLES
2015 HEDIS Aggregate Report Page A-11 California Department of Health Care Services Health Services Advisory Group, Inc.
Table A.9—HEDIS 2015 Trend Table for Anthem Blue Cross Partnership Plan—Sacramento County
Measure RY
2012 RY
2013 RY
2014 RY
2015 RYs 2014–15
Rate Difference All-Cause Readmissions—Statewide Collaborative QIP measure — 12.63% 11.83% 16.76% Ambulatory Care—Emergency Department Visits per 1,000 Member Months* 41.30 53.18 53.51 54.99 Not Tested Ambulatory Care—Outpatient Visits per 1,000 Member Months* 210.80 210.46 216.69 198.90 Not Tested Annual Monitoring for Patients on Persistent Medications—ACE Inhibitors or ARBs 61.68% 65.15% 80.33% 85.37%
Annual Monitoring for Patients on Persistent Medications—Digoxin NA 86.11% 87.80% NA Not Comparable Annual Monitoring for Patients on Persistent Medications—Diuretics 61.75% 67.21% 80.50% 85.13%
Avoidance of Antibiotic Treatment in Adults With Acute Bronchitis 24.14% 31.29% 27.54% 32.92% Cervical Cancer Screening — — 50.70% 56.51% Childhood Immunization Status—Combination 3 57.42% 62.77% 58.80% 66.20% Children and Adolescents' Access to Primary Care Practitioners—12 to 24 Months 94.51% 93.16% 94.03% 92.27% Children and Adolescents' Access to Primary Care Practitioners—25 Months to 6 Years 81.91% 80.19% 81.58% 81.66% Children and Adolescents' Access to Primary Care Practitioners—7 to 11 Years 81.22% 81.14% 80.92% 83.49% Children and Adolescents' Access to Primary Care Practitioners—12 to 19 Years 80.23% 80.56% 78.14% 80.93%
Comprehensive Diabetes Care—Blood Pressure Control (<140/90 mm Hg) 56.20% 57.04% 50.11% 49.88% Comprehensive Diabetes Care—Eye Exam (Retinal) Performed 32.36% 28.16% 37.75% 40.60% Comprehensive Diabetes Care—HbA1c Testing 76.16% 75.24% 75.28% 76.80% Comprehensive Diabetes Care—HbA1c Control (<8.0 Percent) 49.15% 46.12% 40.18% 46.17% Comprehensive Diabetes Care—Medical Attention for Nephropathy 71.53% 71.60% 79.47% 81.67% Comprehensive Diabetes Care—HbA1c Poor Control (>9.0 Percent) 42.58% 47.09% 47.68% 43.85% Controlling High Blood Pressure — 47.45% 48.11% 43.43% Immunizations for Adolescents—Combination 1 51.58% 61.80% 62.62% 66.44% Medication Management for People with Asthma—Medication Compliance 50% Total — 44.31% 49.21% 42.25%
Medication Management for People with Asthma—Medication Compliance 75% Total — 21.54% 30.61% 23.61%
Prenatal and Postpartum Care—Postpartum Care 54.26% 47.92% 49.88% 56.25% Prenatal and Postpartum Care—Timeliness of Prenatal Care 76.89% 78.73% 72.39% 79.86%
Use of Imaging Studies for Low Back Pain 84.94% 84.34% 83.20% 81.54% Weight Assessment and Counseling for Nutrition and Physical Activity for Children/Adolescents—BMI Assessment: Total 63.02% 65.45% 61.11% 68.06%
Weight Assessment and Counseling for Nutrition and Physical Activity for Children/Adolescents—Nutrition Counseling: Total 71.29% 69.34% 63.43% 62.96% Weight Assessment and Counseling for Nutrition and Physical Activity for Children/Adolescents—Physical Activity Counseling: Total 39.42% 44.53% 47.45% 49.54%
Well-Child Visits in the Third, Fourth, Fifth, and Sixth Years of Life 64.33% 67.37% 70.83% 67.21% *Member months are a member’s “contribution” to the total yearly membership.

TREND TABLES
2015 HEDIS Aggregate Report Page A-12 California Department of Health Care Services Health Services Advisory Group, Inc.
Table A.10—HEDIS 2015 Trend Table for Anthem Blue Cross Partnership Plan—San Benito County
Measure RY
2012 RY
2013 RY
2014 RY
2015 RYs 2014–15
Rate Difference All-Cause Readmissions—Statewide Collaborative QIP measure — — — NA Not Comparable Ambulatory Care—Emergency Department Visits per 1,000 Member Months* — — — 50.76 Not Tested Ambulatory Care—Outpatient Visits per 1,000 Member Months* — — — 234.71 Not Tested Annual Monitoring for Patients on Persistent Medications—ACE Inhibitors or ARBs — — — NA Not Comparable
Annual Monitoring for Patients on Persistent Medications—Digoxin — — — NA Not Comparable Annual Monitoring for Patients on Persistent Medications—Diuretics — — — NA Not Comparable Avoidance of Antibiotic Treatment in Adults With Acute Bronchitis — — — NA Not Comparable Cervical Cancer Screening — — — 43.06% Not Comparable Childhood Immunization Status—Combination 3 — — — 58.33% Not Comparable Children and Adolescents' Access to Primary Care Practitioners—12 to 24 Months — — — 93.08% Not Comparable Children and Adolescents' Access to Primary Care Practitioners—25 Months to 6 Years — — — 78.21% Not Comparable
Children and Adolescents' Access to Primary Care Practitioners—7 to 11 Years — — — NA Not Comparable Children and Adolescents' Access to Primary Care Practitioners—12 to 19 Years — — — NA Not Comparable Comprehensive Diabetes Care—Blood Pressure Control (<140/90 mm Hg) — — — 62.86% Not Comparable Comprehensive Diabetes Care—Eye Exam (Retinal) Performed — — — 34.29% Not Comparable Comprehensive Diabetes Care—HbA1c Testing — — — 77.14% Not Comparable Comprehensive Diabetes Care—HbA1c Control (<8.0 Percent) — — — S Not Comparable Comprehensive Diabetes Care—Medical Attention for Nephropathy — — — 54.29% Not Comparable Comprehensive Diabetes Care—HbA1c Poor Control (>9.0 Percent) — — — 62.86% Not Comparable Controlling High Blood Pressure — — — NA Not Comparable Immunizations for Adolescents—Combination 1 — — — 76.92% Not Comparable Medication Management for People with Asthma—Medication Compliance 50% Total — — — NA Not Comparable
Medication Management for People with Asthma—Medication Compliance 75% Total — — — NA Not Comparable
Prenatal and Postpartum Care—Postpartum Care — — — 48.15% Not Comparable Prenatal and Postpartum Care—Timeliness of Prenatal Care — — — 77.78% Not Comparable Use of Imaging Studies for Low Back Pain — — — NA Not Comparable Weight Assessment and Counseling for Nutrition and Physical Activity for Children/Adolescents—BMI Assessment: Total — — — 71.76% Not Comparable
Weight Assessment and Counseling for Nutrition and Physical Activity for Children/Adolescents—Nutrition Counseling: Total — — — 50.46% Not Comparable
Weight Assessment and Counseling for Nutrition and Physical Activity for Children/Adolescents—Physical Activity Counseling: Total — — — 23.84% Not Comparable
Well-Child Visits in the Third, Fourth, Fifth, and Sixth Years of Life — — — 65.74% Not Comparable
*Member months are a member’s “contribution” to the total yearly membership.
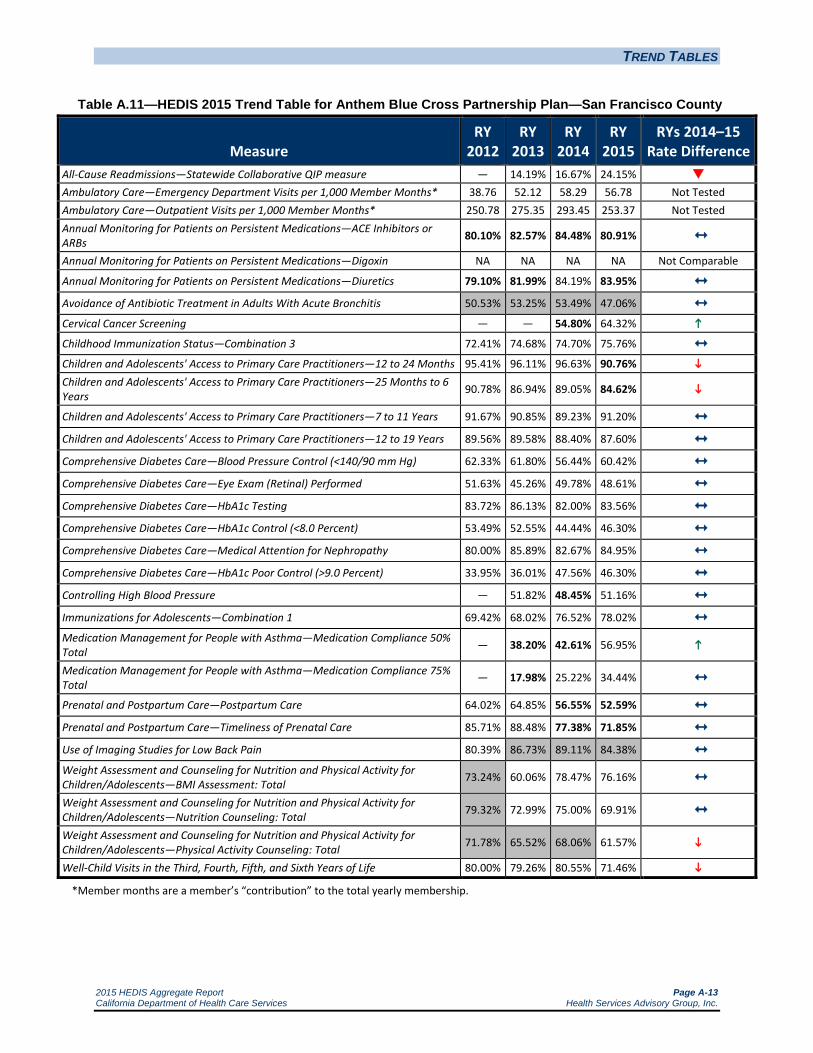
TREND TABLES
2015 HEDIS Aggregate Report Page A-13 California Department of Health Care Services Health Services Advisory Group, Inc.
Table A.11—HEDIS 2015 Trend Table for Anthem Blue Cross Partnership Plan—San Francisco County
Measure RY
2012 RY
2013 RY
2014 RY
2015 RYs 2014–15
Rate Difference All-Cause Readmissions—Statewide Collaborative QIP measure — 14.19% 16.67% 24.15% Ambulatory Care—Emergency Department Visits per 1,000 Member Months* 38.76 52.12 58.29 56.78 Not Tested Ambulatory Care—Outpatient Visits per 1,000 Member Months* 250.78 275.35 293.45 253.37 Not Tested Annual Monitoring for Patients on Persistent Medications—ACE Inhibitors or ARBs 80.10% 82.57% 84.48% 80.91% Annual Monitoring for Patients on Persistent Medications—Digoxin NA NA NA NA Not Comparable
Annual Monitoring for Patients on Persistent Medications—Diuretics 79.10% 81.99% 84.19% 83.95% Avoidance of Antibiotic Treatment in Adults With Acute Bronchitis 50.53% 53.25% 53.49% 47.06% Cervical Cancer Screening — — 54.80% 64.32%
Childhood Immunization Status—Combination 3 72.41% 74.68% 74.70% 75.76% Children and Adolescents' Access to Primary Care Practitioners—12 to 24 Months 95.41% 96.11% 96.63% 90.76% Children and Adolescents' Access to Primary Care Practitioners—25 Months to 6 Years 90.78% 86.94% 89.05% 84.62%
Children and Adolescents' Access to Primary Care Practitioners—7 to 11 Years 91.67% 90.85% 89.23% 91.20% Children and Adolescents' Access to Primary Care Practitioners—12 to 19 Years 89.56% 89.58% 88.40% 87.60% Comprehensive Diabetes Care—Blood Pressure Control (<140/90 mm Hg) 62.33% 61.80% 56.44% 60.42% Comprehensive Diabetes Care—Eye Exam (Retinal) Performed 51.63% 45.26% 49.78% 48.61% Comprehensive Diabetes Care—HbA1c Testing 83.72% 86.13% 82.00% 83.56% Comprehensive Diabetes Care—HbA1c Control (<8.0 Percent) 53.49% 52.55% 44.44% 46.30% Comprehensive Diabetes Care—Medical Attention for Nephropathy 80.00% 85.89% 82.67% 84.95% Comprehensive Diabetes Care—HbA1c Poor Control (>9.0 Percent) 33.95% 36.01% 47.56% 46.30% Controlling High Blood Pressure — 51.82% 48.45% 51.16% Immunizations for Adolescents—Combination 1 69.42% 68.02% 76.52% 78.02% Medication Management for People with Asthma—Medication Compliance 50% Total — 38.20% 42.61% 56.95%
Medication Management for People with Asthma—Medication Compliance 75% Total — 17.98% 25.22% 34.44%
Prenatal and Postpartum Care—Postpartum Care 64.02% 64.85% 56.55% 52.59% Prenatal and Postpartum Care—Timeliness of Prenatal Care 85.71% 88.48% 77.38% 71.85% Use of Imaging Studies for Low Back Pain 80.39% 86.73% 89.11% 84.38% Weight Assessment and Counseling for Nutrition and Physical Activity for Children/Adolescents—BMI Assessment: Total 73.24% 60.06% 78.47% 76.16% Weight Assessment and Counseling for Nutrition and Physical Activity for Children/Adolescents—Nutrition Counseling: Total 79.32% 72.99% 75.00% 69.91% Weight Assessment and Counseling for Nutrition and Physical Activity for Children/Adolescents—Physical Activity Counseling: Total 71.78% 65.52% 68.06% 61.57%
Well-Child Visits in the Third, Fourth, Fifth, and Sixth Years of Life 80.00% 79.26% 80.55% 71.46% *Member months are a member’s “contribution” to the total yearly membership.

TREND TABLES
2015 HEDIS Aggregate Report Page A-14 California Department of Health Care Services Health Services Advisory Group, Inc.
Table A.12—HEDIS 2015 Trend Table for Anthem Blue Cross Partnership Plan—Santa Clara County
Measure RY
2012 RY
2013 RY
2014 RY
2015 RYs 2014–15
Rate Difference All-Cause Readmissions—Statewide Collaborative QIP measure — 13.74% 13.75% 17.19% Ambulatory Care—Emergency Department Visits per 1,000 Member Months* 37.89 41.51 47.16 45.39 Not Tested Ambulatory Care—Outpatient Visits per 1,000 Member Months* 232.42 254.81 257.20 209.85 Not Tested Annual Monitoring for Patients on Persistent Medications—ACE Inhibitors or ARBs 84.95% 86.63% 87.64% 86.17% Annual Monitoring for Patients on Persistent Medications—Digoxin NA NA NA NA Not Comparable
Annual Monitoring for Patients on Persistent Medications—Diuretics 84.21% 86.61% 85.77% 85.87% Avoidance of Antibiotic Treatment in Adults With Acute Bronchitis 20.00% 27.20% 28.24% 29.49% Cervical Cancer Screening — — 62.56% 65.35% Childhood Immunization Status—Combination 3 66.91% 74.94% 67.82% 69.21% Children and Adolescents' Access to Primary Care Practitioners—12 to 24 Months 95.63% 95.81% 95.43% 94.04% Children and Adolescents' Access to Primary Care Practitioners—25 Months to 6 Years 86.67% 87.39% 87.49% 86.01%
Children and Adolescents' Access to Primary Care Practitioners—7 to 11 Years 87.63% 88.05% 89.72% 88.86% Children and Adolescents' Access to Primary Care Practitioners—12 to 19 Years 86.34% 87.62% 85.64% 86.24% Comprehensive Diabetes Care—Blood Pressure Control (<140/90 mm Hg) 65.69% 58.50% 44.15% 54.29% Comprehensive Diabetes Care—Eye Exam (Retinal) Performed 64.48% 49.76% 45.25% 52.44% Comprehensive Diabetes Care—HbA1c Testing 85.89% 79.85% 83.00% 84.69% Comprehensive Diabetes Care—HbA1c Control (<8.0 Percent) 61.31% 53.88% 45.03% 56.61%
Comprehensive Diabetes Care—Medical Attention for Nephropathy 79.56% 80.10% 80.13% 83.99% Comprehensive Diabetes Care—HbA1c Poor Control (>9.0 Percent) 29.44% 39.08% 43.27% 33.41% Controlling High Blood Pressure — 46.72% 40.93% 49.77% Immunizations for Adolescents—Combination 1 60.10% 68.86% 72.45% 75.50% Medication Management for People with Asthma—Medication Compliance 50% Total — 43.37% 43.67% 53.50%
Medication Management for People with Asthma—Medication Compliance 75% Total — 28.11% 24.90% 38.27%
Prenatal and Postpartum Care—Postpartum Care 60.64% 56.20% 60.65% 56.84% Prenatal and Postpartum Care—Timeliness of Prenatal Care 79.52% 76.71% 80.09% 80.97% Use of Imaging Studies for Low Back Pain 82.43% 83.67% 80.35% 80.72% Weight Assessment and Counseling for Nutrition and Physical Activity for Children/Adolescents—BMI Assessment: Total 53.28% 55.23% 48.15% 68.75%
Weight Assessment and Counseling for Nutrition and Physical Activity for Children/Adolescents—Nutrition Counseling: Total 70.56% 65.94% 46.99% 64.58%
Weight Assessment and Counseling for Nutrition and Physical Activity for Children/Adolescents—Physical Activity Counseling: Total 38.44% 50.36% 34.49% 52.78%
Well-Child Visits in the Third, Fourth, Fifth, and Sixth Years of Life 76.72% 76.72% 74.45% 77.08% *Member months are a member’s “contribution” to the total yearly membership.

TREND TABLES
2015 HEDIS Aggregate Report Page A-15 California Department of Health Care Services Health Services Advisory Group, Inc.
Table A.13—HEDIS 2015 Trend Table for Anthem Blue Cross Partnership Plan—Tulare County
Measure RY
2012 RY
2013 RY
2014 RY
2015 RYs 2014–15
Rate Difference All-Cause Readmissions—Statewide Collaborative QIP measure — 11.70% 10.59% 16.58% Ambulatory Care—Emergency Department Visits per 1,000 Member Months* 25.62 42.20 42.71 43.20 Not Tested Ambulatory Care—Outpatient Visits per 1,000 Member Months* 194.99 293.82 325.32 317.42 Not Tested Annual Monitoring for Patients on Persistent Medications—ACE Inhibitors or ARBs 70.48% 78.55% 85.06% 83.04% Annual Monitoring for Patients on Persistent Medications—Digoxin NA NA NA NA Not Comparable
Annual Monitoring for Patients on Persistent Medications—Diuretics 69.03% 81.57% 84.53% 82.83% Avoidance of Antibiotic Treatment in Adults With Acute Bronchitis 20.19% 19.52% 23.42% 17.08% Cervical Cancer Screening — — 63.43% 60.79% Childhood Immunization Status—Combination 3 64.96% 71.78% 72.22% 66.67% Children and Adolescents' Access to Primary Care Practitioners—12 to 24 Months 92.51% 92.47% 97.75% 97.24% Children and Adolescents' Access to Primary Care Practitioners—25 Months to 6 Years 71.01% 82.72% 90.35% 91.20%
Children and Adolescents' Access to Primary Care Practitioners—7 to 11 Years 81.80% 79.60% 88.21% 91.28% Children and Adolescents' Access to Primary Care Practitioners—12 to 19 Years 82.21% 82.20% 87.52% 90.62% Comprehensive Diabetes Care—Blood Pressure Control (<140/90 mm Hg) 68.13% 68.45% 54.97% 64.58%
Comprehensive Diabetes Care—Eye Exam (Retinal) Performed 33.09% 35.68% 47.02% 46.30% Comprehensive Diabetes Care—HbA1c Testing 77.13% 78.40% 83.00% 82.87% Comprehensive Diabetes Care—HbA1c Control (<8.0 Percent) 45.26% 48.54% 42.60% 42.13% Comprehensive Diabetes Care—Medical Attention for Nephropathy 77.62% 81.55% 81.46% 78.24% Comprehensive Diabetes Care—HbA1c Poor Control (>9.0 Percent) 45.74% 43.69% 46.36% 48.38% Controlling High Blood Pressure — 53.28% 52.99% 49.07% Immunizations for Adolescents—Combination 1 57.91% 70.97% 78.70% 78.22% Medication Management for People with Asthma—Medication Compliance 50% Total — 38.07% 43.12% 44.21% Medication Management for People with Asthma—Medication Compliance 75% Total — 18.88% 21.05% 23.98%
Prenatal and Postpartum Care—Postpartum Care 53.13% 55.96% 58.24% 59.26% Prenatal and Postpartum Care—Timeliness of Prenatal Care 83.07% 76.16% 82.37% 81.25% Use of Imaging Studies for Low Back Pain 80.85% 81.07% 85.90% 82.18% Weight Assessment and Counseling for Nutrition and Physical Activity for Children/Adolescents—BMI Assessment: Total 83.94% 81.51% 65.28% 79.81%
Weight Assessment and Counseling for Nutrition and Physical Activity for Children/Adolescents—Nutrition Counseling: Total 68.13% 64.23% 57.18% 68.21%
Weight Assessment and Counseling for Nutrition and Physical Activity for Children/Adolescents—Physical Activity Counseling: Total 50.36% 47.93% 47.92% 49.19%
Well-Child Visits in the Third, Fourth, Fifth, and Sixth Years of Life 71.95% 64.91% 71.93% 72.45% *Member months are a member’s “contribution” to the total yearly membership.
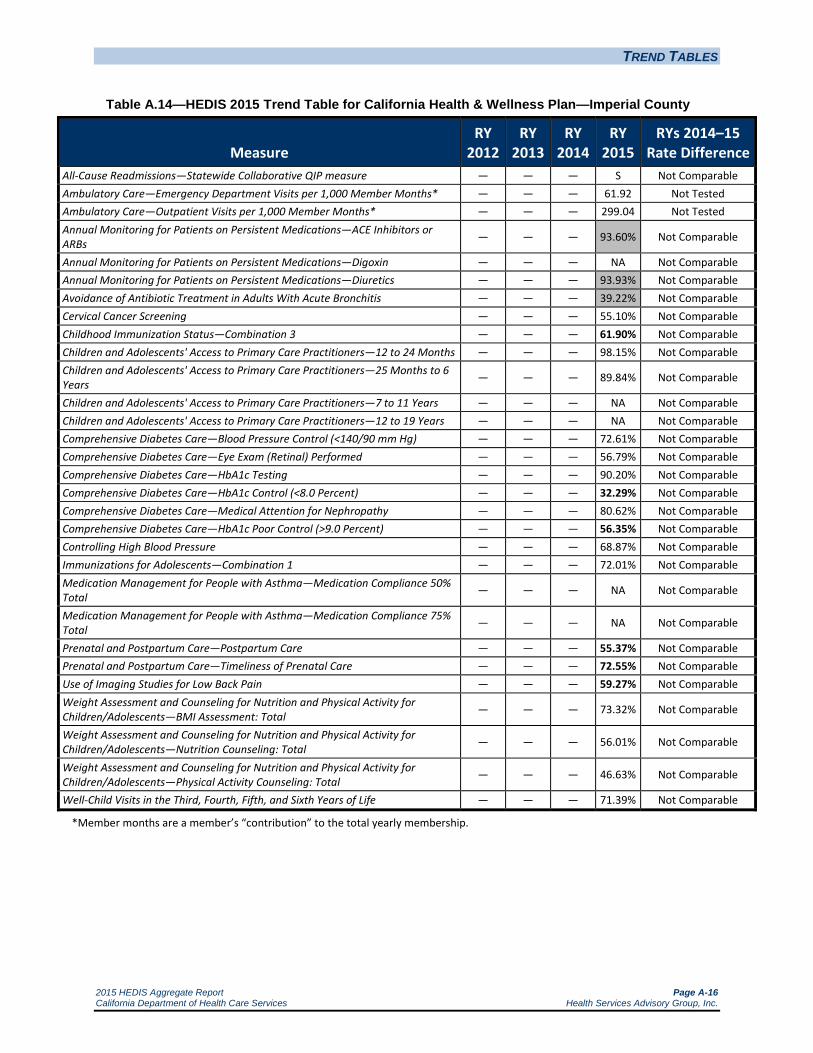
TREND TABLES
2015 HEDIS Aggregate Report Page A-16 California Department of Health Care Services Health Services Advisory Group, Inc.
Table A.14—HEDIS 2015 Trend Table for California Health & Wellness Plan—Imperial County
Measure RY
2012 RY
2013 RY
2014 RY
2015 RYs 2014–15
Rate Difference All-Cause Readmissions—Statewide Collaborative QIP measure — — — S Not Comparable Ambulatory Care—Emergency Department Visits per 1,000 Member Months* — — — 61.92 Not Tested Ambulatory Care—Outpatient Visits per 1,000 Member Months* — — — 299.04 Not Tested Annual Monitoring for Patients on Persistent Medications—ACE Inhibitors or ARBs — — — 93.60% Not Comparable
Annual Monitoring for Patients on Persistent Medications—Digoxin — — — NA Not Comparable Annual Monitoring for Patients on Persistent Medications—Diuretics — — — 93.93% Not Comparable Avoidance of Antibiotic Treatment in Adults With Acute Bronchitis — — — 39.22% Not Comparable Cervical Cancer Screening — — — 55.10% Not Comparable Childhood Immunization Status—Combination 3 — — — 61.90% Not Comparable Children and Adolescents' Access to Primary Care Practitioners—12 to 24 Months — — — 98.15% Not Comparable Children and Adolescents' Access to Primary Care Practitioners—25 Months to 6 Years — — — 89.84% Not Comparable
Children and Adolescents' Access to Primary Care Practitioners—7 to 11 Years — — — NA Not Comparable Children and Adolescents' Access to Primary Care Practitioners—12 to 19 Years — — — NA Not Comparable Comprehensive Diabetes Care—Blood Pressure Control (<140/90 mm Hg) — — — 72.61% Not Comparable Comprehensive Diabetes Care—Eye Exam (Retinal) Performed — — — 56.79% Not Comparable Comprehensive Diabetes Care—HbA1c Testing — — — 90.20% Not Comparable Comprehensive Diabetes Care—HbA1c Control (<8.0 Percent) — — — 32.29% Not Comparable Comprehensive Diabetes Care—Medical Attention for Nephropathy — — — 80.62% Not Comparable Comprehensive Diabetes Care—HbA1c Poor Control (>9.0 Percent) — — — 56.35% Not Comparable Controlling High Blood Pressure — — — 68.87% Not Comparable Immunizations for Adolescents—Combination 1 — — — 72.01% Not Comparable Medication Management for People with Asthma—Medication Compliance 50% Total — — — NA Not Comparable
Medication Management for People with Asthma—Medication Compliance 75% Total — — — NA Not Comparable
Prenatal and Postpartum Care—Postpartum Care — — — 55.37% Not Comparable Prenatal and Postpartum Care—Timeliness of Prenatal Care — — — 72.55% Not Comparable Use of Imaging Studies for Low Back Pain — — — 59.27% Not Comparable Weight Assessment and Counseling for Nutrition and Physical Activity for Children/Adolescents—BMI Assessment: Total — — — 73.32% Not Comparable
Weight Assessment and Counseling for Nutrition and Physical Activity for Children/Adolescents—Nutrition Counseling: Total — — — 56.01% Not Comparable
Weight Assessment and Counseling for Nutrition and Physical Activity for Children/Adolescents—Physical Activity Counseling: Total — — — 46.63% Not Comparable
Well-Child Visits in the Third, Fourth, Fifth, and Sixth Years of Life — — — 71.39% Not Comparable
*Member months are a member’s “contribution” to the total yearly membership.

TREND TABLES
2015 HEDIS Aggregate Report Page A-17 California Department of Health Care Services Health Services Advisory Group, Inc.
Table A.15—HEDIS 2015 Trend Table for California Health & Wellness Plan—Region 1 (Butte, Colusa, Glenn, Plumas, Sierra, Sutter, and Tehama Counties)
Measure RY
2012 RY
2013 RY
2014 RY
2015 RYs 2014–15
Rate Difference All-Cause Readmissions—Statewide Collaborative QIP measure — — — 13.56% Not Comparable Ambulatory Care—Emergency Department Visits per 1,000 Member Months* — — — 47.61 Not Tested Ambulatory Care—Outpatient Visits per 1,000 Member Months* — — — 331.93 Not Tested Annual Monitoring for Patients on Persistent Medications—ACE Inhibitors or ARBs — — — 81.59% Not Comparable
Annual Monitoring for Patients on Persistent Medications—Digoxin — — — NA Not Comparable Annual Monitoring for Patients on Persistent Medications—Diuretics — — — 81.33% Not Comparable Avoidance of Antibiotic Treatment in Adults With Acute Bronchitis — — — 16.15% Not Comparable Cervical Cancer Screening — — — 44.53% Not Comparable Childhood Immunization Status—Combination 3 — — — 63.94% Not Comparable Children and Adolescents' Access to Primary Care Practitioners—12 to 24 Months — — — 94.23% Not Comparable Children and Adolescents' Access to Primary Care Practitioners—25 Months to 6 Years — — — 88.33% Not Comparable
Children and Adolescents' Access to Primary Care Practitioners—7 to 11 Years — — — NA Not Comparable Children and Adolescents' Access to Primary Care Practitioners—12 to 19 Years — — — NA Not Comparable Comprehensive Diabetes Care—Blood Pressure Control (<140/90 mm Hg) — — — 70.60% Not Comparable Comprehensive Diabetes Care—Eye Exam (Retinal) Performed — — — 39.20% Not Comparable Comprehensive Diabetes Care—HbA1c Testing — — — 84.63% Not Comparable Comprehensive Diabetes Care—HbA1c Control (<8.0 Percent) — — — 40.31% Not Comparable Comprehensive Diabetes Care—Medical Attention for Nephropathy — — — 76.17% Not Comparable Comprehensive Diabetes Care—HbA1c Poor Control (>9.0 Percent) — — — 44.99% Not Comparable Controlling High Blood Pressure — — — 54.20% Not Comparable Immunizations for Adolescents—Combination 1 — — — 53.97% Not Comparable Medication Management for People with Asthma—Medication Compliance 50% Total — — — NA Not Comparable
Medication Management for People with Asthma—Medication Compliance 75% Total — — — NA Not Comparable
Prenatal and Postpartum Care—Postpartum Care — — — 63.50% Not Comparable Prenatal and Postpartum Care—Timeliness of Prenatal Care — — — 76.40% Not Comparable Use of Imaging Studies for Low Back Pain — — — 77.96% Not Comparable Weight Assessment and Counseling for Nutrition and Physical Activity for Children/Adolescents—BMI Assessment: Total — — — 50.72% Not Comparable
Weight Assessment and Counseling for Nutrition and Physical Activity for Children/Adolescents—Nutrition Counseling: Total — — — 39.90% Not Comparable
Weight Assessment and Counseling for Nutrition and Physical Activity for Children/Adolescents—Physical Activity Counseling: Total — — — 29.33% Not Comparable
Well-Child Visits in the Third, Fourth, Fifth, and Sixth Years of Life — — — 59.62% Not Comparable
*Member months are a member’s “contribution” to the total yearly membership.

TREND TABLES
2015 HEDIS Aggregate Report Page A-18 California Department of Health Care Services Health Services Advisory Group, Inc.
Table A.16—HEDIS 2015 Trend Table for California Health & Wellness Plan—Region 2 (Alpine, Amador, Calaveras, El Dorado, Inyo, Mariposa, Mono, Nevada, Placer, Tuolumne, and Yuba Counties)
Measure RY
2012 RY
2013 RY
2014 RY
2015 RYs 2014–15
Rate Difference All-Cause Readmissions—Statewide Collaborative QIP measure — — — 17.65% Not Comparable Ambulatory Care—Emergency Department Visits per 1,000 Member Months* — — — 59.57 Not Tested Ambulatory Care—Outpatient Visits per 1,000 Member Months* — — — 257.36 Not Tested Annual Monitoring for Patients on Persistent Medications—ACE Inhibitors or ARBs — — — 81.43% Not Comparable
Annual Monitoring for Patients on Persistent Medications—Digoxin — — — NA Not Comparable Annual Monitoring for Patients on Persistent Medications—Diuretics — — — 82.69% Not Comparable Avoidance of Antibiotic Treatment in Adults With Acute Bronchitis — — — 18.60% Not Comparable Cervical Cancer Screening — — — 40.88% Not Comparable Childhood Immunization Status—Combination 3 — — — 52.08% Not Comparable Children and Adolescents' Access to Primary Care Practitioners—12 to 24 Months — — — 91.36% Not Comparable Children and Adolescents' Access to Primary Care Practitioners—25 Months to 6 Years — — — 80.61% Not Comparable
Children and Adolescents' Access to Primary Care Practitioners—7 to 11 Years — — — NA Not Comparable Children and Adolescents' Access to Primary Care Practitioners—12 to 19 Years — — — NA Not Comparable Comprehensive Diabetes Care—Blood Pressure Control (<140/90 mm Hg) — — — 61.20% Not Comparable Comprehensive Diabetes Care—Eye Exam (Retinal) Performed — — — 38.14% Not Comparable Comprehensive Diabetes Care—HbA1c Testing — — — 87.80% Not Comparable Comprehensive Diabetes Care—HbA1c Control (<8.0 Percent) — — — 40.13% Not Comparable Comprehensive Diabetes Care—Medical Attention for Nephropathy — — — 83.37% Not Comparable Comprehensive Diabetes Care—HbA1c Poor Control (>9.0 Percent) — — — 48.12% Not Comparable Controlling High Blood Pressure — — — 51.88% Not Comparable Immunizations for Adolescents—Combination 1 — — — 48.60% Not Comparable Medication Management for People with Asthma—Medication Compliance 50% Total — — — NA Not Comparable
Medication Management for People with Asthma—Medication Compliance 75% Total — — — NA Not Comparable
Prenatal and Postpartum Care—Postpartum Care — — — 53.28% Not Comparable Prenatal and Postpartum Care—Timeliness of Prenatal Care — — — 72.99% Not Comparable Use of Imaging Studies for Low Back Pain — — — 78.98% Not Comparable Weight Assessment and Counseling for Nutrition and Physical Activity for Children/Adolescents—BMI Assessment: Total — — — 57.21% Not Comparable
Weight Assessment and Counseling for Nutrition and Physical Activity for Children/Adolescents—Nutrition Counseling: Total — — — 53.13% Not Comparable
Weight Assessment and Counseling for Nutrition and Physical Activity for Children/Adolescents—Physical Activity Counseling: Total — — — 42.31% Not Comparable
Well-Child Visits in the Third, Fourth, Fifth, and Sixth Years of Life — — — 59.13% Not Comparable
*Member months are a member’s “contribution” to the total yearly membership.
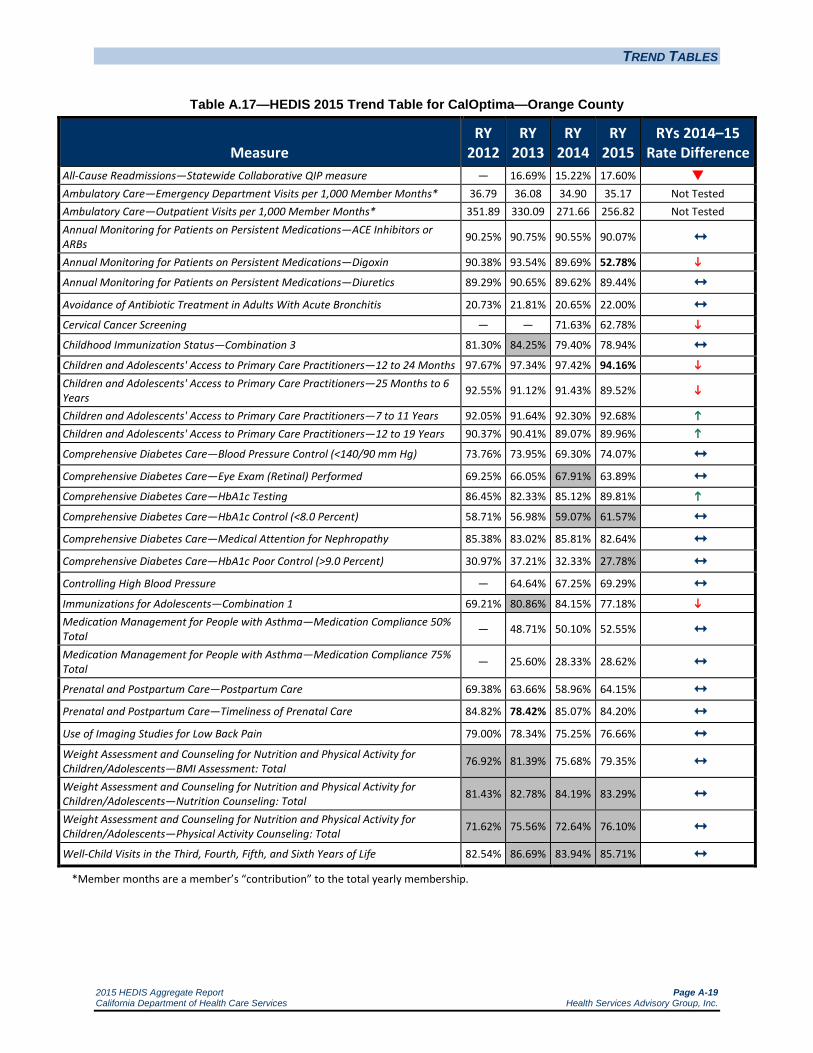
TREND TABLES
2015 HEDIS Aggregate Report Page A-19 California Department of Health Care Services Health Services Advisory Group, Inc.
Table A.17—HEDIS 2015 Trend Table for CalOptima—Orange County
Measure RY
2012 RY
2013 RY
2014 RY
2015 RYs 2014–15
Rate Difference All-Cause Readmissions—Statewide Collaborative QIP measure — 16.69% 15.22% 17.60% Ambulatory Care—Emergency Department Visits per 1,000 Member Months* 36.79 36.08 34.90 35.17 Not Tested Ambulatory Care—Outpatient Visits per 1,000 Member Months* 351.89 330.09 271.66 256.82 Not Tested Annual Monitoring for Patients on Persistent Medications—ACE Inhibitors or ARBs 90.25% 90.75% 90.55% 90.07% Annual Monitoring for Patients on Persistent Medications—Digoxin 90.38% 93.54% 89.69% 52.78% Annual Monitoring for Patients on Persistent Medications—Diuretics 89.29% 90.65% 89.62% 89.44% Avoidance of Antibiotic Treatment in Adults With Acute Bronchitis 20.73% 21.81% 20.65% 22.00% Cervical Cancer Screening — — 71.63% 62.78%
Childhood Immunization Status—Combination 3 81.30% 84.25% 79.40% 78.94% Children and Adolescents' Access to Primary Care Practitioners—12 to 24 Months 97.67% 97.34% 97.42% 94.16% Children and Adolescents' Access to Primary Care Practitioners—25 Months to 6 Years 92.55% 91.12% 91.43% 89.52%
Children and Adolescents' Access to Primary Care Practitioners—7 to 11 Years 92.05% 91.64% 92.30% 92.68% Children and Adolescents' Access to Primary Care Practitioners—12 to 19 Years 90.37% 90.41% 89.07% 89.96%
Comprehensive Diabetes Care—Blood Pressure Control (<140/90 mm Hg) 73.76% 73.95% 69.30% 74.07% Comprehensive Diabetes Care—Eye Exam (Retinal) Performed 69.25% 66.05% 67.91% 63.89% Comprehensive Diabetes Care—HbA1c Testing 86.45% 82.33% 85.12% 89.81% Comprehensive Diabetes Care—HbA1c Control (<8.0 Percent) 58.71% 56.98% 59.07% 61.57% Comprehensive Diabetes Care—Medical Attention for Nephropathy 85.38% 83.02% 85.81% 82.64% Comprehensive Diabetes Care—HbA1c Poor Control (>9.0 Percent) 30.97% 37.21% 32.33% 27.78% Controlling High Blood Pressure — 64.64% 67.25% 69.29% Immunizations for Adolescents—Combination 1 69.21% 80.86% 84.15% 77.18% Medication Management for People with Asthma—Medication Compliance 50% Total — 48.71% 50.10% 52.55% Medication Management for People with Asthma—Medication Compliance 75% Total — 25.60% 28.33% 28.62%
Prenatal and Postpartum Care—Postpartum Care 69.38% 63.66% 58.96% 64.15% Prenatal and Postpartum Care—Timeliness of Prenatal Care 84.82% 78.42% 85.07% 84.20% Use of Imaging Studies for Low Back Pain 79.00% 78.34% 75.25% 76.66% Weight Assessment and Counseling for Nutrition and Physical Activity for Children/Adolescents—BMI Assessment: Total 76.92% 81.39% 75.68% 79.35% Weight Assessment and Counseling for Nutrition and Physical Activity for Children/Adolescents—Nutrition Counseling: Total 81.43% 82.78% 84.19% 83.29% Weight Assessment and Counseling for Nutrition and Physical Activity for Children/Adolescents—Physical Activity Counseling: Total 71.62% 75.56% 72.64% 76.10%
Well-Child Visits in the Third, Fourth, Fifth, and Sixth Years of Life 82.54% 86.69% 83.94% 85.71% *Member months are a member’s “contribution” to the total yearly membership.
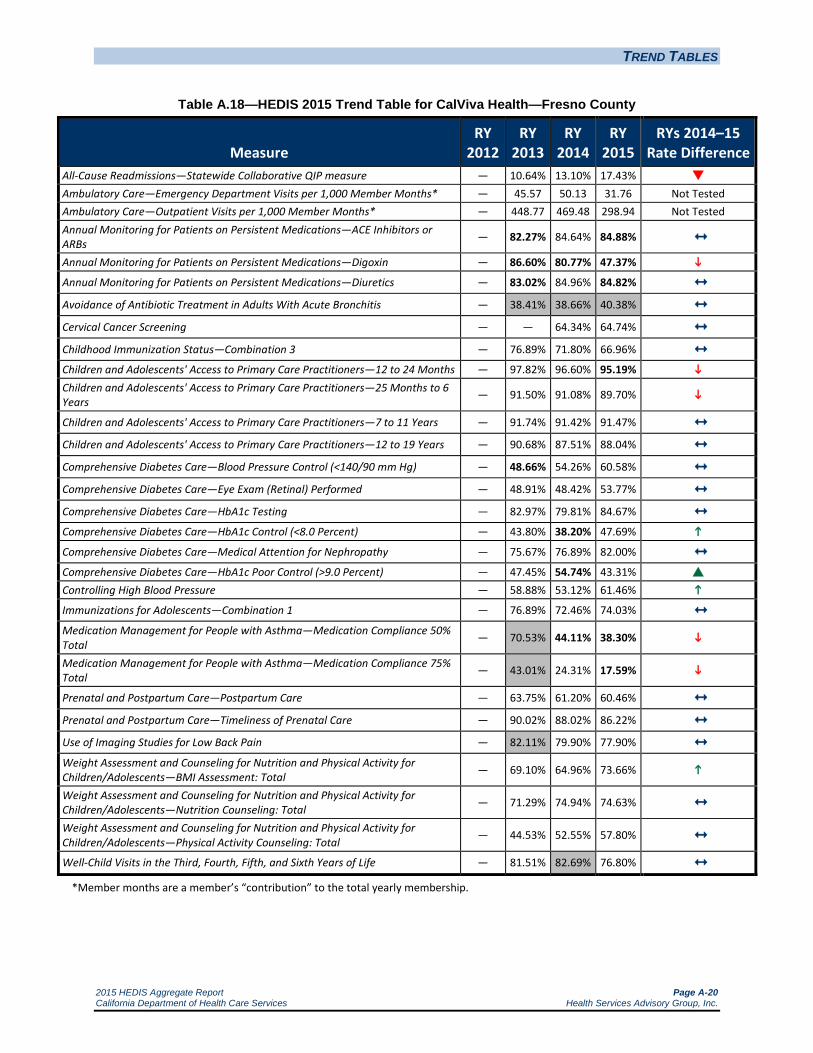
TREND TABLES
2015 HEDIS Aggregate Report Page A-20 California Department of Health Care Services Health Services Advisory Group, Inc.
Table A.18—HEDIS 2015 Trend Table for CalViva Health—Fresno County
Measure RY
2012 RY
2013 RY
2014 RY
2015 RYs 2014–15
Rate Difference All-Cause Readmissions—Statewide Collaborative QIP measure — 10.64% 13.10% 17.43% Ambulatory Care—Emergency Department Visits per 1,000 Member Months* — 45.57 50.13 31.76 Not Tested Ambulatory Care—Outpatient Visits per 1,000 Member Months* — 448.77 469.48 298.94 Not Tested Annual Monitoring for Patients on Persistent Medications—ACE Inhibitors or ARBs — 82.27% 84.64% 84.88% Annual Monitoring for Patients on Persistent Medications—Digoxin — 86.60% 80.77% 47.37% Annual Monitoring for Patients on Persistent Medications—Diuretics — 83.02% 84.96% 84.82% Avoidance of Antibiotic Treatment in Adults With Acute Bronchitis — 38.41% 38.66% 40.38% Cervical Cancer Screening — — 64.34% 64.74% Childhood Immunization Status—Combination 3 — 76.89% 71.80% 66.96% Children and Adolescents' Access to Primary Care Practitioners—12 to 24 Months — 97.82% 96.60% 95.19% Children and Adolescents' Access to Primary Care Practitioners—25 Months to 6 Years — 91.50% 91.08% 89.70%
Children and Adolescents' Access to Primary Care Practitioners—7 to 11 Years — 91.74% 91.42% 91.47% Children and Adolescents' Access to Primary Care Practitioners—12 to 19 Years — 90.68% 87.51% 88.04% Comprehensive Diabetes Care—Blood Pressure Control (<140/90 mm Hg) — 48.66% 54.26% 60.58% Comprehensive Diabetes Care—Eye Exam (Retinal) Performed — 48.91% 48.42% 53.77% Comprehensive Diabetes Care—HbA1c Testing — 82.97% 79.81% 84.67% Comprehensive Diabetes Care—HbA1c Control (<8.0 Percent) — 43.80% 38.20% 47.69% Comprehensive Diabetes Care—Medical Attention for Nephropathy — 75.67% 76.89% 82.00% Comprehensive Diabetes Care—HbA1c Poor Control (>9.0 Percent) — 47.45% 54.74% 43.31% Controlling High Blood Pressure — 58.88% 53.12% 61.46% Immunizations for Adolescents—Combination 1 — 76.89% 72.46% 74.03% Medication Management for People with Asthma—Medication Compliance 50% Total — 70.53% 44.11% 38.30%
Medication Management for People with Asthma—Medication Compliance 75% Total — 43.01% 24.31% 17.59%
Prenatal and Postpartum Care—Postpartum Care — 63.75% 61.20% 60.46% Prenatal and Postpartum Care—Timeliness of Prenatal Care — 90.02% 88.02% 86.22% Use of Imaging Studies for Low Back Pain — 82.11% 79.90% 77.90% Weight Assessment and Counseling for Nutrition and Physical Activity for Children/Adolescents—BMI Assessment: Total — 69.10% 64.96% 73.66%
Weight Assessment and Counseling for Nutrition and Physical Activity for Children/Adolescents—Nutrition Counseling: Total — 71.29% 74.94% 74.63% Weight Assessment and Counseling for Nutrition and Physical Activity for Children/Adolescents—Physical Activity Counseling: Total — 44.53% 52.55% 57.80%
Well-Child Visits in the Third, Fourth, Fifth, and Sixth Years of Life — 81.51% 82.69% 76.80% *Member months are a member’s “contribution” to the total yearly membership.
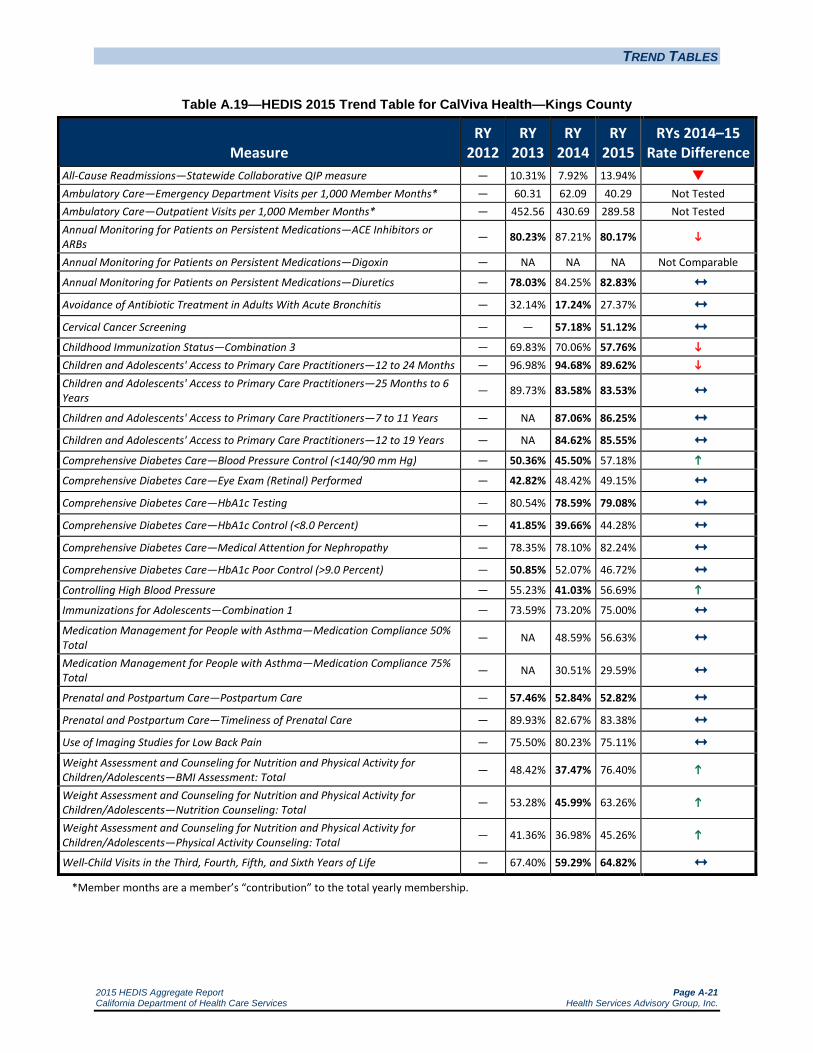
TREND TABLES
2015 HEDIS Aggregate Report Page A-21 California Department of Health Care Services Health Services Advisory Group, Inc.
Table A.19—HEDIS 2015 Trend Table for CalViva Health—Kings County
Measure RY
2012 RY
2013 RY
2014 RY
2015 RYs 2014–15
Rate Difference All-Cause Readmissions—Statewide Collaborative QIP measure — 10.31% 7.92% 13.94% Ambulatory Care—Emergency Department Visits per 1,000 Member Months* — 60.31 62.09 40.29 Not Tested Ambulatory Care—Outpatient Visits per 1,000 Member Months* — 452.56 430.69 289.58 Not Tested Annual Monitoring for Patients on Persistent Medications—ACE Inhibitors or ARBs — 80.23% 87.21% 80.17%
Annual Monitoring for Patients on Persistent Medications—Digoxin — NA NA NA Not Comparable
Annual Monitoring for Patients on Persistent Medications—Diuretics — 78.03% 84.25% 82.83% Avoidance of Antibiotic Treatment in Adults With Acute Bronchitis — 32.14% 17.24% 27.37% Cervical Cancer Screening — — 57.18% 51.12% Childhood Immunization Status—Combination 3 — 69.83% 70.06% 57.76% Children and Adolescents' Access to Primary Care Practitioners—12 to 24 Months — 96.98% 94.68% 89.62% Children and Adolescents' Access to Primary Care Practitioners—25 Months to 6 Years — 89.73% 83.58% 83.53%
Children and Adolescents' Access to Primary Care Practitioners—7 to 11 Years — NA 87.06% 86.25%
Children and Adolescents' Access to Primary Care Practitioners—12 to 19 Years — NA 84.62% 85.55% Comprehensive Diabetes Care—Blood Pressure Control (<140/90 mm Hg) — 50.36% 45.50% 57.18% Comprehensive Diabetes Care—Eye Exam (Retinal) Performed — 42.82% 48.42% 49.15% Comprehensive Diabetes Care—HbA1c Testing — 80.54% 78.59% 79.08% Comprehensive Diabetes Care—HbA1c Control (<8.0 Percent) — 41.85% 39.66% 44.28% Comprehensive Diabetes Care—Medical Attention for Nephropathy — 78.35% 78.10% 82.24% Comprehensive Diabetes Care—HbA1c Poor Control (>9.0 Percent) — 50.85% 52.07% 46.72% Controlling High Blood Pressure — 55.23% 41.03% 56.69%
Immunizations for Adolescents—Combination 1 — 73.59% 73.20% 75.00% Medication Management for People with Asthma—Medication Compliance 50% Total — NA 48.59% 56.63%
Medication Management for People with Asthma—Medication Compliance 75% Total — NA 30.51% 29.59%
Prenatal and Postpartum Care—Postpartum Care — 57.46% 52.84% 52.82% Prenatal and Postpartum Care—Timeliness of Prenatal Care — 89.93% 82.67% 83.38% Use of Imaging Studies for Low Back Pain — 75.50% 80.23% 75.11% Weight Assessment and Counseling for Nutrition and Physical Activity for Children/Adolescents—BMI Assessment: Total — 48.42% 37.47% 76.40%
Weight Assessment and Counseling for Nutrition and Physical Activity for Children/Adolescents—Nutrition Counseling: Total — 53.28% 45.99% 63.26%
Weight Assessment and Counseling for Nutrition and Physical Activity for Children/Adolescents—Physical Activity Counseling: Total — 41.36% 36.98% 45.26%
Well-Child Visits in the Third, Fourth, Fifth, and Sixth Years of Life — 67.40% 59.29% 64.82% *Member months are a member’s “contribution” to the total yearly membership.
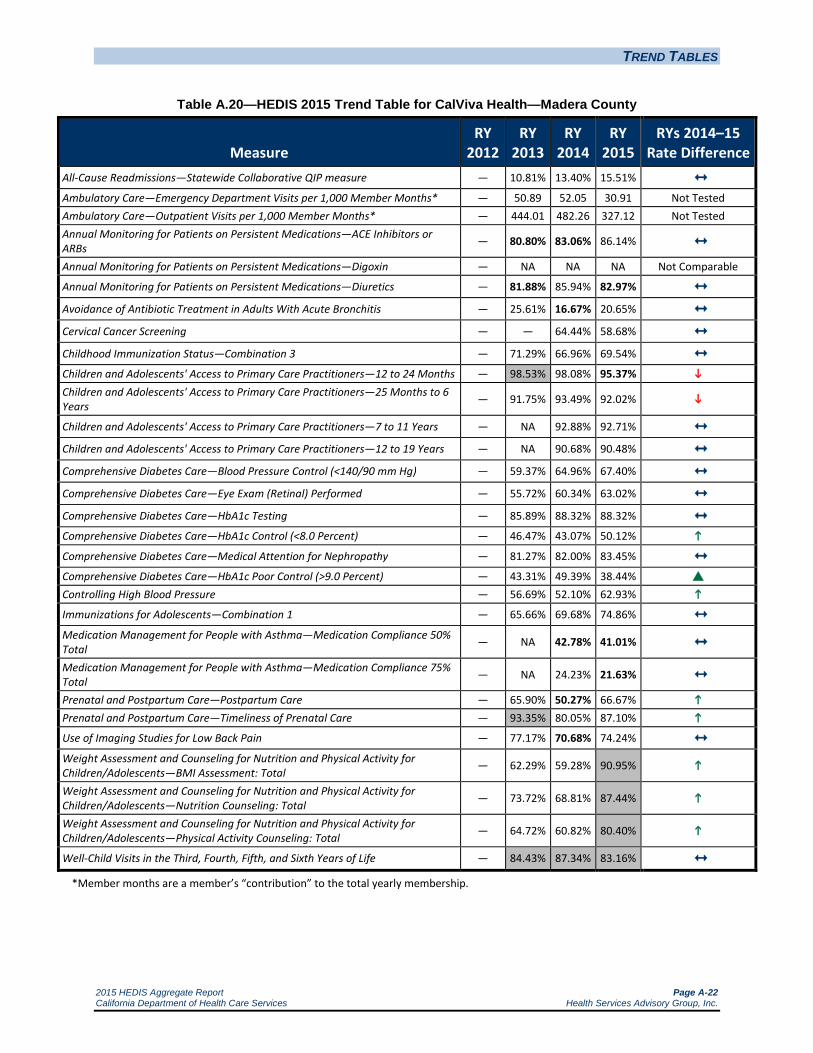
TREND TABLES
2015 HEDIS Aggregate Report Page A-22 California Department of Health Care Services Health Services Advisory Group, Inc.
Table A.20—HEDIS 2015 Trend Table for CalViva Health—Madera County
Measure RY
2012 RY
2013 RY
2014 RY
2015 RYs 2014–15
Rate Difference All-Cause Readmissions—Statewide Collaborative QIP measure — 10.81% 13.40% 15.51% Ambulatory Care—Emergency Department Visits per 1,000 Member Months* — 50.89 52.05 30.91 Not Tested Ambulatory Care—Outpatient Visits per 1,000 Member Months* — 444.01 482.26 327.12 Not Tested Annual Monitoring for Patients on Persistent Medications—ACE Inhibitors or ARBs — 80.80% 83.06% 86.14% Annual Monitoring for Patients on Persistent Medications—Digoxin — NA NA NA Not Comparable
Annual Monitoring for Patients on Persistent Medications—Diuretics — 81.88% 85.94% 82.97% Avoidance of Antibiotic Treatment in Adults With Acute Bronchitis — 25.61% 16.67% 20.65% Cervical Cancer Screening — — 64.44% 58.68%
Childhood Immunization Status—Combination 3 — 71.29% 66.96% 69.54% Children and Adolescents' Access to Primary Care Practitioners—12 to 24 Months — 98.53% 98.08% 95.37% Children and Adolescents' Access to Primary Care Practitioners—25 Months to 6 Years — 91.75% 93.49% 92.02%
Children and Adolescents' Access to Primary Care Practitioners—7 to 11 Years — NA 92.88% 92.71%
Children and Adolescents' Access to Primary Care Practitioners—12 to 19 Years — NA 90.68% 90.48%
Comprehensive Diabetes Care—Blood Pressure Control (<140/90 mm Hg) — 59.37% 64.96% 67.40% Comprehensive Diabetes Care—Eye Exam (Retinal) Performed — 55.72% 60.34% 63.02% Comprehensive Diabetes Care—HbA1c Testing — 85.89% 88.32% 88.32% Comprehensive Diabetes Care—HbA1c Control (<8.0 Percent) — 46.47% 43.07% 50.12% Comprehensive Diabetes Care—Medical Attention for Nephropathy — 81.27% 82.00% 83.45% Comprehensive Diabetes Care—HbA1c Poor Control (>9.0 Percent) — 43.31% 49.39% 38.44% Controlling High Blood Pressure — 56.69% 52.10% 62.93% Immunizations for Adolescents—Combination 1 — 65.66% 69.68% 74.86% Medication Management for People with Asthma—Medication Compliance 50% Total — NA 42.78% 41.01%
Medication Management for People with Asthma—Medication Compliance 75% Total — NA 24.23% 21.63%
Prenatal and Postpartum Care—Postpartum Care — 65.90% 50.27% 66.67% Prenatal and Postpartum Care—Timeliness of Prenatal Care — 93.35% 80.05% 87.10%
Use of Imaging Studies for Low Back Pain — 77.17% 70.68% 74.24% Weight Assessment and Counseling for Nutrition and Physical Activity for Children/Adolescents—BMI Assessment: Total — 62.29% 59.28% 90.95%
Weight Assessment and Counseling for Nutrition and Physical Activity for Children/Adolescents—Nutrition Counseling: Total — 73.72% 68.81% 87.44%
Weight Assessment and Counseling for Nutrition and Physical Activity for Children/Adolescents—Physical Activity Counseling: Total — 64.72% 60.82% 80.40%
Well-Child Visits in the Third, Fourth, Fifth, and Sixth Years of Life — 84.43% 87.34% 83.16% *Member months are a member’s “contribution” to the total yearly membership.
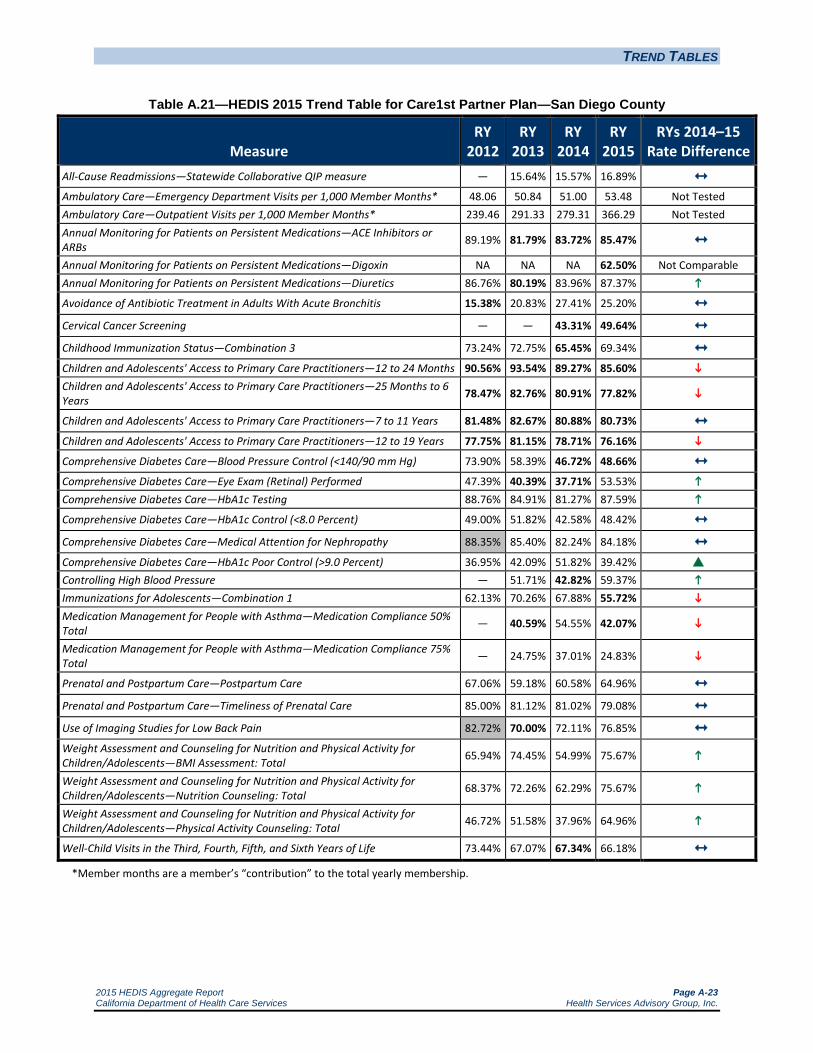
TREND TABLES
2015 HEDIS Aggregate Report Page A-23 California Department of Health Care Services Health Services Advisory Group, Inc.
Table A.21—HEDIS 2015 Trend Table for Care1st Partner Plan—San Diego County
Measure RY
2012 RY
2013 RY
2014 RY
2015 RYs 2014–15
Rate Difference All-Cause Readmissions—Statewide Collaborative QIP measure — 15.64% 15.57% 16.89% Ambulatory Care—Emergency Department Visits per 1,000 Member Months* 48.06 50.84 51.00 53.48 Not Tested Ambulatory Care—Outpatient Visits per 1,000 Member Months* 239.46 291.33 279.31 366.29 Not Tested Annual Monitoring for Patients on Persistent Medications—ACE Inhibitors or ARBs 89.19% 81.79% 83.72% 85.47% Annual Monitoring for Patients on Persistent Medications—Digoxin NA NA NA 62.50% Not Comparable Annual Monitoring for Patients on Persistent Medications—Diuretics 86.76% 80.19% 83.96% 87.37% Avoidance of Antibiotic Treatment in Adults With Acute Bronchitis 15.38% 20.83% 27.41% 25.20% Cervical Cancer Screening — — 43.31% 49.64%
Childhood Immunization Status—Combination 3 73.24% 72.75% 65.45% 69.34% Children and Adolescents' Access to Primary Care Practitioners—12 to 24 Months 90.56% 93.54% 89.27% 85.60% Children and Adolescents' Access to Primary Care Practitioners—25 Months to 6 Years 78.47% 82.76% 80.91% 77.82%
Children and Adolescents' Access to Primary Care Practitioners—7 to 11 Years 81.48% 82.67% 80.88% 80.73% Children and Adolescents' Access to Primary Care Practitioners—12 to 19 Years 77.75% 81.15% 78.71% 76.16% Comprehensive Diabetes Care—Blood Pressure Control (<140/90 mm Hg) 73.90% 58.39% 46.72% 48.66% Comprehensive Diabetes Care—Eye Exam (Retinal) Performed 47.39% 40.39% 37.71% 53.53% Comprehensive Diabetes Care—HbA1c Testing 88.76% 84.91% 81.27% 87.59% Comprehensive Diabetes Care—HbA1c Control (<8.0 Percent) 49.00% 51.82% 42.58% 48.42% Comprehensive Diabetes Care—Medical Attention for Nephropathy 88.35% 85.40% 82.24% 84.18% Comprehensive Diabetes Care—HbA1c Poor Control (>9.0 Percent) 36.95% 42.09% 51.82% 39.42% Controlling High Blood Pressure — 51.71% 42.82% 59.37% Immunizations for Adolescents—Combination 1 62.13% 70.26% 67.88% 55.72% Medication Management for People with Asthma—Medication Compliance 50% Total — 40.59% 54.55% 42.07%
Medication Management for People with Asthma—Medication Compliance 75% Total — 24.75% 37.01% 24.83%
Prenatal and Postpartum Care—Postpartum Care 67.06% 59.18% 60.58% 64.96% Prenatal and Postpartum Care—Timeliness of Prenatal Care 85.00% 81.12% 81.02% 79.08% Use of Imaging Studies for Low Back Pain 82.72% 70.00% 72.11% 76.85% Weight Assessment and Counseling for Nutrition and Physical Activity for Children/Adolescents—BMI Assessment: Total 65.94% 74.45% 54.99% 75.67%
Weight Assessment and Counseling for Nutrition and Physical Activity for Children/Adolescents—Nutrition Counseling: Total 68.37% 72.26% 62.29% 75.67%
Weight Assessment and Counseling for Nutrition and Physical Activity for Children/Adolescents—Physical Activity Counseling: Total 46.72% 51.58% 37.96% 64.96%
Well-Child Visits in the Third, Fourth, Fifth, and Sixth Years of Life 73.44% 67.07% 67.34% 66.18% *Member months are a member’s “contribution” to the total yearly membership.

TREND TABLES
2015 HEDIS Aggregate Report Page A-24 California Department of Health Care Services Health Services Advisory Group, Inc.
Table A.22—HEDIS 2015 Trend Table for CenCal Health—San Luis Obispo County
Measure RY
2012 RY
2013 RY
2014 RY
2015 RYs 2014–15
Rate Difference All-Cause Readmissions—Statewide Collaborative QIP measure — 13.49% 12.28% 12.36% Ambulatory Care—Emergency Department Visits per 1,000 Member Months* 65.82 63.56 58.78 57.39 Not Tested Ambulatory Care—Outpatient Visits per 1,000 Member Months* 343.58 346.43 334.76 341.47 Not Tested Annual Monitoring for Patients on Persistent Medications—ACE Inhibitors or ARBs 82.95% 81.02% 80.16% 83.99% Annual Monitoring for Patients on Persistent Medications—Digoxin NA NA NA NA Not Comparable
Annual Monitoring for Patients on Persistent Medications—Diuretics 82.35% 84.20% 84.92% 85.09% Avoidance of Antibiotic Treatment in Adults With Acute Bronchitis 33.33% 14.46% 17.24% 28.85% Cervical Cancer Screening — — 62.77% 61.34%
Childhood Immunization Status—Combination 3 76.39% 78.03% 77.43% 79.73% Children and Adolescents' Access to Primary Care Practitioners—12 to 24 Months 96.17% 95.31% 96.78% 93.11% Children and Adolescents' Access to Primary Care Practitioners—25 Months to 6 Years 87.31% 86.21% 89.60% 84.30%
Children and Adolescents' Access to Primary Care Practitioners—7 to 11 Years 88.32% 87.64% 90.47% 89.84% Children and Adolescents' Access to Primary Care Practitioners—12 to 19 Years 86.08% 86.69% 86.83% 88.33% Comprehensive Diabetes Care—Blood Pressure Control (<140/90 mm Hg) 67.64% 70.56% 65.94% 68.33% Comprehensive Diabetes Care—Eye Exam (Retinal) Performed 61.56% 58.39% 59.12% 65.59% Comprehensive Diabetes Care—HbA1c Testing 81.02% 82.00% 84.18% 84.29% Comprehensive Diabetes Care—HbA1c Control (<8.0 Percent) 59.37% 61.31% 58.15% 54.61% Comprehensive Diabetes Care—Medical Attention for Nephropathy 84.67% 82.73% 85.40% 83.29% Comprehensive Diabetes Care—HbA1c Poor Control (>9.0 Percent) 32.60% 31.14% 30.90% 34.66% Controlling High Blood Pressure — 63.02% 54.43% 59.90% Immunizations for Adolescents—Combination 1 60.10% 71.65% 65.79% 68.88% Medication Management for People with Asthma—Medication Compliance 50% Total — 42.34% 45.28% 41.04% Medication Management for People with Asthma—Medication Compliance 75% Total — 26.28% 26.77% 21.27%
Prenatal and Postpartum Care—Postpartum Care 70.11% 71.04% 70.47% 67.82% Prenatal and Postpartum Care—Timeliness of Prenatal Care 82.76% 87.43% 87.13% 88.79% Use of Imaging Studies for Low Back Pain 77.86% 75.69% 80.89% 86.51% Weight Assessment and Counseling for Nutrition and Physical Activity for Children/Adolescents—BMI Assessment: Total 62.29% 64.23% 77.13% 84.67%
Weight Assessment and Counseling for Nutrition and Physical Activity for Children/Adolescents—Nutrition Counseling: Total 59.61% 61.31% 60.10% 63.75% Weight Assessment and Counseling for Nutrition and Physical Activity for Children/Adolescents—Physical Activity Counseling: Total 47.69% 50.36% 51.82% 56.45%
Well-Child Visits in the Third, Fourth, Fifth, and Sixth Years of Life 69.79% 67.97% 72.95% 66.87% *Member months are a member’s “contribution” to the total yearly membership.

TREND TABLES
2015 HEDIS Aggregate Report Page A-25 California Department of Health Care Services Health Services Advisory Group, Inc.
Table A.23—HEDIS 2015 Trend Table for CenCal Health—Santa Barbara County
Measure RY
2012 RY
2013 RY
2014 RY
2015 RYs 2014–15
Rate Difference All-Cause Readmissions—Statewide Collaborative QIP measure — 11.13% 13.15% 13.80% Ambulatory Care—Emergency Department Visits per 1,000 Member Months* 48.37 52.16 51.43 51.03 Not Tested Ambulatory Care—Outpatient Visits per 1,000 Member Months* 346.64 335.52 301.90 302.48 Not Tested Annual Monitoring for Patients on Persistent Medications—ACE Inhibitors or ARBs 86.89% 84.72% 85.79% 86.43% Annual Monitoring for Patients on Persistent Medications—Digoxin NA 86.11% 84.85% NA Not Comparable Annual Monitoring for Patients on Persistent Medications—Diuretics 87.25% 85.46% 86.74% 87.26% Avoidance of Antibiotic Treatment in Adults With Acute Bronchitis 29.55% 19.13% 22.62% 28.93% Cervical Cancer Screening — — 74.45% 70.40%
Childhood Immunization Status—Combination 3 85.20% 85.84% 83.56% 81.25% Children and Adolescents' Access to Primary Care Practitioners—12 to 24 Months 97.31% 97.84% 98.49% 96.79% Children and Adolescents' Access to Primary Care Practitioners—25 Months to 6 Years 90.42% 91.16% 93.58% 91.58%
Children and Adolescents' Access to Primary Care Practitioners—7 to 11 Years 89.69% 90.88% 92.88% 93.73%
Children and Adolescents' Access to Primary Care Practitioners—12 to 19 Years 87.69% 89.29% 90.59% 90.59% Comprehensive Diabetes Care—Blood Pressure Control (<140/90 mm Hg) 69.10% 74.21% 72.02% 70.60% Comprehensive Diabetes Care—Eye Exam (Retinal) Performed 71.29% 70.56% 68.61% 71.36% Comprehensive Diabetes Care—HbA1c Testing 92.21% 83.94% 86.37% 90.95% Comprehensive Diabetes Care—HbA1c Control (<8.0 Percent) 69.34% 59.61% 59.37% 61.06% Comprehensive Diabetes Care—Medical Attention for Nephropathy 87.35% 82.48% 84.91% 85.18% Comprehensive Diabetes Care—HbA1c Poor Control (>9.0 Percent) 22.63% 33.58% 31.87% 29.15% Controlling High Blood Pressure — 60.58% 60.25% 62.03% Immunizations for Adolescents—Combination 1 70.07% 78.74% 80.90% 74.44% Medication Management for People with Asthma—Medication Compliance 50% Total — 47.38% 50.28% 45.26% Medication Management for People with Asthma—Medication Compliance 75% Total — 27.67% 26.70% 23.43%
Prenatal and Postpartum Care—Postpartum Care 76.35% 73.44% 76.83% 74.10% Prenatal and Postpartum Care—Timeliness of Prenatal Care 80.74% 81.64% 85.98% 84.92% Use of Imaging Studies for Low Back Pain 80.46% 80.57% 81.72% 83.26% Weight Assessment and Counseling for Nutrition and Physical Activity for Children/Adolescents—BMI Assessment: Total 66.42% 70.56% 74.21% 83.62%
Weight Assessment and Counseling for Nutrition and Physical Activity for Children/Adolescents—Nutrition Counseling: Total 67.88% 72.75% 72.99% 77.92% Weight Assessment and Counseling for Nutrition and Physical Activity for Children/Adolescents—Physical Activity Counseling: Total 44.77% 51.34% 57.66% 67.49%
Well-Child Visits in the Third, Fourth, Fifth, and Sixth Years of Life 76.01% 79.34% 80.65% 74.07%
*Member months are a member’s “contribution” to the total yearly membership.

TREND TABLES
2015 HEDIS Aggregate Report Page A-26 California Department of Health Care Services Health Services Advisory Group, Inc.
Table A.24—HEDIS 2015 Trend Table for Central California Alliance for Health—Merced County
Measure RY
2012 RY
2013 RY
2014 RY
2015 RYs 2014–15
Rate Difference All-Cause Readmissions—Statewide Collaborative QIP measure — 12.73% 12.78% 18.49% Ambulatory Care—Emergency Department Visits per 1,000 Member Months* 49.09 53.69 52.70 50.58 Not Tested Ambulatory Care—Outpatient Visits per 1,000 Member Months* 320.62 324.06 321.41 297.12 Not Tested Annual Monitoring for Patients on Persistent Medications—ACE Inhibitors or ARBs 86.41% 87.14% 86.87% 87.32% Annual Monitoring for Patients on Persistent Medications—Digoxin NA NA 83.33% NA Not Comparable
Annual Monitoring for Patients on Persistent Medications—Diuretics 87.31% 86.97% 86.43% 84.93% Avoidance of Antibiotic Treatment in Adults With Acute Bronchitis 11.61% 16.23% 18.62% 25.14% Cervical Cancer Screening — — 65.63% 64.96%
Childhood Immunization Status—Combination 3 64.72% 64.74% 68.68% 67.88% Children and Adolescents' Access to Primary Care Practitioners—12 to 24 Months 96.92% 97.42% 97.63% 95.28% Children and Adolescents' Access to Primary Care Practitioners—25 Months to 6 Years 91.25% 90.39% 91.65% 89.48%
Children and Adolescents' Access to Primary Care Practitioners—7 to 11 Years 89.54% 89.82% 90.31% 90.80% Children and Adolescents' Access to Primary Care Practitioners—12 to 19 Years 87.63% 90.19% 88.46% 88.98% Comprehensive Diabetes Care—Blood Pressure Control (<140/90 mm Hg) 64.48% 64.96% 62.53% 66.18% Comprehensive Diabetes Care—Eye Exam (Retinal) Performed 56.20% 54.74% 53.53% 52.31% Comprehensive Diabetes Care—HbA1c Testing 87.83% 84.91% 83.94% 86.37% Comprehensive Diabetes Care—HbA1c Control (<8.0 Percent) 51.34% 46.72% 44.28% 45.99% Comprehensive Diabetes Care—Medical Attention for Nephropathy 82.48% 84.91% 81.27% 84.91% Comprehensive Diabetes Care—HbA1c Poor Control (>9.0 Percent) 37.23% 45.99% 45.74% 43.80% Controlling High Blood Pressure — 52.80% 53.66% 62.04% Immunizations for Adolescents—Combination 1 50.12% 55.96% 64.86% 62.04% Medication Management for People with Asthma—Medication Compliance 50% Total — 48.30% 54.14% 50.53% Medication Management for People with Asthma—Medication Compliance 75% Total — 26.16% 29.04% 26.98%
Prenatal and Postpartum Care—Postpartum Care 59.61% 58.79% 60.35% 57.91% Prenatal and Postpartum Care—Timeliness of Prenatal Care 85.40% 83.92% 82.79% 83.45% Use of Imaging Studies for Low Back Pain 84.15% 79.33% 82.49% 78.62% Weight Assessment and Counseling for Nutrition and Physical Activity for Children/Adolescents—BMI Assessment: Total 58.88% 77.62% 82.24% 85.40% Weight Assessment and Counseling for Nutrition and Physical Activity for Children/Adolescents—Nutrition Counseling: Total 64.23% 66.91% 68.13% 66.91% Weight Assessment and Counseling for Nutrition and Physical Activity for Children/Adolescents—Physical Activity Counseling: Total 44.28% 44.77% 43.07% 47.20%
Well-Child Visits in the Third, Fourth, Fifth, and Sixth Years of Life 72.51% 74.33% 76.32% 73.97% *Member months are a member’s “contribution” to the total yearly membership.

TREND TABLES
2015 HEDIS Aggregate Report Page A-27 California Department of Health Care Services Health Services Advisory Group, Inc.
Table A.25—HEDIS 2015 Trend Table for Central California Alliance for Health— Monterey/Santa Cruz Counties
Measure RY
2012 RY
2013 RY
2014 RY
2015 RYs 2014–15
Rate Difference All-Cause Readmissions—Statewide Collaborative QIP measure — 12.06% 11.58% 14.30% Ambulatory Care—Emergency Department Visits per 1,000 Member Months* 51.95 52.10 46.64 45.17 Not Tested Ambulatory Care—Outpatient Visits per 1,000 Member Months* 320.58 318.74 303.75 290.72 Not Tested Annual Monitoring for Patients on Persistent Medications—ACE Inhibitors or ARBs 88.31% 85.86% 87.34% 88.16% Annual Monitoring for Patients on Persistent Medications—Digoxin 87.93% 89.47% 87.76% 50.00% Annual Monitoring for Patients on Persistent Medications—Diuretics 88.95% 85.58% 87.02% 88.70% Avoidance of Antibiotic Treatment in Adults With Acute Bronchitis 27.95% 22.27% 28.07% 25.24% Cervical Cancer Screening — — 72.22% 65.45%
Childhood Immunization Status—Combination 3 84.18% 83.84% 82.48% 77.62% Children and Adolescents' Access to Primary Care Practitioners—12 to 24 Months 97.42% 98.49% 98.31% 95.99% Children and Adolescents' Access to Primary Care Practitioners—25 Months to 6 Years 91.05% 91.29% 92.11% 90.19%
Children and Adolescents' Access to Primary Care Practitioners—7 to 11 Years 89.57% 90.89% 93.18% 92.44% Children and Adolescents' Access to Primary Care Practitioners—12 to 19 Years 88.93% 91.00% 90.94% 89.95% Comprehensive Diabetes Care—Blood Pressure Control (<140/90 mm Hg) 76.64% 71.05% 75.18% 67.40% Comprehensive Diabetes Care—Eye Exam (Retinal) Performed 67.40% 63.02% 56.45% 59.85% Comprehensive Diabetes Care—HbA1c Testing 91.97% 87.35% 86.86% 87.83% Comprehensive Diabetes Care—HbA1c Control (<8.0 Percent) 61.80% 51.09% 51.82% 46.96% Comprehensive Diabetes Care—Medical Attention for Nephropathy 79.81% 79.32% 79.32% 82.00% Comprehensive Diabetes Care—HbA1c Poor Control (>9.0 Percent) 28.22% 36.98% 38.20% 43.80% Controlling High Blood Pressure — 55.96% 59.46% 64.72% Immunizations for Adolescents—Combination 1 63.99% 77.60% 80.29% 78.10% Medication Management for People with Asthma—Medication Compliance 50% Total — 49.96% 52.98% 54.49%
Medication Management for People with Asthma—Medication Compliance 75% Total — 24.42% 30.21% 27.53%
Prenatal and Postpartum Care—Postpartum Care 77.62% 70.27% 69.83% 70.07% Prenatal and Postpartum Care—Timeliness of Prenatal Care 86.13% 81.76% 93.10% 86.13%
Use of Imaging Studies for Low Back Pain 85.12% 88.00% 85.20% 86.47% Weight Assessment and Counseling for Nutrition and Physical Activity for Children/Adolescents—BMI Assessment: Total 79.08% 81.89% 81.02% 86.86%
Weight Assessment and Counseling for Nutrition and Physical Activity for Children/Adolescents—Nutrition Counseling: Total 80.29% 81.63% 78.59% 78.35% Weight Assessment and Counseling for Nutrition and Physical Activity for Children/Adolescents—Physical Activity Counseling: Total 61.31% 66.58% 65.21% 65.21%
Well-Child Visits in the Third, Fourth, Fifth, and Sixth Years of Life 83.21% 82.08% 80.29% 81.27% *Member months are a member’s “contribution” to the total yearly membership.

TREND TABLES
2015 HEDIS Aggregate Report Page A-28 California Department of Health Care Services Health Services Advisory Group, Inc.
Table A.26—HEDIS 2015 Trend Table for Community Health Group Partnership Plan—San Diego County
Measure RY
2012 RY
2013 RY
2014 RY
2015 RYs 2014–15
Rate Difference All-Cause Readmissions—Statewide Collaborative QIP measure — 14.37% 13.28% 18.76% Ambulatory Care—Emergency Department Visits per 1,000 Member Months* 32.73 37.42 36.42 46.22 Not Tested Ambulatory Care—Outpatient Visits per 1,000 Member Months* 329.00 310.89 293.39 288.23 Not Tested Annual Monitoring for Patients on Persistent Medications—ACE Inhibitors or ARBs 87.07% 84.99% 87.41% 84.37%
Annual Monitoring for Patients on Persistent Medications—Digoxin NA 91.23% 95.71% 60.87% Annual Monitoring for Patients on Persistent Medications—Diuretics 85.01% 85.04% 88.16% 85.87%
Avoidance of Antibiotic Treatment in Adults With Acute Bronchitis 14.08% 32.02% 39.69% 44.60% Cervical Cancer Screening — — 65.21% 59.37%
Childhood Immunization Status—Combination 3 73.97% 73.97% 70.07% 75.91% Children and Adolescents' Access to Primary Care Practitioners—12 to 24 Months 96.21% 97.32% 95.95% 93.48% Children and Adolescents' Access to Primary Care Practitioners—25 Months to 6 Years 90.27% 89.85% 89.92% 87.21%
Children and Adolescents' Access to Primary Care Practitioners—7 to 11 Years 89.61% 89.90% 89.41% 90.19% Children and Adolescents' Access to Primary Care Practitioners—12 to 19 Years 88.45% 88.64% 85.47% 85.92% Comprehensive Diabetes Care—Blood Pressure Control (<140/90 mm Hg) 57.18% 64.72% 45.99% 56.45%
Comprehensive Diabetes Care—Eye Exam (Retinal) Performed 53.28% 55.47% 55.47% 54.74% Comprehensive Diabetes Care—HbA1c Testing 87.35% 90.02% 86.13% 91.00% Comprehensive Diabetes Care—HbA1c Control (<8.0 Percent) 47.69% 56.45% 45.01% 54.26% Comprehensive Diabetes Care—Medical Attention for Nephropathy 79.08% 83.21% 81.27% 89.29% Comprehensive Diabetes Care—HbA1c Poor Control (>9.0 Percent) 43.80% 34.31% 40.88% 36.01% Controlling High Blood Pressure — 52.07% 52.07% 50.86% Immunizations for Adolescents—Combination 1 73.48% 79.32% 76.40% 75.67% Medication Management for People with Asthma—Medication Compliance 50% Total — 35.41% 47.09% 47.00% Medication Management for People with Asthma—Medication Compliance 75% Total — 18.66% 27.95% 26.26%
Prenatal and Postpartum Care—Postpartum Care 60.10% 55.23% 57.91% 57.66% Prenatal and Postpartum Care—Timeliness of Prenatal Care 77.86% 82.24% 80.29% 77.86% Use of Imaging Studies for Low Back Pain 75.03% 79.24% 77.32% 72.17% Weight Assessment and Counseling for Nutrition and Physical Activity for Children/Adolescents—BMI Assessment: Total 73.48% 78.10% 87.59% 84.18% Weight Assessment and Counseling for Nutrition and Physical Activity for Children/Adolescents—Nutrition Counseling: Total 71.53% 71.29% 75.43% 69.34% Weight Assessment and Counseling for Nutrition and Physical Activity for Children/Adolescents—Physical Activity Counseling: Total 55.96% 63.99% 70.32% 66.42%
Well-Child Visits in the Third, Fourth, Fifth, and Sixth Years of Life 77.13% 77.86% 78.10% 73.24% *Member months are a member’s “contribution” to the total yearly membership.

TREND TABLES
2015 HEDIS Aggregate Report Page A-29 California Department of Health Care Services Health Services Advisory Group, Inc.
Table A.27—HEDIS 2015 Trend Table for Contra Costa Health Plan—Contra Costa County
Measure RY
2012 RY
2013 RY
2014 RY
2015 RYs 2014–15
Rate Difference All-Cause Readmissions—Statewide Collaborative QIP measure — 16.99% 12.95% 17.35% Ambulatory Care—Emergency Department Visits per 1,000 Member Months* 59.47 60.94 53.25 56.21 Not Tested Ambulatory Care—Outpatient Visits per 1,000 Member Months* 274.88 217.23 246.81 257.12 Not Tested Annual Monitoring for Patients on Persistent Medications—ACE Inhibitors or ARBs 85.62% 83.77% 86.52% 85.55% Annual Monitoring for Patients on Persistent Medications—Digoxin NA 85.71% 95.45% 77.11% Annual Monitoring for Patients on Persistent Medications—Diuretics 80.95% 83.68% 85.11% 84.60% Avoidance of Antibiotic Treatment in Adults With Acute Bronchitis 26.52% 43.27% 44.09% 47.06% Cervical Cancer Screening — — 54.99% 55.47%
Childhood Immunization Status—Combination 3 85.40% 84.47% 74.70% 77.86% Children and Adolescents' Access to Primary Care Practitioners—12 to 24 Months 93.97% 86.74% 94.62% 93.94% Children and Adolescents' Access to Primary Care Practitioners—25 Months to 6 Years 84.54% 76.18% 86.07% 84.21%
Children and Adolescents' Access to Primary Care Practitioners—7 to 11 Years 84.07% 77.96% 86.71% 86.56% Children and Adolescents' Access to Primary Care Practitioners—12 to 19 Years 83.25% 74.86% 83.44% 83.80% Comprehensive Diabetes Care—Blood Pressure Control (<140/90 mm Hg) 54.99% 59.37% 61.31% 60.44% Comprehensive Diabetes Care—Eye Exam (Retinal) Performed 52.80% 51.09% 51.34% 55.10% Comprehensive Diabetes Care—HbA1c Testing 84.91% 85.40% 84.43% 83.98% Comprehensive Diabetes Care—HbA1c Control (<8.0 Percent) 53.04% 49.88% 48.18% 44.17% Comprehensive Diabetes Care—Medical Attention for Nephropathy 87.35% 82.00% 83.94% 82.52% Comprehensive Diabetes Care—HbA1c Poor Control (>9.0 Percent) 36.98% 40.39% 41.61% 41.26% Controlling High Blood Pressure — 51.34% 53.28% 64.23% Immunizations for Adolescents—Combination 1 59.85% 71.61% 73.24% 72.51% Medication Management for People with Asthma—Medication Compliance 50% Total — 56.90% 43.46% 59.10%
Medication Management for People with Asthma—Medication Compliance 75% Total — 33.95% 22.79% 37.92%
Prenatal and Postpartum Care—Postpartum Care 64.96% 62.53% 60.34% 67.15% Prenatal and Postpartum Care—Timeliness of Prenatal Care 83.21% 86.86% 83.45% 85.89% Use of Imaging Studies for Low Back Pain 88.58% 92.06% 87.85% 87.31% Weight Assessment and Counseling for Nutrition and Physical Activity for Children/Adolescents—BMI Assessment: Total 59.37% 56.20% 62.29% 69.34%
Weight Assessment and Counseling for Nutrition and Physical Activity for Children/Adolescents—Nutrition Counseling: Total 55.72% 55.96% 59.37% 67.64%
Weight Assessment and Counseling for Nutrition and Physical Activity for Children/Adolescents—Physical Activity Counseling: Total 46.47% 46.23% 50.85% 66.67%
Well-Child Visits in the Third, Fourth, Fifth, and Sixth Years of Life 77.86% 73.31% 74.45% 79.81% *Member months are a member’s “contribution” to the total yearly membership.
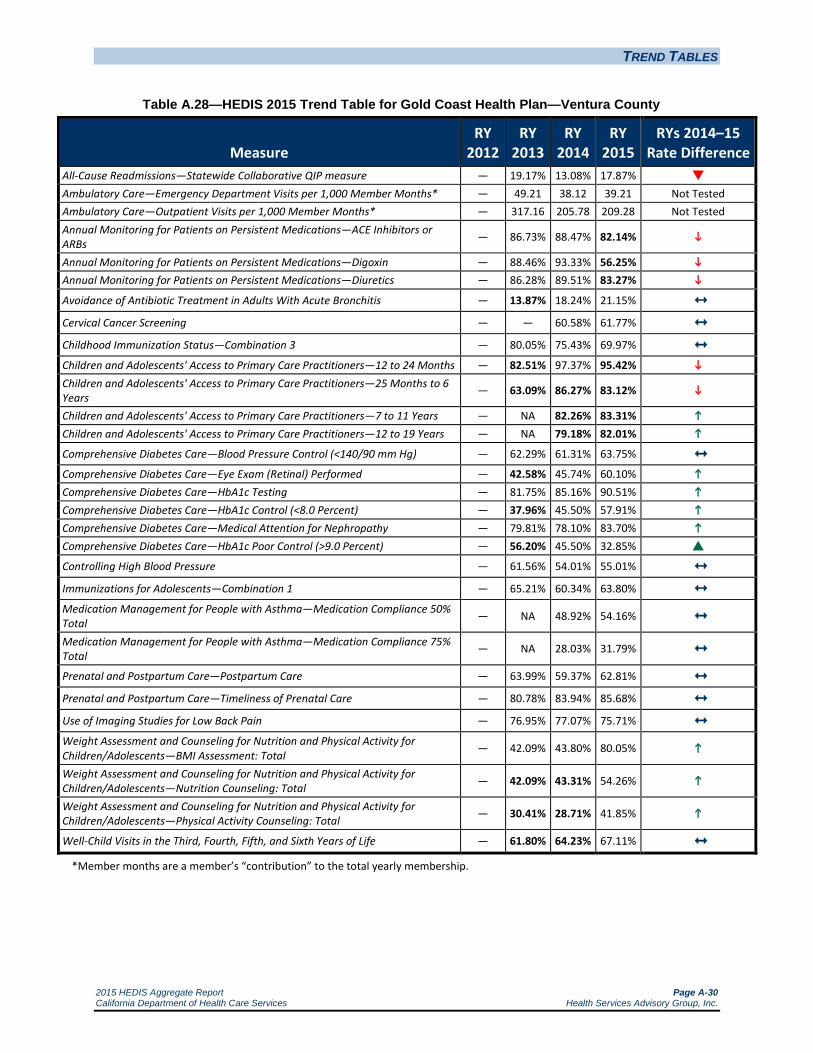
TREND TABLES
2015 HEDIS Aggregate Report Page A-30 California Department of Health Care Services Health Services Advisory Group, Inc.
Table A.28—HEDIS 2015 Trend Table for Gold Coast Health Plan—Ventura County
Measure RY
2012 RY
2013 RY
2014 RY
2015 RYs 2014–15
Rate Difference All-Cause Readmissions—Statewide Collaborative QIP measure — 19.17% 13.08% 17.87% Ambulatory Care—Emergency Department Visits per 1,000 Member Months* — 49.21 38.12 39.21 Not Tested Ambulatory Care—Outpatient Visits per 1,000 Member Months* — 317.16 205.78 209.28 Not Tested Annual Monitoring for Patients on Persistent Medications—ACE Inhibitors or ARBs — 86.73% 88.47% 82.14%
Annual Monitoring for Patients on Persistent Medications—Digoxin — 88.46% 93.33% 56.25% Annual Monitoring for Patients on Persistent Medications—Diuretics — 86.28% 89.51% 83.27%
Avoidance of Antibiotic Treatment in Adults With Acute Bronchitis — 13.87% 18.24% 21.15% Cervical Cancer Screening — — 60.58% 61.77% Childhood Immunization Status—Combination 3 — 80.05% 75.43% 69.97% Children and Adolescents' Access to Primary Care Practitioners—12 to 24 Months — 82.51% 97.37% 95.42% Children and Adolescents' Access to Primary Care Practitioners—25 Months to 6 Years — 63.09% 86.27% 83.12%
Children and Adolescents' Access to Primary Care Practitioners—7 to 11 Years — NA 82.26% 83.31% Children and Adolescents' Access to Primary Care Practitioners—12 to 19 Years — NA 79.18% 82.01%
Comprehensive Diabetes Care—Blood Pressure Control (<140/90 mm Hg) — 62.29% 61.31% 63.75% Comprehensive Diabetes Care—Eye Exam (Retinal) Performed — 42.58% 45.74% 60.10% Comprehensive Diabetes Care—HbA1c Testing — 81.75% 85.16% 90.51% Comprehensive Diabetes Care—HbA1c Control (<8.0 Percent) — 37.96% 45.50% 57.91% Comprehensive Diabetes Care—Medical Attention for Nephropathy — 79.81% 78.10% 83.70% Comprehensive Diabetes Care—HbA1c Poor Control (>9.0 Percent) — 56.20% 45.50% 32.85%
Controlling High Blood Pressure — 61.56% 54.01% 55.01% Immunizations for Adolescents—Combination 1 — 65.21% 60.34% 63.80% Medication Management for People with Asthma—Medication Compliance 50% Total — NA 48.92% 54.16%
Medication Management for People with Asthma—Medication Compliance 75% Total — NA 28.03% 31.79%
Prenatal and Postpartum Care—Postpartum Care — 63.99% 59.37% 62.81% Prenatal and Postpartum Care—Timeliness of Prenatal Care — 80.78% 83.94% 85.68% Use of Imaging Studies for Low Back Pain — 76.95% 77.07% 75.71% Weight Assessment and Counseling for Nutrition and Physical Activity for Children/Adolescents—BMI Assessment: Total — 42.09% 43.80% 80.05%
Weight Assessment and Counseling for Nutrition and Physical Activity for Children/Adolescents—Nutrition Counseling: Total — 42.09% 43.31% 54.26%
Weight Assessment and Counseling for Nutrition and Physical Activity for Children/Adolescents—Physical Activity Counseling: Total — 30.41% 28.71% 41.85%
Well-Child Visits in the Third, Fourth, Fifth, and Sixth Years of Life — 61.80% 64.23% 67.11% *Member months are a member’s “contribution” to the total yearly membership.
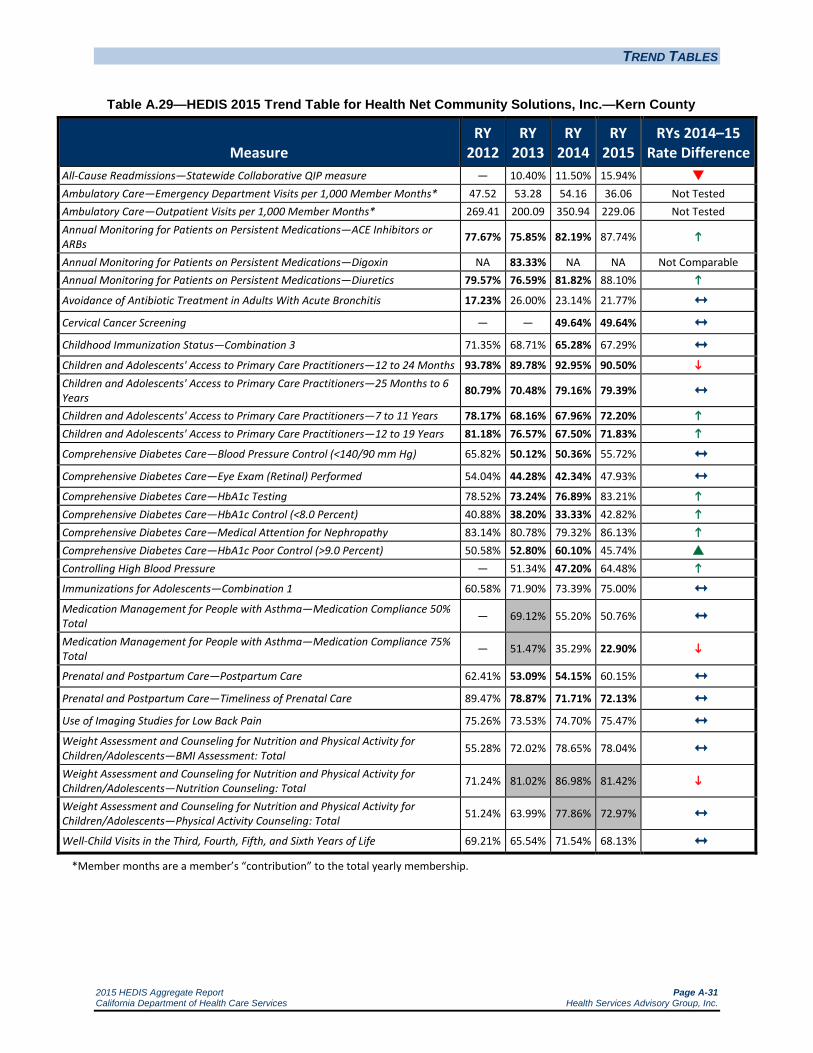
TREND TABLES
2015 HEDIS Aggregate Report Page A-31 California Department of Health Care Services Health Services Advisory Group, Inc.
Table A.29—HEDIS 2015 Trend Table for Health Net Community Solutions, Inc.—Kern County
Measure RY
2012 RY
2013 RY
2014 RY
2015 RYs 2014–15
Rate Difference All-Cause Readmissions—Statewide Collaborative QIP measure — 10.40% 11.50% 15.94% Ambulatory Care—Emergency Department Visits per 1,000 Member Months* 47.52 53.28 54.16 36.06 Not Tested Ambulatory Care—Outpatient Visits per 1,000 Member Months* 269.41 200.09 350.94 229.06 Not Tested Annual Monitoring for Patients on Persistent Medications—ACE Inhibitors or ARBs 77.67% 75.85% 82.19% 87.74%
Annual Monitoring for Patients on Persistent Medications—Digoxin NA 83.33% NA NA Not Comparable Annual Monitoring for Patients on Persistent Medications—Diuretics 79.57% 76.59% 81.82% 88.10%
Avoidance of Antibiotic Treatment in Adults With Acute Bronchitis 17.23% 26.00% 23.14% 21.77% Cervical Cancer Screening — — 49.64% 49.64% Childhood Immunization Status—Combination 3 71.35% 68.71% 65.28% 67.29% Children and Adolescents' Access to Primary Care Practitioners—12 to 24 Months 93.78% 89.78% 92.95% 90.50% Children and Adolescents' Access to Primary Care Practitioners—25 Months to 6 Years 80.79% 70.48% 79.16% 79.39% Children and Adolescents' Access to Primary Care Practitioners—7 to 11 Years 78.17% 68.16% 67.96% 72.20% Children and Adolescents' Access to Primary Care Practitioners—12 to 19 Years 81.18% 76.57% 67.50% 71.83%
Comprehensive Diabetes Care—Blood Pressure Control (<140/90 mm Hg) 65.82% 50.12% 50.36% 55.72% Comprehensive Diabetes Care—Eye Exam (Retinal) Performed 54.04% 44.28% 42.34% 47.93% Comprehensive Diabetes Care—HbA1c Testing 78.52% 73.24% 76.89% 83.21% Comprehensive Diabetes Care—HbA1c Control (<8.0 Percent) 40.88% 38.20% 33.33% 42.82% Comprehensive Diabetes Care—Medical Attention for Nephropathy 83.14% 80.78% 79.32% 86.13% Comprehensive Diabetes Care—HbA1c Poor Control (>9.0 Percent) 50.58% 52.80% 60.10% 45.74% Controlling High Blood Pressure — 51.34% 47.20% 64.48% Immunizations for Adolescents—Combination 1 60.58% 71.90% 73.39% 75.00% Medication Management for People with Asthma—Medication Compliance 50% Total — 69.12% 55.20% 50.76%
Medication Management for People with Asthma—Medication Compliance 75% Total — 51.47% 35.29% 22.90%
Prenatal and Postpartum Care—Postpartum Care 62.41% 53.09% 54.15% 60.15% Prenatal and Postpartum Care—Timeliness of Prenatal Care 89.47% 78.87% 71.71% 72.13% Use of Imaging Studies for Low Back Pain 75.26% 73.53% 74.70% 75.47% Weight Assessment and Counseling for Nutrition and Physical Activity for Children/Adolescents—BMI Assessment: Total 55.28% 72.02% 78.65% 78.04% Weight Assessment and Counseling for Nutrition and Physical Activity for Children/Adolescents—Nutrition Counseling: Total 71.24% 81.02% 86.98% 81.42%
Weight Assessment and Counseling for Nutrition and Physical Activity for Children/Adolescents—Physical Activity Counseling: Total 51.24% 63.99% 77.86% 72.97%
Well-Child Visits in the Third, Fourth, Fifth, and Sixth Years of Life 69.21% 65.54% 71.54% 68.13% *Member months are a member’s “contribution” to the total yearly membership.

TREND TABLES
2015 HEDIS Aggregate Report Page A-32 California Department of Health Care Services Health Services Advisory Group, Inc.
Table A.30—HEDIS 2015 Trend Table for Health Net Community Solutions, Inc.—Los Angeles County
Measure RY
2012 RY
2013 RY
2014 RY
2015 RYs 2014–15
Rate Difference All-Cause Readmissions—Statewide Collaborative QIP measure — 11.93% 11.64% 17.29% Ambulatory Care—Emergency Department Visits per 1,000 Member Months* 33.03 36.51 35.29 22.52 Not Tested Ambulatory Care—Outpatient Visits per 1,000 Member Months* 241.22 251.36 274.97 170.14 Not Tested Annual Monitoring for Patients on Persistent Medications—ACE Inhibitors or ARBs 74.03% 76.09% 80.35% 84.62%
Annual Monitoring for Patients on Persistent Medications—Digoxin 76.99% 85.92% 86.38% 48.23% Annual Monitoring for Patients on Persistent Medications—Diuretics 74.07% 76.27% 80.78% 84.19% Avoidance of Antibiotic Treatment in Adults With Acute Bronchitis 21.40% 40.16% 27.72% 31.32% Cervical Cancer Screening — — 61.80% 51.53% Childhood Immunization Status—Combination 3 87.62% 81.63% 76.15% 75.74% Children and Adolescents' Access to Primary Care Practitioners—12 to 24 Months 96.13% 94.29% 94.47% 91.83% Children and Adolescents' Access to Primary Care Practitioners—25 Months to 6 Years 88.17% 81.11% 81.18% 80.84% Children and Adolescents' Access to Primary Care Practitioners—7 to 11 Years 87.98% 83.12% 81.99% 84.33% Children and Adolescents' Access to Primary Care Practitioners—12 to 19 Years 85.90% 82.82% 77.41% 79.54%
Comprehensive Diabetes Care—Blood Pressure Control (<140/90 mm Hg) 67.53% 50.12% 59.61% 59.85% Comprehensive Diabetes Care—Eye Exam (Retinal) Performed 58.82% 47.69% 50.36% 55.72% Comprehensive Diabetes Care—HbA1c Testing 83.53% 78.10% 79.81% 86.37% Comprehensive Diabetes Care—HbA1c Control (<8.0 Percent) 48.47% 39.90% 45.26% 45.74% Comprehensive Diabetes Care—Medical Attention for Nephropathy 82.35% 82.97% 81.27% 86.13% Comprehensive Diabetes Care—HbA1c Poor Control (>9.0 Percent) 39.76% 48.42% 48.66% 38.20% Controlling High Blood Pressure — 57.91% 56.33% 63.46% Immunizations for Adolescents—Combination 1 65.02% 73.67% 78.66% 73.26% Medication Management for People with Asthma—Medication Compliance 50% Total — 72.65% 53.36% 51.01%
Medication Management for People with Asthma—Medication Compliance 75% Total — 49.52% 33.05% 29.19%
Prenatal and Postpartum Care—Postpartum Care 52.34% 48.05% 45.01% 51.82% Prenatal and Postpartum Care—Timeliness of Prenatal Care 83.64% 73.41% 68.37% 73.97% Use of Imaging Studies for Low Back Pain 81.09% 78.01% 76.76% 76.71% Weight Assessment and Counseling for Nutrition and Physical Activity for Children/Adolescents—BMI Assessment: Total 71.53% 75.78% 70.35% 76.23% Weight Assessment and Counseling for Nutrition and Physical Activity for Children/Adolescents—Nutrition Counseling: Total 79.86% 80.73% 75.47% 74.86% Weight Assessment and Counseling for Nutrition and Physical Activity for Children/Adolescents—Physical Activity Counseling: Total 63.66% 66.41% 67.65% 71.31%
Well-Child Visits in the Third, Fourth, Fifth, and Sixth Years of Life 83.10% 77.08% 69.26% 70.90% *Member months are a member’s “contribution” to the total yearly membership.

TREND TABLES
2015 HEDIS Aggregate Report Page A-33 California Department of Health Care Services Health Services Advisory Group, Inc.
Table A.31—HEDIS 2015 Trend Table for Health Net Community Solutions, Inc.—Sacramento County
Measure RY
2012 RY
2013 RY
2014 RY
2015 RYs 2014–15
Rate Difference All-Cause Readmissions—Statewide Collaborative QIP measure — 12.15% 12.69% 17.19% Ambulatory Care—Emergency Department Visits per 1,000 Member Months* 38.10 45.02 44.04 30.09 Not Tested Ambulatory Care—Outpatient Visits per 1,000 Member Months* 241.00 300.55 305.99 172.89 Not Tested Annual Monitoring for Patients on Persistent Medications—ACE Inhibitors or ARBs 59.33% 67.16% 72.60% 79.88%
Annual Monitoring for Patients on Persistent Medications—Digoxin NA 82.46% 84.75% 38.18% Annual Monitoring for Patients on Persistent Medications—Diuretics 55.59% 67.40% 70.56% 79.52%
Avoidance of Antibiotic Treatment in Adults With Acute Bronchitis 20.21% 51.66% 27.62% 30.96% Cervical Cancer Screening — — 48.91% 51.34% Childhood Immunization Status—Combination 3 69.55% 66.67% 59.57% 62.31% Children and Adolescents' Access to Primary Care Practitioners—12 to 24 Months 95.41% 92.53% 92.57% 88.84% Children and Adolescents' Access to Primary Care Practitioners—25 Months to 6 Years 84.73% 80.19% 81.06% 80.16% Children and Adolescents' Access to Primary Care Practitioners—7 to 11 Years 84.22% 80.69% 79.43% 80.97% Children and Adolescents' Access to Primary Care Practitioners—12 to 19 Years 83.57% 81.64% 75.02% 76.97% Comprehensive Diabetes Care—Blood Pressure Control (<140/90 mm Hg) 62.91% 48.91% 45.99% 59.12% Comprehensive Diabetes Care—Eye Exam (Retinal) Performed 48.36% 40.63% 37.96% 39.90% Comprehensive Diabetes Care—HbA1c Testing 83.57% 77.86% 77.62% 78.59% Comprehensive Diabetes Care—HbA1c Control (<8.0 Percent) 52.82% 43.55% 48.18% 47.69% Comprehensive Diabetes Care—Medical Attention for Nephropathy 82.63% 83.45% 80.29% 84.67% Comprehensive Diabetes Care—HbA1c Poor Control (>9.0 Percent) 35.92% 45.26% 46.23% 40.15% Controlling High Blood Pressure — 54.50% 45.72% 58.88%
Immunizations for Adolescents—Combination 1 54.61% 63.08% 62.76% 62.37% Medication Management for People with Asthma—Medication Compliance 50% Total — 78.74% 58.83% 55.97% Medication Management for People with Asthma—Medication Compliance 75% Total — 55.94% 40.03% 31.96%
Prenatal and Postpartum Care—Postpartum Care 60.78% 53.16% 49.02% 58.15% Prenatal and Postpartum Care—Timeliness of Prenatal Care 83.58% 81.77% 77.07% 82.00% Use of Imaging Studies for Low Back Pain 87.52% 87.00% 85.49% 78.12% Weight Assessment and Counseling for Nutrition and Physical Activity for Children/Adolescents—BMI Assessment: Total 69.51% 77.32% 59.06% 72.82%
Weight Assessment and Counseling for Nutrition and Physical Activity for Children/Adolescents—Nutrition Counseling: Total 77.58% 76.34% 72.95% 70.32% Weight Assessment and Counseling for Nutrition and Physical Activity for Children/Adolescents—Physical Activity Counseling: Total 52.69% 57.07% 58.81% 63.84%
Well-Child Visits in the Third, Fourth, Fifth, and Sixth Years of Life 78.20% 71.18% 67.54% 68.58% *Member months are a member’s “contribution” to the total yearly membership.

TREND TABLES
2015 HEDIS Aggregate Report Page A-34 California Department of Health Care Services Health Services Advisory Group, Inc.
Table A.32—HEDIS 2015 Trend Table for Health Net Community Solutions, Inc.—San Diego County
Measure RY
2012 RY
2013 RY
2014 RY
2015 RYs 2014–15
Rate Difference All-Cause Readmissions—Statewide Collaborative QIP measure — 15.96% 15.90% 24.12% Ambulatory Care—Emergency Department Visits per 1,000 Member Months* 44.10 50.92 46.66 25.76 Not Tested
Ambulatory Care—Outpatient Visits per 1,000 Member Months* 258.60 317.66 354.48 207.58 Not Tested Annual Monitoring for Patients on Persistent Medications—ACE Inhibitors or ARBs 78.12% 83.68% 89.08% 83.46%
Annual Monitoring for Patients on Persistent Medications—Digoxin NA 100.00% NA NA Not Comparable
Annual Monitoring for Patients on Persistent Medications—Diuretics 77.56% 83.82% 88.33% 84.51% Avoidance of Antibiotic Treatment in Adults With Acute Bronchitis 18.46% 44.85% 28.18% 33.82% Cervical Cancer Screening — — 39.66% 41.12% Childhood Immunization Status—Combination 3 77.30% 72.30% 67.46% 74.32% Children and Adolescents' Access to Primary Care Practitioners—12 to 24 Months 94.01% 93.98% 95.87% 92.46%
Children and Adolescents' Access to Primary Care Practitioners—25 Months to 6 Years 85.83% 85.27% 87.67% 84.80%
Children and Adolescents' Access to Primary Care Practitioners—7 to 11 Years 85.38% 84.91% 86.20% 87.52% Children and Adolescents' Access to Primary Care Practitioners—12 to 19 Years 82.99% 82.51% 82.09% 81.01% Comprehensive Diabetes Care—Blood Pressure Control (<140/90 mm Hg) 64.38% 52.07% 46.23% 57.91% Comprehensive Diabetes Care—Eye Exam (Retinal) Performed 51.91% 45.99% 44.77% 49.15% Comprehensive Diabetes Care—HbA1c Testing 84.48% 85.40% 77.13% 77.62% Comprehensive Diabetes Care—HbA1c Control (<8.0 Percent) 48.35% 50.85% 38.69% 47.20%
Comprehensive Diabetes Care—Medical Attention for Nephropathy 78.63% 82.24% 78.10% 80.54% Comprehensive Diabetes Care—HbA1c Poor Control (>9.0 Percent) 41.48% 41.61% 54.01% 43.31% Controlling High Blood Pressure — 55.23% 44.72% 61.56%
Immunizations for Adolescents—Combination 1 65.29% 76.86% 66.23% 70.08% Medication Management for People with Asthma—Medication Compliance 50% Total — 75.28% 57.50% 54.44% Medication Management for People with Asthma—Medication Compliance 75% Total — 55.06% 40.00% 34.36%
Prenatal and Postpartum Care—Postpartum Care 54.77% 53.75% 41.11% 44.12% Prenatal and Postpartum Care—Timeliness of Prenatal Care 83.38% 76.67% 62.78% 60.29% Use of Imaging Studies for Low Back Pain 77.40% 76.04% 64.79% 74.80% Weight Assessment and Counseling for Nutrition and Physical Activity for Children/Adolescents—BMI Assessment: Total 67.56% 72.99% 77.32% 80.46% Weight Assessment and Counseling for Nutrition and Physical Activity for Children/Adolescents—Nutrition Counseling: Total 67.78% 74.70% 74.59% 74.14% Weight Assessment and Counseling for Nutrition and Physical Activity for Children/Adolescents—Physical Activity Counseling: Total 49.56% 67.15% 70.77% 73.56% Well-Child Visits in the Third, Fourth, Fifth, and Sixth Years of Life 70.00% 74.43% 76.64% 69.18%
*Member months are a member’s “contribution” to the total yearly membership.

TREND TABLES
2015 HEDIS Aggregate Report Page A-35 California Department of Health Care Services Health Services Advisory Group, Inc.
Table A.33—HEDIS 2015 Trend Table for Health Net Community Solutions, Inc.—San Joaquin County
Measure RY
2012 RY
2013 RY
2014 RY
2015 RYs 2014–15
Rate Difference All-Cause Readmissions—Statewide Collaborative QIP measure — — 18.60% 21.67%
Ambulatory Care—Emergency Department Visits per 1,000 Member Months* — — 53.47 31.01 Not Tested
Ambulatory Care—Outpatient Visits per 1,000 Member Months* — — 266.70 143.82 Not Tested
Annual Monitoring for Patients on Persistent Medications—ACE Inhibitors or ARBs — — 67.00% 74.48%
Annual Monitoring for Patients on Persistent Medications—Digoxin — — NA NA Not Comparable
Annual Monitoring for Patients on Persistent Medications—Diuretics — — 65.45% 79.21%
Avoidance of Antibiotic Treatment in Adults With Acute Bronchitis — — NA 26.32% Not Comparable
Cervical Cancer Screening — — 20.92% 36.25%
Childhood Immunization Status—Combination 3 — — NA 57.59% Not Comparable
Children and Adolescents' Access to Primary Care Practitioners—12 to 24 Months — — 92.11% 86.51%
Children and Adolescents' Access to Primary Care Practitioners—25 Months to 6 Years — — 76.97% 69.64%
Children and Adolescents' Access to Primary Care Practitioners—7 to 11 Years — — NA 77.40% Not Comparable
Children and Adolescents' Access to Primary Care Practitioners—12 to 19 Years — — NA 75.12% Not Comparable
Comprehensive Diabetes Care—Blood Pressure Control (<140/90 mm Hg) — — 34.96% 54.39%
Comprehensive Diabetes Care—Eye Exam (Retinal) Performed — — 39.02% 53.82%
Comprehensive Diabetes Care—HbA1c Testing — — 73.17% 81.87%
Comprehensive Diabetes Care—HbA1c Control (<8.0 Percent) — — 29.27% 45.33%
Comprehensive Diabetes Care—Medical Attention for Nephropathy — — 81.30% 84.70%
Comprehensive Diabetes Care—HbA1c Poor Control (>9.0 Percent) — — 65.04% 41.08%
Controlling High Blood Pressure — — 30.86% 54.38%
Immunizations for Adolescents—Combination 1 — — NA 59.33% Not Comparable
Medication Management for People with Asthma—Medication Compliance 50% Total — — NA NA Not Comparable
Medication Management for People with Asthma—Medication Compliance 75% Total — — NA NA Not Comparable
Prenatal and Postpartum Care—Postpartum Care — — 46.38% 49.12%
Prenatal and Postpartum Care—Timeliness of Prenatal Care — — 71.01% 78.95%
Use of Imaging Studies for Low Back Pain — — NA 80.72% Not Comparable
Weight Assessment and Counseling for Nutrition and Physical Activity for Children/Adolescents—BMI Assessment: Total — — 61.07% 68.80%
Weight Assessment and Counseling for Nutrition and Physical Activity for Children/Adolescents—Nutrition Counseling: Total — — 68.37% 73.22%
Weight Assessment and Counseling for Nutrition and Physical Activity for Children/Adolescents—Physical Activity Counseling: Total — — 55.72% 63.39%
Well-Child Visits in the Third, Fourth, Fifth, and Sixth Years of Life — — 59.12% 66.08%
*Member months are a member’s “contribution” to the total yearly membership.

TREND TABLES
2015 HEDIS Aggregate Report Page A-36 California Department of Health Care Services Health Services Advisory Group, Inc.
Table A.34—HEDIS 2015 Trend Table for Health Net Community Solutions, Inc.—Stanislaus County
Measure RY
2012 RY
2013 RY
2014 RY
2015 RYs 2014–15
Rate Difference All-Cause Readmissions—Statewide Collaborative QIP measure — 8.71% 10.97% 15.37% Ambulatory Care—Emergency Department Visits per 1,000 Member Months* 49.38 55.13 62.40 41.14 Not Tested Ambulatory Care—Outpatient Visits per 1,000 Member Months* 349.91 369.94 392.65 230.36 Not Tested Annual Monitoring for Patients on Persistent Medications—ACE Inhibitors or ARBs 75.91% 83.73% 83.17% 80.74% Annual Monitoring for Patients on Persistent Medications—Digoxin NA NA NA 50.00% Not Comparable
Annual Monitoring for Patients on Persistent Medications—Diuretics 79.78% 84.46% 84.38% 85.11% Avoidance of Antibiotic Treatment in Adults With Acute Bronchitis 29.55% 32.31% 22.19% 30.69%
Cervical Cancer Screening — — 48.18% 54.99%
Childhood Immunization Status—Combination 3 68.52% 71.67% 70.18% 65.52% Children and Adolescents' Access to Primary Care Practitioners—12 to 24 Months 97.18% 97.04% 95.59% 92.99% Children and Adolescents' Access to Primary Care Practitioners—25 Months to 6 Years 88.90% 87.15% 85.89% 84.31%
Children and Adolescents' Access to Primary Care Practitioners—7 to 11 Years 87.88% 85.24% 86.39% 86.38% Children and Adolescents' Access to Primary Care Practitioners—12 to 19 Years 85.93% 86.00% 83.84% 82.60% Comprehensive Diabetes Care—Blood Pressure Control (<140/90 mm Hg) 67.30% 58.39% 58.64% 63.75% Comprehensive Diabetes Care—Eye Exam (Retinal) Performed 50.00% 41.61% 41.36% 46.47% Comprehensive Diabetes Care—HbA1c Testing 84.60% 88.32% 87.10% 80.29% Comprehensive Diabetes Care—HbA1c Control (<8.0 Percent) 53.08% 56.93% 51.82% 47.20% Comprehensive Diabetes Care—Medical Attention for Nephropathy 77.01% 78.59% 78.35% 75.43% Comprehensive Diabetes Care—HbA1c Poor Control (>9.0 Percent) 36.49% 31.87% 37.23% 41.36% Controlling High Blood Pressure — 56.20% 56.30% 63.46% Immunizations for Adolescents—Combination 1 54.18% 65.77% 56.65% 59.01% Medication Management for People with Asthma—Medication Compliance 50% Total — 77.04% 57.78% 51.68% Medication Management for People with Asthma—Medication Compliance 75% Total — 52.55% 38.22% 33.02%
Prenatal and Postpartum Care—Postpartum Care 60.10% 58.73% 55.61% 58.72% Prenatal and Postpartum Care—Timeliness of Prenatal Care 91.52% 91.90% 83.29% 83.78% Use of Imaging Studies for Low Back Pain 83.83% 83.22% 77.33% 80.41% Weight Assessment and Counseling for Nutrition and Physical Activity for Children/Adolescents—BMI Assessment: Total 58.68% 70.56% 66.83% 80.67%
Weight Assessment and Counseling for Nutrition and Physical Activity for Children/Adolescents—Nutrition Counseling: Total 65.75% 65.69% 62.59% 67.53% Weight Assessment and Counseling for Nutrition and Physical Activity for Children/Adolescents—Physical Activity Counseling: Total 40.18% 58.15% 66.08% 67.01%
Well-Child Visits in the Third, Fourth, Fifth, and Sixth Years of Life 71.11% 70.47% 70.11% 71.26% *Member months are a member’s “contribution” to the total yearly membership.

TREND TABLES
2015 HEDIS Aggregate Report Page A-37 California Department of Health Care Services Health Services Advisory Group, Inc.
Table A.35—HEDIS 2015 Trend Table for Health Net Community Solutions, Inc.—Tulare County
Measure RY
2012 RY
2013 RY
2014 RY
2015 RYs 2014–15
Rate Difference All-Cause Readmissions—Statewide Collaborative QIP measure — 11.86% 11.74% 12.75% Ambulatory Care—Emergency Department Visits per 1,000 Member Months* 39.30 41.73 42.27 27.13 Not Tested Ambulatory Care—Outpatient Visits per 1,000 Member Months* 386.74 467.09 505.10 311.82 Not Tested Annual Monitoring for Patients on Persistent Medications—ACE Inhibitors or ARBs 83.59% 83.50% 84.77% 84.34% Annual Monitoring for Patients on Persistent Medications—Digoxin NA NA 91.43% 42.11%
Annual Monitoring for Patients on Persistent Medications—Diuretics 79.73% 84.60% 84.10% 85.51% Avoidance of Antibiotic Treatment in Adults With Acute Bronchitis 22.85% 26.14% 24.05% 23.25% Cervical Cancer Screening — — 59.85% 63.32%
Childhood Immunization Status—Combination 3 78.93% 78.47% 75.69% 74.44% Children and Adolescents' Access to Primary Care Practitioners—12 to 24 Months 97.32% 97.76% 97.60% 95.94% Children and Adolescents' Access to Primary Care Practitioners—25 Months to 6 Years 92.25% 92.37% 91.99% 89.77%
Children and Adolescents' Access to Primary Care Practitioners—7 to 11 Years 92.76% 91.72% 91.23% 90.35% Children and Adolescents' Access to Primary Care Practitioners—12 to 19 Years 91.48% 93.05% 89.42% 88.53% Comprehensive Diabetes Care—Blood Pressure Control (<140/90 mm Hg) 67.45% 54.26% 55.96% 61.80% Comprehensive Diabetes Care—Eye Exam (Retinal) Performed 56.84% 41.85% 50.12% 50.61% Comprehensive Diabetes Care—HbA1c Testing 83.02% 86.62% 79.56% 84.18% Comprehensive Diabetes Care—HbA1c Control (<8.0 Percent) 47.88% 49.64% 45.26% 49.39% Comprehensive Diabetes Care—Medical Attention for Nephropathy 82.78% 82.00% 79.56% 87.83% Comprehensive Diabetes Care—HbA1c Poor Control (>9.0 Percent) 43.40% 43.55% 47.45% 40.88% Controlling High Blood Pressure — 54.01% 49.39% 64.72% Immunizations for Adolescents—Combination 1 61.80% 78.32% 76.04% 77.70% Medication Management for People with Asthma—Medication Compliance 50% Total — 72.85% 52.92% 43.13%
Medication Management for People with Asthma—Medication Compliance 75% Total — 47.68% 32.82% 22.27%
Prenatal and Postpartum Care—Postpartum Care 67.93% 65.57% 57.98% 63.03% Prenatal and Postpartum Care—Timeliness of Prenatal Care 93.75% 90.16% 88.56% 88.34% Use of Imaging Studies for Low Back Pain 82.72% 80.00% 83.22% 81.70% Weight Assessment and Counseling for Nutrition and Physical Activity for Children/Adolescents—BMI Assessment: Total 77.57% 76.64% 65.94% 86.13%
Weight Assessment and Counseling for Nutrition and Physical Activity for Children/Adolescents—Nutrition Counseling: Total 66.36% 66.42% 65.69% 75.67%
Weight Assessment and Counseling for Nutrition and Physical Activity for Children/Adolescents—Physical Activity Counseling: Total 45.33% 49.15% 49.88% 69.10%
Well-Child Visits in the Third, Fourth, Fifth, and Sixth Years of Life 77.32% 73.31% 80.18% 78.89% *Member months are a member’s “contribution” to the total yearly membership.
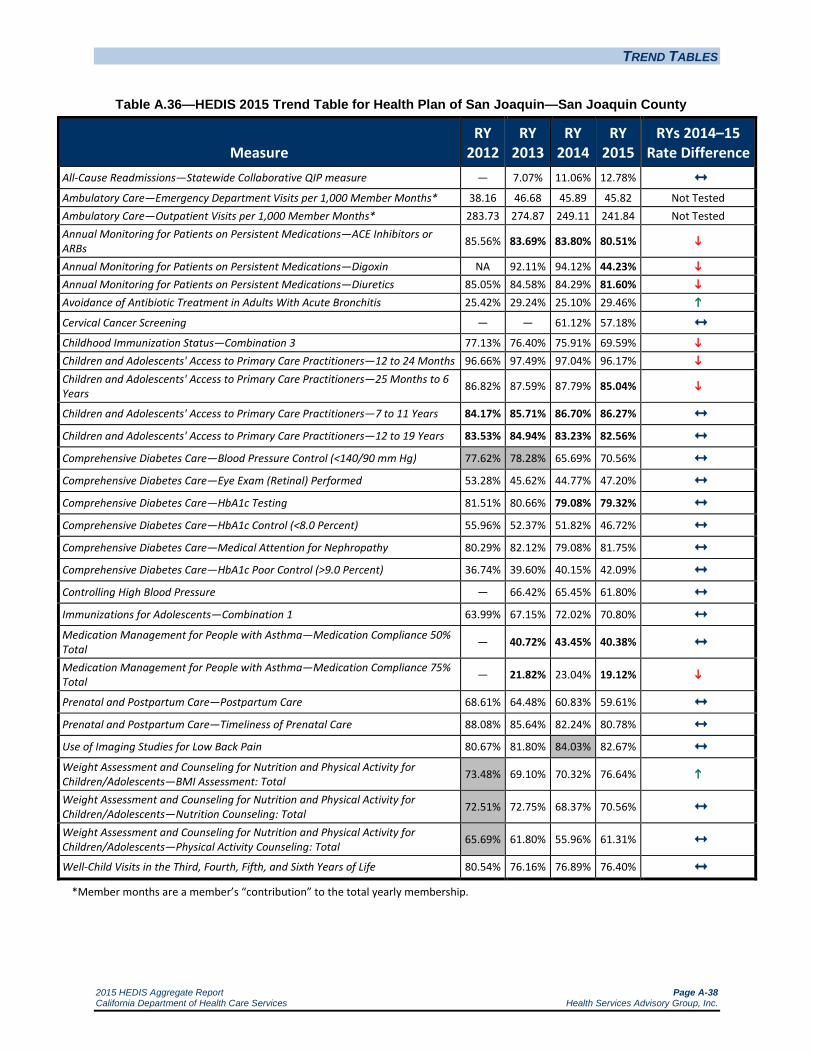
TREND TABLES
2015 HEDIS Aggregate Report Page A-38 California Department of Health Care Services Health Services Advisory Group, Inc.
Table A.36—HEDIS 2015 Trend Table for Health Plan of San Joaquin—San Joaquin County
Measure RY
2012 RY
2013 RY
2014 RY
2015 RYs 2014–15
Rate Difference All-Cause Readmissions—Statewide Collaborative QIP measure — 7.07% 11.06% 12.78% Ambulatory Care—Emergency Department Visits per 1,000 Member Months* 38.16 46.68 45.89 45.82 Not Tested Ambulatory Care—Outpatient Visits per 1,000 Member Months* 283.73 274.87 249.11 241.84 Not Tested Annual Monitoring for Patients on Persistent Medications—ACE Inhibitors or ARBs 85.56% 83.69% 83.80% 80.51%
Annual Monitoring for Patients on Persistent Medications—Digoxin NA 92.11% 94.12% 44.23% Annual Monitoring for Patients on Persistent Medications—Diuretics 85.05% 84.58% 84.29% 81.60% Avoidance of Antibiotic Treatment in Adults With Acute Bronchitis 25.42% 29.24% 25.10% 29.46%
Cervical Cancer Screening — — 61.12% 57.18% Childhood Immunization Status—Combination 3 77.13% 76.40% 75.91% 69.59% Children and Adolescents' Access to Primary Care Practitioners—12 to 24 Months 96.66% 97.49% 97.04% 96.17% Children and Adolescents' Access to Primary Care Practitioners—25 Months to 6 Years 86.82% 87.59% 87.79% 85.04%
Children and Adolescents' Access to Primary Care Practitioners—7 to 11 Years 84.17% 85.71% 86.70% 86.27% Children and Adolescents' Access to Primary Care Practitioners—12 to 19 Years 83.53% 84.94% 83.23% 82.56% Comprehensive Diabetes Care—Blood Pressure Control (<140/90 mm Hg) 77.62% 78.28% 65.69% 70.56% Comprehensive Diabetes Care—Eye Exam (Retinal) Performed 53.28% 45.62% 44.77% 47.20% Comprehensive Diabetes Care—HbA1c Testing 81.51% 80.66% 79.08% 79.32% Comprehensive Diabetes Care—HbA1c Control (<8.0 Percent) 55.96% 52.37% 51.82% 46.72% Comprehensive Diabetes Care—Medical Attention for Nephropathy 80.29% 82.12% 79.08% 81.75% Comprehensive Diabetes Care—HbA1c Poor Control (>9.0 Percent) 36.74% 39.60% 40.15% 42.09% Controlling High Blood Pressure — 66.42% 65.45% 61.80% Immunizations for Adolescents—Combination 1 63.99% 67.15% 72.02% 70.80% Medication Management for People with Asthma—Medication Compliance 50% Total — 40.72% 43.45% 40.38% Medication Management for People with Asthma—Medication Compliance 75% Total — 21.82% 23.04% 19.12%
Prenatal and Postpartum Care—Postpartum Care 68.61% 64.48% 60.83% 59.61% Prenatal and Postpartum Care—Timeliness of Prenatal Care 88.08% 85.64% 82.24% 80.78% Use of Imaging Studies for Low Back Pain 80.67% 81.80% 84.03% 82.67% Weight Assessment and Counseling for Nutrition and Physical Activity for Children/Adolescents—BMI Assessment: Total 73.48% 69.10% 70.32% 76.64%
Weight Assessment and Counseling for Nutrition and Physical Activity for Children/Adolescents—Nutrition Counseling: Total 72.51% 72.75% 68.37% 70.56%
Weight Assessment and Counseling for Nutrition and Physical Activity for Children/Adolescents—Physical Activity Counseling: Total 65.69% 61.80% 55.96% 61.31%
Well-Child Visits in the Third, Fourth, Fifth, and Sixth Years of Life 80.54% 76.16% 76.89% 76.40% *Member months are a member’s “contribution” to the total yearly membership.

TREND TABLES
2015 HEDIS Aggregate Report Page A-39 California Department of Health Care Services Health Services Advisory Group, Inc.
Table A.37—HEDIS 2015 Trend Table for Health Plan of San Joaquin—Stanislaus County
Measure RY
2012 RY
2013 RY
2014 RY
2015 RYs 2014–15
Rate Difference All-Cause Readmissions—Statewide Collaborative QIP measure — — 13.11% 14.29%
Ambulatory Care—Emergency Department Visits per 1,000 Member Months* — — 56.07 60.36 Not Tested
Ambulatory Care—Outpatient Visits per 1,000 Member Months* — — 272.99 274.08 Not Tested
Annual Monitoring for Patients on Persistent Medications—ACE Inhibitors or ARBs
— — 84.64% 85.88%
Annual Monitoring for Patients on Persistent Medications—Digoxin — — NA NA Not Comparable
Annual Monitoring for Patients on Persistent Medications—Diuretics — — 87.39% 86.26%
Avoidance of Antibiotic Treatment in Adults With Acute Bronchitis — — 16.95% 18.65%
Cervical Cancer Screening — — 41.08% 50.12%
Childhood Immunization Status—Combination 3 — — 64.96% 60.58%
Children and Adolescents' Access to Primary Care Practitioners—12 to 24 Months — — 97.23% 92.46%
Children and Adolescents' Access to Primary Care Practitioners—25 Months to 6 Years
— — 88.43% 84.31%
Children and Adolescents' Access to Primary Care Practitioners—7 to 11 Years — — 88.90% 87.59%
Children and Adolescents' Access to Primary Care Practitioners—12 to 19 Years — — 86.60% 84.54%
Comprehensive Diabetes Care—Blood Pressure Control (<140/90 mm Hg) — — 67.88% 72.26%
Comprehensive Diabetes Care—Eye Exam (Retinal) Performed — — 37.23% 36.25%
Comprehensive Diabetes Care—HbA1c Testing — — 85.40% 80.78%
Comprehensive Diabetes Care—HbA1c Control (<8.0 Percent) — — 52.31% 51.82%
Comprehensive Diabetes Care—Medical Attention for Nephropathy — — 80.29% 77.13%
Comprehensive Diabetes Care—HbA1c Poor Control (>9.0 Percent) — — 36.98% 39.90%
Controlling High Blood Pressure — — 56.20% 67.64%
Immunizations for Adolescents—Combination 1 — — 58.15% 56.20%
Medication Management for People with Asthma—Medication Compliance 50% Total
— — 51.65% 49.78%
Medication Management for People with Asthma—Medication Compliance 75% Total
— — 21.98% 23.68%
Prenatal and Postpartum Care—Postpartum Care — — 54.99% 57.18%
Prenatal and Postpartum Care—Timeliness of Prenatal Care — — 73.24% 79.81%
Use of Imaging Studies for Low Back Pain — — 76.51% 78.90%
Weight Assessment and Counseling for Nutrition and Physical Activity for Children/Adolescents—BMI Assessment: Total
— — 54.01% 61.80%
Weight Assessment and Counseling for Nutrition and Physical Activity for Children/Adolescents—Nutrition Counseling: Total
— — 41.85% 56.45%
Weight Assessment and Counseling for Nutrition and Physical Activity for Children/Adolescents—Physical Activity Counseling: Total
— — 39.17% 44.77%
Well-Child Visits in the Third, Fourth, Fifth, and Sixth Years of Life — — 68.61% 65.21%
*Member months are a member’s “contribution” to the total yearly membership.

TREND TABLES
2015 HEDIS Aggregate Report Page A-40 California Department of Health Care Services Health Services Advisory Group, Inc.
Table A.38—HEDIS 2015 Trend Table for Health Plan of San Mateo—San Mateo County
Measure RY
2012 RY
2013 RY
2014 RY
2015 RYs 2014–15
Rate Difference All-Cause Readmissions—Statewide Collaborative QIP measure — 14.52% 15.68% 16.99% Ambulatory Care—Emergency Department Visits per 1,000 Member Months* 51.62 52.11 48.80 49.73 Not Tested Ambulatory Care—Outpatient Visits per 1,000 Member Months* 483.04 546.12 445.65 438.97 Not Tested Annual Monitoring for Patients on Persistent Medications—ACE Inhibitors or ARBs 89.28% 89.51% 90.97% 89.51%
Annual Monitoring for Patients on Persistent Medications—Digoxin 92.71% 94.95% 94.34% 49.35% Annual Monitoring for Patients on Persistent Medications—Diuretics 89.85% 90.57% 91.85% 90.03% Avoidance of Antibiotic Treatment in Adults With Acute Bronchitis 34.06% 34.46% 37.13% 35.50% Cervical Cancer Screening — — 61.80% 55.10%
Childhood Immunization Status—Combination 3 80.29% 75.56% 82.11% 81.60% Children and Adolescents' Access to Primary Care Practitioners—12 to 24 Months 95.89% 96.70% 97.13% 93.89% Children and Adolescents' Access to Primary Care Practitioners—25 Months to 6 Years 88.34% 88.32% 90.40% 89.21%
Children and Adolescents' Access to Primary Care Practitioners—7 to 11 Years 87.75% 89.36% 89.74% 91.49% Children and Adolescents' Access to Primary Care Practitioners—12 to 19 Years 84.89% 85.61% 85.34% 87.36% Comprehensive Diabetes Care—Blood Pressure Control (<140/90 mm Hg) 66.18% 56.93% 46.72% 60.10%
Comprehensive Diabetes Care—Eye Exam (Retinal) Performed 61.07% 57.42% 60.83% 63.75% Comprehensive Diabetes Care—HbA1c Testing 79.81% 83.70% 87.10% 89.29% Comprehensive Diabetes Care—HbA1c Control (<8.0 Percent) 55.72% 56.45% 54.01% 54.99% Comprehensive Diabetes Care—Medical Attention for Nephropathy 87.83% 82.97% 90.02% 83.94%
Comprehensive Diabetes Care—HbA1c Poor Control (>9.0 Percent) 37.96% 35.28% 38.69% 38.20% Controlling High Blood Pressure — 51.34% 29.93% 61.80%
Immunizations for Adolescents—Combination 1 68.49% 70.28% 78.45% 77.08% Medication Management for People with Asthma—Medication Compliance 50% Total — 48.51% 50.21% 47.09% Medication Management for People with Asthma—Medication Compliance 75% Total — 26.38% 27.69% 26.38%
Prenatal and Postpartum Care—Postpartum Care 61.22% 59.18% 59.55% 63.07% Prenatal and Postpartum Care—Timeliness of Prenatal Care 81.89% 84.18% 82.66% 77.89% Use of Imaging Studies for Low Back Pain 81.51% 80.07% 79.18% 83.47% Weight Assessment and Counseling for Nutrition and Physical Activity for Children/Adolescents—BMI Assessment: Total 66.67% 55.47% 67.32% 73.96%
Weight Assessment and Counseling for Nutrition and Physical Activity for Children/Adolescents—Nutrition Counseling: Total 77.62% 70.05% 73.90% 75.00% Weight Assessment and Counseling for Nutrition and Physical Activity for Children/Adolescents—Physical Activity Counseling: Total 63.99% 53.91% 63.66% 61.98%
Well-Child Visits in the Third, Fourth, Fifth, and Sixth Years of Life 73.80% 77.13% 75.68% 73.16% *Member months are a member’s “contribution” to the total yearly membership.
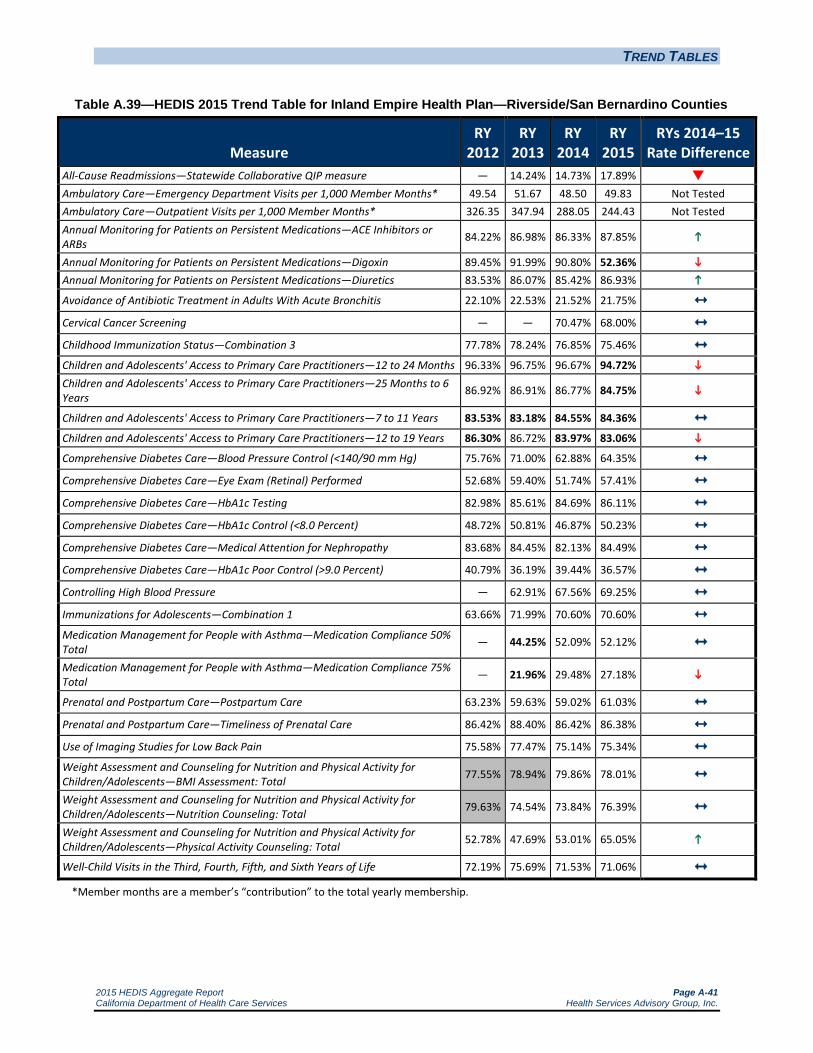
TREND TABLES
2015 HEDIS Aggregate Report Page A-41 California Department of Health Care Services Health Services Advisory Group, Inc.
Table A.39—HEDIS 2015 Trend Table for Inland Empire Health Plan—Riverside/San Bernardino Counties
Measure RY
2012 RY
2013 RY
2014 RY
2015 RYs 2014–15
Rate Difference All-Cause Readmissions—Statewide Collaborative QIP measure — 14.24% 14.73% 17.89% Ambulatory Care—Emergency Department Visits per 1,000 Member Months* 49.54 51.67 48.50 49.83 Not Tested Ambulatory Care—Outpatient Visits per 1,000 Member Months* 326.35 347.94 288.05 244.43 Not Tested Annual Monitoring for Patients on Persistent Medications—ACE Inhibitors or ARBs 84.22% 86.98% 86.33% 87.85%
Annual Monitoring for Patients on Persistent Medications—Digoxin 89.45% 91.99% 90.80% 52.36% Annual Monitoring for Patients on Persistent Medications—Diuretics 83.53% 86.07% 85.42% 86.93% Avoidance of Antibiotic Treatment in Adults With Acute Bronchitis 22.10% 22.53% 21.52% 21.75% Cervical Cancer Screening — — 70.47% 68.00%
Childhood Immunization Status—Combination 3 77.78% 78.24% 76.85% 75.46% Children and Adolescents' Access to Primary Care Practitioners—12 to 24 Months 96.33% 96.75% 96.67% 94.72% Children and Adolescents' Access to Primary Care Practitioners—25 Months to 6 Years 86.92% 86.91% 86.77% 84.75%
Children and Adolescents' Access to Primary Care Practitioners—7 to 11 Years 83.53% 83.18% 84.55% 84.36% Children and Adolescents' Access to Primary Care Practitioners—12 to 19 Years 86.30% 86.72% 83.97% 83.06%
Comprehensive Diabetes Care—Blood Pressure Control (<140/90 mm Hg) 75.76% 71.00% 62.88% 64.35% Comprehensive Diabetes Care—Eye Exam (Retinal) Performed 52.68% 59.40% 51.74% 57.41% Comprehensive Diabetes Care—HbA1c Testing 82.98% 85.61% 84.69% 86.11% Comprehensive Diabetes Care—HbA1c Control (<8.0 Percent) 48.72% 50.81% 46.87% 50.23% Comprehensive Diabetes Care—Medical Attention for Nephropathy 83.68% 84.45% 82.13% 84.49% Comprehensive Diabetes Care—HbA1c Poor Control (>9.0 Percent) 40.79% 36.19% 39.44% 36.57% Controlling High Blood Pressure — 62.91% 67.56% 69.25% Immunizations for Adolescents—Combination 1 63.66% 71.99% 70.60% 70.60% Medication Management for People with Asthma—Medication Compliance 50% Total — 44.25% 52.09% 52.12% Medication Management for People with Asthma—Medication Compliance 75% Total — 21.96% 29.48% 27.18%
Prenatal and Postpartum Care—Postpartum Care 63.23% 59.63% 59.02% 61.03% Prenatal and Postpartum Care—Timeliness of Prenatal Care 86.42% 88.40% 86.42% 86.38% Use of Imaging Studies for Low Back Pain 75.58% 77.47% 75.14% 75.34% Weight Assessment and Counseling for Nutrition and Physical Activity for Children/Adolescents—BMI Assessment: Total 77.55% 78.94% 79.86% 78.01% Weight Assessment and Counseling for Nutrition and Physical Activity for Children/Adolescents—Nutrition Counseling: Total 79.63% 74.54% 73.84% 76.39%
Weight Assessment and Counseling for Nutrition and Physical Activity for Children/Adolescents—Physical Activity Counseling: Total 52.78% 47.69% 53.01% 65.05%
Well-Child Visits in the Third, Fourth, Fifth, and Sixth Years of Life 72.19% 75.69% 71.53% 71.06% *Member months are a member’s “contribution” to the total yearly membership.
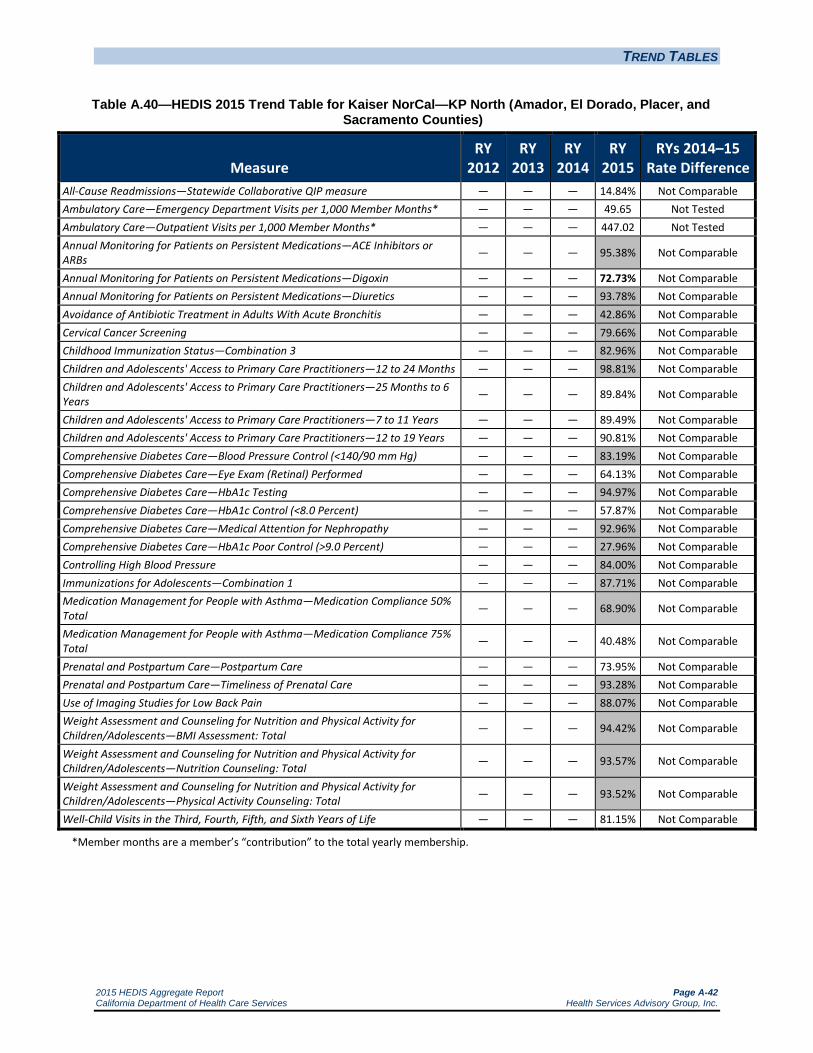
TREND TABLES
2015 HEDIS Aggregate Report Page A-42 California Department of Health Care Services Health Services Advisory Group, Inc.
Table A.40—HEDIS 2015 Trend Table for Kaiser NorCal—KP North (Amador, El Dorado, Placer, and Sacramento Counties)
Measure RY
2012 RY
2013 RY
2014 RY
2015 RYs 2014–15
Rate Difference All-Cause Readmissions—Statewide Collaborative QIP measure — — — 14.84% Not Comparable Ambulatory Care—Emergency Department Visits per 1,000 Member Months* — — — 49.65 Not Tested Ambulatory Care—Outpatient Visits per 1,000 Member Months* — — — 447.02 Not Tested Annual Monitoring for Patients on Persistent Medications—ACE Inhibitors or ARBs — — — 95.38% Not Comparable
Annual Monitoring for Patients on Persistent Medications—Digoxin — — — 72.73% Not Comparable Annual Monitoring for Patients on Persistent Medications—Diuretics — — — 93.78% Not Comparable Avoidance of Antibiotic Treatment in Adults With Acute Bronchitis — — — 42.86% Not Comparable Cervical Cancer Screening — — — 79.66% Not Comparable Childhood Immunization Status—Combination 3 — — — 82.96% Not Comparable Children and Adolescents' Access to Primary Care Practitioners—12 to 24 Months — — — 98.81% Not Comparable Children and Adolescents' Access to Primary Care Practitioners—25 Months to 6 Years — — — 89.84% Not Comparable
Children and Adolescents' Access to Primary Care Practitioners—7 to 11 Years — — — 89.49% Not Comparable Children and Adolescents' Access to Primary Care Practitioners—12 to 19 Years — — — 90.81% Not Comparable Comprehensive Diabetes Care—Blood Pressure Control (<140/90 mm Hg) — — — 83.19% Not Comparable Comprehensive Diabetes Care—Eye Exam (Retinal) Performed — — — 64.13% Not Comparable Comprehensive Diabetes Care—HbA1c Testing — — — 94.97% Not Comparable Comprehensive Diabetes Care—HbA1c Control (<8.0 Percent) — — — 57.87% Not Comparable Comprehensive Diabetes Care—Medical Attention for Nephropathy — — — 92.96% Not Comparable Comprehensive Diabetes Care—HbA1c Poor Control (>9.0 Percent) — — — 27.96% Not Comparable Controlling High Blood Pressure — — — 84.00% Not Comparable Immunizations for Adolescents—Combination 1 — — — 87.71% Not Comparable Medication Management for People with Asthma—Medication Compliance 50% Total — — — 68.90% Not Comparable
Medication Management for People with Asthma—Medication Compliance 75% Total — — — 40.48% Not Comparable
Prenatal and Postpartum Care—Postpartum Care — — — 73.95% Not Comparable Prenatal and Postpartum Care—Timeliness of Prenatal Care — — — 93.28% Not Comparable Use of Imaging Studies for Low Back Pain — — — 88.07% Not Comparable Weight Assessment and Counseling for Nutrition and Physical Activity for Children/Adolescents—BMI Assessment: Total — — — 94.42% Not Comparable
Weight Assessment and Counseling for Nutrition and Physical Activity for Children/Adolescents—Nutrition Counseling: Total — — — 93.57% Not Comparable
Weight Assessment and Counseling for Nutrition and Physical Activity for Children/Adolescents—Physical Activity Counseling: Total — — — 93.52% Not Comparable
Well-Child Visits in the Third, Fourth, Fifth, and Sixth Years of Life — — — 81.15% Not Comparable
*Member months are a member’s “contribution” to the total yearly membership.
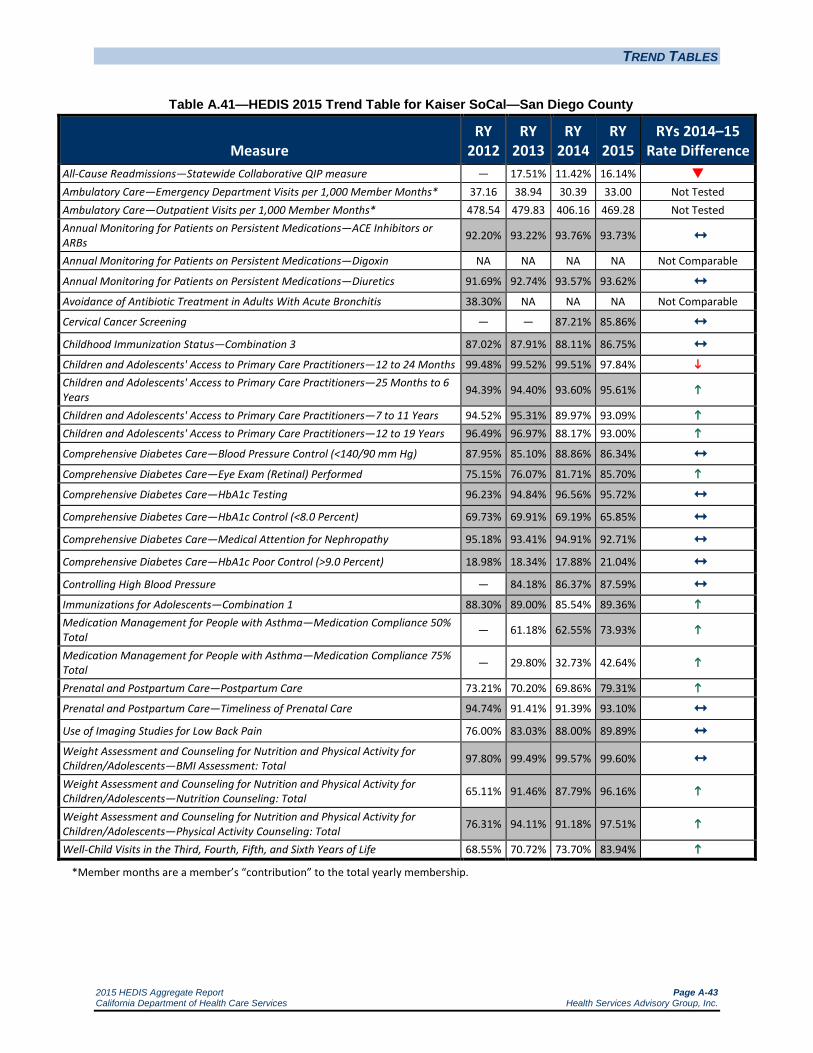
TREND TABLES
2015 HEDIS Aggregate Report Page A-43 California Department of Health Care Services Health Services Advisory Group, Inc.
Table A.41—HEDIS 2015 Trend Table for Kaiser SoCal—San Diego County
Measure RY
2012 RY
2013 RY
2014 RY
2015 RYs 2014–15
Rate Difference All-Cause Readmissions—Statewide Collaborative QIP measure — 17.51% 11.42% 16.14% Ambulatory Care—Emergency Department Visits per 1,000 Member Months* 37.16 38.94 30.39 33.00 Not Tested Ambulatory Care—Outpatient Visits per 1,000 Member Months* 478.54 479.83 406.16 469.28 Not Tested Annual Monitoring for Patients on Persistent Medications—ACE Inhibitors or ARBs 92.20% 93.22% 93.76% 93.73% Annual Monitoring for Patients on Persistent Medications—Digoxin NA NA NA NA Not Comparable
Annual Monitoring for Patients on Persistent Medications—Diuretics 91.69% 92.74% 93.57% 93.62% Avoidance of Antibiotic Treatment in Adults With Acute Bronchitis 38.30% NA NA NA Not Comparable
Cervical Cancer Screening — — 87.21% 85.86%
Childhood Immunization Status—Combination 3 87.02% 87.91% 88.11% 86.75% Children and Adolescents' Access to Primary Care Practitioners—12 to 24 Months 99.48% 99.52% 99.51% 97.84% Children and Adolescents' Access to Primary Care Practitioners—25 Months to 6 Years 94.39% 94.40% 93.60% 95.61%
Children and Adolescents' Access to Primary Care Practitioners—7 to 11 Years 94.52% 95.31% 89.97% 93.09% Children and Adolescents' Access to Primary Care Practitioners—12 to 19 Years 96.49% 96.97% 88.17% 93.00%
Comprehensive Diabetes Care—Blood Pressure Control (<140/90 mm Hg) 87.95% 85.10% 88.86% 86.34% Comprehensive Diabetes Care—Eye Exam (Retinal) Performed 75.15% 76.07% 81.71% 85.70%
Comprehensive Diabetes Care—HbA1c Testing 96.23% 94.84% 96.56% 95.72% Comprehensive Diabetes Care—HbA1c Control (<8.0 Percent) 69.73% 69.91% 69.19% 65.85% Comprehensive Diabetes Care—Medical Attention for Nephropathy 95.18% 93.41% 94.91% 92.71% Comprehensive Diabetes Care—HbA1c Poor Control (>9.0 Percent) 18.98% 18.34% 17.88% 21.04% Controlling High Blood Pressure — 84.18% 86.37% 87.59% Immunizations for Adolescents—Combination 1 88.30% 89.00% 85.54% 89.36% Medication Management for People with Asthma—Medication Compliance 50% Total — 61.18% 62.55% 73.93%
Medication Management for People with Asthma—Medication Compliance 75% Total — 29.80% 32.73% 42.64%
Prenatal and Postpartum Care—Postpartum Care 73.21% 70.20% 69.86% 79.31% Prenatal and Postpartum Care—Timeliness of Prenatal Care 94.74% 91.41% 91.39% 93.10% Use of Imaging Studies for Low Back Pain 76.00% 83.03% 88.00% 89.89% Weight Assessment and Counseling for Nutrition and Physical Activity for Children/Adolescents—BMI Assessment: Total 97.80% 99.49% 99.57% 99.60% Weight Assessment and Counseling for Nutrition and Physical Activity for Children/Adolescents—Nutrition Counseling: Total 65.11% 91.46% 87.79% 96.16%
Weight Assessment and Counseling for Nutrition and Physical Activity for Children/Adolescents—Physical Activity Counseling: Total 76.31% 94.11% 91.18% 97.51%
Well-Child Visits in the Third, Fourth, Fifth, and Sixth Years of Life 68.55% 70.72% 73.70% 83.94%
*Member months are a member’s “contribution” to the total yearly membership.

TREND TABLES
2015 HEDIS Aggregate Report Page A-44 California Department of Health Care Services Health Services Advisory Group, Inc.
Table A.42—HEDIS 2015 Trend Table for Kern Health Systems—Kern County
Measure RY
2012 RY
2013 RY
2014 RY
2015 RYs 2014–15
Rate Difference All-Cause Readmissions—Statewide Collaborative QIP measure — 8.77% 14.94% 17.71% Ambulatory Care—Emergency Department Visits per 1,000 Member Months* 46.64 51.02 50.26 50.65 Not Tested Ambulatory Care—Outpatient Visits per 1,000 Member Months* 282.07 255.5 263.68 272.48 Not Tested Annual Monitoring for Patients on Persistent Medications—ACE Inhibitors or ARBs 83.81% 87.71% 88.95% 88.78% Annual Monitoring for Patients on Persistent Medications—Digoxin NA 90.74% 93.48% 48.08% Annual Monitoring for Patients on Persistent Medications—Diuretics 84.24% 87.62% 89.62% 87.85% Avoidance of Antibiotic Treatment in Adults With Acute Bronchitis 15.69% 23.02% 26.35% 21.54% Cervical Cancer Screening — — 59.37% 57.91%
Childhood Immunization Status—Combination 3 68.61% 65.45% 66.67% 60.10% Children and Adolescents' Access to Primary Care Practitioners—12 to 24 Months 94.23% 92.37% 93.24% 92.78% Children and Adolescents' Access to Primary Care Practitioners—25 Months to 6 Years 84.12% 82.18% 84.37% 82.90%
Children and Adolescents' Access to Primary Care Practitioners—7 to 11 Years 79.80% 79.43% 81.39% 82.59%
Children and Adolescents' Access to Primary Care Practitioners—12 to 19 Years 81.78% 82.20% 80.60% 81.10% Comprehensive Diabetes Care—Blood Pressure Control (<140/90 mm Hg) 72.81% 75.36% 75.67% 65.88% Comprehensive Diabetes Care—Eye Exam (Retinal) Performed 52.55% 45.80% 45.01% 49.45% Comprehensive Diabetes Care—HbA1c Testing 82.12% 80.29% 80.05% 83.03% Comprehensive Diabetes Care—HbA1c Control (<8.0 Percent) 45.26% 47.45% 44.53% 39.78% Comprehensive Diabetes Care—Medical Attention for Nephropathy 80.11% 77.55% 82.48% 81.57% Comprehensive Diabetes Care—HbA1c Poor Control (>9.0 Percent) 45.99% 44.53% 46.96% 51.64% Controlling High Blood Pressure — 64.96% 68.37% 53.53% Immunizations for Adolescents—Combination 1 62.53% 75.67% 78.83% 72.02% Medication Management for People with Asthma—Medication Compliance 50% Total — 45.85% 49.72% 44.58%
Medication Management for People with Asthma—Medication Compliance 75% Total — 21.75% 24.01% 20.98%
Prenatal and Postpartum Care—Postpartum Care 60.34% 62.04% 61.07% 60.10% Prenatal and Postpartum Care—Timeliness of Prenatal Care 81.27% 83.70% 81.02% 79.81% Use of Imaging Studies for Low Back Pain 76.45% 74.07% 75.41% 79.35% Weight Assessment and Counseling for Nutrition and Physical Activity for Children/Adolescents—BMI Assessment: Total 61.80% 64.23% 67.15% 73.97%
Weight Assessment and Counseling for Nutrition and Physical Activity for Children/Adolescents—Nutrition Counseling: Total 51.58% 66.42% 66.91% 64.72% Weight Assessment and Counseling for Nutrition and Physical Activity for Children/Adolescents—Physical Activity Counseling: Total 38.44% 48.91% 56.20% 52.80%
Well-Child Visits in the Third, Fourth, Fifth, and Sixth Years of Life 69.10% 67.64% 66.18% 67.64% *Member months are a member’s “contribution” to the total yearly membership.

TREND TABLES
2015 HEDIS Aggregate Report Page A-45 California Department of Health Care Services Health Services Advisory Group, Inc.
Table A.43—HEDIS 2015 Trend Table for L.A. Care Health Plan—Los Angeles County
Measure RY
2012 RY
2013 RY
2014 RY
2015 RYs 2014–15
Rate Difference All-Cause Readmissions—Statewide Collaborative QIP measure — 17.05% 15.50% 20.83% Ambulatory Care—Emergency Department Visits per 1,000 Member Months* 31.02 32.23 35.61 33.99 Not Tested Ambulatory Care—Outpatient Visits per 1,000 Member Months* 191.44 185.93 310.27 301.62 Not Tested Annual Monitoring for Patients on Persistent Medications—ACE Inhibitors or ARBs 73.44% 73.03% 78.93% 86.55%
Annual Monitoring for Patients on Persistent Medications—Digoxin 78.85% 78.09% 80.72% 47.43% Annual Monitoring for Patients on Persistent Medications—Diuretics 72.28% 72.87% 78.17% 85.67%
Avoidance of Antibiotic Treatment in Adults With Acute Bronchitis 32.31% 35.44% 27.88% 29.73% Cervical Cancer Screening — — 64.25% 61.79%
Childhood Immunization Status—Combination 3 81.45% 80.15% 77.78% 77.65% Children and Adolescents' Access to Primary Care Practitioners—12 to 24 Months 95.16% 91.06% 91.83% 92.26% Children and Adolescents' Access to Primary Care Practitioners—25 Months to 6 Years 86.98% 82.93% 82.82% 84.21%
Children and Adolescents' Access to Primary Care Practitioners—7 to 11 Years 88.20% 87.15% 83.89% 86.49% Children and Adolescents' Access to Primary Care Practitioners—12 to 19 Years 86.43% 85.89% 79.45% 82.39%
Comprehensive Diabetes Care—Blood Pressure Control (<140/90 mm Hg) 64.25% 65.94% 60.05% 65.13% Comprehensive Diabetes Care—Eye Exam (Retinal) Performed 50.72% 49.76% 46.25% 49.65% Comprehensive Diabetes Care—HbA1c Testing 83.82% 84.30% 83.54% 83.14% Comprehensive Diabetes Care—HbA1c Control (<8.0 Percent) 42.27% 48.07% 41.65% 45.96% Comprehensive Diabetes Care—Medical Attention for Nephropathy 79.47% 81.64% 84.99% 86.61% Comprehensive Diabetes Care—HbA1c Poor Control (>9.0 Percent) 42.03% 39.37% 47.46% 41.80% Controlling High Blood Pressure — 61.59% 57.14% 66.83% Immunizations for Adolescents—Combination 1 60.53% 72.15% 73.12% 77.01% Medication Management for People with Asthma—Medication Compliance 50% Total — 79.80% 67.42% 46.69%
Medication Management for People with Asthma—Medication Compliance 75% Total — 57.70% 45.71% 24.85%
Prenatal and Postpartum Care—Postpartum Care 61.26% 55.80% 54.24% 57.04% Prenatal and Postpartum Care—Timeliness of Prenatal Care 80.63% 85.75% 79.90% 82.16% Use of Imaging Studies for Low Back Pain 81.64% 80.14% 80.40% 79.73% Weight Assessment and Counseling for Nutrition and Physical Activity for Children/Adolescents—BMI Assessment: Total 64.65% 71.91% 71.84% 80.15%
Weight Assessment and Counseling for Nutrition and Physical Activity for Children/Adolescents—Nutrition Counseling: Total 70.22% 74.58% 73.06% 80.15%
Weight Assessment and Counseling for Nutrition and Physical Activity for Children/Adolescents—Physical Activity Counseling: Total 57.63% 67.31% 62.62% 69.35%
Well-Child Visits in the Third, Fourth, Fifth, and Sixth Years of Life 77.54% 72.46% 69.49% 69.52% *Member months are a member’s “contribution” to the total yearly membership.

TREND TABLES
2015 HEDIS Aggregate Report Page A-46 California Department of Health Care Services Health Services Advisory Group, Inc.
Table A.44—HEDIS 2015 Trend Table for Molina Healthcare of California Partner Plan, Inc.— Imperial County
Measure RY
2012 RY
2013 RY
2014 RY
2015 RYs 2014–15
Rate Difference All-Cause Readmissions—Statewide Collaborative QIP measure — — — S Not Comparable Ambulatory Care—Emergency Department Visits per 1,000 Member Months* — — — 56.81 Not Tested Ambulatory Care—Outpatient Visits per 1,000 Member Months* — — — 446.79 Not Tested Annual Monitoring for Patients on Persistent Medications—ACE Inhibitors or ARBs — — — 90.05% Not Comparable
Annual Monitoring for Patients on Persistent Medications—Digoxin — — — NA Not Comparable Annual Monitoring for Patients on Persistent Medications—Diuretics — — — 91.03% Not Comparable Avoidance of Antibiotic Treatment in Adults With Acute Bronchitis — — — NA Not Comparable Cervical Cancer Screening — — — 40.22% Not Comparable Childhood Immunization Status—Combination 3 — — — 34.04% Not Comparable Children and Adolescents' Access to Primary Care Practitioners—12 to 24 Months — — — 85.65% Not Comparable Children and Adolescents' Access to Primary Care Practitioners—25 Months to 6 Years — — — 77.44% Not Comparable
Children and Adolescents' Access to Primary Care Practitioners—7 to 11 Years — — — NA Not Comparable Children and Adolescents' Access to Primary Care Practitioners—12 to 19 Years — — — NA Not Comparable Comprehensive Diabetes Care—Blood Pressure Control (<140/90 mm Hg) — — — 46.93% Not Comparable Comprehensive Diabetes Care—Eye Exam (Retinal) Performed — — — 54.51% Not Comparable Comprehensive Diabetes Care—HbA1c Testing — — — 86.64% Not Comparable Comprehensive Diabetes Care—HbA1c Control (<8.0 Percent) — — — 25.27% Not Comparable Comprehensive Diabetes Care—Medical Attention for Nephropathy — — — 81.59% Not Comparable Comprehensive Diabetes Care—HbA1c Poor Control (>9.0 Percent) — — — 67.15% Not Comparable Controlling High Blood Pressure — — — 40.00% Not Comparable Immunizations for Adolescents—Combination 1 — — — 40.00% Not Comparable Medication Management for People with Asthma—Medication Compliance 50% Total — — — NA Not Comparable
Medication Management for People with Asthma—Medication Compliance 75% Total — — — NA Not Comparable
Prenatal and Postpartum Care—Postpartum Care — — — 51.89% Not Comparable Prenatal and Postpartum Care—Timeliness of Prenatal Care — — — 76.22% Not Comparable Use of Imaging Studies for Low Back Pain — — — 59.18% Not Comparable Weight Assessment and Counseling for Nutrition and Physical Activity for Children/Adolescents—BMI Assessment: Total — — — 80.57% Not Comparable
Weight Assessment and Counseling for Nutrition and Physical Activity for Children/Adolescents—Nutrition Counseling: Total — — — 56.51% Not Comparable
Weight Assessment and Counseling for Nutrition and Physical Activity for Children/Adolescents—Physical Activity Counseling: Total — — — 44.37% Not Comparable
Well-Child Visits in the Third, Fourth, Fifth, and Sixth Years of Life — — — 58.94% Not Comparable *Member months are a member’s “contribution” to the total yearly membership.

TREND TABLES
2015 HEDIS Aggregate Report Page A-47 California Department of Health Care Services Health Services Advisory Group, Inc.
Table A.45—HEDIS 2015 Trend Table for Molina Healthcare of California Partner Plan, Inc.— Riverside/San Bernardino Counties
Measure RY
2012 RY
2013 RY
2014 RY
2015 RYs 2014–15
Rate Difference All-Cause Readmissions—Statewide Collaborative QIP measure — 14.65% 14.03% 15.59% Ambulatory Care—Emergency Department Visits per 1,000 Member Months* 43.22 43.60 39.94 39.85 Not Tested Ambulatory Care—Outpatient Visits per 1,000 Member Months* 285.69 260.50 206.96 354.46 Not Tested Annual Monitoring for Patients on Persistent Medications—ACE Inhibitors or ARBs 81.55% 86.05% 87.83% 85.10%
Annual Monitoring for Patients on Persistent Medications—Digoxin NA 92.11% 95.56% 59.38% Annual Monitoring for Patients on Persistent Medications—Diuretics 81.41% 84.41% 86.60% 84.02% Avoidance of Antibiotic Treatment in Adults With Acute Bronchitis 20.13% 30.23% 27.64% 31.68% Cervical Cancer Screening — — 60.81% 58.53% Childhood Immunization Status—Combination 3 59.63% 63.86% 69.57% 68.21% Children and Adolescents' Access to Primary Care Practitioners—12 to 24 Months 94.88% 93.65% 92.67% 90.64% Children and Adolescents' Access to Primary Care Practitioners—25 Months to 6 Years 83.76% 83.03% 85.02% 81.86%
Children and Adolescents' Access to Primary Care Practitioners—7 to 11 Years 82.68% 81.96% 85.15% 84.29% Children and Adolescents' Access to Primary Care Practitioners—12 to 19 Years 84.19% 84.51% 83.63% 83.18% Comprehensive Diabetes Care—Blood Pressure Control (<140/90 mm Hg) 59.33% 56.52% 59.60% 54.75% Comprehensive Diabetes Care—Eye Exam (Retinal) Performed 54.83% 46.68% 50.99% 43.93% Comprehensive Diabetes Care—HbA1c Testing 78.65% 81.92% 82.56% 81.68% Comprehensive Diabetes Care—HbA1c Control (<8.0 Percent) 40.00% 43.48% 38.19% 37.75% Comprehensive Diabetes Care—Medical Attention for Nephropathy 81.80% 83.30% 81.90% 86.31% Comprehensive Diabetes Care—HbA1c Poor Control (>9.0 Percent) 48.76% 43.71% 48.79% 51.43% Controlling High Blood Pressure — 53.83% 47.22% 39.82%
Immunizations for Adolescents—Combination 1 60.88% 69.10% 73.77% 70.83% Medication Management for People with Asthma—Medication Compliance 50% Total — 31.87% 43.36% 44.71% Medication Management for People with Asthma—Medication Compliance 75% Total — 14.51% 25.22% 22.82%
Prenatal and Postpartum Care—Postpartum Care 43.84% 28.99% 47.46% 43.68% Prenatal and Postpartum Care—Timeliness of Prenatal Care 77.17% 64.27% 71.52% 68.96% Use of Imaging Studies for Low Back Pain 76.40% 78.21% 77.08% 74.85% Weight Assessment and Counseling for Nutrition and Physical Activity for Children/Adolescents—BMI Assessment: Total 44.32% 42.00% 55.19% 76.51%
Weight Assessment and Counseling for Nutrition and Physical Activity for Children/Adolescents—Nutrition Counseling: Total 64.97% 59.40% 66.00% 69.35% Weight Assessment and Counseling for Nutrition and Physical Activity for Children/Adolescents—Physical Activity Counseling: Total 57.08% 49.42% 57.40% 52.13%
Well-Child Visits in the Third, Fourth, Fifth, and Sixth Years of Life 74.77% 68.39% 72.73% 66.67% *Member months are a member’s “contribution” to the total yearly membership.

TREND TABLES
2015 HEDIS Aggregate Report Page A-48 California Department of Health Care Services Health Services Advisory Group, Inc.
Table A.46—HEDIS 2015 Trend Table for Molina Healthcare of California Partner Plan, Inc.— Sacramento County
Measure RY
2012 RY
2013 RY
2014 RY
2015 RYs 2014–15
Rate Difference All-Cause Readmissions—Statewide Collaborative QIP measure — 13.20% 13.71% 15.15% Ambulatory Care—Emergency Department Visits per 1,000 Member Months* 44.96 47.83 50.20 58.83 Not Tested Ambulatory Care—Outpatient Visits per 1,000 Member Months* 238.15 261.22 257.68 454.21 Not Tested Annual Monitoring for Patients on Persistent Medications—ACE Inhibitors or ARBs 78.84% 73.99% 79.52% 83.95%
Annual Monitoring for Patients on Persistent Medications—Digoxin NA NA 82.86% 50.00% Annual Monitoring for Patients on Persistent Medications—Diuretics 74.23% 73.63% 79.48% 82.45%
Avoidance of Antibiotic Treatment in Adults With Acute Bronchitis 28.29% 23.08% 32.39% 27.23% Cervical Cancer Screening — — 60.63% 57.27% Childhood Immunization Status—Combination 3 50.12% 54.06% 59.42% 59.29% Children and Adolescents' Access to Primary Care Practitioners—12 to 24 Months 95.79% 94.81% 94.51% 89.13% Children and Adolescents' Access to Primary Care Practitioners—25 Months to 6 Years 84.21% 84.09% 83.89% 80.42%
Children and Adolescents' Access to Primary Care Practitioners—7 to 11 Years 83.45% 83.80% 82.85% 80.44% Children and Adolescents' Access to Primary Care Practitioners—12 to 19 Years 83.38% 84.20% 80.58% 79.99% Comprehensive Diabetes Care—Blood Pressure Control (<140/90 mm Hg) 58.22% 54.65% 52.76% 53.64% Comprehensive Diabetes Care—Eye Exam (Retinal) Performed 56.22% 47.91% 48.79% 48.79% Comprehensive Diabetes Care—HbA1c Testing 81.78% 78.60% 79.25% 77.04% Comprehensive Diabetes Care—HbA1c Control (<8.0 Percent) 46.89% 46.05% 45.25% 44.81% Comprehensive Diabetes Care—Medical Attention for Nephropathy 83.11% 80.47% 79.47% 80.57% Comprehensive Diabetes Care—HbA1c Poor Control (>9.0 Percent) 40.89% 43.26% 46.36% 43.93% Controlling High Blood Pressure — 51.29% 47.23% 50.99% Immunizations for Adolescents—Combination 1 55.32% 66.04% 67.33% 68.73% Medication Management for People with Asthma—Medication Compliance 50% Total — 31.72% 51.36% 43.43% Medication Management for People with Asthma—Medication Compliance 75% Total — 17.24% 22.27% 19.70%
Prenatal and Postpartum Care—Postpartum Care 51.36% 37.47% 43.93% 39.96% Prenatal and Postpartum Care—Timeliness of Prenatal Care 81.45% 69.62% 74.39% 69.54% Use of Imaging Studies for Low Back Pain 84.03% 83.24% 81.50% 80.60% Weight Assessment and Counseling for Nutrition and Physical Activity for Children/Adolescents—BMI Assessment: Total 62.33% 54.61% 45.70% 84.67%
Weight Assessment and Counseling for Nutrition and Physical Activity for Children/Adolescents—Nutrition Counseling: Total 64.65% 59.34% 56.51% 79.33%
Weight Assessment and Counseling for Nutrition and Physical Activity for Children/Adolescents—Physical Activity Counseling: Total 58.37% 49.65% 49.89% 55.11%
Well-Child Visits in the Third, Fourth, Fifth, and Sixth Years of Life 76.10% 73.21% 67.31% 70.97% *Member months are a member’s “contribution” to the total yearly membership.

TREND TABLES
2015 HEDIS Aggregate Report Page A-49 California Department of Health Care Services Health Services Advisory Group, Inc.
Table A.47—HEDIS 2015 Trend Table for Molina Healthcare of California Partner Plan, Inc.— San Diego County
Measure RY
2012 RY
2013 RY
2014 RY
2015 RYs 2014–15
Rate Difference All-Cause Readmissions—Statewide Collaborative QIP measure — 14.45% 14.93% 16.01% Ambulatory Care—Emergency Department Visits per 1,000 Member Months* 43.30 45.58 40.54 41.47 Not Tested Ambulatory Care—Outpatient Visits per 1,000 Member Months* 331.91 305.90 228.23 443.05 Not Tested Annual Monitoring for Patients on Persistent Medications—ACE Inhibitors or ARBs 86.72% 85.15% 86.03% 84.41% Annual Monitoring for Patients on Persistent Medications—Digoxin NA 94.74% 79.66% 56.94% Annual Monitoring for Patients on Persistent Medications—Diuretics 85.85% 86.01% 87.07% 84.90% Avoidance of Antibiotic Treatment in Adults With Acute Bronchitis 18.21% 17.33% 28.29% 28.90% Cervical Cancer Screening — — 68.11% 51.02%
Childhood Immunization Status—Combination 3 73.19% 75.00% 76.89% 74.61% Children and Adolescents' Access to Primary Care Practitioners—12 to 24 Months 94.76% 95.93% 95.73% 93.95% Children and Adolescents' Access to Primary Care Practitioners—25 Months to 6 Years 88.46% 88.02% 88.81% 86.38%
Children and Adolescents' Access to Primary Care Practitioners—7 to 11 Years 87.55% 88.31% 89.06% 89.81% Children and Adolescents' Access to Primary Care Practitioners—12 to 19 Years 83.75% 85.26% 86.20% 87.03% Comprehensive Diabetes Care—Blood Pressure Control (<140/90 mm Hg) 62.00% 62.30% 60.71% 58.72% Comprehensive Diabetes Care—Eye Exam (Retinal) Performed 56.44% 58.55% 55.63% 60.93% Comprehensive Diabetes Care—HbA1c Testing 84.44% 88.76% 87.64% 89.85% Comprehensive Diabetes Care—HbA1c Control (<8.0 Percent) 46.22% 57.85% 49.45% 55.19% Comprehensive Diabetes Care—Medical Attention for Nephropathy 80.22% 84.31% 84.99% 87.42% Comprehensive Diabetes Care—HbA1c Poor Control (>9.0 Percent) 46.67% 32.55% 41.50% 34.44% Controlling High Blood Pressure — 52.76% 53.88% 46.44% Immunizations for Adolescents—Combination 1 71.30% 80.83% 81.44% 73.78% Medication Management for People with Asthma—Medication Compliance 50% Total — 35.33% 45.12% 46.73%
Medication Management for People with Asthma—Medication Compliance 75% Total — 18.63% 25.18% 26.42% Prenatal and Postpartum Care—Postpartum Care 61.40% 51.52% 64.68% 54.20%
Prenatal and Postpartum Care—Timeliness of Prenatal Care 88.94% 79.72% 83.00% 83.21% Use of Imaging Studies for Low Back Pain 71.98% 72.00% 68.64% 68.42% Weight Assessment and Counseling for Nutrition and Physical Activity for Children/Adolescents—BMI Assessment: Total 57.67% 64.79% 68.30% 86.31%
Weight Assessment and Counseling for Nutrition and Physical Activity for Children/Adolescents—Nutrition Counseling: Total 61.86% 65.96% 62.28% 72.41%
Weight Assessment and Counseling for Nutrition and Physical Activity for Children/Adolescents—Physical Activity Counseling: Total 52.33% 55.16% 53.57% 56.51%
Well-Child Visits in the Third, Fourth, Fifth, and Sixth Years of Life 78.89% 74.74% 74.29% 70.06% *Member months are a member’s “contribution” to the total yearly membership.
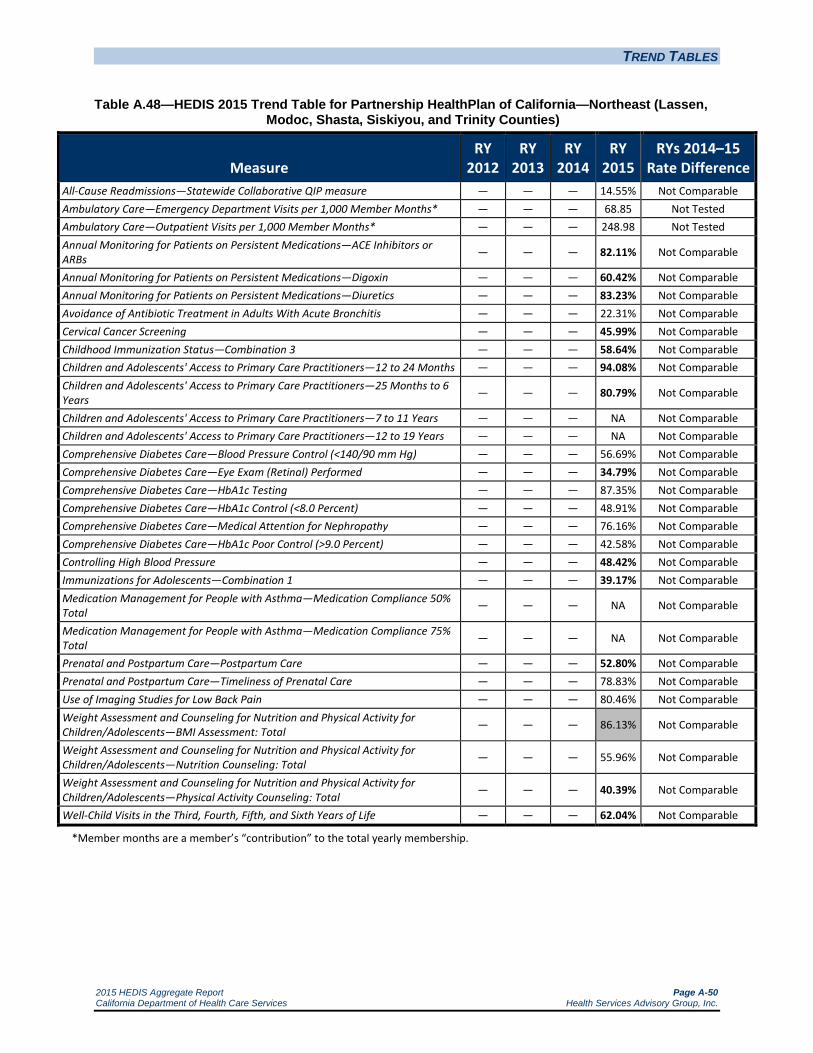
TREND TABLES
2015 HEDIS Aggregate Report Page A-50 California Department of Health Care Services Health Services Advisory Group, Inc.
Table A.48—HEDIS 2015 Trend Table for Partnership HealthPlan of California—Northeast (Lassen, Modoc, Shasta, Siskiyou, and Trinity Counties)
Measure RY
2012 RY
2013 RY
2014 RY
2015 RYs 2014–15
Rate Difference All-Cause Readmissions—Statewide Collaborative QIP measure — — — 14.55% Not Comparable Ambulatory Care—Emergency Department Visits per 1,000 Member Months* — — — 68.85 Not Tested Ambulatory Care—Outpatient Visits per 1,000 Member Months* — — — 248.98 Not Tested Annual Monitoring for Patients on Persistent Medications—ACE Inhibitors or ARBs — — — 82.11% Not Comparable
Annual Monitoring for Patients on Persistent Medications—Digoxin — — — 60.42% Not Comparable Annual Monitoring for Patients on Persistent Medications—Diuretics — — — 83.23% Not Comparable Avoidance of Antibiotic Treatment in Adults With Acute Bronchitis — — — 22.31% Not Comparable Cervical Cancer Screening — — — 45.99% Not Comparable Childhood Immunization Status—Combination 3 — — — 58.64% Not Comparable Children and Adolescents' Access to Primary Care Practitioners—12 to 24 Months — — — 94.08% Not Comparable Children and Adolescents' Access to Primary Care Practitioners—25 Months to 6 Years — — — 80.79% Not Comparable
Children and Adolescents' Access to Primary Care Practitioners—7 to 11 Years — — — NA Not Comparable Children and Adolescents' Access to Primary Care Practitioners—12 to 19 Years — — — NA Not Comparable Comprehensive Diabetes Care—Blood Pressure Control (<140/90 mm Hg) — — — 56.69% Not Comparable Comprehensive Diabetes Care—Eye Exam (Retinal) Performed — — — 34.79% Not Comparable Comprehensive Diabetes Care—HbA1c Testing — — — 87.35% Not Comparable Comprehensive Diabetes Care—HbA1c Control (<8.0 Percent) — — — 48.91% Not Comparable Comprehensive Diabetes Care—Medical Attention for Nephropathy — — — 76.16% Not Comparable Comprehensive Diabetes Care—HbA1c Poor Control (>9.0 Percent) — — — 42.58% Not Comparable Controlling High Blood Pressure — — — 48.42% Not Comparable Immunizations for Adolescents—Combination 1 — — — 39.17% Not Comparable Medication Management for People with Asthma—Medication Compliance 50% Total — — — NA Not Comparable
Medication Management for People with Asthma—Medication Compliance 75% Total — — — NA Not Comparable
Prenatal and Postpartum Care—Postpartum Care — — — 52.80% Not Comparable Prenatal and Postpartum Care—Timeliness of Prenatal Care — — — 78.83% Not Comparable Use of Imaging Studies for Low Back Pain — — — 80.46% Not Comparable Weight Assessment and Counseling for Nutrition and Physical Activity for Children/Adolescents—BMI Assessment: Total — — — 86.13% Not Comparable
Weight Assessment and Counseling for Nutrition and Physical Activity for Children/Adolescents—Nutrition Counseling: Total — — — 55.96% Not Comparable
Weight Assessment and Counseling for Nutrition and Physical Activity for Children/Adolescents—Physical Activity Counseling: Total — — — 40.39% Not Comparable
Well-Child Visits in the Third, Fourth, Fifth, and Sixth Years of Life — — — 62.04% Not Comparable
*Member months are a member’s “contribution” to the total yearly membership.

TREND TABLES
2015 HEDIS Aggregate Report Page A-51 California Department of Health Care Services Health Services Advisory Group, Inc.
Table A.49—HEDIS 2015 Trend Table for Partnership HealthPlan of California—Northwest (Del Norte and Humboldt Counties)
Measure RY
2012 RY
2013 RY
2014 RY
2015 RYs 2014–15
Rate Difference All-Cause Readmissions—Statewide Collaborative QIP measure — — — 13.22% Not Comparable Ambulatory Care—Emergency Department Visits per 1,000 Member Months* — — — 55.74 Not Tested Ambulatory Care—Outpatient Visits per 1,000 Member Months* — — — 251.63 Not Tested Annual Monitoring for Patients on Persistent Medications—ACE Inhibitors or ARBs — — — 80.41% Not Comparable
Annual Monitoring for Patients on Persistent Medications—Digoxin — — — NA Not Comparable Annual Monitoring for Patients on Persistent Medications—Diuretics — — — 83.65% Not Comparable Avoidance of Antibiotic Treatment in Adults With Acute Bronchitis — — — 29.35% Not Comparable Cervical Cancer Screening — — — 49.64% Not Comparable Childhood Immunization Status—Combination 3 — — — 56.13% Not Comparable Children and Adolescents' Access to Primary Care Practitioners—12 to 24 Months — — — 96.54% Not Comparable Children and Adolescents' Access to Primary Care Practitioners—25 Months to 6 Years — — — 87.40% Not Comparable
Children and Adolescents' Access to Primary Care Practitioners—7 to 11 Years — — — NA Not Comparable Children and Adolescents' Access to Primary Care Practitioners—12 to 19 Years — — — NA Not Comparable Comprehensive Diabetes Care—Blood Pressure Control (<140/90 mm Hg) — — — 58.39% Not Comparable Comprehensive Diabetes Care—Eye Exam (Retinal) Performed — — — 39.17% Not Comparable Comprehensive Diabetes Care—HbA1c Testing — — — 92.21% Not Comparable Comprehensive Diabetes Care—HbA1c Control (<8.0 Percent) — — — 56.20% Not Comparable Comprehensive Diabetes Care—Medical Attention for Nephropathy — — — 85.89% Not Comparable Comprehensive Diabetes Care—HbA1c Poor Control (>9.0 Percent) — — — 31.14% Not Comparable Controlling High Blood Pressure — — — 47.45% Not Comparable Immunizations for Adolescents—Combination 1 — — — 57.98% Not Comparable Medication Management for People with Asthma—Medication Compliance 50% Total — — — NA Not Comparable
Medication Management for People with Asthma—Medication Compliance 75% Total — — — NA Not Comparable
Prenatal and Postpartum Care—Postpartum Care — — — 50.36% Not Comparable Prenatal and Postpartum Care—Timeliness of Prenatal Care — — — 82.97% Not Comparable Use of Imaging Studies for Low Back Pain — — — 84.26% Not Comparable Weight Assessment and Counseling for Nutrition and Physical Activity for Children/Adolescents—BMI Assessment: Total — — — 66.91% Not Comparable
Weight Assessment and Counseling for Nutrition and Physical Activity for Children/Adolescents—Nutrition Counseling: Total — — — 46.47% Not Comparable
Weight Assessment and Counseling for Nutrition and Physical Activity for Children/Adolescents—Physical Activity Counseling: Total — — — 36.25% Not Comparable
Well-Child Visits in the Third, Fourth, Fifth, and Sixth Years of Life — — — 62.53% Not Comparable *Member months are a member’s “contribution” to the total yearly membership.

TREND TABLES
2015 HEDIS Aggregate Report Page A-52 California Department of Health Care Services Health Services Advisory Group, Inc.
Table A.50—HEDIS 2015 Trend Table for Partnership HealthPlan of California— Southeast (Napa/Solano/Yolo Counties)
Measure RY
2012 RY
2013 RY
2014 RY
2015 RYs 2014–15
Rate Difference All-Cause Readmissions—Statewide Collaborative QIP measure — 13.25% 15.60% 15.07% Ambulatory Care—Emergency Department Visits per 1,000 Member Months* 47.82 52.33 53.57 58.01 Not Tested Ambulatory Care—Outpatient Visits per 1,000 Member Months* 256.88 312.13 311.38 331.00 Not Tested Annual Monitoring for Patients on Persistent Medications—ACE Inhibitors or ARBs 82.13% 84.46% 89.71% 88.26%
Annual Monitoring for Patients on Persistent Medications—Digoxin 80.88% 90.48% 94.44% 58.64% Annual Monitoring for Patients on Persistent Medications—Diuretics 82.38% 82.35% 89.42% 88.88% Avoidance of Antibiotic Treatment in Adults With Acute Bronchitis 42.76% 33.18% 34.31% 34.83% Cervical Cancer Screening — — 69.59% 58.19% Childhood Immunization Status—Combination 3 71.93% 68.87% 72.32% 68.66% Children and Adolescents' Access to Primary Care Practitioners—12 to 24 Months 94.91% 96.49% 96.81% 94.46% Children and Adolescents' Access to Primary Care Practitioners—25 Months to 6 Years 82.91% 86.42% 87.79% 86.65%
Children and Adolescents' Access to Primary Care Practitioners—7 to 11 Years 80.35% 83.67% 85.84% 85.98% Children and Adolescents' Access to Primary Care Practitioners—12 to 19 Years 77.25% 84.94% 83.80% 84.19% Comprehensive Diabetes Care—Blood Pressure Control (<140/90 mm Hg) 69.27% 66.67% 65.21% 61.95% Comprehensive Diabetes Care—Eye Exam (Retinal) Performed 56.79% 53.42% 60.34% 54.15% Comprehensive Diabetes Care—HbA1c Testing 86.64% 85.65% 82.48% 88.05% Comprehensive Diabetes Care—HbA1c Control (<8.0 Percent) 60.58% 53.64% 52.31% 53.66% Comprehensive Diabetes Care—Medical Attention for Nephropathy 83.74% 84.33% 86.86% 84.88% Comprehensive Diabetes Care—HbA1c Poor Control (>9.0 Percent) 28.73% 35.76% 37.47% 35.37% Controlling High Blood Pressure — 53.86% 56.72% 58.52% Immunizations for Adolescents—Combination 1 56.81% 65.33% 64.10% 71.05% Medication Management for People with Asthma—Medication Compliance 50% Total — 59.90% 61.68% 58.96% Medication Management for People with Asthma—Medication Compliance 75% Total — 39.41% 40.23% 40.13%
Prenatal and Postpartum Care—Postpartum Care 70.29% 75.92% 68.85% 69.17% Prenatal and Postpartum Care—Timeliness of Prenatal Care 87.27% 81.41% 80.00% 87.50% Use of Imaging Studies for Low Back Pain 88.52% 88.95% 89.17% 87.12% Weight Assessment and Counseling for Nutrition and Physical Activity for Children/Adolescents—BMI Assessment: Total 74.77% 77.44% 69.76% 77.02%
Weight Assessment and Counseling for Nutrition and Physical Activity for Children/Adolescents—Nutrition Counseling: Total 65.05% 67.91% 65.12% 73.11%
Weight Assessment and Counseling for Nutrition and Physical Activity for Children/Adolescents—Physical Activity Counseling: Total 53.70% 52.79% 54.15% 67.97%
Well-Child Visits in the Third, Fourth, Fifth, and Sixth Years of Life 74.34% 74.26% 73.83% 75.30% *Member months are a member’s “contribution” to the total yearly membership.

TREND TABLES
2015 HEDIS Aggregate Report Page A-53 California Department of Health Care Services Health Services Advisory Group, Inc.
Table A.51—HEDIS 2015 Trend Table for Partnership HealthPlan of California—Southwest (Marin, Mendocino, Sonoma, and Lake Counties)
Measure RY
2012 RY
2013 RY
2014 RY
2015 RYs 2014–15
Rate Difference All-Cause Readmissions—Statewide Collaborative QIP measure — — — 14.24% Not Comparable Ambulatory Care—Emergency Department Visits per 1,000 Member Months* — — — 50.01 Not Tested Ambulatory Care—Outpatient Visits per 1,000 Member Months* — — — 333.19 Not Tested Annual Monitoring for Patients on Persistent Medications—ACE Inhibitors or ARBs — — — 83.20% Not Comparable
Annual Monitoring for Patients on Persistent Medications—Digoxin — — — 56.38% Not Comparable Annual Monitoring for Patients on Persistent Medications—Diuretics — — — 83.30% Not Comparable Avoidance of Antibiotic Treatment in Adults With Acute Bronchitis — — — 40.97% Not Comparable Cervical Cancer Screening — — — 56.20% Not Comparable Childhood Immunization Status—Combination 3 — — — 73.72% Not Comparable Children and Adolescents' Access to Primary Care Practitioners—12 to 24 Months — — — 95.78% Not Comparable Children and Adolescents' Access to Primary Care Practitioners—25 Months to 6 Years — — — 88.92% Not Comparable
Children and Adolescents' Access to Primary Care Practitioners—7 to 11 Years — — — 89.77% Not Comparable Children and Adolescents' Access to Primary Care Practitioners—12 to 19 Years — — — 87.86% Not Comparable Comprehensive Diabetes Care—Blood Pressure Control (<140/90 mm Hg) — — — 64.48% Not Comparable Comprehensive Diabetes Care—Eye Exam (Retinal) Performed — — — 49.15% Not Comparable Comprehensive Diabetes Care—HbA1c Testing — — — 87.10% Not Comparable Comprehensive Diabetes Care—HbA1c Control (<8.0 Percent) — — — 46.72% Not Comparable Comprehensive Diabetes Care—Medical Attention for Nephropathy — — — 76.64% Not Comparable Comprehensive Diabetes Care—HbA1c Poor Control (>9.0 Percent) — — — 43.31% Not Comparable Controlling High Blood Pressure — — — 54.01% Not Comparable Immunizations for Adolescents—Combination 1 — — — 68.86% Not Comparable Medication Management for People with Asthma—Medication Compliance 50% Total — — — 59.39% Not Comparable
Medication Management for People with Asthma—Medication Compliance 75% Total — — — 37.94% Not Comparable
Prenatal and Postpartum Care—Postpartum Care — — — 68.37% Not Comparable Prenatal and Postpartum Care—Timeliness of Prenatal Care — — — 86.13% Not Comparable Use of Imaging Studies for Low Back Pain — — — 88.00% Not Comparable Weight Assessment and Counseling for Nutrition and Physical Activity for Children/Adolescents—BMI Assessment: Total — — — 86.62% Not Comparable
Weight Assessment and Counseling for Nutrition and Physical Activity for Children/Adolescents—Nutrition Counseling: Total — — — 62.77% Not Comparable
Weight Assessment and Counseling for Nutrition and Physical Activity for Children/Adolescents—Physical Activity Counseling: Total — — — 53.77% Not Comparable
Well-Child Visits in the Third, Fourth, Fifth, and Sixth Years of Life — — — 72.02% Not Comparable
*Member months are a member’s “contribution” to the total yearly membership.

TREND TABLES
2015 HEDIS Aggregate Report Page A-54 California Department of Health Care Services Health Services Advisory Group, Inc.
Table A.52—HEDIS 2015 Trend Table for San Francisco Health Plan—San Francisco County
Measure RY
2012 RY
2013 RY
2014 RY
2015 RYs 2014–15
Rate Difference All-Cause Readmissions—Statewide Collaborative QIP measure — 15.81% 13.86% 19.71% Ambulatory Care—Emergency Department Visits per 1,000 Member Months* 26.68 35.34 33.03 34.32 Not Tested Ambulatory Care—Outpatient Visits per 1,000 Member Months* 354.39 348.95 383.10 369.40 Not Tested Annual Monitoring for Patients on Persistent Medications—ACE Inhibitors or ARBs 73.20% 76.81% 87.32% 86.47% Annual Monitoring for Patients on Persistent Medications—Digoxin NA 81.82% 95.92% 51.02%
Annual Monitoring for Patients on Persistent Medications—Diuretics 71.43% 78.74% 86.31% 86.94% Avoidance of Antibiotic Treatment in Adults With Acute Bronchitis 45.45% 53.75% 44.01% 45.34% Cervical Cancer Screening — — 74.47% 74.00% Childhood Immunization Status—Combination 3 87.04% 85.81% 85.42% 82.87% Children and Adolescents' Access to Primary Care Practitioners—12 to 24 Months 92.98% 95.95% 97.01% 93.66% Children and Adolescents' Access to Primary Care Practitioners—25 Months to 6 Years 87.90% 89.57% 92.55% 90.01%
Children and Adolescents' Access to Primary Care Practitioners—7 to 11 Years 90.08% 93.16% 94.70% 94.11% Children and Adolescents' Access to Primary Care Practitioners—12 to 19 Years 86.78% 91.13% 91.04% 91.05% Comprehensive Diabetes Care—Blood Pressure Control (<140/90 mm Hg) 78.64% 74.77% 76.57% 75.41% Comprehensive Diabetes Care—Eye Exam (Retinal) Performed 69.72% 67.59% 62.41% 68.91% Comprehensive Diabetes Care—HbA1c Testing 91.08% 90.97% 89.33% 91.42% Comprehensive Diabetes Care—HbA1c Control (<8.0 Percent) 63.38% 62.27% 63.57% 62.41% Comprehensive Diabetes Care—Medical Attention for Nephropathy 83.57% 87.73% 86.77% 87.94% Comprehensive Diabetes Care—HbA1c Poor Control (>9.0 Percent) 26.53% 26.39% 24.36% 25.06% Controlling High Blood Pressure — 66.46% 63.42% 72.19% Immunizations for Adolescents—Combination 1 64.35% 81.02% 81.71% 79.40% Medication Management for People with Asthma—Medication Compliance 50% Total — 42.82% 52.10% 55.69% Medication Management for People with Asthma—Medication Compliance 75% Total — 21.55% 32.87% 32.43%
Prenatal and Postpartum Care—Postpartum Care 75.64% 71.76% 70.40% 70.59% Prenatal and Postpartum Care—Timeliness of Prenatal Care 93.44% 87.96% 93.24% 90.12% Use of Imaging Studies for Low Back Pain 82.98% 86.53% 84.86% 86.16% Weight Assessment and Counseling for Nutrition and Physical Activity for Children/Adolescents—BMI Assessment: Total 76.16% 85.19% 86.81% 85.19% Weight Assessment and Counseling for Nutrition and Physical Activity for Children/Adolescents—Nutrition Counseling: Total 80.56% 85.19% 82.41% 81.48% Weight Assessment and Counseling for Nutrition and Physical Activity for Children/Adolescents—Physical Activity Counseling: Total 72.69% 83.80% 79.17% 77.78%
Well-Child Visits in the Third, Fourth, Fifth, and Sixth Years of Life 84.95% 84.26% 86.81% 85.42% *Member months are a member’s “contribution” to the total yearly membership.

TREND TABLES
2015 HEDIS Aggregate Report Page A-55 California Department of Health Care Services Health Services Advisory Group, Inc.
Table A.53—HEDIS 2015 Trend Table for Santa Clara Family Health Plan—Santa Clara County
Measure RY
2012 RY
2013 RY
2014 RY
2015 RYs 2014–15
Rate Difference All-Cause Readmissions—Statewide Collaborative QIP measure — 13.77% 15.20% 16.92% Ambulatory Care—Emergency Department Visits per 1,000 Member Months* 35.89 34.79 32.64 34.98 Not Tested Ambulatory Care—Outpatient Visits per 1,000 Member Months* 292.77 267.45 260.02 233.52 Not Tested Annual Monitoring for Patients on Persistent Medications—ACE Inhibitors or ARBs 86.05% 87.60% 87.39% 87.74% Annual Monitoring for Patients on Persistent Medications—Digoxin 87.18% 88.10% 89.01% 58.16% Annual Monitoring for Patients on Persistent Medications—Diuretics 84.85% 88.08% 87.91% 86.65% Avoidance of Antibiotic Treatment in Adults With Acute Bronchitis 25.81% 26.43% 29.40% 30.94% Cervical Cancer Screening — — 67.40% 57.18% Childhood Immunization Status—Combination 3 80.05% 73.72% 75.43% 71.53% Children and Adolescents' Access to Primary Care Practitioners—12 to 24 Months 96.22% 96.87% 97.15% 94.65% Children and Adolescents' Access to Primary Care Practitioners—25 Months to 6 Years 88.63% 88.90% 88.94% 87.69%
Children and Adolescents' Access to Primary Care Practitioners—7 to 11 Years 89.69% 88.92% 90.46% 90.15% Children and Adolescents' Access to Primary Care Practitioners—12 to 19 Years 86.78% 87.81% 87.46% 86.77% Comprehensive Diabetes Care—Blood Pressure Control (<140/90 mm Hg) 45.01% 53.53% 56.69% 60.58% Comprehensive Diabetes Care—Eye Exam (Retinal) Performed 47.69% 41.85% 46.72% 48.66% Comprehensive Diabetes Care—HbA1c Testing 86.62% 86.62% 86.86% 91.48% Comprehensive Diabetes Care—HbA1c Control (<8.0 Percent) 51.09% 55.47% 54.01% 58.15% Comprehensive Diabetes Care—Medical Attention for Nephropathy 80.05% 79.81% 83.45% 90.51% Comprehensive Diabetes Care—HbA1c Poor Control (>9.0 Percent) 40.88% 34.79% 33.82% 29.68% Controlling High Blood Pressure — 52.80% 52.55% 54.99% Immunizations for Adolescents—Combination 1 69.34% 75.67% 75.43% 81.27% Medication Management for People with Asthma—Medication Compliance 50% Total — 58.61% 61.13% 59.94% Medication Management for People with Asthma—Medication Compliance 75% Total — 35.95% 41.98% 37.01%
Prenatal and Postpartum Care—Postpartum Care 58.39% 67.40% 59.61% 61.07% Prenatal and Postpartum Care—Timeliness of Prenatal Care 82.73% 82.97% 86.13% 82.24% Use of Imaging Studies for Low Back Pain 80.37% 82.42% 86.37% 85.52% Weight Assessment and Counseling for Nutrition and Physical Activity for Children/Adolescents—BMI Assessment: Total 64.23% 66.91% 71.53% 76.64% Weight Assessment and Counseling for Nutrition and Physical Activity for Children/Adolescents—Nutrition Counseling: Total 63.99% 67.88% 67.40% 74.94%
Weight Assessment and Counseling for Nutrition and Physical Activity for Children/Adolescents—Physical Activity Counseling: Total 45.74% 41.85% 49.15% 61.80%
Well-Child Visits in the Third, Fourth, Fifth, and Sixth Years of Life 75.67% 72.75% 69.59% 78.35% *Member months are a member’s “contribution” to the total yearly membership.

2015 HEDIS Aggregate Report Page B-1 California Department of Health Care Services Health Services Advisory Group, Inc.
Appendix B. SPD TREND TABLES
Tables B.1 through B.53 provide three-year trending information for the SPD population across the measures each MCP is required to stratify for the SPD population. The following audit findings are provided within the table:
— = A year that data were not collected. NA = A Not Applicable audit finding, meaning that although an MCP may have complied with all applicable specifications, the MCP’s denominator is too small to report (less than 30).
HSAG calculated statistical significance testing between the reporting year (RY) 2014 and RY 2015 rates for each measure using a Chi-square test and displayed this information within the “RYs 2014–15 Rate Difference” column in Tables B.1 through B.53. The following symbols are used to show statistically significant changes:
= Rates in RY 2015 were significantly higher than they were in RY 2014.
= Rates in RY 2015 were significantly lower than they were in RY 2014.
↔ = Rates in RY 2015 were not significantly different than they were in RY 2014.
Different symbols () are used to indicate a performance change for the All-Cause Readmissions measure where a decrease in the rate indicates better performance. A downward triangle () denotes a significant decline in performance, as denoted by a significant increase in the RY 2015 rate from the RY 2014 rate. An upward triangle () denotes significant improvement in performance, as indicated by a significant decrease of the RY 2015 rate from the RY 2014 rate.
Not Comparable = A RY 2014–15 rate difference could not be calculated because data were not available for both years, or there were significant methodology changes between years that did not allow for comparison.
Not Tested = No comparison was made because high and low rates do not necessarily indicate better or worse performance.
S = The MCP’s measure was reportable based on performance measure validation audit results; however, since there are fewer than 11 cases in the numerator of this measure, DHCS suppresses displaying the rate in this report to satisfy the Health Insurance Portability and Accountability Act of 1996 Privacy Rule’s de-identification standard.

SPD TREND TABLES
2015 HEDIS Aggregate Report Page B-2 California Department of Health Care Services Health Services Advisory Group, Inc.
Table B.1—Alameda Alliance for Health—Alameda County HEDIS 2015 SPD Trend Table
Measure RY
2013 RY
2014 RY
2015
RYs 2014–15 Rate
Difference All-Cause Readmissions—Statewide Collaborative QIP measure 15.86% 19.54% 19.60% Ambulatory Care—Emergency Department Visits per 1,000 MM* 69.61 53.35 59.71 Not Tested
Ambulatory Care—Outpatient Visits per 1,000 MM* 481.81 387.05 422.12 Not Tested
Annual Monitoring for Patients on Persistent Medications—ACE Inhibitors or ARBs 85.99% 84.69% 85.09% Annual Monitoring for Patients on Persistent Medications—Digoxin 94.30% 92.80% 54.90%
Annual Monitoring for Patients on Persistent Medications—Diuretics 84.07% 85.18% 84.74% Children and Adolescents' Access to Primary Care Practitioners—12 to 24 Months 85.71% 100.0% 90.91% Children and Adolescents' Access to Primary Care Practitioners—25 Months to 6 Years
85.99% 86.01% 84.62%
Children and Adolescents' Access to Primary Care Practitioners—7 to 11 Years 86.15% 87.57% 84.47% Children and Adolescents' Access to Primary Care Practitioners—12 to 19 Years 80.59% 79.65% 77.91%
*Member months are a member’s “contribution” to the total yearly membership.

SPD TREND TABLES
2015 HEDIS Aggregate Report Page B-3 California Department of Health Care Services Health Services Advisory Group, Inc.
Table B.2—Anthem Blue Cross Partnership Plan—Alameda County HEDIS 2015 SPD Trend Table
Measure RY
2013 RY
2014 RY
2015
RYs 2014–15 Rate
Difference All-Cause Readmissions—Statewide Collaborative QIP measure 15.98% 19.74% 25.07%
Ambulatory Care—Emergency Department Visits per 1,000 MM* 114.02 115.98 109.49 Not Tested
Ambulatory Care—Outpatient Visits per 1,000 MM* 189.35 294.17 279.57 Not Tested
Annual Monitoring for Patients on Persistent Medications—ACE Inhibitors or ARBs 79.85% 83.77% 84.97% Annual Monitoring for Patients on Persistent Medications—Digoxin NA NA NA Not Comparable
Annual Monitoring for Patients on Persistent Medications—Diuretics 75.70% 82.80% 84.52% Children and Adolescents' Access to Primary Care Practitioners—12 to 24 Months NA NA NA Not Comparable
Children and Adolescents' Access to Primary Care Practitioners—25 Months to 6 Years
63.92% 78.70% 83.43%
Children and Adolescents' Access to Primary Care Practitioners—7 to 11 Years 84.46% 79.11% 80.49% Children and Adolescents' Access to Primary Care Practitioners—12 to 19 Years 77.30% 70.43% 77.83%
*Member months are a member’s “contribution” to the total yearly membership.

SPD TREND TABLES
2015 HEDIS Aggregate Report Page B-4 California Department of Health Care Services Health Services Advisory Group, Inc.
Table B.3—Anthem Blue Cross Partnership Plan—Contra Costa County HEDIS 2015 SPD Trend Table
Measure RY
2013 RY
2014 RY
2015
RYs 2014–15 Rate
Difference All-Cause Readmissions—Statewide Collaborative QIP measure 23.00% 19.78% 17.74% Ambulatory Care—Emergency Department Visits per 1,000 MM* 93.77 97.01 98.09 Not Tested
Ambulatory Care—Outpatient Visits per 1,000 MM* 201.70 284.86 263.60 Not Tested
Annual Monitoring for Patients on Persistent Medications—ACE Inhibitors or ARBs 80.49% 81.38% 80.60% Annual Monitoring for Patients on Persistent Medications—Digoxin NA NA NA Not Comparable
Annual Monitoring for Patients on Persistent Medications—Diuretics 78.72% 78.77% 83.95% Children and Adolescents' Access to Primary Care Practitioners—12 to 24 Months NA NA NA Not Comparable
Children and Adolescents' Access to Primary Care Practitioners—25 Months to 6 Years
89.33% 89.36% 85.29%
Children and Adolescents' Access to Primary Care Practitioners—7 to 11 Years 77.78% 87.61% 85.92% Children and Adolescents' Access to Primary Care Practitioners—12 to 19 Years 82.10% 83.50% 86.15%
*Member months are a member’s “contribution” to the total yearly membership.

SPD TREND TABLES
2015 HEDIS Aggregate Report Page B-5 California Department of Health Care Services Health Services Advisory Group, Inc.
Table B.4—Anthem Blue Cross Partnership Plan—Fresno County HEDIS 2015 SPD Trend Table
Measure RY
2013 RY
2014 RY
2015
RYs 2014–15 Rate
Difference All-Cause Readmissions—Statewide Collaborative QIP measure 16.79% 16.18% 26.58%
Ambulatory Care—Emergency Department Visits per 1,000 MM* 69.24 74.31 77.75 Not Tested
Ambulatory Care—Outpatient Visits per 1,000 MM* 401.81 367.46 380.66 Not Tested
Annual Monitoring for Patients on Persistent Medications—ACE Inhibitors or ARBs 82.19% 83.57% 85.24% Annual Monitoring for Patients on Persistent Medications—Digoxin NA NA NA Not Comparable
Annual Monitoring for Patients on Persistent Medications—Diuretics 83.44% 85.08% 87.22% Children and Adolescents' Access to Primary Care Practitioners—12 to 24 Months NA NA NA Not Comparable
Children and Adolescents' Access to Primary Care Practitioners—25 Months to 6 Years
80.80% 84.85% 88.03%
Children and Adolescents' Access to Primary Care Practitioners—7 to 11 Years 81.52% 84.70% 85.97% Children and Adolescents' Access to Primary Care Practitioners—12 to 19 Years 75.98% 79.00% 84.57%
*Member months are a member’s “contribution” to the total yearly membership.

SPD TREND TABLES
2015 HEDIS Aggregate Report Page B-6 California Department of Health Care Services Health Services Advisory Group, Inc.
Table B.5—Anthem Blue Cross Partnership Plan—Kings County HEDIS 2015 SPD Trend Table
Measure RY
2013 RY
2014 RY
2015
RYs 2014–15 Rate
Difference All-Cause Readmissions—Statewide Collaborative QIP measure 19.82% S 17.11% Ambulatory Care—Emergency Department Visits per 1,000 MM* 140.74 119.47 117.00 Not Tested
Ambulatory Care—Outpatient Visits per 1,000 MM* 662.36 563.40 499.29 Not Tested
Annual Monitoring for Patients on Persistent Medications—ACE Inhibitors or ARBs 86.55% 82.43% 79.75% Annual Monitoring for Patients on Persistent Medications—Digoxin NA NA NA Not Comparable
Annual Monitoring for Patients on Persistent Medications—Diuretics 90.28% 83.70% 82.14% Children and Adolescents' Access to Primary Care Practitioners—12 to 24 Months NA NA NA Not Comparable
Children and Adolescents' Access to Primary Care Practitioners—25 Months to 6 Years
80.00% 80.00% 96.30%
Children and Adolescents' Access to Primary Care Practitioners—7 to 11 Years NA 95.92% 88.89% Children and Adolescents' Access to Primary Care Practitioners—12 to 19 Years NA 84.93% 83.33%
*Member months are a member’s “contribution” to the total yearly membership.

SPD TREND TABLES
2015 HEDIS Aggregate Report Page B-7 California Department of Health Care Services Health Services Advisory Group, Inc.
Table B.6—Anthem Blue Cross Partnership Plan—Madera County HEDIS 2015 SPD Trend Table
Measure RY
2013 RY
2014 RY
2015
RYs 2014–15 Rate
Difference All-Cause Readmissions—Statewide Collaborative QIP measure 17.31% S 25.37%
Ambulatory Care—Emergency Department Visits per 1,000 MM* 95.08 98.73 86.42 Not Tested
Ambulatory Care—Outpatient Visits per 1,000 MM* 542.71 509.81 536.73 Not Tested
Annual Monitoring for Patients on Persistent Medications—ACE Inhibitors or ARBs 78.72% 86.18% 87.80% Annual Monitoring for Patients on Persistent Medications—Digoxin NA NA NA Not Comparable
Annual Monitoring for Patients on Persistent Medications—Diuretics 87.04% 84.62% 85.53% Children and Adolescents' Access to Primary Care Practitioners—12 to 24 Months NA NA NA Not Comparable
Children and Adolescents' Access to Primary Care Practitioners—25 Months to 6 Years
90.48% 93.62% 97.44%
Children and Adolescents' Access to Primary Care Practitioners—7 to 11 Years NA 97.44% 96.67% Children and Adolescents' Access to Primary Care Practitioners—12 to 19 Years NA 92.86% 88.17%
*Member months are a member’s “contribution” to the total yearly membership.
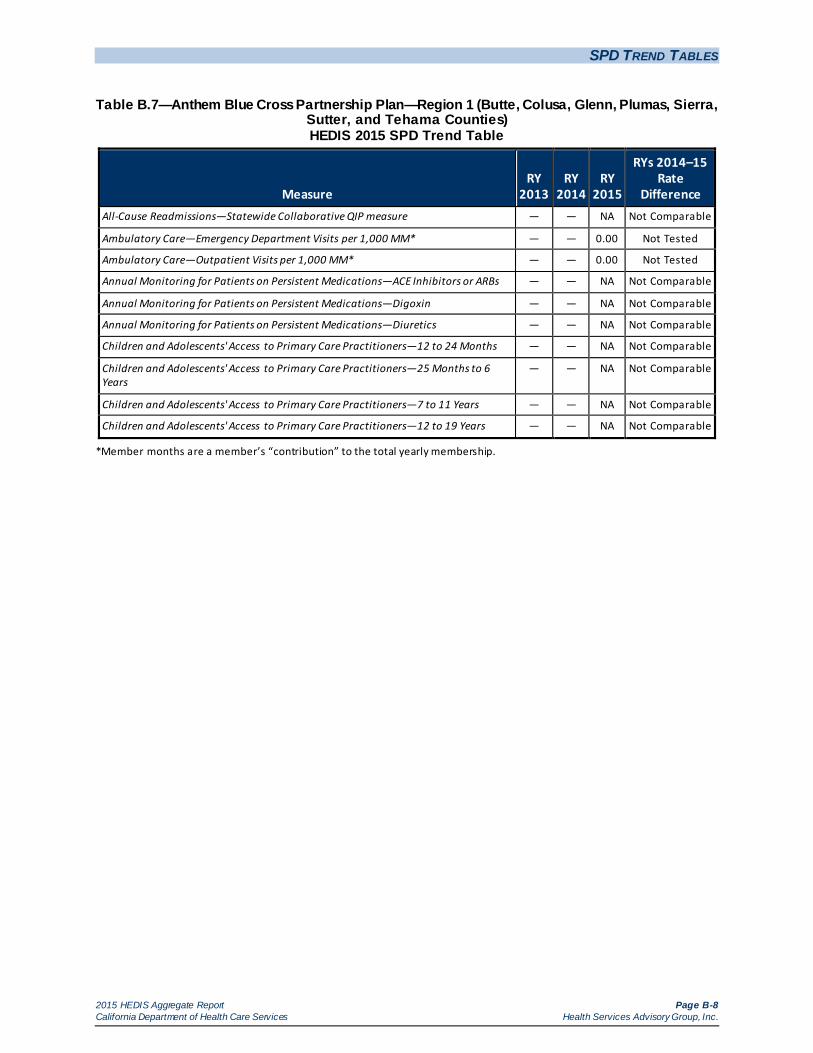
SPD TREND TABLES
2015 HEDIS Aggregate Report Page B-8 California Department of Health Care Services Health Services Advisory Group, Inc.
Table B.7—Anthem Blue Cross Partnership Plan—Region 1 (Butte, Colusa, Glenn, Plumas, Sierra, Sutter, and Tehama Counties) HEDIS 2015 SPD Trend Table
Measure RY
2013 RY
2014 RY
2015
RYs 2014–15 Rate
Difference All-Cause Readmissions—Statewide Collaborative QIP measure — — NA Not Comparable
Ambulatory Care—Emergency Department Visits per 1,000 MM* — — 0.00 Not Tested
Ambulatory Care—Outpatient Visits per 1,000 MM* — — 0.00 Not Tested
Annual Monitoring for Patients on Persistent Medications—ACE Inhibitors or ARBs — — NA Not Comparable
Annual Monitoring for Patients on Persistent Medications—Digoxin — — NA Not Comparable
Annual Monitoring for Patients on Persistent Medications—Diuretics — — NA Not Comparable
Children and Adolescents' Access to Primary Care Practitioners—12 to 24 Months — — NA Not Comparable
Children and Adolescents' Access to Primary Care Practitioners—25 Months to 6 Years
— — NA Not Comparable
Children and Adolescents' Access to Primary Care Practitioners—7 to 11 Years — — NA Not Comparable
Children and Adolescents' Access to Primary Care Practitioners—12 to 19 Years — — NA Not Comparable
*Member months are a member’s “contribution” to the total yearly membership.

SPD TREND TABLES
2015 HEDIS Aggregate Report Page B-9 California Department of Health Care Services Health Services Advisory Group, Inc.
Table B.8—Anthem Blue Cross Partnership Plan—Region 2 (Alpine, Amador, Calaveras, El Dorado, Inyo, Mariposa, Mono, Nevada, Placer, Tuolumne, and Yuba Counties)
HEDIS 2015 SPD Trend Table
Measure RY
2013 RY
2014 RY
2015
RYs 2014–15 Rate
Difference All-Cause Readmissions—Statewide Collaborative QIP measure — — NA Not Comparable
Ambulatory Care—Emergency Department Visits per 1,000 MM* — — 0.00 Not Tested
Ambulatory Care—Outpatient Visits per 1,000 MM* — — 0.00 Not Tested
Annual Monitoring for Patients on Persistent Medications—ACE Inhibitors or ARBs — — NA Not Comparable
Annual Monitoring for Patients on Persistent Medications—Digoxin — — NA Not Comparable
Annual Monitoring for Patients on Persistent Medications—Diuretics — — NA Not Comparable
Children and Adolescents' Access to Primary Care Practitioners—12 to 24 Months — — NA Not Comparable
Children and Adolescents' Access to Primary Care Practitioners—25 Months to 6 Years
— — NA Not Comparable
Children and Adolescents' Access to Primary Care Practitioners—7 to 11 Years — — NA Not Comparable
Children and Adolescents' Access to Primary Care Practitioners—12 to 19 Years — — NA Not Comparable
*Member months are a member’s “contribution” to the total yearly membership.

SPD TREND TABLES
2015 HEDIS Aggregate Report Page B-10 California Department of Health Care Services Health Services Advisory Group, Inc.
Table B.9—Anthem Blue Cross Partnership Plan—Sacramento County HEDIS 2015 SPD Trend Table
Measure RY
2013 RY
2014 RY
2015
RYs 2014–15 Rate
Difference All-Cause Readmissions—Statewide Collaborative QIP measure 15.52% 13.26% 20.29%
Ambulatory Care—Emergency Department Visits per 1,000 MM* 85.17 82.77 85.62 Not Tested
Ambulatory Care—Outpatient Visits per 1,000 MM* 331.70 356.44 340.85 Not Tested
Annual Monitoring for Patients on Persistent Medications—ACE Inhibitors or ARBs 67.13% 82.21% 87.82%
Annual Monitoring for Patients on Persistent Medications—Digoxin NA 85.29% NA Not Comparable
Annual Monitoring for Patients on Persistent Medications—Diuretics 70.32% 83.72% 87.67%
Children and Adolescents' Access to Primary Care Practitioners—12 to 24 Months 88.37% 92.31% NA Not Comparable
Children and Adolescents' Access to Primary Care Practitioners—25 Months to 6 Years
77.94% 78.10% 80.35%
Children and Adolescents' Access to Primary Care Practitioners—7 to 11 Years 83.54% 83.31% 84.38% Children and Adolescents' Access to Primary Care Practitioners—12 to 19 Years 81.66% 79.13% 80.38%
*Member months are a member’s “contribution” to the total yearly membership.

SPD TREND TABLES
2015 HEDIS Aggregate Report Page B-11 California Department of Health Care Services Health Services Advisory Group, Inc.
Table B.10—Anthem Blue Cross Partnership Plan—San Benito County HEDIS 2015 SPD Trend Table
Measure RY
2013 RY
2014 RY
2015
RYs 2014–15 Rate
Difference All-Cause Readmissions—Statewide Collaborative QIP measure — — NA Not Comparable
Ambulatory Care—Emergency Department Visits per 1,000 MM* — — 49.02 Not Tested
Ambulatory Care—Outpatient Visits per 1,000 MM* — — 308.82 Not Tested
Annual Monitoring for Patients on Persistent Medications—ACE Inhibitors or ARBs — — NA Not Comparable
Annual Monitoring for Patients on Persistent Medications—Digoxin — — NA Not Comparable
Annual Monitoring for Patients on Persistent Medications—Diuretics — — NA Not Comparable
Children and Adolescents' Access to Primary Care Practitioners—12 to 24 Months — — NA Not Comparable
Children and Adolescents' Access to Primary Care Practitioners—25 Months to 6 Years
— — NA Not Comparable
Children and Adolescents' Access to Primary Care Practitioners—7 to 11 Years — — NA Not Comparable
Children and Adolescents' Access to Primary Care Practitioners—12 to 19 Years — — NA Not Comparable
*Member months are a member’s “contribution” to the total yearly membership.

SPD TREND TABLES
2015 HEDIS Aggregate Report Page B-12 California Department of Health Care Services Health Services Advisory Group, Inc.
Table B.11—Anthem Blue Cross Partnership Plan—San Francisco County HEDIS 2015 SPD Trend Table
Measure RY
2013 RY
2014 RY
2015
RYs 2014–15 Rate
Difference All-Cause Readmissions—Statewide Collaborative QIP measure 15.35% 17.38% 25.49%
Ambulatory Care—Emergency Department Visits per 1,000 MM* 89.99 95.72 92.01 Not Tested
Ambulatory Care—Outpatient Visits per 1,000 MM* 349.50 373.20 336.25 Not Tested
Annual Monitoring for Patients on Persistent Medications—ACE Inhibitors or ARBs 83.49% 84.77% 81.41% Annual Monitoring for Patients on Persistent Medications—Digoxin NA NA NA Not Comparable
Annual Monitoring for Patients on Persistent Medications—Diuretics 82.14% 84.60% 83.44% Children and Adolescents' Access to Primary Care Practitioners—12 to 24 Months NA NA NA Not Comparable
Children and Adolescents' Access to Primary Care Practitioners—25 Months to 6 Years
NA 70.97% 68.42%
Children and Adolescents' Access to Primary Care Practitioners—7 to 11 Years 94.12% 77.50% 85.42% Children and Adolescents' Access to Primary Care Practitioners—12 to 19 Years 87.78% 88.35% 81.30%
*Member months are a member’s “contribution” to the total yearly membership.

SPD TREND TABLES
2015 HEDIS Aggregate Report Page B-13 California Department of Health Care Services Health Services Advisory Group, Inc.
Table B.12—Anthem Blue Cross Partnership Plan—Santa Clara County HEDIS 2015 SPD Trend Table
Measure RY
2013 RY
2014 RY
2015
RYs 2014–15 Rate
Difference All-Cause Readmissions—Statewide Collaborative QIP measure 14.47% 16.33% 19.38% Ambulatory Care—Emergency Department Visits per 1,000 MM* 62.01 74.19 66.24 Not Tested
Ambulatory Care—Outpatient Visits per 1,000 MM* 364.03 374.95 311.19 Not Tested
Annual Monitoring for Patients on Persistent Medications—ACE Inhibitors or ARBs 88.02% 89.63% 85.50%
Annual Monitoring for Patients on Persistent Medications—Digoxin NA NA NA Not Comparable
Annual Monitoring for Patients on Persistent Medications—Diuretics 87.38% 88.49% 85.44% Children and Adolescents' Access to Primary Care Practitioners—12 to 24 Months NA NA NA Not Comparable
Children and Adolescents' Access to Primary Care Practitioners—25 Months to 6 Years
87.16% 81.45% 74.68%
Children and Adolescents' Access to Primary Care Practitioners—7 to 11 Years 88.81% 86.89% 84.87% Children and Adolescents' Access to Primary Care Practitioners—12 to 19 Years 87.01% 83.11% 80.27%
*Member months are a member’s “contribution” to the total yearly membership.

SPD TREND TABLES
2015 HEDIS Aggregate Report Page B-14 California Department of Health Care Services Health Services Advisory Group, Inc.
Table B.13—Anthem Blue Cross Partnership Plan—Tulare County HEDIS 2015 SPD Trend Table
Measure RY
2013 RY
2014 RY
2015
RYs 2014–15 Rate
Difference All-Cause Readmissions—Statewide Collaborative QIP measure 15.70% 12.83% 21.19%
Ambulatory Care—Emergency Department Visits per 1,000 MM* 85.58 83.89 92.92 Not Tested
Ambulatory Care—Outpatient Visits per 1,000 MM* 494.61 561.54 571.12 Not Tested
Annual Monitoring for Patients on Persistent Medications—ACE Inhibitors or ARBs 82.10% 85.94% 85.03% Annual Monitoring for Patients on Persistent Medications—Digoxin NA NA NA Not Comparable
Annual Monitoring for Patients on Persistent Medications—Diuretics 86.27% 87.12% 86.70% Children and Adolescents' Access to Primary Care Practitioners—12 to 24 Months NA NA NA Not Comparable
Children and Adolescents' Access to Primary Care Practitioners—25 Months to 6 Years
83.87% 89.09% 93.26%
Children and Adolescents' Access to Primary Care Practitioners—7 to 11 Years 81.43% 86.57% 89.50% Children and Adolescents' Access to Primary Care Practitioners—12 to 19 Years 83.68% 86.76% 90.29%
*Member months are a member’s “contribution” to the total yearly membership.

SPD TREND TABLES
2015 HEDIS Aggregate Report Page B-15 California Department of Health Care Services Health Services Advisory Group, Inc.
Table B.14—California Health & Wellness Plan—Imperial County HEDIS 2015 SPD Trend Table
Measure RY
2013 RY
2014 RY
2015
RYs 2014–15 Rate
Difference All-Cause Readmissions—Statewide Collaborative QIP measure — — NA Not Comparable
Ambulatory Care—Emergency Department Visits per 1,000 MM* — — 94.32 Not Tested
Ambulatory Care—Outpatient Visits per 1,000 MM* — — 585.22 Not Tested
Annual Monitoring for Patients on Persistent Medications—ACE Inhibitors or ARBs — — 97.40% Not Comparable
Annual Monitoring for Patients on Persistent Medications—Digoxin — — NA Not Comparable
Annual Monitoring for Patients on Persistent Medications—Diuretics — — 100.0% Not Comparable
Children and Adolescents' Access to Primary Care Practitioners—12 to 24 Months — — NA Not Comparable
Children and Adolescents' Access to Primary Care Practitioners—25 Months to 6 Years
— — 97.78% Not Comparable
Children and Adolescents' Access to Primary Care Practitioners—7 to 11 Years — — NA Not Comparable
Children and Adolescents' Access to Primary Care Practitioners—12 to 19 Years — — NA Not Comparable
*Member months are a member’s “contribution” to the total yearly membership.

SPD TREND TABLES
2015 HEDIS Aggregate Report Page B-16 California Department of Health Care Services Health Services Advisory Group, Inc.
Table B.15—California Health & Wellness Plan—Region 1 (Butte, Colusa, Glenn, Plumas, Sierra, Sutter, and Tehama Counties) HEDIS 2015 SPD Trend Table
Measure RY
2013 RY
2014 RY
2015
RYs 2014–15 Rate
Difference All-Cause Readmissions—Statewide Collaborative QIP measure — — NA Not Comparable
Ambulatory Care—Emergency Department Visits per 1,000 MM* — — 83.85 Not Tested
Ambulatory Care—Outpatient Visits per 1,000 MM* — — 608.59 Not Tested
Annual Monitoring for Patients on Persistent Medications—ACE Inhibitors or ARBs — — 82.81% Not Comparable
Annual Monitoring for Patients on Persistent Medications—Digoxin — — NA Not Comparable
Annual Monitoring for Patients on Persistent Medications—Diuretics — — 87.50% Not Comparable
Children and Adolescents' Access to Primary Care Practitioners—12 to 24 Months — — NA Not Comparable
Children and Adolescents' Access to Primary Care Practitioners—25 Months to 6 Years
— — 93.10% Not Comparable
Children and Adolescents' Access to Primary Care Practitioners—7 to 11 Years — — NA Not Comparable
Children and Adolescents' Access to Primary Care Practitioners—12 to 19 Years — — NA Not Comparable
*Member months are a member’s “contribution” to the total yearly membership.

SPD TREND TABLES
2015 HEDIS Aggregate Report Page B-17 California Department of Health Care Services Health Services Advisory Group, Inc.
Table B.16—California Health & Wellness Plan—Region 2 (Alpine, Amador, Calaveras, El Dorado, Inyo, Mariposa, Mono, Nevada, Placer, Tuolumne, and Yuba Counties)
HEDIS 2015 SPD Trend Table
Measure RY
2013 RY
2014 RY
2015
RYs 2014–15 Rate
Difference All-Cause Readmissions—Statewide Collaborative QIP measure — — NA Not Comparable
Ambulatory Care—Emergency Department Visits per 1,000 MM* — — 86.17 Not Tested
Ambulatory Care—Outpatient Visits per 1,000 MM* — — 454.03 Not Tested
Annual Monitoring for Patients on Persistent Medications—ACE Inhibitors or ARBs — — 83.33% Not Comparable
Annual Monitoring for Patients on Persistent Medications—Digoxin — — NA Not Comparable
Annual Monitoring for Patients on Persistent Medications—Diuretics — — 88.89% Not Comparable
Children and Adolescents' Access to Primary Care Practitioners—12 to 24 Months — — NA Not Comparable
Children and Adolescents' Access to Primary Care Practitioners—25 Months to 6 Years
— — NA Not Comparable
Children and Adolescents' Access to Primary Care Practitioners—7 to 11 Years — — NA Not Comparable
Children and Adolescents' Access to Primary Care Practitioners—12 to 19 Years — — NA Not Comparable
*Member months are a member’s “contribution” to the total yearly membership.

SPD TREND TABLES
2015 HEDIS Aggregate Report Page B-18 California Department of Health Care Services Health Services Advisory Group, Inc.
Table B.17—CalOptima—Orange County HEDIS 2015 SPD Trend Table
Measure RY
2013 RY
2014 RY
2015
RYs 2014–15
Rate Difference
All-Cause Readmissions—Statewide Collaborative QIP measure 18.82% 16.83% 19.97%
Ambulatory Care—Emergency Department Visits per 1,000 MM* 46.80 51.03 52.48 Not Tested
Ambulatory Care—Outpatient Visits per 1,000 MM* 559.23 573.24 536.97 Not Tested
Annual Monitoring for Patients on Persistent Medications—ACE Inhibitors or ARBs 91.78% 91.90% 91.07%
Annual Monitoring for Patients on Persistent Medications—Digoxin 93.77% 90.06% 55.00%
Annual Monitoring for Patients on Persistent Medications—Diuretics 91.88% 91.16% 91.12% Children and Adolescents' Access to Primary Care Practitioners—12 to 24 Months 85.60% 85.27% 75.19%
Children and Adolescents' Access to Primary Care Practitioners—25 Months to 6 Years
86.36% 85.47% 87.18%
Children and Adolescents' Access to Primary Care Practitioners—7 to 11 Years 85.40% 85.84% 88.65%
Children and Adolescents' Access to Primary Care Practitioners—12 to 19 Years 81.99% 80.71% 83.86%
*Member months are a member’s “contribution” to the total yearly membership.

SPD TREND TABLES
2015 HEDIS Aggregate Report Page B-19 California Department of Health Care Services Health Services Advisory Group, Inc.
Table B.18—CalViva Health—Fresno County HEDIS 2015 SPD Trend Table
Measure RY
2013 RY
2014 RY
2015
RYs 2014–15
Rate Difference
All-Cause Readmissions—Statewide Collaborative QIP measure 12.30% 15.39% 20.99%
Ambulatory Care—Emergency Department Visits per 1,000 MM* 66.02 70.05 40.72 Not Tested
Ambulatory Care—Outpatient Visits per 1,000 MM* 551.16 555.25 336.48 Not Tested
Annual Monitoring for Patients on Persistent Medications—ACE Inhibitors or ARBs 83.76% 85.27% 86.47% Annual Monitoring for Patients on Persistent Medications—Digoxin 89.61% 82.26% 51.11%
Annual Monitoring for Patients on Persistent Medications—Diuretics 85.44% 86.97% 87.20% Children and Adolescents' Access to Primary Care Practitioners—12 to 24 Months 91.46% 100.0% 80.95%
Children and Adolescents' Access to Primary Care Practitioners—25 Months to 6 Years
90.62% 91.65% 89.91%
Children and Adolescents' Access to Primary Care Practitioners—7 to 11 Years 93.76% 93.33% 93.95% Children and Adolescents' Access to Primary Care Practitioners—12 to 19 Years 90.79% 88.51% 89.10%
*Member months are a member’s “contribution” to the total yearly membership.
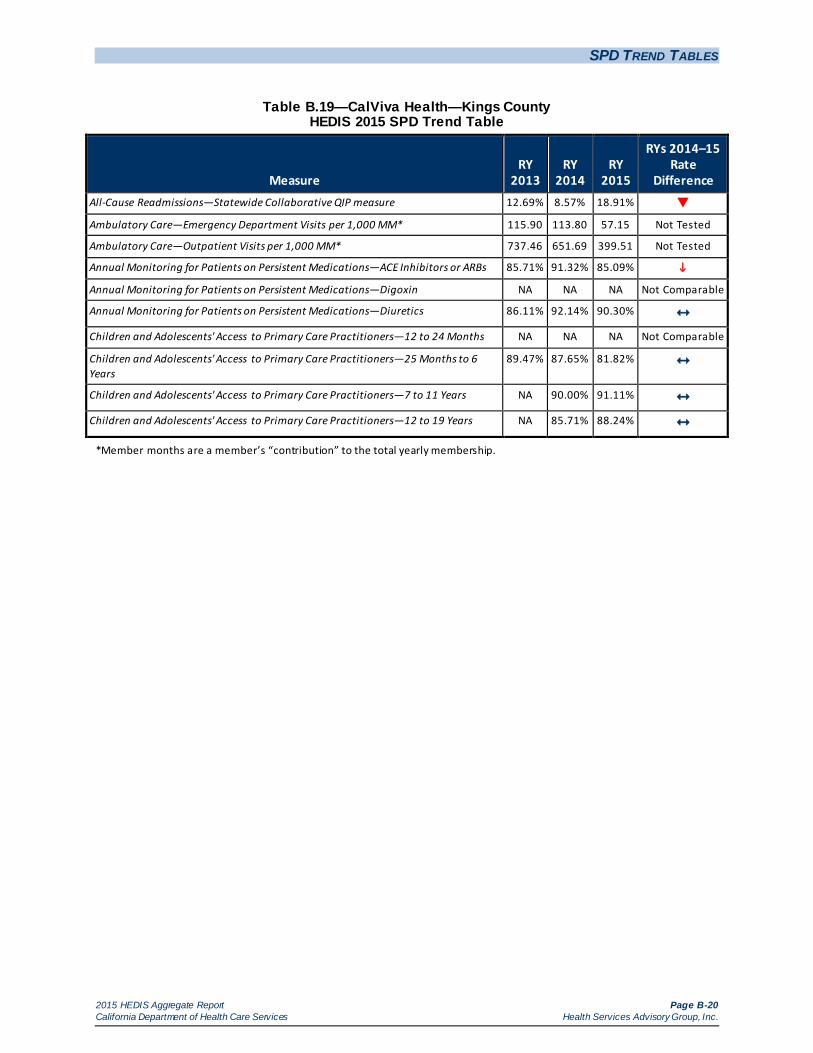
SPD TREND TABLES
2015 HEDIS Aggregate Report Page B-20 California Department of Health Care Services Health Services Advisory Group, Inc.
Table B.19—CalViva Health—Kings County HEDIS 2015 SPD Trend Table
Measure RY
2013 RY
2014 RY
2015
RYs 2014–15 Rate
Difference All-Cause Readmissions—Statewide Collaborative QIP measure 12.69% 8.57% 18.91%
Ambulatory Care—Emergency Department Visits per 1,000 MM* 115.90 113.80 57.15 Not Tested
Ambulatory Care—Outpatient Visits per 1,000 MM* 737.46 651.69 399.51 Not Tested
Annual Monitoring for Patients on Persistent Medications—ACE Inhibitors or ARBs 85.71% 91.32% 85.09%
Annual Monitoring for Patients on Persistent Medications—Digoxin NA NA NA Not Comparable
Annual Monitoring for Patients on Persistent Medications—Diuretics 86.11% 92.14% 90.30% Children and Adolescents' Access to Primary Care Practitioners—12 to 24 Months NA NA NA Not Comparable
Children and Adolescents' Access to Primary Care Practitioners—25 Months to 6 Years
89.47% 87.65% 81.82%
Children and Adolescents' Access to Primary Care Practitioners—7 to 11 Years NA 90.00% 91.11% Children and Adolescents' Access to Primary Care Practitioners—12 to 19 Years NA 85.71% 88.24%
*Member months are a member’s “contribution” to the total yearly membership.

SPD TREND TABLES
2015 HEDIS Aggregate Report Page B-21 California Department of Health Care Services Health Services Advisory Group, Inc.
Table B.20—CalViva Health—Madera County HEDIS 2015 SPD Trend Table
Measure RY
2013 RY
2014 RY
2015
RYs 2014–15 Rate
Difference All-Cause Readmissions—Statewide Collaborative QIP measure 14.04% 16.36% 20.61% Ambulatory Care—Emergency Department Visits per 1,000 MM* 72.47 78.44 40.34 Not Tested
Ambulatory Care—Outpatient Visits per 1,000 MM* 648.89 665.45 406.08 Not Tested
Annual Monitoring for Patients on Persistent Medications—ACE Inhibitors or ARBs 87.11% 85.77% 88.84% Annual Monitoring for Patients on Persistent Medications—Digoxin NA NA NA Not Comparable
Annual Monitoring for Patients on Persistent Medications—Diuretics 88.55% 89.71% 85.00% Children and Adolescents' Access to Primary Care Practitioners—12 to 24 Months NA NA NA Not Comparable
Children and Adolescents' Access to Primary Care Practitioners—25 Months to 6 Years
90.79% 97.17% 94.64%
Children and Adolescents' Access to Primary Care Practitioners—7 to 11 Years NA 94.29% 93.33% Children and Adolescents' Access to Primary Care Practitioners—12 to 19 Years NA 88.42% 87.07%
*Member months are a member’s “contribution” to the total yearly membership.

SPD TREND TABLES
2015 HEDIS Aggregate Report Page B-22 California Department of Health Care Services Health Services Advisory Group, Inc.
Table B.21—Care1st Partner Plan—San Diego County HEDIS 2015 SPD Trend Table
Measure RY
2013 RY
2014 RY
2015
RYs 2014–15 Rate
Difference All-Cause Readmissions—Statewide Collaborative QIP measure 17.35% 16.90% 19.22% Ambulatory Care—Emergency Department Visits per 1,000 MM* 73.34 68.85 74.91 Not Tested
Ambulatory Care—Outpatient Visits per 1,000 MM* 415.00 399.63 478.22 Not Tested
Annual Monitoring for Patients on Persistent Medications—ACE Inhibitors or ARBs 81.13% 85.13% 85.97% Annual Monitoring for Patients on Persistent Medications—Digoxin NA NA NA Not Comparable
Annual Monitoring for Patients on Persistent Medications—Diuretics 81.24% 85.98% 87.10% Children and Adolescents' Access to Primary Care Practitioners—12 to 24 Months NA NA NA Not Comparable
Children and Adolescents' Access to Primary Care Practitioners—25 Months to 6 Years
70.83% 69.03% 59.63%
Children and Adolescents' Access to Primary Care Practitioners—7 to 11 Years 82.50% 62.64% 64.66% Children and Adolescents' Access to Primary Care Practitioners—12 to 19 Years 78.13% 70.67% 58.79%
*Member months are a member’s “contribution” to the total yearly membership.

SPD TREND TABLES
2015 HEDIS Aggregate Report Page B-23 California Department of Health Care Services Health Services Advisory Group, Inc.
Table B.22—CenCal Health—San Luis Obispo County HEDIS 2015 SPD Trend Table
Measure RY
2013 RY
2014 RY
2015
RYs 2014–15 Rate
Difference All-Cause Readmissions—Statewide Collaborative QIP measure 16.54% 14.96% 12.70% Ambulatory Care—Emergency Department Visits per 1,000 MM* 100.09 95.46 100.46 Not Tested
Ambulatory Care—Outpatient Visits per 1,000 MM* 599.51 598.85 646.84 Not Tested
Annual Monitoring for Patients on Persistent Medications—ACE Inhibitors or ARBs 83.88% 83.97% 84.97% Annual Monitoring for Patients on Persistent Medications—Digoxin NA NA NA Not Comparable
Annual Monitoring for Patients on Persistent Medications—Diuretics 86.25% 90.28% 85.96% Children and Adolescents' Access to Primary Care Practitioners—12 to 24 Months NA NA NA Not Comparable
Children and Adolescents' Access to Primary Care Practitioners—25 Months to 6 Years
73.87% 76.07% 78.76%
Children and Adolescents' Access to Primary Care Practitioners—7 to 11 Years 83.22% 83.22% 83.87% Children and Adolescents' Access to Primary Care Practitioners—12 to 19 Years 76.61% 79.72% 77.16%
*Member months are a member’s “contribution” to the total yearly membership.

SPD TREND TABLES
2015 HEDIS Aggregate Report Page B-24 California Department of Health Care Services Health Services Advisory Group, Inc.
Table B.23—CenCal Health—Santa Barbara County HEDIS 2015 SPD Trend Table
Measure RY
2013 RY
2014 RY
2015
RYs 2014–15 Rate
Difference All-Cause Readmissions—Statewide Collaborative QIP measure 13.88% 16.41% 17.34% Ambulatory Care—Emergency Department Visits per 1,000 MM* 101.65 102.10 104.75 Not Tested
Ambulatory Care—Outpatient Visits per 1,000 MM* 566.20 596.56 595.81 Not Tested
Annual Monitoring for Patients on Persistent Medications—ACE Inhibitors or ARBs 86.86% 89.25% 88.66% Annual Monitoring for Patients on Persistent Medications—Digoxin 87.10% 83.33% NA Not Comparable
Annual Monitoring for Patients on Persistent Medications—Diuretics 88.10% 89.19% 90.32% Children and Adolescents' Access to Primary Care Practitioners—12 to 24 Months NA NA NA Not Comparable
Children and Adolescents' Access to Primary Care Practitioners—25 Months to 6 Years
86.40% 90.99% 92.95%
Children and Adolescents' Access to Primary Care Practitioners—7 to 11 Years 87.97% 90.32% 91.17% Children and Adolescents' Access to Primary Care Practitioners—12 to 19 Years 89.83% 89.52% 90.43%
*Member months are a member’s “contribution” to the total yearly membership.

SPD TREND TABLES
2015 HEDIS Aggregate Report Page B-25 California Department of Health Care Services Health Services Advisory Group, Inc.
Table B.24—Central California Alliance for Health—Merced County HEDIS 2015 SPD Trend Table
Measure RY
2013 RY
2014 RY
2015
RYs 2014–15 Rate
Difference All-Cause Readmissions—Statewide Collaborative QIP measure 14.40% 15.78% 22.57%
Ambulatory Care—Emergency Department Visits per 1,000 MM* 75.54 76.83 79.54 Not Tested
Ambulatory Care—Outpatient Visits per 1,000 MM* 536.12 539.90 509.74 Not Tested
Annual Monitoring for Patients on Persistent Medications—ACE Inhibitors or ARBs 87.83% 90.10% 88.89% Annual Monitoring for Patients on Persistent Medications—Digoxin NA NA NA Not Comparable
Annual Monitoring for Patients on Persistent Medications—Diuretics 88.28% 91.17% 86.44%
Children and Adolescents' Access to Primary Care Practitioners—12 to 24 Months 90.32% NA NA Not Comparable
Children and Adolescents' Access to Primary Care Practitioners—25 Months to 6 Years
91.17% 91.03% 90.30%
Children and Adolescents' Access to Primary Care Practitioners—7 to 11 Years 90.89% 94.07% 93.41% Children and Adolescents' Access to Primary Care Practitioners—12 to 19 Years 88.74% 86.86% 84.97%
*Member months are a member’s “contribution” to the total yearly membership.

SPD TREND TABLES
2015 HEDIS Aggregate Report Page B-26 California Department of Health Care Services Health Services Advisory Group, Inc.
Table B.25—Central California Alliance for Health—Monterey/Santa Cruz Counties HEDIS 2015 SPD Trend Table
Measure RY
2013 RY
2014 RY
2015
RYs 2014–15 Rate
Difference All-Cause Readmissions—Statewide Collaborative QIP measure 14.47% 13.89% 17.51%
Ambulatory Care—Emergency Department Visits per 1,000 MM* 79.25 74.76 75.65 Not Tested
Ambulatory Care—Outpatient Visits per 1,000 MM* 543.55 549.69 520.95 Not Tested
Annual Monitoring for Patients on Persistent Medications—ACE Inhibitors or ARBs 89.32% 89.63% 91.91% Annual Monitoring for Patients on Persistent Medications—Digoxin 89.13% 87.80% 45.71%
Annual Monitoring for Patients on Persistent Medications—Diuretics 88.86% 90.06% 91.83% Children and Adolescents' Access to Primary Care Practitioners—12 to 24 Months 96.67% NA 84.38% Not Comparable
Children and Adolescents' Access to Primary Care Practitioners—25 Months to 6 Years
92.76% 95.29% 93.44%
Children and Adolescents' Access to Primary Care Practitioners—7 to 11 Years 91.46% 92.34% 93.24% Children and Adolescents' Access to Primary Care Practitioners—12 to 19 Years 88.47% 87.52% 89.19%
*Member months are a member’s “contribution” to the total yearly membership.
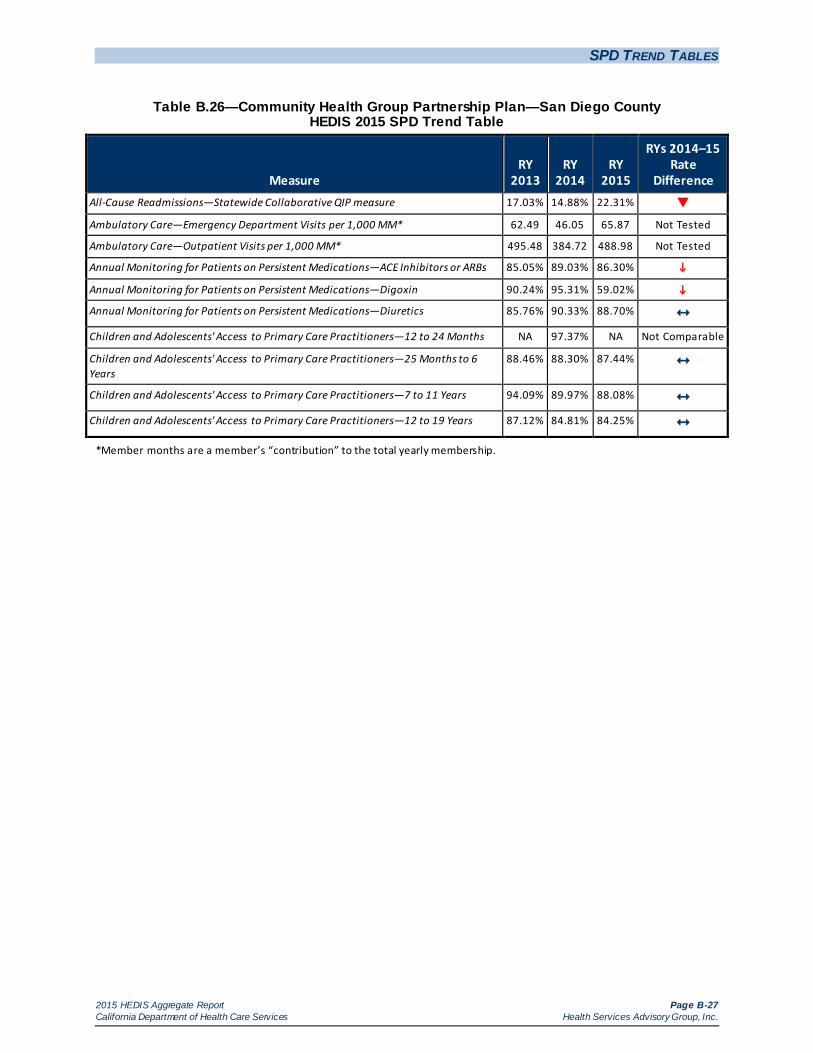
SPD TREND TABLES
2015 HEDIS Aggregate Report Page B-27 California Department of Health Care Services Health Services Advisory Group, Inc.
Table B.26—Community Health Group Partnership Plan—San Diego County HEDIS 2015 SPD Trend Table
Measure RY
2013 RY
2014 RY
2015
RYs 2014–15 Rate
Difference All-Cause Readmissions—Statewide Collaborative QIP measure 17.03% 14.88% 22.31%
Ambulatory Care—Emergency Department Visits per 1,000 MM* 62.49 46.05 65.87 Not Tested
Ambulatory Care—Outpatient Visits per 1,000 MM* 495.48 384.72 488.98 Not Tested
Annual Monitoring for Patients on Persistent Medications—ACE Inhibitors or ARBs 85.05% 89.03% 86.30%
Annual Monitoring for Patients on Persistent Medications—Digoxin 90.24% 95.31% 59.02%
Annual Monitoring for Patients on Persistent Medications—Diuretics 85.76% 90.33% 88.70% Children and Adolescents' Access to Primary Care Practitioners—12 to 24 Months NA 97.37% NA Not Comparable
Children and Adolescents' Access to Primary Care Practitioners—25 Months to 6 Years
88.46% 88.30% 87.44%
Children and Adolescents' Access to Primary Care Practitioners—7 to 11 Years 94.09% 89.97% 88.08% Children and Adolescents' Access to Primary Care Practitioners—12 to 19 Years 87.12% 84.81% 84.25%
*Member months are a member’s “contribution” to the total yearly membership.

SPD TREND TABLES
2015 HEDIS Aggregate Report Page B-28 California Department of Health Care Services Health Services Advisory Group, Inc.
Table B.27—Contra Costa Health Plan—Contra Costa County HEDIS 2015 SPD Trend Table
Measure RY
2013 RY
2014 RY
2015
RYs 2014–15 Rate
Difference All-Cause Readmissions—Statewide Collaborative QIP measure 19.48% 14.13% 23.03%
Ambulatory Care—Emergency Department Visits per 1,000 MM* 83.56 74.83 78.73 Not Tested
Ambulatory Care—Outpatient Visits per 1,000 MM* 299.06 342.59 338.92 Not Tested
Annual Monitoring for Patients on Persistent Medications—ACE Inhibitors or ARBs 85.68% 87.41% 87.44% Annual Monitoring for Patients on Persistent Medications—Digoxin 86.54% 95.00% 77.08%
Annual Monitoring for Patients on Persistent Medications—Diuretics 85.83% 85.24% 87.23% Children and Adolescents' Access to Primary Care Practitioners—12 to 24 Months NA NA NA Not Comparable
Children and Adolescents' Access to Primary Care Practitioners—25 Months to 6 Years
74.13% 87.47% 83.71%
Children and Adolescents' Access to Primary Care Practitioners—7 to 11 Years 82.34% 86.49% 87.52% Children and Adolescents' Access to Primary Care Practitioners—12 to 19 Years 79.63% 82.72% 81.82%
*Member months are a member’s “contribution” to the total yearly membership.

SPD TREND TABLES
2015 HEDIS Aggregate Report Page B-29 California Department of Health Care Services Health Services Advisory Group, Inc.
Table B.28—Gold Coast Health Plan—Ventura County HEDIS 2015 SPD Trend Table
Measure RY
2013 RY
2014 RY
2015
RYs 2014–15 Rate
Difference All-Cause Readmissions—Statewide Collaborative QIP measure 23.16% 15.06% 22.83%
Ambulatory Care—Emergency Department Visits per 1,000 MM* 70.16 64.02 70.45 Not Tested
Ambulatory Care—Outpatient Visits per 1,000 MM* 493.66 361.16 397.29 Not Tested
Annual Monitoring for Patients on Persistent Medications—ACE Inhibitors or ARBs 88.46% 89.11% 86.29% Annual Monitoring for Patients on Persistent Medications—Digoxin 88.37% 92.50% NA Not Comparable
Annual Monitoring for Patients on Persistent Medications—Diuretics 86.97% 90.10% 88.34% Children and Adolescents' Access to Primary Care Practitioners—12 to 24 Months 75.00% 89.74% 84.21% Children and Adolescents' Access to Primary Care Practitioners—25 Months to 6 Years
61.92% 83.61% 86.37%
Children and Adolescents' Access to Primary Care Practitioners—7 to 11 Years NA 77.69% 89.29%
Children and Adolescents' Access to Primary Care Practitioners—12 to 19 Years NA 72.72% 83.31%
*Member months are a member’s “contribution” to the total yearly membership.
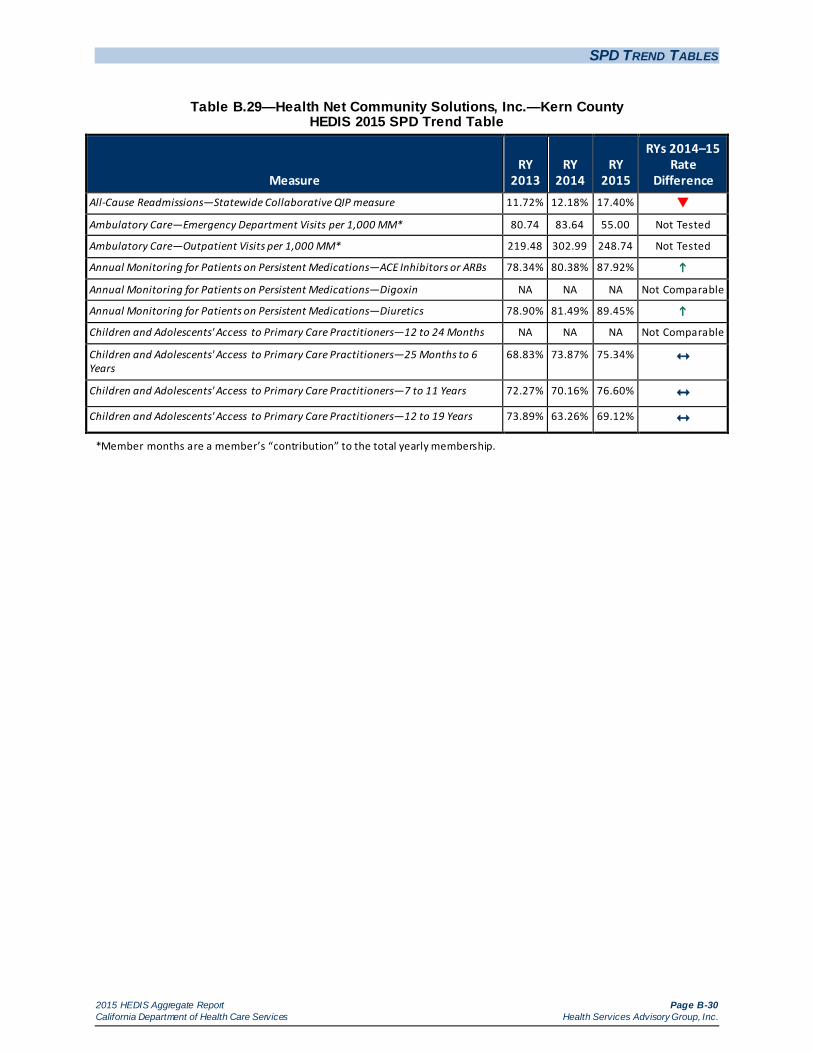
SPD TREND TABLES
2015 HEDIS Aggregate Report Page B-30 California Department of Health Care Services Health Services Advisory Group, Inc.
Table B.29—Health Net Community Solutions, Inc.—Kern County HEDIS 2015 SPD Trend Table
Measure RY
2013 RY
2014 RY
2015
RYs 2014–15 Rate
Difference All-Cause Readmissions—Statewide Collaborative QIP measure 11.72% 12.18% 17.40%
Ambulatory Care—Emergency Department Visits per 1,000 MM* 80.74 83.64 55.00 Not Tested
Ambulatory Care—Outpatient Visits per 1,000 MM* 219.48 302.99 248.74 Not Tested
Annual Monitoring for Patients on Persistent Medications—ACE Inhibitors or ARBs 78.34% 80.38% 87.92%
Annual Monitoring for Patients on Persistent Medications—Digoxin NA NA NA Not Comparable
Annual Monitoring for Patients on Persistent Medications—Diuretics 78.90% 81.49% 89.45%
Children and Adolescents' Access to Primary Care Practitioners—12 to 24 Months NA NA NA Not Comparable
Children and Adolescents' Access to Primary Care Practitioners—25 Months to 6 Years
68.83% 73.87% 75.34%
Children and Adolescents' Access to Primary Care Practitioners—7 to 11 Years 72.27% 70.16% 76.60% Children and Adolescents' Access to Primary Care Practitioners—12 to 19 Years 73.89% 63.26% 69.12%
*Member months are a member’s “contribution” to the total yearly membership.

SPD TREND TABLES
2015 HEDIS Aggregate Report Page B-31 California Department of Health Care Services Health Services Advisory Group, Inc.
Table B.30—Health Net Community Solutions, Inc.—Los Angeles County HEDIS 2015 SPD Trend Table
Measure RY
2013 RY
2014 RY
2015
RYs 2014–15
Rate Difference
All-Cause Readmissions—Statewide Collaborative QIP measure 14.16% 13.40% 20.98%
Ambulatory Care—Emergency Department Visits per 1,000 MM* 55.77 52.60 28.53 Not Tested
Ambulatory Care—Outpatient Visits per 1,000 MM* 267.73 262.13 150.49 Not Tested
Annual Monitoring for Patients on Persistent Medications—ACE Inhibitors or ARBs 77.01% 81.62% 84.74%
Annual Monitoring for Patients on Persistent Medications—Digoxin 86.48% 87.45% 50.23%
Annual Monitoring for Patients on Persistent Medications—Diuretics 78.39% 82.59% 84.98%
Children and Adolescents' Access to Primary Care Practitioners—12 to 24 Months 86.07% 73.01% 69.34% Children and Adolescents' Access to Primary Care Practitioners—25 Months to 6 Years
76.93% 78.05% 77.43%
Children and Adolescents' Access to Primary Care Practitioners—7 to 11 Years 83.57% 81.11% 82.75% Children and Adolescents' Access to Primary Care Practitioners—12 to 19 Years 78.40% 73.04% 75.34%
*Member months are a member’s “contribution” to the total yearly membership.

SPD TREND TABLES
2015 HEDIS Aggregate Report Page B-32 California Department of Health Care Services Health Services Advisory Group, Inc.
Table B.31—Health Net Community Solutions, Inc.—Sacramento County HEDIS 2015 SPD Trend Table
Measure RY
2013 RY
2014 RY
2015
RYs 2014–15
Rate Difference
All-Cause Readmissions—Statewide Collaborative QIP measure 14.03% 13.70% 19.25%
Ambulatory Care—Emergency Department Visits per 1,000 MM* 65.06 64.11 39.16 Not Tested
Ambulatory Care—Outpatient Visits per 1,000 MM* 399.51 358.78 191.02 Not Tested
Annual Monitoring for Patients on Persistent Medications—ACE Inhibitors or ARBs 69.20% 74.02% 81.51%
Annual Monitoring for Patients on Persistent Medications—Digoxin 83.93% 84.75% 37.25%
Annual Monitoring for Patients on Persistent Medications—Diuretics 71.03% 72.64% 82.32%
Children and Adolescents' Access to Primary Care Practitioners—12 to 24 Months NA 97.22% 73.17%
Children and Adolescents' Access to Primary Care Practitioners—25 Months to 6 Years
78.66% 79.88% 81.67%
Children and Adolescents' Access to Primary Care Practitioners—7 to 11 Years 86.48% 83.38% 84.02% Children and Adolescents' Access to Primary Care Practitioners—12 to 19 Years 81.16% 73.71% 77.37%
*Member months are a member’s “contribution” to the total yearly membership.

SPD TREND TABLES
2015 HEDIS Aggregate Report Page B-33 California Department of Health Care Services Health Services Advisory Group, Inc.
Table B.32—Health Net Community Solutions, Inc.—San Diego County HEDIS 2015 SPD Trend Table
Measure RY
2013 RY
2014 RY
2015
RYs 2014–15 Rate
Difference All-Cause Readmissions—Statewide Collaborative QIP measure 17.88% 17.37% 26.64%
Ambulatory Care—Emergency Department Visits per 1,000 MM* 71.22 69.30 29.69 Not Tested
Ambulatory Care—Outpatient Visits per 1,000 MM* 406.58 319.25 155.22 Not Tested
Annual Monitoring for Patients on Persistent Medications—ACE Inhibitors or ARBs 86.17% 90.18% 86.09%
Annual Monitoring for Patients on Persistent Medications—Digoxin NA NA NA Not Comparable
Annual Monitoring for Patients on Persistent Medications—Diuretics 86.79% 90.62% 86.53% Children and Adolescents' Access to Primary Care Practitioners—12 to 24 Months NA NA NA Not Comparable
Children and Adolescents' Access to Primary Care Practitioners—25 Months to 6 Years
81.31% 75.61% 75.36%
Children and Adolescents' Access to Primary Care Practitioners—7 to 11 Years 85.96% 81.54% 80.08% Children and Adolescents' Access to Primary Care Practitioners—12 to 19 Years 80.42% 77.03% 75.00%
*Member months are a member’s “contribution” to the total yearly membership.

SPD TREND TABLES
2015 HEDIS Aggregate Report Page B-34 California Department of Health Care Services Health Services Advisory Group, Inc.
Table B.33—Health Net Community Solutions, Inc.—San Joaquin County HEDIS 2015 SPD Trend Table
Measure RY
2013 RY
2014 RY
2015
RYs 2014–15 Rate
Difference All-Cause Readmissions—Statewide Collaborative QIP measure — 25.00% 27.18% Ambulatory Care—Emergency Department Visits per 1,000 MM* — 104.16 51.30 Not Tested
Ambulatory Care—Outpatient Visits per 1,000 MM* — 344.91 153.04 Not Tested
Annual Monitoring for Patients on Persistent Medications—ACE Inhibitors or ARBs — 75.47% 74.47% Annual Monitoring for Patients on Persistent Medications—Digoxin — NA NA Not Comparable
Annual Monitoring for Patients on Persistent Medications—Diuretics — NA 81.48% Not Comparable
Children and Adolescents' Access to Primary Care Practitioners—12 to 24 Months — NA NA Not Comparable
Children and Adolescents' Access to Primary Care Practitioners—25 Months to 6 Years
— NA NA Not Comparable
Children and Adolescents' Access to Primary Care Practitioners—7 to 11 Years — NA NA Not Comparable
Children and Adolescents' Access to Primary Care Practitioners—12 to 19 Years — NA NA Not Comparable
*Member months are a member’s “contribution” to the total yearly membership.

SPD TREND TABLES
2015 HEDIS Aggregate Report Page B-35 California Department of Health Care Services Health Services Advisory Group, Inc.
Table B.34—Health Net Community Solutions, Inc.—Stanislaus County HEDIS 2015 SPD Trend Table
Measure RY
2013 RY
2014 RY
2015
RYs 2014–15 Rate
Difference All-Cause Readmissions—Statewide Collaborative QIP measure 10.12% 13.24% 17.13%
Ambulatory Care—Emergency Department Visits per 1,000 MM* 82.73 93.41 60.78 Not Tested
Ambulatory Care—Outpatient Visits per 1,000 MM* 491.16 470.09 261.19 Not Tested
Annual Monitoring for Patients on Persistent Medications—ACE Inhibitors or ARBs 83.26% 84.15% 82.29% Annual Monitoring for Patients on Persistent Medications—Digoxin NA NA NA Not Comparable
Annual Monitoring for Patients on Persistent Medications—Diuretics 86.47% 86.17% 86.23% Children and Adolescents' Access to Primary Care Practitioners—12 to 24 Months NA NA NA Not Comparable
Children and Adolescents' Access to Primary Care Practitioners—25 Months to 6 Years
86.27% 86.32% 86.89%
Children and Adolescents' Access to Primary Care Practitioners—7 to 11 Years 90.98% 87.57% 87.26% Children and Adolescents' Access to Primary Care Practitioners—12 to 19 Years 94.25% 83.08% 84.42%
*Member months are a member’s “contribution” to the total yearly membership.

SPD TREND TABLES
2015 HEDIS Aggregate Report Page B-36 California Department of Health Care Services Health Services Advisory Group, Inc.
Table B.35—Health Net Community Solutions, Inc.—Tulare County HEDIS 2015 SPD Trend Table
Measure RY
2013 RY
2014 RY
2015
RYs 2014–15 Rate
Difference All-Cause Readmissions—Statewide Collaborative QIP measure 15.86% 12.77% 14.81% Ambulatory Care—Emergency Department Visits per 1,000 MM* 71.55 70.74 42.48 Not Tested
Ambulatory Care—Outpatient Visits per 1,000 MM* 602.84 651.79 375.32 Not Tested
Annual Monitoring for Patients on Persistent Medications—ACE Inhibitors or ARBs 83.74% 84.40% 85.33% Annual Monitoring for Patients on Persistent Medications—Digoxin NA 90.00% NA Not Comparable
Annual Monitoring for Patients on Persistent Medications—Diuretics 87.50% 85.63% 87.97% Children and Adolescents' Access to Primary Care Practitioners—12 to 24 Months NA NA NA Not Comparable
Children and Adolescents' Access to Primary Care Practitioners—25 Months to 6 Years
94.74% 90.20% 90.75%
Children and Adolescents' Access to Primary Care Practitioners—7 to 11 Years 94.50% 94.23% 91.46% Children and Adolescents' Access to Primary Care Practitioners—12 to 19 Years 92.00% 90.40% 88.97%
*Member months are a member’s “contribution” to the total yearly membership.

SPD TREND TABLES
2015 HEDIS Aggregate Report Page B-37 California Department of Health Care Services Health Services Advisory Group, Inc.
Table B.36—Health Plan of San Joaquin—San Joaquin County HEDIS 2015 SPD Trend Table
Measure RY
2013 RY
2014 RY
2015
RYs 2014–15
Rate Difference
All-Cause Readmissions—Statewide Collaborative QIP measure 13.75% 13.65% 16.82%
Ambulatory Care—Emergency Department Visits per 1,000 MM* 72.22 71.99 70.82 Not Tested
Ambulatory Care—Outpatient Visits per 1,000 MM* 474.21 438.00 401.82 Not Tested
Annual Monitoring for Patients on Persistent Medications—ACE Inhibitors or ARBs 85.44% 85.07% 81.04%
Annual Monitoring for Patients on Persistent Medications—Digoxin 90.91% 93.18% 50.00%
Annual Monitoring for Patients on Persistent Medications—Diuretics 86.39% 86.24% 84.20% Children and Adolescents' Access to Primary Care Practitioners—12 to 24 Months 96.30% 100.0% 100.0%
Children and Adolescents' Access to Primary Care Practitioners—25 Months to 6 Years
89.90% 86.09% 83.28%
Children and Adolescents' Access to Primary Care Practitioners—7 to 11 Years 88.53% 87.37% 87.42% Children and Adolescents' Access to Primary Care Practitioners—12 to 19 Years 87.69% 85.91% 84.27%
*Member months are a member’s “contribution” to the total yearly membership.

SPD TREND TABLES
2015 HEDIS Aggregate Report Page B-38 California Department of Health Care Services Health Services Advisory Group, Inc.
Table B.37—Health Plan of San Joaquin—Stanislaus County HEDIS 2015 SPD Trend Table
Measure RY
2013 RY
2014 RY
2015
RYs 2014–15 Rate
Difference All-Cause Readmissions—Statewide Collaborative QIP measure — 15.88% 20.55% Ambulatory Care—Emergency Department Visits per 1,000 MM* — 105.58 105.69 Not Tested
Ambulatory Care—Outpatient Visits per 1,000 MM* — 585.69 535.60 Not Tested
Annual Monitoring for Patients on Persistent Medications—ACE Inhibitors or ARBs — 87.72% 89.02% Annual Monitoring for Patients on Persistent Medications—Digoxin — NA NA Not Comparable
Annual Monitoring for Patients on Persistent Medications—Diuretics — 89.27% 88.44% Children and Adolescents' Access to Primary Care Practitioners—12 to 24 Months — NA NA Not Comparable
Children and Adolescents' Access to Primary Care Practitioners—25 Months to 6 Years
— 93.20% 82.25%
Children and Adolescents' Access to Primary Care Practitioners—7 to 11 Years — NA 92.06% Not Comparable
Children and Adolescents' Access to Primary Care Practitioners—12 to 19 Years — NA 89.64% Not Comparable
*Member months are a member’s “contribution” to the total yearly membership.

SPD TREND TABLES
2015 HEDIS Aggregate Report Page B-39 California Department of Health Care Services Health Services Advisory Group, Inc.
Table B.38—Health Plan of San Mateo—San Mateo County HEDIS 2015 SPD Trend Table
Measure RY
2013 RY
2014 RY
2015
RYs 2014–15 Rate
Difference All-Cause Readmissions—Statewide Collaborative QIP measure 13.28% 16.78% 20.91%
Ambulatory Care—Emergency Department Visits per 1,000 MM* 58.21 60.39 60.26 Not Tested
Ambulatory Care—Outpatient Visits per 1,000 MM* 924.90 797.31 803.65 Not Tested
Annual Monitoring for Patients on Persistent Medications—ACE Inhibitors or ARBs 89.95% 91.58% 90.60% Annual Monitoring for Patients on Persistent Medications—Digoxin 94.79% 94.84% 47.58%
Annual Monitoring for Patients on Persistent Medications—Diuretics 91.23% 92.65% 91.55% Children and Adolescents' Access to Primary Care Practitioners—12 to 24 Months 79.41% NA NA Not Comparable
Children and Adolescents' Access to Primary Care Practitioners—25 Months to 6 Years
74.72% 77.57% 77.54%
Children and Adolescents' Access to Primary Care Practitioners—7 to 11 Years 72.19% 72.88% 72.75% Children and Adolescents' Access to Primary Care Practitioners—12 to 19 Years 65.03% 68.15% 69.49%
*Member months are a member’s “contribution” to the total yearly membership.

SPD TREND TABLES
2015 HEDIS Aggregate Report Page B-40 California Department of Health Care Services Health Services Advisory Group, Inc.
Table B.39—Inland Empire Health Plan—Riverside/San Bernardino Counties HEDIS 2015 SPD Trend Table
Measure RY
2013 RY
2014 RY
2015
RYs 2014–15
Rate Difference
All-Cause Readmissions—Statewide Collaborative QIP measure 16.95% 17.37% 21.77%
Ambulatory Care—Emergency Department Visits per 1,000 MM* 75.75 82.89 83.70 Not Tested
Ambulatory Care—Outpatient Visits per 1,000 MM* 630.72 632.06 452.07 Not Tested
Annual Monitoring for Patients on Persistent Medications—ACE Inhibitors or ARBs 89.22% 88.35% 89.54%
Annual Monitoring for Patients on Persistent Medications—Digoxin 91.32% 91.64% 53.23%
Annual Monitoring for Patients on Persistent Medications—Diuretics 88.78% 87.55% 88.93%
Children and Adolescents' Access to Primary Care Practitioners—12 to 24 Months 96.12% 94.61% 93.81% Children and Adolescents' Access to Primary Care Practitioners—25 Months to 6 Years
86.54% 85.58% 86.10%
Children and Adolescents' Access to Primary Care Practitioners—7 to 11 Years 87.66% 86.46% 86.29% Children and Adolescents' Access to Primary Care Practitioners—12 to 19 Years 86.60% 82.45% 82.37%
*Member months are a member’s “contribution” to the total yearly membership.

SPD TREND TABLES
2015 HEDIS Aggregate Report Page B-41 California Department of Health Care Services Health Services Advisory Group, Inc.
Table B.40—Kaiser NorCal—KP North (Amador, El Dorado, Placer, and Sacramento Counties) HEDIS 2015 SPD Trend Table
Measure RY
2013 RY
2014 RY
2015
RYs 2014–15 Rate
Difference All-Cause Readmissions—Statewide Collaborative QIP measure — — 15.01% Not Comparable
Ambulatory Care—Emergency Department Visits per 1,000 MM* — — 87.64 Not Tested
Ambulatory Care—Outpatient Visits per 1,000 MM* — — 899.26 Not Tested
Annual Monitoring for Patients on Persistent Medications—ACE Inhibitors or ARBs — — 96.81% Not Comparable
Annual Monitoring for Patients on Persistent Medications—Digoxin — — NA Not Comparable
Annual Monitoring for Patients on Persistent Medications—Diuretics — — 95.86% Not Comparable
Children and Adolescents' Access to Primary Care Practitioners—12 to 24 Months — — NA Not Comparable
Children and Adolescents' Access to Primary Care Practitioners—25 Months to 6 Years
— — 94.78% Not Comparable
Children and Adolescents' Access to Primary Care Practitioners—7 to 11 Years — — 96.67% Not Comparable
Children and Adolescents' Access to Primary Care Practitioners—12 to 19 Years — — 94.39% Not Comparable
*Member months are a member’s “contribution” to the total yearly membership.

SPD TREND TABLES
2015 HEDIS Aggregate Report Page B-42 California Department of Health Care Services Health Services Advisory Group, Inc.
Table B.41—Kaiser SoCal—San Diego County HEDIS 2015 SPD Trend Table
Measure RY
2013 RY
2014 RY
2015
RYs 2014–15 Rate
Difference All-Cause Readmissions—Statewide Collaborative QIP measure 20.74% 11.41% 19.04%
Ambulatory Care—Emergency Department Visits per 1,000 MM* 52.40 59.41 61.23 Not Tested
Ambulatory Care—Outpatient Visits per 1,000 MM* 737.64 890.21 972.64 Not Tested
Annual Monitoring for Patients on Persistent Medications—ACE Inhibitors or ARBs 94.76% 96.68% 95.32% Annual Monitoring for Patients on Persistent Medications—Digoxin NA NA NA Not Comparable
Annual Monitoring for Patients on Persistent Medications—Diuretics 94.24% 96.13% 95.71% Children and Adolescents' Access to Primary Care Practitioners—12 to 24 Months NA NA NA Not Comparable
Children and Adolescents' Access to Primary Care Practitioners—25 Months to 6 Years
98.70% 98.80% 98.89%
Children and Adolescents' Access to Primary Care Practitioners—7 to 11 Years 97.80% 99.08% 95.28% Children and Adolescents' Access to Primary Care Practitioners—12 to 19 Years 93.57% 96.32% 96.34%
*Member months are a member’s “contribution” to the total yearly membership.

SPD TREND TABLES
2015 HEDIS Aggregate Report Page B-43 California Department of Health Care Services Health Services Advisory Group, Inc.
Table B.42—Kern Health Systems—Kern County HEDIS 2015 SPD Trend Table
Measure RY
2013 RY
2014 RY
2015
RYs 2014–15
Rate Difference
All-Cause Readmissions—Statewide Collaborative QIP measure 17.07% 18.74% 23.45%
Ambulatory Care—Emergency Department Visits per 1,000 MM* 95.53 99.42 97.43 Not Tested
Ambulatory Care—Outpatient Visits per 1,000 MM* 487.16 492.89 488.71 Not Tested
Annual Monitoring for Patients on Persistent Medications—ACE Inhibitors or ARBs 92.05% 90.14% 89.60% Annual Monitoring for Patients on Persistent Medications—Digoxin NA 93.33% 56.67%
Annual Monitoring for Patients on Persistent Medications—Diuretics 91.17% 91.41% 89.09% Children and Adolescents' Access to Primary Care Practitioners—12 to 24 Months 87.76% 92.59% 95.92% Children and Adolescents' Access to Primary Care Practitioners—25 Months to 6 Years
86.32% 84.46% 85.39%
Children and Adolescents' Access to Primary Care Practitioners—7 to 11 Years 85.00% 79.50% 81.69% Children and Adolescents' Access to Primary Care Practitioners—12 to 19 Years 85.37% 78.43% 79.74%
*Member months are a member’s “contribution” to the total yearly membership.

SPD TREND TABLES
2015 HEDIS Aggregate Report Page B-44 California Department of Health Care Services Health Services Advisory Group, Inc.
Table B.43—L.A. Care Health Plan—Los Angeles County HEDIS 2015 SPD Trend Table
Measure RY
2013 RY
2014 RY
2015
RYs 2014–15
Rate Difference
All-Cause Readmissions—Statewide Collaborative QIP measure 19.69% 18.44% 25.53%
Ambulatory Care—Emergency Department Visits per 1,000 MM* 61.70 57.87 58.66 Not Tested
Ambulatory Care—Outpatient Visits per 1,000 MM* 284.56 421.46 450.94 Not Tested
Annual Monitoring for Patients on Persistent Medications—ACE Inhibitors or ARBs 73.17% 79.22% 87.63%
Annual Monitoring for Patients on Persistent Medications—Digoxin 78.75% 79.65% 49.29%
Annual Monitoring for Patients on Persistent Medications—Diuretics 73.59% 78.52% 87.55%
Children and Adolescents' Access to Primary Care Practitioners—12 to 24 Months 77.40% 79.34% 83.56% Children and Adolescents' Access to Primary Care Practitioners—25 Months to 6 Years
81.54% 81.02% 84.22%
Children and Adolescents' Access to Primary Care Practitioners—7 to 11 Years 87.85% 83.01% 86.87%
Children and Adolescents' Access to Primary Care Practitioners—12 to 19 Years 84.37% 77.77% 81.92%
*Member months are a member’s “contribution” to the total yearly membership.

SPD TREND TABLES
2015 HEDIS Aggregate Report Page B-45 California Department of Health Care Services Health Services Advisory Group, Inc.
Table B.44—Molina Healthcare of California Partner Plan, Inc.—Imperial County HEDIS 2015 SPD Trend Table
Measure RY
2013 RY
2014 RY
2015
RYs 2014–15 Rate
Difference All-Cause Readmissions—Statewide Collaborative QIP measure — — NA Not Comparable
Ambulatory Care—Emergency Department Visits per 1,000 MM* — — 132.65 Not Tested
Ambulatory Care—Outpatient Visits per 1,000 MM* — — 899.94 Not Tested
Annual Monitoring for Patients on Persistent Medications—ACE Inhibitors or ARBs — — NA Not Comparable
Annual Monitoring for Patients on Persistent Medications—Digoxin — — NA Not Comparable
Annual Monitoring for Patients on Persistent Medications—Diuretics — — NA Not Comparable
Children and Adolescents' Access to Primary Care Practitioners—12 to 24 Months — — NA Not Comparable
Children and Adolescents' Access to Primary Care Practitioners—25 Months to 6 Years
— — NA Not Comparable
Children and Adolescents' Access to Primary Care Practitioners—7 to 11 Years — — NA Not Comparable
Children and Adolescents' Access to Primary Care Practitioners—12 to 19 Years — — NA Not Comparable
*Member months are a member’s “contribution” to the total yearly membership.

SPD TREND TABLES
2015 HEDIS Aggregate Report Page B-46 California Department of Health Care Services Health Services Advisory Group, Inc.
Table B.45—Molina Healthcare of California Partner Plan, Inc.—Riverside/San Bernardino Counties HEDIS 2015 SPD Trend Table
Measure RY
2013 RY
2014 RY
2015
RYs 2014–15 Rate
Difference All-Cause Readmissions—Statewide Collaborative QIP measure 18.15% 16.27% 19.55%
Ambulatory Care—Emergency Department Visits per 1,000 MM* 67.24 72.83 71.10 Not Tested
Ambulatory Care—Outpatient Visits per 1,000 MM* 346.49 312.01 571.37 Not Tested
Annual Monitoring for Patients on Persistent Medications—ACE Inhibitors or ARBs 87.80% 89.83% 85.53%
Annual Monitoring for Patients on Persistent Medications—Digoxin 90.63% 95.00% NA Not Comparable
Annual Monitoring for Patients on Persistent Medications—Diuretics 87.06% 89.26% 84.93%
Children and Adolescents' Access to Primary Care Practitioners—12 to 24 Months NA NA NA Not Comparable
Children and Adolescents' Access to Primary Care Practitioners—25 Months to 6 Years
79.18% 78.45% 80.74%
Children and Adolescents' Access to Primary Care Practitioners—7 to 11 Years 84.52% 83.40% 83.99% Children and Adolescents' Access to Primary Care Practitioners—12 to 19 Years 83.44% 76.02% 75.52%
*Member months are a member’s “contribution” to the total yearly membership.

SPD TREND TABLES
2015 HEDIS Aggregate Report Page B-47 California Department of Health Care Services Health Services Advisory Group, Inc.
Table B.46—Molina Healthcare of California Partner Plan, Inc.—Sacramento County HEDIS 2015 SPD Trend Table
Measure RY
2013 RY
2014 RY
2015
RYs 2014–15 Rate
Difference All-Cause Readmissions—Statewide Collaborative QIP measure 14.68% 15.39% 16.14% Ambulatory Care—Emergency Department Visits per 1,000 MM* 65.28 68.46 80.14 Not Tested
Ambulatory Care—Outpatient Visits per 1,000 MM* 415.9 423.73 799.21 Not Tested
Annual Monitoring for Patients on Persistent Medications—ACE Inhibitors or ARBs 74.59% 80.05% 84.69%
Annual Monitoring for Patients on Persistent Medications—Digoxin NA 83.87% NA Not Comparable
Annual Monitoring for Patients on Persistent Medications—Diuretics 74.40% 80.25% 85.01%
Children and Adolescents' Access to Primary Care Practitioners—12 to 24 Months NA NA NA Not Comparable
Children and Adolescents' Access to Primary Care Practitioners—25 Months to 6 Years
79.27% 80.95% 75.00%
Children and Adolescents' Access to Primary Care Practitioners—7 to 11 Years 87.88% 79.07% 77.42% Children and Adolescents' Access to Primary Care Practitioners—12 to 19 Years 79.40% 74.85% 70.32%
*Member months are a member’s “contribution” to the total yearly membership.

SPD TREND TABLES
2015 HEDIS Aggregate Report Page B-48 California Department of Health Care Services Health Services Advisory Group, Inc.
Table B.47—Molina Healthcare of California Partner Plan, Inc.—San Diego County HEDIS 2015 SPD Trend Table
Measure RY
2013 RY
2014 RY
2015
RYs 2014–15 Rate
Difference All-Cause Readmissions—Statewide Collaborative QIP measure 17.65% 17.07% 18.01% Ambulatory Care—Emergency Department Visits per 1,000 MM* 61.02 71.93 75.48 Not Tested
Ambulatory Care—Outpatient Visits per 1,000 MM* 512.86 434.68 913.25 Not Tested
Annual Monitoring for Patients on Persistent Medications—ACE Inhibitors or ARBs 85.79% 87.49% 85.90% Annual Monitoring for Patients on Persistent Medications—Digoxin 94.12% 80.36% 56.86%
Annual Monitoring for Patients on Persistent Medications—Diuretics 88.10% 88.57% 88.06% Children and Adolescents' Access to Primary Care Practitioners—12 to 24 Months 80.65% NA NA Not Comparable
Children and Adolescents' Access to Primary Care Practitioners—25 Months to 6 Years
84.13% 86.83% 85.64%
Children and Adolescents' Access to Primary Care Practitioners—7 to 11 Years 89.63% 84.92% 88.47% Children and Adolescents' Access to Primary Care Practitioners—12 to 19 Years 84.01% 81.87% 83.53%
*Member months are a member’s “contribution” to the total yearly membership.

SPD TREND TABLES
2015 HEDIS Aggregate Report Page B-49 California Department of Health Care Services Health Services Advisory Group, Inc.
Table B.48—Partnership HealthPlan of California—Northeast (Lassen, Modoc, Shasta, Siskiyou, and Trinity Counties)
HEDIS 2015 SPD Trend Table
Measure RY
2013 RY
2014 RY
2015
RYs 2014–15 Rate
Difference All-Cause Readmissions—Statewide Collaborative QIP measure — — 16.60% Not Comparable
Ambulatory Care—Emergency Department Visits per 1,000 MM* — — 109.59 Not Tested
Ambulatory Care—Outpatient Visits per 1,000 MM* — — 413.55 Not Tested
Annual Monitoring for Patients on Persistent Medications—ACE Inhibitors or ARBs — — 85.14% Not Comparable
Annual Monitoring for Patients on Persistent Medications—Digoxin — — NA Not Comparable
Annual Monitoring for Patients on Persistent Medications—Diuretics — — 85.41% Not Comparable
Children and Adolescents' Access to Primary Care Practitioners—12 to 24 Months — — NA Not Comparable
Children and Adolescents' Access to Primary Care Practitioners—25 Months to 6 Years
— — 88.41% Not Comparable
Children and Adolescents' Access to Primary Care Practitioners—7 to 11 Years — — NA Not Comparable
Children and Adolescents' Access to Primary Care Practitioners—12 to 19 Years — — NA Not Comparable
*Member months are a member’s “contribution” to the total yearly membership.
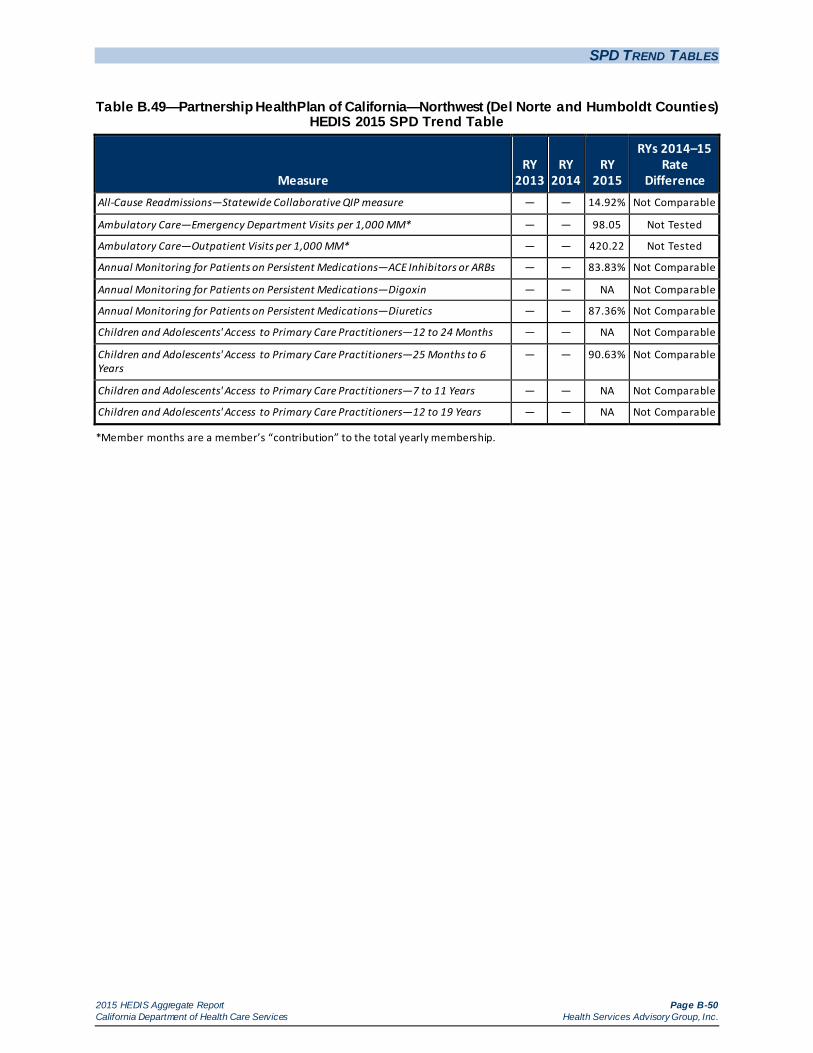
SPD TREND TABLES
2015 HEDIS Aggregate Report Page B-50 California Department of Health Care Services Health Services Advisory Group, Inc.
Table B.49—Partnership HealthPlan of California—Northwest (Del Norte and Humboldt Counties) HEDIS 2015 SPD Trend Table
Measure RY
2013 RY
2014 RY
2015
RYs 2014–15 Rate
Difference All-Cause Readmissions—Statewide Collaborative QIP measure — — 14.92% Not Comparable
Ambulatory Care—Emergency Department Visits per 1,000 MM* — — 98.05 Not Tested
Ambulatory Care—Outpatient Visits per 1,000 MM* — — 420.22 Not Tested
Annual Monitoring for Patients on Persistent Medications—ACE Inhibitors or ARBs — — 83.83% Not Comparable
Annual Monitoring for Patients on Persistent Medications—Digoxin — — NA Not Comparable
Annual Monitoring for Patients on Persistent Medications—Diuretics — — 87.36% Not Comparable
Children and Adolescents' Access to Primary Care Practitioners—12 to 24 Months — — NA Not Comparable
Children and Adolescents' Access to Primary Care Practitioners—25 Months to 6 Years
— — 90.63% Not Comparable
Children and Adolescents' Access to Primary Care Practitioners—7 to 11 Years — — NA Not Comparable
Children and Adolescents' Access to Primary Care Practitioners—12 to 19 Years — — NA Not Comparable
*Member months are a member’s “contribution” to the total yearly membership.

SPD TREND TABLES
2015 HEDIS Aggregate Report Page B-51 California Department of Health Care Services Health Services Advisory Group, Inc.
Table B.50—Partnership HealthPlan of California—Southeast (Napa/Solano/Yolo Counties) HEDIS 2015 SPD Trend Table
Measure RY
2013 RY
2014 RY
2015
RYs 2014–15
Rate Difference
All-Cause Readmissions—Statewide Collaborative QIP measure 15.67% 16.98% 16.32% Ambulatory Care—Emergency Department Visits per 1,000 MM* 79.44 81.68 89.77 Not Tested
Ambulatory Care—Outpatient Visits per 1,000 MM* 503.87 565.93 602.57 Not Tested
Annual Monitoring for Patients on Persistent Medications—ACE Inhibitors or ARBs 86.70% 90.49% 89.41% Annual Monitoring for Patients on Persistent Medications—Digoxin 91.07% 94.90% 59.42%
Annual Monitoring for Patients on Persistent Medications—Diuretics 85.26% 90.39% 90.76% Children and Adolescents' Access to Primary Care Practitioners—12 to 24 Months 86.79% 92.31% 95.35% Children and Adolescents' Access to Primary Care Practitioners—25 Months to 6 Years
82.56% 85.68% 84.08%
Children and Adolescents' Access to Primary Care Practitioners—7 to 11 Years 84.64% 85.27% 85.40% Children and Adolescents' Access to Primary Care Practitioners—12 to 19 Years 81.91% 81.25% 81.39%
*Member months are a member’s “contribution” to the total yearly membership.

SPD TREND TABLES
2015 HEDIS Aggregate Report Page B-52 California Department of Health Care Services Health Services Advisory Group, Inc.
Table B.51—Partnership HealthPlan of California—Southwest (Marin, Mendocino, Sonoma, and Lake Counties)
HEDIS 2015 SPD Trend Table
Measure RY
2013 RY
2014 RY
2015
RYs 2014–15 Rate
Difference All-Cause Readmissions—Statewide Collaborative QIP measure — — 16.07% Not Comparable
Ambulatory Care—Emergency Department Visits per 1,000 MM* — — 91.33 Not Tested
Ambulatory Care—Outpatient Visits per 1,000 MM* — — 590.09 Not Tested
Annual Monitoring for Patients on Persistent Medications—ACE Inhibitors or ARBs — — 84.83% Not Comparable
Annual Monitoring for Patients on Persistent Medications—Digoxin — — 53.13% Not Comparable
Annual Monitoring for Patients on Persistent Medications—Diuretics — — 86.29% Not Comparable
Children and Adolescents' Access to Primary Care Practitioners—12 to 24 Months — — NA Not Comparable
Children and Adolescents' Access to Primary Care Practitioners—25 Months to 6 Years
— — 91.02% Not Comparable
Children and Adolescents' Access to Primary Care Practitioners—7 to 11 Years — — 87.14% Not Comparable
Children and Adolescents' Access to Primary Care Practitioners—12 to 19 Years — — 84.88% Not Comparable
*Member months are a member’s “contribution” to the total yearly membership.

SPD TREND TABLES
2015 HEDIS Aggregate Report Page B-53 California Department of Health Care Services Health Services Advisory Group, Inc.
Table B.52—San Francisco Health Plan—San Francisco County HEDIS 2015 SPD Trend Table
Measure RY
2013 RY
2014 RY
2015
RYs 2014–15 Rate
Difference All-Cause Readmissions—Statewide Collaborative QIP measure 18.08% 17.88% 25.15%
Ambulatory Care—Emergency Department Visits per 1,000 MM* 74.89 75.73 78.27 Not Tested
Ambulatory Care—Outpatient Visits per 1,000 MM* 527.95 615.01 621.71 Not Tested
Annual Monitoring for Patients on Persistent Medications—ACE Inhibitors or ARBs 77.85% 87.62% 87.32% Annual Monitoring for Patients on Persistent Medications—Digoxin 80.56% 95.12% 48.65%
Annual Monitoring for Patients on Persistent Medications—Diuretics 79.97% 86.98% 88.21% Children and Adolescents' Access to Primary Care Practitioners—12 to 24 Months NA NA NA Not Comparable
Children and Adolescents' Access to Primary Care Practitioners—25 Months to 6 Years
83.67% 83.33% 84.00%
Children and Adolescents' Access to Primary Care Practitioners—7 to 11 Years 90.85% 89.41% 88.38% Children and Adolescents' Access to Primary Care Practitioners—12 to 19 Years 87.06% 86.96% 82.37%
*Member months are a member’s “contribution” to the total yearly membership.

SPD TREND TABLES
2015 HEDIS Aggregate Report Page B-54 California Department of Health Care Services Health Services Advisory Group, Inc.
Table B.53—Santa Clara Family Health Plan—Santa Clara County HEDIS 2015 SPD Trend Table
Measure RY
2013 RY
2014 RY
2015
RYs 2014–15
Rate Difference
All-Cause Readmissions—Statewide Collaborative QIP measure 16.54% 18.25% 21.25%
Ambulatory Care—Emergency Department Visits per 1,000 MM* 42.92 45.66 44.71 Not Tested
Ambulatory Care—Outpatient Visits per 1,000 MM* 403.89 411.17 399.37 Not Tested
Annual Monitoring for Patients on Persistent Medications—ACE Inhibitors or ARBs 88.79% 89.10% 88.66% Annual Monitoring for Patients on Persistent Medications—Digoxin 89.33% 88.61% 60.29%
Annual Monitoring for Patients on Persistent Medications—Diuretics 90.07% 90.26% 88.35% Children and Adolescents' Access to Primary Care Practitioners—12 to 24 Months 96.30% 80.95% 67.31% Children and Adolescents' Access to Primary Care Practitioners—25 Months to 6 Years
88.74% 88.93% 84.40%
Children and Adolescents' Access to Primary Care Practitioners—7 to 11 Years 89.16% 88.55% 86.37% Children and Adolescents' Access to Primary Care Practitioners—12 to 19 Years 89.55% 86.53% 81.33%
*Member months are a member’s “contribution” to the total yearly membership.

2015 HEDIS Aggregate Report Page C-1 California Department of Health Care Services Health Services Advisory Group, Inc.
Appendix C. NON-SPD TREND TABLES
Tables C.1 through C.53 provide two-year trending information for the non-SPD population across the measures each MCP is required to stratify for the SPD population. The following audit findings are provided within the table:
— = A year that data were not collected. NA = A Not Applicable audit finding, meaning that although an MCP may have complied with all applicable specifications, the MCP’s denominator is too small to report (less than 30).
HSAG calculated statistical significance testing between the reporting year (RY) 2014 and RY 2015 rates for each measure using a Chi-square test and displayed this information within the “RYs 2014–15 Rate Difference” column in Tables C.1 through C.53. The following symbols are used to show statistically significant changes:
= Rates in RY 2015 were significantly higher than they were in 2014.
= Rates in RY 2015 were significantly lower than they were in 2014.
↔ = Rates in RY 2015 were not significantly different than they were in 2014.
Different symbols () are used to indicate a performance change for the All-Cause Readmissions measure where a decrease in the rate indicates better performance. A downward triangle () denotes a significant decline in performance, as denoted by a significant increase in the RY 2015 rate from the RY 2014 rate. An upward triangle () denotes significant improvement in performance, as indicated by a significant decrease of the RY 2015 rate from the RY 2014 rate.
Not Comparable = A RY 2014–15 rate difference could not be calculated because data were not available for both years, or there were significant methodology changes between years that did not allow for comparison.
Not Tested = No comparison was made because high and low rates do not necessarily indicate better or worse performance.
S = The MCP’s measure was reportable based on performance measure validation audit results; however, since there are fewer than 11 cases in the numerator of this measure, DHCS suppresses displaying the rate in this report to satisfy the Health Insurance Portability and Accountability Act of 1996 Privacy Rule’s de-identification standard.

NON-SPD TREND TABLES
2015 HEDIS Aggregate Report Page C-2 California Department of Health Care Services Health Services Advisory Group, Inc.
Table C.1—Alameda Alliance for Health—Alameda County HEDIS 2015 Non-SPD Trend Table
Measure RY
2013 RY
2014 RY
2015
RYs 2014–15 Rate
Difference All-Cause Readmissions—Statewide Collaborative QIP measure 10.47% 13.64% 13.50% Ambulatory Care—Emergency Department Visits per 1,000 MM* 40.42 24.72 32.31 Not Tested
Ambulatory Care—Outpatient Visits per 1,000 MM* 240.90 212.26 253.99 Not Tested
Annual Monitoring for Patients on Persistent Medications—ACE Inhibitors or ARBs 77.54% 80.91% 81.83% Annual Monitoring for Patients on Persistent Medications—Digoxin NA NA 41.77% Not
Comparable
Annual Monitoring for Patients on Persistent Medications—Diuretics 73.16% 81.90% 79.71% Children and Adolescents' Access to Primary Care Practitioners—12 to 24 Months 92.41% 94.25% 88.22%
Children and Adolescents' Access to Primary Care Practitioners—25 Months to 6 Years
83.84% 85.07% 81.35%
Children and Adolescents' Access to Primary Care Practitioners—7 to 11 Years 85.00% 87.03% 84.78%
Children and Adolescents' Access to Primary Care Practitioners—12 to 19 Years 84.99% 83.59% 81.92%
*Member months are a member’s “contribution” to the total yearly membership.

NON-SPD TREND TABLES
2015 HEDIS Aggregate Report Page C-3 California Department of Health Care Services Health Services Advisory Group, Inc.
Table C.2—Anthem Blue Cross Partnership Plan—Alameda County HEDIS 2015 Non-SPD Trend Table
Measure RY
2013 RY
2014 RY
2015
RYs 2014–15 Rate
Difference All-Cause Readmissions—Statewide Collaborative QIP measure 9.84% 10.91% 13.26% Ambulatory Care—Emergency Department Visits per 1,000 MM* 55.23 53.18 49.70 Not Tested
Ambulatory Care—Outpatient Visits per 1,000 MM* 144.94 187.84 168.72 Not Tested
Annual Monitoring for Patients on Persistent Medications—ACE Inhibitors or ARBs 66.07% 71.79% 84.44%
Annual Monitoring for Patients on Persistent Medications—Digoxin NA NA NA Not Comparable
Annual Monitoring for Patients on Persistent Medications—Diuretics 62.94% 70.77% 74.66% Children and Adolescents' Access to Primary Care Practitioners—12 to 24 Months 84.31% 85.30% 87.00% Children and Adolescents' Access to Primary Care Practitioners—25 Months to 6 Years
67.90% 77.79% 82.86%
Children and Adolescents' Access to Primary Care Practitioners—7 to 11 Years 78.76% 78.54% 84.81%
Children and Adolescents' Access to Primary Care Practitioners—12 to 19 Years 77.69% 75.79% 80.28%
*Member months are a member’s “contribution” to the total yearly membership.

NON-SPD TREND TABLES
2015 HEDIS Aggregate Report Page C-4 California Department of Health Care Services Health Services Advisory Group, Inc.
Table C.3—Anthem Blue Cross Partnership Plan—Contra Costa County HEDIS 2015 Non-SPD Trend Table
Measure RY
2013 RY
2014 RY
2015
RYs 2014–15 Rate
Difference All-Cause Readmissions—Statewide Collaborative QIP measure 8.89% S 13.75% Ambulatory Care—Emergency Department Visits per 1,000 MM* 56.21 56.15 53.97 Not Tested
Ambulatory Care—Outpatient Visits per 1,000 MM* 202.82 225.26 191.29 Not Tested
Annual Monitoring for Patients on Persistent Medications—ACE Inhibitors or ARBs 72.41% 76.47% 79.17% Annual Monitoring for Patients on Persistent Medications—Digoxin NA NA NA Not Comparable
Annual Monitoring for Patients on Persistent Medications—Diuretics 58.00% 67.35% 76.47% Children and Adolescents' Access to Primary Care Practitioners—12 to 24 Months 96.88% 95.23% 93.82% Children and Adolescents' Access to Primary Care Practitioners—25 Months to 6 Years
84.85% 86.31% 85.36%
Children and Adolescents' Access to Primary Care Practitioners—7 to 11 Years 85.69% 88.35% 88.73% Children and Adolescents' Access to Primary Care Practitioners—12 to 19 Years 82.84% 85.16% 87.49%
*Member months are a member’s “contribution” to the total yearly membership.

NON-SPD TREND TABLES
2015 HEDIS Aggregate Report Page C-5 California Department of Health Care Services Health Services Advisory Group, Inc.
Table C.4—Anthem Blue Cross Partnership Plan—Fresno County HEDIS 2015 Non-SPD Trend Table
Measure RY
2013 RY
2014 RY
2015
RYs 2014–15 Rate
Difference All-Cause Readmissions—Statewide Collaborative QIP measure 10.55% 10.68% 9.90% Ambulatory Care—Emergency Department Visits per 1,000 MM* 40.31 45.59 46.64 Not Tested
Ambulatory Care—Outpatient Visits per 1,000 MM* 231.05 219.48 214.46 Not Tested
Annual Monitoring for Patients on Persistent Medications—ACE Inhibitors or ARBs 79.15% 81.76% 80.12% Annual Monitoring for Patients on Persistent Medications—Digoxin NA NA NA Not Comparable
Annual Monitoring for Patients on Persistent Medications—Diuretics 78.81% 78.59% 80.36% Children and Adolescents' Access to Primary Care Practitioners—12 to 24 Months 94.28% 93.86% 92.83% Children and Adolescents' Access to Primary Care Practitioners—25 Months to 6 Years
82.89% 83.33% 86.11%
Children and Adolescents' Access to Primary Care Practitioners—7 to 11 Years 80.30% 83.46% 85.47%
Children and Adolescents' Access to Primary Care Practitioners—12 to 19 Years 76.57% 79.14% 82.88%
*Member months are a member’s “contribution” to the total yearly membership.

NON-SPD TREND TABLES
2015 HEDIS Aggregate Report Page C-6 California Department of Health Care Services Health Services Advisory Group, Inc.
Table C.5—Anthem Blue Cross Partnership Plan—Kings County HEDIS 2015 Non-SPD Trend Table
Measure RY
2013 RY
2014 RY
2015
RYs 2014–15 Rate
Difference All-Cause Readmissions—Statewide Collaborative QIP measure 11.84% S S Ambulatory Care—Emergency Department Visits per 1,000 MM* 61.10 61.93 58.16 Not Tested
Ambulatory Care—Outpatient Visits per 1,000 MM* 337.12 291.39 255.64 Not Tested
Annual Monitoring for Patients on Persistent Medications—ACE Inhibitors or ARBs 84.82% 80.56% 82.84% Annual Monitoring for Patients on Persistent Medications—Digoxin NA NA NA Not Comparable
Annual Monitoring for Patients on Persistent Medications—Diuretics 78.13% 68.66% 73.97% Children and Adolescents' Access to Primary Care Practitioners—12 to 24 Months 95.01% 94.71% 94.74% Children and Adolescents' Access to Primary Care Practitioners—25 Months to 6 Years
86.69% 83.36% 86.28%
Children and Adolescents' Access to Primary Care Practitioners—7 to 11 Years NA 84.26% 83.64% Children and Adolescents' Access to Primary Care Practitioners—12 to 19 Years NA 84.62% 86.26%
*Member months are a member’s “contribution” to the total yearly membership.

NON-SPD TREND TABLES
2015 HEDIS Aggregate Report Page C-7 California Department of Health Care Services Health Services Advisory Group, Inc.
Table C.6—Anthem Blue Cross Partnership Plan—Madera County HEDIS 2015 Non-SPD Trend Table
Measure RY
2013 RY
2014 RY
2015
RYs 2014–15 Rate
Difference All-Cause Readmissions—Statewide Collaborative QIP measure 2.50% S 17.35% Ambulatory Care—Emergency Department Visits per 1,000 MM* 56.55 54.40 53.49 Not Tested
Ambulatory Care—Outpatient Visits per 1,000 MM* 293.16 272.13 267.13 Not Tested
Annual Monitoring for Patients on Persistent Medications—ACE Inhibitors or ARBs 74.47% 81.82% 75.24% Annual Monitoring for Patients on Persistent Medications—Digoxin NA NA NA Not Comparable
Annual Monitoring for Patients on Persistent Medications—Diuretics 65.79% 68.42% 79.55% Children and Adolescents' Access to Primary Care Practitioners—12 to 24 Months 98.05% 98.45% 95.06%
Children and Adolescents' Access to Primary Care Practitioners—25 Months to 6 Years
88.48% 90.87% 92.04%
Children and Adolescents' Access to Primary Care Practitioners—7 to 11 Years NA 90.58% 90.19% Children and Adolescents' Access to Primary Care Practitioners—12 to 19 Years NA 88.52% 90.21%
*Member months are a member’s “contribution” to the total yearly membership.

NON-SPD TREND TABLES
2015 HEDIS Aggregate Report Page C-8 California Department of Health Care Services Health Services Advisory Group, Inc.
Table C.7—Anthem Blue Cross Partnership Plan—Region 1 (Butte, Colusa, Glenn, Plumas, Sierra, Sutter, and Tehama Counties)
HEDIS 2015 Non-SPD Trend Table
Measure RY
2013 RY
2014 RY
2015
RYs 2014–15 Rate
Difference All-Cause Readmissions—Statewide Collaborative QIP measure — — 11.04% Not Comparable
Ambulatory Care—Emergency Department Visits per 1,000 MM* — — 46.39 Not Tested
Ambulatory Care—Outpatient Visits per 1,000 MM* — — 292.88 Not Tested
Annual Monitoring for Patients on Persistent Medications—ACE Inhibitors or ARBs — — 84.36% Not Comparable
Annual Monitoring for Patients on Persistent Medications—Digoxin — — NA Not Comparable
Annual Monitoring for Patients on Persistent Medications—Diuretics — — 86.83% Not Comparable
Children and Adolescents' Access to Primary Care Practitioners—12 to 24 Months — — 96.82% Not Comparable
Children and Adolescents' Access to Primary Care Practitioners—25 Months to 6 Years — — 87.27% Not Comparable
Children and Adolescents' Access to Primary Care Practitioners—7 to 11 Years — — 92.54% Not Comparable
Children and Adolescents' Access to Primary Care Practitioners—12 to 19 Years — — 95.74% Not Comparable
*Member months are a member’s “contribution” to the total yearly membership.

NON-SPD TREND TABLES
2015 HEDIS Aggregate Report Page C-9 California Department of Health Care Services Health Services Advisory Group, Inc.
Table C.8—Anthem Blue Cross Partnership Plan—Region 2 (Alpine, Amador, Calaveras, El Dorado, Inyo, Mariposa, Mono, Nevada, Placer, Tuolumne, and Yuba Counties)
HEDIS 2015 Non-SPD Trend Table
Measure RY
2013 RY
2014 RY
2015
RYs 2014–15 Rate
Difference All-Cause Readmissions—Statewide Collaborative QIP measure — — 8.39% Not Comparable
Ambulatory Care—Emergency Department Visits per 1,000 MM* — — 54.21 Not Tested
Ambulatory Care—Outpatient Visits per 1,000 MM* — — 212.47 Not Tested
Annual Monitoring for Patients on Persistent Medications—ACE Inhibitors or ARBs — — 77.42% Not Comparable
Annual Monitoring for Patients on Persistent Medications—Digoxin — — NA Not Comparable
Annual Monitoring for Patients on Persistent Medications—Diuretics — — 80.41% Not Comparable
Children and Adolescents' Access to Primary Care Practitioners—12 to 24 Months — — 93.56% Not Comparable
Children and Adolescents' Access to Primary Care Practitioners—25 Months to 6 Years — — 82.95% Not Comparable
Children and Adolescents' Access to Primary Care Practitioners—7 to 11 Years — — 92.77% Not Comparable
Children and Adolescents' Access to Primary Care Practitioners—12 to 19 Years — — 93.40% Not Comparable
*Member months are a member’s “contribution” to the total yearly membership.

NON-SPD TREND TABLES
2015 HEDIS Aggregate Report Page C-10 California Department of Health Care Services Health Services Advisory Group, Inc.
Table C.9—Anthem Blue Cross Partnership Plan—Sacramento County HEDIS 2015 Non-SPD Trend Table
Measure RY
2013 RY
2014 RY
2015
RYs 2014–15 Rate
Difference All-Cause Readmissions—Statewide Collaborative QIP measure 7.85% 8.70% 7.09% Ambulatory Care—Emergency Department Visits per 1,000 MM* 47.88 48.19 49.78 Not Tested
Ambulatory Care—Outpatient Visits per 1,000 MM* 190.39 191.26 174.75 Not Tested
Annual Monitoring for Patients on Persistent Medications—ACE Inhibitors or ARBs 60.90% 75.38% 79.35% Annual Monitoring for Patients on Persistent Medications—Digoxin NA NA NA Not Comparable
Annual Monitoring for Patients on Persistent Medications—Diuretics 59.22% 70.27% 77.75%
Children and Adolescents' Access to Primary Care Practitioners—12 to 24 Months 93.23% 94.06% 92.23%
Children and Adolescents' Access to Primary Care Practitioners—25 Months to 6 Years
80.26% 81.70% 81.71%
Children and Adolescents' Access to Primary Care Practitioners—7 to 11 Years 81.02% 80.76% 83.42%
Children and Adolescents' Access to Primary Care Practitioners—12 to 19 Years 80.47% 78.05% 80.99%
*Member months are a member’s “contribution” to the total yearly membership.

NON-SPD TREND TABLES
2015 HEDIS Aggregate Report Page C-11 California Department of Health Care Services Health Services Advisory Group, Inc.
Table C.10—Anthem Blue Cross Partnership Plan—San Benito County HEDIS 2015 Non-SPD Trend Table
Measure RY
2013 RY
2014 RY
2015
RYs 2014–15 Rate
Difference All-Cause Readmissions—Statewide Collaborative QIP measure — — NA Not Comparable
Ambulatory Care—Emergency Department Visits per 1,000 MM* — — 50.77 Not Tested
Ambulatory Care—Outpatient Visits per 1,000 MM* — — 234.43 Not Tested
Annual Monitoring for Patients on Persistent Medications—ACE Inhibitors or ARBs — — NA Not Comparable
Annual Monitoring for Patients on Persistent Medications—Digoxin — — NA Not Comparable
Annual Monitoring for Patients on Persistent Medications—Diuretics — — NA Not Comparable
Children and Adolescents' Access to Primary Care Practitioners—12 to 24 Months — — 93.08% Not Comparable
Children and Adolescents' Access to Primary Care Practitioners—25 Months to 6 Years
— — 78.23% Not Comparable
Children and Adolescents' Access to Primary Care Practitioners—7 to 11 Years — — NA Not Comparable
Children and Adolescents' Access to Primary Care Practitioners—12 to 19 Years — — NA Not Comparable
*Member months are a member’s “contribution” to the total yearly membership.

NON-SPD TREND TABLES
2015 HEDIS Aggregate Report Page C-12 California Department of Health Care Services Health Services Advisory Group, Inc.
Table C.11—Anthem Blue Cross Partnership Plan—San Francisco County HEDIS 2015 Non-SPD Trend Table
Measure RY
2013 RY
2014 RY
2015
RYs 2014–15 Rate
Difference All-Cause Readmissions—Statewide Collaborative QIP measure 6.56% S S Ambulatory Care—Emergency Department Visits per 1,000 MM* 32.91 35.87 37.25 Not Tested
Ambulatory Care—Outpatient Visits per 1,000 MM* 237.72 245.67 207.43 Not Tested
Annual Monitoring for Patients on Persistent Medications—ACE Inhibitors or ARBs 77.78% 82.42% 77.98% Annual Monitoring for Patients on Persistent Medications—Digoxin NA NA NA Not Comparable
Annual Monitoring for Patients on Persistent Medications—Diuretics 81.13% 80.39% 89.13% Children and Adolescents' Access to Primary Care Practitioners—12 to 24 Months 96.08% 96.95% 90.64%
Children and Adolescents' Access to Primary Care Practitioners—25 Months to 6 Years
87.28% 89.53% 85.13%
Children and Adolescents' Access to Primary Care Practitioners—7 to 11 Years 90.74% 89.73% 91.52% Children and Adolescents' Access to Primary Care Practitioners—12 to 19 Years 89.69% 88.40% 88.26%
*Member months are a member’s “contribution” to the total yearly membership.

NON-SPD TREND TABLES
2015 HEDIS Aggregate Report Page C-13 California Department of Health Care Services Health Services Advisory Group, Inc.
Table C.12—Anthem Blue Cross Partnership Plan—Santa Clara County HEDIS 2015 Non-SPD Trend Table
Measure RY
2013 RY
2014 RY
2015
RYs 2014–15 Rate
Difference All-Cause Readmissions—Statewide Collaborative QIP measure 12.43% 6.88% 11.06% Ambulatory Care—Emergency Department Visits per 1,000 MM* 37.66 41.56 41.49 Not Tested
Ambulatory Care—Outpatient Visits per 1,000 MM* 234.32 232.83 190.87 Not Tested
Annual Monitoring for Patients on Persistent Medications—ACE Inhibitors or ARBs 84.37% 83.51% 87.56% Annual Monitoring for Patients on Persistent Medications—Digoxin NA NA NA Not Comparable
Annual Monitoring for Patients on Persistent Medications—Diuretics 85.21% 79.27% 87.01% Children and Adolescents' Access to Primary Care Practitioners—12 to 24 Months 96.07% 95.97% 94.31% Children and Adolescents' Access to Primary Care Practitioners—25 Months to 6 Years
87.40% 87.66% 86.22%
Children and Adolescents' Access to Primary Care Practitioners—7 to 11 Years 88.02% 89.89% 89.02% Children and Adolescents' Access to Primary Care Practitioners—12 to 19 Years 87.64% 85.77% 86.46%
*Member months are a member’s “contribution” to the total yearly membership.

NON-SPD TREND TABLES
2015 HEDIS Aggregate Report Page C-14 California Department of Health Care Services Health Services Advisory Group, Inc.
Table C.13—Anthem Blue Cross Partnership Plan—Tulare County HEDIS 2015 Non-SPD Trend Table
Measure RY
2013 RY
2014 RY
2015
RYs 2014–15 Rate
Difference All-Cause Readmissions—Statewide Collaborative QIP measure 7.83% 8.22% 9.45% Ambulatory Care—Emergency Department Visits per 1,000 MM* 38.85 39.20 39.08 Not Tested
Ambulatory Care—Outpatient Visits per 1,000 MM* 278.32 305.19 296.37 Not Tested
Annual Monitoring for Patients on Persistent Medications—ACE Inhibitors or ARBs 75.69% 84.20% 81.37% Annual Monitoring for Patients on Persistent Medications—Digoxin NA NA NA Not Comparable
Annual Monitoring for Patients on Persistent Medications—Diuretics 77.22% 81.50% 79.21% Children and Adolescents' Access to Primary Care Practitioners—12 to 24 Months 92.49% 97.77% 97.22% Children and Adolescents' Access to Primary Care Practitioners—25 Months to 6 Years
82.70% 90.38% 91.15%
Children and Adolescents' Access to Primary Care Practitioners—7 to 11 Years 79.53% 88.28% 91.36%
Children and Adolescents' Access to Primary Care Practitioners—12 to 19 Years 82.13% 87.56% 90.64%
*Member months are a member’s “contribution” to the total yearly membership.
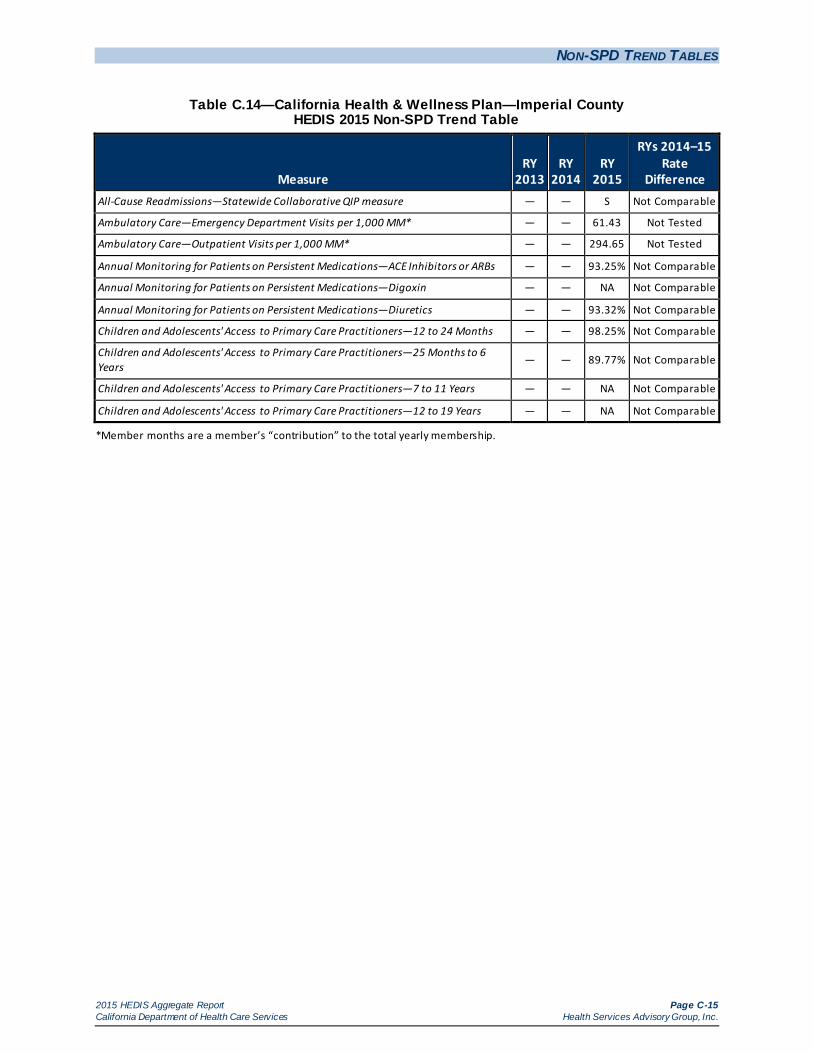
NON-SPD TREND TABLES
2015 HEDIS Aggregate Report Page C-15 California Department of Health Care Services Health Services Advisory Group, Inc.
Table C.14—California Health & Wellness Plan—Imperial County HEDIS 2015 Non-SPD Trend Table
Measure RY
2013 RY
2014 RY
2015
RYs 2014–15 Rate
Difference All-Cause Readmissions—Statewide Collaborative QIP measure — — S Not Comparable
Ambulatory Care—Emergency Department Visits per 1,000 MM* — — 61.43 Not Tested
Ambulatory Care—Outpatient Visits per 1,000 MM* — — 294.65 Not Tested
Annual Monitoring for Patients on Persistent Medications—ACE Inhibitors or ARBs — — 93.25% Not Comparable
Annual Monitoring for Patients on Persistent Medications—Digoxin — — NA Not Comparable
Annual Monitoring for Patients on Persistent Medications—Diuretics — — 93.32% Not Comparable
Children and Adolescents' Access to Primary Care Practitioners—12 to 24 Months — — 98.25% Not Comparable
Children and Adolescents' Access to Primary Care Practitioners—25 Months to 6 Years
— — 89.77% Not Comparable
Children and Adolescents' Access to Primary Care Practitioners—7 to 11 Years — — NA Not Comparable
Children and Adolescents' Access to Primary Care Practitioners—12 to 19 Years — — NA Not Comparable
*Member months are a member’s “contribution” to the total yearly membership.

NON-SPD TREND TABLES
2015 HEDIS Aggregate Report Page C-16 California Department of Health Care Services Health Services Advisory Group, Inc.
Table C.15—California Health & Wellness Plan—Region 1 (Butte, Colusa, Glenn, Plumas, Sierra, Sutter, and Tehama Counties)
HEDIS 2015 Non-SPD Trend Table
Measure RY
2013 RY
2014 RY
2015
RYs 2014–15 Rate
Difference All-Cause Readmissions—Statewide Collaborative QIP measure — — 12.38% Not Comparable
Ambulatory Care—Emergency Department Visits per 1,000 MM* — — 46.76 Not Tested
Ambulatory Care—Outpatient Visits per 1,000 MM* — — 325.44 Not Tested
Annual Monitoring for Patients on Persistent Medications—ACE Inhibitors or ARBs — — 81.51% Not Comparable
Annual Monitoring for Patients on Persistent Medications—Digoxin — — NA Not Comparable
Annual Monitoring for Patients on Persistent Medications—Diuretics — — 80.84% Not Comparable
Children and Adolescents' Access to Primary Care Practitioners—12 to 24 Months — — 94.20% Not Comparable
Children and Adolescents' Access to Primary Care Practitioners—25 Months to 6 Years — — 88.29% Not Comparable
Children and Adolescents' Access to Primary Care Practitioners—7 to 11 Years — — NA Not Comparable
Children and Adolescents' Access to Primary Care Practitioners—12 to 19 Years — — NA Not Comparable
*Member months are a member’s “contribution” to the total yearly membership.

NON-SPD TREND TABLES
2015 HEDIS Aggregate Report Page C-17 California Department of Health Care Services Health Services Advisory Group, Inc.
Table C.16—California Health & Wellness Plan—Region 2 (Alpine, Amador, Calaveras, El Dorado, Inyo, Mariposa, Mono, Nevada, Placer, Tuolumne, and Yuba Counties)
HEDIS 2015 Non-SPD Trend Table
Measure RY
2013 RY
2014 RY
2015
RYs 2014–15 Rate
Difference All-Cause Readmissions—Statewide Collaborative QIP measure — — S Not Comparable
Ambulatory Care—Emergency Department Visits per 1,000 MM* — — 59.01 Not Tested
Ambulatory Care—Outpatient Visits per 1,000 MM* — — 253.23 Not Tested
Annual Monitoring for Patients on Persistent Medications—ACE Inhibitors or ARBs — — 81.31% Not Comparable
Annual Monitoring for Patients on Persistent Medications—Digoxin — — NA Not Comparable
Annual Monitoring for Patients on Persistent Medications—Diuretics — — 82.15% Not Comparable
Children and Adolescents' Access to Primary Care Practitioners—12 to 24 Months — — 91.35% Not Comparable
Children and Adolescents' Access to Primary Care Practitioners—25 Months to 6 Years — — 80.58% Not Comparable
Children and Adolescents' Access to Primary Care Practitioners—7 to 11 Years — — NA Not Comparable
Children and Adolescents' Access to Primary Care Practitioners—12 to 19 Years — — NA Not Comparable
*Member months are a member’s “contribution” to the total yearly membership.

NON-SPD TREND TABLES
2015 HEDIS Aggregate Report Page C-18 California Department of Health Care Services Health Services Advisory Group, Inc.
Table C.17—CalOptima—Orange County HEDIS 2015 Non-SPD Trend Table
Measure RY
2013 RY
2014 RY
2015
RYs 2014–15 Rate
Difference All-Cause Readmissions—Statewide Collaborative QIP measure 11.35% 10.83% 14.49%
Ambulatory Care—Emergency Department Visits per 1,000 MM* 34.15 32.50 33.33 Not Tested
Ambulatory Care—Outpatient Visits per 1,000 MM* 288.81 226.81 227.07 Not Tested
Annual Monitoring for Patients on Persistent Medications—ACE Inhibitors or ARBs 87.58% 86.11% 88.91%
Annual Monitoring for Patients on Persistent Medications—Digoxin 91.18% NA 46.90% Not Comparable
Annual Monitoring for Patients on Persistent Medications—Diuretics 86.39% 83.73% 87.62%
Children and Adolescents' Access to Primary Care Practitioners—12 to 24 Months 97.45% 97.54% 94.33%
Children and Adolescents' Access to Primary Care Practitioners—25 Months to 6 Years 91.29% 91.62% 89.59%
Children and Adolescents' Access to Primary Care Practitioners—7 to 11 Years 92.03% 92.64% 92.88% Children and Adolescents' Access to Primary Care Practitioners—12 to 19 Years 90.99% 89.52% 90.27%
*Member months are a member’s “contribution” to the total yearly membership.

NON-SPD TREND TABLES
2015 HEDIS Aggregate Report Page C-19 California Department of Health Care Services Health Services Advisory Group, Inc.
Table C.18—CalViva Health—Fresno County HEDIS 2015 Non-SPD Trend Table
Measure RY
2013 RY
2014 RY
2015
RYs 2014–15 Rate
Difference All-Cause Readmissions—Statewide Collaborative QIP measure 7.69% 7.78% 11.20%
Ambulatory Care—Emergency Department Visits per 1,000 MM* 42.99 47.62 30.78 Not Tested
Ambulatory Care—Outpatient Visits per 1,000 MM* 435.84 458.67 294.85 Not Tested
Annual Monitoring for Patients on Persistent Medications—ACE Inhibitors or ARBs 80.26% 83.64% 82.74% Annual Monitoring for Patients on Persistent Medications—Digoxin
NA NA NA Not
Comparable
Annual Monitoring for Patients on Persistent Medications—Diuretics 79.47% 81.23% 81.37% Children and Adolescents' Access to Primary Care Practitioners—12 to 24 Months 97.90% 96.57% 95.28%
Children and Adolescents' Access to Primary Care Practitioners—25 Months to 6 Years
91.52% 91.06% 89.69%
Children and Adolescents' Access to Primary Care Practitioners—7 to 11 Years 91.65% 91.33% 91.36% Children and Adolescents' Access to Primary Care Practitioners—12 to 19 Years 90.67% 87.45% 87.98%
*Member months are a member’s “contribution” to the total yearly membership.

NON-SPD TREND TABLES
2015 HEDIS Aggregate Report Page C-20 California Department of Health Care Services Health Services Advisory Group, Inc.
Table C.19—CalViva Health—Kings County HEDIS 2015 Non-SPD Trend Table
Measure RY
2013 RY
2014 RY
2015
RYs 2014–15 Rate
Difference All-Cause Readmissions—Statewide Collaborative QIP measure 5.00% S 9.13% Ambulatory Care—Emergency Department Visits per 1,000 MM* 53.80 55.66 38.54 Not Tested
Ambulatory Care—Outpatient Visits per 1,000 MM* 419.16 403.24 278.19 Not Tested
Annual Monitoring for Patients on Persistent Medications—ACE Inhibitors or ARBs 74.65% 81.71% 77.15% Annual Monitoring for Patients on Persistent Medications—Digoxin NA NA NA Not Comparable
Annual Monitoring for Patients on Persistent Medications—Diuretics 71.18% 74.56% 78.54% Children and Adolescents' Access to Primary Care Practitioners—12 to 24 Months 96.94% 94.85% 89.65%
Children and Adolescents' Access to Primary Care Practitioners—25 Months to 6 Years
89.73% 83.44% 83.59%
Children and Adolescents' Access to Primary Care Practitioners—7 to 11 Years NA 86.92% 86.01% Children and Adolescents' Access to Primary Care Practitioners—12 to 19 Years NA 84.55% 85.35%
*Member months are a member’s “contribution” to the total yearly membership.

NON-SPD TREND TABLES
2015 HEDIS Aggregate Report Page C-21 California Department of Health Care Services Health Services Advisory Group, Inc.
Table C.20—CalViva Health—Madera County HEDIS 2015 Non-SPD Trend Table
Measure RY
2013 RY
2014 RY
2015
RYs 2014–15 Rate
Difference All-Cause Readmissions—Statewide Collaborative QIP measure 7.41% S 9.80% Ambulatory Care—Emergency Department Visits per 1,000 MM* 48.98 49.54 30.13 Not Tested
Ambulatory Care—Outpatient Visits per 1,000 MM* 425.90 464.83 320.60 Not Tested
Annual Monitoring for Patients on Persistent Medications—ACE Inhibitors or ARBs 76.08% 80.41% 84.62% Annual Monitoring for Patients on Persistent Medications—Digoxin NA NA NA Not Comparable
Annual Monitoring for Patients on Persistent Medications—Diuretics 75.86% 81.42% 81.77% Children and Adolescents' Access to Primary Care Practitioners—12 to 24 Months 98.67% 98.06% 95.30%
Children and Adolescents' Access to Primary Care Practitioners—25 Months to 6 Years
91.77% 93.38% 91.95%
Children and Adolescents' Access to Primary Care Practitioners—7 to 11 Years NA 92.84% 92.69% Children and Adolescents' Access to Primary Care Practitioners—12 to 19 Years NA 90.76% 90.64%
*Member months are a member’s “contribution” to the total yearly membership.

NON-SPD TREND TABLES
2015 HEDIS Aggregate Report Page C-22 California Department of Health Care Services Health Services Advisory Group, Inc.
Table C.21—Care1st Partner Plan—San Diego County HEDIS 2015 Non-SPD Trend Table
Measure RY
2013 RY
2014 RY
2015
RYs 2014–15 Rate
Difference All-Cause Readmissions—Statewide Collaborative QIP measure 8.65% 8.64% 13.92%
Ambulatory Care—Emergency Department Visits per 1,000 MM* 43.32 44.72 49.57 Not Tested
Ambulatory Care—Outpatient Visits per 1,000 MM* 249.97 237.00 345.87 Not Tested
Annual Monitoring for Patients on Persistent Medications—ACE Inhibitors or ARBs 84.85% 76.14% 84.75%
Annual Monitoring for Patients on Persistent Medications—Digoxin NA NA NA Not Comparable
Annual Monitoring for Patients on Persistent Medications—Diuretics 75.23% 72.65% 87.75%
Children and Adolescents' Access to Primary Care Practitioners—12 to 24 Months 93.78% 89.78% 86.15%
Children and Adolescents' Access to Primary Care Practitioners—25 Months to 6 Years 83.10% 81.31% 78.31%
Children and Adolescents' Access to Primary Care Practitioners—7 to 11 Years 82.68% 81.93% 81.66% Children and Adolescents' Access to Primary Care Practitioners—12 to 19 Years 81.22% 79.34% 77.52%
*Member months are a member’s “contribution” to the total yearly membership.

NON-SPD TREND TABLES
2015 HEDIS Aggregate Report Page C-23 California Department of Health Care Services Health Services Advisory Group, Inc.
Table C.22—CenCal Health—San Luis Obispo County HEDIS 2015 Non-SPD Trend Table
Measure RY
2013 RY
2014 RY
2015
RYs 2014–15 Rate
Difference All-Cause Readmissions—Statewide Collaborative QIP measure 6.70% 6.71% 12.06% Ambulatory Care—Emergency Department Visits per 1,000 MM* 57.42 53.41 53.41 Not Tested
Ambulatory Care—Outpatient Visits per 1,000 MM* 303.89 296.02 313.29 Not Tested
Annual Monitoring for Patients on Persistent Medications—ACE Inhibitors or ARBs 74.84% 71.79% 83.10%
Annual Monitoring for Patients on Persistent Medications—Digoxin NA NA NA Not Comparable
Annual Monitoring for Patients on Persistent Medications—Diuretics 78.57% 72.97% 84.36%
Children and Adolescents' Access to Primary Care Practitioners—12 to 24 Months 95.37% 96.86% 93.18%
Children and Adolescents' Access to Primary Care Practitioners—25 Months to 6 Years
86.59% 90.04% 84.43%
Children and Adolescents' Access to Primary Care Practitioners—7 to 11 Years 87.92% 90.91% 90.17% Children and Adolescents' Access to Primary Care Practitioners—12 to 19 Years 87.58% 87.41% 89.19%
*Member months are a member’s “contribution” to the total yearly membership.

NON-SPD TREND TABLES
2015 HEDIS Aggregate Report Page C-24 California Department of Health Care Services Health Services Advisory Group, Inc.
Table C.23—CenCal Health—Santa Barbara County HEDIS 2015 Non-SPD Trend Table
Measure RY
2013 RY
2014 RY
2015
RYs 2014–15 Rate
Difference All-Cause Readmissions—Statewide Collaborative QIP measure 5.54% 7.29% 9.81% Ambulatory Care—Emergency Department Visits per 1,000 MM* 46.35 46.42 47.04 Not Tested
Ambulatory Care—Outpatient Visits per 1,000 MM* 308.44 272.79 280.68 Not Tested
Annual Monitoring for Patients on Persistent Medications—ACE Inhibitors or ARBs 80.90% 79.54% 83.97% Annual Monitoring for Patients on Persistent Medications—Digoxin NA NA NA Not Comparable
Annual Monitoring for Patients on Persistent Medications—Diuretics 78.97% 81.53% 83.57% Children and Adolescents' Access to Primary Care Practitioners—12 to 24 Months 97.87% 98.48% 96.80%
Children and Adolescents' Access to Primary Care Practitioners—25 Months to 6 Years
91.26% 93.63% 91.56%
Children and Adolescents' Access to Primary Care Practitioners—7 to 11 Years 91.01% 92.99% 93.82%
Children and Adolescents' Access to Primary Care Practitioners—12 to 19 Years 89.25% 90.65% 90.60%
*Member months are a member’s “contribution” to the total yearly membership.

NON-SPD TREND TABLES
2015 HEDIS Aggregate Report Page C-25 California Department of Health Care Services Health Services Advisory Group, Inc.
Table C.24—Central California Alliance for Health—Merced County HEDIS 2015 Non-SPD Trend Table
Measure RY
2013 RY
2014 RY
2015
RYs 2014–15 Rate
Difference All-Cause Readmissions—Statewide Collaborative QIP measure 9.86% 8.00% 14.39%
Ambulatory Care—Emergency Department Visits per 1,000 MM* 51.12 50.05 48.28 Not Tested
Ambulatory Care—Outpatient Visits per 1,000 MM* 299.06 297.38 280.19 Not Tested
Annual Monitoring for Patients on Persistent Medications—ACE Inhibitors or ARBs 86.26% 82.92% 86.14% Annual Monitoring for Patients on Persistent Medications—Digoxin NA NA NA Not Comparable
Annual Monitoring for Patients on Persistent Medications—Diuretics 84.96% 79.91% 83.73% Children and Adolescents' Access to Primary Care Practitioners—12 to 24 Months 97.51% 97.66% 95.35%
Children and Adolescents' Access to Primary Care Practitioners—25 Months to 6 Years
90.37% 91.67% 89.46%
Children and Adolescents' Access to Primary Care Practitioners—7 to 11 Years 89.76% 90.11% 90.67% Children and Adolescents' Access to Primary Care Practitioners—12 to 19 Years 90.30% 88.58% 89.23%
*Member months are a member’s “contribution” to the total yearly membership.

NON-SPD TREND TABLES
2015 HEDIS Aggregate Report Page C-26 California Department of Health Care Services Health Services Advisory Group, Inc.
Table C.25—Central California Alliance for Health—Monterey/Santa Cruz Counties HEDIS 2015 Non-SPD Trend Table
Measure RY
2013 RY
2014 RY
2015
RYs 2014–15 Rate
Difference All-Cause Readmissions—Statewide Collaborative QIP measure 7.78% 7.69% 11.32%
Ambulatory Care—Emergency Department Visits per 1,000 MM* 49.10 44.17 43.18 Not Tested
Ambulatory Care—Outpatient Visits per 1,000 MM* 293.93 282.10 275.69 Not Tested
Annual Monitoring for Patients on Persistent Medications—ACE Inhibitors or ARBs 80.15% 83.28% 85.21% Annual Monitoring for Patients on Persistent Medications—Digoxin NA NA NA Not Comparable
Annual Monitoring for Patients on Persistent Medications—Diuretics 78.84% 80.85% 85.83%
Children and Adolescents' Access to Primary Care Practitioners—12 to 24 Months 98.50% 98.32% 96.05%
Children and Adolescents' Access to Primary Care Practitioners—25 Months to 6 Years
91.26% 92.06% 90.14%
Children and Adolescents' Access to Primary Care Practitioners—7 to 11 Years 90.86% 93.21% 92.42%
Children and Adolescents' Access to Primary Care Practitioners—12 to 19 Years 91.17% 91.08% 89.98%
*Member months are a member’s “contribution” to the total yearly membership.

NON-SPD TREND TABLES
2015 HEDIS Aggregate Report Page C-27 California Department of Health Care Services Health Services Advisory Group, Inc.
Table C.26—Community Health Group Partnership Plan—San Diego County HEDIS 2015 Non-SPD Trend Table
Measure RY
2013 RY
2014 RY
2015
RYs 2014–15 Rate
Difference All-Cause Readmissions—Statewide Collaborative QIP measure 10.79% 10.38% 15.62%
Ambulatory Care—Emergency Department Visits per 1,000 MM* 34.30 35.06 44.00 Not Tested
Ambulatory Care—Outpatient Visits per 1,000 MM* 287.97 280.48 265.64 Not Tested
Annual Monitoring for Patients on Persistent Medications—ACE Inhibitors or ARBs 84.91% 83.18% 82.85% Annual Monitoring for Patients on Persistent Medications—Digoxin NA NA 64.52% Not Comparable
Annual Monitoring for Patients on Persistent Medications—Diuretics 84.06% 81.92% 83.57% Children and Adolescents' Access to Primary Care Practitioners—12 to 24 Months 97.34% 95.94% 93.46%
Children and Adolescents' Access to Primary Care Practitioners—25 Months to 6 Years
89.87% 89.97% 87.21%
Children and Adolescents' Access to Primary Care Practitioners—7 to 11 Years 89.76% 89.39% 90.27%
Children and Adolescents' Access to Primary Care Practitioners—12 to 19 Years 88.70% 85.50% 85.99%
*Member months are a member’s “contribution” to the total yearly membership.

NON-SPD TREND TABLES
2015 HEDIS Aggregate Report Page C-28 California Department of Health Care Services Health Services Advisory Group, Inc.
Table C.27—Contra Costa Health Plan—Contra Costa County HEDIS 2015 Non-SPD Trend Table
Measure RY
2013 RY
2014 RY
2015
RYs 2014–15 Rate
Difference All-Cause Readmissions—Statewide Collaborative QIP measure 12.72% 9.53% 10.62% Ambulatory Care—Emergency Department Visits per 1,000 MM* 55.98 48.06 52.20 Not Tested
Ambulatory Care—Outpatient Visits per 1,000 MM* 199.28 223.77 242.58 Not Tested
Annual Monitoring for Patients on Persistent Medications—ACE Inhibitors or ARBs 78.37% 83.51% 83.66% Annual Monitoring for Patients on Persistent Medications—Digoxin NA NA 77.14% Not Comparable
Annual Monitoring for Patients on Persistent Medications—Diuretics 77.84% 84.67% 82.04% Children and Adolescents' Access to Primary Care Practitioners—12 to 24 Months 86.81% 94.62% 94.03% Children and Adolescents' Access to Primary Care Practitioners—25 Months to 6 Years
76.24% 86.03% 84.22%
Children and Adolescents' Access to Primary Care Practitioners—7 to 11 Years 77.74% 86.72% 86.51% Children and Adolescents' Access to Primary Care Practitioners—12 to 19 Years 74.46% 83.50% 83.96%
*Member months are a member’s “contribution” to the total yearly membership.
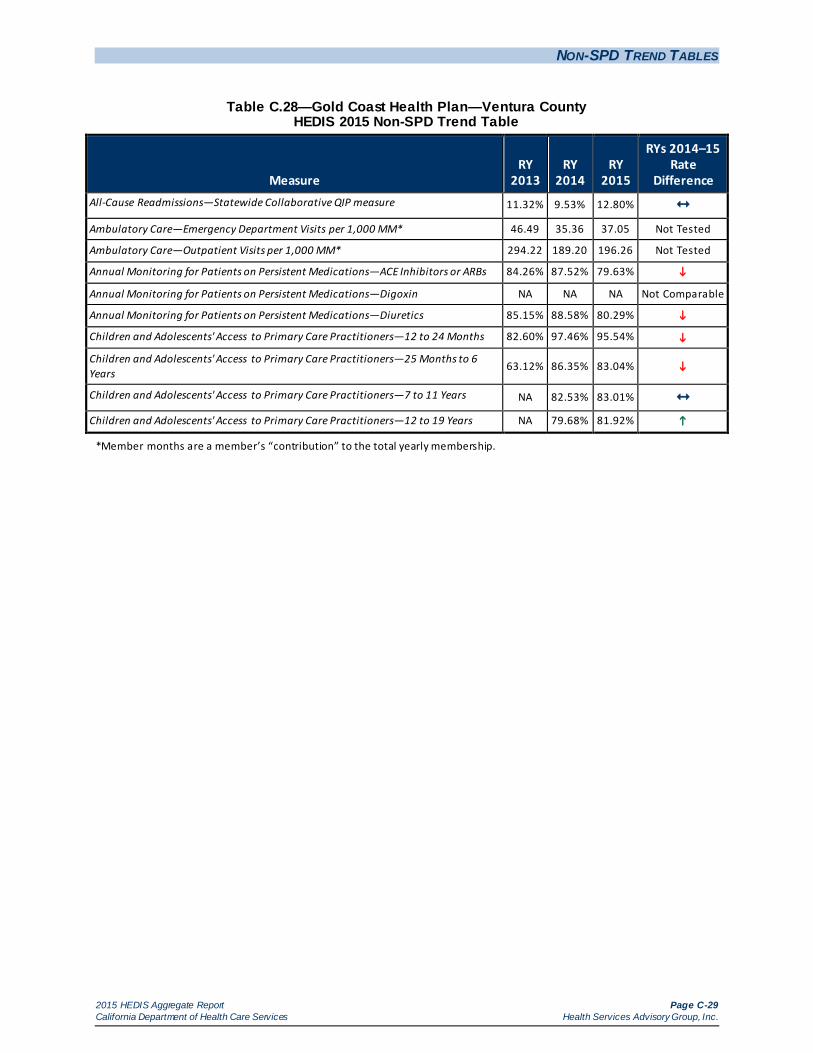
NON-SPD TREND TABLES
2015 HEDIS Aggregate Report Page C-29 California Department of Health Care Services Health Services Advisory Group, Inc.
Table C.28—Gold Coast Health Plan—Ventura County HEDIS 2015 Non-SPD Trend Table
Measure RY
2013 RY
2014 RY
2015
RYs 2014–15 Rate
Difference All-Cause Readmissions—Statewide Collaborative QIP measure 11.32% 9.53% 12.80% Ambulatory Care—Emergency Department Visits per 1,000 MM* 46.49 35.36 37.05 Not Tested
Ambulatory Care—Outpatient Visits per 1,000 MM* 294.22 189.20 196.26 Not Tested
Annual Monitoring for Patients on Persistent Medications—ACE Inhibitors or ARBs 84.26% 87.52% 79.63%
Annual Monitoring for Patients on Persistent Medications—Digoxin NA NA NA Not Comparable
Annual Monitoring for Patients on Persistent Medications—Diuretics 85.15% 88.58% 80.29%
Children and Adolescents' Access to Primary Care Practitioners—12 to 24 Months 82.60% 97.46% 95.54%
Children and Adolescents' Access to Primary Care Practitioners—25 Months to 6 Years
63.12% 86.35% 83.04%
Children and Adolescents' Access to Primary Care Practitioners—7 to 11 Years NA 82.53% 83.01% Children and Adolescents' Access to Primary Care Practitioners—12 to 19 Years NA 79.68% 81.92%
*Member months are a member’s “contribution” to the total yearly membership.

NON-SPD TREND TABLES
2015 HEDIS Aggregate Report Page C-30 California Department of Health Care Services Health Services Advisory Group, Inc.
Table C.29—Health Net Community Solutions, Inc.—Kern County HEDIS 2015 Non-SPD Trend Table
Measure RY
2013 RY
2014 RY
2015
RYs 2014–15 Rate
Difference All-Cause Readmissions—Statewide Collaborative QIP measure 7.36% 9.35% 13.78% Ambulatory Care—Emergency Department Visits per 1,000 MM* 47.99 48.90 33.30 Not Tested
Ambulatory Care—Outpatient Visits per 1,000 MM* 196.35 359.51 226.19 Not Tested
Annual Monitoring for Patients on Persistent Medications—ACE Inhibitors or ARBs 70.82% 86.73% 87.59% Annual Monitoring for Patients on Persistent Medications—Digoxin NA NA NA Not Comparable
Annual Monitoring for Patients on Persistent Medications—Diuretics 70.73% 82.89% 86.56% Children and Adolescents' Access to Primary Care Practitioners—12 to 24 Months 89.99% 93.14% 90.57%
Children and Adolescents' Access to Primary Care Practitioners—25 Months to 6 Years
70.52% 79.32% 79.49%
Children and Adolescents' Access to Primary Care Practitioners—7 to 11 Years 68.00% 67.84% 71.93%
Children and Adolescents' Access to Primary Care Practitioners—12 to 19 Years 76.72% 67.83% 72.05%
*Member months are a member’s “contribution” to the total yearly membership.
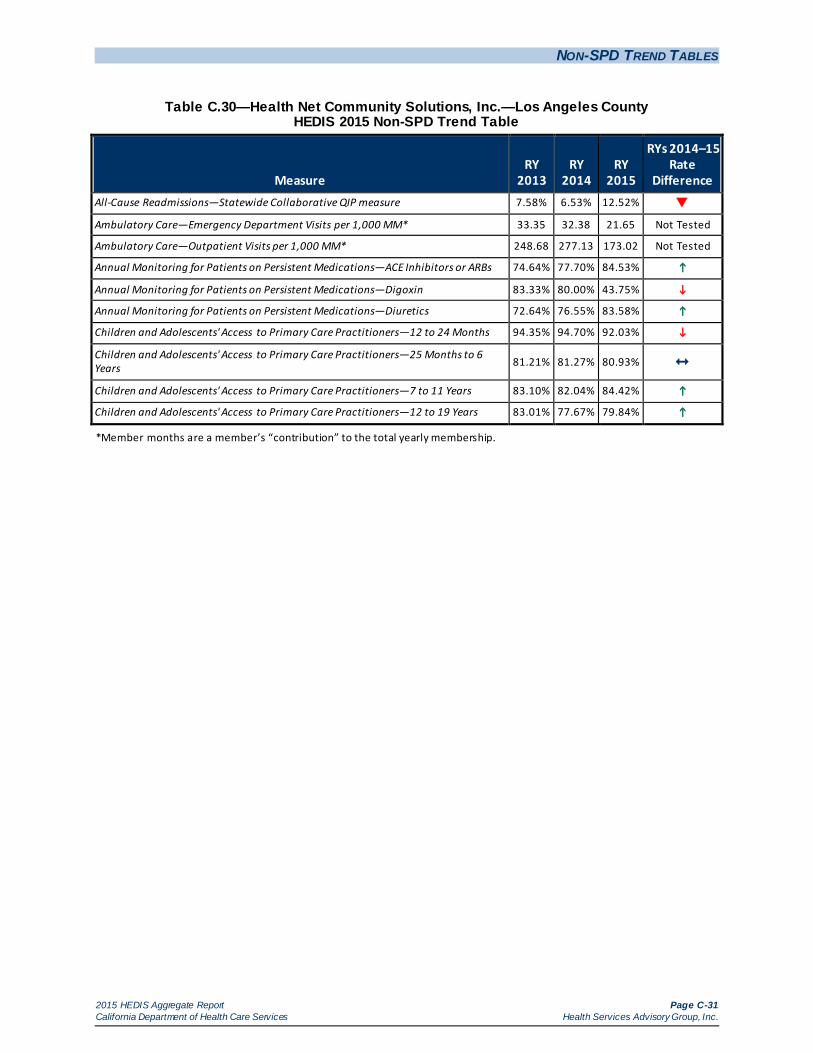
NON-SPD TREND TABLES
2015 HEDIS Aggregate Report Page C-31 California Department of Health Care Services Health Services Advisory Group, Inc.
Table C.30—Health Net Community Solutions, Inc.—Los Angeles County HEDIS 2015 Non-SPD Trend Table
Measure RY
2013 RY
2014 RY
2015
RYs 2014–15 Rate
Difference All-Cause Readmissions—Statewide Collaborative QIP measure 7.58% 6.53% 12.52%
Ambulatory Care—Emergency Department Visits per 1,000 MM* 33.35 32.38 21.65 Not Tested
Ambulatory Care—Outpatient Visits per 1,000 MM* 248.68 277.13 173.02 Not Tested
Annual Monitoring for Patients on Persistent Medications—ACE Inhibitors or ARBs 74.64% 77.70% 84.53%
Annual Monitoring for Patients on Persistent Medications—Digoxin 83.33% 80.00% 43.75%
Annual Monitoring for Patients on Persistent Medications—Diuretics 72.64% 76.55% 83.58%
Children and Adolescents' Access to Primary Care Practitioners—12 to 24 Months 94.35% 94.70% 92.03%
Children and Adolescents' Access to Primary Care Practitioners—25 Months to 6 Years 81.21% 81.27% 80.93%
Children and Adolescents' Access to Primary Care Practitioners—7 to 11 Years 83.10% 82.04% 84.42%
Children and Adolescents' Access to Primary Care Practitioners—12 to 19 Years 83.01% 77.67% 79.84%
*Member months are a member’s “contribution” to the total yearly membership.

NON-SPD TREND TABLES
2015 HEDIS Aggregate Report Page C-32 California Department of Health Care Services Health Services Advisory Group, Inc.
Table C.31—Health Net Community Solutions, Inc.—Sacramento County HEDIS 2015 Non-SPD Trend Table
Measure RY
2013 RY
2014 RY
2015
RYs 2014–15
Rate Difference
All-Cause Readmissions—Statewide Collaborative QIP measure 6.02% 9.16% 12.34% Ambulatory Care—Emergency Department Visits per 1,000 MM* 39.84 39.23 28.31 Not Tested
Ambulatory Care—Outpatient Visits per 1,000 MM* 274.99 293.32 169.33 Not Tested
Annual Monitoring for Patients on Persistent Medications—ACE Inhibitors or ARBs 61.52% 67.61% 76.78%
Annual Monitoring for Patients on Persistent Medications—Digoxin NA NA NA
Not Comparable
Annual Monitoring for Patients on Persistent Medications—Diuretics 56.74% 63.48% 74.42%
Children and Adolescents' Access to Primary Care Practitioners—12 to 24 Months 92.71% 92.50% 89.13%
Children and Adolescents' Access to Primary Care Practitioners—25 Months to 6 Years 80.23% 81.11% 80.12%
Children and Adolescents' Access to Primary Care Practitioners—7 to 11 Years 80.41% 79.18% 80.76%
Children and Adolescents' Access to Primary Care Practitioners—12 to 19 Years 81.67% 75.14% 76.93%
*Member months are a member’s “contribution” to the total yearly membership.

NON-SPD TREND TABLES
2015 HEDIS Aggregate Report Page C-33 California Department of Health Care Services Health Services Advisory Group, Inc.
Table C.32—Health Net Community Solutions, Inc.—San Diego County HEDIS 2015 Non-SPD Trend Table
Measure RY
2013 RY
2014 RY
2015
RYs 2014–15 Rate
Difference All-Cause Readmissions—Statewide Collaborative QIP measure 9.38% 7.87% 13.39% Ambulatory Care—Emergency Department Visits per 1,000 MM* 46.14 41.81 24.93 Not Tested
Ambulatory Care—Outpatient Visits per 1,000 MM* 296.72 362.03 218.65 Not Tested
Annual Monitoring for Patients on Persistent Medications—ACE Inhibitors or ARBs 76.98% 83.47% 74.66% Annual Monitoring for Patients on Persistent Medications—Digoxin NA NA NA Not Comparable
Annual Monitoring for Patients on Persistent Medications—Diuretics 75.42% 78.26% 77.67% Children and Adolescents' Access to Primary Care Practitioners—12 to 24 Months 94.45% 96.17% 92.45%
Children and Adolescents' Access to Primary Care Practitioners—25 Months to 6 Years
85.41% 88.28% 85.13%
Children and Adolescents' Access to Primary Care Practitioners—7 to 11 Years 84.87% 86.55% 88.08% Children and Adolescents' Access to Primary Care Practitioners—12 to 19 Years 82.60% 82.56% 81.69%
*Member months are a member’s “contribution” to the total yearly membership.

NON-SPD TREND TABLES
2015 HEDIS Aggregate Report Page C-34 California Department of Health Care Services Health Services Advisory Group, Inc.
Table C.33—Health Net Community Solutions, Inc.—San Joaquin County HEDIS 2015 Non-SPD Trend Table
Measure RY
2013 RY
2014 RY
2015
RYs 2014–15 Rate
Difference All-Cause Readmissions—Statewide Collaborative QIP measure — NA 15.96% Not Comparable
Ambulatory Care—Emergency Department Visits per 1,000 MM* — 46.94 29.20 Not Tested
Ambulatory Care—Outpatient Visits per 1,000 MM* — 256.64 142.99 Not Tested
Annual Monitoring for Patients on Persistent Medications—ACE Inhibitors or ARBs — 57.45% 74.48%
Annual Monitoring for Patients on Persistent Medications—Digoxin — NA NA Not Comparable
Annual Monitoring for Patients on Persistent Medications—Diuretics — NA 78.23% Not Comparable
Children and Adolescents' Access to Primary Care Practitioners—12 to 24 Months — 91.89% 86.67% Children and Adolescents' Access to Primary Care Practitioners—25 Months to 6 Years
— 76.48% 69.42%
Children and Adolescents' Access to Primary Care Practitioners—7 to 11 Years — NA 76.98% Not Comparable
Children and Adolescents' Access to Primary Care Practitioners—12 to 19 Years — NA 75.17% Not Comparable
*Member months are a member’s “contribution” to the total yearly membership.

NON-SPD TREND TABLES
2015 HEDIS Aggregate Report Page C-35 California Department of Health Care Services Health Services Advisory Group, Inc.
Table C.34—Health Net Community Solutions, Inc.—Stanislaus County HEDIS 2015 Non-SPD Trend Table
Measure RY
2013 RY
2014 RY
2015
RYs 2014–15 Rate
Difference All-Cause Readmissions—Statewide Collaborative QIP measure 5.66% S 12.35%
Ambulatory Care—Emergency Department Visits per 1,000 MM* 50.77 56.78 38.34 Not Tested
Ambulatory Care—Outpatient Visits per 1,000 MM* 350.80 378.60 225.96 Not Tested
Annual Monitoring for Patients on Persistent Medications—ACE Inhibitors or ARBs 84.65% 81.05% 78.65% Annual Monitoring for Patients on Persistent Medications—Digoxin NA NA NA Not Comparable
Annual Monitoring for Patients on Persistent Medications—Diuretics 80.25% 79.47% 83.29% Children and Adolescents' Access to Primary Care Practitioners—12 to 24 Months 97.12% 95.53% 93.01%
Children and Adolescents' Access to Primary Care Practitioners—25 Months to 6 Years
87.18% 85.74% 84.22%
Children and Adolescents' Access to Primary Care Practitioners—7 to 11 Years 84.96% 86.32% 86.31% Children and Adolescents' Access to Primary Care Practitioners—12 to 19 Years 85.74% 83.89% 82.44%
*Member months are a member’s “contribution” to the total yearly membership.

NON-SPD TREND TABLES
2015 HEDIS Aggregate Report Page C-36 California Department of Health Care Services Health Services Advisory Group, Inc.
Table C.35—Health Net Community Solutions, Inc.—Tulare County HEDIS 2015 Non-SPD Trend Table
Measure RY
2013 RY
2014 RY
2015
RYs 2014–15 Rate
Difference All-Cause Readmissions—Statewide Collaborative QIP measure 5.79% 9.62% 10.34% Ambulatory Care—Emergency Department Visits per 1,000 MM* 37.86 38.64 25.50 Not Tested
Ambulatory Care—Outpatient Visits per 1,000 MM* 449.45 486.43 305.08 Not Tested
Annual Monitoring for Patients on Persistent Medications—ACE Inhibitors or ARBs 83.16% 85.29% 83.43% Annual Monitoring for Patients on Persistent Medications—Digoxin NA NA NA Not Comparable
Annual Monitoring for Patients on Persistent Medications—Diuretics 79.55% 81.40% 83.07% Children and Adolescents' Access to Primary Care Practitioners—12 to 24 Months 97.78% 97.57% 95.95%
Children and Adolescents' Access to Primary Care Practitioners—25 Months to 6 Years
92.30% 92.05% 89.74%
Children and Adolescents' Access to Primary Care Practitioners—7 to 11 Years 91.58% 91.06% 90.28% Children and Adolescents' Access to Primary Care Practitioners—12 to 19 Years 93.09% 89.35% 88.49%
*Member months are a member’s “contribution” to the total yearly membership.

NON-SPD TREND TABLES
2015 HEDIS Aggregate Report Page C-37 California Department of Health Care Services Health Services Advisory Group, Inc.
Table C.36—Health Plan of San Joaquin—San Joaquin County HEDIS 2015 Non-SPD Trend Table
Measure RY
2013 RY
2014 RY
2015
RYs 2014–15 Rate
Difference All-Cause Readmissions—Statewide Collaborative QIP measure 6.27% 6.86% 7.91% Ambulatory Care—Emergency Department Visits per 1,000 MM* 43.01 42.34 43.63 Not Tested
Ambulatory Care—Outpatient Visits per 1,000 MM* 246.24 223.43 225.18 Not Tested
Annual Monitoring for Patients on Persistent Medications—ACE Inhibitors or ARBs 80.70% 81.28% 79.93% Annual Monitoring for Patients on Persistent Medications—Digoxin NA NA NA Not Comparable
Annual Monitoring for Patients on Persistent Medications—Diuretics 81.44% 80.14% 78.50% Children and Adolescents' Access to Primary Care Practitioners—12 to 24 Months 97.51% 97.00% 96.14%
Children and Adolescents' Access to Primary Care Practitioners—25 Months to 6 Years
87.52% 87.86% 85.08%
Children and Adolescents' Access to Primary Care Practitioners—7 to 11 Years 85.55% 86.67% 86.21% Children and Adolescents' Access to Primary Care Practitioners—12 to 19 Years 84.77% 83.07% 82.44%
*Member months are a member’s “contribution” to the total yearly membership.

NON-SPD TREND TABLES
2015 HEDIS Aggregate Report Page C-38 California Department of Health Care Services Health Services Advisory Group, Inc.
Table C.37—Health Plan of San Joaquin—Stanislaus County HEDIS 2015 Non-SPD Trend Table
Measure RY
2013 RY
2014 RY
2015
RYs 2014–15 Rate
Difference All-Cause Readmissions—Statewide Collaborative QIP measure — 8.67% 8.95% Ambulatory Care—Emergency Department Visits per 1,000 MM* — 51.51 56.92 Not Tested
Ambulatory Care—Outpatient Visits per 1,000 MM* — 244.19 254.18 Not Tested
Annual Monitoring for Patients on Persistent Medications—ACE Inhibitors or ARBs — 80.48% 82.84% Annual Monitoring for Patients on Persistent Medications—Digoxin — NA NA Not Comparable
Annual Monitoring for Patients on Persistent Medications—Diuretics — 84.05% 83.86% Children and Adolescents' Access to Primary Care Practitioners—12 to 24 Months — 97.21% 92.42%
Children and Adolescents' Access to Primary Care Practitioners—25 Months to 6 Years
— 88.33% 84.35%
Children and Adolescents' Access to Primary Care Practitioners—7 to 11 Years — 88.87% 87.48% Children and Adolescents' Access to Primary Care Practitioners—12 to 19 Years — 86.62% 84.41%
*Member months are a member’s “contribution” to the total yearly membership.

NON-SPD TREND TABLES
2015 HEDIS Aggregate Report Page C-39 California Department of Health Care Services Health Services Advisory Group, Inc.
Table C.38—Health Plan of San Mateo—San Mateo County HEDIS 2015 Non-SPD Trend Table
Measure RY
2013 RY
2014 RY
2015
RYs 2014–15 Rate
Difference All-Cause Readmissions—Statewide Collaborative QIP measure 19.24% 11.52% 11.64% Ambulatory Care—Emergency Department Visits per 1,000 MM* 49.86 44.87 47.21 Not Tested
Ambulatory Care—Outpatient Visits per 1,000 MM* 405.92 326.37 351.81 Not Tested
Annual Monitoring for Patients on Persistent Medications—ACE Inhibitors or ARBs 85.52% 83.57% 86.99% Annual Monitoring for Patients on Persistent Medications—Digoxin NA NA 56.67% Not Comparable
Annual Monitoring for Patients on Persistent Medications—Diuretics 84.70% 82.05% 86.47% Children and Adolescents' Access to Primary Care Practitioners—12 to 24 Months 96.98% 97.15% 93.94%
Children and Adolescents' Access to Primary Care Practitioners—25 Months to 6 Years
88.77% 90.80% 89.51%
Children and Adolescents' Access to Primary Care Practitioners—7 to 11 Years 90.72% 90.92% 92.37%
Children and Adolescents' Access to Primary Care Practitioners—12 to 19 Years 87.60% 86.89% 88.43%
*Member months are a member’s “contribution” to the total yearly membership.

NON-SPD TREND TABLES
2015 HEDIS Aggregate Report Page C-40 California Department of Health Care Services Health Services Advisory Group, Inc.
Table C.39—Inland Empire Health Plan—Riverside/San Bernardino Counties HEDIS 2015 Non-SPD Trend Table
Measure RY
2013 RY
2014 RY
2015
RYs 2014–15 Rate
Difference All-Cause Readmissions—Statewide Collaborative QIP measure 9.82% 9.67% 13.43%
Ambulatory Care—Emergency Department Visits per 1,000 MM* 48.29 44.44 46.76 Not Tested
Ambulatory Care—Outpatient Visits per 1,000 MM* 308.23 247.47 225.61 Not Tested
Annual Monitoring for Patients on Persistent Medications—ACE Inhibitors or ARBs 83.14% 82.43% 86.53%
Annual Monitoring for Patients on Persistent Medications—Digoxin 96.23% 85.19% 50.35%
Annual Monitoring for Patients on Persistent Medications—Diuretics 81.24% 80.92% 85.29%
Children and Adolescents' Access to Primary Care Practitioners—12 to 24 Months 96.76% 96.70% 94.73%
Children and Adolescents' Access to Primary Care Practitioners—25 Months to 6 Years 86.92% 86.81% 84.71%
Children and Adolescents' Access to Primary Care Practitioners—7 to 11 Years 82.97% 84.46% 84.26% Children and Adolescents' Access to Primary Care Practitioners—12 to 19 Years 86.73% 84.06% 83.10%
*Member months are a member’s “contribution” to the total yearly membership.
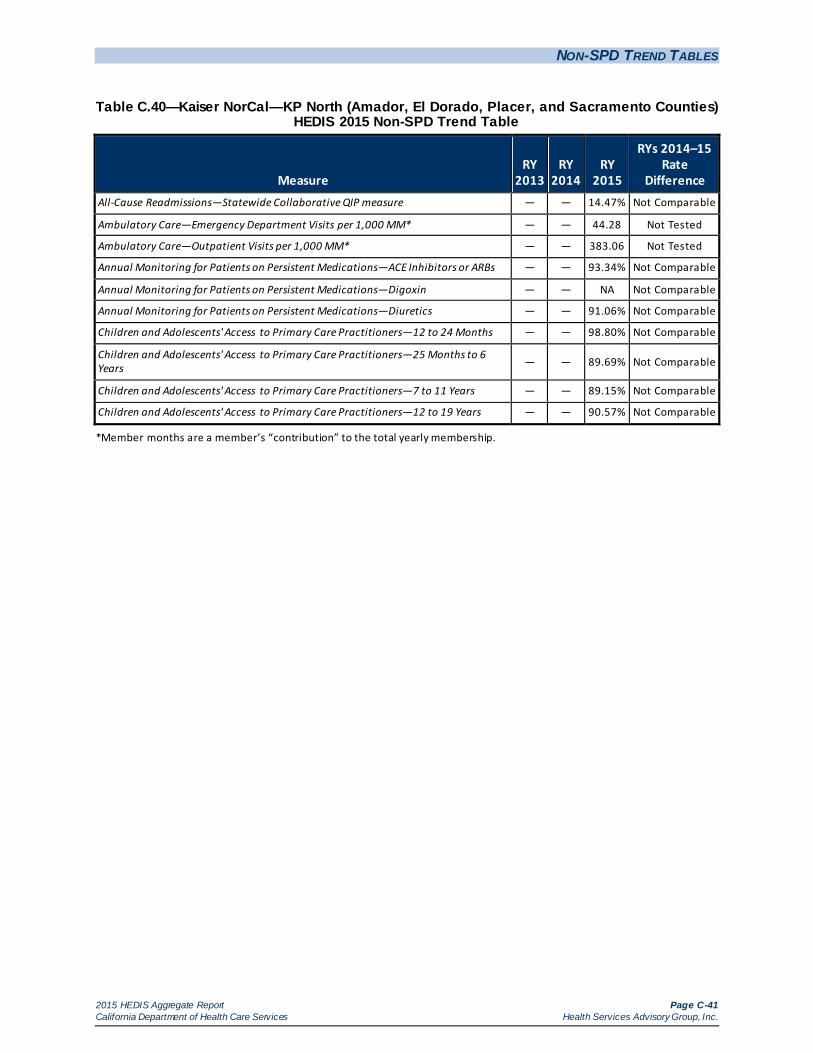
NON-SPD TREND TABLES
2015 HEDIS Aggregate Report Page C-41 California Department of Health Care Services Health Services Advisory Group, Inc.
Table C.40—Kaiser NorCal—KP North (Amador, El Dorado, Placer, and Sacramento Counties) HEDIS 2015 Non-SPD Trend Table
Measure RY
2013 RY
2014 RY
2015
RYs 2014–15 Rate
Difference All-Cause Readmissions—Statewide Collaborative QIP measure — — 14.47% Not Comparable
Ambulatory Care—Emergency Department Visits per 1,000 MM* — — 44.28 Not Tested
Ambulatory Care—Outpatient Visits per 1,000 MM* — — 383.06 Not Tested
Annual Monitoring for Patients on Persistent Medications—ACE Inhibitors or ARBs — — 93.34% Not Comparable
Annual Monitoring for Patients on Persistent Medications—Digoxin — — NA Not Comparable
Annual Monitoring for Patients on Persistent Medications—Diuretics — — 91.06% Not Comparable
Children and Adolescents' Access to Primary Care Practitioners—12 to 24 Months — — 98.80% Not Comparable
Children and Adolescents' Access to Primary Care Practitioners—25 Months to 6 Years — — 89.69% Not Comparable
Children and Adolescents' Access to Primary Care Practitioners—7 to 11 Years — — 89.15% Not Comparable
Children and Adolescents' Access to Primary Care Practitioners—12 to 19 Years — — 90.57% Not Comparable
*Member months are a member’s “contribution” to the total yearly membership.

NON-SPD TREND TABLES
2015 HEDIS Aggregate Report Page C-42 California Department of Health Care Services Health Services Advisory Group, Inc.
Table C.41—Kaiser SoCal—San Diego County HEDIS 2015 Non-SPD Trend Table
Measure RY
2013 RY
2014 RY
2015
RYs 2014–15 Rate
Difference All-Cause Readmissions—Statewide Collaborative QIP measure 6.67% 11.46% 9.91% Ambulatory Care—Emergency Department Visits per 1,000 MM* 35.60 26.61 29.60 Not Tested
Ambulatory Care—Outpatient Visits per 1,000 MM* 415.75 343.04 408.75 Not Tested
Annual Monitoring for Patients on Persistent Medications—ACE Inhibitors or ARBs 91.74% 90.99% 91.89% Annual Monitoring for Patients on Persistent Medications—Digoxin NA NA NA Not Comparable
Annual Monitoring for Patients on Persistent Medications—Diuretics 91.46% 91.03% 91.36% Children and Adolescents' Access to Primary Care Practitioners—12 to 24 Months 99.51% 99.50% 97.83%
Children and Adolescents' Access to Primary Care Practitioners—25 Months to 6 Years
94.23% 93.49% 95.54%
Children and Adolescents' Access to Primary Care Practitioners—7 to 11 Years 95.14% 89.42% 93.01%
Children and Adolescents' Access to Primary Care Practitioners—12 to 19 Years 97.23% 87.65% 92.89%
*Member months are a member’s “contribution” to the total yearly membership.

NON-SPD TREND TABLES
2015 HEDIS Aggregate Report Page C-43 California Department of Health Care Services Health Services Advisory Group, Inc.
Table C.42—Kern Health Systems—Kern County HEDIS 2015 Non-SPD Trend Table
Measure RY
2013 RY
2014 RY
2015
RYs 2014–15 Rate
Difference All-Cause Readmissions—Statewide Collaborative QIP measure 6.27% 11.62% 13.32% Ambulatory Care—Emergency Department Visits per 1,000 MM* 48.21 46.93 47.95 Not Tested
Ambulatory Care—Outpatient Visits per 1,000 MM* 240.89 248.15 259.98 Not Tested
Annual Monitoring for Patients on Persistent Medications—ACE Inhibitors or ARBs 85.38% 88.05% 88.39% Annual Monitoring for Patients on Persistent Medications—Digoxin NA NA NA Not Comparable
Annual Monitoring for Patients on Persistent Medications—Diuretics 85.34% 88.03% 87.18% Children and Adolescents' Access to Primary Care Practitioners—12 to 24 Months 92.43% 93.25% 92.75% Children and Adolescents' Access to Primary Care Practitioners—25 Months to 6 Years
82.13% 84.37% 82.85%
Children and Adolescents' Access to Primary Care Practitioners—7 to 11 Years 79.38% 81.42% 82.61%
Children and Adolescents' Access to Primary Care Practitioners—12 to 19 Years 82.19% 80.64% 81.14%
*Member months are a member’s “contribution” to the total yearly membership.

NON-SPD TREND TABLES
2015 HEDIS Aggregate Report Page C-44 California Department of Health Care Services Health Services Advisory Group, Inc.
Table C.43—L.A. Care Health Plan—Los Angeles County HEDIS 2015 Non-SPD Trend Table
Measure RY
2013 RY
2014 RY
2015
RYs 2014–15 Rate
Difference All-Cause Readmissions—Statewide Collaborative QIP measure 10.99% 9.19% 13.55%
Ambulatory Care—Emergency Department Visits per 1,000 MM* 27.42 32.50 31.16 Not Tested
Ambulatory Care—Outpatient Visits per 1,000 MM* 169.83 294.71 284.50 Not Tested
Annual Monitoring for Patients on Persistent Medications—ACE Inhibitors or ARBs 72.80% 78.24% 85.50%
Annual Monitoring for Patients on Persistent Medications—Digoxin 75.57% 89.77% 40.65%
Annual Monitoring for Patients on Persistent Medications—Diuretics 71.64% 77.33% 83.81%
Children and Adolescents' Access to Primary Care Practitioners—12 to 24 Months 91.20% 91.98% 92.33% Children and Adolescents' Access to Primary Care Practitioners—25 Months to 6 Years
82.97% 82.88% 84.21%
Children and Adolescents' Access to Primary Care Practitioners—7 to 11 Years 87.12% 83.93% 86.47%
Children and Adolescents' Access to Primary Care Practitioners—12 to 19 Years 85.96% 79.56% 82.42%
*Member months are a member’s “contribution” to the total yearly membership.
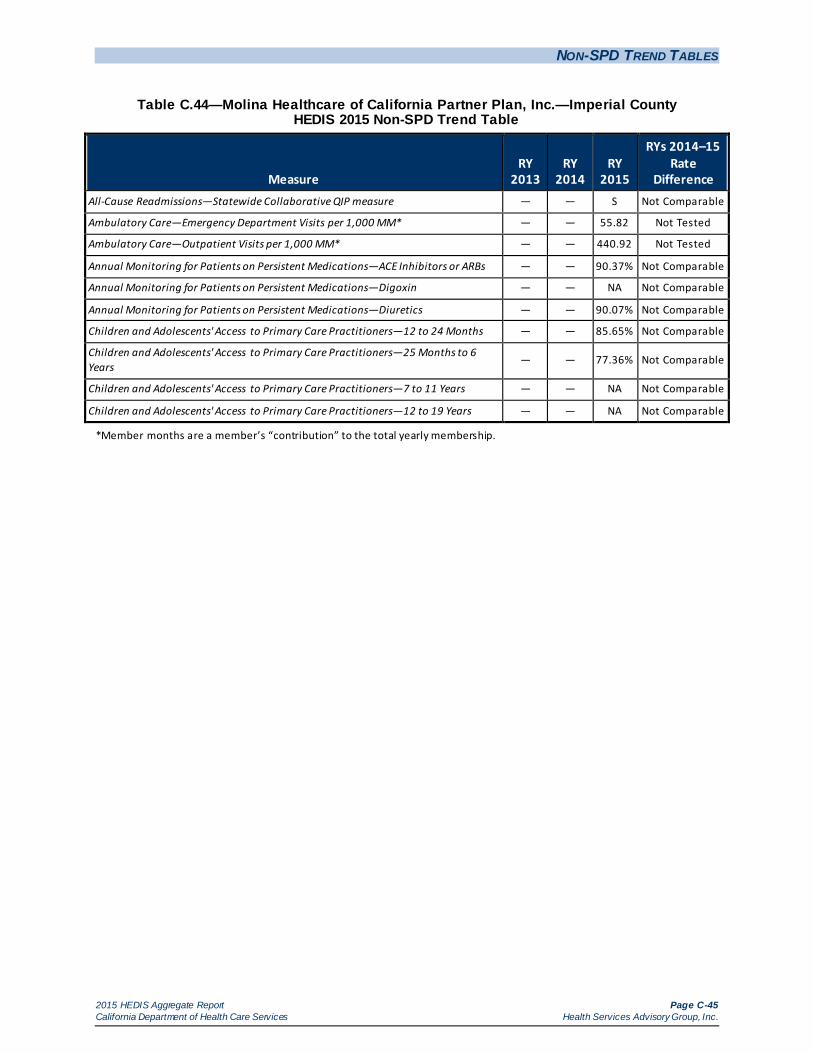
NON-SPD TREND TABLES
2015 HEDIS Aggregate Report Page C-45 California Department of Health Care Services Health Services Advisory Group, Inc.
Table C.44—Molina Healthcare of California Partner Plan, Inc.—Imperial County HEDIS 2015 Non-SPD Trend Table
Measure RY
2013 RY
2014 RY
2015
RYs 2014–15 Rate
Difference All-Cause Readmissions—Statewide Collaborative QIP measure — — S Not Comparable
Ambulatory Care—Emergency Department Visits per 1,000 MM* — — 55.82 Not Tested
Ambulatory Care—Outpatient Visits per 1,000 MM* — — 440.92 Not Tested
Annual Monitoring for Patients on Persistent Medications—ACE Inhibitors or ARBs — — 90.37% Not Comparable
Annual Monitoring for Patients on Persistent Medications—Digoxin — — NA Not Comparable
Annual Monitoring for Patients on Persistent Medications—Diuretics — — 90.07% Not Comparable
Children and Adolescents' Access to Primary Care Practitioners—12 to 24 Months — — 85.65% Not Comparable
Children and Adolescents' Access to Primary Care Practitioners—25 Months to 6 Years
— — 77.36% Not Comparable
Children and Adolescents' Access to Primary Care Practitioners—7 to 11 Years — — NA Not Comparable
Children and Adolescents' Access to Primary Care Practitioners—12 to 19 Years — — NA Not Comparable
*Member months are a member’s “contribution” to the total yearly membership.

NON-SPD TREND TABLES
2015 HEDIS Aggregate Report Page C-46 California Department of Health Care Services Health Services Advisory Group, Inc.
Table C.45—Molina Healthcare of California Partner Plan, Inc.—Riverside/San Bernardino Counties HEDIS 2015 Non-SPD Trend Table
Measure RY
2013 RY
2014 RY
2015
RYs 2014–15 Rate
Difference All-Cause Readmissions—Statewide Collaborative QIP measure 9.17% 8.46% 10.87% Ambulatory Care—Emergency Department Visits per 1,000 MM* 40.14 35.41 37.13 Not Tested
Ambulatory Care—Outpatient Visits per 1,000 MM* 247.94 192.15 335.56 Not Tested
Annual Monitoring for Patients on Persistent Medications—ACE Inhibitors or ARBs 83.14% 83.84% 84.73% Annual Monitoring for Patients on Persistent Medications—Digoxin NA NA NA Not Comparable
Annual Monitoring for Patients on Persistent Medications—Diuretics 80.14% 81.00% 83.25% Children and Adolescents' Access to Primary Care Practitioners—12 to 24 Months 93.77% 92.80% 90.92%
Children and Adolescents' Access to Primary Care Practitioners—25 Months to 6 Years
83.13% 85.22% 81.89%
Children and Adolescents' Access to Primary Care Practitioners—7 to 11 Years 81.88% 85.22% 84.31% Children and Adolescents' Access to Primary Care Practitioners—12 to 19 Years 84.55% 84.03% 83.65%
*Member months are a member’s “contribution” to the total yearly membership.
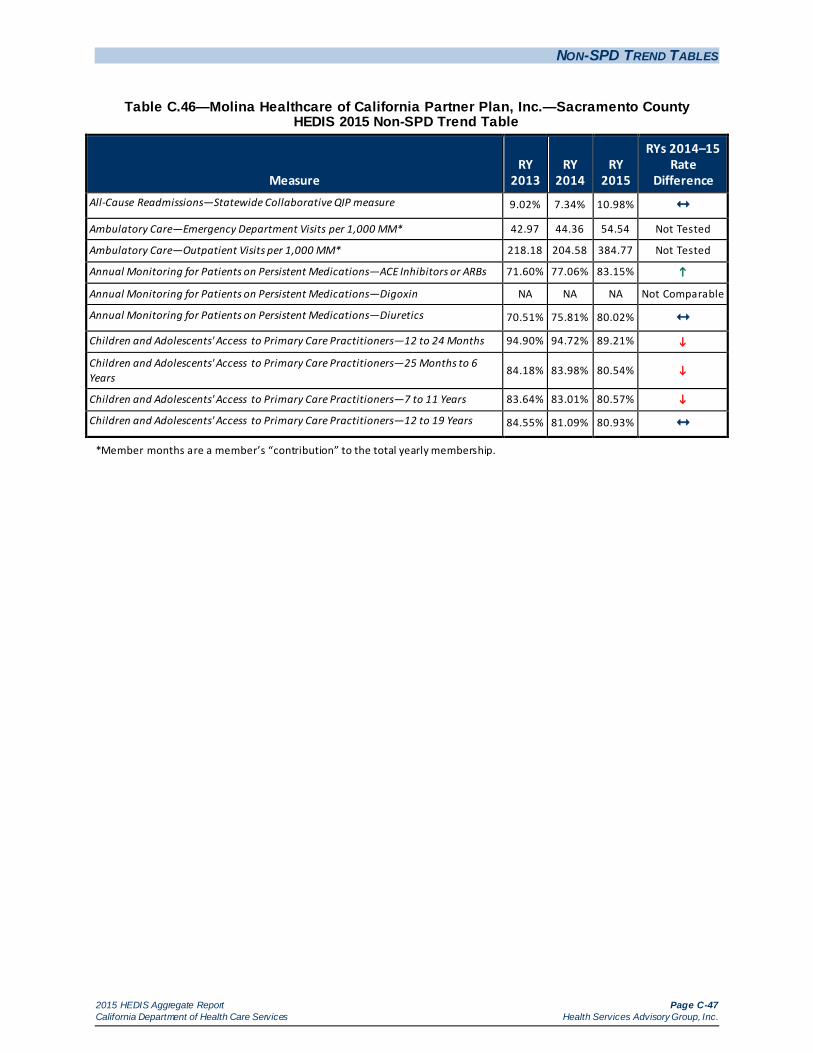
NON-SPD TREND TABLES
2015 HEDIS Aggregate Report Page C-47 California Department of Health Care Services Health Services Advisory Group, Inc.
Table C.46—Molina Healthcare of California Partner Plan, Inc.—Sacramento County HEDIS 2015 Non-SPD Trend Table
Measure RY
2013 RY
2014 RY
2015
RYs 2014–15 Rate
Difference All-Cause Readmissions—Statewide Collaborative QIP measure 9.02% 7.34% 10.98% Ambulatory Care—Emergency Department Visits per 1,000 MM* 42.97 44.36 54.54 Not Tested
Ambulatory Care—Outpatient Visits per 1,000 MM* 218.18 204.58 384.77 Not Tested
Annual Monitoring for Patients on Persistent Medications—ACE Inhibitors or ARBs 71.60% 77.06% 83.15%
Annual Monitoring for Patients on Persistent Medications—Digoxin NA NA NA Not Comparable
Annual Monitoring for Patients on Persistent Medications—Diuretics 70.51% 75.81% 80.02% Children and Adolescents' Access to Primary Care Practitioners—12 to 24 Months 94.90% 94.72% 89.21%
Children and Adolescents' Access to Primary Care Practitioners—25 Months to 6 Years
84.18% 83.98% 80.54%
Children and Adolescents' Access to Primary Care Practitioners—7 to 11 Years 83.64% 83.01% 80.57%
Children and Adolescents' Access to Primary Care Practitioners—12 to 19 Years 84.55% 81.09% 80.93%
*Member months are a member’s “contribution” to the total yearly membership.
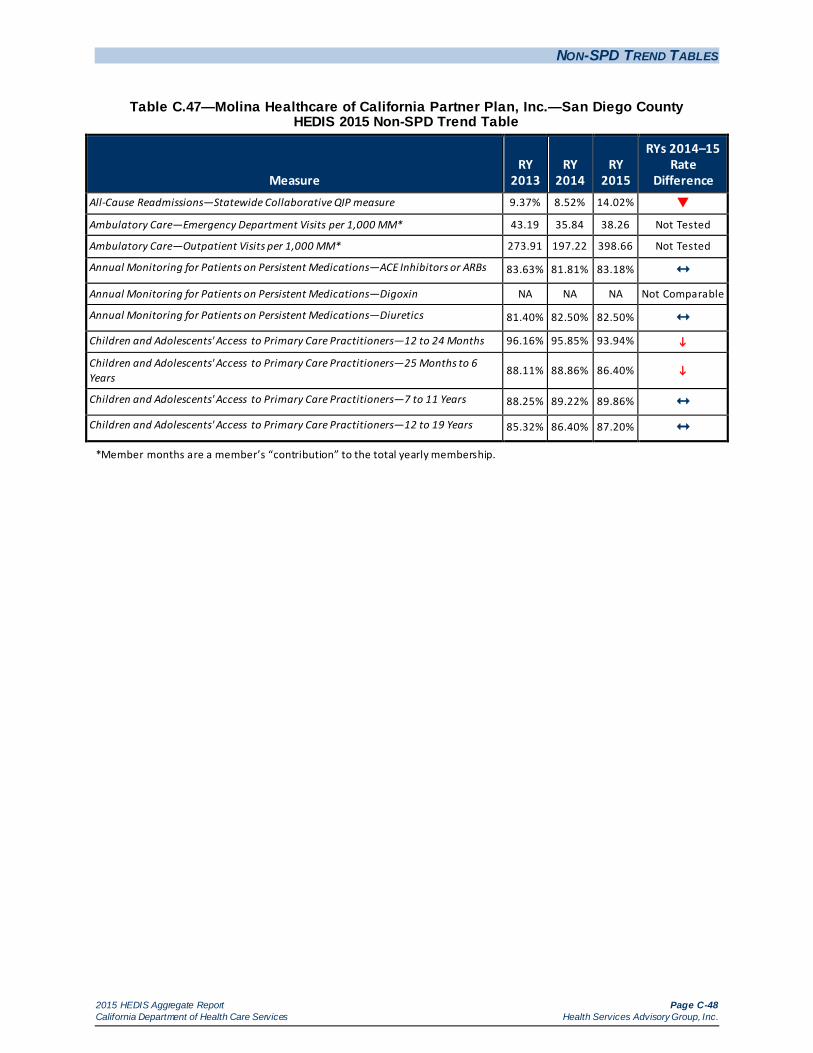
NON-SPD TREND TABLES
2015 HEDIS Aggregate Report Page C-48 California Department of Health Care Services Health Services Advisory Group, Inc.
Table C.47—Molina Healthcare of California Partner Plan, Inc.—San Diego County HEDIS 2015 Non-SPD Trend Table
Measure RY
2013 RY
2014 RY
2015
RYs 2014–15 Rate
Difference All-Cause Readmissions—Statewide Collaborative QIP measure 9.37% 8.52% 14.02%
Ambulatory Care—Emergency Department Visits per 1,000 MM* 43.19 35.84 38.26 Not Tested
Ambulatory Care—Outpatient Visits per 1,000 MM* 273.91 197.22 398.66 Not Tested
Annual Monitoring for Patients on Persistent Medications—ACE Inhibitors or ARBs 83.63% 81.81% 83.18% Annual Monitoring for Patients on Persistent Medications—Digoxin NA NA NA Not Comparable
Annual Monitoring for Patients on Persistent Medications—Diuretics 81.40% 82.50% 82.50% Children and Adolescents' Access to Primary Care Practitioners—12 to 24 Months 96.16% 95.85% 93.94%
Children and Adolescents' Access to Primary Care Practitioners—25 Months to 6 Years
88.11% 88.86% 86.40%
Children and Adolescents' Access to Primary Care Practitioners—7 to 11 Years 88.25% 89.22% 89.86% Children and Adolescents' Access to Primary Care Practitioners—12 to 19 Years 85.32% 86.40% 87.20%
*Member months are a member’s “contribution” to the total yearly membership.
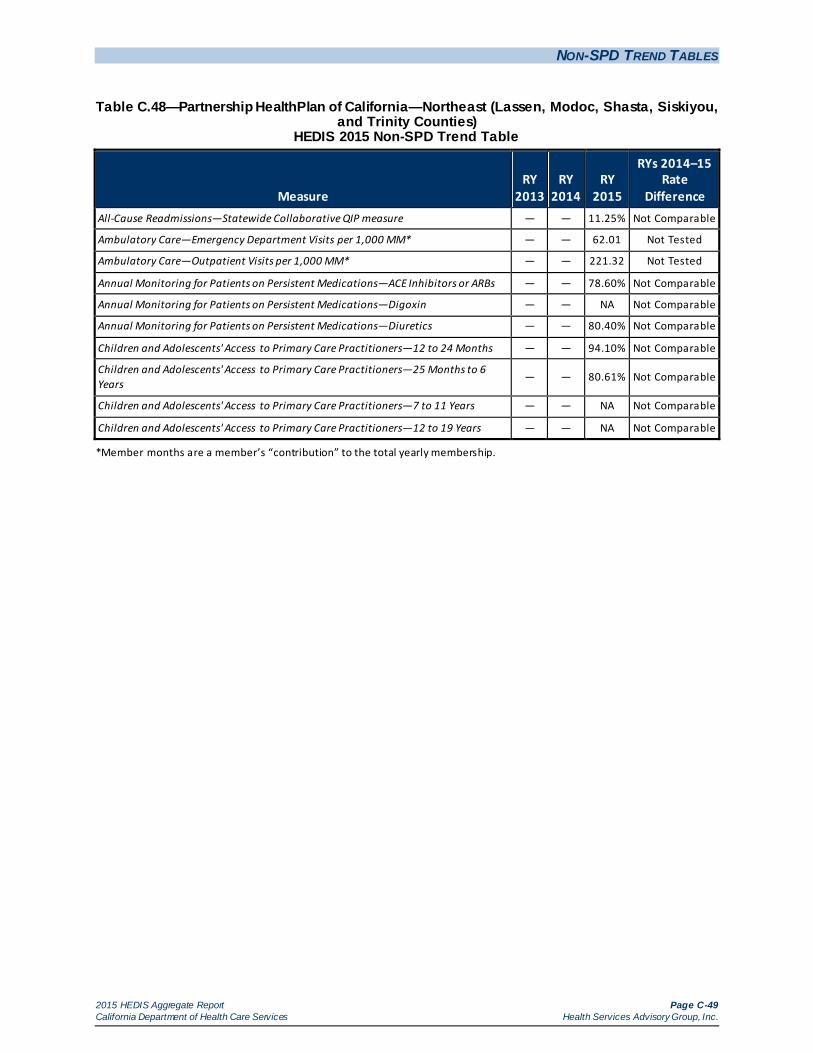
NON-SPD TREND TABLES
2015 HEDIS Aggregate Report Page C-49 California Department of Health Care Services Health Services Advisory Group, Inc.
Table C.48—Partnership HealthPlan of California—Northeast (Lassen, Modoc, Shasta, Siskiyou, and Trinity Counties)
HEDIS 2015 Non-SPD Trend Table
Measure RY
2013 RY
2014 RY
2015
RYs 2014–15 Rate
Difference All-Cause Readmissions—Statewide Collaborative QIP measure — — 11.25% Not Comparable
Ambulatory Care—Emergency Department Visits per 1,000 MM* — — 62.01 Not Tested
Ambulatory Care—Outpatient Visits per 1,000 MM* — — 221.32 Not Tested
Annual Monitoring for Patients on Persistent Medications—ACE Inhibitors or ARBs — — 78.60% Not Comparable
Annual Monitoring for Patients on Persistent Medications—Digoxin — — NA Not Comparable
Annual Monitoring for Patients on Persistent Medications—Diuretics — — 80.40% Not Comparable
Children and Adolescents' Access to Primary Care Practitioners—12 to 24 Months — — 94.10% Not Comparable
Children and Adolescents' Access to Primary Care Practitioners—25 Months to 6 Years
— — 80.61% Not Comparable
Children and Adolescents' Access to Primary Care Practitioners—7 to 11 Years — — NA Not Comparable
Children and Adolescents' Access to Primary Care Practitioners—12 to 19 Years — — NA Not Comparable
*Member months are a member’s “contribution” to the total yearly membership.

NON-SPD TREND TABLES
2015 HEDIS Aggregate Report Page C-50 California Department of Health Care Services Health Services Advisory Group, Inc.
Table C.49—Partnership HealthPlan of California—Northwest (Del Norte and Humboldt Counties) HEDIS 2015 Non-SPD Trend Table
Measure RY
2013 RY
2014 RY
2015
RYs 2014–15 Rate
Difference All-Cause Readmissions—Statewide Collaborative QIP measure — — 10.44% Not Comparable
Ambulatory Care—Emergency Department Visits per 1,000 MM* — — 48.98 Not Tested
Ambulatory Care—Outpatient Visits per 1,000 MM* — — 224.69 Not Tested
Annual Monitoring for Patients on Persistent Medications—ACE Inhibitors or ARBs — — 76.35% Not Comparable
Annual Monitoring for Patients on Persistent Medications—Digoxin — — NA Not Comparable
Annual Monitoring for Patients on Persistent Medications—Diuretics — — 78.86% Not Comparable
Children and Adolescents' Access to Primary Care Practitioners—12 to 24 Months — — 96.54% Not Comparable
Children and Adolescents' Access to Primary Care Practitioners—25 Months to 6 Years — — 87.34% Not Comparable
Children and Adolescents' Access to Primary Care Practitioners—7 to 11 Years — — NA Not Comparable
Children and Adolescents' Access to Primary Care Practitioners—12 to 19 Years — — NA Not Comparable
*Member months are a member’s “contribution” to the total yearly membership.

NON-SPD TREND TABLES
2015 HEDIS Aggregate Report Page C-51 California Department of Health Care Services Health Services Advisory Group, Inc.
Table C.50—Partnership HealthPlan of California—Southeast (Napa/Solano/Yolo Counties) HEDIS 2015 Non-SPD Trend Table
Measure RY
2013 RY
2014 RY
2015
RYs 2014–15 Rate
Difference All-Cause Readmissions—Statewide Collaborative QIP measure 6.84% 7.48% 10.71% Ambulatory Care—Emergency Department Visits per 1,000 MM* 47.01 45.79 51.68 Not Tested
Ambulatory Care—Outpatient Visits per 1,000 MM* 274.50 240.94 276.89 Not Tested
Annual Monitoring for Patients on Persistent Medications—ACE Inhibitors or ARBs 78.93% 84.91% 85.52% Annual Monitoring for Patients on Persistent Medications—Digoxin
NA NA NA Not
Comparable
Annual Monitoring for Patients on Persistent Medications—Diuretics 74.90% 83.24% 84.59% Children and Adolescents' Access to Primary Care Practitioners—12 to 24 Months 96.69% 96.88% 94.45%
Children and Adolescents' Access to Primary Care Practitioners—25 Months to 6 Years
86.57% 87.88% 86.73%
Children and Adolescents' Access to Primary Care Practitioners—7 to 11 Years 83.59% 85.88% 86.02% Children and Adolescents' Access to Primary Care Practitioners—12 to 19 Years 85.36% 84.15% 84.52%
*Member months are a member’s “contribution” to the total yearly membership.
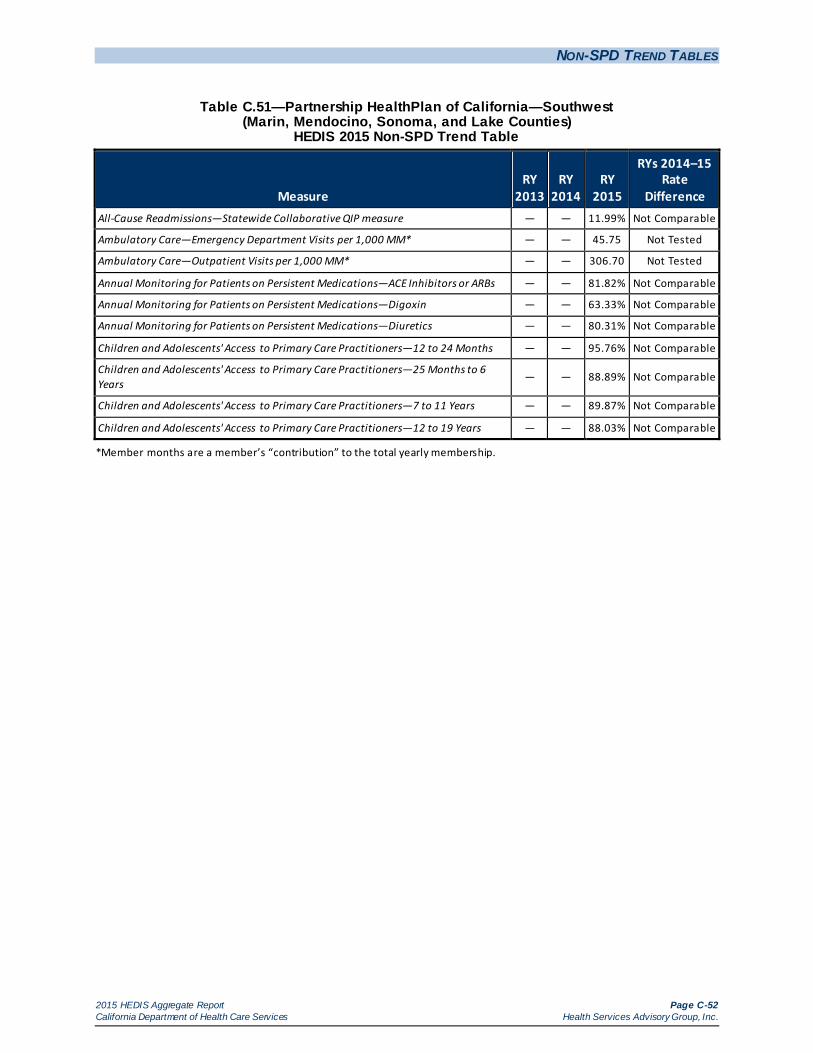
NON-SPD TREND TABLES
2015 HEDIS Aggregate Report Page C-52 California Department of Health Care Services Health Services Advisory Group, Inc.
Table C.51—Partnership HealthPlan of California—Southwest (Marin, Mendocino, Sonoma, and Lake Counties)
HEDIS 2015 Non-SPD Trend Table
Measure RY
2013 RY
2014 RY
2015
RYs 2014–15 Rate
Difference All-Cause Readmissions—Statewide Collaborative QIP measure — — 11.99% Not Comparable
Ambulatory Care—Emergency Department Visits per 1,000 MM* — — 45.75 Not Tested
Ambulatory Care—Outpatient Visits per 1,000 MM* — — 306.70 Not Tested
Annual Monitoring for Patients on Persistent Medications—ACE Inhibitors or ARBs — — 81.82% Not Comparable
Annual Monitoring for Patients on Persistent Medications—Digoxin — — 63.33% Not Comparable
Annual Monitoring for Patients on Persistent Medications—Diuretics — — 80.31% Not Comparable
Children and Adolescents' Access to Primary Care Practitioners—12 to 24 Months — — 95.76% Not Comparable
Children and Adolescents' Access to Primary Care Practitioners—25 Months to 6 Years
— — 88.89% Not Comparable
Children and Adolescents' Access to Primary Care Practitioners—7 to 11 Years — — 89.87% Not Comparable
Children and Adolescents' Access to Primary Care Practitioners—12 to 19 Years — — 88.03% Not Comparable
*Member months are a member’s “contribution” to the total yearly membership.

NON-SPD TREND TABLES
2015 HEDIS Aggregate Report Page C-53 California Department of Health Care Services Health Services Advisory Group, Inc.
Table C.52—San Francisco Health Plan—San Francisco County HEDIS 2015 Non-SPD Trend Table
Measure RY
2013 RY
2014 RY
2015
RYs 2014–15 Rate
Difference All-Cause Readmissions—Statewide Collaborative QIP measure 7.59% 5.69% 9.81%
Ambulatory Care—Emergency Department Visits per 1,000 MM* 24.57 23.26 27.68 Not Tested
Ambulatory Care—Outpatient Visits per 1,000 MM* 300.16 330.07 331.26 Not Tested
Annual Monitoring for Patients on Persistent Medications—ACE Inhibitors or ARBs 73.62% 86.25% 85.37% Annual Monitoring for Patients on Persistent Medications—Digoxin NA NA NA Not Comparable
Annual Monitoring for Patients on Persistent Medications—Diuretics 74.36% 83.72% 85.24% Children and Adolescents' Access to Primary Care Practitioners—12 to 24 Months 95.91% 97.04% 93.78%
Children and Adolescents' Access to Primary Care Practitioners—25 Months to 6 Years
89.65% 92.69% 90.09%
Children and Adolescents' Access to Primary Care Practitioners—7 to 11 Years 93.25% 94.85% 94.27% Children and Adolescents' Access to Primary Care Practitioners—12 to 19 Years 91.27% 91.16% 91.33%
*Member months are a member’s “contribution” to the total yearly membership.

NON-SPD TREND TABLES
2015 HEDIS Aggregate Report Page C-54 California Department of Health Care Services Health Services Advisory Group, Inc.
Table C.53—Santa Clara Family Health Plan—Santa Clara County HEDIS 2015 Non-SPD Trend Table
Measure RY
2013 RY
2014 RY
2015
RYs 2014–15 Rate
Difference All-Cause Readmissions—Statewide Collaborative QIP measure 8.26% 8.29% 11.91%
Ambulatory Care—Emergency Department Visits per 1,000 MM* 33.44 30.95 33.98 Not Tested
Ambulatory Care—Outpatient Visits per 1,000 MM* 244.89 240.37 216.50 Not Tested
Annual Monitoring for Patients on Persistent Medications—ACE Inhibitors or ARBs 84.67% 82.83% 86.90%
Annual Monitoring for Patients on Persistent Medications—Digoxin NA NA 53.33%
Not Comparable
Annual Monitoring for Patients on Persistent Medications—Diuretics 83.20% 81.68% 85.22%
Children and Adolescents' Access to Primary Care Practitioners—12 to 24 Months 96.87% 97.31% 94.97%
Children and Adolescents' Access to Primary Care Practitioners—25 Months to 6 Years
88.91% 88.94% 87.77%
Children and Adolescents' Access to Primary Care Practitioners—7 to 11 Years 88.91% 90.52% 90.30% Children and Adolescents' Access to Primary Care Practitioners—12 to 19 Years 87.74% 87.49% 87.02%
*Member months are a member’s “contribution” to the total yearly membership.

2015 HEDIS Aggregate Report Page D-1 California Department of Health Care Services Health Services Advisory Group, Inc.
Appendix D. MEDI-CAL MANAGED CARE HEDIS 2015 AT-A-GLANCE PERFORMANCE SUMMARY
Table D.1 provides abbreviations used throughout Appendix D, which provides a summary of each full-scope MCP’s performance.
Table D.1—Reporting Year (RY) 2015 HEDIS Performance Measures Name Key
Abbreviation Full Name AAB Avoidance of Antibiotic Treatment in Adults With Acute Bronchitis CAP-1224 Children and Adolescents' Access to Primary Care Practitioners—12 to 24 months CAP-256 Children and Adolescents' Access to Primary Care Practitioners—25 months to 6 years CAP-711 Children and Adolescents' Access to Primary Care Practitioners—7 to 11 years CAP-1219 Children and Adolescents' Access to Primary Care Practitioners—12 to 19 years CBP Controlling High Blood Pressure CCS Cervical Cancer Screening CDC-BP Comprehensive Diabetes Care—Blood Pressure Control (<140/90 mm Hg) CDC-E Comprehensive Diabetes Care—Eye Exam (Retinal) Performed CDC-H8 Comprehensive Diabetes Care—HbA1c Control (<8.0 Percent) CDC-H9 Comprehensive Diabetes Care—HbA1c Poor Control (>9.0 Percent) CDC-HT Comprehensive Diabetes Care—HbA1 Testing CDC-N Comprehensive Diabetes Care—Medical Attention for Nephropathy CIS-3 Childhood Immunization Status—Combination 3 IMA-1 Immunizations for Adolescents—Combination 1 LBP Use of Imaging Studies for Low Back Pain MMA-50 Medication Management for People with Asthma—Medication Compliance 50% Total MMA-75 Medication Management for People with Asthma—Medication Compliance 75% Total MPM-ACE Annual Monitoring for Patients on Persistent Medications—ACE Inhibitors or ARBs MPM-DIG Annual Monitoring for Patients on Persistent Medications— Digoxin MPM-DIU Annual Monitoring for Patients on Persistent Medications—Diuretics PPC-Pre Prenatal and Postpartum Care—Timeliness of Prenatal Care PPC-Pst Prenatal and Postpartum Care—Postpartum Care
WCC-BMI Weight Assessment and Counseling for Nutrition and Physical Activity for Children/Adolescents—BMI Assessment: Total
WCC-N Weight Assessment and Counseling for Nutrition and Physical Activity for Children/Adolescents—Nutrition Counseling: Total
WCC-PA Weight Assessment and Counseling for Nutrition and Physical Activity for Children/Adolescents—Physical Activity Counseling: Total
W34 Well-Child Visits in the Third, Fourth, Fifth, and Sixth Years of Life

MEDI-CAL MANAGED CARE HEDIS 2015 AT-A-GLANCE PERFORM ANCE SUM M ARY
2015 HEDIS Aggregate Report Page D-2 California Department of Health Care Services Health Services Advisory Group, Inc.
Tables D.2 and D.3 provide a summary of each full-scope MCP’s rates for each measure relative to the DHCS-established MPLs and HPLs. Although the tables reflect all RY 2015 rates that were below the MPLs and above the HPLs, DHCS did not hold the MCPs accountable to meet the MPLs in the following cases: (1) for first-year measures, (2) for measures that had significant specification changes impacting comparability, or (3) if DHCS decided to prioritize efforts in other areas of poor performance.
Table D.2—MCP Comparisons to DHCS’s Minimum Performance Levels (MPLs) and High Performance Levels (HPLs) for RY 2015
Managed Care Plan Name County Total Measures
Below MPLs Total Measures at
or Above HPLs Alameda Alliance for Health Alameda 14 1 Alameda Alliance for Health Total 14 1
Anthem Blue Cross Partnership Plan Alameda 13 1 Anthem Blue Cross Partnership Plan Contra Costa 9 1 Anthem Blue Cross Partnership Plan Fresno 10 0 Anthem Blue Cross Partnership Plan Kings 15 0 Anthem Blue Cross Partnership Plan Madera 5 4 Anthem Blue Cross Partnership Plan Sacramento 13 0 Anthem Blue Cross Partnership Plan San Francisco 6 2 Anthem Blue Cross Partnership Plan Santa Clara 2 0 Anthem Blue Cross Partnership Plan Tulare 5 0 Anthem Blue Cross Partnership Plan Region 1 8 1 Anthem Blue Cross Partnership Plan Region 2 13 0 Anthem Blue Cross Partnership Plan San Benito 13 0 Anthem Blue Cross Partnership Plan Total 112 9
California Health & Wellness Plan Imperial 6 3 California Health & Wellness Plan Region 1 12 0 California Health & Wellness Plan Region 2 12 0 California Health & Wellness Plan Total 30 3
CalOptima Orange 2 5 CalOptima Total 2 5
CalViva Health Fresno 6 1 CalViva Health Kings 11 0 CalViva Health Madera 4 4 CalViva Health Total 21 5
Care1st Partner Plan San Diego 10 0 Care1st Partner Plan Total 10 0

MEDI-CAL MANAGED CARE HEDIS 2015 AT-A-GLANCE PERFORM ANCE SUM M ARY
2015 HEDIS Aggregate Report Page D-3 California Department of Health Care Services Health Services Advisory Group, Inc.
Managed Care Plan Name County Total Measures
Below MPLs Total Measures at
or Above HPLs
CenCal Health San Luis Obispo 6 2 CenCal Health Santa Barbara 2 7 CenCal Health Total 8 9
Central California Alliance for Health Merced 2 1 Central California Alliance for Health Monterey/Santa Cruz 1 3 Central California Alliance for Health Total 3 4
Community Health Group Partnership Plan San Diego 4 3
Community Health Group Partnership Plan Total 4 3
Contra Costa Health Plan Contra Costa 7 2 Contra Costa Health Plan Total 7 2
Gold Coast Health Plan Ventura 7 0 Gold Coast Health Plan Total 7 0
Health Net Community Solutions, Inc. Kern 7 2 Health Net Community Solutions, Inc. Los Angeles 10 1 Health Net Community Solutions, Inc. Sacramento 11 0 Health Net Community Solutions, Inc. San Diego 10 1 Health Net Community Solutions, Inc. San Joaquin 10 0 Health Net Community Solutions, Inc. Stanislaus 10 0 Health Net Community Solutions, Inc. Tulare 5 2 Health Net Community Solutions, Inc., Total 63 6
Health Plan of San Joaquin San Joaquin 9 0 Health Plan of San Joaquin Stanislaus 11 0 Health Plan of San Joaquin Total 20 0
Health Plan of San Mateo San Mateo 3 1 Health Plan of San Mateo Total 3 1
Inland Empire Health Plan Riverside/San Bernardino 5 0 Inland Empire Health Plan Total 5 0
Kern Health Systems Kern 8 0 Kern Health Systems Total 8 0
KP Cal LLC (Kaiser NorCal) Sacramento 1 18 KP Cal LLC (Kaiser NorCal) Total 1 18
KP Cal (Kaiser SoCal) San Diego 0 21 KP Cal (Kaiser SoCal) Total 0 21
L.A. Care Health Plan Los Angeles 7 1 L.A. Care Health Plan Total 7 1

MEDI-CAL MANAGED CARE HEDIS 2015 AT-A-GLANCE PERFORM ANCE SUM M ARY
2015 HEDIS Aggregate Report Page D-4 California Department of Health Care Services Health Services Advisory Group, Inc.
Managed Care Plan Name County Total Measures
Below MPLs Total Measures at
or Above HPLs
Molina Healthcare of California Partner Plan, Inc. Riverside/San Bernardino 14 0
Molina Healthcare of California Partner Plan, Inc.
Sacramento 13 2
Molina Healthcare of California Partner Plan, Inc.
San Diego 9 2
Molina Healthcare of California Partner Plan, Inc.
Imperial 13 0
Molina Healthcare of California Partner Plan, Inc., Total 49 4
Partnership HealthPlan of California Southwest 4 3 Partnership HealthPlan of California Southeast 4 1 Partnership HealthPlan of California Northwest 11 2 Partnership HealthPlan of California Northeast 13 1 Partnership HealthPlan of California Total 32 7
San Francisco Health Plan San Francisco 2 13 San Francisco Health Plan Total 2 13
Santa Clara Family Health Plan Santa Clara 2 3 Santa Clara Family Health Plan Total 2 3

MEDI-CAL MANAGED CARE HEDIS 2015 AT-A-GLANCE PERFORM ANCE SUM M ARY
2015 HEDIS Aggregate Report Page D-5 California Department of Health Care Services Health Services Advisory Group, Inc.
The following symbols are used in Table D.3 below: Measures below MPL Measures at or above HPL
Table D.3—Medi-Cal Managed Care RY 2015 HEDIS Performance Summary
MCP Name County AAB CAP-1224
CAP- 256
CAP-711
CAP- 1219 CBP CCS
Alameda Alliance for Health Alameda
Anthem Blue Cross Partnership Plan Alameda
Anthem Blue Cross Partnership Plan Contra Costa
Anthem Blue Cross Partnership Plan Fresno
Anthem Blue Cross Partnership Plan Kings
Anthem Blue Cross Partnership Plan Madera
Anthem Blue Cross Partnership Plan Sacramento
Anthem Blue Cross Partnership Plan San Francisco
Anthem Blue Cross Partnership Plan Santa Clara
Anthem Blue Cross Partnership Plan Tulare
Anthem Blue Cross Partnership Plan Region 1
Anthem Blue Cross Partnership Plan Region 2
Anthem Blue Cross Partnership Plan San Benito
California Health & Wellness Plan Imperial
California Health & Wellness Plan Region 1
California Health & Wellness Plan Region 2
CalOptima Orange
CalViv a Health Fresno
CalViv a Health Kings
CalViv a Health Madera
Care1st Partner Plan, LLC San Diego
CenCal Health San Luis Obispo
CenCal Health Santa Barbara
Central CA Alliance for Health Merced
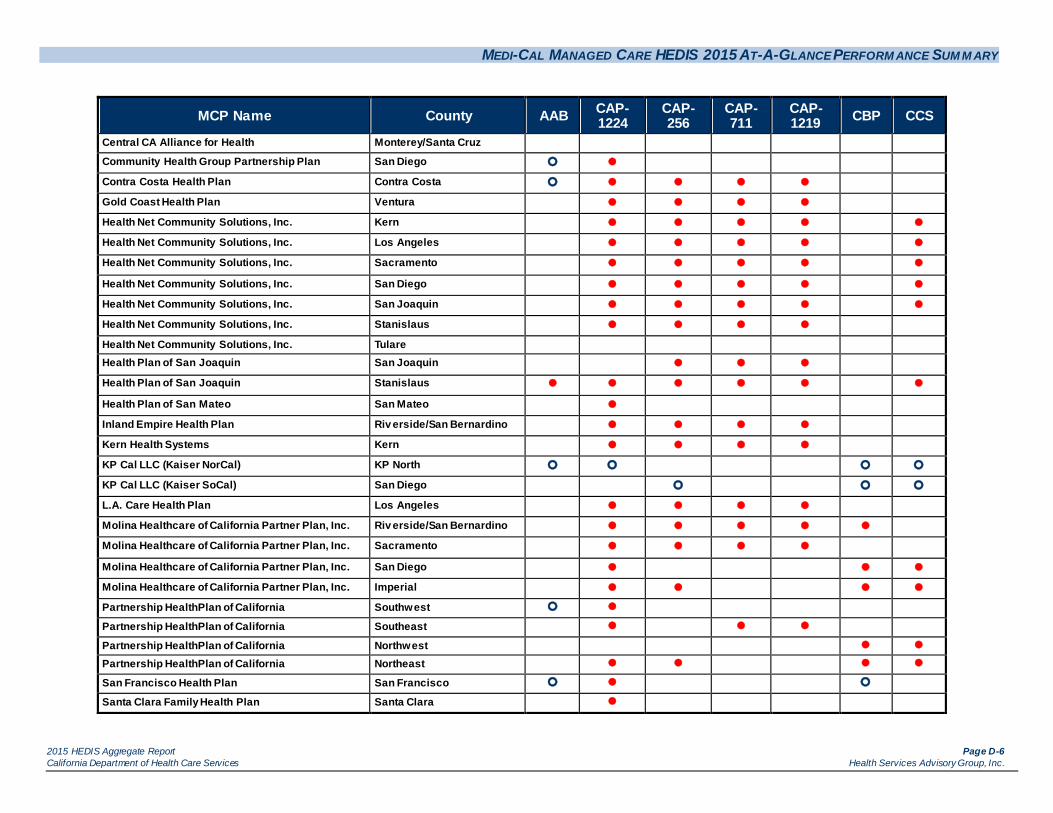
MEDI-CAL MANAGED CARE HEDIS 2015 AT-A-GLANCE PERFORM ANCE SUM M ARY
2015 HEDIS Aggregate Report Page D-6 California Department of Health Care Services Health Services Advisory Group, Inc.
MCP Name County AAB CAP-1224
CAP- 256
CAP-711
CAP- 1219 CBP CCS
Central CA Alliance for Health Monterey/Santa Cruz
Community Health Group Partnership Plan San Diego
Contra Costa Health Plan Contra Costa
Gold Coast Health Plan Ventura
Health Net Community Solutions, Inc. Kern
Health Net Community Solutions, Inc. Los Angeles
Health Net Community Solutions, Inc. Sacramento
Health Net Community Solutions, Inc. San Diego
Health Net Community Solutions, Inc. San Joaquin
Health Net Community Solutions, Inc. Stanislaus
Health Net Community Solutions, Inc. Tulare Health Plan of San Joaquin San Joaquin
Health Plan of San Joaquin Stanislaus
Health Plan of San Mateo San Mateo
Inland Empire Health Plan Riv erside/San Bernardino
Kern Health Systems Kern
KP Cal LLC (Kaiser NorCal) KP North
KP Cal LLC (Kaiser SoCal) San Diego
L.A. Care Health Plan Los Angeles
Molina Healthcare of California Partner Plan, Inc. Riv erside/San Bernardino
Molina Healthcare of California Partner Plan, Inc. Sacramento
Molina Healthcare of California Partner Plan, Inc. San Diego
Molina Healthcare of California Partner Plan, Inc. Imperial
Partnership HealthPlan of California Southwest
Partnership HealthPlan of California Southeast
Partnership HealthPlan of California Northwest
Partnership HealthPlan of California Northeast
San Francisco Health Plan San Francisco
Santa Clara Family Health Plan Santa Clara
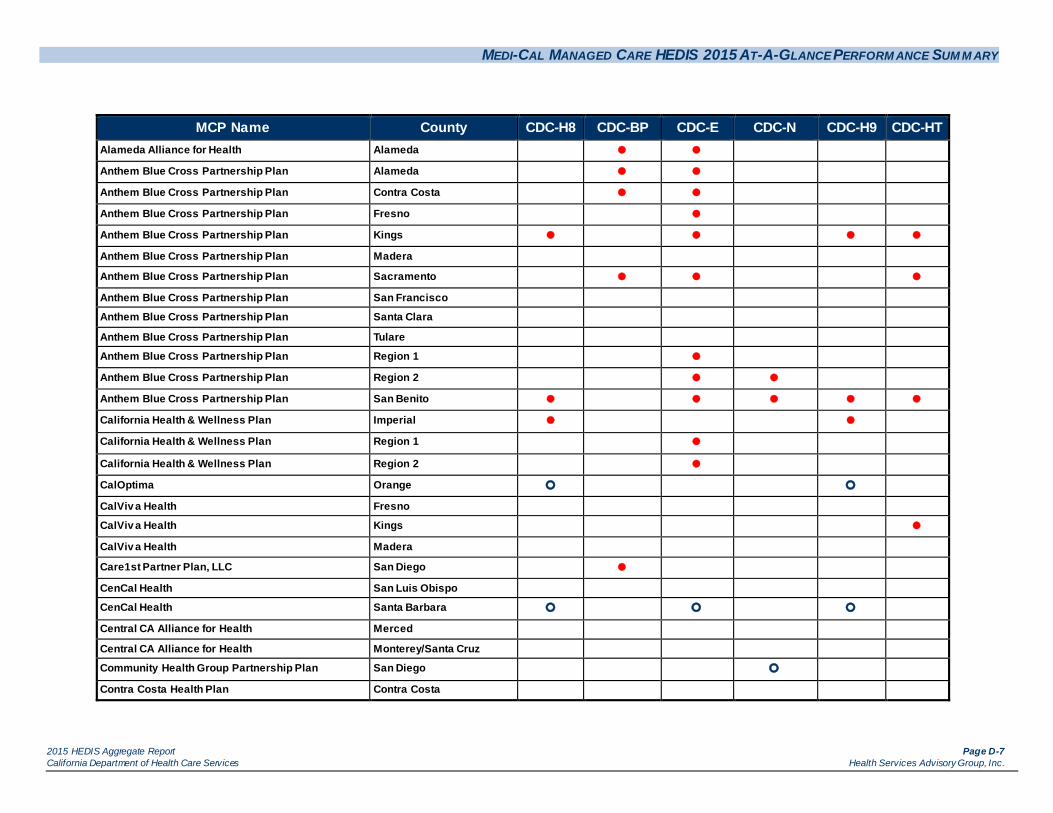
MEDI-CAL MANAGED CARE HEDIS 2015 AT-A-GLANCE PERFORM ANCE SUM M ARY
2015 HEDIS Aggregate Report Page D-7 California Department of Health Care Services Health Services Advisory Group, Inc.
MCP Name County CDC-H8 CDC-BP CDC-E CDC-N CDC-H9 CDC-HT
Alameda Alliance for Health Alameda
Anthem Blue Cross Partnership Plan Alameda
Anthem Blue Cross Partnership Plan Contra Costa
Anthem Blue Cross Partnership Plan Fresno
Anthem Blue Cross Partnership Plan Kings
Anthem Blue Cross Partnership Plan Madera
Anthem Blue Cross Partnership Plan Sacramento
Anthem Blue Cross Partnership Plan San Francisco
Anthem Blue Cross Partnership Plan Santa Clara
Anthem Blue Cross Partnership Plan Tulare
Anthem Blue Cross Partnership Plan Region 1
Anthem Blue Cross Partnership Plan Region 2
Anthem Blue Cross Partnership Plan San Benito
California Health & Wellness Plan Imperial
California Health & Wellness Plan Region 1
California Health & Wellness Plan Region 2
CalOptima Orange
CalViv a Health Fresno
CalViv a Health Kings
CalViv a Health Madera
Care1st Partner Plan, LLC San Diego
CenCal Health San Luis Obispo
CenCal Health Santa Barbara
Central CA Alliance for Health Merced
Central CA Alliance for Health Monterey/Santa Cruz
Community Health Group Partnership Plan San Diego
Contra Costa Health Plan Contra Costa
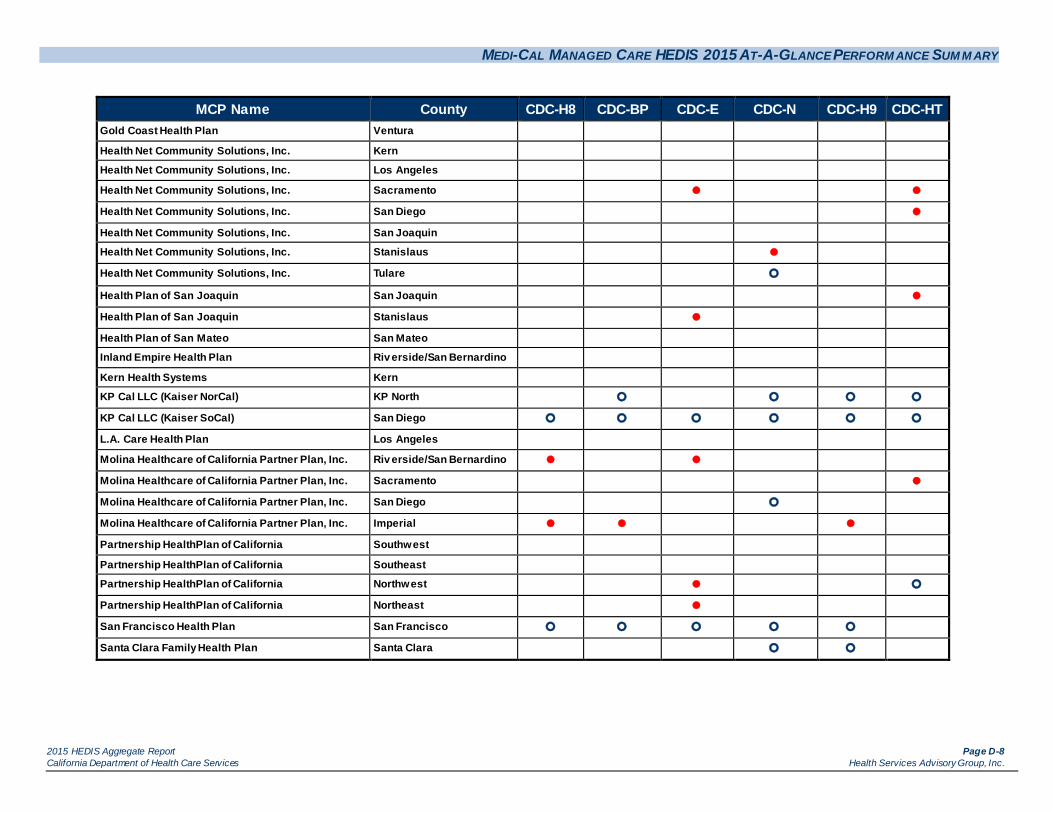
MEDI-CAL MANAGED CARE HEDIS 2015 AT-A-GLANCE PERFORM ANCE SUM M ARY
2015 HEDIS Aggregate Report Page D-8 California Department of Health Care Services Health Services Advisory Group, Inc.
MCP Name County CDC-H8 CDC-BP CDC-E CDC-N CDC-H9 CDC-HT Gold Coast Health Plan Ventura
Health Net Community Solutions, Inc. Kern
Health Net Community Solutions, Inc. Los Angeles
Health Net Community Solutions, Inc. Sacramento
Health Net Community Solutions, Inc. San Diego
Health Net Community Solutions, Inc. San Joaquin
Health Net Community Solutions, Inc. Stanislaus
Health Net Community Solutions, Inc. Tulare
Health Plan of San Joaquin San Joaquin
Health Plan of San Joaquin Stanislaus
Health Plan of San Mateo San Mateo
Inland Empire Health Plan Riv erside/San Bernardino
Kern Health Systems Kern
KP Cal LLC (Kaiser NorCal) KP North
KP Cal LLC (Kaiser SoCal) San Diego
L.A. Care Health Plan Los Angeles
Molina Healthcare of California Partner Plan, Inc. Riv erside/San Bernardino
Molina Healthcare of California Partner Plan, Inc. Sacramento
Molina Healthcare of California Partner Plan, Inc. San Diego
Molina Healthcare of California Partner Plan, Inc. Imperial
Partnership HealthPlan of California Southwest
Partnership HealthPlan of California Southeast
Partnership HealthPlan of California Northwest
Partnership HealthPlan of California Northeast
San Francisco Health Plan San Francisco
Santa Clara Family Health Plan Santa Clara

MEDI-CAL MANAGED CARE HEDIS 2015 AT-A-GLANCE PERFORM ANCE SUM M ARY
2015 HEDIS Aggregate Report Page D-9 California Department of Health Care Services Health Services Advisory Group, Inc.
MCP Name County CIS-3 IMA-1 LBP MMA-50 MMA-75 MPM-ACE MPM-DIG MPM-DIU Alameda Alliance for Health Alameda
Anthem Blue Cross Partnership Plan Alameda
Anthem Blue Cross Partnership Plan Contra Costa
Anthem Blue Cross Partnership Plan Fresno
Anthem Blue Cross Partnership Plan Kings
Anthem Blue Cross Partnership Plan Madera
Anthem Blue Cross Partnership Plan Sacramento
Anthem Blue Cross Partnership Plan San Francisco
Anthem Blue Cross Partnership Plan Santa Clara
Anthem Blue Cross Partnership Plan Tulare
Anthem Blue Cross Partnership Plan Region 1
Anthem Blue Cross Partnership Plan Region 2
Anthem Blue Cross Partnership Plan San Benito
California Health & Wellness Plan Imperial
California Health & Wellness Plan Region 1
California Health & Wellness Plan Region 2
CalOptima Orange
CalViv a Health Fresno
CalViv a Health Kings
CalViv a Health Madera
Care1st Partner Plan, LLC San Diego
CenCal Health San Luis Obispo
CenCal Health Santa Barbara
Central CA Alliance for Health Merced
Central CA Alliance for Health Monterey/Santa Cruz
Community Health Group Partnership Plan San Diego
Contra Costa Health Plan Contra Costa
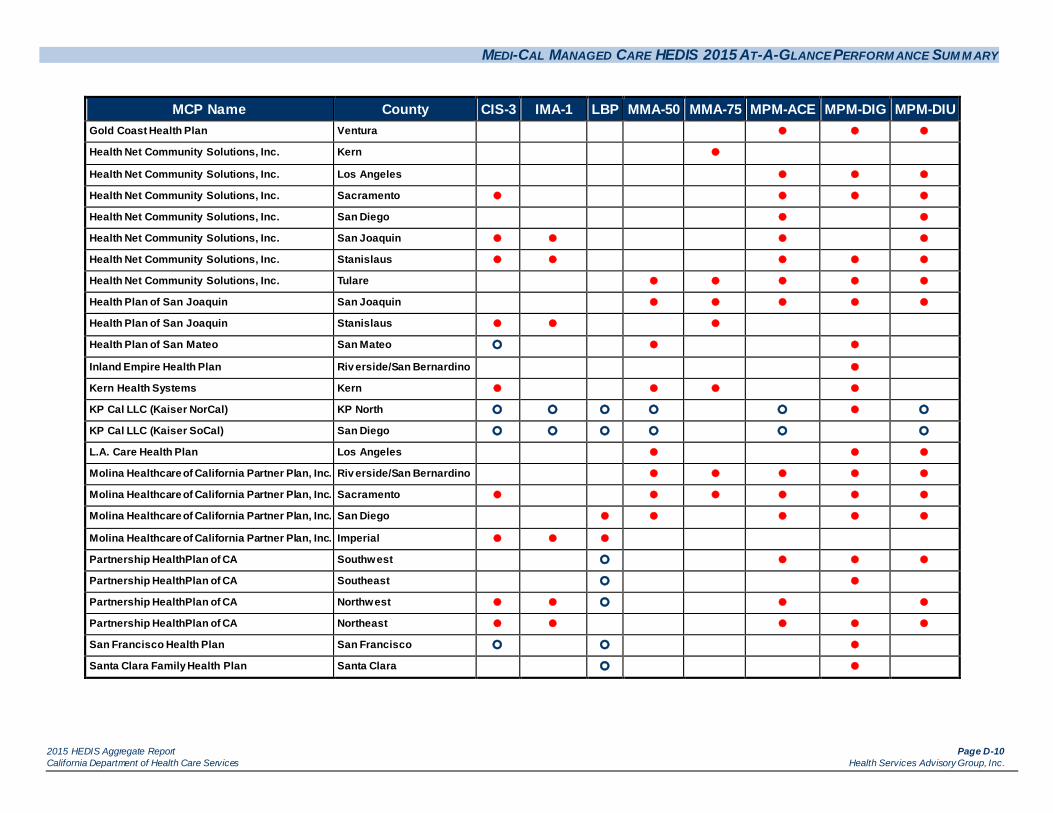
MEDI-CAL MANAGED CARE HEDIS 2015 AT-A-GLANCE PERFORM ANCE SUM M ARY
2015 HEDIS Aggregate Report Page D-10 California Department of Health Care Services Health Services Advisory Group, Inc.
MCP Name County CIS-3 IMA-1 LBP MMA-50 MMA-75 MPM-ACE MPM-DIG MPM-DIU Gold Coast Health Plan Ventura
Health Net Community Solutions, Inc. Kern
Health Net Community Solutions, Inc. Los Angeles
Health Net Community Solutions, Inc. Sacramento
Health Net Community Solutions, Inc. San Diego
Health Net Community Solutions, Inc. San Joaquin
Health Net Community Solutions, Inc. Stanislaus
Health Net Community Solutions, Inc. Tulare
Health Plan of San Joaquin San Joaquin
Health Plan of San Joaquin Stanislaus
Health Plan of San Mateo San Mateo
Inland Empire Health Plan Riv erside/San Bernardino
Kern Health Systems Kern
KP Cal LLC (Kaiser NorCal) KP North
KP Cal LLC (Kaiser SoCal) San Diego
L.A. Care Health Plan Los Angeles
Molina Healthcare of California Partner Plan, Inc. Riv erside/San Bernardino
Molina Healthcare of California Partner Plan, Inc. Sacramento
Molina Healthcare of California Partner Plan, Inc. San Diego
Molina Healthcare of California Partner Plan, Inc. Imperial
Partnership HealthPlan of CA Southwest
Partnership HealthPlan of CA Southeast
Partnership HealthPlan of CA Northwest
Partnership HealthPlan of CA Northeast
San Francisco Health Plan San Francisco
Santa Clara Family Health Plan Santa Clara

MEDI-CAL MANAGED CARE HEDIS 2015 AT-A-GLANCE PERFORM ANCE SUM M ARY
2015 HEDIS Aggregate Report Page D-11 California Department of Health Care Services Health Services Advisory Group, Inc.
MCP Name County PPC-Pst PPC-Pre W34 WCC-BMI WCC-N WCC-PA Alameda Alliance for Health Alameda
Anthem Blue Cross Partnership Plan Alameda
Anthem Blue Cross Partnership Plan Contra Costa
Anthem Blue Cross Partnership Plan Fresno
Anthem Blue Cross Partnership Plan Kings
Anthem Blue Cross Partnership Plan Madera
Anthem Blue Cross Partnership Plan Sacramento
Anthem Blue Cross Partnership Plan San Francisco
Anthem Blue Cross Partnership Plan Santa Clara
Anthem Blue Cross Partnership Plan Tulare
Anthem Blue Cross Partnership Plan Region 1
Anthem Blue Cross Partnership Plan Region 2
Anthem Blue Cross Partnership Plan San Benito
California Health & Wellness Plan Imperial
California Health & Wellness Plan Region 1
California Health & Wellness Plan Region 2
CalOptima Orange
CalViv a Health Fresno
CalViv a Health Kings
CalViv a Health Madera
Care1st Partner Plan, LLC San Diego
CenCal Health San Luis Obispo
CenCal Health Santa Barbara
Central CA Alliance for Health Merced
Central CA Alliance for Health Monterey/Santa Cruz
Community Health Group Partnership Plan San Diego
Contra Costa Health Plan Contra Costa
Gold Coast Health Plan Ventura
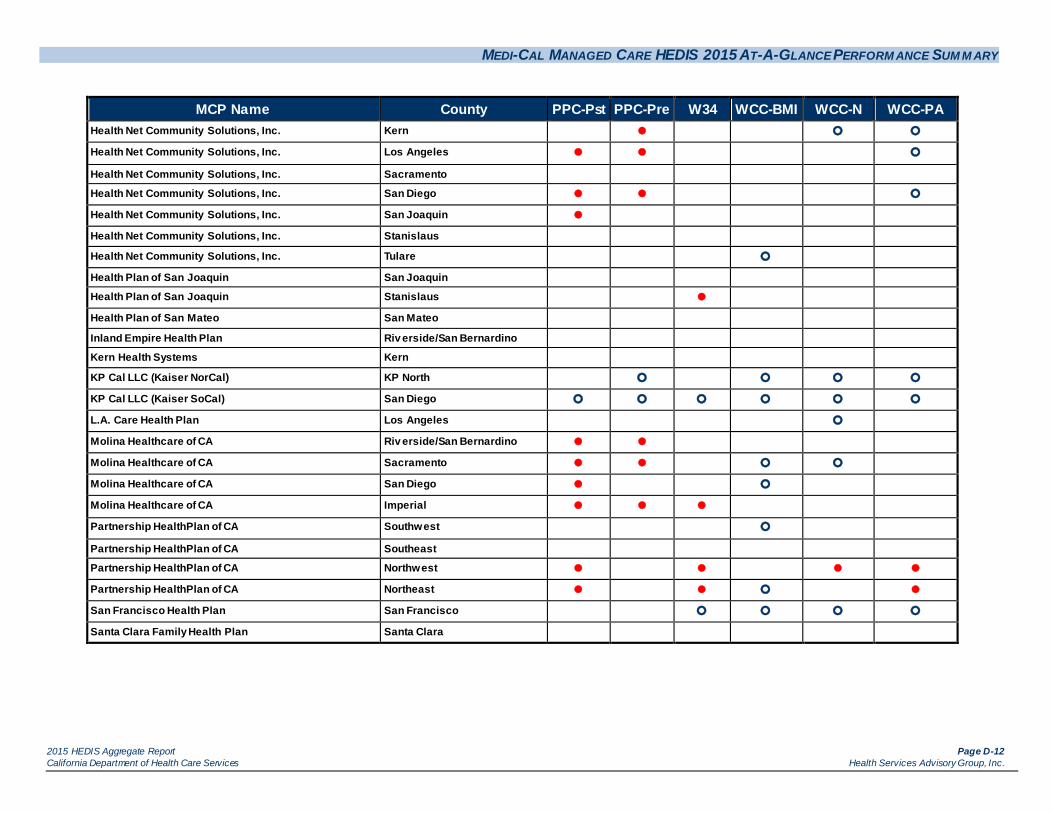
MEDI-CAL MANAGED CARE HEDIS 2015 AT-A-GLANCE PERFORM ANCE SUM M ARY
2015 HEDIS Aggregate Report Page D-12 California Department of Health Care Services Health Services Advisory Group, Inc.
MCP Name County PPC-Pst PPC-Pre W34 WCC-BMI WCC-N WCC-PA Health Net Community Solutions, Inc. Kern
Health Net Community Solutions, Inc. Los Angeles
Health Net Community Solutions, Inc. Sacramento
Health Net Community Solutions, Inc. San Diego
Health Net Community Solutions, Inc. San Joaquin
Health Net Community Solutions, Inc. Stanislaus
Health Net Community Solutions, Inc. Tulare
Health Plan of San Joaquin San Joaquin
Health Plan of San Joaquin Stanislaus
Health Plan of San Mateo San Mateo
Inland Empire Health Plan Riv erside/San Bernardino
Kern Health Systems Kern
KP Cal LLC (Kaiser NorCal) KP North
KP Cal LLC (Kaiser SoCal) San Diego
L.A. Care Health Plan Los Angeles
Molina Healthcare of CA Riv erside/San Bernardino
Molina Healthcare of CA Sacramento
Molina Healthcare of CA San Diego
Molina Healthcare of CA Imperial
Partnership HealthPlan of CA Southwest
Partnership HealthPlan of CA Southeast
Partnership HealthPlan of CA Northwest
Partnership HealthPlan of CA Northeast
San Francisco Health Plan San Francisco
Santa Clara Family Health Plan Santa Clara
Copyright © 2022 FDOKUMEN