Extending stratified datalog to capture complexity classes ranging from ${\cal P} to {\cal QH}$
Upload
khangminh22Category
view
1download
0
Medi-Cal Managed Care External Quality Review Technical Report
July 1, 2017–June 30, 2018
Managed Care Quality and Monitoring Division California Department of Health Care Services
April 2019
Medi-Cal Managed Care External Quality Review Technical ReportJuly 1, 2017–June 30, 2018
Table of Contents
Commonly Used Abbreviations and Acronyms ...............................................................vi 1. Executive Summary................................................................................................... 1
Summary of Performance................................................................................................ 2 Recommendations across All Assessed Activities ........................................................ 12
2. Introduction.............................................................................................................. 13 Purpose of Report.......................................................................................................... 13 Quality, Access, and Timeliness.................................................................................... 14 Summary of Report Content .......................................................................................... 15 Medi-Cal Managed Care Overview................................................................................ 16
3. Medi-Cal Managed Care Quality Strategy.............................................................. 21 4. Compliance Reviews ............................................................................................... 23
Background.................................................................................................................... 23 Compliance Reviews ..................................................................................................... 24 Objectives ...................................................................................................................... 25 Methodology................................................................................................................... 25 Results—Compliance Reviews...................................................................................... 26 Conclusions—Compliance Reviews.............................................................................. 27 Recommendations—Compliance Reviews ................................................................... 27
5. Performance Measure Validation ........................................................................... 28 Background.................................................................................................................... 28 Objectives ...................................................................................................................... 28 Methodology................................................................................................................... 29 Performance Measure Validation Results ..................................................................... 31 Recommendations—Performance Measure Validation ................................................ 33
6. Managed Care Health Plan Performance Measures ............................................. 34Managed Care Health Plan Performance Measure Requirements............................... 34 Managed Care Health Plans Performance Measure Results ....................................... 42 Seniors and Persons with Disabilities Results............................................................... 64 Encounter Data Diabetes Subset Seniors and Persons with Disabilities Results......... 66 HEDIS Improvement Plans............................................................................................ 69 HEDIS Corrective Action Plans ..................................................................................... 70 Conclusions—Managed Care Health Plan Performance Measures ............................. 71 Recommendations—Managed Care Health Plan Performance Measures................... 73
7. Specialty Health Plan Performance Measures ...................................................... 74Specialty Health Plan Performance Measure Requirements ........................................ 74 Specialty Health Plan Performance Measure Results and Findings............................. 75 Recommendations—Specialty Health Plan Performance Measures............................ 76
8. Managed Long-Term Services and Supports Plan Performance Measures....... 77Managed Long-Term Services and Supports Plans...................................................... 77
Medi-Cal Managed Care Technical Report: July 1, 2017–June 30, 2018 California Department of Health Care Services
Page i Health Services Advisory Group, Inc.

TABLE OF CONTENTS
Managed Long-Term Services and Supports Plan Performance Measure Requirements 78 Managed Long-Term Services and Supports Plan Performance Measure Results ..... 79 Managed Long-Term Services and Supports Plan Performance Measure Findings.... 80 Recommendations—Managed Long-Term Services and Supports Plan Performance Measures.................................................................................................. 80
9. Performance Improvement Projects ...................................................................... 81Background.................................................................................................................... 81 Objectives ...................................................................................................................... 84 Methodology................................................................................................................... 84 Results—Performance Improvement Projects .............................................................. 87 Conclusions—Performance Improvement Projects....................................................... 93 Recommendations—Performance Improvement Projects ............................................ 93
10. Consumer Surveys .................................................................................................. 94Background.................................................................................................................... 94 Objective ........................................................................................................................ 94 Methodology................................................................................................................... 94 Results—Consumer Surveys......................................................................................... 96 Conclusions—Consumer Surveys............................................................................... 102 Recommendations—Consumer Surveys .................................................................... 103
11. Encounter Data Validation .................................................................................... 104 Background.................................................................................................................. 104 Objective ...................................................................................................................... 104 Methodology................................................................................................................. 104 Conclusions.................................................................................................................. 105 Recommendations—Encounter Data Validation ......................................................... 108
12. Focused Studies .................................................................................................... 109 Background.................................................................................................................. 109 2015–16 Health Disparities Focused Study ................................................................ 110 2016–17 Health Disparities Focused Study ................................................................ 116 Long-Acting Reversible Contraceptive Utilization Focused Study .............................. 116 Managed Long-Term Services and Supports Focused Study .................................... 119 Opioid Focused Study.................................................................................................. 122 Timely Access Focused Study..................................................................................... 122 Tobacco Cessation Focused Study............................................................................. 125 Recommendations across All Focused Studies .......................................................... 129
13. Technical Assistance ............................................................................................ 130 Background.................................................................................................................. 130 Technical Assistance Activity for Performance Measures........................................... 130 Technical Assistance Activity for Quality Improvement Collaboration......................... 134 Technical Assistance Activity for ArcGIS Template Development .............................. 136
14. Follow-Up on Prior Year’s Recommendations .................................................... 138Assessment of DHCS’ Self-Reported Actions............................................................. 139
Medi-Cal Managed Care Technical Report: July 1, 2017–June 30, 2018 California Department of Health Care Services
Page ii Health Services Advisory Group, Inc.

TABLE OF CONTENTS
Appendix A. Aetna Better Health of California MCP-Specific Evaluation Report ...A-1 Appendix B. AIDS Healthcare Foundation SHP-Specific Evaluation Report ........B-1 Appendix C. Alameda Alliance for Health MCP-Specific Evaluation Report.........C-1 Appendix D. Anthem Blue Cross Partnership Plan MCP-Specific Evaluation
Report....................................................................................................D-1 Appendix E. California Health & Wellness Plan MCP-Specific Evaluation
Report....................................................................................................E-1 Appendix F. CalOptima MCP-Specific Evaluation Report ......................................F-1 Appendix G. CalViva Health MCP-Specific Evaluation Report .............................. G-1 Appendix H. Care1st Partner Plan MCP-Specific Evaluation Report.....................H-1 Appendix I. CenCal Health MCP-Specific Evaluation Report................................. I-1 Appendix J. Central California Alliance for Health MCP-Specific Evaluation
Report.................................................................................................... J-1 Appendix K. Community Health Group Partnership Plan MCP-Specific
Evaluation Report.................................................................................K-1 Appendix L. Contra Costa Health Plan MCP-Specific Evaluation Report .............L-1 Appendix M. Family Mosaic Project SHP-Specific Evaluation Report .................. M-1 Appendix N. Gold Coast Health Plan MCP-Specific Evaluation Report.................N-1 Appendix O. Health Net Community Solutions, Inc. MCP-Specific Evaluation
Report................................................................................................... O-1 Appendix P. Health Plan of San Joaquin MCP-Specific Evaluation Report ..........P-1 Appendix Q. Health Plan of San Mateo MCP-Specific Evaluation Report ............ Q-1 Appendix R. Inland Empire Health Plan MCP-Specific Evaluation Report ............R-1 Appendix S. Kern Family Health Care MCP-Specific Evaluation Report...............S-1 Appendix T. Kaiser NorCal (KP Cal, LLC) MCP-Specific Evaluation Report.........T-1 Appendix U. Kaiser SoCal (KP Cal, LLC) MCP-Specific Evaluation Report ..........U-1 Appendix V. L.A. Care Health Plan MCP-Specific Evaluation Report ....................V-1 Appendix W. Molina Healthcare of California Partner Plan, Inc. .................................
MCP-Specific Evaluation Report ........................................................W-1 Appendix X. Partnership HealthPlan of California MCP-Specific Evaluation
Report....................................................................................................X-1 Appendix Y. San Francisco Health Plan MCP-Specific Evaluation Report ...........Y-1 Appendix Z. Santa Clara Family Health Plan MCP-Specific Evaluation Report....Z-1 Appendix AA. SCAN Health Plan SHP-Specific Evaluation Report ......................AA-1 Appendix BB. UnitedHealthcare Community Plan MCP-Specific Evaluation Report ..BB-1
Medi-Cal Managed Care Technical Report: July 1, 2017–June 30, 2018 California Department of Health Care Services
Page iii Health Services Advisory Group, Inc.

TABLE OF CONTENTS
Table of Tables
Table 2.1—Medi-Cal Managed Care Health Plans by Model Type as of June 30, 2018. 18 Table 6.1—RY 2018 (MY 2017) External Accountability Set Measures .......................... 35 Table 6.2—High Performance Level and Minimum Performance Level Benchmark |
Values for RY 2018 (MY 2017)*.................................................................... 39 Table 6.3—Preventive Screening and Children’s Health Domain Multi-Year Statewide
Medi-Cal Managed Care Weighted Average Performance Measure Results . 44 Table 6.4—Preventive Screening and Children’s Health Domain Multi-Year Statewide
Medi-Cal Managed Care Weighted Average Performance Measure Results Compared to National Medicaid Averages.................................................... 46
Table 6.5—Preventive Screening and Children’s Health Domain Multi-Year Statewide Medi-Cal Managed Care Weighted Average Performance Measure Results Compared to National Commercial Averages............................................... 47
Table 6.6—Preventive Screening and Children’s Health Domain Multi-Year Statewide Medi-Cal Managed Care Weighted Average Performance Measure Results Compared to Healthy People 2020 Goals..................................................... 48
Table 6.7—Preventive Screening and Women’s Health Domain—Multi-Year Statewide Medi-Cal Managed Care Weighted Average Performance Measure Results . 50
Table 6.8—Preventive Screening and Women’s Health Domain Multi-Year Statewide Medi-Cal Managed Care Weighted Average Performance Measure Results Compared to National Medicaid Averages.................................................... 51
Table 6.9—Preventive Screening and Women’s Health Domain Multi-Year Statewide Medi-Cal Managed Care Weighted Average Performance Measure Results Compared to National Commercial Averages............................................... 52
Table 6.10—Preventive Screening and Women’s Health Domain Multi-Year Statewide Medi-Cal Managed Care Weighted Average Performance Measure Results Compared to Healthy People 2020 Goals..................................................... 53
Table 6.11—Care for Chronic Conditions Domain—Multi-Year Statewide Medi-Cal Managed Care Weighted Average Performance Measure Results .............. 55
Table 6.12—Care for Chronic Conditions Domain Multi-Year Statewide Medi-Cal Managed Care Weighted Average Performance Measure Results Compared to National Medicaid Averages.................................................... 56
Table 6.13—Care for Chronic Conditions Domain Multi-Year Statewide Medi-Cal Managed Care Weighted Average Performance Measure Results Compared to National Commercial Averages............................................... 57
Table 6.14—Care for Chronic Conditions Domain Multi-Year Statewide Medi-Cal Managed Care Weighted Average Performance Measure Results Compared to Healthy People 2020 Goals..................................................... 58
Table 6.15—Appropriate Treatment and Utilization Domain—Multi-Year Statewide Medi-Cal Managed Care Weighted Average Performance Measure Results . 61
Medi-Cal Managed Care Technical Report: July 1, 2017–June 30, 2018 California Department of Health Care Services
Page iv Health Services Advisory Group, Inc.
TABLE OF CONTENTS
Table 6.16—Appropriate Treatment and Utilization Domain Multi-Year Statewide Medi-Cal Managed Care Weighted Average Performance Measure Results Compared to National Medicaid Averages.................................................... 62
Table 6.17—Appropriate Treatment and Utilization Domain Multi-Year Statewide Medi-Cal Managed Care Weighted Average Performance Measure Results Compared to National Commercial Averages............................................... 62
Table 6.18—RY 2018 (MY 2017) Medi-Cal Managed Care Weighted Averages Comparison and Results for Measures Stratified by the SPD Population..... 64
Table 6.19—California Department of Health Care Services, RY 2018 Medi-Cal Managed Care Encounter Data Diabetes Subset Seniors and Persons with Disabilities Results ................................................................................ 66
Table 7.1—RY 2018 (MY 2017) Specialty Health Plan Performance Measures ............. 74 Table 8.1—Managed Long-Term Services and Supports Plans ..................................... 77 Table 8.2—RY 2018 (MY 2017) Managed Long-Term Services and Supports Plan
Performance Measures................................................................................. 78 Table 8.3—Multi-Year Statewide Weighted Average Performance Measure Results for
Managed Long-Term Services and Supports Plans...................................... 79 Table 9.1—Medi-Cal Managed Care Performance Improvement Project Topics............ 88 Table 10.1—CAHPS Measures....................................................................................... 94 Table 11.1—Encounter Data Completeness Summary................................................. 105 Table 11.2—Encounter Data Accuracy Summary......................................................... 107 Table 12.1—EAS Measures Included in 2015–16 Health Disparities Focused Study,
by Domain................................................................................................... 111 Table 12.2—Study Indicators ........................................................................................ 118 Table 12.3—California Department of Health Care Services Timely Access Standards . 122 Table 12.4—Study Indicators ........................................................................................ 127 Table 14.1—DHCS’ Self-Reported Follow-Up on External Quality Review
Recommendations from the 2016–17 Medi-Cal Managed Care Technical Report ......................................................................................................... 138
Table of Figures
Figure 10.1—Global Ratings: General Child Question Summary Rates ......................... 97 Figure 10.2—Composite Measures: General Child Global Proportions .......................... 98 Figure 10.3—Global Ratings: CCC Question Summary Rates ....................................... 99 Figure 10.4—Composite Measures: CCC Global Proportions ...................................... 100 Figure 10.5—CCC Composite Measures and Items: CCC Question Summary Rates
and Global Proportions ............................................................................... 101
Medi-Cal Managed Care Technical Report: July 1, 2017–June 30, 2018 California Department of Health Care Services
Page v Health Services Advisory Group, Inc.
TABLE OF CONTENTS
Commonly Used Abbreviations and Acronyms Following is a list of abbreviations and acronyms used throughout this report.
♦ A&I—Audits and Investigations Division ♦ AHRQ—Agency for Healthcare Research and Quality
CAHPS®—Consumer Assessment of Healthcare Providers and Systems1 ♦♦ CAP—corrective action plan ♦ CATI—computer-assisted telephone interviewing ♦ CCC—Children with Chronic Conditions ♦ CCI—Coordinated Care Initiative ♦ CFR—Code of Federal Regulations ♦ CHIP—Children’s Health Insurance Program ♦ CMS—Centers for Medicare & Medicaid Services ♦ COHS—County Organized Health System ♦ CP—commercial plan ♦ CPT-4—Current Procedural Terminology, Fourth Edition ♦ CSH—California Smokers’ Helplines ♦ DHCS—California Department of Health Care Services ♦ DMHC—California Department of Managed Health Care ♦ EAS—External Accountability Set ♦ ECDS—Electronic Clinical Data Systems ♦ ED—Emergency Department ♦ EQR—external quality review ♦ EQRO—external quality review organization ♦ FFS—fee-for-service ♦ FMEA—failure modes and effects analysis ♦ GMC—Geographic Managed Care ♦ HCPCS—Healthcare Common Procedure Coding System ♦♦ HMO—health maintenance organization ♦ HPL—high performance level ♦ HSAG—Health Services Advisory Group, Inc.
HEDIS®—Healthcare Effectiveness Data and Information Set2
1 CAHPS® is a registered trademark of the Agency for Healthcare Research and Quality (AHRQ).
2 HEDIS® is a registered trademark of the National Committee for Quality Assurance (NCQA).
Medi-Cal Managed Care Technical Report: July 1, 2017–June 30, 2018 California Department of Health Care Services
Page vi Health Services Advisory Group, Inc.
TABLE OF CONTENTS
♦ ICD-10—International Statistical Classification of Diseases and Related Health Problems, 10th Revision
♦ IP—improvement plan ♦ IS—information systems ♦ LARC—Long-Acting Reversible Contraception ♦ LI—Local Initiative ♦ MCMC—Medi-Cal Managed Care ♦ MCO—managed care organization ♦ MCP—managed care health plan ♦ MLTSS—Managed Long-Term Services and Supports ♦ MLTSSP—Managed Long-Term Services and Supports Plan ♦ MPL—minimum performance level ♦ MY—measurement year ♦ NCQA—National Committee for Quality Assurance ♦ Non-SPD—Non-Seniors and Persons with Disabilities ♦ NRT—nicotine replacement therapy ♦ OFP—Office of Family Planning ♦ PAHP—prepaid ambulatory health plan ♦ PCCM—primary care case management ♦ PCP—primary care provider ♦ PDSA—Plan-Do-Study-Act ♦ PIHP—prepaid inpatient health plan ♦ PIP—performance improvement project (formerly referred to as quality improvement
project [QIP]) ♦ QMED—quality measures for encounter data ♦ Roadmap—HEDIS Record of Administration, Data Management, and Processes ♦ RY—reporting year ♦ QIP—quality improvement project ♦ SFY—State Fiscal Year ♦ SHP—specialty health plan ♦ SMART—Specific, Measurable, Achievable, Relevant, and Time-bound ♦ SPD—Seniors and Persons with Disabilities ♦ TPM—Two-Plan Model ♦ UM—utilization management
Medi-Cal Managed Care Technical Report: July 1, 2017–June 30, 2018 California Department of Health Care Services
Page vii Health Services Advisory Group, Inc.

Medi-Cal Managed Care External Quality Review Technical ReportJuly 1, 2017–June 30, 2018
1. Executive Summary
As required by the Code of Federal Regulations (CFR) at Title 42, Section (§)438.364,3 the California Department of Health Care Services (DHCS) contracts with Health Services Advisory Group, Inc. (HSAG), an external quality review organization (EQRO), to prepare an annual, independent, technical report. As described in the CFR, the independent report must summarize findings on access and quality of care, including:
♦ A description of the manner in which the data from all activities conducted in accordance with §438.358 were aggregated and analyzed, and conclusions were drawn as to the quality and timeliness of, and access to the care furnished by the managed care organization (MCO), prepaid inpatient health plan (PIHP), prepaid ambulatory health plan (PAHP), or primary care case management (PCCM) entity.
♦ For each external quality review (EQR)-related activity conducted in accordance with §438.358: ■ Objectives ■ Technical methods of data collection and analysis ■ Description of data obtained, including validated performance measurement data for
each activity conducted in accordance with §438.358(b)(1)(i) and (ii) ■ Conclusions drawn from the data
♦ An assessment of each MCO, PIHP, PAHP, or PCCM entity’s strengths and weaknesses for the quality and timeliness of, and access to health care services furnished to Medicaid beneficiaries.
♦ Recommendations for improving the quality of health care services furnished by each MCO, PIHP, PAHP, and PCCM entity, including how the State can target goals and objectives in the quality strategy, under §438.340, to better support improvement in the quality and timeliness of, and access to health care services furnished to Medicaid beneficiaries.
♦ Methodologically appropriate, comparative information about all MCOs, PIHPs, PAHPs, and PCCM entities, consistent with guidance included in the EQR protocols issued in accordance with §438.352(e).
♦ An assessment of the degree to which each MCO, PIHP, PAHP, or PCCM entity has addressed effectively the recommendations for quality improvement made by the EQRO during the previous year’s EQR.
3 Department of Health and Human Services, Centers for Medicare & Medicaid Services. Federal Register/Vol. 81, No. 88/Friday, May 6, 2016. 42 CFR Parts 431,433, 438, et al. Medicaid and Children’s Health Insurance Program (CHIP) Programs; Medicaid Managed Care, CHIP Delivered in Managed Care, and Revisions Related to Third Party Liability; Final Rule. Available at: https://www.gpo.gov/fdsys/pkg/FR-2016-05-06/pdf/2016-09581.pdf. Accessed on: Jul 25, 2018.
Medi-Cal Managed Care Technical Report: July 1, 2017–June 30, 2018 Page 1 California Department of Health Care Services Health Services Advisory Group, Inc.
EXECUTIVE SUMMARY
The review period for this 2017‒18 Medi-Cal Managed Care External Quality Review Technical Report is July 1, 2017, through June 30, 2018. HSAG will report on activities that take place beyond the review period in the 2018–19 Medi-Cal Managed Care External Quality Review Technical Report.
Medi-Cal Managed Care (MCMC) provides managed health care services to more than 10 million beneficiaries (as of June 2018)4 in the State of California through a combination of contracted full-scope managed care health plans (MCPs) and specialty health plans (SHPs). During the review period, DHCS contracted with 24 MCPs5 and three SHPs to provide health care services in all 58 counties throughout California. A summary of HSAG’s assessment of performance and notable results for the July 1, 2017, through June 30, 2018, review period follows.
Summary of Performance
Medi-Cal Managed Care Quality Strategy
In 2018, to meet the 42 CFR §438.340 Medicaid Managed Care and Children’s Health Insurance Program (CHIP) Managed Care Final Rule, DHCS produced a quality strategy report that encompasses the quality strategies across all of California’s Medicaid managed care delivery systems including the following:
♦ MCPs and SHPs ♦ County mental health plans ♦ Drug Medi-Cal organized delivery systems ♦ Dental managed care plans
Specific to MCPs, the June 29, 2018, quality strategy outlines the same focus areas for improvement as the previous October 2017 Medi-Cal Managed Care Quality Strategy Report Annual Update. These areas include the following:
♦ Maternal and child health ■ Postpartum care ■ Childhood immunizations
♦ Chronic disease ■ Diabetes care ■ Hypertension control
4 Medi-Cal Managed Care Enrollment Report—June 2018. Available at: http://www.dhcs.ca.gov/dataandstats/reports/Pages/MMCDMonthlyEnrollment.aspx. Accessed on: Jul 25, 2018.
5 Note: HSAG refers to Kaiser NorCal and Kaiser SoCal as two separate MCPs in this report; however, DHCS holds just one contract with Kaiser (KP Cal, LLC).
Medi-Cal Managed Care Technical Report: July 1, 2017–June 30, 2018 Page 2 California Department of Health Care Services Health Services Advisory Group, Inc.

EXECUTIVE SUMMARY
♦ Tobacco cessation ♦ Reducing health disparities ♦ Fostering healthy communities through reducing opioid misuse and overuse
DHCS monitors quality, timeliness, and accessibility of services related to the maternal and child health, chronic disease, and tobacco cessation focus areas through quality metrics. DHCS engages in non-measure-related strategies with both MCPs and external stakeholders to address the focus areas related to health disparities and opioid medication misuse and overuse.
Compliance Reviews
In accordance with California Welfare and Institutions Code §19130(b)(3), DHCS directly conducts compliance reviews of MCPs and SHPs rather than contracting with the EQRO to conduct reviews on its behalf. HSAG identified the following notable conclusions based on HSAG’s assessment of all relevant compliance-related documents provided by DHCS (i.e., audit reports, corrective action plan [CAP] responses, and final closeout letters):
♦ Deficiencies identified during DHCS Audits & Investigations Division (A&I) audits reflected opportunities for improvement for MCPs and SHPs in the areas of quality and timeliness of and access to health care.
♦ Following the audits, MCPs and SHPs took actions to resolve the deficiencies which resulted in DHCS closing the CAPs. Audit findings within the assessed areas were MCP-/SHP-specific; therefore, across all MCPs and SHPs, HSAG identified no specific areas for improvement.
♦ As in previous years, DHCS demonstrated ongoing efforts to follow up on deficiencies.
Performance Measures
HSAG auditors determined that all MCPs, SHPs, and Managed Long-Term Services and Supports Plans (MLTSSPs) followed the appropriate performance measure specifications to produce valid rates. HSAG conducted analyses of MCP, SHP, and MLTSSP performance measure results, including performance comparisons between reporting year (RY) 2017 and RY 2018 using the Chi-square test of statistical significance.6
6 Performance comparisons are based on the Chi-square test of statistical significance, with a p value of <0.05.
Medi-Cal Managed Care Technical Report: July 1, 2017–June 30, 2018 Page 3 California Department of Health Care Services Health Services Advisory Group, Inc.
EXECUTIVE SUMMARY
Performance Measures—Medi-Cal Managed Care Health Plans7
HSAG observed the following notable MCP aggregate performance measure results for RY 2018:
♦ The MCMC weighted average for the Immunizations for Adolescents—Combination 2 measure was above the DHCS-established high performance level (HPL) in RY 2018.
♦ For measures for which DHCS held MCPs accountable to meet the minimum performance levels (MPLs), all MCMC weighted averages were above the MPLs in RY 2018.
♦ For MCMC weighted averages for which HSAG made comparisons between RY 2017 and RY 2018, 19 of 22 MCMC weighted averages (86 percent) improved significantly from RY 2017 to RY 2018. MCPs’ quality improvement efforts, combined with DHCS’ quality improvement strategies, may have contributed to this statistically significant improvement across all measure domains from RY 2017 to RY 2018.
♦ The RY 2018 MCMC weighted average was significantly worse than the RY 2017 MCMC weighted average for the All-Cause Readmissions measure, reflecting an increase in unplanned acute readmissions within 30 days of discharge for beneficiaries 21 years of age and older.
Performance Measures—Specialty Health Plans
For SHP performance measure rates for which a comparison could be made between RY 2017 and RY 2018, no statistically significant changes occurred. Additionally, all SHP performance measure rates for performance measures with established MPLs in RY 2018 were above the MPLs.
Performance Measures—Managed Long-Term Services and Supports Plans
MLTSSPs reported rates for three measures in RY 2018. Two of the measures were utilization measures; therefore, HSAG only conducted comparative analysis on one of the measures— Medication Reconciliation Post-Discharge. The Managed Long-Term Services and Supports (MLTSS) weighted average for the Medication Reconciliation Post-Discharge measure improved significantly from RY 2017 to RY 2018. This reflects statewide improvement for ensuring that MLTSS beneficiaries 18 years of age and older who are discharged from acute or nonacute inpatient care have their medications reconciled by 30 days after discharge.
7 Note that HSAG’s assessment related to performance measures does not include measures for which MCPs were not held accountable to meet the MPLs in RY 2018.
Medi-Cal Managed Care Technical Report: July 1, 2017–June 30, 2018 Page 4 California Department of Health Care Services Health Services Advisory Group, Inc.
EXECUTIVE SUMMARY
Performance Improvement Projects
Through HSAG’s performance improvement project (PIP) training, validation, and technical assistance, MCPs and SHPs successfully completed the 2015–17 PIPs using HSAG’s rapid-cycle PIP process. HSAG assessed the validity and reliability of the PIP results to determine whether or not key stakeholders may have confidence in the reported PIP findings; and HSAG assigned final confidence levels to the 2015–17 PIPs.
Following is a breakdown of the final confidence levels HSAG assigned to the 53 PIPs that MCPs and SHPs concluded by June 30, 2017:
♦ High Confidence: 5 (9 percent) ♦ Confidence: 15 (28 percent) ♦ Low Confidence: 25 (47 percent) ♦ Not Credible: 8 (15 percent)
The 2015–17 PIPs with a High Confidence rating:
♦ Followed the approved PIP methodology. ♦ Presented the findings clearly and accurately, in alignment with the approved methodology. ♦ Achieved the SMART (Specific, Measurable, Achievable, Relevant, and Time-bound) Aim
goal. ♦ Demonstrated improvement for several SMART Aim data points after intervention testing
began. ♦ Documented a positive correlation/clearly linked improvement to tested interventions. ♦ Indicated testing interventions for reliability at additional sites.
During the review period, MCPs and SHPs also initiated the 2017–19 PIPs on a variety of health topics and health disparities. Most MCPs and SHPs achieved all required criteria for modules 1 and 2 for the 2017–19 PIPs, with 33 PIPs progressing to Module 3 and 14 PIPs progressing to the intervention testing phase. MCPs and SHPs will conduct the 2017–19 PIPs through June 30, 2019.
Consumer Surveys
During the review period, HSAG administered the 2018 Consumer Assessment of Healthcare Providers and Systems (CAHPS®) 5.0 Child Medicaid Health Plan Survey for the CHIP population. The survey included the Healthcare Effectiveness Data and Information Set (HEDIS®) and children with chronic conditions (CCC) measurement sets. The rates for all measures with reportable results (i.e., measures with at least 100 responses) were below the 2017 National Committee for Quality Assurance (NCQA) national averages—except the rate for the Rating of All Health Care global rating for the general child population, which was above the 2017 NCQA national average.
Medi-Cal Managed Care Technical Report: July 1, 2017–June 30, 2018 Page 5 California Department of Health Care Services Health Services Advisory Group, Inc.

EXECUTIVE SUMMARY
Encounter Data Validation
HSAG conducted the State Fiscal Year (SFY) 2017–18 Encounter Data Validation (EDV) Study to examine, through a review of medical records, the completeness and accuracy of the professional encounter data submitted to DHCS by the 23 MCPs and two SHPs included in the study. HSAG assessed the following data elements:
♦ Date of Service ♦ Diagnosis Code ♦ Procedure Code ♦ Procedure Code Modifier ♦ Rendering Provider Name
The following are summaries of the key findings from the study.
Encounter Data Completeness
Omissions identified in the medical records (services located in the encounter data but not supported in the medical records) and omissions in the encounter data (services located in the medical records but not in the encounter data) illustrate discrepancies in completeness of DHCS’ encounter data. Overall, DHCS’ encounter data are relatively complete for the key data elements when compared to the medical records. Below are some main findings:
♦ Two data elements (i.e., Date of Service and Rendering Provider Name) had medical record omission rates of less than 10 percent each, which met the EDV Study standard.8
For the remaining three data elements, DHCS encounters were moderately supported by the documentation in the beneficiaries’ medical records.
♦ Three data elements (i.e., Date of Service, Procedure Code, and Procedure Code Modifier) each had an encounter data omission rate of less than 10 percent, which met the EDV Study standard. DHCS encounters had supporting documentation in the medical records at a moderate level for the remaining two data elements.
♦ When the statewide rate met the EDV Study standard for a data element, the data completeness at the MCP/SHP level varied minimally. A larger difference between the statewide rate and the EDV Study standard for a data element also signified a larger variation among MCPs and SHPs.
8 HSAG developed the EDV Study standards based on the statement from quality measures for encounter data (QMED) for measure DCMT.003: “Fewer than 10% of the visits identified in medical records are unmatched to DHCS encounter data; AND fewer than 10% of the DHCS encounter data are unmatched to the medical records.” California Department of Health Care Services, Managed Care Quality and Monitoring Division. Quality Measures for Encounter Data—Version 1.0; January 1, 2015.
Medi-Cal Managed Care Technical Report: July 1, 2017–June 30, 2018 Page 6 California Department of Health Care Services Health Services Advisory Group, Inc.

EXECUTIVE SUMMARY
Encounter Data Accuracy
♦ Among the four data elements evaluated for accuracy, three data elements (i.e., Diagnosis Code, Procedure Code, and Procedure Code Modifier) each had an accuracy rate greater than 90 percent, which met the EDV Study standard. Statewide, 59.9 percent of rendering provider names identified in the electronic encounter data were supported by medical record documentation.
♦ Approximately one quarter (i.e., 26.3 percent) of the dates of service present in both data sources contained matching values for all four key data elements (i.e. Diagnosis Code, Procedure Code, Procedure Code Modifier, and Rendering Provider Name) when compared to the beneficiaries’ medical records.
When comparing results from the SFY 2013–14 EDV medical record review activity with the SFY 2017–18 EDV Study results, nearly all results from the 2017–18 study were better, indicating that DHCS’ encounter data were more complete and accurate for the key data elements during the 2017–18 study period.
Focused Studies
During the review period, HSAG conducted focused studies on the following topics to assist DHCS in gaining better understanding of and identifying opportunities for improving care provided to beneficiaries:
♦ Health Disparities ♦ Long-Acting Reversible Contraception (LARC) ♦ MLTSS Population Identification and Demographics ♦ Opioids ♦ Timely Access ♦ Tobacco Cessation
The following are summaries of HSAG’s notable conclusions from the focused studies that HSAG either concluded during the review period or for which HSAG had concluded the analyses and finalized the reports prior to producing the final version of this EQR technical report.
2015–16 Health Disparities Focused Study
HSAG conducted the 2015–16 Health Disparities Focused Study to determine whether or not health disparities exist among Medi-Cal beneficiaries using RY 2016 External Accountability Set (EAS) measure rates reported by MCPs. Of the 30 EAS measures, DHCS selected 12 measures for the study to represent a range of clinical health topics of interest that impact Medi-Cal beneficiaries throughout their lives and grouped the measures into four domains. HSAG conducted the disparities analyses at the statewide and county levels, and stratified analytic results by age, gender, race/ethnicity, and primary language demographic categories. The focused study results demonstrated that health disparities exist across the four domains
Medi-Cal Managed Care Technical Report: July 1, 2017–June 30, 2018 Page 7 California Department of Health Care Services Health Services Advisory Group, Inc.
EXECUTIVE SUMMARY
for all demographic categories, both at the statewide and county levels, with the exception of the gender demographic category within the Care for Children and Adolescents domain.
Long-Acting Reversible Contraception Focused Study
DHCS contracted with HSAG in contract year 2017–18 to conduct a focused study to learn more about MCPs’ LARC utilization patterns and contraceptive management policies to potentially shape future MCMC guidance and improve access to LARCs. The methodology consisted of an MCP questionnaire and an administrative analysis. The following are notable conclusions from the LARC Utilization Focused Study:
♦ Questionnaire responses reflected that all MCPs actively work to meet Medi-Cal’s family planning coverage standards concerning LARC devices for MCMC adult and adolescent beneficiaries. MCPs have no utilization management (UM) policies requiring prior authorization, step therapy, or multiple visits. Additionally, MCPs employ privacy protection policies for teen and adolescent beneficiaries in compliance with Medi-Cal’s Sensitive Services and Minor Consent Services standards. MCPs make efforts to ensure coverage and service administration policies are consistent for beneficiaries through regular monitoring of their delegated entities’/medical groups’ policies.
♦ While MCPs reimburse providers offering family planning services in outpatient settings for the administration of LARC services, MCPs do not facilitate device availability in outpatient settings (i.e., in provider offices) through incentive programs. Additionally, MCPs indicated that they engage in minimal efforts to combat deterrents such as recouping expenses for unused devices or the high cost associated with in-office availability of devices in the absence of pharmacy benefit programs.
♦ Some MCPs indicated that beneficiary and provider barriers to device utilization and service administration revolve around education. However, very few MCPs indicated that they offer education to either group. Additionally, very few MCPs conduct regular monitoring activities that extend beyond reviews of claim denials or grievances.
♦ HSAG’s review of administrative data for all age-eligible MCMC beneficiaries revealed that the overall 2015 LARC utilization rate of 4.2 percent was low relative to the national rate of 7.2 percent observed between 2011 and 2013.9 HSAG found that LARC utilization rates varied based on beneficiary age, race/ethnic group, and preferred language as well as the plan model type. ■ Beneficiaries between 21 and 44 years of age had higher LARC utilization than
beneficiaries between 15 and 20 years of age. ■ Alaskan Native/American Indian and White beneficiaries had higher LARC utilization
rates than beneficiaries in the Asian or Pacific Islander, Black or African American, Hispanic or Latino, and Other/Unknown race/ethnic groups.
9 Daniels K, Daugherty J, Jones J, Mosher W. Current contraceptive use and variation by selected characteristics among women aged 15-44: United States, 2011–13. National Health Statistics reports; no 86. Hyattsville, MD: National Center for Health Statistics. 2015. Available at: https://www.cdc.gov/nchs/data/nhsr/nhsr086.pdf. Accessed on: Oct 17, 2018.
Medi-Cal Managed Care Technical Report: July 1, 2017–June 30, 2018 Page 8 California Department of Health Care Services Health Services Advisory Group, Inc.
EXECUTIVE SUMMARY
■ Beneficiaries who indicated that English was their preferred language had higher LARC utilization rates than beneficiaries who indicated that they preferred Spanish or Other/Unknown language.
■ MCPs under the County Organized Health System (COHS) model served approximately 20 percent of the eligible MCMC population and had the highest LARC utilization rates.
Managed Long-Term Services and Supports Population Identification and Demographics Focused Study
The goal of the MLTSS Population Identification and Demographic Focused Study was to determine the most effective methodology for identifying beneficiaries receiving MLTSS benefits solely through MCMC. HSAG surveyed two MLTSSPs and DHCS to determine existing methodologies for identifying the Medi-Cal only MLTSS population. HSAG then conducted data analyses to compare the existing methodologies and determine the best methodology for identifying the Medi-Cal only MLTSS population.
HSAG concluded that survey data and administrative analyses demonstrated the complexity of identifying Medi-Cal-only MLTSS beneficiaries through use of enrollment data. While no formal process exists to identify the Medi-Cal-only subset of MLTSS beneficiaries, DHCS has worked to streamline the processes by which aid codes and Coordinated Care Initiative (CCI) risk category indicators are updated to identify beneficiaries receiving MLTSS services.
HSAG determined that there was no single “best methodology” among the methodologies submitted by the MLTSSPs and DHCS. The methodology using both enrollment and encounter data was more inclusive and captured more Medi-Cal-only MLTSS beneficiaries than the methodology using enrollment data alone; however, the methodology using enrollment data alone was more consistent, likely due to the more extensive consideration of aid codes that could be assigned to various MLTSS risk groups. HSAG’s review of encounter data quantified the extent to which the lags in updates to CCI risk category indicators limited the reliability of enrollment data to identify MLTSS beneficiaries. Regardless of the enrollment identification criteria, HSAG’s encounter data assessment consistently produced beneficiaries receiving long-term care/skilled nursing facility services who were not identifiable through aid codes or CCI risk category indicators.
Tobacco Cessation Focused Study
In contract year 2017–18, DHCS contracted with HSAG to conduct an assessment of the utilization of tobacco cessation services and medications among MCPs’ and SHPs’ beneficiaries. HSAG collaborated with key staff members from DHCS, MCPs, and SHPs to perform the following activities:
♦ Administered a questionnaire to collect information from MCPs and SHPs regarding the method(s) they use to identify tobacco users, as well as efforts made or activities conducted to improve their identification of tobacco users, to track treatment utilization by tobacco users, and to administer ongoing interventions or educational activities related to tobacco use.
Medi-Cal Managed Care Technical Report: July 1, 2017–June 30, 2018 Page 9 California Department of Health Care Services Health Services Advisory Group, Inc.

EXECUTIVE SUMMARY
♦ Collected from MCPs and SHPs lists of their tobacco users and descriptions of the methods used to identify tobacco users.
♦ Used DHCS’ administrative health care utilization data (i.e., claims/encounter data) to identify tobacco users and tobacco cessation treatment utilization among the identified users. Additionally, HSAG compared the tobacco users identified through administrative data with those identified by MCPs and SHPs.
The following are notable conclusions from the Tobacco Cessation Focused Study:
♦ In general, MCPs/SHPs are monitoring their providers to ensure that the providers have instituted a tobacco user identification system and are tracking beneficiaries who may need tobacco cessation services.
♦ HSAG determined that tobacco use was reported at a higher rate among men, beneficiaries ages 50–59, and beneficiaries from the Alaskan Native and American Indian and White race/ethnicity groups.
♦ Among the reported tobacco users, the rate of tobacco cessation therapy use was the highest among women, beneficiaries ages 40–49 and 50–59, and beneficiaries from the White race/ethnicity group.
♦ HSAG’s administrative analysis supported findings from the questionnaire results; reported rates of tobacco use were lower than expected across the State, which is likely due to inconsistent reporting of tobacco use by providers with the International Statistical Classification of Diseases and Related Health Problems, 10th revision (ICD-10) codes. ■ HSAG’s comparison of beneficiaries identified as tobacco users by the administrative
data and those identified by MCPs/SHPs further indicates that using administrative data alone does not identify all tobacco users.
■ The inconsistent reporting of tobacco use by providers can present a challenge with identifying the tobacco users through diagnosis codes alone.
Technical Assistance
The following are summaries of HSAG’s notable conclusions from the technical assistance activities that HSAG conducted during the review period.
Technical Assistance Activity for Performance Measures
Under the Technical Assistance Activity for Performance Measures, HSAG used a team approach to provide technical assistance related to performance measures, identifying the most pertinent subject matter experts for each technical assistance session to ensure the most efficient provision of technical assistance with the greatest likelihood of resulting in enhanced skills and, ultimately, improved performance. As a result of the technical assistance that HSAG provided to DHCS, MCPs, and SHPs:
♦ MCPs gained pertinent information regarding the new Depression Screening and Follow-Up for Adolescents and Adults measure for the RY 2018 EAS.
Medi-Cal Managed Care Technical Report: July 1, 2017–June 30, 2018 Page 10 California Department of Health Care Services Health Services Advisory Group, Inc.

EXECUTIVE SUMMARY
♦ DHCS gained up-to-date information on HEDIS measure specification changes and how the changes may impact EAS measure analyses.
♦ DHCS has a better understanding of performance measures, which will enable DHCS to make informed decisions regarding future EAS measure requirements.
♦ DHCS found HSAG’s secondary review of Plan-Do-Study-Act (PDSA) cycles and CAPs helpful as it reinforced DHCS’ findings and created synergy to provide optimal recommendations to MCPs.
♦ MCPs under CAPs became more proficient in conducting the rapid-cycle PIP process. ♦ DHCS enhanced its understanding of EQRO activities.
Technical Assistance Activity for Quality Improvement Collaboration
Under the Technical Assistance Activity for Quality Improvement Collaboration, HSAG coordinated with DHCS to plan and facilitate quarterly collaborative discussions with MCPs and SHPs to support MCPs’ and SHPs’ quality improvement efforts. MCPs and SHPs actively participated in the collaborative discussions by asking presenters questions and sharing about their own experiences, challenges, and lessons learned. The post-collaborative discussion surveys revealed that MCPs and SHPs found the presentations and sharing of ideas, successes, and lessons learned helpful. HSAG and DHCS agreed to explore different strategies to improve survey response rates to obtain more feedback from MCPs and SHPs regarding the collaborative discussions.
Technical Assistance Activity for ArcGIS Template Development
Under the Technical Assistance Activity for ArcGIS Template Development, HSAG provided technical assistance to DHCS in the development of geographic information mapping reports using ArcGIS Desktop (ArcGIS) software10 to support DHCS’ network monitoring activities. HSAG developed the ArcGIS reporting templates and supporting resource documents through an iterative process with DHCS. HSAG also conducted on-site training at DHCS to demonstrate the ArcGIS reporting templates’ functionalities in DHCS’ computing environment. As a result of the technical assistance that HSAG provided, DHCS has the ability to run ArcGIS reports to support DHCS’ network monitoring efforts and to support DHCS in meeting the network monitoring requirements outlined in the managed care final rule (i.e., CFRs §438.68, §438.206, and §438.207).
10 Esri 2017. ArcGIS Desktop: Release 10. Redlands, CA: Environmental Systems Research Institute.
Medi-Cal Managed Care Technical Report: July 1, 2017–June 30, 2018 Page 11 California Department of Health Care Services Health Services Advisory Group, Inc.
EXECUTIVE SUMMARY
Recommendations across All Assessed Activities As part of the EQR technical report production process, HSAG identified the following recommendation for DHCS:
♦ When DHCS evaluates whether or not to change the required measures for MLTSSPs, HSAG recommends that DHCS obtain input from MLTSSPs and other stakeholders through various methods such as questionnaires or focused studies regarding the feasibility and applicability of requiring MLTSSPs to report the newly created Long-Term Services and Supports HEDIS measures.
Note that MCP- and SHP-specific recommendations are included in appendices A through BB.
Medi-Cal Managed Care Technical Report: July 1, 2017–June 30, 2018 Page 12 California Department of Health Care Services Health Services Advisory Group, Inc.

Medi-Cal Managed Care External Quality Review Technical ReportJuly 1, 2017–June 30, 2018
2. Introduction
Purpose of Report As required by 42 CFR §438.364,11 DHCS contracts with HSAG, an EQRO, to prepare an annual, independent, technical report that summarizes findings on access and quality of care related to the health care services provided by California’s MCPs and SHPs.
Note: Title 42 CFR §438.2 defines a MCO, in part, as “an entity that has or is seeking to qualify for a comprehensive risk contract.” The Centers for Medicare & Medicaid Services (CMS) designates all DHCS-contracted MCPs and two DHCS-contracted SHPs as MCOs. CMS designates one DHCS-contracted SHP as a PIHP. Unless citing Title 42 CFR, this report will refer to DHCS’ MCOs as MCPs and the PIHP as an SHP.
As described in the CFR, the independent report must summarize findings on access and quality of care, including:
♦ A description of the manner in which the data from all activities conducted in accordance with §438.358 were aggregated and analyzed, and conclusions were drawn as to the quality and timeliness of, and access to the care furnished by the MCO, PIHP, PAHP, or PCCM entity.
♦ For each EQR-related activity conducted in accordance with §438.358: ■ Objectives ■ Technical methods of data collection and analysis ■ Description of data obtained, including validated performance measurement data for
each activity conducted in accordance with §438.358(b)(1)(i) and (ii) ■ Conclusions drawn from the data
♦ An assessment of each MCO, PIHP, PAHP, or PCCM entity’s strengths and weaknesses for the quality and timeliness of, and access to health care services furnished to Medicaid beneficiaries.
♦ Recommendations for improving the quality of health care services furnished by each MCO, PIHP, PAHP, or PCCM entity, including how the State can target goals and objectives in the quality strategy, under §438.340, to better support improvement in the quality and timeliness of, and access to health care services furnished to Medicaid beneficiaries.
11 Department of Health and Human Services, Centers for Medicare & Medicaid Services. Federal Register/Vol. 81, No. 88/Friday, May 6, 2016. 42 CFR Parts 431, 433, 438, et al. Medicaid and Children’s Health Insurance Program (CHIP) Programs; Medicaid Managed Care, CHIP Delivered in Managed Care, and Revisions Related to Third Party Liability; Final Rule. Available at: https://www.gpo.gov/fdsys/pkg/FR-2016-05-06/pdf/2016-09581.pdf. Accessed on: Nov 14, 2017.
Medi-Cal Managed Care Technical Report: July 1, 2017–June 30, 2018 Page 13 California Department of Health Care Services Health Services Advisory Group, Inc.

INTRODUCTION
♦ Methodologically appropriate, comparative information about all MCOs, PIHPs, PAHPs, and PCCM entities, consistent with guidance included in the EQR protocols issued in accordance with §438.352(e).
♦ An assessment of the degree to which each MCO, PIHP, PAHP, or PCCM entity has addressed effectively the recommendations for quality improvement made by the EQRO during the previous year’s EQR.
Quality, Access, and Timeliness CMS requires that the EQR evaluate the performance of MCOs, PIHPs, PAHPs, and PCCM entities related to the quality and timeliness of, and access to care delivered by the MCOs, PIHPs, PAHPs, and PCCM entities.
♦ Quality—The CFR indicates that quality, as it pertains to EQR, means the degree to which an MCO, PIHP, PAHP, or PCCM entity increases the likelihood of desired outcomes of its enrollees through: ■ Its structural and operational characteristics. ■ The provision of services that are consistent with current professional, evidence-based
knowledge. ■ Interventions for performance improvement.
♦ Access—The CFR indicates that access, as it pertains to EQR, means the timely use of services to achieve optimal outcomes, as evidenced by managed care plans successfully demonstrating and reporting on outcome information for the availability and timeliness elements defined under §438.68 (Network adequacy standards) and §438.206 (Availability of services).
♦ Timeliness—NCQA defines timeliness relative to utilization decisions as follows: “The organization makes utilization decisions in a timely manner to accommodate the clinical urgency of a situation.”12 NCQA further discusses the intent of this standard as being to minimize any disruption in the provision of health care. HSAG extends this definition of timeliness to include other managed care provisions that impact services to beneficiaries and that require timely response by the MCP—e.g., processing expedited appeals and providing timely follow-up care. The Agency for Healthcare Research and Quality (AHRQ) indicates that “timeliness is the health care system’s capacity to provide health care quickly after a need is recognized.”13 Timeliness includes the interval between identifying a need for specific tests and treatments and actually receiving those services.14
12 National Committee for Quality Assurance. 2006 Standards and Guidelines for MBHOs and MCOs.
13 Agency for Healthcare Research and Quality. National Healthcare Quality Report 2007. AHRQ Publication No. 08-0040. February 2008.
14 Ibid.
Medi-Cal Managed Care Technical Report: July 1, 2017–June 30, 2018 Page 14 California Department of Health Care Services Health Services Advisory Group, Inc.
INTRODUCTION
This report includes conclusions drawn by HSAG related to MCPs’ and SHPs’ strengths and weaknesses with respect to the quality and timeliness of, and access to the health care services furnished to MCMC beneficiaries (referred to as “beneficiaries” in this report). While quality, access, and timeliness are distinct aspects of care, most MCP and SHP activities and services cut across more than one area. Collectively, all MCP and SHP activities and services affect the quality, access, and timeliness of care delivered to beneficiaries. In this report, when applicable, HSAG indicates instances in which MCP or SHP performance affects one specific aspect of care more than another.
Summary of Report Content This report provides:
♦ A description of MCMC. ♦ A description of DHCS’ annual assessment of the MCMC quality strategy. ♦ A description of the scope of EQR activities for the period of July 1, 2017, through June 30,
2018, including the methodology used for data collection and analysis, a description of the data for each activity, and an aggregate assessment of MCP and SHP performance related to each activity, as applicable.
♦ A description of HSAG’s assessment related to the three federally mandated activities, three of the six optional activities, and the technical assistance provided to DHCS, MCPs, and SHPs as set forth in 42 CFR §438.358: ■ Mandatory activities:
○ Health plan compliance reviews ○ Validation of performance measures ○ Validation of PIPs
■ Optional activities: ○ Administration of consumer surveys ○ Encounter data validations ○ Focused studies
■ Technical assistance ♦ MCP- and SHP-specific evaluation reports, included as appendices (A through BB). Each
MCP- and SHP-specific evaluation report provides an assessment of the MCP’s and SHP’s strengths and weaknesses with respect to the quality and timeliness of, and access to health care services as well as recommendations to the MCP and SHP for improving quality of health care services for its beneficiaries.
The technical report and MCP- and SHP-specific evaluation reports all align to the same review period—July 1, 2017, through June 30, 2018.
Medi-Cal Managed Care Technical Report: July 1, 2017–June 30, 2018 Page 15 California Department of Health Care Services Health Services Advisory Group, Inc.

INTRODUCTION
Medi-Cal Managed Care Overview In the State of California, DHCS administers the Medicaid program (Medi-Cal) through its fee-for-service (FFS) and managed care delivery systems. DHCS is responsible for assessing the quality of care delivered to beneficiaries through its MCPs and SHPs, making improvements to care and services, and ensuring that contracted MCPs and SHPs comply with federal and State standards.
MCMC provides managed health care services to more than 10 million beneficiaries (as of June 30, 2018)15 in the State of California through a combination of contracted MCPs and SHPs. During the review period, DHCS contracted with 24 MCPs16 and three SHPs to provide health care services in all 58 counties throughout California. DHCS operates MCMC through a service delivery system that encompasses six models of managed care for its full-scope services as well as a model for SHPs. DHCS monitors MCP and SHP performance across model types. A link to the MCMC county map, which depicts the location of each model type, may be found at http://www.dhcs.ca.gov/services/Pages/Medi-CalManagedCare.aspx.
Following is a description of each managed care model type. HSAG includes the numbers of beneficiaries served by each model type as of June 30, 2018, within the model type descriptions. HSAG obtained the enrollment information from the Medi-Cal Managed Care Enrollment Report—June 2018.15
County Organized Health System (COHS) model. A COHS is a nonprofit, independent public agency that contracts with DHCS to administer Medi-Cal benefits through a wide network of health care providers. Each COHS MCP is established by the County Board of Supervisors and governed by an independent commission. A COHS model has been implemented in 22 counties and operates in each as a single, county-operated health plan. This model does not offer FFS Medi-Cal. As of June 30, 2018, the COHS model was serving about 2.15 million beneficiaries through six health plans in 22 counties; six of those counties were added in 2013.
Two-Plan Model (TPM). Under TPM, beneficiaries may choose between two MCPs; typically, one MCP is a local initiative (LI) and the other a commercial plan (CP). DHCS contracts with both plans. The LI is established under authority of the local government with input from State and federal agencies, local community groups, and health care providers to meet the needs and concerns of the community. The CP is a private insurance plan that also provides care for Medi-Cal beneficiaries. As of June 30, 2018, the TPM was serving about 6.92 million beneficiaries through 12 health plans in 14 counties. Note that Anthem Blue Cross Partnership Plan serves as an LI in Tulare County and a CP in all other TPM counties.
15 Medi-Cal Managed Care Enrollment Report—June 2018. Available at: http://www.dhcs.ca.gov/dataandstats/reports/Pages/MMCDMonthlyEnrollment.aspx. Accessed on: Jul 25, 2018.
16 Note: HSAG refers to Kaiser NorCal and Kaiser SoCal as two separate MCPs in this report; however, DHCS holds just one contract with Kaiser (KP Cal, LLC).
Medi-Cal Managed Care Technical Report: July 1, 2017–June 30, 2018 Page 16 California Department of Health Care Services Health Services Advisory Group, Inc.

INTRODUCTION
Geographic Managed Care (GMC) model. Under a GMC model, DHCS allows Medi-Cal beneficiaries to select from several MCPs within a specified geographic area (county). As of June 30, 2018, the GMC model had nine health plans serving about 1.15 million beneficiaries in Sacramento and San Diego counties.
Regional model. This model consists of three commercial health plans that provide services to beneficiaries in the rural counties of the State, primarily in northern and eastern California. The Regional model was implemented in November 2013, bringing MCMC to counties that historically offered only FFS Medi-Cal. As of June 30, 2018, the Regional model was serving more than 299,000 beneficiaries in 18 counties.
Imperial model. This model operates in Imperial County with two commercial health plans. As of June 30, 2018, this model was serving more than 76,000 beneficiaries.
San Benito model. This model operates in San Benito County and provides services to beneficiaries through a CP and FFS Medi-Cal. As of June 30, 2018, the San Benito model was serving more than 8,000 beneficiaries. San Benito is California’s only county where enrollment in managed care is not mandatory.
Specialty Health Plans. SHPs provide health care services to specialized populations. During the review period, DHCS held contracts with three SHPs:
♦ AIDS Healthcare Foundation—provides services in Los Angeles County primarily to beneficiaries living with human immunodeficiency virus (HIV) or acquired immunodeficiency syndrome (AIDS). As of June 30, 2018, AIDS Healthcare Foundation was serving 669 beneficiaries.
♦ Family Mosaic Project—provides intensive case management and wraparound services in San Francisco County for MCMC children and adolescents at risk of out-of-home placement. As of June 30, 2018, Family Mosaic Project was serving 28 beneficiaries.
♦ SCAN Health Plan—is a Medicare Advantage Special Needs Plan that provides services for the dual-eligible Medicare/Medi-Cal population subset residing in Los Angeles, Riverside, and San Bernardino counties. According to DHCS, as of June 30, 2018, SCAN Health Plan was serving 13,311 beneficiaries.
Medi-Cal Managed Care Technical Report: July 1, 2017–June 30, 2018 Page 17 California Department of Health Care Services Health Services Advisory Group, Inc.

INTRODUCTION
Table 2.1 shows participating MCPs and SHPs by model type and includes the counties in which they provide Medi-Cal services.
Table 2.1—Medi-Cal Managed Care Health Plans by Model Type as of June 30, 2018
Two-Plan Commercial Model Type MCP Name Counties
Anthem Blue Cross Partnership Plan
Alameda, Contra Costa, Fresno, Kings, Madera, San Francisco, Santa Clara
Health Net Community Solutions, Inc. Kern, Los Angeles, San Joaquin, Stanislaus, Tulare
Molina Healthcare of California Partner Plan, Inc. Riverside, San Bernardino
Two-Plan Local Initiative Model Type MCP Name Counties
Alameda Alliance for Health Alameda Anthem Blue Cross Partnership Plan Tulare CalViva Health Fresno, Kings, Madera Contra Costa Health Plan Contra Costa Health Plan of San Joaquin San Joaquin, Stanislaus Inland Empire Health Plan Riverside, San Bernardino Kern Health Systems Kern L.A. Care Health Plan Los Angeles San Francisco Health Plan San Francisco Santa Clara Family Health Plan Santa Clara
Geographic Managed Care Model Type MCP Name Counties
Aetna Better Health of California
Sacramento
Anthem Blue Cross Partnership Plan Health Net Community Solutions, Inc. Kaiser NorCal (KP Cal, LLC)* Molina Healthcare of California Partner Plan, Inc. UnitedHealthcare Community Plan
Medi-Cal Managed Care Technical Report: July 1, 2017–June 30, 2018 Page 18 California Department of Health Care Services Health Services Advisory Group, Inc.

INTRODUCTION
Geographic Managed Care Model Type MCP Name Counties
Aetna Better Health of California
San Diego
Care1st Partner Plan Community Health Group Partnership Plan Health Net Community Solutions, Inc. Kaiser SoCal (KP Cal, LLC) Molina Healthcare of California Partner Plan, Inc. UnitedHealthcare Community Plan
County-Organized Health System Model Type MCP Name Counties
CalOptima Orange
CenCal Health San Luis Obispo, Santa Barbara
Central California Alliance for Health Merced, Monterey, Santa Cruz
Gold Coast Health Plan Ventura Health Plan of San Mateo San Mateo
Partnership HealthPlan of California
Del Norte, Humboldt, Lake, Lassen, Marin, Mendocino, Modoc, Napa, Shasta, Siskiyou, Solano, Sonoma, Trinity, Yolo
Imperial Model Type MCP Name Counties
Molina Healthcare of California Partner Plan, Inc. Imperial
California Health & Wellness Plan
San Benito Model Type MCP Name Counties
Anthem Blue Cross Partnership Plan San Benito
Medi-Cal Managed Care Technical Report: July 1, 2017–June 30, 2018 Page 19 California Department of Health Care Services Health Services Advisory Group, Inc.

INTRODUCTION
Regional Model Type MCP Name Counties
Anthem Blue Cross Partnership Plan Butte, Colusa, Glenn, Plumas, Sierra, Sutter, Tehama (MCPs will report a single, multi-county rate for these counties, which are collectively referred to as Region 1.)
California Health & Wellness Plan
Anthem Blue Cross Partnership Plan Alpine, Amador, Calaveras, El Dorado, Inyo, Mariposa, Mono, Nevada, Placer, Tuolumne, Yuba (MCPs will report a single, multi-county rate for these counties, which are collectively referred to as Region 2.)
California Health & Wellness Plan
Kaiser NorCal* Amador, El Dorado, Placer
Specialty Health Plan Model Type Name Counties
AIDS Healthcare Foundation Los Angeles Family Mosaic Project San Francisco
SCAN Health Plan Los Angeles, Riverside, San Bernardino
*Kaiser NorCal provides Medi-Cal services in Sacramento County as a GMC model type and in Amador, El Dorado, and Placer counties as a Regional model type; however, the MCP reports performance measure rates for all counties combined. DHCS’ decision to have Kaiser NorCal report the combined rates ensures that the MCP has a sufficient sample size to compute accurate performance measure rates that represent the availability and quality of care provided for the population in the region and assists Kaiser NorCal with maximizing operational and financial efficiencies by reducing the number of encounter data validation, improvement plans, PIPs, and CAHPS survey activities.
For enrollment information about each county, go to http://www.dhcs.ca.gov/dataandstats/reports/Pages/MMCDMonthlyEnrollment.aspx.
Medi-Cal Managed Care Technical Report: July 1, 2017–June 30, 2018 Page 20 California Department of Health Care Services Health Services Advisory Group, Inc.
Medi-Cal Managed Care External Quality Review Technical ReportJuly 1, 2017–June 30, 2018
3. Medi-Cal Managed Care Quality Strategy
In accordance with 42 CFR §438.340, each state contracting with an MCO, PIHP, or PAHP, as defined in §438.2 or with a PCCM entity as described in §438.310(c) must draft and implement a written quality strategy for assessing and improving the quality of health care and services furnished by the MCO, PIHP, PAHP, or PCCM entity.
In 2018, to meet the 42 CFR §438.340 Medicaid Managed Care and CHIP Managed Care Final Rule, DHCS produced a quality strategy report that encompasses the quality strategies across all of California’s Medicaid managed care delivery systems including:
♦ MCPs and SHPs ♦ County mental health plans ♦ Drug Medi-Cal organized delivery systems ♦ Dental managed care plans
DHCS posted the proposed quality strategy for public comment from March 28, 2018, through April 27, 2018, and submitted the final report, dated June 29, 2018, to CMS by July 1, 2018. The quality strategy, along with other most recent publicly posted DHCS managed care quality strategy documents, may be found at https://www.dhcs.ca.gov/formsandpubs/Pages/ManagedCareQSR.aspx.
Specific to MCPs, the June 29, 2018, quality strategy outlines the same focus areas for improvement as the previous October 2017 Medi-Cal Managed Care Quality Strategy Report Annual Update. These areas are:
♦ Maternal and child health ■ Postpartum care ■ Childhood immunizations
♦ Chronic disease ■ Diabetes care ■ Hypertension control
♦ Tobacco cessation ♦ Reducing health disparities ♦ Fostering healthy communities through reducing opioid misuse and overuse
DHCS monitors quality, timeliness, and accessibility of services related to the maternal and child health, chronic disease, and tobacco cessation focus areas through quality metrics. DHCS engages in non-measure-related strategies with both MCPs and external stakeholders to address the focus areas related to health disparities and opioid medication misuse and overuse.
Medi-Cal Managed Care Technical Report: July 1, 2017–June 30, 2018 Page 21 California Department of Health Care Services Health Services Advisory Group, Inc.

MEDI-CAL MANAGED CARE QUALITY STRATEGY
Based on DHCS submitting the quality strategy to CMS by July 1, 2018, DHCS was unable to include RY 2018 performance measure results in the report. Moving forward, DHCS will make efforts to time the Managed Care Quality Strategy Report submission so that DHCS can include the most recent performance measure results in the report.
Medi-Cal Managed Care Technical Report: July 1, 2017–June 30, 2018 Page 22 California Department of Health Care Services Health Services Advisory Group, Inc.

Medi-Cal Managed Care External Quality Review Technical ReportJuly 1, 2017–June 30, 2018
4. Compliance Reviews
The Balanced Budget Act of 1997 as set forth in 42 CFR §438.358 requires that the state or its designee conduct a review within the previous three-year period to determine the MCO’s, PIHP’s, PAHP’s, or PCCM entity’s compliance with the standards established by the state for access to care, structure and operations, and quality measurement and improvement. The EQR technical report must include information on the reviews conducted within the previous three-year period to determine the health plans’ compliance with the standards established by the state.
Background To ensure that MCPs and SHPs meet all federal requirements, DHCS incorporates into its contracts with MCPs and SHPs specific standards for elements outlined in the CFR.
In accordance with California Welfare & Institutions Code §19130(b)(3), DHCS directly conducts compliance reviews of MCPs and SHPs rather than contracting with the EQRO to conduct reviews on its behalf. DHCS applies the Generally Accepted Government Auditing Standards, also known as the Yellow Book. DHCS has determined that its auditing tools are proprietary. Thus, DHCS cannot provide the EQRO with information that would allow the EQRO to determine whether DHCS’ tools assess compliance with all federal and State requirements.
DHCS’ compliance review process includes, but is not limited to, a review of MCPs’ and SHPs’ policies and procedures, on-site interviews, on-site provider site visits, and file verification studies. Additionally, DHCS actively engages with MCPs and SHPs throughout the CAP process by providing technical assistance and ongoing monitoring to ensure full remediation of identified deficiencies.
Under DHCS’ monitoring protocols, DHCS oversees the CAP process to ensure that MCPs and SHPs address all deficiencies identified in the following types of compliance reviews conducted by DHCS A&I: Medical Audits, State Supported Services Audits, 1115 Waiver Seniors and Persons with Disabilities (SPD) Medical Surveys, and Rural Expansion Medical Surveys. DHCS issues final closeout letters to MCPs and SHPs once MCPs and SHPs have submitted supporting documentation to substantiate that they have fully remediated all identified deficiencies and that the deficiencies are unlikely to recur. However, if corrective action requires more extensive changes to MCP and SHP operations and full implementation cannot be reasonably achieved without additional time, DHCS may close some deficiencies on the basis that sufficient progress has been made toward meeting set milestones. In these instances, DHCS may issue closeout letters to MCPs and SHPs with the understanding that progress on full implementation of corrective actions will be assessed in the consecutive audit.
Medi-Cal Managed Care Technical Report: July 1, 2017–June 30, 2018 Page 23 California Department of Health Care Services Health Services Advisory Group, Inc.

COMPLIANCE REVIEWS
Compliance Reviews DHCS assesses MCPs and SHPs through various compliance reviews. While most areas assessed under these reviews are similar, the results are reported separately and are distinct to specific populations. Descriptions of the various types of compliance reviews are indicated following, including the areas assessed along with the frequency of the reviews.
DHCS Audits & Investigations Division Medical Audits
Prior to 2015, DHCS conducted medical audits of MCPs and SHPs once every three years. These medical audits assessed MCPs’ and SHPs’ compliance with contract requirements and State and federal regulations. In January 2015, California Welfare and Institutions Code §14456 became law, mandating annual audits for MCPs. In response, A&I currently conducts on-site medical audits of each MCP and SHP annually, alternating between comprehensive full-scope and reduced-scope audits. Additionally, A&I conducts annual follow-up on the previous year’s CAP. A&I Medical Audits cover the following review categories:
♦ Utilization Management ♦ Case Management and Coordination of Care ♦ Access and Availability of Care ♦ Member’s Rights ♦ Quality Management ♦ Administrative and Organizational Capacity
Seniors and Persons with Disabilities
The Medi-Cal 1115 “Bridge to Reform” Waiver from the federal government authorized DHCS to conduct mandatory enrollment of SPD beneficiaries into managed care beginning in June 2011. At the initial transition, under an interagency agreement with DHCS, the Department of Managed Health Care (DMHC) conducted health plan medical surveys (SPD Medical Surveys) every three years to ensure that beneficiaries affected by this mandatory transition are assisted and protected under California’s strong patients’ rights laws. In 2017, A&I began to include SPD Medical Surveys as part of its medical audit process, with ongoing follow-up on CAPs. These reviews cover the following categories:
♦ Utilization Management ♦ Continuity of Care ♦ Availability and Accessibility ♦ Member Rights ♦ Quality Management
Medi-Cal Managed Care Technical Report: July 1, 2017–June 30, 2018 Page 24 California Department of Health Care Services Health Services Advisory Group, Inc.

COMPLIANCE REVIEWS
Rural Expansion
Beginning in September 2013, pursuant to California Welfare and Institutions Code §14005.27 and authorized under Assembly Bill 1467, DHCS expanded MCMC to Medi-Cal beneficiaries residing in 28 rural California counties. At the initial transition, DHCS entered into an interagency agreement with DMHC to perform medical surveys of each health plan participating in the rural expansion. In 2017, A&I began to include Rural Expansion Medical Surveys as part of its medical audit process, providing ongoing follow-up on CAPs. These reviews cover the following categories:
♦ Utilization Management ♦ Continuity of Care ♦ Availability and Accessibility ♦ Member Rights ♦ Quality Management
State Supported Services
A&I conducts State Supported Services (abortion services) Audits in tandem with its A&I Medical Audits. State Supported Services Audits are conducted in accordance with California Welfare and Institutions Code §14456. In conducting this audit, the audit team evaluates the MCP’s compliance with the State Supported Services contract and regulations. A&I conducts these audits annually. Additionally, A&I conducts follow-up on the previous year’s CAP.
Objectives HSAG’s objectives related to compliance reviews are to assess:
♦ DHCS’ compliance with conducting reviews with all MCPs and SHPs within the three-year period prior to the review dates for this report.
♦ MCPs’ and SHPs’ compliance with the areas DHCS reviewed as part of the compliance review process.
Methodology As part of the EQR technical report production, DHCS submitted to HSAG all compliance-related documentation for reviews occurring within the previous three-year period that HSAG had not already reported on in previous EQR technical reports.
HSAG determined whether or not DHCS conducted compliance monitoring reviews for all MCPs and SHPs at least once within the three-year period prior to the review dates for this report by assessing the dates of each MCP’s and SHP’s review. Unless noted, HSAG excluded from its analysis information from compliance reviews conducted earlier than three
Medi-Cal Managed Care Technical Report: July 1, 2017–June 30, 2018 Page 25 California Department of Health Care Services Health Services Advisory Group, Inc.

COMPLIANCE REVIEWS
years prior to the start of the review period (July 1, 2017) and later than the end of the review period (June 30, 2018).
HSAG reviewed all compliance-related information to assess the degree to which MCPs and SHPs are meeting the standards assessed as part of the compliance review process. Additionally, HSAG organized, aggregated, and analyzed results from the compliance monitoring reviews to draw conclusions about overall MCP and SHP performance in providing quality, accessible, and timely health care and services to beneficiaries.
In addition to summarizing the aggregated results, HSAG also summarized MCP- and SHP-specific results, including HSAG’s recommendations. MCP- and SHP-specific compliance review results and HSAG’s recommendations are included in appendices A through BB.
Results—Compliance Reviews HSAG reviewed the dates on which DHCS conducted its most recent compliance reviews of MCPs and SHPs and determined that DHCS conducted a compliance review no earlier than three years from the start of the review period for this report (July 1, 2017) and no later than the end of the review period for this report (June 30, 2018) for all MCPs and SHPs.
The following is a summary of notable results from HSAG’s assessment of the compliance review information submitted by DHCS to HSAG for production of the 2017–18 MCP- and SHP-specific evaluation reports and this EQR technical report. The summary includes new information not reported on in previous review periods.
♦ DHCS provided evidence to HSAG of DHCS’ ongoing follow-up with MCPs and SHPs regarding deficiencies A&I identified during audits. DHCS provided documentation to HSAG of its follow-up with MCPs on CAPs as well as deficiency-related documentation from MCPs.
♦ HSAG received results from 15 State Supported Services audits of MCPs. A&I identified no deficiencies in 12 of the 15 audits (80 percent), reflecting full compliance with the State Supported Services contract and regulations.
♦ Twenty-four of the 25 MCPs and SHPs for which HSAG received A&I Medical Audit results (96 percent) had a deficiency in at least one review area (e.g., Utilization Management, Access and Availability of Care). Deficiencies were MCP-/SHP-specific, with no specific findings cutting across most or all MCPs/SHPs.
For the most up-to-date A&I audit reports and related CAP information, go to: http://www.dhcs.ca.gov/services/Pages/MedRevAuditsCAP.aspx.
For the most up-to-date DMHC medical survey reports and related CAP information, go to: http://www.dhcs.ca.gov/services/Pages/MngdHlthMedSrvyCAP.aspx.
Medi-Cal Managed Care Technical Report: July 1, 2017–June 30, 2018 Page 26 California Department of Health Care Services Health Services Advisory Group, Inc.
COMPLIANCE REVIEWS
Conclusions—Compliance Reviews Deficiencies identified during A&I audits reflected opportunities for improvement for MCPs and SHPs in the areas of quality and timeliness of and access to health care. DHCS submitted audit follow-up information to HSAG that provided evidence of MCPs’ and SHPs’ actions to resolve the deficiencies which resulted in DHCS closing the CAPs. Audit findings within the assessed areas were MCP-/SHP-specific; therefore, across all MCPs and SHPs, HSAG identified no specific areas for improvement. As in previous years, DHCS demonstrated ongoing efforts to follow up on deficiencies as evidenced in the audit reports, CAP responses, and final closeout letters that DHCS submitted to HSAG for review.
Recommendations—Compliance Reviews HSAG has no recommendations for DHCS related to compliance reviews.
Medi-Cal Managed Care Technical Report: July 1, 2017–June 30, 2018 Page 27 California Department of Health Care Services Health Services Advisory Group, Inc.

Medi-Cal Managed Care External Quality Review Technical ReportJuly 1, 2017–June 30, 2018
5. Performance Measure Validation
In accordance with 42 CFR §438.330(c), states must require that MCOs, PIHPs, PAHPs, and PCCM entities submit performance measurement data as part of the MCOs’, PIHPs’, PAHPs’, and PCCM entities’ quality assessment and performance improvement programs. Validating performance measures is one of the mandatory EQR activities described in §438.358(b)(2). The EQR technical report must include information on the validation of MCO, PIHP, PAHP, and PCCM entity performance measures (as required by the state) or MCO, PIHP, PAHP, and PCCM entity performance measures calculated by the state during the preceding 12 months.
Background To comply with §438.358, DHCS contracted with HSAG to conduct an independent validation, through NCQA HEDIS Compliance AuditsTM,17 and performance measure validation for non-HEDIS measures, of the DHCS-selected performance measures calculated and submitted by MCPs and SHPs. Additionally, as part of California’s Coordinated Care Initiative (CCI), DHCS contracted with HSAG to conduct an independent validation of the DHCS-selected performance measures calculated and submitted by MLTSSPs.
HSAG evaluates two aspects of performance measures for each MCP, SHP, and MLTSSP. First, HSAG assesses the validity of each MCP’s, SHP’s, and MLTSSP’s data using protocols required by CMS.18 Then, HSAG organizes, aggregates, and analyzes validated performance measure data to draw conclusions about MCPs’, SHPs’, and MLTSSPs’ performances in providing quality, accessible, and timely care and services to beneficiaries.
Objectives The purpose of HSAG’s performance measure validation is to ensure that MCPs, SHPs, and MLTSSPs calculate and report performance measures consistent with the established specifications and that the results can be compared to one another.
HSAG conducts NCQA HEDIS Compliance Audits and performance measure validations and analyzes performance measures results to:
♦ Evaluate the accuracy of the performance measure data collected. ♦ Determine the extent to which the specific performance measures calculated by MCPs,
SHPs, and MLTSSPs followed the specifications established for calculation of the performance measures.
♦ Identify overall strengths and areas for improvement in the performance measure process.
17 NCQA HEDIS Compliance Audit™ is a trademark of NCQA. 18 The CMS EQR protocols may be found at https://www.medicaid.gov/medicaid/quality-of-
care/medicaid-managed-care/external-quality-review/index.html. Accessed on: Mar 4, 2019.
Medi-Cal Managed Care Technical Report: July 1, 2017–June 30, 2018 Page 28 California Department of Health Care Services Health Services Advisory Group, Inc.

PERFORMANCE MEASURE VALIDATION
Methodology HSAG adheres to NCQA’s HEDIS Compliance Audit Standards, Policies, and Procedures, Volume 5, which outlines the accepted approach for auditors to use when conducting an Information Systems (IS) capabilities assessment and an evaluation of compliance with HEDIS specifications for a plan. All of HSAG’s lead auditors are Certified HEDIS Compliance Auditors (CHCAs).
Performance Measure Validation Activities
Performance measure validation involved three phases: off-site, on-site, and post-on-site.19
The following provides a summary of HSAG’s activities with MCPs, SHPs, and MLTSSPs, as applicable, within each of the validation phases.
Off-Site Activity (October 2017 through May 2018) ♦ Forwarded HEDIS 2018 Record of Administration, Data Management, and Processes
(Roadmap) upon release from NCQA. ♦ Conducted annual HEDIS updates webinar to review the audit timeline and discuss any
changes to the measures, technical specifications, and processes. ♦ Scheduled on-site visit dates. ♦ Conducted kick-off calls to introduce the audit team; discuss the on-site agenda; provide
guidance on HEDIS audit and performance measure validation processes; and ensure that MCPs, SHPs, and MLTSSPs were aware of important deadlines.
♦ Reviewed completed HEDIS Roadmaps and Information Systems Capabilities Assessment Tool (ISCAT) to assess compliance with the audit standards and provided the IS standard tracking report that listed outstanding items and areas that required additional clarification.
♦ Reviewed source code used for calculating the HEDIS performance measure rates to ensure compliance with the technical specifications, unless the MCP/SHP/MLTSSP used a vendor whose measures were certified by NCQA.
♦ Reviewed source code used for calculating the non-HEDIS performance measure rates to ensure compliance with the specifications required by the State.
♦ Conducted validation for all supplemental data sources intended for reporting, and provided a final supplemental data validation report that listed the types of supplemental data reviewed and the validation results.
♦ Conducted preliminary rate review to assess data completeness and accuracy early in the audit process to allow time for making corrections, if needed, prior to final rate submission.
19 Department of Health and Human Services, Centers for Medicare & Medicaid Services. EQR Protocol 2: Validation of Performance Measures Reported by the MCO: A Mandatory Protocol for External Quality Review (EQR), Version 2.0, September 2012. Available at: https://www.medicaid.gov/medicaid/quality-of-care/downloads/eqr-protocol-2.pdf. Accessed on: Dec 3, 2018.
Medi-Cal Managed Care Technical Report: July 1, 2017–June 30, 2018 Page 29 California Department of Health Care Services Health Services Advisory Group, Inc.

PERFORMANCE MEASURE VALIDATION
♦ Conducted medical record review validation to ensure the integrity of medical record review processes for performance measures that required medical record data for HEDIS reporting.
On-Site Activity (January 2018 through April 2018) ♦ Conducted on-site audits to assess capabilities to collect and integrate data from internal
and external sources and produce reliable performance measure results. ♦ Provided preliminary audit findings.
Post-On-Site Activity (May 2018 through July 2018) ♦ Worked collaboratively to resolve any outstanding items and corrective actions, if
applicable, and provided a final IS standard tracking report that documented the resolution of each item.
♦ Conducted final rate review and provided a rate analysis report that included a comparison to the preliminary rate submission and prior two years’ rates (if available) and showed how the rates compared to the NCQA HEDIS 2017 Audit Means, Percentiles, and Ratios. The report also included requests for clarification on any notable changes in rates, eligible populations, and measures with rates that remained the same from year to year.
♦ Compared the final rates to the Patient Level Detail files required by DHCS, ensuring that data matched the final rate submission and met DHCS requirements.
♦ Approved the final rates; and assigned a final, audited result to each selected measure. ♦ Produced and provided final audit reports containing a summary of all audit activities.
Description of Data Obtained
Through the methodology, HSAG obtained a number of different information sources to conduct the performance measure validation. These included: ♦ HEDIS Roadmap and ISCAT. ♦ Source code, computer programming, and query language (if applicable) used to calculate
the selected measures. ♦ Supporting documentation such as file layouts, system flow diagrams, system log files, and
policies and procedures. ♦ Re-abstraction of a sample of medical records selected by HSAG auditors.
HSAG also obtained information through interaction, discussion, and formal interviews with key MCP, SHP, and MLTSSP staff members as well as through observing system demonstrations and data processing.
Medi-Cal Managed Care Technical Report: July 1, 2017–June 30, 2018 Page 30 California Department of Health Care Services Health Services Advisory Group, Inc.

PERFORMANCE MEASURE VALIDATION
Performance Measure Results Analyses
Using the validated performance measure rates, HSAG organized, aggregated, and analyzed the data to draw conclusions about MCP/SHP/MLTSSP performance in providing accessible, timely, and quality health care services to beneficiaries. To aid in the analyses, HSAG produced spreadsheets with detailed comparative results. Additionally, HSAG submitted to DHCS the spreadsheets for DHCS to use in its assessment of MCP/SHP/MLTSSP performance across all performance measures.
HSAG assessed for trends relative to MCPs’/SHPs’/MLTSSPs’ performances in comparison to HPLs and MPLs and for statistically significant improvement or decline in performance from the previous RY. HSAG identified strengths, opportunities for improvement, and recommendations based on its assessment of MCP/SHP/MLTSSP performance.
Aggregate MCP, SHP, and MLTSSP performance measure results, findings, and recommendations (if applicable) are included in Section 6, Section 7, and Section 8 of this report (“Managed Care Health Plan Performance Measures,” “Specialty Health Plan Performance Measures,” and “Managed Long-Term Services and Supports Plan Performance Measures,” respectively).
Performance Measure Validation Results In RY 2018, HSAG conducted 26 performance measure validations, with 25 of those being NCQA HEDIS Compliance Audits. The exception was Family Mosaic Project, an SHP that reported non-HEDIS measures and underwent performance measure validation consistent with CMS protocols. These 26 MCPs and SHPs represented 56 separate data submissions for performance measure rates at the reporting unit level. HSAG also conducted performance measure validations with 23 MCPs for a select set of measures that DHCS required MCPs to stratify by the SPD and non-SPD populations, and with 11 MLTSSPs for their MLTSS populations.
Note that HSAG includes no performance measure validation results in this report or in the MCP-specific reports for Aetna Better Health of California and UnitedHealthcare Community Plan. While DHCS held contracts with both MCPs during the review period for this report, beneficiaries from neither MCP met the continuous enrollment criteria for RY 2018 performance measure reporting. HSAG will include Aetna Better Health of California and UnitedHealthcare Community Plan in the RY 2019 HEDIS Compliance Audit process.
Each performance measure validation included pre-on-site preparation, data source review, an on-site visit, medical record review validation when appropriate, primary source validation, query review, preliminary and final rate review, and initial and final audit reports production.
Medi-Cal Managed Care Technical Report: July 1, 2017–June 30, 2018 Page 31 California Department of Health Care Services Health Services Advisory Group, Inc.
PERFORMANCE MEASURE VALIDATION
Of the 23 MCPs and two SHPs that underwent NCQA HEDIS Compliance Audits, 23 used vendors with HEDIS Certified MeasuresSM,20 to calculate and produce HEDIS measure rates. This was the same number as in RY 2017. Five of the six vendors that represented these MCPs and SHPs each achieved full NCQA Measure CertificationSM,21 status for the reported HEDIS measures; one vendor that represented seven of the MCPs achieved NCQA Measure Certification status for all reported measures except for the new Depression Screening and Follow-Up for Adolescents and Adults measure. As a result, HSAG reviewed and approved this vendor’s source code and the process the vendor used for calculating this measure. HSAG reviewed and approved the source code that Family Mosaic Project, Kaiser NorCal, and Kaiser SoCal each developed internally for measure calculation. Additionally, HSAG reviewed and approved each MCP’s source code for the non-HEDIS All-Cause Readmissions measure defined by DHCS.
Strengths—Performance Measure Validation
HSAG auditors identified the following strengths during the performance measure validation process:
♦ Auditors noted that in general, with few exceptions, MCPs and SHPs have developed integrated teams comprised of necessary staff members from both quality and information technology departments. It was apparent that both areas worked closely together and had a sound understanding of the NCQA HEDIS Compliance Audit process. This multidisciplinary approach is key to reporting accurate and timely performance measure rates.
♦ MCPs and SHPs used enrollment data as the primary data source for determining the eligible population for most measures. The routine data transfer and longstanding relationship between MCPs/SHPs and DHCS have helped to create best practices and stable processes for acquiring membership data. In addition to smooth and accurate processing by MCPs and SHPs, the data included fewer issues and retrospective enrollment concerns.
♦ In RY 2018, MCPs and SHPs continued to increase use of supplemental data sources. These additional data sources offered MCPs and SHPs the opportunity to more accurately capture the services provided to beneficiaries. Reporting hybrid measures along with supplemental data reduced the burden and resources that MCPs and SHPs had to expend to abstract the clinical information. Moreover, measures reported with administrative data only, and for which MCPs and SHPs also included supplemental data, more accurately reflected performance rates for those measures.
♦ MCPs/SHPs had rigorous editing processes in place to ensure accurate and complete pharmacy data.
20 HEDIS Certified MeasuresSM is a service mark of NCQA. 21 NCQA Measure CertificationSM is a service mark of NCQA.
Medi-Cal Managed Care Technical Report: July 1, 2017–June 30, 2018 Page 32 California Department of Health Care Services Health Services Advisory Group, Inc.

PERFORMANCE MEASURE VALIDATION
♦ Generally, and with few exceptions, MCPs and SHPs receive most claims data electronically and have a very small percentage of claims that require manual data entry, minimizing the potential for errors.
♦ Auditors noted that in general, MCPs and SHPs demonstrated that they had sufficient processes in place to maintain adequate oversight of their vendors.
Opportunities for Improvement—Performance Measure Validation
HSAG auditors identified the following challenges and opportunities for improvement during the performance measure validation process.
♦ Due to the increased number of supplemental data sources used for performance measure calculations, MCPs and SHPs have the opportunity to ensure that that they have comprehensive and ongoing oversight processes in place.
♦ RY 2018 was the first year that DHCS required full-scope MCPs to report rates for the HEDIS Electronic Clinical Data Systems (ECDS) Depression Screening and Follow-Up for Adolescents and Adults measure. MCPs struggled with identifying appropriate data sources and codes used to identify depression screening tools as required by NCQA’s measure specifications. DHCS worked closely with NCQA and HSAG to provide guidance to MCPs and will continue to work collaboratively with NCQA and HSAG to provide guidance to the MCPs for RY 2019.
Most challenges and opportunities for improvement were MCP-/SHP-specific. HSAG auditors determined that all but one MCP was fully compliant with encounter data processing (IS Standard 2.0). While the one MCP was partially compliant with this standard, HSAG determined that the identified issue had a minimal impact to reporting. Additionally, HSAG auditors determined that all but one MCP was fully compliant with medical record review processes (IS Standard 4.0); however, HSAG determined that the identified medical record review process issue had a minimal impact to reporting.
Recommendations—Performance Measure Validation HSAG has no recommendations for DHCS related to performance measure validation.
MCP-, SHP-, and MLTSSP-specific performance measure validation findings and recommendations are included in appendices A through BB.
Medi-Cal Managed Care Technical Report: July 1, 2017–June 30, 2018 Page 33 California Department of Health Care Services Health Services Advisory Group, Inc.

Medi-Cal Managed Care External Quality Review Technical ReportJuly 1, 2017–June 30, 2018
6. Managed Care Health Plan Performance Measures
Managed Care Health Plan Performance Measure Requirements To comply with §438.330, DHCS selects a set of performance measures through which to evaluate the quality of care delivered by the contracted MCPs to beneficiaries. DHCS consults with MCPs, HSAG, and stakeholders to determine the performance measures DHCS will require. MCMC’s quality strategy describes the program’s processes to define, collect, and report MCP-specific performance data, as well as overall MCMC performance data, on DHCS-required measures. MCPs must report county or regional rates unless otherwise approved by DHCS.
External Accountability Set
DHCS refers to the DHCS-selected performance measures for MCPs as the External Accountability Set (EAS). MCPs’ reporting of EAS rates provides DHCS with a standardized method for objectively evaluating MCPs’ delivery of services to beneficiaries.
In alignment with the quality strategy report reassessment timeline, DHCS evaluates the EAS every three years using the following criteria:
1. Meaningful to the public, the beneficiaries, the State, and the MCPs. 2. Improves quality of care or services for the Medi-Cal population. 3. High population impact by affecting large numbers of beneficiaries or having substantial
impact on smaller, special populations. 4. Known impact of poor quality linked with severe health outcomes (morbidity, mortality) or
other consequences (high resource use). 5. Performance improvement needed based on available data demonstrating opportunity to
improve, variation across performance, and disparities in care. 6. Evidence-based practices available to demonstrate that the problem is amenable to
intervention and that there are pathways to improvement. 7. Availability of standardized measures and data that can be collected. 8. Alignment with other national and State priority areas. 9. Health care system value demonstrated through cost-savings, cost-effectiveness, risk-
benefit balance, or health economic benefit. 10. Avoid negative unintended consequences.
DHCS also considers other issues when determining whether or not to add or remove measures from the EAS, including:
♦ Limiting burden and intrusion on primary care provider (PCP) offices (administrative versus hybrid measures, for instance).
♦ Needing to retain measures in the core set for three years for baseline and trend analysis.
Medi-Cal Managed Care Technical Report: July 1, 2017–June 30, 2018 Page 34 California Department of Health Care Services Health Services Advisory Group, Inc.

MANAGED CARE HEALTH PLAN PERFORMANCE MEASURES
♦ Considering the impact of adding/deleting measure(s) used in the auto-assignment and default algorithm.
As part of its evaluation of the EAS measures, DHCS seeks input from MCP medical directors, external partners, and various stakeholder advisory groups.
DHCS’ RY22 2018 EAS consisted of 16 HEDIS measures and one non-HEDIS measure that DHCS and MCPs originally developed (with guidance from HSAG) to be used for a statewide collaborative quality improvement project (QIP). Several required measures include more than one indicator, bringing the total number of performance measure rates required for MCP reporting to 30. In this report, HSAG uses “performance measure” or “measure” (rather than indicator) to reference required EAS measures. Collectively, performance measure results reflect the quality and timeliness of and access to care provided by MCPs to beneficiaries.
Table 6.1 lists the RY 2018 EAS measures by measure domain. HSAG organized the measures into measure domains based on the health care areas they affect. Organizing the measures by domains allows HSAG to provide meaningful assessment of MCP performance and actionable recommendations to MCPs and DHCS.
Table 6.1—RY 2018 (MY 2017) External Accountability Set Measures
Measure NCQA Method of Data Capture*
Preventive Screening and Children’s Health Domain
Childhood Immunization Status—Combination 3 Hybrid Children and Adolescents’ Access to Primary Care Practitioners—12–24 Months Admin
Children and Adolescents’ Access to Primary Care Practitioners—25 Months–6 Years Admin
Children and Adolescents’ Access to Primary Care Practitioners—7–11 Years Admin
Children and Adolescents’ Access to Primary Care Practitioners—12–19 Years Admin
Immunizations for Adolescents—Combination 2 Hybrid Weight Assessment and Counseling for Nutrition and Physical Activity for Children and Adolescents—Counseling for Nutrition—Total Hybrid
22 The RY is the year in which MCPs report the rates. The RY rates reflect measurement year (MY) data from the previous calendar year.
Medi-Cal Managed Care Technical Report: July 1, 2017–June 30, 2018 Page 35 California Department of Health Care Services Health Services Advisory Group, Inc.

MANAGED CARE HEALTH PLAN PERFORMANCE MEASURES
Measure NCQA Method of Data Capture*
Weight Assessment and Counseling for Nutrition and Physical Activity for Children and Adolescents—Counseling for Physical Activity—Total Hybrid
Well-Child Visits in the Third, Fourth, Fifth, and Sixth Years of Life Hybrid
Preventive Screening and Women’s Health Domain
Breast Cancer Screening Admin Cervical Cancer Screening Hybrid Prenatal and Postpartum Care—Postpartum Care Hybrid Prenatal and Postpartum Care—Timeliness of Prenatal Care Hybrid
Care for Chronic Conditions Domain
Annual Monitoring for Patients on Persistent Medications—ACE Inhibitors or ARBs Admin
Annual Monitoring for Patients on Persistent Medications—Diuretics Admin Asthma Medication Ratio Admin Comprehensive Diabetes Care—Blood Pressure Control (<140/90 mm Hg) Hybrid Comprehensive Diabetes Care—Eye Exam (Retinal) Performed Hybrid Comprehensive Diabetes Care—HbA1c Control (<8.0 Percent) Hybrid Comprehensive Diabetes Care—HbA1c Poor Control (>9.0 Percent) Hybrid Comprehensive Diabetes Care—Hemoglobin A1c (HbA1c) Testing Hybrid Comprehensive Diabetes Care—Medical Attention for Nephropathy Hybrid Controlling High Blood Pressure Hybrid
Appropriate Treatment and Utilization Domain
All-Cause Readmissions (non-HEDIS measure originally developed for the Statewide Collaborative All-Cause Readmissions QIP) Admin
Ambulatory Care—Emergency Department (ED) Visits per 1,000 Member Months** Admin
Ambulatory Care—Outpatient Visits per 1,000 Member Months** Admin Avoidance of Antibiotic Treatment in Adults With Acute Bronchitis Admin Depression Screening and Follow-Up for Adolescents and Adults— Depression Screening ECDS
Medi-Cal Managed Care Technical Report: July 1, 2017–June 30, 2018 Page 36 California Department of Health Care Services Health Services Advisory Group, Inc.

MANAGED CARE HEALTH PLAN PERFORMANCE MEASURES
Measure NCQA Method of Data Capture*
Depression Screening and Follow-Up for Adolescents and Adults— Follow-Up on Positive Screen ECDS
Use of Imaging Studies for Low Back Pain Admin * Admin = administrative method, which requires that MCPs identify the eligible population (i.e., the denominator) using administrative data such as enrollment, claims, and encounters. Additionally, MCPs derive the numerator (services provided to beneficiaries in the eligible population) from administrative data sources and auditor-approved supplemental data sources. MCPs may not use medical records to retrieve information. When using the administrative method, MCPs use the entire eligible population as the denominator because NCQA does not allow sampling. Hybrid = hybrid method, which requires that MCPs identify the eligible population using administrative data, then extract a systematic sample of beneficiaries from the eligible population, which becomes the denominator. MCPs use administrative data to identify services provided to these beneficiaries. When administrative data do not show evidence that MCPs provided the service, MCPs review medical records for those beneficiaries to derive the numerator. ECDS = Electronic Clinical Data Systems method, which expands the use of electronic data for quality measurement. Data sources that MCPs may use to identify the denominator and derive the numerator include, but are not limited to, beneficiary eligibility files, electronic health records, clinical registries, health information exchange, administrative claims systems, electronic laboratory reports, electronic pharmacy systems, immunization information systems, and disease/case management registries. ** Member months are a member's “contribution” to the total yearly membership.
Seniors and Persons with Disabilities Performance Measure Stratification
In addition to requiring MCPs to report rates for EAS measures in RY 2018, DHCS required MCPs to report separate rates for their SPD and non-SPD populations for the following measures:
♦ All-Cause Readmissions ♦ Ambulatory Care—Emergency Department (ED) Visits per 1,000 Member Months ♦ Ambulatory Care—Outpatient Visits per 1,000 Member Months ♦ Annual Monitoring for Patients on Persistent Medications—ACE Inhibitors or ARBs ♦ Annual Monitoring for Patients on Persistent Medications—Diuretics ♦ Children and Adolescents’ Access to Primary Care Practitioners—12–24 Months ♦ Children and Adolescents’ Access to Primary Care Practitioners—25 Months–6 Years ♦ Children and Adolescents’ Access to Primary Care Practitioners—7–11 Years ♦ Children and Adolescents’ Access to Primary Care Practitioners—12–19 Years
Medi-Cal Managed Care Technical Report: July 1, 2017–June 30, 2018 Page 37 California Department of Health Care Services Health Services Advisory Group, Inc.

MANAGED CARE HEALTH PLAN PERFORMANCE MEASURES
Reporting Year 2018 Encounter Data Diabetes Subset Comparing SPD and Non-SPD Rates
In RY 2015, DHCS initiated an encounter data validation and improvement project that substantially improves the quality of DHCS’ encounter data. As part of this project, DHCS augmented HSAG’s reporting of SPD performance by getting approval from CMS to calculate a subset of SPD rates using encounter data submitted by MCPs for the following indicators:
♦ Comprehensive Diabetes Care— Eye Exam (Retinal) Performed ♦ Comprehensive Diabetes Care—HbA1c Testing ♦ Comprehensive Diabetes Care—Medical Attention for Nephropathy
These SPD and non-SPD rates were calculated by DHCS and were not validated by HSAG. Further, DHCS provided the results and findings for HSAG to include in this report.
DHCS-Established Performance Levels
To create a uniform standard for assessing MCPs on performance measures, DHCS established an HPL and MPL for each HEDIS measure except for the two Depression Screening and Follow-Up for Adolescents and Adults measures, because no comparable benchmarks exist for DHCS to use to establish HPLs and MPLs. Additionally, DHCS did not establish an HPL or MPL for the non-HEDIS All-Cause Readmissions measure.
To establish the HPLs and MPLs for the RY 2018 HEDIS measures, DHCS used NCQA’s Quality Compass®,23 HEDIS 2017 national Medicaid benchmarks. The Quality Compass HEDIS 2017 national Medicaid benchmarks reflect the previous year’s benchmark percentiles (calendar year [CY] 2016).
DHCS based the HPLs for RY 2018 on the national Medicaid 90th percentiles and the MPLs for RY 2018 on the national Medicaid 25th percentiles. DHCS uses the established HPLs as performance goals and recognizes MCPs for outstanding performance. MCPs are contractually required to perform at or above DHCS-established MPLs. Per DHCS’ license agreement with NCQA, HSAG includes in Table 6.2 the benchmarks that DHCS used to establish the HPLs and MPLs for the RY 2018 HEDIS measures.24
23 Quality Compass® is a registered trademark of NCQA. 24 The source for data contained in this publication is Quality Compass® 2017 and is used with
the permission of NCQA. Quality Compass 2017 includes certain CAHPS data. Any data display, analysis, interpretation, or conclusion based on these data is solely that of the authors; and NCQA specifically disclaims responsibility for any such display, analysis, interpretation, or conclusion.
Medi-Cal Managed Care Technical Report: July 1, 2017–June 30, 2018 Page 38 California Department of Health Care Services Health Services Advisory Group, Inc.

MANAGED CARE HEALTH PLAN PERFORMANCE MEASURES
Table 6.2—High Performance Level and Minimum Performance Level Benchmark Values for RY 2018 (MY 2017)*
Measure RY 2018 HPL
RY 2018 MPL
Preventive Screening and Children’s Health
Childhood Immunization Status—Combination 3 79.32% 65.25% Children and Adolescents' Access to Primary Care Practitioners—12–24 Months 97.89% 93.27%
Children and Adolescents' Access to Primary Care Practitioners—25 Months–6 Years 93.16% 84.94%
Children and Adolescents' Access to Primary Care Practitioners—7–11 Years 96.09% 87.58%
Children and Adolescents' Access to Primary Care Practitioners—12–19 Years 94.72% 85.65%
Immunizations for Adolescents—Combination 2 30.39% 15.87% Weight Assessment and Counseling for Nutrition and Physical Activity for Children and Adolescents—Nutrition Counseling— Total
82.53% 58.56%
Weight Assessment and Counseling for Nutrition and Physical Activity for Children and Adolescents—Physical Activity Counseling—Total
75.40% 49.06%
Well-Child Visits in the Third, Fourth, Fifth, and Sixth Years of Life 82.77% 66.18%
Preventive Screening and Women’s Health
Breast Cancer Screening 70.29% 52.70% Cervical Cancer Screening 70.80% 51.82% Prenatal and Postpartum Care—Postpartum Care 73.67% 59.59% Prenatal and Postpartum Care—Timeliness of Prenatal Care 91.67% 77.66%
Care for Chronic Conditions
Annual Monitoring for Patients on Persistent Medications— ACE Inhibitors or ARBs 92.79% 85.93%
Annual Monitoring for Patients on Persistent Medications— Diuretics 92.47% 85.52%
Asthma Medication Ratio—Total 72.38% 55.33%
Medi-Cal Managed Care Technical Report: July 1, 2017–June 30, 2018 Page 39 California Department of Health Care Services Health Services Advisory Group, Inc.

MANAGED CARE HEALTH PLAN PERFORMANCE MEASURES
Measure RY 2018 HPL
RY 2018 MPL
Comprehensive Diabetes Care—Blood Pressure Control (<140/90 mm Hg) 75.91% 52.70%
Comprehensive Diabetes Care—Eye Exam (Retinal) Performed 68.33% 47.57% Comprehensive Diabetes Care—HbA1c Control (<8.0 Percent) 59.12% 41.94% Comprehensive Diabetes Care—HbA1c Poor Control (>9.0 Percent)** 29.07% 48.57%
Comprehensive Diabetes Care—HbA1c Testing 92.82% 84.25% Comprehensive Diabetes Care—Medical Attention for Nephropathy 93.27% 88.56%
Controlling High Blood Pressure 71.69% 47.69%
Appropriate Treatment and Utilization
All-Cause Readmissions** — — Ambulatory Care—Emergency Department (ED) Visits per 1,000 Member Months*** 86.43 52.27
Ambulatory Care—Outpatient Visits per 1,000 Member Months*** 473.73 303.58
Avoidance of Antibiotic Treatment in Adults With Acute Bronchitis 39.53% 24.91%
Use of Imaging Studies for Low Back Pain 78.29% 66.23% * RY 2018 HPL and MPL benchmark values represent NCQA’s Quality Compass HEDIS 2017 Medicaid health maintenance organization (HMO) 90th and 25th percentiles, respectively, reflecting the MY from January 1, 2016, through December 31, 2016. ** A lower rate indicates better performance for this measure. *** Ambulatory Care—Emergency Department (ED) Visits per 1,000 Member Months and Outpatient Visits per 1,000 Member Months summarize utilization of ambulatory care for outpatient and ED visits. Member months are a member's “contribution” to the total yearly membership. DHCS establishes MPLs or HPLs for these utilization measures; however, as a higher or lower rate does not necessarily indicate better or worse performance, rates are not compared to benchmarks. — DHCS did not establish an HPL or MPL for this measure because no comparable benchmark exists.
Medi-Cal Managed Care Technical Report: July 1, 2017–June 30, 2018 Page 40 California Department of Health Care Services Health Services Advisory Group, Inc.

MANAGED CARE HEALTH PLAN PERFORMANCE MEASURES
Although DHCS established HPLs and MPLs for the following measures, DHCS did not hold MCPs accountable to meet the MPLs for these measures for RY 2018 (i.e., DHCS did not require MCPs to submit improvement plans [IPs] if their rates for the measures were below the MPLs):
♦ The two Ambulatory Care measures—due to these measures being utilization measures, which means that high and low rates do not necessarily indicate better or worse performance.
♦ All four Children and Adolescents’ Access to Primary Care measures—due to the small range of variation between the HPL and MPL threshold for each measure.
HSAG includes HPL and MPL information for the measures listed preceding in applicable tables in this report. However, DHCS did not hold MCPs accountable to meet the MPLs for these measures; therefore, HSAG drew no conclusions from the comparative analyses on these measures for RY 2018 and did not include these measures in its assessment of MCP performance.
HEDIS Improvement Plan Process
Annually, DHCS assesses each MCP’s performance measure rates against the established MPLs and requires MCPs to submit to DHCS an IP for each measure with a rate below the MPL (unless the MCP is reporting a rate for the measure for the first time). An IP consists of an MCP’s submission of PDSA Cycle Worksheets or Quality Improvement Summaries, or completion of PIPs—as determined by DHCS. DHCS reviews each IP submission for design soundness and anticipated intervention effectiveness.
The IP process is one way that DHCS and MCPs engage in efforts to improve the quality and timeliness of, and access to care for beneficiaries, including targeting key quality improvement areas as outlined in California’s MCMC quality strategy (i.e., immunizations, diabetes care, controlling hypertension, tobacco cessation, and postpartum care). MCPs use structured quality improvement resources and a rapid-cycle approach (including the PDSA cycle process) to strengthen these key quality improvement areas. As a result, DHCS may not have required an MCP to submit IPs for all measures with rates below the MPLs. However, MCPs continue to be contractually required to meet MPLs for all EAS measures for which DHCS holds MCPs accountable to meet the MPLs.
DHCS provides HSAG with an annual summary of MCPs’ IPs for inclusion in the EQR technical report and in MCP-specific evaluation reports.
Corrective Action Plans
Annually, DHCS assesses each MCP’s performance measure rates to determine if the MCP meets any of the following thresholds, which may result in DHCS placing the MCP on a CAP:
♦ The rates for three or more EAS measures for which DHCS holds MCPs accountable to meet the MPLs are below the MPLs in the same reporting unit for the last three or more consecutive years.
Medi-Cal Managed Care Technical Report: July 1, 2017–June 30, 2018 Page 41 California Department of Health Care Services Health Services Advisory Group, Inc.

MANAGED CARE HEALTH PLAN PERFORMANCE MEASURES
♦ The rates for more than 50 percent of the EAS measures for which DHCS holds MCPs accountable to meet the MPLs are below the MPLs for any reporting unit in the current RY.
♦ DHCS determines that the imposition of a CAP is necessary because the MCP is out of compliance with EAS requirements as set forth in its DHCS/MCP contract and/or the most recent DHCS Quality Improvement All Plan Letter related to the quality and performance improvement requirements,25 or DHCS identifies a serious quality improvement trend or issue that the MCP needs to correct.
To help MCPs avoid being placed on CAPs, DHCS issues an advance warning letter to each MCP at risk of being placed on a CAP in the next reporting year if the MCP’s performance does not improve. DHCS will issue an advance warning letter to an MCP if the MCP meets any of the following thresholds:
♦ The rates for three or more EAS measures for which DHCS holds MCPs accountable to meet the MPLs are below the MPLs in the same reporting unit for the last two consecutive years.
♦ The rates for 40 percent or more of EAS measures for which DHCS holds MCPs accountable to meet the MPLs are below the MPLs for any reporting unit in the current RY.
♦ DHCS identifies a concerning quality improvement trend or issue that DHCS needs to address with the MCP.
DHCS provides HSAG with an annual summary of MCPs’ CAPs for inclusion in the EQR technical report and in MCP-specific evaluation reports.
Managed Care Health Plans Performance Measure Results As noted previously, HSAG includes no performance measure results, findings, or recommendations in this report or in the MCP-specific reports for Aetna Better Health of California and UnitedHealthcare Community Plan. While DHCS held contracts with both MCPs during the review period for this report, beneficiaries from neither MCP met the continuous enrollment criteria for RY 2018 performance measure reporting.
HSAG presents the following performance measure results grouped by measure domains in Table 6.3 through Table 6.17:
♦ The RYs 2015–18 MCMC weighted average rates for each EAS measure and a comparison of the current year’s rates both to the prior year’s rates and to the DHCS-established HPLs and MPLs.
♦ The RYs 2015–18 MCMC weighted average rates for each EAS measure for which HSAG made a comparison to the corresponding national Medicaid average for the measure and whether the rate was above or below the national Medicaid average for each RY.
25 DHCS’ most recent quality and performance improvement requirements APL may be found at http://www.dhcs.ca.gov/formsandpubs/Pages/AllPlanLetters.aspx. Accessed on: Feb 16, 2018.
Medi-Cal Managed Care Technical Report: July 1, 2017–June 30, 2018 Page 42 California Department of Health Care Services Health Services Advisory Group, Inc.

MANAGED CARE HEALTH PLAN PERFORMANCE MEASURES
♦ The RY 2015–18 MCMC weighted average rates for each EAS measure for which HSAG made a comparison to the corresponding national commercial average for the measure and whether the rate was above or below the national commercial average for each RY.
♦ The RYs 2015–18 MCMC weighted average rate for each EAS measure with a corresponding Healthy People 2020 goal and whether the rate was above or below the Healthy People 2020 goal for that measure.26
■ Note that no corresponding Healthy People 2020 goals exist for any of the EAS measures within the Appropriate Treatment and Utilization domain.
Note the following regarding the benchmarks HSAG used for comparison for Table 6.3 through Table 6.17:
♦ HPLs and MPLs ■ For RYs 2016, 2017, and 2018, the HPLs and MPLs represent the NCQA Quality
Compass Medicaid HMO 90th and 25th percentiles, respectively. ■ For RY 2015, the HPLs and MPLs represent the NCQA HEDIS Audit Means,
Percentiles, and Ratios 90th and 25th percentiles, respectively. For the Comprehensive Diabetes Care—HbA1c Poor Control (>9.0 Percent) measure, for which a lower rate indicates more favorable performance, the HPL and MPL are based on the 10th and 75th percentiles, respectively.
♦ National Medicaid Averages ■ For RYs 2016, 2017, and 2018, the benchmarks represent the NCQA Quality Compass
national Medicaid averages. ■ For RY 2015, the benchmarks represent the NCQA HEDIS Audit Means, Percentiles,
and Ratios national Medicaid averages. ♦ National Commercial Averages—HSAG acknowledges the limitations of making
comparisons to the national commercial averages due to differences in the specifications used to derive the statewide MCMC weighted average rates and the national commercial averages. ■ For RYs 2016, 2017, and 2018, the benchmarks represent the NCQA Quality Compass
national commercial averages. ■ For RY 2015, the benchmarks represent the NCQA HEDIS Audit Means, Percentiles,
and Ratios national commercial averages. ♦ Healthy People 2020 Goals—HSAG acknowledges the limitations of making comparisons
to the Healthy People 2020 goals due to the differences in specifications used to derive the statewide MCMC weighted average rates and the Healthy People 2020 goals. ■ For RYs 2015–18, the benchmarks represent the Healthy People 2020 Goals.
26 Information about Healthy People 2020 may be found at https://www.healthypeople.gov/. Accessed on: Jul 26, 2018.
Medi-Cal Managed Care Technical Report: July 1, 2017–June 30, 2018 Page 43 California Department of Health Care Services Health Services Advisory Group, Inc.

MANAGED CARE HEALTH PLAN PERFORMANCE MEASURES
Preventive Screening and Children’s Health Domain
Table 6.3 through Table 6.6 present the performance measures results for measures within the Preventive Screening and Children’s Health domain.
Note the following regarding Table 6.3 through Table 6.6:
♦ Although HSAG includes information about the MCPs' performance related to the four Children and Adolescents’ Access to Primary Care measures, DHCS did not hold MCPs accountable to meet the MPLs for these measures for RYs 2015 through 2018 (i.e., DHCS did not require MCPs to submit IPs if rates for the measures were below the MPLs). HSAG therefore drew no conclusions from the comparative analyses on these measures for RY 2018 and did not include these measures in its assessment of MCP performance.
♦ Any comparison of RY 2018 performance to RY 2017 or to benchmarks related to the Immunizations for Adolescents—Combination 2 measure should be exercised with caution given the changes that NCQA made to the specification for this measure for RY 2018. NCQA released guidance that recommended a break in trending for this measure; however, DHCS determined to continue trending because the specification change should result in higher rates.
Table 6.3—Preventive Screening and Children’s Health Domain Multi-Year Statewide Medi-Cal Managed Care Weighted Average Performance Measure Results
H = Rate indicates performance above the HPL. Bolded Rate = Rate indicates performance below the MPL.
B = Statistical testing result indicates that the RY 2018 rate is significantly better than the RY 2017 rate.
W = Statistical testing result indicates that the RY 2018 rate is significantly worse than the RY 2017 rate.
Measure RY
2015 Rate1
RY 2016
Rate2
RY 2017
Rate3
RY 2018
Rate4
RYs 2017–18 Rate
Difference5
Childhood Immunization Status—Combination 3 73.84% 70.59% 70.70% 70.47% -0.23
Children and Adolescents’ Access to Primary Care Practitioners—12–24 Months
M 93.54% M 92.40% 93.14% M 92.99% -0.15
Children and Adolescents’ Access to Primary Care Practitioners— 25 Months–6 Years
M 85.39% M 84.20% M 83.92% M 84.43% B 0.51
Medi-Cal Managed Care Technical Report: July 1, 2017–June 30, 2018 Page 44 California Department of Health Care Services Health Services Advisory Group, Inc.

MANAGED CARE HEALTH PLAN PERFORMANCE MEASURES
Measure RY
2015 Rate1
RY 2016
Rate2
RY 2017
Rate3
RY 2018
Rate4
RYs 2017–18 Rate
Difference5
Children and Adolescents’ Access to Primary Care Practitioners—7–11 Years
M 87.24% M 87.21% M 86.29% M 86.85% B 0.56
Children and Adolescents’ Access to Primary Care Practitioners—12–19 Years
M 84.19% M 84.56% M 83.50% M 84.44% B 0.94
Immunizations for Adolescents— Combination 2^ -- -- 26.89% H37.84% B 10.95
Weight Assessment and Counseling for Nutrition and Physical Activity for Children and Adolescents—Nutrition Counseling—Total
73.42% 73.43% 76.48% 78.87% B 2.39
Weight Assessment and Counseling for Nutrition and Physical Activity for Children and Adolescents—Physical Activity Counseling—Total
63.64% 64.57% 68.79% 72.34% B 3.55
Well-Child Visits in the Third, Fourth, Fifth, and Sixth Years of Life
72.78% 71.30% 73.90% 75.44% B 1.54
1 RY 2015 rates reflect MY data from January 1, 2014, through December 31, 2014. 2 RY 2016 rates reflect MY data from January 1, 2015, through December 31, 2015. 3 RY 2017 rates reflect MY data from January 1, 2016, through December 31, 2016. 4 RY 2018 rates reflect MY data from January 1, 2017, through December 31, 2017. 5 Performance comparisons are based on the Chi-square test of statistical significance, with a p value of <0.05. ^ Caution should be exercised when assessing MCP performance for this measure given the changes that NCQA made to the specification for this measure for RY 2018. -- Indicates that the rate is not available.
Medi-Cal Managed Care Technical Report: July 1, 2017–June 30, 2018 Page 45 California Department of Health Care Services Health Services Advisory Group, Inc.

MANAGED CARE HEALTH PLAN PERFORMANCE MEASURES
Table 6.4—Preventive Screening and Children’s Health Domain Multi-Year Statewide Medi-Cal Managed Care Weighted Average Performance Measure Results Compared toNational Medicaid Averages
A = Rate indicates performance above the national Medicaid average. Bolded Rate = Rate indicates performance below the national Medicaid average.
Measure RY
2015 Rate1
RY 2016
Rate2
RY 2017
Rate3
RY 2018
Rate4
Childhood Immunization Status—Combination 3 A 73.84% A 70.59% A 70.70% A 70.47% Children and Adolescents’ Access to Primary Care Practitioners—12–24 Months B 93.54% B 92.40% B 93.14% B 92.99%
Children and Adolescents’ Access to Primary Care Practitioners—25 Months–6 Years B 85.39% B 84.20% B 83.92% B 84.43%
Children and Adolescents’ Access to Primary Care Practitioners—7–11 Years B 87.24% B 87.21% B 86.29% B 86.85%
Children and Adolescents’ Access to Primary Care Practitioners—12–19 Years B 84.19% B 84.56% B 83.50% B 84.44%
Immunizations for Adolescents—Combination 2^ -- -- 26.89%* A 37.84% Weight Assessment and Counseling for Nutrition and Physical Activity for Children and Adolescents—Nutrition Counseling—Total
A 73.42% A 73.43% A 76.48% A 78.87%
Weight Assessment and Counseling for Nutrition and Physical Activity for Children and Adolescents—Physical Activity Counseling—Total
A 63.64% A 64.57% A 68.79% A 72.34%
Well-Child Visits in the Third, Fourth, Fifth, and Sixth Years of Life A 72.78% B 71.30% A 73.90% A 75.44%
1 RY 2015 rates reflect MY data from January 1, 2014, through December 31, 2014. 2 RY 2016 rates reflect MY data from January 1, 2015, through December 31, 2015. 3 RY 2017 rates reflect MY data from January 1, 2016, through December 31, 2016. 4 RY 2018 rates reflect MY data from January 1, 2017, through December 31, 2017. ^ Caution should be exercised when assessing MCP performance for this measure given the changes that NCQA made to the specification for this measure for RY 2018. -- Indicates that the rate is not available. * A comparison cannot be made because no national benchmarks existed for this measure in RY 2017.
Medi-Cal Managed Care Technical Report: July 1, 2017–June 30, 2018 Page 46 California Department of Health Care Services Health Services Advisory Group, Inc.

MANAGED CARE HEALTH PLAN PERFORMANCE MEASURES
Table 6.5—Preventive Screening and Children’s Health Domain Multi-Year Statewide Medi-Cal Managed Care Weighted Average Performance Measure Results Compared toNational Commercial Averages
A = Rate indicates performance above the national commercial average. Bolded Rate = Rate indicates performance below the national commercial average.
Measure RY
2015 Rate1
RY 2016
Rate2
RY 2017
Rate3
RY 2018
Rate4
Childhood Immunization Status—Combination 3 B 73.84% B 70.59% B 70.70% B
70.47% Children and Adolescents’ Access to Primary Care Practitioners—12–24 Months B 93.54% B 92.40% B 93.14% B 92.99%
Children and Adolescents’ Access to Primary Care Practitioners—25 Months–6 Years B 85.39% B 84.20% B 83.92% B 84.43%
Children and Adolescents’ Access to Primary Care Practitioners—7–11 Years B 87.24% B 87.21% B 86.29% B 86.85%
Children and Adolescents’ Access to Primary Care Practitioners—12–19 Years B 84.19% B 84.56% B 83.50% B 84.44%
Immunizations for Adolescents—Combination 2^ -- -- 26.89%* A 37.84% Weight Assessment and Counseling for Nutrition and Physical Activity for Children and Adolescents—Nutrition Counseling—Total
A 73.42% A 73.43% A 76.48% A 78.87%
Weight Assessment and Counseling for Nutrition and Physical Activity for Children and Adolescents—Physical Activity Counseling—Total
A 63.64% A 64.57% A 68.79% A A72.34%
Well-Child Visits in the Third, Fourth, Fifth, and Sixth Years of Life B 72.78% A 71.30% A 73.90% A 75.44%
1 RY 2015 rates reflect MY data from January 1, 2014, through December 31, 2014. 2 RY 2016 rates reflect MY data from January 1, 2015, through December 31, 2015. 3 RY 2017 rates reflect MY data from January 1, 2016, through December 31, 2016. 4 RY 2018 rates reflect MY data from January 1, 2017, through December 31, 2017. ^ Caution should be exercised when assessing MCP performance for this measure given the changes that NCQA made to the specification for this measure for RY 2018. -- Indicates that the rate is not available. * A comparison cannot be made because no national benchmarks existed for this measure in RY 2017.
Medi-Cal Managed Care Technical Report: July 1, 2017–June 30, 2018 Page 47 California Department of Health Care Services Health Services Advisory Group, Inc.

MANAGED CARE HEALTH PLAN PERFORMANCE MEASURES
Table 6.6—Preventive Screening and Children’s Health Domain Multi-Year Statewide Medi-Cal Managed Care Weighted Average Performance Measure Results Compared toHealthy People 2020 Goals
A = Rate indicates performance above the Healthy People 2020 goal. Bolded Rate = Rate indicates performance below the Healthy People 2020 goal.
Measure HealthyPeople
2020 Goal
RY 2015
Rate1
RY 2016
Rate2
RY 2017
Rate3
RY 2018
Rate4
Weight Assessment and Counseling for Nutrition and Physical Activity for Children and Adolescents— Nutrition Counseling—Total
22.90% A 73.42% A 73.43% A 76.48% A 78.87%
Weight Assessment and Counseling for Nutrition and Physical Activity for Children and Adolescents— Physical Activity Counseling—Total
22.90% A 63.64% A 64.57% A 68.79% A 72.34%
1 RY 2015 rates reflect MY data from January 1, 2014, through December 31, 2014. 2 RY 2016 rates reflect MY data from January 1, 2015, through December 31, 2015. 3 RY 2017 rates reflect MY data from January 1, 2016, through December 31, 2016. 4 RY 2018 rates reflect MY data from January 1, 2017, through December 31, 2017.
Findings—Preventive Screening and Children’s Health
Within the Preventive Screening and Children’s Health domain, the MCMC weighted average for one of five measures (20 percent) was above the HPL; for measures for which DHCS held MCPs accountable to meet the MPLs, no MCMC weighted averages were below the MPLs in RY 2018. The MCMC weighted averages improved significantly from RY 2017 to RY 2018 for the following measures within this domain:
♦ Immunizations for Adolescents—Combination 2, resulting in the MCMC weighted average for this measure moving to above the HPL in RY 2018.
♦ Both Weight Assessment and Counseling for Nutrition and Physical Activity for Children and Adolescents measures
♦ Well-Child Visits in the Third, Fourth, Fifth, and Sixth Years of Life
The MCMC weighted averages for all five measures within the Preventive Screening and Children’s Health domain were above the national Medicaid averages in RY 2018.
Medi-Cal Managed Care Technical Report: July 1, 2017–June 30, 2018 Page 48 California Department of Health Care Services Health Services Advisory Group, Inc.
MANAGED CARE HEALTH PLAN PERFORMANCE MEASURES
HSAG observed the following notable comparisons between the MCMC weighted averages and the national commercial averages for measures within the Preventive Screening and Children’s Health domain:
♦ The MCMC weighted averages were above the national commercial averages for the following four of five (80 percent) measures: ■ Immunizations for Adolescents—Combination 2 ■ Both Weight Assessment and Counseling for Nutrition and Physical Activity for Children
and Adolescents measures for all RYs displayed in Table 6.5.
♦■ Well-Child Visits in the Third, Fourth, Fifth, and Sixth Years of Life The MCMC weighted averages for the Childhood Immunization Status—Combination 3 measure were below the national commercial averages for all RYs displayed in Table 6.5.
Aggregate MCP performance remained consistent for both Weight Assessment and Counseling for Nutrition and Physical Activity for Children and Adolescents measures, with the MCMC weighted averages being above the Healthy People 2020 goals for both measures for all RYs displayed in Table 6.6.
High- and Low-Performing Medi-Cal Managed Care Health Plans—Preventive Screeningand Children’s Health
HSAG identified the following MCPs as the highest-performing MCPs within the Preventive Screening and Children’s Health domain in RY 2018, based on the MCPs having the highest percentage of reported rates across all their reporting units above the HPLs in RY 2018 (80 percent).
♦ CalOptima—four of five rates ♦ CenCal Health—eight of 10 rates ♦ Kaiser NorCal—four of five rates ♦ Kaiser SoCal—four of five rates ♦ San Francisco Health Plan—four of five rates
HSAG identified Health Plan of San Joaquin as the lowest-performing MCP within the Preventive Screening and Children’s Health domain in RY 2018, based on the MCP having the highest percentage of reported rates across both reporting units below the MPLs in RY 2018— three of 10 rates (30 percent).
Medi-Cal Managed Care Technical Report: July 1, 2017–June 30, 2018 Page 49 California Department of Health Care Services Health Services Advisory Group, Inc.

MANAGED CARE HEALTH PLAN PERFORMANCE MEASURES
Preventive Screening and Women’s Health
Table 6.7 through Table 6.10 present the performance measures results for measures within the Preventive Screening and Women’s Health domain.
Note that any comparison of RY 2018 performance to RY 2017 or to benchmarks related to the Breast Cancer Screening measure should be exercised with caution given the changes that NCQA made to the specification for this measure for RY 2018. NCQA released guidance that recommended a break in trending for this measure; however, DHCS determined to continue trending because the specification change should result in higher rates.
Table 6.7—Preventive Screening and Women’s Health Domain—Multi-Year Statewide Medi-Cal Managed Care Weighted Average Performance Measure Results
H = Rate indicates performance above the HPL. Bolded Rate = Rate indicates performance below the MPL.
B = Statistical testing result indicates that the RY 2018 rate is significantly better than the RY 2017 rate.
W = Statistical testing result indicates that the RY 2018 rate is significantly worse than the RY 2017 rate.
Measure RY 2015 Rate1
RY 2016 Rate2
RY 2017 Rate3
RY 2018 Rate4
RYs 2017–18 Rate
Difference5
Breast Cancer Screening^ -- -- 59.16% 59.29% 0.13 Cervical Cancer Screening 59.26% M 53.61% 56.26% 59.86% B 3.60 Prenatal and Postpartum Care— Postpartum Care 59.35% 59.29% 63.77% 64.41% B 0.64
Prenatal and Postpartum Care— Timeliness of Prenatal Care 81.80% 79.17% 81.95% 82.74% B 0.79
1 RY 2015 rates reflect MY data from January 1, 2014, through December 31, 2014. 2 RY 2016 rates reflect MY data from January 1, 2015, through December 31, 2015. 3 RY 2017 rates reflect MY data from January 1, 2016, through December 31, 2016. 4 RY 2018 rates reflect MY data from January 1, 2017, through December 31, 2017. 5 Performance comparisons are based on the Chi-square test of statistical significance, with a p value of <0.05. ^ Caution should be exercised when assessing MCP performance for this measure given the changes that NCQA made to the specification for this measure for RY 2018. -- Indicates that the rate is not available.
Medi-Cal Managed Care Technical Report: July 1, 2017–June 30, 2018 Page 50 California Department of Health Care Services Health Services Advisory Group, Inc.

MANAGED CARE HEALTH PLAN PERFORMANCE MEASURES
Table 6.8—Preventive Screening and Women’s Health Domain Multi-Year StatewideMedi-Cal Managed Care Weighted Average Performance Measure Results Compared toNational Medicaid Averages
Bolded Rate = Rate indicates performance below the national Medicaid average. A = Rate indicates performance above the national Medicaid average.
Measure RY 2015 Rate1
RY 2016 Rate2
RY 2017 Rate3
RY 2018 Rate4
Breast Cancer Screening^ -- -- A 59.16% A 59.29% Cervical Cancer Screening B 59.26% B 53.61% A 56.26% A 59.86% Prenatal and Postpartum Care— Postpartum Care B 59.35% B 59.29% A 63.77% A 64.41%
Prenatal and Postpartum Care— Timeliness of Prenatal Care B 81.80% B 79.17% A81.95% A82.74%
1 RY 2015 rates reflect MY data from January 1, 2014, through December 31, 2014. 2 RY 2016 rates reflect MY data from January 1, 2015, through December 31, 2015. 3 RY 2017 rates reflect MY data from January 1, 2016, through December 31, 2016. 4 RY 2018 rates reflect MY data from January 1, 2017, through December 31, 2017. ^ Caution should be exercised when assessing MCP performance for this measure given the changes that NCQA made to the specification for this measure for RY 2018. -- Indicates that the rate is not available.
Medi-Cal Managed Care Technical Report: July 1, 2017–June 30, 2018 Page 51 California Department of Health Care Services Health Services Advisory Group, Inc.

MANAGED CARE HEALTH PLAN PERFORMANCE MEASURES
Table 6.9—Preventive Screening and Women’s Health Domain Multi-Year Statewide Medi-Cal Managed Care Weighted Average Performance Measure Results Compared toNational Commercial Averages
Bolded Rate = Rate indicates performance below the national commercial average. A = Rate indicates performance above the national commercial average.
Measure RY 2015 Rate1
RY 2016 Rate2
RY 2017 Rate3
RY 2018 Rate4
Breast Cancer Screening^ -- -- B 59.16% B 59.29% Cervical Cancer Screening B 59.26% B 53.61% B 56.26% B 59.86% Prenatal and Postpartum Care— Postpartum Care B 59.35% B 59.29% B 63.77% B 64.41%
Prenatal and Postpartum Care— Timeliness of Prenatal Care B 81.80% B 79.17% A81.95% B 82.74%
1 RY 2015 rates reflect MY data from January 1, 2014, through December 31, 2014. 2 RY 2016 rates reflect MY data from January 1, 2015, through December 31, 2015. 3 RY 2017 rates reflect MY data from January 1, 2016, through December 31, 2016. 4 RY 2018 rates reflect MY data from January 1, 2017, through December 31, 2017. ^ Caution should be exercised when assessing MCP performance for this measure given the changes that NCQA made to the specification for this measure for RY 2018. -- Indicates that the rate is not available.
Medi-Cal Managed Care Technical Report: July 1, 2017–June 30, 2018 Page 52 California Department of Health Care Services Health Services Advisory Group, Inc.

MANAGED CARE HEALTH PLAN PERFORMANCE MEASURES
Table 6.10—Preventive Screening and Women’s Health Domain Multi-Year StatewideMedi-Cal Managed Care Weighted Average Performance Measure Results Compared toHealthy People 2020 Goals
A = Rate indicates performance above the Healthy People 2020 goal. Bolded Rate = Rate indicates performance below the Healthy People 2020 goal.
Measure HealthyPeople
2020 Goal
RY 2015
Rate1
RY 2016
Rate2
RY 2017
Rate3
RY 2018
Rate4
Breast Cancer Screening^ 81.10% -- -- B 59.16% B 59.29% Cervical Cancer Screening 93.00% B 59.26% B 53.61% B 56.26% B 59.86% Prenatal and Postpartum Care— Timeliness of Prenatal Care 77.90% A81.80% A 79.17% A81.95% A82.74%
1 RY 2015 rates reflect MY data from January 1, 2014, through December 31, 2014. 2 RY 2016 rates reflect MY data from January 1, 2015, through December 31, 2015. 3 RY 2017 rates reflect MY data from January 1, 2016, through December 31, 2016. 4 RY 2018 rates reflect MY data from January 1, 2017, through December 31, 2017. ^ Caution should be exercised when assessing MCP performance for this measure given the changes that NCQA made to the specification for this measure for RY 2018. -- Indicates that the rate is not available.
Findings—Preventive Screening and Women’s Health
All MCMC weighted averages within the Preventive Screening and Women’s Health domain were between the HPLs and MPLs in RY 2018. The MCMC weighted averages improved significantly from RY 2017 to RY 2018 for the following measures within this domain:
♦ Cervical Cancer Screening ♦ Both Prenatal and Postpartum Care measures
The MCMC weighted averages for all four measures within this domain were above the national Medicaid averages in RY 2018; however, the MCMC weighted averages for all four measures were below the national commercial averages in RY 2018, with the MCMC weighted averages for the Cervical Cancer Screening and Prenatal and Postpartum Care—Postpartum Care measures being below the national commercial averages for all RYs displayed in Table 6.9.
Medi-Cal Managed Care Technical Report: July 1, 2017–June 30, 2018 Page 53 California Department of Health Care Services Health Services Advisory Group, Inc.
MANAGED CARE HEALTH PLAN PERFORMANCE MEASURES
Aggregate MCP performance in comparison to the Healthy People 2020 goals remained consistent:
♦ The MCMC weighted averages for the Prenatal and Postpartum Care—Timeliness of Prenatal Care measure were above the Healthy People 2020 goal for all RYs displayed in Table 6.10.
♦ The MCMC weighted averages for the Breast Cancer Screening and Cervical Cancer Screening measures were below the Healthy People 2020 goals for RY 2018, with the MCMC weighted averages for the Cervical Cancer Screening measure being below the Healthy People 2020 goal for all RYs displayed in Table 6.10.
High- and Low-Performing Medi-Cal Managed Care Health Plans—Preventive Screeningand Women’s Health
HSAG identified the following MCPs as the highest-performing MCPs within the Preventive Screening and Women’s Health domain in RY 2018, based on the MCPs having the highest percentage of reported rates within this domain above the HPLs in RY 2018—four of four rates (100 percent).
♦ Kaiser NorCal ♦ Kaiser SoCal
HSAG identified Health Net Community Solutions, Inc., as the lowest-performing MCP within the Preventive Screening and Women’s Health domain in RY 2018, based on the MCP having the highest percentage of reported rates across all reporting units below the MPLs in RY 2018—16 of 28 rates (57 percent).
Care for Chronic Conditions
Table 6.11 through Table 6.14 present the performance measures results for measures within the Care for Chronic Conditions domain.
Medi-Cal Managed Care Technical Report: July 1, 2017–June 30, 2018 Page 54 California Department of Health Care Services Health Services Advisory Group, Inc.

MANAGED CARE HEALTH PLAN PERFORMANCE MEASURES
Table 6.11—Care for Chronic Conditions Domain—Multi-Year Statewide Medi-Cal Managed Care Weighted Average Performance Measure Results
H = Rate indicates performance above the HPL. Bolded Rate = Rate indicates performance below the MPL.
B = Statistical testing result indicates that the RY 2018 rate is significantly better than the RY 2017 rate.
W = Statistical testing result indicates that the RY 2018 rate is significantly worse than the RY 2017 rate.
Measure RY 2015 Rate1
RY 2016 Rate2
RY 2017 Rate3
RY 2018 Rate4
RYs 2017–18 Rate
Difference5
Annual Monitoring for Patients on Persistent Medications— ACE Inhibitors or ARBs
86.12% 86.60% 87.59% 88.24% B 0.65
Annual Monitoring for Patients on Persistent Medications—Diuretics 85.77% 86.23% 87.09% 87.88% B 0.79
Asthma Medication Ratio -- -- 60.14% 61.71% B 1.57 Comprehensive Diabetes Care— Blood Pressure Control (<140/90 mm Hg)
62.63% 60.51% 63.38% 66.40% B 3.02
Comprehensive Diabetes Care— Eye Exam (Retinal) Performed 53.34% 55.29% 57.06% 60.87% B 3.81
Comprehensive Diabetes Care— HbA1c Control (<8.0 Percent) 49.08% 49.71% 51.67% 53.50% B 1.83
Comprehensive Diabetes Care— HbA1c Poor Control (>9.0 Percent)*
39.35% 39.74% 37.75% 34.91% B -2.84
Comprehensive Diabetes Care— HbA1c Testing 85.81% 85.62% 86.82% 87.20% B 0.38
Comprehensive Diabetes Care— Medical Attention for Nephropathy 84.45% H 90.73% 90.35% 90.92% B 0.57
Controlling High Blood Pressure 61.22% 61.18% 62.68% 63.47% B 0.79 1 RY 2015 rates reflect MY data from January 1, 2014, through December 31, 2014. 2 RY 2016 rates reflect MY data from January 1, 2015, through December 31, 2015. 3 RY 2017 rates reflect MY data from January 1, 2016, through December 31, 2016. 4 RY 2018 rates reflect MY data from January 1, 2017, through December 31, 2017. 5 Performance comparisons are based on the Chi-square test of statistical significance, with a p value of <0.05. * A lower rate indicates better performance for this measure. -- Indicates that the rate is not available.
Medi-Cal Managed Care Technical Report: July 1, 2017–June 30, 2018 Page 55 California Department of Health Care Services Health Services Advisory Group, Inc.

MANAGED CARE HEALTH PLAN PERFORMANCE MEASURES
Table 6.12—Care for Chronic Conditions Domain Multi-Year Statewide Medi-Cal Managed Care Weighted Average Performance Measure Results Compared to NationalMedicaid Averages
A = Rate indicates performance above the national Medicaid average. Bolded Rate = Rate indicates performance below the national Medicaid average.
Measure RY 2015 Rate1
RY 2016 Rate2
RY 2017 Rate3
RY 2018 Rate4
Annual Monitoring for Patients on Persistent Medications—ACE Inhibitors or ARBs B 86.12% B 86.60% A87.59% A88.24%
Annual Monitoring for Patients on Persistent Medications—Diuretics B 85.77% B 86.23% B 87.09% B 87.88%
Asthma Medication Ratio -- -- A 60.14% A 61.71% Comprehensive Diabetes Care— Blood Pressure Control (<140/90 mm Hg) A 62.63% B 60.51% A 63.38% A 66.40%
Comprehensive Diabetes Care— Eye Exam (Retinal) Performed B 53.34% A 55.29% A 57.06% A 60.87%
Comprehensive Diabetes Care— HbA1c Control (<8.0 Percent) A 49.08% A 49.71% A 51.67% A 53.50%
Comprehensive Diabetes Care— HbA1c Poor Control (>9.0 Percent)* A 39.35% A 39.74% A 37.75% A 34.91%
Comprehensive Diabetes Care— HbA1c Testing A85.81% B 85.62% A86.82% A87.20%
Comprehensive Diabetes Care— Medical Attention for Nephropathy A84.45% A 90.73% A 90.35% A 90.92%
Controlling High Blood Pressure A 61.22% A 61.18% A 62.68% A 63.47% 1 RY 2015 rates reflect MY data from January 1, 2014, through December 31, 2014. 2 RY 2016 rates reflect MY data from January 1, 2015, through December 31, 2015. 3 RY 2017 rates reflect MY data from January 1, 2016, through December 31, 2016. 4 RY 2018 rates reflect MY data from January 1, 2017, through December 31, 2017. * A lower rate indicates better performance for this measure. -- Indicates that the rate is not available.
Medi-Cal Managed Care Technical Report: July 1, 2017–June 30, 2018 Page 56 California Department of Health Care Services Health Services Advisory Group, Inc.

MANAGED CARE HEALTH PLAN PERFORMANCE MEASURES
Table 6.13—Care for Chronic Conditions Domain Multi-Year Statewide Medi-Cal Managed Care Weighted Average Performance Measure Results Compared to NationalCommercial Averages
Bolded Rate = Rate indicates performance below the national commercial average. A = Rate indicates performance above the national commercial average.
Measure RY 2015 Rate1
RY 2016 Rate2
RY 2017 Rate3
RY 2018 Rate4
Annual Monitoring for Patients on Persistent Medications—ACE Inhibitors or ARBs A86.12% A86.60% A87.59% A88.24%
Annual Monitoring for Patients on Persistent Medications—Diuretics A85.77% A86.23% A87.09% A87.88%
Asthma Medication Ratio -- -- B 60.14% B 61.71% Comprehensive Diabetes Care— Blood Pressure Control (<140/90 mm Hg) B 62.63% B 60.51% B 63.38% A 66.40%
Comprehensive Diabetes Care— Eye Exam (Retinal) Performed B 53.34% B 55.29% A 57.06% A 60.87%
Comprehensive Diabetes Care— HbA1c Control (<8.0 Percent) B 49.08% B 49.71% B 51.67% B 53.50%
Comprehensive Diabetes Care— HbA1c Poor Control (>9.0 Percent)* B 39.35% B 39.74% B 37.75% A 34.91%
Comprehensive Diabetes Care— HbA1c Testing B 85.81% B 85.62% B 86.82% B 87.20%
Comprehensive Diabetes Care— Medical Attention for Nephropathy B 84.45% A 90.73% B 90.35% A 90.92%
Controlling High Blood Pressure B 61.22% B 61.18% B 62.68% B 63.47% 1 RY 2015 rates reflect MY data from January 1, 2014, through December 31, 2014. 2 RY 2016 rates reflect MY data from January 1, 2015, through December 31, 2015. 3 RY 2017 rates reflect MY data from January 1, 2016, through December 31, 2016. 4 RY 2018 rates reflect MY data from January 1, 2017, through December 31, 2017. * A lower rate indicates better performance for this measure. -- Indicates that the rate is not available.
Medi-Cal Managed Care Technical Report: July 1, 2017–June 30, 2018 Page 57 California Department of Health Care Services Health Services Advisory Group, Inc.

MANAGED CARE HEALTH PLAN PERFORMANCE MEASURES
Table 6.14—Care for Chronic Conditions Domain Multi-Year Statewide Medi-Cal Managed Care Weighted Average Performance Measure Results Compared to HealthyPeople 2020 Goals
A = Rate indicates performance above the Healthy People 2020 goal. Bolded Rate = Rate indicates performance below the Healthy People 2020 goal.
Measure HealthyPeople
2020 Goal
RY 2015
Rate1
RY 2016
Rate2
RY 2017
Rate3
RY 2018
Rate4
Comprehensive Diabetes Care— Blood Pressure Control (<140/90 mm Hg) 57.00% A 62.63% A 60.51% A 63.38% A 66.40%
Comprehensive Diabetes Care— Eye Exam (Retinal) Performed 58.70% B 53.34% B 55.29% B 57.06% A 60.87%
Comprehensive Diabetes Care— HbA1c Poor Control (>9.0 Percent)* 16.20% B 39.35% B 39.74% B 37.75% B 34.91%
Controlling High Blood Pressure 61.20% A 61.22% B 61.18% A 62.68% A 63.47% 1 RY 2015 rates reflect MY data from January 1, 2014, through December 31, 2014. 2 RY 2016 rates reflect MY data from January 1, 2015, through December 31, 2015. 3 RY 2017 rates reflect MY data from January 1, 2016, through December 31, 2016. 4 RY 2018 rates reflect MY data from January 1, 2017, through December 31, 2017. * A lower rate indicates better performance for this measure.
Findings—Care for Chronic Conditions
All MCMC weighted averages within the Care for Chronic Conditions domain were between the HPLs and MPLs in RY 2018. The MCMC weighted averages improved significantly from RY 2017 to RY 2018 for all measures within this domain.
HSAG observed the following notable comparisons between the MCMC weighted averages and national Medicaid averages for measures within the Care for Chronic Conditions domain:
♦ The MCMC weighted averages for all measures within the Care for Chronic Conditions domain, except for the Annual Monitoring for Patients on Persistent Medications—Diuretics measure, were above the national Medicaid averages in RY 2018.
♦ The MCMC weighted averages for the following measures within this domain were above the national Medicaid averages for all RYs displayed in Table 6.12. ■ Comprehensive Diabetes Care—HbA1c Control (<8.0 Percent) ■ Comprehensive Diabetes Care—HbA1c Poor Control (>9.0 Percent) ■ Comprehensive Diabetes Care—Medical Attention for Nephropathy ■ Controlling High Blood Pressure
Medi-Cal Managed Care Technical Report: July 1, 2017–June 30, 2018 Page 58 California Department of Health Care Services Health Services Advisory Group, Inc.
MANAGED CARE HEALTH PLAN PERFORMANCE MEASURES
♦ The MCMC weighted averages for the Annual Monitoring for Patients on Persistent Medications—Diuretics measure were below the national Medicaid averages for all RYs displayed in Table 6.12.
HSAG observed the following notable comparisons between the MCMC weighted averages and national commercial averages for measures within the Care for Chronic Conditions domain:
♦ The MCMC weighted averages were above the national commercial averages for the following six of 10 measures (60 percent) in RY 2018: ■ Both Annual Monitoring for Patients on Persistent Medications measures—for all RYs
displayed in Table 6.13. ■ Comprehensive Diabetes Care—Blood Pressure Control (<140/90 mm Hg)—the MCMC
weighted average moved from below the national commercial average in RY 2017 to above the national commercial average in RY 2018.
■ Comprehensive Diabetes Care—Eye Exam (Retinal) Performed. ■ Comprehensive Diabetes Care—HbA1c Poor Control (>9.0 Percent)—the MCMC
weighted average moved from worse than the national commercial average in RY 2017 to better than the national commercial average in RY 2018.
■ Comprehensive Diabetes Care—Medical Attention for Nephropathy—the MCMC weighted average moved from below the national commercial average in RY 2017 to above the national commercial average in RY 2018.
♦ The MCMC weighted averages were below the national commercial averages for the following four of 10 measures (40 percent) in RY 2018: ■ Asthma Medication Ratio.
Comprehensive Diabetes Care—HbA1c Control (<8.0 Percent)—for all RYs displayed in Table 6.13.
■ Comprehensive Diabetes Care—Hemoglobin A1c (HbA1c) Testing—for all RYs displayed in Table 6.13.
■ Controlling High Blood Pressure—for all RYs displayed in Table 6.13.
The MCMC weighted averages for the following measures were above the Healthy People 2020 goals in RY 2018:
♦ Comprehensive Diabetes Care—Blood Pressure Control (<140/90 mm Hg)—for all RYs displayed in Table 6.14.
■
♦ Comprehensive Diabetes Care—Eye Exam (Retinal) Performed. ♦ Controlling High Blood Pressure.
The MCMC weighted average for the Comprehensive Diabetes Care—HbA1c Poor Control (>9.0 Percent) measure was worse than the Heathy People 2020 goal. Note that in 2015 the Heathy People 2020 goal for reducing the proportion of persons with diabetes with an HbA1c value greater than 9 percent was adjusted from 16.1 percent to 16.2 percent due to the
Medi-Cal Managed Care Technical Report: July 1, 2017–June 30, 2018 Page 59 California Department of Health Care Services Health Services Advisory Group, Inc.

MANAGED CARE HEALTH PLAN PERFORMANCE MEASURES
baseline for the measure being revised to more explicitly exclude pregnant women from the analysis.
High- and Low-Performing Medi-Cal Managed Care Health Plans—Care for ChronicConditions
HSAG identified Kaiser SoCal as the highest-performing MCP in RY 2018 within the Care for Chronic Conditions domain, based on the MCP having the highest percentage of reported rates within this domain above the HPLs in RY 2018—10 of 10 rates (100 percent).
HSAG identified Health Plan of San Joaquin as the lowest-performing MCP in RY 2018 within the Care for Chronic Conditions domain, based on the MCP having the highest percentage of reported rates across both reporting units below the MPLs in RY 2018—eight of 20 rates (40 percent).
Appropriate Treatment and Utilization
Table 6.15 through Table 6.17 present the performance measures results for measures within the Appropriate Treatment and Utilization domain. Note the following regarding Table 6.15 through Table 6.17:
♦ No benchmarks exist for the All-Cause Readmissions measure because it is a non-HEDIS measure originally developed for DHCS’ All-Cause Readmissions collaborative QIP and DHCS does not establish an HPL or MPL for this measure. HSAG therefore makes no comparisons to an HPL, MPL, or the national Medicaid and commercial averages for the All-Cause Readmissions measure.
♦ The two Ambulatory Care measures are utilization measures, which measure the volume of services used. DHCS does not hold MCPs accountable to meet MPLs for utilization measures. HSAG does not compare performance for these measures against HPLs and MPLs or against the national Medicaid and commercial averages. Additionally, because high and low rates do not necessarily indicate better or worse performance, HSAG did not compare performance for these measures across years.
♦ Although MCPs reported the two Depression Screening and Follow-Up for Adolescents and Adults measures for RY 2018, HSAG does not present the performance measure results for these measures in this report because the reported rates do not accurately represent services being provided. This is due to the Depression Screening and Follow-Up for Adolescents and Adults measures being new HEDIS measures for RY 2018, NCQA requiring MCPs to submit rates for these measures using the new ECDS reporting methodology, and inconsistent data reporting processes by calculation vendors. Thus, MCPs experienced numerous challenges obtaining data sources to use for ECDS reporting. DHCS and HSAG, in consultation with NCQA, will work with MCPs to improve data capture for RY 2019.
♦ Due to changes that NCQA made to the specifications for the Use of Imaging Studies for Low Back Pain measure in RY 2018, NCQA released guidance to exercise caution when trending the results for this measure. Therefore, caution should be used when comparing
Medi-Cal Managed Care Technical Report: July 1, 2017–June 30, 2018 Page 60 California Department of Health Care Services Health Services Advisory Group, Inc.

MANAGED CARE HEALTH PLAN PERFORMANCE MEASURES
MCP performance across years or when comparing MCP results to benchmarks related to the Use of Imaging Studies for Low Back Pain measure, as differences in rates may be a result of the specification changes rather than a reflection of performance.
Table 6.15—Appropriate Treatment and Utilization Domain—Multi-Year Statewide Medi-Cal Managed Care Weighted Average Performance Measure Results
H = Rate indicates performance above the HPL. Bolded Rate = Rate indicates performance below the MPL.
B = Statistical testing result indicates that the RY 2018 rate is significantly better than the RY 2017 rate.
W = Statistical testing result indicates that the RY 2018 rate is significantly worse than the RY 2017 rate.
Measure RY 2015 Rate1
RY 2016 Rate2
RY 2017 Rate3
RY 2018 Rate4
RYs 2017–18 Rate
Difference5
All-Cause Readmissions* 17.72% 17.24% 15.66% 16.27% W0.61 Ambulatory Care—Emergency Department (ED) Visits per 1,000 Member Months**
40.45 44.94 43.32 44.10 Not Tested
Ambulatory Care—Outpatient Visits per 1,000 Member Months** 272.82 281.57 268.58 284.64 Not Tested
Avoidance of Antibiotic Treatment in Adults With Acute Bronchitis 28.81% 28.73% 31.00% 33.87% B2.87
Use of Imaging Studies for Low Back Pain^ 79.54% 77.60% 72.87% 74.52% B 1.65
1 RY 2015 rates reflect MY data from January 1, 2014, through December 31, 2014. 2 RY 2016 rates reflect MY data from January 1, 2015, through December 31, 2015. 3 RY 2017 rates reflect MY data from January 1, 2016, through December 31, 2016. 4 RY 2018 rates reflect MY data from January 1, 2017, through December 31, 2017. 5 Performance comparisons are based on the Chi-square test of statistical significance, with a p value of <0.05. * A lower rate indicates better performance for this measure. ** Member months are a member's “contribution” to the total yearly membership. ^ Caution should be exercised when assessing MCP performance for this measure given the changes that NCQA made to the specification for this measure for RY 2018. Not Tested = An RY 2017–18 rate difference was not calculated because high and low rates do not necessarily indicate better or worse performance.
Medi-Cal Managed Care Technical Report: July 1, 2017–June 30, 2018 Page 61 California Department of Health Care Services Health Services Advisory Group, Inc.

MANAGED CARE HEALTH PLAN PERFORMANCE MEASURES
Table 6.16—Appropriate Treatment and Utilization Domain Multi-Year Statewide Medi-Cal Managed Care Weighted Average Performance Measure Results Compared toNational Medicaid Averages
Bolded Rate = Rate indicates performance below the national Medicaid average. A = Rate indicates performance above the national Medicaid average.
Measure RY 2015 Rate1
RY 2016 Rate2
RY 2017 Rate3
RY 2018 Rate4
Avoidance of Antibiotic Treatment in Adults With Acute Bronchitis A 28.81% A 28.73% A 31.00% A 33.87%
Use of Imaging Studies for Low Back Pain^ A 79.54% A 77.60% B 72.87% A 74.52% 1 RY 2015 rates reflect MY data from January 1, 2014, through December 31, 2014. 2 RY 2016 rates reflect MY data from January 1, 2015, through December 31, 2015. 3 RY 2017 rates reflect MY data from January 1, 2016, through December 31, 2016. 4 RY 2018 rates reflect MY data from January 1, 2017, through December 31, 2017. ^ Caution should be exercised when assessing MCP performance for this measure given the changes that NCQA made to the specification for this measure for RY 2018.
Table 6.17—Appropriate Treatment and Utilization Domain Multi-Year Statewide Medi-Cal Managed Care Weighted Average Performance Measure Results Compared toNational Commercial Averages
A = Rate indicates performance above the national commercial average. Bolded Rate = Rate indicates performance below the national commercial average.
Measure RY 2015 Rate1
RY 2016 Rate2
RY 2017 Rate3
RY 2018 Rate4
Avoidance of Antibiotic Treatment in Adults With Acute Bronchitis A28.81% B 28.73% B 31.00% A 33.87%
Use of Imaging Studies for Low Back Pain^ A 79.54% A 77.60% B 72.87% B 74.52% 1 RY 2015 rates reflect MY data from January 1, 2014, through December 31, 2014. 2 RY 2016 rates reflect MY data from January 1, 2015, through December 31, 2015. 3 RY 2017 rates reflect MY data from January 1, 2016, through December 31, 2016. 4 RY 2018 rates reflect MY data from January 1, 2017, through December 31, 2017. ^ Caution should be exercised when assessing MCP performance for this measure given the changes that NCQA made to the specification for this measure for RY 2018.
Medi-Cal Managed Care Technical Report: July 1, 2017–June 30, 2018 Page 62 California Department of Health Care Services Health Services Advisory Group, Inc.

MANAGED CARE HEALTH PLAN PERFORMANCE MEASURES
Findings—Appropriate Treatment and Utilization
All MCMC weighted averages within the Appropriate Treatment and Utilization domain were between the HPLs and MPLs in RY 2018. The MCMC weighted averages improved significantly from RY 2017 to RY 2018 for the following two measures:
♦ Avoidance of Antibiotic Treatment in Adults With Acute Bronchitis ♦ Use of Imaging Studies for Low Back Pain
The RY 2018 MCMC weighted average was significantly worse than the RY 2017 MCMC weighted average for the All-Cause Readmissions measure, reflecting an increase in unplanned acute readmissions within 30 days of discharge for beneficiaries 21 years and older.
Aggregate MCP performance compared to the national Medicaid average for the Avoidance of Antibiotic Treatment in Adults With Acute Bronchitis measure remained consistent, with the MCMC weighted averages for this measure being above the national Medicaid averages for all RYs displayed in Table 6.16. The MCMC weighted average for the Use of Imaging Studies for Low Back Pain measure moved from below the national Medicaid average in RY 2017 to above the national Medicaid average in RY 2018.
The MCMC weighted average for the Avoidance of Antibiotic Treatment in Adults With Acute Bronchitis measure moved from below the national commercial average in RY 2017 to above the national commercial average in RY 2018. The MCMC weighted average for the Use of Imaging Studies for Low Back Pain measure was below the national commercial average in RY 2018.
High- and Low-Performing Medi-Cal Managed Care Health Plans—Appropriate Treatment and Utilization
HSAG identified the following MCPs as the highest-performing MCPs within the Appropriate Treatment and Utilization domain in RY 2018, based on the MCPs having the highest percentage of reported rates within this domain above the HPLs in RY 2018—two of two rates (100 percent).
♦ Alameda Alliance for Health ♦ Contra Costa Health Plan ♦ Health Plan of San Mateo ♦ Kaiser NorCal ♦ Kaiser SoCal ♦ San Francisco Health Plan
HSAG identified Care1st Partner Plan as the lowest-performing MCP within the Appropriate Treatment and Utilization domain in RY 2018, based on the MCP having the highest percentage of reported rates within this domain below the MPLs in RY 2018—one of two rates (50 percent).
Medi-Cal Managed Care Technical Report: July 1, 2017–June 30, 2018 Page 63 California Department of Health Care Services Health Services Advisory Group, Inc.

MANAGED CARE HEALTH PLAN PERFORMANCE MEASURES
Seniors and Persons with Disabilities Results Table 6.18 presents the SPD and non-SPD MCMC weighted averages, a comparison of the SPD and non-SPD MCMC weighted averages, and the total MCMC weighted averages for all measures MCPs stratified by SPD and non-SPD populations for RY 2018.
Table 6.18—RY 2018 (MY 2017) Medi-Cal Managed Care Weighted Averages Comparison and Results for Measures Stratified by the SPD Population
B = Statistical testing result indicates that the RY 2018 SPD rate is significantly better than the RY 2018 non-SPD rate.
W = Statistical testing result indicates that the RY 2018 SPD rate is significantly worse than the RY 2018 non-SPD rate.
Measure RY 2018
SPD Rate1
RY 2018 Non- SPD
Rate1
SPD/Non-SPDRate
Difference2
RY 2018 Total Rate3
All-Cause Readmissions* 21.26% 13.08% W8.18 16.27% Ambulatory Care—Emergency Department (ED) Visits per 1,000 Member Months**
71.36 41.71 Not Tested 43.99
Ambulatory Care—Outpatient Visits per 1,000 Member Months** 519.72 264.33 Not Tested 283.92
Annual Monitoring for Patients on Persistent Medications— ACE Inhibitors or ARBs
90.78% 87.07% B3.71 88.25%
Annual Monitoring for Patients on Persistent Medications—Diuretics 91.05% 86.32% B4.73 87.88%
Children and Adolescents’ Access to Primary Care Practitioners— 12–24 Months
89.71% 93.01% W-3.30 92.99%
Children and Adolescents’ Access to Primary Care Practitioners— 25 Months–6 Years
86.00% 84.39% B1.61 84.43%
Children and Adolescents’ Access to Primary Care Practitioners— 7–11 Years
88.72% 86.78% B1.94 86.85%
Children and Adolescents’ Access to Primary Care Practitioners— 12–19 Years
84.19% 84.45% 0.26 84.44%
1 RY 2018 rates reflect MY data from January 1, 2017, through December 31, 2017.
Medi-Cal Managed Care Technical Report: July 1, 2017–June 30, 2018 Page 64 California Department of Health Care Services Health Services Advisory Group, Inc.
MANAGED CARE HEALTH PLAN PERFORMANCE MEASURES
2 Performance comparisons are based on the Chi-square test of statistical significance, with a p value of <0.05. 3 Total rates are based on the total statewide results, including the SPD and non-SPD populations. Please note, if no data are available for either the SPD or non-SPD population, the total rate is based on results reported for the available population. * A lower rate indicates better performance for this measure. ** Member months are a member's “contribution” to the total yearly membership. Not Tested = An SPD/non-SPD rate difference was not calculated because high and low rates do not necessarily indicate better or worse performance.
Seniors and Persons with Disabilities Findings
HSAG observed the following notable comparisons between the MCMC weighted averages for the SPD population and MCMC weighted averages for the non-SPD population in RY 2017:
♦ The RY 2018 MCMC weighted averages for the SPD population were significantly better than the RY 2018 MCMC weighted averages for the non-SPD population for the following measures: ■ Both Annual Monitoring for Patients on Persistent Medications measures ■ Children and Adolescents’ Access to Primary Care Practitioners—25 Months–6 Years ■ Children and Adolescents’ Access to Primary Care Practitioners—7–11 Years
♦ The RY 2017 MCMC weighted averages for the SPD population were significantly worse than the RY 2017 MCMC weighted averages for the non-SPD population for the following measures: ■ All-Cause Readmissions ■ Children and Adolescents’ Access to Primary Care Practitioners—12–24 Months Note that the higher rate of hospital readmissions for the SPD population is expected based on the greater and often more complicated health care needs of these beneficiaries. Additionally, the statistically significant differences in the Children and Adolescents’ Access to Primary Care Practitioners—12–24 Months measure rates may be attributed to beneficiaries in this age group in the SPD population choosing to receive all health care services from specialist providers due to their complicated health care needs, rather than accessing care from primary care providers.
Medi-Cal Managed Care Technical Report: July 1, 2017–June 30, 2018 Page 65 California Department of Health Care Services Health Services Advisory Group, Inc.

MANAGED CARE HEALTH PLAN PERFORMANCE MEASURES
Encounter Data Diabetes Subset Seniors and Persons with Disabilities Results DHCS generated the data and findings for the diabetes subset comparison of SPD and non-SPD rates. HSAG has inserted this section at DHCS’ request. HSAG did not validate DHCS’ data or findings.
DHCS initiated an encounter data validation and improvement project in 2015 that significantly improved encounter data quality. In RY 2018, DHCS continued to conform to the CMS requirements for reporting performance related to the SPD population enrolled in MCMC.
As approved by CMS, DHCS calculated a subset of SPD rates using encounter data submitted by MCPs. Table 6.19 presents the RY 2018 SPD and non-SPD rates that DHCS calculated using encounter data for the following indicators:
♦ Comprehensive Diabetes Care— Eye Exam (Retinal) Performed (CDC-E) ♦ Comprehensive Diabetes Care—HbA1c Testing (CDC-HT) ♦ Comprehensive Diabetes Care—Medical Attention for Nephropathy (CDC-N)
DHCS calculated the rates displayed in Table 6.19 based on the administrative specifications.
Table 6.19—California Department of Health Care Services, RY 2018 Medi-Cal ManagedCare Encounter Data Diabetes Subset Seniors and Persons with Disabilities Results
MCP Name Reporting Units
SPD CDC-E
Rate
Non-SPD
CDC-E Rate
SPD CDC-HT
Rate
Non-SPD
CDC-HT Rate
SPD CDC-N
Rate
Non-SPD
CDC-N Rate
Alameda Alliance for Health
Alameda 51.1% 54.5% 87.5% 85.2% 90.0% 86.9%
Anthem Blue Cross Partnership Plan
Alameda 42.1% 47.0% 84.7% 81.9% 90.9% 84.9% Contra Costa 36.6% 37.8% 84.3% 84.4% 90.7% 82.6% Fresno 38.0% 40.0% 76.7% 78.4% 90.1% 87.2% Kings 48.6% 42.1% 86.6% 80.1% 95.1% 89.4% Madera 47.2% 51.8% 87.7% 86.4% 98.1% 93.2% Sacramento 42.1% 40.5% 80.2% 75.6% 91.7% 86.1% San Francisco 33.2% 31.5% 84.3% 82.4% 88.3% 82.9% Santa Clara 38.1% 34.6% 81.4% 79.4% 90.5% 85.8% Tulare 30.2% 29.6% 89.0% 85.5% 91.6% 88.6%
Medi-Cal Managed Care Technical Report: July 1, 2017–June 30, 2018 Page 66 California Department of Health Care Services Health Services Advisory Group, Inc.

MANAGED CARE HEALTH PLAN PERFORMANCE MEASURES
MCP Name Reporting Units
SPD CDC-E
Rate
Non-SPD
CDC-E Rate
SPD CDC-HT
Rate
Non-SPD
CDC-HT Rate
SPD CDC-N
Rate
Non-SPD
CDC-N Rate
Region 1 37.6% 36.8% 81.7% 80.2% 86.6% 84.5% Region 2 38.2% 32.9% 83.4% 81.7% 88.2% 83.8% San Benito NA 48.9% NA 78.1% NA 86.9%
California Health & Wellness Plan
Imperial 64.0% 58.3% 67.6% 57.5% 90.8% 84.3% Region 1 49.2% 42.2% 83.5% 81.3% 86.3% 82.0% Region 2 43.2% 36.2% 83.9% 80.0% 89.0% 84.6% Orange 49.0% 43.9% 85.7% 85.5% 92.8% 90.3%
CalViva Health Fresno 37.3% 39.3% 81.8% 80.1% 90.8% 87.5% Kings 40.7% 37.7% 85.0% 84.5% 93.1% 90.1% Madera 45.2% 48.1% 86.7% 84.4% 94.3% 89.5%
Care1st Partner Plan, LLC
San Diego 46.3% 46.2% 86.0% 85.4% 93.7% 89.9%
CenCal Health
San Luis Obispo 53.9% 44.6% 56.6% 58.5% 83.5% 82.2%
Santa Barbara 51.9% 48.3% 69.4% 69.1% 88.9% 84.5%
Central California Alliance for Health
Merced 50.1% 45.9% 85.3% 82.3% 91.9% 87.2%
Monterey/ Santa Cruz 56.7% 55.5% 88.0% 84.1% 90.5% 86.4%
Community Health Group Partnership Plan
San Diego 53.6% 51.6% 84.6% 82.5% 93.3% 89.0%
Contra Costa Health Plan Contra Costa 47.5% 47.8% 86.0% 83.3% 85.6% 77.6%
Gold Coast Health Plan Ventura 45.7% 42.3% 88.5% 83.9% 88.7% 86.0%
Medi-Cal Managed Care Technical Report: July 1, 2017–June 30, 2018 Page 67 California Department of Health Care Services Health Services Advisory Group, Inc.

MANAGED CARE HEALTH PLAN PERFORMANCE MEASURES
MCP Name Reporting Units
SPD CDC-E
Rate
Non-SPD
CDC-E Rate
SPD CDC-HT
Rate
Non-SPD
CDC-HT Rate
SPD CDC-N
Rate
Non-SPD
CDC-N Rate
Health Net Community Solutions, Inc.
Kern 35.1% 39.2% 81.2% 79.4% 91.2% 86.8% Los Angeles 45.0% 43.8% 80.7% 80.6% 92.3% 88.6% Sacramento 40.2% 36.2% 77.8% 73.9% 90.2% 84.3% San Diego 44.2% 53.2% 75.4% 78.8% 87.1% 85.2% San Joaquin 33.1% 27.7% 75.0% 74.1% 92.7% 84.3% Stanislaus 19.4% 18.9% 85.9% 78.0% 88.0% 82.4% Tulare 30.6% 30.2% 86.1% 84.4% 90.4% 88.2%
Health Plan of San Joaquin
San Joaquin 47.5% 51.9% 81.4% 79.4% 90.2% 86.1% Stanislaus 40.6% 34.4% 81.5% 80.1% 89.1% 85.3%
Health Plan of San Mateo San Mateo 53.2% 51.0% 87.9% 85.3% 92.3% 87.9%
Inland Empire Health Plan
Riverside/San Bernardino 42.9% 39.1% 84.8% 83.3% 92.4% 89.0%
Kern Health Systems Kern 27.2% 25.0% 86.6% 85.7% 92.2% 89.7%
KP Cal, LLC (Kaiser NorCal) KP North NA 58.7% NA 92.4% NA 91.2%
KP Cal, LLC (Kaiser SoCal) San Diego 62.7% 62.2% 94.4% 93.8% 97.2% 92.5%
L.A. Care Health Plan Los Angeles 46.3% 46.9% 84.4% 83.9% 93.1% 89.8%
Molina Healthcare of California Partner Plan, Inc.
Riverside/San Bernardino 50.8% 48.5% 80.1% 78.5% 91.7% 87.8%
Sacramento 56.4% 59.0% 82.6% 82.9% 92.1% 87.2% San Diego 59.0% 54.2% 88.6% 85.4% 93.6% 89.6% Imperial 48.4% 43.4% 87.6% 84.3% 92.8% 88.1%
Partnership HealthPlan of California
Southwest 34.6% 32.4% 74.1% 71.8% 90.5% 86.1% Southeast 42.3% 35.3% 78.3% 77.8% 91.3% 88.8% Northwest 34.6% 29.3% 88.2% 86.2% 88.2% 84.1% Northeast 37.3% 35.4% 89.4% 86.0% 89.5% 84.9%
Medi-Cal Managed Care Technical Report: July 1, 2017–June 30, 2018 Page 68 California Department of Health Care Services Health Services Advisory Group, Inc.

MANAGED CARE HEALTH PLAN PERFORMANCE MEASURES
MCP Name Reporting Units
SPD CDC-E
Rate
Non-SPD
CDC-E Rate
SPD CDC-HT
Rate
Non-SPD
CDC-HT Rate
SPD CDC-N
Rate
Non-SPD
CDC-N Rate
San Francisco Health Plan San Francisco 34.6% 44.3% 84.3% 86.7% 90.2% 87.1%
Santa Clara Family Health Plan
Santa Clara 55.0% 54.0% 83.9% 81.5% 88.7% 85.5%
NA = Denominator too small (less than 30) to report a rate.
Encounter Data Diabetes Subset Seniors and Persons with Disabilities Findings
The results displayed in Table 6.19 show that the SPD rates were slightly higher than the non-SPD rates for all three indicators in most MCP counties/regions. Higher SPD rates for all three indicators included in Table 6.19 indicate that rates for the SPD population were better than for the non-SPD population. These findings are consistent with SPD and non-SPD rates in RY 2013, RY 2014, RY 2015, RY 2016, and RY 2017. These findings are likely due to the greater and often more complex health care needs of this population, resulting in these beneficiaries being seen more regularly by providers and leading to better monitoring of care. Moreover, comparing the results of the trends from RY 2013 to RY 2018, MCPs consistently improved their performance in all three indicators for both the SPD and non-SPD populations.
HEDIS Improvement Plans During the review period, 12 of 23 MCPs (52 percent) had IPs in progress for performance measures with rates below the MPLs in RY 2017 (unless the MCP reported the rate for the measure for the first time in RY 2017). MCPs submitted PDSA Cycle Worksheets or Quality Improvement Summaries to DHCS describing efforts to improve their performance on measures with rates below the MPLs, or conducted PIPs to improve performance. Triennially, at minimum, DHCS monitored MCPs on quality improvement activities and progress being made on improving performance. Additionally, DHCS provided technical assistance to MCPs as needed, in collaboration with HSAG.
IP summary information provided to HSAG by DHCS showed that 11 of the 12 MCPs with IPs in progress during the review period (92 percent) had at least one measure with a rate that improved from below the MPL in RY 2017 to above the MPL in RY 2018. Two of the 12 MCPs (17 percent) will no longer be required to conduct IPs in 2018 based on these MCPs having no rates below the MPLs in RY 2018.
Medi-Cal Managed Care Technical Report: July 1, 2017–June 30, 2018 Page 69 California Department of Health Care Services Health Services Advisory Group, Inc.

MANAGED CARE HEALTH PLAN PERFORMANCE MEASURES
Based on RY 2018 performance measure results,13 MCPs will be required to either continue conducting existing IPs or submit new IPs in 2018.
MCP-specific information related to IPs are included within the MCP-specific evaluation reports, located in appendices A through BB.
HEDIS Corrective Action Plans DHCS had four MCPs under Quality of Care CAPs during the review period for this report. All four MCPs conducted a variety of quality improvement activities including strategies focused on data, providers, and beneficiaries. While all four MCPs demonstrated improvement from RY 2017 to RY 2018, all four MCPs showed continued opportunities for improvement. A detailed summary of the MCPs’ progress on their CAPs is included in their individual MCP-specific evaluation reports, located in the following appendices:
♦ Anthem Blue Cross Partnership Plan—Appendix D ♦ Health Net Community Solutions, Inc.—Appendix O ♦ Health Plan of San Joaquin—Appendix P ♦ Molina Healthcare of California Partner Plan, Inc.—Appendix W
Based on RY 2018 performance measure results, Anthem Blue Cross Partnership Plan and Molina Healthcare of California Partner Plan, Inc., met the MCPs’ respective CAP goals and will therefore no longer be on CAPs. Based on RY 2018 performance measure results, the following MCPs will remain on a Quality of Care CAP:
♦ Health Net Community Solutions, Inc. ♦ Health Plan of San Joaquin
Additionally, DHCS will issue new CAPs for the following three MCPs based on RY 2018 performance measure results:
♦ California Health and Wellness Plan ♦ CalViva Health ♦ Partnership HealthPlan of California
Medi-Cal Managed Care Technical Report: July 1, 2017–June 30, 2018 Page 70 California Department of Health Care Services Health Services Advisory Group, Inc.

MANAGED CARE HEALTH PLAN PERFORMANCE MEASURES
Conclusions—Managed Care Health Plan Performance Measures
Aggregate Performance
DHCS’ EAS includes measures that assess the quality and timeliness of and access to care that MCPs provide to beneficiaries, and reflect prevention, screening, health care, and utilization services. The DHCS-established MPLs and DHCS’ processes for monitoring MCPs make DHCS’ performance expectations clear and provide a framework from which DHCS and MCPs may prioritize improvement efforts.
HSAG observed the following notable aggregate performance measure results for RY 2018:
♦ The MCMC weighted average for the Immunizations for Adolescents—Combination 2 measure was above the HPL in RY 2018.
♦ For measures for which DHCS held MCPs accountable to meet the MPLs, all MCMC weighted averages were above the MPLs in RY 2018.
♦ For MCMC weighted averages for which HSAG made comparisons between RY 2017 and RY 2018, 19 of 22 MCMC weighted averages (86 percent) improved significantly from RY 2017 to RY 2018. MCPs’ quality improvement efforts, combined with DHCS’ quality improvement strategies, may have contributed to the statistically significant improvement across all measure domains from RY 2017 to RY 2018.
♦ The RY 2018 MCMC weighted average was significantly worse than the RY 2017 MCMC weighted average for the All-Cause Readmissions measure, reflecting an increase in unplanned acute readmissions within 30 days of discharge for beneficiaries 21 years of age and older.
Performance Measures Addressing Quality Strategy Focus Areas
For quality strategy areas that DHCS monitors through EAS performance measures, HSAG identified the following notable information:
♦ Prenatal and Postpartum Care—Postpartum Care ■ The MCMC weighted average for the Prenatal and Postpartum Care—Postpartum Care
measure improved significantly from RY 2017 to RY 2018, reflecting MCPs’ continued improved performance related to ensuring that women with live births are seen for their postpartum visits within the recommended time frame after delivery.
■ MCPs continued to exceed the quality strategy RY 2019 target of at least 80 percent of MCP reporting units meeting the MPL for the Prenatal and Postpartum Care— Postpartum Care measure, with 46 of 53 reporting units (87 percent) having rates meeting or exceeding the MPL in RY 2018.
Medi-Cal Managed Care Technical Report: July 1, 2017–June 30, 2018 Page 71 California Department of Health Care Services Health Services Advisory Group, Inc.

MANAGED CARE HEALTH PLAN PERFORMANCE MEASURES
♦ Immunizations of Two-Year-Olds ■ The MCMC weighted average for the Childhood Immunization Status—Combination 3
measure remained consistent, showing no statistically significant change from RY 2017 to RY 2018.
♦ Comprehensive Diabetes Care ■ The MCMC weighted averages for all Comprehensive Diabetes Care measures
improved significantly from RY 2017 to RY 2018, and all weighted averages were above the MPLs in RY 2018. Aggregate performance measure results reflect MCPs’ improved performance related to ensuring that beneficiaries with diabetes receive quality, accessible, and timely health care services.
■ MCPs met the quality strategy RY 2018 goal of decreasing the rate to 35 percent of beneficiaries with diabetes who had an HbA1c greater than 9.0 percent.
♦ Controlling High Blood Pressure ■ The MCMC weighted average for the Controlling High Blood Pressure measure
improved significantly from RY 2017 to RY 2018, reflecting MCPs’ improved performance related to ensuring that beneficiaries ages 18 to 85 with diagnoses of hypertension had their blood pressure adequately controlled during the MY, based on specified criteria for their ages.
DHCS Initiatives to Support MCPs in Improving Care
Throughout the review period, DHCS supported MCPs’ efforts to provide quality, accessible, and timely health care to beneficiaries, including:
♦ Provided technical assistance to MCPs in collaboration with HSAG on implementation of rapid-cycle quality improvement strategies for measures with rates below the MPLs and measures with year-over-year declining rates.
♦ Assisted MCPs with prioritizing measures in need of improvement and identifying measures for MCPs to use as focus areas for IPs.
♦ Conducted monthly technical assistance calls and quarterly in-person leadership meetings with MCPs on CAPs to improve performance related to measures for which these MCPs had multiple years of performance below the MPLs.
♦ Conducted technical assistance calls for MCPs not engaged in a CAP, as needed. ♦ Provided opportunities through quarterly collaborative discussions for DHCS to provide
MCPs with information on resources and for MCPs to share information with each other about quality improvement efforts, successes, and lessons learned.
♦ Produced and disseminated to MCPs quality improvement briefs highlighting MCP promising practices and provided resources related to the following measures for which MCPs have opportunities for improvement: ■ Avoidance of Antibiotic Treatment in Adults With Acute Bronchitis ■ Comprehensive Diabetes Care—HbA1c Testing ■ Prenatal and Postpartum Care—Postpartum Care
Medi-Cal Managed Care Technical Report: July 1, 2017–June 30, 2018 Page 72 California Department of Health Care Services Health Services Advisory Group, Inc.

MANAGED CARE HEALTH PLAN PERFORMANCE MEASURES
♦ Disseminated to MCPs the results of the July 2017 annual quality improvement survey. DHCS indicated that it intends to use the survey results to improve its strategies for providing relevant quality improvement technical assistance and support to MCPs.
Recommendations—Managed Care Health Plan Performance Measures Based on RY 2018 MCP aggregate performance measure results, HSAG has no recommendations for DHCS in the area of performance measures related to MCPs.
The RY 2018 MCMC weighted average was significantly worse than the RY 2017 MCMC weighted average for the All-Cause Readmissions measure. DHCS decided to replace the All-Cause Readmissions measure with the Plan All-Cause Readmissions HEDIS measure for RY 2019. DHCS made this decision so that DHCS can use the newly available national Medicaid benchmarks in the NCQA Quality Compass to establish an MPL. Establishing an MPL will allow DHCS to monitor MCP performance in relation to the MPL and require the MCPs to conduct quality improvement work when MCPs do not meet the MPL. Due to the change in measure, DHCS cannot monitor the MCMC weighted average for the All-Cause Readmissions measure moving forward but will instead begin monitoring the MCMC weighted average for the Plan All-Cause Readmissions HEDIS measure. Therefore, HSAG makes no recommendations to DHCS regarding the All-Cause Readmissions measure.
MCP-specific performance measure results, findings, and recommendations are included in the applicable appendices at the end of this report (appendices A through BB).
Medi-Cal Managed Care Technical Report: July 1, 2017–June 30, 2018 Page 73 California Department of Health Care Services Health Services Advisory Group, Inc.

Medi-Cal Managed Care External Quality Review Technical ReportJuly 1, 2017–June 30, 2018
7. Specialty Health Plan Performance Measures
Specialty Health Plan Performance Measure Requirements To comply with §438.330, DHCS selects performance measures through which to evaluate the quality of care delivered by the contracted SHPs to their beneficiaries. Due to the specialized populations that SHPs serve, rather than requiring SHPs to report rates for the EAS measures, DHCS collaborates with each SHP to select two measures appropriate to the SHP’s Medi-Cal population. SHPs may select HEDIS measures or develop SHP-specific measures. SHPs must report county or regional rates unless otherwise approved by DHCS. Table 7.1 lists the RY 2018 performance measures for each SHP.
Table 7.1—RY 2018 (MY 2017) Specialty Health Plan Performance Measures
Specialty HealthPlan Measure NCQA Method of
Data Capture***
AIDS Healthcare Foundation
Colorectal Cancer Screening* Hybrid Controlling High Blood Pressure* Hybrid
Family Mosaic Project
Promotion of Positive Pro-Social Activity** Not Applicable School Attendance** Not Applicable
SCAN Health Plan Colorectal Cancer Screening* Hybrid Osteoporosis Management in Women Who Had a Fracture* Admin
* HEDIS measure ** Non-HEDIS measure; SHP designed the measure in collaboration with DHCS and HSAG to evaluate performance elements specific to the SHP. *** Admin = administrative method, which requires that SHPs identify the eligible population (i.e., the denominator) using administrative data such as enrollment, claims, and encounters. Additionally, SHPs derive the numerator, or services provided to beneficiaries in the eligible population, from administrative data sources and auditor-approved supplemental data sources. SHPs cannot use medical records to retrieve information. When using the administrative method, SHPs use the entire eligible population as the denominator because NCQA does not allow sampling. Hybrid = hybrid method, which requires that SHPs identify the eligible population using administrative data, then extract a systematic sample of beneficiaries from the eligible population, which becomes the denominator. SHPs use administrative data to identify services provided to these beneficiaries. When administrative data do not show evidence that SHPs provided the service, SHPs review medical records for those beneficiaries to derive the numerator.
Medi-Cal Managed Care Technical Report: July 1, 2017–June 30, 2018 Page 74 California Department of Health Care Services Health Services Advisory Group, Inc.
SPECIALTY HEALTH PLAN PERFORMANCE MEASURES
DHCS-Established Performance Levels
For SHPs, DHCS established the HPLs and MPLs for RY 2018 HEDIS measures based on NCQA’s Quality Compass HEDIS 2017 national Medicaid and national commercial benchmarks, as appropriate to the performance measures being reported. The HPLs and MPLs align with NCQA’s national 90th percentiles and 25th percentiles, respectively. No national benchmarks exist for non-HEDIS measures; therefore, DHCS did not establish performance levels for non-HEDIS measures.
As applicable, SHPs are contractually required to perform at or above DHCS-established MPLs; and DHCS uses the established HPLs as performance goals, recognizing SHPs for outstanding performance. DHCS assesses each SHP’s performance measure rates against the established MPLs and requires SHPs to submit to DHCS an IP for each measure with a rate below the MPL. As with MCPs, an IP consists of an SHP’s submission of PDSA Cycle Worksheets or Quality Improvement Summaries, or completion of PIPs—as determined by DHCS. DHCS reviews each IP submission for design soundness and anticipated intervention effectiveness.
Specialty Health Plan Performance Measure Results and Findings The following is a summary of the SHPs’ performance measure results and findings:
♦ AIDS Healthcare Foundation—The rates for the Colorectal Cancer Screening and Controlling High Blood Pressure measures showed no statistically significant changes from RY 2017 to RY 2018, and the rate for each measure was between the HPL and MPL in RY 2018.
♦ Family Mosaic Project—While the SHP previously reported rates for the Promotion of Positive Pro-Social Activity and School Attendance measures, during the RY 2018 performance measure validation process, the auditor determined that the specification for each measure needed to be modified. This resulted in both measures being first-year measures in RY 2018. The denominator for each measure was too small to report a valid rate (less than 30).
♦ SCAN Health Plan—While the SHP previously reported rates for the Osteoporosis Management in Women Who Had a Fracture measure, based on specification changes that NCQA made to this measure for RY 2018 and NCQA’s recommendation for a break in trending, the measure was considered a first-year measure in RY 2018. The rate for the Colorectal Cancer Screening measure showed no statistically significant change from RY 2017 to RY 2018, and the rate was between the HPL and MPL in RY 2018.
Medi-Cal Managed Care Technical Report: July 1, 2017–June 30, 2018 Page 75 California Department of Health Care Services Health Services Advisory Group, Inc.

SPECIALTY HEALTH PLAN PERFORMANCE MEASURES
Recommendations—Specialty Health Plan Performance Measures Based on RY 2018 SHP performance measure results, HSAG has no recommendations for DHCS in the area of performance measures related to SHPs.
SHP-specific performance measure results, findings, and recommendations are included in the applicable appendices at the end of this report (appendices A through BB).
Medi-Cal Managed Care Technical Report: July 1, 2017–June 30, 2018 Page 76 California Department of Health Care Services Health Services Advisory Group, Inc.

Medi-Cal Managed Care External Quality Review Technical ReportJuly 1, 2017–June 30, 2018
8. Managed Long-Term Services and Supports PlanPerformance Measures
Managed Long-Term Services and Supports Plans As part of the CCI, DHCS holds contracts with 11 MLTSSPs to provide long-term support services and Medicare wraparound benefits to dual eligible beneficiaries who have opted out of Cal MediConnect27 or who are not eligible for Cal MediConnect. Table 8.1 lists MLTSSPs and the counties in which they operate.
Table 8.1—Managed Long-Term Services and Supports Plans
Managed Long-Term Services andSupports Plans Counties
Anthem Blue Cross Partnership Plan Santa Clara CalOptima Orange Care1st Partner Plan San Diego Community Health Group Partnership Plan San Diego
Health Net Community Solutions, Inc. Los Angeles and San Diego Health Plan of San Mateo San Mateo Inland Empire Health Plan Riverside and San Bernardino Kaiser SoCal (KP Cal, LLC) San Diego L.A. Care Health Plan Los Angeles Molina Healthcare of California Partner Plan, Inc. Riverside, San Bernardino, and San Diego
Santa Clara Family Health Plan Santa Clara
27 Cal MediConnect—All of a beneficiary’s medical, behavioral health, long-term institutional, and home- and community-based services are combined into a single health plan. This allows providers to better coordinate care and to simplify for beneficiaries the process of obtaining appropriate, timely, accessible care.
Medi-Cal Managed Care Technical Report: July 1, 2017–June 30, 2018 Page 77 California Department of Health Care Services Health Services Advisory Group, Inc.

MANAGED LONG-TERM SERVICES AND SUPPORTS PLAN PERFORMANCE MEASURES
Managed Long-Term Services and Supports Plan Performance Measure Requirements In RY 2018, DHCS required the MLTSSPs to report rates for three HEDIS measures. Table 8.2 lists the HEDIS performance measures which DHCS required that MLTSSPs report for RY 2017.
Table 8.2—RY 2018 (MY 2017) Managed Long-Term Services and Supports PlanPerformance Measures
Measure NCQA Method of Data Capture*
Ambulatory Care—Emergency Department (ED) Visits per 1,000 Member Months** Admin
Ambulatory Care—Outpatient Visits per 1,000 Member Months** Admin Medication Reconciliation Post-Discharge Hybrid * Admin = administrative method, which requires that MLTSSPs identify the eligible population (i.e., the denominator) using administrative data such as enrollment, claims, and encounters. Additionally, MLTSSPs derive the numerator, or services provided to beneficiaries in the eligible population, from administrative data sources and auditor-approved supplemental data sources. MLTSSPs cannot use medical records to retrieve information. When using the administrative method, MLTSSPs use the entire eligible population as the denominator because NCQA does not allow sampling. Hybrid = hybrid method, which requires that MLTSSPs identify the eligible population using administrative data, then extract a systematic sample of beneficiaries from the eligible population, which becomes the denominator. MLTSSPs use administrative data to identify services provided to these beneficiaries. When administrative data do not show evidence that MLTSSPs provided the service, MLTSSPs review medical records for those beneficiaries to derive the numerator. **Member months are a member’s “contribution” to the total yearly membership.
Medi-Cal Managed Care Technical Report: July 1, 2017–June 30, 2018 Page 78 California Department of Health Care Services Health Services Advisory Group, Inc.

MANAGED LONG-TERM SERVICES AND SUPPORTS PLAN PERFORMANCE MEASURES
Managed Long-Term Services and Supports Plan Performance Measure Results Table 8.3 presents the MLTSSP weighted averages for each required performance measure for RYs 2016, 2017, and 2018 and compares the RY 2018 rates to the RY 2017 rates. Note that DHCS does not hold MLTSSPs accountable to meet MPLs for the required measures.
Table 8.3—Multi-Year Statewide Weighted Average Performance Measure Results forManaged Long-Term Services and Supports Plans
B = Statistical testing result indicates that the RY 2018 rate is significantly better than the RY 2017 rate.
W = Statistical testing result indicates that the RY 2018 rate is significantly worse than the RY 2017 rate.
Measure RY
2016 Rate1
RY 2017
Rate2
RY 2018
Rate3
RYs 2017–18 Rate
Difference4
Ambulatory Care—Emergency Department (ED) Visits per 1,000 Member Months* 53.20 34.14 51.87 Not Tested
Ambulatory Care—Outpatient Visits per 1,000 Member Months* 407.10 307.31 440.39 Not Tested
Medication Reconciliation Post-Discharge 10.95% 19.71% 21.74% B2.03 1 RY 2016 rates reflect MY data from January 1, 2015, through December 31, 2015. 2 RY 2017 rates reflect MY data from January 1, 2016, through December 31, 2016. 3 RY 2018 rates reflect MY data from January 1, 2017, through December 31, 2017. 4 Performance comparisons are based on the Chi-square test of statistical significance, with a p value of <0.05. * Member months are a member's “contribution” to the total yearly membership. Not Tested = An RY 2017–18 rate difference was not calculated because high and low rates do not necessarily indicate better or worse performance.
Medi-Cal Managed Care Technical Report: July 1, 2017–June 30, 2018 Page 79 California Department of Health Care Services Health Services Advisory Group, Inc.
MANAGED LONG-TERM SERVICES AND SUPPORTS PLAN PERFORMANCE MEASURES
Managed Long-Term Services and Supports Plan Performance Measure Findings The MLTSS weighted average for the Medication Reconciliation Post-Discharge measure improved significantly from RY 2017 to RY 2018, which was reflected across all MLTSSPs combined for ensuring that beneficiaries18 years of age and older who are discharged from acute or nonacute inpatient care have their medications reconciled by 30 days after discharge.
Recommendations—Managed Long-Term Services and Supports Plan Performance Measures When DHCS evaluates whether or not to change the required measures for MLTSSPs, HSAG recommends that DHCS obtain input from MLTSSPs and other stakeholders through various methods such as questionnaires or focused studies regarding the feasibility and applicability of requiring MLTSSPs to report the newly created Long-Term Services and Supports HEDIS measures.
MLTSSP-specific performance measure results, findings, and recommendations are included in the applicable appendices at the end of this report (appendices A through BB).
Medi-Cal Managed Care Technical Report: July 1, 2017–June 30, 2018 Page 80 California Department of Health Care Services Health Services Advisory Group, Inc.

Medi-Cal Managed Care External Quality Review Technical ReportJuly 1, 2017–June 30, 2018
9. Performance Improvement Projects
Validating PIPs is one of the mandatory external quality review activities described at 42 CFR §438.358(b)(1). In accordance with §438.330 (d), MCOs, PIHPs, PAHPs, and PCCM entities are required to have a quality program that (1) includes ongoing PIPs designed to have a favorable effect on health outcomes and beneficiary satisfaction and (2) focuses on clinical and/or nonclinical areas that involve the following:
♦ Measuring performance using objective quality indicators ♦ Implementing system interventions to achieve quality improvement ♦ Evaluating effectiveness of the interventions ♦ Planning and initiating activities for increasing and sustaining improvement
The EQR technical report must include information on the validation of performance improvement projects required by the state and underway during the preceding 12 months.
Background To comply with the CMS requirements, DHCS contracts with HSAG to conduct an independent validation of PIPs submitted by MCPs and SHPs. HSAG uses a two-pronged approach. First, HSAG provides training and technical assistance to MCPs and SHPs on how to design, conduct, and report PIPs in a methodologically sound manner, meeting all State and federal requirements. Then, HSAG assesses the validity and reliability of PIP submissions to draw conclusions about the quality and timeliness of, and access to care furnished by MCPs and SHPs.
Requirements
DHCS requires that each MCP and SHP conduct a minimum of two DHCS-approved PIPs per each Medi-Cal contract held with DHCS. If an MCP or SHP holds multiple contracts with DHCS and the areas in need of improvement are similar across contracts, DHCS may approve the MCP or SHP to conduct the same two PIPs across all contracts (i.e., conduct two PIPs total).
Medi-Cal Managed Care Technical Report: July 1, 2017–June 30, 2018 Page 81 California Department of Health Care Services Health Services Advisory Group, Inc.

PERFORMANCE IMPROVEMENT PROJECTS
2015–17 Performance Improvement Projects
For PIPs that began in October 2015, DHCS set two categories of topic selection. For MCPs, DHCS required that the first PIP topic be related to one of the following four MCMC quality strategy priority areas28 (DHCS-priority PIP):
♦ Diabetes ♦ Hypertension ♦ Postpartum visits ♦ Immunizations of two-year-olds
For the second topic, selected in January 2016, DHCS required that MCPs target an MCP-specific area with demonstrated need for improvement (MCP-specific PIP). For SHPs, when DHCS-priority PIP topics were not applicable, DHCS required that SHPs conduct two SHP-specific PIPs.
The PIPs that began in 2015 and 2016 concluded on June 30, 2017.
2017–19 Performance Improvement Projects
Beginning in July 2017, DHCS set two new categories of PIP topic selection for MCPs and SHPs. For MCPs, DHCS required that the first PIP topic involve an identified health disparity (Disparity PIP). DHCS required that the second PIP topic be related to the MCP’s performance on a metric related to one of the four MCMC quality strategy priority areas (DHCS-priority PIP). DHCS set the following DHCS-priority PIP topic selection criteria:
a. DHCS required an MCP to choose Childhood Immunizations—Combination 3 as its topic if the MCP performed below the MPL on the measure in RY 2017 or performed below the statewide MCMC average, with declining performance on the measure having occurred in RY 2017. If not required to choose Childhood Immunizations—Combination 3 as a topic based on the criteria in “a”, DHCS required that the MCP focus the DHCS-priority PIP topic on:
b. Controlling High Blood Pressure, Comprehensive Diabetes Care, or Prenatal and Postpartum Care—Postpartum Care if the MCP performed below the MPLs on any of these measures in RY 2017. If an MCP performed below the MPLs for more than one of these measures in RY 2017, DHCS required that the MCP choose the measure for which it has performed below the MPL for consecutive years or the measure for which the MCP’s performance has been significantly declining for consecutive years; Or:
28 DHCS’ Medi-Cal managed care quality strategy reports are available at: http://www.dhcs.ca.gov/dataandstats/reports/Pages/MMCDQualPerfMsrRpts.aspx. Accessed on: Nov 28, 2017.
Medi-Cal Managed Care Technical Report: July 1, 2017–June 30, 2018 Page 82 California Department of Health Care Services Health Services Advisory Group, Inc.

PERFORMANCE IMPROVEMENT PROJECTS
c. If in RY 2017 an MCP performed above the MPL and MCMC average for Childhood Immunizations—Combination 3 and above the MPLs for Controlling High Blood Pressure, Comprehensive Diabetes Care, and Prenatal and Postpartum Care—Postpartum Care, DHCS required that the MCP choose a PIP topic for any area in need of improvement.
For SHPs, when Disparity PIP topics were not applicable, DHCS required that SHPs identify two topics using the topic selection criteria for DHCS-priority PIPs.
MCPs and SHPs will conduct the 2017–19 PIPs through the SMART Aim end date of June 30, 2019.
Performance Improvement Projects Approach
HSAG’s rapid-cycle PIP validation approach places emphasis on improving both health care outcomes and processes through the integration of quality improvement science. This approach guides MCPs and SHPs through a process for conducting PIPs using a rapid-cycle improvement method to pilot small changes rather than implementing one large transformation. Performing small tests of changes requires fewer resources and allows more flexibility for adjusting throughout the improvement process. By piloting changes on a smaller scale, MCPs and SHPs have opportunities to determine the effectiveness of several changes prior to expanding the successful interventions. The following modules guide MCPs and SHPs through the rapid-cycle PIP approach:
♦ Module 1: PIP Initiation ♦ Module 2: SMART (Specific, Measurable, Achievable, Relevant, and Time-bound) Aim
Data Collection ♦ Module 3: Intervention Determination ♦ Module 4: Plan-Do-Study-Act (PDSA) ♦ Module 5: PIP Conclusions
The rapid-cycle PIP approach requires up-front preparation to allow for a more structured, scientific approach to quality improvement. Modules 1 through 3 create the basic infrastructure to help MCPs and SHPs identify interventions to test. Through an iterative process, MCPs and SHPs have opportunities to revise modules 1 through 3 to achieve all validation criteria. Once MCPs and SHPs achieve all validation criteria for modules 1 through 3 and receive feedback on the Plan portion of Module 4, MCPs test interventions. For each intervention it tests on a small scale using the PDSA cycle, each MCP or SHP must submit a separate Module 4.
Once MCPs and SHPs complete intervention testing, MCPs and SHPs determine the next steps based on results and lessons learned—whether the intervention was successful and should be spread (adopt), whether modifications need to be made to the existing intervention (adapt), or whether the intervention was not successful and should be stopped (abandon). MCPs and SHPs complete Module 5 after testing all interventions and finalizing analyses of the PDSA cycles. Module 5 summarizes the results of the tested interventions. At the end of
Medi-Cal Managed Care Technical Report: July 1, 2017–June 30, 2018 Page 83 California Department of Health Care Services Health Services Advisory Group, Inc.

PERFORMANCE IMPROVEMENT PROJECTS
the PIP, MCPs and SHPs identify successful interventions that may be implemented on a larger scale to achieve the desired health care outcomes.
Objectives The purpose of HSAG’s PIP validation is to ensure that MCPs, SHPs, DHCS, and stakeholders can have confidence that any reported improvement is related and can be linked to the quality improvement strategies conducted through the PIPs.
HSAG evaluates two key components of each PIP:
♦ Technical structure, to determine whether a PIP’s initiation (i.e., topic rationale, PIP team, global aim, SMART aim, key driver diagram, and data collection methodology) is based on sound methodology and could reliably measure outcomes. Successful execution of this component ensures that reported PIP results are accurate and capable of measuring sustained improvement.
♦ Conducting of quality improvement activities. Once designed, a PIP’s effectiveness in improving outcomes depends on thoughtful and relevant intervention determination, intervention testing, evaluation using PDSA cycles, sustainability, and spreading successful change. This component evaluates how well MCPS and SHPs execute quality improvement activities and whether the PIP achieves and sustains the desired aim.
Methodology Based on the agreed-upon timeline, MCPs and SHPs submit each module to HSAG for validation. Throughout the rapid-cycle PIP process, HSAG provides technical assistance to MCPs and SHPs to ensure that PIPs are methodologically sound and to problem-solve with MCPs and SHPs regarding how to address challenges that occur. HSAG conducts PIP validation in accordance with the CMS publication, EQR Protocol 3: Validating Performance Improvement Projects (PIPs): A Mandatory Protocol for External Quality Review (EQR), Version 2.0, September 2012.29 Following are the validation criteria that HSAG uses for each module:
Module 1
♦ The topic and narrowed focus were supported by the data and were aligned with the State’s quality strategy.
♦ The MCP/SHP identified team members from both internal MCP/SHP staff and external partners, including representation for the narrowed focus.
29 The CMS protocols may be found at https://www.medicaid.gov/medicaid/quality-of-care/medicaid-managed-care/external-quality-review/index.html. Accessed on: Jul 26, 2018.
Medi-Cal Managed Care Technical Report: July 1, 2017–June 30, 2018 Page 84 California Department of Health Care Services Health Services Advisory Group, Inc.
PERFORMANCE IMPROVEMENT PROJECTS
♦ The SMART Aim included all required components; and the MCP/SHP developed the SMART Aim based on literature review, MCP/SHP data, and/or experience.
♦ The Global Aim, SMART Aim, key drivers, and potential interventions were aligned and stated accurately.
Module 2
♦ The SMART Aim measure included all of the following components: ■ Well-defined numerator and denominator ■ Appropriate baseline measurement period ■ Appropriate measurement intervals for the SMART Aim ■ Appropriate SMART Aim goal based on the baseline rate and denominator size
♦ The SMART Aim data collection methodology supported the rapid-cycle process and included the following: ■ Data source(s). ■ Step-by-step process that was in alignment with the baseline data collection
methodology. ■ List of team members responsible for collecting the data.
♦ If used, the data collection tool(s) was appropriate and captured all required data elements. ♦ The run/control chart included the titles, SMART Aim goal, baseline percentage, and data
collection interval.
Module 3
♦ The MCP/SHP documented the team members responsible for completing the process map and failure modes and effects analysis (FMEA).
♦ The process map illustrated a step-by-step flow of the current overall process. The sub-processes identified in the process map as opportunities for improvement were numbered and clearly referenced in the FMEA table.
♦ The MCP/SHP included a description of the process and rationale used for selecting the subprocesses for the FMEA table.
♦ The FMEA table included: ■ Subprocesses that aligned with the opportunities for improvement identified in the
process map. ■ Failure modes, causes, and effects for each subprocess listed in the table.
♦ The MCP/SHP described its failure mode priority ranking process. ♦ The interventions listed in the Intervention Determination Table were appropriate based on
the ranked failure modes. ♦ The MCP/SHP considered the intervention’s reliability and sustainability as part of its
intervention selection process.
Medi-Cal Managed Care Technical Report: July 1, 2017–June 30, 2018 Page 85 California Department of Health Care Services Health Services Advisory Group, Inc.

PERFORMANCE IMPROVEMENT PROJECTS
Module 4
♦ The tested intervention addressed at least one or more of the key drivers or identified failures, and the MCP/SHP explained how the intervention fits into the theory of change.
♦ The MCP/SHP documented an appropriate intervention plan (who, what, where, and how). ♦ The intervention effectiveness measure was methodologically sound and appropriate for
the tested intervention. ♦ The MCP/SHP provided a complete and accurate summary of the intervention testing
results. ♦ The MCP’s/SHP’s decision to adopt, adapt, or abandon the intervention was supported by
appropriate rationale and intervention testing results.
Module 5
♦ The PIP demonstrated evidence of having achieved the SMART Aim goal. ♦ If the SMART Aim goal was achieved, the improvement was clearly linked to the tested
intervention(s). ♦ The narrative summary of the overall findings and interpretation of results was accurate
and complete. ♦ The MCP/SHP documented lessons learned. ♦ If the SMART Aim goal was achieved, the MCP/SHP documented a plan for sustaining the
improvement beyond the SMART Aim end date. ♦ The MCP/SHP provided the final key driver diagram, FMEA, and Intervention
Determination Table.
Once a PIP reaches completion, HSAG assesses the validity and reliability of the results to determine whether or not key stakeholders may have confidence in the reported PIP findings. HSAG assigns the following confidence levels for each PIP:
♦ High confidence—the PIP was methodologically sound and achieved the SMART Aim goal; the demonstrated improvement was clearly linked to the quality improvement processes conducted and intervention(s) tested; and, the MCP accurately summarized the key findings.
♦ Confidence—the PIP was methodologically sound and achieved the SMART Aim goal, and the MCP accurately summarized the key findings; however, some, but not all, of the quality improvement processes conducted and/or intervention(s) tested were clearly linked to the demonstrated improvement.
♦ Low confidence—either (A) the PIP was methodologically sound; however, the SMART Aim goal was not achieved; or (B) the SMART Aim goal was achieved; however, the quality improvement processes and/or intervention(s) tested were poorly executed and could not be linked to the improvement.
♦ Reported PIP results were not credible (referred to in this report as “not credible”)—the PIP methodology was not executed as approved.
Medi-Cal Managed Care Technical Report: July 1, 2017–June 30, 2018 Page 86 California Department of Health Care Services Health Services Advisory Group, Inc.

PERFORMANCE IMPROVEMENT PROJECTS
After validating each PIP module, HSAG provides written feedback to MCPs and SHPs summarizing HSAG’s findings and whether or not the MCPs and SHPs achieved all validation criteria. Once MCPs and SHPs achieve all validation criteria for modules 1 through 3, HSAG conducts a pre-validation review on each MCP’s and SHP’s Plan portion of Module 4 and provides feedback for MCPs and SHPs to consider prior to beginning intervention testing. HSAG requests status updates from MCPs and SHPs throughout the intervention testing phase of the PIP process and, when needed, provides technical assistance.
HSAG validated up to the point of PIP progression for each MCP/SHP as of June 30, 2018; results of the validation activities completed by June 30, 2018, are included in this report.
MCP- and SHP-specific activities are included in the MCP- and SHP-specific evaluation reports in appendices A through BB.
Results—Performance Improvement Projects
2015–17 Performance Improvement Projects
During the review period, MCPs and SHPs submitted modules 4 and 5 for the 2015–17 PIPs, which concluded on June 30, 2017. HSAG validated 73 Module 4 submissions and 52 Module 5 submissions, and notified MCPs, SHPs, and DHCS of the validation findings.
Across all PIPs, MCPs and SHPs tested interventions targeting beneficiaries and providers. MCP- and SHP-specific intervention testing validation and SMART Aim measure attainment results are included in the MCP- and SHP-specific evaluation reports in appendices A through BB, along with information on whether or not MCPs and SHPs decided, based on intervention testing results, to adopt, adapt, or abandon the interventions.
2017–19 Performance Improvement Projects
Prior to beginning the 2017–19 PIPs, DHCS required MCPs and SHPs to submit proposals for both the Disparity PIP and DHCS-priority PIP topics. HSAG approved 24 Disparity PIP topics that demonstrated evidence of a health disparity, and with HSAG’s input, DHCS approved 28 DHCS-priority PIP topics.
Upon receiving PIP topic approvals, MCPs and SHPs initiated the 2017–19 PIPs. During the review period, for modules 1, 2, and 3 of these PIPs, HSAG validated the following and notified MCPs, SHPs, and DHCS of the validation findings:
♦ Module 1—52 initial submissions and 86 resubmissions ♦ Module 2—52 initial submissions and 111 resubmissions ♦ Module 3—25 initial submissions and 16 resubmissions
Medi-Cal Managed Care Technical Report: July 1, 2017–June 30, 2018 Page 87 California Department of Health Care Services Health Services Advisory Group, Inc.
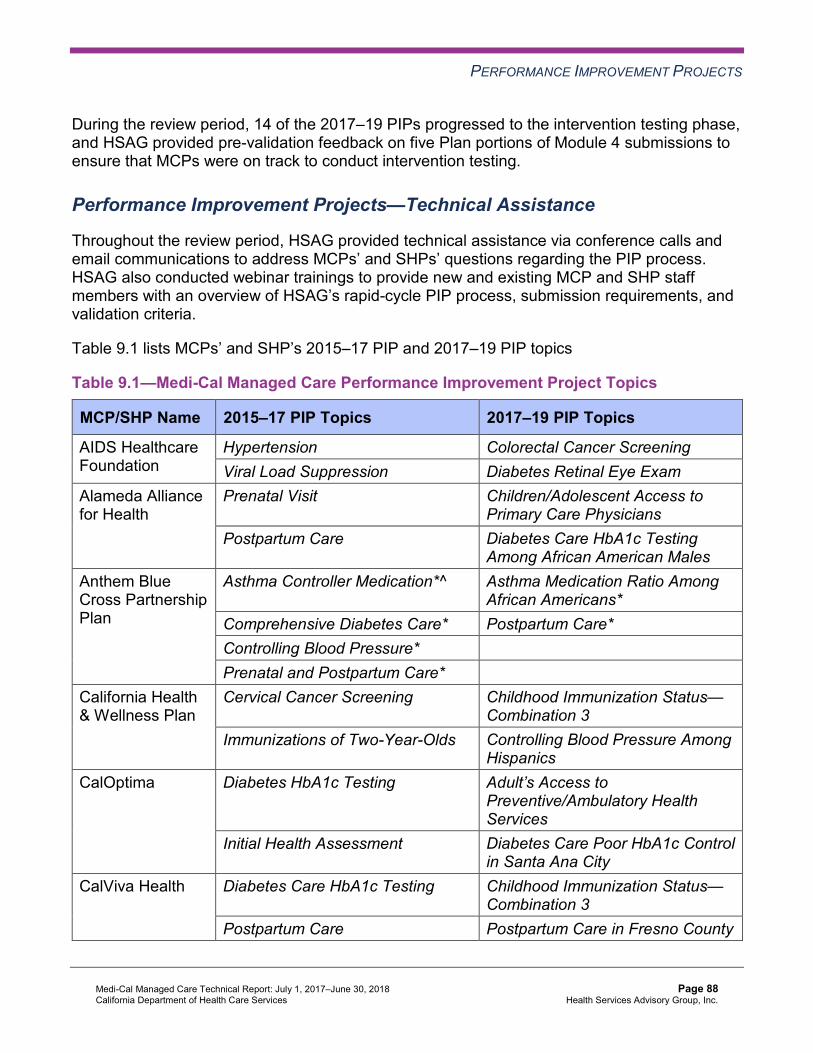
PERFORMANCE IMPROVEMENT PROJECTS
During the review period, 14 of the 2017–19 PIPs progressed to the intervention testing phase, and HSAG provided pre-validation feedback on five Plan portions of Module 4 submissions to ensure that MCPs were on track to conduct intervention testing.
Performance Improvement Projects—Technical Assistance
Throughout the review period, HSAG provided technical assistance via conference calls and email communications to address MCPs’ and SHPs’ questions regarding the PIP process. HSAG also conducted webinar trainings to provide new and existing MCP and SHP staff members with an overview of HSAG’s rapid-cycle PIP process, submission requirements, and validation criteria.
Table 9.1 lists MCPs’ and SHP’s 2015–17 PIP and 2017–19 PIP topics
Table 9.1—Medi-Cal Managed Care Performance Improvement Project Topics
MCP/SHP Name 2015–17 PIP Topics 2017–19 PIP Topics
AIDS Healthcare Foundation
Hypertension Colorectal Cancer Screening Viral Load Suppression Diabetes Retinal Eye Exam
Alameda Alliance for Health
Prenatal Visit Children/Adolescent Access to Primary Care Physicians
Postpartum Care Diabetes Care HbA1c Testing Among African American Males
Anthem Blue Cross Partnership Plan
Asthma Controller Medication*^ Asthma Medication Ratio Among African Americans*
Comprehensive Diabetes Care* Postpartum Care* Controlling Blood Pressure* Prenatal and Postpartum Care*
California Health & Wellness Plan
Cervical Cancer Screening Childhood Immunization Status— Combination 3
Immunizations of Two-Year-Olds Controlling Blood Pressure Among Hispanics
CalOptima Diabetes HbA1c Testing Adult’s Access to Preventive/Ambulatory Health Services
Initial Health Assessment Diabetes Care Poor HbA1c Control in Santa Ana City
CalViva Health Diabetes Care HbA1c Testing Childhood Immunization Status— Combination 3
Postpartum Care Postpartum Care in Fresno County
Medi-Cal Managed Care Technical Report: July 1, 2017–June 30, 2018 Page 88 California Department of Health Care Services Health Services Advisory Group, Inc.
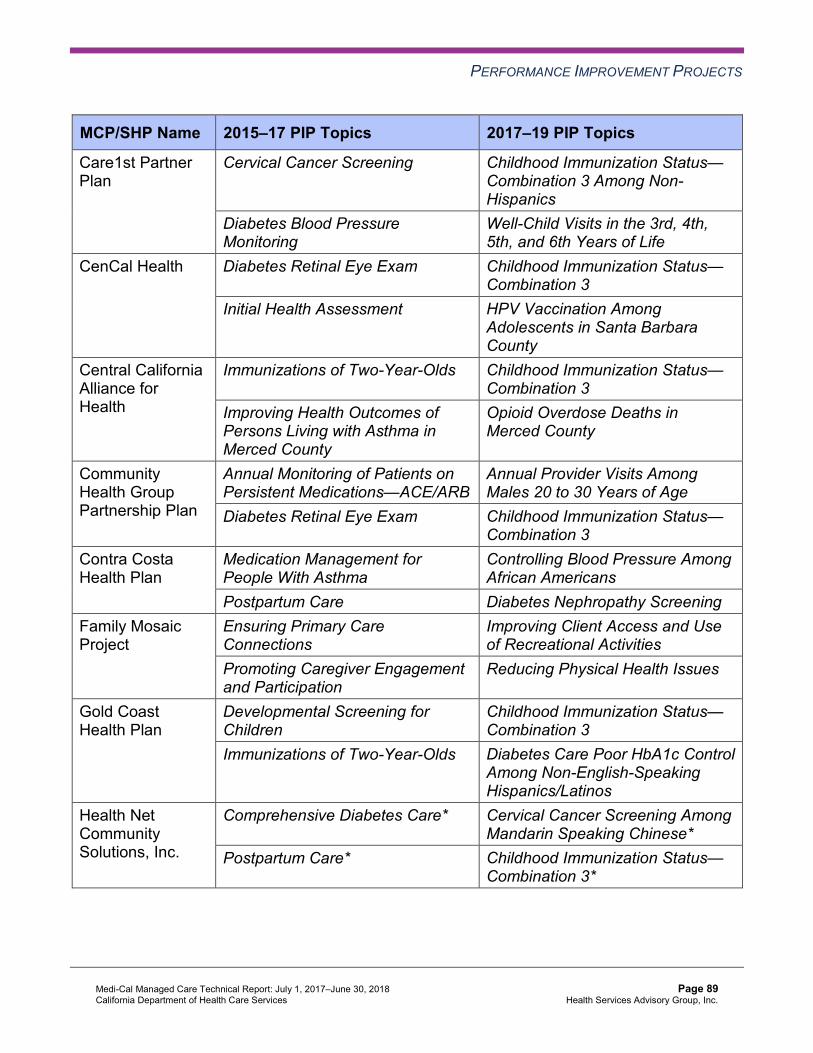
PERFORMANCE IMPROVEMENT PROJECTS
MCP/SHP Name 2015–17 PIP Topics 2017–19 PIP Topics
Care1st Partner Plan
Cervical Cancer Screening Childhood Immunization Status— Combination 3 Among Non-Hispanics
Diabetes Blood Pressure Monitoring
Well-Child Visits in the 3rd, 4th, 5th, and 6th Years of Life
CenCal Health Diabetes Retinal Eye Exam Childhood Immunization Status— Combination 3
Initial Health Assessment HPV Vaccination Among Adolescents in Santa Barbara County
Central California Alliance for Health
Immunizations of Two-Year-Olds Childhood Immunization Status— Combination 3
Improving Health Outcomes of Persons Living with Asthma in Merced County
Opioid Overdose Deaths in Merced County
Community Health Group Partnership Plan
Annual Monitoring of Patients on Persistent Medications—ACE/ARB
Annual Provider Visits Among Males 20 to 30 Years of Age
Diabetes Retinal Eye Exam Childhood Immunization Status— Combination 3
Contra Costa Health Plan
Medication Management for People With Asthma
Controlling Blood Pressure Among African Americans
Postpartum Care Diabetes Nephropathy Screening Family Mosaic Project
Ensuring Primary Care Connections
Improving Client Access and Use of Recreational Activities
Promoting Caregiver Engagement and Participation
Reducing Physical Health Issues
Gold Coast Health Plan
Developmental Screening for Children
Childhood Immunization Status— Combination 3
Immunizations of Two-Year-Olds Diabetes Care Poor HbA1c Control Among Non-English-Speaking Hispanics/Latinos
Health Net Community Solutions, Inc.
Comprehensive Diabetes Care* Cervical Cancer Screening Among Mandarin Speaking Chinese*
Postpartum Care* Childhood Immunization Status— Combination 3*
Medi-Cal Managed Care Technical Report: July 1, 2017–June 30, 2018 Page 89 California Department of Health Care Services Health Services Advisory Group, Inc.

PERFORMANCE IMPROVEMENT PROJECTS
MCP/SHP Name 2015–17 PIP Topics 2017–19 PIP Topics
Health Plan of San Joaquin
Cervical Cancer Screening* Cervical Cancer Screening Among White Women 24 to 64 Years of Age in Stanislaus County*
Diabetes HbA1c Testing* Childhood Immunization Status— Combination 3*
Health Plan of San Mateo
Cervical Cancer Screening Asthma Medication Ratio Postpartum Care Cervical Cancer Screening Among
English-Speaking Population Inland Empire Health Plan
Cervical Cancer Screening Asthma Medication Ratio Diabetes HbA1c Testing Childhood Immunization Status—
Combination 10 Among African Americans in Riverside County
Kaiser NorCal Initial Health Assessment Contraception Use Among Adolescent Women in South Sacramento
Postpartum Care Initial Health Assessment Kaiser SoCal Diabetes Adolescent Vaccinations
Initial Health Assessment within 120 Days of Enrollment
Depression Screening Among Hispanics/Latinos
Kern Family Health Care
Immunizations of Two-Year-Olds Childhood Immunization Status— Combination 3 Among African Americans
Medication Management for People with Asthma
Use of Imaging Studies for Lower Back Pain
L.A. Care Health Plan
Immunizations of Two-Year-Olds Childhood Immunization Status— Combination 3
Medication Management for People with Asthma
Diabetes Medication Adherence Among African Americans
Molina Healthcare of California Partner Plan, Inc.
Annual Monitoring of Patients on Persistent Medications*
Childhood Immunization Status— Combination 3*
Postpartum Care* Postpartum Care Among African Americans in Riverside/San Bernardino Counties*
Partnership HealthPlan of California
Diabetes Retinal Eye Exam Childhood Immunization Status— Combination 3
Hypertension Diabetes Nephropathy Screening in Southwest Region
Medi-Cal Managed Care Technical Report: July 1, 2017–June 30, 2018 Page 90 California Department of Health Care Services Health Services Advisory Group, Inc.
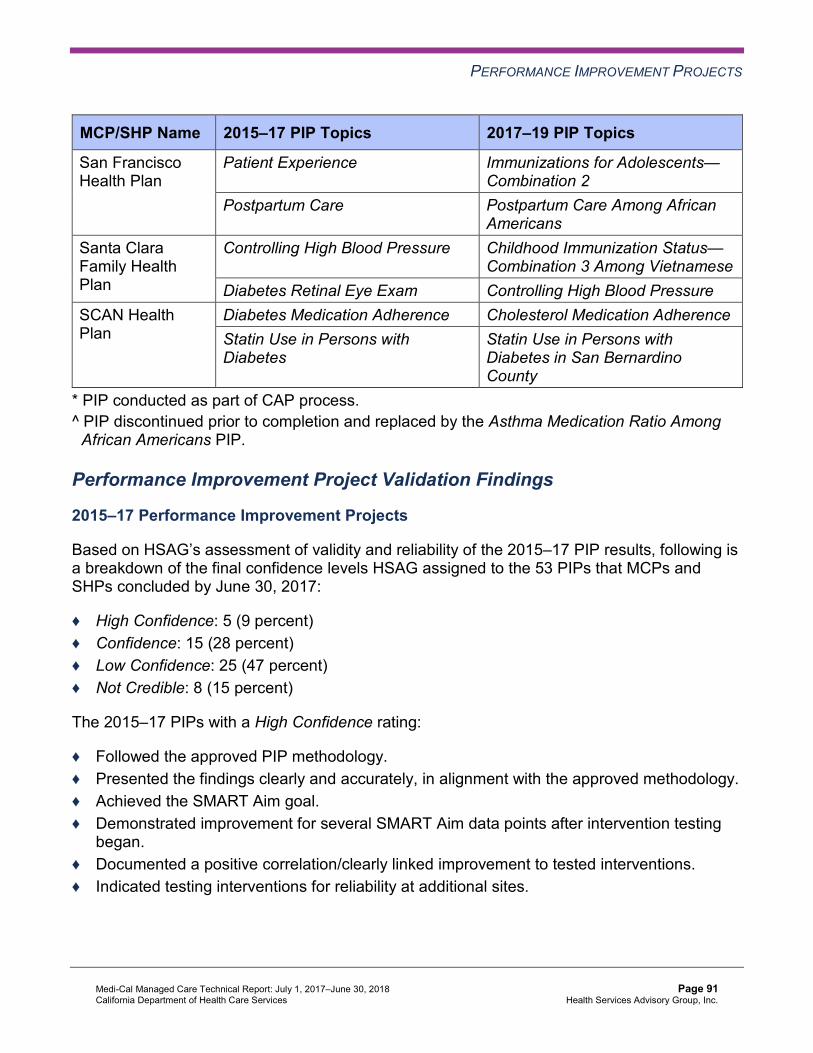
PERFORMANCE IMPROVEMENT PROJECTS
MCP/SHP Name 2015–17 PIP Topics 2017–19 PIP Topics
San Francisco Health Plan
Patient Experience Immunizations for Adolescents— Combination 2
Postpartum Care Postpartum Care Among African Americans
Santa Clara Family Health Plan
Controlling High Blood Pressure Childhood Immunization Status— Combination 3 Among Vietnamese
Diabetes Retinal Eye Exam Controlling High Blood Pressure SCAN Health Plan
Diabetes Medication Adherence Cholesterol Medication Adherence Statin Use in Persons with Diabetes
Statin Use in Persons with Diabetes in San Bernardino County
* PIP conducted as part of CAP process. ^ PIP discontinued prior to completion and replaced by the Asthma Medication Ratio Among
African Americans PIP.
Performance Improvement Project Validation Findings
2015–17 Performance Improvement Projects
Based on HSAG’s assessment of validity and reliability of the 2015–17 PIP results, following is a breakdown of the final confidence levels HSAG assigned to the 53 PIPs that MCPs and SHPs concluded by June 30, 2017:
♦ High Confidence: 5 (9 percent) ♦ Confidence: 15 (28 percent) ♦ Low Confidence: 25 (47 percent) ♦ Not Credible: 8 (15 percent)
The 2015–17 PIPs with a High Confidence rating:
♦ Followed the approved PIP methodology. ♦ Presented the findings clearly and accurately, in alignment with the approved methodology. ♦ Achieved the SMART Aim goal. ♦ Demonstrated improvement for several SMART Aim data points after intervention testing
began. ♦ Documented a positive correlation/clearly linked improvement to tested interventions. ♦ Indicated testing interventions for reliability at additional sites.
Medi-Cal Managed Care Technical Report: July 1, 2017–June 30, 2018 Page 91 California Department of Health Care Services Health Services Advisory Group, Inc.

PERFORMANCE IMPROVEMENT PROJECTS
2017–19 Performance Improvement Projects
HSAG noted the following for the 2017–19 PIPs that HSAG validated during the review period:
♦ MCPs and SHPs are targeting a wide range of disparities and health topics for the Disparity PIPs.
♦ While 11 of the 28 DHCS-priority PIPs (39 percent) relate to the topic of Childhood Immunization Status—Combination 3, the remaining DHCS-priority PIP topics vary widely.
♦ Most MCPs and SHPs achieved all required criteria for modules 1 and 2. ■ Thirty-three PIPs progressed to Module 3. ■ Fourteen PIPs progressed to the intervention testing phase.
Performance Improvement Project Technical Assistance Findings
The following are areas for which MCPs and SHPs requested technical assistance from HSAG during the review period:
♦ Questions on the PIP requirements: ■ Modules 4 and 5 submission requirements for the 2015–17 PIPs. ■ Modules 1, 2, and 3 submission requirements for the 2017–19 PIPs. ■ Clarification on HSAG’s validation findings on PIP modules.
♦ Assistance with the PIP methodology: ■ Disparity PIP topics and data calculation. ■ SMART Aim data collection methodology.
○ HSAG conducted extensive technical assistance on the rolling 12-month methodology to ensure that remeasurements are comparable to the baseline rates.
■ Administrative and claims data completeness requirements. ♦ Suggestions for alleviating unforeseen issues:
■ Lack of provider partner participation. ■ New data analyses indicating higher performance of the PIP topic than originally
calculated.
Medi-Cal Managed Care Technical Report: July 1, 2017–June 30, 2018 Page 92 California Department of Health Care Services Health Services Advisory Group, Inc.

PERFORMANCE IMPROVEMENT PROJECTS
Conclusions—Performance Improvement Projects Through HSAG’s PIP training, validation, and technical assistance, MCPs and SHPs successfully completed the 2015–17 PIPs and initiated the 2017–19 PIPs on a variety of health topics and health disparities.
Based on observations made across all 2015–17 PIPs, HSAG noted that to provide the best opportunity for successful PIPs, it is important for MCPs and SHPs to:
♦ Use HSAG’s PIP Reference Guide and contact HSAG for technical assistance as often as needed.
♦ Discuss the need to make changes to their approved PIP methodologies with HSAG and DHCS prior to making the changes.
♦ Contact DHCS and HSAG as soon as possible if they encounter difficulties as the PIPs progress to determine next steps.
♦ Ensure that their PIP team members and provider partners understand expectations at the beginning of the project.
♦ Communicate frequently with their teams and provider partners to offer support and assist with alleviating challenges with the project.
Recommendations—Performance Improvement Projects HSAG has no recommendations for DHCS related to PIPs. HSAG includes MCP- and SHP-specific PIP recommendations, as applicable, in appendices A through BB.
Medi-Cal Managed Care Technical Report: July 1, 2017–June 30, 2018 Page 93 California Department of Health Care Services Health Services Advisory Group, Inc.
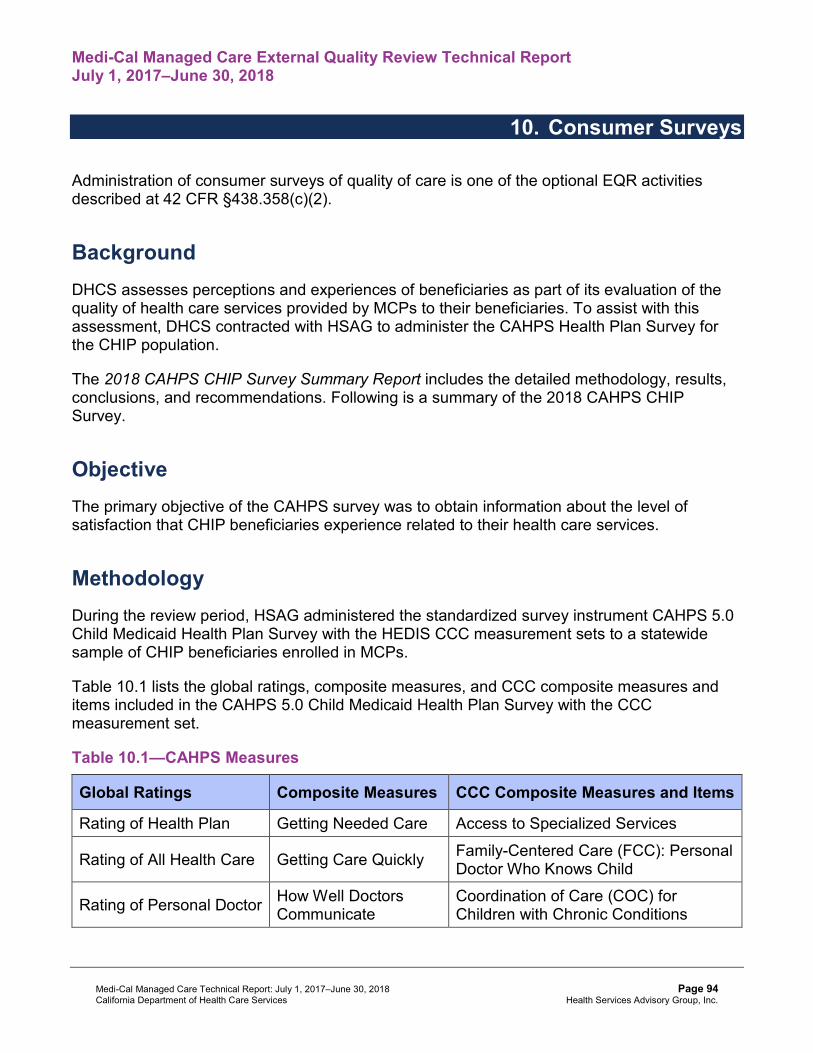
Medi-Cal Managed Care External Quality Review Technical ReportJuly 1, 2017–June 30, 2018
10. Consumer Surveys
Administration of consumer surveys of quality of care is one of the optional EQR activities described at 42 CFR §438.358(c)(2).
Background DHCS assesses perceptions and experiences of beneficiaries as part of its evaluation of the quality of health care services provided by MCPs to their beneficiaries. To assist with this assessment, DHCS contracted with HSAG to administer the CAHPS Health Plan Survey for the CHIP population.
The 2018 CAHPS CHIP Survey Summary Report includes the detailed methodology, results, conclusions, and recommendations. Following is a summary of the 2018 CAHPS CHIP Survey.
Objective The primary objective of the CAHPS survey was to obtain information about the level of satisfaction that CHIP beneficiaries experience related to their health care services.
Methodology During the review period, HSAG administered the standardized survey instrument CAHPS 5.0 Child Medicaid Health Plan Survey with the HEDIS CCC measurement sets to a statewide sample of CHIP beneficiaries enrolled in MCPs.
Table 10.1 lists the global ratings, composite measures, and CCC composite measures and items included in the CAHPS 5.0 Child Medicaid Health Plan Survey with the CCC measurement set.
Table 10.1—CAHPS Measures
Global Ratings Composite Measures CCC Composite Measures and Items
Rating of Health Plan Getting Needed Care Access to Specialized Services
Rating of All Health Care Getting Care Quickly Family-Centered Care (FCC): Personal Doctor Who Knows Child
Rating of Personal Doctor How Well Doctors Communicate
Coordination of Care (COC) for Children with Chronic Conditions
Medi-Cal Managed Care Technical Report: July 1, 2017–June 30, 2018 Page 94 California Department of Health Care Services Health Services Advisory Group, Inc.

Consumer Surveys
Global Ratings Composite Measures CCC Composite Measures and Items
Rating of Specialist Seen Most Often Customer Service Access to Prescription Medicines
Shared Decision Making FCC: Getting Needed Information
Survey Sampling Procedures
CHIP beneficiaries eligible for sampling included those who were enrolled in the California CHIP at the time the sample was drawn and who were continuously enrolled in CHIP for at least five of the last six months (July through December) of 2017 and were 17 years of age or younger (as of December 31, 2017).
For the CHIP population, HSAG selected a random sample of CHIP beneficiaries for surveying. For the general child population, HSAG selected a random sample of 2,850 CHIP beneficiaries for the CAHPS 5.0 general child sample. After selecting child beneficiaries for the CAHPS general child sample, HSAG selected a sample of 2,665 child beneficiaries for the CCC supplemental sample, which represented the population of children who were more likely to have a chronic condition.
Survey Administration
HSAG designed the survey administration protocol to achieve a high response rate, thus minimizing the potential effects of nonresponse bias. The survey process allowed two methods for completing surveys. The first, or mail phase, consisted of an English or Spanish version of the survey being mailed to the sampled beneficiaries. All nonrespondents received a reminder postcard, followed by a second survey mailing and reminder postcard. The second phase, or telephone phase, consisted of conducting computer-assisted telephone interviewing (CATI) of sampled beneficiaries who had not returned a completed survey. HSAG attempted up to three CATI calls for each nonrespondent.1
1 National Committee for Quality Assurance. Quality Assurance Plan for HEDIS 2018 Survey Measures. Washington, DC: NCQA Publication; 2017.
Medi-Cal Managed Care Technical Report: July 1, 2017–June 30, 2018 Page 95 California Department of Health Care Services Health Services Advisory Group, Inc.

Consumer Surveys
Survey Analyses
HSAG used the CAHPS scoring approach recommended by NCQA in HEDIS 2018, Volume 3: Specifications for Survey Measures.2 Based on NCQA’s recommendations and HSAG’s extensive experience evaluating CAHPS data, HSAG conducted the following types of analyses to comprehensively assess beneficiary satisfaction:
♦ Response Rates ♦ Child and Respondent Demographics ♦ Respondent ♦ Rates and Proportions ♦ Trend ♦ Correlation
The 2018 CAHPS CHIP Survey Summary Report includes full descriptions of the methodologies that HSAG used to conduct the survey analyses.
Results—Consumer Surveys HSAG mailed 5,515 child surveys to the CHIP sample of beneficiaries selected for surveying. Of these, 1,496 child surveys were completed for the CHIP sample. HSAG used these completed surveys to calculate the CAHPS survey results. The following provides a summary of the general child and CCC population results. Detailed results are available in the 2018 CAHPS CHIP Survey Summary Report.
General Child Results
Figure 10.1 displays the 2017 and 2018 general child population question summary rates for the four global ratings, the 2017 NCQA child Medicaid national averages, the NCQA Medicaid national 25th percentiles, and the NCQA Medicaid national 90th percentiles.
2 National Committee for Quality Assurance. HEDIS 2018, Volume 3: Specifications for Survey Measures. Washington, DC. NCQA; 2017.
Medi-Cal Managed Care Technical Report: July 1, 2017–June 30, 2018 Page 96 California Department of Health Care Services Health Services Advisory Group, Inc.

Consumer Surveys
Figure 10.1—Global Ratings: General Child Question Summary Rates
Medi-Cal Managed Care Technical Report: July 1, 2017–June 30, 2018 Page 97 California Department of Health Care Services Health Services Advisory Group, Inc.

Consumer Surveys
Figure 10.2 displays the 2017 and 2018 general child population global proportions for the five composite measures, the 2017 NCQA child Medicaid national averages, the NCQA Medicaid national 25th percentiles, and the NCQA Medicaid national 90th percentiles.
Figure 10.2—Composite Measures: General Child Global Proportions
Medi-Cal Managed Care Technical Report: July 1, 2017–June 30, 2018 Page 98 California Department of Health Care Services Health Services Advisory Group, Inc.

Consumer Surveys
Children with Chronic Conditions Results
Figure 10.3 displays the 2017 and 2018 CCC population question summary rates for the four global ratings, the 2017 NCQA CCC Medicaid national averages, the NCQA Medicaid national 25th percentiles, and the NCQA Medicaid national 90th percentiles.
Figure 10.3—Global Ratings: CCC Question Summary Rates
Medi-Cal Managed Care Technical Report: July 1, 2017–June 30, 2018 Page 99 California Department of Health Care Services Health Services Advisory Group, Inc.
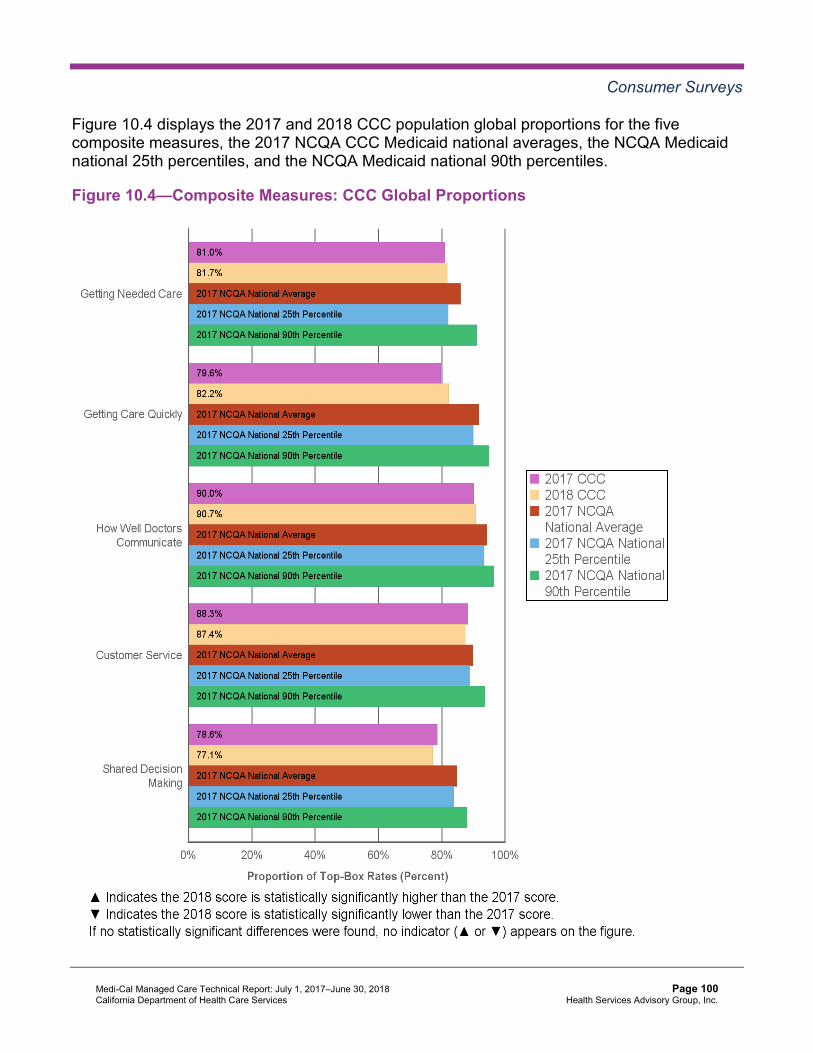
Consumer Surveys
Figure 10.4 displays the 2017 and 2018 CCC population global proportions for the five composite measures, the 2017 NCQA CCC Medicaid national averages, the NCQA Medicaid national 25th percentiles, and the NCQA Medicaid national 90th percentiles.
Figure 10.4—Composite Measures: CCC Global Proportions
Medi-Cal Managed Care Technical Report: July 1, 2017–June 30, 2018 Page 100 California Department of Health Care Services Health Services Advisory Group, Inc.

Consumer Surveys
Figure 10.5 displays the 2017 and 2018 CCC population question summary rates and global proportions for the CCC composite measures and items, the 2017 NCQA CCC Medicaid national averages, the NCQA Medicaid national 25th percentiles, and the NCQA Medicaid national 90th percentiles.
Figure 10.5—CCC Composite Measures and Items: CCC Question Summary Rates andGlobal Proportions
Medi-Cal Managed Care Technical Report: July 1, 2017–June 30, 2018 Page 101 California Department of Health Care Services Health Services Advisory Group, Inc.
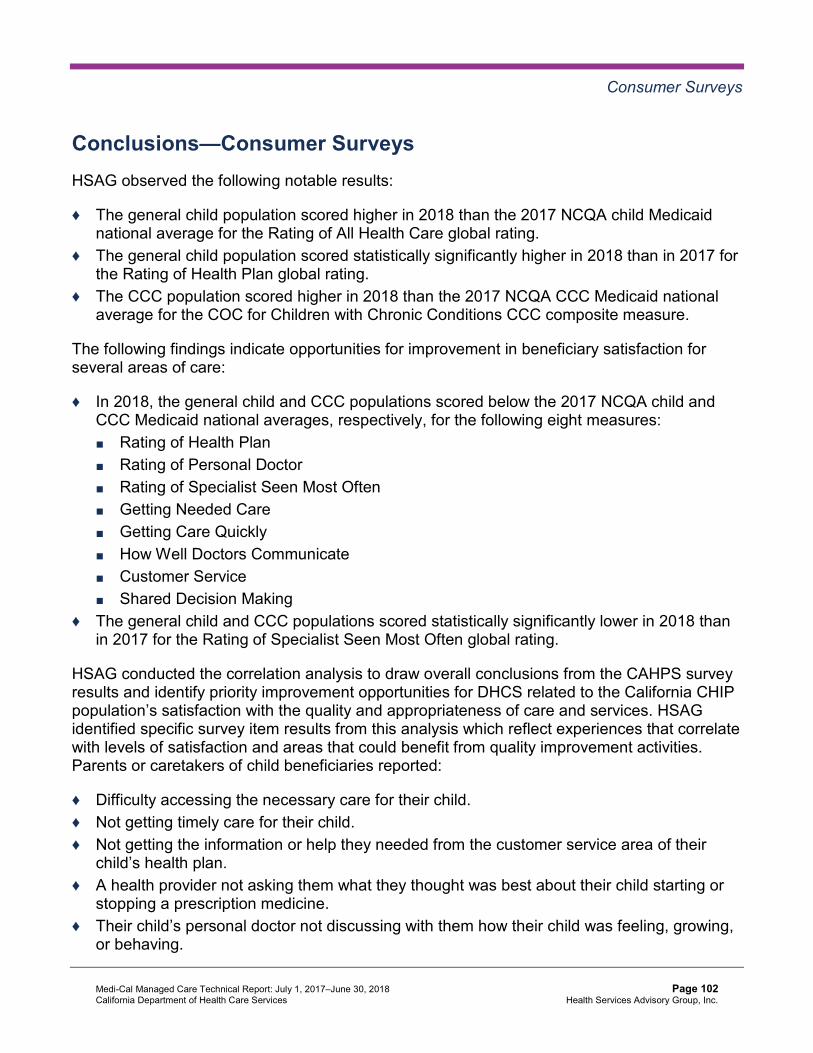
Consumer Surveys
Conclusions—Consumer Surveys HSAG observed the following notable results:
♦ The general child population scored higher in 2018 than the 2017 NCQA child Medicaid national average for the Rating of All Health Care global rating.
♦ The general child population scored statistically significantly higher in 2018 than in 2017 for the Rating of Health Plan global rating.
♦ The CCC population scored higher in 2018 than the 2017 NCQA CCC Medicaid national average for the COC for Children with Chronic Conditions CCC composite measure.
The following findings indicate opportunities for improvement in beneficiary satisfaction for several areas of care:
♦ In 2018, the general child and CCC populations scored below the 2017 NCQA child and CCC Medicaid national averages, respectively, for the following eight measures: ■ Rating of Health Plan ■ Rating of Personal Doctor ■ Rating of Specialist Seen Most Often ■ Getting Needed Care ■ Getting Care Quickly ■ How Well Doctors Communicate ■ Customer Service ■ Shared Decision Making
♦ The general child and CCC populations scored statistically significantly lower in 2018 than in 2017 for the Rating of Specialist Seen Most Often global rating.
HSAG conducted the correlation analysis to draw overall conclusions from the CAHPS survey results and identify priority improvement opportunities for DHCS related to the California CHIP population’s satisfaction with the quality and appropriateness of care and services. HSAG identified specific survey item results from this analysis which reflect experiences that correlate with levels of satisfaction and areas that could benefit from quality improvement activities. Parents or caretakers of child beneficiaries reported:
♦ Difficulty accessing the necessary care for their child. ♦ Not getting timely care for their child. ♦ Not getting the information or help they needed from the customer service area of their
child’s health plan. ♦ A health provider not asking them what they thought was best about their child starting or
stopping a prescription medicine. ♦ Their child’s personal doctor not discussing with them how their child was feeling, growing,
or behaving.
Medi-Cal Managed Care Technical Report: July 1, 2017–June 30, 2018 Page 102 California Department of Health Care Services Health Services Advisory Group, Inc.
CONSUMER SURVEYS
♦ Their child’s personal doctor not seeming to be informed about the care their child received from other doctors or health providers.
♦ The forms from their child’s health plan not being easy to fill out.
Recommendations—Consumer Surveys As part of the EQR technical report production process, HSAG identified no recommendations for DHCS in the area of consumer surveys.
Medi-Cal Managed Care Technical Report: July 1, 2017–June 30, 2018 Page 103 California Department of Health Care Services Health Services Advisory Group, Inc.

Medi-Cal Managed Care External Quality Review Technical ReportJuly 1, 2017–June 30, 2018
11. Encounter Data Validation
Validation of encounter data reported by an MCO, PIHP, PAHP, or PCCM entity is one of the optional EQR activities described at 42 CFR §438.310(c)(2).
Background Accurate and complete encounter data are critical to assessing quality, monitoring program integrity, and making financial decisions. Therefore, DHCS requires MCPs and SHPs to submit high-quality encounter data. DHCS relies on the quality of the encounter data to accurately and effectively monitor and improve quality of care, establish appropriate performance metrics, generate accurate and reliable reports, and obtain complete and accurate utilization information. The completeness and accuracy of these data are essential to the success of DHCS’ overall management and oversight of MCMC.
The SFY 2017–18 Encounter Data Validation Study Report includes the detailed methodology, study results, conclusions, and recommendations. Following is a summary of the SFY 2017– 18 EDV Study.
Note: HSAG concluded the SFY 2017–18 EDV Study outside the review period for this EQR technical report; however, HSAG includes a summary of the study because the information was available at the time this EQR technical report was produced.
Objective The objective of the SFY 2017–18 EDV Study was to examine, through a review of medical records, the completeness and accuracy of the professional encounter data submitted to DHCS by the 23 MCPs and two SHPs included in the study.
Methodology Medical and clinical records are considered the “gold standard” for documenting access to and quality of health care services. During SFY 2017–18, HSAG evaluated MCMC encounter data completeness and accuracy via a review of medical records for physician services rendered between July 1, 2016, and December 31, 2016. The study answered the following question:
♦ Are the data elements Date of Service, Diagnosis Code, Procedure Code, Procedure Code Modifier, and Rendering Provider Name, found on the professional encounters, complete and accurate when compared to information contained within the medical records?
Medi-Cal Managed Care Technical Report: July 1, 2017–June 30, 2018 Page 104 California Department of Health Care Services Health Services Advisory Group, Inc.

ENCOUNTER DATA VALIDATION
HSAG conducted the following actions to answer the study question:
♦ Identified the eligible population and generated samples from data extracted from the DHCS data warehouse.
♦ Assisted MCPs and SHPs to procure medical records from providers, as appropriate. ♦ Reviewed medical records against DHCS encounter data. ♦ Calculated study indicators.
Conclusions
Encounter Data Completeness
Table 11.1 displays the medical record and encounter data omission rates for each key data element.
Table 11.1—Encounter Data Completeness Summary
Medical Record Omission Encounter Data Omission
Key DataElements Statewide Rate MCP/SHP
Range Statewide Rate MCP/SHPRange
Date of Service 4.9%+ 2.7%–15.6% 6.1%+ 1.8%–10.5% Diagnosis Code 16.4% 8.7%–27.9% 14.6% 6.1%–21.6% Procedure Code 26.2% 6.4%–48.3% 8.7%+ 2.7%–16.0% Procedure Code Modifier 30.7% 17.1%–67.1% 9.7%+ 3.9%–31.5%
Rendering Provider Name 6.5%+ 3.5%–16.5% 24.6% 6.5%–83.2%
Note: Omission rates of less than 10 percent are shaded in gray and denoted with a cross (+) to show that they met the EDV Study standards.
Based on the cases sampled for medical record review, HSAG found that the documentation in the beneficiaries’ medical records supported the key data elements in the electronic encounter data at different rates. For example, the Dates of Service and Rendering Provider Name data elements within the electronic encounter data were well supported by the medical records as evidenced by the respective 4.9 percent and 6.5 percent medical record omission rates. However, the Diagnosis Code (16.4 percent), Procedure Code (26.2 percent), and Procedure Code Modifier (30.7 percent) data elements within the electronic encounter data were moderately supported by the medical records.
Medi-Cal Managed Care Technical Report: July 1, 2017–June 30, 2018 Page 105 California Department of Health Care Services Health Services Advisory Group, Inc.

ENCOUNTER DATA VALIDATION
The variations among MCP and SHP medical record omission rates also depended on the data element. For the Date of Service and Rendering Provider Name data elements, the difference between the lowest and highest MCP and SHP rates was no more than 13 percentage points. For the Procedure Code and Procedure Code Modifier data elements, the difference was more than 40 percentage points.
As determined during the review, the potential reasons for medical record omissions follow:
♦ The medical record was not submitted for the study. ♦ The provider did not document the services performed in the medical record despite
submitting a claim or encounter. ♦ A data entry error existed for one or more elements (e.g., Date of Service). ♦ The provider did not perform the service.
The encounter data omission rates reveal that the key data elements, Dates of Service, Procedure Code, and Procedure Code Modifier found in the medical records were well supported by the data found in the electronic encounter data extracted from DHCS’ data warehouse. For instance, only 6.1 percent of the dates of service documented in the beneficiaries’ medical records were absent from the electronic encounter data, 8.7 percent of the procedure codes documented in the beneficiaries’ medical records were absent from the electronic encounter data, and 9.7 percent of the rendering provider names documented in the beneficiaries’ medical records were absent from the electronic encounter data. The remaining data elements (Diagnosis Code and Rendering Provider Name) documented in the medical records were moderately supported by the electronic encounter data. For instance, 14.6 percent of the diagnosis codes documented in the beneficiaries’ medical records were absent from the electronic data, and 24.6 percent of the rendering provider names documented in the medical records were absent from the electronic encounter data.
The MCP and SHP rates varied considerably for the Rendering Provider Name data element (i.e., a difference of 76.7 percentage points). For the remaining key data elements, the MCP and SHP variations were minimal or moderate.
The potential reasons for encounter data omissions follow:
♦ MCPs and SHPs did not populate the rendering provider identification number field or populated it with an invalid rendering provider identification number when submitting data to DHCS, or the provider files submitted by MCPs or SHPs to DHCS were incomplete or inaccurate.
♦ DHCS’ data warehouse only stores up to two diagnosis codes per encounter record although MCPs and SHPs may submit more than two diagnosis codes in the 837 professional files.
♦ The provider’s billing office made a coding error or did not submit the procedure codes or modifiers despite performing the specific services.
♦ Deficiencies existed in MCPs’ or SHPs’ encounter data submission processes or a deficiency existed in the resubmission of denied or rejected encounters to DHCS.
Medi-Cal Managed Care Technical Report: July 1, 2017–June 30, 2018 Page 106 California Department of Health Care Services Health Services Advisory Group, Inc.
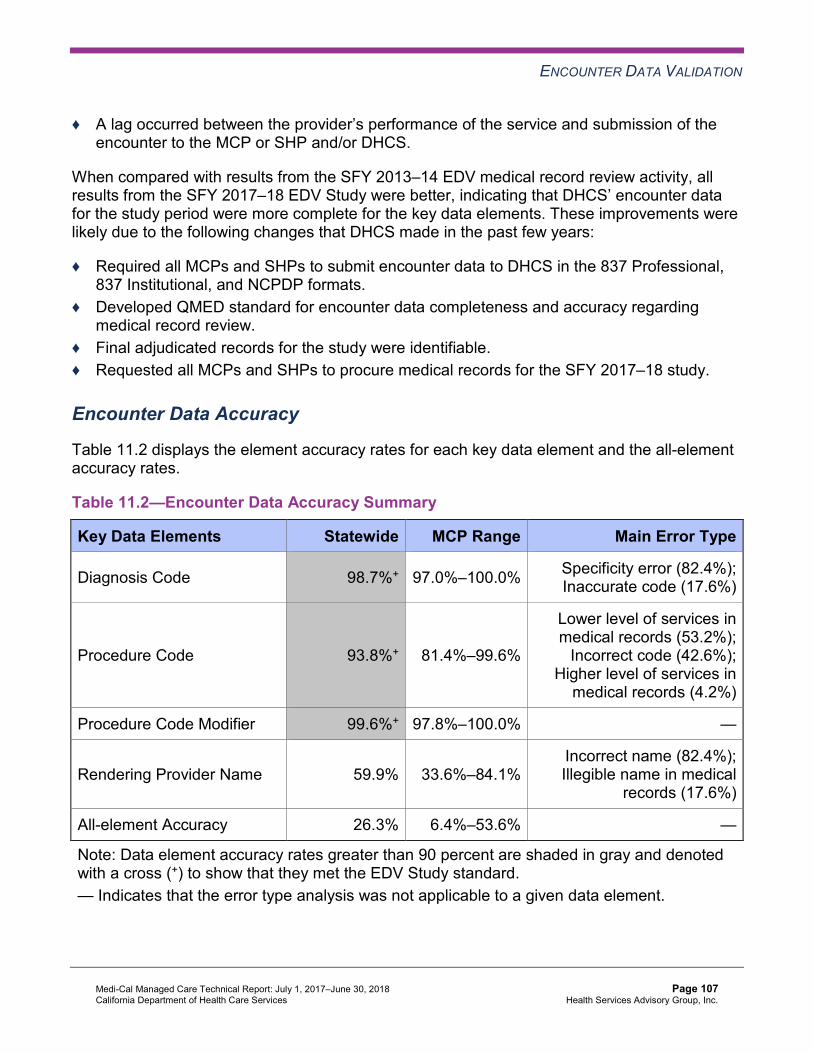
ENCOUNTER DATA VALIDATION
♦ A lag occurred between the provider’s performance of the service and submission of the encounter to the MCP or SHP and/or DHCS.
When compared with results from the SFY 2013–14 EDV medical record review activity, all results from the SFY 2017–18 EDV Study were better, indicating that DHCS’ encounter data for the study period were more complete for the key data elements. These improvements were likely due to the following changes that DHCS made in the past few years:
♦ Required all MCPs and SHPs to submit encounter data to DHCS in the 837 Professional, 837 Institutional, and NCPDP formats.
♦ Developed QMED standard for encounter data completeness and accuracy regarding medical record review.
♦ Final adjudicated records for the study were identifiable. ♦ Requested all MCPs and SHPs to procure medical records for the SFY 2017–18 study.
Encounter Data Accuracy
Table 11.2 displays the element accuracy rates for each key data element and the all-element accuracy rates.
Table 11.2—Encounter Data Accuracy Summary
Key Data Elements Statewide MCP Range Main Error Type
Diagnosis Code 98.7%+ 97.0%–100.0% Specificity error (82.4%); Inaccurate code (17.6%)
Procedure Code 93.8%+ 81.4%–99.6%
Lower level of services in medical records (53.2%);
Incorrect code (42.6%); Higher level of services in
medical records (4.2%)
Procedure Code Modifier 99.6%+ 97.8%–100.0% —
Rendering Provider Name 59.9% 33.6%–84.1% Incorrect name (82.4%); Illegible name in medical
records (17.6%)
All-element Accuracy 26.3% 6.4%–53.6% —
Note: Data element accuracy rates greater than 90 percent are shaded in gray and denoted with a cross (+) to show that they met the EDV Study standard. — Indicates that the error type analysis was not applicable to a given data element.
Medi-Cal Managed Care Technical Report: July 1, 2017–June 30, 2018 Page 107 California Department of Health Care Services Health Services Advisory Group, Inc.
ENCOUNTER DATA VALIDATION
In general, when key data elements were present in both the DHCS electronic encounter data and the medical records, and were evaluated independently, the data elements were found to be accurate. For instance, 98.7 percent of diagnosis codes, 93.8 percent of procedure codes, and 99.6 percent of procedure code modifiers present in both sources were accurate. The accuracy rate for the data element Rendering Provider Name was much lower (i.e., 59.9 percent).
The most common error type found for the Diagnosis Code data element was a specificity error. For the Procedure Code data element, 53.2 percent of the procedure code errors involved providers submitting a higher level service code than that supported in beneficiaries’ medical records, and 42.6 percent of the identified errors were associated with the use of inaccurate codes not supported by the DHCS Medi-Cal provider manuals and NCCI coding standards. Finally, most rendering provider name errors (i.e., 82.4 percent) were associated with rendering provider name discrepancies between the medical records and the DHCS data warehouse rather than with illegible names in medical records.
Approximately one quarter of the dates of service (i.e., 26.3 percent) present in both data sources accurately represented all four data elements (Diagnosis Code, Procedure Code, Procedure Code Modifier, and Rendering Provider Name) when compared to the beneficiaries’ medical records. While all key data elements contributed to the low statewide all-element accuracy rate, the Rendering Provider Name data element contributed most to the inaccuracy. At the MCP/SHP level, the all-element accuracy rate ranged from 6.4 percent (SCAN) to 53.6 percent (Kaiser SoCal).
When comparing results from the SFY 2013–14 EDV medical record review activity, all accuracy rates except the Rendering Provider Name rate from the SFY 2017–18 EDV Study were better, indicating that DHCS’ encounter data for the SFY 2017–18 study period were generally more accurate for key data elements.
Recommendations—Encounter Data Validation As part of the EQR technical report production process, HSAG identified no recommendations for DHCS in the area of encounter data validation.
Medi-Cal Managed Care Technical Report: July 1, 2017–June 30, 2018 Page 108 California Department of Health Care Services Health Services Advisory Group, Inc.

Medi-Cal Managed Care External Quality Review Technical ReportJuly 1, 2017–June 30, 2018
12. Focused Studies
Conducting studies on quality that focus on a particular aspect of clinical or nonclinical services at a point in time is one of the optional external quality review activities described at 42 CFR §438.358(c)(5).
Background DHCS contracts with HSAG to conduct focused studies to gain better understanding of and identify opportunities for improving care provided to beneficiaries. HSAG conducted activities related to the following focused studies during the review period:
♦ Health Disparities ♦ LARC ♦ MLTSS Population Identification and Demographics ♦ Opioids ♦ Timely Access ♦ Tobacco Cessation
HSAG’s Approach to Focused Studies
HSAG conducts each focused study in accordance with CMS’ EQR Protocol 8, Conducting Focused Studies of Health Care Quality: A Voluntary Protocol for External Quality Review (EQR), Version 2.0, September 2012.32
Study Design
HSAG defines the scope of work and expected objectives for the focused study topic. HSAG then conducts an in-depth literature review to identify the best practices for the populations under study and develops a study proposal encompassing the study question, study population, measurement period(s), data sources, study indicators, data collection process, and analytic plan. Each focused study may require the adaptation of standard health care quality measures for applicability to special populations; therefore, HSAG’s analytic plan details the technical specification for these measures to ensure methodological soundness and reliable calculability for the populations under study.
32 Department of Health and Human Services, Centers for Medicare & Medicaid Services. EQR Protocol 8: Conducting Focused Studies of Health Care Quality: A Voluntary Protocol for External Quality Review (EQR), Version 2.0, September 2012. Available at: https://www.medicaid.gov/medicaid/quality-of-care/medicaid-managed-care/external-quality-review/index.html. Accessed on Jul 27, 2018.
Medi-Cal Managed Care Technical Report: July 1, 2017–June 30, 2018 Page 109 California Department of Health Care Services Health Services Advisory Group, Inc.
FOCUSED STUDIES
Data Collection
As much as possible, HSAG uses administrative data to conduct focused studies. While medical record review may provide valuable insight into selected focused study topics, HSAG uses this approach sparingly in order to provide focused study results within a single contract year. After finalizing the methodology for each focused study, HSAG works with DHCS to develop study-specific data submission file layout.
Data Analyses
HSAG conducts statistical analyses according to the approved analytic plan. Primary analysis addresses the study question and provides results for the study indicators. HSAG also performs a secondary analysis to examine variation among subgroups (e.g., male and female), patterns of care and outcomes, impact of explanatory variables on indicators, and correlation among variables. HSAG is cognizant of the various threats to internal and external validity outlined by Cook & Campbell (1979).33 In designing each focused study, HSAG addresses and minimizes each threat to the extent possible. A staff member not involved in initial calculation of results validates all final results.
Final Report
At the end of each focused study, HSAG produces a report in the format and with the content approved by DHCS. In addition to presenting the findings associated with the study question(s), the report discusses the implications of the results in light of the policy environment within the State and presents actionable recommendations to improve the delivery of health care to beneficiaries.
2015–16 Health Disparities Focused Study DHCS contracted with HSAG to conduct a focused study on health care disparities in the MCMC population using RY 2016 EAS measure rates reported by MCPs to identify disparities based on age, gender, race/ethnicity, and primary language. HSAG began this focused study in contract year 2015–16 and concluded the analyses during the review period for this EQR technical report. Although HSAG did not finalize the report for the 2015–16 Health Disparities Focused Study until July 2018, which is outside the review period for this EQR technical report, HSAG includes the study results because HSAG concluded the analyses during the review period.
The 2015–16 Disparities Focused Study 12-Measure Report includes the detailed study methodology and findings. Following are summaries of the study methodology and findings.
33 Cook, TD & Campbell, DT. Quasi-Experimentation: Design & Analysis Issues for Field Settings. Boston, MA: Houghton-Mifflin; 1979.
Medi-Cal Managed Care Technical Report: July 1, 2017–June 30, 2018 Page 110 California Department of Health Care Services Health Services Advisory Group, Inc.

FOCUSED STUDIES
Methodology for 2015–16 Health Disparities Focused Study
For RY 2016, DHCS required MCPs to report 30 EAS measures as well as demographic information about their beneficiaries, including the demographic characteristics chosen for the 2015–16 Health Disparities Focused Study. Of the 30 EAS measures, DHCS requested that HSAG focus on 10 HEDIS measures (representing 11 indicators) and one measure originally developed by DHCS and the MCPs, for a total of 12 measures. DHCS selected the 12 measures to represent a range of clinical health topics of interest that would impact Medi-Cal beneficiaries throughout their lives and grouped the measures into four domains. Table 12.1 lists the measures included in the study by domain.
Table 12.1—EAS Measures Included in 2015–16 Health Disparities Focused Study, by Domain
Care for Children and Adolescents
Childhood Immunization Status—Combination 3
Children and Adolescents’ Access to Primary Care Practitioners—12 to 19 Years
Immunizations for Adolescents—Combination 1
Well-Child Visits in the Third, Fourth, Fifth, and Sixth Years of Life
Women’s Health
Cervical Cancer Screening
Prenatal and Postpartum Care—Postpartum Care
Prenatal and Postpartum Care—Timeliness of Prenatal Care
Care for Chronic Conditions
Comprehensive Diabetes Care—HbA1c Poor Control (>9.0 Percent)
Controlling High Blood Pressure
Medication Management for People With Asthma—Medication Compliance 75% Total
Appropriate Treatment and Utilization
All-Cause Readmissions
Ambulatory Care—Emergency Department (ED) Visits34
34 In accordance with DHCS’ request, HSAG calculated this measure per 1,000 members instead of per 1,000 member months.
Medi-Cal Managed Care Technical Report: July 1, 2017–June 30, 2018 Page 111 California Department of Health Care Services Health Services Advisory Group, Inc.
FOCUSED STUDIES
HSAG conducted the disparities analyses at the statewide and county/county group levels and stratified analytic results by age, gender, race/ethnicity, and primary language. The age parameter varied for each measure, and except for measures applicable to females only, the gender subgroups were Male, Female, and Unknown/Missing. HSAG collaborated with DHCS to define the following eight race/ethnicity subgroups for the analysis:
♦ White ♦ Black ♦ Hispanic/Latino ♦ Asian/Pacific Islander ♦ American Indian/Alaskan Native ♦ Multiracial ♦ Other ♦ Unknown/Missing
For primary language spoken, HSAG and DHCS defined the most meaningful and prevalent comparison groups for each measure.
HSAG calculated aggregated rates for the 12 measures included in the study and followed detailed data validation and rate calculation methodologies. HSAG used the rates for administrative and hybrid measures stratified by demographic variables to identify areas of “disparity.” The detailed study methodology, including cautions, limitations, and definition of “disparity,” can be found in the 2015–16 Disparities Focused Study 12-Measure Report.
Key Findings for 2015–16 Health Disparities Focused Study
The following is a high-level summary of the statewide- and county-level findings for the 12 measures included in the study. For this focused study, a “disparity” was defined as a relative difference greater than or equal to 10 percent for a particular demographic subgroup when compared to the reference group. For each demographic category, the reference group for a particular measure was the subgroup with the most favorable rate. Please note, demographic data were not complete; therefore, exercise caution when interpreting these findings.
Care for Children and Adolescents
In this domain, HSAG analyzed four measures related to childhood access to care, immunizations, and well-child visits at the statewide and county levels.
Statewide Findings
♦ For the gender demographic category, no disparities were identified for any of the measures between genders, demonstrating a success story.
♦ For the race/ethnicity demographic category, Hispanics/Latinos had the highest rate for the Immunizations for Adolescents—Combination 1 measure and the second-highest rate for
Medi-Cal Managed Care Technical Report: July 1, 2017–June 30, 2018 Page 112 California Department of Health Care Services Health Services Advisory Group, Inc.

FOCUSED STUDIES
these measures: Childhood Immunization Status—Combination 3; Children and Adolescents’ Access to Primary Care Practitioners—12 to 19 Years; and Well-Child Visits in the Third, Fourth, Fifth, and Sixth Years of Life. Asians/Pacific Islanders had the highest rate for the Childhood Immunization Status—Combination 3 and Well-Child Visits in the Third, Fourth, Fifth, and Sixth Years of Life measures. ■ Conversely, Blacks had the lowest rate for the Childhood Immunization Status—
Combination 3 and Children and Adolescents’ Access to Primary Care Practitioners— 12 to 19 Years measures and the second-lowest rate for the Well-Child Visits in the Third, Fourth, Fifth, and Sixth Years of Life measure. Whites had the lowest rate for the Well-Child Visits in the Third, Fourth, Fifth, and Sixth Years of Life measure and the second-lowest rate for the Children and Adolescents’ Access to Primary Care Practitioners—12 to 19 Years and Immunizations for Adolescents—Combination 1 measures.
♦ For the language demographic category, Other European language speakers had the lowest rate for every measure, except for the Well-Child Visits in the Third, Fourth, Fifth, and Sixth Years of Life measure, where this group had the second-lowest rate.
County Findings
♦ For the Children and Adolescents’ Access to Primary Care Practitioners—12 to 19 Years measure, Black beneficiaries had the lowest rate statewide, and disparities for the Black population were demonstrated in less than half (13 of 30) of the counties/county groups with reported rates for Blacks.
♦ For the Immunizations for Adolescents—Combination 1 measure, the American Indians/Alaskan Natives subgroup had low rates and showed a disparity at the statewide level, yet this subgroup demonstrated the highest rate in three counties/county groups: Los Angeles County, Region 1, and Northwest.
Women’s Health
HSAG analyzed three women’s health measures related to cervical cancer screening and prenatal and postpartum care at the statewide and county levels.
Statewide Findings
♦ For the age demographic category, the 24 to 29, 18 to 24, and younger than 18 age groups had the lowest rate for the Cervical Cancer Screening, Prenatal and Postpartum Care— Postpartum Care, and Prenatal and Postpartum Care—Timeliness of Prenatal Care measures, respectively. The 18 to 24 age group demonstrated a disparity for the Prenatal and Postpartum Care—Postpartum Care measure, and the younger than 18 age group demonstrated a disparity for the Prenatal and Postpartum Care—Timeliness of Prenatal Care measure.
♦ For the race/ethnicity demographic category, Black beneficiaries had the lowest and second-lowest rate for the Prenatal and Postpartum Care—Postpartum Care and Timeliness of Prenatal Care measures, respectively, demonstrating disparities. Conversely,
Medi-Cal Managed Care Technical Report: July 1, 2017–June 30, 2018 Page 113 California Department of Health Care Services Health Services Advisory Group, Inc.

FOCUSED STUDIES
Asian/Pacific Islander beneficiaries had the highest and second-highest rate for these measures, respectively.
♦ For the language demographic category, rates for Armenian and Vietnamese language speakers were among the top three highest rates for the Cervical Cancer Screening and Prenatal and Postpartum Care—Timeliness of Prenatal Care measures.
County Findings
♦ For the Cervical Cancer Screening measure, American Indians/Alaskan Natives had the third lowest rate and demonstrated a disparity at the statewide level. However, American Indians/Alaskan Natives demonstrated the highest rates in eight counties/county groups, including Alameda County, Los Angeles County, Orange County, Monterey/Santa Cruz, Southwest, San Diego County, San Mateo County, and Santa Barbara County, demonstrating success stories.
♦ For the Prenatal and Postpartum Care—Timeliness of Prenatal Care measure, beneficiaries in the younger than 18 age group had the lowest rates at the statewide level; however, this age group also demonstrated the highest rate in two of the counties/county groups (Region 1 and San Joaquin) and relative differences of less than 10 percent in three of the counties/county groups (Alameda, Southeast, and Tulare) of the 16 counties/county groups that had a reported rate for the younger than 18 age group.
Care for Chronic Conditions
HSAG analyzed three chronic conditions related to diabetes control, high blood pressure, and medication management for asthma at the statewide and county levels.
Statewide Findings
♦ For the age demographic category, older beneficiaries (i.e., the 60 and older age group and the 51 to 64 age group) had more favorable rates for all three measures.
♦ For the gender demographic category, Males reported higher (less favorable) rates for the Comprehensive Diabetes Care—HbA1c Poor Control (> 9.0 Percent) measure and lower rates for the Medication Management for People With Asthma—Medication Compliance 75% Total measure. For both these measures, Males demonstrated disparities when compared to Females.
♦ For the race/ethnicity demographic group, Blacks and American Indians/Alaskan Natives demonstrated less favorable rates and disparities for the Comprehensive Diabetes Care— HbA1c Poor Control (> 9.0 Percent) and Controlling High Blood Pressure measures, while Asians/Pacific Islanders demonstrated more favorable rates for all three measures in this domain.
Medi-Cal Managed Care Technical Report: July 1, 2017–June 30, 2018 Page 114 California Department of Health Care Services Health Services Advisory Group, Inc.
FOCUSED STUDIES
County Findings
♦ For the Comprehensive Diabetes Care—HbA1c Poor Control (> 9.0 Percent) measure, American Indians/Alaskan Natives demonstrated the highest (least favorable) rates at the statewide level for this measure but demonstrated the lowest (most favorable) rates in three of the 12 counties/county groups (Fresno, Riverside/San Bernardino, and Region 1) that reported rates for this population.
♦ For the Controlling High Blood Pressure measure, American Indians/Alaskan Natives had the lowest rate at the statewide level but had the highest rate in four of the 19 counties/county groups (Kern, Orange, Santa Barbara, and Tulare counties) with reportable rates for American Indians/Alaskan Natives.
Appropriate Treatment and Utilization
HSAG analyzed two measures related to all-cause hospital readmissions and emergency department (ED) utilization at the statewide and county levels.
Statewide Findings
♦ For the age demographic category, beneficiaries in the 21 to 44 age group had the lowest (most favorable) reportable hospital readmission rate, while beneficiaries in the Unknown/Other age group and younger than 1 age group had the highest ED utilization rates.
♦ For the gender demographic category, Females had a lower readmission rate but higher ED utilization rate compared to Males.
♦ For the race/ethnicity demographic category, Blacks had the highest readmission and ED utilization rates. Conversely, beneficiaries of Other race/ethnicity had the lowest (most favorable) readmission rate and Asians/Pacific Islanders had the second-lowest readmission rate. Asians/Pacific Islanders also had the lowest ED utilization rate, and beneficiaries of Other race/ethnicity had the second-lowest ED utilization rate.
♦ For the language demographic category, English speakers had the highest (least favorable) readmission rate, while Other European language speakers had the lowest (most favorable) readmission rate. English speakers also had the highest ED utilization rate, while Korean speakers had the lowest rate. In addition, Chinese and Vietnamese language speakers had two of the three lowest (most favorable) rates for readmission and two of the three lowest rates for ED utilization.
County Findings
For the All-Cause Readmissions measure, Blacks had the highest rate (least favorable) at the statewide level but had the lowest rates (most favorable) in four county groups (Amador/El Dorado/Placer/Sacramento, Monterey/Santa Cruz, Southwest, and Northeast), demonstrating success stories.
Medi-Cal Managed Care Technical Report: July 1, 2017–June 30, 2018 Page 115 California Department of Health Care Services Health Services Advisory Group, Inc.

FOCUSED STUDIES
2016–17 Health Disparities Focused Study DHCS contracted with HSAG to conduct a focused study on statewide health care disparities in the MCMC population using RY 2017 rates for all EAS measures. During the review period for this EQR technical report, DHCS and HSAG had preliminary discussions about the demographic variables that will be included in the study; however, as of the end of the review period, HSAG did not yet begin the analyses. HSAG will include the results of the 2016–17 Health Disparities Focused Study in the 2018–19 EQR technical report.
Long-Acting Reversible Contraceptive Utilization Focused Study The 2017 DHCS Strategy for Quality Improvement in Health Care outlines an advance prevention goal of increasing the availability of the most highly efficient reversible contraceptives (i.e., LARCs).35 In support of the advance prevention goal, DHCS contracted with HSAG in contract year 2017–18 to conduct a focused study to learn more about MCPs’ LARC utilization patterns and contraceptive management policies to potentially shape future MCMC guidance and improve access to LARCs. While the LARC Utilization Focused Study concluded outside the review period for this EQR technical report, HSAG includes a summary of this focused study because HSAG concluded the analyses and finalized the report prior to producing the final version of this EQR technical report.
The SFY 2017–18 LARC Utilization Focused Study: An Assessment of MCP Questionnaire Findings and CY 2015 LARC Utilization Aggregate Report includes the detailed methodology, study results, conclusions, and recommendations. Following is a summary of the SFY 2017– 18 LARC Utilization Focused Study.
Objectives—Long-Acting Reversible Contraceptive Utilization Focused Study
The LARC Utilization Focused Study addressed the following questions:
1. To what extent does LARC utilization among women in MCMC differ across the 25 MCPs included in the study and their associated reporting units?
2. What are MCPs’ utilization management policies regarding LARCs, and to what extent may these policies impact LARC utilization among Medi-Cal beneficiaries?
35 DHCS Strategy for Quality Improvement in Health Care. Available at http://www.dhcs.ca.gov/services/Documents/DHCS_Quality_Strategy_2017.pdf. Accessed on: Jan 9, 2019.
Medi-Cal Managed Care Technical Report: July 1, 2017–June 30, 2018 Page 116 California Department of Health Care Services Health Services Advisory Group, Inc.

FOCUSED STUDIES
Methodology—Long-Acting Reversible Contraceptive Utilization Focused Study
The methodology consisted of a questionnaire for MCPs and an administrative analysis.
Questionnaire for MCPs
HSAG collaborated with DHCS to identify appropriate MCP contacts and prepare the questionnaire, which solicited MCPs’ input on LARC utilization-related topics among eligible Medi-Cal beneficiaries including the following:
♦ Information regarding which providers and in which settings the providers are reimbursed to provide LARC services
♦ UM policies related to LARC access or service administration ♦ LARC reimbursement structures ♦ Barriers that prevent providers from offering LARC services ♦ Monitoring of LARC utilization and administration
HSAG coordinated with DHCS to distribute the questionnaires to MCPs. Upon receipt of questionnaire responses, HSAG reviewed the responses and conducted follow-up by email or conference calls with individual MCPs to address outstanding questions.
Administrative Analysis
Data Collection
DHCS submitted to HSAG the CY 2015 LARC utilization data from the Office of Family Planning (OFP) containing information on LARC utilization for female MCMC beneficiaries between 15 and 44 years of age who were continuously enrolled for 12 months. The data contained information on beneficiary age, race/ethnic group, preferred language, MCP, plan code, and whether the beneficiary was a LARC user. The OFP data were limited to the 23 MCPs that were active in CY 2015.
Study Indicators
Table 12.2 lists the study indicators included in the study and the strata36 that MCPs reported. The study indicators were reported at the MCP, reporting unit, and statewide levels. HSAG conducted all analyses of LARC utilization at the beneficiary level but aggregated the results at the MCP, reporting unit, and statewide levels.
36 All strata categories are based on the categories available in the OFP CY 2015 data.
Medi-Cal Managed Care Technical Report: July 1, 2017–June 30, 2018 Page 117 California Department of Health Care Services Health Services Advisory Group, Inc.

FOCUSED STUDIES
Table 12.2—Study Indicators
Indicator Strata
Measure 1: Number and percentage of LARC Users by Beneficiary Age Group1
15–20 Years of Age 21–44 Years of Age
Measure 2: Number and percentage of LARC Users by Beneficiary Race/Ethnic Group2
Alaskan Native/American Indian Asian or Pacific Islander Black or African American Hispanic or Latino Other/Unknown White
Measure 3: Number and percentage of LARC Users by Beneficiary Preferred Language
English Spanish Other/Unknown
Measure 4: Number and percentage of LARC Users by Plan Model Type
COHS Model CP (TPM) GMC Model Imperial Model LI (TPM) Regional Model San Benito Model
1 Age strata categories are based on the categories available in the OFP CY 2015 data. 2 HSAG combined Asian and Other Asian or Pacific Islander to create a single “Asian or Pacific Islander” stratum.
Conclusions—Long-Acting Reversible Contraceptive Utilization Focused Study
Questionnaire responses reflected that all MCPs actively work to meet Medi-Cal’s family planning coverage standards concerning LARC devices for MCMC adult and adolescent beneficiaries. MCPs have no UM policies requiring prior authorization, step therapy, or multiple visits. Additionally, MCPs employ privacy protection policies for teen and adolescent beneficiaries in compliance with Medi-Cal’s Sensitive Services and Minor Consent Services standards. MCPs make efforts to ensure coverage and service administration policies are consistent for beneficiaries through regular monitoring of their delegated entities’/medical groups’ policies.
While MCPs reimburse providers offering family planning services in outpatient settings for the administration of LARC services, MCPs do not facilitate device availability in outpatient settings (i.e., in provider offices) through incentive programs. Additionally, MCPs indicated that they engage in minimal efforts to combat deterrents such as recouping expenses for unused
Medi-Cal Managed Care Technical Report: July 1, 2017–June 30, 2018 Page 118 California Department of Health Care Services Health Services Advisory Group, Inc.

FOCUSED STUDIES
devices or the high cost associated with in-office availability of devices in the absence of pharmacy benefit programs.
Some MCPs indicated that beneficiary and provider barriers to device utilization and service administration revolve around education. However, very few MCPs indicated that they offer education to either group. Additionally, very few MCPs conduct regular monitoring activities that extend beyond reviews of claim denials or grievances.
HSAG’s review of administrative data for all age-eligible MCMC beneficiaries revealed that the overall 2015 LARC utilization rate of 4.2 percent was low relative to the national rate of 7.2 percent observed between 2011 and 2013.37 HSAG found that LARC utilization rates varied based on beneficiary age, race/ethnic group, and preferred language as well as the plan model type. Beneficiaries between 21 and 44 years of age had higher LARC utilization than beneficiaries between 15 and 20 years of age. Alaskan Native/American Indian and White beneficiaries had higher LARC utilization rates than beneficiaries in the Asian or Pacific Islander, Black or African American, Hispanic or Latino, and Other/Unknown race/ethnic groups. Beneficiaries who indicated that English was their preferred language had higher LARC utilization rates than beneficiaries who indicated that they preferred Spanish or Other/Unknown language. MCPs under the COHS model served approximately 20 percent of the eligible MCMC population and had the highest LARC utilization rates.
Managed Long-Term Services and Supports Focused Study During contract year 2016–17, DHCS contracted with HSAG to conduct a focused study assessing the segment of the population receiving MLTSS benefits solely through MCMC. Although HSAG began this focused study in contract year 2016–17, HSAG completed the study during the review period for this EQR technical report.
The SFY 2016–17 Focused Study Report—Managed Long-Term Services and Supports includes the detailed methodology, study results, conclusions, and recommendations. Following is a summary of the SFY 2016–17 MLTSS Focused Study.
37 Daniels K, Daugherty J, Jones J, Mosher W. Current contraceptive use and variation by selected characteristics among women aged 15-44: United States, 2011–13. National Health Statistics reports; no 86. Hyattsville, MD: National Center for Health Statistics. 2015. Available at: https://www.cdc.gov/nchs/data/nhsr/nhsr086.pdf. Accessed on: Oct 17, 2018.
Medi-Cal Managed Care Technical Report: July 1, 2017–June 30, 2018 Page 119 California Department of Health Care Services Health Services Advisory Group, Inc.

FOCUSED STUDIES
Objectives—Managed Long-Term Services and Supports Focused Study
The goal of the focused study was to determine the most effective methodology for identifying the Medi-Cal-only MLTSS population. To make recommendations to DHCS regarding a standardized process for identifying this population, HSAG conducted an assessment with the following three objectives:
1. Determine which methods already exist for identifying the Medi-Cal-only MLTSS population through a survey of two MLTSSPs and DHCS.
2. Compare existing methods for identifying the MLTSS population. 3. Determine the best method for identifying the MLTSS population from the methodologies
detailed in the survey responses.
Methodology—Managed Long-Term Services and Supports Focused Study
Survey
HSAG collaborated with DHCS to develop and distribute surveys to the two selected MLTSSPs and DHCS subject matter experts who collected information regarding the following items:
♦ Existing guidelines for the identification of the MLTSS Medi-Cal-only population ♦ Data sources used in the identification process ♦ Barriers to identifying the MLTSS Medi-Cal-only population ♦ Historical data studies conducted by the MLTSSPs on their MLTSS Medi-Cal-only
population
Anthem Blue Cross Partnership Plan and Molina Healthcare of California Partner Plan, Inc., were the two MLTSSPs surveyed for this assessment. Additionally, HSAG surveyed DHCS to ascertain a baseline method of identifying the Medi-Cal-only MLTSS population. HSAG submitted survey documentation to the two MLTSSPs and DHCS for completion, and then conducted follow-up teleconferences to collect any necessary supplemental information.
Data Analyses
HSAG requested DHCS to provide the Medi-Cal administrative and encounter data for Anthem Blue Cross Partnership Plan and Molina Healthcare of California Partner Plan, Inc., Medi-Cal beneficiaries in four CCI-eligible counties for the time period from January 1, 2016, to December 31, 2016. DHCS extracted the data from the enrollment and encounter tables for all Anthem Blue Cross Partnership Plan and Molina Healthcare of California Partner Plan, Inc., beneficiaries. HSAG conducted a two-stage assessment (1) to verify the feasibility of identifying individual Medi-Cal-only MLTSS populations based on the methodology described by the participating MLTSSPs and DHCS, and (2) to compare the populations identified using each of the methodologies. HSAG grouped the methodology comparisons into three domains:
Medi-Cal Managed Care Technical Report: July 1, 2017–June 30, 2018 Page 120 California Department of Health Care Services Health Services Advisory Group, Inc.

FOCUSED STUDIES
♦ Method inclusivity: This portion of the analysis sought to quantify how many distinct beneficiaries could be identified from data sources using the MLTSSPs’ or DHCS’ methodologies.
♦ Method consistency: This portion of the analysis sought to determine if the same beneficiaries were identified when comparing one methodology to another.
♦ Method impact: This portion of the analysis sought to identify unique aspects of the submitted methodologies, and to determine whether such tactics had significant impact on beneficiary identification (i.e., did the tactic affect the overall volume of beneficiaries identified?).
Building on the findings from the previously mentioned study domains, HSAG assessed the limitations of each method to determine if a “best” method could be identified. Additionally, HSAG compared the identification fields from the CCI risk category identification tables against the assigned risk classifications to assess whether information from the tables was effective.
Conclusions—Managed Long-Term Services and Supports Focused Study
HSAG concluded that survey data and administrative analyses demonstrated the complexity of identifying Medi-Cal-only MLTSS beneficiaries through use of enrollment data. While no formal process exists to identify the Medi-Cal-only subset of MLTSS beneficiaries, DHCS has worked to streamline the processes by which aid codes and CCI risk category indicators are updated to identify beneficiaries receiving MLTSS services.
HSAG determined that there was no single “best method” among the methodologies submitted by the MLTSSPs and DHCS, with advantages and limitations identified through review of enrollment data alone (Anthem’s and DHCS’ methodologies), as well as through review of enrollment and encounter data (Molina’s methodology). Molina’s identification methodology was more inclusive in that it captured more beneficiaries than the Anthem/DHCS methodology through a review of encounter data. However, the Anthem/DHCS methodology, which focused on a review of enrollment data, was found to be more consistent, a finding more than likely due to the extensive consideration of aid codes that could be assigned to various MLTSS risk groups. HSAG’s review of encounter data quantified the extent to which the lags in updates to CCI risk category indicators limited the reliability of enrollment data to identify MLTSS beneficiaries. Regardless of the enrollment identification criteria, HSAG’s encounter data assessment consistently produced beneficiaries receiving long-term care/skilled nursing facility services who were not identifiable through aid codes or CCI risk category indicators.
Medi-Cal Managed Care Technical Report: July 1, 2017–June 30, 2018 Page 121 California Department of Health Care Services Health Services Advisory Group, Inc.

FOCUSED STUDIES
Opioid Focused Study In contract year 2017–18, DHCS contracted with HSAG to conduct an evaluation of opioid use and medication assisted treatment within the State’s MCMC population to determine the need and capacity for addressing opioid overuse. The intended study period is July 1, 2016, through June 30, 2017.
During the review period for this EQR technical report, HSAG completed the following activities for the Opioid Focused Study:
♦ Met with DHCS to discuss DHCS’ goals for the study and based on those discussions, developed the scope of work and methodology for the study.
♦ Collaborated with DHCS to develop definitions for the measures that will be included in the study.
♦ Collaborated with DHCS to identify a list of the data elements that HSAG will use to conduct the analyses for the study.
Although HSAG began conducting the Opioid Focused Study during the review period for this report, the results of this study were not available to include in this EQR technical report. HSAG will include a summary of the results in the 2018–19 EQR technical report.
Timely Access Focused Study DHCS requires MCPs to ensure that their participating providers offer appointments that meet the wait time standards described in Table 12.3. Beginning in contract year 2016–17, DHCS contracted with HSAG to conduct a focused study to evaluate the extent to which MCPs are meeting the wait time standards listed in Table 12.3.
Table 12.3—California Department of Health Care Services Timely Access Standards
Appointment Type Wait Time Standard
Primary care appointment 10 business days 48 hours Specialist appointment 15 business days 96 hours Appointment with a mental health care provider (who is not a physician)
10 business days 96 hours
First prenatal visits 2 weeks GMC and TPM (including both LI and CP); 10 business days COHS
—
Appointment with ancillary providers 15 business days —
Medi-Cal Managed Care Technical Report: July 1, 2017–June 30, 2018 Page 122 California Department of Health Care Services Health Services Advisory Group, Inc.

FOCUSED STUDIES
HSAG conducts the Timely Access Focused Study in phases, which span three to five months, to evaluate MCPs’ wait time standard compliance ongoing. The following is a summary of activities HSAG conducted during the review period for this EQR technical report:
♦ Finalized the scope of work for the study and survey script for the provider survey calls. ♦ Met with DHCS to discuss the data requirements for the study and developed a data
requirements document for DHCS to use for extracting the provider data. ♦ Collaborated with DHCS to determine the best way for identifying providers for each
appointment type. ♦ Collaborated with DHCS to finalize the raw data file layout. ♦ Developed the report template and with DHCS’ input, finalized the template. ♦ Conducted the Phase 1 and Phase 2 provider survey calls. ♦ Submitted the final Phase 1 report to DHCS.
Phase 1—Timely Access Focused Study
HSAG conducted the Phase 1 provider survey calls between February 1, 2018, and March 27, 2018. HSAG provided DHCS with detailed results, conclusions, and recommendations. Following is a summary of the Phase 1 methodology.
Phase 1 Methodology—Timely Access Focused Study
For Phase 1 of the Timely Access Focused Study, HSAG limited the study population to providers meeting the following criteria:
♦ Resides in the State of California ♦ Has an available phone number ♦ Contracted with an MCP for Medi-Cal managed care ♦ Met the DHCS-approved identification criteria for the following provider types:
■ PCP ■ First prenatal visit providers ■ Specialists (cardiologists and psychiatrists) ■ Ancillary providers (physical therapy, magnetic resonance imaging [MRI], and
mammogram) ■ Nonphysician mental health providers
HSAG randomly sampled a maximum of 136 providers across the five provider types listed previously for each of the 57 MCP reporting units included in the study. HSAG also randomly assigned a sample or oversample status to each case so that each provider type would have a maximum of 21 sample cases and a maximum of six oversample cases (except for the ancillary provider group which could have a maximum of seven oversample cases). HSAG worked with a survey administration vendor to contact all sampled providers to collect data.
Medi-Cal Managed Care Technical Report: July 1, 2017–June 30, 2018 Page 123 California Department of Health Care Services Health Services Advisory Group, Inc.
FOCUSED STUDIES
HSAG then cleaned and standardized the data to provide a quantitative basis for the following study indicators:
♦ Measure 1—Percentage of sampled providers replaced by oversample and the distribution of replacement reasons
♦ Measure 2—Percentage of providers with “Accepting New Patient” status confirmed by the call
♦ Measure 3—Percentage of providers accepting new patients ♦ Measure 4—Percentage of providers with appointment times collected and the distribution
of reasons why appointment times were not collected ♦ Measure 5—Percentage of providers meeting wait time standards based on the first,
second, and third appointment times ♦ Measure 6—Minimum, median, maximum, and mean waiting times based on the first,
second, and third appointment times ♦ Measure 7—Percentage of providers contracted with other MCPs in the same
county/region ♦ Measure 8—Percentage of providers in DHCS’ provider data, but not contracted with MCPs
according to the survey ♦ Measure 9—Percentage of providers contracted with MCPs according to the survey, but
not in DHCS’ provider data ■ Note: This measure is only applicable to a reporting unit if one or more reporting units
are operating in the same county/region. ♦ Measure 10—Percentage of providers with different appointment times for adults and
children
Phase 2—Timely Access Focused Study
HSAG completed the Phase 2 analyses outside the review period for this EQR technical report; therefore, HSAG will include information on the Phase 2 analyses in the 2018–19 EQR technical report. HSAG also will include in the 2018–19 EQR technical report a summary of activities conducted for phases 3 and 4.
Medi-Cal Managed Care Technical Report: July 1, 2017–June 30, 2018 Page 124 California Department of Health Care Services Health Services Advisory Group, Inc.
FOCUSED STUDIES
Tobacco Cessation Focused Study In contract year 2017–18, DHCS contracted with HSAG to conduct an assessment of the utilization of tobacco cessation services and medications among MCPs’ and SHPs’ beneficiaries. While the Tobacco Cessation Focused Study concluded outside the review period for this EQR technical report, HSAG includes a summary of this study because HSAG concluded the analyses and finalized the report prior to producing the final version of this EQR technical report.
The SFY 2017–18 Tobacco Cessation Focused Study Report includes the detailed methodology, study results, conclusions, and recommendations. Following is a summary of the SFY 2017–18 Tobacco Cessation Focused Study.
Objectives—Tobacco Cessation Focused Study
The Tobacco Cessation Focused Study addressed the following questions:
1. To what extent does tobacco cessation utilization among MCMC beneficiaries differ across the 25 MCPs and two SHPs included in the study and their associated counties? a. How do tobacco cessation efforts/activities vary across MCPs and SHPs?
2. To what extent can DHCS’ administrative health care utilization data (i.e., claims/encounter data) be used to identify tobacco users? a. What role do MCPs’ and SHPs’ methods for identifying tobacco users play in the ability
to identify these beneficiaries from DHCS’ administrative data?
Methodology—Tobacco Cessation Focused Study
Questionnaire for MCPs and SHPs
DHCS provided HSAG with the contact information for the MCP and SHP staff to whom HSAG sent the questionnaire regarding the identification of tobacco users and tobacco cessation-related activities. HSAG collaborated with DHCS to prepare the questionnaire, which solicited MCPs’ and SHPs’ input on topics including the following:
♦ Description of the methods used to identify tobacco users ♦ Information about current or historic efforts or activities used to improve the identification of
tobacco users or track treatment utilization by tobacco users ♦ Information regarding ongoing interventions or educational activities related to tobacco use ♦ Description of any known barrier(s) for the MCP/SHP in identifying tobacco users ♦ Description of any known barrier(s) for the MCP/SHP in tracking and monitoring tobacco
cessation treatment utilization
Medi-Cal Managed Care Technical Report: July 1, 2017–June 30, 2018 Page 125 California Department of Health Care Services Health Services Advisory Group, Inc.

FOCUSED STUDIES
HSAG coordinated with DHCS to distribute the questionnaire to MCPs and SHPs. Upon receipt of questionnaire responses, HSAG reviewed the responses and conducted follow-up by email with individual MCPs/SHPs to address outstanding questions, as needed.
MCP and SHP Tobacco User Identification
In addition to the questionnaire, HSAG requested that each MCP and SHP submit a list of tobacco users, including information on the identification method the MCP/SHP used to identify each listed individual. HSAG collaborated with DHCS and the appropriate MCP/SHP contacts to provide guidance regarding the format for the data and detailed descriptions of the requested information.
HSAG reviewed the data and conducted follow-up by email with individual MCPs/SHPs to address outstanding questions, as needed.
Tobacco Cessation Therapy Use Analysis
To perform the tobacco cessation therapy analysis, HSAG submitted a detailed data requirements document to DHCS in March 2018. HSAG reviewed the data requirements document with DHCS through emails and conference calls to provide clarification. DHCS extracted and submitted data to HSAG through a secure file transfer protocol site. After receiving the extracted data, HSAG conducted a preliminary file review of the data before performing the data analysis.
Study Indicators
Table 12.4 lists the study indicators included in the Tobacco Cessation Focused Study, as well as the specifications for the indicators. HSAG reported the study indicators at the MCP/SHP, reporting unit, and statewide levels. (See the SFY 2017–18 Tobacco Cessation Focused Study Report for detailed study indicator results.) All analyses were limited to beneficiaries ages 15 and older. HSAG calculated measures 1 through 3 stratified by age, sex, and race/ethnicity at the statewide level. Race/ethnicity was categorized into the following six race/ethnic groups:
♦ Alaskan Native or American Indian ♦ Asian or Pacific Islander (included the following race/ethnic categories: Amerasian, Indian
American, Cambodian, Chinese, Filipino, Guamanian, Hawaiian, Japanese, Korean, Laotian, Samoan, Vietnamese, or Other Asian or Pacific Islander)
♦ Black ♦ Hispanic ♦ White ♦ Other/Unknown (included the following categories: No valid data reported; No response,
client declined to state; or Other)
HSAG stratified Measure 4 by intervention type (i.e., counseling, nicotine replacement therapy, other pharmaceutical intervention).
Medi-Cal Managed Care Technical Report: July 1, 2017–June 30, 2018 Page 126 California Department of Health Care Services Health Services Advisory Group, Inc.

FOCUSED STUDIES
Table 12.4—Study Indicators Indicator Specification
Measure 1: Number of tobacco users identified from encounters for services rendered from 1/1/17–8/30/17
Tobacco users identified from encounters with the following ICD-10 codes: • F17.2X Nicotine dependence • O99.33 Smoking (tobacco) complicating pregnancy,
childbirth, and the puerperium • Z72.0 Tobacco use not otherwise specified
Measure 2: Percentage of beneficiaries identified as tobacco users through administrative data
Denominator = All beneficiaries identified with at least one encounter between 1/1/17–8/30/17
Numerator = Number of tobacco users identified from encounters for services rendered between 1/1/17–8/30/17
Measure 3: Percentage of beneficiaries identified as tobacco users who received tobacco cessation therapy in the four months following the beneficiary’s earliest date of tobacco use.
Denominator = All tobacco users identified from encounters for services rendered between 1/1/17–8/30/17
Numerator = All tobacco users identified as having received tobacco cessation therapy interventions in the four months following the beneficiary’s earliest date of tobacco use. Tobacco cessation therapies are defined by:
Healthcare Common Procedure Coding System (HCPCS) or Current Procedural Terminology, Fourth Edition (CPT-4) code indicating counseling for tobacco use: • 99406: Intermediate Counseling—Smoking and
tobacco use cessation counseling visit is greater than three minutes, but not more than 10 minutes
• 99407: Intensive Counseling—Smoking and tobacco use cessation counseling visit is greater than 10 minutes
• S9456: Smoking Cessation Classes—Nonphysician provider, per session
-OR-From a history of nicotine replacement therapy claims, including pharmacy claims for the following: • Bupropion SR (Zyban) • Varenicline (Chantix) • Nicotine gum • Nicotine inhaler • Nicotine lozenge • Nicotine nasal spray • Nicotine patch
Medi-Cal Managed Care Technical Report: July 1, 2017–June 30, 2018 Page 127 California Department of Health Care Services Health Services Advisory Group, Inc.
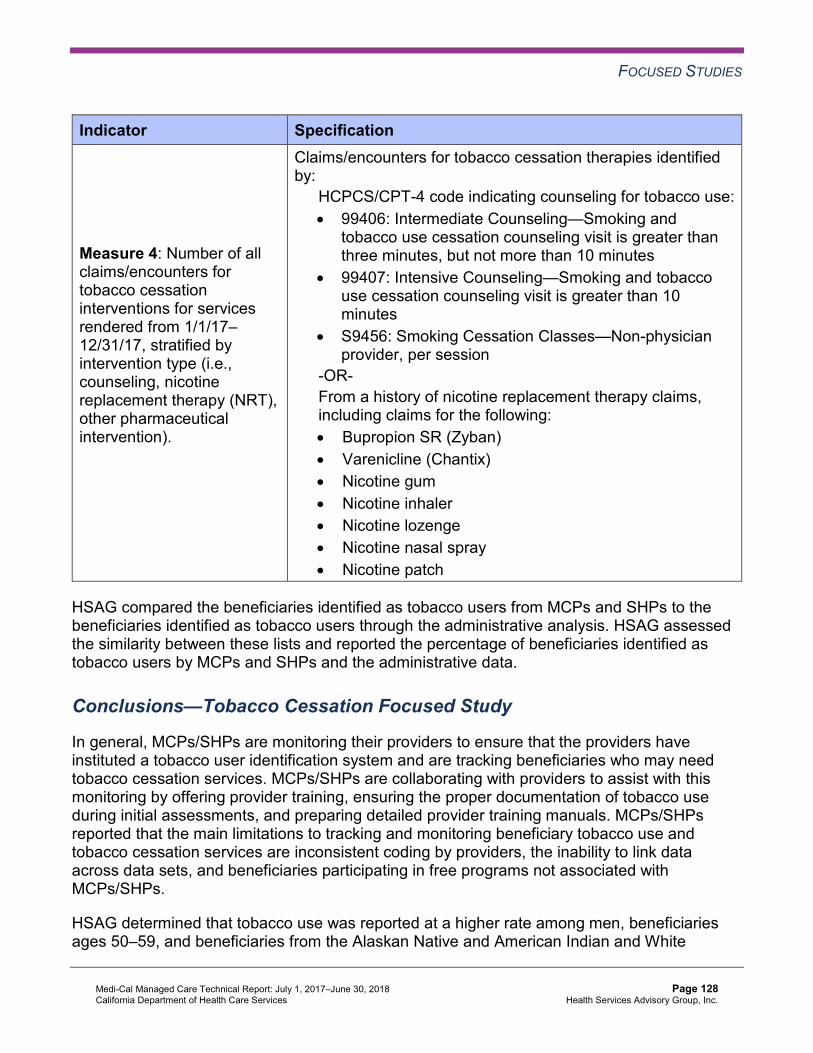
FOCUSED STUDIES
Indicator Specification
Measure 4: Number of all claims/encounters for tobacco cessation interventions for services rendered from 1/1/17– 12/31/17, stratified by intervention type (i.e., counseling, nicotine replacement therapy (NRT), other pharmaceutical intervention).
Claims/encounters for tobacco cessation therapies identified by:
HCPCS/CPT-4 code indicating counseling for tobacco use: • 99406: Intermediate Counseling—Smoking and
tobacco use cessation counseling visit is greater than three minutes, but not more than 10 minutes
• 99407: Intensive Counseling—Smoking and tobacco use cessation counseling visit is greater than 10 minutes
• S9456: Smoking Cessation Classes—Non-physician provider, per session
-OR-From a history of nicotine replacement therapy claims, including claims for the following: • Bupropion SR (Zyban) • Varenicline (Chantix) • Nicotine gum • Nicotine inhaler • Nicotine lozenge • Nicotine nasal spray • Nicotine patch
HSAG compared the beneficiaries identified as tobacco users from MCPs and SHPs to the beneficiaries identified as tobacco users through the administrative analysis. HSAG assessed the similarity between these lists and reported the percentage of beneficiaries identified as tobacco users by MCPs and SHPs and the administrative data.
Conclusions—Tobacco Cessation Focused Study
In general, MCPs/SHPs are monitoring their providers to ensure that the providers have instituted a tobacco user identification system and are tracking beneficiaries who may need tobacco cessation services. MCPs/SHPs are collaborating with providers to assist with this monitoring by offering provider training, ensuring the proper documentation of tobacco use during initial assessments, and preparing detailed provider training manuals. MCPs/SHPs reported that the main limitations to tracking and monitoring beneficiary tobacco use and tobacco cessation services are inconsistent coding by providers, the inability to link data across data sets, and beneficiaries participating in free programs not associated with MCPs/SHPs.
HSAG determined that tobacco use was reported at a higher rate among men, beneficiaries ages 50–59, and beneficiaries from the Alaskan Native and American Indian and White
Medi-Cal Managed Care Technical Report: July 1, 2017–June 30, 2018 Page 128 California Department of Health Care Services Health Services Advisory Group, Inc.
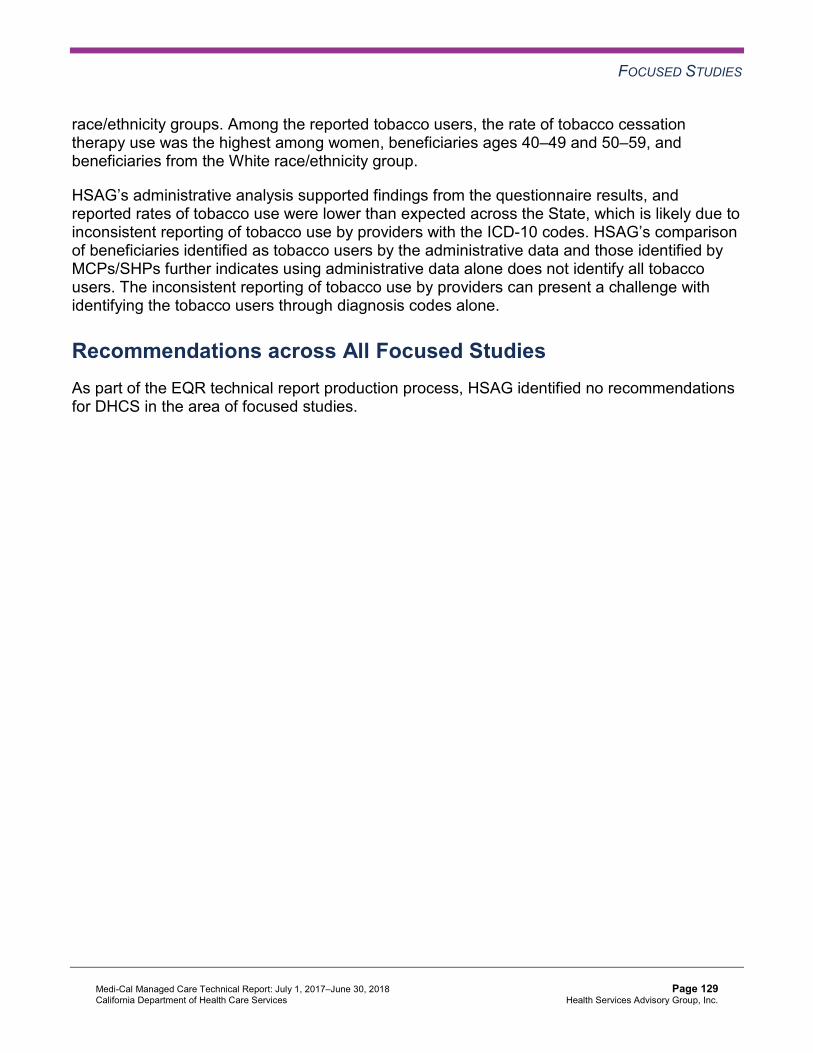
FOCUSED STUDIES
race/ethnicity groups. Among the reported tobacco users, the rate of tobacco cessation therapy use was the highest among women, beneficiaries ages 40–49 and 50–59, and beneficiaries from the White race/ethnicity group.
HSAG’s administrative analysis supported findings from the questionnaire results, and reported rates of tobacco use were lower than expected across the State, which is likely due to inconsistent reporting of tobacco use by providers with the ICD-10 codes. HSAG’s comparison of beneficiaries identified as tobacco users by the administrative data and those identified by MCPs/SHPs further indicates using administrative data alone does not identify all tobacco users. The inconsistent reporting of tobacco use by providers can present a challenge with identifying the tobacco users through diagnosis codes alone.
Recommendations across All Focused Studies As part of the EQR technical report production process, HSAG identified no recommendations for DHCS in the area of focused studies.
Medi-Cal Managed Care Technical Report: July 1, 2017–June 30, 2018 Page 129 California Department of Health Care Services Health Services Advisory Group, Inc.

Medi-Cal Managed Care External Quality Review Technical ReportJuly 1, 2017–June 30, 2018
13. Technical Assistance
At the State’s direction, the EQRO may provide technical assistance to groups of MCPs, PIHPs, PAHPs, or PCCM entities as described at 42 CFR §438.358(d).
Background In addition to the technical assistance provided to MCPs and SHPs as part of the PIP process, DHCS contracted with HSAG to provide supplemental technical assistance to help improve overall statewide performance. DHCS selected three Technical Assistance Activity Sets for HSAG to conduct during the July 1, 2017, through June 30, 2018, review period.
Technical Assistance Activity for Performance Measures
Objective
Under the Technical Assistance Activity for Performance Measures, HSAG provided technical assistance to DHCS to:
♦ Help build the DHCS quality improvement team’s capacity to work directly with MCPs and SHPs to improve performance on EAS measures.
♦ Assist DHCS in identifying priority performance measures. Specifically, assist DHCS in developing and monitoring a strategy to raise performance on each of the priority focus areas identified in DHCS’ annual Medi-Cal Managed Care Quality Strategy Report.
♦ Provide input and feedback to DHCS regarding DHCS’ development and monitoring of CAPs and IPs for MCPs and SHPs with persistent substandard performance on one or more measures.
♦ Provide guidance to DHCS on improving monitoring activities and make recommendations, as appropriate, for improving DHCS’ processes for holding MCPs and SHPs accountable for meeting contractual requirements.
♦ Review and provide feedback to DHCS on an array of documents related to quality improvement activities.
♦ Respond to requests from DHCS for input on a variety of quality improvement-related issues and topics via telephone and email.
Under the Technical Assistance Activity for Performance Measures, HSAG also provided technical assistance to MCPs and SHPs requiring additional guidance with IPs and CAPs, as identified by DHCS.
Medi-Cal Managed Care Technical Report: July 1, 2017–June 30, 2018 Page 130 California Department of Health Care Services Health Services Advisory Group, Inc.

TECHNICAL ASSISTANCE
Methodology
HSAG used a team approach to provide technical assistance, identifying the most pertinent subject matter experts for each technical assistance session to ensure the most efficient provision of technical assistance with the greatest likelihood of resulting in enhanced skills and, ultimately, improved performance. To promote timely and flexible delivery, HSAG conducted technical assistance with DHCS, MCPs, and SHPs by email, telephone, and Web conferences.
Results—Technical Assistance Activity for Performance Measures
During the review period, HSAG provided technical assistance to DHCS on various topics related to improving statewide performance on EAS measures.
Improvement Plans/Plan-Do-Study-Act Cycles and Corrective Action Plans
DHCS required MCPs to conduct PDSA cycles and submit PDSA Cycle Worksheets triannually for performance measures with rates that did not meet the MPLs for the previous year. At DHCS’ request, HSAG conducted secondary reviews of the PDSA Cycle Worksheets and provided suggestions to DHCS on the next steps for MCPs. As part of conducting secondary reviews, HSAG reviewed both PDSA Cycle Worksheets and DHCS’ initial feedback on the PDSA Cycle Worksheets.
As part of the CAP process, DHCS also required MCPs under CAPs to conduct PDSA cycles and submit PDSA Cycle Worksheets triannually for performance measures with rates below the MPLs for multiple years. HSAG conducted a secondary review of PDSA Cycle Worksheets submitted by MCPs under CAPs. For each PDSA Cycle Worksheet, HSAG focused on how the MCP carried out and evaluated the intervention testing. When indicated through HSAG’s assessment of the PDSA cycles, HSAG conducted technical assistance during DHCS’ CAP monitoring calls with MCPs. Additionally, HSAG validated PIPs submitted by MCPs under CAPs and, when needed, conducted individual technical assistance calls with MCPs to assist those MCPs with the rapid-cycle PIP approach.
HSAG includes information regarding MCP- and SHP-specific technical assistance related to IPs and CAPs, as applicable, in appendices A through BB.
External Accountability Set
HSAG assisted DHCS with addressing MCPs’ inquiries regarding the new Depression Screening and Follow-Up for Adolescents and Adults measure that DHCS added to the RY 2018 EAS. HSAG coordinated a call with DHCS and NCQA to discuss MCPs’ questions; and following the call, DHCS and HSAG notified MCPs about NCQA posting on its website frequently asked questions and answers regarding the measure. Additionally, HSAG jointly facilitated a webinar with NCQA and DHCS to provide MCPs an opportunity to obtain pertinent information and ask questions regarding the Depression Screening and Follow-Up for Adolescents and Adults measure.
Medi-Cal Managed Care Technical Report: July 1, 2017–June 30, 2018 Page 131 California Department of Health Care Services Health Services Advisory Group, Inc.

TECHNICAL ASSISTANCE
Based on NCQA’s HEDIS 2018 Measure Trending Determinations Memo, HSAG provided impact analyses and considerations for DHCS on the following EAS measures:
♦ Asthma Medication Ratio ♦ Breast Cancer Screening ♦ Colorectal Cancer Screening ♦ Immunizations for Adolescents—Combination 2 ♦ Osteoporosis Management in Women Who Had a Fracture ♦ Use of Imaging Studies for Low Back Pain
Regarding RY 2019 EAS measure reporting, HSAG:
♦ Suggested that DHCS consider replacing the non-HEDIS All-Cause Readmissions measure with the HEDIS Plan All-Cause Readmissions measure since NCQA added the Plan All-Cause Readmissions measure to the Medicaid product line in RY 2018. Requiring MCPs to report the HEDIS measure would enable DHCS to compare MCPs’ performance to national benchmarks.
♦ Confirmed that the two new MCPs that began providing services to Medi-Cal beneficiaries as of October 2017 and January 2018 will be responsible for performance measure reporting requirements for RY 2019.
♦ Reviewed and provided feedback on potential performance measures that DHCS is considering having SHPs report.
External Quality Review Organization Activities
HSAG assisted DHCS staff members in gaining a more comprehensive understanding of various EQRO activities by providing:
♦ Orientation on the CAHPS survey process, which consisted of background information about the general CAHPS survey process as well as California-specific historical information.
♦ Background information on the rapid-cycle PIP approach, including historical information on DHCS’ decision to require MCPs and SHPs to conduct rapid-cycle PIPs. Additionally, HSAG provided information regarding how the various components of HSAG’s rapid-cycle PIP process meet the CMS protocols.
♦ Historical information on DHCS’ requirement for MCPs to report stratified rates for the SPD and non-SPD populations to assist DHCS with determining whether or not to continue including SPD rates and analyses in the EQR technical reports.
Medi-Cal Managed Care Technical Report: July 1, 2017–June 30, 2018 Page 132 California Department of Health Care Services Health Services Advisory Group, Inc.

TECHNICAL ASSISTANCE
Other Technical Assistance
HSAG provided DHCS with technical assistance on various topics, including:
♦ HEDIS measure and performance measure specifications and validation processes. ♦ Patient-level detail file layout and submission requirements. ♦ CAHPS survey administration and data submission processes. ♦ Rapid-cycle PIP methodology and validation criteria. ♦ Telehealth and network adequacy assessments. ♦ Guidance on applying for continuing medical education units for a conference meeting.
Additionally, at DHCS’ request, HSAG reviewed and provided feedback on numerous documents related to statewide performance quality improvement efforts.
Conclusions—Technical Assistance Activity for Performance Measures
Due to the technical assistance that HSAG provided to DHCS, MCPs, and SHPs during the review period:
♦ MCPs gained pertinent information regarding the new Depression Screening and Follow-Up for Adolescents and Adults measure for RY 2018 EAS.
♦ DHCS gained up-to-date information on HEDIS measure specification changes and how the changes may impact EAS measure analyses.
♦ DHCS has a better understanding of performance measures, which will enable DHCS to make informed decisions regarding future EAS measure requirements.
♦ DHCS found HSAG’s secondary review of PDSA cycles and CAPs helpful as it reinforced DHCS’ findings and created synergy to provide optimal recommendations to MCPs.
♦ MCPs under CAPs became more proficient conducting the rapid-cycle PIP process. ♦ DHCS enhanced its understanding of EQRO activities.
Recommendations—Technical Assistance Activity for Performance Measures
HSAG has no recommendations for DHCS related to technical assistance activity for performance measures.
Medi-Cal Managed Care Technical Report: July 1, 2017–June 30, 2018 Page 133 California Department of Health Care Services Health Services Advisory Group, Inc.

TECHNICAL ASSISTANCE
Technical Assistance Activity for Quality ImprovementCollaboration
Objective
Under the Technical Assistance Activity for Quality Improvement Collaboration, HSAG facilitated collaborative discussions with MCPs and SHPs for each focus area selected by DHCS. The objectives of the collaborative discussions were:
♦ To provide MCPs and SHPs the opportunity to share with each other about issues, barriers, promising practices, and solutions related to their quality improvement work in the focus areas.
♦ For MCPs and SHPs to benefit from HSAG’s insight and expertise, particularly related to the PIP process.
♦ For DHCS to share pertinent resources and insights, particularly around the possibility of collaboration with external partners.
Methodology
Through joint planning meetings, HSAG and DHCS discussed potential topics for the collaborative discussions and the appropriate structure of the meetings based on those topics. DHCS and HSAG collaboratively determined the topic for each collaborative discussion based on:
♦ Feedback received from MCPs and SHPs about discussion topic preferences. ♦ MCPs’ and SHP’s progression of the PIP process. ♦ Issues identified by HSAG through its validation of PIPs. ♦ Issues identified by HSAG during MCP- and SHP-specific technical assistance sessions. ♦ Issues identified by DHCS and HSAG through review of MCPs’ PDSA cycles. ♦ Issues identified by DHCS as part of its monitoring and oversight processes with MCPs and
SHPs.
HSAG conducted the collaborative discussions through webinars and conference calls. Immediately following each collaborative discussion, HSAG emailed an online survey link to participants for their anonymous feedback about the discussion and their input for future discussions. Within 10 business days following each collaborative discussion, HSAG distributed a meeting summary by email to MCPs and SHPs and reminded collaborative discussion participants to complete the surveys.
Medi-Cal Managed Care Technical Report: July 1, 2017–June 30, 2018 Page 134 California Department of Health Care Services Health Services Advisory Group, Inc.
TECHNICAL ASSISTANCE
Results—Technical Assistance Activity for Quality Improvement Collaboration
During the review period, HSAG and DHCS jointly facilitated collaborative discussions during three of the four quarters.
Due to MCPs and SHPs completing intervention testing for the 2015–17 PIPs as of June 30, 2017, DHCS decided to use the first quarter collaborative discussion as a forum to hear MCPs’ and SHPs’ experiences related to conducting the rapid-cycle PIPs. Thus, DHCS and HSAG conducted one collaborative discussion call in 2017–18 Quarter 1 to obtain MCPs’ and SHPs’ feedback on the rapid-cycle PIP process.
To align with the new 2017–19 PIP topics and based on MCPs’/SHPs’ feedback, DHCS selected the following collaborative discussion focus areas starting in 2017–18 Quarter 3:
♦ Data—A discussion focused on improving access to and collection of accurate laboratory, pharmacy, vendor, and supplemental data to help ensure better health outcomes and improve quality metric performance.
♦ Health Disparities—A discussion focused on ways to address health inequities at the MCP-and SHP- levels.
♦ Immunizations—A discussion focused on the quality improvement work of the numerous MCPs working on the Childhood Immunizations and Immunizations for Adolescents measures.
HSAG and DHCS conducted collaborative discussions on the new focus areas during the third and fourth quarters. At the beginning of each collaborative discussion, DHCS provided an update on statewide efforts, partnerships, resources, and other pertinent information related to the collaborative discussion topic. Following DHCS’ update, HSAG facilitated topic-specific MCP/SHP presentations followed by an open discussion that provided the opportunity for MCPs and SHPs to share about successful quality improvement efforts as well as challenges and potential solutions related to the topic.
HSAG and DHCS worked with staff members from Anthem Blue Cross Partnership Plan and Health Net Community Solutions, Inc., to present about their successful quality improvement efforts related to the collaborative discussion focus areas. Additionally, HSAG and DHCS worked with staff members from the California Department of Public Health to present about the California Immunization Registry 2.
Post-collaborative discussion survey respondents rated all collaborative discussions held during the review period as “better than average”; however, HSAG and DHCS noted low survey response rates and are considering alternative approaches for soliciting participant feedback for future collaborative discussions.
Medi-Cal Managed Care Technical Report: July 1, 2017–June 30, 2018 Page 135 California Department of Health Care Services Health Services Advisory Group, Inc.

TECHNICAL ASSISTANCE
Conclusions—Technical Assistance Activity for Quality Improvement Collaboration
MCPs and SHPs actively participated in the collaborative discussions by asking presenters questions and sharing about their own experiences, challenges, and lessons learned. The post-collaborative discussion surveys revealed that MCPs and SHPs found MCPs’/SHPs’ presentations and sharing of ideas, successes, and lessons learned helpful. HSAG and DHCS agreed to explore different strategies to improve survey response rates to obtain more feedback from MCPs and SHPs regarding the collaborative discussions.
Recommendations—Technical Assistance Activity for Quality Improvement Collaboration
HSAG has no recommendations for DHCS related to technical assistance activity for quality improvement collaboration.
Technical Assistance Activity for ArcGIS Template Development
Objective
Under the Technical Assistance Activity for ArcGIS Template Development, HSAG provided technical assistance to DHCS through development of geographic information mapping reports to support DHCS’ network monitoring activities. The key objective of this activity was to assist DHCS in developing and implementing reporting templates to augment existing network monitoring reports with relevant geographic information system (GIS) maps, as well as to develop reports that address new network monitoring requirements outlined in the managed care final rule (i.e., CFRs §438.68, §438.206, and §438.207).
Methodology
In collaboration with DHCS, HSAG developed the methodology for this technical assistance activity that involved the development of reporting templates using ArcGIS Desktop software38
to address DHCS’ network monitoring requirements. To maximize portability and future utility, the methodology for this technical assistance activity included four distinct stages:
♦ Gathering reporting requirements ♦ Developing network-monitoring input datasets ♦ Designing and developing ArcGIS reporting templates ♦ Implementing ArcGIS reporting templates and training
38 ESRI 2017. ArcGIS Desktop: Release 10. Redlands, CA: Environmental Systems Research Institute.
Medi-Cal Managed Care Technical Report: July 1, 2017–June 30, 2018 Page 136 California Department of Health Care Services Health Services Advisory Group, Inc.

TECHNICAL ASSISTANCE
Results—Technical Assistance Activity for ArcGIS Template Development
HSAG began this technical assistance activity in contract year 2016–17 and concluded the activity during the review period. Through an iterative process with DHCS, HSAG developed the following ArcGIS reporting templates:
♦ Aggregated utilization ♦ Time and distance polygon ♦ Beneficiary access ♦ Provider ratio ♦ Provider count
For each reporting template, HSAG provided DHCS with a PowerPoint presentation, quick reference guide, and data dictionary. Additionally, HSAG produced the following resources for DHCS:
♦ Ad hoc quick reference guide for: ■ Copying the ArcGIS symbology layer ■ Adding labels to a map ■ Modifying output borders ■ Applying a 62-bit geoprocessing extension
♦ Data connections and imports quick reference guide ♦ Additional Esri training resources
HSAG conducted on-site training at DHCS on February 26–27, 2018, to provide DHCS staff members technical assistance on the ArcGIS reporting templates’ functionalities in DHCS’ computing environment.
Conclusions—Technical Assistance Activity for ArcGIS Template Development
As a result of the technical assistance that HSAG provided, DHCS has the ability to run ArcGIS reports to support DHCS’ network monitoring efforts and to support DHCS in meeting the network monitoring requirements outlined in the managed care final rule (i.e., CFRs §438.68, §438.206, and §438.207).
Recommendations—Technical Assistance Activity for ArcGIS Template Development
HSAG has no recommendations for DHCS related to technical assistance activity for ArcGIS template development.
Medi-Cal Managed Care Technical Report: July 1, 2017–June 30, 2018 Page 137 California Department of Health Care Services Health Services Advisory Group, Inc.

Medi-Cal Managed Care External Quality Review Technical ReportJuly 1, 2017–June 30, 2018
14. Follow-Up on Prior Year’s Recommendations
As part of the process for producing the 2017–18 Medi-Cal Managed Care Technical Report, DHCS provided the following information on the actions that DHCS took to address recommendations that HSAG made in the 2016–17 Medi-Cal Managed Care Technical Report. Table 14.1 provides EQR recommendations from the 2016–17 Medi-Cal Managed Care Technical Report, along with the DHCS’ self-reported actions taken through June 30, 2018, that address the EQR recommendations. Please note that HSAG made minimal edits to Table 14.1 to preserve the accuracy of DHCS’ self-reported actions.
Table 14.1—DHCS’ Self-Reported Follow-Up on External Quality ReviewRecommendations from the 2016–17 Medi-Cal Managed Care Technical Report
2016–17 External Quality ReviewRecommendations
Self-Reported Actions Taken by DHCSduring the Period of July 1, 2017–June 30,2018, that Address the External QualityReview Recommendations
1. To help DHCS monitor MCMC’s progress on the MCMC quality strategy area of reducing opioid medication misuse and overuse, obtain input from MCPs and other stakeholders through various methods such as questionnaires or focused studies regarding the feasibility and applicability of adding one of NCQA’s Use of Opioids measures to the EAS.
The opioid focus study conducted by HSAG in collaboration with DHCS will examine the need and capacity for addressing opioid overuse in each MCP’s beneficiary population through the creation of a plan report card or similar mechanism. Need and capacity will be measured primarily by quality metrics for high-risk opioid prescribing, and opioid use disorder prevalence and treatment. The results of the focus study will help DHCS better target its opioid misuse reduction efforts, as well as help demonstrate the feasibility of, or barriers to, including opioid quality metrics as annual reporting measures in the EAS.
2. Seek feedback on the 2017 CAHPS survey results for measures with at least 100 responses from MCPs and the Medi-Cal Children’s Health Advisory Panel (MCHAP) and factor the feedback from MCPs and MCHAP into DHCS’ determination of priority areas for improvement and strategies related to ensuring quality, accessible, and timely health care services for the Medi-Cal child population.
DHCS shared the CAHPS survey results with MCPs and other stakeholders, as appropriate, and used quality improvement tools and processes to identify priority areas in which DHCS and MCPs should focus related to the following four aspects of care: ♦ Accessing necessary care ♦ Getting timely care ♦ Getting information or help from the MCP’s
customer service ♦ Getting individualized care
Medi-Cal Managed Care Technical Report: July 1, 2017–June 30, 2018 Page 138 California Department of Health Care Services Health Services Advisory Group, Inc.
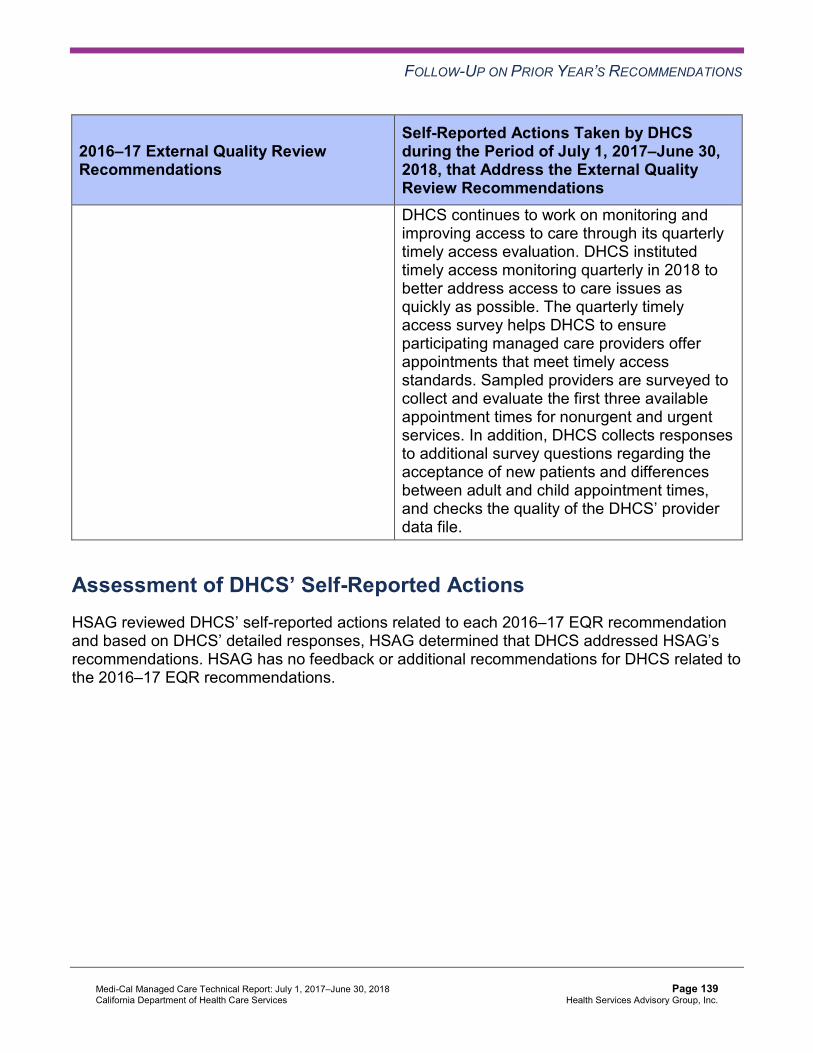
FOLLOW-UP ON PRIOR YEAR’S RECOMMENDATIONS
2016–17 External Quality ReviewRecommendations
Self-Reported Actions Taken by DHCSduring the Period of July 1, 2017–June 30,2018, that Address the External QualityReview Recommendations DHCS continues to work on monitoring and improving access to care through its quarterly timely access evaluation. DHCS instituted timely access monitoring quarterly in 2018 to better address access to care issues as quickly as possible. The quarterly timely access survey helps DHCS to ensure participating managed care providers offer appointments that meet timely access standards. Sampled providers are surveyed to collect and evaluate the first three available appointment times for nonurgent and urgent services. In addition, DHCS collects responses to additional survey questions regarding the acceptance of new patients and differences between adult and child appointment times, and checks the quality of the DHCS’ provider data file.
Assessment of DHCS’ Self-Reported Actions HSAG reviewed DHCS’ self-reported actions related to each 2016–17 EQR recommendation and based on DHCS’ detailed responses, HSAG determined that DHCS addressed HSAG’s recommendations. HSAG has no feedback or additional recommendations for DHCS related to the 2016–17 EQR recommendations.
Medi-Cal Managed Care Technical Report: July 1, 2017–June 30, 2018 Page 139 California Department of Health Care Services Health Services Advisory Group, Inc.

Medi-Cal Managed CareExternal Quality Review Technical Report
Appendix A: Performance Evaluation Report Aetna Better Health of California
July 1, 2017–June 30, 2018

Medi-Cal Managed Care External Quality Review Technical ReportAppendix A: Performance Evaluation ReportAetna Better Health of California July 1, 2017–June 30, 2018
Table of Contents
1. Introduction.............................................................................................................A-1 Medi-Cal Managed Care Health Plan Overview .......................................................A-1
2. Managed Care Health Plan Compliance ...............................................................A-3 3. Managed Care Health Plan Performance Measures ............................................A-4 4. Performance Improvement Projects .....................................................................A-5 5. Recommendations..................................................................................................A-6
Aetna Better Health of California Performance Evaluation Report: July 1, 2017–June 30, 2018 California Department of Health Care Services
Page A-i Health Services Advisory Group, Inc.

Medi-Cal Managed Care External Quality Review Technical ReportAppendix A: Performance Evaluation ReportAetna Better Health of California July 1, 2017–June 30, 2018
1. Introduction
The California Department of Health Care Services (DHCS) contracted with Health Services Advisory Group, Inc. (HSAG), an external quality review organization (EQRO), to prepare the federally required Medi-Cal Managed Care External Quality Review Technical Report, July 1, 2017–June 30, 2018. The technical report provides an overview of the objectives and methodology for conducting the external quality review (EQR) activities, including requirements related to each activity. Additionally, the technical report provides aggregated results and recommendations for DHCS for each activity.
This appendix is specific to DHCS’ contracted Medi-Cal managed care health plan (MCP), Aetna Better Health of California (“Aetna” or “the MCP”). The purpose of this appendix is to provide MCP-specific results of each activity and an assessment of the MCP’s strengths and opportunities for improvement with respect to the quality and timeliness of and access to health care services furnished to Medi-Cal Managed Care (MCMC) beneficiaries (referred to as “beneficiaries” in this report). The review period for this MCP-specific evaluation report is July 1, 2017, through June 30, 2018. HSAG will report on activities that take place beyond the review period in Aetna’s 2018–19 MCP-specific evaluation report. This MCP-specific evaluation report references activities and methodologies described in detail by HSAG in the technical report section.
The aggregate EQR technical report and all MCP- and specialty health plan (SHP)-specific performance evaluation reports reflect HSAG’s external, independent assessment of the quality and timeliness of, and access to, care that MCPs and SHPs are providing to beneficiaries.
Medi-Cal Managed Care Health Plan Overview Aetna is a full-scope MCP delivering services to beneficiaries under a Geographic Managed Care (GMC) model. The GMC model currently operates in the counties of San Diego and Sacramento. In this GMC model, DHCS allows beneficiaries to select from several commercial MCPs within the specified geographic service area (county).
In addition to Aetna, Sacramento County’s beneficiaries may select from the following MCPs:
♦ Anthem Blue Cross Partnership Plan ♦ Health Net Community Solutions, Inc. ♦ Kaiser NorCal ♦ Molina Healthcare of California Partner Plan, Inc. ♦ UnitedHealthcare Community Plan
Aetna Better Health of California Performance Evaluation Report: July 1, 2017–June 30, 2018 California Department of Health Care Services
Page A-1 Health Services Advisory Group, Inc.

INTRODUCTION
In addition to Aetna, San Diego County’s beneficiaries may select from the following MCPs:
♦ Care1st Partner Plan ♦ Community Health Group Partnership Plan ♦ Health Net Community Solutions, Inc. ♦ Kaiser SoCal ♦ Molina Healthcare of California Partner Plan, Inc. ♦ UnitedHealthcare Community Plan
Aetna became operational in Sacramento and San Diego counties to provide MCMC services effective January 1, 2018. As of June 30, 2018, Aetna had 2,033 beneficiaries in Sacramento County, and 3,976 in San Diego County—for a total of 6,009 beneficiaries.1 This represents 0.5 percent of the beneficiaries enrolled in Sacramento County and 0.6 percent of the beneficiaries enrolled in San Diego County.
1 Medi-Cal Managed Care Enrollment Report—June 2018. Available at: http://www.dhcs.ca.gov/dataandstats/reports/Pages/MMCDMonthlyEnrollment.aspx. Accessed on: Nov 14, 2018.
Aetna Better Health of California Performance Evaluation Report: July 1, 2017–June 30, 2018 California Department of Health Care Services
Page A-2 Health Services Advisory Group, Inc.

Medi-Cal Managed Care External Quality Review Technical ReportAppendix A: Performance Evaluation ReportAetna Better Health of California July 1, 2017–June 30, 2018
2. Managed Care Health Plan Compliance
DHCS Audits & Investigations Division (A&I) conducted a Focused Medical Audit of Aetna for the operational period of January 1, 2018, through March 31, 2018. A&I conducted the on-site audit from April 16, 2018, through April 17, 2018, assessing the categories of Utilization Management, Member’s Rights, and Quality Management.
The final report from the April 2018 A&I Focused Medical Audit was not available at the time that HSAG produced Aetna’s 2017–18 MCP-specific evaluation report. HSAG will include a summary of the April 2018 audit in Aetna’s 2018–19 MCP-specific evaluation report.
Aetna Better Health of California Performance Evaluation Report: July 1, 2017–June 30, 2018 California Department of Health Care Services
Page A-3 Health Services Advisory Group, Inc.
Medi-Cal Managed Care External Quality Review Technical ReportAppendix A: Performance Evaluation ReportAetna Better Health of California July 1, 2017–June 30, 2018
3. Managed Care Health Plan Performance Measures
To comply with federal requirements, DHCS selects a set of performance measures through which to evaluate the quality of care delivered by the contracted MCPs and SHPs to beneficiaries. MCPs and SHPs must report county or regional rates unless otherwise approved by DHCS. DHCS refers to the DHCS-selected performance measures for MCPs as the External Accountability Set (EAS). MCPs’ reporting of EAS rates provides DHCS with a standardized method for objectively evaluating MCPs’ delivery of services to beneficiaries.
In order to report performance measure rates, an MCP’s beneficiaries must meet continuous enrollment requirements for each measure that the MCP is reporting, which means that beneficiaries need to be enrolled in the MCP for 11 of 12 months during the measurement year (MY). Reporting year (RY) 2018 performance measure rates reflect data from MY 2017 (January 1, 2017, through December 31, 2017). Aetna began providing MCMC services in January 1, 2018; therefore, no Aetna MCMC beneficiaries had continuous enrollment during MY 2017. Consequently, Aetna reported no performance measure results and HSAG did not conduct an NCQA HEDIS Compliance Audit™2 of Aetna for RY 2018.
Aetna will report performance measure rates for the first time in RY 2019 (MY 2018).
2 NCQA HEDIS Compliance AuditTM is a trademark of NCQA.
Aetna Better Health of California Performance Evaluation Report: July 1, 2017–June 30, 2018 California Department of Health Care Services
Page A-4 Health Services Advisory Group, Inc.

Medi-Cal Managed Care External Quality Review Technical ReportAppendix A: Performance Evaluation ReportAetna Better Health of California July 1, 2017–June 30, 2018
4. Performance Improvement Projects
DHCS requires that each MCP and SHP conduct a minimum of two DHCS-approved performance improvement projects (PIPs) per each Medi-Cal contract held with DHCS. If an MCP or SHP holds multiple contracts with DHCS and the areas in need of improvement are similar across contracts, DHCS may approve the MCP or SHP to conduct the same two PIPs across all contracts (i.e., conduct two PIPs total).
Based on Aetna providing services starting January 1, 2018, DHCS waived the requirement for the MCP to conduct PIPs during the review period for this MCP-specific evaluation report. HSAG will provide training to Aetna on the PIP process and requirements beginning in April 2019 so that the MCP will be prepared to conduct PIPs, beginning with the PIP topic selection process in July 2019.
Aetna Better Health of California Performance Evaluation Report: July 1, 2017–June 30, 2018 California Department of Health Care Services
Page A-5 Health Services Advisory Group, Inc.

Medi-Cal Managed Care External Quality Review Technical ReportAppendix A: Performance Evaluation ReportAetna Better Health of California July 1, 2017–June 30, 2018
5. Recommendations
HSAG recommends that Aetna work with DHCS and HSAG to ensure that the MCP fully understands all EQRO activities and DHCS’ requirements of the MCP related to each activity.
In the next annual review, HSAG will evaluate Aetna’s successes related to conducting the required activities as well as how the MCP addressed this recommendation.
Aetna Better Health of California Performance Evaluation Report: July 1, 2017–June 30, 2018 California Department of Health Care Services
Page A-6 Health Services Advisory Group, Inc.

Medi-Cal Managed CareExternal Quality Review Technical Report
Appendix B: Performance Evaluation Report
AIDS Healthcare Foundation July 1, 2017–June 30, 2018

Medi-Cal Managed Care External Quality Review Technical ReportAppendix B: Performance Evaluation ReportAIDS Healthcare Foundation July 1, 2017–June 30, 2018
Table of Contents
1. Introduction.............................................................................................................B-1 Medi-Cal Managed Care Specialty Health Plan Overview........................................B-1
2. Specialty Health Plan Compliance ........................................................................B-2Compliance Reviews Conducted..............................................................................B-2 Strengths—Compliance Reviews .............................................................................B-3 Opportunities for Improvement—Compliance Reviews ............................................B-3
3. Performance Measures ..........................................................................................B-4 Performance Measure Validation Results ................................................................B-4 Performance Measure Results and Findings............................................................B-4
Performance Measure Findings ............................................................................B-5 Strengths—Performance Measures .........................................................................B-6 Opportunities for Improvement—Performance Measures ........................................B-6
4. Performance Improvement Projects .....................................................................B-7Performance Improvement Project Overview ...........................................................B-7 Performance Improvement Project Results and Findings.........................................B-9
2015–17 DHCS-Priority Performance Improvement Project .................................B-9 2015–17 SHP-Specific Performance Improvement Project.................................B-10 2017–19 Colorectal Cancer Screening Performance Improvement Project ........B-11 2017–19 Diabetes Retinal Eye Exam Performance Improvement Project ..........B-12
Strengths—Performance Improvement Projects ....................................................B-13 Opportunities for Improvement—Performance Improvement Projects ...................B-13
5. Recommendations................................................................................................B-14 Follow-Up on Prior Year Recommendations ..........................................................B-14 2017–18 Recommendations...................................................................................B-14
AIDS Healthcare Foundation Performance Evaluation Report: July 1, 2017–June 30, 2018 California Department of Health Care Services
Page B-i Health Services Advisory Group, Inc.

TABLE OF CONTENTS
Table of Tables
Table 2.1—DHCS A&I Medical Audits of AHF Audit Review Period: October 1, 2016, through September 30, 2017 .......................................................................B-2
Table 3.1—Multi-Year Performance Measure Results AHF—Los Angeles County........B-5 Table 4.1—AHF Hypertension PIP SMART Aim Measure Results ................................B-9 Table 4.2—AHF Hypertension PIP Intervention Testing Results ...................................B-9 Table 4.3—AHF Viral Load Suppression PIP SMART Aim Measure Results ..............B-10 Table 4.4—AHF Viral Load Suppression PIP Intervention Testing Results..................B-11 Table 4.5—AHF Colorectal Cancer Screening PIP SMART Aim Measure...................B-11 Table 4.6—AHF Diabetes Retinal Eye Exam PIP SMART Aim Measure.....................B-12
AIDS Healthcare Foundation Performance Evaluation Report: July 1, 2017–June 30, 2018 California Department of Health Care Services
Page B-ii Health Services Advisory Group, Inc.

Medi-Cal Managed Care External Quality Review Technical ReportAppendix B: Performance Evaluation ReportAIDS Healthcare Foundation July 1, 2017–June 30, 2018
1. Introduction
The California Department of Health Care Services (DHCS) contracted with Health Services Advisory Group, Inc. (HSAG), an external quality review organization (EQRO), to prepare the federally required Medi-Cal Managed Care External Quality Review Technical Report, July 1, 2017–June 30, 2018. The technical report provides an overview of the objectives and methodology for conducting the external quality review (EQR) activities, including requirements related to each activity. Additionally, the technical report provides aggregated results and recommendations for DHCS for each activity.
This appendix is specific to DHCS’ contracted Medi-Cal managed care specialty plan (SHP), AIDS Healthcare Foundation (“AHF” or “the SHP”). The purpose of this appendix is to provide SHP-specific results of each activity and an assessment of the SHP’s strengths and opportunities for improvement with respect to the quality and timeliness of and access to health care services furnished to Medi-Cal Managed Care (MCMC) beneficiaries (referred to as “beneficiaries” in this report). The review period for this SHP-specific evaluation report is July 1, 2017, through June 30, 2018. HSAG will report on activities that take place beyond the review period in AHF’s 2018–19 SHP-specific evaluation report. This SHP-specific evaluation report references activities and methodologies described in detail by HSAG in the technical report section.
The aggregate EQR technical report and all Medi-Cal full-scope managed care health plan (MCP)- and SHP-specific performance evaluation reports reflect HSAG’s external, independent assessment of the quality and timeliness of, and access to, care that MCPs and SHPs are providing to beneficiaries.
Medi-Cal Managed Care Specialty Health Plan Overview AHF is an SHP operating in Los Angeles County, providing services primarily to beneficiaries living with human immunodeficiency virus (HIV) or acquired immunodeficiency syndrome (AIDS). Due to AFH’s unique membership, some of the SHP’s contract requirements are different from MCP contract requirements. AHF became operational in Los Angeles County to provide MCMC services effective April 1995. As of June 30, 2018, AHF had 669 beneficiaries.1
1 Medi-Cal Managed Care Enrollment Report—June 2018. Available at: http://www.dhcs.ca.gov/dataandstats/reports/Pages/MMCDMonthlyEnrollment.aspx. Accessed on: Nov 5, 2018.
AIDS Healthcare Foundation Performance Evaluation Report: July 1, 2017–June 30, 2018 California Department of Health Care Services
Page B-1 Health Services Advisory Group, Inc.

Medi-Cal Managed Care External Quality Review Technical ReportAppendix B: Performance Evaluation ReportAIDS Healthcare Foundation July 1, 2017–June 30, 2018
2. Specialty Health Plan Compliance
Compliance Reviews Conducted The following is a summary of the most recent reviews conducted for AHF. The descriptions of the various types of reviews may be found within the main section of this technical report.
Table 2.1 summarizes the results and status of the DHCS Audits & Investigations Division (A&I) Medical Audit of AHF. A&I conducted the on-site audit from February 5, 2018, through February 15, 2018. During the 2018 Medical Audit, DHCS assessed the extent to which AHF implemented the SHP’s corrective action plan (CAP) from the October 31, 2016, through November 10, 2016, A&I Medical Audit, noting that the CAP included a finding of an uncorrected deficiency substantially similar to a deficiency identified in the previous audit. Note that DHCS issued the final closeout letter on September 28, 2018, which is outside the review period for this report; however, HSAG includes the information from the letter because it reflects full resolution of all deficiencies from the February 5, 2018, through February 15, 2018, audit.
Table 2.1—DHCS A&I Medical Audits of AHF Audit Review Period: October 1, 2016, through September 30, 2017
Category Evaluated Deficiencies (Yes/No) Monitoring Status
Utilization Management No Not applicable.
Access and Availability of Care Yes CAP initiated following the audit and subsequently closed.
Member’s Rights Yes CAP initiated following the audit and subsequently closed.
Quality Management Yes CAP initiated following the audit and subsequently closed.
Administrative and Organizational Capacity No Not applicable.
AIDS Healthcare Foundation Performance Evaluation Report: July 1, 2017–June 30, 2018 California Department of Health Care Services
Page B-2 Health Services Advisory Group, Inc.
SPECIALTY HEALTH PLAN COMPLIANCE
Strengths—Compliance Reviews A&I identified no deficiencies in the Utilization Management or Administrative and Organizational Capacity categories during the February 2018 Medical Audit of AHF. Additionally, AHF’s CAP responses regarding the deficiencies in the categories of Access and Availability of Care, Member’s Rights, and Quality Management resulted in DHCS closing the CAP.
Opportunities for Improvement—Compliance Reviews AHF has no outstanding deficiencies from the February 2018 A& I Medical Audit of the SHP; therefore, HSAG has no recommendations for the SHP in the area of compliance reviews.
AIDS Healthcare Foundation Performance Evaluation Report: July 1, 2017–June 30, 2018 California Department of Health Care Services
Page B-3 Health Services Advisory Group, Inc.

Medi-Cal Managed Care External Quality Review Technical ReportAppendix B: Performance Evaluation ReportAIDS Healthcare Foundation July 1, 2017–June 30, 2018
3. Performance Measures
Performance Measure Validation Results The HEDIS®2 2018 Compliance Audit Final Report of Findings for AIDS Healthcare Foundation contains the detailed findings and recommendations from HSAG’s NCQA HEDIS Compliance Audit™.3 HSAG auditors determined that AHF followed the appropriate specifications to produce valid rates, and identified no issues of concern.
Performance Measure Results and Findings After validating the SHP’s performance measure rates, HSAG assessed the results. See Table 3.1 for AHF’s performance measure results for reporting years (RYs) 2015 through 2018. The RY is the year in which the SHP reported the rates. The RY rates reflect measurement year (MY) data from the previous calendar year. Note that data may not be available for all four years.
To assess performance, HSAG compares the performance measure rates to national benchmarks. Rates indicating performance above the high performance levels (HPLs) are shaded in gray, and rates indicating performance below the minimum performance levels (MPLs) are bolded.
♦ For measures with rates below the MPLs, DHCS requires SHPs to submit to DHCS improvement plans (IPs) to address the rates below the MPLs (unless SHPs are reporting the rates for the first time).
♦ IPs and CAPs consist of submission of Plan-Do-Study-Act (PDSA) Cycle Worksheets, Quality Improvement (QI) Summaries, or completion of Performance Improvement Projects (PIPs)—as determined by DHCS.
2 Healthcare Effectiveness Data and Information Set (HEDIS®) is a registered trademark of the National Committee for Quality Assurance (NCQA).
3 NCQA HEDIS Compliance AuditTM is a trademark of NCQA.
AIDS Healthcare Foundation Performance Evaluation Report: July 1, 2017–June 30, 2018 California Department of Health Care Services
Page B-4 Health Services Advisory Group, Inc.

PERFORMANCE MEASURES
Table 3.1—Multi-Year Performance Measure Results AHF—Los Angeles County
H = Rate indicates performance above the HPL. Bolded Rate = Rate indicates performance below the MPL.
B = Statistical testing result indicates that the RY 2018 rate is significantly better than the RY 2017 rate.
W = Statistical testing result indicates that the RY 2018 rate is significantly worse than the RY 2017 rate.
Measure RY
2015 Rate1
RY 2016
Rate2
RY 2017
Rate3
RY 2018
Rate4
RYs 2017–18 Rate
Difference5
Colorectal Cancer Screening* -- -- 58.26% 58.45% 0.19 Controlling High Blood Pressure** 61.16% 66.67% 57.89% 69.41% 11.52
1 RY 2015 rates reflect MY data from January 1, 2014, through December 31, 2014. 2 RY 2016 rates reflect MY data from January 1, 2015, through December 31, 2015. 3 RY 2017 rates reflect MY data from January 1, 2016, through December 31, 2016. 4 RY 2018 rates reflect MY data from January 1, 2017, through December 31, 2017. 5 Performance comparisons are based on the Chi-square test of statistical significance, with a p value of <0.05. * The HPL and MPL for this measure represent the NCQA Quality Compass®4 Commercial 90th and 25th percentiles, respectively. ** The RY 2015 HPL and MPL for this measure represent the NCQA HEDIS Audit Means, Percentiles, and Ratios 90th and 25th percentiles, respectively. The RY 2016, RY 2017, and RY 2018 HPLs and MPLs represent the NCQA Quality Compass® Medicaid health maintenance organization (HMO) 90th and 25th percentiles, respectively. -- Indicates that the rate is not available.
Performance Measure Findings
The rates for the Colorectal Cancer Screening and Controlling High Blood Pressure measures showed no statistically significant changes from RY 2017 to RY 2018, and the rate for each measure was between the HPL and MPL in RY 2018.
4 Quality Compass® is a registered trademark of NCQA.
AIDS Healthcare Foundation Performance Evaluation Report: July 1, 2017–June 30, 2018 California Department of Health Care Services
Page B-5 Health Services Advisory Group, Inc.

PERFORMANCE MEASURES
Strengths—Performance Measures HSAG auditors determined that AHF followed the appropriate specifications to produce valid rates, and identified no issues of concern.
Opportunities for Improvement—Performance Measures Based on AHF’s RY 2018 performance measure results, HSAG has no recommendations for the SHP in the area of performance measures.
AIDS Healthcare Foundation Performance Evaluation Report: July 1, 2017–June 30, 2018 California Department of Health Care Services
Page B-6 Health Services Advisory Group, Inc.

Medi-Cal Managed Care External Quality Review Technical ReportAppendix B: Performance Evaluation ReportAIDS Healthcare Foundation July 1, 2017–June 30, 2018
4. Performance Improvement Projects
Performance Improvement Project Overview The key concepts of the rapid-cycle PIP framework include forming a PIP team, setting aims, establishing measures, determining interventions using quality improvement tools, conducting PDSA cycles to test interventions, and planning for the spread of successful changes. The core component of the rapid-cycle PIP approach involves testing changes on a small scale so that improvement can occur more efficiently and lead to long-term sustainability. The following modules guide MCPs and SHPs through this rapid-cycle PIP process:
♦ Module 1—PIP Initiation ■ MCPs and SHPs outline the framework for the PIP, which includes:
○ The topic rationale. ○ Comparative data supporting the need to improve the selected topic. ○ A list of the PIP team members, which consists of internal and external stakeholders. ○ A completed key driver diagram that defines the theory of change for improvement,
including the SMART (Specific, Measurable, Achievable, Relevant, and Time-bound) Aim and Global Aim.
♦ Module 2—SMART Aim Data Collection ■ MCPs and SHPs define the SMART Aim measure and data collection methodology and
develop the SMART Aim data run chart. ♦ Module 3—Intervention Determination
■ MCPs and SHPs use process mapping and failure modes and effects analysis to identify potential interventions to test which may have direct effects on the SMART Aim.
♦ Module 4—Plan-Do-Study-Act (PDSA) ■ MCPs and SHPs test and evaluate the interventions identified in Module 3 through a
series of PDSA cycles. ♦ Module 5—PIP Conclusions
■ MCPs and SHPs interpret results and summarize: ○ Key findings and outcomes achieved. ○ Assessment of each tested intervention. ○ Lessons learned, including how demonstrated improvement can be shared and used
as a foundation for further improvement going forward. ○ Plan for sustained improvement.
AIDS Healthcare Foundation Performance Evaluation Report: July 1, 2017–June 30, 2018 California Department of Health Care Services
Page B-7 Health Services Advisory Group, Inc.

PERFORMANCE IMPROVEMENT PROJECTS
Based on the agreed-upon timeline, MCPs and SHPs submit each module to HSAG for validation. Throughout the rapid-cycle PIP process, HSAG provides technical assistance to MCPs and SHPs to ensure that PIPs are methodologically sound and to problem-solve with MCPs and SHPs regarding how to address challenges that occur. Through an iterative process, MCPs and SHPs have opportunities to make corrections to modules 1 through 3 to achieve all validation criteria.
Once MCPs and SHPs achieve all validation criteria for modules 1 through 3 and receive feedback on the intervention Plan portion of Module 4, MCPs and SHPs test interventions. During the intervention testing phase of the PIP, HSAG conducts periodic progress check-ins to ensure that MCPs and SHPs have addressed HSAG’s feedback on the Plan portion of Module 4 and are making appropriate progress with intervention testing. Once MCPs and SHPs complete testing an intervention, MCPs and SHPs determine the next steps based on results and lessons learned—whether the intervention was successful and should be spread (adopt), whether modifications need to be made to the existing intervention (adapt), or whether the intervention was not successful and should be stopped (abandon).
In Module 5, MCPs and SHPs summarize the overall PIP. When validating Module 5, HSAG assesses the validity and reliability of the results based on the Centers for Medicare & Medicaid Services (CMS) validation protocols to determine whether key stakeholders can have confidence in the reported PIP findings. HSAG assigns the following final confidence levels for each PIP:
♦ High confidence—the PIP was methodologically sound and achieved the SMART Aim goal; the demonstrated improvement was clearly linked to the quality improvement processes conducted and intervention(s) tested; and, the MCP/SHP accurately summarized the key findings.
♦ Confidence—the PIP was methodologically sound and achieved the SMART Aim goal, and the MCP/SHP accurately summarized the key findings. However, some, but not all, of the quality improvement processes conducted and/or intervention(s) tested were clearly linked to the demonstrated improvement.
♦ Low confidence—either (A) the PIP was methodologically sound; however, the SMART Aim goal was not achieved; or (B) the SMART Aim goal was achieved; however, the quality improvement processes and/or intervention(s) tested were poorly executed and could not be linked to the improvement.
♦ Reported PIP results were not credible—the PIP methodology was not executed as approved.
AIDS Healthcare Foundation Performance Evaluation Report: July 1, 2017–June 30, 2018 California Department of Health Care Services
Page B-8 Health Services Advisory Group, Inc.
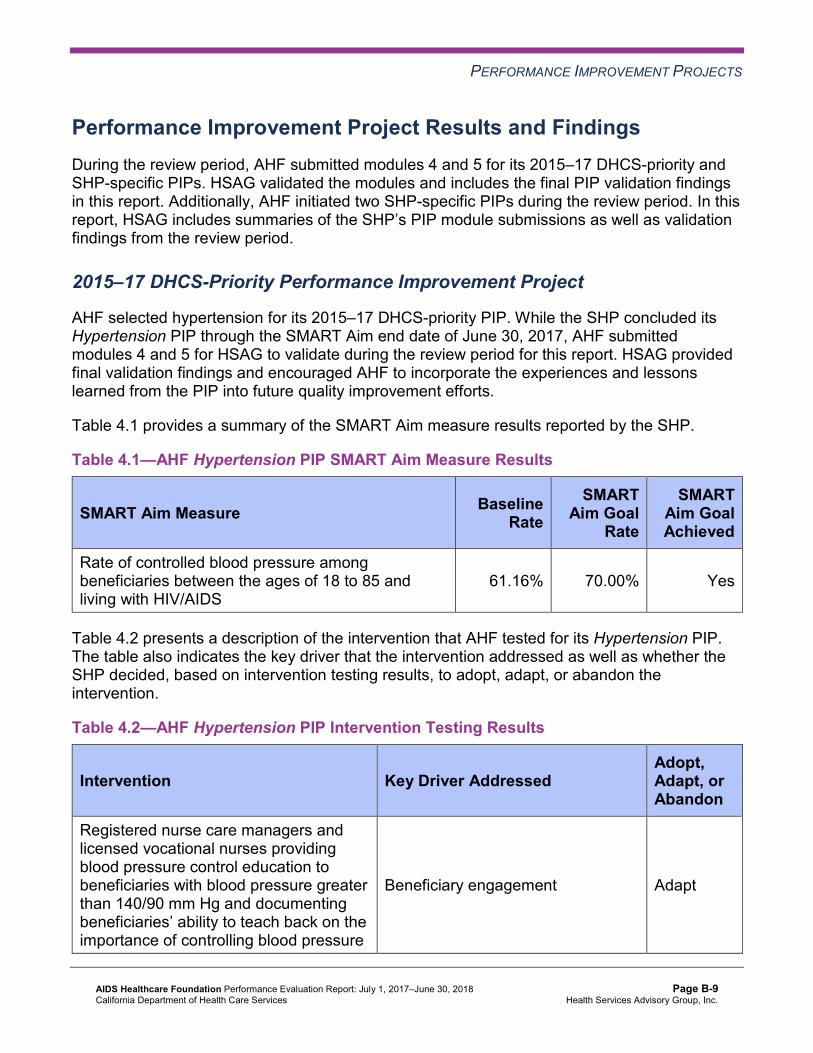
PERFORMANCE IMPROVEMENT PROJECTS
Performance Improvement Project Results and Findings During the review period, AHF submitted modules 4 and 5 for its 2015–17 DHCS-priority and SHP-specific PIPs. HSAG validated the modules and includes the final PIP validation findings in this report. Additionally, AHF initiated two SHP-specific PIPs during the review period. In this report, HSAG includes summaries of the SHP’s PIP module submissions as well as validation findings from the review period.
2015–17 DHCS-Priority Performance Improvement Project
AHF selected hypertension for its 2015–17 DHCS-priority PIP. While the SHP concluded its Hypertension PIP through the SMART Aim end date of June 30, 2017, AHF submitted modules 4 and 5 for HSAG to validate during the review period for this report. HSAG provided final validation findings and encouraged AHF to incorporate the experiences and lessons learned from the PIP into future quality improvement efforts.
Table 4.1 provides a summary of the SMART Aim measure results reported by the SHP.
Table 4.1—AHF Hypertension PIP SMART Aim Measure Results
SMART Aim Measure Baseline Rate
SMART Aim Goal
Rate
SMART Aim Goal Achieved
Rate of controlled blood pressure among beneficiaries between the ages of 18 to 85 and living with HIV/AIDS
61.16% 70.00% Yes
Table 4.2 presents a description of the intervention that AHF tested for its Hypertension PIP. The table also indicates the key driver that the intervention addressed as well as whether the SHP decided, based on intervention testing results, to adopt, adapt, or abandon the intervention.
Table 4.2—AHF Hypertension PIP Intervention Testing Results
Intervention Key Driver Addressed Adopt,Adapt, orAbandon
Registered nurse care managers and licensed vocational nurses providing blood pressure control education to beneficiaries with blood pressure greater than 140/90 mm Hg and documenting beneficiaries’ ability to teach back on the importance of controlling blood pressure
Beneficiary engagement Adapt
AIDS Healthcare Foundation Performance Evaluation Report: July 1, 2017–June 30, 2018 California Department of Health Care Services
Page B-9 Health Services Advisory Group, Inc.

PERFORMANCE IMPROVEMENT PROJECTS
Performance Improvement Project Validation Findings
During the review period for this report, HSAG validated modules 4 and 5 for the SHP’s Hypertension PIP. The SHP began intervention testing in February 2017 and achieved the SMART Aim goal in June 2017, with a rate of 70.8 percent. AHF documented a positive correlation between the blood pressure control education provided to beneficiaries and the increased rate of beneficiaries with controlled blood pressure.
Upon assessment of validity and reliability of the PIP results, HSAG assigned AHF’s Hypertension PIP a final confidence level of High Confidence.
2015–17 SHP-Specific Performance Improvement Project
AHF selected viral load suppression for its 2015–17 SHP-specific PIP. While the SHP concluded its Viral Load Suppression PIP through the SMART Aim end date of June 30, 2017, AHF submitted modules 4 and 5 for HSAG to validate during the review period for this report. HSAG provided final validation findings and encouraged AHF to incorporate the experiences and lessons learned from the PIP into future quality improvement efforts.
Table 4.3 provides a summary of the SMART Aim measure results reported by the SHP.
Table 4.3—AHF Viral Load Suppression PIP SMART Aim Measure Results
SMART Aim Measure Baseline Rate
SMART Aim Goal
Rate
SMART Aim Goal Achieved
Rate of beneficiaries whose viral load is fewer than 200 copies/mL (viral load suppression) among all active beneficiaries (regardless of age)
68% 78% Yes
Table 4.4 presents a description of the intervention that AHF tested for its Viral Load Suppression PIP. The table also indicates the key driver that the intervention addressed as well as whether the SHP decided, based on intervention testing results, to adopt, adapt, or abandon the intervention.
AIDS Healthcare Foundation Performance Evaluation Report: July 1, 2017–June 30, 2018 California Department of Health Care Services
Page B-10 Health Services Advisory Group, Inc.

PERFORMANCE IMPROVEMENT PROJECTS
Table 4.4—AHF Viral Load Suppression PIP Intervention Testing Results
Intervention Key Driver Addressed Adopt,Adapt, orAbandon
Registered nurse care managers assisting beneficiaries with appointment scheduling, specifically, directing beneficiaries to see primary care providers for medical assessment(s)
Beneficiary engagement Adapt
Performance Improvement Project Validation Findings
During the review period for this report, HSAG validated modules 4 and 5 for the SHP’s Viral Load Suppression PIP. While the SHP achieved the SMART Aim goal for every month from January 2016 through June 2017, the intervention testing occurred from November 2016 through June 2017. The SHP did not document how it achieved the SMART Aim goal for 10 consecutive months prior to beginning its intervention testing in November 2016. Therefore, the intervention was not clearly linked with the performance of the SMART Aim measure.
Upon assessment of validity and reliability of the PIP results, HSAG assigned AHF’s Viral Load Suppression PIP a final confidence level of Confidence.
2017–19 Colorectal Cancer Screening Performance Improvement Project
AHF selected colorectal cancer screening as one of its 2017–19 PIP topics based on its SHP-specific data.
Table 4.5 provides the SMART Aim measure description, baseline rate, and SMART Aim goal rate for the PIP. The SMART Aim end date for this PIP is June 30, 2019.
Table 4.5—AHF Colorectal Cancer Screening PIP SMART Aim Measure
SMART Aim Measure Baseline Rate
SMART Aim Goal
Rate
Rate of colorectal cancer screening among beneficiaries 50 to 75 years of age and residing in Los Angeles County 58.26% 70.50%
AIDS Healthcare Foundation Performance Evaluation Report: July 1, 2017–June 30, 2018 California Department of Health Care Services
Page B-11 Health Services Advisory Group, Inc.

PERFORMANCE IMPROVEMENT PROJECTS
Performance Improvement Project Validation Findings
During the review period of this report, HSAG validated modules 1 and 2 for the SHP’s Colorectal Cancer Screening PIP. Upon initial review of the modules, HSAG determined that AHF met some required validation criteria; however, HSAG identified opportunities for improvement related to:
♦ Supporting the topic selection with the SHP’s data. ♦ Including all required components of the:
■ SMART Aim measure. ■ SMART Aim data collection methodology. ■ Run/control chart.
After receiving technical assistance from HSAG, AHF incorporated HSAG’s feedback into the PIP modules. Upon HSAG’s final review, HSAG determined that the SHP met all validation criteria for modules 1 and 2.
2017–19 Diabetes Retinal Eye Exam Performance Improvement Project
AHF selected diabetes retinal eye exam as one of its 2017–19 PIP topics based on its SHP-specific data.
Table 4.6 provides the SMART Aim measure description, baseline rate, and SMART Aim goal rate for the PIP. The SMART Aim end date for this PIP is June 30, 2019.
Table 4.6—AHF Diabetes Retinal Eye Exam PIP SMART Aim Measure
SMART Aim Measure Baseline Rate
SMART Aim Goal
Rate Rate of retinal eye exam rate among beneficiaries 18 to 75 years of age and residing in Los Angeles County 38.64% 57.00%
Performance Improvement Project Validation Findings
During the review period of this report, HSAG validated modules 1 and 2 for the SHP’s Diabetes Retinal Eye Exam PIP. Upon initial review of the modules, HSAG determined that AHF met some required validation criteria; however, HSAG identified opportunities for improvement related to:
♦ Supporting the topic selection with the SHP’s data. ♦ Including all required components of the:
■ SMART Aim measure. ■ SMART Aim data collection methodology. ■ Run/control chart.
AIDS Healthcare Foundation Performance Evaluation Report: July 1, 2017–June 30, 2018 California Department of Health Care Services
Page B-12 Health Services Advisory Group, Inc.

PERFORMANCE IMPROVEMENT PROJECTS
After receiving technical assistance from HSAG, AHF incorporated HSAG’s feedback into the PIP modules. Upon HSAG’s final review, HSAG determined that the SHP met all validation criteria for modules 1 and 2.
Strengths—Performance Improvement Projects AHF achieved the SMART Aim goals for both 2015–17 PIPs and linked the quality improvement activities to the demonstrated improvement. Based on HSAG’s assessment, HSAG assigned the 2015–17 Hypertension PIP a final confidence level of High Confidence and the 2015–17 Viral Load Suppression PIP a final confidence level of Confidence.
Opportunities for Improvement—Performance Improvement Projects AHF has the opportunity to continue monitoring adapted interventions and outcomes to facilitate long-term, sustained improvement beyond the life of the 2015–17 Hypertension and Viral Load Suppression PIPs. Ongoing monitoring will enable long-term evaluation of sustained improvement and allow the SHP to continually refine interventions to achieve and sustain optimal outcomes.
AIDS Healthcare Foundation Performance Evaluation Report: July 1, 2017–June 30, 2018 California Department of Health Care Services
Page B-13 Health Services Advisory Group, Inc.

Medi-Cal Managed Care External Quality Review Technical ReportAppendix B: Performance Evaluation ReportAIDS Healthcare Foundation July 1, 2017–June 30, 2018
5. Recommendations
Follow-Up on Prior Year Recommendations DHCS provided each MCP and SHP an opportunity to outline actions taken to address recommendations that HSAG made in its 2016–17 MCP/SHP-specific evaluation report. Based on HSAG’s assessment of AHF’s delivery of quality, accessible, and timely care through the activities described in the SHP’s 2016–17 SHP-specific evaluation report, HSAG had no recommendations in AHF’s 2016–17 SHP-specific evaluation report. Therefore, AHF had no recommendations for which it was required to provide self-reported actions.
2017–18 Recommendations Based on the overall assessment of AHF’s delivery of quality, accessible, and timely care through the activities described in previous sections of this report, HSAG recommends that the SHP continue monitoring adapted interventions and outcomes to facilitate long-term, sustained improvement beyond the life of the 2015–17 Hypertension and Viral Load Suppression PIPs.
In the next annual review, HSAG will evaluate continued successes of AHF as well as the SHP’s progress with these recommendations.
AIDS Healthcare Foundation Performance Evaluation Report: July 1, 2017–June 30, 2018 California Department of Health Care Services
Page B-14 Health Services Advisory Group, Inc.

Medi-Cal Managed CareExternal Quality Review Technical Report
Appendix C: Performance Evaluation Report
Alameda Alliance for Health July 1, 2017–June 30, 2018

Medi-Cal Managed Care External Quality Review Technical ReportAppendix C: Performance Evaluation ReportAlameda Alliance for Health July 1, 2017–June 30, 2018
Table of Contents
1. Introduction.............................................................................................................C-1 Medi-Cal Managed Care Health Plan Overview .......................................................C-1
2. Managed Care Health Plan Compliance ...............................................................C-2Compliance Reviews Conducted..............................................................................C-2 Strengths—Compliance Reviews .............................................................................C-3 Opportunities for Improvement—Compliance Reviews ............................................C-3
3. Managed Care Health Plan Performance Measures ............................................C-4Performance Measure Validation Results ................................................................C-4 Performance Measure Results and Findings............................................................C-4
Preventive Screening and Children’s Health .........................................................C-5 Preventive Screening and Women’s Health ..........................................................C-9 Care for Chronic Conditions ................................................................................C-11 Appropriate Treatment and Utilization.................................................................C-14 Performance Measure Findings—All Domains....................................................C-17
Seniors and Persons with Disabilities Performance Measure Results ........................C-18 Seniors and Persons with Disabilities Findings ...................................................C-23
Strengths—Performance Measures .......................................................................C-23 Opportunities for Improvement—Performance Measures ......................................C-24
4. Performance Improvement Projects ...................................................................C-25Performance Improvement Project Overview .........................................................C-25 Performance Improvement Project Results and Findings.......................................C-26
2015–17 DHCS-Priority Performance Improvement Project ...............................C-27 2015–17 MCP-Specific Performance Improvement Project ................................C-28 2017–19 Disparity Performance Improvement Project ........................................C-30 2017–19 DHCS-Priority Performance Improvement Project ...............................C-31
Strengths—Performance Improvement Projects ....................................................C-32 Opportunities for Improvement—Performance Improvement Projects ...................C-32
5. Recommendations................................................................................................C-33 Follow-Up on Prior Year Recommendations ..........................................................C-33 2017–18 Recommendations...................................................................................C-35
Alameda Alliance for Health Performance Evaluation Report: July 1, 2017–June 30, 2018 California Department of Health Care Services
Page C-i Health Services Advisory Group, Inc.

TABLE OF CONTENTS
Table of Tables
Table 2.1—DHCS A&I Medical and State Supported Services Audits of AAH Audit Review Period: June 1, 2015, through May 31, 2017 ..................................C-2
Table 3.1—Preventive Screening and Children’s Health Domain Multi-Year Performance Measure Results AAH—Alameda County.....................................................C-6
Table 3.2—Preventive Screening and Children’s Health Domain RY 2018 (MY 2017) Performance Measure Findings AAH—Alameda County.............................C-8
Table 3.3—Preventive Screening and Women’s Health Domain Multi-Year Performance Measure Results AAH—Alameda County.....................................................C-9
Table 3.4—Preventive Screening and Women’s Health Domain RY 2018 (MY 2017) Performance Measure Findings AAH—Alameda County...........................C-10
Table 3.5—Care for Chronic Conditions Domain Multi-Year Performance Measure Results AAH—Alameda County.................................................................C-11
Table 3.6—Care for Chronic Conditions Domain RY 2018 (MY 2017) Performance Measure Findings AAH—Alameda County ................................................C-12
Table 3.7—Appropriate Treatment and Utilization Domain Multi-Year Performance Measure Results AAH—Alameda County..................................................C-15
Table 3.8—Appropriate Treatment and Utilization Domain RY 2018 (MY 2017) Performance Measure Findings AAH—Alameda County...........................C-16
Table 3.9—RY 2018 (MY 2017) Performance Measure Findings for All Domains AAH—Alameda County .............................................................................C-17
Table 3.10—Multi-Year SPD Performance Measure Trend Table AAH—Alameda CountyC-18 Table 3.11—Multi-Year Non-SPD Performance Measure Trend Table AAH—
Alameda County ........................................................................................C-20 Table 3.12—RY 2018 (MY 2017) Performance Measure Comparison and Results for
Measures Stratified by the SPD and Non-SPD Populations AAH— Alameda County ........................................................................................C-21
Table 4.1—AAH Postpartum Care PIP SMART Aim Measure Results ........................C-27 Table 4.2—AAH Postpartum Care PIP Intervention Testing Results ...........................C-27 Table 4.3—AAH Prenatal Visit PIP SMART Aim Measure Results ..............................C-28 Table 4.4—AAH Prenatal Visit PIP Intervention Testing Results .................................C-29 Table 4.5—AAH Diabetes HbA1c Testing Disparity PIP SMART Aim Measure...........C-30 Table 4.6—AAH Children/Adolescent Access to Primary Care Physicians PIP
SMART Aim Measure ................................................................................C-31 Table 5.1—AAH’s Self-Reported Follow-Up on External Quality Review
Recommendations from the July 1, 2016, through June 30, 2017, MCP-Specific Evaluation Report................................................................C-33
Alameda Alliance for Health Performance Evaluation Report: July 1, 2017–June 30, 2018 California Department of Health Care Services
Page C-ii Health Services Advisory Group, Inc.

Medi-Cal Managed Care External Quality Review Technical ReportAppendix C: Performance Evaluation ReportAlameda Alliance for Health July 1, 2017–June 30, 2018
1. Introduction
The California Department of Health Care Services (DHCS) contracted with Health Services Advisory Group, Inc. (HSAG), an external quality review organization (EQRO), to prepare the federally required Medi-Cal Managed Care External Quality Review Technical Report, July 1, 2017–June 30, 2018. The technical report provides an overview of the objectives and methodology for conducting the external quality review (EQR) activities, including requirements related to each activity. Additionally, the technical report provides aggregated results and recommendations for DHCS for each activity.
This appendix is specific to DHCS’ contracted Medi-Cal managed care health plan (MCP), Alameda Alliance for Health (“AAH” or “the MCP”). The purpose of this appendix is to provide MCP-specific results of each activity and an assessment of the MCP’s strengths and opportunities for improvement with respect to the quality and timeliness of and access to health care services furnished to Medi-Cal Managed Care (MCMC) beneficiaries (referred to as “beneficiaries” in this report). The review period for this MCP-specific evaluation report is July 1, 2017, through June 30, 2018. HSAG will report on activities that take place beyond the review period in AAH’s 2018–19 MCP-specific evaluation report. This MCP-specific evaluation report references activities and methodologies described in detail by HSAG in the technical report section.
The aggregate EQR technical report and all MCP- and specialty health plan (SHP)-specific performance evaluation reports reflect HSAG’s external, independent assessment of the quality and timeliness of, and access to, care that MCPs and SHPs are providing to beneficiaries.
Medi-Cal Managed Care Health Plan Overview AAH is a full-scope MCP delivering services to beneficiaries as a “Local Initiative” (LI) MCP under the Two-Plan Model (TPM). Beneficiaries may enroll in AAH, the LI MCP; or in Anthem Blue Cross Partnership Plan, the alternative commercial plan (CP).
AAH became operational in Alameda County to provide MCMC services effective 1996. As of June 30, 2018, AAH had 260,226 beneficiaries.1 This represents 81 percent of the beneficiaries enrolled in Alameda County.
1 Medi-Cal Managed Care Enrollment Report—June 2018. Available at: http://www.dhcs.ca.gov/dataandstats/reports/Pages/MMCDMonthlyEnrollment.aspx. Accessed on: Sep 19, 2018.
Alameda Alliance for Health Performance Evaluation Report: July 1, 2017–June 30, 2018 California Department of Health Care Services
Page C-1 Health Services Advisory Group, Inc.

Medi-Cal Managed Care External Quality Review Technical ReportAppendix C: Performance Evaluation ReportAlameda Alliance for Health July 1, 2017–June 30, 2018
2. Managed Care Health Plan Compliance
Compliance Reviews Conducted The following is a summary of the most recent reviews conducted for AAH. Unless noted, HSAG’s compliance review summaries are based on final audit/survey reports issued and corrective action plan (CAP) closeout letters dated on or before the end of the review period for this report (June 30, 2018). The descriptions of the various types of reviews may be found within the main section of this technical report.
Table 2.1 summarizes the results and status of the DHCS Audits & Investigations Division (A&I) Medical and State Supported Services Audits of AAH. A&I conducted the initial on-site audits from June 27, 2016, through July 7, 2016, for the audit period of June 1, 2015, through May 31, 2016. Due to subsequent information received, A&I expanded its review and conducted additional on-site reviews in intervals from February 7, 2017, through May 9, 2017. A&I also extended the audit review period through May 31, 2017.
Table 2.1—DHCS A&I Medical and State Supported Services Audits of AAHAudit Review Period: June 1, 2015, through May 31, 2017
Category Evaluated Deficiencies (Yes/No) Monitoring Status
Utilization Management Yes CAP initiated following the audit and subsequently closed.
Case Management and Coordination of Care Yes CAP initiated following the audit
and subsequently closed.
Access and Availability of Care Yes CAP initiated following the audit and subsequently closed.
Member’s Rights Yes CAP initiated following the audit and subsequently closed.
Quality Management Yes CAP initiated following the audit and subsequently closed.
Administrative and Organizational Capacity Yes CAP initiated following the audit
and subsequently closed. State Supported Services No Not applicable.
Alameda Alliance for Health Performance Evaluation Report: July 1, 2017–June 30, 2018 California Department of Health Care Services
Page C-2 Health Services Advisory Group, Inc.

MANAGED CARE HEALTH PLAN COMPLIANCE
Strengths—Compliance Reviews A&I identified no deficiencies in the State Supported Services category during the June 27, 2016, through July 7, 2016, and February 7, 2017, through May 9, 2017, Medical and State Supported Services Audits of AAH. Additionally, AAH’s responses to the MCP’s CAP for the deficiencies that A&I identified during the audits resulted in DHCS closing the CAP.
Opportunities for Improvement—Compliance Reviews While the MCP has no outstanding deficiencies from the June 27, 2016, through July 7, 2016, or February 7, 2017, through May 9, 2017, A&I Medical and State Supported Services Audits, AAH’s CAP required the MCP to make extensive changes to the MCP’s operations that could not be reasonably achieved without additional time. The CAP closeout letters to AAH indicated that A&I would assess the MCP’s progress on full implementation of corrective actions during the consecutive Medical Audit, which DHCS conducted in June 2018. HSAG will summarize the results of the June 2018 audit in AAH’s 2018–19 MCP-specific evaluation report.
Alameda Alliance for Health Performance Evaluation Report: July 1, 2017–June 30, 2018 California Department of Health Care Services
Page C-3 Health Services Advisory Group, Inc.

Medi-Cal Managed Care External Quality Review Technical ReportAppendix C: Performance Evaluation ReportAlameda Alliance for Health July 1, 2017–June 30, 2018
3. Managed Care Health Plan Performance Measures
Performance Measure Validation Results The HEDIS®2 2018 Compliance Audit Final Report of Findings for Alameda Alliance for Health contains the detailed findings and recommendations from HSAG’s NCQA HEDIS Compliance Audit™.3 HSAG auditors determined that AAH followed the appropriate specifications to produce valid rates, and identified no issues of concern.
Performance Measure Results and Findings After validating the MCP’s performance measure rates, HSAG assessed the results. See Table 3.1 through Table 3.9 for AAH’s performance measure results for reporting years (RYs) 2015 through 2018 and performance measure findings for RY 2018. The RY is the year in which the MCP reported the rates. The RY rates reflect measurement year (MY) data from the previous calendar year. Note that data may not be available for all four years.
Note the following regarding Table 3.1 through Table 3.9:
♦ To allow HSAG to provide meaningful assessment of MCP performance and actionable recommendations, HSAG, in collaboration with DHCS, organized the measures into domains based on the health care areas each measure affects. Table 3.1 through Table 3.8 present the performance measure results and findings by domain, and Table 3.9 presents the RY 2018 performance measure findings for the domains combined.
♦ To assess performance for each MCP reporting unit, HSAG compares the rates to national benchmarks. Rates indicating performance above the high performance levels (HPLs) are shaded in gray, and rates indicating performance below the minimum performance levels (MPLs) are bolded. ■ For measures with rates below the MPLs, DHCS requires MCPs to submit to DHCS
improvement plans (IPs) to address the rates below the MPLs (unless MCPs are reporting the rates for the first time).
■ For MCPs that meet DHCS’ Quality of Care CAP thresholds, DHCS issues a CAP; if an MCP’s performance is such that it may trigger a CAP in the following year, DHCS issues an advance warning letter.
■ IPs and CAPs consist of submission of Plan-Do-Study-Act (PDSA) Cycle Worksheets, Quality Improvement (QI) Summaries, or completion of Performance Improvement Projects (PIPs)—as determined by DHCS.
2 Healthcare Effectiveness Data and Information Set (HEDIS®) is a registered trademark of the National Committee for Quality Assurance (NCQA).
3 NCQA HEDIS Compliance AuditTM is a trademark of NCQA.
Alameda Alliance for Health Performance Evaluation Report: July 1, 2017–June 30, 2018 California Department of Health Care Services
Page C-4 Health Services Advisory Group, Inc.

MANAGED CARE HEALTH PLAN PERFORMANCE MEASURES
♦ For RYs 2016, 2017, and 2018, the HPLs and MPLs represent the NCQA Quality Compass®4 Medicaid health maintenance organization (HMO) 90th and 25th percentiles, respectively.
♦ For RY 2015, the HPLs and MPLs represent the NCQA HEDIS Audit Means, Percentiles, and Ratios 90th and 25th percentiles, respectively. For the Comprehensive Diabetes Care—HbA1c Poor Control (>9.0 Percent) measure, for which a lower rate indicates more favorable performance, the HPL and MPL are based on the 10th and 75th percentiles, respectively.
♦ HSAG includes the specific HPL and MPL values for RY 2018 in Section 6 of the Medi-Cal Managed Care External Quality Review Technical Report, July 1, 2017–June 30, 2018 (“Managed Care Health Plan Performance Measures”).
Preventive Screening and Children’s Health
Table 3.1 presents the four-year trending information for the performance measures within the Preventive Screening and Children’s Health domain.
Note the following regarding Table 3.1:
♦ Although HSAG includes information on the MCP’s performance related to the four Children and Adolescents’ Access to Primary Care measures, DHCS did not hold MCPs accountable to meet the MPLs for these measures for RYs 2015 through 2018 (i.e., DHCS did not require MCPs to submit IPs if rates for the measures were below the MPLs). DHCS made this decision due to the small range of variation between the HPL and MPL thresholds for each measure.
♦ Any comparison of RY 2018 performance to RY 2017 or to benchmarks related to the Immunizations for Adolescents—Combination 2 measure should be exercised with caution given the changes that NCQA made to the specification for this measure for RY 2018. NCQA released guidance that recommended a break in trending for this measure; however, DHCS determined to continue trending because the specification change should result in higher rates.
4 Quality Compass® is a registered trademark of NCQA.
Alameda Alliance for Health Performance Evaluation Report: July 1, 2017–June 30, 2018 California Department of Health Care Services
Page C-5 Health Services Advisory Group, Inc.
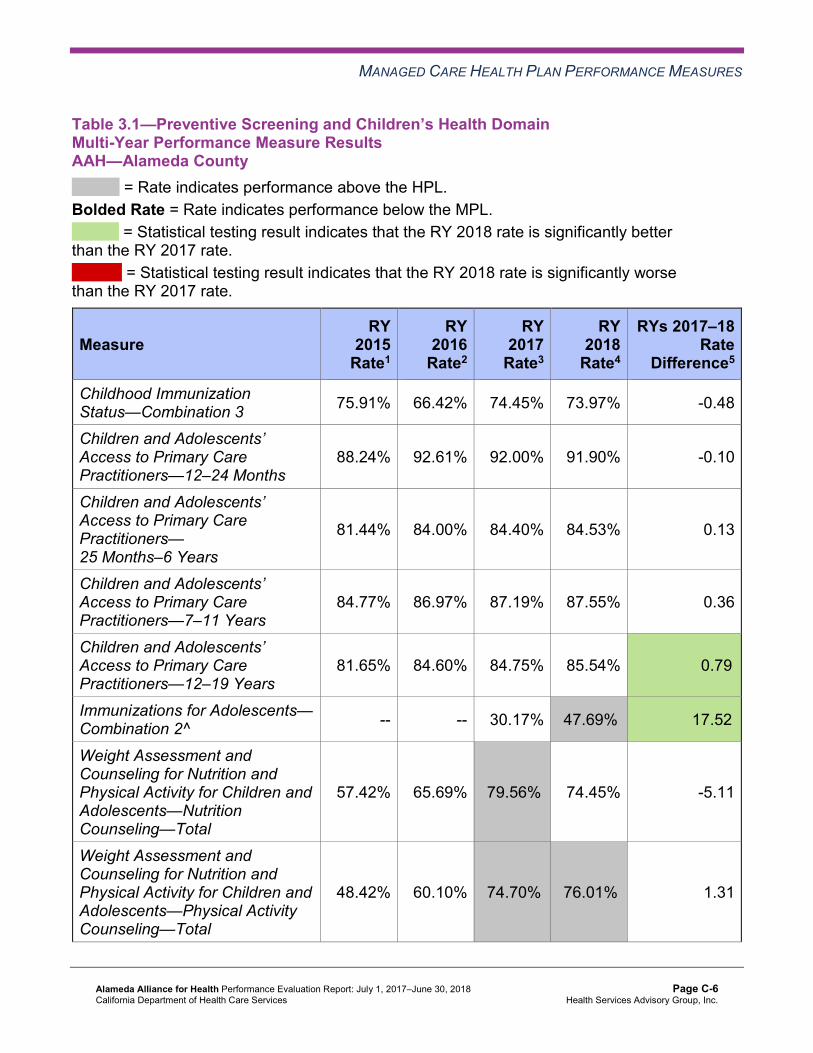
MANAGED CARE HEALTH PLAN PERFORMANCE MEASURES
Table 3.1—Preventive Screening and Children’s Health DomainMulti-Year Performance Measure Results AAH—Alameda County
H = Rate indicates performance above the HPL. Bolded Rate = Rate indicates performance below the MPL.
B = Statistical testing result indicates that the RY 2018 rate is significantly better than the RY 2017 rate.
W = Statistical testing result indicates that the RY 2018 rate is significantly worse than the RY 2017 rate.
Measure RY
2015 Rate1
RY 2016
Rate2
RY 2017
Rate3
RY 2018
Rate4
RYs 2017–18 Rate
Difference5
Childhood Immunization Status—Combination 3 75.91% 66.42% 74.45% 73.97% -0.48
Children and Adolescents’ Access to Primary Care Practitioners—12–24 Months
88.24% 92.61% 92.00% 91.90% -0.10
Children and Adolescents’ Access to Primary Care Practitioners— 25 Months–6 Years
81.44% 84.00% 84.40% 84.53% 0.13
Children and Adolescents’ Access to Primary Care Practitioners—7–11 Years
84.77% 86.97% 87.19% 87.55% 0.36
Children and Adolescents’ Access to Primary Care Practitioners—12–19 Years
81.65% 84.60% 84.75% 85.54% 0.79B
Immunizations for Adolescents— Combination 2^ -- -- 30.17% 47.69%H 17.52B
Weight Assessment and Counseling for Nutrition and Physical Activity for Children and Adolescents—Nutrition Counseling—Total
57.42% 65.69% 79.56%H 74.45% -5.11
Weight Assessment and Counseling for Nutrition and Physical Activity for Children and Adolescents—Physical Activity Counseling—Total
48.42% 60.10% 74.70%H 76.01%H 1.31
Alameda Alliance for Health Performance Evaluation Report: July 1, 2017–June 30, 2018 California Department of Health Care Services
Page C-6 Health Services Advisory Group, Inc.

MANAGED CARE HEALTH PLAN PERFORMANCE MEASURES
Measure RY
2015 Rate1
RY 2016
Rate2
RY 2017
Rate3
RY 2018
Rate4
RYs 2017–18 Rate
Difference5
Well-Child Visits in the Third, Fourth, Fifth, and Sixth Years of Life
71.53% 68.61% 73.13% 79.27% 6.14
1 RY 2015 rates reflect MY data from January 1, 2014, through December 31, 2014. 2 RY 2016 rates reflect MY data from January 1, 2015, through December 31, 2015. 3 RY 2017 rates reflect MY data from January 1, 2016, through December 31, 2016. 4 RY 2018 rates reflect MY data from January 1, 2017, through December 31, 2017. 5 Performance comparisons are based on the Chi-square test of statistical significance, with a p value of <0.05. ^ Caution should be exercised when assessing MCP performance for this measure given the changes that NCQA made to the specification for this measure for RY 2018. -- Indicates that the rate is not available.
Table 3.2 presents findings for the RY 2018 performance measures within the Preventive Screening and Children’s Health domain.
Note the following regarding Table 3.2:
♦ DHCS did not hold MCPs accountable to meet MPLs for all four Children and Adolescents’ Access to Primary Care measures within this domain; therefore, HSAG did not include these measures in its assessment of the MCP’s performance related to HPLs and MPLs.
♦ The Immunizations for Adolescents—Combination 2 measure was a first-year measure in RY 2017, and DHCS established no MPL for this measure for RY 2017 because no comparable benchmark existed; therefore, HSAG did not include this measure in the denominators for calculating the percentage of measures with rates that moved to above or below the MPLs in RY 2018.
Alameda Alliance for Health Performance Evaluation Report: July 1, 2017–June 30, 2018 California Department of Health Care Services
Page C-7 Health Services Advisory Group, Inc.

MANAGED CARE HEALTH PLAN PERFORMANCE MEASURES
Table 3.2—Preventive Screening and Children’s Health DomainRY 2018 (MY 2017) Performance Measure Findings AAH—Alameda County
Criteria Number of Measures
MeetingCriteria
Total Number of Measures
Percentage of Measures
MeetingCriteria
RY 2018 Rates Above HPLs 2 5 40.00% Rates Above HPLs for the Last Three or More Consecutive Years 0 4 0.00%
RY 2018 Rates Significantly Better than RY 2017 Rates* 1 5 20.00%
Rates that Moved from Below MPLs in RY 2017 to Above MPLs in RY 2018 0 0 N/A
RY 2018 Rates Below MPLs 0 5 0.00% Rates Below MPLs for the Last Three or More Consecutive Years 0 4 0.00%
RY 2018 Rates Significantly Worse than RY 2017 Rates* 0 5 0.00%
Rates that Moved from Above MPLs in RY 2017 to Below MPLs in RY 2018 0 4 0.00%
* Performance comparisons are based on the Chi-square test of statistical significance, with a p value of <0.05. N/A = No rates above or below the MPLs from the previous year exist to include in the denominator for calculating whether or not rates moved to above or below MPLs in the most recent year.
Alameda Alliance for Health Performance Evaluation Report: July 1, 2017–June 30, 2018 California Department of Health Care Services
Page C-8 Health Services Advisory Group, Inc.

MANAGED CARE HEALTH PLAN PERFORMANCE MEASURES
Preventive Screening and Women’s Health
Table 3.3 presents the four-year trending information for the performance measures within the Preventive Screening and Women’s Health domain.
Note that any comparison of RY 2018 performance to RY 2017 or to benchmarks related to the Breast Cancer Screening measure should be exercised with caution given the changes that NCQA made to the specification for this measure for RY 2018. NCQA released guidance that recommended a break in trending for this measure; however, DHCS determined to continue trending because the specification change should result in higher rates.
Table 3.3—Preventive Screening and Women’s Health DomainMulti-Year Performance Measure Results AAH—Alameda County
H = Rate indicates performance above the HPL. Bolded Rate = Rate indicates performance below the MPL.
B = Statistical testing result indicates that the RY 2018 rate is significantly better than the RY 2017 rate.
W = Statistical testing result indicates that the RY 2018 rate is significantly worse than the RY 2017 rate.
Measure RY
2015 Rate1
RY 2016
Rate2
RY 2017
Rate3
RY 2018
Rate4
RYs 2017–18 Rate
Difference5
Breast Cancer Screening^ -- -- 62.52% 63.88% 1.36B
Cervical Cancer Screening 53.53% 51.09% 60.34% 60.00% -0.34 Prenatal and Postpartum Care— Postpartum Care 55.47% 59.61% 67.15% 68.31% 1.16
Prenatal and Postpartum Care— Timeliness of Prenatal Care 66.67% 73.97% 84.43% 85.52% 1.09
1 RY 2015 rates reflect MY data from January 1, 2014, through December 31, 2014. 2 RY 2016 rates reflect MY data from January 1, 2015, through December 31, 2015. 3 RY 2017 rates reflect MY data from January 1, 2016, through December 31, 2016. 4 RY 2018 rates reflect MY data from January 1, 2017, through December 31, 2017. 5 Performance comparisons are based on the Chi-square test of statistical significance, with a p value of <0.05. ^ Caution should be exercised when assessing MCP performance for this measure given the changes that NCQA made to the specification for this measure for RY 2018. -- Indicates that the rate is not available.
Alameda Alliance for Health Performance Evaluation Report: July 1, 2017–June 30, 2018 California Department of Health Care Services
Page C-9 Health Services Advisory Group, Inc.

MANAGED CARE HEALTH PLAN PERFORMANCE MEASURES
Table 3.4 presents findings for the RY 2018 performance measures within the Preventive Screening and Women’s Health domain. Note that the Breast Cancer Screening measure was a first-year measure in RY 2017, and DHCS did not hold MCPs accountable to meet an MPL for this measure in RY 2017; therefore, HSAG did not include this measure in the denominators for calculating the percentage of measures with rates that moved to above or below the MPLs in RY 2018.
Table 3.4—Preventive Screening and Women’s Health DomainRY 2018 (MY 2017) Performance Measure Findings AAH—Alameda County
Criteria Number of Measures
MeetingCriteria
Total Number of Measures
Percentage of Measures
MeetingCriteria
RY 2018 Rates Above HPLs 0 4 0.00% Rates Above HPLs for the Last Three or More Consecutive Years 0 3 0.00%
RY 2018 Rates Significantly Better than RY 2017 Rates* 1 4 25.00%
Rates that Moved from Below MPLs in RY 2017 to Above MPLs in RY 2018 0 0 N/A
RY 2018 Rates Below MPLs 0 4 0.00% Rates Below MPLs for the Last Three or More Consecutive Years 0 3 0.00%
RY 2018 Rates Significantly Worse than RY 2017 Rates* 0 4 0.00%
Rates that Moved from Above MPLs in RY 2017 to Below MPLs in RY 2018 0 3 0.00%
* Performance comparisons are based on the Chi-square test of statistical significance, with a p value of <0.05. N/A = No rates above or below the MPLs from the previous year exist to include in the denominator for calculating whether or not rates moved to above or below MPLs in the most recent year.
Alameda Alliance for Health Performance Evaluation Report: July 1, 2017–June 30, 2018 California Department of Health Care Services
Page C-10 Health Services Advisory Group, Inc.

MANAGED CARE HEALTH PLAN PERFORMANCE MEASURES
Care for Chronic Conditions
Table 3.5 presents the four-year trending information for the performance measures within the Care for Chronic Conditions domain.
Table 3.5—Care for Chronic Conditions Domain Multi-Year Performance Measure Results AAH—Alameda County
H = Rate indicates performance above the HPL. Bolded Rate = Rate indicates performance below the MPL.
B = Statistical testing result indicates that the RY 2018 rate is significantly better than the RY 2017 rate.
W = Statistical testing result indicates that the RY 2018 rate is significantly worse than the RY 2017 rate.
Measure RY
2015 Rate1
RY 2016
Rate2
RY 2017
Rate3
RY 2018
Rate4
RYs 2017–18 Rate
Difference5
Annual Monitoring for Patients on Persistent Medications— ACE Inhibitors or ARBs
83.12% 84.27% 86.06% 86.52% 0.46
Annual Monitoring for Patients on Persistent Medications— Diuretics
81.67% 83.22% 85.14% 85.60% 0.46
Asthma Medication Ratio -- -- 60.65% 62.85% 2.20B
Comprehensive Diabetes Care— Blood Pressure Control (<140/90 mm Hg)
40.39% 58.64% 61.56% 61.80% 0.24
Comprehensive Diabetes Care— Eye Exam (Retinal) Performed 46.23% 49.64% 55.23% 58.64% 3.41
Comprehensive Diabetes Care— HbA1c Control (<8.0 Percent) 41.85% 48.42% 50.12% 53.77% 3.65
Comprehensive Diabetes Care— HbA1c Poor Control (>9.0 Percent)*
51.09% 40.63% 37.96% 34.31% -3.65
Comprehensive Diabetes Care— HbA1c Testing 87.10% 83.21% 85.89% 87.59% 1.70
Alameda Alliance for Health Performance Evaluation Report: July 1, 2017–June 30, 2018 California Department of Health Care Services
Page C-11 Health Services Advisory Group, Inc.

MANAGED CARE HEALTH PLAN PERFORMANCE MEASURES
Measure RY
2015 Rate1
RY 2016
Rate2
RY 2017
Rate3
RY 2018
Rate4
RYs 2017–18 Rate
Difference5
Comprehensive Diabetes Care— Medical Attention for Nephropathy
80.05% 88.08%H 88.81% 89.54% 0.73
Controlling High Blood Pressure 43.07% 57.66% 65.21% 65.69% 0.48 1 RY 2015 rates reflect MY data from January 1, 2014, through December 31, 2014. 2 RY 2016 rates reflect MY data from January 1, 2015, through December 31, 2015. 3 RY 2017 rates reflect MY data from January 1, 2016, through December 31, 2016. 4 RY 2018 rates reflect MY data from January 1, 2017, through December 31, 2017. 5 Performance comparisons are based on the Chi-square test of statistical significance, with a p value of <0.05. * A lower rate indicates better performance for this measure. -- Indicates that the rate is not available.
Table 3.6 presents findings for the RY 2018 performance measures within the Care for Chronic Conditions domain. Note that the Asthma Medication Ratio measure was a first-year measure in RY 2017, and DHCS did not hold MCPs accountable to meet an MPL for this measure in RY 2017; therefore, HSAG did not include this measure in the denominators for calculating the percentage of measures with rates that moved to above or below the MPLs in RY 2018.
Table 3.6—Care for Chronic Conditions Domain RY 2018 (MY 2017) Performance Measure Findings AAH—Alameda County
Criteria Number of Measures
MeetingCriteria
Total Number of Measures
Percentage of Measures
MeetingCriteria
RY 2018 Rates Above HPLs 0 10 0.00% Rates Above HPLs for the Last Three or More Consecutive Years 0 9 0.00%
RY 2018 Rates Significantly Better than RY 2017 Rates* 1 10 10.00%
Rates that Moved from Below MPLs in RY 2017 to Above MPLs in RY 2018 1 1 100.00%
RY 2018 Rates Below MPLs 0 10 0.00%
Alameda Alliance for Health Performance Evaluation Report: July 1, 2017–June 30, 2018 California Department of Health Care Services
Page C-12 Health Services Advisory Group, Inc.

MANAGED CARE HEALTH PLAN PERFORMANCE MEASURES
Criteria Number of Measures
MeetingCriteria
Total Number of Measures
Percentage of Measures
MeetingCriteria
Rates Below MPLs for the Last Three or More Consecutive Years 0 9 0.00%
RY 2018 Rates Significantly Worse than RY 2017 Rates* 0 10 0.00%
Rates that Moved from Above MPLs in RY 2017 to Below MPLs in RY 2018 0 8 0.00%
* Performance comparisons are based on the Chi-square test of statistical significance, with a p value of <0.05.
Assessment of Improvement Plans—Care for Chronic Conditions
Based on RY 2017 performance measure results, AAH was required to submit an IP for the Annual Monitoring for Patients on Persistent Medications—Diuretics measure.
To address AAH’s performance below the MPL for multiple years for the Annual Monitoring for Patients on Persistent Medications—Diuretics measure, DHCS required AAH to submit a Pilot QI Strategy Summary/Progress Report that described the quality improvement strategies that the MCP implemented to improve its performance on the measure. AAH indicated that the MCP initially conducted a SWOT analysis (Strengths, Weaknesses, Opportunities, Threats). Based on the SWOT analysis results, AAH identified multiple strategies for the MCP to implement at the provider and beneficiary levels to improve the rate for the Annual Monitoring for Patients on Persistent Medications— Diuretics measure. AAH reported implementing the following strategies:
♦ In coordination with a lab vendor, AAH offered beneficiaries a lab application for their smartphones that enables the beneficiaries to search lab locations and receive notifications of lab services wait times. When rolling out the lab application, the MCP prioritized making it available to beneficiaries identified on the gap-in-care reports as needing labs conducted.
♦ The MCP implemented pre-ordered labs prior to beneficiary appointments at low-performing, high-volume delegated provider sites.
♦ AAH partnered with pharmacists to provide to beneficiaries reminders regarding obtaining labs when the beneficiaries were seen for routine medication refills.
The rate for the Annual Monitoring for Patients on Persistent Medications—Diuretics measure improved to above the MPL in RY 2018.
Alameda Alliance for Health Performance Evaluation Report: July 1, 2017–June 30, 2018 California Department of Health Care Services
Page C-13 Health Services Advisory Group, Inc.

MANAGED CARE HEALTH PLAN PERFORMANCE MEASURES
Appropriate Treatment and Utilization
Table 3.7 presents the four-year trending information for the performance measures within the Appropriate Treatment and Utilization domain.
Note the following regarding Table 3.7:
♦ The All-Cause Readmissions measure is a non-HEDIS measure originally developed for DHCS’ All-Cause Readmissions collaborative quality improvement project (QIP); therefore, DHCS does not establish an HPL or MPL for this measure. For the All-Cause Readmissions measure, a lower rate indicates better performance (i.e., fewer readmissions).
♦ The two Ambulatory Care measures are utilization measures, which measure the volume of services used. DHCS does not hold MCPs accountable to meet MPLs for utilization measures, and HSAG does not compare performance for these measures against HPLs and MPLs. Additionally, because high and low rates do not necessarily indicate better or worse performance, HSAG did not compare performance for these measures across years.
♦ DHCS established no HPL or MPL for the two Depression Screening and Follow-Up for Adolescents and Adults measures for RY 2018 because no comparable benchmarks exist. Additionally, although MCPs reported the two Depression Screening and Follow-Up for Adolescents and Adults measures for RY 2018, HSAG does not present the performance measure results for these measures in this report because the reported rates do not accurately represent services being provided. This is due to the Depression Screening and Follow-Up for Adolescents and Adults measures being new HEDIS measures for RY 2018, NCQA requiring MCPs to submit rates for these measures using the new Electronic Clinical Data Systems (ECDS) reporting methodology, and inconsistent data reporting processes by calculation vendors. Thus, MCPs experienced numerous challenges obtaining data sources to use for ECDS reporting. DHCS and HSAG, in consultation with NCQA, will work with MCPs to improve data capture for RY 2019.
♦ Note that due to changes that NCQA made to the specifications for the Use of Imaging Studies for Low Back Pain measure in RY 2018, NCQA released guidance to exercise caution when trending the results for this measure. Therefore, caution should be used when comparing MCP performance across years or when comparing MCP results to benchmarks related to the Use of Imaging Studies for Low Back Pain measure, as differences in rates may be a result of the specification changes rather than a reflection of performance.
Alameda Alliance for Health Performance Evaluation Report: July 1, 2017–June 30, 2018 California Department of Health Care Services
Page C-14 Health Services Advisory Group, Inc.

MANAGED CARE HEALTH PLAN PERFORMANCE MEASURES
Table 3.7—Appropriate Treatment and Utilization DomainMulti-Year Performance Measure Results AAH—Alameda County
H = Rate indicates performance above the HPL. Bolded Rate = Rate indicates performance below the MPL.
B = Statistical testing result indicates that the RY 2018 rate is significantly better than the RY 2017 rate.
W = Statistical testing result indicates that the RY 2018 rate is significantly worse than the RY 2017 rate.
Measure RY
2015 Rate1
RY 2016
Rate2
RY 2017
Rate3
RY 2018
Rate4
RYs 2017–18 Rate
Difference5
All-Cause Readmissions* 16.44% 20.03% 16.00% 17.10% 1.10 Ambulatory Care—Emergency Department (ED) Visits per 1,000 Member Months**
35.88 60.05 46.02 44.64 Not Tested
Ambulatory Care—Outpatient Visits per 1,000 Member Months**
275.87 286.41 253.95 278.91 Not Tested
Avoidance of Antibiotic Treatment in Adults With Acute Bronchitis
34.48% 32.80% 38.05% 41.23%H 3.18
Use of Imaging Studies for Low Back Pain^ 87.33%H 83.45%H 76.28% 81.99%H 5.71B
1 RY 2015 rates reflect MY data from January 1, 2014, through December 31, 2014. 2 RY 2016 rates reflect MY data from January 1, 2015, through December 31, 2015. 3 RY 2017 rates reflect MY data from January 1, 2016, through December 31, 2016. 4 RY 2018 rates reflect MY data from January 1, 2017, through December 31, 2017. 5 Performance comparisons are based on the Chi-square test of statistical significance, with a p value of <0.05. * A lower rate indicates better performance for this measure. ** Member months are a member's “contribution” to the total yearly membership. ^ Caution should be exercised when assessing MCP performance for this measure given the changes that NCQA made to the specification for this measure for RY 2018. Not Tested = An RY 2017–18 rate difference was not calculated because high and low rates do not necessarily indicate better or worse performance.
Alameda Alliance for Health Performance Evaluation Report: July 1, 2017–June 30, 2018 California Department of Health Care Services
Page C-15 Health Services Advisory Group, Inc.

MANAGED CARE HEALTH PLAN PERFORMANCE MEASURES
Table 3.8 presents findings for the RY 2018 performance measures within the Appropriate Treatment and Utilization domain. DHCS did not hold MCPs accountable to meet MPLs for the following measures within this domain; therefore, HSAG did not include these measures in its assessment of the MCP’s performance related to HPLs and MPLs:
♦ All-Cause Readmissions ♦ Both Ambulatory Care measures
Table 3.8—Appropriate Treatment and Utilization DomainRY 2018 (MY 2017) Performance Measure FindingsAAH—Alameda County
Criteria Number of Measures
MeetingCriteria
Total Number of Measures
Percentage of Measures
MeetingCriteria
RY 2018 Rates Above HPLs 2 2 100.00% Rates Above HPLs for the Last Three or More Consecutive Years 0 2 0.00%
RY 2018 Rates Significantly Better than RY 2017 Rates* 1 3 33.33%
Rates that Moved from Below MPLs in RY 2017 to Above MPLs in RY 2018 0 0 N/A
RY 2018 Rates Below MPLs 0 2 0.00% Rates Below MPLs for the Last Three or More Consecutive Years 0 2 0.00%
RY 2018 Rates Significantly Worse than RY 2017 Rates* 0 3 0.00%
Rates that Moved from Above MPLs in RY 2017 to Below MPLs in RY 2018 0 2 0.00%
* Performance comparisons are based on the Chi-square test of statistical significance, with a p value of <0.05. N/A = No rates above or below the MPLs from the previous year exist to include in the denominator for calculating whether or not rates moved to above or below MPLs in the most recent year.
Alameda Alliance for Health Performance Evaluation Report: July 1, 2017–June 30, 2018 California Department of Health Care Services
Page C-16 Health Services Advisory Group, Inc.

MANAGED CARE HEALTH PLAN PERFORMANCE MEASURES
Performance Measure Findings—All Domains
Table 3.9 presents a summary of AAH’s RY 2018 performance across all External Accountability Set (EAS) measures.
Note the following regarding Table 3.9: ♦ DHCS did not hold MCPs accountable to meet MPLs for the following measures; therefore,
HSAG did not include these measures in its assessment of the MCP’s performance related to HPLs and MPLs: ■ All-Cause Readmissions ■ Both Ambulatory Care measures ■ All four Children and Adolescents’ Access to Primary Care measures
♦ DHCS did not hold MCPs accountable to meet MPLs for the following measures in RY 2017; therefore, HSAG did not include these measures in the denominators for calculating the percentage of measures with rates that moved to above or below the MPLs in RY 2018 and for calculating the percentage of measures with rates below MPLs for only the last two consecutive years: ■ Asthma Medication Ratio ■ Breast Cancer Screening ■ Immunizations for Adolescents—Combination 2
Table 3.9—RY 2018 (MY 2017) Performance Measure Findings for All Domains AAH—Alameda County
Criteria Number of Measures
MeetingCriteria
Total Number of Measures
Percentage of Measures
MeetingCriteria
RY 2018 Rates Above HPLs 4 21 19.05% Rates Above HPLs for the Last Three or More Consecutive Years 0 18 0.00%
RY 2018 Rates Significantly Better than RY 2017 Rates* 4 22 18.18%
Rates that Moved from Below MPLs in RY 2017 to Above MPLs in RY 2018 1 1 100.00%
RY 2018 Rates Below MPLs 0 21 0.00% Rates Below MPLs for Only the Last Two Consecutive Years 0 18 0.00%
Rates Below MPLs for the Last Three or More Consecutive Years 0 18 0.00%
Alameda Alliance for Health Performance Evaluation Report: July 1, 2017–June 30, 2018 California Department of Health Care Services
Page C-17 Health Services Advisory Group, Inc.

MANAGED CARE HEALTH PLAN PERFORMANCE MEASURES
Criteria Number of Measures
MeetingCriteria
Total Number of Measures
Percentage of Measures
MeetingCriteria
RY 2018 Rates Significantly Worse than RY 2017 Rates* 0 22 0.00%
Rates that Moved from Above MPLs in RY 2017 to Below MPLs in RY 2018 0 17 0.00%
* Performance comparisons are based on the Chi-square test of statistical significance, with a p value of <0.05.
Seniors and Persons with Disabilities Performance Measure Results Table 3.10 presents the four-year trending information for the Seniors and Persons with Disabilities (SPD) population, and Table 3.11 presents the four-year trending information for the non-SPD population for the measures that DHCS required MCPs to stratify for the SPD and non-SPD populations. The tables also show the differences in rates between RY 2017 and RY 2018.
Table 3.12 presents the SPD and non-SPD rates, a comparison of the SPD and non-SPD rates,5 and the total combined rate for each measure.
Table 3.10—Multi-Year SPD Performance Measure Trend Table AAH—Alameda County
B = Statistical testing result indicates that the RY 2018 SPD rate is significantly better than the RY 2017 SPD rate.
W = Statistical testing result indicates that the RY 2018 SPD rate is significantly worse than the RY 2017 SPD rate.
Measure RY
2015 SPD
Rate1
RY 2016 SPD
Rate2
RY 2017 SPD
Rate3
RY 2018 SPD
Rate4
RYs 2017–18 Rate
Difference5
All-Cause Readmissions* 19.60% 25.11% 19.24% 19.98% 0.74 Ambulatory Care—Emergency Department (ED) Visits per 1,000 Member Months**
59.71 150.09 84.58 81.35 Not Tested
5 HSAG calculated statistical significance between the SPD and non-SPD rates for each measure using a Chi-square test. This information is displayed in the “SPD/Non-SPD Rate Difference” column in Table 3.12.
Alameda Alliance for Health Performance Evaluation Report: July 1, 2017–June 30, 2018 California Department of Health Care Services
Page C-18 Health Services Advisory Group, Inc.
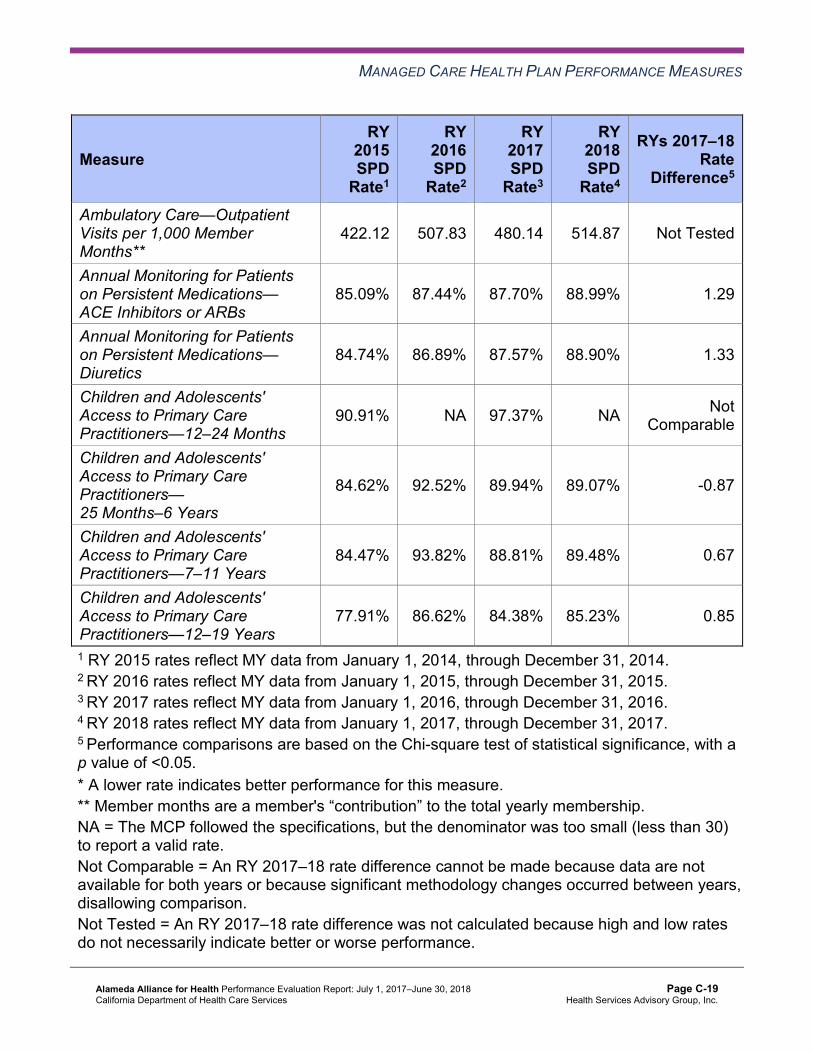
MANAGED CARE HEALTH PLAN PERFORMANCE MEASURES
Measure RY
2015 SPD
Rate1
RY 2016 SPD
Rate2
RY 2017 SPD
Rate3
RY 2018 SPD
Rate4
RYs 2017–18 Rate
Difference5
Ambulatory Care—Outpatient Visits per 1,000 Member Months**
422.12 507.83 480.14 514.87 Not Tested
Annual Monitoring for Patients on Persistent Medications— ACE Inhibitors or ARBs
85.09% 87.44% 87.70% 88.99% 1.29
Annual Monitoring for Patients on Persistent Medications— Diuretics
84.74% 86.89% 87.57% 88.90% 1.33
Children and Adolescents' Access to Primary Care Practitioners—12–24 Months
90.91% NA 97.37% NA Not Comparable
Children and Adolescents' Access to Primary Care Practitioners— 25 Months–6 Years
84.62% 92.52% 89.94% 89.07% -0.87
Children and Adolescents' Access to Primary Care Practitioners—7–11 Years
84.47% 93.82% 88.81% 89.48% 0.67
Children and Adolescents' Access to Primary Care Practitioners—12–19 Years
77.91% 86.62% 84.38% 85.23% 0.85
1 RY 2015 rates reflect MY data from January 1, 2014, through December 31, 2014. 2 RY 2016 rates reflect MY data from January 1, 2015, through December 31, 2015. 3 RY 2017 rates reflect MY data from January 1, 2016, through December 31, 2016. 4 RY 2018 rates reflect MY data from January 1, 2017, through December 31, 2017. 5 Performance comparisons are based on the Chi-square test of statistical significance, with a p value of <0.05. * A lower rate indicates better performance for this measure. ** Member months are a member's “contribution” to the total yearly membership. NA = The MCP followed the specifications, but the denominator was too small (less than 30) to report a valid rate. Not Comparable = An RY 2017–18 rate difference cannot be made because data are not available for both years or because significant methodology changes occurred between years, disallowing comparison. Not Tested = An RY 2017–18 rate difference was not calculated because high and low rates do not necessarily indicate better or worse performance.
Alameda Alliance for Health Performance Evaluation Report: July 1, 2017–June 30, 2018 California Department of Health Care Services
Page C-19 Health Services Advisory Group, Inc.
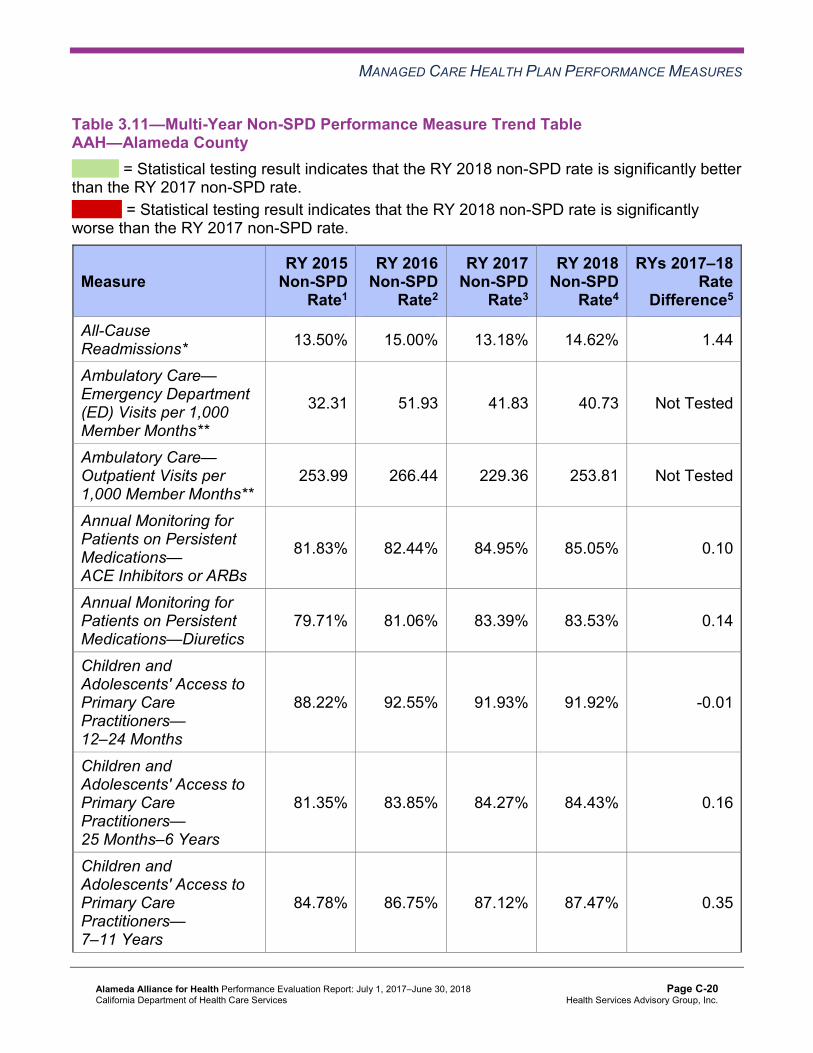
MANAGED CARE HEALTH PLAN PERFORMANCE MEASURES
Table 3.11—Multi-Year Non-SPD Performance Measure Trend Table AAH—Alameda County
B = Statistical testing result indicates that the RY 2018 non-SPD rate is significantly better than the RY 2017 non-SPD rate.
W = Statistical testing result indicates that the RY 2018 non-SPD rate is significantly worse than the RY 2017 non-SPD rate.
Measure RY 2015
Non-SPD Rate1
RY 2016 Non-SPD
Rate2
RY 2017 Non-SPD
Rate3
RY 2018 Non-SPD
Rate4
RYs 2017–18 Rate
Difference5
All-Cause Readmissions* 13.50% 15.00% 13.18% 14.62% 1.44
Ambulatory Care— Emergency Department (ED) Visits per 1,000 Member Months**
32.31 51.93 41.83 40.73 Not Tested
Ambulatory Care— Outpatient Visits per 1,000 Member Months**
253.99 266.44 229.36 253.81 Not Tested
Annual Monitoring for Patients on Persistent Medications— ACE Inhibitors or ARBs
81.83% 82.44% 84.95% 85.05% 0.10
Annual Monitoring for Patients on Persistent Medications—Diuretics
79.71% 81.06% 83.39% 83.53% 0.14
Children and Adolescents' Access to Primary Care Practitioners— 12–24 Months
88.22% 92.55% 91.93% 91.92% -0.01
Children and Adolescents' Access to Primary Care Practitioners— 25 Months–6 Years
81.35% 83.85% 84.27% 84.43% 0.16
Children and Adolescents' Access to Primary Care Practitioners— 7–11 Years
84.78% 86.75% 87.12% 87.47% 0.35
Alameda Alliance for Health Performance Evaluation Report: July 1, 2017–June 30, 2018 California Department of Health Care Services
Page C-20 Health Services Advisory Group, Inc.

MANAGED CARE HEALTH PLAN PERFORMANCE MEASURES
Measure RY 2015
Non-SPD Rate1
RY 2016 Non-SPD
Rate2
RY 2017 Non-SPD
Rate3
RY 2018 Non-SPD
Rate4
RYs 2017–18 Rate
Difference5
Children and Adolescents' Access to Primary Care Practitioners— 12–19 Years
81.92% 84.53% 84.77% 85.55% 0.78B
1 RY 2015 rates reflect MY data from January 1, 2014, through December 31, 2014. 2 RY 2016 rates reflect MY data from January 1, 2015, through December 31, 2015. 3 RY 2017 rates reflect MY data from January 1, 2016, through December 31, 2016. 4 RY 2018 rates reflect MY data from January 1, 2017, through December 31, 2017. 5 Performance comparisons are based on the Chi-square test of statistical significance, with a p value of <0.05. * A lower rate indicates better performance for this measure. ** Member months are a member's “contribution” to the total yearly membership. Not Tested = An RY 2017–18 rate difference was not calculated because high and low rates do not necessarily indicate better or worse performance.
Table 3.12—RY 2018 (MY 2017) Performance Measure Comparison and Results forMeasures Stratified by the SPD and Non-SPD PopulationsAAH—Alameda County
B = Statistical testing result indicates that the RY 2018 SPD rate is significantly better than the RY 2018 non-SPD rate.
W = Statistical testing result indicates that the RY 2018 SPD rate is significantly worse than the RY 2018 non-SPD rate.
Measure RY 2018
SPD Rate1
RY 2018 Non-SPD
Rate1
SPD/Non-SPDRate
Difference2
RY 2018 Total Rate3
All-Cause Readmissions* 19.98% 14.62% 5.36W 17.10% Ambulatory Care—Emergency Department (ED) Visits per 1,000 Member Months**
81.35 40.73 Not Tested 44.64
Ambulatory Care—Outpatient Visits per 1,000 Member Months** 514.87 253.81 Not Tested 278.91
Annual Monitoring for Patients on Persistent Medications— ACE Inhibitors or ARBs
88.99% 85.05% 3.94B 86.52%
Alameda Alliance for Health Performance Evaluation Report: July 1, 2017–June 30, 2018 California Department of Health Care Services
Page C-21 Health Services Advisory Group, Inc.

MANAGED CARE HEALTH PLAN PERFORMANCE MEASURES
Measure RY 2018
SPD Rate1
RY 2018 Non-SPD
Rate1
SPD/Non-SPDRate
Difference2
RY 2018 Total Rate3
Annual Monitoring for Patients on Persistent Medications—Diuretics 88.90% 83.53% 5.37B 85.60%
Children and Adolescents' Access to Primary Care Practitioners— 12–24 Months
NA 91.92% Not Comparable 91.90%
Children and Adolescents' Access to Primary Care Practitioners— 25 Months–6 Years
89.07% 84.43% 4.64B 84.53%
Children and Adolescents' Access to Primary Care Practitioners— 7–11 Years
89.48% 87.47% 2.01 87.55%
Children and Adolescents' Access to Primary Care Practitioners— 12–19 Years
85.23% 85.55% -0.32 85.54%
1 RY 2018 rates reflect MY data from January 1, 2017, through December 31, 2017. 2 Performance comparisons are based on the Chi-square test of statistical significance, with a p value of <0.05. 3 Total rates are based on the MCP reporting unit’s total results, including the SPD and non-SPD populations. Please note, if data are not available for either the SPD or non-SPD population, the total rate is based on results reported for the available population. * A lower rate indicates better performance for this measure. ** Member months are a member's “contribution” to the total yearly membership. NA = The MCP followed the specifications, but the denominator was too small (less than 30) to report a valid rate. Not Comparable = An SPD/non-SPD rate difference cannot be made because data are not available for both populations. Not Tested = An SPD/non-SPD rate difference was not calculated because high and low rates do not necessarily indicate better or worse performance.
Alameda Alliance for Health Performance Evaluation Report: July 1, 2017–June 30, 2018 California Department of Health Care Services
Page C-22 Health Services Advisory Group, Inc.

MANAGED CARE HEALTH PLAN PERFORMANCE MEASURES
Seniors and Persons with Disabilities Findings
HSAG observed the following notable results in RY 2018 for measures that AAH stratified by the SPD and non-SPD populations:
♦ For SPD rates for which HSAG could make a comparison between RY 2017 and RY 2018, no statistically significant changes occurred between RY 2017 and RY 2018.
♦ The non-SPD rate for the Children and Adolescents’ Access to Primary Care Practitioners—12–19 Years measure improved significantly from RY 2017 to RY 2018.
♦ For measures for which HSAG could compare the RY 2018 SPD rates to the RY 2018 non-SPD rates: ■ The RY 2018 SPD rate was significantly better than the RY 2018 non-SPD rate for the
following measures: ○ Both Annual Monitoring for Patients on Persistent Medications measures. ○ Children and Adolescents’ Access to Primary Care Practitioners—25 Months–6
Years. ■ The RY 2018 SPD rate was significantly worse than the RY 2018 non-SPD rate for the
All-Cause Readmissions measure. Note that the higher rate of hospital readmissions for the SPD population is expected based on the greater and often more complicated health care needs of these beneficiaries.
Strengths—Performance Measures HSAG auditors determined that AAH followed the appropriate specifications to produce valid rates, and identified no issues of concern.
HSAG identified the following notable RY 2018 performance measure results for AAH:
♦ The MCP had no rates below the MPLs in RY 2018, and the rates for the following four of 21 measures (19 percent) were above the HPLs in RY 2018: ■ Avoidance of Antibiotic Treatment in Adults With Acute Bronchitis. ■ Immunizations for Adolescents—Combination 2. The rate for this measure improved
significantly from RY 2017 to RY 2018. ■ Use of Imaging Studies for Low Back Pain. The rate for this measure improved
significantly from RY 2017 to RY 2018. ■ Weight Assessment and Counseling for Nutrition and Physical Activity for Children and
Adolescents—Physical Activity Counseling—Total. ♦ In addition to the rates improving significantly from RY 2017 to RY 2018 for the
Immunizations for Adolescents—Combination 2 and Use of Imaging Studies for Low Back Pain measures, the rates improved significantly from RY 2017 to RY 2018 for the following measures: ■ Asthma Medication Ratio ■ Breast Cancer Screening
Alameda Alliance for Health Performance Evaluation Report: July 1, 2017–June 30, 2018 California Department of Health Care Services
Page C-23 Health Services Advisory Group, Inc.

MANAGED CARE HEALTH PLAN PERFORMANCE MEASURES
♦ The rate for the Annual Monitoring for Patients on Persistent Medications—Diuretics measure improved from below the MPL in RY 2017 to above the MPL in RY 2018. The quality improvement strategies that the MCP implemented as described under the “Assessment of Improvement Plans—Care for Chronic Conditions” heading in this section of the report and the actions that AAH reported during the review period to improve the MCP’s performance on this measure (see Table 5.1) may have contributed to the rate improving to above the MPL in RY 2018.
Opportunities for Improvement—Performance Measures Based on RY 2018 performance measure results, HSAG has no recommendations for AAH in the area of performance measures.
Alameda Alliance for Health Performance Evaluation Report: July 1, 2017–June 30, 2018 California Department of Health Care Services
Page C-24 Health Services Advisory Group, Inc.

Medi-Cal Managed Care External Quality Review Technical ReportAppendix C: Performance Evaluation ReportAlameda Alliance for Health July 1, 2017–June 30, 2018
4. Performance Improvement Projects
Performance Improvement Project Overview The key concepts of the rapid-cycle PIP framework include forming a PIP team, setting aims, establishing measures, determining interventions using quality improvement tools, conducting PDSA cycles to test interventions, and planning for the spread of successful changes. The core component of the rapid-cycle PIP approach involves testing changes on a small scale so that improvement can occur more efficiently and lead to long-term sustainability. The following modules guide MCPs through this rapid-cycle PIP process:
♦ Module 1—PIP Initiation ■ MCPs outline the framework for the PIP, which includes:
○ The topic rationale. ○ Comparative data supporting the need to improve the selected topic. ○ A list of the PIP team members, which consists of internal and external stakeholders. ○ A completed key driver diagram that defines the theory of change for improvement,
including the SMART (Specific, Measurable, Achievable, Relevant, and Time-bound) Aim and Global Aim.
♦ Module 2—SMART Aim Data Collection ■ MCPs define the SMART Aim measure and data collection methodology and develop
the SMART Aim data run chart. ♦ Module 3—Intervention Determination
■ MCPs use process mapping and failure modes and effects analysis to identify potential interventions to test which may have direct effects on the SMART Aim.
♦ Module 4—Plan-Do-Study-Act (PDSA) ■ MCPs test and evaluate the interventions identified in Module 3 through a series of
PDSA cycles. ♦ Module 5—PIP Conclusions
■ MCPs interpret results and summarize: ○ Key findings and outcomes achieved. ○ Assessment of each tested intervention. ○ Lessons learned, including how demonstrated improvement can be shared and used
as a foundation for further improvement going forward. ○ Plan for sustained improvement.
Alameda Alliance for Health Performance Evaluation Report: July 1, 2017–June 30, 2018 California Department of Health Care Services
Page C-25 Health Services Advisory Group, Inc.

PERFORMANCE IMPROVEMENT PROJECTS
Based on the agreed-upon timeline, MCPs submit each module to HSAG for validation. Throughout the rapid-cycle PIP process, HSAG provides technical assistance to MCPs to ensure that PIPs are methodologically sound and to problem-solve with MCPs regarding how to address challenges that occur. Through an iterative process, MCPs have opportunities to make corrections to modules 1 through 3 to achieve all validation criteria.
Once MCPs achieve all validation criteria for modules 1 through 3 and receive feedback on the intervention Plan portion of Module 4, MCPs test interventions. During the intervention testing phase of the PIP, HSAG conducts periodic progress check-ins to ensure that MCPs have addressed HSAG’s feedback on the Plan portion of Module 4 and are making appropriate progress with intervention testing. Once MCPs complete testing an intervention, MCPs determine the next steps based on results and lessons learned—whether the intervention was successful and should be spread (adopt), whether modifications need to be made to the existing intervention (adapt), or whether the intervention was not successful and should be stopped (abandon).
In Module 5, MCPs summarize the overall PIP. When validating Module 5, HSAG assesses the validity and reliability of the results based on the Centers for Medicare & Medicaid Services (CMS) validation protocols to determine whether key stakeholders can have confidence in the reported PIP findings. HSAG assigns the following final confidence levels for each PIP:
♦ High confidence—the PIP was methodologically sound and achieved the SMART Aim goal; the demonstrated improvement was clearly linked to the quality improvement processes conducted and intervention(s) tested; and, the MCP accurately summarized the key findings.
♦ Confidence—the PIP was methodologically sound and achieved the SMART Aim goal, and the MCP accurately summarized the key findings. However, some, but not all, of the quality improvement processes conducted and/or intervention(s) tested were clearly linked to the demonstrated improvement.
♦ Low confidence—either (A) the PIP was methodologically sound; however, the SMART Aim goal was not achieved; or (B) the SMART Aim goal was achieved; however, the quality improvement processes and/or intervention(s) tested were poorly executed and could not be linked to the improvement.
♦ Reported PIP results were not credible—the PIP methodology was not executed as approved.
Performance Improvement Project Results and Findings During the review period, AAH submitted modules 4 and 5 for its 2015–17 DHCS-priority and MCP-specific PIPs. HSAG validated the modules and includes the final PIP validation findings in this report. Additionally, AAH initiated a Disparity PIP and a DHCS-priority PIP during the review period. In this report, HSAG includes summaries of the MCP’s Disparity and DHCS-priority PIP module submissions as well as validation findings from the review period.
Alameda Alliance for Health Performance Evaluation Report: July 1, 2017–June 30, 2018 California Department of Health Care Services
Page C-26 Health Services Advisory Group, Inc.

PERFORMANCE IMPROVEMENT PROJECTS
2015–17 DHCS-Priority Performance Improvement Project
AAH selected postpartum care for its 2015–17 DHCS-priority PIP. While the MCP concluded its Postpartum Care PIP through the SMART Aim end date of June 30, 2017, AAH submitted modules 4 and 5 for HSAG to validate during the review period for this report. HSAG provided final validation findings and encouraged AAH to incorporate the experiences and lessons learned from the PIP into future quality improvement efforts.
Table 4.1 provides a summary of the SMART Aim measure results reported by the MCP.
Table 4.1—AAH Postpartum Care PIP SMART Aim Measure Results
SMART Aim Measure Baseline Rate
SMART Aim Goal
Rate
SMART Aim Goal Achieved
Administrative rate of postpartum visits that occur between 21 to 56 days post delivery among African-American women
38.19% 45.19% Yes
Table 4.2 presents a description of the intervention that AAH tested for its Postpartum Care PIP. The table also indicates the failure modes that the intervention addressed as well as whether the MCP decided, based on intervention testing results, to adopt, adapt, or abandon the intervention.
Table 4.2—AAH Postpartum Care PIP Intervention Testing Results
Intervention Failure Modes Addressed Adopt,Adapt, orAbandon
Obstetric case management program that provides support to African-American female beneficiaries for attending their postpartum visits between 21 to 56 days after delivery
♦ Beneficiaries’ lack of understanding of the need and importance of timely postpartum care
♦ Lack of transportation ♦ Complex health care system ♦ Lack of support systems for
beneficiaries
Adapt
Alameda Alliance for Health Performance Evaluation Report: July 1, 2017–June 30, 2018 California Department of Health Care Services
Page C-27 Health Services Advisory Group, Inc.

PERFORMANCE IMPROVEMENT PROJECTS
Performance Improvement Project Validation Findings
During the review period for this report, HSAG validated modules 4 and 5 for the MCP’s Postpartum Care PIP. AAH documented in the modules having begun testing the intervention for the Postpartum Care PIP in January 2017. Although the MCP met the SMART Aim goal in February 2017, the SMART Aim run chart indicated a downward trend in the months thereafter. Additionally, the SMART Aim measure rate was above the baseline for five months in calendar year 2016, before intervention testing started. Finally, the MCP indicated being unable to evaluate how many beneficiaries enrolled in the obstetric case management program completed a timely postpartum visit. While the MCP met the SMART Aim goal in February 2017, the achievement of the SMART Aim goal could not be directly attributed to the tested intervention.
Upon assessment of validity and reliability of the PIP results, HSAG assigned AAH’s Postpartum Care PIP a final confidence level of Low Confidence.
2015–17 MCP-Specific Performance Improvement Project
AAH selected prenatal visit for its 2015–17 MCP-specific PIP. While the MCP concluded its Prenatal Visit PIP through the SMART Aim end date of June 30, 2017, AAH submitted modules 4 and 5 for HSAG to validate during the review period for this report. HSAG provided final validation findings and encouraged AAH to incorporate the experiences and lessons learned from the PIP into future quality improvement efforts.
Table 4.3 provides a summary of the SMART Aim measure results reported by the MCP.
Table 4.3—AAH Prenatal Visit PIP SMART Aim Measure Results
SMART Aim Measure Baseline Rate
SMART Aim Goal
Rate
SMART Aim Goal Achieved
Administrative rate of timely prenatal visits that occur within the first trimester or 42 days of enrollment among African-American women
43.24% 49.24% Yes
Alameda Alliance for Health Performance Evaluation Report: July 1, 2017–June 30, 2018 California Department of Health Care Services
Page C-28 Health Services Advisory Group, Inc.
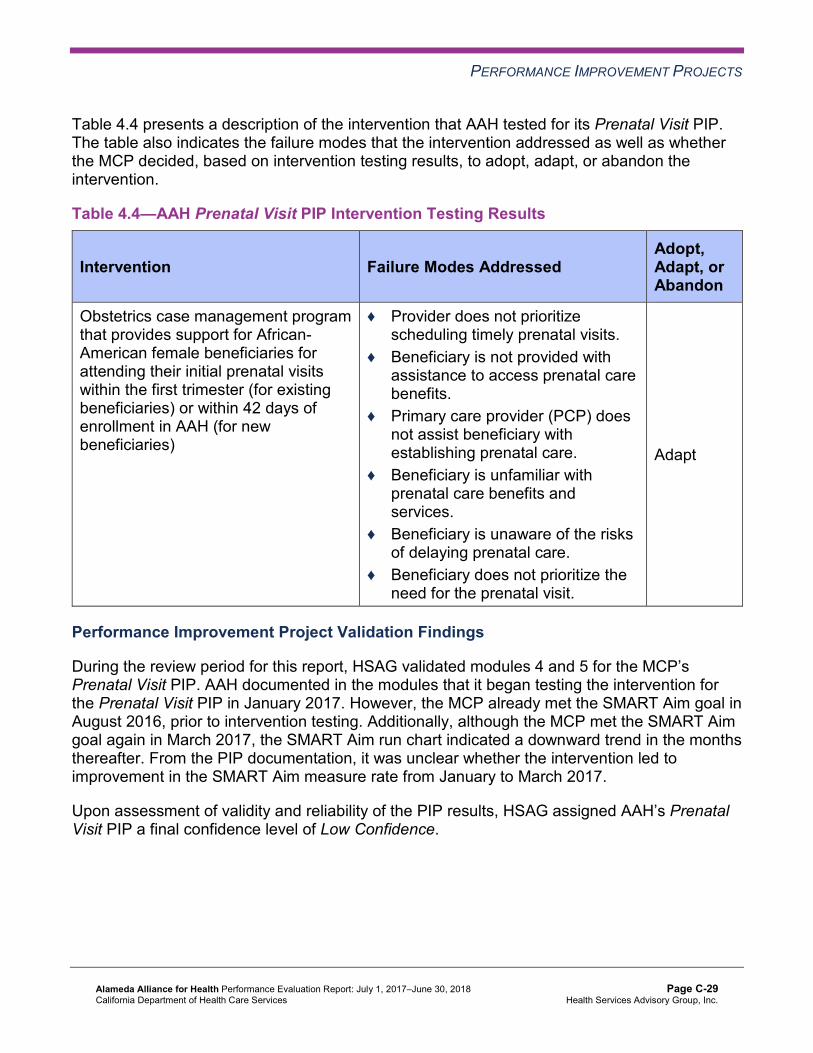
PERFORMANCE IMPROVEMENT PROJECTS
Table 4.4 presents a description of the intervention that AAH tested for its Prenatal Visit PIP. The table also indicates the failure modes that the intervention addressed as well as whether the MCP decided, based on intervention testing results, to adopt, adapt, or abandon the intervention.
Table 4.4—AAH Prenatal Visit PIP Intervention Testing Results
Intervention Failure Modes Addressed Adopt,Adapt, orAbandon
Obstetrics case management program that provides support for African-American female beneficiaries for attending their initial prenatal visits within the first trimester (for existing beneficiaries) or within 42 days of enrollment in AAH (for new beneficiaries)
♦ Provider does not prioritize scheduling timely prenatal visits.
♦ Beneficiary is not provided with assistance to access prenatal care benefits.
♦ Primary care provider (PCP) does not assist beneficiary with establishing prenatal care.
♦ Beneficiary is unfamiliar with prenatal care benefits and services.
♦ Beneficiary is unaware of the risks of delaying prenatal care.
♦ Beneficiary does not prioritize the need for the prenatal visit.
Adapt
Performance Improvement Project Validation Findings
During the review period for this report, HSAG validated modules 4 and 5 for the MCP’s Prenatal Visit PIP. AAH documented in the modules that it began testing the intervention for the Prenatal Visit PIP in January 2017. However, the MCP already met the SMART Aim goal in August 2016, prior to intervention testing. Additionally, although the MCP met the SMART Aim goal again in March 2017, the SMART Aim run chart indicated a downward trend in the months thereafter. From the PIP documentation, it was unclear whether the intervention led to improvement in the SMART Aim measure rate from January to March 2017.
Upon assessment of validity and reliability of the PIP results, HSAG assigned AAH’s Prenatal Visit PIP a final confidence level of Low Confidence.
Alameda Alliance for Health Performance Evaluation Report: July 1, 2017–June 30, 2018 California Department of Health Care Services
Page C-29 Health Services Advisory Group, Inc.

PERFORMANCE IMPROVEMENT PROJECTS
2017–19 Disparity Performance Improvement Project
During the review period, DHCS required AAH to initiate a PIP focusing on an identified health disparity based on, but not limited to, age, gender, race or ethnicity, language spoken, income, educational attainment, sexual orientation or gender identity, occupation, provider, or geographic area. AAH selected diabetes HbA1c testing among the African-American male population as its 2017–19 Disparity PIP topic. Using its own MCP-specific data, the MCP provided evidence of the health disparity by demonstrating a statistically significant rate difference between two subgroups, with the disparate subgroup having the lower rate.
Table 4.5 provides the SMART Aim measure description, baseline rate, and SMART Aim goal rate for the PIP. The SMART Aim end date for this PIP is June 30, 2019.
Table 4.5—AAH Diabetes HbA1c Testing Disparity PIP SMART Aim Measure
SMART Aim Measure Baseline Rate
SMART Aim Goal
Rate
Rate of HbA1c testing among African-American males aged 18 to 75 in Alameda County 73.12% 79.00%
Performance Improvement Project Validation Findings
During the review period for this report, HSAG validated modules 1 and 2 for the MCP’s Diabetes HbA1c Testing Disparity PIP. Upon initial review of the modules, HSAG determined that AAH met some required validation criteria; however, HSAG identified opportunities for improvement related to:
♦ Supporting the topic selection with the MCP’s data. ♦ Including all required components of the SMART Aim, developed based on literature
review, data, and/or experience. ♦ Aligning accurately the Global Aim, SMART Aim, key drivers, and potential interventions. ♦ Including all required components of the:
■ SMART Aim measure. ■ SMART Aim data collection methodology. ■ Run/control chart.
After receiving technical assistance from HSAG, AAH incorporated HSAG’s feedback into the PIP modules. Upon HSAG’s final review, HSAG determined that the MCP met all validation criteria for modules 1 and 2.
Alameda Alliance for Health Performance Evaluation Report: July 1, 2017–June 30, 2018 California Department of Health Care Services
Page C-30 Health Services Advisory Group, Inc.

PERFORMANCE IMPROVEMENT PROJECTS
2017–19 DHCS-Priority Performance Improvement Project
During the review period, DHCS required MCPs to initiate a PIP related to one of DHCS’ Quality Strategy focus areas: Childhood Immunization Status—Combination 3, Controlling High Blood Pressure, Comprehensive Diabetes Care, or Prenatal and Postpartum Care— Postpartum Care. However, based on AAH demonstrating high performance on DHCS’ Quality Strategy focus areas, DHCS allowed the MCP to choose an alternative topic for its DHCS-priority PIP based on an identified area in need of improvement. AAH selected children’s and adolescents’ access to primary care physicians as its 2017–19 DHCS-priority PIP topic based on its MCP-specific data.
Table 4.6 provides the SMART Aim measure description, baseline rate, and SMART Aim goal rate for the PIP. The SMART Aim end date for this PIP is June 30, 2019.
Table 4.6—AAH Children/Adolescent Access to Primary Care Physicians PIP SMART Aim Measure
SMART Aim Measure Baseline Rate
SMART Aim Goal
Rate
Rate of primary care visits among beneficiaries ages 12 to 19 who are assigned to partnering clinics 81.12% 86.00%
Performance Improvement Project Validation Findings
During the review period for this report, HSAG validated modules 1 and 2 for the MCP’s Children/Adolescent Access to Primary Care Physicians PIP. Upon initial review of the modules, HSAG determined that AAH met some required validation criteria; however, HSAG identified opportunities for improvement related to:
♦ Supporting the topic selection with the MCP’s data. ♦ Including all required components of the SMART Aim, developed based on literature
review, data, and/or experience. ♦ Aligning accurately the Global Aim, SMART Aim, key drivers, and potential interventions. ♦ Including all required components of the:
■ SMART Aim measure. ■ SMART Aim data collection methodology. ■ Run/control chart.
After receiving technical assistance from HSAG, AAH incorporated HSAG’s feedback into the PIP modules. Upon HSAG’s final review, HSAG determined that the MCP met all validation criteria for modules 1 and 2.
Alameda Alliance for Health Performance Evaluation Report: July 1, 2017–June 30, 2018 California Department of Health Care Services
Page C-31 Health Services Advisory Group, Inc.

PERFORMANCE IMPROVEMENT PROJECTS
Strengths—Performance Improvement Projects Upon completion of the 2015–17 PIPs, AAH identified interventions that it can adapt to improve prenatal and postpartum care for its beneficiaries.
Opportunities for Improvement—Performance Improvement Projects AAH has the opportunity to monitor the adapted interventions to achieve optimal outcomes beyond the life of the 2015–17 Prenatal Visits and Postpartum Care PIPs. Additionally, the MCP should apply lessons learned from the 2015–17 PIPs to facilitate improvement of the adapted interventions.
Alameda Alliance for Health Performance Evaluation Report: July 1, 2017–June 30, 2018 California Department of Health Care Services
Page C-32 Health Services Advisory Group, Inc.

Medi-Cal Managed Care External Quality Review Technical ReportAppendix C: Performance Evaluation ReportAlameda Alliance for Health July 1, 2017–June 30, 2018
5. Recommendations
Follow-Up on Prior Year Recommendations DHCS provided each MCP an opportunity to outline actions taken to address recommendations HSAG made in its 2016–17 MCP-specific evaluation report. Table 5.1 provides EQR recommendations from AAH’s July 1, 2016, through June 30, 2017, MCP-specific evaluation report, along with the MCP’s self-reported actions taken through June 30, 2018, that address the recommendations. Please note that HSAG made minimal edits to Table 5.1 to preserve the accuracy of AAH’s self-reported actions.
Table 5.1—AAH’s Self-Reported Follow-Up on External Quality ReviewRecommendations from the July 1, 2016, through June 30, 2017, MCP-SpecificEvaluation Report
2016–17 External Quality ReviewRecommendations Directed to AAH
Self-Reported Actions Taken by AAHduring the Period of July 1, 2017–June 30,2018, that Address the External QualityReview Recommendations
1. Assess whether current improvement efforts for the Annual Monitoring for Patients on Persistent Medications— Diuretics measure need to be modified or expanded to ensure that beneficiaries 18 and older on diuretics receive annual monitoring.
In MY 2016, AAH did not meet the MPL for the Annual Monitoring for Patients on Persistent Medications—Diuretics measure. In August 2017, DHCS enlisted AAH to conduct a SWOT analysis.
The first draft of the SWOT analysis was completed in September 2017. AAH identified the need to expand efforts to ensure annual monitoring. Four strategies were identified, with several interventions in each. The strategies included pharmacy intervention, increasing member engagement, increasing provider engagement, and improving clinic internal processes. Potential interventions included analytics team developing code for identifying members still in need of labs and which pharmacy they used to pick up their last prescription; sending outreach letters to members who had not visited their PCP in the past 12 months; sending an outreach letter addressing information on member condition and importance of lab screening; sharing
Alameda Alliance for Health Performance Evaluation Report: July 1, 2017–June 30, 2018 California Department of Health Care Services
Page C-33 Health Services Advisory Group, Inc.

RECOMMENDATIONS
2016–17 External Quality ReviewRecommendations Directed to AAH
Self-Reported Actions Taken by AAHduring the Period of July 1, 2017–June 30,2018, that Address the External QualityReview Recommendations monthly number of members needed to reach next HEDIS quartile with select clinics; and generating a process map with clinic sites to gain understanding of how the lab process works.
The HEDIS 2018 rate for this measure was 85.60 percent, which is above the MPL. We attribute this increase to an improved data collection methodology. Due to meeting the RY 2018 MPL, DHCS will no longer require AAH to conduct the IP; however, AAH will continue identified interventions for this measure.
2. Explore the causes for the rate for the Use of Imaging Studies for Low Back Pain measure declining significantly from RY 2016 to RY 2017.
In October 2016, NCQA provided correspondence updating this measure’s criteria. The updates addressed considerable changes to the technical specifications, and AAH implemented them accordingly. Some of those technical specification changes included adding two additional value sets (six total) on how to identify eligible members, adding required exclusions with value sets to address which members to exclude, and not including denied claims in the numerator.
In March 2017, during our annual HEDIS audit with our NCQA certified auditor (HSAG), it was noted that the trending between 2017 and prior years should be considered with caution. HSAG felt that it was not fair to compare the rates from RY 2016 to RY 2017 due to considerable changes to the technical specifications. For this reason, further research by AAH was not needed regarding this measure. No actions were taken during the requested period; but the final rate for RY 2018 did increase to 81.99 percent, from 76.28 percent in RY 2017.
Alameda Alliance for Health Performance Evaluation Report: July 1, 2017–June 30, 2018 California Department of Health Care Services
Page C-34 Health Services Advisory Group, Inc.
RECOMMENDATIONS
2017–18 Recommendations Based on the overall assessment of AAH’s delivery of quality, accessible, and timely care through the activities described in previous sections of this report, HSAG recommends the following to the MCP:
♦ Monitor the adapted interventions to achieve optimal outcomes beyond the life of the 2015– 17 Prenatal Visits and Postpartum Care PIPs. Additionally, the MCP should apply lessons learned from these PIPs to facilitate improvement of the adapted interventions.
In the next annual review, HSAG will evaluate continued successes of AAH as well as the MCP’s progress with these recommendations.
Alameda Alliance for Health Performance Evaluation Report: July 1, 2017–June 30, 2018 California Department of Health Care Services
Page C-35 Health Services Advisory Group, Inc.

Medi-Cal Managed CareExternal Quality Review Technical Report
Appendix D: Performance Evaluation Report
Anthem Blue Cross Partnership Plan July 1, 2017–June 30, 2018
Medi-Cal Managed Care External Quality Review Technical ReportAppendix D: Performance Evaluation ReportAnthem Blue Cross Partnership PlanJuly 1, 2017–June 30, 2018
Table of Contents 1. Introduction.............................................................................................................D-1
Medi-Cal Managed Care Health Plan Overview .......................................................D-1 Anthem’s Two-Plan Model ....................................................................................D-2 Anthem’s Geographic Managed Care Model ........................................................D-2 Anthem’s Regional Model .....................................................................................D-3 Anthem’s Enrollment .............................................................................................D-3
2. Managed Care Health Plan Compliance ...............................................................D-5Compliance Reviews Conducted..............................................................................D-5
Follow-Up on 2016 Department of Managed Health Care Seniors and Persons with Disabilities Medical Survey ............................................................................D-5
Strengths—Compliance Reviews .............................................................................D-6 Opportunities for Improvement—Compliance Reviews ............................................D-6
3. Managed Care Health Plan Performance Measures ............................................D-7Performance Measure Validation Results ................................................................D-7 Performance Measure Results and Findings............................................................D-7
Preventive Screening and Children’s Health .........................................................D-8 Preventive Screening and Women’s Health ........................................................D-39 Care for Chronic Conditions ................................................................................D-65 Appropriate Treatment and Utilization.................................................................D-94 Performance Measure Findings—All Domains..................................................D-120
Corrective Action Plan Requirements for 2018.....................................................D-132 Improvement Plan Requirements for 2018 ...........................................................D-133 Seniors and Persons with Disabilities Performance Measure Results..................D-134
Seniors and Persons with Disabilities Findings .................................................D-188 Strengths—Performance Measures .....................................................................D-189 Opportunities for Improvement—Performance Measures ....................................D-190
4. MLTSSP Performance Measure Results...........................................................D-191 Managed Long-Term Services and Supports Plan Performance Measure Findings D-192
5. Performance Improvement Projects .................................................................D-193Performance Improvement Project Overview .......................................................D-193 Performance Improvement Project Results and Findings.....................................D-194
2015–17 Controlling Blood Pressure Performance Improvement Project .........D-195 2015–17 Comprehensive Diabetes Care Performance Improvement Project ...D-196 2017–19 Disparity Performance Improvement Project ......................................D-198 2017–19 DHCS-Priority Performance Improvement Project .............................D-199
Strengths—Performance Improvement Projects ..................................................D-200 Opportunities for Improvement—Performance Improvement Projects .................D-200
6. Recommendations..............................................................................................D-201 Follow-Up on Prior Year Recommendations ........................................................D-201 2017–18 Recommendations.................................................................................D-203
Anthem Blue Cross Partnership Plan Performance Evaluation Report: July 1, 2017–June 30, 2018 California Department of Health Care Services
Page D-i Health Services Advisory Group, Inc.
TABLE OF CONTENTS
Table of Tables Table 1.1—Anthem Counties Under the Two-Plan Model..............................................D-2 Table 1.2—Anthem Enrollment as of June 30, 2018......................................................D-3 Table 2.1—DHCS A&I Medical Audit of Anthem Audit Review Period: November 1,
2016, through October 31, 2017 ..................................................................D-5 Table 3.1—Preventive Screening and Children’s Health Domain Multi-Year Performance
Measure Results Anthem—Alameda County...............................................D-9 Table 3.2—Preventive Screening and Children’s Health Domain Multi-Year Performance
Measure Results Anthem—Contra Costa County......................................D-10 Table 3.3—Preventive Screening and Children’s Health Domain Multi-Year Performance
Measure Results Anthem—Fresno County................................................D-12 Table 3.4—Preventive Screening and Children’s Health Domain Multi-Year Performance
Measure Results Anthem—Kings County..................................................D-13 Table 3.5—Preventive Screening and Children’s Health Domain Multi-Year Performance
Measure Results Anthem—Madera County...............................................D-15 Table 3.6—Preventive Screening and Children’s Health Domain Multi-Year Performance
Measure Results Anthem—Region 1 (Butte, Colusa, Glenn, Plumas, Sierra, Sutter, and Tehama Counties)...................................................................D-16
Table 3.7—Preventive Screening and Children’s Health Domain Multi-Year Performance Measure Results Anthem—Region 2 (Alpine, Amador, Calaveras, El Dorado, Inyo, Mariposa, Mono, Nevada, Placer, Tuolumne, and Yuba Counties)...D-18
Table 3.8—Preventive Screening and Children’s Health Domain Multi-Year Performance Measure Results Anthem—Sacramento County........................................D-19
Table 3.9—Preventive Screening and Children’s Health Domain Multi-Year Performance Measure Results Anthem—San Benito County .........................................D-21
Table 3.10—Preventive Screening and Children’s Health Domain Multi-Year Performance Measure Results Anthem—San Francisco County ..............D-22
Table 3.11—Preventive Screening and Children’s Health Domain Multi-Year Performance Measure Results Anthem—Santa Clara County ..................D-24
Table 3.12—Preventive Screening and Children’s Health Domain Multi-Year Performance Measure Results Anthem—Tulare County ...........................D-25
Table 3.13—Preventive Screening and Children’s Health Domain RY 2018 (MY 2017) Performance Measure Findings Anthem—Alameda County......................D-27
Table 3.14—Preventive Screening and Children’s Health Domain RY 2018 (MY 2017) Performance Measure Findings Anthem—Contra Costa County...............D-28
Table 3.15—Preventive Screening and Children’s Health Domain RY 2018 (MY 2017) Performance Measure Findings Anthem—Fresno County.........................D-29
Table 3.16—Preventive Screening and Children’s Health Domain RY 2018 (MY 2017) Performance Measure Findings Anthem—Kings County...........................D-30
Anthem Blue Cross Partnership Plan Performance Evaluation Report: July 1, 2017–June 30, 2018 California Department of Health Care Services
Page D-ii Health Services Advisory Group, Inc.

TABLE OF CONTENTS
Table 3.17—Preventive Screening and Children’s Health Domain RY 2018 (MY 2017) Performance Measure Findings Anthem—Madera County........................D-31
Table 3.18—Preventive Screening and Children’s Health Domain RY 2018 (MY 2017) Performance Measure Findings Anthem—Region 1 (Butte, Colusa, Glenn, Plumas, Sierra, Sutter, and Tehama Counties) ..............................D-32
Table 3.19—Preventive Screening and Children’s Health Domain RY 2018 (MY 2017) Performance Measure Findings Anthem—Region 2 (Alpine, Amador, Calaveras, El Dorado, Inyo, Mariposa, Mono, Nevada, Placer, Tuolumne, and Yuba Counties) ...................................................................................D-33
Table 3.20—Preventive Screening and Children’s Health Domain RY 2018 (MY 2017) Performance Measure Findings Anthem—Sacramento County ................D-34
Table 3.21—Preventive Screening and Children’s Health Domain RY 2018 (MY 2017) Performance Measure Findings Anthem—San Benito County ..................D-35
Table 3.22—Preventive Screening and Children’s Health Domain RY 2018 (MY 2017) Performance Measure Findings Anthem—San Francisco County.............D-36
Table 3.23—Preventive Screening and Children’s Health Domain RY 2018 (MY 2017) Performance Measure Findings Anthem—Santa Clara County.................D-37
Table 3.24—Preventive Screening and Children’s Health Domain RY 2018 (MY 2017) Performance Measure Findings Anthem—Tulare County..........................D-38
Table 3.25—Preventive Screening and Women’s Health Domain Multi-Year Performance Measure Results Anthem—Alameda County.............................................D-40
Table 3.26—Preventive Screening and Women’s Health Domain Multi-Year Performance Measure Results Anthem—Contra Costa County......................................D-41
Table 3.27—Preventive Screening and Women’s Health Domain Multi-Year Performance Measure Results Anthem—Fresno County................................................D-42
Table 3.28—Preventive Screening and Women’s Health Domain Multi-Year Performance Measure Results Anthem—Kings County..................................................D-43
Table 3.29—Preventive Screening and Women’s Health Domain Multi-Year Performance Measure Results Anthem—Madera County...............................................D-44
Table 3.30—Preventive Screening and Women’s Health Domain Multi-Year Performance Measure Results Anthem—Region 1 (Butte, Colusa, Glenn, Plumas, Sierra, Sutter, and Tehama Counties)...................................................................D-45
Table 3.31—Preventive Screening and Women’s Health Domain Multi-Year Performance Measure Results Anthem—Region 2 (Alpine, Amador, Calaveras, El Dorado, Inyo, Mariposa, Mono, Nevada, Placer, Tuolumne, and Yuba Counties)...D-46
Table 3.32—Preventive Screening and Women’s Health Domain Multi-Year Performance Measure Results Anthem—Sacramento County........................................D-47
Table 3.33—Preventive Screening and Women’s Health Domain Multi-Year Performance Measure Results Anthem—San Benito County .........................................D-48
Table 3.34—Preventive Screening and Women’s Health Domain Multi-Year Performance Measure Results Anthem—San Francisco County....................................D-49
Anthem Blue Cross Partnership Plan Performance Evaluation Report: July 1, 2017–June 30, 2018 California Department of Health Care Services
Page D-iii Health Services Advisory Group, Inc.
TABLE OF CONTENTS
Table 3.35—Preventive Screening and Women’s Health Domain Multi-Year Performance Measure Results Anthem—Santa Clara County........................................D-50
Table 3.36—Preventive Screening and Women’s Health Domain Multi-Year Performance Measure Results Anthem—Tulare County.................................................D-51
Table 3.37—Preventive Screening and Women’s Health Domain RY 2018 (MY 2017) Performance Measure Findings Anthem—Alameda County......................D-52
Table 3.38—Preventive Screening and Women’s Health Domain RY 2018 (MY 2017) Performance Measure Findings Anthem—Contra Costa County...............D-53
Table 3.39—Preventive Screening and Women’s Health Domain RY 2018 (MY 2017) Performance Measure Findings Anthem—Fresno County.........................D-54
Table 3.40—Preventive Screening and Women’s Health Domain RY 2018 (MY 2017) Performance Measure Findings Anthem—Kings County...........................D-55
Table 3.41—Preventive Screening and Women’s Health Domain RY 2018 (MY 2017) Performance Measure Findings Anthem—Madera County........................D-56
Table 3.42—Preventive Screening and Women’s Health Domain RY 2018 (MY 2017) Performance Measure Findings Anthem—Region 1 (Butte, Colusa, Glenn, Plumas, Sierra, Sutter, and Tehama Counties) .........................................D-57
Table 3.43—Preventive Screening and Women’s Health Domain RY 2018 (MY 2017) Performance Measure Findings Anthem—Region 2 (Alpine, Amador, Calaveras, El Dorado, Inyo, Mariposa, Mono, Nevada, Placer, Tuolumne, and Yuba Counties) ...................................................................................D-58
Table 3.44—Preventive Screening and Women’s Health Domain RY 2018 (MY 2017) Performance Measure Findings Anthem—Sacramento County ................D-59
Table 3.45—Preventive Screening and Women’s Health Domain RY 2018 (MY 2017) Performance Measure Findings Anthem—San Benito County ..................D-60
Table 3.46—Preventive Screening and Women’s Health Domain RY 2018 (MY 2017) Performance Measure Findings Anthem—San Francisco County.............D-61
Table 3.47—Preventive Screening and Women’s Health Domain RY 2018 (MY 2017) Performance Measure Findings Anthem—Santa Clara County.................D-62
Table 3.48—Preventive Screening and Women’s Health Domain RY 2018 (MY 2017) Performance Measure Findings Anthem—Tulare County..........................D-63
Table 3.49—Care for Chronic Conditions Domain Multi-Year Performance Measure Results Anthem—Alameda County............................................................D-65
Table 3.50—Care for Chronic Conditions Domain Multi-Year Performance Measure Results Anthem—Contra Costa County.....................................................D-66
Table 3.51—Care for Chronic Conditions Domain Multi-Year Performance Measure Results Anthem—Fresno County...............................................................D-68
Table 3.52—Care for Chronic Conditions Domain Multi-Year Performance Measure Results Anthem—Kings County.................................................................D-69
Table 3.53—Care for Chronic Conditions Domain Multi-Year Performance Measure Results Anthem—Madera County..............................................................D-70
Anthem Blue Cross Partnership Plan Performance Evaluation Report: July 1, 2017–June 30, 2018 California Department of Health Care Services
Page D-iv Health Services Advisory Group, Inc.
TABLE OF CONTENTS
Table 3.54—Care for Chronic Conditions Domain Multi-Year Performance Measure Results Anthem—Region 1 (Butte, Colusa, Glenn, Plumas, Sierra, Sutter, and Tehama Counties) ..............................................................................D-72
Table 3.55—Care for Chronic Conditions Domain Multi-Year Performance Measure Results Anthem—Region 2 (Alpine, Amador, Calaveras, El Dorado, Inyo, Mariposa, Mono, Nevada, Placer, Tuolumne, and Yuba Counties) ...........D-73
Table 3.56—Care for Chronic Conditions Domain Multi-Year Performance Measure Results Anthem—Sacramento County ......................................................D-74
Table 3.57—Care for Chronic Conditions Domain Multi-Year Performance Measure Results Anthem—San Benito County ........................................................D-76
Table 3.58—Care for Chronic Conditions Domain Multi-Year Performance Measure Results Anthem—San Francisco County...................................................D-77
Table 3.59—Care for Chronic Conditions Domain Multi-Year Performance Measure Results Anthem—Santa Clara County.......................................................D-78
Table 3.60—Care for Chronic Conditions Domain Multi-Year Performance Measure Results Anthem—Tulare County................................................................D-80
Table 3.61—Care for Chronic Conditions Domain RY 2018 (MY 2017) Performance Measure Findings Anthem—Alameda County ...........................................D-81
Table 3.62—Care for Chronic Conditions Domain RY 2018 (MY 2017) Performance Measure Findings Anthem—Contra Costa County ....................................D-82
Table 3.63—Care for Chronic Conditions Domain RY 2018 (MY 2017) Performance Measure Findings Anthem—Fresno County ..............................................D-83
Table 3.64—Care for Chronic Conditions Domain RY 2018 (MY 2017) Performance Measure Findings Anthem—Kings County ................................................D-84
Table 3.65—Care for Chronic Conditions Domain RY 2018 (MY 2017) Performance Measure Findings Anthem—Madera County .............................................D-85
Table 3.66—Care for Chronic Conditions Domain RY 2018 (MY 2017) Performance Measure Findings Anthem—Region 1 (Butte, Colusa, Glenn, Plumas, Sierra, Sutter, and Tehama Counties) .......................................................D-86
Table 3.67—Care for Chronic Conditions Domain RY 2018 (MY 2017) Performance Measure Findings Anthem—Region 2 (Alpine, Amador, Calaveras, El Dorado, Inyo, Mariposa, Mono, Nevada, Placer, Tuolumne, and Yuba Counties) ...................................................................................................D-87
Table 3.68—Care for Chronic Conditions Domain RY 2018 (MY 2017) Performance Measure Findings Anthem—Sacramento County......................................D-88
Table 3.69—Care for Chronic Conditions Domain RY 2018 (MY 2017) Performance Measure Findings Anthem—San Benito County........................................D-89
Table 3.70—Care for Chronic Conditions Domain RY 2018 (MY 2017) Performance Measure Findings Anthem—San Francisco County ..................................D-90
Table 3.71—Care for Chronic Conditions Domain RY 2018 (MY 2017) Performance Measure Findings Anthem—Santa Clara County ......................................D-91
Anthem Blue Cross Partnership Plan Performance Evaluation Report: July 1, 2017–June 30, 2018 California Department of Health Care Services
Page D-v Health Services Advisory Group, Inc.

TABLE OF CONTENTS
Table 3.72—Care for Chronic Conditions Domain RY 2018 (MY 2017) Performance Measure Findings Anthem—Tulare County ...............................................D-92
Table 3.73—Appropriate Treatment and Utilization Domain Multi-Year Performance Measure Results Anthem—Alameda County.............................................D-96
Table 3.74—Appropriate Treatment and Utilization Domain Multi-Year Performance Measure Results Anthem—Contra Costa County......................................D-97
Table 3.75—Appropriate Treatment and Utilization Domain Multi-Year Performance Measure Results Anthem—Fresno County................................................D-98
Table 3.76—Appropriate Treatment and Utilization Domain Multi-Year Performance Measure Results Anthem—Kings County..................................................D-99
Table 3.77—Appropriate Treatment and Utilization Domain Multi-Year Performance Measure Results Anthem—Madera County.............................................D-100
Table 3.78—Appropriate Treatment and Utilization Domain Multi-Year Performance Measure Results Anthem—Region 1 (Butte, Colusa, Glenn, Plumas, Sierra, Sutter, and Tehama Counties) .....................................................D-101
Table 3.79—Appropriate Treatment and Utilization Domain Multi-Year Performance Measure Results Anthem—Region 2 (Alpine, Amador, Calaveras, El Dorado, Inyo, Mariposa, Mono, Nevada, Placer, Tuolumne, and Yuba Counties)....D-102
Table 3.80—Appropriate Treatment and Utilization Domain Multi-Year Performance Measure Results Anthem—Sacramento County......................................D-103
Table 3.81—Appropriate Treatment and Utilization Domain Multi-Year Performance Measure Results Anthem—San Benito County .......................................D-104
Table 3.82—Appropriate Treatment and Utilization Domain Multi-Year Performance Measure Results Anthem—San Francisco County..................................D-105
Table 3.83—Appropriate Treatment and Utilization Domain Multi-Year Performance Measure Results Anthem—Santa Clara County......................................D-106
Table 3.84—Appropriate Treatment and Utilization Domain Multi-Year Performance Measure Results Anthem—Tulare County...............................................D-107
Table 3.85—Appropriate Treatment and Utilization Domain RY 2018 (MY 2017) Performance Measure Findings Anthem—Alameda County....................D-108
Table 3.86—Appropriate Treatment and Utilization Domain RY 2018 (MY 2017) Performance Measure Findings Anthem—Contra Costa County.............D-109
Table 3.87—Appropriate Treatment and Utilization Domain RY 2018 (MY 2017) Performance Measure Findings Anthem—Fresno County.......................D-110
Table 3.88—Appropriate Treatment and Utilization Domain RY 2018 (MY 2017) Performance Measure Findings Anthem—Kings County.........................D-111
Table 3.89—Appropriate Treatment and Utilization Domain RY 2018 (MY 2017) Performance Measure Findings Anthem—Madera County......................D-112
Table 3.90—Appropriate Treatment and Utilization Domain RY 2018 (MY 2017) Performance Measure Findings Anthem—Region 1 (Butte, Colusa, Glenn, Plumas, Sierra, Sutter, and Tehama Counties) ............................D-113
Anthem Blue Cross Partnership Plan Performance Evaluation Report: July 1, 2017–June 30, 2018 California Department of Health Care Services
Page D-vi Health Services Advisory Group, Inc.

TABLE OF CONTENTS
Table 3.91—Appropriate Treatment and Utilization Domain RY 2018 (MY 2017) Performance Measure Findings Anthem—Region 2 (Alpine, Amador, Calaveras, El Dorado, Inyo, Mariposa, Mono, Nevada, Placer, Tuolumne, and Yuba Counties) .................................................................................D-114
Table 3.92—Appropriate Treatment and Utilization Domain RY 2018 (MY 2017) Performance Measure Findings Anthem—Sacramento County ..............D-115
Table 3.93—Appropriate Treatment and Utilization Domain RY 2018 (MY 2017) Performance Measure Findings Anthem—San Benito County ................D-116
Table 3.94—Appropriate Treatment and Utilization Domain RY 2018 (MY 2017) Performance Measure Findings Anthem—San Francisco County...........D-117
Table 3.95—Appropriate Treatment and Utilization Domain RY 2018 (MY 2017) Performance Measure Findings Anthem—Santa Clara County...............D-118
Table 3.96—Appropriate Treatment and Utilization Domain RY 2018 (MY 2017) Performance Measure Findings Anthem—Tulare County........................D-119
Table 3.97—RY 2018 (MY 2017) Performance Measure Findings for All Domains Anthem—Alameda County ......................................................................D-121
Table 3.98—RY 2018 (MY 2017) Performance Measure Findings for All Domains Anthem—Contra Costa County................................................................D-122
Table 3.99—RY 2018 (MY 2017) Performance Measure Findings for All Domains Anthem—Fresno County .........................................................................D-123
Table 3.100—RY 2018 (MY 2017) Performance Measure Findings for All Domains Anthem—Kings County............................................................................D-124
Table 3.101—RY 2018 (MY 2017) Performance Measure Findings for All Domains Anthem—Madera County ........................................................................D-125
Table 3.102—RY 2018 (MY 2017) Performance Measure Findings for All Domains Anthem—Region 1 (Butte, Colusa, Glenn, Plumas, Sierra, Sutter, and Tehama Counties) ...................................................................................D-126
Table 3.103—RY 2018 (MY 2017) Performance Measure Findings for All Domains Anthem—Region 2 (Alpine, Amador, Calaveras, El Dorado, Inyo, Mariposa, Mono, Nevada, Placer, Tuolumne, and Yuba Counties) .........D-127
Table 3.104—RY 2018 (MY 2017) Performance Measure Findings for All Domains Anthem—Sacramento County .................................................................D-128
Table 3.105—RY 2018 (MY 2017) Performance Measure Findings for All Domains Anthem—San Benito County ...................................................................D-129
Table 3.106—RY 2018 (MY 2017) Performance Measure Findings for All Domains Anthem—San Francisco County..............................................................D-130
Table 3.107—RY 2018 (MY 2017) Performance Measure Findings for All Domains Anthem—Santa Clara County..................................................................D-131
Table 3.108—RY 2018 (MY 2017) Performance Measure Findings for All Domains Anthem—Tulare County ..........................................................................D-132
Anthem Blue Cross Partnership Plan Performance Evaluation Report: July 1, 2017–June 30, 2018 California Department of Health Care Services
Page D-vii Health Services Advisory Group, Inc.

TABLE OF CONTENTS
Table 3.109—Multi-Year SPD Performance Measure Trend Table Anthem— Alameda County ......................................................................................D-134
Table 3.110—Multi-Year SPD Performance Measure Trend Table Anthem— Contra Costa County ...............................................................................D-136
Table 3.111—Multi-Year SPD Performance Measure Trend Table Anthem— “Fresno County ........................................................................................D-137
Table 3.112—Multi-Year SPD Performance Measure Trend Table Anthem— Kings County ...........................................................................................D-139
Table 3.113—Multi-Year SPD Performance Measure Trend Table Anthem— Madera County ........................................................................................D-140
Table 3.114—Multi-Year SPD Performance Measure Trend Table Anthem—Region 1 (Butte, Colusa, Glenn, Plumas, Sierra, Sutter, and Tehama Counties) ...D-142
Table 3.115—Multi-Year SPD Performance Measure Trend Table Anthem—Region 2 (Alpine, Amador, Calaveras, El Dorado, Inyo, Mariposa, Mono, Nevada, Placer, Tuolumne, and Yuba Counties) ...................................................D-143
Table 3.116—Multi-Year SPD Performance Measure Trend Table Anthem— Sacramento County .................................................................................D-145
Table 3.117—Multi-Year SPD Performance Measure Trend Table Anthem— San Benito County...................................................................................D-146
Table 3.118—Multi-Year SPD Performance Measure Trend Table Anthem— San Francisco County..............................................................................D-148
Table 3.119—Multi-Year SPD Performance Measure Trend Table Anthem— Santa Clara County..................................................................................D-149
Table 3.120—Multi-Year SPD Performance Measure Trend Table Anthem— Tulare County ..........................................................................................D-151
Table 3.121—Multi-Year Non-SPD Performance Measure Trend Table Anthem— Alameda County ......................................................................................D-152
Table 3.122—Multi-Year Non-SPD Performance Measure Trend Table Anthem— Contra Costa County ...............................................................................D-154
Table 3.123—Multi-Year Non-SPD Performance Measure Trend Table Anthem— Fresno County .........................................................................................D-155
Table 3.124—Multi-Year Non-SPD Performance Measure Trend Table Anthem— Kings County ...........................................................................................D-157
Table 3.125—Multi-Year Non-SPD Performance Measure Trend Table Anthem— Madera County ........................................................................................D-159
Table 3.126—Multi-Year Non-SPD Performance Measure Trend Table Anthem— Region 1 (Butte, Colusa, Glenn, Plumas, Sierra, Sutter, and Tehama Counties) .................................................................................................D-160
Table 3.127—Multi-Year Non-SPD Performance Measure Trend Table Anthem— Region 2 (Alpine, Amador, Calaveras, El Dorado, Inyo, Mariposa, Mono, Nevada, Placer, Tuolumne, and Yuba Counties) .....................................D-162
Anthem Blue Cross Partnership Plan Performance Evaluation Report: July 1, 2017–June 30, 2018 California Department of Health Care Services
Page D-viii Health Services Advisory Group, Inc.

TABLE OF CONTENTS
Table 3.128—Multi-Year Non-SPD Performance Measure Trend Table Anthem— Sacramento County .................................................................................D-163
Table 3.129—Multi-Year Non-SPD Performance Measure Trend Table Anthem— San Benito County...................................................................................D-165
Table 3.130—Multi-Year Non-SPD Performance Measure Trend Table Anthem— San Francisco County..............................................................................D-167
Table 3.131—Multi-Year Non-SPD Performance Measure Trend Table Anthem— Santa Clara County..................................................................................D-169
Table 3.132—Multi-Year Non-SPD Performance Measure Trend Table Anthem— Tulare County ..........................................................................................D-170
Table 3.133—RY 2018 (MY 2017) Performance Measure Comparison and Results for Measures Stratified by the SPD and Non-SPD Populations Anthem— Alameda County ......................................................................................D-172
Table 3.134—RY 2018 (MY 2017) Performance Measure Comparison and Results for Measures Stratified by the SPD and Non-SPD Populations Anthem— Contra Costa County ...............................................................................D-173
Table 3.135—RY 2018 (MY 2017) Performance Measure Comparison and Results for Measures Stratified by the SPD and Non-SPD Populations Anthem— Fresno County .........................................................................................D-174
Table 3.136—RY 2018 (MY 2017) Performance Measure Comparison and Results for Measures Stratified by the SPD and Non-SPD Populations Anthem— Kings County ...........................................................................................D-176
Table 3.137—RY 2018 (MY 2017) Performance Measure Comparison and Results for Measures Stratified by the SPD and Non-SPD Populations Anthem— Madera County ........................................................................................D-177
Table 3.138—RY 2018 (MY 2017) Performance Measure Comparison and Results for Measures Stratified by the SPD and Non-SPD Populations Anthem— Region 1 (Butte, Colusa, Glenn, Plumas, Sierra, Sutter, and Tehama Counties) .................................................................................................D-178
Table 3.139—RY 2018 (MY 2017) Performance Measure Comparison and Results for Measures Stratified by the SPD and Non-SPD Populations Anthem— Region 2 (Alpine, Amador, Calaveras, El Dorado, Inyo, Mariposa, Mono, Nevada, Placer, Tuolumne, and Yuba Counties) .....................................D-180
Table 3.140—RY 2018 (MY 2017) Performance Measure Comparison and Results for Measures Stratified by the SPD and Non-SPD Populations Anthem— Sacramento County .................................................................................D-181
Table 3.141—RY 2018 (MY 2017) Performance Measure Comparison and Results for Measures Stratified by the SPD and Non-SPD Populations Anthem— San Benito County...................................................................................D-182
Table 3.142—RY 2018 (MY 2017) Performance Measure Comparison and Results for Measures Stratified by the SPD and Non-SPD Populations Anthem— San Francisco County..............................................................................D-184
Anthem Blue Cross Partnership Plan Performance Evaluation Report: July 1, 2017–June 30, 2018 California Department of Health Care Services
Page D-ix Health Services Advisory Group, Inc.

TABLE OF CONTENTS
Table 3.143—RY 2018 (MY 2017) Performance Measure Comparison and Results for Measures Stratified by the SPD and Non-SPD Populations Anthem— Santa Clara County..................................................................................D-185
Table 3.144—RY 2018 (MY 2017) Performance Measure Comparison and Results for Measures Stratified by the SPD and Non-SPD Populations Anthem— Tulare County ..........................................................................................D-186
Table 4.1—Multi-Year MLTSSP Performance Measure Results Anthem— Santa Clara County..................................................................................D-191
Table 5.1—Anthem Controlling Blood Pressure PIP SMART Aim Measure Results..D-195 Table 5.2—Anthem Controlling Blood Pressure PIP Intervention Testing Results .....D-195 Table 5.3—Anthem Comprehensive Diabetes Care PIP SMART Aim Measure Results D-196 Table 5.4—Anthem Comprehensive Diabetes Care PIP Intervention Testing Results D-197 Table 5.5—Anthem Asthma Medication Ratio Disparity PIP SMART Aim Measure...D-198 Table 5.6—Anthem Postpartum Care PIP SMART Aim Measure ..............................D-199 Table 5.7—Anthem Postpartum Care PIP Intervention Testing .................................D-200 Table 6.1—Anthem’s Self-Reported Follow-Up on External Quality Review
Recommendations from the July 1, 2016, through June 30, 2017, MCP-Specific Evaluation Report..............................................................D-201
Anthem Blue Cross Partnership Plan Performance Evaluation Report: July 1, 2017–June 30, 2018 California Department of Health Care Services
Page D-x Health Services Advisory Group, Inc.
Medi-Cal Managed Care External Quality Review Technical ReportAppendix D: Performance Evaluation ReportAnthem Blue Cross Partnership PlanJuly 1, 2017–June 30, 2018
1. Introduction
The California Department of Health Care Services (DHCS) contracted with Health Services Advisory Group, Inc. (HSAG), an external quality review organization (EQRO), to prepare the federally required Medi-Cal Managed Care External Quality Review Technical Report, July 1, 2017–June 30, 2018. The technical report provides an overview of the objectives and methodology for conducting the external quality review (EQR) activities, including requirements related to each activity. Additionally, the technical report provides aggregated results and recommendations for DHCS for each activity.
This appendix is specific to DHCS’ contracted Medi-Cal managed care health plan (MCP), Anthem Blue Cross Partnership Plan (“Anthem” or “the MCP”). The purpose of this appendix is to provide MCP-specific results of each activity and an assessment of the MCP’s strengths and opportunities for improvement with respect to the quality and timeliness of and access to health care services furnished to Medi-Cal Managed Care (MCMC) beneficiaries (referred to as “beneficiaries” in this report). The review period for this MCP-specific evaluation report is July 1, 2017, through June 30, 2018. HSAG will report on activities that take place beyond the review period in Anthem’s 2018–19 MCP-specific evaluation report. This MCP-specific evaluation report references activities and methodologies described in detail by HSAG in the technical report section.
The aggregate EQR technical report and all MCP- and specialty health plan (SHP)-specific performance evaluation reports reflect HSAG’s external, independent assessment of the quality and timeliness of, and access to, care that MCPs and SHPs are providing to beneficiaries.
Medi-Cal Managed Care Health Plan Overview Anthem, formerly Blue Cross of California prior to April 1, 2008, operated in 28 counties during the July 1, 2017, through June 30, 2018, review period for this report. Anthem, a full-scope MCP, delivers care to beneficiaries under the Two-Plan Model (TPM) in eight counties, the Regional model in 18 counties, the Geographic Managed Care (GMC) model in one county, and the San Benito model in one county.
Anthem became operational in Sacramento County to provide MCMC services effective in 1994, with expansion into additional counties occurring in subsequent years—Alameda, Contra Costa, Fresno, San Francisco, and Santa Clara counties in 1996 and Tulare County in 2005. Anthem expanded into Kings and Madera counties in March 2011 and continued providing services in Fresno County under a new contract covering Fresno, Kings, and Madera counties. As part of the expansion authority under Section 1115 of the Social Security Act, MCMC expanded into several rural eastern counties of California in 2013. Under the expansion, Anthem contracted with DHCS to provide MCMC services in Alpine, Amador, Butte, Calaveras,
Anthem Blue Cross Partnership Plan Performance Evaluation Report: July 1, 2017–June 30, 2018 California Department of Health Care Services
Page D-1 Health Services Advisory Group, Inc.
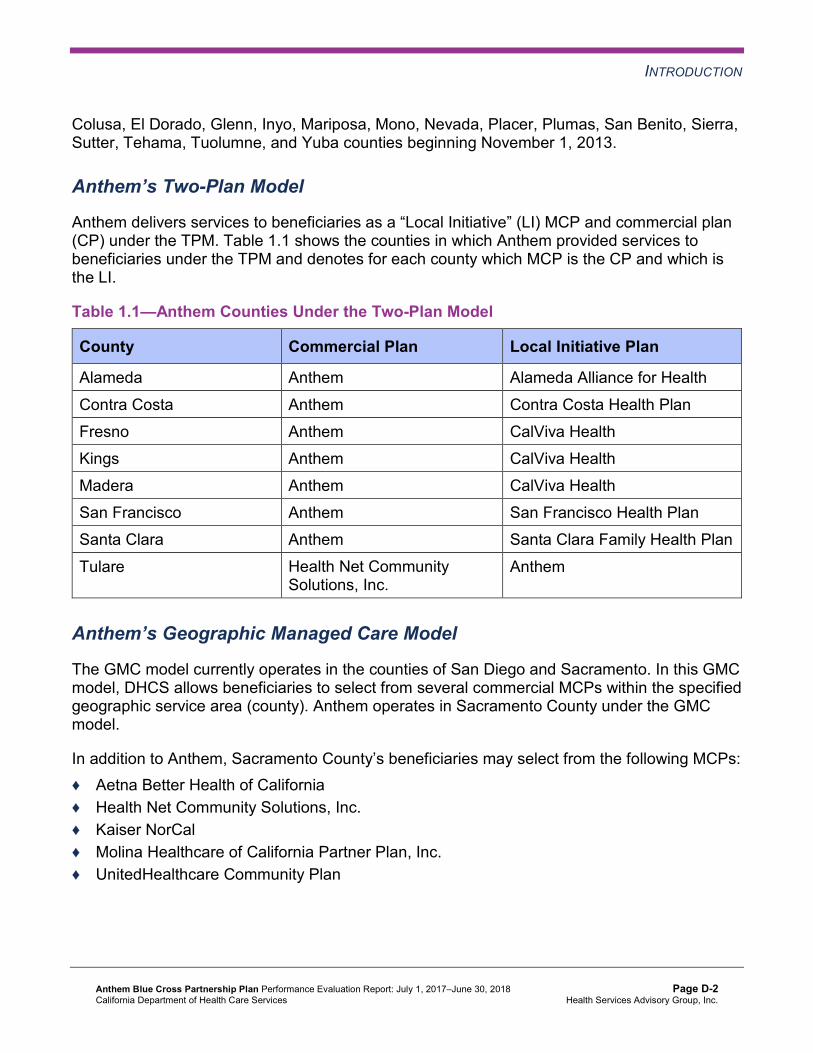
INTRODUCTION
Colusa, El Dorado, Glenn, Inyo, Mariposa, Mono, Nevada, Placer, Plumas, San Benito, Sierra, Sutter, Tehama, Tuolumne, and Yuba counties beginning November 1, 2013.
Anthem’s Two-Plan Model
Anthem delivers services to beneficiaries as a “Local Initiative” (LI) MCP and commercial plan (CP) under the TPM. Table 1.1 shows the counties in which Anthem provided services to beneficiaries under the TPM and denotes for each county which MCP is the CP and which is the LI.
Table 1.1—Anthem Counties Under the Two-Plan Model
County Commercial Plan Local Initiative Plan
Alameda Anthem Alameda Alliance for Health Contra Costa Anthem Contra Costa Health Plan Fresno Anthem CalViva Health Kings Anthem CalViva Health Madera Anthem CalViva Health San Francisco Anthem San Francisco Health Plan Santa Clara Anthem Santa Clara Family Health Plan Tulare Health Net Community
Solutions, Inc. Anthem
Anthem’s Geographic Managed Care Model
The GMC model currently operates in the counties of San Diego and Sacramento. In this GMC model, DHCS allows beneficiaries to select from several commercial MCPs within the specified geographic service area (county). Anthem operates in Sacramento County under the GMC model.
In addition to Anthem, Sacramento County’s beneficiaries may select from the following MCPs: ♦ Aetna Better Health of California ♦ Health Net Community Solutions, Inc. ♦ Kaiser NorCal ♦ Molina Healthcare of California Partner Plan, Inc. ♦ UnitedHealthcare Community Plan
Anthem Blue Cross Partnership Plan Performance Evaluation Report: July 1, 2017–June 30, 2018 California Department of Health Care Services
Page D-2 Health Services Advisory Group, Inc.

INTRODUCTION
Anthem’s Regional Model
Anthem delivers services to its beneficiaries under the Regional model in Alpine, Amador, Butte, Calaveras, Colusa, El Dorado, Glenn, Inyo, Mariposa, Mono, Nevada, Placer, Plumas, Sierra, Sutter, Tehama, Tuolumne, and Yuba counties. The other MCPs operating under the Regional model are California Health & Wellness Plan and Kaiser NorCal. California Health & Wellness Plan operates in all 18 counties; and Kaiser NorCal operates in Amador, El Dorado, and Placer counties. Beneficiaries may enroll in Anthem or in the alternative CP in the respective counties.
Anthem’s Enrollment
Table 1.2 shows the number of beneficiaries for Anthem for each county, the percentage of Anthem’s beneficiaries enrolled in the county, and the MCP’s total number of beneficiaries as of June 30, 2018.1
Table 1.2—Anthem Enrollment as of June 30, 2018
County Anthem Enrollment as of June 30, 2018
Percentage of AnthemBeneficiaries Enrolled
in the County
Alameda 60,518 19% Alpine 128 56% Amador 5,150 82% Butte 26,536 40% Calaveras 3,975 42% Colusa 4,692 62% Contra Costa 27,157 13% El Dorado 8,433 28% Fresno 108,341 27% Glenn 3,213 32% Inyo 2,074 52% Kings 19,695 41% Madera 19,253 34%
1 Medi-Cal Managed Care Enrollment Report—June 2018. Available at: http://www.dhcs.ca.gov/dataandstats/reports/Pages/MMCDMonthlyEnrollment.aspx. Accessed on: Oct 31, 2018.
Anthem Blue Cross Partnership Plan Performance Evaluation Report: July 1, 2017–June 30, 2018 California Department of Health Care Services
Page D-3 Health Services Advisory Group, Inc.
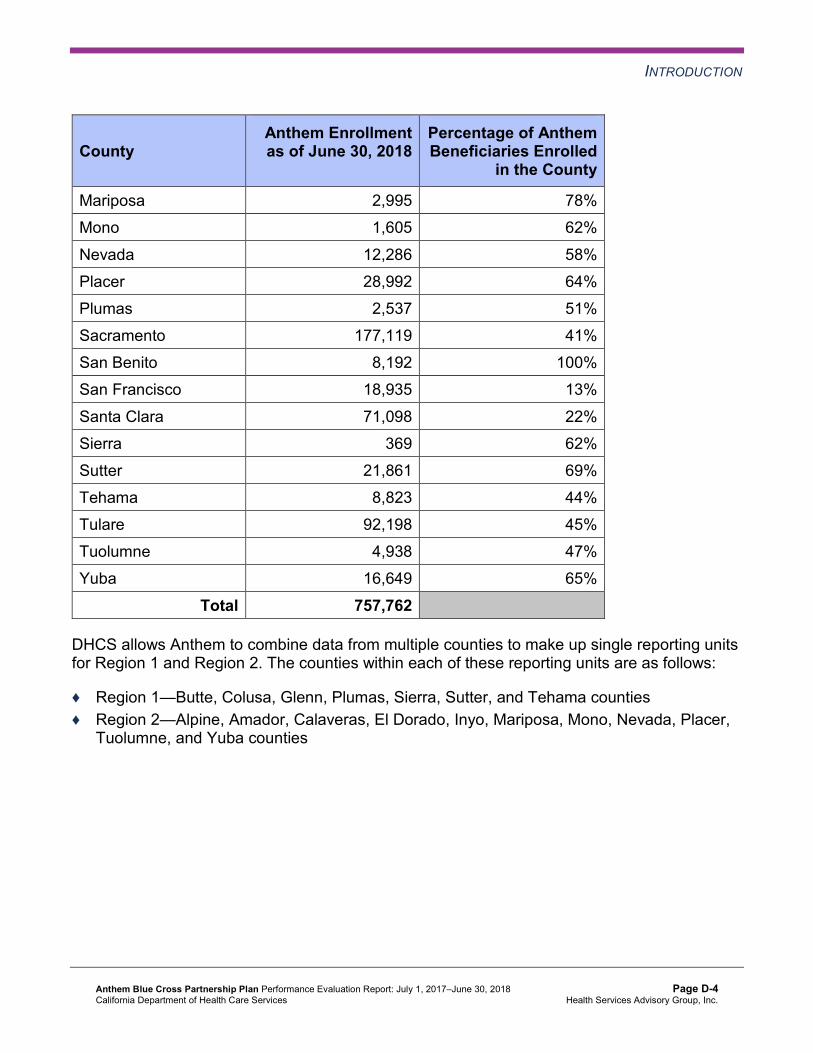
INTRODUCTION
County Anthem Enrollment as of June 30, 2018
Percentage of AnthemBeneficiaries Enrolled
in the County
Mariposa 2,995 78% Mono 1,605 62% Nevada 12,286 58% Placer 28,992 64% Plumas 2,537 51% Sacramento 177,119 41% San Benito 8,192 100% San Francisco 18,935 13% Santa Clara 71,098 22% Sierra 369 62% Sutter 21,861 69% Tehama 8,823 44% Tulare 92,198 45% Tuolumne 4,938 47% Yuba 16,649 65%
Total 757,762
DHCS allows Anthem to combine data from multiple counties to make up single reporting units for Region 1 and Region 2. The counties within each of these reporting units are as follows:
♦ Region 1—Butte, Colusa, Glenn, Plumas, Sierra, Sutter, and Tehama counties ♦ Region 2—Alpine, Amador, Calaveras, El Dorado, Inyo, Mariposa, Mono, Nevada, Placer,
Tuolumne, and Yuba counties
Anthem Blue Cross Partnership Plan Performance Evaluation Report: July 1, 2017–June 30, 2018 California Department of Health Care Services
Page D-4 Health Services Advisory Group, Inc.
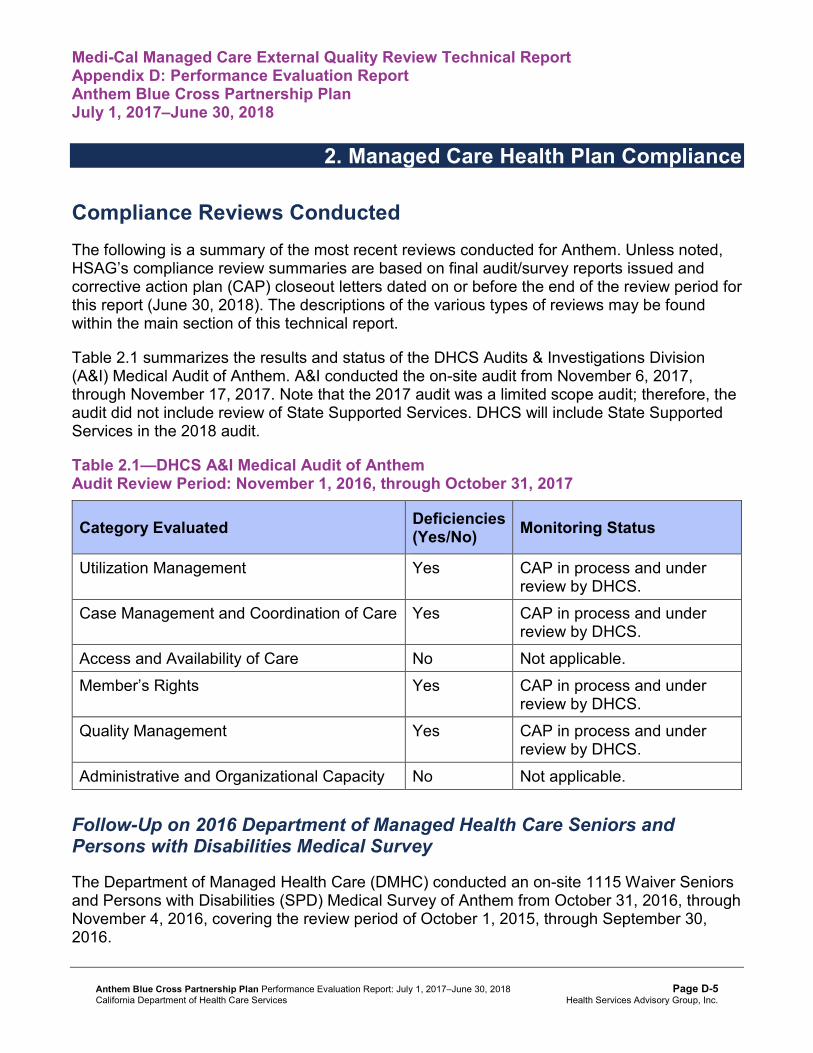
Medi-Cal Managed Care External Quality Review Technical ReportAppendix D: Performance Evaluation ReportAnthem Blue Cross Partnership PlanJuly 1, 2017–June 30, 2018
2. Managed Care Health Plan Compliance
Compliance Reviews Conducted The following is a summary of the most recent reviews conducted for Anthem. Unless noted, HSAG’s compliance review summaries are based on final audit/survey reports issued and corrective action plan (CAP) closeout letters dated on or before the end of the review period for this report (June 30, 2018). The descriptions of the various types of reviews may be found within the main section of this technical report.
Table 2.1 summarizes the results and status of the DHCS Audits & Investigations Division (A&I) Medical Audit of Anthem. A&I conducted the on-site audit from November 6, 2017, through November 17, 2017. Note that the 2017 audit was a limited scope audit; therefore, the audit did not include review of State Supported Services. DHCS will include State Supported Services in the 2018 audit.
Table 2.1—DHCS A&I Medical Audit of Anthem Audit Review Period: November 1, 2016, through October 31, 2017
Category Evaluated Deficiencies (Yes/No) Monitoring Status
Utilization Management Yes CAP in process and under review by DHCS.
Case Management and Coordination of Care Yes CAP in process and under review by DHCS.
Access and Availability of Care No Not applicable. Member’s Rights Yes CAP in process and under
review by DHCS. Quality Management Yes CAP in process and under
review by DHCS. Administrative and Organizational Capacity No Not applicable.
Follow-Up on 2016 Department of Managed Health Care Seniors and Persons with Disabilities Medical Survey
The Department of Managed Health Care (DMHC) conducted an on-site 1115 Waiver Seniors and Persons with Disabilities (SPD) Medical Survey of Anthem from October 31, 2016, through November 4, 2016, covering the review period of October 1, 2015, through September 30, 2016.
Anthem Blue Cross Partnership Plan Performance Evaluation Report: July 1, 2017–June 30, 2018 California Department of Health Care Services
Page D-5 Health Services Advisory Group, Inc.
MANAGED CARE HEALTH PLAN COMPLIANCE
HSAG provided a summary of the survey results and status in Anthem’s 2016–17 MCP-specific evaluation report. At the time of the 2016–17 MCP-specific evaluation report publication, Anthem’s CAP was in progress and under review by DHCS. Additionally, the MCP was to submit to DHCS documented evidence of full remediation of identified issues in the area of Grievances and Appeals. A letter from DHCS dated July 17, 2018, stated that Anthem provided DHCS with additional information and that DHCS accepted the MCP’s submitted CAP; therefore, DHCS closed the CAP. The letter also stated that DHCS will monitor Anthem’s full implementation of the CAP during the subsequent audit.
Note that while DHCS sent Anthem its final response to the MCP’s CAP outside the review period for this report, HSAG includes the information because it reflects full resolution of all deficiencies from the October 31, 2016, through November 4, 2016, DMHC SPD Medical Survey.
Strengths—Compliance Reviews A&I identified no deficiencies in the Access and Availability of Care and Administrative and Organizational Capacity categories during the November 2017 Medical Audit of Anthem. Additionally, the MCP fully resolved all outstanding deficiencies from the October 31, 2016, through November 4, 2016, DMHC SPD Medical Survey.
Opportunities for Improvement—Compliance Reviews Anthem has the opportunity to work with DHCS to ensure that the MCP fully resolves all deficiencies from the November 2017 A&I Medical Audit.
Anthem Blue Cross Partnership Plan Performance Evaluation Report: July 1, 2017–June 30, 2018 California Department of Health Care Services
Page D-6 Health Services Advisory Group, Inc.

Medi-Cal Managed Care External Quality Review Technical ReportAppendix D: Performance Evaluation ReportAnthem Blue Cross Partnership PlanJuly 1, 2017–June 30, 2018
3. Managed Care Health Plan Performance Measures
Performance Measure Validation Results The HEDIS®2 2018 Compliance Audit Final Report of Findings for Anthem Blue Cross Partnership Plan contains the detailed findings and recommendations from HSAG’s NCQA HEDIS Compliance Audit™.3 HSAG auditors determined that Anthem followed the appropriate specifications to produce valid rates, and identified no issues of concern.
Performance Measure Results and Findings After validating the MCP’s performance measure rates, HSAG assessed the results. See Table 3.1 through Table 3.108 for Anthem’s performance measure results for reporting years (RYs) 2015 through 2018 and performance measure findings for RY 2018. The RY is the year in which the MCP reported the rates. The RY rates reflect measurement year (MY) data from the previous calendar year. Note that data may not be available for all four years.
Note the following regarding Table 3.1 through Table 3.108:
♦ To allow HSAG to provide meaningful assessment of MCP performance and actionable recommendations, HSAG, in collaboration with DHCS, organized the measures into domains based on the health care areas each measure affects. Table 3.1 through Table 3.96 present the performance measure results and findings by domain, and Table 3.97 through Table 3.108 present the RY 2018 performance measure findings for the domains combined.
♦ To assess performance for each MCP reporting unit, HSAG compares the rates to national benchmarks. Rates indicating performance above the high performance levels (HPLs) are shaded in gray, and rates indicating performance below the minimum performance levels (MPLs) are bolded. ■ For measures with rates below the MPLs, DHCS requires MCPs to submit to DHCS
improvement plans (IPs) to address the rates below the MPLs (unless MCPs are reporting the rates for the first time).
■ For MCPs that meet DHCS’ Quality of Care CAP thresholds, DHCS issues a CAP; if an MCP’s performance is such that it may trigger a CAP in the following year, DHCS issues an advance warning letter.
2 Healthcare Effectiveness Data and Information Set (HEDIS®) is a registered trademark of the National Committee for Quality Assurance (NCQA).
3 NCQA HEDIS Compliance AuditTM is a trademark of NCQA.
Anthem Blue Cross Partnership Plan Performance Evaluation Report: July 1, 2017–June 30, 2018 California Department of Health Care Services
Page D-7 Health Services Advisory Group, Inc.

MANAGED CARE HEALTH PLAN PERFORMANCE MEASURES
■ IPs and CAPs consist of submission of Plan-Do-Study-Act (PDSA) Cycle Worksheets, Quality Improvement (QI) Summaries, or completion of Performance Improvement Projects (PIPs)—as determined by DHCS.
♦ For RYs 2016, 2017, and 2018, the HPLs and MPLs represent the NCQA Quality Compass®4 Medicaid health maintenance organization (HMO) 90th and 25th percentiles, respectively.
♦ For RY 2015, the HPLs and MPLs represent the NCQA HEDIS Audit Means, Percentiles, and Ratios 90th and 25th percentiles, respectively. For the Comprehensive Diabetes Care—HbA1c Poor Control (>9.0 Percent) measure, for which a lower rate indicates more favorable performance, the HPL and MPL are based on the 10th and 75th percentiles, respectively.
♦ HSAG includes the specific HPL and MPL values for RY 2018 in Section 6 of the Medi-Cal Managed Care External Quality Review Technical Report, July 1, 2017–June 30, 2018 (“Managed Care Health Plan Performance Measures”).
Preventive Screening and Children’s Health
Table 3.1 through Table 3.12 present the four-year trending information for the performance measures within the Preventive Screening and Children’s Health domain.
Note the following regarding Table 3.1 through Table 3.12:
♦ Although HSAG includes information on the MCP’s performance related to the four Children and Adolescents’ Access to Primary Care measures, DHCS did not hold MCPs accountable to meet the MPLs for these measures for RYs 2015 through 2018 (i.e., DHCS did not require MCPs to submit IPs if rates for the measures were below the MPLs). DHCS made this decision due to the small range of variation between the HPL and MPL thresholds for each measure.
♦ Any comparison of RY 2018 performance to RY 2017 or to benchmarks related to the Immunizations for Adolescents—Combination 2 measure should be exercised with caution given the changes that NCQA made to the specification for this measure for RY 2018. NCQA released guidance that recommended a break in trending for this measure; however, DHCS determined to continue trending because the specification change should result in higher rates.
4 Quality Compass® is a registered trademark of NCQA.
Anthem Blue Cross Partnership Plan Performance Evaluation Report: July 1, 2017–June 30, 2018 California Department of Health Care Services
Page D-8 Health Services Advisory Group, Inc.

MANAGED CARE HEALTH PLAN PERFORMANCE MEASURES
Table 3.1—Preventive Screening and Children’s Health DomainMulti-Year Performance Measure Results Anthem—Alameda County
H = Rate indicates performance above the HPL. Bolded Rate = Rate indicates performance below the MPL.
B = Statistical testing result indicates that the RY 2018 rate is significantly better than the RY 2017 rate.
W = Statistical testing result indicates that the RY 2018 rate is significantly worse than the RY 2017 rate.
Measure RY
2015 Rate1
RY 2016
Rate2
RY 2017
Rate3
RY 2018
Rate4
RYs 2017–18 Rate
Difference5
Childhood Immunization Status—Combination 3 71.00% 66.67% 69.68% 68.86% -0.82
Children and Adolescents’ Access to Primary Care Practitioners—12–24 Months
87.06% 88.48% 86.91% 87.08% 0.17
Children and Adolescents’ Access to Primary Care Practitioners— 25 Months–6 Years
82.88% 78.86% 78.08% 82.19% 4.11B
Children and Adolescents’ Access to Primary Care Practitioners—7–11 Years
84.49% 84.58% 82.66% 86.04% 3.38B
Children and Adolescents’ Access to Primary Care Practitioners—12–19 Years
80.02% 80.25% 77.34% 82.37% 5.03B
Immunizations for Adolescents— Combination 2^ -- -- 22.22% 39.90%H 17.68B
Weight Assessment and Counseling for Nutrition and Physical Activity for Children and Adolescents—Nutrition Counseling—Total
61.81% 59.95% 71.99% 76.04% 4.05
Weight Assessment and Counseling for Nutrition and Physical Activity for Children and Adolescents—Physical Activity Counseling—Total
49.77% 53.01% 63.89% 72.40% 8.51B
Anthem Blue Cross Partnership Plan Performance Evaluation Report: July 1, 2017–June 30, 2018 California Department of Health Care Services
Page D-9 Health Services Advisory Group, Inc.

MANAGED CARE HEALTH PLAN PERFORMANCE MEASURES
Measure RY
2015 Rate1
RY 2016
Rate2
RY 2017
Rate3
RY 2018
Rate4
RYs 2017–18 Rate
Difference5
Well-Child Visits in the Third, Fourth, Fifth, and Sixth Years of Life
72.41% 66.44% 69.44% 77.13% 7.69B
1 RY 2015 rates reflect MY data from January 1, 2014, through December 31, 2014. 2 RY 2016 rates reflect MY data from January 1, 2015, through December 31, 2015. 3 RY 2017 rates reflect MY data from January 1, 2016, through December 31, 2016. 4 RY 2018 rates reflect MY data from January 1, 2017, through December 31, 2017. 5 Performance comparisons are based on the Chi-square test of statistical significance, with a p value of <0.05. ^ Caution should be exercised when assessing MCP performance for this measure given the changes that NCQA made to the specification for this measure for RY 2018. -- Indicates that the rate is not available.
Table 3.2—Preventive Screening and Children’s Health DomainMulti-Year Performance Measure Results Anthem—Contra Costa County
H = Rate indicates performance above the HPL. Bolded Rate = Rate indicates performance below the MPL.
B = Statistical testing result indicates that the RY 2018 rate is significantly better than the RY 2017 rate.
W = Statistical testing result indicates that the RY 2018 rate is significantly worse than the RY 2017 rate.
Measure RY
2015 Rate1
RY 2016
Rate2
RY 2017
Rate3
RY 2018
Rate4
RYs 2017–18 Rate
Difference5
Childhood Immunization Status—Combination 3 68.29% 67.99% 64.94% 73.68% 8.74B
Children and Adolescents’ Access to Primary Care Practitioners—12–24 Months
93.77% 90.76% 89.37% 94.33% 4.96B
Children and Adolescents’ Access to Primary Care Practitioners— 25 Months–6 Years
85.36% 83.81% 82.28% 89.86% 7.58B
Anthem Blue Cross Partnership Plan Performance Evaluation Report: July 1, 2017–June 30, 2018 California Department of Health Care Services
Page D-10 Health Services Advisory Group, Inc.

MANAGED CARE HEALTH PLAN PERFORMANCE MEASURES
Measure RY
2015 Rate1
RY 2016
Rate2
RY 2017
Rate3
RY 2018
Rate4
RYs 2017–18 Rate
Difference5
Children and Adolescents’ Access to Primary Care Practitioners—7–11 Years
88.50% 87.58% 85.82% 89.22% 3.40B
Children and Adolescents’ Access to Primary Care Practitioners—12–19 Years
87.31% 83.87% 81.82% 86.28% 4.46B
Immunizations for Adolescents— Combination 2^ -- -- 21.06% 36.74%H 15.68B
Weight Assessment and Counseling for Nutrition and Physical Activity for Children and Adolescents—Nutrition Counseling—Total
55.79% 56.94% 71.76% 67.02% -4.74
Weight Assessment and Counseling for Nutrition and Physical Activity for Children and Adolescents—Physical Activity Counseling—Total
46.99% 51.62% 65.74% 63.56% -2.18
Well-Child Visits in the Third, Fourth, Fifth, and Sixth Years of Life
66.87% 67.13% 71.99% 80.41% 8.42B
1 RY 2015 rates reflect MY data from January 1, 2014, through December 31, 2014. 2 RY 2016 rates reflect MY data from January 1, 2015, through December 31, 2015. 3 RY 2017 rates reflect MY data from January 1, 2016, through December 31, 2016. 4 RY 2018 rates reflect MY data from January 1, 2017, through December 31, 2017. 5 Performance comparisons are based on the Chi-square test of statistical significance, with a p value of <0.05. ^ Caution should be exercised when assessing MCP performance for this measure given the changes that NCQA made to the specification for this measure for RY 2018. -- Indicates that the rate is not available.
Anthem Blue Cross Partnership Plan Performance Evaluation Report: July 1, 2017–June 30, 2018 California Department of Health Care Services
Page D-11 Health Services Advisory Group, Inc.

MANAGED CARE HEALTH PLAN PERFORMANCE MEASURES
Table 3.3—Preventive Screening and Children’s Health DomainMulti-Year Performance Measure Results Anthem—Fresno County
H = Rate indicates performance above the HPL. Bolded Rate = Rate indicates performance below the MPL.
B = Statistical testing result indicates that the RY 2018 rate is significantly better than the RY 2017 rate.
W = Statistical testing result indicates that the RY 2018 rate is significantly worse than the RY 2017 rate.
Measure RY
2015 Rate1
RY 2016
Rate2
RY 2017
Rate3
RY 2018
Rate4
RYs 2017–18 Rate
Difference5
Childhood Immunization Status—Combination 3 67.82% 68.52% 70.11% 72.26% 2.15
Children and Adolescents’ Access to Primary Care Practitioners—12–24 Months
92.76% 93.71% 92.70% 94.37% 1.67B
Children and Adolescents’ Access to Primary Care Practitioners— 25 Months–6 Years
86.16% 84.73% 84.44% 84.73% 0.29
Children and Adolescents’ Access to Primary Care Practitioners—7–11 Years
85.49% 86.11% 84.71% 84.34% -0.37
Children and Adolescents’ Access to Primary Care Practitioners—12–19 Years
83.00% 82.31% 80.37% 80.19% -0.18
Immunizations for Adolescents— Combination 2^ -- -- 26.16% 33.82%H 7.66B
Weight Assessment and Counseling for Nutrition and Physical Activity for Children and Adolescents—Nutrition Counseling—Total
59.26% 67.36% 69.66% 66.84% -2.82
Weight Assessment and Counseling for Nutrition and Physical Activity for Children and Adolescents—Physical Activity Counseling—Total
46.30% 61.57% 64.81% 60.79% -4.02
Anthem Blue Cross Partnership Plan Performance Evaluation Report: July 1, 2017–June 30, 2018 California Department of Health Care Services
Page D-12 Health Services Advisory Group, Inc.

MANAGED CARE HEALTH PLAN PERFORMANCE MEASURES
Measure RY
2015 Rate1
RY 2016
Rate2
RY 2017
Rate3
RY 2018
Rate4
RYs 2017–18 Rate
Difference5
Well-Child Visits in the Third, Fourth, Fifth, and Sixth Years of Life
76.62% 70.60% 72.68% 75.52% 2.84
1 RY 2015 rates reflect MY data from January 1, 2014, through December 31, 2014. 2 RY 2016 rates reflect MY data from January 1, 2015, through December 31, 2015. 3 RY 2017 rates reflect MY data from January 1, 2016, through December 31, 2016. 4 RY 2018 rates reflect MY data from January 1, 2017, through December 31, 2017. 5 Performance comparisons are based on the Chi-square test of statistical significance, with a p value of <0.05. ^ Caution should be exercised when assessing MCP performance for this measure given the changes that NCQA made to the specification for this measure for RY 2018. -- Indicates that the rate is not available.
Table 3.4—Preventive Screening and Children’s Health DomainMulti-Year Performance Measure Results Anthem—Kings County
H = Rate indicates performance above the HPL. Bolded Rate = Rate indicates performance below the MPL.
B = Statistical testing result indicates that the RY 2018 rate is significantly better than the RY 2017 rate.
W = Statistical testing result indicates that the RY 2018 rate is significantly worse than the RY 2017 rate.
Measure RY
2015 Rate1
RY 2016
Rate2
RY 2017
Rate3
RY 2018
Rate4
RYs 2017–18 Rate
Difference5
Childhood Immunization Status—Combination 3 66.31% 68.75% 70.90% 68.86% -2.04
Children and Adolescents’ Access to Primary Care Practitioners—12–24 Months
94.85% 93.92% 91.55% 94.08% 2.53
Children and Adolescents’ Access to Primary Care Practitioners— 25 Months–6 Years
86.59% 87.25% 84.77% 86.99% 2.22B
Anthem Blue Cross Partnership Plan Performance Evaluation Report: July 1, 2017–June 30, 2018 California Department of Health Care Services
Page D-13 Health Services Advisory Group, Inc.

MANAGED CARE HEALTH PLAN PERFORMANCE MEASURES
Measure RY
2015 Rate1
RY 2016
Rate2
RY 2017
Rate3
RY 2018
Rate4
RYs 2017–18 Rate
Difference5
Children and Adolescents’ Access to Primary Care Practitioners—7–11 Years
83.98% 85.42% 86.22% 85.59% -0.63
Children and Adolescents’ Access to Primary Care Practitioners—12–19 Years
85.98% 84.75% 85.81% 84.70% -1.11
Immunizations for Adolescents— Combination 2^ -- -- 18.98% 27.01% 8.03B
Weight Assessment and Counseling for Nutrition and Physical Activity for Children and Adolescents—Nutrition Counseling—Total
56.25% 58.10% 65.89% 69.08% 3.19
Weight Assessment and Counseling for Nutrition and Physical Activity for Children and Adolescents—Physical Activity Counseling—Total
36.34% 47.22% 58.70% 61.85% 3.15
Well-Child Visits in the Third, Fourth, Fifth, and Sixth Years of Life
70.60% 65.85% 72.22% 74.63% 2.41
1 RY 2015 rates reflect MY data from January 1, 2014, through December 31, 2014. 2 RY 2016 rates reflect MY data from January 1, 2015, through December 31, 2015. 3 RY 2017 rates reflect MY data from January 1, 2016, through December 31, 2016. 4 RY 2018 rates reflect MY data from January 1, 2017, through December 31, 2017. 5 Performance comparisons are based on the Chi-square test of statistical significance, with a p value of <0.05. ^ Caution should be exercised when assessing MCP performance for this measure given the changes that NCQA made to the specification for this measure for RY 2018. -- Indicates that the rate is not available.
Anthem Blue Cross Partnership Plan Performance Evaluation Report: July 1, 2017–June 30, 2018 California Department of Health Care Services
Page D-14 Health Services Advisory Group, Inc.

MANAGED CARE HEALTH PLAN PERFORMANCE MEASURES
Table 3.5—Preventive Screening and Children’s Health DomainMulti-Year Performance Measure Results Anthem—Madera County
H = Rate indicates performance above the HPL. Bolded Rate = Rate indicates performance below the MPL.
B = Statistical testing result indicates that the RY 2018 rate is significantly better than the RY 2017 rate.
W = Statistical testing result indicates that the RY 2018 rate is significantly worse than the RY 2017 rate.
Measure RY
2015 Rate1
RY 2016
Rate2
RY 2017
Rate3
RY 2018
Rate4
RYs 2017–18 Rate
Difference5
Childhood Immunization Status—Combination 3 69.38% 76.88% 72.27% 76.12% 3.85
Children and Adolescents’ Access to Primary Care Practitioners—12–24 Months
95.07% 97.08% 97.40% 97.73% 0.33
Children and Adolescents’ Access to Primary Care Practitioners— 25 Months–6 Years
92.14% 93.10% 91.91% 90.99% -0.92
Children and Adolescents’ Access to Primary Care Practitioners—7–11 Years
90.49% 92.61% 93.12% 92.20% -0.92
Children and Adolescents’ Access to Primary Care Practitioners—12–19 Years
90.07% 89.30% 88.84% 88.97% 0.13
Immunizations for Adolescents— Combination 2^ -- -- 42.59% 57.42%H 14.83B
Weight Assessment and Counseling for Nutrition and Physical Activity for Children and Adolescents—Nutrition Counseling—Total
82.83%H 78.01% 81.69%H 83.39%H 1.70
Weight Assessment and Counseling for Nutrition and Physical Activity for Children and Adolescents—Physical Activity Counseling—Total
69.84%H 70.60% 75.96%H 80.19%H 4.23
Anthem Blue Cross Partnership Plan Performance Evaluation Report: July 1, 2017–June 30, 2018 California Department of Health Care Services
Page D-15 Health Services Advisory Group, Inc.

MANAGED CARE HEALTH PLAN PERFORMANCE MEASURES
Measure RY
2015 Rate1
RY 2016
Rate2
RY 2017
Rate3
RY 2018
Rate4
RYs 2017–18 Rate
Difference5
Well-Child Visits in the Third, Fourth, Fifth, and Sixth Years of Life
85.19%H 83.48% 84.26%H 83.84%H -0.42
1 RY 2015 rates reflect MY data from January 1, 2014, through December 31, 2014. 2 RY 2016 rates reflect MY data from January 1, 2015, through December 31, 2015. 3 RY 2017 rates reflect MY data from January 1, 2016, through December 31, 2016. 4 RY 2018 rates reflect MY data from January 1, 2017, through December 31, 2017. 5 Performance comparisons are based on the Chi-square test of statistical significance, with a p value of <0.05. ^ Caution should be exercised when assessing MCP performance for this measure given the changes that NCQA made to the specification for this measure for RY 2018. -- Indicates that the rate is not available.
Table 3.6—Preventive Screening and Children’s Health DomainMulti-Year Performance Measure Results Anthem—Region 1 (Butte, Colusa, Glenn, Plumas, Sierra, Sutter, and Tehama Counties)
H = Rate indicates performance above the HPL. Bolded Rate = Rate indicates performance below the MPL.
B = Statistical testing result indicates that the RY 2018 rate is significantly better than the RY 2017 rate.
W = Statistical testing result indicates that the RY 2018 rate is significantly worse than the RY 2017 rate.
Measure RY
2015 Rate1
RY 2016
Rate2
RY 2017
Rate3
RY 2018
Rate4
RYs 2017–18 Rate
Difference5
Childhood Immunization Status—Combination 3 67.04% 67.82% 71.95% 65.45% -6.50W
Children and Adolescents’ Access to Primary Care Practitioners—12–24 Months
96.82% 96.56% 96.13% 95.59% -0.54
Children and Adolescents’ Access to Primary Care Practitioners— 25 Months–6 Years
87.27% 88.89% 88.34% 86.53% -1.81W
Anthem Blue Cross Partnership Plan Performance Evaluation Report: July 1, 2017–June 30, 2018 California Department of Health Care Services
Page D-16 Health Services Advisory Group, Inc.
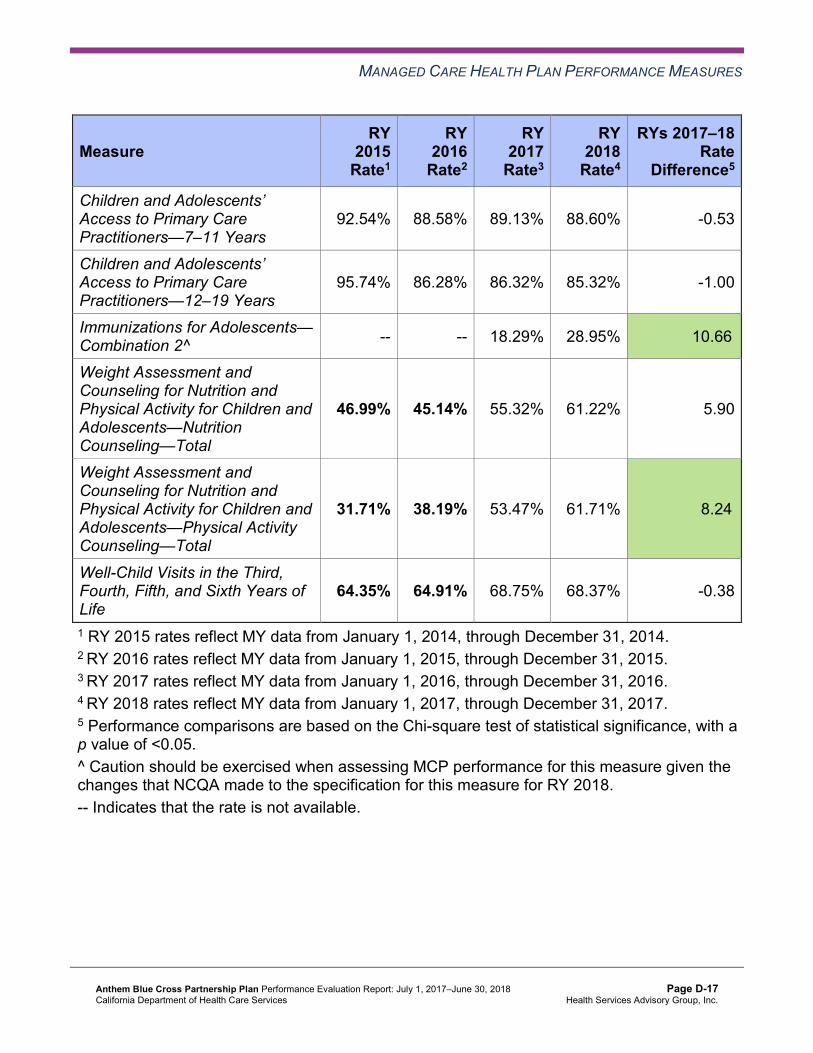
MANAGED CARE HEALTH PLAN PERFORMANCE MEASURES
Measure RY
2015 Rate1
RY 2016
Rate2
RY 2017
Rate3
RY 2018
Rate4
RYs 2017–18 Rate
Difference5
Children and Adolescents’ Access to Primary Care Practitioners—7–11 Years
92.54% 88.58% 89.13% 88.60% -0.53
Children and Adolescents’ Access to Primary Care Practitioners—12–19 Years
95.74% 86.28% 86.32% 85.32% -1.00
Immunizations for Adolescents— Combination 2^ -- -- 18.29% 28.95% 10.66B
Weight Assessment and Counseling for Nutrition and Physical Activity for Children and Adolescents—Nutrition Counseling—Total
46.99% 45.14% 55.32% 61.22% 5.90
Weight Assessment and Counseling for Nutrition and Physical Activity for Children and Adolescents—Physical Activity Counseling—Total
31.71% 38.19% 53.47% 61.71% 8.24B
Well-Child Visits in the Third, Fourth, Fifth, and Sixth Years of Life
64.35% 64.91% 68.75% 68.37% -0.38
1 RY 2015 rates reflect MY data from January 1, 2014, through December 31, 2014. 2 RY 2016 rates reflect MY data from January 1, 2015, through December 31, 2015. 3 RY 2017 rates reflect MY data from January 1, 2016, through December 31, 2016. 4 RY 2018 rates reflect MY data from January 1, 2017, through December 31, 2017. 5 Performance comparisons are based on the Chi-square test of statistical significance, with a p value of <0.05. ^ Caution should be exercised when assessing MCP performance for this measure given the changes that NCQA made to the specification for this measure for RY 2018. -- Indicates that the rate is not available.
Anthem Blue Cross Partnership Plan Performance Evaluation Report: July 1, 2017–June 30, 2018 California Department of Health Care Services
Page D-17 Health Services Advisory Group, Inc.

MANAGED CARE HEALTH PLAN PERFORMANCE MEASURES
Table 3.7—Preventive Screening and Children’s Health DomainMulti-Year Performance Measure Results Anthem—Region 2 (Alpine, Amador, Calaveras, El Dorado, Inyo, Mariposa, Mono,Nevada, Placer, Tuolumne, and Yuba Counties)
H = Rate indicates performance above the HPL. Bolded Rate = Rate indicates performance below the MPL.
B = Statistical testing result indicates that the RY 2018 rate is significantly better than the RY 2017 rate.
W = Statistical testing result indicates that the RY 2018 rate is significantly worse than the RY 2017 rate.
Measure RY
2015 Rate1
RY 2016
Rate2
RY 2017
Rate3
RY 2018
Rate4
RYs 2017–18 Rate
Difference5
Childhood Immunization Status—Combination 3 50.82% 56.94% 65.05% 60.58% -4.47
Children and Adolescents’ Access to Primary Care Practitioners—12–24 Months
93.56% 92.37% 92.22% 92.11% -0.11
Children and Adolescents’ Access to Primary Care Practitioners— 25 Months–6 Years
82.95% 83.55% 81.52% 81.75% 0.23
Children and Adolescents’ Access to Primary Care Practitioners—7–11 Years
92.77% 83.19% 83.11% 82.98% -0.13
Children and Adolescents’ Access to Primary Care Practitioners—12–19 Years
93.40% 83.35% 81.67% 81.86% 0.19
Immunizations for Adolescents— Combination 2^ -- -- 20.37% 28.71% 8.34B
Weight Assessment and Counseling for Nutrition and Physical Activity for Children and Adolescents—Nutrition Counseling—Total
45.14% 51.85% 61.34% 63.07% 1.73
Anthem Blue Cross Partnership Plan Performance Evaluation Report: July 1, 2017–June 30, 2018 California Department of Health Care Services
Page D-18 Health Services Advisory Group, Inc.

MANAGED CARE HEALTH PLAN PERFORMANCE MEASURES
Measure RY
2015 Rate1
RY 2016
Rate2
RY 2017
Rate3
RY 2018
Rate4
RYs 2017–18 Rate
Difference5
Weight Assessment and Counseling for Nutrition and Physical Activity for Children and Adolescents—Physical Activity Counseling—Total
35.42% 44.91% 59.72% 61.81% 2.09
Well-Child Visits in the Third, Fourth, Fifth, and Sixth Years of Life
58.93% 62.50% 65.51% 66.42% 0.91
1 RY 2015 rates reflect MY data from January 1, 2014, through December 31, 2014. 2 RY 2016 rates reflect MY data from January 1, 2015, through December 31, 2015. 3 RY 2017 rates reflect MY data from January 1, 2016, through December 31, 2016. 4 RY 2018 rates reflect MY data from January 1, 2017, through December 31, 2017. 5 Performance comparisons are based on the Chi-square test of statistical significance, with a p value of <0.05. ^ Caution should be exercised when assessing MCP performance for this measure given the changes that NCQA made to the specification for this measure for RY 2018. -- Indicates that the rate is not available.
Table 3.8—Preventive Screening and Children’s Health DomainMulti-Year Performance Measure Results Anthem—Sacramento County
H = Rate indicates performance above the HPL. Bolded Rate = Rate indicates performance below the MPL.
B = Statistical testing result indicates that the RY 2018 rate is significantly better than the RY 2017 rate.
W = Statistical testing result indicates that the RY 2018 rate is significantly worse than the RY 2017 rate.
Measure RY
2015 Rate1
RY 2016
Rate2
RY 2017
Rate3
RY 2018
Rate4
RYs 2017–18 Rate
Difference5
Childhood Immunization Status—Combination 3 66.20% 62.04% 66.67% 65.69% -0.98
Children and Adolescents’ Access to Primary Care Practitioners—12–24 Months
92.27% 91.18% 91.24% 91.42% 0.18
Anthem Blue Cross Partnership Plan Performance Evaluation Report: July 1, 2017–June 30, 2018 California Department of Health Care Services
Page D-19 Health Services Advisory Group, Inc.

MANAGED CARE HEALTH PLAN PERFORMANCE MEASURES
Measure RY
2015 Rate1
RY 2016
Rate2
RY 2017
Rate3
RY 2018
Rate4
RYs 2017–18 Rate
Difference5
Children and Adolescents’ Access to Primary Care Practitioners— 25 Months–6 Years
81.66% 81.28% 79.09% 79.24% 0.15
Children and Adolescents’ Access to Primary Care Practitioners—7–11 Years
83.49% 84.32% 82.57% 82.36% -0.21
Children and Adolescents’ Access to Primary Care Practitioners—12–19 Years
80.93% 80.44% 79.32% 79.45% 0.13
Immunizations for Adolescents— Combination 2^ -- -- 23.38% 33.58%H 10.20B
Weight Assessment and Counseling for Nutrition and Physical Activity for Children and Adolescents—Nutrition Counseling—Total
62.96% 67.59% 72.92% 76.05% 3.13
Weight Assessment and Counseling for Nutrition and Physical Activity for Children and Adolescents—Physical Activity Counseling—Total
49.54% 53.24% 64.12% 70.53% 6.41
Well-Child Visits in the Third, Fourth, Fifth, and Sixth Years of Life
67.21% 65.97% 71.53% 66.67% -4.86
1 RY 2015 rates reflect MY data from January 1, 2014, through December 31, 2014. 2 RY 2016 rates reflect MY data from January 1, 2015, through December 31, 2015. 3 RY 2017 rates reflect MY data from January 1, 2016, through December 31, 2016. 4 RY 2018 rates reflect MY data from January 1, 2017, through December 31, 2017. 5 Performance comparisons are based on the Chi-square test of statistical significance, with a p value of <0.05. ^ Caution should be exercised when assessing MCP performance for this measure given the changes that NCQA made to the specification for this measure for RY 2018. -- Indicates that the rate is not available.
Anthem Blue Cross Partnership Plan Performance Evaluation Report: July 1, 2017–June 30, 2018 California Department of Health Care Services
Page D-20 Health Services Advisory Group, Inc.

MANAGED CARE HEALTH PLAN PERFORMANCE MEASURES
Table 3.9—Preventive Screening and Children’s Health DomainMulti-Year Performance Measure Results Anthem—San Benito County
H = Rate indicates performance above the HPL. Bolded Rate = Rate indicates performance below the MPL.
B = Statistical testing result indicates that the RY 2018 rate is significantly better than the RY 2017 rate.
W = Statistical testing result indicates that the RY 2018 rate is significantly worse than the RY 2017 rate.
Measure RY
2015 Rate1
RY 2016
Rate2
RY 2017
Rate3
RY 2018
Rate4
RYs 2017–18 Rate
Difference5
Childhood Immunization Status—Combination 3 58.33% 67.43% 72.41% 63.13% -9.28
Children and Adolescents’ Access to Primary Care Practitioners—12–24 Months
93.08% 92.50% 91.89% 94.06% 2.17
Children and Adolescents’ Access to Primary Care Practitioners— 25 Months–6 Years
78.21% 84.97% 83.54% 83.84% 0.30
Children and Adolescents’ Access to Primary Care Practitioners—7–11 Years
NA 86.12% 84.41% 84.64% 0.23
Children and Adolescents’ Access to Primary Care Practitioners—12–19 Years
NA 82.26% 78.65% 80.82% 2.17
Immunizations for Adolescents— Combination 2^ -- -- 14.29% 25.84% 11.55B
Weight Assessment and Counseling for Nutrition and Physical Activity for Children and Adolescents—Nutrition Counseling—Total
50.46% 53.60% 61.57% 61.23% -0.34
Weight Assessment and Counseling for Nutrition and Physical Activity for Children and Adolescents—Physical Activity Counseling—Total
23.84% 42.46% 56.71% 58.02% 1.31
Anthem Blue Cross Partnership Plan Performance Evaluation Report: July 1, 2017–June 30, 2018 California Department of Health Care Services
Page D-21 Health Services Advisory Group, Inc.

MANAGED CARE HEALTH PLAN PERFORMANCE MEASURES
Measure RY
2015 Rate1
RY 2016
Rate2
RY 2017
Rate3
RY 2018
Rate4
RYs 2017–18 Rate
Difference5
Well-Child Visits in the Third, Fourth, Fifth, and Sixth Years of Life
65.74% 64.35% 65.66% 71.01% 5.35
1 RY 2015 rates reflect MY data from January 1, 2014, through December 31, 2014. 2 RY 2016 rates reflect MY data from January 1, 2015, through December 31, 2015. 3 RY 2017 rates reflect MY data from January 1, 2016, through December 31, 2016. 4 RY 2018 rates reflect MY data from January 1, 2017, through December 31, 2017. 5 Performance comparisons are based on the Chi-square test of statistical significance, with a p value of <0.05. ^ Caution should be exercised when assessing MCP performance for this measure given the changes that NCQA made to the specification for this measure for RY 2018. -- Indicates that the rate is not available. NA = The MCP followed the specifications, but the denominator was too small (less than 30) to report a valid rate.
Table 3.10—Preventive Screening and Children’s Health DomainMulti-Year Performance Measure Results Anthem—San Francisco County
H = Rate indicates performance above the HPL. Bolded Rate = Rate indicates performance below the MPL.
B = Statistical testing result indicates that the RY 2018 rate is significantly better than the RY 2017 rate.
W = Statistical testing result indicates that the RY 2018 rate is significantly worse than the RY 2017 rate.
Measure RY
2015 Rate1
RY 2016
Rate2
RY 2017
Rate3
RY 2018
Rate4
RYs 2017–18 Rate
Difference5
Childhood Immunization Status—Combination 3 75.76% 72.39% 75.78% 76.80% 1.02
Children and Adolescents’ Access to Primary Care Practitioners—12–24 Months
90.76% 94.26% 93.30% 96.76% 3.46
Children and Adolescents’ Access to Primary Care Practitioners— 25 Months–6 Years
84.62% 84.12% 85.28% 85.44% 0.16
Anthem Blue Cross Partnership Plan Performance Evaluation Report: July 1, 2017–June 30, 2018 California Department of Health Care Services
Page D-22 Health Services Advisory Group, Inc.

MANAGED CARE HEALTH PLAN PERFORMANCE MEASURES
Measure RY
2015 Rate1
RY 2016
Rate2
RY 2017
Rate3
RY 2018
Rate4
RYs 2017–18 Rate
Difference5
Children and Adolescents’ Access to Primary Care Practitioners—7–11 Years
91.20% 89.98% 89.16% 88.08% -1.08
Children and Adolescents’ Access to Primary Care Practitioners—12–19 Years
87.60% 88.06% 87.38% 87.19% -0.19
Immunizations for Adolescents— Combination 2^ -- -- 31.71% 38.40%H 6.69
Weight Assessment and Counseling for Nutrition and Physical Activity for Children and Adolescents—Nutrition Counseling—Total
69.91% 72.22% 77.78% 78.03% 0.25
Weight Assessment and Counseling for Nutrition and Physical Activity for Children and Adolescents—Physical Activity Counseling—Total
61.57% 68.75% 76.16%H 75.08% -1.08
Well-Child Visits in the Third, Fourth, Fifth, and Sixth Years of Life
71.46% 75.28% 76.29% 75.67% -0.62
1 RY 2015 rates reflect MY data from January 1, 2014, through December 31, 2014. 2 RY 2016 rates reflect MY data from January 1, 2015, through December 31, 2015. 3 RY 2017 rates reflect MY data from January 1, 2016, through December 31, 2016. 4 RY 2018 rates reflect MY data from January 1, 2017, through December 31, 2017. 5 Performance comparisons are based on the Chi-square test of statistical significance, with a p value of <0.05. ^ Caution should be exercised when assessing MCP performance for this measure given the changes that NCQA made to the specification for this measure for RY 2018. -- Indicates that the rate is not available.
Anthem Blue Cross Partnership Plan Performance Evaluation Report: July 1, 2017–June 30, 2018 California Department of Health Care Services
Page D-23 Health Services Advisory Group, Inc.

MANAGED CARE HEALTH PLAN PERFORMANCE MEASURES
Table 3.11—Preventive Screening and Children’s Health DomainMulti-Year Performance Measure Results Anthem—Santa Clara County
H = Rate indicates performance above the HPL. Bolded Rate = Rate indicates performance below the MPL.
B = Statistical testing result indicates that the RY 2018 rate is significantly better than the RY 2017 rate.
W = Statistical testing result indicates that the RY 2018 rate is significantly worse than the RY 2017 rate.
Measure RY
2015 Rate1
RY 2016
Rate2
RY 2017
Rate3
RY 2018
Rate4
RYs 2017–18 Rate
Difference5
Childhood Immunization Status—Combination 3 69.21% 70.83% 73.77% 71.95% -1.82
Children and Adolescents’ Access to Primary Care Practitioners—12–24 Months
94.04% 91.29% 91.43% 92.06% 0.63
Children and Adolescents’ Access to Primary Care Practitioners— 25 Months–6 Years
86.01% 82.62% 82.23% 83.01% 0.78
Children and Adolescents’ Access to Primary Care Practitioners—7–11 Years
88.86% 86.48% 85.83% 85.41% -0.42
Children and Adolescents’ Access to Primary Care Practitioners—12–19 Years
86.24% 84.22% 80.77% 82.05% 1.28B
Immunizations for Adolescents— Combination 2^ -- -- 27.55% 38.69%H 11.14B
Weight Assessment and Counseling for Nutrition and Physical Activity for Children and Adolescents—Nutrition Counseling—Total
64.58% 65.51% 73.61% 72.63% -0.98
Weight Assessment and Counseling for Nutrition and Physical Activity for Children and Adolescents—Physical Activity Counseling—Total
52.78% 53.94% 64.12% 65.53% 1.41
Anthem Blue Cross Partnership Plan Performance Evaluation Report: July 1, 2017–June 30, 2018 California Department of Health Care Services
Page D-24 Health Services Advisory Group, Inc.

MANAGED CARE HEALTH PLAN PERFORMANCE MEASURES
Measure RY
2015 Rate1
RY 2016
Rate2
RY 2017
Rate3
RY 2018
Rate4
RYs 2017–18 Rate
Difference5
Well-Child Visits in the Third, Fourth, Fifth, and Sixth Years of Life
77.08% 69.21% 75.46% 73.97% -1.49
1 RY 2015 rates reflect MY data from January 1, 2014, through December 31, 2014. 2 RY 2016 rates reflect MY data from January 1, 2015, through December 31, 2015. 3 RY 2017 rates reflect MY data from January 1, 2016, through December 31, 2016. 4 RY 2018 rates reflect MY data from January 1, 2017, through December 31, 2017. 5 Performance comparisons are based on the Chi-square test of statistical significance, with a p value of <0.05. ^ Caution should be exercised when assessing MCP performance for this measure given the changes that NCQA made to the specification for this measure for RY 2018. -- Indicates that the rate is not available.
Table 3.12—Preventive Screening and Children’s Health DomainMulti-Year Performance Measure Results Anthem—Tulare County
H = Rate indicates performance above the HPL. Bolded Rate = Rate indicates performance below the MPL.
B = Statistical testing result indicates that the RY 2018 rate is significantly better than the RY 2017 rate.
W = Statistical testing result indicates that the RY 2018 rate is significantly worse than the RY 2017 rate.
Measure RY
2015 Rate1
RY 2016
Rate2
RY 2017
Rate3
RY 2018
Rate4
RYs 2017–18 Rate
Difference5
Childhood Immunization Status—Combination 3 66.67% 69.74% 72.69% 81.75%H 9.06B
Children and Adolescents’ Access to Primary Care Practitioners—12–24 Months
97.24% 97.29% 96.62% 96.93% 0.31
Children and Adolescents’ Access to Primary Care Practitioners— 25 Months–6 Years
91.20% 91.69% 90.61% 90.11% -0.50
Anthem Blue Cross Partnership Plan Performance Evaluation Report: July 1, 2017–June 30, 2018 California Department of Health Care Services
Page D-25 Health Services Advisory Group, Inc.

MANAGED CARE HEALTH PLAN PERFORMANCE MEASURES
Measure RY
2015 Rate1
RY 2016
Rate2
RY 2017
Rate3
RY 2018
Rate4
RYs 2017–18 Rate
Difference5
Children and Adolescents’ Access to Primary Care Practitioners—7–11 Years
91.28% 91.83% 91.69% 91.53% -0.16
Children and Adolescents’ Access to Primary Care Practitioners—12–19 Years
90.62% 90.69% 90.25% 90.01% -0.24
Immunizations for Adolescents— Combination 2^ -- -- 29.63% 37.47%H 7.84B
Weight Assessment and Counseling for Nutrition and Physical Activity for Children and Adolescents—Nutrition Counseling—Total
68.21% 74.54% 77.25% 81.19% 3.94
Weight Assessment and Counseling for Nutrition and Physical Activity for Children and Adolescents—Physical Activity Counseling—Total
49.19% 68.75% 72.75%H 78.51%H 5.76
Well-Child Visits in the Third, Fourth, Fifth, and Sixth Years of Life
72.45% 75.57% 79.17% 84.59%H 5.42
1 RY 2015 rates reflect MY data from January 1, 2014, through December 31, 2014. 2 RY 2016 rates reflect MY data from January 1, 2015, through December 31, 2015. 3 RY 2017 rates reflect MY data from January 1, 2016, through December 31, 2016. 4 RY 2018 rates reflect MY data from January 1, 2017, through December 31, 2017. 5 Performance comparisons are based on the Chi-square test of statistical significance, with a p value of <0.05. ^ Caution should be exercised when assessing MCP performance for this measure given the changes that NCQA made to the specification for this measure for RY 2018. -- Indicates that the rate is not available.
Anthem Blue Cross Partnership Plan Performance Evaluation Report: July 1, 2017–June 30, 2018 California Department of Health Care Services
Page D-26 Health Services Advisory Group, Inc.
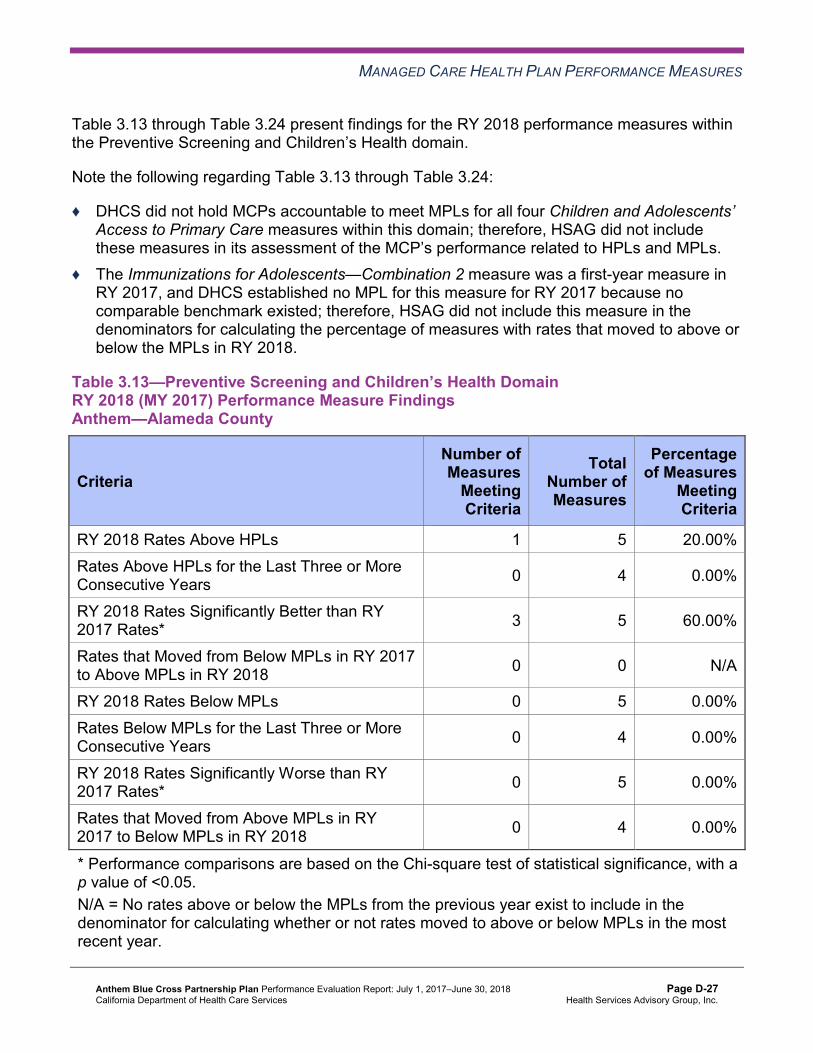
MANAGED CARE HEALTH PLAN PERFORMANCE MEASURES
Table 3.13 through Table 3.24 present findings for the RY 2018 performance measures within the Preventive Screening and Children’s Health domain.
Note the following regarding Table 3.13 through Table 3.24:
♦ DHCS did not hold MCPs accountable to meet MPLs for all four Children and Adolescents’ Access to Primary Care measures within this domain; therefore, HSAG did not include these measures in its assessment of the MCP’s performance related to HPLs and MPLs.
♦ The Immunizations for Adolescents—Combination 2 measure was a first-year measure in RY 2017, and DHCS established no MPL for this measure for RY 2017 because no comparable benchmark existed; therefore, HSAG did not include this measure in the denominators for calculating the percentage of measures with rates that moved to above or below the MPLs in RY 2018.
Table 3.13—Preventive Screening and Children’s Health DomainRY 2018 (MY 2017) Performance Measure FindingsAnthem—Alameda County
Criteria Number of Measures
MeetingCriteria
Total Number of Measures
Percentage of Measures
MeetingCriteria
RY 2018 Rates Above HPLs 1 5 20.00% Rates Above HPLs for the Last Three or More Consecutive Years 0 4 0.00%
RY 2018 Rates Significantly Better than RY 2017 Rates* 3 5 60.00%
Rates that Moved from Below MPLs in RY 2017 to Above MPLs in RY 2018 0 0 N/A
RY 2018 Rates Below MPLs 0 5 0.00% Rates Below MPLs for the Last Three or More Consecutive Years 0 4 0.00%
RY 2018 Rates Significantly Worse than RY 2017 Rates* 0 5 0.00%
Rates that Moved from Above MPLs in RY 2017 to Below MPLs in RY 2018 0 4 0.00%
* Performance comparisons are based on the Chi-square test of statistical significance, with a p value of <0.05. N/A = No rates above or below the MPLs from the previous year exist to include in the denominator for calculating whether or not rates moved to above or below MPLs in the most recent year.
Anthem Blue Cross Partnership Plan Performance Evaluation Report: July 1, 2017–June 30, 2018 California Department of Health Care Services
Page D-27 Health Services Advisory Group, Inc.

MANAGED CARE HEALTH PLAN PERFORMANCE MEASURES
Table 3.14—Preventive Screening and Children’s Health DomainRY 2018 (MY 2017) Performance Measure Findings Anthem—Contra Costa County
Criteria Number of Measures
MeetingCriteria
Total Number of Measures
Percentage of Measures
MeetingCriteria
RY 2018 Rates Above HPLs 1 5 20.00% Rates Above HPLs for the Last Three or More Consecutive Years 0 4 0.00%
RY 2018 Rates Significantly Better than RY 2017 Rates* 3 5 60.00%
Rates that Moved from Below MPLs in RY 2017 to Above MPLs in RY 2018 0 0 N/A
RY 2018 Rates Below MPLs 0 5 0.00% Rates Below MPLs for the Last Three or More Consecutive Years 0 4 0.00%
RY 2018 Rates Significantly Worse than RY 2017 Rates* 0 5 0.00%
Rates that Moved from Above MPLs in RY 2017 to Below MPLs in RY 2018 0 4 0.00%
* Performance comparisons are based on the Chi-square test of statistical significance, with a p value of <0.05. N/A = No rates above or below the MPLs from the previous year exist to include in the denominator for calculating whether or not rates moved to above or below MPLs in the most recent year.
Anthem Blue Cross Partnership Plan Performance Evaluation Report: July 1, 2017–June 30, 2018 California Department of Health Care Services
Page D-28 Health Services Advisory Group, Inc.

MANAGED CARE HEALTH PLAN PERFORMANCE MEASURES
Table 3.15—Preventive Screening and Children’s Health DomainRY 2018 (MY 2017) Performance Measure Findings Anthem—Fresno County
Criteria Number of Measures
MeetingCriteria
Total Number of Measures
Percentage of Measures
MeetingCriteria
RY 2018 Rates Above HPLs 1 5 20.00% Rates Above HPLs for the Last Three or More Consecutive Years 0 4 0.00%
RY 2018 Rates Significantly Better than RY 2017 Rates* 1 5 20.00%
Rates that Moved from Below MPLs in RY 2017 to Above MPLs in RY 2018 0 0 N/A
RY 2018 Rates Below MPLs 0 5 0.00% Rates Below MPLs for the Last Three or More Consecutive Years 0 4 0.00%
RY 2018 Rates Significantly Worse than RY 2017 Rates* 0 5 0.00%
Rates that Moved from Above MPLs in RY 2017 to Below MPLs in RY 2018 0 4 0.00%
* Performance comparisons are based on the Chi-square test of statistical significance, with a p value of <0.05. N/A = No rates above or below the MPLs from the previous year exist to include in the denominator for calculating whether or not rates moved to above or below MPLs in the most recent year.
Anthem Blue Cross Partnership Plan Performance Evaluation Report: July 1, 2017–June 30, 2018 California Department of Health Care Services
Page D-29 Health Services Advisory Group, Inc.

MANAGED CARE HEALTH PLAN PERFORMANCE MEASURES
Table 3.16—Preventive Screening and Children’s Health DomainRY 2018 (MY 2017) Performance Measure Findings Anthem—Kings County
Criteria Number of Measures
MeetingCriteria
Total Number of Measures
Percentage of Measures
MeetingCriteria
RY 2018 Rates Above HPLs 0 5 0.00% Rates Above HPLs for the Last Three or More Consecutive Years 0 4 0.00%
RY 2018 Rates Significantly Better than RY 2017 Rates* 1 5 20.00%
Rates that Moved from Below MPLs in RY 2017 to Above MPLs in RY 2018 0 0 N/A
RY 2018 Rates Below MPLs 0 5 0.00% Rates Below MPLs for the Last Three or More Consecutive Years 0 4 0.00%
RY 2018 Rates Significantly Worse than RY 2017 Rates* 0 5 0.00%
Rates that Moved from Above MPLs in RY 2017 to Below MPLs in RY 2018 0 4 0.00%
* Performance comparisons are based on the Chi-square test of statistical significance, with a p value of <0.05. N/A = No rates above or below the MPLs from the previous year exist to include in the denominator for calculating whether or not rates moved to above or below MPLs in the most recent year.
Anthem Blue Cross Partnership Plan Performance Evaluation Report: July 1, 2017–June 30, 2018 California Department of Health Care Services
Page D-30 Health Services Advisory Group, Inc.
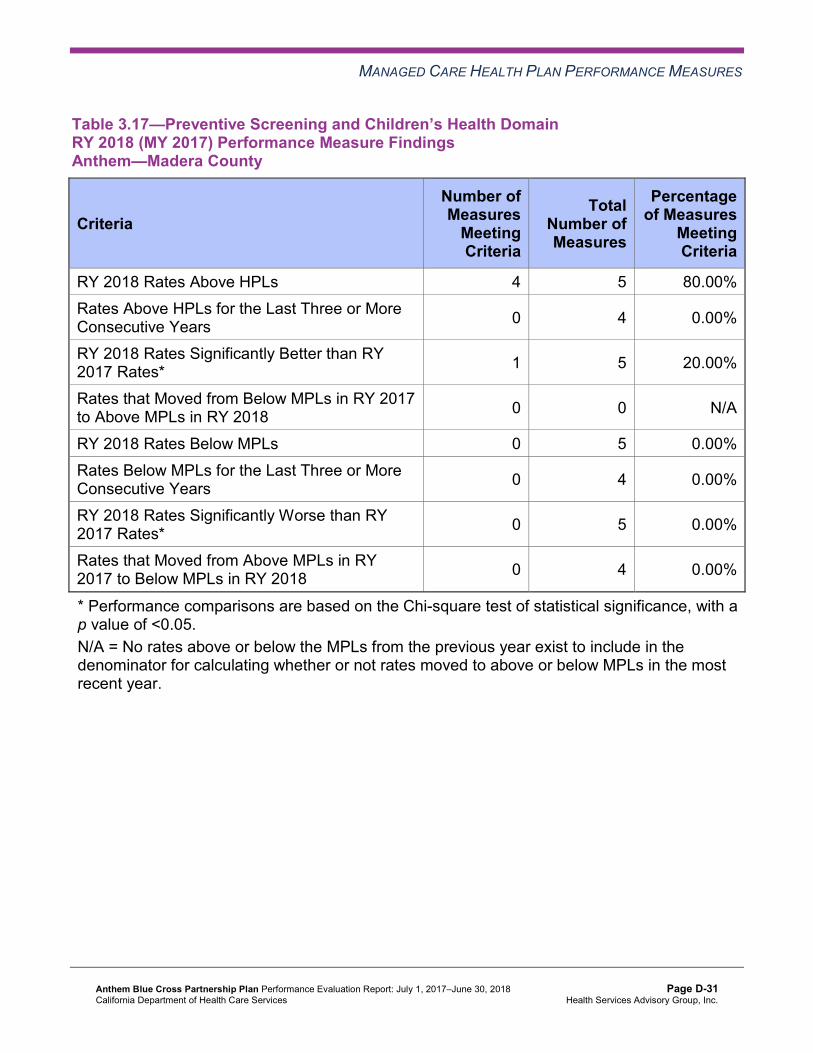
MANAGED CARE HEALTH PLAN PERFORMANCE MEASURES
Table 3.17—Preventive Screening and Children’s Health DomainRY 2018 (MY 2017) Performance Measure Findings Anthem—Madera County
Criteria Number of Measures
MeetingCriteria
Total Number of Measures
Percentage of Measures
MeetingCriteria
RY 2018 Rates Above HPLs 4 5 80.00% Rates Above HPLs for the Last Three or More Consecutive Years 0 4 0.00%
RY 2018 Rates Significantly Better than RY 2017 Rates* 1 5 20.00%
Rates that Moved from Below MPLs in RY 2017 to Above MPLs in RY 2018 0 0 N/A
RY 2018 Rates Below MPLs 0 5 0.00% Rates Below MPLs for the Last Three or More Consecutive Years 0 4 0.00%
RY 2018 Rates Significantly Worse than RY 2017 Rates* 0 5 0.00%
Rates that Moved from Above MPLs in RY 2017 to Below MPLs in RY 2018 0 4 0.00%
* Performance comparisons are based on the Chi-square test of statistical significance, with a p value of <0.05. N/A = No rates above or below the MPLs from the previous year exist to include in the denominator for calculating whether or not rates moved to above or below MPLs in the most recent year.
Anthem Blue Cross Partnership Plan Performance Evaluation Report: July 1, 2017–June 30, 2018 California Department of Health Care Services
Page D-31 Health Services Advisory Group, Inc.

MANAGED CARE HEALTH PLAN PERFORMANCE MEASURES
Table 3.18—Preventive Screening and Children’s Health DomainRY 2018 (MY 2017) Performance Measure Findings Anthem—Region 1 (Butte, Colusa, Glenn, Plumas, Sierra, Sutter, and Tehama Counties)
Criteria Number of Measures
MeetingCriteria
Total Number of Measures
Percentage of Measures
MeetingCriteria
RY 2018 Rates Above HPLs 0 5 0.00% Rates Above HPLs for the Last Three or More Consecutive Years 0 4 0.00%
RY 2018 Rates Significantly Better than RY 2017 Rates* 2 5 40.00%
Rates that Moved from Below MPLs in RY 2017 to Above MPLs in RY 2018 0 0 N/A
RY 2018 Rates Below MPLs 0 5 0.00% Rates Below MPLs for the Last Three or More Consecutive Years 0 4 0.00%
RY 2018 Rates Significantly Worse than RY 2017 Rates* 1 5 20.00%
Rates that Moved from Above MPLs in RY 2017 to Below MPLs in RY 2018 0 4 0.00%
* Performance comparisons are based on the Chi-square test of statistical significance, with a p value of <0.05. N/A = No rates above or below the MPLs from the previous year exist to include in the denominator for calculating whether or not rates moved to above or below MPLs in the most recent year.
Anthem Blue Cross Partnership Plan Performance Evaluation Report: July 1, 2017–June 30, 2018 California Department of Health Care Services
Page D-32 Health Services Advisory Group, Inc.

MANAGED CARE HEALTH PLAN PERFORMANCE MEASURES
Table 3.19—Preventive Screening and Children’s Health DomainRY 2018 (MY 2017) Performance Measure Findings Anthem—Region 2 (Alpine, Amador, Calaveras, El Dorado, Inyo, Mariposa, Mono,Nevada, Placer, Tuolumne, and Yuba Counties)
Criteria Number of Measures
MeetingCriteria
Total Number of Measures
Percentage of Measures
MeetingCriteria
RY 2018 Rates Above HPLs 0 5 0.00% Rates Above HPLs for the Last Three or More Consecutive Years 0 4 0.00%
RY 2018 Rates Significantly Better than RY 2017 Rates* 1 5 20.00%
Rates that Moved from Below MPLs in RY 2017 to Above MPLs in RY 2018 0 0 N/A
RY 2018 Rates Below MPLs 1 5 20.00% Rates Below MPLs for the Last Three or More Consecutive Years 0 4 0.00%
RY 2018 Rates Significantly Worse than RY 2017 Rates* 0 5 0.00%
Rates that Moved from Above MPLs in RY 2017 to Below MPLs in RY 2018 1 4 25.00%
* Performance comparisons are based on the Chi-square test of statistical significance, with a p value of <0.05. N/A = No rates above or below the MPLs from the previous year exist to include in the denominator for calculating whether or not rates moved to above or below MPLs in the most recent year.
Anthem Blue Cross Partnership Plan Performance Evaluation Report: July 1, 2017–June 30, 2018 California Department of Health Care Services
Page D-33 Health Services Advisory Group, Inc.

MANAGED CARE HEALTH PLAN PERFORMANCE MEASURES
Table 3.20—Preventive Screening and Children’s Health DomainRY 2018 (MY 2017) Performance Measure Findings Anthem—Sacramento County
Criteria Number of Measures
MeetingCriteria
Total Number of Measures
Percentage of Measures
MeetingCriteria
RY 2018 Rates Above HPLs 1 5 20.00% Rates Above HPLs for the Last Three or More Consecutive Years 0 4 0.00%
RY 2018 Rates Significantly Better than RY 2017 Rates* 1 5 20.00%
Rates that Moved from Below MPLs in RY 2017 to Above MPLs in RY 2018 0 0 N/A
RY 2018 Rates Below MPLs 0 5 0.00% Rates Below MPLs for the Last Three or More Consecutive Years 0 4 0.00%
RY 2018 Rates Significantly Worse than RY 2017 Rates* 0 5 0.00%
Rates that Moved from Above MPLs in RY 2017 to Below MPLs in RY 2018 0 4 0.00%
* Performance comparisons are based on the Chi-square test of statistical significance, with a p value of <0.05. N/A = No rates above or below the MPLs from the previous year exist to include in the denominator for calculating whether or not rates moved to above or below MPLs in the most recent year.
Anthem Blue Cross Partnership Plan Performance Evaluation Report: July 1, 2017–June 30, 2018 California Department of Health Care Services
Page D-34 Health Services Advisory Group, Inc.

MANAGED CARE HEALTH PLAN PERFORMANCE MEASURES
Table 3.21—Preventive Screening and Children’s Health DomainRY 2018 (MY 2017) Performance Measure Findings Anthem—San Benito County
Criteria Number of Measures
MeetingCriteria
Total Number of Measures
Percentage of Measures
MeetingCriteria
RY 2018 Rates Above HPLs 0 5 0.00% Rates Above HPLs for the Last Three or More Consecutive Years 0 4 0.00%
RY 2018 Rates Significantly Better than RY 2017 Rates* 1 5 20.00%
Rates that Moved from Below MPLs in RY 2017 to Above MPLs in RY 2018 0 0 N/A
RY 2018 Rates Below MPLs 1 5 20.00% Rates Below MPLs for the Last Three or More Consecutive Years 0 4 0.00%
RY 2018 Rates Significantly Worse than RY 2017 Rates* 0 5 0.00%
Rates that Moved from Above MPLs in RY 2017 to Below MPLs in RY 2018 1 4 25.00%
* Performance comparisons are based on the Chi-square test of statistical significance, with a p value of <0.05. N/A = No rates above or below the MPLs from the previous year exist to include in the denominator for calculating whether or not rates moved to above or below MPLs in the most recent year.
Anthem Blue Cross Partnership Plan Performance Evaluation Report: July 1, 2017–June 30, 2018 California Department of Health Care Services
Page D-35 Health Services Advisory Group, Inc.

MANAGED CARE HEALTH PLAN PERFORMANCE MEASURES
Table 3.22—Preventive Screening and Children’s Health DomainRY 2018 (MY 2017) Performance Measure Findings Anthem—San Francisco County
Criteria Number of Measures
MeetingCriteria
Total Number of Measures
Percentage of Measures
MeetingCriteria
RY 2018 Rates Above HPLs 1 5 20.00% Rates Above HPLs for the Last Three or More Consecutive Years 0 4 0.00%
RY 2018 Rates Significantly Better than RY 2017 Rates* 0 5 0.00%
Rates that Moved from Below MPLs in RY 2017 to Above MPLs in RY 2018 0 0 N/A
RY 2018 Rates Below MPLs 0 5 0.00% Rates Below MPLs for the Last Three or More Consecutive Years 0 4 0.00%
RY 2018 Rates Significantly Worse than RY 2017 Rates* 0 5 0.00%
Rates that Moved from Above MPLs in RY 2017 to Below MPLs in RY 2018 0 4 0.00%
* Performance comparisons are based on the Chi-square test of statistical significance, with a p value of <0.05. N/A = No rates above or below the MPLs from the previous year exist to include in the denominator for calculating whether or not rates moved to above or below MPLs in the most recent year.
Anthem Blue Cross Partnership Plan Performance Evaluation Report: July 1, 2017–June 30, 2018 California Department of Health Care Services
Page D-36 Health Services Advisory Group, Inc.

MANAGED CARE HEALTH PLAN PERFORMANCE MEASURES
Table 3.23—Preventive Screening and Children’s Health DomainRY 2018 (MY 2017) Performance Measure Findings Anthem—Santa Clara County
Criteria Number of Measures
MeetingCriteria
Total Number of Measures
Percentage of Measures
Meeting Criteria
RY 2018 Rates Above HPLs 1 5 20.00% Rates Above HPLs for the Last Three or More Consecutive Years 0 4 0.00%
RY 2018 Rates Significantly Better than RY 2017 Rates* 1 5 20.00%
Rates that Moved from Below MPLs in RY 2017 to Above MPLs in RY 2018 0 0 N/A
RY 2018 Rates Below MPLs 0 5 0.00% Rates Below MPLs for the Last Three or More Consecutive Years 0 4 0.00%
RY 2018 Rates Significantly Worse than RY 2017 Rates* 0 5 0.00%
Rates that Moved from Above MPLs in RY 2017 to Below MPLs in RY 2018 0 4 0.00%
* Performance comparisons are based on the Chi-square test of statistical significance, with a p value of <0.05. N/A = No rates above or below the MPLs from the previous year exist to include in the denominator for calculating whether or not rates moved to above or below MPLs in the most recent year.
Anthem Blue Cross Partnership Plan Performance Evaluation Report: July 1, 2017–June 30, 2018 California Department of Health Care Services
Page D-37 Health Services Advisory Group, Inc.

MANAGED CARE HEALTH PLAN PERFORMANCE MEASURES
Table 3.24—Preventive Screening and Children’s Health DomainRY 2018 (MY 2017) Performance Measure Findings Anthem—Tulare County
Criteria Number of Measures
MeetingCriteria
Total Number of Measures
Percentage of Measures
MeetingCriteria
RY 2018 Rates Above HPLs 4 5 80.00% Rates Above HPLs for the Last Three or More Consecutive Years 0 4 0.00%
RY 2018 Rates Significantly Better than RY 2017 Rates* 2 5 40.00%
Rates that Moved from Below MPLs in RY 2017 to Above MPLs in RY 2018 0 0 N/A
RY 2018 Rates Below MPLs 0 5 0.00% Rates Below MPLs for the Last Three or More Consecutive Years 0 4 0.00%
RY 2018 Rates Significantly Worse than RY 2017 Rates* 0 5 0.00%
Rates that Moved from Above MPLs in RY 2017 to Below MPLs in RY 2018 0 4 0.00%
* Performance comparisons are based on the Chi-square test of statistical significance, with a p value of <0.05. N/A = No rates above or below the MPLs from the previous year exist to include in the denominator for calculating whether or not rates moved to above or below MPLs in the most recent year.
Assessment of Corrective Action Plan—Preventive Screening and Children’s HealthDomain
DHCS initiated Anthem’s Quality of Care CAP in November 2013 covering nine reporting units for a period of three years or until the CAP goals are achieved. In September 2014, DHCS extended the timeline for completion of the CAP goals until at least MY 2016 (RY 2017). Based on RY 2017 performance measure results, DHCS required Anthem to continue implementing the CAP.
Anthem Blue Cross Partnership Plan Performance Evaluation Report: July 1, 2017–June 30, 2018 California Department of Health Care Services
Page D-38 Health Services Advisory Group, Inc.
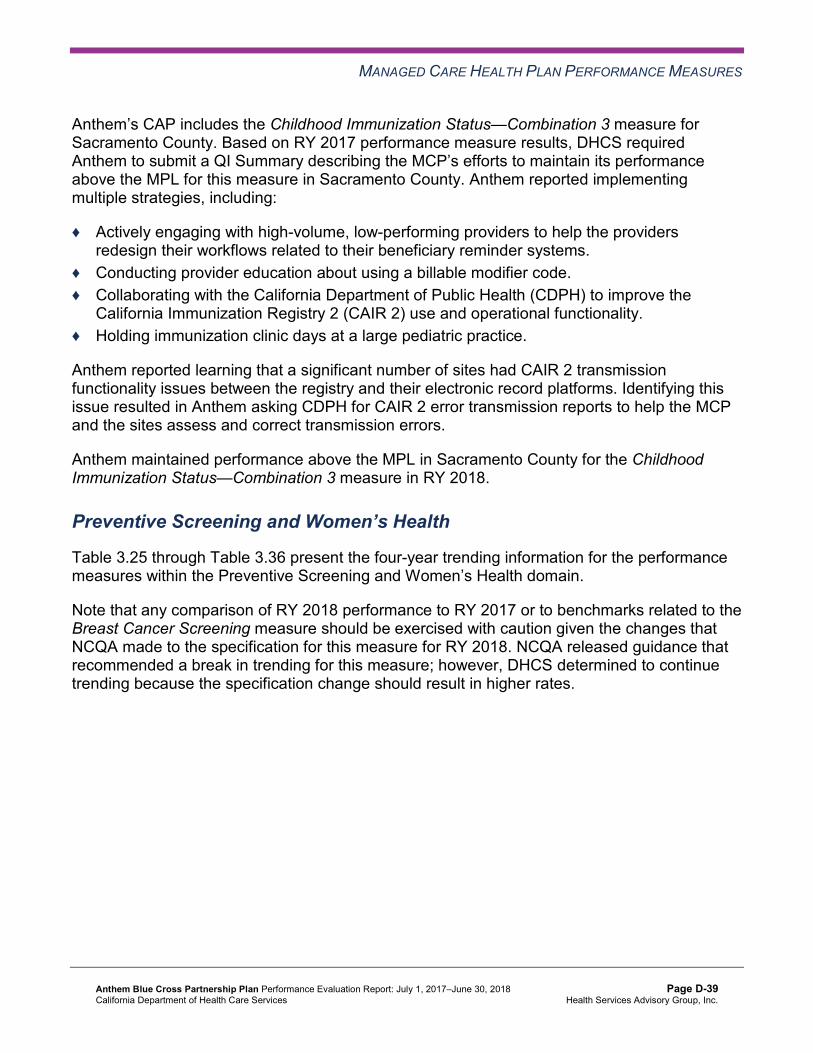
MANAGED CARE HEALTH PLAN PERFORMANCE MEASURES
Anthem’s CAP includes the Childhood Immunization Status—Combination 3 measure for Sacramento County. Based on RY 2017 performance measure results, DHCS required Anthem to submit a QI Summary describing the MCP’s efforts to maintain its performance above the MPL for this measure in Sacramento County. Anthem reported implementing multiple strategies, including:
♦ Actively engaging with high-volume, low-performing providers to help the providers redesign their workflows related to their beneficiary reminder systems.
♦ Conducting provider education about using a billable modifier code. ♦ Collaborating with the California Department of Public Health (CDPH) to improve the
California Immunization Registry 2 (CAIR 2) use and operational functionality. ♦ Holding immunization clinic days at a large pediatric practice.
Anthem reported learning that a significant number of sites had CAIR 2 transmission functionality issues between the registry and their electronic record platforms. Identifying this issue resulted in Anthem asking CDPH for CAIR 2 error transmission reports to help the MCP and the sites assess and correct transmission errors.
Anthem maintained performance above the MPL in Sacramento County for the Childhood Immunization Status—Combination 3 measure in RY 2018.
Preventive Screening and Women’s Health
Table 3.25 through Table 3.36 present the four-year trending information for the performance measures within the Preventive Screening and Women’s Health domain.
Note that any comparison of RY 2018 performance to RY 2017 or to benchmarks related to the Breast Cancer Screening measure should be exercised with caution given the changes that NCQA made to the specification for this measure for RY 2018. NCQA released guidance that recommended a break in trending for this measure; however, DHCS determined to continue trending because the specification change should result in higher rates.
Anthem Blue Cross Partnership Plan Performance Evaluation Report: July 1, 2017–June 30, 2018 California Department of Health Care Services
Page D-39 Health Services Advisory Group, Inc.

MANAGED CARE HEALTH PLAN PERFORMANCE MEASURES
Table 3.25—Preventive Screening and Women’s Health DomainMulti-Year Performance Measure Results Anthem—Alameda County
H = Rate indicates performance above the HPL. Bolded Rate = Rate indicates performance below the MPL.
B = Statistical testing result indicates that the RY 2018 rate is significantly better than the RY 2017 rate.
W = Statistical testing result indicates that the RY 2018 rate is significantly worse than the RY 2017 rate.
Measure RY
2015 Rate1
RY 2016
Rate2
RY 2017
Rate3
RY 2018
Rate4
RYs 2017–18 Rate
Difference5
Breast Cancer Screening^ -- -- 51.34% 53.37% 2.03 Cervical Cancer Screening 56.88% 43.46% 50.58% 49.15% -1.43 Prenatal and Postpartum Care— Postpartum Care 50.46% 52.56% 57.08% 58.88% 1.80
Prenatal and Postpartum Care— Timeliness of Prenatal Care 77.08% 75.81% 76.10% 82.00% 5.90B
1 RY 2015 rates reflect MY data from January 1, 2014, through December 31, 2014. 2 RY 2016 rates reflect MY data from January 1, 2015, through December 31, 2015. 3 RY 2017 rates reflect MY data from January 1, 2016, through December 31, 2016. 4 RY 2018 rates reflect MY data from January 1, 2017, through December 31, 2017. 5 Performance comparisons are based on the Chi-square test of statistical significance, with a p value of <0.05. ^ Caution should be exercised when assessing MCP performance for this measure given the changes that NCQA made to the specification for this measure for RY 2018. -- Indicates that the rate is not available.
Anthem Blue Cross Partnership Plan Performance Evaluation Report: July 1, 2017–June 30, 2018 California Department of Health Care Services
Page D-40 Health Services Advisory Group, Inc.

MANAGED CARE HEALTH PLAN PERFORMANCE MEASURES
Table 3.26—Preventive Screening and Women’s Health DomainMulti-Year Performance Measure Results Anthem—Contra Costa County
H = Rate indicates performance above the HPL. Bolded Rate = Rate indicates performance below the MPL.
B = Statistical testing result indicates that the RY 2018 rate is significantly better than the RY 2017 rate.
W = Statistical testing result indicates that the RY 2018 rate is significantly worse than the RY 2017 rate.
Measure RY
2015 Rate1
RY 2016
Rate2
RY 2017
Rate3
RY 2018
Rate4
RYs 2017–18 Rate
Difference5
Breast Cancer Screening^ -- -- 42.98% 47.43% 4.45 Cervical Cancer Screening 48.38% 41.07% 43.49% 50.12% 6.63 Prenatal and Postpartum Care— Postpartum Care 43.70% 49.13% 56.62% 72.30% 15.68B
Prenatal and Postpartum Care— Timeliness of Prenatal Care 72.27% 82.08% 79.45% 87.32% 7.87B
1 RY 2015 rates reflect MY data from January 1, 2014, through December 31, 2014. 2 RY 2016 rates reflect MY data from January 1, 2015, through December 31, 2015. 3 RY 2017 rates reflect MY data from January 1, 2016, through December 31, 2016. 4 RY 2018 rates reflect MY data from January 1, 2017, through December 31, 2017. 5 Performance comparisons are based on the Chi-square test of statistical significance, with a p value of <0.05. ^ Caution should be exercised when assessing MCP performance for this measure given the changes that NCQA made to the specification for this measure for RY 2018. -- Indicates that the rate is not available.
Anthem Blue Cross Partnership Plan Performance Evaluation Report: July 1, 2017–June 30, 2018 California Department of Health Care Services
Page D-41 Health Services Advisory Group, Inc.
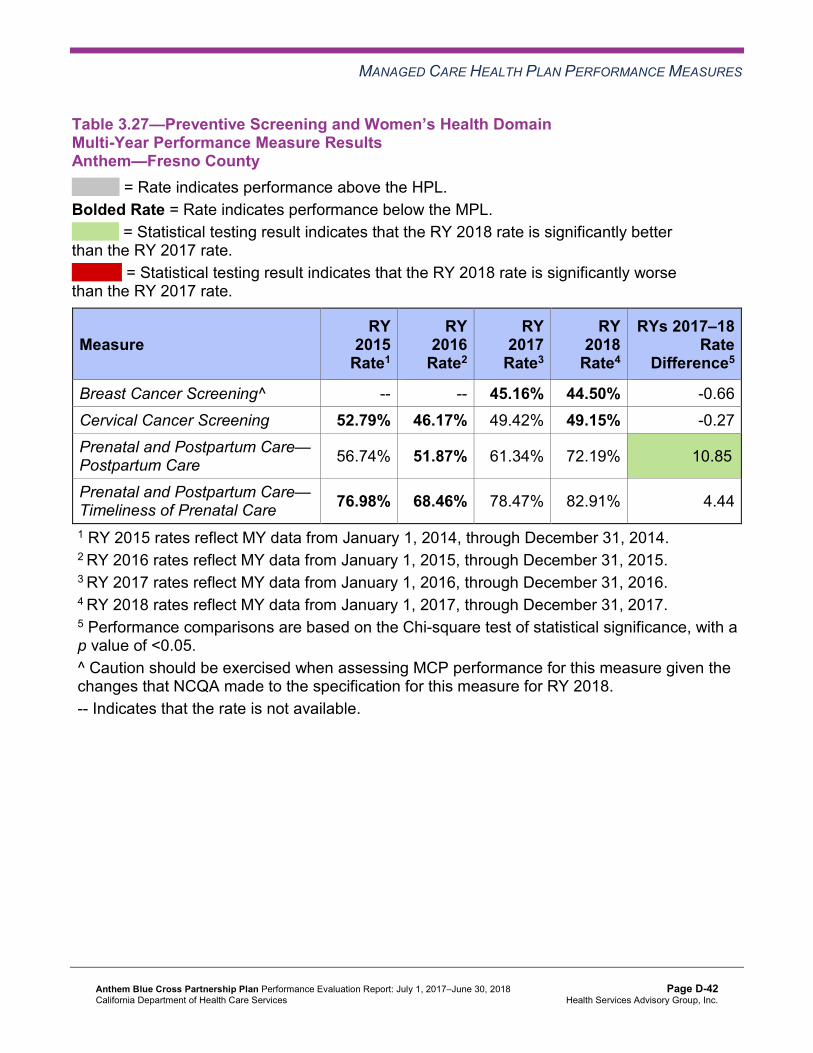
MANAGED CARE HEALTH PLAN PERFORMANCE MEASURES
Table 3.27—Preventive Screening and Women’s Health DomainMulti-Year Performance Measure Results Anthem—Fresno County
H = Rate indicates performance above the HPL. Bolded Rate = Rate indicates performance below the MPL.
B = Statistical testing result indicates that the RY 2018 rate is significantly better than the RY 2017 rate.
W = Statistical testing result indicates that the RY 2018 rate is significantly worse than the RY 2017 rate.
Measure RY
2015 Rate1
RY 2016
Rate2
RY 2017
Rate3
RY 2018
Rate4
RYs 2017–18 Rate
Difference5
Breast Cancer Screening^ -- -- 45.16% 44.50% -0.66 Cervical Cancer Screening 52.79% 46.17% 49.42% 49.15% -0.27 Prenatal and Postpartum Care— Postpartum Care 56.74% 51.87% 61.34% 72.19% 10.85B
Prenatal and Postpartum Care— Timeliness of Prenatal Care 76.98% 68.46% 78.47% 82.91% 4.44
1 RY 2015 rates reflect MY data from January 1, 2014, through December 31, 2014. 2 RY 2016 rates reflect MY data from January 1, 2015, through December 31, 2015. 3 RY 2017 rates reflect MY data from January 1, 2016, through December 31, 2016. 4 RY 2018 rates reflect MY data from January 1, 2017, through December 31, 2017. 5 Performance comparisons are based on the Chi-square test of statistical significance, with a p value of <0.05. ^ Caution should be exercised when assessing MCP performance for this measure given the changes that NCQA made to the specification for this measure for RY 2018. -- Indicates that the rate is not available.
Anthem Blue Cross Partnership Plan Performance Evaluation Report: July 1, 2017–June 30, 2018 California Department of Health Care Services
Page D-42 Health Services Advisory Group, Inc.

MANAGED CARE HEALTH PLAN PERFORMANCE MEASURES
Table 3.28—Preventive Screening and Women’s Health DomainMulti-Year Performance Measure Results Anthem—Kings County
H = Rate indicates performance above the HPL. Bolded Rate = Rate indicates performance below the MPL.
B = Statistical testing result indicates that the RY 2018 rate is significantly better than the RY 2017 rate.
W = Statistical testing result indicates that the RY 2018 rate is significantly worse than the RY 2017 rate.
Measure RY
2015 Rate1
RY 2016
Rate2
RY 2017
Rate3
RY 2018
Rate4
RYs 2017–18 Rate
Difference5
Breast Cancer Screening^ -- -- 48.32% 50.39% 2.07 Cervical Cancer Screening 49.76% 46.40% 49.42% 48.91% -0.51 Prenatal and Postpartum Care— Postpartum Care 45.41% 52.13% 52.63% 62.09% 9.46B
Prenatal and Postpartum Care— Timeliness of Prenatal Care 76.53% 81.56% 78.95% 88.96% 10.01B
1 RY 2015 rates reflect MY data from January 1, 2014, through December 31, 2014. 2 RY 2016 rates reflect MY data from January 1, 2015, through December 31, 2015. 3 RY 2017 rates reflect MY data from January 1, 2016, through December 31, 2016. 4 RY 2018 rates reflect MY data from January 1, 2017, through December 31, 2017. 5 Performance comparisons are based on the Chi-square test of statistical significance, with a p value of <0.05. ^ Caution should be exercised when assessing MCP performance for this measure given the changes that NCQA made to the specification for this measure for RY 2018. -- Indicates that the rate is not available.
Anthem Blue Cross Partnership Plan Performance Evaluation Report: July 1, 2017–June 30, 2018 California Department of Health Care Services
Page D-43 Health Services Advisory Group, Inc.

MANAGED CARE HEALTH PLAN PERFORMANCE MEASURES
Table 3.29—Preventive Screening and Women’s Health DomainMulti-Year Performance Measure Results Anthem—Madera County
H = Rate indicates performance above the HPL. Bolded Rate = Rate indicates performance below the MPL.
B = Statistical testing result indicates that the RY 2018 rate is significantly better than the RY 2017 rate.
W = Statistical testing result indicates that the RY 2018 rate is significantly worse than the RY 2017 rate.
Measure RY
2015 Rate1
RY 2016
Rate2
RY 2017
Rate3
RY 2018
Rate4
RYs 2017–18 Rate
Difference5
Breast Cancer Screening^ -- -- 54.47% 54.96% 0.49 Cervical Cancer Screening 61.31% 50.47% 53.83% 53.53% -0.30 Prenatal and Postpartum Care— Postpartum Care 57.37% 52.16% 60.47% 61.32% 0.85
Prenatal and Postpartum Care— Timeliness of Prenatal Care 79.47% 71.98% 75.58% 81.48% 5.90
1 RY 2015 rates reflect MY data from January 1, 2014, through December 31, 2014. 2 RY 2016 rates reflect MY data from January 1, 2015, through December 31, 2015. 3 RY 2017 rates reflect MY data from January 1, 2016, through December 31, 2016. 4 RY 2018 rates reflect MY data from January 1, 2017, through December 31, 2017. 5 Performance comparisons are based on the Chi-square test of statistical significance, with a p value of <0.05. ^ Caution should be exercised when assessing MCP performance for this measure given the changes that NCQA made to the specification for this measure for RY 2018. -- Indicates that the rate is not available.
Anthem Blue Cross Partnership Plan Performance Evaluation Report: July 1, 2017–June 30, 2018 California Department of Health Care Services
Page D-44 Health Services Advisory Group, Inc.
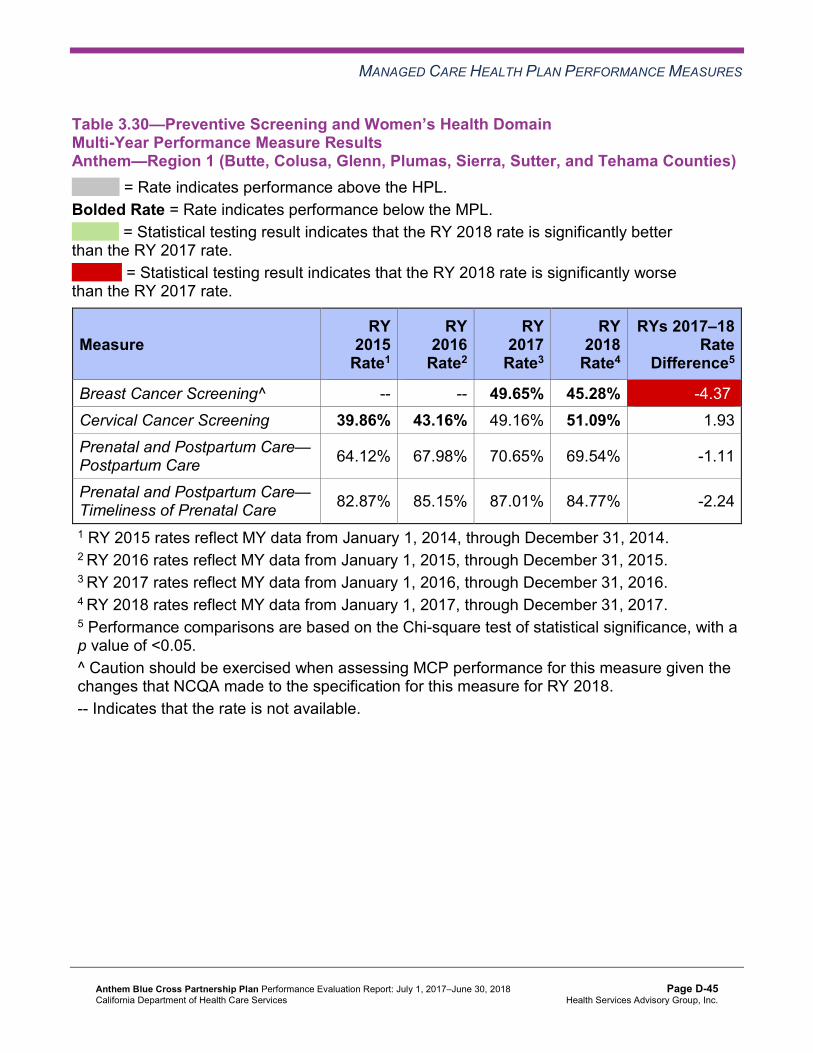
MANAGED CARE HEALTH PLAN PERFORMANCE MEASURES
Table 3.30—Preventive Screening and Women’s Health DomainMulti-Year Performance Measure Results Anthem—Region 1 (Butte, Colusa, Glenn, Plumas, Sierra, Sutter, and Tehama Counties)
H = Rate indicates performance above the HPL. Bolded Rate = Rate indicates performance below the MPL.
B = Statistical testing result indicates that the RY 2018 rate is significantly better than the RY 2017 rate.
W = Statistical testing result indicates that the RY 2018 rate is significantly worse than the RY 2017 rate.
Measure RY
2015 Rate1
RY 2016
Rate2
RY 2017
Rate3
RY 2018
Rate4
RYs 2017–18 Rate
Difference5
Breast Cancer Screening^ -- -- 49.65% 45.28% -4.37W
Cervical Cancer Screening 39.86% 43.16% 49.16% 51.09% 1.93 Prenatal and Postpartum Care— Postpartum Care 64.12% 67.98% 70.65% 69.54% -1.11
Prenatal and Postpartum Care— Timeliness of Prenatal Care 82.87% 85.15% 87.01% 84.77% -2.24
1 RY 2015 rates reflect MY data from January 1, 2014, through December 31, 2014. 2 RY 2016 rates reflect MY data from January 1, 2015, through December 31, 2015. 3 RY 2017 rates reflect MY data from January 1, 2016, through December 31, 2016. 4 RY 2018 rates reflect MY data from January 1, 2017, through December 31, 2017. 5 Performance comparisons are based on the Chi-square test of statistical significance, with a p value of <0.05. ^ Caution should be exercised when assessing MCP performance for this measure given the changes that NCQA made to the specification for this measure for RY 2018. -- Indicates that the rate is not available.
Anthem Blue Cross Partnership Plan Performance Evaluation Report: July 1, 2017–June 30, 2018 California Department of Health Care Services
Page D-45 Health Services Advisory Group, Inc.
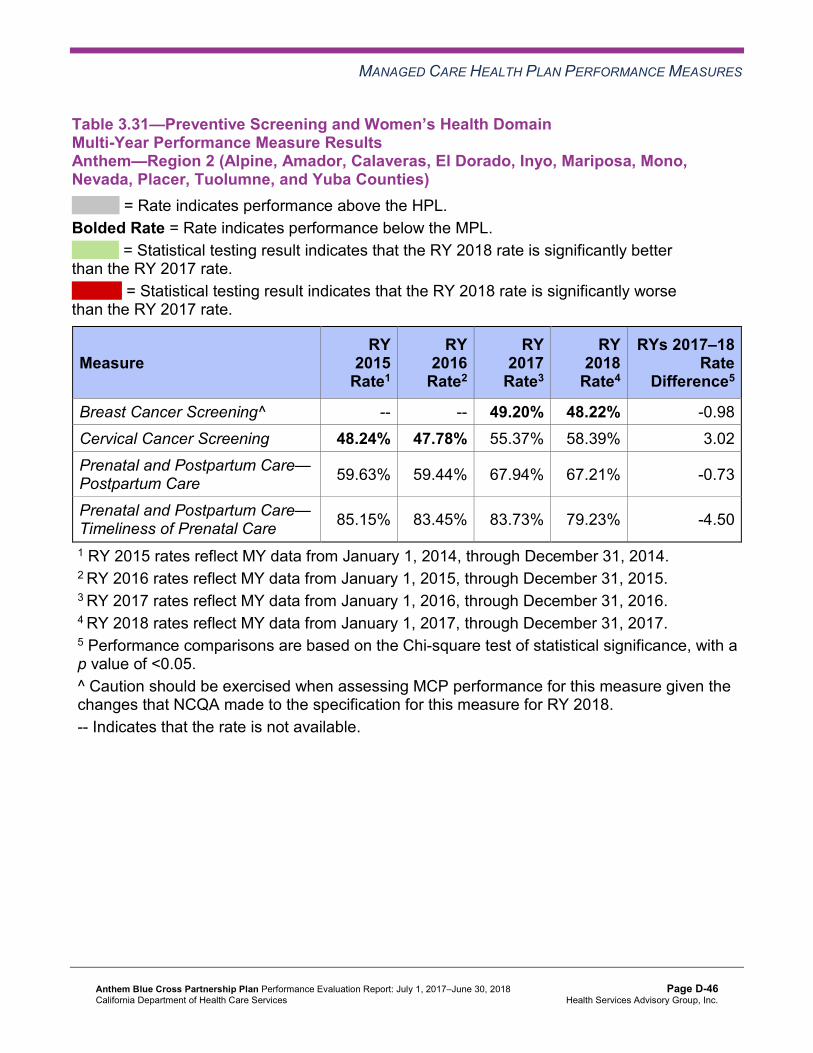
MANAGED CARE HEALTH PLAN PERFORMANCE MEASURES
Table 3.31—Preventive Screening and Women’s Health DomainMulti-Year Performance Measure Results Anthem—Region 2 (Alpine, Amador, Calaveras, El Dorado, Inyo, Mariposa, Mono,Nevada, Placer, Tuolumne, and Yuba Counties)
H = Rate indicates performance above the HPL. Bolded Rate = Rate indicates performance below the MPL.
B = Statistical testing result indicates that the RY 2018 rate is significantly better than the RY 2017 rate.
W = Statistical testing result indicates that the RY 2018 rate is significantly worse than the RY 2017 rate.
Measure RY
2015 Rate1
RY 2016
Rate2
RY 2017
Rate3
RY 2018
Rate4
RYs 2017–18 Rate
Difference5
Breast Cancer Screening^ -- -- 49.20% 48.22% -0.98 Cervical Cancer Screening 48.24% 47.78% 55.37% 58.39% 3.02 Prenatal and Postpartum Care— Postpartum Care 59.63% 59.44% 67.94% 67.21% -0.73
Prenatal and Postpartum Care— Timeliness of Prenatal Care 85.15% 83.45% 83.73% 79.23% -4.50
1 RY 2015 rates reflect MY data from January 1, 2014, through December 31, 2014. 2 RY 2016 rates reflect MY data from January 1, 2015, through December 31, 2015. 3 RY 2017 rates reflect MY data from January 1, 2016, through December 31, 2016. 4 RY 2018 rates reflect MY data from January 1, 2017, through December 31, 2017. 5 Performance comparisons are based on the Chi-square test of statistical significance, with a p value of <0.05. ^ Caution should be exercised when assessing MCP performance for this measure given the changes that NCQA made to the specification for this measure for RY 2018. -- Indicates that the rate is not available.
Anthem Blue Cross Partnership Plan Performance Evaluation Report: July 1, 2017–June 30, 2018 California Department of Health Care Services
Page D-46 Health Services Advisory Group, Inc.

MANAGED CARE HEALTH PLAN PERFORMANCE MEASURES
Table 3.32—Preventive Screening and Women’s Health DomainMulti-Year Performance Measure Results Anthem—Sacramento County
H = Rate indicates performance above the HPL. Bolded Rate = Rate indicates performance below the MPL.
B = Statistical testing result indicates that the RY 2018 rate is significantly better than the RY 2017 rate.
W = Statistical testing result indicates that the RY 2018 rate is significantly worse than the RY 2017 rate.
Measure RY
2015 Rate1
RY 2016
Rate2
RY 2017
Rate3
RY 2018
Rate4
RYs 2017–18 Rate
Difference5
Breast Cancer Screening^ -- -- 54.54% 53.61% -0.93 Cervical Cancer Screening 56.51% 46.73% 49.53% 53.04% 3.51 Prenatal and Postpartum Care— Postpartum Care 56.25% 61.42% 59.12% 65.08% 5.96
Prenatal and Postpartum Care— Timeliness of Prenatal Care 79.86% 79.82% 84.18% 80.90% -3.28
1 RY 2015 rates reflect MY data from January 1, 2014, through December 31, 2014. 2 RY 2016 rates reflect MY data from January 1, 2015, through December 31, 2015. 3 RY 2017 rates reflect MY data from January 1, 2016, through December 31, 2016. 4 RY 2018 rates reflect MY data from January 1, 2017, through December 31, 2017. 5 Performance comparisons are based on the Chi-square test of statistical significance, with a p value of <0.05. ^ Caution should be exercised when assessing MCP performance for this measure given the changes that NCQA made to the specification for this measure for RY 2018. -- Indicates that the rate is not available.
Anthem Blue Cross Partnership Plan Performance Evaluation Report: July 1, 2017–June 30, 2018 California Department of Health Care Services
Page D-47 Health Services Advisory Group, Inc.

MANAGED CARE HEALTH PLAN PERFORMANCE MEASURES
Table 3.33—Preventive Screening and Women’s Health DomainMulti-Year Performance Measure Results Anthem—San Benito County
H = Rate indicates performance above the HPL. Bolded Rate = Rate indicates performance below the MPL.
B = Statistical testing result indicates that the RY 2018 rate is significantly better than the RY 2017 rate.
W = Statistical testing result indicates that the RY 2018 rate is significantly worse than the RY 2017 rate.
Measure RY
2015 Rate1
RY 2016
Rate2
RY 2017
Rate3
RY 2018
Rate4
RYs 2017–18 Rate
Difference5
Breast Cancer Screening^ -- -- 51.46% 53.68% 2.22 Cervical Cancer Screening 43.06% 44.88% 50.35% 56.69% 6.34 Prenatal and Postpartum Care— Postpartum Care 48.15% 38.36% 67.33% 70.09% 2.76
Prenatal and Postpartum Care— Timeliness of Prenatal Care 77.78% 71.23% 91.09%H 86.92% -4.17
1 RY 2015 rates reflect MY data from January 1, 2014, through December 31, 2014. 2 RY 2016 rates reflect MY data from January 1, 2015, through December 31, 2015. 3 RY 2017 rates reflect MY data from January 1, 2016, through December 31, 2016. 4 RY 2018 rates reflect MY data from January 1, 2017, through December 31, 2017. 5 Performance comparisons are based on the Chi-square test of statistical significance, with a p value of <0.05. ^ Caution should be exercised when assessing MCP performance for this measure given the changes that NCQA made to the specification for this measure for RY 2018. -- Indicates that the rate is not available.
Anthem Blue Cross Partnership Plan Performance Evaluation Report: July 1, 2017–June 30, 2018 California Department of Health Care Services
Page D-48 Health Services Advisory Group, Inc.

MANAGED CARE HEALTH PLAN PERFORMANCE MEASURES
Table 3.34—Preventive Screening and Women’s Health DomainMulti-Year Performance Measure Results Anthem—San Francisco County
H = Rate indicates performance above the HPL. Bolded Rate = Rate indicates performance below the MPL.
B = Statistical testing result indicates that the RY 2018 rate is significantly better than the RY 2017 rate.
W = Statistical testing result indicates that the RY 2018 rate is significantly worse than the RY 2017 rate.
Measure RY
2015 Rate1
RY 2016
Rate2
RY 2017
Rate3
RY 2018
Rate4
RYs 2017–18 Rate
Difference5
Breast Cancer Screening^ -- -- 61.03% 59.02% -2.01 Cervical Cancer Screening 64.32% 53.99% 60.24% 56.93% -3.31 Prenatal and Postpartum Care— Postpartum Care 52.59% 57.89% 63.33% 67.14% 3.81
Prenatal and Postpartum Care— Timeliness of Prenatal Care 71.85% 78.95% 86.00% 85.71% -0.29
1 RY 2015 rates reflect MY data from January 1, 2014, through December 31, 2014. 2 RY 2016 rates reflect MY data from January 1, 2015, through December 31, 2015. 3 RY 2017 rates reflect MY data from January 1, 2016, through December 31, 2016. 4 RY 2018 rates reflect MY data from January 1, 2017, through December 31, 2017. 5 Performance comparisons are based on the Chi-square test of statistical significance, with a p value of <0.05. ^ Caution should be exercised when assessing MCP performance for this measure given the changes that NCQA made to the specification for this measure for RY 2018. -- Indicates that the rate is not available.
Anthem Blue Cross Partnership Plan Performance Evaluation Report: July 1, 2017–June 30, 2018 California Department of Health Care Services
Page D-49 Health Services Advisory Group, Inc.

MANAGED CARE HEALTH PLAN PERFORMANCE MEASURES
Table 3.35—Preventive Screening and Women’s Health DomainMulti-Year Performance Measure Results Anthem—Santa Clara County
H = Rate indicates performance above the HPL. Bolded Rate = Rate indicates performance below the MPL.
B = Statistical testing result indicates that the RY 2018 rate is significantly better than the RY 2017 rate.
W = Statistical testing result indicates that the RY 2018 rate is significantly worse than the RY 2017 rate.
Measure RY
2015 Rate1
RY 2016
Rate2
RY 2017
Rate3
RY 2018
Rate4
RYs 2017–18 Rate
Difference5
Breast Cancer Screening^ -- -- 55.60% 57.39% 1.79 Cervical Cancer Screening 65.35% 47.10% 50.82% 46.96% -3.86 Prenatal and Postpartum Care— Postpartum Care 56.84% 64.90% 68.21% 68.06% -0.15
Prenatal and Postpartum Care— Timeliness of Prenatal Care 80.97% 82.56% 85.85% 83.06% -2.79
1 RY 2015 rates reflect MY data from January 1, 2014, through December 31, 2014. 2 RY 2016 rates reflect MY data from January 1, 2015, through December 31, 2015. 3 RY 2017 rates reflect MY data from January 1, 2016, through December 31, 2016. 4 RY 2018 rates reflect MY data from January 1, 2017, through December 31, 2017. 5 Performance comparisons are based on the Chi-square test of statistical significance, with a p value of <0.05. ^ Caution should be exercised when assessing MCP performance for this measure given the changes that NCQA made to the specification for this measure for RY 2018. -- Indicates that the rate is not available.
Anthem Blue Cross Partnership Plan Performance Evaluation Report: July 1, 2017–June 30, 2018 California Department of Health Care Services
Page D-50 Health Services Advisory Group, Inc.

MANAGED CARE HEALTH PLAN PERFORMANCE MEASURES
Table 3.36—Preventive Screening and Women’s Health DomainMulti-Year Performance Measure Results Anthem—Tulare County
H = Rate indicates performance above the HPL. Bolded Rate = Rate indicates performance below the MPL.
B = Statistical testing result indicates that the RY 2018 rate is significantly better than the RY 2017 rate.
W = Statistical testing result indicates that the RY 2018 rate is significantly worse than the RY 2017 rate.
Measure RY
2015 Rate1
RY 2016
Rate2
RY 2017
Rate3
RY 2018
Rate4
RYs 2017–18 Rate
Difference5
Breast Cancer Screening^ -- -- 58.29% 62.56% 4.27B
Cervical Cancer Screening 60.79% 62.41% 62.24% 68.37% 6.13 Prenatal and Postpartum Care— Postpartum Care 59.26% 63.49% 71.04% 74.45%H 3.41
Prenatal and Postpartum Care— Timeliness of Prenatal Care 81.25% 81.16% 88.37% 83.21% -5.16W
1 RY 2015 rates reflect MY data from January 1, 2014, through December 31, 2014. 2 RY 2016 rates reflect MY data from January 1, 2015, through December 31, 2015. 3 RY 2017 rates reflect MY data from January 1, 2016, through December 31, 2016. 4 RY 2018 rates reflect MY data from January 1, 2017, through December 31, 2017. 5 Performance comparisons are based on the Chi-square test of statistical significance, with a p value of <0.05. ^ Caution should be exercised when assessing MCP performance for this measure given the changes that NCQA made to the specification for this measure for RY 2018. -- Indicates that the rate is not available.
Anthem Blue Cross Partnership Plan Performance Evaluation Report: July 1, 2017–June 30, 2018 California Department of Health Care Services
Page D-51 Health Services Advisory Group, Inc.

MANAGED CARE HEALTH PLAN PERFORMANCE MEASURES
Table 3.37 through Table 3.48 present findings for the RY 2018 performance measures within the Preventive Screening and Women’s Health domain. Note that the Breast Cancer Screening measure was a first-year measure in RY 2017, and DHCS did not hold MCPs accountable to meet an MPL for this measure in RY 2017; therefore, HSAG did not include this measure in the denominators for calculating the percentage of measures with rates that moved to above or below the MPLs in RY 2018.
Table 3.37—Preventive Screening and Women’s Health DomainRY 2018 (MY 2017) Performance Measure Findings Anthem—Alameda County
Criteria Number of Measures
MeetingCriteria
Total Number of Measures
Percentage of Measures
MeetingCriteria
RY 2018 Rates Above HPLs 0 4 0.00% Rates Above HPLs for the Last Three or More Consecutive Years 0 3 0.00%
RY 2018 Rates Significantly Better than RY 2017 Rates* 1 4 25.00%
Rates that Moved from Below MPLs in RY 2017 to Above MPLs in RY 2018 0 0 N/A
RY 2018 Rates Below MPLs 2 4 50.00% Rates Below MPLs for the Last Three or More Consecutive Years 0 3 0.00%
RY 2018 Rates Significantly Worse than RY 2017 Rates* 0 4 0.00%
Rates that Moved from Above MPLs in RY 2017 to Below MPLs in RY 2018 2 3 66.67%
* Performance comparisons are based on the Chi-square test of statistical significance, with a p value of <0.05. N/A = No rates above or below the MPLs from the previous year exist to include in the denominator for calculating whether or not rates moved to above or below MPLs in the most recent year.
Anthem Blue Cross Partnership Plan Performance Evaluation Report: July 1, 2017–June 30, 2018 California Department of Health Care Services
Page D-52 Health Services Advisory Group, Inc.

MANAGED CARE HEALTH PLAN PERFORMANCE MEASURES
Table 3.38—Preventive Screening and Women’s Health DomainRY 2018 (MY 2017) Performance Measure Findings Anthem—Contra Costa County
Criteria Number of Measures
MeetingCriteria
Total Number of Measures
Percentage of Measures
MeetingCriteria
RY 2018 Rates Above HPLs 0 4 0.00% Rates Above HPLs for the Last Three or More Consecutive Years 0 3 0.00%
RY 2018 Rates Significantly Better than RY 2017 Rates* 2 4 50.00%
Rates that Moved from Below MPLs in RY 2017 to Above MPLs in RY 2018 0 1 0.00%
RY 2018 Rates Below MPLs 2 4 50.00% Rates Below MPLs for the Last Three or More Consecutive Years 1 3 33.33%
RY 2018 Rates Significantly Worse than RY 2017 Rates* 0 4 0.00%
Rates that Moved from Above MPLs in RY 2017 to Below MPLs in RY 2018 0 2 0.00%
* Performance comparisons are based on the Chi-square test of statistical significance, with a p value of <0.05.
Anthem Blue Cross Partnership Plan Performance Evaluation Report: July 1, 2017–June 30, 2018 California Department of Health Care Services
Page D-53 Health Services Advisory Group, Inc.

MANAGED CARE HEALTH PLAN PERFORMANCE MEASURES
Table 3.39—Preventive Screening and Women’s Health DomainRY 2018 (MY 2017) Performance Measure Findings Anthem—Fresno County
Criteria Number of Measures
MeetingCriteria
Total Number of Measures
Percentage of Measures
MeetingCriteria
RY 2018 Rates Above HPLs 0 4 0.00% Rates Above HPLs for the Last Three or More Consecutive Years 0 3 0.00%
RY 2018 Rates Significantly Better than RY 2017 Rates* 1 4 25.00%
Rates that Moved from Below MPLs in RY 2017 to Above MPLs in RY 2018 0 0 N/A
RY 2018 Rates Below MPLs 2 4 50.00% Rates Below MPLs for the Last Three or More Consecutive Years 0 3 0.00%
RY 2018 Rates Significantly Worse than RY 2017 Rates* 0 4 0.00%
Rates that Moved from Above MPLs in RY 2017 to Below MPLs in RY 2018 1 3 33.33%
* Performance comparisons are based on the Chi-square test of statistical significance, with a p value of <0.05. N/A = No rates above or below the MPLs from the previous year exist to include in the denominator for calculating whether or not rates moved to above or below MPLs in the most recent year.
Anthem Blue Cross Partnership Plan Performance Evaluation Report: July 1, 2017–June 30, 2018 California Department of Health Care Services
Page D-54 Health Services Advisory Group, Inc.

MANAGED CARE HEALTH PLAN PERFORMANCE MEASURES
Table 3.40—Preventive Screening and Women’s Health DomainRY 2018 (MY 2017) Performance Measure FindingsAnthem—Kings County
Criteria Number of Measures
MeetingCriteria
Total Number of Measures
Percentage of Measures
MeetingCriteria
RY 2018 Rates Above HPLs 0 4 0.00% Rates Above HPLs for the Last Three or More Consecutive Years 0 3 0.00%
RY 2018 Rates Significantly Better than RY 2017 Rates* 2 4 50.00%
Rates that Moved from Below MPLs in RY 2017 to Above MPLs in RY 2018 1 1 100.00%
RY 2018 Rates Below MPLs 2 4 50.00% Rates Below MPLs for the Last Three or More Consecutive Years 0 3 0.00%
RY 2018 Rates Significantly Worse than RY 2017 Rates* 0 4 0.00%
Rates that Moved from Above MPLs in RY 2017 to Below MPLs in RY 2018 1 2 50.00%
* Performance comparisons are based on the Chi-square test of statistical significance, with a p value of <0.05.
Anthem Blue Cross Partnership Plan Performance Evaluation Report: July 1, 2017–June 30, 2018 California Department of Health Care Services
Page D-55 Health Services Advisory Group, Inc.

MANAGED CARE HEALTH PLAN PERFORMANCE MEASURES
Table 3.41—Preventive Screening and Women’s Health DomainRY 2018 (MY 2017) Performance Measure FindingsAnthem—Madera County
Criteria Number of Measures
MeetingCriteria
Total Number of Measures
Percentage of Measures
MeetingCriteria
RY 2018 Rates Above HPLs 0 4 0.00% Rates Above HPLs for the Last Three or More Consecutive Years 0 3 0.00%
RY 2018 Rates Significantly Better than RY 2017 Rates* 0 4 0.00%
Rates that Moved from Below MPLs in RY 2017 to Above MPLs in RY 2018 0 0 N/A
RY 2018 Rates Below MPLs 0 4 0.00% Rates Below MPLs for the Last Three or More Consecutive Years 0 3 0.00%
RY 2018 Rates Significantly Worse than RY 2017 Rates* 0 4 0.00%
Rates that Moved from Above MPLs in RY 2017 to Below MPLs in RY 2018 0 3 0.00%
* Performance comparisons are based on the Chi-square test of statistical significance, with a p value of <0.05. N/A = No rates above or below the MPLs from the previous year exist to include in the denominator for calculating whether or not rates moved to above or below MPLs in the most recent year.
Anthem Blue Cross Partnership Plan Performance Evaluation Report: July 1, 2017–June 30, 2018 California Department of Health Care Services
Page D-56 Health Services Advisory Group, Inc.

MANAGED CARE HEALTH PLAN PERFORMANCE MEASURES
Table 3.42—Preventive Screening and Women’s Health DomainRY 2018 (MY 2017) Performance Measure Findings Anthem—Region 1 (Butte, Colusa, Glenn, Plumas, Sierra, Sutter, and Tehama Counties)
Criteria Number of Measures
MeetingCriteria
Total Number of Measures
Percentage of Measures
MeetingCriteria
RY 2018 Rates Above HPLs 0 4 0.00% Rates Above HPLs for the Last Three or More Consecutive Years 0 3 0.00%
RY 2018 Rates Significantly Better than RY 2017 Rates* 0 4 0.00%
Rates that Moved from Below MPLs in RY 2017 to Above MPLs in RY 2018 0 0 N/A
RY 2018 Rates Below MPLs 2 4 50.00% Rates Below MPLs for the Last Three or More Consecutive Years 0 3 0.00%
RY 2018 Rates Significantly Worse than RY 2017 Rates* 1 4 25.00%
Rates that Moved from Above MPLs in RY 2017 to Below MPLs in RY 2018 1 3 33.33%
* Performance comparisons are based on the Chi-square test of statistical significance, with a p value of <0.05. N/A = No rates above or below the MPLs from the previous year exist to include in the denominator for calculating whether or not rates moved to above or below MPLs in the most recent year.
Anthem Blue Cross Partnership Plan Performance Evaluation Report: July 1, 2017–June 30, 2018 California Department of Health Care Services
Page D-57 Health Services Advisory Group, Inc.
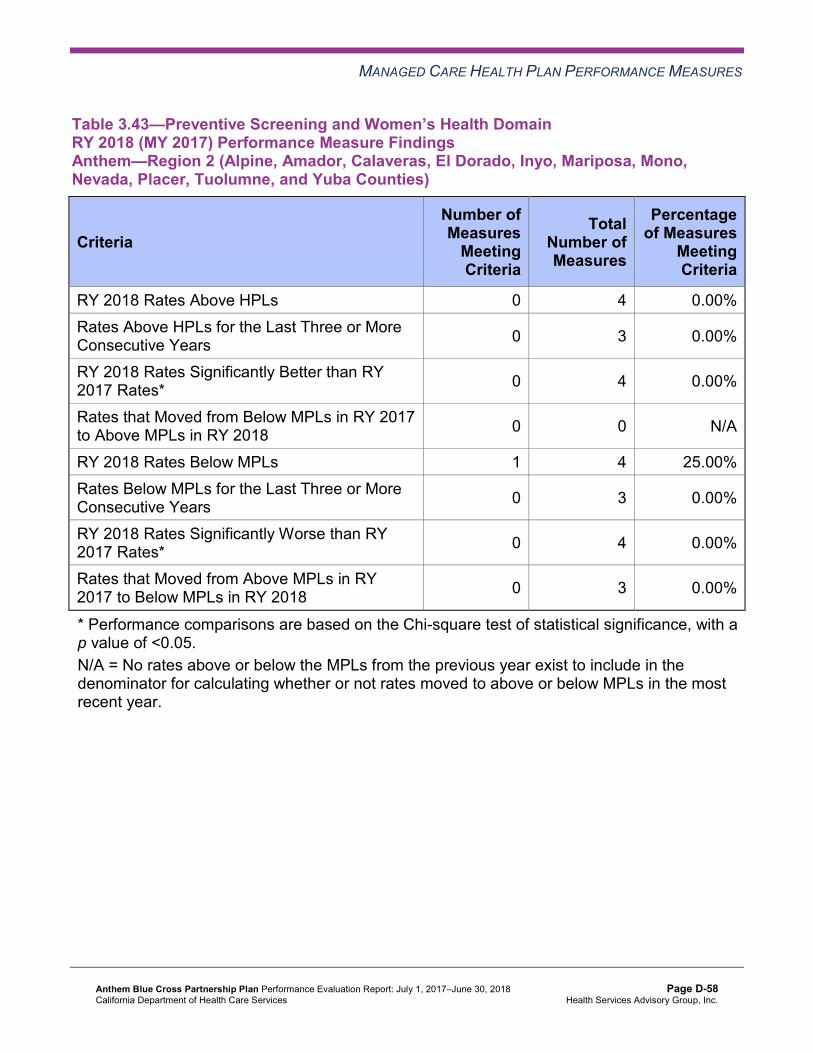
MANAGED CARE HEALTH PLAN PERFORMANCE MEASURES
Table 3.43—Preventive Screening and Women’s Health DomainRY 2018 (MY 2017) Performance Measure Findings Anthem—Region 2 (Alpine, Amador, Calaveras, El Dorado, Inyo, Mariposa, Mono,Nevada, Placer, Tuolumne, and Yuba Counties)
Criteria Number of Measures
MeetingCriteria
Total Number of Measures
Percentage of Measures
MeetingCriteria
RY 2018 Rates Above HPLs 0 4 0.00% Rates Above HPLs for the Last Three or More Consecutive Years 0 3 0.00%
RY 2018 Rates Significantly Better than RY 2017 Rates* 0 4 0.00%
Rates that Moved from Below MPLs in RY 2017 to Above MPLs in RY 2018 0 0 N/A
RY 2018 Rates Below MPLs 1 4 25.00% Rates Below MPLs for the Last Three or More Consecutive Years 0 3 0.00%
RY 2018 Rates Significantly Worse than RY 2017 Rates* 0 4 0.00%
Rates that Moved from Above MPLs in RY 2017 to Below MPLs in RY 2018 0 3 0.00%
* Performance comparisons are based on the Chi-square test of statistical significance, with a p value of <0.05. N/A = No rates above or below the MPLs from the previous year exist to include in the denominator for calculating whether or not rates moved to above or below MPLs in the most recent year.
Anthem Blue Cross Partnership Plan Performance Evaluation Report: July 1, 2017–June 30, 2018 California Department of Health Care Services
Page D-58 Health Services Advisory Group, Inc.

MANAGED CARE HEALTH PLAN PERFORMANCE MEASURES
Table 3.44—Preventive Screening and Women’s Health DomainRY 2018 (MY 2017) Performance Measure Findings Anthem—Sacramento County
Criteria Number of Measures
MeetingCriteria
Total Number of Measures
Percentage of Measures
MeetingCriteria
RY 2018 Rates Above HPLs 0 4 0.00% Rates Above HPLs for the Last Three or More Consecutive Years 0 3 0.00%
RY 2018 Rates Significantly Better than RY 2017 Rates* 0 4 0.00%
Rates that Moved from Below MPLs in RY 2017 to Above MPLs in RY 2018 0 0 N/A
RY 2018 Rates Below MPLs 0 4 0.00% Rates Below MPLs for the Last Three or More Consecutive Years 0 3 0.00%
RY 2018 Rates Significantly Worse than RY 2017 Rates* 0 4 0.00%
Rates that Moved from Above MPLs in RY 2017 to Below MPLs in RY 2018 0 3 0.00%
* Performance comparisons are based on the Chi-square test of statistical significance, with a p value of <0.05. N/A = No rates above or below the MPLs from the previous year exist to include in the denominator for calculating whether or not rates moved to above or below MPLs in the most recent year.
Anthem Blue Cross Partnership Plan Performance Evaluation Report: July 1, 2017–June 30, 2018 California Department of Health Care Services
Page D-59 Health Services Advisory Group, Inc.

MANAGED CARE HEALTH PLAN PERFORMANCE MEASURES
Table 3.45—Preventive Screening and Women’s Health DomainRY 2018 (MY 2017) Performance Measure Findings Anthem—San Benito County
Criteria Number of Measures
MeetingCriteria
Total Number of Measures
Percentage of Measures
MeetingCriteria
RY 2018 Rates Above HPLs 0 4 0.00% Rates Above HPLs for the Last Three or More Consecutive Years 0 3 0.00%
RY 2018 Rates Significantly Better than RY 2017 Rates* 0 4 0.00%
Rates that Moved from Below MPLs in RY 2017 to Above MPLs in RY 2018 0 0 N/A
RY 2018 Rates Below MPLs 0 4 0.00% Rates Below MPLs for the Last Three or More Consecutive Years 0 3 0.00%
RY 2018 Rates Significantly Worse than RY 2017 Rates* 0 4 0.00%
Rates that Moved from Above MPLs in RY 2017 to Below MPLs in RY 2018 0 3 0.00%
* Performance comparisons are based on the Chi-square test of statistical significance, with a p value of <0.05. N/A = No rates above or below the MPLs from the previous year exist to include in the denominator for calculating whether or not rates moved to above or below MPLs in the most recent year.
Anthem Blue Cross Partnership Plan Performance Evaluation Report: July 1, 2017–June 30, 2018 California Department of Health Care Services
Page D-60 Health Services Advisory Group, Inc.

MANAGED CARE HEALTH PLAN PERFORMANCE MEASURES
Table 3.46—Preventive Screening and Women’s Health DomainRY 2018 (MY 2017) Performance Measure Findings Anthem—San Francisco County
Criteria Number of Measures
MeetingCriteria
Total Number of Measures
Percentage of Measures
MeetingCriteria
RY 2018 Rates Above HPLs 0 4 0.00% Rates Above HPLs for the Last Three or More Consecutive Years 0 3 0.00%
RY 2018 Rates Significantly Better than RY 2017 Rates* 0 4 0.00%
Rates that Moved from Below MPLs in RY 2017 to Above MPLs in RY 2018 0 0 N/A
RY 2018 Rates Below MPLs 0 4 0.00% Rates Below MPLs for the Last Three or More Consecutive Years 0 3 0.00%
RY 2018 Rates Significantly Worse than RY 2017 Rates* 0 4 0.00%
Rates that Moved from Above MPLs in RY 2017 to Below MPLs in RY 2018 0 3 0.00%
* Performance comparisons are based on the Chi-square test of statistical significance, with a p value of <0.05. N/A = No rates above or below the MPLs from the previous year exist to include in the denominator for calculating whether or not rates moved to above or below MPLs in the most recent year.
Anthem Blue Cross Partnership Plan Performance Evaluation Report: July 1, 2017–June 30, 2018 California Department of Health Care Services
Page D-61 Health Services Advisory Group, Inc.

MANAGED CARE HEALTH PLAN PERFORMANCE MEASURES
Table 3.47—Preventive Screening and Women’s Health DomainRY 2018 (MY 2017) Performance Measure Findings Anthem—Santa Clara County
Criteria Number of Measures
MeetingCriteria
Total Number of Measures
Percentage of Measures
MeetingCriteria
RY 2018 Rates Above HPLs 0 4 0.00% Rates Above HPLs for the Last Three or More Consecutive Years 0 3 0.00%
RY 2018 Rates Significantly Better than RY 2017 Rates* 0 4 0.00%
Rates that Moved from Below MPLs in RY 2017 to Above MPLs in RY 2018 0 0 N/A
RY 2018 Rates Below MPLs 1 4 25.00% Rates Below MPLs for the Last Three or More Consecutive Years 0 3 0.00%
RY 2018 Rates Significantly Worse than RY 2017 Rates* 0 4 0.00%
Rates that Moved from Above MPLs in RY 2017 to Below MPLs in RY 2018 1 3 33.33%
* Performance comparisons are based on the Chi-square test of statistical significance, with a p value of <0.05. N/A = No rates above or below the MPLs from the previous year exist to include in the denominator for calculating whether or not rates moved to above or below MPLs in the most recent year.
Anthem Blue Cross Partnership Plan Performance Evaluation Report: July 1, 2017–June 30, 2018 California Department of Health Care Services
Page D-62 Health Services Advisory Group, Inc.

MANAGED CARE HEALTH PLAN PERFORMANCE MEASURES
Table 3.48—Preventive Screening and Women’s Health DomainRY 2018 (MY 2017) Performance Measure Findings Anthem—Tulare County
Criteria Number of Measures
MeetingCriteria
Total Number of Measures
Percentage of Measures
MeetingCriteria
RY 2018 Rates Above HPLs 1 4 25.00% Rates Above HPLs for the Last Three or More Consecutive Years 0 3 0.00%
RY 2018 Rates Significantly Better than RY 2017 Rates* 1 4 25.00%
Rates that Moved from Below MPLs in RY 2017 to Above MPLs in RY 2018 0 0 N/A
RY 2018 Rates Below MPLs 0 4 0.00% Rates Below MPLs for the Last Three or More Consecutive Years 0 3 0.00%
RY 2018 Rates Significantly Worse than RY 2017 Rates* 1 4 25.00%
Rates that Moved from Above MPLs in RY 2017 to Below MPLs in RY 2018 0 3 0.00%
* Performance comparisons are based on the Chi-square test of statistical significance, with a p value of <0.05. N/A = No rates above or below the MPLs from the previous year exist to include in the denominator for calculating whether or not rates moved to above or below MPLs in the most recent year.
Assessment of Corrective Action Plan—Preventive Screening and Women’s Health
Anthem’s CAP includes the following measures within the Preventive Screening and Women’s Health domain:
♦ Prenatal and Postpartum Care—Postpartum Care in Kings County ♦ Prenatal and Postpartum Care—Timeliness of Prenatal Care in Alameda, Fresno, and
Madera counties
Anthem Blue Cross Partnership Plan Performance Evaluation Report: July 1, 2017–June 30, 2018 California Department of Health Care Services
Page D-63 Health Services Advisory Group, Inc.

MANAGED CARE HEALTH PLAN PERFORMANCE MEASURES
Postpartum Care
DHCS approved Anthem to conduct a PIP to address the MCP’s performance below the MPL for multiple years for the Prenatal and Postpartum Care—Postpartum Care measure in Kings County. The MCP is conducting a 2017–19 Postpartum Care PIP with a narrowed focus on African-American women. HSAG includes a summary of Anthem’s progress on this PIP in Section 5 of this report (“Performance Improvement Projects”).
The rate improved significantly from RY 2017 to RY 2018 for the Prenatal and Postpartum Care—Postpartum Care measure in Kings County, resulting in the rate moving to above the MPL in RY 2018. Please note that the improvement in the rate for this measure in Kings County was not a result of the 2017–19 Postpartum Care PIP since Anthem did not begin intervention testing for this PIP during MY 2017 (RY 2018).
Timeliness of Prenatal Care
Based on RY 2017 performance measure results, DHCS required Anthem to submit a QI Summary describing the MCP’s efforts to maintain its performance above the MPL for the Prenatal and Postpartum Care—Timeliness of Prenatal Care measure for Alameda, Fresno, and Madera counties. Anthem reported conducting provider education on the required documentation and working with providers on redesigning their workflow processes. Anthem also reported that the MCP actively participated in local public health initiatives to identify, support, and refer beneficiaries for early prenatal care.
The rates in all three reporting units remained above the MPL for the Prenatal and Postpartum Care—Timeliness of Prenatal Care measure in RY 2018.
Assessment of Improvement Plans—Preventive Screening and Women’s Health
Based on RY 2017 performance measure results, DHCS required Anthem to conduct PDSA cycles to address the MCP’s performance below the MPL for the Cervical Cancer Screening measure in Contra Costa County. Anthem conducted two PDSA cycles to help improve the MCP’s performance on the Cervical Cancer Screening measure.
Plan-Do-Study-Act Cycle 1
For the first PDSA cycle, Anthem tested whether or not conducting a provider training using a standard Cervical Cancer Screening HEDIS measure curriculum would improve the clinic staff members’ knowledge of the measure. Anthem used a paired t-test statistical software analysis to determine whether or not a significant difference between the pre- and post-test results existed. Additionally, Anthem used Cronbach’s alpha tests to confirm that the pre- and post-test survey questionnaire was an appropriate way to measure clinic staff members’ knowledge.
Plan-Do-Study-Act Cycle 2
For the second PDSA cycle, Anthem tested whether or not conducting a focused presentation on documentation and the importance of timely scheduling beneficiaries’ Pap smear test
Anthem Blue Cross Partnership Plan Performance Evaluation Report: July 1, 2017–June 30, 2018 California Department of Health Care Services
Page D-64 Health Services Advisory Group, Inc.
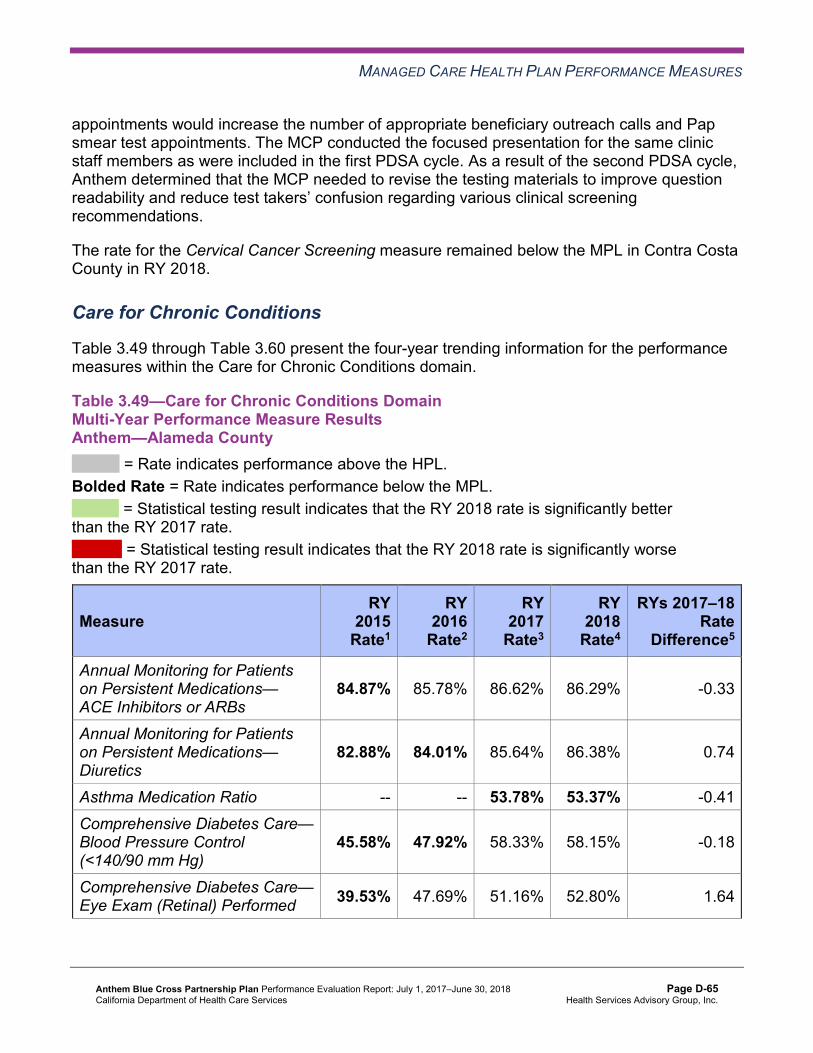
MANAGED CARE HEALTH PLAN PERFORMANCE MEASURES
appointments would increase the number of appropriate beneficiary outreach calls and Pap smear test appointments. The MCP conducted the focused presentation for the same clinic staff members as were included in the first PDSA cycle. As a result of the second PDSA cycle, Anthem determined that the MCP needed to revise the testing materials to improve question readability and reduce test takers’ confusion regarding various clinical screening recommendations.
The rate for the Cervical Cancer Screening measure remained below the MPL in Contra Costa County in RY 2018.
Care for Chronic Conditions
Table 3.49 through Table 3.60 present the four-year trending information for the performance measures within the Care for Chronic Conditions domain.
Table 3.49—Care for Chronic Conditions Domain Multi-Year Performance Measure Results Anthem—Alameda County
H = Rate indicates performance above the HPL. Bolded Rate = Rate indicates performance below the MPL.
B = Statistical testing result indicates that the RY 2018 rate is significantly better than the RY 2017 rate.
W = Statistical testing result indicates that the RY 2018 rate is significantly worse than the RY 2017 rate.
Measure RY
2015 Rate1
RY 2016
Rate2
RY 2017
Rate3
RY 2018
Rate4
RYs 2017–18 Rate
Difference5
Annual Monitoring for Patients on Persistent Medications— ACE Inhibitors or ARBs
84.87% 85.78% 86.62% 86.29% -0.33
Annual Monitoring for Patients on Persistent Medications— Diuretics
82.88% 84.01% 85.64% 86.38% 0.74
Asthma Medication Ratio -- -- 53.78% 53.37% -0.41 Comprehensive Diabetes Care— Blood Pressure Control (<140/90 mm Hg)
45.58% 47.92% 58.33% 58.15% -0.18
Comprehensive Diabetes Care— Eye Exam (Retinal) Performed 39.53% 47.69% 51.16% 52.80% 1.64
Anthem Blue Cross Partnership Plan Performance Evaluation Report: July 1, 2017–June 30, 2018 California Department of Health Care Services
Page D-65 Health Services Advisory Group, Inc.
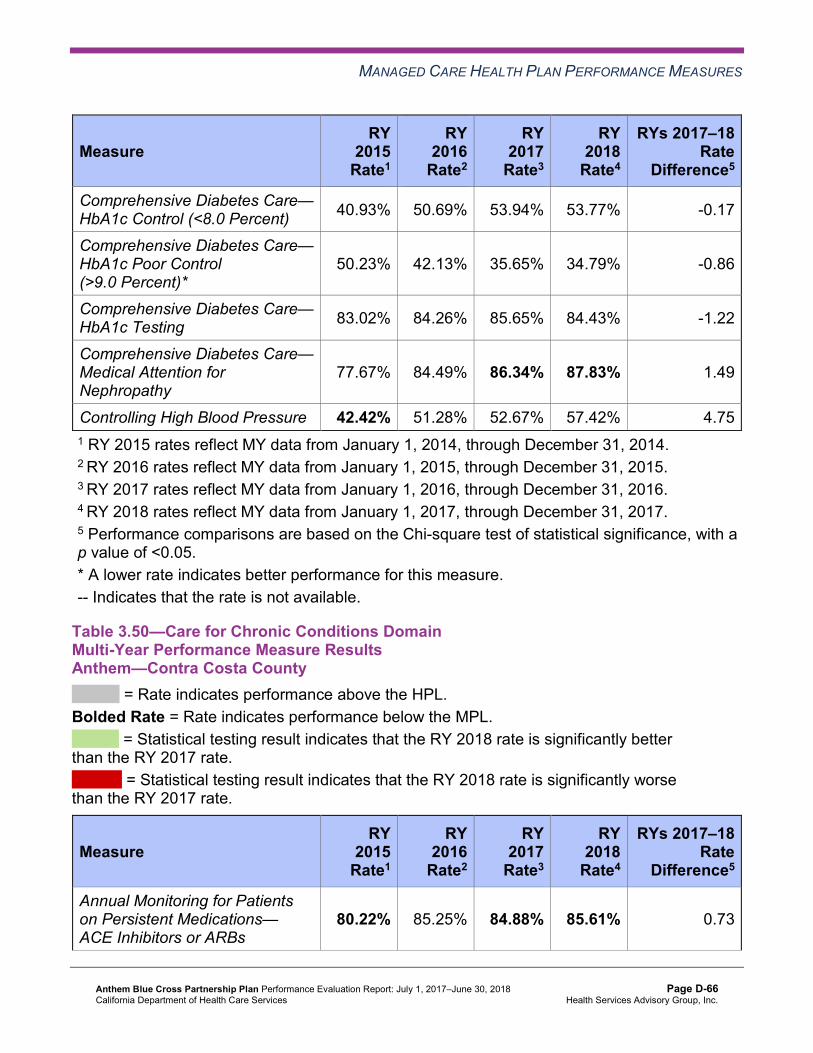
MANAGED CARE HEALTH PLAN PERFORMANCE MEASURES
Measure RY
2015 Rate1
RY 2016
Rate2
RY 2017
Rate3
RY 2018
Rate4
RYs 2017–18 Rate
Difference5
Comprehensive Diabetes Care— HbA1c Control (<8.0 Percent) 40.93% 50.69% 53.94% 53.77% -0.17
Comprehensive Diabetes Care— HbA1c Poor Control (>9.0 Percent)*
50.23% 42.13% 35.65% 34.79% -0.86
Comprehensive Diabetes Care— HbA1c Testing 83.02% 84.26% 85.65% 84.43% -1.22
Comprehensive Diabetes Care— Medical Attention for Nephropathy
77.67% 84.49% 86.34% 87.83% 1.49
Controlling High Blood Pressure 42.42% 51.28% 52.67% 57.42% 4.75 1 RY 2015 rates reflect MY data from January 1, 2014, through December 31, 2014. 2 RY 2016 rates reflect MY data from January 1, 2015, through December 31, 2015. 3 RY 2017 rates reflect MY data from January 1, 2016, through December 31, 2016. 4 RY 2018 rates reflect MY data from January 1, 2017, through December 31, 2017. 5 Performance comparisons are based on the Chi-square test of statistical significance, with a p value of <0.05. * A lower rate indicates better performance for this measure. -- Indicates that the rate is not available.
Table 3.50—Care for Chronic Conditions Domain Multi-Year Performance Measure Results Anthem—Contra Costa County
H = Rate indicates performance above the HPL. Bolded Rate = Rate indicates performance below the MPL.
B = Statistical testing result indicates that the RY 2018 rate is significantly better than the RY 2017 rate.
W = Statistical testing result indicates that the RY 2018 rate is significantly worse than the RY 2017 rate.
Measure RY
2015 Rate1
RY 2016
Rate2
RY 2017
Rate3
RY 2018
Rate4
RYs 2017–18 Rate
Difference5
Annual Monitoring for Patients on Persistent Medications— ACE Inhibitors or ARBs
80.22% 85.25% 84.88% 85.61% 0.73
Anthem Blue Cross Partnership Plan Performance Evaluation Report: July 1, 2017–June 30, 2018 California Department of Health Care Services
Page D-66 Health Services Advisory Group, Inc.

MANAGED CARE HEALTH PLAN PERFORMANCE MEASURES
Measure RY
2015 Rate1
RY 2016
Rate2
RY 2017
Rate3
RY 2018
Rate4
RYs 2017–18 Rate
Difference5
Annual Monitoring for Patients on Persistent Medications— Diuretics
81.74% 85.07% 80.00% 87.57% 7.57B
Asthma Medication Ratio -- -- 60.74% 59.80% -0.94 Comprehensive Diabetes Care— Blood Pressure Control (<140/90 mm Hg)
52.30% 58.00% 56.25% 61.56% 5.31
Comprehensive Diabetes Care— Eye Exam (Retinal) Performed 45.94% 47.33% 47.92% 50.85% 2.93
Comprehensive Diabetes Care— HbA1c Control (<8.0 Percent) 46.64% 49.88% 53.70% 55.23% 1.53
Comprehensive Diabetes Care— HbA1c Poor Control (>9.0 Percent)*
42.40% 39.44% 38.43% 33.58% -4.85
Comprehensive Diabetes Care— HbA1c Testing 81.27% 80.51% 84.26% 86.62% 2.36
Comprehensive Diabetes Care— Medical Attention for Nephropathy
79.15% 84.45% 88.19% 88.56% 0.37
Controlling High Blood Pressure 49.71% 51.85% 53.72% 60.83% 7.11B
1 RY 2015 rates reflect MY data from January 1, 2014, through December 31, 2014. 2 RY 2016 rates reflect MY data from January 1, 2015, through December 31, 2015. 3 RY 2017 rates reflect MY data from January 1, 2016, through December 31, 2016. 4 RY 2018 rates reflect MY data from January 1, 2017, through December 31, 2017. 5 Performance comparisons are based on the Chi-square test of statistical significance, with a p value of <0.05. * A lower rate indicates better performance for this measure. -- Indicates that the rate is not available.
Anthem Blue Cross Partnership Plan Performance Evaluation Report: July 1, 2017–June 30, 2018 California Department of Health Care Services
Page D-67 Health Services Advisory Group, Inc.

MANAGED CARE HEALTH PLAN PERFORMANCE MEASURES
Table 3.51—Care for Chronic Conditions Domain Multi-Year Performance Measure Results Anthem—Fresno County
H = Rate indicates performance above the HPL. Bolded Rate = Rate indicates performance below the MPL.
B = Statistical testing result indicates that the RY 2018 rate is significantly better than the RY 2017 rate.
W = Statistical testing result indicates that the RY 2018 rate is significantly worse than the RY 2017 rate.
Measure RY
2015 Rate1
RY 2016
Rate2
RY 2017
Rate3
RY 2018
Rate4
RYs 2017–18 Rate
Difference5
Annual Monitoring for Patients on Persistent Medications— ACE Inhibitors or ARBs
83.15% 83.34% 85.84% 86.31% 0.47
Annual Monitoring for Patients on Persistent Medications— Diuretics
84.60% 84.35% 85.76% 86.35% 0.59
Asthma Medication Ratio -- -- 55.91% 54.22% -1.69 Comprehensive Diabetes Care— Blood Pressure Control (<140/90 mm Hg)
54.17% 58.33% 62.27% 63.50% 1.23
Comprehensive Diabetes Care— Eye Exam (Retinal) Performed 39.58% 47.45% 53.70% 51.34% -2.36
Comprehensive Diabetes Care— HbA1c Control (<8.0 Percent) 42.13% 47.22% 45.60% 47.20% 1.60
Comprehensive Diabetes Care— HbA1c Poor Control (>9.0 Percent)*
51.39% 44.91% 44.21% 41.61% -2.60
Comprehensive Diabetes Care— HbA1c Testing 83.10% 84.03% 86.11% 84.91% -1.20
Comprehensive Diabetes Care— Medical Attention for Nephropathy
81.02% 89.81%H 90.28% 87.59% -2.69
Controlling High Blood Pressure 50.47% 51.28% 52.68% 54.74% 2.06 1 RY 2015 rates reflect MY data from January 1, 2014, through December 31, 2014. 2 RY 2016 rates reflect MY data from January 1, 2015, through December 31, 2015. 3 RY 2017 rates reflect MY data from January 1, 2016, through December 31, 2016.
Anthem Blue Cross Partnership Plan Performance Evaluation Report: July 1, 2017–June 30, 2018 California Department of Health Care Services
Page D-68 Health Services Advisory Group, Inc.
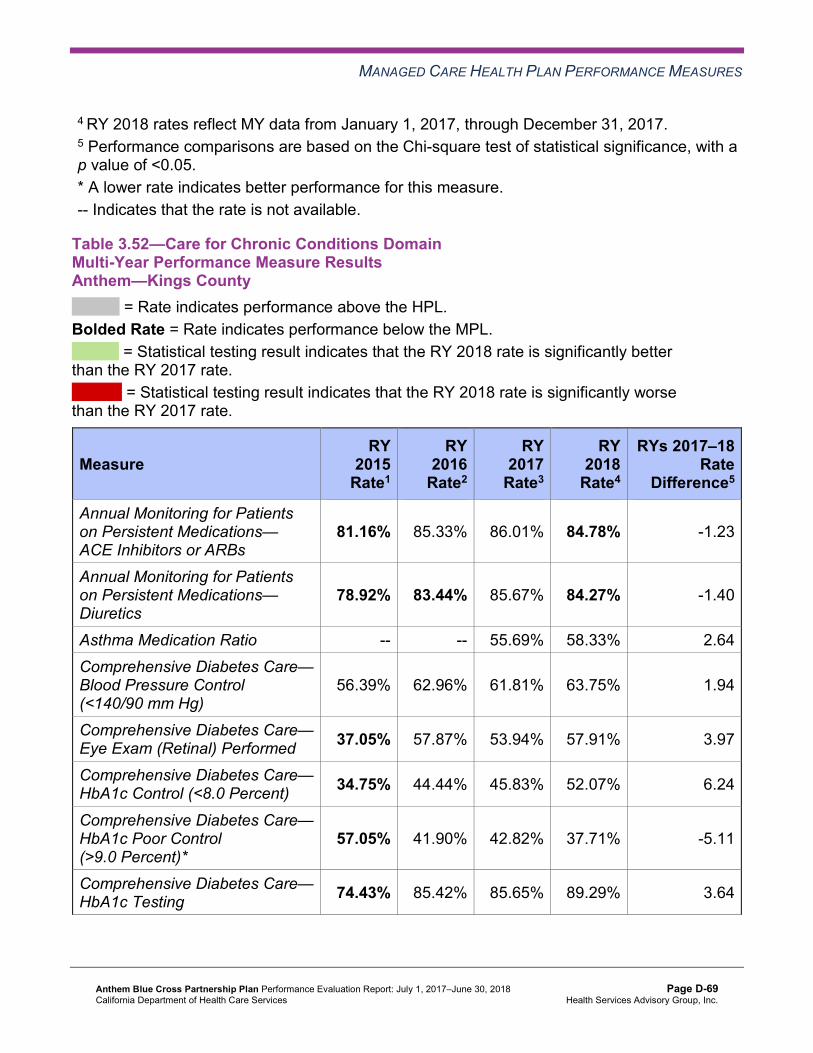
MANAGED CARE HEALTH PLAN PERFORMANCE MEASURES
4 RY 2018 rates reflect MY data from January 1, 2017, through December 31, 2017. 5 Performance comparisons are based on the Chi-square test of statistical significance, with a p value of <0.05. * A lower rate indicates better performance for this measure. -- Indicates that the rate is not available.
Table 3.52—Care for Chronic Conditions Domain Multi-Year Performance Measure Results Anthem—Kings County
H = Rate indicates performance above the HPL. Bolded Rate = Rate indicates performance below the MPL.
B = Statistical testing result indicates that the RY 2018 rate is significantly better than the RY 2017 rate.
W = Statistical testing result indicates that the RY 2018 rate is significantly worse than the RY 2017 rate.
Measure RY
2015 Rate1
RY 2016
Rate2
RY 2017
Rate3
RY 2018
Rate4
RYs 2017–18 Rate
Difference5
Annual Monitoring for Patients on Persistent Medications— ACE Inhibitors or ARBs
81.16% 85.33% 86.01% 84.78% -1.23
Annual Monitoring for Patients on Persistent Medications— Diuretics
78.92% 83.44% 85.67% 84.27% -1.40
Asthma Medication Ratio -- -- 55.69% 58.33% 2.64 Comprehensive Diabetes Care— Blood Pressure Control (<140/90 mm Hg)
56.39% 62.96% 61.81% 63.75% 1.94
Comprehensive Diabetes Care— Eye Exam (Retinal) Performed 37.05% 57.87% 53.94% 57.91% 3.97
Comprehensive Diabetes Care— HbA1c Control (<8.0 Percent) 34.75% 44.44% 45.83% 52.07% 6.24
Comprehensive Diabetes Care— HbA1c Poor Control (>9.0 Percent)*
57.05% 41.90% 42.82% 37.71% -5.11
Comprehensive Diabetes Care— HbA1c Testing 74.43% 85.42% 85.65% 89.29% 3.64
Anthem Blue Cross Partnership Plan Performance Evaluation Report: July 1, 2017–June 30, 2018 California Department of Health Care Services
Page D-69 Health Services Advisory Group, Inc.

MANAGED CARE HEALTH PLAN PERFORMANCE MEASURES
Measure RY
2015 Rate1
RY 2016
Rate2
RY 2017
Rate3
RY 2018
Rate4
RYs 2017–18 Rate
Difference5
Comprehensive Diabetes Care— Medical Attention for Nephropathy
81.97% 90.74%H 91.44% 91.00% -0.44
Controlling High Blood Pressure 49.65% 53.95% 57.08% 57.66% 0.58 1 RY 2015 rates reflect MY data from January 1, 2014, through December 31, 2014. 2 RY 2016 rates reflect MY data from January 1, 2015, through December 31, 2015. 3 RY 2017 rates reflect MY data from January 1, 2016, through December 31, 2016. 4 RY 2018 rates reflect MY data from January 1, 2017, through December 31, 2017. 5 Performance comparisons are based on the Chi-square test of statistical significance, with a p value of <0.05. * A lower rate indicates better performance for this measure. -- Indicates that the rate is not available.
Table 3.53—Care for Chronic Conditions Domain Multi-Year Performance Measure Results Anthem—Madera County
H = Rate indicates performance above the HPL. Bolded Rate = Rate indicates performance below the MPL.
B = Statistical testing result indicates that the RY 2018 rate is significantly better than the RY 2017 rate.
W = Statistical testing result indicates that the RY 2018 rate is significantly worse than the RY 2017 rate.
Measure RY
2015 Rate1
RY 2016
Rate2
RY 2017
Rate3
RY 2018
Rate4
RYs 2017–18 Rate
Difference5
Annual Monitoring for Patients on Persistent Medications— ACE Inhibitors or ARBs
82.02% 82.19% 83.49% 80.75% -2.74
Annual Monitoring for Patients on Persistent Medications— Diuretics
83.33% 79.61% 85.67% 84.74% -0.93
Asthma Medication Ratio -- -- 67.31% 59.27% -8.04W
Comprehensive Diabetes Care— Blood Pressure Control (<140/90 mm Hg)
62.68% 61.11% 71.30% 69.83% -1.47
Anthem Blue Cross Partnership Plan Performance Evaluation Report: July 1, 2017–June 30, 2018 California Department of Health Care Services
Page D-70 Health Services Advisory Group, Inc.

MANAGED CARE HEALTH PLAN PERFORMANCE MEASURES
Measure RY
2015 Rate1
RY 2016
Rate2
RY 2017
Rate3
RY 2018
Rate4
RYs 2017–18 Rate
Difference5
Comprehensive Diabetes Care— Eye Exam (Retinal) Performed 54.35% 56.02% 62.96% 65.21% 2.25
Comprehensive Diabetes Care— HbA1c Control (<8.0 Percent) 42.39% 44.68% 50.93% 49.39% -1.54
Comprehensive Diabetes Care— HbA1c Poor Control (>9.0 Percent)*
51.81% 45.83% 37.04% 40.88% 3.84
Comprehensive Diabetes Care— HbA1c Testing 84.06% 88.43% 88.19% 88.32% 0.13
Comprehensive Diabetes Care— Medical Attention for Nephropathy
84.78% 90.97%H 90.97% 91.97% 1.00
Controlling High Blood Pressure 50.71% 52.91% 54.40% 63.99% 9.59B
1 RY 2015 rates reflect MY data from January 1, 2014, through December 31, 2014. 2 RY 2016 rates reflect MY data from January 1, 2015, through December 31, 2015. 3 RY 2017 rates reflect MY data from January 1, 2016, through December 31, 2016. 4 RY 2018 rates reflect MY data from January 1, 2017, through December 31, 2017. 5 Performance comparisons are based on the Chi-square test of statistical significance, with a p value of <0.05. * A lower rate indicates better performance for this measure. -- Indicates that the rate is not available.
Anthem Blue Cross Partnership Plan Performance Evaluation Report: July 1, 2017–June 30, 2018 California Department of Health Care Services
Page D-71 Health Services Advisory Group, Inc.

MANAGED CARE HEALTH PLAN PERFORMANCE MEASURES
Table 3.54—Care for Chronic Conditions Domain Multi-Year Performance Measure Results Anthem—Region 1 (Butte, Colusa, Glenn, Plumas, Sierra, Sutter, and Tehama Counties)
H = Rate indicates performance above the HPL. Bolded Rate = Rate indicates performance below the MPL.
B = Statistical testing result indicates that the RY 2018 rate is significantly better than the RY 2017 rate.
W = Statistical testing result indicates that the RY 2018 rate is significantly worse than the RY 2017 rate.
Measure RY
2015 Rate1
RY 2016
Rate2
RY 2017
Rate3
RY 2018
Rate4
RYs 2017–18 Rate
Difference5
Annual Monitoring for Patients on Persistent Medications— ACE Inhibitors or ARBs
84.36% 86.15% 85.92% 85.53% -0.39
Annual Monitoring for Patients on Persistent Medications— Diuretics
86.83% 87.08% 85.92% 84.62% -1.30
Asthma Medication Ratio -- -- 57.25% 59.19% 1.94 Comprehensive Diabetes Care— Blood Pressure Control (<140/90 mm Hg)
63.74% 64.35% 67.05% 68.86% 1.81
Comprehensive Diabetes Care— Eye Exam (Retinal) Performed 41.76% 44.21% 51.97% 51.34% -0.63
Comprehensive Diabetes Care— HbA1c Control (<8.0 Percent) 39.84% 49.07% 54.29% 52.07% -2.22
Comprehensive Diabetes Care— HbA1c Poor Control (>9.0 Percent)*
50.55% 42.13% 35.50% 36.50% 1.00
Comprehensive Diabetes Care— HbA1c Testing 86.54% 84.95% 81.44% 85.89% 4.45
Comprehensive Diabetes Care— Medical Attention for Nephropathy
76.10% 85.42% 85.15% 87.10% 1.95
Controlling High Blood Pressure 50.93% 60.32% 60.37% 57.91% -2.46 1 RY 2015 rates reflect MY data from January 1, 2014, through December 31, 2014. 2 RY 2016 rates reflect MY data from January 1, 2015, through December 31, 2015. 3 RY 2017 rates reflect MY data from January 1, 2016, through December 31, 2016.
Anthem Blue Cross Partnership Plan Performance Evaluation Report: July 1, 2017–June 30, 2018 California Department of Health Care Services
Page D-72 Health Services Advisory Group, Inc.

MANAGED CARE HEALTH PLAN PERFORMANCE MEASURES
4 RY 2018 rates reflect MY data from January 1, 2017, through December 31, 2017. 5 Performance comparisons are based on the Chi-square test of statistical significance, with a p value of <0.05. * A lower rate indicates better performance for this measure. -- Indicates that the rate is not available.
Table 3.55—Care for Chronic Conditions Domain Multi-Year Performance Measure Results Anthem—Region 2 (Alpine, Amador, Calaveras, El Dorado, Inyo, Mariposa, Mono,Nevada, Placer, Tuolumne, and Yuba Counties)
H = Rate indicates performance above the HPL. Bolded Rate = Rate indicates performance below the MPL.
B = Statistical testing result indicates that the RY 2018 rate is significantly better than the RY 2017 rate.
W = Statistical testing result indicates that the RY 2018 rate is significantly worse than the RY 2017 rate.
Measure RY
2015 Rate1
RY 2016
Rate2
RY 2017
Rate3
RY 2018
Rate4
RYs 2017–18 Rate
Difference5
Annual Monitoring for Patients on Persistent Medications— ACE Inhibitors or ARBs
77.42% 81.21% 83.27% 85.22% 1.95
Annual Monitoring for Patients on Persistent Medications— Diuretics
80.41% 83.28% 82.66% 85.58% 2.92B
Asthma Medication Ratio -- -- 55.24% 58.10% 2.86 Comprehensive Diabetes Care— Blood Pressure Control (<140/90 mm Hg)
63.41% 64.35% 62.73% 66.18% 3.45
Comprehensive Diabetes Care— Eye Exam (Retinal) Performed 36.28% 41.90% 46.30% 49.64% 3.34
Comprehensive Diabetes Care— HbA1c Control (<8.0 Percent) 39.43% 49.07% 50.69% 54.01% 3.32
Comprehensive Diabetes Care— HbA1c Poor Control (>9.0 Percent)*
50.79% 39.81% 38.89% 36.25% -2.64
Comprehensive Diabetes Care— HbA1c Testing 83.60% 82.41% 82.87% 85.40% 2.53
Anthem Blue Cross Partnership Plan Performance Evaluation Report: July 1, 2017–June 30, 2018 California Department of Health Care Services
Page D-73 Health Services Advisory Group, Inc.

MANAGED CARE HEALTH PLAN PERFORMANCE MEASURES
Measure RY
2015 Rate1
RY 2016
Rate2
RY 2017
Rate3
RY 2018
Rate4
RYs 2017–18 Rate
Difference5
Comprehensive Diabetes Care— Medical Attention for Nephropathy
73.19% 86.81% 87.96% 85.40% -2.56
Controlling High Blood Pressure 44.65% 52.67% 55.09% 59.12% 4.03 1 RY 2015 rates reflect MY data from January 1, 2014, through December 31, 2014. 2 RY 2016 rates reflect MY data from January 1, 2015, through December 31, 2015. 3 RY 2017 rates reflect MY data from January 1, 2016, through December 31, 2016. 4 RY 2018 rates reflect MY data from January 1, 2017, through December 31, 2017. 5 Performance comparisons are based on the Chi-square test of statistical significance, with a p value of <0.05. * A lower rate indicates better performance for this measure. -- Indicates that the rate is not available.
Table 3.56—Care for Chronic Conditions Domain Multi-Year Performance Measure Results Anthem—Sacramento County
H = Rate indicates performance above the HPL. Bolded Rate = Rate indicates performance below the MPL.
B = Statistical testing result indicates that the RY 2018 rate is significantly better than the RY 2017 rate.
W = Statistical testing result indicates that the RY 2018 rate is significantly worse than the RY 2017 rate.
Measure RY
2015 Rate1
RY 2016
Rate2
RY 2017
Rate3
RY 2018
Rate4
RYs 2017–18 Rate
Difference5
Annual Monitoring for Patients on Persistent Medications— ACE Inhibitors or ARBs
85.37% 84.38% 84.90% 85.65% 0.75
Annual Monitoring for Patients on Persistent Medications— Diuretics
85.13% 84.96% 85.34% 84.74% -0.60
Asthma Medication Ratio -- -- 53.01% 51.83% -1.18 Comprehensive Diabetes Care— Blood Pressure Control (<140/90 mm Hg)
49.88% 56.73% 53.94% 54.99% 1.05
Anthem Blue Cross Partnership Plan Performance Evaluation Report: July 1, 2017–June 30, 2018 California Department of Health Care Services
Page D-74 Health Services Advisory Group, Inc.

MANAGED CARE HEALTH PLAN PERFORMANCE MEASURES
Measure RY
2015 Rate1
RY 2016
Rate2
RY 2017
Rate3
RY 2018
Rate4
RYs 2017–18 Rate
Difference5
Comprehensive Diabetes Care— Eye Exam (Retinal) Performed 40.60% 41.06% 46.53% 49.15% 2.62
Comprehensive Diabetes Care— HbA1c Control (<8.0 Percent) 46.17% 46.14% 48.38% 46.72% -1.66
Comprehensive Diabetes Care— HbA1c Poor Control (>9.0 Percent)*
43.85% 41.50% 38.66% 42.58% 3.92
Comprehensive Diabetes Care— HbA1c Testing 76.80% 76.82% 81.94% 80.05% -1.89
Comprehensive Diabetes Care— Medical Attention for Nephropathy
81.67% 90.07%H 89.12% 89.05% -0.07
Controlling High Blood Pressure 43.43% 55.24% 49.42% 54.26% 4.84 1 RY 2015 rates reflect MY data from January 1, 2014, through December 31, 2014. 2 RY 2016 rates reflect MY data from January 1, 2015, through December 31, 2015. 3 RY 2017 rates reflect MY data from January 1, 2016, through December 31, 2016. 4 RY 2018 rates reflect MY data from January 1, 2017, through December 31, 2017. 5 Performance comparisons are based on the Chi-square test of statistical significance, with a p value of <0.05. * A lower rate indicates better performance for this measure. -- Indicates that the rate is not available.
Anthem Blue Cross Partnership Plan Performance Evaluation Report: July 1, 2017–June 30, 2018 California Department of Health Care Services
Page D-75 Health Services Advisory Group, Inc.

MANAGED CARE HEALTH PLAN PERFORMANCE MEASURES
Table 3.57—Care for Chronic Conditions Domain Multi-Year Performance Measure Results Anthem—San Benito County
H = Rate indicates performance above the HPL. Bolded Rate = Rate indicates performance below the MPL.
B = Statistical testing result indicates that the RY 2018 rate is significantly better than the RY 2017 rate.
W = Statistical testing result indicates that the RY 2018 rate is significantly worse than the RY 2017 rate.
Measure RY
2015 Rate1
RY 2016
Rate2
RY 2017
Rate3
RY 2018
Rate4
RYs 2017–18 Rate
Difference5
Annual Monitoring for Patients on Persistent Medications— ACE Inhibitors or ARBs
NA 84.00% 85.95% 82.09% -3.86
Annual Monitoring for Patients on Persistent Medications— Diuretics
NA 84.62% 85.71% 78.75% -6.96
Asthma Medication Ratio -- -- 77.36%H 68.49% -8.87 Comprehensive Diabetes Care— Blood Pressure Control (<140/90 mm Hg)
62.86% 60.58% 59.15% 67.06% 7.91
Comprehensive Diabetes Care— Eye Exam (Retinal) Performed 34.29% 52.55% 48.59% 54.12% 5.53
Comprehensive Diabetes Care— HbA1c Control (<8.0 Percent) S 35.77% 44.37% 40.59% -3.78
Comprehensive Diabetes Care— HbA1c Poor Control (>9.0 Percent)*
62.86% 54.74% 45.77% 45.29% -0.48
Comprehensive Diabetes Care— HbA1c Testing 77.14% 73.72% 75.35% 79.41% 4.06
Comprehensive Diabetes Care— Medical Attention for Nephropathy
54.29% 86.13% 81.69% 89.41% 7.72
Controlling High Blood Pressure NA 50.38% 49.11% 68.85% 19.74B
1 RY 2015 rates reflect MY data from January 1, 2014, through December 31, 2014. 2 RY 2016 rates reflect MY data from January 1, 2015, through December 31, 2015. 3 RY 2017 rates reflect MY data from January 1, 2016, through December 31, 2016.
Anthem Blue Cross Partnership Plan Performance Evaluation Report: July 1, 2017–June 30, 2018 California Department of Health Care Services
Page D-76 Health Services Advisory Group, Inc.
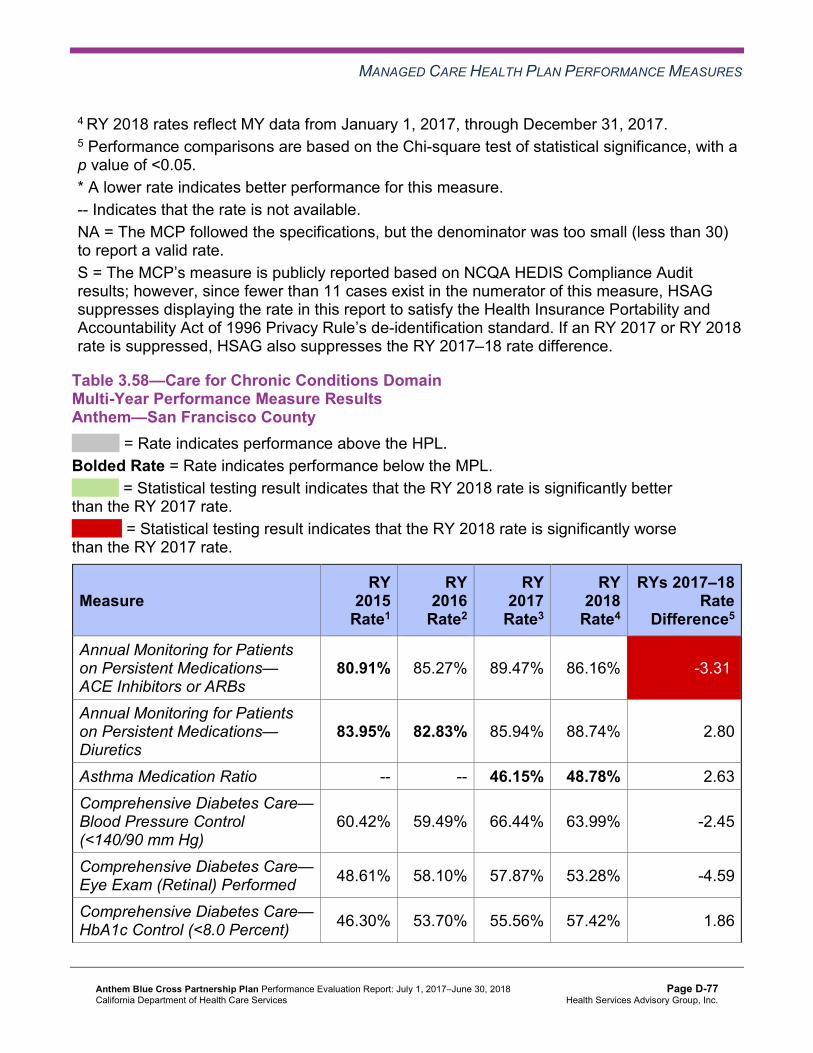
MANAGED CARE HEALTH PLAN PERFORMANCE MEASURES
4 RY 2018 rates reflect MY data from January 1, 2017, through December 31, 2017. 5 Performance comparisons are based on the Chi-square test of statistical significance, with a p value of <0.05. * A lower rate indicates better performance for this measure. -- Indicates that the rate is not available. NA = The MCP followed the specifications, but the denominator was too small (less than 30) to report a valid rate. S = The MCP’s measure is publicly reported based on NCQA HEDIS Compliance Audit results; however, since fewer than 11 cases exist in the numerator of this measure, HSAG suppresses displaying the rate in this report to satisfy the Health Insurance Portability and Accountability Act of 1996 Privacy Rule’s de-identification standard. If an RY 2017 or RY 2018 rate is suppressed, HSAG also suppresses the RY 2017–18 rate difference.
Table 3.58—Care for Chronic Conditions Domain Multi-Year Performance Measure Results Anthem—San Francisco County
H = Rate indicates performance above the HPL. Bolded Rate = Rate indicates performance below the MPL.
B = Statistical testing result indicates that the RY 2018 rate is significantly better than the RY 2017 rate.
W = Statistical testing result indicates that the RY 2018 rate is significantly worse than the RY 2017 rate.
Measure RY
2015 Rate1
RY 2016
Rate2
RY 2017
Rate3
RY 2018
Rate4
RYs 2017–18 Rate
Difference5
Annual Monitoring for Patients on Persistent Medications— ACE Inhibitors or ARBs
80.91% 85.27% 89.47% 86.16% -3.31W
Annual Monitoring for Patients on Persistent Medications— Diuretics
83.95% 82.83% 85.94% 88.74% 2.80
Asthma Medication Ratio -- -- 46.15% 48.78% 2.63 Comprehensive Diabetes Care— Blood Pressure Control (<140/90 mm Hg)
60.42% 59.49% 66.44% 63.99% -2.45
Comprehensive Diabetes Care— Eye Exam (Retinal) Performed 48.61% 58.10% 57.87% 53.28% -4.59
Comprehensive Diabetes Care— HbA1c Control (<8.0 Percent) 46.30% 53.70% 55.56% 57.42% 1.86
Anthem Blue Cross Partnership Plan Performance Evaluation Report: July 1, 2017–June 30, 2018 California Department of Health Care Services
Page D-77 Health Services Advisory Group, Inc.

MANAGED CARE HEALTH PLAN PERFORMANCE MEASURES
Measure RY
2015 Rate1
RY 2016
Rate2
RY 2017
Rate3
RY 2018
Rate4
RYs 2017–18 Rate
Difference5
Comprehensive Diabetes Care— HbA1c Poor Control (>9.0 Percent)*
46.30% 37.73% 33.10% 32.85% -0.25
Comprehensive Diabetes Care— HbA1c Testing 83.56% 89.12% 90.05% 84.43% -5.62W
Comprehensive Diabetes Care— Medical Attention for Nephropathy
84.95% 92.13%H 88.66% 87.83% -0.83
Controlling High Blood Pressure 51.16% 58.93% 63.34% 60.83% -2.51 1 RY 2015 rates reflect MY data from January 1, 2014, through December 31, 2014. 2 RY 2016 rates reflect MY data from January 1, 2015, through December 31, 2015. 3 RY 2017 rates reflect MY data from January 1, 2016, through December 31, 2016. 4 RY 2018 rates reflect MY data from January 1, 2017, through December 31, 2017. 5 Performance comparisons are based on the Chi-square test of statistical significance, with a p value of <0.05. * A lower rate indicates better performance for this measure. -- Indicates that the rate is not available.
Table 3.59—Care for Chronic Conditions Domain Multi-Year Performance Measure Results Anthem—Santa Clara County
H = Rate indicates performance above the HPL. Bolded Rate = Rate indicates performance below the MPL.
B = Statistical testing result indicates that the RY 2018 rate is significantly better than the RY 2017 rate.
W = Statistical testing result indicates that the RY 2018 rate is significantly worse than the RY 2017 rate.
Measure RY
2015 Rate1
RY 2016
Rate2
RY 2017
Rate3
RY 2018
Rate4
RYs 2017–18 Rate
Difference5
Annual Monitoring for Patients on Persistent Medications— ACE Inhibitors or ARBs
86.17% 87.37% 88.31% 88.27% -0.04
Anthem Blue Cross Partnership Plan Performance Evaluation Report: July 1, 2017–June 30, 2018 California Department of Health Care Services
Page D-78 Health Services Advisory Group, Inc.
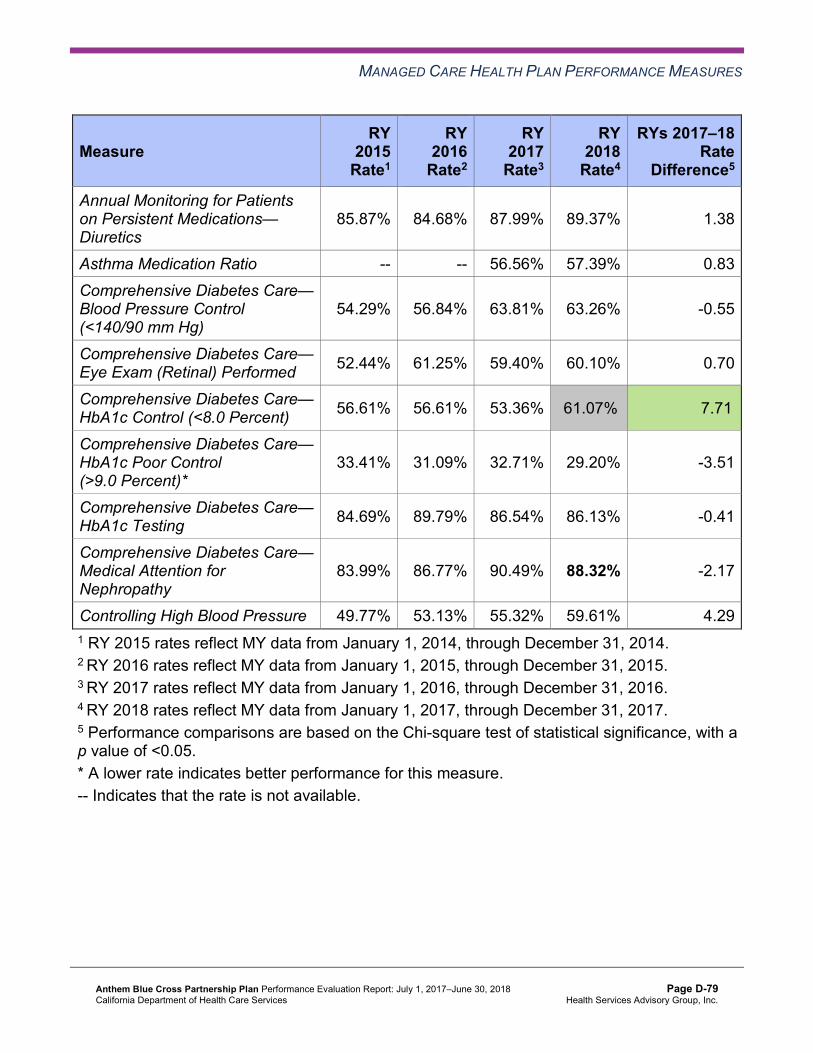
MANAGED CARE HEALTH PLAN PERFORMANCE MEASURES
Measure RY
2015 Rate1
RY 2016
Rate2
RY 2017
Rate3
RY 2018
Rate4
RYs 2017–18 Rate
Difference5
Annual Monitoring for Patients on Persistent Medications— Diuretics
85.87% 84.68% 87.99% 89.37% 1.38
Asthma Medication Ratio -- -- 56.56% 57.39% 0.83 Comprehensive Diabetes Care— Blood Pressure Control (<140/90 mm Hg)
54.29% 56.84% 63.81% 63.26% -0.55
Comprehensive Diabetes Care— Eye Exam (Retinal) Performed 52.44% 61.25% 59.40% 60.10% 0.70
Comprehensive Diabetes Care— HbA1c Control (<8.0 Percent) 56.61% 56.61% 53.36% 61.07%H 7.71B
Comprehensive Diabetes Care— HbA1c Poor Control (>9.0 Percent)*
33.41% 31.09% 32.71% 29.20% -3.51
Comprehensive Diabetes Care— HbA1c Testing 84.69% 89.79% 86.54% 86.13% -0.41
Comprehensive Diabetes Care— Medical Attention for Nephropathy
83.99% 86.77% 90.49% 88.32% -2.17
Controlling High Blood Pressure 49.77% 53.13% 55.32% 59.61% 4.29 1 RY 2015 rates reflect MY data from January 1, 2014, through December 31, 2014. 2 RY 2016 rates reflect MY data from January 1, 2015, through December 31, 2015. 3 RY 2017 rates reflect MY data from January 1, 2016, through December 31, 2016. 4 RY 2018 rates reflect MY data from January 1, 2017, through December 31, 2017. 5 Performance comparisons are based on the Chi-square test of statistical significance, with a p value of <0.05. * A lower rate indicates better performance for this measure. -- Indicates that the rate is not available.
Anthem Blue Cross Partnership Plan Performance Evaluation Report: July 1, 2017–June 30, 2018 California Department of Health Care Services
Page D-79 Health Services Advisory Group, Inc.

MANAGED CARE HEALTH PLAN PERFORMANCE MEASURES
Table 3.60—Care for Chronic Conditions Domain Multi-Year Performance Measure Results Anthem—Tulare County
H = Rate indicates performance above the HPL. Bolded Rate = Rate indicates performance below the MPL.
B = Statistical testing result indicates that the RY 2018 rate is significantly better than the RY 2017 rate.
W = Statistical testing result indicates that the RY 2018 rate is significantly worse than the RY 2017 rate.
Measure RY
2015 Rate1
RY 2016
Rate2
RY 2017
Rate3
RY 2018
Rate4
RYs 2017–18 Rate
Difference5
Annual Monitoring for Patients on Persistent Medications— ACE Inhibitors or ARBs
83.04% 87.32% 87.87% 88.22% 0.35
Annual Monitoring for Patients on Persistent Medications— Diuretics
82.83% 87.83% 86.64% 87.14% 0.50
Asthma Medication Ratio -- -- 57.55% 57.36% -0.19 Comprehensive Diabetes Care— Blood Pressure Control (<140/90 mm Hg)
64.58% 62.96% 67.36% 63.99% -3.37
Comprehensive Diabetes Care— Eye Exam (Retinal) Performed 46.30% 51.16% 59.26% 57.18% -2.08
Comprehensive Diabetes Care— HbA1c Control (<8.0 Percent) 42.13% 45.83% 49.31% 53.28% 3.97
Comprehensive Diabetes Care— HbA1c Poor Control (>9.0 Percent)*
48.38% 41.20% 39.35% 36.25% -3.10
Comprehensive Diabetes Care— HbA1c Testing 82.87% 87.50% 91.44% 91.00% -0.44
Comprehensive Diabetes Care— Medical Attention for Nephropathy
78.24% 93.98%H 90.97% 90.75% -0.22
Controlling High Blood Pressure 49.07% 56.25% 58.24% 62.29% 4.05 1 RY 2015 rates reflect MY data from January 1, 2014, through December 31, 2014. 2 RY 2016 rates reflect MY data from January 1, 2015, through December 31, 2015. 3 RY 2017 rates reflect MY data from January 1, 2016, through December 31, 2016.
Anthem Blue Cross Partnership Plan Performance Evaluation Report: July 1, 2017–June 30, 2018 California Department of Health Care Services
Page D-80 Health Services Advisory Group, Inc.
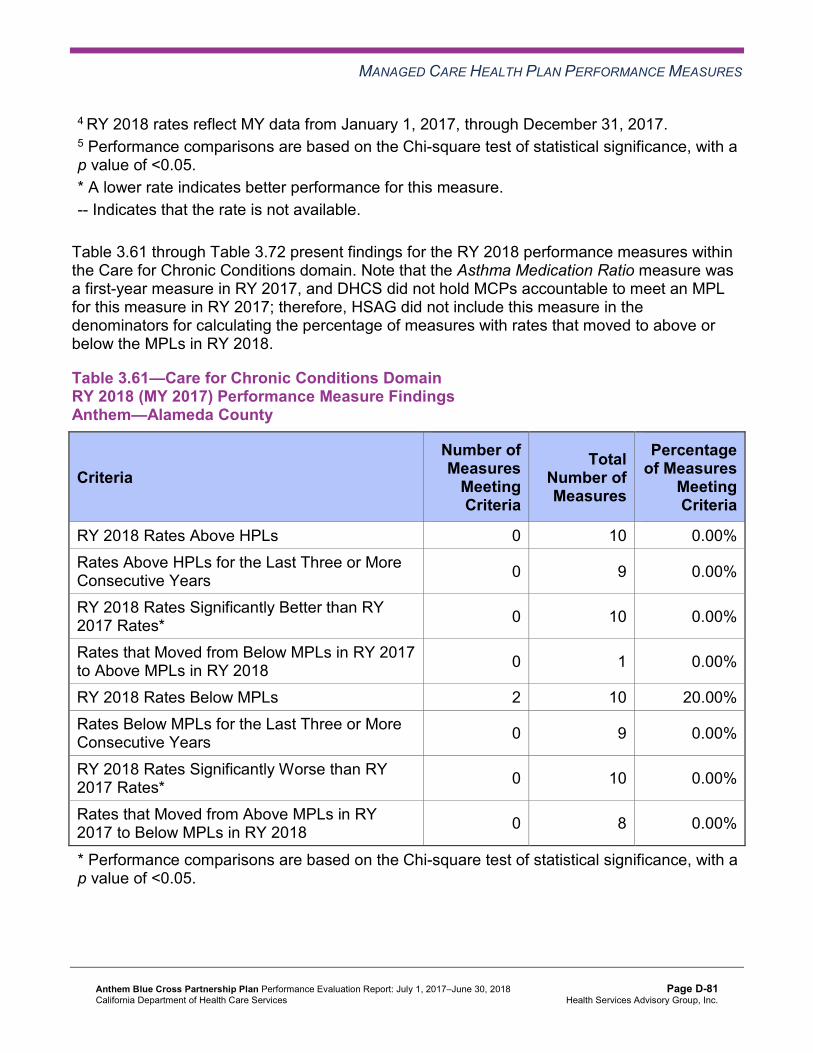
MANAGED CARE HEALTH PLAN PERFORMANCE MEASURES
4 RY 2018 rates reflect MY data from January 1, 2017, through December 31, 2017. 5 Performance comparisons are based on the Chi-square test of statistical significance, with a p value of <0.05. * A lower rate indicates better performance for this measure. -- Indicates that the rate is not available.
Table 3.61 through Table 3.72 present findings for the RY 2018 performance measures within the Care for Chronic Conditions domain. Note that the Asthma Medication Ratio measure was a first-year measure in RY 2017, and DHCS did not hold MCPs accountable to meet an MPL for this measure in RY 2017; therefore, HSAG did not include this measure in the denominators for calculating the percentage of measures with rates that moved to above or below the MPLs in RY 2018.
Table 3.61—Care for Chronic Conditions Domain RY 2018 (MY 2017) Performance Measure Findings Anthem—Alameda County
Criteria Number of Measures
MeetingCriteria
Total Number of Measures
Percentage of Measures
MeetingCriteria
RY 2018 Rates Above HPLs 0 10 0.00% Rates Above HPLs for the Last Three or More Consecutive Years 0 9 0.00%
RY 2018 Rates Significantly Better than RY 2017 Rates* 0 10 0.00%
Rates that Moved from Below MPLs in RY 2017 to Above MPLs in RY 2018 0 1 0.00%
RY 2018 Rates Below MPLs 2 10 20.00% Rates Below MPLs for the Last Three or More Consecutive Years 0 9 0.00%
RY 2018 Rates Significantly Worse than RY 2017 Rates* 0 10 0.00%
Rates that Moved from Above MPLs in RY 2017 to Below MPLs in RY 2018 0 8 0.00%
* Performance comparisons are based on the Chi-square test of statistical significance, with a p value of <0.05.
Anthem Blue Cross Partnership Plan Performance Evaluation Report: July 1, 2017–June 30, 2018 California Department of Health Care Services
Page D-81 Health Services Advisory Group, Inc.

MANAGED CARE HEALTH PLAN PERFORMANCE MEASURES
Table 3.62—Care for Chronic Conditions Domain RY 2018 (MY 2017) Performance Measure Findings Anthem—Contra Costa County
Criteria Number of Measures
MeetingCriteria
Total Number of Measures
Percentage of Measures
MeetingCriteria
RY 2018 Rates Above HPLs 0 10 0.00% Rates Above HPLs for the Last Three or More Consecutive Years 0 9 0.00%
RY 2018 Rates Significantly Better than RY 2017 Rates* 2 10 20.00%
Rates that Moved from Below MPLs in RY 2017 to Above MPLs in RY 2018 2 3 66.67%
RY 2018 Rates Below MPLs 1 10 10.00% Rates Below MPLs for the Last Three or More Consecutive Years 0 9 0.00%
RY 2018 Rates Significantly Worse than RY 2017 Rates* 0 10 0.00%
Rates that Moved from Above MPLs in RY 2017 to Below MPLs in RY 2018 0 6 0.00%
* Performance comparisons are based on the Chi-square test of statistical significance, with a p value of <0.05.
Anthem Blue Cross Partnership Plan Performance Evaluation Report: July 1, 2017–June 30, 2018 California Department of Health Care Services
Page D-82 Health Services Advisory Group, Inc.

MANAGED CARE HEALTH PLAN PERFORMANCE MEASURES
Table 3.63—Care for Chronic Conditions Domain RY 2018 (MY 2017) Performance Measure Findings Anthem—Fresno County
Criteria Number of Measures
MeetingCriteria
Total Number of Measures
Percentage of Measures
MeetingCriteria
RY 2018 Rates Above HPLs 0 10 0.00% Rates Above HPLs for the Last Three or More Consecutive Years 0 9 0.00%
RY 2018 Rates Significantly Better than RY 2017 Rates* 0 10 0.00%
Rates that Moved from Below MPLs in RY 2017 to Above MPLs in RY 2018 0 0 N/A
RY 2018 Rates Below MPLs 2 10 20.00% Rates Below MPLs for the Last Three or More Consecutive Years 0 9 0.00%
RY 2018 Rates Significantly Worse than RY 2017 Rates* 0 10 0.00%
Rates that Moved from Above MPLs in RY 2017 to Below MPLs in RY 2018 1 9 11.11%
* Performance comparisons are based on the Chi-square test of statistical significance, with a p value of <0.05. N/A = No rates above or below the MPLs from the previous year exist to include in the denominator for calculating whether or not rates moved to above or below MPLs in the most recent year.
Anthem Blue Cross Partnership Plan Performance Evaluation Report: July 1, 2017–June 30, 2018 California Department of Health Care Services
Page D-83 Health Services Advisory Group, Inc.

MANAGED CARE HEALTH PLAN PERFORMANCE MEASURES
Table 3.64—Care for Chronic Conditions Domain RY 2018 (MY 2017) Performance Measure Findings Anthem—Kings County
Criteria Number of Measures
MeetingCriteria
Total Number of Measures
Percentage of Measures
MeetingCriteria
RY 2018 Rates Above HPLs 0 10 0.00% Rates Above HPLs for the Last Three or More Consecutive Years 0 9 0.00%
RY 2018 Rates Significantly Better than RY 2017 Rates* 0 10 0.00%
Rates that Moved from Below MPLs in RY 2017 to Above MPLs in RY 2018 0 0 N/A
RY 2018 Rates Below MPLs 2 10 20.00% Rates Below MPLs for the Last Three or More Consecutive Years 0 9 0.00%
RY 2018 Rates Significantly Worse than RY 2017 Rates* 0 10 0.00%
Rates that Moved from Above MPLs in RY 2017 to Below MPLs in RY 2018 2 9 22.22%
* Performance comparisons are based on the Chi-square test of statistical significance, with a p value of <0.05. N/A = No rates above or below the MPLs from the previous year exist to include in the denominator for calculating whether or not rates moved to above or below MPLs in the most recent year.
Anthem Blue Cross Partnership Plan Performance Evaluation Report: July 1, 2017–June 30, 2018 California Department of Health Care Services
Page D-84 Health Services Advisory Group, Inc.

MANAGED CARE HEALTH PLAN PERFORMANCE MEASURES
Table 3.65—Care for Chronic Conditions Domain RY 2018 (MY 2017) Performance Measure Findings Anthem—Madera County
Criteria Number of Measures
MeetingCriteria
Total Number of Measures
Percentage of Measures
MeetingCriteria
RY 2018 Rates Above HPLs 0 10 0.00% Rates Above HPLs for the Last Three or More Consecutive Years 0 9 0.00%
RY 2018 Rates Significantly Better than RY 2017 Rates* 1 10 10.00%
Rates that Moved from Below MPLs in RY 2017 to Above MPLs in RY 2018 0 1 0.00%
RY 2018 Rates Below MPLs 2 10 20.00% Rates Below MPLs for the Last Three or More Consecutive Years 1 9 11.11%
RY 2018 Rates Significantly Worse than RY 2017 Rates* 1 10 10.00%
Rates that Moved from Above MPLs in RY 2017 to Below MPLs in RY 2018 1 8 12.50%
* Performance comparisons are based on the Chi-square test of statistical significance, with a p value of <0.05.
Anthem Blue Cross Partnership Plan Performance Evaluation Report: July 1, 2017–June 30, 2018 California Department of Health Care Services
Page D-85 Health Services Advisory Group, Inc.

MANAGED CARE HEALTH PLAN PERFORMANCE MEASURES
Table 3.66—Care for Chronic Conditions Domain RY 2018 (MY 2017) Performance Measure Findings Anthem—Region 1 (Butte, Colusa, Glenn, Plumas, Sierra, Sutter, and Tehama Counties)
Criteria Number of Measures
MeetingCriteria
Total Number of Measures
Percentage of Measures
MeetingCriteria
RY 2018 Rates Above HPLs 0 10 0.00% Rates Above HPLs for the Last Three or More Consecutive Years 0 9 0.00%
RY 2018 Rates Significantly Better than RY 2017 Rates* 0 10 0.00%
Rates that Moved from Below MPLs in RY 2017 to Above MPLs in RY 2018 1 2 50.00%
RY 2018 Rates Below MPLs 3 10 30.00% Rates Below MPLs for the Last Three or More Consecutive Years 0 9 0.00%
RY 2018 Rates Significantly Worse than RY 2017 Rates* 0 10 0.00%
Rates that Moved from Above MPLs in RY 2017 to Below MPLs in RY 2018 2 7 28.57%
* Performance comparisons are based on the Chi-square test of statistical significance, with a p value of <0.05.
Anthem Blue Cross Partnership Plan Performance Evaluation Report: July 1, 2017–June 30, 2018 California Department of Health Care Services
Page D-86 Health Services Advisory Group, Inc.

MANAGED CARE HEALTH PLAN PERFORMANCE MEASURES
Table 3.67—Care for Chronic Conditions Domain RY 2018 (MY 2017) Performance Measure Findings Anthem—Region 2 (Alpine, Amador, Calaveras, El Dorado, Inyo, Mariposa, Mono,Nevada, Placer, Tuolumne, and Yuba Counties)
Criteria Number of Measures
MeetingCriteria
Total Number of Measures
Percentage of Measures
MeetingCriteria
RY 2018 Rates Above HPLs 0 10 0.00% Rates Above HPLs for the Last Three or More Consecutive Years 0 9 0.00%
RY 2018 Rates Significantly Better than RY 2017 Rates* 1 10 10.00%
Rates that Moved from Below MPLs in RY 2017 to Above MPLs in RY 2018 2 4 50.00%
RY 2018 Rates Below MPLs 2 10 20.00% Rates Below MPLs for the Last Three or More Consecutive Years 1 9 11.11%
RY 2018 Rates Significantly Worse than RY 2017 Rates* 0 10 0.00%
Rates that Moved from Above MPLs in RY 2017 to Below MPLs in RY 2018 0 5 0.00%
* Performance comparisons are based on the Chi-square test of statistical significance, with a p value of <0.05.
Anthem Blue Cross Partnership Plan Performance Evaluation Report: July 1, 2017–June 30, 2018 California Department of Health Care Services
Page D-87 Health Services Advisory Group, Inc.

MANAGED CARE HEALTH PLAN PERFORMANCE MEASURES
Table 3.68—Care for Chronic Conditions Domain RY 2018 (MY 2017) Performance Measure Findings Anthem—Sacramento County
Criteria Number of Measures
MeetingCriteria
Total Number of Measures
Percentage of Measures
MeetingCriteria
RY 2018 Rates Above HPLs 0 10 0.00% Rates Above HPLs for the Last Three or More Consecutive Years 0 9 0.00%
RY 2018 Rates Significantly Better than RY 2017 Rates* 0 10 0.00%
Rates that Moved from Below MPLs in RY 2017 to Above MPLs in RY 2018 0 2 0.00%
RY 2018 Rates Below MPLs 4 10 40.00% Rates Below MPLs for the Last Three or More Consecutive Years 2 9 22.22%
RY 2018 Rates Significantly Worse than RY 2017 Rates* 0 10 0.00%
Rates that Moved from Above MPLs in RY 2017 to Below MPLs in RY 2018 1 7 14.29%
* Performance comparisons are based on the Chi-square test of statistical significance, with a p value of <0.05.
Anthem Blue Cross Partnership Plan Performance Evaluation Report: July 1, 2017–June 30, 2018 California Department of Health Care Services
Page D-88 Health Services Advisory Group, Inc.

MANAGED CARE HEALTH PLAN PERFORMANCE MEASURES
Table 3.69—Care for Chronic Conditions Domain RY 2018 (MY 2017) Performance Measure Findings Anthem—San Benito County
Criteria Number of Measures
MeetingCriteria
Total Number of Measures
Percentage of Measures
MeetingCriteria
RY 2018 Rates Above HPLs 0 10 0.00% Rates Above HPLs for the Last Three or More Consecutive Years 0 9 0.00%
RY 2018 Rates Significantly Better than RY 2017 Rates* 1 10 10.00%
Rates that Moved from Below MPLs in RY 2017 to Above MPLs in RY 2018 1 2 50.00%
RY 2018 Rates Below MPLs 4 10 40.00% Rates Below MPLs for the Last Three or More Consecutive Years 1 9 11.11%
RY 2018 Rates Significantly Worse than RY 2017 Rates* 0 10 0.00%
Rates that Moved from Above MPLs in RY 2017 to Below MPLs in RY 2018 3 7 42.86%
* Performance comparisons are based on the Chi-square test of statistical significance, with a p value of <0.05.
Anthem Blue Cross Partnership Plan Performance Evaluation Report: July 1, 2017–June 30, 2018 California Department of Health Care Services
Page D-89 Health Services Advisory Group, Inc.

MANAGED CARE HEALTH PLAN PERFORMANCE MEASURES
Table 3.70—Care for Chronic Conditions Domain RY 2018 (MY 2017) Performance Measure Findings Anthem—San Francisco County
Criteria Number of Measures
MeetingCriteria
Total Number of Measures
Percentage of Measures
MeetingCriteria
RY 2018 Rates Above HPLs 0 10 0.00% Rates Above HPLs for the Last Three or More Consecutive Years 0 9 0.00%
RY 2018 Rates Significantly Better than RY 2017 Rates* 0 10 0.00%
Rates that Moved from Below MPLs in RY 2017 to Above MPLs in RY 2018 0 0 N/A
RY 2018 Rates Below MPLs 2 10 20.00% Rates Below MPLs for the Last Three or More Consecutive Years 0 9 0.00%
RY 2018 Rates Significantly Worse than RY 2017 Rates* 2 10 20.00%
Rates that Moved from Above MPLs in RY 2017 to Below MPLs in RY 2018 1 9 11.11%
* Performance comparisons are based on the Chi-square test of statistical significance, with a p value of <0.05. N/A = No rates above or below the MPLs from the previous year exist to include in the denominator for calculating whether or not rates moved to above or below MPLs in the most recent year.
Anthem Blue Cross Partnership Plan Performance Evaluation Report: July 1, 2017–June 30, 2018 California Department of Health Care Services
Page D-90 Health Services Advisory Group, Inc.

MANAGED CARE HEALTH PLAN PERFORMANCE MEASURES
Table 3.71—Care for Chronic Conditions Domain RY 2018 (MY 2017) Performance Measure Findings Anthem—Santa Clara County
Criteria Number of Measures
MeetingCriteria
Total Number of Measures
Percentage of Measures
MeetingCriteria
RY 2018 Rates Above HPLs 1 10 10.00% Rates Above HPLs for the Last Three or More Consecutive Years 0 9 0.00%
RY 2018 Rates Significantly Better than RY 2017 Rates* 1 10 10.00%
Rates that Moved from Below MPLs in RY 2017 to Above MPLs in RY 2018 0 0 N/A
RY 2018 Rates Below MPLs 1 10 10.00% Rates Below MPLs for the Last Three or More Consecutive Years 0 9 0.00%
RY 2018 Rates Significantly Worse than RY 2017 Rates* 0 10 0.00%
Rates that Moved from Above MPLs in RY 2017 to Below MPLs in RY 2018 1 9 11.11%
* Performance comparisons are based on the Chi-square test of statistical significance, with a p value of <0.05. N/A = No rates above or below the MPLs from the previous year exist to include in the denominator for calculating whether or not rates moved to above or below MPLs in the most recent year.
Anthem Blue Cross Partnership Plan Performance Evaluation Report: July 1, 2017–June 30, 2018 California Department of Health Care Services
Page D-91 Health Services Advisory Group, Inc.

MANAGED CARE HEALTH PLAN PERFORMANCE MEASURES
Table 3.72—Care for Chronic Conditions Domain RY 2018 (MY 2017) Performance Measure Findings Anthem—Tulare County
Criteria Number of Measures
MeetingCriteria
Total Number of Measures
Percentage of Measures
MeetingCriteria
RY 2018 Rates Above HPLs 0 10 0.00% Rates Above HPLs for the Last Three or More Consecutive Years 0 9 0.00%
RY 2018 Rates Significantly Better than RY 2017 Rates* 0 10 0.00%
Rates that Moved from Below MPLs in RY 2017 to Above MPLs in RY 2018 0 0 N/A
RY 2018 Rates Below MPLs 0 10 0.00% Rates Below MPLs for the Last Three or More Consecutive Years 0 9 0.00%
RY 2018 Rates Significantly Worse than RY 2017 Rates* 0 10 0.00%
Rates that Moved from Above MPLs in RY 2017 to Below MPLs in RY 2018 0 9 0.00%
* Performance comparisons are based on the Chi-square test of statistical significance, with a p value of <0.05. N/A = No rates above or below the MPLs from the previous year exist to include in the denominator for calculating whether or not rates moved to above or below MPLs in the most recent year.
Assessment of Corrective Action Plan and Improvement Plans—Care for ChronicConditions
The following measures within the Care for Chronic Conditions domain are included in Anthem’s CAP or are measures for which DHCS required the MCP to submit IPs:
♦ Annual Monitoring for Patients on Persistent Medications—ACE Inhibitors or ARBs in Contra Costa County, Madera County, Region 2, and Sacramento County.
♦ Annual Monitoring for Patients on Persistent Medications—Diuretics in Contra Costa County and Region 2.
♦ Asthma Medication Ratio for Alameda, Fresno, Madera, and San Benito counties. Note that this measure is a substitute for the Medication Management for People With Asthma
Anthem Blue Cross Partnership Plan Performance Evaluation Report: July 1, 2017–June 30, 2018 California Department of Health Care Services
Page D-92 Health Services Advisory Group, Inc.

MANAGED CARE HEALTH PLAN PERFORMANCE MEASURES
measures because DHCS replaced these measures with the Asthma Medication Ratio measure beginning RY 2017.
♦ Comprehensive Diabetes Care—HbA1c Testing in Region 1, Region 2, Sacramento County, and San Benito County.
♦ Comprehensive Diabetes Care—Medical Attention for Nephropathy in Alameda County, Contra Costa County, Region 1, Region 2, and San Benito County.
Asthma Medication Ratio
DHCS approved Anthem to conduct a PIP to address the MCP’s performance below the MPL for the Asthma Medication Ratio measure. The MCP is conducting a 2017–19 Asthma Medication Ratio Disparity PIP with a narrowed focus on a cohort of non-compliant African Americans 5 to 64 years of age residing in Alameda County and who are assigned to a specific provider. HSAG includes a summary of Anthem’s progress on this PIP in Section 5 of this report (“Performance Improvement Projects”).
The rates were above the MPL for the Asthma Medication Ratio measure in Madera and San Benito counties. The rates were below the MPL for this measure in Alameda and Fresno counties in RY 2018.
Laboratory Tests
DHCS approved Anthem to conduct one set of PDSA cycles to address the MCP’s performance below the MPLs on the following measures within the Care for Chronic Conditions domain:
♦ Annual Monitoring for Patients on Persistent Medications—ACE Inhibitors or ARBs in Contra Costa County, Madera County, Region 2, and Sacramento County
♦ Annual Monitoring for Patients on Persistent Medications—Diuretics in Contra Costa County and Region 2
♦ Comprehensive Diabetes Care—HbA1c Testing in Region 1, Region 2, Sacramento County, and San Benito County
♦ Comprehensive Diabetes Care—Medical Attention for Nephropathy in Alameda County, Contra Costa County, Region 1, Region 2, and San Benito County
For the first PDSA cycle, Anthem tested whether or not having a laboratory testing vendor perform laboratory test services in beneficiaries’ homes would improve the MCP’s performance on both the Annual Monitoring for Patients on Persistent Medications and Comprehensive Diabetes Care measures in San Benito County. The intervention included Anthem staff members, along with the laboratory testing vendor visiting beneficiaries at their homes. Anthem reported learning that the return on investment was low and attributed it to beneficiaries being apprehensive about receiving laboratory services in their homes since that is not the typical environment in which they receive medical services.
Anthem Blue Cross Partnership Plan Performance Evaluation Report: July 1, 2017–June 30, 2018 California Department of Health Care Services
Page D-93 Health Services Advisory Group, Inc.

MANAGED CARE HEALTH PLAN PERFORMANCE MEASURES
For the second PDSA cycle, Anthem tested whether or not conducting a clinic day at a provider’s office with laboratory testing access would improve diabetes HbA1c testing rates. The intervention was tested within a specific time frame during the day and targeted beneficiaries seen by four clinicians within the provider office.
The rates for the following measures included in the laboratory tests PDSA cycles improved to above the MPLs in RY 2018:
♦ Annual Monitoring for Patients on Persistent Medications—Diuretics in Contra Costa County and Region 2
♦ Comprehensive Diabetes Care—HbA1c Testing in Region 1 and Region 2 ♦ Comprehensive Diabetes Care—Medical Attention for Nephropathy in Contra Costa and
San Benito counties
The rates for the following measures included in the laboratory test PDSA cycles remained below the MPLs in RY 2018:
♦ Annual Monitoring for Patients on Persistent Medications—ACE Inhibitors or ARBs in Contra Costa County, Madera County, Region 2, and Sacramento County
♦ Comprehensive Diabetes Care—HbA1c Testing in Sacramento and San Benito counties ♦ Comprehensive Diabetes Care—Medical Attention for Nephropathy in Alameda County,
Region 1, and Region 2
Appropriate Treatment and Utilization
Table 3.73 through Table 3.84 present the four-year trending information for the performance measures within the Appropriate Treatment and Utilization domain.
Note the following regarding Table 3.73 through Table 3.84:
♦ The All-Cause Readmissions measure is a non-HEDIS measure originally developed for DHCS’ All-Cause Readmissions collaborative quality improvement project (QIP); therefore, DHCS does not establish an HPL or MPL for this measure. For the All-Cause Readmissions measure, a lower rate indicates better performance (i.e., fewer readmissions).
♦ The two Ambulatory Care measures are utilization measures, which measure the volume of services used. DHCS does not hold MCPs accountable to meet MPLs for utilization measures, and HSAG does not compare performance for these measures against HPLs and MPLs. Additionally, because high and low rates do not necessarily indicate better or worse performance, HSAG did not compare performance for these measures across years.
Anthem Blue Cross Partnership Plan Performance Evaluation Report: July 1, 2017–June 30, 2018 California Department of Health Care Services
Page D-94 Health Services Advisory Group, Inc.

MANAGED CARE HEALTH PLAN PERFORMANCE MEASURES
♦ DHCS established no HPL or MPL for the two Depression Screening and Follow-Up for Adolescents and Adults measures for RY 2018 because no comparable benchmarks exist. Additionally, although MCPs reported the two Depression Screening and Follow-Up for Adolescents and Adults measures for RY 2018, HSAG does not present the performance measure results for these measures in this report because the reported rates do not accurately represent services being provided. This is due to the Depression Screening and Follow-Up for Adolescents and Adults measures being new HEDIS measures for RY 2018, NCQA requiring MCPs to submit rates for these measures using the new Electronic Clinical Data Systems (ECDS) reporting methodology, and inconsistent data reporting processes by calculation vendors. Thus, MCPs experienced numerous challenges obtaining data sources to use for ECDS reporting. DHCS and HSAG, in consultation with NCQA, will work with MCPs to improve data capture for RY 2019.
♦ Note that due to changes that NCQA made to the specifications for the Use of Imaging Studies for Low Back Pain measure in RY 2018, NCQA released guidance to exercise caution when trending the results for this measure. Therefore, caution should be used when comparing MCP performance across years or when comparing MCP results to benchmarks related to the Use of Imaging Studies for Low Back Pain measure, as differences in rates may be a result of the specification changes rather than a reflection of performance.
Anthem Blue Cross Partnership Plan Performance Evaluation Report: July 1, 2017–June 30, 2018 California Department of Health Care Services
Page D-95 Health Services Advisory Group, Inc.

MANAGED CARE HEALTH PLAN PERFORMANCE MEASURES
Table 3.73—Appropriate Treatment and Utilization DomainMulti-Year Performance Measure Results Anthem—Alameda County
H = Rate indicates performance above the HPL. Bolded Rate = Rate indicates performance below the MPL.
B = Statistical testing result indicates that the RY 2018 rate is significantly better than the RY 2017 rate.
W = Statistical testing result indicates that the RY 2018 rate is significantly worse than the RY 2017 rate.
Measure RY
2015 Rate1
RY 2016
Rate2
RY 2017
Rate3
RY 2018
Rate4
RYs 2017–18 Rate
Difference5
All-Cause Readmissions* 23.31% 17.60% 16.97% 15.80% -1.17 Ambulatory Care—Emergency Department (ED) Visits per 1,000 Member Months**
61.74 51.37 48.13 48.34 Not Tested
Ambulatory Care—Outpatient Visits per 1,000 Member Months**
191.03 170.67 175.42 189.70 Not Tested
Avoidance of Antibiotic Treatment in Adults With Acute Bronchitis
32.65% 41.32%H 49.04%H 55.07%H 6.03
Use of Imaging Studies for Low Back Pain^ 84.68%H 82.19% 81.87%H 78.57%H -3.30
1 RY 2015 rates reflect MY data from January 1, 2014, through December 31, 2014. 2 RY 2016 rates reflect MY data from January 1, 2015, through December 31, 2015. 3 RY 2017 rates reflect MY data from January 1, 2016, through December 31, 2016. 4 RY 2018 rates reflect MY data from January 1, 2017, through December 31, 2017. 5 Performance comparisons are based on the Chi-square test of statistical significance, with a p value of <0.05. * A lower rate indicates better performance for this measure. ** Member months are a member's “contribution” to the total yearly membership. ^ Caution should be exercised when assessing MCP performance for this measure given the changes that NCQA made to the specification for this measure for RY 2018. Not Tested = An RY 2017–18 rate difference was not calculated because high and low rates do not necessarily indicate better or worse performance.
Anthem Blue Cross Partnership Plan Performance Evaluation Report: July 1, 2017–June 30, 2018 California Department of Health Care Services
Page D-96 Health Services Advisory Group, Inc.

MANAGED CARE HEALTH PLAN PERFORMANCE MEASURES
Table 3.74—Appropriate Treatment and Utilization DomainMulti-Year Performance Measure Results Anthem—Contra Costa County
H = Rate indicates performance above the HPL. Bolded Rate = Rate indicates performance below the MPL.
B = Statistical testing result indicates that the RY 2018 rate is significantly better than the RY 2017 rate.
W = Statistical testing result indicates that the RY 2018 rate is significantly worse than the RY 2017 rate.
Measure RY
2015 Rate1
RY 2016
Rate2
RY 2017
Rate3
RY 2018
Rate4
RYs 2017–18 Rate
Difference5
All-Cause Readmissions* 16.77% 14.26% 16.01% 21.64% 5.63W
Ambulatory Care—Emergency Department (ED) Visits per 1,000 Member Months**
59.90 49.15 44.93 44.94 Not Tested
Ambulatory Care—Outpatient Visits per 1,000 Member Months**
201.00 167.21 169.14 193.34 Not Tested
Avoidance of Antibiotic Treatment in Adults With Acute Bronchitis
NA 53.66%H 62.03%H 60.94%H -1.09
Use of Imaging Studies for Low Back Pain^ SH 80.84% 82.77%H 79.30%H -3.47
1 RY 2015 rates reflect MY data from January 1, 2014, through December 31, 2014. 2 RY 2016 rates reflect MY data from January 1, 2015, through December 31, 2015. 3 RY 2017 rates reflect MY data from January 1, 2016, through December 31, 2016. 4 RY 2018 rates reflect MY data from January 1, 2017, through December 31, 2017. 5 Performance comparisons are based on the Chi-square test of statistical significance, with a p value of <0.05. * A lower rate indicates better performance for this measure. ** Member months are a member's “contribution” to the total yearly membership. ^ Caution should be exercised when assessing MCP performance for this measure given the changes that NCQA made to the specification for this measure for RY 2018. NA = The MCP followed the specifications, but the denominator was too small (less than 30) to report a valid rate. S = The MCP’s measure is publicly reported based on NCQA HEDIS Compliance Audit results; however, since fewer than 11 cases exist in the numerator of this measure, HSAG suppresses displaying the rate in this report to satisfy the Health Insurance Portability and Accountability Act of 1996 Privacy Rule’s de-identification standard. If an RY 2017 or RY 2018 rate is suppressed, HSAG also suppresses the RY 2017–18 rate difference.
Anthem Blue Cross Partnership Plan Performance Evaluation Report: July 1, 2017–June 30, 2018 California Department of Health Care Services
Page D-97 Health Services Advisory Group, Inc.

MANAGED CARE HEALTH PLAN PERFORMANCE MEASURES
Not Tested = An RY 2017–18 rate difference was not calculated because high and low rates do not necessarily indicate better or worse performance.
Table 3.75—Appropriate Treatment and Utilization DomainMulti-Year Performance Measure Results Anthem—Fresno County
H = Rate indicates performance above the HPL. Bolded Rate = Rate indicates performance below the MPL.
B = Statistical testing result indicates that the RY 2018 rate is significantly better than the RY 2017 rate.
W = Statistical testing result indicates that the RY 2018 rate is significantly worse than the RY 2017 rate.
Measure RY
2015 Rate1
RY 2016
Rate2
RY 2017
Rate3
RY 2018
Rate4
RYs 2017–18 Rate
Difference5
All-Cause Readmissions* 21.30% 18.51% 13.26% 13.32% 0.06 Ambulatory Care—Emergency Department (ED) Visits per 1,000 Member Months**
50.04 49.25 46.66 48.40 Not Tested
Ambulatory Care—Outpatient Visits per 1,000 Member Months**
232.63 221.60 221.41 242.89 Not Tested
Avoidance of Antibiotic Treatment in Adults With Acute Bronchitis
34.20% 35.19% 36.58% 32.67% -3.91
Use of Imaging Studies for Low Back Pain^ 80.13% 78.42% 74.91% 74.49% -0.42
1 RY 2015 rates reflect MY data from January 1, 2014, through December 31, 2014. 2 RY 2016 rates reflect MY data from January 1, 2015, through December 31, 2015. 3 RY 2017 rates reflect MY data from January 1, 2016, through December 31, 2016. 4 RY 2018 rates reflect MY data from January 1, 2017, through December 31, 2017. 5 Performance comparisons are based on the Chi-square test of statistical significance, with a p value of <0.05. * A lower rate indicates better performance for this measure. ** Member months are a member's “contribution” to the total yearly membership. ^ Caution should be exercised when assessing MCP performance for this measure given the changes that NCQA made to the specification for this measure for RY 2018. Not Tested = An RY 2017–18 rate difference was not calculated because high and low rates do not necessarily indicate better or worse performance.
Anthem Blue Cross Partnership Plan Performance Evaluation Report: July 1, 2017–June 30, 2018 California Department of Health Care Services
Page D-98 Health Services Advisory Group, Inc.

MANAGED CARE HEALTH PLAN PERFORMANCE MEASURES
Table 3.76—Appropriate Treatment and Utilization DomainMulti-Year Performance Measure Results Anthem—Kings County
H = Rate indicates performance above the HPL. Bolded Rate = Rate indicates performance below the MPL.
B = Statistical testing result indicates that the RY 2018 rate is significantly better than the RY 2017 rate.
W = Statistical testing result indicates that the RY 2018 rate is significantly worse than the RY 2017 rate.
Measure RY
2015 Rate1
RY 2016
Rate2
RY 2017
Rate3
RY 2018
Rate4
RYs 2017–18 Rate
Difference5
All-Cause Readmissions* 15.63% 13.78% 11.85% 15.40% 3.55 Ambulatory Care—Emergency Department (ED) Visits per 1,000 Member Months**
64.22 58.42 56.54 56.82 Not Tested
Ambulatory Care—Outpatient Visits per 1,000 Member Months**
280.75 267.79 271.12 306.23 Not Tested
Avoidance of Antibiotic Treatment in Adults With Acute Bronchitis
31.82% 29.79% 44.57%H 52.75%H 8.18
Use of Imaging Studies for Low Back Pain^ 76.92% 75.68% 81.73%H 78.47%H -3.26
1 RY 2015 rates reflect MY data from January 1, 2014, through December 31, 2014. 2 RY 2016 rates reflect MY data from January 1, 2015, through December 31, 2015. 3 RY 2017 rates reflect MY data from January 1, 2016, through December 31, 2016. 4 RY 2018 rates reflect MY data from January 1, 2017, through December 31, 2017. 5 Performance comparisons are based on the Chi-square test of statistical significance, with a p value of <0.05. * A lower rate indicates better performance for this measure. ** Member months are a member's “contribution” to the total yearly membership. ^ Caution should be exercised when assessing MCP performance for this measure given the changes that NCQA made to the specification for this measure for RY 2018. Not Tested = An RY 2017–18 rate difference was not calculated because high and low rates do not necessarily indicate better or worse performance.
Anthem Blue Cross Partnership Plan Performance Evaluation Report: July 1, 2017–June 30, 2018 California Department of Health Care Services
Page D-99 Health Services Advisory Group, Inc.

MANAGED CARE HEALTH PLAN PERFORMANCE MEASURES
Table 3.77—Appropriate Treatment and Utilization DomainMulti-Year Performance Measure Results Anthem—Madera County
H = Rate indicates performance above the HPL. Bolded Rate = Rate indicates performance below the MPL.
B = Statistical testing result indicates that the RY 2018 rate is significantly better than the RY 2017 rate.
W = Statistical testing result indicates that the RY 2018 rate is significantly worse than the RY 2017 rate.
Measure RY
2015 Rate1
RY 2016
Rate2
RY 2017
Rate3
RY 2018
Rate4
RYs 2017–18 Rate
Difference5
All-Cause Readmissions* 21.98% 15.24% 12.42% 10.75% -1.67 Ambulatory Care—Emergency Department (ED) Visits per 1,000 Member Months**
56.13 50.58 49.89 48.93 Not Tested
Ambulatory Care—Outpatient Visits per 1,000 Member Months**
288.72 287.61 267.76 290.54 Not Tested
Avoidance of Antibiotic Treatment in Adults With Acute Bronchitis
6.35% 13.01% 10.95% 25.19% 14.24B
Use of Imaging Studies for Low Back Pain^ 81.91% 75.31% 80.45% 77.04% -3.41
1 RY 2015 rates reflect MY data from January 1, 2014, through December 31, 2014. 2 RY 2016 rates reflect MY data from January 1, 2015, through December 31, 2015. 3 RY 2017 rates reflect MY data from January 1, 2016, through December 31, 2016. 4 RY 2018 rates reflect MY data from January 1, 2017, through December 31, 2017. 5 Performance comparisons are based on the Chi-square test of statistical significance, with a p value of <0.05. * A lower rate indicates better performance for this measure. ** Member months are a member's “contribution” to the total yearly membership. ^ Caution should be exercised when assessing MCP performance for this measure given the changes that NCQA made to the specification for this measure for RY 2018. Not Tested = An RY 2017–18 rate difference was not calculated because high and low rates do not necessarily indicate better or worse performance.
Anthem Blue Cross Partnership Plan Performance Evaluation Report: July 1, 2017–June 30, 2018 California Department of Health Care Services
Page D-100 Health Services Advisory Group, Inc.
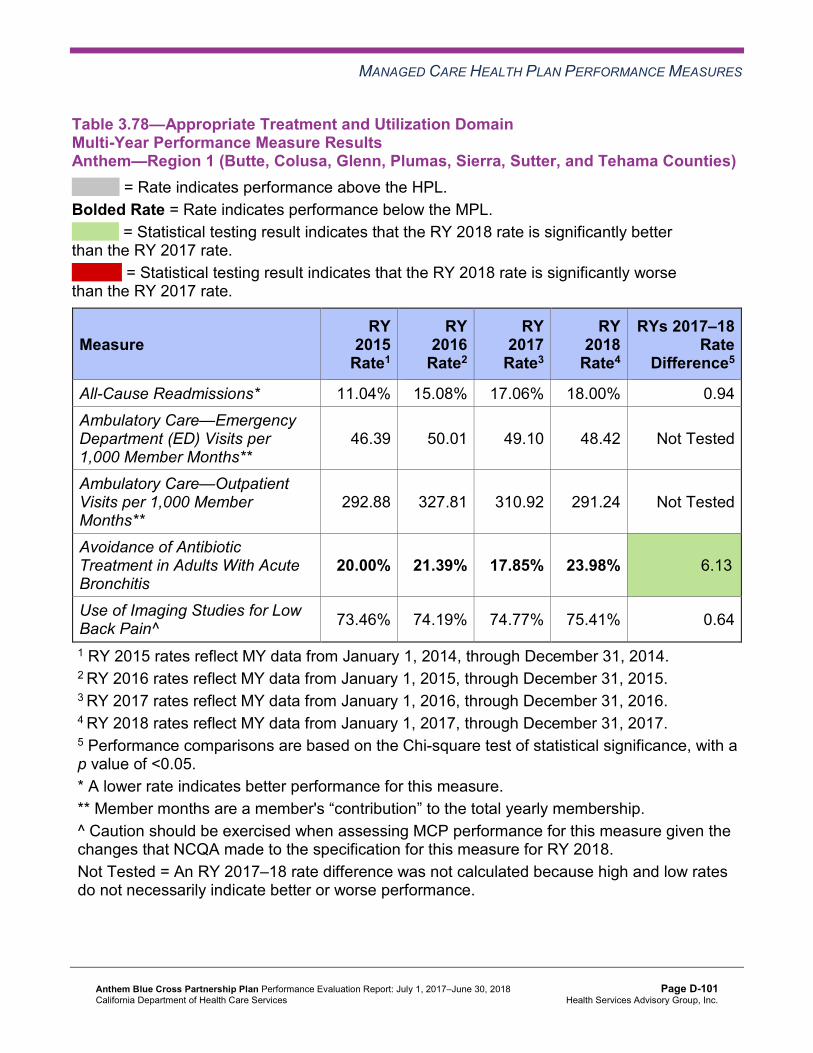
MANAGED CARE HEALTH PLAN PERFORMANCE MEASURES
Table 3.78—Appropriate Treatment and Utilization DomainMulti-Year Performance Measure Results Anthem—Region 1 (Butte, Colusa, Glenn, Plumas, Sierra, Sutter, and Tehama Counties)
H = Rate indicates performance above the HPL. Bolded Rate = Rate indicates performance below the MPL.
B = Statistical testing result indicates that the RY 2018 rate is significantly better than the RY 2017 rate.
W = Statistical testing result indicates that the RY 2018 rate is significantly worse than the RY 2017 rate.
Measure RY
2015 Rate1
RY 2016
Rate2
RY 2017
Rate3
RY 2018
Rate4
RYs 2017–18 Rate
Difference5
All-Cause Readmissions* 11.04% 15.08% 17.06% 18.00% 0.94 Ambulatory Care—Emergency Department (ED) Visits per 1,000 Member Months**
46.39 50.01 49.10 48.42 Not Tested
Ambulatory Care—Outpatient Visits per 1,000 Member Months**
292.88 327.81 310.92 291.24 Not Tested
Avoidance of Antibiotic Treatment in Adults With Acute Bronchitis
20.00% 21.39% 17.85% 23.98% 6.13B
Use of Imaging Studies for Low Back Pain^ 73.46% 74.19% 74.77% 75.41% 0.64
1 RY 2015 rates reflect MY data from January 1, 2014, through December 31, 2014. 2 RY 2016 rates reflect MY data from January 1, 2015, through December 31, 2015. 3 RY 2017 rates reflect MY data from January 1, 2016, through December 31, 2016. 4 RY 2018 rates reflect MY data from January 1, 2017, through December 31, 2017. 5 Performance comparisons are based on the Chi-square test of statistical significance, with a p value of <0.05. * A lower rate indicates better performance for this measure. ** Member months are a member's “contribution” to the total yearly membership. ^ Caution should be exercised when assessing MCP performance for this measure given the changes that NCQA made to the specification for this measure for RY 2018. Not Tested = An RY 2017–18 rate difference was not calculated because high and low rates do not necessarily indicate better or worse performance.
Anthem Blue Cross Partnership Plan Performance Evaluation Report: July 1, 2017–June 30, 2018 California Department of Health Care Services
Page D-101 Health Services Advisory Group, Inc.

MANAGED CARE HEALTH PLAN PERFORMANCE MEASURES
Table 3.79—Appropriate Treatment and Utilization DomainMulti-Year Performance Measure Results Anthem—Region 2 (Alpine, Amador, Calaveras, El Dorado, Inyo, Mariposa, Mono,Nevada, Placer, Tuolumne, and Yuba Counties)
H = Rate indicates performance above the HPL. Bolded Rate = Rate indicates performance below the MPL.
B = Statistical testing result indicates that the RY 2018 rate is significantly better than the RY 2017 rate.
W = Statistical testing result indicates that the RY 2018 rate is significantly worse than the RY 2017 rate.
Measure RY
2015 Rate1
RY 2016
Rate2
RY 2017
Rate3
RY 2018
Rate4
RYs 2017–18 Rate
Difference5
All-Cause Readmissions* 8.39% 12.03% 13.00% 12.03% -0.97 Ambulatory Care—Emergency Department (ED) Visits per 1,000 Member Months**
54.21 52.86 52.53 53.56 Not Tested
Ambulatory Care—Outpatient Visits per 1,000 Member Months**
212.47 230.38 231.95 230.73 Not Tested
Avoidance of Antibiotic Treatment in Adults With Acute Bronchitis
22.50% 33.67% 33.43% 34.63% 1.20
Use of Imaging Studies for Low Back Pain^ 74.30% 75.92% 73.39% 71.93% -1.46
1 RY 2015 rates reflect MY data from January 1, 2014, through December 31, 2014. 2 RY 2016 rates reflect MY data from January 1, 2015, through December 31, 2015. 3 RY 2017 rates reflect MY data from January 1, 2016, through December 31, 2016. 4 RY 2018 rates reflect MY data from January 1, 2017, through December 31, 2017. 5 Performance comparisons are based on the Chi-square test of statistical significance, with a p value of <0.05. * A lower rate indicates better performance for this measure. ** Member months are a member's “contribution” to the total yearly membership. ^ Caution should be exercised when assessing MCP performance for this measure given the changes that NCQA made to the specification for this measure for RY 2018. Not Tested = An RY 2017–18 rate difference was not calculated because high and low rates do not necessarily indicate better or worse performance.
Anthem Blue Cross Partnership Plan Performance Evaluation Report: July 1, 2017–June 30, 2018 California Department of Health Care Services
Page D-102 Health Services Advisory Group, Inc.

MANAGED CARE HEALTH PLAN PERFORMANCE MEASURES
Table 3.80—Appropriate Treatment and Utilization DomainMulti-Year Performance Measure Results Anthem—Sacramento County
H = Rate indicates performance above the HPL. Bolded Rate = Rate indicates performance below the MPL.
B = Statistical testing result indicates that the RY 2018 rate is significantly better than the RY 2017 rate.
W = Statistical testing result indicates that the RY 2018 rate is significantly worse than the RY 2017 rate.
Measure RY
2015 Rate1
RY 2016
Rate2
RY 2017
Rate3
RY 2018
Rate4
RYs 2017–18 Rate
Difference5
All-Cause Readmissions* 16.76% 15.46% 14.01% 15.91% 1.90W
Ambulatory Care—Emergency Department (ED) Visits per 1,000 Member Months**
54.99 53.84 53.99 55.97 Not Tested
Ambulatory Care—Outpatient Visits per 1,000 Member Months**
198.90 200.75 196.08 212.44 Not Tested
Avoidance of Antibiotic Treatment in Adults With Acute Bronchitis
32.92% 30.61% 40.92%H 44.00%H 3.08
Use of Imaging Studies for Low Back Pain^ 81.54% 77.44% 76.32% 74.13% -2.19
1 RY 2015 rates reflect MY data from January 1, 2014, through December 31, 2014. 2 RY 2016 rates reflect MY data from January 1, 2015, through December 31, 2015. 3 RY 2017 rates reflect MY data from January 1, 2016, through December 31, 2016. 4 RY 2018 rates reflect MY data from January 1, 2017, through December 31, 2017. 5 Performance comparisons are based on the Chi-square test of statistical significance, with a p value of <0.05. * A lower rate indicates better performance for this measure. ** Member months are a member's “contribution” to the total yearly membership. ^ Caution should be exercised when assessing MCP performance for this measure given the changes that NCQA made to the specification for this measure for RY 2018. Not Tested = An RY 2017–18 rate difference was not calculated because high and low rates do not necessarily indicate better or worse performance.
Anthem Blue Cross Partnership Plan Performance Evaluation Report: July 1, 2017–June 30, 2018 California Department of Health Care Services
Page D-103 Health Services Advisory Group, Inc.
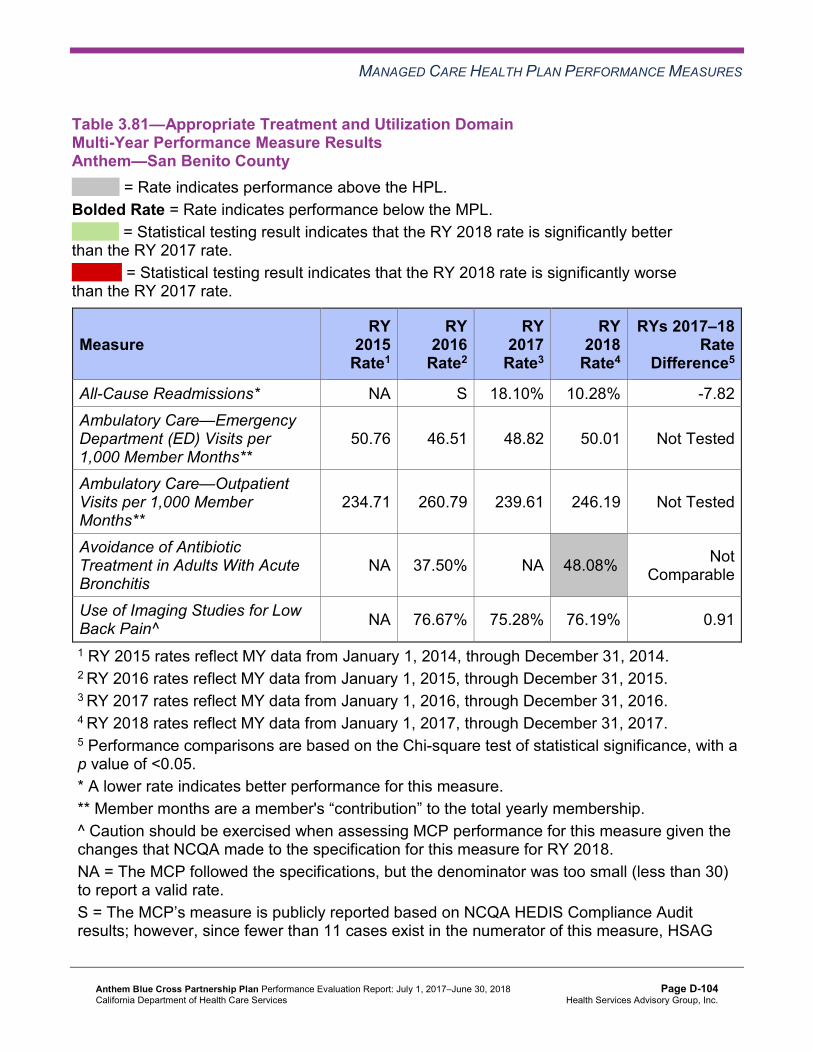
MANAGED CARE HEALTH PLAN PERFORMANCE MEASURES
Table 3.81—Appropriate Treatment and Utilization DomainMulti-Year Performance Measure Results Anthem—San Benito County
H = Rate indicates performance above the HPL. Bolded Rate = Rate indicates performance below the MPL.
B = Statistical testing result indicates that the RY 2018 rate is significantly better than the RY 2017 rate.
W = Statistical testing result indicates that the RY 2018 rate is significantly worse than the RY 2017 rate.
Measure RY
2015 Rate1
RY 2016
Rate2
RY 2017
Rate3
RY 2018
Rate4
RYs 2017–18 Rate
Difference5
All-Cause Readmissions* NA S 18.10% 10.28% -7.82 Ambulatory Care—Emergency Department (ED) Visits per 1,000 Member Months**
50.76 46.51 48.82 50.01 Not Tested
Ambulatory Care—Outpatient Visits per 1,000 Member Months**
234.71 260.79 239.61 246.19 Not Tested
Avoidance of Antibiotic Treatment in Adults With Acute Bronchitis
NA 37.50% NA 48.08%H
Not Comparable
Use of Imaging Studies for Low Back Pain^ NA 76.67% 75.28% 76.19% 0.91
1 RY 2015 rates reflect MY data from January 1, 2014, through December 31, 2014. 2 RY 2016 rates reflect MY data from January 1, 2015, through December 31, 2015. 3 RY 2017 rates reflect MY data from January 1, 2016, through December 31, 2016. 4 RY 2018 rates reflect MY data from January 1, 2017, through December 31, 2017. 5 Performance comparisons are based on the Chi-square test of statistical significance, with a p value of <0.05. * A lower rate indicates better performance for this measure. ** Member months are a member's “contribution” to the total yearly membership. ^ Caution should be exercised when assessing MCP performance for this measure given the changes that NCQA made to the specification for this measure for RY 2018. NA = The MCP followed the specifications, but the denominator was too small (less than 30) to report a valid rate. S = The MCP’s measure is publicly reported based on NCQA HEDIS Compliance Audit results; however, since fewer than 11 cases exist in the numerator of this measure, HSAG
Anthem Blue Cross Partnership Plan Performance Evaluation Report: July 1, 2017–June 30, 2018 California Department of Health Care Services
Page D-104 Health Services Advisory Group, Inc.

MANAGED CARE HEALTH PLAN PERFORMANCE MEASURES
suppresses displaying the rate in this report to satisfy the Health Insurance Portability and Accountability Act of 1996 Privacy Rule’s de-identification standard. If an RY 2017 or RY 2018 rate is suppressed, HSAG also suppresses the RY 2017–18 rate difference. Not Comparable = An RY 2017–18 rate difference cannot be made because data are not available for both years or because significant methodology changes occurred between years, disallowing comparison. Not Tested = An RY 2017–18 rate difference was not calculated because high and low rates do not necessarily indicate better or worse performance.
Table 3.82—Appropriate Treatment and Utilization DomainMulti-Year Performance Measure Results Anthem—San Francisco County
H = Rate indicates performance above the HPL. Bolded Rate = Rate indicates performance below the MPL.
B = Statistical testing result indicates that the RY 2018 rate is significantly better than the RY 2017 rate.
W = Statistical testing result indicates that the RY 2018 rate is significantly worse than the RY 2017 rate.
Measure RY
2015 Rate1
RY 2016
Rate2
RY 2017
Rate3
RY 2018
Rate4
RYs 2017–18 Rate
Difference5
All-Cause Readmissions* 24.15% 21.12% 19.05% 22.21% 3.16 Ambulatory Care—Emergency Department (ED) Visits per 1,000 Member Months**
56.78 47.95 46.65 45.46 Not Tested
Ambulatory Care—Outpatient Visits per 1,000 Member Months**
253.37 230.13 230.95 243.22 Not Tested
Avoidance of Antibiotic Treatment in Adults With Acute Bronchitis
47.06%H 54.84%H 68.18%H 61.40%H -6.78
Use of Imaging Studies for Low Back Pain^ 84.38%H 79.22% 85.16%H 80.24%H -4.92
1 RY 2015 rates reflect MY data from January 1, 2014, through December 31, 2014. 2 RY 2016 rates reflect MY data from January 1, 2015, through December 31, 2015. 3 RY 2017 rates reflect MY data from January 1, 2016, through December 31, 2016. 4 RY 2018 rates reflect MY data from January 1, 2017, through December 31, 2017. 5 Performance comparisons are based on the Chi-square test of statistical significance, with a p value of <0.05.
Anthem Blue Cross Partnership Plan Performance Evaluation Report: July 1, 2017–June 30, 2018 California Department of Health Care Services
Page D-105 Health Services Advisory Group, Inc.

MANAGED CARE HEALTH PLAN PERFORMANCE MEASURES
* A lower rate indicates better performance for this measure. ** Member months are a member's “contribution” to the total yearly membership. ^ Caution should be exercised when assessing MCP performance for this measure given the changes that NCQA made to the specification for this measure for RY 2018. Not Tested = An RY 2017–18 rate difference was not calculated because high and low rates do not necessarily indicate better or worse performance.
Table 3.83—Appropriate Treatment and Utilization DomainMulti-Year Performance Measure Results Anthem—Santa Clara County
H = Rate indicates performance above the HPL. Bolded Rate = Rate indicates performance below the MPL.
B = Statistical testing result indicates that the RY 2018 rate is significantly better than the RY 2017 rate.
W = Statistical testing result indicates that the RY 2018 rate is significantly worse than the RY 2017 rate.
Measure RY
2015 Rate1
RY 2016
Rate2
RY 2017
Rate3
RY 2018
Rate4
RYs 2017–18 Rate
Difference5
All-Cause Readmissions* 17.19% 14.96% 15.11% 14.30% -0.81 Ambulatory Care—Emergency Department (ED) Visits per 1,000 Member Months**
45.39 38.27 37.73 40.47 Not Tested
Ambulatory Care—Outpatient Visits per 1,000 Member Months**
209.85 207.56 186.88 190.99 Not Tested
Avoidance of Antibiotic Treatment in Adults With Acute Bronchitis
29.49% 30.19% 33.42% 36.92% 3.50
Use of Imaging Studies for Low Back Pain^ 80.72% 80.05% 78.64% 81.25%H 2.61
1 RY 2015 rates reflect MY data from January 1, 2014, through December 31, 2014. 2 RY 2016 rates reflect MY data from January 1, 2015, through December 31, 2015. 3 RY 2017 rates reflect MY data from January 1, 2016, through December 31, 2016. 4 RY 2018 rates reflect MY data from January 1, 2017, through December 31, 2017. 5 Performance comparisons are based on the Chi-square test of statistical significance, with a p value of <0.05. * A lower rate indicates better performance for this measure. ** Member months are a member's “contribution” to the total yearly membership.
Anthem Blue Cross Partnership Plan Performance Evaluation Report: July 1, 2017–June 30, 2018 California Department of Health Care Services
Page D-106 Health Services Advisory Group, Inc.

MANAGED CARE HEALTH PLAN PERFORMANCE MEASURES
^ Caution should be exercised when assessing MCP performance for this measure given the changes that NCQA made to the specification for this measure for RY 2018. Not Tested = An RY 2017–18 rate difference was not calculated because high and low rates do not necessarily indicate better or worse performance.
Table 3.84—Appropriate Treatment and Utilization DomainMulti-Year Performance Measure Results Anthem—Tulare County
H = Rate indicates performance above the HPL. Bolded Rate = Rate indicates performance below the MPL.
B = Statistical testing result indicates that the RY 2018 rate is significantly better than the RY 2017 rate.
W = Statistical testing result indicates that the RY 2018 rate is significantly worse than the RY 2017 rate.
Measure RY
2015 Rate1
RY 2016
Rate2
RY 2017
Rate3
RY 2018
Rate4
RYs 2017–18 Rate
Difference5
All-Cause Readmissions* 16.58% 15.29% 14.30% 12.33% -1.97 Ambulatory Care—Emergency Department (ED) Visits per 1,000 Member Months**
43.20 40.01 37.12 35.53 Not Tested
Ambulatory Care—Outpatient Visits per 1,000 Member Months** 317.42 299.33 296.89 302.92 Not Tested
Avoidance of Antibiotic Treatment in Adults With Acute Bronchitis 17.08% 24.45% 30.16% 31.99% 1.83
Use of Imaging Studies for Low Back Pain^ 82.18% 80.13% 75.63% 80.63%H 5.00B
1 RY 2015 rates reflect MY data from January 1, 2014, through December 31, 2014. 2 RY 2016 rates reflect MY data from January 1, 2015, through December 31, 2015. 3 RY 2017 rates reflect MY data from January 1, 2016, through December 31, 2016. 4 RY 2018 rates reflect MY data from January 1, 2017, through December 31, 2017. 5 Performance comparisons are based on the Chi-square test of statistical significance, with a p value of <0.05. * A lower rate indicates better performance for this measure. ** Member months are a member's “contribution” to the total yearly membership. ^ Caution should be exercised when assessing MCP performance for this measure given the changes that NCQA made to the specification for this measure for RY 2018. Not Tested = An RY 2017–18 rate difference was not calculated because high and low rates do not necessarily indicate better or worse performance.
Anthem Blue Cross Partnership Plan Performance Evaluation Report: July 1, 2017–June 30, 2018 California Department of Health Care Services
Page D-107 Health Services Advisory Group, Inc.
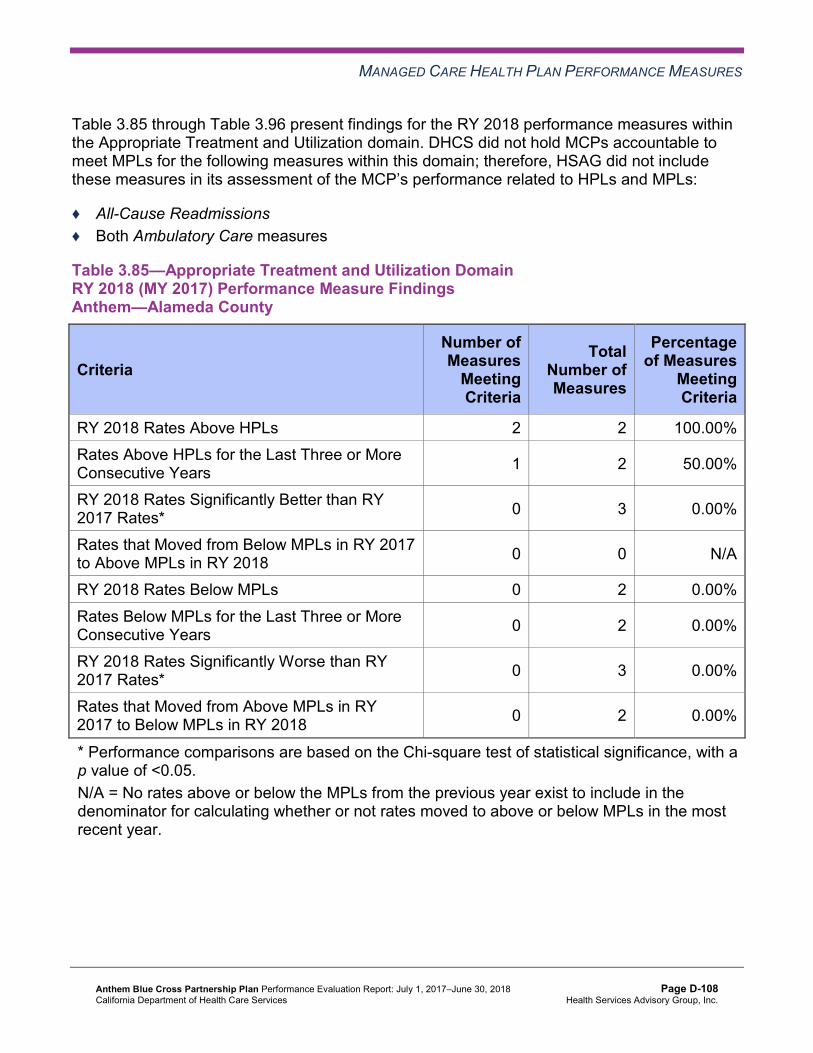
MANAGED CARE HEALTH PLAN PERFORMANCE MEASURES
Table 3.85 through Table 3.96 present findings for the RY 2018 performance measures within the Appropriate Treatment and Utilization domain. DHCS did not hold MCPs accountable to meet MPLs for the following measures within this domain; therefore, HSAG did not include these measures in its assessment of the MCP’s performance related to HPLs and MPLs:
♦ All-Cause Readmissions ♦ Both Ambulatory Care measures
Table 3.85—Appropriate Treatment and Utilization DomainRY 2018 (MY 2017) Performance Measure Findings Anthem—Alameda County
Criteria Number of Measures
MeetingCriteria
Total Number of Measures
Percentage of Measures
MeetingCriteria
RY 2018 Rates Above HPLs 2 2 100.00% Rates Above HPLs for the Last Three or More Consecutive Years 1 2 50.00%
RY 2018 Rates Significantly Better than RY 2017 Rates* 0 3 0.00%
Rates that Moved from Below MPLs in RY 2017 to Above MPLs in RY 2018 0 0 N/A
RY 2018 Rates Below MPLs 0 2 0.00% Rates Below MPLs for the Last Three or More Consecutive Years 0 2 0.00%
RY 2018 Rates Significantly Worse than RY 2017 Rates* 0 3 0.00%
Rates that Moved from Above MPLs in RY 2017 to Below MPLs in RY 2018 0 2 0.00%
* Performance comparisons are based on the Chi-square test of statistical significance, with a p value of <0.05. N/A = No rates above or below the MPLs from the previous year exist to include in the denominator for calculating whether or not rates moved to above or below MPLs in the most recent year.
Anthem Blue Cross Partnership Plan Performance Evaluation Report: July 1, 2017–June 30, 2018 California Department of Health Care Services
Page D-108 Health Services Advisory Group, Inc.

MANAGED CARE HEALTH PLAN PERFORMANCE MEASURES
Table 3.86—Appropriate Treatment and Utilization DomainRY 2018 (MY 2017) Performance Measure Findings Anthem—Contra Costa County
Criteria Number of Measures
MeetingCriteria
Total Number of Measures
Percentage of Measures
MeetingCriteria
RY 2018 Rates Above HPLs 2 2 100.00% Rates Above HPLs for the Last Three or More Consecutive Years 1 2 50.00%
RY 2018 Rates Significantly Better than RY 2017 Rates* 0 3 0.00%
Rates that Moved from Below MPLs in RY 2017 to Above MPLs in RY 2018 0 0 N/A
RY 2018 Rates Below MPLs 0 2 0.00% Rates Below MPLs for the Last Three or More Consecutive Years 0 2 0.00%
RY 2018 Rates Significantly Worse than RY 2017 Rates* 1 3 33.33%
Rates that Moved from Above MPLs in RY 2017 to Below MPLs in RY 2018 0 2 0.00%
* Performance comparisons are based on the Chi-square test of statistical significance, with a p value of <0.05. N/A = No rates above or below the MPLs from the previous year exist to include in the denominator for calculating whether or not rates moved to above or below MPLs in the most recent year.
Anthem Blue Cross Partnership Plan Performance Evaluation Report: July 1, 2017–June 30, 2018 California Department of Health Care Services
Page D-109 Health Services Advisory Group, Inc.

MANAGED CARE HEALTH PLAN PERFORMANCE MEASURES
Table 3.87—Appropriate Treatment and Utilization DomainRY 2018 (MY 2017) Performance Measure Findings Anthem—Fresno County
Criteria Number of Measures
MeetingCriteria
Total Number of Measures
Percentage of Measures
MeetingCriteria
RY 2018 Rates Above HPLs 0 2 0.00% Rates Above HPLs for the Last Three or More Consecutive Years 0 2 0.00%
RY 2018 Rates Significantly Better than RY 2017 Rates* 0 3 0.00%
Rates that Moved from Below MPLs in RY 2017 to Above MPLs in RY 2018 0 0 N/A
RY 2018 Rates Below MPLs 0 2 0.00% Rates Below MPLs for the Last Three or More Consecutive Years 0 2 0.00%
RY 2018 Rates Significantly Worse than RY 2017 Rates* 0 3 0.00%
Rates that Moved from Above MPLs in RY 2017 to Below MPLs in RY 2018 0 2 0.00%
* Performance comparisons are based on the Chi-square test of statistical significance, with a p value of <0.05. N/A = No rates above or below the MPLs from the previous year exist to include in the denominator for calculating whether or not rates moved to above or below MPLs in the most recent year.
Anthem Blue Cross Partnership Plan Performance Evaluation Report: July 1, 2017–June 30, 2018 California Department of Health Care Services
Page D-110 Health Services Advisory Group, Inc.
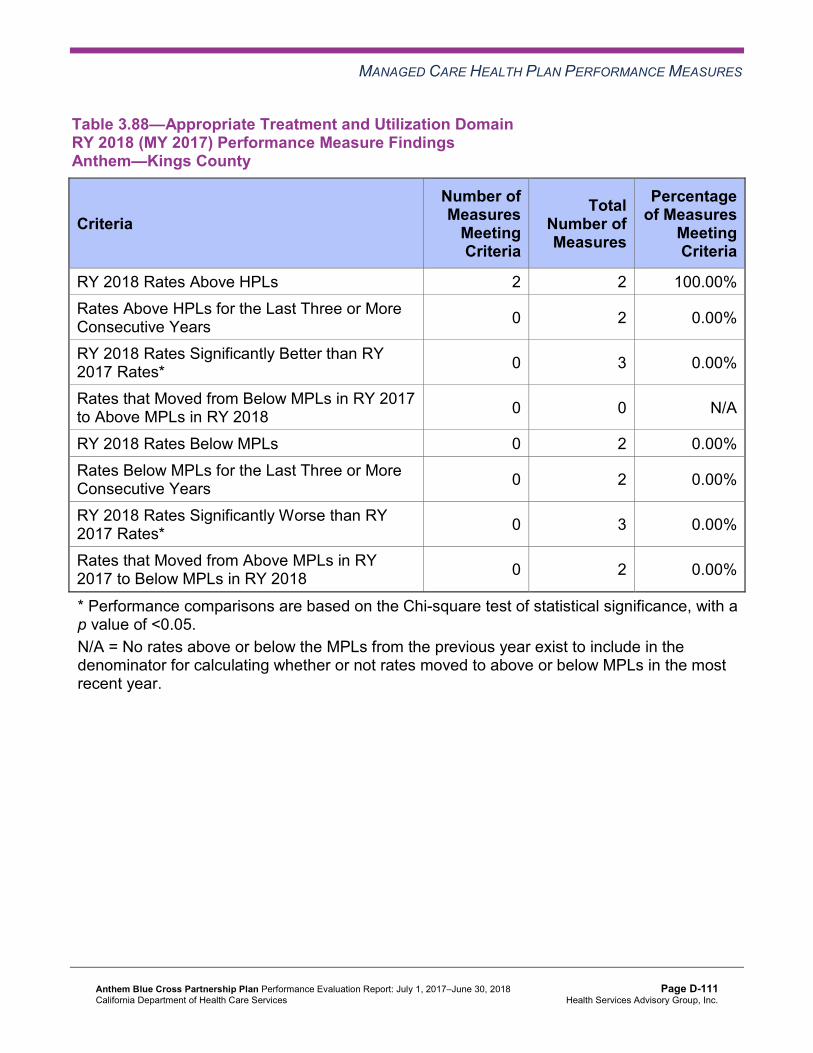
MANAGED CARE HEALTH PLAN PERFORMANCE MEASURES
Table 3.88—Appropriate Treatment and Utilization DomainRY 2018 (MY 2017) Performance Measure Findings Anthem—Kings County
Criteria Number of Measures
MeetingCriteria
Total Number of Measures
Percentage of Measures
MeetingCriteria
RY 2018 Rates Above HPLs 2 2 100.00% Rates Above HPLs for the Last Three or More Consecutive Years 0 2 0.00%
RY 2018 Rates Significantly Better than RY 2017 Rates* 0 3 0.00%
Rates that Moved from Below MPLs in RY 2017 to Above MPLs in RY 2018 0 0 N/A
RY 2018 Rates Below MPLs 0 2 0.00% Rates Below MPLs for the Last Three or More Consecutive Years 0 2 0.00%
RY 2018 Rates Significantly Worse than RY 2017 Rates* 0 3 0.00%
Rates that Moved from Above MPLs in RY 2017 to Below MPLs in RY 2018 0 2 0.00%
* Performance comparisons are based on the Chi-square test of statistical significance, with a p value of <0.05. N/A = No rates above or below the MPLs from the previous year exist to include in the denominator for calculating whether or not rates moved to above or below MPLs in the most recent year.
Anthem Blue Cross Partnership Plan Performance Evaluation Report: July 1, 2017–June 30, 2018 California Department of Health Care Services
Page D-111 Health Services Advisory Group, Inc.
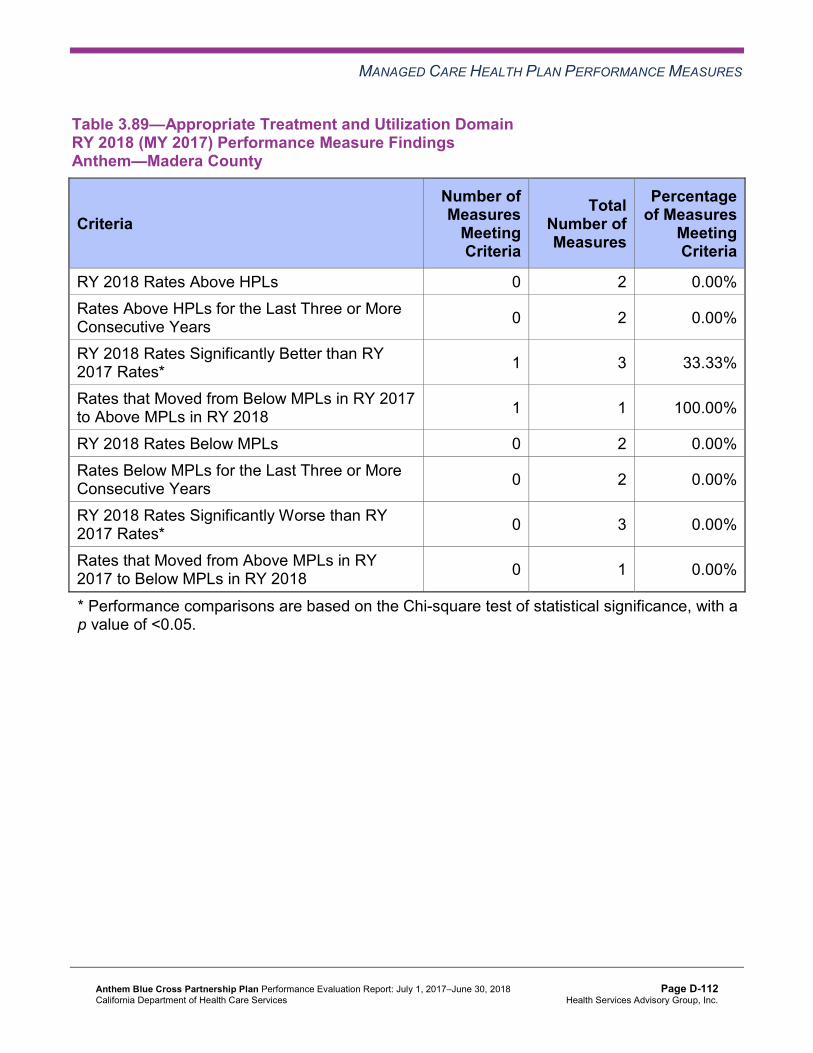
MANAGED CARE HEALTH PLAN PERFORMANCE MEASURES
Table 3.89—Appropriate Treatment and Utilization DomainRY 2018 (MY 2017) Performance Measure Findings Anthem—Madera County
Criteria Number of Measures
MeetingCriteria
Total Number of Measures
Percentage of Measures
MeetingCriteria
RY 2018 Rates Above HPLs 0 2 0.00% Rates Above HPLs for the Last Three or More Consecutive Years 0 2 0.00%
RY 2018 Rates Significantly Better than RY 2017 Rates* 1 3 33.33%
Rates that Moved from Below MPLs in RY 2017 to Above MPLs in RY 2018 1 1 100.00%
RY 2018 Rates Below MPLs 0 2 0.00% Rates Below MPLs for the Last Three or More Consecutive Years 0 2 0.00%
RY 2018 Rates Significantly Worse than RY 2017 Rates* 0 3 0.00%
Rates that Moved from Above MPLs in RY 2017 to Below MPLs in RY 2018 0 1 0.00%
* Performance comparisons are based on the Chi-square test of statistical significance, with a p value of <0.05.
Anthem Blue Cross Partnership Plan Performance Evaluation Report: July 1, 2017–June 30, 2018 California Department of Health Care Services
Page D-112 Health Services Advisory Group, Inc.

MANAGED CARE HEALTH PLAN PERFORMANCE MEASURES
Table 3.90—Appropriate Treatment and Utilization DomainRY 2018 (MY 2017) Performance Measure Findings Anthem—Region 1 (Butte, Colusa, Glenn, Plumas, Sierra, Sutter, and Tehama Counties)
Criteria Number of Measures
MeetingCriteria
Total Number of Measures
Percentage of Measures
MeetingCriteria
RY 2018 Rates Above HPLs 0 2 0.00% Rates Above HPLs for the Last Three or More Consecutive Years 0 2 0.00%
RY 2018 Rates Significantly Better than RY 2017 Rates* 1 3 33.33%
Rates that Moved from Below MPLs in RY 2017 to Above MPLs in RY 2018 0 1 0.00%
RY 2018 Rates Below MPLs 1 2 50.00% Rates Below MPLs for the Last Three or More Consecutive Years 1 2 50.00%
RY 2018 Rates Significantly Worse than RY 2017 Rates* 0 3 0.00%
Rates that Moved from Above MPLs in RY 2017 to Below MPLs in RY 2018 0 1 0.00%
* Performance comparisons are based on the Chi-square test of statistical significance, with a p value of <0.05.
Anthem Blue Cross Partnership Plan Performance Evaluation Report: July 1, 2017–June 30, 2018 California Department of Health Care Services
Page D-113 Health Services Advisory Group, Inc.
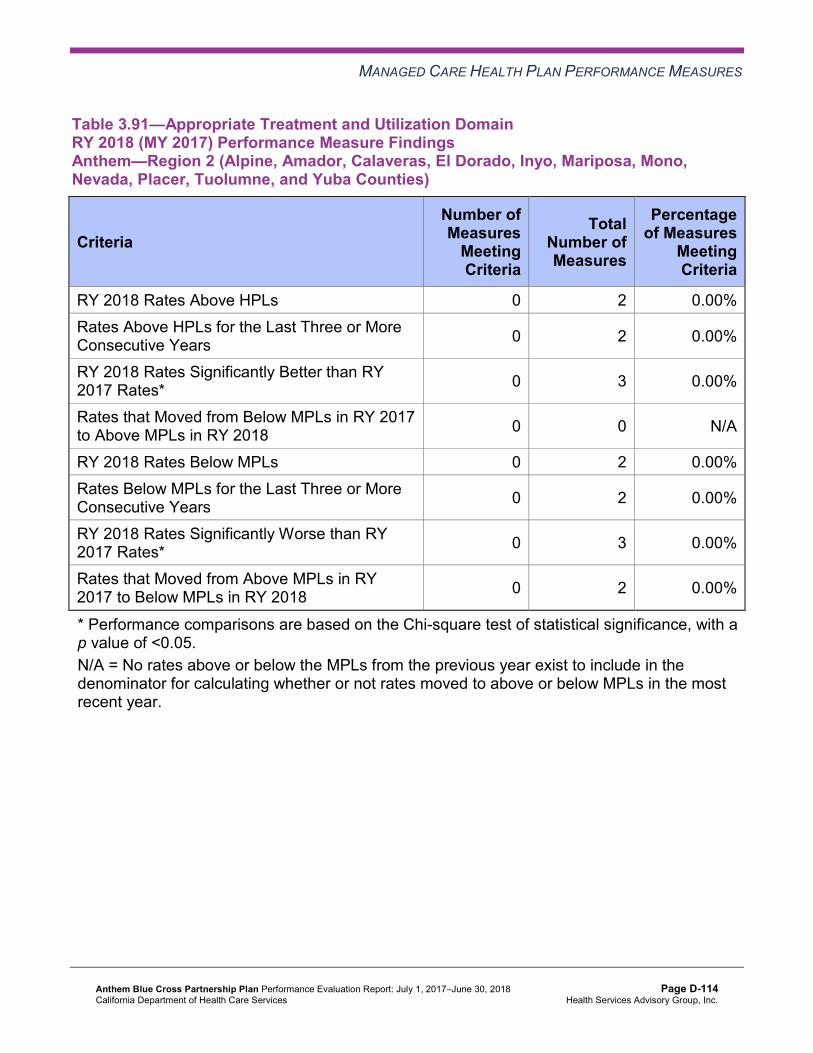
MANAGED CARE HEALTH PLAN PERFORMANCE MEASURES
Table 3.91—Appropriate Treatment and Utilization DomainRY 2018 (MY 2017) Performance Measure Findings Anthem—Region 2 (Alpine, Amador, Calaveras, El Dorado, Inyo, Mariposa, Mono,Nevada, Placer, Tuolumne, and Yuba Counties)
Criteria Number of Measures
MeetingCriteria
Total Number of Measures
Percentage of Measures
MeetingCriteria
RY 2018 Rates Above HPLs 0 2 0.00% Rates Above HPLs for the Last Three or More Consecutive Years 0 2 0.00%
RY 2018 Rates Significantly Better than RY 2017 Rates* 0 3 0.00%
Rates that Moved from Below MPLs in RY 2017 to Above MPLs in RY 2018 0 0 N/A
RY 2018 Rates Below MPLs 0 2 0.00% Rates Below MPLs for the Last Three or More Consecutive Years 0 2 0.00%
RY 2018 Rates Significantly Worse than RY 2017 Rates* 0 3 0.00%
Rates that Moved from Above MPLs in RY 2017 to Below MPLs in RY 2018 0 2 0.00%
* Performance comparisons are based on the Chi-square test of statistical significance, with a p value of <0.05. N/A = No rates above or below the MPLs from the previous year exist to include in the denominator for calculating whether or not rates moved to above or below MPLs in the most recent year.
Anthem Blue Cross Partnership Plan Performance Evaluation Report: July 1, 2017–June 30, 2018 California Department of Health Care Services
Page D-114 Health Services Advisory Group, Inc.

MANAGED CARE HEALTH PLAN PERFORMANCE MEASURES
Table 3.92—Appropriate Treatment and Utilization DomainRY 2018 (MY 2017) Performance Measure Findings Anthem—Sacramento County
Criteria Number of Measures
MeetingCriteria
Total Number of Measures
Percentage of Measures
MeetingCriteria
RY 2018 Rates Above HPLs 1 2 50.00% Rates Above HPLs for the Last Three or More Consecutive Years 0 2 0.00%
RY 2018 Rates Significantly Better than RY 2017 Rates* 0 3 0.00%
Rates that Moved from Below MPLs in RY 2017 to Above MPLs in RY 2018 0 0 N/A
RY 2018 Rates Below MPLs 0 2 0.00% Rates Below MPLs for the Last Three or More Consecutive Years 0 2 0.00%
RY 2018 Rates Significantly Worse than RY 2017 Rates* 1 3 33.33%
Rates that Moved from Above MPLs in RY 2017 to Below MPLs in RY 2018 0 2 0.00%
* Performance comparisons are based on the Chi-square test of statistical significance, with a p value of <0.05. N/A = No rates above or below the MPLs from the previous year exist to include in the denominator for calculating whether or not rates moved to above or below MPLs in the most recent year.
Anthem Blue Cross Partnership Plan Performance Evaluation Report: July 1, 2017–June 30, 2018 California Department of Health Care Services
Page D-115 Health Services Advisory Group, Inc.

MANAGED CARE HEALTH PLAN PERFORMANCE MEASURES
Table 3.93—Appropriate Treatment and Utilization DomainRY 2018 (MY 2017) Performance Measure Findings Anthem—San Benito County
Criteria Number of Measures
MeetingCriteria
Total Number of Measures
Percentage of Measures
MeetingCriteria
RY 2018 Rates Above HPLs 1 2 50.00% Rates Above HPLs for the Last Three or More Consecutive Years 0 2 0.00%
RY 2018 Rates Significantly Better than RY 2017 Rates* 0 3 0.00%
Rates that Moved from Below MPLs in RY 2017 to Above MPLs in RY 2018 0 0 N/A
RY 2018 Rates Below MPLs 0 2 0.00% Rates Below MPLs for the Last Three or More Consecutive Years 0 2 0.00%
RY 2018 Rates Significantly Worse than RY 2017 Rates* 0 3 0.00%
Rates that Moved from Above MPLs in RY 2017 to Below MPLs in RY 2018 0 2 0.00%
* Performance comparisons are based on the Chi-square test of statistical significance, with a p value of <0.05. N/A = No rates above or below the MPLs from the previous year exist to include in the denominator for calculating whether or not rates moved to above or below MPLs in the most recent year.
Anthem Blue Cross Partnership Plan Performance Evaluation Report: July 1, 2017–June 30, 2018 California Department of Health Care Services
Page D-116 Health Services Advisory Group, Inc.

MANAGED CARE HEALTH PLAN PERFORMANCE MEASURES
Table 3.94—Appropriate Treatment and Utilization DomainRY 2018 (MY 2017) Performance Measure Findings Anthem—San Francisco County
Criteria Number of Measures
MeetingCriteria
Total Number of Measures
Percentage of Measures
MeetingCriteria
RY 2018 Rates Above HPLs 2 2 100.00% Rates Above HPLs for the Last Three or More Consecutive Years 1 2 50.00%
RY 2018 Rates Significantly Better than RY 2017 Rates* 0 3 0.00%
Rates that Moved from Below MPLs in RY 2017 to Above MPLs in RY 2018 0 0 N/A
RY 2018 Rates Below MPLs 0 2 0.00% Rates Below MPLs for the Last Three or More Consecutive Years 0 2 0.00%
RY 2018 Rates Significantly Worse than RY 2017 Rates* 0 3 0.00%
Rates that Moved from Above MPLs in RY 2017 to Below MPLs in RY 2018 0 2 0.00%
* Performance comparisons are based on the Chi-square test of statistical significance, with a p value of <0.05. N/A = No rates above or below the MPLs from the previous year exist to include in the denominator for calculating whether or not rates moved to above or below MPLs in the most recent year.
Anthem Blue Cross Partnership Plan Performance Evaluation Report: July 1, 2017–June 30, 2018 California Department of Health Care Services
Page D-117 Health Services Advisory Group, Inc.

MANAGED CARE HEALTH PLAN PERFORMANCE MEASURES
Table 3.95—Appropriate Treatment and Utilization DomainRY 2018 (MY 2017) Performance Measure Findings Anthem—Santa Clara County
Criteria Number of Measures
MeetingCriteria
Total Number of Measures
Percentage of Measures
MeetingCriteria
RY 2018 Rates Above HPLs 1 2 50.00% Rates Above HPLs for the Last Three or More Consecutive Years 0 2 0.00%
RY 2018 Rates Significantly Better than RY 2017 Rates* 0 3 0.00%
Rates that Moved from Below MPLs in RY 2017 to Above MPLs in RY 2018 0 0 N/A
RY 2018 Rates Below MPLs 0 2 0.00% Rates Below MPLs for the Last Three or More Consecutive Years 0 2 0.00%
RY 2018 Rates Significantly Worse than RY 2017 Rates* 0 3 0.00%
Rates that Moved from Above MPLs in RY 2017 to Below MPLs in RY 2018 0 2 0.00%
* Performance comparisons are based on the Chi-square test of statistical significance, with a p value of <0.05. N/A = No rates above or below the MPLs from the previous year exist to include in the denominator for calculating whether or not rates moved to above or below MPLs in the most recent year.
Anthem Blue Cross Partnership Plan Performance Evaluation Report: July 1, 2017–June 30, 2018 California Department of Health Care Services
Page D-118 Health Services Advisory Group, Inc.

MANAGED CARE HEALTH PLAN PERFORMANCE MEASURES
Table 3.96—Appropriate Treatment and Utilization DomainRY 2018 (MY 2017) Performance Measure Findings Anthem—Tulare County
Criteria Number of Measures
MeetingCriteria
Total Number of Measures
Percentage of Measures
MeetingCriteria
RY 2018 Rates Above HPLs 1 2 50.00% Rates Above HPLs for the Last Three or More Consecutive Years 0 2 0.00%
RY 2018 Rates Significantly Better than RY 2017 Rates* 1 3 33.33%
Rates that Moved from Below MPLs in RY 2017 to Above MPLs in RY 2018 0 0 N/A
RY 2018 Rates Below MPLs 0 2 0.00% Rates Below MPLs for the Last Three or More Consecutive Years 0 2 0.00%
RY 2018 Rates Significantly Worse than RY 2017 Rates* 0 3 0.00%
Rates that Moved from Above MPLs in RY 2017 to Below MPLs in RY 2018 0 2 0.00%
* Performance comparisons are based on the Chi-square test of statistical significance, with a p value of <0.05. N/A = No rates above or below the MPLs from the previous year exist to include in the denominator for calculating whether or not rates moved to above or below MPLs in the most recent year.
Assessment of Improvement Plans—Appropriate Treatment and Utilization
Based on RY 2017 performance measure results, DHCS required Anthem to submit an IP for the Avoidance of Antibiotic Treatment in Adults With Acute Bronchitis measure in Madera County and Region 1. Anthem conducted two PDSA cycles to improve the MCP’s performance to above the MPL.
Plan-Do-Study-Act Cycle 1
For the first PDSA cycle, Anthem tested whether or not conducting targeted provider education at targeted clinics would improve appropriate prescribing of antibiotics at the clinics for adults with acute bronchitis. Anthem reported that, based on the small number of beneficiaries in the
Anthem Blue Cross Partnership Plan Performance Evaluation Report: July 1, 2017–June 30, 2018 California Department of Health Care Services
Page D-119 Health Services Advisory Group, Inc.
MANAGED CARE HEALTH PLAN PERFORMANCE MEASURES
denominator for this measure at the clinics, the MCP was unable to accurately assess the effectiveness of the intervention.
Plan-Do-Study-Act Cycle 2
For the second PDSA cycle, Anthem targeted a different clinic to test whether or not educating the clinic’s providers on the use of the Centers for Disease Control and Prevention viral infection prescription pads, along with other supporting education materials (e.g., DHCS’ Avoidance of Antibiotic Treatment in Adults With Acute Bronchitis Highlight and information about appropriate documentation), would improve appropriate prescribing of antibiotics at the clinic for adults with acute bronchitis. Anthem indicated that the clinic staff members willingness to learn and participate in the education contributed to the intervention’s success.
The rates improved significantly from RY 2017 to RY 2018 for the Avoidance of Antibiotic Treatment in Adults With Acute Bronchitis measure in Madera County and Region 1. The improvement in Madera County resulted in the rate moving to above the MPL in RY 2018; however, the rate remained below the MPL in Region 1 in RY 2018.
Performance Measure Findings—All Domains
Table 3.97 through Table 3.108 present a summary of Anthem’s RY 2018 performance across all External Accountability Set (EAS) measures.
Note the following regarding Table 3.97 through Table 3.108:
♦ DHCS did not hold MCPs accountable to meet MPLs for the following measures; therefore, HSAG did not include these measures in its assessment of the MCP’s performance related to HPLs and MPLs: ■ All-Cause Readmissions ■ Both Ambulatory Care measures ■ All four Children and Adolescents’ Access to Primary Care measures
♦ DHCS did not hold MCPs accountable to meet MPLs for the following measures in RY 2017; therefore, HSAG did not include these measures in the denominators for calculating the percentage of measures with rates that moved to above or below the MPLs in RY 2018 and for calculating the percentage of measures with rates below MPLs for only the last two consecutive years: ■ Asthma Medication Ratio ■ Breast Cancer Screening ■ Immunizations for Adolescents—Combination 2
Anthem Blue Cross Partnership Plan Performance Evaluation Report: July 1, 2017–June 30, 2018 California Department of Health Care Services
Page D-120 Health Services Advisory Group, Inc.

MANAGED CARE HEALTH PLAN PERFORMANCE MEASURES
Table 3.97—RY 2018 (MY 2017) Performance Measure Findings for All Domains Anthem—Alameda County
Criteria Number of Measures
MeetingCriteria
Total Number of Measures
Percentage of Measures
MeetingCriteria
RY 2018 Rates Above HPLs 3 21 14.29% Rates Above HPLs for the Last Three or More Consecutive Years 1 18 5.56%
RY 2018 Rates Significantly Better than RY 2017 Rates* 4 22 18.18%
Rates that Moved from Below MPLs in RY 2017 to Above MPLs in RY 2018 0 1 0.00%
RY 2018 Rates Below MPLs 4 21 19.05% Rates Below MPLs for Only the Last Two Consecutive Years 1 18 5.56%
Rates Below MPLs for the Last Three or More Consecutive Years 0 18 0.00%
RY 2018 Rates Significantly Worse than RY 2017 Rates* 0 22 0.00%
Rates that Moved from Above MPLs in RY 2017 to Below MPLs in RY 2018 2 17 11.76%
* Performance comparisons are based on the Chi-square test of statistical significance, with a p value of <0.05.
Anthem Blue Cross Partnership Plan Performance Evaluation Report: July 1, 2017–June 30, 2018 California Department of Health Care Services
Page D-121 Health Services Advisory Group, Inc.

MANAGED CARE HEALTH PLAN PERFORMANCE MEASURES
Table 3.98—RY 2018 (MY 2017) Performance Measure Findings for All Domains Anthem—Contra Costa County
Criteria Number of Measures
MeetingCriteria
Total Number of Measures
Percentage of Measures
MeetingCriteria
RY 2018 Rates Above HPLs 3 21 14.29% Rates Above HPLs for the Last Three or More Consecutive Years 1 18 5.56%
RY 2018 Rates Significantly Better than RY 2017 Rates* 7 22 31.82%
Rates that Moved from Below MPLs in RY 2017 to Above MPLs in RY 2018 2 4 50.00%
RY 2018 Rates Below MPLs 3 21 14.29% Rates Below MPLs for Only the Last Two Consecutive Years 1 18 5.56%
Rates Below MPLs for the Last Three or More Consecutive Years 1 18 5.56%
RY 2018 Rates Significantly Worse than RY 2017 Rates* 1 22 4.55%
Rates that Moved from Above MPLs in RY 2017 to Below MPLs in RY 2018 0 14 0.00%
* Performance comparisons are based on the Chi-square test of statistical significance, with a p value of <0.05.
Anthem Blue Cross Partnership Plan Performance Evaluation Report: July 1, 2017–June 30, 2018 California Department of Health Care Services
Page D-122 Health Services Advisory Group, Inc.

MANAGED CARE HEALTH PLAN PERFORMANCE MEASURES
Table 3.99—RY 2018 (MY 2017) Performance Measure Findings for All Domains Anthem—Fresno County
Criteria Number of Measures
MeetingCriteria
Total Number of Measures
Percentage of Measures
MeetingCriteria
RY 2018 Rates Above HPLs 1 21 4.76% Rates Above HPLs for the Last Three or More Consecutive Years 0 18 0.00%
RY 2018 Rates Significantly Better than RY 2017 Rates* 2 22 9.09%
Rates that Moved from Below MPLs in RY 2017 to Above MPLs in RY 2018 0 0 N/A
RY 2018 Rates Below MPLs 4 21 19.05% Rates Below MPLs for Only the Last Two Consecutive Years 0 18 0.00%
Rates Below MPLs for the Last Three or More Consecutive Years 0 18 0.00%
RY 2018 Rates Significantly Worse than RY 2017 Rates* 0 22 0.00%
Rates that Moved from Above MPLs in RY 2017 to Below MPLs in RY 2018 2 18 11.11%
* Performance comparisons are based on the Chi-square test of statistical significance, with a p value of <0.05. N/A = No rates above or below the MPLs from the previous year exist to include in the denominator for calculating whether or not rates moved to above or below MPLs in the most recent year.
Anthem Blue Cross Partnership Plan Performance Evaluation Report: July 1, 2017–June 30, 2018 California Department of Health Care Services
Page D-123 Health Services Advisory Group, Inc.

MANAGED CARE HEALTH PLAN PERFORMANCE MEASURES
Table 3.100—RY 2018 (MY 2017) Performance Measure Findings for All Domains Anthem—Kings County
Criteria Number of Measures
MeetingCriteria
Total Number of Measures
Percentage of Measures
MeetingCriteria
RY 2018 Rates Above HPLs 2 21 9.52% Rates Above HPLs for the Last Three or More Consecutive Years 0 18 0.00%
RY 2018 Rates Significantly Better than RY 2017 Rates* 3 22 13.64%
Rates that Moved from Below MPLs in RY 2017 to Above MPLs in RY 2018 1 1 100.00%
RY 2018 Rates Below MPLs 4 21 19.05% Rates Below MPLs for Only the Last Two Consecutive Years 0 18 0.00%
Rates Below MPLs for the Last Three or More Consecutive Years 0 18 0.00%
RY 2018 Rates Significantly Worse than RY 2017 Rates* 0 22 0.00%
Rates that Moved from Above MPLs in RY 2017 to Below MPLs in RY 2018 3 17 17.65%
* Performance comparisons are based on the Chi-square test of statistical significance, with a p value of <0.05.
Anthem Blue Cross Partnership Plan Performance Evaluation Report: July 1, 2017–June 30, 2018 California Department of Health Care Services
Page D-124 Health Services Advisory Group, Inc.

MANAGED CARE HEALTH PLAN PERFORMANCE MEASURES
Table 3.101—RY 2018 (MY 2017) Performance Measure Findings for All Domains Anthem—Madera County
Criteria Number of Measures
MeetingCriteria
Total Number of Measures
Percentage of Measures
MeetingCriteria
RY 2018 Rates Above HPLs 4 21 19.05% Rates Above HPLs for the Last Three or More Consecutive Years 0 18 0.00%
RY 2018 Rates Significantly Better than RY 2017 Rates* 3 22 13.64%
Rates that Moved from Below MPLs in RY 2017 to Above MPLs in RY 2018 1 2 50.00%
RY 2018 Rates Below MPLs 2 21 9.52% Rates Below MPLs for Only the Last Two Consecutive Years 0 18 0.00%
Rates Below MPLs for the Last Three or More Consecutive Years 1 18 5.56%
RY 2018 Rates Significantly Worse than RY 2017 Rates* 1 22 4.55%
Rates that Moved from Above MPLs in RY 2017 to Below MPLs in RY 2018 1 16 6.25%
* Performance comparisons are based on the Chi-square test of statistical significance, with a p value of <0.05.
Anthem Blue Cross Partnership Plan Performance Evaluation Report: July 1, 2017–June 30, 2018 California Department of Health Care Services
Page D-125 Health Services Advisory Group, Inc.

MANAGED CARE HEALTH PLAN PERFORMANCE MEASURES
Table 3.102—RY 2018 (MY 2017) Performance Measure Findings for All Domains Anthem—Region 1 (Butte, Colusa, Glenn, Plumas, Sierra, Sutter, and Tehama Counties)
Criteria Number of Measures
MeetingCriteria
Total Number of Measures
Percentage of Measures
MeetingCriteria
RY 2018 Rates Above HPLs 0 21 0.00% Rates Above HPLs for the Last Three or More Consecutive Years 0 18 0.00%
RY 2018 Rates Significantly Better than RY 2017 Rates* 3 22 13.64%
Rates that Moved from Below MPLs in RY 2017 to Above MPLs in RY 2018 1 3 33.33%
RY 2018 Rates Below MPLs 6 21 28.57% Rates Below MPLs for Only the Last Two Consecutive Years 1 18 5.56%
Rates Below MPLs for the Last Three or More Consecutive Years 1 18 5.56%
RY 2018 Rates Significantly Worse than RY 2017 Rates* 2 22 9.09%
Rates that Moved from Above MPLs in RY 2017 to Below MPLs in RY 2018 3 15 20.00%
* Performance comparisons are based on the Chi-square test of statistical significance, with a p value of <0.05.
Anthem Blue Cross Partnership Plan Performance Evaluation Report: July 1, 2017–June 30, 2018 California Department of Health Care Services
Page D-126 Health Services Advisory Group, Inc.
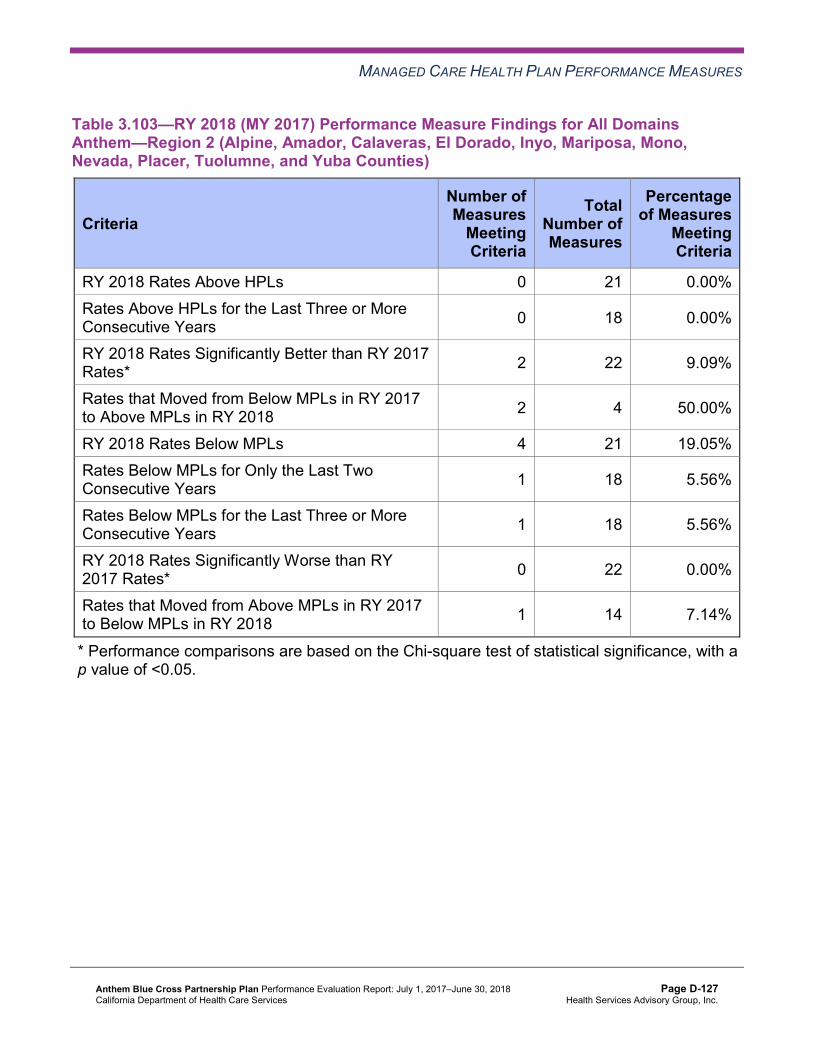
MANAGED CARE HEALTH PLAN PERFORMANCE MEASURES
Table 3.103—RY 2018 (MY 2017) Performance Measure Findings for All DomainsAnthem—Region 2 (Alpine, Amador, Calaveras, El Dorado, Inyo, Mariposa, Mono,Nevada, Placer, Tuolumne, and Yuba Counties)
Criteria Number of Measures
MeetingCriteria
Total Number of Measures
Percentage of Measures
MeetingCriteria
RY 2018 Rates Above HPLs 0 21 0.00% Rates Above HPLs for the Last Three or More Consecutive Years 0 18 0.00%
RY 2018 Rates Significantly Better than RY 2017 Rates* 2 22 9.09%
Rates that Moved from Below MPLs in RY 2017 to Above MPLs in RY 2018 2 4 50.00%
RY 2018 Rates Below MPLs 4 21 19.05% Rates Below MPLs for Only the Last Two Consecutive Years 1 18 5.56%
Rates Below MPLs for the Last Three or More Consecutive Years 1 18 5.56%
RY 2018 Rates Significantly Worse than RY 2017 Rates* 0 22 0.00%
Rates that Moved from Above MPLs in RY 2017 to Below MPLs in RY 2018 1 14 7.14%
* Performance comparisons are based on the Chi-square test of statistical significance, with a p value of <0.05.
Anthem Blue Cross Partnership Plan Performance Evaluation Report: July 1, 2017–June 30, 2018 California Department of Health Care Services
Page D-127 Health Services Advisory Group, Inc.
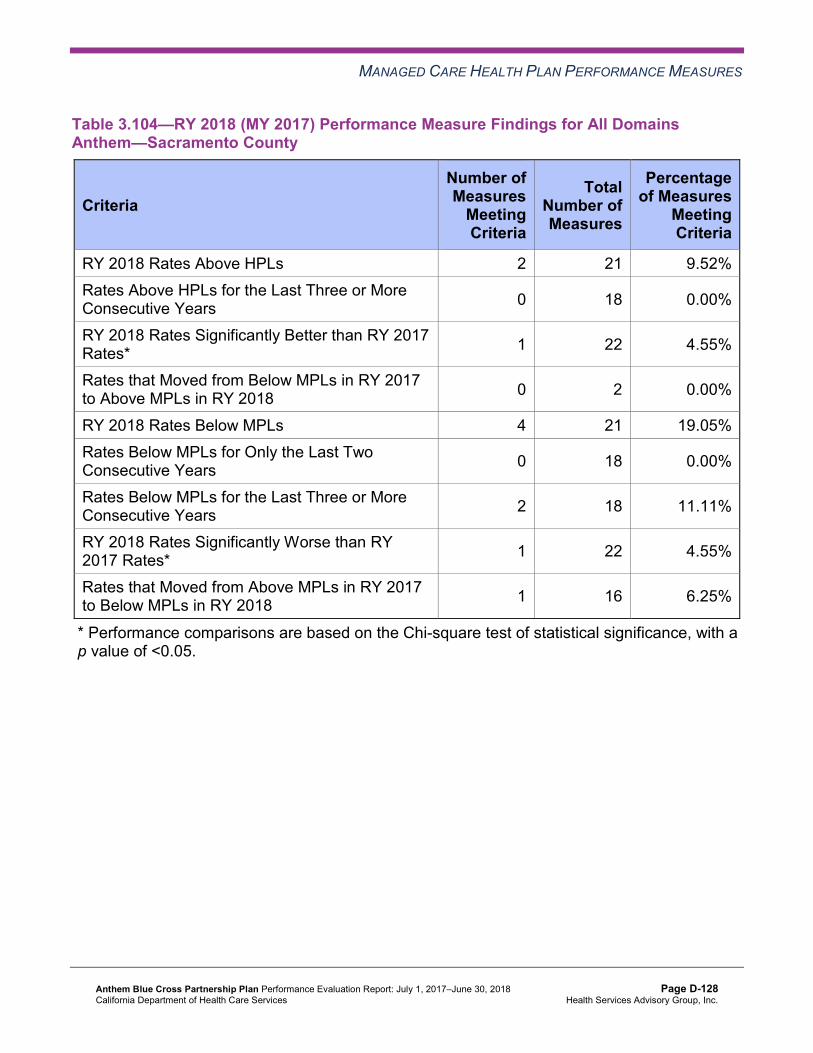
MANAGED CARE HEALTH PLAN PERFORMANCE MEASURES
Table 3.104—RY 2018 (MY 2017) Performance Measure Findings for All Domains Anthem—Sacramento County
Criteria Number of Measures
MeetingCriteria
Total Number of Measures
Percentage of Measures
MeetingCriteria
RY 2018 Rates Above HPLs 2 21 9.52% Rates Above HPLs for the Last Three or More Consecutive Years 0 18 0.00%
RY 2018 Rates Significantly Better than RY 2017 Rates* 1 22 4.55%
Rates that Moved from Below MPLs in RY 2017 to Above MPLs in RY 2018 0 2 0.00%
RY 2018 Rates Below MPLs 4 21 19.05% Rates Below MPLs for Only the Last Two Consecutive Years 0 18 0.00%
Rates Below MPLs for the Last Three or More Consecutive Years 2 18 11.11%
RY 2018 Rates Significantly Worse than RY 2017 Rates* 1 22 4.55%
Rates that Moved from Above MPLs in RY 2017 to Below MPLs in RY 2018 1 16 6.25%
* Performance comparisons are based on the Chi-square test of statistical significance, with a p value of <0.05.
Anthem Blue Cross Partnership Plan Performance Evaluation Report: July 1, 2017–June 30, 2018 California Department of Health Care Services
Page D-128 Health Services Advisory Group, Inc.

MANAGED CARE HEALTH PLAN PERFORMANCE MEASURES
Table 3.105—RY 2018 (MY 2017) Performance Measure Findings for All Domains Anthem—San Benito County
Criteria Number of Measures
MeetingCriteria
Total Number of Measures
Percentage of Measures
MeetingCriteria
RY 2018 Rates Above HPLs 1 21 4.76% Rates Above HPLs for the Last Three or More Consecutive Years 0 18 0.00%
RY 2018 Rates Significantly Better than RY 2017 Rates* 2 22 9.09%
Rates that Moved from Below MPLs in RY 2017 to Above MPLs in RY 2018 1 2 50.00%
RY 2018 Rates Below MPLs 5 21 23.81% Rates Below MPLs for Only the Last Two Consecutive Years 0 18 0.00%
Rates Below MPLs for the Last Three or More Consecutive Years 1 18 5.56%
RY 2018 Rates Significantly Worse than RY 2017 Rates* 0 22 0.00%
Rates that Moved from Above MPLs in RY 2017 to Below MPLs in RY 2018 4 16 25.00%
* Performance comparisons are based on the Chi-square test of statistical significance, with a p value of <0.05.
Anthem Blue Cross Partnership Plan Performance Evaluation Report: July 1, 2017–June 30, 2018 California Department of Health Care Services
Page D-129 Health Services Advisory Group, Inc.
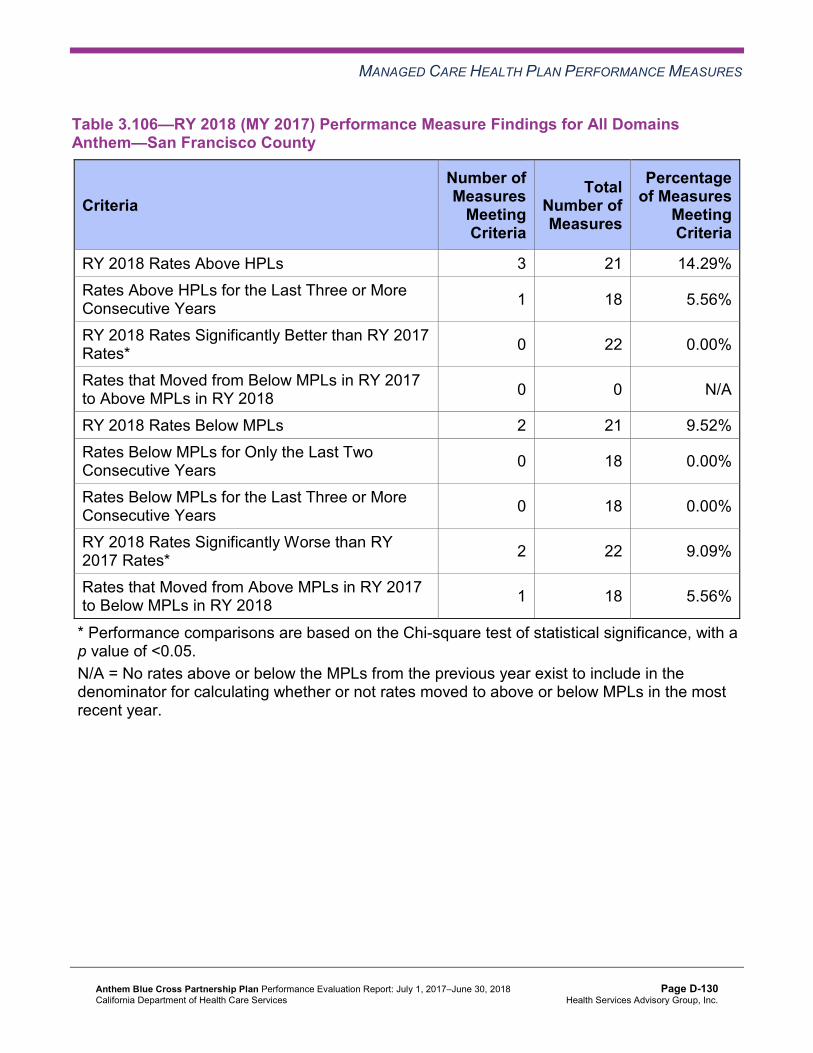
MANAGED CARE HEALTH PLAN PERFORMANCE MEASURES
Table 3.106—RY 2018 (MY 2017) Performance Measure Findings for All Domains Anthem—San Francisco County
Criteria Number of Measures
MeetingCriteria
Total Number of Measures
Percentage of Measures
MeetingCriteria
RY 2018 Rates Above HPLs 3 21 14.29% Rates Above HPLs for the Last Three or More Consecutive Years 1 18 5.56%
RY 2018 Rates Significantly Better than RY 2017 Rates* 0 22 0.00%
Rates that Moved from Below MPLs in RY 2017 to Above MPLs in RY 2018 0 0 N/A
RY 2018 Rates Below MPLs 2 21 9.52% Rates Below MPLs for Only the Last Two Consecutive Years 0 18 0.00%
Rates Below MPLs for the Last Three or More Consecutive Years 0 18 0.00%
RY 2018 Rates Significantly Worse than RY 2017 Rates* 2 22 9.09%
Rates that Moved from Above MPLs in RY 2017 to Below MPLs in RY 2018 1 18 5.56%
* Performance comparisons are based on the Chi-square test of statistical significance, with a p value of <0.05. N/A = No rates above or below the MPLs from the previous year exist to include in the denominator for calculating whether or not rates moved to above or below MPLs in the most recent year.
Anthem Blue Cross Partnership Plan Performance Evaluation Report: July 1, 2017–June 30, 2018 California Department of Health Care Services
Page D-130 Health Services Advisory Group, Inc.

MANAGED CARE HEALTH PLAN PERFORMANCE MEASURES
Table 3.107—RY 2018 (MY 2017) Performance Measure Findings for All DomainsAnthem—Santa Clara County
Criteria Number of Measures
MeetingCriteria
Total Number of Measures
Percentage of Measures
MeetingCriteria
RY 2018 Rates Above HPLs 3 21 14.29% Rates Above HPLs for the Last Three or More Consecutive Years 0 18 0.00%
RY 2018 Rates Significantly Better than RY 2017 Rates* 2 22 9.09%
Rates that Moved from Below MPLs in RY 2017 to Above MPLs in RY 2018 0 0 N/A
RY 2018 Rates Below MPLs 2 21 9.52% Rates Below MPLs for Only the Last Two Consecutive Years 0 18 0.00%
Rates Below MPLs for the Last Three or More Consecutive Years 0 18 0.00%
RY 2018 Rates Significantly Worse than RY 2017 Rates* 0 22 0.00%
Rates that Moved from Above MPLs in RY 2017 to Below MPLs in RY 2018 2 18 11.11%
* Performance comparisons are based on the Chi-square test of statistical significance, with a p value of <0.05. N/A = No rates above or below the MPLs from the previous year exist to include in the denominator for calculating whether or not rates moved to above or below MPLs in the most recent year.
Anthem Blue Cross Partnership Plan Performance Evaluation Report: July 1, 2017–June 30, 2018 California Department of Health Care Services
Page D-131 Health Services Advisory Group, Inc.

MANAGED CARE HEALTH PLAN PERFORMANCE MEASURES
Table 3.108—RY 2018 (MY 2017) Performance Measure Findings for All Domains Anthem—Tulare County
Criteria Number of Measures
MeetingCriteria
Total Number of Measures
Percentage of Measures
MeetingCriteria
RY 2018 Rates Above HPLs 6 21 28.57% Rates Above HPLs for the Last Three or More Consecutive Years 0 18 0.00%
RY 2018 Rates Significantly Better than RY 2017 Rates* 4 22 18.18%
Rates that Moved from Below MPLs in RY 2017 to Above MPLs in RY 2018 0 0 N/A
RY 2018 Rates Below MPLs 0 21 0.00% Rates Below MPLs for Only the Last Two Consecutive Years 0 18 0.00%
Rates Below MPLs for the Last Three or More Consecutive Years 0 18 0.00%
RY 2018 Rates Significantly Worse than RY 2017 Rates* 1 22 4.55%
Rates that Moved from Above MPLs in RY 2017 to Below MPLs in RY 2018 0 18 0.00%
* Performance comparisons are based on the Chi-square test of statistical significance, with a p value of <0.05. N/A = No rates above or below the MPLs from the previous year exist to include in the denominator for calculating whether or not rates moved to above or below MPLs in the most recent year.
Corrective Action Plan Requirements for 2018 Based on RY 2018 performance measure results, Anthem met the required CAP milestones and no CAP was triggered in any of the MCP’s reporting units.
Anthem Blue Cross Partnership Plan Performance Evaluation Report: July 1, 2017–June 30, 2018 California Department of Health Care Services
Page D-132 Health Services Advisory Group, Inc.
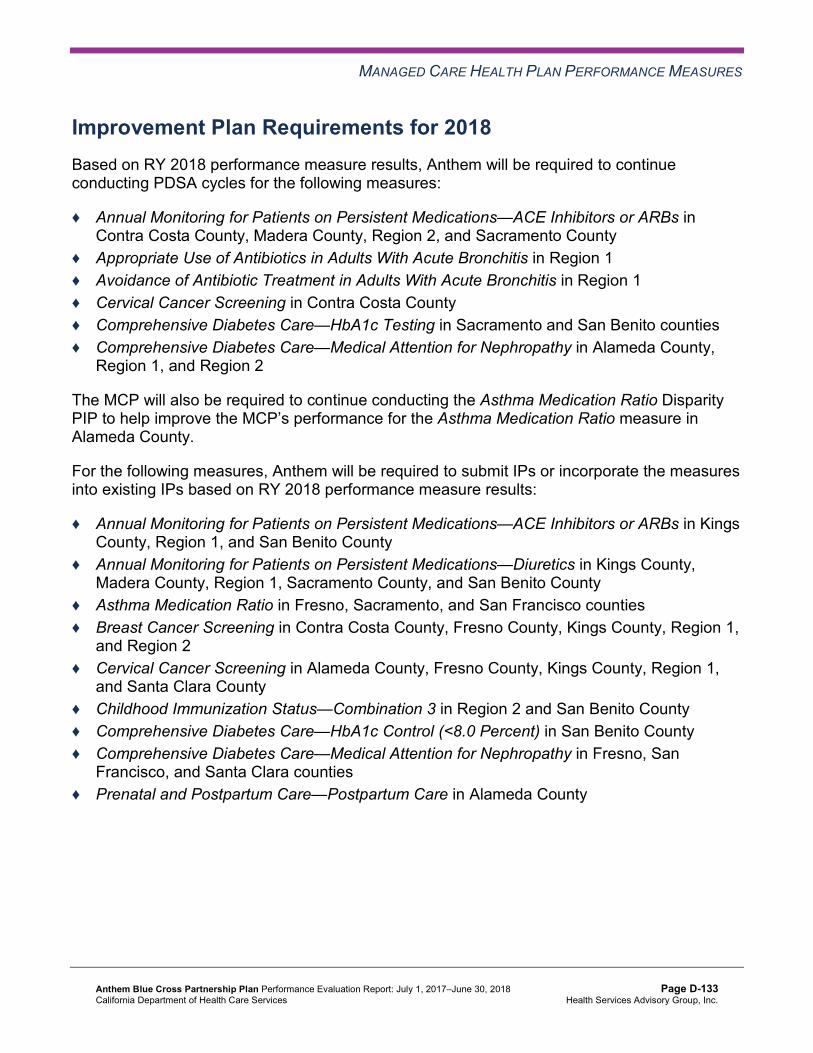
MANAGED CARE HEALTH PLAN PERFORMANCE MEASURES
Improvement Plan Requirements for 2018 Based on RY 2018 performance measure results, Anthem will be required to continue conducting PDSA cycles for the following measures:
♦ Annual Monitoring for Patients on Persistent Medications—ACE Inhibitors or ARBs in Contra Costa County, Madera County, Region 2, and Sacramento County
♦ Appropriate Use of Antibiotics in Adults With Acute Bronchitis in Region 1 ♦ Avoidance of Antibiotic Treatment in Adults With Acute Bronchitis in Region 1 ♦ Cervical Cancer Screening in Contra Costa County ♦ Comprehensive Diabetes Care—HbA1c Testing in Sacramento and San Benito counties ♦ Comprehensive Diabetes Care—Medical Attention for Nephropathy in Alameda County,
Region 1, and Region 2
The MCP will also be required to continue conducting the Asthma Medication Ratio Disparity PIP to help improve the MCP’s performance for the Asthma Medication Ratio measure in Alameda County.
For the following measures, Anthem will be required to submit IPs or incorporate the measures into existing IPs based on RY 2018 performance measure results:
♦ Annual Monitoring for Patients on Persistent Medications—ACE Inhibitors or ARBs in Kings County, Region 1, and San Benito County
♦ Annual Monitoring for Patients on Persistent Medications—Diuretics in Kings County, Madera County, Region 1, Sacramento County, and San Benito County
♦ Asthma Medication Ratio in Fresno, Sacramento, and San Francisco counties ♦ Breast Cancer Screening in Contra Costa County, Fresno County, Kings County, Region 1,
and Region 2 ♦ Cervical Cancer Screening in Alameda County, Fresno County, Kings County, Region 1,
and Santa Clara County ♦ Childhood Immunization Status—Combination 3 in Region 2 and San Benito County ♦ Comprehensive Diabetes Care—HbA1c Control (<8.0 Percent) in San Benito County ♦ Comprehensive Diabetes Care—Medical Attention for Nephropathy in Fresno, San
Francisco, and Santa Clara counties ♦ Prenatal and Postpartum Care—Postpartum Care in Alameda County
Anthem Blue Cross Partnership Plan Performance Evaluation Report: July 1, 2017–June 30, 2018 California Department of Health Care Services
Page D-133 Health Services Advisory Group, Inc.
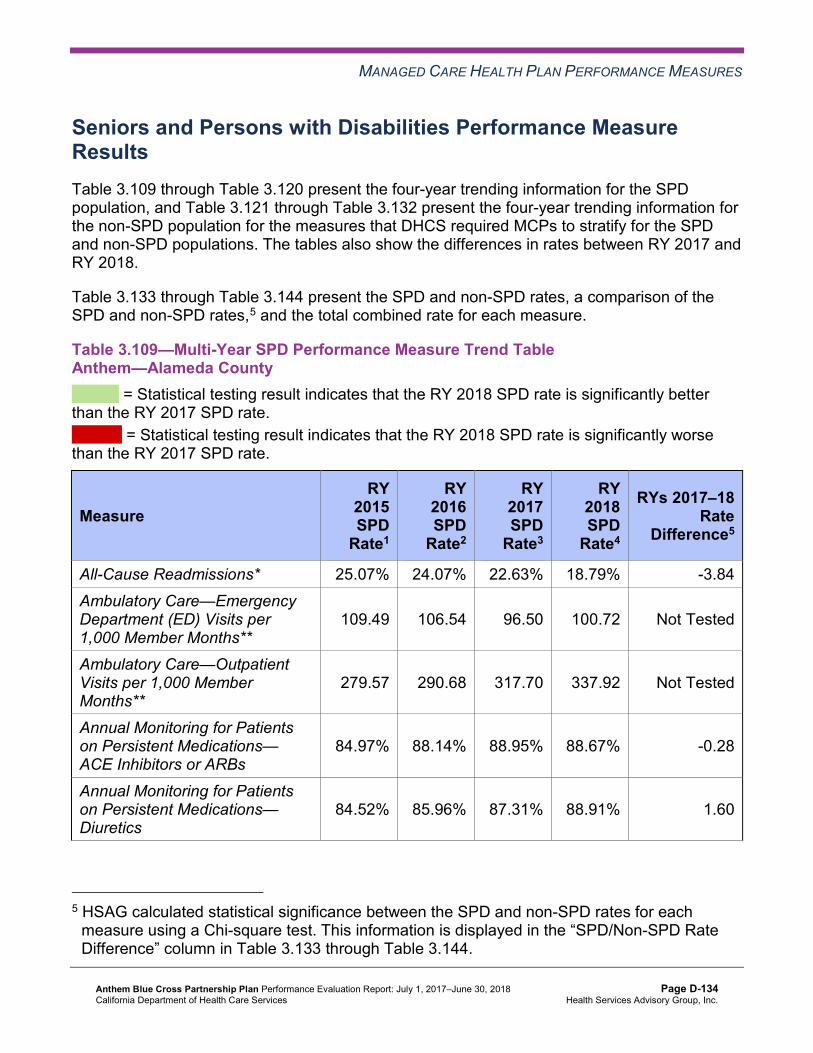
MANAGED CARE HEALTH PLAN PERFORMANCE MEASURES
Seniors and Persons with Disabilities Performance Measure Results Table 3.109 through Table 3.120 present the four-year trending information for the SPD population, and Table 3.121 through Table 3.132 present the four-year trending information for the non-SPD population for the measures that DHCS required MCPs to stratify for the SPD and non-SPD populations. The tables also show the differences in rates between RY 2017 and RY 2018.
Table 3.133 through Table 3.144 present the SPD and non-SPD rates, a comparison of the SPD and non-SPD rates,5 and the total combined rate for each measure.
Table 3.109—Multi-Year SPD Performance Measure Trend Table Anthem—Alameda County
B = Statistical testing result indicates that the RY 2018 SPD rate is significantly better than the RY 2017 SPD rate.
W = Statistical testing result indicates that the RY 2018 SPD rate is significantly worse than the RY 2017 SPD rate.
Measure RY
2015 SPD
Rate1
RY 2016 SPD
Rate2
RY 2017 SPD
Rate3
RY 2018 SPD
Rate4
RYs 2017–18 Rate
Difference5
All-Cause Readmissions* 25.07% 24.07% 22.63% 18.79% -3.84 Ambulatory Care—Emergency Department (ED) Visits per 1,000 Member Months**
109.49 106.54 96.50 100.72 Not Tested
Ambulatory Care—Outpatient Visits per 1,000 Member Months**
279.57 290.68 317.70 337.92 Not Tested
Annual Monitoring for Patients on Persistent Medications— ACE Inhibitors or ARBs
84.97% 88.14% 88.95% 88.67% -0.28
Annual Monitoring for Patients on Persistent Medications— Diuretics
84.52% 85.96% 87.31% 88.91% 1.60
5 HSAG calculated statistical significance between the SPD and non-SPD rates for each measure using a Chi-square test. This information is displayed in the “SPD/Non-SPD Rate Difference” column in Table 3.133 through Table 3.144.
Anthem Blue Cross Partnership Plan Performance Evaluation Report: July 1, 2017–June 30, 2018 California Department of Health Care Services
Page D-134 Health Services Advisory Group, Inc.

MANAGED CARE HEALTH PLAN PERFORMANCE MEASURES
Measure RY
2015 SPD
Rate1
RY 2016 SPD
Rate2
RY 2017 SPD
Rate3
RY 2018 SPD
Rate4
RYs 2017–18 Rate
Difference5
Children and Adolescents' Access to Primary Care Practitioners—12–24 Months
NA NA NA NA Not Comparable
Children and Adolescents' Access to Primary Care Practitioners— 25 Months–6 Years
83.43% 85.35% 89.06% 80.00% -9.06
Children and Adolescents' Access to Primary Care Practitioners—7–11 Years
80.49% 85.32% 85.78% 89.81% 4.03
Children and Adolescents' Access to Primary Care Practitioners—12–19 Years
77.83% 81.86% 80.20% 84.68% 4.48
1 RY 2015 rates reflect MY data from January 1, 2014, through December 31, 2014. 2 RY 2016 rates reflect MY data from January 1, 2015, through December 31, 2015. 3 RY 2017 rates reflect MY data from January 1, 2016, through December 31, 2016. 4 RY 2018 rates reflect MY data from January 1, 2017, through December 31, 2017. 5 Performance comparisons are based on the Chi-square test of statistical significance, with a p value of <0.05. * A lower rate indicates better performance for this measure. ** Member months are a member's “contribution” to the total yearly membership. NA = The MCP followed the specifications, but the denominator was too small (less than 30) to report a valid rate. Not Comparable = An RY 2017–18 rate difference cannot be made because data are not available for both years or because significant methodology changes occurred between years, disallowing comparison. Not Tested = An RY 2017–18 rate difference was not calculated because high and low rates do not necessarily indicate better or worse performance.
Anthem Blue Cross Partnership Plan Performance Evaluation Report: July 1, 2017–June 30, 2018 California Department of Health Care Services
Page D-135 Health Services Advisory Group, Inc.

MANAGED CARE HEALTH PLAN PERFORMANCE MEASURES
Table 3.110—Multi-Year SPD Performance Measure Trend Table Anthem—Contra Costa County
B = Statistical testing result indicates that the RY 2018 SPD rate is significantly better than the RY 2017 SPD rate.
W = Statistical testing result indicates that the RY 2018 SPD rate is significantly worse than the RY 2017 SPD rate.
Measure RY
2015 SPD
Rate1
RY 2016 SPD
Rate2
RY 2017 SPD
Rate3
RY 2018 SPD
Rate4
RYs 2017–18 Rate
Difference5
All-Cause Readmissions* 17.74% 17.41% 20.67% 24.55% 3.88 Ambulatory Care—Emergency Department (ED) Visits per 1,000 Member Months**
98.09 87.74 76.90 80.45 Not Tested
Ambulatory Care—Outpatient Visits per 1,000 Member Months**
263.60 262.12 297.88 318.47 Not Tested
Annual Monitoring for Patients on Persistent Medications— ACE Inhibitors or ARBs
80.60% 86.98% 88.57% 90.00% 1.43
Annual Monitoring for Patients on Persistent Medications— Diuretics
83.95% 82.24% 85.00% 90.70% 5.70
Children and Adolescents' Access to Primary Care Practitioners—12–24 Months
NA NA NA NA Not Comparable
Children and Adolescents' Access to Primary Care Practitioners— 25 Months–6 Years
85.29% 92.86% 92.71% 89.13% -3.58
Children and Adolescents' Access to Primary Care Practitioners—7–11 Years
85.92% 85.71% 88.06% 89.39% 1.33
Children and Adolescents' Access to Primary Care Practitioners—12–19 Years
86.15% 80.73% 81.51% 86.94% 5.43
1 RY 2015 rates reflect MY data from January 1, 2014, through December 31, 2014. 2 RY 2016 rates reflect MY data from January 1, 2015, through December 31, 2015. 3 RY 2017 rates reflect MY data from January 1, 2016, through December 31, 2016.
Anthem Blue Cross Partnership Plan Performance Evaluation Report: July 1, 2017–June 30, 2018 California Department of Health Care Services
Page D-136 Health Services Advisory Group, Inc.
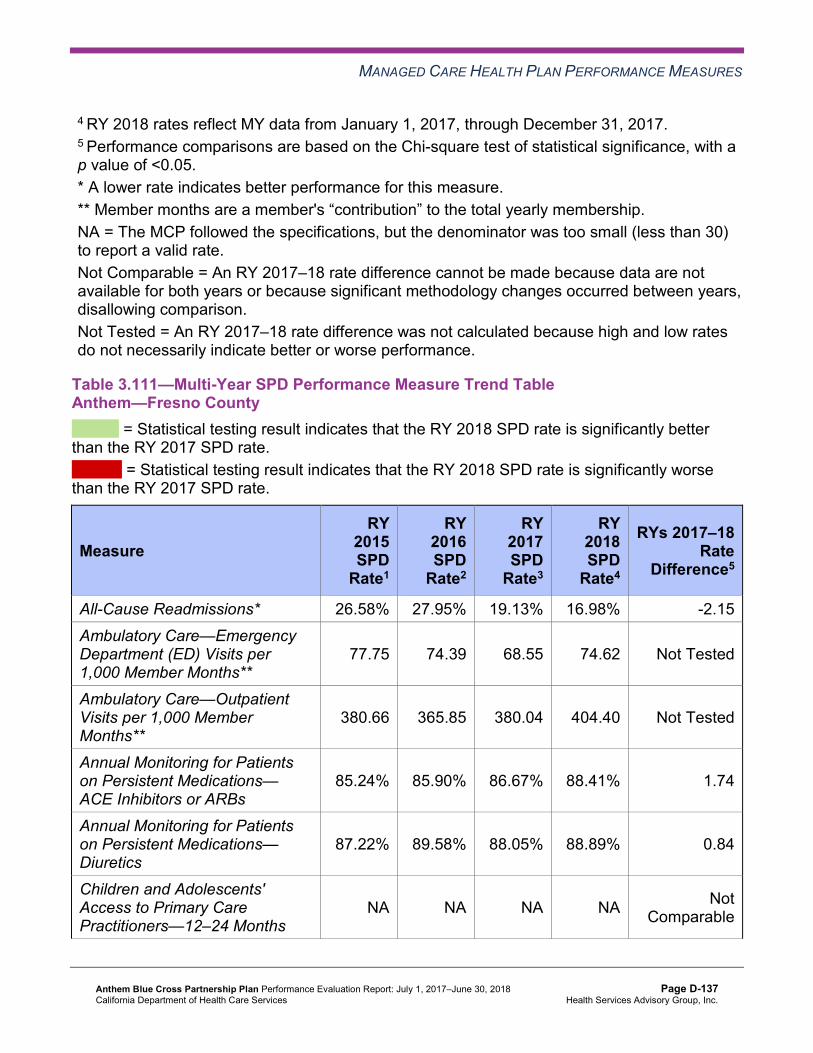
MANAGED CARE HEALTH PLAN PERFORMANCE MEASURES
4 RY 2018 rates reflect MY data from January 1, 2017, through December 31, 2017. 5 Performance comparisons are based on the Chi-square test of statistical significance, with a p value of <0.05. * A lower rate indicates better performance for this measure. ** Member months are a member's “contribution” to the total yearly membership. NA = The MCP followed the specifications, but the denominator was too small (less than 30) to report a valid rate. Not Comparable = An RY 2017–18 rate difference cannot be made because data are not available for both years or because significant methodology changes occurred between years, disallowing comparison. Not Tested = An RY 2017–18 rate difference was not calculated because high and low rates do not necessarily indicate better or worse performance.
Table 3.111—Multi-Year SPD Performance Measure Trend Table Anthem—Fresno County
B = Statistical testing result indicates that the RY 2018 SPD rate is significantly better than the RY 2017 SPD rate.
W = Statistical testing result indicates that the RY 2018 SPD rate is significantly worse than the RY 2017 SPD rate.
Measure RY
2015 SPD
Rate1
RY 2016 SPD
Rate2
RY 2017 SPD
Rate3
RY 2018 SPD
Rate4
RYs 2017–18 Rate
Difference5
All-Cause Readmissions* 26.58% 27.95% 19.13% 16.98% -2.15 Ambulatory Care—Emergency Department (ED) Visits per 1,000 Member Months**
77.75 74.39 68.55 74.62 Not Tested
Ambulatory Care—Outpatient Visits per 1,000 Member Months**
380.66 365.85 380.04 404.40 Not Tested
Annual Monitoring for Patients on Persistent Medications— ACE Inhibitors or ARBs
85.24% 85.90% 86.67% 88.41% 1.74
Annual Monitoring for Patients on Persistent Medications— Diuretics
87.22% 89.58% 88.05% 88.89% 0.84
Children and Adolescents' Access to Primary Care Practitioners—12–24 Months
NA NA NA NA Not Comparable
Anthem Blue Cross Partnership Plan Performance Evaluation Report: July 1, 2017–June 30, 2018 California Department of Health Care Services
Page D-137 Health Services Advisory Group, Inc.
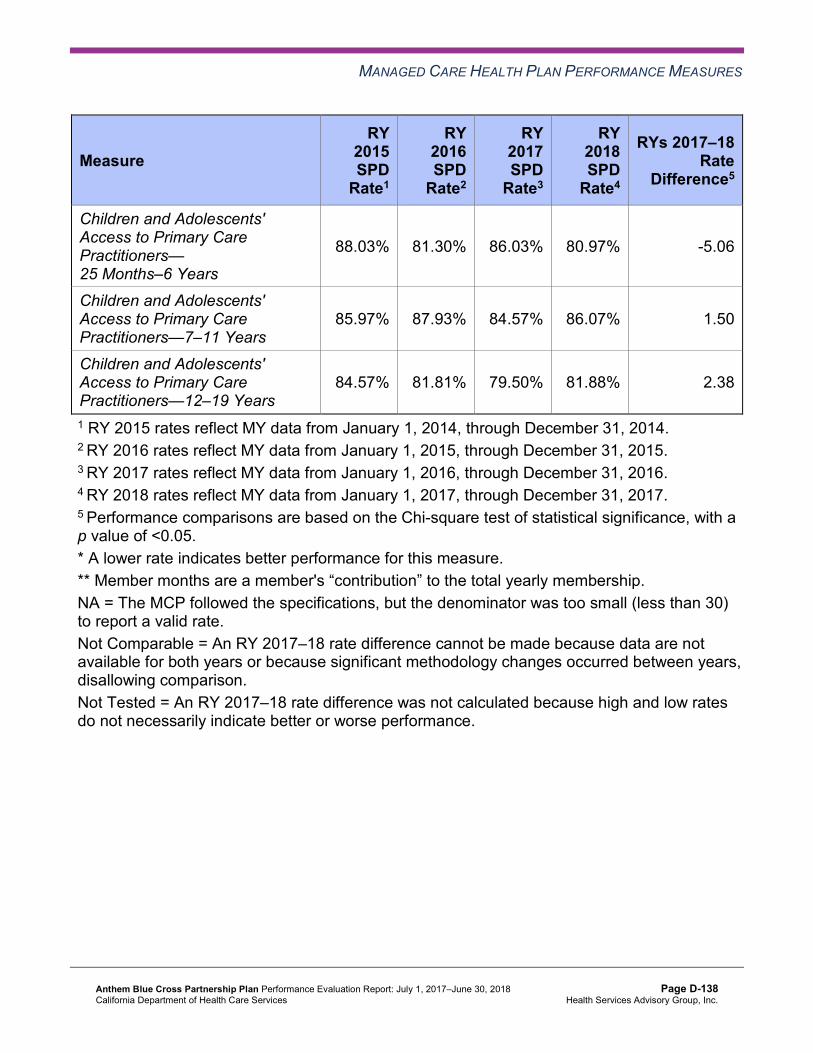
MANAGED CARE HEALTH PLAN PERFORMANCE MEASURES
Measure RY
2015 SPD
Rate1
RY 2016 SPD
Rate2
RY 2017 SPD
Rate3
RY 2018 SPD
Rate4
RYs 2017–18 Rate
Difference5
Children and Adolescents' Access to Primary Care Practitioners— 25 Months–6 Years
88.03% 81.30% 86.03% 80.97% -5.06
Children and Adolescents' Access to Primary Care Practitioners—7–11 Years
85.97% 87.93% 84.57% 86.07% 1.50
Children and Adolescents' Access to Primary Care Practitioners—12–19 Years
84.57% 81.81% 79.50% 81.88% 2.38
1 RY 2015 rates reflect MY data from January 1, 2014, through December 31, 2014. 2 RY 2016 rates reflect MY data from January 1, 2015, through December 31, 2015. 3 RY 2017 rates reflect MY data from January 1, 2016, through December 31, 2016. 4 RY 2018 rates reflect MY data from January 1, 2017, through December 31, 2017. 5 Performance comparisons are based on the Chi-square test of statistical significance, with a p value of <0.05. * A lower rate indicates better performance for this measure. ** Member months are a member's “contribution” to the total yearly membership. NA = The MCP followed the specifications, but the denominator was too small (less than 30) to report a valid rate. Not Comparable = An RY 2017–18 rate difference cannot be made because data are not available for both years or because significant methodology changes occurred between years, disallowing comparison. Not Tested = An RY 2017–18 rate difference was not calculated because high and low rates do not necessarily indicate better or worse performance.
Anthem Blue Cross Partnership Plan Performance Evaluation Report: July 1, 2017–June 30, 2018 California Department of Health Care Services
Page D-138 Health Services Advisory Group, Inc.
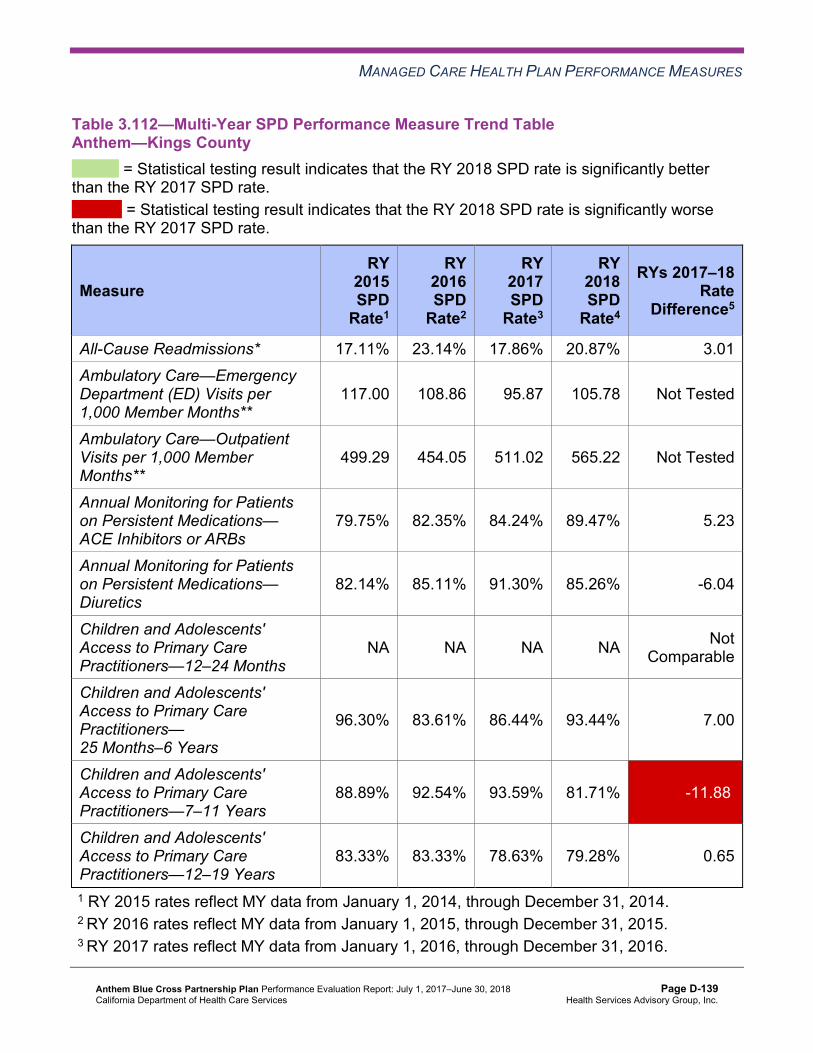
MANAGED CARE HEALTH PLAN PERFORMANCE MEASURES
Table 3.112—Multi-Year SPD Performance Measure Trend Table Anthem—Kings County
B = Statistical testing result indicates that the RY 2018 SPD rate is significantly better than the RY 2017 SPD rate.
W = Statistical testing result indicates that the RY 2018 SPD rate is significantly worse than the RY 2017 SPD rate.
Measure RY
2015 SPD
Rate1
RY 2016 SPD
Rate2
RY 2017 SPD
Rate3
RY 2018 SPD
Rate4
RYs 2017–18 Rate
Difference5
All-Cause Readmissions* 17.11% 23.14% 17.86% 20.87% 3.01 Ambulatory Care—Emergency Department (ED) Visits per 1,000 Member Months**
117.00 108.86 95.87 105.78 Not Tested
Ambulatory Care—Outpatient Visits per 1,000 Member Months**
499.29 454.05 511.02 565.22 Not Tested
Annual Monitoring for Patients on Persistent Medications— ACE Inhibitors or ARBs
79.75% 82.35% 84.24% 89.47% 5.23
Annual Monitoring for Patients on Persistent Medications— Diuretics
82.14% 85.11% 91.30% 85.26% -6.04
Children and Adolescents' Access to Primary Care Practitioners—12–24 Months
NA NA NA NA Not Comparable
Children and Adolescents' Access to Primary Care Practitioners— 25 Months–6 Years
96.30% 83.61% 86.44% 93.44% 7.00
Children and Adolescents' Access to Primary Care Practitioners—7–11 Years
88.89% 92.54% 93.59% 81.71% -11.88W
Children and Adolescents' Access to Primary Care Practitioners—12–19 Years
83.33% 83.33% 78.63% 79.28% 0.65
1 RY 2015 rates reflect MY data from January 1, 2014, through December 31, 2014. 2 RY 2016 rates reflect MY data from January 1, 2015, through December 31, 2015. 3 RY 2017 rates reflect MY data from January 1, 2016, through December 31, 2016.
Anthem Blue Cross Partnership Plan Performance Evaluation Report: July 1, 2017–June 30, 2018 California Department of Health Care Services
Page D-139 Health Services Advisory Group, Inc.
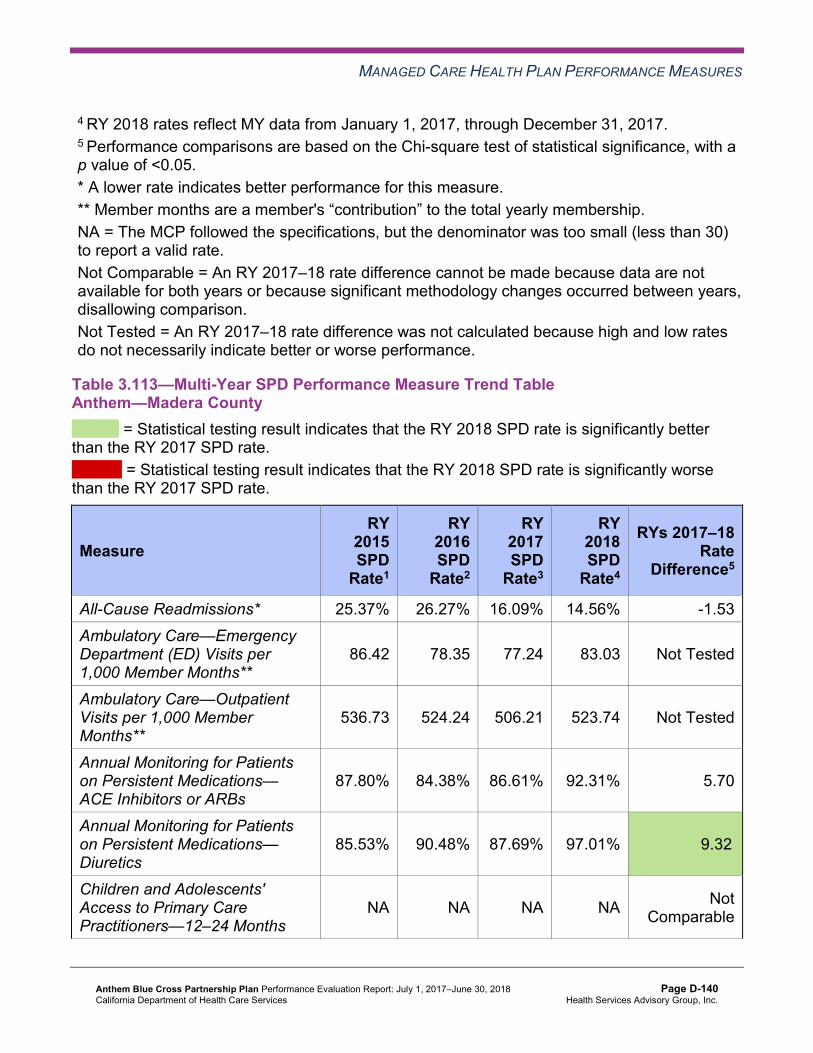
MANAGED CARE HEALTH PLAN PERFORMANCE MEASURES
4 RY 2018 rates reflect MY data from January 1, 2017, through December 31, 2017. 5 Performance comparisons are based on the Chi-square test of statistical significance, with a p value of <0.05. * A lower rate indicates better performance for this measure. ** Member months are a member's “contribution” to the total yearly membership. NA = The MCP followed the specifications, but the denominator was too small (less than 30) to report a valid rate. Not Comparable = An RY 2017–18 rate difference cannot be made because data are not available for both years or because significant methodology changes occurred between years, disallowing comparison. Not Tested = An RY 2017–18 rate difference was not calculated because high and low rates do not necessarily indicate better or worse performance.
Table 3.113—Multi-Year SPD Performance Measure Trend Table Anthem—Madera County
B = Statistical testing result indicates that the RY 2018 SPD rate is significantly better than the RY 2017 SPD rate.
W = Statistical testing result indicates that the RY 2018 SPD rate is significantly worse than the RY 2017 SPD rate.
Measure RY
2015 SPD
Rate1
RY 2016 SPD
Rate2
RY 2017 SPD
Rate3
RY 2018 SPD
Rate4
RYs 2017–18 Rate
Difference5
All-Cause Readmissions* 25.37% 26.27% 16.09% 14.56% -1.53 Ambulatory Care—Emergency Department (ED) Visits per 1,000 Member Months**
86.42 78.35 77.24 83.03 Not Tested
Ambulatory Care—Outpatient Visits per 1,000 Member Months**
536.73 524.24 506.21 523.74 Not Tested
Annual Monitoring for Patients on Persistent Medications— ACE Inhibitors or ARBs
87.80% 84.38% 86.61% 92.31% 5.70
Annual Monitoring for Patients on Persistent Medications— Diuretics
85.53% 90.48% 87.69% 97.01% 9.32B
Children and Adolescents' Access to Primary Care Practitioners—12–24 Months
NA NA NA NA Not Comparable
Anthem Blue Cross Partnership Plan Performance Evaluation Report: July 1, 2017–June 30, 2018 California Department of Health Care Services
Page D-140 Health Services Advisory Group, Inc.

MANAGED CARE HEALTH PLAN PERFORMANCE MEASURES
Measure RY
2015 SPD
Rate1
RY 2016 SPD
Rate2
RY 2017 SPD
Rate3
RY 2018 SPD
Rate4
RYs 2017–18 Rate
Difference5
Children and Adolescents' Access to Primary Care Practitioners— 25 Months–6 Years
97.44% 100.00% 83.33% NA Not Comparable
Children and Adolescents' Access to Primary Care Practitioners—7–11 Years
96.67% 93.55% 92.06% 94.83% 2.77
Children and Adolescents' Access to Primary Care Practitioners—12–19 Years
88.17% 80.68% 87.36% 83.91% -3.45
1 RY 2015 rates reflect MY data from January 1, 2014, through December 31, 2014. 2 RY 2016 rates reflect MY data from January 1, 2015, through December 31, 2015. 3 RY 2017 rates reflect MY data from January 1, 2016, through December 31, 2016. 4 RY 2018 rates reflect MY data from January 1, 2017, through December 31, 2017. 5 Performance comparisons are based on the Chi-square test of statistical significance, with a p value of <0.05. * A lower rate indicates better performance for this measure. ** Member months are a member's “contribution” to the total yearly membership. NA = The MCP followed the specifications, but the denominator was too small (less than 30) to report a valid rate. Not Comparable = An RY 2017–18 rate difference cannot be made because data are not available for both years or because significant methodology changes occurred between years, disallowing comparison. Not Tested = An RY 2017–18 rate difference was not calculated because high and low rates do not necessarily indicate better or worse performance.
Anthem Blue Cross Partnership Plan Performance Evaluation Report: July 1, 2017–June 30, 2018 California Department of Health Care Services
Page D-141 Health Services Advisory Group, Inc.
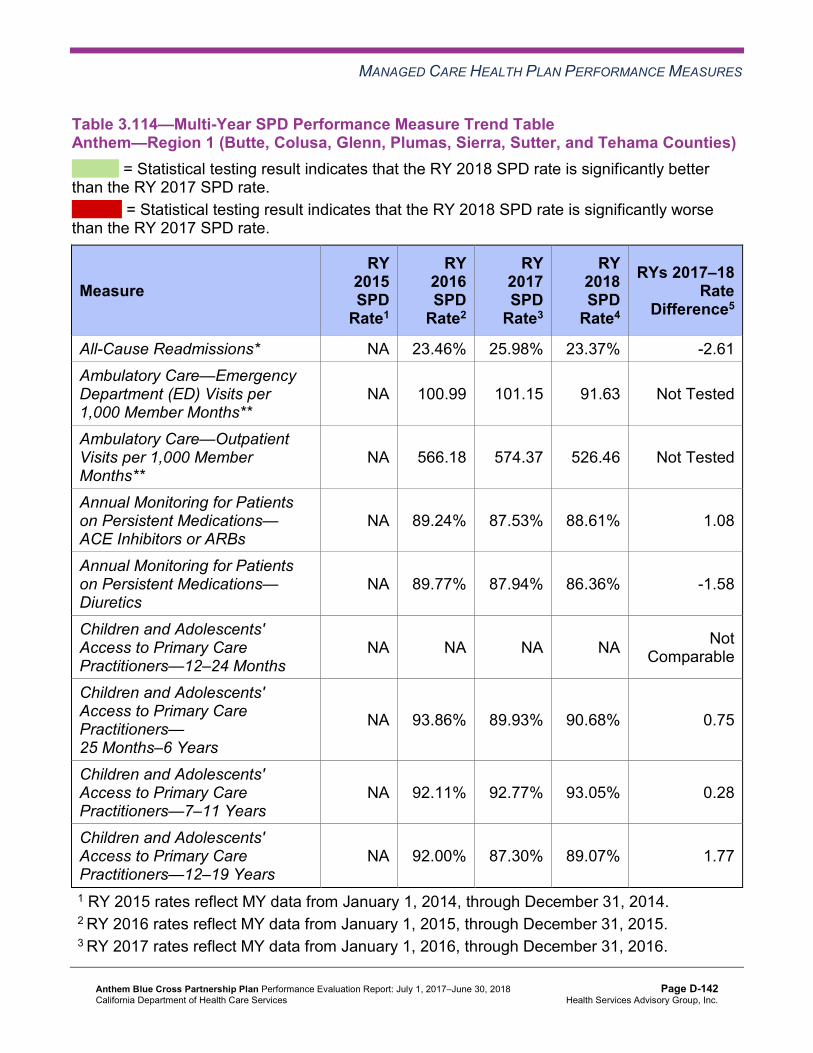
MANAGED CARE HEALTH PLAN PERFORMANCE MEASURES
Table 3.114—Multi-Year SPD Performance Measure Trend Table Anthem—Region 1 (Butte, Colusa, Glenn, Plumas, Sierra, Sutter, and Tehama Counties)
B = Statistical testing result indicates that the RY 2018 SPD rate is significantly better than the RY 2017 SPD rate.
W = Statistical testing result indicates that the RY 2018 SPD rate is significantly worse than the RY 2017 SPD rate.
Measure RY
2015 SPD
Rate1
RY 2016 SPD
Rate2
RY 2017 SPD
Rate3
RY 2018 SPD
Rate4
RYs 2017–18 Rate
Difference5
All-Cause Readmissions* NA 23.46% 25.98% 23.37% -2.61 Ambulatory Care—Emergency Department (ED) Visits per 1,000 Member Months**
NA 100.99 101.15 91.63 Not Tested
Ambulatory Care—Outpatient Visits per 1,000 Member Months**
NA 566.18 574.37 526.46 Not Tested
Annual Monitoring for Patients on Persistent Medications— ACE Inhibitors or ARBs
NA 89.24% 87.53% 88.61% 1.08
Annual Monitoring for Patients on Persistent Medications— Diuretics
NA 89.77% 87.94% 86.36% -1.58
Children and Adolescents' Access to Primary Care Practitioners—12–24 Months
NA NA NA NA Not Comparable
Children and Adolescents' Access to Primary Care Practitioners— 25 Months–6 Years
NA 93.86% 89.93% 90.68% 0.75
Children and Adolescents' Access to Primary Care Practitioners—7–11 Years
NA 92.11% 92.77% 93.05% 0.28
Children and Adolescents' Access to Primary Care Practitioners—12–19 Years
NA 92.00% 87.30% 89.07% 1.77
1 RY 2015 rates reflect MY data from January 1, 2014, through December 31, 2014. 2 RY 2016 rates reflect MY data from January 1, 2015, through December 31, 2015. 3 RY 2017 rates reflect MY data from January 1, 2016, through December 31, 2016.
Anthem Blue Cross Partnership Plan Performance Evaluation Report: July 1, 2017–June 30, 2018 California Department of Health Care Services
Page D-142 Health Services Advisory Group, Inc.

MANAGED CARE HEALTH PLAN PERFORMANCE MEASURES
4 RY 2018 rates reflect MY data from January 1, 2017, through December 31, 2017. 5 Performance comparisons are based on the Chi-square test of statistical significance, with a p value of <0.05. * A lower rate indicates better performance for this measure. ** Member months are a member's “contribution” to the total yearly membership. NA = The MCP followed the specifications, but the denominator was too small (less than 30) to report a valid rate. Not Comparable = An RY 2017–18 rate difference cannot be made because data are not available for both years or because significant methodology changes occurred between years, disallowing comparison. Not Tested = An RY 2017–18 rate difference was not calculated because high and low rates do not necessarily indicate better or worse performance.
Table 3.115—Multi-Year SPD Performance Measure Trend Table Anthem—Region 2 (Alpine, Amador, Calaveras, El Dorado, Inyo, Mariposa, Mono,Nevada, Placer, Tuolumne, and Yuba Counties)
B = Statistical testing result indicates that the RY 2018 SPD rate is significantly better than the RY 2017 SPD rate.
W = Statistical testing result indicates that the RY 2018 SPD rate is significantly worse than the RY 2017 SPD rate.
Measure RY
2015 SPD
Rate1
RY 2016 SPD
Rate2
RY 2017 SPD
Rate3
RY 2018 SPD
Rate4
RYs 2017–18 Rate
Difference5
All-Cause Readmissions* NA 19.69% 18.11% 18.16% 0.05 Ambulatory Care—Emergency Department (ED) Visits per 1,000 Member Months**
NA 91.71 90.22 90.05 Not Tested
Ambulatory Care—Outpatient Visits per 1,000 Member Months**
NA 416.86 437.37 436.87 Not Tested
Annual Monitoring for Patients on Persistent Medications— ACE Inhibitors or ARBs
NA 82.32% 86.94% 87.93% 0.99
Annual Monitoring for Patients on Persistent Medications— Diuretics
NA 83.80% 87.21% 89.20% 1.99
Anthem Blue Cross Partnership Plan Performance Evaluation Report: July 1, 2017–June 30, 2018 California Department of Health Care Services
Page D-143 Health Services Advisory Group, Inc.
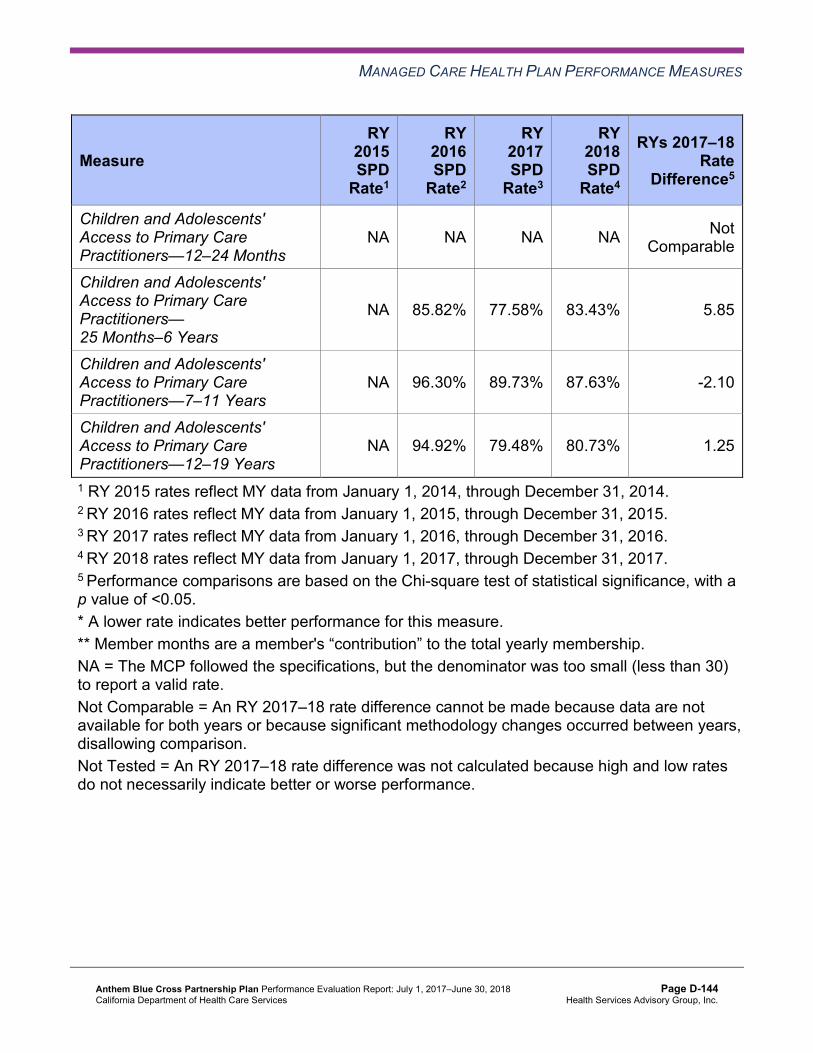
MANAGED CARE HEALTH PLAN PERFORMANCE MEASURES
Measure RY
2015 SPD
Rate1
RY 2016 SPD
Rate2
RY 2017 SPD
Rate3
RY 2018 SPD
Rate4
RYs 2017–18 Rate
Difference5
Children and Adolescents' Access to Primary Care Practitioners—12–24 Months
NA NA NA NA Not Comparable
Children and Adolescents' Access to Primary Care Practitioners— 25 Months–6 Years
NA 85.82% 77.58% 83.43% 5.85
Children and Adolescents' Access to Primary Care Practitioners—7–11 Years
NA 96.30% 89.73% 87.63% -2.10
Children and Adolescents' Access to Primary Care Practitioners—12–19 Years
NA 94.92% 79.48% 80.73% 1.25
1 RY 2015 rates reflect MY data from January 1, 2014, through December 31, 2014. 2 RY 2016 rates reflect MY data from January 1, 2015, through December 31, 2015. 3 RY 2017 rates reflect MY data from January 1, 2016, through December 31, 2016. 4 RY 2018 rates reflect MY data from January 1, 2017, through December 31, 2017. 5 Performance comparisons are based on the Chi-square test of statistical significance, with a p value of <0.05. * A lower rate indicates better performance for this measure. ** Member months are a member's “contribution” to the total yearly membership. NA = The MCP followed the specifications, but the denominator was too small (less than 30) to report a valid rate. Not Comparable = An RY 2017–18 rate difference cannot be made because data are not available for both years or because significant methodology changes occurred between years, disallowing comparison. Not Tested = An RY 2017–18 rate difference was not calculated because high and low rates do not necessarily indicate better or worse performance.
Anthem Blue Cross Partnership Plan Performance Evaluation Report: July 1, 2017–June 30, 2018 California Department of Health Care Services
Page D-144 Health Services Advisory Group, Inc.
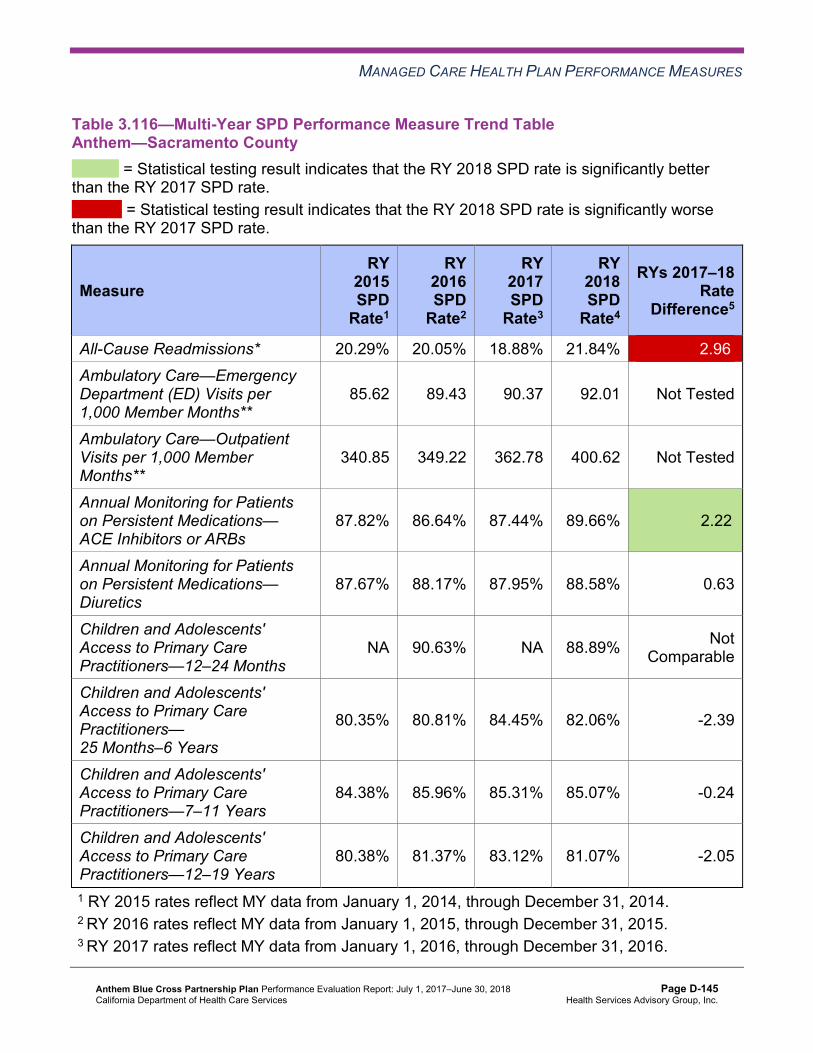
MANAGED CARE HEALTH PLAN PERFORMANCE MEASURES
Table 3.116—Multi-Year SPD Performance Measure Trend Table Anthem—Sacramento County
B = Statistical testing result indicates that the RY 2018 SPD rate is significantly better than the RY 2017 SPD rate.
W = Statistical testing result indicates that the RY 2018 SPD rate is significantly worse than the RY 2017 SPD rate.
Measure RY
2015 SPD
Rate1
RY 2016 SPD
Rate2
RY 2017 SPD
Rate3
RY 2018 SPD
Rate4
RYs 2017–18 Rate
Difference5
All-Cause Readmissions* 20.29% 20.05% 18.88% 21.84% 2.96W
Ambulatory Care—Emergency Department (ED) Visits per 1,000 Member Months**
85.62 89.43 90.37 92.01 Not Tested
Ambulatory Care—Outpatient Visits per 1,000 Member Months**
340.85 349.22 362.78 400.62 Not Tested
Annual Monitoring for Patients on Persistent Medications— ACE Inhibitors or ARBs
87.82% 86.64% 87.44% 89.66% 2.22B
Annual Monitoring for Patients on Persistent Medications— Diuretics
87.67% 88.17% 87.95% 88.58% 0.63
Children and Adolescents' Access to Primary Care Practitioners—12–24 Months
NA 90.63% NA 88.89% Not Comparable
Children and Adolescents' Access to Primary Care Practitioners— 25 Months–6 Years
80.35% 80.81% 84.45% 82.06% -2.39
Children and Adolescents' Access to Primary Care Practitioners—7–11 Years
84.38% 85.96% 85.31% 85.07% -0.24
Children and Adolescents' Access to Primary Care Practitioners—12–19 Years
80.38% 81.37% 83.12% 81.07% -2.05
1 RY 2015 rates reflect MY data from January 1, 2014, through December 31, 2014. 2 RY 2016 rates reflect MY data from January 1, 2015, through December 31, 2015. 3 RY 2017 rates reflect MY data from January 1, 2016, through December 31, 2016.
Anthem Blue Cross Partnership Plan Performance Evaluation Report: July 1, 2017–June 30, 2018 California Department of Health Care Services
Page D-145 Health Services Advisory Group, Inc.

MANAGED CARE HEALTH PLAN PERFORMANCE MEASURES
4 RY 2018 rates reflect MY data from January 1, 2017, through December 31, 2017. 5 Performance comparisons are based on the Chi-square test of statistical significance, with a p value of <0.05. * A lower rate indicates better performance for this measure. ** Member months are a member's “contribution” to the total yearly membership. NA = The MCP followed the specifications, but the denominator was too small (less than 30) to report a valid rate. Not Comparable = An RY 2017–18 rate difference cannot be made because data are not available for both years or because significant methodology changes occurred between years, disallowing comparison. Not Tested = An RY 2017–18 rate difference was not calculated because high and low rates do not necessarily indicate better or worse performance.
Table 3.117—Multi-Year SPD Performance Measure Trend Table Anthem—San Benito County
B = Statistical testing result indicates that the RY 2018 SPD rate is significantly better than the RY 2017 SPD rate.
W = Statistical testing result indicates that the RY 2018 SPD rate is significantly worse than the RY 2017 SPD rate.
Measure RY
2015 SPD
Rate1
RY 2016 SPD
Rate2
RY 2017 SPD
Rate3
RY 2018 SPD
Rate4
RYs 2017–18 Rate
Difference5
All-Cause Readmissions* NA NA NA NA Not Comparable
Ambulatory Care—Emergency Department (ED) Visits per 1,000 Member Months**
S 142.86 125.79 70.85 Not Tested
Ambulatory Care—Outpatient Visits per 1,000 Member Months**
308.82 566.82 454.40 421.60 Not Tested
Annual Monitoring for Patients on Persistent Medications— ACE Inhibitors or ARBs
NA NA NA NA Not Comparable
Annual Monitoring for Patients on Persistent Medications— Diuretics
NA NA NA NA Not Comparable
Anthem Blue Cross Partnership Plan Performance Evaluation Report: July 1, 2017–June 30, 2018 California Department of Health Care Services
Page D-146 Health Services Advisory Group, Inc.
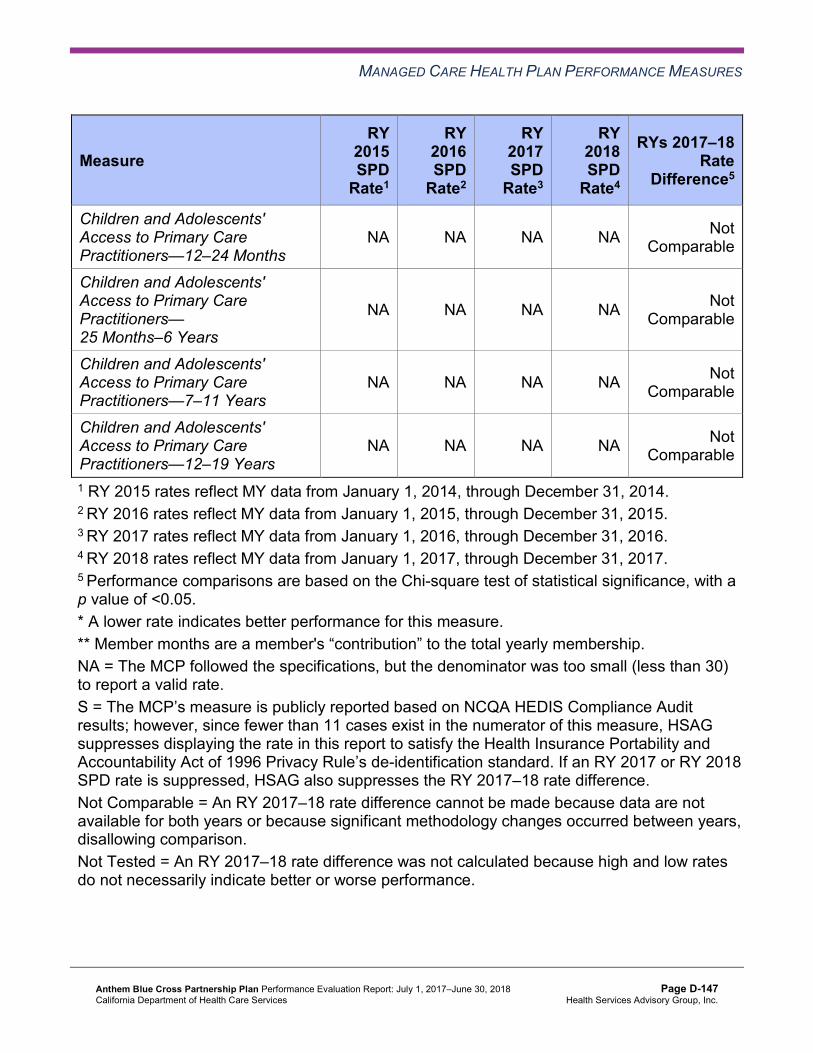
MANAGED CARE HEALTH PLAN PERFORMANCE MEASURES
Measure RY
2015 SPD
Rate1
RY 2016 SPD
Rate2
RY 2017 SPD
Rate3
RY 2018 SPD
Rate4
RYs 2017–18 Rate
Difference5
Children and Adolescents' Access to Primary Care Practitioners—12–24 Months
NA NA NA NA Not Comparable
Children and Adolescents' Access to Primary Care Practitioners— 25 Months–6 Years
NA NA NA NA Not Comparable
Children and Adolescents' Access to Primary Care Practitioners—7–11 Years
NA NA NA NA Not Comparable
Children and Adolescents' Access to Primary Care Practitioners—12–19 Years
NA NA NA NA Not Comparable
1 RY 2015 rates reflect MY data from January 1, 2014, through December 31, 2014. 2 RY 2016 rates reflect MY data from January 1, 2015, through December 31, 2015. 3 RY 2017 rates reflect MY data from January 1, 2016, through December 31, 2016. 4 RY 2018 rates reflect MY data from January 1, 2017, through December 31, 2017. 5 Performance comparisons are based on the Chi-square test of statistical significance, with a p value of <0.05. * A lower rate indicates better performance for this measure. ** Member months are a member's “contribution” to the total yearly membership. NA = The MCP followed the specifications, but the denominator was too small (less than 30) to report a valid rate. S = The MCP’s measure is publicly reported based on NCQA HEDIS Compliance Audit results; however, since fewer than 11 cases exist in the numerator of this measure, HSAG suppresses displaying the rate in this report to satisfy the Health Insurance Portability and Accountability Act of 1996 Privacy Rule’s de-identification standard. If an RY 2017 or RY 2018 SPD rate is suppressed, HSAG also suppresses the RY 2017–18 rate difference. Not Comparable = An RY 2017–18 rate difference cannot be made because data are not available for both years or because significant methodology changes occurred between years, disallowing comparison. Not Tested = An RY 2017–18 rate difference was not calculated because high and low rates do not necessarily indicate better or worse performance.
Anthem Blue Cross Partnership Plan Performance Evaluation Report: July 1, 2017–June 30, 2018 California Department of Health Care Services
Page D-147 Health Services Advisory Group, Inc.
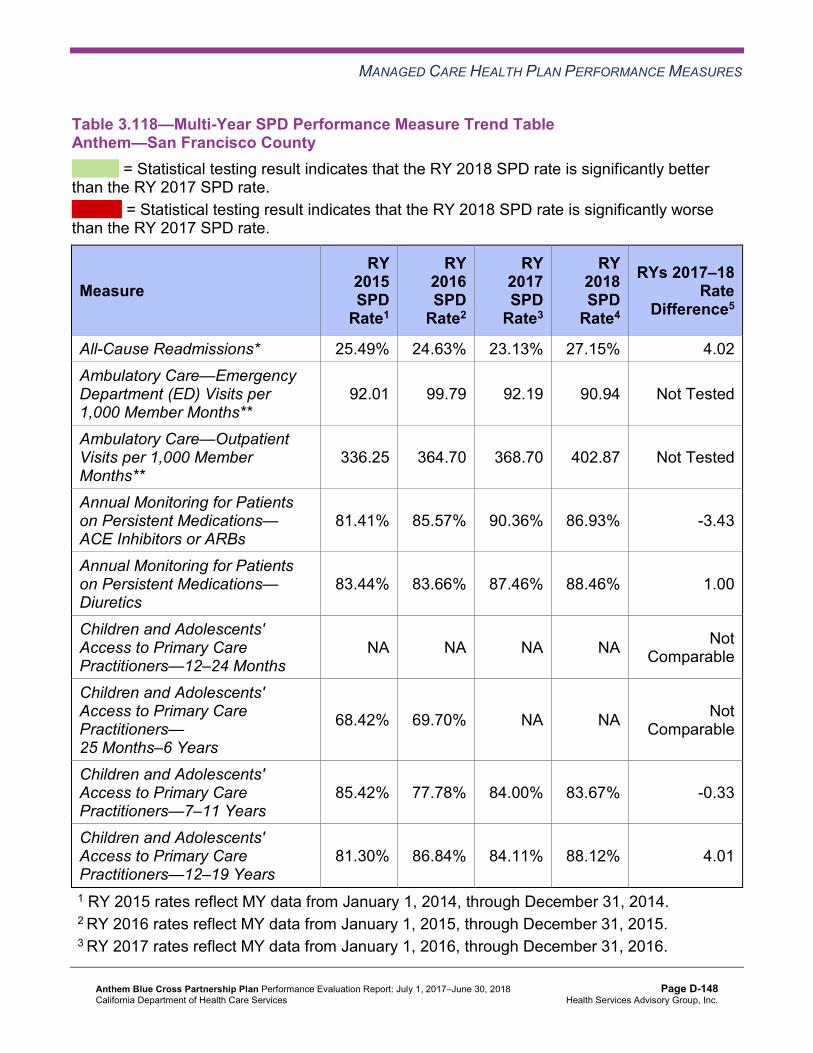
MANAGED CARE HEALTH PLAN PERFORMANCE MEASURES
Table 3.118—Multi-Year SPD Performance Measure Trend Table Anthem—San Francisco County
B = Statistical testing result indicates that the RY 2018 SPD rate is significantly better than the RY 2017 SPD rate.
W = Statistical testing result indicates that the RY 2018 SPD rate is significantly worse than the RY 2017 SPD rate.
Measure RY
2015 SPD
Rate1
RY 2016 SPD
Rate2
RY 2017 SPD
Rate3
RY 2018 SPD
Rate4
RYs 2017–18 Rate
Difference5
All-Cause Readmissions* 25.49% 24.63% 23.13% 27.15% 4.02 Ambulatory Care—Emergency Department (ED) Visits per 1,000 Member Months**
92.01 99.79 92.19 90.94 Not Tested
Ambulatory Care—Outpatient Visits per 1,000 Member Months**
336.25 364.70 368.70 402.87 Not Tested
Annual Monitoring for Patients on Persistent Medications— ACE Inhibitors or ARBs
81.41% 85.57% 90.36% 86.93% -3.43
Annual Monitoring for Patients on Persistent Medications— Diuretics
83.44% 83.66% 87.46% 88.46% 1.00
Children and Adolescents' Access to Primary Care Practitioners—12–24 Months
NA NA NA NA Not Comparable
Children and Adolescents' Access to Primary Care Practitioners— 25 Months–6 Years
68.42% 69.70% NA NA Not Comparable
Children and Adolescents' Access to Primary Care Practitioners—7–11 Years
85.42% 77.78% 84.00% 83.67% -0.33
Children and Adolescents' Access to Primary Care Practitioners—12–19 Years
81.30% 86.84% 84.11% 88.12% 4.01
1 RY 2015 rates reflect MY data from January 1, 2014, through December 31, 2014. 2 RY 2016 rates reflect MY data from January 1, 2015, through December 31, 2015. 3 RY 2017 rates reflect MY data from January 1, 2016, through December 31, 2016.
Anthem Blue Cross Partnership Plan Performance Evaluation Report: July 1, 2017–June 30, 2018 California Department of Health Care Services
Page D-148 Health Services Advisory Group, Inc.

MANAGED CARE HEALTH PLAN PERFORMANCE MEASURES
4 RY 2018 rates reflect MY data from January 1, 2017, through December 31, 2017. 5 Performance comparisons are based on the Chi-square test of statistical significance, with a p value of <0.05. * A lower rate indicates better performance for this measure. ** Member months are a member's “contribution” to the total yearly membership. NA = The MCP followed the specifications, but the denominator was too small (less than 30) to report a valid rate. Not Comparable = An RY 2017–18 rate difference cannot be made because data are not available for both years or because significant methodology changes occurred between years, disallowing comparison. Not Tested = An RY 2017–18 rate difference was not calculated because high and low rates do not necessarily indicate better or worse performance.
Table 3.119—Multi-Year SPD Performance Measure Trend Table Anthem—Santa Clara County
B = Statistical testing result indicates that the RY 2018 SPD rate is significantly better than the RY 2017 SPD rate.
W = Statistical testing result indicates that the RY 2018 SPD rate is significantly worse than the RY 2017 SPD rate.
Measure RY
2015 SPD
Rate1
RY 2016 SPD
Rate2
RY 2017 SPD
Rate3
RY 2018 SPD
Rate4
RYs 2017–18 Rate
Difference5
All-Cause Readmissions* 19.38% 16.64% 17.90% 16.54% -1.36 Ambulatory Care—Emergency Department (ED) Visits per 1,000 Member Months**
66.24 61.69 57.50 60.67 Not Tested
Ambulatory Care—Outpatient Visits per 1,000 Member Months**
311.19 326.21 332.38 326.26 Not Tested
Annual Monitoring for Patients on Persistent Medications— ACE Inhibitors or ARBs
85.50% 88.35% 90.07% 88.77% -1.30
Annual Monitoring for Patients on Persistent Medications— Diuretics
85.44% 89.70% 91.26% 92.36% 1.10
Children and Adolescents' Access to Primary Care Practitioners—12–24 Months
NA NA NA NA Not Comparable
Anthem Blue Cross Partnership Plan Performance Evaluation Report: July 1, 2017–June 30, 2018 California Department of Health Care Services
Page D-149 Health Services Advisory Group, Inc.

MANAGED CARE HEALTH PLAN PERFORMANCE MEASURES
Measure RY
2015 SPD
Rate1
RY 2016 SPD
Rate2
RY 2017 SPD
Rate3
RY 2018 SPD
Rate4
RYs 2017–18 Rate
Difference5
Children and Adolescents' Access to Primary Care Practitioners— 25 Months–6 Years
74.68% 75.76% 74.71% 76.74% 2.03
Children and Adolescents' Access to Primary Care Practitioners—7–11 Years
84.87% 82.04% 77.51% 80.00% 2.49
Children and Adolescents' Access to Primary Care Practitioners—12–19 Years
80.27% 77.13% 75.17% 80.82% 5.65
1 RY 2015 rates reflect MY data from January 1, 2014, through December 31, 2014. 2 RY 2016 rates reflect MY data from January 1, 2015, through December 31, 2015. 3 RY 2017 rates reflect MY data from January 1, 2016, through December 31, 2016. 4 RY 2018 rates reflect MY data from January 1, 2017, through December 31, 2017. 5 Performance comparisons are based on the Chi-square test of statistical significance, with a p value of <0.05. * A lower rate indicates better performance for this measure. ** Member months are a member's “contribution” to the total yearly membership. NA = The MCP followed the specifications, but the denominator was too small (less than 30) to report a valid rate. Not Comparable = An RY 2017–18 rate difference cannot be made because data are not available for both years or because significant methodology changes occurred between years, disallowing comparison. Not Tested = An RY 2017–18 rate difference was not calculated because high and low rates do not necessarily indicate better or worse performance.
Anthem Blue Cross Partnership Plan Performance Evaluation Report: July 1, 2017–June 30, 2018 California Department of Health Care Services
Page D-150 Health Services Advisory Group, Inc.

MANAGED CARE HEALTH PLAN PERFORMANCE MEASURES
Table 3.120—Multi-Year SPD Performance Measure Trend Table Anthem—Tulare County
B = Statistical testing result indicates that the RY 2018 SPD rate is significantly better than the RY 2017 SPD rate.
W = Statistical testing result indicates that the RY 2018 SPD rate is significantly worse than the RY 2017 SPD rate.
Measure RY
2015 SPD
Rate1
RY 2016 SPD
Rate2
RY 2017 SPD
Rate3
RY 2018 SPD
Rate4
RYs 2017–18 Rate
Difference5
All-Cause Readmissions* 21.19% 20.73% 21.68% 19.84% -1.84 Ambulatory Care—Emergency Department (ED) Visits per 1,000 Member Months**
92.92 81.03 77.86 75.53 Not Tested
Ambulatory Care—Outpatient Visits per 1,000 Member Months**
571.12 519.48 548.38 548.61 Not Tested
Annual Monitoring for Patients on Persistent Medications— ACE Inhibitors or ARBs
85.03% 86.81% 91.20% 90.09% -1.11
Annual Monitoring for Patients on Persistent Medications— Diuretics
86.70% 92.70% 89.22% 92.17% 2.95
Children and Adolescents' Access to Primary Care Practitioners—12–24 Months
NA NA NA NA Not Comparable
Children and Adolescents' Access to Primary Care Practitioners— 25 Months–6 Years
93.26% 92.16% 92.09% 92.61% 0.52
Children and Adolescents' Access to Primary Care Practitioners—7–11 Years
89.50% 92.25% 93.42% 94.12% 0.70
Children and Adolescents' Access to Primary Care Practitioners—12–19 Years
90.29% 90.32% 91.97% 91.40% -0.57
1 RY 2015 rates reflect MY data from January 1, 2014, through December 31, 2014. 2 RY 2016 rates reflect MY data from January 1, 2015, through December 31, 2015. 3 RY 2017 rates reflect MY data from January 1, 2016, through December 31, 2016.
Anthem Blue Cross Partnership Plan Performance Evaluation Report: July 1, 2017–June 30, 2018 California Department of Health Care Services
Page D-151 Health Services Advisory Group, Inc.
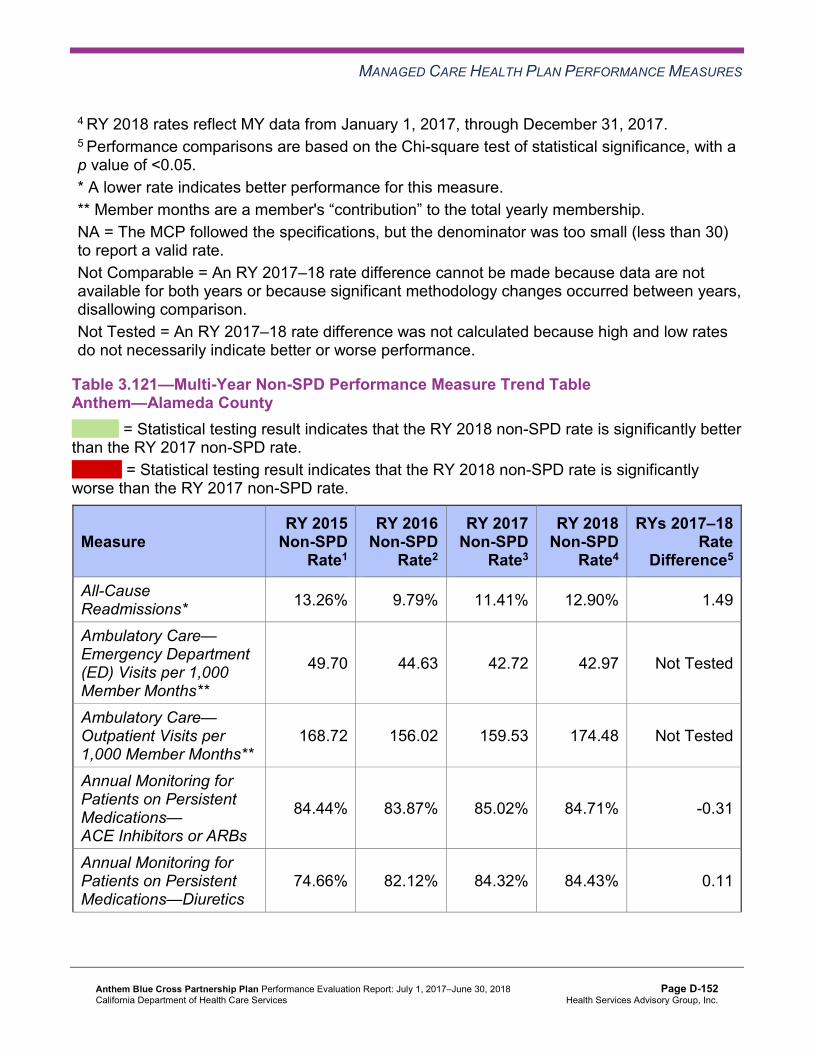
MANAGED CARE HEALTH PLAN PERFORMANCE MEASURES
4 RY 2018 rates reflect MY data from January 1, 2017, through December 31, 2017. 5 Performance comparisons are based on the Chi-square test of statistical significance, with a p value of <0.05. * A lower rate indicates better performance for this measure. ** Member months are a member's “contribution” to the total yearly membership. NA = The MCP followed the specifications, but the denominator was too small (less than 30) to report a valid rate. Not Comparable = An RY 2017–18 rate difference cannot be made because data are not available for both years or because significant methodology changes occurred between years, disallowing comparison. Not Tested = An RY 2017–18 rate difference was not calculated because high and low rates do not necessarily indicate better or worse performance.
Table 3.121—Multi-Year Non-SPD Performance Measure Trend Table Anthem—Alameda County
B = Statistical testing result indicates that the RY 2018 non-SPD rate is significantly better than the RY 2017 non-SPD rate.
W = Statistical testing result indicates that the RY 2018 non-SPD rate is significantly worse than the RY 2017 non-SPD rate.
Measure RY 2015
Non-SPD Rate1
RY 2016 Non-SPD
Rate2
RY 2017 Non-SPD
Rate3
RY 2018 Non-SPD
Rate4
RYs 2017–18 Rate
Difference5
All-Cause Readmissions* 13.26% 9.79% 11.41% 12.90% 1.49
Ambulatory Care— Emergency Department (ED) Visits per 1,000 Member Months**
49.70 44.63 42.72 42.97 Not Tested
Ambulatory Care— Outpatient Visits per 1,000 Member Months**
168.72 156.02 159.53 174.48 Not Tested
Annual Monitoring for Patients on Persistent Medications— ACE Inhibitors or ARBs
84.44% 83.87% 85.02% 84.71% -0.31
Annual Monitoring for Patients on Persistent Medications—Diuretics
74.66% 82.12% 84.32% 84.43% 0.11
Anthem Blue Cross Partnership Plan Performance Evaluation Report: July 1, 2017–June 30, 2018 California Department of Health Care Services
Page D-152 Health Services Advisory Group, Inc.
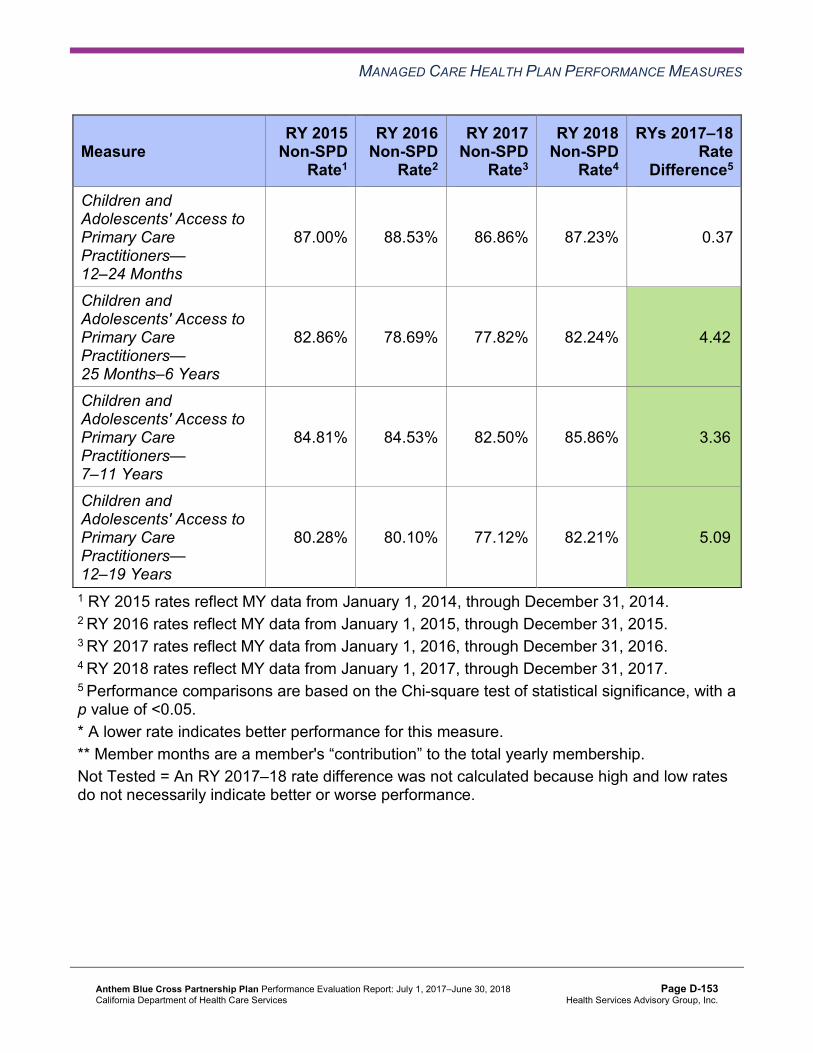
MANAGED CARE HEALTH PLAN PERFORMANCE MEASURES
Measure RY 2015
Non-SPD Rate1
RY 2016 Non-SPD
Rate2
RY 2017 Non-SPD
Rate3
RY 2018 Non-SPD
Rate4
RYs 2017–18 Rate
Difference5
Children and Adolescents' Access to Primary Care Practitioners— 12–24 Months
87.00% 88.53% 86.86% 87.23% 0.37
Children and Adolescents' Access to Primary Care Practitioners— 25 Months–6 Years
82.86% 78.69% 77.82% 82.24% 4.42B
Children and Adolescents' Access to Primary Care Practitioners— 7–11 Years
84.81% 84.53% 82.50% 85.86% 3.36B
Children and Adolescents' Access to Primary Care Practitioners— 12–19 Years
80.28% 80.10% 77.12% 82.21% 5.09B
1 RY 2015 rates reflect MY data from January 1, 2014, through December 31, 2014. 2 RY 2016 rates reflect MY data from January 1, 2015, through December 31, 2015. 3 RY 2017 rates reflect MY data from January 1, 2016, through December 31, 2016. 4 RY 2018 rates reflect MY data from January 1, 2017, through December 31, 2017. 5 Performance comparisons are based on the Chi-square test of statistical significance, with a p value of <0.05. * A lower rate indicates better performance for this measure. ** Member months are a member's “contribution” to the total yearly membership. Not Tested = An RY 2017–18 rate difference was not calculated because high and low rates do not necessarily indicate better or worse performance.
Anthem Blue Cross Partnership Plan Performance Evaluation Report: July 1, 2017–June 30, 2018 California Department of Health Care Services
Page D-153 Health Services Advisory Group, Inc.

MANAGED CARE HEALTH PLAN PERFORMANCE MEASURES
Table 3.122—Multi-Year Non-SPD Performance Measure Trend Table Anthem—Contra Costa County
B = Statistical testing result indicates that the RY 2018 non-SPD rate is significantly better than the RY 2017 non-SPD rate.
W = Statistical testing result indicates that the RY 2018 non-SPD rate is significantly worse than the RY 2017 non-SPD rate.
Measure RY 2015
Non-SPD Rate1
RY 2016 Non-SPD
Rate2
RY 2017 Non-SPD
Rate3
RY 2018 Non-SPD
Rate4
RYs 2017–18 Rate
Difference5
All-Cause Readmissions* 13.75% 12.01% 13.22% 19.70% 6.48W
Ambulatory Care— Emergency Department (ED) Visits per 1,000 Member Months**
53.97 45.85 42.40 41.99 Not Tested
Ambulatory Care— Outpatient Visits per 1,000 Member Months**
191.29 159.08 158.94 182.96 Not Tested
Annual Monitoring for Patients on Persistent Medications— ACE Inhibitors or ARBs
79.17% 84.01% 82.60% 83.00% 0.40
Annual Monitoring for Patients on Persistent Medications—Diuretics
76.47% 86.74% 77.27% 85.78% 8.51B
Children and Adolescents' Access to Primary Care Practitioners— 12–24 Months
93.82% 90.85% 89.29% 94.24% 4.95B
Children and Adolescents' Access to Primary Care Practitioners— 25 Months–6 Years
85.36% 83.55% 81.97% 89.88% 7.91B
Children and Adolescents' Access to Primary Care Practitioners— 7–11 Years
88.73% 87.70% 85.70% 89.22% 3.52B
Anthem Blue Cross Partnership Plan Performance Evaluation Report: July 1, 2017–June 30, 2018 California Department of Health Care Services
Page D-154 Health Services Advisory Group, Inc.

MANAGED CARE HEALTH PLAN PERFORMANCE MEASURES
Measure RY 2015
Non-SPD Rate1
RY 2016 Non-SPD
Rate2
RY 2017 Non-SPD
Rate3
RY 2018 Non-SPD
Rate4
RYs 2017–18 Rate
Difference5
Children and Adolescents' Access to Primary Care Practitioners— 12–19 Years
87.49% 84.20% 81.84% 86.23% 4.39B
1 RY 2015 rates reflect MY data from January 1, 2014, through December 31, 2014. 2 RY 2016 rates reflect MY data from January 1, 2015, through December 31, 2015. 3 RY 2017 rates reflect MY data from January 1, 2016, through December 31, 2016. 4 RY 2018 rates reflect MY data from January 1, 2017, through December 31, 2017. 5 Performance comparisons are based on the Chi-square test of statistical significance, with a p value of <0.05. * A lower rate indicates better performance for this measure. ** Member months are a member's “contribution” to the total yearly membership. Not Tested = An RY 2017–18 rate difference was not calculated because high and low rates do not necessarily indicate better or worse performance.
Table 3.123—Multi-Year Non-SPD Performance Measure Trend Table Anthem—Fresno County
B = Statistical testing result indicates that the RY 2018 non-SPD rate is significantly better than the RY 2017 non-SPD rate.
W = Statistical testing result indicates that the RY 2018 non-SPD rate is significantly worse than the RY 2017 non-SPD rate.
Measure RY 2015
Non-SPD Rate1
RY 2016 Non-SPD
Rate2
RY 2017 Non-SPD
Rate3
RY 2018 Non-SPD
Rate4
RYs 2017–18 Rate
Difference5
All-Cause Readmissions* 9.90% 12.05% 10.66% 11.64% 0.98
Ambulatory Care— Emergency Department (ED) Visits per 1,000 Member Months**
46.64 47.35 45.14 46.57 Not Tested
Ambulatory Care— Outpatient Visits per 1,000 Member Months**
214.46 210.71 210.43 231.59 Not Tested
Anthem Blue Cross Partnership Plan Performance Evaluation Report: July 1, 2017–June 30, 2018 California Department of Health Care Services
Page D-155 Health Services Advisory Group, Inc.

MANAGED CARE HEALTH PLAN PERFORMANCE MEASURES
Measure RY 2015
Non-SPD Rate1
RY 2016 Non-SPD
Rate2
RY 2017 Non-SPD
Rate3
RY 2018 Non-SPD
Rate4
RYs 2017–18 Rate
Difference5
Annual Monitoring for Patients on Persistent Medications— ACE Inhibitors or ARBs
80.12% 82.25% 85.56% 85.56% 0.00
Annual Monitoring for Patients on Persistent Medications—Diuretics
80.36% 81.87% 84.94% 85.45% 0.51
Children and Adolescents' Access to Primary Care Practitioners— 12–24 Months
92.83% 93.92% 92.81% 94.36% 1.55B
Children and Adolescents' Access to Primary Care Practitioners— 25 Months–6 Years
86.11% 84.82% 84.40% 84.84% 0.44
Children and Adolescents' Access to Primary Care Practitioners— 7–11 Years
85.47% 86.04% 84.71% 84.27% -0.44
Children and Adolescents' Access to Primary Care Practitioners— 12–19 Years
82.88% 82.34% 80.41% 80.11% -0.30
1 RY 2015 rates reflect MY data from January 1, 2014, through December 31, 2014. 2 RY 2016 rates reflect MY data from January 1, 2015, through December 31, 2015. 3 RY 2017 rates reflect MY data from January 1, 2016, through December 31, 2016. 4 RY 2018 rates reflect MY data from January 1, 2017, through December 31, 2017. 5 Performance comparisons are based on the Chi-square test of statistical significance, with a p value of <0.05. * A lower rate indicates better performance for this measure. ** Member months are a member's “contribution” to the total yearly membership. Not Tested = An RY 2017–18 rate difference was not calculated because high and low rates do not necessarily indicate better or worse performance.
Anthem Blue Cross Partnership Plan Performance Evaluation Report: July 1, 2017–June 30, 2018 California Department of Health Care Services
Page D-156 Health Services Advisory Group, Inc.
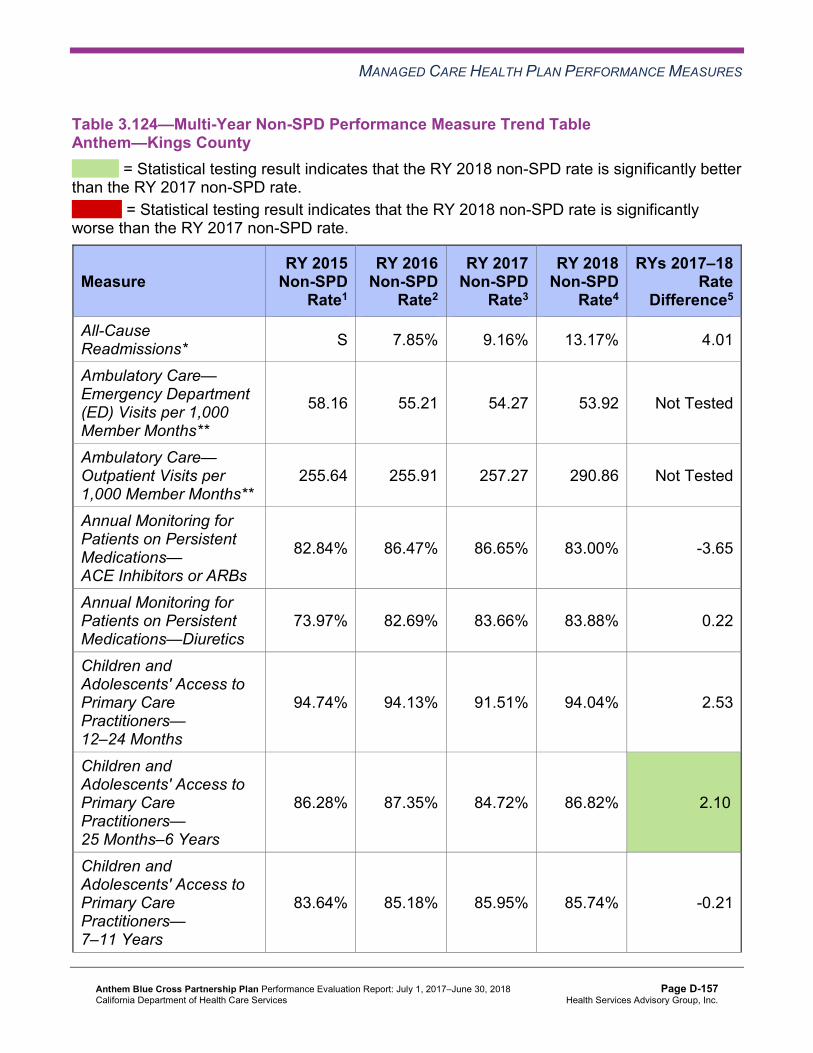
MANAGED CARE HEALTH PLAN PERFORMANCE MEASURES
Table 3.124—Multi-Year Non-SPD Performance Measure Trend Table Anthem—Kings County
B = Statistical testing result indicates that the RY 2018 non-SPD rate is significantly better than the RY 2017 non-SPD rate.
W = Statistical testing result indicates that the RY 2018 non-SPD rate is significantly worse than the RY 2017 non-SPD rate.
Measure RY 2015
Non-SPD Rate1
RY 2016 Non-SPD
Rate2
RY 2017 Non-SPD
Rate3
RY 2018 Non-SPD
Rate4
RYs 2017–18 Rate
Difference5
All-Cause Readmissions* S 7.85% 9.16% 13.17% 4.01
Ambulatory Care— Emergency Department (ED) Visits per 1,000 Member Months**
58.16 55.21 54.27 53.92 Not Tested
Ambulatory Care— Outpatient Visits per 1,000 Member Months**
255.64 255.91 257.27 290.86 Not Tested
Annual Monitoring for Patients on Persistent Medications— ACE Inhibitors or ARBs
82.84% 86.47% 86.65% 83.00% -3.65
Annual Monitoring for Patients on Persistent Medications—Diuretics
73.97% 82.69% 83.66% 83.88% 0.22
Children and Adolescents' Access to Primary Care Practitioners— 12–24 Months
94.74% 94.13% 91.51% 94.04% 2.53
Children and Adolescents' Access to Primary Care Practitioners— 25 Months–6 Years
86.28% 87.35% 84.72% 86.82% 2.10B
Children and Adolescents' Access to Primary Care Practitioners— 7–11 Years
83.64% 85.18% 85.95% 85.74% -0.21
Anthem Blue Cross Partnership Plan Performance Evaluation Report: July 1, 2017–June 30, 2018 California Department of Health Care Services
Page D-157 Health Services Advisory Group, Inc.

MANAGED CARE HEALTH PLAN PERFORMANCE MEASURES
Measure RY 2015
Non-SPD Rate1
RY 2016 Non-SPD
Rate2
RY 2017 Non-SPD
Rate3
RY 2018 Non-SPD
Rate4
RYs 2017–18 Rate
Difference5
Children and Adolescents' Access to Primary Care Practitioners— 12–19 Years
86.26% 84.82% 86.14% 84.92% -1.22
1 RY 2015 rates reflect MY data from January 1, 2014, through December 31, 2014. 2 RY 2016 rates reflect MY data from January 1, 2015, through December 31, 2015. 3 RY 2017 rates reflect MY data from January 1, 2016, through December 31, 2016. 4 RY 2018 rates reflect MY data from January 1, 2017, through December 31, 2017. 5 Performance comparisons are based on the Chi-square test of statistical significance, with a p value of <0.05. * A lower rate indicates better performance for this measure. ** Member months are a member's “contribution” to the total yearly membership. S = The MCP’s measure is publicly reported based on NCQA HEDIS Compliance Audit results; however, since fewer than 11 cases exist in the numerator of this measure, HSAG suppresses displaying the rate in this report to satisfy the Health Insurance Portability and Accountability Act of 1996 Privacy Rule’s de-identification standard. If an RY 2017 or RY 2018 non-SPD rate is suppressed, HSAG also suppresses the RY 2017–18 rate difference. Not Tested = An RY 2017–18 rate difference was not calculated because high and low rates do not necessarily indicate better or worse performance.
Anthem Blue Cross Partnership Plan Performance Evaluation Report: July 1, 2017–June 30, 2018 California Department of Health Care Services
Page D-158 Health Services Advisory Group, Inc.

MANAGED CARE HEALTH PLAN PERFORMANCE MEASURES
Table 3.125—Multi-Year Non-SPD Performance Measure Trend Table Anthem—Madera County
B = Statistical testing result indicates that the RY 2018 non-SPD rate is significantly better than the RY 2017 non-SPD rate.
W = Statistical testing result indicates that the RY 2018 non-SPD rate is significantly worse than the RY 2017 non-SPD rate.
Measure RY 2015
Non-SPD Rate1
RY 2016 Non-SPD
Rate2
RY 2017 Non-SPD
Rate3
RY 2018 Non-SPD
Rate4
RYs 2017–18 Rate
Difference5
All-Cause Readmissions* 17.35% 9.05% 11.11% 9.05% -2.06
Ambulatory Care— Emergency Department (ED) Visits per 1,000 Member Months**
53.49 49.19 48.60 47.38 Not Tested
Ambulatory Care— Outpatient Visits per 1,000 Member Months**
267.13 275.80 256.45 279.94 Not Tested
Annual Monitoring for Patients on Persistent Medications— ACE Inhibitors or ARBs
75.24% 81.55% 82.73% 77.94% -4.79
Annual Monitoring for Patients on Persistent Medications—Diuretics
79.55% 76.04% 85.11% 81.33% -3.78
Children and Adolescents' Access to Primary Care Practitioners— 12–24 Months
95.06% 97.06% 97.39% 97.73% 0.34
Children and Adolescents' Access to Primary Care Practitioners— 25 Months–6 Years
92.04% 93.01% 92.01% 91.01% -1.00
Children and Adolescents' Access to Primary Care Practitioners— 7–11 Years
90.19% 92.58% 93.15% 92.14% -1.01
Anthem Blue Cross Partnership Plan Performance Evaluation Report: July 1, 2017–June 30, 2018 California Department of Health Care Services
Page D-159 Health Services Advisory Group, Inc.

MANAGED CARE HEALTH PLAN PERFORMANCE MEASURES
Measure RY 2015
Non-SPD Rate1
RY 2016 Non-SPD
Rate2
RY 2017 Non-SPD
Rate3
RY 2018 Non-SPD
Rate4
RYs 2017–18 Rate
Difference5
Children and Adolescents' Access to Primary Care Practitioners— 12–19 Years
90.21% 89.60% 88.88% 89.11% 0.23
1 RY 2015 rates reflect MY data from January 1, 2014, through December 31, 2014. 2 RY 2016 rates reflect MY data from January 1, 2015, through December 31, 2015. 3 RY 2017 rates reflect MY data from January 1, 2016, through December 31, 2016. 4 RY 2018 rates reflect MY data from January 1, 2017, through December 31, 2017. 5 Performance comparisons are based on the Chi-square test of statistical significance, with a p value of <0.05. * A lower rate indicates better performance for this measure. ** Member months are a member's “contribution” to the total yearly membership. Not Tested = An RY 2017–18 rate difference was not calculated because high and low rates do not necessarily indicate better or worse performance.
Table 3.126—Multi-Year Non-SPD Performance Measure Trend Table Anthem—Region 1 (Butte, Colusa, Glenn, Plumas, Sierra, Sutter, and Tehama Counties)
B = Statistical testing result indicates that the RY 2018 non-SPD rate is significantly better than the RY 2017 non-SPD rate.
W = Statistical testing result indicates that the RY 2018 non-SPD rate is significantly worse than the RY 2017 non-SPD rate.
Measure RY 2015
Non-SPD Rate1
RY 2016 Non-SPD
Rate2
RY 2017 Non-SPD
Rate3
RY 2018 Non-SPD
Rate4
RYs 2017–18 Rate
Difference5
All-Cause Readmissions* 11.04% 10.55% 10.96% 14.54% 3.58W
Ambulatory Care— Emergency Department (ED) Visits per 1,000 Member Months**
46.39 45.39 44.75 44.87 Not Tested
Ambulatory Care— Outpatient Visits per 1,000 Member Months**
292.88 306.19 288.88 271.92 Not Tested
Anthem Blue Cross Partnership Plan Performance Evaluation Report: July 1, 2017–June 30, 2018 California Department of Health Care Services
Page D-160 Health Services Advisory Group, Inc.

MANAGED CARE HEALTH PLAN PERFORMANCE MEASURES
Measure RY 2015
Non-SPD Rate1
RY 2016 Non-SPD
Rate2
RY 2017 Non-SPD
Rate3
RY 2018 Non-SPD
Rate4
RYs 2017–18 Rate
Difference5
Annual Monitoring for Patients on Persistent Medications— ACE Inhibitors or ARBs
84.36% 84.79% 85.28% 84.28% -1.00
Annual Monitoring for Patients on Persistent Medications—Diuretics
86.83% 85.73% 84.96% 83.80% -1.16
Children and Adolescents' Access to Primary Care Practitioners— 12–24 Months
96.82% 96.55% 96.12% 95.63% -0.49
Children and Adolescents' Access to Primary Care Practitioners— 25 Months–6 Years
87.27% 88.79% 88.31% 86.45% -1.86W
Children and Adolescents' Access to Primary Care Practitioners— 7–11 Years
92.54% 88.55% 89.04% 88.46% -0.58
Children and Adolescents' Access to Primary Care Practitioners— 12–19 Years
95.74% 86.25% 86.28% 85.19% -1.09W
1 RY 2015 rates reflect MY data from January 1, 2014, through December 31, 2014. 2 RY 2016 rates reflect MY data from January 1, 2015, through December 31, 2015. 3 RY 2017 rates reflect MY data from January 1, 2016, through December 31, 2016. 4 RY 2018 rates reflect MY data from January 1, 2017, through December 31, 2017. 5 Performance comparisons are based on the Chi-square test of statistical significance, with a p value of <0.05. * A lower rate indicates better performance for this measure. ** Member months are a member's “contribution” to the total yearly membership. Not Tested = An RY 2017–18 rate difference was not calculated because high and low rates do not necessarily indicate better or worse performance.
Anthem Blue Cross Partnership Plan Performance Evaluation Report: July 1, 2017–June 30, 2018 California Department of Health Care Services
Page D-161 Health Services Advisory Group, Inc.

MANAGED CARE HEALTH PLAN PERFORMANCE MEASURES
Table 3.127—Multi-Year Non-SPD Performance Measure Trend Table Anthem—Region 2 (Alpine, Amador, Calaveras, El Dorado, Inyo, Mariposa, Mono,Nevada, Placer, Tuolumne, and Yuba Counties)
B = Statistical testing result indicates that the RY 2018 non-SPD rate is significantly better than the RY 2017 non-SPD rate.
W = Statistical testing result indicates that the RY 2018 non-SPD rate is significantly worse than the RY 2017 non-SPD rate.
Measure RY 2015
Non-SPD Rate1
RY 2016 Non-SPD
Rate2
RY 2017 Non-SPD
Rate3
RY 2018 Non-SPD
Rate4
RYs 2017–18 Rate
Difference5
All-Cause Readmissions* 8.39% 9.35% 10.88% 9.02% -1.86
Ambulatory Care— Emergency Department (ED) Visits per 1,000 Member Months**
54.21 50.11 49.94 51.00 Not Tested
Ambulatory Care— Outpatient Visits per 1,000 Member Months**
212.47 217.19 217.86 216.25 Not Tested
Annual Monitoring for Patients on Persistent Medications— ACE Inhibitors or ARBs
77.42% 80.78% 81.95% 84.21% 2.26
Annual Monitoring for Patients on Persistent Medications—Diuretics
80.41% 83.05% 80.87% 84.07% 3.20
Children and Adolescents' Access to Primary Care Practitioners— 12–24 Months
93.56% 92.35% 92.16% 92.13% -0.03
Children and Adolescents' Access to Primary Care Practitioners— 25 Months–6 Years
82.95% 83.51% 81.60% 81.71% 0.11
Anthem Blue Cross Partnership Plan Performance Evaluation Report: July 1, 2017–June 30, 2018 California Department of Health Care Services
Page D-162 Health Services Advisory Group, Inc.
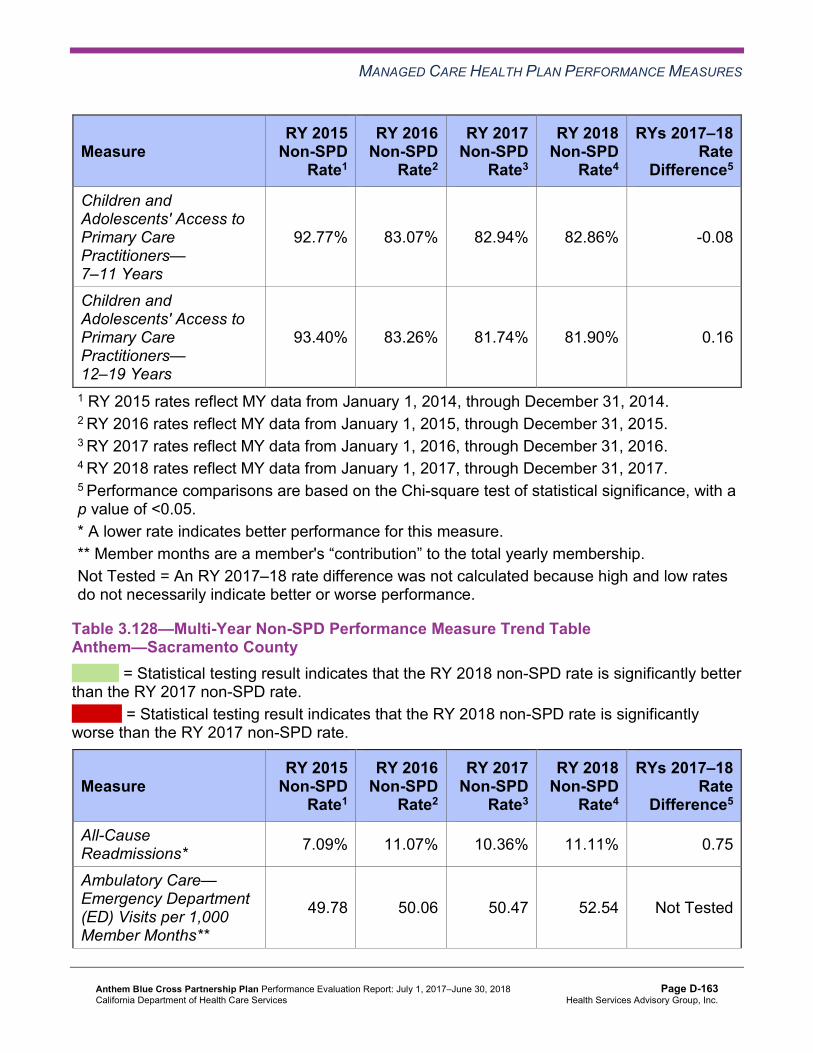
MANAGED CARE HEALTH PLAN PERFORMANCE MEASURES
Measure RY 2015
Non-SPD Rate1
RY 2016 Non-SPD
Rate2
RY 2017 Non-SPD
Rate3
RY 2018 Non-SPD
Rate4
RYs 2017–18 Rate
Difference5
Children and Adolescents' Access to Primary Care Practitioners— 7–11 Years
92.77% 83.07% 82.94% 82.86% -0.08
Children and Adolescents' Access to Primary Care Practitioners— 12–19 Years
93.40% 83.26% 81.74% 81.90% 0.16
1 RY 2015 rates reflect MY data from January 1, 2014, through December 31, 2014. 2 RY 2016 rates reflect MY data from January 1, 2015, through December 31, 2015. 3 RY 2017 rates reflect MY data from January 1, 2016, through December 31, 2016. 4 RY 2018 rates reflect MY data from January 1, 2017, through December 31, 2017. 5 Performance comparisons are based on the Chi-square test of statistical significance, with a p value of <0.05. * A lower rate indicates better performance for this measure. ** Member months are a member's “contribution” to the total yearly membership. Not Tested = An RY 2017–18 rate difference was not calculated because high and low rates do not necessarily indicate better or worse performance.
Table 3.128—Multi-Year Non-SPD Performance Measure Trend Table Anthem—Sacramento County
B = Statistical testing result indicates that the RY 2018 non-SPD rate is significantly better than the RY 2017 non-SPD rate.
W = Statistical testing result indicates that the RY 2018 non-SPD rate is significantly worse than the RY 2017 non-SPD rate.
Measure RY 2015
Non-SPD Rate1
RY 2016 Non-SPD
Rate2
RY 2017 Non-SPD
Rate3
RY 2018 Non-SPD
Rate4
RYs 2017–18 Rate
Difference5
All-Cause Readmissions* 7.09% 11.07% 10.36% 11.11% 0.75
Ambulatory Care— Emergency Department (ED) Visits per 1,000 Member Months**
49.78 50.06 50.47 52.54 Not Tested
Anthem Blue Cross Partnership Plan Performance Evaluation Report: July 1, 2017–June 30, 2018 California Department of Health Care Services
Page D-163 Health Services Advisory Group, Inc.

MANAGED CARE HEALTH PLAN PERFORMANCE MEASURES
Measure RY 2015
Non-SPD Rate1
RY 2016 Non-SPD
Rate2
RY 2017 Non-SPD
Rate3
RY 2018 Non-SPD
Rate4
RYs 2017–18 Rate
Difference5
Ambulatory Care— Outpatient Visits per 1,000 Member Months**
174.75 185.01 179.98 194.48 Not Tested
Annual Monitoring for Patients on Persistent Medications— ACE Inhibitors or ARBs
79.35% 82.75% 83.40% 83.22% -0.18
Annual Monitoring for Patients on Persistent Medications—Diuretics
77.75% 82.24% 83.66% 82.19% -1.47
Children and Adolescents' Access to Primary Care Practitioners— 12–24 Months
92.23% 91.19% 91.16% 91.44% 0.28
Children and Adolescents' Access to Primary Care Practitioners— 25 Months–6 Years
81.71% 81.29% 78.96% 79.16% 0.20
Children and Adolescents' Access to Primary Care Practitioners— 7–11 Years
83.42% 84.22% 82.44% 82.24% -0.20
Children and Adolescents' Access to Primary Care Practitioners— 12–19 Years
80.99% 80.36% 79.05% 79.34% 0.29
1 RY 2015 rates reflect MY data from January 1, 2014, through December 31, 2014. 2 RY 2016 rates reflect MY data from January 1, 2015, through December 31, 2015. 3 RY 2017 rates reflect MY data from January 1, 2016, through December 31, 2016. 4 RY 2018 rates reflect MY data from January 1, 2017, through December 31, 2017. 5 Performance comparisons are based on the Chi-square test of statistical significance, with a p value of <0.05. * A lower rate indicates better performance for this measure.
Anthem Blue Cross Partnership Plan Performance Evaluation Report: July 1, 2017–June 30, 2018 California Department of Health Care Services
Page D-164 Health Services Advisory Group, Inc.
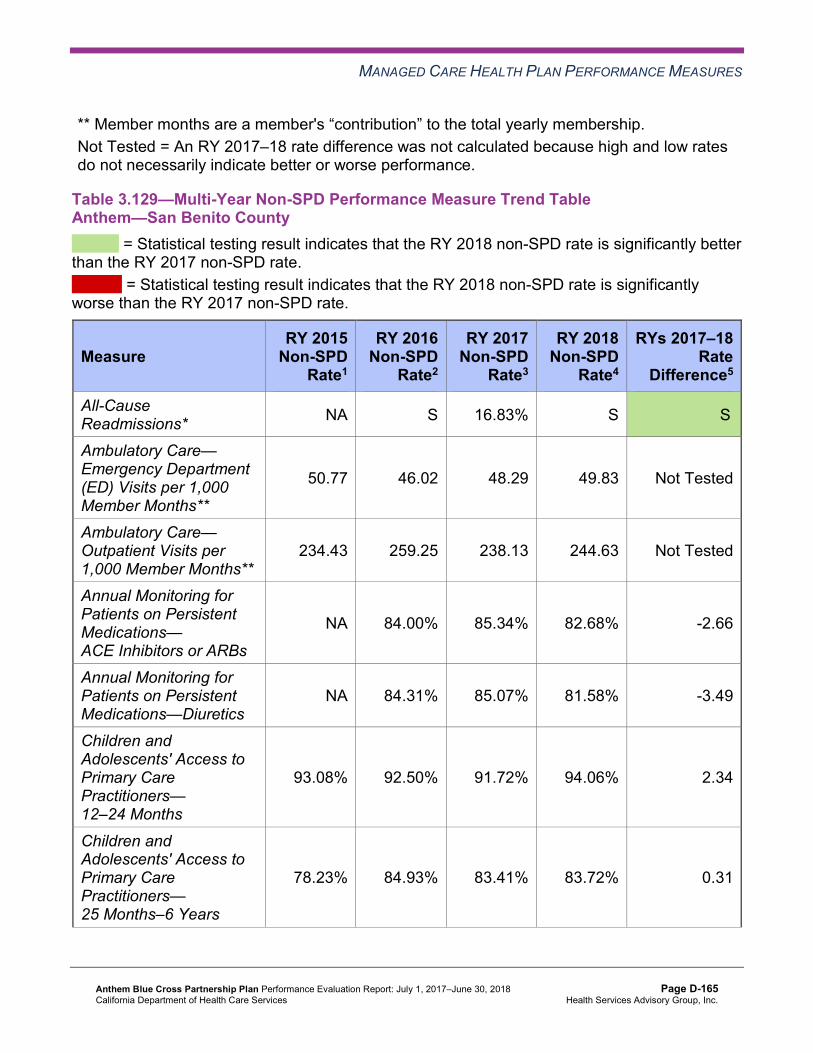
MANAGED CARE HEALTH PLAN PERFORMANCE MEASURES
** Member months are a member's “contribution” to the total yearly membership. Not Tested = An RY 2017–18 rate difference was not calculated because high and low rates do not necessarily indicate better or worse performance.
Table 3.129—Multi-Year Non-SPD Performance Measure Trend Table Anthem—San Benito County
B = Statistical testing result indicates that the RY 2018 non-SPD rate is significantly better than the RY 2017 non-SPD rate.
W = Statistical testing result indicates that the RY 2018 non-SPD rate is significantly worse than the RY 2017 non-SPD rate.
Measure RY 2015
Non-SPD Rate1
RY 2016 Non-SPD
Rate2
RY 2017 Non-SPD
Rate3
RY 2018 Non-SPD
Rate4
RYs 2017–18 Rate
Difference5
All-Cause Readmissions* NA S 16.83% S SB
Ambulatory Care— Emergency Department (ED) Visits per 1,000 Member Months**
50.77 46.02 48.29 49.83 Not Tested
Ambulatory Care— Outpatient Visits per 1,000 Member Months**
234.43 259.25 238.13 244.63 Not Tested
Annual Monitoring for Patients on Persistent Medications— ACE Inhibitors or ARBs
NA 84.00% 85.34% 82.68% -2.66
Annual Monitoring for Patients on Persistent Medications—Diuretics
NA 84.31% 85.07% 81.58% -3.49
Children and Adolescents' Access to Primary Care Practitioners— 12–24 Months
93.08% 92.50% 91.72% 94.06% 2.34
Children and Adolescents' Access to Primary Care Practitioners— 25 Months–6 Years
78.23% 84.93% 83.41% 83.72% 0.31
Anthem Blue Cross Partnership Plan Performance Evaluation Report: July 1, 2017–June 30, 2018 California Department of Health Care Services
Page D-165 Health Services Advisory Group, Inc.
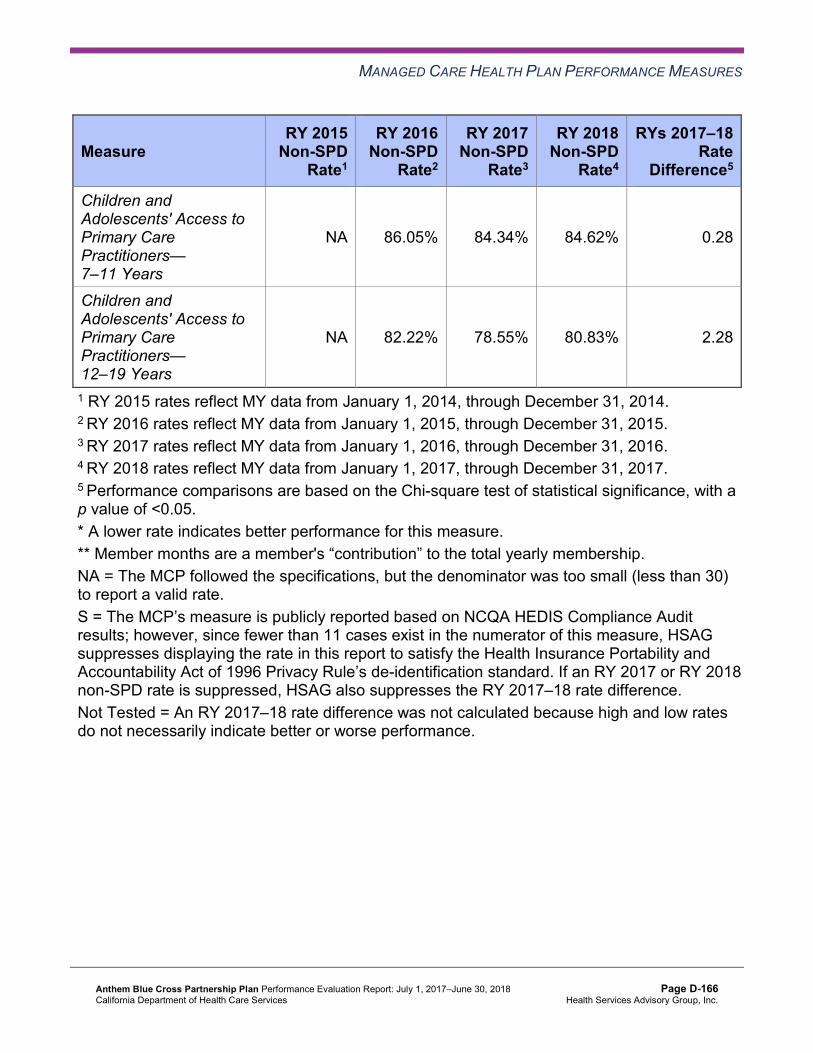
MANAGED CARE HEALTH PLAN PERFORMANCE MEASURES
Measure RY 2015
Non-SPD Rate1
RY 2016 Non-SPD
Rate2
RY 2017 Non-SPD
Rate3
RY 2018 Non-SPD
Rate4
RYs 2017–18 Rate
Difference5
Children and Adolescents' Access to Primary Care Practitioners— 7–11 Years
NA 86.05% 84.34% 84.62% 0.28
Children and Adolescents' Access to Primary Care Practitioners— 12–19 Years
NA 82.22% 78.55% 80.83% 2.28
1 RY 2015 rates reflect MY data from January 1, 2014, through December 31, 2014. 2 RY 2016 rates reflect MY data from January 1, 2015, through December 31, 2015. 3 RY 2017 rates reflect MY data from January 1, 2016, through December 31, 2016. 4 RY 2018 rates reflect MY data from January 1, 2017, through December 31, 2017. 5 Performance comparisons are based on the Chi-square test of statistical significance, with a p value of <0.05. * A lower rate indicates better performance for this measure. ** Member months are a member's “contribution” to the total yearly membership. NA = The MCP followed the specifications, but the denominator was too small (less than 30) to report a valid rate. S = The MCP’s measure is publicly reported based on NCQA HEDIS Compliance Audit results; however, since fewer than 11 cases exist in the numerator of this measure, HSAG suppresses displaying the rate in this report to satisfy the Health Insurance Portability and Accountability Act of 1996 Privacy Rule’s de-identification standard. If an RY 2017 or RY 2018 non-SPD rate is suppressed, HSAG also suppresses the RY 2017–18 rate difference. Not Tested = An RY 2017–18 rate difference was not calculated because high and low rates do not necessarily indicate better or worse performance.
Anthem Blue Cross Partnership Plan Performance Evaluation Report: July 1, 2017–June 30, 2018 California Department of Health Care Services
Page D-166 Health Services Advisory Group, Inc.
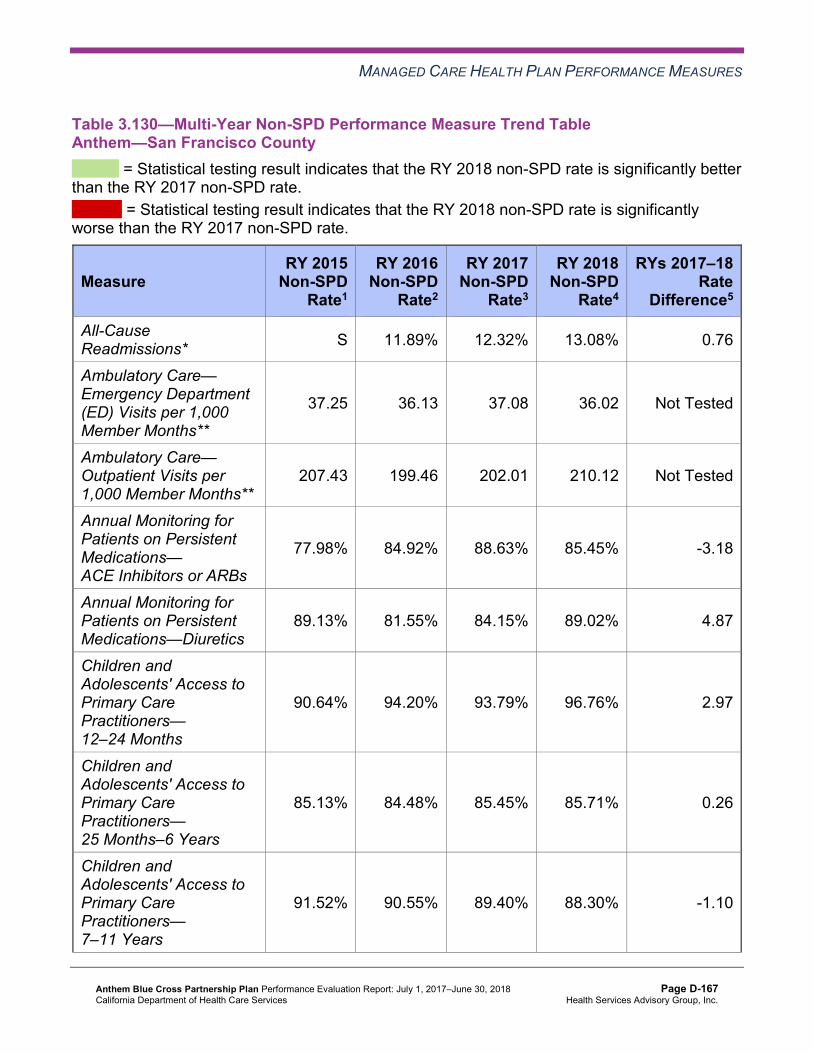
MANAGED CARE HEALTH PLAN PERFORMANCE MEASURES
Table 3.130—Multi-Year Non-SPD Performance Measure Trend Table Anthem—San Francisco County
B = Statistical testing result indicates that the RY 2018 non-SPD rate is significantly better than the RY 2017 non-SPD rate.
W = Statistical testing result indicates that the RY 2018 non-SPD rate is significantly worse than the RY 2017 non-SPD rate.
Measure RY 2015
Non-SPD Rate1
RY 2016 Non-SPD
Rate2
RY 2017 Non-SPD
Rate3
RY 2018 Non-SPD
Rate4
RYs 2017–18 Rate
Difference5
All-Cause Readmissions* S 11.89% 12.32% 13.08% 0.76
Ambulatory Care— Emergency Department (ED) Visits per 1,000 Member Months**
37.25 36.13 37.08 36.02 Not Tested
Ambulatory Care— Outpatient Visits per 1,000 Member Months**
207.43 199.46 202.01 210.12 Not Tested
Annual Monitoring for Patients on Persistent Medications— ACE Inhibitors or ARBs
77.98% 84.92% 88.63% 85.45% -3.18
Annual Monitoring for Patients on Persistent Medications—Diuretics
89.13% 81.55% 84.15% 89.02% 4.87
Children and Adolescents' Access to Primary Care Practitioners— 12–24 Months
90.64% 94.20% 93.79% 96.76% 2.97
Children and Adolescents' Access to Primary Care Practitioners— 25 Months–6 Years
85.13% 84.48% 85.45% 85.71% 0.26
Children and Adolescents' Access to Primary Care Practitioners— 7–11 Years
91.52% 90.55% 89.40% 88.30% -1.10
Anthem Blue Cross Partnership Plan Performance Evaluation Report: July 1, 2017–June 30, 2018 California Department of Health Care Services
Page D-167 Health Services Advisory Group, Inc.
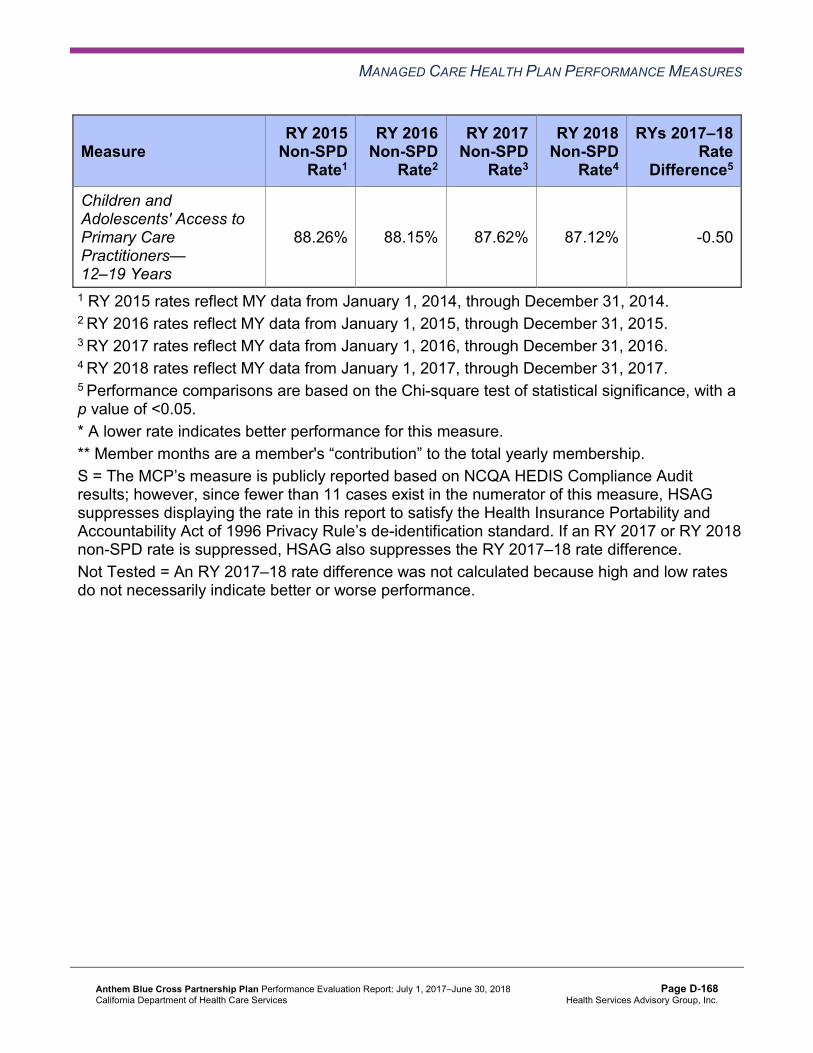
MANAGED CARE HEALTH PLAN PERFORMANCE MEASURES
Measure RY 2015
Non-SPD Rate1
RY 2016 Non-SPD
Rate2
RY 2017 Non-SPD
Rate3
RY 2018 Non-SPD
Rate4
RYs 2017–18 Rate
Difference5
Children and Adolescents' Access to Primary Care Practitioners— 12–19 Years
88.26% 88.15% 87.62% 87.12% -0.50
1 RY 2015 rates reflect MY data from January 1, 2014, through December 31, 2014. 2 RY 2016 rates reflect MY data from January 1, 2015, through December 31, 2015. 3 RY 2017 rates reflect MY data from January 1, 2016, through December 31, 2016. 4 RY 2018 rates reflect MY data from January 1, 2017, through December 31, 2017. 5 Performance comparisons are based on the Chi-square test of statistical significance, with a p value of <0.05. * A lower rate indicates better performance for this measure. ** Member months are a member's “contribution” to the total yearly membership. S = The MCP’s measure is publicly reported based on NCQA HEDIS Compliance Audit results; however, since fewer than 11 cases exist in the numerator of this measure, HSAG suppresses displaying the rate in this report to satisfy the Health Insurance Portability and Accountability Act of 1996 Privacy Rule’s de-identification standard. If an RY 2017 or RY 2018 non-SPD rate is suppressed, HSAG also suppresses the RY 2017–18 rate difference. Not Tested = An RY 2017–18 rate difference was not calculated because high and low rates do not necessarily indicate better or worse performance.
Anthem Blue Cross Partnership Plan Performance Evaluation Report: July 1, 2017–June 30, 2018 California Department of Health Care Services
Page D-168 Health Services Advisory Group, Inc.
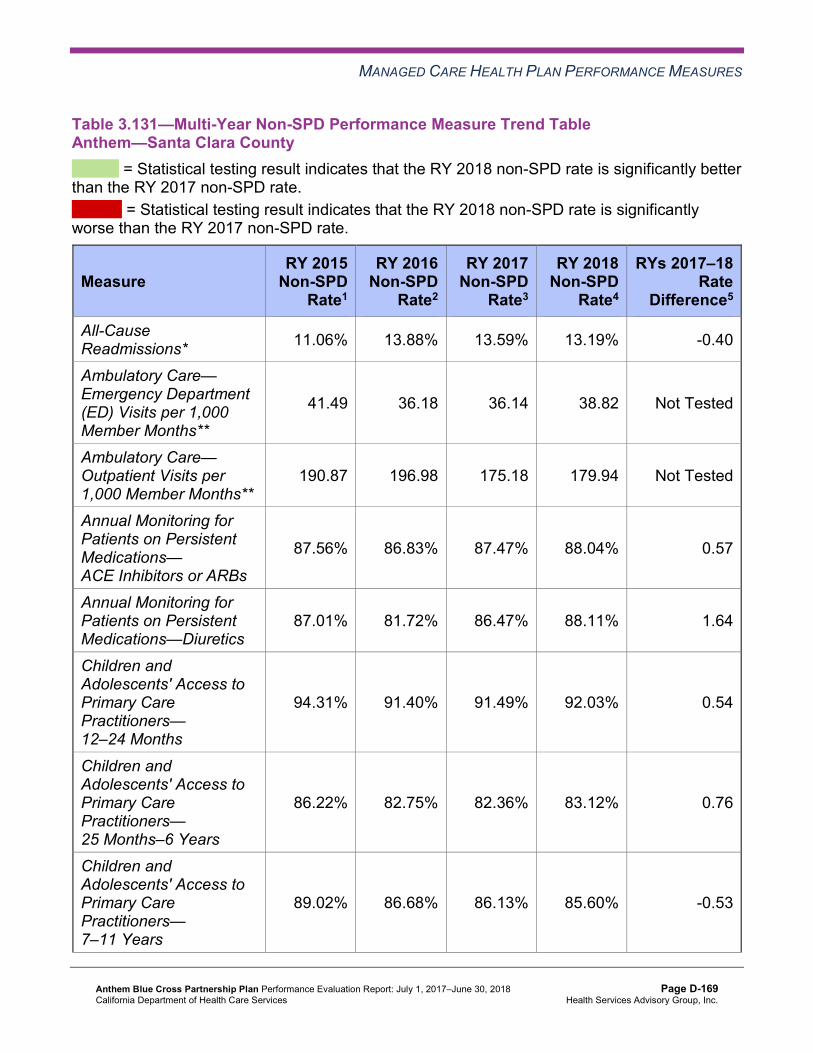
MANAGED CARE HEALTH PLAN PERFORMANCE MEASURES
Table 3.131—Multi-Year Non-SPD Performance Measure Trend Table Anthem—Santa Clara County
B = Statistical testing result indicates that the RY 2018 non-SPD rate is significantly better than the RY 2017 non-SPD rate.
W = Statistical testing result indicates that the RY 2018 non-SPD rate is significantly worse than the RY 2017 non-SPD rate.
Measure RY 2015
Non-SPD Rate1
RY 2016 Non-SPD
Rate2
RY 2017 Non-SPD
Rate3
RY 2018 Non-SPD
Rate4
RYs 2017–18 Rate
Difference5
All-Cause Readmissions* 11.06% 13.88% 13.59% 13.19% -0.40
Ambulatory Care— Emergency Department (ED) Visits per 1,000 Member Months**
41.49 36.18 36.14 38.82 Not Tested
Ambulatory Care— Outpatient Visits per 1,000 Member Months**
190.87 196.98 175.18 179.94 Not Tested
Annual Monitoring for Patients on Persistent Medications— ACE Inhibitors or ARBs
87.56% 86.83% 87.47% 88.04% 0.57
Annual Monitoring for Patients on Persistent Medications—Diuretics
87.01% 81.72% 86.47% 88.11% 1.64
Children and Adolescents' Access to Primary Care Practitioners— 12–24 Months
94.31% 91.40% 91.49% 92.03% 0.54
Children and Adolescents' Access to Primary Care Practitioners— 25 Months–6 Years
86.22% 82.75% 82.36% 83.12% 0.76
Children and Adolescents' Access to Primary Care Practitioners— 7–11 Years
89.02% 86.68% 86.13% 85.60% -0.53
Anthem Blue Cross Partnership Plan Performance Evaluation Report: July 1, 2017–June 30, 2018 California Department of Health Care Services
Page D-169 Health Services Advisory Group, Inc.

MANAGED CARE HEALTH PLAN PERFORMANCE MEASURES
Measure RY 2015
Non-SPD Rate1
RY 2016 Non-SPD
Rate2
RY 2017 Non-SPD
Rate3
RY 2018 Non-SPD
Rate4
RYs 2017–18 Rate
Difference5
Children and Adolescents' Access to Primary Care Practitioners— 12–19 Years
86.46% 84.60% 81.02% 82.11% 1.09
1 RY 2015 rates reflect MY data from January 1, 2014, through December 31, 2014. 2 RY 2016 rates reflect MY data from January 1, 2015, through December 31, 2015. 3 RY 2017 rates reflect MY data from January 1, 2016, through December 31, 2016. 4 RY 2018 rates reflect MY data from January 1, 2017, through December 31, 2017. 5 Performance comparisons are based on the Chi-square test of statistical significance, with a p value of <0.05. * A lower rate indicates better performance for this measure. ** Member months are a member's “contribution” to the total yearly membership. Not Tested = An RY 2017–18 rate difference was not calculated because high and low rates do not necessarily indicate better or worse performance.
Table 3.132—Multi-Year Non-SPD Performance Measure Trend Table Anthem—Tulare County
B = Statistical testing result indicates that the RY 2018 non-SPD rate is significantly better than the RY 2017 non-SPD rate.
W = Statistical testing result indicates that the RY 2018 non-SPD rate is significantly worse than the RY 2017 non-SPD rate.
Measure RY 2015
Non-SPD Rate1
RY 2016 Non-SPD
Rate2
RY 2017 Non-SPD
Rate3
RY 2018 Non-SPD
Rate4
RYs 2017–18 Rate
Difference5
All-Cause Readmissions* 9.45% 11.95% 11.05% 8.79% -2.26
Ambulatory Care— Emergency Department (ED) Visits per 1,000 Member Months**
39.08 37.55 34.96 33.45 Not Tested
Ambulatory Care— Outpatient Visits per 1,000 Member Months**
296.37 286.12 283.51 290.09 Not Tested
Anthem Blue Cross Partnership Plan Performance Evaluation Report: July 1, 2017–June 30, 2018 California Department of Health Care Services
Page D-170 Health Services Advisory Group, Inc.

MANAGED CARE HEALTH PLAN PERFORMANCE MEASURES
Measure RY 2015
Non-SPD Rate1
RY 2016 Non-SPD
Rate2
RY 2017 Non-SPD
Rate3
RY 2018 Non-SPD
Rate4
RYs 2017–18 Rate
Difference5
Annual Monitoring for Patients on Persistent Medications— ACE Inhibitors or ARBs
81.37% 87.51% 86.92% 87.64% 0.72
Annual Monitoring for Patients on Persistent Medications—Diuretics
79.21% 85.47% 85.67% 85.27% -0.40
Children and Adolescents' Access to Primary Care Practitioners— 12–24 Months
97.22% 97.27% 96.59% 96.90% 0.31
Children and Adolescents' Access to Primary Care Practitioners— 25 Months–6 Years
91.15% 91.68% 90.58% 90.05% -0.53
Children and Adolescents' Access to Primary Care Practitioners— 7–11 Years
91.36% 91.81% 91.64% 91.46% -0.18
Children and Adolescents' Access to Primary Care Practitioners— 12–19 Years
90.64% 90.71% 90.18% 89.95% -0.23
1 RY 2015 rates reflect MY data from January 1, 2014, through December 31, 2014. 2 RY 2016 rates reflect MY data from January 1, 2015, through December 31, 2015. 3 RY 2017 rates reflect MY data from January 1, 2016, through December 31, 2016. 4 RY 2018 rates reflect MY data from January 1, 2017, through December 31, 2017. 5 Performance comparisons are based on the Chi-square test of statistical significance, with a p value of <0.05. * A lower rate indicates better performance for this measure. ** Member months are a member's “contribution” to the total yearly membership. Not Tested = An RY 2017–18 rate difference was not calculated because high and low rates do not necessarily indicate better or worse performance.
Anthem Blue Cross Partnership Plan Performance Evaluation Report: July 1, 2017–June 30, 2018 California Department of Health Care Services
Page D-171 Health Services Advisory Group, Inc.
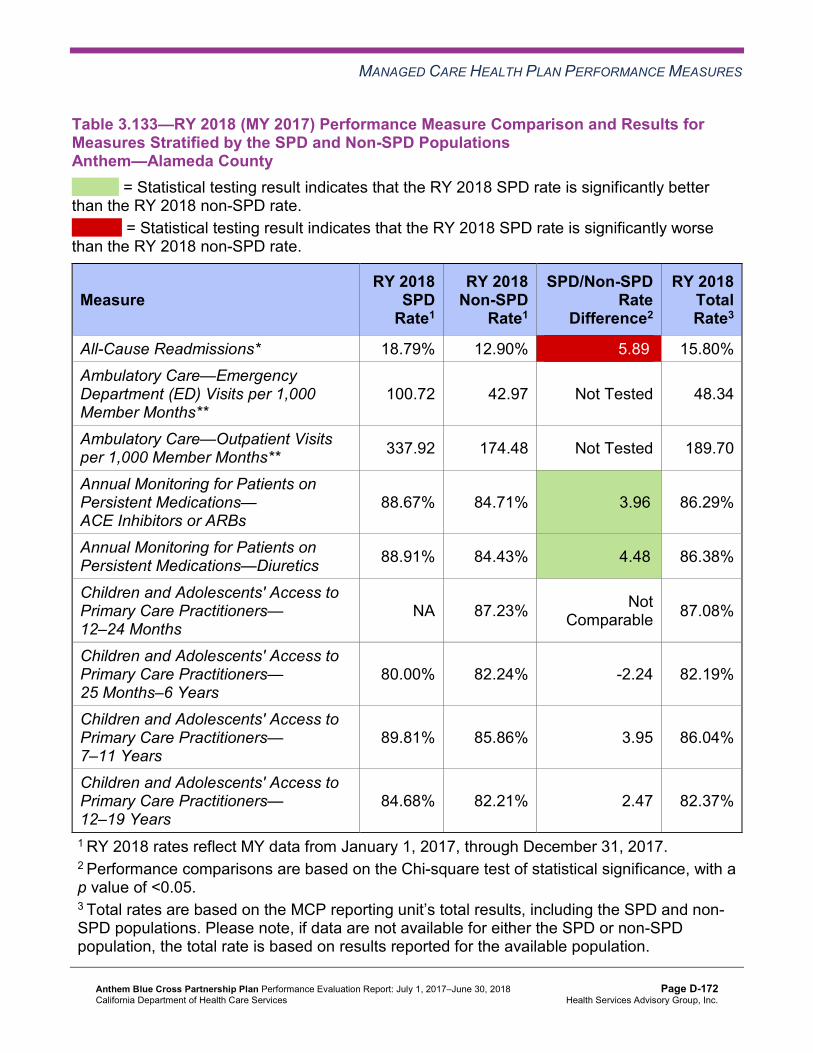
MANAGED CARE HEALTH PLAN PERFORMANCE MEASURES
Table 3.133—RY 2018 (MY 2017) Performance Measure Comparison and Results forMeasures Stratified by the SPD and Non-SPD PopulationsAnthem—Alameda County
B = Statistical testing result indicates that the RY 2018 SPD rate is significantly better than the RY 2018 non-SPD rate.
W = Statistical testing result indicates that the RY 2018 SPD rate is significantly worse than the RY 2018 non-SPD rate.
Measure RY 2018
SPD Rate1
RY 2018 Non-SPD
Rate1
SPD/Non-SPDRate
Difference2
RY 2018 Total Rate3
All-Cause Readmissions* 18.79% 12.90% 5.89W 15.80% Ambulatory Care—Emergency Department (ED) Visits per 1,000 Member Months**
100.72 42.97 Not Tested 48.34
Ambulatory Care—Outpatient Visits per 1,000 Member Months** 337.92 174.48 Not Tested 189.70
Annual Monitoring for Patients on Persistent Medications— ACE Inhibitors or ARBs
88.67% 84.71% 3.96B 86.29%
Annual Monitoring for Patients on Persistent Medications—Diuretics 88.91% 84.43% 4.48B 86.38%
Children and Adolescents' Access to Primary Care Practitioners— 12–24 Months
NA 87.23% Not Comparable 87.08%
Children and Adolescents' Access to Primary Care Practitioners— 25 Months–6 Years
80.00% 82.24% -2.24 82.19%
Children and Adolescents' Access to Primary Care Practitioners— 7–11 Years
89.81% 85.86% 3.95 86.04%
Children and Adolescents' Access to Primary Care Practitioners— 12–19 Years
84.68% 82.21% 2.47 82.37%
1 RY 2018 rates reflect MY data from January 1, 2017, through December 31, 2017. 2 Performance comparisons are based on the Chi-square test of statistical significance, with a p value of <0.05. 3 Total rates are based on the MCP reporting unit’s total results, including the SPD and non-SPD populations. Please note, if data are not available for either the SPD or non-SPD population, the total rate is based on results reported for the available population.
Anthem Blue Cross Partnership Plan Performance Evaluation Report: July 1, 2017–June 30, 2018 California Department of Health Care Services
Page D-172 Health Services Advisory Group, Inc.

MANAGED CARE HEALTH PLAN PERFORMANCE MEASURES
* A lower rate indicates better performance for this measure. ** Member months are a member's “contribution” to the total yearly membership. NA = The MCP followed the specifications, but the denominator was too small (less than 30) to report a valid rate. Not Comparable = An SPD/non-SPD rate difference cannot be made because data are not available for both populations. Not Tested = An SPD/non-SPD rate difference was not calculated because high and low rates do not necessarily indicate better or worse performance.
Table 3.134—RY 2018 (MY 2017) Performance Measure Comparison and Results forMeasures Stratified by the SPD and Non-SPD PopulationsAnthem—Contra Costa County
B = Statistical testing result indicates that the RY 2018 SPD rate is significantly better than the RY 2018 non-SPD rate.
W = Statistical testing result indicates that the RY 2018 SPD rate is significantly worse than the RY 2018 non-SPD rate.
Measure RY 2018
SPD Rate1
RY 2018 Non-SPD
Rate1
SPD/Non-SPDRate
Difference2
RY 2018 Total Rate3
All-Cause Readmissions* 24.55% 19.70% 4.85 21.64% Ambulatory Care—Emergency Department (ED) Visits per 1,000 Member Months**
80.45 41.99 Not Tested 44.94
Ambulatory Care—Outpatient Visits per 1,000 Member Months** 318.47 182.96 Not Tested 193.34
Annual Monitoring for Patients on Persistent Medications— ACE Inhibitors or ARBs
90.00% 83.00% 7.00B 85.61%
Annual Monitoring for Patients on Persistent Medications—Diuretics 90.70% 85.78% 4.92 87.57%
Children and Adolescents' Access to Primary Care Practitioners— 12–24 Months
NA 94.24% Not Comparable 94.33%
Children and Adolescents' Access to Primary Care Practitioners— 25 Months–6 Years
89.13% 89.88% -0.75 89.86%
Children and Adolescents' Access to Primary Care Practitioners— 7–11 Years
89.39% 89.22% 0.17 89.22%
Anthem Blue Cross Partnership Plan Performance Evaluation Report: July 1, 2017–June 30, 2018 California Department of Health Care Services
Page D-173 Health Services Advisory Group, Inc.

MANAGED CARE HEALTH PLAN PERFORMANCE MEASURES
Measure RY 2018
SPD Rate1
RY 2018 Non-SPD
Rate1
SPD/Non-SPDRate
Difference2
RY 2018 Total Rate3
Children and Adolescents' Access to Primary Care Practitioners— 12–19 Years
86.94% 86.23% 0.71 86.28%
1 RY 2018 rates reflect MY data from January 1, 2017, through December 31, 2017. 2 Performance comparisons are based on the Chi-square test of statistical significance, with a p value of <0.05. 3 Total rates are based on the MCP reporting unit’s total results, including the SPD and non-SPD populations. Please note, if data are not available for either the SPD or non-SPD population, the total rate is based on results reported for the available population. * A lower rate indicates better performance for this measure. ** Member months are a member's “contribution” to the total yearly membership. NA = The MCP followed the specifications, but the denominator was too small (less than 30) to report a valid rate. Not Comparable = An SPD/non-SPD rate difference cannot be made because data are not available for both populations. Not Tested = An SPD/non-SPD rate difference was not calculated because high and low rates do not necessarily indicate better or worse performance.
Table 3.135—RY 2018 (MY 2017) Performance Measure Comparison and Results for Measures Stratified by the SPD and Non-SPD PopulationsAnthem—Fresno County
B = Statistical testing result indicates that the RY 2018 SPD rate is significantly better than the RY 2018 non-SPD rate.
W = Statistical testing result indicates that the RY 2018 SPD rate is significantly worse than the RY 2018 non-SPD rate.
Measure RY 2018
SPD Rate1
RY 2018 Non-SPD
Rate1
SPD/Non-SPDRate
Difference2
RY 2018 Total Rate3
All-Cause Readmissions* 16.98% 11.64% 5.34W 13.32% Ambulatory Care—Emergency Department (ED) Visits per 1,000 Member Months**
74.62 46.57 Not Tested 48.40
Ambulatory Care—Outpatient Visits per 1,000 Member Months** 404.40 231.59 Not Tested 242.89
Anthem Blue Cross Partnership Plan Performance Evaluation Report: July 1, 2017–June 30, 2018 California Department of Health Care Services
Page D-174 Health Services Advisory Group, Inc.

MANAGED CARE HEALTH PLAN PERFORMANCE MEASURES
Measure RY 2018
SPD Rate1
RY 2018 Non-SPD
Rate1
SPD/Non-SPDRate
Difference2
RY 2018 Total Rate3
Annual Monitoring for Patients on Persistent Medications— ACE Inhibitors or ARBs
88.41% 85.56% 2.85B 86.31%
Annual Monitoring for Patients on Persistent Medications—Diuretics 88.89% 85.45% 3.44 86.35%
Children and Adolescents' Access to Primary Care Practitioners— 12–24 Months
NA 94.36% Not Comparable 94.37%
Children and Adolescents' Access to Primary Care Practitioners— 25 Months–6 Years
80.97% 84.84% -3.87 84.73%
Children and Adolescents' Access to Primary Care Practitioners— 7–11 Years
86.07% 84.27% 1.80 84.34%
Children and Adolescents' Access to Primary Care Practitioners— 12–19 Years
81.88% 80.11% 1.77 80.19%
1 RY 2018 rates reflect MY data from January 1, 2017, through December 31, 2017. 2 Performance comparisons are based on the Chi-square test of statistical significance, with a p value of <0.05. 3 Total rates are based on the MCP reporting unit’s total results, including the SPD and non-SPD populations. Please note, if data are not available for either the SPD or non-SPD population, the total rate is based on results reported for the available population. * A lower rate indicates better performance for this measure. ** Member months are a member's “contribution” to the total yearly membership. NA = The MCP followed the specifications, but the denominator was too small (less than 30) to report a valid rate. Not Comparable = An SPD/non-SPD rate difference cannot be made because data are not available for both populations. Not Tested = An SPD/non-SPD rate difference was not calculated because high and low rates do not necessarily indicate better or worse performance.
Anthem Blue Cross Partnership Plan Performance Evaluation Report: July 1, 2017–June 30, 2018 California Department of Health Care Services
Page D-175 Health Services Advisory Group, Inc.

MANAGED CARE HEALTH PLAN PERFORMANCE MEASURES
Table 3.136—RY 2018 (MY 2017) Performance Measure Comparison and Results for Measures Stratified by the SPD and Non-SPD PopulationsAnthem—Kings County
B = Statistical testing result indicates that the RY 2018 SPD rate is significantly better than the RY 2018 non-SPD rate.
W = Statistical testing result indicates that the RY 2018 SPD rate is significantly worse than the RY 2018 non-SPD rate.
Measure RY 2018
SPD Rate1
RY 2018 Non-SPD
Rate1
SPD/Non-SPDRate
Difference2
RY 2018 Total Rate3
All-Cause Readmissions* 20.87% 13.17% 7.70 15.40% Ambulatory Care—Emergency Department (ED) Visits per 1,000 Member Months**
105.78 53.92 Not Tested 56.82
Ambulatory Care—Outpatient Visits per 1,000 Member Months** 565.22 290.86 Not Tested 306.23
Annual Monitoring for Patients on Persistent Medications— ACE Inhibitors or ARBs
89.47% 83.00% 6.47B 84.78%
Annual Monitoring for Patients on Persistent Medications—Diuretics 85.26% 83.88% 1.38 84.27%
Children and Adolescents' Access to Primary Care Practitioners— 12–24 Months
NA 94.04% Not Comparable 94.08%
Children and Adolescents' Access to Primary Care Practitioners— 25 Months–6 Years
93.44% 86.82% 6.62 86.99%
Children and Adolescents' Access to Primary Care Practitioners— 7–11 Years
81.71% 85.74% -4.03 85.59%
Children and Adolescents' Access to Primary Care Practitioners— 12–19 Years
79.28% 84.92% -5.64 84.70%
1 RY 2018 rates reflect MY data from January 1, 2017, through December 31, 2017. 2 Performance comparisons are based on the Chi-square test of statistical significance, with a p value of <0.05. 3 Total rates are based on the MCP reporting unit’s total results, including the SPD and non-SPD populations. Please note, if data are not available for either the SPD or non-SPD population, the total rate is based on results reported for the available population.
Anthem Blue Cross Partnership Plan Performance Evaluation Report: July 1, 2017–June 30, 2018 California Department of Health Care Services
Page D-176 Health Services Advisory Group, Inc.

MANAGED CARE HEALTH PLAN PERFORMANCE MEASURES
* A lower rate indicates better performance for this measure. ** Member months are a member's “contribution” to the total yearly membership. NA = The MCP followed the specifications, but the denominator was too small (less than 30) to report a valid rate. Not Comparable = An SPD/non-SPD rate difference cannot be made because data are not available for both populations. Not Tested = An SPD/non-SPD rate difference was not calculated because high and low rates do not necessarily indicate better or worse performance.
Table 3.137—RY 2018 (MY 2017) Performance Measure Comparison and Results forMeasures Stratified by the SPD and Non-SPD PopulationsAnthem—Madera County
B = Statistical testing result indicates that the RY 2018 SPD rate is significantly better than the RY 2018 non-SPD rate.
W = Statistical testing result indicates that the RY 2018 SPD rate is significantly worse than the RY 2018 non-SPD rate.
Measure RY 2018
SPD Rate1
RY 2018 Non-SPD
Rate1
SPD/Non-SPDRate
Difference2
RY 2018 Total Rate3
All-Cause Readmissions* 14.56% 9.05% 5.51 10.75% Ambulatory Care—Emergency Department (ED) Visits per 1,000 Member Months**
83.03 47.38 Not Tested 48.93
Ambulatory Care—Outpatient Visits per 1,000 Member Months** 523.74 279.94 Not Tested 290.54
Annual Monitoring for Patients on Persistent Medications— ACE Inhibitors or ARBs
92.31% 77.94% 14.37B 80.75%
Annual Monitoring for Patients on Persistent Medications—Diuretics 97.01% 81.33% 15.68B 84.74%
Children and Adolescents' Access to Primary Care Practitioners— 12–24 Months
NA 97.73% Not Comparable 97.73%
Children and Adolescents' Access to Primary Care Practitioners— 25 Months–6 Years
NA 91.01% Not Comparable 90.99%
Children and Adolescents' Access to Primary Care Practitioners— 7–11 Years
94.83% 92.14% 2.69 92.20%
Anthem Blue Cross Partnership Plan Performance Evaluation Report: July 1, 2017–June 30, 2018 California Department of Health Care Services
Page D-177 Health Services Advisory Group, Inc.

MANAGED CARE HEALTH PLAN PERFORMANCE MEASURES
Measure RY 2018
SPD Rate1
RY 2018 Non-SPD
Rate1
SPD/Non-SPDRate
Difference2
RY 2018 Total Rate3
Children and Adolescents' Access to Primary Care Practitioners— 12–19 Years
83.91% 89.11% -5.20 88.97%
1 RY 2018 rates reflect MY data from January 1, 2017, through December 31, 2017. 2 Performance comparisons are based on the Chi-square test of statistical significance, with a p value of <0.05. 3 Total rates are based on the MCP reporting unit’s total results, including the SPD and non-SPD populations. Please note, if data are not available for either the SPD or non-SPD population, the total rate is based on results reported for the available population. * A lower rate indicates better performance for this measure. ** Member months are a member's “contribution” to the total yearly membership. NA = The MCP followed the specifications, but the denominator was too small (less than 30) to report a valid rate. Not Comparable = An SPD/non-SPD rate difference cannot be made because data are not available for both populations. Not Tested = An SPD/non-SPD rate difference was not calculated because high and low rates do not necessarily indicate better or worse performance.
Table 3.138—RY 2018 (MY 2017) Performance Measure Comparison and Results forMeasures Stratified by the SPD and Non-SPD PopulationsAnthem—Region 1 (Butte, Colusa, Glenn, Plumas, Sierra, Sutter, and Tehama Counties)
B = Statistical testing result indicates that the RY 2018 SPD rate is significantly better than the RY 2018 non-SPD rate.
W = Statistical testing result indicates that the RY 2018 SPD rate is significantly worse than the RY 2018 non-SPD rate.
Measure RY 2018
SPD Rate1
RY 2018 Non-SPD
Rate1
SPD/Non-SPDRate
Difference2
RY 2018 Total Rate3
All-Cause Readmissions* 23.37% 14.54% 8.83W 18.00% Ambulatory Care—Emergency Department (ED) Visits per 1,000 Member Months**
91.63 44.87 Not Tested 48.42
Ambulatory Care—Outpatient Visits per 1,000 Member Months** 526.46 271.92 Not Tested 291.24
Anthem Blue Cross Partnership Plan Performance Evaluation Report: July 1, 2017–June 30, 2018 California Department of Health Care Services
Page D-178 Health Services Advisory Group, Inc.
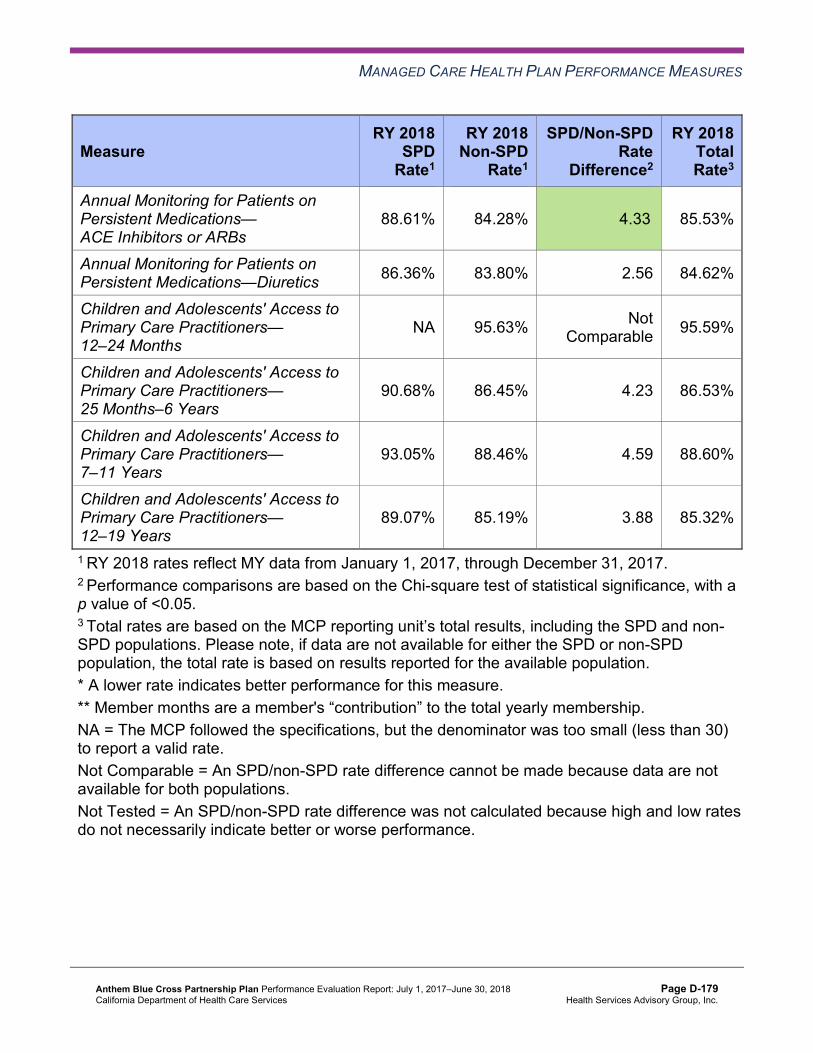
MANAGED CARE HEALTH PLAN PERFORMANCE MEASURES
Measure RY 2018
SPD Rate1
RY 2018 Non-SPD
Rate1
SPD/Non-SPDRate
Difference2
RY 2018 Total Rate3
Annual Monitoring for Patients on Persistent Medications— ACE Inhibitors or ARBs
88.61% 84.28% 4.33B 85.53%
Annual Monitoring for Patients on Persistent Medications—Diuretics 86.36% 83.80% 2.56 84.62%
Children and Adolescents' Access to Primary Care Practitioners— 12–24 Months
NA 95.63% Not Comparable 95.59%
Children and Adolescents' Access to Primary Care Practitioners— 25 Months–6 Years
90.68% 86.45% 4.23 86.53%
Children and Adolescents' Access to Primary Care Practitioners— 7–11 Years
93.05% 88.46% 4.59 88.60%
Children and Adolescents' Access to Primary Care Practitioners— 12–19 Years
89.07% 85.19% 3.88 85.32%
1 RY 2018 rates reflect MY data from January 1, 2017, through December 31, 2017. 2 Performance comparisons are based on the Chi-square test of statistical significance, with a p value of <0.05. 3 Total rates are based on the MCP reporting unit’s total results, including the SPD and non-SPD populations. Please note, if data are not available for either the SPD or non-SPD population, the total rate is based on results reported for the available population. * A lower rate indicates better performance for this measure. ** Member months are a member's “contribution” to the total yearly membership. NA = The MCP followed the specifications, but the denominator was too small (less than 30) to report a valid rate. Not Comparable = An SPD/non-SPD rate difference cannot be made because data are not available for both populations. Not Tested = An SPD/non-SPD rate difference was not calculated because high and low rates do not necessarily indicate better or worse performance.
Anthem Blue Cross Partnership Plan Performance Evaluation Report: July 1, 2017–June 30, 2018 California Department of Health Care Services
Page D-179 Health Services Advisory Group, Inc.

MANAGED CARE HEALTH PLAN PERFORMANCE MEASURES
Table 3.139—RY 2018 (MY 2017) Performance Measure Comparison and Results for Measures Stratified by the SPD and Non-SPD PopulationsAnthem—Region 2 (Alpine, Amador, Calaveras, El Dorado, Inyo, Mariposa, Mono,Nevada, Placer, Tuolumne, and Yuba Counties)
B = Statistical testing result indicates that the RY 2018 SPD rate is significantly better than the RY 2018 non-SPD rate.
W = Statistical testing result indicates that the RY 2018 SPD rate is significantly worse than the RY 2018 non-SPD rate.
Measure RY 2018
SPD Rate1
RY 2018 Non-SPD
Rate1
SPD/Non-SPDRate
Difference2
RY 2018 Total Rate3
All-Cause Readmissions* 18.16% 9.02% 9.14W 12.03% Ambulatory Care—Emergency Department (ED) Visits per 1,000 Member Months**
90.05 51.00 Not Tested 53.56
Ambulatory Care—Outpatient Visits per 1,000 Member Months** 436.87 216.25 Not Tested 230.73
Annual Monitoring for Patients on Persistent Medications— ACE Inhibitors or ARBs
87.93% 84.21% 3.72B 85.22%
Annual Monitoring for Patients on Persistent Medications—Diuretics 89.20% 84.07% 5.13B 85.58%
Children and Adolescents' Access to Primary Care Practitioners— 12–24 Months
NA 92.13% Not Comparable 92.11%
Children and Adolescents' Access to Primary Care Practitioners— 25 Months–6 Years
83.43% 81.71% 1.72 81.75%
Children and Adolescents' Access to Primary Care Practitioners— 7–11 Years
87.63% 82.86% 4.77 82.98%
Children and Adolescents' Access to Primary Care Practitioners— 12–19 Years
80.73% 81.90% -1.17 81.86%
1 RY 2018 rates reflect MY data from January 1, 2017, through December 31, 2017. 2 Performance comparisons are based on the Chi-square test of statistical significance, with a p value of <0.05.
Anthem Blue Cross Partnership Plan Performance Evaluation Report: July 1, 2017–June 30, 2018 California Department of Health Care Services
Page D-180 Health Services Advisory Group, Inc.

MANAGED CARE HEALTH PLAN PERFORMANCE MEASURES
3 Total rates are based on the MCP reporting unit’s total results, including the SPD and non-SPD populations. Please note, if data are not available for either the SPD or non-SPD population, the total rate is based on results reported for the available population. * A lower rate indicates better performance for this measure. ** Member months are a member's “contribution” to the total yearly membership. NA = The MCP followed the specifications, but the denominator was too small (less than 30) to report a valid rate. Not Comparable = An SPD/non-SPD rate difference cannot be made because data are not available for both populations. Not Tested = An SPD/non-SPD rate difference was not calculated because high and low rates do not necessarily indicate better or worse performance.
Table 3.140—RY 2018 (MY 2017) Performance Measure Comparison and Results forMeasures Stratified by the SPD and Non-SPD PopulationsAnthem—Sacramento County
B = Statistical testing result indicates that the RY 2018 SPD rate is significantly better than the RY 2018 non-SPD rate.
W = Statistical testing result indicates that the RY 2018 SPD rate is significantly worse than the RY 2018 non-SPD rate.
Measure RY 2018
SPD Rate1
RY 2018 Non-SPD
Rate1
SPD/Non-SPDRate
Difference2
RY 2018 Total Rate3
All-Cause Readmissions* 21.84% 11.11% 10.73W 15.91% Ambulatory Care—Emergency Department (ED) Visits per 1,000 Member Months**
92.01 52.54 Not Tested 55.97
Ambulatory Care—Outpatient Visits per 1,000 Member Months** 400.62 194.48 Not Tested 212.44
Annual Monitoring for Patients on Persistent Medications— ACE Inhibitors or ARBs
89.66% 83.22% 6.44B 85.65%
Annual Monitoring for Patients on Persistent Medications—Diuretics 88.58% 82.19% 6.39B 84.74%
Children and Adolescents' Access to Primary Care Practitioners— 12–24 Months
88.89% 91.44% -2.55 91.42%
Children and Adolescents' Access to Primary Care Practitioners— 25 Months–6 Years
82.06% 79.16% 2.90 79.24%
Anthem Blue Cross Partnership Plan Performance Evaluation Report: July 1, 2017–June 30, 2018 California Department of Health Care Services
Page D-181 Health Services Advisory Group, Inc.

MANAGED CARE HEALTH PLAN PERFORMANCE MEASURES
Measure RY 2018
SPD Rate1
RY 2018 Non-SPD
Rate1
SPD/Non-SPDRate
Difference2
RY 2018 Total Rate3
Children and Adolescents' Access to Primary Care Practitioners— 7–11 Years
85.07% 82.24% 2.83 82.36%
Children and Adolescents' Access to Primary Care Practitioners— 12–19 Years
81.07% 79.34% 1.73 79.45%
1 RY 2018 rates reflect MY data from January 1, 2017, through December 31, 2017. 2 Performance comparisons are based on the Chi-square test of statistical significance, with a p value of <0.05. 3 Total rates are based on the MCP reporting unit’s total results, including the SPD and non-SPD populations. Please note, if data are not available for either the SPD or non-SPD population, the total rate is based on results reported for the available population. * A lower rate indicates better performance for this measure. ** Member months are a member's “contribution” to the total yearly membership. Not Tested = An SPD/non-SPD rate difference was not calculated because high and low rates do not necessarily indicate better or worse performance.
Table 3.141—RY 2018 (MY 2017) Performance Measure Comparison and Results forMeasures Stratified by the SPD and Non-SPD PopulationsAnthem—San Benito County
B = Statistical testing result indicates that the RY 2018 SPD rate is significantly better than the RY 2018 non-SPD rate.
W = Statistical testing result indicates that the RY 2018 SPD rate is significantly worse than the RY 2018 non-SPD rate.
Measure RY 2018
SPD Rate1
RY 2018 Non-SPD
Rate1
SPD/Non-SPDRate
Difference2
RY 2018 Total Rate3
All-Cause Readmissions* NA S Not Comparable 10.28%
Ambulatory Care—Emergency Department (ED) Visits per 1,000 Member Months**
70.85 49.83 Not Tested 50.01
Ambulatory Care—Outpatient Visits per 1,000 Member Months** 421.60 244.63 Not Tested 246.19
Anthem Blue Cross Partnership Plan Performance Evaluation Report: July 1, 2017–June 30, 2018 California Department of Health Care Services
Page D-182 Health Services Advisory Group, Inc.

MANAGED CARE HEALTH PLAN PERFORMANCE MEASURES
Measure RY 2018
SPD Rate1
RY 2018 Non-SPD
Rate1
SPD/Non-SPDRate
Difference2
RY 2018 Total Rate3
Annual Monitoring for Patients on Persistent Medications— ACE Inhibitors or ARBs
NA 82.68% Not Comparable 82.09%
Annual Monitoring for Patients on Persistent Medications—Diuretics NA 81.58% Not
Comparable 78.75%
Children and Adolescents' Access to Primary Care Practitioners— 12–24 Months
NA 94.06% Not Comparable 94.06%
Children and Adolescents' Access to Primary Care Practitioners— 25 Months–6 Years
NA 83.72% Not Comparable 83.84%
Children and Adolescents' Access to Primary Care Practitioners— 7–11 Years
NA 84.62% Not Comparable 84.64%
Children and Adolescents' Access to Primary Care Practitioners— 12–19 Years
NA 80.83% Not Comparable 80.82%
1 RY 2018 rates reflect MY data from January 1, 2017, through December 31, 2017. 2 Performance comparisons are based on the Chi-square test of statistical significance, with a p value of <0.05. 3 Total rates are based on the MCP reporting unit’s total results, including the SPD and non-SPD populations. Please note, if data are not available for either the SPD or non-SPD population, the total rate is based on results reported for the available population. * A lower rate indicates better performance for this measure. ** Member months are a member's “contribution” to the total yearly membership. NA = The MCP followed the specifications, but the denominator was too small (less than 30) to report a valid rate. S = The MCP’s measure is publicly reported based on NCQA HEDIS Compliance Audit results; however, since fewer than 11 cases exist in the numerator of this measure, HSAG suppresses displaying the rate in this report to satisfy the Health Insurance Portability and Accountability Act of 1996 Privacy Rule’s de-identification standard. If an RY 2018 SPD or non-SPD rate is suppressed, HSAG also suppresses the SPD/non-SPD rate difference. Not Comparable = An SPD/non-SPD rate difference cannot be made because data are not available for both populations. Not Tested = An SPD/non-SPD rate difference was not calculated because high and low rates do not necessarily indicate better or worse performance.
Anthem Blue Cross Partnership Plan Performance Evaluation Report: July 1, 2017–June 30, 2018 California Department of Health Care Services
Page D-183 Health Services Advisory Group, Inc.
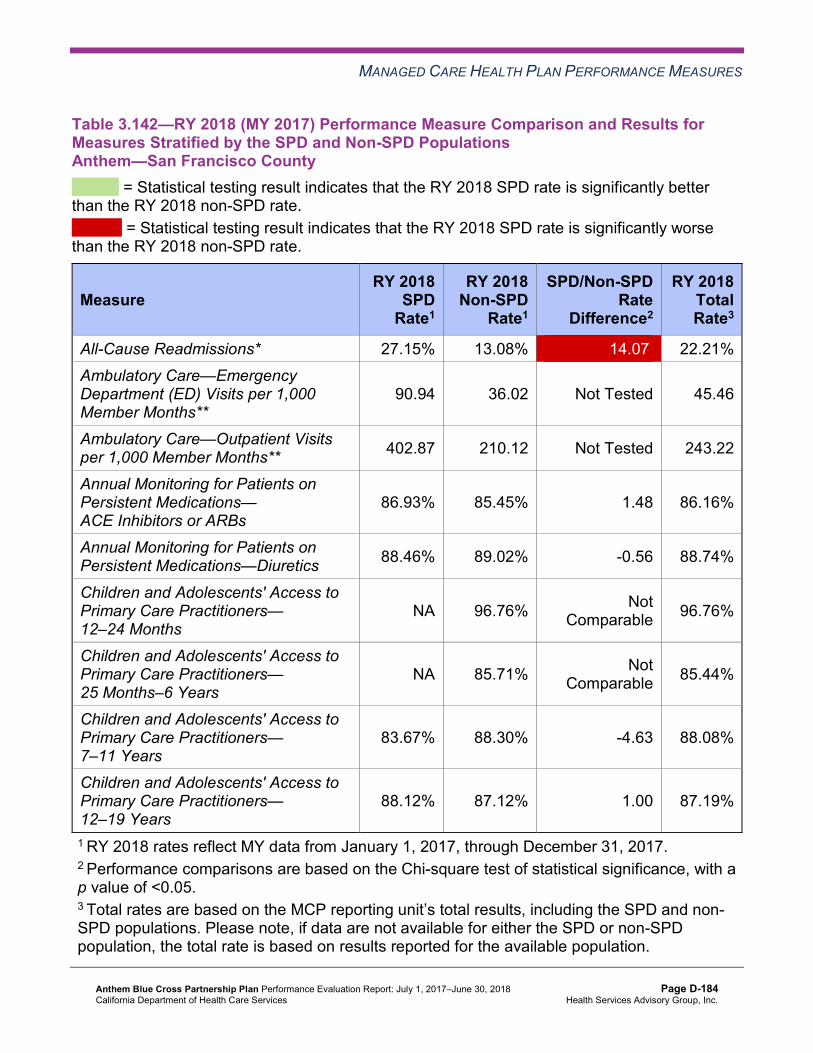
MANAGED CARE HEALTH PLAN PERFORMANCE MEASURES
Table 3.142—RY 2018 (MY 2017) Performance Measure Comparison and Results forMeasures Stratified by the SPD and Non-SPD PopulationsAnthem—San Francisco County
B = Statistical testing result indicates that the RY 2018 SPD rate is significantly better than the RY 2018 non-SPD rate.
W = Statistical testing result indicates that the RY 2018 SPD rate is significantly worse than the RY 2018 non-SPD rate.
Measure RY 2018
SPD Rate1
RY 2018 Non-SPD
Rate1
SPD/Non-SPDRate
Difference2
RY 2018 Total Rate3
All-Cause Readmissions* 27.15% 13.08% 14.07W 22.21% Ambulatory Care—Emergency Department (ED) Visits per 1,000 Member Months**
90.94 36.02 Not Tested 45.46
Ambulatory Care—Outpatient Visits per 1,000 Member Months** 402.87 210.12 Not Tested 243.22
Annual Monitoring for Patients on Persistent Medications— ACE Inhibitors or ARBs
86.93% 85.45% 1.48 86.16%
Annual Monitoring for Patients on Persistent Medications—Diuretics 88.46% 89.02% -0.56 88.74%
Children and Adolescents' Access to Primary Care Practitioners— 12–24 Months
NA 96.76% Not Comparable 96.76%
Children and Adolescents' Access to Primary Care Practitioners— 25 Months–6 Years
NA 85.71% Not Comparable 85.44%
Children and Adolescents' Access to Primary Care Practitioners— 7–11 Years
83.67% 88.30% -4.63 88.08%
Children and Adolescents' Access to Primary Care Practitioners— 12–19 Years
88.12% 87.12% 1.00 87.19%
1 RY 2018 rates reflect MY data from January 1, 2017, through December 31, 2017. 2 Performance comparisons are based on the Chi-square test of statistical significance, with a p value of <0.05. 3 Total rates are based on the MCP reporting unit’s total results, including the SPD and non-SPD populations. Please note, if data are not available for either the SPD or non-SPD population, the total rate is based on results reported for the available population.
Anthem Blue Cross Partnership Plan Performance Evaluation Report: July 1, 2017–June 30, 2018 California Department of Health Care Services
Page D-184 Health Services Advisory Group, Inc.

MANAGED CARE HEALTH PLAN PERFORMANCE MEASURES
* A lower rate indicates better performance for this measure. ** Member months are a member's “contribution” to the total yearly membership. NA = The MCP followed the specifications, but the denominator was too small (less than 30) to report a valid rate. Not Comparable = An SPD/non-SPD rate difference cannot be made because data are not available for both populations. Not Tested = An SPD/non-SPD rate difference was not calculated because high and low rates do not necessarily indicate better or worse performance.
Table 3.143—RY 2018 (MY 2017) Performance Measure Comparison and Results for Measures Stratified by the SPD and Non-SPD PopulationsAnthem—Santa Clara County
B = Statistical testing result indicates that the RY 2018 SPD rate is significantly better than the RY 2018 non-SPD rate.
W = Statistical testing result indicates that the RY 2018 SPD rate is significantly worse than the RY 2018 non-SPD rate.
Measure RY 2018
SPD Rate1
RY 2018 Non-SPD
Rate1
SPD/Non-SPDRate
Difference2
RY 2018 Total Rate3
All-Cause Readmissions* 16.54% 13.19% 3.35 14.30% Ambulatory Care—Emergency Department (ED) Visits per 1,000 Member Months**
60.67 38.82 Not Tested 40.47
Ambulatory Care—Outpatient Visits per 1,000 Member Months** 326.26 179.94 Not Tested 190.99
Annual Monitoring for Patients on Persistent Medications— ACE Inhibitors or ARBs
88.77% 88.04% 0.73 88.27%
Annual Monitoring for Patients on Persistent Medications—Diuretics 92.36% 88.11% 4.25 89.37%
Children and Adolescents' Access to Primary Care Practitioners— 12–24 Months
NA 92.03% Not Comparable 92.06%
Children and Adolescents' Access to Primary Care Practitioners— 25 Months–6 Years
76.74% 83.12% -6.38 83.01%
Children and Adolescents' Access to Primary Care Practitioners— 7–11 Years
80.00% 85.60% -5.60W 85.41%
Anthem Blue Cross Partnership Plan Performance Evaluation Report: July 1, 2017–June 30, 2018 California Department of Health Care Services
Page D-185 Health Services Advisory Group, Inc.

MANAGED CARE HEALTH PLAN PERFORMANCE MEASURES
Measure RY 2018
SPD Rate1
RY 2018 Non-SPD
Rate1
SPD/Non-SPDRate
Difference2
RY 2018 Total Rate3
Children and Adolescents' Access to Primary Care Practitioners— 12–19 Years
80.82% 82.11% -1.29 82.05%
1 RY 2018 rates reflect MY data from January 1, 2017, through December 31, 2017. 2 Performance comparisons are based on the Chi-square test of statistical significance, with a p value of <0.05. 3 Total rates are based on the MCP reporting unit’s total results, including the SPD and non-SPD populations. Please note, if data are not available for either the SPD or non-SPD population, the total rate is based on results reported for the available population. * A lower rate indicates better performance for this measure. ** Member months are a member's “contribution” to the total yearly membership. NA = The MCP followed the specifications, but the denominator was too small (less than 30) to report a valid rate. Not Comparable = An SPD/non-SPD rate difference cannot be made because data are not available for both populations. Not Tested = An SPD/non-SPD rate difference was not calculated because high and low rates do not necessarily indicate better or worse performance.
Table 3.144—RY 2018 (MY 2017) Performance Measure Comparison and Results forMeasures Stratified by the SPD and Non-SPD PopulationsAnthem—Tulare County
B = Statistical testing result indicates that the RY 2018 SPD rate is significantly better than the RY 2018 non-SPD rate.
W = Statistical testing result indicates that the RY 2018 SPD rate is significantly worse than the RY 2018 non-SPD rate.
Measure RY 2018
SPD Rate1
RY 2018 Non-SPD
Rate1
SPD/Non-SPDRate
Difference2
RY 2018 Total Rate3
All-Cause Readmissions* 19.84% 8.79% 11.05W 12.33% Ambulatory Care—Emergency Department (ED) Visits per 1,000 Member Months**
75.53 33.45 Not Tested 35.53
Ambulatory Care—Outpatient Visits per 1,000 Member Months** 548.61 290.09 Not Tested 302.92
Anthem Blue Cross Partnership Plan Performance Evaluation Report: July 1, 2017–June 30, 2018 California Department of Health Care Services
Page D-186 Health Services Advisory Group, Inc.

MANAGED CARE HEALTH PLAN PERFORMANCE MEASURES
Measure RY 2018
SPD Rate1
RY 2018 Non-SPD
Rate1
SPD/Non-SPDRate
Difference2
RY 2018 Total Rate3
Annual Monitoring for Patients on Persistent Medications— ACE Inhibitors or ARBs
90.09% 87.64% 2.45 88.22%
Annual Monitoring for Patients on Persistent Medications—Diuretics 92.17% 85.27% 6.90B 87.14%
Children and Adolescents' Access to Primary Care Practitioners— 12–24 Months
NA 96.90% Not Comparable 96.93%
Children and Adolescents' Access to Primary Care Practitioners— 25 Months–6 Years
92.61% 90.05% 2.56 90.11%
Children and Adolescents' Access to Primary Care Practitioners— 7–11 Years
94.12% 91.46% 2.66 91.53%
Children and Adolescents' Access to Primary Care Practitioners— 12–19 Years
91.40% 89.95% 1.45 90.01%
1 RY 2018 rates reflect MY data from January 1, 2017, through December 31, 2017. 2 Performance comparisons are based on the Chi-square test of statistical significance, with a p value of <0.05. 3 Total rates are based on the MCP reporting unit’s total results, including the SPD and non-SPD populations. Please note, if data are not available for either the SPD or non-SPD population, the total rate is based on results reported for the available population. * A lower rate indicates better performance for this measure. ** Member months are a member's “contribution” to the total yearly membership. NA = The MCP followed the specifications, but the denominator was too small (less than 30) to report a valid rate. Not Comparable = An SPD/non-SPD rate difference cannot be made because data are not available for both populations. Not Tested = An SPD/non-SPD rate difference was not calculated because high and low rates do not necessarily indicate better or worse performance.
Anthem Blue Cross Partnership Plan Performance Evaluation Report: July 1, 2017–June 30, 2018 California Department of Health Care Services
Page D-187 Health Services Advisory Group, Inc.

MANAGED CARE HEALTH PLAN PERFORMANCE MEASURES
Seniors and Persons with Disabilities Findings
HSAG observed the following notable results in RY 2018 for measures that Anthem stratified by the SPD and non-SPD populations:
SPD Rate Changes from RY 2017 to RY 2018
For SPD rates for which HSAG could make a comparison between RY 2017 and RY 2018:
♦ The RY 2018 SPD rates were significantly better than the RY 2017 SPD rates for the following measures: ■ Annual Monitoring for Patients on Persistent Medications—ACE Inhibitors or ARBs in
Sacramento County ■ Annual Monitoring for Patients on Persistent Medications—Diuretics in Madera County
♦ The RY 2018 SPD rates were significantly worse than the RY 2017 SPD rates for the following measures: ■ All-Cause Readmissions in Sacramento County ■ Children and Adolescents’ Access to Primary Care Practitioners—7–11 Years in Kings
County
Non-SPD Rate Changes from RY 2017 to RY 2018
For non-SPD rates for which HSAG could make comparisons between RY 2017 and RY 2018:
♦ The RY 2018 non-SPD rates were significantly better than the RY 2017 non-SPD rates for the following measures: ■ All-Cause Readmissions in San Benito County ■ Annual Monitoring for Patients on Persistent Medications—Diuretics in Contra Costa
County ■ Children and Adolescents’ Access to Primary Care Practitioners—12–24 Months in
Contra Costa and Fresno counties ■ Children and Adolescents’ Access to Primary Care Practitioners—25 Months–6 Years in
Alameda, Contra Costa, and Kings counties ■ Children and Adolescents’ Access to Primary Care Practitioners—7–11 Years and 12–
19 Years in Alameda and Contra Costa counties ♦ The RY 2018 non-SPD rates were significantly worse than the RY 2017 non-SPD rates for
the following measures: ■ All-Cause Readmissions in Contra Costa County and Region 1 ■ Children and Adolescents’ Access to Primary Care Practitioners—25 Months–6 Years
and 12–19 Years in Region 1
Anthem Blue Cross Partnership Plan Performance Evaluation Report: July 1, 2017–June 30, 2018 California Department of Health Care Services
Page D-188 Health Services Advisory Group, Inc.

MANAGED CARE HEALTH PLAN PERFORMANCE MEASURES
RY 2018 SPD and RY 2018 Non-SPD Rate Comparisons
For measures for which HSAG could make comparisons between the RY 2018 SPD and RY 2018 non-SPD rates:
♦ The RY 2018 SPD rates were significantly better than the RY 2018 non-SPD rates for the following measures: ■ Annual Monitoring for Patients on Persistent Medications—ACE Inhibitors or ARBs in
Alameda County, Contra Costa County, Fresno County, Kings County, Madera County, Region 1, Region 2, and Sacramento County
■ Annual Monitoring for Patients on Persistent Medications—Diuretics in Alameda County, Madera County, Region 2, Sacramento County, and Tulare County
♦ The RY 2018 SPD rates were significantly worse than the RY 2018 non-SPD rates for the following measures: ■ All-Cause Readmissions measure in Alameda County, Fresno County, Region 1,
Region 2, Sacramento County, San Francisco County, and Tulare County. Note that the higher rates of hospital readmissions for the SPD population are expected based on the greater and often more complicated health care needs of these beneficiaries.
■ Children and Adolescents’ Access to Primary Care Practitioners—7–11 Years in Santa Clara County. The significant differences in rates for this measure may be attributed to beneficiaries in this age group in the SPD population choosing to receive all health care services from specialist providers due to their complicated health care needs rather than accessing care from primary care providers.
Strengths—Performance Measures HSAG auditors determined that Anthem followed the appropriate specifications to produce valid rates, and identified no issues of concern.
HSAG identified the following notable RY 2018 performance measure results for Anthem across all domains and reporting units:
♦ Twenty-eight of 252 rates for which MCPs were held accountable to meet the MPLs in RY 2018 (11 percent) were above the HPLs in RY 2018. ■ The Appropriate Treatment and Utilization domain had the highest percentage of rates
above the HPLs, with 12 of 24 rates (50 percent) being above the HPLs in RY 2018. The Preventive Screening and Children’s Health domain had 14 of 60 rates (23 percent) above the HPLs in RY 2018, and the Preventive Screening and Women’s Health and Care for Chronic Conditions domains each had one rate above the HPL in RY 2018 (2 percent and 1 percent, respectively).
♦ Thirty-three of the 264 rates for which HSAG made comparisons between RY 2017 and RY 2018 (13 percent) improved significantly from RY 2017 to RY 2018.
Anthem Blue Cross Partnership Plan Performance Evaluation Report: July 1, 2017–June 30, 2018 California Department of Health Care Services
Page D-189 Health Services Advisory Group, Inc.

MANAGED CARE HEALTH PLAN PERFORMANCE MEASURES
♦ For rates for which MCPs were held accountable to meet the MPLs in RY 2017, eight of the 19 rates that were below the MPLs in RY 2017 (42 percent) improved from below the MPLs in RY 2017 to above the MPLs in RY 2018.
♦ Tulare County performed the best compared to other reporting units, with six of 21 rates (29 percent) above the HPLs in RY 2018 and four of 22 rates (18 percent) that improved significantly from RY 2017 to RY 2018.
The MCP’s QI activities as described previously within this section of the report, the PIP activities as described in Section 5 of this report (“Performance Improvement Projects”), and Anthem’s self-reported actions as described in Table 6.1 may have contributed to the MCP’s improved performance across all domains and reporting units.
Opportunities for Improvement—Performance Measures Across all domains and reporting units, 40 of 252 rates for which MCPs were held accountable to meet the MPLs in RY 2018 (16 percent) were below the MPLs in RY 2018. The Preventive Screening and Women’s Health domain had the highest percentage of rates below the MPLs in RY 2018, with 12 of 48 rates (25 percent) being below the MPLs. The Care for Chronic Conditions domain had 25 of 120 rates (21 percent) below the MPLs in RY 2018, the Appropriate Treatment and Utilization domain had one of 24 rates (4 percent) below the MPL in RY 2018, and the Preventive Screening and Children’s Health domain had two of 60 rates (3 percent) below the MPLs in RY 2018.
Performance measure results show that while Anthem has made significant improvements across all domains and reporting units, the MCP has continued opportunities for improvement, with most opportunities for improvement being in the Preventive Screening and Women’s Health and Care for Chronic Conditions domains. To build on improvements already achieved, Anthem should identify which strategies contributed to performance measure improvement from RY 2017 to RY 2018 and expand these successful strategies within the MCP and new provider sites, as applicable.
Anthem Blue Cross Partnership Plan Performance Evaluation Report: July 1, 2017–June 30, 2018 California Department of Health Care Services
Page D-190 Health Services Advisory Group, Inc.

Medi-Cal Managed Care External Quality Review Technical ReportAppendix D: Performance Evaluation ReportAnthem Blue Cross Partnership PlanJuly 1, 2017–June 30, 2018
4. MLTSSP Performance Measure Results
Due to Anthem’s participation in California’s Coordinated Care Initiative as a Managed Long-Term Services and Supports Plan (MLTSSP), DHCS required that Anthem report rates for three HEDIS measures for HSAG to validate as part of the NCQA HEDIS Compliance Audit.
Table 4.1 presents the rates for each required MLTSSP performance measure for RYs 2016, 2017, and 2018. The RY is the year in which the MLTSSP reported the rates. The RY rates reflect MY data from the previous calendar year. Note that the Ambulatory Care—Emergency Department Visits and Ambulatory Care—Outpatient Visits measures are utilization measures which measure the volume of services used. High and low rates do not necessarily indicate better or worse performance; therefore, for these measures, HSAG did not compare performance between RY 2017 and RY 2018.
Table 4.1—Multi-Year MLTSSP Performance Measure Results Anthem—Santa Clara County
B = Statistical testing result indicates that the RY 2018 rate is significantly better than the RY 2017 rate.
W = Statistical testing result indicates that the RY 2018 rate is significantly worse than the RY 2017 rate.
Measure RY 2016 MLTSS
Rate1
RY 2017 MLTSS
Rate2
RY 2018 MLTSS
Rate3
RYs 2017–18 Rate
Difference4
Ambulatory Care—Emergency Department (ED) Visits per 1,000 Member Months*
43.04 63.09 73.72 Not Tested
Ambulatory Care—Outpatient Visits per 1,000 Member Months* 282.89 480.17 545.27 Not Tested
Medication Reconciliation Post-Discharge 31.71% 37.84% 41.04% 3.20
1 RY 2016 rates reflect MY data from January 1, 2015, through December 31, 2015. 2 RY 2017 rates reflect MY data from January 1, 2016, through December 31, 2016. 3 RY 2018 rates reflect MY data from January 1, 2017, through December 31, 2017. 4 Performance comparisons are based on the Chi-square test of statistical significance, with a p value of <0.05. * Member months are a member's “contribution” to the total yearly membership. Not Tested = An RY 2017–18 rate difference was not calculated because high and low rates do not necessarily indicate better or worse performance.
Anthem Blue Cross Partnership Plan Performance Evaluation Report: July 1, 2017–June 30, 2018 California Department of Health Care Services
Page D-191 Health Services Advisory Group, Inc.

MLTSSP PERFORMANCE MEASURE RESULTS
Managed Long-Term Services and Supports Plan PerformanceMeasure Findings The rate for the Medication Reconciliation Post-Discharge measure showed no statistically significant change from RY 2017 to RY 2018.
Anthem Blue Cross Partnership Plan Performance Evaluation Report: July 1, 2017–June 30, 2018 California Department of Health Care Services
Page D-192 Health Services Advisory Group, Inc.
Medi-Cal Managed Care External Quality Review Technical ReportAppendix D: Performance Evaluation ReportAnthem Blue Cross Partnership PlanJuly 1, 2017–June 30, 2018
5. Performance Improvement Projects
Performance Improvement Project Overview The key concepts of the rapid-cycle PIP framework include forming a PIP team, setting aims, establishing measures, determining interventions using quality improvement tools, conducting PDSA cycles to test interventions, and planning for the spread of successful changes. The core component of the rapid-cycle PIP approach involves testing changes on a small scale so that improvement can occur more efficiently and lead to long-term sustainability. The following modules guide MCPs through this rapid-cycle PIP process:
♦ Module 1—PIP Initiation ■ MCPs outline the framework for the PIP, which includes:
○ The topic rationale. ○ Comparative data supporting the need to improve the selected topic. ○ A list of the PIP team members, which consists of internal and external stakeholders. ○ A completed key driver diagram that defines the theory of change for improvement,
including the SMART (Specific, Measurable, Achievable, Relevant, and Time-bound) Aim and Global Aim.
♦ Module 2—SMART Aim Data Collection ■ MCPs define the SMART Aim measure and data collection methodology and develop
the SMART Aim data run chart. ♦ Module 3—Intervention Determination
■ MCPs use process mapping and failure modes and effects analysis (FMEA) to identify potential interventions to test which may have direct effects on the SMART Aim.
♦ Module 4—Plan-Do-Study-Act (PDSA) ■ MCPs test and evaluate the interventions identified in Module 3 through a series of
PDSA cycles. ♦ Module 5—PIP Conclusions
■ MCPs interpret results and summarize: ○ Key findings and outcomes achieved. ○ Assessment of each tested intervention. ○ Lessons learned, including how demonstrated improvement can be shared and used
as a foundation for further improvement going forward. ○ Plan for sustained improvement.
Anthem Blue Cross Partnership Plan Performance Evaluation Report: July 1, 2017–June 30, 2018 California Department of Health Care Services
Page D-193 Health Services Advisory Group, Inc.
PERFORMANCE IMPROVEMENT PROJECTS
Based on the agreed-upon timeline, MCPs submit each module to HSAG for validation. Throughout the rapid-cycle PIP process, HSAG provides technical assistance to MCPs to ensure that PIPs are methodologically sound and to problem-solve with MCPs regarding how to address challenges that occur. Through an iterative process, MCPs have opportunities to make corrections to modules 1 through 3 to achieve all validation criteria.
Once MCPs achieve all validation criteria for modules 1 through 3 and receive feedback on the intervention Plan portion of Module 4, MCPs test interventions. During the intervention testing phase of the PIP, HSAG conducts periodic progress check-ins to ensure that MCPs have addressed HSAG’s feedback on the Plan portion of Module 4 and are making appropriate progress with intervention testing. Once MCPs complete testing an intervention, MCPs determine the next steps based on results and lessons learned—whether the intervention was successful and should be spread (adopt), whether modifications need to be made to the existing intervention (adapt), or whether the intervention was not successful and should be stopped (abandon).
In Module 5, MCPs summarize the overall PIP. When validating Module 5, HSAG assesses the validity and reliability of the results based on the Centers for Medicare & Medicaid Services (CMS) validation protocols to determine whether key stakeholders can have confidence in the reported PIP findings. HSAG assigns the following final confidence levels for each PIP:
♦ High confidence—the PIP was methodologically sound and achieved the SMART Aim goal; the demonstrated improvement was clearly linked to the quality improvement processes conducted and intervention(s) tested; and, the MCP accurately summarized the key findings.
♦ Confidence—the PIP was methodologically sound and achieved the SMART Aim goal, and the MCP accurately summarized the key findings. However, some, but not all, of the quality improvement processes conducted and/or intervention(s) tested were clearly linked to the demonstrated improvement.
♦ Low confidence—either (A) the PIP was methodologically sound; however, the SMART Aim goal was not achieved; or (B) the SMART Aim goal was achieved; however, the quality improvement processes and/or intervention(s) tested were poorly executed and could not be linked to the improvement.
♦ Reported PIP results were not credible (referred to in this report as “not credible”)—the PIP methodology was not executed as approved.
Performance Improvement Project Results and Findings During the review period, Anthem submitted modules 4 and 5 for two 2015–17 CAP PIPs. HSAG validated the modules and includes the final PIP validation findings in this report. Additionally, Anthem initiated a Disparity PIP and a DHCS-priority PIP during the review period. In this report, HSAG includes summaries of the MCP’s Disparity and DHCS-priority PIP module submissions as well as validation findings from the review period.
Anthem Blue Cross Partnership Plan Performance Evaluation Report: July 1, 2017–June 30, 2018 California Department of Health Care Services
Page D-194 Health Services Advisory Group, Inc.

PERFORMANCE IMPROVEMENT PROJECTS
2015–17 Controlling Blood Pressure Performance Improvement Project
DHCS required Anthem to conduct a PIP on controlling blood pressure as part of its CAP. While the MCP concluded its Controlling Blood Pressure PIP through the SMART Aim end date of June 30, 2017, Anthem submitted modules 4 and 5 for HSAG to validate during the review period for this report. HSAG provided final validation findings and encouraged Anthem to incorporate the experiences and lessons learned from the PIP into future quality improvement efforts.
Table 5.1 provides a summary of the SMART Aim measure results reported by the MCP.
Table 5.1—Anthem Controlling Blood Pressure PIP SMART Aim Measure Results
SMART Aim Measure Baseline Rate
SMART Aim Goal
Rate
SMART Aim Goal Achieved
Compliance rate of hypertensive medication among beneficiaries diagnosed with hypertension in Kings County who are assigned to Provider Network A6
providers
55.27% 60.27% No
Table 5.2 presents a description of the intervention that Anthem tested for its Controlling Blood Pressure PIP. The table also indicates the key driver that the intervention addressed as well as whether the MCP decided, based on intervention testing results, to adopt, adapt, or abandon the intervention.
Table 5.2—Anthem Controlling Blood Pressure PIP Intervention Testing Results
Intervention Key Driver Addressed Adopt,Adapt, orAbandon
Creation of a process co-developed with a pharmacy in Kings County and Provider Network A to follow up with beneficiaries through provider notifications if the beneficiaries do not pick up their medications
Provider awareness Adapt
6 Provider network name removed for confidentiality.
Anthem Blue Cross Partnership Plan Performance Evaluation Report: July 1, 2017–June 30, 2018 California Department of Health Care Services
Page D-195 Health Services Advisory Group, Inc.

PERFORMANCE IMPROVEMENT PROJECTS
Anthem documented the following lessons learned during the scope of the 2015–17 Controlling Blood Pressure PIP, which the MCP may apply to future PIPs:
♦ Assign one main contact person to facilitate ongoing communication regarding the intervention.
♦ Create a single-page spreadsheet tracking log to be used by both organizations involved in the intervention, the pharmacy and the provider network.
Performance Improvement Project Validation Findings
During the review period for this report, HSAG validated modules 4 and 5 for the MCP’s Controlling Blood Pressure PIP. Anthem indicated the same denominator size for every month from January 2016 through June 2017, and the denominator size did not change from the baseline measurement period. The approved data collection methodology in modules 1 and 2 did not include using a fixed cohort of beneficiaries. Thus, HSAG determined that Anthem did not execute the approved PIP methodology.
Upon assessment of validity and reliability of the PIP results, HSAG assigned Anthem’s Controlling Blood Pressure PIP a final confidence level of Not Credible.
2015–17 Comprehensive Diabetes Care Performance Improvement Project
DHCS required Anthem to conduct a PIP on comprehensive diabetes care as part of its CAP. While the Comprehensive Diabetes Care PIP SMART Aim end date was December 31, 2017, DHCS approved the MCP to conclude the PIP by August 30, 2017, based on the MCP’s progress on the measure rate. Thus, Anthem completed testing interventions for its Comprehensive Diabetes Care PIP through August 30, 2017, and submitted modules 4 and 5 for HSAG to validate during the review period for this report. HSAG provided final validation findings and encouraged Anthem to incorporate the experiences and lessons learned from the PIP into future QI efforts.
Table 5.3 provides a summary of the SMART Aim measure results reported by the MCP.
Table 5.3—Anthem Comprehensive Diabetes Care PIP SMART Aim Measure Results
SMART Aim Measure Baseline Rate
SMART Aim Goal
Rate
SMART Aim Goal Achieved
Compliance rate of diabetic retinal exam (DRE) among beneficiaries in Tulare County who have Provider A7 as their primary care provider
24.07% 29.07% Yes
7 Provider name removed for confidentiality.
Anthem Blue Cross Partnership Plan Performance Evaluation Report: July 1, 2017–June 30, 2018 California Department of Health Care Services
Page D-196 Health Services Advisory Group, Inc.
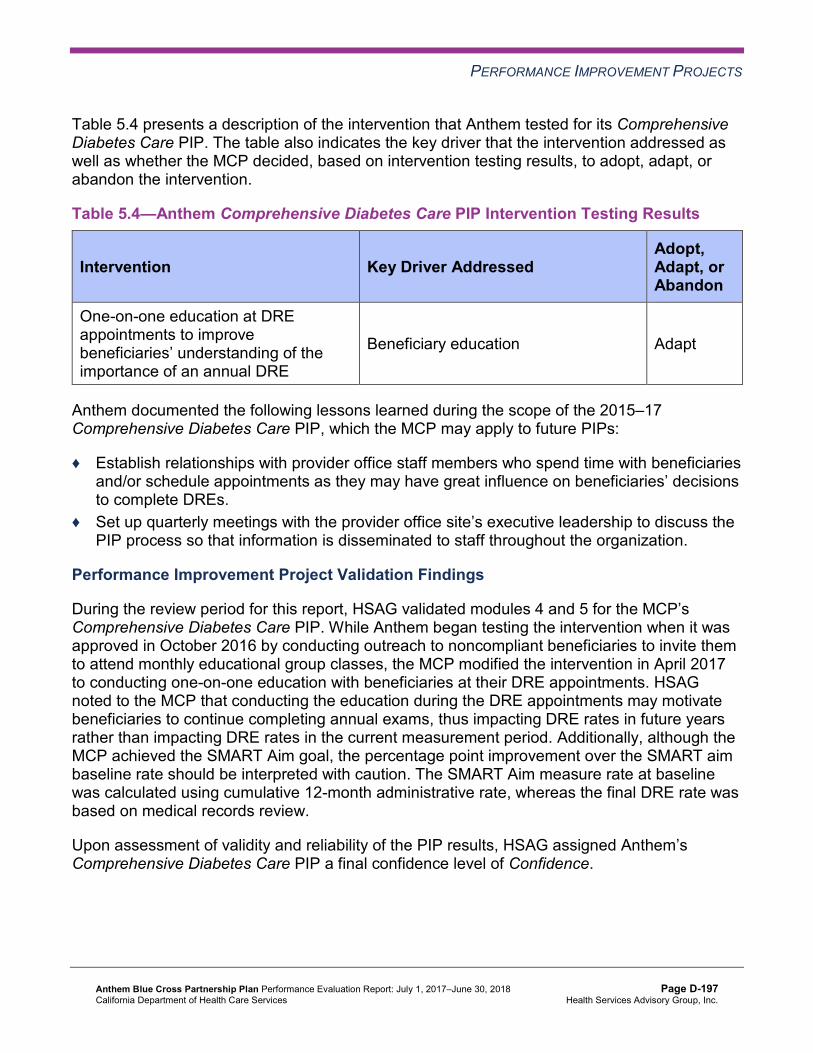
PERFORMANCE IMPROVEMENT PROJECTS
Table 5.4 presents a description of the intervention that Anthem tested for its Comprehensive Diabetes Care PIP. The table also indicates the key driver that the intervention addressed as well as whether the MCP decided, based on intervention testing results, to adopt, adapt, or abandon the intervention.
Table 5.4—Anthem Comprehensive Diabetes Care PIP Intervention Testing Results
Intervention Key Driver Addressed Adopt,Adapt, orAbandon
One-on-one education at DRE appointments to improve beneficiaries’ understanding of the importance of an annual DRE
Beneficiary education Adapt
Anthem documented the following lessons learned during the scope of the 2015–17 Comprehensive Diabetes Care PIP, which the MCP may apply to future PIPs:
♦ Establish relationships with provider office staff members who spend time with beneficiaries and/or schedule appointments as they may have great influence on beneficiaries’ decisions to complete DREs.
♦ Set up quarterly meetings with the provider office site’s executive leadership to discuss the PIP process so that information is disseminated to staff throughout the organization.
Performance Improvement Project Validation Findings
During the review period for this report, HSAG validated modules 4 and 5 for the MCP’s Comprehensive Diabetes Care PIP. While Anthem began testing the intervention when it was approved in October 2016 by conducting outreach to noncompliant beneficiaries to invite them to attend monthly educational group classes, the MCP modified the intervention in April 2017 to conducting one-on-one education with beneficiaries at their DRE appointments. HSAG noted to the MCP that conducting the education during the DRE appointments may motivate beneficiaries to continue completing annual exams, thus impacting DRE rates in future years rather than impacting DRE rates in the current measurement period. Additionally, although the MCP achieved the SMART Aim goal, the percentage point improvement over the SMART aim baseline rate should be interpreted with caution. The SMART Aim measure rate at baseline was calculated using cumulative 12-month administrative rate, whereas the final DRE rate was based on medical records review.
Upon assessment of validity and reliability of the PIP results, HSAG assigned Anthem’s Comprehensive Diabetes Care PIP a final confidence level of Confidence.
Anthem Blue Cross Partnership Plan Performance Evaluation Report: July 1, 2017–June 30, 2018 California Department of Health Care Services
Page D-197 Health Services Advisory Group, Inc.

PERFORMANCE IMPROVEMENT PROJECTS
2017–19 Disparity Performance Improvement Project
During the review period, DHCS required Anthem to initiate a PIP focusing on an identified health disparity based on, but not limited to, age, gender, race or ethnicity, language spoken, income, educational attainment, sexual orientation or gender identity, occupation, provider, or geographic area. Anthem selected asthma medication ratio among the African American population as its 2017–19 Disparity PIP topic. Using its own MCP-specific data, the MCP provided evidence of the health disparity by demonstrating a statistically significant rate difference between two subgroups, with the disparate subgroup having the lower rate.
Table 5.5 provides the SMART Aim measure description, baseline rate, and SMART Aim goal rate for the PIP. The SMART Aim end date for this PIP is June 30, 2019.
Table 5.5—Anthem Asthma Medication Ratio Disparity PIP SMART Aim Measure
SMART Aim Measure Baseline Rate
SMART Aim Goal
Rate
Rate of controller medication refills among a cohort of 67 non-compliant African Americans 5 to 64 years of age residing in Alameda County who have Provider Network B8 as their primary care provider
21.0% 25.2%
Performance Improvement Project Validation Findings
During the review period of this report, HSAG validated modules 1 through 3 for the MCP’s Asthma Medication Ratio Disparity PIP. Upon initial review of the modules, HSAG determined that Anthem met some required validation criteria; however, HSAG identified opportunities for improvement related to:
♦ Supporting the topic selection with the MCP’s data. ♦ Including all required components of the SMART Aim measure. ♦ Including a step-by-step flow of the overall process in the process map. ♦ Listing the appropriate potential interventions based on the ranked failure modes. ♦ Considering the potential interventions’ reliability and sustainability.
After receiving technical assistance from HSAG, Anthem incorporated HSAG’s feedback into the PIP modules. Upon HSAG’s final review, HSAG determined that the MCP met all validation criteria for all submitted modules.
8 Provider network name removed for confidentiality.
Anthem Blue Cross Partnership Plan Performance Evaluation Report: July 1, 2017–June 30, 2018 California Department of Health Care Services
Page D-198 Health Services Advisory Group, Inc.

PERFORMANCE IMPROVEMENT PROJECTS
2017–19 DHCS-Priority Performance Improvement Project
During the review period, DHCS required Anthem to initiate a PIP related to one of DHCS’ Quality Strategy focus areas: Childhood Immunization Status—Combination 3, Controlling High Blood Pressure, Comprehensive Diabetes Care, or Prenatal and Postpartum Care— Postpartum Care. Based on the MCP’s performance measure results, Anthem selected postpartum care as its 2017–19 DHCS-priority PIP topic.
Table 5.6 provides the SMART Aim measure description, baseline rate, and SMART Aim goal rate for the PIP. The SMART Aim end date for this PIP is June 30, 2019.
Table 5.6—Anthem Postpartum Care PIP SMART Aim Measure
SMART Aim Measure Baseline Rate
SMART Aim Goal
Rate
Administrative rate of postpartum visits that occur between 21 to 56 days post delivery among African-American women. 38.19% 45.19%
Performance Improvement Project Validation Findings
During the review period of this report, HSAG validated modules 1 through 3 for the MCP’s Postpartum Care PIP. Upon initial review of the modules, HSAG determined that Anthem met some required validation criteria; however, HSAG identified opportunities for improvement related to:
♦ Supporting the topic selection with the MCP’s data. ♦ Including all required components of the:
■ SMART Aim, developed based on literature review, data, and/or experience. ■ SMART Aim measure. ■ SMART Aim data collection methodology. ■ FMEA table.
♦ Aligning accurately the Global Aim, SMART Aim, key drivers, and potential interventions. ♦ Including a step-by-step flow of the overall process in the process map.
After receiving technical assistance from HSAG, Anthem incorporated HSAG’s feedback into the PIP modules. Upon HSAG’s final review, HSAG determined that the MCP met all validation criteria for all submitted modules.
Anthem Blue Cross Partnership Plan Performance Evaluation Report: July 1, 2017–June 30, 2018 California Department of Health Care Services
Page D-199 Health Services Advisory Group, Inc.
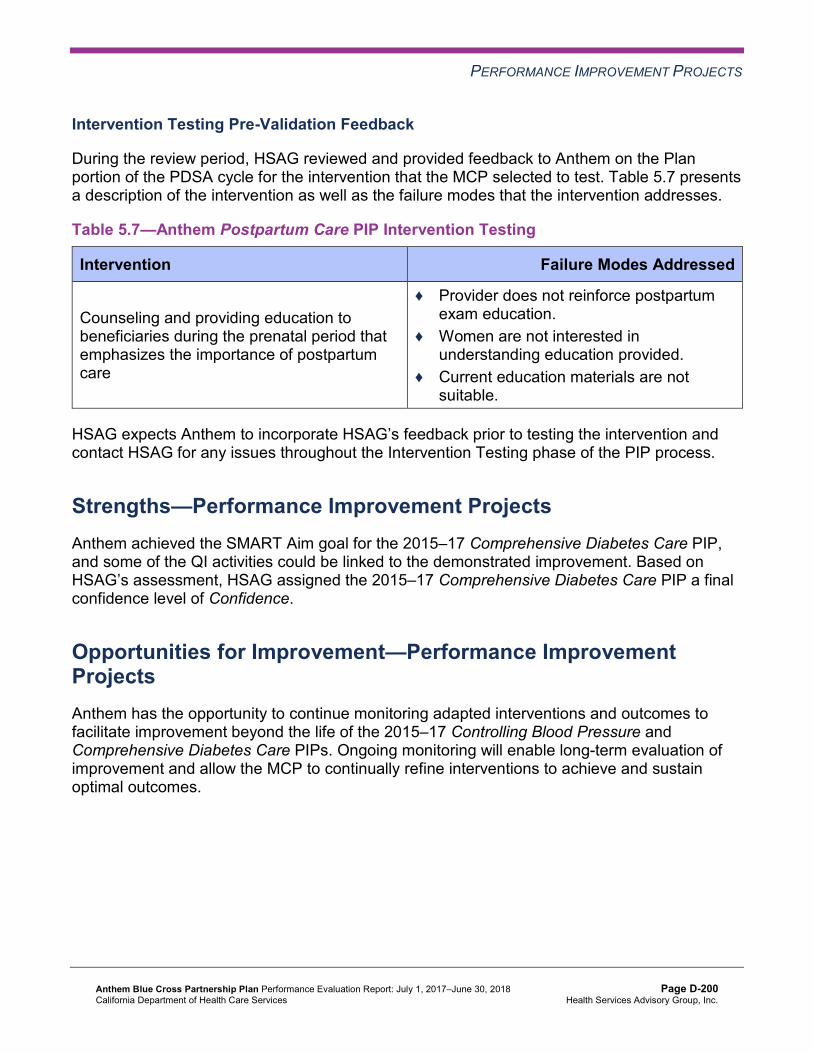
PERFORMANCE IMPROVEMENT PROJECTS
Intervention Testing Pre-Validation Feedback
During the review period, HSAG reviewed and provided feedback to Anthem on the Plan portion of the PDSA cycle for the intervention that the MCP selected to test. Table 5.7 presents a description of the intervention as well as the failure modes that the intervention addresses.
Table 5.7—Anthem Postpartum Care PIP Intervention Testing
Intervention Failure Modes Addressed
Counseling and providing education to beneficiaries during the prenatal period that emphasizes the importance of postpartum care
♦ Provider does not reinforce postpartum exam education.
♦ Women are not interested in understanding education provided.
♦ Current education materials are not suitable.
HSAG expects Anthem to incorporate HSAG’s feedback prior to testing the intervention and contact HSAG for any issues throughout the Intervention Testing phase of the PIP process.
Strengths—Performance Improvement Projects Anthem achieved the SMART Aim goal for the 2015–17 Comprehensive Diabetes Care PIP, and some of the QI activities could be linked to the demonstrated improvement. Based on HSAG’s assessment, HSAG assigned the 2015–17 Comprehensive Diabetes Care PIP a final confidence level of Confidence.
Opportunities for Improvement—Performance Improvement Projects Anthem has the opportunity to continue monitoring adapted interventions and outcomes to facilitate improvement beyond the life of the 2015–17 Controlling Blood Pressure and Comprehensive Diabetes Care PIPs. Ongoing monitoring will enable long-term evaluation of improvement and allow the MCP to continually refine interventions to achieve and sustain optimal outcomes.
Anthem Blue Cross Partnership Plan Performance Evaluation Report: July 1, 2017–June 30, 2018 California Department of Health Care Services
Page D-200 Health Services Advisory Group, Inc.

Medi-Cal Managed Care External Quality Review Technical ReportAppendix D: Performance Evaluation ReportAnthem Blue Cross Partnership PlanJuly 1, 2017–June 30, 2018
6. Recommendations
Follow-Up on Prior Year Recommendations DHCS provided each MCP an opportunity to outline actions taken to address recommendations HSAG made in its 2016–17 MCP-specific evaluation report. Table 6.1 provides EQR recommendations from Anthem’s July 1, 2016, through June 30, 2017, MCP-specific evaluation report, along with the MCP’s self-reported actions taken through June 30, 2018, that address the recommendations. Please note that HSAG made minimal edits to Table 6.1 to preserve the accuracy of Anthem’s self-reported actions.
Table 6.1—Anthem’s Self-Reported Follow-Up on External Quality ReviewRecommendations from the July 1, 2016, through June 30, 2017, MCP-SpecificEvaluation Report
2016–17 External Quality ReviewRecommendations Directed to Anthem
Self-Reported Actions Taken by Anthemduring the Period of July 1, 2017–June 30,2018, that Address the External QualityReview Recommendations
1. Work with DHCS to resolve all deficiencies from the October 31, 2016, through November 4, 2016, SPD Medical Survey, particularly in the area of Grievances and Appeals within the Member Rights category.
Anthem provided DHCS with revised policies and job aids to document the improvements made as a result of the 2016 SPD Medical Survey findings. Anthem received notification from DHCS on July 18, 2018, that Anthem’s CAP submissions had been reviewed and found in compliance, bringing this CAP to a close.
2. Continue to work with DHCS to prioritize areas for improvement and determine whether or not current strategies need to be modified or expanded to improve the MCP’s performance to above the MPLs for all measures. HSAG recommends that Anthem focus on the following measures for which the MCP performed below the MPLs in RY 2017: a. Annual Monitoring for Patients on
Persistent Medications—ACE Inhibitors or ARBs in Contra Costa
RY 2017 (MY 2016) HEDIS results showed that Anthem was below the MPLs for Annual Monitoring for Patients on Persistent Medications (MPM), Avoidance of Antibiotic Treatment in Adults With Acute Bronchitis (AAB), Cervical Cancer Screening (CCS),Comprehensive Diabetes Care (CDC), and Prenatal and Postpartum Care—Postpartum Care (PPC) measures. Anthem implemented PDSA cycles for MPM, AAB, CCS, and CDC measures. MPM and CDC measures were combined into a lab PDSA cycle. Anthem submitted PDSA cycle worksheets on these measures in September 2017, February 2018,
Anthem Blue Cross Partnership Plan Performance Evaluation Report: July 1, 2017–June 30, 2018 California Department of Health Care Services
Page D-201 Health Services Advisory Group, Inc.

RECOMMENDATIONS
2016–17 External Quality ReviewRecommendations Directed to Anthem
Self-Reported Actions Taken by Anthemduring the Period of July 1, 2017–June 30,2018, that Address the External QualityReview Recommendations
County, Madera County, Region 2, and Sacramento County
b. Annual Monitoring for Patients on Persistent Medications—Diuretics in Contra Costa County and Region 2
c. Avoidance of Antibiotic Treatment in Adults With Acute Bronchitis in Madera County and Region 1
d. Cervical Cancer Screening in Contra Costa County
e. Comprehensive Diabetes Care— Hemoglobin A1c (HbA1c) Testing in Region 1, Region 2, Sacramento County, and San Benito County
f. Comprehensive Diabetes Care— Medical Attention for Nephropathy in Alameda County, Contra Costa County, Region 1, Region 2, and San Benito County
g. Prenatal and Postpartum Care— Postpartum Care in Kings County
and June 2018. Anthem implemented feedback from DHCS in the subsequent reporting period. Anthem also implemented a PIP for the PPCmeasure and met the deliverable timelines set forth (Modules 1 and 2 on January 12, 2018; Module 3 on April 20, 2018; and Module 4 on May 24, 2018) and incorporated feedback as received. The PPC PIP will not be completed until June 30, 2019.
Anthem Blue Cross Partnership Plan Performance Evaluation Report: July 1, 2017–June 30, 2018 California Department of Health Care Services
Page D-202 Health Services Advisory Group, Inc.
RECOMMENDATIONS
2017–18 Recommendations Based on the overall assessment of Anthem’s delivery of quality, accessible, and timely care through the activities described in previous sections of this report, HSAG recommends the following to the MCP:
♦ Work with DHCS to ensure that the MCP fully resolves all deficiencies from the November 2017 A&I Medical Audit.
♦ To build on improvements already achieved, identify which strategies contributed to performance measure improvement from RY 2017 to RY 2018 and expand these successful strategies within the MCP and new provider sites, as applicable. The MCP should prioritize efforts on measures within the Preventive Screening and Women’s Health and Care for Chronic Conditions domains.
♦ Continue monitoring adapted interventions and outcomes to facilitate improvement beyond the life of the 2015–17 Controlling Blood Pressure and Comprehensive Diabetes Care PIPs.
In the next annual review, HSAG will evaluate continued successes of Anthem as well as the MCP’s progress with these recommendations.
Anthem Blue Cross Partnership Plan Performance Evaluation Report: July 1, 2017–June 30, 2018 California Department of Health Care Services
Page D-203 Health Services Advisory Group, Inc.

Medi-Cal Managed CareExternal Quality Review Technical Report
Appendix E: Performance Evaluation Report
California Health & Wellness Plan July 1, 2017–June 30, 2018

Medi-Cal Managed Care External Quality Review Technical ReportAppendix E: Performance Evaluation ReportCalifornia Health & Wellness Plan July 1, 2017–June 30, 2018
Table of Contents
1. Introduction.............................................................................................................E-1 Medi-Cal Managed Care Health Plan Overview .......................................................E-1
2. Managed Care Health Plan Compliance ...............................................................E-4Compliance Reviews Conducted..............................................................................E-4 Strengths—Compliance Reviews .............................................................................E-4 Opportunities for Improvement—Compliance Reviews ............................................E-5
3. Managed Care Health Plan Performance Measures ............................................E-6Performance Measure Validation Results ................................................................E-6 Performance Measure Results and Findings............................................................E-6
Preventive Screening and Children’s Health .........................................................E-7 Preventive Screening and Women’s Health ........................................................E-16 Care for Chronic Conditions ................................................................................E-23 Appropriate Treatment and Utilization.................................................................E-30 Performance Measure Findings—All Domains....................................................E-39
Improvement Plan Requirements for 2018 .............................................................E-42 Corrective Action Plan ............................................................................................E-42 Seniors and Persons with Disabilities Performance Measure Results....................E-43
Seniors and Persons with Disabilities Findings ...................................................E-58 Strengths—Performance Measures .......................................................................E-59 Opportunities for Improvement—Performance Measures ......................................E-59
4. Performance Improvement Projects ...................................................................E-61Performance Improvement Project Overview .........................................................E-61 Performance Improvement Project Results and Findings.......................................E-62
2015–17 DHCS-Priority Performance Improvement Project ...............................E-63 2015–17 MCP-Specific Performance Improvement Project ................................E-64 2017–19 Disparity Performance Improvement Project ........................................E-65 2017–19 DHCS-Priority Performance Improvement Project ...............................E-66
Strengths—Performance Improvement Projects ....................................................E-68 Opportunities for Improvement—Performance Improvement Projects ...................E-68
5. Recommendations................................................................................................E-69 Follow-Up on Prior Year Recommendations ..........................................................E-69 2017–18 Recommendations...................................................................................E-71
California Health & Wellness Plan Performance Evaluation Report: July 1, 2017–June 30, 2018 California Department of Health Care Services
Page E-i Health Services Advisory Group, Inc.

TABLE OF CONTENTS
Table of Tables
Table 1.1—CHW Enrollment as of June 30, 2018..........................................................E-2 Table 2.1—DHCS A&I Medical and State Supported Services Audits of CHW Audit
Review Period: November 1, 2015, through October 31, 2016....................E-4 Table 3.1—Preventive Screening and Children’s Health Domain Multi-Year
Performance Measure Results CHW—Imperial County ..............................E-8 Table 3.2—Preventive Screening and Children’s Health Domain Multi-Year
Performance Measure Results CHW—Region 1 (Butte, Colusa, Glenn, Plumas, Sierra, Sutter, and Tehama Counties) ...........................................E-9
Table 3.3—Preventive Screening and Children’s Health Domain Multi-Year Performance Measure Results CHW—Region 2 (Alpine, Amador, Calaveras, El Dorado, Inyo, Mariposa, Mono, Nevada, Placer, Tuolumne, and Yuba Counties)...E-11
Table 3.4—Preventive Screening and Children’s Health Domain RY 2018 (MY 2017) Performance Measure Findings CHW—Imperial County...........................E-13
Table 3.5—Preventive Screening and Children’s Health Domain RY 2018 (MY 2017) Performance Measure Findings CHW—Region 1 (Butte, Colusa, Glenn, Plumas, Sierra, Sutter, and Tehama Counties) .........................................E-14
Table 3.6—Preventive Screening and Children’s Health Domain RY 2018 (MY 2017) Performance Measure Findings CHW—Region 2 (Alpine, Amador, Calaveras, El Dorado, Inyo, Mariposa, Mono, Nevada, Placer, Tuolumne, and Yuba Counties) ...................................................................................E-15
Table 3.7—Preventive Screening and Women’s Health Domain Multi-Year Performance Measure Results CHW—Imperial County..................................................E-17
Table 3.8—Preventive Screening and Women’s Health Domain Multi-Year Performance Measure Results CHW—Region 1 (Butte, Colusa, Glenn, Plumas, Sierra, Sutter, and Tehama Counties)...................................................................E-18
Table 3.9—Preventive Screening and Women’s Health Domain Multi-Year Performance Measure Results CHW—Region 2 (Alpine, Amador, Calaveras, El Dorado, Inyo, Mariposa, Mono, Nevada, Placer, Tuolumne, and Yuba Counties)...E-19
Table 3.10—Preventive Screening and Women’s Health Domain RY 2018 (MY 2017) Performance Measure Findings CHW—Imperial County...........................E-20
Table 3.11—Preventive Screening and Women’s Health Domain RY 2018 (MY 2017) Performance Measure Findings CHW—Region 1 (Butte, Colusa, Glenn, Plumas, Sierra, Sutter, and Tehama Counties) .........................................E-21
Table 3.12—Preventive Screening and Women’s Health Domain RY 2018 (MY 2017) Performance Measure Findings CHW—Region 2 (Alpine, Amador, Calaveras, El Dorado, Inyo, Mariposa, Mono, Nevada, Placer, Tuolumne, and Yuba Counties) ...................................................................................E-22
Table 3.13—Care for Chronic Conditions Domain Multi-Year Performance Measure Results CHW—Imperial County.................................................................E-23
California Health & Wellness Plan Performance Evaluation Report: July 1, 2017–June 30, 2018 California Department of Health Care Services
Page E-ii Health Services Advisory Group, Inc.

TABLE OF CONTENTS
Table 3.14—Care for Chronic Conditions Domain Multi-Year Performance Measure Results CHW—Region 1 (Butte, Colusa, Glenn, Plumas, Sierra, Sutter, and Tehama Counties) ..............................................................................E-24
Table 3.15—Care for Chronic Conditions Domain Multi-Year Performance Measure Results CHW—Region 2 (Alpine, Amador, Calaveras, El Dorado, Inyo, Mariposa, Mono, Nevada, Placer, Tuolumne, and Yuba Counties) ...........E-26
Table 3.16—Care for Chronic Conditions Domain RY 2018 (MY 2017) Performance Measure Findings CHW—Imperial County ................................................E-27
Table 3.17—Care for Chronic Conditions Domain RY 2018 (MY 2017) Performance Measure Findings CHW—Region 1 (Butte, Colusa, Glenn, Plumas, Sierra, Sutter, and Tehama Counties)...................................................................E-28
Table 3.18—Care for Chronic Conditions Domain RY 2018 (MY 2017) Performance Measure Findings CHW—Region 2 (Alpine, Amador, Calaveras, El Dorado, Inyo, Mariposa, Mono, Nevada, Placer, Tuolumne, and Yuba Counties)...E-28
Table 3.19—Appropriate Treatment and Utilization Domain Multi-Year Performance Measure Results CHW—Imperial County..................................................E-31
Table 3.20—Appropriate Treatment and Utilization Domain Multi-Year Performance Measure Results CHW—Region 1 (Butte, Colusa, Glenn, Plumas, Sierra, Sutter, and Tehama Counties)...................................................................E-33
Table 3.21—Appropriate Treatment and Utilization Domain Multi-Year Performance Measure Results CHW—Region 2 (Alpine, Amador, Calaveras, El Dorado, Inyo, Mariposa, Mono, Nevada, Placer, Tuolumne, and Yuba Counties)...E-34
Table 3.22—Appropriate Treatment and Utilization Domain RY 2018 (MY 2017) Performance Measure Findings CHW—Imperial County...........................E-35
Table 3.23—Appropriate Treatment and Utilization Domain RY 2018 (MY 2017) Performance Measure Findings CHW—Region 1 (Butte, Colusa, Glenn, Plumas, Sierra, Sutter, and Tehama Counties) .........................................E-36
Table 3.24—Appropriate Treatment and Utilization Domain RY 2018 (MY 2017) Performance Measure Findings CHW—Region 2 (Alpine, Amador, Calaveras, El Dorado, Inyo, Mariposa, Mono, Nevada, Placer, Tuolumne, and Yuba Counties) ...................................................................................E-37
Table 3.25—RY 2018 (MY 2017) Performance Measure Findings for All Domains CHW—Imperial County..............................................................................E-39
Table 3.26—RY 2018 (MY 2017) Performance Measure Findings for All Domains CHW—Region 1 (Butte, Colusa, Glenn, Plumas, Sierra, Sutter, and Tehama Counties) .....................................................................................E-40
Table 3.27—RY 2018 (MY 2017) Performance Measure Findings for All Domains CHW—Region 2 (Alpine, Amador, Calaveras, El Dorado, Inyo, Mariposa, Mono, Nevada, Placer, Tuolumne, and Yuba Counties) ............................E-41
Table 3.28—Multi-Year SPD Performance Measure Trend Table CHW—Imperial County E-43 Table 3.29—Multi-Year SPD Performance Measure Trend Table CHW—Region 1
(Butte, Colusa, Glenn, Plumas, Sierra, Sutter, and Tehama Counties) .....E-45
California Health & Wellness Plan Performance Evaluation Report: July 1, 2017–June 30, 2018 California Department of Health Care Services
Page E-iii Health Services Advisory Group, Inc.
TABLE OF CONTENTS
Table 3.30—Multi-Year SPD Performance Measure Trend Table CHW—Region 2 (Alpine, Amador, Calaveras, El Dorado, Inyo, Mariposa, Mono, Nevada, Placer, Tuolumne, and Yuba Counties) .....................................................E-46
Table 3.31—Multi-Year Non-SPD Performance Measure Trend Table CHW—Imperial County .......................................................................................................E-48
Table 3.32—Multi-Year Non-SPD Performance Measure Trend Table CHW—Region 1 (Butte, Colusa, Glenn, Plumas, Sierra, Sutter, and Tehama Counties) .....E-50
Table 3.33—Multi-Year Non-SPD Performance Measure Trend Table CHW—Region 2 (Alpine, Amador, Calaveras, El Dorado, Inyo, Mariposa, Mono, Nevada, Placer, Tuolumne, and Yuba Counties) .....................................................E-52
Table 3.34—RY 2018 (MY 2017) Performance Measure Comparison and Results for Measures Stratified by the SPD and Non-SPD Populations CHW— Imperial County..........................................................................................E-54
Table 3.35—RY 2018 (MY 2017) Performance Measure Comparison and Results for Measures Stratified by the SPD and Non-SPD Populations CHW—Region 1 (Butte, Colusa, Glenn, Plumas, Sierra, Sutter, and Tehama Counties) .......E-55
Table 3.36—RY 2018 (MY 2017) Performance Measure Comparison and Results for Measures Stratified by the SPD and Non-SPD Populations CHW—Region 2 (Alpine, Amador, Calaveras, El Dorado, Inyo, Mariposa, Mono, Nevada, Placer, Tuolumne, and Yuba Counties) ......................................................E-57
Table 4.1—CHW Immunizations of Two-Year-Olds PIP SMART Aim Measure Results E-63 Table 4.2—CHW Immunizations of Two-Year-Olds PIP Intervention Testing Results .E-63 Table 4.3—CHW Cervical Cancer Screening PIP SMART Aim Measure Results........E-64 Table 4.4—CHW Cervical Cancer Screening PIP Intervention Testing Results...........E-65 Table 4.5—CHW Controlling Blood Pressure Disparity PIP SMART Aim Measure......E-65 Table 4.6—CHW Childhood Immunization Status—Combination 3 PIP SMART Aim
Measure.....................................................................................................E-66 Table 4.7—CHW Childhood Immunization Status—Combination 3 PIP Intervention
Testing .......................................................................................................E-67 Table 5.1—CHW’s Self-Reported Follow-Up on External Quality Review
Recommendations from the July 1, 2016, through June 30, 2017, MCP-Specific Evaluation Report................................................................E-69
California Health & Wellness Plan Performance Evaluation Report: July 1, 2017–June 30, 2018 California Department of Health Care Services
Page E-iv Health Services Advisory Group, Inc.

Medi-Cal Managed Care External Quality Review Technical ReportAppendix E: Performance Evaluation ReportCalifornia Health & Wellness Plan July 1, 2017–June 30, 2018
1. Introduction
The California Department of Health Care Services (DHCS) contracted with Health Services Advisory Group, Inc. (HSAG), an external quality review organization (EQRO), to prepare the federally required Medi-Cal Managed Care External Quality Review Technical Report, July 1, 2017–June 30, 2018. The technical report provides an overview of the objectives and methodology for conducting the external quality review (EQR) activities, including requirements related to each activity. Additionally, the technical report provides aggregated results and recommendations for DHCS for each activity.
This appendix is specific to DHCS’ contracted Medi-Cal managed care health plan (MCP), California Health & Wellness Plan (“CHW” or “the MCP”). The purpose of this appendix is to provide MCP-specific results of each activity and an assessment of the MCP’s strengths and opportunities for improvement with respect to the quality and timeliness of and access to health care services furnished to Medi-Cal Managed Care (MCMC) beneficiaries (referred to as “beneficiaries” in this report). The review period for this MCP-specific evaluation report is July 1, 2017, through June 30, 2018. HSAG will report on activities that take place beyond the review period in CHW’s 2018–19 MCP-specific evaluation report. This MCP-specific evaluation report references activities and methodologies described in detail by HSAG in the technical report section.
The aggregate EQR technical report and all MCP- and specialty health plan (SHP)-specific performance evaluation reports reflect HSAG’s external, independent assessment of the quality and timeliness of, and access to, care that MCPs and SHPs are providing to beneficiaries.
Medi-Cal Managed Care Health Plan Overview CHW is a full-scope MCP delivering services to beneficiaries under the Regional and Imperial models. In all counties, beneficiaries may enroll in CHW or the other commercial plan (CP).
CHW became operational to provide MCMC services effective November 1, 2013. Table 1.1 shows the counties in which CHW provides MCMC services, the other CPs for each county, the number and percentage of beneficiaries enrolled in CHW for each county, and the MCP’s total number of beneficiaries as of June 30, 2018.1
1 Medi-Cal Managed Care Enrollment Report—June 2018. Available at: http://www.dhcs.ca.gov/dataandstats/reports/Pages/MMCDMonthlyEnrollment.aspx. Accessed on: Aug 13, 2018.
California Health & Wellness Plan Performance Evaluation Report: July 1, 2017–June 30, 2018 California Department of Health Care Services
Page E-1 Health Services Advisory Group, Inc.
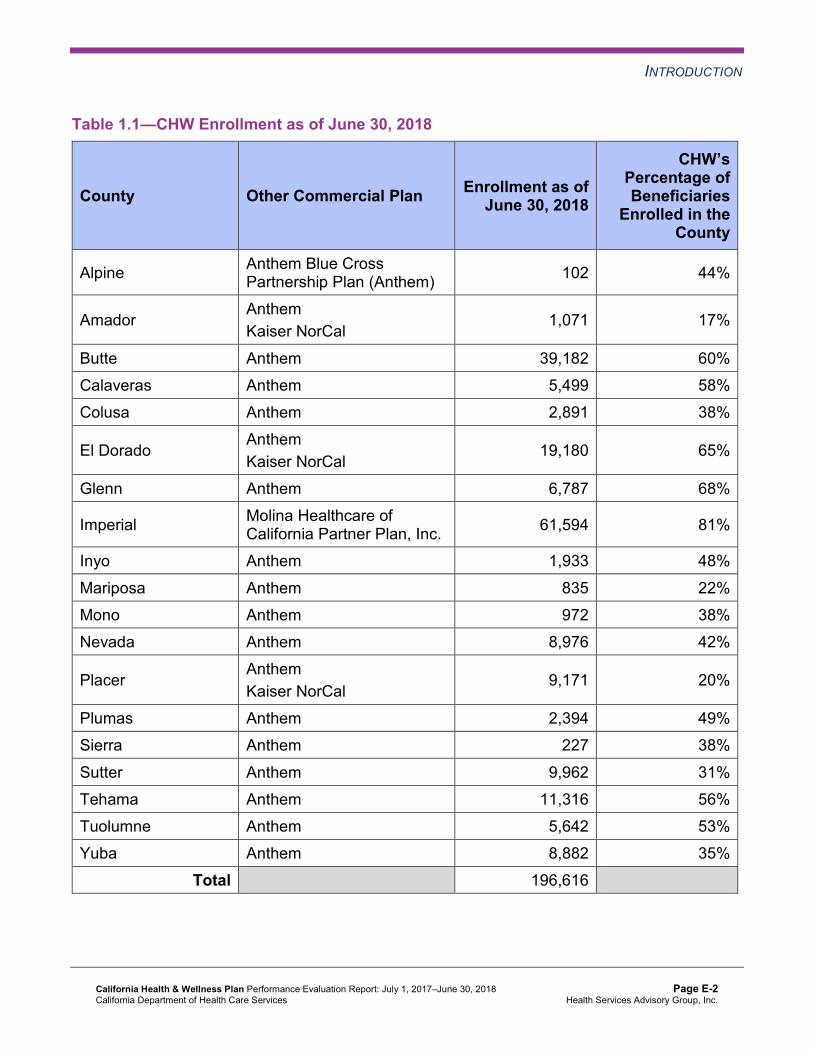
INTRODUCTION
Table 1.1—CHW Enrollment as of June 30, 2018
County Other Commercial Plan Enrollment as of June 30, 2018
CHW’s Percentage ofBeneficiaries
Enrolled in the County
Alpine Anthem Blue Cross Partnership Plan (Anthem) 102 44%
Amador Anthem Kaiser NorCal
1,071 17%
Butte Anthem 39,182 60% Calaveras Anthem 5,499 58% Colusa Anthem 2,891 38%
El Dorado Anthem Kaiser NorCal
19,180 65%
Glenn Anthem 6,787 68%
Imperial Molina Healthcare of California Partner Plan, Inc. 61,594 81%
Inyo Anthem 1,933 48% Mariposa Anthem 835 22% Mono Anthem 972 38% Nevada Anthem 8,976 42%
Placer Anthem Kaiser NorCal
9,171 20%
Plumas Anthem 2,394 49% Sierra Anthem 227 38% Sutter Anthem 9,962 31% Tehama Anthem 11,316 56% Tuolumne Anthem 5,642 53% Yuba Anthem 8,882 35%
Total 196,616
California Health & Wellness Plan Performance Evaluation Report: July 1, 2017–June 30, 2018 California Department of Health Care Services
Page E-2 Health Services Advisory Group, Inc.
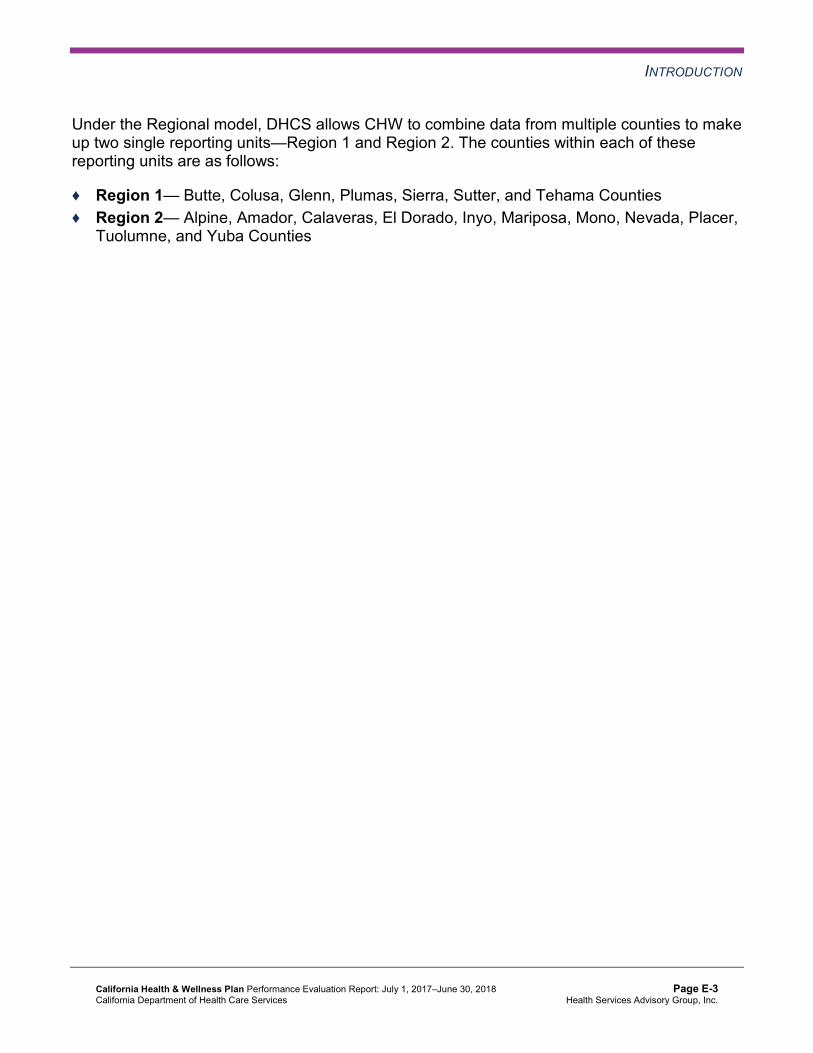
INTRODUCTION
Under the Regional model, DHCS allows CHW to combine data from multiple counties to make up two single reporting units—Region 1 and Region 2. The counties within each of these reporting units are as follows:
♦ Region 1— Butte, Colusa, Glenn, Plumas, Sierra, Sutter, and Tehama Counties ♦ Region 2— Alpine, Amador, Calaveras, El Dorado, Inyo, Mariposa, Mono, Nevada, Placer,
Tuolumne, and Yuba Counties
California Health & Wellness Plan Performance Evaluation Report: July 1, 2017–June 30, 2018 California Department of Health Care Services
Page E-3 Health Services Advisory Group, Inc.

Medi-Cal Managed Care External Quality Review Technical ReportAppendix E: Performance Evaluation ReportCalifornia Health & Wellness Plan July 1, 2017–June 30, 2018
2. Managed Care Health Plan Compliance
Compliance Reviews Conducted The following is a summary of the most recent reviews conducted for CHW. Unless noted, HSAG’s compliance review summaries are based on final audit/survey reports issued and corrective action plan (CAP) closeout letters dated on or before the end of the review period for this report (June 30, 2018). The descriptions of the various types of reviews may be found within the main section of this technical report.
Table 2.1 summarizes the results and status of the DHCS Audits & Investigations Division (A&I) Medical and State Supported Services Audits of CHW. A&I conducted the on-site audits from November 7, 2016, through November 18, 2016.
Table 2.1—DHCS A&I Medical and State Supported Services Audits of CHWAudit Review Period: November 1, 2015, through October 31, 2016
Category Evaluated Deficiencies (Yes/No) Monitoring Status
Utilization Management Yes CAP initiated following the audit and subsequently closed.
Case Management and Coordination of Care No Not applicable. Access and Availability of Care Yes CAP initiated following the
audit and subsequently closed.
Member’s Rights Yes CAP initiated following the audit and subsequently closed.
Quality Management Yes CAP initiated following the audit and subsequently closed.
Administrative and Organizational Capacity No Not applicable. State Supported Services No Not applicable.
Strengths—Compliance Reviews A&I identified no deficiencies in the Case Management and Coordination of Care, Administrative and Organizational Capacity, and State Supported Services categories during
California Health & Wellness Plan Performance Evaluation Report: July 1, 2017–June 30, 2018 California Department of Health Care Services
Page E-4 Health Services Advisory Group, Inc.

MANAGED CARE HEALTH PLAN COMPLIANCE
the November 2016 A&I Medical and State Supported Services Audits of CHW. Additionally, CHW’s responses to the MCP’s CAP for the deficiencies that A&I identified during the Medical Audit resulted in DHCS closing the CAP.
Opportunities for Improvement—Compliance Reviews CHW has no outstanding deficiencies from the November 2016 A&I Medical Audit; therefore, HSAG has no recommendations for the MCP in the area of compliance reviews.
California Health & Wellness Plan Performance Evaluation Report: July 1, 2017–June 30, 2018 California Department of Health Care Services
Page E-5 Health Services Advisory Group, Inc.

Medi-Cal Managed Care External Quality Review Technical ReportAppendix E: Performance Evaluation ReportCalifornia Health & Wellness Plan July 1, 2017–June 30, 2018
3. Managed Care Health Plan Performance Measures
Performance Measure Validation Results The HEDIS®2 2018 Compliance Audit Final Report of Findings for California Health & Wellness Plan contains the detailed findings and recommendations from HSAG’s NCQA HEDIS Compliance Audit™.3 HSAG auditors determined that CHW followed the appropriate specifications to produce valid rates, and identified no issues of concern.
Performance Measure Results and Findings After validating the MCP’s performance measure rates, HSAG assessed the results. See Table 3.1 through Table 3.25 for CHW’s performance measure results for reporting years (RYs) 2015 through 2018 and performance measure findings for RY 2018. The RY is the year in which the MCP reported the rates. The RY rates reflect measurement year (MY) data from the previous calendar year. Note that data may not be available for all four years.
Note the following regarding Table 3.1 through Table 3.27:
♦ To allow HSAG to provide meaningful assessment of MCP performance and actionable recommendations, HSAG, in collaboration with DHCS, organized the measures into domains based on the health care areas each measure affects. Table 3.1 through Table 3.22 present the performance measure results and findings by domain, and Table 3.25 through Table 3.27 present the RY 2018 performance measure findings for the domains combined.
♦ To assess performance for each MCP reporting unit, HSAG compares the rates to national benchmarks. Rates indicating performance above the high performance levels (HPLs) are shaded in gray, and rates indicating performance below the minimum performance levels (MPLs) are bolded. ■ For measures with rates below the MPLs, DHCS requires MCPs to submit to DHCS
improvement plans (IPs) to address the rates below the MPLs (unless MCPs are reporting the rates for the first time).
■ For MCPs that meet DHCS’ Quality of Care Corrective Action Plan (CAP) thresholds, DHCS issues a CAP; if an MCP’s performance is such that it may trigger a CAP in the following year, DHCS issues an advance warning letter.
2 Healthcare Effectiveness Data and Information Set (HEDIS®) is a registered trademark of the National Committee for Quality Assurance (NCQA).
3 NCQA HEDIS Compliance AuditTM is a trademark of NCQA.
California Health & Wellness Plan Performance Evaluation Report: July 1, 2017–June 30, 2018 California Department of Health Care Services
Page E-6 Health Services Advisory Group, Inc.

MANAGED CARE HEALTH PLAN PERFORMANCE MEASURES
■ IPs and CAPs consist of submission of Plan-Do-Study-Act (PDSA) Cycle Worksheets, Quality Improvement (QI) Summaries, or completion of Performance Improvement Projects (PIPs)—as determined by DHCS.
♦ For RYs 2016, 2017, and 2018, the HPLs and MPLs represent the NCQA Quality Compass®4 Medicaid health maintenance organization (HMO) 90th and 25th percentiles, respectively.
♦ For RY 2015, the HPLs and MPLs represent the NCQA HEDIS Audit Means, Percentiles, and Ratios 90th and 25th percentiles, respectively. For the Comprehensive Diabetes Care—HbA1c Poor Control (>9.0 Percent) measure, for which a lower rate indicates more favorable performance, the HPL and MPL are based on the 10th and 75th percentiles, respectively.
♦ HSAG includes the specific HPL and MPL values for RY 2018 in Section 6 of the Medi-Cal Managed Care External Quality Review Technical Report, July 1, 2017–June 30, 2018 (“Managed Care Health Plan Performance Measures”).
Preventive Screening and Children’s Health
Table 3.1 through Table 3.3 present the four-year trending information for the performance measures within the Preventive Screening and Children’s Health domain.
Note the following regarding Table 3.1 through Table 3.3:
♦ Although HSAG includes information on the MCP’s performance related to the four Children and Adolescents’ Access to Primary Care measures, DHCS did not hold MCPs accountable to meet the MPLs for these measures for RYs 2015 through 2018 (i.e., DHCS did not require MCPs to submit IPs if rates for the measures were below the MPLs). DHCS made this decision due to the small range of variation between the HPL and MPL thresholds for each measure.
♦ Any comparison of RY 2018 performance to RY 2017 or to benchmarks related to the Immunizations for Adolescents—Combination 2 measure should be exercised with caution given the changes that NCQA made to the specification for this measure for RY 2018. NCQA released guidance that recommended a break in trending for this measure; however, DHCS determined to continue trending because the specification change should result in higher rates.
4 Quality Compass® is a registered trademark of NCQA.
California Health & Wellness Plan Performance Evaluation Report: July 1, 2017–June 30, 2018 California Department of Health Care Services
Page E-7 Health Services Advisory Group, Inc.

MANAGED CARE HEALTH PLAN PERFORMANCE MEASURES
Table 3.1—Preventive Screening and Children’s Health DomainMulti-Year Performance Measure Results CHW—Imperial County
H = Rate indicates performance above the HPL. Bolded Rate = Rate indicates performance below the MPL.
B = Statistical testing result indicates that the RY 2018 rate is significantly better than the RY 2017 rate.
W = Statistical testing result indicates that the RY 2018 rate is significantly worse than the RY 2017 rate.
Measure RY
2015 Rate1
RY 2016
Rate2
RY 2017
Rate3
RY 2018
Rate4
RYs 2017–18 Rate
Difference5
Childhood Immunization Status—Combination 3 61.90% 64.66% 66.05% 72.24% 6.19
Children and Adolescents’ Access to Primary Care Practitioners—12–24 Months
98.15% 96.89% 97.05% 97.09% 0.04
Children and Adolescents’ Access to Primary Care Practitioners— 25 Months–6 Years
89.84% 91.07% 90.01% 90.09% 0.08
Children and Adolescents’ Access to Primary Care Practitioners—7–11 Years
NA 89.57% 88.96% 87.47% -1.49W
Children and Adolescents’ Access to Primary Care Practitioners—12–19 Years
NA 88.34% 86.38% 85.18% -1.20W
Immunizations for Adolescents— Combination 2^ -- -- 24.82% 38.44%H 13.62B
Weight Assessment and Counseling for Nutrition and Physical Activity for Children and Adolescents—Nutrition Counseling—Total
56.01% 68.75% 70.24% 65.08% -5.16
Weight Assessment and Counseling for Nutrition and Physical Activity for Children and Adolescents—Physical Activity Counseling—Total
46.63% 58.17% 63.66% 58.79% -4.87
California Health & Wellness Plan Performance Evaluation Report: July 1, 2017–June 30, 2018 California Department of Health Care Services
Page E-8 Health Services Advisory Group, Inc.
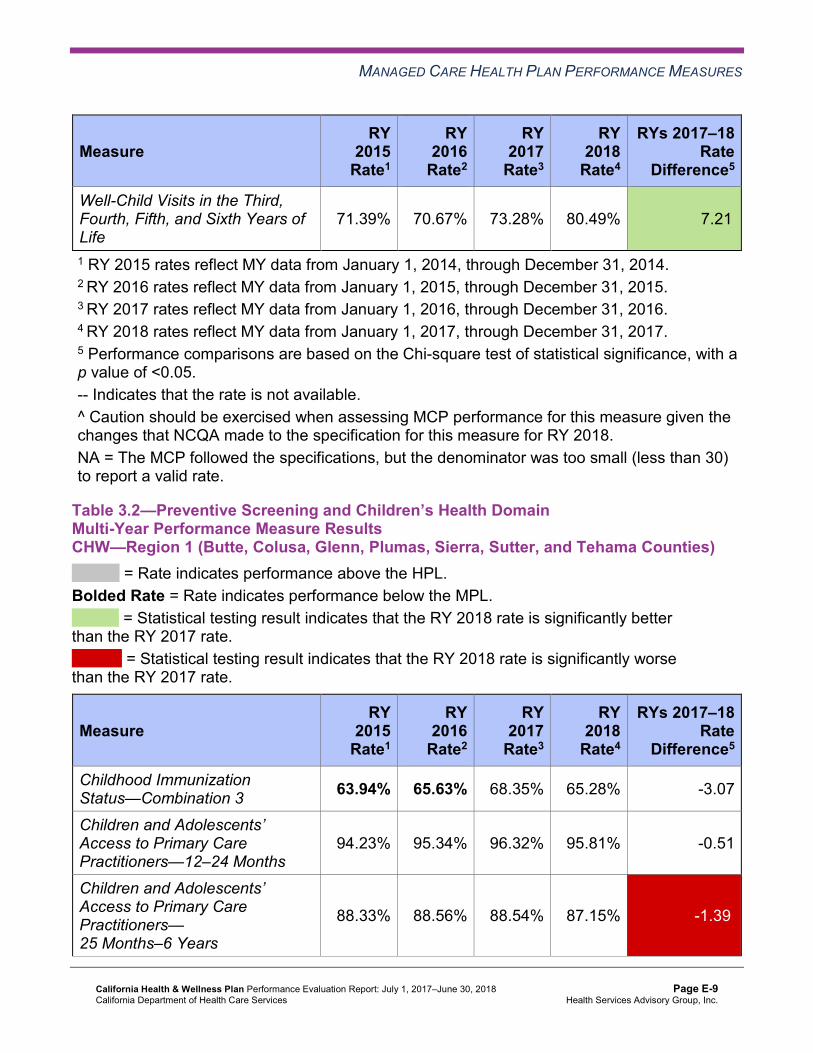
MANAGED CARE HEALTH PLAN PERFORMANCE MEASURES
Measure RY
2015 Rate1
RY 2016
Rate2
RY 2017
Rate3
RY 2018
Rate4
RYs 2017–18 Rate
Difference5
Well-Child Visits in the Third, Fourth, Fifth, and Sixth Years of Life
71.39% 70.67% 73.28% 80.49% 7.21B
1 RY 2015 rates reflect MY data from January 1, 2014, through December 31, 2014. 2 RY 2016 rates reflect MY data from January 1, 2015, through December 31, 2015. 3 RY 2017 rates reflect MY data from January 1, 2016, through December 31, 2016. 4 RY 2018 rates reflect MY data from January 1, 2017, through December 31, 2017. 5 Performance comparisons are based on the Chi-square test of statistical significance, with a p value of <0.05. -- Indicates that the rate is not available. ^ Caution should be exercised when assessing MCP performance for this measure given the changes that NCQA made to the specification for this measure for RY 2018. NA = The MCP followed the specifications, but the denominator was too small (less than 30) to report a valid rate.
Table 3.2—Preventive Screening and Children’s Health DomainMulti-Year Performance Measure Results CHW—Region 1 (Butte, Colusa, Glenn, Plumas, Sierra, Sutter, and Tehama Counties)
H = Rate indicates performance above the HPL. Bolded Rate = Rate indicates performance below the MPL.
B = Statistical testing result indicates that the RY 2018 rate is significantly better than the RY 2017 rate.
W = Statistical testing result indicates that the RY 2018 rate is significantly worse than the RY 2017 rate.
Measure RY
2015 Rate1
RY 2016
Rate2
RY 2017
Rate3
RY 2018
Rate4
RYs 2017–18 Rate
Difference5
Childhood Immunization Status—Combination 3 63.94% 65.63% 68.35% 65.28% -3.07
Children and Adolescents’ Access to Primary Care Practitioners—12–24 Months
94.23% 95.34% 96.32% 95.81% -0.51
Children and Adolescents’ Access to Primary Care Practitioners— 25 Months–6 Years
88.33% 88.56% 88.54% 87.15% -1.39W
California Health & Wellness Plan Performance Evaluation Report: July 1, 2017–June 30, 2018 California Department of Health Care Services
Page E-9 Health Services Advisory Group, Inc.

MANAGED CARE HEALTH PLAN PERFORMANCE MEASURES
Measure RY
2015 Rate1
RY 2016
Rate2
RY 2017
Rate3
RY 2018
Rate4
RYs 2017–18 Rate
Difference5
Children and Adolescents’ Access to Primary Care Practitioners—7–11 Years
NA 90.30% 89.40% 87.73% -1.67W
Children and Adolescents’ Access to Primary Care Practitioners—12–19 Years
NA 88.08% 86.58% 85.29% -1.29W
Immunizations for Adolescents— Combination 2^ -- -- 20.92% 22.87% 1.95
Weight Assessment and Counseling for Nutrition and Physical Activity for Children and Adolescents—Nutrition Counseling—Total
39.90% 46.02% 60.58% 56.45% -4.13
Weight Assessment and Counseling for Nutrition and Physical Activity for Children and Adolescents—Physical Activity Counseling—Total
29.33% 35.90% 52.07% 55.47% 3.40
Well-Child Visits in the Third, Fourth, Fifth, and Sixth Years of Life
59.62% 63.22% 68.49% 69.44% 0.95
1 RY 2015 rates reflect MY data from January 1, 2014, through December 31, 2014. 2 RY 2016 rates reflect MY data from January 1, 2015, through December 31, 2015. 3 RY 2017 rates reflect MY data from January 1, 2016, through December 31, 2016. 4 RY 2018 rates reflect MY data from January 1, 2017, through December 31, 2017. 5 Performance comparisons are based on the Chi-square test of statistical significance, with a p value of <0.05. -- Indicates that the rate is not available. ^ Caution should be exercised when assessing MCP performance for this measure given the changes that NCQA made to the specification for this measure for RY 2018. NA = The MCP followed the specifications, but the denominator was too small (less than 30) to report a valid rate.
California Health & Wellness Plan Performance Evaluation Report: July 1, 2017–June 30, 2018 California Department of Health Care Services
Page E-10 Health Services Advisory Group, Inc.

MANAGED CARE HEALTH PLAN PERFORMANCE MEASURES
Table 3.3—Preventive Screening and Children’s Health DomainMulti-Year Performance Measure Results CHW—Region 2 (Alpine, Amador, Calaveras, El Dorado, Inyo, Mariposa, Mono, Nevada,Placer, Tuolumne, and Yuba Counties)
H = Rate indicates performance above the HPL. Bolded Rate = Rate indicates performance below the MPL.
B = Statistical testing result indicates that the RY 2018 rate is significantly better than the RY 2017 rate.
W = Statistical testing result indicates that the RY 2018 rate is significantly worse than the RY 2017 rate.
Measure RY
2015 Rate1
RY 2016
Rate2
RY 2017
Rate3
RY 2018
Rate4
RYs 2017–18 Rate
Difference5
Childhood Immunization Status—Combination 3 52.08% 53.13% 58.05% 54.86% -3.19
Children and Adolescents’ Access to Primary Care Practitioners—12–24 Months
91.36% 92.36% 92.30% 91.59% -0.71
Children and Adolescents’ Access to Primary Care Practitioners—25 Months–6 Years
80.61% 82.57% 82.41% 78.06% -4.35W
Children and Adolescents’ Access to Primary Care Practitioners—7–11 Years
NA 84.16% 83.39% 80.62% -2.77W
Children and Adolescents’ Access to Primary Care Practitioners—12–19 Years
NA 82.34% 81.87% 79.47% -2.40W
Immunizations for Adolescents— Combination 2^ -- -- 17.76% 24.09% 6.33B
Weight Assessment and Counseling for Nutrition and Physical Activity for Children and Adolescents—Nutrition Counseling—Total
53.13% 44.82% 61.07% 61.80% 0.73
California Health & Wellness Plan Performance Evaluation Report: July 1, 2017–June 30, 2018 California Department of Health Care Services
Page E-11 Health Services Advisory Group, Inc.

MANAGED CARE HEALTH PLAN PERFORMANCE MEASURES
Measure RY
2015 Rate1
RY 2016
Rate2
RY 2017
Rate3
RY 2018
Rate4
RYs 2017–18 Rate
Difference5
Weight Assessment and Counseling for Nutrition and Physical Activity for Children and Adolescents—Physical Activity Counseling—Total
42.31% 36.87% 51.82% 55.72% 3.90
Well-Child Visits in the Third, Fourth, Fifth, and Sixth Years of Life
59.13% 58.65% 63.34% 61.20% -2.14
1 RY 2015 rates reflect MY data from January 1, 2014, through December 31, 2014. 2 RY 2016 rates reflect MY data from January 1, 2015, through December 31, 2015. 3 RY 2017 rates reflect MY data from January 1, 2016, through December 31, 2016. 4 RY 2018 rates reflect MY data from January 1, 2017, through December 31, 2017. 5 Performance comparisons are based on the Chi-square test of statistical significance, with a p value of <0.05. -- Indicates that the rate is not available. ^ Caution should be exercised when assessing MCP performance for this measure given the changes that NCQA made to the specification for this measure for RY 2018. NA = The MCP followed the specifications, but the denominator was too small (less than 30) to report a valid rate.
Table 3.4 through Table 3.6 present findings for the RY 2018 performance measures within the Preventive Screening and Children’s Health domain.
Note the following regarding Table 3.4 through Table 3.6:
♦ DHCS did not hold MCPs accountable to meet MPLs for all four Children and Adolescents’ Access to Primary Care measures within this domain; therefore, HSAG did not include these measures in its assessment of the MCP’s performance related to HPLs and MPLs.
♦ The Immunizations for Adolescents—Combination 2 measure was a first-year measure in RY 2017, and DHCS established no MPL for this measure for RY 2017 because no comparable benchmark existed; therefore, HSAG did not include this measure in the denominators for calculating the percentage of measures with rates that moved to above or below the MPLs in RY 2018.
California Health & Wellness Plan Performance Evaluation Report: July 1, 2017–June 30, 2018 California Department of Health Care Services
Page E-12 Health Services Advisory Group, Inc.

MANAGED CARE HEALTH PLAN PERFORMANCE MEASURES
Table 3.4—Preventive Screening and Children’s Health DomainRY 2018 (MY 2017) Performance Measure Findings CHW—Imperial County
Criteria Number of Measures
MeetingCriteria
Total Number of Measures
Percentage of Measures
MeetingCriteria
RY 2018 Rates Above HPLs 1 5 20.00% Rates Above HPLs for the Last Three or More Consecutive Years 0 4 0.00%
RY 2018 Rates Significantly Better than RY 2017 Rates* 2 5 40.00%
Rates that Moved from Below MPLs in RY 2017 to Above MPLs in RY 2018 0 0 N/A
RY 2018 Rates Below MPLs 0 5 0.00% Rates Below MPLs for the Last Three or More Consecutive Years 0 4 0.00%
RY 2018 Rates Significantly Worse than RY 2017 Rates* 0 5 0.00%
Rates that Moved from Above MPLs in RY 2017 to Below MPLs in RY 2018 0 4 0.00%
* Performance comparisons are based on the Chi-square test of statistical significance, with a p value of <0.05. N/A = No rates above or below the MPLs from the previous year exist to include in the denominator for calculating whether or not rates moved to above or below MPLs in the most recent year.
California Health & Wellness Plan Performance Evaluation Report: July 1, 2017–June 30, 2018 California Department of Health Care Services
Page E-13 Health Services Advisory Group, Inc.
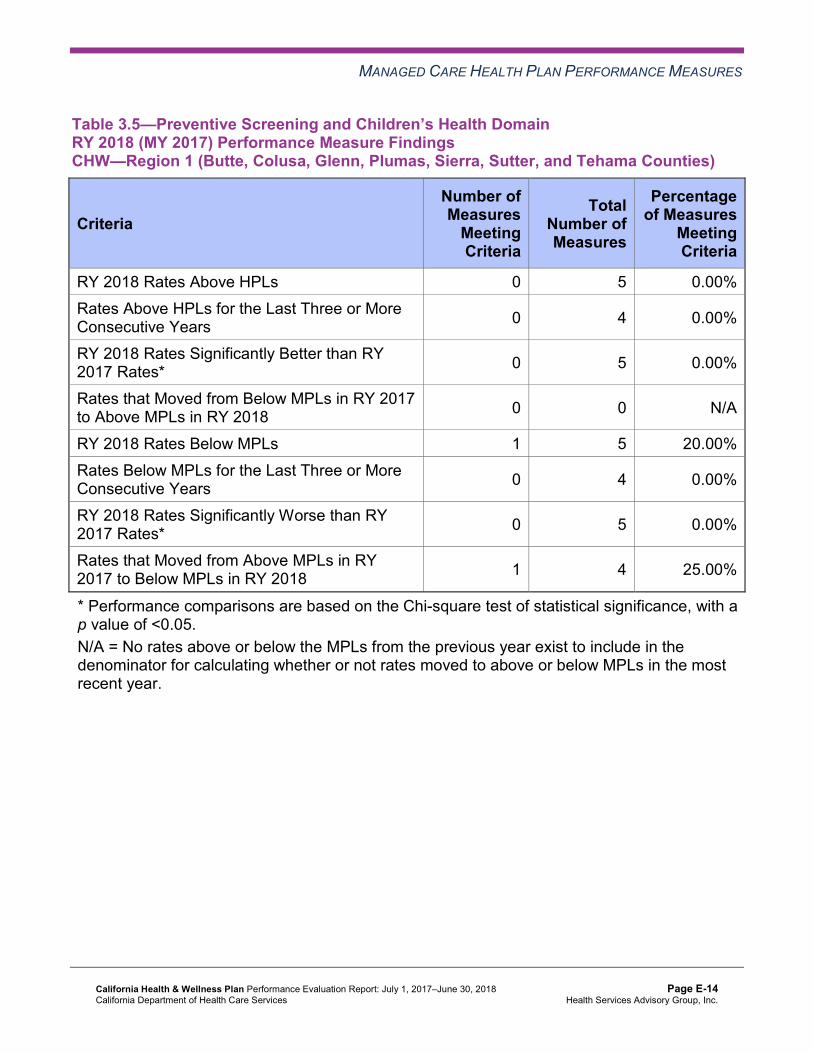
MANAGED CARE HEALTH PLAN PERFORMANCE MEASURES
Table 3.5—Preventive Screening and Children’s Health DomainRY 2018 (MY 2017) Performance Measure FindingsCHW—Region 1 (Butte, Colusa, Glenn, Plumas, Sierra, Sutter, and Tehama Counties)
Criteria Number of Measures
MeetingCriteria
Total Number of Measures
Percentage of Measures
MeetingCriteria
RY 2018 Rates Above HPLs 0 5 0.00% Rates Above HPLs for the Last Three or More Consecutive Years 0 4 0.00%
RY 2018 Rates Significantly Better than RY 2017 Rates* 0 5 0.00%
Rates that Moved from Below MPLs in RY 2017 to Above MPLs in RY 2018 0 0 N/A
RY 2018 Rates Below MPLs 1 5 20.00% Rates Below MPLs for the Last Three or More Consecutive Years 0 4 0.00%
RY 2018 Rates Significantly Worse than RY 2017 Rates* 0 5 0.00%
Rates that Moved from Above MPLs in RY 2017 to Below MPLs in RY 2018 1 4 25.00%
* Performance comparisons are based on the Chi-square test of statistical significance, with a p value of <0.05. N/A = No rates above or below the MPLs from the previous year exist to include in the denominator for calculating whether or not rates moved to above or below MPLs in the most recent year.
California Health & Wellness Plan Performance Evaluation Report: July 1, 2017–June 30, 2018 California Department of Health Care Services
Page E-14 Health Services Advisory Group, Inc.

MANAGED CARE HEALTH PLAN PERFORMANCE MEASURES
Table 3.6—Preventive Screening and Children’s Health DomainRY 2018 (MY 2017) Performance Measure Findings CHW—Region 2 (Alpine, Amador, Calaveras, El Dorado, Inyo, Mariposa, Mono, Nevada,Placer, Tuolumne, and Yuba Counties)
Criteria Number of Measures
MeetingCriteria
Total Number of Measures
Percentage of Measures
MeetingCriteria
RY 2018 Rates Above HPLs 0 5 0.00% Rates Above HPLs for the Last Three or More Consecutive Years 0 4 0.00%
RY 2018 Rates Significantly Better than RY 2017 Rates* 1 5 20.00%
Rates that Moved from Below MPLs in RY 2017 to Above MPLs in RY 2018 0 2 0.00%
RY 2018 Rates Below MPLs 2 5 40.00% Rates Below MPLs for the Last Three or More Consecutive Years 2 4 50.00%
RY 2018 Rates Significantly Worse than RY 2017 Rates* 0 5 0.00%
Rates that Moved from Above MPLs in RY 2017 to Below MPLs in RY 2018 0 2 0.00%
* Performance comparisons are based on the Chi-square test of statistical significance, with a p value of <0.05.
Assessment of Improvement Plans—Preventive Screening and Children’s Health
Based on RY 2017 performance measure results, DHCS required CHW to submit IPs for the following measures within the Preventive Screening and Children’s Health domain for Region 2:
♦ Childhood Immunization Status—Combination 3 ♦ Well-Child Visits in the Third, Fourth, Fifth, and Sixth Years of Life
Childhood Immunization Status
DHCS approved CHW to conduct a PIP to address the rate for the Childhood Immunization Status—Combination 3 measure being below the MPL in RY 2017 in Region 2. HSAG includes a summary of CHW’s progress on the Childhood Immunization Status—Combination 3 PIP in Section 4 of this report (“Performance Improvement Projects”).
California Health & Wellness Plan Performance Evaluation Report: July 1, 2017–June 30, 2018 California Department of Health Care Services
Page E-15 Health Services Advisory Group, Inc.
MANAGED CARE HEALTH PLAN PERFORMANCE MEASURES
The rate for the Childhood Immunization Status—Combination 3 measure remained below the MPL in Region 2 in RY 2018.
Well-Child Visits
CHW conducted two PDSA cycles to improve the MCP’s performance in Region 2 for the Well-Child Visits in the Third, Fourth, Fifth, and Sixth Years of Life measure. The MCP tested whether or not:
♦ Providing gap-in-care reports to primary care providers (PCPs) and scheduling beneficiary appointments would improve the rate for the Well-Child Visits in the Third, Fourth, Fifth, and Sixth Years of Life measure. The MCP indicated that a barrier to the success of this intervention was that the MCP had inaccurate data about beneficiaries’ PCPs. CHW indicated that the MCP needs to develop a better process to identify beneficiaries’ current PCPs so that the MCP can reach more beneficiaries.
♦ Having clinic staff members call beneficiaries to schedule appointments and educate beneficiaries’ parents would help to improve the rate for the Well-Child Visits in the Third, Fourth, Fifth, and Sixth Years of Life measure. CHW indicated that it learned that the clinic’s beneficiary contact information provided the most accurate list of beneficiaries who had received care from the clinic.
The rate for the Well-Child Visits in the Third, Fourth, Fifth, and Sixth Years of Life measure remained below the MPL in Region 2 in RY 2018.
Preventive Screening and Women’s Health
Table 3.7 through Table 3.9 present the four-year trending information for the performance measures within the Preventive Screening and Women’s Health domain.
Note that any comparison of RY 2018 performance to RY 2017 or to benchmarks related to the Breast Cancer Screening measure should be exercised with caution given the changes that NCQA made to the specification for this measure for RY 2018. NCQA released guidance that recommended a break in trending for this measure; however, DHCS determined to continue trending because the specification change should result in higher rates.
California Health & Wellness Plan Performance Evaluation Report: July 1, 2017–June 30, 2018 California Department of Health Care Services
Page E-16 Health Services Advisory Group, Inc.

MANAGED CARE HEALTH PLAN PERFORMANCE MEASURES
Table 3.7—Preventive Screening and Women’s Health DomainMulti-Year Performance Measure Results CHW—Imperial County
H = Rate indicates performance above the HPL. Bolded Rate = Rate indicates performance below the MPL.
B = Statistical testing result indicates that the RY 2018 rate is significantly better than the RY 2017 rate.
W = Statistical testing result indicates that the RY 2018 rate is significantly worse than the RY 2017 rate.
Measure RY
2015 Rate1
RY 2016
Rate2
RY 2017
Rate3
RY 2018
Rate4
RYs 2017–18 Rate
Difference5
Breast Cancer Screening^ -- -- 59.80% 63.79% 3.99B
Cervical Cancer Screening 55.10% 58.60% 60.35% 68.10% 7.75B
Prenatal and Postpartum Care— Postpartum Care 55.37% 55.48% 63.64% 61.46% -2.18
Prenatal and Postpartum Care— Timeliness of Prenatal Care 72.55% 76.46% 83.54% 85.42% 1.88
1 RY 2015 rates reflect MY data from January 1, 2014, through December 31, 2014. 2 RY 2016 rates reflect MY data from January 1, 2015, through December 31, 2015. 3 RY 2017 rates reflect MY data from January 1, 2016, through December 31, 2016. 4 RY 2018 rates reflect MY data from January 1, 2017, through December 31, 2017. 5 Performance comparisons are based on the Chi-square test of statistical significance, with a p value of <0.05. ^ Caution should be exercised when assessing MCP performance for this measure given the changes that NCQA made to the specification for this measure for RY 2018. -- Indicates that the rate is not available.
California Health & Wellness Plan Performance Evaluation Report: July 1, 2017–June 30, 2018 California Department of Health Care Services
Page E-17 Health Services Advisory Group, Inc.

MANAGED CARE HEALTH PLAN PERFORMANCE MEASURES
Table 3.8—Preventive Screening and Women’s Health DomainMulti-Year Performance Measure Results CHW—Region 1 (Butte, Colusa, Glenn, Plumas, Sierra, Sutter, and Tehama Counties)
H = Rate indicates performance above the HPL. Bolded Rate = Rate indicates performance below the MPL.
B = Statistical testing result indicates that the RY 2018 rate is significantly better than the RY 2017 rate.
W = Statistical testing result indicates that the RY 2018 rate is significantly worse than the RY 2017 rate.
Measure RY
2015 Rate1
RY 2016
Rate2
RY 2017
Rate3
RY 2018
Rate4
RYs 2017–18 Rate
Difference5
Breast Cancer Screening^ -- -- 49.37% 50.57% 1.20 Cervical Cancer Screening 44.53% 41.88% 48.66% 54.99% 6.33 Prenatal and Postpartum Care— Postpartum Care 63.50% 61.14% 64.54% 65.26% 0.72
Prenatal and Postpartum Care— Timeliness of Prenatal Care 76.40% 72.04% 83.93% 85.26% 1.33
1 RY 2015 rates reflect MY data from January 1, 2014, through December 31, 2014. 2 RY 2016 rates reflect MY data from January 1, 2015, through December 31, 2015. 3 RY 2017 rates reflect MY data from January 1, 2016, through December 31, 2016. 4 RY 2018 rates reflect MY data from January 1, 2017, through December 31, 2017. 5 Performance comparisons are based on the Chi-square test of statistical significance, with a p value of <0.05. ^ Caution should be exercised when assessing MCP performance for this measure given the changes that NCQA made to the specification for this measure for RY 2018. -- Indicates that the rate is not available.
California Health & Wellness Plan Performance Evaluation Report: July 1, 2017–June 30, 2018 California Department of Health Care Services
Page E-18 Health Services Advisory Group, Inc.

MANAGED CARE HEALTH PLAN PERFORMANCE MEASURES
Table 3.9—Preventive Screening and Women’s Health DomainMulti-Year Performance Measure Results CHW—Region 2 (Alpine, Amador, Calaveras, El Dorado, Inyo, Mariposa, Mono, Nevada,Placer, Tuolumne, and Yuba Counties)
H = Rate indicates performance above the HPL. Bolded Rate = Rate indicates performance below the MPL.
B = Statistical testing result indicates that the RY 2018 rate is significantly better than the RY 2017 rate.
W = Statistical testing result indicates that the RY 2018 rate is significantly worse than the RY 2017 rate.
Measure RY
2015 Rate1
RY 2016
Rate2
RY 2017
Rate3
RY 2018
Rate4
RYs 2017–18 Rate
Difference5
Breast Cancer Screening^ -- -- 48.08% 47.14% -0.94 Cervical Cancer Screening 40.88% 44.55% 52.31% 56.34% 4.03 Prenatal and Postpartum Care— Postpartum Care 53.28% 62.91% 69.07% 67.23% -1.84
Prenatal and Postpartum Care— Timeliness of Prenatal Care 72.99% 73.47% 86.60% 85.59% -1.01
1 RY 2015 rates reflect MY data from January 1, 2014, through December 31, 2014. 2 RY 2016 rates reflect MY data from January 1, 2015, through December 31, 2015. 3 RY 2017 rates reflect MY data from January 1, 2016, through December 31, 2016. 4 RY 2018 rates reflect MY data from January 1, 2017, through December 31, 2017. 5 Performance comparisons are based on the Chi-square test of statistical significance, with a p value of <0.05. ^ Caution should be exercised when assessing MCP performance for this measure given the changes that NCQA made to the specification for this measure for RY 2018. -- Indicates that the rate is not available.
California Health & Wellness Plan Performance Evaluation Report: July 1, 2017–June 30, 2018 California Department of Health Care Services
Page E-19 Health Services Advisory Group, Inc.
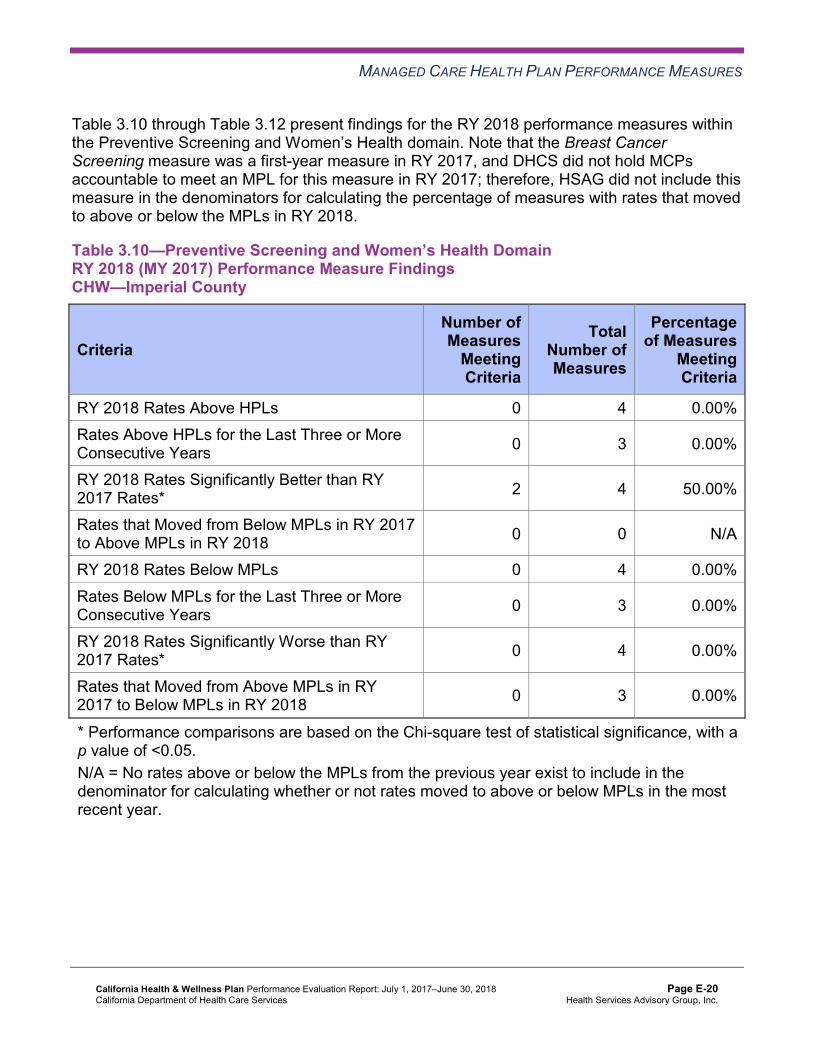
MANAGED CARE HEALTH PLAN PERFORMANCE MEASURES
Table 3.10 through Table 3.12 present findings for the RY 2018 performance measures within the Preventive Screening and Women’s Health domain. Note that the Breast Cancer Screening measure was a first-year measure in RY 2017, and DHCS did not hold MCPs accountable to meet an MPL for this measure in RY 2017; therefore, HSAG did not include this measure in the denominators for calculating the percentage of measures with rates that moved to above or below the MPLs in RY 2018.
Table 3.10—Preventive Screening and Women’s Health DomainRY 2018 (MY 2017) Performance Measure Findings CHW—Imperial County
Criteria Number of Measures
MeetingCriteria
Total Number of Measures
Percentage of Measures
MeetingCriteria
RY 2018 Rates Above HPLs 0 4 0.00% Rates Above HPLs for the Last Three or More Consecutive Years 0 3 0.00%
RY 2018 Rates Significantly Better than RY 2017 Rates* 2 4 50.00%
Rates that Moved from Below MPLs in RY 2017 to Above MPLs in RY 2018 0 0 N/A
RY 2018 Rates Below MPLs 0 4 0.00% Rates Below MPLs for the Last Three or More Consecutive Years 0 3 0.00%
RY 2018 Rates Significantly Worse than RY 2017 Rates* 0 4 0.00%
Rates that Moved from Above MPLs in RY 2017 to Below MPLs in RY 2018 0 3 0.00%
* Performance comparisons are based on the Chi-square test of statistical significance, with a p value of <0.05. N/A = No rates above or below the MPLs from the previous year exist to include in the denominator for calculating whether or not rates moved to above or below MPLs in the most recent year.
California Health & Wellness Plan Performance Evaluation Report: July 1, 2017–June 30, 2018 California Department of Health Care Services
Page E-20 Health Services Advisory Group, Inc.

MANAGED CARE HEALTH PLAN PERFORMANCE MEASURES
Table 3.11—Preventive Screening and Women’s Health DomainRY 2018 (MY 2017) Performance Measure Findings CHW—Region 1 (Butte, Colusa, Glenn, Plumas, Sierra, Sutter, and Tehama Counties)
Criteria Number of Measures
MeetingCriteria
Total Number of Measures
Percentage of Measures
MeetingCriteria
RY 2018 Rates Above HPLs 0 4 0.00% Rates Above HPLs for the Last Three or More Consecutive Years 0 3 0.00%
RY 2018 Rates Significantly Better than RY 2017 Rates* 0 4 0.00%
Rates that Moved from Below MPLs in RY 2017 to Above MPLs in RY 2018 0 0 N/A
RY 2018 Rates Below MPLs 1 4 25.00% Rates Below MPLs for the Last Three or More Consecutive Years 0 3 0.00%
RY 2018 Rates Significantly Worse than RY 2017 Rates* 0 4 0.00%
Rates that Moved from Above MPLs in RY 2017 to Below MPLs in RY 2018 0 3 0.00%
* Performance comparisons are based on the Chi-square test of statistical significance, with a p value of <0.05. N/A = No rates above or below the MPLs from the previous year exist to include in the denominator for calculating whether or not rates moved to above or below MPLs in the most recent year.
California Health & Wellness Plan Performance Evaluation Report: July 1, 2017–June 30, 2018 California Department of Health Care Services
Page E-21 Health Services Advisory Group, Inc.
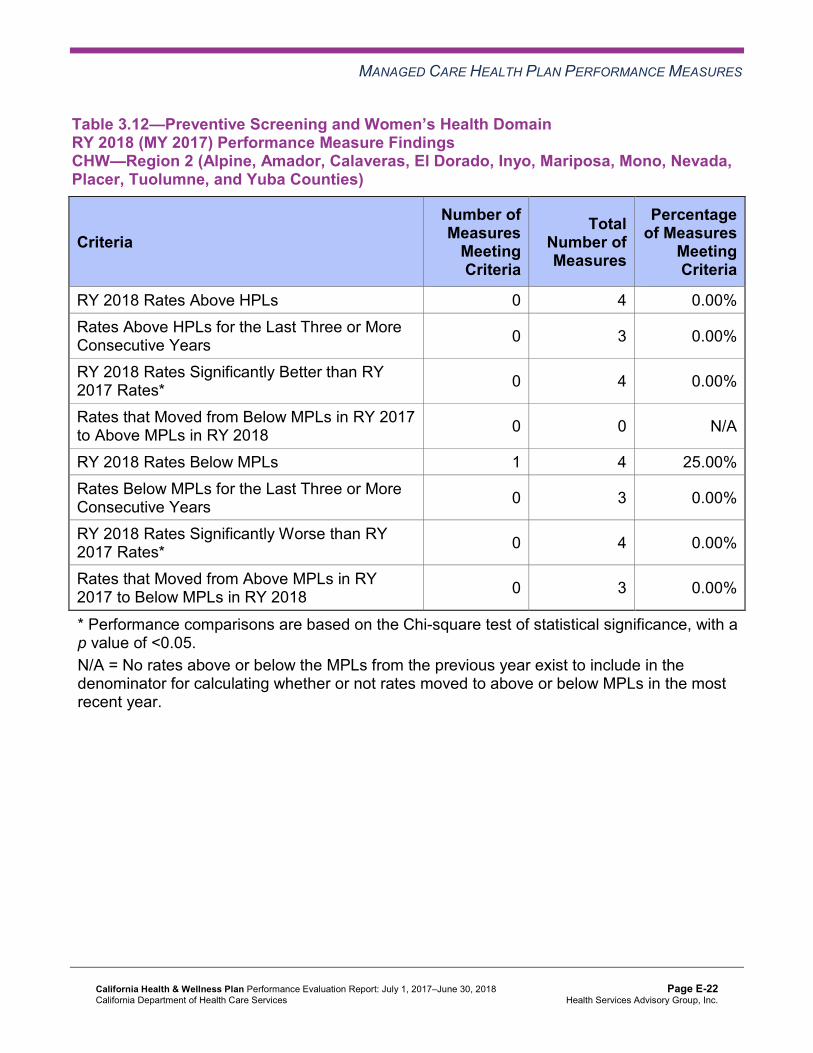
MANAGED CARE HEALTH PLAN PERFORMANCE MEASURES
Table 3.12—Preventive Screening and Women’s Health DomainRY 2018 (MY 2017) Performance Measure Findings CHW—Region 2 (Alpine, Amador, Calaveras, El Dorado, Inyo, Mariposa, Mono, Nevada,Placer, Tuolumne, and Yuba Counties)
Criteria Number of Measures
MeetingCriteria
Total Number of Measures
Percentage of Measures
MeetingCriteria
RY 2018 Rates Above HPLs 0 4 0.00% Rates Above HPLs for the Last Three or More Consecutive Years 0 3 0.00%
RY 2018 Rates Significantly Better than RY 2017 Rates* 0 4 0.00%
Rates that Moved from Below MPLs in RY 2017 to Above MPLs in RY 2018 0 0 N/A
RY 2018 Rates Below MPLs 1 4 25.00% Rates Below MPLs for the Last Three or More Consecutive Years 0 3 0.00%
RY 2018 Rates Significantly Worse than RY 2017 Rates* 0 4 0.00%
Rates that Moved from Above MPLs in RY 2017 to Below MPLs in RY 2018 0 3 0.00%
* Performance comparisons are based on the Chi-square test of statistical significance, with a p value of <0.05. N/A = No rates above or below the MPLs from the previous year exist to include in the denominator for calculating whether or not rates moved to above or below MPLs in the most recent year.
California Health & Wellness Plan Performance Evaluation Report: July 1, 2017–June 30, 2018 California Department of Health Care Services
Page E-22 Health Services Advisory Group, Inc.

MANAGED CARE HEALTH PLAN PERFORMANCE MEASURES
Care for Chronic Conditions
Table 3.13 through Table 3.15 present the four-year trending information for the performance measures within the Care for Chronic Conditions domain.
Table 3.13—Care for Chronic Conditions Domain Multi-Year Performance Measure Results CHW—Imperial County
H = Rate indicates performance above the HPL. Bolded Rate = Rate indicates performance below the MPL.
B = Statistical testing result indicates that the RY 2018 rate is significantly better than the RY 2017 rate.
W = Statistical testing result indicates that the RY 2018 rate is significantly worse than the RY 2017 rate.
Measure RY
2015 Rate1
RY 2016
Rate2
RY 2017
Rate3
RY 2018
Rate4
RYs 2017–18 Rate
Difference5
Annual Monitoring for Patients on Persistent Medications— ACE Inhibitors or ARBs
93.60%H 91.65% 92.98%H 94.01%H 1.03
Annual Monitoring for Patients on Persistent Medications— Diuretics
93.93%H 92.57%H 92.78%H 93.03%H 0.25
Asthma Medication Ratio -- -- 72.25%H 68.92% -3.33 Comprehensive Diabetes Care— Blood Pressure Control (<140/90 mm Hg)
72.61% 65.74% 72.99% 75.91%H 2.92
Comprehensive Diabetes Care— Eye Exam (Retinal) Performed 56.79% 65.74% 68.86%H 67.40% -1.46
Comprehensive Diabetes Care— HbA1c Control (<8.0 Percent) 32.29% 45.14% 49.15% 55.23% 6.08
Comprehensive Diabetes Care— HbA1c Poor Control (>9.0 Percent)*
56.35% 47.22% 41.12% 33.82% -7.30B
Comprehensive Diabetes Care— HbA1c Testing 90.20% 88.89% 88.81% 88.81% 0.00
Comprehensive Diabetes Care— Medical Attention for Nephropathy
80.62% 91.20%H 92.70% 90.75% -1.95
California Health & Wellness Plan Performance Evaluation Report: July 1, 2017–June 30, 2018 California Department of Health Care Services
Page E-23 Health Services Advisory Group, Inc.

MANAGED CARE HEALTH PLAN PERFORMANCE MEASURES
Measure RY
2015 Rate1
RY 2016
Rate2
RY 2017
Rate3
RY 2018
Rate4
RYs 2017–18 Rate
Difference5
Controlling High Blood Pressure 68.87% 70.69%H 69.25% 72.32%H 3.07 1 RY 2015 rates reflect MY data from January 1, 2014, through December 31, 2014. 2 RY 2016 rates reflect MY data from January 1, 2015, through December 31, 2015. 3 RY 2017 rates reflect MY data from January 1, 2016, through December 31, 2016. 4 RY 2018 rates reflect MY data from January 1, 2017, through December 31, 2017. 5 Performance comparisons are based on the Chi-square test of statistical significance, with a p value of <0.05. * A lower rate indicates better performance for this measure. -- Indicates that the rate is not available.
Table 3.14—Care for Chronic Conditions Domain Multi-Year Performance Measure Results CHW—Region 1 (Butte, Colusa, Glenn, Plumas, Sierra, Sutter, and Tehama Counties)
H = Rate indicates performance above the HPL. Bolded Rate = Rate indicates performance below the MPL.
B = Statistical testing result indicates that the RY 2018 rate is significantly better than the RY 2017 rate.
W = Statistical testing result indicates that the RY 2018 rate is significantly worse than the RY 2017 rate.
Measure RY
2015 Rate1
RY 2016
Rate2
RY 2017
Rate3
RY 2018
Rate4
RYs 2017–18 Rate
Difference5
Annual Monitoring for Patients on Persistent Medications— ACE Inhibitors or ARBs
81.59% 84.03% 84.40% 85.43% 1.03
Annual Monitoring for Patients on Persistent Medications— Diuretics
81.33% 83.02% 85.43% 82.58% -2.85W
Asthma Medication Ratio -- -- 62.13% 62.47% 0.34 Comprehensive Diabetes Care— Blood Pressure Control (<140/90 mm Hg)
70.60% 66.67% 65.94% 69.10% 3.16
Comprehensive Diabetes Care— Eye Exam (Retinal) Performed 39.20% 46.99% 54.01% 56.20% 2.19
California Health & Wellness Plan Performance Evaluation Report: July 1, 2017–June 30, 2018 California Department of Health Care Services
Page E-24 Health Services Advisory Group, Inc.

MANAGED CARE HEALTH PLAN PERFORMANCE MEASURES
Measure RY
2015 Rate1
RY 2016
Rate2
RY 2017
Rate3
RY 2018
Rate4
RYs 2017–18 Rate
Difference5
Comprehensive Diabetes Care— HbA1c Control (<8.0 Percent) 40.31% 45.83% 47.20% 52.31% 5.11
Comprehensive Diabetes Care— HbA1c Poor Control (>9.0 Percent)*
44.99% 44.91% 41.36% 36.01% -5.35
Comprehensive Diabetes Care— HbA1c Testing 84.63% 83.33% 83.45% 85.40% 1.95
Comprehensive Diabetes Care— Medical Attention for Nephropathy
76.17% 84.95% 84.43% 85.89% 1.46
Controlling High Blood Pressure 54.20% 66.35% 66.58% 64.69% -1.89 1 RY 2015 rates reflect MY data from January 1, 2014, through December 31, 2014. 2 RY 2016 rates reflect MY data from January 1, 2015, through December 31, 2015. 3 RY 2017 rates reflect MY data from January 1, 2016, through December 31, 2016. 4 RY 2018 rates reflect MY data from January 1, 2017, through December 31, 2017. 5 Performance comparisons are based on the Chi-square test of statistical significance, with a p value of <0.05. * A lower rate indicates better performance for this measure. -- Indicates that the rate is not available.
California Health & Wellness Plan Performance Evaluation Report: July 1, 2017–June 30, 2018 California Department of Health Care Services
Page E-25 Health Services Advisory Group, Inc.

MANAGED CARE HEALTH PLAN PERFORMANCE MEASURES
Table 3.15—Care for Chronic Conditions Domain Multi-Year Performance Measure Results CHW—Region 2 (Alpine, Amador, Calaveras, El Dorado, Inyo, Mariposa, Mono, Nevada,Placer, Tuolumne, and Yuba Counties)
H = Rate indicates performance above the HPL. Bolded Rate = Rate indicates performance below the MPL.
B = Statistical testing result indicates that the RY 2018 rate is significantly better than the RY 2017 rate.
W = Statistical testing result indicates that the RY 2018 rate is significantly worse than the RY 2017 rate.
Measure RY
2015 Rate1
RY 2016
Rate2
RY 2017
Rate3
RY 2018
Rate4
RYs 2017–18 Rate
Difference5
Annual Monitoring for Patients on Persistent Medications—ACE Inhibitors or ARBs
81.43% 81.94% 81.93% 81.85% -0.08
Annual Monitoring for Patients on Persistent Medications— Diuretics
82.69% 81.25% 82.76% 83.49% 0.73
Asthma Medication Ratio -- -- 54.81% 54.63% -0.18 Comprehensive Diabetes Care— Blood Pressure Control (<140/90 mm Hg)
61.20% 62.27% 62.53% 71.46% 8.93B
Comprehensive Diabetes Care— Eye Exam (Retinal) Performed 38.14% 41.20% 52.80% 50.24% -2.56
Comprehensive Diabetes Care— HbA1c Control (<8.0 Percent) 40.13% 46.30% 54.99% 56.59% 1.60
Comprehensive Diabetes Care— HbA1c Poor Control (>9.0 Percent)*
48.12% 45.14% 34.06% 33.90% -0.16
Comprehensive Diabetes Care— HbA1c Testing 87.80% 83.80% 85.89% 84.39% -1.50
Comprehensive Diabetes Care— Medical Attention for Nephropathy
83.37% 87.27% 88.56% 88.78% 0.22
Controlling High Blood Pressure 51.88% 54.95% 63.33% 61.72% -1.61 1 RY 2015 rates reflect MY data from January 1, 2014, through December 31, 2014. 2 RY 2016 rates reflect MY data from January 1, 2015, through December 31, 2015.
California Health & Wellness Plan Performance Evaluation Report: July 1, 2017–June 30, 2018 California Department of Health Care Services
Page E-26 Health Services Advisory Group, Inc.
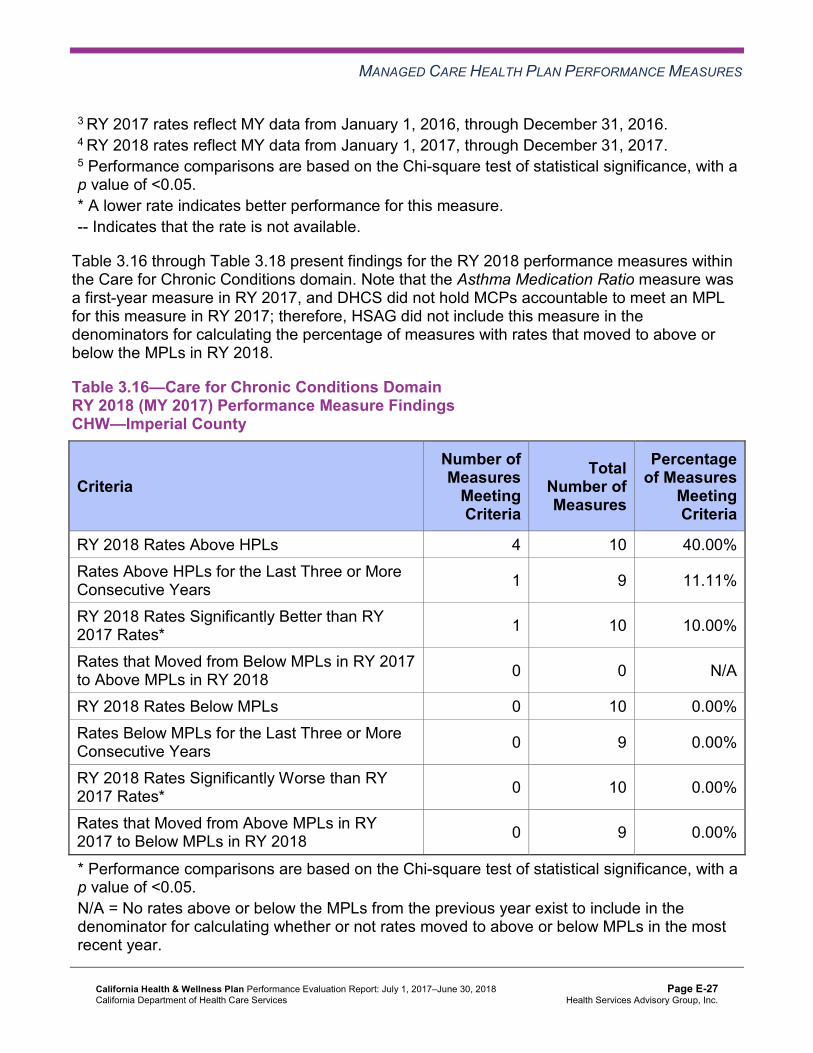
MANAGED CARE HEALTH PLAN PERFORMANCE MEASURES
3 RY 2017 rates reflect MY data from January 1, 2016, through December 31, 2016. 4 RY 2018 rates reflect MY data from January 1, 2017, through December 31, 2017. 5 Performance comparisons are based on the Chi-square test of statistical significance, with a p value of <0.05. * A lower rate indicates better performance for this measure. -- Indicates that the rate is not available.
Table 3.16 through Table 3.18 present findings for the RY 2018 performance measures within the Care for Chronic Conditions domain. Note that the Asthma Medication Ratio measure was a first-year measure in RY 2017, and DHCS did not hold MCPs accountable to meet an MPL for this measure in RY 2017; therefore, HSAG did not include this measure in the denominators for calculating the percentage of measures with rates that moved to above or below the MPLs in RY 2018.
Table 3.16—Care for Chronic Conditions Domain RY 2018 (MY 2017) Performance Measure Findings CHW—Imperial County
Criteria Number of Measures
MeetingCriteria
Total Number of Measures
Percentage of Measures
MeetingCriteria
RY 2018 Rates Above HPLs 4 10 40.00% Rates Above HPLs for the Last Three or More Consecutive Years 1 9 11.11%
RY 2018 Rates Significantly Better than RY 2017 Rates* 1 10 10.00%
Rates that Moved from Below MPLs in RY 2017 to Above MPLs in RY 2018 0 0 N/A
RY 2018 Rates Below MPLs 0 10 0.00% Rates Below MPLs for the Last Three or More Consecutive Years 0 9 0.00%
RY 2018 Rates Significantly Worse than RY 2017 Rates* 0 10 0.00%
Rates that Moved from Above MPLs in RY 2017 to Below MPLs in RY 2018 0 9 0.00%
* Performance comparisons are based on the Chi-square test of statistical significance, with a p value of <0.05. N/A = No rates above or below the MPLs from the previous year exist to include in the denominator for calculating whether or not rates moved to above or below MPLs in the most recent year.
California Health & Wellness Plan Performance Evaluation Report: July 1, 2017–June 30, 2018 California Department of Health Care Services
Page E-27 Health Services Advisory Group, Inc.

MANAGED CARE HEALTH PLAN PERFORMANCE MEASURES
Table 3.17—Care for Chronic Conditions Domain RY 2018 (MY 2017) Performance Measure Findings CHW—Region 1 (Butte, Colusa, Glenn, Plumas, Sierra, Sutter, and Tehama Counties)
Criteria Number of Measures
MeetingCriteria
Total Number of Measures
Percentage of Measures
MeetingCriteria
RY 2018 Rates Above HPLs 0 10 0.00% Rates Above HPLs for the Last Three or More Consecutive Years 0 9 0.00%
RY 2018 Rates Significantly Better than RY 2017 Rates* 0 10 0.00%
Rates that Moved from Below MPLs in RY 2017 to Above MPLs in RY 2018 0 2 0.00%
RY 2018 Rates Below MPLs 3 10 30.00% Rates Below MPLs for the Last Three or More Consecutive Years 1 9 11.11%
RY 2018 Rates Significantly Worse than RY 2017 Rates* 1 10 10.00%
Rates that Moved from Above MPLs in RY 2017 to Below MPLs in RY 2018 1 7 14.29%
* Performance comparisons are based on the Chi-square test of statistical significance, with a p value of <0.05.
Table 3.18—Care for Chronic Conditions Domain RY 2018 (MY 2017) Performance Measure Findings CHW—Region 2 (Alpine, Amador, Calaveras, El Dorado, Inyo, Mariposa, Mono, Nevada,Placer, Tuolumne, and Yuba Counties)
Criteria Number of Measures
MeetingCriteria
Total Number of Measures
Percentage of Measures
MeetingCriteria
RY 2018 Rates Above HPLs 0 10 0.00% Rates Above HPLs for the Last Three or More Consecutive Years 0 9 0.00%
RY 2018 Rates Significantly Better than RY 2017 Rates* 1 10 10.00%
California Health & Wellness Plan Performance Evaluation Report: July 1, 2017–June 30, 2018 California Department of Health Care Services
Page E-28 Health Services Advisory Group, Inc.
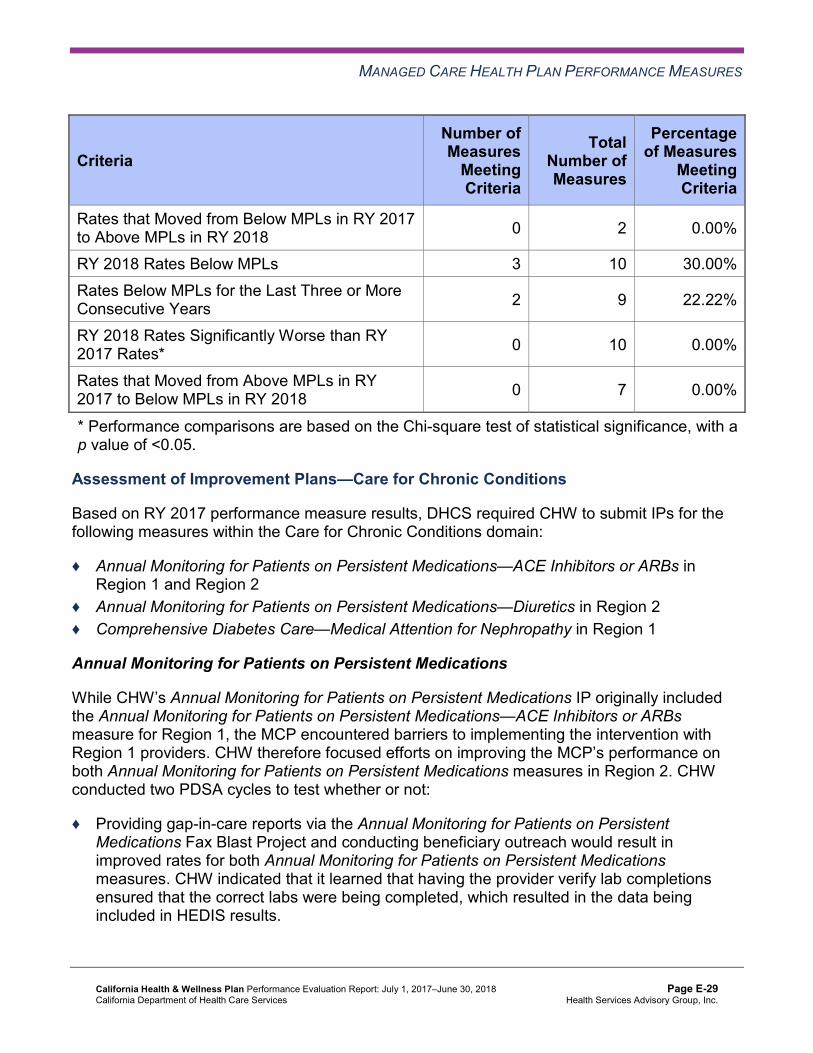
MANAGED CARE HEALTH PLAN PERFORMANCE MEASURES
Criteria Number of Measures
MeetingCriteria
Total Number of Measures
Percentage of Measures
MeetingCriteria
Rates that Moved from Below MPLs in RY 2017 to Above MPLs in RY 2018 0 2 0.00%
RY 2018 Rates Below MPLs 3 10 30.00% Rates Below MPLs for the Last Three or More Consecutive Years 2 9 22.22%
RY 2018 Rates Significantly Worse than RY 2017 Rates* 0 10 0.00%
Rates that Moved from Above MPLs in RY 2017 to Below MPLs in RY 2018 0 7 0.00%
* Performance comparisons are based on the Chi-square test of statistical significance, with a p value of <0.05.
Assessment of Improvement Plans—Care for Chronic Conditions
Based on RY 2017 performance measure results, DHCS required CHW to submit IPs for the following measures within the Care for Chronic Conditions domain:
♦ Annual Monitoring for Patients on Persistent Medications—ACE Inhibitors or ARBs in Region 1 and Region 2
♦ Annual Monitoring for Patients on Persistent Medications—Diuretics in Region 2 ♦ Comprehensive Diabetes Care—Medical Attention for Nephropathy in Region 1
Annual Monitoring for Patients on Persistent Medications
While CHW’s Annual Monitoring for Patients on Persistent Medications IP originally included the Annual Monitoring for Patients on Persistent Medications—ACE Inhibitors or ARBs measure for Region 1, the MCP encountered barriers to implementing the intervention with Region 1 providers. CHW therefore focused efforts on improving the MCP’s performance on both Annual Monitoring for Patients on Persistent Medications measures in Region 2. CHW conducted two PDSA cycles to test whether or not:
♦ Providing gap-in-care reports via the Annual Monitoring for Patients on Persistent Medications Fax Blast Project and conducting beneficiary outreach would result in improved rates for both Annual Monitoring for Patients on Persistent Medications measures. CHW indicated that it learned that having the provider verify lab completions ensured that the correct labs were being completed, which resulted in the data being included in HEDIS results.
California Health & Wellness Plan Performance Evaluation Report: July 1, 2017–June 30, 2018 California Department of Health Care Services
Page E-29 Health Services Advisory Group, Inc.

MANAGED CARE HEALTH PLAN PERFORMANCE MEASURES
♦ Sending text messages to remind beneficiaries about obtaining their lab tests would help improve the MCP’s rates for both Annual Monitoring for Patients on Persistent Medications measures. CHW indicated having learned that including the clinic’s quality improvement lead in the planning results in a more successful intervention. The MCP decided to delay testing this intervention due to competing priorities and will consider testing the intervention later in 2018.
The rates for the Annual Monitoring for Patients on Persistent Medications—ACE Inhibitors or ARBs measure in Region 1 and Region 2 remained below the MPL in RY 2018. Additionally, the rate for the Annual Monitoring for Patients on Persistent Medications—Diuretics in Region 2 remained below the MPL in RY 2018.
Comprehensive Diabetes Care
To improve the MCP’s performance on the Comprehensive Diabetes Care—Medical Attention for Nephropathy measure in Region 1, CHW conducted two PDSA cycles consisting of the same intervention. CHW tested whether or not providing training and education regarding gap-in-care reports and scheduling beneficiary appointments would improve the rate for the Comprehensive Diabetes Care—Medical Attention for Nephropathy measure. CHW indicated that the MCP learned that having the provider cross-reference the CHW-generated non-compliant beneficiary list with the clinic’s data helped to identify which beneficiaries were seeking care at the clinic and whether beneficiaries needed a nephropathy screening or monitoring test.
The rate for the Comprehensive Diabetes Care—Medical Attention for Nephropathy measure in Region 1 remained below the MPL in RY 2018.
Appropriate Treatment and Utilization
Table 3.19 through Table 3.21 present the four-year trending information for the performance measures within the Appropriate Treatment and Utilization domain.
Note the following regarding Table 3.19 through Table 3.21:
♦ The All-Cause Readmissions measure is a non-HEDIS measure originally developed for DHCS’ All-Cause Readmissions collaborative quality improvement project (QIP); therefore, DHCS does not establish an HPL or MPL for this measure. For the All-Cause Readmissions measure, a lower rate indicates better performance (i.e., fewer readmissions).
♦ The two Ambulatory Care measures are utilization measures, which measure the volume of services used. DHCS does not hold MCPs accountable to meet MPLs for utilization measures, and HSAG does not compare performance for these measures against HPLs and MPLs. Additionally, because high and low rates do not necessarily indicate better or worse performance, HSAG did not compare performance for these measures across years.
California Health & Wellness Plan Performance Evaluation Report: July 1, 2017–June 30, 2018 California Department of Health Care Services
Page E-30 Health Services Advisory Group, Inc.

MANAGED CARE HEALTH PLAN PERFORMANCE MEASURES
♦ DHCS established no HPL or MPL for the two Depression Screening and Follow-Up for Adolescents and Adults measures for RY 2018 because no comparable benchmarks exist. Additionally, although MCPs reported the two Depression Screening and Follow-Up for Adolescents and Adults measures for RY 2018, HSAG does not present the performance measure results for these measures in this report because the reported rates do not accurately represent services being provided. This is due to the Depression Screening and Follow-Up for Adolescents and Adults measures being new HEDIS measures for RY 2018, NCQA requiring MCPs to submit rates for these measures using the new Electronic Clinical Data Systems (ECDS) reporting methodology, and inconsistent data reporting processes by calculation vendors. Thus, MCPs experienced numerous challenges obtaining data sources to use for ECDS reporting. DHCS and HSAG, in consultation with NCQA, will work with MCPs to improve data capture for RY 2019.
♦ Note that due to changes that NCQA made to the specifications for the Use of Imaging Studies for Low Back Pain measure in RY 2018, NCQA released guidance to exercise caution when trending the results for this measure. Therefore, caution should be used when comparing MCP performance across years or when comparing MCP results to benchmarks related to the Use of Imaging Studies for Low Back Pain measure, as differences in rates may be a result of the specification changes rather than a reflection of performance.
Table 3.19—Appropriate Treatment and Utilization DomainMulti-Year Performance Measure Results CHW—Imperial County
H = Rate indicates performance above the HPL. Bolded Rate = Rate indicates performance below the MPL.
B = Statistical testing result indicates that the RY 2018 rate is significantly better than the RY 2017 rate.
W = Statistical testing result indicates that the RY 2018 rate is significantly worse than the RY 2017 rate.
Measure RY
2015 Rate1
RY 2016
Rate2
RY 2017
Rate3
RY 2018
Rate4
RYs 2017–18 Rate
Difference5
All-Cause Readmissions* S 10.15% 11.80% 11.96% 0.16 Ambulatory Care—Emergency Department (ED) Visits per 1,000 Member Months**
61.92 60.72 58.33 57.42 Not Tested
Ambulatory Care—Outpatient Visits per 1,000 Member Months**
299.04 285.71 290.81 232.88 Not Tested
California Health & Wellness Plan Performance Evaluation Report: July 1, 2017–June 30, 2018 California Department of Health Care Services
Page E-31 Health Services Advisory Group, Inc.

MANAGED CARE HEALTH PLAN PERFORMANCE MEASURES
Measure RY
2015 Rate1
RY 2016
Rate2
RY 2017
Rate3
RY 2018
Rate4
RYs 2017–18 Rate
Difference5
Avoidance of Antibiotic Treatment in Adults With Acute Bronchitis
39.22%H 35.18% 35.97% 32.49% -3.48
Use of Imaging Studies for Low Back Pain^ 59.27% 58.50% 50.92% 62.76% 11.84B
1 RY 2015 rates reflect MY data from January 1, 2014, through December 31, 2014. 2 RY 2016 rates reflect MY data from January 1, 2015, through December 31, 2015. 3 RY 2017 rates reflect MY data from January 1, 2016, through December 31, 2016. 4 RY 2018 rates reflect MY data from January 1, 2017, through December 31, 2017. 5 Performance comparisons are based on the Chi-square test of statistical significance, with a p value of <0.05. * A lower rate indicates better performance for this measure. ** Member months are a member's “contribution” to the total yearly membership. ^ Caution should be exercised when assessing MCP performance for this measure given the changes that NCQA made to the specification for this measure for RY 2018. S = The MCP’s measure is publicly reported based on NCQA HEDIS Compliance Audit results; however, since fewer than 11 cases exist in the numerator of this measure, HSAG suppresses displaying the rate in this report to satisfy the Health Insurance Portability and Accountability Act of 1996 Privacy Rule’s de-identification standard. If an RY 2017 or RY 2018 rate is suppressed, HSAG also suppresses the RY 2017–18 rate difference. Not Tested = An RY 2017–18 rate difference was not calculated because high and low rates do not necessarily indicate better or worse performance.
California Health & Wellness Plan Performance Evaluation Report: July 1, 2017–June 30, 2018 California Department of Health Care Services
Page E-32 Health Services Advisory Group, Inc.

MANAGED CARE HEALTH PLAN PERFORMANCE MEASURES
Table 3.20—Appropriate Treatment and Utilization DomainMulti-Year Performance Measure Results CHW—Region 1 (Butte, Colusa, Glenn, Plumas, Sierra, Sutter, and Tehama Counties)
H = Rate indicates performance above the HPL. Bolded Rate = Rate indicates performance below the MPL.
B = Statistical testing result indicates that the RY 2018 rate is significantly better than the RY 2017 rate.
W = Statistical testing result indicates that the RY 2018 rate is significantly worse than the RY 2017 rate.
Measure RY
2015 Rate1
RY 2016
Rate2
RY 2017
Rate3
RY 2018
Rate4
RYs 2017–18 Rate
Difference5
All-Cause Readmissions* 13.56% 17.54% 19.27% 19.04% -0.23 Ambulatory Care—Emergency Department (ED) Visits per 1,000 Member Months**
47.61 54.37 53.99 51.22 Not Tested
Ambulatory Care—Outpatient Visits per 1,000 Member Months**
331.93 348.53 341.25 343.18 Not Tested
Avoidance of Antibiotic Treatment in Adults With Acute Bronchitis
16.15% 16.59% 20.92% 15.73% -5.19W
Use of Imaging Studies for Low Back Pain^ 77.96% 78.05% 67.24% 74.92% 7.68B
1 RY 2015 rates reflect MY data from January 1, 2014, through December 31, 2014. 2 RY 2016 rates reflect MY data from January 1, 2015, through December 31, 2015. 3 RY 2017 rates reflect MY data from January 1, 2016, through December 31, 2016. 4 RY 2018 rates reflect MY data from January 1, 2017, through December 31, 2017. 5 Performance comparisons are based on the Chi-square test of statistical significance, with a p value of <0.05. * A lower rate indicates better performance for this measure. ** Member months are a member's “contribution” to the total yearly membership. ^ Caution should be exercised when assessing MCP performance for this measure given the changes that NCQA made to the specification for this measure for RY 2018. Not Tested = An RY 2017–18 rate difference was not calculated because high and low rates do not necessarily indicate better or worse performance.
California Health & Wellness Plan Performance Evaluation Report: July 1, 2017–June 30, 2018 California Department of Health Care Services
Page E-33 Health Services Advisory Group, Inc.
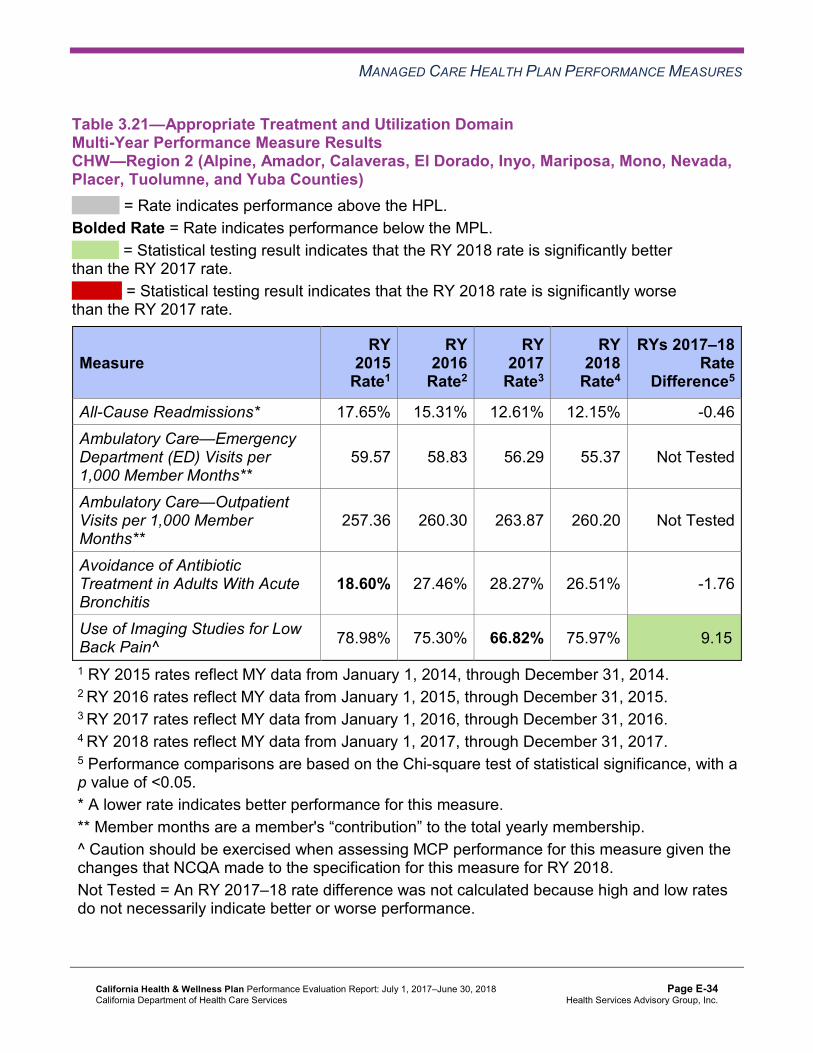
MANAGED CARE HEALTH PLAN PERFORMANCE MEASURES
Table 3.21—Appropriate Treatment and Utilization DomainMulti-Year Performance Measure Results CHW—Region 2 (Alpine, Amador, Calaveras, El Dorado, Inyo, Mariposa, Mono, Nevada,Placer, Tuolumne, and Yuba Counties)
H = Rate indicates performance above the HPL. Bolded Rate = Rate indicates performance below the MPL.
B = Statistical testing result indicates that the RY 2018 rate is significantly better than the RY 2017 rate.
W = Statistical testing result indicates that the RY 2018 rate is significantly worse than the RY 2017 rate.
Measure RY
2015 Rate1
RY 2016
Rate2
RY 2017
Rate3
RY 2018
Rate4
RYs 2017–18 Rate
Difference5
All-Cause Readmissions* 17.65% 15.31% 12.61% 12.15% -0.46 Ambulatory Care—Emergency Department (ED) Visits per 1,000 Member Months**
59.57 58.83 56.29 55.37 Not Tested
Ambulatory Care—Outpatient Visits per 1,000 Member Months**
257.36 260.30 263.87 260.20 Not Tested
Avoidance of Antibiotic Treatment in Adults With Acute Bronchitis
18.60% 27.46% 28.27% 26.51% -1.76
Use of Imaging Studies for Low Back Pain^ 78.98% 75.30% 66.82% 75.97% 9.15B
1 RY 2015 rates reflect MY data from January 1, 2014, through December 31, 2014. 2 RY 2016 rates reflect MY data from January 1, 2015, through December 31, 2015. 3 RY 2017 rates reflect MY data from January 1, 2016, through December 31, 2016. 4 RY 2018 rates reflect MY data from January 1, 2017, through December 31, 2017. 5 Performance comparisons are based on the Chi-square test of statistical significance, with a p value of <0.05. * A lower rate indicates better performance for this measure. ** Member months are a member's “contribution” to the total yearly membership. ^ Caution should be exercised when assessing MCP performance for this measure given the changes that NCQA made to the specification for this measure for RY 2018. Not Tested = An RY 2017–18 rate difference was not calculated because high and low rates do not necessarily indicate better or worse performance.
California Health & Wellness Plan Performance Evaluation Report: July 1, 2017–June 30, 2018 California Department of Health Care Services
Page E-34 Health Services Advisory Group, Inc.
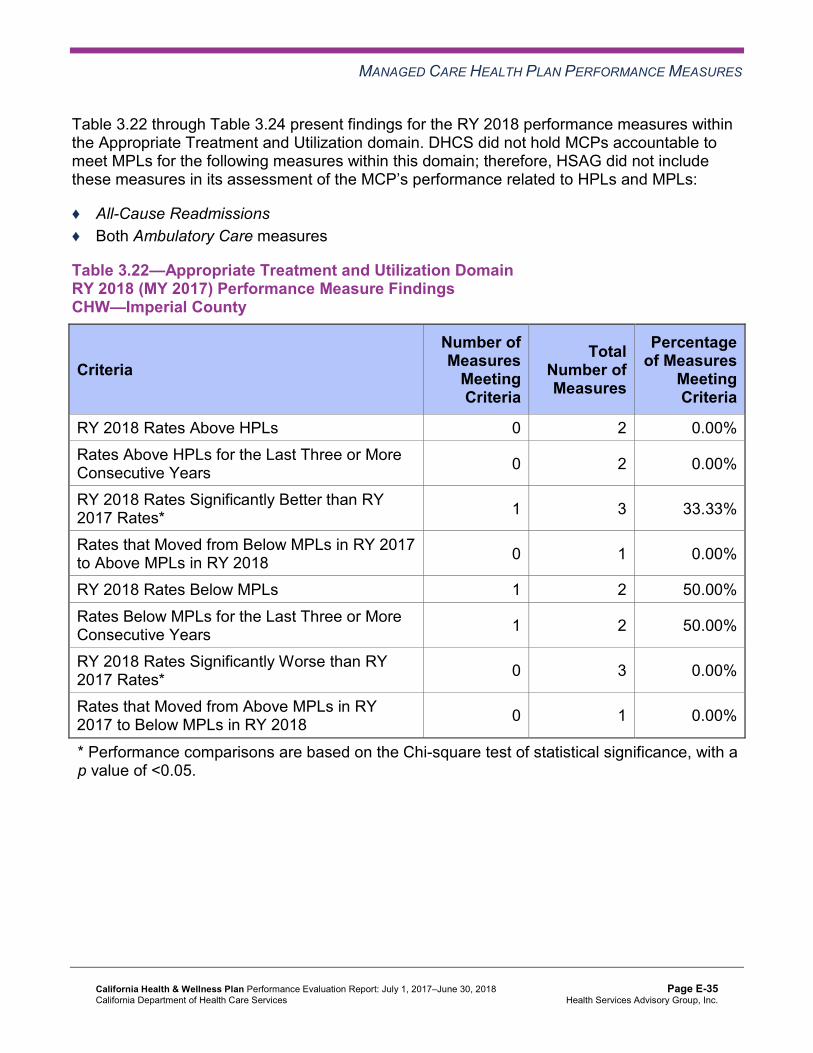
MANAGED CARE HEALTH PLAN PERFORMANCE MEASURES
Table 3.22 through Table 3.24 present findings for the RY 2018 performance measures within the Appropriate Treatment and Utilization domain. DHCS did not hold MCPs accountable to meet MPLs for the following measures within this domain; therefore, HSAG did not include these measures in its assessment of the MCP’s performance related to HPLs and MPLs:
♦ All-Cause Readmissions ♦ Both Ambulatory Care measures
Table 3.22—Appropriate Treatment and Utilization DomainRY 2018 (MY 2017) Performance Measure Findings CHW—Imperial County
Criteria Number of Measures
MeetingCriteria
Total Number of Measures
Percentage of Measures
MeetingCriteria
RY 2018 Rates Above HPLs 0 2 0.00% Rates Above HPLs for the Last Three or More Consecutive Years 0 2 0.00%
RY 2018 Rates Significantly Better than RY 2017 Rates* 1 3 33.33%
Rates that Moved from Below MPLs in RY 2017 to Above MPLs in RY 2018 0 1 0.00%
RY 2018 Rates Below MPLs 1 2 50.00% Rates Below MPLs for the Last Three or More Consecutive Years 1 2 50.00%
RY 2018 Rates Significantly Worse than RY 2017 Rates* 0 3 0.00%
Rates that Moved from Above MPLs in RY 2017 to Below MPLs in RY 2018 0 1 0.00%
* Performance comparisons are based on the Chi-square test of statistical significance, with a p value of <0.05.
California Health & Wellness Plan Performance Evaluation Report: July 1, 2017–June 30, 2018 California Department of Health Care Services
Page E-35 Health Services Advisory Group, Inc.

MANAGED CARE HEALTH PLAN PERFORMANCE MEASURES
Table 3.23—Appropriate Treatment and Utilization DomainRY 2018 (MY 2017) Performance Measure Findings CHW—Region 1 (Butte, Colusa, Glenn, Plumas, Sierra, Sutter, and Tehama Counties)
Criteria Number of Measures
MeetingCriteria
Total Number of Measures
Percentage of Measures
MeetingCriteria
RY 2018 Rates Above HPLs 0 2 0.00% Rates Above HPLs for the Last Three or More Consecutive Years 0 2 0.00%
RY 2018 Rates Significantly Better than RY 2017 Rates* 1 3 33.33%
Rates that Moved from Below MPLs in RY 2017 to Above MPLs in RY 2018 1 2 50.00%
RY 2018 Rates Below MPLs 1 2 50.00% Rates Below MPLs for the Last Three or More Consecutive Years 1 2 50.00%
RY 2018 Rates Significantly Worse than RY 2017 Rates* 1 3 33.33%
Rates that Moved from Above MPLs in RY 2017 to Below MPLs in RY 2018 0 0 N/A
* Performance comparisons are based on the Chi-square test of statistical significance, with a p value of <0.05. N/A = No rates above or below the MPLs from the previous year exist to include in the denominator for calculating whether or not rates moved to above or below MPLs in the most recent year.
California Health & Wellness Plan Performance Evaluation Report: July 1, 2017–June 30, 2018 California Department of Health Care Services
Page E-36 Health Services Advisory Group, Inc.

MANAGED CARE HEALTH PLAN PERFORMANCE MEASURES
Table 3.24—Appropriate Treatment and Utilization DomainRY 2018 (MY 2017) Performance Measure Findings CHW—Region 2 (Alpine, Amador, Calaveras, El Dorado, Inyo, Mariposa, Mono, Nevada,Placer, Tuolumne, and Yuba Counties)
Criteria Number of Measures
MeetingCriteria
Total Number of Measures
Percentage of Measures
MeetingCriteria
RY 2018 Rates Above HPLs 0 2 0.00% Rates Above HPLs for the Last Three or More Consecutive Years 0 2 0.00%
RY 2018 Rates Significantly Better than RY 2017 Rates* 1 3 33.33%
Rates that Moved from Below MPLs in RY 2017 to Above MPLs in RY 2018 1 1 100.00%
RY 2018 Rates Below MPLs 0 2 0.00% Rates Below MPLs for the Last Three or More Consecutive Years 0 2 0.00%
RY 2018 Rates Significantly Worse than RY 2017 Rates* 0 3 0.00%
Rates that Moved from Above MPLs in RY 2017 to Below MPLs in RY 2018 0 1 0.00%
* Performance comparisons are based on the Chi-square test of statistical significance, with a p value of <0.05.
Assessment of Improvement Plans—Appropriate Treatment and Utilization
Based on RY 2017 performance measure results, CHW was required to submit IPs for the following measures within the Appropriate Treatment and Utilization domain:
♦ Avoidance of Antibiotics in Adults With Acute Bronchitis in Region 1 ♦ Use of Imaging Studies for Low Back Pain in all three reporting units
Avoidance of Antibiotics in Adults With Acute Bronchitis
CHW conducted two PDSA cycles to improve the MCP’s performance in Region 1 for the Avoidance of Antibiotics in Adults With Acute Bronchitis measure. The MCP tested whether or not:
♦ Providing training and an Alliance Working for Antibiotic Resistance Education (AWARE) prescription pad to clinic providers would increase providers’ knowledge and compliance
California Health & Wellness Plan Performance Evaluation Report: July 1, 2017–June 30, 2018 California Department of Health Care Services
Page E-37 Health Services Advisory Group, Inc.
MANAGED CARE HEALTH PLAN PERFORMANCE MEASURES
with not prescribing antibiotics for adults with acute bronchitis. CHW indicated that it learned that some clinic providers feel more comfortable encouraging patients against the use of antibiotics while using the prescription pad as supplemental educational material.
♦ Giving providers the AWARE prescription pads would help to decrease the number of patients with acute bronchitis who were prescribed antibiotics. CHW indicated having learned that obtaining clinic staff member feedback and having frequent interactions with clinic staff members are crucial elements to successful implementation of the intervention.
Although the MCP met the SMART (Specific, Measurable, Achievable, Relevant, and Time-bound) objective for each PDSA cycle, the rate decreased significantly from RY 2017 to RY 2018 in Region 1 for the Avoidance of Antibiotics in Adults With Acute Bronchitis measure, and the rate remained below the MPL in RY 2018.
Use of Imaging Studies for Low Back Pain
While DHCS required CHW to submit an IP for the Use of Imaging Studies for Low Back Pain measure in all three reporting units, DHCS approved CHW to focus the IP in Imperial County. To improve the MCP’s performance on the Use of Imaging Studies for Low Back Pain measure in Imperial County, CHW initially identified high-volume/low-performing provider groups with which to partner. The MCP disseminated toolkits to the providers that included both provider and beneficiary educational materials, conducted technical assistance with high-prescribing providers, and created a “Low Back Pain Tip Sheet” for provider education. CHW indicated having found that offering provider education and partnering with provider groups is likely to improve appropriate imaging studies ordering for diagnoses of low back pain.
Specific to Imperial County only, CHW conducted two PDSA cycles consisting of the same intervention to improve the MCP’s performance on the Use of Imaging Studies for Low Back Pain measure. CHW tested whether or not implementing screening guidelines that included placing clinical “red flags” within the medical center’s electronic medical record which indicated potential need for imaging studies would help to improve appropriate imaging studies ordering for diagnoses of low back pain. CHW indicated having learned that an established contact and partnership are crucial to intervention success.
In all three reporting units, the rates for the Use of Imaging Studies for Low Back Pain measure improved significantly from RY 2017 to RY 2018. The significant improvement resulted in the rates in Region 1 and Region 2 moving to above the MPL in RY 2018; however, the rate in Imperial County remained below the MPL in RY 2018.
California Health & Wellness Plan Performance Evaluation Report: July 1, 2017–June 30, 2018 California Department of Health Care Services
Page E-38 Health Services Advisory Group, Inc.

MANAGED CARE HEALTH PLAN PERFORMANCE MEASURES
Performance Measure Findings—All Domains
Table 3.25 through Table 3.27 present a summary of CHW’s RY 2018 performance across all External Accountability Set (EAS) measures.
Note the following regarding Table 3.25 through Table 3.27:
♦ DHCS did not hold MCPs accountable to meet MPLs for the following measures; therefore, HSAG did not include these measures in its assessment of the MCP’s performance related to HPLs and MPLs: ■ All-Cause Readmissions ■ Both Ambulatory Care measures ■ All four Children and Adolescents’ Access to Primary Care measures
♦ DHCS did not hold MCPs accountable to meet MPLs for the following measures in RY 2017; therefore, HSAG did not include these measures in the denominators for calculating the percentage of measures with rates that moved to above or below the MPLs in RY 2018 and for calculating the percentage of measures with rates below MPLs for only the last two consecutive years: ■ Asthma Medication Ratio ■ Breast Cancer Screening ■ Immunizations for Adolescents—Combination 2
Table 3.25—RY 2018 (MY 2017) Performance Measure Findings for All Domains CHW—Imperial County
Criteria Number of Measures
MeetingCriteria
Total Number of Measures
Percentage of Measures
MeetingCriteria
RY 2018 Rates Above HPLs 5 21 23.81% Rates Above HPLs for the Last Three or More Consecutive Years 1 18 5.56%
RY 2018 Rates Significantly Better than RY 2017 Rates* 6 22 27.27%
Rates that Moved from Below MPLs in RY 2017 to Above MPLs in RY 2018 0 1 0.00%
RY 2018 Rates Below MPLs 1 21 4.76% Rates Below MPLs for Only the Last Two Consecutive Years 0 18 0.00%
California Health & Wellness Plan Performance Evaluation Report: July 1, 2017–June 30, 2018 California Department of Health Care Services
Page E-39 Health Services Advisory Group, Inc.

MANAGED CARE HEALTH PLAN PERFORMANCE MEASURES
Criteria Number of Measures
MeetingCriteria
Total Number of Measures
Percentage of Measures
MeetingCriteria
Rates Below MPLs for the Last Three or More Consecutive Years 1 18 5.56%
RY 2018 Rates Significantly Worse than RY 2017 Rates* 0 22 0.00%
Rates that Moved from Above MPLs in RY 2017 to Below MPLs in RY 2018 0 17 0.00%
* Performance comparisons are based on the Chi-square test of statistical significance, with a p value of <0.05.
Table 3.26—RY 2018 (MY 2017) Performance Measure Findings for All Domains CHW—Region 1 (Butte, Colusa, Glenn, Plumas, Sierra, Sutter, and Tehama Counties)
Criteria Number of Measures
MeetingCriteria
Total Number of Measures
Percentage of Measures
MeetingCriteria
RY 2018 Rates Above HPLs 0 21 0.00%
Rates Above HPLs for the Last Three or More Consecutive Years 0 18 0.00%
RY 2018 Rates Significantly Better than RY 2017 Rates* 1 22 4.55%
Rates that Moved from Below MPLs in RY 2017 to Above MPLs in RY 2018 1 4 25.00%
RY 2018 Rates Below MPLs 6 21 28.57%
Rates Below MPLs for Only the Last Two Consecutive Years 1 18 5.56%
Rates Below MPLs for the Last Three or More Consecutive Years 2 18 11.11%
California Health & Wellness Plan Performance Evaluation Report: July 1, 2017–June 30, 2018 California Department of Health Care Services
Page E-40 Health Services Advisory Group, Inc.

MANAGED CARE HEALTH PLAN PERFORMANCE MEASURES
Criteria Number of Measures
MeetingCriteria
Total Number of Measures
Percentage of Measures
MeetingCriteria
RY 2018 Rates Significantly Worse than RY 2017 Rates* 2 22 9.09%
Rates that Moved from Above MPLs in RY 2017 to Below MPLs in RY 2018 2 14 14.29%
* Performance comparisons are based on the Chi-square test of statistical significance, with a p value of <0.05.
Table 3.27—RY 2018 (MY 2017) Performance Measure Findings for All Domains CHW—Region 2 (Alpine, Amador, Calaveras, El Dorado, Inyo, Mariposa, Mono, Nevada,Placer, Tuolumne, and Yuba Counties)
C = For this reporting unit, DHCS issued a CAP to the MCP due to either (1) three or more EAS measures for which MCPs are held accountable to meet the MPLs having rates below the MPLs for the last three or more consecutive years, or (2) greater than 50 percent of EAS measures for which MCPs are held accountable to meet the MPLs having rates below the MPLs in the most recent year.
Criteria Number of Measures
MeetingCriteria
Total Number of Measures
Percentage of Measures
MeetingCriteria
RY 2018 Rates Above HPLs 0 21 0.00% Rates Above HPLs for the Last Three or More Consecutive Years 0 18 0.00%
RY 2018 Rates Significantly Better than RY 2017 Rates* 3 22 13.64%
Rates that Moved from Below MPLs in RY 2017 to Above MPLs in RY 2018 1 5 20.00%
RY 2018 Rates Below MPLs 6 21 28.57% Rates Below MPLs for Only the Last Two Consecutive Years 0 18 0.00%
Rates Below MPLs for the Last Three or More Consecutive Years 4 18 22.22%C
RY 2018 Rates Significantly Worse than RY 2017 Rates* 0 22 0.00%
California Health & Wellness Plan Performance Evaluation Report: July 1, 2017–June 30, 2018 California Department of Health Care Services
Page E-41 Health Services Advisory Group, Inc.

MANAGED CARE HEALTH PLAN PERFORMANCE MEASURES
Criteria Number of Measures
MeetingCriteria
Total Number of Measures
Percentage of Measures
MeetingCriteria
Rates that Moved from Above MPLs in RY 2017 to Below MPLs in RY 2018 0 13 0.00%
* Performance comparisons are based on the Chi-square test of statistical significance, with a p value of <0.05.
Improvement Plan Requirements for 2018 Based on RY 2018 performance measure results, CHW will be required to continue conducting PDSA cycles for the following measures:
♦ Annual Monitoring for Patients on Persistent Medications—ACE Inhibitors or ARBs in Region 1
♦ Avoidance of Antibiotic Treatment in Adults With Acute Bronchitis in Region 1 ♦ Comprehensive Diabetes Care—Medical Attention for Nephropathy in Region 1 ♦ Use of Imaging Studies for Low Back Pain in Imperial County
Based on RY 2018 performance measure results, CHW will be required to submit IPs for the following measures:
♦ Annual Monitoring for Patients on Persistent Medications—Diuretics in Region 1 ♦ Asthma Medication Ratio in Region 2 ♦ Breast Cancer Screening in Region 1 and Region 2 ♦ Weight Assessment and Counseling for Nutrition and Physical Activity for Children and
Adolescents—Nutrition Counseling—Total in Region 1
Corrective Action Plan Based on the rates for the following measures being below the MPLs for the last three or more consecutive years in Region 2, DHCS issued a CAP for CHW in Region 2:
♦ Both Annual Monitoring for Patients on Persistent Medications measures ♦ Childhood Immunization Status—Combination 3 ♦ Well-Child Visits in the Third, Fourth, Fifth, and Sixth Years of Life
California Health & Wellness Plan Performance Evaluation Report: July 1, 2017–June 30, 2018 California Department of Health Care Services
Page E-42 Health Services Advisory Group, Inc.

MANAGED CARE HEALTH PLAN PERFORMANCE MEASURES
Seniors and Persons with Disabilities Performance Measure Results Table 3.28 through Table 3.30 present the four-year trending information for the Seniors and Persons with Disabilities (SPD) population, and Table 3.31 through Table 3.33 present the four-year trending information for the non-SPD population for the measures that DHCS required MCPs to stratify for the SPD and non-SPD populations. The tables also show the differences in rates between RY 2017 and RY 2018.
Table 3.34 through Table 3.36 present the SPD and non-SPD rates, a comparison of the SPD and non-SPD rates,5 and the total combined rate for each measure.
Table 3.28—Multi-Year SPD Performance Measure Trend Table CHW—Imperial County
B = Statistical testing result indicates that the RY 2018 SPD rate is significantly better than the RY 2017 SPD rate.
W = Statistical testing result indicates that the RY 2018 SPD rate is significantly worse than the RY 2017 SPD rate.
Measure RY 2015
SPD Rate1
RY 2016 SPD
Rate2
RY 2017 SPD
Rate3
RY 2018 SPD
Rate4
RYs 2017–18 Rate
Difference5
All-Cause Readmissions* NA 11.00% 13.78% 12.95% -0.83 Ambulatory Care—Emergency Department (ED) Visits per 1,000 Member Months**
94.32 101.51 96.35 107.06 Not Tested
Ambulatory Care—Outpatient Visits per 1,000 Member Months**
585.22 540.67 582.11 697.25 Not Tested
Annual Monitoring for Patients on Persistent Medications— ACE Inhibitors or ARBs
97.40% 94.46% 93.70% 95.89% 2.19
Annual Monitoring for Patients on Persistent Medications— Diuretics
100.00% 94.72% 94.34% 96.07% 1.73
5 HSAG calculated statistical significance between the SPD and non-SPD rates for each measure using a Chi-square test. This information is displayed in the “SPD/Non-SPD Rate Difference” column in Table 3.34 through Table 3.36.
California Health & Wellness Plan Performance Evaluation Report: July 1, 2017–June 30, 2018 California Department of Health Care Services
Page E-43 Health Services Advisory Group, Inc.
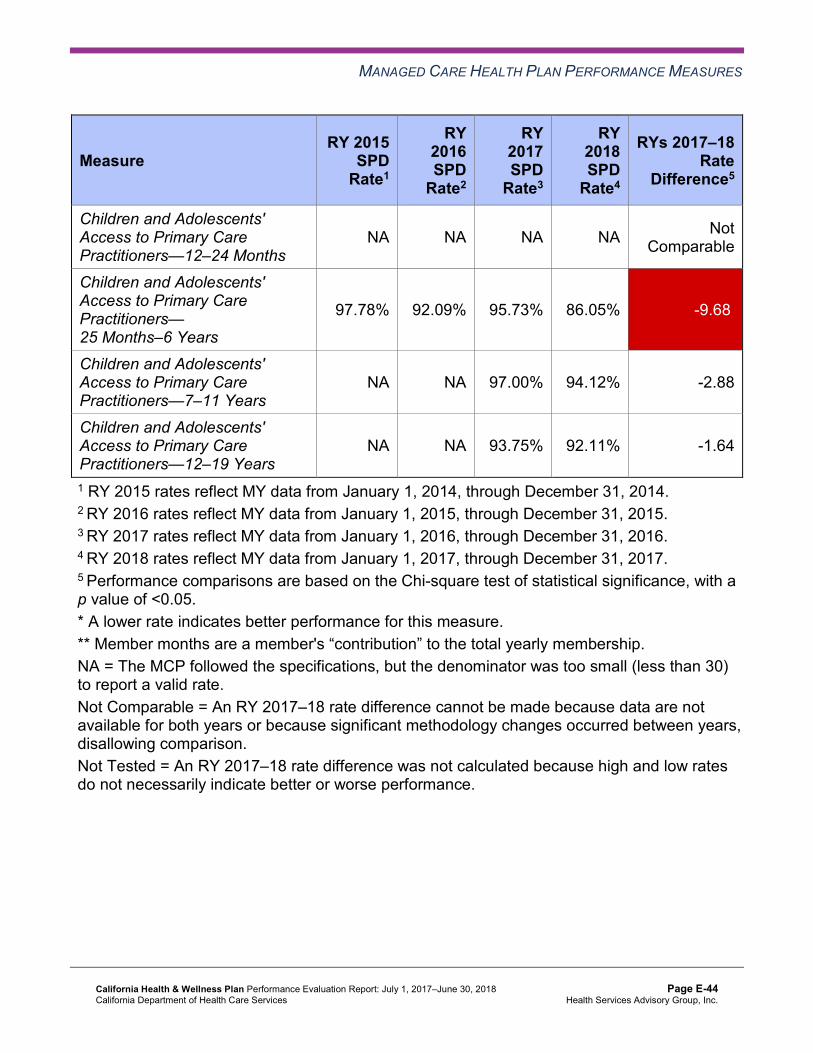
MANAGED CARE HEALTH PLAN PERFORMANCE MEASURES
Measure RY 2015
SPD Rate1
RY 2016 SPD
Rate2
RY 2017 SPD
Rate3
RY 2018 SPD
Rate4
RYs 2017–18 Rate
Difference5
Children and Adolescents' Access to Primary Care Practitioners—12–24 Months
NA NA NA NA Not Comparable
Children and Adolescents' Access to Primary Care Practitioners— 25 Months–6 Years
97.78% 92.09% 95.73% 86.05% -9.68W
Children and Adolescents' Access to Primary Care Practitioners—7–11 Years
NA NA 97.00% 94.12% -2.88
Children and Adolescents' Access to Primary Care Practitioners—12–19 Years
NA NA 93.75% 92.11% -1.64
1 RY 2015 rates reflect MY data from January 1, 2014, through December 31, 2014. 2 RY 2016 rates reflect MY data from January 1, 2015, through December 31, 2015. 3 RY 2017 rates reflect MY data from January 1, 2016, through December 31, 2016. 4 RY 2018 rates reflect MY data from January 1, 2017, through December 31, 2017. 5 Performance comparisons are based on the Chi-square test of statistical significance, with a p value of <0.05. * A lower rate indicates better performance for this measure. ** Member months are a member's “contribution” to the total yearly membership. NA = The MCP followed the specifications, but the denominator was too small (less than 30) to report a valid rate. Not Comparable = An RY 2017–18 rate difference cannot be made because data are not available for both years or because significant methodology changes occurred between years, disallowing comparison. Not Tested = An RY 2017–18 rate difference was not calculated because high and low rates do not necessarily indicate better or worse performance.
California Health & Wellness Plan Performance Evaluation Report: July 1, 2017–June 30, 2018 California Department of Health Care Services
Page E-44 Health Services Advisory Group, Inc.

MANAGED CARE HEALTH PLAN PERFORMANCE MEASURES
Table 3.29—Multi-Year SPD Performance Measure Trend Table CHW—Region 1 (Butte, Colusa, Glenn, Plumas, Sierra, Sutter, and Tehama Counties)
B = Statistical testing result indicates that the RY 2018 SPD rate is significantly better than the RY 2017 SPD rate.
W = Statistical testing result indicates that the RY 2018 SPD rate is significantly worse than the RY 2017 SPD rate.
Measure RY
2015 SPD
Rate1
RY 2016 SPD
Rate2
RY 2017 SPD
Rate3
RY 2018 SPD
Rate4
RYs 2017–18 Rate
Difference5
All-Cause Readmissions* NA 21.68% 25.81% 26.44% 0.63 Ambulatory Care—Emergency Department (ED) Visits per 1,000 Member Months**
83.85 87.91 89.02 85.96 Not Tested
Ambulatory Care—Outpatient Visits per 1,000 Member Months**
608.59 599.31 591.80 608.45 Not Tested
Annual Monitoring for Patients on Persistent Medications— ACE Inhibitors or ARBs
82.81% 87.51% 87.17% 89.13% 1.96
Annual Monitoring for Patients on Persistent Medications— Diuretics
87.50% 86.54% 88.69% 89.03% 0.34
Children and Adolescents' Access to Primary Care Practitioners—12–24 Months
NA NA NA NA Not Comparable
Children and Adolescents' Access to Primary Care Practitioners— 25 Months–6 Years
93.10% 91.49% 93.21% 91.57% -1.64
Children and Adolescents' Access to Primary Care Practitioners—7–11 Years
NA 95.35% 92.46% 91.71% -0.75
Children and Adolescents' Access to Primary Care Practitioners—12–19 Years
NA 95.65% 86.17% 83.01% -3.16
1 RY 2015 rates reflect MY data from January 1, 2014, through December 31, 2014. 2 RY 2016 rates reflect MY data from January 1, 2015, through December 31, 2015. 3 RY 2017 rates reflect MY data from January 1, 2016, through December 31, 2016.
California Health & Wellness Plan Performance Evaluation Report: July 1, 2017–June 30, 2018 California Department of Health Care Services
Page E-45 Health Services Advisory Group, Inc.

MANAGED CARE HEALTH PLAN PERFORMANCE MEASURES
4 RY 2018 rates reflect MY data from January 1, 2017, through December 31, 2017. 5 Performance comparisons are based on the Chi-square test of statistical significance, with a p value of <0.05. * A lower rate indicates better performance for this measure. ** Member months are a member's “contribution” to the total yearly membership. NA = The MCP followed the specifications, but the denominator was too small (less than 30) to report a valid rate. Not Comparable = An RY 2017–18 rate difference cannot be made because data are not available for both years or because significant methodology changes occurred between years, disallowing comparison. Not Tested = An RY 2017–18 rate difference was not calculated because high and low rates do not necessarily indicate better or worse performance.
Table 3.30—Multi-Year SPD Performance Measure Trend Table CHW—Region 2 (Alpine, Amador, Calaveras, El Dorado, Inyo, Mariposa, Mono, Nevada,Placer, Tuolumne, and Yuba Counties)
B = Statistical testing result indicates that the RY 2018 SPD rate is significantly better than the RY 2017 SPD rate.
W = Statistical testing result indicates that the RY 2018 SPD rate is significantly worse than the RY 2017 SPD rate.
Measure RY
2015 SPD
Rate1
RY 2016 SPD
Rate2
RY 2017 SPD
Rate3
RY 2018 SPD
Rate4
RYs 2017–18 Rate
Difference5
All-Cause Readmissions* NA 18.44% 16.73% 13.23% -3.50 Ambulatory Care—Emergency Department (ED) Visits per 1,000 Member Months**
86.17 88.42 87.04 94.83 Not Tested
Ambulatory Care—Outpatient Visits per 1,000 Member Months**
454.03 444.22 443.12 478.32 Not Tested
Annual Monitoring for Patients on Persistent Medications— ACE Inhibitors or ARBs
83.33% 87.08% 87.64% 86.61% -1.03
Annual Monitoring for Patients on Persistent Medications— Diuretics
88.89% 86.40% 87.05% 88.95% 1.90
California Health & Wellness Plan Performance Evaluation Report: July 1, 2017–June 30, 2018 California Department of Health Care Services
Page E-46 Health Services Advisory Group, Inc.

MANAGED CARE HEALTH PLAN PERFORMANCE MEASURES
Measure RY
2015 SPD
Rate1
RY 2016 SPD
Rate2
RY 2017 SPD
Rate3
RY 2018 SPD
Rate4
RYs 2017–18 Rate
Difference5
Children and Adolescents' Access to Primary Care Practitioners—12–24 Months
NA NA NA NA Not Comparable
Children and Adolescents' Access to Primary Care Practitioners— 25 Months–6 Years
NA 65.38% 83.91% 81.08% -2.83
Children and Adolescents' Access to Primary Care Practitioners—7–11 Years
NA 88.24% 81.55% 81.08% -0.47
Children and Adolescents' Access to Primary Care Practitioners—12–19 Years
NA 90.00% 82.11% 75.28% -6.83
1 RY 2015 rates reflect MY data from January 1, 2014, through December 31, 2014. 2 RY 2016 rates reflect MY data from January 1, 2015, through December 31, 2015. 3 RY 2017 rates reflect MY data from January 1, 2016, through December 31, 2016. 4 RY 2018 rates reflect MY data from January 1, 2017, through December 31, 2017. 5 Performance comparisons are based on the Chi-square test of statistical significance, with a p value of <0.05. * A lower rate indicates better performance for this measure. ** Member months are a member's “contribution” to the total yearly membership. NA = The MCP followed the specifications, but the denominator was too small (less than 30) to report a valid rate. Not Comparable = An RY 2017–18 rate difference cannot be made because data are not available for both years or because significant methodology changes occurred between years, disallowing comparison. Not Tested = An RY 2017–18 rate difference was not calculated because high and low rates do not necessarily indicate better or worse performance.
California Health & Wellness Plan Performance Evaluation Report: July 1, 2017–June 30, 2018 California Department of Health Care Services
Page E-47 Health Services Advisory Group, Inc.

MANAGED CARE HEALTH PLAN PERFORMANCE MEASURES
Table 3.31—Multi-Year Non-SPD Performance Measure Trend Table CHW—Imperial County
B = Statistical testing result indicates that the RY 2018 non-SPD rate is significantly better than the RY 2017 non-SPD rate.
W = Statistical testing result indicates that the RY 2018 non-SPD rate is significantly worse than the RY 2017 non-SPD rate.
Measure RY 2015
Non-SPD Rate1
RY 2016 Non-SPD
Rate2
RY 2017 Non-SPD
Rate3
RY 2018 Non-SPD
Rate4
RYs 2017–18 Rate
Difference5
All-Cause Readmissions* S 9.73% 10.66% 11.72% 1.06
Ambulatory Care— Emergency Department (ED) Visits per 1,000 Member Months**
61.43 58.09 55.87 56.07 Not Tested
Ambulatory Care— Outpatient Visits per 1,000 Member Months**
294.65 269.30 271.92 220.16 Not Tested
Annual Monitoring for Patients on Persistent Medications— ACE Inhibitors or ARBs
93.25% 90.61% 92.86% 93.74% 0.88
Annual Monitoring for Patients on Persistent Medications—Diuretics
93.32% 91.66% 92.46% 92.51% 0.05
Children and Adolescents' Access to Primary Care Practitioners— 12–24 Months
98.25% 96.88% 97.03% 97.06% 0.03
Children and Adolescents' Access to Primary Care Practitioners— 25 Months–6 Years
89.77% 91.04% 89.91% 90.17% 0.26
Children and Adolescents' Access to Primary Care Practitioners— 7–11 Years
NA 89.53% 88.82% 87.31% -1.51W
California Health & Wellness Plan Performance Evaluation Report: July 1, 2017–June 30, 2018 California Department of Health Care Services
Page E-48 Health Services Advisory Group, Inc.

MANAGED CARE HEALTH PLAN PERFORMANCE MEASURES
Measure RY 2015
Non-SPD Rate1
RY 2016 Non-SPD
Rate2
RY 2017 Non-SPD
Rate3
RY 2018 Non-SPD
Rate4
RYs 2017–18 Rate
Difference5
Children and Adolescents' Access to Primary Care Practitioners— 12–19 Years
NA 88.32% 86.28% 85.09% -1.19W
1 RY 2015 rates reflect MY data from January 1, 2014, through December 31, 2014. 2 RY 2016 rates reflect MY data from January 1, 2015, through December 31, 2015. 3 RY 2017 rates reflect MY data from January 1, 2016, through December 31, 2016. 4 RY 2018 rates reflect MY data from January 1, 2017, through December 31, 2017. 5 Performance comparisons are based on the Chi-square test of statistical significance, with a p value of <0.05. * A lower rate indicates better performance for this measure. ** Member months are a member's “contribution” to the total yearly membership. NA = The MCP followed the specifications, but the denominator was too small (less than 30) to report a valid rate. S = The MCP’s measure is publicly reported based on NCQA HEDIS Compliance Audit results; however, since fewer than 11 cases exist in the numerator of this measure, HSAG suppresses displaying the rate in this report to satisfy the Health Insurance Portability and Accountability Act of 1996 Privacy Rule’s de-identification standard. If an RY 2017 or RY 2018 non-SPD rate is suppressed, HSAG also suppresses the RY 2017–18 rate difference. Not Tested = An RY 2017–18 rate difference was not calculated because high and low rates do not necessarily indicate better or worse performance.
California Health & Wellness Plan Performance Evaluation Report: July 1, 2017–June 30, 2018 California Department of Health Care Services
Page E-49 Health Services Advisory Group, Inc.

MANAGED CARE HEALTH PLAN PERFORMANCE MEASURES
Table 3.32—Multi-Year Non-SPD Performance Measure Trend Table CHW—Region 1 (Butte, Colusa, Glenn, Plumas, Sierra, Sutter, and Tehama Counties)
B = Statistical testing result indicates that the RY 2018 non-SPD rate is significantly better than the RY 2017 non-SPD rate.
W = Statistical testing result indicates that the RY 2018 non-SPD rate is significantly worse than the RY 2017 non-SPD rate.
Measure RY 2015
Non-SPD Rate1
RY 2016 Non-SPD
Rate2
RY 2017 Non-SPD
Rate3
RY 2018 Non-SPD
Rate4
RYs 2017–18 Rate
Difference5
All-Cause Readmissions* 12.38% 14.80% 13.76% 13.14% -0.62
Ambulatory Care— Emergency Department (ED) Visits per 1,000 Member Months**
46.76 50.39 49.77 47.81 Not Tested
Ambulatory Care— Outpatient Visits per 1,000 Member Months**
325.44 318.81 311.04 317.14 Not Tested
Annual Monitoring for Patients on Persistent Medications— ACE Inhibitors or ARBs
81.51% 82.17% 82.98% 83.58% 0.60
Annual Monitoring for Patients on Persistent Medications—Diuretics
80.84% 80.73% 83.42% 78.71% -4.71W
Children and Adolescents' Access to Primary Care Practitioners— 12–24 Months
94.20% 95.33% 96.37% 95.79% -0.58
Children and Adolescents' Access to Primary Care Practitioners— 25 Months–6 Years
88.29% 88.51% 88.44% 87.04% -1.40W
Children and Adolescents' Access to Primary Care Practitioners— 7–11 Years
NA 90.26% 89.30% 87.60% -1.70W
California Health & Wellness Plan Performance Evaluation Report: July 1, 2017–June 30, 2018 California Department of Health Care Services
Page E-50 Health Services Advisory Group, Inc.

MANAGED CARE HEALTH PLAN PERFORMANCE MEASURES
Measure RY 2015
Non-SPD Rate1
RY 2016 Non-SPD
Rate2
RY 2017 Non-SPD
Rate3
RY 2018 Non-SPD
Rate4
RYs 2017–18 Rate
Difference5
Children and Adolescents' Access to Primary Care Practitioners— 12–19 Years
NA 88.01% 86.60% 85.41% -1.19W
1 RY 2015 rates reflect MY data from January 1, 2014, through December 31, 2014. 2 RY 2016 rates reflect MY data from January 1, 2015, through December 31, 2015. 3 RY 2017 rates reflect MY data from January 1, 2016, through December 31, 2016. 4 RY 2018 rates reflect MY data from January 1, 2017, through December 31, 2017. 5 Performance comparisons are based on the Chi-square test of statistical significance, with a p value of <0.05. * A lower rate indicates better performance for this measure. ** Member months are a member's “contribution” to the total yearly membership. NA = The MCP followed the specifications, but the denominator was too small (less than 30) to report a valid rate. Not Tested = An RY 2017–18 rate difference was not calculated because high and low rates do not necessarily indicate better or worse performance.
California Health & Wellness Plan Performance Evaluation Report: July 1, 2017–June 30, 2018 California Department of Health Care Services
Page E-51 Health Services Advisory Group, Inc.

MANAGED CARE HEALTH PLAN PERFORMANCE MEASURES
Table 3.33—Multi-Year Non-SPD Performance Measure Trend Table CHW—Region 2 (Alpine, Amador, Calaveras, El Dorado, Inyo, Mariposa, Mono, Nevada,Placer, Tuolumne, and Yuba Counties)
B = Statistical testing result indicates that the RY 2018 non-SPD rate is significantly better than the RY 2017 non-SPD rate.
W = Statistical testing result indicates that the RY 2018 non-SPD rate is significantly worse than the RY 2017 non-SPD rate.
Measure RY 2015
Non-SPD Rate1
RY 2016 Non-SPD
Rate2
RY 2017 Non-SPD
Rate3
RY 2018 Non-SPD
Rate4
RYs 2017–18 Rate
Difference5
All-Cause Readmissions* S 13.93% 10.25% 11.58% 1.33
Ambulatory Care— Emergency Department (ED) Visits per 1,000 Member Months**
59.01 56.02 53.27 52.29 Not Tested
Ambulatory Care— Outpatient Visits per 1,000 Member Months**
253.23 242.81 246.30 243.18 Not Tested
Annual Monitoring for Patients on Persistent Medications— ACE Inhibitors or ARBs
81.31% 79.79% 79.56% 79.89% 0.33
Annual Monitoring for Patients on Persistent Medications—Diuretics
82.15% 78.85% 80.85% 81.12% 0.27
Children and Adolescents' Access to Primary Care Practitioners— 12–24 Months
91.35% 92.44% 92.27% 91.54% -0.73
Children and Adolescents' Access to Primary Care Practitioners— 25 Months–6 Years
80.58% 82.81% 82.39% 78.01% -4.38W
California Health & Wellness Plan Performance Evaluation Report: July 1, 2017–June 30, 2018 California Department of Health Care Services
Page E-52 Health Services Advisory Group, Inc.
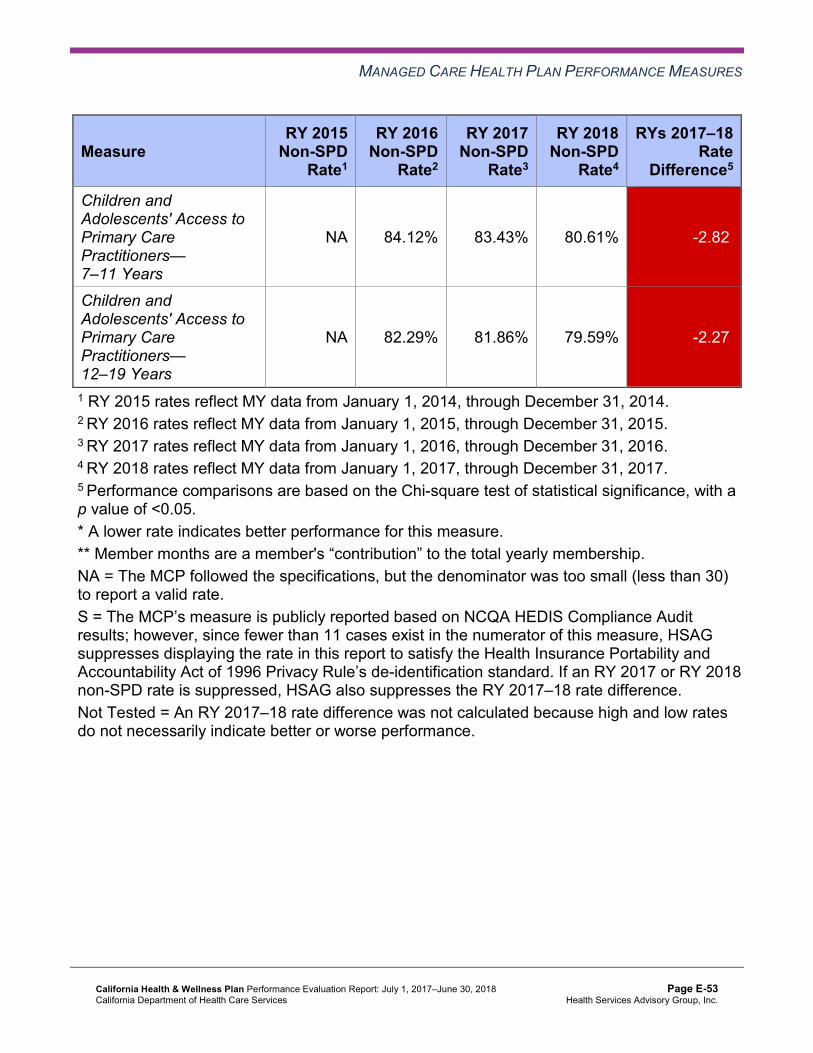
MANAGED CARE HEALTH PLAN PERFORMANCE MEASURES
Measure RY 2015
Non-SPD Rate1
RY 2016 Non-SPD
Rate2
RY 2017 Non-SPD
Rate3
RY 2018 Non-SPD
Rate4
RYs 2017–18 Rate
Difference5
Children and Adolescents' Access to Primary Care Practitioners— 7–11 Years
NA 84.12% 83.43% 80.61% -2.82W
Children and Adolescents' Access to Primary Care Practitioners— 12–19 Years
NA 82.29% 81.86% 79.59% -2.27W
1 RY 2015 rates reflect MY data from January 1, 2014, through December 31, 2014. 2 RY 2016 rates reflect MY data from January 1, 2015, through December 31, 2015. 3 RY 2017 rates reflect MY data from January 1, 2016, through December 31, 2016. 4 RY 2018 rates reflect MY data from January 1, 2017, through December 31, 2017. 5 Performance comparisons are based on the Chi-square test of statistical significance, with a p value of <0.05. * A lower rate indicates better performance for this measure. ** Member months are a member's “contribution” to the total yearly membership. NA = The MCP followed the specifications, but the denominator was too small (less than 30) to report a valid rate. S = The MCP’s measure is publicly reported based on NCQA HEDIS Compliance Audit results; however, since fewer than 11 cases exist in the numerator of this measure, HSAG suppresses displaying the rate in this report to satisfy the Health Insurance Portability and Accountability Act of 1996 Privacy Rule’s de-identification standard. If an RY 2017 or RY 2018 non-SPD rate is suppressed, HSAG also suppresses the RY 2017–18 rate difference. Not Tested = An RY 2017–18 rate difference was not calculated because high and low rates do not necessarily indicate better or worse performance.
California Health & Wellness Plan Performance Evaluation Report: July 1, 2017–June 30, 2018 California Department of Health Care Services
Page E-53 Health Services Advisory Group, Inc.

MANAGED CARE HEALTH PLAN PERFORMANCE MEASURES
Table 3.34—RY 2018 (MY 2017) Performance Measure Comparison and Results forMeasures Stratified by the SPD and Non-SPD PopulationsCHW—Imperial County
B = Statistical testing result indicates that the RY 2018 SPD rate is significantly better than the RY 2018 non-SPD rate.
W = Statistical testing result indicates that the RY 2018 SPD rate is significantly worse than the RY 2018 non-SPD rate.
Measure RY 2018
SPD Rate1
RY 2018 Non-SPD
Rate1
SPD/Non-SPDRate
Difference2
RY 2018 Total Rate3
All-Cause Readmissions* 12.95% 11.72% 1.23 11.96% Ambulatory Care—Emergency Department (ED) Visits per 1,000 Member Months**
107.06 56.07 Not Tested 57.42
Ambulatory Care—Outpatient Visits per 1,000 Member Months** 697.25 220.16 Not Tested 232.88
Annual Monitoring for Patients on Persistent Medications— ACE Inhibitors or ARBs
95.89% 93.74% 2.15 94.01%
Annual Monitoring for Patients on Persistent Medications—Diuretics 96.07% 92.51% 3.56 93.03%
Children and Adolescents' Access to Primary Care Practitioners— 12–24 Months
NA 97.06% Not Comparable 97.09%
Children and Adolescents' Access to Primary Care Practitioners— 25 Months–6 Years
86.05% 90.17% -4.12 90.09%
Children and Adolescents' Access to Primary Care Practitioners— 7–11 Years
94.12% 87.31% 6.81B 87.47%
Children and Adolescents' Access to Primary Care Practitioners— 12–19 Years
92.11% 85.09% 7.02B 85.18%
1 RY 2018 rates reflect MY data from January 1, 2017, through December 31, 2017. 2 Performance comparisons are based on the Chi-square test of statistical significance, with a p value of <0.05. 3 Total rates are based on the MCP reporting unit’s total results, including the SPD and non-SPD populations. Please note, if data are not available for either the SPD or non-SPD population, the total rate is based on results reported for the available population.
California Health & Wellness Plan Performance Evaluation Report: July 1, 2017–June 30, 2018 California Department of Health Care Services
Page E-54 Health Services Advisory Group, Inc.

MANAGED CARE HEALTH PLAN PERFORMANCE MEASURES
* A lower rate indicates better performance for this measure. ** Member months are a member's “contribution” to the total yearly membership. NA = The MCP followed the specifications, but the denominator was too small (less than 30) to report a valid rate. Not Comparable = An SPD/non-SPD rate difference cannot be made because data are not available for both populations. Not Tested = An SPD/non-SPD rate difference was not calculated because high and low rates do not necessarily indicate better or worse performance.
Table 3.35—RY 2018 (MY 2017) Performance Measure Comparison and Results forMeasures Stratified by the SPD and Non-SPD PopulationsCHW—Region 1 (Butte, Colusa, Glenn, Plumas, Sierra, Sutter, and Tehama Counties)
B = Statistical testing result indicates that the RY 2018 SPD rate is significantly better than the RY 2018 non-SPD rate.
W = Statistical testing result indicates that the RY 2018 SPD rate is significantly worse than the RY 2018 non-SPD rate.
Measure RY 2018
SPD Rate1
RY 2018 Non-SPD
Rate1
SPD/Non-SPDRate
Difference2
RY 2018 Total Rate3
All-Cause Readmissions* 26.44% 13.14% 13.30W 19.04% Ambulatory Care—Emergency Department (ED) Visits per 1,000 Member Months**
85.96 47.81 Not Tested 51.22
Ambulatory Care—Outpatient Visits per 1,000 Member Months** 608.45 317.14 Not Tested 343.18
Annual Monitoring for Patients on Persistent Medications— ACE Inhibitors or ARBs
89.13% 83.58% 5.55B 85.43%
Annual Monitoring for Patients on Persistent Medications—Diuretics 89.03% 78.71% 10.32B 82.58%
Children and Adolescents' Access to Primary Care Practitioners— 12–24 Months
NA 95.79% Not Comparable 95.81%
Children and Adolescents' Access to Primary Care Practitioners— 25 Months–6 Years
91.57% 87.04% 4.53 87.15%
Children and Adolescents' Access to Primary Care Practitioners— 7–11 Years
91.71% 87.60% 4.11 87.73%
California Health & Wellness Plan Performance Evaluation Report: July 1, 2017–June 30, 2018 California Department of Health Care Services
Page E-55 Health Services Advisory Group, Inc.

MANAGED CARE HEALTH PLAN PERFORMANCE MEASURES
Measure RY 2018
SPD Rate1
RY 2018 Non-SPD
Rate1
SPD/Non-SPDRate
Difference2
RY 2018 Total Rate3
Children and Adolescents' Access to Primary Care Practitioners— 12–19 Years
83.01% 85.41% -2.40 85.29%
1 RY 2018 rates reflect MY data from January 1, 2017, through December 31, 2017. 2 Performance comparisons are based on the Chi-square test of statistical significance, with a p value of <0.05. 3 Total rates are based on the MCP reporting unit’s total results, including the SPD and non-SPD populations. Please note, if data are not available for either the SPD or non-SPD population, the total rate is based on results reported for the available population. * A lower rate indicates better performance for this measure. ** Member months are a member's “contribution” to the total yearly membership. NA = The MCP followed the specifications, but the denominator was too small (less than 30) to report a valid rate. Not Comparable = An SPD/non-SPD rate difference cannot be made because data are not available for both populations. Not Tested = An SPD/non-SPD rate difference was not calculated because high and low rates do not necessarily indicate better or worse performance.
California Health & Wellness Plan Performance Evaluation Report: July 1, 2017–June 30, 2018 California Department of Health Care Services
Page E-56 Health Services Advisory Group, Inc.

MANAGED CARE HEALTH PLAN PERFORMANCE MEASURES
Table 3.36—RY 2018 (MY 2017) Performance Measure Comparison and Results forMeasures Stratified by the SPD and Non-SPD PopulationsCHW—Region 2 (Alpine, Amador, Calaveras, El Dorado, Inyo, Mariposa, Mono, Nevada,Placer, Tuolumne, and Yuba Counties)
B = Statistical testing result indicates that the RY 2018 SPD rate is significantly better than the RY 2018 non-SPD rate.
W = Statistical testing result indicates that the RY 2018 SPD rate is significantly worse than the RY 2018 non-SPD rate.
Measure RY 2018
SPD Rate1
RY 2018 Non-SPD
Rate1
SPD/Non-SPDRate
Difference2
RY 2018 Total Rate3
All-Cause Readmissions* 13.23% 11.58% 1.65 12.15% Ambulatory Care—Emergency Department (ED) Visits per 1,000 Member Months**
94.83 52.29 Not Tested 55.37
Ambulatory Care—Outpatient Visits per 1,000 Member Months** 478.32 243.18 Not Tested 260.20
Annual Monitoring for Patients on Persistent Medications—ACE Inhibitors or ARBs
86.61% 79.89% 6.72B 81.85%
Annual Monitoring for Patients on Persistent Medications—Diuretics 88.95% 81.12% 7.83B 83.49%
Children and Adolescents' Access to Primary Care Practitioners—12–24 Months
NA 91.54% Not Comparable 91.59%
Children and Adolescents' Access to Primary Care Practitioners—25 Months–6 Years
81.08% 78.01% 3.07 78.06%
Children and Adolescents' Access to Primary Care Practitioners—7–11 Years
81.08% 80.61% 0.47 80.62%
Children and Adolescents' Access to Primary Care Practitioners—12–19 Years
75.28% 79.59% -4.31 79.47%
1 RY 2018 rates reflect MY data from January 1, 2017, through December 31, 2017. 2 Performance comparisons are based on the Chi-square test of statistical significance, with a p value of <0.05.
California Health & Wellness Plan Performance Evaluation Report: July 1, 2017–June 30, 2018 California Department of Health Care Services
Page E-57 Health Services Advisory Group, Inc.

MANAGED CARE HEALTH PLAN PERFORMANCE MEASURES
3 Total rates are based on the MCP reporting unit’s total results, including the SPD and non-SPD populations. Please note, if data are not available for either the SPD or non-SPD population, the total rate is based on results reported for the available population. * A lower rate indicates better performance for this measure. ** Member months are a member's “contribution” to the total yearly membership. NA = The MCP followed the specifications, but the denominator was too small (less than 30) to report a valid rate. Not Comparable = An SPD/non-SPD rate difference cannot be made because data are not available for both populations. Not Tested = An SPD/non-SPD rate difference was not calculated because high and low rates do not necessarily indicate better or worse performance.
Seniors and Persons with Disabilities Findings
HSAG observed the following notable results in RY 2018 for measures that CHW stratified by the SPD and non-SPD populations:
♦ For SPD rates for which HSAG could make a comparison between RY 2017 and RY 2018, the RY 2018 SPD rate was significantly worse than the RY 2017 SPD rate for the Children and Adolescent’s Access to Primary Care Practitioners—25 Months–6 Years measure in Imperial County.
♦ The RY 2018 non-SPD rates were significantly worse than the RY 2017 non-SPD rates for the following measures: ■ Annual Monitoring for Patients on Persistent Medications—Diuretics in Region 1 ■ Children and Adolescent’s Access to Primary Care Practitioners—25 Months–6 Years in
Region 1 and Region 2 ■ Children and Adolescent’s Access to Primary Care Practitioners—7–11 Years and 12–
19 Years in all three reporting units ♦ For measures for which HSAG could compare the RY 2018 SPD rates to the RY 2018 non-
SPD rates: ■ The RY 2018 SPD rates were significantly better than the RY 2018 non-SPD rates for
the following measures: ○ Both Annual Monitoring for Patients on Persistent Medications measures in Region 1
and Region 2 ○ Children and Adolescent’s Access to Primary Care Practitioners—7–11 Years and
12–19 Years in Imperial County ■ The RY 2018 SPD rate was significantly worse than the RY 2018 non-SPD rate for the
All-Cause Readmissions measure in Region 1. Note that the higher rate of hospital readmissions for the SPD population is expected based on the greater and often more complicated health care needs of these beneficiaries.
California Health & Wellness Plan Performance Evaluation Report: July 1, 2017–June 30, 2018 California Department of Health Care Services
Page E-58 Health Services Advisory Group, Inc.

MANAGED CARE HEALTH PLAN PERFORMANCE MEASURES
Strengths—Performance Measures HSAG auditors determined that CHW followed the appropriate specifications to produce valid rates, and identified no issues of concern.
Across all domains and reporting units in RY 2018, HSAG identified the following notable RY 2018 performance measure results:
♦ The rates for five of 21 measures (24 percent) were above the HPLs in Imperial County. Four of the five measures (80 percent) were within the Care for Chronic Conditions domain.
♦ Across all reporting units, 10 of 66 rates (15 percent) improved significantly from RY 2017 to RY 2018. ■ Imperial County had the highest percentage of rates that improved significantly, with six
of 22 rates in this reporting unit (27 percent) improving significantly from RY 2017 to RY 2018.
■ The significant improvement for the Use of Imaging Studies for Low Back Pain measure in Region 1 and Region 2 resulted in the rates for this measure in these reporting units moving from below the MPL in RY 2017 to above the MPL in RY 2018.
Opportunities for Improvement—Performance Measures Across all domains and reporting units, 13 of 63 rates for which the MCP was held accountable to meet the MPLs (21 percent) were below the MPLs in RY 2018. Both Region 1 and Region 2 had six of 21 measures (29 percent) with rates below the MPLs in RY 2018. Region 1 had two measures with rates that declined significantly from RY 2017 to RY 2018.
Performance measure results show that CHW has the most opportunities for improvement within Region 2. The rates for the following four measures in in Region 2 were below the MPLs for the last three or more consecutive years, which resulted in DHCS issuing a CAP to the MCP for this reporting unit:
♦ Both Annual Monitoring for Patients on Persistent Medications measures ♦ Childhood Immunization Status—Combination 3 ♦ Well-Child Visits in the Third, Fourth, Fifth, and Sixth Years of Life
For the following measures, CHW has the opportunity to assess the causes for the MCP’s declining performance or performance below the MPLs and to identify strategies to improve the MCP’s performance:
♦ Both Annual Monitoring for Patients on Persistent Medications measures in Region 1 ♦ Asthma Medication Ratio in Region 2 ♦ Avoidance of Antibiotic Treatment in Adults With Acute Bronchitis in Region 1 ♦ Breast Cancer Screening in Region 1 and Region 2
California Health & Wellness Plan Performance Evaluation Report: July 1, 2017–June 30, 2018 California Department of Health Care Services
Page E-59 Health Services Advisory Group, Inc.
MANAGED CARE HEALTH PLAN PERFORMANCE MEASURES
♦ Comprehensive Diabetes Care—Medical Attention for Nephropathy in Region 1 ♦ Use of Imaging Studies for Low Back Pain in Imperial County ♦ Weight Assessment and Counseling for Nutrition and Physical Activity for Children and
Adolescents—Nutrition Counseling—Total in Region 1
When identifying strategies to improve performance, CHW should apply lessons learned from PDSA cycles, PIPs, and other quality improvement activities, as applicable.
California Health & Wellness Plan Performance Evaluation Report: July 1, 2017–June 30, 2018 California Department of Health Care Services
Page E-60 Health Services Advisory Group, Inc.
Medi-Cal Managed Care External Quality Review Technical ReportAppendix E: Performance Evaluation ReportCalifornia Health & Wellness Plan July 1, 2017–June 30, 2018
4. Performance Improvement Projects
Performance Improvement Project Overview The key concepts of the rapid-cycle PIP framework include forming a PIP team, setting aims, establishing measures, determining interventions using quality improvement tools, conducting PDSA cycles to test interventions, and planning for the spread of successful changes. The core component of the rapid-cycle PIP approach involves testing changes on a small scale so that improvement can occur more efficiently and lead to long-term sustainability. The following modules guide MCPs through this rapid-cycle PIP process:
♦ Module 1—PIP Initiation ■ MCPs outline the framework for the PIP, which includes:
○ The topic rationale. ○ Comparative data supporting the need to improve the selected topic. ○ A list of the PIP team members, which consists of internal and external stakeholders. ○ A completed key driver diagram that defines the theory of change for improvement,
including the SMART Aim and Global Aim. ♦ Module 2—SMART Aim Data Collection
■ MCPs define the SMART Aim measure and data collection methodology and develop the SMART Aim data run chart.
♦ Module 3—Intervention Determination ■ MCPs use process mapping and failure modes and effects analysis to identify potential
interventions to test which may have direct effects on the SMART Aim. ♦ Module 4—Plan-Do-Study-Act (PDSA)
■ MCPs test and evaluate the interventions identified in Module 3 through a series of PDSA cycles.
♦ Module 5—PIP Conclusions ■ MCPs interpret results and summarize:
○ Key findings and outcomes achieved. ○ Assessment of each tested intervention. ○ Lessons learned, including how demonstrated improvement can be shared and used
as a foundation for further improvement going forward. ○ Plan for sustained improvement.
California Health & Wellness Plan Performance Evaluation Report: July 1, 2017–June 30, 2018 California Department of Health Care Services
Page E-61 Health Services Advisory Group, Inc.

PERFORMANCE IMPROVEMENT PROJECTS
Based on the agreed-upon timeline, MCPs submit each module to HSAG for validation. Throughout the rapid-cycle PIP process, HSAG provides technical assistance to MCPs to ensure that PIPs are methodologically sound and to problem-solve with MCPs regarding how to address challenges that occur. Through an iterative process, MCPs have opportunities to make corrections to modules 1 through 3 to achieve all validation criteria.
Once MCPs achieve all validation criteria for modules 1 through 3 and receive feedback on the intervention Plan portion of Module 4, MCPs test interventions. During the intervention testing phase of the PIP, HSAG conducts periodic progress check-ins to ensure that MCPs have addressed HSAG’s feedback on the Plan portion of Module 4 and are making appropriate progress with intervention testing. Once MCPs complete testing an intervention, MCPs determine the next steps based on results and lessons learned—whether the intervention was successful and should be spread (adopt), whether modifications need to be made to the existing intervention (adapt), or whether the intervention was not successful and should be stopped (abandon).
In Module 5, MCPs summarize the overall PIP. When validating Module 5, HSAG assesses the validity and reliability of the results based on the Centers for Medicare & Medicaid Services (CMS) validation protocols to determine whether key stakeholders can have confidence in the reported PIP findings. HSAG assigns the following final confidence levels for each PIP:
♦ High confidence—the PIP was methodologically sound and achieved the SMART Aim goal; the demonstrated improvement was clearly linked to the quality improvement processes conducted and intervention(s) tested; and, the MCP accurately summarized the key findings.
♦ Confidence—the PIP was methodologically sound and achieved the SMART Aim goal, and the MCP accurately summarized the key findings. However, some, but not all, of the quality improvement processes conducted and/or intervention(s) tested were clearly linked to the demonstrated improvement.
♦ Low confidence—either (A) the PIP was methodologically sound; however, the SMART Aim goal was not achieved; or (B) the SMART Aim goal was achieved; however, the quality improvement processes and/or intervention(s) tested were poorly executed and could not be linked to the improvement.
♦ Reported PIP results were not credible (referred to in this report as “not credible”)—the PIP methodology was not executed as approved.
Performance Improvement Project Results and Findings During the review period, CHW submitted modules 4 and 5 for its 2015–17 DHCS-priority and MCP-specific PIPs. HSAG validated the modules and includes the final PIP validation findings in this report. Additionally, CHW initiated a Disparity PIP and a DHCS-priority PIP during the review period. In this report, HSAG includes summaries of the MCP’s Disparity and DHCS-priority PIP module submissions as well as validation findings from the review period.
California Health & Wellness Plan Performance Evaluation Report: July 1, 2017–June 30, 2018 California Department of Health Care Services
Page E-62 Health Services Advisory Group, Inc.
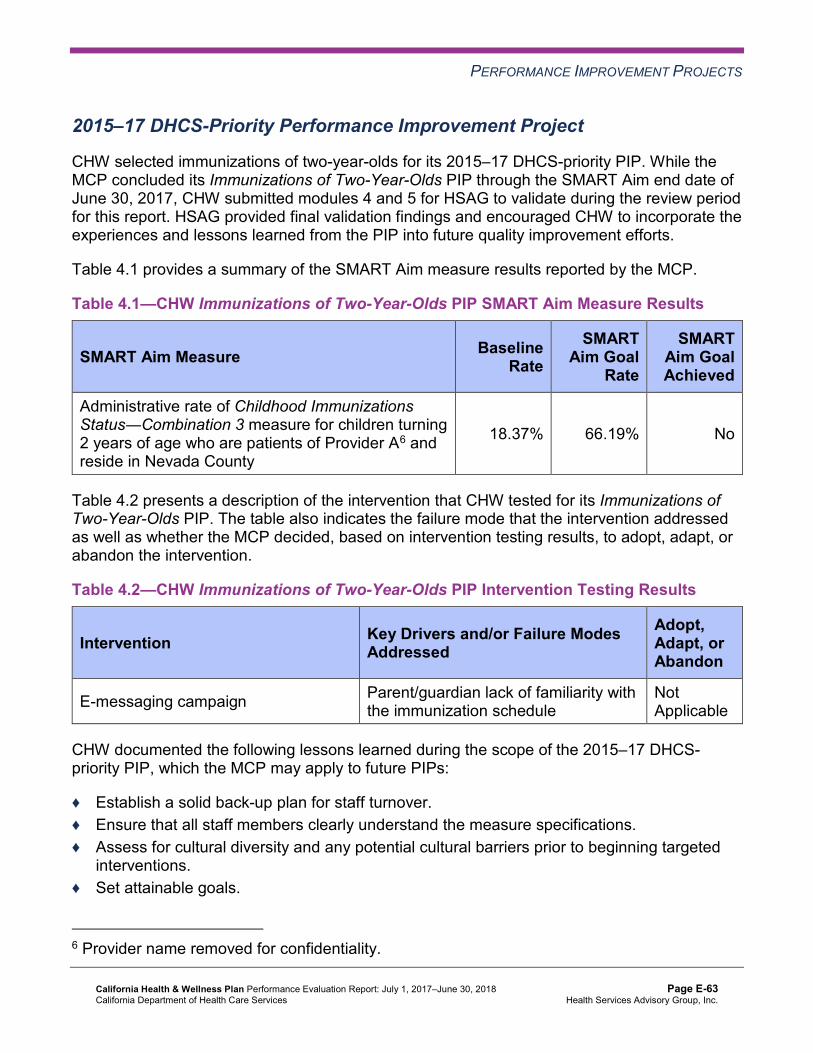
PERFORMANCE IMPROVEMENT PROJECTS
2015–17 DHCS-Priority Performance Improvement Project
CHW selected immunizations of two-year-olds for its 2015–17 DHCS-priority PIP. While the MCP concluded its Immunizations of Two-Year-Olds PIP through the SMART Aim end date of June 30, 2017, CHW submitted modules 4 and 5 for HSAG to validate during the review period for this report. HSAG provided final validation findings and encouraged CHW to incorporate the experiences and lessons learned from the PIP into future quality improvement efforts.
Table 4.1 provides a summary of the SMART Aim measure results reported by the MCP.
Table 4.1—CHW Immunizations of Two-Year-Olds PIP SMART Aim Measure Results
SMART Aim Measure Baseline Rate
SMART Aim Goal
Rate
SMART Aim Goal Achieved
Administrative rate of Childhood Immunizations Status―Combination 3 measure for children turning 2 years of age who are patients of Provider A6 and reside in Nevada County
18.37% 66.19% No
Table 4.2 presents a description of the intervention that CHW tested for its Immunizations of Two-Year-Olds PIP. The table also indicates the failure mode that the intervention addressed as well as whether the MCP decided, based on intervention testing results, to adopt, adapt, or abandon the intervention.
Table 4.2—CHW Immunizations of Two-Year-Olds PIP Intervention Testing Results
Intervention Key Drivers and/or Failure ModesAddressed
Adopt,Adapt, orAbandon
E-messaging campaign Parent/guardian lack of familiarity with the immunization schedule
Not Applicable
CHW documented the following lessons learned during the scope of the 2015–17 DHCS-priority PIP, which the MCP may apply to future PIPs:
♦ Establish a solid back-up plan for staff turnover. ♦ Ensure that all staff members clearly understand the measure specifications. ♦ Assess for cultural diversity and any potential cultural barriers prior to beginning targeted
interventions. ♦ Set attainable goals.
6 Provider name removed for confidentiality.
California Health & Wellness Plan Performance Evaluation Report: July 1, 2017–June 30, 2018 California Department of Health Care Services
Page E-63 Health Services Advisory Group, Inc.

PERFORMANCE IMPROVEMENT PROJECTS
Performance Improvement Project Validation Findings
During the review period for this report, HSAG validated modules 4 and 5 for the MCP’s Immunizations of Two-Year-Olds PIP. CHW initiated intervention testing in August 2016; however, the MCP did not continue testing the intervention through the SMART Aim end date of June 30, 2017. Additionally, the MCP did not start testing a new intervention to replace the discontinued intervention. Finally, CHW submitted no SMART Aim run chart data, so it was unclear whether or not the MCP collected data at least monthly to monitor results over the course of the project.
Upon assessment of validity and reliability of the PIP results, HSAG assigned CHW’s Immunizations of Two-Year-Olds PIP a final confidence level of Not Credible.
2015–17 MCP-Specific Performance Improvement Project
CHW selected cervical cancer screening for its 2015–17 MCP-specific PIP. While the MCP concluded its Cervical Cancer Screening PIP through the SMART Aim end date of June 30, 2017, CHW submitted modules 4 and 5 for HSAG to validate during the review period for this report. HSAG provided final validation findings and encouraged CHW to incorporate the experiences and lessons learned from the PIP into future quality improvement efforts.
Table 4.3 provides a summary of the SMART Aim measure results reported by the MCP.
Table 4.3—CHW Cervical Cancer Screening PIP SMART Aim Measure Results
SMART Aim Measure Baseline Rate
SMART Aim Goal
Rate
SMART Aim Goal Achieved
Rate of cervical cancer screening among female beneficiaries ages 21 to 64 years and residing in Yuba County who receive care at Provider B7
31.49% 54.33% No
Table 4.4 presents a description of the intervention that CHW tested for its Cervical Cancer Screening PIP. The table also indicates the key driver that the intervention addressed as well as whether the MCP decided, based on intervention testing results, to adopt, adapt, or abandon the intervention.
7 Provider name removed for confidentiality.
California Health & Wellness Plan Performance Evaluation Report: July 1, 2017–June 30, 2018 California Department of Health Care Services
Page E-64 Health Services Advisory Group, Inc.

PERFORMANCE IMPROVEMENT PROJECTS
Table 4.4—CHW Cervical Cancer Screening PIP Intervention Testing Results
Intervention Key Driver Addressed Adopt,Adapt, orAbandon
Offering financial incentives to providers for scheduling cervical cancer screening appointments with eligible beneficiaries
Provider engagement Adapt
Performance Improvement Project Validation Findings
During the review period for this report, HSAG validated modules 4 and 5 for the MCP’s Cervical Cancer Screening PIP. CHW reported numerous challenges with intervention testing, including staff turnover at the partnered provider site, resulting in the provider not collecting intervention evaluation data after December 2016. Upon assessment of validity and reliability of the PIP results, HSAG assigned CHW’s Cervical Cancer Screening PIP a final confidence level of Low Confidence.
2017–19 Disparity Performance Improvement Project
During the review period, DHCS required CHW to initiate a PIP focusing on an identified health disparity based on, but not limited to, age, gender, race or ethnicity, language spoken, income, educational attainment, sexual orientation or gender identity, occupation, provider, or geographic area. CHW selected controlling blood pressure among Hispanic beneficiaries as its 2017–19 Disparity PIP topic. Using its own MCP-specific data, the MCP provided evidence of the health disparity by demonstrating a statistically significant rate difference between two subgroups, with the disparate subgroup having the lower rate.
Table 4.5 provides the SMART Aim measure description, baseline rate, and SMART Aim goal rate for the PIP. The SMART Aim end date for this PIP is June 30, 2019.
Table 4.5—CHW Controlling Blood Pressure Disparity PIP SMART Aim Measure
SMART Aim Measure Baseline Rate
SMART Aim Goal
Rate
Rate of controlled blood pressure among Hispanic beneficiaries diagnosed with hypertension at Health Center A and Health Center B (both in Region 2)8
73.2% 91.0%
8 Health center names removed for confidentiality.
California Health & Wellness Plan Performance Evaluation Report: July 1, 2017–June 30, 2018 California Department of Health Care Services
Page E-65 Health Services Advisory Group, Inc.
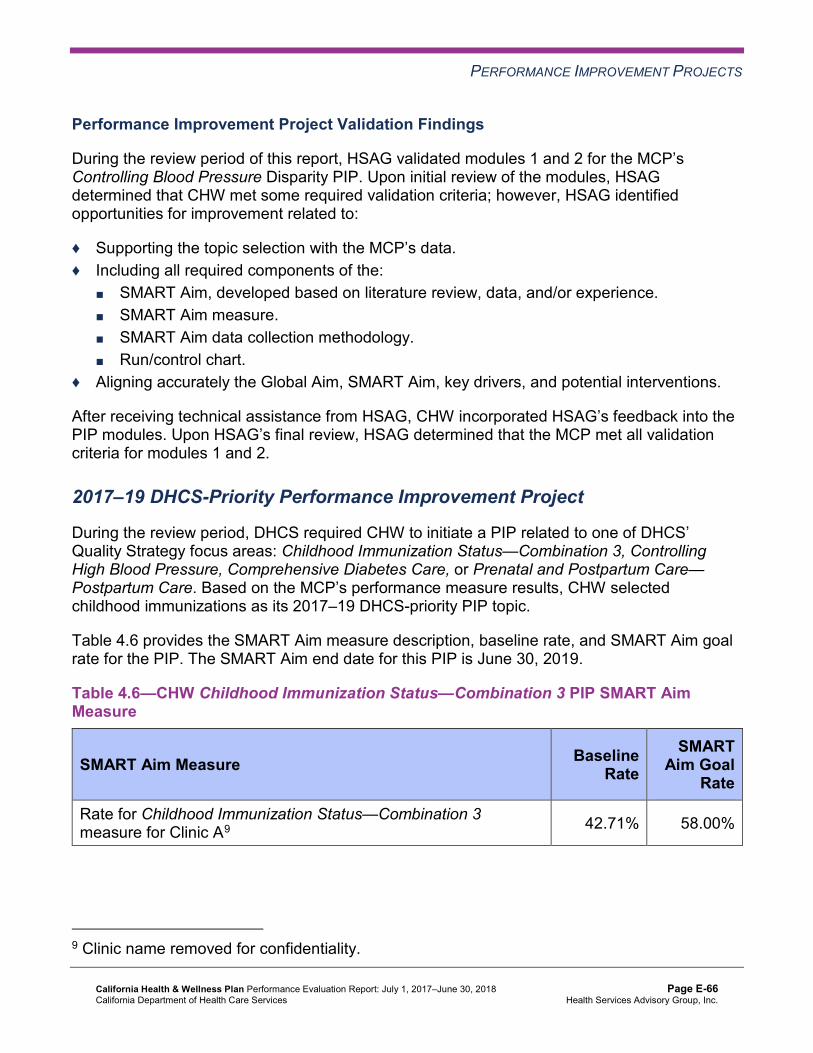
PERFORMANCE IMPROVEMENT PROJECTS
Performance Improvement Project Validation Findings
During the review period of this report, HSAG validated modules 1 and 2 for the MCP’s Controlling Blood Pressure Disparity PIP. Upon initial review of the modules, HSAG determined that CHW met some required validation criteria; however, HSAG identified opportunities for improvement related to:
♦ Supporting the topic selection with the MCP’s data. ♦ Including all required components of the:
■ SMART Aim, developed based on literature review, data, and/or experience. ■ SMART Aim measure. ■ SMART Aim data collection methodology. ■ Run/control chart.
♦ Aligning accurately the Global Aim, SMART Aim, key drivers, and potential interventions.
After receiving technical assistance from HSAG, CHW incorporated HSAG’s feedback into the PIP modules. Upon HSAG’s final review, HSAG determined that the MCP met all validation criteria for modules 1 and 2.
2017–19 DHCS-Priority Performance Improvement Project
During the review period, DHCS required CHW to initiate a PIP related to one of DHCS’ Quality Strategy focus areas: Childhood Immunization Status—Combination 3, Controlling High Blood Pressure, Comprehensive Diabetes Care, or Prenatal and Postpartum Care— Postpartum Care. Based on the MCP’s performance measure results, CHW selected childhood immunizations as its 2017–19 DHCS-priority PIP topic.
Table 4.6 provides the SMART Aim measure description, baseline rate, and SMART Aim goal rate for the PIP. The SMART Aim end date for this PIP is June 30, 2019.
Table 4.6—CHW Childhood Immunization Status—Combination 3 PIP SMART Aim Measure
SMART Aim Measure Baseline Rate
SMART Aim Goal
Rate
Rate for Childhood Immunization Status—Combination 3 measure for Clinic A9 42.71% 58.00%
9 Clinic name removed for confidentiality.
California Health & Wellness Plan Performance Evaluation Report: July 1, 2017–June 30, 2018 California Department of Health Care Services
Page E-66 Health Services Advisory Group, Inc.
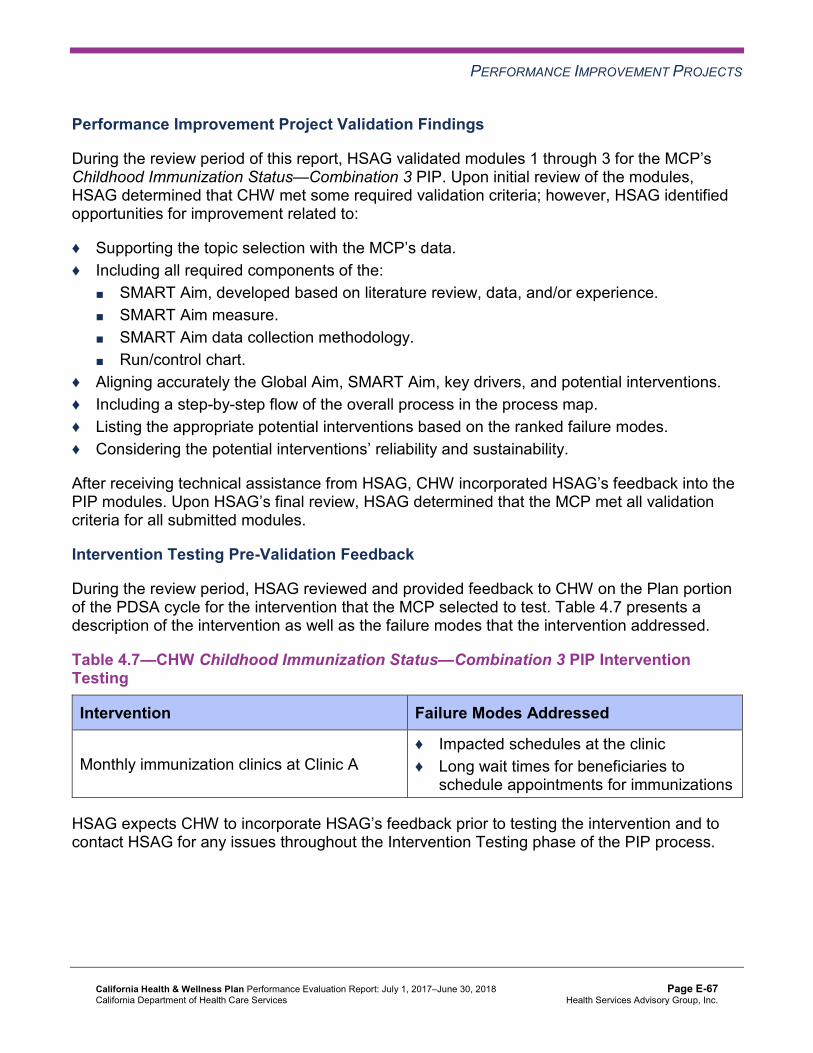
PERFORMANCE IMPROVEMENT PROJECTS
Performance Improvement Project Validation Findings
During the review period of this report, HSAG validated modules 1 through 3 for the MCP’s Childhood Immunization Status—Combination 3 PIP. Upon initial review of the modules, HSAG determined that CHW met some required validation criteria; however, HSAG identified opportunities for improvement related to:
♦ Supporting the topic selection with the MCP’s data. ♦ Including all required components of the:
■ SMART Aim, developed based on literature review, data, and/or experience. ■ SMART Aim measure. ■ SMART Aim data collection methodology. ■ Run/control chart.
♦ Aligning accurately the Global Aim, SMART Aim, key drivers, and potential interventions. ♦ Including a step-by-step flow of the overall process in the process map. ♦ Listing the appropriate potential interventions based on the ranked failure modes. ♦ Considering the potential interventions’ reliability and sustainability.
After receiving technical assistance from HSAG, CHW incorporated HSAG’s feedback into the PIP modules. Upon HSAG’s final review, HSAG determined that the MCP met all validation criteria for all submitted modules.
Intervention Testing Pre-Validation Feedback
During the review period, HSAG reviewed and provided feedback to CHW on the Plan portion of the PDSA cycle for the intervention that the MCP selected to test. Table 4.7 presents a description of the intervention as well as the failure modes that the intervention addressed.
Table 4.7—CHW Childhood Immunization Status—Combination 3 PIP Intervention Testing
Intervention Failure Modes Addressed
Monthly immunization clinics at Clinic A ♦ Impacted schedules at the clinic ♦ Long wait times for beneficiaries to
schedule appointments for immunizations
HSAG expects CHW to incorporate HSAG’s feedback prior to testing the intervention and to contact HSAG for any issues throughout the Intervention Testing phase of the PIP process.
California Health & Wellness Plan Performance Evaluation Report: July 1, 2017–June 30, 2018 California Department of Health Care Services
Page E-67 Health Services Advisory Group, Inc.

PERFORMANCE IMPROVEMENT PROJECTS
Strengths—Performance Improvement Projects Upon completion of the 2015–17 PIPs, CHW identified an intervention that it can adapt to improve cervical cancer screening adherence among beneficiaries.
Opportunities for Improvement—Performance Improvement Projects CHW has the opportunity to monitor the adapted intervention to achieve optimal outcomes beyond the life of the 2015–17 Cervical Cancer Screening PIP. The MCP should apply lessons learned from the 2015–17 Cervical Cancer Screening PIP to facilitate improvement of the adapted intervention.
Additionally, CHW has the opportunity to apply the lessons learned from the 2015–17 Immunizations of Two-Year-Olds PIP in the MCP’s 2017–19 Childhood Immunization Status— Combination 3 PIP.
California Health & Wellness Plan Performance Evaluation Report: July 1, 2017–June 30, 2018 California Department of Health Care Services
Page E-68 Health Services Advisory Group, Inc.

Medi-Cal Managed Care External Quality Review Technical ReportAppendix E: Performance Evaluation ReportCalifornia Health & Wellness Plan July 1, 2017–June 30, 2018
5. Recommendations
Follow-Up on Prior Year Recommendations DHCS provided each MCP an opportunity to outline actions taken to address recommendations HSAG made in its 2016–17 MCP-specific evaluation report. Table 5.1 provides EQR recommendations from CHW’s July 1, 2016, through June 30, 2017, MCP-specific evaluation report, along with the MCP’s self-reported actions taken through June 30, 2018, that address the recommendations. Please note that HSAG made minimal edits to Table 5.1 to preserve the accuracy of CHW’s self-reported actions.
Table 5.1—CHW’s Self-Reported Follow-Up on External Quality ReviewRecommendations from the July 1, 2016, through June 30, 2017, MCP-SpecificEvaluation Report
2016–17 External Quality ReviewRecommendations Directed to CHW
Self-Reported Actions Taken by CHWduring the Period of July 1, 2017–June 30,2018, that Address the External QualityReview Recommendations
1. For the following measures for which CHW performed below the MPLs, identify the causes for the MCP’s performance below the MPLs and, when applicable, apply successful improvement strategies from PDSA cycles and PIPs to improve the MCP’s performance to above the MPLs: a. Annual Monitoring for Patients on
Persistent Medications—ACE Inhibitors or ARBs in regions 1 and 2
b. Annual Monitoring for Patients on Persistent Medications—Diuretics in Region 2
c. Avoidance of Antibiotic Treatment in Adults With Acute Bronchitis in Region 1
d. Childhood Immunization Status— Combination 3 in Region 2
e. Comprehensive Diabetes Care— Medical Attention for Nephropathy in Region 1
In response to the HEDIS 2017 rates and in collaboration with DHCS, CHW addressed the underperforming, high-priority measures with PDSA cycles, PIPs, and additional interventions.
For the Annual Monitoring for Patients on Persistent Medications measure, CHW found that the providers were not aware of HEDIS technical specification requirements and best practices for the measures. The Pharmacy department and the provider relations transformation coaches for regions 1 and 2 conducted provider education, provided practice transformation strategies, and requested verification from providers that members had completed lab work.
For the Avoidance of Antibiotic Treatment in Adults With Acute Bronchitis measure, the primary barrier that was addressed was the provider and member awareness and knowledge about acute bronchitis treatment
California Health & Wellness Plan Performance Evaluation Report: July 1, 2017–June 30, 2018 California Department of Health Care Services
Page E-69 Health Services Advisory Group, Inc.

RECOMMENDATIONS
2016–17 External Quality ReviewRecommendations Directed to CHW
Self-Reported Actions Taken by CHWduring the Period of July 1, 2017–June 30,2018, that Address the External QualityReview Recommendations
f. Use of Imaging Studies for Low Back Pain in all three reporting units
g. Well-Child Visits in the Third, Fourth, Fifth, and Sixth Years of Life in Region 2
and recommended care. CHW collaborated with a high-volume clinic and provided the clinic with an Alliance Working for Antibiotic Resistance Education (AWARE) prescription pad to use as a patient education tool. This resulted in increased awareness of the measure.
For the Childhood Immunization Status— Combination 3 measure in Region 2, CHW found a provider shortage for a clinic with a high volume of pediatric members. This made it hard for parents to find time to schedule immunization appointments. An intervention has been planned for a pediatrician/ nurse/medical assistant to administer walk-in and scheduled immunizations one day per month.
For the Comprehensive Diabetes Care— Medical Attention for Nephropathy (CDC—N) measure, CHW found that providers were unaware of their CDC—N measure compliance rates. CHW provided training and education along with a list of non-compliant members. This resulted in increased provider awareness of the measure and facilitated stronger member outreach by providers to schedule appointments for medical attention for nephropathy.
For the Use of Imaging Studies for Low Back Pain measure, strategies have been implemented to address providers’ and members’ lack of knowledge about recommended care for low back pain. Targeted providers have made enhancements to their electronic medical records that create “stop and check” systems before ordering imaging studies.
California Health & Wellness Plan Performance Evaluation Report: July 1, 2017–June 30, 2018 California Department of Health Care Services
Page E-70 Health Services Advisory Group, Inc.

RECOMMENDATIONS
2016–17 External Quality ReviewRecommendations Directed to CHW
Self-Reported Actions Taken by CHWduring the Period of July 1, 2017–June 30,2018, that Address the External QualityReview Recommendations
For the Well-Child Visits in the Third, Fourth, Fifth, and Sixth Years of Life measure, CHW found that members were not attending appointments with their assigned providers due to systemic issues and member choice. CHW collaborated with a targeted clinic to schedule noncompliant members for well-child visits by making multiple calling attempts, resulting in more member scheduling of appointments.
2017–18 Recommendations Based on the overall assessment of CHW’s delivery of quality, accessible, and timely care through the activities described in previous sections of this report, HSAG recommends the following to the MCP:
♦ Work with DHCS to ensure that the MCP meets all CAP requirements in Region 2; and apply applicable lessons learned from PDSA cycles, PIPs, and other quality improvement activities to identify improvement strategies to address the MCP’s consecutive years of performance below the MPLs for the following measures: ■ Both Annual Monitoring for Patients on Persistent Medications measures ■ Childhood Immunization Status—Combination 3 ■ Well-Child Visits in the Third, Fourth, Fifth, and Sixth Years of Life
♦ For the following measures, assess the causes for the MCP’s declining performance or performance below the MPLs; and apply applicable lessons learned from PDSA cycles, PIPs, and other quality improvement activities to identify strategies to improve the MCP’s performance: ■ Imperial County
○ Use of Imaging Studies for Low Back Pain ■ Region 1
○ Both Annual Monitoring for Patients on Persistent Medications measures ○ Avoidance of Antibiotic Treatment in Adults With Acute Bronchitis ○ Breast Cancer Screening ○ Comprehensive Diabetes Care—Medical Attention for Nephropathy
California Health & Wellness Plan Performance Evaluation Report: July 1, 2017–June 30, 2018 California Department of Health Care Services
Page E-71 Health Services Advisory Group, Inc.
RECOMMENDATIONS
○ Weight Assessment and Counseling for Nutrition and Physical Activity for Children and Adolescents—Nutrition Counseling—Total
■ Region 2 ○ Asthma Medication Ratio ○ Breast Cancer Screening
♦ Monitor the adapted intervention to achieve optimal outcomes beyond the life of the 2015–17 Cervical Cancer Screening PIP. The MCP should apply lessons learned from the 2015–17 Cervical Cancer Screening PIP to facilitate improvement of the adapted intervention.
♦ Apply the lessons learned from the 2015–17 Immunizations of Two-Year-Olds PIP in the MCP’s 2017–19 Childhood Immunization Status—Combination 3 PIP.
In the next annual review, HSAG will evaluate continued successes of CHW as well as the MCP’s progress with these recommendations.
California Health & Wellness Plan Performance Evaluation Report: July 1, 2017–June 30, 2018 California Department of Health Care Services
Page E-72 Health Services Advisory Group, Inc.

Medi-Cal Managed CareExternal Quality Review Technical Report
Appendix F: Performance Evaluation Report
CalOptima July 1, 2017–June 30, 2018

Medi-Cal Managed Care External Quality Review Technical ReportAppendix F: Performance Evaluation ReportCalOptimaJuly 1, 2017–June 30, 2018
Table of Contents
1. Introduction.............................................................................................................F-1 Medi-Cal Managed Care Health Plan Overview .......................................................F-1
2. Managed Care Health Plan Compliance ...............................................................F-2Compliance Reviews Conducted..............................................................................F-2
Follow-Up on 2017 A&I Seniors and Persons with Disabilities Medical Survey ....F-2 Strengths—Compliance Reviews .............................................................................F-3 Opportunities for Improvement—Compliance Reviews ............................................F-3
3. Managed Care Health Plan Performance Measures ............................................F-4Performance Measure Validation Results ................................................................F-4 Performance Measure Results and Findings............................................................F-4
Preventive Screening and Children’s Health .........................................................F-5 Preventive Screening and Women’s Health ..........................................................F-9 Care for Chronic Conditions ................................................................................F-11 Appropriate Treatment and Utilization.................................................................F-13 Performance Measure Findings—All Domains....................................................F-16
Seniors and Persons with Disabilities Performance Measure Results....................F-17 Seniors and Persons with Disabilities Findings ...................................................F-22
Strengths—Performance Measures .......................................................................F-22 Opportunities for Improvement—Performance Measures ......................................F-23
4. MLTSSP Performance Measure Results.............................................................F-24 Managed Long-Term Services and Supports Plan Performance Measure Findings..F-25
5. Performance Improvement Projects ...................................................................F-26Performance Improvement Project Overview .........................................................F-26 Performance Improvement Project Results and Findings.......................................F-27
2015–17 DHCS-Priority Performance Improvement Project ...............................F-28 2015–17 MCP-Specific Performance Improvement Project ................................F-29 2017–19 Disparity Performance Improvement Project ........................................F-30 2017–19 DHCS-Priority Performance Improvement Project ...............................F-31
Strengths—Performance Improvement Projects ....................................................F-33 Opportunities for Improvement—Performance Improvement Projects ...................F-33
6. Recommendations................................................................................................F-34 Follow-Up on Prior Year Recommendations ..........................................................F-34 2017–18 Recommendations...................................................................................F-36
CalOptima Performance Evaluation Report: July 1, 2017–June 30, 2018 California Department of Health Care Services
Page F-i Health Services Advisory Group, Inc.

TABLE OF CONTENTS
Table of Tables
Table 2.1—DHCS A&I Medical and State Supported Services Audits of CalOptima Audit Review Period: February 1, 2016, through January 31, 2017.............F-2
Table 3.1—Preventive Screening and Children’s Health Domain Multi-Year Performance Measure Results CalOptima—Orange County.......................F-6
Table 3.2—Preventive Screening and Children’s Health Domain RY 2018 (MY 2017) Performance Measure Findings CalOptima—Orange County .....................F-8
Table 3.3—Preventive Screening and Women’s Health Domain Multi-Year Performance Measure Results CalOptima—Orange County.......................F-9
Table 3.4—Preventive Screening and Women’s Health Domain RY 2018 (MY 2017) Performance Measure Findings CalOptima—Orange County ...................F-10
Table 3.5—Care for Chronic Conditions Domain Multi-Year Performance Measure Results CalOptima—Orange County .........................................................F-11
Table 3.6—Care for Chronic Conditions Domain RY 2018 (MY 2017) Performance Measure Findings CalOptima—Orange County.........................................F-12
Table 3.7—Appropriate Treatment and Utilization Domain Multi-Year Performance Measure Results CalOptima—Orange County ..........................................F-14
Table 3.8—Appropriate Treatment and Utilization Domain RY 2018 (MY 2017) Performance Measure Findings CalOptima—Orange County ...................F-15
Table 3.9—RY 2018 (MY 2017) Performance Measure Findings for All Domains CalOptima—Orange County ......................................................................F-16
Table 3.10—Multi-Year SPD Performance Measure Trend Table CalOptima— Orange County...........................................................................................F-18
Table 3.11—Multi-Year Non-SPD Performance Measure Trend Table CalOptima— Orange County...........................................................................................F-19
Table 3.12—RY 2018 (MY 2017) Performance Measure Comparison and Results for Measures Stratified by the SPD and Non-SPD Populations CalOptima— Orange County...........................................................................................F-21
Table 4.1—Multi-Year MLTSSP Performance Measure Results CalOptima— Orange County...........................................................................................F-24
Table 5.1—CalOptima Diabetes HbA1c Testing PIP SMART Aim Measure Results ...F-28 Table 5.2—CalOptima Diabetes HbA1c Testing PIP Intervention Testing Results ......F-28 Table 5.3—CalOptima Initial Health Assessment PIP SMART Aim Measure Results..F-29 Table 5.4—CalOptima Initial Health Assessment PIP Intervention Testing Results.....F-30 Table 5.5—CalOptima Diabetes Poor HbA1c Control Disparity PIP SMART Aim Measure F-31 Table 5.6—CalOptima Adults’ Access to Preventive and Ambulatory Health Services
PIP SMART Aim Measure .........................................................................F-32 Table 6.1—CalOptima’s Self-Reported Follow-Up on External Quality Review
Recommendations from the July 1, 2016, through June 30, 2017, MCP-Specific Evaluation Report................................................................F-34
CalOptima Performance Evaluation Report: July 1, 2017–June 30, 2018 California Department of Health Care Services
Page F-ii Health Services Advisory Group, Inc.
Medi-Cal Managed Care External Quality Review Technical ReportAppendix F: Performance Evaluation ReportCalOptimaJuly 1, 2017–June 30, 2018
1. Introduction
The California Department of Health Care Services (DHCS) contracted with Health Services Advisory Group, Inc. (HSAG), an external quality review organization (EQRO), to prepare the federally required Medi-Cal Managed Care External Quality Review Technical Report, July 1, 2017–June 30, 2018. The technical report provides an overview of the objectives and methodology for conducting the external quality review (EQR) activities, including requirements related to each activity. Additionally, the technical report provides aggregated results and recommendations for DHCS for each activity.
This appendix is specific to DHCS’ contracted Medi-Cal managed care health plan (MCP), CalOptima (or “the MCP”). The purpose of this appendix is to provide MCP-specific results of each activity and an assessment of the MCP’s strengths and opportunities for improvement with respect to the quality and timeliness of and access to health care services furnished to Medi-Cal Managed Care (MCMC) beneficiaries (referred to as “beneficiaries” in this report). The review period for this MCP-specific evaluation report is July 1, 2017, through June 30, 2018. HSAG will report on activities that take place beyond the review period in CalOptima’s 2018–19 MCP-specific evaluation report. This MCP-specific evaluation report references activities and methodologies described in detail by HSAG in the technical report section.
The aggregate EQR technical report and all MCP- and specialty health plan (SHP)-specific performance evaluation reports reflect HSAG’s external, independent assessment of the quality and timeliness of, and access to, care that MCPs and SHPs are providing to beneficiaries.
Medi-Cal Managed Care Health Plan Overview CalOptima is a full-scope MCP delivering services to beneficiaries in the County Organized Health System (COHS) model.
CalOptima became operational to provide MCMC services in Orange County effective October 1995. As of June 30, 2018, CalOptima had 756,881 beneficiaries in Orange County.1
1 Medi-Cal Managed Care Enrollment Report—June 2018. Available at: http://www.dhcs.ca.gov/dataandstats/reports/Pages/MMCDMonthlyEnrollment.aspx. Accessed on: Aug 27, 2018.
CalOptima Performance Evaluation Report: July 1, 2017–June 30, 2018 California Department of Health Care Services
Page F-1 Health Services Advisory Group, Inc.
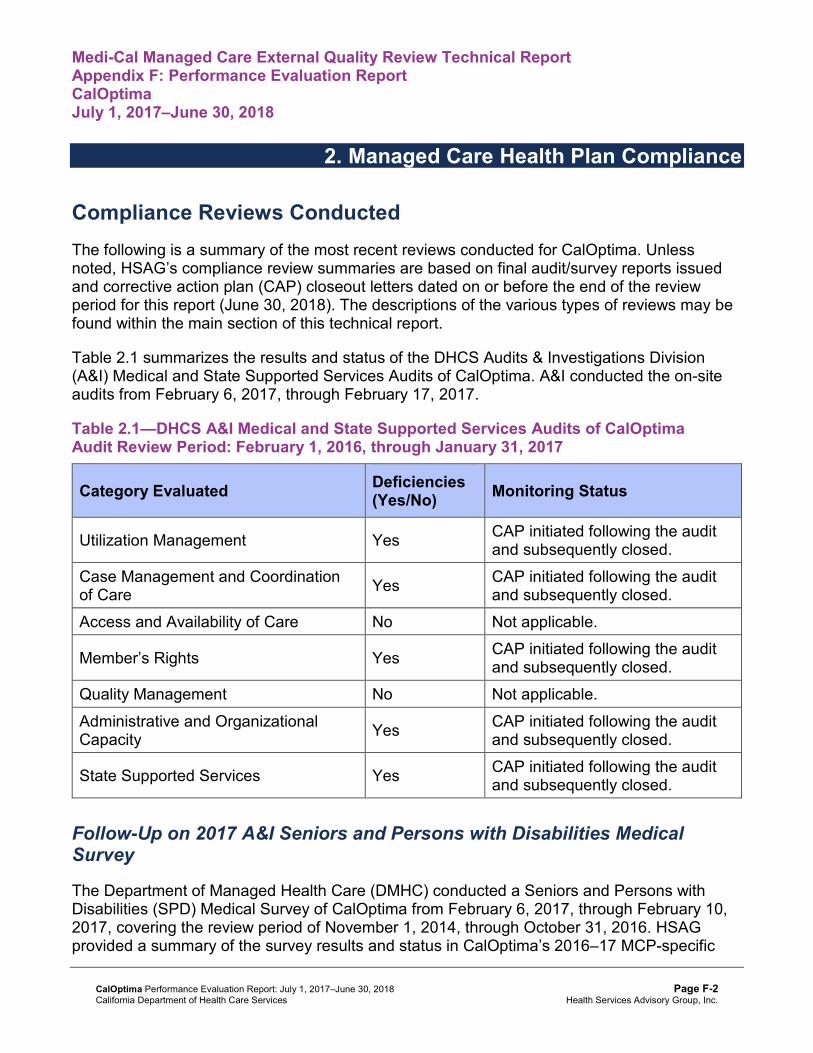
Medi-Cal Managed Care External Quality Review Technical ReportAppendix F: Performance Evaluation ReportCalOptimaJuly 1, 2017–June 30, 2018
2. Managed Care Health Plan Compliance
Compliance Reviews Conducted The following is a summary of the most recent reviews conducted for CalOptima. Unless noted, HSAG’s compliance review summaries are based on final audit/survey reports issued and corrective action plan (CAP) closeout letters dated on or before the end of the review period for this report (June 30, 2018). The descriptions of the various types of reviews may be found within the main section of this technical report.
Table 2.1 summarizes the results and status of the DHCS Audits & Investigations Division (A&I) Medical and State Supported Services Audits of CalOptima. A&I conducted the on-site audits from February 6, 2017, through February 17, 2017.
Table 2.1—DHCS A&I Medical and State Supported Services Audits of CalOptimaAudit Review Period: February 1, 2016, through January 31, 2017
Category Evaluated Deficiencies (Yes/No) Monitoring Status
Utilization Management Yes CAP initiated following the audit and subsequently closed.
Case Management and Coordination of Care Yes CAP initiated following the audit
and subsequently closed. Access and Availability of Care No Not applicable.
Member’s Rights Yes CAP initiated following the audit and subsequently closed.
Quality Management No Not applicable. Administrative and Organizational Capacity Yes CAP initiated following the audit
and subsequently closed.
State Supported Services Yes CAP initiated following the audit and subsequently closed.
Follow-Up on 2017 A&I Seniors and Persons with Disabilities Medical Survey
The Department of Managed Health Care (DMHC) conducted a Seniors and Persons with Disabilities (SPD) Medical Survey of CalOptima from February 6, 2017, through February 10, 2017, covering the review period of November 1, 2014, through October 31, 2016. HSAG provided a summary of the survey results and status in CalOptima’s 2016–17 MCP-specific
CalOptima Performance Evaluation Report: July 1, 2017–June 30, 2018 California Department of Health Care Services
Page F-2 Health Services Advisory Group, Inc.

MANAGED CARE HEALTH PLAN COMPLIANCE
evaluation report. At the time of the 2016–17 MCP-specific evaluation report publication, CalOptima’s CAP was in progress and under review by DHCS. A letter from DHCS dated November 2, 2017, stated that CalOptima provided DHCS with additional information regarding the CAP and that DHCS had found all items to be in compliance; therefore, DHCS closed the CAP.
Strengths—Compliance Reviews A&I identified no deficiencies in the Access and Availability of Care and Quality Management categories during the February 2017 Medical and State Supported Services Audits of CalOptima. Additionally, CalOptima fully resolved all outstanding deficiencies from the February 2017 A&I Medical and State Supported Services Audits and February 2017 DMHC SPD Medical Survey.
Opportunities for Improvement—Compliance Reviews CalOptima has no outstanding deficiencies from the February 2017 A&I Medical and State Supported Services Audits; therefore, HSAG has no recommendations for the MCP in the area of compliance reviews.
CalOptima Performance Evaluation Report: July 1, 2017–June 30, 2018 California Department of Health Care Services
Page F-3 Health Services Advisory Group, Inc.

Medi-Cal Managed Care External Quality Review Technical ReportAppendix F: Performance Evaluation ReportCalOptimaJuly 1, 2017–June 30, 2018
3. Managed Care Health Plan Performance Measures
Performance Measure Validation Results The HEDIS®2 2018 Compliance Audit Final Report of Findings for CalOptima contains the detailed findings and recommendations from HSAG’s NCQA HEDIS Compliance Audit™.3
HSAG auditors determined that CalOptima followed the appropriate specifications to produce valid rates, and identified no issues of concern.
Performance Measure Results and Findings After validating the MCP’s performance measure rates, HSAG assessed the results. See Table 3.1 through Table 3.9 for CalOptima’s performance measure results for reporting years (RYs) 2015 through 2018 and performance measure findings for RY 2018. The RY is the year in which the MCP reported the rates. The RY rates reflect measurement year (MY) data from the previous calendar year. Note that data may not be available for all four years.
Note the following regarding Table 3.1 through Table 3.9:
♦ To allow HSAG to provide meaningful assessment of MCP performance and actionable recommendations, HSAG, in collaboration with DHCS, organized the measures into domains based on the health care areas each measure affects. Table 3.1 through Table 3.8 present the performance measure results and findings by domain, and Table 3.9 presents the RY 2018 performance measure findings for the domains combined.
♦ To assess performance for each MCP reporting unit, HSAG compares the rates to national benchmarks. Rates indicating performance above the high performance levels (HPLs) are shaded in gray, and rates indicating performance below the minimum performance levels (MPLs) are bolded. ■ For measures with rates below the MPLs, DHCS requires MCPs to submit to DHCS
improvement plans (IPs) to address the rates below the MPLs (unless MCPs are reporting the rates for the first time).
■ For MCPs that meet DHCS’ Quality of Care CAP thresholds, DHCS issues a CAP; if an MCP’s performance is such that it may trigger a CAP in the following year, DHCS issues an advance warning letter.
2 Healthcare Effectiveness Data and Information Set (HEDIS®) is a registered trademark of the National Committee for Quality Assurance (NCQA).
3 NCQA HEDIS Compliance AuditTM is a trademark of NCQA.
CalOptima Performance Evaluation Report: July 1, 2017–June 30, 2018 California Department of Health Care Services
Page F-4 Health Services Advisory Group, Inc.

MANAGED CARE HEALTH PLAN PERFORMANCE MEASURES
■ IPs and CAPs consist of submission of Plan-Do-Study-Act (PDSA) Cycle Worksheets, Quality Improvement (QI) Summaries, or completion of Performance Improvement Projects (PIPs)—as determined by DHCS.
♦ For RYs 2016, 2017, and 2018, the HPLs and MPLs represent the NCQA Quality Compass®4 Medicaid health maintenance organization (HMO) 90th and 25th percentiles, respectively.
♦ For RY 2015, the HPLs and MPLs represent the NCQA HEDIS Audit Means, Percentiles, and Ratios 90th and 25th percentiles, respectively. For the Comprehensive Diabetes Care—HbA1c Poor Control (>9.0 Percent) measure, for which a lower rate indicates more favorable performance, the HPL and MPL are based on the 10th and 75th percentiles, respectively.
♦ HSAG includes the specific HPL and MPL values for RY 2018 in Section 6 of the Medi-Cal Managed Care External Quality Review Technical Report, July 1, 2017–June 30, 2018 (“Managed Care Health Plan Performance Measures”).
Preventive Screening and Children’s Health
Table 3.1 presents the four-year trending information for the performance measures within the Preventive Screening and Children’s Health domain.
Note the following regarding Table 3.1:
♦ Although HSAG includes information on the MCP’s performance related to the four Children and Adolescents’ Access to Primary Care measures, DHCS did not hold MCPs accountable to meet the MPLs for these measures for RYs 2015 through 2018 (i.e., DHCS did not require MCPs to submit IPs if rates for the measures were below the MPLs). DHCS made this decision due to the small range of variation between the HPL and MPL thresholds for each measure.
♦ Any comparison of RY 2018 performance to RY 2017 or to benchmarks related to the Immunizations for Adolescents—Combination 2 measure should be exercised with caution given the changes that NCQA made to the specification for this measure for RY 2018. NCQA released guidance that recommended a break in trending for this measure; however, DHCS determined to continue trending because the specification change should result in higher rates.
4 Quality Compass® is a registered trademark of NCQA.
CalOptima Performance Evaluation Report: July 1, 2017–June 30, 2018 California Department of Health Care Services
Page F-5 Health Services Advisory Group, Inc.
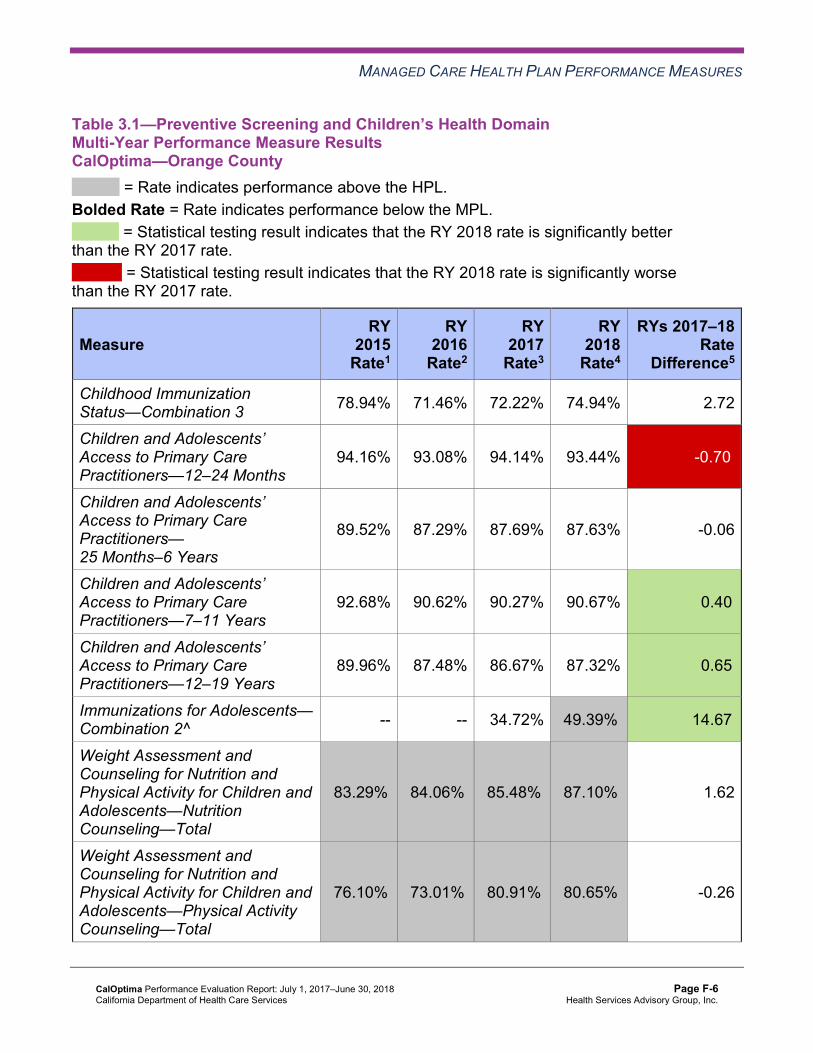
MANAGED CARE HEALTH PLAN PERFORMANCE MEASURES
Table 3.1—Preventive Screening and Children’s Health DomainMulti-Year Performance Measure Results CalOptima—Orange County
H = Rate indicates performance above the HPL. Bolded Rate = Rate indicates performance below the MPL.
B = Statistical testing result indicates that the RY 2018 rate is significantly better than the RY 2017 rate.
W = Statistical testing result indicates that the RY 2018 rate is significantly worse than the RY 2017 rate.
Measure RY
2015 Rate1
RY 2016
Rate2
RY 2017
Rate3
RY 2018
Rate4
RYs 2017–18 Rate
Difference5
Childhood Immunization Status—Combination 3 78.94% 71.46% 72.22% 74.94% 2.72
Children and Adolescents’ Access to Primary Care Practitioners—12–24 Months
94.16% 93.08% 94.14% 93.44% -0.70W
Children and Adolescents’ Access to Primary Care Practitioners— 25 Months–6 Years
89.52% 87.29% 87.69% 87.63% -0.06
Children and Adolescents’ Access to Primary Care Practitioners—7–11 Years
92.68% 90.62% 90.27% 90.67% 0.40B
Children and Adolescents’ Access to Primary Care Practitioners—12–19 Years
89.96% 87.48% 86.67% 87.32% 0.65B
Immunizations for Adolescents— Combination 2^ -- -- 34.72% 49.39%H 14.67B
Weight Assessment and Counseling for Nutrition and Physical Activity for Children and Adolescents—Nutrition Counseling—Total
83.29%H 84.06%H 85.48%H 87.10%H 1.62
Weight Assessment and Counseling for Nutrition and Physical Activity for Children and Adolescents—Physical Activity Counseling—Total
76.10%H 73.01%H 80.91%H 80.65%H -0.26
CalOptima Performance Evaluation Report: July 1, 2017–June 30, 2018 California Department of Health Care Services
Page F-6 Health Services Advisory Group, Inc.
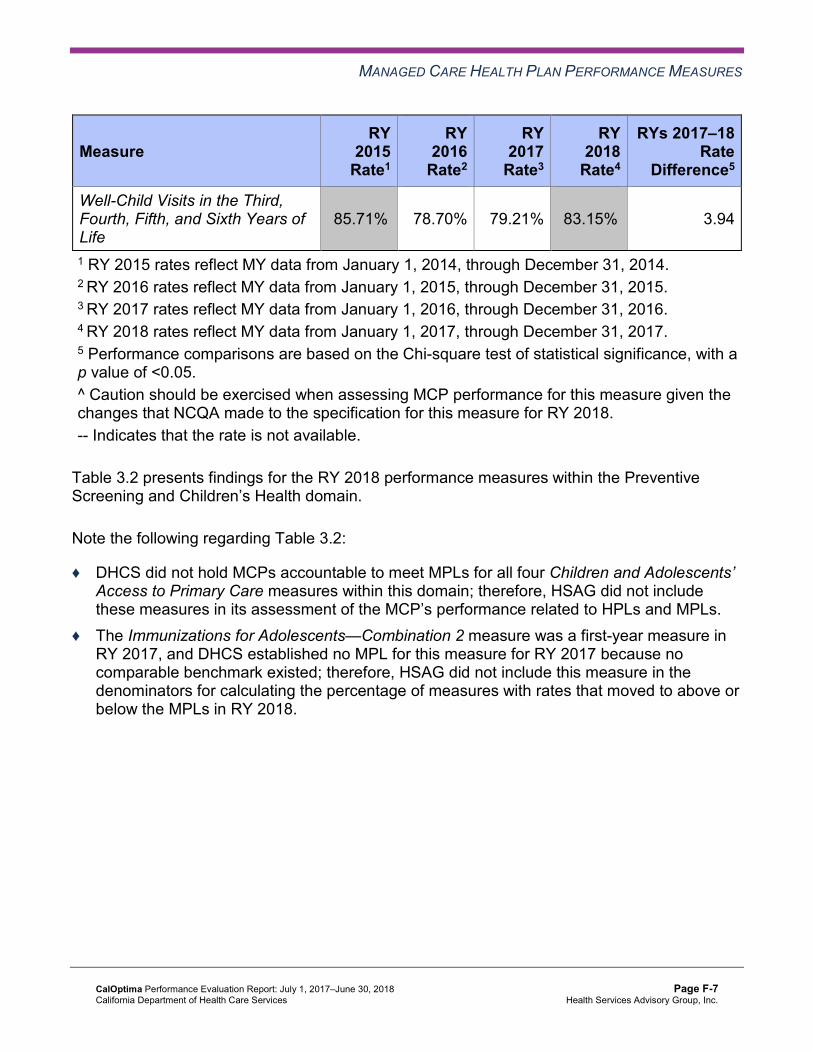
MANAGED CARE HEALTH PLAN PERFORMANCE MEASURES
Measure RY
2015 Rate1
RY 2016
Rate2
RY 2017
Rate3
RY 2018
Rate4
RYs 2017–18 Rate
Difference5
Well-Child Visits in the Third, Fourth, Fifth, and Sixth Years of Life
85.71%H 78.70% 79.21% 83.15%H 3.94
1 RY 2015 rates reflect MY data from January 1, 2014, through December 31, 2014. 2 RY 2016 rates reflect MY data from January 1, 2015, through December 31, 2015. 3 RY 2017 rates reflect MY data from January 1, 2016, through December 31, 2016. 4 RY 2018 rates reflect MY data from January 1, 2017, through December 31, 2017. 5 Performance comparisons are based on the Chi-square test of statistical significance, with a p value of <0.05. ^ Caution should be exercised when assessing MCP performance for this measure given the changes that NCQA made to the specification for this measure for RY 2018. -- Indicates that the rate is not available.
Table 3.2 presents findings for the RY 2018 performance measures within the Preventive Screening and Children’s Health domain.
Note the following regarding Table 3.2:
♦ DHCS did not hold MCPs accountable to meet MPLs for all four Children and Adolescents’ Access to Primary Care measures within this domain; therefore, HSAG did not include these measures in its assessment of the MCP’s performance related to HPLs and MPLs.
♦ The Immunizations for Adolescents—Combination 2 measure was a first-year measure in RY 2017, and DHCS established no MPL for this measure for RY 2017 because no comparable benchmark existed; therefore, HSAG did not include this measure in the denominators for calculating the percentage of measures with rates that moved to above or below the MPLs in RY 2018.
CalOptima Performance Evaluation Report: July 1, 2017–June 30, 2018 California Department of Health Care Services
Page F-7 Health Services Advisory Group, Inc.

MANAGED CARE HEALTH PLAN PERFORMANCE MEASURES
Table 3.2—Preventive Screening and Children’s Health DomainRY 2018 (MY 2017) Performance Measure Findings CalOptima—Orange County
Criteria Number of Measures
MeetingCriteria
Total Number of Measures
Percentage of Measures
MeetingCriteria
RY 2018 Rates Above HPLs 4 5 80.00% Rates Above HPLs for the Last Three or More Consecutive Years 2 4 50.00%
RY 2018 Rates Significantly Better than RY 2017 Rates* 1 5 20.00%
Rates that Moved from Below MPLs in RY 2017 to Above MPLs in RY 2018 0 0 N/A
RY 2018 Rates Below MPLs 0 5 0.00% Rates Below MPLs for the Last Three or More Consecutive Years 0 4 0.00%
RY 2018 Rates Significantly Worse than RY 2017 Rates* 0 5 0.00%
Rates that Moved from Above MPLs in RY 2017 to Below MPLs in RY 2018 0 4 0.00%
* Performance comparisons are based on the Chi-square test of statistical significance, with a p value of <0.05. N/A = No rates above or below the MPLs from the previous year exist to include in the denominator for calculating whether or not rates moved to above or below MPLs in the most recent year.
CalOptima Performance Evaluation Report: July 1, 2017–June 30, 2018 California Department of Health Care Services
Page F-8 Health Services Advisory Group, Inc.
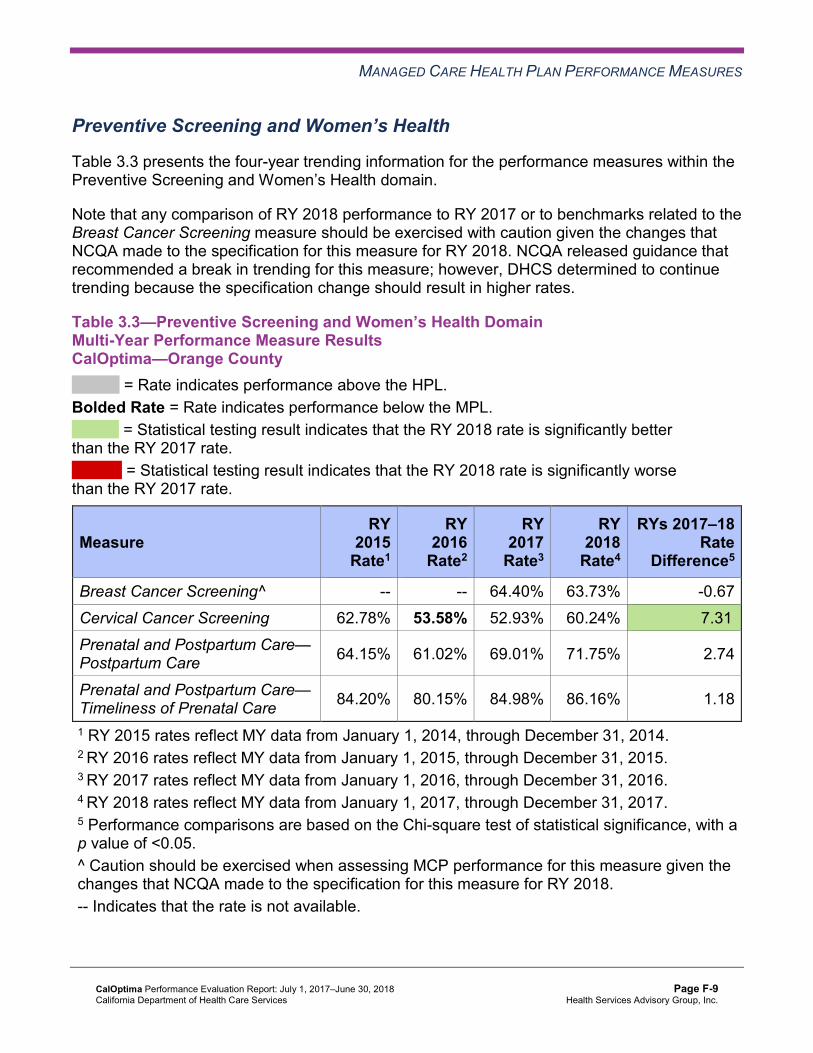
MANAGED CARE HEALTH PLAN PERFORMANCE MEASURES
Preventive Screening and Women’s Health
Table 3.3 presents the four-year trending information for the performance measures within the Preventive Screening and Women’s Health domain.
Note that any comparison of RY 2018 performance to RY 2017 or to benchmarks related to the Breast Cancer Screening measure should be exercised with caution given the changes that NCQA made to the specification for this measure for RY 2018. NCQA released guidance that recommended a break in trending for this measure; however, DHCS determined to continue trending because the specification change should result in higher rates.
Table 3.3—Preventive Screening and Women’s Health DomainMulti-Year Performance Measure Results CalOptima—Orange County
H = Rate indicates performance above the HPL. Bolded Rate = Rate indicates performance below the MPL.
B = Statistical testing result indicates that the RY 2018 rate is significantly better than the RY 2017 rate.
W = Statistical testing result indicates that the RY 2018 rate is significantly worse than the RY 2017 rate.
Measure RY
2015 Rate1
RY 2016
Rate2
RY 2017
Rate3
RY 2018
Rate4
RYs 2017–18 Rate
Difference5
Breast Cancer Screening^ -- -- 64.40% 63.73% -0.67 Cervical Cancer Screening 62.78% 53.58% 52.93% 60.24% 7.31B
Prenatal and Postpartum Care— Postpartum Care 64.15% 61.02% 69.01% 71.75% 2.74
Prenatal and Postpartum Care— Timeliness of Prenatal Care 84.20% 80.15% 84.98% 86.16% 1.18
1 RY 2015 rates reflect MY data from January 1, 2014, through December 31, 2014. 2 RY 2016 rates reflect MY data from January 1, 2015, through December 31, 2015. 3 RY 2017 rates reflect MY data from January 1, 2016, through December 31, 2016. 4 RY 2018 rates reflect MY data from January 1, 2017, through December 31, 2017. 5 Performance comparisons are based on the Chi-square test of statistical significance, with a p value of <0.05. ^ Caution should be exercised when assessing MCP performance for this measure given the changes that NCQA made to the specification for this measure for RY 2018. -- Indicates that the rate is not available.
CalOptima Performance Evaluation Report: July 1, 2017–June 30, 2018 California Department of Health Care Services
Page F-9 Health Services Advisory Group, Inc.
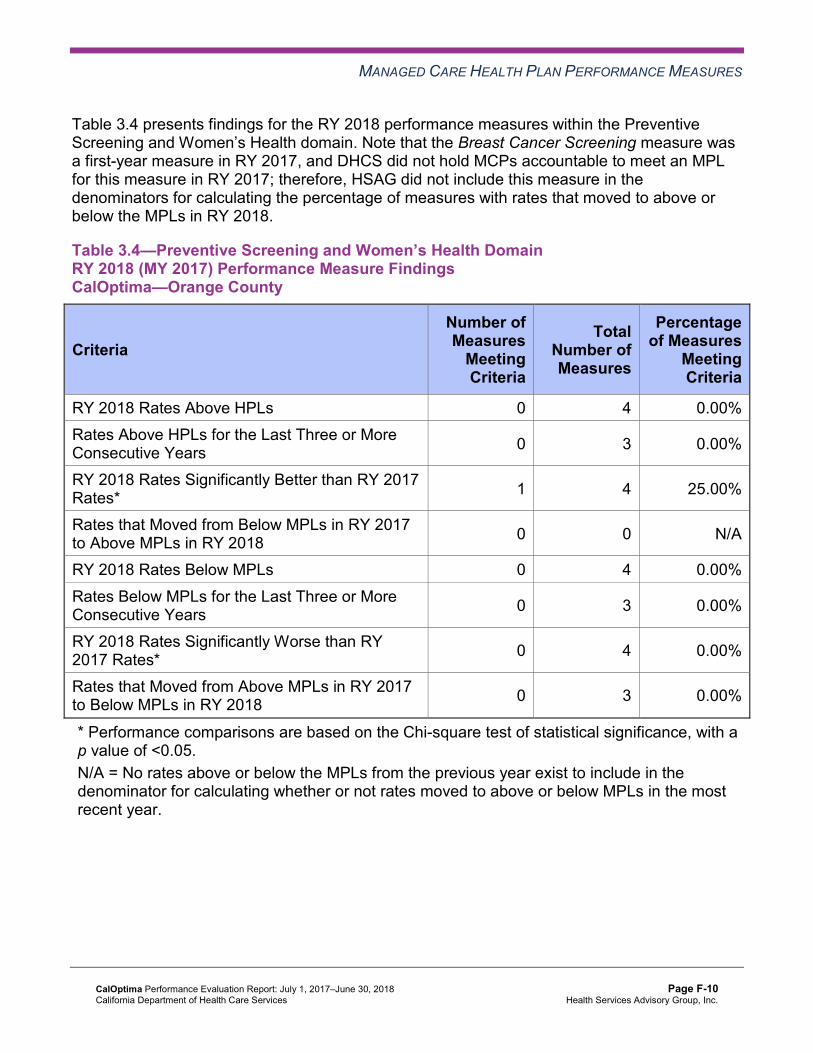
MANAGED CARE HEALTH PLAN PERFORMANCE MEASURES
Table 3.4 presents findings for the RY 2018 performance measures within the Preventive Screening and Women’s Health domain. Note that the Breast Cancer Screening measure was a first-year measure in RY 2017, and DHCS did not hold MCPs accountable to meet an MPL for this measure in RY 2017; therefore, HSAG did not include this measure in the denominators for calculating the percentage of measures with rates that moved to above or below the MPLs in RY 2018.
Table 3.4—Preventive Screening and Women’s Health DomainRY 2018 (MY 2017) Performance Measure Findings CalOptima—Orange County
Criteria Number of Measures
Meeting Criteria
Total Number of Measures
Percentage of Measures
MeetingCriteria
RY 2018 Rates Above HPLs 0 4 0.00% Rates Above HPLs for the Last Three or More Consecutive Years 0 3 0.00%
RY 2018 Rates Significantly Better than RY 2017 Rates* 1 4 25.00%
Rates that Moved from Below MPLs in RY 2017 to Above MPLs in RY 2018 0 0 N/A
RY 2018 Rates Below MPLs 0 4 0.00% Rates Below MPLs for the Last Three or More Consecutive Years 0 3 0.00%
RY 2018 Rates Significantly Worse than RY 2017 Rates* 0 4 0.00%
Rates that Moved from Above MPLs in RY 2017 to Below MPLs in RY 2018 0 3 0.00%
* Performance comparisons are based on the Chi-square test of statistical significance, with a p value of <0.05. N/A = No rates above or below the MPLs from the previous year exist to include in the denominator for calculating whether or not rates moved to above or below MPLs in the most recent year.
CalOptima Performance Evaluation Report: July 1, 2017–June 30, 2018 California Department of Health Care Services
Page F-10 Health Services Advisory Group, Inc.
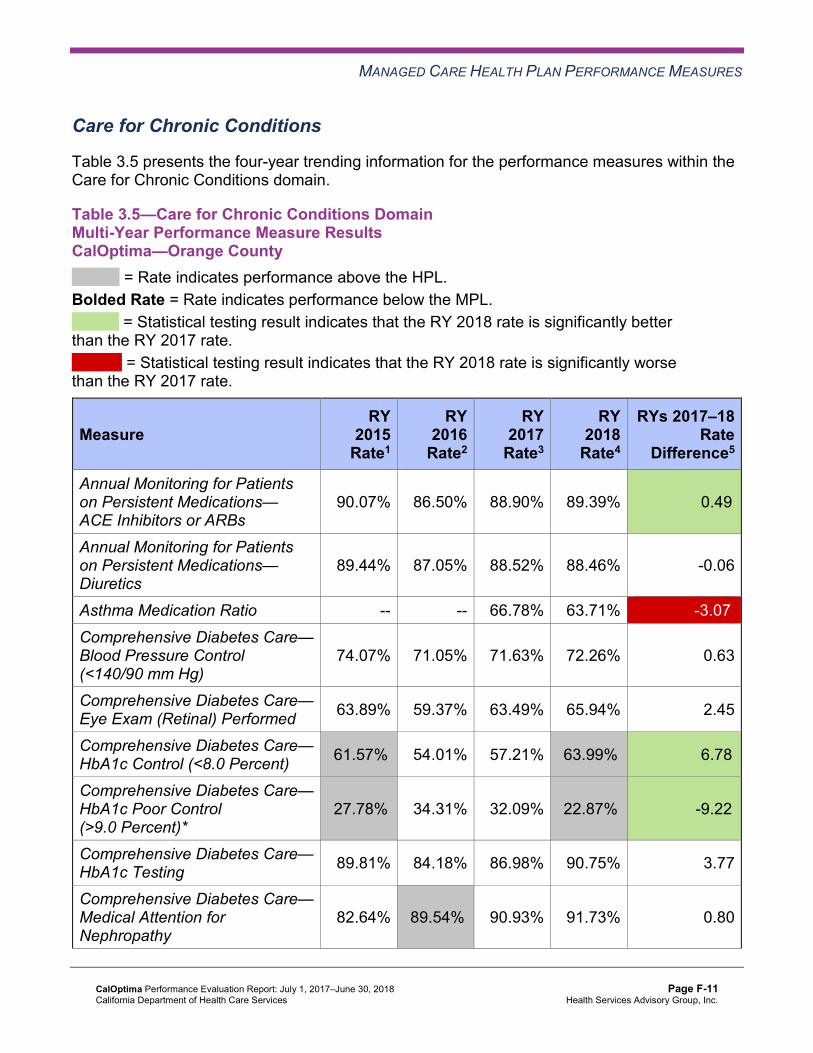
MANAGED CARE HEALTH PLAN PERFORMANCE MEASURES
Care for Chronic Conditions
Table 3.5 presents the four-year trending information for the performance measures within the Care for Chronic Conditions domain.
Table 3.5—Care for Chronic Conditions Domain Multi-Year Performance Measure Results CalOptima—Orange County
H = Rate indicates performance above the HPL. Bolded Rate = Rate indicates performance below the MPL.
B = Statistical testing result indicates that the RY 2018 rate is significantly better than the RY 2017 rate.
W = Statistical testing result indicates that the RY 2018 rate is significantly worse than the RY 2017 rate.
Measure RY
2015 Rate1
RY 2016
Rate2
RY 2017
Rate3
RY 2018
Rate4
RYs 2017–18 Rate
Difference5
Annual Monitoring for Patients on Persistent Medications— ACE Inhibitors or ARBs
90.07% 86.50% 88.90% 89.39% 0.49B
Annual Monitoring for Patients on Persistent Medications— Diuretics
89.44% 87.05% 88.52% 88.46% -0.06
Asthma Medication Ratio -- -- 66.78% 63.71% -3.07W
Comprehensive Diabetes Care— Blood Pressure Control (<140/90 mm Hg)
74.07% 71.05% 71.63% 72.26% 0.63
Comprehensive Diabetes Care— Eye Exam (Retinal) Performed 63.89% 59.37% 63.49% 65.94% 2.45
Comprehensive Diabetes Care— HbA1c Control (<8.0 Percent) 61.57%H 54.01% 57.21% 63.99%H 6.78B
Comprehensive Diabetes Care— HbA1c Poor Control (>9.0 Percent)*
27.78%H 34.31% 32.09% 22.87%H -9.22B
Comprehensive Diabetes Care— HbA1c Testing 89.81% 84.18% 86.98% 90.75% 3.77
Comprehensive Diabetes Care— Medical Attention for Nephropathy
82.64% 89.54%H 90.93% 91.73% 0.80
CalOptima Performance Evaluation Report: July 1, 2017–June 30, 2018 California Department of Health Care Services
Page F-11 Health Services Advisory Group, Inc.
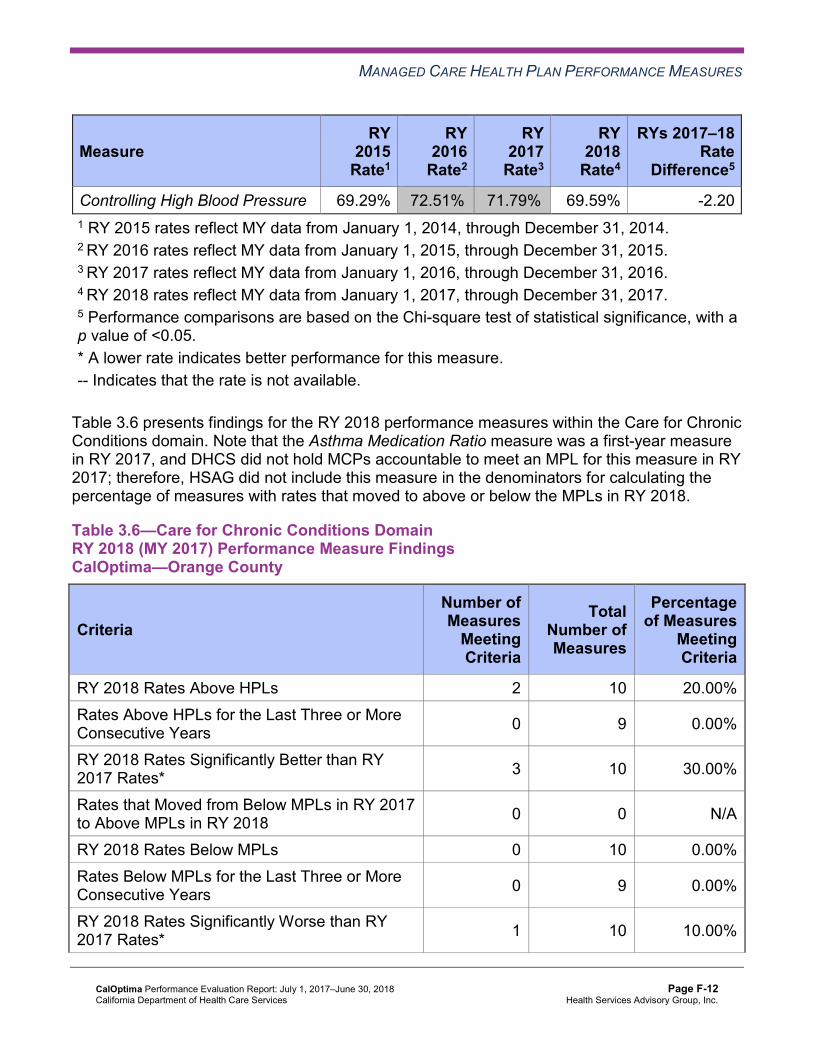
MANAGED CARE HEALTH PLAN PERFORMANCE MEASURES
Measure RY
2015 Rate1
RY 2016
Rate2
RY 2017
Rate3
RY 2018
Rate4
RYs 2017–18 Rate
Difference5
Controlling High Blood Pressure 69.29% 72.51%H 71.79%H 69.59% -2.20 1 RY 2015 rates reflect MY data from January 1, 2014, through December 31, 2014. 2 RY 2016 rates reflect MY data from January 1, 2015, through December 31, 2015. 3 RY 2017 rates reflect MY data from January 1, 2016, through December 31, 2016. 4 RY 2018 rates reflect MY data from January 1, 2017, through December 31, 2017. 5 Performance comparisons are based on the Chi-square test of statistical significance, with a p value of <0.05. * A lower rate indicates better performance for this measure. -- Indicates that the rate is not available.
Table 3.6 presents findings for the RY 2018 performance measures within the Care for Chronic Conditions domain. Note that the Asthma Medication Ratio measure was a first-year measure in RY 2017, and DHCS did not hold MCPs accountable to meet an MPL for this measure in RY 2017; therefore, HSAG did not include this measure in the denominators for calculating the percentage of measures with rates that moved to above or below the MPLs in RY 2018.
Table 3.6—Care for Chronic Conditions Domain RY 2018 (MY 2017) Performance Measure Findings CalOptima—Orange County
Criteria Number of Measures
MeetingCriteria
Total Number of Measures
Percentage of Measures
MeetingCriteria
RY 2018 Rates Above HPLs 2 10 20.00% Rates Above HPLs for the Last Three or More Consecutive Years 0 9 0.00%
RY 2018 Rates Significantly Better than RY 2017 Rates* 3 10 30.00%
Rates that Moved from Below MPLs in RY 2017 to Above MPLs in RY 2018 0 0 N/A
RY 2018 Rates Below MPLs 0 10 0.00% Rates Below MPLs for the Last Three or More Consecutive Years 0 9 0.00%
RY 2018 Rates Significantly Worse than RY 2017 Rates* 1 10 10.00%
CalOptima Performance Evaluation Report: July 1, 2017–June 30, 2018 California Department of Health Care Services
Page F-12 Health Services Advisory Group, Inc.

MANAGED CARE HEALTH PLAN PERFORMANCE MEASURES
Criteria Number of Measures
MeetingCriteria
Total Number of Measures
Percentage of Measures
MeetingCriteria
Rates that Moved from Above MPLs in RY 2017 to Below MPLs in RY 2018 0 9 0.00%
* Performance comparisons are based on the Chi-square test of statistical significance, with a p value of <0.05. N/A = No rates above or below the MPLs from the previous year exist to include in the denominator for calculating whether or not rates moved to above or below MPLs in the most recent year.
Appropriate Treatment and Utilization
Table 3.7 presents the four-year trending information for the performance measures within the Appropriate Treatment and Utilization domain.
Note the following regarding Table 3.7:
♦ The All-Cause Readmissions measure is a non-HEDIS measure originally developed for DHCS’ All-Cause Readmissions collaborative quality improvement project (QIP); therefore, DHCS does not establish an HPL or MPL for this measure. For the All-Cause Readmissions measure, a lower rate indicates better performance (i.e., fewer readmissions).
♦ The two Ambulatory Care measures are utilization measures, which measure the volume of services used. DHCS does not hold MCPs accountable to meet MPLs for utilization measures, and HSAG does not compare performance for these measures against HPLs and MPLs. Additionally, because high and low rates do not necessarily indicate better or worse performance, HSAG did not compare performance for these measures across years.
♦ DHCS established no HPL or MPL for the two Depression Screening and Follow-Up for Adolescents and Adults measures for RY 2018 because no comparable benchmarks exist. Additionally, although MCPs reported the two Depression Screening and Follow-Up for Adolescents and Adults measures for RY 2018, HSAG does not present the performance measure results for these measures in this report because the reported rates do not accurately represent services being provided. This is due to the Depression Screening and Follow-Up for Adolescents and Adults measures being new HEDIS measures for RY 2018, NCQA requiring MCPs to submit rates for these measures using the new Electronic Clinical Data Systems (ECDS) reporting methodology, and inconsistent data reporting processes by calculation vendors. Thus, MCPs experienced numerous challenges obtaining data sources to use for ECDS reporting. DHCS and HSAG, in consultation with NCQA, will work with MCPs to improve data capture for RY 2019.
♦ Note that due to changes that NCQA made to the specifications for the Use of Imaging Studies for Low Back Pain measure in RY 2018, NCQA released guidance to exercise
CalOptima Performance Evaluation Report: July 1, 2017–June 30, 2018 California Department of Health Care Services
Page F-13 Health Services Advisory Group, Inc.
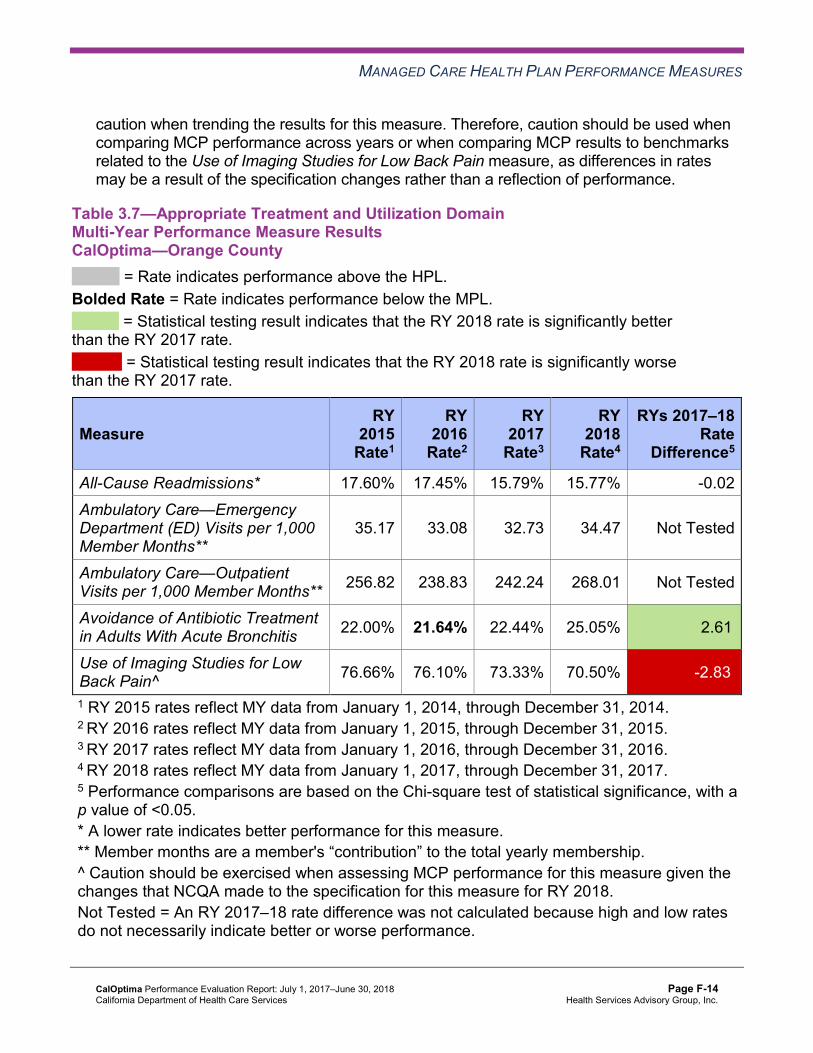
MANAGED CARE HEALTH PLAN PERFORMANCE MEASURES
caution when trending the results for this measure. Therefore, caution should be used when comparing MCP performance across years or when comparing MCP results to benchmarks related to the Use of Imaging Studies for Low Back Pain measure, as differences in rates may be a result of the specification changes rather than a reflection of performance.
Table 3.7—Appropriate Treatment and Utilization DomainMulti-Year Performance Measure Results CalOptima—Orange County
H = Rate indicates performance above the HPL. Bolded Rate = Rate indicates performance below the MPL.
B = Statistical testing result indicates that the RY 2018 rate is significantly better than the RY 2017 rate.
W = Statistical testing result indicates that the RY 2018 rate is significantly worse than the RY 2017 rate.
Measure RY
2015 Rate1
RY 2016
Rate2
RY 2017
Rate3
RY 2018
Rate4
RYs 2017–18 Rate
Difference5
All-Cause Readmissions* 17.60% 17.45% 15.79% 15.77% -0.02 Ambulatory Care—Emergency Department (ED) Visits per 1,000 Member Months**
35.17 33.08 32.73 34.47 Not Tested
Ambulatory Care—Outpatient Visits per 1,000 Member Months** 256.82 238.83 242.24 268.01 Not Tested
Avoidance of Antibiotic Treatment in Adults With Acute Bronchitis 22.00% 21.64% 22.44% 25.05% 2.61B
Use of Imaging Studies for Low Back Pain^ 76.66% 76.10% 73.33% 70.50% -2.83W
1 RY 2015 rates reflect MY data from January 1, 2014, through December 31, 2014. 2 RY 2016 rates reflect MY data from January 1, 2015, through December 31, 2015. 3 RY 2017 rates reflect MY data from January 1, 2016, through December 31, 2016. 4 RY 2018 rates reflect MY data from January 1, 2017, through December 31, 2017. 5 Performance comparisons are based on the Chi-square test of statistical significance, with a p value of <0.05. * A lower rate indicates better performance for this measure. ** Member months are a member's “contribution” to the total yearly membership. ^ Caution should be exercised when assessing MCP performance for this measure given the changes that NCQA made to the specification for this measure for RY 2018. Not Tested = An RY 2017–18 rate difference was not calculated because high and low rates do not necessarily indicate better or worse performance.
CalOptima Performance Evaluation Report: July 1, 2017–June 30, 2018 California Department of Health Care Services
Page F-14 Health Services Advisory Group, Inc.

MANAGED CARE HEALTH PLAN PERFORMANCE MEASURES
Table 3.8 presents findings for the RY 2018 performance measures within the Appropriate Treatment and Utilization domain. DHCS did not hold MCPs accountable to meet MPLs for the following measures within this domain; therefore, HSAG did not include these measures in its assessment of the MCP’s performance related to HPLs and MPLs:
♦ All-Cause Readmissions ♦ Both Ambulatory Care measures
Table 3.8—Appropriate Treatment and Utilization DomainRY 2018 (MY 2017) Performance Measure Findings CalOptima—Orange County
Criteria Number of Measures
MeetingCriteria
Total Number of Measures
Percentage of Measures
MeetingCriteria
RY 2018 Rates Above HPLs 0 2 0.00% Rates Above HPLs for the Last Three or More Consecutive Years 0 2 0.00%
RY 2018 Rates Significantly Better than RY 2017 Rates* 1 3 33.33%
Rates that Moved from Below MPLs in RY 2017 to Above MPLs in RY 2018 0 0 N/A
RY 2018 Rates Below MPLs 0 2 0.00% Rates Below MPLs for the Last Three or More Consecutive Years 0 2 0.00%
RY 2018 Rates Significantly Worse than RY 2017 Rates* 1 3 33.33%
Rates that Moved from Above MPLs in RY 2017 to Below MPLs in RY 2018 0 2 0.00%
* Performance comparisons are based on the Chi-square test of statistical significance, with a p value of <0.05. N/A = No rates above or below the MPLs from the previous year exist to include in the denominator for calculating whether or not rates moved to above or below MPLs in the most recent year.
CalOptima Performance Evaluation Report: July 1, 2017–June 30, 2018 California Department of Health Care Services
Page F-15 Health Services Advisory Group, Inc.
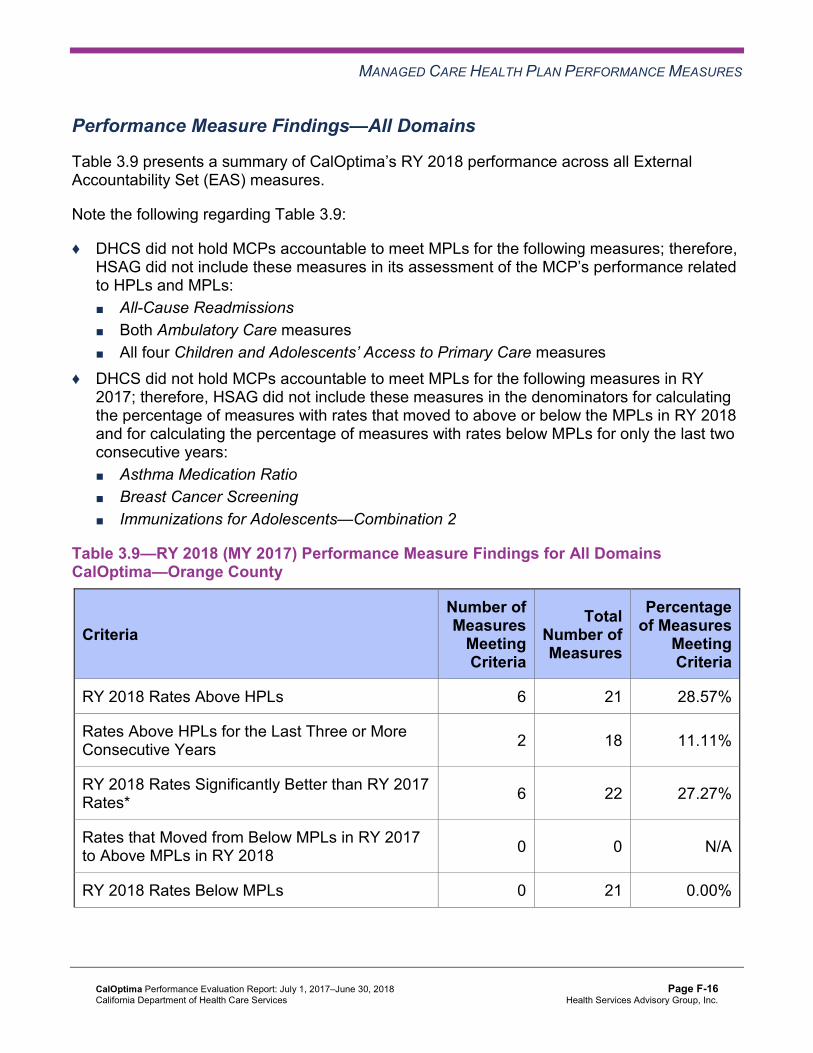
MANAGED CARE HEALTH PLAN PERFORMANCE MEASURES
Performance Measure Findings—All Domains
Table 3.9 presents a summary of CalOptima’s RY 2018 performance across all External Accountability Set (EAS) measures.
Note the following regarding Table 3.9:
♦ DHCS did not hold MCPs accountable to meet MPLs for the following measures; therefore, HSAG did not include these measures in its assessment of the MCP’s performance related to HPLs and MPLs: ■ All-Cause Readmissions ■ Both Ambulatory Care measures ■ All four Children and Adolescents’ Access to Primary Care measures
♦ DHCS did not hold MCPs accountable to meet MPLs for the following measures in RY 2017; therefore, HSAG did not include these measures in the denominators for calculating the percentage of measures with rates that moved to above or below the MPLs in RY 2018 and for calculating the percentage of measures with rates below MPLs for only the last two consecutive years: ■ Asthma Medication Ratio ■ Breast Cancer Screening ■ Immunizations for Adolescents—Combination 2
Table 3.9—RY 2018 (MY 2017) Performance Measure Findings for All Domains CalOptima—Orange County
Criteria Number of Measures
MeetingCriteria
Total Number of Measures
Percentage of Measures
MeetingCriteria
RY 2018 Rates Above HPLs 6 21 28.57%
Rates Above HPLs for the Last Three or More Consecutive Years 2 18 11.11%
RY 2018 Rates Significantly Better than RY 2017 Rates* 6 22 27.27%
Rates that Moved from Below MPLs in RY 2017 to Above MPLs in RY 2018 0 0 N/A
RY 2018 Rates Below MPLs 0 21 0.00%
CalOptima Performance Evaluation Report: July 1, 2017–June 30, 2018 California Department of Health Care Services
Page F-16 Health Services Advisory Group, Inc.

MANAGED CARE HEALTH PLAN PERFORMANCE MEASURES
Criteria Number of Measures
MeetingCriteria
Total Number of Measures
Percentage of Measures
MeetingCriteria
Rates Below MPLs for Only the Last Two Consecutive Years 0 18 0.00%
Rates Below MPLs for the Last Three or More Consecutive Years 0 18 0.00%
RY 2018 Rates Significantly Worse than RY 2017 Rates* 2 22 9.09%
Rates that Moved from Above MPLs in RY 2017 to Below MPLs in RY 2018 0 18 0.00%
* Performance comparisons are based on the Chi-square test of statistical significance, with a p value of <0.05. N/A = No rates above or below the MPLs from the previous year exist to include in the denominator for calculating whether or not rates moved to above or below MPLs in the most recent year.
Seniors and Persons with Disabilities Performance Measure Results Table 3.10 presents the four-year trending information for the SPD population, and Table 3.11 presents the four-year trending information for the non-SPD population for the measures that DHCS required MCPs to stratify for the SPD and non-SPD populations. The tables also show the differences in rates between RY 2017 and RY 2018.
Table 3.12 presents the SPD and non-SPD rates, a comparison of the SPD and non-SPD rates,5 and the total combined rate for each measure.
5 HSAG calculated statistical significance between the SPD and non-SPD rates for each measure using a Chi-square test. This information is displayed in the “SPD/Non-SPD Rate Difference” column in Table 3.12.
CalOptima Performance Evaluation Report: July 1, 2017–June 30, 2018 California Department of Health Care Services
Page F-17 Health Services Advisory Group, Inc.

MANAGED CARE HEALTH PLAN PERFORMANCE MEASURES
Table 3.10—Multi-Year SPD Performance Measure Trend Table CalOptima—Orange County
B = Statistical testing result indicates that the RY 2018 SPD rate is significantly better than the RY 2017 SPD rate.
W = Statistical testing result indicates that the RY 2018 SPD rate is significantly worse than the RY 2017 SPD rate.
Measure RY
2015 SPD
Rate1
RY 2016 SPD
Rate2
RY 2017 SPD
Rate3
RY 2018 SPD
Rate4
RYs 2017–18 Rate
Difference5
All-Cause Readmissions* 19.97% 20.48% 19.29% 18.36% -0.93 Ambulatory Care—Emergency Department (ED) Visits per 1,000 Member Months**
52.48 50.02 46.55 46.55 Not Tested
Ambulatory Care—Outpatient Visits per 1,000 Member Months**
536.97 495.20 491.25 556.31 Not Tested
Annual Monitoring for Patients on Persistent Medications— ACE Inhibitors or ARBs
91.07% 88.83% 90.95% 91.92% 0.97B
Annual Monitoring for Patients on Persistent Medications— Diuretics
91.12% 90.14% 92.20% 92.24% 0.04
Children and Adolescents' Access to Primary Care Practitioners—12–24 Months
75.19% 70.09% 86.27% 89.32% 3.05
Children and Adolescents' Access to Primary Care Practitioners— 25 Months–6 Years
87.18% 83.01% 84.34% 87.76% 3.42B
Children and Adolescents' Access to Primary Care Practitioners—7–11 Years
88.65% 86.29% 85.99% 87.74% 1.75
Children and Adolescents' Access to Primary Care Practitioners—12–19 Years
83.86% 79.16% 81.38% 82.35% 0.97
1 RY 2015 rates reflect MY data from January 1, 2014, through December 31, 2014. 2 RY 2016 rates reflect MY data from January 1, 2015, through December 31, 2015. 3 RY 2017 rates reflect MY data from January 1, 2016, through December 31, 2016.
CalOptima Performance Evaluation Report: July 1, 2017–June 30, 2018 California Department of Health Care Services
Page F-18 Health Services Advisory Group, Inc.

MANAGED CARE HEALTH PLAN PERFORMANCE MEASURES
4 RY 2018 rates reflect MY data from January 1, 2017, through December 31, 2017. 5 Performance comparisons are based on the Chi-square test of statistical significance, with a p value of <0.05. * A lower rate indicates better performance for this measure. ** Member months are a member's “contribution” to the total yearly membership. Not Tested = An RY 2017–18 rate difference was not calculated because high and low rates do not necessarily indicate better or worse performance.
Table 3.11—Multi-Year Non-SPD Performance Measure Trend Table CalOptima—Orange County
B = Statistical testing result indicates that the RY 2018 non-SPD rate is significantly better than the RY 2017 non-SPD rate.
W = Statistical testing result indicates that the RY 2018 non-SPD rate is significantly worse than the RY 2017 non-SPD rate.
Measure RY 2015
Non-SPD Rate1
RY 2016 Non-SPD
Rate2
RY 2017 Non-SPD
Rate3
RY 2018 Non-SPD
Rate4
RYs 2017–18 Rate
Difference5
All-Cause Readmissions* 14.49% 15.45% 13.70% 14.38% 0.68
Ambulatory Care— Emergency Department (ED) Visits per 1,000 Member Months**
33.33 31.65 31.53 33.47 Not Tested
Ambulatory Care— Outpatient Visits per 1,000 Member Months**
227.07 217.20 220.63 244.14 Not Tested
Annual Monitoring for Patients on Persistent Medications— ACE Inhibitors or ARBs
88.91% 85.14% 87.74% 87.95% 0.21
Annual Monitoring for Patients on Persistent Medications—Diuretics
87.62% 85.17% 86.41% 86.32% -0.09
Children and Adolescents' Access to Primary Care Practitioners— 12–24 Months
94.33% 93.27% 94.20% 93.47% -0.73W
CalOptima Performance Evaluation Report: July 1, 2017–June 30, 2018 California Department of Health Care Services
Page F-19 Health Services Advisory Group, Inc.

MANAGED CARE HEALTH PLAN PERFORMANCE MEASURES
Measure RY 2015
Non-SPD Rate1
RY 2016 Non-SPD
Rate2
RY 2017 Non-SPD
Rate3
RY 2018 Non-SPD
Rate4
RYs 2017–18 Rate
Difference5
Children and Adolescents' Access to Primary Care Practitioners— 25 Months–6 Years
89.59% 87.39% 87.77% 87.63% -0.14
Children and Adolescents' Access to Primary Care Practitioners— 7–11 Years
92.88% 90.80% 90.44% 90.78% 0.34B
Children and Adolescents' Access to Primary Care Practitioners— 12–19 Years
90.27% 87.82% 86.87% 87.50% 0.63B
1 RY 2015 rates reflect MY data from January 1, 2014, through December 31, 2014. 2 RY 2016 rates reflect MY data from January 1, 2015, through December 31, 2015. 3 RY 2017 rates reflect MY data from January 1, 2016, through December 31, 2016. 4 RY 2018 rates reflect MY data from January 1, 2017, through December 31, 2017. 5 Performance comparisons are based on the Chi-square test of statistical significance, with a p value of <0.05. * A lower rate indicates better performance for this measure. ** Member months are a member's “contribution” to the total yearly membership. Not Tested = An RY 2017–18 rate difference was not calculated because high and low rates do not necessarily indicate better or worse performance.
CalOptima Performance Evaluation Report: July 1, 2017–June 30, 2018 California Department of Health Care Services
Page F-20 Health Services Advisory Group, Inc.

MANAGED CARE HEALTH PLAN PERFORMANCE MEASURES
Table 3.12—RY 2018 (MY 2017) Performance Measure Comparison and Results forMeasures Stratified by the SPD and Non-SPD PopulationsCalOptima—Orange County
B = Statistical testing result indicates that the RY 2018 SPD rate is significantly better than the RY 2018 non-SPD rate.
W = Statistical testing result indicates that the RY 2018 SPD rate is significantly worse than the RY 2018 non-SPD rate.
Measure RY 2018
SPD Rate1
RY 2018 Non-SPD
Rate1
SPD/Non-SPDRate
Difference2
RY 2018 Total Rate3
All-Cause Readmissions* 18.36% 14.38% 3.98W 15.77% Ambulatory Care—Emergency Department (ED) Visits per 1,000 Member Months**
46.55 33.47 Not Tested 34.47
Ambulatory Care—Outpatient Visits per 1,000 Member Months** 556.31 244.14 Not Tested 268.01
Annual Monitoring for Patients on Persistent Medications— ACE Inhibitors or ARBs
91.92% 87.95% 3.97B 89.39%
Annual Monitoring for Patients on Persistent Medications—Diuretics 92.24% 86.32% 5.92B 88.46%
Children and Adolescents' Access to Primary Care Practitioners— 12–24 Months
89.32% 93.47% -4.15 93.44%
Children and Adolescents' Access to Primary Care Practitioners— 25 Months–6 Years
87.76% 87.63% 0.13 87.63%
Children and Adolescents' Access to Primary Care Practitioners— 7–11 Years
87.74% 90.78% -3.04W 90.67%
Children and Adolescents' Access to Primary Care Practitioners— 12–19 Years
82.35% 87.50% -5.15W 87.32%
1 RY 2018 rates reflect MY data from January 1, 2017, through December 31, 2017. 2 Performance comparisons are based on the Chi-square test of statistical significance, with a p value of <0.05. 3 Total rates are based on the MCP reporting unit’s total results, including the SPD and non-SPD populations. Please note, if data are not available for either the SPD or non-SPD population, the total rate is based on results reported for the available population.
CalOptima Performance Evaluation Report: July 1, 2017–June 30, 2018 California Department of Health Care Services
Page F-21 Health Services Advisory Group, Inc.
MANAGED CARE HEALTH PLAN PERFORMANCE MEASURES
* A lower rate indicates better performance for this measure. ** Member months are a member's “contribution” to the total yearly membership. Not Tested = An SPD/non-SPD rate difference was not calculated because high and low rates do not necessarily indicate better or worse performance.
Seniors and Persons with Disabilities Findings
HSAG observed the following notable results in RY 2018 for measures that CalOptima stratified by the SPD and non-SPD populations:
♦ The SPD rates improved significantly from RY 2017 to RY 2018 for the following measures: ■ Annual Monitoring for Patients on Persistent Medications—ACE Inhibitors or ARBs ■ Children and Adolescents’ Access to Primary Care Practitioners—25 Months–6 Years
♦ The non-SPD rates improved significantly from RY 2017 to RY 2018 for the Children and Adolescents’ Access to Primary Care Practitioners—7–11 Years and 12–19 Years measures.
♦ The RY 2018 SPD rates were significantly better than the RY 2018 non-SPD rates for both Annual Monitoring for Patients on Persistent Medications measures.
♦ The RY 2018 non-SPD rate was significantly worse than the RY 2017 non-SPD rate for the Children and Adolescents’ Access to Primary Care Practitioners—12–24 Months measure.
♦ The RY 2018 SPD rates were significantly worse than the RY 2018 non-SPD rates for the following measures: ■ All-Cause Readmissions. Note that the higher rate of hospital readmissions for the SPD
population is expected based on the greater and often more complicated health care needs of these beneficiaries.
■ Children and Adolescents’ Access to Primary Care Practitioners—7–11 Years and 12– 19 Years measures. The significant differences in these measures may be attributed to beneficiaries in these age groups in the SPD population choosing to receive all health care services from specialist providers due to their complicated health care needs, rather than accessing care from primary care providers.
Strengths—Performance Measures HSAG auditors determined that CalOptima followed the appropriate specifications to produce valid rates, and identified no issues of concern.
HSAG identified the following notable RY 2018 performance measure results for CalOptima:
♦ Across all domains, the MCP had no measures with rates below the MPLs, and the rates for six of 21 measures (29 percent) were above the HPLs, with the rates for both Weight Assessment and Counseling for Nutrition and Physical Activity for Children and Adolescents measures being above the HPLs for the last three or more consecutive years.
CalOptima Performance Evaluation Report: July 1, 2017–June 30, 2018 California Department of Health Care Services
Page F-22 Health Services Advisory Group, Inc.

MANAGED CARE HEALTH PLAN PERFORMANCE MEASURES
♦ The rates for the following measures improved significantly from RY 2017 to RY 2018: ■ Annual Monitoring for Patients on Persistent Medications—ACE Inhibitors or ARBs ■ Avoidance of Antibiotic Treatment in Adults With Acute Bronchitis ■ Cervical Cancer Screening ■ Comprehensive Diabetes Care—HbA1c Control (<8.0 Percent) ■ Comprehensive Diabetes Care—HbA1c Poor Control (>9.0 Percent) ■ Immunizations for Adolescents—Combination 2
Opportunities for Improvement—Performance Measures CalOptima has the opportunity to assess the causes for the rate declining significantly from RY 2017 to RY 2018 for the Asthma Medication Ratio measure, and to identify strategies to ensure that beneficiaries ages 5 to 64 who are identified as having persistent asthma have a ratio of controller medications to total asthma medications of 0.50 or greater. CalOptima also has the opportunity to assess whether or not the self-reported actions included in Table 6.1 need to be modified or expanded to prevent the rate for the Use of Imaging Studies for Low Back Pain measure from continuing to decline.
CalOptima Performance Evaluation Report: July 1, 2017–June 30, 2018 California Department of Health Care Services
Page F-23 Health Services Advisory Group, Inc.

Medi-Cal Managed Care External Quality Review Technical ReportAppendix F: Performance Evaluation ReportCalOptimaJuly 1, 2017–June 30, 2018
4. MLTSSP Performance Measure Results
Due to CalOptima’s participation in California’s Coordinated Care Initiative as a Managed Long-Term Services and Supports Plan (MLTSSP), DHCS required that CalOptima report rates for three HEDIS measures for HSAG to validate as part of the NCQA HEDIS Compliance Audit.
Table 4.1 presents the rates for each required MLTSSP performance measure for RYs 2017 and 2018. The RY is the year in which the MLTSSP reported the rates. The RY rates reflect MY data from the previous calendar year. Although RY 2016 was the first year that DHCS required MLTSSPs to report rates, DHCS did not require CalOptima to report MLTSS rates in RY 2016 because CalOptima became operational as an MLTSSP in late 2015 and therefore did not have a full year of data to report. RY 2017 was the first year that DHCS required CalOptima to report MLTSSP performance measure rates.
Note that the Ambulatory Care—Emergency Department Visits and Ambulatory Care— Outpatient Visits measures are utilization measures which measure the volume of services used. High and low rates do not necessarily indicate better or worse performance; therefore, for these measures, HSAG did not compare performance between RY 2017 and RY 2018.
Table 4.1—Multi-Year MLTSSP Performance Measure Results CalOptima—Orange County
B = Statistical testing result indicates that the RY 2018 rate is significantly better than the RY 2017 rate.
W = Statistical testing result indicates that the RY 2018 rate is significantly worse than the RY 2017 rate.
Measure RY 2017 MLTSS
Rate1
RY 2018 MLTSS
Rate2
RYs 2017–18 Rate
Difference3
Ambulatory Care—Emergency Department (ED) Visits per 1,000 Member Months* 61.81 60.10 Not Tested
Ambulatory Care—Outpatient Visits per 1,000 Member Months* 806.24 925.30 Not Tested
Medication Reconciliation Post-Discharge 24.35% 28.71% 4.36 1 RY 2017 rates reflect MY data from January 1, 2016, through December 31, 2016. 2 RY 2018 rates reflect MY data from January 1, 2017, through December 31, 2017. 3 Performance comparisons are based on the Chi-square test of statistical significance, with a p value of <0.05. * Member months are a member's “contribution” to the total yearly membership. Not Tested = An RY 2017–18 rate difference was not calculated because high and low rates do not necessarily indicate better or worse performance.
CalOptima Performance Evaluation Report: July 1, 2017–June 30, 2018 California Department of Health Care Services
Page F-24 Health Services Advisory Group, Inc.

MLTSSP PERFORMANCE MEASURE RESULTS
Managed Long-Term Services and Supports Plan PerformanceMeasure Findings The rate for the Medication Reconciliation Post-Discharge measure showed no statistically significant change from RY 2017 to RY 2018.
CalOptima Performance Evaluation Report: July 1, 2017–June 30, 2018 California Department of Health Care Services
Page F-25 Health Services Advisory Group, Inc.

Medi-Cal Managed Care External Quality Review Technical ReportAppendix F: Performance Evaluation ReportCalOptimaJuly 1, 2017–June 30, 2018
5. Performance Improvement Projects
Performance Improvement Project Overview The key concepts of the rapid-cycle PIP framework include forming a PIP team, setting aims, establishing measures, determining interventions using quality improvement tools, conducting PDSA cycles to test interventions, and planning for the spread of successful changes. The core component of the rapid-cycle PIP approach involves testing changes on a small scale so that improvement can occur more efficiently and lead to long-term sustainability. The following modules guide MCPs through this rapid-cycle PIP process:
♦ Module 1—PIP Initiation ■ MCPs outline the framework for the PIP, which includes:
○ The topic rationale. ○ Comparative data supporting the need to improve the selected topic. ○ A list of the PIP team members, which consists of internal and external stakeholders. ○ A completed key driver diagram that defines the theory of change for improvement,
including the SMART (Specific, Measurable, Achievable, Relevant, and Time-bound) Aim and Global Aim.
♦ Module 2—SMART Aim Data Collection ■ MCPs define the SMART Aim measure and data collection methodology and develop
the SMART Aim data run chart. ♦ Module 3—Intervention Determination
■ MCPs use process mapping and failure modes and effects analysis to identify potential interventions to test which may have direct effects on the SMART Aim.
♦ Module 4—Plan-Do-Study-Act (PDSA) ■ MCPs test and evaluate the interventions identified in Module 3 through a series of
PDSA cycles. ♦ Module 5—PIP Conclusions
■ MCPs interpret results and summarize: ○ Key findings and outcomes achieved. ○ Assessment of each tested intervention. ○ Lessons learned, including how demonstrated improvement can be shared and used
as a foundation for further improvement going forward. ○ Plan for sustained improvement.
CalOptima Performance Evaluation Report: July 1, 2017–June 30, 2018 California Department of Health Care Services
Page F-26 Health Services Advisory Group, Inc.

PERFORMANCE IMPROVEMENT PROJECTS
Based on the agreed-upon timeline, MCPs submit each module to HSAG for validation. Throughout the rapid-cycle PIP process, HSAG provides technical assistance to MCPs to ensure that PIPs are methodologically sound and to problem-solve with MCPs regarding how to address challenges that occur. Through an iterative process, MCPs have opportunities to make corrections to modules 1 through 3 to achieve all validation criteria.
Once MCPs achieve all validation criteria for modules 1 through 3 and receive feedback on the intervention Plan portion of Module 4, MCPs test interventions. During the intervention testing phase of the PIP, HSAG conducts periodic progress check-ins to ensure that MCPs have addressed HSAG’s feedback on the Plan portion of Module 4 and are making appropriate progress with intervention testing. Once MCPs complete testing an intervention, MCPs determine the next steps based on results and lessons learned—whether the intervention was successful and should be spread (adopt), whether modifications need to be made to the existing intervention (adapt), or whether the intervention was not successful and should be stopped (abandon).
In Module 5, MCPs summarize the overall PIP. When validating Module 5, HSAG assesses the validity and reliability of the results based on the Centers for Medicare & Medicaid Services (CMS) validation protocols to determine whether key stakeholders can have confidence in the reported PIP findings. HSAG assigns the following final confidence levels for each PIP:
♦ High confidence—the PIP was methodologically sound and achieved the SMART Aim goal; the demonstrated improvement was clearly linked to the quality improvement processes conducted and intervention(s) tested; and, the MCP accurately summarized the key findings.
♦ Confidence—the PIP was methodologically sound and achieved the SMART Aim goal, and the MCP accurately summarized the key findings. However, some, but not all, of the quality improvement processes conducted and/or intervention(s) tested were clearly linked to the demonstrated improvement.
♦ Low confidence—either (A) the PIP was methodologically sound; however, the SMART Aim goal was not achieved; or (B) the SMART Aim goal was achieved; however, the quality improvement processes and/or intervention(s) tested were poorly executed and could not be linked to the improvement.
♦ Reported PIP results were not credible—the PIP methodology was not executed as approved.
Performance Improvement Project Results and Findings During the review period, CalOptima submitted modules 4 and 5 for its 2015–17 DHCS-priority and MCP-specific PIPs. HSAG validated the modules and includes the final PIP validation findings in this report. Additionally, CalOptima initiated a Disparity PIP and a DHCS-priority PIP during the review period. In this report, HSAG includes summaries of the MCP’s Disparity and DHCS-priority PIP module submissions as well as validation findings from the review period.
CalOptima Performance Evaluation Report: July 1, 2017–June 30, 2018 California Department of Health Care Services
Page F-27 Health Services Advisory Group, Inc.

PERFORMANCE IMPROVEMENT PROJECTS
2015–17 DHCS-Priority Performance Improvement Project
CalOptima selected diabetes HbA1c testing for its 2015–17 DHCS-priority PIP. While the MCP concluded its Diabetes HbA1c Testing PIP through the SMART Aim end date of June 30, 2017, CalOptima submitted modules 4 and 5 for HSAG to validate during the review period for this report. HSAG provided final validation findings and encouraged CalOptima to incorporate the experiences and lessons learned from the PIP into future quality improvement efforts.
Table 5.1 provides a summary of the SMART Aim measure results reported by the MCP.
Table 5.1—CalOptima Diabetes HbA1c Testing PIP SMART Aim Measure Results
SMART Aim Measure Baseline Rate
SMART Aim Goal
Rate
SMART Aim Goal Achieved
Rate of HbA1c testing among CalOptima beneficiaries at Provider Office A6 70.15% 80.00% Yes
Table 5.2 presents a description of the interventions that CalOptima tested for its Diabetes HbA1c Testing PIP. The table also indicates the key drivers that each intervention addressed as well as whether the MCP decided, based on intervention testing results, to adopt, adapt, or abandon the intervention.
Table 5.2—CalOptima Diabetes HbA1c Testing PIP Intervention Testing Results
Intervention Key Drivers Addressed Adopt,Adapt, orAbandon
Working with Provider Office A to implement better beneficiary educational outreach for HbA1c testing
♦ Beneficiary engagement ♦ Provider awareness ♦ Access and availability of
resources related to diabetes care management
Adapt
Sharing bi-monthly list of beneficiaries needing their HbA1c tests with Provider Office A for outreach
♦ Beneficiary engagement ♦ Provider awareness ♦ Identification of beneficiaries
needing HbA1c testing
Adopt
6 Provider office name removed for confidentiality.
CalOptima Performance Evaluation Report: July 1, 2017–June 30, 2018 California Department of Health Care Services
Page F-28 Health Services Advisory Group, Inc.

PERFORMANCE IMPROVEMENT PROJECTS
Intervention Key Drivers Addressed Adopt,Adapt, orAbandon
Working with Provider Office A to identify a list of laboratories (labs) and those labs’ hours to provide to beneficiaries who may not be aware of all options
♦ Beneficiary engagement ♦ Access and availability of
resources related to diabetes care management
Abandon
Performance Improvement Project Validation Findings
During the review period for this report, HSAG validated modules 4 and 5 for the MCP’s Diabetes HbA1c Testing PIP. Although CalOptima achieved the SMART Aim goal, the MCP concluded that all three tested interventions had no clear impact on the SMART Aim measure rate. Upon assessment of validity and reliability of the PIP results, HSAG assigned CalOptima’s Diabetes HbA1c Testing PIP a final confidence level of Low Confidence since the tested interventions could not be linked to the SMART Aim measure rate improvement.
2015–17 MCP-Specific Performance Improvement Project
CalOptima selected initial health assessment (IHA) for its 2015–17 MCP-specific PIP. While the MCP concluded its Initial Health Assessment PIP through the SMART Aim end date of June 30, 2017, CalOptima submitted modules 4 and 5 for HSAG to validate during the review period for this report. HSAG provided final validation findings and encouraged CalOptima to incorporate the experiences and lessons learned from the PIP into future quality improvement efforts.
Table 5.3 provides a summary of the SMART Aim measure results reported by the MCP.
Table 5.3—CalOptima Initial Health Assessment PIP SMART Aim Measure Results
SMART Aim Measure Baseline Rate
SMART Aim Goal
Rate
SMART Aim Goal Achieved
Rate of IHA completion among CalOptima beneficiaries assigned to Provider Office A and Provider Office B7
3.4% 25.0% Yes
7 Provider office names removed for confidentiality.
CalOptima Performance Evaluation Report: July 1, 2017–June 30, 2018 California Department of Health Care Services
Page F-29 Health Services Advisory Group, Inc.

PERFORMANCE IMPROVEMENT PROJECTS
Table 5.4 presents a description of the interventions that CalOptima tested for its Initial Health Assessment PIP. The table also indicates the key drivers that each intervention addressed as well as whether the MCP decided, based on intervention testing results, to adopt, adapt, or abandon the intervention.
Table 5.4—CalOptima Initial Health Assessment PIP Intervention Testing Results
Intervention Key Drivers Addressed Adopt,Adapt, orAbandon
Conducting an in-service to partnered providers to include quick reference guides and other supportive tools
♦ Provider awareness Adapt
Identifying administrative resources to reschedule missed IHA completion appointments
♦ Access and availability of resources Abandon
Conducting phone call reminders to new beneficiaries assigned to partnered providers
♦ Beneficiary engagement ♦ Access and availability of
resources Abandon
Performance Improvement Project Validation Findings
During the review period for this report, HSAG validated modules 4 and 5 for the MCP’s Initial Health Assessment PIP. Although CalOptima achieved the SMART Aim goal, the MCP indicated that it abandoned two of the three interventions due to low impact and resource constraints. Upon assessment of validity and reliability of the PIP results, HSAG assigned CalOptima’s Initial Health Assessment PIP a final confidence level of Confidence since not all the interventions were directly linked with the improvement reflected in the SMART Aim measure rate.
2017–19 Disparity Performance Improvement Project
During the review period, DHCS required CalOptima to initiate a PIP focusing on an identified health disparity based on, but not limited to, age, gender, race or ethnicity, language spoken, income, educational attainment, sexual orientation or gender identity, occupation, provider, or geographic area. CalOptima selected diabetes poor HbA1c control among beneficiaries residing in Santa Ana city as its 2017–19 Disparity PIP topic. Using its own MCP-specific data, the MCP provided evidence of the health disparity by demonstrating a statistically significant rate difference between two subgroups, with the disparate subgroup having the lower rate.
CalOptima Performance Evaluation Report: July 1, 2017–June 30, 2018 California Department of Health Care Services
Page F-30 Health Services Advisory Group, Inc.
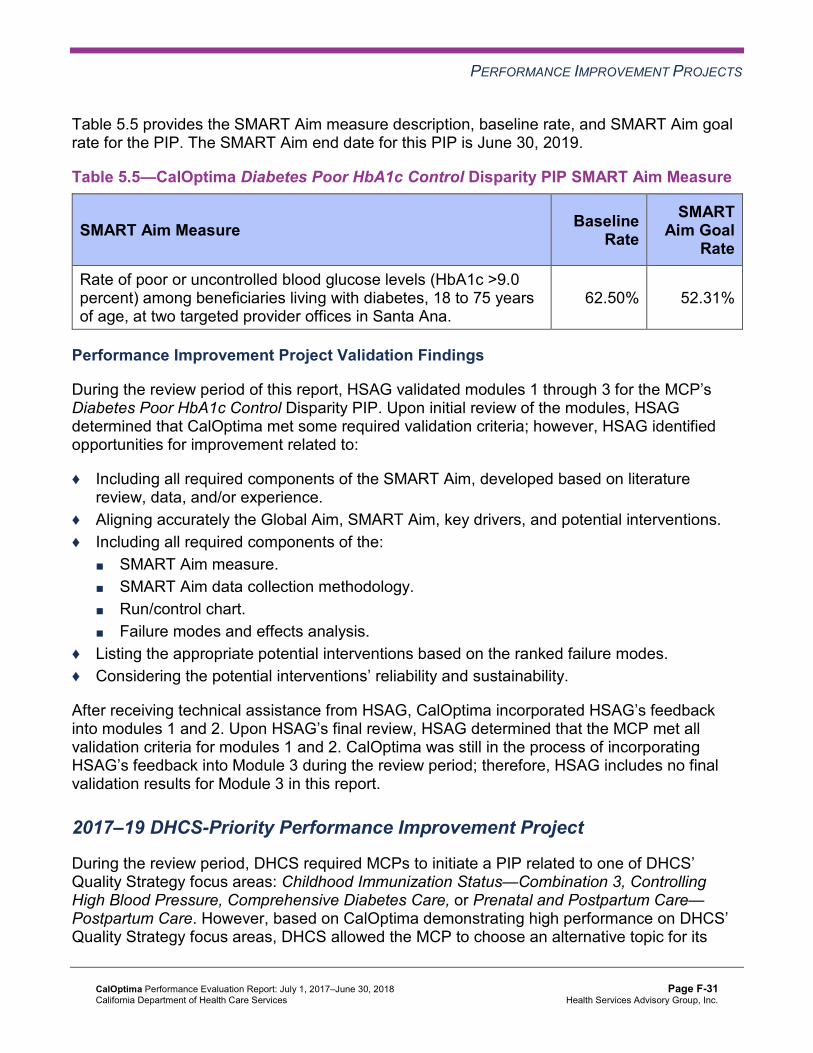
PERFORMANCE IMPROVEMENT PROJECTS
Table 5.5 provides the SMART Aim measure description, baseline rate, and SMART Aim goal rate for the PIP. The SMART Aim end date for this PIP is June 30, 2019.
Table 5.5—CalOptima Diabetes Poor HbA1c Control Disparity PIP SMART Aim Measure
SMART Aim Measure Baseline Rate
SMART Aim Goal
Rate
Rate of poor or uncontrolled blood glucose levels (HbA1c >9.0 percent) among beneficiaries living with diabetes, 18 to 75 years of age, at two targeted provider offices in Santa Ana.
62.50% 52.31%
Performance Improvement Project Validation Findings
During the review period of this report, HSAG validated modules 1 through 3 for the MCP’s Diabetes Poor HbA1c Control Disparity PIP. Upon initial review of the modules, HSAG determined that CalOptima met some required validation criteria; however, HSAG identified opportunities for improvement related to:
♦ Including all required components of the SMART Aim, developed based on literature review, data, and/or experience.
♦ Aligning accurately the Global Aim, SMART Aim, key drivers, and potential interventions. ♦ Including all required components of the:
■ SMART Aim measure. ■ SMART Aim data collection methodology. ■ Run/control chart. ■ Failure modes and effects analysis.
♦ Listing the appropriate potential interventions based on the ranked failure modes. ♦ Considering the potential interventions’ reliability and sustainability.
After receiving technical assistance from HSAG, CalOptima incorporated HSAG’s feedback into modules 1 and 2. Upon HSAG’s final review, HSAG determined that the MCP met all validation criteria for modules 1 and 2. CalOptima was still in the process of incorporating HSAG’s feedback into Module 3 during the review period; therefore, HSAG includes no final validation results for Module 3 in this report.
2017–19 DHCS-Priority Performance Improvement Project
During the review period, DHCS required MCPs to initiate a PIP related to one of DHCS’ Quality Strategy focus areas: Childhood Immunization Status—Combination 3, Controlling High Blood Pressure, Comprehensive Diabetes Care, or Prenatal and Postpartum Care— Postpartum Care. However, based on CalOptima demonstrating high performance on DHCS’ Quality Strategy focus areas, DHCS allowed the MCP to choose an alternative topic for its
CalOptima Performance Evaluation Report: July 1, 2017–June 30, 2018 California Department of Health Care Services
Page F-31 Health Services Advisory Group, Inc.
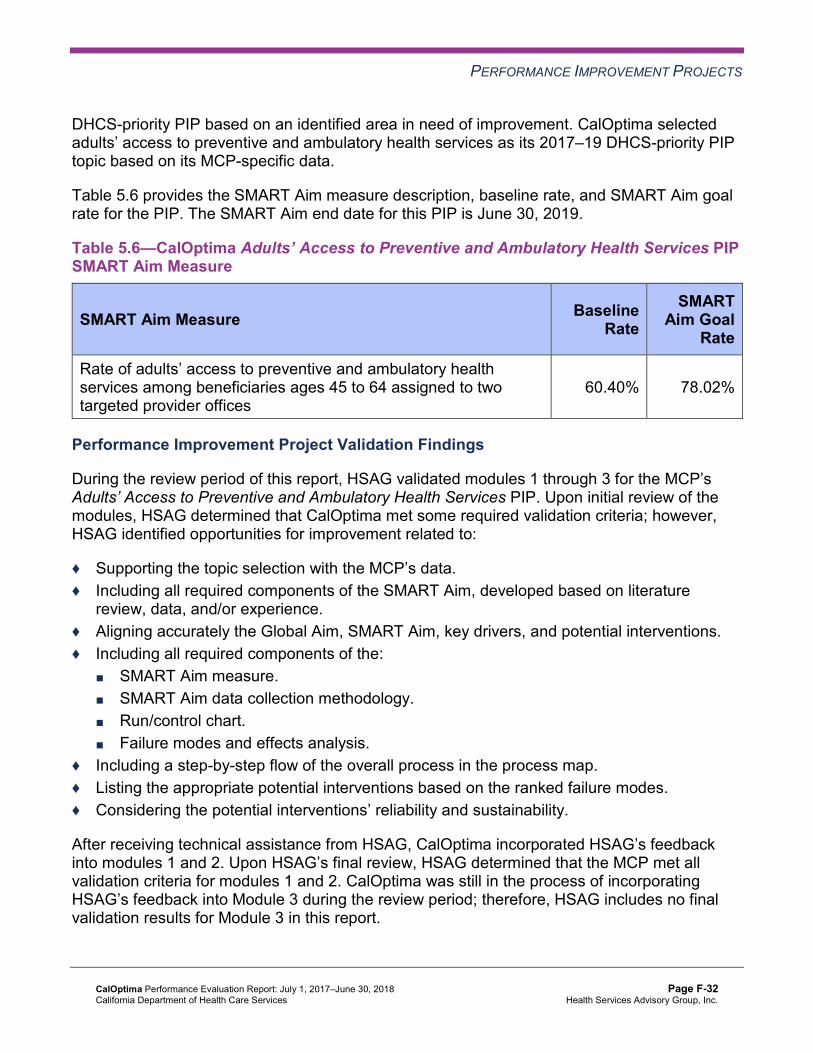
PERFORMANCE IMPROVEMENT PROJECTS
DHCS-priority PIP based on an identified area in need of improvement. CalOptima selected adults’ access to preventive and ambulatory health services as its 2017–19 DHCS-priority PIP topic based on its MCP-specific data.
Table 5.6 provides the SMART Aim measure description, baseline rate, and SMART Aim goal rate for the PIP. The SMART Aim end date for this PIP is June 30, 2019.
Table 5.6—CalOptima Adults’ Access to Preventive and Ambulatory Health Services PIP SMART Aim Measure
SMART Aim Measure Baseline Rate
SMART Aim Goal
Rate
Rate of adults’ access to preventive and ambulatory health services among beneficiaries ages 45 to 64 assigned to two targeted provider offices
60.40% 78.02%
Performance Improvement Project Validation Findings
During the review period of this report, HSAG validated modules 1 through 3 for the MCP’s Adults’ Access to Preventive and Ambulatory Health Services PIP. Upon initial review of the modules, HSAG determined that CalOptima met some required validation criteria; however, HSAG identified opportunities for improvement related to:
♦ Supporting the topic selection with the MCP’s data. ♦ Including all required components of the SMART Aim, developed based on literature
review, data, and/or experience. ♦ Aligning accurately the Global Aim, SMART Aim, key drivers, and potential interventions. ♦ Including all required components of the:
■ SMART Aim measure. ■ SMART Aim data collection methodology. ■ Run/control chart. ■ Failure modes and effects analysis.
♦ Including a step-by-step flow of the overall process in the process map. ♦ Listing the appropriate potential interventions based on the ranked failure modes. ♦ Considering the potential interventions’ reliability and sustainability.
After receiving technical assistance from HSAG, CalOptima incorporated HSAG’s feedback into modules 1 and 2. Upon HSAG’s final review, HSAG determined that the MCP met all validation criteria for modules 1 and 2. CalOptima was still in the process of incorporating HSAG’s feedback into Module 3 during the review period; therefore, HSAG includes no final validation results for Module 3 in this report.
CalOptima Performance Evaluation Report: July 1, 2017–June 30, 2018 California Department of Health Care Services
Page F-32 Health Services Advisory Group, Inc.

PERFORMANCE IMPROVEMENT PROJECTS
Strengths—Performance Improvement Projects CalOptima achieved the SMART Aim goal for the 2015–17 Initial Health Assessment PIP, and some of the quality improvement activities could be linked to the demonstrated improvement. Based on HSAG’s assessment, HSAG assigned the 2015–17 Initial Health Assessment PIP a final confidence level of Confidence.
Opportunities for Improvement—Performance Improvement Projects CalOptima has the opportunity to continue monitoring adapted and adopted interventions and outcomes to facilitate improvement beyond the life of the 2015–17 Diabetes HbA1c Testing and Initial Health Assessment PIPs. Ongoing monitoring will enable long-term evaluation of improvement and allow the MCP to continually refine interventions to achieve and sustain optimal outcomes.
CalOptima Performance Evaluation Report: July 1, 2017–June 30, 2018 California Department of Health Care Services
Page F-33 Health Services Advisory Group, Inc.

Medi-Cal Managed Care External Quality Review Technical ReportAppendix F: Performance Evaluation ReportCalOptimaJuly 1, 2017–June 30, 2018
6. Recommendations
Follow-Up on Prior Year Recommendations DHCS provided each MCP an opportunity to outline actions taken to address recommendations HSAG made in its 2016–17 MCP-specific evaluation report. Table 6.1 provides EQR recommendations from CalOptima’s July 1, 2016, through June 30, 2017, MCP-specific evaluation report, along with the MCP’s self-reported actions taken through June 30, 2018, that address the recommendations. Please note that HSAG made minimal edits to Table 6.1 to preserve the accuracy of CalOptima’s self-reported actions.
Table 6.1—CalOptima’s Self-Reported Follow-Up on External Quality ReviewRecommendations from the July 1, 2016, through June 30, 2017, MCP-SpecificEvaluation Report
2016–17 External Quality ReviewRecommendations Directed to CalOptima
Self-Reported Actions Taken by CalOptimaduring the Period of July 1, 2017–June 30,2018, that Address the External QualityReview Recommendations
1. Ensure resolution of all deficiencies from the February 2017 DMHC SPD Medical Survey.
CalOptima fully resolved all outstanding deficiencies from the February 2017 DMHC SPD Medical Survey. A letter from DMHC dated November 2, 2017, stated that CalOptima provided DMHC with additional information regarding the CAP and that DMHC had found all items to be in compliance and closed the CAP.
2. To help ensure that capitated encounter data are complete for performance measure reporting, expand use of the MCP’s oversight metrics to monitor paper claims and incoming encounters from the clearinghouses.
The following actions were taken based on the review recommendations: ♦ Inventory reporting was created to monitor
trend received date versus load date in Facets. Escalation process was implemented to ensure that gaps in received and load dates are reported to the clearinghouse for explanation, root cause for the delay, and mitigation plans.
♦ Claims impacted are prioritized within the workflow queues and claims assignment to ensure claims are adjudicated immediately.
CalOptima Performance Evaluation Report: July 1, 2017–June 30, 2018 California Department of Health Care Services
Page F-34 Health Services Advisory Group, Inc.

RECOMMENDATIONS
2016–17 External Quality ReviewRecommendations Directed to CalOptima
Self-Reported Actions Taken by CalOptimaduring the Period of July 1, 2017–June 30,2018, that Address the External QualityReview Recommendations ♦ An internal workgroup is closely monitoring
clearinghouses’ manifests and reporting for delays in submitting the files to CalOptima.
♦ All incidents of file load delays are reported to claims management each morning during the management huddle. Daily email notifications are also sent by an internal workgroup.
3. Identify the causes for the rate for the Use of Imaging Studies for Low Back Pain measure declining significantly from RY 2016 to RY 2017.
Causes for the rate decline for the Use of Imaging Studies for Low Back Pain (LBP) measure from RY 2016 to RY 2017 include the following: ♦ Member complaints ♦ Patient satisfaction ♦ Provider lack of awareness of the LBP
measure
Opportunities for addressing barriers: ♦ Conduct provider outreach via fax with
HEDIS information regarding the LBP measure.
♦ Target provider outreach mailing, to include: ■ HEDIS measure fact sheet. ■ Clinical practice guidelines. ■ HEDIS provider profile for LBP measure. ■ Talking points to members.
CalOptima Performance Evaluation Report: July 1, 2017–June 30, 2018 California Department of Health Care Services
Page F-35 Health Services Advisory Group, Inc.

RECOMMENDATIONS
2017–18 Recommendations Based on the overall assessment of CalOptima’s delivery of quality, accessible, and timely care through the activities described in previous sections of this report, HSAG recommends the following to the MCP:
♦ Assess the causes for the rate declining significantly from RY 2017 to RY 2018 for the Asthma Medication Ratio measure and identify strategies to ensure that beneficiaries ages 5 to 64 who are identified as having persistent asthma have a ratio of controller medications to total asthma medications of 0.50 or greater.
♦ Assess whether or not current strategies need to be modified or expanded to prevent the rate for the Use of Imaging Studies for Low Back Pain measure from continuing to decline.
♦ Continue monitoring adapted and adopted interventions and outcomes to facilitate improvement beyond the life of the 2015–17 Diabetes HbA1c Testing and Initial Health Assessment PIPs.
In the next annual review, HSAG will evaluate continued successes of CalOptima as well as the MCP’s progress with these recommendations.
CalOptima Performance Evaluation Report: July 1, 2017–June 30, 2018 California Department of Health Care Services
Page F-36 Health Services Advisory Group, Inc.
Medi-Cal Managed CareExternal Quality Review Technical Report
Appendix G: Performance Evaluation Report
CalViva Health July 1, 2017–June 30, 2018

Medi-Cal Managed Care External Quality Review Technical ReportAppendix G: Performance Evaluation ReportCalViva Health July 1, 2017–June 30, 2018
Table of Contents
1. Introduction............................................................................................................ G-1 Medi-Cal Managed Care Health Plan Overview ...................................................... G-1
2. Managed Care Health Plan Compliance .............................................................. G-2Compliance Reviews Conducted............................................................................. G-2 Strengths—Compliance Reviews ............................................................................ G-3 Opportunities for Improvement—Compliance Reviews ........................................... G-3
3. Managed Care Health Plan Performance Measures ........................................... G-4Performance Measure Validation Results ............................................................... G-4 Performance Measure Results and Findings........................................................... G-4
Preventive Screening and Children’s Health ........................................................ G-5 Preventive Screening and Women’s Health ....................................................... G-14 Care for Chronic Conditions ............................................................................... G-20 Appropriate Treatment and Utilization................................................................ G-27 Performance Measure Findings—All Domains................................................... G-35
Corrective Action Plan Requirements for 2018...................................................... G-38 Improvement Plan Requirements for 2018 ............................................................ G-38 Seniors and Persons with Disabilities Performance Measure Results................... G-38
Seniors and Persons with Disabilities Findings .................................................. G-52 Strengths—Performance Measures ...................................................................... G-52 Opportunities for Improvement—Performance Measures ..................................... G-53
4. Performance Improvement Projects .................................................................. G-54Performance Improvement Project Overview ........................................................ G-54 Performance Improvement Project Results and Findings...................................... G-55
2015–17 DHCS-Priority Performance Improvement Project .............................. G-56 2015–17 MCP-Specific Performance Improvement Project ............................... G-57 2017–19 Disparity Performance Improvement Project ....................................... G-58 2017–19 DHCS-Priority Performance Improvement Project .............................. G-59
Strengths—Performance Improvement Projects ................................................... G-60 Opportunities for Improvement—Performance Improvement Projects .................. G-60
5. Recommendations............................................................................................... G-61 Follow-Up on Prior Year Recommendations ......................................................... G-61 2017–18 Recommendations.................................................................................. G-65
CalViva Health Performance Evaluation Report: July 1, 2017–June 30, 2018 California Department of Health Care Services
Page G-i Health Services Advisory Group, Inc.

TABLE OF CONTENTS
Table of Tables
Table 2.1—DHCS A&I Medical and State Supported Services Audits of CalViva Audit Review Period: April 1, 2016, through March 31, 2017............................... G-2
Table 3.1—Preventive Screening and Children’s Health Domain Multi-Year Performance Measure Results CalViva—Fresno County................................................. G-6
Table 3.2—Preventive Screening and Children’s Health Domain Multi-Year Performance Measure Results CalViva—Kings County................................................... G-7
Table 3.3—Preventive Screening and Children’s Health Domain Multi-Year Performance Measure Results CalViva—Madera County................................................ G-9
Table 3.4—Preventive Screening and Children’s Health Domain RY 2018 (MY 2017) Performance Measure Findings CalViva—Fresno County........................ G-11
Table 3.5—Preventive Screening and Children’s Health Domain RY 2018 (MY 2017) Performance Measure Findings CalViva—Kings County.......................... G-12
Table 3.6—Preventive Screening and Children’s Health Domain RY 2018 (MY 2017) Performance Measure Findings CalViva—Madera County....................... G-13
Table 3.7—Preventive Screening and Women’s Health Domain Multi-Year Performance Measure Results CalViva—Fresno County............................................... G-14
Table 3.8—Preventive Screening and Women’s Health Domain Multi-Year Performance Measure Results CalViva—Kings County................................................. G-15
Table 3.9—Preventive Screening and Women’s Health Domain Multi-Year Performance Measure Results CalViva—Madera County.............................................. G-16
Table 3.10—Preventive Screening and Women’s Health Domain RY 2018 (MY 2017) Performance Measure Findings CalViva—Fresno County........................ G-17
Table 3.11—Preventive Screening and Women’s Health Domain RY 2018 (MY 2017) Performance Measure Findings CalViva—Kings County.......................... G-18
Table 3.12—Preventive Screening and Women’s Health Domain RY 2018 (MY 2017) Performance Measure Findings CalViva—Madera County....................... G-19
Table 3.13—Care for Chronic Conditions Domain Multi-Year Performance Measure Results CalViva—Fresno County.............................................................. G-20
Table 3.14—Care for Chronic Conditions Domain Multi-Year Performance Measure Results CalViva—Kings County................................................................ G-21
Table 3.15—Care for Chronic Conditions Domain Multi-Year Performance Measure Results CalViva—Madera County............................................................. G-23
Table 3.16—Care for Chronic Conditions Domain RY 2018 (MY 2017) Performance Measure Findings CalViva—Fresno County ............................................. G-24
Table 3.17—Care for Chronic Conditions Domain RY 2018 (MY 2017) Performance Measure Findings CalViva—Kings County ............................................... G-25
Table 3.18—Care for Chronic Conditions Domain RY 2018 (MY 2017) Performance Measure Findings CalViva—Madera County ............................................ G-26
CalViva Health Performance Evaluation Report: July 1, 2017–June 30, 2018 California Department of Health Care Services
Page G-ii Health Services Advisory Group, Inc.

TABLE OF CONTENTS
Table 3.19—Appropriate Treatment and Utilization Domain Multi-Year Performance Measure Results CalViva—Fresno County............................................... G-28
Table 3.20—Appropriate Treatment and Utilization Domain Multi-Year Performance Measure Results CalViva—Kings County................................................. G-29
Table 3.21—Appropriate Treatment and Utilization Domain Multi-Year Performance Measure Results CalViva—Madera County.............................................. G-30
Table 3.22—Appropriate Treatment and Utilization Domain RY 2018 (MY 2017) Performance Measure Findings CalViva—Fresno County........................ G-31
Table 3.23—Appropriate Treatment and Utilization Domain RY 2018 (MY 2017) Performance Measure Findings CalViva—Kings County.......................... G-32
Table 3.24—Appropriate Treatment and Utilization Domain RY 2018 (MY 2017) Performance Measure Findings CalViva—Madera County....................... G-33
Table 3.25—RY 2018 (MY 2017) Performance Measure Findings for All Domains CalViva—Fresno County .......................................................................... G-35
Table 3.26—RY 2018 (MY 2017) Performance Measure Findings for All Domains CalViva—Kings County............................................................................. G-36
Table 3.27—RY 2018 (MY 2017) Performance Measure Findings for All Domains CalViva—Madera County ......................................................................... G-37
Table 3.28—Multi-Year SPD Performance Measure Trend Table CalViva— Fresno County .......................................................................................... G-39
Table 3.29—Multi-Year SPD Performance Measure Trend Table CalViva—Kings County G-40 Table 3.30—Multi-Year SPD Performance Measure Trend Table CalViva—
Madera County ......................................................................................... G-42 Table 3.31—Multi-Year Non-SPD Performance Measure Trend Table CalViva—
Fresno County .......................................................................................... G-43 Table 3.32—Multi-Year Non-SPD Performance Measure Trend Table CalViva—
Kings County ............................................................................................ G-45 Table 3.33—Multi-Year Non-SPD Performance Measure Trend Table CalViva—
Madera County ......................................................................................... G-46 Table 3.34—RY 2018 (MY 2017) Performance Measure Comparison and Results for
Measures Stratified by the SPD and Non-SPD Populations CalViva— Fresno County .......................................................................................... G-48
Table 3.35—RY 2018 (MY 2017) Performance Measure Comparison and Results for Measures Stratified by the SPD and Non-SPD Populations CalViva— Kings County ............................................................................................ G-49
Table 3.36—RY 2018 (MY 2017) Performance Measure Comparison and Results for Measures Stratified by the SPD and Non-SPD Populations CalViva— Madera County ......................................................................................... G-50
Table 4.1—CalViva Postpartum Care PIP SMART Aim Measure Results .................. G-56 Table 4.2—CalViva Postpartum Care PIP Intervention Testing Results ..................... G-56 Table 4.3—CalViva Diabetes HbA1c Testing PIP SMART Aim Measure Results....... G-57
CalViva Health Performance Evaluation Report: July 1, 2017–June 30, 2018 California Department of Health Care Services
Page G-iii Health Services Advisory Group, Inc.
TABLE OF CONTENTS
Table 4.4—CalViva Diabetes HbA1c Testing PIP Intervention Testing Results.......... G-57 Table 4.5—CalViva Postpartum Care Disparity PIP SMART Aim Measure ................ G-59 Table 4.6—CalViva Childhood Immunization Status—Combination 3 PIP SMART
Aim Measure............................................................................................. G-59 Table 5.1—CalViva’s Self-Reported Follow-Up on External Quality Review
Recommendations from the July 1, 2016, through June 30, 2017, MCP-Specific Evaluation Report............................................................... G-61
CalViva Health Performance Evaluation Report: July 1, 2017–June 30, 2018 California Department of Health Care Services
Page G-iv Health Services Advisory Group, Inc.

Medi-Cal Managed Care External Quality Review Technical ReportAppendix G: Performance Evaluation ReportCalViva Health July 1, 2017–June 30, 2018
1. Introduction
The California Department of Health Care Services (DHCS) contracted with Health Services Advisory Group, Inc. (HSAG), an external quality review organization (EQRO), to prepare the federally required Medi-Cal Managed Care External Quality Review Technical Report, July 1, 2017–June 30, 2018. The technical report provides an overview of the objectives and methodology for conducting the external quality review (EQR) activities, including requirements related to each activity. Additionally, the technical report provides aggregated results and recommendations for DHCS for each activity.
This appendix is specific to DHCS’ contracted Medi-Cal managed care health plan (MCP), CalViva Health (“CalViva” or “the MCP”). The purpose of this appendix is to provide MCP-specific results of each activity and an assessment of the MCP’s strengths and opportunities for improvement with respect to the quality and timeliness of and access to health care services furnished to Medi-Cal Managed Care (MCMC) beneficiaries (referred to as “beneficiaries” in this report). The review period for this MCP-specific evaluation report is July 1, 2017, through June 30, 2018. HSAG will report on activities that take place beyond the review period in CalViva’s 2018–19 MCP-specific evaluation report. This MCP-specific evaluation report references activities and methodologies described in detail by HSAG in the technical report section.
The aggregate EQR technical report and all MCP- and specialty health plan (SHP)-specific performance evaluation reports reflect HSAG’s external, independent assessment of the quality and timeliness of, and access to, care that MCPs and SHPs are providing to beneficiaries.
Medi-Cal Managed Care Health Plan Overview CalViva is a full-scope MCP delivering services to beneficiaries as a “Local Initiative” (LI) MCP under the Two-Plan Model (TPM). Beneficiaries may enroll in CalViva, the LI MCP; or in Anthem Blue Cross Partnership Plan, the alternative commercial plan (CP).
CalViva became operational in Fresno, Kings, and Madera counties to provide MCMC services effective March 2011. As of June 30, 2018, CalViva had 296,550 beneficiaries in Fresno County, 28,135 in Kings County, and 36,991 in Madera County—for a total of 361,676 beneficiaries.1 This represents 73 percent of the beneficiaries enrolled in Fresno County, 59 percent in Kings County, and 66 percent in Madera County.
1 Medi-Cal Managed Care Enrollment Report—June 2018. Available at: http://www.dhcs.ca.gov/dataandstats/reports/Pages/MMCDMonthlyEnrollment.aspx. Accessed on: Oct 22, 2018.
CalViva Health Performance Evaluation Report: July 1, 2017–June 30, 2018 California Department of Health Care Services
Page G-1 Health Services Advisory Group, Inc.

Medi-Cal Managed Care External Quality Review Technical ReportAppendix G: Performance Evaluation ReportCalViva Health July 1, 2017–June 30, 2018
2. Managed Care Health Plan Compliance
Compliance Reviews Conducted The following is a summary of the most recent reviews conducted for CalViva. Unless noted, HSAG’s compliance review summaries are based on final audit/survey reports issued and corrective action plan (CAP) closeout letters dated on or before the end of the review period for this report (June 30, 2018). The descriptions of the various types of reviews may be found within the main section of this technical report.
Table 2.1 summarizes the results and status of the DHCS Audits & Investigations Division (A&I) Medical and State Supported Services Audits of CalViva. A&I conducted the on-site audits from April 17, 2017, through April 27, 2017.
Table 2.1—DHCS A&I Medical and State Supported Services Audits of CalVivaAudit Review Period: April 1, 2016, through March 31, 2017
Category Evaluated Deficiencies (Yes/No) Monitoring Status
Utilization Management No Not applicable.
Case Management and Coordination of Care No Not applicable.
Access and Availability of Care Yes CAP initiated following the audit and subsequently closed.
Member’s Rights No Not applicable.
Quality Management No Not applicable.
Administrative and Organizational Capacity No Not applicable.
State Supported Services Yes CAP initiated following the audit and subsequently closed.
CalViva Health Performance Evaluation Report: July 1, 2017–June 30, 2018 California Department of Health Care Services
Page G-2 Health Services Advisory Group, Inc.

MANAGED CARE HEALTH PLAN COMPLIANCE
Strengths—Compliance Reviews A&I identified no deficiencies in the following categories during the April 2017 Medical and State Supported Services Audits of CalViva:
♦ Utilization Management ♦ Case Management and Coordination of Care ♦ Member’s Rights ♦ Quality Management ♦ Administrative and Organizational Capacity
Additionally, CalViva’s CAP response related to the deficiencies A&I identified in the Access and Availability of Care and State Supported Services categories resulted in DHCS closing the CAP.
Opportunities for Improvement—Compliance Reviews CalViva has no outstanding deficiencies from the April 2017 A&I Medical and State Supported Services Audits; therefore, HSAG has no recommendations for the MCP in the area of compliance reviews.
CalViva Health Performance Evaluation Report: July 1, 2017–June 30, 2018 California Department of Health Care Services
Page G-3 Health Services Advisory Group, Inc.
Medi-Cal Managed Care External Quality Review Technical ReportAppendix G: Performance Evaluation ReportCalViva Health July 1, 2017–June 30, 2018
3. Managed Care Health Plan Performance Measures
Performance Measure Validation Results The HEDIS®2 2018 Compliance Audit Final Report of Findings for CalViva Health contains the detailed findings and recommendations from HSAG’s NCQA HEDIS Compliance Audit™.3
HSAG auditors determined that CalViva followed the appropriate specifications to produce valid rates, and identified no issues of concern.
Performance Measure Results and Findings After validating the MCP’s performance measure rates, HSAG assessed the results. See Table 3.1 through Table 3.27 for CalViva’s performance measure results for reporting years (RYs) 2015 through 2018 and performance measure findings for RY 2018. The RY is the year in which the MCP reported the rates. The RY rates reflect measurement year (MY) data from the previous calendar year. Note that data may not be available for all four years.
Note the following regarding Table 3.1 through Table 3.27:
♦ To allow HSAG to provide meaningful assessment of MCP performance and actionable recommendations, HSAG, in collaboration with DHCS, organized the measures into domains based on the health care areas each measure affects. Table 3.1 through Table 3.24 present the performance measure results and findings by domain, and Table 3.25 through Table 3.27 present the RY 2018 performance measure findings for the domains combined.
♦ To assess performance for each MCP reporting unit, HSAG compares the rates to national benchmarks. Rates indicating performance above the high performance levels (HPLs) are shaded in gray, and rates indicating performance below the minimum performance levels (MPLs) are bolded. ■ For measures with rates below the MPLs, DHCS requires MCPs to submit to DHCS
improvement plans (IPs) to address the rates below the MPLs (unless MCPs are reporting the rates for the first time).
■ For MCPs that meet DHCS’ Quality of Care CAP thresholds, DHCS issues a CAP; if an MCP’s performance is such that it may trigger a CAP in the following year, DHCS issues an advance warning letter.
2 Healthcare Effectiveness Data and Information Set (HEDIS®) is a registered trademark of the National Committee for Quality Assurance (NCQA).
3 NCQA HEDIS Compliance AuditTM is a trademark of NCQA.
CalViva Health Performance Evaluation Report: July 1, 2017–June 30, 2018 California Department of Health Care Services
Page G-4 Health Services Advisory Group, Inc.

MANAGED CARE HEALTH PLAN PERFORMANCE MEASURES
■ IPs and CAPs consist of submission of Plan-Do-Study-Act (PDSA) Cycle Worksheets, Quality Improvement (QI) Summaries, or completion of Performance Improvement Projects (PIPs)—as determined by DHCS.
♦ For RYs 2016, 2017, and 2018, the HPLs and MPLs represent the NCQA Quality Compass®4 Medicaid health maintenance organization (HMO) 90th and 25th percentiles, respectively.
♦ For RY 2015, the HPLs and MPLs represent the NCQA HEDIS Audit Means, Percentiles, and Ratios 90th and 25th percentiles, respectively. For the Comprehensive Diabetes Care—HbA1c Poor Control (>9.0 Percent) measure, for which a lower rate indicates more favorable performance, the HPL and MPL are based on the 10th and 75th percentiles, respectively.
♦ HSAG includes the specific HPL and MPL values for RY 2018 in Section 6 of the Medi-Cal Managed Care External Quality Review Technical Report, July 1, 2017–June 30, 2018 (“Managed Care Health Plan Performance Measures”).
Preventive Screening and Children’s Health
Table 3.1 through Table 3.3 present the four-year trending information for the performance measures within the Preventive Screening and Children’s Health domain.
Note the following regarding Table 3.1 through Table 3.3:
♦ Although HSAG includes information on the MCP’s performance related to the four Children and Adolescents’ Access to Primary Care measures, DHCS did not hold MCPs accountable to meet the MPLs for these measures for RYs 2015 through 2018 (i.e., DHCS did not require MCPs to submit IPs if rates for the measures were below the MPLs). DHCS made this decision due to the small range of variation between the HPL and MPL thresholds for each measure.
♦ Any comparison of RY 2018 performance to RY 2017 or to benchmarks related to the Immunizations for Adolescents—Combination 2 measure should be exercised with caution given the changes that NCQA made to the specification for this measure for RY 2018. NCQA released guidance that recommended a break in trending for this measure; however, DHCS determined to continue trending because the specification change should result in higher rates.
4 Quality Compass® is a registered trademark of NCQA.
CalViva Health Performance Evaluation Report: July 1, 2017–June 30, 2018 California Department of Health Care Services
Page G-5 Health Services Advisory Group, Inc.

MANAGED CARE HEALTH PLAN PERFORMANCE MEASURES
Table 3.1—Preventive Screening and Children’s Health DomainMulti-Year Performance Measure Results CalViva—Fresno County
H = Rate indicates performance above the HPL. Bolded Rate = Rate indicates performance below the MPL.
B = Statistical testing result indicates that the RY 2018 rate is significantly better than the RY 2017 rate.
W = Statistical testing result indicates that the RY 2018 rate is significantly worse than the RY 2017 rate.
Measure RY
2015 Rate1
RY 2016
Rate2
RY 2017
Rate3
RY 2018
Rate4
RYs 2017–18 Rate
Difference5
Childhood Immunization Status—Combination 3 66.96% 68.19% 65.00% 71.28% 6.28
Children and Adolescents’ Access to Primary Care Practitioners—12–24 Months
95.19% 94.29% 94.12% 94.71% 0.59
Children and Adolescents’ Access to Primary Care Practitioners— 25 Months–6 Years
89.70% 86.89% 85.65% 87.00% 1.35B
Children and Adolescents’ Access to Primary Care Practitioners—7–11 Years
91.47% 89.98% 88.19% 87.34% -0.85W
Children and Adolescents’ Access to Primary Care Practitioners—12–19 Years
88.04% 86.68% 84.96% 84.69% -0.27
Immunizations for Adolescents— Combination 2^ -- -- 27.49% 41.12%H 13.63B
Weight Assessment and Counseling for Nutrition and Physical Activity for Children and Adolescents—Nutrition Counseling—Total
74.63% 73.71% 71.17% 77.06% 5.89
Weight Assessment and Counseling for Nutrition and Physical Activity for Children and Adolescents—Physical Activity Counseling—Total
57.80% 61.18% 60.97% 62.59% 1.62
CalViva Health Performance Evaluation Report: July 1, 2017–June 30, 2018 California Department of Health Care Services
Page G-6 Health Services Advisory Group, Inc.

MANAGED CARE HEALTH PLAN PERFORMANCE MEASURES
Measure RY
2015 Rate1
RY 2016
Rate2
RY 2017
Rate3
RY 2018
Rate4
RYs 2017–18 Rate
Difference5
Well-Child Visits in the Third, Fourth, Fifth, and Sixth Years of Life
76.80% 76.39% 74.43% 81.00% 6.57B
1 RY 2015 rates reflect MY data from January 1, 2014, through December 31, 2014. 2 RY 2016 rates reflect MY data from January 1, 2015, through December 31, 2015. 3 RY 2017 rates reflect MY data from January 1, 2016, through December 31, 2016. 4 RY 2018 rates reflect MY data from January 1, 2017, through December 31, 2017. 5 Performance comparisons are based on the Chi-square test of statistical significance, with a p value of <0.05. ^ Caution should be exercised when assessing MCP performance for this measure given the changes that NCQA made to the specification for this measure for RY 2018. -- Indicates that the rate is not available.
Table 3.2—Preventive Screening and Children’s Health DomainMulti-Year Performance Measure Results CalViva—Kings County
H = Rate indicates performance above the HPL. Bolded Rate = Rate indicates performance below the MPL.
B = Statistical testing result indicates that the RY 2018 rate is significantly better than the RY 2017 rate.
W = Statistical testing result indicates that the RY 2018 rate is significantly worse than the RY 2017 rate.
Measure RY
2015 Rate1
RY 2016
Rate2
RY 2017
Rate3
RY 2018
Rate4
RYs 2017–18 Rate
Difference5
Childhood Immunization Status—Combination 3 57.76% 63.03% 67.71% 66.67% -1.04
Children and Adolescents’ Access to Primary Care Practitioners—12–24 Months
89.62% 92.49% 92.96% 92.68% -0.28
Children and Adolescents’ Access to Primary Care Practitioners— 25 Months–6 Years
83.53% 83.71% 83.36% 85.30% 1.94B
CalViva Health Performance Evaluation Report: July 1, 2017–June 30, 2018 California Department of Health Care Services
Page G-7 Health Services Advisory Group, Inc.

MANAGED CARE HEALTH PLAN PERFORMANCE MEASURES
Measure RY
2015 Rate1
RY 2016
Rate2
RY 2017
Rate3
RY 2018
Rate4
RYs 2017–18 Rate
Difference5
Children and Adolescents’ Access to Primary Care Practitioners—7–11 Years
86.25% 83.31% 83.45% 82.66% -0.79
Children and Adolescents’ Access to Primary Care Practitioners—12–19 Years
85.55% 84.21% 82.99% 82.11% -0.88
Immunizations for Adolescents— Combination 2^ -- -- 15.33% 30.90%H 15.57B
Weight Assessment and Counseling for Nutrition and Physical Activity for Children and Adolescents—Nutrition Counseling—Total
63.26% 56.20% 69.83% 74.06% 4.23
Weight Assessment and Counseling for Nutrition and Physical Activity for Children and Adolescents—Physical Activity Counseling—Total
45.26% 46.23% 63.26% 67.08% 3.82
Well-Child Visits in the Third, Fourth, Fifth, and Sixth Years of Life
64.82% 66.32% 73.32% 71.65% -1.67
1 RY 2015 rates reflect MY data from January 1, 2014, through December 31, 2014. 2 RY 2016 rates reflect MY data from January 1, 2015, through December 31, 2015. 3 RY 2017 rates reflect MY data from January 1, 2016, through December 31, 2016. 4 RY 2018 rates reflect MY data from January 1, 2017, through December 31, 2017. 5 Performance comparisons are based on the Chi-square test of statistical significance, with a p value of <0.05. ^ Caution should be exercised when assessing MCP performance for this measure given the changes that NCQA made to the specification for this measure for RY 2018. -- Indicates that the rate is not available.
CalViva Health Performance Evaluation Report: July 1, 2017–June 30, 2018 California Department of Health Care Services
Page G-8 Health Services Advisory Group, Inc.

MANAGED CARE HEALTH PLAN PERFORMANCE MEASURES
Table 3.3—Preventive Screening and Children’s Health DomainMulti-Year Performance Measure Results CalViva—Madera County
H = Rate indicates performance above the HPL. Bolded Rate = Rate indicates performance below the MPL.
B = Statistical testing result indicates that the RY 2018 rate is significantly better than the RY 2017 rate.
W = Statistical testing result indicates that the RY 2018 rate is significantly worse than the RY 2017 rate.
Measure RY
2015 Rate1
RY 2016
Rate2
RY 2017
Rate3
RY 2018
Rate4
RYs 2017–18 Rate
Difference5
Childhood Immunization Status—Combination 3 69.54% 71.19% 72.22% 72.54% 0.32
Children and Adolescents’ Access to Primary Care Practitioners—12–24 Months
95.37% 97.28% 96.39% 97.08% 0.69
Children and Adolescents’ Access to Primary Care Practitioners— 25 Months–6 Years
92.02% 91.18% 90.83% 91.65% 0.82
Children and Adolescents’ Access to Primary Care Practitioners—7–11 Years
92.71% 91.71% 90.84% 90.57% -0.27
Children and Adolescents’ Access to Primary Care Practitioners—12–19 Years
90.48% 90.37% 88.54% 88.56% 0.02
Immunizations for Adolescents— Combination 2^ -- -- 43.07% 54.74%H 11.67B
Weight Assessment and Counseling for Nutrition and Physical Activity for Children and Adolescents—Nutrition Counseling—Total
87.44%H 82.08%H 82.75%H 83.23%H 0.48
Weight Assessment and Counseling for Nutrition and Physical Activity for Children and Adolescents—Physical Activity Counseling—Total
80.40%H 73.48%H 77.49%H 79.27%H 1.78
CalViva Health Performance Evaluation Report: July 1, 2017–June 30, 2018 California Department of Health Care Services
Page G-9 Health Services Advisory Group, Inc.

MANAGED CARE HEALTH PLAN PERFORMANCE MEASURES
Measure RY
2015 Rate1
RY 2016
Rate2
RY 2017
Rate3
RY 2018
Rate4
RYs 2017–18 Rate
Difference5
Well-Child Visits in the Third, Fourth, Fifth, and Sixth Years of Life
83.16%H 87.08%H 86.22%H 86.96%H 0.74
1 RY 2015 rates reflect MY data from January 1, 2014, through December 31, 2014. 2 RY 2016 rates reflect MY data from January 1, 2015, through December 31, 2015. 3 RY 2017 rates reflect MY data from January 1, 2016, through December 31, 2016. 4 RY 2018 rates reflect MY data from January 1, 2017, through December 31, 2017. 5 Performance comparisons are based on the Chi-square test of statistical significance, with a p value of <0.05. ^ Caution should be exercised when assessing MCP performance for this measure given the changes that NCQA made to the specification for this measure for RY 2018. -- Indicates that the rate is not available.
Table 3.4 through Table 3.6 present findings for the RY 2018 performance measures within the Preventive Screening and Children’s Health domain.
Note the following regarding Table 3.4 through Table 3.6:
♦ DHCS did not hold MCPs accountable to meet MPLs for all four Children and Adolescents’ Access to Primary Care measures within this domain; therefore, HSAG did not include these measures in its assessment of the MCP’s performance related to HPLs and MPLs.
♦ The Immunizations for Adolescents—Combination 2 measure was a first-year measure in RY 2017, and DHCS established no MPL for this measure for RY 2017 because no comparable benchmark existed; therefore, HSAG did not include this measure in the denominators for calculating the percentage of measures with rates that moved to above or below the MPLs in RY 2018.
CalViva Health Performance Evaluation Report: July 1, 2017–June 30, 2018 California Department of Health Care Services
Page G-10 Health Services Advisory Group, Inc.

MANAGED CARE HEALTH PLAN PERFORMANCE MEASURES
Table 3.4—Preventive Screening and Children’s Health DomainRY 2018 (MY 2017) Performance Measure Findings CalViva—Fresno County
Criteria Number of Measures
MeetingCriteria
Total Number of Measures
Percentage of Measures
MeetingCriteria
RY 2018 Rates Above HPLs 1 5 20.00% Rates Above HPLs for the Last Three or More Consecutive Years 0 4 0.00%
RY 2018 Rates Significantly Better than RY 2017 Rates* 2 5 40.00%
Rates that Moved from Below MPLs in RY 2017 to Above MPLs in RY 2018 0 0 N/A
RY 2018 Rates Below MPLs 0 5 0.00% Rates Below MPLs for the Last Three or More Consecutive Years 0 4 0.00%
RY 2018 Rates Significantly Worse than RY 2017 Rates* 0 5 0.00%
Rates that Moved from Above MPLs in RY 2017 to Below MPLs in RY 2018 0 4 0.00%
* Performance comparisons are based on the Chi-square test of statistical significance, with a p value of <0.05. N/A = No rates above or below the MPLs from the previous year exist to include in the denominator for calculating whether or not rates moved to above or below MPLs in the most recent year.
CalViva Health Performance Evaluation Report: July 1, 2017–June 30, 2018 California Department of Health Care Services
Page G-11 Health Services Advisory Group, Inc.

MANAGED CARE HEALTH PLAN PERFORMANCE MEASURES
Table 3.5—Preventive Screening and Children’s Health DomainRY 2018 (MY 2017) Performance Measure Findings CalViva—Kings County
Criteria Number of Measures
MeetingCriteria
Total Number of Measures
Percentage of Measures
MeetingCriteria
RY 2018 Rates Above HPLs 1 5 20.00% Rates Above HPLs for the Last Three or More Consecutive Years 0 4 0.00%
RY 2018 Rates Significantly Better than RY 2017 Rates* 1 5 20.00%
Rates that Moved from Below MPLs in RY 2017 to Above MPLs in RY 2018 0 0 N/A
RY 2018 Rates Below MPLs 0 5 0.00% Rates Below MPLs for the Last Three or More Consecutive Years 0 4 0.00%
RY 2018 Rates Significantly Worse than RY 2017 Rates* 0 5 0.00%
Rates that Moved from Above MPLs in RY 2017 to Below MPLs in RY 2018 0 4 0.00%
* Performance comparisons are based on the Chi-square test of statistical significance, with a p value of <0.05. N/A = No rates above or below the MPLs from the previous year exist to include in the denominator for calculating whether or not rates moved to above or below MPLs in the most recent year.
CalViva Health Performance Evaluation Report: July 1, 2017–June 30, 2018 California Department of Health Care Services
Page G-12 Health Services Advisory Group, Inc.

MANAGED CARE HEALTH PLAN PERFORMANCE MEASURES
Table 3.6—Preventive Screening and Children’s Health DomainRY 2018 (MY 2017) Performance Measure Findings CalViva—Madera County
Criteria Number of Measures
MeetingCriteria
Total Number of Measures
Percentage of Measures
MeetingCriteria
RY 2018 Rates Above HPLs 4 5 80.00% Rates Above HPLs for the Last Three or More Consecutive Years 3 4 75.00%
RY 2018 Rates Significantly Better than RY 2017 Rates* 1 5 20.00%
Rates that Moved from Below MPLs in RY 2017 to Above MPLs in RY 2018 0 0 N/A
RY 2018 Rates Below MPLs 0 5 0.00% Rates Below MPLs for the Last Three or More Consecutive Years 0 4 0.00%
RY 2018 Rates Significantly Worse than RY 2017 Rates* 0 5 0.00%
Rates that Moved from Above MPLs in RY 2017 to Below MPLs in RY 2018 0 4 0.00%
* Performance comparisons are based on the Chi-square test of statistical significance, with a p value of <0.05. N/A = No rates above or below the MPLs from the previous year exist to include in the denominator for calculating whether or not rates moved to above or below MPLs in the most recent year.
CalViva Health Performance Evaluation Report: July 1, 2017–June 30, 2018 California Department of Health Care Services
Page G-13 Health Services Advisory Group, Inc.
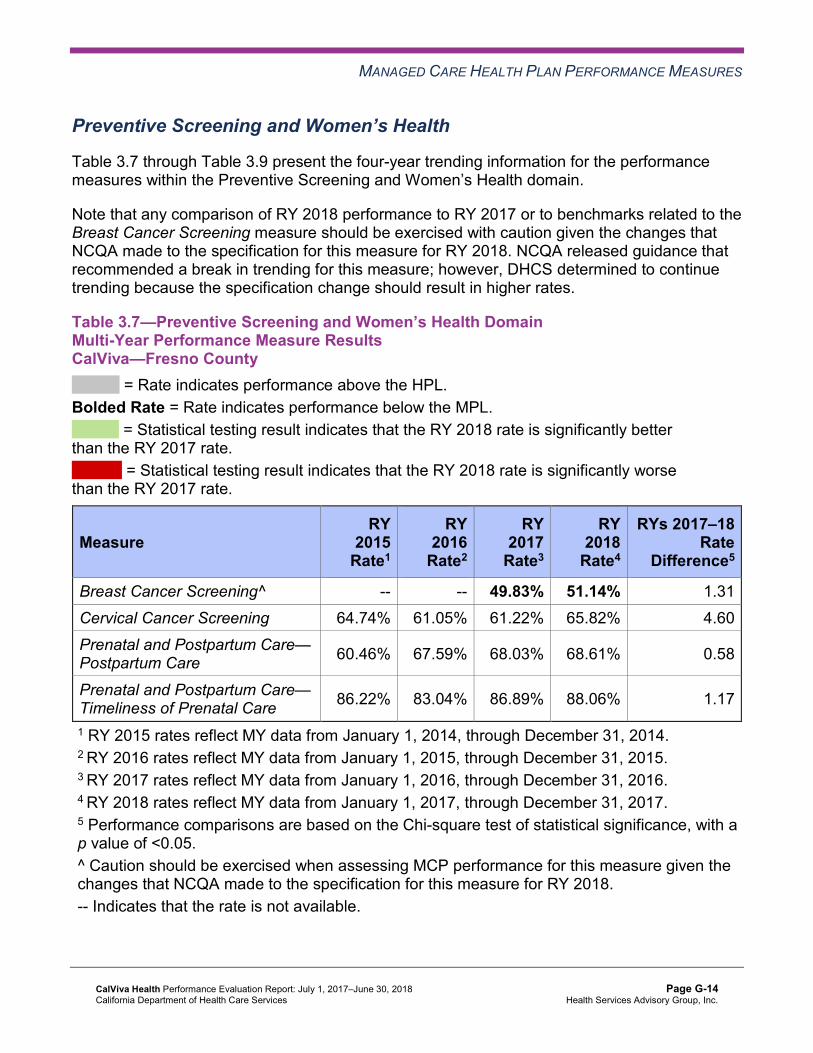
MANAGED CARE HEALTH PLAN PERFORMANCE MEASURES
Preventive Screening and Women’s Health
Table 3.7 through Table 3.9 present the four-year trending information for the performance measures within the Preventive Screening and Women’s Health domain.
Note that any comparison of RY 2018 performance to RY 2017 or to benchmarks related to the Breast Cancer Screening measure should be exercised with caution given the changes that NCQA made to the specification for this measure for RY 2018. NCQA released guidance that recommended a break in trending for this measure; however, DHCS determined to continue trending because the specification change should result in higher rates.
Table 3.7—Preventive Screening and Women’s Health DomainMulti-Year Performance Measure Results CalViva—Fresno County
H = Rate indicates performance above the HPL. Bolded Rate = Rate indicates performance below the MPL.
B = Statistical testing result indicates that the RY 2018 rate is significantly better than the RY 2017 rate.
W = Statistical testing result indicates that the RY 2018 rate is significantly worse than the RY 2017 rate.
Measure RY
2015 Rate1
RY 2016
Rate2
RY 2017
Rate3
RY 2018
Rate4
RYs 2017–18 Rate
Difference5
Breast Cancer Screening^ -- -- 49.83% 51.14% 1.31 Cervical Cancer Screening 64.74% 61.05% 61.22% 65.82% 4.60 Prenatal and Postpartum Care— Postpartum Care 60.46% 67.59% 68.03% 68.61% 0.58
Prenatal and Postpartum Care— Timeliness of Prenatal Care 86.22% 83.04% 86.89% 88.06% 1.17
1 RY 2015 rates reflect MY data from January 1, 2014, through December 31, 2014. 2 RY 2016 rates reflect MY data from January 1, 2015, through December 31, 2015. 3 RY 2017 rates reflect MY data from January 1, 2016, through December 31, 2016. 4 RY 2018 rates reflect MY data from January 1, 2017, through December 31, 2017. 5 Performance comparisons are based on the Chi-square test of statistical significance, with a p value of <0.05. ^ Caution should be exercised when assessing MCP performance for this measure given the changes that NCQA made to the specification for this measure for RY 2018. -- Indicates that the rate is not available.
CalViva Health Performance Evaluation Report: July 1, 2017–June 30, 2018 California Department of Health Care Services
Page G-14 Health Services Advisory Group, Inc.
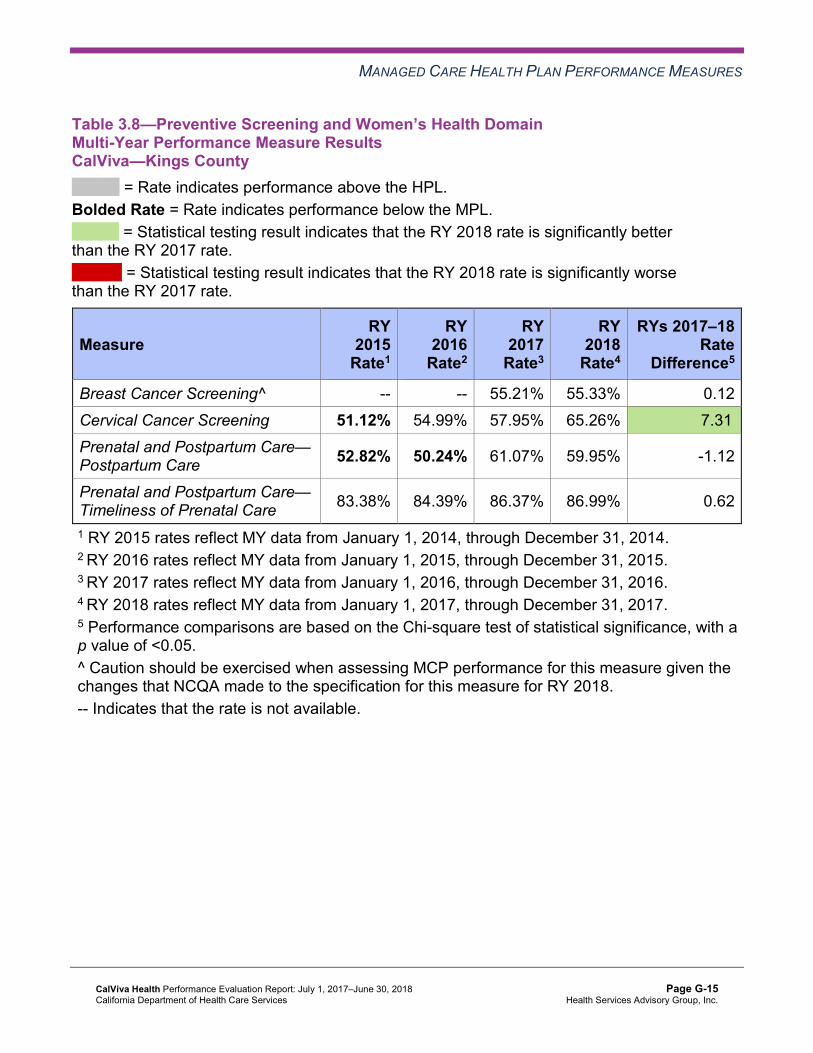
MANAGED CARE HEALTH PLAN PERFORMANCE MEASURES
Table 3.8—Preventive Screening and Women’s Health DomainMulti-Year Performance Measure Results CalViva—Kings County
H = Rate indicates performance above the HPL. Bolded Rate = Rate indicates performance below the MPL.
B = Statistical testing result indicates that the RY 2018 rate is significantly better than the RY 2017 rate.
W = Statistical testing result indicates that the RY 2018 rate is significantly worse than the RY 2017 rate.
Measure RY
2015 Rate1
RY 2016
Rate2
RY 2017
Rate3
RY 2018
Rate4
RYs 2017–18 Rate
Difference5
Breast Cancer Screening^ -- -- 55.21% 55.33% 0.12 Cervical Cancer Screening 51.12% 54.99% 57.95% 65.26% 7.31B
Prenatal and Postpartum Care— Postpartum Care 52.82% 50.24% 61.07% 59.95% -1.12
Prenatal and Postpartum Care— Timeliness of Prenatal Care 83.38% 84.39% 86.37% 86.99% 0.62
1 RY 2015 rates reflect MY data from January 1, 2014, through December 31, 2014. 2 RY 2016 rates reflect MY data from January 1, 2015, through December 31, 2015. 3 RY 2017 rates reflect MY data from January 1, 2016, through December 31, 2016. 4 RY 2018 rates reflect MY data from January 1, 2017, through December 31, 2017. 5 Performance comparisons are based on the Chi-square test of statistical significance, with a p value of <0.05. ^ Caution should be exercised when assessing MCP performance for this measure given the changes that NCQA made to the specification for this measure for RY 2018. -- Indicates that the rate is not available.
CalViva Health Performance Evaluation Report: July 1, 2017–June 30, 2018 California Department of Health Care Services
Page G-15 Health Services Advisory Group, Inc.

MANAGED CARE HEALTH PLAN PERFORMANCE MEASURES
Table 3.9—Preventive Screening and Women’s Health DomainMulti-Year Performance Measure Results CalViva—Madera County
H = Rate indicates performance above the HPL. Bolded Rate = Rate indicates performance below the MPL.
B = Statistical testing result indicates that the RY 2018 rate is significantly better than the RY 2017 rate.
W = Statistical testing result indicates that the RY 2018 rate is significantly worse than the RY 2017 rate.
Measure RY
2015 Rate1
RY 2016
Rate2
RY 2017
Rate3
RY 2018
Rate4
RYs 2017–18 Rate
Difference5
Breast Cancer Screening^ -- -- 58.34% 55.68% -2.66 Cervical Cancer Screening 58.68% 52.87% 57.56% 62.78% 5.22 Prenatal and Postpartum Care— Postpartum Care 66.67% 58.76% 64.09% 63.68% -0.41
Prenatal and Postpartum Care— Timeliness of Prenatal Care 87.10% 83.83% 82.29% 85.79% 3.50
1 RY 2015 rates reflect MY data from January 1, 2014, through December 31, 2014. 2 RY 2016 rates reflect MY data from January 1, 2015, through December 31, 2015. 3 RY 2017 rates reflect MY data from January 1, 2016, through December 31, 2016. 4 RY 2018 rates reflect MY data from January 1, 2017, through December 31, 2017. 5 Performance comparisons are based on the Chi-square test of statistical significance, with a p value of <0.05. ^ Caution should be exercised when assessing MCP performance for this measure given the changes that NCQA made to the specification for this measure for RY 2018. -- Indicates that the rate is not available.
CalViva Health Performance Evaluation Report: July 1, 2017–June 30, 2018 California Department of Health Care Services
Page G-16 Health Services Advisory Group, Inc.

MANAGED CARE HEALTH PLAN PERFORMANCE MEASURES
Table 3.10 through Table 3.12 present findings for the RY 2018 performance measures within the Preventive Screening and Women’s Health domain. Note that the Breast Cancer Screening measure was a first-year measure in RY 2017, and DHCS did not hold MCPs accountable to meet an MPL for this measure in RY 2017; therefore, HSAG did not include this measure in the denominators for calculating the percentage of measures with rates that moved to above or below the MPLs in RY 2018.
Table 3.10—Preventive Screening and Women’s Health DomainRY 2018 (MY 2017) Performance Measure Findings CalViva—Fresno County
Criteria Number of Measures
MeetingCriteria
Total Number of Measures
Percentage of Measures
MeetingCriteria
RY 2018 Rates Above HPLs 0 4 0.00% Rates Above HPLs for the Last Three or More Consecutive Years 0 3 0.00%
RY 2018 Rates Significantly Better than RY 2017 Rates* 0 4 0.00%
Rates that Moved from Below MPLs in RY 2017 to Above MPLs in RY 2018 0 0 N/A
RY 2018 Rates Below MPLs 1 4 25.00% Rates Below MPLs for the Last Three or More Consecutive Years 0 3 0.00%
RY 2018 Rates Significantly Worse than RY 2017 Rates* 0 4 0.00%
Rates that Moved from Above MPLs in RY 2017 to Below MPLs in RY 2018 0 3 0.00%
* Performance comparisons are based on the Chi-square test of statistical significance, with a p value of <0.05. N/A = No rates above or below the MPLs from the previous year exist to include in the denominator for calculating whether or not rates moved to above or below MPLs in the most recent year.
CalViva Health Performance Evaluation Report: July 1, 2017–June 30, 2018 California Department of Health Care Services
Page G-17 Health Services Advisory Group, Inc.

MANAGED CARE HEALTH PLAN PERFORMANCE MEASURES
Table 3.11—Preventive Screening and Women’s Health DomainRY 2018 (MY 2017) Performance Measure Findings CalViva—Kings County
Criteria Number of Measures
MeetingCriteria
Total Number of Measures
Percentage of Measures
MeetingCriteria
RY 2018 Rates Above HPLs 0 4 0.00% Rates Above HPLs for the Last Three or More Consecutive Years 0 3 0.00%
RY 2018 Rates Significantly Better than RY 2017 Rates* 1 4 25.00%
Rates that Moved from Below MPLs in RY 2017 to Above MPLs in RY 2018 0 0 N/A
RY 2018 Rates Below MPLs 0 4 0.00% Rates Below MPLs for the Last Three or More Consecutive Years 0 3 0.00%
RY 2018 Rates Significantly Worse than RY 2017 Rates* 0 4 0.00%
Rates that Moved from Above MPLs in RY 2017 to Below MPLs in RY 2018 0 3 0.00%
* Performance comparisons are based on the Chi-square test of statistical significance, with a p value of <0.05. N/A = No rates above or below the MPLs from the previous year exist to include in the denominator for calculating whether or not rates moved to above or below MPLs in the most recent year.
CalViva Health Performance Evaluation Report: July 1, 2017–June 30, 2018 California Department of Health Care Services
Page G-18 Health Services Advisory Group, Inc.

MANAGED CARE HEALTH PLAN PERFORMANCE MEASURES
Table 3.12—Preventive Screening and Women’s Health DomainRY 2018 (MY 2017) Performance Measure Findings CalViva—Madera County
Criteria Number of Measures
MeetingCriteria
Total Number of Measures
Percentage of Measures
MeetingCriteria
RY 2018 Rates Above HPLs 0 4 0.00% Rates Above HPLs for the Last Three or More Consecutive Years 0 3 0.00%
RY 2018 Rates Significantly Better than RY 2017 Rates* 0 4 0.00%
Rates that Moved from Below MPLs in RY 2017 to Above MPLs in RY 2018 0 0 N/A
RY 2018 Rates Below MPLs 0 4 0.00% Rates Below MPLs for the Last Three or More Consecutive Years 0 3 0.00%
RY 2018 Rates Significantly Worse than RY 2017 Rates* 0 4 0.00%
Rates that Moved from Above MPLs in RY 2017 to Below MPLs in RY 2018 0 3 0.00%
* Performance comparisons are based on the Chi-square test of statistical significance, with a p value of <0.05. N/A = No rates above or below the MPLs from the previous year exist to include in the denominator for calculating whether or not rates moved to above or below MPLs in the most recent year.
CalViva Health Performance Evaluation Report: July 1, 2017–June 30, 2018 California Department of Health Care Services
Page G-19 Health Services Advisory Group, Inc.
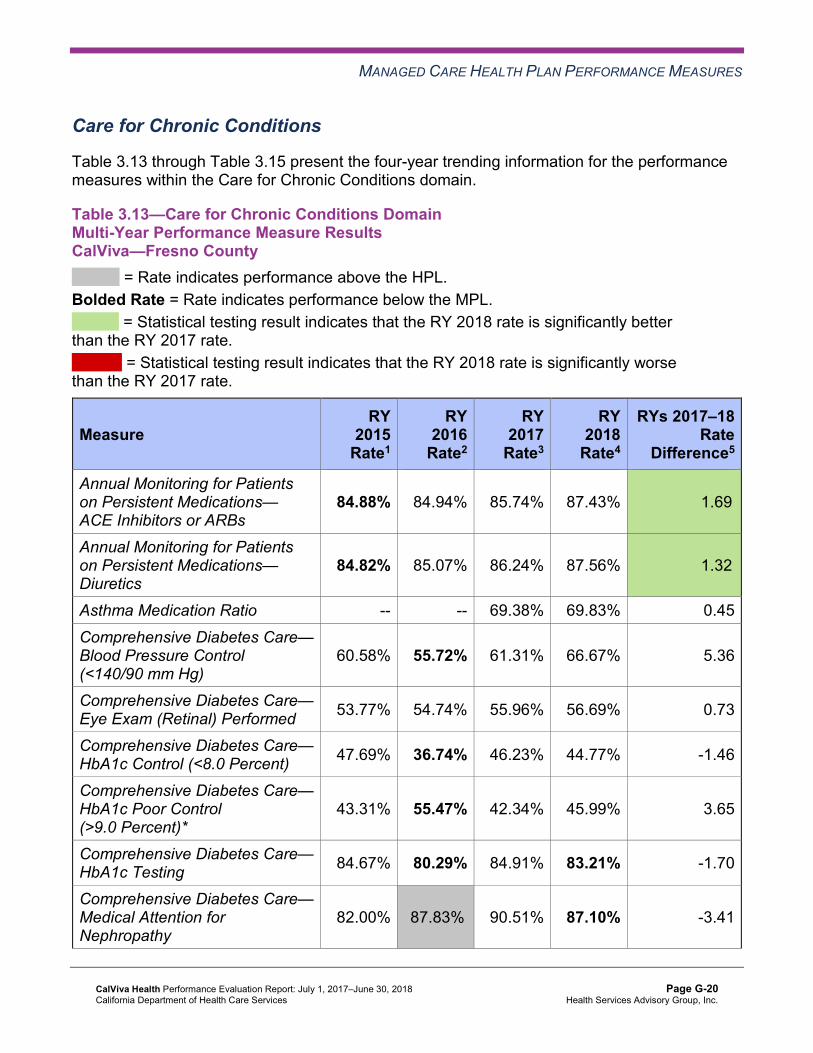
MANAGED CARE HEALTH PLAN PERFORMANCE MEASURES
Care for Chronic Conditions
Table 3.13 through Table 3.15 present the four-year trending information for the performance measures within the Care for Chronic Conditions domain.
Table 3.13—Care for Chronic Conditions Domain Multi-Year Performance Measure Results CalViva—Fresno County
H = Rate indicates performance above the HPL. Bolded Rate = Rate indicates performance below the MPL.
B = Statistical testing result indicates that the RY 2018 rate is significantly better than the RY 2017 rate.
W = Statistical testing result indicates that the RY 2018 rate is significantly worse than the RY 2017 rate.
Measure RY
2015 Rate1
RY 2016
Rate2
RY 2017
Rate3
RY 2018
Rate4
RYs 2017–18 Rate
Difference5
Annual Monitoring for Patients on Persistent Medications— ACE Inhibitors or ARBs
84.88% 84.94% 85.74% 87.43% 1.69B
Annual Monitoring for Patients on Persistent Medications— Diuretics
84.82% 85.07% 86.24% 87.56% 1.32B
Asthma Medication Ratio -- -- 69.38% 69.83% 0.45 Comprehensive Diabetes Care— Blood Pressure Control (<140/90 mm Hg)
60.58% 55.72% 61.31% 66.67% 5.36
Comprehensive Diabetes Care— Eye Exam (Retinal) Performed 53.77% 54.74% 55.96% 56.69% 0.73
Comprehensive Diabetes Care— HbA1c Control (<8.0 Percent) 47.69% 36.74% 46.23% 44.77% -1.46
Comprehensive Diabetes Care— HbA1c Poor Control (>9.0 Percent)*
43.31% 55.47% 42.34% 45.99% 3.65
Comprehensive Diabetes Care— HbA1c Testing 84.67% 80.29% 84.91% 83.21% -1.70
Comprehensive Diabetes Care— Medical Attention for Nephropathy
82.00% 87.83%H 90.51% 87.10% -3.41
CalViva Health Performance Evaluation Report: July 1, 2017–June 30, 2018 California Department of Health Care Services
Page G-20 Health Services Advisory Group, Inc.
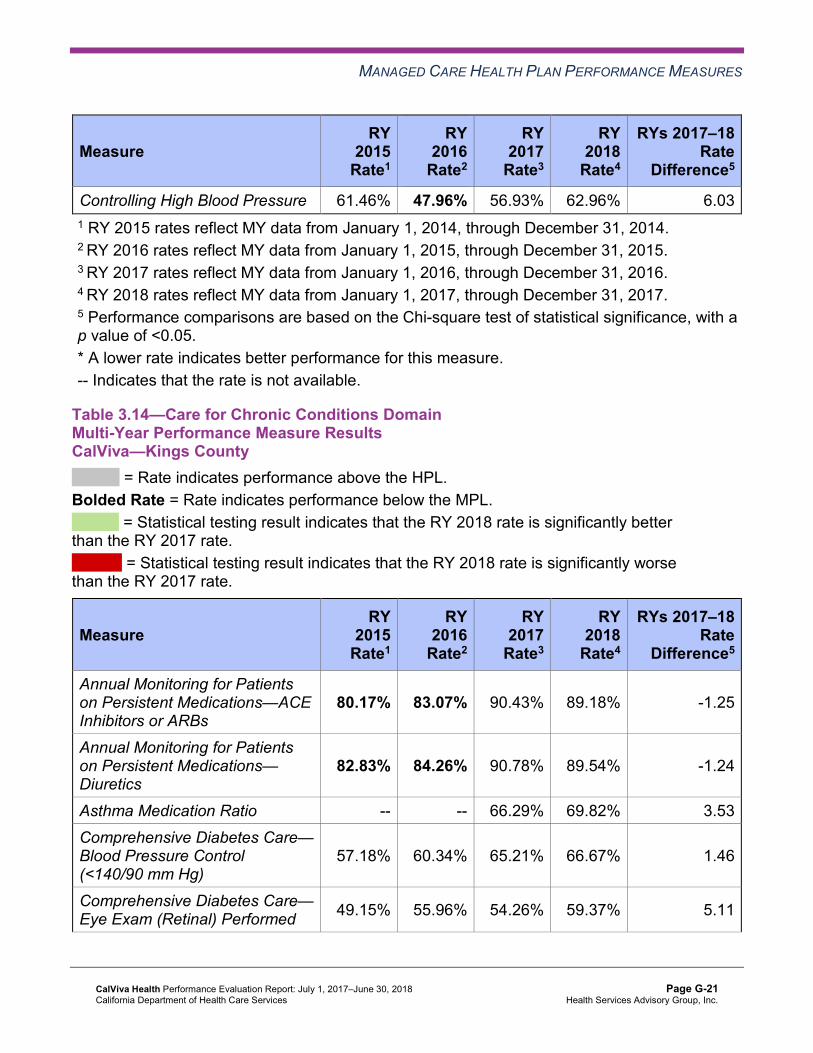
MANAGED CARE HEALTH PLAN PERFORMANCE MEASURES
Measure RY
2015 Rate1
RY 2016
Rate2
RY 2017
Rate3
RY 2018
Rate4
RYs 2017–18 Rate
Difference5
Controlling High Blood Pressure 61.46% 47.96% 56.93% 62.96% 6.03 1 RY 2015 rates reflect MY data from January 1, 2014, through December 31, 2014. 2 RY 2016 rates reflect MY data from January 1, 2015, through December 31, 2015. 3 RY 2017 rates reflect MY data from January 1, 2016, through December 31, 2016. 4 RY 2018 rates reflect MY data from January 1, 2017, through December 31, 2017. 5 Performance comparisons are based on the Chi-square test of statistical significance, with a p value of <0.05. * A lower rate indicates better performance for this measure. -- Indicates that the rate is not available.
Table 3.14—Care for Chronic Conditions Domain Multi-Year Performance Measure Results CalViva—Kings County
H = Rate indicates performance above the HPL. Bolded Rate = Rate indicates performance below the MPL.
B = Statistical testing result indicates that the RY 2018 rate is significantly better than the RY 2017 rate.
W = Statistical testing result indicates that the RY 2018 rate is significantly worse than the RY 2017 rate.
Measure RY
2015 Rate1
RY 2016
Rate2
RY 2017
Rate3
RY 2018
Rate4
RYs 2017–18 Rate
Difference5
Annual Monitoring for Patients on Persistent Medications—ACE Inhibitors or ARBs
80.17% 83.07% 90.43% 89.18% -1.25
Annual Monitoring for Patients on Persistent Medications— Diuretics
82.83% 84.26% 90.78% 89.54% -1.24
Asthma Medication Ratio -- -- 66.29% 69.82% 3.53 Comprehensive Diabetes Care— Blood Pressure Control (<140/90 mm Hg)
57.18% 60.34% 65.21% 66.67% 1.46
Comprehensive Diabetes Care— Eye Exam (Retinal) Performed 49.15% 55.96% 54.26% 59.37% 5.11
CalViva Health Performance Evaluation Report: July 1, 2017–June 30, 2018 California Department of Health Care Services
Page G-21 Health Services Advisory Group, Inc.

MANAGED CARE HEALTH PLAN PERFORMANCE MEASURES
Measure RY
2015 Rate1
RY 2016
Rate2
RY 2017
Rate3
RY 2018
Rate4
RYs 2017–18 Rate
Difference5
Comprehensive Diabetes Care— HbA1c Control (<8.0 Percent) 44.28% 42.34% 47.69% 51.58% 3.89
Comprehensive Diabetes Care— HbA1c Poor Control (>9.0 Percent)*
46.72% 47.69% 41.85% 35.04% -6.81B
Comprehensive Diabetes Care— HbA1c Testing 79.08% 76.64% 86.62% 89.05% 2.43
Comprehensive Diabetes Care— Medical Attention for Nephropathy
82.24% 91.97%H 91.97% 90.75% -1.22
Controlling High Blood Pressure 56.69% 58.77% 55.61% 55.77% 0.16 1 RY 2015 rates reflect MY data from January 1, 2014, through December 31, 2014. 2 RY 2016 rates reflect MY data from January 1, 2015, through December 31, 2015. 3 RY 2017 rates reflect MY data from January 1, 2016, through December 31, 2016. 4 RY 2018 rates reflect MY data from January 1, 2017, through December 31, 2017. 5 Performance comparisons are based on the Chi-square test of statistical significance, with a p value of <0.05. * A lower rate indicates better performance for this measure. -- Indicates that the rate is not available.
CalViva Health Performance Evaluation Report: July 1, 2017–June 30, 2018 California Department of Health Care Services
Page G-22 Health Services Advisory Group, Inc.

MANAGED CARE HEALTH PLAN PERFORMANCE MEASURES
Table 3.15—Care for Chronic Conditions Domain Multi-Year Performance Measure Results CalViva—Madera County
H = Rate indicates performance above the HPL. Bolded Rate = Rate indicates performance below the MPL.
B = Statistical testing result indicates that the RY 2018 rate is significantly better than the RY 2017 rate.
W = Statistical testing result indicates that the RY 2018 rate is significantly worse than the RY 2017 rate.
Measure RY
2015 Rate1
RY 2016
Rate2
RY 2017
Rate3
RY 2018
Rate4
RYs 2017–18 Rate
Difference5
Annual Monitoring for Patients on Persistent Medications— ACE Inhibitors or ARBs
86.14% 83.98% 82.64% 84.74% 2.10
Annual Monitoring for Patients on Persistent Medications— Diuretics
82.97% 83.57% 82.20% 84.88% 2.68
Asthma Medication Ratio -- -- 71.38%H 69.98% -1.40 Comprehensive Diabetes Care— Blood Pressure Control (<140/90 mm Hg)
67.40% 65.45% 67.15% 71.29% 4.14
Comprehensive Diabetes Care— Eye Exam (Retinal) Performed 63.02% 59.12% 66.42% 62.29% -4.13
Comprehensive Diabetes Care— HbA1c Control (<8.0 Percent) 50.12% 44.28% 49.39% 55.47% 6.08
Comprehensive Diabetes Care— HbA1c Poor Control (>9.0 Percent)*
38.44% 50.36% 43.31% 33.33% -9.98B
Comprehensive Diabetes Care— HbA1c Testing 88.32% 87.10% 86.62% 88.56% 1.94
Comprehensive Diabetes Care— Medical Attention for Nephropathy
83.45% 91.73%H 90.51% 91.48% 0.97
Controlling High Blood Pressure 62.93% 57.99% 59.80% 61.81% 2.01 1 RY 2015 rates reflect MY data from January 1, 2014, through December 31, 2014. 2 RY 2016 rates reflect MY data from January 1, 2015, through December 31, 2015. 3 RY 2017 rates reflect MY data from January 1, 2016, through December 31, 2016.
CalViva Health Performance Evaluation Report: July 1, 2017–June 30, 2018 California Department of Health Care Services
Page G-23 Health Services Advisory Group, Inc.
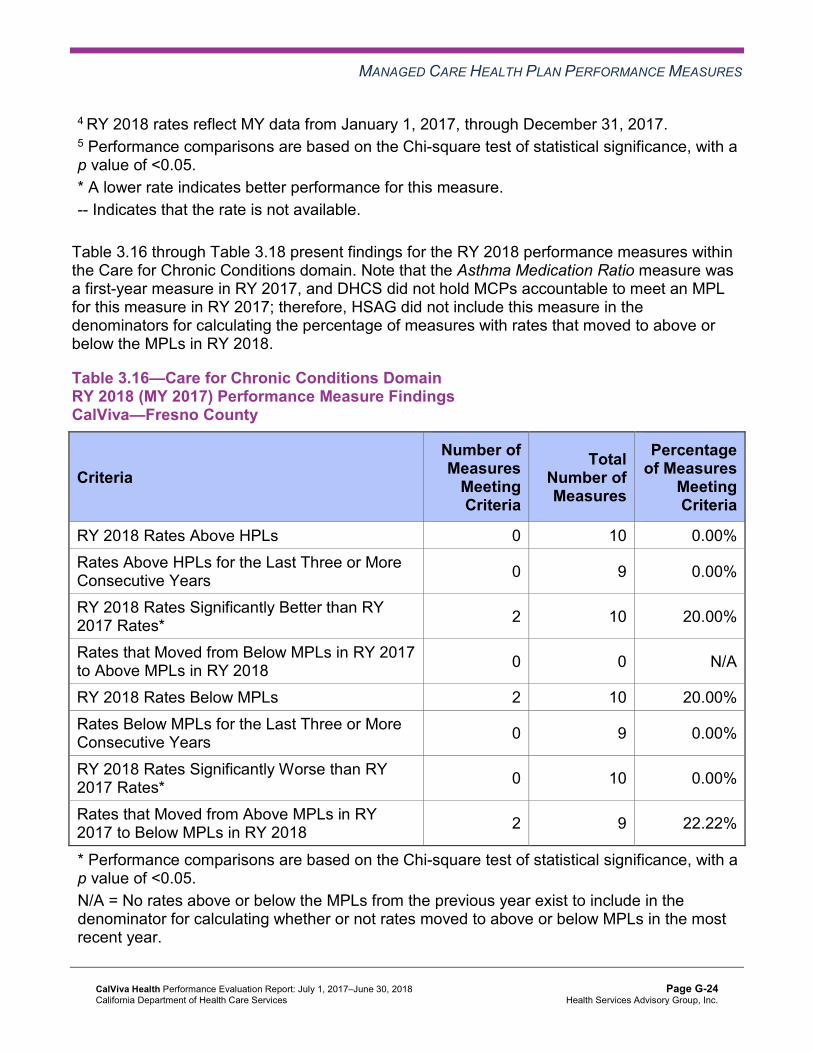
MANAGED CARE HEALTH PLAN PERFORMANCE MEASURES
4 RY 2018 rates reflect MY data from January 1, 2017, through December 31, 2017. 5 Performance comparisons are based on the Chi-square test of statistical significance, with a p value of <0.05. * A lower rate indicates better performance for this measure. -- Indicates that the rate is not available.
Table 3.16 through Table 3.18 present findings for the RY 2018 performance measures within the Care for Chronic Conditions domain. Note that the Asthma Medication Ratio measure was a first-year measure in RY 2017, and DHCS did not hold MCPs accountable to meet an MPL for this measure in RY 2017; therefore, HSAG did not include this measure in the denominators for calculating the percentage of measures with rates that moved to above or below the MPLs in RY 2018.
Table 3.16—Care for Chronic Conditions Domain RY 2018 (MY 2017) Performance Measure Findings CalViva—Fresno County
Criteria Number of Measures
MeetingCriteria
Total Number of Measures
Percentage of Measures
MeetingCriteria
RY 2018 Rates Above HPLs 0 10 0.00% Rates Above HPLs for the Last Three or More Consecutive Years 0 9 0.00%
RY 2018 Rates Significantly Better than RY 2017 Rates* 2 10 20.00%
Rates that Moved from Below MPLs in RY 2017 to Above MPLs in RY 2018 0 0 N/A
RY 2018 Rates Below MPLs 2 10 20.00% Rates Below MPLs for the Last Three or More Consecutive Years 0 9 0.00%
RY 2018 Rates Significantly Worse than RY 2017 Rates* 0 10 0.00%
Rates that Moved from Above MPLs in RY 2017 to Below MPLs in RY 2018 2 9 22.22%
* Performance comparisons are based on the Chi-square test of statistical significance, with a p value of <0.05. N/A = No rates above or below the MPLs from the previous year exist to include in the denominator for calculating whether or not rates moved to above or below MPLs in the most recent year.
CalViva Health Performance Evaluation Report: July 1, 2017–June 30, 2018 California Department of Health Care Services
Page G-24 Health Services Advisory Group, Inc.
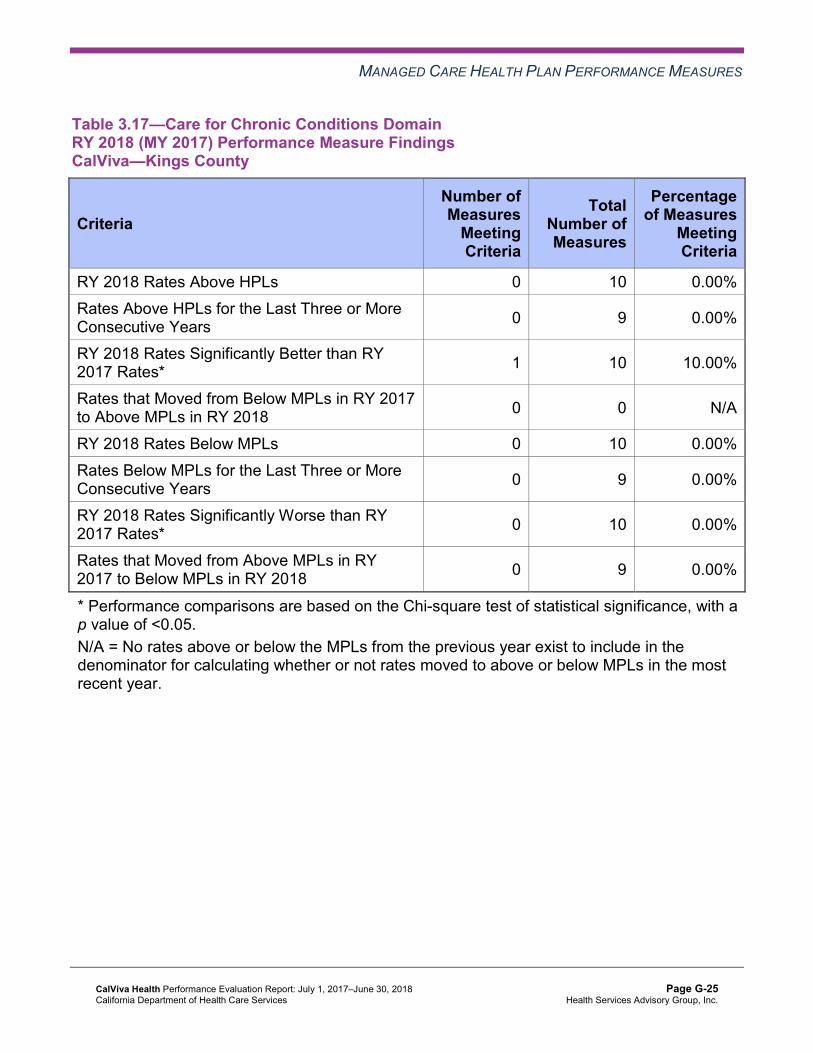
MANAGED CARE HEALTH PLAN PERFORMANCE MEASURES
Table 3.17—Care for Chronic Conditions Domain RY 2018 (MY 2017) Performance Measure Findings CalViva—Kings County
Criteria Number of Measures
MeetingCriteria
Total Number of Measures
Percentage of Measures
MeetingCriteria
RY 2018 Rates Above HPLs 0 10 0.00% Rates Above HPLs for the Last Three or More Consecutive Years 0 9 0.00%
RY 2018 Rates Significantly Better than RY 2017 Rates* 1 10 10.00%
Rates that Moved from Below MPLs in RY 2017 to Above MPLs in RY 2018 0 0 N/A
RY 2018 Rates Below MPLs 0 10 0.00% Rates Below MPLs for the Last Three or More Consecutive Years 0 9 0.00%
RY 2018 Rates Significantly Worse than RY 2017 Rates* 0 10 0.00%
Rates that Moved from Above MPLs in RY 2017 to Below MPLs in RY 2018 0 9 0.00%
* Performance comparisons are based on the Chi-square test of statistical significance, with a p value of <0.05. N/A = No rates above or below the MPLs from the previous year exist to include in the denominator for calculating whether or not rates moved to above or below MPLs in the most recent year.
CalViva Health Performance Evaluation Report: July 1, 2017–June 30, 2018 California Department of Health Care Services
Page G-25 Health Services Advisory Group, Inc.

MANAGED CARE HEALTH PLAN PERFORMANCE MEASURES
Table 3.18—Care for Chronic Conditions Domain RY 2018 (MY 2017) Performance Measure Findings CalViva—Madera County
Criteria Number of Measures
MeetingCriteria
Total Number of Measures
Percentage of Measures
MeetingCriteria
RY 2018 Rates Above HPLs 0 10 0.00% Rates Above HPLs for the Last Three or More Consecutive Years 0 9 0.00%
RY 2018 Rates Significantly Better than RY 2017 Rates* 1 10 10.00%
Rates that Moved from Below MPLs in RY 2017 to Above MPLs in RY 2018 0 2 0.00%
RY 2018 Rates Below MPLs 2 10 20.00% Rates Below MPLs for the Last Three or More Consecutive Years 2 9 22.22%
RY 2018 Rates Significantly Worse than RY 2017 Rates* 0 10 0.00%
Rates that Moved from Above MPLs in RY 2017 to Below MPLs in RY 2018 0 7 0.00%
* Performance comparisons are based on the Chi-square test of statistical significance, with a p value of <0.05.
Assessment of Improvement Plans—Care for Chronic Conditions
Based on RY 2017 performance measure results, CalViva was required to submit an IP for both Annual Monitoring for Patients on Persistent Medication measures for Madera County. CalViva conducted two PDSA cycles to improve the MCP’s performance on both measures in Madera County.
Plan-Do-Study-Act Cycle 1
CalViva tested whether or not distributing a gaps-in-care list to the clinic partner would result in the clinic staff members contacting beneficiaries about obtaining their required lab tests or scheduling their appointments. The MCP reported learning that reconciling the list of beneficiaries with the claims and eligibility data prior to sending the gaps-in-care list to the clinic enabled the MCP to ensure that the list only included beneficiaries in need of lab tests or appointments.
CalViva Health Performance Evaluation Report: July 1, 2017–June 30, 2018 California Department of Health Care Services
Page G-26 Health Services Advisory Group, Inc.

MANAGED CARE HEALTH PLAN PERFORMANCE MEASURES
Plan-Do-Study-Act Cycle 2
CalViva tested whether or not using text messaging to remind beneficiaries of their annual lab tests, in combination with offering beneficiaries an incentive, would improve beneficiaries’ compliance with obtaining needed lab tests. The MCP reported learning that having the clinic reconcile the beneficiaries’ phone numbers with the local pharmacy increased the number of mobile phone numbers available for inclusion in the texting campaign.
Although the MCP met the SMART (Specific, Measurable, Achievable, Relevant, and Time-bound) objective for each PDSA cycle, the rates for both Annual Monitoring for Patients on Persistent Medication measures in Madera County remained below the MPLs in RY 2018.
Appropriate Treatment and Utilization
Table 3.19 through Table 3.21 present the four-year trending information for the performance measures within the Appropriate Treatment and Utilization domain.
Note the following regarding Table 3.19 through Table 3.21:
♦ The All-Cause Readmissions measure is a non-HEDIS measure originally developed for DHCS’ All-Cause Readmissions collaborative quality improvement project (QIP); therefore, DHCS does not establish an HPL or MPL for this measure. For the All-Cause Readmissions measure, a lower rate indicates better performance (i.e., fewer readmissions).
♦ The two Ambulatory Care measures are utilization measures, which measure the volume of services used. DHCS does not hold MCPs accountable to meet MPLs for utilization measures, and HSAG does not compare performance for these measures against HPLs and MPLs. Additionally, because high and low rates do not necessarily indicate better or worse performance, HSAG did not compare performance for these measures across years.
♦ DHCS established no HPL or MPL for the two Depression Screening and Follow-Up for Adolescents and Adults measures for RY 2018 because no comparable benchmarks exist. Additionally, although MCPs reported the two Depression Screening and Follow-Up for Adolescents and Adults measures for RY 2018, HSAG does not present the performance measure results for these measures in this report because the reported rates do not accurately represent services being provided. This is due to the Depression Screening and Follow-Up for Adolescents and Adults measures being new HEDIS measures for RY 2018, NCQA requiring MCPs to submit rates for these measures using the new Electronic Clinical Data Systems (ECDS) reporting methodology, and inconsistent data reporting processes by calculation vendors. Thus, MCPs experienced numerous challenges obtaining data sources to use for ECDS reporting. DHCS and HSAG, in consultation with NCQA, will work with MCPs to improve data capture for RY 2019.
♦ Note that due to changes that NCQA made to the specifications for the Use of Imaging Studies for Low Back Pain measure in RY 2018, NCQA released guidance to exercise caution when trending the results for this measure. Therefore, caution should be used when
CalViva Health Performance Evaluation Report: July 1, 2017–June 30, 2018 California Department of Health Care Services
Page G-27 Health Services Advisory Group, Inc.

MANAGED CARE HEALTH PLAN PERFORMANCE MEASURES
comparing MCP performance across years or when comparing MCP results to benchmarks related to the Use of Imaging Studies for Low Back Pain measure, as differences in rates may be a result of the specification changes rather than a reflection of performance.
Table 3.19—Appropriate Treatment and Utilization DomainMulti-Year Performance Measure Results CalViva—Fresno County
H = Rate indicates performance above the HPL. Bolded Rate = Rate indicates performance below the MPL.
B = Statistical testing result indicates that the RY 2018 rate is significantly better than the RY 2017 rate.
W = Statistical testing result indicates that the RY 2018 rate is significantly worse than the RY 2017 rate.
Measure RY
2015 Rate1
RY 2016
Rate2
RY 2017
Rate3
RY 2018
Rate4
RYs 2017–18 Rate
Difference5
All-Cause Readmissions* 17.43% 17.90% 15.52% 15.94% 0.42 Ambulatory Care—Emergency Department (ED) Visits per 1,000 Member Months**
31.76 52.99 51.53 52.57 Not Tested
Ambulatory Care—Outpatient Visits per 1,000 Member Months**
298.94 363.32 341.77 339.01 Not Tested
Avoidance of Antibiotic Treatment in Adults With Acute Bronchitis
40.38%H 37.62% 35.34% 31.72% -3.62W
Use of Imaging Studies for Low Back Pain^ 77.90% 76.03% 70.65% 74.27% 3.62B
1 RY 2015 rates reflect MY data from January 1, 2014, through December 31, 2014. 2 RY 2016 rates reflect MY data from January 1, 2015, through December 31, 2015. 3 RY 2017 rates reflect MY data from January 1, 2016, through December 31, 2016. 4 RY 2018 rates reflect MY data from January 1, 2017, through December 31, 2017. 5 Performance comparisons are based on the Chi-square test of statistical significance, with a p value of <0.05. * A lower rate indicates better performance for this measure. ** Member months are a member's “contribution” to the total yearly membership. ^ Caution should be exercised when assessing MCP performance for this measure given the changes that NCQA made to the specification for this measure for RY 2018. Not Tested = An RY 2017–18 rate difference was not calculated because high and low rates do not necessarily indicate better or worse performance.
CalViva Health Performance Evaluation Report: July 1, 2017–June 30, 2018 California Department of Health Care Services
Page G-28 Health Services Advisory Group, Inc.

MANAGED CARE HEALTH PLAN PERFORMANCE MEASURES
Table 3.20—Appropriate Treatment and Utilization DomainMulti-Year Performance Measure Results CalViva—Kings County
H = Rate indicates performance above the HPL. Bolded Rate = Rate indicates performance below the MPL.
B = Statistical testing result indicates that the RY 2018 rate is significantly better than the RY 2017 rate.
W = Statistical testing result indicates that the RY 2018 rate is significantly worse than the RY 2017 rate.
Measure RY
2015 Rate1
RY 2016
Rate2
RY 2017
Rate3
RY 2018
Rate4
RYs 2017–18 Rate
Difference5
All-Cause Readmissions* 13.94% 12.87% 11.88% 10.81% -1.07 Ambulatory Care—Emergency Department (ED) Visits per 1,000 Member Months**
40.29 65.99 63.76 60.98 Not Tested
Ambulatory Care—Outpatient Visits per 1,000 Member Months**
289.58 369.80 365.98 370.86 Not Tested
Avoidance of Antibiotic Treatment in Adults With Acute Bronchitis
27.37% 21.38% 29.56% 35.29% 5.73
Use of Imaging Studies for Low Back Pain^ 75.11% 72.87% 75.50% 85.89%H 10.39B
1 RY 2015 rates reflect MY data from January 1, 2014, through December 31, 2014. 2 RY 2016 rates reflect MY data from January 1, 2015, through December 31, 2015. 3 RY 2017 rates reflect MY data from January 1, 2016, through December 31, 2016. 4 RY 2018 rates reflect MY data from January 1, 2017, through December 31, 2017. 5 Performance comparisons are based on the Chi-square test of statistical significance, with a p value of <0.05. * A lower rate indicates better performance for this measure. ** Member months are a member's “contribution” to the total yearly membership. ^ Caution should be exercised when assessing MCP performance for this measure given the changes that NCQA made to the specification for this measure for RY 2018. Not Tested = An RY 2017–18 rate difference was not calculated because high and low rates do not necessarily indicate better or worse performance.
CalViva Health Performance Evaluation Report: July 1, 2017–June 30, 2018 California Department of Health Care Services
Page G-29 Health Services Advisory Group, Inc.

MANAGED CARE HEALTH PLAN PERFORMANCE MEASURES
Table 3.21—Appropriate Treatment and Utilization DomainMulti-Year Performance Measure Results CalViva—Madera County
H = Rate indicates performance above the HPL. Bolded Rate = Rate indicates performance below the MPL.
B = Statistical testing result indicates that the RY 2018 rate is significantly better than the RY 2017 rate.
W = Statistical testing result indicates that the RY 2018 rate is significantly worse than the RY 2017 rate.
Measure RY
2015 Rate1
RY 2016
Rate2
RY 2017
Rate3
RY 2018
Rate4
RYs 2017–18 Rate
Difference5
All-Cause Readmissions* 15.51% 14.22% 13.11% 11.97% -1.14 Ambulatory Care—Emergency Department (ED) Visits per 1,000 Member Months**
30.91 49.44 50.13 49.82 Not Tested
Ambulatory Care—Outpatient Visits per 1,000 Member Months**
327.12 396.51 379.96 353.68 Not Tested
Avoidance of Antibiotic Treatment in Adults With Acute Bronchitis
20.65% 19.69% 18.26% 24.58% 6.32
Use of Imaging Studies for Low Back Pain^ 74.24% 74.17% 66.67% 75.64% 8.97B
1 RY 2015 rates reflect MY data from January 1, 2014, through December 31, 2014. 2 RY 2016 rates reflect MY data from January 1, 2015, through December 31, 2015. 3 RY 2017 rates reflect MY data from January 1, 2016, through December 31, 2016. 4 RY 2018 rates reflect MY data from January 1, 2017, through December 31, 2017. 5 Performance comparisons are based on the Chi-square test of statistical significance, with a p value of <0.05. * A lower rate indicates better performance for this measure. ** Member months are a member's “contribution” to the total yearly membership. ^ Caution should be exercised when assessing MCP performance for this measure given the changes that NCQA made to the specification for this measure for RY 2018. Not Tested = An RY 2017–18 rate difference was not calculated because high and low rates do not necessarily indicate better or worse performance.
CalViva Health Performance Evaluation Report: July 1, 2017–June 30, 2018 California Department of Health Care Services
Page G-30 Health Services Advisory Group, Inc.

MANAGED CARE HEALTH PLAN PERFORMANCE MEASURES
Table 3.22 through Table 3.24 present findings for the RY 2018 performance measures within the Appropriate Treatment and Utilization domain. DHCS did not hold MCPs accountable to meet MPLs for the following measures within this domain; therefore, HSAG did not include these measures in its assessment of the MCP’s performance related to HPLs and MPLs:
♦ All-Cause Readmissions ♦ Both Ambulatory Care measures
Table 3.22—Appropriate Treatment and Utilization DomainRY 2018 (MY 2017) Performance Measure Findings CalViva—Fresno County
Criteria Number of Measures
MeetingCriteria
Total Number of Measures
Percentage of Measures
MeetingCriteria
RY 2018 Rates Above HPLs 0 2 0.00% Rates Above HPLs for the Last Three or More Consecutive Years 0 2 0.00%
RY 2018 Rates Significantly Better than RY 2017 Rates* 1 3 33.33%
Rates that Moved from Below MPLs in RY 2017 to Above MPLs in RY 2018 0 0 N/A
RY 2018 Rates Below MPLs 0 2 0.00% Rates Below MPLs for the Last Three or More Consecutive Years 0 2 0.00%
RY 2018 Rates Significantly Worse than RY 2017 Rates* 1 3 33.33%
Rates that Moved from Above MPLs in RY 2017 to Below MPLs in RY 2018 0 2 0.00%
* Performance comparisons are based on the Chi-square test of statistical significance, with a p value of <0.05. N/A = No rates above or below the MPLs from the previous year exist to include in the denominator for calculating whether or not rates moved to above or below MPLs in the most recent year.
CalViva Health Performance Evaluation Report: July 1, 2017–June 30, 2018 California Department of Health Care Services
Page G-31 Health Services Advisory Group, Inc.

MANAGED CARE HEALTH PLAN PERFORMANCE MEASURES
Table 3.23—Appropriate Treatment and Utilization DomainRY 2018 (MY 2017) Performance Measure Findings CalViva—Kings County
Criteria Number of Measures
MeetingCriteria
Total Number of Measures
Percentage of Measures
MeetingCriteria
RY 2018 Rates Above HPLs 1 2 50.00% Rates Above HPLs for the Last Three or More Consecutive Years 0 2 0.00%
RY 2018 Rates Significantly Better than RY 2017 Rates* 1 3 33.33%
Rates that Moved from Below MPLs in RY 2017 to Above MPLs in RY 2018 0 0 N/A
RY 2018 Rates Below MPLs 0 2 0.00% Rates Below MPLs for the Last Three or More Consecutive Years 0 2 0.00%
RY 2018 Rates Significantly Worse than RY 2017 Rates* 0 3 0.00%
Rates that Moved from Above MPLs in RY 2017 to Below MPLs in RY 2018 0 2 0.00%
* Performance comparisons are based on the Chi-square test of statistical significance, with a p value of <0.05. N/A = No rates above or below the MPLs from the previous year exist to include in the denominator for calculating whether or not rates moved to above or below MPLs in the most recent year.
CalViva Health Performance Evaluation Report: July 1, 2017–June 30, 2018 California Department of Health Care Services
Page G-32 Health Services Advisory Group, Inc.
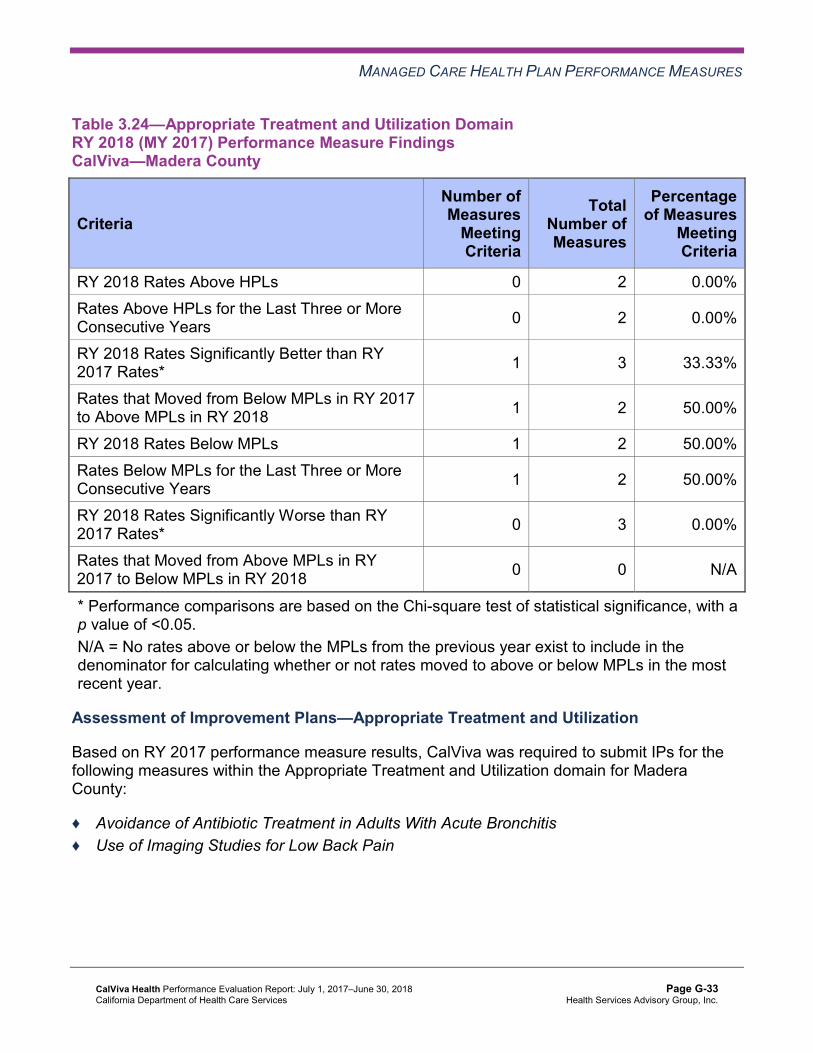
MANAGED CARE HEALTH PLAN PERFORMANCE MEASURES
Table 3.24—Appropriate Treatment and Utilization DomainRY 2018 (MY 2017) Performance Measure Findings CalViva—Madera County
Criteria Number of Measures
MeetingCriteria
Total Number of Measures
Percentage of Measures
MeetingCriteria
RY 2018 Rates Above HPLs 0 2 0.00% Rates Above HPLs for the Last Three or More Consecutive Years 0 2 0.00%
RY 2018 Rates Significantly Better than RY 2017 Rates* 1 3 33.33%
Rates that Moved from Below MPLs in RY 2017 to Above MPLs in RY 2018 1 2 50.00%
RY 2018 Rates Below MPLs 1 2 50.00% Rates Below MPLs for the Last Three or More Consecutive Years 1 2 50.00%
RY 2018 Rates Significantly Worse than RY 2017 Rates* 0 3 0.00%
Rates that Moved from Above MPLs in RY 2017 to Below MPLs in RY 2018 0 0 N/A
* Performance comparisons are based on the Chi-square test of statistical significance, with a p value of <0.05. N/A = No rates above or below the MPLs from the previous year exist to include in the denominator for calculating whether or not rates moved to above or below MPLs in the most recent year.
Assessment of Improvement Plans—Appropriate Treatment and Utilization
Based on RY 2017 performance measure results, CalViva was required to submit IPs for the following measures within the Appropriate Treatment and Utilization domain for Madera County:
♦ Avoidance of Antibiotic Treatment in Adults With Acute Bronchitis ♦ Use of Imaging Studies for Low Back Pain
CalViva Health Performance Evaluation Report: July 1, 2017–June 30, 2018 California Department of Health Care Services
Page G-33 Health Services Advisory Group, Inc.

MANAGED CARE HEALTH PLAN PERFORMANCE MEASURES
Avoidance of Antibiotic Treatment in Adults With Acute Bronchitis
DHCS required CalViva to submit a QI Summary describing the MCP’s efforts to address the rate being below the MPL for the Avoidance of Antibiotic Treatment in Adults With Acute Bronchitis measure in Madera County. CalViva reported conducting the following interventions:
♦ Participated in the Alliance Working for Antibiotic Resistance Education (AWARE) initiative, and distributed the AWARE toolkit to high-prescribing providers.
♦ Conducted quarterly provider education “Lunch and Learn” events at clinic sites in each county.
♦ Included on prescription bag labels educational messages about the appropriate use of antibiotics and recommended care tips for adults with acute bronchitis.
CalViva reported learning that the AWARE project’s interventions were limited to physicians. CalViva drilled further into the data to identify mid-level clinicians (e.g., nurse practitioners, physicians assistants) who were also potentially high-prescribers of antibiotics so that the MCP could ensure that these mid-level clinicians also received the AWARE toolkits.
The rate remained below the MPL in RY 2018 for the Avoidance of Antibiotic Treatment in Adults With Acute Bronchitis measure in Madera County.
Use of Imaging Studies for Low Back Pain
CalViva conducted two PDSA cycles to improve the MCP’s performance on the Use of Imaging Studies for Low Back Pain measure in Madera County.
For the first PDSA cycle, CalViva tested whether or not conducting a mandatory training for all outpatient clinic providers would increase the providers’ knowledge of the recommended use of imaging studies and initial treatment of uncomplicated low back pain. CalViva reported learning that conducting a mandatory training resulted in most clinic providers being trained.
For the second PDSA cycle, CalViva tested whether or not conducting a mandatory training for all outpatient clinic providers in combination with giving the providers a “Low Back Pain Tip Sheet” that included definitions, best practices, and a recommended treatment plan would result in the providers changing their clinical practices and increase providers’ compliance with the treatment guidelines for low back pain. CalViva reported learning that active participation of the clinic’s chief medical officer and quality improvement lead served as a model for providers’ behavior changes.
The rate improved significantly from RY 2017 to RY 2018 for the Use of Imaging Studies for Low Back Pain measure in Madera County, resulting in the rate moving to above the MPL in RY 2018.
CalViva Health Performance Evaluation Report: July 1, 2017–June 30, 2018 California Department of Health Care Services
Page G-34 Health Services Advisory Group, Inc.

MANAGED CARE HEALTH PLAN PERFORMANCE MEASURES
Performance Measure Findings—All Domains
Table 3.25 through Table 3.27 present a summary of CalViva’s RY 2018 performance across all External Accountability Set (EAS) measures.
Note the following regarding Table 3.25 through Table 3.27:
♦ DHCS did not hold MCPs accountable to meet MPLs for the following measures; therefore, HSAG did not include these measures in its assessment of the MCP’s performance related to HPLs and MPLs: ■ All-Cause Readmissions ■ Both Ambulatory Care measures ■ All four Children and Adolescents’ Access to Primary Care measures
♦ DHCS did not hold MCPs accountable to meet MPLs for the following measures in RY 2017; therefore, HSAG did not include these measures in the denominators for calculating the percentage of measures with rates that moved to above or below the MPLs in RY 2018 and for calculating the percentage of measures with rates below MPLs for only the last two consecutive years: ■ Asthma Medication Ratio ■ Breast Cancer Screening ■ Immunizations for Adolescents—Combination 2
Table 3.25—RY 2018 (MY 2017) Performance Measure Findings for All Domains CalViva—Fresno County
Criteria Number of Measures
MeetingCriteria
Total Number of Measures
Percentage of Measures
MeetingCriteria
RY 2018 Rates Above HPLs 1 21 4.76% Rates Above HPLs for the Last Three or More Consecutive Years 0 18 0.00%
RY 2018 Rates Significantly Better than RY 2017 Rates* 5 22 22.73%
Rates that Moved from Below MPLs in RY 2017 to Above MPLs in RY 2018 0 0 N/A
RY 2018 Rates Below MPLs 3 21 14.29% Rates Below MPLs for Only the Last Two Consecutive Years 0 18 0.00%
CalViva Health Performance Evaluation Report: July 1, 2017–June 30, 2018 California Department of Health Care Services
Page G-35 Health Services Advisory Group, Inc.
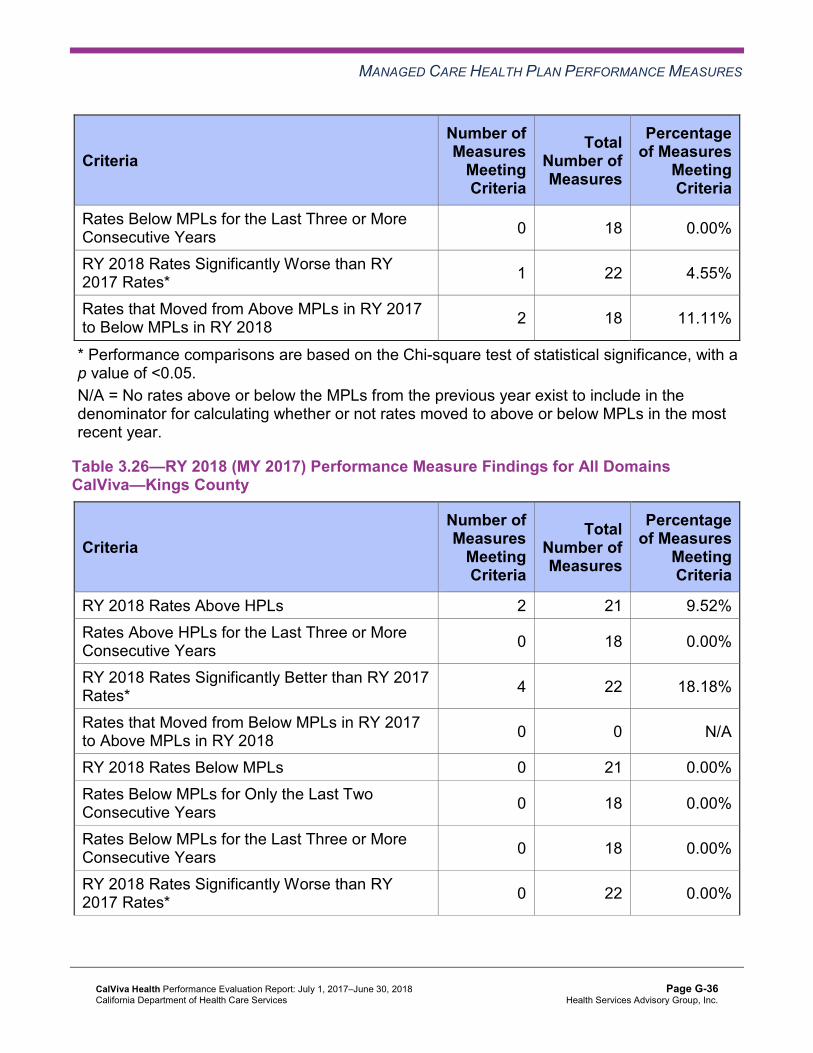
MANAGED CARE HEALTH PLAN PERFORMANCE MEASURES
Criteria Number of Measures
MeetingCriteria
Total Number of Measures
Percentage of Measures
MeetingCriteria
Rates Below MPLs for the Last Three or More Consecutive Years 0 18 0.00%
RY 2018 Rates Significantly Worse than RY 2017 Rates* 1 22 4.55%
Rates that Moved from Above MPLs in RY 2017 to Below MPLs in RY 2018 2 18 11.11%
* Performance comparisons are based on the Chi-square test of statistical significance, with a p value of <0.05. N/A = No rates above or below the MPLs from the previous year exist to include in the denominator for calculating whether or not rates moved to above or below MPLs in the most recent year.
Table 3.26—RY 2018 (MY 2017) Performance Measure Findings for All Domains CalViva—Kings County
Criteria Number of Measures
MeetingCriteria
Total Number of Measures
Percentage of Measures
MeetingCriteria
RY 2018 Rates Above HPLs 2 21 9.52% Rates Above HPLs for the Last Three or More Consecutive Years 0 18 0.00%
RY 2018 Rates Significantly Better than RY 2017 Rates* 4 22 18.18%
Rates that Moved from Below MPLs in RY 2017 to Above MPLs in RY 2018 0 0 N/A
RY 2018 Rates Below MPLs 0 21 0.00% Rates Below MPLs for Only the Last Two Consecutive Years 0 18 0.00%
Rates Below MPLs for the Last Three or More Consecutive Years 0 18 0.00%
RY 2018 Rates Significantly Worse than RY 2017 Rates* 0 22 0.00%
CalViva Health Performance Evaluation Report: July 1, 2017–June 30, 2018 California Department of Health Care Services
Page G-36 Health Services Advisory Group, Inc.

MANAGED CARE HEALTH PLAN PERFORMANCE MEASURES
Criteria Number of Measures
MeetingCriteria
Total Number of Measures
Percentage of Measures
MeetingCriteria
Rates that Moved from Above MPLs in RY 2017 to Below MPLs in RY 2018 0 18 0.00%
* Performance comparisons are based on the Chi-square test of statistical significance, with a p value of <0.05. N/A = No rates above or below the MPLs from the previous year exist to include in the denominator for calculating whether or not rates moved to above or below MPLs in the most recent year.
Table 3.27—RY 2018 (MY 2017) Performance Measure Findings for All Domains CalViva—Madera County
C = For this reporting unit, DHCS issued a CAP to the MCP due to either (1) three or more EAS measures for which MCPs are held accountable to meet the MPLs having rates below the MPLs for the last three or more consecutive years, or (2) greater than 50 percent of EAS measures for which MCPs are held accountable to meet the MPLs having rates below the MPLs in the most recent year.
Criteria Number of Measures
MeetingCriteria
Total Number of Measures
Percentage of Measures
MeetingCriteria
RY 2018 Rates Above HPLs 4 21 19.05% Rates Above HPLs for the Last Three or More Consecutive Years 3 18 16.67%
RY 2018 Rates Significantly Better than RY 2017 Rates* 3 22 13.64%
Rates that Moved from Below MPLs in RY 2017 to Above MPLs in RY 2018 1 4 25.00%
RY 2018 Rates Below MPLs 3 21 14.29% Rates Below MPLs for Only the Last Two Consecutive Years 0 18 0.00%
Rates Below MPLs for the Last Three or More Consecutive Years 3 18 16.67%C
RY 2018 Rates Significantly Worse than RY 2017 Rates* 0 22 0.00%
CalViva Health Performance Evaluation Report: July 1, 2017–June 30, 2018 California Department of Health Care Services
Page G-37 Health Services Advisory Group, Inc.
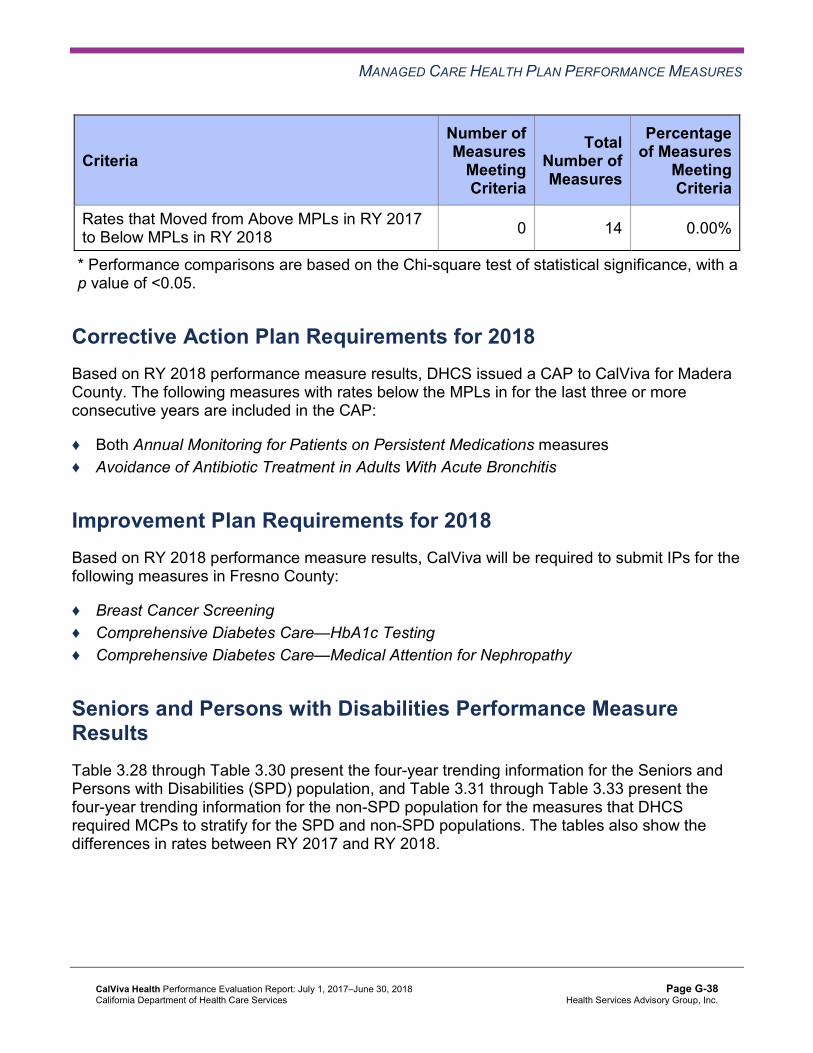
MANAGED CARE HEALTH PLAN PERFORMANCE MEASURES
Criteria Number of Measures
MeetingCriteria
Total Number of Measures
Percentage of Measures
MeetingCriteria
Rates that Moved from Above MPLs in RY 2017 to Below MPLs in RY 2018 0 14 0.00%
* Performance comparisons are based on the Chi-square test of statistical significance, with a p value of <0.05.
Corrective Action Plan Requirements for 2018 Based on RY 2018 performance measure results, DHCS issued a CAP to CalViva for Madera County. The following measures with rates below the MPLs in for the last three or more consecutive years are included in the CAP:
♦ Both Annual Monitoring for Patients on Persistent Medications measures ♦ Avoidance of Antibiotic Treatment in Adults With Acute Bronchitis
Improvement Plan Requirements for 2018 Based on RY 2018 performance measure results, CalViva will be required to submit IPs for the following measures in Fresno County:
♦ Breast Cancer Screening ♦ Comprehensive Diabetes Care—HbA1c Testing ♦ Comprehensive Diabetes Care—Medical Attention for Nephropathy
Seniors and Persons with Disabilities Performance Measure Results Table 3.28 through Table 3.30 present the four-year trending information for the Seniors and Persons with Disabilities (SPD) population, and Table 3.31 through Table 3.33 present the four-year trending information for the non-SPD population for the measures that DHCS required MCPs to stratify for the SPD and non-SPD populations. The tables also show the differences in rates between RY 2017 and RY 2018.
CalViva Health Performance Evaluation Report: July 1, 2017–June 30, 2018 California Department of Health Care Services
Page G-38 Health Services Advisory Group, Inc.

MANAGED CARE HEALTH PLAN PERFORMANCE MEASURES
Table 3.34 through Table 3.36 present the SPD and non-SPD rates, a comparison of the SPD and non-SPD rates,5 and the total combined rate for each measure.
Table 3.28—Multi-Year SPD Performance Measure Trend Table CalViva—Fresno County
B = Statistical testing result indicates that the RY 2018 SPD rate is significantly better than the RY 2017 SPD rate.
W = Statistical testing result indicates that the RY 2018 SPD rate is significantly worse than the RY 2017 SPD rate.
Measure RY
2015 SPD
Rate1
RY 2016 SPD
Rate2
RY 2017 SPD
Rate3
RY 2018 SPD
Rate4
RYs 2017–18 Rate
Difference5
All-Cause Readmissions* 20.99% 25.64% 22.54% 22.37% -0.17 Ambulatory Care—Emergency Department (ED) Visits per 1,000 Member Months**
40.72 81.25 76.74 77.45 Not Tested
Ambulatory Care—Outpatient Visits per 1,000 Member Months**
336.48 560.97 522.46 533.83 Not Tested
Annual Monitoring for Patients on Persistent Medications— ACE Inhibitors or ARBs
86.47% 87.15% 87.62% 88.53% 0.91
Annual Monitoring for Patients on Persistent Medications— Diuretics
87.20% 88.96% 88.20% 90.10% 1.90
Children and Adolescents' Access to Primary Care Practitioners—12–24 Months
80.95% 92.86% 91.67% NA Not Comparable
Children and Adolescents' Access to Primary Care Practitioners— 25 Months–6 Years
89.91% 86.16% 85.73% 91.35% 5.62B
Children and Adolescents' Access to Primary Care Practitioners—7–11 Years
93.95% 91.31% 91.24% 91.66% 0.42
5 HSAG calculated statistical significance between the SPD and non-SPD rates for each measure using a Chi-square test. This information is displayed in the “SPD/Non-SPD Rate Difference” column in Table 3.34 through Table 3.36.
CalViva Health Performance Evaluation Report: July 1, 2017–June 30, 2018 California Department of Health Care Services
Page G-39 Health Services Advisory Group, Inc.
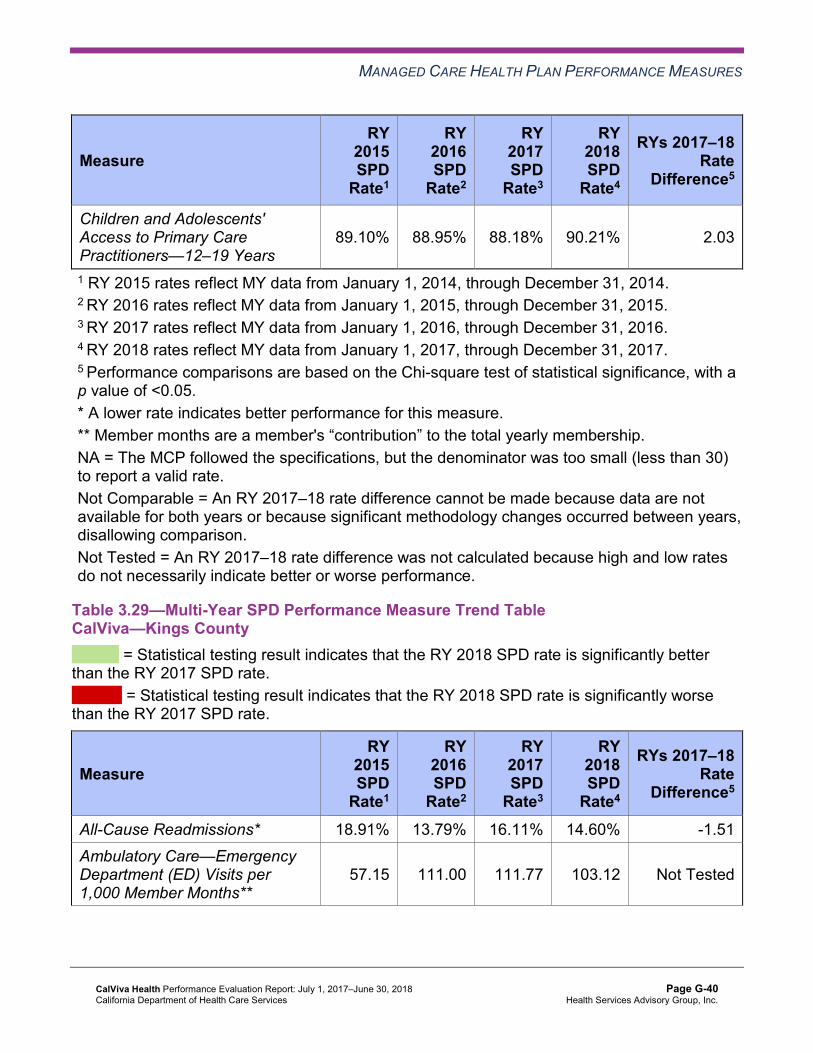
MANAGED CARE HEALTH PLAN PERFORMANCE MEASURES
Measure RY
2015 SPD
Rate1
RY 2016 SPD
Rate2
RY 2017 SPD
Rate3
RY 2018 SPD
Rate4
RYs 2017–18 Rate
Difference5
Children and Adolescents' Access to Primary Care Practitioners—12–19 Years
89.10% 88.95% 88.18% 90.21% 2.03
1 RY 2015 rates reflect MY data from January 1, 2014, through December 31, 2014. 2 RY 2016 rates reflect MY data from January 1, 2015, through December 31, 2015. 3 RY 2017 rates reflect MY data from January 1, 2016, through December 31, 2016. 4 RY 2018 rates reflect MY data from January 1, 2017, through December 31, 2017. 5 Performance comparisons are based on the Chi-square test of statistical significance, with a p value of <0.05. * A lower rate indicates better performance for this measure. ** Member months are a member's “contribution” to the total yearly membership. NA = The MCP followed the specifications, but the denominator was too small (less than 30) to report a valid rate. Not Comparable = An RY 2017–18 rate difference cannot be made because data are not available for both years or because significant methodology changes occurred between years, disallowing comparison. Not Tested = An RY 2017–18 rate difference was not calculated because high and low rates do not necessarily indicate better or worse performance.
Table 3.29—Multi-Year SPD Performance Measure Trend Table CalViva—Kings County
B = Statistical testing result indicates that the RY 2018 SPD rate is significantly better than the RY 2017 SPD rate.
W = Statistical testing result indicates that the RY 2018 SPD rate is significantly worse than the RY 2017 SPD rate.
Measure RY
2015 SPD
Rate1
RY 2016 SPD
Rate2
RY 2017 SPD
Rate3
RY 2018 SPD
Rate4
RYs 2017–18 Rate
Difference5
All-Cause Readmissions* 18.91% 13.79% 16.11% 14.60% -1.51 Ambulatory Care—Emergency Department (ED) Visits per 1,000 Member Months**
57.15 111.00 111.77 103.12 Not Tested
CalViva Health Performance Evaluation Report: July 1, 2017–June 30, 2018 California Department of Health Care Services
Page G-40 Health Services Advisory Group, Inc.

MANAGED CARE HEALTH PLAN PERFORMANCE MEASURES
Measure RY
2015 SPD
Rate1
RY 2016 SPD
Rate2
RY 2017 SPD
Rate3
RY 2018 SPD
Rate4
RYs 2017–18 Rate
Difference5
Ambulatory Care—Outpatient Visits per 1,000 Member Months**
399.51 654.22 629.67 665.82 Not Tested
Annual Monitoring for Patients on Persistent Medications— |ACE Inhibitors or ARBs
85.09% 86.88% 91.70% 92.47% 0.77
Annual Monitoring for Patients on Persistent Medications— Diuretics
90.30% 85.82% 95.04% 93.66% -1.38
Children and Adolescents' Access to Primary Care Practitioners—12–24 Months
NA NA NA NA Not Comparable
Children and Adolescents' Access to Primary Care Practitioners— 25 Months–6 Years
81.82% 83.95% 78.08% 84.06% 5.98
Children and Adolescents' Access to Primary Care Practitioners—7–11 Years
91.11% 82.69% 88.50% 85.58% -2.92
Children and Adolescents' Access to Primary Care Practitioners—12–19 Years
88.24% 86.79% 88.27% 86.47% -1.80
1 RY 2015 rates reflect MY data from January 1, 2014, through December 31, 2014. 2 RY 2016 rates reflect MY data from January 1, 2015, through December 31, 2015. 3 RY 2017 rates reflect MY data from January 1, 2016, through December 31, 2016. 4 RY 2018 rates reflect MY data from January 1, 2017, through December 31, 2017. 5 Performance comparisons are based on the Chi-square test of statistical significance, with a p value of <0.05. * A lower rate indicates better performance for this measure. ** Member months are a member's “contribution” to the total yearly membership. NA = The MCP followed the specifications, but the denominator was too small (less than 30) to report a valid rate. Not Comparable = An RY 2017–18 rate difference cannot be made because data are not available for both years or because significant methodology changes occurred between years, disallowing comparison. Not Tested = An RY 2017–18 rate difference was not calculated because high and low rates do not necessarily indicate better or worse performance.
CalViva Health Performance Evaluation Report: July 1, 2017–June 30, 2018 California Department of Health Care Services
Page G-41 Health Services Advisory Group, Inc.

MANAGED CARE HEALTH PLAN PERFORMANCE MEASURES
Table 3.30—Multi-Year SPD Performance Measure Trend Table CalViva—Madera County
B = Statistical testing result indicates that the RY 2018 SPD rate is significantly better than the RY 2017 SPD rate.
W = Statistical testing result indicates that the RY 2018 SPD rate is significantly worse than the RY 2017 SPD rate.
Measure RY
2015 SPD
Rate1
RY 2016 SPD
Rate2
RY 2017 SPD
Rate3
RY 2018 SPD
Rate4
RYs 2017–18 Rate
Difference5
All-Cause Readmissions* 20.61% 22.71% 16.77% 21.33% 4.56 Ambulatory Care—Emergency Department (ED) Visits per 1,000 Member Months**
40.34 75.78 67.31 67.66 Not Tested
Ambulatory Care—Outpatient Visits per 1,000 Member Months**
406.08 705.32 661.97 629.97 Not Tested
Annual Monitoring for Patients on Persistent Medications— ACE Inhibitors or ARBs
88.84% 89.52% 89.79% 87.30% -2.49
Annual Monitoring for Patients on Persistent Medications— Diuretics
85.00% 89.60% 87.69% 88.49% 0.80
Children and Adolescents' Access to Primary Care Practitioners—12–24 Months
NA NA NA NA Not Comparable
Children and Adolescents' Access to Primary Care Practitioners— 25 Months–6 Years
94.64% 94.23% 91.11% 91.21% 0.10
Children and Adolescents' Access to Primary Care Practitioners—7–11 Years
93.33% 94.69% 97.50% 96.38% -1.12
Children and Adolescents' Access to Primary Care Practitioners—12–19 Years
87.07% 88.10% 86.93% 90.91% 3.98
1 RY 2015 rates reflect MY data from January 1, 2014, through December 31, 2014. 2 RY 2016 rates reflect MY data from January 1, 2015, through December 31, 2015. 3 RY 2017 rates reflect MY data from January 1, 2016, through December 31, 2016.
CalViva Health Performance Evaluation Report: July 1, 2017–June 30, 2018 California Department of Health Care Services
Page G-42 Health Services Advisory Group, Inc.

MANAGED CARE HEALTH PLAN PERFORMANCE MEASURES
4 RY 2018 rates reflect MY data from January 1, 2017, through December 31, 2017. 5 Performance comparisons are based on the Chi-square test of statistical significance, with a p value of <0.05. * A lower rate indicates better performance for this measure. ** Member months are a member's “contribution” to the total yearly membership. NA = The MCP followed the specifications, but the denominator was too small (less than 30) to report a valid rate. Not Comparable = An RY 2017–18 rate difference cannot be made because data are not available for both years or because significant methodology changes occurred between years, disallowing comparison. Not Tested = An RY 2017–18 rate difference was not calculated because high and low rates do not necessarily indicate better or worse performance.
Table 3.31—Multi-Year Non-SPD Performance Measure Trend Table CalViva—Fresno County
B = Statistical testing result indicates that the RY 2018 non-SPD rate is significantly better than the RY 2017 non-SPD rate.
W = Statistical testing result indicates that the RY 2018 non-SPD rate is significantly worse than the RY 2017 non-SPD rate.
Measure RY 2015
Non-SPD Rate1
RY 2016 Non-SPD
Rate2
RY 2017 Non-SPD
Rate3
RY 2018 Non-SPD
Rate4
RYs 2017–18 Rate
Difference5
All-Cause Readmissions* 11.20% 12.61% 12.10% 12.93% 0.83
Ambulatory Care— Emergency Department (ED) Visits per 1,000 Member Months**
30.78 51.09 50.03 51.16 Not Tested
Ambulatory Care— Outpatient Visits per 1,000 Member Months**
294.85 350.06 331.07 327.97 Not Tested
Annual Monitoring for Patients on Persistent Medications— ACE Inhibitors or ARBs
82.74% 83.91% 85.07% 87.07% 2.00B
Annual Monitoring for Patients on Persistent Medications—Diuretics
81.37% 83.06% 85.47% 86.63% 1.16
CalViva Health Performance Evaluation Report: July 1, 2017–June 30, 2018 California Department of Health Care Services
Page G-43 Health Services Advisory Group, Inc.

MANAGED CARE HEALTH PLAN PERFORMANCE MEASURES
Measure RY 2015
Non-SPD Rate1
RY 2016 Non-SPD
Rate2
RY 2017 Non-SPD
Rate3
RY 2018 Non-SPD
Rate4
RYs 2017–18 Rate
Difference5
Children and Adolescents' Access to Primary Care Practitioners— 12–24 Months
95.28% 94.30% 94.13% 94.74% 0.61
Children and Adolescents' Access to Primary Care Practitioners— 25 Months–6 Years
89.69% 86.90% 85.65% 86.93% 1.28B
Children and Adolescents' Access to Primary Care Practitioners— 7–11 Years
91.36% 89.94% 88.09% 87.21% -0.88W
Children and Adolescents' Access to Primary Care Practitioners— 12–19 Years
87.98% 86.58% 84.84% 84.49% -0.35
1 RY 2015 rates reflect MY data from January 1, 2014, through December 31, 2014. 2 RY 2016 rates reflect MY data from January 1, 2015, through December 31, 2015. 3 RY 2017 rates reflect MY data from January 1, 2016, through December 31, 2016. 4 RY 2018 rates reflect MY data from January 1, 2017, through December 31, 2017. 5 Performance comparisons are based on the Chi-square test of statistical significance, with a p value of <0.05. * A lower rate indicates better performance for this measure. ** Member months are a member's “contribution” to the total yearly membership. Not Tested = An RY 2017–18 rate difference was not calculated because high and low rates do not necessarily indicate better or worse performance.
CalViva Health Performance Evaluation Report: July 1, 2017–June 30, 2018 California Department of Health Care Services
Page G-44 Health Services Advisory Group, Inc.

MANAGED CARE HEALTH PLAN PERFORMANCE MEASURES
Table 3.32—Multi-Year Non-SPD Performance Measure Trend Table CalViva—Kings County
B = Statistical testing result indicates that the RY 2018 non-SPD rate is significantly better than the RY 2017 non-SPD rate.
W = Statistical testing result indicates that the RY 2018 non-SPD rate is significantly worse than the RY 2017 non-SPD rate.
Measure RY 2015
Non-SPD Rate1
RY 2016 Non-SPD
Rate2
RY 2017 Non-SPD
Rate3
RY 2018 Non-SPD
Rate4
RYs 2017–18 Rate
Difference5
All-Cause Readmissions* 9.13% 12.50% 10.19% 9.67% -0.52
Ambulatory Care— Emergency Department (ED) Visits per 1,000 Member Months**
38.54 63.09 60.94 58.61 Not Tested
Ambulatory Care— Outpatient Visits per 1,000 Member Months**
278.19 351.49 350.49 354.28 Not Tested
Annual Monitoring for Patients on Persistent Medications— ACE Inhibitors or ARBs
77.15% 81.68% 90.06% 88.26% -1.80
Annual Monitoring for Patients on Persistent Medications—Diuretics
78.54% 83.68% 89.55% 88.39% -1.16
Children and Adolescents' Access to Primary Care Practitioners— 12–24 Months
89.65% 92.75% 93.11% 92.66% -0.45
Children and Adolescents' Access to Primary Care Practitioners— 25 Months–6 Years
83.59% 83.70% 83.48% 85.33% 1.85B
Children and Adolescents' Access to Primary Care Practitioners— 7–11 Years
86.01% 83.33% 83.25% 82.56% -0.69
CalViva Health Performance Evaluation Report: July 1, 2017–June 30, 2018 California Department of Health Care Services
Page G-45 Health Services Advisory Group, Inc.

MANAGED CARE HEALTH PLAN PERFORMANCE MEASURES
Measure RY 2015
Non-SPD Rate1
RY 2016 Non-SPD
Rate2
RY 2017 Non-SPD
Rate3
RY 2018 Non-SPD
Rate4
RYs 2017–18 Rate
Difference5
Children and Adolescents' Access to Primary Care Practitioners— 12–19 Years
85.35% 84.05% 82.73% 81.91% -0.82
1 RY 2015 rates reflect MY data from January 1, 2014, through December 31, 2014. 2 RY 2016 rates reflect MY data from January 1, 2015, through December 31, 2015. 3 RY 2017 rates reflect MY data from January 1, 2016, through December 31, 2016. 4 RY 2018 rates reflect MY data from January 1, 2017, through December 31, 2017. 5 Performance comparisons are based on the Chi-square test of statistical significance, with a p value of <0.05. * A lower rate indicates better performance for this measure. ** Member months are a member's “contribution” to the total yearly membership. Not Tested = An RY 2017–18 rate difference was not calculated because high and low rates do not necessarily indicate better or worse performance.
Table 3.33—Multi-Year Non-SPD Performance Measure Trend Table CalViva—Madera County
B = Statistical testing result indicates that the RY 2018 non-SPD rate is significantly better than the RY 2017 non-SPD rate.
W = Statistical testing result indicates that the RY 2018 non-SPD rate is significantly worse than the RY 2017 non-SPD rate.
Measure RY 2015
Non-SPD Rate1
RY 2016 Non-SPD
Rate2
RY 2017 Non-SPD
Rate3
RY 2018 Non-SPD
Rate4
RYs 2017–18 Rate
Difference5
All-Cause Readmissions* 9.80% 10.23% 11.96% 9.07% -2.89
Ambulatory Care— Emergency Department (ED) Visits per 1,000 Member Months**
30.13 48.14 49.37 49.05 Not Tested
Ambulatory Care— Outpatient Visits per 1,000 Member Months**
320.60 381.28 367.48 341.80 Not Tested
CalViva Health Performance Evaluation Report: July 1, 2017–June 30, 2018 California Department of Health Care Services
Page G-46 Health Services Advisory Group, Inc.

MANAGED CARE HEALTH PLAN PERFORMANCE MEASURES
Measure RY 2015
Non-SPD Rate1
RY 2016 Non-SPD
Rate2
RY 2017 Non-SPD
Rate3
RY 2018 Non-SPD
Rate4
RYs 2017–18 Rate
Difference5
Annual Monitoring for Patients on Persistent Medications— ACE Inhibitors or ARBs
84.62% 82.44% 80.99% 84.13% 3.14
Annual Monitoring for Patients on Persistent Medications—Diuretics
81.77% 81.49% 80.68% 83.87% 3.19
Children and Adolescents' Access to Primary Care Practitioners— 12–24 Months
95.30% 97.26% 96.36% 97.06% 0.70
Children and Adolescents' Access to Primary Care Practitioners— 25 Months–6 Years
91.95% 91.11% 90.83% 91.66% 0.83
Children and Adolescents' Access to Primary Care Practitioners— 7–11 Years
92.69% 91.62% 90.66% 90.40% -0.26
Children and Adolescents' Access to Primary Care Practitioners— 12–19 Years
90.64% 90.46% 88.58% 88.49% -0.09
1 RY 2015 rates reflect MY data from January 1, 2014, through December 31, 2014. 2 RY 2016 rates reflect MY data from January 1, 2015, through December 31, 2015. 3 RY 2017 rates reflect MY data from January 1, 2016, through December 31, 2016. 4 RY 2018 rates reflect MY data from January 1, 2017, through December 31, 2017. 5 Performance comparisons are based on the Chi-square test of statistical significance, with a p value of <0.05. * A lower rate indicates better performance for this measure. ** Member months are a member's “contribution” to the total yearly membership. Not Tested = An RY 2017–18 rate difference was not calculated because high and low rates do not necessarily indicate better or worse performance.
CalViva Health Performance Evaluation Report: July 1, 2017–June 30, 2018 California Department of Health Care Services
Page G-47 Health Services Advisory Group, Inc.

MANAGED CARE HEALTH PLAN PERFORMANCE MEASURES
Table 3.34—RY 2018 (MY 2017) Performance Measure Comparison and Results forMeasures Stratified by the SPD and Non-SPD PopulationsCalViva—Fresno County
B = Statistical testing result indicates that the RY 2018 SPD rate is significantly better than the RY 2018 non-SPD rate.
W = Statistical testing result indicates that the RY 2018 SPD rate is significantly worse than the RY 2018 non-SPD rate.
Measure RY 2018
SPD Rate1
RY 2018 Non-SPD
Rate1
SPD/Non-SPDRate
Difference2
RY 2018 Total Rate3
All-Cause Readmissions* 22.37% 12.93% 9.44W 15.94% Ambulatory Care—Emergency Department (ED) Visits per 1,000 Member Months**
77.45 51.16 Not Tested 52.57
Ambulatory Care—Outpatient Visits per 1,000 Member Months** 533.83 327.97 Not Tested 339.01
Annual Monitoring for Patients on Persistent Medications— ACE Inhibitors or ARBs
88.53% 87.07% 1.46B 87.43%
Annual Monitoring for Patients on Persistent Medications—Diuretics 90.10% 86.63% 3.47B 87.56%
Children and Adolescents' Access to Primary Care Practitioners— 12–24 Months
NA 94.74% Not Comparable 94.71%
Children and Adolescents' Access to Primary Care Practitioners— 25 Months–6 Years
91.35% 86.93% 4.42B 87.00%
Children and Adolescents' Access to Primary Care Practitioners— 7–11 Years
91.66% 87.21% 4.45B 87.34%
Children and Adolescents' Access to Primary Care Practitioners— 12–19 Years
90.21% 84.49% 5.72B 84.69%
1 RY 2018 rates reflect MY data from January 1, 2017, through December 31, 2017. 2 Performance comparisons are based on the Chi-square test of statistical significance, with a p value of <0.05. 3 Total rates are based on the MCP reporting unit’s total results, including the SPD and non-SPD populations. Please note, if data are not available for either the SPD or non-SPD population, the total rate is based on results reported for the available population.
CalViva Health Performance Evaluation Report: July 1, 2017–June 30, 2018 California Department of Health Care Services
Page G-48 Health Services Advisory Group, Inc.

MANAGED CARE HEALTH PLAN PERFORMANCE MEASURES
* A lower rate indicates better performance for this measure. ** Member months are a member's “contribution” to the total yearly membership. NA = The MCP followed the specifications, but the denominator was too small (less than 30) to report a valid rate. Not Comparable = An SPD/non-SPD rate difference cannot be made because data are not available for both populations. Not Tested = An SPD/non-SPD rate difference was not calculated because high and low rates do not necessarily indicate better or worse performance.
Table 3.35—RY 2018 (MY 2017) Performance Measure Comparison and Results forMeasures Stratified by the SPD and Non-SPD PopulationsCalViva—Kings County
B = Statistical testing result indicates that the RY 2018 SPD rate is significantly better than the RY 2018 non-SPD rate.
W = Statistical testing result indicates that the RY 2018 SPD rate is significantly worse than the RY 2018 non-SPD rate.
Measure RY 2018
SPD Rate1
RY 2018 Non-SPD
Rate1
SPD/Non-SPDRate
Difference2
RY 2018 Total Rate3
All-Cause Readmissions* 14.60% 9.67% 4.93 10.81% Ambulatory Care—Emergency Department (ED) Visits per 1,000 Member Months**
103.12 58.61 Not Tested 60.98
Ambulatory Care—Outpatient Visits per 1,000 Member Months** 665.82 354.28 Not Tested 370.86
Annual Monitoring for Patients on Persistent Medications— ACE Inhibitors or ARBs
92.47% 88.26% 4.21 89.18%
Annual Monitoring for Patients on Persistent Medications—Diuretics 93.66% 88.39% 5.27 89.54%
Children and Adolescents' Access to Primary Care Practitioners— 12–24 Months
NA 92.66% Not Comparable 92.68%
Children and Adolescents' Access to Primary Care Practitioners— 25 Months–6 Years
84.06% 85.33% -1.27 85.30%
Children and Adolescents' Access to Primary Care Practitioners— 7–11 Years
85.58% 82.56% 3.02 82.66%
CalViva Health Performance Evaluation Report: July 1, 2017–June 30, 2018 California Department of Health Care Services
Page G-49 Health Services Advisory Group, Inc.

MANAGED CARE HEALTH PLAN PERFORMANCE MEASURES
Measure RY 2018
SPD Rate1
RY 2018 Non-SPD
Rate1
SPD/Non-SPDRate
Difference2
RY 2018 Total Rate3
Children and Adolescents' Access to Primary Care Practitioners— 12–19 Years
86.47% 81.91% 4.56 82.11%
1 RY 2018 rates reflect MY data from January 1, 2017, through December 31, 2017. 2 Performance comparisons are based on the Chi-square test of statistical significance, with a p value of <0.05. 3 Total rates are based on the MCP reporting unit’s total results, including the SPD and non-SPD populations. Please note, if data are not available for either the SPD or non-SPD population, the total rate is based on results reported for the available population. * A lower rate indicates better performance for this measure. ** Member months are a member's “contribution” to the total yearly membership. NA = The MCP followed the specifications, but the denominator was too small (less than 30) to report a valid rate. Not Comparable = An SPD/non-SPD rate difference cannot be made because data are not available for both populations. Not Tested = An SPD/non-SPD rate difference was not calculated because high and low rates do not necessarily indicate better or worse performance.
Table 3.36—RY 2018 (MY 2017) Performance Measure Comparison and Results forMeasures Stratified by the SPD and Non-SPD PopulationsCalViva—Madera County
B = Statistical testing result indicates that the RY 2018 SPD rate is significantly better than the RY 2018 non-SPD rate.
W = Statistical testing result indicates that the RY 2018 SPD rate is significantly worse than the RY 2018 non-SPD rate.
Measure RY 2018
SPD Rate1
RY 2018 Non-SPD
Rate1
SPD/Non-SPDRate
Difference2
RY 2018 Total Rate3
All-Cause Readmissions* 21.33% 9.07% 12.26W 11.97% Ambulatory Care—Emergency Department (ED) Visits per 1,000 Member Months**
67.66 49.05 Not Tested 49.82
Ambulatory Care—Outpatient Visits per 1,000 Member Months** 629.97 341.80 Not Tested 353.68
CalViva Health Performance Evaluation Report: July 1, 2017–June 30, 2018 California Department of Health Care Services
Page G-50 Health Services Advisory Group, Inc.
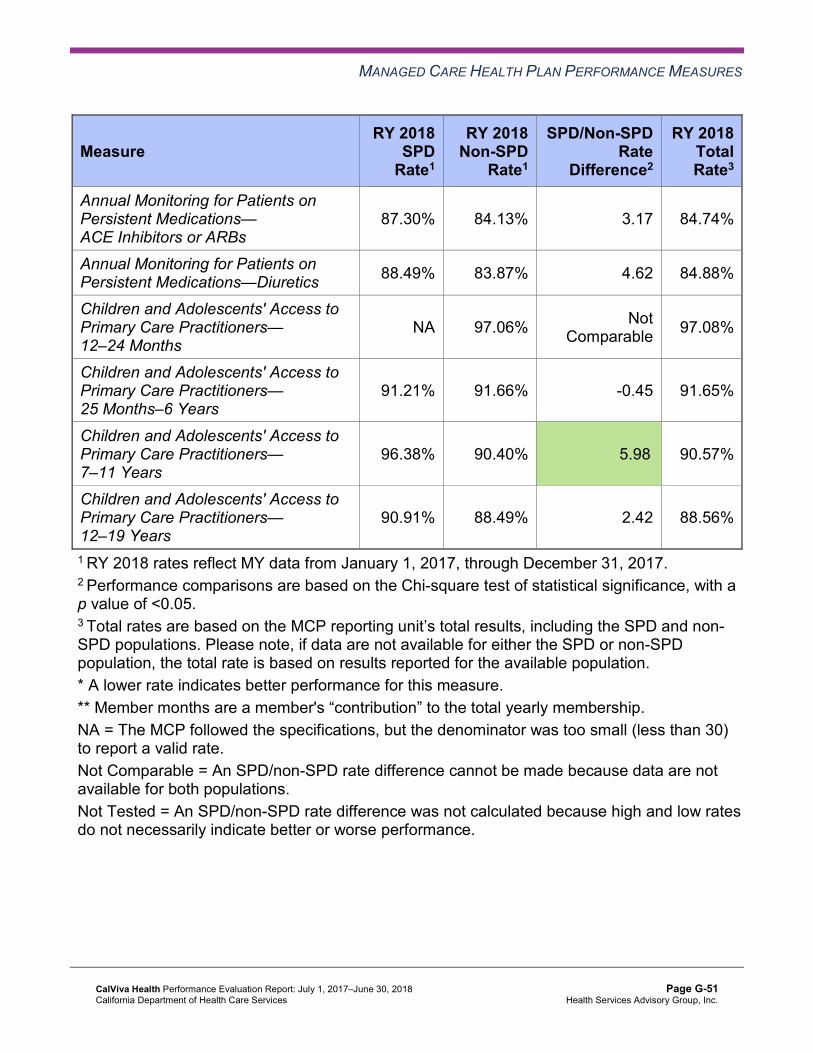
MANAGED CARE HEALTH PLAN PERFORMANCE MEASURES
Measure RY 2018
SPD Rate1
RY 2018 Non-SPD
Rate1
SPD/Non-SPDRate
Difference2
RY 2018 Total Rate3
Annual Monitoring for Patients on Persistent Medications— ACE Inhibitors or ARBs
87.30% 84.13% 3.17 84.74%
Annual Monitoring for Patients on Persistent Medications—Diuretics 88.49% 83.87% 4.62 84.88%
Children and Adolescents' Access to Primary Care Practitioners— 12–24 Months
NA 97.06% Not Comparable 97.08%
Children and Adolescents' Access to Primary Care Practitioners— 25 Months–6 Years
91.21% 91.66% -0.45 91.65%
Children and Adolescents' Access to Primary Care Practitioners— 7–11 Years
96.38% 90.40% 5.98B 90.57%
Children and Adolescents' Access to Primary Care Practitioners— 12–19 Years
90.91% 88.49% 2.42 88.56%
1 RY 2018 rates reflect MY data from January 1, 2017, through December 31, 2017. 2 Performance comparisons are based on the Chi-square test of statistical significance, with a p value of <0.05. 3 Total rates are based on the MCP reporting unit’s total results, including the SPD and non-SPD populations. Please note, if data are not available for either the SPD or non-SPD population, the total rate is based on results reported for the available population. * A lower rate indicates better performance for this measure. ** Member months are a member's “contribution” to the total yearly membership. NA = The MCP followed the specifications, but the denominator was too small (less than 30) to report a valid rate. Not Comparable = An SPD/non-SPD rate difference cannot be made because data are not available for both populations. Not Tested = An SPD/non-SPD rate difference was not calculated because high and low rates do not necessarily indicate better or worse performance.
CalViva Health Performance Evaluation Report: July 1, 2017–June 30, 2018 California Department of Health Care Services
Page G-51 Health Services Advisory Group, Inc.

MANAGED CARE HEALTH PLAN PERFORMANCE MEASURES
Seniors and Persons with Disabilities Findings
HSAG observed the following notable results in RY 2018 for measures that CalViva stratified by the SPD and non-SPD populations:
♦ For SPD rates for which HSAG could make a comparison between RY 2017 and RY 2018, the RY 2018 SPD rate was significantly better than the RY 2017 SPD rate for the Children and Adolescents’ Access to Primary Care Practitioners—25 Months–6 Years measure in Fresno County.
♦ The RY 2018 non-SPD rates were significantly better than the RY 2017 non-SPD rates for the following measures: ■ Annual Monitoring for Patients on Persistent Medications—ACE Inhibitors or ARBs in
Fresno County. ■ Children and Adolescents’ Access to Primary Care Practitioners—25 Months–6 Years in
Fresno and Kings counties. ♦ The RY 2018 non-SPD rate was significantly worse than the RY 2017 non-SPD rate for the
Children and Adolescents’ Access to Primary Care Practitioners—7–11 Years in Fresno County.
♦ For measures for which HSAG could make a comparison between RY 2018 SPD rates and RY 2018 non-SPD rates: ■ The RY 2018 SPD rates were significantly better than the RY 2018 non-SPD rates for
the following measures: ○ Both Annual Monitoring for Patients on Persistent Medications measures in Fresno
County ○ Children and Adolescents’ Access to Primary Care Practitioners—25 Months–6
Years and 12–19 Years in Fresno County ○ Children and Adolescents’ Access to Primary Care Practitioners—7–11 Years in
Fresno and Madera counties ■ The RY 2018 SPD rate was significantly worse than the RY 2018 non-SPD rate for the
All-Cause Readmissions measure in Fresno and Madera counties. Note that the higher rate of hospital readmissions for the SPD population is expected based on the greater and often more complicated health care needs of these beneficiaries.
Strengths—Performance Measures HSAG auditors determined that CalViva followed the appropriate specifications to produce valid rates, and identified no issues of concern.
HSAG identified the following notable RY 2018 performance measure results for CalViva:
♦ Across all domains and reporting units, seven of 63 rates (11 percent) were above the HPLs in RY 2018, with six of the rates being within the Preventive Screening and Children’s Health domain and one rate being within the Appropriate Treatment and Utilization domain.
CalViva Health Performance Evaluation Report: July 1, 2017–June 30, 2018 California Department of Health Care Services
Page G-52 Health Services Advisory Group, Inc.

MANAGED CARE HEALTH PLAN PERFORMANCE MEASURES
■ Madera County had the highest percentage of rates above the HPLs, with four of 21 rates (19 percent) above the HPLs. Kings County had two of 21 rates (10 percent) above the HPLs, and Fresno County had one of 21 rates above the HPL (5 percent).
■ The following measures had rates above the HPLs in RY 2018: ○ Immunizations for Adolescents—Combination 2 in all three reporting units ○ Both Weight Assessment and Counseling for Nutrition and Physical Activity for
Children and Adolescents measures in Madera County ○ Well-Child Visits in the Third, Fourth, Fifth, and Sixth Years of Life measures in
Madera County ○ Use of Imaging Studies for Low Back Pain in Kings County
♦ Kings County had no rates below the MPLs and no rates that declined significantly from RY 2017 to RY 2018.
♦ Across all domains and reporting units, 12 of 66 rates for which HSAG made a comparison between RY 2017 and RY 2018 (18 percent) improved significantly from RY 2017 to RY 2018. ■ The rates improved significantly from RY 2017 to RY 2018 for the Immunizations for
Adolescents—Combination 2 and Use of Imaging Studies for Low Back Pain measures in all three reporting units. ○ The significant improvement for the Use of Imaging Studies for Low Back Pain
measure in Madera County resulted in the rate for this measure moving from below the MPL in RY 2017 to above the MPL in RY 2018. The MCP’s PDSA cycles, as described within the “Assessment of Improvement Plans—Appropriate Treatment and Utilization” heading within this section of the report, along with CalViva’s self-reported actions as described in Table 5.1, may have contributed to the MCP’s improved performance in Madera County.
Opportunities for Improvement—Performance Measures Through the MCP’s CAP, CalViva has the opportunity to assess whether current improvement efforts should be modified or expanded to improve the MCP’s performance to above the MPLs in Madera County for the following measures:
♦ Both Annual Monitoring for Patients on Persistent Medications measures ♦ Avoidance of Antibiotic Treatment in Adults With Acute Bronchitis
Additionally, for the following measures in Fresno County, CalViva has the opportunity to assess the causes for the MCP’s declining performance or performance below the MPLs and to identify strategies to improve the MCP’s performance:
♦ Avoidance of Antibiotic Treatment in Adults With Acute Bronchitis ♦ Breast Cancer Screening ♦ Comprehensive Diabetes Care—HbA1c Testing ♦ Comprehensive Diabetes Care—Medical Attention for Nephropathy
CalViva Health Performance Evaluation Report: July 1, 2017–June 30, 2018 California Department of Health Care Services
Page G-53 Health Services Advisory Group, Inc.

Medi-Cal Managed Care External Quality Review Technical ReportAppendix G: Performance Evaluation ReportCalViva Health July 1, 2017–June 30, 2018
4. Performance Improvement Projects
Performance Improvement Project Overview The key concepts of the rapid-cycle PIP framework include forming a PIP team, setting aims, establishing measures, determining interventions using quality improvement tools, conducting PDSA cycles to test interventions, and planning for the spread of successful changes. The core component of the rapid-cycle PIP approach involves testing changes on a small scale so that improvement can occur more efficiently and lead to long-term sustainability. The following modules guide MCPs through this rapid-cycle PIP process:
♦ Module 1—PIP Initiation ■ MCPs outline the framework for the PIP, which includes:
○ The topic rationale. ○ Comparative data supporting the need to improve the selected topic. ○ A list of the PIP team members, which consists of internal and external stakeholders. ○ A completed key driver diagram that defines the theory of change for improvement,
including the SMART Aim and Global Aim. ♦ Module 2—SMART Aim Data Collection
■ MCPs define the SMART Aim measure and data collection methodology and develop the SMART Aim data run chart.
♦ Module 3—Intervention Determination ■ MCPs use process mapping and failure modes and effects analysis (FMEA) to identify
potential interventions to test which may have direct effects on the SMART Aim. ♦ Module 4—Plan-Do-Study-Act (PDSA)
■ MCPs test and evaluate the interventions identified in Module 3 through a series of PDSA cycles.
♦ Module 5—PIP Conclusions ■ MCPs interpret results and summarize:
○ Key findings and outcomes achieved. ○ Assessment of each tested intervention. ○ Lessons learned, including how demonstrated improvement can be shared and used
as a foundation for further improvement going forward. ○ Plan for sustained improvement.
CalViva Health Performance Evaluation Report: July 1, 2017–June 30, 2018 California Department of Health Care Services
Page G-54 Health Services Advisory Group, Inc.

PERFORMANCE IMPROVEMENT PROJECTS
Based on the agreed-upon timeline, MCPs submit each module to HSAG for validation. Throughout the rapid-cycle PIP process, HSAG provides technical assistance to MCPs to ensure that PIPs are methodologically sound and to problem-solve with MCPs regarding how to address challenges that occur. Through an iterative process, MCPs have opportunities to make corrections to modules 1 through 3 to achieve all validation criteria.
Once MCPs achieve all validation criteria for modules 1 through 3 and receive feedback on the intervention Plan portion of Module 4, MCPs test interventions. During the intervention testing phase of the PIP, HSAG conducts periodic progress check-ins to ensure that MCPs have addressed HSAG’s feedback on the Plan portion of Module 4 and are making appropriate progress with intervention testing. Once MCPs complete testing an intervention, MCPs determine the next steps based on results and lessons learned—whether the intervention was successful and should be spread (adopt), whether modifications need to be made to the existing intervention (adapt), or whether the intervention was not successful and should be stopped (abandon).
In Module 5, MCPs summarize the overall PIP. When validating Module 5, HSAG assesses the validity and reliability of the results based on the Centers for Medicare & Medicaid Services (CMS) validation protocols to determine whether key stakeholders can have confidence in the reported PIP findings. HSAG assigns the following final confidence levels for each PIP:
♦ High confidence—the PIP was methodologically sound and achieved the SMART Aim goal; the demonstrated improvement was clearly linked to the quality improvement processes conducted and intervention(s) tested; and, the MCP accurately summarized the key findings.
♦ Confidence—the PIP was methodologically sound and achieved the SMART Aim goal, and the MCP accurately summarized the key findings. However, some, but not all, of the quality improvement processes conducted and/or intervention(s) tested were clearly linked to the demonstrated improvement.
♦ Low confidence—either (A) the PIP was methodologically sound; however, the SMART Aim goal was not achieved; or (B) the SMART Aim goal was achieved; however, the quality improvement processes and/or intervention(s) tested were poorly executed and could not be linked to the improvement.
♦ Reported PIP results were not credible—the PIP methodology was not executed as approved.
Performance Improvement Project Results and Findings During the review period, CalViva submitted modules 4 and 5 for its 2015–17 DHCS-priority and MCP-specific PIPs. HSAG validated the modules and includes the final PIP validation findings in this report. Additionally, CalViva initiated a Disparity PIP and a DHCS-priority PIP during the review period. In this report, HSAG includes summaries of the MCP’s Disparity and DHCS-priority PIP module submissions as well as validation findings from the review period.
CalViva Health Performance Evaluation Report: July 1, 2017–June 30, 2018 California Department of Health Care Services
Page G-55 Health Services Advisory Group, Inc.

PERFORMANCE IMPROVEMENT PROJECTS
2015–17 DHCS-Priority Performance Improvement Project
CalViva selected postpartum care for its 2015–17 DHCS-priority PIP. While the MCP concluded its Postpartum Care PIP through the SMART Aim end date of June 30, 2017, CalViva submitted modules 4 and 5 for HSAG to validate during the review period for this report. HSAG provided final validation findings and encouraged CalViva to incorporate the experiences and lessons learned from the PIP into future quality improvement efforts.
Table 4.1 provides a summary of the SMART Aim measure results reported by the MCP.
Table 4.1—CalViva Postpartum Care PIP SMART Aim Measure Results
SMART Aim Measure Baseline Rate
SMART Aim Goal
Rate
SMART Aim Goal Achieved
Rate of postpartum visits among CalViva Health beneficiaries who belong to the selected high-volume clinic.
55% 65% Yes
Table 4.2 presents a description of the interventions that CalViva tested for its Postpartum Care PIP. The table also indicates the failure mode that each intervention addressed as well as whether the MCP decided, based on intervention testing results, to adopt, adapt, or abandon the intervention.
Table 4.2—CalViva Postpartum Care PIP Intervention Testing Results
Intervention Failure Mode Addressed Adopt,Adapt, orAbandon
Collecting contact information specific to the postpartum recovery period (the two months after delivery) while the beneficiaries are hospitalized.
♦ Lack of reminders for beneficiaries to attend postpartum visits, and postpartum visits occurring out of the specified time frame.
Adopt
Offering a $25 gift card incentive to beneficiaries at the time of their postpartum visits between 21 and 56 days post delivery.
♦ Lack of beneficiaries’ understanding of the difference between the first- or second-week visit and the postpartum visit.
Adapt
Performance Improvement Project Validation Findings
During the review period for this report, HSAG validated modules 4 and 5 for the MCP’s Postpartum Care PIP. CalViva achieved the SMART Aim goal. Of the two interventions tested, the MCP attributed the gift card incentive intervention as having greater impact on the SMART Aim rate. However, the intervention evaluation data for the gift card incentive showed that the
CalViva Health Performance Evaluation Report: July 1, 2017–June 30, 2018 California Department of Health Care Services
Page G-56 Health Services Advisory Group, Inc.
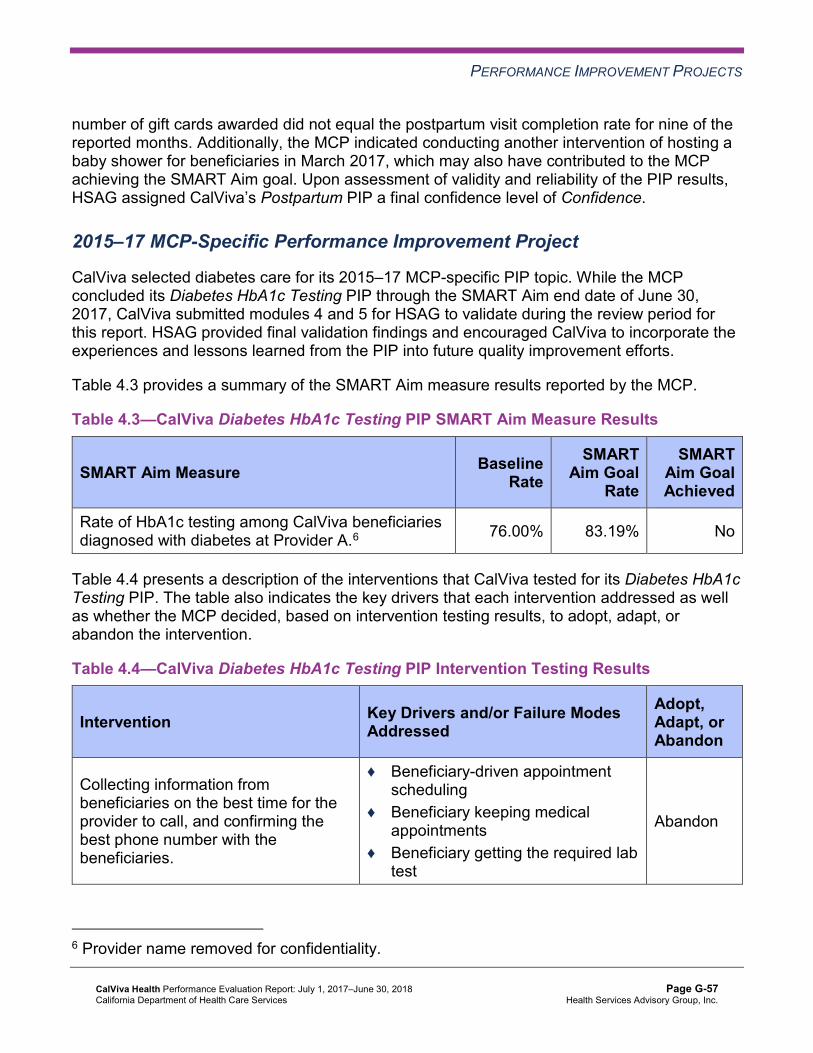
PERFORMANCE IMPROVEMENT PROJECTS
number of gift cards awarded did not equal the postpartum visit completion rate for nine of the reported months. Additionally, the MCP indicated conducting another intervention of hosting a baby shower for beneficiaries in March 2017, which may also have contributed to the MCP achieving the SMART Aim goal. Upon assessment of validity and reliability of the PIP results, HSAG assigned CalViva’s Postpartum PIP a final confidence level of Confidence.
2015–17 MCP-Specific Performance Improvement Project
CalViva selected diabetes care for its 2015–17 MCP-specific PIP topic. While the MCP concluded its Diabetes HbA1c Testing PIP through the SMART Aim end date of June 30, 2017, CalViva submitted modules 4 and 5 for HSAG to validate during the review period for this report. HSAG provided final validation findings and encouraged CalViva to incorporate the experiences and lessons learned from the PIP into future quality improvement efforts.
Table 4.3 provides a summary of the SMART Aim measure results reported by the MCP.
Table 4.3—CalViva Diabetes HbA1c Testing PIP SMART Aim Measure Results
SMART Aim Measure Baseline Rate
SMART Aim Goal
Rate
SMART Aim Goal Achieved
Rate of HbA1c testing among CalViva beneficiaries diagnosed with diabetes at Provider A.6 76.00% 83.19% No
Table 4.4 presents a description of the interventions that CalViva tested for its Diabetes HbA1c Testing PIP. The table also indicates the key drivers that each intervention addressed as well as whether the MCP decided, based on intervention testing results, to adopt, adapt, or abandon the intervention.
Table 4.4—CalViva Diabetes HbA1c Testing PIP Intervention Testing Results
Intervention Key Drivers and/or Failure ModesAddressed
Adopt,Adapt, orAbandon
Collecting information from beneficiaries on the best time for the provider to call, and confirming the best phone number with the beneficiaries.
♦ Beneficiary-driven appointment scheduling
♦ Beneficiary keeping medical appointments
♦ Beneficiary getting the required lab test
Abandon
6 Provider name removed for confidentiality.
CalViva Health Performance Evaluation Report: July 1, 2017–June 30, 2018 California Department of Health Care Services
Page G-57 Health Services Advisory Group, Inc.

PERFORMANCE IMPROVEMENT PROJECTS
Intervention Key Drivers and/or Failure ModesAddressed
Adopt,Adapt, orAbandon
Supplying to Provider A, a list of beneficiaries needing HbA1c testing for the provider to verify in its database.
♦ Identification of beneficiaries who need HbA1c testing Adapt
Performance Improvement Project Validation Findings
During the review period for this report, HSAG validated modules 4 and 5 for the MCP’s Diabetes HbA1c Testing PIP. CalViva selected to test whether or not the provider collecting information from beneficiaries on the best time to call and confirming with the beneficiaries the best phone number would improve the ability for the provider to contact beneficiaries and provide reminders for HbA1c tests. However, after testing the intervention for two months, the MCP abandoned the intervention testing due to the MCP not being able to gather contact information on an adequate number of beneficiaries. After abandoning the first intervention, CalViva selected to test whether or not the MCP supplying the provider with a list of beneficiaries who need HbA1c tests to verify against the provider’s database would improve the provider’s ability to contact beneficiaries and provide reminders for HbA1c tests. Despite CalViva’s efforts to implement the second intervention to better impact the SMART Aim measure rate, CalViva did not meet the SMART Aim goal.
Upon assessment of validity and reliability of the PIP results, HSAG assigned CalViva’s Diabetes HbA1c Testing PIP a final confidence level of Low Confidence.
2017–19 Disparity Performance Improvement Project
During the review period, DHCS required CalViva to initiate a PIP focusing on an identified health disparity based on, but not limited to, age, gender, race or ethnicity, language spoken, income, educational attainment, sexual orientation or gender identity, occupation, provider, or geographic area. CalViva selected postpartum care in Fresno County as its 2017–19 Disparity PIP topic. Using its own MCP-specific data, the MCP provided evidence of the health disparity by demonstrating a statistically significant rate difference between two subgroups, with the disparate subgroup having the lower rate.
Table 4.5 provides the SMART Aim measure description, baseline rate, and SMART Aim goal rate for the PIP. The SMART Aim end date for this PIP is June 30, 2019.
CalViva Health Performance Evaluation Report: July 1, 2017–June 30, 2018 California Department of Health Care Services
Page G-58 Health Services Advisory Group, Inc.

PERFORMANCE IMPROVEMENT PROJECTS
Table 4.5—CalViva Postpartum Care Disparity PIP SMART Aim Measure
SMART Aim Measure Baseline Rate
SMART Aim Goal
Rate
Rate of postpartum visit completion among beneficiaries at a high- volume, low-compliance clinic in Fresno County. 50% 64%
Performance Improvement Project Validation Findings
During the review period of this report, HSAG validated modules 1 through 3 for the MCP’s Postpartum Care Disparity PIP. In CalViva’s initial submission of modules 1 and 2, the MCP met all validation criteria for both modules. Upon initial review of Module 3, HSAG determined that CalViva met some required validation criteria; however, HSAG identified opportunities for improvement related to:
♦ Including a step-by-step flow of the overall process in the process map. ♦ Supporting the sub-processes selection for the FMEA table. ♦ Including all required components of the FMEA.
CalViva was still in process of incorporating HSAG’s feedback into Module 3 during the review period; therefore, HSAG includes no final validation results for Module 3 in this report.
2017–19 DHCS-Priority Performance Improvement Project
During the review period, DHCS required CalViva to initiate a PIP related to one of DHCS’ Quality Strategy focus areas: Childhood Immunization Status—Combination 3, Controlling High Blood Pressure, Comprehensive Diabetes Care, or Prenatal and Postpartum Care— Postpartum Care. Based on the MCP’s performance measure results, CalViva selected childhood immunizations as its 2017–19 DHCS-priority PIP topic.
Table 4.6 provides the SMART Aim measure description, baseline rate, and SMART Aim goal rate for the PIP. The SMART Aim end date for this PIP is June 30, 2019.
Table 4.6—CalViva Childhood Immunization Status—Combination 3 PIP SMART Aim Measure
SMART Aim Measure Baseline Rate
SMART Aim Goal
Rate Rate of Childhood Immunization Status—Combination 3 measure compliance among beneficiaries assigned to health centers A and B7 in Fresno County.
62.5% 71.0%
7 Health center names removed for confidentiality.
CalViva Health Performance Evaluation Report: July 1, 2017–June 30, 2018 California Department of Health Care Services
Page G-59 Health Services Advisory Group, Inc.

PERFORMANCE IMPROVEMENT PROJECTS
Performance Improvement Project Validation Findings
During the review period of this report, HSAG validated modules 1 and 2 for the MCP’s Childhood Immunization Status—Combination 3 PIP. Upon initial review of the modules, HSAG determined that CalViva met some required validation criteria; however, HSAG identified opportunities for improvement related to:
♦ Supporting the topic selection with the MCP’s data. ♦ Including all required components of the:
■ SMART Aim data collection methodology. ■ Run/control chart.
After receiving technical assistance from HSAG, CalViva incorporated HSAG’s feedback into the PIP modules. Upon HSAG’s final review, HSAG determined that the MCP met all validation criteria for modules 1 and 2.
Strengths—Performance Improvement Projects CalViva achieved the SMART Aim goal for the 2015–17 Postpartum Care PIP, and some of the quality improvement activities could be linked to the demonstrated improvement. Based on HSAG’s assessment, HSAG assigned the 2015–17 Postpartum Care PIP a final confidence level of Confidence.
Opportunities for Improvement—Performance Improvement Projects CalViva has the opportunity to continue monitoring adapted and adopted interventions and outcomes to facilitate improvement beyond the life of the 2015–17 Postpartum Care and Diabetes HbA1c Testing PIPs. Ongoing monitoring will enable long-term evaluation of improvement and allow the MCP to continually refine interventions to achieve and sustain optimal outcomes.
CalViva Health Performance Evaluation Report: July 1, 2017–June 30, 2018 California Department of Health Care Services
Page G-60 Health Services Advisory Group, Inc.

Medi-Cal Managed Care External Quality Review Technical ReportAppendix G: Performance Evaluation ReportCalViva Health July 1, 2017–June 30, 2018
5. Recommendations
Follow-Up on Prior Year Recommendations DHCS provided each MCP an opportunity to outline actions taken to address recommendations HSAG made in its 2016–17 MCP-specific evaluation report. Table 5.1 provides EQR recommendations from CalViva’s July 1, 2016, through June 30, 2017, MCP-specific evaluation report, along with the MCP’s self-reported actions taken through June 30, 2018, that address the recommendations. Please note that HSAG made minimal edits to Table 5.1 to preserve the accuracy of CalViva’s self-reported actions.
Table 5.1—CalViva’s Self-Reported Follow-Up on External Quality ReviewRecommendations from the July 1, 2016, through June 30, 2017, MCP-SpecificEvaluation Report
2016–17 External Quality ReviewRecommendations Directed to CalViva
Self-Reported Actions Taken by CalVivaduring the Period of July 1, 2017–June 30,2018, that Address the External QualityReview Recommendations
1. Assess whether current strategies need to be modified or expanded to address the MCP’s performance below the MPLs in RY 2017 for the following measures in Madera County:
a. Both Annual Monitoring for Patients on Persistent Medications measures
a. During the 2017–18 intervention period, CalViva examined the barriers for the Annual Monitoring for Patients on Persistent Medications (MPM) measure, which was performing below the MPL. CalViva implemented two PDSA cycles which included, but were not limited to, the following interventions: ■ Supplying high-volume, low-performing
clinics in Madera County with provider profiles (lists of members who meet the MPM measure specifications and those members’ demographic information) to designated clinic staff to be used to contact members and remind them to complete their required lab tests and to assist them with scheduling appointments.
■ Sending SMS/text messages to members who needed their lab tests to encourage and remind them to schedule and keep their appointments.
CalViva Health Performance Evaluation Report: July 1, 2017–June 30, 2018 California Department of Health Care Services
Page G-61 Health Services Advisory Group, Inc.

RECOMMENDATIONS
2016–17 External Quality ReviewRecommendations Directed to CalViva
Self-Reported Actions Taken by CalVivaduring the Period of July 1, 2017–June 30,2018, that Address the External QualityReview Recommendations
b. Avoidance of Antibiotic Treatment in Adults With Acute Bronchitis
■ Members who completed their lab draws were offered an incentive gift card at the point of care.
These interventions were evaluated frequently throughout the year to assess whether the strategies, as designed, provided the desired improvement based upon pre-established goals and actual performance rates. All goals were met for PDSA cycles; however, a population of members continues to be difficult to contact. New interventions will be considered to address challenges and successful interventions expanded throughout the county.
b. During the 2017–18 intervention period, CalViva examined the barriers for the Avoidance of Antibiotic Treatment in Adults With Acute Bronchitis (AAB) measure in Madera county. CalViva completed a barrier analysis and initiated interventions. Interventions conducted included but were not limited to the following: ■ Participated in the AWARE initiative
lead by the California Medical Association including distribution via U.S. mail of AWARE toolkits to physicians (MD and DO) in Madera County identified as being high prescribers (highest was 20 percent).
■ Provider Relations Representatives hand-delivered AWARE toolkits along with a CalViva AAB Provider HEDIS tip sheet.
■ Launched a pilot prescription (Rx) program with high-volume, high-prescribing providers in efforts to promote provider and member
CalViva Health Performance Evaluation Report: July 1, 2017–June 30, 2018 California Department of Health Care Services
Page G-62 Health Services Advisory Group, Inc.

RECOMMENDATIONS
2016–17 External Quality ReviewRecommendations Directed to CalViva
Self-Reported Actions Taken by CalVivaduring the Period of July 1, 2017–June 30,2018, that Address the External QualityReview Recommendations
education regarding appropriate treatment for bronchitis.
These interventions were evaluated frequently throughout the year to assess whether the strategies as designed provided the desired improvement based upon pre-established goals and actual performance rates. Current strategies have demonstrated improvement and will be continued while expanding our assessment of mid-level practitioners and other facility types such as urgent care. The pilot Rx program was initially implemented at the end of the cold and flu season; therefore, it will be re-implemented at the beginning of the next cold and flu cycle.
2. Identify the causes for the rates declining significantly from RY 2016 to RY 2017 for the Use of Imaging Studies for Low Back Pain measure in Fresno and Madera counties and the MCP’s performance below the MPL for this measure in Madera County.
During the 2017–18 intervention period, CalViva examined the barriers to compliance with the Use of Imaging Studies for Low Back Pain (LBP) HEDIS measure. A barrier analysis was completed, and it was determined that providers may not have had a full understanding of the HEDIS technical specifications criteria during RY 2017 when imaging studies were ordered. Additionally, the recent focus on opioid prescribing may have resulted in providers ordering more imaging studies to support their decisions to prescribe stronger pain medications for documented evidence of pathology. A PDSA methodology was implemented for improvement. CalViva identified a high-volume, low-performing clinic in Madera County which demonstrated opportunity for improvement and willingness to collaborate with CalViva to address this issue. A team was formed; and following the PDSA process interventions were planned, implemented, and evaluated. The interventions executed consisted of the following:
CalViva Health Performance Evaluation Report: July 1, 2017–June 30, 2018 California Department of Health Care Services
Page G-63 Health Services Advisory Group, Inc.

RECOMMENDATIONS
2016–17 External Quality ReviewRecommendations Directed to CalViva
Self-Reported Actions Taken by CalVivaduring the Period of July 1, 2017–June 30,2018, that Address the External QualityReview Recommendations
■ Mandatory educational sessions for providers including mid-level clinicians on the HEDIS guidelines for the diagnosis and treatment of initial episode of uncomplicated low back pain and including the current HEDIS compliance rates (county and clinic).
■ Treatment guidelines were provided (Summary of Medical Guidelines) reference for the first 28 days of a low back pain episode including use of non-narcotic pain medications.
■ A “Tip Sheet for Low Back Pain” was developed that included general information on this HEDIS measure and the “red flags” that may indicate the need for an imaging study at the time of initial diagnosis with documentation guidance. This tip sheet was distributed during the training and faxed to all providers.
■ Group dialogue was facilitated regarding the challenges associated with treating low back pain.
■ A provider update, “Alternative Treatments for Low Back Pain,” was developed and distributed to all providers.
The providers completed a pre-test to assess their levels of knowledge prior to the training; then, the same test was administered at the end of the educational session. A comparison of the results of the pre- and post-tests demonstrated a significant improvement in provider comprehension of the recommended guidelines. To assess how this new knowledge was integrated into daily practice, the compliance data for the LBP measure was monitored and
CalViva Health Performance Evaluation Report: July 1, 2017–June 30, 2018 California Department of Health Care Services
Page G-64 Health Services Advisory Group, Inc.
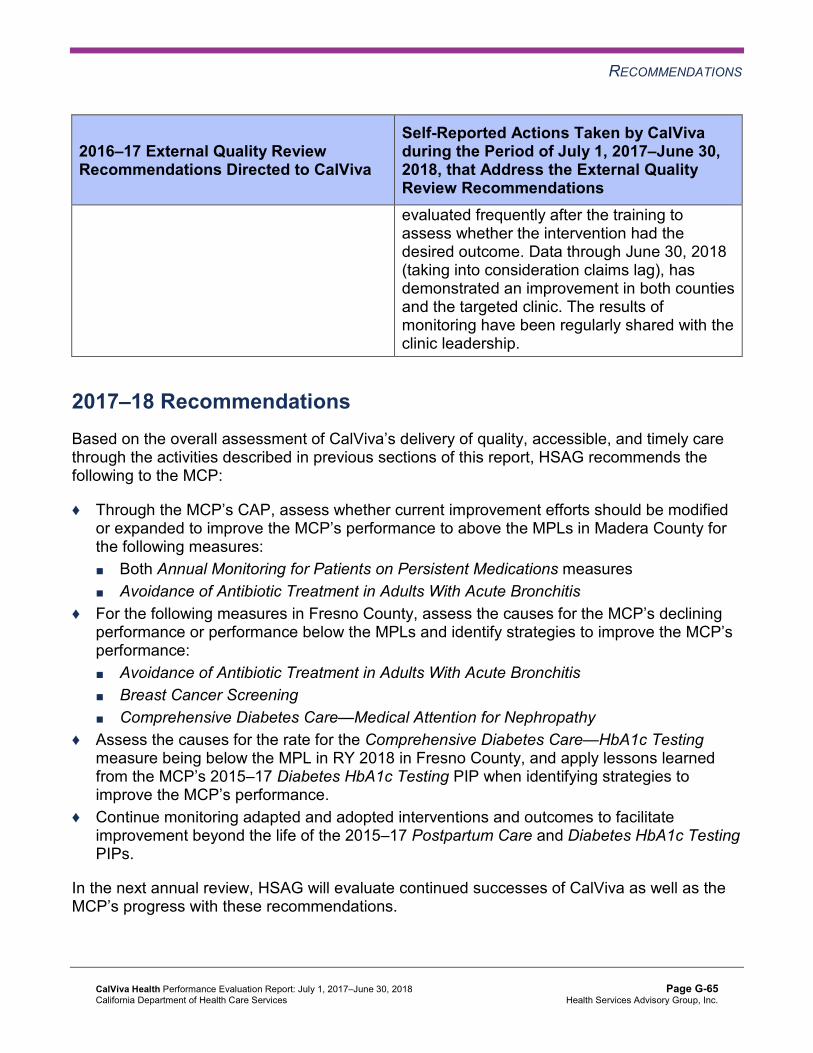
RECOMMENDATIONS
2016–17 External Quality ReviewRecommendations Directed to CalViva
Self-Reported Actions Taken by CalVivaduring the Period of July 1, 2017–June 30,2018, that Address the External QualityReview Recommendations evaluated frequently after the training to assess whether the intervention had the desired outcome. Data through June 30, 2018 (taking into consideration claims lag), has demonstrated an improvement in both counties and the targeted clinic. The results of monitoring have been regularly shared with the clinic leadership.
2017–18 Recommendations Based on the overall assessment of CalViva’s delivery of quality, accessible, and timely care through the activities described in previous sections of this report, HSAG recommends the following to the MCP:
♦ Through the MCP’s CAP, assess whether current improvement efforts should be modified or expanded to improve the MCP’s performance to above the MPLs in Madera County for the following measures: ■ Both Annual Monitoring for Patients on Persistent Medications measures ■ Avoidance of Antibiotic Treatment in Adults With Acute Bronchitis
♦ For the following measures in Fresno County, assess the causes for the MCP’s declining performance or performance below the MPLs and identify strategies to improve the MCP’s performance: ■ Avoidance of Antibiotic Treatment in Adults With Acute Bronchitis ■ Breast Cancer Screening ■ Comprehensive Diabetes Care—Medical Attention for Nephropathy
♦ Assess the causes for the rate for the Comprehensive Diabetes Care—HbA1c Testing measure being below the MPL in RY 2018 in Fresno County, and apply lessons learned from the MCP’s 2015–17 Diabetes HbA1c Testing PIP when identifying strategies to improve the MCP’s performance.
♦ Continue monitoring adapted and adopted interventions and outcomes to facilitate improvement beyond the life of the 2015–17 Postpartum Care and Diabetes HbA1c Testing PIPs.
In the next annual review, HSAG will evaluate continued successes of CalViva as well as the MCP’s progress with these recommendations.
CalViva Health Performance Evaluation Report: July 1, 2017–June 30, 2018 California Department of Health Care Services
Page G-65 Health Services Advisory Group, Inc.

Medi-Cal Managed CareExternal Quality Review Technical Report
Appendix H: Performance Evaluation Report
Care1st Partner Plan July 1, 2017–June 30, 2018

Medi-Cal Managed Care External Quality Review Technical ReportAppendix H: Performance Evaluation ReportCare1st Partner Plan July 1, 2017–June 30, 2018
Table of Contents
1. Introduction.............................................................................................................H-1 Medi-Cal Managed Care Health Plan Overview .......................................................H-1
2. Managed Care Health Plan Compliance ...............................................................H-3Compliance Reviews Conducted..............................................................................H-3 Strengths—Compliance Reviews .............................................................................H-3 Opportunities for Improvement—Compliance Reviews ............................................H-4
3. Managed Care Health Plan Performance Measures ............................................H-5Performance Measure Validation Results ................................................................H-5 Performance Measure Results and Findings............................................................H-5
Preventive Screening and Children’s Health .........................................................H-6 Preventive Screening and Women’s Health ........................................................H-10 Care for Chronic Conditions ................................................................................H-12 Appropriate Treatment and Utilization.................................................................H-14 Performance Measure Findings—All Domains....................................................H-17
Improvement Plan Requirements for 2018 .............................................................H-18 Seniors and Persons with Disabilities Performance Measure Results....................H-19
Seniors and Persons with Disabilities Findings ...................................................H-24 Strengths—Performance Measures .......................................................................H-24 Opportunities for Improvement—Performance Measures ......................................H-25
4. MLTSSP Performance Measure Results.............................................................H-26 Managed Long-Term Services and Supports Plan Performance Measure Findings. H-27
5. Performance Improvement Projects ...................................................................H-28Performance Improvement Project Overview .........................................................H-28 Performance Improvement Project Results and Findings.......................................H-29
2015–17 DHCS-Priority Performance Improvement Project ...............................H-30 2015–17 MCP-Specific Performance Improvement Project ................................H-31 2017–19 Disparity Performance Improvement Project ........................................H-32 2017–19 DHCS-Priority Performance Improvement Project ...............................H-33
Strengths—Performance Improvement Projects ....................................................H-33 Opportunities for Improvement—Performance Improvement Projects ...................H-34
6. Recommendations................................................................................................H-35 Follow-Up on Prior Year Recommendations ..........................................................H-35 2017–18 Recommendations...................................................................................H-38
Care1st Partner Plan Performance Evaluation Report: July 1, 2017–June 30, 2018 California Department of Health Care Services
Page H-i Health Services Advisory Group, Inc.
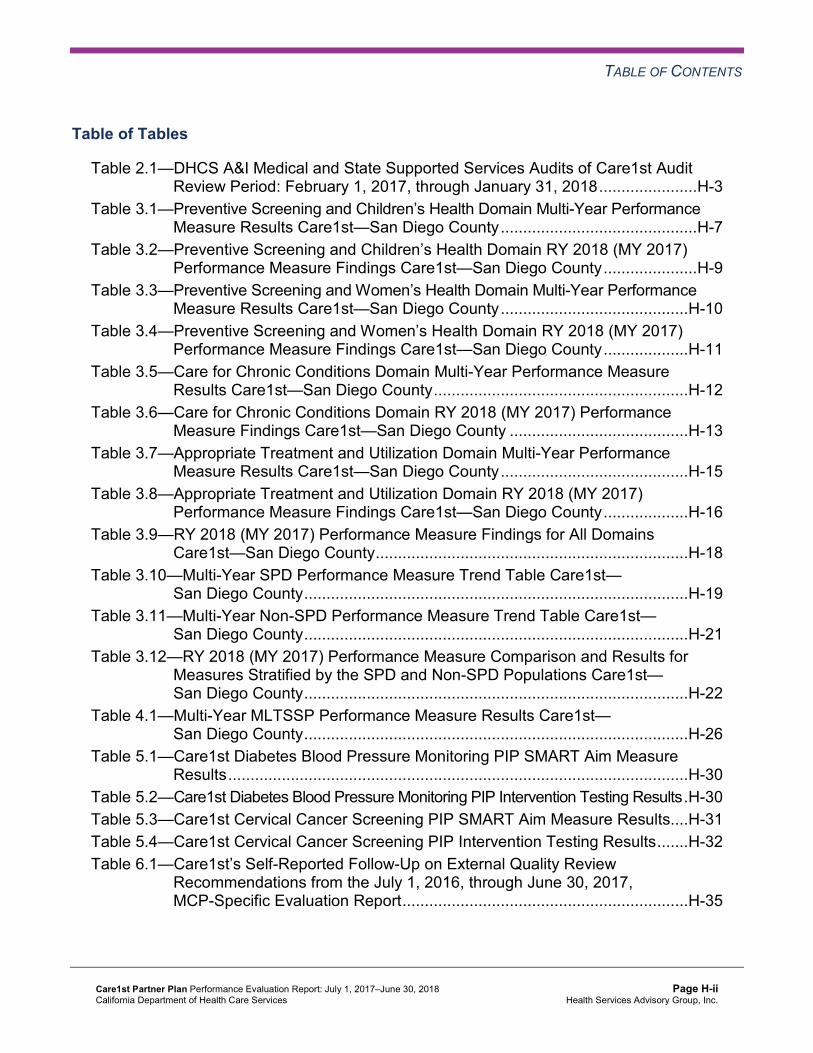
TABLE OF CONTENTS
Table of Tables
Table 2.1—DHCS A&I Medical and State Supported Services Audits of Care1st Audit Review Period: February 1, 2017, through January 31, 2018......................H-3
Table 3.1—Preventive Screening and Children’s Health Domain Multi-Year Performance Measure Results Care1st—San Diego County............................................H-7
Table 3.2—Preventive Screening and Children’s Health Domain RY 2018 (MY 2017) Performance Measure Findings Care1st—San Diego County.....................H-9
Table 3.3—Preventive Screening and Women’s Health Domain Multi-Year Performance Measure Results Care1st—San Diego County..........................................H-10
Table 3.4—Preventive Screening and Women’s Health Domain RY 2018 (MY 2017) Performance Measure Findings Care1st—San Diego County...................H-11
Table 3.5—Care for Chronic Conditions Domain Multi-Year Performance Measure Results Care1st—San Diego County.........................................................H-12
Table 3.6—Care for Chronic Conditions Domain RY 2018 (MY 2017) Performance Measure Findings Care1st—San Diego County ........................................H-13
Table 3.7—Appropriate Treatment and Utilization Domain Multi-Year Performance Measure Results Care1st—San Diego County..........................................H-15
Table 3.8—Appropriate Treatment and Utilization Domain RY 2018 (MY 2017) Performance Measure Findings Care1st—San Diego County...................H-16
Table 3.9—RY 2018 (MY 2017) Performance Measure Findings for All Domains Care1st—San Diego County......................................................................H-18
Table 3.10—Multi-Year SPD Performance Measure Trend Table Care1st— San Diego County......................................................................................H-19
Table 3.11—Multi-Year Non-SPD Performance Measure Trend Table Care1st— San Diego County......................................................................................H-21
Table 3.12—RY 2018 (MY 2017) Performance Measure Comparison and Results for Measures Stratified by the SPD and Non-SPD Populations Care1st— San Diego County......................................................................................H-22
Table 4.1—Multi-Year MLTSSP Performance Measure Results Care1st— San Diego County......................................................................................H-26
Table 5.1—Care1st Diabetes Blood Pressure Monitoring PIP SMART Aim Measure Results.......................................................................................................H-30
Table 5.2—Care1st Diabetes Blood Pressure Monitoring PIP Intervention Testing Results.H-30 Table 5.3—Care1st Cervical Cancer Screening PIP SMART Aim Measure Results....H-31 Table 5.4—Care1st Cervical Cancer Screening PIP Intervention Testing Results.......H-32 Table 6.1—Care1st’s Self-Reported Follow-Up on External Quality Review
Recommendations from the July 1, 2016, through June 30, 2017, MCP-Specific Evaluation Report................................................................H-35
Care1st Partner Plan Performance Evaluation Report: July 1, 2017–June 30, 2018 California Department of Health Care Services
Page H-ii Health Services Advisory Group, Inc.
Medi-Cal Managed Care External Quality Review Technical ReportAppendix H: Performance Evaluation ReportCare1st Partner Plan July 1, 2017–June 30, 2018
1. Introduction
The California Department of Health Care Services (DHCS) contracted with Health Services Advisory Group, Inc. (HSAG), an external quality review organization (EQRO), to prepare the federally required Medi-Cal Managed Care External Quality Review Technical Report, July 1, 2017–June 30, 2018. The technical report provides an overview of the objectives and methodology for conducting the external quality review (EQR) activities, including requirements related to each activity. Additionally, the technical report provides aggregated results and recommendations for DHCS for each activity.
This appendix is specific to DHCS’ contracted Medi-Cal managed care health plan (MCP), Care1st Partner Plan (“Care1st” or “the MCP”). The purpose of this appendix is to provide MCP-specific results of each activity and an assessment of the MCP’s strengths and opportunities for improvement with respect to the quality and timeliness of and access to health care services furnished to Medi-Cal Managed Care (MCMC) beneficiaries (referred to as “beneficiaries” in this report). The review period for this MCP-specific evaluation report is July 1, 2017, through June 30, 2018. HSAG will report on activities that take place beyond the review period in Care1st’s 2018–19 MCP-specific evaluation report. This MCP-specific evaluation report references activities and methodologies described in detail by HSAG in the technical report section.
The aggregate EQR technical report and all MCP- and specialty health plan (SHP)-specific performance evaluation reports reflect HSAG’s external, independent assessment of the quality and timeliness of, and access to, care that MCPs and SHPs are providing to beneficiaries.
Medi-Cal Managed Care Health Plan Overview Care1st is a full-scope MCP delivering services to beneficiaries under a Geographic Managed Care (GMC) model. The GMC model currently operates in the counties of San Diego and Sacramento. In this GMC model, DHCS allows beneficiaries to select from several commercial MCPs within the specified geographic service area (county).
In addition to Care1st, San Diego County’s beneficiaries may select from the following MCPs: ♦ Aetna Better Health of California ♦ Community Health Group Partnership Plan ♦ Health Net Community Solutions, Inc. ♦ Kaiser SoCal ♦ Molina Healthcare of California Partner Plan, Inc. ♦ UnitedHealthcare Community Plan
Care1st Partner Plan Performance Evaluation Report: July 1, 2017–June 30, 2018 California Department of Health Care Services
Page H-1 Health Services Advisory Group, Inc.

INTRODUCTION
Care1st became operational in San Diego County to provide MCMC services effective February 2006. As of June 30, 2018, Care1st had 83,819 beneficiaries.1 This represents 12 percent of the beneficiaries enrolled in San Diego County.
1 Medi-Cal Managed Care Enrollment Report—June 2018. Available at: http://www.dhcs.ca.gov/dataandstats/reports/Pages/MMCDMonthlyEnrollment.aspx. Accessed on: Oct 10, 2018.
Care1st Partner Plan Performance Evaluation Report: July 1, 2017–June 30, 2018 California Department of Health Care Services
Page H-2 Health Services Advisory Group, Inc.

Medi-Cal Managed Care External Quality Review Technical ReportAppendix H: Performance Evaluation ReportCare1st Partner Plan July 1, 2017–June 30, 2018
2. Managed Care Health Plan Compliance
Compliance Reviews Conducted The following is a summary of the most recent reviews conducted for Care1st. The descriptions of the various types of reviews may be found within the main section of this technical report.
Table 2.1 summarizes the results and status of the DHCS Audits & Investigations Division (A&I) Medical and State Supported Services Audits of Care1st. A&I conducted the on-site audits from February 26, 2018, through February 28, 2018. DHCS issued the final closeout letter on August 2, 2018, which is outside the review period for this report; however, HSAG includes the information from the letter because it reflects full resolution of all deficiencies from the February 2018 audits.
Table 2.1—DHCS A&I Medical and State Supported Services Audits of Care1stAudit Review Period: February 1, 2017, through January 31, 2018
Category Evaluated Deficiencies (Yes/No) Monitoring Status
Utilization Management No Not applicable.
Case Management and Coordination of Care Yes
Corrective action plan (CAP) initiated following the audit and subsequently closed.
Access and Availability of Care No Not applicable. Member’s Rights No Not applicable. Quality Management No Not applicable. Administrative and Organizational Capacity No Not applicable. State Supported Services No Not applicable.
Strengths—Compliance Reviews A&I identified a deficiency in only one category (Case Management and Coordination of Care) during the February 2018 Medical and State Supported Services Audits of Care1st. Care1st’s CAP response regarding the deficiency in the Case Management and Coordination of Care category resulted in DHCS closing the CAP.
Care1st Partner Plan Performance Evaluation Report: July 1, 2017–June 30, 2018 California Department of Health Care Services
Page H-3 Health Services Advisory Group, Inc.
MANAGED CARE HEALTH PLAN COMPLIANCE
Opportunities for Improvement—Compliance Reviews Care1st has no outstanding deficiencies from the February 2018 A&I Medical and State Supported Services Audits of the MCP; therefore, HSAG has no recommendations for the MCP in the area of compliance reviews.
Care1st Partner Plan Performance Evaluation Report: July 1, 2017–June 30, 2018 California Department of Health Care Services
Page H-4 Health Services Advisory Group, Inc.
Medi-Cal Managed Care External Quality Review Technical ReportAppendix H: Performance Evaluation ReportCare1st Partner Plan July 1, 2017–June 30, 2018
3. Managed Care Health Plan Performance Measures
Performance Measure Validation Results The HEDIS®2 2018 Compliance Audit Final Report of Findings for Care1st Partner Plan contains the detailed findings and recommendations from HSAG’s NCQA HEDIS Compliance Audit™.3 HSAG auditors determined that Care1st followed the appropriate specifications to produce valid rates, and identified no issues of concern.
Performance Measure Results and Findings After validating the MCP’s performance measure rates, HSAG assessed the results. See Table 3.1 through Table 3.9 for Care1st’s performance measure results for reporting years (RYs) 2015 through 2018 and performance measure findings for RY 2018. The RY is the year in which the MCP reported the rates. The RY rates reflect measurement year (MY) data from the previous calendar year. Note that data may not be available for all four years.
Note the following regarding Table 3.1 through Table 3.9:
♦ To allow HSAG to provide meaningful assessment of MCP performance and actionable recommendations, HSAG, in collaboration with DHCS, organized the measures into domains based on the health care areas each measure affects. Table 3.1 through Table 3.8 present the performance measure results and findings by domain, and Table 3.9 presents the RY 2018 performance measure findings for the domains combined.
♦ To assess performance for each MCP reporting unit, HSAG compares the rates to national benchmarks. Rates indicating performance above the high performance levels (HPLs) are shaded in gray, and rates indicating performance below the minimum performance levels (MPLs) are bolded. ■ For measures with rates below the MPLs, DHCS requires MCPs to submit to DHCS
improvement plans (IPs) to address the rates below the MPLs (unless MCPs are reporting the rates for the first time).
■ For MCPs that meet DHCS’ Quality of Care CAP thresholds, DHCS issues a CAP; if an MCP’s performance is such that it may trigger a CAP in the following year, DHCS issues an advance warning letter.
■ IPs and CAPs consist of submission of Plan-Do-Study-Act (PDSA) Cycle Worksheets, Quality Improvement (QI) Summaries, or completion of Performance Improvement Projects (PIPs)—as determined by DHCS.
2 Healthcare Effectiveness Data and Information Set (HEDIS®) is a registered trademark of the National Committee for Quality Assurance (NCQA).
3 NCQA HEDIS Compliance AuditTM is a trademark of NCQA.
Care1st Partner Plan Performance Evaluation Report: July 1, 2017–June 30, 2018 California Department of Health Care Services
Page H-5 Health Services Advisory Group, Inc.

MANAGED CARE HEALTH PLAN PERFORMANCE MEASURES
♦ For RYs 2016, 2017, and 2018, the HPLs and MPLs represent the NCQA Quality Compass®4 Medicaid health maintenance organization (HMO) 90th and 25th percentiles, respectively.
♦ For RY 2015, the HPLs and MPLs represent the NCQA HEDIS Audit Means, Percentiles, and Ratios 90th and 25th percentiles, respectively. For the Comprehensive Diabetes Care—HbA1c Poor Control (>9.0 Percent) measure, for which a lower rate indicates more favorable performance, the HPL and MPL are based on the 10th and 75th percentiles, respectively.
♦ HSAG includes the specific HPL and MPL values for RY 2018 in Section 6 of the Medi-Cal Managed Care External Quality Review Technical Report, July 1, 2017–June 30, 2018 (“Managed Care Health Plan Performance Measures”).
Preventive Screening and Children’s Health
Table 3.1 presents the four-year trending information for the performance measures within the Preventive Screening and Children’s Health domain.
Note the following regarding Table 3.1:
♦ Although HSAG includes information on the MCP’s performance related to the four Children and Adolescents’ Access to Primary Care measures, DHCS did not hold MCPs accountable to meet the MPLs for these measures for RYs 2015 through 2018 (i.e., DHCS did not require MCPs to submit IPs if rates for the measures were below the MPLs). DHCS made this decision due to the small range of variation between the HPL and MPL thresholds for each measure.
♦ Any comparison of RY 2018 performance to RY 2017 or to benchmarks related to the Immunizations for Adolescents—Combination 2 measure should be exercised with caution given the changes that NCQA made to the specification for this measure for RY 2018. NCQA released guidance that recommended a break in trending for this measure; however, DHCS determined to continue trending because the specification change should result in higher rates.
4 Quality Compass® is a registered trademark of NCQA.
Care1st Partner Plan Performance Evaluation Report: July 1, 2017–June 30, 2018 California Department of Health Care Services
Page H-6 Health Services Advisory Group, Inc.

MANAGED CARE HEALTH PLAN PERFORMANCE MEASURES
Table 3.1—Preventive Screening and Children’s Health DomainMulti-Year Performance Measure Results Care1st—San Diego County
H = Rate indicates performance above the HPL. Bolded Rate = Rate indicates performance below the MPL.
B = Statistical testing result indicates that the RY 2018 rate is significantly better than the RY 2017 rate.
W = Statistical testing result indicates that the RY 2018 rate is significantly worse than the RY 2017 rate.
Measure RY
2015 Rate1
RY 2016
Rate2
RY 2017
Rate3
RY 2018
Rate4
RYs 2017–18 Rate
Difference5
Childhood Immunization Status—Combination 3 69.34% 66.18% 70.07% 66.18% -3.89
Children and Adolescents’ Access to Primary Care Practitioners—12–24 Months
85.60% 82.07% 81.38% 81.29% -0.09
Children and Adolescents’ Access to Primary Care Practitioners— 25 Months–6 Years
77.82% 73.77% 72.10% 71.27% -0.83
Children and Adolescents’ Access to Primary Care Practitioners—7–11 Years
80.73% 77.72% 74.91% 76.21% 1.30
Children and Adolescents’ Access to Primary Care Practitioners—12–19 Years
76.16% 73.59% 68.67% 70.67% 2.00B
Immunizations for Adolescents— Combination 2^ -- -- 18.68% 28.22% 9.54B
Weight Assessment and Counseling for Nutrition and Physical Activity for Children and Adolescents—Nutrition Counseling—Total
75.67% 76.64% 79.23% 82.49% 3.26
Weight Assessment and Counseling for Nutrition and Physical Activity for Children and Adolescents—Physical Activity Counseling—Total
64.96% 66.67% 69.40% 76.84%H 7.44B
Care1st Partner Plan Performance Evaluation Report: July 1, 2017–June 30, 2018 California Department of Health Care Services
Page H-7 Health Services Advisory Group, Inc.

MANAGED CARE HEALTH PLAN PERFORMANCE MEASURES
Measure RY
2015 Rate1
RY 2016
Rate2
RY 2017
Rate3
RY 2018
Rate4
RYs 2017–18 Rate
Difference5
Well-Child Visits in the Third, Fourth, Fifth, and Sixth Years of Life
66.18% 61.99% 63.66% 67.71% 4.05
1 RY 2015 rates reflect MY data from January 1, 2014, through December 31, 2014. 2 RY 2016 rates reflect MY data from January 1, 2015, through December 31, 2015. 3 RY 2017 rates reflect MY data from January 1, 2016, through December 31, 2016. 4 RY 2018 rates reflect MY data from January 1, 2017, through December 31, 2017. 5 Performance comparisons are based on the Chi-square test of statistical significance, with a p value of <0.05. ^ Caution should be exercised when assessing MCP performance for this measure given the changes that NCQA made to the specification for this measure for RY 2018. -- Indicates that the rate is not available.
Table 3.2 presents findings for the RY 2018 performance measures within the Preventive Screening and Children’s Health domain.
Note the following regarding Table 3.2:
♦ DHCS did not hold MCPs accountable to meet MPLs for all four Children and Adolescents’ Access to Primary Care measures within this domain; therefore, HSAG did not include these measures in its assessment of the MCP’s performance related to HPLs and MPLs.
♦ The Immunizations for Adolescents—Combination 2 measure was a first-year measure in RY 2017, and DHCS established no MPL for this measure for RY 2017 because no comparable benchmark existed; therefore, HSAG did not include this measure in the denominators for calculating the percentage of measures with rates that moved to above or below the MPLs in RY 2018.
Care1st Partner Plan Performance Evaluation Report: July 1, 2017–June 30, 2018 California Department of Health Care Services
Page H-8 Health Services Advisory Group, Inc.
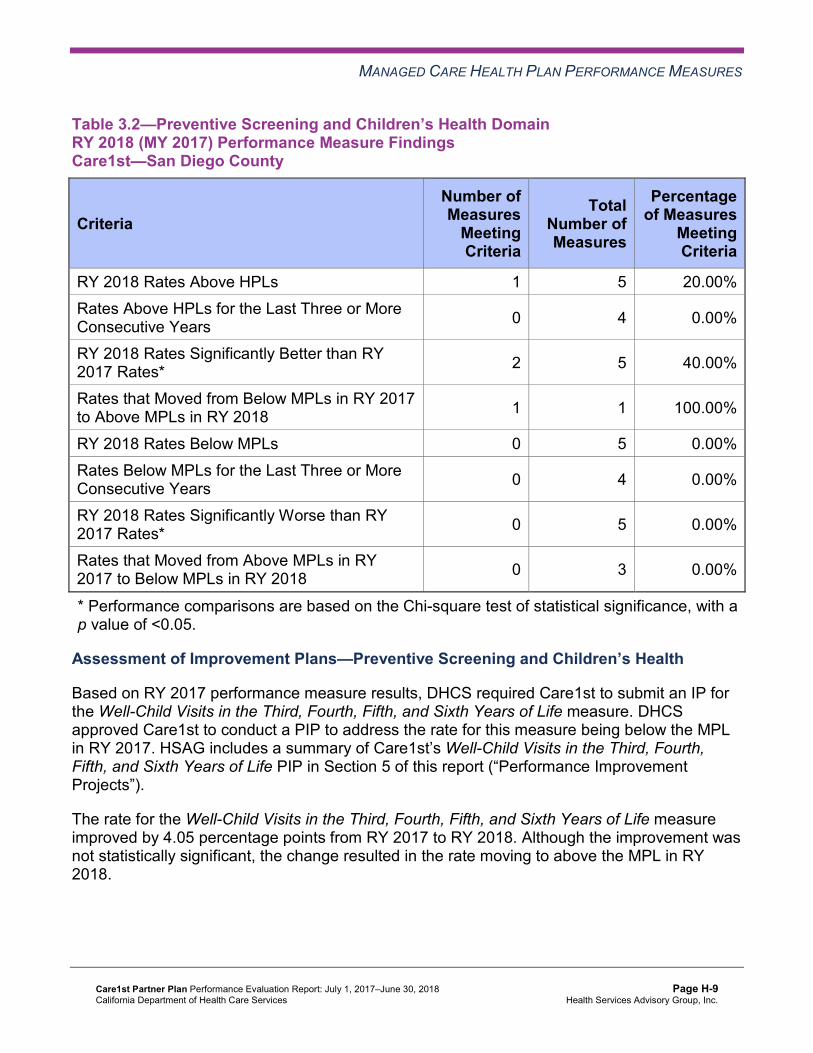
MANAGED CARE HEALTH PLAN PERFORMANCE MEASURES
Table 3.2—Preventive Screening and Children’s Health DomainRY 2018 (MY 2017) Performance Measure Findings Care1st—San Diego County
Criteria Number of Measures
MeetingCriteria
Total Number of Measures
Percentage of Measures
MeetingCriteria
RY 2018 Rates Above HPLs 1 5 20.00% Rates Above HPLs for the Last Three or More Consecutive Years 0 4 0.00%
RY 2018 Rates Significantly Better than RY 2017 Rates* 2 5 40.00%
Rates that Moved from Below MPLs in RY 2017 to Above MPLs in RY 2018 1 1 100.00%
RY 2018 Rates Below MPLs 0 5 0.00% Rates Below MPLs for the Last Three or More Consecutive Years 0 4 0.00%
RY 2018 Rates Significantly Worse than RY 2017 Rates* 0 5 0.00%
Rates that Moved from Above MPLs in RY 2017 to Below MPLs in RY 2018 0 3 0.00%
* Performance comparisons are based on the Chi-square test of statistical significance, with a p value of <0.05.
Assessment of Improvement Plans—Preventive Screening and Children’s Health
Based on RY 2017 performance measure results, DHCS required Care1st to submit an IP for the Well-Child Visits in the Third, Fourth, Fifth, and Sixth Years of Life measure. DHCS approved Care1st to conduct a PIP to address the rate for this measure being below the MPL in RY 2017. HSAG includes a summary of Care1st’s Well-Child Visits in the Third, Fourth, Fifth, and Sixth Years of Life PIP in Section 5 of this report (“Performance Improvement Projects”).
The rate for the Well-Child Visits in the Third, Fourth, Fifth, and Sixth Years of Life measure improved by 4.05 percentage points from RY 2017 to RY 2018. Although the improvement was not statistically significant, the change resulted in the rate moving to above the MPL in RY 2018.
Care1st Partner Plan Performance Evaluation Report: July 1, 2017–June 30, 2018 California Department of Health Care Services
Page H-9 Health Services Advisory Group, Inc.

MANAGED CARE HEALTH PLAN PERFORMANCE MEASURES
Preventive Screening and Women’s Health
Table 3.3 presents the four-year trending information for the performance measures within the Preventive Screening and Women’s Health domain.
Note that any comparison of RY 2018 performance to RY 2017 or to benchmarks related to the Breast Cancer Screening measure should be exercised with caution given the changes that NCQA made to the specification for this measure for RY 2018. NCQA released guidance that recommended a break in trending for this measure; however, DHCS determined to continue trending because the specification change should result in higher rates.
Table 3.3—Preventive Screening and Women’s Health DomainMulti-Year Performance Measure Results Care1st—San Diego County
H = Rate indicates performance above the HPL. Bolded Rate = Rate indicates performance below the MPL.
B = Statistical testing result indicates that the RY 2018 rate is significantly better than the RY 2017 rate.
W = Statistical testing result indicates that the RY 2018 rate is significantly worse than the RY 2017 rate.
Measure RY
2015 Rate1
RY 2016
Rate2
RY 2017
Rate3
RY 2018
Rate4
RYs 2017–18 Rate
Difference5
Breast Cancer Screening^ -- -- 54.02% 51.35% -2.67W
Cervical Cancer Screening 49.64% 47.45% 58.39% 49.63% -8.76W
Prenatal and Postpartum Care— Postpartum Care 64.96% 64.72% 69.21% 67.80% -1.41
Prenatal and Postpartum Care— Timeliness of Prenatal Care 79.08% 81.51% 78.42% 82.49% 4.07
1 RY 2015 rates reflect MY data from January 1, 2014, through December 31, 2014. 2 RY 2016 rates reflect MY data from January 1, 2015, through December 31, 2015. 3 RY 2017 rates reflect MY data from January 1, 2016, through December 31, 2016. 4 RY 2018 rates reflect MY data from January 1, 2017, through December 31, 2017. 5 Performance comparisons are based on the Chi-square test of statistical significance, with a p value of <0.05. ^ Caution should be exercised when assessing MCP performance for this measure given the changes that NCQA made to the specification for this measure for RY 2018. -- Indicates that the rate is not available.
Care1st Partner Plan Performance Evaluation Report: July 1, 2017–June 30, 2018 California Department of Health Care Services
Page H-10 Health Services Advisory Group, Inc.
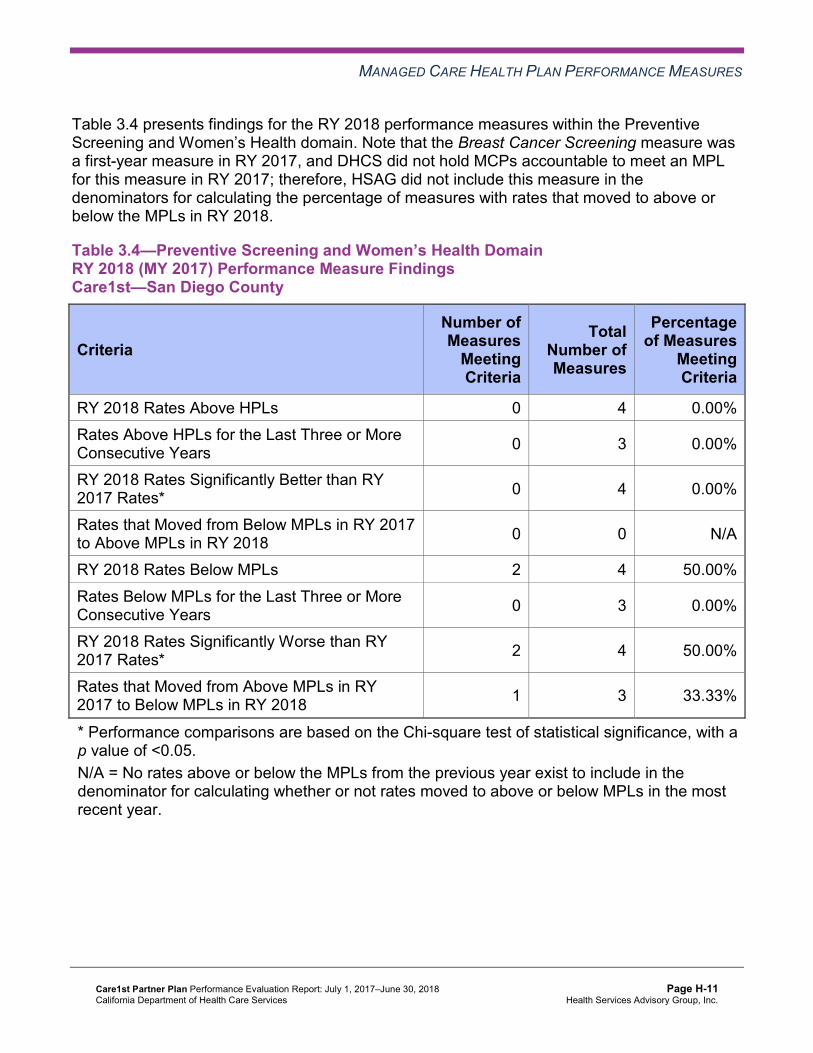
MANAGED CARE HEALTH PLAN PERFORMANCE MEASURES
Table 3.4 presents findings for the RY 2018 performance measures within the Preventive Screening and Women’s Health domain. Note that the Breast Cancer Screening measure was a first-year measure in RY 2017, and DHCS did not hold MCPs accountable to meet an MPL for this measure in RY 2017; therefore, HSAG did not include this measure in the denominators for calculating the percentage of measures with rates that moved to above or below the MPLs in RY 2018.
Table 3.4—Preventive Screening and Women’s Health DomainRY 2018 (MY 2017) Performance Measure Findings Care1st—San Diego County
Criteria Number of Measures
MeetingCriteria
Total Number of Measures
Percentage of Measures
MeetingCriteria
RY 2018 Rates Above HPLs 0 4 0.00% Rates Above HPLs for the Last Three or More Consecutive Years 0 3 0.00%
RY 2018 Rates Significantly Better than RY 2017 Rates* 0 4 0.00%
Rates that Moved from Below MPLs in RY 2017 to Above MPLs in RY 2018 0 0 N/A
RY 2018 Rates Below MPLs 2 4 50.00% Rates Below MPLs for the Last Three or More Consecutive Years 0 3 0.00%
RY 2018 Rates Significantly Worse than RY 2017 Rates* 2 4 50.00%
Rates that Moved from Above MPLs in RY 2017 to Below MPLs in RY 2018 1 3 33.33%
* Performance comparisons are based on the Chi-square test of statistical significance, with a p value of <0.05. N/A = No rates above or below the MPLs from the previous year exist to include in the denominator for calculating whether or not rates moved to above or below MPLs in the most recent year.
Care1st Partner Plan Performance Evaluation Report: July 1, 2017–June 30, 2018 California Department of Health Care Services
Page H-11 Health Services Advisory Group, Inc.
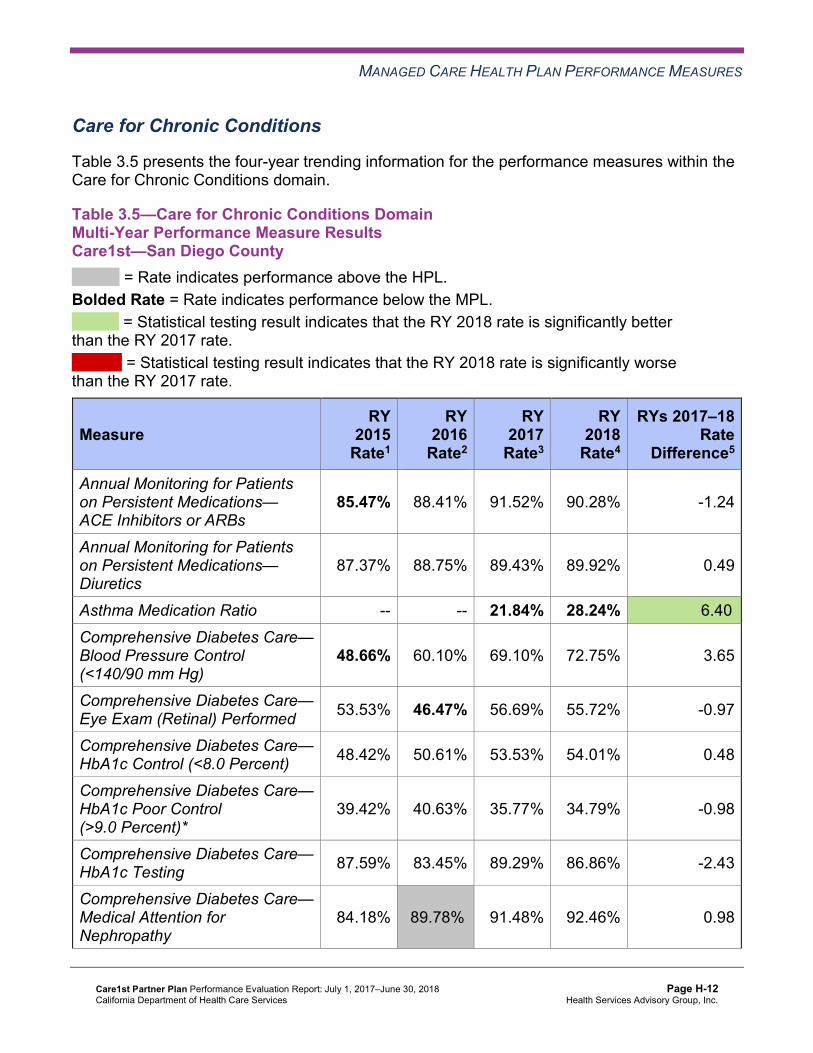
MANAGED CARE HEALTH PLAN PERFORMANCE MEASURES
Care for Chronic Conditions
Table 3.5 presents the four-year trending information for the performance measures within the Care for Chronic Conditions domain.
Table 3.5—Care for Chronic Conditions Domain Multi-Year Performance Measure Results Care1st—San Diego County
H = Rate indicates performance above the HPL. Bolded Rate = Rate indicates performance below the MPL.
B = Statistical testing result indicates that the RY 2018 rate is significantly better than the RY 2017 rate.
W = Statistical testing result indicates that the RY 2018 rate is significantly worse than the RY 2017 rate.
Measure RY
2015 Rate1
RY 2016
Rate2
RY 2017
Rate3
RY 2018
Rate4
RYs 2017–18 Rate
Difference5
Annual Monitoring for Patients on Persistent Medications— ACE Inhibitors or ARBs
85.47% 88.41% 91.52% 90.28% -1.24
Annual Monitoring for Patients on Persistent Medications— Diuretics
87.37% 88.75% 89.43% 89.92% 0.49
Asthma Medication Ratio -- -- 21.84% 28.24% 6.40B
Comprehensive Diabetes Care— Blood Pressure Control (<140/90 mm Hg)
48.66% 60.10% 69.10% 72.75% 3.65
Comprehensive Diabetes Care— Eye Exam (Retinal) Performed 53.53% 46.47% 56.69% 55.72% -0.97
Comprehensive Diabetes Care— HbA1c Control (<8.0 Percent) 48.42% 50.61% 53.53% 54.01% 0.48
Comprehensive Diabetes Care— HbA1c Poor Control (>9.0 Percent)*
39.42% 40.63% 35.77% 34.79% -0.98
Comprehensive Diabetes Care— HbA1c Testing 87.59% 83.45% 89.29% 86.86% -2.43
Comprehensive Diabetes Care— Medical Attention for Nephropathy
84.18% 89.78%H 91.48% 92.46% 0.98
Care1st Partner Plan Performance Evaluation Report: July 1, 2017–June 30, 2018 California Department of Health Care Services
Page H-12 Health Services Advisory Group, Inc.

MANAGED CARE HEALTH PLAN PERFORMANCE MEASURES
Measure RY
2015 Rate1
RY 2016
Rate2
RY 2017
Rate3
RY 2018
Rate4
RYs 2017–18 Rate
Difference5
Controlling High Blood Pressure 59.37% 54.02% 67.73% 67.49% -0.24 1 RY 2015 rates reflect MY data from January 1, 2014, through December 31, 2014. 2 RY 2016 rates reflect MY data from January 1, 2015, through December 31, 2015. 3 RY 2017 rates reflect MY data from January 1, 2016, through December 31, 2016. 4 RY 2018 rates reflect MY data from January 1, 2017, through December 31, 2017. 5 Performance comparisons are based on the Chi-square test of statistical significance, with a p value of <0.05. * A lower rate indicates better performance for this measure. -- Indicates that the rate is not available.
Table 3.6 presents findings for the RY 2018 performance measures within the Care for Chronic Conditions domain. Note that the Asthma Medication Ratio measure was a first-year measure in RY 2017, and DHCS did not hold MCPs accountable to meet an MPL for this measure in RY 2017; therefore, HSAG did not include this measure in the denominators for calculating the percentage of measures with rates that moved to above or below the MPLs in RY 2018.
Table 3.6—Care for Chronic Conditions Domain RY 2018 (MY 2017) Performance Measure Findings Care1st—San Diego County
Criteria Number of Measures
MeetingCriteria
Total Number of Measures
Percentage of Measures
MeetingCriteria
RY 2018 Rates Above HPLs 0 10 0.00% Rates Above HPLs for the Last Three or More Consecutive Years 0 9 0.00%
RY 2018 Rates Significantly Better than RY 2017 Rates* 1 10 10.00%
Rates that Moved from Below MPLs in RY 2017 to Above MPLs in RY 2018 0 0 N/A
RY 2018 Rates Below MPLs 1 10 10.00% Rates Below MPLs for the Last Three or More Consecutive Years 0 9 0.00%
RY 2018 Rates Significantly Worse than RY 2017 Rates* 0 10 0.00%
Care1st Partner Plan Performance Evaluation Report: July 1, 2017–June 30, 2018 California Department of Health Care Services
Page H-13 Health Services Advisory Group, Inc.

MANAGED CARE HEALTH PLAN PERFORMANCE MEASURES
Criteria Number of Measures
MeetingCriteria
Total Number of Measures
Percentage of Measures
MeetingCriteria
Rates that Moved from Above MPLs in RY 2017 to Below MPLs in RY 2018 0 9 0.00%
* Performance comparisons are based on the Chi-square test of statistical significance, with a p value of <0.05. N/A = No rates above or below the MPLs from the previous year exist to include in the denominator for calculating whether or not rates moved to above or below MPLs in the most recent year.
Appropriate Treatment and Utilization
Table 3.7 presents the four-year trending information for the performance measures within the Appropriate Treatment and Utilization domain.
Note the following regarding Table 3.7:
♦ The All-Cause Readmissions measure is a non-HEDIS measure originally developed for DHCS’ All-Cause Readmissions collaborative quality improvement project (QIP); therefore, DHCS does not establish an HPL or MPL for this measure. For the All-Cause Readmissions measure, a lower rate indicates better performance (i.e., fewer readmissions).
♦ The two Ambulatory Care measures are utilization measures, which measure the volume of services used. DHCS does not hold MCPs accountable to meet MPLs for utilization measures, and HSAG does not compare performance for these measures against HPLs and MPLs. Additionally, because high and low rates do not necessarily indicate better or worse performance, HSAG did not compare performance for these measures across years.
♦ DHCS established no HPL or MPL for the two Depression Screening and Follow-Up for Adolescents and Adults measures for RY 2018 because no comparable benchmarks exist. Additionally, although MCPs reported the two Depression Screening and Follow-Up for Adolescents and Adults measures for RY 2018, HSAG does not present the performance measure results for these measures in this report because the reported rates do not accurately represent services being provided. This is due to the Depression Screening and Follow-Up for Adolescents and Adults measures being new HEDIS measures for RY 2018, NCQA requiring MCPs to submit rates for these measures using the new Electronic Clinical Data Systems (ECDS) reporting methodology, and inconsistent data reporting processes by calculation vendors. Thus, MCPs experienced numerous challenges obtaining data sources to use for ECDS reporting. DHCS and HSAG, in consultation with NCQA, will work with MCPs to improve data capture for RY 2019.
Care1st Partner Plan Performance Evaluation Report: July 1, 2017–June 30, 2018 California Department of Health Care Services
Page H-14 Health Services Advisory Group, Inc.

MANAGED CARE HEALTH PLAN PERFORMANCE MEASURES
♦ Note that due to changes that NCQA made to the specifications for the Use of Imaging Studies for Low Back Pain measure in RY 2018, NCQA released guidance to exercise caution when trending the results for this measure. Therefore, caution should be used when comparing MCP performance across years or when comparing MCP results to benchmarks related to the Use of Imaging Studies for Low Back Pain measure, as differences in rates may be a result of the specification changes rather than a reflection of performance.
Table 3.7—Appropriate Treatment and Utilization DomainMulti-Year Performance Measure Results Care1st—San Diego County
H = Rate indicates performance above the HPL. Bolded Rate = Rate indicates performance below the MPL.
B = Statistical testing result indicates that the RY 2018 rate is significantly better than the RY 2017 rate.
W = Statistical testing result indicates that the RY 2018 rate is significantly worse than the RY 2017 rate.
Measure RY
2015 Rate1
RY 2016
Rate2
RY 2017
Rate3
RY 2018
Rate4
RYs 2017–18 Rate
Difference5
All-Cause Readmissions* 16.89% 19.00% 17.72% 16.90% -0.82 Ambulatory Care—Emergency Department (ED) Visits per 1,000 Member Months**
53.48 46.25 42.99 42.79 Not Tested
Ambulatory Care—Outpatient Visits per 1,000 Member Months**
366.29 341.22 350.69 269.38 Not Tested
Avoidance of Antibiotic Treatment in Adults With Acute Bronchitis
25.20% 25.14% 30.83% 40.36%H 9.53B
Use of Imaging Studies for Low Back Pain^ 76.85% 66.59% 64.19% 62.56% -1.63
1 RY 2015 rates reflect MY data from January 1, 2014, through December 31, 2014. 2 RY 2016 rates reflect MY data from January 1, 2015, through December 31, 2015. 3 RY 2017 rates reflect MY data from January 1, 2016, through December 31, 2016. 4 RY 2018 rates reflect MY data from January 1, 2017, through December 31, 2017. 5 Performance comparisons are based on the Chi-square test of statistical significance, with a p value of <0.05. * A lower rate indicates better performance for this measure.
Care1st Partner Plan Performance Evaluation Report: July 1, 2017–June 30, 2018 California Department of Health Care Services
Page H-15 Health Services Advisory Group, Inc.

MANAGED CARE HEALTH PLAN PERFORMANCE MEASURES
** Member months are a member's “contribution” to the total yearly membership. ^ Caution should be exercised when assessing MCP performance for this measure given the changes that NCQA made to the specification for this measure for RY 2018. Not Tested = An RY 2017–18 rate difference was not calculated because high and low rates do not necessarily indicate better or worse performance.
Table 3.8 presents findings for the RY 2018 performance measures within the Appropriate Treatment and Utilization domain. DHCS did not hold MCPs accountable to meet MPLs for the following measures within this domain; therefore, HSAG did not include these measures in its assessment of the MCP’s performance related to HPLs and MPLs:
♦ All-Cause Readmissions ♦ Both Ambulatory Care measures
Table 3.8—Appropriate Treatment and Utilization DomainRY 2018 (MY 2017) Performance Measure FindingsCare1st—San Diego County
Criteria Number of Measures
MeetingCriteria
Total Number of Measures
Percentage of Measures
MeetingCriteria
RY 2018 Rates Above HPLs 1 2 50.00% Rates Above HPLs for the Last Three or More Consecutive Years 0 2 0.00%
RY 2018 Rates Significantly Better than RY 2017 Rates* 1 3 33.33%
Rates that Moved from Below MPLs in RY 2017 to Above MPLs in RY 2018 0 1 0.00%
RY 2018 Rates Below MPLs 1 2 50.00% Rates Below MPLs for the Last Three or More Consecutive Years 1 2 50.00%
RY 2018 Rates Significantly Worse than RY 2017 Rates* 0 3 0.00%
Rates that Moved from Above MPLs in RY 2017 to Below MPLs in RY 2018 0 1 0.00%
* Performance comparisons are based on the Chi-square test of statistical significance, with a p value of <0.05.
Care1st Partner Plan Performance Evaluation Report: July 1, 2017–June 30, 2018 California Department of Health Care Services
Page H-16 Health Services Advisory Group, Inc.
MANAGED CARE HEALTH PLAN PERFORMANCE MEASURES
Assessment of Improvement Plans—Appropriate Treatment and Utilization
Based on RY 2017 performance measure results, DHCS required Care1st to submit an IP for the Use of Imaging Studies for Low Back Pain measure. Care1st submitted a Pilot QI Strategy Summary/Progress Report to DHCS that described the quality improvement strategies that the MCP implemented to address its performance below the MPL for the Use of Imaging Studies for Low Back Pain measure. Care1st indicated that the MCP initially conducted a SWOT (Strengths, Weaknesses, Opportunities, Threats) analysis. Based on the SWOT analysis results, Care1st identified multiple strategies for the MCP to implement at the provider and beneficiary levels to improve the rate for the Use of Imaging Studies for Low Back Pain measure. Care1st reported developing and implementing the following: ♦ An on-hold messaging alert for incoming calls from outside callers that included educational
information on low back pain management and self-care ♦ A three-tiered beneficiary incentive program that integrated appropriate use of imaging
studies for low back pain as part of health and wellness for beneficiaries ♦ New use of imaging studies for low back pain clinical practice guidelines made accessible
to all Care1st providers ♦ A “boots on the ground” approach to foster direct engagement with a Federally Qualified
Health Center (FQHC) monthly and quarterly
The rate for the Use of Imaging Studies for Low Back Pain measure remained below the MPL in RY 2018.
Performance Measure Findings—All Domains
Table 3.9 presents a summary of Care1st’s RY 2018 performance across all External Accountability Set (EAS) measures.
Note the following regarding Table 3.9: ♦ DHCS did not hold MCPs accountable to meet MPLs for the following measures; therefore,
HSAG did not include these measures in its assessment of the MCP’s performance related to HPLs and MPLs: ■ All-Cause Readmissions ■ Both Ambulatory Care measures ■ All four Children and Adolescents’ Access to Primary Care measures
♦ DHCS did not hold MCPs accountable to meet MPLs for the following measures in RY 2017; therefore, HSAG did not include these measures in the denominators for calculating the percentage of measures with rates that moved to above or below the MPLs in RY 2018 and for calculating the percentage of measures with rates below MPLs for only the last two consecutive years: ■ Asthma Medication Ratio ■ Breast Cancer Screening ■ Immunizations for Adolescents—Combination 2
Care1st Partner Plan Performance Evaluation Report: July 1, 2017–June 30, 2018 California Department of Health Care Services
Page H-17 Health Services Advisory Group, Inc.

MANAGED CARE HEALTH PLAN PERFORMANCE MEASURES
Table 3.9—RY 2018 (MY 2017) Performance Measure Findings for All Domains Care1st—San Diego County
Criteria Number of Measures
MeetingCriteria
Total Number of Measures
Percentage of Measures
MeetingCriteria
RY 2018 Rates Above HPLs 2 21 9.52% Rates Above HPLs for the Last Three or More Consecutive Years 0 18 0.00%
RY 2018 Rates Significantly Better than RY 2017 Rates* 4 22 18.18%
Rates that Moved from Below MPLs in RY 2017 to Above MPLs in RY 2018 1 2 50.00%
RY 2018 Rates Below MPLs 4 21 19.05% Rates Below MPLs for Only the Last Two Consecutive Years 0 18 0.00%
Rates Below MPLs for the Last Three or More Consecutive Years 1 18 5.56%
RY 2018 Rates Significantly Worse than RY 2017 Rates* 2 22 9.09%
Rates that Moved from Above MPLs in RY 2017 to Below MPLs in RY 2018 1 16 6.25%
* Performance comparisons are based on the Chi-square test of statistical significance, with a p value of <0.05.
Improvement Plan Requirements for 2018 Based on RY 2018 performance measure results, Care1st will be required to:
♦ Continue conducting an IP for the Use of Imaging Studies for Low Back Pain measure. ♦ Submit IPs for the following measures:
■ Asthma Medication Ratio ■ Breast Cancer Screening ■ Cervical Cancer Screening
Care1st Partner Plan Performance Evaluation Report: July 1, 2017–June 30, 2018 California Department of Health Care Services
Page H-18 Health Services Advisory Group, Inc.

MANAGED CARE HEALTH PLAN PERFORMANCE MEASURES
Seniors and Persons with Disabilities Performance Measure Results Table 3.10 presents the four-year trending information for the Seniors and Persons with Disabilities (SPD) population, and Table 3.11 presents the four-year trending information for the non-SPD population for the measures that DHCS required MCPs to stratify for the SPD and non-SPD populations. The tables also show the differences in rates between RY 2017 and RY 2018.
Table 3.12 presents the SPD and non-SPD rates, a comparison of the SPD and non-SPD rates,5 and the total combined rate for each measure.
Table 3.10—Multi-Year SPD Performance Measure Trend Table Care1st—San Diego County
B = Statistical testing result indicates that the RY 2018 SPD rate is significantly better than the RY 2017 SPD rate.
W = Statistical testing result indicates that the RY 2018 SPD rate is significantly worse than the RY 2017 SPD rate.
Measure RY
2015 SPD
Rate1
RY 2016 SPD
Rate2
RY 2017 SPD
Rate3
RY 2018 SPD
Rate4
RYs 2017–18 Rate
Difference5
All-Cause Readmissions* 19.22% 23.89% 22.75% 21.89% -0.86 Ambulatory Care—Emergency Department (ED) Visits per 1,000 Member Months**
74.91 90.10 84.98 86.05 Not Tested
Ambulatory Care—Outpatient Visits per 1,000 Member Months**
478.22 587.62 653.93 510.33 Not Tested
Annual Monitoring for Patients on Persistent Medications— ACE Inhibitors or ARBs
85.97% 91.55% 93.96% 92.41% -1.55
Annual Monitoring for Patients on Persistent Medications— Diuretics
87.10% 91.68% 93.82% 93.12% -0.70
5 HSAG calculated statistical significance between the SPD and non-SPD rates for each measure using a Chi-square test. This information is displayed in the “SPD/Non-SPD Rate Difference” column in Table 3.12.
Care1st Partner Plan Performance Evaluation Report: July 1, 2017–June 30, 2018 California Department of Health Care Services
Page H-19 Health Services Advisory Group, Inc.
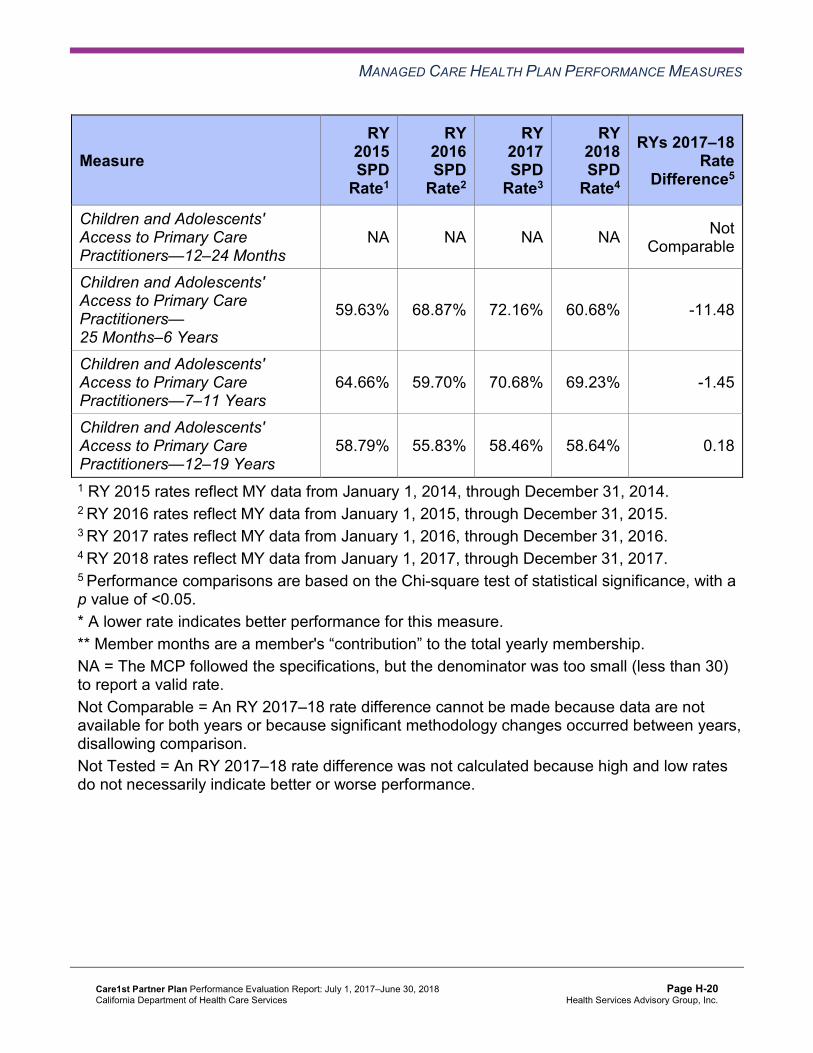
MANAGED CARE HEALTH PLAN PERFORMANCE MEASURES
Measure RY
2015 SPD
Rate1
RY 2016 SPD
Rate2
RY 2017 SPD
Rate3
RY 2018 SPD
Rate4
RYs 2017–18 Rate
Difference5
Children and Adolescents' Access to Primary Care Practitioners—12–24 Months
NA NA NA NA Not Comparable
Children and Adolescents' Access to Primary Care Practitioners— 25 Months–6 Years
59.63% 68.87% 72.16% 60.68% -11.48
Children and Adolescents' Access to Primary Care Practitioners—7–11 Years
64.66% 59.70% 70.68% 69.23% -1.45
Children and Adolescents' Access to Primary Care Practitioners—12–19 Years
58.79% 55.83% 58.46% 58.64% 0.18
1 RY 2015 rates reflect MY data from January 1, 2014, through December 31, 2014. 2 RY 2016 rates reflect MY data from January 1, 2015, through December 31, 2015. 3 RY 2017 rates reflect MY data from January 1, 2016, through December 31, 2016. 4 RY 2018 rates reflect MY data from January 1, 2017, through December 31, 2017. 5 Performance comparisons are based on the Chi-square test of statistical significance, with a p value of <0.05. * A lower rate indicates better performance for this measure. ** Member months are a member's “contribution” to the total yearly membership. NA = The MCP followed the specifications, but the denominator was too small (less than 30) to report a valid rate. Not Comparable = An RY 2017–18 rate difference cannot be made because data are not available for both years or because significant methodology changes occurred between years, disallowing comparison. Not Tested = An RY 2017–18 rate difference was not calculated because high and low rates do not necessarily indicate better or worse performance.
Care1st Partner Plan Performance Evaluation Report: July 1, 2017–June 30, 2018 California Department of Health Care Services
Page H-20 Health Services Advisory Group, Inc.

MANAGED CARE HEALTH PLAN PERFORMANCE MEASURES
Table 3.11—Multi-Year Non-SPD Performance Measure Trend Table Care1st—San Diego County
B = Statistical testing result indicates that the RY 2018 non-SPD rate is significantly better than the RY 2017 non-SPD rate.
W = Statistical testing result indicates that the RY 2018 non-SPD rate is significantly worse than the RY 2017 non-SPD rate.
Measure RY 2015
Non-SPD Rate1
RY 2016 Non-SPD
Rate2
RY 2017 Non-SPD
Rate3
RY 2018 Non-SPD
Rate4
RYs 2017–18 Rate
Difference5
All-Cause Readmissions* 13.92% 16.32% 15.49% 14.31% -1.18
Ambulatory Care— Emergency Department (ED) Visits per 1,000 Member Months**
49.57 42.14 39.68 39.37 Not Tested
Ambulatory Care— Outpatient Visits per 1,000 Member Months**
345.87 318.11 326.81 250.34 Not Tested
Annual Monitoring for Patients on Persistent Medications— ACE Inhibitors or ARBs
84.75% 87.21% 90.70% 89.50% -1.20
Annual Monitoring for Patients on Persistent Medications—Diuretics
87.75% 87.53% 87.83% 88.67% 0.84
Children and Adolescents' Access to Primary Care Practitioners— 12–24 Months
86.15% 82.06% 81.47% 81.63% 0.16
Children and Adolescents' Access to Primary Care Practitioners— 25 Months–6 Years
78.31% 73.89% 72.10% 71.55% -0.55
Children and Adolescents' Access to Primary Care Practitioners— 7–11 Years
81.66% 78.58% 75.08% 76.49% 1.41
Care1st Partner Plan Performance Evaluation Report: July 1, 2017–June 30, 2018 California Department of Health Care Services
Page H-21 Health Services Advisory Group, Inc.

MANAGED CARE HEALTH PLAN PERFORMANCE MEASURES
Measure RY 2015
Non-SPD Rate1
RY 2016 Non-SPD
Rate2
RY 2017 Non-SPD
Rate3
RY 2018 Non-SPD
Rate4
RYs 2017–18 Rate
Difference5
Children and Adolescents' Access to Primary Care Practitioners— 12–19 Years
77.52% 74.69% 69.15% 71.22% 2.07B
1 RY 2015 rates reflect MY data from January 1, 2014, through December 31, 2014. 2 RY 2016 rates reflect MY data from January 1, 2015, through December 31, 2015. 3 RY 2017 rates reflect MY data from January 1, 2016, through December 31, 2016. 4 RY 2018 rates reflect MY data from January 1, 2017, through December 31, 2017. 5 Performance comparisons are based on the Chi-square test of statistical significance, with a p value of <0.05. * A lower rate indicates better performance for this measure. ** Member months are a member's “contribution” to the total yearly membership. Not Tested = An RY 2017–18 rate difference was not calculated because high and low rates do not necessarily indicate better or worse performance.
Table 3.12—RY 2018 (MY 2017) Performance Measure Comparison and Results forMeasures Stratified by the SPD and Non-SPD PopulationsCare1st—San Diego County
B = Statistical testing result indicates that the RY 2018 SPD rate is significantly better than the RY 2018 non-SPD rate.
W = Statistical testing result indicates that the RY 2018 SPD rate is significantly worse than the RY 2018 non-SPD rate.
Measure RY 2018
SPD Rate1
RY 2018 Non-SPD
Rate1
SPD/Non-SPDRate
Difference2
RY 2018 Total Rate3
All-Cause Readmissions* 21.89% 14.31% 7.58W 16.90% Ambulatory Care—Emergency Department (ED) Visits per 1,000 Member Months**
86.05 39.37 Not Tested 42.79
Ambulatory Care—Outpatient Visits per 1,000 Member Months** 510.33 250.34 Not Tested 269.38
Annual Monitoring for Patients on Persistent Medications— ACE Inhibitors or ARBs
92.41% 89.50% 2.91B 90.28%
Care1st Partner Plan Performance Evaluation Report: July 1, 2017–June 30, 2018 California Department of Health Care Services
Page H-22 Health Services Advisory Group, Inc.

MANAGED CARE HEALTH PLAN PERFORMANCE MEASURES
Measure RY 2018
SPD Rate1
RY 2018 Non-SPD
Rate1
SPD/Non-SPDRate
Difference2
RY 2018 Total Rate3
Annual Monitoring for Patients on Persistent Medications—Diuretics 93.12% 88.67% 4.45B 89.92%
Children and Adolescents' Access to Primary Care Practitioners— 12–24 Months
NA 81.63% Not Comparable 81.29%
Children and Adolescents' Access to Primary Care Practitioners— 25 Months–6 Years
60.68% 71.55% -10.87W 71.27%
Children and Adolescents' Access to Primary Care Practitioners— 7–11 Years
69.23% 76.49% -7.26 76.21%
Children and Adolescents' Access to Primary Care Practitioners— 12–19 Years
58.64% 71.22% -12.58W 70.67%
1 RY 2018 rates reflect MY data from January 1, 2017, through December 31, 2017. 2 Performance comparisons are based on the Chi-square test of statistical significance, with a p value of <0.05. 3 Total rates are based on the MCP reporting unit’s total results, including the SPD and non-SPD populations. Please note, if data are not available for either the SPD or non-SPD population, the total rate is based on results reported for the available population. * A lower rate indicates better performance for this measure. ** Member months are a member's “contribution” to the total yearly membership. NA = The MCP followed the specifications, but the denominator was too small (less than 30) to report a valid rate. Not Comparable = An SPD/non-SPD rate difference cannot be made because data are not available for both populations. Not Tested = An SPD/non-SPD rate difference was not calculated because high and low rates do not necessarily indicate better or worse performance.
Care1st Partner Plan Performance Evaluation Report: July 1, 2017–June 30, 2018 California Department of Health Care Services
Page H-23 Health Services Advisory Group, Inc.

MANAGED CARE HEALTH PLAN PERFORMANCE MEASURES
Seniors and Persons with Disabilities Findings
HSAG observed the following notable results in RY 2018 for measures that Care1st stratified by the SPD and non-SPD populations:
♦ For SPD rates for which HSAG could make a comparison, no statistically significant changes occurred for any SPD rates between RY 2017 and RY 2018.
♦ The RY 2018 non-SPD rate was significantly better than the RY 2017 non-SPD rate for the Children and Adolescents’ Access to Primary Care Practitioners—12–19 Years measure.
♦ For measures for which HSAG could compare the RY 2018 SPD rates to the RY 2018 non-SPD rates: ■ The RY 2018 SPD rates were significantly better than the RY 2018 non-SPD rates for
both Annual Monitoring for Patients on Persistent Medications measures. ■ The RY 2018 SPD rate was significantly worse than the RY 2018 non-SPD rate for the
following measures: ○ All-Cause Readmissions. Note that the higher rate of hospital readmissions for the
SPD population is expected based on the greater and often more complicated health care needs of these beneficiaries.
○ Children and Adolescents’ Access to Primary Care Practitioners—25 Months–6 Years and 12–19 Years. The significant differences in rates for these measures may be attributed to beneficiaries in these age groups in the SPD population choosing to receive all health care services from specialist providers due to their complicated health care needs rather than accessing care from primary care providers (PCPs).
Strengths—Performance Measures HSAG auditors determined that Care1st followed the appropriate specifications to produce valid rates, and identified no issues of concern.
HSAG identified the following notable RY 2018 performance measure results for Care1st:
♦ Across all domains, Care1st performed above the HPLs for two of 21 measures (10 percent); and the rates for four of 22 measures for which HSAG made a comparison between RY 2017 and RY 2018 (18 percent) improved significantly from RY 2017 to RY 2018.
♦ The MCP had notable performance on the following measures in RY 2018: ■ The rates for the following measures improved significantly from RY 2017 to RY 2018:
○ Asthma Medication Ratio ○ Avoidance of Antibiotic Treatment in Adults with Acute Bronchitis. Additionally, the
rate for this measure was above the HPL in RY 2018. ○ Immunizations for Adolescents—Combination 2
Care1st Partner Plan Performance Evaluation Report: July 1, 2017–June 30, 2018 California Department of Health Care Services
Page H-24 Health Services Advisory Group, Inc.
MANAGED CARE HEALTH PLAN PERFORMANCE MEASURES
○ Weight Assessment and Counseling for Nutrition and Physical Activity for Children and Adolescents—Physical Activity Counseling—Total. Additionally, the rate for this measure was above the HPL in RY 2018.
♦ The rate for the Well-Child Visits in the Third, Fourth, Fifth, and Sixth Years of Life measure improved by 4.05 percentage points from RY 2017 to RY 2018. Although the improvement was not statistically significant, the change resulted in the rate for this measure moving from below the MPL in RY 2017 to above the MPL in RY 2018.
Opportunities for Improvement—Performance Measures The rates for the following four of 21 measures (19 percent) were below the MPLs in RY 2018:
♦ Asthma Medication Ratio ♦ Breast Cancer Screening. Note that the MCP’s performance below the MPL may be due to
NCQA’s RY 2018 specification changes for this measure for RY 2018 and therefore may not be related to Care1st’s performance.
♦ Cervical Cancer Screening ♦ Use of Imaging Studies for Low Back Pain. Note that the MCP’s continued performance
below the MPL may be due to NCQA’s RY 2018 specification changes for this measure and therefore may not be related to Care1st’s performance.
Based on RY 2018 performance measure results, Care1st has opportunities to identify the causes for the MCP’s performance below the MPLs for the following measures and to identify strategies to improve the MCP’s performance to above the MPLs:
♦ Asthma Medication Ratio ♦ Breast Cancer Screening ♦ Cervical Cancer Screening
Care1st also has the opportunity to determine whether the MCP should modify or expand the improvement strategies described previously under the “Assessment of Improvement Plans— Appropriate Treatment and Utilization” heading and in Table 6.1 (“Care1st’s Self-Reported Follow-Up on External Quality Review Recommendations from the July 1, 2016, through June 30, 2017, MCP-Specific Evaluation Report”) to ensure that only beneficiaries ages 18 to 50 with lower back pain and who show clinical necessity receive imaging studies.
Care1st Partner Plan Performance Evaluation Report: July 1, 2017–June 30, 2018 California Department of Health Care Services
Page H-25 Health Services Advisory Group, Inc.

Medi-Cal Managed Care External Quality Review Technical ReportAppendix H: Performance Evaluation ReportCare1st Partner Plan July 1, 2017–June 30, 2018
4. MLTSSP Performance Measure Results
Due to Care1st’s participation in California’s Coordinated Care Initiative as a Managed Long-Term Services and Supports Plan (MLTSSP), DHCS required that Care1st report rates for three HEDIS measures for HSAG to validate as part of the NCQA HEDIS Compliance Audit.
Table 4.1 presents the rates for each required MLTSSP performance measure for RYs 2016, 2017, and 2018. The RY is the year in which the MLTSSP reported the rates. The RY rates reflect MY data from the previous calendar year. Note that the Ambulatory Care—Emergency Department Visits and Ambulatory Care—Outpatient Visits measures are utilization measures which measure the volume of services used. High and low rates do not necessarily indicate better or worse performance; therefore, for these measures, HSAG did not compare performance between RY 2017 and RY 2018.
Table 4.1—Multi-Year MLTSSP Performance Measure Results Care1st—San Diego County
B = Statistical testing result indicates that the RY 2018 rate is significantly better than the RY 2017 rate.
W = Statistical testing result indicates that the RY 2018 rate is significantly worse than the RY 2017 rate.
Measure RY 2016 MLTSS
Rate1
RY 2017 MLTSS
Rate2
RY 2018 MLTSS
Rate3
RYs 2017–18 Rate
Difference4
Ambulatory Care—Emergency Department (ED) Visits per 1,000 Member Months*
70.17 98.21 90.88 Not Tested
Ambulatory Care—Outpatient Visits per 1,000 Member Months* 756.33 1,061.99 872.43 Not Tested
Medication Reconciliation Post-Discharge 22.49% 29.50% 30.50% 1.00
1 RY 2016 rates reflect MY data from January 1, 2015, through December 31, 2015. 2 RY 2017 rates reflect MY data from January 1, 2016, through December 31, 2016. 3 RY 2018 rates reflect MY data from January 1, 2017, through December 31, 2017. 4 Performance comparisons are based on the Chi-square test of statistical significance, with a p value of <0.05. * Member months are a member's “contribution” to the total yearly membership. Not Tested = An RY 2017–18 rate difference was not calculated because high and low rates do not necessarily indicate better or worse performance.
Care1st Partner Plan Performance Evaluation Report: July 1, 2017–June 30, 2018 California Department of Health Care Services
Page H-26 Health Services Advisory Group, Inc.

MLTSSP PERFORMANCE MEASURE RESULTS
Managed Long-Term Services and Supports Plan PerformanceMeasure Findings The rate for the Medication Reconciliation Post-Discharge measure showed no statistically significant change from RY 2017 to RY 2018.
Care1st Partner Plan Performance Evaluation Report: July 1, 2017–June 30, 2018 California Department of Health Care Services
Page H-27 Health Services Advisory Group, Inc.

Medi-Cal Managed Care External Quality Review Technical ReportAppendix H: Performance Evaluation ReportCare1st Partner Plan July 1, 2017–June 30, 2018
5. Performance Improvement Projects
Performance Improvement Project Overview The key concepts of the rapid-cycle PIP framework include forming a PIP team, setting aims, establishing measures, determining interventions using quality improvement tools, conducting PDSA cycles to test interventions, and planning for the spread of successful changes. The core component of the rapid-cycle PIP approach involves testing changes on a small scale so that improvement can occur more efficiently and lead to long-term sustainability. The following modules guide MCPs through this rapid-cycle PIP process:
♦ Module 1—PIP Initiation ■ MCPs outline the framework for the PIP, which includes:
○ The topic rationale. ○ Comparative data supporting the need to improve the selected topic. ○ A list of the PIP team members, which consists of internal and external stakeholders. ○ A completed key driver diagram that defines the theory of change for improvement,
including the SMART (Specific, Measurable, Achievable, Relevant, and Time-bound) Aim and Global Aim.
♦ Module 2—SMART Aim Data Collection ■ MCPs define the SMART Aim measure and data collection methodology and develop
the SMART Aim data run chart. ♦ Module 3—Intervention Determination
■ MCPs use process mapping and failure modes and effects analysis to identify potential interventions to test which may have direct effects on the SMART Aim.
♦ Module 4—Plan-Do-Study-Act (PDSA) ■ MCPs test and evaluate the interventions identified in Module 3 through a series of
PDSA cycles. ♦ Module 5—PIP Conclusions
■ MCPs interpret results and summarize: ○ Key findings and outcomes achieved. ○ Assessment of each tested intervention. ○ Lessons learned, including how demonstrated improvement can be shared and used
as a foundation for further improvement going forward. ○ Plan for sustained improvement.
Care1st Partner Plan Performance Evaluation Report: July 1, 2017–June 30, 2018 California Department of Health Care Services
Page H-28 Health Services Advisory Group, Inc.
PERFORMANCE IMPROVEMENT PROJECTS
Based on the agreed-upon timeline, MCPs submit each module to HSAG for validation. Throughout the rapid-cycle PIP process, HSAG provides technical assistance to MCPs to ensure that PIPs are methodologically sound and to problem-solve with MCPs regarding how to address challenges that occur. Through an iterative process, MCPs have opportunities to make corrections to modules 1 through 3 to achieve all validation criteria.
Once MCPs achieve all validation criteria for modules 1 through 3 and receive feedback on the intervention Plan portion of Module 4, MCPs test interventions. During the intervention testing phase of the PIP, HSAG conducts periodic progress check-ins to ensure that MCPs have addressed HSAG’s feedback on the Plan portion of Module 4 and are making appropriate progress with intervention testing. Once MCPs complete testing an intervention, MCPs determine the next steps based on results and lessons learned—whether the intervention was successful and should be spread (adopt), whether modifications need to be made to the existing intervention (adapt), or whether the intervention was not successful and should be stopped (abandon).
In Module 5, MCPs summarize the overall PIP. When validating Module 5, HSAG assesses the validity and reliability of the results based on the Centers for Medicare & Medicaid Services (CMS) validation protocols to determine whether key stakeholders can have confidence in the reported PIP findings. HSAG assigns the following final confidence levels for each PIP:
♦ High confidence—the PIP was methodologically sound and achieved the SMART Aim goal; the demonstrated improvement was clearly linked to the quality improvement processes conducted and intervention(s) tested; and, the MCP accurately summarized the key findings.
♦ Confidence—the PIP was methodologically sound and achieved the SMART Aim goal, and the MCP accurately summarized the key findings. However, some, but not all, of the quality improvement processes conducted and/or intervention(s) tested were clearly linked to the demonstrated improvement.
♦ Low confidence—either (A) the PIP was methodologically sound; however, the SMART Aim goal was not achieved; or (B) the SMART Aim goal was achieved; however, the quality improvement processes and/or intervention(s) tested were poorly executed and could not be linked to the improvement.
♦ Reported PIP results were not credible (referred to in this report as “not credible”)—the PIP methodology was not executed as approved.
Performance Improvement Project Results and Findings During the review period, Care1st submitted modules 4 and 5 for its 2015–17 DHCS-priority and MCP-specific PIPs. HSAG validated the modules and includes the final PIP validation findings in this report. Additionally, Care1st initiated a Disparity PIP and a DHCS-priority PIP during the review period. In this report, HSAG includes summaries of the MCP’s Disparity and DHCS-priority PIP module submissions as well as validation findings from the review period.
Care1st Partner Plan Performance Evaluation Report: July 1, 2017–June 30, 2018 California Department of Health Care Services
Page H-29 Health Services Advisory Group, Inc.
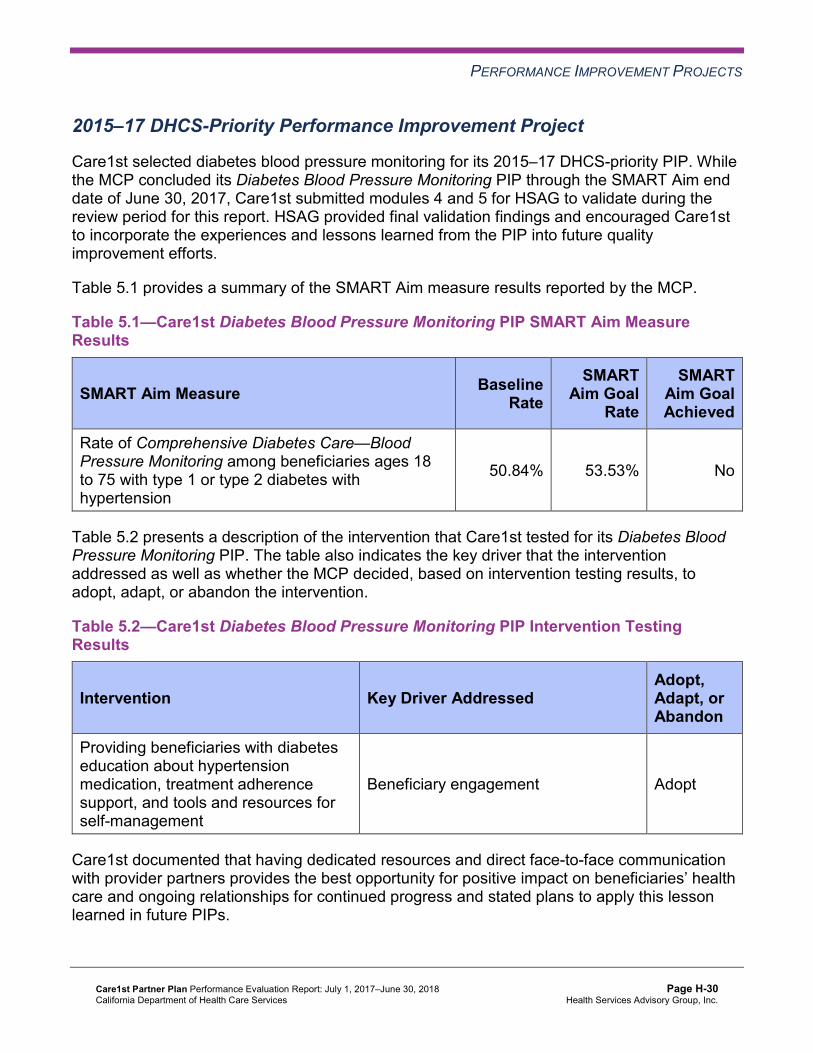
PERFORMANCE IMPROVEMENT PROJECTS
2015–17 DHCS-Priority Performance Improvement Project
Care1st selected diabetes blood pressure monitoring for its 2015–17 DHCS-priority PIP. While the MCP concluded its Diabetes Blood Pressure Monitoring PIP through the SMART Aim end date of June 30, 2017, Care1st submitted modules 4 and 5 for HSAG to validate during the review period for this report. HSAG provided final validation findings and encouraged Care1st to incorporate the experiences and lessons learned from the PIP into future quality improvement efforts.
Table 5.1 provides a summary of the SMART Aim measure results reported by the MCP.
Table 5.1—Care1st Diabetes Blood Pressure Monitoring PIP SMART Aim Measure Results
SMART Aim Measure Baseline Rate
SMART Aim Goal
Rate
SMART Aim Goal Achieved
Rate of Comprehensive Diabetes Care—Blood Pressure Monitoring among beneficiaries ages 18 to 75 with type 1 or type 2 diabetes with hypertension
50.84% 53.53% No
Table 5.2 presents a description of the intervention that Care1st tested for its Diabetes Blood Pressure Monitoring PIP. The table also indicates the key driver that the intervention addressed as well as whether the MCP decided, based on intervention testing results, to adopt, adapt, or abandon the intervention.
Table 5.2—Care1st Diabetes Blood Pressure Monitoring PIP Intervention Testing Results
Intervention Key Driver Addressed Adopt,Adapt, orAbandon
Providing beneficiaries with diabetes education about hypertension medication, treatment adherence support, and tools and resources for self-management
Beneficiary engagement Adopt
Care1st documented that having dedicated resources and direct face-to-face communication with provider partners provides the best opportunity for positive impact on beneficiaries’ health care and ongoing relationships for continued progress and stated plans to apply this lesson learned in future PIPs.
Care1st Partner Plan Performance Evaluation Report: July 1, 2017–June 30, 2018 California Department of Health Care Services
Page H-30 Health Services Advisory Group, Inc.

PERFORMANCE IMPROVEMENT PROJECTS
Performance Improvement Project Validation Findings
During the review period for this report, HSAG validated modules 4 and 5 for the MCP’s Diabetes Blood Pressure Monitoring PIP. Care1st did not follow the approved PIP methodology of tracking the SMART Aim measure monthly. Instead, the MCP documented an annual rate for 2016 rate and quarterly rates for 2017. Thus, HSAG could not assess whether or not the PIP met the SMART Aim goal. Upon assessment of validity and reliability of the PIP results, HSAG assigned Care1st’s Diabetes Blood Pressure Monitoring PIP a final confidence level of Not Credible.
2015–17 MCP-Specific Performance Improvement Project
Care1st selected cervical cancer screening for its 2015–17 MCP-specific PIP. While the MCP concluded its Cervical Cancer Screening PIP through the SMART Aim end date of June 30, 2017, Care1st submitted modules 4 and 5 for HSAG to validate during the review period for this report. HSAG provided final validation findings and encouraged Care1st to incorporate the experiences and lessons learned from the PIP into future quality improvement efforts.
Table 5.3 provides a summary of the SMART Aim measure results reported by the MCP.
Table 5.3—Care1st Cervical Cancer Screening PIP SMART Aim Measure Results
SMART Aim Measure Baseline Rate
SMART Aim Goal
Rate
SMART Aim Goal Achieved
Rate of cervical cancer screening among women ages 21 to 64 who had cervical cytology within the last three years or women ages 30 to 64 who had cervical cytology/human papillomavirus co-testing within the last five years
43.9% 46.0% No
Table 5.4 presents a description of the intervention that Care1st tested for its Cervical Cancer Screening PIP. The table also indicates the key driver that the intervention addressed as well as whether the MCP decided, based on intervention testing results, to adopt, adapt, or abandon the intervention.
Care1st Partner Plan Performance Evaluation Report: July 1, 2017–June 30, 2018 California Department of Health Care Services
Page H-31 Health Services Advisory Group, Inc.
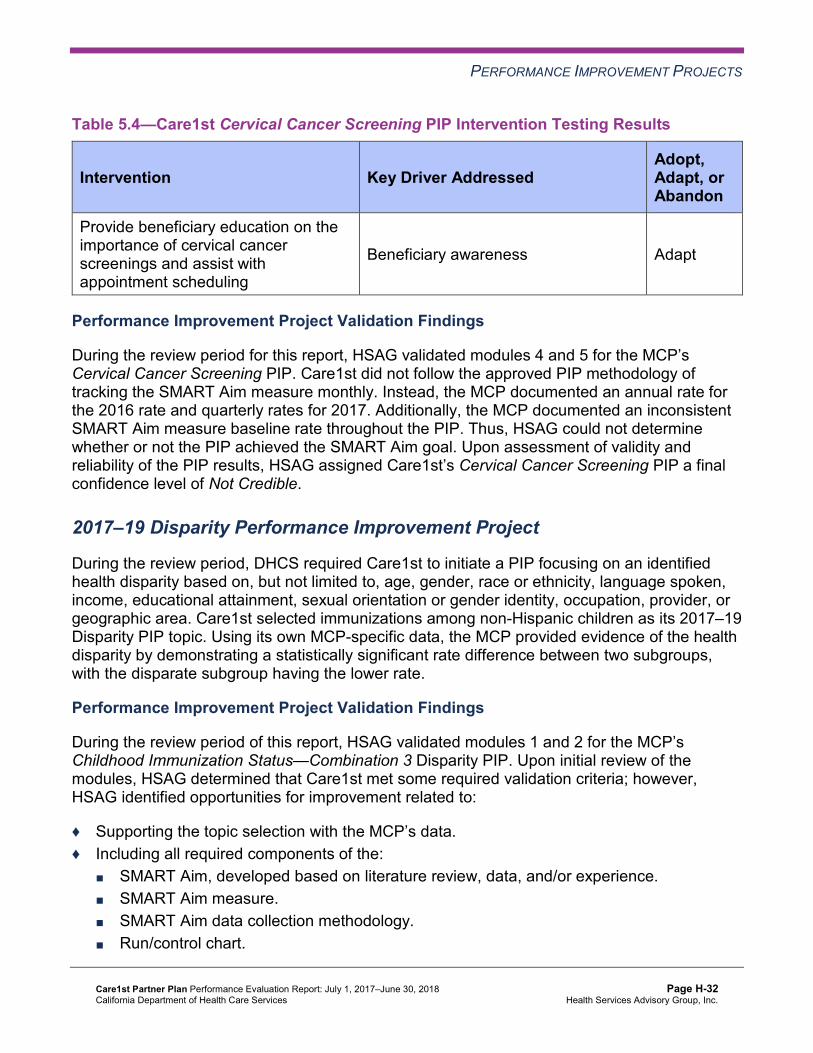
PERFORMANCE IMPROVEMENT PROJECTS
Table 5.4—Care1st Cervical Cancer Screening PIP Intervention Testing Results
Intervention Key Driver Addressed Adopt,Adapt, orAbandon
Provide beneficiary education on the importance of cervical cancer screenings and assist with appointment scheduling
Beneficiary awareness Adapt
Performance Improvement Project Validation Findings
During the review period for this report, HSAG validated modules 4 and 5 for the MCP’s Cervical Cancer Screening PIP. Care1st did not follow the approved PIP methodology of tracking the SMART Aim measure monthly. Instead, the MCP documented an annual rate for the 2016 rate and quarterly rates for 2017. Additionally, the MCP documented an inconsistent SMART Aim measure baseline rate throughout the PIP. Thus, HSAG could not determine whether or not the PIP achieved the SMART Aim goal. Upon assessment of validity and reliability of the PIP results, HSAG assigned Care1st’s Cervical Cancer Screening PIP a final confidence level of Not Credible.
2017–19 Disparity Performance Improvement Project
During the review period, DHCS required Care1st to initiate a PIP focusing on an identified health disparity based on, but not limited to, age, gender, race or ethnicity, language spoken, income, educational attainment, sexual orientation or gender identity, occupation, provider, or geographic area. Care1st selected immunizations among non-Hispanic children as its 2017–19 Disparity PIP topic. Using its own MCP-specific data, the MCP provided evidence of the health disparity by demonstrating a statistically significant rate difference between two subgroups, with the disparate subgroup having the lower rate.
Performance Improvement Project Validation Findings
During the review period of this report, HSAG validated modules 1 and 2 for the MCP’s Childhood Immunization Status—Combination 3 Disparity PIP. Upon initial review of the modules, HSAG determined that Care1st met some required validation criteria; however, HSAG identified opportunities for improvement related to:
♦ Supporting the topic selection with the MCP’s data. ♦ Including all required components of the:
■ SMART Aim, developed based on literature review, data, and/or experience. ■ SMART Aim measure. ■ SMART Aim data collection methodology. ■ Run/control chart.
Care1st Partner Plan Performance Evaluation Report: July 1, 2017–June 30, 2018 California Department of Health Care Services
Page H-32 Health Services Advisory Group, Inc.
PERFORMANCE IMPROVEMENT PROJECTS
♦ Aligning accurately the Global Aim, SMART Aim, key drivers, and potential interventions. ♦ Capturing all required data elements in the data collection tool.
Care1st was still in process of incorporating HSAG’s feedback into the PIP modules during the review period; therefore, HSAG includes no final validation results in this report.
2017–19 DHCS-Priority Performance Improvement Project
During the review period, DHCS required MCPs to initiate a PIP related to one of DHCS’ Quality Strategy focus areas: Childhood Immunization Status—Combination 3, Controlling High Blood Pressure, Comprehensive Diabetes Care, or Prenatal and Postpartum Care— Postpartum Care. However, based on Care1st demonstrating high performance on DHCS’ Quality Strategy focus areas, DHCS allowed the MCP to choose an alternative topic for its DHCS-priority PIP based on an identified area in need of improvement. Care1st selected well-child visits among beneficiaries ages 3 to 6 as its 2017–19 DHCS-priority PIP topic based on its MCP-specific data.
Performance Improvement Project Validation Findings
During the review period of this report, HSAG validated modules 1 and 2 for the MCP’s Well-Child Visits in the Third, Fourth, Fifth, and Sixth Years of Life PIP. Upon initial review of the modules, HSAG determined that Care1st met some required validation criteria; however, HSAG identified opportunities for improvement related to:
♦ Supporting the topic selection with the MCP’s data. ♦ Including all required components of the:
■ SMART Aim, developed based on literature review, data, and/or experience. ■ SMART Aim measure. ■ SMART Aim data collection methodology. ■ Run/control chart.
♦ Aligning accurately the Global Aim, SMART Aim, key drivers, and potential interventions. ♦ Capturing all required data elements in the data collection tool.
Care1st was still in process of incorporating HSAG’s feedback into the PIP modules during the review period; therefore, HSAG includes no final validation results in this report.
Strengths—Performance Improvement Projects Upon completion of the 2015–17 PIPs, Care1st decided to adopt the tested intervention that resulted in improved blood pressure monitoring among beneficiaries living with diabetes and to adapt the tested intervention that helped to improve cervical cancer screening rates.
Care1st Partner Plan Performance Evaluation Report: July 1, 2017–June 30, 2018 California Department of Health Care Services
Page H-33 Health Services Advisory Group, Inc.

PERFORMANCE IMPROVEMENT PROJECTS
Opportunities for Improvement—Performance Improvement Projects Care1st has the opportunity to monitor the adopted and adapted interventions to achieve optimal outcomes beyond the life of the 2015–17 Diabetes Blood Pressure Monitoring and Cervical Cancer Screening PIPs. The MCP should apply lessons learned from the 2015–17 PIPs to facilitate improvement of the adopted and adapted interventions.
Care1st Partner Plan Performance Evaluation Report: July 1, 2017–June 30, 2018 California Department of Health Care Services
Page H-34 Health Services Advisory Group, Inc.
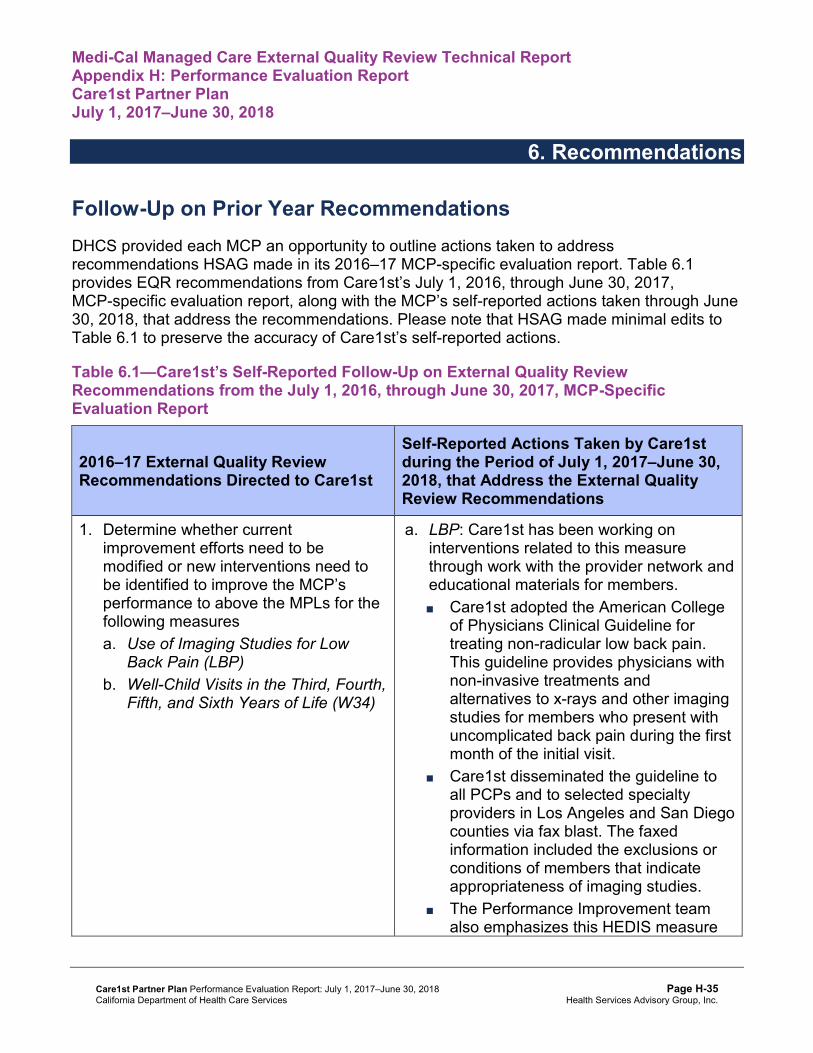
Medi-Cal Managed Care External Quality Review Technical ReportAppendix H: Performance Evaluation ReportCare1st Partner Plan July 1, 2017–June 30, 2018
6. Recommendations
Follow-Up on Prior Year Recommendations DHCS provided each MCP an opportunity to outline actions taken to address recommendations HSAG made in its 2016–17 MCP-specific evaluation report. Table 6.1 provides EQR recommendations from Care1st’s July 1, 2016, through June 30, 2017, MCP-specific evaluation report, along with the MCP’s self-reported actions taken through June 30, 2018, that address the recommendations. Please note that HSAG made minimal edits to Table 6.1 to preserve the accuracy of Care1st’s self-reported actions.
Table 6.1—Care1st’s Self-Reported Follow-Up on External Quality ReviewRecommendations from the July 1, 2016, through June 30, 2017, MCP-SpecificEvaluation Report
2016–17 External Quality ReviewRecommendations Directed to Care1st
Self-Reported Actions Taken by Care1stduring the Period of July 1, 2017–June 30,2018, that Address the External QualityReview Recommendations
1. Determine whether current improvement efforts need to be modified or new interventions need to be identified to improve the MCP’s performance to above the MPLs for the following measures a. Use of Imaging Studies for Low
Back Pain (LBP) b. Well-Child Visits in the Third, Fourth,
Fifth, and Sixth Years of Life (W34)
a. LBP: Care1st has been working on interventions related to this measure through work with the provider network and educational materials for members. ■ Care1st adopted the American College
of Physicians Clinical Guideline for treating non-radicular low back pain. This guideline provides physicians with non-invasive treatments and alternatives to x-rays and other imaging studies for members who present with uncomplicated back pain during the first month of the initial visit.
■ Care1st disseminated the guideline to all PCPs and to selected specialty providers in Los Angeles and San Diego counties via fax blast. The faxed information included the exclusions or conditions of members that indicate appropriateness of imaging studies.
■ The Performance Improvement team also emphasizes this HEDIS measure
Care1st Partner Plan Performance Evaluation Report: July 1, 2017–June 30, 2018 California Department of Health Care Services
Page H-35 Health Services Advisory Group, Inc.
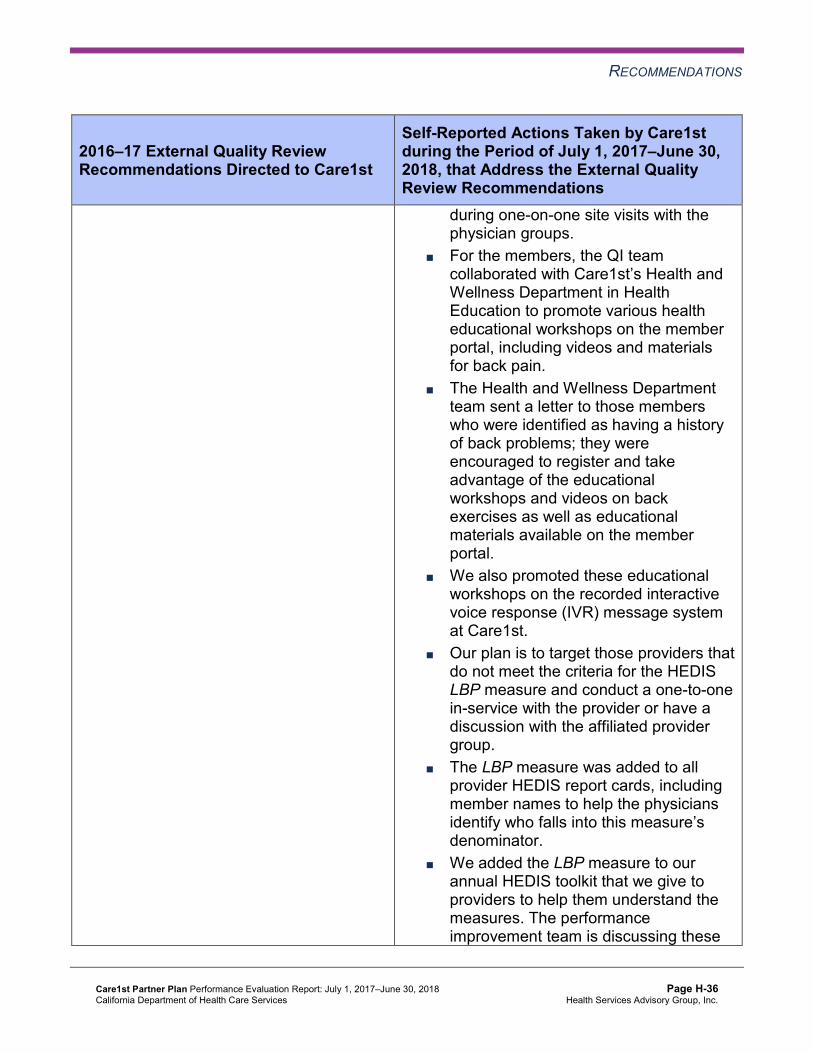
RECOMMENDATIONS
2016–17 External Quality ReviewRecommendations Directed to Care1st
Self-Reported Actions Taken by Care1stduring the Period of July 1, 2017–June 30,2018, that Address the External QualityReview Recommendations
during one-on-one site visits with the physician groups.
■ For the members, the QI team collaborated with Care1st’s Health and Wellness Department in Health Education to promote various health educational workshops on the member portal, including videos and materials for back pain.
■ The Health and Wellness Department team sent a letter to those members who were identified as having a history of back problems; they were encouraged to register and take advantage of the educational workshops and videos on back exercises as well as educational materials available on the member portal.
■ We also promoted these educational workshops on the recorded interactive voice response (IVR) message system at Care1st.
■ Our plan is to target those providers that do not meet the criteria for the HEDIS LBP measure and conduct a one-to-one in-service with the provider or have a discussion with the affiliated provider group.
■ The LBP measure was added to all provider HEDIS report cards, including member names to help the physicians identify who falls into this measure’s denominator.
■ We added the LBP measure to our annual HEDIS toolkit that we give to providers to help them understand the measures. The performance improvement team is discussing these
Care1st Partner Plan Performance Evaluation Report: July 1, 2017–June 30, 2018 California Department of Health Care Services
Page H-36 Health Services Advisory Group, Inc.
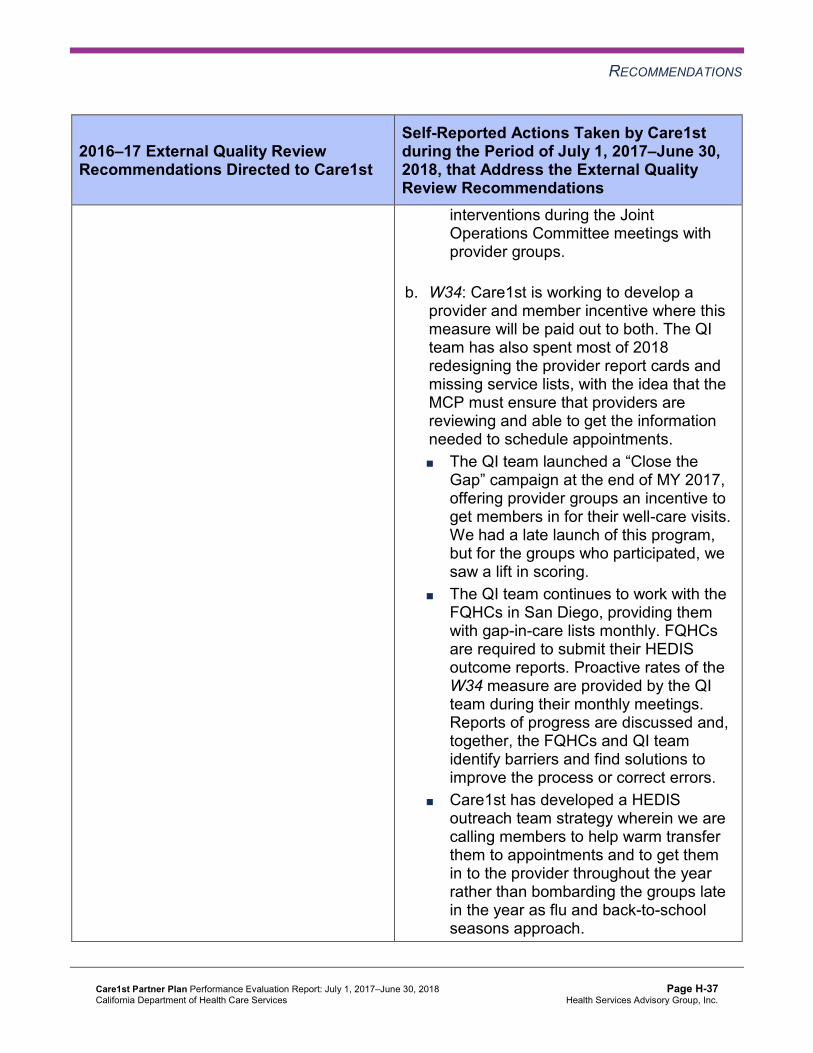
RECOMMENDATIONS
2016–17 External Quality ReviewRecommendations Directed to Care1st
Self-Reported Actions Taken by Care1stduring the Period of July 1, 2017–June 30,2018, that Address the External QualityReview Recommendations
interventions during the Joint Operations Committee meetings with provider groups.
b. W34: Care1st is working to develop a provider and member incentive where this measure will be paid out to both. The QI team has also spent most of 2018 redesigning the provider report cards and missing service lists, with the idea that the MCP must ensure that providers are reviewing and able to get the information needed to schedule appointments. ■ The QI team launched a “Close the
Gap” campaign at the end of MY 2017, offering provider groups an incentive to get members in for their well-care visits. We had a late launch of this program, but for the groups who participated, we saw a lift in scoring.
■ The QI team continues to work with the FQHCs in San Diego, providing them with gap-in-care lists monthly. FQHCs are required to submit their HEDIS outcome reports. Proactive rates of the W34 measure are provided by the QI team during their monthly meetings. Reports of progress are discussed and, together, the FQHCs and QI team identify barriers and find solutions to improve the process or correct errors.
■ Care1st has developed a HEDIS outreach team strategy wherein we are calling members to help warm transfer them to appointments and to get them in to the provider throughout the year rather than bombarding the groups late in the year as flu and back-to-school seasons approach.
Care1st Partner Plan Performance Evaluation Report: July 1, 2017–June 30, 2018 California Department of Health Care Services
Page H-37 Health Services Advisory Group, Inc.

RECOMMENDATIONS
2016–17 External Quality ReviewRecommendations Directed to Care1st
Self-Reported Actions Taken by Care1stduring the Period of July 1, 2017–June 30,2018, that Address the External QualityReview Recommendations
■ We are also developing tools such as reminder postcards for members; we plan to send these once we determine the member incentive to help drive members to their provider groups.
■ We are now meeting monthly with our contracted provider groups to help determine a strategic partnership on how we can close care gaps.
2017–18 Recommendations Based on the overall assessment of Care1st’s delivery of quality, accessible, and timely care through the activities described in previous sections of this report, HSAG recommends the following to the MCP:
♦ Identify the causes for the MCP’s performance below the MPLs for the following measures, and identify strategies to improve the MCP’s performance to above the MPLs: ■ Asthma Medication Ratio ■ Breast Cancer Screening ■ Cervical Cancer Screening
♦ Determine whether or not the MCP should modify or expand previously tested improvement strategies to improve the MCP’s performance to above the MPL for the Use of Imaging Studies for Low Back Pain measure.
♦ Monitor the adopted and adapted interventions to achieve optimal outcomes beyond the life of the 2015–17 Diabetes Blood Pressure Monitoring and Cervical Cancer Screening PIPs. The MCP should apply lessons learned from the 2015–17 PIPs to facilitate improvement of the adopted and adapted interventions.
In the next annual review, HSAG will evaluate continued successes of Care1st as well as the MCP’s progress with these recommendations.
Care1st Partner Plan Performance Evaluation Report: July 1, 2017–June 30, 2018 California Department of Health Care Services
Page H-38 Health Services Advisory Group, Inc.

Medi-Cal Managed CareExternal Quality Review Technical Report
Appendix I: Performance Evaluation Report
CenCal Health July 1, 2017–June 30, 2018

Medi-Cal Managed Care External Quality Review Technical ReportAppendix I: Performance Evaluation ReportCenCal Health July 1, 2017–June 30, 2018
Table of Contents
1. Introduction.............................................................................................................. I-1 Medi-Cal Managed Care Health Plan Overview ........................................................ I-1
2. Managed Care Health Plan Compliance ................................................................ I-2Compliance Reviews Conducted............................................................................... I-2 Strengths—Compliance Reviews .............................................................................. I-2 Opportunities for Improvement—Compliance Reviews ............................................. I-3
3. Managed Care Health Plan Performance Measures ............................................. I-4Performance Measure Validation Results ................................................................. I-4 Performance Measure Results and Findings............................................................. I-4
Preventive Screening and Children’s Health .......................................................... I-5 Preventive Screening and Women’s Health ......................................................... I-11 Care for Chronic Conditions ................................................................................. I-15 Appropriate Treatment and Utilization.................................................................. I-20 Performance Measure Findings—All Domains..................................................... I-24
Improvement Plan Requirements for 2018 .............................................................. I-26 Seniors and Persons with Disabilities Performance Measure Results..................... I-27
Seniors and Persons with Disabilities Findings .................................................... I-36 Strengths—Performance Measures ........................................................................ I-37 Opportunities for Improvement—Performance Measures ....................................... I-37
4. Performance Improvement Projects .................................................................... I-39Performance Improvement Project Overview .......................................................... I-39 Performance Improvement Project Results and Findings........................................ I-40
2015–17 DHCS-Priority Performance Improvement Project ................................ I-41 2015–17 MCP-Specific Performance Improvement Project ................................. I-42 2017–19 Disparity Performance Improvement Project ......................................... I-43 2017–19 DHCS-Priority Performance Improvement Project ................................ I-44
Strengths—Performance Improvement Projects ..................................................... I-45 Opportunities for Improvement—Performance Improvement Projects .................... I-45
5. Recommendations................................................................................................. I-46 Follow-Up on Prior Year Recommendations ........................................................... I-46 2017–18 Recommendations.................................................................................... I-48
CenCal Health Performance Evaluation Report: July 1, 2017–June 30, 2018 California Department of Health Care Services
Page I-i Health Services Advisory Group, Inc.

TABLE OF CONTENTS
Table of Tables
Table 2.1—DHCS A&I Medical and State Supported Services Audits of CenCal Audit Review Period: November 1, 2016, through October 31, 2017..................... I-2
Table 3.1—Preventive Screening and Children’s Health Domain Multi-Year Performance Measure Results CenCal—San Luis Obispo County .............. I-6
Table 3.2—Preventive Screening and Children’s Health Domain Multi-Year Performance Measure Results CenCal—Santa Barbara County.................. I-7
Table 3.3—Preventive Screening and Children’s Health Domain RY 2018 (MY 2017) Performance Measure Findings CenCal—San Luis Obispo County............. I-9
Table 3.4—Preventive Screening and Children’s Health Domain RY 2018 (MY 2017) Performance Measure Findings CenCal—Santa Barbara County .............. I-10
Table 3.5—Preventive Screening and Women’s Health Domain Multi-Year Performance Measure Results CenCal—San Luis Obispo County ............ I-11
Table 3.6—Preventive Screening and Women’s Health Domain Multi-Year Performance Measure Results CenCal—Santa Barbara County................ I-12
Table 3.7—Preventive Screening and Women’s Health Domain RY 2018 (MY 2017) Performance Measure Findings CenCal—San Luis Obispo County........... I-13
Table 3.8—Preventive Screening and Women’s Health Domain RY 2018 (MY 2017) Performance Measure Findings CenCal—Santa Barbara County .............. I-14
Table 3.9—Care for Chronic Conditions Domain Multi-Year Performance Measure Results CenCal—San Luis Obispo County................................................. I-15
Table 3.10—Care for Chronic Conditions Domain Multi-Year Performance Measure Results CenCal—Santa Barbara County .................................................... I-16
Table 3.11—Care for Chronic Conditions Domain RY 2018 (MY 2017) Performance Measure Findings CenCal—San Luis Obispo County ................................ I-18
Table 3.12—Care for Chronic Conditions Domain RY 2018 (MY 2017) Performance Measure Findings CenCal—Santa Barbara County.................................... I-19
Table 3.13—Appropriate Treatment and Utilization Domain Multi-Year Performance Measure Results CenCal—San Luis Obispo County.................................. I-21
Table 3.14—Appropriate Treatment and Utilization Domain Multi-Year Performance Measure Results CenCal—Santa Barbara County ..................................... I-22
Table 3.15—Appropriate Treatment and Utilization Domain RY 2018 (MY 2017) Performance Measure Findings CenCal—San Luis Obispo County........... I-23
Table 3.16—Appropriate Treatment and Utilization Domain RY 2018 (MY 2017) Performance Measure Findings CenCal—Santa Barbara County .............. I-24
Table 3.17—RY 2018 (MY 2017) Performance Measure Findings for All Domains CenCal—San Luis Obispo County.............................................................. I-25
Table 3.18—RY 2018 (MY 2017) Performance Measure Findings for All Domains CenCal—Santa Barbara County................................................................. I-26
CenCal Health Performance Evaluation Report: July 1, 2017–June 30, 2018 California Department of Health Care Services
Page I-ii Health Services Advisory Group, Inc.

TABLE OF CONTENTS
Table 3.19—Multi-Year SPD Performance Measure Trend Table CenCal— San Luis Obispo County ............................................................................. I-27
Table 3.20—Multi-Year SPD Performance Measure Trend Table CenCal— Santa Barbara County ................................................................................ I-29
Table 3.21—Multi-Year Non-SPD Performance Measure Trend Table CenCal— San Luis Obispo County ............................................................................. I-30
Table 3.22—Multi-Year Non-SPD Performance Measure Trend Table CenCal— Santa Barbara County ................................................................................ I-32
Table 3.23—RY 2018 (MY 2017) Performance Measure Comparison and Results for Measures Stratified by the SPD and Non-SPD Populations CenCal— San Luis Obispo County ............................................................................. I-33
Table 3.24—RY 2018 (MY 2017) Performance Measure Comparison and Results for Measures Stratified by the SPD and Non-SPD Populations CenCal— Santa Barbara County ................................................................................ I-35
Table 4.1—CenCal Diabetes Retinal Eye Exam PIP SMART Aim Measure Results .... I-41 Table 4.2—CenCal Diabetes Retinal Eye Exam PIP Intervention Testing Results ....... I-41 Table 4.3—CenCal Initial Health Assessment PIP SMART Aim Measure Results........ I-42 Table 4.4—CenCal Initial Health Assessment PIP Intervention Testing Results........... I-43 Table 4.5—CenCal HPV Vaccination Disparity PIP SMART Aim Measure................... I-44 Table 4.6—CenCal Childhood Immunization Status—Combination 3 PIP SMART
Aim Measure............................................................................................... I-45 Table 5.1—CenCal’s Self-Reported Follow-Up on External Quality Review
Recommendations from the July 1, 2016, through June 30, 2017, MCP-Specific Evaluation Report................................................................. I-46
CenCal Health Performance Evaluation Report: July 1, 2017–June 30, 2018 California Department of Health Care Services
Page I-iii Health Services Advisory Group, Inc.

Medi-Cal Managed Care External Quality Review Technical ReportAppendix I: Performance Evaluation ReportCenCal Health July 1, 2017–June 30, 2018
1. Introduction
The California Department of Health Care Services (DHCS) contracted with Health Services Advisory Group, Inc. (HSAG), an external quality review organization (EQRO), to prepare the federally required Medi-Cal Managed Care External Quality Review Technical Report, July 1, 2017–June 30, 2018. The technical report provides an overview of the objectives and methodology for conducting the external quality review (EQR) activities, including requirements related to each activity. Additionally, the technical report provides aggregated results and recommendations for DHCS for each activity.
This appendix is specific to DHCS’ contracted Medi-Cal managed care health plan (MCP), CenCal Health (“CenCal” or “the MCP”). The purpose of this appendix is to provide MCP-specific results of each activity and an assessment of the MCP’s strengths and opportunities for improvement with respect to the quality and timeliness of and access to health care services furnished to Medi-Cal Managed Care (MCMC) beneficiaries (referred to as “beneficiaries” in this report). The review period for this MCP-specific evaluation report is July 1, 2017, through June 30, 2018. HSAG will report on activities that take place beyond the review period in CenCal’s 2018–19 MCP-specific evaluation report. This MCP-specific evaluation report references activities and methodologies described in detail by HSAG in the technical report section.
The aggregate EQR technical report and all MCP- and specialty health plan (SHP)-specific performance evaluation reports reflect HSAG’s external, independent assessment of the quality and timeliness of, and access to, care that MCPs and SHPs are providing to beneficiaries.
Medi-Cal Managed Care Health Plan Overview CenCal is a full-scope MCP delivering services to beneficiaries in the County Organized Health System (COHS) model.
CenCal became operational to provide MCMC services in Santa Barbara County effective September 1983 and San Luis Obispo County in March 2008. As of June 30, 2018, CenCal had 124,474 beneficiaries in Santa Barbara County and 52,824 beneficiaries in San Luis Obispo County—for a total of 177,298 beneficiaries. 1
1 Medi-Cal Managed Care Enrollment Report—June 2018. Available at: http://www.dhcs.ca.gov/dataandstats/reports/Pages/MMCDMonthlyEnrollment.aspx. Accessed on: Sep 05, 2018.
CenCal Health Performance Evaluation Report: July 1, 2017–June 30, 2018 California Department of Health Care Services
Page I-1 Health Services Advisory Group, Inc.
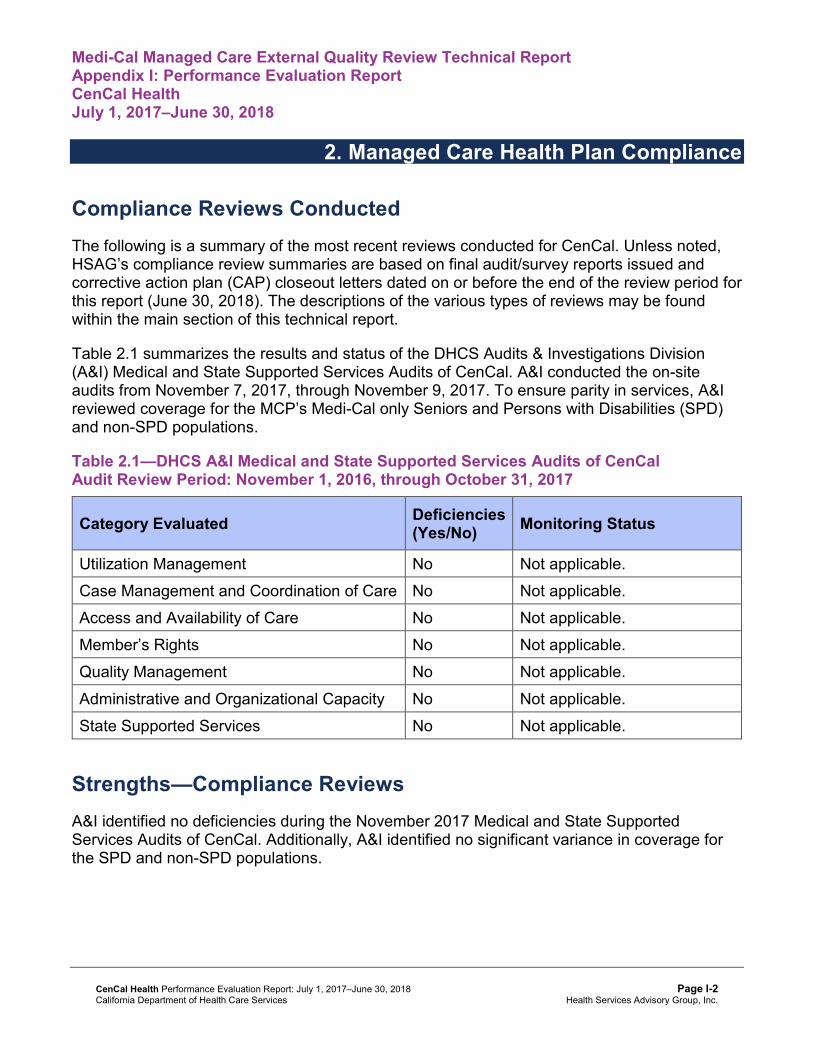
Medi-Cal Managed Care External Quality Review Technical ReportAppendix I: Performance Evaluation ReportCenCal Health July 1, 2017–June 30, 2018
2. Managed Care Health Plan Compliance
Compliance Reviews Conducted The following is a summary of the most recent reviews conducted for CenCal. Unless noted, HSAG’s compliance review summaries are based on final audit/survey reports issued and corrective action plan (CAP) closeout letters dated on or before the end of the review period for this report (June 30, 2018). The descriptions of the various types of reviews may be found within the main section of this technical report.
Table 2.1 summarizes the results and status of the DHCS Audits & Investigations Division (A&I) Medical and State Supported Services Audits of CenCal. A&I conducted the on-site audits from November 7, 2017, through November 9, 2017. To ensure parity in services, A&I reviewed coverage for the MCP’s Medi-Cal only Seniors and Persons with Disabilities (SPD) and non-SPD populations.
Table 2.1—DHCS A&I Medical and State Supported Services Audits of CenCalAudit Review Period: November 1, 2016, through October 31, 2017
Category Evaluated Deficiencies (Yes/No) Monitoring Status
Utilization Management No Not applicable. Case Management and Coordination of Care No Not applicable. Access and Availability of Care No Not applicable. Member’s Rights No Not applicable. Quality Management No Not applicable. Administrative and Organizational Capacity No Not applicable. State Supported Services No Not applicable.
Strengths—Compliance Reviews A&I identified no deficiencies during the November 2017 Medical and State Supported Services Audits of CenCal. Additionally, A&I identified no significant variance in coverage for the SPD and non-SPD populations.
CenCal Health Performance Evaluation Report: July 1, 2017–June 30, 2018 California Department of Health Care Services
Page I-2 Health Services Advisory Group, Inc.
MANAGED CARE HEALTH PLAN COMPLIANCE
Opportunities for Improvement—Compliance Reviews CenCal had no deficiencies from the November 2017 A&I Medical and State Supported Services Audits; therefore, HSAG has no recommendations for the MCP in the area of compliance reviews.
CenCal Health Performance Evaluation Report: July 1, 2017–June 30, 2018 California Department of Health Care Services
Page I-3 Health Services Advisory Group, Inc.
Medi-Cal Managed Care External Quality Review Technical ReportAppendix I: Performance Evaluation ReportCenCal Health July 1, 2017–June 30, 2018
3. Managed Care Health Plan Performance Measures
Performance Measure Validation Results The HEDIS®2 2018 Compliance Audit Final Report of Findings for CenCal Health contains the detailed findings and recommendations from HSAG’s NCQA HEDIS Compliance Audit™.3
HSAG auditors determined that CenCal followed the appropriate specifications to produce valid rates, and identified no issues of concern.
Performance Measure Results and Findings After validating the MCP’s performance measure rates, HSAG assessed the results. See Table 3.1 through Table 3.18 for CenCal’s performance measure results for reporting years (RYs) 2015 through 2018 and performance measure findings for RY 2018. The RY is the year in which the MCP reported the rates. The RY rates reflect measurement year (MY) data from the previous calendar year. Note that data may not be available for all four years.
Note the following regarding Table 3.1 through Table 3.18:
♦ To allow HSAG to provide meaningful assessment of MCP performance and actionable recommendations, HSAG, in collaboration with DHCS, organized the measures into domains based on the health care areas each measure affects. Table 3.1 through Table 3.16 present the performance measure results and findings by domain, and Table 3.17 and Table 3.18 present the RY 2018 performance measure findings for the domains combined.
♦ To assess performance for each MCP reporting unit, HSAG compares the rates to national benchmarks. Rates indicating performance above the high performance levels (HPLs) are shaded in gray, and rates indicating performance below the minimum performance levels (MPLs) are bolded. ■ For measures with rates below the MPLs, DHCS requires MCPs to submit to DHCS
improvement plans (IPs) to address the rates below the MPLs (unless MCPs are reporting the rates for the first time).
■ For MCPs that meet DHCS’ Quality of Care CAP thresholds, DHCS issues a CAP; if an MCP’s performance is such that it may trigger a CAP in the following year, DHCS issues an advance warning letter.
2 Healthcare Effectiveness Data and Information Set (HEDIS®) is a registered trademark of the National Committee for Quality Assurance (NCQA).
3 NCQA HEDIS Compliance AuditTM is a trademark of NCQA.
CenCal Health Performance Evaluation Report: July 1, 2017–June 30, 2018 California Department of Health Care Services
Page I-4 Health Services Advisory Group, Inc.

MANAGED CARE HEALTH PLAN PERFORMANCE MEASURES
■ IPs and CAPs consist of submission of Plan-Do-Study-Act (PDSA) Cycle Worksheets, Quality Improvement (QI) Summaries, or completion of Performance Improvement Projects (PIPs)—as determined by DHCS.
♦ For RYs 2016, 2017, and 2018, the HPLs and MPLs represent the NCQA Quality Compass®4 Medicaid health maintenance organization (HMO) 90th and 25th percentiles, respectively.
♦ For RY 2015, the HPLs and MPLs represent the NCQA HEDIS Audit Means, Percentiles, and Ratios 90th and 25th percentiles, respectively. For the Comprehensive Diabetes Care—HbA1c Poor Control (>9.0 Percent) measure, for which a lower rate indicates more favorable performance, the HPL and MPL are based on the 10th and 75th percentiles, respectively.
♦ HSAG includes the specific HPL and MPL values for RY 2018 in Section 6 of the Medi-Cal Managed Care External Quality Review Technical Report, July 1, 2017–June 30, 2018 (“Managed Care Health Plan Performance Measures”).
Preventive Screening and Children’s Health
Table 3.1 and Table 3.2 present the four-year trending information for the performance measures within the Preventive Screening and Children’s Health domain.
Note the following regarding Table 3.1 and Table 3.2:
♦ Although HSAG includes information on the MCP’s performance related to the four Children and Adolescents’ Access to Primary Care measures, DHCS did not hold MCPs accountable to meet the MPLs for these measures for RYs 2015 through 2018 (i.e., DHCS did not require MCPs to submit IPs if rates for the measures were below the MPLs). DHCS made this decision due to the small range of variation between the HPL and MPL thresholds for each measure.
♦ Any comparison of RY 2018 performance to RY 2017 or to benchmarks related to the Immunizations for Adolescents—Combination 2 measure should be exercised with caution given the changes that NCQA made to the specification for this measure for RY 2018. NCQA released guidance that recommended a break in trending for this measure; however, DHCS determined to continue trending because the specification change should result in higher rates.
4 Quality Compass® is a registered trademark of NCQA.
CenCal Health Performance Evaluation Report: July 1, 2017–June 30, 2018 California Department of Health Care Services
Page I-5 Health Services Advisory Group, Inc.

MANAGED CARE HEALTH PLAN PERFORMANCE MEASURES
Table 3.1—Preventive Screening and Children’s Health DomainMulti-Year Performance Measure Results CenCal—San Luis Obispo County
H = Rate indicates performance above the HPL. Bolded Rate = Rate indicates performance below the MPL.
B = Statistical testing result indicates that the RY 2018 rate is significantly better than the RY 2017 rate.
W = Statistical testing result indicates that the RY 2018 rate is significantly worse than the RY 2017 rate.
Measure RY
2015 Rate1
RY 2016
Rate2
RY 2017
Rate3
RY 2018
Rate4
RYs 2017–18 Rate
Difference5
Childhood Immunization Status—Combination 3 79.73% 70.25% 69.54% 72.88% 3.34
Children and Adolescents’ Access to Primary Care Practitioners—12–24 Months
93.11% 94.22% 95.37% 96.10% 0.73
Children and Adolescents’ Access to Primary Care Practitioners— 25 Months–6 Years
84.30% 86.99% 85.97% 88.70% 2.73B
Children and Adolescents’ Access to Primary Care Practitioners—7–11 Years
89.84% 89.63% 89.86% 91.49% 1.63B
Children and Adolescents’ Access to Primary Care Practitioners—12–19 Years
88.33% 88.92% 88.58% 89.73% 1.15B
Immunizations for Adolescents— Combination 2^ -- -- 37.38% 46.72%H 9.34B
Weight Assessment and Counseling for Nutrition and Physical Activity for Children and Adolescents—Nutrition Counseling—Total
63.75% 73.09% 79.69%H 86.28%H 6.59B
Weight Assessment and Counseling for Nutrition and Physical Activity for Children and Adolescents—Physical Activity Counseling—Total
56.45% 63.21% 73.70%H 84.45%H 10.75B
CenCal Health Performance Evaluation Report: July 1, 2017–June 30, 2018 California Department of Health Care Services
Page I-6 Health Services Advisory Group, Inc.

MANAGED CARE HEALTH PLAN PERFORMANCE MEASURES
Measure RY
2015 Rate1
RY 2016
Rate2
RY 2017
Rate3
RY 2018
Rate4
RYs 2017–18 Rate
Difference5
Well-Child Visits in the Third, Fourth, Fifth, and Sixth Years of Life
66.87% 68.46% 69.44% 83.90%H 14.46B
1 RY 2015 rates reflect MY data from January 1, 2014, through December 31, 2014. 2 RY 2016 rates reflect MY data from January 1, 2015, through December 31, 2015. 3 RY 2017 rates reflect MY data from January 1, 2016, through December 31, 2016. 4 RY 2018 rates reflect MY data from January 1, 2017, through December 31, 2017. 5 Performance comparisons are based on the Chi-square test of statistical significance, with a p value of <0.05. ^ Caution should be exercised when assessing MCP performance for this measure given the changes that NCQA made to the specification for this measure for RY 2018. -- Indicates that the rate is not available.
Table 3.2—Preventive Screening and Children’s Health DomainMulti-Year Performance Measure Results CenCal—Santa Barbara County
H = Rate indicates performance above the HPL. Bolded Rate = Rate indicates performance below the MPL.
B = Statistical testing result indicates that the RY 2018 rate is significantly better than the RY 2017 rate.
W = Statistical testing result indicates that the RY 2018 rate is significantly worse than the RY 2017 rate.
Measure RY
2015 Rate1
RY 2016
Rate2
RY 2017
Rate3
RY 2018
Rate4
RYs 2017–18 Rate
Difference5
Childhood Immunization Status—Combination 3 81.25%H 78.46% 77.08% 74.66% -2.42
Children and Adolescents’ Access to Primary Care Practitioners—12–24 Months
96.79% 94.87% 91.56% 95.78% 4.22B
Children and Adolescents’ Access to Primary Care Practitioners— 25 Months–6 Years
91.58% 89.86% 81.00% 91.12% 10.12B
CenCal Health Performance Evaluation Report: July 1, 2017–June 30, 2018 California Department of Health Care Services
Page I-7 Health Services Advisory Group, Inc.

MANAGED CARE HEALTH PLAN PERFORMANCE MEASURES
Measure RY
2015 Rate1
RY 2016
Rate2
RY 2017
Rate3
RY 2018
Rate4
RYs 2017–18 Rate
Difference5
Children and Adolescents’ Access to Primary Care Practitioners—7–11 Years
93.73% 93.82% 84.52% 92.99% 8.47B
Children and Adolescents’ Access to Primary Care Practitioners—12–19 Years
90.59% 90.96% 79.07% 90.16% 11.09B
Immunizations for Adolescents— Combination 2^ -- -- 34.43% 46.96%H 12.53B
Weight Assessment and Counseling for Nutrition and Physical Activity for Children and Adolescents—Nutrition Counseling—Total
77.92%H 74.86% 80.93%H 83.28%H 2.35
Weight Assessment and Counseling for Nutrition and Physical Activity for Children and Adolescents—Physical Activity Counseling—Total
67.49% 62.02% 72.94%H 75.82%H 2.88
Well-Child Visits in the Third, Fourth, Fifth, and Sixth Years of Life
74.07% 68.85% 74.17% 83.49%H 9.32B
1 RY 2015 rates reflect MY data from January 1, 2014, through December 31, 2014. 2 RY 2016 rates reflect MY data from January 1, 2015, through December 31, 2015. 3 RY 2017 rates reflect MY data from January 1, 2016, through December 31, 2016. 4 RY 2018 rates reflect MY data from January 1, 2017, through December 31, 2017. 5 Performance comparisons are based on the Chi-square test of statistical significance, with a p value of <0.05. ^ Caution should be exercised when assessing MCP performance for this measure given the changes that NCQA made to the specification for this measure for RY 2018. -- Indicates that the rate is not available.
CenCal Health Performance Evaluation Report: July 1, 2017–June 30, 2018 California Department of Health Care Services
Page I-8 Health Services Advisory Group, Inc.
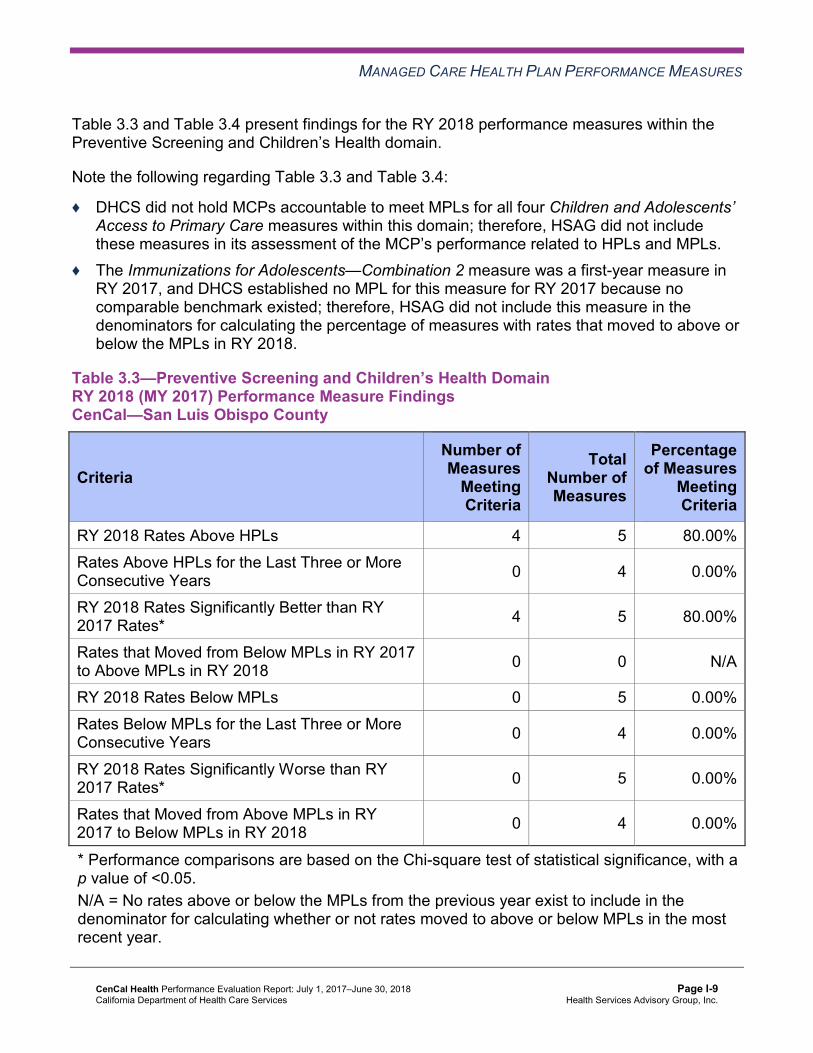
MANAGED CARE HEALTH PLAN PERFORMANCE MEASURES
Table 3.3 and Table 3.4 present findings for the RY 2018 performance measures within the Preventive Screening and Children’s Health domain.
Note the following regarding Table 3.3 and Table 3.4:
♦ DHCS did not hold MCPs accountable to meet MPLs for all four Children and Adolescents’ Access to Primary Care measures within this domain; therefore, HSAG did not include these measures in its assessment of the MCP’s performance related to HPLs and MPLs.
♦ The Immunizations for Adolescents—Combination 2 measure was a first-year measure in RY 2017, and DHCS established no MPL for this measure for RY 2017 because no comparable benchmark existed; therefore, HSAG did not include this measure in the denominators for calculating the percentage of measures with rates that moved to above or below the MPLs in RY 2018.
Table 3.3—Preventive Screening and Children’s Health DomainRY 2018 (MY 2017) Performance Measure Findings CenCal—San Luis Obispo County
Criteria Number of Measures
MeetingCriteria
Total Number of Measures
Percentage of Measures
MeetingCriteria
RY 2018 Rates Above HPLs 4 5 80.00% Rates Above HPLs for the Last Three or More Consecutive Years 0 4 0.00%
RY 2018 Rates Significantly Better than RY 2017 Rates* 4 5 80.00%
Rates that Moved from Below MPLs in RY 2017 to Above MPLs in RY 2018 0 0 N/A
RY 2018 Rates Below MPLs 0 5 0.00% Rates Below MPLs for the Last Three or More Consecutive Years 0 4 0.00%
RY 2018 Rates Significantly Worse than RY 2017 Rates* 0 5 0.00%
Rates that Moved from Above MPLs in RY 2017 to Below MPLs in RY 2018 0 4 0.00%
* Performance comparisons are based on the Chi-square test of statistical significance, with a p value of <0.05. N/A = No rates above or below the MPLs from the previous year exist to include in the denominator for calculating whether or not rates moved to above or below MPLs in the most recent year.
CenCal Health Performance Evaluation Report: July 1, 2017–June 30, 2018 California Department of Health Care Services
Page I-9 Health Services Advisory Group, Inc.

MANAGED CARE HEALTH PLAN PERFORMANCE MEASURES
Table 3.4—Preventive Screening and Children’s Health DomainRY 2018 (MY 2017) Performance Measure Findings CenCal—Santa Barbara County
Criteria Number of Measures
MeetingCriteria
Total Number of Measures
Percentage of Measures
MeetingCriteria
RY 2018 Rates Above HPLs 4 5 80.00% Rates Above HPLs for the Last Three or More Consecutive Years 0 4 0.00%
RY 2018 Rates Significantly Better than RY 2017 Rates* 2 5 40.00%
Rates that Moved from Below MPLs in RY 2017 to Above MPLs in RY 2018 0 0 N/A
RY 2018 Rates Below MPLs 0 5 0.00% Rates Below MPLs for the Last Three or More Consecutive Years 0 4 0.00%
RY 2018 Rates Significantly Worse than RY 2017 Rates* 0 5 0.00%
Rates that Moved from Above MPLs in RY 2017 to Below MPLs in RY 2018 0 4 0.00%
* Performance comparisons are based on the Chi-square test of statistical significance, with a p value of <0.05. N/A = No rates above or below the MPLs from the previous year exist to include in the denominator for calculating whether or not rates moved to above or below MPLs in the most recent year.
CenCal Health Performance Evaluation Report: July 1, 2017–June 30, 2018 California Department of Health Care Services
Page I-10 Health Services Advisory Group, Inc.
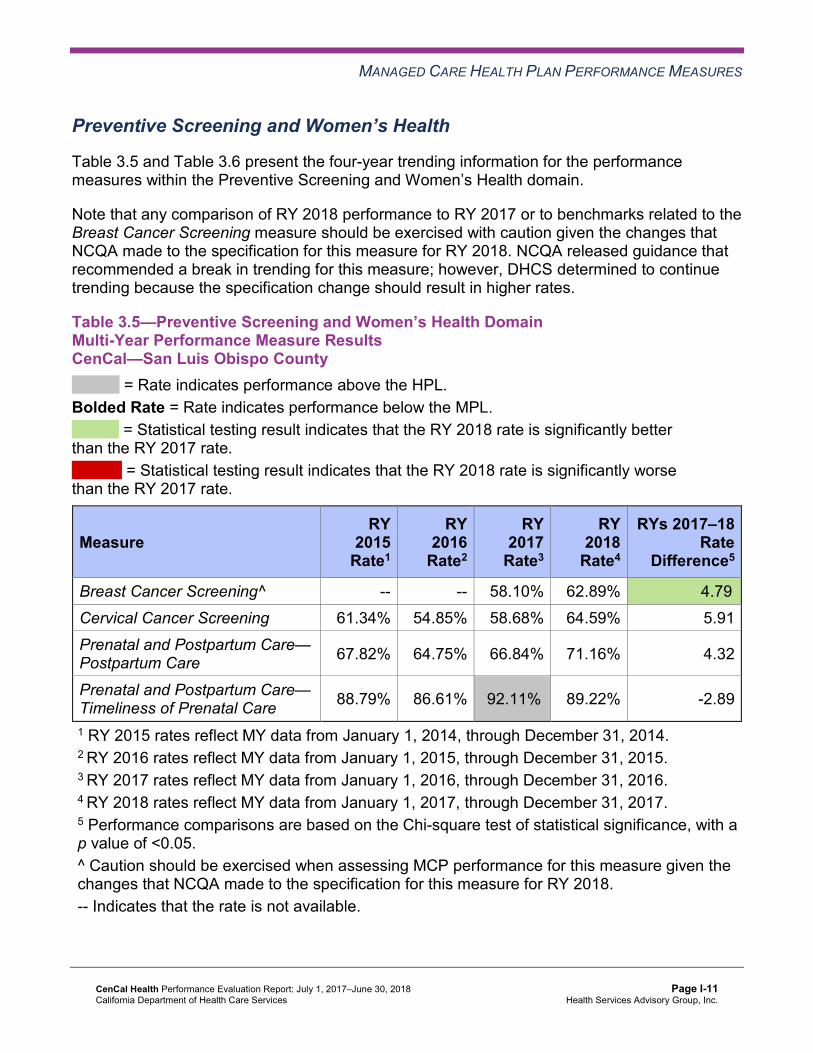
MANAGED CARE HEALTH PLAN PERFORMANCE MEASURES
Preventive Screening and Women’s Health
Table 3.5 and Table 3.6 present the four-year trending information for the performance measures within the Preventive Screening and Women’s Health domain.
Note that any comparison of RY 2018 performance to RY 2017 or to benchmarks related to the Breast Cancer Screening measure should be exercised with caution given the changes that NCQA made to the specification for this measure for RY 2018. NCQA released guidance that recommended a break in trending for this measure; however, DHCS determined to continue trending because the specification change should result in higher rates.
Table 3.5—Preventive Screening and Women’s Health DomainMulti-Year Performance Measure Results CenCal—San Luis Obispo County
H = Rate indicates performance above the HPL. Bolded Rate = Rate indicates performance below the MPL.
B = Statistical testing result indicates that the RY 2018 rate is significantly better than the RY 2017 rate.
W = Statistical testing result indicates that the RY 2018 rate is significantly worse than the RY 2017 rate.
Measure RY
2015 Rate1
RY 2016
Rate2
RY 2017
Rate3
RY 2018
Rate4
RYs 2017–18 Rate
Difference5
Breast Cancer Screening^ -- -- 58.10% 62.89% 4.79B
Cervical Cancer Screening 61.34% 54.85% 58.68% 64.59% 5.91 Prenatal and Postpartum Care— Postpartum Care 67.82% 64.75% 66.84% 71.16% 4.32
Prenatal and Postpartum Care— Timeliness of Prenatal Care 88.79% 86.61% 92.11%H 89.22% -2.89
1 RY 2015 rates reflect MY data from January 1, 2014, through December 31, 2014. 2 RY 2016 rates reflect MY data from January 1, 2015, through December 31, 2015. 3 RY 2017 rates reflect MY data from January 1, 2016, through December 31, 2016. 4 RY 2018 rates reflect MY data from January 1, 2017, through December 31, 2017. 5 Performance comparisons are based on the Chi-square test of statistical significance, with a p value of <0.05. ^ Caution should be exercised when assessing MCP performance for this measure given the changes that NCQA made to the specification for this measure for RY 2018. -- Indicates that the rate is not available.
CenCal Health Performance Evaluation Report: July 1, 2017–June 30, 2018 California Department of Health Care Services
Page I-11 Health Services Advisory Group, Inc.
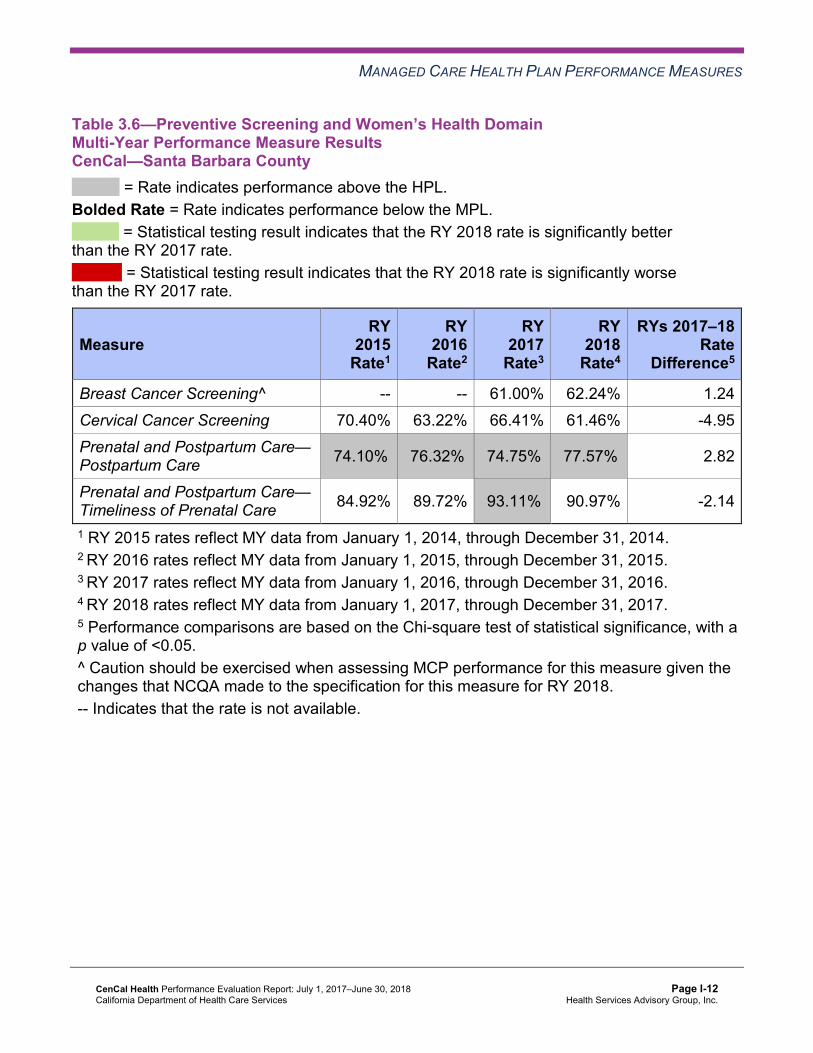
MANAGED CARE HEALTH PLAN PERFORMANCE MEASURES
Table 3.6—Preventive Screening and Women’s Health DomainMulti-Year Performance Measure Results CenCal—Santa Barbara County
H = Rate indicates performance above the HPL. Bolded Rate = Rate indicates performance below the MPL.
B = Statistical testing result indicates that the RY 2018 rate is significantly better than the RY 2017 rate.
W = Statistical testing result indicates that the RY 2018 rate is significantly worse than the RY 2017 rate.
Measure RY
2015 Rate1
RY 2016
Rate2
RY 2017
Rate3
RY 2018
Rate4
RYs 2017–18 Rate
Difference5
Breast Cancer Screening^ -- -- 61.00% 62.24% 1.24 Cervical Cancer Screening 70.40% 63.22% 66.41% 61.46% -4.95 Prenatal and Postpartum Care— Postpartum Care 74.10%H 76.32%H 74.75%H 77.57%H 2.82
Prenatal and Postpartum Care— Timeliness of Prenatal Care 84.92% 89.72% 93.11%H 90.97% -2.14
1 RY 2015 rates reflect MY data from January 1, 2014, through December 31, 2014. 2 RY 2016 rates reflect MY data from January 1, 2015, through December 31, 2015. 3 RY 2017 rates reflect MY data from January 1, 2016, through December 31, 2016. 4 RY 2018 rates reflect MY data from January 1, 2017, through December 31, 2017. 5 Performance comparisons are based on the Chi-square test of statistical significance, with a p value of <0.05. ^ Caution should be exercised when assessing MCP performance for this measure given the changes that NCQA made to the specification for this measure for RY 2018. -- Indicates that the rate is not available.
CenCal Health Performance Evaluation Report: July 1, 2017–June 30, 2018 California Department of Health Care Services
Page I-12 Health Services Advisory Group, Inc.

MANAGED CARE HEALTH PLAN PERFORMANCE MEASURES
Table 3.7 and Table 3.8 present findings for the RY 2018 performance measures within the Preventive Screening and Women’s Health domain. Note that the Breast Cancer Screening measure was a first-year measure in RY 2017, and DHCS did not hold MCPs accountable to meet an MPL for this measure in RY 2017; therefore, HSAG did not include this measure in the denominators for calculating the percentage of measures with rates that moved to above or below the MPLs in RY 2018.
Table 3.7—Preventive Screening and Women’s Health DomainRY 2018 (MY 2017) Performance Measure Findings CenCal—San Luis Obispo County
Criteria Number of Measures
MeetingCriteria
Total Number of Measures
Percentage of Measures
MeetingCriteria
RY 2018 Rates Above HPLs 0 4 0.00% Rates Above HPLs for the Last Three or More Consecutive Years 0 3 0.00%
RY 2018 Rates Significantly Better than RY 2017 Rates* 1 4 25.00%
Rates that Moved from Below MPLs in RY 2017 to Above MPLs in RY 2018 0 0 N/A
RY 2018 Rates Below MPLs 0 4 0.00% Rates Below MPLs for the Last Three or More Consecutive Years 0 3 0.00%
RY 2018 Rates Significantly Worse than RY 2017 Rates* 0 4 0.00%
Rates that Moved from Above MPLs in RY 2017 to Below MPLs in RY 2018 0 3 0.00%
* Performance comparisons are based on the Chi-square test of statistical significance, with a p value of <0.05. N/A = No rates above or below the MPLs from the previous year exist to include in the denominator for calculating whether or not rates moved to above or below MPLs in the most recent year.
CenCal Health Performance Evaluation Report: July 1, 2017–June 30, 2018 California Department of Health Care Services
Page I-13 Health Services Advisory Group, Inc.
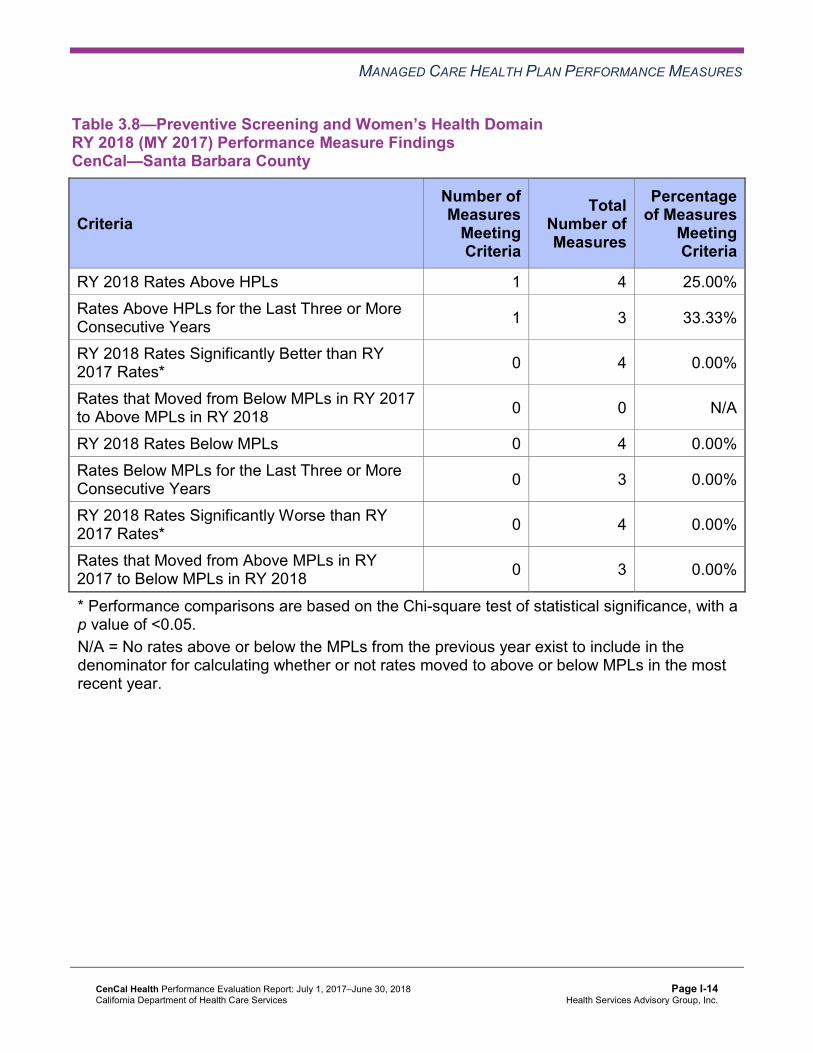
MANAGED CARE HEALTH PLAN PERFORMANCE MEASURES
Table 3.8—Preventive Screening and Women’s Health DomainRY 2018 (MY 2017) Performance Measure Findings CenCal—Santa Barbara County
Criteria Number of Measures
MeetingCriteria
Total Number of Measures
Percentage of Measures
MeetingCriteria
RY 2018 Rates Above HPLs 1 4 25.00% Rates Above HPLs for the Last Three or More Consecutive Years 1 3 33.33%
RY 2018 Rates Significantly Better than RY 2017 Rates* 0 4 0.00%
Rates that Moved from Below MPLs in RY 2017 to Above MPLs in RY 2018 0 0 N/A
RY 2018 Rates Below MPLs 0 4 0.00% Rates Below MPLs for the Last Three or More Consecutive Years 0 3 0.00%
RY 2018 Rates Significantly Worse than RY 2017 Rates* 0 4 0.00%
Rates that Moved from Above MPLs in RY 2017 to Below MPLs in RY 2018 0 3 0.00%
* Performance comparisons are based on the Chi-square test of statistical significance, with a p value of <0.05. N/A = No rates above or below the MPLs from the previous year exist to include in the denominator for calculating whether or not rates moved to above or below MPLs in the most recent year.
CenCal Health Performance Evaluation Report: July 1, 2017–June 30, 2018 California Department of Health Care Services
Page I-14 Health Services Advisory Group, Inc.

MANAGED CARE HEALTH PLAN PERFORMANCE MEASURES
Care for Chronic Conditions
Table 3.9 and Table 3.10 present the four-year trending information for the performance measures within the Care for Chronic Conditions domain.
Table 3.9—Care for Chronic Conditions Domain Multi-Year Performance Measure Results CenCal—San Luis Obispo County
H = Rate indicates performance above the HPL. Bolded Rate = Rate indicates performance below the MPL.
B = Statistical testing result indicates that the RY 2018 rate is significantly better than the RY 2017 rate.
W = Statistical testing result indicates that the RY 2018 rate is significantly worse than the RY 2017 rate.
Measure RY
2015 Rate1
RY 2016
Rate2
RY 2017
Rate3
RY 2018
Rate4
RYs 2017–18 Rate
Difference5
Annual Monitoring for Patients on Persistent Medications— ACE Inhibitors or ARBs
83.99% 87.48% 84.29% 86.60% 2.31
Annual Monitoring for Patients on Persistent Medications— Diuretics
85.09% 86.82% 83.54% 85.17% 1.63
Asthma Medication Ratio -- -- 69.06% 61.67% -7.39W
Comprehensive Diabetes Care— Blood Pressure Control (<140/90 mm Hg)
68.33% 68.95% 72.57% 71.39% -1.18
Comprehensive Diabetes Care— Eye Exam (Retinal) Performed 65.59% 59.41% 70.57%H 72.41%H 1.84
Comprehensive Diabetes Care— HbA1c Control (<8.0 Percent) 54.61% 58.68%H 60.85%H 59.49%H -1.36
Comprehensive Diabetes Care— HbA1c Poor Control (>9.0 Percent)*
34.66% 25.92%H 28.18%H 30.13% 1.95
Comprehensive Diabetes Care— HbA1c Testing 84.29% 90.71% 88.03% 88.10% 0.07
Comprehensive Diabetes Care— Medical Attention for Nephropathy
83.29% 89.98%H 90.52% 90.13% -0.39
CenCal Health Performance Evaluation Report: July 1, 2017–June 30, 2018 California Department of Health Care Services
Page I-15 Health Services Advisory Group, Inc.

MANAGED CARE HEALTH PLAN PERFORMANCE MEASURES
Measure RY
2015 Rate1
RY 2016
Rate2
RY 2017
Rate3
RY 2018
Rate4
RYs 2017–18 Rate
Difference5
Controlling High Blood Pressure 59.90% 61.81% 66.58% 71.70%H 5.12 1 RY 2015 rates reflect MY data from January 1, 2014, through December 31, 2014. 2 RY 2016 rates reflect MY data from January 1, 2015, through December 31, 2015. 3 RY 2017 rates reflect MY data from January 1, 2016, through December 31, 2016. 4 RY 2018 rates reflect MY data from January 1, 2017, through December 31, 2017. 5 Performance comparisons are based on the Chi-square test of statistical significance, with a p value of <0.05. * A lower rate indicates better performance for this measure. -- Indicates that the rate is not available.
Table 3.10—Care for Chronic Conditions Domain Multi-Year Performance Measure Results CenCal—Santa Barbara County
H = Rate indicates performance above the HPL. Bolded Rate = Rate indicates performance below the MPL.
B = Statistical testing result indicates that the RY 2018 rate is significantly better than the RY 2017 rate.
W = Statistical testing result indicates that the RY 2018 rate is significantly worse than the RY 2017 rate.
Measure RY
2015 Rate1
RY 2016
Rate2
RY 2017
Rate3
RY 2018
Rate4
RYs 2017–18 Rate
Difference5
Annual Monitoring for Patients on Persistent Medications— ACE Inhibitors or ARBs
86.43% 88.58% 86.45% 88.16% 1.71B
Annual Monitoring for Patients on Persistent Medications— Diuretics
87.26% 87.42% 85.93% 87.47% 1.54
Asthma Medication Ratio -- -- 72.30%H 60.72% -11.58W
Comprehensive Diabetes Care— Blood Pressure Control (<140/90 mm Hg)
70.60% 70.66% 67.29% 76.82%H 9.53B
Comprehensive Diabetes Care— Eye Exam (Retinal) Performed 71.36%H 71.68%H 69.68%H 70.57%H 0.89
CenCal Health Performance Evaluation Report: July 1, 2017–June 30, 2018 California Department of Health Care Services
Page I-16 Health Services Advisory Group, Inc.

MANAGED CARE HEALTH PLAN PERFORMANCE MEASURES
Measure RY
2015 Rate1
RY 2016
Rate2
RY 2017
Rate3
RY 2018
Rate4
RYs 2017–18 Rate
Difference5
Comprehensive Diabetes Care— HbA1c Control (<8.0 Percent) 61.06%H 65.05%H 63.03%H 65.89%H 2.86
Comprehensive Diabetes Care— HbA1c Poor Control (>9.0 Percent)*
29.15%H 25.77%H 26.33%H 25.52%H -0.81
Comprehensive Diabetes Care— HbA1c Testing 90.95% 91.07% 90.43% 91.41% 0.98
Comprehensive Diabetes Care— Medical Attention for Nephropathy
85.18% 90.82%H 88.56% 90.89% 2.33
Controlling High Blood Pressure 62.03% 58.51% 61.10% 64.80% 3.70 1 RY 2015 rates reflect MY data from January 1, 2014, through December 31, 2014. 2 RY 2016 rates reflect MY data from January 1, 2015, through December 31, 2015. 3 RY 2017 rates reflect MY data from January 1, 2016, through December 31, 2016. 4 RY 2018 rates reflect MY data from January 1, 2017, through December 31, 2017. 5 Performance comparisons are based on the Chi-square test of statistical significance, with a p value of <0.05. * A lower rate indicates better performance for this measure. -- Indicates that the rate is not available.
CenCal Health Performance Evaluation Report: July 1, 2017–June 30, 2018 California Department of Health Care Services
Page I-17 Health Services Advisory Group, Inc.

MANAGED CARE HEALTH PLAN PERFORMANCE MEASURES
Table 3.11 and Table 3.12 present findings for the RY 2018 performance measures within the Care for Chronic Conditions domain. Note that the Asthma Medication Ratio measure was a first-year measure in RY 2017, and DHCS did not hold MCPs accountable to meet an MPL for this measure in RY 2017; therefore, HSAG did not include this measure in the denominators for calculating the percentage of measures with rates that moved to above or below the MPLs in RY 2018.
Table 3.11—Care for Chronic Conditions Domain RY 2018 (MY 2017) Performance Measure Findings CenCal—San Luis Obispo County
Criteria Number of Measures
MeetingCriteria
Total Number of Measures
Percentage of Measures
MeetingCriteria
RY 2018 Rates Above HPLs 3 10 30.00% Rates Above HPLs for the Last Three or More Consecutive Years 1 9 11.11%
RY 2018 Rates Significantly Better than RY 2017 Rates* 0 10 0.00%
Rates that Moved from Below MPLs in RY 2017 to Above MPLs in RY 2018 1 2 50.00%
RY 2018 Rates Below MPLs 1 10 10.00% Rates Below MPLs for the Last Three or More Consecutive Years 0 9 0.00%
RY 2018 Rates Significantly Worse than RY 2017 Rates* 1 10 10.00%
Rates that Moved from Above MPLs in RY 2017 to Below MPLs in RY 2018 0 7 0.00%
* Performance comparisons are based on the Chi-square test of statistical significance, with a p value of <0.05.
CenCal Health Performance Evaluation Report: July 1, 2017–June 30, 2018 California Department of Health Care Services
Page I-18 Health Services Advisory Group, Inc.
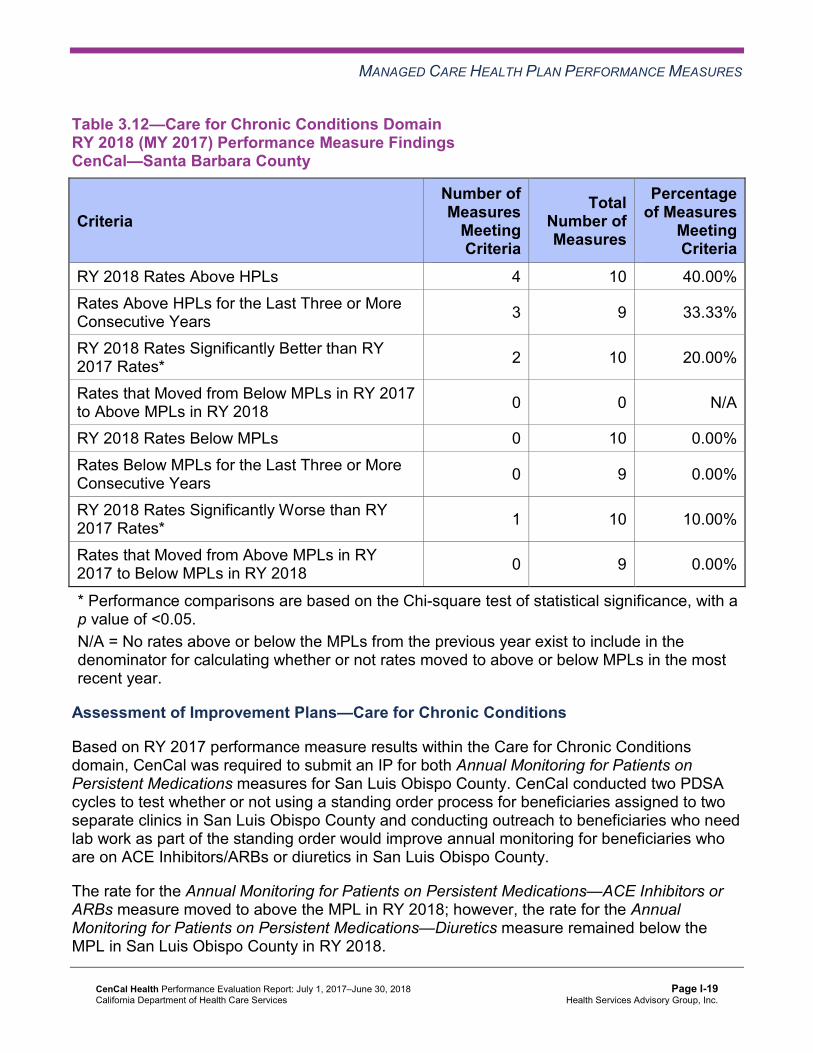
MANAGED CARE HEALTH PLAN PERFORMANCE MEASURES
Table 3.12—Care for Chronic Conditions Domain RY 2018 (MY 2017) Performance Measure Findings CenCal—Santa Barbara County
Criteria Number of Measures
MeetingCriteria
Total Number of Measures
Percentage of Measures
MeetingCriteria
RY 2018 Rates Above HPLs 4 10 40.00% Rates Above HPLs for the Last Three or More Consecutive Years 3 9 33.33%
RY 2018 Rates Significantly Better than RY 2017 Rates* 2 10 20.00%
Rates that Moved from Below MPLs in RY 2017 to Above MPLs in RY 2018 0 0 N/A
RY 2018 Rates Below MPLs 0 10 0.00% Rates Below MPLs for the Last Three or More Consecutive Years 0 9 0.00%
RY 2018 Rates Significantly Worse than RY 2017 Rates* 1 10 10.00%
Rates that Moved from Above MPLs in RY 2017 to Below MPLs in RY 2018 0 9 0.00%
* Performance comparisons are based on the Chi-square test of statistical significance, with a p value of <0.05. N/A = No rates above or below the MPLs from the previous year exist to include in the denominator for calculating whether or not rates moved to above or below MPLs in the most recent year.
Assessment of Improvement Plans—Care for Chronic Conditions
Based on RY 2017 performance measure results within the Care for Chronic Conditions domain, CenCal was required to submit an IP for both Annual Monitoring for Patients on Persistent Medications measures for San Luis Obispo County. CenCal conducted two PDSA cycles to test whether or not using a standing order process for beneficiaries assigned to two separate clinics in San Luis Obispo County and conducting outreach to beneficiaries who need lab work as part of the standing order would improve annual monitoring for beneficiaries who are on ACE Inhibitors/ARBs or diuretics in San Luis Obispo County.
The rate for the Annual Monitoring for Patients on Persistent Medications—ACE Inhibitors or ARBs measure moved to above the MPL in RY 2018; however, the rate for the Annual Monitoring for Patients on Persistent Medications—Diuretics measure remained below the MPL in San Luis Obispo County in RY 2018.
CenCal Health Performance Evaluation Report: July 1, 2017–June 30, 2018 California Department of Health Care Services
Page I-19 Health Services Advisory Group, Inc.

MANAGED CARE HEALTH PLAN PERFORMANCE MEASURES
Appropriate Treatment and Utilization
Table 3.13 and Table 3.14 present the four-year trending information for the performance measures within the Appropriate Treatment and Utilization domain.
Note the following regarding Table 3.13 and Table 3.14:
♦ The All-Cause Readmissions measure is a non-HEDIS measure originally developed for DHCS’ All-Cause Readmissions collaborative quality improvement project (QIP); therefore, DHCS does not establish an HPL or MPL for this measure. For the All-Cause Readmissions measure, a lower rate indicates better performance (i.e., fewer readmissions).
♦ The two Ambulatory Care measures are utilization measures, which measure the volume of services used. DHCS does not hold MCPs accountable to meet MPLs for utilization measures, and HSAG does not compare performance for these measures against HPLs and MPLs. Additionally, because high and low rates do not necessarily indicate better or worse performance, HSAG did not compare performance for these measures across years.
♦ DHCS established no HPL or MPL for the two Depression Screening and Follow-Up for Adolescents and Adults measures for RY 2018 because no comparable benchmarks exist. Additionally, although MCPs reported the two Depression Screening and Follow-Up for Adolescents and Adults measures for RY 2018, HSAG does not present the performance measure results for these measures in this report because the reported rates do not accurately represent services being provided. This is due to the Depression Screening and Follow-Up for Adolescents and Adults measures being new HEDIS measures for RY 2018, NCQA requiring MCPs to submit rates for these measures using the new Electronic Clinical Data Systems (ECDS) reporting methodology, and inconsistent data reporting processes by calculation vendors. Thus, MCPs experienced numerous challenges obtaining data sources to use for ECDS reporting. DHCS and HSAG, in consultation with NCQA, will work with MCPs to improve data capture for RY 2019.
♦ Note that due to changes that NCQA made to the specifications for the Use of Imaging Studies for Low Back Pain measure in RY 2018, NCQA released guidance to exercise caution when trending the results for this measure. Therefore, caution should be used when comparing MCP performance across years or when comparing MCP results to benchmarks related to the Use of Imaging Studies for Low Back Pain measure, as differences in rates may be a result of the specification changes rather than a reflection of performance.
CenCal Health Performance Evaluation Report: July 1, 2017–June 30, 2018 California Department of Health Care Services
Page I-20 Health Services Advisory Group, Inc.

MANAGED CARE HEALTH PLAN PERFORMANCE MEASURES
Table 3.13—Appropriate Treatment and Utilization DomainMulti-Year Performance Measure Results CenCal—San Luis Obispo County
H = Rate indicates performance above the HPL. Bolded Rate = Rate indicates performance below the MPL.
B = Statistical testing result indicates that the RY 2018 rate is significantly better than the RY 2017 rate.
W = Statistical testing result indicates that the RY 2018 rate is significantly worse than the RY 2017 rate.
Measure RY
2015 Rate1
RY 2016
Rate2
RY 2017
Rate3
RY 2018
Rate4
RYs 2017–18 Rate
Difference5
All-Cause Readmissions* 12.36% 13.78% 11.21% 10.57% -0.64 Ambulatory Care—Emergency Department (ED) Visits per 1,000 Member Months**
57.39 56.49 57.18 54.06 Not Tested
Ambulatory Care—Outpatient Visits per 1,000 Member Months**
341.47 336.94 325.37 345.93 Not Tested
Avoidance of Antibiotic Treatment in Adults With Acute Bronchitis
28.85% 26.88% 33.48% 36.20% 2.72
Use of Imaging Studies for Low Back Pain^ 86.51%H 80.43% 69.88% 71.52% 1.64
1 RY 2015 rates reflect MY data from January 1, 2014, through December 31, 2014. 2 RY 2016 rates reflect MY data from January 1, 2015, through December 31, 2015. 3 RY 2017 rates reflect MY data from January 1, 2016, through December 31, 2016. 4 RY 2018 rates reflect MY data from January 1, 2017, through December 31, 2017. 5 Performance comparisons are based on the Chi-square test of statistical significance, with a p value of <0.05. * A lower rate indicates better performance for this measure. ** Member months are a member's “contribution” to the total yearly membership. ^ Caution should be exercised when assessing MCP performance for this measure given the changes that NCQA made to the specification for this measure for RY 2018. Not Tested = An RY 2017–18 rate difference was not calculated because high and low rates do not necessarily indicate better or worse performance.
CenCal Health Performance Evaluation Report: July 1, 2017–June 30, 2018 California Department of Health Care Services
Page I-21 Health Services Advisory Group, Inc.

MANAGED CARE HEALTH PLAN PERFORMANCE MEASURES
Table 3.14—Appropriate Treatment and Utilization DomainMulti-Year Performance Measure Results CenCal—Santa Barbara County
H = Rate indicates performance above the HPL. Bolded Rate = Rate indicates performance below the MPL.
B = Statistical testing result indicates that the RY 2018 rate is significantly better than the RY 2017 rate.
W = Statistical testing result indicates that the RY 2018 rate is significantly worse than the RY 2017 rate.
Measure RY
2015 Rate1
RY 2016
Rate2
RY 2017
Rate3
RY 2018
Rate4
RYs 2017–18 Rate
Difference5
All-Cause Readmissions* 13.80% 14.25% 11.97% 12.07% 0.10 Ambulatory Care—Emergency Department (ED) Visits per 1,000 Member Months**
51.03 50.83 48.72 47.76 Not Tested
Ambulatory Care—Outpatient Visits per 1,000 Member Months**
302.48 296.77 305.58 318.93 Not Tested
Avoidance of Antibiotic Treatment in Adults With Acute Bronchitis
28.93% 28.44% 28.61% 27.10% -1.51
Use of Imaging Studies for Low Back Pain^ 83.26% 80.81% 73.34% 79.57%H 6.23B
1 RY 2015 rates reflect MY data from January 1, 2014, through December 31, 2014. 2 RY 2016 rates reflect MY data from January 1, 2015, through December 31, 2015. 3 RY 2017 rates reflect MY data from January 1, 2016, through December 31, 2016. 4 RY 2018 rates reflect MY data from January 1, 2017, through December 31, 2017. 5 Performance comparisons are based on the Chi-square test of statistical significance, with a p value of <0.05. * A lower rate indicates better performance for this measure. ** Member months are a member's “contribution” to the total yearly membership. ^ Caution should be exercised when assessing MCP performance for this measure given the changes that NCQA made to the specification for this measure for RY 2018. Not Tested = An RY 2017–18 rate difference was not calculated because high and low rates do not necessarily indicate better or worse performance.
CenCal Health Performance Evaluation Report: July 1, 2017–June 30, 2018 California Department of Health Care Services
Page I-22 Health Services Advisory Group, Inc.

MANAGED CARE HEALTH PLAN PERFORMANCE MEASURES
Table 3.15 and Table 3.16 present findings for the RY 2018 performance measures within the Appropriate Treatment and Utilization domain. DHCS did not hold MCPs accountable to meet MPLs for the following measures within this domain; therefore, HSAG did not include these measures in its assessment of the MCP’s performance related to HPLs and MPLs:
♦ All-Cause Readmissions ♦ Both Ambulatory Care measures
Table 3.15—Appropriate Treatment and Utilization DomainRY 2018 (MY 2017) Performance Measure Findings CenCal—San Luis Obispo County
Criteria Number of Measures
MeetingCriteria
Total Number of Measures
Percentage of Measures
MeetingCriteria
RY 2018 Rates Above HPLs 0 2 0.00% Rates Above HPLs for the Last Three or More Consecutive Years 0 2 0.00%
RY 2018 Rates Significantly Better than RY 2017 Rates* 0 3 0.00%
Rates that Moved from Below MPLs in RY 2017 to Above MPLs in RY 2018 0 0 N/A
RY 2018 Rates Below MPLs 0 2 0.00% Rates Below MPLs for the Last Three or More Consecutive Years 0 2 0.00%
RY 2018 Rates Significantly Worse than RY 2017 Rates* 0 3 0.00%
Rates that Moved from Above MPLs in RY 2017 to Below MPLs in RY 2018 0 2 0.00%
* Performance comparisons are based on the Chi-square test of statistical significance, with a p value of <0.05. N/A = No rates above or below the MPLs from the previous year exist to include in the denominator for calculating whether or not rates moved to above or below MPLs in the most recent year.
CenCal Health Performance Evaluation Report: July 1, 2017–June 30, 2018 California Department of Health Care Services
Page I-23 Health Services Advisory Group, Inc.
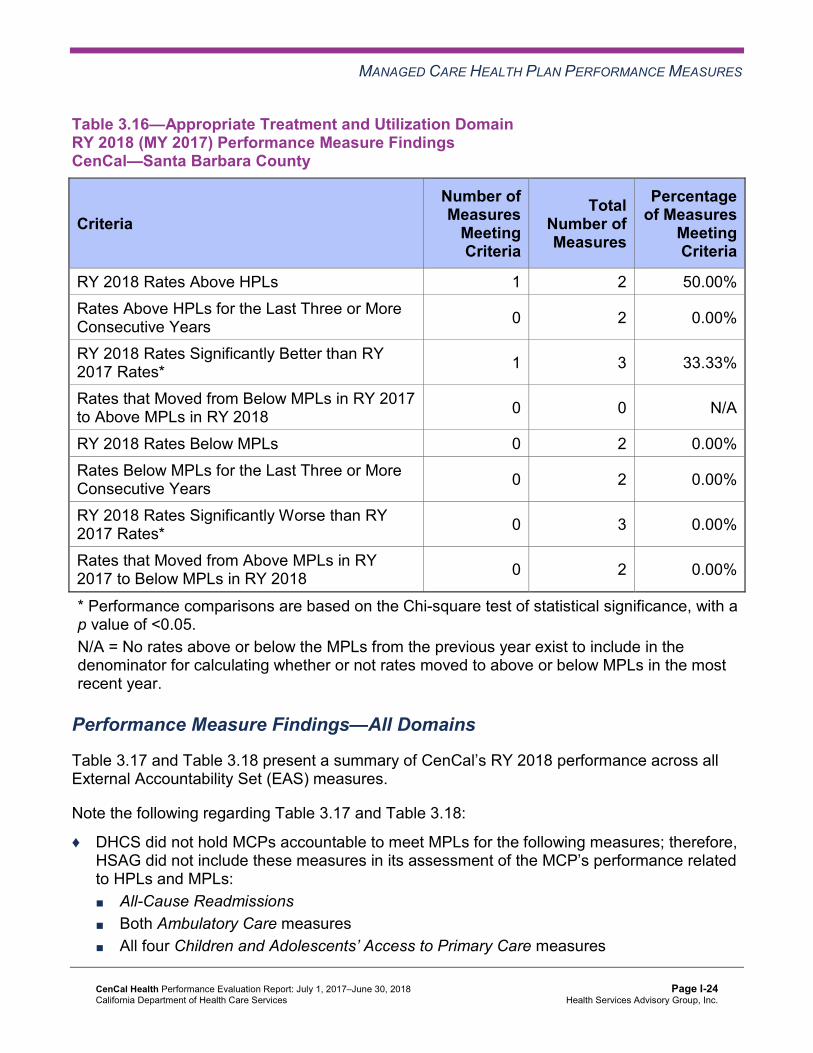
MANAGED CARE HEALTH PLAN PERFORMANCE MEASURES
Table 3.16—Appropriate Treatment and Utilization DomainRY 2018 (MY 2017) Performance Measure Findings CenCal—Santa Barbara County
Criteria Number of Measures
MeetingCriteria
Total Number of Measures
Percentage of Measures
Meeting Criteria
RY 2018 Rates Above HPLs 1 2 50.00% Rates Above HPLs for the Last Three or More Consecutive Years 0 2 0.00%
RY 2018 Rates Significantly Better than RY 2017 Rates* 1 3 33.33%
Rates that Moved from Below MPLs in RY 2017 to Above MPLs in RY 2018 0 0 N/A
RY 2018 Rates Below MPLs 0 2 0.00% Rates Below MPLs for the Last Three or More Consecutive Years 0 2 0.00%
RY 2018 Rates Significantly Worse than RY 2017 Rates* 0 3 0.00%
Rates that Moved from Above MPLs in RY 2017 to Below MPLs in RY 2018 0 2 0.00%
* Performance comparisons are based on the Chi-square test of statistical significance, with a p value of <0.05. N/A = No rates above or below the MPLs from the previous year exist to include in the denominator for calculating whether or not rates moved to above or below MPLs in the most recent year.
Performance Measure Findings—All Domains
Table 3.17 and Table 3.18 present a summary of CenCal’s RY 2018 performance across all External Accountability Set (EAS) measures.
Note the following regarding Table 3.17 and Table 3.18:
♦ DHCS did not hold MCPs accountable to meet MPLs for the following measures; therefore, HSAG did not include these measures in its assessment of the MCP’s performance related to HPLs and MPLs: ■ All-Cause Readmissions ■ Both Ambulatory Care measures ■ All four Children and Adolescents’ Access to Primary Care measures
CenCal Health Performance Evaluation Report: July 1, 2017–June 30, 2018 California Department of Health Care Services
Page I-24 Health Services Advisory Group, Inc.

MANAGED CARE HEALTH PLAN PERFORMANCE MEASURES
♦ DHCS did not hold MCPs accountable to meet MPLs for the following measures in RY 2017; therefore, HSAG did not include these measures in the denominators for calculating the percentage of measures with rates that moved to above or below the MPLs in RY 2018 and for calculating the percentage of measures with rates below MPLs for only the last two consecutive years: ■ Asthma Medication Ratio ■ Breast Cancer Screening ■ Immunizations for Adolescents—Combination 2
Table 3.17—RY 2018 (MY 2017) Performance Measure Findings for All Domains CenCal—San Luis Obispo County
Criteria Number of Measures
MeetingCriteria
Total Number of Measures
Percentage of Measures
MeetingCriteria
RY 2018 Rates Above HPLs 7 21 33.33% Rates Above HPLs for the Last Three or More Consecutive Years 1 18 5.56%
RY 2018 Rates Significantly Better than RY 2017 Rates* 5 22 22.73%
Rates that Moved from Below MPLs in RY 2017 to Above MPLs in RY 2018 1 2 50.00%
RY 2018 Rates Below MPLs 1 21 4.76% Rates Below MPLs for Only the Last Two Consecutive Years 1 18 5.56%
Rates Below MPLs for the Last Three or More Consecutive Years 0 18 0.00%
RY 2018 Rates Significantly Worse than RY 2017 Rates* 1 22 4.55%
Rates that Moved from Above MPLs in RY 2017 to Below MPLs in RY 2018 0 16 0.00%
* Performance comparisons are based on the Chi-square test of statistical significance, with a p value of <0.05.
CenCal Health Performance Evaluation Report: July 1, 2017–June 30, 2018 California Department of Health Care Services
Page I-25 Health Services Advisory Group, Inc.

MANAGED CARE HEALTH PLAN PERFORMANCE MEASURES
Table 3.18—RY 2018 (MY 2017) Performance Measure Findings for All Domains CenCal—Santa Barbara County
Criteria Number of Measures
MeetingCriteria
Total Number of Measures
Percentage of Measures
MeetingCriteria
RY 2018 Rates Above HPLs 10 21 47.62% Rates Above HPLs for the Last Three or More Consecutive Years 4 18 22.22%
RY 2018 Rates Significantly Better than RY 2017 Rates* 5 22 22.73%
Rates that Moved from Below MPLs in RY 2017 to Above MPLs in RY 2018 0 0 N/A
RY 2018 Rates Below MPLs 0 21 0.00% Rates Below MPLs for Only the Last Two Consecutive Years 0 18 0.00%
Rates Below MPLs for the Last Three or More Consecutive Years 0 18 0.00%
RY 2018 Rates Significantly Worse than RY 2017 Rates* 1 22 4.55%
Rates that Moved from Above MPLs in RY 2017 to Below MPLs in RY 2018 0 18 0.00%
* Performance comparisons are based on the Chi-square test of statistical significance, with a p value of <0.05. N/A = No rates above or below the MPLs from the previous year exist to include in the denominator for calculating whether or not rates moved to above or below MPLs in the most recent year.
Improvement Plan Requirements for 2018 Based on RY 2018 performance measure results, CenCal will be required to continue submitting an IP for the Annual Monitoring for Patients on Persistent Medications—Diuretics measure for San Luis Obispo County.
CenCal Health Performance Evaluation Report: July 1, 2017–June 30, 2018 California Department of Health Care Services
Page I-26 Health Services Advisory Group, Inc.

MANAGED CARE HEALTH PLAN PERFORMANCE MEASURES
Seniors and Persons with Disabilities Performance Measure Results Table 3.19 and Table 3.20 present the four-year trending information for SPD population, and Table 3.21 and Table 3.22 present the four-year trending information for the non-SPD population for the measures that DHCS required MCPs to stratify for the SPD and non-SPD populations. The tables also show the differences in rates between RY 2017 and RY 2018.
Table 3.23 and Table 3.24 present the SPD and non-SPD rates, a comparison of the SPD and non-SPD rates,5 and the total combined rate for each measure.
Table 3.19—Multi-Year SPD Performance Measure Trend Table CenCal—San Luis Obispo County
B = Statistical testing result indicates that the RY 2018 SPD rate is significantly better than the RY 2017 SPD rate.
W = Statistical testing result indicates that the RY 2018 SPD rate is significantly worse than the RY 2017 SPD rate.
Measure RY
2015 SPD
Rate1
RY 2016 SPD
Rate2
RY 2017 SPD
Rate3
RY 2018 SPD
Rate4
RYs 2017–18 Rate
Difference5
All-Cause Readmissions* 12.70% 20.05% 12.23% 15.48% 3.25 Ambulatory Care—Emergency Department (ED) Visits per 1,000 Member Months**
100.46 96.76 108.28 101.81 Not Tested
Ambulatory Care—Outpatient Visits per 1,000 Member Months**
646.84 618.97 591.41 597.81 Not Tested
Annual Monitoring for Patients on Persistent Medications— ACE Inhibitors or ARBs
84.97% 92.21% 86.67% 88.46% 1.79
Annual Monitoring for Patients on Persistent Medications— Diuretics
85.96% 90.91% 88.00% 90.32% 2.32
5 HSAG calculated statistical significance between the SPD and non-SPD rates for each measure using a Chi-square test. This information is displayed in the “SPD/Non-SPD Rate Difference” column in Table 3.23 and Table 3.24.
CenCal Health Performance Evaluation Report: July 1, 2017–June 30, 2018 California Department of Health Care Services
Page I-27 Health Services Advisory Group, Inc.
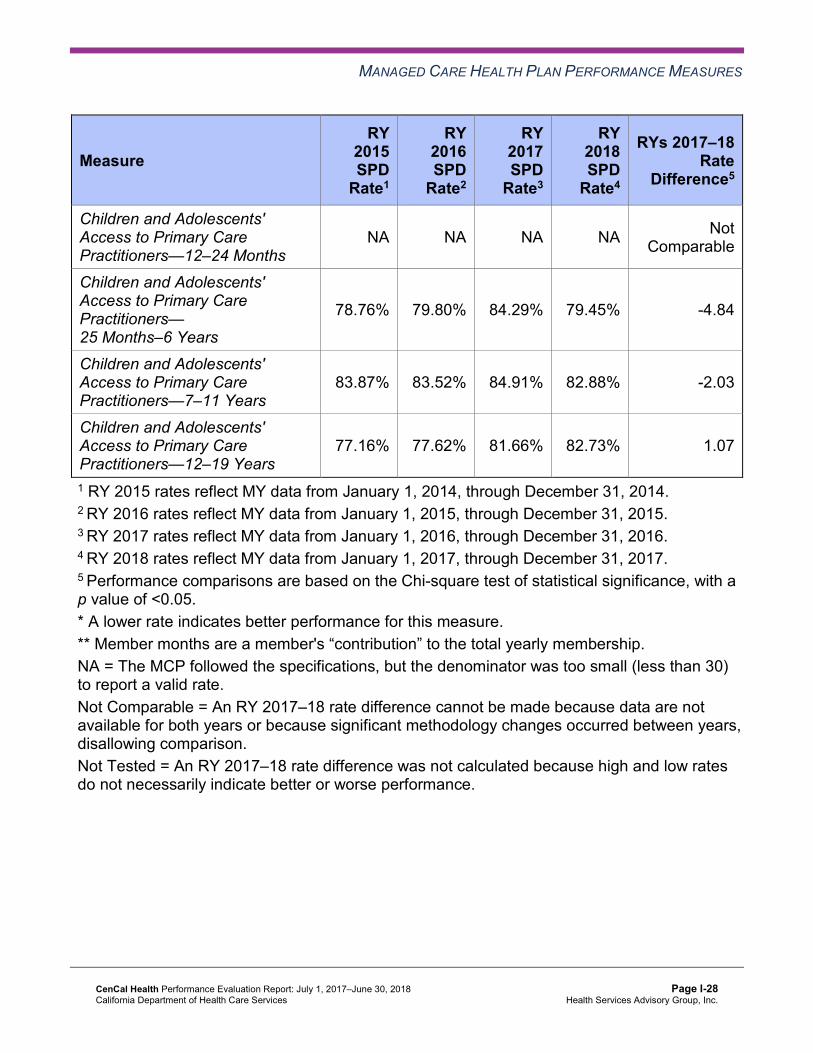
MANAGED CARE HEALTH PLAN PERFORMANCE MEASURES
Measure RY
2015 SPD
Rate1
RY 2016 SPD
Rate2
RY 2017 SPD
Rate3
RY 2018 SPD
Rate4
RYs 2017–18 Rate
Difference5
Children and Adolescents' Access to Primary Care Practitioners—12–24 Months
NA NA NA NA Not Comparable
Children and Adolescents' Access to Primary Care Practitioners— 25 Months–6 Years
78.76% 79.80% 84.29% 79.45% -4.84
Children and Adolescents' Access to Primary Care Practitioners—7–11 Years
83.87% 83.52% 84.91% 82.88% -2.03
Children and Adolescents' Access to Primary Care Practitioners—12–19 Years
77.16% 77.62% 81.66% 82.73% 1.07
1 RY 2015 rates reflect MY data from January 1, 2014, through December 31, 2014. 2 RY 2016 rates reflect MY data from January 1, 2015, through December 31, 2015. 3 RY 2017 rates reflect MY data from January 1, 2016, through December 31, 2016. 4 RY 2018 rates reflect MY data from January 1, 2017, through December 31, 2017. 5 Performance comparisons are based on the Chi-square test of statistical significance, with a p value of <0.05. * A lower rate indicates better performance for this measure. ** Member months are a member's “contribution” to the total yearly membership. NA = The MCP followed the specifications, but the denominator was too small (less than 30) to report a valid rate. Not Comparable = An RY 2017–18 rate difference cannot be made because data are not available for both years or because significant methodology changes occurred between years, disallowing comparison. Not Tested = An RY 2017–18 rate difference was not calculated because high and low rates do not necessarily indicate better or worse performance.
CenCal Health Performance Evaluation Report: July 1, 2017–June 30, 2018 California Department of Health Care Services
Page I-28 Health Services Advisory Group, Inc.

MANAGED CARE HEALTH PLAN PERFORMANCE MEASURES
Table 3.20—Multi-Year SPD Performance Measure Trend Table CenCal—Santa Barbara County
B = Statistical testing result indicates that the RY 2018 SPD rate is significantly better than the RY 2017 SPD rate.
W = Statistical testing result indicates that the RY 2018 SPD rate is significantly worse than the RY 2017 SPD rate.
Measure RY
2015 SPD
Rate1
RY 2016 SPD
Rate2
RY 2017 SPD
Rate3
RY 2018 SPD
Rate4
RYs 2017–18 Rate
Difference5
All-Cause Readmissions* 17.34% 18.76% 15.36% 18.73% 3.37 Ambulatory Care—Emergency Department (ED) Visits per 1,000 Member Months**
104.75 100.61 107.10 92.17 Not Tested
Ambulatory Care—Outpatient Visits per 1,000 Member Months**
595.81 598.50 611.80 627.40 Not Tested
Annual Monitoring for Patients on Persistent Medications— ACE Inhibitors or ARBs
88.66% 90.60% 90.43% 90.33% -0.10
Annual Monitoring for Patients on Persistent Medications— Diuretics
90.32% 91.28% 91.23% 90.48% -0.75
Children and Adolescents' Access to Primary Care Practitioners—12–24 Months
NA NA NA NA Not Comparable
Children and Adolescents' Access to Primary Care Practitioners— 25 Months–6 Years
92.95% 93.94% 79.25% 92.73% 13.48B
Children and Adolescents' Access to Primary Care Practitioners—7–11 Years
91.17% 93.71% 85.67% 92.38% 6.71B
Children and Adolescents' Access to Primary Care Practitioners—12–19 Years
90.43% 90.62% 79.32% 92.29% 12.97B
1 RY 2015 rates reflect MY data from January 1, 2014, through December 31, 2014. 2 RY 2016 rates reflect MY data from January 1, 2015, through December 31, 2015. 3 RY 2017 rates reflect MY data from January 1, 2016, through December 31, 2016.
CenCal Health Performance Evaluation Report: July 1, 2017–June 30, 2018 California Department of Health Care Services
Page I-29 Health Services Advisory Group, Inc.

MANAGED CARE HEALTH PLAN PERFORMANCE MEASURES
4 RY 2018 rates reflect MY data from January 1, 2017, through December 31, 2017. 5 Performance comparisons are based on the Chi-square test of statistical significance, with a p value of <0.05. * A lower rate indicates better performance for this measure. ** Member months are a member's “contribution” to the total yearly membership. NA = The MCP followed the specifications, but the denominator was too small (less than 30) to report a valid rate. Not Comparable = An RY 2017–18 rate difference cannot be made because data are not available for both years or because significant methodology changes occurred between years, disallowing comparison. Not Tested = An RY 2017–18 rate difference was not calculated because high and low rates do not necessarily indicate better or worse performance.
Table 3.21—Multi-Year Non-SPD Performance Measure Trend Table CenCal—San Luis Obispo County
B = Statistical testing result indicates that the RY 2018 non-SPD rate is significantly better than the RY 2017 non-SPD rate.
W = Statistical testing result indicates that the RY 2018 non-SPD rate is significantly worse than the RY 2017 non-SPD rate.
Measure RY 2015
Non-SPD Rate1
RY 2016 Non-SPD
Rate2
RY 2017 Non-SPD
Rate3
RY 2018 Non-SPD
Rate4
RYs 2017–18 Rate
Difference5
All-Cause Readmissions* 12.06% 10.92% 10.88% 8.56% -2.32
Ambulatory Care— Emergency Department (ED) Visits per 1,000 Member Months**
53.41 53.77 54.11 51.25 Not Tested
Ambulatory Care— Outpatient Visits per 1,000 Member Months**
313.29 317.85 309.39 331.12 Not Tested
Annual Monitoring for Patients on Persistent Medications— ACE Inhibitors or ARBs
83.10% 85.95% 83.63% 86.07% 2.44
Annual Monitoring for Patients on Persistent Medications—Diuretics
84.36% 85.27% 82.22% 83.71% 1.49
CenCal Health Performance Evaluation Report: July 1, 2017–June 30, 2018 California Department of Health Care Services
Page I-30 Health Services Advisory Group, Inc.

MANAGED CARE HEALTH PLAN PERFORMANCE MEASURES
Measure RY 2015
Non-SPD Rate1
RY 2016 Non-SPD
Rate2
RY 2017 Non-SPD
Rate3
RY 2018 Non-SPD
Rate4
RYs 2017–18 Rate
Difference5
Children and Adolescents' Access to Primary Care Practitioners— 12–24 Months
93.18% 94.19% 95.45% 96.07% 0.62
Children and Adolescents' Access to Primary Care Practitioners— 25 Months–6 Years
84.43% 87.12% 86.00% 88.84% 2.84B
Children and Adolescents' Access to Primary Care Practitioners— 7–11 Years
90.17% 89.87% 90.03% 91.76% 1.73B
Children and Adolescents' Access to Primary Care Practitioners— 12–19 Years
89.19% 89.39% 88.85% 89.99% 1.14B
1 RY 2015 rates reflect MY data from January 1, 2014, through December 31, 2014. 2 RY 2016 rates reflect MY data from January 1, 2015, through December 31, 2015. 3 RY 2017 rates reflect MY data from January 1, 2016, through December 31, 2016. 4 RY 2018 rates reflect MY data from January 1, 2017, through December 31, 2017. 5 Performance comparisons are based on the Chi-square test of statistical significance, with a p value of <0.05. * A lower rate indicates better performance for this measure. ** Member months are a member's “contribution” to the total yearly membership. Not Tested = An RY 2017–18 rate difference was not calculated because high and low rates do not necessarily indicate better or worse performance.
CenCal Health Performance Evaluation Report: July 1, 2017–June 30, 2018 California Department of Health Care Services
Page I-31 Health Services Advisory Group, Inc.

MANAGED CARE HEALTH PLAN PERFORMANCE MEASURES
Table 3.22—Multi-Year Non-SPD Performance Measure Trend Table CenCal—Santa Barbara County
B = Statistical testing result indicates that the RY 2018 non-SPD rate is significantly better than the RY 2017 non-SPD rate.
W = Statistical testing result indicates that the RY 2018 non-SPD rate is significantly worse than the RY 2017 non-SPD rate.
Measure RY 2015
Non-SPD Rate1
RY 2016 Non-SPD
Rate2
RY 2017 Non-SPD
Rate3
RY 2018 Non-SPD
Rate4
RYs 2017–18 Rate
Difference5
All-Cause Readmissions* 9.81% 12.02% 10.67% 9.43% -1.24
Ambulatory Care— Emergency Department (ED) Visits per 1,000 Member Months**
47.04 48.01 45.86 45.70 Not Tested
Ambulatory Care— Outpatient Visits per 1,000 Member Months**
280.68 279.72 290.59 304.63 Not Tested
Annual Monitoring for Patients on Persistent Medications— ACE Inhibitors or ARBs
83.97% 87.83% 85.27% 87.55% 2.28B
Annual Monitoring for Patients on Persistent Medications—Diuretics
83.57% 85.76% 84.17% 86.50% 2.33
Children and Adolescents' Access to Primary Care Practitioners— 12–24 Months
96.80% 94.85% 91.55% 95.79% 4.24B
Children and Adolescents' Access to Primary Care Practitioners— 25 Months–6 Years
91.56% 89.80% 81.02% 91.10% 10.08B
Children and Adolescents' Access to Primary Care Practitioners— 7–11 Years
93.82% 93.82% 84.49% 93.00% 8.51B
CenCal Health Performance Evaluation Report: July 1, 2017–June 30, 2018 California Department of Health Care Services
Page I-32 Health Services Advisory Group, Inc.

MANAGED CARE HEALTH PLAN PERFORMANCE MEASURES
Measure RY 2015
Non-SPD Rate1
RY 2016 Non-SPD
Rate2
RY 2017 Non-SPD
Rate3
RY 2018 Non-SPD
Rate4
RYs 2017–18 Rate
Difference5
Children and Adolescents' Access to Primary Care Practitioners—12–19 Years
90.60% 90.97% 79.06% 90.11% 11.05B
1 RY 2015 rates reflect MY data from January 1, 2014, through December 31, 2014. 2 RY 2016 rates reflect MY data from January 1, 2015, through December 31, 2015. 3 RY 2017 rates reflect MY data from January 1, 2016, through December 31, 2016. 4 RY 2018 rates reflect MY data from January 1, 2017, through December 31, 2017. 5 Performance comparisons are based on the Chi-square test of statistical significance, with a p value of <0.05. * A lower rate indicates better performance for this measure. ** Member months are a member's “contribution” to the total yearly membership. Not Tested = An RY 2017–18 rate difference was not calculated because high and low rates do not necessarily indicate better or worse performance.
Table 3.23—RY 2018 (MY 2017) Performance Measure Comparison and Results forMeasures Stratified by the SPD and Non-SPD PopulationsCenCal—San Luis Obispo County
B = Statistical testing result indicates that the RY 2018 SPD rate is significantly better than the RY 2018 non-SPD rate.
W = Statistical testing result indicates that the RY 2018 SPD rate is significantly worse than the RY 2018 non-SPD rate.
Measure RY 2018
SPD Rate1
RY 2018 Non-SPD
Rate1
SPD/Non-SPDRate
Difference2
RY 2018 Total Rate3
All-Cause Readmissions* 15.48% 8.56% 6.92W 10.57% Ambulatory Care—Emergency Department (ED) Visits per 1,000 Member Months**
101.81 51.25 Not Tested 54.06
Ambulatory Care—Outpatient Visits per 1,000 Member Months** 597.81 331.12 Not Tested 345.93
Annual Monitoring for Patients on Persistent Medications— ACE Inhibitors or ARBs
88.46% 86.07% 2.39 86.60%
CenCal Health Performance Evaluation Report: July 1, 2017–June 30, 2018 California Department of Health Care Services
Page I-33 Health Services Advisory Group, Inc.

MANAGED CARE HEALTH PLAN PERFORMANCE MEASURES
Measure RY 2018
SPD Rate1
RY 2018 Non-SPD
Rate1
SPD/Non-SPDRate
Difference2
RY 2018 Total Rate3
Annual Monitoring for Patients on Persistent Medications—Diuretics 90.32% 83.71% 6.61B 85.17%
Children and Adolescents' Access to Primary Care Practitioners— 12–24 Months
NA 96.07% Not Comparable 96.10%
Children and Adolescents' Access to Primary Care Practitioners— 25 Months–6 Years
79.45% 88.84% -9.39W 88.70%
Children and Adolescents' Access to Primary Care Practitioners— 7–11 Years
82.88% 91.76% -8.88W 91.49%
Children and Adolescents' Access to Primary Care Practitioners— 12–19 Years
82.73% 89.99% -7.26W 89.73%
1 RY 2018 rates reflect MY data from January 1, 2017, through December 31, 2017. 2 Performance comparisons are based on the Chi-square test of statistical significance, with a p value of <0.05. 3 Total rates are based on the MCP reporting unit’s total results, including the SPD and non-SPD populations. Please note, if data are not available for either the SPD or non-SPD population, the total rate is based on results reported for the available population. * A lower rate indicates better performance for this measure. ** Member months are a member's “contribution” to the total yearly membership. Not Comparable = An SPD/non-SPD rate difference cannot be made because data are not available for both populations. Not Tested = An SPD/non-SPD rate difference was not calculated because high and low rates do not necessarily indicate better or worse performance.
CenCal Health Performance Evaluation Report: July 1, 2017–June 30, 2018 California Department of Health Care Services
Page I-34 Health Services Advisory Group, Inc.

MANAGED CARE HEALTH PLAN PERFORMANCE MEASURES
Table 3.24—RY 2018 (MY 2017) Performance Measure Comparison and Results forMeasures Stratified by the SPD and Non-SPD PopulationsCenCal—Santa Barbara County
B = Statistical testing result indicates that the RY 2018 SPD rate is significantly better than the RY 2018 non-SPD rate.
W = Statistical testing result indicates that the RY 2018 SPD rate is significantly worse than the RY 2018 non-SPD rate.
Measure RY 2018
SPD Rate1
RY 2018 Non-SPD
Rate1
SPD/Non-SPDRate
Difference2
RY 2018 Total Rate3
All-Cause Readmissions* 18.73% 9.43% 9.30W 12.07% Ambulatory Care—Emergency Department (ED) Visits per 1,000 Member Months**
92.17 45.70 Not Tested 47.76
Ambulatory Care—Outpatient Visits per 1,000 Member Months** 627.40 304.63 Not Tested 318.93
Annual Monitoring for Patients on Persistent Medications— ACE Inhibitors or ARBs
90.33% 87.55% 2.78B 88.16%
Annual Monitoring for Patients on Persistent Medications—Diuretics 90.48% 86.50% 3.98B 87.47%
Children and Adolescents' Access to Primary Care Practitioners— 12–24 Months
NA 95.79% Not Comparable 95.78%
Children and Adolescents' Access to Primary Care Practitioners— 25 Months–6 Years
92.73% 91.10% 1.63 91.12%
Children and Adolescents' Access to Primary Care Practitioners— 7–11 Years
92.38% 93.00% -0.62 92.99%
Children and Adolescents' Access to Primary Care Practitioners— 12–19 Years
92.29% 90.11% 2.18 90.16%
1 RY 2018 rates reflect MY data from January 1, 2017, through December 31, 2017. 2 Performance comparisons are based on the Chi-square test of statistical significance, with a p value of <0.05. 3 Total rates are based on the MCP reporting unit’s total results, including the SPD and non-SPD populations. Please note, if data are not available for either the SPD or non-SPD population, the total rate is based on results reported for the available population.
CenCal Health Performance Evaluation Report: July 1, 2017–June 30, 2018 California Department of Health Care Services
Page I-35 Health Services Advisory Group, Inc.

MANAGED CARE HEALTH PLAN PERFORMANCE MEASURES
* A lower rate indicates better performance for this measure. ** Member months are a member's “contribution” to the total yearly membership. NA = The MCP followed the specifications, but the denominator was too small (less than 30) to report a valid rate. Not Comparable = An SPD/non-SPD rate difference cannot be made because data are not available for both populations. Not Tested = An SPD/non-SPD rate difference was not calculated because high and low rates do not necessarily indicate better or worse performance.
Seniors and Persons with Disabilities Findings
HSAG observed the following notable results in RY 2018 for measures that CenCal stratified by the SPD and non-SPD populations:
♦ For SPD rates for which HSAG could make a comparison between RY 2017 and RY 2018, the SPD rates improved significantly from RY 2017 to RY 2018 for the Children and Adolescents’ Access to Primary Care Practitioners—25 Months–6 Years, 7–11 Years, and 12–19 Years measures in Santa Barbara County.
♦ The non-SPD rates improved significantly from RY 2017 to RY 2018 for the following measures: ■ Annual Monitoring for Patients on Persistent Medications—ACE Inhibitors or ARBs in
Santa Barbara County. ■ Children and Adolescents’ Access to Primary Care Practitioners—12–24 Months in
Santa Barbara County. ■ Children and Adolescents’ Access to Primary Care Practitioners—25 Months–6 Years,
7–11 Years, and 12–19 Years in both reporting units. ♦ For measures for which HSAG could make a comparison between the RY 2018 SPD rates
and RY 2018 non-SPD rates: ■ The RY 2018 SPD rates were significantly better than the RY 2018 non-SPD rates for
the following measures: ○ Annual Monitoring for Patients on Persistent Medications—ACE Inhibitors or ARBs
in Santa Barbara County. ○ Annual Monitoring for Patients on Persistent Medications—Diuretics in both
reporting units. ■ The RY 2018 SPD rates were significantly worse than the RY 2018 non-SPD rates for
the following measures: ○ All-Cause Readmissions in both reporting units. Note that the higher rate of hospital
readmissions for the SPD population is expected based on the greater and often more complicated health care needs of these beneficiaries.
○ Children and Adolescents’ Access to Primary Care Practitioners—25 Months–6 Years, 7–11 Years, and 12–19 Years in San Luis Obispo County. The significant differences in rates for these measures may be attributed to beneficiaries in these
CenCal Health Performance Evaluation Report: July 1, 2017–June 30, 2018 California Department of Health Care Services
Page I-36 Health Services Advisory Group, Inc.
MANAGED CARE HEALTH PLAN PERFORMANCE MEASURES
age groups in the SPD population choosing to receive all health care services from specialist providers due to their complicated health care needs rather than accessing care from primary care providers (PCPs).
Strengths—Performance Measures HSAG auditors determined that CenCal followed the appropriate specifications to produce valid rates, and identified no issues of concern.
HSAG identified the following notable RY 2018 performance measure results for CenCal across all domains:
♦ Across both reporting units, 17 of 42 rates (40 percent) were above the HPLs, with the following five rates being above the HPLs for three or more consecutive years: ■ Comprehensive Diabetes Care—Eye Exam (Retinal) Performed in Santa Barbara
County ■ Comprehensive Diabetes Care—HbA1c Control (<8.0 Percent) in both reporting units ■ Comprehensive Diabetes Care—HbA1c Poor Control (>9.0 Percent) in Santa Barbara
County ■ Prenatal and Postpartum Care—Postpartum Care in Santa Barbara County
♦ The rates for five of 22 measures (23 percent) in each reporting unit improved significantly from RY 2017 to RY 2018.
♦ In San Luis Obispo County, the rate for the Annual Monitoring for Patients on Persistent Medications—ACE Inhibitors or ARBs measure improved from RY 2017 to RY 2018. Although the improvement was not statistically significant, the change resulted in the rate moving from below the MPL in RY 2017 to above the MPL in RY 2018. The actions that CenCal reported during the review period to improve the MCP’s performance on the Annual Monitoring for Patients on Persistent Medications measures may have contributed to the rate improving for the Annual Monitoring for Patients on Persistent Medications—ACE Inhibitors or ARBs measure. (See Table 5.1.)
Opportunities for Improvement—Performance Measures The rate in San Luis Obispo County was below the MPL in RY 2018 for the Annual Monitoring for Patients on Persistent Medications—Diuretics measure. Additionally, in both reporting units, the rates for the Asthma Medication Ratio measure declined significantly from RY 2017 to RY 2018.
Performance measure results show that CenCal has the opportunity to evaluate the results of the MCP expanding the use of standing orders for lab-monitoring tests and conducting targeted case management for beneficiaries on ACE Inhibitors/ARBs or diuretics (see Table 5.1), to determine whether or not the intervention is resulting in improved annual monitoring for beneficiaries ages 18 and older who are on diuretics in San Luis Obispo County. Additionally,
CenCal Health Performance Evaluation Report: July 1, 2017–June 30, 2018 California Department of Health Care Services
Page I-37 Health Services Advisory Group, Inc.
MANAGED CARE HEALTH PLAN PERFORMANCE MEASURES
CenCal has the opportunity to assess the causes for the rates in both reporting units declining significantly from RY 2017 to RY 2018 for the Asthma Medication Ratio measure and to identify strategies to ensure that beneficiaries ages 5 to 64 who are identified as having persistent asthma have a ratio of controller medications to total asthma medications of 0.50 or greater.
CenCal Health Performance Evaluation Report: July 1, 2017–June 30, 2018 California Department of Health Care Services
Page I-38 Health Services Advisory Group, Inc.

Medi-Cal Managed Care External Quality Review Technical ReportAppendix I: Performance Evaluation ReportCenCal Health July 1, 2017–June 30, 2018
4. Performance Improvement Projects
Performance Improvement Project Overview The key concepts of the rapid-cycle PIP framework include forming a PIP team, setting aims, establishing measures, determining interventions using quality improvement tools, conducting PDSA cycles to test interventions, and planning for the spread of successful changes. The core component of the rapid-cycle PIP approach involves testing changes on a small scale so that improvement can occur more efficiently and lead to long-term sustainability. The following modules guide MCPs through this rapid-cycle PIP process:
♦ Module 1—PIP Initiation ■ MCPs outline the framework for the PIP, which includes:
○ The topic rationale. ○ Comparative data supporting the need to improve the selected topic. ○ A list of the PIP team members, which consists of internal and external stakeholders. ○ A completed key driver diagram that defines the theory of change for improvement,
including the SMART (Specific, Measurable, Achievable, Relevant, and Time-bound) Aim and Global Aim.
♦ Module 2—SMART Aim Data Collection ■ MCPs define the SMART Aim measure and data collection methodology and develop
the SMART Aim data run chart. ♦ Module 3—Intervention Determination
■ MCPs use process mapping and failure modes and effects analysis to identify potential interventions to test which may have direct effects on the SMART Aim.
♦ Module 4—Plan-Do-Study-Act (PDSA) ■ MCPs test and evaluate the interventions identified in Module 3 through a series of
PDSA cycles. ♦ Module 5—PIP Conclusions
■ MCPs interpret results and summarize: ○ Key findings and outcomes achieved. ○ Assessment of each tested intervention. ○ Lessons learned, including how demonstrated improvement can be shared and used
as a foundation for further improvement going forward. ○ Plan for sustained improvement.
CenCal Health Performance Evaluation Report: July 1, 2017–June 30, 2018 California Department of Health Care Services
Page I-39 Health Services Advisory Group, Inc.

PERFORMANCE IMPROVEMENT PROJECTS
Based on the agreed-upon timeline, MCPs submit each module to HSAG for validation. Throughout the rapid-cycle PIP process, HSAG provides technical assistance to MCPs to ensure that PIPs are methodologically sound and to problem-solve with MCPs regarding how to address challenges that occur. Through an iterative process, MCPs have opportunities to make corrections to modules 1 through 3 to achieve all validation criteria.
Once MCPs achieve all validation criteria for modules 1 through 3 and receive feedback on the intervention Plan portion of Module 4, MCPs test interventions. During the intervention testing phase of the PIP, HSAG conducts periodic progress check-ins to ensure that MCPs have addressed HSAG’s feedback on the Plan portion of Module 4 and are making appropriate progress with intervention testing. Once MCPs complete testing an intervention, MCPs determine the next steps based on results and lessons learned—whether the intervention was successful and should be spread (adopt), whether modifications need to be made to the existing intervention (adapt), or whether the intervention was not successful and should be stopped (abandon).
In Module 5, MCPs summarize the overall PIP. When validating Module 5, HSAG assesses the validity and reliability of the results based on the Centers for Medicare & Medicaid Services (CMS) validation protocols to determine whether key stakeholders can have confidence in the reported PIP findings. HSAG assigns the following final confidence levels for each PIP:
♦ High confidence—the PIP was methodologically sound and achieved the SMART Aim goal; the demonstrated improvement was clearly linked to the quality improvement processes conducted and intervention(s) tested; and, the MCP accurately summarized the key findings.
♦ Confidence—the PIP was methodologically sound and achieved the SMART Aim goal, and the MCP accurately summarized the key findings. However, some, but not all, of the quality improvement processes conducted and/or intervention(s) tested were clearly linked to the demonstrated improvement.
♦ Low confidence—either (A) the PIP was methodologically sound; however, the SMART Aim goal was not achieved; or (B) the SMART Aim goal was achieved; however, the quality improvement processes and/or intervention(s) tested were poorly executed and could not be linked to the improvement.
♦ Reported PIP results were not credible—the PIP methodology was not executed as approved.
Performance Improvement Project Results and Findings During the review period, CenCal submitted modules 4 and 5 for its 2015–17 DHCS-priority and MCP-specific PIPs. HSAG validated the modules and includes the final PIP validation findings in this report. Additionally, CenCal initiated a Disparity PIP and a DHCS-priority PIP during the review period. In this report, HSAG includes summaries of the MCP’s Disparity and DHCS-priority PIP module submissions as well as validation findings from the review period.
CenCal Health Performance Evaluation Report: July 1, 2017–June 30, 2018 California Department of Health Care Services
Page I-40 Health Services Advisory Group, Inc.
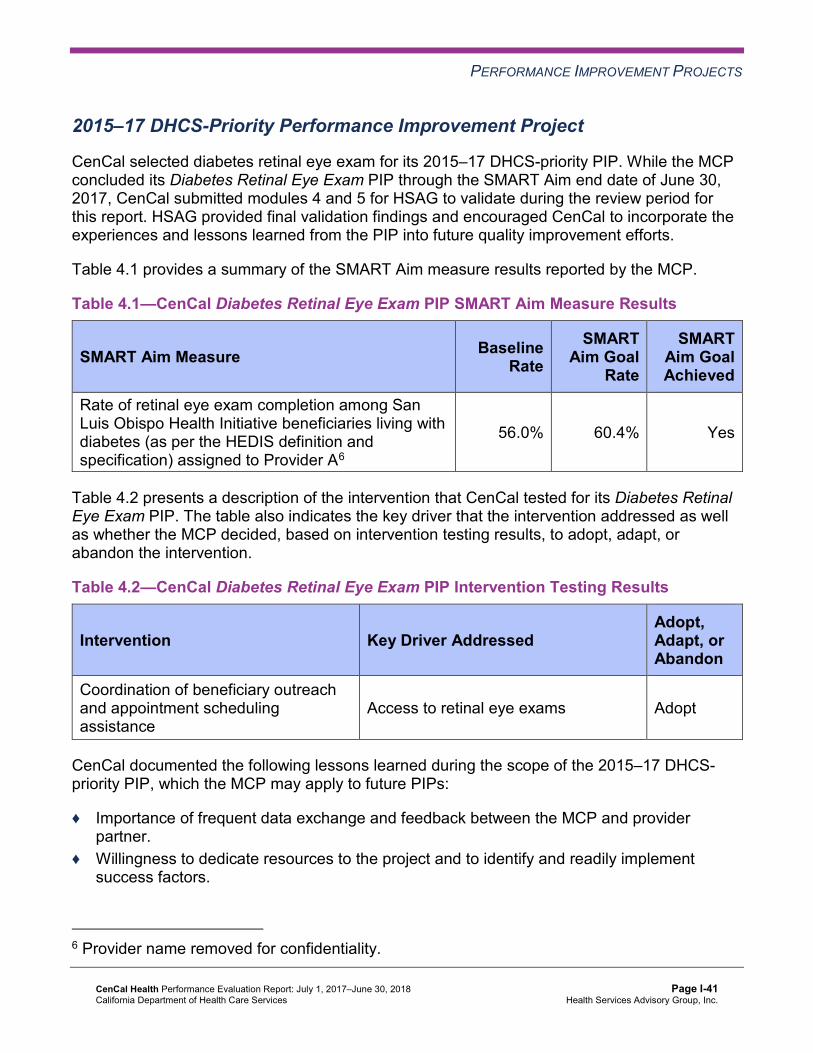
PERFORMANCE IMPROVEMENT PROJECTS
2015–17 DHCS-Priority Performance Improvement Project
CenCal selected diabetes retinal eye exam for its 2015–17 DHCS-priority PIP. While the MCP concluded its Diabetes Retinal Eye Exam PIP through the SMART Aim end date of June 30, 2017, CenCal submitted modules 4 and 5 for HSAG to validate during the review period for this report. HSAG provided final validation findings and encouraged CenCal to incorporate the experiences and lessons learned from the PIP into future quality improvement efforts.
Table 4.1 provides a summary of the SMART Aim measure results reported by the MCP.
Table 4.1—CenCal Diabetes Retinal Eye Exam PIP SMART Aim Measure Results
SMART Aim Measure Baseline Rate
SMART Aim Goal
Rate
SMART Aim Goal Achieved
Rate of retinal eye exam completion among San Luis Obispo Health Initiative beneficiaries living with diabetes (as per the HEDIS definition and specification) assigned to Provider A6
56.0% 60.4% Yes
Table 4.2 presents a description of the intervention that CenCal tested for its Diabetes Retinal Eye Exam PIP. The table also indicates the key driver that the intervention addressed as well as whether the MCP decided, based on intervention testing results, to adopt, adapt, or abandon the intervention.
Table 4.2—CenCal Diabetes Retinal Eye Exam PIP Intervention Testing Results
Intervention Key Driver Addressed Adopt,Adapt, orAbandon
Coordination of beneficiary outreach and appointment scheduling assistance
Access to retinal eye exams Adopt
CenCal documented the following lessons learned during the scope of the 2015–17 DHCS-priority PIP, which the MCP may apply to future PIPs:
♦ Importance of frequent data exchange and feedback between the MCP and provider partner.
♦ Willingness to dedicate resources to the project and to identify and readily implement success factors.
6 Provider name removed for confidentiality.
CenCal Health Performance Evaluation Report: July 1, 2017–June 30, 2018 California Department of Health Care Services
Page I-41 Health Services Advisory Group, Inc.

PERFORMANCE IMPROVEMENT PROJECTS
Performance Improvement Project Validation Findings
During the review period for this report, HSAG validated modules 4 and 5 for the MCP’s Diabetes PIP. CenCal achieved the SMART Aim goal, and the MCP linked the tested intervention to the demonstrated improvement. However, the MCP documented that the provider partner installed a new EyePACS unit and began offering on-site eye exams to beneficiaries during the intervention testing phase of the PIP. Due to this confounding effort during the PIP, it may be difficult to attribute the beneficiary outreach and appointment scheduling intervention as the only contributor to the demonstrated improvement of the SMART Aim measure rate. Part of the success may also be due to the provider offering the eye exams on-site.
Upon assessment of validity and reliability of the PIP results, HSAG assigned CenCal’s Diabetes Retinal Eye Exam PIP a final confidence level of Confidence.
2015–17 MCP-Specific Performance Improvement Project
CenCal selected initial health assessment (IHA) for its 2015–17 MCP-specific PIP. While the MCP concluded its Initial Health Assessment PIP through the SMART Aim end date of June 30, 2017, CenCal submitted modules 4 and 5 for HSAG to validate during the review period for this report. HSAG provided final validation findings and encouraged CenCal to incorporate the experiences and lessons learned from the PIP into future quality improvement efforts.
Table 4.3 provides a summary of the SMART Aim measure results reported by the MCP.
Table 4.3—CenCal Initial Health Assessment PIP SMART Aim Measure Results
SMART Aim Measure Baseline Rate
SMART Aim Goal
Rate
SMART Aim Goal Achieved
Rate of IHA completion within 120 days of enrollment among adult Santa Barbara Health Initiative beneficiaries ages 21 years or older assigned to Provider B7
10.8% 19.7% Yes
7 Provider name removed for confidentiality.
CenCal Health Performance Evaluation Report: July 1, 2017–June 30, 2018 California Department of Health Care Services
Page I-42 Health Services Advisory Group, Inc.

PERFORMANCE IMPROVEMENT PROJECTS
Table 4.4 presents a description of the intervention that CenCal tested for its Initial Health Assessment PIP. The table also indicates the key driver that the intervention addressed as well as whether the MCP decided, based on intervention testing results, to adopt, adapt, or abandon the intervention.
Table 4.4—CenCal Initial Health Assessment PIP Intervention Testing Results
Intervention Key Driver Addressed Adopt,Adapt, orAbandon
At the beginning of each month, supplying Provider B with a list of newly assigned beneficiaries, including specific timelines that indicate when each beneficiary is due for his or her IHA; and providing an incentive to Provider B for completion of IHAs for beneficiaries on the list.
Identification of beneficiaries due for IHAs Adapt
Performance Improvement Project Validation Findings
During the review period for this report, HSAG validated modules 4 and 5 for the MCP’s Initial Health Assessment PIP.
CenCal began intervention testing in July 2016. Although the MCP achieved the SMART Aim goal in September 2016 and November 2016, the SMART Aim measure rates remained below the baseline from February through June 2017. CenCal indicated that the partnered provider site experienced a shortage in staffing during those months and therefore could not make outreach calls as planned. Upon assessment of validity and reliability of the PIP results, HSAG assigned CenCal’s Initial Health Assessment PIP a final confidence level of Low Confidence.
2017–19 Disparity Performance Improvement Project
During the review period, DHCS required CenCal to initiate a PIP focusing on an identified health disparity based on, but not limited to, age, gender, race or ethnicity, language spoken, income, educational attainment, sexual orientation or gender identity, occupation, provider, or geographic area. CenCal selected completion of the human papillomavirus (HPV) vaccination among adolescents in Santa Barbara County as its 2017–19 Disparity PIP topic. Using its own MCP-specific data, the MCP provided evidence of the health disparity by demonstrating a statistically significant rate difference between two subgroups, with the disparate subgroup having the lower rate.
CenCal Health Performance Evaluation Report: July 1, 2017–June 30, 2018 California Department of Health Care Services
Page I-43 Health Services Advisory Group, Inc.
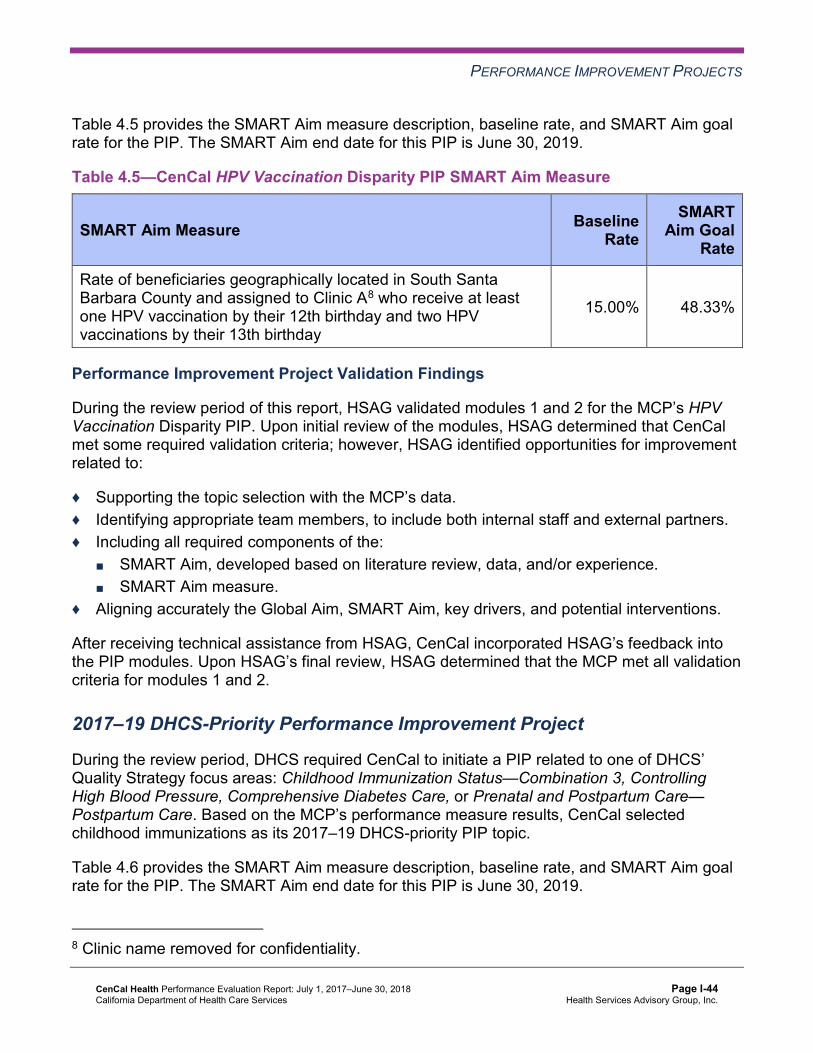
PERFORMANCE IMPROVEMENT PROJECTS
Table 4.5 provides the SMART Aim measure description, baseline rate, and SMART Aim goal rate for the PIP. The SMART Aim end date for this PIP is June 30, 2019.
Table 4.5—CenCal HPV Vaccination Disparity PIP SMART Aim Measure
SMART Aim Measure Baseline Rate
SMART Aim Goal
Rate
Rate of beneficiaries geographically located in South Santa Barbara County and assigned to Clinic A8 who receive at least one HPV vaccination by their 12th birthday and two HPV vaccinations by their 13th birthday
15.00% 48.33%
Performance Improvement Project Validation Findings
During the review period of this report, HSAG validated modules 1 and 2 for the MCP’s HPV Vaccination Disparity PIP. Upon initial review of the modules, HSAG determined that CenCal met some required validation criteria; however, HSAG identified opportunities for improvement related to:
♦ Supporting the topic selection with the MCP’s data. ♦ Identifying appropriate team members, to include both internal staff and external partners. ♦ Including all required components of the:
■ SMART Aim, developed based on literature review, data, and/or experience. ■ SMART Aim measure.
♦ Aligning accurately the Global Aim, SMART Aim, key drivers, and potential interventions.
After receiving technical assistance from HSAG, CenCal incorporated HSAG’s feedback into the PIP modules. Upon HSAG’s final review, HSAG determined that the MCP met all validation criteria for modules 1 and 2.
2017–19 DHCS-Priority Performance Improvement Project
During the review period, DHCS required CenCal to initiate a PIP related to one of DHCS’ Quality Strategy focus areas: Childhood Immunization Status—Combination 3, Controlling High Blood Pressure, Comprehensive Diabetes Care, or Prenatal and Postpartum Care— Postpartum Care. Based on the MCP’s performance measure results, CenCal selected childhood immunizations as its 2017–19 DHCS-priority PIP topic.
Table 4.6 provides the SMART Aim measure description, baseline rate, and SMART Aim goal rate for the PIP. The SMART Aim end date for this PIP is June 30, 2019.
8 Clinic name removed for confidentiality.
CenCal Health Performance Evaluation Report: July 1, 2017–June 30, 2018 California Department of Health Care Services
Page I-44 Health Services Advisory Group, Inc.

PERFORMANCE IMPROVEMENT PROJECTS
Table 4.6—CenCal Childhood Immunization Status—Combination 3 PIP SMART Aim Measure
SMART Aim Measure Baseline Rate
SMART Aim Goal
Rate Rate of Childhood Immunization Status—Combination 3 measure at Provider C9 in San Luis Obispo County 47.13% 65.25%
Performance Improvement Project Validation Findings
During the review period of this report, HSAG validated modules 1 and 2 for the MCP’s Childhood Immunization Status—Combination 3 PIP. Upon initial review of the modules, HSAG determined that CenCal met some required validation criteria; however, HSAG identified opportunities for improvement related to:
♦ Supporting the topic selection with the MCP’s data. ♦ Including all required components of the:
■ SMART Aim, developed based on literature review, data, and/or experience. ■ SMART Aim measure.
♦ Aligning accurately the Global Aim, SMART Aim, key drivers, and potential interventions.
After receiving technical assistance from HSAG, CenCal incorporated HSAG’s feedback into the PIP modules. Upon HSAG’s final review, HSAG determined that the MCP met all validation criteria for modules 1 and 2.
Strengths—Performance Improvement Projects CenCal achieved the SMART Aim goal for the 2015–17 Diabetes Retinal Eye Exam PIP, and some of the quality improvement activities could be linked to the demonstrated improvement. Based on HSAG’s assessment, HSAG assigned the 2015–17 Diabetes Retinal Eye Exam PIP a confidence level of Confidence.
Opportunities for Improvement—Performance Improvement Projects CenCal has the opportunity to continue monitoring interventions and outcomes to facilitate improvement beyond the life of the 2015–17 Diabetes Retinal Eye Exam and Initial Health Assessment PIPs. Ongoing monitoring will enable long-term evaluation of improvement and allow the MCP to continually refine interventions to achieve and sustain optimal outcomes.
9 Provider name removed for confidentiality.
CenCal Health Performance Evaluation Report: July 1, 2017–June 30, 2018 California Department of Health Care Services
Page I-45 Health Services Advisory Group, Inc.
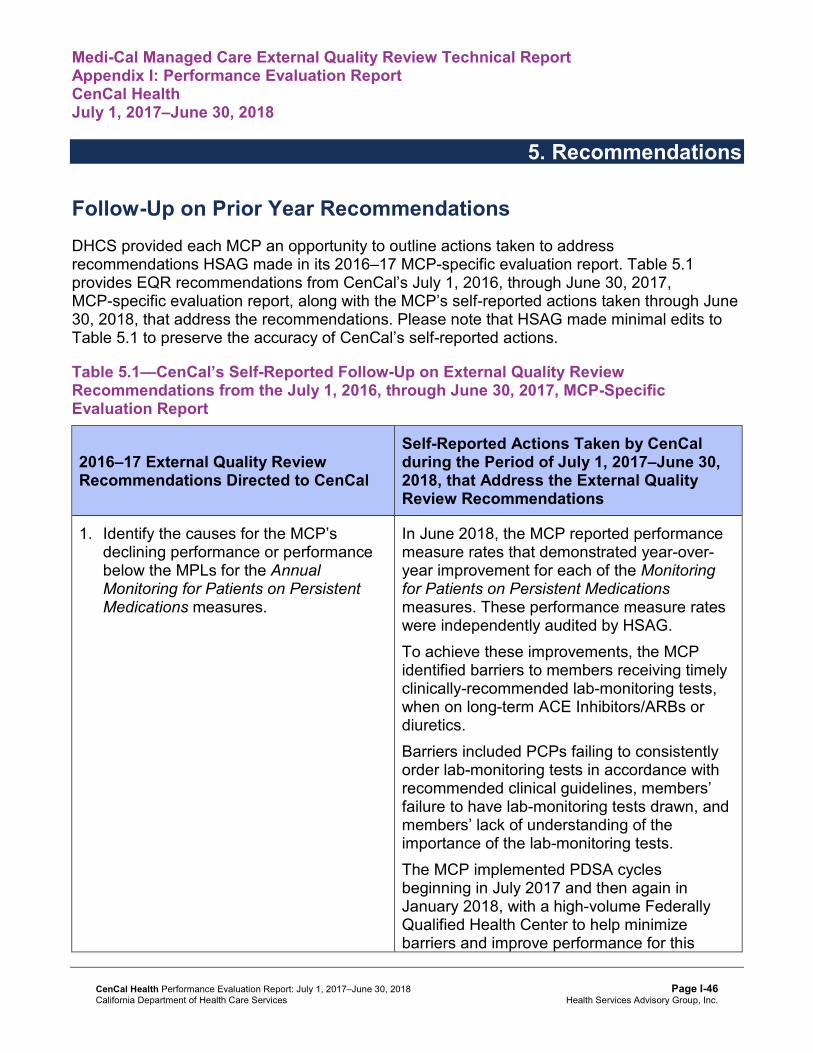
Medi-Cal Managed Care External Quality Review Technical ReportAppendix I: Performance Evaluation ReportCenCal Health July 1, 2017–June 30, 2018
5. Recommendations
Follow-Up on Prior Year Recommendations DHCS provided each MCP an opportunity to outline actions taken to address recommendations HSAG made in its 2016–17 MCP-specific evaluation report. Table 5.1 provides EQR recommendations from CenCal’s July 1, 2016, through June 30, 2017, MCP-specific evaluation report, along with the MCP’s self-reported actions taken through June 30, 2018, that address the recommendations. Please note that HSAG made minimal edits to Table 5.1 to preserve the accuracy of CenCal’s self-reported actions.
Table 5.1—CenCal’s Self-Reported Follow-Up on External Quality ReviewRecommendations from the July 1, 2016, through June 30, 2017, MCP-SpecificEvaluation Report
2016–17 External Quality ReviewRecommendations Directed to CenCal
Self-Reported Actions Taken by CenCalduring the Period of July 1, 2017–June 30,2018, that Address the External QualityReview Recommendations
1. Identify the causes for the MCP’s declining performance or performance below the MPLs for the Annual Monitoring for Patients on Persistent Medications measures.
In June 2018, the MCP reported performance measure rates that demonstrated year-over-year improvement for each of the Monitoring for Patients on Persistent Medications measures. These performance measure rates were independently audited by HSAG. To achieve these improvements, the MCP identified barriers to members receiving timely clinically-recommended lab-monitoring tests, when on long-term ACE Inhibitors/ARBs or diuretics. Barriers included PCPs failing to consistently order lab-monitoring tests in accordance with recommended clinical guidelines, members’ failure to have lab-monitoring tests drawn, and members’ lack of understanding of the importance of the lab-monitoring tests. The MCP implemented PDSA cycles beginning in July 2017 and then again in January 2018, with a high-volume Federally Qualified Health Center to help minimize barriers and improve performance for this
CenCal Health Performance Evaluation Report: July 1, 2017–June 30, 2018 California Department of Health Care Services
Page I-46 Health Services Advisory Group, Inc.

RECOMMENDATIONS
2016–17 External Quality ReviewRecommendations Directed to CenCal
Self-Reported Actions Taken by CenCalduring the Period of July 1, 2017–June 30,2018, that Address the External QualityReview Recommendations aspect of care. The PDSA cycles included implementation of standing orders for lab-monitoring tests as well as targeted case management for members on ACE Inhibitors/ARBs or diuretics. Since the PDSA cycle results showed improvement in the proportion of members who received clinically recommended lab-monitoring tests, the MCP is spreading the success of the PDSA cycles to other locations within the MCP’s provider network.
2. Identify the causes for the MCP’s declining performance in both reporting units for the Use of Imaging Studies for Low Back Pain measure to assist the MCP in developing strategies, as applicable, to address the MCP’s declining performance for this measure.
In June 2018, the MCP reported performance measure rates that demonstrated year-over-year improvement in the Use of Imaging Studies for Low Back Pain measure. Performance in one of CenCal’s service regions now rates among the top 10 percent of Medicaid plans nationally. These performance rates were also independently audited by HSAG. To identify barriers to improved performance, the MCP performed an analysis to identify practices with high imaging utilization. The identified practices were visited by the MCP and the current clinical guidelines for imaging after new diagnoses of low back pain were reviewed. In the MCP’s member newsletter, relevant member education was also provided to the MCP’s entire membership regarding imaging studies for low back pain. The MCP’s interventions have demonstrated improvement for this aspect of care and therefore will be continued.
CenCal Health Performance Evaluation Report: July 1, 2017–June 30, 2018 California Department of Health Care Services
Page I-47 Health Services Advisory Group, Inc.

RECOMMENDATIONS
2017–18 Recommendations Based on the overall assessment of CenCal’s delivery of quality, accessible, and timely care through the activities described in previous sections of this report, HSAG recommends the following to the MCP:
♦ Evaluate the results of the MCP expanding the use of standing orders for lab-monitoring tests and conducting targeted case management for beneficiaries on ACE Inhibitors/ARBs or diuretics, to determine whether or not the intervention is resulting in improved annual monitoring for beneficiaries ages 18 and older who are on diuretics in San Luis Obispo County.
♦ Assess the causes for the rates in both reporting units declining significantly from RY 2017 to RY 2018 for the Asthma Medication Ratio measure, and identify strategies to prevent the rates for this measure continuing to decline.
♦ Continue monitoring interventions and outcomes to facilitate improvement beyond the life of the 2015–17 Diabetes Retinal Eye Exam and Initial Health Assessment PIPs.
In the next annual review, HSAG will evaluate continued successes of CenCal as well as the MCP’s progress with these recommendations.
CenCal Health Performance Evaluation Report: July 1, 2017–June 30, 2018 California Department of Health Care Services
Page I-48 Health Services Advisory Group, Inc.

Medi-Cal Managed CareExternal Quality Review Technical Report
Appendix J: Performance Evaluation Report
Central California Alliance for Health July 1, 2017–June 30, 2018

Medi-Cal Managed Care External Quality Review Technical ReportAppendix J: Performance Evaluation ReportCentral California Alliance for Health July 1, 2017–June 30, 2018
Table of Contents
1. Introduction............................................................................................................. J-1 Medi-Cal Managed Care Health Plan Overview ....................................................... J-1
2. Managed Care Health Plan Compliance ............................................................... J-3Compliance Reviews Conducted.............................................................................. J-3 Strengths—Compliance Reviews ............................................................................. J-4 Opportunities for Improvement—Compliance Reviews ............................................ J-4
3. Managed Care Health Plan Performance Measures ............................................ J-5Performance Measure Validation Results ................................................................ J-5 Performance Measure Results and Findings............................................................ J-5
Preventive Screening and Children’s Health ......................................................... J-6 Preventive Screening and Women’s Health ........................................................ J-12 Care for Chronic Conditions ................................................................................ J-16 Appropriate Treatment and Utilization................................................................. J-21 Performance Measure Findings—All Domains.................................................... J-25
Improvement Plan Requirements for 2018 ............................................................. J-27 Seniors and Persons with Disabilities Performance Measure Results.................... J-28
Seniors and Persons with Disabilities Findings ................................................... J-37 Strengths—Performance Measures ....................................................................... J-38 Opportunities for Improvement—Performance Measures ...................................... J-38
4. Performance Improvement Projects ................................................................... J-39Performance Improvement Project Overview ......................................................... J-39 Performance Improvement Project Results and Findings....................................... J-40
2015–17 DHCS-Priority Performance Improvement Project ............................... J-41 2015–17 MCP-Specific Performance Improvement Project ................................ J-42 2017–19 Disparity Performance Improvement Project ........................................ J-43 2017–19 DHCS-Priority Performance Improvement Project ............................... J-44
Strengths—Performance Improvement Projects .................................................... J-46 Opportunities for Improvement—Performance Improvement Projects ................... J-46
5. Recommendations................................................................................................ J-47 Follow-Up on Prior Year Recommendations .......................................................... J-47 2017–18 Recommendations................................................................................... J-48
Central California Alliance for Health Performance Evaluation Report: July 1, 2017–June 30, 2018 California Department of Health Care Services
Page J-i Health Services Advisory Group, Inc.
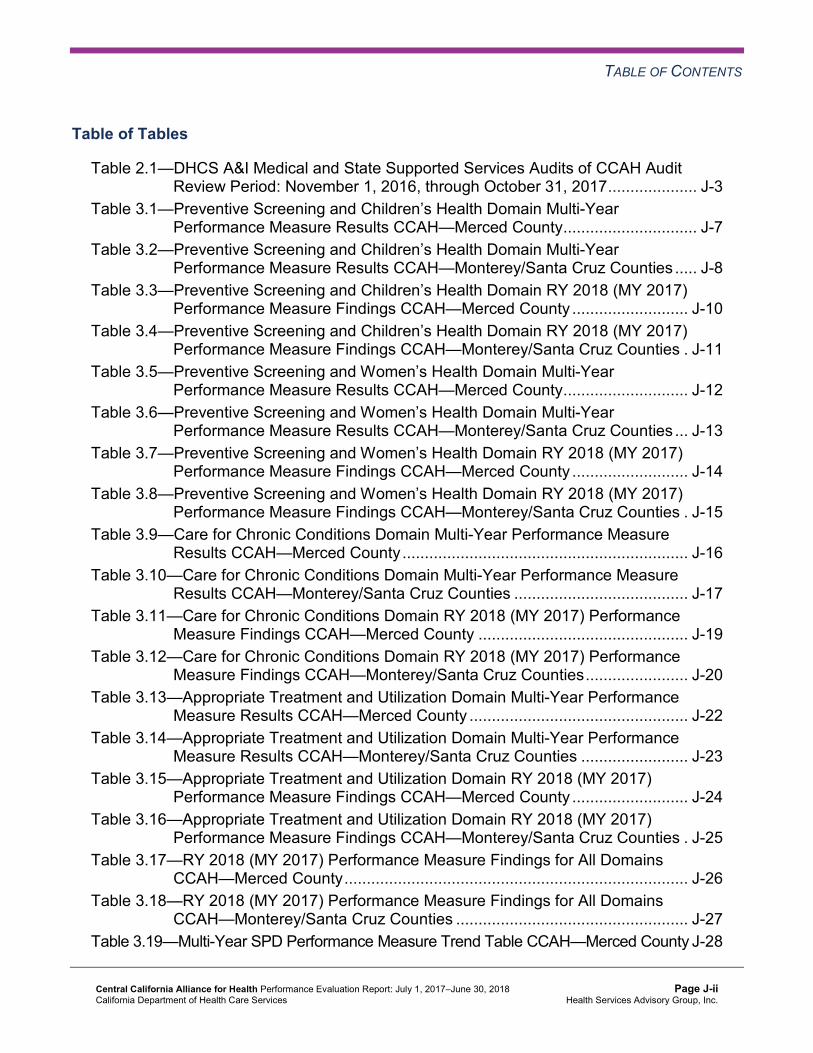
TABLE OF CONTENTS
Table of Tables
Table 2.1—DHCS A&I Medical and State Supported Services Audits of CCAH Audit Review Period: November 1, 2016, through October 31, 2017.................... J-3
Table 3.1—Preventive Screening and Children’s Health Domain Multi-Year Performance Measure Results CCAH—Merced County.............................. J-7
Table 3.2—Preventive Screening and Children’s Health Domain Multi-Year Performance Measure Results CCAH—Monterey/Santa Cruz Counties ..... J-8
Table 3.3—Preventive Screening and Children’s Health Domain RY 2018 (MY 2017) Performance Measure Findings CCAH—Merced County .......................... J-10
Table 3.4—Preventive Screening and Children’s Health Domain RY 2018 (MY 2017) Performance Measure Findings CCAH—Monterey/Santa Cruz Counties . J-11
Table 3.5—Preventive Screening and Women’s Health Domain Multi-Year Performance Measure Results CCAH—Merced County............................ J-12
Table 3.6—Preventive Screening and Women’s Health Domain Multi-Year Performance Measure Results CCAH—Monterey/Santa Cruz Counties ... J-13
Table 3.7—Preventive Screening and Women’s Health Domain RY 2018 (MY 2017) Performance Measure Findings CCAH—Merced County .......................... J-14
Table 3.8—Preventive Screening and Women’s Health Domain RY 2018 (MY 2017) Performance Measure Findings CCAH—Monterey/Santa Cruz Counties . J-15
Table 3.9—Care for Chronic Conditions Domain Multi-Year Performance Measure Results CCAH—Merced County................................................................ J-16
Table 3.10—Care for Chronic Conditions Domain Multi-Year Performance Measure Results CCAH—Monterey/Santa Cruz Counties ....................................... J-17
Table 3.11—Care for Chronic Conditions Domain RY 2018 (MY 2017) Performance Measure Findings CCAH—Merced County ............................................... J-19
Table 3.12—Care for Chronic Conditions Domain RY 2018 (MY 2017) Performance Measure Findings CCAH—Monterey/Santa Cruz Counties....................... J-20
Table 3.13—Appropriate Treatment and Utilization Domain Multi-Year Performance Measure Results CCAH—Merced County ................................................. J-22
Table 3.14—Appropriate Treatment and Utilization Domain Multi-Year Performance Measure Results CCAH—Monterey/Santa Cruz Counties ........................ J-23
Table 3.15—Appropriate Treatment and Utilization Domain RY 2018 (MY 2017) Performance Measure Findings CCAH—Merced County .......................... J-24
Table 3.16—Appropriate Treatment and Utilization Domain RY 2018 (MY 2017) Performance Measure Findings CCAH—Monterey/Santa Cruz Counties . J-25
Table 3.17—RY 2018 (MY 2017) Performance Measure Findings for All Domains CCAH—Merced County............................................................................. J-26
Table 3.18—RY 2018 (MY 2017) Performance Measure Findings for All Domains CCAH—Monterey/Santa Cruz Counties .................................................... J-27
Table 3.19—Multi-Year SPD Performance Measure Trend Table CCAH—Merced County J-28
Central California Alliance for Health Performance Evaluation Report: July 1, 2017–June 30, 2018 California Department of Health Care Services
Page J-ii Health Services Advisory Group, Inc.

TABLE OF CONTENTS
Table 3.20—Multi-Year SPD Performance Measure Trend Table CCAH— Monterey/Santa Cruz Counties.................................................................. J-30
Table 3.21—Multi-Year Non-SPD Performance Measure Trend Table CCAH— Merced County........................................................................................... J-31
Table 3.22—Multi-Year Non-SPD Performance Measure Trend Table CCAH— Monterey/Santa Cruz Counties.................................................................. J-33
Table 3.23—RY 2018 (MY 2017) Performance Measure Comparison and Results for Measures Stratified by the SPD and Non-SPD Populations CCAH— Merced County........................................................................................... J-34
Table 3.24—RY 2018 (MY 2017) Performance Measure Comparison and Results for Measures Stratified by the SPD and Non-SPD Populations CCAH— Monterey/Santa Cruz Counties.................................................................. J-36
Table 4.1—CCAH Immunizations of Two-Year-Olds PIP SMART Aim Measure Results. J-41 Table 4.2—CCAH Immunizations of Two-Year-Olds PIP Intervention Testing Results J-41 Table 4.3—CCAH Improving Health Outcomes of Persons Living With Asthma in
Merced County PIP SMART Aim Measure Results ................................... J-42 Table 4.4—CCAH Improving Health Outcomes of Persons Living With Asthma in
Merced County PIP Intervention Testing Results ...................................... J-43 Table 4.5—CCAH Opioid Overdose Deaths Disparity PIP SMART Aim Measure ....... J-44 Table 4.6—CCAH Childhood Immunization Status—Combination 3 PIP SMART Aim
Measure..................................................................................................... J-45 Table 5.1—CCAH’s Self-Reported Follow-Up on External Quality Review
Recommendations from the July 1, 2016, through June 30, 2017, MCP-Specific Evaluation Report................................................................ J-47
Central California Alliance for Health Performance Evaluation Report: July 1, 2017–June 30, 2018 California Department of Health Care Services
Page J-iii Health Services Advisory Group, Inc.

Medi-Cal Managed Care External Quality Review Technical ReportAppendix J: Performance Evaluation ReportCentral California Alliance for Health July 1, 2017–June 30, 2018
1. Introduction
The California Department of Health Care Services (DHCS) contracted with Health Services Advisory Group, Inc. (HSAG), an external quality review organization (EQRO), to prepare the federally required Medi-Cal Managed Care External Quality Review Technical Report, July 1, 2017–June 30, 2018. The technical report provides an overview of the objectives and methodology for conducting the external quality review (EQR) activities, including requirements related to each activity. Additionally, the technical report provides aggregated results and recommendations for DHCS for each activity.
This appendix is specific to DHCS’ contracted Medi-Cal managed care health plan (MCP), Central California Alliance for Health (“CCAH” or “the MCP”). The purpose of this appendix is to provide MCP-specific results of each activity and an assessment of the MCP’s strengths and opportunities for improvement with respect to the quality and timeliness of and access to health care services furnished to Medi-Cal Managed Care (MCMC) beneficiaries (referred to as “beneficiaries” in this report). The review period for this MCP-specific evaluation report is July 1, 2017, through June 30, 2018. HSAG will report on activities that take place beyond the review period in CCAH’s 2018–19 MCP-specific evaluation report. This MCP-specific evaluation report references activities and methodologies described in detail by HSAG in the technical report section.
The aggregate EQR technical report and all MCP- and specialty health plan (SHP)-specific performance evaluation reports reflect HSAG’s external, independent assessment of the quality and timeliness of, and access to, care that MCPs and SHPs are providing to beneficiaries.
Medi-Cal Managed Care Health Plan Overview CCAH is a full-scope MCP delivering services to beneficiaries in the County Organized Health System (COHS) model.
CCAH became operational to provide MCMC services in Santa Cruz County effective January 1996, in Monterey County effective October 1999, and in Merced County effective October 2009. As of June 30, 2018, CCAH had 123,739 beneficiaries in Merced County, 157,553 in Monterey County, and 67,752 in Santa Cruz County—for a total of 349,044 beneficiaries.1
1 Medi-Cal Managed Care Enrollment Report—June 2018. Available at: http://www.dhcs.ca.gov/dataandstats/reports/Pages/MMCDMonthlyEnrollment.aspx. Accessed on: Sep 17, 2018.
Central California Alliance for Health Performance Evaluation Report: July 1, 2017–June 30, 2018 California Department of Health Care Services
Page J-1 Health Services Advisory Group, Inc.
INTRODUCTION
DHCS allows CCAH to combine data for Monterey and Santa Cruz counties for reporting purposes. For this report, Monterey and Santa Cruz counties are considered a single reporting unit.
Central California Alliance for Health Performance Evaluation Report: July 1, 2017–June 30, 2018 California Department of Health Care Services
Page J-2 Health Services Advisory Group, Inc.
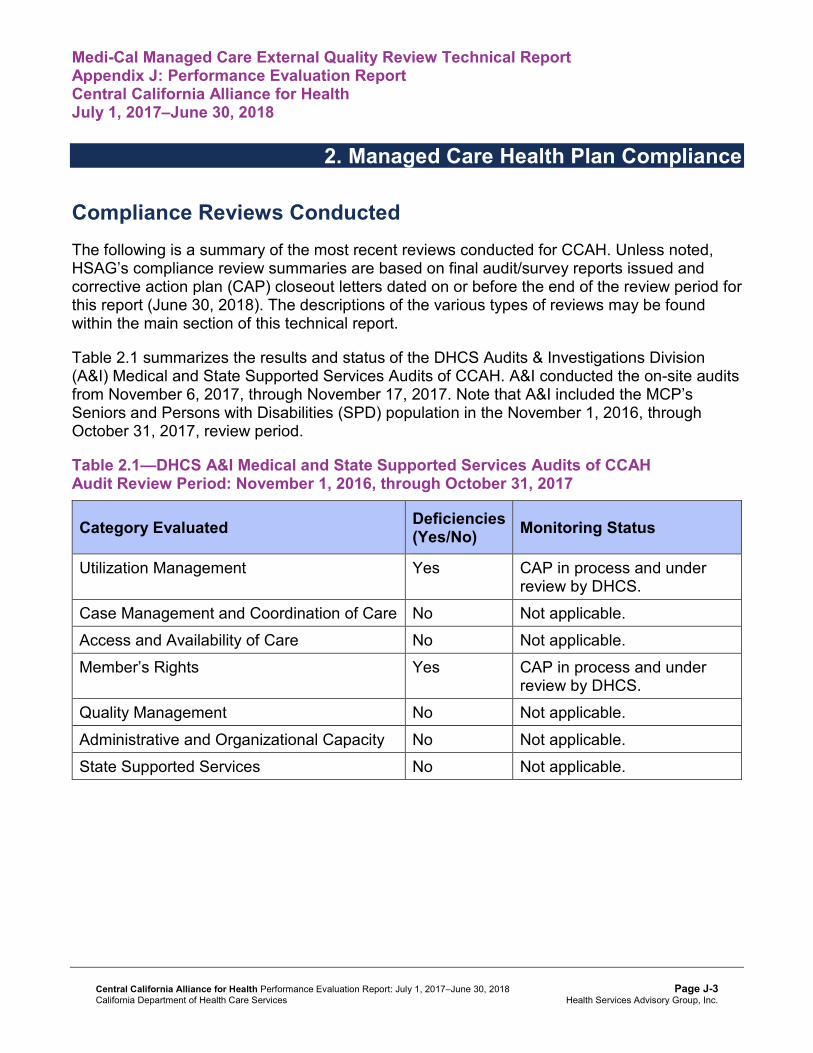
Medi-Cal Managed Care External Quality Review Technical ReportAppendix J: Performance Evaluation ReportCentral California Alliance for Health July 1, 2017–June 30, 2018
2. Managed Care Health Plan Compliance
Compliance Reviews Conducted The following is a summary of the most recent reviews conducted for CCAH. Unless noted, HSAG’s compliance review summaries are based on final audit/survey reports issued and corrective action plan (CAP) closeout letters dated on or before the end of the review period for this report (June 30, 2018). The descriptions of the various types of reviews may be found within the main section of this technical report.
Table 2.1 summarizes the results and status of the DHCS Audits & Investigations Division (A&I) Medical and State Supported Services Audits of CCAH. A&I conducted the on-site audits from November 6, 2017, through November 17, 2017. Note that A&I included the MCP’s Seniors and Persons with Disabilities (SPD) population in the November 1, 2016, through October 31, 2017, review period.
Table 2.1—DHCS A&I Medical and State Supported Services Audits of CCAHAudit Review Period: November 1, 2016, through October 31, 2017
Category Evaluated Deficiencies (Yes/No) Monitoring Status
Utilization Management Yes CAP in process and under review by DHCS.
Case Management and Coordination of Care No Not applicable. Access and Availability of Care No Not applicable. Member’s Rights Yes CAP in process and under
review by DHCS. Quality Management No Not applicable. Administrative and Organizational Capacity No Not applicable. State Supported Services No Not applicable.
Central California Alliance for Health Performance Evaluation Report: July 1, 2017–June 30, 2018 California Department of Health Care Services
Page J-3 Health Services Advisory Group, Inc.

MANAGED CARE HEALTH PLAN COMPLIANCE
Strengths—Compliance Reviews A&I identified no deficiencies in the following categories during the November 2017 Medical and State Supported Services Audits of CCAH:
♦ Case Management and Coordination of Care ♦ Access and Availability of Care ♦ Quality Management ♦ Administrative and Organizational Capacity ♦ State Supported Services
Opportunities for Improvement—Compliance Reviews CCAH has the opportunity to work with DHCS to ensure that the MCP resolves all deficiencies from the November 2017 A&I Medical and State Supported Services Audits.
Central California Alliance for Health Performance Evaluation Report: July 1, 2017–June 30, 2018 California Department of Health Care Services
Page J-4 Health Services Advisory Group, Inc.

Medi-Cal Managed Care External Quality Review Technical ReportAppendix J: Performance Evaluation ReportCentral California Alliance for Health July 1, 2017–June 30, 2018
3. Managed Care Health Plan Performance Measures
Performance Measure Validation Results The HEDIS®2 2018 Compliance Audit Final Report of Findings for Central California Alliance for Health contains the detailed findings and recommendations from HSAG’s NCQA HEDIS Compliance Audit™.3
Performance Measure Results and Findings After validating the MCP’s performance measure rates, HSAG assessed the results. See Table 3.1 through Table 3.18 for CCAH’s performance measure results for reporting years (RYs) 2015 through 2018 and performance measure findings for RY 2018. The RY is the year in which the MCP reported the rates. The RY rates reflect measurement year (MY) data from the previous calendar year. Note that data may not be available for all four years.
Note the following regarding Table 3.1 through Table 3.18:
♦ To allow HSAG to provide meaningful assessment of MCP performance and actionable recommendations, HSAG, in collaboration with DHCS, organized the measures into domains based on the health care areas each measure affects. Table 3.1 through Table 3.16 present the performance measure results and findings by domain, and Table 3.17 and Table 3.18 present the RY 2018 performance measure findings for the domains combined.
♦ To assess performance for each MCP reporting unit, HSAG compares the rates to national benchmarks. Rates indicating performance above the high performance levels (HPLs) are shaded in gray, and rates indicating performance below the minimum performance levels (MPLs) are bolded. ■ For measures with rates below the MPLs, DHCS requires MCPs to submit to DHCS
improvement plans (IPs) to address the rates below the MPLs (unless MCPs are reporting the rates for the first time).
■ For MCPs that meet DHCS’ Quality of Care CAP thresholds, DHCS issues a CAP; if an MCP’s performance is such that it may trigger a CAP in the following year, DHCS issues an advance warning letter.
■ IPs and CAPs consist of submission of Plan-Do-Study-Act (PDSA) Cycle Worksheets, Quality Improvement (QI) Summaries, or completion of Performance Improvement Projects (PIPs)—as determined by DHCS.
2 Healthcare Effectiveness Data and Information Set (HEDIS®) is a registered trademark of the National Committee for Quality Assurance (NCQA).
3 NCQA HEDIS Compliance AuditTM is a trademark of NCQA.
Central California Alliance for Health Performance Evaluation Report: July 1, 2017–June 30, 2018 California Department of Health Care Services
Page J-5 Health Services Advisory Group, Inc.

MANAGED CARE HEALTH PLAN PERFORMANCE MEASURES
♦ For RYs 2016, 2017, and 2018, the HPLs and MPLs represent the NCQA Quality Compass®4 Medicaid health maintenance organization (HMO) 90th and 25th percentiles, respectively.
♦ For RY 2015, the HPLs and MPLs represent the NCQA HEDIS Audit Means, Percentiles, and Ratios 90th and 25th percentiles, respectively. For the Comprehensive Diabetes Care—HbA1c Poor Control (>9.0 Percent) measure, for which a lower rate indicates more favorable performance, the HPL and MPL are based on the 10th and 75th percentiles, respectively.
♦ HSAG includes the specific HPL and MPL values for RY 2018 in Section 6 of the Medi-Cal Managed Care External Quality Review Technical Report, July 1, 2017–June 30, 2018 (“Managed Care Health Plan Performance Measures”).
Preventive Screening and Children’s Health
Table 3.1 and Table 3.2 present the four-year trending information for the performance measures within the Preventive Screening and Children’s Health domain.
Note the following regarding Table 3.1 and Table 3.2:
♦ Although HSAG includes information on the MCP’s performance related to the four Children and Adolescents’ Access to Primary Care measures, DHCS did not hold MCPs accountable to meet the MPLs for these measures for RYs 2015 through 2018 (i.e., DHCS did not require MCPs to submit IPs if rates for the measures were below the MPLs). DHCS made this decision due to the small range of variation between the HPL and MPL thresholds for each measure.
♦ Any comparison of RY 2018 performance to RY 2017 or to benchmarks related to the Immunizations for Adolescents—Combination 2 measure should be exercised with caution given the changes that NCQA made to the specification for this measure for RY 2018. NCQA released guidance that recommended a break in trending for this measure; however, DHCS determined to continue trending because the specification change should result in higher rates.
4 Quality Compass® is a registered trademark of NCQA.
Central California Alliance for Health Performance Evaluation Report: July 1, 2017–June 30, 2018 California Department of Health Care Services
Page J-6 Health Services Advisory Group, Inc.

MANAGED CARE HEALTH PLAN PERFORMANCE MEASURES
Table 3.1—Preventive Screening and Children’s Health DomainMulti-Year Performance Measure Results CCAH—Merced County
H = Rate indicates performance above the HPL. Bolded Rate = Rate indicates performance below the MPL.
B = Statistical testing result indicates that the RY 2018 rate is significantly better than the RY 2017 rate.
W = Statistical testing result indicates that the RY 2018 rate is significantly worse than the RY 2017 rate.
Measure RY
2015 Rate1
RY 2016
Rate2
RY 2017
Rate3
RY 2018
Rate4
RYs 2017–18 Rate
Difference5
Childhood Immunization Status—Combination 3 67.88% 68.03% 66.67% 63.07% -3.60
Children and Adolescents’ Access to Primary Care Practitioners—12–24 Months
95.28% 94.50% 93.96% 95.20% 1.24B
Children and Adolescents’ Access to Primary Care Practitioners— 25 Months–6 Years
89.48% 87.30% 87.24% 87.85% 0.61
Children and Adolescents’ Access to Primary Care Practitioners—7–11 Years
90.80% 89.60% 90.31% 89.38% -0.93W
Children and Adolescents’ Access to Primary Care Practitioners—12–19 Years
88.98% 87.78% 87.88% 88.01% 0.13
Immunizations for Adolescents— Combination 2^ -- -- 20.44% 26.52% 6.08B
Weight Assessment and Counseling for Nutrition and Physical Activity for Children and Adolescents—Nutrition Counseling—Total
66.91% 62.77% 74.45% 77.13% 2.68
Weight Assessment and Counseling for Nutrition and Physical Activity for Children and Adolescents—Physical Activity Counseling—Total
47.20% 45.74% 51.82% 64.48% 12.66B
Central California Alliance for Health Performance Evaluation Report: July 1, 2017–June 30, 2018 California Department of Health Care Services
Page J-7 Health Services Advisory Group, Inc.

MANAGED CARE HEALTH PLAN PERFORMANCE MEASURES
Measure RY
2015 Rate1
RY 2016
Rate2
RY 2017
Rate3
RY 2018
Rate4
RYs 2017–18 Rate
Difference5
Well-Child Visits in the Third, Fourth, Fifth, and Sixth Years of Life
73.97% 72.56% 71.34% 70.18% -1.16
1 RY 2015 rates reflect MY data from January 1, 2014, through December 31, 2014. 2 RY 2016 rates reflect MY data from January 1, 2015, through December 31, 2015. 3 RY 2017 rates reflect MY data from January 1, 2016, through December 31, 2016. 4 RY 2018 rates reflect MY data from January 1, 2017, through December 31, 2017. 5 Performance comparisons are based on the Chi-square test of statistical significance, with a p value of <0.05. ^ Caution should be exercised when assessing MCP performance for this measure given the changes that NCQA made to the specification for this measure for RY 2018. -- Indicates that the rate is not available.
Table 3.2—Preventive Screening and Children’s Health DomainMulti-Year Performance Measure Results CCAH—Monterey/Santa Cruz Counties
H = Rate indicates performance above the HPL. Bolded Rate = Rate indicates performance below the MPL.
B = Statistical testing result indicates that the RY 2018 rate is significantly better than the RY 2017 rate.
W = Statistical testing result indicates that the RY 2018 rate is significantly worse than the RY 2017 rate.
Measure RY
2015 Rate1
RY 2016
Rate2
RY 2017
Rate3
RY 2018
Rate4
RYs 2017–18 Rate
Difference5
Childhood Immunization Status—Combination 3 77.62% 78.72% 79.86%H 79.93%H 0.07
Children and Adolescents’ Access to Primary Care Practitioners—12–24 Months
95.99% 94.77% 96.31% 96.48% 0.17
Children and Adolescents’ Access to Primary Care Practitioners— 25 Months–6 Years
90.19% 88.12% 90.32% 90.93% 0.61B
Central California Alliance for Health Performance Evaluation Report: July 1, 2017–June 30, 2018 California Department of Health Care Services
Page J-8 Health Services Advisory Group, Inc.

MANAGED CARE HEALTH PLAN PERFORMANCE MEASURES
Measure RY
2015 Rate1
RY 2016
Rate2
RY 2017
Rate3
RY 2018
Rate4
RYs 2017–18 Rate
Difference5
Children and Adolescents’ Access to Primary Care Practitioners—7–11 Years
92.44% 91.31% 92.30% 93.04% 0.74B
Children and Adolescents’ Access to Primary Care Practitioners—12–19 Years
89.95% 88.67% 89.02% 89.81% 0.79B
Immunizations for Adolescents— Combination 2^ -- -- 29.20% 44.53%H 15.33B
Weight Assessment and Counseling for Nutrition and Physical Activity for Children and Adolescents—Nutrition Counseling—Total
78.35%H 79.52% 88.30%H 89.10%H 0.80
Weight Assessment and Counseling for Nutrition and Physical Activity for Children and Adolescents—Physical Activity Counseling—Total
65.21% 65.43% 74.73%H 83.18%H 8.45B
Well-Child Visits in the Third, Fourth, Fifth, and Sixth Years of Life
81.27% 78.46% 82.29% 84.40%H 2.11
1 RY 2015 rates reflect MY data from January 1, 2014, through December 31, 2014. 2 RY 2016 rates reflect MY data from January 1, 2015, through December 31, 2015. 3 RY 2017 rates reflect MY data from January 1, 2016, through December 31, 2016. 4 RY 2018 rates reflect MY data from January 1, 2017, through December 31, 2017. 5 Performance comparisons are based on the Chi-square test of statistical significance, with a p value of <0.05. ^ Caution should be exercised when assessing MCP performance for this measure given the changes that NCQA made to the specification for this measure for RY 2018. -- Indicates that the rate is not available.
Central California Alliance for Health Performance Evaluation Report: July 1, 2017–June 30, 2018 California Department of Health Care Services
Page J-9 Health Services Advisory Group, Inc.

MANAGED CARE HEALTH PLAN PERFORMANCE MEASURES
Table 3.3 and Table 3.4 present findings for the RY 2018 performance measures within the Preventive Screening and Children’s Health domain.
Note the following regarding Table 3.3 and Table 3.4:
♦ DHCS did not hold MCPs accountable to meet MPLs for all four Children and Adolescents’ Access to Primary Care measures within this domain; therefore, HSAG did not include these measures in its assessment of the MCP’s performance related to HPLs and MPLs.
♦ The Immunizations for Adolescents—Combination 2 measure was a first-year measure in RY 2017, and DHCS established no MPL for this measure for RY 2017 because no comparable benchmark existed; therefore, HSAG did not include this measure in the denominators for calculating the percentage of measures with rates that moved to above or below the MPLs in RY 2018.
Table 3.3—Preventive Screening and Children’s Health DomainRY 2018 (MY 2017) Performance Measure Findings CCAH—Merced County
Criteria Number of Measures
MeetingCriteria
Total Number of Measures
Percentage of Measures
MeetingCriteria
RY 2018 Rates Above HPLs 0 5 0.00% Rates Above HPLs for the Last Three or More Consecutive Years 0 4 0.00%
RY 2018 Rates Significantly Better than RY 2017 Rates* 2 5 40.00%
Rates that Moved from Below MPLs in RY 2017 to Above MPLs in RY 2018 0 0 N/A
RY 2018 Rates Below MPLs 1 5 20.00% Rates Below MPLs for the Last Three or More Consecutive Years 0 4 0.00%
RY 2018 Rates Significantly Worse than RY 2017 Rates* 0 5 0.00%
Rates that Moved from Above MPLs in RY 2017 to Below MPLs in RY 2018 1 4 25.00%
* Performance comparisons are based on the Chi-square test of statistical significance, with a p value of <0.05. N/A = No rates above or below the MPLs from the previous year exist to include in the denominator for calculating whether or not rates moved to above or below MPLs in the most recent year.
Central California Alliance for Health Performance Evaluation Report: July 1, 2017–June 30, 2018 California Department of Health Care Services
Page J-10 Health Services Advisory Group, Inc.

MANAGED CARE HEALTH PLAN PERFORMANCE MEASURES
Table 3.4—Preventive Screening and Children’s Health DomainRY 2018 (MY 2017) Performance Measure Findings CCAH—Monterey/Santa Cruz Counties
Criteria Number of Measures
MeetingCriteria
Total Number of Measures
Percentage of Measures
MeetingCriteria
RY 2018 Rates Above HPLs 5 5 100.00% Rates Above HPLs for the Last Three or More Consecutive Years 0 4 0.00%
RY 2018 Rates Significantly Better than RY 2017 Rates* 2 5 40.00%
Rates that Moved from Below MPLs in RY 2017 to Above MPLs in RY 2018 0 0 N/A
RY 2018 Rates Below MPLs 0 5 0.00% Rates Below MPLs for the Last Three or More Consecutive Years 0 4 0.00%
RY 2018 Rates Significantly Worse than RY 2017 Rates* 0 5 0.00%
Rates that Moved from Above MPLs in RY 2017 to Below MPLs in RY 2018 0 4 0.00%
* Performance comparisons are based on the Chi-square test of statistical significance, with a p value of <0.05. N/A = No rates above or below the MPLs from the previous year exist to include in the denominator for calculating whether or not rates moved to above or below MPLs in the most recent year.
Central California Alliance for Health Performance Evaluation Report: July 1, 2017–June 30, 2018 California Department of Health Care Services
Page J-11 Health Services Advisory Group, Inc.
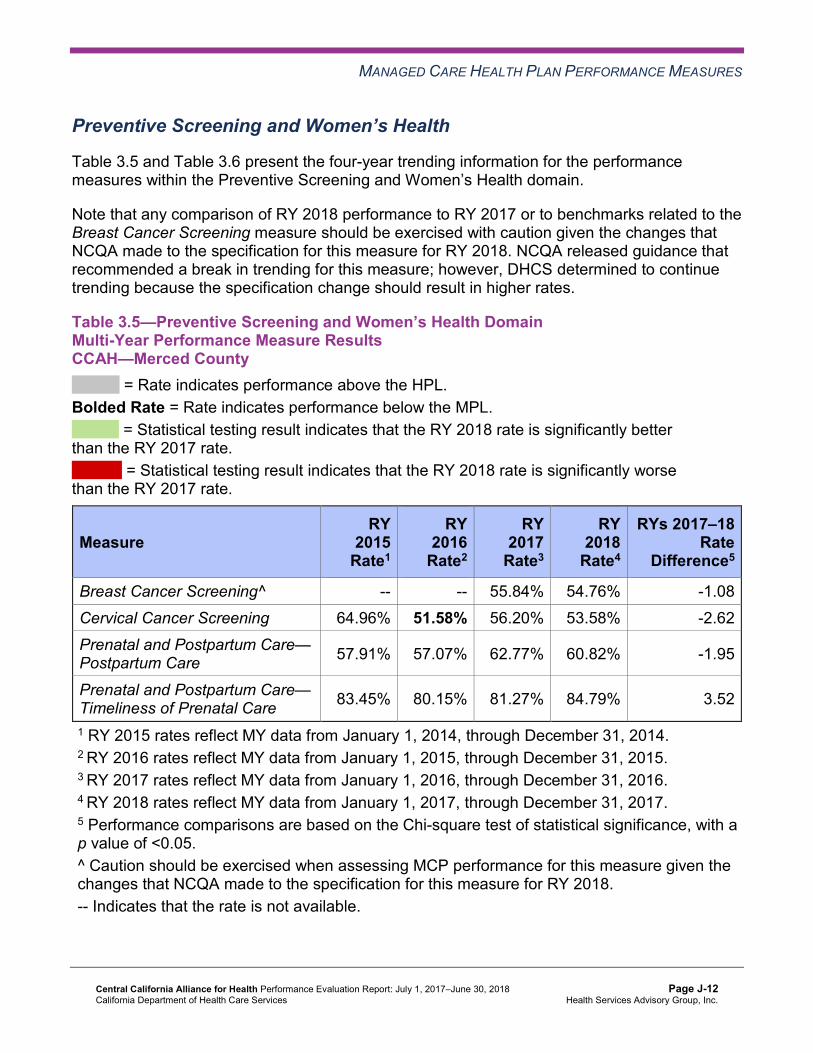
MANAGED CARE HEALTH PLAN PERFORMANCE MEASURES
Preventive Screening and Women’s Health
Table 3.5 and Table 3.6 present the four-year trending information for the performance measures within the Preventive Screening and Women’s Health domain.
Note that any comparison of RY 2018 performance to RY 2017 or to benchmarks related to the Breast Cancer Screening measure should be exercised with caution given the changes that NCQA made to the specification for this measure for RY 2018. NCQA released guidance that recommended a break in trending for this measure; however, DHCS determined to continue trending because the specification change should result in higher rates.
Table 3.5—Preventive Screening and Women’s Health DomainMulti-Year Performance Measure Results CCAH—Merced County
H = Rate indicates performance above the HPL. Bolded Rate = Rate indicates performance below the MPL.
B = Statistical testing result indicates that the RY 2018 rate is significantly better than the RY 2017 rate.
W = Statistical testing result indicates that the RY 2018 rate is significantly worse than the RY 2017 rate.
Measure RY
2015 Rate1
RY 2016
Rate2
RY 2017
Rate3
RY 2018
Rate4
RYs 2017–18 Rate
Difference5
Breast Cancer Screening^ -- -- 55.84% 54.76% -1.08 Cervical Cancer Screening 64.96% 51.58% 56.20% 53.58% -2.62 Prenatal and Postpartum Care— Postpartum Care 57.91% 57.07% 62.77% 60.82% -1.95
Prenatal and Postpartum Care— Timeliness of Prenatal Care 83.45% 80.15% 81.27% 84.79% 3.52
1 RY 2015 rates reflect MY data from January 1, 2014, through December 31, 2014. 2 RY 2016 rates reflect MY data from January 1, 2015, through December 31, 2015. 3 RY 2017 rates reflect MY data from January 1, 2016, through December 31, 2016. 4 RY 2018 rates reflect MY data from January 1, 2017, through December 31, 2017. 5 Performance comparisons are based on the Chi-square test of statistical significance, with a p value of <0.05. ^ Caution should be exercised when assessing MCP performance for this measure given the changes that NCQA made to the specification for this measure for RY 2018. -- Indicates that the rate is not available.
Central California Alliance for Health Performance Evaluation Report: July 1, 2017–June 30, 2018 California Department of Health Care Services
Page J-12 Health Services Advisory Group, Inc.

MANAGED CARE HEALTH PLAN PERFORMANCE MEASURES
Table 3.6—Preventive Screening and Women’s Health DomainMulti-Year Performance Measure Results CCAH—Monterey/Santa Cruz Counties
H = Rate indicates performance above the HPL. Bolded Rate = Rate indicates performance below the MPL.
B = Statistical testing result indicates that the RY 2018 rate is significantly better than the RY 2017 rate.
W = Statistical testing result indicates that the RY 2018 rate is significantly worse than the RY 2017 rate.
Measure RY
2015 Rate1
RY 2016
Rate2
RY 2017
Rate3
RY 2018
Rate4
RYs 2017–18 Rate
Difference5
Breast Cancer Screening^ -- -- 61.01% 59.74% -1.27 Cervical Cancer Screening 65.45% 54.79% 54.50% 69.44% 14.94B
Prenatal and Postpartum Care— Postpartum Care 70.07% 72.99%H 75.52%H 81.15%H 5.63
Prenatal and Postpartum Care— Timeliness of Prenatal Care 86.13% 83.62% 84.78% 85.94% 1.16
1 RY 2015 rates reflect MY data from January 1, 2014, through December 31, 2014. 2 RY 2016 rates reflect MY data from January 1, 2015, through December 31, 2015. 3 RY 2017 rates reflect MY data from January 1, 2016, through December 31, 2016. 4 RY 2018 rates reflect MY data from January 1, 2017, through December 31, 2017. 5 Performance comparisons are based on the Chi-square test of statistical significance, with a p value of <0.05. ^ Caution should be exercised when assessing MCP performance for this measure given the changes that NCQA made to the specification for this measure for RY 2018. -- Indicates that the rate is not available.
Central California Alliance for Health Performance Evaluation Report: July 1, 2017–June 30, 2018 California Department of Health Care Services
Page J-13 Health Services Advisory Group, Inc.

MANAGED CARE HEALTH PLAN PERFORMANCE MEASURES
Table 3.7 and Table 3.8 present findings for the RY 2018 performance measures within the Preventive Screening and Women’s Health domain. Note that the Breast Cancer Screening measure was a first-year measure in RY 2017, and DHCS did not hold MCPs accountable to meet an MPL for this measure in RY 2017; therefore, HSAG did not include this measure in the denominators for calculating the percentage of measures with rates that moved to above or below the MPLs in RY 2018.
Table 3.7—Preventive Screening and Women’s Health DomainRY 2018 (MY 2017) Performance Measure Findings CCAH—Merced County
Criteria Number of Measures
MeetingCriteria
Total Number of Measures
Percentage of Measures
MeetingCriteria
RY 2018 Rates Above HPLs 0 4 0.00% Rates Above HPLs for the Last Three or More Consecutive Years 0 3 0.00%
RY 2018 Rates Significantly Better than RY 2017 Rates* 0 4 0.00%
Rates that Moved from Below MPLs in RY 2017 to Above MPLs in RY 2018 0 0 N/A
RY 2018 Rates Below MPLs 0 4 0.00% Rates Below MPLs for the Last Three or More Consecutive Years 0 3 0.00%
RY 2018 Rates Significantly Worse than RY 2017 Rates* 0 4 0.00%
Rates that Moved from Above MPLs in RY 2017 to Below MPLs in RY 2018 0 3 0.00%
* Performance comparisons are based on the Chi-square test of statistical significance, with a p value of <0.05. N/A = No rates above or below the MPLs from the previous year exist to include in the denominator for calculating whether or not rates moved to above or below MPLs in the most recent year.
Central California Alliance for Health Performance Evaluation Report: July 1, 2017–June 30, 2018 California Department of Health Care Services
Page J-14 Health Services Advisory Group, Inc.

MANAGED CARE HEALTH PLAN PERFORMANCE MEASURES
Table 3.8—Preventive Screening and Women’s Health DomainRY 2018 (MY 2017) Performance Measure Findings CCAH—Monterey/Santa Cruz Counties
Criteria Number of Measures
MeetingCriteria
Total Number of Measures
Percentage of Measures
MeetingCriteria
RY 2018 Rates Above HPLs 1 4 25.00% Rates Above HPLs for the Last Three or More Consecutive Years 1 3 33.33%
RY 2018 Rates Significantly Better than RY 2017 Rates* 1 4 25.00%
Rates that Moved from Below MPLs in RY 2017 to Above MPLs in RY 2018 0 0 N/A
RY 2018 Rates Below MPLs 0 4 0.00% Rates Below MPLs for the Last Three or More Consecutive Years 0 3 0.00%
RY 2018 Rates Significantly Worse than RY 2017 Rates* 0 4 0.00%
Rates that Moved from Above MPLs in RY 2017 to Below MPLs in RY 2018 0 3 0.00%
* Performance comparisons are based on the Chi-square test of statistical significance, with a p value of <0.05. N/A = No rates above or below the MPLs from the previous year exist to include in the denominator for calculating whether or not rates moved to above or below MPLs in the most recent year.
Central California Alliance for Health Performance Evaluation Report: July 1, 2017–June 30, 2018 California Department of Health Care Services
Page J-15 Health Services Advisory Group, Inc.

MANAGED CARE HEALTH PLAN PERFORMANCE MEASURES
Care for Chronic Conditions
Table 3.9 and Table 3.10 present the four-year trending information for the performance measures within the Care for Chronic Conditions domain.
Table 3.9—Care for Chronic Conditions Domain Multi-Year Performance Measure Results CCAH—Merced County
H = Rate indicates performance above the HPL. Bolded Rate = Rate indicates performance below the MPL.
B = Statistical testing result indicates that the RY 2018 rate is significantly better than the RY 2017 rate.
W = Statistical testing result indicates that the RY 2018 rate is significantly worse than the RY 2017 rate.
Measure RY
2015 Rate1
RY 2016
Rate2
RY 2017
Rate3
RY 2018
Rate4
RYs 2017–18 Rate
Difference5
Annual Monitoring for Patients on Persistent Medications— ACE Inhibitors or ARBs
87.32% 87.20% 86.91% 86.56% -0.35
Annual Monitoring for Patients on Persistent Medications— Diuretics
84.93% 87.37% 87.06% 85.85% -1.21
Asthma Medication Ratio -- -- 60.75% 66.21% 5.46B
Comprehensive Diabetes Care— Blood Pressure Control (<140/90 mm Hg)
66.18% 59.85% 56.20% 60.34% 4.14
Comprehensive Diabetes Care— Eye Exam (Retinal) Performed 52.31% 53.28% 52.80% 60.58% 7.78B
Comprehensive Diabetes Care— HbA1c Control (<8.0 Percent) 45.99% 47.93% 44.04% 50.36% 6.32
Comprehensive Diabetes Care— HbA1c Poor Control (>9.0 Percent)*
43.80% 40.63% 44.77% 38.93% -5.84
Comprehensive Diabetes Care— HbA1c Testing 86.37% 85.64% 88.56% 84.43% -4.13
Comprehensive Diabetes Care— Medical Attention for Nephropathy
84.91% 89.29%H 91.73% 89.78% -1.95
Central California Alliance for Health Performance Evaluation Report: July 1, 2017–June 30, 2018 California Department of Health Care Services
Page J-16 Health Services Advisory Group, Inc.

MANAGED CARE HEALTH PLAN PERFORMANCE MEASURES
Measure RY
2015 Rate1
RY 2016
Rate2
RY 2017
Rate3
RY 2018
Rate4
RYs 2017–18 Rate
Difference5
Controlling High Blood Pressure 62.04% 54.38% 53.53% 57.07% 3.54 1 RY 2015 rates reflect MY data from January 1, 2014, through December 31, 2014. 2 RY 2016 rates reflect MY data from January 1, 2015, through December 31, 2015. 3 RY 2017 rates reflect MY data from January 1, 2016, through December 31, 2016. 4 RY 2018 rates reflect MY data from January 1, 2017, through December 31, 2017. 5 Performance comparisons are based on the Chi-square test of statistical significance, with a p value of <0.05. * A lower rate indicates better performance for this measure. -- Indicates that the rate is not available.
Table 3.10—Care for Chronic Conditions Domain Multi-Year Performance Measure Results CCAH—Monterey/Santa Cruz Counties
H = Rate indicates performance above the HPL. Bolded Rate = Rate indicates performance below the MPL.
B = Statistical testing result indicates that the RY 2018 rate is significantly better than the RY 2017 rate.
W = Statistical testing result indicates that the RY 2018 rate is significantly worse than the RY 2017 rate.
Measure RY
2015 Rate1
RY 2016
Rate2
RY 2017
Rate3
RY 2018
Rate4
RYs 2017–18 Rate
Difference5
Annual Monitoring for Patients on Persistent Medications— ACE Inhibitors or ARBs
88.16% 84.93% 86.99% 86.03% -0.96
Annual Monitoring for Patients on Persistent Medications— Diuretics
88.70% 86.64% 87.34% 85.59% -1.75
Asthma Medication Ratio -- -- 70.78%H 72.91%H 2.13 Comprehensive Diabetes Care— Blood Pressure Control (<140/90 mm Hg)
67.40% 63.75% 63.26% 73.48% 10.22B
Comprehensive Diabetes Care— Eye Exam (Retinal) Performed 59.85% 60.34% 59.12% 68.37%H 9.25B
Central California Alliance for Health Performance Evaluation Report: July 1, 2017–June 30, 2018 California Department of Health Care Services
Page J-17 Health Services Advisory Group, Inc.
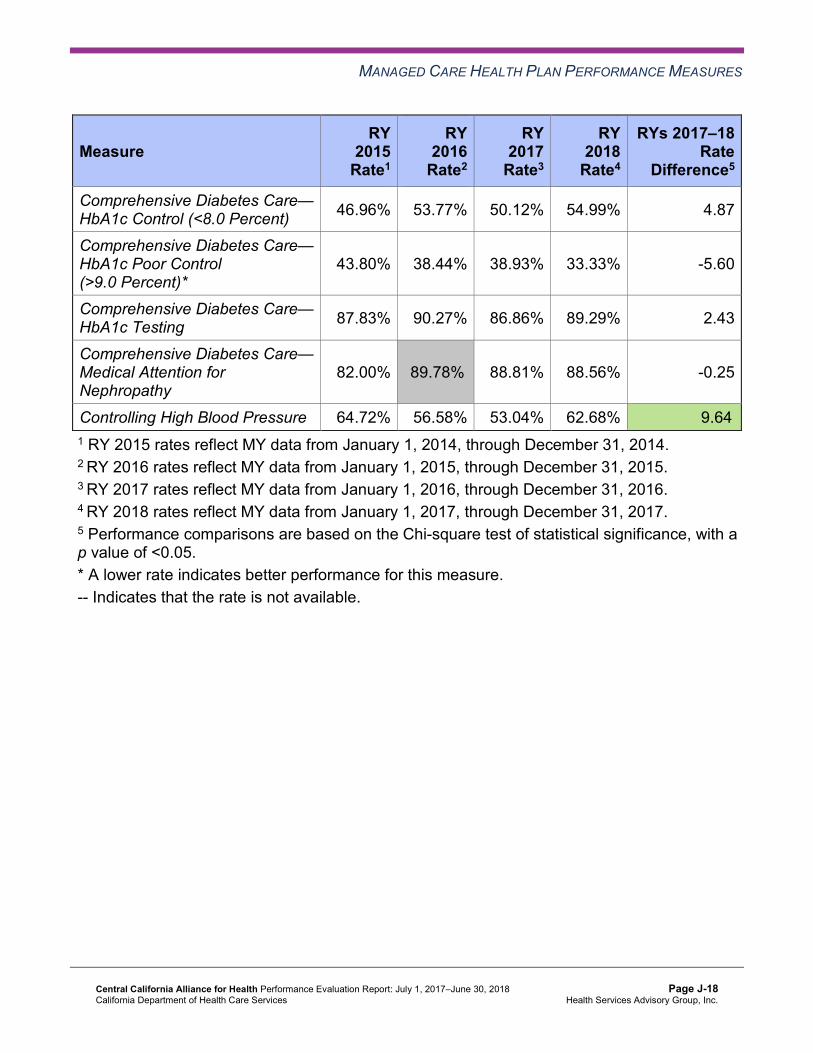
MANAGED CARE HEALTH PLAN PERFORMANCE MEASURES
Measure RY
2015 Rate1
RY 2016
Rate2
RY 2017
Rate3
RY 2018
Rate4
RYs 2017–18 Rate
Difference5
Comprehensive Diabetes Care— HbA1c Control (<8.0 Percent) 46.96% 53.77% 50.12% 54.99% 4.87
Comprehensive Diabetes Care— HbA1c Poor Control (>9.0 Percent)*
43.80% 38.44% 38.93% 33.33% -5.60
Comprehensive Diabetes Care— HbA1c Testing 87.83% 90.27% 86.86% 89.29% 2.43
Comprehensive Diabetes Care— Medical Attention for Nephropathy
82.00% 89.78%H 88.81% 88.56% -0.25
Controlling High Blood Pressure 64.72% 56.58% 53.04% 62.68% 9.64B
1 RY 2015 rates reflect MY data from January 1, 2014, through December 31, 2014. 2 RY 2016 rates reflect MY data from January 1, 2015, through December 31, 2015. 3 RY 2017 rates reflect MY data from January 1, 2016, through December 31, 2016. 4 RY 2018 rates reflect MY data from January 1, 2017, through December 31, 2017. 5 Performance comparisons are based on the Chi-square test of statistical significance, with a p value of <0.05. * A lower rate indicates better performance for this measure. -- Indicates that the rate is not available.
Central California Alliance for Health Performance Evaluation Report: July 1, 2017–June 30, 2018 California Department of Health Care Services
Page J-18 Health Services Advisory Group, Inc.

MANAGED CARE HEALTH PLAN PERFORMANCE MEASURES
Table 3.11 and Table 3.12 present findings for the RY 2018 performance measures within the Care for Chronic Conditions domain. Note that the Asthma Medication Ratio measure was a first-year measure in RY 2017, and DHCS did not hold MCPs accountable to meet an MPL for this measure in RY 2017; therefore, HSAG did not include this measure in the denominators for calculating the percentage of measures with rates that moved to above or below the MPLs in RY 2018.
Table 3.11—Care for Chronic Conditions Domain RY 2018 (MY 2017) Performance Measure Findings CCAH—Merced County
Criteria Number of Measures
MeetingCriteria
Total Number of Measures
Percentage of Measures
MeetingCriteria
RY 2018 Rates Above HPLs 0 10 0.00% Rates Above HPLs for the Last Three or More Consecutive Years 0 9 0.00%
RY 2018 Rates Significantly Better than RY 2017 Rates* 2 10 20.00%
Rates that Moved from Below MPLs in RY 2017 to Above MPLs in RY 2018 0 0 N/A
RY 2018 Rates Below MPLs 0 10 0.00% Rates Below MPLs for the Last Three or More Consecutive Years 0 9 0.00%
RY 2018 Rates Significantly Worse than RY 2017 Rates* 0 10 0.00%
Rates that Moved from Above MPLs in RY 2017 to Below MPLs in RY 2018 0 9 0.00%
* Performance comparisons are based on the Chi-square test of statistical significance, with a p value of <0.05. N/A = No rates above or below the MPLs from the previous year exist to include in the denominator for calculating whether or not rates moved to above or below MPLs in the most recent year.
Central California Alliance for Health Performance Evaluation Report: July 1, 2017–June 30, 2018 California Department of Health Care Services
Page J-19 Health Services Advisory Group, Inc.

MANAGED CARE HEALTH PLAN PERFORMANCE MEASURES
Table 3.12—Care for Chronic Conditions Domain RY 2018 (MY 2017) Performance Measure Findings CCAH—Monterey/Santa Cruz Counties
Criteria Number of Measures
MeetingCriteria
Total Number of Measures
Percentage of Measures
MeetingCriteria
RY 2018 Rates Above HPLs 2 10 20.00% Rates Above HPLs for the Last Three or More Consecutive Years 0 9 0.00%
RY 2018 Rates Significantly Better than RY 2017 Rates* 3 10 30.00%
Rates that Moved from Below MPLs in RY 2017 to Above MPLs in RY 2018 0 0 N/A
RY 2018 Rates Below MPLs 0 10 0.00% Rates Below MPLs for the Last Three or More Consecutive Years 0 9 0.00%
RY 2018 Rates Significantly Worse than RY 2017 Rates* 0 10 0.00%
Rates that Moved from Above MPLs in RY 2017 to Below MPLs in RY 2018 0 9 0.00%
* Performance comparisons are based on the Chi-square test of statistical significance, with a p value of <0.05. N/A = No rates above or below the MPLs from the previous year exist to include in the denominator for calculating whether or not rates moved to above or below MPLs in the most recent year.
Central California Alliance for Health Performance Evaluation Report: July 1, 2017–June 30, 2018 California Department of Health Care Services
Page J-20 Health Services Advisory Group, Inc.

MANAGED CARE HEALTH PLAN PERFORMANCE MEASURES
Appropriate Treatment and Utilization
Table 3.13 and Table 3.14 present the four-year trending information for the performance measures within the Appropriate Treatment and Utilization domain.
Note the following regarding Table 3.13 and Table 3.14:
♦ The All-Cause Readmissions measure is a non-HEDIS measure originally developed for DHCS’ All-Cause Readmissions collaborative quality improvement project (QIP); therefore, DHCS does not establish an HPL or MPL for this measure. For the All-Cause Readmissions measure, a lower rate indicates better performance (i.e., fewer readmissions).
♦ The two Ambulatory Care measures are utilization measures, which measure the volume of services used. DHCS does not hold MCPs accountable to meet MPLs for utilization measures, and HSAG does not compare performance for these measures against HPLs and MPLs. Additionally, because high and low rates do not necessarily indicate better or worse performance, HSAG did not compare performance for these measures across years.
♦ DHCS established no HPL or MPL for the two Depression Screening and Follow-Up for Adolescents and Adults measures for RY 2018 because no comparable benchmarks exist. Additionally, although MCPs reported the two Depression Screening and Follow-Up for Adolescents and Adults measures for RY 2018, HSAG does not present the performance measure results for these measures in this report because the reported rates do not accurately represent services being provided. This is due to the Depression Screening and Follow-Up for Adolescents and Adults measures being new HEDIS measures for RY 2018, NCQA requiring MCPs to submit rates for these measures using the new Electronic Clinical Data Systems (ECDS) reporting methodology, and inconsistent data reporting processes by calculation vendors. Thus, MCPs experienced numerous challenges obtaining data sources to use for ECDS reporting. DHCS and HSAG, in consultation with NCQA, will work with MCPs to improve data capture for RY 2019.
♦ Note that due to changes that NCQA made to the specifications for the Use of Imaging Studies for Low Back Pain measure in RY 2018, NCQA released guidance to exercise caution when trending the results for this measure. Therefore, caution should be used when comparing MCP performance across years or when comparing MCP results to benchmarks related to the Use of Imaging Studies for Low Back Pain measure, as differences in rates may be a result of the specification changes rather than a reflection of performance.
Central California Alliance for Health Performance Evaluation Report: July 1, 2017–June 30, 2018 California Department of Health Care Services
Page J-21 Health Services Advisory Group, Inc.

MANAGED CARE HEALTH PLAN PERFORMANCE MEASURES
Table 3.13—Appropriate Treatment and Utilization DomainMulti-Year Performance Measure Results CCAH—Merced County
H = Rate indicates performance above the HPL. Bolded Rate = Rate indicates performance below the MPL.
B = Statistical testing result indicates that the RY 2018 rate is significantly better than the RY 2017 rate.
W = Statistical testing result indicates that the RY 2018 rate is significantly worse than the RY 2017 rate.
Measure RY
2015 Rate1
RY 2016
Rate2
RY 2017
Rate3
RY 2018
Rate4
RYs 2017–18 Rate
Difference5
All-Cause Readmissions* 18.49% 14.74% 14.48% 14.30% -0.18 Ambulatory Care—Emergency Department (ED) Visits per 1,000 Member Months**
50.58 51.37 53.37 53.56 Not Tested
Ambulatory Care—Outpatient Visits per 1,000 Member Months**
297.12 288.32 303.35 316.90 Not Tested
Avoidance of Antibiotic Treatment in Adults With Acute Bronchitis
25.14% 21.87% 22.57% 39.40% 16.83B
Use of Imaging Studies for Low Back Pain^ 78.62% 77.09% 70.49% 71.91% 1.42
1 RY 2015 rates reflect MY data from January 1, 2014, through December 31, 2014. 2 RY 2016 rates reflect MY data from January 1, 2015, through December 31, 2015. 3 RY 2017 rates reflect MY data from January 1, 2016, through December 31, 2016. 4 RY 2018 rates reflect MY data from January 1, 2017, through December 31, 2017. 5 Performance comparisons are based on the Chi-square test of statistical significance, with a p value of <0.05. * A lower rate indicates better performance for this measure. ** Member months are a member's “contribution” to the total yearly membership. ^ Caution should be exercised when assessing MCP performance for this measure given the changes that NCQA made to the specification for this measure for RY 2018. Not Tested = An RY 2017–18 rate difference was not calculated because high and low rates do not necessarily indicate better or worse performance.
Central California Alliance for Health Performance Evaluation Report: July 1, 2017–June 30, 2018 California Department of Health Care Services
Page J-22 Health Services Advisory Group, Inc.

MANAGED CARE HEALTH PLAN PERFORMANCE MEASURES
Table 3.14—Appropriate Treatment and Utilization DomainMulti-Year Performance Measure Results CCAH—Monterey/Santa Cruz Counties
H = Rate indicates performance above the HPL. Bolded Rate = Rate indicates performance below the MPL.
B = Statistical testing result indicates that the RY 2018 rate is significantly better than the RY 2017 rate.
W = Statistical testing result indicates that the RY 2018 rate is significantly worse than the RY 2017 rate.
Measure RY
2015 Rate1
RY 2016
Rate2
RY 2017
Rate3
RY 2018
Rate4
RYs 2017–18 Rate
Difference5
All-Cause Readmissions* 14.30% 13.61% 14.27% 14.54% 0.27 Ambulatory Care—Emergency Department (ED) Visits per 1,000 Member Months**
45.17 44.44 49.40 47.75 Not Tested
Ambulatory Care—Outpatient Visits per 1,000 Member Months**
290.72 270.16 313.45 317.86 Not Tested
Avoidance of Antibiotic Treatment in Adults With Acute Bronchitis
25.24% 29.24% 37.15% 45.73%H 8.58B
Use of Imaging Studies for Low Back Pain^ 86.47%H 84.47%H 75.79% 78.35%H 2.56
1 RY 2015 rates reflect MY data from January 1, 2014, through December 31, 2014. 2 RY 2016 rates reflect MY data from January 1, 2015, through December 31, 2015. 3 RY 2017 rates reflect MY data from January 1, 2016, through December 31, 2016. 4 RY 2018 rates reflect MY data from January 1, 2017, through December 31, 2017. 5 Performance comparisons are based on the Chi-square test of statistical significance, with a p value of <0.05. * A lower rate indicates better performance for this measure. ** Member months are a member's “contribution” to the total yearly membership. ^ Caution should be exercised when assessing MCP performance for this measure given the changes that NCQA made to the specification for this measure for RY 2018. Not Tested = An RY 2017–18 rate difference was not calculated because high and low rates do not necessarily indicate better or worse performance.
Central California Alliance for Health Performance Evaluation Report: July 1, 2017–June 30, 2018 California Department of Health Care Services
Page J-23 Health Services Advisory Group, Inc.

MANAGED CARE HEALTH PLAN PERFORMANCE MEASURES
Table 3.15 and Table 3.16 present findings for the RY 2018 performance measures within the Appropriate Treatment and Utilization domain. DHCS did not hold MCPs accountable to meet MPLs for the following measures within this domain; therefore, HSAG did not include these measures in its assessment of the MCP’s performance related to HPLs and MPLs:
♦ All-Cause Readmissions ♦ Both Ambulatory Care measures
Table 3.15—Appropriate Treatment and Utilization DomainRY 2018 (MY 2017) Performance Measure Findings CCAH—Merced County
Criteria Number of Measures
MeetingCriteria
Total Number of Measures
Percentage of Measures
MeetingCriteria
RY 2018 Rates Above HPLs 0 2 0.00% Rates Above HPLs for the Last Three or More Consecutive Years 0 2 0.00%
RY 2018 Rates Significantly Better than RY 2017 Rates* 1 3 33.33%
Rates that Moved from Below MPLs in RY 2017 to Above MPLs in RY 2018 0 0 N/A
RY 2018 Rates Below MPLs 0 2 0.00% Rates Below MPLs for the Last Three or More Consecutive Years 0 2 0.00%
RY 2018 Rates Significantly Worse than RY 2017 Rates* 0 3 0.00%
Rates that Moved from Above MPLs in RY 2017 to Below MPLs in RY 2018 0 2 0.00%
* Performance comparisons are based on the Chi-square test of statistical significance, with a p value of <0.05. N/A = No rates above or below the MPLs from the previous year exist to include in the denominator for calculating whether or not rates moved to above or below MPLs in the most recent year.
Central California Alliance for Health Performance Evaluation Report: July 1, 2017–June 30, 2018 California Department of Health Care Services
Page J-24 Health Services Advisory Group, Inc.

MANAGED CARE HEALTH PLAN PERFORMANCE MEASURES
Table 3.16—Appropriate Treatment and Utilization DomainRY 2018 (MY 2017) Performance Measure Findings CCAH—Monterey/Santa Cruz Counties
Criteria Number of Measures
MeetingCriteria
Total Number of Measures
Percentage of Measures
MeetingCriteria
RY 2018 Rates Above HPLs 2 2 100.00% Rates Above HPLs for the Last Three or More Consecutive Years 0 2 0.00%
RY 2018 Rates Significantly Better than RY 2017 Rates* 1 3 33.33%
Rates that Moved from Below MPLs in RY 2017 to Above MPLs in RY 2018 0 0 N/A
RY 2018 Rates Below MPLs 0 2 0.00% Rates Below MPLs for the Last Three or More Consecutive Years 0 2 0.00%
RY 2018 Rates Significantly Worse than RY 2017 Rates* 0 3 0.00%
Rates that Moved from Above MPLs in RY 2017 to Below MPLs in RY 2018 0 2 0.00%
* Performance comparisons are based on the Chi-square test of statistical significance, with a p value of <0.05. N/A = No rates above or below the MPLs from the previous year exist to include in the denominator for calculating whether or not rates moved to above or below MPLs in the most recent year.
Performance Measure Findings—All Domains
Table 3.17 and Table 3.18 present a summary of CCAH’s RY 2018 performance across all External Accountability Set (EAS) measures.
Note the following regarding Table 3.17 and Table 3.18:
♦ DHCS did not hold MCPs accountable to meet MPLs for the following measures; therefore, HSAG did not include these measures in its assessment of the MCP’s performance related to HPLs and MPLs: ■ All-Cause Readmissions ■ Both Ambulatory Care measures
Central California Alliance for Health Performance Evaluation Report: July 1, 2017–June 30, 2018 California Department of Health Care Services
Page J-25 Health Services Advisory Group, Inc.

MANAGED CARE HEALTH PLAN PERFORMANCE MEASURES
■ All four Children and Adolescents’ Access to Primary Care measures ♦ DHCS did not hold MCPs accountable to meet MPLs for the following measures in RY
2017; therefore, HSAG did not include these measures in the denominators for calculating the percentage of measures with rates that moved to above or below the MPLs in RY 2018 and for calculating the percentage of measures with rates below MPLs for only the last two consecutive years: ■ Asthma Medication Ratio ■ Breast Cancer Screening ■ Immunizations for Adolescents—Combination 2
Table 3.17—RY 2018 (MY 2017) Performance Measure Findings for All Domains CCAH—Merced County
Criteria Number of Measures
MeetingCriteria
Total Number of Measures
Percentage of Measures
MeetingCriteria
RY 2018 Rates Above HPLs 0 21 0.00% Rates Above HPLs for the Last Three or More Consecutive Years 0 18 0.00%
RY 2018 Rates Significantly Better than RY 2017 Rates* 5 22 22.73%
Rates that Moved from Below MPLs in RY 2017 to Above MPLs in RY 2018 0 0 N/A
RY 2018 Rates Below MPLs 1 21 4.76% Rates Below MPLs for Only the Last Two Consecutive Years 0 18 0.00%
Rates Below MPLs for the Last Three or More Consecutive Years 0 18 0.00%
RY 2018 Rates Significantly Worse than RY 2017 Rates* 0 22 0.00%
Rates that Moved from Above MPLs in RY 2017 to Below MPLs in RY 2018 1 18 5.56%
* Performance comparisons are based on the Chi-square test of statistical significance, with a p value of <0.05. N/A = No rates above or below the MPLs from the previous year exist to include in the denominator for calculating whether or not rates moved to above or below MPLs in the most recent year.
Central California Alliance for Health Performance Evaluation Report: July 1, 2017–June 30, 2018 California Department of Health Care Services
Page J-26 Health Services Advisory Group, Inc.

MANAGED CARE HEALTH PLAN PERFORMANCE MEASURES
Table 3.18—RY 2018 (MY 2017) Performance Measure Findings for All Domains CCAH—Monterey/Santa Cruz Counties
Criteria Number of Measures
MeetingCriteria
Total Number of Measures
Percentage of Measures
MeetingCriteria
RY 2018 Rates Above HPLs 10 21 47.62% Rates Above HPLs for the Last Three or More Consecutive Years 1 18 5.56%
RY 2018 Rates Significantly Better than RY 2017 Rates* 7 22 31.82%
Rates that Moved from Below MPLs in RY 2017 to Above MPLs in RY 2018 0 0 N/A
RY 2018 Rates Below MPLs 0 21 0.00% Rates Below MPLs for Only the Last Two Consecutive Years 0 18 0.00%
Rates Below MPLs for the Last Three or More Consecutive Years 0 18 0.00%
RY 2018 Rates Significantly Worse than RY 2017 Rates* 0 22 0.00%
Rates that Moved from Above MPLs in RY 2017 to Below MPLs in RY 2018 0 18 0.00%
* Performance comparisons are based on the Chi-square test of statistical significance, with a p value of <0.05. N/A = No rates above or below the MPLs from the previous year exist to include in the denominator for calculating whether or not rates moved to above or below MPLs in the most recent year.
Improvement Plan Requirements for 2018 Based on RY 2018 performance measure results, CCAH will be required to submit an IP for the Childhood Immunization Status—Combination 3 measure in Merced County.
Central California Alliance for Health Performance Evaluation Report: July 1, 2017–June 30, 2018 California Department of Health Care Services
Page J-27 Health Services Advisory Group, Inc.

MANAGED CARE HEALTH PLAN PERFORMANCE MEASURES
Seniors and Persons with Disabilities Performance Measure Results Table 3.19 and Table 3.20 present the four-year trending information for the SPD population, and Table 3.21 and Table 3.22 present the four-year trending information for the non-SPD population for the measures that DHCS required MCPs to stratify for the SPD and non-SPD populations. The tables also show the differences in rates between RY 2017 and RY 2018.
Table 3.23 and Table 3.24 present the SPD and non-SPD rates, a comparison of the SPD and non-SPD rates,5 and the total combined rate for each measure.
Table 3.19—Multi-Year SPD Performance Measure Trend Table CCAH—Merced County
B = Statistical testing result indicates that the RY 2018 SPD rate is significantly better than the RY 2017 SPD rate.
W = Statistical testing result indicates that the RY 2018 SPD rate is significantly worse than the RY 2017 SPD rate.
Measure RY
2015 SPD
Rate1
RY 2016 SPD
Rate2
RY 2017 SPD
Rate3
RY 2018 SPD
Rate4
RYs 2017–18 Rate
Difference5
All-Cause Readmissions* 22.57% 18.51% 21.38% 22.33% 0.95 Ambulatory Care—Emergency Department (ED) Visits per 1,000 Member Months**
79.54 80.83 91.55 90.12 Not Tested
Ambulatory Care—Outpatient Visits per 1,000 Member Months**
509.74 490.67 515.31 550.60 Not Tested
Annual Monitoring for Patients on Persistent Medications— ACE Inhibitors or ARBs
88.89% 88.82% 89.81% 91.68% 1.87
Annual Monitoring for Patients on Persistent Medications— Diuretics
86.44% 88.79% 91.44% 90.43% -1.01
5 HSAG calculated statistical significance between the SPD and non-SPD rates for each measure using a Chi-square test. This information is displayed in the “SPD/Non-SPD Rate Difference” column in Table 3.23 and Table 3.24.
Central California Alliance for Health Performance Evaluation Report: July 1, 2017–June 30, 2018 California Department of Health Care Services
Page J-28 Health Services Advisory Group, Inc.

MANAGED CARE HEALTH PLAN PERFORMANCE MEASURES
Measure RY
2015 SPD
Rate1
RY 2016 SPD
Rate2
RY 2017 SPD
Rate3
RY 2018 SPD
Rate4
RYs 2017–18 Rate
Difference5
Children and Adolescents' Access to Primary Care Practitioners—12–24 Months
NA NA NA NA Not Comparable
Children and Adolescents' Access to Primary Care Practitioners— 25 Months–6 Years
90.30% 89.44% 89.12% 91.01% 1.89
Children and Adolescents' Access to Primary Care Practitioners—7–11 Years
93.41% 90.45% 94.70% 93.37% -1.33
Children and Adolescents' Access to Primary Care Practitioners—12–19 Years
84.97% 86.10% 86.30% 89.39% 3.09
1 RY 2015 rates reflect MY data from January 1, 2014, through December 31, 2014. 2 RY 2016 rates reflect MY data from January 1, 2015, through December 31, 2015. 3 RY 2017 rates reflect MY data from January 1, 2016, through December 31, 2016. 4 RY 2018 rates reflect MY data from January 1, 2017, through December 31, 2017. 5 Performance comparisons are based on the Chi-square test of statistical significance, with a p value of <0.05. * A lower rate indicates better performance for this measure. ** Member months are a member's “contribution” to the total yearly membership. NA = The MCP followed the specifications, but the denominator was too small (less than 30) to report a valid rate. Not Comparable = An RY 2017–18 rate difference cannot be made because data are not available for both years or because significant methodology changes occurred between years, disallowing comparison. Not Tested = An RY 2017–18 rate difference was not calculated because high and low rates do not necessarily indicate better or worse performance.
Central California Alliance for Health Performance Evaluation Report: July 1, 2017–June 30, 2018 California Department of Health Care Services
Page J-29 Health Services Advisory Group, Inc.

MANAGED CARE HEALTH PLAN PERFORMANCE MEASURES
Table 3.20—Multi-Year SPD Performance Measure Trend Table CCAH—Monterey/Santa Cruz Counties
B = Statistical testing result indicates that the RY 2018 SPD rate is significantly better than the RY 2017 SPD rate.
W = Statistical testing result indicates that the RY 2018 SPD rate is significantly worse than the RY 2017 SPD rate.
Measure RY
2015 SPD
Rate1
RY 2016 SPD
Rate2
RY 2017 SPD
Rate3
RY 2018 SPD
Rate4
RYs 2017–18 Rate
Difference5
All-Cause Readmissions* 17.51% 20.62% 19.03% 17.64% -1.39 Ambulatory Care—Emergency Department (ED) Visits per 1,000 Member Months**
75.65 74.49 85.20 79.17 Not Tested
Ambulatory Care—Outpatient Visits per 1,000 Member Months**
520.95 492.08 575.95 570.07 Not Tested
Annual Monitoring for Patients on Persistent Medications— ACE Inhibitors or ARBs
91.91% 88.62% 91.20% 89.98% -1.22
Annual Monitoring for Patients on Persistent Medications— Diuretics
91.83% 91.51% 91.34% 90.53% -0.81
Children and Adolescents' Access to Primary Care Practitioners—12–24 Months
84.38% 91.49% 90.24% 96.67% 6.43
Children and Adolescents' Access to Primary Care Practitioners— 25 Months–6 Years
93.44% 94.34% 94.78% 94.78% 0.00
Children and Adolescents' Access to Primary Care Practitioners—7–11 Years
93.24% 93.18% 95.21% 96.64% 1.43
Children and Adolescents' Access to Primary Care Practitioners—12–19 Years
89.19% 90.02% 93.67% 95.42% 1.75
1 RY 2015 rates reflect MY data from January 1, 2014, through December 31, 2014. 2 RY 2016 rates reflect MY data from January 1, 2015, through December 31, 2015. 3 RY 2017 rates reflect MY data from January 1, 2016, through December 31, 2016.
Central California Alliance for Health Performance Evaluation Report: July 1, 2017–June 30, 2018 California Department of Health Care Services
Page J-30 Health Services Advisory Group, Inc.

MANAGED CARE HEALTH PLAN PERFORMANCE MEASURES
4 RY 2018 rates reflect MY data from January 1, 2017, through December 31, 2017. 5 Performance comparisons are based on the Chi-square test of statistical significance, with a p value of <0.05. * A lower rate indicates better performance for this measure. ** Member months are a member's “contribution” to the total yearly membership. Not Tested = An RY 2017–18 rate difference was not calculated because high and low rates do not necessarily indicate better or worse performance.
Table 3.21—Multi-Year Non-SPD Performance Measure Trend Table CCAH—Merced County
B = Statistical testing result indicates that the RY 2018 non-SPD rate is significantly better than the RY 2017 non-SPD rate.
W = Statistical testing result indicates that the RY 2018 non-SPD rate is significantly worse than the RY 2017 non-SPD rate.
Measure RY 2015
Non-SPD Rate1
RY 2016 Non-SPD
Rate2
RY 2017 Non-SPD
Rate3
RY 2018 Non-SPD
Rate4
RYs 2017–18 Rate
Difference5
All-Cause Readmissions* 14.39% 12.31% 10.49% 9.54% -0.95
Ambulatory Care— Emergency Department (ED) Visits per 1,000 Member Months**
48.28 49.26 50.91 51.30 Not Tested
Ambulatory Care— Outpatient Visits per 1,000 Member Months**
280.19 273.80 289.74 302.44 Not Tested
Annual Monitoring for Patients on Persistent Medications— ACE Inhibitors or ARBs
86.14% 86.61% 85.93% 84.80% -1.13
Annual Monitoring for Patients on Persistent Medications—Diuretics
83.73% 86.77% 85.38% 84.10% -1.28
Children and Adolescents' Access to Primary Care Practitioners— 12–24 Months
95.35% 94.55% 93.98% 95.17% 1.19
Central California Alliance for Health Performance Evaluation Report: July 1, 2017–June 30, 2018 California Department of Health Care Services
Page J-31 Health Services Advisory Group, Inc.

MANAGED CARE HEALTH PLAN PERFORMANCE MEASURES
Measure RY 2015
Non-SPD Rate1
RY 2016 Non-SPD
Rate2
RY 2017 Non-SPD
Rate3
RY 2018 Non-SPD
Rate4
RYs 2017–18 Rate
Difference5
Children and Adolescents' Access to Primary Care Practitioners— 25 Months–6 Years
89.46% 87.25% 87.20% 87.79% 0.59
Children and Adolescents' Access to Primary Care Practitioners— 7–11 Years
90.67% 89.57% 90.17% 89.26% -0.91W
Children and Adolescents' Access to Primary Care Practitioners— 12–19 Years
89.23% 87.86% 87.95% 87.96% 0.01
1 RY 2015 rates reflect MY data from January 1, 2014, through December 31, 2014. 2 RY 2016 rates reflect MY data from January 1, 2015, through December 31, 2015. 3 RY 2017 rates reflect MY data from January 1, 2016, through December 31, 2016. 4 RY 2018 rates reflect MY data from January 1, 2017, through December 31, 2017. 5 Performance comparisons are based on the Chi-square test of statistical significance, with a p value of <0.05. * A lower rate indicates better performance for this measure. ** Member months are a member's “contribution” to the total yearly membership. Not Tested = An RY 2017–18 rate difference was not calculated because high and low rates do not necessarily indicate better or worse performance.
Central California Alliance for Health Performance Evaluation Report: July 1, 2017–June 30, 2018 California Department of Health Care Services
Page J-32 Health Services Advisory Group, Inc.
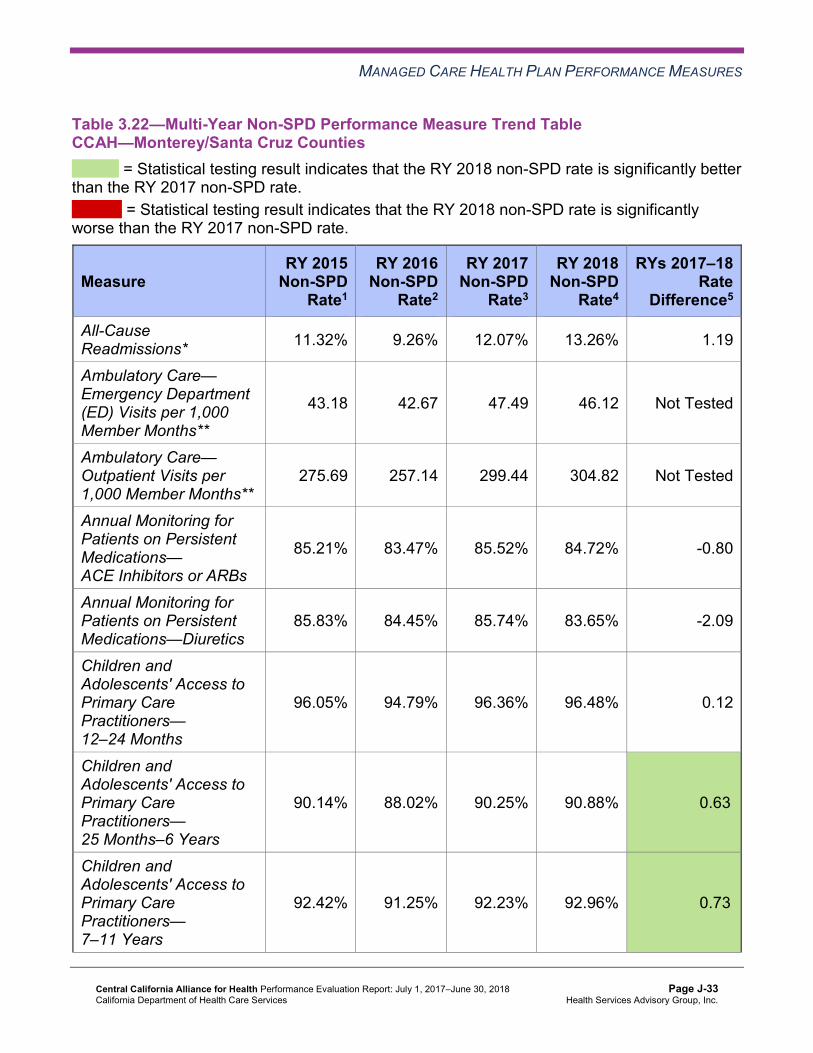
MANAGED CARE HEALTH PLAN PERFORMANCE MEASURES
Table 3.22—Multi-Year Non-SPD Performance Measure Trend Table CCAH—Monterey/Santa Cruz Counties
B = Statistical testing result indicates that the RY 2018 non-SPD rate is significantly better than the RY 2017 non-SPD rate.
W = Statistical testing result indicates that the RY 2018 non-SPD rate is significantly worse than the RY 2017 non-SPD rate.
Measure RY 2015
Non-SPD Rate1
RY 2016 Non-SPD
Rate2
RY 2017 Non-SPD
Rate3
RY 2018 Non-SPD
Rate4
RYs 2017–18 Rate
Difference5
All-Cause Readmissions* 11.32% 9.26% 12.07% 13.26% 1.19
Ambulatory Care— Emergency Department (ED) Visits per 1,000 Member Months**
43.18 42.67 47.49 46.12 Not Tested
Ambulatory Care— Outpatient Visits per 1,000 Member Months**
275.69 257.14 299.44 304.82 Not Tested
Annual Monitoring for Patients on Persistent Medications— ACE Inhibitors or ARBs
85.21% 83.47% 85.52% 84.72% -0.80
Annual Monitoring for Patients on Persistent Medications—Diuretics
85.83% 84.45% 85.74% 83.65% -2.09
Children and Adolescents' Access to Primary Care Practitioners— 12–24 Months
96.05% 94.79% 96.36% 96.48% 0.12
Children and Adolescents' Access to Primary Care Practitioners— 25 Months–6 Years
90.14% 88.02% 90.25% 90.88% 0.63B
Children and Adolescents' Access to Primary Care Practitioners— 7–11 Years
92.42% 91.25% 92.23% 92.96% 0.73B
Central California Alliance for Health Performance Evaluation Report: July 1, 2017–June 30, 2018 California Department of Health Care Services
Page J-33 Health Services Advisory Group, Inc.

MANAGED CARE HEALTH PLAN PERFORMANCE MEASURES
Measure RY 2015
Non-SPD Rate1
RY 2016 Non-SPD
Rate2
RY 2017 Non-SPD
Rate3
RY 2018 Non-SPD
Rate4
RYs 2017–18 Rate
Difference5
Children and Adolescents' Access to Primary Care Practitioners— 12–19 Years
89.98% 88.62% 88.90% 89.66% 0.76B
1 RY 2015 rates reflect MY data from January 1, 2014, through December 31, 2014. 2 RY 2016 rates reflect MY data from January 1, 2015, through December 31, 2015. 3 RY 2017 rates reflect MY data from January 1, 2016, through December 31, 2016. 4 RY 2018 rates reflect MY data from January 1, 2017, through December 31, 2017. 5 Performance comparisons are based on the Chi-square test of statistical significance, with a p value of <0.05. * A lower rate indicates better performance for this measure. ** Member months are a member's “contribution” to the total yearly membership. Not Tested = An RY 2017–18 rate difference was not calculated because high and low rates do not necessarily indicate better or worse performance.
Table 3.23—RY 2018 (MY 2017) Performance Measure Comparison and Results forMeasures Stratified by the SPD and Non-SPD PopulationsCCAH—Merced County
B = Statistical testing result indicates that the RY 2018 SPD rate is significantly better than the RY 2018 non-SPD rate.
W = Statistical testing result indicates that the RY 2018 SPD rate is significantly worse than the RY 2018 non-SPD rate.
Measure RY 2018
SPD Rate1
RY 2018 Non-SPD
Rate1
SPD/Non-SPDRate
Difference2
RY 2018 Total Rate3
All-Cause Readmissions* 22.33% 9.54% 12.79W 14.30% Ambulatory Care—Emergency Department (ED) Visits per 1,000 Member Months**
90.12 51.30 Not Tested 53.56
Ambulatory Care—Outpatient Visits per 1,000 Member Months** 550.60 302.44 Not Tested 316.90
Annual Monitoring for Patients on Persistent Medications— ACE Inhibitors or ARBs
91.68% 84.80% 6.88B 86.56%
Central California Alliance for Health Performance Evaluation Report: July 1, 2017–June 30, 2018 California Department of Health Care Services
Page J-34 Health Services Advisory Group, Inc.
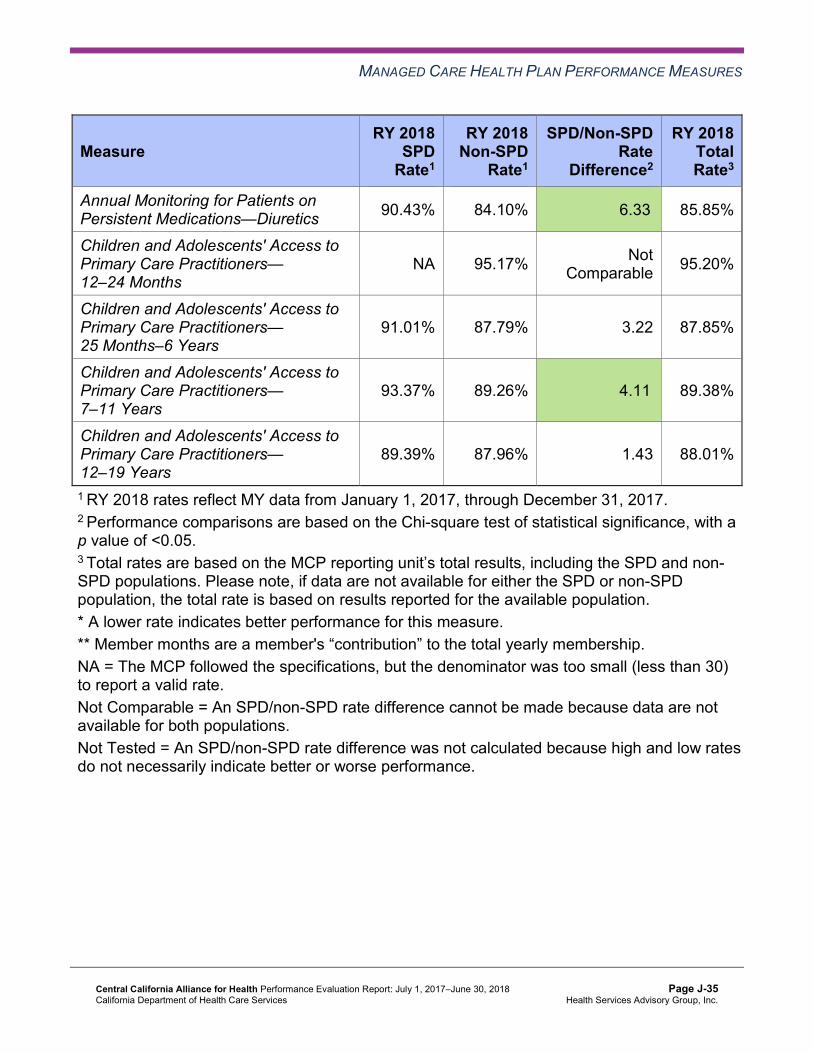
MANAGED CARE HEALTH PLAN PERFORMANCE MEASURES
Measure RY 2018
SPD Rate1
RY 2018 Non-SPD
Rate1
SPD/Non-SPDRate
Difference2
RY 2018 Total Rate3
Annual Monitoring for Patients on Persistent Medications—Diuretics 90.43% 84.10% 6.33B 85.85%
Children and Adolescents' Access to Primary Care Practitioners— 12–24 Months
NA 95.17% Not Comparable 95.20%
Children and Adolescents' Access to Primary Care Practitioners— 25 Months–6 Years
91.01% 87.79% 3.22 87.85%
Children and Adolescents' Access to Primary Care Practitioners— 7–11 Years
93.37% 89.26% 4.11B 89.38%
Children and Adolescents' Access to Primary Care Practitioners— 12–19 Years
89.39% 87.96% 1.43 88.01%
1 RY 2018 rates reflect MY data from January 1, 2017, through December 31, 2017. 2 Performance comparisons are based on the Chi-square test of statistical significance, with a p value of <0.05. 3 Total rates are based on the MCP reporting unit’s total results, including the SPD and non-SPD populations. Please note, if data are not available for either the SPD or non-SPD population, the total rate is based on results reported for the available population. * A lower rate indicates better performance for this measure. ** Member months are a member's “contribution” to the total yearly membership. NA = The MCP followed the specifications, but the denominator was too small (less than 30) to report a valid rate. Not Comparable = An SPD/non-SPD rate difference cannot be made because data are not available for both populations. Not Tested = An SPD/non-SPD rate difference was not calculated because high and low rates do not necessarily indicate better or worse performance.
Central California Alliance for Health Performance Evaluation Report: July 1, 2017–June 30, 2018 California Department of Health Care Services
Page J-35 Health Services Advisory Group, Inc.

MANAGED CARE HEALTH PLAN PERFORMANCE MEASURES
Table 3.24—RY 2018 (MY 2017) Performance Measure Comparison and Results for Measures Stratified by the SPD and Non-SPD PopulationsCCAH—Monterey/Santa Cruz Counties
B = Statistical testing result indicates that the RY 2018 SPD rate is significantly better than the RY 2018 non-SPD rate.
W = Statistical testing result indicates that the RY 2018 SPD rate is significantly worse than the RY 2018 non-SPD rate.
Measure RY 2018
SPD Rate1
RY 2018 Non-SPD
Rate1
SPD/Non-SPDRate
Difference2
RY 2018 Total Rate3
All-Cause Readmissions* 17.64% 13.26% 4.38W 14.54% Ambulatory Care—Emergency Department (ED) Visits per 1,000 Member Months**
79.17 46.12 Not Tested 47.75
Ambulatory Care—Outpatient Visits per 1,000 Member Months** 570.07 304.82 Not Tested 317.86
Annual Monitoring for Patients on Persistent Medications—ACE Inhibitors or ARBs
89.98% 84.72% 5.26B 86.03%
Annual Monitoring for Patients on Persistent Medications—Diuretics 90.53% 83.65% 6.88B 85.59%
Children and Adolescents' Access to Primary Care Practitioners—12–24 Months
96.67% 96.48% 0.19 96.48%
Children and Adolescents' Access to Primary Care Practitioners—25 Months–6 Years
94.78% 90.88% 3.90B 90.93%
Children and Adolescents' Access to Primary Care Practitioners—7–11 Years
96.64% 92.96% 3.68B 93.04%
Children and Adolescents' Access to Primary Care Practitioners—12–19 Years
95.42% 89.66% 5.76B 89.81%
1 RY 2018 rates reflect MY data from January 1, 2017, through December 31, 2017. 2 Performance comparisons are based on the Chi-square test of statistical significance, with a p value of <0.05. 3 Total rates are based on the MCP reporting unit’s total results, including the SPD and non-SPD populations. Please note, if data are not available for either the SPD or non-SPD population, the total rate is based on results reported for the available population.
Central California Alliance for Health Performance Evaluation Report: July 1, 2017–June 30, 2018 California Department of Health Care Services
Page J-36 Health Services Advisory Group, Inc.
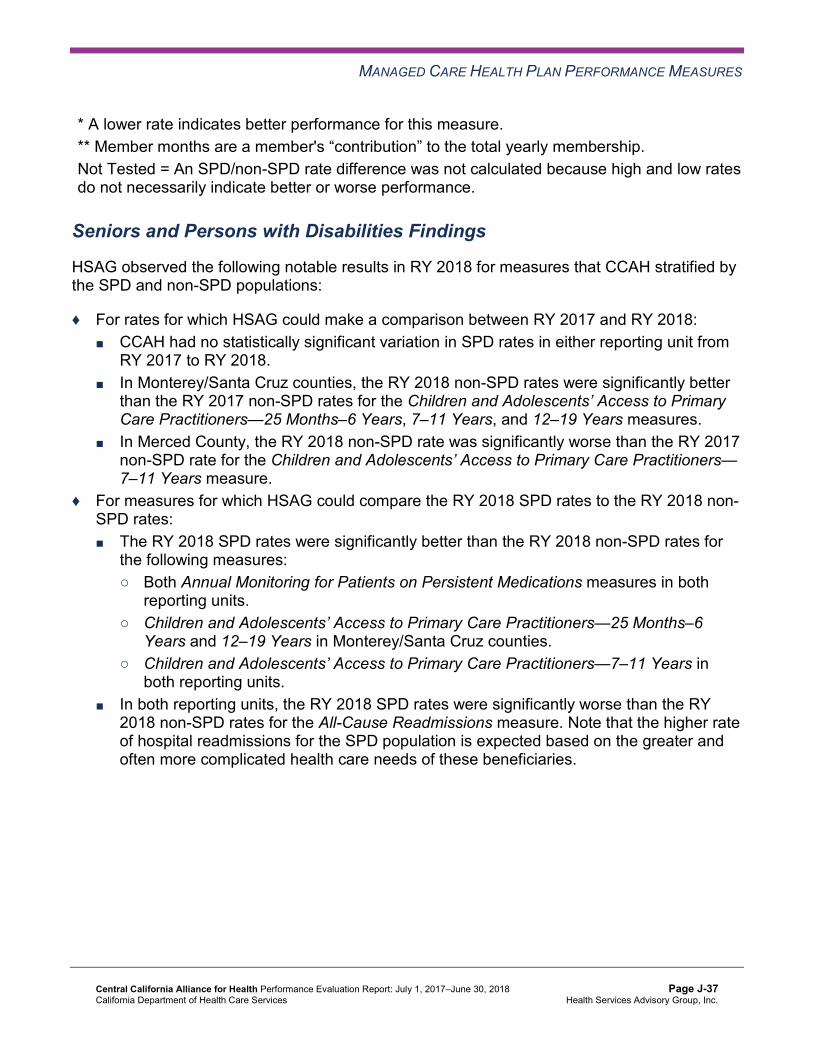
MANAGED CARE HEALTH PLAN PERFORMANCE MEASURES
* A lower rate indicates better performance for this measure. ** Member months are a member's “contribution” to the total yearly membership. Not Tested = An SPD/non-SPD rate difference was not calculated because high and low rates do not necessarily indicate better or worse performance.
Seniors and Persons with Disabilities Findings
HSAG observed the following notable results in RY 2018 for measures that CCAH stratified by the SPD and non-SPD populations:
♦ For rates for which HSAG could make a comparison between RY 2017 and RY 2018: ■ CCAH had no statistically significant variation in SPD rates in either reporting unit from
RY 2017 to RY 2018. ■ In Monterey/Santa Cruz counties, the RY 2018 non-SPD rates were significantly better
than the RY 2017 non-SPD rates for the Children and Adolescents’ Access to Primary Care Practitioners—25 Months–6 Years, 7–11 Years, and 12–19 Years measures.
■ In Merced County, the RY 2018 non-SPD rate was significantly worse than the RY 2017 non-SPD rate for the Children and Adolescents’ Access to Primary Care Practitioners— 7–11 Years measure.
♦ For measures for which HSAG could compare the RY 2018 SPD rates to the RY 2018 non-SPD rates: ■ The RY 2018 SPD rates were significantly better than the RY 2018 non-SPD rates for
the following measures: ○ Both Annual Monitoring for Patients on Persistent Medications measures in both
reporting units. ○ Children and Adolescents’ Access to Primary Care Practitioners—25 Months–6
Years and 12–19 Years in Monterey/Santa Cruz counties. ○ Children and Adolescents’ Access to Primary Care Practitioners—7–11 Years in
both reporting units. ■ In both reporting units, the RY 2018 SPD rates were significantly worse than the RY
2018 non-SPD rates for the All-Cause Readmissions measure. Note that the higher rate of hospital readmissions for the SPD population is expected based on the greater and often more complicated health care needs of these beneficiaries.
Central California Alliance for Health Performance Evaluation Report: July 1, 2017–June 30, 2018 California Department of Health Care Services
Page J-37 Health Services Advisory Group, Inc.

MANAGED CARE HEALTH PLAN PERFORMANCE MEASURES
Strengths—Performance Measures HSAG auditors determined that CCAH followed the appropriate specifications to produce valid rates, and identified no issues of concern.
HSAG identified the following notable RY 2018 performance measure results for CCAH:
♦ In Monterey/Santa Cruz counties, across all domains the rates were above the HPLs for 10 of 21 measures (48 percent), and no rates were below the MPLs. ■ Within the Preventive Screening and Children’s Health and Appropriate Treatment and
Utilization domains, the rates for all measures for which DHCS compared rates to HPLs were above the HPLs in Monterey/Santa Cruz counties.
♦ Across both reporting units and domains, 12 of 44 rates (27 percent) improved significantly from RY 2017 to RY 2018. ■ Monterey/Santa Cruz counties had seven of 22 rates that improved significantly (32
percent), and Merced County had five of 22 rates that improved significantly (23 percent).
Opportunities for Improvement—Performance Measures In Merced County, the rate for the Childhood Immunization Status—Combination 3 measure moved from above the MPL in RY 2017 to below the MPL in RY 2018, reflecting that in this reporting unit CCAH has an opportunity for improvement through ensuring that beneficiaries receive specified immunization dosages by age 2.
To address CCAH’s declining performance for the Childhood Immunization Status— Combination 3 measure, the MCP selected childhood immunizations as its 2017–19 DHCS-priority PIP topic. See Section 4 of this report (“Performance Improvement Projects”) for a summary of CCAH’s progress on this PIP. CCAH has the opportunity to conduct ongoing evaluation of the 2017–19 Childhood Immunization Status—Combination 3 PIP intervention testing to monitor the effectiveness of the tested intervention(s). Based on evaluation results, the MCP should build on successes and, if needed, make changes in response to lessons learned to help ensure improvement to above the MPL in Merced County for the Childhood Immunization Status—Combination 3 measure.
Central California Alliance for Health Performance Evaluation Report: July 1, 2017–June 30, 2018 California Department of Health Care Services
Page J-38 Health Services Advisory Group, Inc.

Medi-Cal Managed Care External Quality Review Technical ReportAppendix J: Performance Evaluation ReportCentral California Alliance for Health July 1, 2017–June 30, 2018
4. Performance Improvement Projects
Performance Improvement Project Overview The key concepts of the rapid-cycle PIP framework include forming a PIP team, setting aims, establishing measures, determining interventions using quality improvement tools, conducting PDSA cycles to test interventions, and planning for the spread of successful changes. The core component of the rapid-cycle PIP approach involves testing changes on a small scale so that improvement can occur more efficiently and lead to long-term sustainability. The following modules guide MCPs through this rapid-cycle PIP process:
♦ Module 1—PIP Initiation ■ MCPs outline the framework for the PIP, which includes:
○ The topic rationale. ○ Comparative data supporting the need to improve the selected topic. ○ A list of the PIP team members, which consists of internal and external stakeholders. ○ A completed key driver diagram that defines the theory of change for improvement,
including the SMART (Specific, Measurable, Achievable, Relevant, and Time-bound) Aim and Global Aim.
♦ Module 2—SMART Aim Data Collection ■ MCPs define the SMART Aim measure and data collection methodology and develop
the SMART Aim data run chart. ♦ Module 3—Intervention Determination
■ MCPs use process mapping and failure modes and effects analysis (FMEA) to identify potential interventions to test which may have direct effects on the SMART Aim.
♦ Module 4—Plan-Do-Study-Act (PDSA) ■ MCPs test and evaluate the interventions identified in Module 3 through a series of
PDSA cycles. ♦ Module 5—PIP Conclusions
■ MCPs interpret results and summarize: ○ Key findings and outcomes achieved. ○ Assessment of each tested intervention. ○ Lessons learned, including how demonstrated improvement can be shared and used
as a foundation for further improvement going forward. ○ Plan for sustained improvement.
Central California Alliance for Health Performance Evaluation Report: July 1, 2017–June 30, 2018 California Department of Health Care Services
Page J-39 Health Services Advisory Group, Inc.

PERFORMANCE IMPROVEMENT PROJECTS
Based on the agreed-upon timeline, MCPs submit each module to HSAG for validation. Throughout the rapid-cycle PIP process, HSAG provides technical assistance to MCPs to ensure that PIPs are methodologically sound and to problem-solve with MCPs regarding how to address challenges that occur. Through an iterative process, MCPs have opportunities to make corrections to modules 1 through 3 to achieve all validation criteria.
Once MCPs achieve all validation criteria for modules 1 through 3 and receive feedback on the intervention Plan portion of Module 4, MCPs test interventions. During the intervention testing phase of the PIP, HSAG conducts periodic progress check-ins to ensure that MCPs have addressed HSAG’s feedback on the Plan portion of Module 4 and are making appropriate progress with intervention testing. Once MCPs complete testing an intervention, MCPs determine the next steps based on results and lessons learned—whether the intervention was successful and should be spread (adopt), whether modifications need to be made to the existing intervention (adapt), or whether the intervention was not successful and should be stopped (abandon).
In Module 5, MCPs summarize the overall PIP. When validating Module 5, HSAG assesses the validity and reliability of the results based on the Centers for Medicare & Medicaid Services (CMS) validation protocols to determine whether key stakeholders can have confidence in the reported PIP findings. HSAG assigns the following final confidence levels for each PIP:
♦ High confidence—the PIP was methodologically sound and achieved the SMART Aim goal; the demonstrated improvement was clearly linked to the quality improvement processes conducted and intervention(s) tested; and, the MCP accurately summarized the key findings.
♦ Confidence—the PIP was methodologically sound and achieved the SMART Aim goal, and the MCP accurately summarized the key findings. However, some, but not all, of the quality improvement processes conducted and/or intervention(s) tested were clearly linked to the demonstrated improvement.
♦ Low confidence—either (A) the PIP was methodologically sound; however, the SMART Aim goal was not achieved; or (B) the SMART Aim goal was achieved; however, the quality improvement processes and/or intervention(s) tested were poorly executed and could not be linked to the improvement.
♦ Reported PIP results were not credible—the PIP methodology was not executed as approved.
Performance Improvement Project Results and Findings During the review period, CCAH submitted modules 4 and 5 for its 2015–17 DHCS-priority and MCP-specific PIPs. HSAG validated the modules and includes the final PIP validation findings in this report. Additionally, CCAH initiated a Disparity PIP and a DHCS-priority PIP during the review period. In this report, HSAG includes summaries of the MCP’s Disparity and DHCS-priority PIP module submissions as well as validation findings from the review period.
Central California Alliance for Health Performance Evaluation Report: July 1, 2017–June 30, 2018 California Department of Health Care Services
Page J-40 Health Services Advisory Group, Inc.

PERFORMANCE IMPROVEMENT PROJECTS
2015–17 DHCS-Priority Performance Improvement Project
CCAH selected immunizations of two-year-olds for its 2015–17 DHCS-priority PIP. While the MCP concluded its Immunizations of Two-Year-Olds PIP through the SMART Aim end date of June 30, 2017, CCAH submitted modules 4 and 5 for HSAG to validate during the review period for this report. HSAG provided final validation findings and encouraged CCAH to incorporate the experiences and lessons learned from the PIP into future quality improvement efforts.
Table 4.1 provides a summary of the SMART Aim measure results reported by the MCP.
Table 4.1—CCAH Immunizations of Two-Year-Olds PIP SMART Aim Measure Results
SMART Aim Measure Baseline Rate
SMART Aim Goal
Rate
SMART Aim Goal Achieved
Rate of Childhood Immunization Status— Combination 3 measure among two-year-olds who have Clinic A6 as their primary care provider
48.42% 70.00% No
Table 4.2 presents a description of the interventions that CCAH tested for its Immunizations of Two-Year-Olds PIP. The table also indicates the key driver that each intervention addressed as well as whether the MCP decided, based on intervention testing results, to adopt, adapt, or abandon the intervention.
Table 4.2—CCAH Immunizations of Two-Year-Olds PIP Intervention Testing Results
Intervention Key Driver Addressed Adopt,Adapt, orAbandon
Monthly telephone reminder calls by an immunization champion for beneficiaries who have turned 9 months of age in the previous calendar month and are past due on immunizations
Collaboration and local partnerships Adapt
Postcard reminders for immunizations sent to beneficiaries at 1 and 5 months of age
Identification of beneficiaries who need or are past due for immunizations
Adapt
6 Clinic name removed for confidentiality.
Central California Alliance for Health Performance Evaluation Report: July 1, 2017–June 30, 2018 California Department of Health Care Services
Page J-41 Health Services Advisory Group, Inc.

PERFORMANCE IMPROVEMENT PROJECTS
CCAH documented the following lessons learned during the scope of the 2015–17 DHCS-priority PIP, which the MCP may apply to future PIPs:
♦ Do not give up testing new options, because a new lesson learned and an improved process can be obtained with each new intervention test.
♦ Population management tools are important for quality improvement; and more support is needed in this area, especially for small provider sites that do not have a robust information technology department.
Performance Improvement Project Validation Findings
During the review period for this report, HSAG validated modules 4 and 5 for the MCP’s Immunizations of Two-Year-Olds PIP. Although CCAH documented some increase in the SMART Aim measure rate, the MCP did not achieve the SMART Aim goal. Additionally, the increase in the SMART Aim measure rate occurred before the MCP began intervention testing; therefore, the improvement cannot be directly linked to the intervention.
Upon assessment of validity and reliability of the PIP results, HSAG assigned CCAH’s Immunizations of Two-Year-Olds PIP a final confidence level of Low Confidence.
2015–17 MCP-Specific Performance Improvement Project
CCAH selected improving health outcomes of persons living with asthma in Merced County for its 2015–17 MCP-specific PIP. While the MCP concluded its Improving Health Outcomes of Persons Living With Asthma in Merced County PIP through the SMART Aim end date of June 30, 2017, CCAH submitted modules 4 and 5 for HSAG to validate during the review period for this report. HSAG provided final validation findings and encouraged CCAH to incorporate the experiences and lessons learned from the PIP into future quality improvement efforts.
Table 4.3 provides a summary of the SMART Aim measure results reported by the MCP.
Table 4.3—CCAH Improving Health Outcomes of Persons Living With Asthma in Merced County PIP SMART Aim Measure Results
SMART Aim Measure Baseline Rate
SMART Aim Goal
Rate
SMART Aim Goal Achieved
Completion rate of asthma action plans (AAPs) among beneficiaries ages 5 to 18 years, with a diagnosis of persistent asthma, and who are linked to Provider A.7
7% 10% Yes
7 Provider name removed for confidentiality.
Central California Alliance for Health Performance Evaluation Report: July 1, 2017–June 30, 2018 California Department of Health Care Services
Page J-42 Health Services Advisory Group, Inc.
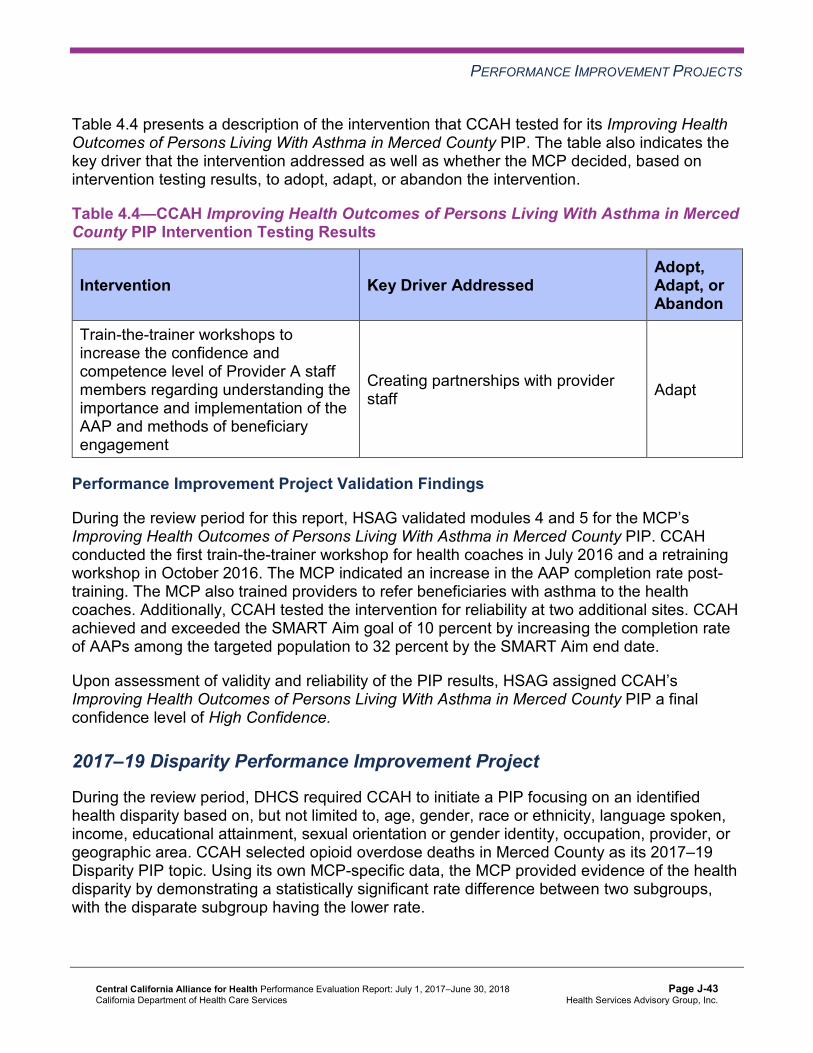
PERFORMANCE IMPROVEMENT PROJECTS
Table 4.4 presents a description of the intervention that CCAH tested for its Improving Health Outcomes of Persons Living With Asthma in Merced County PIP. The table also indicates the key driver that the intervention addressed as well as whether the MCP decided, based on intervention testing results, to adopt, adapt, or abandon the intervention.
Table 4.4—CCAH Improving Health Outcomes of Persons Living With Asthma in Merced County PIP Intervention Testing Results
Intervention Key Driver Addressed Adopt,Adapt, orAbandon
Train-the-trainer workshops to increase the confidence and competence level of Provider A staff members regarding understanding the importance and implementation of the AAP and methods of beneficiary engagement
Creating partnerships with provider staff Adapt
Performance Improvement Project Validation Findings
During the review period for this report, HSAG validated modules 4 and 5 for the MCP’s Improving Health Outcomes of Persons Living With Asthma in Merced County PIP. CCAH conducted the first train-the-trainer workshop for health coaches in July 2016 and a retraining workshop in October 2016. The MCP indicated an increase in the AAP completion rate post-training. The MCP also trained providers to refer beneficiaries with asthma to the health coaches. Additionally, CCAH tested the intervention for reliability at two additional sites. CCAH achieved and exceeded the SMART Aim goal of 10 percent by increasing the completion rate of AAPs among the targeted population to 32 percent by the SMART Aim end date.
Upon assessment of validity and reliability of the PIP results, HSAG assigned CCAH’s Improving Health Outcomes of Persons Living With Asthma in Merced County PIP a final confidence level of High Confidence.
2017–19 Disparity Performance Improvement Project
During the review period, DHCS required CCAH to initiate a PIP focusing on an identified health disparity based on, but not limited to, age, gender, race or ethnicity, language spoken, income, educational attainment, sexual orientation or gender identity, occupation, provider, or geographic area. CCAH selected opioid overdose deaths in Merced County as its 2017–19 Disparity PIP topic. Using its own MCP-specific data, the MCP provided evidence of the health disparity by demonstrating a statistically significant rate difference between two subgroups, with the disparate subgroup having the lower rate.
Central California Alliance for Health Performance Evaluation Report: July 1, 2017–June 30, 2018 California Department of Health Care Services
Page J-43 Health Services Advisory Group, Inc.

PERFORMANCE IMPROVEMENT PROJECTS
Table 4.5 provides the SMART Aim measure description, baseline rate, and SMART Aim goal rate for the PIP. The SMART Aim end date for this PIP is June 30, 2019.
Table 4.5—CCAH Opioid Overdose Deaths Disparity PIP SMART Aim Measure
SMART Aim Measure Baseline Rate
SMART Aim Goal
Rate
Rate of naloxone (Narcan®) fills among beneficiaries on chronic opioids (opioid fills greater than 30 days within a rolling 12-month period, excluding those with a diagnosis of malignant neoplasm, end stage renal disease, human immunodeficiency virus, transplant, or end-of-life/palliative care) residing in Merced County.
0.07% 4.80%
Performance Improvement Project Validation Findings
During the review period of this report, HSAG validated modules 1 through 3 for the MCP’s Opioid Overdose Deaths Disparity PIP. Upon initial review of the modules, HSAG determined that CCAH met some required validation criteria; however, HSAG identified opportunities for improvement related to:
♦ Supporting the topic selection with the MCP’s data. ♦ Including all required components of the SMART Aim data collection methodology. ♦ Listing the appropriate potential interventions based on the ranked failure modes.
After receiving technical assistance from HSAG, CCAH incorporated HSAG’s feedback into the PIP modules. Upon HSAG’s final review, HSAG determined that the MCP met all validation criteria for all submitted modules.
2017–19 DHCS-Priority Performance Improvement Project
During the review period, DHCS required CCAH to initiate a PIP related to one of DHCS’ Quality Strategy focus areas: Childhood Immunization Status—Combination 3, Controlling High Blood Pressure, Comprehensive Diabetes Care, or Prenatal and Postpartum Care— Postpartum Care. Based on the MCP’s performance measure results, CCAH selected childhood immunizations as its 2017–19 DHCS-priority PIP topic.
Table 4.6 provides the SMART Aim measure description, baseline rate, and SMART Aim goal rate for the PIP. The SMART Aim end date for this PIP is June 30, 2019.
Central California Alliance for Health Performance Evaluation Report: July 1, 2017–June 30, 2018 California Department of Health Care Services
Page J-44 Health Services Advisory Group, Inc.

PERFORMANCE IMPROVEMENT PROJECTS
Table 4.6—CCAH Childhood Immunization Status—Combination 3 PIP SMART Aim Measure
SMART Aim Measure Baseline Rate
SMART Aim Goal
Rate
Rate of Childhood Immunization Status—Combination 3 measure for beneficiaries assigned to Provider B8 33.8% 40.0%
Performance Improvement Project Validation Findings
During the review period of this report, HSAG validated modules 1 through 3 for the MCP’s Childhood Immunization Status—Combination 3 PIP. Upon initial review of the modules, HSAG determined that CCAH met some required validation criteria; however, HSAG identified opportunities for improvement related to:
♦ Supporting the topic selection with the MCP’s data. ♦ Identifying appropriate team members, to include both internal staff and external partners. ♦ Including all required components of the:
■ SMART Aim, developed based on literature review, data, and/or experience. ■ SMART Aim measure. ■ SMART Aim data collection methodology. ■ Run/control chart. ■ FMEA table.
♦ Aligning accurately the Global Aim, SMART Aim, key drivers, and potential interventions. ♦ Capturing all required data elements in the data collection tool. ♦ Including a step-by-step flow of the overall process in the process map. ♦ Supporting the sub-processes selection for the FMEA table. ♦ Describing the priority-ranking process. ♦ Listing the appropriate potential interventions based on the ranked failure modes. ♦ Considering the potential interventions’ reliability and sustainability.
After receiving technical assistance from HSAG, CCAH incorporated HSAG’s feedback into the PIP modules. Upon HSAG’s final review, HSAG determined that the MCP met all validation criteria for all submitted modules.
8 Provider name removed for confidentiality.
Central California Alliance for Health Performance Evaluation Report: July 1, 2017–June 30, 2018 California Department of Health Care Services
Page J-45 Health Services Advisory Group, Inc.

PERFORMANCE IMPROVEMENT PROJECTS
Strengths—Performance Improvement Projects CCAH achieved the SMART Aim goal for the 2015–17 Improving Health Outcomes of Persons Living With Asthma in Merced County PIP, and all quality improvement activities could be linked to the demonstrated improvement. Based on HSAG’s assessment, HSAG assigned the 2015–17 Improving Health Outcomes of Persons Living With Asthma in Merced County PIP a confidence level of High Confidence.
Opportunities for Improvement—Performance Improvement Projects CCAH has the opportunity to continue monitoring the adapted interventions and outcomes to facilitate improvement beyond the life of the 2015–17 Immunizations of Two-Year-Olds and Improving Health Outcomes of Persons Living With Asthma in Merced County PIPs. Ongoing monitoring will enable long-term evaluation of improvement and allow the MCP to continually refine interventions to achieve and sustain optimal outcomes.
Additionally, CCAH has the opportunity to apply the lessons learned from the 2015–17 Immunizations of Two-Year-Olds PIP to the MCP’s 2017–19 Childhood Immunization Status— Combination 3 PIP to address the MCP’s rate below the MPL in RY 2018 for the Childhood Immunization Status—Combination 3 measure in Merced County.
Central California Alliance for Health Performance Evaluation Report: July 1, 2017–June 30, 2018 California Department of Health Care Services
Page J-46 Health Services Advisory Group, Inc.

Medi-Cal Managed Care External Quality Review Technical ReportAppendix J: Performance Evaluation ReportCentral California Alliance for Health July 1, 2017–June 30, 2018
5. Recommendations
Follow-Up on Prior Year Recommendations DHCS provided each MCP an opportunity to outline actions taken to address recommendations HSAG made in its 2016–17 MCP-specific evaluation report. Table 5.1 provides EQR recommendations from CCAH’s July 1, 2016, through June 30, 2017, MCP-specific evaluation report, along with the MCP’s self-reported actions taken through June 30, 2018, that address the recommendations. Please note that HSAG made minimal edits to Table 5.1 to preserve the accuracy of CCAH’s self-reported actions.
Table 5.1—CCAH’s Self-Reported Follow-Up on External Quality ReviewRecommendations from the July 1, 2016, through June 30, 2017, MCP-SpecificEvaluation Report
2016–17 External Quality ReviewRecommendations Directed to CCAH
Self-Reported Actions Taken by CCAHduring the Period of July 1, 2017–June 30,2018, that Address the External QualityReview Recommendations
1. To allow for the MCP to research with its vendor and/or providers whether or not extreme lab values are accurate, implement data integrity reviews throughout the year and, if possible, system edits that will result in warnings for extreme lab values upon receipt from the vendor and/or providers.
CCAH reached out to lab providers prior to the HEDIS 2018 on-site audit to determine origination of extreme lab values. It was determined that alpha and numeric characters for Test Not Performed (TNP) were populating fields that should have otherwise been left as null. Internal HEDIS software dropped TNP values, but left numeric values during HEDIS 2017, hence causing errata. This was corrected by CCAH nulling out TNPXXX fields prior to HEDIS aggregation; the EQRO approved this methodology for CCAH's HEDIS 2018 audit.
2. Identify the causes for the MCP’s declining performance in both reporting units for the Use of Imaging Studies for Low Back Pain measure.
The Use of Imaging Studies for Low Back Pain measure is a low-denominator measure for CCAH. HEDIS results, determined by the value set, allowed more required exclusions in HEDIS 2016 than in HEDIS 2017, also shifting rate reporting. For example, HEDIS 2016 showed in one product as having a required exclusion rate of 32.44 percent for a denominator of 1,378, versus a required exclusion rate of 18.53 percent in HEDIS 2017
Central California Alliance for Health Performance Evaluation Report: July 1, 2017–June 30, 2018 California Department of Health Care Services
Page J-47 Health Services Advisory Group, Inc.

RECOMMENDATIONS
2016–17 External Quality ReviewRecommendations Directed to CCAH
Self-Reported Actions Taken by CCAHduring the Period of July 1, 2017–June 30,2018, that Address the External QualityReview Recommendations with a denominator of 1,797. Analysis revealed that value set changes could have prompted this. HEDIS 2018 results showed stable improvement in alignment with the HEDIS 2017 value set directory.
2017–18 Recommendations Based on the overall assessment of CCAH’s delivery of quality, accessible, and timely care through the activities described in previous sections of this report, HSAG recommends the following to the MCP:
♦ Work with DHCS to ensure that the MCP resolves all deficiencies from the November 2017 A&I Medical and State Supported Services Audits.
♦ To help improve the MCP’s performance to above the MPL in Merced County for the Childhood Immunization Status—Combination 3 measure: ■ Continue monitoring adapted interventions and outcomes to facilitate improvement
beyond the life of the 2015–17 Immunizations of Two-Year-Olds PIP. ■ Apply the lessons learned from the 2015–17 Immunizations of Two-Year-Olds PIP to
the MCP’s 2017–19 Childhood Immunization Status—Combination 3 PIP. ■ Conduct ongoing evaluation of the 2017–19 Childhood Immunization Status—
Combination 3 PIP intervention testing to monitor the effectiveness of the tested intervention(s). Based on evaluation results, the MCP should build on successes and, if needed, make changes in response to lessons learned.
♦ Continue monitoring the adapted intervention and outcomes to facilitate improvement beyond the life of the 2015–17 Improving Health Outcomes of Persons Living With Asthma in Merced County PIP.
In the next annual review, HSAG will evaluate continued successes of CCAH as well as the MCP’s progress with these recommendations.
Central California Alliance for Health Performance Evaluation Report: July 1, 2017–June 30, 2018 California Department of Health Care Services
Page J-48 Health Services Advisory Group, Inc.

Medi-Cal Managed CareExternal Quality Review Technical Report
Appendix K: Performance Evaluation Report
Community Health Group Partnership Plan
July 1, 2017–June 30, 2018
Medi-Cal Managed Care External Quality Review Technical ReportAppendix K: Performance Evaluation ReportCommunity Health Group Partnership PlanJuly 1, 2017–June 30, 2018
Table of Contents
1. Introduction.............................................................................................................K-1 Medi-Cal Managed Care Health Plan Overview .......................................................K-1
2. Managed Care Health Plan Compliance ...............................................................K-3Compliance Reviews Conducted..............................................................................K-3
3. Managed Care Health Plan Performance Measures ............................................K-4Performance Measure Validation Results ................................................................K-4 Performance Measure Results and Findings............................................................K-4
Preventive Screening and Children’s Health .........................................................K-5 Preventive Screening and Women’s Health ..........................................................K-9 Care for Chronic Conditions ................................................................................K-11 Appropriate Treatment and Utilization.................................................................K-13 Performance Measure Findings—All Domains....................................................K-16
Seniors and Persons with Disabilities Performance Measure Results....................K-18 Seniors and Persons with Disabilities Findings ...................................................K-23
Strengths—Performance Measures .......................................................................K-23 Opportunities for Improvement—Performance Measures ......................................K-24
4. MLTSSP Performance Measure Results.............................................................K-25 Managed Long-Term Services and Supports Plan Performance Measure Findings K-26
5. Performance Improvement Projects ...................................................................K-27Performance Improvement Project Overview .........................................................K-27 Performance Improvement Project Results and Findings.......................................K-28
2015–17 DHCS-Priority Performance Improvement Project ...............................K-29 2015–17 MCP-Specific Performance Improvement Project ................................K-30 2017–19 Disparity Performance Improvement Project ........................................K-31 2017–19 DHCS-Priority Performance Improvement Project ...............................K-32
Strengths—Performance Improvement Projects ....................................................K-33 Opportunities for Improvement—Performance Improvement Projects ...................K-34
6. Recommendations................................................................................................K-35 Follow-Up on Prior Year Recommendations ..........................................................K-35 2017–18 Recommendations...................................................................................K-36
Community Health Group Partnership Plan Performance Evaluation Report: July 1, 2017–June 30, 2018 California Department of Health Care Services
Page K-i Health Services Advisory Group, Inc.

TABLE OF CONTENTS
Table of Tables
Table 3.1—Preventive Screening and Children’s Health Domain Multi-Year Performance Measure Results CHG—San Diego County ................................................K-6
Table 3.2—Preventive Screening and Children’s Health Domain RY 2018 (MY 2017) Performance Measure Findings CHG—San Diego County .........................K-8
Table 3.3—Preventive Screening and Women’s Health Domain Multi-Year Performance Measure Results CHG—San Diego County ................................................K-9
Table 3.4—Preventive Screening and Women’s Health Domain RY 2018 (MY 2017) Performance Measure Findings CHG—San Diego County .......................K-10
Table 3.5—Care for Chronic Conditions Domain Multi-Year Performance Measure Results CHG—San Diego County .............................................................K-11
Table 3.6—Care for Chronic Conditions Domain RY 2018 (MY 2017) Performance Measure Findings CHG—San Diego County.............................................K-12
Table 3.7—Appropriate Treatment and Utilization Domain Multi-Year Performance Measure Results CHG—San Diego County ..............................................K-14
Table 3.8—Appropriate Treatment and Utilization Domain RY 2018 (MY 2017) Performance Measure Findings CHG—San Diego County .......................K-15
Table 3.9—RY 2018 (MY 2017) Performance Measure Findings for All Domains CHG—San Diego County ..........................................................................K-17
Table 3.10—Multi-Year SPD Performance Measure Trend Table CHG— San Diego County......................................................................................K-18
Table 3.11—Multi-Year Non-SPD Performance Measure Trend Table CHG— San Diego County......................................................................................K-20
Table 3.12—RY 2018 (MY 2017) Performance Measure Comparison and Results for Measures Stratified by the SPD and Non-SPD Populations CHG— San Diego County......................................................................................K-21
Table 4.1—Multi-Year MLTSSP Performance Measure Results CHG—San Diego County K-25 Table 5.1—CHG Diabetes Retinal Eye Exam PIP SMART Aim Measure Results .......K-29 Table 5.2—CHG Diabetes Retinal Eye Exam PIP Intervention Testing Results ..........K-29 Table 5.3—CHG Annual Monitoring of Patients on Persistent Medications—
ACE Inhibitors or ARBs PIP SMART Aim Measure Results ......................K-30 Table 5.4—CHG Annual Monitoring of Patients on Persistent Medications—
ACE Inhibitors or ARBs PIP Intervention Testing Results..........................K-31 Table 5.5—CHG Annual Provider Visits Disparity PIP SMART Aim Measure..............K-32 Table 5.6—CHG Childhood Immunization Status—Combination 3 PIP SMART Aim
Measure.....................................................................................................K-33 Table 6.1—CHG’s Self-Reported Follow-Up on External Quality Review
Recommendations from the July 1, 2016, through June 30, 2017, MCP-Specific Evaluation Report................................................................K-35
Community Health Group Partnership Plan Performance Evaluation Report: July 1, 2017–June 30, 2018 California Department of Health Care Services
Page K-ii Health Services Advisory Group, Inc.

Medi-Cal Managed Care External Quality Review Technical ReportAppendix K: Performance Evaluation ReportCommunity Health Group Partnership PlanJuly 1, 2017–June 30, 2018
1. Introduction
The California Department of Health Care Services (DHCS) contracted with Health Services Advisory Group, Inc. (HSAG), an external quality review organization (EQRO), to prepare the federally required Medi-Cal Managed Care External Quality Review Technical Report, July 1, 2017–June 30, 2018. The technical report provides an overview of the objectives and methodology for conducting the external quality review (EQR) activities, including requirements related to each activity. Additionally, the technical report provides aggregated results and recommendations for DHCS for each activity.
This appendix is specific to DHCS’ contracted Medi-Cal managed care health plan (MCP), Community Health Group Partnership Plan (“CHG” or “the MCP”). The purpose of this appendix is to provide MCP-specific results of each activity and an assessment of the MCP’s strengths and opportunities for improvement with respect to the quality and timeliness of and access to health care services furnished to Medi-Cal Managed Care (MCMC) beneficiaries (referred to as “beneficiaries” in this report). The review period for this MCP-specific evaluation report is July 1, 2017, through June 30, 2018. HSAG will report on activities that take place beyond the review period in CHG’s 2018–19 MCP-specific evaluation report. This MCP-specific evaluation report references activities and methodologies described in detail by HSAG in the technical report section.
The aggregate EQR technical report and all MCP- and specialty health plan (SHP)-specific performance evaluation reports reflect HSAG’s external, independent assessment of the quality and timeliness of, and access to, care that MCPs and SHPs are providing to beneficiaries.
Medi-Cal Managed Care Health Plan Overview CHG is a full-scope MCP delivering services to beneficiaries under a Geographic Managed Care (GMC) model. The GMC model currently operates in the counties of San Diego and Sacramento. In this GMC model, DHCS allows beneficiaries to select from several commercial MCPs within the specified geographic service area (county).
In addition to CHG, San Diego County’s beneficiaries may select from the following MCPs: ♦ Aetna Better Health of California ♦ Care1st Partner Plan ♦ Health Net Community Solutions, Inc. ♦ Kaiser SoCal ♦ Molina Healthcare of California Partner Plan, Inc. ♦ UnitedHealthcare Community Plan
Community Health Group Partnership Plan Performance Evaluation Report: July 1, 2017–June 30, 2018 California Department of Health Care Services
Page K-1 Health Services Advisory Group, Inc.

INTRODUCTION
CHG became operational in San Diego County to provide MCMC services effective August 1998. As of June 30, 2018, CHG had 273,540 beneficiaries.1 This represents 38 percent of the beneficiaries enrolled in San Diego County.
1 Medi-Cal Managed Care Enrollment Report—June 2018. Available at: http://www.dhcs.ca.gov/dataandstats/reports/Pages/MMCDMonthlyEnrollment.aspx. Accessed on: Oct 10, 2018.
Community Health Group Partnership Plan Performance Evaluation Report: July 1, 2017–June 30, 2018 California Department of Health Care Services
Page K-2 Health Services Advisory Group, Inc.

Medi-Cal Managed Care External Quality Review Technical ReportAppendix K: Performance Evaluation ReportCommunity Health Group Partnership PlanJuly 1, 2017–June 30, 2018
2. Managed Care Health Plan Compliance
Compliance Reviews Conducted DHCS Audits & Investigations Division (A&I) conducted on-site Medical and State Supported Services Audits of CHG from June 25, 2018, through June 27, 2018, covering the review period of June 1, 2017, through May 31, 2018. At the time that this MCP-specific evaluation report was produced, the audit reports were pending. HSAG will include the results of the June 2018 audits in CHG’s 2018–19 MCP-specific evaluation report.
Community Health Group Partnership Plan Performance Evaluation Report: July 1, 2017–June 30, 2018 California Department of Health Care Services
Page K-3 Health Services Advisory Group, Inc.
Medi-Cal Managed Care External Quality Review Technical ReportAppendix K: Performance Evaluation ReportCommunity Health Group Partnership PlanJuly 1, 2017–June 30, 2018
3. Managed Care Health Plan Performance Measures
Performance Measure Validation Results The HEDIS®2 2018 Compliance Audit Final Report of Findings for Community Health Group Partnership Plan contains the detailed findings and recommendations from HSAG’s NCQA HEDIS Compliance Audit™.3 HSAG auditors determined that CHG followed the appropriate specifications to produce valid rates, and identified no issues of concern.
Performance Measure Results and Findings After validating the MCP’s performance measure rates, HSAG assessed the results. See Table 3.1 through Table 3.9 for CHG’s performance measure results for reporting years (RYs) 2015 through 2018 and performance measure findings for RY 2018. The RY is the year in which the MCP reported the rates. The RY rates reflect measurement year (MY) data from the previous calendar year. Note that data may not be available for all four years.
Note the following regarding Table 3.1 through Table 3.9:
♦ To allow HSAG to provide meaningful assessment of MCP performance and actionable recommendations, HSAG, in collaboration with DHCS, organized the measures into domains based on the health care areas each measure affects. Table 3.1 through Table 3.8 present the performance measure results and findings by domain, and Table 3.9 presents the RY 2018 performance measure findings for the domains combined.
♦ To assess performance for each MCP reporting unit, HSAG compares the rates to national benchmarks. Rates indicating performance above the high performance levels (HPLs) are shaded in gray, and rates indicating performance below the minimum performance levels (MPLs) are bolded. ■ For measures with rates below the MPLs, DHCS requires MCPs to submit to DHCS
improvement plans (IPs) to address the rates below the MPLs (unless MCPs are reporting the rates for the first time).
■ For MCPs that meet DHCS’ Quality of Care CAP thresholds, DHCS issues a CAP; if an MCP’s performance is such that it may trigger a CAP in the following year, DHCS issues an advance warning letter.
■ IPs and CAPs consist of submission of Plan-Do-Study-Act (PDSA) Cycle Worksheets, Quality Improvement (QI) Summaries, or completion of Performance Improvement Projects (PIPs)—as determined by DHCS.
2 Healthcare Effectiveness Data and Information Set (HEDIS®) is a registered trademark of the National Committee for Quality Assurance (NCQA).
3 NCQA HEDIS Compliance AuditTM is a trademark of NCQA.
Community Health Group Partnership Plan Performance Evaluation Report: July 1, 2017–June 30, 2018 California Department of Health Care Services
Page K-4 Health Services Advisory Group, Inc.

MANAGED CARE HEALTH PLAN PERFORMANCE MEASURES
♦ For RYs 2016, 2017, and 2018, the HPLs and MPLs represent the NCQA Quality Compass®4 Medicaid health maintenance organization (HMO) 90th and 25th percentiles, respectively.
♦ For RY 2015, the HPLs and MPLs represent the NCQA HEDIS Audit Means, Percentiles, and Ratios 90th and 25th percentiles, respectively. For the Comprehensive Diabetes Care—HbA1c Poor Control (>9.0 Percent) measure, for which a lower rate indicates more favorable performance, the HPL and MPL are based on the 10th and 75th percentiles, respectively.
♦ HSAG includes the specific HPL and MPL values for RY 2018 in Section 6 of the Medi-Cal Managed Care External Quality Review Technical Report, July 1, 2017–June 30, 2018 (“Managed Care Health Plan Performance Measures”).
Preventive Screening and Children’s Health
Table 3.1 presents the four-year trending information for the performance measures within the Preventive Screening and Children’s Health domain.
Note the following regarding Table 3.1:
♦ Although HSAG includes information on the MCP’s performance related to the four Children and Adolescents’ Access to Primary Care measures, DHCS did not hold MCPs accountable to meet the MPLs for these measures for RYs 2015 through 2018 (i.e., DHCS did not require MCPs to submit IPs if rates for the measures were below the MPLs). DHCS made this decision due to the small range of variation between the HPL and MPL thresholds for each measure.
♦ Any comparison of RY 2018 performance to RY 2017 or to benchmarks related to the Immunizations for Adolescents—Combination 2 measure should be exercised with caution given the changes that NCQA made to the specification for this measure for RY 2018. NCQA released guidance that recommended a break in trending for this measure; however, DHCS determined to continue trending because the specification change should result in higher rates.
4 Quality Compass® is a registered trademark of NCQA.
Community Health Group Partnership Plan Performance Evaluation Report: July 1, 2017–June 30, 2018 California Department of Health Care Services
Page K-5 Health Services Advisory Group, Inc.
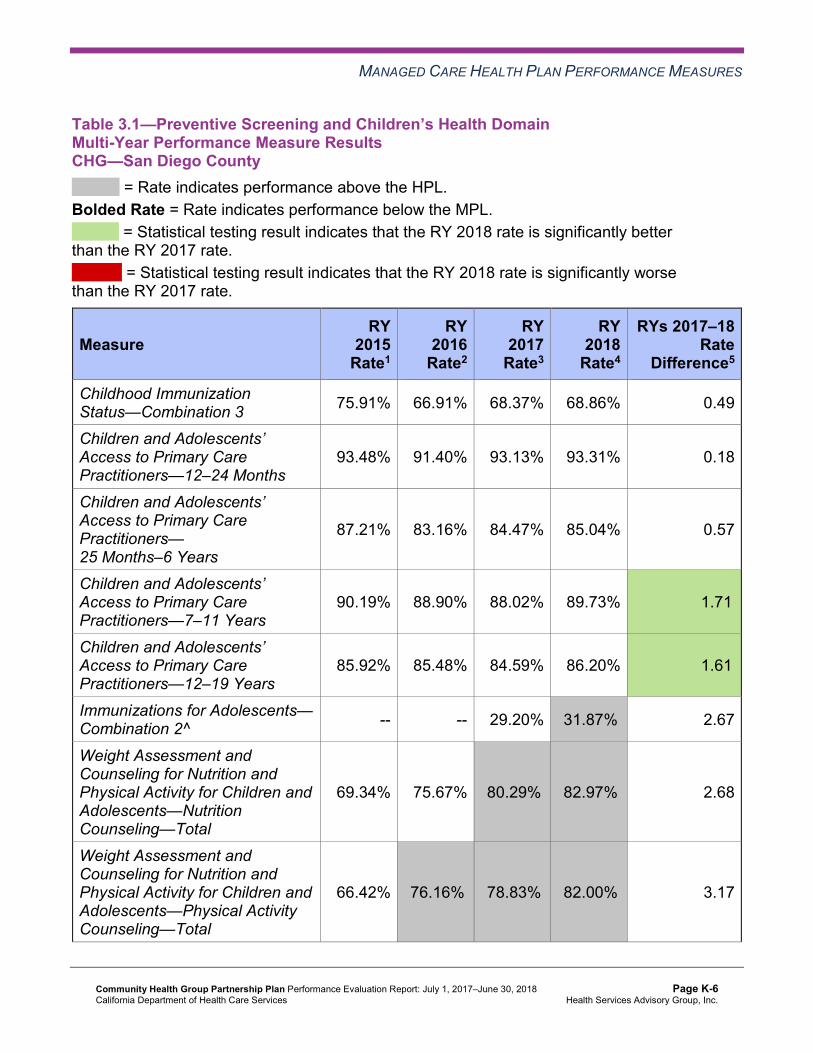
MANAGED CARE HEALTH PLAN PERFORMANCE MEASURES
Table 3.1—Preventive Screening and Children’s Health DomainMulti-Year Performance Measure Results CHG—San Diego County
H = Rate indicates performance above the HPL. Bolded Rate = Rate indicates performance below the MPL.
B = Statistical testing result indicates that the RY 2018 rate is significantly better than the RY 2017 rate.
W = Statistical testing result indicates that the RY 2018 rate is significantly worse than the RY 2017 rate.
Measure RY
2015 Rate1
RY 2016
Rate2
RY 2017
Rate3
RY 2018
Rate4
RYs 2017–18 Rate
Difference5
Childhood Immunization Status—Combination 3 75.91% 66.91% 68.37% 68.86% 0.49
Children and Adolescents’ Access to Primary Care Practitioners—12–24 Months
93.48% 91.40% 93.13% 93.31% 0.18
Children and Adolescents’ Access to Primary Care Practitioners— 25 Months–6 Years
87.21% 83.16% 84.47% 85.04% 0.57
Children and Adolescents’ Access to Primary Care Practitioners—7–11 Years
90.19% 88.90% 88.02% 89.73% 1.71B
Children and Adolescents’ Access to Primary Care Practitioners—12–19 Years
85.92% 85.48% 84.59% 86.20% 1.61B
Immunizations for Adolescents— Combination 2^ -- -- 29.20% 31.87%H 2.67
Weight Assessment and Counseling for Nutrition and Physical Activity for Children and Adolescents—Nutrition Counseling—Total
69.34% 75.67% 80.29%H 82.97%H 2.68
Weight Assessment and Counseling for Nutrition and Physical Activity for Children and Adolescents—Physical Activity Counseling—Total
66.42% 76.16%H 78.83%H 82.00%H 3.17
Community Health Group Partnership Plan Performance Evaluation Report: July 1, 2017–June 30, 2018 California Department of Health Care Services
Page K-6 Health Services Advisory Group, Inc.

MANAGED CARE HEALTH PLAN PERFORMANCE MEASURES
Measure RY
2015 Rate1
RY 2016
Rate2
RY 2017
Rate3
RY 2018
Rate4
RYs 2017–18 Rate
Difference5
Well-Child Visits in the Third, Fourth, Fifth, and Sixth Years of Life
73.24% 70.32% 71.05% 73.24% 2.19
1 RY 2015 rates reflect MY data from January 1, 2014, through December 31, 2014. 2 RY 2016 rates reflect MY data from January 1, 2015, through December 31, 2015. 3 RY 2017 rates reflect MY data from January 1, 2016, through December 31, 2016. 4 RY 2018 rates reflect MY data from January 1, 2017, through December 31, 2017. 5 Performance comparisons are based on the Chi-square test of statistical significance, with a p value of <0.05. ^ Caution should be exercised when assessing MCP performance for this measure given the changes that NCQA made to the specification for this measure for RY 2018. -- Indicates that the rate is not available.
Table 3.2 presents findings for the RY 2018 performance measures within the Preventive Screening and Children’s Health domain.
Note the following regarding Table 3.2:
♦ DHCS did not hold MCPs accountable to meet MPLs for all four Children and Adolescents’ Access to Primary Care measures within this domain; therefore, HSAG did not include these measures in its assessment of the MCP’s performance related to HPLs and MPLs.
♦ The Immunizations for Adolescents—Combination 2 measure was a first-year measure in RY 2017, and DHCS established no MPL for this measure for RY 2017 because no comparable benchmark existed; therefore, HSAG did not include this measure in the denominators for calculating the percentage of measures with rates that moved to above or below the MPLs in RY 2018.
Community Health Group Partnership Plan Performance Evaluation Report: July 1, 2017–June 30, 2018 California Department of Health Care Services
Page K-7 Health Services Advisory Group, Inc.

MANAGED CARE HEALTH PLAN PERFORMANCE MEASURES
Table 3.2—Preventive Screening and Children’s Health DomainRY 2018 (MY 2017) Performance Measure Findings CHG—San Diego County
Criteria Number of Measures
MeetingCriteria
Total Number of Measures
Percentage of Measures
MeetingCriteria
RY 2018 Rates Above HPLs 3 5 60.00% Rates Above HPLs for the Last Three or More Consecutive Years 1 4 25.00%
RY 2018 Rates Significantly Better than RY 2017 Rates* 0 5 0.00%
Rates that Moved from Below MPLs in RY 2017 to Above MPLs in RY 2018 0 0 N/A
RY 2018 Rates Below MPLs 0 5 0.00% Rates Below MPLs for the Last Three or More Consecutive Years 0 4 0.00%
RY 2018 Rates Significantly Worse than RY 2017 Rates* 0 5 0.00%
Rates that Moved from Above MPLs in RY 2017 to Below MPLs in RY 2018 0 4 0.00%
* Performance comparisons are based on the Chi-square test of statistical significance, with a p value of <0.05. N/A = No rates above or below the MPLs from the previous year exist to include in the denominator for calculating whether or not rates moved to above or below MPLs in the most recent year.
Community Health Group Partnership Plan Performance Evaluation Report: July 1, 2017–June 30, 2018 California Department of Health Care Services
Page K-8 Health Services Advisory Group, Inc.

MANAGED CARE HEALTH PLAN PERFORMANCE MEASURES
Preventive Screening and Women’s Health
Table 3.3 presents the four-year trending information for the performance measures within the Preventive Screening and Women’s Health domain.
Note that any comparison of RY 2018 performance to RY 2017 or to benchmarks related to the Breast Cancer Screening measure should be exercised with caution given the changes that NCQA made to the specification for this measure for RY 2018. NCQA released guidance that recommended a break in trending for this measure; however, DHCS determined to continue trending because the specification change should result in higher rates.
Table 3.3—Preventive Screening and Women’s Health DomainMulti-Year Performance Measure Results CHG—San Diego County
H = Rate indicates performance above the HPL. Bolded Rate = Rate indicates performance below the MPL.
B = Statistical testing result indicates that the RY 2018 rate is significantly better than the RY 2017 rate.
W = Statistical testing result indicates that the RY 2018 rate is significantly worse than the RY 2017 rate.
Measure RY
2015 Rate1
RY 2016
Rate2
RY 2017
Rate3
RY 2018
Rate4
RYs 2017–18 Rate
Difference5
Breast Cancer Screening^ -- -- 64.15% 65.18% 1.03 Cervical Cancer Screening 59.37% 54.78% 55.23% 57.42% 2.19 Prenatal and Postpartum Care— Postpartum Care 57.66% 56.93% 58.15% 66.91% 8.76B
Prenatal and Postpartum Care— Timeliness of Prenatal Care 77.86% 78.83% 79.32% 84.18% 4.86
1 RY 2015 rates reflect MY data from January 1, 2014, through December 31, 2014. 2 RY 2016 rates reflect MY data from January 1, 2015, through December 31, 2015. 3 RY 2017 rates reflect MY data from January 1, 2016, through December 31, 2016. 4 RY 2018 rates reflect MY data from January 1, 2017, through December 31, 2017. 5 Performance comparisons are based on the Chi-square test of statistical significance, with a p value of <0.05. ^ Caution should be exercised when assessing MCP performance for this measure given the changes that NCQA made to the specification for this measure for RY 2018. -- Indicates that the rate is not available.
Community Health Group Partnership Plan Performance Evaluation Report: July 1, 2017–June 30, 2018 California Department of Health Care Services
Page K-9 Health Services Advisory Group, Inc.

MANAGED CARE HEALTH PLAN PERFORMANCE MEASURES
Table 3.4 presents findings for the RY 2018 performance measures within the Preventive Screening and Women’s Health domain. Note that the Breast Cancer Screening measure was a first-year measure in RY 2017, and DHCS did not hold MCPs accountable to meet an MPL for this measure in RY 2017; therefore, HSAG did not include this measure in the denominators for calculating the percentage of measures with rates that moved to above or below the MPLs in RY 2018.
Table 3.4—Preventive Screening and Women’s Health DomainRY 2018 (MY 2017) Performance Measure FindingsCHG—San Diego County
Criteria Number of Measures
MeetingCriteria
Total Number of Measures
Percentage of Measures
MeetingCriteria
RY 2018 Rates Above HPLs 0 4 0.00% Rates Above HPLs for the Last Three or More Consecutive Years 0 3 0.00%
RY 2018 Rates Significantly Better than RY 2017 Rates* 1 4 25.00%
Rates that Moved from Below MPLs in RY 2017 to Above MPLs in RY 2018 0 0 N/A
RY 2018 Rates Below MPLs 0 4 0.00% Rates Below MPLs for the Last Three or More Consecutive Years 0 3 0.00%
RY 2018 Rates Significantly Worse than RY 2017 Rates* 0 4 0.00%
Rates that Moved from Above MPLs in RY 2017 to Below MPLs in RY 2018 0 3 0.00%
* Performance comparisons are based on the Chi-square test of statistical significance, with a p value of <0.05. N/A = No rates above or below the MPLs from the previous year exist to include in the denominator for calculating whether or not rates moved to above or below MPLs in the most recent year.
Community Health Group Partnership Plan Performance Evaluation Report: July 1, 2017–June 30, 2018 California Department of Health Care Services
Page K-10 Health Services Advisory Group, Inc.

MANAGED CARE HEALTH PLAN PERFORMANCE MEASURES
Care for Chronic Conditions
Table 3.5 presents the four-year trending information for the performance measures within the Care for Chronic Conditions domain.
Table 3.5—Care for Chronic Conditions Domain Multi-Year Performance Measure Results CHG—San Diego County
H = Rate indicates performance above the HPL. Bolded Rate = Rate indicates performance below the MPL.
B = Statistical testing result indicates that the RY 2018 rate is significantly better than the RY 2017 rate.
W = Statistical testing result indicates that the RY 2018 rate is significantly worse than the RY 2017 rate.
Measure RY
2015 Rate1
RY 2016
Rate2
RY 2017
Rate3
RY 2018
Rate4
RYs 2017–18 Rate
Difference5
Annual Monitoring for Patients on Persistent Medications— ACE Inhibitors or ARBs
84.37% 87.62% 91.28% 90.72% -0.56
Annual Monitoring for Patients on Persistent Medications— Diuretics
85.87% 87.44% 92.01% 91.00% -1.01W
Asthma Medication Ratio -- -- 81.98%H 64.29% -17.69W
Comprehensive Diabetes Care— Blood Pressure Control (<140/90 mm Hg)
56.45% 57.18% 63.50% 76.28%H 12.78B
Comprehensive Diabetes Care— Eye Exam (Retinal) Performed 54.74% 51.82% 60.34% 66.97% 6.63B
Comprehensive Diabetes Care— HbA1c Control (<8.0 Percent) 54.26% 50.61% 59.12%H 59.49%H 0.37
Comprehensive Diabetes Care— HbA1c Poor Control (>9.0 Percent)*
36.01% 38.44% 29.93% 30.29% 0.36
Comprehensive Diabetes Care— HbA1c Testing 91.00% 89.54% 90.02% 90.69% 0.67
Comprehensive Diabetes Care— Medical Attention for Nephropathy
89.29%H 90.51%H 93.67%H 93.07% -0.60
Community Health Group Partnership Plan Performance Evaluation Report: July 1, 2017–June 30, 2018 California Department of Health Care Services
Page K-11 Health Services Advisory Group, Inc.

MANAGED CARE HEALTH PLAN PERFORMANCE MEASURES
Measure RY
2015 Rate1
RY 2016
Rate2
RY 2017
Rate3
RY 2018
Rate4
RYs 2017–18 Rate
Difference5
Controlling High Blood Pressure 50.86% 51.82% 56.69% 62.53% 5.84 1 RY 2015 rates reflect MY data from January 1, 2014, through December 31, 2014. 2 RY 2016 rates reflect MY data from January 1, 2015, through December 31, 2015. 3 RY 2017 rates reflect MY data from January 1, 2016, through December 31, 2016. 4 RY 2018 rates reflect MY data from January 1, 2017, through December 31, 2017. 5 Performance comparisons are based on the Chi-square test of statistical significance, with a p value of <0.05. * A lower rate indicates better performance for this measure. -- Indicates that the rate is not available.
Table 3.6 presents findings for the RY 2018 performance measures within the Care for Chronic Conditions domain. Note that the Asthma Medication Ratio measure was a first-year measure in RY 2017, and DHCS did not hold MCPs accountable to meet an MPL for this measure in RY 2017; therefore, HSAG did not include this measure in the denominators for calculating the percentage of measures with rates that moved to above or below the MPLs in RY 2018.
Table 3.6—Care for Chronic Conditions Domain RY 2018 (MY 2017) Performance Measure Findings CHG—San Diego County
Criteria Number of Measures
MeetingCriteria
Total Number of Measures
Percentage of Measures
MeetingCriteria
RY 2018 Rates Above HPLs 2 10 20.00% Rates Above HPLs for the Last Three or More Consecutive Years 0 9 0.00%
RY 2018 Rates Significantly Better than RY 2017 Rates* 2 10 20.00%
Rates that Moved from Below MPLs in RY 2017 to Above MPLs in RY 2018 0 0 N/A
RY 2018 Rates Below MPLs 0 10 0.00% Rates Below MPLs for the Last Three or More Consecutive Years 0 9 0.00%
RY 2018 Rates Significantly Worse than RY 2017 Rates* 2 10 20.00%
Community Health Group Partnership Plan Performance Evaluation Report: July 1, 2017–June 30, 2018 California Department of Health Care Services
Page K-12 Health Services Advisory Group, Inc.
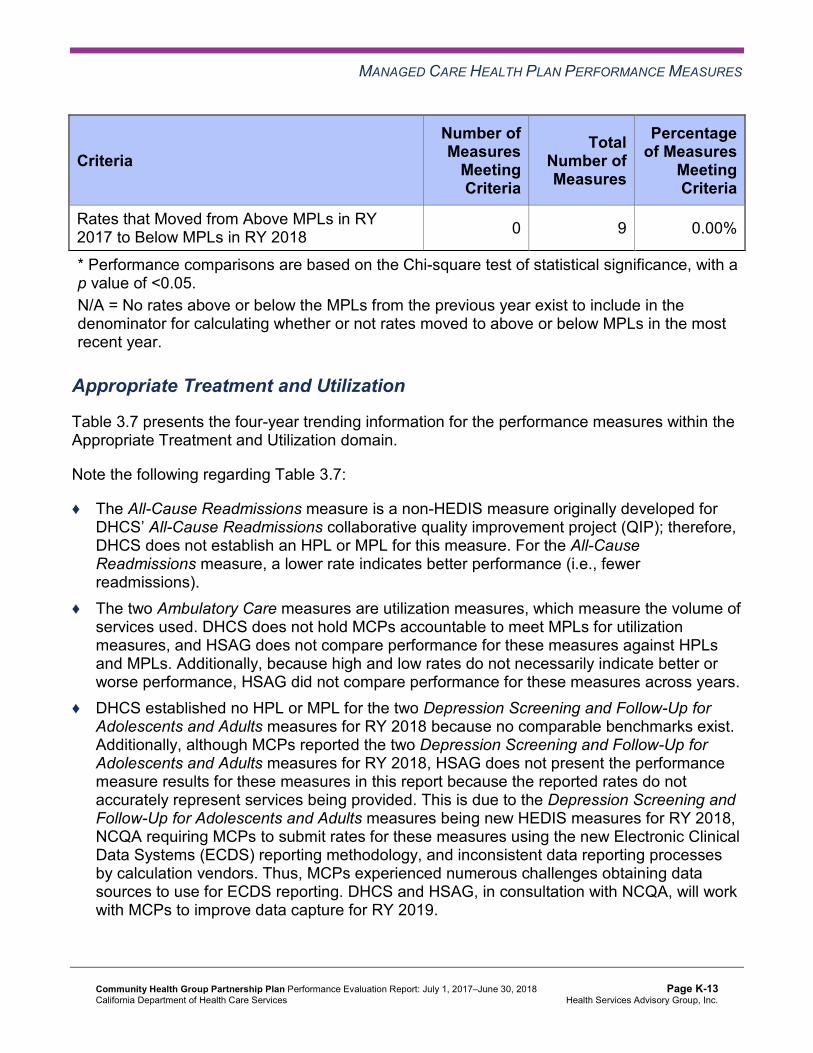
MANAGED CARE HEALTH PLAN PERFORMANCE MEASURES
Criteria Number of Measures
MeetingCriteria
Total Number of Measures
Percentage of Measures
MeetingCriteria
Rates that Moved from Above MPLs in RY 2017 to Below MPLs in RY 2018 0 9 0.00%
* Performance comparisons are based on the Chi-square test of statistical significance, with a p value of <0.05. N/A = No rates above or below the MPLs from the previous year exist to include in the denominator for calculating whether or not rates moved to above or below MPLs in the most recent year.
Appropriate Treatment and Utilization
Table 3.7 presents the four-year trending information for the performance measures within the Appropriate Treatment and Utilization domain.
Note the following regarding Table 3.7:
♦ The All-Cause Readmissions measure is a non-HEDIS measure originally developed for DHCS’ All-Cause Readmissions collaborative quality improvement project (QIP); therefore, DHCS does not establish an HPL or MPL for this measure. For the All-Cause Readmissions measure, a lower rate indicates better performance (i.e., fewer readmissions).
♦ The two Ambulatory Care measures are utilization measures, which measure the volume of services used. DHCS does not hold MCPs accountable to meet MPLs for utilization measures, and HSAG does not compare performance for these measures against HPLs and MPLs. Additionally, because high and low rates do not necessarily indicate better or worse performance, HSAG did not compare performance for these measures across years.
♦ DHCS established no HPL or MPL for the two Depression Screening and Follow-Up for Adolescents and Adults measures for RY 2018 because no comparable benchmarks exist. Additionally, although MCPs reported the two Depression Screening and Follow-Up for Adolescents and Adults measures for RY 2018, HSAG does not present the performance measure results for these measures in this report because the reported rates do not accurately represent services being provided. This is due to the Depression Screening and Follow-Up for Adolescents and Adults measures being new HEDIS measures for RY 2018, NCQA requiring MCPs to submit rates for these measures using the new Electronic Clinical Data Systems (ECDS) reporting methodology, and inconsistent data reporting processes by calculation vendors. Thus, MCPs experienced numerous challenges obtaining data sources to use for ECDS reporting. DHCS and HSAG, in consultation with NCQA, will work with MCPs to improve data capture for RY 2019.
Community Health Group Partnership Plan Performance Evaluation Report: July 1, 2017–June 30, 2018 California Department of Health Care Services
Page K-13 Health Services Advisory Group, Inc.

MANAGED CARE HEALTH PLAN PERFORMANCE MEASURES
♦ Note that due to changes that NCQA made to the specifications for the Use of Imaging Studies for Low Back Pain measure in RY 2018, NCQA released guidance to exercise caution when trending the results for this measure. Therefore, caution should be used when comparing MCP performance across years or when comparing MCP results to benchmarks related to the Use of Imaging Studies for Low Back Pain measure, as differences in rates may be a result of the specification changes rather than a reflection of performance.
Table 3.7—Appropriate Treatment and Utilization DomainMulti-Year Performance Measure Results CHG—San Diego County
H = Rate indicates performance above the HPL. Bolded Rate = Rate indicates performance below the MPL.
B = Statistical testing result indicates that the RY 2018 rate is significantly better than the RY 2017 rate.
W = Statistical testing result indicates that the RY 2018 rate is significantly worse than the RY 2017 rate.
Measure RY
2015 Rate1
RY 2016
Rate2
RY 2017
Rate3
RY 2018
Rate4
RYs 2017–18 Rate
Difference5
All-Cause Readmissions* 18.76% 15.66% 14.73% 14.88% 0.15 Ambulatory Care—Emergency Department (ED) Visits per 1,000 Member Months**
46.22 43.83 42.05 41.47 Not Tested
Ambulatory Care—Outpatient Visits per 1,000 Member Months**
288.23 281.00 274.02 298.87 Not Tested
Avoidance of Antibiotic Treatment in Adults With Acute Bronchitis
44.60%H 41.67%H 50.74%H 61.03%H 10.29B
Use of Imaging Studies for Low Back Pain^ 72.17% 70.98% 63.95% 71.44% 7.49B
1 RY 2015 rates reflect MY data from January 1, 2014, through December 31, 2014. 2 RY 2016 rates reflect MY data from January 1, 2015, through December 31, 2015. 3 RY 2017 rates reflect MY data from January 1, 2016, through December 31, 2016. 4 RY 2018 rates reflect MY data from January 1, 2017, through December 31, 2017. 5 Performance comparisons are based on the Chi-square test of statistical significance, with a p value of <0.05. * A lower rate indicates better performance for this measure.
Community Health Group Partnership Plan Performance Evaluation Report: July 1, 2017–June 30, 2018 California Department of Health Care Services
Page K-14 Health Services Advisory Group, Inc.

MANAGED CARE HEALTH PLAN PERFORMANCE MEASURES
** Member months are a member's “contribution” to the total yearly membership. ^ Caution should be exercised when assessing MCP performance for this measure given the changes that NCQA made to the specification for this measure for RY 2018. Not Tested = An RY 2017–18 rate difference was not calculated because high and low rates do not necessarily indicate better or worse performance.
Table 3.8 presents findings for the RY 2018 performance measures within the Appropriate Treatment and Utilization domain. DHCS did not hold MCPs accountable to meet MPLs for the following measures within this domain; therefore, HSAG did not include these measures in its assessment of the MCP’s performance related to HPLs and MPLs:
♦ All-Cause Readmissions ♦ Both Ambulatory Care measures
Table 3.8—Appropriate Treatment and Utilization DomainRY 2018 (MY 2017) Performance Measure Findings CHG—San Diego County
Criteria Number of Measures
MeetingCriteria
Total Number of Measures
Percentage of Measures
MeetingCriteria
RY 2018 Rates Above HPLs 1 2 50.00% Rates Above HPLs for the Last Three or More Consecutive Years 1 2 50.00%
RY 2018 Rates Significantly Better than RY 2017 Rates* 2 3 66.67%
Rates that Moved from Below MPLs in RY 2017 to Above MPLs in RY 2018 1 1 100.00%
RY 2018 Rates Below MPLs 0 2 0.00% Rates Below MPLs for the Last Three or More Consecutive Years 0 2 0.00%
RY 2018 Rates Significantly Worse than RY 2017 Rates* 0 3 0.00%
Rates that Moved from Above MPLs in RY 2017 to Below MPLs in RY 2018 0 1 0.00%
* Performance comparisons are based on the Chi-square test of statistical significance, with a p value of <0.05.
Community Health Group Partnership Plan Performance Evaluation Report: July 1, 2017–June 30, 2018 California Department of Health Care Services
Page K-15 Health Services Advisory Group, Inc.

MANAGED CARE HEALTH PLAN PERFORMANCE MEASURES
Assessment of Improvement Plans—Appropriate Treatment and Utilization
Based on RY 2017 performance measure results, CHG was required to submit an IP for the Use of Imaging Studies for Low Back Pain measure. CHG conducted two PDSA cycles to test whether or not conducting train-the-trainer trainings on promoting physicians to follow the American College of Physicians guidelines and the Use of Imaging Studies for Low Back Pain measure specification would result in a decrease in inappropriate imaging prescribing. The MCP reported that inappropriate imaging decreased and reported learning the importance of also providing the train-the-trainer trainings to non-physician providers (e.g., nurse practitioners, physician assistants).
The rate for the Use of Imaging Studies for Low Back Pain measure improved significantly from RY 2017 to RY 2018, resulting in the rate moving to above the MPL in RY 2018.
Performance Measure Findings—All Domains
Table 3.9 presents a summary of CHG’s RY 2018 performance across all External Accountability Set (EAS) measures.
Note the following regarding Table 3.9:
♦ DHCS did not hold MCPs accountable to meet MPLs for the following measures; therefore, HSAG did not include these measures in its assessment of the MCP’s performance related to HPLs and MPLs: ■ All-Cause Readmissions ■ Both Ambulatory Care measures ■ All four Children and Adolescents’ Access to Primary Care measures
♦ DHCS did not hold MCPs accountable to meet MPLs for the following measures in RY 2017; therefore, HSAG did not include these measures in the denominators for calculating the percentage of measures with rates that moved to above or below the MPLs in RY 2018 and for calculating the percentage of measures with rates below MPLs for only the last two consecutive years: ■ Asthma Medication Ratio ■ Breast Cancer Screening ■ Immunizations for Adolescents—Combination 2
Community Health Group Partnership Plan Performance Evaluation Report: July 1, 2017–June 30, 2018 California Department of Health Care Services
Page K-16 Health Services Advisory Group, Inc.

MANAGED CARE HEALTH PLAN PERFORMANCE MEASURES
Table 3.9—RY 2018 (MY 2017) Performance Measure Findings for All Domains CHG—San Diego County
Criteria Number of Measures
MeetingCriteria
Total Number of Measures
Percentage of Measures
MeetingCriteria
RY 2018 Rates Above HPLs 6 21 28.57% Rates Above HPLs for the Last Three or More Consecutive Years 2 18 11.11%
RY 2018 Rates Significantly Better than RY 2017 Rates* 5 22 22.73%
Rates that Moved from Below MPLs in RY 2017 to Above MPLs in RY 2018 1 1 100.00%
RY 2018 Rates Below MPLs 0 21 0.00% Rates Below MPLs for Only the Last Two Consecutive Years 0 18 0.00%
Rates Below MPLs for the Last Three or More Consecutive Years 0 18 0.00%
RY 2018 Rates Significantly Worse than RY 2017 Rates* 2 22 9.09%
Rates that Moved from Above MPLs in RY 2017 to Below MPLs in RY 2018 0 17 0.00%
* Performance comparisons are based on the Chi-square test of statistical significance, with a p value of <0.05.
Community Health Group Partnership Plan Performance Evaluation Report: July 1, 2017–June 30, 2018 California Department of Health Care Services
Page K-17 Health Services Advisory Group, Inc.

MANAGED CARE HEALTH PLAN PERFORMANCE MEASURES
Seniors and Persons with Disabilities Performance Measure Results Table 3.10 presents the four-year trending information for the Seniors and Persons with Disabilities (SPD) population, and Table 3.11 presents the four-year trending information for the non-SPD population for the measures that DHCS required MCPs to stratify for the SPD and non-SPD populations. The tables also show the differences in rates between RY 2017 and RY 2018.
Table 3.12 presents the SPD and non-SPD rates, a comparison of the SPD and non-SPD rates,5 and the total combined rate for each measure.
Table 3.10—Multi-Year SPD Performance Measure Trend Table CHG—San Diego County
B = Statistical testing result indicates that the RY 2018 SPD rate is significantly better than the RY 2017 SPD rate.
W = Statistical testing result indicates that the RY 2018 SPD rate is significantly worse than the RY 2017 SPD rate.
Measure RY
2015 SPD
Rate1
RY 2016 SPD
Rate2
RY 2017 SPD
Rate3
RY 2018 SPD
Rate4
RYs 2017–18 Rate
Difference5
All-Cause Readmissions* 22.31% 19.45% 18.41% 19.38% 0.97 Ambulatory Care—Emergency Department (ED) Visits per 1,000 Member Months**
65.87 68.38 72.47 70.92 Not Tested
Ambulatory Care—Outpatient Visits per 1,000 Member Months**
488.98 494.40 544.84 592.05 Not Tested
Annual Monitoring for Patients on Persistent Medications— ACE Inhibitors or ARBs
86.30% 89.34% 93.42% 92.58% -0.84
Annual Monitoring for Patients on Persistent Medications— Diuretics
88.70% 90.66% 93.67% 93.19% -0.48
5 HSAG calculated statistical significance between the SPD and non-SPD rates for each measure using a Chi-square test. This information is displayed in the “SPD/Non-SPD Rate Difference” column in Table 3.12.
Community Health Group Partnership Plan Performance Evaluation Report: July 1, 2017–June 30, 2018 California Department of Health Care Services
Page K-18 Health Services Advisory Group, Inc.

MANAGED CARE HEALTH PLAN PERFORMANCE MEASURES
Measure RY
2015 SPD
Rate1
RY 2016 SPD
Rate2
RY 2017 SPD
Rate3
RY 2018 SPD
Rate4
RYs 2017–18 Rate
Difference5
Children and Adolescents' Access to Primary Care Practitioners—12–24 Months
NA NA NA NA Not Comparable
Children and Adolescents' Access to Primary Care Practitioners— 25 Months–6 Years
87.44% 86.56% 90.31% 89.34% -0.97
Children and Adolescents' Access to Primary Care Practitioners—7–11 Years
88.08% 87.76% 90.65% 93.41% 2.76B
Children and Adolescents' Access to Primary Care Practitioners—12–19 Years
84.25% 82.57% 85.08% 86.98% 1.90
1 RY 2015 rates reflect MY data from January 1, 2014, through December 31, 2014. 2 RY 2016 rates reflect MY data from January 1, 2015, through December 31, 2015. 3 RY 2017 rates reflect MY data from January 1, 2016, through December 31, 2016. 4 RY 2018 rates reflect MY data from January 1, 2017, through December 31, 2017. 5 Performance comparisons are based on the Chi-square test of statistical significance, with a p value of <0.05. * A lower rate indicates better performance for this measure. ** Member months are a member's “contribution” to the total yearly membership. NA = The MCP followed the specifications, but the denominator was too small (less than 30) to report a valid rate. Not Comparable = An RY 2017–18 rate difference cannot be made because data are not available for both years or because significant methodology changes occurred between years, disallowing comparison. Not Tested = An RY 2017–18 rate difference was not calculated because high and low rates do not necessarily indicate better or worse performance.
Community Health Group Partnership Plan Performance Evaluation Report: July 1, 2017–June 30, 2018 California Department of Health Care Services
Page K-19 Health Services Advisory Group, Inc.
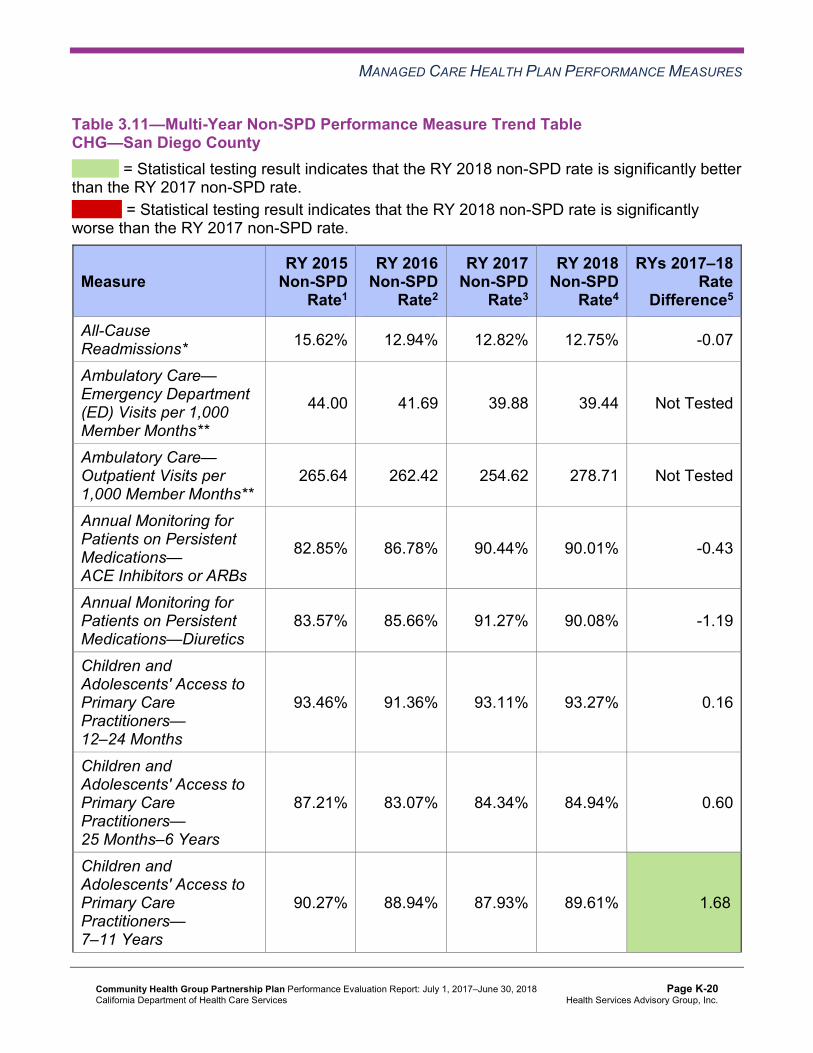
MANAGED CARE HEALTH PLAN PERFORMANCE MEASURES
Table 3.11—Multi-Year Non-SPD Performance Measure Trend Table CHG—San Diego County
B = Statistical testing result indicates that the RY 2018 non-SPD rate is significantly better than the RY 2017 non-SPD rate.
W = Statistical testing result indicates that the RY 2018 non-SPD rate is significantly worse than the RY 2017 non-SPD rate.
Measure RY 2015
Non-SPD Rate1
RY 2016 Non-SPD
Rate2
RY 2017 Non-SPD
Rate3
RY 2018 Non-SPD
Rate4
RYs 2017–18 Rate
Difference5
All-Cause Readmissions* 15.62% 12.94% 12.82% 12.75% -0.07
Ambulatory Care— Emergency Department (ED) Visits per 1,000 Member Months**
44.00 41.69 39.88 39.44 Not Tested
Ambulatory Care— Outpatient Visits per 1,000 Member Months**
265.64 262.42 254.62 278.71 Not Tested
Annual Monitoring for Patients on Persistent Medications— ACE Inhibitors or ARBs
82.85% 86.78% 90.44% 90.01% -0.43
Annual Monitoring for Patients on Persistent Medications—Diuretics
83.57% 85.66% 91.27% 90.08% -1.19
Children and Adolescents' Access to Primary Care Practitioners— 12–24 Months
93.46% 91.36% 93.11% 93.27% 0.16
Children and Adolescents' Access to Primary Care Practitioners— 25 Months–6 Years
87.21% 83.07% 84.34% 84.94% 0.60
Children and Adolescents' Access to Primary Care Practitioners— 7–11 Years
90.27% 88.94% 87.93% 89.61% 1.68B
Community Health Group Partnership Plan Performance Evaluation Report: July 1, 2017–June 30, 2018 California Department of Health Care Services
Page K-20 Health Services Advisory Group, Inc.
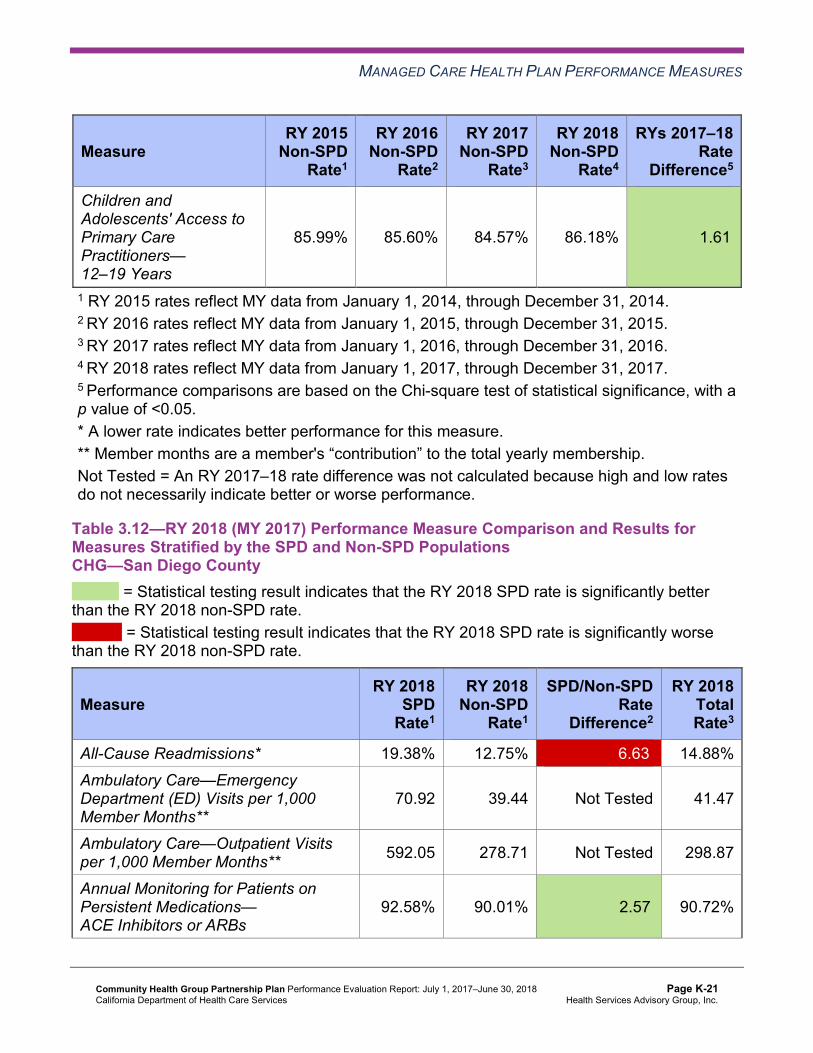
MANAGED CARE HEALTH PLAN PERFORMANCE MEASURES
Measure RY 2015
Non-SPD Rate1
RY 2016 Non-SPD
Rate2
RY 2017 Non-SPD
Rate3
RY 2018 Non-SPD
Rate4
RYs 2017–18 Rate
Difference5
Children and Adolescents' Access to Primary Care Practitioners— 12–19 Years
85.99% 85.60% 84.57% 86.18% 1.61B
1 RY 2015 rates reflect MY data from January 1, 2014, through December 31, 2014. 2 RY 2016 rates reflect MY data from January 1, 2015, through December 31, 2015. 3 RY 2017 rates reflect MY data from January 1, 2016, through December 31, 2016. 4 RY 2018 rates reflect MY data from January 1, 2017, through December 31, 2017. 5 Performance comparisons are based on the Chi-square test of statistical significance, with a p value of <0.05. * A lower rate indicates better performance for this measure. ** Member months are a member's “contribution” to the total yearly membership. Not Tested = An RY 2017–18 rate difference was not calculated because high and low rates do not necessarily indicate better or worse performance.
Table 3.12—RY 2018 (MY 2017) Performance Measure Comparison and Results forMeasures Stratified by the SPD and Non-SPD PopulationsCHG—San Diego County
B = Statistical testing result indicates that the RY 2018 SPD rate is significantly better than the RY 2018 non-SPD rate.
W = Statistical testing result indicates that the RY 2018 SPD rate is significantly worse than the RY 2018 non-SPD rate.
Measure RY 2018
SPD Rate1
RY 2018 Non-SPD
Rate1
SPD/Non-SPDRate
Difference2
RY 2018 Total Rate3
All-Cause Readmissions* 19.38% 12.75% 6.63W 14.88% Ambulatory Care—Emergency Department (ED) Visits per 1,000 Member Months**
70.92 39.44 Not Tested 41.47
Ambulatory Care—Outpatient Visits per 1,000 Member Months** 592.05 278.71 Not Tested 298.87
Annual Monitoring for Patients on Persistent Medications— ACE Inhibitors or ARBs
92.58% 90.01% 2.57B 90.72%
Community Health Group Partnership Plan Performance Evaluation Report: July 1, 2017–June 30, 2018 California Department of Health Care Services
Page K-21 Health Services Advisory Group, Inc.

MANAGED CARE HEALTH PLAN PERFORMANCE MEASURES
Measure RY 2018
SPD Rate1
RY 2018 Non-SPD
Rate1
SPD/Non-SPDRate
Difference2
RY 2018 Total Rate3
Annual Monitoring for Patients on Persistent Medications—Diuretics 93.19% 90.08% 3.11B 91.00%
Children and Adolescents' Access to Primary Care Practitioners— 12–24 Months
NA 93.27% Not Comparable 93.31%
Children and Adolescents' Access to Primary Care Practitioners— 25 Months–6 Years
89.34% 84.94% 4.40B 85.04%
Children and Adolescents' Access to Primary Care Practitioners— 7–11 Years
93.41% 89.61% 3.80B 89.73%
Children and Adolescents' Access to Primary Care Practitioners— 12–19 Years
86.98% 86.18% 0.80 86.20%
1 RY 2018 rates reflect MY data from January 1, 2017, through December 31, 2017. 2 Performance comparisons are based on the Chi-square test of statistical significance, with a p value of <0.05. 3 Total rates are based on the MCP reporting unit’s total results, including the SPD and non-SPD populations. Please note, if data are not available for either the SPD or non-SPD population, the total rate is based on results reported for the available population. * A lower rate indicates better performance for this measure. ** Member months are a member's “contribution” to the total yearly membership. NA = The MCP followed the specifications, but the denominator was too small (less than 30) to report a valid rate. Not Comparable = An SPD/non-SPD rate difference cannot be made because data are not available for both populations. Not Tested = An SPD/non-SPD rate difference was not calculated because high and low rates do not necessarily indicate better or worse performance.
Community Health Group Partnership Plan Performance Evaluation Report: July 1, 2017–June 30, 2018 California Department of Health Care Services
Page K-22 Health Services Advisory Group, Inc.
MANAGED CARE HEALTH PLAN PERFORMANCE MEASURES
Seniors and Persons with Disabilities Findings
HSAG observed the following notable results in RY 2018 for measures that CHG stratified by the SPD and non-SPD populations:
♦ For SPD rates for which HSAG could make a comparison between RY 2017 and RY 2018, the SPD rate improved significantly from RY 2017 to RY 2018 for the Children and Adolescents’ Access to Primary Care Practitioners—7–11 Years.
♦ The non-SPD rates improved significantly from RY 2017 to RY 2018 for the Children and Adolescents’ Access to Primary Care Practitioners—7–11 Years and 12–19 Years measures.
♦ For measures for which HSAG could compare the RY 2018 SPD rates to the RY 2018 non-SPD rates: ■ The RY 2018 SPD rates were significantly better than the RY 2018 non-SPD rates for
the following measures: ○ Both Annual Monitoring for Patients on Persistent Medications measures ○ Children and Adolescents’ Access to Primary Care Practitioners—25 Months–6
Years and 7–11 Years ■ The RY 2018 SPD rate was significantly worse than the RY 2018 non-SPD rate for the
All-Cause Readmissions measure. Note that the higher rate of hospital readmissions for the SPD population is expected based on the greater and often more complicated health care needs of these beneficiaries.
Strengths—Performance Measures HSAG auditors determined that CHG followed the appropriate specifications to produce valid rates, and identified no issues of concern.
HSAG identified the following notable RY 2018 performance measure results for CHG:
♦ Across all domains, CHG performed above the HPLs for six of 21 measures (29 percent); and the rates for five of 22 measures for which HSAG made a comparison between RY 2017 and RY 2018 (23 percent) improved significantly from RY 2017 to RY 2018. Additionally, the MCP had no rates below the MPLs in RY 2018.
♦ The MCP had notable performance on the following measures in RY 2018: ■ The rate improved significantly from RY 2017 to RY 2018 for the Avoidance of Antibiotic
Treatment in Adults With Acute Bronchitis measure, and the rates for all RYs displayed in Table 3.7 were above the HPLs.
■ The rate improved significantly from RY 2017 to RY 2018 for the Comprehensive Diabetes Care—Blood Pressure Control (<140/90 mm Hg) measure, and the rate for this measure was above the HPL in RY 2018.
■ The rate improved significantly from RY 2017 to RY 2018 for the Comprehensive Diabetes Care—Eye Exam (Retinal) Performed measure.
Community Health Group Partnership Plan Performance Evaluation Report: July 1, 2017–June 30, 2018 California Department of Health Care Services
Page K-23 Health Services Advisory Group, Inc.

MANAGED CARE HEALTH PLAN PERFORMANCE MEASURES
■ The rate was above the HPL for the Comprehensive Diabetes Care—HbA1c Control (<8.0 Percent) measure.
■ The rate was above the HPL for the Immunizations for Adolescents—Combination 2 measure.
■ The rate improved significantly from RY 2017 to RY 2018 for the Prenatal and Postpartum Care—Postpartum Care measure.
■ The rate improved significantly from RY 2017 to RY 2018 for the Use of Imaging Studies for Low Back Pain measure, resulting in the rate for this measure moving from below the MPL in RY 2017 to above the MPL in RY 2018. ○ CHG’s improvement efforts as described previously within this section under the
“Assessment of Improvement Plans—Appropriate Treatment and Utilization” heading, and as described in Table 6.1, may have contributed to the rate improving significantly from RY 2017 to RY 2018 for the Use of Imaging Studies for Low Back Pain measure.
■ The rates were above the HPLs for both Weight Assessment and Counseling for Nutrition and Physical Activity for Children and Adolescents measures. ○ The rate for the Weight Assessment and Counseling for Nutrition and Physical
Activity for Children and Adolescents—Physical Activity Counseling—Total measure was above the HPL for the third consecutive year.
Opportunities for Improvement—Performance Measures To prevent further decline in performance, CHG has the opportunity to assess the causes for the rates declining significantly from RY 2017 to RY 2018 for the Annual Monitoring for Patients on Persistent Medications—Diuretics and Asthma Medication Ratio measures and to identify strategies to ensure that:
♦ Beneficiaries ages 18 and older on diuretics receive annual monitoring. ♦ Beneficiaries ages 5 to 64 who are identified as having persistent asthma have a ratio of
controller medications to total asthma medications of 0.50 or greater.
Community Health Group Partnership Plan Performance Evaluation Report: July 1, 2017–June 30, 2018 California Department of Health Care Services
Page K-24 Health Services Advisory Group, Inc.

Medi-Cal Managed Care External Quality Review Technical ReportAppendix K: Performance Evaluation ReportCommunity Health Group Partnership PlanJuly 1, 2017–June 30, 2018
4. MLTSSP Performance Measure Results
Due to CHG’s participation in California’s Coordinated Care Initiative as a Managed Long-Term Services and Supports Plan (MLTSSP), DHCS required that CHG report rates for three HEDIS measures for HSAG to validate as part of the NCQA HEDIS Compliance Audit.
Table 4.1 presents the rates for each required MLTSSP performance measure for RYs 2016, 2017, and 2018. The RY is the year in which the MLTSSP reported the rates. The RY rates reflect MY data from the previous calendar year. Note that the Ambulatory Care—Emergency Department Visits and Ambulatory Care—Outpatient Visits measures are utilization measures which measure the volume of services used. High and low rates do not necessarily indicate better or worse performance; therefore, for these measures, HSAG did not compare performance between RY 2017 and RY 2018.
Table 4.1—Multi-Year MLTSSP Performance Measure Results CHG—San Diego County
B = Statistical testing result indicates that the RY 2018 rate is significantly better than the RY 2017 rate.
W = Statistical testing result indicates that the RY 2018 rate is significantly worse than the RY 2017 rate.
Measure RY 2016 MLTSS
Rate1
RY 2017 MLTSS
Rate2
RY 2018 MLTSS
Rate3
RYs 2017–18 Rate
Difference4
Ambulatory Care—Emergency Department (ED) Visits per 1,000 Member Months*
49.17 13.28 44.71 Not Tested
Ambulatory Care—Outpatient Visits per 1,000 Member Months* 325.92 100.06 353.07 Not Tested
Medication Reconciliation Post-Discharge 5.60% 5.35% 4.14% -1.21
1 RY 2016 rates reflect MY data from January 1, 2015, through December 31, 2015. 2 RY 2017 rates reflect MY data from January 1, 2016, through December 31, 2016. 3 RY 2018 rates reflect MY data from January 1, 2017, through December 31, 2017. 4 Performance comparisons are based on the Chi-square test of statistical significance, with a p value of <0.05. * Member months are a member's “contribution” to the total yearly membership. Not Tested = An RY 2017–18 rate difference was not calculated because high and low rates do not necessarily indicate better or worse performance.
Community Health Group Partnership Plan Performance Evaluation Report: July 1, 2017–June 30, 2018 California Department of Health Care Services
Page K-25 Health Services Advisory Group, Inc.
MLTSSP PERFORMANCE MEASURE RESULTS
Managed Long-Term Services and Supports Plan PerformanceMeasure Findings The rate for the Medication Reconciliation Post-Discharge measure showed no statistically significant change from RY 2017 to RY 2018.
Community Health Group Partnership Plan Performance Evaluation Report: July 1, 2017–June 30, 2018 California Department of Health Care Services
Page K-26 Health Services Advisory Group, Inc.
Medi-Cal Managed Care External Quality Review Technical ReportAppendix K: Performance Evaluation ReportCommunity Health Group Partnership PlanJuly 1, 2017–June 30, 2018
5. Performance Improvement Projects
Performance Improvement Project Overview The key concepts of the rapid-cycle PIP framework include forming a PIP team, setting aims, establishing measures, determining interventions using quality improvement tools, conducting PDSA cycles to test interventions, and planning for the spread of successful changes. The core component of the rapid-cycle PIP approach involves testing changes on a small scale so that improvement can occur more efficiently and lead to long-term sustainability. The following modules guide MCPs through this rapid-cycle PIP process:
♦ Module 1—PIP Initiation ■ MCPs outline the framework for the PIP, which includes:
○ The topic rationale. ○ Comparative data supporting the need to improve the selected topic. ○ A list of the PIP team members, which consists of internal and external stakeholders. ○ A completed key driver diagram that defines the theory of change for improvement,
including the SMART (Specific, Measurable, Achievable, Relevant, and Time-bound) Aim and Global Aim.
♦ Module 2—SMART Aim Data Collection ■ MCPs define the SMART Aim measure and data collection methodology and develop
the SMART Aim data run chart. ♦ Module 3—Intervention Determination
■ MCPs use process mapping and failure modes and effects analysis to identify potential interventions to test which may have direct effects on the SMART Aim.
♦ Module 4—Plan-Do-Study-Act (PDSA) ■ MCPs test and evaluate the interventions identified in Module 3 through a series of
PDSA cycles. ♦ Module 5—PIP Conclusions
■ MCPs interpret results and summarize: ○ Key findings and outcomes achieved. ○ Assessment of each tested intervention. ○ Lessons learned, including how demonstrated improvement can be shared and used
as a foundation for further improvement going forward. ○ Plan for sustained improvement.
Community Health Group Partnership Plan Performance Evaluation Report: July 1, 2017–June 30, 2018 California Department of Health Care Services
Page K-27 Health Services Advisory Group, Inc.
PERFORMANCE IMPROVEMENT PROJECTS
Based on the agreed-upon timeline, MCPs submit each module to HSAG for validation. Throughout the rapid-cycle PIP process, HSAG provides technical assistance to MCPs to ensure that PIPs are methodologically sound and to problem-solve with MCPs regarding how to address challenges that occur. Through an iterative process, MCPs have opportunities to make corrections to modules 1 through 3 to achieve all validation criteria.
Once MCPs achieve all validation criteria for modules 1 through 3 and receive feedback on the intervention Plan portion of Module 4, MCPs test interventions. During the intervention testing phase of the PIP, HSAG conducts periodic progress check-ins to ensure that MCPs have addressed HSAG’s feedback on the Plan portion of Module 4 and are making appropriate progress with intervention testing. Once MCPs complete testing an intervention, MCPs determine the next steps based on results and lessons learned—whether the intervention was successful and should be spread (adopt), whether modifications need to be made to the existing intervention (adapt), or whether the intervention was not successful and should be stopped (abandon).
In Module 5, MCPs summarize the overall PIP. When validating Module 5, HSAG assesses the validity and reliability of the results based on the Centers for Medicare & Medicaid Services (CMS) validation protocols to determine whether key stakeholders can have confidence in the reported PIP findings. HSAG assigns the following final confidence levels for each PIP:
♦ High confidence—the PIP was methodologically sound and achieved the SMART Aim goal; the demonstrated improvement was clearly linked to the quality improvement processes conducted and intervention(s) tested; and, the MCP accurately summarized the key findings.
♦ Confidence—the PIP was methodologically sound and achieved the SMART Aim goal, and the MCP accurately summarized the key findings. However, some, but not all, of the quality improvement processes conducted and/or intervention(s) tested were clearly linked to the demonstrated improvement.
♦ Low confidence—either (A) the PIP was methodologically sound; however, the SMART Aim goal was not achieved; or (B) the SMART Aim goal was achieved; however, the quality improvement processes and/or intervention(s) tested were poorly executed and could not be linked to the improvement.
♦ Reported PIP results were not credible (referred to in this report as “not credible”)—the PIP methodology was not executed as approved.
Performance Improvement Project Results and Findings During the review period, CHG submitted modules 4 and 5 for its 2015–17 DHCS-priority and MCP-specific PIPs. HSAG validated the modules and includes the final PIP validation findings in this report. Additionally, CHG initiated a Disparity PIP and a DHCS-priority PIP during the review period. In this report, HSAG includes summaries of the MCP’s Disparity and DHCS-priority PIP module submissions as well as validation findings from the review period.
Community Health Group Partnership Plan Performance Evaluation Report: July 1, 2017–June 30, 2018 California Department of Health Care Services
Page K-28 Health Services Advisory Group, Inc.

PERFORMANCE IMPROVEMENT PROJECTS
2015–17 DHCS-Priority Performance Improvement Project
CHG selected diabetes retinal eye exam for its 2015–17 DHCS-priority PIP. While the MCP concluded its Diabetes Retinal Eye Exam PIP through the SMART Aim end date of June 30, 2017, CHG submitted modules 4 and 5 for HSAG to validate during the review period for this report. HSAG provided final validation findings and encouraged CHG to incorporate the experiences and lessons learned from the PIP into future quality improvement efforts.
Table 5.1 provides a summary of the SMART Aim measure results reported by the MCP.
Table 5.1—CHG Diabetes Retinal Eye Exam PIP SMART Aim Measure Results
SMART Aim Measure Baseline Rate
SMART Aim Goal
Rate
SMART Aim Goal Achieved
Rate of diabetes retinal eye exams among beneficiaries assigned to Provider A6 18.63% 37.00% Yes
Table 5.2 presents a description of the intervention that CHG tested for its Diabetes Retinal Eye Exam PIP. The table also indicates the failure mode that the intervention addressed as well as whether the MCP decided, based on intervention testing results, to adopt, adapt, or abandon the intervention.
Table 5.2—CHG Diabetes Retinal Eye Exam PIP Intervention Testing Results
Intervention Failure Mode Addressed Adopt,Adapt, orAbandon
Sending primary care providers (PCPs) lists of their respective beneficiaries who are due for retinal eye exams along with a pre-prepared written reminder which PCPs can send to their beneficiaries, followed by telephonic outreach.
PCPs not communicating with beneficiaries regarding retinal eye exams.
Adapt
CHG documented the following lessons learned during the scope of the 2015–17 DHCS-priority PIP, which the MCP may apply to future PIPs:
♦ Ensure that an effective and reliable mechanism is in place for tracking the interventions being tested.
6 Provider name removed for confidentiality.
Community Health Group Partnership Plan Performance Evaluation Report: July 1, 2017–June 30, 2018 California Department of Health Care Services
Page K-29 Health Services Advisory Group, Inc.

PERFORMANCE IMPROVEMENT PROJECTS
♦ Use HSAG’s technical assistance as a resource to discuss any challenges that arise during the PIP process.
Performance Improvement Project Validation Findings
During the review period for this report, HSAG validated modules 4 and 5 for the MCP’s Diabetes Retinal Eye Exam PIP. CHG documented testing the intervention from August 2016 through December 2016; and the MCP did not indicate continuing to test the intervention or starting to test a new intervention through the SMART Aim end date of June 30, 2017. Additionally, CHG documented a 0 percent diabetes retinal exam rate in June 2016 due to the MCP including only those beneficiaries who were due for an eye exam in the denominator rather than including the entire eligible population as defined in the denominator description in Module 2. Although the SMART Aim run chart indicated that CHG achieved the SMART Aim goal, it is unclear if the MCP calculated the SMART Aim measure rate based on the approved PIP methodology.
Upon assessment of validity and reliability of the PIP results, HSAG assigned CHG’s Diabetes Retinal Eye Exam PIP a final confidence level of Not Credible.
2015–17 MCP-Specific Performance Improvement Project
CHG selected annual monitoring of patients on persistent medications—ACE inhibitors or ARBs for its 2015–17 MCP-specific PIP. While the MCP concluded its Annual Monitoring of Patients on Persistent Medications—ACE Inhibitors or ARBs PIP through the SMART Aim end date of June 30, 2017, CHG submitted modules 4 and 5 for HSAG to validate during the review period for this report. HSAG provided final validation findings and encouraged CHG to incorporate the experiences and lessons learned from the PIP into future quality improvement efforts.
Table 5.3 provides a summary of the SMART Aim measure results reported by the MCP.
Table 5.3—CHG Annual Monitoring of Patients on Persistent Medications—ACE Inhibitors or ARBs PIP SMART Aim Measure Results
SMART Aim Measure Baseline Rate
SMART Aim Goal
Rate
SMART Aim Goal Achieved
Rate of lab monitoring among beneficiaries ages 18 years and older assigned to Provider B7 60% 75% Yes
7 Provider name removed for confidentiality.
Community Health Group Partnership Plan Performance Evaluation Report: July 1, 2017–June 30, 2018 California Department of Health Care Services
Page K-30 Health Services Advisory Group, Inc.
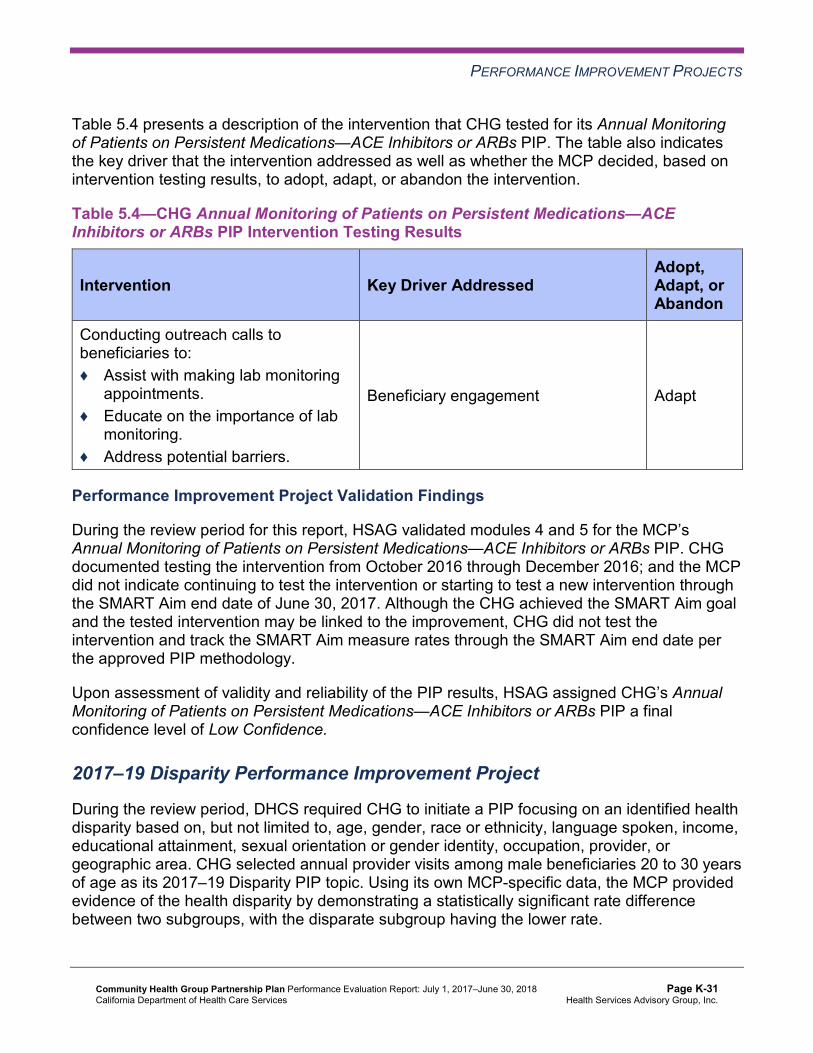
PERFORMANCE IMPROVEMENT PROJECTS
Table 5.4 presents a description of the intervention that CHG tested for its Annual Monitoring of Patients on Persistent Medications—ACE Inhibitors or ARBs PIP. The table also indicates the key driver that the intervention addressed as well as whether the MCP decided, based on intervention testing results, to adopt, adapt, or abandon the intervention.
Table 5.4—CHG Annual Monitoring of Patients on Persistent Medications—ACE Inhibitors or ARBs PIP Intervention Testing Results
Intervention Key Driver Addressed Adopt,Adapt, orAbandon
Conducting outreach calls to beneficiaries to: ♦ Assist with making lab monitoring
appointments. ♦ Educate on the importance of lab
monitoring. ♦ Address potential barriers.
Beneficiary engagement Adapt
Performance Improvement Project Validation Findings
During the review period for this report, HSAG validated modules 4 and 5 for the MCP’s Annual Monitoring of Patients on Persistent Medications—ACE Inhibitors or ARBs PIP. CHG documented testing the intervention from October 2016 through December 2016; and the MCP did not indicate continuing to test the intervention or starting to test a new intervention through the SMART Aim end date of June 30, 2017. Although the CHG achieved the SMART Aim goal and the tested intervention may be linked to the improvement, CHG did not test the intervention and track the SMART Aim measure rates through the SMART Aim end date per the approved PIP methodology.
Upon assessment of validity and reliability of the PIP results, HSAG assigned CHG’s Annual Monitoring of Patients on Persistent Medications—ACE Inhibitors or ARBs PIP a final confidence level of Low Confidence.
2017–19 Disparity Performance Improvement Project
During the review period, DHCS required CHG to initiate a PIP focusing on an identified health disparity based on, but not limited to, age, gender, race or ethnicity, language spoken, income, educational attainment, sexual orientation or gender identity, occupation, provider, or geographic area. CHG selected annual provider visits among male beneficiaries 20 to 30 years of age as its 2017–19 Disparity PIP topic. Using its own MCP-specific data, the MCP provided evidence of the health disparity by demonstrating a statistically significant rate difference between two subgroups, with the disparate subgroup having the lower rate.
Community Health Group Partnership Plan Performance Evaluation Report: July 1, 2017–June 30, 2018 California Department of Health Care Services
Page K-31 Health Services Advisory Group, Inc.
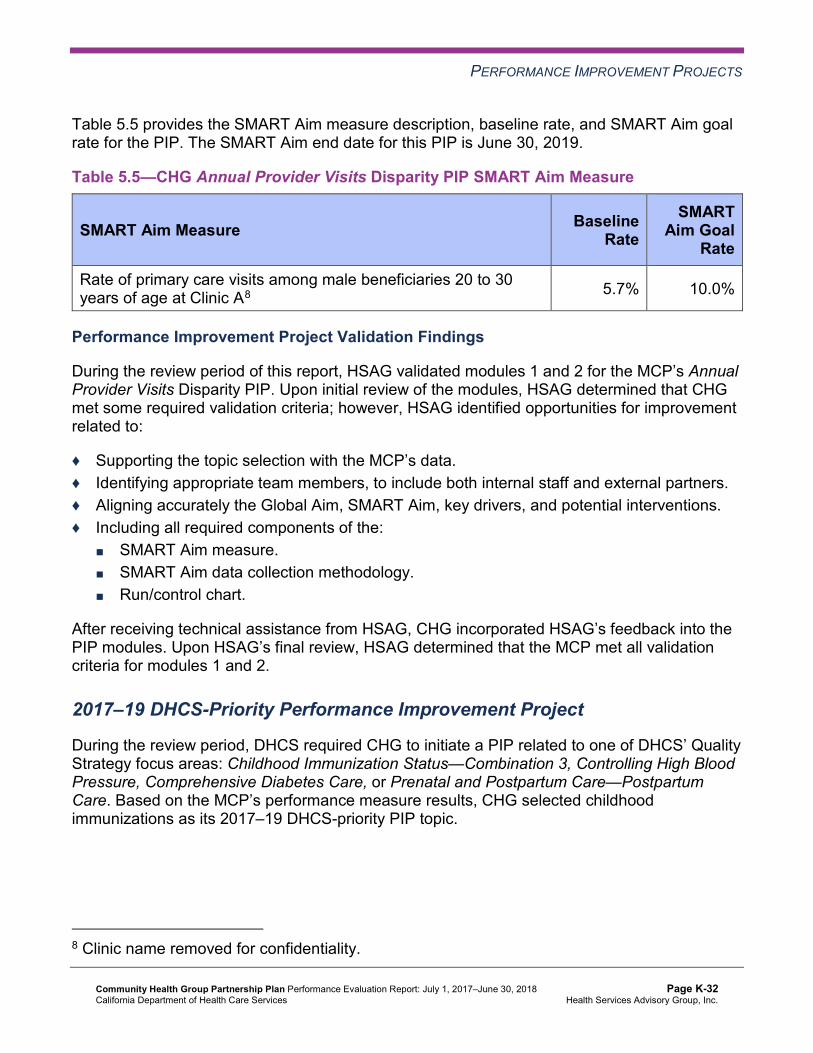
PERFORMANCE IMPROVEMENT PROJECTS
Table 5.5 provides the SMART Aim measure description, baseline rate, and SMART Aim goal rate for the PIP. The SMART Aim end date for this PIP is June 30, 2019.
Table 5.5—CHG Annual Provider Visits Disparity PIP SMART Aim Measure
SMART Aim Measure Baseline Rate
SMART Aim Goal
Rate
Rate of primary care visits among male beneficiaries 20 to 30 years of age at Clinic A8 5.7% 10.0%
Performance Improvement Project Validation Findings
During the review period of this report, HSAG validated modules 1 and 2 for the MCP’s Annual Provider Visits Disparity PIP. Upon initial review of the modules, HSAG determined that CHG met some required validation criteria; however, HSAG identified opportunities for improvement related to:
♦ Supporting the topic selection with the MCP’s data. ♦ Identifying appropriate team members, to include both internal staff and external partners. ♦ Aligning accurately the Global Aim, SMART Aim, key drivers, and potential interventions. ♦ Including all required components of the:
■ SMART Aim measure. ■ SMART Aim data collection methodology. ■ Run/control chart.
After receiving technical assistance from HSAG, CHG incorporated HSAG’s feedback into the PIP modules. Upon HSAG’s final review, HSAG determined that the MCP met all validation criteria for modules 1 and 2.
2017–19 DHCS-Priority Performance Improvement Project
During the review period, DHCS required CHG to initiate a PIP related to one of DHCS’ Quality Strategy focus areas: Childhood Immunization Status—Combination 3, Controlling High Blood Pressure, Comprehensive Diabetes Care, or Prenatal and Postpartum Care—Postpartum Care. Based on the MCP’s performance measure results, CHG selected childhood immunizations as its 2017–19 DHCS-priority PIP topic.
8 Clinic name removed for confidentiality.
Community Health Group Partnership Plan Performance Evaluation Report: July 1, 2017–June 30, 2018 California Department of Health Care Services
Page K-32 Health Services Advisory Group, Inc.

PERFORMANCE IMPROVEMENT PROJECTS
Table 5.6 provides the SMART Aim measure description, baseline rate, and SMART Aim goal rate for the PIP. The SMART Aim end date for this PIP is June 30, 2019.
Table 5.6—CHG Childhood Immunization Status—Combination 3 PIP SMART Aim Measure
SMART Aim Measure Baseline Rate
SMART Aim Goal
Rate
Rate of Childhood Immunization Status—Combination 3 measure for Medical Group A9 67.1% 79.0%
Performance Improvement Project Validation Findings
During the review period of this report, HSAG validated modules 1 and 2 for the MCP’s Childhood Immunization Status—Combination 3 PIP. Upon initial review of the modules, HSAG determined that CHG met some required validation criteria; however, HSAG identified opportunities for improvement related to:
♦ Supporting the topic selection with the MCP’s data. ♦ Identifying appropriate team members, to include both internal staff and external partners. ♦ Including all required components of the:
■ SMART Aim, developed based on literature review, data, and/or experience. ■ SMART Aim measure. ■ SMART Aim data collection methodology. ■ Run/control chart.
♦ Aligning accurately the Global Aim, SMART Aim, key drivers, and potential interventions.
After receiving technical assistance from HSAG, CHG incorporated HSAG’s feedback into the PIP modules. Upon HSAG’s final review, HSAG determined that the MCP met all validation criteria for modules 1 and 2.
Strengths—Performance Improvement Projects Upon completion of the 2015–17 PIPs, CHG identified interventions that it can adapt to improve retinal eye exam completion for beneficiaries living with diabetes and annual monitoring of beneficiaries on ACE inhibitors or ARBs.
9 Medical group name removed for confidentiality.
Community Health Group Partnership Plan Performance Evaluation Report: July 1, 2017–June 30, 2018 California Department of Health Care Services
Page K-33 Health Services Advisory Group, Inc.

PERFORMANCE IMPROVEMENT PROJECTS
Opportunities for Improvement—Performance Improvement Projects CHG has the opportunity to monitor the adapted interventions to achieve optimal outcomes beyond the life of the 2015–17 Diabetes Retinal Eye Exam and Annual Monitoring of Patients on Persistent Medications—ACE Inhibitors or ARBs PIPs. The MCP should apply lessons learned from both 2015–17 PIPs to facilitate improvement of the adapted interventions.
Community Health Group Partnership Plan Performance Evaluation Report: July 1, 2017–June 30, 2018 California Department of Health Care Services
Page K-34 Health Services Advisory Group, Inc.

Medi-Cal Managed Care External Quality Review Technical ReportAppendix K: Performance Evaluation ReportCommunity Health Group Partnership PlanJuly 1, 2017–June 30, 2018
6. Recommendations
Follow-Up on Prior Year Recommendations DHCS provided each MCP an opportunity to outline actions taken to address recommendations HSAG made in its 2016–17 MCP-specific evaluation report. Table 6.1 provides EQR recommendations from CHG’s July 1, 2016, through June 30, 2017, MCP-specific evaluation report, along with the MCP’s self-reported actions taken through June 30, 2018, that address the recommendations. Please note that HSAG made minimal edits to Table 6.1 to preserve the accuracy of CHG’s self-reported actions.
Table 6.1—CHG’s Self-Reported Follow-Up on External Quality ReviewRecommendations from the July 1, 2016, through June 30, 2017, MCP-SpecificEvaluation Report
2016–17 External Quality ReviewRecommendations Directed to CHG
Self-Reported Actions Taken by CHGduring the Period of July 1, 2017–June 30,2018, that Address the External QualityReview Recommendations
1. Update the MCP’s annual HEDIS data analysis report to reflect, by product line, data used for HEDIS measure production.
CHG’s annual HEDIS data analysis report has been broken out by product line for HEDIS measure production. This was noted in the HEDIS 2018 Compliance Audit Final Report of Findings.
2. Implement a mechanism to identify beneficiaries receiving hospice benefits across all lines of business.
Based on HSAG’s recommendations from the prior year, CHG implemented a process to identify and track Medi-Cal members receiving hospice services. Members are identified through authorizations and/or claims, and these members are flagged in the enrollment file loaded into the HEDIS engine. Medicare hospice members are identified by the transaction reply code for Medicare beneficiaries receiving hospice services.
3. To improve the MCP’s performance to above the MPL for the Use of Imaging Studies for Low Back Pain measure, determine whether current improvement efforts need to be modified or new interventions need to be identified.
The use of imaging by emergency room (ER) physicians continues to drive much of the inappropriate use of imaging studies in the diagnosis and treatment of low back pain. The consensus by CHG’s Quality Improvement Committee was that we would not be successful in changing the practice of the ER
Community Health Group Partnership Plan Performance Evaluation Report: July 1, 2017–June 30, 2018 California Department of Health Care Services
Page K-35 Health Services Advisory Group, Inc.

RECOMMENDATIONS
2016–17 External Quality ReviewRecommendations Directed to CHG
Self-Reported Actions Taken by CHGduring the Period of July 1, 2017–June 30,2018, that Address the External QualityReview Recommendations physicians. Therefore, CHG plans to adapt the intervention to provide educational material on low back pain and to target sites with a higher number of imaging tests ordered.
2017–18 Recommendations Based on the overall assessment of CHG’s delivery of quality, accessible, and timely care through the activities described in previous sections of this report, HSAG recommends the following to the MCP:
♦ Assess the causes for the rates for the following measures declining significantly from RY 2017 to RY 2018, and identify strategies to prevent further decline in performance: ■ Annual Monitoring for Patients on Persistent Medications—Diuretics ■ Asthma Medication Ratio
♦ Monitor the adapted interventions to achieve optimal outcomes beyond the life of the 2015–17 Diabetes Retinal Eye Exam and Annual Monitoring of Patients on Persistent Medications—ACE Inhibitors or ARBs PIPs. The MCP should apply lessons learned from both 2015–17 PIPs to facilitate improvement of the adapted interventions.
In the next annual review, HSAG will evaluate continued successes of CHG as well as the MCP’s progress with these recommendations.
Community Health Group Partnership Plan Performance Evaluation Report: July 1, 2017–June 30, 2018 California Department of Health Care Services
Page K-36 Health Services Advisory Group, Inc.

Medi-Cal Managed CareExternal Quality Review Technical Report
Appendix L: Performance Evaluation Report
Contra Costa Health Plan July 1, 2017–June 30, 2018
Medi-Cal Managed Care External Quality Review Technical ReportAppendix L: Performance Evaluation ReportContra Costa Health Plan July 1, 2017–June 30, 2018
Table of Contents
1. Introduction.............................................................................................................L-1 Medi-Cal Managed Care Health Plan Overview ....................................................... L-1
2. Managed Care Health Plan Compliance ...............................................................L-2Compliance Reviews Conducted.............................................................................. L-2 Strengths—Compliance Reviews ............................................................................. L-3 Opportunities for Improvement—Compliance Reviews ............................................ L-3
3. Managed Care Health Plan Performance Measures ............................................L-4Performance Measure Validation Results ................................................................ L-4 Performance Measure Results and Findings............................................................ L-4
Preventive Screening and Children’s Health ......................................................... L-5 Preventive Screening and Women’s Health .......................................................... L-9 Care for Chronic Conditions ................................................................................ L-11 Appropriate Treatment and Utilization................................................................. L-13 Performance Measure Findings—All Domains.................................................... L-16
Improvement Plan Requirements for 2018 ............................................................. L-17 Seniors and Persons with Disabilities Performance Measure Results.................... L-18
Seniors and Persons with Disabilities Findings ................................................... L-22 Strengths—Performance Measures ....................................................................... L-23 Opportunities for Improvement—Performance Measures ...................................... L-24
4. Performance Improvement Projects ...................................................................L-25Performance Improvement Project Overview ......................................................... L-25 Performance Improvement Project Results and Findings....................................... L-26
2015–17 DHCS-Priority Performance Improvement Project ............................... L-27 2015–17 MCP-Specific Performance Improvement Project ................................ L-28 2017–19 Disparity Performance Improvement Project ........................................ L-29 2017–19 DHCS-Priority Performance Improvement Project ............................... L-30
Strengths—Performance Improvement Projects .................................................... L-32 Opportunities for Improvement—Performance Improvement Projects ................... L-32
5. Recommendations................................................................................................L-33 Follow-Up on Prior Year Recommendations .......................................................... L-33 2017–18 Recommendations................................................................................... L-34
Contra Costa Health Plan Performance Evaluation Report: July 1, 2017–June 30, 2018 California Department of Health Care Services
Page L-i Health Services Advisory Group, Inc.
TABLE OF CONTENTS
Table of Tables
Table 2.1—DHCS A&I Medical and State Supported Services Audits of CCHP Audit Review Period: May 1, 2016, through April 30, 2017................................... L-2
Table 3.1—Preventive Screening and Children’s Health Domain Multi-Year Performance Measure Results CCHP—Contra Costa County............................................. L-6
Table 3.2—Preventive Screening and Children’s Health Domain RY 2018 (MY 2017) Performance Measure Findings CCHP—Contra Costa County................... L-8
Table 3.3—Preventive Screening and Women’s Health Domain Multi-Year Performance Measure Results CCHP—Contra Costa County............................................. L-9
Table 3.4—Preventive Screening and Women’s Health Domain RY 2018 (MY 2017) Performance Measure Findings CCHP—Contra Costa County................. L-10
Table 3.5—Care for Chronic Conditions Domain Multi-Year Performance Measure Results CCHP—Contra Costa County....................................................... L-11
Table 3.6—Care for Chronic Conditions Domain RY 2018 (MY 2017) Performance Measure Findings CCHP—Contra Costa County ...................................... L-12
Table 3.7—Appropriate Treatment and Utilization Domain Multi-Year Performance Measure Results CCHP—Contra Costa County........................................ L-14
Table 3.8—Appropriate Treatment and Utilization Domain RY 2018 (MY 2017) Performance Measure Findings CCHP—Contra Costa County................. L-15
Table 3.9—RY 2018 (MY 2017) Performance Measure Findings for All Domains CCHP—Contra Costa County.................................................................... L-16
Table 3.10—Multi-Year SPD Performance Measure Trend Table CCHP— Contra Costa County ................................................................................. L-18
Table 3.11—Multi-Year Non-SPD Performance Measure Trend Table CCHP— Contra Costa County ................................................................................. L-20
Table 3.12—RY 2018 (MY 2017) Performance Measure Comparison and Results for Measures Stratified by the SPD and Non-SPD Populations CCHP— Contra Costa County ................................................................................. L-21
Table 4.1—CCHP Postpartum Care PIP SMART Aim Measure Results ..................... L-27 Table 4.2—CCHP Postpartum Care PIP Intervention Testing Results......................... L-27 Table 4.3—CCHP Medication Management for People With Asthma PIP SMART
Aim Measure Results................................................................................. L-28 Table 4.4—CCHP Medication Management for People With Asthma PIP Intervention
Testing Results .......................................................................................... L-28 Table 4.5—CCHP Controlling Blood Pressure Disparity PIP SMART Aim Measure.... L-29 Table 4.6—CCHP Diabetes Nephropathy Screening PIP SMART Aim Measure......... L-30 Table 4.7—CCHP Diabetes Nephropathy Screening PIP Intervention Testing............ L-31 Table 5.1—CCHP’s Self-Reported Follow-Up on External Quality Review
Recommendations from the July 1, 2016, through June 30, 2017, MCP-Specific Evaluation Report................................................................ L-33
Contra Costa Health Plan Performance Evaluation Report: July 1, 2017–June 30, 2018 California Department of Health Care Services
Page L-ii Health Services Advisory Group, Inc.
Medi-Cal Managed Care External Quality Review Technical ReportAppendix L: Performance Evaluation ReportContra Costa Health Plan July 1, 2017–June 30, 2018
1. Introduction
The California Department of Health Care Services (DHCS) contracted with Health Services Advisory Group, Inc. (HSAG), an external quality review organization (EQRO), to prepare the federally required Medi-Cal Managed Care External Quality Review Technical Report, July 1, 2017–June 30, 2018. The technical report provides an overview of the objectives and methodology for conducting the external quality review (EQR) activities, including requirements related to each activity. Additionally, the technical report provides aggregated results and recommendations for DHCS for each activity.
This appendix is specific to DHCS’ contracted Medi-Cal managed care health plan (MCP), Contra Costa Health Plan (“CCHP” or “the MCP”). The purpose of this appendix is to provide MCP-specific results of each activity and an assessment of the MCP’s strengths and opportunities for improvement with respect to the quality and timeliness of and access to health care services furnished to Medi-Cal Managed Care (MCMC) beneficiaries (referred to as “beneficiaries” in this report). The review period for this MCP-specific evaluation report is July 1, 2017, through June 30, 2018. HSAG will report on activities that take place beyond the review period in CCHP’s 2018–19 MCP-specific evaluation report. This MCP-specific evaluation report references activities and methodologies described in detail by HSAG in the technical report section.
The aggregate EQR technical report and all MCP- and specialty health plan (SHP)-specific performance evaluation reports reflect HSAG’s external, independent assessment of the quality and timeliness of, and access to, care that MCPs and SHPs are providing to beneficiaries.
Medi-Cal Managed Care Health Plan Overview CCHP is a full-scope MCP delivering services to beneficiaries as a “Local Initiative” (LI) MCP under the Two-Plan Model (TPM). Beneficiaries may enroll in CCHP, the LI MCP; or in Anthem Blue Cross Partnership Plan, the alternative commercial plan (CP).
CCHP became operational in Contra Costa County to provide MCMC services effective February 1997. As of June 30, 2018, CCHP had 181,402 beneficiaries in Contra Costa County.1 This represents 87 percent of the beneficiaries enrolled in Contra Costa County.
1 Medi-Cal Managed Care Enrollment Report—June 2018. Available at: http://www.dhcs.ca.gov/dataandstats/reports/Pages/MMCDMonthlyEnrollment.aspx. Accessed on: Sep 28, 2018.
Contra Costa Health Plan Performance Evaluation Report: July 1, 2017–June 30, 2018 California Department of Health Care Services
Page L-1 Health Services Advisory Group, Inc.

Medi-Cal Managed Care External Quality Review Technical ReportAppendix L: Performance Evaluation ReportContra Costa Health Plan July 1, 2017–June 30, 2018
2. Managed Care Health Plan Compliance
Compliance Reviews Conducted The following is a summary of the most recent reviews conducted for CCHP. Unless noted, HSAG’s compliance review summaries are based on final audit/survey reports issued and corrective action plan (CAP) closeout letters dated on or before the end of the review period for this report (June 30, 2018). The descriptions of the various types of reviews may be found within the main section of this technical report.
Table 2.1 summarizes the results and status of the DHCS Audits & Investigations Division (A&I) Medical and State Supported Services (SSS) Audits of CCHP. A&I conducted the on-site audits from June 12, 2017, through June 22, 2017.
Table 2.1—DHCS A&I Medical and State Supported Services Audits of CCHPAudit Review Period: May 1, 2016, through April 30, 2017
Category Evaluated Deficiencies (Yes/No) Monitoring Status
Utilization Management Yes CAP initiated following the audit and subsequently closed.
Case Management and Coordination of Care Yes CAP initiated following the audit and subsequently closed.
Access and Availability of Care Yes CAP initiated following the audit and subsequently closed.
Member’s Rights No Not applicable.
Quality Management Yes CAP initiated following the audit and subsequently closed.
Administrative and Organizational Capacity No Not applicable.
State Supported Services No Not applicable.
Contra Costa Health Plan Performance Evaluation Report: July 1, 2017–June 30, 2018 California Department of Health Care Services
Page L-2 Health Services Advisory Group, Inc.

MANAGED CARE HEALTH PLAN COMPLIANCE
Strengths—Compliance Reviews A&I identified no deficiencies in the Member’s Rights, Administrative and Organizational Capacity, or SSS categories during the June 2017 Medical and SSS Audits of CCHP. Additionally, CCHP’s responses to the MCP’s CAP for the deficiencies that A&I identified during the audits resulted in DHCS closing the CAP.
Opportunities for Improvement—Compliance Reviews While the MCP has no outstanding deficiencies from the June 2017 A&I Medical and SSS Audits, CCHP’s CAP required the MCP to make extensive changes to one of its utilization management policies. The CAP closeout letter to CCHP indicated that A&I would assess the MCP’s progress on full implementation of the corrective actions during the consecutive audit, which DHCS conducted in June 2018. HSAG will summarize the results of the June 2018 audit in CCHP’s 2018–19 MCP-specific evaluation report.
Contra Costa Health Plan Performance Evaluation Report: July 1, 2017–June 30, 2018 California Department of Health Care Services
Page L-3 Health Services Advisory Group, Inc.

Medi-Cal Managed Care External Quality Review Technical ReportAppendix L: Performance Evaluation ReportContra Costa Health Plan July 1, 2017–June 30, 2018
3. Managed Care Health Plan Performance Measures
Performance Measure Validation Results The HEDIS®2 2018 Compliance Audit Final Report of Findings for Contra Costa Health Plan contains the detailed findings and recommendations from HSAG’s NCQA HEDIS Compliance Audit™.3 HSAG auditors determined that CCHP followed the appropriate specifications to produce valid rates, and identified no issues of concern.
Performance Measure Results and Findings After validating the MCP’s performance measure rates, HSAG assessed the results. See Table 3.1 through Table 3.9 for CCHP’s performance measure results for reporting years (RYs) 2015 through 2018 and performance measure findings for RY 2018. The RY is the year in which the MCP reported the rates. The RY rates reflect measurement year (MY) data from the previous calendar year. Note that data may not be available for all four years.
Note the following regarding Table 3.1 through Table 3.9:
♦ To allow HSAG to provide meaningful assessment of MCP performance and actionable recommendations, HSAG, in collaboration with DHCS, organized the measures into domains based on the health care areas each measure affects. Table 3.1 through Table 3.8 present the performance measure results and findings by domain, and Table 3.9 presents the RY 2018 performance measure findings for the domains combined.
♦ To assess performance for each MCP reporting unit, HSAG compares the rates to national benchmarks. Rates indicating performance above the high performance levels (HPLs) are shaded in gray, and rates indicating performance below the minimum performance levels (MPLs) are bolded. ■ For measures with rates below the MPLs, DHCS requires MCPs to submit to DHCS
improvement plans (IPs) to address the rates below the MPLs (unless MCPs are reporting the rates for the first time).
■ For MCPs that meet DHCS’ Quality of Care CAP thresholds, DHCS issues a CAP; if an MCP’s performance is such that it may trigger a CAP in the following year, DHCS issues an advance warning letter.
■ IPs and CAPs consist of submission of Plan-Do-Study-Act (PDSA) Cycle Worksheets, Quality Improvement (QI) Summaries, or completion of Performance Improvement Projects (PIPs)—as determined by DHCS.
2 Healthcare Effectiveness Data and Information Set (HEDIS®) is a registered trademark of the National Committee for Quality Assurance (NCQA).
3 NCQA HEDIS Compliance AuditTM is a trademark of NCQA.
Contra Costa Health Plan Performance Evaluation Report: July 1, 2017–June 30, 2018 California Department of Health Care Services
Page L-4 Health Services Advisory Group, Inc.

MANAGED CARE HEALTH PLAN PERFORMANCE MEASURES
♦ For RYs 2016, 2017, and 2018, the HPLs and MPLs represent the NCQA Quality Compass®4 Medicaid health maintenance organization (HMO) 90th and 25th percentiles, respectively.
♦ For RY 2015, the HPLs and MPLs represent the NCQA HEDIS Audit Means, Percentiles, and Ratios 90th and 25th percentiles, respectively. For the Comprehensive Diabetes Care—HbA1c Poor Control (>9.0 Percent) measure, for which a lower rate indicates more favorable performance, the HPL and MPL are based on the 10th and 75th percentiles, respectively.
♦ HSAG includes the specific HPL and MPL values for RY 2018 in Section 6 of the Medi-Cal Managed Care External Quality Review Technical Report, July 1, 2017–June 30, 2018 (“Managed Care Health Plan Performance Measures”).
Preventive Screening and Children’s Health
Table 3.1 presents the four-year trending information for the performance measures within the Preventive Screening and Children’s Health domain.
Note the following regarding Table 3.1:
♦ Although HSAG includes information on the MCP’s performance related to the four Children and Adolescents’ Access to Primary Care measures, DHCS did not hold MCPs accountable to meet the MPLs for these measures for RYs 2015 through 2018 (i.e., DHCS did not require MCPs to submit IPs if rates for the measures were below the MPLs). DHCS made this decision due to the small range of variation between the HPL and MPL thresholds for each measure.
♦ Any comparison of RY 2018 performance to RY 2017 or to benchmarks related to the Immunizations for Adolescents—Combination 2 measure should be exercised with caution given the changes that NCQA made to the specification for this measure for RY 2018. NCQA released guidance that recommended a break in trending for this measure; however, DHCS determined to continue trending because the specification change should result in higher rates.
4 Quality Compass® is a registered trademark of NCQA.
Contra Costa Health Plan Performance Evaluation Report: July 1, 2017–June 30, 2018 California Department of Health Care Services
Page L-5 Health Services Advisory Group, Inc.
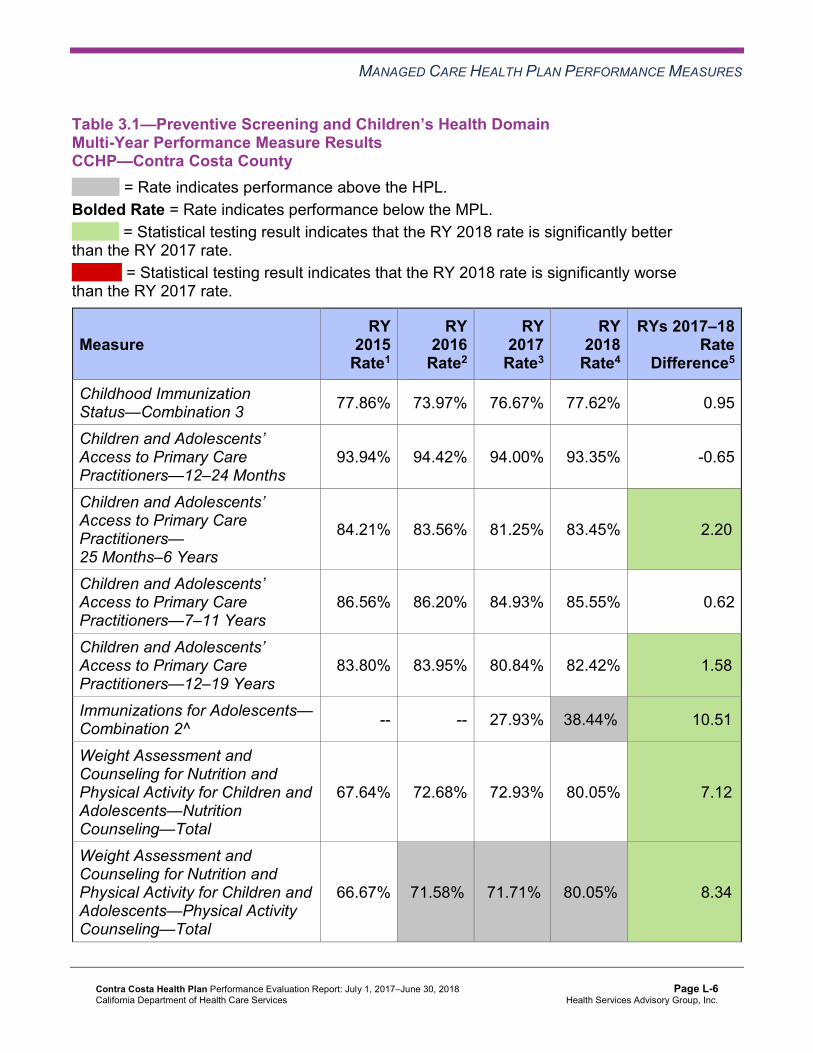
MANAGED CARE HEALTH PLAN PERFORMANCE MEASURES
Table 3.1—Preventive Screening and Children’s Health DomainMulti-Year Performance Measure Results CCHP—Contra Costa County
H = Rate indicates performance above the HPL. Bolded Rate = Rate indicates performance below the MPL.
B = Statistical testing result indicates that the RY 2018 rate is significantly better than the RY 2017 rate.
W = Statistical testing result indicates that the RY 2018 rate is significantly worse than the RY 2017 rate.
Measure RY
2015 Rate1
RY 2016
Rate2
RY 2017
Rate3
RY 2018
Rate4
RYs 2017–18 Rate
Difference5
Childhood Immunization Status—Combination 3 77.86% 73.97% 76.67% 77.62% 0.95
Children and Adolescents’ Access to Primary Care Practitioners—12–24 Months
93.94% 94.42% 94.00% 93.35% -0.65
Children and Adolescents’ Access to Primary Care Practitioners— 25 Months–6 Years
84.21% 83.56% 81.25% 83.45% 2.20B
Children and Adolescents’ Access to Primary Care Practitioners—7–11 Years
86.56% 86.20% 84.93% 85.55% 0.62
Children and Adolescents’ Access to Primary Care Practitioners—12–19 Years
83.80% 83.95% 80.84% 82.42% 1.58B
Immunizations for Adolescents— Combination 2^ -- -- 27.93% 38.44%H 10.51B
Weight Assessment and Counseling for Nutrition and Physical Activity for Children and Adolescents—Nutrition Counseling—Total
67.64% 72.68% 72.93% 80.05% 7.12B
Weight Assessment and Counseling for Nutrition and Physical Activity for Children and Adolescents—Physical Activity Counseling—Total
66.67% 71.58%H 71.71%H 80.05%H 8.34B
Contra Costa Health Plan Performance Evaluation Report: July 1, 2017–June 30, 2018 California Department of Health Care Services
Page L-6 Health Services Advisory Group, Inc.

MANAGED CARE HEALTH PLAN PERFORMANCE MEASURES
Measure RY
2015 Rate1
RY 2016
Rate2
RY 2017
Rate3
RY 2018
Rate4
RYs 2017–18 Rate
Difference5
Well-Child Visits in the Third, Fourth, Fifth, and Sixth Years of Life
79.81% 78.14% 71.57% 74.70% 3.13
1 RY 2015 rates reflect MY data from January 1, 2014, through December 31, 2014. 2 RY 2016 rates reflect MY data from January 1, 2015, through December 31, 2015. 3 RY 2017 rates reflect MY data from January 1, 2016, through December 31, 2016. 4 RY 2018 rates reflect MY data from January 1, 2017, through December 31, 2017. 5 Performance comparisons are based on the Chi-square test of statistical significance, with a p value of <0.05. ^ Caution should be exercised when assessing MCP performance for this measure given the changes that NCQA made to the specification for this measure for RY 2018. -- Indicates that the rate is not available.
Table 3.2 presents findings for the RY 2018 performance measures within the Preventive Screening and Children’s Health domain.
Note the following regarding Table 3.2:
♦ DHCS did not hold MCPs accountable to meet MPLs for all four Children and Adolescents’ Access to Primary Care measures within this domain; therefore, HSAG did not include these measures in its assessment of the MCP’s performance related to HPLs and MPLs.
♦ The Immunizations for Adolescents—Combination 2 measure was a first-year measure in RY 2017, and DHCS established no MPL for this measure for RY 2017 because no comparable benchmark existed; therefore, HSAG did not include this measure in the denominators for calculating the percentage of measures with rates that moved to above or below the MPLs in RY 2018.
Contra Costa Health Plan Performance Evaluation Report: July 1, 2017–June 30, 2018 California Department of Health Care Services
Page L-7 Health Services Advisory Group, Inc.

MANAGED CARE HEALTH PLAN PERFORMANCE MEASURES
Table 3.2—Preventive Screening and Children’s Health DomainRY 2018 (MY 2017) Performance Measure Findings CCHP—Contra Costa County
Criteria Number of Measures
MeetingCriteria
Total Number of Measures
Percentage of Measures
MeetingCriteria
RY 2018 Rates Above HPLs 2 5 40.00% Rates Above HPLs for the Last Three or More Consecutive Years 1 4 25.00%
RY 2018 Rates Significantly Better than RY 2017 Rates* 3 5 60.00%
Rates that Moved from Below MPLs in RY 2017 to Above MPLs in RY 2018 0 0 N/A
RY 2018 Rates Below MPLs 0 5 0.00% Rates Below MPLs for the Last Three or More Consecutive Years 0 4 0.00%
RY 2018 Rates Significantly Worse than RY 2017 Rates* 0 5 0.00%
Rates that Moved from Above MPLs in RY 2017 to Below MPLs in RY 2018 0 4 0.00%
* Performance comparisons are based on the Chi-square test of statistical significance, with a p value of <0.05. N/A = No rates above or below the MPLs from the previous year exist to include in the denominator for calculating whether or not rates moved to above or below MPLs in the most recent year.
Contra Costa Health Plan Performance Evaluation Report: July 1, 2017–June 30, 2018 California Department of Health Care Services
Page L-8 Health Services Advisory Group, Inc.

MANAGED CARE HEALTH PLAN PERFORMANCE MEASURES
Preventive Screening and Women’s Health
Table 3.3 presents the four-year trending information for the performance measures within the Preventive Screening and Women’s Health domain.
Note that any comparison of RY 2018 performance to RY 2017 or to benchmarks related to the Breast Cancer Screening measure should be exercised with caution given the changes that NCQA made to the specification for this measure for RY 2018. NCQA released guidance that recommended a break in trending for this measure; however, DHCS determined to continue trending because the specification change should result in higher rates.
Table 3.3—Preventive Screening and Women’s Health DomainMulti-Year Performance Measure Results CCHP—Contra Costa County
H = Rate indicates performance above the HPL. Bolded Rate = Rate indicates performance below the MPL.
B = Statistical testing result indicates that the RY 2018 rate is significantly better than the RY 2017 rate.
W = Statistical testing result indicates that the RY 2018 rate is significantly worse than the RY 2017 rate.
Measure RY
2015 Rate1
RY 2016
Rate2
RY 2017
Rate3
RY 2018
Rate4
RYs 2017–18 Rate
Difference5
Breast Cancer Screening^ -- -- 58.96% 58.94% -0.02 Cervical Cancer Screening 55.47% 58.15% 58.48% 66.59% 8.11B
Prenatal and Postpartum Care— Postpartum Care 67.15% 68.13% 75.43%H 70.56% -4.87
Prenatal and Postpartum Care— Timeliness of Prenatal Care 85.89% 86.13% 91.24%H 86.37% -4.87W
1 RY 2015 rates reflect MY data from January 1, 2014, through December 31, 2014. 2 RY 2016 rates reflect MY data from January 1, 2015, through December 31, 2015. 3 RY 2017 rates reflect MY data from January 1, 2016, through December 31, 2016. 4 RY 2018 rates reflect MY data from January 1, 2017, through December 31, 2017. 5 Performance comparisons are based on the Chi-square test of statistical significance, with a p value of <0.05. ^ Caution should be exercised when assessing MCP performance for this measure given the changes that NCQA made to the specification for this measure for RY 2018. -- Indicates that the rate is not available.
Contra Costa Health Plan Performance Evaluation Report: July 1, 2017–June 30, 2018 California Department of Health Care Services
Page L-9 Health Services Advisory Group, Inc.
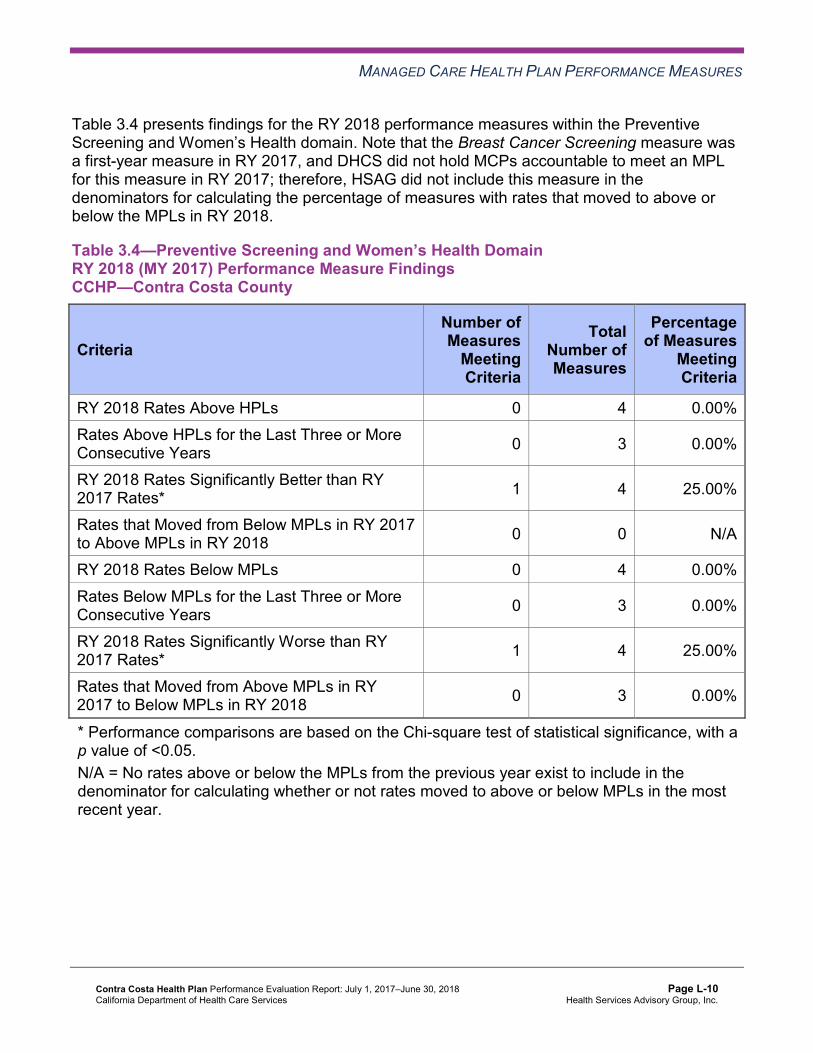
MANAGED CARE HEALTH PLAN PERFORMANCE MEASURES
Table 3.4 presents findings for the RY 2018 performance measures within the Preventive Screening and Women’s Health domain. Note that the Breast Cancer Screening measure was a first-year measure in RY 2017, and DHCS did not hold MCPs accountable to meet an MPL for this measure in RY 2017; therefore, HSAG did not include this measure in the denominators for calculating the percentage of measures with rates that moved to above or below the MPLs in RY 2018.
Table 3.4—Preventive Screening and Women’s Health DomainRY 2018 (MY 2017) Performance Measure Findings CCHP—Contra Costa County
Criteria Number of Measures
MeetingCriteria
Total Number of Measures
Percentage of Measures
MeetingCriteria
RY 2018 Rates Above HPLs 0 4 0.00% Rates Above HPLs for the Last Three or More Consecutive Years 0 3 0.00%
RY 2018 Rates Significantly Better than RY 2017 Rates* 1 4 25.00%
Rates that Moved from Below MPLs in RY 2017 to Above MPLs in RY 2018 0 0 N/A
RY 2018 Rates Below MPLs 0 4 0.00% Rates Below MPLs for the Last Three or More Consecutive Years 0 3 0.00%
RY 2018 Rates Significantly Worse than RY 2017 Rates* 1 4 25.00%
Rates that Moved from Above MPLs in RY 2017 to Below MPLs in RY 2018 0 3 0.00%
* Performance comparisons are based on the Chi-square test of statistical significance, with a p value of <0.05. N/A = No rates above or below the MPLs from the previous year exist to include in the denominator for calculating whether or not rates moved to above or below MPLs in the most recent year.
Contra Costa Health Plan Performance Evaluation Report: July 1, 2017–June 30, 2018 California Department of Health Care Services
Page L-10 Health Services Advisory Group, Inc.
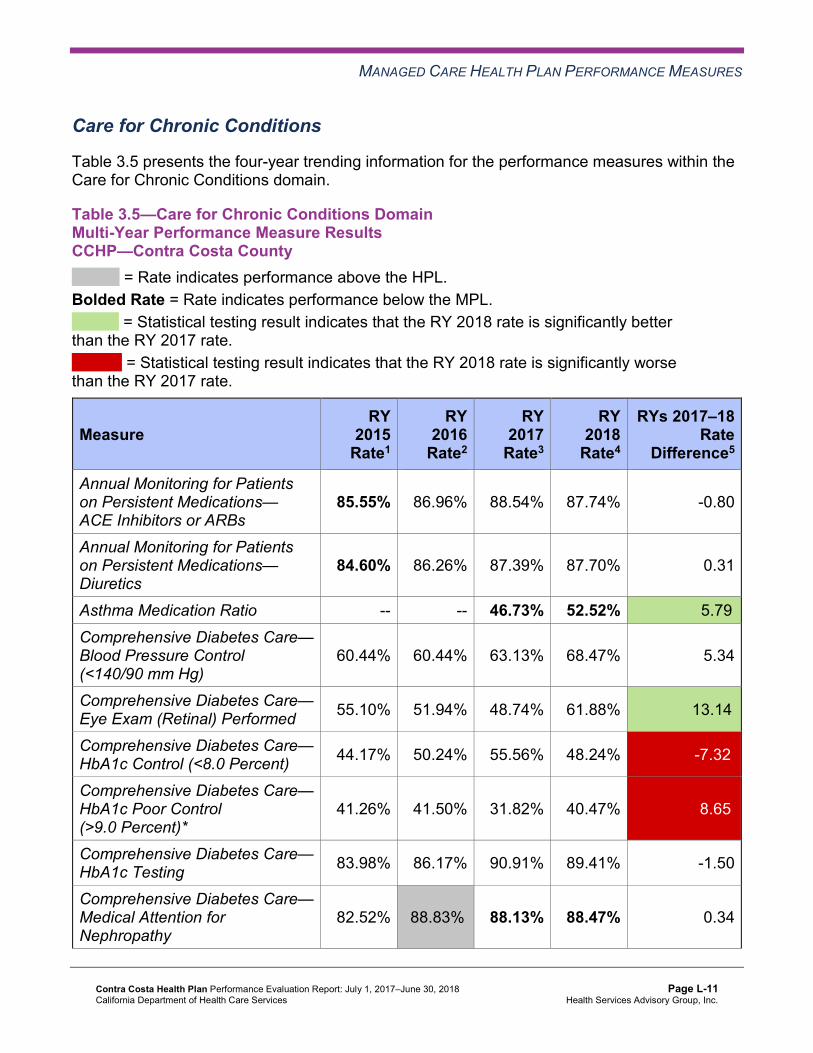
MANAGED CARE HEALTH PLAN PERFORMANCE MEASURES
Care for Chronic Conditions
Table 3.5 presents the four-year trending information for the performance measures within the Care for Chronic Conditions domain.
Table 3.5—Care for Chronic Conditions Domain Multi-Year Performance Measure Results CCHP—Contra Costa County
H = Rate indicates performance above the HPL. Bolded Rate = Rate indicates performance below the MPL.
B = Statistical testing result indicates that the RY 2018 rate is significantly better than the RY 2017 rate.
W = Statistical testing result indicates that the RY 2018 rate is significantly worse than the RY 2017 rate.
Measure RY
2015 Rate1
RY 2016
Rate2
RY 2017
Rate3
RY 2018
Rate4
RYs 2017–18 Rate
Difference5
Annual Monitoring for Patients on Persistent Medications— ACE Inhibitors or ARBs
85.55% 86.96% 88.54% 87.74% -0.80
Annual Monitoring for Patients on Persistent Medications— Diuretics
84.60% 86.26% 87.39% 87.70% 0.31
Asthma Medication Ratio -- -- 46.73% 52.52% 5.79B
Comprehensive Diabetes Care— Blood Pressure Control (<140/90 mm Hg)
60.44% 60.44% 63.13% 68.47% 5.34
Comprehensive Diabetes Care— Eye Exam (Retinal) Performed 55.10% 51.94% 48.74% 61.88% 13.14B
Comprehensive Diabetes Care— HbA1c Control (<8.0 Percent) 44.17% 50.24% 55.56% 48.24% -7.32W
Comprehensive Diabetes Care— HbA1c Poor Control (>9.0 Percent)*
41.26% 41.50% 31.82% 40.47% 8.65W
Comprehensive Diabetes Care— HbA1c Testing 83.98% 86.17% 90.91% 89.41% -1.50
Comprehensive Diabetes Care— Medical Attention for Nephropathy
82.52% 88.83%H 88.13% 88.47% 0.34
Contra Costa Health Plan Performance Evaluation Report: July 1, 2017–June 30, 2018 California Department of Health Care Services
Page L-11 Health Services Advisory Group, Inc.

MANAGED CARE HEALTH PLAN PERFORMANCE MEASURES
Measure RY
2015 Rate1
RY 2016
Rate2
RY 2017
Rate3
RY 2018
Rate4
RYs 2017–18 Rate
Difference5
Controlling High Blood Pressure 64.23% 57.11% 58.87% 69.59% 10.72B
1 RY 2015 rates reflect MY data from January 1, 2014, through December 31, 2014. 2 RY 2016 rates reflect MY data from January 1, 2015, through December 31, 2015. 3 RY 2017 rates reflect MY data from January 1, 2016, through December 31, 2016. 4 RY 2018 rates reflect MY data from January 1, 2017, through December 31, 2017. 5 Performance comparisons are based on the Chi-square test of statistical significance, with a p value of <0.05. * A lower rate indicates better performance for this measure. -- Indicates that the rate is not available.
Table 3.6 presents findings for the RY 2018 performance measures within the Care for Chronic Conditions domain. Note that the Asthma Medication Ratio measure was a first-year measure in RY 2017, and DHCS did not hold MCPs accountable to meet an MPL for this measure in RY 2017; therefore, HSAG did not include this measure in the denominators for calculating the percentage of measures with rates that moved to above or below the MPLs in RY 2018.
Table 3.6—Care for Chronic Conditions Domain RY 2018 (MY 2017) Performance Measure Findings CCHP—Contra Costa County
Criteria Number of Measures
MeetingCriteria
Total Number of Measures
Percentage of Measures
MeetingCriteria
RY 2018 Rates Above HPLs 0 10 0.00% Rates Above HPLs for the Last Three or More Consecutive Years 0 9 0.00%
RY 2018 Rates Significantly Better than RY 2017 Rates* 3 10 30.00%
Rates that Moved from Below MPLs in RY 2017 to Above MPLs in RY 2018 0 1 0.00%
RY 2018 Rates Below MPLs 2 10 20.00% Rates Below MPLs for the Last Three or More Consecutive Years 0 9 0.00%
RY 2018 Rates Significantly Worse than RY 2017 Rates* 2 10 20.00%
Contra Costa Health Plan Performance Evaluation Report: July 1, 2017–June 30, 2018 California Department of Health Care Services
Page L-12 Health Services Advisory Group, Inc.

MANAGED CARE HEALTH PLAN PERFORMANCE MEASURES
Criteria Number of Measures
MeetingCriteria
Total Number of Measures
Percentage of Measures
MeetingCriteria
Rates that Moved from Above MPLs in RY 2017 to Below MPLs in RY 2018 0 8 0.00%
* Performance comparisons are based on the Chi-square test of statistical significance, with a p value of <0.05.
Assessment of Improvement Plans—Care for Chronic Conditions
DHCS approved CCHP to conduct a PIP to address the rate for the Comprehensive Diabetes Care—Medical Attention for Nephropathy measure being below the MPL in RY 2017. HSAG includes a summary of CCHP’s progress on the Diabetes Nephropathy Screening PIP in Section 4 of this report (“Performance Improvement Projects”).
The rate for the Comprehensive Diabetes Care—Medical Attention for Nephropathy measure remained below the MPL in RY 2018.
Appropriate Treatment and Utilization
Table 3.7 presents the four-year trending information for the performance measures within the Appropriate Treatment and Utilization domain.
Note the following regarding Table 3.7:
♦ The All-Cause Readmissions measure is a non-HEDIS measure originally developed for DHCS’ All-Cause Readmissions collaborative quality improvement project (QIP); therefore, DHCS does not establish an HPL or MPL for this measure. For the All-Cause Readmissions measure, a lower rate indicates better performance (i.e., fewer readmissions).
♦ The two Ambulatory Care measures are utilization measures, which measure the volume of services used. DHCS does not hold MCPs accountable to meet MPLs for utilization measures, and HSAG does not compare performance for these measures against HPLs and MPLs. Additionally, because high and low rates do not necessarily indicate better or worse performance, HSAG did not compare performance for these measures across years.
♦ DHCS established no HPL or MPL for the two Depression Screening and Follow-Up for Adolescents and Adults measures for RY 2018 because no comparable benchmarks exist. Additionally, although MCPs reported the two Depression Screening and Follow-Up for Adolescents and Adults measures for RY 2018, HSAG does not present the performance measure results for these measures in this report because the reported rates do not accurately represent services being provided. This is due to the Depression Screening and Follow-Up for Adolescents and Adults measures being new HEDIS measures for RY 2018,
Contra Costa Health Plan Performance Evaluation Report: July 1, 2017–June 30, 2018 California Department of Health Care Services
Page L-13 Health Services Advisory Group, Inc.
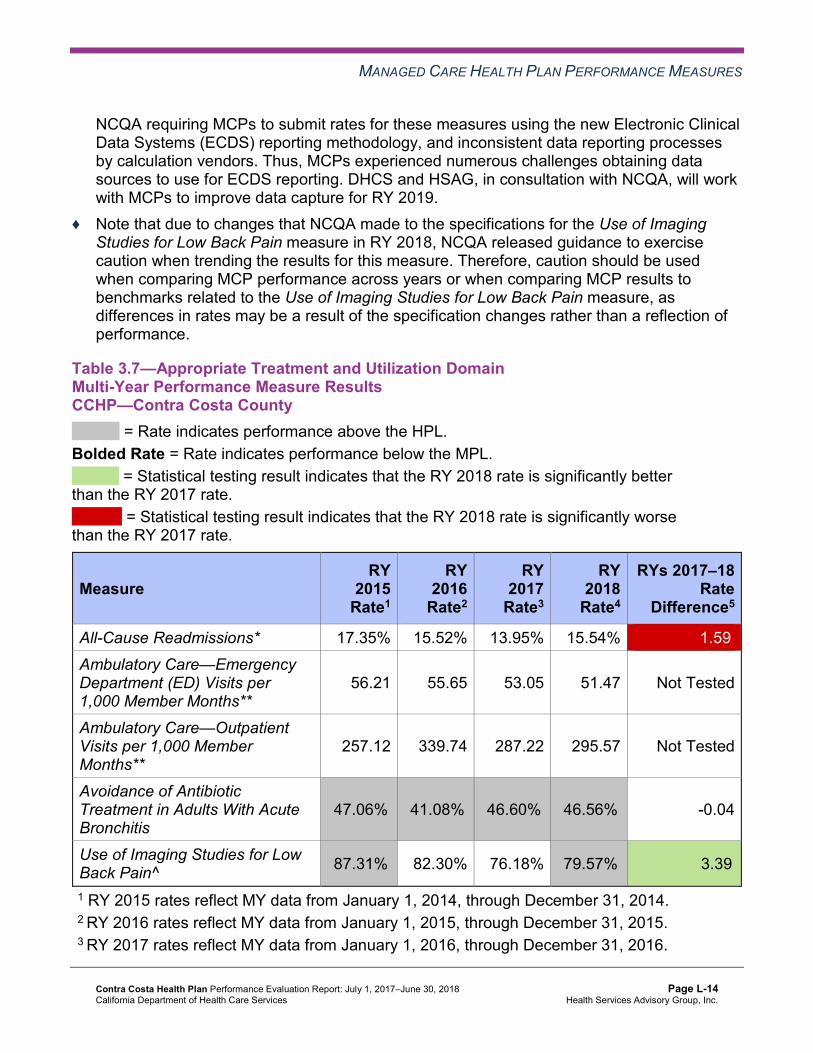
MANAGED CARE HEALTH PLAN PERFORMANCE MEASURES
NCQA requiring MCPs to submit rates for these measures using the new Electronic Clinical Data Systems (ECDS) reporting methodology, and inconsistent data reporting processes by calculation vendors. Thus, MCPs experienced numerous challenges obtaining data sources to use for ECDS reporting. DHCS and HSAG, in consultation with NCQA, will work with MCPs to improve data capture for RY 2019.
♦ Note that due to changes that NCQA made to the specifications for the Use of Imaging Studies for Low Back Pain measure in RY 2018, NCQA released guidance to exercise caution when trending the results for this measure. Therefore, caution should be used when comparing MCP performance across years or when comparing MCP results to benchmarks related to the Use of Imaging Studies for Low Back Pain measure, as differences in rates may be a result of the specification changes rather than a reflection of performance.
Table 3.7—Appropriate Treatment and Utilization DomainMulti-Year Performance Measure Results CCHP—Contra Costa County
H = Rate indicates performance above the HPL. Bolded Rate = Rate indicates performance below the MPL.
B = Statistical testing result indicates that the RY 2018 rate is significantly better than the RY 2017 rate.
W = Statistical testing result indicates that the RY 2018 rate is significantly worse than the RY 2017 rate.
Measure RY
2015 Rate1
RY 2016
Rate2
RY 2017
Rate3
RY 2018
Rate4
RYs 2017–18 Rate
Difference5
All-Cause Readmissions* 17.35% 15.52% 13.95% 15.54% 1.59W
Ambulatory Care—Emergency Department (ED) Visits per 1,000 Member Months**
56.21 55.65 53.05 51.47 Not Tested
Ambulatory Care—Outpatient Visits per 1,000 Member Months**
257.12 339.74 287.22 295.57 Not Tested
Avoidance of Antibiotic Treatment in Adults With Acute Bronchitis
47.06%H 41.08%H 46.60%H 46.56%H -0.04
Use of Imaging Studies for Low Back Pain^ 87.31%H 82.30% 76.18% 79.57%H 3.39B
1 RY 2015 rates reflect MY data from January 1, 2014, through December 31, 2014. 2 RY 2016 rates reflect MY data from January 1, 2015, through December 31, 2015. 3 RY 2017 rates reflect MY data from January 1, 2016, through December 31, 2016.
Contra Costa Health Plan Performance Evaluation Report: July 1, 2017–June 30, 2018 California Department of Health Care Services
Page L-14 Health Services Advisory Group, Inc.
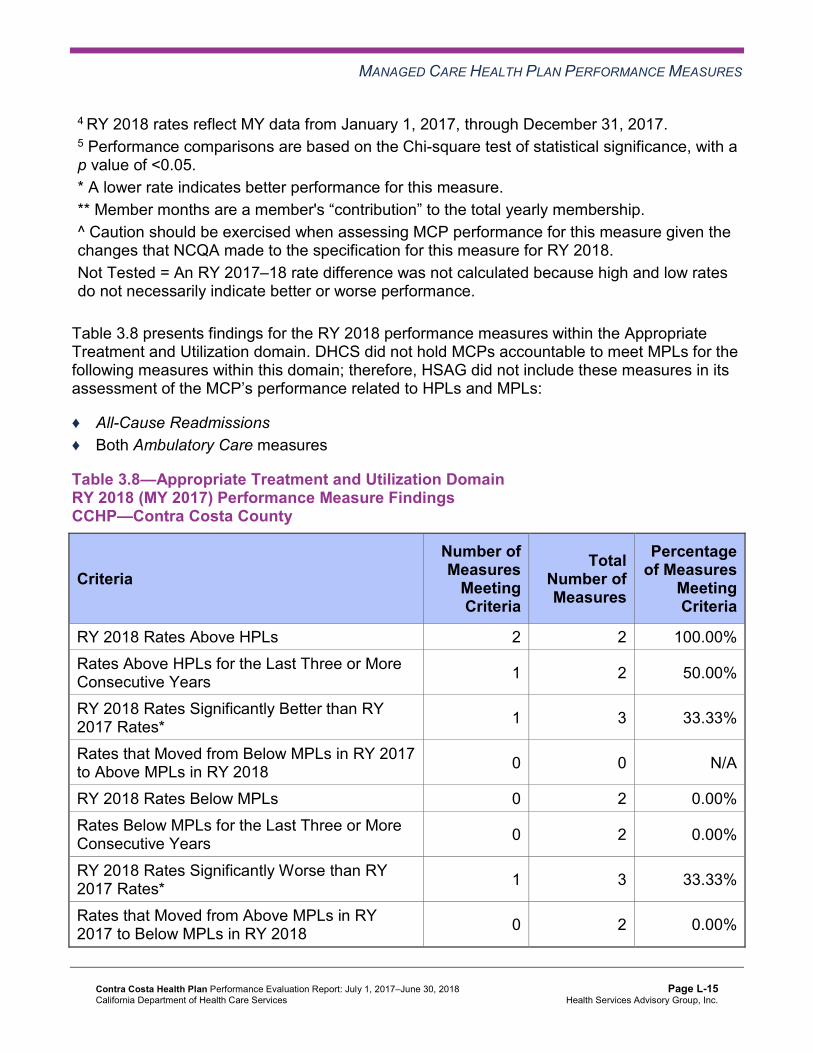
MANAGED CARE HEALTH PLAN PERFORMANCE MEASURES
4 RY 2018 rates reflect MY data from January 1, 2017, through December 31, 2017. 5 Performance comparisons are based on the Chi-square test of statistical significance, with a p value of <0.05. * A lower rate indicates better performance for this measure. ** Member months are a member's “contribution” to the total yearly membership. ^ Caution should be exercised when assessing MCP performance for this measure given the changes that NCQA made to the specification for this measure for RY 2018. Not Tested = An RY 2017–18 rate difference was not calculated because high and low rates do not necessarily indicate better or worse performance.
Table 3.8 presents findings for the RY 2018 performance measures within the Appropriate Treatment and Utilization domain. DHCS did not hold MCPs accountable to meet MPLs for the following measures within this domain; therefore, HSAG did not include these measures in its assessment of the MCP’s performance related to HPLs and MPLs:
♦ All-Cause Readmissions ♦ Both Ambulatory Care measures
Table 3.8—Appropriate Treatment and Utilization DomainRY 2018 (MY 2017) Performance Measure Findings CCHP—Contra Costa County
Criteria Number of Measures
MeetingCriteria
Total Number of Measures
Percentage of Measures
MeetingCriteria
RY 2018 Rates Above HPLs 2 2 100.00% Rates Above HPLs for the Last Three or More Consecutive Years 1 2 50.00%
RY 2018 Rates Significantly Better than RY 2017 Rates* 1 3 33.33%
Rates that Moved from Below MPLs in RY 2017 to Above MPLs in RY 2018 0 0 N/A
RY 2018 Rates Below MPLs 0 2 0.00% Rates Below MPLs for the Last Three or More Consecutive Years 0 2 0.00%
RY 2018 Rates Significantly Worse than RY 2017 Rates* 1 3 33.33%
Rates that Moved from Above MPLs in RY 2017 to Below MPLs in RY 2018 0 2 0.00%
Contra Costa Health Plan Performance Evaluation Report: July 1, 2017–June 30, 2018 California Department of Health Care Services
Page L-15 Health Services Advisory Group, Inc.

MANAGED CARE HEALTH PLAN PERFORMANCE MEASURES
* Performance comparisons are based on the Chi-square test of statistical significance, with a p value of <0.05. N/A = No rates above or below the MPLs from the previous year exist to include in the denominator for calculating whether or not rates moved to above or below MPLs in the most recent year.
Performance Measure Findings—All Domains
Table 3.9 presents a summary of CCHP’s RY 2018 performance across all External Accountability Set (EAS) measures.
Note the following regarding Table 3.9:
♦ DHCS did not hold MCPs accountable to meet MPLs for the following measures; therefore, HSAG did not include these measures in its assessment of the MCP’s performance related to HPLs and MPLs: ■ All-Cause Readmissions ■ Both Ambulatory Care measures ■ All four Children and Adolescents’ Access to Primary Care measures
♦ DHCS did not hold MCPs accountable to meet MPLs for the following measures in RY 2017; therefore, HSAG did not include these measures in the denominators for calculating the percentage of measures with rates that moved to above or below the MPLs in RY 2018 and for calculating the percentage of measures with rates below MPLs for only the last two consecutive years: ■ Asthma Medication Ratio ■ Breast Cancer Screening ■ Immunizations for Adolescents—Combination 2
Table 3.9—RY 2018 (MY 2017) Performance Measure Findings for All Domains CCHP—Contra Costa County
Criteria Number of Measures
MeetingCriteria
Total Number of Measures
Percentage of Measures
MeetingCriteria
RY 2018 Rates Above HPLs 4 21 19.05% Rates Above HPLs for the Last Three or More Consecutive Years 2 18 11.11%
RY 2018 Rates Significantly Better than RY 2017 Rates* 8 22 36.36%
Contra Costa Health Plan Performance Evaluation Report: July 1, 2017–June 30, 2018 California Department of Health Care Services
Page L-16 Health Services Advisory Group, Inc.

MANAGED CARE HEALTH PLAN PERFORMANCE MEASURES
Criteria Number of Measures
MeetingCriteria
Total Number of Measures
Percentage of Measures
MeetingCriteria
Rates that Moved from Below MPLs in RY 2017 to Above MPLs in RY 2018 0 1 0.00%
RY 2018 Rates Below MPLs 2 21 9.52% Rates Below MPLs for Only the Last Two Consecutive Years 1 18 5.56%
Rates Below MPLs for the Last Three or More Consecutive Years 0 18 0.00%
RY 2018 Rates Significantly Worse than RY 2017 Rates* 4 22 18.18%
Rates that Moved from Above MPLs in RY 2017 to Below MPLs in RY 2018 0 17 0.00%
* Performance comparisons are based on the Chi-square test of statistical significance, with a p value of <0.05.
Improvement Plan Requirements for 2018 Based on RY 2018 performance measure results:
♦ CCHP will be required to continue conducting the MCP’s Diabetes Nephropathy Screening PIP.
♦ CCHP will be required to submit an IP for the Asthma Medication Ratio measure.
Contra Costa Health Plan Performance Evaluation Report: July 1, 2017–June 30, 2018 California Department of Health Care Services
Page L-17 Health Services Advisory Group, Inc.
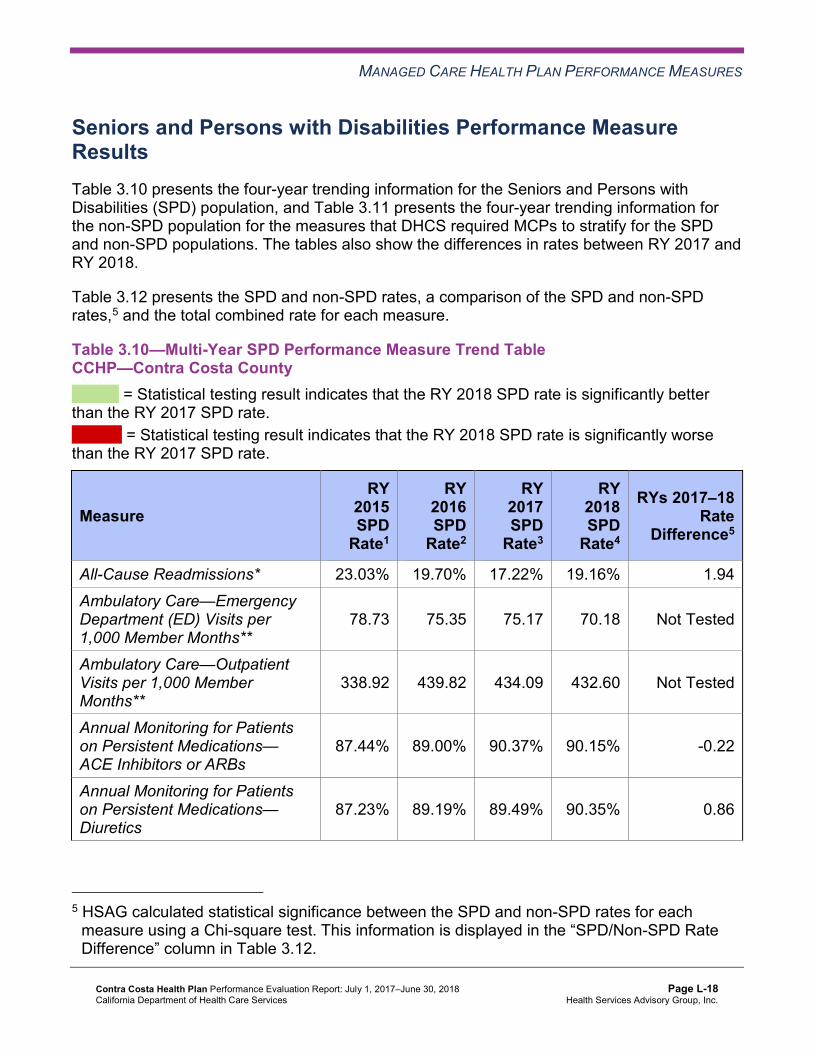
MANAGED CARE HEALTH PLAN PERFORMANCE MEASURES
Seniors and Persons with Disabilities Performance Measure Results Table 3.10 presents the four-year trending information for the Seniors and Persons with Disabilities (SPD) population, and Table 3.11 presents the four-year trending information for the non-SPD population for the measures that DHCS required MCPs to stratify for the SPD and non-SPD populations. The tables also show the differences in rates between RY 2017 and RY 2018.
Table 3.12 presents the SPD and non-SPD rates, a comparison of the SPD and non-SPD rates,5 and the total combined rate for each measure.
Table 3.10—Multi-Year SPD Performance Measure Trend Table CCHP—Contra Costa County
B = Statistical testing result indicates that the RY 2018 SPD rate is significantly better than the RY 2017 SPD rate.
W = Statistical testing result indicates that the RY 2018 SPD rate is significantly worse than the RY 2017 SPD rate.
Measure RY
2015 SPD
Rate1
RY 2016 SPD
Rate2
RY 2017 SPD
Rate3
RY 2018 SPD
Rate4
RYs 2017–18 Rate
Difference5
All-Cause Readmissions* 23.03% 19.70% 17.22% 19.16% 1.94 Ambulatory Care—Emergency Department (ED) Visits per 1,000 Member Months**
78.73 75.35 75.17 70.18 Not Tested
Ambulatory Care—Outpatient Visits per 1,000 Member Months**
338.92 439.82 434.09 432.60 Not Tested
Annual Monitoring for Patients on Persistent Medications— ACE Inhibitors or ARBs
87.44% 89.00% 90.37% 90.15% -0.22
Annual Monitoring for Patients on Persistent Medications— Diuretics
87.23% 89.19% 89.49% 90.35% 0.86
5 HSAG calculated statistical significance between the SPD and non-SPD rates for each measure using a Chi-square test. This information is displayed in the “SPD/Non-SPD Rate Difference” column in Table 3.12.
Contra Costa Health Plan Performance Evaluation Report: July 1, 2017–June 30, 2018 California Department of Health Care Services
Page L-18 Health Services Advisory Group, Inc.

MANAGED CARE HEALTH PLAN PERFORMANCE MEASURES
Measure RY
2015 SPD
Rate1
RY 2016 SPD
Rate2
RY 2017 SPD
Rate3
RY 2018 SPD
Rate4
RYs 2017–18 Rate
Difference5
Children and Adolescents' Access to Primary Care Practitioners—12–24 Months
NA 96.77% NA NA Not Comparable
Children and Adolescents' Access to Primary Care Practitioners— 25 Months–6 Years
83.71% 86.65% 85.37% 82.20% -3.17
Children and Adolescents' Access to Primary Care Practitioners—7–11 Years
87.52% 85.54% 85.16% 84.17% -0.99
Children and Adolescents' Access to Primary Care Practitioners—12–19 Years
81.82% 82.65% 80.22% 80.51% 0.29
1 RY 2015 rates reflect MY data from January 1, 2014, through December 31, 2014. 2 RY 2016 rates reflect MY data from January 1, 2015, through December 31, 2015. 3 RY 2017 rates reflect MY data from January 1, 2016, through December 31, 2016. 4 RY 2018 rates reflect MY data from January 1, 2017, through December 31, 2017. 5 Performance comparisons are based on the Chi-square test of statistical significance, with a p value of <0.05. * A lower rate indicates better performance for this measure. ** Member months are a member's “contribution” to the total yearly membership. NA = The MCP followed the specifications, but the denominator was too small (less than 30) to report a valid rate. Not Comparable = An RY 2017–18 rate difference cannot be made because data are not available for both years or because significant methodology changes occurred between years, disallowing comparison. Not Tested = An RY 2017–18 rate difference was not calculated because high and low rates do not necessarily indicate better or worse performance.
Contra Costa Health Plan Performance Evaluation Report: July 1, 2017–June 30, 2018 California Department of Health Care Services
Page L-19 Health Services Advisory Group, Inc.
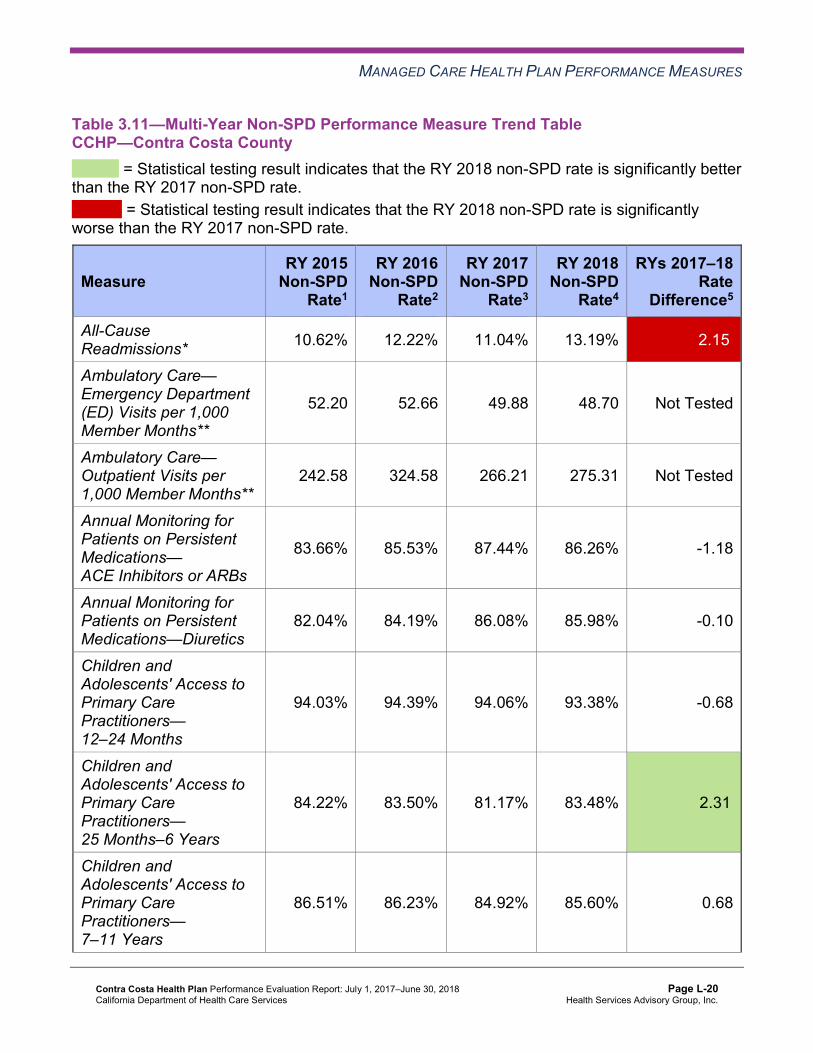
MANAGED CARE HEALTH PLAN PERFORMANCE MEASURES
Table 3.11—Multi-Year Non-SPD Performance Measure Trend Table CCHP—Contra Costa County
B = Statistical testing result indicates that the RY 2018 non-SPD rate is significantly better than the RY 2017 non-SPD rate.
W = Statistical testing result indicates that the RY 2018 non-SPD rate is significantly worse than the RY 2017 non-SPD rate.
Measure RY 2015
Non-SPD Rate1
RY 2016 Non-SPD
Rate2
RY 2017 Non-SPD
Rate3
RY 2018 Non-SPD
Rate4
RYs 2017–18 Rate
Difference5
All-Cause Readmissions* 10.62% 12.22% 11.04% 13.19% 2.15W
Ambulatory Care— Emergency Department (ED) Visits per 1,000 Member Months**
52.20 52.66 49.88 48.70 Not Tested
Ambulatory Care— Outpatient Visits per 1,000 Member Months**
242.58 324.58 266.21 275.31 Not Tested
Annual Monitoring for Patients on Persistent Medications— ACE Inhibitors or ARBs
83.66% 85.53% 87.44% 86.26% -1.18
Annual Monitoring for Patients on Persistent Medications—Diuretics
82.04% 84.19% 86.08% 85.98% -0.10
Children and Adolescents' Access to Primary Care Practitioners— 12–24 Months
94.03% 94.39% 94.06% 93.38% -0.68
Children and Adolescents' Access to Primary Care Practitioners— 25 Months–6 Years
84.22% 83.50% 81.17% 83.48% 2.31B
Children and Adolescents' Access to Primary Care Practitioners— 7–11 Years
86.51% 86.23% 84.92% 85.60% 0.68
Contra Costa Health Plan Performance Evaluation Report: July 1, 2017–June 30, 2018 California Department of Health Care Services
Page L-20 Health Services Advisory Group, Inc.

MANAGED CARE HEALTH PLAN PERFORMANCE MEASURES
Measure RY 2015
Non-SPD Rate1
RY 2016 Non-SPD
Rate2
RY 2017 Non-SPD
Rate3
RY 2018 Non-SPD
Rate4
RYs 2017–18 Rate
Difference5
Children and Adolescents' Access to Primary Care Practitioners— 12–19 Years
83.96% 84.02% 80.87% 82.52% 1.65B
1 RY 2015 rates reflect MY data from January 1, 2014, through December 31, 2014. 2 RY 2016 rates reflect MY data from January 1, 2015, through December 31, 2015. 3 RY 2017 rates reflect MY data from January 1, 2016, through December 31, 2016. 4 RY 2018 rates reflect MY data from January 1, 2017, through December 31, 2017. 5 Performance comparisons are based on the Chi-square test of statistical significance, with a p value of <0.05. * A lower rate indicates better performance for this measure. ** Member months are a member's “contribution” to the total yearly membership. Not Tested = An RY 2017–18 rate difference was not calculated because high and low rates do not necessarily indicate better or worse performance.
Table 3.12—RY 2018 (MY 2017) Performance Measure Comparison and Results forMeasures Stratified by the SPD and Non-SPD PopulationsCCHP—Contra Costa County
B = Statistical testing result indicates that the RY 2018 SPD rate is significantly better than the RY 2018 non-SPD rate.
W = Statistical testing result indicates that the RY 2018 SPD rate is significantly worse than the RY 2018 non-SPD rate.
Measure RY 2018
SPD Rate1
RY 2018 Non-SPD
Rate1
SPD/Non-SPDRate
Difference2
RY 2018 Total Rate3
All-Cause Readmissions* 19.16% 13.19% 5.97W 15.54% Ambulatory Care—Emergency Department (ED) Visits per 1,000 Member Months**
70.18 48.70 Not Tested 51.47
Ambulatory Care—Outpatient Visits per 1,000 Member Months** 432.60 275.31 Not Tested 295.57
Annual Monitoring for Patients on Persistent Medications— ACE Inhibitors or ARBs
90.15% 86.26% 3.89B 87.74%
Contra Costa Health Plan Performance Evaluation Report: July 1, 2017–June 30, 2018 California Department of Health Care Services
Page L-21 Health Services Advisory Group, Inc.
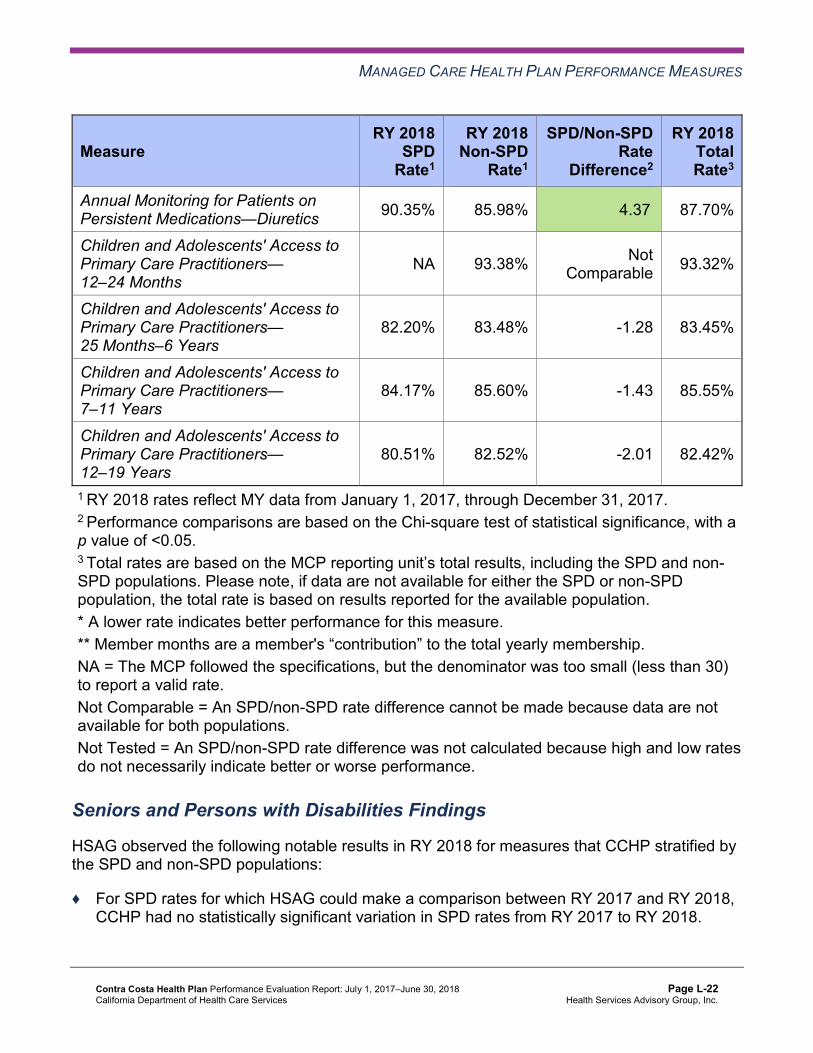
MANAGED CARE HEALTH PLAN PERFORMANCE MEASURES
Measure RY 2018
SPD Rate1
RY 2018 Non-SPD
Rate1
SPD/Non-SPDRate
Difference2
RY 2018 Total Rate3
Annual Monitoring for Patients on Persistent Medications—Diuretics 90.35% 85.98% 4.37B 87.70%
Children and Adolescents' Access to Primary Care Practitioners— 12–24 Months
NA 93.38% Not Comparable 93.32%
Children and Adolescents' Access to Primary Care Practitioners— 25 Months–6 Years
82.20% 83.48% -1.28 83.45%
Children and Adolescents' Access to Primary Care Practitioners— 7–11 Years
84.17% 85.60% -1.43 85.55%
Children and Adolescents' Access to Primary Care Practitioners— 12–19 Years
80.51% 82.52% -2.01 82.42%
1 RY 2018 rates reflect MY data from January 1, 2017, through December 31, 2017. 2 Performance comparisons are based on the Chi-square test of statistical significance, with a p value of <0.05. 3 Total rates are based on the MCP reporting unit’s total results, including the SPD and non-SPD populations. Please note, if data are not available for either the SPD or non-SPD population, the total rate is based on results reported for the available population. * A lower rate indicates better performance for this measure. ** Member months are a member's “contribution” to the total yearly membership. NA = The MCP followed the specifications, but the denominator was too small (less than 30) to report a valid rate. Not Comparable = An SPD/non-SPD rate difference cannot be made because data are not available for both populations. Not Tested = An SPD/non-SPD rate difference was not calculated because high and low rates do not necessarily indicate better or worse performance.
Seniors and Persons with Disabilities Findings
HSAG observed the following notable results in RY 2018 for measures that CCHP stratified by the SPD and non-SPD populations:
♦ For SPD rates for which HSAG could make a comparison between RY 2017 and RY 2018, CCHP had no statistically significant variation in SPD rates from RY 2017 to RY 2018.
Contra Costa Health Plan Performance Evaluation Report: July 1, 2017–June 30, 2018 California Department of Health Care Services
Page L-22 Health Services Advisory Group, Inc.
MANAGED CARE HEALTH PLAN PERFORMANCE MEASURES
♦ The non-SPD rates improved significantly from RY 2017 to RY 2018 for the Children and Adolescents’ Access to Primary Care Practitioners—25 Months–6 Years and 12–19 Years measures.
♦ The RY 2018 non-SPD rate was significantly worse than the RY 2017 non-SPD rate for the All-Cause Readmissions measure.
♦ For measures for which HSAG could compare the RY 2018 SPD rates to the RY 2018 non-SPD rates: ■ The RY 2018 SPD rates were significantly better than the RY 2018 non-SPD rates for
both Annual Monitoring for Patients on Persistent Medications measures. ■ The RY 2018 SPD rate was significantly worse than the RY 2018 non-SPD rate for the
All-Cause Readmissions measure. Note that the higher rate of hospital readmissions for the SPD population is expected based on the greater and often more complicated health care needs of these beneficiaries.
Strengths—Performance Measures HSAG auditors determined that CCHP followed the appropriate specifications to produce valid rates, and identified no issues of concern.
HSAG identified the following notable RY 2018 performance measure results for CCHP:
♦ Across all domains, four of 21 rates (19 percent) were above the HPLs in RY 2018 and eight of 22 rates for which HSAG could make a comparison (36 percent) improved significantly from RY 2017 to RY 2018.
♦ Across all domains, the rates for the following eight measures improved significantly from RY 2017 to RY 2018: ■ Asthma Medication Ratio ■ Cervical Cancer Screening ■ Comprehensive Diabetes Care—Eye Exam (Retinal) Performed ■ Controlling High Blood Pressure ■ Immunizations for Adolescents—Combination 2
○ The rate for this measure was above the HPL in RY 2018. ■ Use of Imaging Studies for Low Back Pain
○ The rate for this measure was above the HPL in RY 2018. ■ Both Weight Assessment and Counseling for Nutrition and Physical Activity for Children
and Adolescents measures ○ The rate for the Weight Assessment and Counseling for Nutrition and Physical
Activity for Children and Adolescents—Physical Activity Counseling—Total measure was above the HPL for the third consecutive year.
Contra Costa Health Plan Performance Evaluation Report: July 1, 2017–June 30, 2018 California Department of Health Care Services
Page L-23 Health Services Advisory Group, Inc.

MANAGED CARE HEALTH PLAN PERFORMANCE MEASURES
♦ In addition to the three measures noted previously with rates above the HPLs in RY 2018, the rate for the Avoidance of Antibiotic Treatment in Adults With Acute Bronchitis measure was above the HPL for at least the fourth consecutive year.
Opportunities for Improvement—Performance Measures The rates for the following two of 21 measures (10 percent) were below the MPLs in RY 2018:
♦ Asthma Medication Ratio ♦ Comprehensive Diabetes Care—Medical Attention for Nephropathy
The MCP’s performance related to the following four of 22 measures for which HSAG could make a comparison (18 percent) declined significantly from RY 2017 to RY 2018:
♦ All-Cause Readmissions ♦ Comprehensive Diabetes Care—HbA1c Control (<8.0 Percent) ♦ Comprehensive Diabetes Care—HbA1c Poor Control (>9.0 Percent) ♦ Prenatal and Postpartum Care—Timeliness of Prenatal Care
Based on RY 2018 performance measure results, CCHP has the following opportunities for improvement:
♦ Identify strategies to address the MCP’s performance below the MPL for the Asthma Medication Ratio measure. CCHP should consider applying lessons learned, as applicable, from the MCP’s 2015–17 Medication Management for People With Asthma PIP as well as spreading successful strategies that contributed to the rate for this measure improving significantly from RY 2017 to RY 2018.
♦ To support the MCP’s efforts to improve performance to above the MPL for the Comprehensive Diabetes Care—Medical Attention for Nephropathy measure, ensure that the MCP incorporates HSAG’s initial feedback on the Plan portion of Module 4 prior to testing the in-home nephropathy screening intervention for the MCP’s Diabetes Nephropathy Screening PIP. CCHP should monitor the intervention effectiveness measure throughout the intervention testing phase and take appropriate actions (i.e., adopt, adapt, or abandon) based on intervention testing results. If CCHP determines the tested intervention to be successful, the MCP should expand the intervention in multiple environments. Assess the causes for the MCP’s performance declining significantly from RY 2017 to RY 2018 for the following measures; and identify strategies to prevent the MCP’s performance from continuing to decline: ■ All-Cause Readmissions ■ Comprehensive Diabetes Care—HbA1c Control (<8.0 Percent) ■ Comprehensive Diabetes Care—HbA1c Poor Control (>9.0 Percent) ■ Prenatal and Postpartum Care—Timeliness of Prenatal Care
Contra Costa Health Plan Performance Evaluation Report: July 1, 2017–June 30, 2018 California Department of Health Care Services
Page L-24 Health Services Advisory Group, Inc.

Medi-Cal Managed Care External Quality Review Technical ReportAppendix L: Performance Evaluation ReportContra Costa Health Plan July 1, 2017–June 30, 2018
4. Performance Improvement Projects
Performance Improvement Project Overview The key concepts of the rapid-cycle PIP framework include forming a PIP team, setting aims, establishing measures, determining interventions using quality improvement tools, conducting PDSA cycles to test interventions, and planning for the spread of successful changes. The core component of the rapid-cycle PIP approach involves testing changes on a small scale so that improvement can occur more efficiently and lead to long-term sustainability. The following modules guide MCPs through this rapid-cycle PIP process:
♦ Module 1—PIP Initiation ■ MCPs outline the framework for the PIP, which includes:
○ The topic rationale. ○ Comparative data supporting the need to improve the selected topic. ○ A list of the PIP team members, which consists of internal and external stakeholders. ○ A completed key driver diagram that defines the theory of change for improvement,
including the SMART (Specific, Measurable, Achievable, Relevant, and Time-bound) Aim and Global Aim.
♦ Module 2—SMART Aim Data Collection ■ MCPs define the SMART Aim measure and data collection methodology and develop
the SMART Aim data run chart. ♦ Module 3—Intervention Determination
■ MCPs use process mapping and failure modes and effects analysis (FMEA) to identify potential interventions to test which may have direct effects on the SMART Aim.
♦ Module 4—Plan-Do-Study-Act (PDSA) ■ MCPs test and evaluate the interventions identified in Module 3 through a series of
PDSA cycles. ♦ Module 5—PIP Conclusions
■ MCPs interpret results and summarize: ○ Key findings and outcomes achieved. ○ Assessment of each tested intervention. ○ Lessons learned, including how demonstrated improvement can be shared and used
as a foundation for further improvement going forward. ○ Plan for sustained improvement.
Contra Costa Health Plan Performance Evaluation Report: July 1, 2017–June 30, 2018 California Department of Health Care Services
Page L-25 Health Services Advisory Group, Inc.

PERFORMANCE IMPROVEMENT PROJECTS
Based on the agreed-upon timeline, MCPs submit each module to HSAG for validation. Throughout the rapid-cycle PIP process, HSAG provides technical assistance to MCPs to ensure that PIPs are methodologically sound and to problem-solve with MCPs regarding how to address challenges that occur. Through an iterative process, MCPs have opportunities to make corrections to modules 1 through 3 to achieve all validation criteria.
Once MCPs achieve all validation criteria for modules 1 through 3 and receive feedback on the intervention Plan portion of Module 4, MCPs test interventions. During the intervention testing phase of the PIP, HSAG conducts periodic progress check-ins to ensure that MCPs have addressed HSAG’s feedback on the Plan portion of Module 4 and are making appropriate progress with intervention testing. Once MCPs complete testing an intervention, MCPs determine the next steps based on results and lessons learned—whether the intervention was successful and should be spread (adopt), whether modifications need to be made to the existing intervention (adapt), or whether the intervention was not successful and should be stopped (abandon).
In Module 5, MCPs summarize the overall PIP. When validating Module 5, HSAG assesses the validity and reliability of the results based on the Centers for Medicare & Medicaid Services (CMS) validation protocols to determine whether key stakeholders can have confidence in the reported PIP findings. HSAG assigns the following final confidence levels for each PIP:
♦ High confidence—the PIP was methodologically sound and achieved the SMART Aim goal; the demonstrated improvement was clearly linked to the quality improvement processes conducted and intervention(s) tested; and, the MCP accurately summarized the key findings.
♦ Confidence—the PIP was methodologically sound and achieved the SMART Aim goal, and the MCP accurately summarized the key findings. However, some, but not all, of the quality improvement processes conducted and/or intervention(s) tested were clearly linked to the demonstrated improvement.
♦ Low confidence—either (A) the PIP was methodologically sound; however, the SMART Aim goal was not achieved; or (B) the SMART Aim goal was achieved; however, the quality improvement processes and/or intervention(s) tested were poorly executed and could not be linked to the improvement.
♦ Reported PIP results were not credible (referred to in this report as “not credible”)—the PIP methodology was not executed as approved.
Performance Improvement Project Results and Findings During the review period, CCHP submitted modules 4 and 5 for its 2015–17 DHCS-priority and MCP-specific PIPs. HSAG validated the modules and includes the final PIP validation findings in this report. Additionally, CCHP initiated a Disparity PIP and a DHCS-priority PIP during the review period. In this report, HSAG includes summaries of the MCP’s Disparity and DHCS-priority PIP module submissions as well as validation findings from the review period.
Contra Costa Health Plan Performance Evaluation Report: July 1, 2017–June 30, 2018 California Department of Health Care Services
Page L-26 Health Services Advisory Group, Inc.
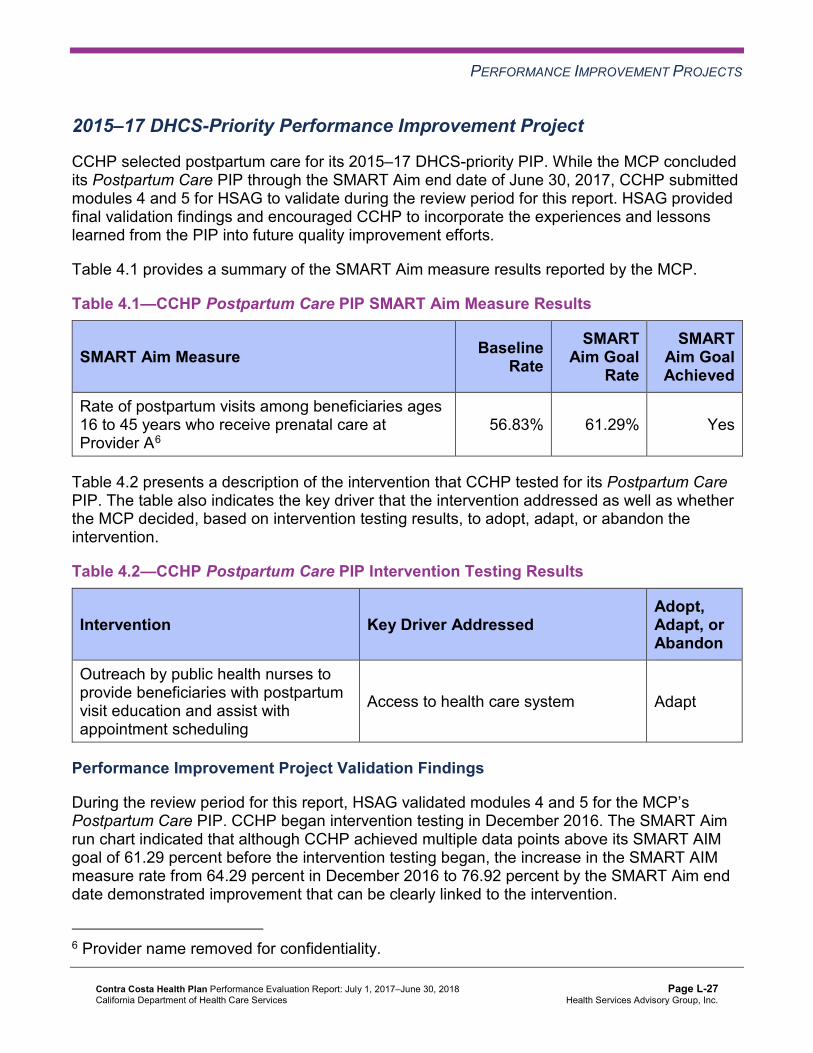
PERFORMANCE IMPROVEMENT PROJECTS
2015–17 DHCS-Priority Performance Improvement Project
CCHP selected postpartum care for its 2015–17 DHCS-priority PIP. While the MCP concluded its Postpartum Care PIP through the SMART Aim end date of June 30, 2017, CCHP submitted modules 4 and 5 for HSAG to validate during the review period for this report. HSAG provided final validation findings and encouraged CCHP to incorporate the experiences and lessons learned from the PIP into future quality improvement efforts.
Table 4.1 provides a summary of the SMART Aim measure results reported by the MCP.
Table 4.1—CCHP Postpartum Care PIP SMART Aim Measure Results
SMART Aim Measure Baseline Rate
SMART Aim Goal
Rate
SMART Aim Goal Achieved
Rate of postpartum visits among beneficiaries ages 16 to 45 years who receive prenatal care at Provider A6
56.83% 61.29% Yes
Table 4.2 presents a description of the intervention that CCHP tested for its Postpartum Care PIP. The table also indicates the key driver that the intervention addressed as well as whether the MCP decided, based on intervention testing results, to adopt, adapt, or abandon the intervention.
Table 4.2—CCHP Postpartum Care PIP Intervention Testing Results
Intervention Key Driver Addressed Adopt,Adapt, orAbandon
Outreach by public health nurses to provide beneficiaries with postpartum visit education and assist with appointment scheduling
Access to health care system Adapt
Performance Improvement Project Validation Findings
During the review period for this report, HSAG validated modules 4 and 5 for the MCP’s Postpartum Care PIP. CCHP began intervention testing in December 2016. The SMART Aim run chart indicated that although CCHP achieved multiple data points above its SMART AIM goal of 61.29 percent before the intervention testing began, the increase in the SMART AIM measure rate from 64.29 percent in December 2016 to 76.92 percent by the SMART Aim end date demonstrated improvement that can be clearly linked to the intervention.
6 Provider name removed for confidentiality.
Contra Costa Health Plan Performance Evaluation Report: July 1, 2017–June 30, 2018 California Department of Health Care Services
Page L-27 Health Services Advisory Group, Inc.
PERFORMANCE IMPROVEMENT PROJECTS
Upon assessment of validity and reliability of the PIP results, HSAG assigned CCHP’s Postpartum Care PIP a final confidence level of High Confidence.
2015–17 MCP-Specific Performance Improvement Project
CCHP selected medication management for people with asthma for its 2015–17 MCP-specific PIP topic. While the MCP concluded its Medication Management for People With Asthma PIP through the SMART Aim end date of June 30, 2017, CCHP submitted modules 4 and 5 for HSAG to validate during the review period for this report. HSAG provided final validation findings and encouraged CCHP to incorporate the experiences and lessons learned from the PIP into future quality improvement efforts.
Table 4.3 provides a summary of the SMART Aim measure results reported by the MCP.
Table 4.3—CCHP Medication Management for People With Asthma PIP SMART Aim Measure Results
SMART Aim Measure Baseline Rate
SMART Aim Goal
Rate
SMART Aim Goal Achieved
Rate of asthma medication compliance among beneficiaries ages 5 to 18 years who receive care at Provider B7
58.42% 63.44% Yes
Table 4.4 presents a description of the intervention that CCHP tested for its Medication Management for People With Asthma PIP. The table also indicates the failure mode that the intervention addressed as well as whether the MCP decided, based on intervention testing results, to adopt, adapt, or abandon the intervention.
Table 4.4—CCHP Medication Management for People With Asthma PIP Intervention Testing Results
Intervention Failure Mode Addressed Adopt, Adapt, orAbandon
Mailing asthma education materials to parents of beneficiaries 5 to 18 years of age who have asthma
Beneficiary’s and family’s lack of understanding of asthma self-management skills
Undetermined due to no data being available to review the effectiveness of the intervention
7 Provider name removed for confidentiality.
Contra Costa Health Plan Performance Evaluation Report: July 1, 2017–June 30, 2018 California Department of Health Care Services
Page L-28 Health Services Advisory Group, Inc.

PERFORMANCE IMPROVEMENT PROJECTS
Performance Improvement Project Validation Findings
During the review period for this report, HSAG validated modules 4 and 5 for the MCP’s Medication Management for People With Asthma PIP. Although CCHP indicated that it met the SMART Aim goal, the MCP documented that it did not begin intervention testing until August 2017, which was after the SMART Aim end date; therefore, the MCP could not link the improvement to the tested intervention. Upon assessment of validity and reliability of the PIP results, HSAG assigned CCHP’s Medication Management for People With Asthma PIP a final confidence level of Not Credible.
2017–19 Disparity Performance Improvement Project
During the review period, DHCS required CCHP to initiate a PIP focusing on an identified health disparity based on, but not limited to, age, gender, race or ethnicity, language spoken, income, educational attainment, sexual orientation or gender identity, occupation, provider, or geographic area. CCHP selected controlling blood pressure among African American beneficiaries as its 2017–19 Disparity PIP topic. Using its own MCP-specific data, the MCP provided evidence of the health disparity by demonstrating a statistically significant rate difference between two subgroups, with the disparate subgroup having the lower rate.
Table 4.5 provides the SMART Aim measure description, baseline rate, and SMART Aim goal rate for the PIP. The SMART Aim end date for this PIP is June 30, 2019.
Table 4.5—CCHP Controlling Blood Pressure Disparity PIP SMART Aim Measure
SMART Aim Measure Baseline Rate
SMART Aim Goal
Rate
Rate of hypertension control among African American beneficiaries ages 18 to 85 who receive care at Clinic A8 61.40% 66.58%
Performance Improvement Project Validation Findings
During the review period of this report, HSAG validated modules 1 through 3 for the MCP’s Controlling Blood Pressure Disparity PIP. Upon initial review of the modules, HSAG determined that CCHP met some required validation criteria; however, HSAG identified opportunities for improvement related to:
♦ Supporting the topic selection with the MCP’s data. ♦ Including all required components of the:
■ SMART Aim, developed based on literature review, data, and/or experience. ■ SMART Aim measure.
8 Clinic name removed for confidentiality.
Contra Costa Health Plan Performance Evaluation Report: July 1, 2017–June 30, 2018 California Department of Health Care Services
Page L-29 Health Services Advisory Group, Inc.

PERFORMANCE IMPROVEMENT PROJECTS
■ SMART Aim data collection methodology. ■ Run/control chart. ■ FMEA table.
♦ Including a step-by-step flow of the overall process in the process map. ♦ Listing the appropriate potential interventions based on the ranked failure modes. ♦ Considering the potential interventions’ reliability and sustainability.
After receiving technical assistance from HSAG, CCHP incorporated HSAG’s feedback into the PIP modules. Upon HSAG’s final review, HSAG determined that the MCP met all validation criteria for all submitted modules.
2017–19 DHCS-Priority Performance Improvement Project
During the review period, DHCS required MCPs to initiate a PIP related to one of DHCS’ Quality Strategy focus areas: Childhood Immunization Status—Combination 3, Controlling High Blood Pressure, Comprehensive Diabetes Care, or Prenatal and Postpartum Care— Postpartum Care. However, based on CCHP demonstrating high performance on DHCS’ Quality Strategy focus areas, DHCS allowed the MCP to choose an alternative topic for its DHCS-priority PIP based on an identified area in need of improvement. CCHP selected nephropathy screening among beneficiaries living with diabetes as its 2017–19 DHCS-priority PIP topic based on its MCP-specific data.
Table 4.6 provides the SMART Aim measure description, baseline rate, and SMART Aim goal rate for the PIP. The SMART Aim end date for this PIP is June 30, 2019.
Table 4.6—CCHP Diabetes Nephropathy Screening PIP SMART Aim Measure
SMART Aim Measure Baseline Rate
SMART Aim Goal
Rate
Rate of nephropathy screening among beneficiaries ages 18 to 75 with a diagnosis of diabetes who reside in Contra Costa County and receive care at Health Center9
77.78% 91.97%
9 Health center name removed for confidentiality.
Contra Costa Health Plan Performance Evaluation Report: July 1, 2017–June 30, 2018 California Department of Health Care Services
Page L-30 Health Services Advisory Group, Inc.

PERFORMANCE IMPROVEMENT PROJECTS
Performance Improvement Project Validation Findings
During the review period of this report, HSAG validated modules 1 through 3 for the MCP’s Diabetes Nephropathy Screening PIP. Upon initial review of the modules, HSAG determined that CCHP met some required validation criteria; however, HSAG identified opportunities for improvement related to:
♦ Supporting the topic selection with the MCP’s data. ♦ Including all required components of the:
■ SMART Aim measure. ■ SMART Aim data collection methodology. ■ Run/control chart. ■ FMEA.
♦ Capturing all required data elements in the data collection tool. ♦ Including a step-by-step flow of the overall process in the process map. ♦ Listing the appropriate potential interventions based on the ranked failure modes. ♦ Considering the potential interventions’ reliability and sustainability.
After receiving technical assistance from HSAG, CCHP incorporated HSAG’s feedback into the PIP modules. Upon HSAG’s final review, HSAG determined that the MCP met all validation criteria for all submitted modules.
Intervention Testing Pre-Validation Feedback
During the review period, HSAG reviewed and provided feedback to CCHP on the Plan portion of the PDSA cycle for the intervention that the MCP selected to test. Table 4.7 presents a description of the intervention as well as the key drivers that the intervention addressed.
Table 4.7—CCHP Diabetes Nephropathy Screening PIP Intervention Testing
Intervention Key Drivers Addressed
Offer in-home testing option for nephropathy screening
♦ Tailoring education about the importance of nephropathy testing
♦ Avoiding lab wait times ♦ Resolving transportation concerns
HSAG expects CCHP to incorporate HSAG’s feedback prior to testing the intervention and to contact HSAG related to any issues throughout the Intervention Testing phase of the PIP process.
Contra Costa Health Plan Performance Evaluation Report: July 1, 2017–June 30, 2018 California Department of Health Care Services
Page L-31 Health Services Advisory Group, Inc.
PERFORMANCE IMPROVEMENT PROJECTS
Strengths—Performance Improvement Projects CCHP achieved the SMART Aim goal for the 2015–17 Postpartum Care PIP and clearly linked the tested intervention to the demonstrated improvement. Based on HSAG’s assessment, HSAG assigned the 2015–17 Postpartum Care PIP a final confidence level of High Confidence.
Opportunities for Improvement—Performance Improvement Projects CCHP has the opportunity to continue monitoring interventions and outcomes to facilitate long-term, sustained improvement beyond the life of the 2015–17 Postpartum Care PIP. Ongoing monitoring will enable long-term evaluation of sustained improvement and allow the MCP to continually refine interventions to achieve and sustain optimal outcomes.
Additionally, CCHP has the opportunity to apply the lessons learned from the 2015–17 Medication Management for People With Asthma PIP to facilitate improvement for future PIPs.
Contra Costa Health Plan Performance Evaluation Report: July 1, 2017–June 30, 2018 California Department of Health Care Services
Page L-32 Health Services Advisory Group, Inc.

Medi-Cal Managed Care External Quality Review Technical ReportAppendix L: Performance Evaluation ReportContra Costa Health Plan July 1, 2017–June 30, 2018
5. Recommendations
Follow-Up on Prior Year Recommendations DHCS provided each MCP an opportunity to outline actions taken to address recommendations HSAG made in its 2016–17 MCP-specific evaluation report. Table 5.1 provides EQR recommendations from CCHP’s July 1, 2016, through June 30, 2017, MCP-specific evaluation report, along with the MCP’s self-reported actions taken through June 30, 2018, that address the recommendations. Please note that HSAG made minimal edits to Table 5.1 to preserve the accuracy of CCHP’s self-reported actions.
Table 5.1—CCHP’s Self-Reported Follow-Up on External Quality ReviewRecommendations from the July 1, 2016, through June 30, 2017, MCP-SpecificEvaluation Report
2016–17 External Quality ReviewRecommendations Directed to CCHP
Self-Reported Actions Taken by CCHPduring the Period of July 1, 2017–June 30,2018, that Address the External QualityReview Recommendations
1. Identify the causes for the MCP’s performance below the MPL in RY 2017 for the Comprehensive Diabetes Care— Medical Attention for Nephropathy measure.
We launched a PIP to study and correct this deficiency. We will soon be sending nephropathy screening test kits to members’ homes.
2. Identify the causes for the rate for the Use of Imaging Studies for Low Back Pain measure declining significantly from RY 2016 to RY 2017.
We spoke to providers and leaders to see whether there had been any change of practice, but did not find any. Our rate has since gone back up a bit.
Contra Costa Health Plan Performance Evaluation Report: July 1, 2017–June 30, 2018 California Department of Health Care Services
Page L-33 Health Services Advisory Group, Inc.
RECOMMENDATIONS
2017–18 Recommendations Based on the overall assessment of CCHP’s delivery of quality, accessible, and timely care through the activities described in previous sections of this report, HSAG recommends the following to the MCP:
♦ Identify strategies to address the MCP’s performance below the MPL for the Asthma Medication Ratio measure. During the process of identifying strategies, apply lessons learned, as applicable, from the MCP’s 2015–17 Medication Management for People With Asthma PIP; and spread successful strategies that contributed to the rate for this measure improving significantly from RY 2017 to RY 2018.
♦ To support the MCP’s efforts to improve performance to above the MPL for the Comprehensive Diabetes Care—Medical Attention for Nephropathy measure, ensure that the MCP incorporates HSAG’s initial feedback on the Plan portion of Module 4 prior to testing the in-home nephropathy screening intervention for the MCP’s Diabetes Nephropathy Screening PIP. Additionally, the MCP should monitor the intervention effectiveness measure throughout the intervention testing phase and take appropriate actions (i.e., adopt, adapt, or abandon) based on intervention testing results. If CCHP determines the tested intervention to be successful, the MCP should expand the intervention in multiple environments.
♦ Assess the causes for the MCP’s performance declining significantly from RY 2017 to RY 2018 for the following measures; and identify strategies to prevent the MCP’s performance from continuing to decline: ■ All-Cause Readmissions ■ Comprehensive Diabetes Care—HbA1c Control (<8.0 Percent) ■ Comprehensive Diabetes Care—HbA1c Poor Control (>9.0 Percent) ■ Prenatal and Postpartum Care—Timeliness of Prenatal Care
♦ Continue monitoring interventions and outcomes to facilitate long-term, sustained improvement beyond the life of the 2015–17 Postpartum Care PIP.
In the next annual review, HSAG will evaluate continued successes of CCHP as well as the MCP’s progress with these recommendations.
Contra Costa Health Plan Performance Evaluation Report: July 1, 2017–June 30, 2018 California Department of Health Care Services
Page L-34 Health Services Advisory Group, Inc.
Medi-Cal Managed CareExternal Quality Review Technical Report
Appendix M: Performance Evaluation Report
Family Mosaic Project July 1, 2017–June 30, 2018

Medi-Cal Managed Care External Quality Review Technical ReportAppendix M: Performance Evaluation ReportFamily Mosaic ProjectJuly 1, 2017–June 30, 2018
Table of Contents
1. Introduction............................................................................................................ M-1 Medi-Cal Managed Care Specialty Health Plan Overview....................................... M-1
2. Specialty Health Plan Compliance ....................................................................... M-3 3. Performance Measures ......................................................................................... M-4
Performance Measure Validation Results ............................................................... M-4 Performance Measure Results ................................................................................ M-5 Strengths—Performance Measures ........................................................................ M-5 Opportunities for Improvement—Performance Measures ....................................... M-5
4. Performance Improvement Projects .................................................................... M-6Performance Improvement Project Overview .......................................................... M-6 Performance Improvement Project Results and Findings........................................ M-8
2015–17 Promoting Caregiver Engagement and Participation Performance Improvement Project ............................................................................................ M-8 2015–17 Ensuring Primary Care Connections Performance Improvement Project M-9 2017–19 Reducing Physical Health Issues Performance Improvement Project. M-10 2017–19 Improving Client Access and Use of Recreational Activities Performance Improvement Project..................................................................... M-11
Strengths—Performance Improvement Projects ................................................... M-11 Opportunities for Improvement—Performance Improvement Projects .................. M-12
5. Recommendations............................................................................................... M-13 Follow-Up on Prior Year Recommendations ......................................................... M-13 2017–18 Recommendations.................................................................................. M-13
Table of Tables
Table 3.1—Performance Measure Results FMP—San Francisco County .................... M-5 Table 4.1—FMP Promoting Caregiver Engagement and Participation PIP SMART
Aim Measure Results.................................................................................. M-8 Table 4.2—FMP Promoting Caregiver Engagement and Participation PIP Intervention
Testing Results ........................................................................................... M-8 Table 4.3—FMP Ensuring Primary Care Connections PIP SMART Aim Measure Results M-9 Table 4.4—FMP Ensuring Primary Care Connections PIP Intervention Testing Results.M-10
Family Mosaic Project Performance Evaluation Report: July 1, 2017–June 30, 2018 California Department of Health Care Services
Page M-i Health Services Advisory Group, Inc.
Medi-Cal Managed Care External Quality Review Technical ReportAppendix M: Performance Evaluation ReportFamily Mosaic ProjectJuly 1, 2017–June 30, 2018
1. Introduction
The California Department of Health Care Services (DHCS) contracted with Health Services Advisory Group, Inc. (HSAG), an external quality review organization (EQRO), to prepare the federally required Medi-Cal Managed Care External Quality Review Technical Report, July 1, 2017–June 30, 2018. The technical report provides an overview of the objectives and methodology for conducting the external quality review (EQR) activities, including requirements related to each activity. Additionally, the technical report provides aggregated results and recommendations for DHCS for each activity.
This appendix is specific to DHCS’ contracted Medi-Cal managed care specialty plan (SHP), Family Mosaic Project (“FMP” or “the SHP”). The purpose of this appendix is to provide SHP-specific results of each activity and an assessment of the SHP’s strengths and opportunities for improvement with respect to the quality and timeliness of and access to health care services furnished to Medi-Cal Managed Care (MCMC) beneficiaries (referred to as “beneficiaries” in this report). The review period for this SHP-specific evaluation report is July 1, 2017, through June 30, 2018. HSAG will report on activities that take place beyond the review period in FMP’s 2018–19 SHP-specific evaluation report. This SHP-specific evaluation report references activities and methodologies described in detail by HSAG in the technical report section.
The aggregate EQR technical report and all Medi-Cal full-scope managed care health plan (MCP)- and SHP-specific performance evaluation reports reflect HSAG’s external, independent assessment of the quality and timeliness of, and access to, care that MCPs and SHPs are providing to beneficiaries.
Medi-Cal Managed Care Specialty Health Plan Overview FMP is an SHP which provides intensive case management and wraparound services for MCMC children and adolescents at risk of out-of-home placement in San Francisco County. FMP is part of the Child, Youth, and Family System of Care operated by the City and County of San Francisco Department of Public Health (SFDPH) Community Behavioral Health Services. To receive services from FMP, a beneficiary must meet specific enrollment criteria, including being a San Francisco resident between 3 and 18 years of age, having serious mental health care needs, and being at imminent risk of (or already in) out-of-home placement. FMP submits qualifying clients to DHCS for approval to be enrolled in FMP’s MCMC. Once a client is approved and included under FMP’s contract with DHCS, the SHP receives a per-beneficiary, per-month capitated rate to provide mental health and related wraparound services. Due to FMP’s unique membership, some SHP contract requirements differ from the MCP contract requirements.
Family Mosaic Project Performance Evaluation Report: July 1, 2017–June 30, 2018 California Department of Health Care Services
Page M-1 Health Services Advisory Group, Inc.

INTRODUCTION
FMP became operational in San Francisco County to provide MCMC services effective December 1992. As of June 30, 2018, FMP had 28 beneficiaries.1
1 Medi-Cal Managed Care Enrollment Report—June 2018. Available at: http://www.dhcs.ca.gov/dataandstats/reports/Pages/MMCDMonthlyEnrollment.aspx. Accessed on: Nov 8, 2018.
Family Mosaic Project Performance Evaluation Report: July 1, 2017–June 30, 2018 California Department of Health Care Services
Page M-2 Health Services Advisory Group, Inc.
Medi-Cal Managed Care External Quality Review Technical ReportAppendix M: Performance Evaluation ReportFamily Mosaic ProjectJuly 1, 2017–June 30, 2018
2. Specialty Health Plan Compliance
DHCS’ Mental Health Services Division (MHSD) conducts triennial oversight reviews of each county mental health plan (MHP) to determine compliance with federal and State regulations as well as with the terms of the MHP contract. DHCS works closely with each MHP to ensure compliance and to identify opportunities for improvement. Using a collaborative and educational approach, DHCS provides guidance and technical assistance when DHCS determines that the MHP is out of compliance. After the review, DHCS identifies strength-based practices of the MHP and provides feedback related to areas of non-compliance. DHCS provides the MHP with a written report of findings which includes a description of each finding, a description of any corrective action(s) needed, and the time frames in which the MHP is required to become compliant. For all items that DHCS determines to be out of compliance, MHPs are required to submit a plan of correction (POC) to DHCS within 60 days of the MHP’s receipt of the final report of findings. If an urgent issue is identified, the issue is addressed immediately.
DHCS did not conducted an oversight review of FMP directly during the review period for this report; however, DHCS conducted a triennial on-site review of the San Francisco County MHP from April 24, 2017, through April 27, 2017. FMP is part of the Child, Youth, and Family System of Care operated by the San Francisco Department of Public Health Community Behavioral Health Services; therefore, FMP was included in the April 24, 2017, review. HSAG included a summary of the April 2017 review in FMP’s 2016–17 SHP-specific evaluation report.
Family Mosaic Project Performance Evaluation Report: July 1, 2017–June 30, 2018 California Department of Health Care Services
Page M-3 Health Services Advisory Group, Inc.

Medi-Cal Managed Care External Quality Review Technical ReportAppendix M: Performance Evaluation ReportFamily Mosaic ProjectJuly 1, 2017–June 30, 2018
3. Performance Measures
Performance Measure Validation Results For reporting year (RY) 2018, FMP was required to report two performance measures— Promotion of Positive Pro-Social Activity and School Attendance. Neither is a HEDIS®2
measure; therefore, HSAG conducted performance measure validation for the two performance measures selected, calculated, and reported by the SHP. HSAG conducted the validation activities as outlined in the Centers for Medicare & Medicaid Services’ (CMS’) publication, EQR Protocol 2: Validation of Performance Measures Reported by the MCO: A Mandatory Protocol for External Quality Review (EQR), Version 2.0, September 20123 (i.e., CMS’ performance measure validation protocol).
The 2018 Performance Measure Validation Final Report of Findings for Family Mosaic Project contains the detailed findings and recommendations from HSAG’s performance measure validation of the two measures that FMP reported. During the audit process, the FMP team and HSAG auditor noted that the specifications for both measures did not fully represent improvement for beneficiaries identified during the initial intake as having recreational and school attendance issues. Additionally, the measure specifications were difficult to understand and therefore were not meaningful indicators to the SHP. Thus, the auditor revised the performance measure specifications to more accurately measure members’ recreational and school attendance issues, and obtained DHCS’ approval of the revisions. The change in measure specifications resulted in both measures being first-year measures.
The auditor determined that FMP followed the new measure specifications and accurately calculated the rates. Additionally, the auditor identified no issues of concern.
2 Healthcare Effectiveness Data and Information Set (HEDIS®) is a registered trademark of the National Committee for Quality Assurance (NCQA).
3 Department of Health and Human Services, Centers for Medicare & Medicaid Services. EQR Protocol 2: Validation of Performance Measures Reported by the MCO: A Mandatory Protocol for External Quality Review (EQR), Version 2.0, September 2012. Available at: https://www.medicaid.gov/medicaid/quality-of-care/medicaid-managed-care/external-quality-review/index.html. Accessed on: Nov 8, 2018.
Family Mosaic Project Performance Evaluation Report: July 1, 2017–June 30, 2018 California Department of Health Care Services
Page M-4 Health Services Advisory Group, Inc.

PERFORMANCE MEASURES
Performance Measure Results Table 3.1 presents FMP’s RY 2018 performance measure results. Note that because both measures were first year measures, HSAG conducted no analyses of the results.
Table 3.1—Performance Measure Results FMP—San Francisco County
Measure RY 2018 Rate
Promotion of Positive Pro-Social Activity NA
School Attendance NA NA = The SHP followed the specifications, but the denominator was too small (less than 30) to report a valid rate.
Strengths—Performance Measures HSAG auditors determined that FMP followed the appropriate specifications to produce valid rates, and identified no issues of concern.
Opportunities for Improvement—Performance Measures Based on performance measure results, HSAG has no recommendations for FMP in the area of performance measures.
Family Mosaic Project Performance Evaluation Report: July 1, 2017–June 30, 2018 California Department of Health Care Services
Page M-5 Health Services Advisory Group, Inc.

Medi-Cal Managed Care External Quality Review Technical ReportAppendix M: Performance Evaluation ReportFamily Mosaic ProjectJuly 1, 2017–June 30, 2018
4. Performance Improvement Projects
Performance Improvement Project Overview The key concepts of the rapid-cycle PIP framework include forming a PIP team, setting aims, establishing measures, determining interventions using quality improvement tools, conducting PDSA cycles to test interventions, and planning for the spread of successful changes. The core component of the rapid-cycle PIP approach involves testing changes on a small scale so that improvement can occur more efficiently and lead to long-term sustainability. The following modules guide MCPs and SHPs through this rapid-cycle PIP process:
♦ Module 1—PIP Initiation ■ MCPs and SHPs outline the framework for the PIP, which includes:
○ The topic rationale. ○ Comparative data supporting the need to improve the selected topic. ○ A list of the PIP team members, which consists of internal and external stakeholders. ○ A completed key driver diagram that defines the theory of change for improvement,
including the SMART (Specific, Measurable, Achievable, Relevant, and Time-bound) Aim and Global Aim.
♦ Module 2—SMART Aim Data Collection ■ MCPs and SHPs define the SMART Aim measure and data collection methodology and
develop the SMART Aim data run chart. ♦ Module 3—Intervention Determination
■ MCPs and SHPs use process mapping and failure modes and effects analysis to identify potential interventions to test which may have direct effects on the SMART Aim.
♦ Module 4—Plan-Do-Study-Act (PDSA) ■ MCPs and SHPs test and evaluate the interventions identified in Module 3 through a
series of PDSA cycles. ♦ Module 5—PIP Conclusions
■ MCPs and SHPs interpret results and summarize: ○ Key findings and outcomes achieved. ○ Assessment of each tested intervention. ○ Lessons learned, including how demonstrated improvement can be shared and used
as a foundation for further improvement going forward. ○ Plan for sustained improvement.
Family Mosaic Project Performance Evaluation Report: July 1, 2017–June 30, 2018 California Department of Health Care Services
Page M-6 Health Services Advisory Group, Inc.

PERFORMANCE IMPROVEMENT PROJECTS
Based on the agreed-upon timeline, MCPs and SHPs submit each module to HSAG for validation. Throughout the rapid-cycle PIP process, HSAG provides technical assistance to MCPs and SHPs to ensure that PIPs are methodologically sound and to problem-solve with MCPs and SHPs regarding how to address challenges that occur. Through an iterative process, MCPs and SHPs have opportunities to make corrections to modules 1 through 3 to achieve all validation criteria.
Once MCPs and SHPs achieve all validation criteria for modules 1 through 3 and receive feedback on the intervention Plan portion of Module 4, MCPs and SHPs test interventions. During the intervention testing phase of the PIP, HSAG conducts periodic progress check-ins to ensure that MCPs and SHPs have addressed HSAG’s feedback on the Plan portion of Module 4 and are making appropriate progress with intervention testing. Once MCPs and SHPs complete testing an intervention, MCPs and SHPs determine the next steps based on results and lessons learned—whether the intervention was successful and should be spread (adopt), whether modifications need to be made to the existing intervention (adapt), or whether the intervention was not successful and should be stopped (abandon).
In Module 5, MCPs and SHPs summarize the overall PIP. When validating Module 5, HSAG assesses the validity and reliability of the results based on the Centers for Medicare & Medicaid Services (CMS) validation protocols to determine whether key stakeholders can have confidence in the reported PIP findings. HSAG assigns the following final confidence levels for each PIP:
♦ High confidence—the PIP was methodologically sound and achieved the SMART Aim goal; the demonstrated improvement was clearly linked to the quality improvement processes conducted and intervention(s) tested; and, the MCP/SHP accurately summarized the key findings.
♦ Confidence—the PIP was methodologically sound and achieved the SMART Aim goal, and the MCP/SHP accurately summarized the key findings. However, some, but not all, of the quality improvement processes conducted and/or intervention(s) tested were clearly linked to the demonstrated improvement.
♦ Low confidence—either (A) the PIP was methodologically sound; however, the SMART Aim goal was not achieved; or (B) the SMART Aim goal was achieved; however, the quality improvement processes and/or intervention(s) tested were poorly executed and could not be linked to the improvement.
♦ Reported PIP results were not credible—the PIP methodology was not executed as approved.
Family Mosaic Project Performance Evaluation Report: July 1, 2017–June 30, 2018 California Department of Health Care Services
Page M-7 Health Services Advisory Group, Inc.

PERFORMANCE IMPROVEMENT PROJECTS
Performance Improvement Project Results and Findings During the review period, FMP submitted modules 4 and 5 for two 2015–17 SHP-specific PIPs. HSAG validated the modules and includes the final PIP validation findings in this report. Additionally, FMP initiated two new SHP-specific PIPs during the review period. In this report, HSAG includes summaries of the SHP’s PIP module submissions as well as validation findings from the review period.
2015–17 Promoting Caregiver Engagement and Participation Performance Improvement Project
While the SHP concluded its Promoting Caregiver Engagement and Participation PIP through the SMART Aim end date of June 30, 2017, FMP submitted modules 4 and 5 for HSAG to validate during the review period for this report. HSAG provided final validation findings and encouraged FMP to incorporate the experiences and lessons learned from the PIP into future quality improvement efforts.
Table 4.1 provides a summary of the SMART Aim measure results reported by the SHP.
Table 4.1—FMP Promoting Caregiver Engagement and Participation PIP SMART Aim Measure Results
SMART Aim Measure Baseline Rate
SMART Aim Goal
Rate
SMART Aim Goal Achieved
Rate of caregiver attendance at care coordination meetings among enrolled families 53.8% 80.0% Yes
Table 4.2 presents a description of the intervention that FMP tested for its Promoting Caregiver Engagement and Participation PIP. The table also indicates the failure mode that the intervention addressed as well as whether the SHP decided, based on intervention testing results, to adopt, adapt, or abandon the intervention.
Table 4.2—FMP Promoting Caregiver Engagement and Participation PIP Intervention Testing Results
Intervention Failure Modes Addressed Adopt,Adapt, orAbandon
Scheduling the initial care team meeting immediately after beneficiary enrollment and before the assessment period begins
Competing demands, stressors, and perceived crises that the caregiver may be experiencing at the time of service
Abandon
Family Mosaic Project Performance Evaluation Report: July 1, 2017–June 30, 2018 California Department of Health Care Services
Page M-8 Health Services Advisory Group, Inc.

PERFORMANCE IMPROVEMENT PROJECTS
FMP documented the following lessons learned during the scope of the 2015–17 Promoting Caregiver Engagement and Participation PIP, which the SHP may apply to future PIPs:
♦ Targeting existing beneficiaries is most efficient; it takes longer to implement interventions that involve new beneficiaries.
♦ Collecting data outside the existing electronic data collection system is burdensome and unsustainable.
♦ Gathering qualitative data is feasible for the small population that FMP serves and provides useful information regarding the intervention.
Performance Improvement Project Validation Findings
During the review period for this report, HSAG validated modules 4 and 5 for the SHP’s Promoting Caregiver Engagement and Participation PIP. FMP documented that it did not find the intervention to be effective based on the qualitative data collected both during and after the intervention testing, and determined to abandon the intervention. Although FMP achieved the SMART Aim goal, the SHP could not clearly link the tested intervention to the improvement.
Upon assessment of validity and reliability of the PIP results, HSAG assigned FMP’s Promoting Caregiver Engagement and Participation PIP a final confidence level of Low Confidence.
2015–17 Ensuring Primary Care Connections Performance Improvement Project
While the SHP concluded its Ensuring Primary Care Connections PIP through the SMART Aim end date of June 30, 2017, FMP submitted modules 4 and 5 for HSAG to validate during the review period for this report. HSAG provided final validation findings and encouraged FMP to incorporate the experiences and lessons learned from the PIP into future quality improvement efforts.
Table 4.3 provides a summary of the SMART Aim measure results reported by the SHP.
Table 4.3—FMP Ensuring Primary Care Connections PIP SMART Aim Measure Results
SMART Aim Measure Baseline Rate
SMART Aim Goal
Rate
SMART Aim Goal Achieved
Rate of primary care connections among beneficiaries 71% 90% No
Family Mosaic Project Performance Evaluation Report: July 1, 2017–June 30, 2018 California Department of Health Care Services
Page M-9 Health Services Advisory Group, Inc.
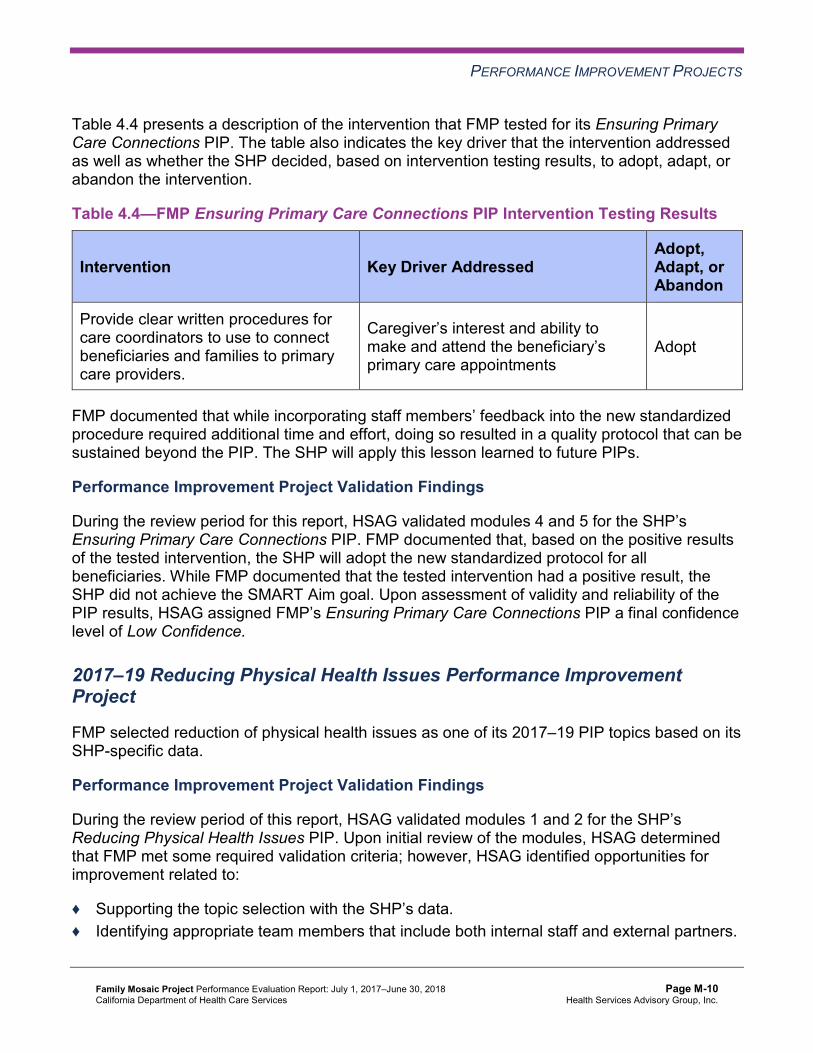
PERFORMANCE IMPROVEMENT PROJECTS
Table 4.4 presents a description of the intervention that FMP tested for its Ensuring Primary Care Connections PIP. The table also indicates the key driver that the intervention addressed as well as whether the SHP decided, based on intervention testing results, to adopt, adapt, or abandon the intervention.
Table 4.4—FMP Ensuring Primary Care Connections PIP Intervention Testing Results
Intervention Key Driver Addressed Adopt,Adapt, orAbandon
Provide clear written procedures for care coordinators to use to connect beneficiaries and families to primary care providers.
Caregiver’s interest and ability to make and attend the beneficiary’s primary care appointments
Adopt
FMP documented that while incorporating staff members’ feedback into the new standardized procedure required additional time and effort, doing so resulted in a quality protocol that can be sustained beyond the PIP. The SHP will apply this lesson learned to future PIPs.
Performance Improvement Project Validation Findings
During the review period for this report, HSAG validated modules 4 and 5 for the SHP’s Ensuring Primary Care Connections PIP. FMP documented that, based on the positive results of the tested intervention, the SHP will adopt the new standardized protocol for all beneficiaries. While FMP documented that the tested intervention had a positive result, the SHP did not achieve the SMART Aim goal. Upon assessment of validity and reliability of the PIP results, HSAG assigned FMP’s Ensuring Primary Care Connections PIP a final confidence level of Low Confidence.
2017–19 Reducing Physical Health Issues Performance Improvement Project
FMP selected reduction of physical health issues as one of its 2017–19 PIP topics based on its SHP-specific data.
Performance Improvement Project Validation Findings
During the review period of this report, HSAG validated modules 1 and 2 for the SHP’s Reducing Physical Health Issues PIP. Upon initial review of the modules, HSAG determined that FMP met some required validation criteria; however, HSAG identified opportunities for improvement related to:
♦ Supporting the topic selection with the SHP’s data. ♦ Identifying appropriate team members that include both internal staff and external partners.
Family Mosaic Project Performance Evaluation Report: July 1, 2017–June 30, 2018 California Department of Health Care Services
Page M-10 Health Services Advisory Group, Inc.

PERFORMANCE IMPROVEMENT PROJECTS
♦ Including all required components of the: ■ SMART Aim, developed based on literature review, data, and/or experience. ■ SMART Aim measure. ■ SMART Aim data collection methodology. ■ Run/control chart.
♦ Aligning accurately the Global Aim, SMART Aim, key drivers, and potential interventions.
FMP was still in the process of incorporating HSAG’s feedback into the PIP modules during the review period; therefore, HSAG includes no final validation results in this report.
2017–19 Improving Client Access and Use of Recreational Activities Performance Improvement Project
FMP selected improving client access and use of recreational activities as one of its 2017–19 PIP topics based on its SHP-specific data.
Performance Improvement Project Validation Findings
During the review period of this report, HSAG validated modules 1 and 2 for the SHP’s Improving Client Access and Use of Recreational Activities PIP. Upon initial review of the modules, HSAG determined that FMP met some required validation criteria; however, HSAG identified opportunities for improvement related to:
♦ Supporting the topic selection with the SHP’s data. ♦ Identifying appropriate team members that include both internal staff and external partners. ♦ Including all required components of the:
■ SMART Aim, developed based on literature review, data, and/or experience. ■ SMART Aim measure. ■ SMART Aim data collection methodology. ■ Run/control chart.
♦ Aligning accurately the Global Aim, SMART Aim, key drivers, and potential interventions.
FMP was still in the process of incorporating HSAG’s feedback into the PIP modules during the review period; therefore, HSAG includes no final validation results in this report.
Strengths—Performance Improvement Projects Upon completion of the 2015–17 Ensuring Primary Care Connections PIP, FMP developed a new standardized procedure that the SHP can adopt for its care coordinators to connect beneficiaries and families to primary care providers.
Family Mosaic Project Performance Evaluation Report: July 1, 2017–June 30, 2018 California Department of Health Care Services
Page M-11 Health Services Advisory Group, Inc.

PERFORMANCE IMPROVEMENT PROJECTS
Opportunities for Improvement—Performance Improvement Projects FMP has the opportunity to monitor the adopted intervention to achieve optimal outcomes beyond the life of the 2015–17 Ensuring Primary Care Connections PIP. The SHP should incorporate lessons learned from the 2015–17 Ensuring Primary Care Connections PIP to improve the effectiveness of the adopted intervention.
Additionally, FMP has the opportunity to apply the lessons learned from the 2015–17 Promoting Caregiver Engagement and Participation PIP to facilitate improvement for future PIPs.
Family Mosaic Project Performance Evaluation Report: July 1, 2017–June 30, 2018 California Department of Health Care Services
Page M-12 Health Services Advisory Group, Inc.

Medi-Cal Managed Care External Quality Review Technical ReportAppendix M: Performance Evaluation ReportFamily Mosaic ProjectJuly 1, 2017–June 30, 2018
5. Recommendations
Follow-Up on Prior Year Recommendations DHCS provided each MCP and SHP an opportunity to outline actions taken to address recommendations that HSAG made in its 2016–17 MCP/SHP-specific evaluation report. Based on HSAG’s assessment of FMP’s delivery of quality, accessible, and timely care through the activities described in the SHP’s 2016–17 SHP-specific evaluation report, HSAG included no recommendations in FMP’s 2016–17 SHP-specific evaluation report. Therefore, FMP had no recommendations for which it was required to provide the SHP’s self-reported actions.
2017–18 Recommendations Based on the overall assessment of FMP’s delivery of quality, accessible, and timely care through the activities described in previous sections of this report, HSAG recommends the following to the SHP:
♦ Monitor the adopted intervention to achieve optimal outcomes beyond the life of the 2015-17 Ensuring Primary Care Connections PIP, and incorporate lessons learned from this PIP to improve the effectiveness of the adopted intervention.
♦ Apply the lessons learned from the 2015–17 Promoting Caregiver Engagement and Participation PIP to facilitate improvement for future PIPs.
In the next annual review, HSAG will evaluate continued successes of FMP as well as the SHP’s progress with these recommendations.
Family Mosaic Project Performance Evaluation Report: July 1, 2017–June 30, 2018 California Department of Health Care Services
Page M-13 Health Services Advisory Group, Inc.

Medi-Cal Managed CareExternal Quality Review Technical Report
Appendix N: Performance Evaluation Report
Gold Coast Health Plan July 1, 2017–June 30, 2018

Medi-Cal Managed Care External Quality Review Technical ReportAppendix N: Performance Evaluation ReportGold Coast Health Plan July 1, 2017–June 30, 2018
Table of Contents
1. Introduction.............................................................................................................N-1 Medi-Cal Managed Care Health Plan Overview .......................................................N-1
2. Managed Care Health Plan Compliance ...............................................................N-2Compliance Reviews Conducted..............................................................................N-2 Strengths—Compliance Reviews .............................................................................N-2 Opportunities for Improvement—Compliance Reviews ............................................N-3
3. Managed Care Health Plan Performance Measures ............................................N-4Performance Measure Validation Results ................................................................N-4 Performance Measure Results and Findings............................................................N-4
Preventive Screening and Children’s Health .........................................................N-5 Preventive Screening and Women’s Health ..........................................................N-8 Care for Chronic Conditions ................................................................................N-11 Appropriate Treatment and Utilization.................................................................N-14 Performance Measure Findings—All Domains....................................................N-17
Improvement Plan Requirements for 2018 .............................................................N-18 Seniors and Persons with Disabilities Performance Measure Results....................N-18
Seniors and Persons with Disabilities Findings ...................................................N-23 Strengths—Performance Measures .......................................................................N-23 Opportunities for Improvement—Performance Measures ......................................N-24
4. Performance Improvement Projects ...................................................................N-25Performance Improvement Project Overview .........................................................N-25 Performance Improvement Project Results and Findings.......................................N-26
2015–17 DHCS-Priority Performance Improvement Project ...............................N-27 2015–17 MCP-Specific Performance Improvement Project ................................N-28 2017–19 Disparity Performance Improvement Project ........................................N-30 2017–19 DHCS-Priority Performance Improvement Project ...............................N-31
Strengths—Performance Improvement Projects ....................................................N-32 Opportunities for Improvement—Performance Improvement Projects ...................N-32
5. Recommendations................................................................................................N-33 Follow-Up on Prior Year Recommendations ..........................................................N-33 2017–18 Recommendations...................................................................................N-44
Gold Coast Health Plan Performance Evaluation Report: July 1, 2017–June 30, 2018 California Department of Health Care Services
Page N-i Health Services Advisory Group, Inc.

TABLE OF CONTENTS
Table of Tables
Table 2.1—DHCS A&I Medical and State Supported Services Audits of Gold Coast Audit Review Period: April 1, 2016, through March 31, 2017.......................N-2
Table 3.1—Preventive Screening and Children’s Health Domain Multi-Year Performance Measure Results Gold Coast—Ventura County .....................N-6
Table 3.2—Preventive Screening and Children’s Health Domain RY 2018 (MY 2017) Performance Measure Findings Gold Coast—Ventura County....................N-7
Table 3.3—Preventive Screening and Women’s Health Domain Multi-Year Performance Measure Results Gold Coast—Ventura County .....................N-9
Table 3.4—Preventive Screening and Women’s Health Domain RY 2018 (MY 2017) Performance Measure Findings Gold Coast—Ventura County..................N-10
Table 3.5—Care for Chronic Conditions Domain Multi-Year Performance Measure Results Gold Coast—Ventura County........................................................N-11
Table 3.6—Care for Chronic Conditions Domain RY 2018 (MY 2017) Performance Measure Findings Gold Coast—Ventura County .......................................N-12
Table 3.7—Appropriate Treatment and Utilization Domain Multi-Year Performance Measure Results Gold Coast—Ventura County.........................................N-15
Table 3.8—Appropriate Treatment and Utilization Domain RY 2018 (MY 2017) Performance Measure Findings Gold Coast—Ventura County..................N-16
Table 3.9—RY 2018 (MY 2017) Performance Measure Findings for All Domains Gold Coast—Ventura County ....................................................................N-17
Table 3.10—Multi-Year SPD Performance Measure Trend Table Gold Coast— Ventura County..........................................................................................N-19
Table 3.11—Multi-Year Non-SPD Performance Measure Trend Table Gold Coast— Ventura County..........................................................................................N-20
Table 3.12—RY 2018 (MY 2017) Performance Measure Comparison and Results for Measures Stratified by the SPD and Non-SPD Populations Gold Coast— Ventura County..........................................................................................N-22
Table 4.1—Gold Coast Immunizations of Two-Year-Olds PIP SMART Aim Measure Results.......................................................................................................N-27
Table 4.2—Gold Coast Immunizations of Two-Year-Olds PIP Intervention Testing Results.N-27 Table 4.3—Gold Coast Developmental Screening for Children PIP SMART Aim
Measure Results ........................................................................................N-29 Table 4.4—Gold Coast Developmental Screening for Children PIP Intervention
Testing Results ..........................................................................................N-29 Table 4.5—Gold Coast Diabetes Poor HbA1c Control Disparity PIP SMART Aim Measure N-30 Table 4.6—Gold Coast Childhood Immunization Status—Combination 3 PIP SMART
Aim Measure..............................................................................................N-31
Gold Coast Health Plan Performance Evaluation Report: July 1, 2017–June 30, 2018 California Department of Health Care Services
Page N-ii Health Services Advisory Group, Inc.

TABLE OF CONTENTS
Table 5.1—Gold Coast’s Self-Reported Follow-Up on External Quality Review Recommendations from the July 1, 2016, through June 30, 2017, MCP-Specific Evaluation Report................................................................N-33
Gold Coast Health Plan Performance Evaluation Report: July 1, 2017–June 30, 2018 California Department of Health Care Services
Page N-iii Health Services Advisory Group, Inc.

Medi-Cal Managed Care External Quality Review Technical ReportAppendix N: Performance Evaluation ReportGold Coast Health Plan July 1, 2017–June 30, 2018
1. Introduction
The California Department of Health Care Services (DHCS) contracted with Health Services Advisory Group, Inc. (HSAG), an external quality review organization (EQRO), to prepare the federally required Medi-Cal Managed Care External Quality Review Technical Report, July 1, 2017–June 30, 2018. The technical report provides an overview of the objectives and methodology for conducting the external quality review (EQR) activities, including requirements related to each activity. Additionally, the technical report provides aggregated results and recommendations for DHCS for each activity.
This appendix is specific to DHCS’ contracted Medi-Cal managed care health plan (MCP), Gold Coast Health Plan (“Gold Coast” or “the MCP”). The purpose of this appendix is to provide MCP-specific results of each activity and an assessment of the MCP’s strengths and opportunities for improvement with respect to the quality and timeliness of and access to health care services furnished to Medi-Cal Managed Care (MCMC) beneficiaries (referred to as “beneficiaries” in this report). The review period for this MCP-specific evaluation report is July 1, 2017, through June 30, 2018. HSAG will report on activities that take place beyond the review period in Gold Coast’s 2018–19 MCP-specific evaluation report. This MCP-specific evaluation report references activities and methodologies described in detail by HSAG in the technical report section.
The aggregate EQR technical report and all MCP- and specialty health plan (SHP)-specific performance evaluation reports reflect HSAG’s external, independent assessment of the quality and timeliness of, and access to, care that MCPs and SHPs are providing to beneficiaries.
Medi-Cal Managed Care Health Plan Overview Gold Coast is a full-scope MCP delivering services to beneficiaries in the County Organized Health System (COHS) model.
Gold Coast became operational to provide MCMC services in Ventura County effective July 2011. As of June 30, 2018, Gold Coast had 198,722 beneficiaries.1
1 Medi-Cal Managed Care Enrollment Report—June 2018. Available at: http://www.dhcs.ca.gov/dataandstats/reports/Pages/MMCDMonthlyEnrollment.aspx. Accessed on: Aug 13, 2018.
Gold Coast Health Plan Performance Evaluation Report: July 1, 2017–June 30, 2018 California Department of Health Care Services
Page N-1 Health Services Advisory Group, Inc.
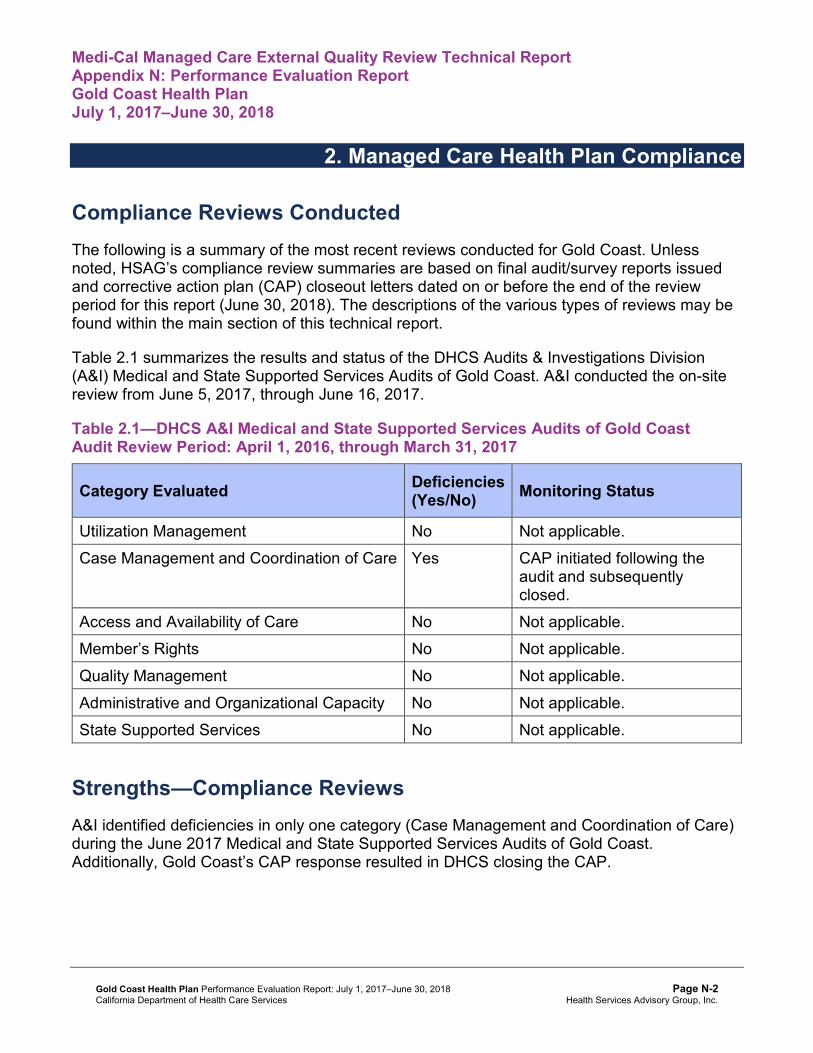
Medi-Cal Managed Care External Quality Review Technical ReportAppendix N: Performance Evaluation ReportGold Coast Health Plan July 1, 2017–June 30, 2018
2. Managed Care Health Plan Compliance
Compliance Reviews Conducted The following is a summary of the most recent reviews conducted for Gold Coast. Unless noted, HSAG’s compliance review summaries are based on final audit/survey reports issued and corrective action plan (CAP) closeout letters dated on or before the end of the review period for this report (June 30, 2018). The descriptions of the various types of reviews may be found within the main section of this technical report.
Table 2.1 summarizes the results and status of the DHCS Audits & Investigations Division (A&I) Medical and State Supported Services Audits of Gold Coast. A&I conducted the on-site review from June 5, 2017, through June 16, 2017.
Table 2.1—DHCS A&I Medical and State Supported Services Audits of Gold CoastAudit Review Period: April 1, 2016, through March 31, 2017
Category Evaluated Deficiencies (Yes/No) Monitoring Status
Utilization Management No Not applicable. Case Management and Coordination of Care Yes CAP initiated following the
audit and subsequently closed.
Access and Availability of Care No Not applicable. Member’s Rights No Not applicable. Quality Management No Not applicable. Administrative and Organizational Capacity No Not applicable. State Supported Services No Not applicable.
Strengths—Compliance Reviews A&I identified deficiencies in only one category (Case Management and Coordination of Care) during the June 2017 Medical and State Supported Services Audits of Gold Coast. Additionally, Gold Coast’s CAP response resulted in DHCS closing the CAP.
Gold Coast Health Plan Performance Evaluation Report: July 1, 2017–June 30, 2018 California Department of Health Care Services
Page N-2 Health Services Advisory Group, Inc.

MANAGED CARE HEALTH PLAN COMPLIANCE
Opportunities for Improvement—Compliance Reviews While the MCP has no outstanding deficiencies from the June 2017 A&I Medical and State Supported Services Audits, Gold Coast’s CAP required the MCP to make extensive changes to the MCP’s operations that could not be reasonably achieved without additional time. The CAP closeout letter to Gold Coast indicated that A&I would assess the MCP’s progress on full implementation of the corrective actions during the consecutive audit, which DHCS conducted in June 2018. HSAG will summarize the results of the June 2018 audit in Gold Coast’s 2018– 19 MCP-specific evaluation report.
Gold Coast Health Plan Performance Evaluation Report: July 1, 2017–June 30, 2018 California Department of Health Care Services
Page N-3 Health Services Advisory Group, Inc.

Medi-Cal Managed Care External Quality Review Technical ReportAppendix N: Performance Evaluation ReportGold Coast Health Plan July 1, 2017–June 30, 2018
3. Managed Care Health Plan Performance Measures
Performance Measure Validation Results The HEDIS®2 2018 Compliance Audit Final Report of Findings for Gold Coast Health Plan contains the detailed findings and recommendations from HSAG’s NCQA HEDIS Compliance Audit™.3 HSAG auditors determined that Gold Coast followed the appropriate specifications to produce valid rates. During the audit process, HSAG recommended that Gold Coast:
♦ Include in HEDIS performance measure reporting appropriate eligibility spans for newborns.
♦ Implement a formal process to track and document quality audit results.
Performance Measure Results and Findings After validating the MCP’s performance measure rates, HSAG assessed the results. See Table 3.1 through Table 3.9 for Gold Coast’s performance measure results for reporting years (RYs) 2015 through 2018 and performance measure findings for RY 2018. The RY is the year in which the MCP reported the rates. The RY rates reflect measurement year (MY) data from the previous calendar year. Note that data may not be available for all four years.
Note the following regarding Table 3.1 through Table 3.9:
♦ To allow HSAG to provide meaningful assessment of MCP performance and actionable recommendations, HSAG, in collaboration with DHCS, organized the measures into domains based on the health care areas each measure affects. Table 3.1 through Table 3.8 present the performance measure results and findings by domain, and Table 3.9 presents the RY 2018 performance measure findings for the domains combined.
♦ To assess performance for each MCP reporting unit, HSAG compares the rates to national benchmarks. Rates indicating performance above the high performance levels (HPLs) are shaded in gray, and rates indicating performance below the minimum performance levels (MPLs) are bolded. ■ For measures with rates below the MPLs, DHCS requires MCPs to submit to DHCS
improvement plans (IPs) to address the rates below the MPLs (unless MCPs are reporting the rates for the first time).
2 Healthcare Effectiveness Data and Information Set (HEDIS®) is a registered trademark of the National Committee for Quality Assurance (NCQA).
3 NCQA HEDIS Compliance AuditTM is a trademark of NCQA.
Gold Coast Health Plan Performance Evaluation Report: July 1, 2017–June 30, 2018 California Department of Health Care Services
Page N-4 Health Services Advisory Group, Inc.
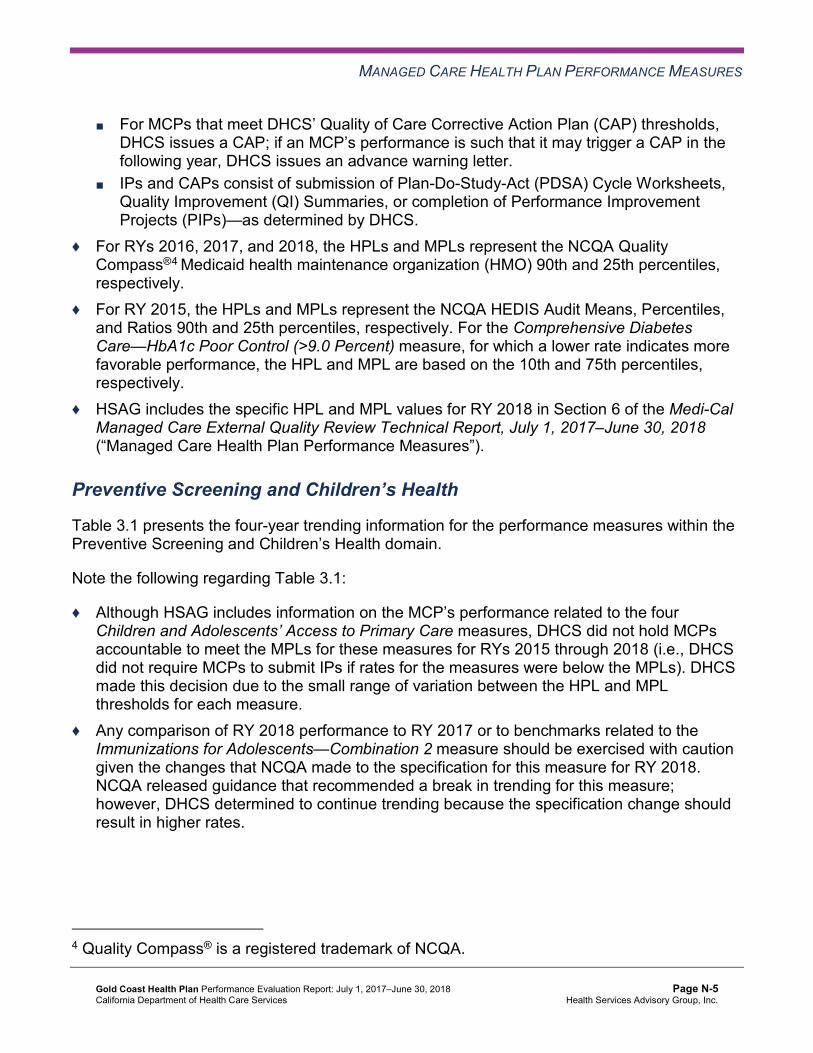
MANAGED CARE HEALTH PLAN PERFORMANCE MEASURES
■ For MCPs that meet DHCS’ Quality of Care Corrective Action Plan (CAP) thresholds, DHCS issues a CAP; if an MCP’s performance is such that it may trigger a CAP in the following year, DHCS issues an advance warning letter.
■ IPs and CAPs consist of submission of Plan-Do-Study-Act (PDSA) Cycle Worksheets, Quality Improvement (QI) Summaries, or completion of Performance Improvement Projects (PIPs)—as determined by DHCS.
♦ For RYs 2016, 2017, and 2018, the HPLs and MPLs represent the NCQA Quality Compass®4 Medicaid health maintenance organization (HMO) 90th and 25th percentiles, respectively.
♦ For RY 2015, the HPLs and MPLs represent the NCQA HEDIS Audit Means, Percentiles, and Ratios 90th and 25th percentiles, respectively. For the Comprehensive Diabetes Care—HbA1c Poor Control (>9.0 Percent) measure, for which a lower rate indicates more favorable performance, the HPL and MPL are based on the 10th and 75th percentiles, respectively.
♦ HSAG includes the specific HPL and MPL values for RY 2018 in Section 6 of the Medi-Cal Managed Care External Quality Review Technical Report, July 1, 2017–June 30, 2018 (“Managed Care Health Plan Performance Measures”).
Preventive Screening and Children’s Health
Table 3.1 presents the four-year trending information for the performance measures within the Preventive Screening and Children’s Health domain.
Note the following regarding Table 3.1:
♦ Although HSAG includes information on the MCP’s performance related to the four Children and Adolescents’ Access to Primary Care measures, DHCS did not hold MCPs accountable to meet the MPLs for these measures for RYs 2015 through 2018 (i.e., DHCS did not require MCPs to submit IPs if rates for the measures were below the MPLs). DHCS made this decision due to the small range of variation between the HPL and MPL thresholds for each measure.
♦ Any comparison of RY 2018 performance to RY 2017 or to benchmarks related to the Immunizations for Adolescents—Combination 2 measure should be exercised with caution given the changes that NCQA made to the specification for this measure for RY 2018. NCQA released guidance that recommended a break in trending for this measure; however, DHCS determined to continue trending because the specification change should result in higher rates.
4 Quality Compass® is a registered trademark of NCQA.
Gold Coast Health Plan Performance Evaluation Report: July 1, 2017–June 30, 2018 California Department of Health Care Services
Page N-5 Health Services Advisory Group, Inc.

MANAGED CARE HEALTH PLAN PERFORMANCE MEASURES
Table 3.1—Preventive Screening and Children’s Health DomainMulti-Year Performance Measure Results Gold Coast—Ventura County
H = Rate indicates performance above the HPL. Bolded Rate = Rate indicates performance below the MPL.
B = Statistical testing result indicates that the RY 2018 rate is significantly better than the RY 2017 rate.
W = Statistical testing result indicates that the RY 2018 rate is significantly worse than the RY 2017 rate.
Measure RY
2015 Rate1
RY 2016
Rate2
RY 2017
Rate3
RY 2018
Rate4
RYs 2017–18 Rate
Difference5
Childhood Immunization Status—Combination 3 69.97% 75.43% 64.96% 70.53% 5.57
Children and Adolescents’ Access to Primary Care Practitioners—12–24 Months
95.42% 94.65% 93.86% 95.05% 1.19B
Children and Adolescents’ Access to Primary Care Practitioners— 25 Months–6 Years
83.12% 84.87% 85.52% 84.72% -0.80W
Children and Adolescents’ Access to Primary Care Practitioners—7–11 Years
83.31% 85.62% 84.54% 86.12% 1.58B
Children and Adolescents’ Access to Primary Care Practitioners—12–19 Years
82.01% 84.14% 82.32% 83.69% 1.37B
Immunizations for Adolescents— Combination 2^ -- -- 23.11% 33.58%H 10.47B
Weight Assessment and Counseling for Nutrition and Physical Activity for Children and Adolescents—Nutrition Counseling—Total
54.26% 55.96% 54.50% 79.56% 25.06B
Weight Assessment and Counseling for Nutrition and Physical Activity for Children and Adolescents—Physical Activity Counseling—Total
41.85% 49.88% 48.66% 74.94% 26.28B
Gold Coast Health Plan Performance Evaluation Report: July 1, 2017–June 30, 2018 California Department of Health Care Services
Page N-6 Health Services Advisory Group, Inc.

MANAGED CARE HEALTH PLAN PERFORMANCE MEASURES
Measure RY
2015 Rate1
RY 2016
Rate2
RY 2017
Rate3
RY 2018
Rate4
RYs 2017–18 Rate
Difference5
Well-Child Visits in the Third, Fourth, Fifth, and Sixth Years of Life
67.11% 64.72% 66.18% 75.47% 9.29B
1 RY 2015 rates reflect MY data from January 1, 2014, through December 31, 2014. 2 RY 2016 rates reflect MY data from January 1, 2015, through December 31, 2015. 3 RY 2017 rates reflect MY data from January 1, 2016, through December 31, 2016. 4 RY 2018 rates reflect MY data from January 1, 2017, through December 31, 2017. 5 Performance comparisons are based on the Chi-square test of statistical significance, with a p value of <0.05. -- Indicates that the rate is not available. ^ Caution should be exercised when assessing MCP performance for this measure given the changes that NCQA made to the specification for this measure for RY 2018.
Table 3.2 presents findings for the RY 2018 performance measures within the Preventive Screening and Children’s Health domain.
Note the following regarding Table 3.2:
♦ DHCS did not hold MCPs accountable to meet MPLs for all four Children and Adolescents’ Access to Primary Care measures within this domain; therefore, HSAG did not include these measures in its assessment of the MCP’s performance related to HPLs and MPLs.
♦ The Immunizations for Adolescents—Combination 2 measure was a first-year measure in RY 2017, and DHCS established no MPL for this measure for RY 2017 because no comparable benchmark existed; therefore, HSAG did not include this measure in the denominators for calculating the percentage of measures with rates that moved to above or below the MPLs in RY 2018.
Table 3.2—Preventive Screening and Children’s Health DomainRY 2018 (MY 2017) Performance Measure Findings Gold Coast—Ventura County
Criteria Number of Measures
MeetingCriteria
Total Number of Measures
Percentage of Measures
MeetingCriteria
RY 2018 Rates Above HPLs 1 5 20.00% Rates Above HPLs for the Last Three or More Consecutive Years 0 4 0.00%
Gold Coast Health Plan Performance Evaluation Report: July 1, 2017–June 30, 2018 California Department of Health Care Services
Page N-7 Health Services Advisory Group, Inc.
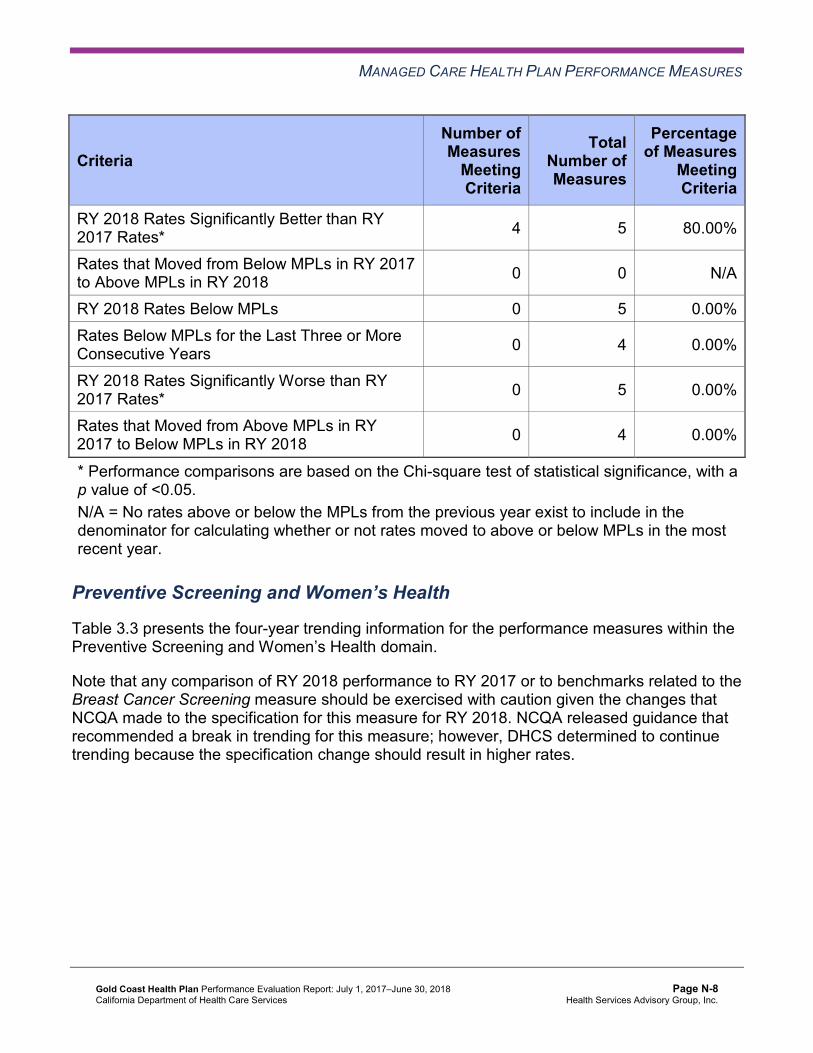
MANAGED CARE HEALTH PLAN PERFORMANCE MEASURES
Criteria Number of Measures
MeetingCriteria
Total Number of Measures
Percentage of Measures
MeetingCriteria
RY 2018 Rates Significantly Better than RY 2017 Rates* 4 5 80.00%
Rates that Moved from Below MPLs in RY 2017 to Above MPLs in RY 2018 0 0 N/A
RY 2018 Rates Below MPLs 0 5 0.00% Rates Below MPLs for the Last Three or More Consecutive Years 0 4 0.00%
RY 2018 Rates Significantly Worse than RY 2017 Rates* 0 5 0.00%
Rates that Moved from Above MPLs in RY 2017 to Below MPLs in RY 2018 0 4 0.00%
* Performance comparisons are based on the Chi-square test of statistical significance, with a p value of <0.05. N/A = No rates above or below the MPLs from the previous year exist to include in the denominator for calculating whether or not rates moved to above or below MPLs in the most recent year.
Preventive Screening and Women’s Health
Table 3.3 presents the four-year trending information for the performance measures within the Preventive Screening and Women’s Health domain.
Note that any comparison of RY 2018 performance to RY 2017 or to benchmarks related to the Breast Cancer Screening measure should be exercised with caution given the changes that NCQA made to the specification for this measure for RY 2018. NCQA released guidance that recommended a break in trending for this measure; however, DHCS determined to continue trending because the specification change should result in higher rates.
Gold Coast Health Plan Performance Evaluation Report: July 1, 2017–June 30, 2018 California Department of Health Care Services
Page N-8 Health Services Advisory Group, Inc.
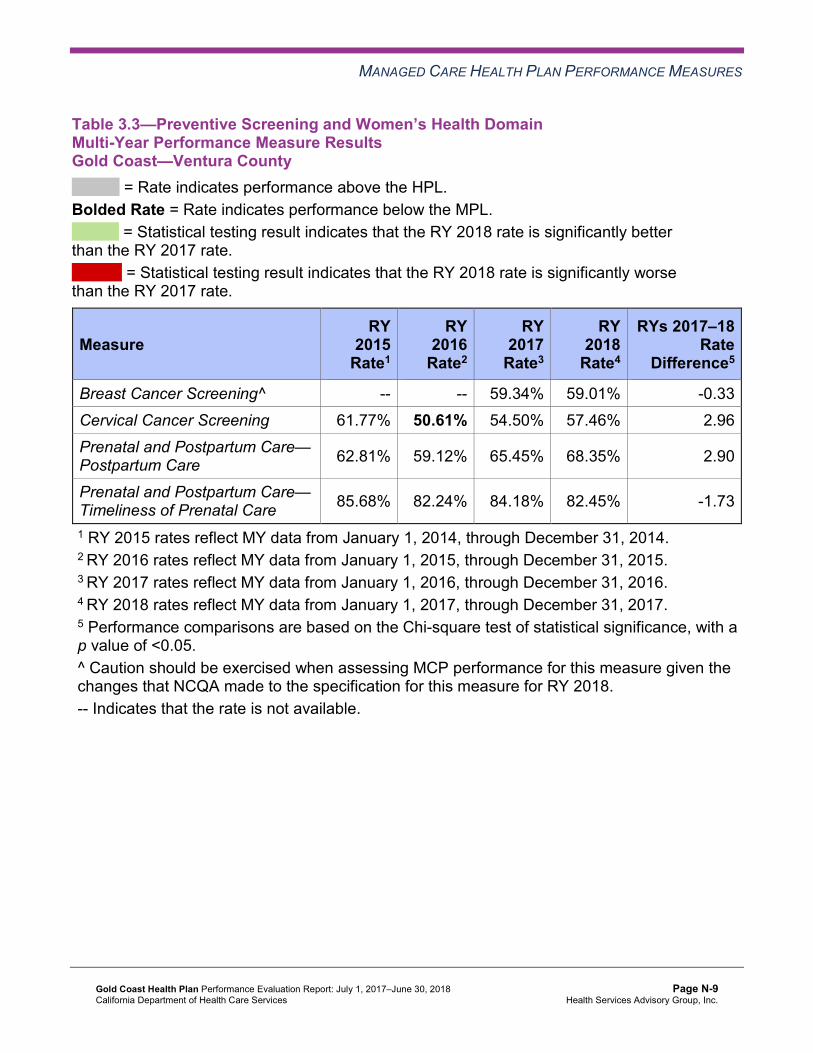
MANAGED CARE HEALTH PLAN PERFORMANCE MEASURES
Table 3.3—Preventive Screening and Women’s Health DomainMulti-Year Performance Measure Results Gold Coast—Ventura County
H = Rate indicates performance above the HPL. Bolded Rate = Rate indicates performance below the MPL.
B = Statistical testing result indicates that the RY 2018 rate is significantly better than the RY 2017 rate.
W = Statistical testing result indicates that the RY 2018 rate is significantly worse than the RY 2017 rate.
Measure RY
2015 Rate1
RY 2016
Rate2
RY 2017
Rate3
RY 2018
Rate4
RYs 2017–18 Rate
Difference5
Breast Cancer Screening^ -- -- 59.34% 59.01% -0.33 Cervical Cancer Screening 61.77% 50.61% 54.50% 57.46% 2.96 Prenatal and Postpartum Care— Postpartum Care 62.81% 59.12% 65.45% 68.35% 2.90
Prenatal and Postpartum Care— Timeliness of Prenatal Care 85.68% 82.24% 84.18% 82.45% -1.73
1 RY 2015 rates reflect MY data from January 1, 2014, through December 31, 2014. 2 RY 2016 rates reflect MY data from January 1, 2015, through December 31, 2015. 3 RY 2017 rates reflect MY data from January 1, 2016, through December 31, 2016. 4 RY 2018 rates reflect MY data from January 1, 2017, through December 31, 2017. 5 Performance comparisons are based on the Chi-square test of statistical significance, with a p value of <0.05. ^ Caution should be exercised when assessing MCP performance for this measure given the changes that NCQA made to the specification for this measure for RY 2018. -- Indicates that the rate is not available.
Gold Coast Health Plan Performance Evaluation Report: July 1, 2017–June 30, 2018 California Department of Health Care Services
Page N-9 Health Services Advisory Group, Inc.

MANAGED CARE HEALTH PLAN PERFORMANCE MEASURES
Table 3.4 presents findings for the RY 2018 performance measures within the Preventive Screening and Women’s Health domain. Note that the Breast Cancer Screening measure was a first-year measure in RY 2017, and DHCS did not hold MCPs accountable to meet an MPL for this measure in RY 2017; therefore, HSAG did not include this measure in the denominators for calculating the percentage of measures with rates that moved to above or below the MPLs in RY 2018.
Table 3.4—Preventive Screening and Women’s Health DomainRY 2018 (MY 2017) Performance Measure Findings Gold Coast—Ventura County
Criteria Number of Measures
MeetingCriteria
Total Number of Measures
Percentage of Measures
Meeting Criteria
RY 2018 Rates Above HPLs 0 4 0.00% Rates Above HPLs for the Last Three or More Consecutive Years 0 3 0.00%
RY 2018 Rates Significantly Better than RY 2017 Rates* 0 4 0.00%
Rates that Moved from Below MPLs in RY 2017 to Above MPLs in RY 2018 0 0 N/A
RY 2018 Rates Below MPLs 0 4 0.00% Rates Below MPLs for the Last Three or More Consecutive Years 0 3 0.00%
RY 2018 Rates Significantly Worse than RY 2017 Rates* 0 4 0.00%
Rates that Moved from Above MPLs in RY 2017 to Below MPLs in RY 2018 0 3 0.00%
* Performance comparisons are based on the Chi-square test of statistical significance, with a p value of <0.05. N/A = No rates above or below the MPLs from the previous year exist to include in the denominator for calculating whether or not rates moved to above or below MPLs in the most recent year.
Gold Coast Health Plan Performance Evaluation Report: July 1, 2017–June 30, 2018 California Department of Health Care Services
Page N-10 Health Services Advisory Group, Inc.

MANAGED CARE HEALTH PLAN PERFORMANCE MEASURES
Care for Chronic Conditions
Table 3.5 presents the four-year trending information for the performance measures within the Care for Chronic Conditions domain.
Table 3.5—Care for Chronic Conditions Domain Multi-Year Performance Measure Results Gold Coast—Ventura County
H = Rate indicates performance above the HPL. Bolded Rate = Rate indicates performance below the MPL.
B = Statistical testing result indicates that the RY 2018 rate is significantly better than the RY 2017 rate.
W = Statistical testing result indicates that the RY 2018 rate is significantly worse than the RY 2017 rate.
Measure RY
2015 Rate1
RY 2016
Rate2
RY 2017
Rate3
RY 2018
Rate4
RYs 2017–18 Rate
Difference5
Annual Monitoring for Patients on Persistent Medications— ACE Inhibitors or ARBs
82.14% 86.94% 85.09% 85.48% 0.39
Annual Monitoring for Patients on Persistent Medications— Diuretics
83.27% 87.37% 85.14% 86.54% 1.40
Asthma Medication Ratio -- -- 51.24% 54.41% 3.17 Comprehensive Diabetes Care— Blood Pressure Control (<140/90 mm Hg)
63.75% 65.69% 48.66% 65.94% 17.28B
Comprehensive Diabetes Care— Eye Exam (Retinal) Performed 60.10% 81.51%H 50.61% 57.91% 7.30B
Comprehensive Diabetes Care— HbA1c Control (<8.0 Percent) 57.91% 54.50% 36.98% 55.96% 18.98B
Comprehensive Diabetes Care— HbA1c Poor Control (>9.0 Percent)*
32.85% 37.71% 54.50% 35.77% -18.73B
Comprehensive Diabetes Care— HbA1c Testing 90.51% 88.56% 86.86% 88.08% 1.22
Comprehensive Diabetes Care— Medical Attention for Nephropathy
83.70% 91.24%H 89.05% 88.08% -0.97
Gold Coast Health Plan Performance Evaluation Report: July 1, 2017–June 30, 2018 California Department of Health Care Services
Page N-11 Health Services Advisory Group, Inc.

MANAGED CARE HEALTH PLAN PERFORMANCE MEASURES
Measure RY
2015 Rate1
RY 2016
Rate2
RY 2017
Rate3
RY 2018
Rate4
RYs 2017–18 Rate
Difference5
Controlling High Blood Pressure 55.01% 64.72% 44.77% 54.50% 9.73B
1 RY 2015 rates reflect MY data from January 1, 2014, through December 31, 2014. 2 RY 2016 rates reflect MY data from January 1, 2015, through December 31, 2015. 3 RY 2017 rates reflect MY data from January 1, 2016, through December 31, 2016. 4 RY 2018 rates reflect MY data from January 1, 2017, through December 31, 2017. 5 Performance comparisons are based on the Chi-square test of statistical significance, with a p value of <0.05. * A lower rate indicates better performance for this measure. -- Indicates that the rate is not available.
Table 3.6 presents findings for the RY 2018 performance measures within the Care for Chronic Conditions domain. Note that the Asthma Medication Ratio measure was a first-year measure in RY 2017, and DHCS did not hold MCPs accountable to meet an MPL for this measure in RY 2017; therefore, HSAG did not include this measure in the denominators for calculating the percentage of measures with rates that moved to above or below the MPLs in RY 2018.
Table 3.6—Care for Chronic Conditions Domain RY 2018 (MY 2017) Performance Measure Findings Gold Coast—Ventura County
Criteria Number of Measures
MeetingCriteria
Total Number of Measures
Percentage of Measures
MeetingCriteria
RY 2018 Rates Above HPLs 0 10 0.00% Rates Above HPLs for the Last Three or More Consecutive Years 0 9 0.00%
RY 2018 Rates Significantly Better than RY 2017 Rates* 5 10 50.00%
Rates that Moved from Below MPLs in RY 2017 to Above MPLs in RY 2018 5 6 83.33%
RY 2018 Rates Below MPLs 3 10 30.00% Rates Below MPLs for the Last Three or More Consecutive Years 0 9 0.00%
RY 2018 Rates Significantly Worse than RY 2017 Rates* 0 10 0.00%
Gold Coast Health Plan Performance Evaluation Report: July 1, 2017–June 30, 2018 California Department of Health Care Services
Page N-12 Health Services Advisory Group, Inc.

MANAGED CARE HEALTH PLAN PERFORMANCE MEASURES
Criteria Number of Measures
MeetingCriteria
Total Number of Measures
Percentage of Measures
MeetingCriteria
Rates that Moved from Above MPLs in RY 2017 to Below MPLs in RY 2018 1 3 33.33%
* Performance comparisons are based on the Chi-square test of statistical significance, with a p value of <0.05.
Assessment of Improvement Plans—Care for Chronic Conditions
Based on RY 2017 performance measure results, Gold Coast was required to submit IPs for the following measures within the Care for Chronic Conditions domain:
♦ Both Annual Monitoring for Patients on Persistent Medications measures ♦ Comprehensive Diabetes Care—Blood Pressure Control (<140/90 mm Hg) ♦ Comprehensive Diabetes Care—HbA1c Control (<8.0 Percent) ♦ Comprehensive Diabetes Care—HbA1c Poor Control (>9.0 Percent) ♦ Controlling High Blood Pressure
Annual Monitoring for Patients on Persistent Medications
Gold Coast conducted two PDSA cycles to improve the MCP’s performance on both Annual Monitoring for Patients on Persistent Medications measures. For the first PDSA cycle, the MCP sent HEDIS 2017 report cards and performance feedback reports to two clinics to test whether or not sending this information would result in the clinic staff members contacting beneficiaries regarding obtaining their required lab testing, thereby improving the rates.
During the first PDSA cycle, Gold Coast identified missing lab data as a barrier; therefore, for the second PDSA cycle, the MCP tested the effectiveness of a supplemental data validation process to ensure that the performance feedback report was accurate and that no lab data were missing.
The rate for the Annual Monitoring for Patients on Persistent Medications—Diuretics measure moved to above the MPL in RY 2018; however, the rate for the Annual Monitoring for Patients on Persistent Medications—ACE Inhibitors or ARBs measure remained below the MPL in RY 2018.
Blood Pressure Control
DHCS required Gold Coast to submit a QI Summary describing the MCP’s efforts to address the rates being below the MPLs in RY 2017 for the Comprehensive Diabetes Care—Blood Pressure Control (<140/90 mm Hg) and Controlling High Blood Pressure measures. Gold Coast reported that implementing oversight of the MCP’s vendor’s medical record review
Gold Coast Health Plan Performance Evaluation Report: July 1, 2017–June 30, 2018 California Department of Health Care Services
Page N-13 Health Services Advisory Group, Inc.
MANAGED CARE HEALTH PLAN PERFORMANCE MEASURES
retrieval and abstraction activities resulted in the final hybrid HEDIS rates more accurately representing the MCP’s performance level.
The rates for both the Comprehensive Diabetes Care—Blood Pressure Control (<140/90 mm Hg) and Controlling High Blood Pressure measures improved to above the MPLs in RY 2018.
Comprehensive Diabetes Care—HbA1c Control
DHCS approved Gold Coast to conduct a PIP to address the rates for the Comprehensive Diabetes Care—HbA1c Control (<8.0 Percent) and HbA1c Poor Control (>9.0 Percent) measures being below the MPLs in RY 2017. HSAG includes a summary of Gold Coast’s progress on the Diabetes Poor HbA1c Control Disparity PIP in Section 4 of this report (“Performance Improvement Projects”).
Gold Coast performed above the MPLs for both the Comprehensive Diabetes Care—HbA1c Control (<8.0 Percent) and HbA1c Poor Control (>9.0 Percent) measures in RY 2018.
Appropriate Treatment and Utilization
Table 3.7 presents the four-year trending information for the performance measures within the Appropriate Treatment and Utilization domain.
Note the following regarding Table 3.7:
♦ The All-Cause Readmissions measure is a non-HEDIS measure originally developed for DHCS’ All-Cause Readmissions collaborative quality improvement project (QIP); therefore, DHCS does not establish an HPL or MPL for this measure. For the All-Cause Readmissions measure, a lower rate indicates better performance (i.e., fewer readmissions).
♦ The two Ambulatory Care measures are utilization measures, which measure the volume of services used. DHCS does not hold MCPs accountable to meet MPLs for utilization measures, and HSAG does not compare performance for these measures against HPLs and MPLs. Additionally, because high and low rates do not necessarily indicate better or worse performance, HSAG did not compare performance for these measures across years.
♦ DHCS established no HPL or MPL for the two Depression Screening and Follow-Up for Adolescents and Adults measures for RY 2018 because no comparable benchmarks exist. Additionally, although MCPs reported the two Depression Screening and Follow-Up for Adolescents and Adults measures for RY 2018, HSAG does not present the performance measure results for these measures in this report because the reported rates do not accurately represent services being provided. This is due to the Depression Screening and Follow-Up for Adolescents and Adults measures being new HEDIS measures for RY 2018, NCQA requiring MCPs to submit rates for these measures using the new Electronic Clinical Data Systems (ECDS) reporting methodology, and inconsistent data reporting processes by calculation vendors. Thus, MCPs experienced numerous challenges obtaining data sources to use for ECDS reporting. DHCS and HSAG, in consultation with NCQA, will work with MCPs to improve data capture for RY 2019.
Gold Coast Health Plan Performance Evaluation Report: July 1, 2017–June 30, 2018 California Department of Health Care Services
Page N-14 Health Services Advisory Group, Inc.

MANAGED CARE HEALTH PLAN PERFORMANCE MEASURES
♦ Note that due to changes that NCQA made to the specifications for the Use of Imaging Studies for Low Back Pain measure in RY 2018, NCQA released guidance to exercise caution when trending the results for this measure. Therefore, caution should be used when comparing MCP performance across years or when comparing MCP results to benchmarks related to the Use of Imaging Studies for Low Back Pain measure, as differences in rates may be a result of the specification changes rather than a reflection of performance.
Table 3.7—Appropriate Treatment and Utilization DomainMulti-Year Performance Measure Results Gold Coast—Ventura County
H = Rate indicates performance above the HPL. Bolded Rate = Rate indicates performance below the MPL.
B = Statistical testing result indicates that the RY 2018 rate is significantly better than the RY 2017 rate.
W = Statistical testing result indicates that the RY 2018 rate is significantly worse than the RY 2017 rate.
Measure RY
2015 Rate1
RY 2016
Rate2
RY 2017
Rate3
RY 2018
Rate4
RYs 2017–18 Rate
Difference5
All-Cause Readmissions* 17.87% 15.77% 14.33% 14.37% 0.04
Ambulatory Care—Emergency Department (ED) Visits per 1,000 Member Months**
39.21 41.05 40.20 41.21 Not Tested
Ambulatory Care—Outpatient Visits per 1,000 Member Months**
209.28 246.05 263.85 271.06 Not Tested
Avoidance of Antibiotic Treatment in Adults With Acute Bronchitis
21.15% 25.58% 29.27% 32.75% 3.48
Use of Imaging Studies for Low Back Pain^ 75.71% 73.51% 73.89% 69.01% -4.88W
1 RY 2015 rates reflect MY data from January 1, 2014, through December 31, 2014. 2 RY 2016 rates reflect MY data from January 1, 2015, through December 31, 2015. 3 RY 2017 rates reflect MY data from January 1, 2016, through December 31, 2016. 4 RY 2018 rates reflect MY data from January 1, 2017, through December 31, 2017. 5 Performance comparisons are based on the Chi-square test of statistical significance, with a p value of <0.05.
Gold Coast Health Plan Performance Evaluation Report: July 1, 2017–June 30, 2018 California Department of Health Care Services
Page N-15 Health Services Advisory Group, Inc.

MANAGED CARE HEALTH PLAN PERFORMANCE MEASURES
* A lower rate indicates better performance for this measure. ** Member months are a member's “contribution” to the total yearly membership. ^ Caution should be exercised when assessing MCP performance for this measure given the changes that NCQA made to the specification for this measure for RY 2018. -- Indicates that the rate is not available. Not Tested = An RY 2017–18 rate difference was not calculated because high and low rates do not necessarily indicate better or worse performance.
Table 3.8 presents findings for the RY 2018 performance measures within the Appropriate Treatment and Utilization domain. DHCS did not hold MCPs accountable to meet MPLs for the following measures within this domain; therefore, HSAG did not include these measures in its assessment of the MCP’s performance related to HPLs and MPLs:
♦ All-Cause Readmissions ♦ Both Ambulatory Care measures
Table 3.8—Appropriate Treatment and Utilization DomainRY 2018 (MY 2017) Performance Measure Findings Gold Coast—Ventura County
Criteria Number of Measures
MeetingCriteria
Total Number of Measures
Percentage of Measures
MeetingCriteria
RY 2018 Rates Above HPLs 0 2 0.00% Rates Above HPLs for the Last Three or More Consecutive Years 0 2 0.00%
RY 2018 Rates Significantly Better than RY 2017 Rates* 0 3 0.00%
Rates that Moved from Below MPLs in RY 2017 to Above MPLs in RY 2018 0 0 N/A
RY 2018 Rates Below MPLs 0 2 0.00% Rates Below MPLs for the Last Three or More Consecutive Years 0 2 0.00%
RY 2018 Rates Significantly Worse than RY 2017 Rates* 1 3 33.33%
Rates that Moved from Above MPLs in RY 2017 to Below MPLs in RY 2018 0 2 0.00%
* Performance comparisons are based on the Chi-square test of statistical significance, with a p value of <0.05.
Gold Coast Health Plan Performance Evaluation Report: July 1, 2017–June 30, 2018 California Department of Health Care Services
Page N-16 Health Services Advisory Group, Inc.

MANAGED CARE HEALTH PLAN PERFORMANCE MEASURES
N/A = No rates above or below the MPLs from the previous year exist to include in the denominator for calculating whether or not rates moved to above or below MPLs in the most recent year.
Performance Measure Findings—All Domains
Table 3.9 presents a summary of Gold Coast’s RY 2018 performance across all External Accountability Set (EAS) measures.
Note the following regarding Table 3.9:
♦ DHCS did not hold MCPs accountable to meet MPLs for the following measures; therefore, HSAG did not include these measures in its assessment of the MCP’s performance related to HPLs and MPLs: ■ All-Cause Readmissions ■ Both Ambulatory Care measures ■ All four Children and Adolescents’ Access to Primary Care measures
♦ DHCS did not hold MCPs accountable to meet MPLs for the following measures in RY 2017; therefore, HSAG did not include these measures in the denominators for calculating the percentage of measures with rates that moved to above or below the MPLs in RY 2018 and for calculating the percentage of measures with rates below MPLs for only the last two consecutive years: ■ Asthma Medication Ratio ■ Breast Cancer Screening ■ Immunizations for Adolescents—Combination 2
Table 3.9—RY 2018 (MY 2017) Performance Measure Findings for All DomainsGold Coast—Ventura County
Criteria Number of Measures
MeetingCriteria
Total Number of Measures
Percentage of Measures
MeetingCriteria
RY 2018 Rates Above HPLs 1 21 4.76% Rates Above HPLs for the Last Three or More Consecutive Years 0 18 0.00%
RY 2018 Rates Significantly Better than RY 2017 Rates* 9 22 40.91%
Rates that Moved from Below MPLs in RY 2017 to Above MPLs in RY 2018 5 6 83.33%
RY 2018 Rates Below MPLs 3 21 14.29%
Gold Coast Health Plan Performance Evaluation Report: July 1, 2017–June 30, 2018 California Department of Health Care Services
Page N-17 Health Services Advisory Group, Inc.
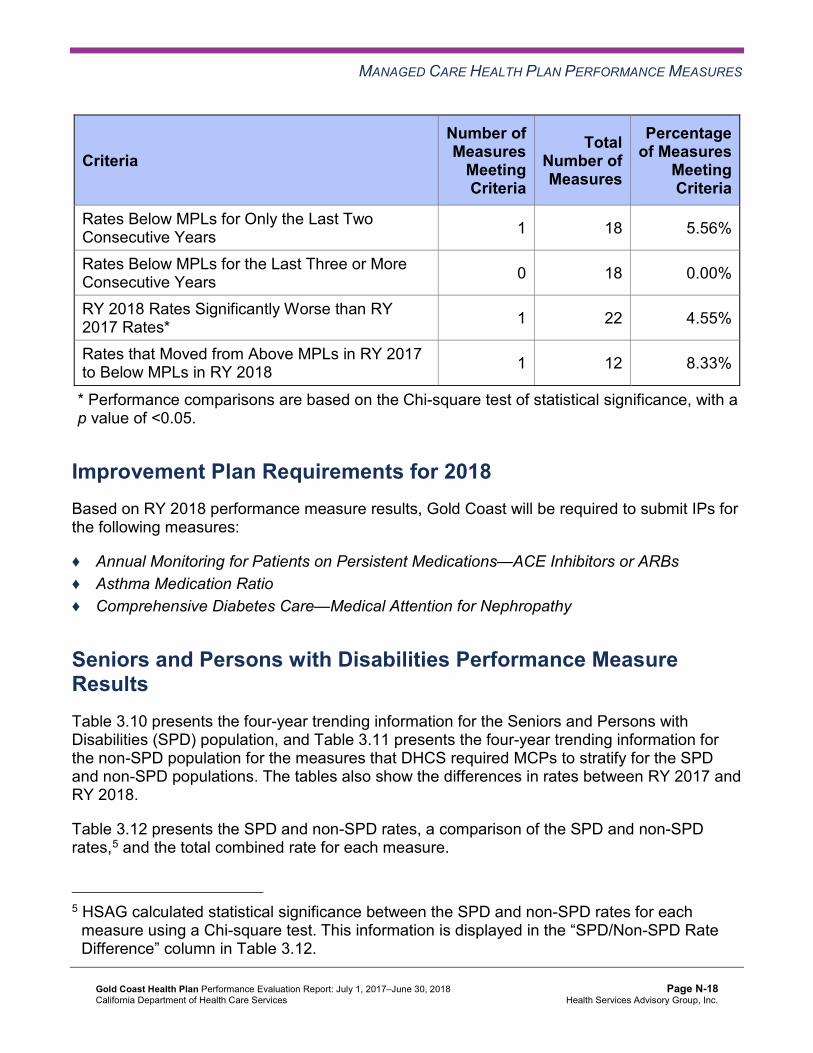
MANAGED CARE HEALTH PLAN PERFORMANCE MEASURES
Criteria Number of Measures
MeetingCriteria
Total Number of Measures
Percentage of Measures
MeetingCriteria
Rates Below MPLs for Only the Last Two Consecutive Years 1 18 5.56%
Rates Below MPLs for the Last Three or More Consecutive Years 0 18 0.00%
RY 2018 Rates Significantly Worse than RY 2017 Rates* 1 22 4.55%
Rates that Moved from Above MPLs in RY 2017 to Below MPLs in RY 2018 1 12 8.33%
* Performance comparisons are based on the Chi-square test of statistical significance, with a p value of <0.05.
Improvement Plan Requirements for 2018 Based on RY 2018 performance measure results, Gold Coast will be required to submit IPs for the following measures:
♦ Annual Monitoring for Patients on Persistent Medications—ACE Inhibitors or ARBs ♦ Asthma Medication Ratio ♦ Comprehensive Diabetes Care—Medical Attention for Nephropathy
Seniors and Persons with Disabilities Performance Measure Results Table 3.10 presents the four-year trending information for the Seniors and Persons with Disabilities (SPD) population, and Table 3.11 presents the four-year trending information for the non-SPD population for the measures that DHCS required MCPs to stratify for the SPD and non-SPD populations. The tables also show the differences in rates between RY 2017 and RY 2018.
Table 3.12 presents the SPD and non-SPD rates, a comparison of the SPD and non-SPD rates,5 and the total combined rate for each measure.
5 HSAG calculated statistical significance between the SPD and non-SPD rates for each measure using a Chi-square test. This information is displayed in the “SPD/Non-SPD Rate Difference” column in Table 3.12.
Gold Coast Health Plan Performance Evaluation Report: July 1, 2017–June 30, 2018 California Department of Health Care Services
Page N-18 Health Services Advisory Group, Inc.

MANAGED CARE HEALTH PLAN PERFORMANCE MEASURES
Table 3.10—Multi-Year SPD Performance Measure Trend Table Gold Coast—Ventura County
B = Statistical testing result indicates that the RY 2018 SPD rate is significantly better than the RY 2017 SPD rate.
W = Statistical testing result indicates that the RY 2018 SPD rate is significantly worse than the RY 2017 SPD rate.
Measure RY
2015 SPD
Rate1
RY 2016 SPD
Rate2
RY 2017 SPD
Rate3
RY 2018 SPD
Rate4
RYs 2017–18 Rate
Difference5
All-Cause Readmissions* 22.83% 20.71% 21.08% 18.11% -2.97 Ambulatory Care—Emergency Department (ED) Visits per 1,000 Member Months**
70.45 71.34 71.60 72.55 Not Tested
Ambulatory Care—Outpatient Visits per 1,000 Member Months**
397.29 440.50 470.59 490.65 Not Tested
Annual Monitoring for Patients on Persistent Medications— ACE Inhibitors or ARBs
86.29% 89.21% 89.12% 89.73% 0.61
Annual Monitoring for Patients on Persistent Medications— Diuretics
88.34% 90.47% 90.36% 91.41% 1.05
Children and Adolescents' Access to Primary Care Practitioners—12–24 Months
84.21% 88.64% 85.00% 91.18% 6.18
Children and Adolescents' Access to Primary Care Practitioners— 25 Months–6 Years
86.37% 87.59% 88.14% 87.69% -0.45
Children and Adolescents' Access to Primary Care Practitioners—7–11 Years
89.29% 89.55% 90.21% 91.07% 0.86
Children and Adolescents' Access to Primary Care Practitioners—12–19 Years
83.31% 86.58% 86.54% 86.57% 0.03
1 RY 2015 rates reflect MY data from January 1, 2014, through December 31, 2014. 2 RY 2016 rates reflect MY data from January 1, 2015, through December 31, 2015. 3 RY 2017 rates reflect MY data from January 1, 2016, through December 31, 2016.
Gold Coast Health Plan Performance Evaluation Report: July 1, 2017–June 30, 2018 California Department of Health Care Services
Page N-19 Health Services Advisory Group, Inc.

MANAGED CARE HEALTH PLAN PERFORMANCE MEASURES
4 RY 2018 rates reflect MY data from January 1, 2017, through December 31, 2017. 5 Performance comparisons are based on the Chi-square test of statistical significance, with a p value of <0.05. * A lower rate indicates better performance for this measure. ** Member months are a member's “contribution” to the total yearly membership. Not Tested = An RY 2017–18 rate difference was not calculated because high and low rates do not necessarily indicate better or worse performance.
Table 3.11—Multi-Year Non-SPD Performance Measure Trend Table Gold Coast—Ventura County
B = Statistical testing result indicates that the RY 2018 non-SPD rate is significantly better than the RY 2017 non-SPD rate.
W = Statistical testing result indicates that the RY 2018 non-SPD rate is significantly worse than the RY 2017 non-SPD rate.
Measure RY 2015
Non-SPD Rate1
RY 2016 Non-SPD
Rate2
RY 2017 Non-SPD
Rate3
RY 2018 Non-SPD
Rate4
RYs 2017–18 Rate
Difference5
All-Cause Readmissions* 12.80% 13.62% 11.88% 13.18% 1.30
Ambulatory Care— Emergency Department (ED) Visits per 1,000 Member Months**
37.05 39.38 38.63 39.66 Not Tested
Ambulatory Care— Outpatient Visits per 1,000 Member Months**
196.26 235.33 253.54 260.25 Not Tested
Annual Monitoring for Patients on Persistent Medications— ACE Inhibitors or ARBs
79.63% 86.29% 84.07% 84.50% 0.43
Annual Monitoring for Patients on Persistent Medications—Diuretics
80.29% 86.40% 83.75% 85.44% 1.69
Children and Adolescents' Access to Primary Care Practitioners— 12–24 Months
95.54% 94.72% 93.96% 95.09% 1.13B
Gold Coast Health Plan Performance Evaluation Report: July 1, 2017–June 30, 2018 California Department of Health Care Services
Page N-20 Health Services Advisory Group, Inc.

MANAGED CARE HEALTH PLAN PERFORMANCE MEASURES
Measure RY 2015
Non-SPD Rate1
RY 2016 Non-SPD
Rate2
RY 2017 Non-SPD
Rate3
RY 2018 Non-SPD
Rate4
RYs 2017–18 Rate
Difference5
Children and Adolescents' Access to Primary Care Practitioners— 25 Months–6 Years
83.04% 84.81% 85.46% 84.64% -0.82W
Children and Adolescents' Access to Primary Care Practitioners— 7–11 Years
83.01% 85.49% 84.37% 85.99% 1.62B
Children and Adolescents' Access to Primary Care Practitioners— 12–19 Years
81.92% 84.04% 82.18% 83.60% 1.42B
1 RY 2015 rates reflect MY data from January 1, 2014, through December 31, 2014. 2 RY 2016 rates reflect MY data from January 1, 2015, through December 31, 2015. 3 RY 2017 rates reflect MY data from January 1, 2016, through December 31, 2016. 4 RY 2018 rates reflect MY data from January 1, 2017, through December 31, 2017. 5 Performance comparisons are based on the Chi-square test of statistical significance, with a p value of <0.05. * A lower rate indicates better performance for this measure. ** Member months are a member's “contribution” to the total yearly membership. Not Tested = An RY 2017–18 rate difference was not calculated because high and low rates do not necessarily indicate better or worse performance.
Gold Coast Health Plan Performance Evaluation Report: July 1, 2017–June 30, 2018 California Department of Health Care Services
Page N-21 Health Services Advisory Group, Inc.

MANAGED CARE HEALTH PLAN PERFORMANCE MEASURES
Table 3.12—RY 2018 (MY 2017) Performance Measure Comparison and Results forMeasures Stratified by the SPD and Non-SPD PopulationsGold Coast—Ventura County
B = Statistical testing result indicates that the RY 2018 SPD rate is significantly better than the RY 2018 non-SPD rate.
W = Statistical testing result indicates that the RY 2018 SPD rate is significantly worse than the RY 2018 non-SPD rate.
Measure RY 2018
SPD Rate1
RY 2018 Non-SPD
Rate1
SPD/Non-SPDRate
Difference2
RY 2018 Total Rate3
All-Cause Readmissions* 18.11% 13.18% 4.93W 14.37% Ambulatory Care—Emergency Department (ED) Visits per 1,000 Member Months**
72.55 39.66 Not Tested 41.21
Ambulatory Care—Outpatient Visits per 1,000 Member Months** 490.65 260.25 Not Tested 271.06
Annual Monitoring for Patients on Persistent Medications— ACE Inhibitors or ARBs
89.73% 84.50% 5.23B 85.48%
Annual Monitoring for Patients on Persistent Medications—Diuretics 91.41% 85.44% 5.97B 86.54%
Children and Adolescents' Access to Primary Care Practitioners— 12–24 Months
91.18% 95.09% -3.91 95.05%
Children and Adolescents' Access to Primary Care Practitioners— 25 Months–6 Years
87.69% 84.64% 3.05 84.72%
Children and Adolescents' Access to Primary Care Practitioners— 7–11 Years
91.07% 85.99% 5.08B 86.12%
Children and Adolescents' Access to Primary Care Practitioners— 12–19 Years
86.57% 83.60% 2.97B 83.69%
1 RY 2018 rates reflect MY data from January 1, 2017, through December 31, 2017. 2 Performance comparisons are based on the Chi-square test of statistical significance, with a p value of <0.05. 3 Total rates are based on the MCP reporting unit’s total results, including the SPD and non-SPD populations. Please note, if data are not available for either the SPD or non-SPD population, the total rate is based on results reported for the available population.
Gold Coast Health Plan Performance Evaluation Report: July 1, 2017–June 30, 2018 California Department of Health Care Services
Page N-22 Health Services Advisory Group, Inc.

MANAGED CARE HEALTH PLAN PERFORMANCE MEASURES
* A lower rate indicates better performance for this measure. ** Member months are a member's “contribution” to the total yearly membership. Not Tested = An SPD/non-SPD rate difference was not calculated because high and low rates do not necessarily indicate better or worse performance.
Seniors and Persons with Disabilities Findings
HSAG observed the following notable results in RY 2018 for measures that Gold Coast stratified by the SPD and non-SPD populations:
♦ Gold Coast had no statistically significant variation in SPD rates from RY 2017 to RY 2018. ♦ The non-SPD rate improved significantly from RY 2017 to RY 2018 for the Children and
Adolescents’ Access to Primary Care Practitioners—12–24 Months, 7–11 Years, and 12– 19 Years measures.
♦ The RY 2018 non-SPD rate was significantly worse than the RY 2017 non-SPD rate for the Children and Adolescents’ Access to Primary Care Practitioners—25 Months–6 Years measure.
♦ The RY 2018 SPD rates were significantly better than the RY 2018 non-SPD rates for the following measures: ■ Both Annual Monitoring for Patients on Persistent Medications measures ■ Children and Adolescents’ Access to Primary Care Practitioners—7–11 Years and 12–
19 Years measures ♦ The RY 2018 SPD rate was significantly worse than the RY 2018 non-SPD rate for the All-
Cause Readmissions measure. Note that the higher rate of hospital readmissions for the SPD population is expected based on the greater and often more complicated health care needs of these beneficiaries.
Strengths—Performance Measures HSAG auditors determined that Gold Coast followed the appropriate specifications to produce valid rates.
HSAG identified the following notable RY 2018 performance measure results for Gold Coast:
♦ The rate for the Immunizations for Adolescents—Combination 2 measure was above the HPL.
♦ Across all domains, nine of 22 rates (41 percent) improved significantly from RY 2017 to RY 2018. ■ Gold Coast’s performance improved most within the Preventive Screening and
Children’s Health domain, with four of five rates within this domain (80 percent) improving significantly from RY 2017 to RY 2018.
Gold Coast Health Plan Performance Evaluation Report: July 1, 2017–June 30, 2018 California Department of Health Care Services
Page N-23 Health Services Advisory Group, Inc.

MANAGED CARE HEALTH PLAN PERFORMANCE MEASURES
■ The significant improvement resulted in the rates for the following measures improving from below the MPLs in RY 2017 to above the MPLs in RY 2018: ○ Comprehensive Diabetes Care—Blood Pressure Control (<140/90 mm Hg) ○ Comprehensive Diabetes Care—HbA1c Control (<8.0 Percent) ○ Comprehensive Diabetes Care—HbA1c Poor Control (>9.0 Percent) ○ Controlling High Blood Pressure
♦ The rate for the Annual Monitoring for Patients on Persistent Medications—Diuretics measure improved from RY 2017 to RY 2018. Although the improvement was not statistically significant, the change resulted in the rate for this measure moving from below the MPL in RY 2017 to above the MPL in RY 2018.
Gold Coast provided information on actions that the MCP took during the reporting period to improve performance on measures with declining performance from RY 2016 to RY 2017 and performance below the MPLs in RY 2017. (See Table 5.1.) Gold Coast’s efforts may have contributed to the MCP’s improved performance from RY 2017 to RY 2018.
Opportunities for Improvement—Performance Measures For HEDIS performance measure reporting, Gold Coast has the opportunity to:
♦ Ensure that the MCP includes appropriate eligibility spans for newborns. ♦ Implement a formal process to track and document quality HEDIS audit results.
Performance measure results indicate that Gold Coast has opportunities to assess the causes for the rates for the following measures being below the MPLs in RY 2018 and to identify strategies for improving the MCP’s performance:
♦ Annual Monitoring for Patients on Persistent Medications—ACE Inhibitors or ARBs ♦ Asthma Medication Ratio ♦ Comprehensive Diabetes Care—Medical Attention for Nephropathy
The MCP also has the opportunity to identify the causes for the rate declining significantly from RY 2017 to RY 2018 for the Use of Imaging Studies for Low Back Pain measure to ensure that only beneficiaries ages 18 to 50 with lower back pain and who show clinical necessity receive an imaging study. Note that the significant decline in the Use of Imaging Studies for Low Back Pain rate from RY 2017 to RY 2018 may be due to NCQA’s RY 2018 specification changes for this measure and therefore may not be related to Gold Coast’s performance.
Gold Coast Health Plan Performance Evaluation Report: July 1, 2017–June 30, 2018 California Department of Health Care Services
Page N-24 Health Services Advisory Group, Inc.

Medi-Cal Managed Care External Quality Review Technical ReportAppendix N: Performance Evaluation ReportGold Coast Health Plan July 1, 2017–June 30, 2018
4. Performance Improvement Projects
Performance Improvement Project Overview The key concepts of the rapid-cycle PIP framework include forming a PIP team, setting aims, establishing measures, determining interventions using quality improvement tools, conducting PDSA cycles to test interventions, and planning for the spread of successful changes. The core component of the rapid-cycle PIP approach involves testing changes on a small scale so that improvement can occur more efficiently and lead to long-term sustainability. The following modules guide MCPs through this rapid-cycle PIP process:
♦ Module 1—PIP Initiation ■ MCPs outline the framework for the PIP, which includes:
○ The topic rationale. ○ Comparative data supporting the need to improve the selected topic. ○ A list of the PIP team members, which consists of internal and external stakeholders. ○ A completed key driver diagram that defines the theory of change for improvement,
including the SMART (Specific, Measurable, Achievable, Relevant, and Time-bound) Aim and Global Aim.
♦ Module 2—SMART Aim Data Collection ■ MCPs define the SMART Aim measure and data collection methodology and develop
the SMART Aim data run chart. ♦ Module 3—Intervention Determination
■ MCPs use process mapping and failure modes and effects analysis (FMEA) to identify potential interventions to test which may have direct effects on the SMART Aim.
♦ Module 4—Plan-Do-Study-Act (PDSA) ■ MCPs test and evaluate the interventions identified in Module 3 through a series of
PDSA cycles. ♦ Module 5—PIP Conclusions
■ MCPs interpret results and summarize: ○ Key findings and outcomes achieved. ○ Assessment of each tested intervention. ○ Lessons learned, including how demonstrated improvement can be shared and used
as a foundation for further improvement going forward. ○ Plan for sustained improvement.
Gold Coast Health Plan Performance Evaluation Report: July 1, 2017–June 30, 2018 California Department of Health Care Services
Page N-25 Health Services Advisory Group, Inc.
PERFORMANCE IMPROVEMENT PROJECTS
Based on the agreed-upon timeline, MCPs submit each module to HSAG for validation. Throughout the rapid-cycle PIP process, HSAG provides technical assistance to MCPs to ensure that PIPs are methodologically sound and to problem-solve with MCPs regarding how to address challenges that occur. Through an iterative process, MCPs have opportunities to make corrections to modules 1 through 3 to achieve all validation criteria.
Once MCPs achieve all validation criteria for modules 1 through 3 and receive feedback on the intervention Plan portion of Module 4, MCPs test interventions. During the intervention testing phase of the PIP, HSAG conducts periodic progress check-ins to ensure that MCPs have addressed HSAG’s feedback on the Plan portion of Module 4 and are making appropriate progress with intervention testing. Once MCPs complete testing an intervention, MCPs determine the next steps based on results and lessons learned—whether the intervention was successful and should be spread (adopt), whether modifications need to be made to the existing intervention (adapt), or whether the intervention was not successful and should be stopped (abandon).
In Module 5, MCPs summarize the overall PIP. When validating Module 5, HSAG assesses the validity and reliability of the results based on the Centers for Medicare & Medicaid Services (CMS) validation protocols to determine whether key stakeholders can have confidence in the reported PIP findings. HSAG assigns the following final confidence levels for each PIP:
♦ High confidence—the PIP was methodologically sound and achieved the SMART Aim goal; the demonstrated improvement was clearly linked to the quality improvement processes conducted and intervention(s) tested; and, the MCP accurately summarized the key findings.
♦ Confidence—the PIP was methodologically sound and achieved the SMART Aim goal, and the MCP accurately summarized the key findings. However, some, but not all, of the quality improvement processes conducted and/or intervention(s) tested were clearly linked to the demonstrated improvement.
♦ Low confidence—either (A) the PIP was methodologically sound; however, the SMART Aim goal was not achieved; or (B) the SMART Aim goal was achieved; however, the quality improvement processes and/or intervention(s) tested were poorly executed and could not be linked to the improvement.
♦ Reported PIP results were not credible—the PIP methodology was not executed as approved.
Performance Improvement Project Results and Findings During the review period, Gold Coast submitted modules 4 and 5 for its 2015–17 DHCS-priority and MCP-specific PIPs. HSAG validated the modules and includes the final PIP validation findings in this report. Additionally, Gold Coast initiated a Disparity PIP and a DHCS-priority PIP during the review period. In this report, HSAG includes summaries of the MCP’s Disparity and DHCS-priority PIP module submissions as well as validation findings from the review period.
Gold Coast Health Plan Performance Evaluation Report: July 1, 2017–June 30, 2018 California Department of Health Care Services
Page N-26 Health Services Advisory Group, Inc.

PERFORMANCE IMPROVEMENT PROJECTS
2015–17 DHCS-Priority Performance Improvement Project
Gold Coast selected immunizations of two-year-olds for its 2015–17 DHCS-priority PIP. While the MCP concluded its Immunizations of Two-Year-Olds PIP through the SMART Aim end date of June 30, 2017, Gold Coast submitted modules 4 and 5 for HSAG to validate during the review period for this report. HSAG provided final validation findings and encouraged Gold Coast to incorporate the experiences and lessons learned from the PIP into future quality improvement efforts.
Table 4.1 provides a summary of the SMART Aim measure results reported by the MCP.
Table 4.1—Gold Coast Immunizations of Two-Year-Olds PIP SMART Aim Measure Results
SMART Aim Measure Baseline Rate
SMART Aim Goal
Rate
SMART Aim Goal Achieved
Rate of childhood immunizations for beneficiaries ages two years and younger, at Provider Group A.6 67.66% 77.66% Yes
Table 4.2 presents a description of the intervention that Gold Coast tested for its Immunizations of Two-Year-Olds PIP. The table also indicates the key driver that the intervention addressed as well as whether the MCP decided, based on intervention testing results, to adopt, adapt, or abandon the intervention.
Table 4.2—Gold Coast Immunizations of Two-Year-Olds PIP Intervention Testing Results
Intervention Key Driver Addressed Adopt,Adapt, orAbandon
Using reports from electronic health records (EHRs), Comprehensive Clinic Assessment Software Application (CoCASA), and California Immunization Registry (CAIR) to identify beneficiaries (younger than or equal to 24 months of age) with incomplete immunizations and to contact the parents/guardians of these beneficiaries to schedule appointments for immunizations.
Provider follow-up with parent or guardian Adapt
6 Provider group name removed for confidentiality.
Gold Coast Health Plan Performance Evaluation Report: July 1, 2017–June 30, 2018 California Department of Health Care Services
Page N-27 Health Services Advisory Group, Inc.
PERFORMANCE IMPROVEMENT PROJECTS
Gold Coast documented the following lessons learned during the scope of the 2015–17 DHCS-priority PIP, which the MCP may apply to future PIPs:
♦ The tested intervention helped improve the internal workflow and collaboration with provider staff (pediatricians, nurses, medical assistants, office staff) to ensure that providers were aware of what immunizations were due when a child had an office visit and to facilitate scheduling follow-up appointments for future immunizations before the parent or guardian left the clinic.
♦ Parents and guardians preferred weekend clinics because these did not necessitate parents and guardians to take time off from work.
♦ Provider staff member identified physicians who split immunizations across more than one appointment instead of administering them at one office visit. The clinic implemented a process to ensure that parents and guardians were aware of which immunizations were not administered and offered the choice of parents and guardians attending a walk-in or weekend clinic.
♦ Making outreach calls was time-intensive and required one full-time staff member to manage the outreach calls and appointment scheduling.
Performance Improvement Project Validation Findings
During the review period for this report, HSAG validated modules 4 and 5 for the MCP’s Immunizations of Two-Year-Olds PIP. The SMART Aim run chart indicates that Gold Coast exceeded the SMART Aim goal before the MCP began intervention testing in July 2016; however, the SMART Aim measure rate continued to increase after intervention testing began and reached 94.74 percent in February 2017. HSAG advises caution in interpreting improvement from the baseline rate because the MCP calculated the SMART Aim measure baseline and goal rates using administrative data whereas the MCP used medical record reviews to calculate the SMART AIM measure rates throughout the PIP process. HSAG assigned a level of Confidence to this PIP.
Upon assessment of validity and reliability of the PIP results, HSAG assigned Gold Coast’s Immunizations of Two-Year-Olds PIP a final confidence level of Confidence.
2015–17 MCP-Specific Performance Improvement Project
Gold Coast selected developmental screening for children for its 2015–17 MCP-specific PIP. While the MCP concluded its Developmental Screening for Children PIP through the SMART Aim end date of June 30, 2017, Gold Coast submitted modules 4 and 5 for HSAG to validate during the review period for this report. HSAG provided final validation findings and encouraged Gold Coast to incorporate the experiences and lessons learned from the PIP into future quality improvement efforts.
Table 4.3 provides a summary of the SMART Aim measure results reported by the MCP.
Gold Coast Health Plan Performance Evaluation Report: July 1, 2017–June 30, 2018 California Department of Health Care Services
Page N-28 Health Services Advisory Group, Inc.

PERFORMANCE IMPROVEMENT PROJECTS
Table 4.3—Gold Coast Developmental Screening for Children PIP SMART Aim Measure Results
SMART Aim Measure Baseline Rate
SMART Aim Goal
Rate
SMART Aim Goal Achieved
Rate of standardized, child developmental screening tools completed for children 8 to 11 months who are due for their developmental screenings and enrolled at Provider A.7
45.82% 55.82% Yes
Table 4.4 presents a description of the intervention that Gold Coast tested for its Developmental Screening for Children PIP. The table also indicates the failure modes that the intervention addressed as well as whether the MCP decided, based on intervention testing results, to adopt, adapt, or abandon the intervention.
Table 4.4—Gold Coast Developmental Screening for Children PIP Intervention Testing Results
Intervention Failure Modes Addressed Adopt,Adapt, orAbandon
Training clinic staff members on using a screening tool during well-child exams
♦ Parent or guardian does not have enough time to complete the child developmental screening questionnaire form.
♦ Parent or guardian does not receive the questionnaire to complete, or the parent is given the wrong age-specific questionnaire.
Adopt
Gold Coast documented the following lessons learned during the scope of the 2015–17 MCP-specific PIP, which the MCP may apply to future PIPs:
♦ It is important to set reasonable goals and expectations with provider partners to account for their busy clinic schedules.
♦ Parents and guardians are more prepared to discuss their child’s development and answer the screening questions after they are given educational and reference materials on the developmental screening questionnaires.
7 Provider name removed for confidentiality.
Gold Coast Health Plan Performance Evaluation Report: July 1, 2017–June 30, 2018 California Department of Health Care Services
Page N-29 Health Services Advisory Group, Inc.

PERFORMANCE IMPROVEMENT PROJECTS
Performance Improvement Project Validation Findings
During the review period for this report, HSAG validated modules 4 and 5 for the MCP’s Developmental Screening for Children PIP. Gold Coast partnered with a provider office to test the intervention; however, due to competing priorities, the provider partner could not continue testing the training program. To continue to increase the percentage of children who received developmental screenings, Gold Coast partnered with another provider to test the intervention. Gold Coast having to change provider partners resulted in the MCP testing the intervention from February 2017 to June 2017 only; however, the MCP achieved the SMART Aim measure goal for three of the five months during which the intervention was being tested.
Upon assessment of validity and reliability of the PIP results, HSAG assigned Gold Coast’s Developmental Screening for Children PIP a final confidence level of Confidence.
2017–19 Disparity Performance Improvement Project
During the review period, DHCS required Gold Coast to initiate a PIP focusing on an identified health disparity based on, but not limited to, age, gender, race or ethnicity, language spoken, income, educational attainment, sexual orientation or gender identity, occupation, provider, or geographic area. Gold Coast selected diabetes poor HbA1c control among non-English speaking Hispanic/Latino beneficiaries as its 2017–19 Disparity PIP topic. Using its own MCP-specific data, the MCP provided evidence of the health disparity by demonstrating a statistically significant rate difference between two subgroups, with the disparate subgroup having the lower rate.
Table 4.5 provides the SMART Aim measure description, baseline rate, and SMART Aim goal rate for the PIP. The SMART Aim end date for this PIP is June 30, 2019.
Table 4.5—Gold Coast Diabetes Poor HbA1c Control Disparity PIP SMART Aim Measure
SMART Aim Measure Baseline Rate
SMART Aim Goal
Rate
Rate of poor blood glucose levels (HbA1c > 9.0 percent) among beneficiaries 18 to 75 years of age, non-English speaking Hispanic/Latinos, living with diabetes, who are enrolled at Provider Group B.8
70.39% 59.20%
8 Provider group name removed for confidentiality.
Gold Coast Health Plan Performance Evaluation Report: July 1, 2017–June 30, 2018 California Department of Health Care Services
Page N-30 Health Services Advisory Group, Inc.

PERFORMANCE IMPROVEMENT PROJECTS
Performance Improvement Project Validation Findings
During the review period of this report, HSAG validated modules 1 through 3 for the MCP’s Diabetes Poor HbA1c Control Disparity PIP. Upon initial review of the modules, HSAG determined that Gold Coast met some required validation criteria; however, HSAG identified opportunities for improvement related to:
♦ Including all required components of the: ■ SMART Aim, developed based on literature review, data, and/or experience. ■ SMART Aim measure. ■ SMART Aim data collection methodology. ■ Run/control chart. ■ FMEA table.
♦ Aligning accurately the Global Aim, SMART Aim, key drivers, and potential interventions. ♦ Capturing all required data elements in the data collection tool. ♦ Including a step-by-step flow of the overall process in the process map. ♦ Listing the appropriate potential interventions based on the ranked failure modes. ♦ Considering the potential interventions’ reliability and sustainability.
After receiving technical assistance from HSAG, Gold Coast incorporated HSAG’s feedback into the PIP modules. Upon HSAG’s final review, HSAG determined that the MCP met all validation criteria for all submitted modules.
2017–19 DHCS-Priority Performance Improvement Project
During the review period, DHCS required Gold Coast to initiate a PIP related to one of DHCS’ Quality Strategy focus areas: Childhood Immunization Status—Combination 3, Controlling High Blood Pressure, Comprehensive Diabetes Care, or Prenatal and Postpartum Care— Postpartum Care. Based on the MCP’s performance measure results, Gold Coast selected childhood immunizations as its 2017–19 DHCS-priority PIP topic.
Table 4.6 provides the SMART Aim measure description, baseline rate, and SMART Aim goal rate for the PIP. The SMART Aim end date for this PIP is June 30, 2019.
Table 4.6—Gold Coast Childhood Immunization Status—Combination 3 PIP SMART Aim Measure
SMART Aim Measure Baseline Rate
SMART Aim Goal
Rate
Rate of Childhood Immunization Status—Combination 3 measure for Provider Group C9 73.64% 83.64%
9 Provider group name removed for confidentiality.
Gold Coast Health Plan Performance Evaluation Report: July 1, 2017–June 30, 2018 California Department of Health Care Services
Page N-31 Health Services Advisory Group, Inc.
PERFORMANCE IMPROVEMENT PROJECTS
Performance Improvement Project Validation Findings
During the review period of this report, HSAG validated modules 1 through 3 for the MCP’s Childhood Immunization Status—Combination 3 PIP. Upon initial review of the modules, HSAG determined that Gold Coast met some required validation criteria; however, HSAG identified opportunities for improvement related to:
♦ Supporting the topic selection with the MCP’s data. ♦ Identifying appropriate team members that include both internal staff and external partners. ♦ Including all required components of the SMART Aim measure. ♦ Including a step-by-step flow of the overall process in the process map. ♦ Considering the potential interventions’ reliability and sustainability.
After receiving technical assistance from HSAG, Gold Coast incorporated HSAG’s feedback into the PIP modules. Upon HSAG’s final review, HSAG determined that the MCP met all validation criteria for all submitted modules.
Strengths—Performance Improvement Projects Gold Coast achieved the SMART Aim goals for the 2015–17 Immunizations of Two-Year-Olds and Developmental Screening for Children PIPs and linked some quality improvement activities to the demonstrated improvement. Based on HSAG’s assessment, HSAG assigned a final confidence level of Confidence to both 2015–17 PIPs.
Opportunities for Improvement—Performance Improvement Projects Gold Coast has the opportunity to continue monitoring interventions and outcomes to facilitate long-term, sustained improvement beyond the life of the 2015–17 Immunizations of Two-Year-Olds and Developmental Screening for Children PIPs. Ongoing monitoring will enable long-term evaluation of sustained improvement and allow the MCP to continually refine interventions to achieve and sustain optimal outcomes.
Gold Coast Health Plan Performance Evaluation Report: July 1, 2017–June 30, 2018 California Department of Health Care Services
Page N-32 Health Services Advisory Group, Inc.

Medi-Cal Managed Care External Quality Review Technical ReportAppendix N: Performance Evaluation ReportGold Coast Health Plan July 1, 2017–June 30, 2018
5. Recommendations
Follow-Up on Prior Year Recommendations DHCS provided each MCP an opportunity to outline actions taken to address recommendations HSAG made in its 2016–17 MCP-specific evaluation report. Table 5.1 provides EQR recommendations from Gold Coast’s July 1, 2016, through June 30, 2017, MCP-specific evaluation report, along with the MCP’s self-reported actions taken through June 30, 2018, that address the recommendations. Please note that HSAG made minimal edits to Table 5.1 to preserve the accuracy of Gold Coast’s self-reported actions.
Table 5.1—Gold Coast’s Self-Reported Follow-Up on External Quality ReviewRecommendations from the July 1, 2016, through June 30, 2017, MCP-SpecificEvaluation Report
2016–17 External Quality ReviewRecommendations Directed to Gold Coast
Self-Reported Actions Taken by Gold Coastduring the Period of July 1, 2017–June 30, 2018,that Address the External Quality ReviewRecommendations
1. Identify the causes for the MCP’s declining performance and performance being below the MPLs in RY 2017 for the following measures: a. Both Annual Monitoring for
Patients on Persistent Medications measures (MPM—ACE/ARBs and MPM—Diuretics)
b. Childhood Immunization Status—Combination 3 (CIS— Combo 3)
c. Comprehensive Diabetes Care—Blood Pressure Control (<140/90 mm Hg) (CDC—BP)
d. Comprehensive Diabetes Care—Eye Exam (Retinal) Performed (CDC—Eye)
e. Comprehensive Diabetes Care—HbA1c Control (<8.0 Percent) (CDC—H8)
MY 2016–MY 2017 Rate Comparison Table
Measure MY 2016 Rate
MY 2017 Rate
Rate Change
Current Percentile Rank
MPM— ACE/ARBs
85.09 85.48 +0.39 10th
MPM— Diuretics
85.14 86.54 +1.40 25th
CIS— Combo 3
64.96 70.53 +5.57 25th
CDC—BP 48.66 65.94 +17.28 50th CDC—Eye 50.61 57.91 +7.30 50th CDC—H8 36.98 55.96 +18.98 75th CDC—H9 54.50 35.77* -18.73 50th CBP 45.01 54.50 +9.49 25th
* Lower rate indicates better performance a. MPM—ACE/ARBs and MPM—Diuretics
Causes for declining performance and performance below the MPLs in RY 2017:
Gold Coast Health Plan Performance Evaluation Report: July 1, 2017–June 30, 2018 California Department of Health Care Services
Page N-33 Health Services Advisory Group, Inc.

RECOMMENDATIONS
2016–17 External Quality ReviewRecommendations Directed to Gold Coast
Self-Reported Actions Taken by Gold Coastduring the Period of July 1, 2017–June 30, 2018,that Address the External Quality ReviewRecommendations
f. Comprehensive Diabetes Care—HbA1c Poor Control (>9.0 Percent) (CDC—H9)
g. Controlling High Blood Pressure (CBP)
■ Lack of provider adherence to clinical practice guidelines; labs not being ordered annually or ordered every other year.
■ Lack of member compliance with completing labs ordered by providers.
■ No internal supplemental data validation process to check the quality and quantity of lab data received from lab vendors.
Actions Taken: ■ Increased provider awareness on
performance measure rates and provider engagement in member outreach through recurring HEDIS rate progress reports and member-level gap reports.
■ Created annual lab monitoring reminder letters to increase member awareness of the importance of annual lab monitoring for patients on persistent medications.
■ Improved the retrieval and storage of lab data by implementing alerts to notify information technology staff if key fields are missing or incorrectly formatted in the monthly lab files received from lab vendors.
■ Improved the retrieval and storage of Quest Diagnostics lab data by transitioning from a manual to automated process that includes daily file checks on Gold Coast’s secure file transfer protocol site where the vendor uploads its monthly lab files.
Outcomes: ■ The MPM—ACE/ARBs measure rate
increased 0.39 percentage points, from 85.09 percent to 85.48 percent, but still ranks in the 10th percentile.
■ The MPM—Diuretics measure rate increased 1.40 percentage points, from 85.14 percent to 86.54 percent, and currently ranks in the 25th percentile.
Gold Coast Health Plan Performance Evaluation Report: July 1, 2017–June 30, 2018 California Department of Health Care Services
Page N-34 Health Services Advisory Group, Inc.

RECOMMENDATIONS
2016–17 External Quality ReviewRecommendations Directed to Gold Coast
Self-Reported Actions Taken by Gold Coastduring the Period of July 1, 2017–June 30, 2018,that Address the External Quality ReviewRecommendations b. CIS—Combo 3
Causes for declining performance and performance below the MPL in RY 2017: ■ Missed opportunities for providers to
administer immunizations during clinic visits. ■ Many CIS—Combo 3 measure
immunizations were administered after the child turned two years old.
■ Immunizations that required a higher number of doses (e.g., pneumococcal and DTaP) were incomplete.
■ Lack of clinic outreach staff to schedule immunization appointments and to call back “no show” patients.
■ During the HEDIS 2017 medical record review period: ○ Non-compliant records not overread. ○ No secondary pursuits for non-compliant
medical records. ○ Incomplete medical record retrieval and
abstraction to validate if immunizations were administered due to the following barriers: - Difficulty retrieving medical records
from a clinic system with a high volume of medical record requests.
- Difficulty retrieving records from a clinic’s contracted release of information (ROI) vendor that required payment for medical records.
- Due to changes in data mapping, medical record requests were sent to incorrect provider types (e.g., labs, specialists).
Actions Taken: ■ Increased provider awareness on
performance measure rates and provider engagement in member outreach through
Gold Coast Health Plan Performance Evaluation Report: July 1, 2017–June 30, 2018 California Department of Health Care Services
Page N-35 Health Services Advisory Group, Inc.

RECOMMENDATIONS
2016–17 External Quality ReviewRecommendations Directed to Gold Coast
Self-Reported Actions Taken by Gold Coastduring the Period of July 1, 2017–June 30, 2018,that Address the External Quality ReviewRecommendations
recurring HEDIS rate progress reports and member-level gap reports.
■ Reinstated the overread process that included overreading 100 percent of compliant and non-compliant medical records.
■ Corrected the provider type mapping to exclude sending medical record requests to non-primary care providers (PCPs).
■ To improve access to medical records for the vendor and to facilitate the MCP’s overread and secondary pursuit processes, both the HEDIS vendor and QI staff had access to the electronic medical records (EMRs) of the two largest clinic systems.
Outcomes: ■ The CIS—Combo 3 measure rate increased
5.57 percentage points, from 64.96 percent to 70.53 percent, and currently ranks in the 25th percentile.
c. CDC—BP Causes for declining performance and performance below the MPL in RY 2017: ■ The recurring HEDIS progress and gap
reports did not include rates or member-level detail on the CDC—BP measure.
■ No member outreach to remind members diagnosed with diabetes to get annual screenings.
■ No provider education on the HEDIS measure specifications for the blood pressure measures.
■ During the HEDIS 2017 medical record review period: ○ Non-compliant records not overread. ○ No secondary pursuits for non-compliant
medical records.
Gold Coast Health Plan Performance Evaluation Report: July 1, 2017–June 30, 2018 California Department of Health Care Services
Page N-36 Health Services Advisory Group, Inc.

RECOMMENDATIONS
2016–17 External Quality ReviewRecommendations Directed to Gold Coast
Self-Reported Actions Taken by Gold Coastduring the Period of July 1, 2017–June 30, 2018,that Address the External Quality ReviewRecommendations
○ Incomplete medical record retrieval and abstraction to validate blood pressure assessments due to the following barriers: - Difficulty retrieving medical records
from a clinic system with a high volume of medical record requests.
- Difficulty retrieving records from a clinic’s contracted ROI vendor that required payment for medical records.
- Due to changes in data mapping, medical record requests were sent to incorrect provider types (e.g., labs, specialists).
Actions Taken: ■ Increased provider awareness of
performance measure rates and provider engagement in member outreach through recurring HEDIS rate progress reports and member-level gap reports.
■ Included the CDC—BP measure in the gap report.
■ Created annual diabetes screening reminder letters to increase member awareness of the importance of annual screening exams for members diagnosed with diabetes.
■ Reinstated the overread process that included overreading 100 percent of compliant and non-compliant medical records.
■ Corrected the provider type mapping to exclude sending medical record requests to non-PCPs.
■ To improve access to medical records for the vendor and to facilitate the MCP’s overread and secondary pursuit process, both the HEDIS vendor and QI staff had access to the EMRs of the two largest clinic systems.
Gold Coast Health Plan Performance Evaluation Report: July 1, 2017–June 30, 2018 California Department of Health Care Services
Page N-37 Health Services Advisory Group, Inc.

RECOMMENDATIONS
2016–17 External Quality ReviewRecommendations Directed to Gold Coast
Self-Reported Actions Taken by Gold Coastduring the Period of July 1, 2017–June 30, 2018,that Address the External Quality ReviewRecommendations
■ Published provider education to increase provider awareness on the blood pressure measure specifications and on proper blood pressure intake techniques.
Outcomes: ■ The CDC—BP measure rate increased 17.28
percentage points, from 48.66 percent to 65.94 percent, and currently ranks in the 50th percentile.
d. CDC—Eye Causes for declining performance and performance below the MPL in RY 2017: ■ No member outreach to remind members
diagnosed with diabetes to get annual screenings.
■ During the HEDIS 2017 medical record review period: ○ Non-compliant records not overread. ○ No secondary pursuits for non-compliant
medical records. ○ Incomplete medical record retrieval and
abstraction to validate if retinal eye exams were completed due to the following barriers: - Difficulty retrieving medical records
from a clinic system with a high volume of medical record requests.
- Difficulty retrieving records from a clinic’s contracted ROI vendor that required payment for medical records.
- Due to changes in data mapping, medical record requests were sent to incorrect provider types (e.g., labs, specialists).
Actions Taken: ■ Increased provider awareness of
performance measure rates and provider
Gold Coast Health Plan Performance Evaluation Report: July 1, 2017–June 30, 2018 California Department of Health Care Services
Page N-38 Health Services Advisory Group, Inc.

RECOMMENDATIONS
2016–17 External Quality ReviewRecommendations Directed to Gold Coast
Self-Reported Actions Taken by Gold Coastduring the Period of July 1, 2017–June 30, 2018,that Address the External Quality ReviewRecommendations
engagement in member outreach through recurring HEDIS rate progress reports and member-level gap reports.
■ Created annual diabetes screening reminder letters to increase member awareness of the importance of annual screening exams for members diagnosed with diabetes.
■ Reinstated the overread process that included overreading 100 percent of compliant and non-compliant medical records.
■ Corrected the provider type mapping to exclude sending medical record requests to non-PCPs.
■ To improve access to medical records for the vendor and to facilitate the MCP’s overread and secondary pursuit process, both the HEDIS vendor and QI staff had access to the EMRs of the two largest clinic systems.
Outcomes: ■ The CDC—Eye Exam measure rate
increased 7.30 percentage points, from 50.61 percent to 57.91 percent, and currently ranks in the 50th percentile.
e. CDC—H8 Causes for declining performance and performance below the MPL in RY 2017: ■ No member outreach to remind members
diagnosed with diabetes to get annual screenings.
■ During the HEDIS 2017 medical record review period: ○ Non-compliant records not overread. ○ No secondary pursuits for non-compliant
medical records.
Gold Coast Health Plan Performance Evaluation Report: July 1, 2017–June 30, 2018 California Department of Health Care Services
Page N-39 Health Services Advisory Group, Inc.

RECOMMENDATIONS
2016–17 External Quality ReviewRecommendations Directed to Gold Coast
Self-Reported Actions Taken by Gold Coastduring the Period of July 1, 2017–June 30, 2018,that Address the External Quality ReviewRecommendations
○ Incomplete medical record retrieval and abstraction to validate HbA1c testing and results due to the following barriers: - Difficulty retrieving medical records
from a clinic system with a high volume of medical record requests.
- Difficulty retrieving records from a clinic’s contracted ROI vendor that required payment for medical records.
- Due to changes in data mapping, medical record requests were sent to incorrect provider types (e.g., labs, specialists).
Actions Taken: ■ Increased provider awareness on their
performance measure rates and provider engagement in member outreach through recurring HEDIS rate progress reports and member-level gap reports.
■ Created annual diabetes screening reminder letters to increase member awareness of the importance of annual screening exams for members diagnosed with diabetes.
■ Reinstated the overread process that included overreading 100 percent of compliant and non-compliant medical records.
■ Corrected the provider type mapping to exclude sending medical record requests to non-PCPs.
■ To improve access to medical records for the vendor and to facilitate the MCP’s overread and secondary pursuit process, both the HEDIS vendor and QI staff had access to the EMRs of the two largest clinic systems.
Outcomes: ■ The CDC—H8 measure rate increased 18.98
percentage points, from 36.98 percent to
Gold Coast Health Plan Performance Evaluation Report: July 1, 2017–June 30, 2018 California Department of Health Care Services
Page N-40 Health Services Advisory Group, Inc.

RECOMMENDATIONS
2016–17 External Quality ReviewRecommendations Directed to Gold Coast
Self-Reported Actions Taken by Gold Coastduring the Period of July 1, 2017–June 30, 2018,that Address the External Quality ReviewRecommendations
55.96 percent, and currently ranks in the 75th percentile.
f. CDC—H9 Causes for declining performance and performance below the MPL in RY 2017: ■ No member outreach to remind members
diagnosed with diabetes to get annual screenings.
■ During the HEDIS 2017 medical record review period: ○ Non-compliant records not overread. ○ No secondary pursuits for non-compliant
medical records. ○ Incomplete medical record retrieval and
abstraction to validate HbA1c test and results due to the following barriers: - Difficulty retrieving medical records
from a clinic system with a high volume of medical record requests.
- Difficulty retrieving records from a clinic’s contracted ROI vendor that required payment for medical records.
- Due to changes in data mapping, medical record requests were sent to incorrect provider types (e.g., labs, specialists).
Actions Taken: ■ Increased provider awareness of
performance measure rates and provider engagement in member outreach through recurring HEDIS rate progress reports and member-level gap reports.
■ Created annual diabetes screening reminder letters to increase member awareness of the importance of annual screening exams for members diagnosed with diabetes.
Gold Coast Health Plan Performance Evaluation Report: July 1, 2017–June 30, 2018 California Department of Health Care Services
Page N-41 Health Services Advisory Group, Inc.

RECOMMENDATIONS
2016–17 External Quality ReviewRecommendations Directed to Gold Coast
Self-Reported Actions Taken by Gold Coastduring the Period of July 1, 2017–June 30, 2018,that Address the External Quality ReviewRecommendations
■ Reinstated the overread process that included overreading 100 percent of compliant and non-compliant medical records.
■ Corrected the provider type mapping to exclude sending medical record requests to non-PCPs.
■ To improve access to medical records for the vendor and to facilitate the MCP’s overread and secondary pursuit process, both the HEDIS vendor and QI staff had access to the EMRs of the two largest clinic systems.
Outcomes: ■ The CDC—H9 measure rate decreased
(improved) 18.73 percentage points, from 54.50 percent to 35.77 percent, and currently ranks in the 50th percentile.
g. CBP Causes for declining performance and performance below the MPL in RY 2017: ■ The HEDIS progress and gap reports did not
include rates or member-level detail on the CBP measure.
■ No member outreach to remind members diagnosed with hypertension to get annual screenings.
■ No provider education on the HEDIS measure specifications for the blood pressure measures.
■ During the HEDIS 2017 medical record review period: ○ Non-compliant records not overread. ○ No secondary pursuits for non-compliant
medical records. ○ Incomplete medical record retrieval and
abstraction to validate if services were completed due to the following barriers:
Gold Coast Health Plan Performance Evaluation Report: July 1, 2017–June 30, 2018 California Department of Health Care Services
Page N-42 Health Services Advisory Group, Inc.
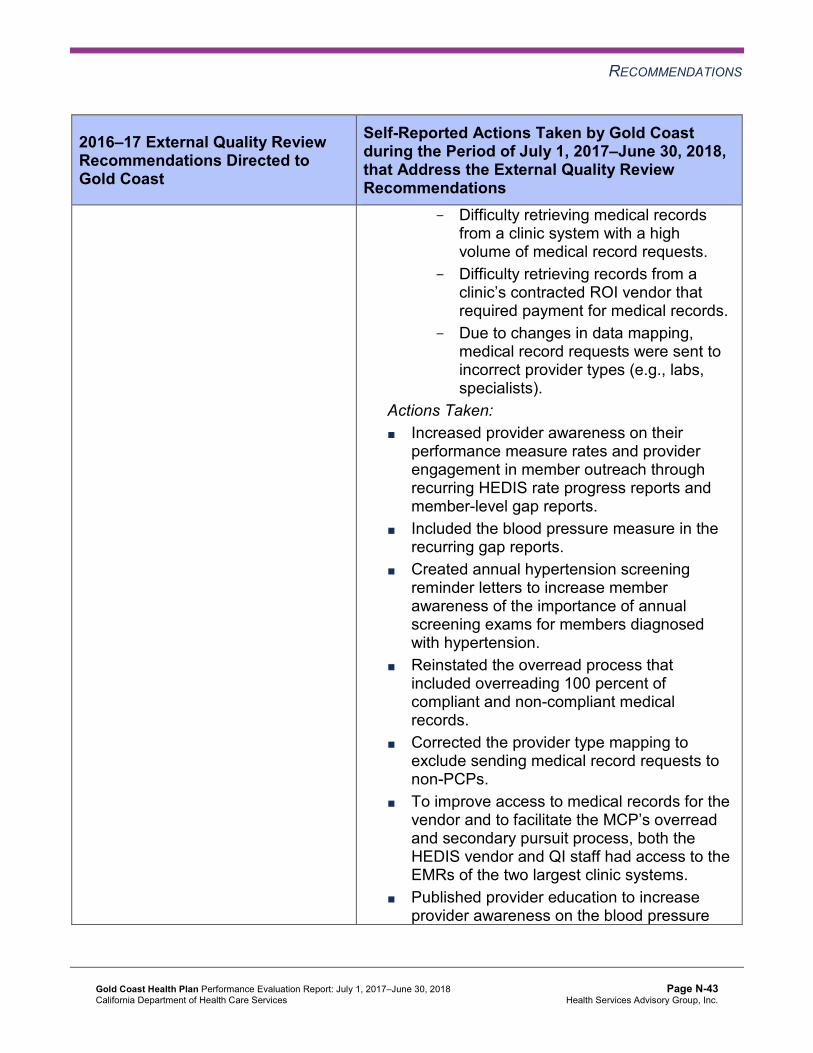
RECOMMENDATIONS
2016–17 External Quality ReviewRecommendations Directed to Gold Coast
Self-Reported Actions Taken by Gold Coastduring the Period of July 1, 2017–June 30, 2018,that Address the External Quality ReviewRecommendations
- Difficulty retrieving medical records from a clinic system with a high volume of medical record requests.
- Difficulty retrieving records from a clinic’s contracted ROI vendor that required payment for medical records.
- Due to changes in data mapping, medical record requests were sent to incorrect provider types (e.g., labs, specialists).
Actions Taken: ■ Increased provider awareness on their
performance measure rates and provider engagement in member outreach through recurring HEDIS rate progress reports and member-level gap reports.
■ Included the blood pressure measure in the recurring gap reports.
■ Created annual hypertension screening reminder letters to increase member awareness of the importance of annual screening exams for members diagnosed with hypertension.
■ Reinstated the overread process that included overreading 100 percent of compliant and non-compliant medical records.
■ Corrected the provider type mapping to exclude sending medical record requests to non-PCPs.
■ To improve access to medical records for the vendor and to facilitate the MCP’s overread and secondary pursuit process, both the HEDIS vendor and QI staff had access to the EMRs of the two largest clinic systems.
■ Published provider education to increase provider awareness on the blood pressure
Gold Coast Health Plan Performance Evaluation Report: July 1, 2017–June 30, 2018 California Department of Health Care Services
Page N-43 Health Services Advisory Group, Inc.

RECOMMENDATIONS
2016–17 External Quality ReviewRecommendations Directed to Gold Coast
Self-Reported Actions Taken by Gold Coastduring the Period of July 1, 2017–June 30, 2018,that Address the External Quality ReviewRecommendations
measures and awareness on proper blood pressure intake techniques.
Outcomes: ■ The CBP measure rate increased 9.49
percentage points, from 45.01 percent to 54.50 percent, and currently ranks in the 25th percentile.
2017–18 Recommendations Based on the overall assessment of Gold Coast’s delivery of quality, accessible, and timely care through the activities described in previous sections of this report, HSAG recommends the following to the MCP:
♦ For HEDIS performance measure reporting: ■ Ensure inclusion of appropriate eligibility spans for newborns. ■ Implement a formal process to track and document quality HEDIS audit results.
♦ Assess the causes for the rates for the following measures being below the MPLs in RY 2018, and identify strategies for improving the MCP’s performance: ■ Annual Monitoring for Patients on Persistent Medications—ACE Inhibitors or ARBs ■ Asthma Medication Ratio ■ Comprehensive Diabetes Care—Medical Attention for Nephropathy
♦ Identify the causes for the rate declining significantly from RY 2017 to RY 2018 for the Use of Imaging Studies for Low Back Pain measure to ensure that only beneficiaries ages 18 to 50 with lower back pain and who show clinical necessity receive an imaging study.
♦ Continue monitoring interventions and outcomes to facilitate long-term, sustained improvement beyond the life of the 2015–17 Immunizations of Two-Year-Olds and Developmental Screening for Children PIPs.
In the next annual review, HSAG will evaluate continued successes of Gold Coast as well as the MCP’s progress with these recommendations.
Gold Coast Health Plan Performance Evaluation Report: July 1, 2017–June 30, 2018 California Department of Health Care Services
Page N-44 Health Services Advisory Group, Inc.

Medi-Cal Managed CareExternal Quality Review Technical Report
Appendix O: Performance Evaluation Report
Health Net Community Solutions, Inc. July 1, 2017–June 30, 2018

Medi-Cal Managed Care External Quality Review Technical ReportAppendix O: Performance Evaluation ReportHealth Net Community Solutions, Inc.July 1, 2017–June 30, 2018
Table of Contents
1. Introduction............................................................................................................ O-1 Medi-Cal Managed Care Health Plan Overview ...................................................... O-1
2. Managed Care Health Plan Compliance .............................................................. O-4Compliance Reviews Conducted............................................................................. O-4 Strengths—Compliance Reviews ............................................................................ O-5 Opportunities for Improvement—Compliance Reviews ........................................... O-5
3. Managed Care Health Plan Performance Measures ........................................... O-6Performance Measure Validation Results ............................................................... O-6 Performance Measure Results and Findings........................................................... O-6
Preventive Screening and Children’s Health ........................................................ O-7 Preventive Screening and Women’s Health ....................................................... O-27 Care for Chronic Conditions ............................................................................... O-41 Appropriate Treatment and Utilization................................................................ O-58 Performance Measure Findings—All Domains................................................... O-74
Corrective Action Plan Requirements for 2018...................................................... O-81 Seniors and Persons with Disabilities Performance Measure Results................... O-81
Seniors and Persons with Disabilities Findings ................................................ O-112 Strengths—Performance Measures .................................................................... O-114 Opportunities for Improvement—Performance Measures ................................... O-114
4. MLTSSP Performance Measure Results.......................................................... O-115 Managed Long-Term Services and Supports Plan Performance Measure Findings O-116
5. Performance Improvement Projects ................................................................ O-117Performance Improvement Project Overview ...................................................... O-117 Performance Improvement Project Results and Findings.................................... O-119
2015–17 DHCS-Priority Performance Improvement Project ............................ O-119 2015–17 MCP-Specific Performance Improvement Project ............................. O-120 2017–19 Disparity Performance Improvement Project ..................................... O-121 2017–19 DHCS-Priority Performance Improvement Project ............................ O-122
Strengths—Performance Improvement Projects ................................................. O-123 Opportunities for Improvement—Performance Improvement Projects ................ O-123
6. Recommendations............................................................................................. O-124 Follow-Up on Prior Year Recommendations ....................................................... O-124 2017–18 Recommendations................................................................................ O-125
Health Net Community Solutions, Inc. Performance Evaluation Report: July 1, 2017–June 30, 2018 California Department of Health Care Services
Page O-i Health Services Advisory Group, Inc.

TABLE OF CONTENTS
Table of Tables
Table 1.1—Local Initiative Plans under the Two-Plan Model in Counties in which Health Net Serves as the Commercial Managed Care Health Plan ....................... O-2
Table 1.2—Health Net Enrollment as of June 30, 2018 ................................................ O-3 Table 2.1—DHCS A&I Medical and State Supported Services Audits of Health Net
Audit Review Period: May 1, 2016, through April 30, 2017......................... O-4 Table 3.1—Preventive Screening and Children’s Health Domain Multi-Year Performance
Measure Results Health Net—Kern County................................................... O-8 Table 3.2—Preventive Screening and Children’s Health Domain Multi-Year Performance
Measure Results Health Net—Los Angeles County....................................... O-9 Table 3.3—Preventive Screening and Children’s Health Domain Multi-Year Performance
Measure Results Health Net—Sacramento County..................................... O-11 Table 3.4—Preventive Screening and Children’s Health Domain Multi-Year Performance
Measure Results Health Net—San Diego County........................................ O-12 Table 3.5—Preventive Screening and Children’s Health Domain Multi-Year Performance
Measure Results Health Net—San Joaquin County .................................... O-14 Table 3.6—Preventive Screening and Children’s Health Domain Multi-Year Performance
Measure Results Health Net—Stanislaus County........................................ O-15 Table 3.7—Preventive Screening and Children’s Health Domain Multi-Year Performance
Measure Results Health Net—Tulare County .............................................. O-17 Table 3.8—Preventive Screening and Children’s Health Domain RY 2018 (MY 2017)
Performance Measure Findings Health Net—Kern County....................... O-19 Table 3.9—Preventive Screening and Children’s Health Domain RY 2018 (MY 2017)
Performance Measure Findings Health Net—Los Angeles County........... O-20 Table 3.10—Preventive Screening and Children’s Health Domain RY 2018 (MY 2017)
Performance Measure Findings Health Net—Sacramento County........... O-21 Table 3.11—Preventive Screening and Children’s Health Domain RY 2018 (MY 2017)
Performance Measure Findings Health Net—San Diego County ............. O-22 Table 3.12—Preventive Screening and Children’s Health Domain RY 2018 (MY 2017)
Performance Measure Findings Health Net—San Joaquin County .......... O-23 Table 3.13—Preventive Screening and Children’s Health Domain RY 2018 (MY 2017)
Performance Measure Findings Health Net—Stanislaus County.............. O-24 Table 3.14—Preventive Screening and Children’s Health Domain RY 2018 (MY 2017)
Performance Measure Findings Health Net—Tulare County .................... O-25 Table 3.15—Preventive Screening and Women’s Health Domain Multi-Year Performance
Measure Results Health Net—Kern County.................................................... O-27 Table 3.16—Preventive Screening and Women’s Health Domain Multi-Year Performance
Measure Results Health Net—Los Angeles County ....................................... O-28 Table 3.17—Preventive Screening and Women’s Health Domain Multi-Year Performance
Measure Results Health Net—Sacramento County........................................ O-29
Health Net Community Solutions, Inc. Performance Evaluation Report: July 1, 2017–June 30, 2018 California Department of Health Care Services
Page O-ii Health Services Advisory Group, Inc.
TABLE OF CONTENTS
Table 3.18—Preventive Screening and Women’s Health Domain Multi-Year Performance Measure Results Health Net—San Diego County .......................................... O-30
Table 3.19—Preventive Screening and Women’s Health Domain Multi-Year Performance Measure Results Health Net—San Joaquin County ....................................... O-31
Table 3.20—Preventive Screening and Women’s Health Domain Multi-Year Performance Measure Results Health Net—Stanislaus County........................................... O-32
Table 3.21—Preventive Screening and Women’s Health Domain Multi-Year Performance Measure Results Health Net—Tulare County ................................................. O-33
Table 3.22—Preventive Screening and Women’s Health Domain RY 2018 (MY 2017) Performance Measure Findings Health Net—Kern County....................... O-34
Table 3.23—Preventive Screening and Women’s Health Domain RY 2018 (MY 2017) Performance Measure Findings Health Net—Los Angeles County........... O-35
Table 3.24—Preventive Screening and Women’s Health Domain RY 2018 (MY 2017) Performance Measure Findings Health Net—Sacramento County........... O-36
Table 3.25—Preventive Screening and Women’s Health Domain RY 2018 (MY 2017) Performance Measure Findings Health Net—San Diego County ............. O-37
Table 3.26—Preventive Screening and Women’s Health Domain RY 2018 (MY 2017) Performance Measure Findings Health Net—San Joaquin County .......... O-38
Table 3.27—Preventive Screening and Women’s Health Domain RY 2018 (MY 2017) Performance Measure Findings Health Net—Stanislaus County.............. O-39
Table 3.28—Preventive Screening and Women’s Health Domain RY 2018 (MY 2017) Performance Measure Findings Health Net—Tulare County .................... O-40
Table 3.29—Care for Chronic Conditions Domain Multi-Year Performance Measure Results Health Net—Kern County............................................................. O-41
Table 3.30—Care for Chronic Conditions Domain Multi-Year Performance Measure Results Health Net—Los Angeles County ................................................ O-42
Table 3.31—Care for Chronic Conditions Domain Multi-Year Performance Measure Results Health Net—Sacramento County................................................. O-44
Table 3.32—Care for Chronic Conditions Domain Multi-Year Performance Measure Results Health Net—San Diego County ................................................... O-45
Table 3.33—Care for Chronic Conditions Domain Multi-Year Performance Measure Results Health Net—San Joaquin County ................................................ O-46
Table 3.34—Care for Chronic Conditions Domain Multi-Year Performance Measure Results Health Net—Stanislaus County.................................................... O-48
Table 3.35—Care for Chronic Conditions Domain Multi-Year Performance Measure Results Health Net—Tulare County.......................................................... O-49
Table 3.36—Care for Chronic Conditions Domain RY 2018 (MY 2017) Performance Measure Findings Health Net—Kern County ............................................ O-50
Table 3.37—Care for Chronic Conditions Domain RY 2018 (MY 2017) Performance Measure Findings Health Net—Los Angeles County................................ O-51
Health Net Community Solutions, Inc. Performance Evaluation Report: July 1, 2017–June 30, 2018 California Department of Health Care Services
Page O-iii Health Services Advisory Group, Inc.

TABLE OF CONTENTS
Table 3.38—Care for Chronic Conditions Domain RY 2018 (MY 2017) Performance Measure Findings Health Net—Sacramento County ................................ O-52
Table 3.39—Care for Chronic Conditions Domain RY 2018 (MY 2017) Performance Measure Findings Health Net—San Diego County................................... O-53
Table 3.40—Care for Chronic Conditions Domain RY 2018 (MY 2017) Performance Measure Findings Health Net—San Joaquin County................................ O-54
Table 3.41—Care for Chronic Conditions Domain RY 2018 (MY 2017) Performance Measure Findings Health Net—Stanislaus County ................................... O-55
Table 3.42—Care for Chronic Conditions Domain RY 2018 (MY 2017) Performance Measure Findings Health Net—Tulare County ......................................... O-56
Table 3.43—Appropriate Treatment and Utilization Domain Multi-Year Performance Measure Results Health Net—Kern County.............................................. O-59
Table 3.44—Appropriate Treatment and Utilization Domain Multi-Year Performance Measure Results Health Net—Los Angeles County.................................. O-60
Table 3.45—Appropriate Treatment and Utilization Domain Multi-Year Performance Measure Results Health Net—Sacramento County.................................. O-61
Table 3.46—Appropriate Treatment and Utilization Domain Multi-Year Performance Measure Results Health Net—San Diego County..................................... O-62
Table 3.47—Appropriate Treatment and Utilization Domain Multi-Year Performance Measure Results Health Net—San Joaquin County ................................. O-63
Table 3.48—Appropriate Treatment and Utilization Domain Multi-Year Performance Measure Results Health Net—Stanislaus County..................................... O-64
Table 3.49—Appropriate Treatment and Utilization Domain Multi-Year Performance Measure Results Health Net—Tulare County ........................................... O-65
Table 3.50—Appropriate Treatment and Utilization Domain RY 2018 (MY 2017) Performance Measure Findings Health Net—Kern County....................... O-66
Table 3.51—Appropriate Treatment and Utilization Domain RY 2018 (MY 2017) Performance Measure Findings Health Net—Los Angeles County........... O-67
Table 3.52—Appropriate Treatment and Utilization Domain RY 2018 (MY 2017) Performance Measure Findings Health Net—Sacramento County........... O-68
Table 3.53—Appropriate Treatment and Utilization Domain RY 2018 (MY 2017) Performance Measure Findings Health Net—San Diego County ............. O-69
Table 3.54—Appropriate Treatment and Utilization Domain RY 2018 (MY 2017) Performance Measure Findings Health Net—San Joaquin County .......... O-70
Table 3.55—Appropriate Treatment and Utilization Domain RY 2018 (MY 2017) Performance Measure Findings Health Net—Stanislaus County.............. O-71
Table 3.56—Appropriate Treatment and Utilization Domain RY 2018 (MY 2017) Performance Measure Findings Health Net—Tulare County .................... O-72
Table 3.57—RY 2018 (MY 2017) Performance Measure Findings for All Domains Health Net—Kern County ......................................................................... O-74
Health Net Community Solutions, Inc. Performance Evaluation Report: July 1, 2017–June 30, 2018 California Department of Health Care Services
Page O-iv Health Services Advisory Group, Inc.

TABLE OF CONTENTS
Table 3.58—RY 2018 (MY 2017) Performance Measure Findings for All Domains Health Net—Los Angeles County ............................................................. O-75
Table 3.59—RY 2018 (MY 2017) Performance Measure Findings for All Domains Health Net—Sacramento County.............................................................. O-76
Table 3.60—RY 2018 (MY 2017) Performance Measure Findings for All Domains Health Net—San Diego County ................................................................ O-77
Table 3.61—RY 2018 (MY 2017) Performance Measure Findings for All Domains Health Net—San Joaquin County ............................................................. O-78
Table 3.62—RY 2018 (MY 2017) Performance Measure Findings for All Domains Health Net—Stanislaus County ................................................................ O-79
Table 3.63—RY 2018 (MY 2017) Performance Measure Findings for All Domains Health Net—Tulare County....................................................................... O-80
Table 3.64—Multi-Year SPD Performance Measure Trend Table Health Net— Kern County.............................................................................................. O-82
Table 3.65—Multi-Year SPD Performance Measure Trend Table Health Net— Los Angeles County.................................................................................. O-83
Table 3.66—Multi-Year SPD Performance Measure Trend Table Health Net— Sacramento County .................................................................................. O-85
Table 3.67—Multi-Year SPD Performance Measure Trend Table Health Net— San Diego County..................................................................................... O-86
Table 3.68—Multi-Year SPD Performance Measure Trend Table Health Net— San Joaquin County.................................................................................. O-88
Table 3.69—Multi-Year SPD Performance Measure Trend Table Health Net— Stanislaus County..................................................................................... O-89
Table 3.70—Multi-Year SPD Performance Measure Trend Table Health Net— Tulare County ........................................................................................... O-91
Table 3.71—Multi-Year Non-SPD Performance Measure Trend Table Health Net— Kern County.............................................................................................. O-92
Table 3.72—Multi-Year Non-SPD Performance Measure Trend Table Health Net— Los Angeles County.................................................................................. O-94
Table 3.73—Multi-Year Non-SPD Performance Measure Trend Table Health Net— Sacramento County .................................................................................. O-95
Table 3.74—Multi-Year Non-SPD Performance Measure Trend Table Health Net— San Diego County..................................................................................... O-97
Table 3.75—Multi-Year Non-SPD Performance Measure Trend Table Health Net— San Joaquin County.................................................................................. O-98
Table 3.76—Multi-Year Non-SPD Performance Measure Trend Table Health Net— Stanislaus County................................................................................... O-100
Table 3.77—Multi-Year Non-SPD Performance Measure Trend Table Health Net— Tulare County ......................................................................................... O-101
Health Net Community Solutions, Inc. Performance Evaluation Report: July 1, 2017–June 30, 2018 California Department of Health Care Services
Page O-v Health Services Advisory Group, Inc.
TABLE OF CONTENTS
Table 3.78—RY 2018 (MY 2017) Performance Measure Comparison and Results for Measures Stratified by the SPD and Non-SPD Populations Health Net— Kern County............................................................................................ O-103
Table 3.79—RY 2018 (MY 2017) Performance Measure Comparison and Results for Measures Stratified by the SPD and Non-SPD Populations Health Net— Los Angeles County................................................................................ O-104
Table 3.80—RY 2018 (MY 2017) Performance Measure Comparison and Results for Measures Stratified by the SPD and Non-SPD Populations Health Net— Sacramento County ................................................................................ O-105
Table 3.81—RY 2018 (MY 2017) Performance Measure Comparison and Results for Measures Stratified by the SPD and Non-SPD Populations Health Net— San Diego County................................................................................... O-107
Table 3.82—RY 2018 (MY 2017) Performance Measure Comparison and Results for Measures Stratified by the SPD and Non-SPD Populations Health Net— San Joaquin County................................................................................ O-108
Table 3.83—RY 2018 (MY 2017) Performance Measure Comparison and Results for Measures Stratified by the SPD and Non-SPD Populations Health Net— Stanislaus County................................................................................... O-109
Table 3.84—RY 2018 (MY 2017) Performance Measure Comparison and Results for Measures Stratified by the SPD and Non-SPD Populations Health Net— Tulare County ......................................................................................... O-111
Table 4.1—Multi-Year MLTSSP Performance Measure Results Health Net— Los Angeles County................................................................................ O-115
Table 4.2—Multi-Year MLTSSP Performance Measure Results Health Net— San Diego County................................................................................... O-116
Table 5.1—Health Net Postpartum Care PIP SMART Aim Measure Results............ O-119 Table 5.2—Health Net Postpartum Care PIP Intervention Testing Results............... O-119 Table 5.3—Health Net Comprehensive Diabetes Care PIP SMART Aim Measure ResultsO-120 Table 5.4—Health Net Comprehensive Diabetes Care PIP Intervention Testing Results O-121 Table 5.5—Health Net Childhood Immunization Status—Combination 3 PIP SMART
Aim Measure........................................................................................... O-122 Table 6.1—Health Net’s Self-Reported Follow-Up on External Quality Review
Recommendations from the July 1, 2016, through June 30, 2017, MCP-Specific Evaluation Report............................................................. O-124
Health Net Community Solutions, Inc. Performance Evaluation Report: July 1, 2017–June 30, 2018 California Department of Health Care Services
Page O-vi Health Services Advisory Group, Inc.

Medi-Cal Managed Care External Quality Review Technical ReportAppendix O: Performance Evaluation ReportHealth Net Community Solutions, Inc.July 1, 2017–June 30, 2018
1. Introduction
The California Department of Health Care Services (DHCS) contracted with Health Services Advisory Group, Inc. (HSAG), an external quality review organization (EQRO), to prepare the federally required Medi-Cal Managed Care External Quality Review Technical Report, July 1, 2017–June 30, 2018. The technical report provides an overview of the objectives and methodology for conducting the external quality review (EQR) activities, including requirements related to each activity. Additionally, the technical report provides aggregated results and recommendations for DHCS for each activity.
This appendix is specific to DHCS’ contracted Medi-Cal managed care health plan (MCP), Health Net Community Solutions, Inc. (“Health Net” or “the MCP”). The purpose of this appendix is to provide MCP-specific results of each activity and an assessment of the MCP’s strengths and opportunities for improvement with respect to the quality and timeliness of and access to health care services furnished to Medi-Cal Managed Care (MCMC) beneficiaries (referred to as “beneficiaries” in this report). The review period for this MCP-specific evaluation report is July 1, 2017, through June 30, 2018. HSAG will report on activities that take place beyond the review period in Health Net’s 2018–19 MCP-specific evaluation report. This MCP-specific evaluation report references activities and methodologies described in detail by HSAG in the technical report section.
The aggregate EQR technical report and all MCP- and specialty health plan (SHP)-specific performance evaluation reports reflect HSAG’s external, independent assessment of the quality and timeliness of, and access to, care that MCPs and SHPs are providing to beneficiaries.
Medi-Cal Managed Care Health Plan Overview Health Net is a full-scope MCP delivering services to beneficiaries as a commercial MCP under the Two-Plan Model (TPM) and also under a Geographic Managed Care (GMC) model.
Table 1.1 shows the counties in which Health Net provided services to beneficiaries under the TPM and denotes which MCP is the “Local Initiative” (LI). Beneficiaries may enroll in Health Net, the commercial MCP; or in the alternative LI.
Health Net Community Solutions, Inc. Performance Evaluation Report: July 1, 2017–June 30, 2018 California Department of Health Care Services
Page O-1 Health Services Advisory Group, Inc.

INTRODUCTION
Table 1.1—Local Initiative Plans under the Two-Plan Model in Counties in which Health Net Serves as the Commercial Managed Care Health Plan
County Local Initiative Plan
Kern Kern Family Health Care Los Angeles L.A. Care Health Plan San Joaquin Health Plan of San Joaquin Stanislaus Health Plan of San Joaquin Tulare Anthem Blue Cross Partnership Plan
Health Net operates under a GMC model in the counties of Sacramento and San Diego. In this GMC model, DHCS allows beneficiaries to select from several commercial MCPs within the specified geographic service area (county).
In addition to Health Net, Sacramento County’s beneficiaries may select from the following MCPs: ♦ Aetna Better Health of California ♦ Anthem Blue Cross Partnership Plan ♦ Kaiser NorCal ♦ Molina Healthcare of California Partner Plan, Inc. ♦ UnitedHealthcare Community Plan
In addition to Health Net, San Diego County’s beneficiaries may select from the following MCPs: ♦ Aetna Better Health of California ♦ Care1st Partner Plan ♦ Community Health Group Partnership Plan ♦ Kaiser SoCal ♦ Molina Healthcare of California Partner Plan, Inc. ♦ UnitedHealthcare Community Plan
Health Net Community Solutions, Inc. Performance Evaluation Report: July 1, 2017–June 30, 2018 California Department of Health Care Services
Page O-2 Health Services Advisory Group, Inc.

INTRODUCTION
Health Net became operational in Sacramento County to provide MCMC services in 1994 and then expanded to additional contracted counties, the most recent being San Joaquin County, effective January 2013. Table 1.2 shows the number of beneficiaries enrolled in Health Net for each county, Health Net’s percentage of beneficiaries enrolled in each county, and the MCP’s total number of beneficiaries as of June 30, 2018.1
Table 1.2—Health Net Enrollment as of June 30, 2018
County Enrollment as of June 30, 2018
Health Net’s Percentage ofBeneficiaries
Enrolled in the County
Kern 73,730 22% Los Angeles 996,713 33% Sacramento 107,403 25% San Diego 72,938 10% San Joaquin 21,013 9% Stanislaus 69,037 35% Tulare 114,026 55%
Total 1,454,860
1 Medi-Cal Managed Care Enrollment Report—June 2018. Available at: http://www.dhcs.ca.gov/dataandstats/reports/Pages/MMCDMonthlyEnrollment.aspx. Accessed on: Sep 28, 2018.
Health Net Community Solutions, Inc. Performance Evaluation Report: July 1, 2017–June 30, 2018 California Department of Health Care Services
Page O-3 Health Services Advisory Group, Inc.
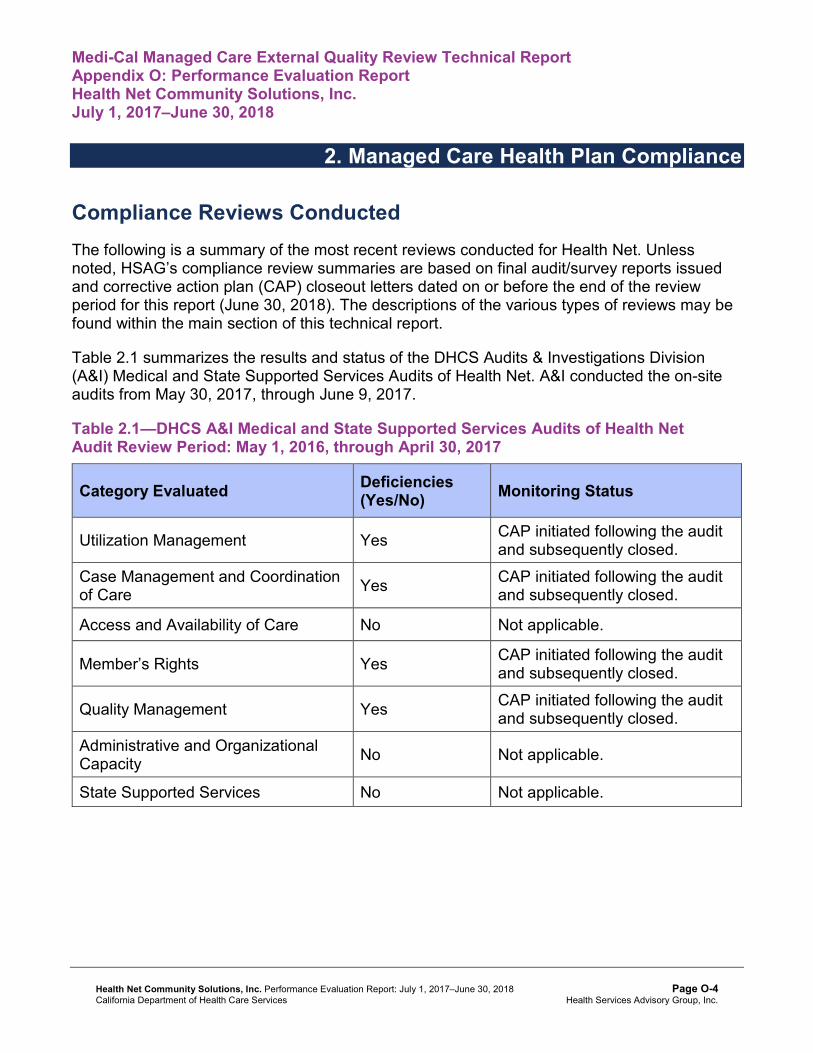
Medi-Cal Managed Care External Quality Review Technical ReportAppendix O: Performance Evaluation ReportHealth Net Community Solutions, Inc.July 1, 2017–June 30, 2018
2. Managed Care Health Plan Compliance
Compliance Reviews Conducted The following is a summary of the most recent reviews conducted for Health Net. Unless noted, HSAG’s compliance review summaries are based on final audit/survey reports issued and corrective action plan (CAP) closeout letters dated on or before the end of the review period for this report (June 30, 2018). The descriptions of the various types of reviews may be found within the main section of this technical report.
Table 2.1 summarizes the results and status of the DHCS Audits & Investigations Division (A&I) Medical and State Supported Services Audits of Health Net. A&I conducted the on-site audits from May 30, 2017, through June 9, 2017.
Table 2.1—DHCS A&I Medical and State Supported Services Audits of Health NetAudit Review Period: May 1, 2016, through April 30, 2017
Category Evaluated Deficiencies (Yes/No) Monitoring Status
Utilization Management Yes CAP initiated following the audit and subsequently closed.
Case Management and Coordination of Care Yes CAP initiated following the audit
and subsequently closed.
Access and Availability of Care No Not applicable.
Member’s Rights Yes CAP initiated following the audit and subsequently closed.
Quality Management Yes CAP initiated following the audit and subsequently closed.
Administrative and Organizational Capacity No Not applicable.
State Supported Services No Not applicable.
Health Net Community Solutions, Inc. Performance Evaluation Report: July 1, 2017–June 30, 2018 California Department of Health Care Services
Page O-4 Health Services Advisory Group, Inc.

MANAGED CARE HEALTH PLAN COMPLIANCE
Strengths—Compliance Reviews A&I identified no deficiencies in the Access and Availability of Care, Administrative and Organizational Capacity, or State Supported Services categories during the May 30, 2017, through June 9, 2017, Medical and State Supported Services Audits of Health Net. Additionally, Health Net’s responses to the MCP’s CAP for the deficiencies that A&I identified during the audits resulted in DHCS closing the CAP.
Opportunities for Improvement—Compliance Reviews Health Net has no outstanding deficiencies from the May 30, 2017, through June 9, 2017, A&I Medical and State Supported Services Audits; therefore, HSAG has no recommendations for the MCP in the area of compliance reviews.
Health Net Community Solutions, Inc. Performance Evaluation Report: July 1, 2017–June 30, 2018 California Department of Health Care Services
Page O-5 Health Services Advisory Group, Inc.

Medi-Cal Managed Care External Quality Review Technical ReportAppendix O: Performance Evaluation ReportHealth Net Community Solutions, Inc.July 1, 2017–June 30, 2018
3. Managed Care Health Plan Performance Measures
Performance Measure Validation Results The HEDIS®2 2018 Compliance Audit Final Report of Findings for Health Net Community Solutions, Inc. contains the detailed findings and recommendations from HSAG’s NCQA HEDIS Compliance Audit™.3 HSAG auditors determined that Health Net followed the appropriate specifications to produce valid rates, and identified no issues of concern.
Performance Measure Results and Findings After validating the MCP’s performance measure rates, HSAG assessed the results. See Table 3.1 through Table 3.63 for Health Net’s performance measure results for reporting years (RYs) 2015 through 2018 and performance measure findings for RY 2018. The RY is the year in which the MCP reported the rates. The RY rates reflect measurement year (MY) data from the previous calendar year. Note that data may not be available for all four years.
Note the following regarding Table 3.1 through Table 3.63:
♦ To allow HSAG to provide meaningful assessment of MCP performance and actionable recommendations, HSAG, in collaboration with DHCS, organized the measures into domains based on the health care areas each measure affects. Table 3.1 through Table 3.56 present the performance measure results and findings by domain, and Table 3.57 through Table 3.63 present the RY 2018 performance measure findings for the domains combined.
♦ To assess performance for each MCP reporting unit, HSAG compares the rates to national benchmarks. Rates indicating performance above the high performance levels (HPLs) are shaded in gray, and rates indicating performance below the minimum performance levels (MPLs) are bolded. ■ For measures with rates below the MPLs, DHCS requires MCPs to submit to DHCS
improvement plans (IPs) to address the rates below the MPLs (unless MCPs are reporting the rates for the first time).
■ For MCPs that meet DHCS’ Quality of Care CAP thresholds, DHCS issues a CAP; if an MCP’s performance is such that it may trigger a CAP in the following year, DHCS issues an advance warning letter.
2 Healthcare Effectiveness Data and Information Set (HEDIS®) is a registered trademark of the National Committee for Quality Assurance (NCQA).
3 NCQA HEDIS Compliance AuditTM is a trademark of NCQA.
Health Net Community Solutions, Inc. Performance Evaluation Report: July 1, 2017–June 30, 2018 California Department of Health Care Services
Page O-6 Health Services Advisory Group, Inc.

MANAGED CARE HEALTH PLAN PERFORMANCE MEASURES
■ IPs and CAPs consist of submission of Plan-Do-Study-Act (PDSA) Cycle Worksheets, Quality Improvement (QI) Summaries, or completion of Performance Improvement Projects (PIPs)—as determined by DHCS.
♦ For RYs 2016, 2017, and 2018, the HPLs and MPLs represent the NCQA Quality Compass®4 Medicaid health maintenance organization (HMO) 90th and 25th percentiles, respectively.
♦ For RY 2015, the HPLs and MPLs represent the NCQA HEDIS Audit Means, Percentiles, and Ratios 90th and 25th percentiles, respectively. For the Comprehensive Diabetes Care—HbA1c Poor Control (>9.0 Percent) measure, for which a lower rate indicates more favorable performance, the HPL and MPL are based on the 10th and 75th percentiles, respectively.
♦ HSAG includes the specific HPL and MPL values for RY 2018 in Section 6 of the Medi-Cal Managed Care External Quality Review Technical Report, July 1, 2017–June 30, 2018 (“Managed Care Health Plan Performance Measures”).
Preventive Screening and Children’s Health
Table 3.1 through Table 3.7 present the four-year trending information for the performance measures within the Preventive Screening and Children’s Health domain.
Note the following regarding Table 3.1 through Table 3.7:
♦ Although HSAG includes information on the MCP’s performance related to the four Children and Adolescents’ Access to Primary Care measures, DHCS did not hold MCPs accountable to meet the MPLs for these measures for RYs 2015 through 2018 (i.e., DHCS did not require MCPs to submit IPs if rates for the measures were below the MPLs). DHCS made this decision due to the small range of variation between the HPL and MPL thresholds for each measure.
♦ Any comparison of RY 2018 performance to RY 2017 or to benchmarks related to the Immunizations for Adolescents—Combination 2 measure should be exercised with caution given the changes that NCQA made to the specification for this measure for RY 2018. NCQA released guidance that recommended a break in trending for this measure; however, DHCS determined to continue trending because the specification change should result in higher rates.
4 Quality Compass® is a registered trademark of NCQA.
Health Net Community Solutions, Inc. Performance Evaluation Report: July 1, 2017–June 30, 2018 California Department of Health Care Services
Page O-7 Health Services Advisory Group, Inc.

MANAGED CARE HEALTH PLAN PERFORMANCE MEASURES
Table 3.1—Preventive Screening and Children’s Health DomainMulti-Year Performance Measure Results Health Net—Kern County
H = Rate indicates performance above the HPL. Bolded Rate = Rate indicates performance below the MPL.
B = Statistical testing result indicates that the RY 2018 rate is significantly better than the RY 2017 rate.
W = Statistical testing result indicates that the RY 2018 rate is significantly worse than the RY 2017 rate.
Measure RY
2015 Rate1
RY 2016
Rate2
RY 2017
Rate3
RY 2018
Rate4
RYs 2017–18 Rate
Difference5
Childhood Immunization Status—Combination 3 67.29% 61.48% 58.93% 54.61% -4.32
Children and Adolescents’ Access to Primary Care Practitioners—12–24 Months
90.50% 87.95% 89.96% 89.16% -0.80
Children and Adolescents’ Access to Primary Care Practitioners— 25 Months–6 Years
79.39% 78.86% 78.46% 78.86% 0.40
Children and Adolescents’ Access to Primary Care Practitioners—7–11 Years
72.20% 75.28% 75.39% 77.10% 1.71B
Children and Adolescents’ Access to Primary Care Practitioners—12–19 Years
71.83% 75.39% 75.71% 77.06% 1.35B
Immunizations for Adolescents— Combination 2^ -- -- 20.44% 32.60%H 12.16B
Weight Assessment and Counseling for Nutrition and Physical Activity for Children and Adolescents—Nutrition Counseling—Total
81.42%H 76.15% 82.53%H 77.05% -5.48
Weight Assessment and Counseling for Nutrition and Physical Activity for Children and Adolescents—Physical Activity Counseling—Total
72.97%H 68.68% 75.95%H 72.13% -3.82
Health Net Community Solutions, Inc. Performance Evaluation Report: July 1, 2017–June 30, 2018 California Department of Health Care Services
Page O-8 Health Services Advisory Group, Inc.
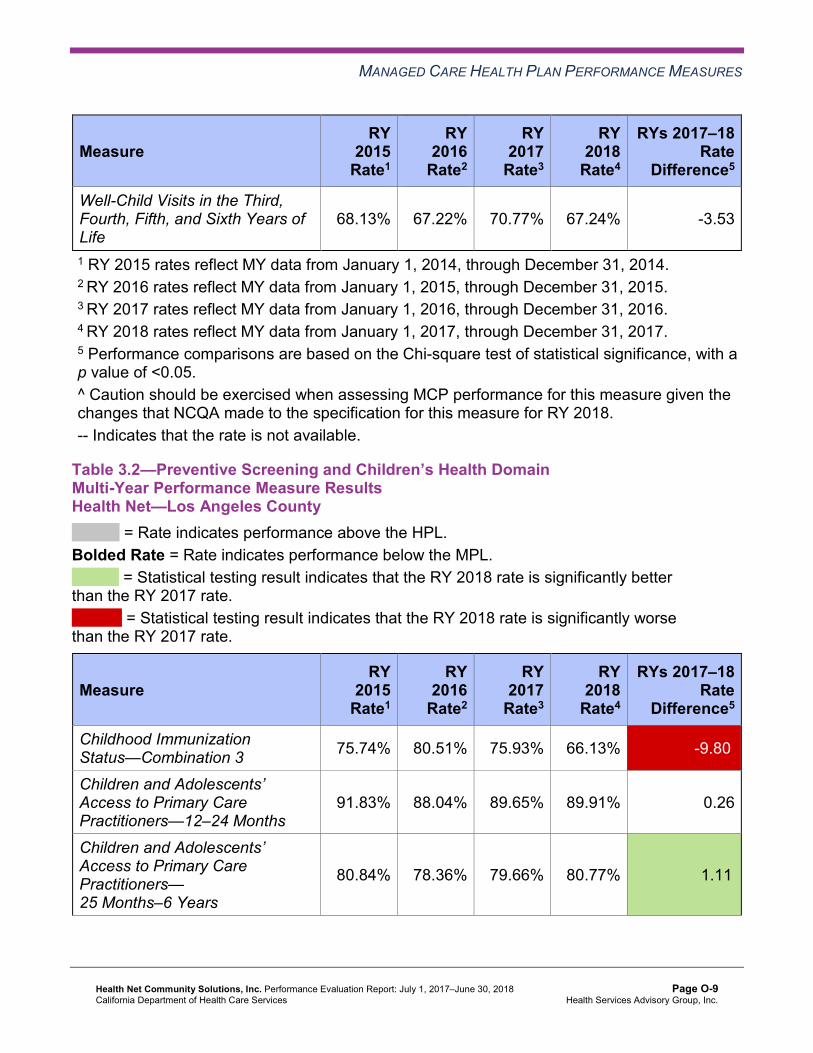
MANAGED CARE HEALTH PLAN PERFORMANCE MEASURES
Measure RY
2015 Rate1
RY 2016
Rate2
RY 2017
Rate3
RY 2018
Rate4
RYs 2017–18 Rate
Difference5
Well-Child Visits in the Third, Fourth, Fifth, and Sixth Years of Life
68.13% 67.22% 70.77% 67.24% -3.53
1 RY 2015 rates reflect MY data from January 1, 2014, through December 31, 2014. 2 RY 2016 rates reflect MY data from January 1, 2015, through December 31, 2015. 3 RY 2017 rates reflect MY data from January 1, 2016, through December 31, 2016. 4 RY 2018 rates reflect MY data from January 1, 2017, through December 31, 2017. 5 Performance comparisons are based on the Chi-square test of statistical significance, with a p value of <0.05. ^ Caution should be exercised when assessing MCP performance for this measure given the changes that NCQA made to the specification for this measure for RY 2018. -- Indicates that the rate is not available.
Table 3.2—Preventive Screening and Children’s Health DomainMulti-Year Performance Measure Results Health Net—Los Angeles County
H = Rate indicates performance above the HPL. Bolded Rate = Rate indicates performance below the MPL.
B = Statistical testing result indicates that the RY 2018 rate is significantly better than the RY 2017 rate.
W = Statistical testing result indicates that the RY 2018 rate is significantly worse than the RY 2017 rate.
Measure RY
2015 Rate1
RY 2016
Rate2
RY 2017
Rate3
RY 2018
Rate4
RYs 2017–18 Rate
Difference5
Childhood Immunization Status—Combination 3 75.74% 80.51% 75.93% 66.13% -9.80W
Children and Adolescents’ Access to Primary Care Practitioners—12–24 Months
91.83% 88.04% 89.65% 89.91% 0.26
Children and Adolescents’ Access to Primary Care Practitioners— 25 Months–6 Years
80.84% 78.36% 79.66% 80.77% 1.11B
Health Net Community Solutions, Inc. Performance Evaluation Report: July 1, 2017–June 30, 2018 California Department of Health Care Services
Page O-9 Health Services Advisory Group, Inc.
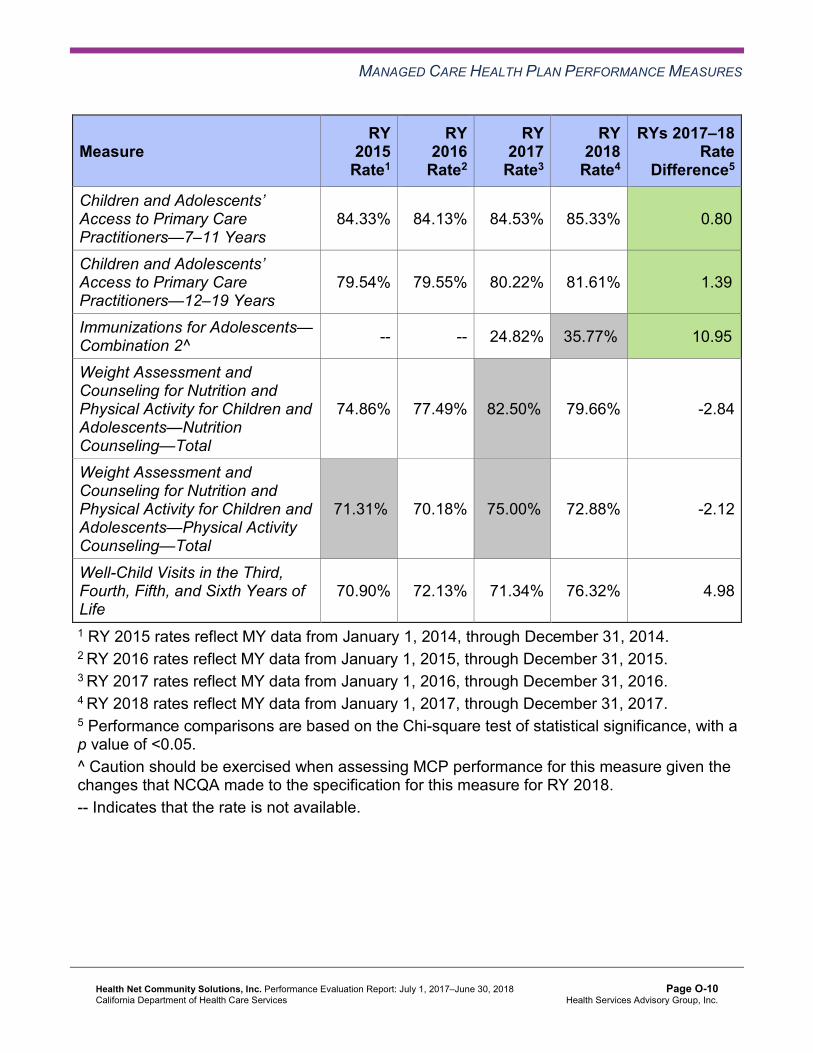
MANAGED CARE HEALTH PLAN PERFORMANCE MEASURES
Measure RY
2015 Rate1
RY 2016
Rate2
RY 2017
Rate3
RY 2018
Rate4
RYs 2017–18 Rate
Difference5
Children and Adolescents’ Access to Primary Care Practitioners—7–11 Years
84.33% 84.13% 84.53% 85.33% 0.80B
Children and Adolescents’ Access to Primary Care Practitioners—12–19 Years
79.54% 79.55% 80.22% 81.61% 1.39B
Immunizations for Adolescents— Combination 2^ -- -- 24.82% 35.77%H 10.95B
Weight Assessment and Counseling for Nutrition and Physical Activity for Children and Adolescents—Nutrition Counseling—Total
74.86% 77.49% 82.50%H 79.66% -2.84
Weight Assessment and Counseling for Nutrition and Physical Activity for Children and Adolescents—Physical Activity Counseling—Total
71.31%H 70.18% 75.00%H 72.88% -2.12
Well-Child Visits in the Third, Fourth, Fifth, and Sixth Years of Life
70.90% 72.13% 71.34% 76.32% 4.98
1 RY 2015 rates reflect MY data from January 1, 2014, through December 31, 2014. 2 RY 2016 rates reflect MY data from January 1, 2015, through December 31, 2015. 3 RY 2017 rates reflect MY data from January 1, 2016, through December 31, 2016. 4 RY 2018 rates reflect MY data from January 1, 2017, through December 31, 2017. 5 Performance comparisons are based on the Chi-square test of statistical significance, with a p value of <0.05. ^ Caution should be exercised when assessing MCP performance for this measure given the changes that NCQA made to the specification for this measure for RY 2018. -- Indicates that the rate is not available.
Health Net Community Solutions, Inc. Performance Evaluation Report: July 1, 2017–June 30, 2018 California Department of Health Care Services
Page O-10 Health Services Advisory Group, Inc.
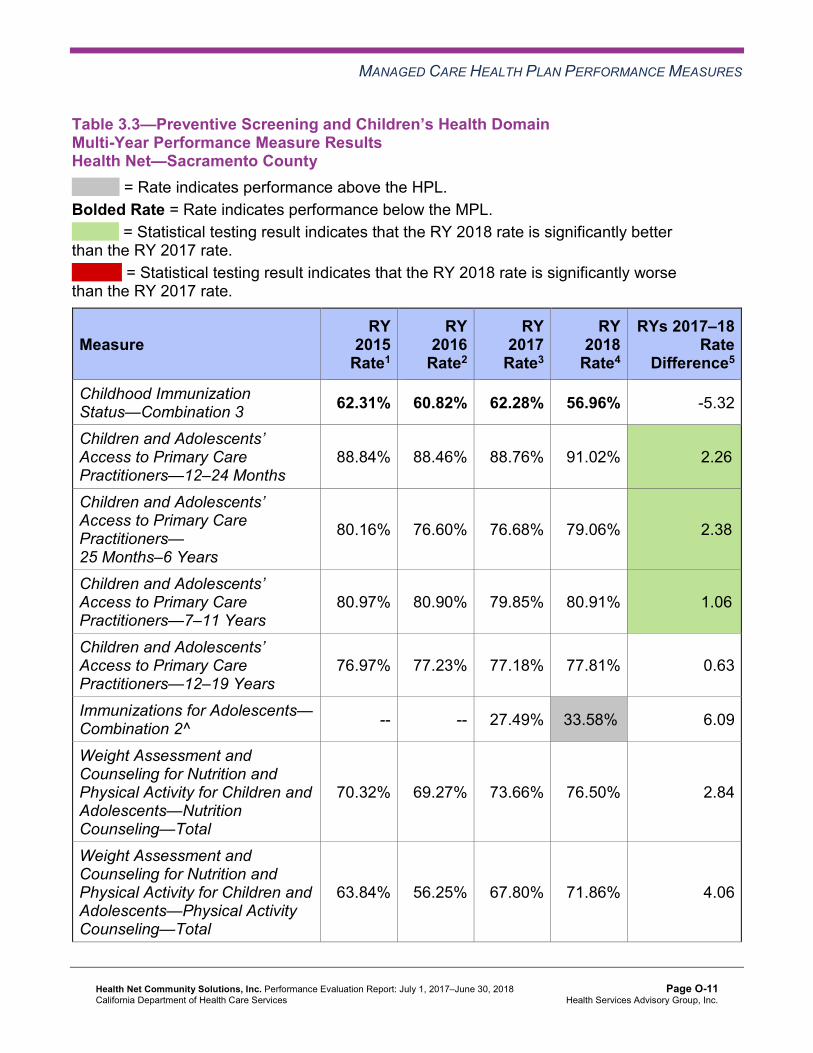
MANAGED CARE HEALTH PLAN PERFORMANCE MEASURES
Table 3.3—Preventive Screening and Children’s Health DomainMulti-Year Performance Measure Results Health Net—Sacramento County
H = Rate indicates performance above the HPL. Bolded Rate = Rate indicates performance below the MPL.
B = Statistical testing result indicates that the RY 2018 rate is significantly better than the RY 2017 rate.
W = Statistical testing result indicates that the RY 2018 rate is significantly worse than the RY 2017 rate.
Measure RY
2015 Rate1
RY 2016
Rate2
RY 2017
Rate3
RY 2018
Rate4
RYs 2017–18 Rate
Difference5
Childhood Immunization Status—Combination 3 62.31% 60.82% 62.28% 56.96% -5.32
Children and Adolescents’ Access to Primary Care Practitioners—12–24 Months
88.84% 88.46% 88.76% 91.02% 2.26B
Children and Adolescents’ Access to Primary Care Practitioners— 25 Months–6 Years
80.16% 76.60% 76.68% 79.06% 2.38B
Children and Adolescents’ Access to Primary Care Practitioners—7–11 Years
80.97% 80.90% 79.85% 80.91% 1.06B
Children and Adolescents’ Access to Primary Care Practitioners—12–19 Years
76.97% 77.23% 77.18% 77.81% 0.63
Immunizations for Adolescents— Combination 2^ -- -- 27.49% 33.58%H 6.09
Weight Assessment and Counseling for Nutrition and Physical Activity for Children and Adolescents—Nutrition Counseling—Total
70.32% 69.27% 73.66% 76.50% 2.84
Weight Assessment and Counseling for Nutrition and Physical Activity for Children and Adolescents—Physical Activity Counseling—Total
63.84% 56.25% 67.80% 71.86% 4.06
Health Net Community Solutions, Inc. Performance Evaluation Report: July 1, 2017–June 30, 2018 California Department of Health Care Services
Page O-11 Health Services Advisory Group, Inc.

MANAGED CARE HEALTH PLAN PERFORMANCE MEASURES
Measure RY
2015 Rate1
RY 2016
Rate2
RY 2017
Rate3
RY 2018
Rate4
RYs 2017–18 Rate
Difference5
Well-Child Visits in the Third, Fourth, Fifth, and Sixth Years of Life
68.58% 61.67% 64.80% 71.05% 6.25
1 RY 2015 rates reflect MY data from January 1, 2014, through December 31, 2014. 2 RY 2016 rates reflect MY data from January 1, 2015, through December 31, 2015. 3 RY 2017 rates reflect MY data from January 1, 2016, through December 31, 2016. 4 RY 2018 rates reflect MY data from January 1, 2017, through December 31, 2017. 5 Performance comparisons are based on the Chi-square test of statistical significance, with a p value of <0.05. ^ Caution should be exercised when assessing MCP performance for this measure given the changes that NCQA made to the specification for this measure for RY 2018. -- Indicates that the rate is not available.
Table 3.4—Preventive Screening and Children’s Health DomainMulti-Year Performance Measure Results Health Net—San Diego County
H = Rate indicates performance above the HPL. Bolded Rate = Rate indicates performance below the MPL.
B = Statistical testing result indicates that the RY 2018 rate is significantly better than the RY 2017 rate.
W = Statistical testing result indicates that the RY 2018 rate is significantly worse than the RY 2017 rate.
Measure RY
2015 Rate1
RY 2016
Rate2
RY 2017
Rate3
RY 2018
Rate4
RYs 2017–18 Rate
Difference5
Childhood Immunization Status—Combination 3 74.32% 72.27% 75.52% 68.37% -7.15W
Children and Adolescents’ Access to Primary Care Practitioners—12–24 Months
92.46% 92.41% 90.95% 88.07% -2.88W
Children and Adolescents’ Access to Primary Care Practitioners— 25 Months–6 Years
84.80% 81.86% 83.01% 80.76% -2.25W
Health Net Community Solutions, Inc. Performance Evaluation Report: July 1, 2017–June 30, 2018 California Department of Health Care Services
Page O-12 Health Services Advisory Group, Inc.

MANAGED CARE HEALTH PLAN PERFORMANCE MEASURES
Measure RY
2015 Rate1
RY 2016
Rate2
RY 2017
Rate3
RY 2018
Rate4
RYs 2017–18 Rate
Difference5
Children and Adolescents’ Access to Primary Care Practitioners—7–11 Years
87.52% 86.81% 86.87% 86.33% -0.54
Children and Adolescents’ Access to Primary Care Practitioners—12–19 Years
81.01% 83.38% 82.75% 82.25% -0.50
Immunizations for Adolescents— Combination 2^ -- -- 16.79% 30.90%H 14.11B
Weight Assessment and Counseling for Nutrition and Physical Activity for Children and Adolescents—Nutrition Counseling—Total
74.14% 69.85% 67.01% 74.62% 7.61B
Weight Assessment and Counseling for Nutrition and Physical Activity for Children and Adolescents—Physical Activity Counseling—Total
73.56%H 65.67% 62.11% 70.85% 8.74B
Well-Child Visits in the Third, Fourth, Fifth, and Sixth Years of Life
69.18% 71.75% 73.10% 73.17% 0.07
1 RY 2015 rates reflect MY data from January 1, 2014, through December 31, 2014. 2 RY 2016 rates reflect MY data from January 1, 2015, through December 31, 2015. 3 RY 2017 rates reflect MY data from January 1, 2016, through December 31, 2016. 4 RY 2018 rates reflect MY data from January 1, 2017, through December 31, 2017. 5 Performance comparisons are based on the Chi-square test of statistical significance, with a p value of <0.05. ^ Caution should be exercised when assessing MCP performance for this measure given the changes that NCQA made to the specification for this measure for RY 2018. -- Indicates that the rate is not available.
Health Net Community Solutions, Inc. Performance Evaluation Report: July 1, 2017–June 30, 2018 California Department of Health Care Services
Page O-13 Health Services Advisory Group, Inc.

MANAGED CARE HEALTH PLAN PERFORMANCE MEASURES
Table 3.5—Preventive Screening and Children’s Health DomainMulti-Year Performance Measure Results Health Net—San Joaquin County
H = Rate indicates performance above the HPL. Bolded Rate = Rate indicates performance below the MPL.
B = Statistical testing result indicates that the RY 2018 rate is significantly better than the RY 2017 rate.
W = Statistical testing result indicates that the RY 2018 rate is significantly worse than the RY 2017 rate.
Measure RY
2015 Rate1
RY 2016
Rate2
RY 2017
Rate3
RY 2018
Rate4
RYs 2017–18 Rate
Difference5
Childhood Immunization Status—Combination 3 57.59% 54.89% 55.26% 58.72% 3.46
Children and Adolescents’ Access to Primary Care Practitioners—12–24 Months
86.51% 83.15% 85.17% 87.84% 2.67
Children and Adolescents’ Access to Primary Care Practitioners— 25 Months–6 Years
69.64% 66.95% 72.98% 75.42% 2.44
Children and Adolescents’ Access to Primary Care Practitioners—7–11 Years
77.40% 74.38% 71.12% 71.36% 0.24
Children and Adolescents’ Access to Primary Care Practitioners—12–19 Years
75.12% 72.92% 71.70% 72.28% 0.58
Immunizations for Adolescents— Combination 2^ -- -- 11.75% 25.39% 13.64B
Weight Assessment and Counseling for Nutrition and Physical Activity for Children and Adolescents—Nutrition Counseling—Total
73.22% 64.09% 59.37% 62.44% 3.07
Weight Assessment and Counseling for Nutrition and Physical Activity for Children and Adolescents—Physical Activity Counseling—Total
63.39% 51.37% 54.26% 55.85% 1.59
Health Net Community Solutions, Inc. Performance Evaluation Report: July 1, 2017–June 30, 2018 California Department of Health Care Services
Page O-14 Health Services Advisory Group, Inc.

MANAGED CARE HEALTH PLAN PERFORMANCE MEASURES
Measure RY
2015 Rate1
RY 2016
Rate2
RY 2017
Rate3
RY 2018
Rate4
RYs 2017–18 Rate
Difference5
Well-Child Visits in the Third, Fourth, Fifth, and Sixth Years of Life
66.08% 56.87% 59.75% 60.05% 0.30
1 RY 2015 rates reflect MY data from January 1, 2014, through December 31, 2014. 2 RY 2016 rates reflect MY data from January 1, 2015, through December 31, 2015. 3 RY 2017 rates reflect MY data from January 1, 2016, through December 31, 2016. 4 RY 2018 rates reflect MY data from January 1, 2017, through December 31, 2017. 5 Performance comparisons are based on the Chi-square test of statistical significance, with a p value of <0.05. ^ Caution should be exercised when assessing MCP performance for this measure given the changes that NCQA made to the specification for this measure for RY 2018. -- Indicates that the rate is not available.
Table 3.6—Preventive Screening and Children’s Health DomainMulti-Year Performance Measure Results Health Net—Stanislaus County
H = Rate indicates performance above the HPL. Bolded Rate = Rate indicates performance below the MPL.
B = Statistical testing result indicates that the RY 2018 rate is significantly better than the RY 2017 rate.
W = Statistical testing result indicates that the RY 2018 rate is significantly worse than the RY 2017 rate.
Measure RY
2015 Rate1
RY 2016
Rate2
RY 2017
Rate3
RY 2018
Rate4
RYs 2017–18 Rate
Difference5
Childhood Immunization Status—Combination 3 65.52% 61.44% 58.42% 59.10% 0.68
Children and Adolescents’ Access to Primary Care Practitioners—12–24 Months
92.99% 90.02% 89.98% 89.16% -0.82
Children and Adolescents’ Access to Primary Care Practitioners— 25 Months–6 Years
84.31% 81.60% 79.67% 78.59% -1.08
Health Net Community Solutions, Inc. Performance Evaluation Report: July 1, 2017–June 30, 2018 California Department of Health Care Services
Page O-15 Health Services Advisory Group, Inc.

MANAGED CARE HEALTH PLAN PERFORMANCE MEASURES
Measure RY
2015 Rate1
RY 2016
Rate2
RY 2017
Rate3
RY 2018
Rate4
RYs 2017–18 Rate
Difference5
Children and Adolescents’ Access to Primary Care Practitioners—7–11 Years
86.38% 84.68% 81.68% 81.05% -0.63
Children and Adolescents’ Access to Primary Care Practitioners—12–19 Years
82.60% 80.73% 78.19% 77.42% -0.77
Immunizations for Adolescents— Combination 2^ -- -- 16.79% 26.28% 9.49B
Weight Assessment and Counseling for Nutrition and Physical Activity for Children and Adolescents—Nutrition Counseling—Total
67.53% 67.35% 68.11% 69.21% 1.10
Weight Assessment and Counseling for Nutrition and Physical Activity for Children and Adolescents—Physical Activity Counseling—Total
67.01% 66.84% 68.62% 67.11% -1.51
Well-Child Visits in the Third, Fourth, Fifth, and Sixth Years of Life
71.26% 63.74% 69.01% 62.15% -6.86W
1 RY 2015 rates reflect MY data from January 1, 2014, through December 31, 2014. 2 RY 2016 rates reflect MY data from January 1, 2015, through December 31, 2015. 3 RY 2017 rates reflect MY data from January 1, 2016, through December 31, 2016. 4 RY 2018 rates reflect MY data from January 1, 2017, through December 31, 2017. 5 Performance comparisons are based on the Chi-square test of statistical significance, with a p value of <0.05. ^ Caution should be exercised when assessing MCP performance for this measure given the changes that NCQA made to the specification for this measure for RY 2018. -- Indicates that the rate is not available.
Health Net Community Solutions, Inc. Performance Evaluation Report: July 1, 2017–June 30, 2018 California Department of Health Care Services
Page O-16 Health Services Advisory Group, Inc.

MANAGED CARE HEALTH PLAN PERFORMANCE MEASURES
Table 3.7—Preventive Screening and Children’s Health DomainMulti-Year Performance Measure Results Health Net—Tulare County
H = Rate indicates performance above the HPL. Bolded Rate = Rate indicates performance below the MPL.
B = Statistical testing result indicates that the RY 2018 rate is significantly better than the RY 2017 rate.
W = Statistical testing result indicates that the RY 2018 rate is significantly worse than the RY 2017 rate.
Measure RY
2015 Rate1
RY 2016
Rate2
RY 2017
Rate3
RY 2018
Rate4
RYs 2017–18 Rate
Difference5
Childhood Immunization Status—Combination 3 74.44% 73.21% 74.39% 72.90% -1.49
Children and Adolescents’ Access to Primary Care Practitioners—12–24 Months
95.94% 94.80% 94.67% 96.27% 1.60B
Children and Adolescents’ Access to Primary Care Practitioners— 25 Months–6 Years
89.77% 87.27% 88.40% 89.84% 1.44B
Children and Adolescents’ Access to Primary Care Practitioners—7–11 Years
90.35% 89.82% 89.76% 90.03% 0.27
Children and Adolescents’ Access to Primary Care Practitioners—12–19 Years
88.53% 87.55% 87.52% 87.96% 0.44
Immunizations for Adolescents— Combination 2^ -- -- 31.39% 43.31%H 11.92B
Weight Assessment and Counseling for Nutrition and Physical Activity for Children and Adolescents—Nutrition Counseling—Total
75.67% 81.11%H 80.83%H 82.79%H 1.96
Weight Assessment and Counseling for Nutrition and Physical Activity for Children and Adolescents—Physical Activity Counseling—Total
69.10% 76.94%H 75.40%H 78.14%H 2.74
Health Net Community Solutions, Inc. Performance Evaluation Report: July 1, 2017–June 30, 2018 California Department of Health Care Services
Page O-17 Health Services Advisory Group, Inc.

MANAGED CARE HEALTH PLAN PERFORMANCE MEASURES
Measure RY
2015 Rate1
RY 2016
Rate2
RY 2017
Rate3
RY 2018
Rate4
RYs 2017–18 Rate
Difference5
Well-Child Visits in the Third, Fourth, Fifth, and Sixth Years of Life
78.89% 73.96% 75.61% 78.91% 3.30
1 RY 2015 rates reflect MY data from January 1, 2014, through December 31, 2014. 2 RY 2016 rates reflect MY data from January 1, 2015, through December 31, 2015. 3 RY 2017 rates reflect MY data from January 1, 2016, through December 31, 2016. 4 RY 2018 rates reflect MY data from January 1, 2017, through December 31, 2017. 5 Performance comparisons are based on the Chi-square test of statistical significance, with a p value of <0.05. ^ Caution should be exercised when assessing MCP performance for this measure given the changes that NCQA made to the specification for this measure for RY 2018. -- Indicates that the rate is not available.
Table 3.8 through Table 3.14 present findings for the RY 2018 performance measures within the Preventive Screening and Children’s Health domain.
Note the following regarding Table 3.8 through Table 3.14:
♦ DHCS did not hold MCPs accountable to meet MPLs for all four Children and Adolescents’ Access to Primary Care measures within this domain; therefore, HSAG did not include these measures in its assessment of the MCP’s performance related to HPLs and MPLs.
♦ The Immunizations for Adolescents—Combination 2 measure was a first-year measure in RY 2017, and DHCS established no MPL for this measure for RY 2017 because no comparable benchmark existed; therefore, HSAG did not include this measure in the denominators for calculating the percentage of measures with rates that moved to above or below the MPLs in RY 2018.
Health Net Community Solutions, Inc. Performance Evaluation Report: July 1, 2017–June 30, 2018 California Department of Health Care Services
Page O-18 Health Services Advisory Group, Inc.

MANAGED CARE HEALTH PLAN PERFORMANCE MEASURES
Table 3.8—Preventive Screening and Children’s Health DomainRY 2018 (MY 2017) Performance Measure FindingsHealth Net—Kern County
Criteria Number of Measures
MeetingCriteria
Total Number of Measures
Percentage of Measures
MeetingCriteria
RY 2018 Rates Above HPLs 1 5 20.00% Rates Above HPLs for the Last Three or More Consecutive Years 0 4 0.00%
RY 2018 Rates Significantly Better than RY 2017 Rates* 1 5 20.00%
Rates that Moved from Below MPLs in RY 2017 to Above MPLs in RY 2018 0 1 0.00%
RY 2018 Rates Below MPLs 1 5 20.00% Rates Below MPLs for the Last Three or More Consecutive Years 1 4 25.00%
RY 2018 Rates Significantly Worse than RY 2017 Rates* 0 5 0.00%
Rates that Moved from Above MPLs in RY 2017 to Below MPLs in RY 2018 0 3 0.00%
* Performance comparisons are based on the Chi-square test of statistical significance, with a p value of <0.05.
Health Net Community Solutions, Inc. Performance Evaluation Report: July 1, 2017–June 30, 2018 California Department of Health Care Services
Page O-19 Health Services Advisory Group, Inc.

MANAGED CARE HEALTH PLAN PERFORMANCE MEASURES
Table 3.9—Preventive Screening and Children’s Health DomainRY 2018 (MY 2017) Performance Measure FindingsHealth Net—Los Angeles County
Criteria Number of Measures
MeetingCriteria
Total Number of Measures
Percentage of Measures
MeetingCriteria
RY 2018 Rates Above HPLs 1 5 20.00% Rates Above HPLs for the Last Three or More Consecutive Years 0 4 0.00%
RY 2018 Rates Significantly Better than RY 2017 Rates* 1 5 20.00%
Rates that Moved from Below MPLs in RY 2017 to Above MPLs in RY 2018 0 0 N/A
RY 2018 Rates Below MPLs 0 5 0.00% Rates Below MPLs for the Last Three or More Consecutive Years 0 4 0.00%
RY 2018 Rates Significantly Worse than RY 2017 Rates* 1 5 20.00%
Rates that Moved from Above MPLs in RY 2017 to Below MPLs in RY 2018 0 4 0.00%
* Performance comparisons are based on the Chi-square test of statistical significance, with a p value of <0.05. N/A = No rates above or below the MPLs from the previous year exist to include in the denominator for calculating whether or not rates moved to above or below MPLs in the most recent year.
Health Net Community Solutions, Inc. Performance Evaluation Report: July 1, 2017–June 30, 2018 California Department of Health Care Services
Page O-20 Health Services Advisory Group, Inc.
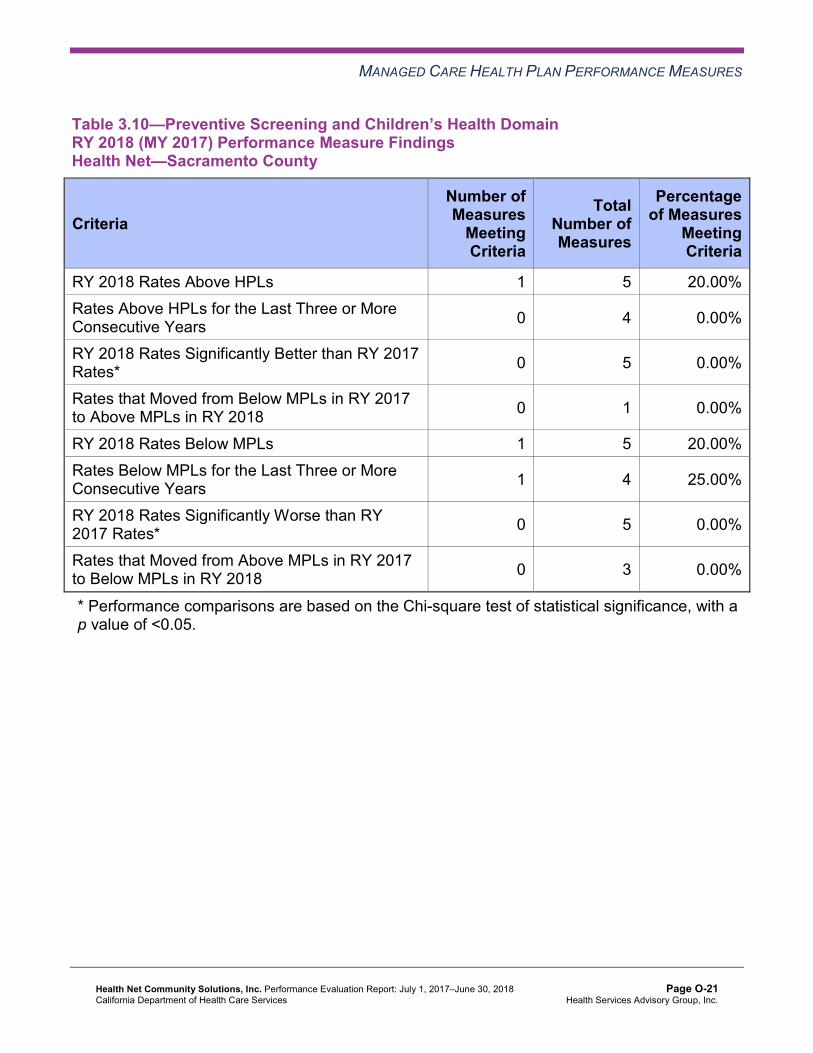
MANAGED CARE HEALTH PLAN PERFORMANCE MEASURES
Table 3.10—Preventive Screening and Children’s Health DomainRY 2018 (MY 2017) Performance Measure Findings Health Net—Sacramento County
Criteria Number of Measures
MeetingCriteria
Total Number of Measures
Percentage of Measures
MeetingCriteria
RY 2018 Rates Above HPLs 1 5 20.00% Rates Above HPLs for the Last Three or More Consecutive Years 0 4 0.00%
RY 2018 Rates Significantly Better than RY 2017 Rates* 0 5 0.00%
Rates that Moved from Below MPLs in RY 2017 to Above MPLs in RY 2018 0 1 0.00%
RY 2018 Rates Below MPLs 1 5 20.00% Rates Below MPLs for the Last Three or More Consecutive Years 1 4 25.00%
RY 2018 Rates Significantly Worse than RY 2017 Rates* 0 5 0.00%
Rates that Moved from Above MPLs in RY 2017 to Below MPLs in RY 2018 0 3 0.00%
* Performance comparisons are based on the Chi-square test of statistical significance, with a p value of <0.05.
Health Net Community Solutions, Inc. Performance Evaluation Report: July 1, 2017–June 30, 2018 California Department of Health Care Services
Page O-21 Health Services Advisory Group, Inc.

MANAGED CARE HEALTH PLAN PERFORMANCE MEASURES
Table 3.11—Preventive Screening and Children’s Health DomainRY 2018 (MY 2017) Performance Measure Findings Health Net—San Diego County
Criteria Number of Measures
MeetingCriteria
Total Number of Measures
Percentage of Measures
MeetingCriteria
RY 2018 Rates Above HPLs 1 5 20.00% Rates Above HPLs for the Last Three or More Consecutive Years 0 4 0.00%
RY 2018 Rates Significantly Better than RY 2017 Rates* 3 5 60.00%
Rates that Moved from Below MPLs in RY 2017 to Above MPLs in RY 2018 0 0 N/A
RY 2018 Rates Below MPLs 0 5 0.00% Rates Below MPLs for the Last Three or More Consecutive Years 0 4 0.00%
RY 2018 Rates Significantly Worse than RY 2017 Rates* 1 5 20.00%
Rates that Moved from Above MPLs in RY 2017 to Below MPLs in RY 2018 0 4 0.00%
* Performance comparisons are based on the Chi-square test of statistical significance, with a p value of <0.05. N/A = No rates above or below the MPLs from the previous year exist to include in the denominator for calculating whether or not rates moved to above or below MPLs in the most recent year.
Health Net Community Solutions, Inc. Performance Evaluation Report: July 1, 2017–June 30, 2018 California Department of Health Care Services
Page O-22 Health Services Advisory Group, Inc.

MANAGED CARE HEALTH PLAN PERFORMANCE MEASURES
Table 3.12—Preventive Screening and Children’s Health DomainRY 2018 (MY 2017) Performance Measure Findings Health Net—San Joaquin County
Criteria Number of Measures
MeetingCriteria
Total Number of Measures
Percentage of Measures
MeetingCriteria
RY 2018 Rates Above HPLs 0 5 0.00% Rates Above HPLs for the Last Three or More Consecutive Years 0 4 0.00%
RY 2018 Rates Significantly Better than RY 2017 Rates* 1 5 20.00%
Rates that Moved from Below MPLs in RY 2017 to Above MPLs in RY 2018 0 2 0.00%
RY 2018 Rates Below MPLs 2 5 40.00% Rates Below MPLs for the Last Three or More Consecutive Years 2 4 50.00%
RY 2018 Rates Significantly Worse than RY 2017 Rates* 0 5 0.00%
Rates that Moved from Above MPLs in RY 2017 to Below MPLs in RY 2018 0 2 0.00%
* Performance comparisons are based on the Chi-square test of statistical significance, with a p value of <0.05.
Health Net Community Solutions, Inc. Performance Evaluation Report: July 1, 2017–June 30, 2018 California Department of Health Care Services
Page O-23 Health Services Advisory Group, Inc.

MANAGED CARE HEALTH PLAN PERFORMANCE MEASURES
Table 3.13—Preventive Screening and Children’s Health DomainRY 2018 (MY 2017) Performance Measure FindingsHealth Net—Stanislaus County
Criteria Number of Measures
MeetingCriteria
Total Number of Measures
Percentage of Measures
MeetingCriteria
RY 2018 Rates Above HPLs 0 5 0.00% Rates Above HPLs for the Last Three or More Consecutive Years 0 4 0.00%
RY 2018 Rates Significantly Better than RY 2017 Rates* 1 5 20.00%
Rates that Moved from Below MPLs in RY 2017 to Above MPLs in RY 2018 0 1 0.00%
RY 2018 Rates Below MPLs 2 5 40.00% Rates Below MPLs for the Last Three or More Consecutive Years 1 4 25.00%
RY 2018 Rates Significantly Worse than RY 2017 Rates* 1 5 20.00%
Rates that Moved from Above MPLs in RY 2017 to Below MPLs in RY 2018 1 3 33.33%
* Performance comparisons are based on the Chi-square test of statistical significance, with a p value of <0.05.
Health Net Community Solutions, Inc. Performance Evaluation Report: July 1, 2017–June 30, 2018 California Department of Health Care Services
Page O-24 Health Services Advisory Group, Inc.

MANAGED CARE HEALTH PLAN PERFORMANCE MEASURES
Table 3.14—Preventive Screening and Children’s Health DomainRY 2018 (MY 2017) Performance Measure FindingsHealth Net—Tulare County
Criteria Number of Measures
MeetingCriteria
Total Number of Measures
Percentage of Measures
MeetingCriteria
RY 2018 Rates Above HPLs 3 5 60.00% Rates Above HPLs for the Last Three or More Consecutive Years 2 4 50.00%
RY 2018 Rates Significantly Better than RY 2017 Rates* 1 5 20.00%
Rates that Moved from Below MPLs in RY 2017 to Above MPLs in RY 2018 0 0 N/A
RY 2018 Rates Below MPLs 0 5 0.00% Rates Below MPLs for the Last Three or More Consecutive Years 0 4 0.00%
RY 2018 Rates Significantly Worse than RY 2017 Rates* 0 5 0.00%
Rates that Moved from Above MPLs in RY 2017 to Below MPLs in RY 2018 0 4 0.00%
* Performance comparisons are based on the Chi-square test of statistical significance, with a p value of <0.05. N/A = No rates above or below the MPLs from the previous year exist to include in the denominator for calculating whether or not rates moved to above or below MPLs in the most recent year.
Health Net Community Solutions, Inc. Performance Evaluation Report: July 1, 2017–June 30, 2018 California Department of Health Care Services
Page O-25 Health Services Advisory Group, Inc.

MANAGED CARE HEALTH PLAN PERFORMANCE MEASURES
Assessment of Corrective Action Plan Efforts—Preventive Screening and Children’sHealth
DHCS required Health Net to implement a Quality of Care CAP in December 2015 for a period of four or more years and until the CAP goals are achieved. The following measures within the Preventive Screening and Children’s Health domain are included in Health Net’s CAP:
♦ Childhood Immunization Status—Combination 3 in Kern, Sacramento, San Joaquin, and Stanislaus counties
♦ Well-Child Visits in the Third, Fourth, Fifth, and Sixth Years of Life in San Joaquin County
Childhood Immunizations
DHCS approved Health Net to conduct a PIP to address the MCP’s performance below the MPL for multiple years for the Childhood Immunization Status—Combination 3 measure in Kern, Sacramento, San Joaquin, and Stanislaus counties. The MCP is conducting a 2017–19 Childhood Immunization Status—Combination 3 PIP with a narrowed focus on a provider group in Kern County. HSAG includes a summary of Health Net’s progress on this PIP in Section 5 of this report (“Performance Improvement Projects”).
The rates for the Childhood Immunization Status—Combination 3 measure remained below the MPL in Kern, Sacramento, San Joaquin, and Stanislaus counties in RY 2018.
Well-Child Visits
Health Net conducted two PDSA cycles to address the MCP’s performance below the MPL in RY 2017 for the Well-Child Visits in the Third, Fourth, Fifth, and Sixth Years of Life measure in San Joaquin County.
For the first PDSA cycle, Health Net tested whether or not collaborating with a select hospital and physicians’ group to provide weekend clinics for beneficiaries would improve compliance for the Well-Child Visits in the Third, Fourth, Fifth, and Sixth Years of Life measure. Health Net reported that it appeared that offering incentives on-site motivated beneficiaries to participate in the Saturday clinics.
For the second PDSA cycle, Health Net tested whether or not having a vendor design a program that offers in-home well-child visits to non-compliant beneficiaries assigned to a high-volume low-performing provider group would improve compliance for the Well-Child Visits in the Third, Fourth, Fifth, and Sixth Years of Life measure. Health Net conducted outreach by letters and phone calls and reported having learned that including additional modes of communication (i.e., text messaging and email) may have resulted in reaching more beneficiaries, thereby resulting in the provider scheduling and completing more well-child visits.
The rate in San Joaquin County for the Well-Child Visits in the Third, Fourth, Fifth, and Sixth Years of Life measure remained below the MPL in RY 2018.
Health Net Community Solutions, Inc. Performance Evaluation Report: July 1, 2017–June 30, 2018 California Department of Health Care Services
Page O-26 Health Services Advisory Group, Inc.

MANAGED CARE HEALTH PLAN PERFORMANCE MEASURES
Preventive Screening and Women’s Health
Table 3.15 through Table 3.21 present the four-year trending information for the performance measures within the Preventive Screening and Women’s Health domain.
Note that any comparison of RY 2018 performance to RY 2017 or to benchmarks related to the Breast Cancer Screening measure should be exercised with caution given the changes that NCQA made to the specification for this measure for RY 2018. NCQA released guidance that recommended a break in trending for this measure; however, DHCS determined to continue trending because the specification change should result in higher rates.
Table 3.15—Preventive Screening and Women’s Health DomainMulti-Year Performance Measure Results Health Net—Kern County
H = Rate indicates performance above the HPL. Bolded Rate = Rate indicates performance below the MPL.
B = Statistical testing result indicates that the RY 2018 rate is significantly better than the RY 2017 rate.
W = Statistical testing result indicates that the RY 2018 rate is significantly worse than the RY 2017 rate.
Measure RY
2015 Rate1
RY 2016
Rate2
RY 2017
Rate3
RY 2018
Rate4
RYs 2017–18 Rate
Difference5
Breast Cancer Screening^ -- -- 48.30% 48.31% 0.01 Cervical Cancer Screening 49.64% 43.55% 43.31% 48.91% 5.60 Prenatal and Postpartum Care— Postpartum Care 60.15% 58.99% 63.34% 65.10% 1.76
Prenatal and Postpartum Care— Timeliness of Prenatal Care 72.13% 77.97% 79.05% 75.78% -3.27
1 RY 2015 rates reflect MY data from January 1, 2014, through December 31, 2014. 2 RY 2016 rates reflect MY data from January 1, 2015, through December 31, 2015. 3 RY 2017 rates reflect MY data from January 1, 2016, through December 31, 2016. 4 RY 2018 rates reflect MY data from January 1, 2017, through December 31, 2017. 5 Performance comparisons are based on the Chi-square test of statistical significance, with a p value of <0.05. ^ Caution should be exercised when assessing MCP performance for this measure given the changes that NCQA made to the specification for this measure for RY 2018. -- Indicates that the rate is not available.
Health Net Community Solutions, Inc. Performance Evaluation Report: July 1, 2017–June 30, 2018 California Department of Health Care Services
Page O-27 Health Services Advisory Group, Inc.

MANAGED CARE HEALTH PLAN PERFORMANCE MEASURES
Table 3.16—Preventive Screening and Women’s Health DomainMulti-Year Performance Measure Results Health Net—Los Angeles County
H = Rate indicates performance above the HPL. Bolded Rate = Rate indicates performance below the MPL.
B = Statistical testing result indicates that the RY 2018 rate is significantly better than the RY 2017 rate.
W = Statistical testing result indicates that the RY 2018 rate is significantly worse than the RY 2017 rate.
Measure RY
2015 Rate1
RY 2016
Rate2
RY 2017
Rate3
RY 2018
Rate4
RYs 2017–18 Rate
Difference5
Breast Cancer Screening^ -- -- 56.76% 56.99% 0.23 Cervical Cancer Screening 51.53% 50.61% 48.66% 59.12% 10.46B
Prenatal and Postpartum Care— Postpartum Care 51.82% 55.72% 56.02% 56.54% 0.52
Prenatal and Postpartum Care— Timeliness of Prenatal Care 73.97% 77.86% 78.62% 78.52% -0.10
1 RY 2015 rates reflect MY data from January 1, 2014, through December 31, 2014. 2 RY 2016 rates reflect MY data from January 1, 2015, through December 31, 2015. 3 RY 2017 rates reflect MY data from January 1, 2016, through December 31, 2016. 4 RY 2018 rates reflect MY data from January 1, 2017, through December 31, 2017. 5 Performance comparisons are based on the Chi-square test of statistical significance, with a p value of <0.05. ^ Caution should be exercised when assessing MCP performance for this measure given the changes that NCQA made to the specification for this measure for RY 2018. -- Indicates that the rate is not available.
Health Net Community Solutions, Inc. Performance Evaluation Report: July 1, 2017–June 30, 2018 California Department of Health Care Services
Page O-28 Health Services Advisory Group, Inc.

MANAGED CARE HEALTH PLAN PERFORMANCE MEASURES
Table 3.17—Preventive Screening and Women’s Health DomainMulti-Year Performance Measure Results Health Net—Sacramento County
H = Rate indicates performance above the HPL. Bolded Rate = Rate indicates performance below the MPL.
B = Statistical testing result indicates that the RY 2018 rate is significantly better than the RY 2017 rate.
W = Statistical testing result indicates that the RY 2018 rate is significantly worse than the RY 2017 rate.
Measure RY
2015 Rate1
RY 2016
Rate2
RY 2017
Rate3
RY 2018
Rate4
RYs 2017–18 Rate
Difference5
Breast Cancer Screening^ -- -- 50.29% 50.06% -0.23 Cervical Cancer Screening 51.34% 40.63% 44.28% 49.39% 5.11 Prenatal and Postpartum Care— Postpartum Care 58.15% 57.11% 60.30% 53.67% -6.63
Prenatal and Postpartum Care— Timeliness of Prenatal Care 82.00% 82.29% 81.39% 81.01% -0.38
1 RY 2015 rates reflect MY data from January 1, 2014, through December 31, 2014. 2 RY 2016 rates reflect MY data from January 1, 2015, through December 31, 2015. 3 RY 2017 rates reflect MY data from January 1, 2016, through December 31, 2016. 4 RY 2018 rates reflect MY data from January 1, 2017, through December 31, 2017. 5 Performance comparisons are based on the Chi-square test of statistical significance, with a p value of <0.05. ^ Caution should be exercised when assessing MCP performance for this measure given the changes that NCQA made to the specification for this measure for RY 2018. -- Indicates that the rate is not available.
Health Net Community Solutions, Inc. Performance Evaluation Report: July 1, 2017–June 30, 2018 California Department of Health Care Services
Page O-29 Health Services Advisory Group, Inc.
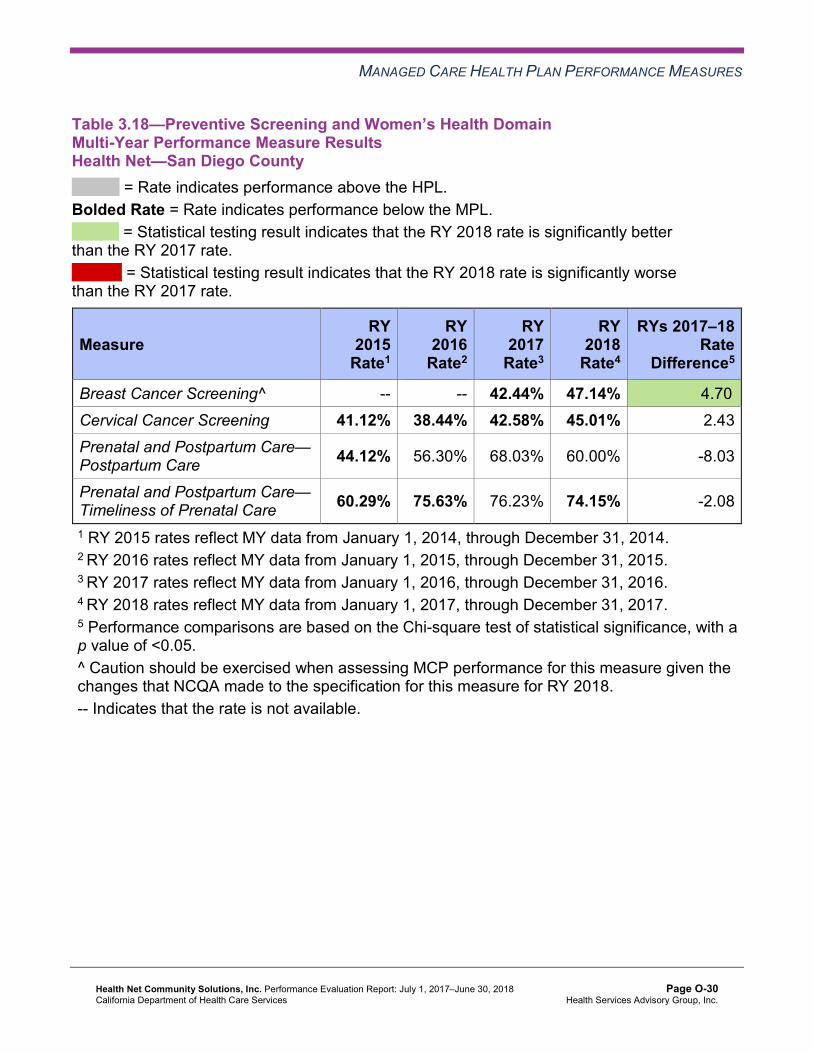
MANAGED CARE HEALTH PLAN PERFORMANCE MEASURES
Table 3.18—Preventive Screening and Women’s Health DomainMulti-Year Performance Measure Results Health Net—San Diego County
H = Rate indicates performance above the HPL. Bolded Rate = Rate indicates performance below the MPL.
B = Statistical testing result indicates that the RY 2018 rate is significantly better than the RY 2017 rate.
W = Statistical testing result indicates that the RY 2018 rate is significantly worse than the RY 2017 rate.
Measure RY
2015 Rate1
RY 2016
Rate2
RY 2017
Rate3
RY 2018
Rate4
RYs 2017–18 Rate
Difference5
Breast Cancer Screening^ -- -- 42.44% 47.14% 4.70B
Cervical Cancer Screening 41.12% 38.44% 42.58% 45.01% 2.43 Prenatal and Postpartum Care— Postpartum Care 44.12% 56.30% 68.03% 60.00% -8.03
Prenatal and Postpartum Care— Timeliness of Prenatal Care 60.29% 75.63% 76.23% 74.15% -2.08
1 RY 2015 rates reflect MY data from January 1, 2014, through December 31, 2014. 2 RY 2016 rates reflect MY data from January 1, 2015, through December 31, 2015. 3 RY 2017 rates reflect MY data from January 1, 2016, through December 31, 2016. 4 RY 2018 rates reflect MY data from January 1, 2017, through December 31, 2017. 5 Performance comparisons are based on the Chi-square test of statistical significance, with a p value of <0.05. ^ Caution should be exercised when assessing MCP performance for this measure given the changes that NCQA made to the specification for this measure for RY 2018. -- Indicates that the rate is not available.
Health Net Community Solutions, Inc. Performance Evaluation Report: July 1, 2017–June 30, 2018 California Department of Health Care Services
Page O-30 Health Services Advisory Group, Inc.
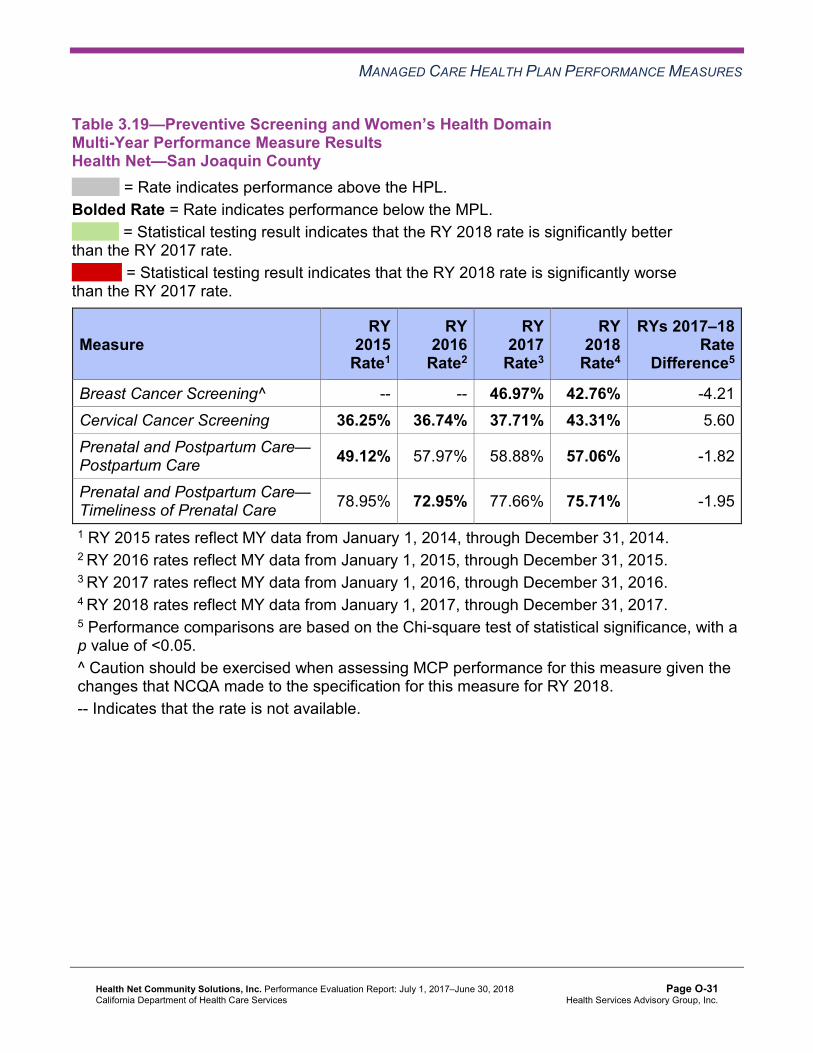
MANAGED CARE HEALTH PLAN PERFORMANCE MEASURES
Table 3.19—Preventive Screening and Women’s Health DomainMulti-Year Performance Measure Results Health Net—San Joaquin County
H = Rate indicates performance above the HPL. Bolded Rate = Rate indicates performance below the MPL.
B = Statistical testing result indicates that the RY 2018 rate is significantly better than the RY 2017 rate.
W = Statistical testing result indicates that the RY 2018 rate is significantly worse than the RY 2017 rate.
Measure RY
2015 Rate1
RY 2016
Rate2
RY 2017
Rate3
RY 2018
Rate4
RYs 2017–18 Rate
Difference5
Breast Cancer Screening^ -- -- 46.97% 42.76% -4.21 Cervical Cancer Screening 36.25% 36.74% 37.71% 43.31% 5.60 Prenatal and Postpartum Care— Postpartum Care 49.12% 57.97% 58.88% 57.06% -1.82
Prenatal and Postpartum Care— Timeliness of Prenatal Care 78.95% 72.95% 77.66% 75.71% -1.95
1 RY 2015 rates reflect MY data from January 1, 2014, through December 31, 2014. 2 RY 2016 rates reflect MY data from January 1, 2015, through December 31, 2015. 3 RY 2017 rates reflect MY data from January 1, 2016, through December 31, 2016. 4 RY 2018 rates reflect MY data from January 1, 2017, through December 31, 2017. 5 Performance comparisons are based on the Chi-square test of statistical significance, with a p value of <0.05. ^ Caution should be exercised when assessing MCP performance for this measure given the changes that NCQA made to the specification for this measure for RY 2018. -- Indicates that the rate is not available.
Health Net Community Solutions, Inc. Performance Evaluation Report: July 1, 2017–June 30, 2018 California Department of Health Care Services
Page O-31 Health Services Advisory Group, Inc.

MANAGED CARE HEALTH PLAN PERFORMANCE MEASURES
Table 3.20—Preventive Screening and Women’s Health DomainMulti-Year Performance Measure Results Health Net—Stanislaus County
H = Rate indicates performance above the HPL. Bolded Rate = Rate indicates performance below the MPL.
B = Statistical testing result indicates that the RY 2018 rate is significantly better than the RY 2017 rate.
W = Statistical testing result indicates that the RY 2018 rate is significantly worse than the RY 2017 rate.
Measure RY
2015 Rate1
RY 2016
Rate2
RY 2017
Rate3
RY 2018
Rate4
RYs 2017–18 Rate
Difference5
Breast Cancer Screening^ -- -- 47.46% 49.45% 1.99 Cervical Cancer Screening 54.99% 42.79% 48.91% 51.09% 2.18 Prenatal and Postpartum Care— Postpartum Care 58.72% 62.34% 63.92% 64.84% 0.92
Prenatal and Postpartum Care— Timeliness of Prenatal Care 83.78% 82.29% 81.96% 81.51% -0.45
1 RY 2015 rates reflect MY data from January 1, 2014, through December 31, 2014. 2 RY 2016 rates reflect MY data from January 1, 2015, through December 31, 2015. 3 RY 2017 rates reflect MY data from January 1, 2016, through December 31, 2016. 4 RY 2018 rates reflect MY data from January 1, 2017, through December 31, 2017. 5 Performance comparisons are based on the Chi-square test of statistical significance, with a p value of <0.05. ^ Caution should be exercised when assessing MCP performance for this measure given the changes that NCQA made to the specification for this measure for RY 2018. -- Indicates that the rate is not available.
Health Net Community Solutions, Inc. Performance Evaluation Report: July 1, 2017–June 30, 2018 California Department of Health Care Services
Page O-32 Health Services Advisory Group, Inc.

MANAGED CARE HEALTH PLAN PERFORMANCE MEASURES
Table 3.21—Preventive Screening and Women’s Health DomainMulti-Year Performance Measure Results Health Net—Tulare County
H = Rate indicates performance above the HPL. Bolded Rate = Rate indicates performance below the MPL.
B = Statistical testing result indicates that the RY 2018 rate is significantly better than the RY 2017 rate.
W = Statistical testing result indicates that the RY 2018 rate is significantly worse than the RY 2017 rate.
Measure RY
2015 Rate1
RY 2016
Rate2
RY 2017
Rate3
RY 2018
Rate4
RYs 2017–18 Rate
Difference5
Breast Cancer Screening^ -- -- 55.34% 57.44% 2.10 Cervical Cancer Screening 63.32% 56.51% 63.46% 62.76% -0.70 Prenatal and Postpartum Care— Postpartum Care 63.03% 62.50% 66.75% 64.69% -2.06
Prenatal and Postpartum Care— Timeliness of Prenatal Care 88.34% 88.02% 87.63% 87.33% -0.30
1 RY 2015 rates reflect MY data from January 1, 2014, through December 31, 2014. 2 RY 2016 rates reflect MY data from January 1, 2015, through December 31, 2015. 3 RY 2017 rates reflect MY data from January 1, 2016, through December 31, 2016. 4 RY 2018 rates reflect MY data from January 1, 2017, through December 31, 2017. 5 Performance comparisons are based on the Chi-square test of statistical significance, with a p value of <0.05. ^ Caution should be exercised when assessing MCP performance for this measure given the changes that NCQA made to the specification for this measure for RY 2018. -- Indicates that the rate is not available.
Health Net Community Solutions, Inc. Performance Evaluation Report: July 1, 2017–June 30, 2018 California Department of Health Care Services
Page O-33 Health Services Advisory Group, Inc.
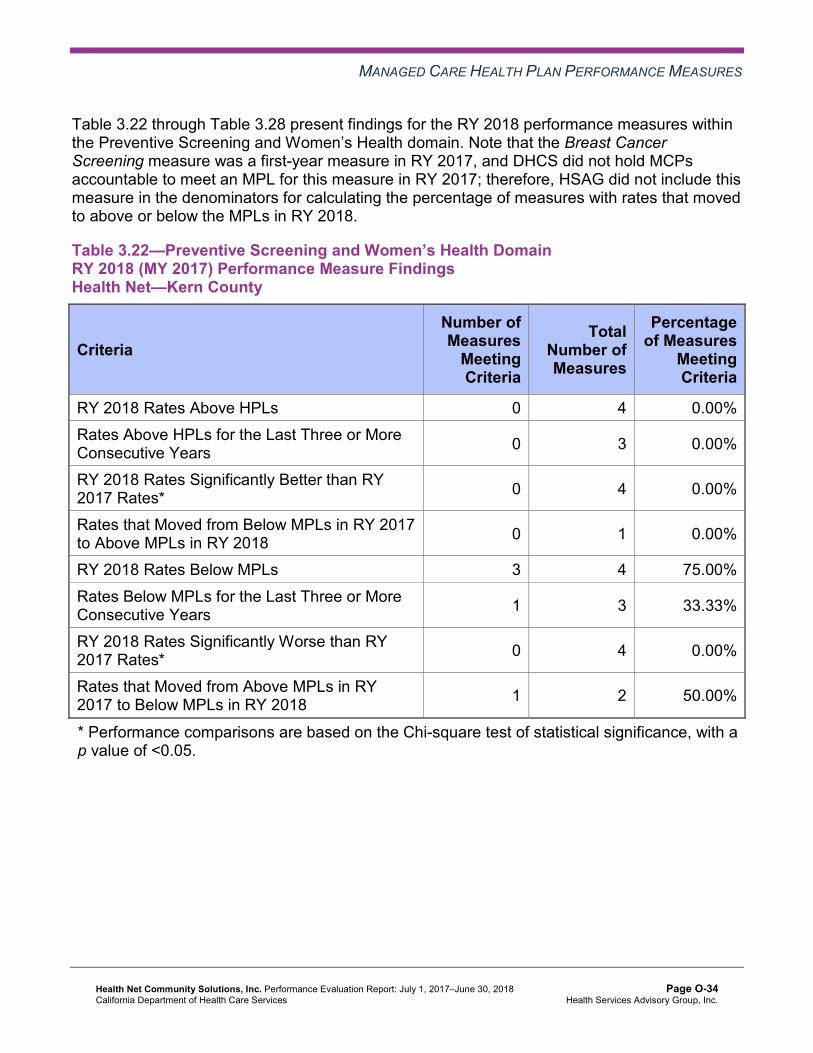
MANAGED CARE HEALTH PLAN PERFORMANCE MEASURES
Table 3.22 through Table 3.28 present findings for the RY 2018 performance measures within the Preventive Screening and Women’s Health domain. Note that the Breast Cancer Screening measure was a first-year measure in RY 2017, and DHCS did not hold MCPs accountable to meet an MPL for this measure in RY 2017; therefore, HSAG did not include this measure in the denominators for calculating the percentage of measures with rates that moved to above or below the MPLs in RY 2018.
Table 3.22—Preventive Screening and Women’s Health DomainRY 2018 (MY 2017) Performance Measure Findings Health Net—Kern County
Criteria Number of Measures
MeetingCriteria
Total Number of Measures
Percentage of Measures
MeetingCriteria
RY 2018 Rates Above HPLs 0 4 0.00% Rates Above HPLs for the Last Three or More Consecutive Years 0 3 0.00%
RY 2018 Rates Significantly Better than RY 2017 Rates* 0 4 0.00%
Rates that Moved from Below MPLs in RY 2017 to Above MPLs in RY 2018 0 1 0.00%
RY 2018 Rates Below MPLs 3 4 75.00% Rates Below MPLs for the Last Three or More Consecutive Years 1 3 33.33%
RY 2018 Rates Significantly Worse than RY 2017 Rates* 0 4 0.00%
Rates that Moved from Above MPLs in RY 2017 to Below MPLs in RY 2018 1 2 50.00%
* Performance comparisons are based on the Chi-square test of statistical significance, with a p value of <0.05.
Health Net Community Solutions, Inc. Performance Evaluation Report: July 1, 2017–June 30, 2018 California Department of Health Care Services
Page O-34 Health Services Advisory Group, Inc.

MANAGED CARE HEALTH PLAN PERFORMANCE MEASURES
Table 3.23—Preventive Screening and Women’s Health DomainRY 2018 (MY 2017) Performance Measure Findings Health Net—Los Angeles County
Criteria Number of Measures
MeetingCriteria
Total Number of Measures
Percentage of Measures
MeetingCriteria
RY 2018 Rates Above HPLs 0 4 0.00% Rates Above HPLs for the Last Three or More Consecutive Years 0 3 0.00%
RY 2018 Rates Significantly Better than RY 2017 Rates* 1 4 25.00%
Rates that Moved from Below MPLs in RY 2017 to Above MPLs in RY 2018 0 0 N/A
RY 2018 Rates Below MPLs 1 4 25.00% Rates Below MPLs for the Last Three or More Consecutive Years 0 3 0.00%
RY 2018 Rates Significantly Worse than RY 2017 Rates* 0 4 0.00%
Rates that Moved from Above MPLs in RY 2017 to Below MPLs in RY 2018 1 3 33.33%
* Performance comparisons are based on the Chi-square test of statistical significance, with a p value of <0.05. N/A = No rates above or below the MPLs from the previous year exist to include in the denominator for calculating whether or not rates moved to above or below MPLs in the most recent year.
Health Net Community Solutions, Inc. Performance Evaluation Report: July 1, 2017–June 30, 2018 California Department of Health Care Services
Page O-35 Health Services Advisory Group, Inc.

MANAGED CARE HEALTH PLAN PERFORMANCE MEASURES
Table 3.24—Preventive Screening and Women’s Health DomainRY 2018 (MY 2017) Performance Measure Findings Health Net—Sacramento County
Criteria Number of Measures
MeetingCriteria
Total Number of Measures
Percentage of Measures
MeetingCriteria
RY 2018 Rates Above HPLs 0 4 0.00% Rates Above HPLs for the Last Three or More Consecutive Years 0 3 0.00%
RY 2018 Rates Significantly Better than RY 2017 Rates* 0 4 0.00%
Rates that Moved from Below MPLs in RY 2017 to Above MPLs in RY 2018 0 1 0.00%
RY 2018 Rates Below MPLs 3 4 75.00% Rates Below MPLs for the Last Three or More Consecutive Years 1 3 33.33%
RY 2018 Rates Significantly Worse than RY 2017 Rates* 0 4 0.00%
Rates that Moved from Above MPLs in RY 2017 to Below MPLs in RY 2018 1 2 50.00%
* Performance comparisons are based on the Chi-square test of statistical significance, with a p value of <0.05.
Health Net Community Solutions, Inc. Performance Evaluation Report: July 1, 2017–June 30, 2018 California Department of Health Care Services
Page O-36 Health Services Advisory Group, Inc.

MANAGED CARE HEALTH PLAN PERFORMANCE MEASURES
Table 3.25—Preventive Screening and Women’s Health DomainRY 2018 (MY 2017) Performance Measure Findings Health Net—San Diego County
Criteria Number of Measures
MeetingCriteria
Total Number of Measures
Percentage of Measures
MeetingCriteria
RY 2018 Rates Above HPLs 0 4 0.00% Rates Above HPLs for the Last Three or More Consecutive Years 0 3 0.00%
RY 2018 Rates Significantly Better than RY 2017 Rates* 1 4 25.00%
Rates that Moved from Below MPLs in RY 2017 to Above MPLs in RY 2018 0 1 0.00%
RY 2018 Rates Below MPLs 3 4 75.00% Rates Below MPLs for the Last Three or More Consecutive Years 1 3 33.33%
RY 2018 Rates Significantly Worse than RY 2017 Rates* 0 4 0.00%
Rates that Moved from Above MPLs in RY 2017 to Below MPLs in RY 2018 1 2 50.00%
* Performance comparisons are based on the Chi-square test of statistical significance, with a p value of <0.05.
Health Net Community Solutions, Inc. Performance Evaluation Report: July 1, 2017–June 30, 2018 California Department of Health Care Services
Page O-37 Health Services Advisory Group, Inc.

MANAGED CARE HEALTH PLAN PERFORMANCE MEASURES
Table 3.26—Preventive Screening and Women’s Health DomainRY 2018 (MY 2017) Performance Measure Findings Health Net—San Joaquin County
Criteria Number of Measures
MeetingCriteria
Total Number of Measures
Percentage of Measures
MeetingCriteria
RY 2018 Rates Above HPLs 0 4 0.00% Rates Above HPLs for the Last Three or More Consecutive Years 0 3 0.00%
RY 2018 Rates Significantly Better than RY 2017 Rates* 0 4 0.00%
Rates that Moved from Below MPLs in RY 2017 to Above MPLs in RY 2018 0 1 0.00%
RY 2018 Rates Below MPLs 4 4 100.00% Rates Below MPLs for the Last Three or More Consecutive Years 1 3 33.33%
RY 2018 Rates Significantly Worse than RY 2017 Rates* 0 4 0.00%
Rates that Moved from Above MPLs in RY 2017 to Below MPLs in RY 2018 2 2 100.00%
* Performance comparisons are based on the Chi-square test of statistical significance, with a p value of <0.05.
Health Net Community Solutions, Inc. Performance Evaluation Report: July 1, 2017–June 30, 2018 California Department of Health Care Services
Page O-38 Health Services Advisory Group, Inc.

MANAGED CARE HEALTH PLAN PERFORMANCE MEASURES
Table 3.27—Preventive Screening and Women’s Health DomainRY 2018 (MY 2017) Performance Measure Findings Health Net—Stanislaus County
Criteria Number of Measures
MeetingCriteria
Total Number of Measures
Percentage of Measures
MeetingCriteria
RY 2018 Rates Above HPLs 0 4 0.00% Rates Above HPLs for the Last Three or More Consecutive Years 0 3 0.00%
RY 2018 Rates Significantly Better than RY 2017 Rates* 0 4 0.00%
Rates that Moved from Below MPLs in RY 2017 to Above MPLs in RY 2018 0 0 N/A
RY 2018 Rates Below MPLs 2 4 50.00% Rates Below MPLs for the Last Three or More Consecutive Years 0 3 0.00%
RY 2018 Rates Significantly Worse than RY 2017 Rates* 0 4 0.00%
Rates that Moved from Above MPLs in RY 2017 to Below MPLs in RY 2018 1 3 33.33%
* Performance comparisons are based on the Chi-square test of statistical significance, with a p value of <0.05. N/A = No rates above or below the MPLs from the previous year exist to include in the denominator for calculating whether or not rates moved to above or below MPLs in the most recent year.
Health Net Community Solutions, Inc. Performance Evaluation Report: July 1, 2017–June 30, 2018 California Department of Health Care Services
Page O-39 Health Services Advisory Group, Inc.

MANAGED CARE HEALTH PLAN PERFORMANCE MEASURES
Table 3.28—Preventive Screening and Women’s Health DomainRY 2018 (MY 2017) Performance Measure Findings Health Net—Tulare County
Criteria Number of Measures
MeetingCriteria
Total Number of Measures
Percentage of Measures
MeetingCriteria
RY 2018 Rates Above HPLs 0 4 0.00% Rates Above HPLs for the Last Three or More Consecutive Years 0 3 0.00%
RY 2018 Rates Significantly Better than RY 2017 Rates* 0 4 0.00%
Rates that Moved from Below MPLs in RY 2017 to Above MPLs in RY 2018 0 0 N/A
RY 2018 Rates Below MPLs 0 4 0.00% Rates Below MPLs for the Last Three or More Consecutive Years 0 3 0.00%
RY 2018 Rates Significantly Worse than RY 2017 Rates* 0 4 0.00%
Rates that Moved from Above MPLs in RY 2017 to Below MPLs in RY 2018 0 3 0.00%
* Performance comparisons are based on the Chi-square test of statistical significance, with a p value of <0.05. N/A = No rates above or below the MPLs from the previous year exist to include in the denominator for calculating whether or not rates moved to above or below MPLs in the most recent year.
Assessment of Corrective Action Plan Efforts—Preventive Screening and Women’s Health
Health Net’s CAP includes the Cervical Cancer Screening measure for Kern, Sacramento, San Diego, and San Joaquin counties. As part of the CAP, DHCS approved Health Net to conduct a PIP to address the MCP’s continued performance below the MPL for this measure. HSAG includes a summary of Health Net’s progress on the Cervical Cancer Screening Disparity PIP in Section 5 of this report (“Performance Improvement Projects”).
In addition to the PIP, Health Net conducted two PDSA cycles to test whether or not holding a Saturday clinic as well as conducting outreach calls to beneficiaries would increase the number of beneficiaries completing cervical cancer screenings. Health Net indicated learning that the clinic has challenges maintaining up-to-date beneficiary contact information, which
Health Net Community Solutions, Inc. Performance Evaluation Report: July 1, 2017–June 30, 2018 California Department of Health Care Services
Page O-40 Health Services Advisory Group, Inc.
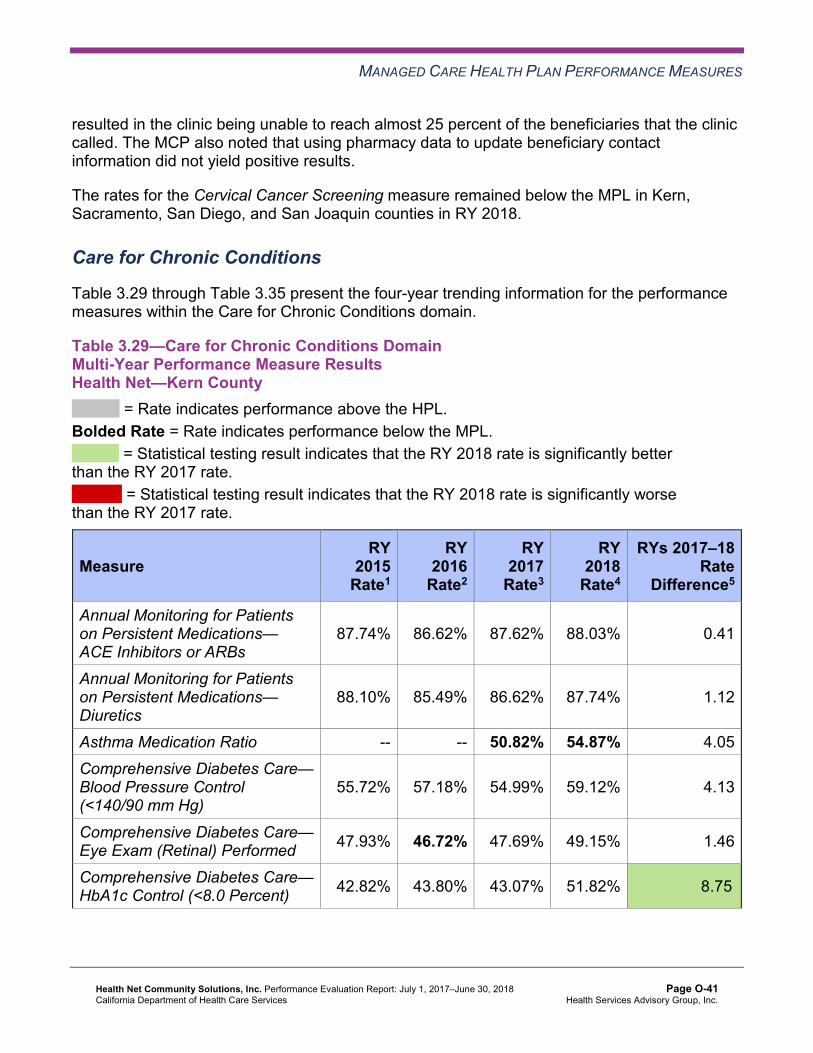
MANAGED CARE HEALTH PLAN PERFORMANCE MEASURES
resulted in the clinic being unable to reach almost 25 percent of the beneficiaries that the clinic called. The MCP also noted that using pharmacy data to update beneficiary contact information did not yield positive results.
The rates for the Cervical Cancer Screening measure remained below the MPL in Kern, Sacramento, San Diego, and San Joaquin counties in RY 2018.
Care for Chronic Conditions
Table 3.29 through Table 3.35 present the four-year trending information for the performance measures within the Care for Chronic Conditions domain.
Table 3.29—Care for Chronic Conditions Domain Multi-Year Performance Measure Results Health Net—Kern County
H = Rate indicates performance above the HPL. Bolded Rate = Rate indicates performance below the MPL.
B = Statistical testing result indicates that the RY 2018 rate is significantly better than the RY 2017 rate.
W = Statistical testing result indicates that the RY 2018 rate is significantly worse than the RY 2017 rate.
Measure RY
2015 Rate1
RY 2016
Rate2
RY 2017
Rate3
RY 2018
Rate4
RYs 2017–18 Rate
Difference5
Annual Monitoring for Patients on Persistent Medications— ACE Inhibitors or ARBs
87.74% 86.62% 87.62% 88.03% 0.41
Annual Monitoring for Patients on Persistent Medications— Diuretics
88.10% 85.49% 86.62% 87.74% 1.12
Asthma Medication Ratio -- -- 50.82% 54.87% 4.05 Comprehensive Diabetes Care— Blood Pressure Control (<140/90 mm Hg)
55.72% 57.18% 54.99% 59.12% 4.13
Comprehensive Diabetes Care— Eye Exam (Retinal) Performed 47.93% 46.72% 47.69% 49.15% 1.46
Comprehensive Diabetes Care— HbA1c Control (<8.0 Percent) 42.82% 43.80% 43.07% 51.82% 8.75B
Health Net Community Solutions, Inc. Performance Evaluation Report: July 1, 2017–June 30, 2018 California Department of Health Care Services
Page O-41 Health Services Advisory Group, Inc.
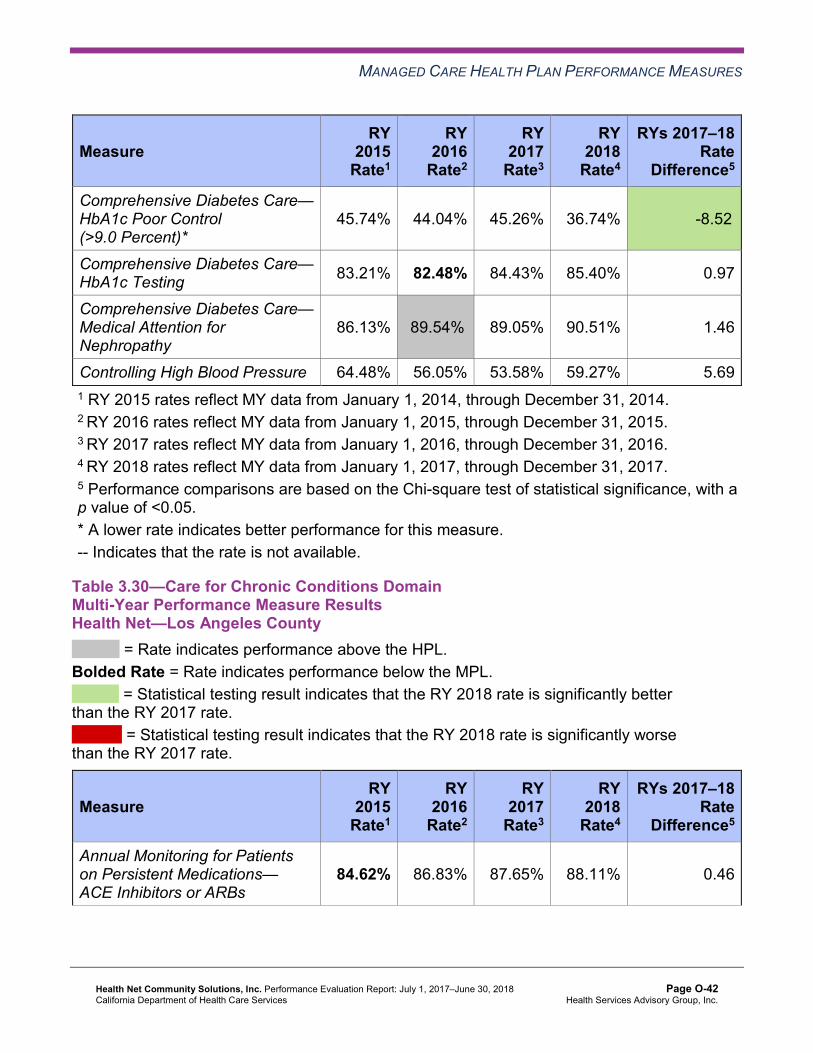
MANAGED CARE HEALTH PLAN PERFORMANCE MEASURES
Measure RY
2015 Rate1
RY 2016
Rate2
RY 2017
Rate3
RY 2018
Rate4
RYs 2017–18 Rate
Difference5
Comprehensive Diabetes Care— HbA1c Poor Control (>9.0 Percent)*
45.74% 44.04% 45.26% 36.74% -8.52B
Comprehensive Diabetes Care— HbA1c Testing 83.21% 82.48% 84.43% 85.40% 0.97
Comprehensive Diabetes Care— Medical Attention for Nephropathy
86.13% 89.54%H 89.05% 90.51% 1.46
Controlling High Blood Pressure 64.48% 56.05% 53.58% 59.27% 5.69 1 RY 2015 rates reflect MY data from January 1, 2014, through December 31, 2014. 2 RY 2016 rates reflect MY data from January 1, 2015, through December 31, 2015. 3 RY 2017 rates reflect MY data from January 1, 2016, through December 31, 2016. 4 RY 2018 rates reflect MY data from January 1, 2017, through December 31, 2017. 5 Performance comparisons are based on the Chi-square test of statistical significance, with a p value of <0.05. * A lower rate indicates better performance for this measure. -- Indicates that the rate is not available.
Table 3.30—Care for Chronic Conditions Domain Multi-Year Performance Measure Results Health Net—Los Angeles County
H = Rate indicates performance above the HPL. Bolded Rate = Rate indicates performance below the MPL.
B = Statistical testing result indicates that the RY 2018 rate is significantly better than the RY 2017 rate.
W = Statistical testing result indicates that the RY 2018 rate is significantly worse than the RY 2017 rate.
Measure RY
2015 Rate1
RY 2016
Rate2
RY 2017
Rate3
RY 2018
Rate4
RYs 2017–18 Rate
Difference5
Annual Monitoring for Patients on Persistent Medications— ACE Inhibitors or ARBs
84.62% 86.83% 87.65% 88.11% 0.46
Health Net Community Solutions, Inc. Performance Evaluation Report: July 1, 2017–June 30, 2018 California Department of Health Care Services
Page O-42 Health Services Advisory Group, Inc.

MANAGED CARE HEALTH PLAN PERFORMANCE MEASURES
Measure RY
2015 Rate1
RY 2016
Rate2
RY 2017
Rate3
RY 2018
Rate4
RYs 2017–18 Rate
Difference5
Annual Monitoring for Patients on Persistent Medications— Diuretics
84.19% 86.16% 86.87% 87.73% 0.86B
Asthma Medication Ratio -- -- 60.65% 61.66% 1.01 Comprehensive Diabetes Care— Blood Pressure Control (<140/90 mm Hg)
59.85% 58.64% 61.31% 62.53% 1.22
Comprehensive Diabetes Care— Eye Exam (Retinal) Performed 55.72% 55.23% 63.02% 63.50% 0.48
Comprehensive Diabetes Care— HbA1c Control (<8.0 Percent) 45.74% 50.36% 50.36% 48.18% -2.18
Comprehensive Diabetes Care— HbA1c Poor Control (>9.0 Percent)*
38.20% 37.47% 40.15% 37.96% -2.19
Comprehensive Diabetes Care— HbA1c Testing 86.37% 85.64% 84.91% 87.10% 2.19
Comprehensive Diabetes Care— Medical Attention for Nephropathy
86.13% 91.48%H 90.51% 92.70% 2.19
Controlling High Blood Pressure 63.46% 60.16% 65.06% 65.43% 0.37 1 RY 2015 rates reflect MY data from January 1, 2014, through December 31, 2014. 2 RY 2016 rates reflect MY data from January 1, 2015, through December 31, 2015. 3 RY 2017 rates reflect MY data from January 1, 2016, through December 31, 2016. 4 RY 2018 rates reflect MY data from January 1, 2017, through December 31, 2017. 5 Performance comparisons are based on the Chi-square test of statistical significance, with a p value of <0.05. * A lower rate indicates better performance for this measure. -- Indicates that the rate is not available.
Health Net Community Solutions, Inc. Performance Evaluation Report: July 1, 2017–June 30, 2018 California Department of Health Care Services
Page O-43 Health Services Advisory Group, Inc.

MANAGED CARE HEALTH PLAN PERFORMANCE MEASURES
Table 3.31—Care for Chronic Conditions Domain Multi-Year Performance Measure Results Health Net—Sacramento County
H = Rate indicates performance above the HPL. Bolded Rate = Rate indicates performance below the MPL.
B = Statistical testing result indicates that the RY 2018 rate is significantly better than the RY 2017 rate.
W = Statistical testing result indicates that the RY 2018 rate is significantly worse than the RY 2017 rate.
Measure RY
2015 Rate1
RY 2016
Rate2
RY 2017
Rate3
RY 2018
Rate4
RYs 2017–18 Rate
Difference5
Annual Monitoring for Patients on Persistent Medications— ACE Inhibitors or ARBs
79.88% 85.68% 82.87% 84.72% 1.85B
Annual Monitoring for Patients on Persistent Medications— Diuretics
79.52% 84.46% 81.46% 84.15% 2.69B
Asthma Medication Ratio -- -- 60.98% 62.30% 1.32 Comprehensive Diabetes Care— Blood Pressure Control (<140/90 mm Hg)
59.12% 57.18% 57.42% 55.72% -1.70
Comprehensive Diabetes Care— Eye Exam (Retinal) Performed 39.90% 35.04% 40.88% 47.69% 6.81B
Comprehensive Diabetes Care— HbA1c Control (<8.0 Percent) 47.69% 49.39% 45.26% 45.99% 0.73
Comprehensive Diabetes Care— HbA1c Poor Control (>9.0 Percent)*
40.15% 39.90% 41.12% 43.07% 1.95
Comprehensive Diabetes Care— HbA1c Testing 78.59% 81.51% 78.35% 80.29% 1.94
Comprehensive Diabetes Care— Medical Attention for Nephropathy
84.67% 90.27%H 89.54% 89.78% 0.24
Controlling High Blood Pressure 58.88% 59.35% 54.77% 57.95% 3.18 1 RY 2015 rates reflect MY data from January 1, 2014, through December 31, 2014. 2 RY 2016 rates reflect MY data from January 1, 2015, through December 31, 2015. 3 RY 2017 rates reflect MY data from January 1, 2016, through December 31, 2016.
Health Net Community Solutions, Inc. Performance Evaluation Report: July 1, 2017–June 30, 2018 California Department of Health Care Services
Page O-44 Health Services Advisory Group, Inc.

MANAGED CARE HEALTH PLAN PERFORMANCE MEASURES
4 RY 2018 rates reflect MY data from January 1, 2017, through December 31, 2017. 5 Performance comparisons are based on the Chi-square test of statistical significance, with a p value of <0.05. * A lower rate indicates better performance for this measure. -- Indicates that the rate is not available.
Table 3.32—Care for Chronic Conditions Domain Multi-Year Performance Measure Results Health Net—San Diego County
H = Rate indicates performance above the HPL. Bolded Rate = Rate indicates performance below the MPL.
B = Statistical testing result indicates that the RY 2018 rate is significantly better than the RY 2017 rate.
W = Statistical testing result indicates that the RY 2018 rate is significantly worse than the RY 2017 rate.
Measure RY
2015 Rate1
RY 2016
Rate2
RY 2017
Rate3
RY 2018
Rate4
RYs 2017–18 Rate
Difference5
Annual Monitoring for Patients on Persistent Medications— ACE Inhibitors or ARBs
83.46% 82.48% 86.18% 86.55% 0.37
Annual Monitoring for Patients on Persistent Medications— Diuretics
84.51% 82.83% 85.40% 87.82% 2.42
Asthma Medication Ratio -- -- 64.15% 67.48% 3.33 Comprehensive Diabetes Care— Blood Pressure Control (<140/90 mm Hg)
57.91% 62.77% 65.69% 67.64% 1.95
Comprehensive Diabetes Care— Eye Exam (Retinal) Performed 49.15% 46.72% 57.91% 58.39% 0.48
Comprehensive Diabetes Care— HbA1c Control (<8.0 Percent) 47.20% 47.93% 49.64% 47.45% -2.19
Comprehensive Diabetes Care— HbA1c Poor Control (>9.0 Percent)*
43.31% 44.28% 37.23% 40.39% 3.16
Comprehensive Diabetes Care— HbA1c Testing 77.62% 77.37% 83.45% 82.73% -0.72
Health Net Community Solutions, Inc. Performance Evaluation Report: July 1, 2017–June 30, 2018 California Department of Health Care Services
Page O-45 Health Services Advisory Group, Inc.
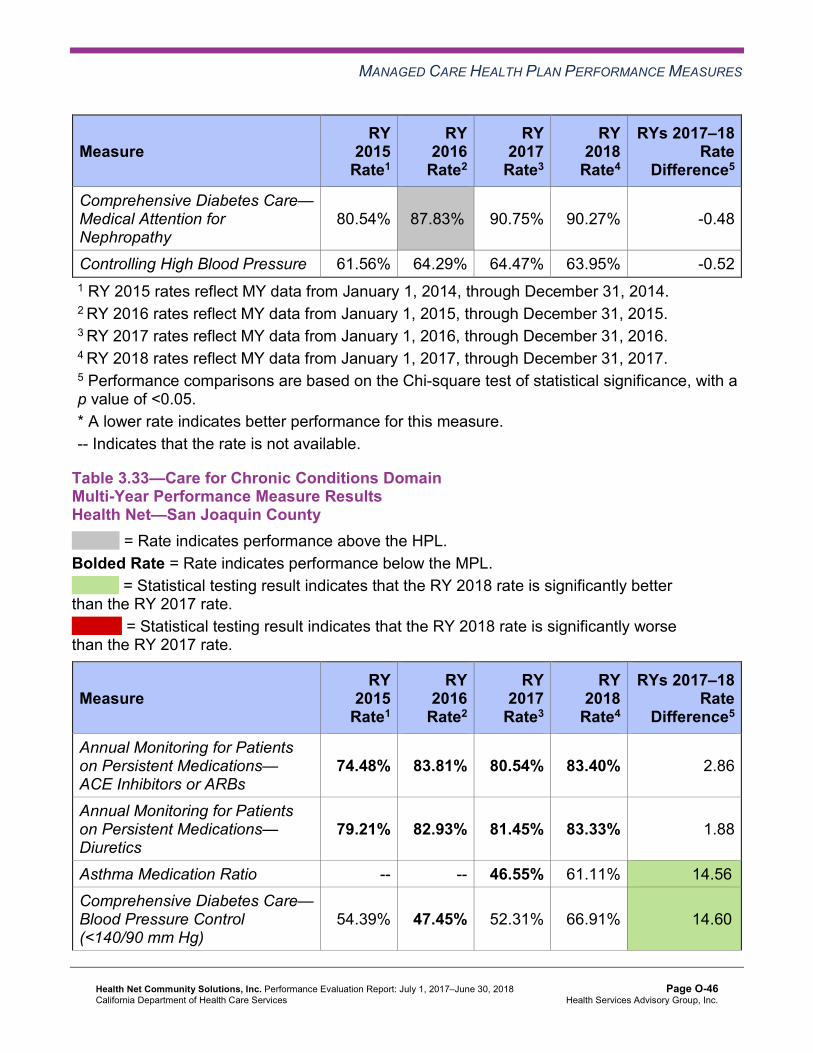
MANAGED CARE HEALTH PLAN PERFORMANCE MEASURES
Measure RY
2015 Rate1
RY 2016
Rate2
RY 2017
Rate3
RY 2018
Rate4
RYs 2017–18 Rate
Difference5
Comprehensive Diabetes Care— Medical Attention for Nephropathy
80.54% 87.83%H 90.75% 90.27% -0.48
Controlling High Blood Pressure 61.56% 64.29% 64.47% 63.95% -0.52 1 RY 2015 rates reflect MY data from January 1, 2014, through December 31, 2014. 2 RY 2016 rates reflect MY data from January 1, 2015, through December 31, 2015. 3 RY 2017 rates reflect MY data from January 1, 2016, through December 31, 2016. 4 RY 2018 rates reflect MY data from January 1, 2017, through December 31, 2017. 5 Performance comparisons are based on the Chi-square test of statistical significance, with a p value of <0.05. * A lower rate indicates better performance for this measure. -- Indicates that the rate is not available.
Table 3.33—Care for Chronic Conditions Domain Multi-Year Performance Measure Results Health Net—San Joaquin County
H = Rate indicates performance above the HPL. Bolded Rate = Rate indicates performance below the MPL.
B = Statistical testing result indicates that the RY 2018 rate is significantly better than the RY 2017 rate.
W = Statistical testing result indicates that the RY 2018 rate is significantly worse than the RY 2017 rate.
Measure RY
2015 Rate1
RY 2016
Rate2
RY 2017
Rate3
RY 2018
Rate4
RYs 2017–18 Rate
Difference5
Annual Monitoring for Patients on Persistent Medications— ACE Inhibitors or ARBs
74.48% 83.81% 80.54% 83.40% 2.86
Annual Monitoring for Patients on Persistent Medications— Diuretics
79.21% 82.93% 81.45% 83.33% 1.88
Asthma Medication Ratio -- -- 46.55% 61.11% 14.56B
Comprehensive Diabetes Care— Blood Pressure Control (<140/90 mm Hg)
54.39% 47.45% 52.31% 66.91% 14.60B
Health Net Community Solutions, Inc. Performance Evaluation Report: July 1, 2017–June 30, 2018 California Department of Health Care Services
Page O-46 Health Services Advisory Group, Inc.

MANAGED CARE HEALTH PLAN PERFORMANCE MEASURES
Measure RY
2015 Rate1
RY 2016
Rate2
RY 2017
Rate3
RY 2018
Rate4
RYs 2017–18 Rate
Difference5
Comprehensive Diabetes Care— Eye Exam (Retinal) Performed 53.82% 53.28% 54.50% 61.80% 7.30B
Comprehensive Diabetes Care— HbA1c Control (<8.0 Percent) 45.33% 39.90% 41.12% 43.80% 2.68
Comprehensive Diabetes Care— HbA1c Poor Control (>9.0 Percent)*
41.08% 50.85% 49.39% 44.77% -4.62
Comprehensive Diabetes Care— HbA1c Testing 81.87% 77.86% 73.97% 79.81% 5.84B
Comprehensive Diabetes Care— Medical Attention for Nephropathy
84.70% 89.05%H 83.21% 86.86% 3.65
Controlling High Blood Pressure 54.38% 38.88% 54.50% 57.95% 3.45 1 RY 2015 rates reflect MY data from January 1, 2014, through December 31, 2014. 2 RY 2016 rates reflect MY data from January 1, 2015, through December 31, 2015. 3 RY 2017 rates reflect MY data from January 1, 2016, through December 31, 2016. 4 RY 2018 rates reflect MY data from January 1, 2017, through December 31, 2017. 5 Performance comparisons are based on the Chi-square test of statistical significance, with a p value of <0.05. * A lower rate indicates better performance for this measure. -- Indicates that the rate is not available.
Health Net Community Solutions, Inc. Performance Evaluation Report: July 1, 2017–June 30, 2018 California Department of Health Care Services
Page O-47 Health Services Advisory Group, Inc.

MANAGED CARE HEALTH PLAN PERFORMANCE MEASURES
Table 3.34—Care for Chronic Conditions Domain Multi-Year Performance Measure Results Health Net—Stanislaus County
H = Rate indicates performance above the HPL. Bolded Rate = Rate indicates performance below the MPL.
B = Statistical testing result indicates that the RY 2018 rate is significantly better than the RY 2017 rate.
W = Statistical testing result indicates that the RY 2018 rate is significantly worse than the RY 2017 rate.
Measure RY
2015 Rate1
RY 2016
Rate2
RY 2017
Rate3
RY 2018
Rate4
RYs 2017–18 Rate
Difference5
Annual Monitoring for Patients on Persistent Medications— ACE Inhibitors or ARBs
80.74% 84.19% 83.64% 84.67% 1.03
Annual Monitoring for Patients on Persistent Medications— Diuretics
85.11% 83.98% 83.07% 84.26% 1.19
Asthma Medication Ratio -- -- 60.33% 65.10% 4.77B
Comprehensive Diabetes Care— Blood Pressure Control (<140/90 mm Hg)
63.75% 59.61% 63.99% 62.53% -1.46
Comprehensive Diabetes Care— Eye Exam (Retinal) Performed 46.47% 44.28% 39.66% 36.25% -3.41
Comprehensive Diabetes Care— HbA1c Control (<8.0 Percent) 47.20% 41.85% 52.31% 47.93% -4.38
Comprehensive Diabetes Care— HbA1c Poor Control (>9.0 Percent)*
41.36% 45.74% 38.93% 41.12% 2.19
Comprehensive Diabetes Care— HbA1c Testing 80.29% 82.97% 81.75% 85.40% 3.65
Comprehensive Diabetes Care— Medical Attention for Nephropathy
75.43% 88.08%H 88.32% 88.56% 0.24
Controlling High Blood Pressure 63.46% 57.55% 61.29% 62.76% 1.47 1 RY 2015 rates reflect MY data from January 1, 2014, through December 31, 2014. 2 RY 2016 rates reflect MY data from January 1, 2015, through December 31, 2015. 3 RY 2017 rates reflect MY data from January 1, 2016, through December 31, 2016.
Health Net Community Solutions, Inc. Performance Evaluation Report: July 1, 2017–June 30, 2018 California Department of Health Care Services
Page O-48 Health Services Advisory Group, Inc.

MANAGED CARE HEALTH PLAN PERFORMANCE MEASURES
4 RY 2018 rates reflect MY data from January 1, 2017, through December 31, 2017. 5 Performance comparisons are based on the Chi-square test of statistical significance, with a p value of <0.05. * A lower rate indicates better performance for this measure. -- Indicates that the rate is not available.
Table 3.35—Care for Chronic Conditions Domain Multi-Year Performance Measure Results Health Net—Tulare County
H = Rate indicates performance above the HPL. Bolded Rate = Rate indicates performance below the MPL.
B = Statistical testing result indicates that the RY 2018 rate is significantly better than the RY 2017 rate.
W = Statistical testing result indicates that the RY 2018 rate is significantly worse than the RY 2017 rate.
Measure RY
2015 Rate1
RY 2016
Rate2
RY 2017
Rate3
RY 2018
Rate4
RYs 2017–18 Rate
Difference5
Annual Monitoring for Patients on Persistent Medications— ACE Inhibitors or ARBs
84.34% 84.52% 86.31% 86.60% 0.29
Annual Monitoring for Patients on Persistent Medications— Diuretics
85.51% 83.68% 85.20% 86.02% 0.82
Asthma Medication Ratio -- -- 68.54% 71.16% 2.62 Comprehensive Diabetes Care— Blood Pressure Control (<140/90 mm Hg)
61.80% 69.34% 66.67% 70.80% 4.13
Comprehensive Diabetes Care— Eye Exam (Retinal) Performed 50.61% 51.09% 52.80% 57.66% 4.86
Comprehensive Diabetes Care— HbA1c Control (<8.0 Percent) 49.39% 44.04% 48.91% 48.42% -0.49
Comprehensive Diabetes Care— HbA1c Poor Control (>9.0 Percent)*
40.88% 43.80% 41.36% 40.15% -1.21
Comprehensive Diabetes Care— HbA1c Testing 84.18% 87.35% 85.40% 90.75% 5.35B
Health Net Community Solutions, Inc. Performance Evaluation Report: July 1, 2017–June 30, 2018 California Department of Health Care Services
Page O-49 Health Services Advisory Group, Inc.

MANAGED CARE HEALTH PLAN PERFORMANCE MEASURES
Measure RY
2015 Rate1
RY 2016
Rate2
RY 2017
Rate3
RY 2018
Rate4
RYs 2017–18 Rate
Difference5
Comprehensive Diabetes Care— Medical Attention for Nephropathy
87.83%H 91.73%H 89.29% 91.24% 1.95
Controlling High Blood Pressure 64.72% 60.79% 61.52% 62.76% 1.24 1 RY 2015 rates reflect MY data from January 1, 2014, through December 31, 2014. 2 RY 2016 rates reflect MY data from January 1, 2015, through December 31, 2015. 3 RY 2017 rates reflect MY data from January 1, 2016, through December 31, 2016. 4 RY 2018 rates reflect MY data from January 1, 2017, through December 31, 2017. 5 Performance comparisons are based on the Chi-square test of statistical significance, with a p value of <0.05. * A lower rate indicates better performance for this measure. -- Indicates that the rate is not available.
Table 3.36 through Table 3.42 present findings for the RY 2018 performance measures within the Care for Chronic Conditions domain. Note that the Asthma Medication Ratio measure was a first-year measure in RY 2017, and DHCS did not hold MCPs accountable to meet an MPL for this measure in RY 2017; therefore, HSAG did not include this measure in the denominators for calculating the percentage of measures with rates that moved to above or below the MPLs in RY 2018.
Table 3.36—Care for Chronic Conditions Domain RY 2018 (MY 2017) Performance Measure Findings Health Net—Kern County
Criteria Number of Measures
MeetingCriteria
Total Number of Measures
Percentage of Measures
MeetingCriteria
RY 2018 Rates Above HPLs 0 10 0.00% Rates Above HPLs for the Last Three or More Consecutive Years 0 9 0.00%
RY 2018 Rates Significantly Better than RY 2017 Rates* 2 10 20.00%
Rates that Moved from Below MPLs in RY 2017 to Above MPLs in RY 2018 0 0 N/A
RY 2018 Rates Below MPLs 1 10 10.00%
Health Net Community Solutions, Inc. Performance Evaluation Report: July 1, 2017–June 30, 2018 California Department of Health Care Services
Page O-50 Health Services Advisory Group, Inc.

MANAGED CARE HEALTH PLAN PERFORMANCE MEASURES
Criteria Number of Measures
MeetingCriteria
Total Number of Measures
Percentage of Measures
MeetingCriteria
Rates Below MPLs for the Last Three or More Consecutive Years 0 9 0.00%
RY 2018 Rates Significantly Worse than RY 2017 Rates* 0 10 0.00%
Rates that Moved from Above MPLs in RY 2017 to Below MPLs in RY 2018 0 9 0.00%
* Performance comparisons are based on the Chi-square test of statistical significance, with a p value of <0.05. N/A = No rates above or below the MPLs from the previous year exist to include in the denominator for calculating whether or not rates moved to above or below MPLs in the most recent year.
Table 3.37—Care for Chronic Conditions Domain RY 2018 (MY 2017) Performance Measure Findings Health Net—Los Angeles County
Criteria Number of Measures
MeetingCriteria
Total Number of Measures
Percentage of Measures
MeetingCriteria
RY 2018 Rates Above HPLs 0 10 0.00% Rates Above HPLs for the Last Three or More Consecutive Years 0 9 0.00%
RY 2018 Rates Significantly Better than RY 2017 Rates* 1 10 10.00%
Rates that Moved from Below MPLs in RY 2017 to Above MPLs in RY 2018 0 0 N/A
RY 2018 Rates Below MPLs 0 10 0.00% Rates Below MPLs for the Last Three or More Consecutive Years 0 9 0.00%
RY 2018 Rates Significantly Worse than RY 2017 Rates* 0 10 0.00%
Rates that Moved from Above MPLs in RY 2017 to Below MPLs in RY 2018 0 9 0.00%
Health Net Community Solutions, Inc. Performance Evaluation Report: July 1, 2017–June 30, 2018 California Department of Health Care Services
Page O-51 Health Services Advisory Group, Inc.

MANAGED CARE HEALTH PLAN PERFORMANCE MEASURES
* Performance comparisons are based on the Chi-square test of statistical significance, with a p value of <0.05. N/A = No rates above or below the MPLs from the previous year exist to include in the denominator for calculating whether or not rates moved to above or below MPLs in the most recent year.
Table 3.38—Care for Chronic Conditions Domain RY 2018 (MY 2017) Performance Measure Findings Health Net—Sacramento County
Criteria Number of Measures
MeetingCriteria
Total Number of Measures
Percentage of Measures
MeetingCriteria
RY 2018 Rates Above HPLs 0 10 0.00% Rates Above HPLs for the Last Three or More Consecutive Years 0 9 0.00%
RY 2018 Rates Significantly Better than RY 2017 Rates* 3 10 30.00%
Rates that Moved from Below MPLs in RY 2017 to Above MPLs in RY 2018 1 4 25.00%
RY 2018 Rates Below MPLs 3 10 30.00% Rates Below MPLs for the Last Three or More Consecutive Years 2 9 22.22%
RY 2018 Rates Significantly Worse than RY 2017 Rates* 0 10 0.00%
Rates that Moved from Above MPLs in RY 2017 to Below MPLs in RY 2018 0 5 0.00%
* Performance comparisons are based on the Chi-square test of statistical significance, with a p value of <0.05.
Health Net Community Solutions, Inc. Performance Evaluation Report: July 1, 2017–June 30, 2018 California Department of Health Care Services
Page O-52 Health Services Advisory Group, Inc.

MANAGED CARE HEALTH PLAN PERFORMANCE MEASURES
Table 3.39—Care for Chronic Conditions Domain RY 2018 (MY 2017) Performance Measure Findings Health Net—San Diego County
Criteria Number of Measures
MeetingCriteria
Total Number of Measures
Percentage of Measures
MeetingCriteria
RY 2018 Rates Above HPLs 0 10 0.00% Rates Above HPLs for the Last Three or More Consecutive Years 0 9 0.00%
RY 2018 Rates Significantly Better than RY 2017 Rates* 0 10 0.00%
Rates that Moved from Below MPLs in RY 2017 to Above MPLs in RY 2018 0 0 N/A
RY 2018 Rates Below MPLs 1 10 10.00% Rates Below MPLs for the Last Three or More Consecutive Years 0 9 0.00%
RY 2018 Rates Significantly Worse than RY 2017 Rates* 0 10 0.00%
Rates that Moved from Above MPLs in RY 2017 to Below MPLs in RY 2018 1 9 11.11%
* Performance comparisons are based on the Chi-square test of statistical significance, with a p value of <0.05. N/A = No rates above or below the MPLs from the previous year exist to include in the denominator for calculating whether or not rates moved to above or below MPLs in the most recent year.
Health Net Community Solutions, Inc. Performance Evaluation Report: July 1, 2017–June 30, 2018 California Department of Health Care Services
Page O-53 Health Services Advisory Group, Inc.

MANAGED CARE HEALTH PLAN PERFORMANCE MEASURES
Table 3.40—Care for Chronic Conditions Domain RY 2018 (MY 2017) Performance Measure Findings Health Net—San Joaquin County
Criteria Number of Measures
MeetingCriteria
Total Number of Measures
Percentage of Measures
MeetingCriteria
RY 2018 Rates Above HPLs 0 10 0.00% Rates Above HPLs for the Last Three or More Consecutive Years 0 9 0.00%
RY 2018 Rates Significantly Better than RY 2017 Rates* 4 10 40.00%
Rates that Moved from Below MPLs in RY 2017 to Above MPLs in RY 2018 0 4 0.00%
RY 2018 Rates Below MPLs 4 10 40.00% Rates Below MPLs for the Last Three or More Consecutive Years 3 9 33.33%
RY 2018 Rates Significantly Worse than RY 2017 Rates* 0 10 0.00%
Rates that Moved from Above MPLs in RY 2017 to Below MPLs in RY 2018 0 5 0.00%
* Performance comparisons are based on the Chi-square test of statistical significance, with a p value of <0.05.
Health Net Community Solutions, Inc. Performance Evaluation Report: July 1, 2017–June 30, 2018 California Department of Health Care Services
Page O-54 Health Services Advisory Group, Inc.

MANAGED CARE HEALTH PLAN PERFORMANCE MEASURES
Table 3.41—Care for Chronic Conditions Domain RY 2018 (MY 2017) Performance Measure Findings Health Net—Stanislaus County
Criteria Number of Measures
MeetingCriteria
Total Number of Measures
Percentage of Measures
MeetingCriteria
RY 2018 Rates Above HPLs 0 10 0.00% Rates Above HPLs for the Last Three or More Consecutive Years 0 9 0.00%
RY 2018 Rates Significantly Better than RY 2017 Rates* 1 10 10.00%
Rates that Moved from Below MPLs in RY 2017 to Above MPLs in RY 2018 1 4 25.00%
RY 2018 Rates Below MPLs 3 10 30.00% Rates Below MPLs for the Last Three or More Consecutive Years 3 9 33.33%
RY 2018 Rates Significantly Worse than RY 2017 Rates* 0 10 0.00%
Rates that Moved from Above MPLs in RY 2017 to Below MPLs in RY 2018 0 5 0.00%
* Performance comparisons are based on the Chi-square test of statistical significance, with a p value of <0.05.
Health Net Community Solutions, Inc. Performance Evaluation Report: July 1, 2017–June 30, 2018 California Department of Health Care Services
Page O-55 Health Services Advisory Group, Inc.

MANAGED CARE HEALTH PLAN PERFORMANCE MEASURES
Table 3.42—Care for Chronic Conditions Domain RY 2018 (MY 2017) Performance Measure Findings Health Net—Tulare County
Criteria Number of Measures
MeetingCriteria
Total Number of Measures
Percentage of Measures
MeetingCriteria
RY 2018 Rates Above HPLs 0 10 0.00% Rates Above HPLs for the Last Three or More Consecutive Years 0 9 0.00%
RY 2018 Rates Significantly Better than RY 2017 Rates* 1 10 10.00%
Rates that Moved from Below MPLs in RY 2017 to Above MPLs in RY 2018 0 0 N/A
RY 2018 Rates Below MPLs 0 10 0.00% Rates Below MPLs for the Last Three or More Consecutive Years 0 9 0.00%
RY 2018 Rates Significantly Worse than RY 2017 Rates* 0 10 0.00%
Rates that Moved from Above MPLs in RY 2017 to Below MPLs in RY 2018 0 9 0.00%
* Performance comparisons are based on the Chi-square test of statistical significance, with a p value of <0.05. N/A = No rates above or below the MPLs from the previous year exist to include in the denominator for calculating whether or not rates moved to above or below MPLs in the most recent year.
Assessment of Corrective Action Plan Efforts—Care for Chronic Conditions
As part of Health Net’s CAP, DHCS approved Health Net to conduct one set of PDSA cycles to address the MCP’s performance below the MPLs on the following measures within the Care for Chronic Conditions domain:
♦ Both Annual Monitoring for Patients on Persistent Medications measures in Sacramento, San Joaquin, and Stanislaus counties
♦ Comprehensive Diabetes Care—Eye Exam (Retinal) Performed in Sacramento and Stanislaus counties
♦ Comprehensive Diabetes Care—HbA1c Testing in Sacramento, San Joaquin, and Stanislaus counties
♦ Comprehensive Diabetes Care—Medical Attention for Nephropathy in San Joaquin County
Health Net Community Solutions, Inc. Performance Evaluation Report: July 1, 2017–June 30, 2018 California Department of Health Care Services
Page O-56 Health Services Advisory Group, Inc.

MANAGED CARE HEALTH PLAN PERFORMANCE MEASURES
Health Net conducted two PDSA cycles to test whether or not deploying a countywide in-home screening program for beneficiaries non-compliant with completing the required lab tests related to the Annual Monitoring for Patients on Persistent Medications and Comprehensive Diabetes Care measures would help improve the MCP’s rates for these measures. After the first PDSA cycle, Health Net used pharmacy data to improve the accuracy and completeness of the beneficiary contact information. After conducting both PDSA cycles, Health Net reported learning that the in-home screening program provided an opportunity for beneficiaries to complete tests and was especially helpful for beneficiaries with barriers related to transportation, mobility, and time.
The RY 2018 performance measure results for the Care for Chronic Conditions domain measures included in the MCP’s CAP were as follows:
♦ Both Annual Monitoring for Patients on Persistent Medications measures: ■ The rates improved significantly from RY 2017 to RY 2018 for both measures in
Sacramento County; however, the rates for both measures remained below the MPLs in RY 2018 in this reporting unit.
■ The rates for both measures remained below the MPLs in RY 2018 in San Joaquin and Stanislaus counties.
♦ Comprehensive Diabetes Care—Eye Exam (Retinal) Performed: ■ The rate improved significantly from RY 2017 to RY 2018 in Sacramento County,
resulting in the rate for this measure moving from below the MPL in RY 2017 to above the MPL in RY 2018.
■ The rate remained below the MPL in Stanislaus County in RY 2018. ♦ Comprehensive Diabetes Care—HbA1c Testing:
■ The rate in Stanislaus County improved from RY 2017 to RY 2018. Although the improvement was not statistically significant, the change resulted in the rate moving from below the MPL in RY 2017 to above the MPL in RY 2018.
■ The rate improved significantly from RY 2017 to RY 2018 in San Joaquin County; however, the rate remained below the MPL in RY 2018.
■ The rate remained below the MPL in Sacramento County in RY 2018. ♦ The rate for the Comprehensive Diabetes Care—Medical Attention for Nephropathy
measure remained below the MPL in RY 2018 in San Joaquin County.
Health Net Community Solutions, Inc. Performance Evaluation Report: July 1, 2017–June 30, 2018 California Department of Health Care Services
Page O-57 Health Services Advisory Group, Inc.
MANAGED CARE HEALTH PLAN PERFORMANCE MEASURES
Appropriate Treatment and Utilization
Table 3.43 through Table 3.49 present the four-year trending information for the performance measures within the Appropriate Treatment and Utilization domain.
Note the following regarding Table 3.43 through Table 3.49:
♦ The All-Cause Readmissions measure is a non-HEDIS measure originally developed for DHCS’ All-Cause Readmissions collaborative quality improvement project (QIP); therefore, DHCS does not establish an HPL or MPL for this measure. For the All-Cause Readmissions measure, a lower rate indicates better performance (i.e., fewer readmissions).
♦ The two Ambulatory Care measures are utilization measures, which measure the volume of services used. DHCS does not hold MCPs accountable to meet MPLs for utilization measures, and HSAG does not compare performance for these measures against HPLs and MPLs. Additionally, because high and low rates do not necessarily indicate better or worse performance, HSAG did not compare performance for these measures across years.
♦ DHCS established no HPL or MPL for the two Depression Screening and Follow-Up for Adolescents and Adults measures for RY 2018 because no comparable benchmarks exist. Additionally, although MCPs reported the two Depression Screening and Follow-Up for Adolescents and Adults measures for RY 2018, HSAG does not present the performance measure results for these measures in this report because the reported rates do not accurately represent services being provided. This is due to the Depression Screening and Follow-Up for Adolescents and Adults measures being new HEDIS measures for RY 2018, NCQA requiring MCPs to submit rates for these measures using the new Electronic Clinical Data Systems (ECDS) reporting methodology, and inconsistent data reporting processes by calculation vendors. Thus, MCPs experienced numerous challenges obtaining data sources to use for ECDS reporting. DHCS and HSAG, in consultation with NCQA, will work with MCPs to improve data capture for RY 2019.
♦ Note that due to changes that NCQA made to the specifications for the Use of Imaging Studies for Low Back Pain measure in RY 2018, NCQA released guidance to exercise caution when trending the results for this measure. Therefore, caution should be used when comparing MCP performance across years or when comparing MCP results to benchmarks related to the Use of Imaging Studies for Low Back Pain measure, as differences in rates may be a result of the specification changes rather than a reflection of performance.
Health Net Community Solutions, Inc. Performance Evaluation Report: July 1, 2017–June 30, 2018 California Department of Health Care Services
Page O-58 Health Services Advisory Group, Inc.
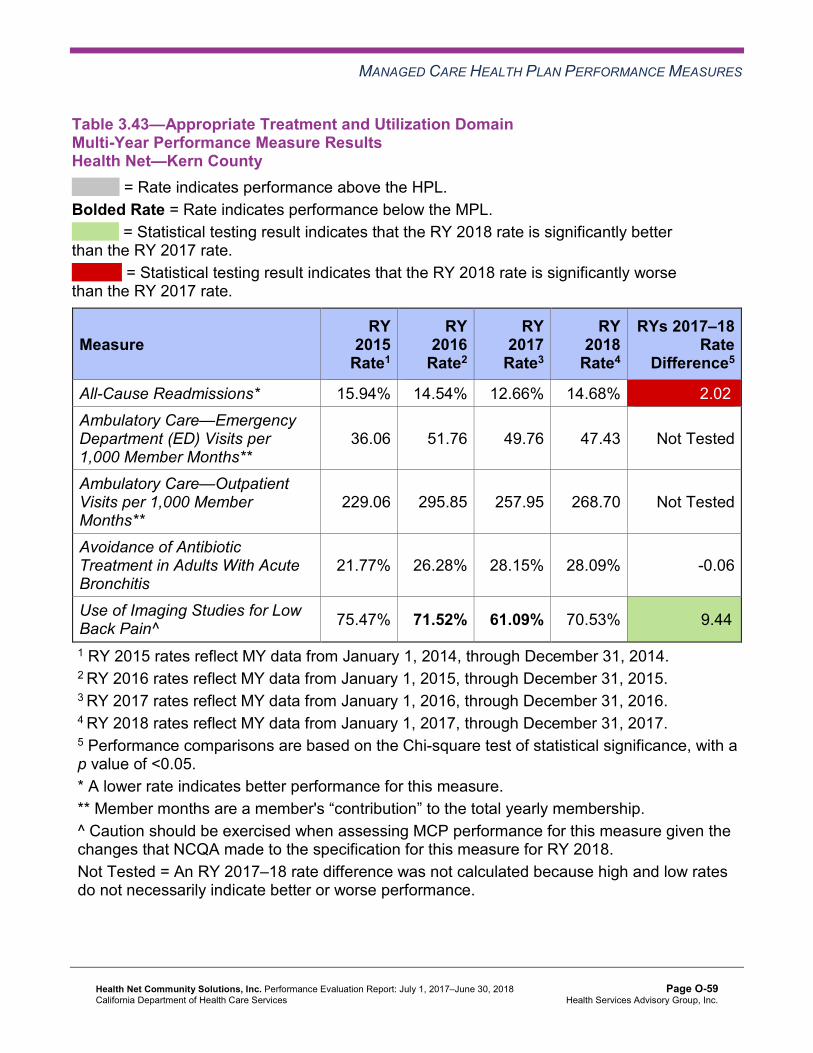
MANAGED CARE HEALTH PLAN PERFORMANCE MEASURES
Table 3.43—Appropriate Treatment and Utilization DomainMulti-Year Performance Measure Results Health Net—Kern County
H = Rate indicates performance above the HPL. Bolded Rate = Rate indicates performance below the MPL.
B = Statistical testing result indicates that the RY 2018 rate is significantly better than the RY 2017 rate.
W = Statistical testing result indicates that the RY 2018 rate is significantly worse than the RY 2017 rate.
Measure RY
2015 Rate1
RY 2016
Rate2
RY 2017
Rate3
RY 2018
Rate4
RYs 2017–18 Rate
Difference5
All-Cause Readmissions* 15.94% 14.54% 12.66% 14.68% 2.02W
Ambulatory Care—Emergency Department (ED) Visits per 1,000 Member Months**
36.06 51.76 49.76 47.43 Not Tested
Ambulatory Care—Outpatient Visits per 1,000 Member Months**
229.06 295.85 257.95 268.70 Not Tested
Avoidance of Antibiotic Treatment in Adults With Acute Bronchitis
21.77% 26.28% 28.15% 28.09% -0.06
Use of Imaging Studies for Low Back Pain^ 75.47% 71.52% 61.09% 70.53% 9.44B
1 RY 2015 rates reflect MY data from January 1, 2014, through December 31, 2014. 2 RY 2016 rates reflect MY data from January 1, 2015, through December 31, 2015. 3 RY 2017 rates reflect MY data from January 1, 2016, through December 31, 2016. 4 RY 2018 rates reflect MY data from January 1, 2017, through December 31, 2017. 5 Performance comparisons are based on the Chi-square test of statistical significance, with a p value of <0.05. * A lower rate indicates better performance for this measure. ** Member months are a member's “contribution” to the total yearly membership. ^ Caution should be exercised when assessing MCP performance for this measure given the changes that NCQA made to the specification for this measure for RY 2018. Not Tested = An RY 2017–18 rate difference was not calculated because high and low rates do not necessarily indicate better or worse performance.
Health Net Community Solutions, Inc. Performance Evaluation Report: July 1, 2017–June 30, 2018 California Department of Health Care Services
Page O-59 Health Services Advisory Group, Inc.

MANAGED CARE HEALTH PLAN PERFORMANCE MEASURES
Table 3.44—Appropriate Treatment and Utilization DomainMulti-Year Performance Measure Results Health Net—Los Angeles County
H = Rate indicates performance above the HPL. Bolded Rate = Rate indicates performance below the MPL.
B = Statistical testing result indicates that the RY 2018 rate is significantly better than the RY 2017 rate.
W = Statistical testing result indicates that the RY 2018 rate is significantly worse than the RY 2017 rate.
Measure RY
2015 Rate1
RY 2016
Rate2
RY 2017
Rate3
RY 2018
Rate4
RYs 2017–18 Rate
Difference5
All-Cause Readmissions* 17.29% 16.00% 14.40% 15.17% 0.77W
Ambulatory Care—Emergency Department (ED) Visits per 1,000 Member Months**
22.52 33.98 35.36 38.34 Not Tested
Ambulatory Care—Outpatient Visits per 1,000 Member Months**
170.14 246.76 239.27 228.93 Not Tested
Avoidance of Antibiotic Treatment in Adults With Acute Bronchitis
31.32% 32.06% 29.99% 31.95% 1.96B
Use of Imaging Studies for Low Back Pain^ 76.71% 75.62% 68.94% 76.09% 7.15B
1 RY 2015 rates reflect MY data from January 1, 2014, through December 31, 2014. 2 RY 2016 rates reflect MY data from January 1, 2015, through December 31, 2015. 3 RY 2017 rates reflect MY data from January 1, 2016, through December 31, 2016. 4 RY 2018 rates reflect MY data from January 1, 2017, through December 31, 2017. 5 Performance comparisons are based on the Chi-square test of statistical significance, with a p value of <0.05. * A lower rate indicates better performance for this measure. ** Member months are a member's “contribution” to the total yearly membership. ^ Caution should be exercised when assessing MCP performance for this measure given the changes that NCQA made to the specification for this measure for RY 2018. Not Tested = An RY 2017–18 rate difference was not calculated because high and low rates do not necessarily indicate better or worse performance.
Health Net Community Solutions, Inc. Performance Evaluation Report: July 1, 2017–June 30, 2018 California Department of Health Care Services
Page O-60 Health Services Advisory Group, Inc.

MANAGED CARE HEALTH PLAN PERFORMANCE MEASURES
Table 3.45—Appropriate Treatment and Utilization DomainMulti-Year Performance Measure Results Health Net—Sacramento County
H = Rate indicates performance above the HPL. Bolded Rate = Rate indicates performance below the MPL.
B = Statistical testing result indicates that the RY 2018 rate is significantly better than the RY 2017 rate.
W = Statistical testing result indicates that the RY 2018 rate is significantly worse than the RY 2017 rate.
Measure RY
2015 Rate1
RY 2016
Rate2
RY 2017
Rate3
RY 2018
Rate4
RYs 2017–18 Rate
Difference5
All-Cause Readmissions* 17.19% 15.62% 15.97% 16.90% 0.93 Ambulatory Care—Emergency Department (ED) Visits per 1,000 Member Months**
30.09 50.27 50.46 51.44 Not Tested
Ambulatory Care—Outpatient Visits per 1,000 Member Months**
172.89 206.66 217.25 212.52 Not Tested
Avoidance of Antibiotic Treatment in Adults With Acute Bronchitis
30.96% 30.57% 38.79% 43.75%H 4.96
Use of Imaging Studies for Low Back Pain^ 78.12% 76.96% 70.46% 73.01% 2.55
1 RY 2015 rates reflect MY data from January 1, 2014, through December 31, 2014. 2 RY 2016 rates reflect MY data from January 1, 2015, through December 31, 2015. 3 RY 2017 rates reflect MY data from January 1, 2016, through December 31, 2016. 4 RY 2018 rates reflect MY data from January 1, 2017, through December 31, 2017. 5 Performance comparisons are based on the Chi-square test of statistical significance, with a p value of <0.05. * A lower rate indicates better performance for this measure. ** Member months are a member's “contribution” to the total yearly membership. ^ Caution should be exercised when assessing MCP performance for this measure given the changes that NCQA made to the specification for this measure for RY 2018. Not Tested = An RY 2017–18 rate difference was not calculated because high and low rates do not necessarily indicate better or worse performance.
Health Net Community Solutions, Inc. Performance Evaluation Report: July 1, 2017–June 30, 2018 California Department of Health Care Services
Page O-61 Health Services Advisory Group, Inc.

MANAGED CARE HEALTH PLAN PERFORMANCE MEASURES
Table 3.46—Appropriate Treatment and Utilization DomainMulti-Year Performance Measure Results Health Net—San Diego County
H = Rate indicates performance above the HPL. Bolded Rate = Rate indicates performance below the MPL.
B = Statistical testing result indicates that the RY 2018 rate is significantly better than the RY 2017 rate.
W = Statistical testing result indicates that the RY 2018 rate is significantly worse than the RY 2017 rate.
Measure RY
2015 Rate1
RY 2016
Rate2
RY 2017
Rate3
RY 2018
Rate4
RYs 2017–18 Rate
Difference5
All-Cause Readmissions* 24.12% 22.11% 20.85% 20.88% 0.03 Ambulatory Care—Emergency Department (ED) Visits per 1,000 Member Months**
25.76 37.53 34.92 35.50 Not Tested
Ambulatory Care—Outpatient Visits per 1,000 Member Months**
207.58 243.95 224.56 219.47 Not Tested
Avoidance of Antibiotic Treatment in Adults With Acute Bronchitis
33.82% 29.82% 34.15% 52.71%H 18.56B
Use of Imaging Studies for Low Back Pain^ 74.80% 76.96% 62.77% 74.92% 12.15B
1 RY 2015 rates reflect MY data from January 1, 2014, through December 31, 2014. 2 RY 2016 rates reflect MY data from January 1, 2015, through December 31, 2015. 3 RY 2017 rates reflect MY data from January 1, 2016, through December 31, 2016. 4 RY 2018 rates reflect MY data from January 1, 2017, through December 31, 2017. 5 Performance comparisons are based on the Chi-square test of statistical significance, with a p value of <0.05. * A lower rate indicates better performance for this measure. ** Member months are a member's “contribution” to the total yearly membership. ^ Caution should be exercised when assessing MCP performance for this measure given the changes that NCQA made to the specification for this measure for RY 2018. Not Tested = An RY 2017–18 rate difference was not calculated because high and low rates do not necessarily indicate better or worse performance.
Health Net Community Solutions, Inc. Performance Evaluation Report: July 1, 2017–June 30, 2018 California Department of Health Care Services
Page O-62 Health Services Advisory Group, Inc.

MANAGED CARE HEALTH PLAN PERFORMANCE MEASURES
Table 3.47—Appropriate Treatment and Utilization DomainMulti-Year Performance Measure Results Health Net—San Joaquin County
H = Rate indicates performance above the HPL. Bolded Rate = Rate indicates performance below the MPL.
B = Statistical testing result indicates that the RY 2018 rate is significantly better than the RY 2017 rate.
W = Statistical testing result indicates that the RY 2018 rate is significantly worse than the RY 2017 rate.
Measure RY
2015 Rate1
RY 2016
Rate2
RY 2017
Rate3
RY 2018
Rate4
RYs 2017–18 Rate
Difference5
All-Cause Readmissions* 21.67% 15.15% 21.87% 22.19% 0.32 Ambulatory Care—Emergency Department (ED) Visits per 1,000 Member Months**
31.01 50.08 46.76 46.27 Not Tested
Ambulatory Care—Outpatient Visits per 1,000 Member Months**
143.82 184.62 178.79 174.47 Not Tested
Avoidance of Antibiotic Treatment in Adults With Acute Bronchitis
26.32% 25.81% 19.47% 25.48% 6.01
Use of Imaging Studies for Low Back Pain^ 80.72% 75.60% 70.97% 79.37%H 8.40B
1 RY 2015 rates reflect MY data from January 1, 2014, through December 31, 2014. 2 RY 2016 rates reflect MY data from January 1, 2015, through December 31, 2015. 3 RY 2017 rates reflect MY data from January 1, 2016, through December 31, 2016. 4 RY 2018 rates reflect MY data from January 1, 2017, through December 31, 2017. 5 Performance comparisons are based on the Chi-square test of statistical significance, with a p value of <0.05. * A lower rate indicates better performance for this measure. ** Member months are a member's “contribution” to the total yearly membership. ^ Caution should be exercised when assessing MCP performance for this measure given the changes that NCQA made to the specification for this measure for RY 2018. Not Tested = An RY 2017–18 rate difference was not calculated because high and low rates do not necessarily indicate better or worse performance.
Health Net Community Solutions, Inc. Performance Evaluation Report: July 1, 2017–June 30, 2018 California Department of Health Care Services
Page O-63 Health Services Advisory Group, Inc.

MANAGED CARE HEALTH PLAN PERFORMANCE MEASURES
Table 3.48—Appropriate Treatment and Utilization DomainMulti-Year Performance Measure Results Health Net—Stanislaus County
H = Rate indicates performance above the HPL. Bolded Rate = Rate indicates performance below the MPL.
B = Statistical testing result indicates that the RY 2018 rate is significantly better than the RY 2017 rate.
W = Statistical testing result indicates that the RY 2018 rate is significantly worse than the RY 2017 rate.
Measure RY
2015 Rate1
RY 2016
Rate2
RY 2017
Rate3
RY 2018
Rate4
RYs 2017–18 Rate
Difference5
All-Cause Readmissions* 15.37% 16.21% 15.62% 15.78% 0.16 Ambulatory Care—Emergency Department (ED) Visits per 1,000 Member Months**
41.14 58.30 56.01 54.36 Not Tested
Ambulatory Care—Outpatient Visits per 1,000 Member Months**
230.36 279.85 256.42 232.13 Not Tested
Avoidance of Antibiotic Treatment in Adults With Acute Bronchitis
30.69% 29.04% 26.64% 34.56% 7.92B
Use of Imaging Studies for Low Back Pain^ 80.41% 78.74% 70.98% 71.83% 0.85
1 RY 2015 rates reflect MY data from January 1, 2014, through December 31, 2014. 2 RY 2016 rates reflect MY data from January 1, 2015, through December 31, 2015. 3 RY 2017 rates reflect MY data from January 1, 2016, through December 31, 2016. 4 RY 2018 rates reflect MY data from January 1, 2017, through December 31, 2017. 5 Performance comparisons are based on the Chi-square test of statistical significance, with a p value of <0.05. * A lower rate indicates better performance for this measure. ** Member months are a member's “contribution” to the total yearly membership. ^ Caution should be exercised when assessing MCP performance for this measure given the changes that NCQA made to the specification for this measure for RY 2018. Not Tested = An RY 2017–18 rate difference was not calculated because high and low rates do not necessarily indicate better or worse performance.
Health Net Community Solutions, Inc. Performance Evaluation Report: July 1, 2017–June 30, 2018 California Department of Health Care Services
Page O-64 Health Services Advisory Group, Inc.

MANAGED CARE HEALTH PLAN PERFORMANCE MEASURES
Table 3.49—Appropriate Treatment and Utilization DomainMulti-Year Performance Measure Results Health Net—Tulare County
H = Rate indicates performance above the HPL. Bolded Rate = Rate indicates performance below the MPL.
B = Statistical testing result indicates that the RY 2018 rate is significantly better than the RY 2017 rate.
W = Statistical testing result indicates that the RY 2018 rate is significantly worse than the RY 2017 rate.
Measure RY
2015 Rate1
RY 2016
Rate2
RY 2017
Rate3
RY 2018
Rate4
RYs 2017–18 Rate
Difference5
All-Cause Readmissions* 12.75% 13.02% 13.95% 14.45% 0.50 Ambulatory Care—Emergency Department (ED) Visits per 1,000 Member Months**
27.13 42.97 38.78 37.01 Not Tested
Ambulatory Care—Outpatient Visits per 1,000 Member Months**
311.82 355.23 364.25 355.45 Not Tested
Avoidance of Antibiotic Treatment in Adults With Acute Bronchitis
23.25% 23.27% 26.71% 26.64% -0.07
Use of Imaging Studies for Low Back Pain^ 81.70% 81.41% 74.37% 78.47%H 4.10B
1 RY 2015 rates reflect MY data from January 1, 2014, through December 31, 2014. 2 RY 2016 rates reflect MY data from January 1, 2015, through December 31, 2015. 3 RY 2017 rates reflect MY data from January 1, 2016, through December 31, 2016. 4 RY 2018 rates reflect MY data from January 1, 2017, through December 31, 2017. 5 Performance comparisons are based on the Chi-square test of statistical significance, with a p value of <0.05. * A lower rate indicates better performance for this measure. ** Member months are a member's “contribution” to the total yearly membership. ^ Caution should be exercised when assessing MCP performance for this measure given the changes that NCQA made to the specification for this measure for RY 2018. Not Tested = An RY 2017–18 rate difference was not calculated because high and low rates do not necessarily indicate better or worse performance.
Health Net Community Solutions, Inc. Performance Evaluation Report: July 1, 2017–June 30, 2018 California Department of Health Care Services
Page O-65 Health Services Advisory Group, Inc.

MANAGED CARE HEALTH PLAN PERFORMANCE MEASURES
Table 3.50 through Table 3.56 present findings for the RY 2018 performance measures within the Appropriate Treatment and Utilization domain. DHCS did not hold MCPs accountable to meet MPLs for the following measures within this domain; therefore, HSAG did not include these measures in its assessment of the MCP’s performance related to HPLs and MPLs:
♦ All-Cause Readmissions ♦ Both Ambulatory Care measures
Table 3.50—Appropriate Treatment and Utilization DomainRY 2018 (MY 2017) Performance Measure Findings Health Net—Kern County
Criteria Number of Measures
MeetingCriteria
Total Number of Measures
Percentage of Measures
MeetingCriteria
RY 2018 Rates Above HPLs 0 2 0.00% Rates Above HPLs for the Last Three or More Consecutive Years 0 2 0.00%
RY 2018 Rates Significantly Better than RY 2017 Rates* 1 3 33.33%
Rates that Moved from Below MPLs in RY 2017 to Above MPLs in RY 2018 1 1 100.00%
RY 2018 Rates Below MPLs 0 2 0.00% Rates Below MPLs for the Last Three or More Consecutive Years 0 2 0.00%
RY 2018 Rates Significantly Worse than RY 2017 Rates* 1 3 33.33%
Rates that Moved from Above MPLs in RY 2017 to Below MPLs in RY 2018 0 1 0.00%
* Performance comparisons are based on the Chi-square test of statistical significance, with a p value of <0.05.
Health Net Community Solutions, Inc. Performance Evaluation Report: July 1, 2017–June 30, 2018 California Department of Health Care Services
Page O-66 Health Services Advisory Group, Inc.

MANAGED CARE HEALTH PLAN PERFORMANCE MEASURES
Table 3.51—Appropriate Treatment and Utilization DomainRY 2018 (MY 2017) Performance Measure Findings Health Net—Los Angeles County
Criteria Number of Measures
Meeting Criteria
Total Number of Measures
Percentage of Measures
MeetingCriteria
RY 2018 Rates Above HPLs 0 2 0.00% Rates Above HPLs for the Last Three or More Consecutive Years 0 2 0.00%
RY 2018 Rates Significantly Better than RY 2017 Rates* 2 3 66.67%
Rates that Moved from Below MPLs in RY 2017 to Above MPLs in RY 2018 1 1 100.00%
RY 2018 Rates Below MPLs 0 2 0.00% Rates Below MPLs for the Last Three or More Consecutive Years 0 2 0.00%
RY 2018 Rates Significantly Worse than RY 2017 Rates* 1 3 33.33%
Rates that Moved from Above MPLs in RY 2017 to Below MPLs in RY 2018 0 1 0.00%
* Performance comparisons are based on the Chi-square test of statistical significance, with a p value of <0.05.
Health Net Community Solutions, Inc. Performance Evaluation Report: July 1, 2017–June 30, 2018 California Department of Health Care Services
Page O-67 Health Services Advisory Group, Inc.

MANAGED CARE HEALTH PLAN PERFORMANCE MEASURES
Table 3.52—Appropriate Treatment and Utilization DomainRY 2018 (MY 2017) Performance Measure Findings Health Net—Sacramento County
Criteria Number of Measures
MeetingCriteria
Total Number of Measures
Percentage of Measures
MeetingCriteria
RY 2018 Rates Above HPLs 1 2 50.00% Rates Above HPLs for the Last Three or More Consecutive Years 0 2 0.00%
RY 2018 Rates Significantly Better than RY 2017 Rates* 0 3 0.00%
Rates that Moved from Below MPLs in RY 2017 to Above MPLs in RY 2018 0 0 N/A
RY 2018 Rates Below MPLs 0 2 0.00% Rates Below MPLs for the Last Three or More Consecutive Years 0 2 0.00%
RY 2018 Rates Significantly Worse than RY 2017 Rates* 0 3 0.00%
Rates that Moved from Above MPLs in RY 2017 to Below MPLs in RY 2018 0 2 0.00%
* Performance comparisons are based on the Chi-square test of statistical significance, with a p value of <0.05. N/A = No rates above or below the MPLs from the previous year exist to include in the denominator for calculating whether or not rates moved to above or below MPLs in the most recent year.
Health Net Community Solutions, Inc. Performance Evaluation Report: July 1, 2017–June 30, 2018 California Department of Health Care Services
Page O-68 Health Services Advisory Group, Inc.

MANAGED CARE HEALTH PLAN PERFORMANCE MEASURES
Table 3.53—Appropriate Treatment and Utilization DomainRY 2018 (MY 2017) Performance Measure Findings Health Net—San Diego County
Criteria Number of Measures
MeetingCriteria
Total Number of Measures
Percentage of Measures
MeetingCriteria
RY 2018 Rates Above HPLs 1 2 50.00% Rates Above HPLs for the Last Three or More Consecutive Years 0 2 0.00%
RY 2018 Rates Significantly Better than RY 2017 Rates* 2 3 66.67%
Rates that Moved from Below MPLs in RY 2017 to Above MPLs in RY 2018 1 1 100.00%
RY 2018 Rates Below MPLs 0 2 0.00% Rates Below MPLs for the Last Three or More Consecutive Years 0 2 0.00%
RY 2018 Rates Significantly Worse than RY 2017 Rates* 0 3 0.00%
Rates that Moved from Above MPLs in RY 2017 to Below MPLs in RY 2018 0 1 0.00%
* Performance comparisons are based on the Chi-square test of statistical significance, with a p value of <0.05.
Health Net Community Solutions, Inc. Performance Evaluation Report: July 1, 2017–June 30, 2018 California Department of Health Care Services
Page O-69 Health Services Advisory Group, Inc.

MANAGED CARE HEALTH PLAN PERFORMANCE MEASURES
Table 3.54—Appropriate Treatment and Utilization DomainRY 2018 (MY 2017) Performance Measure Findings Health Net—San Joaquin County
Criteria Number of Measures
MeetingCriteria
Total Number of Measures
Percentage of Measures
MeetingCriteria
RY 2018 Rates Above HPLs 1 2 50.00% Rates Above HPLs for the Last Three or More Consecutive Years 0 2 0.00%
RY 2018 Rates Significantly Better than RY 2017 Rates* 1 3 33.33%
Rates that Moved from Below MPLs in RY 2017 to Above MPLs in RY 2018 1 1 100.00%
RY 2018 Rates Below MPLs 0 2 0.00% Rates Below MPLs for the Last Three or More Consecutive Years 0 2 0.00%
RY 2018 Rates Significantly Worse than RY 2017 Rates* 0 3 0.00%
Rates that Moved from Above MPLs in RY 2017 to Below MPLs in RY 2018 0 1 0.00%
* Performance comparisons are based on the Chi-square test of statistical significance, with a p value of <0.05.
Health Net Community Solutions, Inc. Performance Evaluation Report: July 1, 2017–June 30, 2018 California Department of Health Care Services
Page O-70 Health Services Advisory Group, Inc.

MANAGED CARE HEALTH PLAN PERFORMANCE MEASURES
Table 3.55—Appropriate Treatment and Utilization DomainRY 2018 (MY 2017) Performance Measure Findings Health Net—Stanislaus County
Criteria Number of Measures
MeetingCriteria
Total Number of Measures
Percentage of Measures
MeetingCriteria
RY 2018 Rates Above HPLs 0 2 0.00% Rates Above HPLs for the Last Three or More Consecutive Years 0 2 0.00%
RY 2018 Rates Significantly Better than RY 2017 Rates* 1 3 33.33%
Rates that Moved from Below MPLs in RY 2017 to Above MPLs in RY 2018 0 0 N/A
RY 2018 Rates Below MPLs 0 2 0.00% Rates Below MPLs for the Last Three or More Consecutive Years 0 2 0.00%
RY 2018 Rates Significantly Worse than RY 2017 Rates* 0 3 0.00%
Rates that Moved from Above MPLs in RY 2017 to Below MPLs in RY 2018 0 2 0.00%
* Performance comparisons are based on the Chi-square test of statistical significance, with a p value of <0.05. N/A = No rates above or below the MPLs from the previous year exist to include in the denominator for calculating whether or not rates moved to above or below MPLs in the most recent year.
Health Net Community Solutions, Inc. Performance Evaluation Report: July 1, 2017–June 30, 2018 California Department of Health Care Services
Page O-71 Health Services Advisory Group, Inc.

MANAGED CARE HEALTH PLAN PERFORMANCE MEASURES
Table 3.56—Appropriate Treatment and Utilization DomainRY 2018 (MY 2017) Performance Measure Findings Health Net—Tulare County
Criteria Number of Measures
MeetingCriteria
Total Number of Measures
Percentage of Measures
MeetingCriteria
RY 2018 Rates Above HPLs 1 2 50.00% Rates Above HPLs for the Last Three or More Consecutive Years 0 2 0.00%
RY 2018 Rates Significantly Better than RY 2017 Rates* 1 3 33.33%
Rates that Moved from Below MPLs in RY 2017 to Above MPLs in RY 2018 0 0 N/A
RY 2018 Rates Below MPLs 0 2 0.00% Rates Below MPLs for the Last Three or More Consecutive Years 0 2 0.00%
RY 2018 Rates Significantly Worse than RY 2017 Rates* 0 3 0.00%
Rates that Moved from Above MPLs in RY 2017 to Below MPLs in RY 2018 0 2 0.00%
* Performance comparisons are based on the Chi-square test of statistical significance, with a p value of <0.05. N/A = No rates above or below the MPLs from the previous year exist to include in the denominator for calculating whether or not rates moved to above or below MPLs in the most recent year.
Assessment of Corrective Action Plan Efforts—Appropriate Treatment and Utilization
The following measures within the Appropriate Treatment and Utilization domain are included in Health Net’s CAP:
♦ Avoidance of Antibiotic Treatment in Adults With Acute Bronchitis in San Joaquin County ♦ Use of Imaging Studies for Low Back Pain in Kern, Los Angeles, and San Diego counties
Avoidance of Antibiotic Treatment
DHCS required Health Net to submit a QI Summary describing the interventions that the MCP conducted to address its performance below the MPL on the Avoidance of Antibiotic Treatment in Adults With Acute Bronchitis measure in San Joaquin County.
Health Net Community Solutions, Inc. Performance Evaluation Report: July 1, 2017–June 30, 2018 California Department of Health Care Services
Page O-72 Health Services Advisory Group, Inc.

MANAGED CARE HEALTH PLAN PERFORMANCE MEASURES
Health Net reported conducting the following interventions:
♦ Participated in the Alliance Working for Antibiotic Resistance Education (AWARE) initiative, and distributed AWARE toolkits to high-prescribing providers.
♦ Sent to providers monthly report cards/gap-in-care reports that indicated the providers’ levels of compliance with avoiding prescribing antibiotics for adults with acute bronchitis.
♦ Included on prescription bag labels educational messages about the appropriate use of antibiotics and recommended care tips for adults with acute bronchitis.
Health Net reported learning that outpatient sites were the largest contributors to the non-compliant antibiotic prescribing rate. Additionally, the MCP learned that not only were high-level clinicians (e.g., primary care providers, emergency department physicians) inappropriately prescribing antibiotics, but mid-level clinicians (e.g., nurse practitioners, physicians assistants) were also inappropriately prescribing antibiotics.
The rate for the Avoidance of Antibiotic Treatment in Adults With Acute Bronchitis measure improved from RY 2017 to RY 2018. Although the improvement was not statistically significant, the change resulted in the rate moving from below the MPL in RY 2017 to above the MPL in 2018.
Use of Imaging Studies for Low Back Pain
Health Net conducted two PDSA cycles to address the MCP’s performance below the MPL in RY 2017 for the Use of Imaging Studies for Low Back Pain measure in Kern, Los Angeles, and San Diego counties.
Health Net tested whether or not providing training sessions to clinicians at a targeted clinic would help to improve appropriate ordering of imaging studies for beneficiaries with low back pain. The MCP reported learning that obtaining staff member feedback is crucial to successful intervention identification and implementation. Additionally, Health Net reported learning that annual training supports information retention by staff members.
The rates improved significantly from RY 2017 to RY 2018 for the Use of Imaging Studies for Low Back Pain measure in Kern, Los Angeles, and San Diego counties, resulting in the rates in all three reporting units moving from below the MPL in RY 2017 to above the MPL in RY 2018.
Health Net Community Solutions, Inc. Performance Evaluation Report: July 1, 2017–June 30, 2018 California Department of Health Care Services
Page O-73 Health Services Advisory Group, Inc.

MANAGED CARE HEALTH PLAN PERFORMANCE MEASURES
Performance Measure Findings—All Domains
Table 3.57 through Table 3.63 present a summary of Health Net’s RY 2018 performance across all External Accountability Set (EAS) measures.
Note the following regarding Table 3.57 through Table 3.63:
♦ DHCS did not hold MCPs accountable to meet MPLs for the following measures; therefore, HSAG did not include these measures in its assessment of the MCP’s performance related to HPLs and MPLs: ■ All-Cause Readmissions ■ Both Ambulatory Care measures ■ All four Children and Adolescents’ Access to Primary Care measures
♦ DHCS did not hold MCPs accountable to meet MPLs for the following measures in RY 2017; therefore, HSAG did not include these measures in the denominators for calculating the percentage of measures with rates that moved to above or below the MPLs in RY 2018 and for calculating the percentage of measures with rates below MPLs for only the last two consecutive years: ■ Asthma Medication Ratio ■ Breast Cancer Screening ■ Immunizations for Adolescents—Combination 2
Table 3.57—RY 2018 (MY 2017) Performance Measure Findings for All Domains Health Net—Kern County
Criteria Number of Measures
MeetingCriteria
Total Number of Measures
Percentage of Measures
MeetingCriteria
RY 2018 Rates Above HPLs 1 21 4.76% Rates Above HPLs for the Last Three or More Consecutive Years 0 18 0.00%
RY 2018 Rates Significantly Better than RY 2017 Rates* 4 22 18.18%
Rates that Moved from Below MPLs in RY 2017 to Above MPLs in RY 2018 1 3 33.33%
RY 2018 Rates Below MPLs 5 21 23.81% Rates Below MPLs for Only the Last Two Consecutive Years 0 18 0.00%
Health Net Community Solutions, Inc. Performance Evaluation Report: July 1, 2017–June 30, 2018 California Department of Health Care Services
Page O-74 Health Services Advisory Group, Inc.
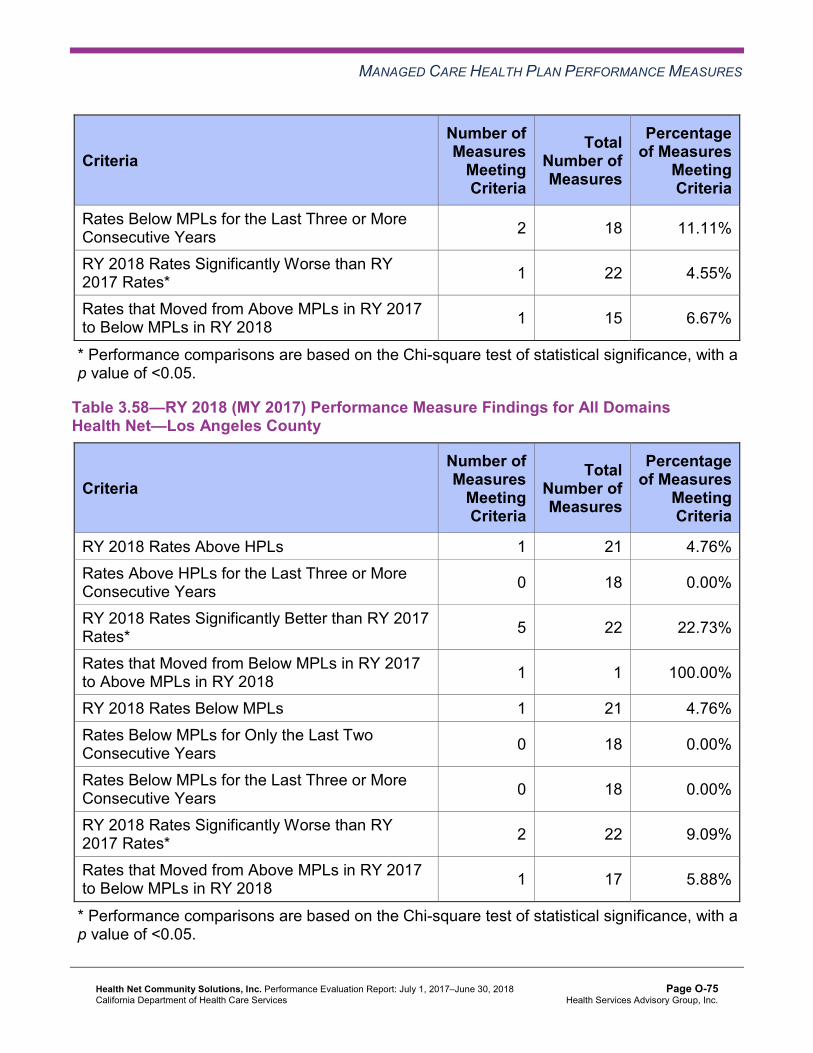
MANAGED CARE HEALTH PLAN PERFORMANCE MEASURES
Criteria Number of Measures
MeetingCriteria
Total Number of Measures
Percentage of Measures
MeetingCriteria
Rates Below MPLs for the Last Three or More Consecutive Years 2 18 11.11%
RY 2018 Rates Significantly Worse than RY 2017 Rates* 1 22 4.55%
Rates that Moved from Above MPLs in RY 2017 to Below MPLs in RY 2018 1 15 6.67%
* Performance comparisons are based on the Chi-square test of statistical significance, with a p value of <0.05.
Table 3.58—RY 2018 (MY 2017) Performance Measure Findings for All Domains Health Net—Los Angeles County
Criteria Number of Measures
MeetingCriteria
Total Number of Measures
Percentage of Measures
MeetingCriteria
RY 2018 Rates Above HPLs 1 21 4.76% Rates Above HPLs for the Last Three or More Consecutive Years 0 18 0.00%
RY 2018 Rates Significantly Better than RY 2017 Rates* 5 22 22.73%
Rates that Moved from Below MPLs in RY 2017 to Above MPLs in RY 2018 1 1 100.00%
RY 2018 Rates Below MPLs 1 21 4.76% Rates Below MPLs for Only the Last Two Consecutive Years 0 18 0.00%
Rates Below MPLs for the Last Three or More Consecutive Years 0 18 0.00%
RY 2018 Rates Significantly Worse than RY 2017 Rates* 2 22 9.09%
Rates that Moved from Above MPLs in RY 2017 to Below MPLs in RY 2018 1 17 5.88%
* Performance comparisons are based on the Chi-square test of statistical significance, with a p value of <0.05.
Health Net Community Solutions, Inc. Performance Evaluation Report: July 1, 2017–June 30, 2018 California Department of Health Care Services
Page O-75 Health Services Advisory Group, Inc.

MANAGED CARE HEALTH PLAN PERFORMANCE MEASURES
Table 3.59—RY 2018 (MY 2017) Performance Measure Findings for All Domains Health Net—Sacramento County
Criteria Number of Measures
MeetingCriteria
Total Number of Measures
Percentage of Measures
MeetingCriteria
RY 2018 Rates Above HPLs 2 21 9.52% Rates Above HPLs for the Last Three or More Consecutive Years 0 18 0.00%
RY 2018 Rates Significantly Better than RY 2017 Rates* 3 22 13.64%
Rates that Moved from Below MPLs in RY 2017 to Above MPLs in RY 2018 1 6 16.67%
RY 2018 Rates Below MPLs 7 21 33.33% Rates Below MPLs for Only the Last Two Consecutive Years 1 18 5.56%
Rates Below MPLs for the Last Three or More Consecutive Years 4 18 22.22%
RY 2018 Rates Significantly Worse than RY 2017 Rates* 0 22 0.00%
Rates that Moved from Above MPLs in RY 2017 to Below MPLs in RY 2018 1 12 8.33%
* Performance comparisons are based on the Chi-square test of statistical significance, with a p value of <0.05.
Health Net Community Solutions, Inc. Performance Evaluation Report: July 1, 2017–June 30, 2018 California Department of Health Care Services
Page O-76 Health Services Advisory Group, Inc.

MANAGED CARE HEALTH PLAN PERFORMANCE MEASURES
Table 3.60—RY 2018 (MY 2017) Performance Measure Findings for All Domains Health Net—San Diego County
Criteria Number of Measures
MeetingCriteria
Total Number of Measures
Percentage of Measures
MeetingCriteria
RY 2018 Rates Above HPLs 2 21 9.52% Rates Above HPLs for the Last Three or More Consecutive Years 0 18 0.00%
RY 2018 Rates Significantly Better than RY 2017 Rates* 6 22 27.27%
Rates that Moved from Below MPLs in RY 2017 to Above MPLs in RY 2018 1 2 50.00%
RY 2018 Rates Below MPLs 4 21 19.05% Rates Below MPLs for Only the Last Two Consecutive Years 0 18 0.00%
Rates Below MPLs for the Last Three or More Consecutive Years 1 18 5.56%
RY 2018 Rates Significantly Worse than RY 2017 Rates* 1 22 4.55%
Rates that Moved from Above MPLs in RY 2017 to Below MPLs in RY 2018 2 16 12.50%
* Performance comparisons are based on the Chi-square test of statistical significance, with a p value of <0.05.
Health Net Community Solutions, Inc. Performance Evaluation Report: July 1, 2017–June 30, 2018 California Department of Health Care Services
Page O-77 Health Services Advisory Group, Inc.

MANAGED CARE HEALTH PLAN PERFORMANCE MEASURES
Table 3.61—RY 2018 (MY 2017) Performance Measure Findings for All Domains Health Net—San Joaquin County
Criteria Number of Measures
MeetingCriteria
Total Number of Measures
Percentage of Measures
MeetingCriteria
RY 2018 Rates Above HPLs 1 21 4.76% Rates Above HPLs for the Last Three or More Consecutive Years 0 18 0.00%
RY 2018 Rates Significantly Better than RY 2017 Rates* 6 22 27.27%
Rates that Moved from Below MPLs in RY 2017 to Above MPLs in RY 2018 1 8 12.50%
RY 2018 Rates Below MPLs 10 21 47.62% Rates Below MPLs for Only the Last Two Consecutive Years 1 18 5.56%
Rates Below MPLs for the Last Three or More Consecutive Years 6 18 33.33%
RY 2018 Rates Significantly Worse than RY 2017 Rates* 0 22 0.00%
Rates that Moved from Above MPLs in RY 2017 to Below MPLs in RY 2018 2 10 20.00%
* Performance comparisons are based on the Chi-square test of statistical significance, with a p value of <0.05.
Health Net Community Solutions, Inc. Performance Evaluation Report: July 1, 2017–June 30, 2018 California Department of Health Care Services
Page O-78 Health Services Advisory Group, Inc.

MANAGED CARE HEALTH PLAN PERFORMANCE MEASURES
Table 3.62—RY 2018 (MY 2017) Performance Measure Findings for All Domains Health Net—Stanislaus County
Criteria Number of Measures
MeetingCriteria
Total Number of Measures
Percentage of Measures
MeetingCriteria
RY 2018 Rates Above HPLs 0 21 0.00% Rates Above HPLs for the Last Three or More Consecutive Years 0 18 0.00%
RY 2018 Rates Significantly Better than RY 2017 Rates* 3 22 13.64%
Rates that Moved from Below MPLs in RY 2017 to Above MPLs in RY 2018 1 5 20.00%
RY 2018 Rates Below MPLs 7 21 33.33% Rates Below MPLs for Only the Last Two Consecutive Years 0 18 0.00%
Rates Below MPLs for the Last Three or More Consecutive Years 4 18 22.22%
RY 2018 Rates Significantly Worse than RY 2017 Rates* 1 22 4.55%
Rates that Moved from Above MPLs in RY 2017 to Below MPLs in RY 2018 2 13 15.38%
* Performance comparisons are based on the Chi-square test of statistical significance, with a p value of <0.05.
Health Net Community Solutions, Inc. Performance Evaluation Report: July 1, 2017–June 30, 2018 California Department of Health Care Services
Page O-79 Health Services Advisory Group, Inc.

MANAGED CARE HEALTH PLAN PERFORMANCE MEASURES
Table 3.63—RY 2018 (MY 2017) Performance Measure Findings for All Domains Health Net—Tulare County
Criteria Number of Measures
MeetingCriteria
Total Number of Measures
Percentage of Measures
MeetingCriteria
RY 2018 Rates Above HPLs 4 21 19.05% Rates Above HPLs for the Last Three or More Consecutive Years 2 18 11.11%
RY 2018 Rates Significantly Better than RY 2017 Rates* 3 22 13.64%
Rates that Moved from Below MPLs in RY 2017 to Above MPLs in RY 2018 0 0 N/A
RY 2018 Rates Below MPLs 0 21 0.00% Rates Below MPLs for Only the Last Two Consecutive Years 0 18 0.00%
Rates Below MPLs for the Last Three or More Consecutive Years 0 18 0.00%
RY 2018 Rates Significantly Worse than RY 2017 Rates* 0 22 0.00%
Rates that Moved from Above MPLs in RY 2017 to Below MPLs in RY 2018 0 18 0.00%
* Performance comparisons are based on the Chi-square test of statistical significance, with a p value of <0.05. N/A = No rates above or below the MPLs from the previous year exist to include in the denominator for calculating whether or not rates moved to above or below MPLs in the most recent year.
Health Net Community Solutions, Inc. Performance Evaluation Report: July 1, 2017–June 30, 2018 California Department of Health Care Services
Page O-80 Health Services Advisory Group, Inc.
MANAGED CARE HEALTH PLAN PERFORMANCE MEASURES
Corrective Action Plan Requirements for 2018 Health Net’s CAP will continue for the fourth year based on the MCP not achieving the CAP goals. The MCP had 34 of 147 rates (23 percent) below the MPLs in RY 2018, and the following measures with rates below the MPLs in RY 2018 are included in the CAP:
♦ Both Annual Monitoring for Patients on Persistent Medications measures in Sacramento, San Joaquin, and Stanislaus counties
♦ Asthma Medication Ratio in Kern County ♦ Breast Cancer Screening in Kern, Sacramento, San Diego, San Joaquin, and Stanislaus
counties ♦ Cervical Cancer Screening in Kern, Sacramento, San Diego, San Joaquin, and Stanislaus
counties ♦ Childhood Immunization Status—Combination 3 in Kern, Sacramento, San Joaquin, and
Stanislaus counties ♦ Comprehensive Diabetes Care—Eye Exam (Retinal) Performed in Stanislaus County ♦ Comprehensive Diabetes Care—HbA1c Testing in Sacramento, San Diego, and San
Joaquin counties ♦ Comprehensive Diabetes Care—Medical Attention for Nephropathy in San Joaquin County ♦ Prenatal and Postpartum Care—Postpartum Care in Los Angeles, Sacramento, and San
Joaquin counties ♦ Prenatal and Postpartum Care—Timeliness of Prenatal Care in Kern, San Diego, and San
Joaquin counties ♦ Well-Child Visits in the Third, Fourth, Fifth, and Sixth Years of Life in San Joaquin and
Stanislaus counties
Seniors and Persons with Disabilities Performance Measure Results Table 3.64 through Table 3.70 present the four-year trending information for the Seniors and Persons with Disabilities (SPD) population, and Table 3.71 through Table 3.77 present the four-year trending information for the non-SPD population for the measures that DHCS required MCPs to stratify for the SPD and non-SPD populations. The tables also show the differences in rates between RY 2017 and RY 2018.
Table 3.78 through Table 3.84 present the SPD and non-SPD rates, a comparison of the SPD and non-SPD rates,5 and the total combined rate for each measure.
5 HSAG calculated statistical significance between the SPD and non-SPD rates for each measure using a Chi-square test. This information is displayed in the “SPD/Non-SPD Rate Difference” column in Table 3.78 through Table 3.84.
Health Net Community Solutions, Inc. Performance Evaluation Report: July 1, 2017–June 30, 2018 California Department of Health Care Services
Page O-81 Health Services Advisory Group, Inc.

MANAGED CARE HEALTH PLAN PERFORMANCE MEASURES
Table 3.64—Multi-Year SPD Performance Measure Trend Table Health Net—Kern County
B = Statistical testing result indicates that the RY 2018 SPD rate is significantly better than the RY 2017 SPD rate.
W = Statistical testing result indicates that the RY 2018 SPD rate is significantly worse than the RY 2017 SPD rate.
Measure RY
2015 SPD
Rate1
RY 2016 SPD
Rate2
RY 2017 SPD
Rate3
RY 2018 SPD
Rate4
RYs 2017–18 Rate
Difference5
All-Cause Readmissions* 17.40% 18.50% 15.71% 19.15% 3.44 Ambulatory Care—Emergency Department (ED) Visits per 1,000 Member Months**
55.00 92.60 90.57 89.26 Not Tested
Ambulatory Care—Outpatient Visits per 1,000 Member Months**
248.74 434.17 415.79 431.65 Not Tested
Annual Monitoring for Patients on Persistent Medications— ACE Inhibitors or ARBs
87.92% 87.91% 86.57% 89.32% 2.75
Annual Monitoring for Patients on Persistent Medications— Diuretics
89.45% 85.69% 86.26% 89.21% 2.95
Children and Adolescents' Access to Primary Care Practitioners—12–24 Months
NA NA NA NA Not Comparable
Children and Adolescents' Access to Primary Care Practitioners— 25 Months–6 Years
75.34% 84.69% 80.50% 86.51% 6.01
Children and Adolescents' Access to Primary Care Practitioners—7–11 Years
76.60% 81.37% 80.92% 82.63% 1.71
Children and Adolescents' Access to Primary Care Practitioners—12–19 Years
69.12% 73.61% 74.23% 80.77% 6.54B
1 RY 2015 rates reflect MY data from January 1, 2014, through December 31, 2014. 2 RY 2016 rates reflect MY data from January 1, 2015, through December 31, 2015. 3 RY 2017 rates reflect MY data from January 1, 2016, through December 31, 2016.
Health Net Community Solutions, Inc. Performance Evaluation Report: July 1, 2017–June 30, 2018 California Department of Health Care Services
Page O-82 Health Services Advisory Group, Inc.

MANAGED CARE HEALTH PLAN PERFORMANCE MEASURES
4 RY 2018 rates reflect MY data from January 1, 2017, through December 31, 2017. 5 Performance comparisons are based on the Chi-square test of statistical significance, with a p value of <0.05. * A lower rate indicates better performance for this measure. ** Member months are a member's “contribution” to the total yearly membership. NA = The MCP followed the specifications, but the denominator was too small (less than 30) to report a valid rate. Not Comparable = An RY 2017–18 rate difference cannot be made because data are not available for both years or because significant methodology changes occurred between years, disallowing comparison. Not Tested = An RY 2017–18 rate difference was not calculated because high and low rates do not necessarily indicate better or worse performance.
Table 3.65—Multi-Year SPD Performance Measure Trend Table Health Net—Los Angeles County
B = Statistical testing result indicates that the RY 2018 SPD rate is significantly better than the RY 2017 SPD rate.
W = Statistical testing result indicates that the RY 2018 SPD rate is significantly worse than the RY 2017 SPD rate.
Measure RY
2015 SPD
Rate1
RY 2016 SPD
Rate2
RY 2017 SPD
Rate3
RY 2018 SPD
Rate4
RYs 2017–18 Rate
Difference5
All-Cause Readmissions* 20.98% 20.94% 19.60% 20.40% 0.80 Ambulatory Care—Emergency Department (ED) Visits per 1,000 Member Months**
28.53 58.87 63.41 65.31 Not Tested
Ambulatory Care—Outpatient Visits per 1,000 Member Months**
150.49 354.75 370.61 354.47 Not Tested
Annual Monitoring for Patients on Persistent Medications— ACE Inhibitors or ARBs
84.74% 87.81% 89.37% 89.78% 0.41
Annual Monitoring for Patients on Persistent Medications— Diuretics
84.98% 88.30% 89.29% 89.93% 0.64
Children and Adolescents' Access to Primary Care Practitioners—12–24 Months
69.34% 89.80% NA 79.03% Not Comparable
Health Net Community Solutions, Inc. Performance Evaluation Report: July 1, 2017–June 30, 2018 California Department of Health Care Services
Page O-83 Health Services Advisory Group, Inc.
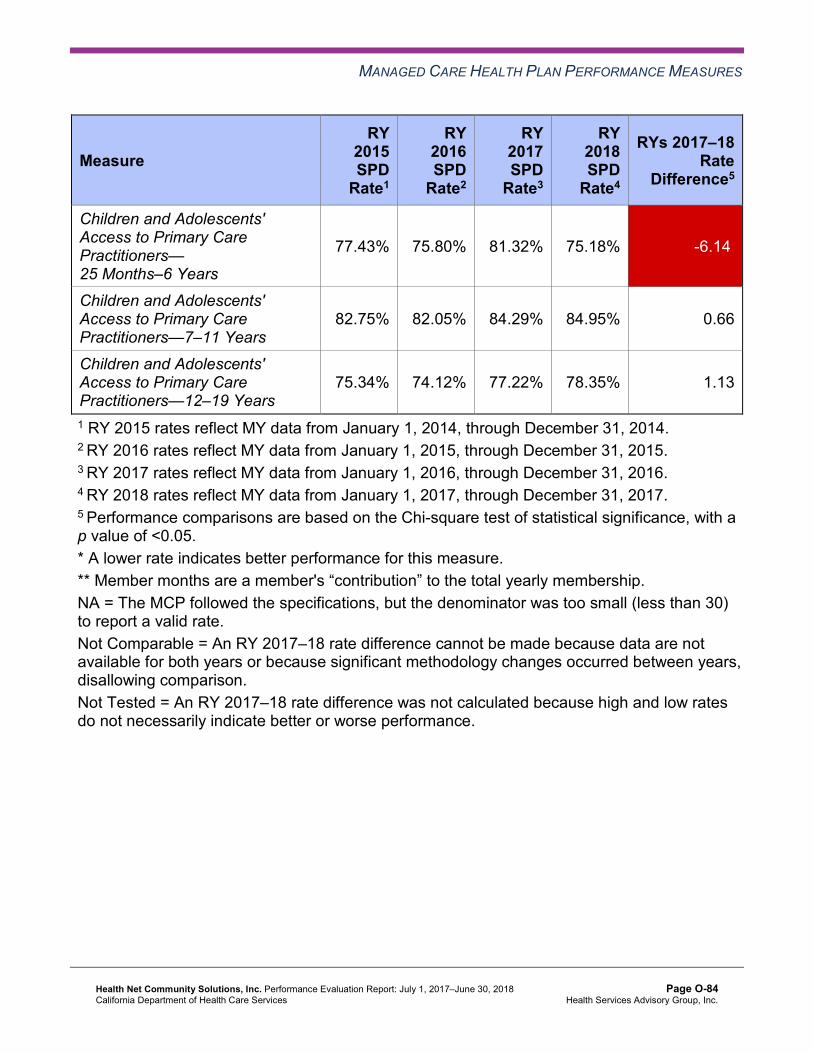
MANAGED CARE HEALTH PLAN PERFORMANCE MEASURES
Measure RY
2015 SPD
Rate1
RY 2016 SPD
Rate2
RY 2017 SPD
Rate3
RY 2018 SPD
Rate4
RYs 2017–18 Rate
Difference5
Children and Adolescents' Access to Primary Care Practitioners— 25 Months–6 Years
77.43% 75.80% 81.32% 75.18% -6.14W
Children and Adolescents' Access to Primary Care Practitioners—7–11 Years
82.75% 82.05% 84.29% 84.95% 0.66
Children and Adolescents' Access to Primary Care Practitioners—12–19 Years
75.34% 74.12% 77.22% 78.35% 1.13
1 RY 2015 rates reflect MY data from January 1, 2014, through December 31, 2014. 2 RY 2016 rates reflect MY data from January 1, 2015, through December 31, 2015. 3 RY 2017 rates reflect MY data from January 1, 2016, through December 31, 2016. 4 RY 2018 rates reflect MY data from January 1, 2017, through December 31, 2017. 5 Performance comparisons are based on the Chi-square test of statistical significance, with a p value of <0.05. * A lower rate indicates better performance for this measure. ** Member months are a member's “contribution” to the total yearly membership. NA = The MCP followed the specifications, but the denominator was too small (less than 30) to report a valid rate. Not Comparable = An RY 2017–18 rate difference cannot be made because data are not available for both years or because significant methodology changes occurred between years, disallowing comparison. Not Tested = An RY 2017–18 rate difference was not calculated because high and low rates do not necessarily indicate better or worse performance.
Health Net Community Solutions, Inc. Performance Evaluation Report: July 1, 2017–June 30, 2018 California Department of Health Care Services
Page O-84 Health Services Advisory Group, Inc.
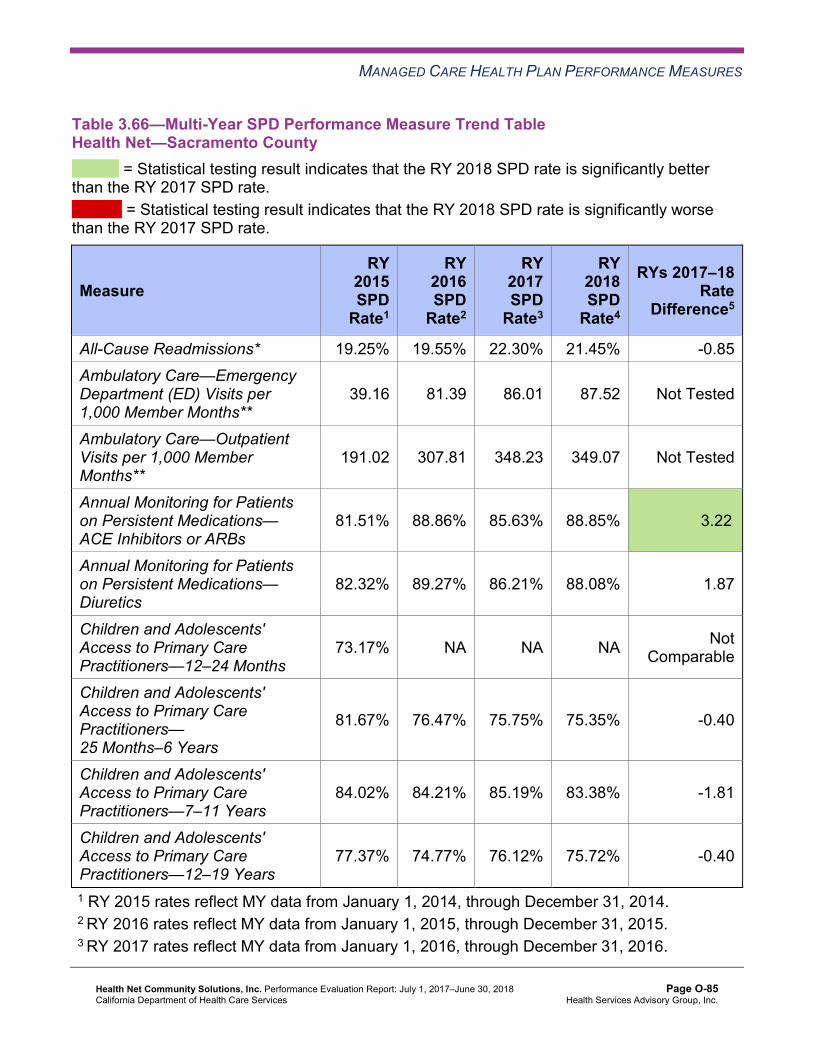
MANAGED CARE HEALTH PLAN PERFORMANCE MEASURES
Table 3.66—Multi-Year SPD Performance Measure Trend Table Health Net—Sacramento County
B = Statistical testing result indicates that the RY 2018 SPD rate is significantly better than the RY 2017 SPD rate.
W = Statistical testing result indicates that the RY 2018 SPD rate is significantly worse than the RY 2017 SPD rate.
Measure RY
2015 SPD
Rate1
RY 2016 SPD
Rate2
RY 2017 SPD
Rate3
RY 2018 SPD
Rate4
RYs 2017–18 Rate
Difference5
All-Cause Readmissions* 19.25% 19.55% 22.30% 21.45% -0.85 Ambulatory Care—Emergency Department (ED) Visits per 1,000 Member Months**
39.16 81.39 86.01 87.52 Not Tested
Ambulatory Care—Outpatient Visits per 1,000 Member Months**
191.02 307.81 348.23 349.07 Not Tested
Annual Monitoring for Patients on Persistent Medications— ACE Inhibitors or ARBs
81.51% 88.86% 85.63% 88.85% 3.22B
Annual Monitoring for Patients on Persistent Medications— Diuretics
82.32% 89.27% 86.21% 88.08% 1.87
Children and Adolescents' Access to Primary Care Practitioners—12–24 Months
73.17% NA NA NA Not Comparable
Children and Adolescents' Access to Primary Care Practitioners— 25 Months–6 Years
81.67% 76.47% 75.75% 75.35% -0.40
Children and Adolescents' Access to Primary Care Practitioners—7–11 Years
84.02% 84.21% 85.19% 83.38% -1.81
Children and Adolescents' Access to Primary Care Practitioners—12–19 Years
77.37% 74.77% 76.12% 75.72% -0.40
1 RY 2015 rates reflect MY data from January 1, 2014, through December 31, 2014. 2 RY 2016 rates reflect MY data from January 1, 2015, through December 31, 2015. 3 RY 2017 rates reflect MY data from January 1, 2016, through December 31, 2016.
Health Net Community Solutions, Inc. Performance Evaluation Report: July 1, 2017–June 30, 2018 California Department of Health Care Services
Page O-85 Health Services Advisory Group, Inc.
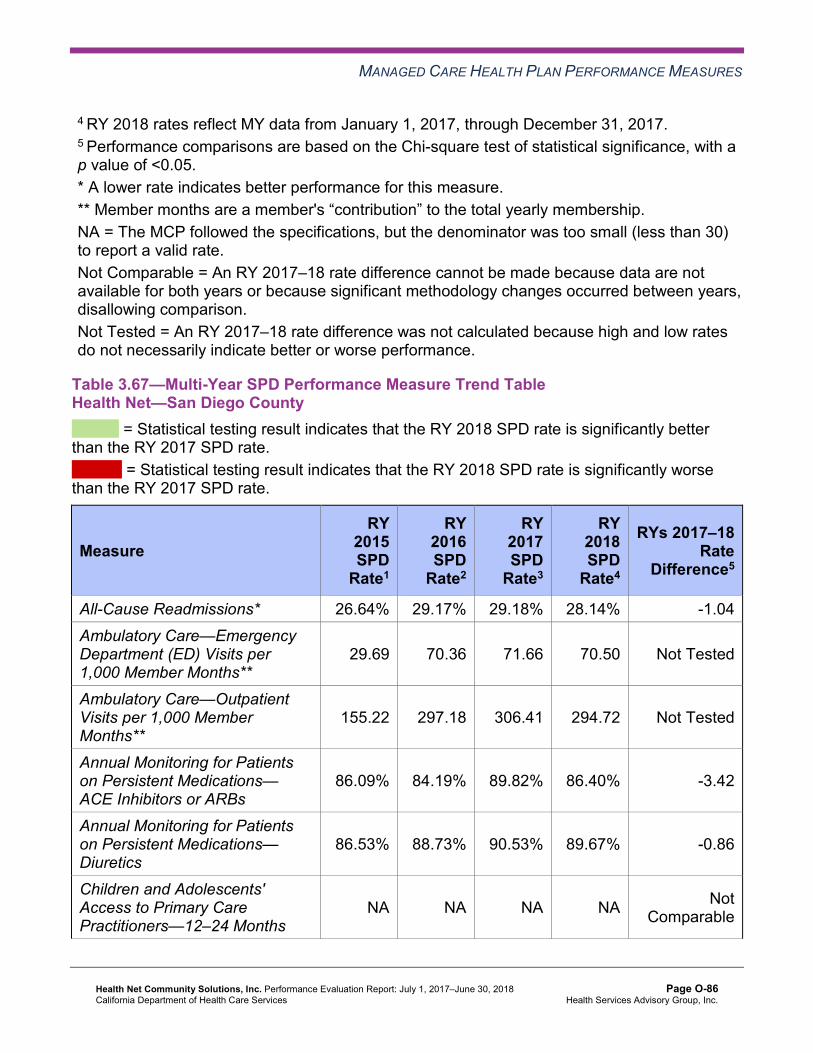
MANAGED CARE HEALTH PLAN PERFORMANCE MEASURES
4 RY 2018 rates reflect MY data from January 1, 2017, through December 31, 2017. 5 Performance comparisons are based on the Chi-square test of statistical significance, with a p value of <0.05. * A lower rate indicates better performance for this measure. ** Member months are a member's “contribution” to the total yearly membership. NA = The MCP followed the specifications, but the denominator was too small (less than 30) to report a valid rate. Not Comparable = An RY 2017–18 rate difference cannot be made because data are not available for both years or because significant methodology changes occurred between years, disallowing comparison. Not Tested = An RY 2017–18 rate difference was not calculated because high and low rates do not necessarily indicate better or worse performance.
Table 3.67—Multi-Year SPD Performance Measure Trend Table Health Net—San Diego County
B = Statistical testing result indicates that the RY 2018 SPD rate is significantly better than the RY 2017 SPD rate.
W = Statistical testing result indicates that the RY 2018 SPD rate is significantly worse than the RY 2017 SPD rate.
Measure RY
2015 SPD
Rate1
RY 2016 SPD
Rate2
RY 2017 SPD
Rate3
RY 2018 SPD
Rate4
RYs 2017–18 Rate
Difference5
All-Cause Readmissions* 26.64% 29.17% 29.18% 28.14% -1.04 Ambulatory Care—Emergency Department (ED) Visits per 1,000 Member Months**
29.69 70.36 71.66 70.50 Not Tested
Ambulatory Care—Outpatient Visits per 1,000 Member Months**
155.22 297.18 306.41 294.72 Not Tested
Annual Monitoring for Patients on Persistent Medications— ACE Inhibitors or ARBs
86.09% 84.19% 89.82% 86.40% -3.42
Annual Monitoring for Patients on Persistent Medications— Diuretics
86.53% 88.73% 90.53% 89.67% -0.86
Children and Adolescents' Access to Primary Care Practitioners—12–24 Months
NA NA NA NA Not Comparable
Health Net Community Solutions, Inc. Performance Evaluation Report: July 1, 2017–June 30, 2018 California Department of Health Care Services
Page O-86 Health Services Advisory Group, Inc.

MANAGED CARE HEALTH PLAN PERFORMANCE MEASURES
Measure RY
2015 SPD
Rate1
RY 2016 SPD
Rate2
RY 2017 SPD
Rate3
RY 2018 SPD
Rate4
RYs 2017–18 Rate
Difference5
Children and Adolescents' Access to Primary Care Practitioners— 25 Months–6 Years
75.36% 74.31% 84.80% 71.61% -13.19W
Children and Adolescents' Access to Primary Care Practitioners—7–11 Years
80.08% 76.25% 80.20% 78.37% -1.83
Children and Adolescents' Access to Primary Care Practitioners—12–19 Years
75.00% 71.03% 70.83% 72.05% 1.22
1 RY 2015 rates reflect MY data from January 1, 2014, through December 31, 2014. 2 RY 2016 rates reflect MY data from January 1, 2015, through December 31, 2015. 3 RY 2017 rates reflect MY data from January 1, 2016, through December 31, 2016. 4 RY 2018 rates reflect MY data from January 1, 2017, through December 31, 2017. 5 Performance comparisons are based on the Chi-square test of statistical significance, with a p value of <0.05. * A lower rate indicates better performance for this measure. ** Member months are a member's “contribution” to the total yearly membership. NA = The MCP followed the specifications, but the denominator was too small (less than 30) to report a valid rate. Not Comparable = An RY 2017–18 rate difference cannot be made because data are not available for both years or because significant methodology changes occurred between years, disallowing comparison. Not Tested = An RY 2017–18 rate difference was not calculated because high and low rates do not necessarily indicate better or worse performance.
Health Net Community Solutions, Inc. Performance Evaluation Report: July 1, 2017–June 30, 2018 California Department of Health Care Services
Page O-87 Health Services Advisory Group, Inc.
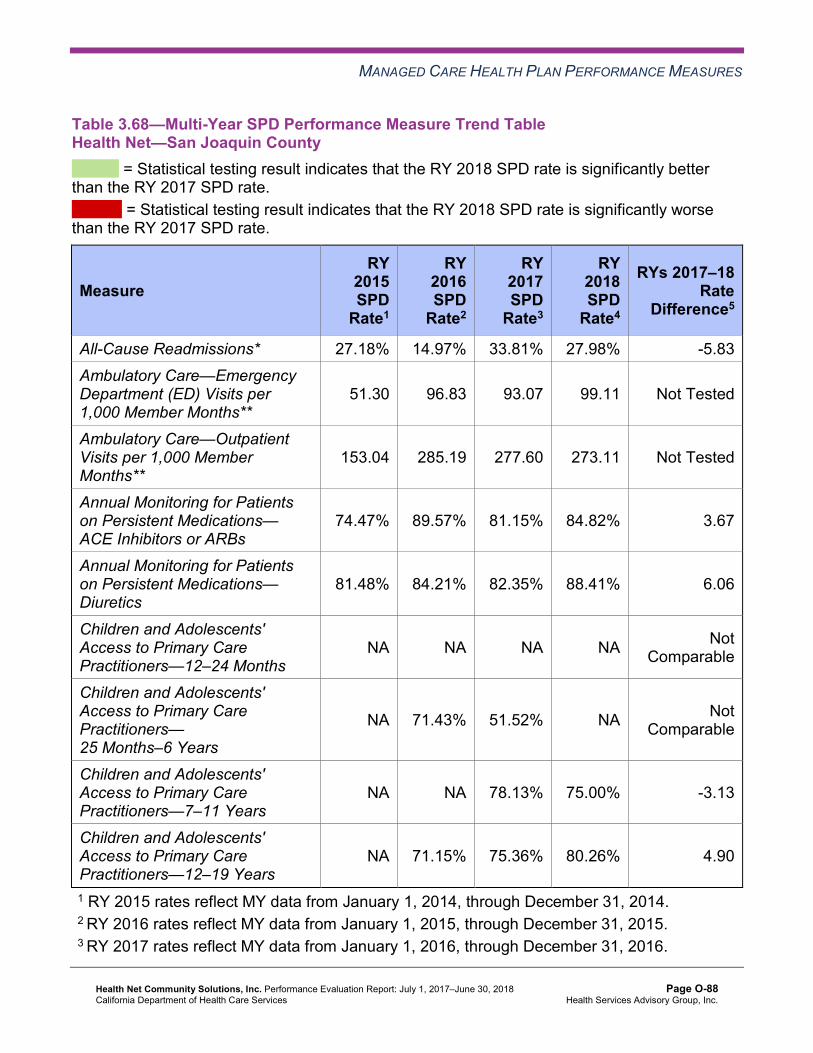
MANAGED CARE HEALTH PLAN PERFORMANCE MEASURES
Table 3.68—Multi-Year SPD Performance Measure Trend Table Health Net—San Joaquin County
B = Statistical testing result indicates that the RY 2018 SPD rate is significantly better than the RY 2017 SPD rate.
W = Statistical testing result indicates that the RY 2018 SPD rate is significantly worse than the RY 2017 SPD rate.
Measure RY
2015 SPD
Rate1
RY 2016 SPD
Rate2
RY 2017 SPD
Rate3
RY 2018 SPD
Rate4
RYs 2017–18 Rate
Difference5
All-Cause Readmissions* 27.18% 14.97% 33.81% 27.98% -5.83 Ambulatory Care—Emergency Department (ED) Visits per 1,000 Member Months**
51.30 96.83 93.07 99.11 Not Tested
Ambulatory Care—Outpatient Visits per 1,000 Member Months**
153.04 285.19 277.60 273.11 Not Tested
Annual Monitoring for Patients on Persistent Medications— ACE Inhibitors or ARBs
74.47% 89.57% 81.15% 84.82% 3.67
Annual Monitoring for Patients on Persistent Medications— Diuretics
81.48% 84.21% 82.35% 88.41% 6.06
Children and Adolescents' Access to Primary Care Practitioners—12–24 Months
NA NA NA NA Not Comparable
Children and Adolescents' Access to Primary Care Practitioners— 25 Months–6 Years
NA 71.43% 51.52% NA Not Comparable
Children and Adolescents' Access to Primary Care Practitioners—7–11 Years
NA NA 78.13% 75.00% -3.13
Children and Adolescents' Access to Primary Care Practitioners—12–19 Years
NA 71.15% 75.36% 80.26% 4.90
1 RY 2015 rates reflect MY data from January 1, 2014, through December 31, 2014. 2 RY 2016 rates reflect MY data from January 1, 2015, through December 31, 2015. 3 RY 2017 rates reflect MY data from January 1, 2016, through December 31, 2016.
Health Net Community Solutions, Inc. Performance Evaluation Report: July 1, 2017–June 30, 2018 California Department of Health Care Services
Page O-88 Health Services Advisory Group, Inc.

MANAGED CARE HEALTH PLAN PERFORMANCE MEASURES
4 RY 2018 rates reflect MY data from January 1, 2017, through December 31, 2017. 5 Performance comparisons are based on the Chi-square test of statistical significance, with a p value of <0.05. * A lower rate indicates better performance for this measure. ** Member months are a member's “contribution” to the total yearly membership. NA = The MCP followed the specifications, but the denominator was too small (less than 30) to report a valid rate. Not Comparable = An RY 2017–18 rate difference cannot be made because data are not available for both years or because significant methodology changes occurred between years, disallowing comparison. Not Tested = An RY 2017–18 rate difference was not calculated because high and low rates do not necessarily indicate better or worse performance.
Table 3.69—Multi-Year SPD Performance Measure Trend Table Health Net—Stanislaus County
B = Statistical testing result indicates that the RY 2018 SPD rate is significantly better than the RY 2017 SPD rate.
W = Statistical testing result indicates that the RY 2018 SPD rate is significantly worse than the RY 2017 SPD rate.
Measure RY
2015 SPD
Rate1
RY 2016 SPD
Rate2
RY 2017 SPD
Rate3
RY 2018 SPD
Rate4
RYs 2017–18 Rate
Difference5
All-Cause Readmissions* 17.13% 20.21% 21.03% 23.88% 2.85 Ambulatory Care—Emergency Department (ED) Visits per 1,000 Member Months**
60.78 92.88 96.15 91.07 Not Tested
Ambulatory Care—Outpatient Visits per 1,000 Member Months**
261.19 404.61 392.14 367.23 Not Tested
Annual Monitoring for Patients on Persistent Medications— ACE Inhibitors or ARBs
82.29% 87.13% 86.16% 87.90% 1.74
Annual Monitoring for Patients on Persistent Medications— Diuretics
86.23% 87.78% 87.45% 86.68% -0.77
Children and Adolescents' Access to Primary Care Practitioners—12–24 Months
NA NA NA NA Not Comparable
Health Net Community Solutions, Inc. Performance Evaluation Report: July 1, 2017–June 30, 2018 California Department of Health Care Services
Page O-89 Health Services Advisory Group, Inc.

MANAGED CARE HEALTH PLAN PERFORMANCE MEASURES
Measure RY
2015 SPD
Rate1
RY 2016 SPD
Rate2
RY 2017 SPD
Rate3
RY 2018 SPD
Rate4
RYs 2017–18 Rate
Difference5
Children and Adolescents' Access to Primary Care Practitioners— 25 Months–6 Years
86.89% 83.27% 83.76% 86.58% 2.82
Children and Adolescents' Access to Primary Care Practitioners—7–11 Years
87.26% 85.75% 85.88% 86.90% 1.02
Children and Adolescents' Access to Primary Care Practitioners—12–19 Years
84.42% 84.66% 84.18% 82.37% -1.81
1 RY 2015 rates reflect MY data from January 1, 2014, through December 31, 2014. 2 RY 2016 rates reflect MY data from January 1, 2015, through December 31, 2015. 3 RY 2017 rates reflect MY data from January 1, 2016, through December 31, 2016. 4 RY 2018 rates reflect MY data from January 1, 2017, through December 31, 2017. 5 Performance comparisons are based on the Chi-square test of statistical significance, with a p value of <0.05. * A lower rate indicates better performance for this measure. ** Member months are a member's “contribution” to the total yearly membership. NA = The MCP followed the specifications, but the denominator was too small (less than 30) to report a valid rate. Not Comparable = An RY 2017–18 rate difference cannot be made because data are not available for both years or because significant methodology changes occurred between years, disallowing comparison. Not Tested = An RY 2017–18 rate difference was not calculated because high and low rates do not necessarily indicate better or worse performance.
Health Net Community Solutions, Inc. Performance Evaluation Report: July 1, 2017–June 30, 2018 California Department of Health Care Services
Page O-90 Health Services Advisory Group, Inc.

MANAGED CARE HEALTH PLAN PERFORMANCE MEASURES
Table 3.70—Multi-Year SPD Performance Measure Trend Table Health Net—Tulare County
B = Statistical testing result indicates that the RY 2018 SPD rate is significantly better than the RY 2017 SPD rate.
W = Statistical testing result indicates that the RY 2018 SPD rate is significantly worse than the RY 2017 SPD rate.
Measure RY
2015 SPD
Rate1
RY 2016 SPD
Rate2
RY 2017 SPD
Rate3
RY 2018 SPD
Rate4
RYs 2017–18 Rate
Difference5
All-Cause Readmissions* 14.81% 17.11% 19.94% 19.86% -0.08 Ambulatory Care—Emergency Department (ED) Visits per 1,000 Member Months**
42.48 73.69 70.51 60.81 Not Tested
Ambulatory Care—Outpatient Visits per 1,000 Member Months**
375.32 523.29 556.77 531.58 Not Tested
Annual Monitoring for Patients on Persistent Medications— ACE Inhibitors or ARBs
85.33% 88.04% 90.65% 89.53% -1.12
Annual Monitoring for Patients on Persistent Medications— Diuretics
87.97% 85.99% 89.80% 89.96% 0.16
Children and Adolescents' Access to Primary Care Practitioners—12–24 Months
NA NA NA NA Not Comparable
Children and Adolescents' Access to Primary Care Practitioners— 25 Months–6 Years
90.75% 88.43% 88.92% 89.26% 0.34
Children and Adolescents' Access to Primary Care Practitioners—7–11 Years
91.46% 91.86% 92.26% 91.28% -0.98
Children and Adolescents' Access to Primary Care Practitioners—12–19 Years
88.97% 88.04% 90.41% 90.21% -0.20
1 RY 2015 rates reflect MY data from January 1, 2014, through December 31, 2014. 2 RY 2016 rates reflect MY data from January 1, 2015, through December 31, 2015. 3 RY 2017 rates reflect MY data from January 1, 2016, through December 31, 2016.
Health Net Community Solutions, Inc. Performance Evaluation Report: July 1, 2017–June 30, 2018 California Department of Health Care Services
Page O-91 Health Services Advisory Group, Inc.

MANAGED CARE HEALTH PLAN PERFORMANCE MEASURES
4 RY 2018 rates reflect MY data from January 1, 2017, through December 31, 2017. 5 Performance comparisons are based on the Chi-square test of statistical significance, with a p value of <0.05. * A lower rate indicates better performance for this measure. ** Member months are a member's “contribution” to the total yearly membership. NA = The MCP followed the specifications, but the denominator was too small (less than 30) to report a valid rate. Not Comparable = An RY 2017–18 rate difference cannot be made because data are not available for both years or because significant methodology changes occurred between years, disallowing comparison. Not Tested = An RY 2017–18 rate difference was not calculated because high and low rates do not necessarily indicate better or worse performance.
Table 3.71—Multi-Year Non-SPD Performance Measure Trend Table Health Net—Kern County
B = Statistical testing result indicates that the RY 2018 non-SPD rate is significantly better than the RY 2017 non-SPD rate.
W = Statistical testing result indicates that the RY 2018 non-SPD rate is significantly worse than the RY 2017 non-SPD rate.
Measure RY 2015
Non-SPD Rate1
RY 2016 Non-SPD
Rate2
RY 2017 Non-SPD
Rate3
RY 2018 Non-SPD
Rate4
RYs 2017–18 Rate
Difference5
All-Cause Readmissions* 13.78% 11.67% 11.01% 12.43% 1.42
Ambulatory Care— Emergency Department (ED) Visits per 1,000 Member Months**
33.30 48.03 46.43 44.21 Not Tested
Ambulatory Care— Outpatient Visits per 1,000 Member Months**
226.19 283.20 245.08 256.16 Not Tested
Annual Monitoring for Patients on Persistent Medications— ACE Inhibitors or ARBs
87.59% 86.02% 88.03% 87.60% -0.43
Annual Monitoring for Patients on Persistent Medications—Diuretics
86.56% 85.38% 86.80% 87.09% 0.29
Health Net Community Solutions, Inc. Performance Evaluation Report: July 1, 2017–June 30, 2018 California Department of Health Care Services
Page O-92 Health Services Advisory Group, Inc.

MANAGED CARE HEALTH PLAN PERFORMANCE MEASURES
Measure RY 2015
Non-SPD Rate1
RY 2016 Non-SPD
Rate2
RY 2017 Non-SPD
Rate3
RY 2018 Non-SPD
Rate4
RYs 2017–18 Rate
Difference5
Children and Adolescents' Access to Primary Care Practitioners— 12–24 Months
90.57% 87.97% 89.87% 89.16% -0.71
Children and Adolescents' Access to Primary Care Practitioners— 25 Months–6 Years
79.49% 78.73% 78.43% 78.75% 0.32
Children and Adolescents' Access to Primary Care Practitioners— 7–11 Years
71.93% 75.03% 75.19% 76.92% 1.73B
Children and Adolescents' Access to Primary Care Practitioners— 12–19 Years
72.05% 75.49% 75.77% 76.91% 1.14
1 RY 2015 rates reflect MY data from January 1, 2014, through December 31, 2014. 2 RY 2016 rates reflect MY data from January 1, 2015, through December 31, 2015. 3 RY 2017 rates reflect MY data from January 1, 2016, through December 31, 2016. 4 RY 2018 rates reflect MY data from January 1, 2017, through December 31, 2017. 5 Performance comparisons are based on the Chi-square test of statistical significance, with a p value of <0.05. * A lower rate indicates better performance for this measure. ** Member months are a member's “contribution” to the total yearly membership. Not Tested = An RY 2017–18 rate difference was not calculated because high and low rates do not necessarily indicate better or worse performance.
Health Net Community Solutions, Inc. Performance Evaluation Report: July 1, 2017–June 30, 2018 California Department of Health Care Services
Page O-93 Health Services Advisory Group, Inc.

MANAGED CARE HEALTH PLAN PERFORMANCE MEASURES
Table 3.72—Multi-Year Non-SPD Performance Measure Trend Table Health Net—Los Angeles County
B = Statistical testing result indicates that the RY 2018 non-SPD rate is significantly better than the RY 2017 non-SPD rate.
W = Statistical testing result indicates that the RY 2018 non-SPD rate is significantly worse than the RY 2017 non-SPD rate.
Measure RY 2015
Non-SPD Rate1
RY 2016 Non-SPD
Rate2
RY 2017 Non-SPD
Rate3
RY 2018 Non-SPD
Rate4
RYs 2017–18 Rate
Difference5
All-Cause Readmissions* 12.52% 12.72% 12.10% 12.77% 0.67
Ambulatory Care— Emergency Department (ED) Visits per 1,000 Member Months**
21.65 32.07 33.51 36.51 Not Tested
Ambulatory Care— Outpatient Visits per 1,000 Member Months**
173.02 238.49 230.62 220.39 Not Tested
Annual Monitoring for Patients on Persistent Medications— ACE Inhibitors or ARBs
84.53% 86.43% 87.07% 87.52% 0.45
Annual Monitoring for Patients on Persistent Medications—Diuretics
83.58% 85.18% 85.94% 86.85% 0.91B
Children and Adolescents' Access to Primary Care Practitioners— 12–24 Months
92.03% 88.03% 89.66% 89.97% 0.31
Children and Adolescents' Access to Primary Care Practitioners— 25 Months–6 Years
80.93% 78.42% 79.62% 80.87% 1.25B
Children and Adolescents' Access to Primary Care Practitioners— 7–11 Years
84.42% 84.24% 84.54% 85.35% 0.81B
Health Net Community Solutions, Inc. Performance Evaluation Report: July 1, 2017–June 30, 2018 California Department of Health Care Services
Page O-94 Health Services Advisory Group, Inc.

MANAGED CARE HEALTH PLAN PERFORMANCE MEASURES
Measure RY 2015
Non-SPD Rate1
RY 2016 Non-SPD
Rate2
RY 2017 Non-SPD
Rate3
RY 2018 Non-SPD
Rate4
RYs 2017–18 Rate
Difference5
Children and Adolescents' Access to Primary Care Practitioners— 12–19 Years
79.84% 79.88% 80.38% 81.76% 1.38B
1 RY 2015 rates reflect MY data from January 1, 2014, through December 31, 2014. 2 RY 2016 rates reflect MY data from January 1, 2015, through December 31, 2015. 3 RY 2017 rates reflect MY data from January 1, 2016, through December 31, 2016. 4 RY 2018 rates reflect MY data from January 1, 2017, through December 31, 2017. 5 Performance comparisons are based on the Chi-square test of statistical significance, with a p value of <0.05. * A lower rate indicates better performance for this measure. ** Member months are a member's “contribution” to the total yearly membership. Not Tested = An RY 2017–18 rate difference was not calculated because high and low rates do not necessarily indicate better or worse performance.
Table 3.73—Multi-Year Non-SPD Performance Measure Trend Table Health Net—Sacramento County
B = Statistical testing result indicates that the RY 2018 non-SPD rate is significantly better than the RY 2017 non-SPD rate.
W = Statistical testing result indicates that the RY 2018 non-SPD rate is significantly worse than the RY 2017 non-SPD rate.
Measure RY 2015
Non-SPD Rate1
RY 2016 Non-SPD
Rate2
RY 2017 Non-SPD
Rate3
RY 2018 Non-SPD
Rate4
RYs 2017–18 Rate
Difference5
All-Cause Readmissions* 12.34% 12.00% 11.23% 13.70% 2.47W
Ambulatory Care— Emergency Department (ED) Visits per 1,000 Member Months**
28.31 46.88 47.02 48.04 Not Tested
Ambulatory Care— Outpatient Visits per 1,000 Member Months**
169.33 195.65 204.57 199.67 Not Tested
Health Net Community Solutions, Inc. Performance Evaluation Report: July 1, 2017–June 30, 2018 California Department of Health Care Services
Page O-95 Health Services Advisory Group, Inc.

MANAGED CARE HEALTH PLAN PERFORMANCE MEASURES
Measure RY 2015
Non-SPD Rate1
RY 2016 Non-SPD
Rate2
RY 2017 Non-SPD
Rate3
RY 2018 Non-SPD
Rate4
RYs 2017–18 Rate
Difference5
Annual Monitoring for Patients on Persistent Medications— ACE Inhibitors or ARBs
76.78% 83.21% 81.14% 82.26% 1.12
Annual Monitoring for Patients on Persistent Medications—Diuretics
74.42% 80.65% 78.41% 81.74% 3.33B
Children and Adolescents' Access to Primary Care Practitioners— 12–24 Months
89.13% 88.58% 88.86% 91.17% 2.31B
Children and Adolescents' Access to Primary Care Practitioners— 25 Months–6 Years
80.12% 76.60% 76.70% 79.13% 2.43B
Children and Adolescents' Access to Primary Care Practitioners— 7–11 Years
80.76% 80.76% 79.66% 80.83% 1.17B
Children and Adolescents' Access to Primary Care Practitioners— 12–19 Years
76.93% 77.39% 77.24% 77.92% 0.68
1 RY 2015 rates reflect MY data from January 1, 2014, through December 31, 2014. 2 RY 2016 rates reflect MY data from January 1, 2015, through December 31, 2015. 3 RY 2017 rates reflect MY data from January 1, 2016, through December 31, 2016. 4 RY 2018 rates reflect MY data from January 1, 2017, through December 31, 2017. 5 Performance comparisons are based on the Chi-square test of statistical significance, with a p value of <0.05. * A lower rate indicates better performance for this measure. ** Member months are a member's “contribution” to the total yearly membership. Not Tested = An RY 2017–18 rate difference was not calculated because high and low rates do not necessarily indicate better or worse performance.
Health Net Community Solutions, Inc. Performance Evaluation Report: July 1, 2017–June 30, 2018 California Department of Health Care Services
Page O-96 Health Services Advisory Group, Inc.
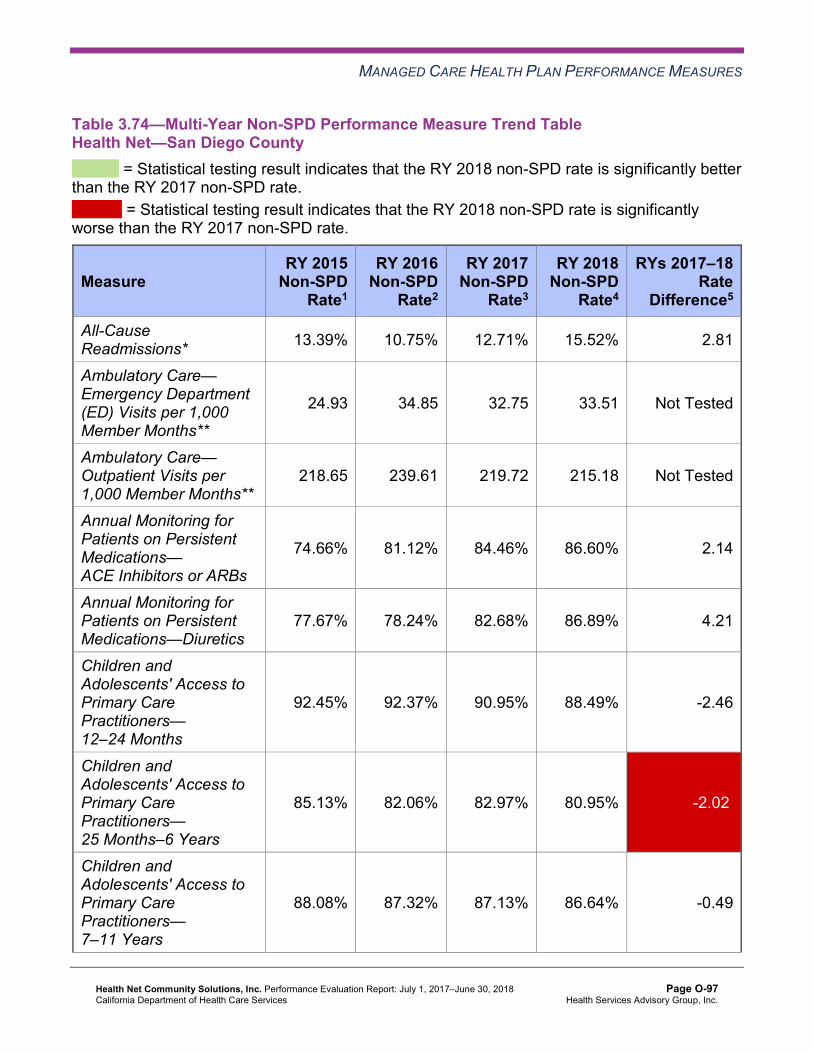
MANAGED CARE HEALTH PLAN PERFORMANCE MEASURES
Table 3.74—Multi-Year Non-SPD Performance Measure Trend Table Health Net—San Diego County
B = Statistical testing result indicates that the RY 2018 non-SPD rate is significantly better than the RY 2017 non-SPD rate.
W = Statistical testing result indicates that the RY 2018 non-SPD rate is significantly worse than the RY 2017 non-SPD rate.
Measure RY 2015
Non-SPD Rate1
RY 2016 Non-SPD
Rate2
RY 2017 Non-SPD
Rate3
RY 2018 Non-SPD
Rate4
RYs 2017–18 Rate
Difference5
All-Cause Readmissions* 13.39% 10.75% 12.71% 15.52% 2.81
Ambulatory Care— Emergency Department (ED) Visits per 1,000 Member Months**
24.93 34.85 32.75 33.51 Not Tested
Ambulatory Care— Outpatient Visits per 1,000 Member Months**
218.65 239.61 219.72 215.18 Not Tested
Annual Monitoring for Patients on Persistent Medications— ACE Inhibitors or ARBs
74.66% 81.12% 84.46% 86.60% 2.14
Annual Monitoring for Patients on Persistent Medications—Diuretics
77.67% 78.24% 82.68% 86.89% 4.21
Children and Adolescents' Access to Primary Care Practitioners— 12–24 Months
92.45% 92.37% 90.95% 88.49% -2.46
Children and Adolescents' Access to Primary Care Practitioners— 25 Months–6 Years
85.13% 82.06% 82.97% 80.95% -2.02W
Children and Adolescents' Access to Primary Care Practitioners— 7–11 Years
88.08% 87.32% 87.13% 86.64% -0.49
Health Net Community Solutions, Inc. Performance Evaluation Report: July 1, 2017–June 30, 2018 California Department of Health Care Services
Page O-97 Health Services Advisory Group, Inc.

MANAGED CARE HEALTH PLAN PERFORMANCE MEASURES
Measure RY 2015
Non-SPD Rate1
RY 2016 Non-SPD
Rate2
RY 2017 Non-SPD
Rate3
RY 2018 Non-SPD
Rate4
RYs 2017–18 Rate
Difference5
Children and Adolescents' Access to Primary Care Practitioners— 12–19 Years
81.69% 84.07% 83.29% 82.67% -0.62
1 RY 2015 rates reflect MY data from January 1, 2014, through December 31, 2014. 2 RY 2016 rates reflect MY data from January 1, 2015, through December 31, 2015. 3 RY 2017 rates reflect MY data from January 1, 2016, through December 31, 2016. 4 RY 2018 rates reflect MY data from January 1, 2017, through December 31, 2017. 5 Performance comparisons are based on the Chi-square test of statistical significance, with a p value of <0.05. * A lower rate indicates better performance for this measure. ** Member months are a member's “contribution” to the total yearly membership. Not Tested = An RY 2017–18 rate difference was not calculated because high and low rates do not necessarily indicate better or worse performance.
Table 3.75—Multi-Year Non-SPD Performance Measure Trend Table Health Net—San Joaquin County
B = Statistical testing result indicates that the RY 2018 non-SPD rate is significantly better than the RY 2017 non-SPD rate.
W = Statistical testing result indicates that the RY 2018 non-SPD rate is significantly worse than the RY 2017 non-SPD rate.
Measure RY 2015
Non-SPD Rate1
RY 2016 Non-SPD
Rate2
RY 2017 Non-SPD
Rate3
RY 2018 Non-SPD
Rate4
RYs 2017–18 Rate
Difference5
All-Cause Readmissions* 15.96% 15.21% 17.56% 20.11% 2.55
Ambulatory Care— Emergency Department (ED) Visits per 1,000 Member Months**
29.20 47.73 44.44 43.56 Not Tested
Ambulatory Care— Outpatient Visits per 1,000 Member Months**
142.99 179.55 173.84 169.42 Not Tested
Health Net Community Solutions, Inc. Performance Evaluation Report: July 1, 2017–June 30, 2018 California Department of Health Care Services
Page O-98 Health Services Advisory Group, Inc.
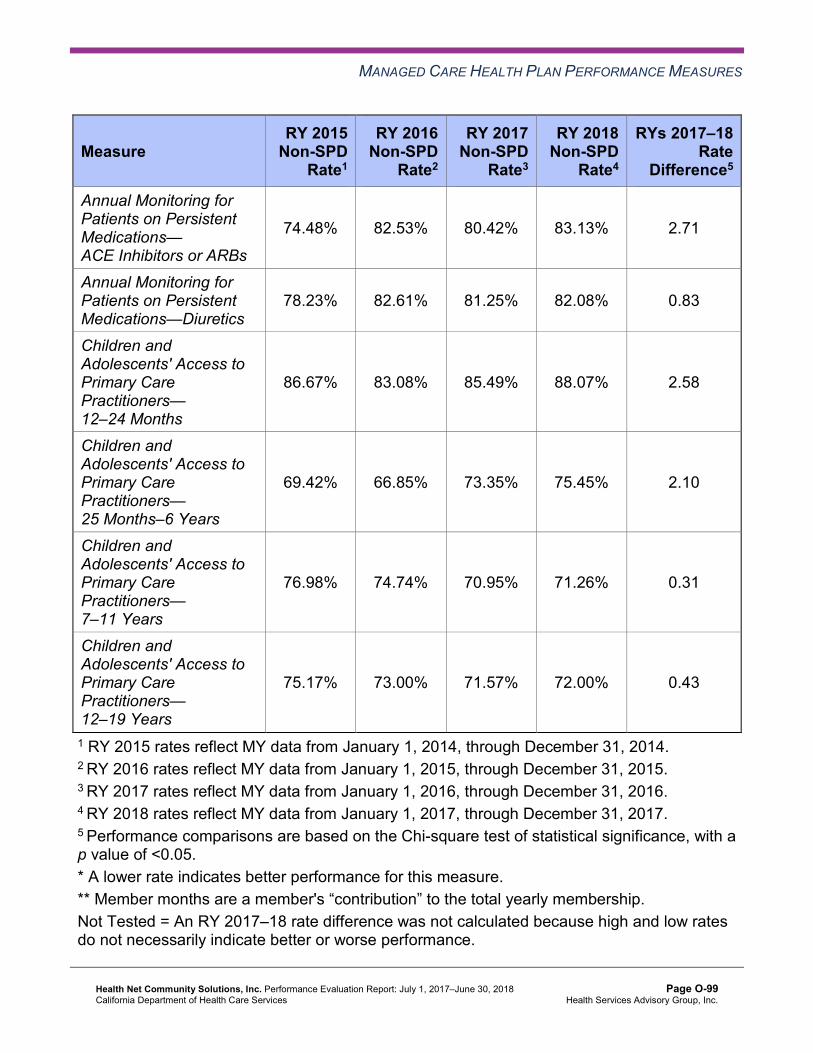
MANAGED CARE HEALTH PLAN PERFORMANCE MEASURES
Measure RY 2015
Non-SPD Rate1
RY 2016 Non-SPD
Rate2
RY 2017 Non-SPD
Rate3
RY 2018 Non-SPD
Rate4
RYs 2017–18 Rate
Difference5
Annual Monitoring for Patients on Persistent Medications— ACE Inhibitors or ARBs
74.48% 82.53% 80.42% 83.13% 2.71
Annual Monitoring for Patients on Persistent Medications—Diuretics
78.23% 82.61% 81.25% 82.08% 0.83
Children and Adolescents' Access to Primary Care Practitioners— 12–24 Months
86.67% 83.08% 85.49% 88.07% 2.58
Children and Adolescents' Access to Primary Care Practitioners— 25 Months–6 Years
69.42% 66.85% 73.35% 75.45% 2.10
Children and Adolescents' Access to Primary Care Practitioners— 7–11 Years
76.98% 74.74% 70.95% 71.26% 0.31
Children and Adolescents' Access to Primary Care Practitioners— 12–19 Years
75.17% 73.00% 71.57% 72.00% 0.43
1 RY 2015 rates reflect MY data from January 1, 2014, through December 31, 2014. 2 RY 2016 rates reflect MY data from January 1, 2015, through December 31, 2015. 3 RY 2017 rates reflect MY data from January 1, 2016, through December 31, 2016. 4 RY 2018 rates reflect MY data from January 1, 2017, through December 31, 2017. 5 Performance comparisons are based on the Chi-square test of statistical significance, with a p value of <0.05. * A lower rate indicates better performance for this measure. ** Member months are a member's “contribution” to the total yearly membership. Not Tested = An RY 2017–18 rate difference was not calculated because high and low rates do not necessarily indicate better or worse performance.
Health Net Community Solutions, Inc. Performance Evaluation Report: July 1, 2017–June 30, 2018 California Department of Health Care Services
Page O-99 Health Services Advisory Group, Inc.
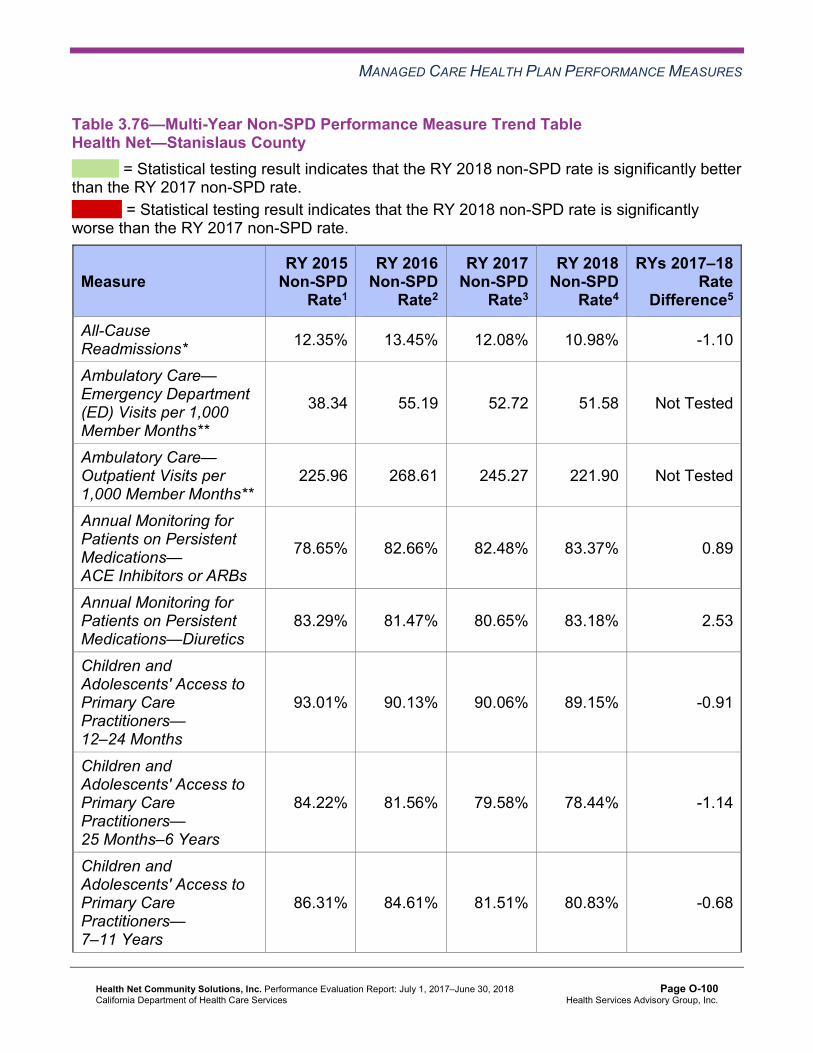
MANAGED CARE HEALTH PLAN PERFORMANCE MEASURES
Table 3.76—Multi-Year Non-SPD Performance Measure Trend Table Health Net—Stanislaus County
B = Statistical testing result indicates that the RY 2018 non-SPD rate is significantly better than the RY 2017 non-SPD rate.
W = Statistical testing result indicates that the RY 2018 non-SPD rate is significantly worse than the RY 2017 non-SPD rate.
Measure RY 2015
Non-SPD Rate1
RY 2016 Non-SPD
Rate2
RY 2017 Non-SPD
Rate3
RY 2018 Non-SPD
Rate4
RYs 2017–18 Rate
Difference5
All-Cause Readmissions* 12.35% 13.45% 12.08% 10.98% -1.10
Ambulatory Care— Emergency Department (ED) Visits per 1,000 Member Months**
38.34 55.19 52.72 51.58 Not Tested
Ambulatory Care— Outpatient Visits per 1,000 Member Months**
225.96 268.61 245.27 221.90 Not Tested
Annual Monitoring for Patients on Persistent Medications— ACE Inhibitors or ARBs
78.65% 82.66% 82.48% 83.37% 0.89
Annual Monitoring for Patients on Persistent Medications—Diuretics
83.29% 81.47% 80.65% 83.18% 2.53
Children and Adolescents' Access to Primary Care Practitioners— 12–24 Months
93.01% 90.13% 90.06% 89.15% -0.91
Children and Adolescents' Access to Primary Care Practitioners— 25 Months–6 Years
84.22% 81.56% 79.58% 78.44% -1.14
Children and Adolescents' Access to Primary Care Practitioners— 7–11 Years
86.31% 84.61% 81.51% 80.83% -0.68
Health Net Community Solutions, Inc. Performance Evaluation Report: July 1, 2017–June 30, 2018 California Department of Health Care Services
Page O-100 Health Services Advisory Group, Inc.

MANAGED CARE HEALTH PLAN PERFORMANCE MEASURES
Measure RY 2015
Non-SPD Rate1
RY 2016 Non-SPD
Rate2
RY 2017 Non-SPD
Rate3
RY 2018 Non-SPD
Rate4
RYs 2017–18 Rate
Difference5
Children and Adolescents' Access to Primary Care Practitioners— 12–19 Years
82.44% 80.47% 77.85% 77.16% -0.69
1 RY 2015 rates reflect MY data from January 1, 2014, through December 31, 2014. 2 RY 2016 rates reflect MY data from January 1, 2015, through December 31, 2015. 3 RY 2017 rates reflect MY data from January 1, 2016, through December 31, 2016. 4 RY 2018 rates reflect MY data from January 1, 2017, through December 31, 2017. 5 Performance comparisons are based on the Chi-square test of statistical significance, with a p value of <0.05. * A lower rate indicates better performance for this measure. ** Member months are a member's “contribution” to the total yearly membership. Not Tested = An RY 2017–18 rate difference was not calculated because high and low rates do not necessarily indicate better or worse performance.
Table 3.77—Multi-Year Non-SPD Performance Measure Trend Table Health Net—Tulare County
B = Statistical testing result indicates that the RY 2018 non-SPD rate is significantly better than the RY 2017 non-SPD rate.
W = Statistical testing result indicates that the RY 2018 non-SPD rate is significantly worse than the RY 2017 non-SPD rate.
Measure RY 2015
Non-SPD Rate1
RY 2016 Non-SPD
Rate2
RY 2017 Non-SPD
Rate3
RY 2018 Non-SPD
Rate4
RYs 2017–18 Rate
Difference5
All-Cause Readmissions* 10.34% 10.76% 11.44% 12.24% 0.80
Ambulatory Care— Emergency Department (ED) Visits per 1,000 Member Months**
25.50 40.93 36.97 35.73 Not Tested
Ambulatory Care— Outpatient Visits per 1,000 Member Months**
305.08 344.08 353.22 345.98 Not Tested
Health Net Community Solutions, Inc. Performance Evaluation Report: July 1, 2017–June 30, 2018 California Department of Health Care Services
Page O-101 Health Services Advisory Group, Inc.

MANAGED CARE HEALTH PLAN PERFORMANCE MEASURES
Measure RY 2015
Non-SPD Rate1
RY 2016 Non-SPD
Rate2
RY 2017 Non-SPD
Rate3
RY 2018 Non-SPD
Rate4
RYs 2017–18 Rate
Difference5
Annual Monitoring for Patients on Persistent Medications— ACE Inhibitors or ARBs
83.43% 83.21% 85.02% 85.86% 0.84
Annual Monitoring for Patients on Persistent Medications—Diuretics
83.07% 82.75% 83.75% 84.81% 1.06
Children and Adolescents' Access to Primary Care Practitioners— 12–24 Months
95.95% 94.78% 94.68% 96.25% 1.57B
Children and Adolescents' Access to Primary Care Practitioners— 25 Months–6 Years
89.74% 87.24% 88.39% 89.85% 1.46B
Children and Adolescents' Access to Primary Care Practitioners— 7–11 Years
90.28% 89.72% 89.66% 89.99% 0.33
Children and Adolescents' Access to Primary Care Practitioners— 12–19 Years
88.49% 87.52% 87.39% 87.86% 0.47
1 RY 2015 rates reflect MY data from January 1, 2014, through December 31, 2014. 2 RY 2016 rates reflect MY data from January 1, 2015, through December 31, 2015. 3 RY 2017 rates reflect MY data from January 1, 2016, through December 31, 2016. 4 RY 2018 rates reflect MY data from January 1, 2017, through December 31, 2017. 5 Performance comparisons are based on the Chi-square test of statistical significance, with a p value of <0.05. * A lower rate indicates better performance for this measure. ** Member months are a member's “contribution” to the total yearly membership. Not Tested = An RY 2017–18 rate difference was not calculated because high and low rates do not necessarily indicate better or worse performance.
Health Net Community Solutions, Inc. Performance Evaluation Report: July 1, 2017–June 30, 2018 California Department of Health Care Services
Page O-102 Health Services Advisory Group, Inc.

MANAGED CARE HEALTH PLAN PERFORMANCE MEASURES
Table 3.78—RY 2018 (MY 2017) Performance Measure Comparison and Results forMeasures Stratified by the SPD and Non-SPD PopulationsHealth Net—Kern County
B = Statistical testing result indicates that the RY 2018 SPD rate is significantly better than the RY 2018 non-SPD rate.
W = Statistical testing result indicates that the RY 2018 SPD rate is significantly worse than the RY 2018 non-SPD rate.
Measure RY 2018
SPD Rate1
RY 2018 Non-SPD
Rate1
SPD/Non-SPDRate
Difference2
RY 2018 Total Rate3
All-Cause Readmissions* 19.15% 12.43% 6.72W 14.68% Ambulatory Care—Emergency Department (ED) Visits per 1,000 Member Months**
89.26 44.21 Not Tested 47.43
Ambulatory Care—Outpatient Visits per 1,000 Member Months** 431.65 256.16 Not Tested 268.70
Annual Monitoring for Patients on Persistent Medications— ACE Inhibitors or ARBs
89.32% 87.60% 1.72 88.03%
Annual Monitoring for Patients on Persistent Medications—Diuretics 89.21% 87.09% 2.12 87.74%
Children and Adolescents' Access to Primary Care Practitioners— 12–24 Months
NA 89.16% Not Comparable 89.16%
Children and Adolescents' Access to Primary Care Practitioners— 25 Months–6 Years
86.51% 78.75% 7.76B 78.86%
Children and Adolescents' Access to Primary Care Practitioners— 7–11 Years
82.63% 76.92% 5.71B 77.10%
Children and Adolescents' Access to Primary Care Practitioners— 12–19 Years
80.77% 76.91% 3.86 77.06%
1 RY 2018 rates reflect MY data from January 1, 2017, through December 31, 2017. 2 Performance comparisons are based on the Chi-square test of statistical significance, with a p value of <0.05. 3 Total rates are based on the MCP reporting unit’s total results, including the SPD and non-SPD populations. Please note, if data are not available for either the SPD or non-SPD population, the total rate is based on results reported for the available population.
Health Net Community Solutions, Inc. Performance Evaluation Report: July 1, 2017–June 30, 2018 California Department of Health Care Services
Page O-103 Health Services Advisory Group, Inc.
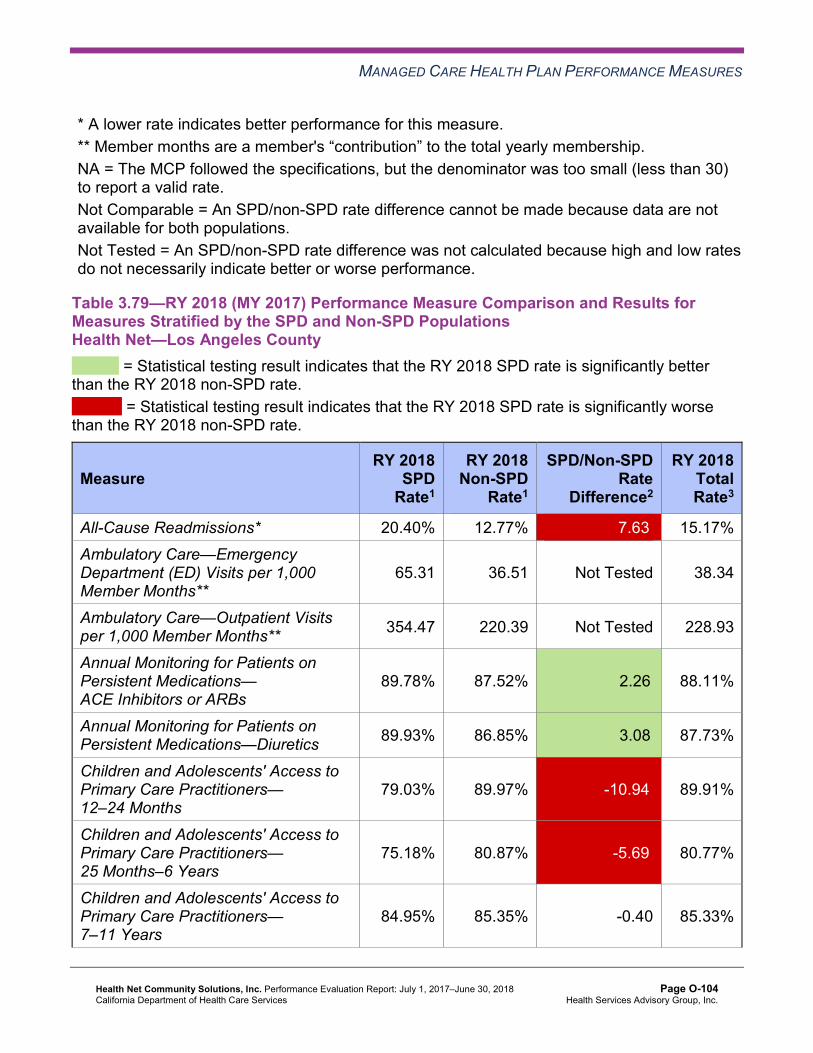
MANAGED CARE HEALTH PLAN PERFORMANCE MEASURES
* A lower rate indicates better performance for this measure. ** Member months are a member's “contribution” to the total yearly membership. NA = The MCP followed the specifications, but the denominator was too small (less than 30) to report a valid rate. Not Comparable = An SPD/non-SPD rate difference cannot be made because data are not available for both populations. Not Tested = An SPD/non-SPD rate difference was not calculated because high and low rates do not necessarily indicate better or worse performance.
Table 3.79—RY 2018 (MY 2017) Performance Measure Comparison and Results forMeasures Stratified by the SPD and Non-SPD PopulationsHealth Net—Los Angeles County
B = Statistical testing result indicates that the RY 2018 SPD rate is significantly better than the RY 2018 non-SPD rate.
W = Statistical testing result indicates that the RY 2018 SPD rate is significantly worse than the RY 2018 non-SPD rate.
Measure RY 2018
SPD Rate1
RY 2018 Non-SPD
Rate1
SPD/Non-SPDRate
Difference2
RY 2018 Total Rate3
All-Cause Readmissions* 20.40% 12.77% 7.63W 15.17% Ambulatory Care—Emergency Department (ED) Visits per 1,000 Member Months**
65.31 36.51 Not Tested 38.34
Ambulatory Care—Outpatient Visits per 1,000 Member Months** 354.47 220.39 Not Tested 228.93
Annual Monitoring for Patients on Persistent Medications— ACE Inhibitors or ARBs
89.78% 87.52% 2.26B 88.11%
Annual Monitoring for Patients on Persistent Medications—Diuretics 89.93% 86.85% 3.08B 87.73%
Children and Adolescents' Access to Primary Care Practitioners— 12–24 Months
79.03% 89.97% -10.94W 89.91%
Children and Adolescents' Access to Primary Care Practitioners— 25 Months–6 Years
75.18% 80.87% -5.69W 80.77%
Children and Adolescents' Access to Primary Care Practitioners— 7–11 Years
84.95% 85.35% -0.40 85.33%
Health Net Community Solutions, Inc. Performance Evaluation Report: July 1, 2017–June 30, 2018 California Department of Health Care Services
Page O-104 Health Services Advisory Group, Inc.

MANAGED CARE HEALTH PLAN PERFORMANCE MEASURES
Measure RY 2018
SPD Rate1
RY 2018 Non-SPD
Rate1
SPD/Non-SPDRate
Difference2
RY 2018 Total Rate3
Children and Adolescents' Access to Primary Care Practitioners— 12–19 Years
78.35% 81.76% -3.41W 81.61%
1 RY 2018 rates reflect MY data from January 1, 2017, through December 31, 2017. 2 Performance comparisons are based on the Chi-square test of statistical significance, with a p value of <0.05. 3 Total rates are based on the MCP reporting unit’s total results, including the SPD and non-SPD populations. Please note, if data are not available for either the SPD or non-SPD population, the total rate is based on results reported for the available population. * A lower rate indicates better performance for this measure. ** Member months are a member's “contribution” to the total yearly membership. Not Tested = An SPD/non-SPD rate difference was not calculated because high and low rates do not necessarily indicate better or worse performance.
Table 3.80—RY 2018 (MY 2017) Performance Measure Comparison and Results forMeasures Stratified by the SPD and Non-SPD PopulationsHealth Net—Sacramento County
B = Statistical testing result indicates that the RY 2018 SPD rate is significantly better than the RY 2018 non-SPD rate.
W = Statistical testing result indicates that the RY 2018 SPD rate is significantly worse than the RY 2018 non-SPD rate.
Measure RY 2018
SPD Rate1
RY 2018 Non-SPD
Rate1
SPD/Non-SPDRate
Difference2
RY 2018 Total Rate3
All-Cause Readmissions* 21.45% 13.70% 7.75W 16.90% Ambulatory Care—Emergency Department (ED) Visits per 1,000 Member Months**
87.52 48.04 Not Tested 51.44
Ambulatory Care—Outpatient Visits per 1,000 Member Months** 349.07 199.67 Not Tested 212.52
Annual Monitoring for Patients on Persistent Medications— ACE Inhibitors or ARBs
88.85% 82.26% 6.59B 84.72%
Annual Monitoring for Patients on Persistent Medications—Diuretics 88.08% 81.74% 6.34B 84.15%
Health Net Community Solutions, Inc. Performance Evaluation Report: July 1, 2017–June 30, 2018 California Department of Health Care Services
Page O-105 Health Services Advisory Group, Inc.

MANAGED CARE HEALTH PLAN PERFORMANCE MEASURES
Measure RY 2018
SPD Rate1
RY 2018 Non-SPD
Rate1
SPD/Non-SPDRate
Difference2
RY 2018 Total Rate3
Children and Adolescents' Access to Primary Care Practitioners— 12–24 Months
NA 91.17% Not Comparable 91.02%
Children and Adolescents' Access to Primary Care Practitioners— 25 Months–6 Years
75.35% 79.13% -3.78 79.06%
Children and Adolescents' Access to Primary Care Practitioners— 7–11 Years
83.38% 80.83% 2.55 80.91%
Children and Adolescents' Access to Primary Care Practitioners— 12–19 Years
75.72% 77.92% -2.20 77.81%
1 RY 2018 rates reflect MY data from January 1, 2017, through December 31, 2017. 2 Performance comparisons are based on the Chi-square test of statistical significance, with a p value of <0.05. 3 Total rates are based on the MCP reporting unit’s total results, including the SPD and non-SPD populations. Please note, if data are not available for either the SPD or non-SPD population, the total rate is based on results reported for the available population. * A lower rate indicates better performance for this measure. ** Member months are a member's “contribution” to the total yearly membership. NA = The MCP followed the specifications, but the denominator was too small (less than 30) to report a valid rate. Not Comparable = An SPD/non-SPD rate difference cannot be made because data are not available for both populations. Not Tested = An SPD/non-SPD rate difference was not calculated because high and low rates do not necessarily indicate better or worse performance.
Health Net Community Solutions, Inc. Performance Evaluation Report: July 1, 2017–June 30, 2018 California Department of Health Care Services
Page O-106 Health Services Advisory Group, Inc.

MANAGED CARE HEALTH PLAN PERFORMANCE MEASURES
Table 3.81—RY 2018 (MY 2017) Performance Measure Comparison and Results forMeasures Stratified by the SPD and Non-SPD PopulationsHealth Net—San Diego County
B = Statistical testing result indicates that the RY 2018 SPD rate is significantly better than the RY 2018 non-SPD rate.
W = Statistical testing result indicates that the RY 2018 SPD rate is significantly worse than the RY 2018 non-SPD rate.
Measure RY 2018
SPD Rate1
RY 2018 Non-SPD
Rate1
SPD/Non-SPDRate
Difference2
RY 2018 Total Rate3
All-Cause Readmissions* 28.14% 15.52% 12.62W 20.88% Ambulatory Care—Emergency Department (ED) Visits per 1,000 Member Months**
70.50 33.51 Not Tested 35.50
Ambulatory Care—Outpatient Visits per 1,000 Member Months** 294.72 215.18 Not Tested 219.47
Annual Monitoring for Patients on Persistent Medications— ACE Inhibitors or ARBs
86.40% 86.60% -0.20 86.55%
Annual Monitoring for Patients on Persistent Medications—Diuretics 89.67% 86.89% 2.78 87.82%
Children and Adolescents' Access to Primary Care Practitioners— 12–24 Months
NA 88.49% Not Comparable 88.07%
Children and Adolescents' Access to Primary Care Practitioners— 25 Months–6 Years
71.61% 80.95% -9.34W 80.76%
Children and Adolescents' Access to Primary Care Practitioners— 7–11 Years
78.37% 86.64% -8.27W 86.33%
Children and Adolescents' Access to Primary Care Practitioners— 12–19 Years
72.05% 82.67% -10.62W 82.25%
1 RY 2018 rates reflect MY data from January 1, 2017, through December 31, 2017. 2 Performance comparisons are based on the Chi-square test of statistical significance, with a p value of <0.05. 3 Total rates are based on the MCP reporting unit’s total results, including the SPD and non-SPD populations. Please note, if data are not available for either the SPD or non-SPD population, the total rate is based on results reported for the available population.
Health Net Community Solutions, Inc. Performance Evaluation Report: July 1, 2017–June 30, 2018 California Department of Health Care Services
Page O-107 Health Services Advisory Group, Inc.
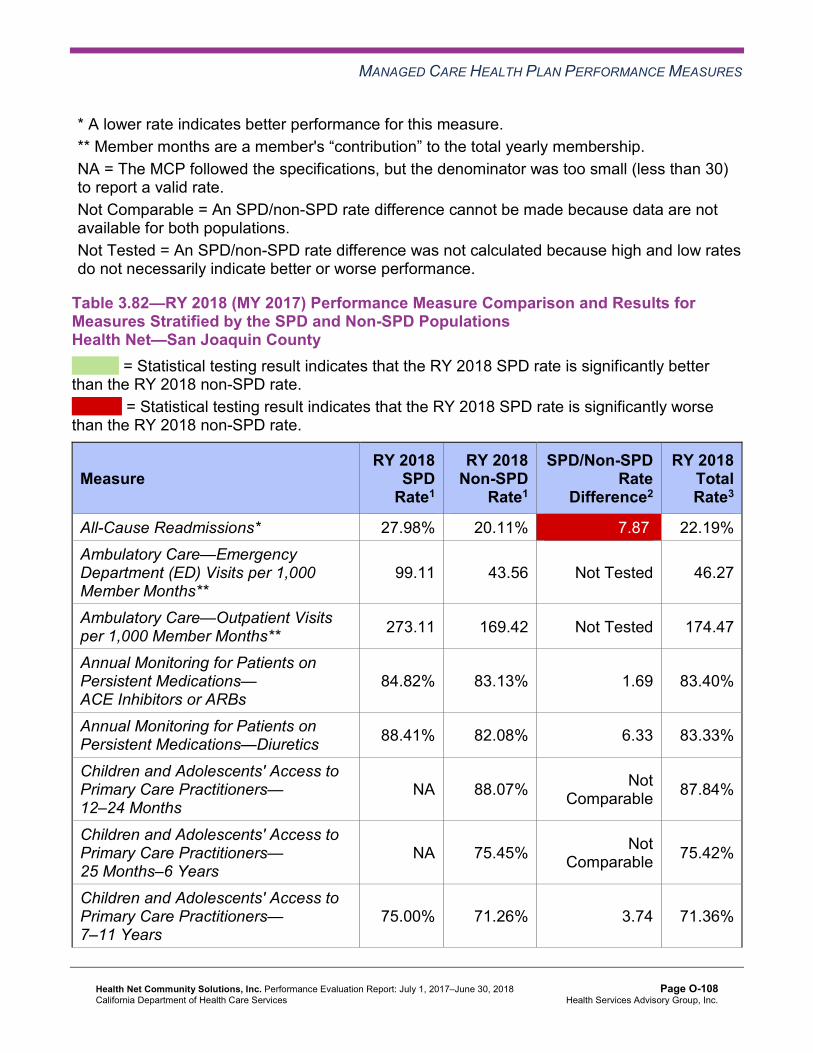
MANAGED CARE HEALTH PLAN PERFORMANCE MEASURES
* A lower rate indicates better performance for this measure. ** Member months are a member's “contribution” to the total yearly membership. NA = The MCP followed the specifications, but the denominator was too small (less than 30) to report a valid rate. Not Comparable = An SPD/non-SPD rate difference cannot be made because data are not available for both populations. Not Tested = An SPD/non-SPD rate difference was not calculated because high and low rates do not necessarily indicate better or worse performance.
Table 3.82—RY 2018 (MY 2017) Performance Measure Comparison and Results forMeasures Stratified by the SPD and Non-SPD PopulationsHealth Net—San Joaquin County
B = Statistical testing result indicates that the RY 2018 SPD rate is significantly better than the RY 2018 non-SPD rate.
W = Statistical testing result indicates that the RY 2018 SPD rate is significantly worse than the RY 2018 non-SPD rate.
Measure RY 2018
SPD Rate1
RY 2018 Non-SPD
Rate1
SPD/Non-SPDRate
Difference2
RY 2018 Total Rate3
All-Cause Readmissions* 27.98% 20.11% 7.87W 22.19% Ambulatory Care—Emergency Department (ED) Visits per 1,000 Member Months**
99.11 43.56 Not Tested 46.27
Ambulatory Care—Outpatient Visits per 1,000 Member Months** 273.11 169.42 Not Tested 174.47
Annual Monitoring for Patients on Persistent Medications— ACE Inhibitors or ARBs
84.82% 83.13% 1.69 83.40%
Annual Monitoring for Patients on Persistent Medications—Diuretics 88.41% 82.08% 6.33 83.33%
Children and Adolescents' Access to Primary Care Practitioners— 12–24 Months
NA 88.07% Not Comparable 87.84%
Children and Adolescents' Access to Primary Care Practitioners— 25 Months–6 Years
NA 75.45% Not Comparable 75.42%
Children and Adolescents' Access to Primary Care Practitioners— 7–11 Years
75.00% 71.26% 3.74 71.36%
Health Net Community Solutions, Inc. Performance Evaluation Report: July 1, 2017–June 30, 2018 California Department of Health Care Services
Page O-108 Health Services Advisory Group, Inc.

MANAGED CARE HEALTH PLAN PERFORMANCE MEASURES
Measure RY 2018
SPD Rate1
RY 2018 Non-SPD
Rate1
SPD/Non-SPDRate
Difference2
RY 2018 Total Rate3
Children and Adolescents' Access to Primary Care Practitioners— 12–19 Years
80.26% 72.00% 8.26 72.28%
1 RY 2018 rates reflect MY data from January 1, 2017, through December 31, 2017. 2 Performance comparisons are based on the Chi-square test of statistical significance, with a p value of <0.05. 3 Total rates are based on the MCP reporting unit’s total results, including the SPD and non-SPD populations. Please note, if data are not available for either the SPD or non-SPD population, the total rate is based on results reported for the available population. * A lower rate indicates better performance for this measure. ** Member months are a member's “contribution” to the total yearly membership. NA = The MCP followed the specifications, but the denominator was too small (less than 30) to report a valid rate. Not Comparable = An SPD/non-SPD rate difference cannot be made because data are not available for both populations. Not Tested = An SPD/non-SPD rate difference was not calculated because high and low rates do not necessarily indicate better or worse performance.
Table 3.83—RY 2018 (MY 2017) Performance Measure Comparison and Results forMeasures Stratified by the SPD and Non-SPD PopulationsHealth Net—Stanislaus County
B = Statistical testing result indicates that the RY 2018 SPD rate is significantly better than the RY 2018 non-SPD rate.
W = Statistical testing result indicates that the RY 2018 SPD rate is significantly worse than the RY 2018 non-SPD rate.
Measure RY 2018
SPD Rate1
RY 2018 Non-SPD
Rate1
SPD/Non-SPDRate
Difference2
RY 2018 Total Rate3
All-Cause Readmissions* 23.88% 10.98% 12.90W 15.78% Ambulatory Care—Emergency Department (ED) Visits per 1,000 Member Months**
91.07 51.58 Not Tested 54.36
Ambulatory Care—Outpatient Visits per 1,000 Member Months** 367.23 221.90 Not Tested 232.13
Health Net Community Solutions, Inc. Performance Evaluation Report: July 1, 2017–June 30, 2018 California Department of Health Care Services
Page O-109 Health Services Advisory Group, Inc.

MANAGED CARE HEALTH PLAN PERFORMANCE MEASURES
Measure RY 2018
SPD Rate1
RY 2018 Non-SPD
Rate1
SPD/Non-SPDRate
Difference2
RY 2018 Total Rate3
Annual Monitoring for Patients on Persistent Medications— ACE Inhibitors or ARBs
87.90% 83.37% 4.53B 84.67%
Annual Monitoring for Patients on Persistent Medications—Diuretics 86.68% 83.18% 3.50 84.26%
Children and Adolescents' Access to Primary Care Practitioners— 12–24 Months
NA 89.15% Not Comparable 89.16%
Children and Adolescents' Access to Primary Care Practitioners— 25 Months–6 Years
86.58% 78.44% 8.14B 78.59%
Children and Adolescents' Access to Primary Care Practitioners— 7–11 Years
86.90% 80.83% 6.07B 81.05%
Children and Adolescents' Access to Primary Care Practitioners— 12–19 Years
82.37% 77.16% 5.21B 77.42%
1 RY 2018 rates reflect MY data from January 1, 2017, through December 31, 2017. 2 Performance comparisons are based on the Chi-square test of statistical significance, with a p value of <0.05. 3 Total rates are based on the MCP reporting unit’s total results, including the SPD and non-SPD populations. Please note, if data are not available for either the SPD or non-SPD population, the total rate is based on results reported for the available population. * A lower rate indicates better performance for this measure. ** Member months are a member's “contribution” to the total yearly membership. NA = The MCP followed the specifications, but the denominator was too small (less than 30) to report a valid rate. Not Comparable = An SPD/non-SPD rate difference cannot be made because data are not available for both populations. Not Tested = An SPD/non-SPD rate difference was not calculated because high and low rates do not necessarily indicate better or worse performance.
Health Net Community Solutions, Inc. Performance Evaluation Report: July 1, 2017–June 30, 2018 California Department of Health Care Services
Page O-110 Health Services Advisory Group, Inc.

MANAGED CARE HEALTH PLAN PERFORMANCE MEASURES
Table 3.84—RY 2018 (MY 2017) Performance Measure Comparison and Results forMeasures Stratified by the SPD and Non-SPD PopulationsHealth Net—Tulare County
B = Statistical testing result indicates that the RY 2018 SPD rate is significantly better than the RY 2018 non-SPD rate.
W = Statistical testing result indicates that the RY 2018 SPD rate is significantly worse than the RY 2018 non-SPD rate.
Measure RY 2018
SPD Rate1
RY 2018 Non-SPD
Rate1
SPD/Non-SPDRate
Difference2
RY 2018 Total Rate3
All-Cause Readmissions* 19.86% 12.24% 7.62W 14.45% Ambulatory Care—Emergency Department (ED) Visits per 1,000 Member Months**
60.81 35.73 Not Tested 37.01
Ambulatory Care—Outpatient Visits per 1,000 Member Months** 531.58 345.98 Not Tested 355.45
Annual Monitoring for Patients on Persistent Medications— ACE Inhibitors or ARBs
89.53% 85.86% 3.67B 86.60%
Annual Monitoring for Patients on Persistent Medications—Diuretics 89.96% 84.81% 5.15B 86.02%
Children and Adolescents' Access to Primary Care Practitioners— 12–24 Months
NA 96.25% Not Comparable 96.27%
Children and Adolescents' Access to Primary Care Practitioners— 25 Months–6 Years
89.26% 89.85% -0.59 89.84%
Children and Adolescents' Access to Primary Care Practitioners— 7–11 Years
91.28% 89.99% 1.29 90.03%
Children and Adolescents' Access to Primary Care Practitioners— 12–19 Years
90.21% 87.86% 2.35 87.96%
1 RY 2018 rates reflect MY data from January 1, 2017, through December 31, 2017. 2 Performance comparisons are based on the Chi-square test of statistical significance, with a p value of <0.05. 3 Total rates are based on the MCP reporting unit’s total results, including the SPD and non-SPD populations. Please note, if data are not available for either the SPD or non-SPD population, the total rate is based on results reported for the available population.
Health Net Community Solutions, Inc. Performance Evaluation Report: July 1, 2017–June 30, 2018 California Department of Health Care Services
Page O-111 Health Services Advisory Group, Inc.

MANAGED CARE HEALTH PLAN PERFORMANCE MEASURES
* A lower rate indicates better performance for this measure. ** Member months are a member's “contribution” to the total yearly membership. NA = The MCP followed the specifications, but the denominator was too small (less than 30) to report a valid rate. Not Comparable = An SPD/non-SPD rate difference cannot be made because data are not available for both populations. Not Tested = An SPD/non-SPD rate difference was not calculated because high and low rates do not necessarily indicate better or worse performance.
Seniors and Persons with Disabilities Findings
HSAG observed the following notable results in RY 2018 for measures that Health Net stratified by the SPD and non-SPD populations:
SPD Rate Changes from RY 2017 to RY 2018
For SPD rates for which HSAG could make a comparison between RY 2017 and RY 2018:
♦ The SPD rates improved significantly from RY 2017 to RY 2018 for the following measures: ■ Annual Monitoring for Patients on Persistent Medications—ACE Inhibitors or ARBs in
Sacramento County. ■ Children and Adolescents’ Access to Primary Care Practitioners—12–19 Years in Kern
County. ♦ The RY 2018 SPD rates were significantly worse than the RY 2017 SPD rates for the
Children and Adolescents’ Access to Primary Care Practitioners—25 Months–6 Years measure in Los Angeles and San Diego counties.
Non-SPD Rate Changes from RY 2017 to RY 2018
The non-SPD rates improved significantly from RY 2017 to RY 2018 for the following measures:
♦ Annual Monitoring for Patients on Persistent Medications—Diuretics in Los Angeles and Sacramento counties.
♦ Children and Adolescents’ Access to Primary Care Practitioners—12–24 Months in Sacramento and Tulare counties.
♦ Children and Adolescents’ Access to Primary Care Practitioners—25 Months–6 Years in Los Angeles, Sacramento, and Tulare counties.
♦ Children and Adolescents’ Access to Primary Care Practitioners—7–11 Years in Kern, Los Angeles, and Sacramento counties.
♦ Children and Adolescents’ Access to Primary Care Practitioners—12–19 Years in Los Angeles County.
Health Net Community Solutions, Inc. Performance Evaluation Report: July 1, 2017–June 30, 2018 California Department of Health Care Services
Page O-112 Health Services Advisory Group, Inc.

MANAGED CARE HEALTH PLAN PERFORMANCE MEASURES
The RY 2018 non-SPD rates were significantly worse than the RY 2017 non-SPD rates for the following measures:
♦ All-Cause Readmissions in Sacramento County ♦ Children and Adolescents’ Access to Primary Care Practitioners—25 Months–6 Years in
San Diego County
Comparisons of RY 2018 SPD and RY 2018 Non-SPD Rates
For measures for which HSAG could make a comparison between the RY 2018 SPD and RY 2018 non-SPD rates:
♦ The RY 2018 SPD rates were significantly better than the RY 2018 non-SPD rates for the following measures: ■ Annual Monitoring for Patients on Persistent Medications—ACE Inhibitors or ARBs in
Los Angeles, Sacramento, Stanislaus, and Tulare counties. ■ Annual Monitoring for Patients on Persistent Medications—Diuretics in Los Angeles,
Sacramento, and Tulare counties. ■ Children and Adolescents’ Access to Primary Care Practitioners—25 Months–6 Years
and 7–11 Years in Kern and Stanislaus counties. ■ Children and Adolescents’ Access to Primary Care Practitioners—12–19 Years in
Stanislaus County. ♦ The RY 2018 SPD rates were significantly worse than the RY 2018 non-SPD rates for the
following measures: ■ All-Cause Readmissions in all seven reporting units. ■ Children and Adolescents’ Access to Primary Care Practitioners—12–24 Months in Los
Angeles County. ■ Children and Adolescents’ Access to Primary Care Practitioners—25 Months–6 Years
and 12–19 Years in Los Angeles and San Diego counties. ■ Children and Adolescents’ Access to Primary Care Practitioners—7–11 Years in San
Diego County
Note that the higher rate of hospital readmissions for the SPD population is expected based on the greater and often more complicated health care needs of these beneficiaries. Additionally, the significantly lower SPD rate for the Children and Adolescents’ Access to Primary Care Practitioners measures may be attributed to beneficiaries in these age groups in the SPD population choosing to receive all health care services from specialist providers due to their complicated health care needs, rather than accessing care from primary care providers.
Health Net Community Solutions, Inc. Performance Evaluation Report: July 1, 2017–June 30, 2018 California Department of Health Care Services
Page O-113 Health Services Advisory Group, Inc.
MANAGED CARE HEALTH PLAN PERFORMANCE MEASURES
Strengths—Performance Measures HSAG auditors determined that Health Net followed the appropriate specifications to produce valid rates, and identified no issues of concern.
HSAG identified the following notable RY 2018 performance measure results for Health Net across all domains and reporting units:
♦ Tulare County had no rates below the MPLs. ♦ The Appropriate Treatment and Utilization domain had no rates below the MPLs.
Additionally, within this domain, all four measures with rates below the MPLs in RY 2017 for which DHCS held MCPs accountable to meet the MPLs in RY 2017 improved to above the MPLs in RY 2018.
♦ The following 11 rates were above the HPLs: ■ Avoidance of Antibiotic Treatment in Adults With Acute Bronchitis in Sacramento and
San Diego counties ■ Immunizations for Adolescents—Combination 2 in Kern, Los Angeles, Sacramento, San
Diego, and Tulare counties ■ Use of Imaging Studies for Low Back Pain in San Joaquin and Tulare counties ■ Both Weight Assessment and Counseling for Nutrition and Physical Activity for Children
and Adolescents measures in Tulare County ♦ Thirty of 154 rates (19 percent) improved significantly from RY 2017 to RY 2018. ♦ For measures for which DHCS held MCPs accountable to meet the MPLs in RY 2017, six
of the 25 rates that were below the MPLs in RY 2017 (24 percent) improved to above the MPLs in RY 2018.
Opportunities for Improvement—Performance Measures While the performance measure results and findings displayed in Table 3.1 through Table 3.84 reflect improvement across all domains and reporting units, Health Net has continued opportunities for improvement based on 34 of 147 rates (23 percent) being below the MPLs in RY 2018. Performance measure results show that San Joaquin, Sacramento, and Stanislaus counties have the greatest opportunities for improvement based on these reporting units having the highest percentage of rates below the MPLs in RY 2018—10 of 21 (48 percent), seven of 21 (33 percent), and seven of 21 (33 percent), respectively.
To build on improvements already achieved, Health Net should identify which strategies contributed to performance measure improvement from RY 2017 to RY 2018 and expand these successful strategies within the MCP and new provider sites, as applicable.
Health Net Community Solutions, Inc. Performance Evaluation Report: July 1, 2017–June 30, 2018 California Department of Health Care Services
Page O-114 Health Services Advisory Group, Inc.
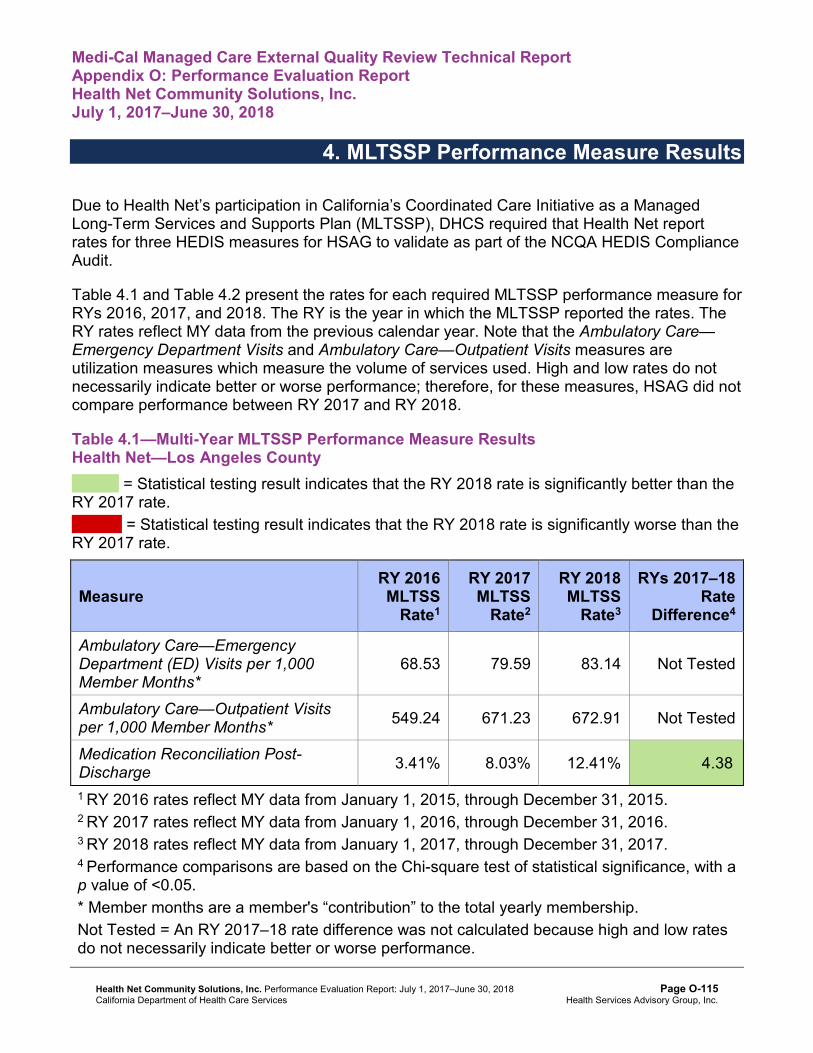
Medi-Cal Managed Care External Quality Review Technical ReportAppendix O: Performance Evaluation ReportHealth Net Community Solutions, Inc.July 1, 2017–June 30, 2018
4. MLTSSP Performance Measure Results
Due to Health Net’s participation in California’s Coordinated Care Initiative as a Managed Long-Term Services and Supports Plan (MLTSSP), DHCS required that Health Net report rates for three HEDIS measures for HSAG to validate as part of the NCQA HEDIS Compliance Audit.
Table 4.1 and Table 4.2 present the rates for each required MLTSSP performance measure for RYs 2016, 2017, and 2018. The RY is the year in which the MLTSSP reported the rates. The RY rates reflect MY data from the previous calendar year. Note that the Ambulatory Care— Emergency Department Visits and Ambulatory Care—Outpatient Visits measures are utilization measures which measure the volume of services used. High and low rates do not necessarily indicate better or worse performance; therefore, for these measures, HSAG did not compare performance between RY 2017 and RY 2018.
Table 4.1—Multi-Year MLTSSP Performance Measure Results Health Net—Los Angeles County
B = Statistical testing result indicates that the RY 2018 rate is significantly better than the RY 2017 rate.
W = Statistical testing result indicates that the RY 2018 rate is significantly worse than the RY 2017 rate.
Measure RY 2016 MLTSS
Rate1
RY 2017 MLTSS
Rate2
RY 2018 MLTSS
Rate3
RYs 2017–18 Rate
Difference4
Ambulatory Care—Emergency Department (ED) Visits per 1,000 Member Months*
68.53 79.59 83.14 Not Tested
Ambulatory Care—Outpatient Visits per 1,000 Member Months* 549.24 671.23 672.91 Not Tested
Medication Reconciliation Post-Discharge 3.41% 8.03% 12.41% 4.38B
1 RY 2016 rates reflect MY data from January 1, 2015, through December 31, 2015. 2 RY 2017 rates reflect MY data from January 1, 2016, through December 31, 2016. 3 RY 2018 rates reflect MY data from January 1, 2017, through December 31, 2017. 4 Performance comparisons are based on the Chi-square test of statistical significance, with a p value of <0.05. * Member months are a member's “contribution” to the total yearly membership. Not Tested = An RY 2017–18 rate difference was not calculated because high and low rates do not necessarily indicate better or worse performance.
Health Net Community Solutions, Inc. Performance Evaluation Report: July 1, 2017–June 30, 2018 California Department of Health Care Services
Page O-115 Health Services Advisory Group, Inc.

MLTSSP PERFORMANCE MEASURE RESULTS
Table 4.2—Multi-Year MLTSSP Performance Measure Results Health Net—San Diego County
B = Statistical testing result indicates that the RY 2018 rate is significantly better than the RY 2017 rate.
W = Statistical testing result indicates that the RY 2018 rate is significantly worse than the RY 2017 rate.
Measure RY 2016 MLTSS
Rate1
RY 2017 MLTSS
Rate2
RY 2018 MLTSS
Rate3
RYs 2017–18 Rate
Difference4
Ambulatory Care—Emergency Department (ED) Visits per 1,000 Member Months*
87.67 91.57 91.07 Not Tested
Ambulatory Care—Outpatient Visits per 1,000 Member Months* 635.00 570.74 606.92 Not Tested
Medication Reconciliation Post-Discharge S 9.21% 19.55% 10.34B
1 RY 2016 rates reflect MY data from January 1, 2015, through December 31, 2015. 2 RY 2017 rates reflect MY data from January 1, 2016, through December 31, 2016. 3 RY 2018 rates reflect MY data from January 1, 2017, through December 31, 2017. 4 Performance comparisons are based on the Chi-square test of statistical significance, with a p value of <0.05. * Member months are a member's “contribution” to the total yearly membership. S = Since there are fewer than 11 cases in the numerator of this measure, HSAG suppresses displaying the rate in this report to satisfy the Health Insurance Portability and Accountability Act of 1996 Privacy Rule’s de-identification standard. If an RY 2017 or RY 2018 rate is suppressed, then HSAG also suppresses the RY 2017–18 rate difference. Not Tested = An RY 2017–18 rate difference was not calculated because high and low rates do not necessarily indicate better or worse performance.
Managed Long-Term Services and Supports Plan Performance Measure Findings The rates for the Medication Reconciliation Post-Discharge measure improved significantly from RY 2017 to RY 2018 in both Los Angeles and San Diego counties.
Health Net Community Solutions, Inc. Performance Evaluation Report: July 1, 2017–June 30, 2018 California Department of Health Care Services
Page O-116 Health Services Advisory Group, Inc.

Medi-Cal Managed Care External Quality Review Technical ReportAppendix O: Performance Evaluation ReportHealth Net Community Solutions, Inc.July 1, 2017–June 30, 2018
5. Performance Improvement Projects
Performance Improvement Project Overview The key concepts of the rapid-cycle PIP framework include forming a PIP team, setting aims, establishing measures, determining interventions using quality improvement tools, conducting PDSA cycles to test interventions, and planning for the spread of successful changes. The core component of the rapid-cycle PIP approach involves testing changes on a small scale so that improvement can occur more efficiently and lead to long-term sustainability. The following modules guide MCPs through this rapid-cycle PIP process:
♦ Module 1—PIP Initiation ■ MCPs outline the framework for the PIP, which includes:
○ The topic rationale. ○ Comparative data supporting the need to improve the selected topic. ○ A list of the PIP team members, which consists of internal and external stakeholders. ○ A completed key driver diagram that defines the theory of change for improvement,
including the SMART (Specific, Measurable, Achievable, Relevant, and Time-bound) Aim and Global Aim.
♦ Module 2—SMART Aim Data Collection ■ MCPs define the SMART Aim measure and data collection methodology and develop
the SMART Aim data run chart. ♦ Module 3—Intervention Determination
■ MCPs use process mapping and failure modes and effects analysis (FMEA) to identify potential interventions to test which may have direct effects on the SMART Aim.
♦ Module 4—Plan-Do-Study-Act (PDSA) ■ MCPs test and evaluate the interventions identified in Module 3 through a series of
PDSA cycles. ♦ Module 5—PIP Conclusions
■ MCPs interpret results and summarize: ○ Key findings and outcomes achieved. ○ Assessment of each tested intervention. ○ Lessons learned, including how demonstrated improvement can be shared and used
as a foundation for further improvement going forward. ○ Plan for sustained improvement.
Health Net Community Solutions, Inc. Performance Evaluation Report: July 1, 2017–June 30, 2018 California Department of Health Care Services
Page O-117 Health Services Advisory Group, Inc.
PERFORMANCE IMPROVEMENT PROJECTS
Based on the agreed-upon timeline, MCPs submit each module to HSAG for validation. Throughout the rapid-cycle PIP process, HSAG provides technical assistance to MCPs to ensure that PIPs are methodologically sound and to problem-solve with MCPs regarding how to address challenges that occur. Through an iterative process, MCPs have opportunities to make corrections to modules 1 through 3 to achieve all validation criteria.
Once MCPs achieve all validation criteria for modules 1 through 3 and receive feedback on the intervention Plan portion of Module 4, MCPs test interventions. During the intervention testing phase of the PIP, HSAG conducts periodic progress check-ins to ensure that MCPs have addressed HSAG’s feedback on the Plan portion of Module 4 and are making appropriate progress with intervention testing. Once MCPs complete testing an intervention, MCPs determine the next steps based on results and lessons learned—whether the intervention was successful and should be spread (adopt), whether modifications need to be made to the existing intervention (adapt), or whether the intervention was not successful and should be stopped (abandon).
In Module 5, MCPs summarize the overall PIP. When validating Module 5, HSAG assesses the validity and reliability of the results based on the Centers for Medicare & Medicaid Services (CMS) validation protocols to determine whether key stakeholders can have confidence in the reported PIP findings. HSAG assigns the following final confidence levels for each PIP:
♦ High confidence—the PIP was methodologically sound and achieved the SMART Aim goal; the demonstrated improvement was clearly linked to the quality improvement processes conducted and intervention(s) tested; and, the MCP accurately summarized the key findings.
♦ Confidence—the PIP was methodologically sound and achieved the SMART Aim goal, and the MCP accurately summarized the key findings. However, some, but not all, of the quality improvement processes conducted and/or intervention(s) tested were clearly linked to the demonstrated improvement.
♦ Low confidence—either (A) the PIP was methodologically sound; however, the SMART Aim goal was not achieved; or (B) the SMART Aim goal was achieved; however, the quality improvement processes and/or intervention(s) tested were poorly executed and could not be linked to the improvement.
♦ Reported PIP results were not credible—the PIP methodology was not executed as approved.
Health Net Community Solutions, Inc. Performance Evaluation Report: July 1, 2017–June 30, 2018 California Department of Health Care Services
Page O-118 Health Services Advisory Group, Inc.

PERFORMANCE IMPROVEMENT PROJECTS
Performance Improvement Project Results and Findings During the review period, Health Net submitted modules 4 and 5 for its 2015–17 DHCS-priority and MCP-specific PIPs. HSAG validated the modules and includes the final PIP validation findings in this report. Additionally, Health Net initiated a Disparity PIP and a DHCS-priority PIP during the review period. In this report, HSAG includes summaries of the MCP’s Disparity and DHCS-priority PIP module submissions as well as validation findings from the review period.
2015–17 DHCS-Priority Performance Improvement Project
Health Net selected postpartum care for its 2015–17 DHCS-priority PIP. While the MCP concluded its Postpartum Care PIP through the SMART Aim end date of June 30, 2017, Health Net submitted modules 4 and 5 for HSAG to validate during the review period for this report. HSAG provided final validation findings and encouraged Health Net to incorporate the experiences and lessons learned from the PIP into future quality improvement efforts.
Table 5.1 provides a summary of the SMART Aim measure results reported by the MCP.
Table 5.1—Health Net Postpartum Care PIP SMART Aim Measure Results
SMART Aim Measure Baseline Rate
SMART Aim Goal
Rate
SMART Aim Goal Achieved
Rate of postpartum visits among beneficiaries assigned to obstetrics/primary care providers in Provider Group A6 in San Diego County
39.00% 55.47% No
Table 5.2 presents a description of the interventions that Health Net tested for its Postpartum Care PIP. The table also indicates the failure modes that each intervention addressed as well as whether the MCP decided, based on intervention testing results, to adopt, adapt, or abandon the intervention.
Table 5.2—Health Net Postpartum Care PIP Intervention Testing Results
Intervention Failure Modes Addressed Adopt,Adapt, orAbandon
Using Postpartum Care Notification Form that collects necessary administrative data required for a positive HEDIS administrative hit for a postpartum care visit
♦ Providers do not document the postpartum visits per HEDIS specifications in medical charts or in claims.
Adapt
6 Provider group name removed for confidentiality.
Health Net Community Solutions, Inc. Performance Evaluation Report: July 1, 2017–June 30, 2018 California Department of Health Care Services
Page O-119 Health Services Advisory Group, Inc.
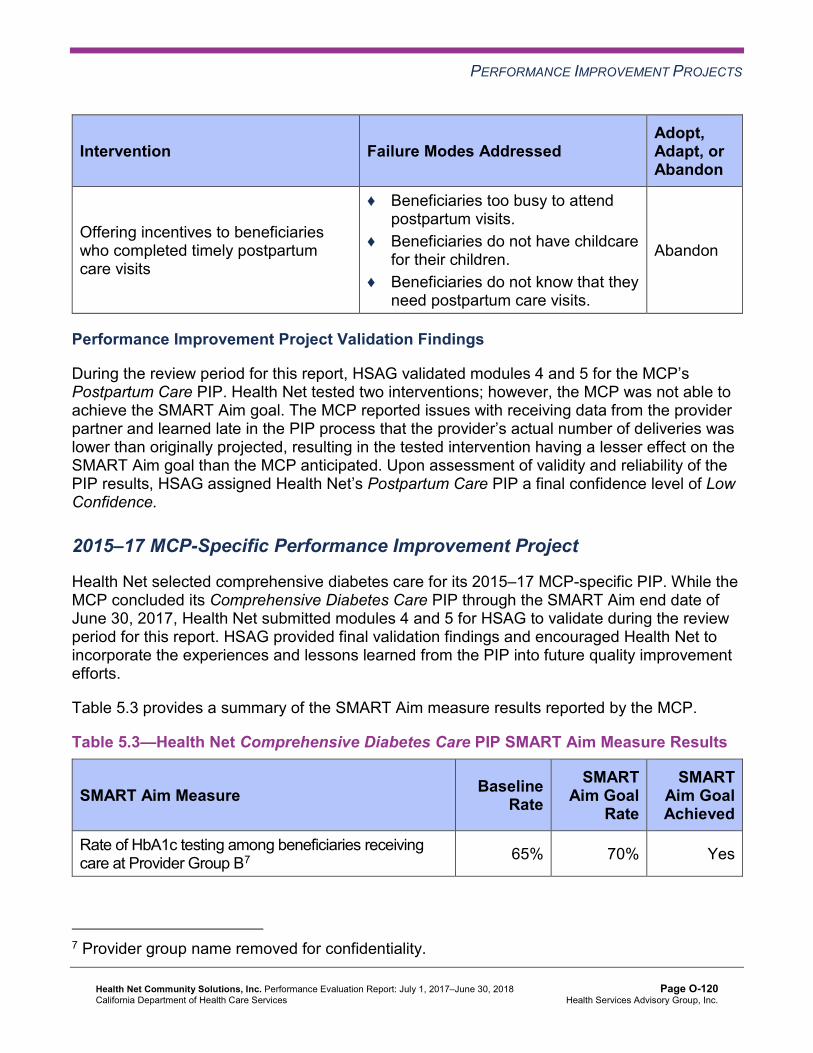
PERFORMANCE IMPROVEMENT PROJECTS
Intervention Failure Modes Addressed Adopt,Adapt, orAbandon
Offering incentives to beneficiaries who completed timely postpartum care visits
♦ Beneficiaries too busy to attend postpartum visits.
♦ Beneficiaries do not have childcare for their children.
♦ Beneficiaries do not know that they need postpartum care visits.
Abandon
Performance Improvement Project Validation Findings
During the review period for this report, HSAG validated modules 4 and 5 for the MCP’s Postpartum Care PIP. Health Net tested two interventions; however, the MCP was not able to achieve the SMART Aim goal. The MCP reported issues with receiving data from the provider partner and learned late in the PIP process that the provider’s actual number of deliveries was lower than originally projected, resulting in the tested intervention having a lesser effect on the SMART Aim goal than the MCP anticipated. Upon assessment of validity and reliability of the PIP results, HSAG assigned Health Net’s Postpartum Care PIP a final confidence level of Low Confidence.
2015–17 MCP-Specific Performance Improvement Project
Health Net selected comprehensive diabetes care for its 2015–17 MCP-specific PIP. While the MCP concluded its Comprehensive Diabetes Care PIP through the SMART Aim end date of June 30, 2017, Health Net submitted modules 4 and 5 for HSAG to validate during the review period for this report. HSAG provided final validation findings and encouraged Health Net to incorporate the experiences and lessons learned from the PIP into future quality improvement efforts.
Table 5.3 provides a summary of the SMART Aim measure results reported by the MCP.
Table 5.3—Health Net Comprehensive Diabetes Care PIP SMART Aim Measure Results
SMART Aim Measure Baseline Rate
SMART Aim Goal
Rate
SMART Aim Goal Achieved
Rate of HbA1c testing among beneficiaries receiving care at Provider Group B7 65% 70% Yes
7 Provider group name removed for confidentiality.
Health Net Community Solutions, Inc. Performance Evaluation Report: July 1, 2017–June 30, 2018 California Department of Health Care Services
Page O-120 Health Services Advisory Group, Inc.

PERFORMANCE IMPROVEMENT PROJECTS
Table 5.4 presents a description of the intervention that Health Net tested for its Comprehensive Diabetes Care PIP. The table also indicates the failure mode that the intervention addressed as well as whether the MCP decided, based on intervention testing results, to adopt, adapt, or abandon the intervention.
Table 5.4—Health Net Comprehensive Diabetes Care PIP Intervention Testing Results
Intervention Failure Mode Addressed Adopt,Adapt, orAbandon
Beneficiary outreach calls for appointment reminders and appointment scheduling
Providers have no protocols in place for beneficiary outreach. Adopt
Health Net documented the following lessons learned during the scope of the 2015–17 MCP-specific PIP, which the MCP may apply to future PIPs:
♦ When working with large entities, try to drill down to clinic-level data prior to deciding on the implementation location.
♦ It is important to have regular process review trainings with implementation staff to ensure that the intervention continues to be implemented as designed.
Performance Improvement Project Validation Findings
During the review period for this report, HSAG validated modules 4 and 5 for the MCP’s Comprehensive Diabetes Care PIP. Health Net achieved the SMART Aim goal and reported that from August 2016 through February 2017 the MCP had outreached to more than 330 beneficiaries, resulting in the MCP scheduling 30 appointments for HbA1c testing. Health Net provided no data beyond April 2017 and no intervention evaluation results that may have demonstrated a clear link between the improvement and the tested intervention. Upon assessment of validity and reliability of the PIP results, HSAG assigned Health Net’s Comprehensive Diabetes Care PIP a final confidence level of Confidence.
2017–19 Disparity Performance Improvement Project
During the review period, DHCS required Health Net to initiate a PIP focusing on an identified health disparity based on, but not limited to, age, gender, race or ethnicity, language spoken, income, educational attainment, sexual orientation or gender identity, occupation, provider, or geographic area. Health Net initially selected postpartum care among Chinese beneficiaries as its 2017–19 Disparity PIP topic. Using its own MCP-specific data, the MCP provided evidence of the health disparity by demonstrating a statistically significant rate difference between two subgroups, with the disparate subgroup having the lower rate. Health Net completed modules 1 and 2 for the Postpartum Care Disparity PIP; however, following completion of medical chart reviews, the MCP identified that the baseline rate was much higher than originally reported.
Health Net Community Solutions, Inc. Performance Evaluation Report: July 1, 2017–June 30, 2018 California Department of Health Care Services
Page O-121 Health Services Advisory Group, Inc.
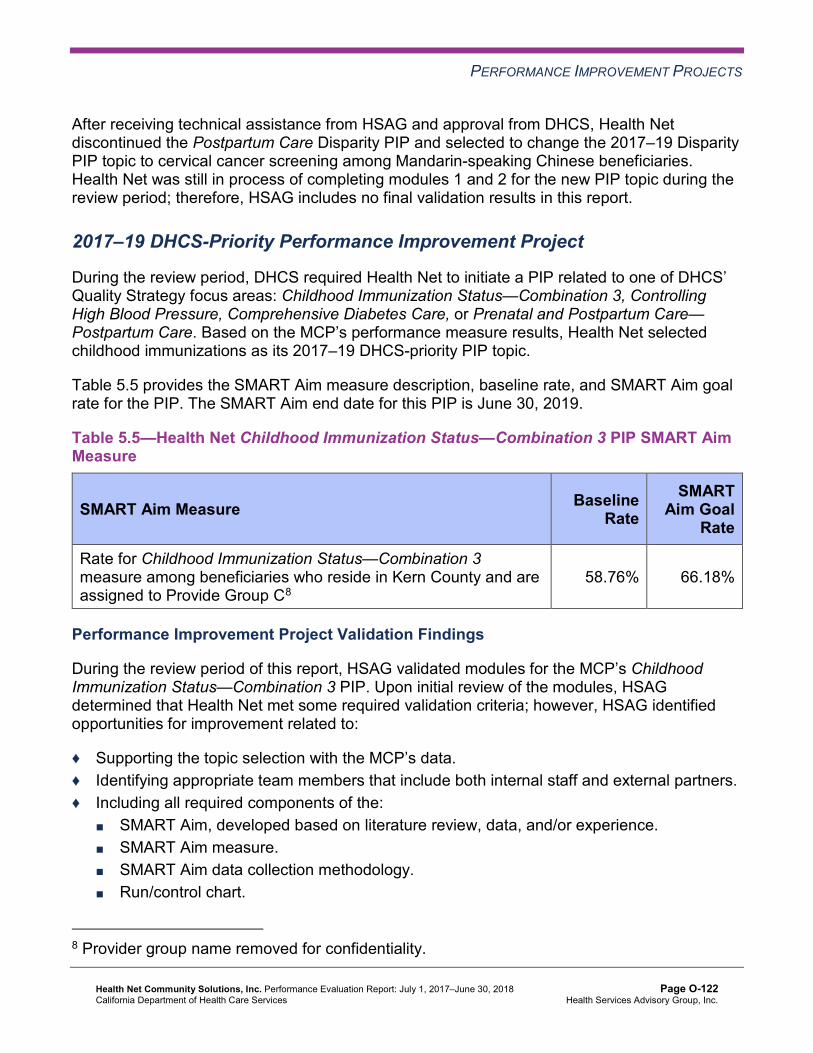
PERFORMANCE IMPROVEMENT PROJECTS
After receiving technical assistance from HSAG and approval from DHCS, Health Net discontinued the Postpartum Care Disparity PIP and selected to change the 2017–19 Disparity PIP topic to cervical cancer screening among Mandarin-speaking Chinese beneficiaries. Health Net was still in process of completing modules 1 and 2 for the new PIP topic during the review period; therefore, HSAG includes no final validation results in this report.
2017–19 DHCS-Priority Performance Improvement Project
During the review period, DHCS required Health Net to initiate a PIP related to one of DHCS’ Quality Strategy focus areas: Childhood Immunization Status—Combination 3, Controlling High Blood Pressure, Comprehensive Diabetes Care, or Prenatal and Postpartum Care— Postpartum Care. Based on the MCP’s performance measure results, Health Net selected childhood immunizations as its 2017–19 DHCS-priority PIP topic.
Table 5.5 provides the SMART Aim measure description, baseline rate, and SMART Aim goal rate for the PIP. The SMART Aim end date for this PIP is June 30, 2019.
Table 5.5—Health Net Childhood Immunization Status—Combination 3 PIP SMART Aim Measure
SMART Aim Measure Baseline Rate
SMART Aim Goal
Rate
Rate for Childhood Immunization Status—Combination 3 measure among beneficiaries who reside in Kern County and are assigned to Provide Group C8
58.76% 66.18%
Performance Improvement Project Validation Findings
During the review period of this report, HSAG validated modules for the MCP’s Childhood Immunization Status—Combination 3 PIP. Upon initial review of the modules, HSAG determined that Health Net met some required validation criteria; however, HSAG identified opportunities for improvement related to:
♦ Supporting the topic selection with the MCP’s data. ♦ Identifying appropriate team members that include both internal staff and external partners. ♦ Including all required components of the:
■ SMART Aim, developed based on literature review, data, and/or experience. ■ SMART Aim measure. ■ SMART Aim data collection methodology. ■ Run/control chart.
8 Provider group name removed for confidentiality.
Health Net Community Solutions, Inc. Performance Evaluation Report: July 1, 2017–June 30, 2018 California Department of Health Care Services
Page O-122 Health Services Advisory Group, Inc.

PERFORMANCE IMPROVEMENT PROJECTS
♦ Aligning accurately the Global Aim, SMART Aim, key drivers, and potential interventions. ♦ Including a step-by-step flow of the overall process in the process map. ♦ Supporting the sub-processes selection for the FMEA table. ♦ Including all required components of the FMEA. ♦ Describing the priority-ranking process. ♦ Listing the appropriate potential interventions based on the ranked failure modes. ♦ Considering the potential interventions’ reliability and sustainability.
After receiving technical assistance from HSAG, Health Net incorporated HSAG’s feedback into the PIP modules. Upon HSAG’s final review of modules 1 and 2, HSAG determined that the MCP met all validation criteria. Health Net was still in the process of incorporating HSAG’s feedback into Module 3 during the review period; therefore, HSAG includes no final validation results for Module 3 in this report.
Strengths—Performance Improvement Projects Health Net’s achieved the SMART Aim goal for the 2015–17 Comprehensive Diabetes Care PIP, and some quality improvement activities could be linked to the demonstrated improvement. Based on HSAG’s assessment, HSAG assigned the 2015–17 Comprehensive Diabetes Care PIP a confidence level of Confidence.
Opportunities for Improvement—Performance Improvement Projects Health Net has the opportunity to continue monitoring interventions and outcomes to facilitate improvement beyond the life of the 2015–17 Postpartum Care and Comprehensive Diabetes Care PIPs. Ongoing monitoring will enable long-term evaluation of improvement and allow the MCP to continually refine interventions to achieve and sustain optimal outcomes.
Health Net Community Solutions, Inc. Performance Evaluation Report: July 1, 2017–June 30, 2018 California Department of Health Care Services
Page O-123 Health Services Advisory Group, Inc.

Medi-Cal Managed Care External Quality Review Technical ReportAppendix O: Performance Evaluation ReportHealth Net Community Solutions, Inc.July 1, 2017–June 30, 2018
6. Recommendations
Follow-Up on Prior Year Recommendations DHCS provided each MCP an opportunity to outline actions taken to address recommendations HSAG made in its 2016–17 MCP-specific evaluation report. Table 6.1 provides EQR recommendations from Health Net’s July 1, 2016, through June 30, 2017, MCP-specific evaluation report, along with the MCP’s self-reported actions taken through June 30, 2018, that address the recommendations. Please note that HSAG made minimal edits to Table 6.1 to preserve the accuracy of Health Net’s self-reported actions.
Table 6.1—Health Net’s Self-Reported Follow-Up on External Quality ReviewRecommendations from the July 1, 2016, through June 30, 2017, MCP-SpecificEvaluation Report
2016–17 External Quality ReviewRecommendations Directed to Health Net
Self-Reported Actions Taken by Health Netduring the Period of July 1, 2017–June 30,2018, that Address the External QualityReview Recommendations
1. Work with DHCS to identify priority areas for improvement based on RY 2017 performance measure results, and expand strategies that the MCP determined contributed to performance above the MPLs in RY 2017 and to improved performance from RY 2016 to RY 2017.
Health Net continues to conduct PIPs and PDSA cycles in collaboration with DHCS and HSAG to address areas in need of improvement.
Barriers and areas of opportunities resulting in low performance in measures include:
♦ Lack of provider awareness of HEDIS technical specification requirements and member care needs.
♦ Lack of member education on care and service requirements
♦ Socio-economic aspects impeding members’ timely access to care.
♦ Patient-provider interactions resulting in care or service refusals or missed and late appointments.
♦ Challenges in data collection, updates, and sharing.
♦ Challenges in communication between providers and organizations.
Health Net Community Solutions, Inc. Performance Evaluation Report: July 1, 2017–June 30, 2018 California Department of Health Care Services
Page O-124 Health Services Advisory Group, Inc.

RECOMMENDATIONS
2016–17 External Quality ReviewRecommendations Directed to Health Net
Self-Reported Actions Taken by Health Netduring the Period of July 1, 2017–June 30,2018, that Address the External QualityReview Recommendations
Health Net continues to implement and expand previous strategies to address care gaps and improve quality performance in low-performing areas. Interventions include focus groups, member in-home screening programs, vendor and health organization collaborations, and multi-modal member and provider education and trainings. Health Net has also expanded provider engagement and practice transformation strategies as well as member and provider incentives to further draw attention to these critical member care measures.
2017–18 Recommendations Based on the overall assessment of Health Net’s delivery of quality, accessible, and timely care through the activities described in previous sections of this report, HSAG recommends the following to the MCP:
♦ To build on improvements already achieved, identify which strategies contributed to performance measure improvement from RY 2017 to RY 2018 and expand these successful strategies within the MCP and new provider sites, as applicable.
♦ Continue monitoring interventions and outcomes to facilitate improvement beyond the life of the 2015–17 Postpartum Care and Comprehensive Diabetes Care PIPs.
In the next annual review, HSAG will evaluate continued successes of Health Net as well as the MCP’s progress with these recommendations.
Health Net Community Solutions, Inc. Performance Evaluation Report: July 1, 2017–June 30, 2018 California Department of Health Care Services
Page O-125 Health Services Advisory Group, Inc.

Medi-Cal Managed CareExternal Quality Review Technical Report
Appendix P: Performance Evaluation Report
Health Plan of San Joaquin July 1, 2017–June 30, 2018
Medi-Cal Managed Care External Quality Review Technical ReportAppendix P: Performance Evaluation ReportHealth Plan of San JoaquinJuly 1, 2017–June 30, 2018
Table of Contents
1. Introduction.............................................................................................................P-1 Medi-Cal Managed Care Health Plan Overview .......................................................P-1
2. Managed Care Health Plan Compliance ...............................................................P-2Compliance Reviews Conducted..............................................................................P-2 Strengths—Compliance Reviews .............................................................................P-2 Opportunities for Improvement—Compliance Reviews ............................................P-3
3. Managed Care Health Plan Performance Measures ............................................P-4Performance Measure Validation Results ................................................................P-4 Performance Measure Results and Findings............................................................P-4
Preventive Screening and Children’s Health .........................................................P-5 Preventive Screening and Women’s Health ........................................................P-11 Care for Chronic Conditions ................................................................................P-15 Appropriate Treatment and Utilization.................................................................P-21 Performance Measure Findings—All Domains....................................................P-26
Corrective Action Plan Requirements for 2018.......................................................P-28 Seniors and Persons with Disabilities Performance Measure Results....................P-29
Seniors and Persons with Disabilities Findings ...................................................P-38 Strengths—Performance Measures .......................................................................P-39 Opportunities for Improvement—Performance Measures ......................................P-40
4. Performance Improvement Projects ...................................................................P-41Performance Improvement Project Overview .........................................................P-41 Performance Improvement Project Results and Findings.......................................P-42
2015–17 DHCS-Priority Performance Improvement Project ...............................P-43 2015–17 MCP-Specific Performance Improvement Project ................................P-44 2017–19 Disparity Performance Improvement Project ........................................P-45 2017–19 DHCS-Priority Performance Improvement Project ...............................P-46
Strengths—Performance Improvement Projects ....................................................P-46 Opportunities for Improvement—Performance Improvement Projects ...................P-47
5. Recommendations................................................................................................P-48 Follow-Up on Prior Year Recommendations ..........................................................P-48 2017–18 Recommendations...................................................................................P-54
Health Plan of San Joaquin Performance Evaluation Report: July 1, 2017–June 30, 2018 California Department of Health Care Services
Page P-i Health Services Advisory Group, Inc.

TABLE OF CONTENTS
Table of Tables
Table 2.1—DHCS A&I Medical and State Supported Services Audits of HPSJ Audit Review Period: July 1, 2016, through June 30, 2017...................................P-2
Table 3.1—Preventive Screening and Children’s Health Domain Multi-Year Performance Measure Results HPSJ—San Joaquin County.......................P-6
Table 3.2—Preventive Screening and Children’s Health Domain Multi-Year Performance Measure Results HPSJ—Stanislaus County ..........................P-7
Table 3.3—Preventive Screening and Children’s Health Domain RY 2018 (MY 2017) Performance Measure Findings HPSJ—San Joaquin County .....................P-9
Table 3.4—Preventive Screening and Children’s Health Domain RY 2018 (MY 2017) Performance Measure Findings HPSJ—Stanislaus County ......................P-10
Table 3.5—Preventive Screening and Women’s Health Domain Multi-Year Performance Measure Results HPSJ—San Joaquin County........................ 11
Table 3.6—Preventive Screening and Women’s Health Domain Multi-Year Performance Measure Results HPSJ—Stanislaus County ........................P-12
Table 3.7—Preventive Screening and Women’s Health Domain RY 2018 (MY 2017) Performance Measure Findings HPSJ—San Joaquin County ...................P-13
Table 3.8—Preventive Screening and Women’s Health Domain RY 2018 (MY 2017) Performance Measure Findings HPSJ—Stanislaus County ......................P-14
Table 3.9—Care for Chronic Conditions Domain Multi-Year Performance Measure Results HPSJ—San Joaquin County.........................................................P-15
Table 3.10—Care for Chronic Conditions Domain Multi-Year Performance Measure Results HPSJ—Stanislaus County ............................................................P-16
Table 3.11—Care for Chronic Conditions Domain RY 2018 (MY 2017) Performance Measure Findings HPSJ—San Joaquin County ........................................P-18
Table 3.12—Care for Chronic Conditions Domain RY 2018 (MY 2017) Performance Measure Findings HPSJ—Stanislaus County............................................P-19
Table 3.13—Appropriate Treatment and Utilization Domain Multi-Year Performance Measure Results HPSJ—San Joaquin County ..........................................P-22
Table 3.14—Appropriate Treatment and Utilization Domain Multi-Year Performance Measure Results HPSJ—Stanislaus County .............................................P-23
Table 3.15—Appropriate Treatment and Utilization Domain RY 2018 (MY 2017) Performance Measure Findings HPSJ—San Joaquin County ...................P-24
Table 3.16—Appropriate Treatment and Utilization Domain RY 2018 (MY 2017) Performance Measure Findings HPSJ—Stanislaus County ......................P-25
Table 3.17—RY 2018 (MY 2017) Performance Measure Findings for All Domains HPSJ—San Joaquin County......................................................................P-26
Table 3.18—RY 2018 (MY 2017) Performance Measure Findings for All Domains HPSJ—Stanislaus County .........................................................................P-27
Health Plan of San Joaquin Performance Evaluation Report: July 1, 2017–June 30, 2018 California Department of Health Care Services
Page P-ii Health Services Advisory Group, Inc.

TABLE OF CONTENTS
Table 3.19—Multi-Year SPD Performance Measure Trend Table HPSJ— San Joaquin County...................................................................................P-29
Table 3.20—Multi-Year SPD Performance Measure Trend Table HPSJ— Stanislaus County......................................................................................P-31
Table 3.21—Multi-Year Non-SPD Performance Measure Trend Table HPSJ— San Joaquin County...................................................................................P-32
Table 3.22—Multi-Year Non-SPD Performance Measure Trend Table HPSJ— Stanislaus County......................................................................................P-34
Table 3.23—RY 2018 (MY 2017) Performance Measure Comparison and Results for Measures Stratified by the SPD and Non-SPD Populations HPSJ— San Joaquin County...................................................................................P-35
Table 3.24—RY 2018 (MY 2017) Performance Measure Comparison and Results for Measures Stratified by the SPD and Non-SPD Populations HPSJ— Stanislaus County......................................................................................P-37
Table 4.1—HPSJ Diabetes HbA1c Testing PIP SMART Aim Measure Results...........P-43 Table 4.2—HPSJ Diabetes HbA1c Testing PIP Intervention Testing Results ..............P-43 Table 4.3—HPSJ Cervical Cancer Screening PIP SMART Aim Measure Results.......P-44 Table 4.4—HPSJ Cervical Cancer Screening PIP Intervention Testing Results ..........P-44 Table 4.5—HPSJ Cervical Cancer Screening Disparity PIP SMART Aim Measure.....P-45 Table 5.1—HPSJ’s Self-Reported Follow-Up on External Quality Review
Recommendations from the July 1, 2016, through June 30, 2017, MCP-Specific Evaluation Report................................................................P-48
Health Plan of San Joaquin Performance Evaluation Report: July 1, 2017–June 30, 2018 California Department of Health Care Services
Page P-iii Health Services Advisory Group, Inc.
Medi-Cal Managed Care External Quality Review Technical ReportAppendix P: Performance Evaluation ReportHealth Plan of San JoaquinJuly 1, 2017–June 30, 2018
1. Introduction
The California Department of Health Care Services (DHCS) contracted with Health Services Advisory Group, Inc. (HSAG), an external quality review organization (EQRO), to prepare the federally required Medi-Cal Managed Care External Quality Review Technical Report, July 1, 2017–June 30, 2018. The technical report provides an overview of the objectives and methodology for conducting the external quality review (EQR) activities, including requirements related to each activity. Additionally, the technical report provides aggregated results and recommendations for DHCS for each activity.
This appendix is specific to DHCS’ contracted Medi-Cal managed care health plan (MCP), Health Plan of San Joaquin (“HPSJ” or “the MCP”). The purpose of this appendix is to provide MCP-specific results of each activity and an assessment of the MCP’s strengths and opportunities for improvement with respect to the quality and timeliness of and access to health care services furnished to Medi-Cal Managed Care (MCMC) beneficiaries (referred to as “beneficiaries” in this report). The review period for this MCP-specific evaluation report is July 1, 2017, through June 30, 2018. HSAG will report on activities that take place beyond the review period in HPSJ’s 2018–19 MCP-specific evaluation report. This MCP-specific evaluation report references activities and methodologies described in detail by HSAG in the technical report section.
The aggregate EQR technical report and all MCP- and specialty health plan (SHP)-specific performance evaluation reports reflect HSAG’s external, independent assessment of the quality and timeliness of, and access to, care that MCPs and SHPs are providing to beneficiaries.
Medi-Cal Managed Care Health Plan Overview HPSJ is a full-scope MCP delivering services to beneficiaries as a “Local Initiative” (LI) MCP under the Two-Plan Model (TPM). Beneficiaries may enroll in HPSJ, the LI MCP; or in Health Net Community Solutions, Inc., the alternative commercial plan (CP).
HPSJ became operational in San Joaquin County to provide MCMC services effective February 1996 and in Stanislaus County effective January 2013. As of June 30, 2018, HPSJ had 217,557 beneficiaries in San Joaquin County and 128,205 in Stanislaus County—for a total of 345,762 beneficiaries.1 This represents 91 percent of the beneficiaries enrolled in San Joaquin County and 65 percent in Stanislaus County.
1 Medi-Cal Managed Care Enrollment Report—June 2018. Available at: http://www.dhcs.ca.gov/dataandstats/reports/Pages/MMCDMonthlyEnrollment.aspx. Accessed on: Sep 05, 2018.
Health Plan of San Joaquin Performance Evaluation Report: July 1, 2017–June 30, 2018 California Department of Health Care Services
Page P-1 Health Services Advisory Group, Inc.

Medi-Cal Managed Care External Quality Review Technical ReportAppendix P: Performance Evaluation ReportHealth Plan of San JoaquinJuly 1, 2017–June 30, 2018
2. Managed Care Health Plan Compliance
Compliance Reviews Conducted The following is a summary of the most recent reviews conducted for HPSJ. Unless noted, HSAG’s compliance review summaries are based on final audit/survey reports issued and corrective action plan (CAP) closeout letters dated on or before the end of the review period for this report (June 30, 2018). The descriptions of the various types of reviews may be found within the main section of this technical report.
Table 2.1 summarizes the results and status of the DHCS Audits & Investigations Division (A&I) Medical and State Supported Services Audits of HPSJ. A&I conducted the on-site audits from July 31, 2017, through August 9, 2017.
Table 2.1—DHCS A&I Medical and State Supported Services Audits of HPSJAudit Review Period: July 1, 2016, through June 30, 2017
Category Evaluated Deficiencies (Yes/No) Monitoring Status
Utilization Management No Not applicable.
Case Management and Coordination of Care Yes CAP in process and under review by DHCS.
Access and Availability of Care No Not applicable. Member’s Rights No Not applicable. Quality Management No Not applicable. Administrative and Organizational Capacity No Not applicable. State Supported Services No Not applicable.
Strengths—Compliance Reviews A&I identified deficiencies in one category only during the July 31, 2017, through August 9, 2017, Medical and State Supported Services Audits of HPSJ.
Health Plan of San Joaquin Performance Evaluation Report: July 1, 2017–June 30, 2018 California Department of Health Care Services
Page P-2 Health Services Advisory Group, Inc.
MANAGED CARE HEALTH PLAN COMPLIANCE
Opportunities for Improvement—Compliance Reviews HPSJ has the opportunity to work with DHCS to ensure that the MCP resolves the deficiencies that A&I identified in the Case Management and Coordination of Care category during the July 31, 2017, through August 9, 2017, Medical and State Supported Services Audits.
Health Plan of San Joaquin Performance Evaluation Report: July 1, 2017–June 30, 2018 California Department of Health Care Services
Page P-3 Health Services Advisory Group, Inc.
Medi-Cal Managed Care External Quality Review Technical ReportAppendix P: Performance Evaluation ReportHealth Plan of San JoaquinJuly 1, 2017–June 30, 2018
3. Managed Care Health Plan Performance Measures
Performance Measure Validation Results The HEDIS®2 2018 Compliance Audit Final Report of Findings for Health Plan of San Joaquin contains the detailed findings and recommendations from HSAG’s NCQA HEDIS Compliance Audit™.3 HSAG auditors determined that HPSJ followed the appropriate specifications to produce valid rates. The auditors recommended that HPSJ continue efforts to identify beneficiaries with retroactive eligibility to determine whether or not exclusion of those beneficiaries impacts the reported HEDIS rates.
Performance Measure Results and Findings After validating the MCP’s performance measure rates, HSAG assessed the results. See Table 3.1 through Table 3.18 for HPSJ’s performance measure results for reporting years (RYs) 2015 through 2018 and performance measure findings for RY 2018. The RY is the year in which the MCP reported the rates. The RY rates reflect measurement year (MY) data from the previous calendar year. Note that data may not be available for all four years.
Note the following regarding Table 3.1 through Table 3.18:
♦ To allow HSAG to provide meaningful assessment of MCP performance and actionable recommendations, HSAG, in collaboration with DHCS, organized the measures into domains based on the health care areas each measure affects. Table 3.1 through Table 3.16 present the performance measure results and findings by domain, and Table 3.17 and Table 3.18 present the RY 2018 performance measure findings for the domains combined.
♦ To assess performance for each MCP reporting unit, HSAG compares the rates to national benchmarks. Rates indicating performance above the high performance levels (HPLs) are shaded in gray, and rates indicating performance below the minimum performance levels (MPLs) are bolded. ■ For measures with rates below the MPLs, DHCS requires MCPs to submit to DHCS
improvement plans (IPs) to address the rates below the MPLs (unless MCPs are reporting the rates for the first time).
■ For MCPs that meet DHCS’ Quality of Care CAP thresholds, DHCS issues a CAP; if an MCP’s performance is such that it may trigger a CAP in the following year, DHCS issues an advance warning letter.
2 Healthcare Effectiveness Data and Information Set (HEDIS®) is a registered trademark of the National Committee for Quality Assurance (NCQA).
3 NCQA HEDIS Compliance AuditTM is a trademark of NCQA.
Health Plan of San Joaquin Performance Evaluation Report: July 1, 2017–June 30, 2018 California Department of Health Care Services
Page P-4 Health Services Advisory Group, Inc.
MANAGED CARE HEALTH PLAN PERFORMANCE MEASURES
■ IPs and CAPs consist of submission of Plan-Do-Study-Act (PDSA) Cycle Worksheets, Quality Improvement (QI) Summaries, or completion of Performance Improvement Projects (PIPs)—as determined by DHCS.
♦ For RYs 2016, 2017, and 2018, the HPLs and MPLs represent the NCQA Quality Compass®4 Medicaid health maintenance organization (HMO) 90th and 25th percentiles, respectively.
♦ For RY 2015, the HPLs and MPLs represent the NCQA HEDIS Audit Means, Percentiles, and Ratios 90th and 25th percentiles, respectively. For the Comprehensive Diabetes Care—HbA1c Poor Control (>9.0 Percent) measure, for which a lower rate indicates more favorable performance, the HPL and MPL are based on the 10th and 75th percentiles, respectively.
♦ HSAG includes the specific HPL and MPL values for RY 2018 in Section 6 of the Medi-Cal Managed Care External Quality Review Technical Report, July 1, 2017–June 30, 2018 (“Managed Care Health Plan Performance Measures”).
Preventive Screening and Children’s Health
Table 3.1 and Table 3.2 present the four-year trending information for the performance measures within the Preventive Screening and Children’s Health domain.
Note the following regarding Table 3.1 and Table 3.2:
♦ Although HSAG includes information on the MCP’s performance related to the four Children and Adolescents’ Access to Primary Care measures, DHCS did not hold MCPs accountable to meet the MPLs for these measures for RYs 2015 through 2018 (i.e., DHCS did not require MCPs to submit IPs if rates for the measures were below the MPLs). DHCS made this decision due to the small range of variation between the HPL and MPL thresholds for each measure.
♦ Any comparison of RY 2018 performance to RY 2017 or to benchmarks related to the Immunizations for Adolescents—Combination 2 measure should be exercised with caution given the changes that NCQA made to the specification for this measure for RY 2018. NCQA released guidance that recommended a break in trending for this measure; however, DHCS determined to continue trending because the specification change should result in higher rates.
4 Quality Compass® is a registered trademark of NCQA.
Health Plan of San Joaquin Performance Evaluation Report: July 1, 2017–June 30, 2018 California Department of Health Care Services
Page P-5 Health Services Advisory Group, Inc.

MANAGED CARE HEALTH PLAN PERFORMANCE MEASURES
Table 3.1—Preventive Screening and Children’s Health DomainMulti-Year Performance Measure Results HPSJ—San Joaquin County
H = Rate indicates performance above the HPL. Bolded Rate = Rate indicates performance below the MPL.
B = Statistical testing result indicates that the RY 2018 rate is significantly better than the RY 2017 rate.
W = Statistical testing result indicates that the RY 2018 rate is significantly worse than the RY 2017 rate.
Measure RY
2015 Rate1
RY 2016
Rate2
RY 2017
Rate3
RY 2018
Rate4
RYs 2017–18 Rate
Difference5
Childhood Immunization Status—Combination 3 69.59% 67.40% 60.58% 55.23% -5.35
Children and Adolescents’ Access to Primary Care Practitioners—12–24 Months
96.17% 95.39% 95.10% 94.74% -0.36
Children and Adolescents’ Access to Primary Care Practitioners— 25 Months–6 Years
85.04% 84.62% 84.89% 85.77% 0.88B
Children and Adolescents’ Access to Primary Care Practitioners—7–11 Years
86.27% 86.87% 86.09% 86.37% 0.28
Children and Adolescents’ Access to Primary Care Practitioners—12–19 Years
82.56% 83.70% 81.94% 83.35% 1.41B
Immunizations for Adolescents— Combination 2^ -- -- 21.65% 31.14%H 9.49B
Weight Assessment and Counseling for Nutrition and Physical Activity for Children and Adolescents—Nutrition Counseling—Total
70.56% 54.01% 60.10% 65.45% 5.35
Weight Assessment and Counseling for Nutrition and Physical Activity for Children and Adolescents—Physical Activity Counseling—Total
61.31% 53.28% 55.23% 60.83% 5.60
Health Plan of San Joaquin Performance Evaluation Report: July 1, 2017–June 30, 2018 California Department of Health Care Services
Page P-6 Health Services Advisory Group, Inc.
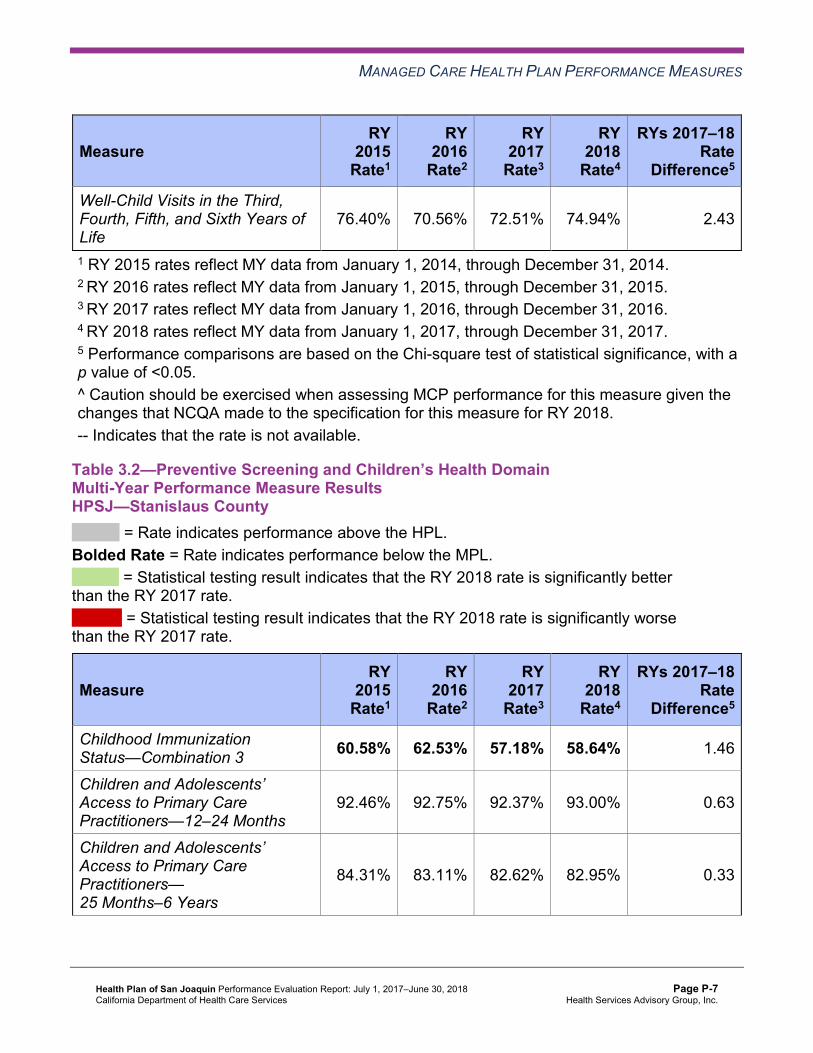
MANAGED CARE HEALTH PLAN PERFORMANCE MEASURES
Measure RY
2015 Rate1
RY 2016
Rate2
RY 2017
Rate3
RY 2018
Rate4
RYs 2017–18 Rate
Difference5
Well-Child Visits in the Third, Fourth, Fifth, and Sixth Years of Life
76.40% 70.56% 72.51% 74.94% 2.43
1 RY 2015 rates reflect MY data from January 1, 2014, through December 31, 2014. 2 RY 2016 rates reflect MY data from January 1, 2015, through December 31, 2015. 3 RY 2017 rates reflect MY data from January 1, 2016, through December 31, 2016. 4 RY 2018 rates reflect MY data from January 1, 2017, through December 31, 2017. 5 Performance comparisons are based on the Chi-square test of statistical significance, with a p value of <0.05. ^ Caution should be exercised when assessing MCP performance for this measure given the changes that NCQA made to the specification for this measure for RY 2018. -- Indicates that the rate is not available.
Table 3.2—Preventive Screening and Children’s Health DomainMulti-Year Performance Measure Results HPSJ—Stanislaus County
H = Rate indicates performance above the HPL. Bolded Rate = Rate indicates performance below the MPL.
B = Statistical testing result indicates that the RY 2018 rate is significantly better than the RY 2017 rate.
W = Statistical testing result indicates that the RY 2018 rate is significantly worse than the RY 2017 rate.
Measure RY
2015 Rate1
RY 2016
Rate2
RY 2017
Rate3
RY 2018
Rate4
RYs 2017–18 Rate
Difference5
Childhood Immunization Status—Combination 3 60.58% 62.53% 57.18% 58.64% 1.46
Children and Adolescents’ Access to Primary Care Practitioners—12–24 Months
92.46% 92.75% 92.37% 93.00% 0.63
Children and Adolescents’ Access to Primary Care Practitioners— 25 Months–6 Years
84.31% 83.11% 82.62% 82.95% 0.33
Health Plan of San Joaquin Performance Evaluation Report: July 1, 2017–June 30, 2018 California Department of Health Care Services
Page P-7 Health Services Advisory Group, Inc.

MANAGED CARE HEALTH PLAN PERFORMANCE MEASURES
Measure RY
2015 Rate1
RY 2016
Rate2
RY 2017
Rate3
RY 2018
Rate4
RYs 2017–18 Rate
Difference5
Children and Adolescents’ Access to Primary Care Practitioners—7–11 Years
87.59% 86.63% 84.48% 84.42% -0.06
Children and Adolescents’ Access to Primary Care Practitioners—12–19 Years
84.54% 83.32% 80.09% 79.82% -0.27
Immunizations for Adolescents— Combination 2^ -- -- 19.46% 22.87% 3.41
Weight Assessment and Counseling for Nutrition and Physical Activity for Children and Adolescents—Nutrition Counseling—Total
56.45% 48.18% 54.26% 60.83% 6.57
Weight Assessment and Counseling for Nutrition and Physical Activity for Children and Adolescents—Physical Activity Counseling—Total
44.77% 43.07% 47.45% 60.10% 12.65B
Well-Child Visits in the Third, Fourth, Fifth, and Sixth Years of Life
65.21% 57.18% 60.83% 62.53% 1.70
1 RY 2015 rates reflect MY data from January 1, 2014, through December 31, 2014. 2 RY 2016 rates reflect MY data from January 1, 2015, through December 31, 2015. 3 RY 2017 rates reflect MY data from January 1, 2016, through December 31, 2016. 4 RY 2018 rates reflect MY data from January 1, 2017, through December 31, 2017. 5 Performance comparisons are based on the Chi-square test of statistical significance, with a p value of <0.05. ^ Caution should be exercised when assessing MCP performance for this measure given the changes that NCQA made to the specification for this measure for RY 2018. -- Indicates that the rate is not available.
Health Plan of San Joaquin Performance Evaluation Report: July 1, 2017–June 30, 2018 California Department of Health Care Services
Page P-8 Health Services Advisory Group, Inc.

MANAGED CARE HEALTH PLAN PERFORMANCE MEASURES
Table 3.3 and Table 3.4 present findings for the RY 2018 performance measures within the Preventive Screening and Children’s Health domain.
Note the following regarding Table 3.3 and Table 3.4:
♦ DHCS did not hold MCPs accountable to meet MPLs for all four Children and Adolescents’ Access to Primary Care measures within this domain; therefore, HSAG did not include these measures in its assessment of the MCP’s performance related to HPLs and MPLs.
♦ The Immunizations for Adolescents—Combination 2 measure was a first-year measure in RY 2017, and DHCS established no MPL for this measure for RY 2017 because no comparable benchmark existed; therefore, HSAG did not include this measure in the denominators for calculating the percentage of measures with rates that moved to above or below the MPLs in RY 2018.
Table 3.3—Preventive Screening and Children’s Health DomainRY 2018 (MY 2017) Performance Measure Findings HPSJ—San Joaquin County
Criteria Number of Measures
MeetingCriteria
Total Number of Measures
Percentage of Measures
MeetingCriteria
RY 2018 Rates Above HPLs 1 5 20.00% Rates Above HPLs for the Last Three or More Consecutive Years 0 4 0.00%
RY 2018 Rates Significantly Better than RY 2017 Rates* 1 5 20.00%
Rates that Moved from Below MPLs in RY 2017 to Above MPLs in RY 2018 0 1 0.00%
RY 2018 Rates Below MPLs 1 5 20.00% Rates Below MPLs for the Last Three or More Consecutive Years 0 4 0.00%
RY 2018 Rates Significantly Worse than RY 2017 Rates* 0 5 0.00%
Rates that Moved from Above MPLs in RY 2017 to Below MPLs in RY 2018 0 3 0.00%
* Performance comparisons are based on the Chi-square test of statistical significance, with a p value of <0.05.
Health Plan of San Joaquin Performance Evaluation Report: July 1, 2017–June 30, 2018 California Department of Health Care Services
Page P-9 Health Services Advisory Group, Inc.

MANAGED CARE HEALTH PLAN PERFORMANCE MEASURES
Table 3.4—Preventive Screening and Children’s Health DomainRY 2018 (MY 2017) Performance Measure Findings HPSJ—Stanislaus County
Criteria Number of Measures
MeetingCriteria
Total Number of Measures
Percentage of Measures
MeetingCriteria
RY 2018 Rates Above HPLs 0 5 0.00% Rates Above HPLs for the Last Three or More Consecutive Years 0 4 0.00%
RY 2018 Rates Significantly Better than RY 2017 Rates* 1 5 20.00%
Rates that Moved from Below MPLs in RY 2017 to Above MPLs in RY 2018 0 2 0.00%
RY 2018 Rates Below MPLs 2 5 40.00% Rates Below MPLs for the Last Three or More Consecutive Years 2 4 50.00%
RY 2018 Rates Significantly Worse than RY 2017 Rates* 0 5 0.00%
Rates that Moved from Above MPLs in RY 2017 to Below MPLs in RY 2018 0 2 0.00%
* Performance comparisons are based on the Chi-square test of statistical significance, with a p value of <0.05.
Assessment of Corrective Action Plan Efforts—Preventive Screening and Children’sHealth
Based on RY 2017 performance measure results, HPSJ’s CAP was expanded from San Joaquin County only to include all performance measures with rates below the MPLs across both reporting units. The following measures within the Preventive Screening and Children’s Health domain were included in the CAP:
♦ Childhood Immunization Status—Combination 3 for both reporting units ♦ Well-Child Visits in the Third, Fourth, Fifth, and Sixth Years of Life in Stanislaus County
Childhood Immunizations
DHCS approved HPSJ to conduct a PIP to address the MCP’s performance below the MPL in RY 2017 for the Childhood Immunization Status—Combination 3 measure in both reporting units. The MCP is conducting a 2017–19 Childhood Immunization Status—Combination 3 PIP with a narrowed focus on a provider in San Joaquin County. HSAG includes a summary of HPSJ’s progress on this PIP in Section 4 of this report (“Performance Improvement Projects”).
Health Plan of San Joaquin Performance Evaluation Report: July 1, 2017–June 30, 2018 California Department of Health Care Services
Page P-10 Health Services Advisory Group, Inc.

MANAGED CARE HEALTH PLAN PERFORMANCE MEASURES
The rates in both reporting units remained below the MPL for the Childhood Immunization Status—Combination 3 measure in RY 2018.
Well-Child Visits
HPSJ conducted two PDSA cycles with a clinic in Stanislaus County to test whether or not using a beneficiary outreach script and a patient care navigator would increase the number of beneficiaries ages 3 to 6 who receive preventive health care services. HPSJ indicated having learned that a robust planning process for intervention testing is inadequate if the providers are not committed and dedicated to the entire quality improvement process. The MCP concluded that involving providers in problem solving and decision making prior to any project implementation may improve the potential for success.
The rate in Stanislaus County remained below the MPL for the Well-Child Visits in the Third, Fourth, Fifth, and Sixth Years of Life measure in RY 2018.
Preventive Screening and Women’s Health
Table 3.5 and Table 3.6 present the four-year trending information for the performance measures within the Preventive Screening and Women’s Health domain.
Note that any comparison of RY 2018 performance to RY 2017 or to benchmarks related to the Breast Cancer Screening measure should be exercised with caution given the changes that NCQA made to the specification for this measure for RY 2018. NCQA released guidance that recommended a break in trending for this measure; however, DHCS determined to continue trending because the specification change should result in higher rates.
Table 3.5—Preventive Screening and Women’s Health DomainMulti-Year Performance Measure Results HPSJ—San Joaquin County
H = Rate indicates performance above the HPL. Bolded Rate = Rate indicates performance below the MPL.
B = Statistical testing result indicates that the RY 2018 rate is significantly better than the RY 2017 rate.
W = Statistical testing result indicates that the RY 2018 rate is significantly worse than the RY 2017 rate.
Measure RY
2015 Rate1
RY 2016
Rate2
RY 2017
Rate3
RY 2018
Rate4
RYs 2017–18 Rate
Difference5
Breast Cancer Screening^ -- -- 51.67% 43.66% -8.01W
Cervical Cancer Screening 57.18% 49.39% 47.20% 55.72% 8.52B
Health Plan of San Joaquin Performance Evaluation Report: July 1, 2017–June 30, 2018 California Department of Health Care Services
Page P-11 Health Services Advisory Group, Inc.
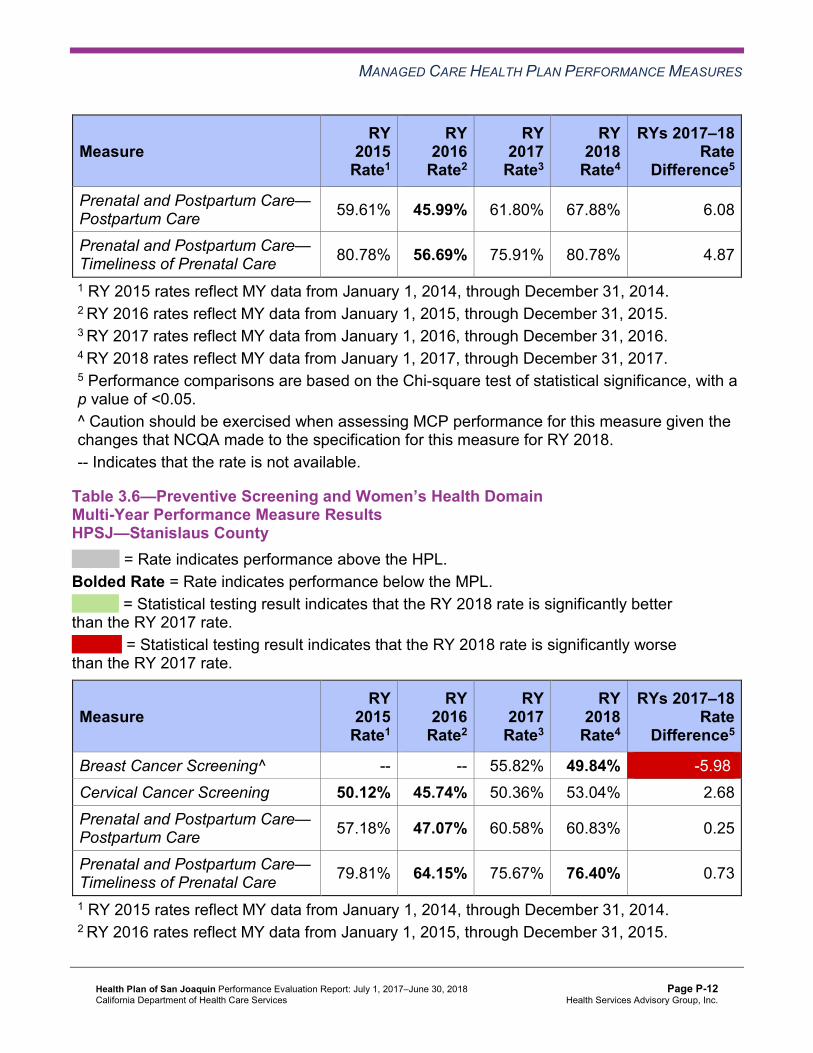
MANAGED CARE HEALTH PLAN PERFORMANCE MEASURES
Measure RY
2015 Rate1
RY 2016
Rate2
RY 2017
Rate3
RY 2018
Rate4
RYs 2017–18 Rate
Difference5
Prenatal and Postpartum Care— Postpartum Care 59.61% 45.99% 61.80% 67.88% 6.08
Prenatal and Postpartum Care— Timeliness of Prenatal Care 80.78% 56.69% 75.91% 80.78% 4.87
1 RY 2015 rates reflect MY data from January 1, 2014, through December 31, 2014. 2 RY 2016 rates reflect MY data from January 1, 2015, through December 31, 2015. 3 RY 2017 rates reflect MY data from January 1, 2016, through December 31, 2016. 4 RY 2018 rates reflect MY data from January 1, 2017, through December 31, 2017. 5 Performance comparisons are based on the Chi-square test of statistical significance, with a p value of <0.05. ^ Caution should be exercised when assessing MCP performance for this measure given the changes that NCQA made to the specification for this measure for RY 2018. -- Indicates that the rate is not available.
Table 3.6—Preventive Screening and Women’s Health DomainMulti-Year Performance Measure Results HPSJ—Stanislaus County
H = Rate indicates performance above the HPL. Bolded Rate = Rate indicates performance below the MPL.
B = Statistical testing result indicates that the RY 2018 rate is significantly better than the RY 2017 rate.
W = Statistical testing result indicates that the RY 2018 rate is significantly worse than the RY 2017 rate.
Measure RY
2015 Rate1
RY 2016
Rate2
RY 2017
Rate3
RY 2018
Rate4
RYs 2017–18 Rate
Difference5
Breast Cancer Screening^ -- -- 55.82% 49.84% -5.98W
Cervical Cancer Screening 50.12% 45.74% 50.36% 53.04% 2.68 Prenatal and Postpartum Care— Postpartum Care 57.18% 47.07% 60.58% 60.83% 0.25
Prenatal and Postpartum Care— Timeliness of Prenatal Care 79.81% 64.15% 75.67% 76.40% 0.73
1 RY 2015 rates reflect MY data from January 1, 2014, through December 31, 2014. 2 RY 2016 rates reflect MY data from January 1, 2015, through December 31, 2015.
Health Plan of San Joaquin Performance Evaluation Report: July 1, 2017–June 30, 2018 California Department of Health Care Services
Page P-12 Health Services Advisory Group, Inc.

MANAGED CARE HEALTH PLAN PERFORMANCE MEASURES
3 RY 2017 rates reflect MY data from January 1, 2016, through December 31, 2016. 4 RY 2018 rates reflect MY data from January 1, 2017, through December 31, 2017. 5 Performance comparisons are based on the Chi-square test of statistical significance, with a p value of <0.05. ^ Caution should be exercised when assessing MCP performance for this measure given the changes that NCQA made to the specification for this measure for RY 2018. -- Indicates that the rate is not available.
Table 3.7 and Table 3.8 present findings for the RY 2018 performance measures within the Preventive Screening and Women’s Health domain. Note that the Breast Cancer Screening measure was a first-year measure in RY 2017, and DHCS did not hold MCPs accountable to meet an MPL for this measure in RY 2017; therefore, HSAG did not include this measure in the denominators for calculating the percentage of measures with rates that moved to above or below the MPLs in RY 2018.
Table 3.7—Preventive Screening and Women’s Health DomainRY 2018 (MY 2017) Performance Measure FindingsHPSJ—San Joaquin County
Criteria Number of Measures
MeetingCriteria
Total Number of Measures
Percentage of Measures
MeetingCriteria
RY 2018 Rates Above HPLs 0 4 0.00% Rates Above HPLs for the Last Three or More Consecutive Years 0 3 0.00%
RY 2018 Rates Significantly Better than RY 2017 Rates* 1 4 25.00%
Rates that Moved from Below MPLs in RY 2017 to Above MPLs in RY 2018 1 1 100.00%
RY 2018 Rates Below MPLs 1 4 25.00% Rates Below MPLs for the Last Three or More Consecutive Years 0 3 0.00%
RY 2018 Rates Significantly Worse than RY 2017 Rates* 1 4 25.00%
Rates that Moved from Above MPLs in RY 2017 to Below MPLs in RY 2018 0 2 0.00%
* Performance comparisons are based on the Chi-square test of statistical significance, with a p value of <0.05.
Health Plan of San Joaquin Performance Evaluation Report: July 1, 2017–June 30, 2018 California Department of Health Care Services
Page P-13 Health Services Advisory Group, Inc.

MANAGED CARE HEALTH PLAN PERFORMANCE MEASURES
Table 3.8—Preventive Screening and Women’s Health DomainRY 2018 (MY 2017) Performance Measure FindingsHPSJ—Stanislaus County
Criteria Number of Measures
MeetingCriteria
Total Number of Measures
Percentage of Measures
MeetingCriteria
RY 2018 Rates Above HPLs 0 4 0.00% Rates Above HPLs for the Last Three or More Consecutive Years 0 3 0.00%
RY 2018 Rates Significantly Better than RY 2017 Rates* 0 4 0.00%
Rates that Moved from Below MPLs in RY 2017 to Above MPLs in RY 2018 0 0 N/A
RY 2018 Rates Below MPLs 2 4 50.00% Rates Below MPLs for the Last Three or More Consecutive Years 0 3 0.00%
RY 2018 Rates Significantly Worse than RY 2017 Rates* 1 4 25.00%
Rates that Moved from Above MPLs in RY 2017 to Below MPLs in RY 2018 1 3 33.33%
* Performance comparisons are based on the Chi-square test of statistical significance, with a p value of <0.05. N/A = No rates above or below the MPLs from the previous year exist to include in the denominator for calculating whether or not rates moved to above or below MPLs in the most recent year.
Assessment of Corrective Action Plan Efforts—Preventive Screening and Women’sHealth
Based on RY 2017 performance measure results, HPSJ’s CAP was expanded from San Joaquin County only, to include all performance measures with rates below the MPLs across both reporting units. Within the Preventive Screening and Women’s Health domain, the Cervical Cancer Screening measure for San Joaquin County was included in the CAP.
DHCS approved HPSJ to conduct a PIP to address the MCP’s performance below the MPL in RY 2017 for the Cervical Cancer Screening measure in San Joaquin County. HPSJ proposed to conduct a 2017–19 Cervical Cancer Screening Disparity PIP to meet the CAP requirements for San Joaquin County; however, after analyzing the data, the MCP determined that no disparity existed in San Joaquin County. Therefore, DHCS approved HPSJ to conduct a
Health Plan of San Joaquin Performance Evaluation Report: July 1, 2017–June 30, 2018 California Department of Health Care Services
Page P-14 Health Services Advisory Group, Inc.

MANAGED CARE HEALTH PLAN PERFORMANCE MEASURES
Cervical Cancer Screening PIP with a narrowed focus of White women, ages 24 to 64, residing in Stanislaus County. HSAG includes a summary of HPSJ’s progress on this PIP in Section 4 of this report (“Performance Improvement Projects”).
The rate in San Joaquin County improved significantly from RY 2017 to RY 2018 for the Cervical Cancer Screening measure, resulting in the rate moving from below the MPL in RY 2017 to above the MPL in RY 2018. The actions that HPSJ reported during the review period to improve the MCP’s performance on the Cervical Cancer Screening measure may have contributed to the significant improvement in the rate for this measure from RY 2017 to RY 2018. (See Table 5.1.)
Care for Chronic Conditions
Table 3.9 and Table 3.10 present the four-year trending information for the performance measures within the Care for Chronic Conditions domain.
Table 3.9—Care for Chronic Conditions Domain Multi-Year Performance Measure Results HPSJ—San Joaquin County
H = Rate indicates performance above the HPL. Bolded Rate = Rate indicates performance below the MPL.
B = Statistical testing result indicates that the RY 2018 rate is significantly better than the RY 2017 rate.
W = Statistical testing result indicates that the RY 2018 rate is significantly worse than the RY 2017 rate.
Measure RY
2015 Rate1
RY 2016
Rate2
RY 2017
Rate3
RY 2018
Rate4
RYs 2017–18 Rate
Difference5
Annual Monitoring for Patients on Persistent Medications— ACE Inhibitors or ARBs
80.51% 83.66% 83.83% 84.89% 1.06
Annual Monitoring for Patients on Persistent Medications— Diuretics
81.60% 83.75% 82.42% 85.60% 3.18B
Asthma Medication Ratio -- -- 57.59% 58.68% 1.09 Comprehensive Diabetes Care— Blood Pressure Control (<140/90 mm Hg)
70.56% 51.34% 54.99% 58.15% 3.16
Comprehensive Diabetes Care— Eye Exam (Retinal) Performed 47.20% 41.85% 40.88% 57.42% 16.54B
Health Plan of San Joaquin Performance Evaluation Report: July 1, 2017–June 30, 2018 California Department of Health Care Services
Page P-15 Health Services Advisory Group, Inc.

MANAGED CARE HEALTH PLAN PERFORMANCE MEASURES
Measure RY
2015 Rate1
RY 2016
Rate2
RY 2017
Rate3
RY 2018
Rate4
RYs 2017–18 Rate
Difference5
Comprehensive Diabetes Care— HbA1c Control (<8.0 Percent) 46.72% 46.96% 45.26% 52.07% 6.81
Comprehensive Diabetes Care— HbA1c Poor Control (>9.0 Percent)*
42.09% 45.01% 46.23% 38.44% -7.79B
Comprehensive Diabetes Care— HbA1c Testing 79.32% 76.89% 81.51% 82.00% 0.49
Comprehensive Diabetes Care— Medical Attention for Nephropathy
81.75% 87.10% 90.27% 84.91% -5.36W
Controlling High Blood Pressure 61.80% 48.42% 54.99% 56.69% 1.70 1 RY 2015 rates reflect MY data from January 1, 2014, through December 31, 2014. 2 RY 2016 rates reflect MY data from January 1, 2015, through December 31, 2015. 3 RY 2017 rates reflect MY data from January 1, 2016, through December 31, 2016. 4 RY 2018 rates reflect MY data from January 1, 2017, through December 31, 2017. 5 Performance comparisons are based on the Chi-square test of statistical significance, with a p value of <0.05. * A lower rate indicates better performance for this measure. -- Indicates that the rate is not available.
Table 3.10—Care for Chronic Conditions Domain Multi-Year Performance Measure Results HPSJ—Stanislaus County
H = Rate indicates performance above the HPL. Bolded Rate = Rate indicates performance below the MPL.
B = Statistical testing result indicates that the RY 2018 rate is significantly better than the RY 2017 rate.
W = Statistical testing result indicates that the RY 2018 rate is significantly worse than the RY 2017 rate.
Measure RY
2015 Rate1
RY 2016
Rate2
RY 2017
Rate3
RY 2018
Rate4
RYs 2017–18 Rate
Difference5
Annual Monitoring for Patients on Persistent Medications—ACE Inhibitors or ARBs
85.88% 84.86% 84.58% 85.06% 0.48
Health Plan of San Joaquin Performance Evaluation Report: July 1, 2017–June 30, 2018 California Department of Health Care Services
Page P-16 Health Services Advisory Group, Inc.
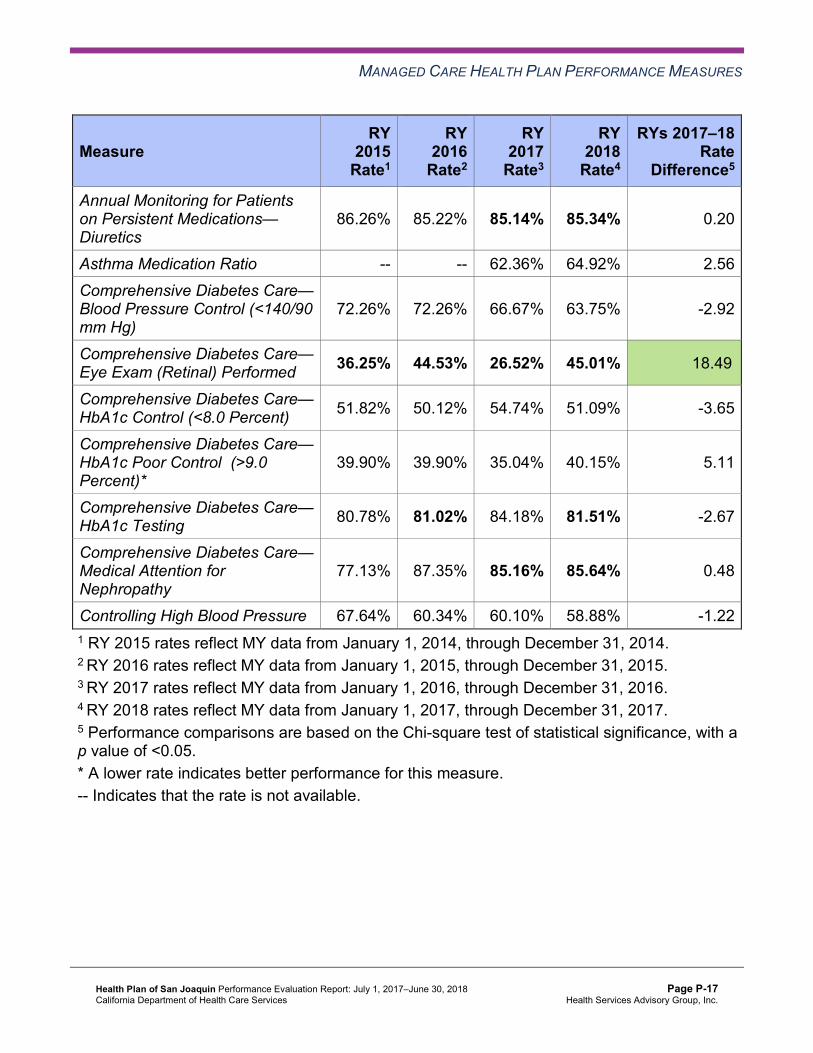
MANAGED CARE HEALTH PLAN PERFORMANCE MEASURES
Measure RY
2015 Rate1
RY 2016
Rate2
RY 2017
Rate3
RY 2018
Rate4
RYs 2017–18 Rate
Difference5
Annual Monitoring for Patients on Persistent Medications— Diuretics
86.26% 85.22% 85.14% 85.34% 0.20
Asthma Medication Ratio -- -- 62.36% 64.92% 2.56 Comprehensive Diabetes Care— Blood Pressure Control (<140/90 mm Hg)
72.26% 72.26% 66.67% 63.75% -2.92
Comprehensive Diabetes Care— Eye Exam (Retinal) Performed 36.25% 44.53% 26.52% 45.01% 18.49B
Comprehensive Diabetes Care— HbA1c Control (<8.0 Percent) 51.82% 50.12% 54.74% 51.09% -3.65
Comprehensive Diabetes Care— HbA1c Poor Control (>9.0 Percent)*
39.90% 39.90% 35.04% 40.15% 5.11
Comprehensive Diabetes Care— HbA1c Testing 80.78% 81.02% 84.18% 81.51% -2.67
Comprehensive Diabetes Care— Medical Attention for Nephropathy
77.13% 87.35% 85.16% 85.64% 0.48
Controlling High Blood Pressure 67.64% 60.34% 60.10% 58.88% -1.22 1 RY 2015 rates reflect MY data from January 1, 2014, through December 31, 2014. 2 RY 2016 rates reflect MY data from January 1, 2015, through December 31, 2015. 3 RY 2017 rates reflect MY data from January 1, 2016, through December 31, 2016. 4 RY 2018 rates reflect MY data from January 1, 2017, through December 31, 2017. 5 Performance comparisons are based on the Chi-square test of statistical significance, with a p value of <0.05. * A lower rate indicates better performance for this measure. -- Indicates that the rate is not available.
Health Plan of San Joaquin Performance Evaluation Report: July 1, 2017–June 30, 2018 California Department of Health Care Services
Page P-17 Health Services Advisory Group, Inc.

MANAGED CARE HEALTH PLAN PERFORMANCE MEASURES
Table 3.11 and Table 3.12 present findings for the RY 2018 performance measures within the Care for Chronic Conditions domain. Note that the Asthma Medication Ratio measure was a first-year measure in RY 2017, and DHCS did not hold MCPs accountable to meet an MPL for this measure in RY 2017; therefore, HSAG did not include this measure in the denominators for calculating the percentage of measures with rates that moved to above or below the MPLs in RY 2018.
Table 3.11—Care for Chronic Conditions Domain RY 2018 (MY 2017) Performance Measure Findings HPSJ—San Joaquin County
Criteria Number of Measures
MeetingCriteria
Total Number of Measures
Percentage of Measures
MeetingCriteria
RY 2018 Rates Above HPLs 0 10 0.00% Rates Above HPLs for the Last Three or More Consecutive Years 0 9 0.00%
RY 2018 Rates Significantly Better than RY 2017 Rates* 3 10 30.00%
Rates that Moved from Below MPLs in RY 2017 to Above MPLs in RY 2018 2 4 50.00%
RY 2018 Rates Below MPLs 3 10 30.00% Rates Below MPLs for the Last Three or More Consecutive Years 2 9 22.22%
RY 2018 Rates Significantly Worse than RY 2017 Rates* 1 10 10.00%
Rates that Moved from Above MPLs in RY 2017 to Below MPLs in RY 2018 1 5 20.00%
* Performance comparisons are based on the Chi-square test of statistical significance, with a p value of <0.05.
Health Plan of San Joaquin Performance Evaluation Report: July 1, 2017–June 30, 2018 California Department of Health Care Services
Page P-18 Health Services Advisory Group, Inc.

MANAGED CARE HEALTH PLAN PERFORMANCE MEASURES
Table 3.12—Care for Chronic Conditions Domain RY 2018 (MY 2017) Performance Measure Findings HPSJ—Stanislaus County
Criteria Number of Measures
MeetingCriteria
Total Number of Measures
Percentage of Measures
MeetingCriteria
RY 2018 Rates Above HPLs 0 10 0.00% Rates Above HPLs for the Last Three or More Consecutive Years 0 9 0.00%
RY 2018 Rates Significantly Better than RY 2017 Rates* 1 10 10.00%
Rates that Moved from Below MPLs in RY 2017 to Above MPLs in RY 2018 0 4 0.00%
RY 2018 Rates Below MPLs 5 10 50.00% Rates Below MPLs for the Last Three or More Consecutive Years 2 9 22.22%
RY 2018 Rates Significantly Worse than RY 2017 Rates* 0 10 0.00%
Rates that Moved from Above MPLs in RY 2017 to Below MPLs in RY 2018 1 5 20.00%
* Performance comparisons are based on the Chi-square test of statistical significance, with a p value of <0.05.
Assessment of Corrective Action Plan Efforts—Care for Chronic Conditions
Based on RY 2017 performance measure results, HPSJ’s CAP was expanded from San Joaquin County only to include all performance measures with rates below the MPLs across both reporting units. The following measures within the Care for Chronic Conditions domain were included in the CAP:
♦ Both Annual Monitoring for Patients on Persistent Medications measures in both reporting units
♦ Comprehensive Diabetes Care—Eye Exam (Retinal) Performed in both reporting units ♦ Comprehensive Diabetes Care—HBA1c Testing in San Joaquin County ♦ Comprehensive Diabetes Care—Medical Attention for Nephropathy in Stanislaus County
Health Plan of San Joaquin Performance Evaluation Report: July 1, 2017–June 30, 2018 California Department of Health Care Services
Page P-19 Health Services Advisory Group, Inc.

MANAGED CARE HEALTH PLAN PERFORMANCE MEASURES
Annual Monitoring for Patients on Persistent Medications
DHCS required HPSJ to submit a Pilot QI Strategy Summary/Progress Report that described the quality improvement strategies that the MCP implemented to address its performance below the MPLs in RY 2017 for both Annual Monitoring for Patients on Persistent Medications measures in both reporting units. HPSJ indicated that it conducted trainings with low-performing providers on how to use the new gap-in-care reports. The MCP trained providers on how to develop actionable strategies for beneficiaries who had multiple gaps displayed in the reports. HPSJ reported having learned that consistent reinforcement through brief encounters with providers regarding the use of the coding tip sheets contributed to improved rates.
The rate in San Joaquin County for the Annual Monitoring for Patients on Persistent Medications—Diuretics measure improved significantly from RY 2017 to RY 2018, resulting in the rate moving to above the MPL in RY 2018. The rate remained below the MPL in RY 2018 in Stanislaus County for the Annual Monitoring for Patients on Persistent Medications— Diuretics measure, and the rates in both reporting units remained below the MPL in RY 2018 for the Annual Monitoring for Patients on Persistent Medications—ACE Inhibitors or ARBs measure.
Comprehensive Diabetes Care—Eye Exam (Retinal) Performed
DHCS required HPSJ to submit a Pilot QI Strategy Summary/Progress Report that described the quality improvement strategies that the MCP implemented to address its performance below the MPL in RY 2017 for the Comprehensive Diabetes Care—Eye Exam (Retinal) Performed measure in both reporting units. HPSJ reported that the MCP changed its vision vendor and implemented a primary care provider (PCP) referral process for retinal eye exams. HPSJ also indicated that the MCP established a process for informing PCPs of the locations of eye specialists near the PCPs’ offices.
The rates in both reporting units for the Comprehensive Diabetes Care—Eye Exam (Retinal) Performed measure improved significantly from RY 2017 to RY 2018. The significant improvement resulted in the rate in San Joaquin County moving to above the MPL in RY 2018; however, the rate in Stanislaus County remained below the MPL in RY 2018.
Comprehensive Diabetes Care—HbA1c Testing and Medical Attention for Nephropathy
DHCS required HPSJ to conduct PDSA cycles to improve the MCP’s performance for the Comprehensive Diabetes Care—HbA1c Testing measure in San Joaquin County and the Comprehensive Diabetes Care—Medical Attention for Nephropathy measure in Stanislaus County.
HPSJ conducted two PDSA cycles to test whether or not using a beneficiary outreach script that assesses and addresses the beneficiaries’ barriers in seeking diabetes care appointments would increase the number of beneficiaries with diabetes seen at a targeted clinic in Stanislaus County. HPSJ identified lessons learned during the PDSA cycle process, including:
Health Plan of San Joaquin Performance Evaluation Report: July 1, 2017–June 30, 2018 California Department of Health Care Services
Page P-20 Health Services Advisory Group, Inc.

MANAGED CARE HEALTH PLAN PERFORMANCE MEASURES
♦ Seasonal variation affects the success of intervention testing. ■ Planning the beneficiary outreach early in the year rather than during holiday season
may maximize beneficiaries’ participation in laboratory screening. ♦ Cross-referencing the MCP’s and clinic’s beneficiary information improves the accuracy of
the contact lists used for outreach calls.
The rate in San Joaquin County for the Comprehensive Diabetes Care—HbA1c Testing measure remained below the MPL in RY 2018. Additionally, the rate in Stanislaus County for the Comprehensive Diabetes Care—Medical Attention for Nephropathy measure remained below the MPL in RY 2018.
Appropriate Treatment and Utilization
Table 3.13 and Table 3.14 present the four-year trending information for the performance measures within the Appropriate Treatment and Utilization domain.
Note the following regarding Table 3.13 and Table 3.14:
♦ The All-Cause Readmissions measure is a non-HEDIS measure originally developed for DHCS’ All-Cause Readmissions collaborative quality improvement project (QIP); therefore, DHCS does not establish an HPL or MPL for this measure. For the All-Cause Readmissions measure, a lower rate indicates better performance (i.e., fewer readmissions).
♦ The two Ambulatory Care measures are utilization measures, which measure the volume of services used. DHCS does not hold MCPs accountable to meet MPLs for utilization measures, and HSAG does not compare performance for these measures against HPLs and MPLs. Additionally, because high and low rates do not necessarily indicate better or worse performance, HSAG did not compare performance for these measures across years.
♦ DHCS established no HPL or MPL for the two Depression Screening and Follow-Up for Adolescents and Adults measures for RY 2018 because no comparable benchmarks exist. Additionally, although MCPs reported the two Depression Screening and Follow-Up for Adolescents and Adults measures for RY 2018, HSAG does not present the performance measure results for these measures in this report because the reported rates do not accurately represent services being provided. This is due to the Depression Screening and Follow-Up for Adolescents and Adults measures being new HEDIS measures for RY 2018, NCQA requiring MCPs to submit rates for these measures using the new Electronic Clinical Data Systems (ECDS) reporting methodology, and inconsistent data reporting processes by calculation vendors. Thus, MCPs experienced numerous challenges obtaining data sources to use for ECDS reporting. DHCS and HSAG, in consultation with NCQA, will work with MCPs to improve data capture for RY 2019.
♦ Note that due to changes that NCQA made to the specifications for the Use of Imaging Studies for Low Back Pain measure in RY 2018, NCQA released guidance to exercise caution when trending the results for this measure. Therefore, caution should be used when comparing MCP performance across years or when comparing MCP results to
Health Plan of San Joaquin Performance Evaluation Report: July 1, 2017–June 30, 2018 California Department of Health Care Services
Page P-21 Health Services Advisory Group, Inc.
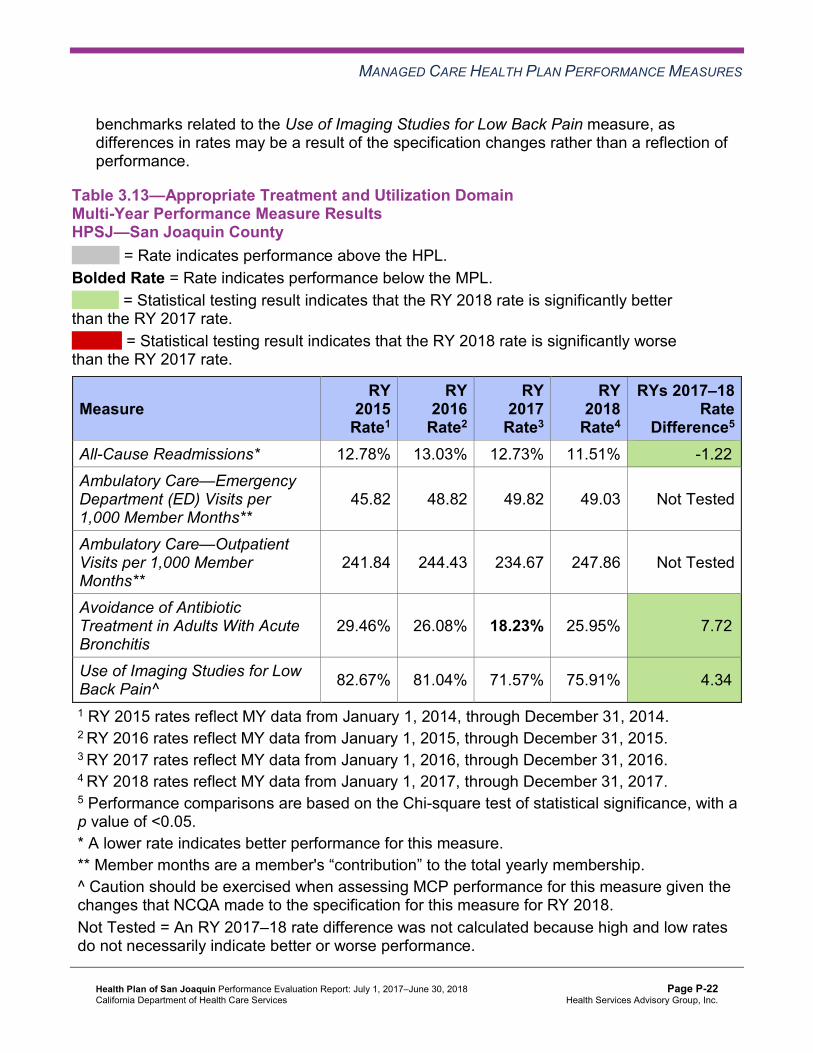
MANAGED CARE HEALTH PLAN PERFORMANCE MEASURES
benchmarks related to the Use of Imaging Studies for Low Back Pain measure, as differences in rates may be a result of the specification changes rather than a reflection of performance.
Table 3.13—Appropriate Treatment and Utilization DomainMulti-Year Performance Measure Results HPSJ—San Joaquin County
H = Rate indicates performance above the HPL. Bolded Rate = Rate indicates performance below the MPL.
B = Statistical testing result indicates that the RY 2018 rate is significantly better than the RY 2017 rate.
W = Statistical testing result indicates that the RY 2018 rate is significantly worse than the RY 2017 rate.
Measure RY
2015 Rate1
RY 2016
Rate2
RY 2017
Rate3
RY 2018
Rate4
RYs 2017–18 Rate
Difference5
All-Cause Readmissions* 12.78% 13.03% 12.73% 11.51% -1.22B
Ambulatory Care—Emergency Department (ED) Visits per 1,000 Member Months**
45.82 48.82 49.82 49.03 Not Tested
Ambulatory Care—Outpatient Visits per 1,000 Member Months**
241.84 244.43 234.67 247.86 Not Tested
Avoidance of Antibiotic Treatment in Adults With Acute Bronchitis
29.46% 26.08% 18.23% 25.95% 7.72B
Use of Imaging Studies for Low Back Pain^ 82.67% 81.04% 71.57% 75.91% 4.34B
1 RY 2015 rates reflect MY data from January 1, 2014, through December 31, 2014. 2 RY 2016 rates reflect MY data from January 1, 2015, through December 31, 2015. 3 RY 2017 rates reflect MY data from January 1, 2016, through December 31, 2016. 4 RY 2018 rates reflect MY data from January 1, 2017, through December 31, 2017. 5 Performance comparisons are based on the Chi-square test of statistical significance, with a p value of <0.05. * A lower rate indicates better performance for this measure. ** Member months are a member's “contribution” to the total yearly membership. ^ Caution should be exercised when assessing MCP performance for this measure given the changes that NCQA made to the specification for this measure for RY 2018. Not Tested = An RY 2017–18 rate difference was not calculated because high and low rates do not necessarily indicate better or worse performance.
Health Plan of San Joaquin Performance Evaluation Report: July 1, 2017–June 30, 2018 California Department of Health Care Services
Page P-22 Health Services Advisory Group, Inc.
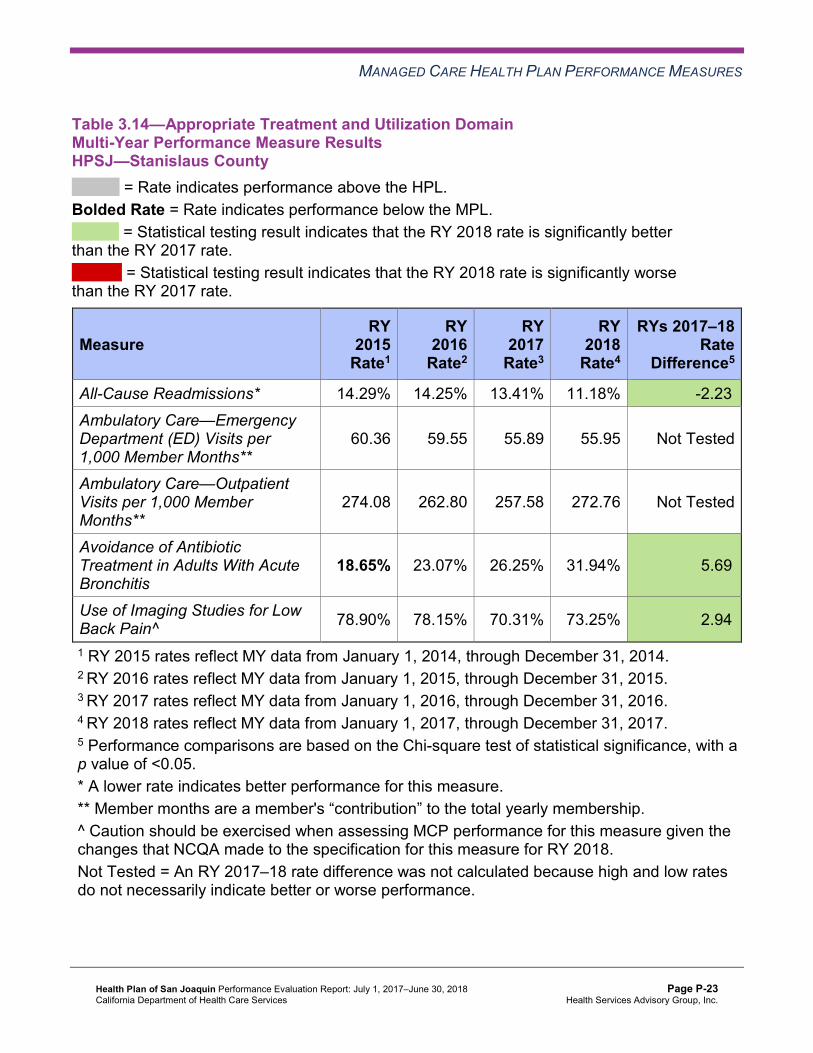
MANAGED CARE HEALTH PLAN PERFORMANCE MEASURES
Table 3.14—Appropriate Treatment and Utilization DomainMulti-Year Performance Measure Results HPSJ—Stanislaus County
H = Rate indicates performance above the HPL. Bolded Rate = Rate indicates performance below the MPL.
B = Statistical testing result indicates that the RY 2018 rate is significantly better than the RY 2017 rate.
W = Statistical testing result indicates that the RY 2018 rate is significantly worse than the RY 2017 rate.
Measure RY
2015 Rate1
RY 2016
Rate2
RY 2017
Rate3
RY 2018
Rate4
RYs 2017–18 Rate
Difference5
All-Cause Readmissions* 14.29% 14.25% 13.41% 11.18% -2.23B
Ambulatory Care—Emergency Department (ED) Visits per 1,000 Member Months**
60.36 59.55 55.89 55.95 Not Tested
Ambulatory Care—Outpatient Visits per 1,000 Member Months**
274.08 262.80 257.58 272.76 Not Tested
Avoidance of Antibiotic Treatment in Adults With Acute Bronchitis
18.65% 23.07% 26.25% 31.94% 5.69B
Use of Imaging Studies for Low Back Pain^ 78.90% 78.15% 70.31% 73.25% 2.94B
1 RY 2015 rates reflect MY data from January 1, 2014, through December 31, 2014. 2 RY 2016 rates reflect MY data from January 1, 2015, through December 31, 2015. 3 RY 2017 rates reflect MY data from January 1, 2016, through December 31, 2016. 4 RY 2018 rates reflect MY data from January 1, 2017, through December 31, 2017. 5 Performance comparisons are based on the Chi-square test of statistical significance, with a p value of <0.05. * A lower rate indicates better performance for this measure. ** Member months are a member's “contribution” to the total yearly membership. ^ Caution should be exercised when assessing MCP performance for this measure given the changes that NCQA made to the specification for this measure for RY 2018. Not Tested = An RY 2017–18 rate difference was not calculated because high and low rates do not necessarily indicate better or worse performance.
Health Plan of San Joaquin Performance Evaluation Report: July 1, 2017–June 30, 2018 California Department of Health Care Services
Page P-23 Health Services Advisory Group, Inc.
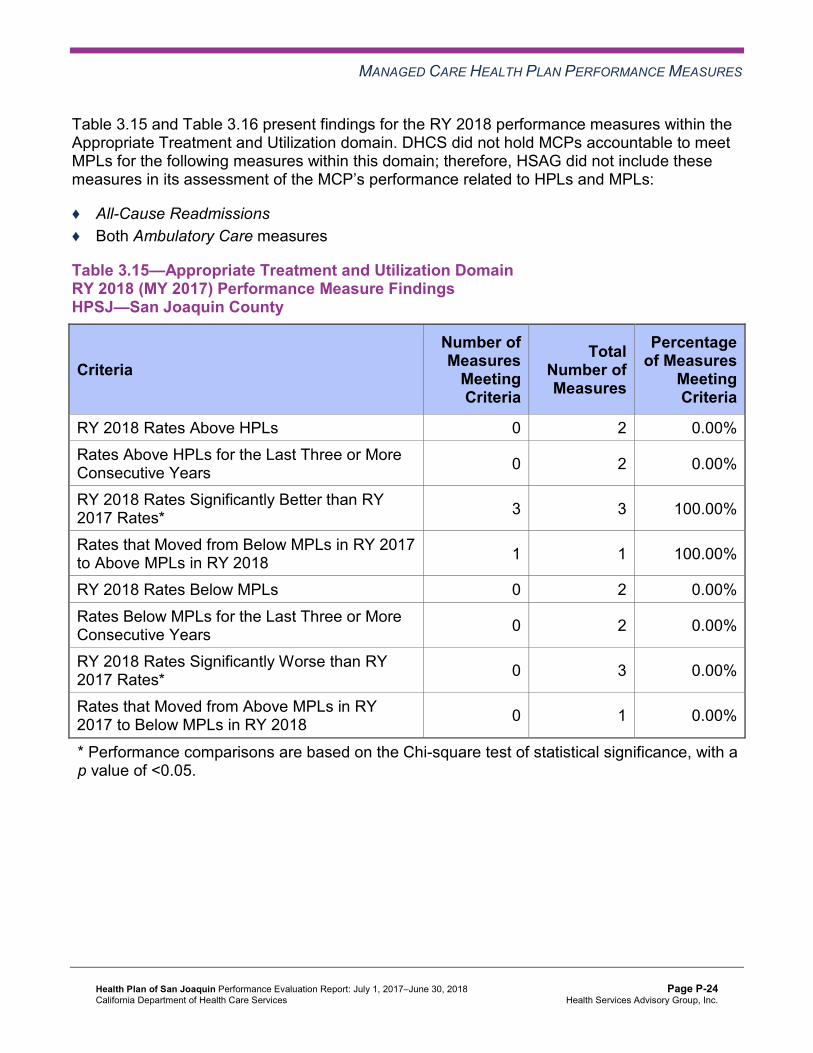
MANAGED CARE HEALTH PLAN PERFORMANCE MEASURES
Table 3.15 and Table 3.16 present findings for the RY 2018 performance measures within the Appropriate Treatment and Utilization domain. DHCS did not hold MCPs accountable to meet MPLs for the following measures within this domain; therefore, HSAG did not include these measures in its assessment of the MCP’s performance related to HPLs and MPLs:
♦ All-Cause Readmissions ♦ Both Ambulatory Care measures
Table 3.15—Appropriate Treatment and Utilization DomainRY 2018 (MY 2017) Performance Measure FindingsHPSJ—San Joaquin County
Criteria Number of Measures
MeetingCriteria
Total Number of Measures
Percentage of Measures
MeetingCriteria
RY 2018 Rates Above HPLs 0 2 0.00% Rates Above HPLs for the Last Three or More Consecutive Years 0 2 0.00%
RY 2018 Rates Significantly Better than RY 2017 Rates* 3 3 100.00%
Rates that Moved from Below MPLs in RY 2017 to Above MPLs in RY 2018 1 1 100.00%
RY 2018 Rates Below MPLs 0 2 0.00% Rates Below MPLs for the Last Three or More Consecutive Years 0 2 0.00%
RY 2018 Rates Significantly Worse than RY 2017 Rates* 0 3 0.00%
Rates that Moved from Above MPLs in RY 2017 to Below MPLs in RY 2018 0 1 0.00%
* Performance comparisons are based on the Chi-square test of statistical significance, with a p value of <0.05.
Health Plan of San Joaquin Performance Evaluation Report: July 1, 2017–June 30, 2018 California Department of Health Care Services
Page P-24 Health Services Advisory Group, Inc.

MANAGED CARE HEALTH PLAN PERFORMANCE MEASURES
Table 3.16—Appropriate Treatment and Utilization DomainRY 2018 (MY 2017) Performance Measure FindingsHPSJ—Stanislaus County
Criteria Number of Measures
MeetingCriteria
Total Number of Measures
Percentage of Measures
MeetingCriteria
RY 2018 Rates Above HPLs 0 2 0.00% Rates Above HPLs for the Last Three or More Consecutive Years 0 2 0.00%
RY 2018 Rates Significantly Better than RY 2017 Rates* 3 3 100.00%
Rates that Moved from Below MPLs in RY 2017 to Above MPLs in RY 2018 0 0 N/A
RY 2018 Rates Below MPLs 0 2 0.00% Rates Below MPLs for the Last Three or More Consecutive Years 0 2 0.00%
RY 2018 Rates Significantly Worse than RY 2017 Rates* 0 3 0.00%
Rates that Moved from Above MPLs in RY 2017 to Below MPLs in RY 2018 0 2 0.00%
* Performance comparisons are based on the Chi-square test of statistical significance, with a p value of <0.05. N/A = No rates above or below the MPLs from the previous year exist to include in the denominator for calculating whether or not rates moved to above or below MPLs in the most recent year.
Assessment of Corrective Action Plan Efforts—Appropriate Treatment and Utilization
Based on RY 2017 performance measure results, HPSJ’s CAP was expanded from San Joaquin County only to include all performance measures with rates below the MPLs across both reporting units. Within the Appropriate Treatment and Utilization domain, the Avoidance of Antibiotic Treatment in Adults With Acute Bronchitis measure for San Joaquin County was included in the CAP.
HPSJ conducted PDSA cycles in partnership with a clinic in San Joaquin County to test whether or not using viral prescription pads would result in fewer beneficiaries being inappropriately prescribed antibiotics. HPSJ indicated having learned that the Viral Prescription Pad downloaded from the Centers for Disease Control and Prevention website was a useful tool for the provider to use to track and monitor appropriate prescribing of antibiotics.
Health Plan of San Joaquin Performance Evaluation Report: July 1, 2017–June 30, 2018 California Department of Health Care Services
Page P-25 Health Services Advisory Group, Inc.

MANAGED CARE HEALTH PLAN PERFORMANCE MEASURES
The rate improved significantly from RY 2017 to RY 2018 for the Avoidance of Antibiotic Treatment in Adults With Acute Bronchitis measure in San Joaquin County, resulting in the rate moving to above the MPL in RY 2018. The actions that HPSJ reported during the review period to improve the MCP’s performance on the Avoidance of Antibiotic Treatment in Adults With Acute Bronchitis measure may have contributed to the significant improvement in the rate for this measure from RY 2017 to RY 2018. (See Table 5.1.)
Performance Measure Findings—All Domains
Table 3.17 and Table 3.18 present a summary of HPSJ’s RY 2018 performance across all External Accountability Set (EAS) measures.
Note the following regarding Table 3.17 and Table 3.18:
♦ DHCS did not hold MCPs accountable to meet MPLs for the following measures; therefore, HSAG did not include these measures in its assessment of the MCP’s performance related to HPLs and MPLs: ■ All-Cause Readmissions ■ Both Ambulatory Care measures ■ All four Children and Adolescents’ Access to Primary Care measures
♦ DHCS did not hold MCPs accountable to meet MPLs for the following measures in RY 2017; therefore, HSAG did not include these measures in the denominators for calculating the percentage of measures with rates that moved to above or below the MPLs in RY 2018 and for calculating the percentage of measures with rates below MPLs for only the last two consecutive years: ■ Asthma Medication Ratio ■ Breast Cancer Screening ■ Immunizations for Adolescents—Combination 2
Table 3.17—RY 2018 (MY 2017) Performance Measure Findings for All Domains HPSJ—San Joaquin County
Criteria Number of Measures
MeetingCriteria
Total Number of Measures
Percentage of Measures
MeetingCriteria
RY 2018 Rates Above HPLs 1 21 4.76% Rates Above HPLs for the Last Three or More Consecutive Years 0 18 0.00%
RY 2018 Rates Significantly Better than RY 2017 Rates* 8 22 36.36%
Health Plan of San Joaquin Performance Evaluation Report: July 1, 2017–June 30, 2018 California Department of Health Care Services
Page P-26 Health Services Advisory Group, Inc.

MANAGED CARE HEALTH PLAN PERFORMANCE MEASURES
Criteria Number of Measures
MeetingCriteria
Total Number of Measures
Percentage of Measures
MeetingCriteria
Rates that Moved from Below MPLs in RY 2017 to Above MPLs in RY 2018 4 7 57.14%
RY 2018 Rates Below MPLs 5 21 23.81% Rates Below MPLs for Only the Last Two Consecutive Years 1 18 5.56%
Rates Below MPLs for the Last Three or More Consecutive Years 2 18 11.11%
RY 2018 Rates Significantly Worse than RY 2017 Rates* 2 22 9.09%
Rates that Moved from Above MPLs in RY 2017 to Below MPLs in RY 2018 1 11 9.09%
* Performance comparisons are based on the Chi-square test of statistical significance, with a p value of <0.05.
Table 3.18—RY 2018 (MY 2017) Performance Measure Findings for All Domains HPSJ—Stanislaus County
C = For this reporting unit, DHCS issued a CAP to the MCP due to either (1) three or more EAS measures for which MCPs are held accountable to meet the MPLs having rates below the MPLs for the last three or more consecutive years, or (2) greater than 50 percent of EAS measures for which MCPs are held accountable to meet the MPLs having rates below the MPLs in the most recent year.
Criteria Number of Measures
MeetingCriteria
Total Number of Measures
Percentage of Measures
MeetingCriteria
RY 2018 Rates Above HPLs 0 21 0.00% Rates Above HPLs for the Last Three or More Consecutive Years 0 18 0.00%
RY 2018 Rates Significantly Better than RY 2017 Rates* 5 22 22.73%
Rates that Moved from Below MPLs in RY 2017 to Above MPLs in RY 2018 0 6 0.00%
RY 2018 Rates Below MPLs 9 21 42.86%
Health Plan of San Joaquin Performance Evaluation Report: July 1, 2017–June 30, 2018 California Department of Health Care Services
Page P-27 Health Services Advisory Group, Inc.

MANAGED CARE HEALTH PLAN PERFORMANCE MEASURES
Criteria Number of Measures
MeetingCriteria
Total Number of Measures
Percentage of Measures
MeetingCriteria
Rates Below MPLs for Only the Last Two Consecutive Years 2 18 11.11%
Rates Below MPLs for the Last Three or More Consecutive Years 4 18 22.22%C
RY 2018 Rates Significantly Worse than RY 2017 Rates* 1 22 4.55%
Rates that Moved from Above MPLs in RY 2017 to Below MPLs in RY 2018 2 12 16.67%
* Performance comparisons are based on the Chi-square test of statistical significance, with a p value of <0.05.
Corrective Action Plan Requirements for 2018 Based on RY 2018 performance measure results, DHCS determined that HPSJ will remain on a CAP. The following measures with rates below the MPLs in RY 2018 will be included in the CAP:
♦ Annual Monitoring for Patients on Persistent Medications—ACE Inhibitors or ARBs in both reporting units
♦ Annual Monitoring for Patients on Persistent Medications—Diuretics in Stanislaus County ♦ Breast Cancer Screening in both reporting units ♦ Childhood Immunization Status—Combination 3 in both reporting units ♦ Comprehensive Diabetes Care—Eye Exam (Retinal) Performed in Stanislaus County ♦ Comprehensive Diabetes Care—HbA1c Testing in both reporting units ♦ Comprehensive Diabetes Care—Medical Attention for Nephropathy in both reporting units ♦ Prenatal and Postpartum Care—Timeliness of Prenatal Care in Stanislaus County ♦ Well-Child Visits in the Third, Fourth, Fifth, and Sixth Years of Life in Stanislaus County
Health Plan of San Joaquin Performance Evaluation Report: July 1, 2017–June 30, 2018 California Department of Health Care Services
Page P-28 Health Services Advisory Group, Inc.

MANAGED CARE HEALTH PLAN PERFORMANCE MEASURES
Seniors and Persons with Disabilities Performance Measure Results Table 3.19 and Table 3.20 present the four-year trending information for the Seniors and Persons with Disabilities (SPD) population, and Table 3.21 and Table 3.22 present the four-year trending information for the non-SPD population for the measures that DHCS required MCPs to stratify for the SPD and non-SPD populations. The tables also show the differences in rates between RY 2017 and RY 2018.
Table 3.23 and Table 3.24 present the SPD and non-SPD rates, a comparison of the SPD and non-SPD rates,5 and the total combined rate for each measure.
Table 3.19—Multi-Year SPD Performance Measure Trend Table HPSJ—San Joaquin County
B = Statistical testing result indicates that the RY 2018 SPD rate is significantly better than the RY 2017 SPD rate.
W = Statistical testing result indicates that the RY 2018 SPD rate is significantly worse than the RY 2017 SPD rate.
Measure RY 2015
SPD Rate1
RY 2016 SPD
Rate2
RY 2017 SPD
Rate3
RY 2018 SPD
Rate4
RYs 2017–18 Rate
Difference5
All-Cause Readmissions* 16.82% 17.73% 17.79% 12.46% -5.33B
Ambulatory Care—Emergency Department (ED) Visits per 1,000 Member Months**
70.82 76.82 81.78 73.53 Not Tested
Ambulatory Care—Outpatient Visits per 1,000 Member Months**
401.82 410.40 414.33 378.25 Not Tested
Annual Monitoring for Patients on Persistent Medications— ACE Inhibitors or ARBs
81.04% 85.39% 85.24% 87.09% 1.85B
Annual Monitoring for Patients on Persistent Medications— Diuretics
84.20% 86.99% 85.68% 88.38% 2.70B
5 HSAG calculated statistical significance between the SPD and non-SPD rates for each measure using a Chi-square test. This information is displayed in the “SPD/Non-SPD Rate Difference” column in Table 3.23 and Table 3.24.
Health Plan of San Joaquin Performance Evaluation Report: July 1, 2017–June 30, 2018 California Department of Health Care Services
Page P-29 Health Services Advisory Group, Inc.

MANAGED CARE HEALTH PLAN PERFORMANCE MEASURES
Measure RY 2015
SPD Rate1
RY 2016 SPD
Rate2
RY 2017 SPD
Rate3
RY 2018 SPD
Rate4
RYs 2017–18 Rate
Difference5
Children and Adolescents' Access to Primary Care Practitioners—12–24 Months
100.00% 94.12% 95.35% 92.86% -2.49
Children and Adolescents' Access to Primary Care Practitioners— 25 Months–6 Years
83.28% 86.07% 88.26% 85.32% -2.94
Children and Adolescents' Access to Primary Care Practitioners—7–11 Years
87.42% 87.47% 87.15% 88.21% 1.06
Children and Adolescents' Access to Primary Care Practitioners—12–19 Years
84.27% 84.42% 82.97% 84.85% 1.88
1 RY 2015 rates reflect MY data from January 1, 2014, through December 31, 2014. 2 RY 2016 rates reflect MY data from January 1, 2015, through December 31, 2015. 3 RY 2017 rates reflect MY data from January 1, 2016, through December 31, 2016. 4 RY 2018 rates reflect MY data from January 1, 2017, through December 31, 2017. 5 Performance comparisons are based on the Chi-square test of statistical significance, with a p value of <0.05. * A lower rate indicates better performance for this measure. ** Member months are a member's “contribution” to the total yearly membership. Not Tested = An RY 2017–18 rate difference was not calculated because high and low rates do not necessarily indicate better or worse performance.
Health Plan of San Joaquin Performance Evaluation Report: July 1, 2017–June 30, 2018 California Department of Health Care Services
Page P-30 Health Services Advisory Group, Inc.

MANAGED CARE HEALTH PLAN PERFORMANCE MEASURES
Table 3.20—Multi-Year SPD Performance Measure Trend Table HPSJ—Stanislaus County
B = Statistical testing result indicates that the RY 2018 SPD rate is significantly better than the RY 2017 SPD rate.
W = Statistical testing result indicates that the RY 2018 SPD rate is significantly worse than the RY 2017 SPD rate.
Measure RY
2015 SPD
Rate1
RY 2016 SPD
Rate2
RY 2017 SPD
Rate3
RY 2018 SPD
Rate4
RYs 2017–18 Rate
Difference5
All-Cause Readmissions* 20.55% 22.96% 19.62% 12.90% -6.72B
Ambulatory Care—Emergency Department (ED) Visits per 1,000 Member Months**
105.69 109.30 105.98 92.32 Not Tested
Ambulatory Care—Outpatient Visits per 1,000 Member Months**
535.60 508.87 513.61 487.97 Not Tested
Annual Monitoring for Patients on Persistent Medications— ACE Inhibitors or ARBs
89.02% 87.73% 89.69% 89.73% 0.04
Annual Monitoring for Patients on Persistent Medications— Diuretics
88.44% 88.32% 89.81% 89.94% 0.13
Children and Adolescents' Access to Primary Care Practitioners—12–24 Months
NA NA NA NA Not Comparable
Children and Adolescents' Access to Primary Care Practitioners— 25 Months–6 Years
82.25% 81.71% 85.71% 87.76% 2.05
Children and Adolescents' Access to Primary Care Practitioners—7–11 Years
92.06% 89.30% 88.27% 89.73% 1.46
Children and Adolescents' Access to Primary Care Practitioners—12–19 Years
89.64% 84.66% 84.45% 85.46% 1.01
1 RY 2015 rates reflect MY data from January 1, 2014, through December 31, 2014. 2 RY 2016 rates reflect MY data from January 1, 2015, through December 31, 2015. 3 RY 2017 rates reflect MY data from January 1, 2016, through December 31, 2016.
Health Plan of San Joaquin Performance Evaluation Report: July 1, 2017–June 30, 2018 California Department of Health Care Services
Page P-31 Health Services Advisory Group, Inc.

MANAGED CARE HEALTH PLAN PERFORMANCE MEASURES
4 RY 2018 rates reflect MY data from January 1, 2017, through December 31, 2017. 5 Performance comparisons are based on the Chi-square test of statistical significance, with a p value of <0.05. * A lower rate indicates better performance for this measure. ** Member months are a member's “contribution” to the total yearly membership. -- Indicates that the rate is not available. NA = The MCP followed the specifications, but the denominator was too small (less than 30) to report a valid rate. Not Comparable = An RY 2017–18 rate difference cannot be made because data are not available for both years or because significant methodology changes occurred between years, disallowing comparison. Not Tested = An RY 2017–18 rate difference was not calculated because high and low rates do not necessarily indicate better or worse performance.
Table 3.21—Multi-Year Non-SPD Performance Measure Trend Table HPSJ—San Joaquin County
B = Statistical testing result indicates that the RY 2018 non-SPD rate is significantly better than the RY 2017 non-SPD rate.
W = Statistical testing result indicates that the RY 2018 non-SPD rate is significantly worse than the RY 2017 non-SPD rate.
Measure RY 2015
Non-SPD Rate1
RY 2016 Non-SPD
Rate2
RY 2017 Non-SPD
Rate3
RY 2018 Non-SPD
Rate4
RYs 2017–18 Rate
Difference5
All-Cause Readmissions* 7.91% 10.48% 9.74% 10.68% 0.94
Ambulatory Care— Emergency Department (ED) Visits per 1,000 Member Months**
43.63 46.52 47.11 46.11 Not Tested
Ambulatory Care— Outpatient Visits per 1,000 Member Months**
225.18 230.79 219.42 232.33 Not Tested
Annual Monitoring for Patients on Persistent Medications— ACE Inhibitors or ARBs
79.93% 82.81% 83.16% 83.78% 0.62
Annual Monitoring for Patients on Persistent Medications—Diuretics
78.50% 81.94% 80.70% 84.03% 3.33B
Health Plan of San Joaquin Performance Evaluation Report: July 1, 2017–June 30, 2018 California Department of Health Care Services
Page P-32 Health Services Advisory Group, Inc.

MANAGED CARE HEALTH PLAN PERFORMANCE MEASURES
Measure RY 2015
Non-SPD Rate1
RY 2016 Non-SPD
Rate2
RY 2017 Non-SPD
Rate3
RY 2018 Non-SPD
Rate4
RYs 2017–18 Rate
Difference5
Children and Adolescents' Access to Primary Care Practitioners— 12–24 Months
96.14% 95.40% 95.10% 94.76% -0.34
Children and Adolescents' Access to Primary Care Practitioners— 25 Months–6 Years
85.08% 84.59% 84.79% 85.79% 1.00B
Children and Adolescents' Access to Primary Care Practitioners— 7–11 Years
86.21% 86.84% 86.05% 86.30% 0.25
Children and Adolescents' Access to Primary Care Practitioners— 12–19 Years
82.44% 83.66% 81.89% 83.29% 1.40B
1 RY 2015 rates reflect MY data from January 1, 2014, through December 31, 2014. 2 RY 2016 rates reflect MY data from January 1, 2015, through December 31, 2015. 3 RY 2017 rates reflect MY data from January 1, 2016, through December 31, 2016. 4 RY 2018 rates reflect MY data from January 1, 2017, through December 31, 2017. 5 Performance comparisons are based on the Chi-square test of statistical significance, with a p value of <0.05. * A lower rate indicates better performance for this measure. ** Member months are a member's “contribution” to the total yearly membership. Not Tested = An RY 2017–18 rate difference was not calculated because high and low rates do not necessarily indicate better or worse performance.
Health Plan of San Joaquin Performance Evaluation Report: July 1, 2017–June 30, 2018 California Department of Health Care Services
Page P-33 Health Services Advisory Group, Inc.

MANAGED CARE HEALTH PLAN PERFORMANCE MEASURES
Table 3.22—Multi-Year Non-SPD Performance Measure Trend Table HPSJ—Stanislaus County
B = Statistical testing result indicates that the RY 2018 non-SPD rate is significantly better than the RY 2017 non-SPD rate.
W = Statistical testing result indicates that the RY 2018 non-SPD rate is significantly worse than the RY 2017 non-SPD rate.
Measure RY 2015
Non-SPD Rate1
RY 2016 Non-SPD
Rate2
RY 2017 Non-SPD
Rate3
RY 2018 Non-SPD
Rate4
RYs 2017–18 Rate
Difference5
All-Cause Readmissions* 8.95% 10.82% 10.79% 10.23% -0.56
Ambulatory Care— Emergency Department (ED) Visits per 1,000 Member Months**
56.92 56.58 52.86 53.03 Not Tested
Ambulatory Care— Outpatient Visits per 1,000 Member Months**
254.18 248.12 242.12 255.47 Not Tested
Annual Monitoring for Patients on Persistent Medications— ACE Inhibitors or ARBs
82.84% 83.93% 82.92% 83.51% 0.59
Annual Monitoring for Patients on Persistent Medications—Diuretics
83.86% 84.01% 83.45% 83.57% 0.12
Children and Adolescents' Access to Primary Care Practitioners— 12–24 Months
92.42% 92.72% 92.35% 92.95% 0.60
Children and Adolescents' Access to Primary Care Practitioners— 25 Months–6 Years
84.35% 83.13% 82.55% 82.85% 0.30
Children and Adolescents' Access to Primary Care Practitioners— 7–11 Years
87.48% 86.55% 84.36% 84.24% -0.12
Health Plan of San Joaquin Performance Evaluation Report: July 1, 2017–June 30, 2018 California Department of Health Care Services
Page P-34 Health Services Advisory Group, Inc.

MANAGED CARE HEALTH PLAN PERFORMANCE MEASURES
Measure RY 2015
Non-SPD Rate1
RY 2016 Non-SPD
Rate2
RY 2017 Non-SPD
Rate3
RY 2018 Non-SPD
Rate4
RYs 2017–18 Rate
Difference5
Children and Adolescents' Access to Primary Care Practitioners— 12–19 Years
84.41% 83.28% 79.95% 79.64% -0.31
1 RY 2015 rates reflect MY data from January 1, 2014, through December 31, 2014. 2 RY 2016 rates reflect MY data from January 1, 2015, through December 31, 2015. 3 RY 2017 rates reflect MY data from January 1, 2016, through December 31, 2016. 4 RY 2018 rates reflect MY data from January 1, 2017, through December 31, 2017. 5 Performance comparisons are based on the Chi-square test of statistical significance, with a p value of <0.05. * A lower rate indicates better performance for this measure. ** Member months are a member's “contribution” to the total yearly membership. Not Tested = An RY 2017–18 rate difference was not calculated because high and low rates do not necessarily indicate better or worse performance.
Table 3.23—RY 2018 (MY 2017) Performance Measure Comparison and Results forMeasures Stratified by the SPD and Non-SPD PopulationsHPSJ—San Joaquin County
B = Statistical testing result indicates that the RY 2018 SPD rate is significantly better than the RY 2018 non-SPD rate.
W = Statistical testing result indicates that the RY 2018 SPD rate is significantly worse than the RY 2018 non-SPD rate.
Measure RY 2018
SPD Rate1
RY 2018 Non-SPD
Rate1
SPD/Non-SPDRate
Difference2
RY 2018 Total Rate3
All-Cause Readmissions* 12.46% 10.68% 1.78W 11.51% Ambulatory Care—Emergency Department (ED) Visits per 1,000 Member Months**
73.53 46.11 Not Tested 49.03
Ambulatory Care—Outpatient Visits per 1,000 Member Months** 378.25 232.33 Not Tested 247.86
Annual Monitoring for Patients on Persistent Medications— ACE Inhibitors or ARBs
87.09% 83.78% 3.31B 84.89%
Health Plan of San Joaquin Performance Evaluation Report: July 1, 2017–June 30, 2018 California Department of Health Care Services
Page P-35 Health Services Advisory Group, Inc.

MANAGED CARE HEALTH PLAN PERFORMANCE MEASURES
Measure RY 2018
SPD Rate1
RY 2018 Non-SPD
Rate1
SPD/Non-SPDRate
Difference2
RY 2018 Total Rate3
Annual Monitoring for Patients on Persistent Medications—Diuretics 88.38% 84.03% 4.35B 85.60%
Children and Adolescents' Access to Primary Care Practitioners— 12–24 Months
92.86% 94.76% -1.90 94.74%
Children and Adolescents' Access to Primary Care Practitioners— 25 Months–6 Years
85.32% 85.79% -0.47 85.77%
Children and Adolescents' Access to Primary Care Practitioners— 7–11 Years
88.21% 86.30% 1.91 86.37%
Children and Adolescents' Access to Primary Care Practitioners— 12–19 Years
84.85% 83.29% 1.56 83.35%
1 RY 2018 rates reflect MY data from January 1, 2017, through December 31, 2017. 2 Performance comparisons are based on the Chi-square test of statistical significance, with a p value of <0.05. 3 Total rates are based on the MCP reporting unit’s total results, including the SPD and non-SPD populations. Please note, if data are not available for either the SPD or non-SPD population, the total rate is based on results reported for the available population. * A lower rate indicates better performance for this measure. ** Member months are a member's “contribution” to the total yearly membership. Not Tested = An SPD/non-SPD rate difference was not calculated because high and low rates do not necessarily indicate better or worse performance.
Health Plan of San Joaquin Performance Evaluation Report: July 1, 2017–June 30, 2018 California Department of Health Care Services
Page P-36 Health Services Advisory Group, Inc.
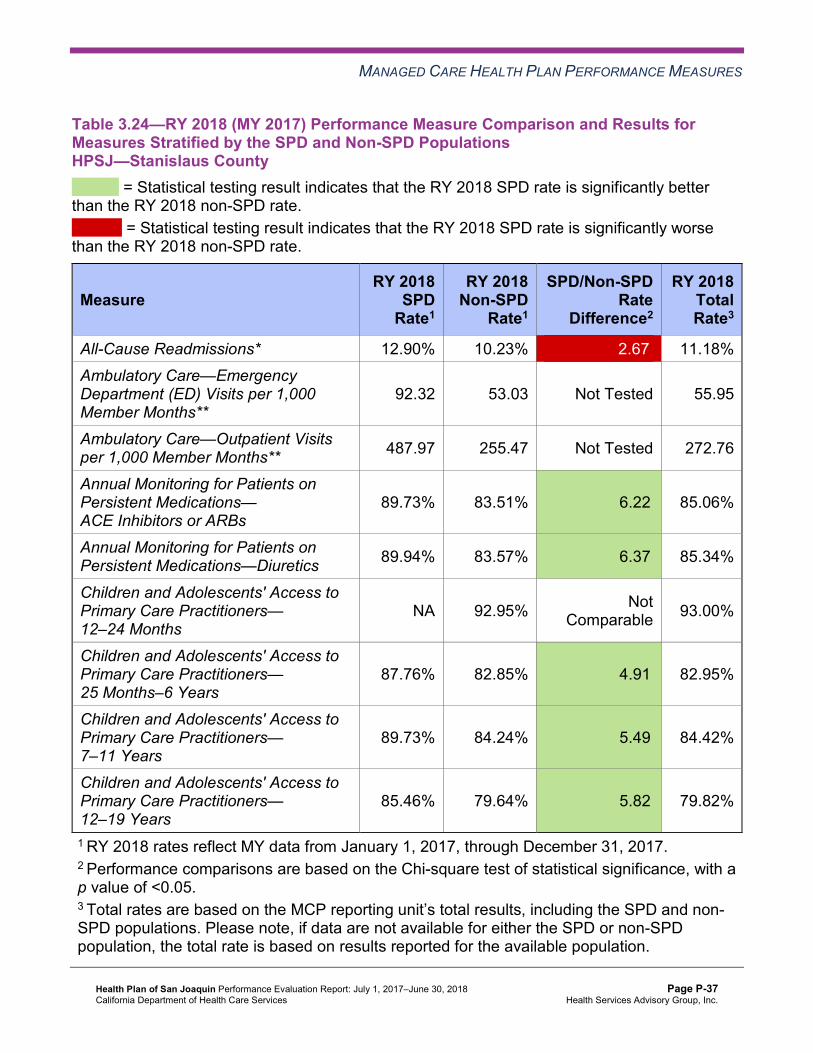
MANAGED CARE HEALTH PLAN PERFORMANCE MEASURES
Table 3.24—RY 2018 (MY 2017) Performance Measure Comparison and Results forMeasures Stratified by the SPD and Non-SPD PopulationsHPSJ—Stanislaus County
B = Statistical testing result indicates that the RY 2018 SPD rate is significantly better than the RY 2018 non-SPD rate.
W = Statistical testing result indicates that the RY 2018 SPD rate is significantly worse than the RY 2018 non-SPD rate.
Measure RY 2018
SPD Rate1
RY 2018 Non-SPD
Rate1
SPD/Non-SPDRate
Difference2
RY 2018 Total Rate3
All-Cause Readmissions* 12.90% 10.23% 2.67W 11.18% Ambulatory Care—Emergency Department (ED) Visits per 1,000 Member Months**
92.32 53.03 Not Tested 55.95
Ambulatory Care—Outpatient Visits per 1,000 Member Months** 487.97 255.47 Not Tested 272.76
Annual Monitoring for Patients on Persistent Medications— ACE Inhibitors or ARBs
89.73% 83.51% 6.22B 85.06%
Annual Monitoring for Patients on Persistent Medications—Diuretics 89.94% 83.57% 6.37B 85.34%
Children and Adolescents' Access to Primary Care Practitioners— 12–24 Months
NA 92.95% Not Comparable 93.00%
Children and Adolescents' Access to Primary Care Practitioners— 25 Months–6 Years
87.76% 82.85% 4.91B 82.95%
Children and Adolescents' Access to Primary Care Practitioners— 7–11 Years
89.73% 84.24% 5.49B 84.42%
Children and Adolescents' Access to Primary Care Practitioners— 12–19 Years
85.46% 79.64% 5.82B 79.82%
1 RY 2018 rates reflect MY data from January 1, 2017, through December 31, 2017. 2 Performance comparisons are based on the Chi-square test of statistical significance, with a p value of <0.05. 3 Total rates are based on the MCP reporting unit’s total results, including the SPD and non-SPD populations. Please note, if data are not available for either the SPD or non-SPD population, the total rate is based on results reported for the available population.
Health Plan of San Joaquin Performance Evaluation Report: July 1, 2017–June 30, 2018 California Department of Health Care Services
Page P-37 Health Services Advisory Group, Inc.

MANAGED CARE HEALTH PLAN PERFORMANCE MEASURES
* A lower rate indicates better performance for this measure. ** Member months are a member's “contribution” to the total yearly membership. NA = The MCP followed the specifications, but the denominator was too small (less than 30) to report a valid rate. Not Comparable = An SPD/non-SPD rate difference cannot be made because data are not available for both populations. Not Tested = An SPD/non-SPD rate difference was not calculated because high and low rates do not necessarily indicate better or worse performance.
Seniors and Persons with Disabilities Findings
HSAG observed the following notable results in RY 2018 for measures that HPSJ stratified by the SPD and non-SPD populations:
♦ For SPD rates for which HSAG could make a comparison between RY 2017 and RY 2018, the SPD rates improved significantly from RY 2017 to RY 2018 for the following measures: ■ All-Cause Readmissions in both reporting units ■ Both Annual Monitoring for Patients on Persistent Medications measures in San
Joaquin County ♦ The non-SPD rates in San Joaquin County improved significantly from RY 2017 to RY 2018
for the following measures: ■ Annual Monitoring for Patients on Persistent Medications—Diuretics ■ Children and Adolescents’ Access to Primary Care Practitioners—25 Months–6 Years
and 12–19 Years ♦ For measures for which HSAG could compare the RY 2018 SPD rates to the RY 2018 non-
SPD rates: ■ The RY 2018 SPD rates were significantly better than the RY 2018 non-SPD rates for
the following measures: ○ Both Annual Monitoring for Patients on Persistent Medications measures in both
reporting units ○ Children and Adolescents’ Access to Primary Care Practitioners—25 Months–6
Years, 7–11 Years, and 12–19 Years in Stanislaus County ■ The RY 2018 SPD rate was significantly worse than the RY 2018 non-SPD rate for the
All-Cause Readmissions measure in both reporting units. Note that the higher rate of readmissions for the SPD population is expected based on the greater and often more complicated health care needs of these beneficiaries.
Health Plan of San Joaquin Performance Evaluation Report: July 1, 2017–June 30, 2018 California Department of Health Care Services
Page P-38 Health Services Advisory Group, Inc.

MANAGED CARE HEALTH PLAN PERFORMANCE MEASURES
Strengths—Performance Measures HSAG auditors determined that HPSJ followed the appropriate specifications to produce valid rates.
HSAG identified the following notable RY 2018 performance measure results for HPSJ:
♦ Across all domains and both reporting units, 13 of 44 rates (30 percent) improved significantly from RY 2017 to RY 2018. The following are the measures for which the rates improved significantly from RY 2017 to RY 2018: ■ All-Cause Readmissions in both reporting units. ■ Annual Monitoring for Patients on Persistent Medications—Diuretics in San Joaquin
County, resulting in the rate moving from below the MPL in RY 2017 to above the MPL in RY 2018.
■ Avoidance of Antibiotic Treatment in Adults With Acute Bronchitis in both reporting units. The significant improvement in San Joaquin County resulted in the rate moving from below the MPL in RY 2017 to above the MPL in RY 2018.
■ Cervical Cancer Screening in San Joaquin County, resulting in the rate moving from below the MPL in RY 2017 to above the MPL in RY 2018.
■ Comprehensive Diabetes Care—Eye Exam (Retinal) Performed in both reporting units. The significant improvement in San Joaquin County resulted in the rate moving from below the MPL in RY 2017 to above the MPL in RY 2018.
■ Comprehensive Diabetes Care—HbA1c Poor Control (>9.0 Percent) in San Joaquin County.
■ Immunizations for Adolescents—Combination 2 in San Joaquin County, resulting in the rate moving to above the HPL in RY 2018.
■ Use of Imaging Studies for Low Back Pain in both reporting units. ■ Weight Assessment and Counseling for Nutrition and Physical Activity for Children and
Adolescents—Physical Activity Counseling—Total in Stanislaus County ♦ The actions that HPSJ reported during the review period to improve the MCP’s
performance on measures with rates below the MPLs in RY 2017 may have contributed to the significant improvement in the MCP’s performance on those measures from RY 2017 to RY 2018. (See Table 5.1.)
♦ San Joaquin County had the higher percentage of rates that improved significantly from RY 2017 to RY 2018, with eight of 22 rates (36 percent), compared to Stanislaus County, which had five of 22 rates (23 percent) that improved significantly from RY 2017 to RY 2018. ■ The significant improvement in San Joaquin County resulted in four of the seven rates
that were below the MPLs in RY 2017 (57 percent) moving to above the MPLs in RY 2018.
♦ The Appropriate Treatment and Utilization domain had the highest percentage of rates that improved significantly from RY 2017 to RY 2018, with all three rates in both reporting units improving significantly from RY 2017 to RY 2018.
Health Plan of San Joaquin Performance Evaluation Report: July 1, 2017–June 30, 2018 California Department of Health Care Services
Page P-39 Health Services Advisory Group, Inc.
MANAGED CARE HEALTH PLAN PERFORMANCE MEASURES
Opportunities for Improvement—Performance Measures HPSJ has the opportunity to continue efforts to identify beneficiaries with retroactive eligibility to determine whether or not exclusion of those beneficiaries impacts the reported HEDIS rates.
Across all domains in RY 2018, Stanislaus County had the higher percentage of rates below the MPLs for the measures for which DHCS held MCPs accountable to meet the MPLs, with nine of 21 rates (43 percent) being below the MPLs. Four of these rates in Stanislaus County were below the MPLs for at least three consecutive years. San Joaquin County had five of 21 rates (24 percent) below the MPLs, with two rates below the MPLs for at least four consecutive years.
Across all domains and reporting units, HPSJ has opportunities to improve performance for the following measures with rates that were below the MPLs in RY 2018:
♦ Annual Monitoring for Patients on Persistent Medications—ACE Inhibitors or ARBs in both reporting units
♦ Annual Monitoring for Patients on Persistent Medications—Diuretics in Stanislaus County ♦ Breast Cancer Screening in both reporting units ♦ Childhood Immunization Status—Combination 3 in both reporting units ♦ Comprehensive Diabetes Care—Eye Exam (Retinal) Performed in Stanislaus County ♦ Comprehensive Diabetes Care—HbA1c Testing in both reporting units ♦ Comprehensive Diabetes Care—Medical Attention for Nephropathy in both reporting units ♦ Prenatal and Postpartum Care—Timeliness of Prenatal Care in Stanislaus County ♦ Well-Child Visits in the Third, Fourth, Fifth, and Sixth Years of Life in Stanislaus County
Health Plan of San Joaquin Performance Evaluation Report: July 1, 2017–June 30, 2018 California Department of Health Care Services
Page P-40 Health Services Advisory Group, Inc.

Medi-Cal Managed Care External Quality Review Technical ReportAppendix P: Performance Evaluation ReportHealth Plan of San JoaquinJuly 1, 2017–June 30, 2018
4. Performance Improvement Projects
Performance Improvement Project Overview The key concepts of the rapid-cycle PIP framework include forming a PIP team, setting aims, establishing measures, determining interventions using quality improvement tools, conducting PDSA cycles to test interventions, and planning for the spread of successful changes. The core component of the rapid-cycle PIP approach involves testing changes on a small scale so that improvement can occur more efficiently and lead to long-term sustainability. The following modules guide MCPs through this rapid-cycle PIP process:
♦ Module 1—PIP Initiation ■ MCPs outline the framework for the PIP, which includes:
○ The topic rationale. ○ Comparative data supporting the need to improve the selected topic. ○ A list of the PIP team members, which consists of internal and external stakeholders. ○ A completed key driver diagram that defines the theory of change for improvement,
including the SMART (Specific, Measurable, Achievable, Relevant, and Time-bound) Aim and Global Aim.
♦ Module 2—SMART Aim Data Collection ■ MCPs define the SMART Aim measure and data collection methodology and develop
the SMART Aim data run chart. ♦ Module 3—Intervention Determination
■ MCPs use process mapping and failure modes and effects analysis to identify potential interventions to test which may have direct effects on the SMART Aim.
♦ Module 4—Plan-Do-Study-Act (PDSA) ■ MCPs test and evaluate the interventions identified in Module 3 through a series of
PDSA cycles. ♦ Module 5—PIP Conclusions
■ MCPs interpret results and summarize: ○ Key findings and outcomes achieved. ○ Assessment of each tested intervention. ○ Lessons learned, including how demonstrated improvement can be shared and used
as a foundation for further improvement going forward. ○ Plan for sustained improvement.
Health Plan of San Joaquin Performance Evaluation Report: July 1, 2017–June 30, 2018 California Department of Health Care Services
Page P-41 Health Services Advisory Group, Inc.

PERFORMANCE IMPROVEMENT PROJECTS
Based on the agreed-upon timeline, MCPs submit each module to HSAG for validation. Throughout the rapid-cycle PIP process, HSAG provides technical assistance to MCPs to ensure that PIPs are methodologically sound and to problem-solve with MCPs regarding how to address challenges that occur. Through an iterative process, MCPs have opportunities to make corrections to modules 1 through 3 to achieve all validation criteria.
Once MCPs achieve all validation criteria for modules 1 through 3 and receive feedback on the intervention Plan portion of Module 4, MCPs test interventions. During the intervention testing phase of the PIP, HSAG conducts periodic progress check-ins to ensure that MCPs have addressed HSAG’s feedback on the Plan portion of Module 4 and are making appropriate progress with intervention testing. Once MCPs complete testing an intervention, MCPs determine the next steps based on results and lessons learned—whether the intervention was successful and should be spread (adopt), whether modifications need to be made to the existing intervention (adapt), or whether the intervention was not successful and should be stopped (abandon).
In Module 5, MCPs summarize the overall PIP. When validating Module 5, HSAG assesses the validity and reliability of the results based on the Centers for Medicare & Medicaid Services (CMS) validation protocols to determine whether key stakeholders can have confidence in the reported PIP findings. HSAG assigns the following final confidence levels for each PIP:
♦ High confidence—the PIP was methodologically sound and achieved the SMART Aim goal; the demonstrated improvement was clearly linked to the quality improvement processes conducted and intervention(s) tested; and, the MCP accurately summarized the key findings.
♦ Confidence—the PIP was methodologically sound and achieved the SMART Aim goal, and the MCP accurately summarized the key findings. However, some, but not all, of the quality improvement processes conducted and/or intervention(s) tested were clearly linked to the demonstrated improvement.
♦ Low confidence—either (A) the PIP was methodologically sound; however, the SMART Aim goal was not achieved; or (B) the SMART Aim goal was achieved; however, the quality improvement processes and/or intervention(s) tested were poorly executed and could not be linked to the improvement.
♦ Reported PIP results were not credible (referred to in this report as “not credible”)—the PIP methodology was not executed as approved.
Performance Improvement Project Results and Findings During the review period, HPSJ submitted modules 4 and 5 for its 2015–17 DHCS-priority and MCP-specific PIPs. HSAG validated the modules and includes the final PIP validation findings in this report. Additionally, HPSJ initiated a Disparity PIP and a DHCS-priority PIP during the review period. In this report, HSAG includes summaries of the MCP’s Disparity and DHCS-priority PIP module submissions as well as validation findings from the review period.
Health Plan of San Joaquin Performance Evaluation Report: July 1, 2017–June 30, 2018 California Department of Health Care Services
Page P-42 Health Services Advisory Group, Inc.

PERFORMANCE IMPROVEMENT PROJECTS
2015–17 DHCS-Priority Performance Improvement Project
HPSJ selected diabetes HbA1c testing for its 2015–17 DHCS-priority PIP. While the MCP concluded its Diabetes HbA1c Testing PIP through the SMART Aim end date of June 30, 2017, HPSJ submitted modules 4 and 5 for HSAG to validate during the review period for this report. HSAG provided final validation findings and encouraged HPSJ to incorporate the experiences and lessons learned from the PIP into future quality improvement efforts.
Table 4.1 provides a summary of the SMART Aim measure results reported by the MCP.
Table 4.1—HPSJ Diabetes HbA1c Testing PIP SMART Aim Measure Results
SMART Aim Measure Baseline Rate
SMART Aim Goal
Rate
SMART Aim Goal Achieved
Rate of HbA1c testing among beneficiaries assigned to Provider A6 72% 75% No
Table 4.2 presents a description of the intervention that HPSJ tested for its Diabetes HbA1c Testing PIP. The table also indicates the failure mode that the intervention addressed as well as whether the MCP decided, based on intervention testing results, to adopt, adapt, or abandon the intervention.
Table 4.2—HPSJ Diabetes HbA1c Testing PIP Intervention Testing Results
Intervention Failure Mode Addressed Adopt,Adapt, orAbandon
Calling and sending text messages to beneficiaries regarding their needing to complete HbA1c testing
Beneficiaries not seeking care from their PCPs Abandon
HPSJ documented that it realized the importance of identifying the most appropriate intervention based on the identified key drivers and the failure modes and effects analysis during the scope of the 2015–17 DHCS-priority PIP, and the MCP indicated that it will apply this lesson learned to future PIPs.
Performance Improvement Project Validation Findings
During the review period for this report, HSAG validated modules 4 and 5 for the MCP’s Diabetes HbA1c Testing PIP. HPSJ did not achieve the SMART Aim goal; however, the MCP documented that it achieved a steady increase in the HbA1c testing compliance rate. HSAG’s
6 Provider name removed for confidentiality.
Health Plan of San Joaquin Performance Evaluation Report: July 1, 2017–June 30, 2018 California Department of Health Care Services
Page P-43 Health Services Advisory Group, Inc.
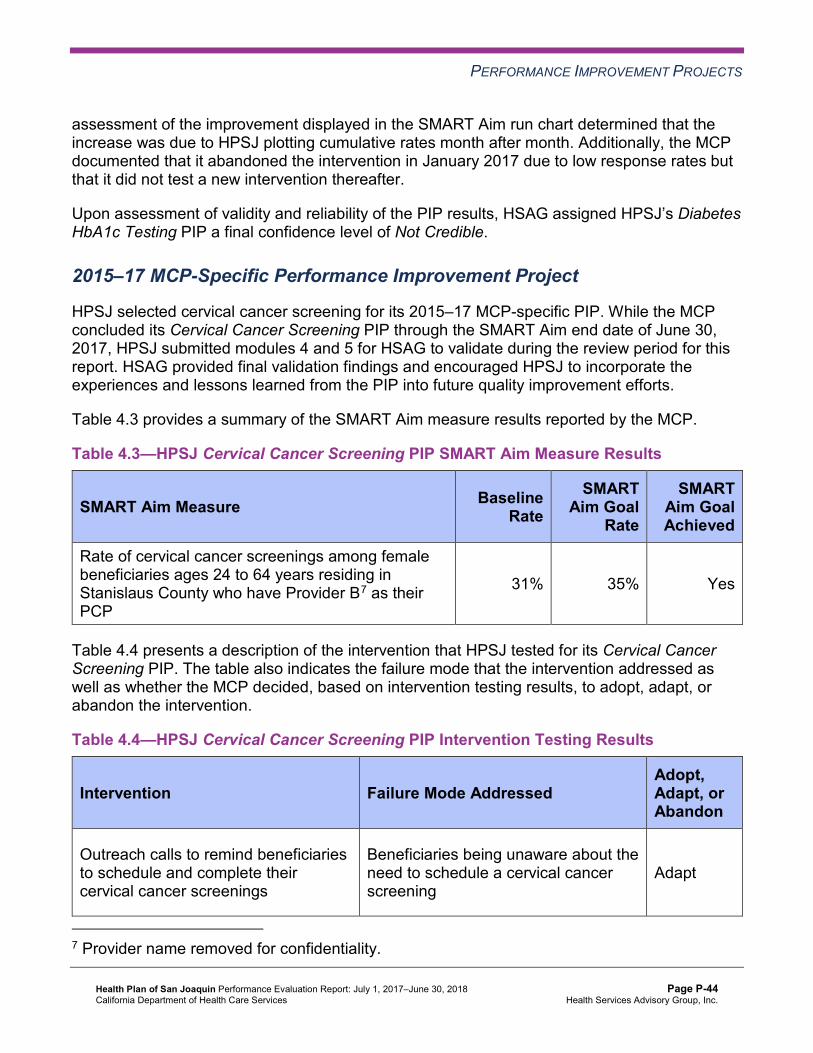
PERFORMANCE IMPROVEMENT PROJECTS
assessment of the improvement displayed in the SMART Aim run chart determined that the increase was due to HPSJ plotting cumulative rates month after month. Additionally, the MCP documented that it abandoned the intervention in January 2017 due to low response rates but that it did not test a new intervention thereafter.
Upon assessment of validity and reliability of the PIP results, HSAG assigned HPSJ’s Diabetes HbA1c Testing PIP a final confidence level of Not Credible.
2015–17 MCP-Specific Performance Improvement Project
HPSJ selected cervical cancer screening for its 2015–17 MCP-specific PIP. While the MCP concluded its Cervical Cancer Screening PIP through the SMART Aim end date of June 30, 2017, HPSJ submitted modules 4 and 5 for HSAG to validate during the review period for this report. HSAG provided final validation findings and encouraged HPSJ to incorporate the experiences and lessons learned from the PIP into future quality improvement efforts.
Table 4.3 provides a summary of the SMART Aim measure results reported by the MCP.
Table 4.3—HPSJ Cervical Cancer Screening PIP SMART Aim Measure Results
SMART Aim Measure Baseline Rate
SMART Aim Goal
Rate
SMART Aim Goal Achieved
Rate of cervical cancer screenings among female beneficiaries ages 24 to 64 years residing in Stanislaus County who have Provider B7 as their PCP
31% 35% Yes
Table 4.4 presents a description of the intervention that HPSJ tested for its Cervical Cancer Screening PIP. The table also indicates the failure mode that the intervention addressed as well as whether the MCP decided, based on intervention testing results, to adopt, adapt, or abandon the intervention.
Table 4.4—HPSJ Cervical Cancer Screening PIP Intervention Testing Results
Intervention Failure Mode Addressed Adopt,Adapt, orAbandon
Outreach calls to remind beneficiaries to schedule and complete their cervical cancer screenings
Beneficiaries being unaware about the need to schedule a cervical cancer screening
Adapt
7 Provider name removed for confidentiality.
Health Plan of San Joaquin Performance Evaluation Report: July 1, 2017–June 30, 2018 California Department of Health Care Services
Page P-44 Health Services Advisory Group, Inc.

PERFORMANCE IMPROVEMENT PROJECTS
Performance Improvement Project Validation Findings
During the review period for this report, HSAG validated modules 4 and 5 for the MCP’s Cervical Cancer Screening PIP. HPSJ achieved the SMART Aim goal; however, the MCP documented that the provider partner did not provide evidence of performing the outreach intervention. HPSJ was therefore unable to evaluate the effectiveness of the intervention, resulting in the MCP not being able to attribute the achievement of the SMART Aim goal to the tested intervention.
Upon assessment of validity and reliability of the PIP results, HSAG assigned HPSJ’s Cervical Cancer Screening PIP a final confidence level of Low Confidence.
2017–19 Disparity Performance Improvement Project
During the review period, DHCS required HPSJ to initiate a PIP focusing on an identified health disparity based on, but not limited to, age, gender, race or ethnicity, language spoken, income, educational attainment, sexual orientation or gender identity, occupation, provider, or geographic area. HPSJ selected cervical cancer screening among White women, ages 24 to 64, residing in Stanislaus County as its 2017–19 Disparity PIP topic. Using its own MCP-specific data, the MCP provided evidence of the health disparity by demonstrating a statistically significant rate difference between two subgroups, with the disparate subgroup having the lower rate.
Table 4.5 provides the SMART Aim measure description, baseline rate, and SMART Aim goal rate for the PIP. The SMART Aim end date for this PIP is June 30, 2019.
Table 4.5—HPSJ Cervical Cancer Screening Disparity PIP SMART Aim Measure
SMART Aim Measure Baseline Rate
SMART Aim Goal
Rate
Rate of cervical cancer screening compliance among White women, ages 24 to 64, residing in Stanislaus County 44.75% 49.20%
Performance Improvement Project Validation Findings
During the review period of this report, HSAG validated modules 1 and 2 for the MCP’s Cervical Cancer Screening Disparity PIP. Upon initial review of the modules, HSAG determined that HPSJ met some required validation criteria; however, HSAG identified opportunities for improvement related to:
♦ Supporting the topic selection with the MCP’s data. ♦ Identifying appropriate team members, to include both internal staff and external partners. ♦ Including all required components of the:
Health Plan of San Joaquin Performance Evaluation Report: July 1, 2017–June 30, 2018 California Department of Health Care Services
Page P-45 Health Services Advisory Group, Inc.

PERFORMANCE IMPROVEMENT PROJECTS
■ SMART Aim, developed based on literature review, data, and/or experience. ■ SMART Aim measure. ■ SMART Aim data collection methodology. ■ Run/control chart.
♦ Aligning accurately the Global Aim, SMART Aim, key drivers, and potential interventions.
After receiving technical assistance from HSAG, HPSJ incorporated HSAG’s feedback into the PIP modules. Upon HSAG’s final review, HSAG determined that the MCP met all validation criteria for modules 1 and 2.
2017–19 DHCS-Priority Performance Improvement Project
During the review period, DHCS required HPSJ to initiate a PIP related to one of DHCS’ Quality Strategy focus areas: Childhood Immunization Status—Combination 3, Controlling High Blood Pressure, Comprehensive Diabetes Care, or Prenatal and Postpartum Care— Postpartum Care. Based on the MCP’s performance measure results, HPSJ selected childhood immunizations as its 2017–19 DHCS-priority PIP topic.
Performance Improvement Project Validation Findings
During the review period of this report, HSAG validated modules 1 and 2 for the MCP’s Childhood Immunization Status—Combination 3 PIP. Upon initial review of the modules, HSAG determined that HPSJ met some required validation criteria; however, HSAG identified opportunities for improvement related to:
♦ Supporting the topic selection with the MCP’s data. ♦ Identifying appropriate team members, to include both internal staff and external partners. ♦ Including all required components of the:
■ SMART Aim, developed based on literature review, data, and/or experience. ■ SMART Aim measure. ■ SMART Aim data collection methodology. ■ Run/control chart.
♦ Aligning accurately the Global Aim, SMART Aim, key drivers, and potential interventions.
HPSJ was still in the process of incorporating HSAG’s feedback into the PIP modules during the review period; therefore, HSAG includes no final validation results in this report.
Strengths—Performance Improvement Projects Upon completion of the 2015–17 Cervical Cancer Screening PIP, HPSJ identified an intervention that the MCP can adapt to improve cervical cancer screening compliance among its female beneficiaries.
Health Plan of San Joaquin Performance Evaluation Report: July 1, 2017–June 30, 2018 California Department of Health Care Services
Page P-46 Health Services Advisory Group, Inc.
PERFORMANCE IMPROVEMENT PROJECTS
Opportunities for Improvement—Performance Improvement Projects HPSJ has the opportunity to incorporate lessons learned from the 2015–17 Cervical Cancer Screening PIP into the 2017–19 Cervical Cancer Screening Disparity PIP. Additionally, HPSJ has the opportunity to apply the lessons learned from both 2015–17 PIPs to facilitate improvement for future PIPs.
Health Plan of San Joaquin Performance Evaluation Report: July 1, 2017–June 30, 2018 California Department of Health Care Services
Page P-47 Health Services Advisory Group, Inc.

Medi-Cal Managed Care External Quality Review Technical ReportAppendix P: Performance Evaluation ReportHealth Plan of San JoaquinJuly 1, 2017–June 30, 2018
5. Recommendations
Follow-Up on Prior Year Recommendations DHCS provided each MCP an opportunity to outline actions taken to address recommendations HSAG made in its 2016–17 MCP-specific evaluation report. Table 5.1 provides EQR recommendations from HPSJ’s July 1, 2016, through June 30, 2017, MCP-specific evaluation report, along with the MCP’s self-reported actions taken through June 30, 2018, that address the recommendations. Please note that HSAG made minimal edits to Table 5.1 to preserve the accuracy of HPSJ’s self-reported actions.
Table 5.1—HPSJ’s Self-Reported Follow-Up on External Quality ReviewRecommendations from the July 1, 2016, through June 30, 2017, MCP-SpecificEvaluation Report
2016–17 External Quality ReviewRecommendations Directed to HPSJ
Self-Reported Actions Taken by HPSJduring the Period of July 1, 2017–June 30,2018, that Address the External QualityReview Recommendations
1. Determine the percentage of retroactive enrollment that occurs for the MCP; determine the impact on the rates; and consider removing these beneficiaries for future HEDIS reporting, as allowed by NCQA.
HPSJ was able to generate a one-time report of members retroactively enrolled with the health plan. There were significant discussions needed to ensure that the new HEDIS vendor would be able to understand the various reasons for retroactive changes to member enrollment and appropriately remove those members from the denominator. Unfortunately, the members remained in the data for RY 2018. The process is expected to be in place for these members to be excluded for RY 2019.
2. Continue to work with DHCS to identify the causes for the rates for the following measures being below the MPLs: a. Both Annual Monitoring for Patients
on Persistent Medications measures in both reporting units
b. Avoidance of Antibiotic Treatment in Adults With Acute Bronchitis in San Joaquin County
a. The Annual Monitoring for Patients on Persistent Medications (MPM)— ACE/ARBs measure rates have remained below the MPL for a number of years. Despite HPSJ’s efforts to educate providers through the partnership program, direct mailing with lists of non-compliant members, member outreach calls, and external communication messages about the services, the medical record review
Health Plan of San Joaquin Performance Evaluation Report: July 1, 2017–June 30, 2018 California Department of Health Care Services
Page P-48 Health Services Advisory Group, Inc.

RECOMMENDATIONS
2016–17 External Quality ReviewRecommendations Directed to HPSJ
Self-Reported Actions Taken by HPSJduring the Period of July 1, 2017–June 30,2018, that Address the External QualityReview Recommendations
c. Cervical Cancer Screening in San Joaquin County
d. Childhood Immunization Status— Combination 3 in both reporting units
e. Comprehensive Diabetes Care— Eye Exam (Retinal) Performed in both reporting units
f. Comprehensive Diabetes Care— Hemoglobin A1c (HbA1c) Testing in San Joaquin County
g. Comprehensive Diabetes Care— Medical Attention for Nephropathy in Stanislaus County
h. Well-Child Visits in the Third, Fourth, Fifth, and Sixth Years of Life in Stanislaus County
showed that members with diabetes in the eligible population for the MPM measure did not get the appropriate test required. Direct education to the assigned PCP and treating physicians continues, but HPSJ is working to determine alternative efforts needed to impact the outcome of this measure. Revisiting the quality and quantity of lab data received from our delegate is one area HPSJ is working on. Continuing to offer providers the incentive remains at the top of HPSJ’s improvement efforts.
b. The Avoidance of Antibiotic Treatment in Adults With Acute Bronchitis (AAB) measure was a targeted measure for improvement. Stanislaus County saw a marked improvement, from 26.25 percent to 31.94 percent. San Joaquin County improved from 18.23 percent to 25.95 percent. HPSJ included education and training in the provider partnership meetings. HPSJ addressed provider barriers to treating members who insisted on receiving antibiotic prescriptions for treatment. Alternative tools were shared with providers to give members over-the-counter medicine or actions that could be done at home to alleviate symptoms (such as resting and increasing fluid intake). Member education was included in the quarterly newsletters and on the member website regarding the appropriate times to prescribe antibiotics and the effect of taking antibiotics when that is not appropriate.
c. HPSJ has a member incentive of $25 and provider incentive of $50 (from $25 in Quarter 1 through Quarter 3) for pap
Health Plan of San Joaquin Performance Evaluation Report: July 1, 2017–June 30, 2018 California Department of Health Care Services
Page P-49 Health Services Advisory Group, Inc.
RECOMMENDATIONS
2016–17 External Quality ReviewRecommendations Directed to HPSJ
Self-Reported Actions Taken by HPSJduring the Period of July 1, 2017–June 30,2018, that Address the External QualityReview Recommendations
smears. HPSJ continues to educate members about the health benefits of getting annual exams and regular cervical cancer screenings. The member newsletters focus on preventive care, and various topics (i.e. women’s health and cancer screenings) are highlighted in each issue. The increase from 47.20 percent to 55.72 percent shows that activities across the MCP have had a positive impact on the outcome rates. The collection of complete and accurate data continues to be a barrier for HPSJ, so we continue to work with Quest and other lab providers to ensure that HPSJ receives timely and accurate data to capture services like the screenings noted for women’s health.
d. The Childhood Immunization Status— Combination 3 measure rate continues to be a statewide issue for California. HPSJ is no exception to the barriers related to receiving vaccinations data for our children and adolescents. HPSJ has worked to receive data from immunization registries: RIDE Immunization Registry and California Immunization Registry (CAIR). One issue found during medical record retrieval is compliance with date restrictions. Members were determined to have received services outside of the date range. Well-child exams are included in the member incentive and provider incentive programs, but immunizations continue to show poor outcome rates. Members of this age group do not have a school enrollment requirement within the required time
Health Plan of San Joaquin Performance Evaluation Report: July 1, 2017–June 30, 2018 California Department of Health Care Services
Page P-50 Health Services Advisory Group, Inc.

RECOMMENDATIONS
2016–17 External Quality ReviewRecommendations Directed to HPSJ
Self-Reported Actions Taken by HPSJduring the Period of July 1, 2017–June 30,2018, that Address the External QualityReview Recommendations
frame, so personal beliefs and varied information about side effects of vaccinations continue to be barriers until school enrollment requirements are applied. HPSJ works with network providers to improve member outpatient well visits. The format includes improvements within the visit to capture immunizations as well as mental and physical development and behavior assessment data. The activities with providers include review of office procedures for coding and accurate identification of services. The annual data exchange with the immunization registry is expected to continue to improve the rates for the next reporting year.
e. The Comprehensive Diabetes Care— Eye Exam (Retinal) Performed measure was targeted by HPSJ for improvement of outcome rates in 2017. HPSJ worked with our delegated vision vendor, VSP, to increase targeted provider education and member outreach efforts. Through the provider partnership program, in 2016 the HPSJ identified an out-of-area ophthalmology group that contracted with local network PCP groups to read the images for diabetic retinal eye exams. HPSJ negotiated a contract with the service provider to bill HPSJ directly for retinal eye exam readings to increase administrative data collection. Contracted efforts were delayed but were finalized in 2017 to increase the administrative outcome for this measure. The outcome rates were impacted more in San Joaquin County than Stanislaus County due to the
Health Plan of San Joaquin Performance Evaluation Report: July 1, 2017–June 30, 2018 California Department of Health Care Services
Page P-51 Health Services Advisory Group, Inc.

RECOMMENDATIONS
2016–17 External Quality ReviewRecommendations Directed to HPSJ
Self-Reported Actions Taken by HPSJduring the Period of July 1, 2017–June 30,2018, that Address the External QualityReview Recommendations
number of agreements in existence between PCPs and eye care providers, and provider understanding of contract changes. HPSJ continues to make network providers aware of this contract to reduce barriers to access to care and to increase alternative avenues for treatment of needed services.
f. Eligible population for the Comprehensive Diabetes Care—HbA1c Testing (CDC—HbA1c Testing) and Comprehensive Diabetes Care— Medical Attention for Nephropathy measures shows an increase resulting from MCP efforts to increase the number of members seen for outpatient care services. As noted under the explanation for AAB, the MCP has worked with network providers to improve the access to care barriers seen in previous years by HPSJ members and to improve provider compliance through year-to-date reporting. HbA1c testing and control are showing improvement as HPSJ works to improve the collection of data and to collaborate with providers to focus on diabetic treatment options. The increase of the CDC—HbA1c Testing measure rate from 45.26 percent to 52.07 percent is a reflection of those efforts. This is also an increase from two years prior, when the score was 46.96 percent.
g. For the Well-Child Visits in the Third, Fourth, Fifth, and Sixth Years of Life (W34) and Weight Assessment and Counseling for Nutrition and Physical Activity for Children and Adolescents (WCC) measures, HPSJ used the gap-
Health Plan of San Joaquin Performance Evaluation Report: July 1, 2017–June 30, 2018 California Department of Health Care Services
Page P-52 Health Services Advisory Group, Inc.

RECOMMENDATIONS
2016–17 External Quality ReviewRecommendations Directed to HPSJ
Self-Reported Actions Taken by HPSJduring the Period of July 1, 2017–June 30,2018, that Address the External QualityReview Recommendations
in-care reports as the primary tool for supporting provider efforts to get members in for well-child services, including preventive care. In addition to the gap reports, the WCC measures were reviewed, and MCP staff members worked with providers to establish efficient procedures to: determine members who need to be seen for wellness exams, include all relevant care related to a comprehensive examination, and appropriately include ICD 10 and CPT codes for services that do not increase claim payments but provide an increased accuracy of outcome rates for each paneled member. The providers worked with MCP staff members from various departments, which included Provider Networks, Case Management, Quality Management, and Claims. Each provider showed improved outcome rates for year-to-date reporting, which focused only on administrative data.
Health Plan of San Joaquin Performance Evaluation Report: July 1, 2017–June 30, 2018 California Department of Health Care Services
Page P-53 Health Services Advisory Group, Inc.

RECOMMENDATIONS
2017–18 Recommendations Based on the overall assessment of HPSJ’s delivery of quality, accessible, and timely care through the activities described in previous sections of this report, HSAG recommends the following to the MCP:
♦ Work with DHCS to ensure that the MCP resolves the deficiencies that A&I identified in the Case Management and Coordination of Care category during the July 31, 2017, through August 9, 2017, Medical and State Supported Services Audits.
♦ Continue efforts to identify beneficiaries with retroactive eligibility to determine whether or not exclusion of those beneficiaries impacts the reported HEDIS rates.
♦ Assess whether or not the MCP’s current improvement strategies need to be modified or expanded to improve the MCP’s performance for the following measures with rates below the MPLs in RY 2018: ■ Annual Monitoring for Patients on Persistent Medications—ACE Inhibitors or ARBs in
both reporting units ■ Annual Monitoring for Patients on Persistent Medications—Diuretics in Stanislaus
County ■ Childhood Immunization Status—Combination 3 in both reporting units ■ Comprehensive Diabetes Care—Eye Exam (Retinal) Performed in Stanislaus County ■ Comprehensive Diabetes Care—HbA1c Testing in both reporting units ■ Comprehensive Diabetes Care—Medical Attention for Nephropathy in both reporting
units ■ Well-Child Visits in the Third, Fourth, Fifth, and Sixth Years of Life in Stanislaus County
♦ For the following measures, assess the causes for the MCP’s performance below the MPLs in RY 2018 and identify strategies to improve performance: ■ Breast Cancer Screening in both reporting units ■ Prenatal and Postpartum Care—Timeliness of Prenatal Care in Stanislaus County
♦ Incorporate lessons learned from the 2015–17 Cervical Cancer Screening PIP into the 2017–19 Cervical Cancer Screening Disparity PIP.
♦ Apply the lessons learned from both 2015–17 PIPs to facilitate improvement for future PIPs.
In the next annual review, HSAG will evaluate continued successes of HPSJ as well as the MCP’s progress with these recommendations.
Health Plan of San Joaquin Performance Evaluation Report: July 1, 2017–June 30, 2018 California Department of Health Care Services
Page P-54 Health Services Advisory Group, Inc.
Medi-Cal Managed CareExternal Quality Review Technical Report
Appendix Q: Performance Evaluation Report
Health Plan of San Mateo July 1, 2017–June 30, 2018

Medi-Cal Managed Care External Quality Review Technical Report Appendix Q: Performance Evaluation ReportHealth Plan of San Mateo July 1, 2017–June 30, 2018
Table of Contents
1. Introduction............................................................................................................ Q-1 Medi-Cal Managed Care Health Plan Overview ...................................................... Q-1
2. Managed Care Health Plan Compliance .............................................................. Q-2Compliance Reviews Conducted............................................................................. Q-2 Strengths—Compliance Reviews ............................................................................ Q-3 Opportunities for Improvement—Compliance Reviews ........................................... Q-3
3. Managed Care Health Plan Performance Measures ........................................... Q-4Performance Measure Validation Results ............................................................... Q-4 Performance Measure Results and Findings........................................................... Q-4
Preventive Screening and Children’s Health ........................................................ Q-5 Preventive Screening and Women’s Health ......................................................... Q-9 Care for Chronic Conditions ............................................................................... Q-11 Appropriate Treatment and Utilization................................................................ Q-13 Performance Measure Findings—All Domains................................................... Q-16
Seniors and Persons with Disabilities Performance Measure Results................... Q-17 Seniors and Persons with Disabilities Findings .................................................. Q-22
Strengths—Performance Measures ...................................................................... Q-22 Opportunities for Improvement—Performance Measures ..................................... Q-23
4. MLTSSP Performance Measure Results............................................................ Q-24 Managed Long-Term Services and Supports Plan Performance Measure Findings . Q-25
5. Performance Improvement Projects .................................................................. Q-26Performance Improvement Project Overview ........................................................ Q-26 Performance Improvement Project Results and Findings...................................... Q-27
2015–17 DHCS-Priority Performance Improvement Project .............................. Q-28 2015–17 MCP-Specific Performance Improvement Project ............................... Q-29 2017–19 Disparity Performance Improvement Project ....................................... Q-30 2017–19 DHCS-Priority Performance Improvement Project .............................. Q-31
Strengths—Performance Improvement Projects ................................................... Q-32 Opportunities for Improvement—Performance Improvement Projects .................. Q-33
6. Recommendations............................................................................................... Q-34 Follow-Up on Prior Year Recommendations ......................................................... Q-34 2017–18 Recommendations.................................................................................. Q-35
Health Plan of San Mateo Performance Evaluation Report: July 1, 2017–June 30, 2018 California Department of Health Care Services
Page Q-i Health Services Advisory Group, Inc.

TABLE OF CONTENTS
Table of Tables
Table 2.1—DHCS A&I Medical Audit of HPSM Audit Review Period: November 1, 2016, through October 31, 2017............................................................................ Q-2
Table 3.1—Preventive Screening and Children’s Health Domain Multi-Year Performance Measure Results HPSM—San Mateo County ....................... Q-6
Table 3.2—Preventive Screening and Children’s Health Domain RY 2018 (MY 2017) Performance Measure Findings HPSM—San Mateo County ..................... Q-8
Table 3.3—Preventive Screening and Women’s Health Domain Multi-Year Performance Measure Results HPSM—San Mateo County ....................... Q-9
Table 3.4—Preventive Screening and Women’s Health Domain RY 2018 (MY 2017) Performance Measure Findings HPSM—San Mateo County ................... Q-10
Table 3.5—Care for Chronic Conditions Domain Multi-Year Performance Measure Results HPSM—San Mateo County ......................................................... Q-11
Table 3.6—Care for Chronic Conditions Domain RY 2018 (MY 2017) Performance Measure Findings HPSM—San Mateo County......................................... Q-12
Table 3.7—Appropriate Treatment and Utilization Domain Multi-Year Performance Measure Results HPSM—San Mateo County .......................................... Q-14
Table 3.8—Appropriate Treatment and Utilization Domain RY 2018 (MY 2017) Performance Measure Findings HPSM—San Mateo County ................... Q-15
Table 3.9—RY 2018 (MY 2017) Performance Measure Findings for All Domains HPSM—San Mateo County ...................................................................... Q-16
Table 3.10—Multi-Year SPD Performance Measure Trend Table HPSM—San Mateo County ...................................................................................................... Q-18
Table 3.11—Multi-Year Non-SPD Performance Measure Trend Table HPSM— San Mateo County .................................................................................... Q-19
Table 3.12—RY 2018 (MY 2017) Performance Measure Comparison and Results for Measures Stratified by the SPD and Non-SPD Populations HPSM— San Mateo County .................................................................................... Q-21
Table 4.1—Multi-Year MLTSSP Performance Measure Results HPSM—San Mateo County ...................................................................................................... Q-24
Table 5.1—HPSM Postpartum Care PIP SMART Aim Measure Results .................... Q-28 Table 5.2—HPSM Postpartum Care PIP Intervention Testing Results ....................... Q-28 Table 5.3—HPSM Cervical Cancer Screening PIP SMART Aim Measure Results..... Q-29 Table 5.4—HPSM Cervical Cancer Screening PIP Intervention Testing Results........ Q-30 Table 5.5—HPSM Cervical Cancer Screening Disparity PIP SMART Aim Measure... Q-31 Table 5.6—HPSM Asthma Medication Ratio PIP SMART Aim Measure .................... Q-32 Table 6.1—HPSM’s Self-Reported Follow-Up on External Quality Review
Recommendations from the July 1, 2016, through June 30, 2017, MCP-Specific Evaluation Report............................................................... Q-34
Health Plan of San Mateo Performance Evaluation Report: July 1, 2017–June 30, 2018 California Department of Health Care Services
Page Q-ii Health Services Advisory Group, Inc.

Medi-Cal Managed Care External Quality Review Technical ReportAppendix Q: Performance Evaluation ReportHealth Plan of San Mateo July 1, 2017–June 30, 2018
1. Introduction
The California Department of Health Care Services (DHCS) contracted with Health Services Advisory Group, Inc. (HSAG), an external quality review organization (EQRO), to prepare the federally required Medi-Cal Managed Care External Quality Review Technical Report, July 1, 2017–June 30, 2018. The technical report provides an overview of the objectives and methodology for conducting the external quality review (EQR) activities, including requirements related to each activity. Additionally, the technical report provides aggregated results and recommendations for DHCS for each activity.
This appendix is specific to DHCS’ contracted Medi-Cal managed care health plan (MCP), Health Plan of San Mateo (“HPSM” or “the MCP”). The purpose of this appendix is to provide MCP-specific results of each activity and an assessment of the MCP’s strengths and opportunities for improvement with respect to the quality and timeliness of and access to health care services furnished to Medi-Cal Managed Care (MCMC) beneficiaries (referred to as “beneficiaries” in this report). The review period for this MCP-specific evaluation report is July 1, 2017, through June 30, 2018. HSAG will report on activities that take place beyond the review period in HPSM’s 2018–19 MCP-specific evaluation report. This MCP-specific evaluation report references activities and methodologies described in detail by HSAG in the technical report section.
The aggregate EQR technical report and all MCP- and specialty health plan (SHP)-specific performance evaluation reports reflect HSAG’s external, independent assessment of the quality and timeliness of, and access to, care that MCPs and SHPs are providing to beneficiaries.
Medi-Cal Managed Care Health Plan Overview HPSM is a full-scope MCP delivering services to beneficiaries in the County Organized Health System (COHS) model.
HPSM became operational to provide MCMC services in San Mateo County effective December 1987. As of June 30, 2018, HPSM had 106,818 beneficiaries in San Mateo County.1
1 Medi-Cal Managed Care Enrollment Report—June 2018. Available at: http://www.dhcs.ca.gov/dataandstats/reports/Pages/MMCDMonthlyEnrollment.aspx. Accessed on: Sep 05, 2018.
Health Plan of San Mateo Performance Evaluation Report: July 1, 2017–June 30, 2018 California Department of Health Care Services
Page Q-1 Health Services Advisory Group, Inc.

Medi-Cal Managed Care External Quality Review Technical ReportAppendix Q: Performance Evaluation ReportHealth Plan of San Mateo July 1, 2017–June 30, 2018
2. Managed Care Health Plan Compliance
Compliance Reviews Conducted The following is a summary of the most recent reviews conducted for HPSM. Unless noted, HSAG’s compliance review summaries are based on final audit/survey reports issued and corrective action plan (CAP) closeout letters dated on or before the end of the review period for this report (June 30, 2018). The descriptions of the various types of reviews may be found within the main section of this technical report.
Table 2.1 summarizes the results and status of the DHCS Audits & Investigations Division (A&I) Medical Audit of HPSM. A&I conducted the on-site audit from November 27, 2017, through December 8, 2017. A&I conducted the audit to ascertain that the medical services provided to HPSM’s beneficiaries, including Seniors and Persons with Disabilities (SPD), comply with federal and State laws, Medi-Cal regulations and guidelines, and the State contract. Note that A&I did not include the State Supported Services portion of the audit for 2017.
Table 2.1—DHCS A&I Medical Audit of HPSM Audit Review Period: November 1, 2016, through October 31, 2017
Category Evaluated Deficiencies (Yes/No) Monitoring Status
Utilization Management Yes CAP in process and under review by DHCS.
Case Management and Coordination of Care No Not applicable.
Access and Availability of Care Yes CAP in process and under review by DHCS.
Member’s Rights Yes CAP in process and under review by DHCS.
Quality Management No Not applicable.
Administrative and Organizational Capacity Yes CAP in process and under
review by DHCS.
Health Plan of San Mateo Performance Evaluation Report: July 1, 2017–June 30, 2018 California Department of Health Care Services
Page Q-2 Health Services Advisory Group, Inc.

MANAGED CARE HEALTH PLAN COMPLIANCE
Strengths—Compliance Reviews A&I identified no deficiencies in the Case Management and Coordination of Care or Quality Management categories during the November 27, 2017, through December 8, 2017, Medical Audit of HPSM.
Opportunities for Improvement—Compliance Reviews HPSM has the opportunity to work with DHCS to ensure that the MCP resolves all deficiencies from the November 27, 2017, through December 8, 2017, A&I Medical Audit.
Health Plan of San Mateo Performance Evaluation Report: July 1, 2017–June 30, 2018 California Department of Health Care Services
Page Q-3 Health Services Advisory Group, Inc.
Medi-Cal Managed Care External Quality Review Technical ReportAppendix Q: Performance Evaluation ReportHealth Plan of San Mateo July 1, 2017–June 30, 2018
3. Managed Care Health Plan Performance Measures
Performance Measure Validation Results The HEDIS®2 2018 Compliance Audit Final Report of Findings for Health Plan of San Mateo contains the detailed findings and recommendations from HSAG’s NCQA HEDIS Compliance Audit™.3 HSAG auditors determined that HPSM followed the appropriate specifications to produce valid rates, and identified no issues of concern.
Performance Measure Results and Findings After validating the MCP’s performance measure rates, HSAG assessed the results. See Table 3.1 through Table 3.9 for HPSM’s performance measure results for reporting years (RYs) 2015 through 2018 and performance measure findings for RY 2018. The RY is the year in which the MCP reported the rates. The RY rates reflect measurement year (MY) data from the previous calendar year. Note that data may not be available for all four years.
Note the following regarding Table 3.1 through Table 3.9:
To allow HSAG to provide meaningful assessment of MCP performance and actionable recommendations, HSAG, in collaboration with DHCS, organized the measures into domains based on the health care areas each measure affects. Table 3.1 through Table 3.8 present the performance measure results and findings by domain, and Table 3.9 presents the RY 2018 performance measure findings for the domains combined. To assess performance for each MCP reporting unit, HSAG compares the rates to national benchmarks. Rates indicating performance above the high performance levels (HPLs) are shaded in gray, and rates indicating performance below the minimum performance levels (MPLs) are bolded. ■ For measures with rates below the MPLs, DHCS requires MCPs to submit to DHCS
improvement plans (IPs) to address the rates below the MPLs (unless MCPs are reporting the rates for the first time).
■ For MCPs that meet DHCS’ Quality of Care CAP thresholds, DHCS issues a CAP; if an MCP’s performance is such that it may trigger a CAP in the following year, DHCS issues an advance warning letter.
■ IPs and CAPs consist of submission of Plan-Do-Study-Act (PDSA) Cycle Worksheets, Quality Improvement (QI) Summaries, or completion of Performance Improvement Projects (PIPs)—as determined by DHCS.
2 Healthcare Effectiveness Data and Information Set (HEDIS®) is a registered trademark of the National Committee for Quality Assurance (NCQA).
3 NCQA HEDIS Compliance AuditTM is a trademark of NCQA.
Health Plan of San Mateo Performance Evaluation Report: July 1, 2017–June 30, 2018 California Department of Health Care Services
Page Q-4 Health Services Advisory Group, Inc.
MANAGED CARE HEALTH PLAN PERFORMANCE MEASURES
For RYs 2016, 2017, and 2018, the HPLs and MPLs represent the NCQA Quality Compass®4 Medicaid health maintenance organization (HMO) 90th and 25th percentiles, respectively. For RY 2015, the HPLs and MPLs represent the NCQA HEDIS Audit Means, Percentiles, and Ratios 90th and 25th percentiles, respectively. For the Comprehensive Diabetes Care—HbA1c Poor Control (>9.0 Percent) measure, for which a lower rate indicates more favorable performance, the HPL and MPL are based on the 10th and 75th percentiles, respectively. HSAG includes the specific HPL and MPL values for RY 2018 in Section 6 of the Medi-Cal Managed Care External Quality Review Technical Report, July 1, 2017–June 30, 2018 (“Managed Care Health Plan Performance Measures”).
Preventive Screening and Children’s Health
Table 3.1 presents the four-year trending information for the performance measures within the Preventive Screening and Children’s Health domain.
Note the following regarding Table 3.1:
Although HSAG includes information on the MCP’s performance related to the four Children and Adolescents’ Access to Primary Care measures, DHCS did not hold MCPs accountable to meet the MPLs for these measures for RYs 2015 through 2018 (i.e., DHCS did not require MCPs to submit IPs if rates for the measures were below the MPLs). DHCS made this decision due to the small range of variation between the HPL and MPL thresholds for each measure. Any comparison of RY 2018 performance to RY 2017 or to benchmarks related to the Immunizations for Adolescents—Combination 2 measure should be exercised with caution given the changes that NCQA made to the specification for this measure for RY 2018. NCQA released guidance that recommended a break in trending for this measure; however, DHCS determined to continue trending because the specification change should result in higher rates.
4 Quality Compass® is a registered trademark of NCQA.
Health Plan of San Mateo Performance Evaluation Report: July 1, 2017–June 30, 2018 California Department of Health Care Services
Page Q-5 Health Services Advisory Group, Inc.

MANAGED CARE HEALTH PLAN PERFORMANCE MEASURES
Table 3.1—Preventive Screening and Children’s Health DomainMulti-Year Performance Measure Results HPSM—San Mateo County
H = Rate indicates performance above the HPL. Bolded Rate = Rate indicates performance below the MPL.
B = Statistical testing result indicates that the RY 2018 rate is significantly better than the RY 2017 rate.
W = Statistical testing result indicates that the RY 2018 rate is significantly worse than the RY 2017 rate.
Measure RY
2015 Rate1
RY 2016
Rate2
RY 2017
Rate3
RY 2018
Rate4
RYs 2017–18 Rate
Difference5
Childhood Immunization Status—Combination 3 81.60%H 78.08% 82.99%H 80.80%H -2.19
Children and Adolescents’ Access to Primary Care Practitioners—12–24 Months
93.89% 92.20% 93.74% 94.46% 0.72
Children and Adolescents’ Access to Primary Care Practitioners— 25 Months–6 Years
89.21% 86.45% 85.91% 85.95% 0.04
Children and Adolescents’ Access to Primary Care Practitioners—7–11 Years
91.49% 90.97% 89.52% 89.82% 0.30
Children and Adolescents’ Access to Primary Care Practitioners—12–19 Years
87.36% 87.89% 86.17% 86.97% 0.80B
Immunizations for Adolescents— Combination 2^ -- -- 38.93% 55.47%H 16.54B
Weight Assessment and Counseling for Nutrition and Physical Activity for Children and Adolescents—Nutrition Counseling—Total
75.00% 79.08% 77.22% 80.85% 3.63
Weight Assessment and Counseling for Nutrition and Physical Activity for Children and Adolescents—Physical Activity Counseling—Total
61.98% 68.62% 65.00% 78.19%H 13.19B
Health Plan of San Mateo Performance Evaluation Report: July 1, 2017–June 30, 2018 California Department of Health Care Services
Page Q-6 Health Services Advisory Group, Inc.
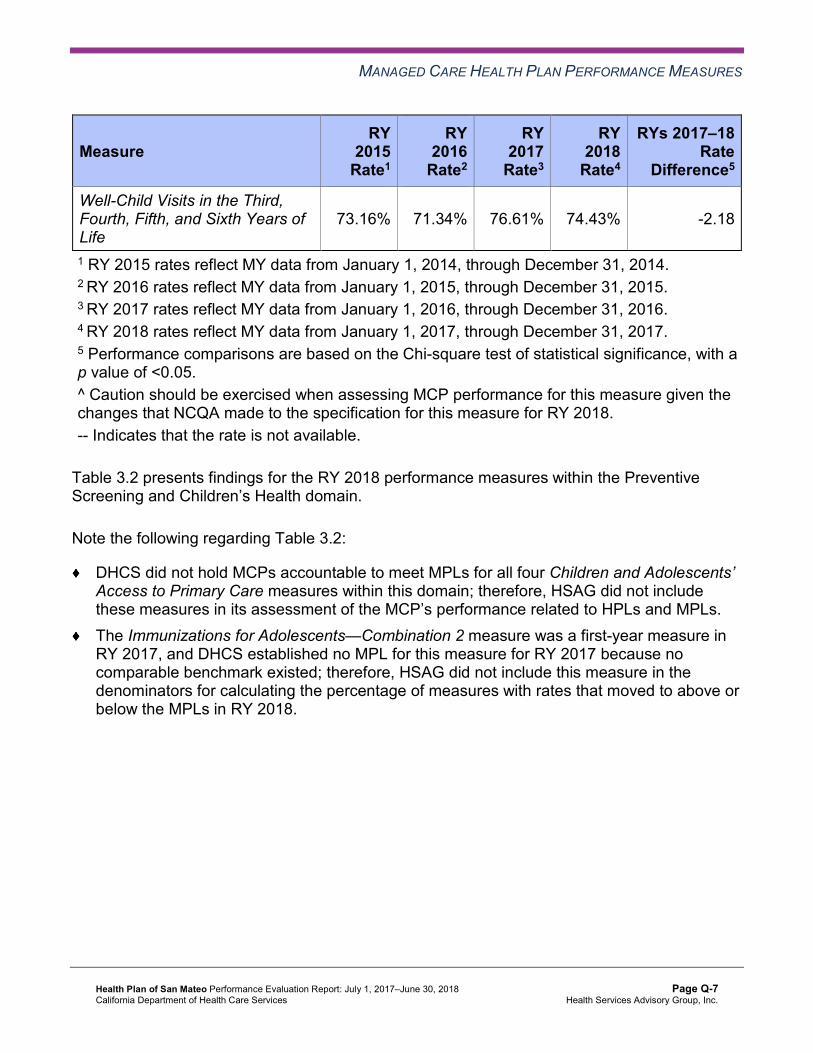
MANAGED CARE HEALTH PLAN PERFORMANCE MEASURES
Measure RY
2015 Rate1
RY 2016
Rate2
RY 2017
Rate3
RY 2018
Rate4
RYs 2017–18 Rate
Difference5
Well-Child Visits in the Third, Fourth, Fifth, and Sixth Years of Life
73.16% 71.34% 76.61% 74.43% -2.18
1 RY 2015 rates reflect MY data from January 1, 2014, through December 31, 2014. 2 RY 2016 rates reflect MY data from January 1, 2015, through December 31, 2015. 3 RY 2017 rates reflect MY data from January 1, 2016, through December 31, 2016. 4 RY 2018 rates reflect MY data from January 1, 2017, through December 31, 2017. 5 Performance comparisons are based on the Chi-square test of statistical significance, with a p value of <0.05. ^ Caution should be exercised when assessing MCP performance for this measure given the changes that NCQA made to the specification for this measure for RY 2018. -- Indicates that the rate is not available.
Table 3.2 presents findings for the RY 2018 performance measures within the Preventive Screening and Children’s Health domain.
Note the following regarding Table 3.2:
DHCS did not hold MCPs accountable to meet MPLs for all four Children and Adolescents’ Access to Primary Care measures within this domain; therefore, HSAG did not include these measures in its assessment of the MCP’s performance related to HPLs and MPLs. The Immunizations for Adolescents—Combination 2 measure was a first-year measure in RY 2017, and DHCS established no MPL for this measure for RY 2017 because no comparable benchmark existed; therefore, HSAG did not include this measure in the denominators for calculating the percentage of measures with rates that moved to above or below the MPLs in RY 2018.
Health Plan of San Mateo Performance Evaluation Report: July 1, 2017–June 30, 2018 California Department of Health Care Services
Page Q-7 Health Services Advisory Group, Inc.

MANAGED CARE HEALTH PLAN PERFORMANCE MEASURES
Table 3.2—Preventive Screening and Children’s Health DomainRY 2018 (MY 2017) Performance Measure Findings HPSM—San Mateo County
Criteria Number of Measures
MeetingCriteria
Total Number of Measures
Percentage of Measures
MeetingCriteria
RY 2018 Rates Above HPLs 3 5 60.00% Rates Above HPLs for the Last Three or More Consecutive Years 0 4 0.00%
RY 2018 Rates Significantly Better than RY 2017 Rates* 2 5 40.00%
Rates that Moved from Below MPLs in RY 2017 to Above MPLs in RY 2018 0 0 N/A
RY 2018 Rates Below MPLs 0 5 0.00% Rates Below MPLs for the Last Three or More Consecutive Years 0 4 0.00%
RY 2018 Rates Significantly Worse than RY 2017 Rates* 0 5 0.00%
Rates that Moved from Above MPLs in RY 2017 to Below MPLs in RY 2018 0 4 0.00%
* Performance comparisons are based on the Chi-square test of statistical significance, with a p value of <0.05. N/A = No rates above or below the MPLs from the previous year exist to include in the denominator for calculating whether or not rates moved to above or below MPLs in the most recent year.
Health Plan of San Mateo Performance Evaluation Report: July 1, 2017–June 30, 2018 California Department of Health Care Services
Page Q-8 Health Services Advisory Group, Inc.

MANAGED CARE HEALTH PLAN PERFORMANCE MEASURES
Preventive Screening and Women’s Health
Table 3.3 presents the four-year trending information for the performance measures within the Preventive Screening and Women’s Health domain.
Note that any comparison of RY 2018 performance to RY 2017 or to benchmarks related to the Breast Cancer Screening measure should be exercised with caution given the changes that NCQA made to the specification for this measure for RY 2018. NCQA released guidance that recommended a break in trending for this measure; however, DHCS determined to continue trending because the specification change should result in higher rates.
Table 3.3—Preventive Screening and Women’s Health DomainMulti-Year Performance Measure Results HPSM—San Mateo County
H = Rate indicates performance above the HPL. Bolded Rate = Rate indicates performance below the MPL.
B = Statistical testing result indicates that the RY 2018 rate is significantly better than the RY 2017 rate.
W = Statistical testing result indicates that the RY 2018 rate is significantly worse than the RY 2017 rate.
Measure RY
2015 Rate1
RY 2016
Rate2
RY 2017
Rate3
RY 2018
Rate4
RYs 2017–18 Rate
Difference5
Breast Cancer Screening^ -- -- 65.77% 62.80% -2.97W
Cervical Cancer Screening 55.10% 54.79% 55.26% 59.95% 4.69 Prenatal and Postpartum Care— Postpartum Care 63.07% 64.84% 67.11% 74.59%H 7.48B
Prenatal and Postpartum Care— Timeliness of Prenatal Care 77.89% 79.95% 82.63% 83.88% 1.25
1 RY 2015 rates reflect MY data from January 1, 2014, through December 31, 2014. 2 RY 2016 rates reflect MY data from January 1, 2015, through December 31, 2015. 3 RY 2017 rates reflect MY data from January 1, 2016, through December 31, 2016. 4 RY 2018 rates reflect MY data from January 1, 2017, through December 31, 2017. 5 Performance comparisons are based on the Chi-square test of statistical significance, with a p value of <0.05. ^ Caution should be exercised when assessing MCP performance for this measure given the changes that NCQA made to the specification for this measure for RY 2018. -- Indicates that the rate is not available.
Health Plan of San Mateo Performance Evaluation Report: July 1, 2017–June 30, 2018 California Department of Health Care Services
Page Q-9 Health Services Advisory Group, Inc.

MANAGED CARE HEALTH PLAN PERFORMANCE MEASURES
Table 3.4 presents findings for the RY 2018 performance measures within the Preventive Screening and Women’s Health domain. Note that the Breast Cancer Screening measure was a first-year measure in RY 2017, and DHCS did not hold MCPs accountable to meet an MPL for this measure in RY 2017; therefore, HSAG did not include this measure in the denominators for calculating the percentage of measures with rates that moved to above or below the MPLs in RY 2018.
Table 3.4—Preventive Screening and Women’s Health DomainRY 2018 (MY 2017) Performance Measure Findings HPSM—San Mateo County
Criteria Number of Measures
MeetingCriteria
Total Number of Measures
Percentage of Measures
MeetingCriteria
RY 2018 Rates Above HPLs 1 4 25.00% Rates Above HPLs for the Last Three or More Consecutive Years 0 3 0.00%
RY 2018 Rates Significantly Better than RY 2017 Rates* 1 4 25.00%
Rates that Moved from Below MPLs in RY 2017 to Above MPLs in RY 2018 0 0 N/A
RY 2018 Rates Below MPLs 0 4 0.00% Rates Below MPLs for the Last Three or More Consecutive Years 0 3 0.00%
RY 2018 Rates Significantly Worse than RY 2017 Rates* 1 4 25.00%
Rates that Moved from Above MPLs in RY 2017 to Below MPLs in RY 2018 0 3 0.00%
* Performance comparisons are based on the Chi-square test of statistical significance, with a p value of <0.05. N/A = No rates above or below the MPLs from the previous year exist to include in the denominator for calculating whether or not rates moved to above or below MPLs in the most recent year.
Health Plan of San Mateo Performance Evaluation Report: July 1, 2017–June 30, 2018 California Department of Health Care Services
Page Q-10 Health Services Advisory Group, Inc.

MANAGED CARE HEALTH PLAN PERFORMANCE MEASURES
Care for Chronic Conditions
Table 3.5 presents the four-year trending information for the performance measures within the Care for Chronic Conditions domain.
Table 3.5—Care for Chronic Conditions Domain Multi-Year Performance Measure Results HPSM—San Mateo County
H = Rate indicates performance above the HPL. Bolded Rate = Rate indicates performance below the MPL.
B = Statistical testing result indicates that the RY 2018 rate is significantly better than the RY 2017 rate.
W = Statistical testing result indicates that the RY 2018 rate is significantly worse than the RY 2017 rate.
Measure RY
2015 Rate1
RY 2016
Rate2
RY 2017
Rate3
RY 2018
Rate4
RYs 2017–18 Rate
Difference5
Annual Monitoring for Patients on Persistent Medications— ACE Inhibitors or ARBs
89.51% 89.92% 90.90% 90.46% -0.44
Annual Monitoring for Patients on Persistent Medications— Diuretics
90.03% 89.69% 90.54% 91.35% 0.81
Asthma Medication Ratio -- -- 54.89% 58.15% 3.26 Comprehensive Diabetes Care— Blood Pressure Control (<140/90 mm Hg)
60.10% 61.12% 61.80% 68.46% 6.66B
Comprehensive Diabetes Care— Eye Exam (Retinal) Performed 63.75% 58.92% 64.48% 70.42%H 5.94
Comprehensive Diabetes Care— HbA1c Control (<8.0 Percent) 54.99% 48.90% 54.26% 52.81% -1.45
Comprehensive Diabetes Care— HbA1c Poor Control (>9.0 Percent)*
38.20% 43.52% 36.01% 36.19% 0.18
Comprehensive Diabetes Care— HbA1c Testing 89.29% 86.55% 85.40% 91.20% 5.80B
Comprehensive Diabetes Care— Medical Attention for Nephropathy
83.94% 87.29% 89.78% 92.18% 2.40
Health Plan of San Mateo Performance Evaluation Report: July 1, 2017–June 30, 2018 California Department of Health Care Services
Page Q-11 Health Services Advisory Group, Inc.
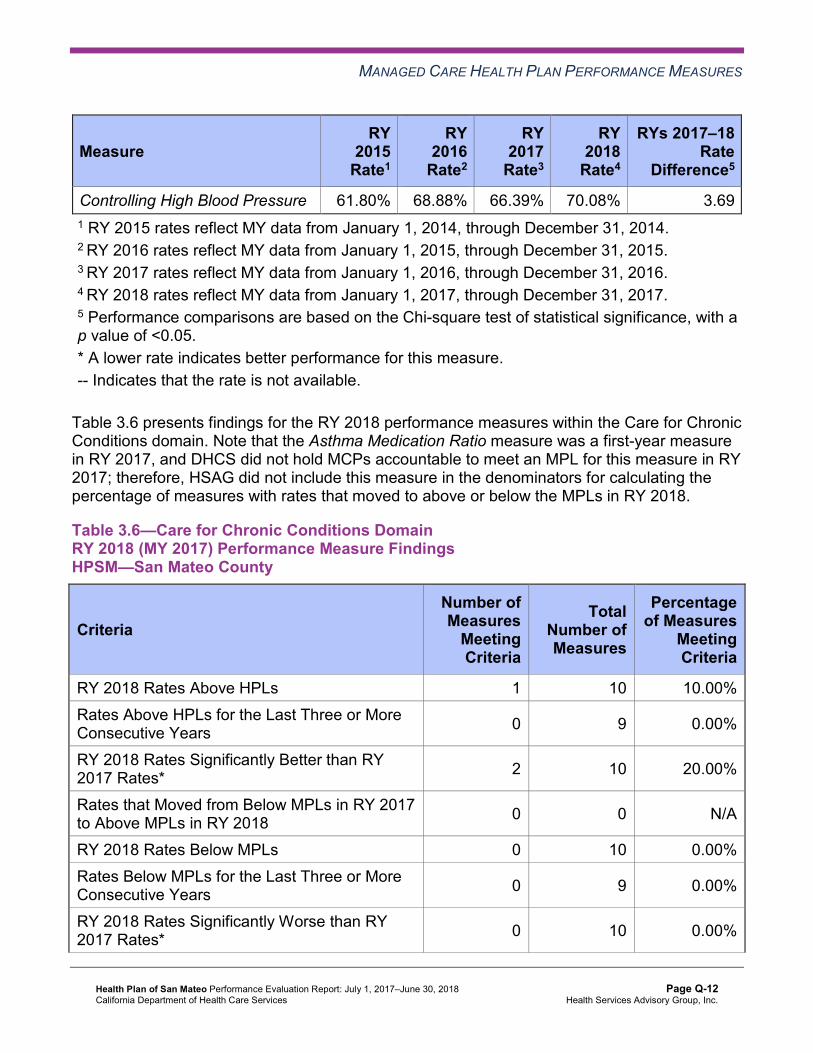
MANAGED CARE HEALTH PLAN PERFORMANCE MEASURES
Measure RY
2015 Rate1
RY 2016
Rate2
RY 2017
Rate3
RY 2018
Rate4
RYs 2017–18 Rate
Difference5
Controlling High Blood Pressure 61.80% 68.88% 66.39% 70.08% 3.69 1 RY 2015 rates reflect MY data from January 1, 2014, through December 31, 2014. 2 RY 2016 rates reflect MY data from January 1, 2015, through December 31, 2015. 3 RY 2017 rates reflect MY data from January 1, 2016, through December 31, 2016. 4 RY 2018 rates reflect MY data from January 1, 2017, through December 31, 2017. 5 Performance comparisons are based on the Chi-square test of statistical significance, with a p value of <0.05. * A lower rate indicates better performance for this measure. -- Indicates that the rate is not available.
Table 3.6 presents findings for the RY 2018 performance measures within the Care for Chronic Conditions domain. Note that the Asthma Medication Ratio measure was a first-year measure in RY 2017, and DHCS did not hold MCPs accountable to meet an MPL for this measure in RY 2017; therefore, HSAG did not include this measure in the denominators for calculating the percentage of measures with rates that moved to above or below the MPLs in RY 2018.
Table 3.6—Care for Chronic Conditions Domain RY 2018 (MY 2017) Performance Measure Findings HPSM—San Mateo County
Criteria Number of Measures
MeetingCriteria
Total Number of Measures
Percentage of Measures
MeetingCriteria
RY 2018 Rates Above HPLs 1 10 10.00% Rates Above HPLs for the Last Three or More Consecutive Years 0 9 0.00%
RY 2018 Rates Significantly Better than RY 2017 Rates* 2 10 20.00%
Rates that Moved from Below MPLs in RY 2017 to Above MPLs in RY 2018 0 0 N/A
RY 2018 Rates Below MPLs 0 10 0.00% Rates Below MPLs for the Last Three or More Consecutive Years 0 9 0.00%
RY 2018 Rates Significantly Worse than RY 2017 Rates* 0 10 0.00%
Health Plan of San Mateo Performance Evaluation Report: July 1, 2017–June 30, 2018 California Department of Health Care Services
Page Q-12 Health Services Advisory Group, Inc.

MANAGED CARE HEALTH PLAN PERFORMANCE MEASURES
Criteria Number of Measures
MeetingCriteria
Total Number of Measures
Percentage of Measures
MeetingCriteria
Rates that Moved from Above MPLs in RY 2017 to Below MPLs in RY 2018 0 9 0.00%
* Performance comparisons are based on the Chi-square test of statistical significance, with a p value of <0.05. N/A = No rates above or below the MPLs from the previous year exist to include in the denominator for calculating whether or not rates moved to above or below MPLs in the most recent year.
Appropriate Treatment and Utilization
Table 3.7 presents the four-year trending information for the performance measures within the Appropriate Treatment and Utilization domain.
Note the following regarding Table 3.7:
The All-Cause Readmissions measure is a non-HEDIS measure originally developed for DHCS’ All-Cause Readmissions collaborative quality improvement project (QIP); therefore, DHCS does not establish an HPL or MPL for this measure. For the All-Cause Readmissions measure, a lower rate indicates better performance (i.e., fewer readmissions). The two Ambulatory Care measures are utilization measures, which measure the volume of services used. DHCS does not hold MCPs accountable to meet MPLs for utilization measures, and HSAG does not compare performance for these measures against HPLs and MPLs. Additionally, because high and low rates do not necessarily indicate better or worse performance, HSAG did not compare performance for these measures across years. DHCS established no HPL or MPL for the two Depression Screening and Follow-Up for Adolescents and Adults measures for RY 2018 because no comparable benchmarks exist. Additionally, although MCPs reported the two Depression Screening and Follow-Up for Adolescents and Adults measures for RY 2018, HSAG does not present the performance measure results for these measures in this report because the reported rates do not accurately represent services being provided. This is due to the Depression Screening and Follow-Up for Adolescents and Adults measures being new HEDIS measures for RY 2018, NCQA requiring MCPs to submit rates for these measures using the new Electronic Clinical Data Systems (ECDS) reporting methodology, and inconsistent data reporting processes by calculation vendors. Thus, MCPs experienced numerous challenges obtaining data sources to use for ECDS reporting. DHCS and HSAG, in consultation with NCQA, will work with MCPs to improve data capture for RY 2019.
Health Plan of San Mateo Performance Evaluation Report: July 1, 2017–June 30, 2018 California Department of Health Care Services
Page Q-13 Health Services Advisory Group, Inc.
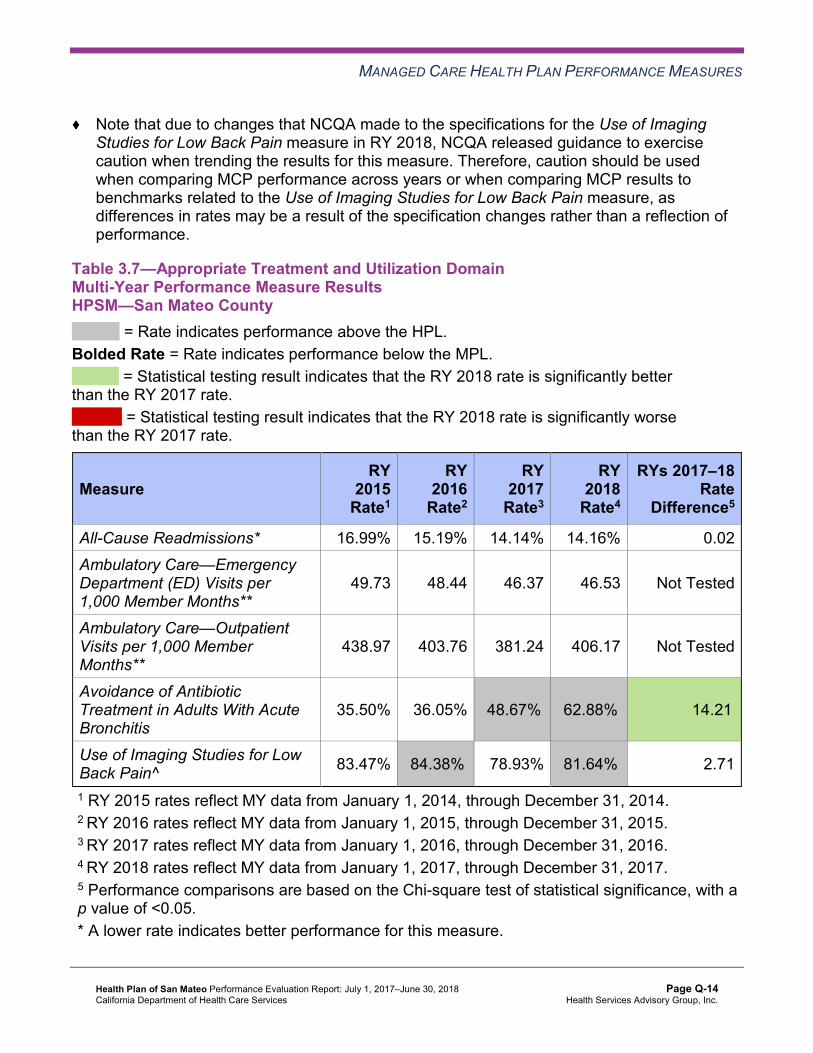
MANAGED CARE HEALTH PLAN PERFORMANCE MEASURES
Note that due to changes that NCQA made to the specifications for the Use of Imaging Studies for Low Back Pain measure in RY 2018, NCQA released guidance to exercise caution when trending the results for this measure. Therefore, caution should be used when comparing MCP performance across years or when comparing MCP results to benchmarks related to the Use of Imaging Studies for Low Back Pain measure, as differences in rates may be a result of the specification changes rather than a reflection of performance.
Table 3.7—Appropriate Treatment and Utilization DomainMulti-Year Performance Measure Results HPSM—San Mateo County
H = Rate indicates performance above the HPL. Bolded Rate = Rate indicates performance below the MPL.
B = Statistical testing result indicates that the RY 2018 rate is significantly better than the RY 2017 rate.
W = Statistical testing result indicates that the RY 2018 rate is significantly worse than the RY 2017 rate.
Measure RY
2015 Rate1
RY 2016
Rate2
RY 2017
Rate3
RY 2018
Rate4
RYs 2017–18 Rate
Difference5
All-Cause Readmissions* 16.99% 15.19% 14.14% 14.16% 0.02 Ambulatory Care—Emergency Department (ED) Visits per 1,000 Member Months**
49.73 48.44 46.37 46.53 Not Tested
Ambulatory Care—Outpatient Visits per 1,000 Member Months**
438.97 403.76 381.24 406.17 Not Tested
Avoidance of Antibiotic Treatment in Adults With Acute Bronchitis
35.50% 36.05% 48.67%H 62.88%H 14.21B
Use of Imaging Studies for Low Back Pain^ 83.47% 84.38%H 78.93% 81.64%H 2.71
1 RY 2015 rates reflect MY data from January 1, 2014, through December 31, 2014. 2 RY 2016 rates reflect MY data from January 1, 2015, through December 31, 2015. 3 RY 2017 rates reflect MY data from January 1, 2016, through December 31, 2016. 4 RY 2018 rates reflect MY data from January 1, 2017, through December 31, 2017. 5 Performance comparisons are based on the Chi-square test of statistical significance, with a p value of <0.05. * A lower rate indicates better performance for this measure.
Health Plan of San Mateo Performance Evaluation Report: July 1, 2017–June 30, 2018 California Department of Health Care Services
Page Q-14 Health Services Advisory Group, Inc.

MANAGED CARE HEALTH PLAN PERFORMANCE MEASURES
** Member months are a member's “contribution” to the total yearly membership. ^ Caution should be exercised when assessing MCP performance for this measure given the changes that NCQA made to the specification for this measure for RY 2018. Not Tested = An RY 2017–18 rate difference was not calculated because high and low rates do not necessarily indicate better or worse performance.
Table 3.8 presents findings for the RY 2018 performance measures within the Appropriate Treatment and Utilization domain. DHCS did not hold MCPs accountable to meet MPLs for the following measures within this domain; therefore, HSAG did not include these measures in its assessment of the MCP’s performance related to HPLs and MPLs:
All-Cause Readmissions Both Ambulatory Care measures
Table 3.8—Appropriate Treatment and Utilization DomainRY 2018 (MY 2017) Performance Measure Findings HPSM—San Mateo County
Criteria Number of Measures
MeetingCriteria
Total Number of Measures
Percentage of Measures
MeetingCriteria
RY 2018 Rates Above HPLs 2 2 100.00% Rates Above HPLs for the Last Three or More Consecutive Years 0 2 0.00%
RY 2018 Rates Significantly Better than RY 2017 Rates* 1 3 33.33%
Rates that Moved from Below MPLs in RY 2017 to Above MPLs in RY 2018 0 0 N/A
RY 2018 Rates Below MPLs 0 2 0.00% Rates Below MPLs for the Last Three or More Consecutive Years 0 2 0.00%
RY 2018 Rates Significantly Worse than RY 2017 Rates* 0 3 0.00%
Rates that Moved from Above MPLs in RY 2017 to Below MPLs in RY 2018 0 2 0.00%
* Performance comparisons are based on the Chi-square test of statistical significance, with a p value of <0.05.
Health Plan of San Mateo Performance Evaluation Report: July 1, 2017–June 30, 2018 California Department of Health Care Services
Page Q-15 Health Services Advisory Group, Inc.

MANAGED CARE HEALTH PLAN PERFORMANCE MEASURES
N/A = No rates above or below the MPLs from the previous year exist to include in the denominator for calculating whether or not rates moved to above or below MPLs in the most recent year.
Performance Measure Findings—All Domains
Table 3.9 presents a summary of HPSM’s RY 2018 performance across all External Accountability Set (EAS) measures.
Note the following regarding Table 3.9:
DHCS did not hold MCPs accountable to meet MPLs for the following measures; therefore, HSAG did not include these measures in its assessment of the MCP’s performance related to HPLs and MPLs: ■ All-Cause Readmissions ■ Both Ambulatory Care measures ■ All four Children and Adolescents’ Access to Primary Care measures DHCS did not hold MCPs accountable to meet MPLs for the following measures in RY 2017; therefore, HSAG did not include these measures in the denominators for calculating the percentage of measures with rates that moved to above or below the MPLs in RY 2018 and for calculating the percentage of measures with rates below MPLs for only the last two consecutive years: ■ Asthma Medication Ratio ■ Breast Cancer Screening ■ Immunizations for Adolescents—Combination 2
Table 3.9—RY 2018 (MY 2017) Performance Measure Findings for All Domains HPSM—San Mateo County
Criteria Number of Measures
MeetingCriteria
Total Number of Measures
Percentage of Measures
MeetingCriteria
RY 2018 Rates Above HPLs 7 21 33.33% Rates Above HPLs for the Last Three or More Consecutive Years 0 18 0.00%
RY 2018 Rates Significantly Better than RY 2017 Rates* 6 22 27.27%
Rates that Moved from Below MPLs in RY 2017 to Above MPLs in RY 2018 0 0 N/A
RY 2018 Rates Below MPLs 0 21 0.00%
Health Plan of San Mateo Performance Evaluation Report: July 1, 2017–June 30, 2018 California Department of Health Care Services
Page Q-16 Health Services Advisory Group, Inc.

MANAGED CARE HEALTH PLAN PERFORMANCE MEASURES
Criteria Number of Measures
MeetingCriteria
Total Number of Measures
Percentage of Measures
MeetingCriteria
Rates Below MPLs for Only the Last Two Consecutive Years 0 18 0.00%
Rates Below MPLs for the Last Three or More Consecutive Years 0 18 0.00%
RY 2018 Rates Significantly Worse than RY 2017 Rates* 1 22 4.55%
Rates that Moved from Above MPLs in RY 2017 to Below MPLs in RY 2018 0 18 0.00%
* Performance comparisons are based on the Chi-square test of statistical significance, with a p value of <0.05. N/A = No rates above or below the MPLs from the previous year exist to include in the denominator for calculating whether or not rates moved to above or below MPLs in the most recent year.
Seniors and Persons with Disabilities Performance Measure Results Table 3.10 presents the four-year trending information for the SPD population, and Table 3.11 presents the four-year trending information for the non-SPD population for the measures that DHCS required MCPs to stratify for the SPD and non-SPD populations. The tables also show the differences in rates between RY 2017 and RY 2018.
Table 3.12 presents the SPD and non-SPD rates, a comparison of the SPD and non-SPD rates,5 and the total combined rate for each measure.
5 HSAG calculated statistical significance between the SPD and non-SPD rates for each measure using a Chi-square test. This information is displayed in the “SPD/Non-SPD Rate Difference” column in Table 3.12.
Health Plan of San Mateo Performance Evaluation Report: July 1, 2017–June 30, 2018 California Department of Health Care Services
Page Q-17 Health Services Advisory Group, Inc.
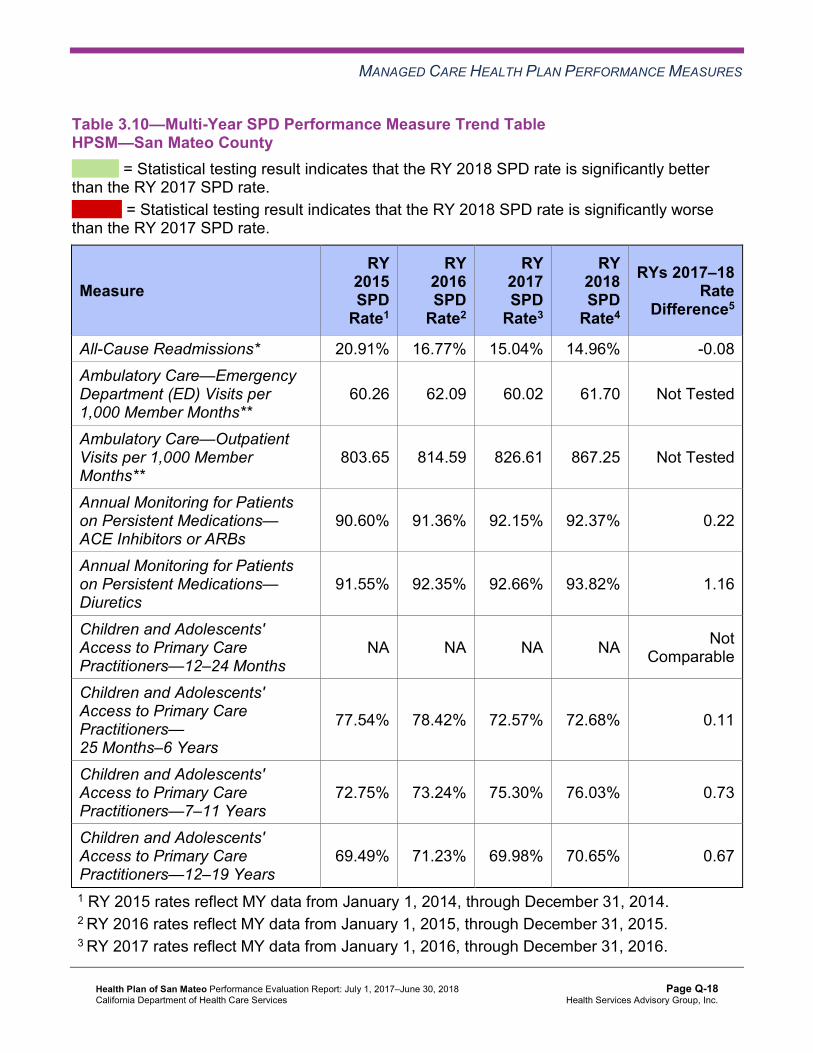
MANAGED CARE HEALTH PLAN PERFORMANCE MEASURES
Table 3.10—Multi-Year SPD Performance Measure Trend Table HPSM—San Mateo County
B = Statistical testing result indicates that the RY 2018 SPD rate is significantly better than the RY 2017 SPD rate.
W = Statistical testing result indicates that the RY 2018 SPD rate is significantly worse than the RY 2017 SPD rate.
Measure RY
2015 SPD
Rate1
RY 2016 SPD
Rate2
RY 2017 SPD
Rate3
RY 2018 SPD
Rate4
RYs 2017–18 Rate
Difference5
All-Cause Readmissions* 20.91% 16.77% 15.04% 14.96% -0.08 Ambulatory Care—Emergency Department (ED) Visits per 1,000 Member Months**
60.26 62.09 60.02 61.70 Not Tested
Ambulatory Care—Outpatient Visits per 1,000 Member Months**
803.65 814.59 826.61 867.25 Not Tested
Annual Monitoring for Patients on Persistent Medications— ACE Inhibitors or ARBs
90.60% 91.36% 92.15% 92.37% 0.22
Annual Monitoring for Patients on Persistent Medications— Diuretics
91.55% 92.35% 92.66% 93.82% 1.16
Children and Adolescents' Access to Primary Care Practitioners—12–24 Months
NA NA NA NA Not Comparable
Children and Adolescents' Access to Primary Care Practitioners— 25 Months–6 Years
77.54% 78.42% 72.57% 72.68% 0.11
Children and Adolescents' Access to Primary Care Practitioners—7–11 Years
72.75% 73.24% 75.30% 76.03% 0.73
Children and Adolescents' Access to Primary Care Practitioners—12–19 Years
69.49% 71.23% 69.98% 70.65% 0.67
1 RY 2015 rates reflect MY data from January 1, 2014, through December 31, 2014. 2 RY 2016 rates reflect MY data from January 1, 2015, through December 31, 2015. 3 RY 2017 rates reflect MY data from January 1, 2016, through December 31, 2016.
Health Plan of San Mateo Performance Evaluation Report: July 1, 2017–June 30, 2018 California Department of Health Care Services
Page Q-18 Health Services Advisory Group, Inc.

MANAGED CARE HEALTH PLAN PERFORMANCE MEASURES
4 RY 2018 rates reflect MY data from January 1, 2017, through December 31, 2017. 5 Performance comparisons are based on the Chi-square test of statistical significance, with a p value of <0.05. * A lower rate indicates better performance for this measure. ** Member months are a member's “contribution” to the total yearly membership. NA = The MCP followed the specifications, but the denominator was too small (less than 30) to report a valid rate. Not Comparable = An RY 2017–18 rate difference cannot be made because data are not available for both years or because significant methodology changes occurred between years, disallowing comparison. Not Tested = An RY 2017–18 rate difference was not calculated because high and low rates do not necessarily indicate better or worse performance.
Table 3.11—Multi-Year Non-SPD Performance Measure Trend Table HPSM—San Mateo County
B = Statistical testing result indicates that the RY 2018 non-SPD rate is significantly better than the RY 2017 non-SPD rate.
W = Statistical testing result indicates that the RY 2018 non-SPD rate is significantly worse than the RY 2017 non-SPD rate.
Measure RY 2015
Non-SPD Rate1
RY 2016 Non-SPD
Rate2
RY 2017 Non-SPD
Rate3
RY 2018 Non-SPD
Rate4
RYs 2017–18 Rate
Difference5
All-Cause Readmissions* 11.64% 11.85% 12.48% 12.73% 0.25
Ambulatory Care— Emergency Department (ED) Visits per 1,000 Member Months**
47.21 45.75 44.04 44.13 Not Tested
Ambulatory Care— Outpatient Visits per 1,000 Member Months**
351.81 322.75 305.27 333.19 Not Tested
Annual Monitoring for Patients on Persistent Medications— ACE Inhibitors or ARBs
86.99% 87.26% 88.87% 87.52% -1.35
Annual Monitoring for Patients on Persistent Medications—Diuretics
86.47% 84.58% 86.99% 87.52% 0.53
Health Plan of San Mateo Performance Evaluation Report: July 1, 2017–June 30, 2018 California Department of Health Care Services
Page Q-19 Health Services Advisory Group, Inc.

MANAGED CARE HEALTH PLAN PERFORMANCE MEASURES
Measure RY 2015
Non-SPD Rate1
RY 2016 Non-SPD
Rate2
RY 2017 Non-SPD
Rate3
RY 2018 Non-SPD
Rate4
RYs 2017–18 Rate
Difference5
Children and Adolescents' Access to Primary Care Practitioners— 12–24 Months
93.94% 92.21% 93.81% 94.47% 0.66
Children and Adolescents' Access to Primary Care Practitioners— 25 Months–6 Years
89.51% 86.63% 86.19% 86.20% 0.01
Children and Adolescents' Access to Primary Care Practitioners— 7–11 Years
92.37% 91.70% 90.01% 90.23% 0.22
Children and Adolescents' Access to Primary Care Practitioners— 12–19 Years
88.43% 88.65% 86.79% 87.53% 0.74
1 RY 2015 rates reflect MY data from January 1, 2014, through December 31, 2014. 2 RY 2016 rates reflect MY data from January 1, 2015, through December 31, 2015. 3 RY 2017 rates reflect MY data from January 1, 2016, through December 31, 2016. 4 RY 2018 rates reflect MY data from January 1, 2017, through December 31, 2017. 5 Performance comparisons are based on the Chi-square test of statistical significance, with a p value of <0.05. * A lower rate indicates better performance for this measure. ** Member months are a member's “contribution” to the total yearly membership. Not Tested = An RY 2017–18 rate difference was not calculated because high and low rates do not necessarily indicate better or worse performance.
Health Plan of San Mateo Performance Evaluation Report: July 1, 2017–June 30, 2018 California Department of Health Care Services
Page Q-20 Health Services Advisory Group, Inc.

MANAGED CARE HEALTH PLAN PERFORMANCE MEASURES
Table 3.12—RY 2018 (MY 2017) Performance Measure Comparison and Results forMeasures Stratified by the SPD and Non-SPD PopulationsHPSM—San Mateo County
B = Statistical testing result indicates that the RY 2018 SPD rate is significantly better than the RY 2018 non-SPD rate.
W = Statistical testing result indicates that the RY 2018 SPD rate is significantly worse than the RY 2018 non-SPD rate.
Measure RY 2018
SPD Rate1
RY 2018 Non-SPD
Rate1
SPD/Non-SPDRate
Difference2
RY 2018 Total Rate3
All-Cause Readmissions* 14.96% 12.73% 2.23W 14.16% Ambulatory Care—Emergency Department (ED) Visits per 1,000 Member Months**
61.70 44.13 Not Tested 46.53
Ambulatory Care—Outpatient Visits per 1,000 Member Months** 867.25 333.19 Not Tested 406.17
Annual Monitoring for Patients on Persistent Medications— ACE Inhibitors or ARBs
92.37% 87.52% 4.85B 90.46%
Annual Monitoring for Patients on Persistent Medications—Diuretics 93.82% 87.52% 6.30B 91.35%
Children and Adolescents' Access to Primary Care Practitioners— 12–24 Months
NA 94.47% Not Comparable 94.46%
Children and Adolescents' Access to Primary Care Practitioners— 25 Months–6 Years
72.68% 86.20% -13.52W 85.95%
Children and Adolescents' Access to Primary Care Practitioners— 7–11 Years
76.03% 90.23% -14.20W 89.82%
Children and Adolescents' Access to Primary Care Practitioners— 12–19 Years
70.65% 87.53% -16.88W 86.97%
1 RY 2018 rates reflect MY data from January 1, 2017, through December 31, 2017. 2 Performance comparisons are based on the Chi-square test of statistical significance, with a p value of <0.05. 3 Total rates are based on the MCP reporting unit’s total results, including the SPD and non-SPD populations. Please note, if data are not available for either the SPD or non-SPD population, the total rate is based on results reported for the available population.
Health Plan of San Mateo Performance Evaluation Report: July 1, 2017–June 30, 2018 California Department of Health Care Services
Page Q-21 Health Services Advisory Group, Inc.

MANAGED CARE HEALTH PLAN PERFORMANCE MEASURES
* A lower rate indicates better performance for this measure. ** Member months are a member's “contribution” to the total yearly membership. NA = The MCP followed the specifications, but the denominator was too small (less than 30) to report a valid rate. Not Comparable = An SPD/non-SPD rate difference cannot be made because data are not available for both populations. Not Tested = An SPD/non-SPD rate difference was not calculated because high and low rates do not necessarily indicate better or worse performance.
Seniors and Persons with Disabilities Findings
HSAG observed the following notable results in RY 2018 for measures that HPSM stratified by the SPD and non-SPD populations:
For rates for which HSAG could make a comparison between RY 2017 and RY 2018, HPSM had no significant variation in SPD and non-SPD rates from RY 2017 to RY 2018. For measures for which HSAG could compare the RY 2018 SPD rates to the RY 2018 non-SPD rates: ■ The RY 2018 SPD rates were significantly better than the RY 2018 non-SPD rates for
both Annual Monitoring for Patients on Persistent Medications measures. ■ The RY 2018 SPD rates were significantly worse than the RY 2018 non-SPD rates for
the following measures: ○ All-Cause Readmissions. Note that the higher rate of hospital readmissions for the
SPD population is expected based on the greater and often more complicated health care needs of these beneficiaries.
○ Children and Adolescents’ Access to Primary Care Practitioners—25 Months–6 Years, 7–11 Years, and 12–19 Years. The significant differences in rates for these measures may be attributed to beneficiaries in these age groups in the SPD population choosing to receive all health care services from specialist providers due to their complicated health care needs, rather than accessing care from primary care providers (PCPs).
Strengths—Performance Measures HSAG auditors determined that HPSM followed the appropriate specifications to produce valid rates, and identified no issues of concern.
HSAG identified the following notable RY 2018 performance measure results for HPSM across all domains:
The rates were above the HPLs for seven of the 21 measures for which HSAG could compare to HPLs (33 percent).
Health Plan of San Mateo Performance Evaluation Report: July 1, 2017–June 30, 2018 California Department of Health Care Services
Page Q-22 Health Services Advisory Group, Inc.

MANAGED CARE HEALTH PLAN PERFORMANCE MEASURES
■ The MCP performed above the HPLs for 100 percent of the measures within the Appropriate Treatment and Utilization domain (two of two measures) and 60 percent of the measures (three of five measures) within the Preventive Screening and Children’s Health domain.
The rates improved significantly from RY 2017 to RY 2018 for six of 22 measures (27 percent).
Opportunities for Improvement—Performance Measures HPSM has the opportunity to assess the causes for the Breast Cancer Screening measure rate declining significantly from RY 2017 to RY 2018 and to identify strategies to ensure that female beneficiaries ages 50 to 74 have a mammogram to screen for breast cancer within the appropriate time frame. Note that the significant decline in the Breast Cancer Screening rate from RY 2017 to RY 2018 may be due to NCQA’s RY 2018 specification changes for this measure and therefore may not be related to HPSM’s performance.
Health Plan of San Mateo Performance Evaluation Report: July 1, 2017–June 30, 2018 California Department of Health Care Services
Page Q-23 Health Services Advisory Group, Inc.

Medi-Cal Managed Care External Quality Review Technical ReportAppendix Q: Performance Evaluation ReportHealth Plan of San Mateo July 1, 2017–June 30, 2018
4. MLTSSP Performance Measure Results
Due to HPSM’s participation in California’s Coordinated Care Initiative as a Managed Long-Term Services and Supports Plan (MLTSSP), DHCS required that HPSM report rates for three HEDIS measures for HSAG to validate as part of the NCQA HEDIS Compliance Audit.
Table 4.1 presents the rates for each required MLTSSP performance measure for RYs 2016, 2017, and 2018. The RY is the year in which the MLTSSP reported the rates. The RY rates reflect MY data from the previous calendar year. Note that the Ambulatory Care—Emergency Department Visits and Ambulatory Care—Outpatient Visits measures are utilization measures which measure the volume of services used. High and low rates do not necessarily indicate better or worse performance; therefore, for these measures, HSAG did not compare performance between RY 2017 and RY 2018.
Table 4.1—Multi-Year MLTSSP Performance Measure Results HPSM—San Mateo County
B = Statistical testing result indicates that the RY 2018 rate is significantly better than the RY 2017 rate.
W = Statistical testing result indicates that the RY 2018 rate is significantly worse than the RY 2017 rate.
Measure RY 2016 MLTSS
Rate1
RY 2017 MLTSS
Rate2
RY 2018 MLTSS
Rate3
RYs 2017–18 Rate
Difference4
Ambulatory Care—Emergency Department (ED) Visits per 1,000 Member Months*
76.52 73.62 76.09 Not Tested
Ambulatory Care—Outpatient Visits per 1,000 Member Months* 630.77 627.79 658.29 Not Tested
Medication Reconciliation Post-Discharge 21.41% 30.41% 37.71% 7.30B
1 RY 2016 rates reflect MY data from January 1, 2015, through December 31, 2015. 2 RY 2017 rates reflect MY data from January 1, 2016, through December 31, 2016. 3 RY 2018 rates reflect MY data from January 1, 2017, through December 31, 2017. 4 Performance comparisons are based on the Chi-square test of statistical significance, with a p value of <0.05. * Member months are a member's “contribution” to the total yearly membership. Not Tested = An RY 2017–18 rate difference was not calculated because high and low rates do not necessarily indicate better or worse performance.
Health Plan of San Mateo Performance Evaluation Report: July 1, 2017–June 30, 2018 California Department of Health Care Services
Page Q-24 Health Services Advisory Group, Inc.

MLTSSP PERFORMANCE MEASURE RESULTS
Managed Long-Term Services and Supports Plan PerformanceMeasure Findings The rate for the Medication Reconciliation Post-Discharge measure improved significantly from RY 2017 to RY 2018.
Health Plan of San Mateo Performance Evaluation Report: July 1, 2017–June 30, 2018 California Department of Health Care Services
Page Q-25 Health Services Advisory Group, Inc.
Medi-Cal Managed Care External Quality Review Technical ReportAppendix Q: Performance Evaluation ReportHealth Plan of San Mateo July 1, 2017–June 30, 2018
5. Performance Improvement Projects
Performance Improvement Project Overview The key concepts of the rapid-cycle PIP framework include forming a PIP team, setting aims, establishing measures, determining interventions using quality improvement tools, conducting PDSA cycles to test interventions, and planning for the spread of successful changes. The core component of the rapid-cycle PIP approach involves testing changes on a small scale so that improvement can occur more efficiently and lead to long-term sustainability. The following modules guide MCPs through this rapid-cycle PIP process:
Module 1—PIP Initiation ■ MCPs outline the framework for the PIP, which includes:
○ The topic rationale. ○ Comparative data supporting the need to improve the selected topic. ○ A list of the PIP team members, which consists of internal and external stakeholders. ○ A completed key driver diagram that defines the theory of change for improvement,
including the SMART (Specific, Measurable, Achievable, Relevant, and Time-bound) Aim and Global Aim.
Module 2—SMART Aim Data Collection ■ MCPs define the SMART Aim measure and data collection methodology and develop
the SMART Aim data run chart. Module 3—Intervention Determination ■ MCPs use process mapping and failure modes and effects analysis (FMEA) to identify
potential interventions to test which may have direct effects on the SMART Aim. Module 4—Plan-Do-Study-Act (PDSA) ■ MCPs test and evaluate the interventions identified in Module 3 through a series of
PDSA cycles. Module 5—PIP Conclusions ■ MCPs interpret results and summarize:
○ Key findings and outcomes achieved. ○ Assessment of each tested intervention. ○ Lessons learned, including how demonstrated improvement can be shared and used
as a foundation for further improvement going forward. ○ Plan for sustained improvement.
Health Plan of San Mateo Performance Evaluation Report: July 1, 2017–June 30, 2018 California Department of Health Care Services
Page Q-26 Health Services Advisory Group, Inc.

PERFORMANCE IMPROVEMENT PROJECTS
Based on the agreed-upon timeline, MCPs submit each module to HSAG for validation. Throughout the rapid-cycle PIP process, HSAG provides technical assistance to MCPs to ensure that PIPs are methodologically sound and to problem-solve with MCPs regarding how to address challenges that occur. Through an iterative process, MCPs have opportunities to make corrections to modules 1 through 3 to achieve all validation criteria.
Once MCPs achieve all validation criteria for modules 1 through 3 and receive feedback on the intervention Plan portion of Module 4, MCPs test interventions. During the intervention testing phase of the PIP, HSAG conducts periodic progress check-ins to ensure that MCPs have addressed HSAG’s feedback on the Plan portion of Module 4 and are making appropriate progress with intervention testing. Once MCPs complete testing an intervention, MCPs determine the next steps based on results and lessons learned—whether the intervention was successful and should be spread (adopt), whether modifications need to be made to the existing intervention (adapt), or whether the intervention was not successful and should be stopped (abandon).
In Module 5, MCPs summarize the overall PIP. When validating Module 5, HSAG assesses the validity and reliability of the results based on the Centers for Medicare & Medicaid Services (CMS) validation protocols to determine whether key stakeholders can have confidence in the reported PIP findings. HSAG assigns the following final confidence levels for each PIP:
High confidence—the PIP was methodologically sound and achieved the SMART Aim goal; the demonstrated improvement was clearly linked to the quality improvement processes conducted and intervention(s) tested; and, the MCP accurately summarized the key findings. Confidence—the PIP was methodologically sound and achieved the SMART Aim goal, and the MCP accurately summarized the key findings. However, some, but not all, of the quality improvement processes conducted and/or intervention(s) tested were clearly linked to the demonstrated improvement. Low confidence—either (A) the PIP was methodologically sound; however, the SMART Aim goal was not achieved; or (B) the SMART Aim goal was achieved; however, the quality improvement processes and/or intervention(s) tested were poorly executed and could not be linked to the improvement. Reported PIP results were not credible—the PIP methodology was not executed as approved.
Performance Improvement Project Results and Findings During the review period, HPSM submitted modules 4 and 5 for its 2015–17 DHCS-priority and MCP-specific PIPs. HSAG validated the modules and includes the final PIP validation findings in this report. Additionally, HPSM initiated a Disparity PIP and a DHCS-priority PIP during the review period. In this report, HSAG includes summaries of the MCP’s Disparity and DHCS-priority PIP module submissions as well as validation findings from the review period.
Health Plan of San Mateo Performance Evaluation Report: July 1, 2017–June 30, 2018 California Department of Health Care Services
Page Q-27 Health Services Advisory Group, Inc.

PERFORMANCE IMPROVEMENT PROJECTS
2015–17 DHCS-Priority Performance Improvement Project
HPSM selected postpartum care for its 2015–17 DHCS-priority PIP. While the MCP concluded its Postpartum Care PIP through the SMART Aim end date of June 30, 2017, HPSM submitted modules 4 and 5 for HSAG to validate during the review period for this report. HSAG provided final validation findings and encouraged HPSM to incorporate the experiences and lessons learned from the PIP into future quality improvement efforts.
Table 5.1 provides a summary of the SMART Aim measure results reported by the MCP.
Table 5.1—HPSM Postpartum Care PIP SMART Aim Measure Results
SMART Aim Measure Baseline Rate
SMART Aim Goal
Rate
SMART Aim Goal Achieved
Rate of timely postpartum care among beneficiaries who had a live birth delivery and received obstetric care from Provider A6
66.46% 75.00% Yes
Table 5.2 presents a description of the intervention that HPSM tested for its Postpartum Care PIP. The table also indicates the failure modes that the intervention addressed as well as whether the MCP decided, based on intervention testing results, to adopt, adapt, or abandon the intervention.
Table 5.2—HPSM Postpartum Care PIP Intervention Testing Results
Intervention Failure Modes Addressed Adopt,Adapt, orAbandon
Text messaging reminder campaign via the CareMessage portal
Beneficiaries’ lack of understanding and value of the postpartum care appointment Beneficiaries’ lack of knowledge that the postpartum care visit is a covered Medi-Cal benefit Beneficiaries’ lack of knowledge of the 21–56-day post-delivery time frame for the postpartum care visit
Adapt
6 Provider name removed for confidentiality.
Health Plan of San Mateo Performance Evaluation Report: July 1, 2017–June 30, 2018 California Department of Health Care Services
Page Q-28 Health Services Advisory Group, Inc.

PERFORMANCE IMPROVEMENT PROJECTS
Performance Improvement Project Validation Findings
During the review period for this report, HSAG validated modules 4 and 5 for the MCP’s Postpartum Care PIP. HPSM documented that the SMART Aim rate was above the SMART Aim goal when the MCP began intervention testing in July 2016. The monthly postpartum care completion rates among women who received the intervention fluctuated from August 2016 through February 2017, with the highest rate at 100 percent and the lowest rate at 40 percent. The MCP indicated that the provider sent follow-up reminders in November 2016 and December 2016; however, the provider still observed high no-show rates, postpartum visits being scheduled outside of the required time frame, and no appointments being scheduled. HPSM also reported that starting in March 2017 the MCP included information in the text messages about an increase in the incentive amount for beneficiaries who attended postpartum care appointments. A change in the incentive amount may be considered another intervention and could have contributed to the increase in SMART Aim measure rates from March 2017 through May 2017.
Upon assessment of validity and reliability of the PIP results, HSAG assigned HPSM’s Postpartum Care PIP a final confidence level of Confidence.
2015–17 MCP-Specific Performance Improvement Project
HPSM selected cervical cancer screening for its 2015–17 MCP-specific PIP. While the MCP concluded its Cervical Cancer Screening PIP through the SMART Aim end date of June 30, 2017, HPSM submitted modules 4 and 5 for HSAG to validate during the review period for this report. HSAG provided final validation findings and encouraged HPSM to incorporate the experiences and lessons learned from the PIP into future quality improvement efforts.
Table 5.3 provides a summary of the SMART Aim measure results reported by the MCP.
Table 5.3—HPSM Cervical Cancer Screening PIP SMART Aim Measure Results
SMART Aim Measure Baseline Rate
SMART Aim Goal
Rate
SMART Aim Goal Achieved
Rate of cervical cancer screening compliance among beneficiaries ages 24 to 64 years assigned to Provider B7
69% 77% Yes
7 Provider name removed for confidentiality.
Health Plan of San Mateo Performance Evaluation Report: July 1, 2017–June 30, 2018 California Department of Health Care Services
Page Q-29 Health Services Advisory Group, Inc.
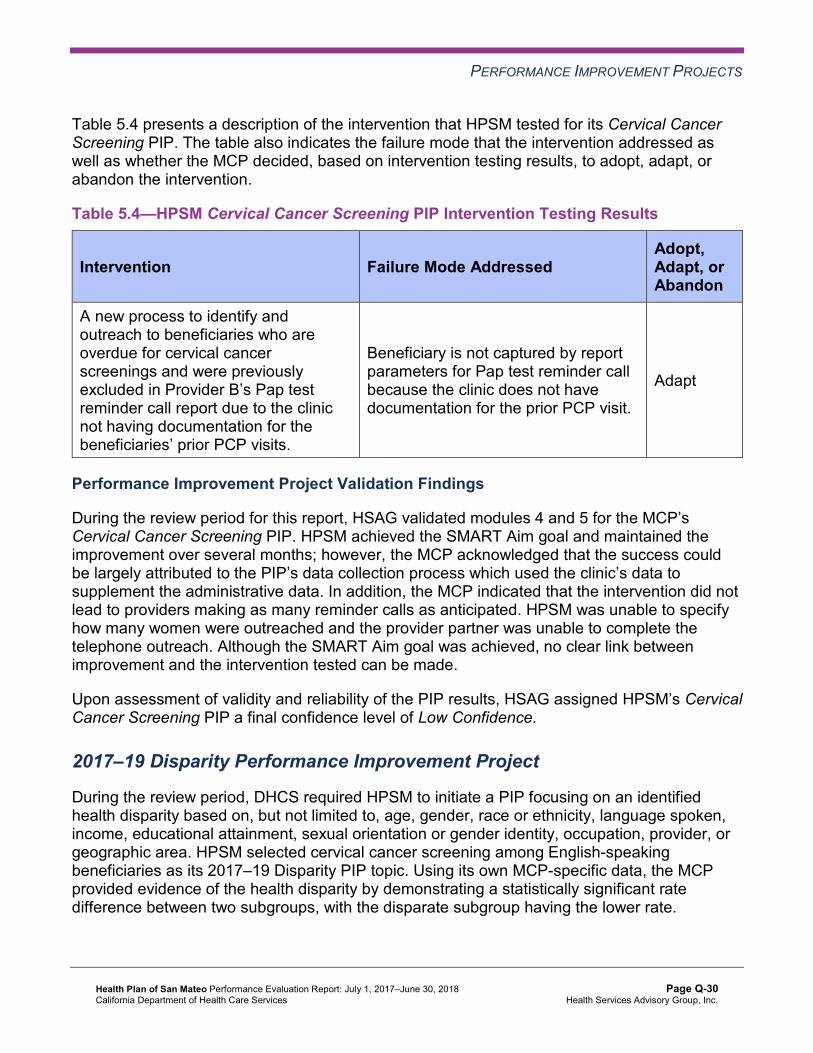
PERFORMANCE IMPROVEMENT PROJECTS
Table 5.4 presents a description of the intervention that HPSM tested for its Cervical Cancer Screening PIP. The table also indicates the failure mode that the intervention addressed as well as whether the MCP decided, based on intervention testing results, to adopt, adapt, or abandon the intervention.
Table 5.4—HPSM Cervical Cancer Screening PIP Intervention Testing Results
Intervention Failure Mode Addressed Adopt,Adapt, orAbandon
A new process to identify and outreach to beneficiaries who are overdue for cervical cancer screenings and were previously excluded in Provider B’s Pap test reminder call report due to the clinic not having documentation for the beneficiaries’ prior PCP visits.
Beneficiary is not captured by report parameters for Pap test reminder call because the clinic does not have documentation for the prior PCP visit.
Adapt
Performance Improvement Project Validation Findings
During the review period for this report, HSAG validated modules 4 and 5 for the MCP’s Cervical Cancer Screening PIP. HPSM achieved the SMART Aim goal and maintained the improvement over several months; however, the MCP acknowledged that the success could be largely attributed to the PIP’s data collection process which used the clinic’s data to supplement the administrative data. In addition, the MCP indicated that the intervention did not lead to providers making as many reminder calls as anticipated. HPSM was unable to specify how many women were outreached and the provider partner was unable to complete the telephone outreach. Although the SMART Aim goal was achieved, no clear link between improvement and the intervention tested can be made.
Upon assessment of validity and reliability of the PIP results, HSAG assigned HPSM’s Cervical Cancer Screening PIP a final confidence level of Low Confidence.
2017–19 Disparity Performance Improvement Project
During the review period, DHCS required HPSM to initiate a PIP focusing on an identified health disparity based on, but not limited to, age, gender, race or ethnicity, language spoken, income, educational attainment, sexual orientation or gender identity, occupation, provider, or geographic area. HPSM selected cervical cancer screening among English-speaking beneficiaries as its 2017–19 Disparity PIP topic. Using its own MCP-specific data, the MCP provided evidence of the health disparity by demonstrating a statistically significant rate difference between two subgroups, with the disparate subgroup having the lower rate.
Health Plan of San Mateo Performance Evaluation Report: July 1, 2017–June 30, 2018 California Department of Health Care Services
Page Q-30 Health Services Advisory Group, Inc.
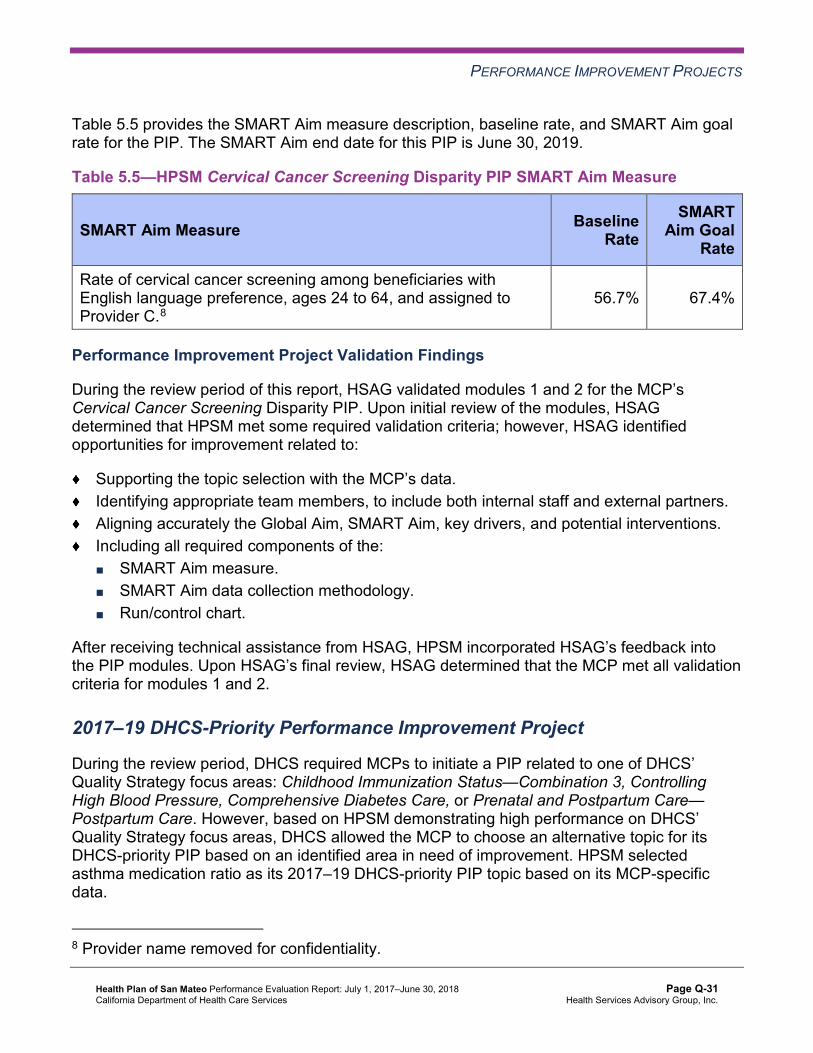
PERFORMANCE IMPROVEMENT PROJECTS
Table 5.5 provides the SMART Aim measure description, baseline rate, and SMART Aim goal rate for the PIP. The SMART Aim end date for this PIP is June 30, 2019.
Table 5.5—HPSM Cervical Cancer Screening Disparity PIP SMART Aim Measure
SMART Aim Measure Baseline Rate
SMART Aim Goal
Rate
Rate of cervical cancer screening among beneficiaries with English language preference, ages 24 to 64, and assigned to Provider C.8
56.7% 67.4%
Performance Improvement Project Validation Findings
During the review period of this report, HSAG validated modules 1 and 2 for the MCP’s Cervical Cancer Screening Disparity PIP. Upon initial review of the modules, HSAG determined that HPSM met some required validation criteria; however, HSAG identified opportunities for improvement related to:
Supporting the topic selection with the MCP’s data. Identifying appropriate team members, to include both internal staff and external partners. Aligning accurately the Global Aim, SMART Aim, key drivers, and potential interventions. Including all required components of the: ■ SMART Aim measure. ■ SMART Aim data collection methodology. ■ Run/control chart.
After receiving technical assistance from HSAG, HPSM incorporated HSAG’s feedback into the PIP modules. Upon HSAG’s final review, HSAG determined that the MCP met all validation criteria for modules 1 and 2.
2017–19 DHCS-Priority Performance Improvement Project
During the review period, DHCS required MCPs to initiate a PIP related to one of DHCS’ Quality Strategy focus areas: Childhood Immunization Status—Combination 3, Controlling High Blood Pressure, Comprehensive Diabetes Care, or Prenatal and Postpartum Care— Postpartum Care. However, based on HPSM demonstrating high performance on DHCS’ Quality Strategy focus areas, DHCS allowed the MCP to choose an alternative topic for its DHCS-priority PIP based on an identified area in need of improvement. HPSM selected asthma medication ratio as its 2017–19 DHCS-priority PIP topic based on its MCP-specific data.
8 Provider name removed for confidentiality.
Health Plan of San Mateo Performance Evaluation Report: July 1, 2017–June 30, 2018 California Department of Health Care Services
Page Q-31 Health Services Advisory Group, Inc.

PERFORMANCE IMPROVEMENT PROJECTS
Table 5.6 provides the SMART Aim measure description, baseline rate, and SMART Aim goal rate for the PIP. The SMART Aim end date for this PIP is June 30, 2019.
Table 5.6—HPSM Asthma Medication Ratio PIP SMART Aim Measure
SMART Aim Measure Baseline Rate
SMART Aim Goal
Rate
Rate of asthma medication ratio of 0.50 or greater for the rolling 12-month lookback period among beneficiaries ages 19 to 50, living with persistent asthma.
60.0% 71.0%
Performance Improvement Project Validation Findings
During the review period of this report, HSAG validated modules 1 through 3 for the MCP’s Asthma Medication Ratio PIP. Upon initial review of the modules, HSAG determined that HPSM met some required validation criteria; however, HSAG identified opportunities for improvement related to:
Supporting the topic selection with the MCP’s data. Including all required components of the: ■ SMART Aim, developed based on literature review, data, and/or experience. ■ Run/control chart. ■ FMEA table. Aligning accurately the Global Aim, SMART Aim, key drivers, and potential interventions. Including a step-by-step flow of the overall process in the process map. Supporting the sub-processes selection for the FMEA table.
After receiving technical assistance from HSAG, HPSM incorporated HSAG’s feedback into the PIP modules. Upon HSAG’s final review of modules 1 and 2, HSAG determined that the MCP met all validation criteria. HPSM was still in the process of incorporating HSAG’s feedback into Module 3 during the review period; therefore, HSAG includes no final validation results for Module 3 in this report.
Strengths—Performance Improvement Projects HPSM achieved the SMART Aim goal for the 2015–17 Postpartum Care PIP, and some of the quality improvement activities could be linked to the demonstrated improvement. Based on HSAG’s assessment, HSAG assigned the 2015–17 Postpartum Care PIP a final confidence level of Confidence.
Health Plan of San Mateo Performance Evaluation Report: July 1, 2017–June 30, 2018 California Department of Health Care Services
Page Q-32 Health Services Advisory Group, Inc.

PERFORMANCE IMPROVEMENT PROJECTS
Opportunities for Improvement—Performance Improvement Projects HPSM has the opportunity to continue monitoring adapted interventions and outcomes to facilitate improvement beyond the life of the 2015–17 Postpartum Care and Cervical Cancer Screening PIPs. Ongoing monitoring will enable long-term evaluation of improvement and allow the MCP to continually refine interventions to achieve and sustain optimal outcomes.
Additionally, HPSM has the opportunity to apply lessons learned from the 2015–17 Cervical Cancer Screening PIP to the MCP’s 2017–19 Cervical Cancer Screening Disparity PIP.
Health Plan of San Mateo Performance Evaluation Report: July 1, 2017–June 30, 2018 California Department of Health Care Services
Page Q-33 Health Services Advisory Group, Inc.

Medi-Cal Managed Care External Quality Review Technical ReportAppendix Q: Performance Evaluation ReportHealth Plan of San Mateo July 1, 2017–June 30, 2018
6. Recommendations
Follow-Up on Prior Year Recommendations DHCS provided each MCP an opportunity to outline actions taken to address recommendations HSAG made in its 2016–17 MCP-specific evaluation report. Table 6.1 provides EQR recommendations from HPSM’s July 1, 2016, through June 30, 2017, MCP-specific evaluation report, along with the MCP’s self-reported actions taken through June 30, 2018, that address the recommendations. Please note that HSAG made minimal edits to Table 6.1 to preserve the accuracy of HPSM’s self-reported actions.
Table 6.1—HPSM’s Self-Reported Follow-Up on External Quality ReviewRecommendations from the July 1, 2016, through June 30, 2017, MCP-SpecificEvaluation Report
2016–17 External Quality ReviewRecommendations Directed to HPSM
Self-Reported Actions Taken by HPSMduring the Period of July 1, 2017–June 30,2018, that Address the External QualityReview Recommendations
1. Identify the causes for the decline in performance for the Use of Imaging Studies for Low Back Pain measure. Identifying the causes will help the MCP to develop strategies, as applicable, to address the MCP’s declining performance for this measure.
There were significant changes to NCQA’s measure specifications for the Imaging Studies for Low Back Pain (LBP) measure for HEDIS RY 2017. Such changes in the measure specifications disallow direct comparisons of rates between RY 2016 and RY 2017. Therefore, the significant decrease in HPSM’s LBP measure rate from RY 2016 to RY 2017 is due to NCQA’s specification changes for this measure and not an indication of a decline in HPSM’s performance for the LBP measure. NCQA’s specification for the LBP measure was stable for RY 2018 and thus comparable to that of RY 2017. HPSM’s reported LBP measure rate was to 81.64 percent for RY 2018, 2.71 percentage points higher than that of RY 2017, demonstrating an improvement in performance for the LBP measure in 2017.
Health Plan of San Mateo Performance Evaluation Report: July 1, 2017–June 30, 2018 California Department of Health Care Services
Page Q-34 Health Services Advisory Group, Inc.

RECOMMENDATIONS
2017–18 Recommendations Based on the overall assessment of HPSM’s delivery of quality, accessible, and timely care through the activities described in previous sections of this report, HSAG recommends the following to the MCP:
Ensure that the MCP resolves all deficiencies from the November 27, 2017, through December 8, 2017, A&I Medical Audit. Assess the causes for the Breast Cancer Screening measure rate declining significantly from RY 2017 to RY 2018, and identify strategies to ensure that female beneficiaries ages 50 to 74 have a mammogram to screen for breast cancer within the appropriate time frame. Continue monitoring adapted interventions and outcomes to facilitate improvement beyond the life of the 2015–17 Postpartum Care and Cervical Cancer Screening PIPs. Apply lessons learned from the 2015–17 Cervical Cancer Screening PIP to the MCP’s 2017–19 Cervical Cancer Screening Disparity PIP.
In the next annual review, HSAG will evaluate continued successes of HPSM as well as the MCP’s progress with these recommendations.
Health Plan of San Mateo Performance Evaluation Report: July 1, 2017–June 30, 2018 California Department of Health Care Services
Page Q-35 Health Services Advisory Group, Inc.

Medi-Cal Managed CareExternal Quality Review Technical Report
Appendix R: Performance Evaluation Report
Inland Empire Health Plan July 1, 2017–June 30, 2018

Medi-Cal Managed Care External Quality Review Technical ReportAppendix R: Performance Evaluation ReportInland Empire Health PlanJuly 1, 2017–June 30, 2018
Table of Contents
1. Introduction.............................................................................................................R-1 Medi-Cal Managed Care Health Plan Overview .......................................................R-1
2. Managed Care Health Plan Compliance ...............................................................R-3Compliance Reviews Conducted..............................................................................R-3 Strengths—Compliance Reviews .............................................................................R-3 Opportunities for Improvement—Compliance Reviews ............................................R-4
3. Managed Care Health Plan Performance Measures ............................................R-5Performance Measure Validation Results ................................................................R-5 Performance Measure Results and Findings............................................................R-5
Preventive Screening and Children’s Health .........................................................R-6 Preventive Screening and Women’s Health ........................................................R-10 Care for Chronic Conditions ................................................................................R-11 Appropriate Treatment and Utilization.................................................................R-14 Performance Measure Findings—All Domains....................................................R-17
Seniors and Persons with Disabilities Performance Measure Results....................R-18 Seniors and Persons with Disabilities Findings ...................................................R-23
Strengths—Performance Measures .......................................................................R-23 Opportunities for Improvement—Performance Measures ......................................R-24
4. MLTSSP Performance Measure Results.............................................................R-25 Managed Long-Term Services and Supports Plan Performance Measure Findings R-26
5. Performance Improvement Projects ...................................................................R-27Performance Improvement Project Overview .........................................................R-27 Performance Improvement Project Results and Findings.......................................R-28
2015–17 DHCS-Priority Performance Improvement Project ...............................R-29 2015–17 MCP-Specific Performance Improvement Project ................................R-30 2017–19 Disparity Performance Improvement Project ........................................R-31 2017–19 DHCS-Priority Performance Improvement Project ...............................R-32
Strengths—Performance Improvement Projects ....................................................R-33 Opportunities for Improvement—Performance Improvement Projects ...................R-33
6. Recommendations................................................................................................R-34 Follow-Up on Prior Year Recommendations ..........................................................R-34 2017–18 Recommendations...................................................................................R-35
Inland Empire Health Plan Performance Evaluation Report: July 1, 2017–June 30, 2018 California Department of Health Care Services
Page R-i Health Services Advisory Group, Inc.

TABLE OF CONTENTS
Table of Tables
Table 2.1—DHCS A&I Medical Audit of IEHP Audit Review Period: October 1, 2016, through September 30, 2017 .......................................................................R-3
Table 3.1—Preventive Screening and Children’s Health Domain Multi-Year Performance Measure Results IEHP—Riverside/San Bernardino Counties..R-7
Table 3.2—Preventive Screening and Children’s Health Domain RY 2018 (MY 2017) Performance Measure Findings IEHP—Riverside/San Bernardino Counties R-9
Table 3.3—Preventive Screening and Women’s Health Domain Multi-Year Performance Measure Results IEHP—Riverside/San Bernardino Counties.R-10
Table 3.4—Preventive Screening and Women’s Health Domain RY 2018 (MY 2017) Performance Measure Findings IEHP—Riverside/San Bernardino Counties R-11
Table 3.5—Care for Chronic Conditions Domain Multi-Year Performance Measure Results IEHP—Riverside/San Bernardino Counties ..................................R-12
Table 3.6—Care for Chronic Conditions Domain RY 2018 (MY 2017) Performance Measure Findings IEHP—Riverside/San Bernardino Counties..................R-13
Table 3.7—Appropriate Treatment and Utilization Domain Multi-Year Performance Measure Results IEHP—Riverside/San Bernardino Counties ...................R-15
Table 3.8—Appropriate Treatment and Utilization Domain RY 2018 (MY 2017) Performance Measure Findings IEHP—Riverside/San Bernardino Counties R-16
Table 3.9—RY 2018 (MY 2017) Performance Measure Findings for All Domains IEHP—Riverside/San Bernardino Counties ...............................................R-17
Table 3.10—Multi-Year SPD Performance Measure Trend Table IEHP— Riverside/San Bernardino Counties...........................................................R-19
Table 3.11—Multi-Year Non-SPD Performance Measure Trend Table IEHP— Riverside/San Bernardino Counties...........................................................R-20
Table 3.12—RY 2018 (MY 2017) Performance Measure Comparison and Results for Measures Stratified by the SPD and Non-SPD Populations IEHP— Riverside/San Bernardino Counties...........................................................R-22
Table 4.1—Multi-Year MLTSSP Performance Measure Results IEHP—Riverside County R-25 Table 5.1—IEHP Diabetes HbA1c Testing PIP SMART Aim Measure Results............R-29 Table 5.2—IEHP Diabetes HbA1c Testing PIP Intervention Testing Results...............R-29 Table 5.3—IEHP Cervical Cancer Screening PIP SMART Aim Measure Results........R-30 Table 5.4—IEHP Cervical Cancer Screening PIP Intervention Testing Results...........R-31 Table 5.5—IEHP Childhood Immunization Status—Combination 10 Disparity PIP
SMART Aim Measure ................................................................................R-32 Table 5.6—IEHP Asthma Medication Ratio PIP SMART Aim Measure .......................R-33 Table 6.1—IEHP’s Self-Reported Follow-Up on External Quality Review
Recommendations from the July 1, 2016, through June 30, 2017, MCP-Specific Evaluation Report................................................................R-34
Inland Empire Health Plan Performance Evaluation Report: July 1, 2017–June 30, 2018 California Department of Health Care Services
Page R-ii Health Services Advisory Group, Inc.

Medi-Cal Managed Care External Quality Review Technical ReportAppendix R: Performance Evaluation ReportInland Empire Health PlanJuly 1, 2017–June 30, 2018
1. Introduction
The California Department of Health Care Services (DHCS) contracted with Health Services Advisory Group, Inc. (HSAG), an external quality review organization (EQRO), to prepare the federally required Medi-Cal Managed Care External Quality Review Technical Report, July 1, 2017–June 30, 2018. The technical report provides an overview of the objectives and methodology for conducting the external quality review (EQR) activities, including requirements related to each activity. Additionally, the technical report provides aggregated results and recommendations for DHCS for each activity.
This appendix is specific to DHCS’ contracted Medi-Cal managed care health plan (MCP), Inland Empire Health Plan (“IEHP” or “the MCP”). The purpose of this appendix is to provide MCP-specific results of each activity and an assessment of the MCP’s strengths and opportunities for improvement with respect to the quality and timeliness of and access to health care services furnished to Medi-Cal Managed Care (MCMC) beneficiaries (referred to as “beneficiaries” in this report). The review period for this MCP-specific evaluation report is July 1, 2017, through June 30, 2018. HSAG will report on activities that take place beyond the review period in IEHP’s 2018–19 MCP-specific evaluation report. This MCP-specific evaluation report references activities and methodologies described in detail by HSAG in the technical report section.
The aggregate EQR technical report and all MCP- and specialty health plan (SHP)-specific performance evaluation reports reflect HSAG’s external, independent assessment of the quality and timeliness of, and access to, care that MCPs and SHPs are providing to beneficiaries.
Medi-Cal Managed Care Health Plan Overview IEHP is a full-scope MCP delivering services to beneficiaries as a “Local Initiative” (LI) MCP under the Two-Plan Model (TPM). Beneficiaries may enroll in IEHP, the LI MCP; or in Molina Healthcare of California Partner Plan, Inc., the alternative commercial plan (CP).
IEHP became operational in Riverside and San Bernardino counties to provide MCMC services effective September 1996. As of June 30, 2018, IEHP had 604,914 beneficiaries in Riverside County, and 617,736 in San Bernardino County—for a total of 1,222,650 beneficiaries.1 This represents 88 percent of the beneficiaries enrolled in Riverside County and 90 percent in San Bernardino County.
1 Medi-Cal Managed Care Enrollment Report—June 2018. Available at: http://www.dhcs.ca.gov/dataandstats/reports/Pages/MMCDMonthlyEnrollment.aspx. Accessed on: Sep 18, 2018.
Inland Empire Health Plan Performance Evaluation Report: July 1, 2017–June 30, 2018 California Department of Health Care Services
Page R-1 Health Services Advisory Group, Inc.

INTRODUCTION
DHCS allows IEHP to combine data for Riverside and San Bernardino counties for reporting purposes. For this report, Riverside and San Bernardino counties are considered a single reporting unit.
Inland Empire Health Plan Performance Evaluation Report: July 1, 2017–June 30, 2018 California Department of Health Care Services
Page R-2 Health Services Advisory Group, Inc.

Medi-Cal Managed Care External Quality Review Technical ReportAppendix R: Performance Evaluation ReportInland Empire Health PlanJuly 1, 2017–June 30, 2018
2. Managed Care Health Plan Compliance
Compliance Reviews Conducted The following is a summary of the most recent reviews conducted for IEHP. Unless noted, HSAG’s compliance review summaries are based on final audit/survey reports issued and corrective action plan (CAP) closeout letters dated on or before the end of the review period for this report (June 30, 2018). The descriptions of the various types of reviews may be found within the main section of this technical report.
Table 2.1 summarizes the results and status of the DHCS Audits & Investigations Division (A&I) Medical Audit of IEHP. A&I conducted the on-site audits from October 16, 2017, through October 20, 2017. Note that A&I did not include the State Supported Services portion of the audit for 2017.
Table 2.1—DHCS A&I Medical Audit of IEHP Audit Review Period: October 1, 2016, through September 30, 2017
Category Evaluated Deficiencies (Yes/No) Monitoring Status
Utilization Management No Not applicable. Case Management and Coordination of Care
No Not applicable.
Access and Availability of Care Yes CAP initiated following the audit and subsequently closed.
Member’s Rights No Not applicable. Quality Management No Not applicable. Administrative and Organizational Capacity
No Not applicable.
Strengths—Compliance Reviews A&I identified no deficiencies in five of six categories evaluated during the October 2017 Medical Audit. IEHP’s responses to the MCP’s CAP for the deficiency that A&I identified in the Access and Availability of Care category during the October 2017 Medical Audit of IEHP resulted in DHCS closing the CAP.
Inland Empire Health Plan Performance Evaluation Report: July 1, 2017–June 30, 2018 California Department of Health Care Services
Page R-3 Health Services Advisory Group, Inc.

MANAGED CARE HEALTH PLAN COMPLIANCE
Opportunities for Improvement—Compliance Reviews IEHP has no outstanding deficiencies from the October 2017 A&I Medical Audit; therefore, HSAG has no recommendations for the MCP in the area of compliance reviews.
Inland Empire Health Plan Performance Evaluation Report: July 1, 2017–June 30, 2018 California Department of Health Care Services
Page R-4 Health Services Advisory Group, Inc.
Medi-Cal Managed Care External Quality Review Technical ReportAppendix R: Performance Evaluation ReportInland Empire Health PlanJuly 1, 2017–June 30, 2018
3. Managed Care Health Plan Performance Measures
Performance Measure Validation Results The HEDIS®2 2018 Compliance Audit Final Report of Findings for Inland Empire Health Plan contains the detailed findings and recommendations from HSAG’s NCQA HEDIS Compliance Audit™.3 HSAG auditors determined that IEHP followed the appropriate specifications to produce valid rates, and identified no issues of concern.
Performance Measure Results and Findings After validating the MCP’s performance measure rates, HSAG assessed the results. See Table 3.1 through Table 3.9 for IEHP’s performance measure results for reporting years (RYs) 2015 through 2018 and performance measure findings for RY 2018. The RY is the year in which the MCP reported the rates. The RY rates reflect measurement year (MY) data from the previous calendar year. Note that data may not be available for all four years.
Note the following regarding Table 3.1 through Table 3.9:
To allow HSAG to provide meaningful assessment of MCP performance and actionable recommendations, HSAG, in collaboration with DHCS, organized the measures into domains based on the health care areas each measure affects. Table 3.1 through Table 3.8 present the performance measure results and findings by domain, and Table 3.9 presents the RY 2018 performance measure findings for the domains combined. To assess performance for each MCP reporting unit, HSAG compares the rates to national benchmarks. Rates indicating performance above the high performance levels (HPLs) are shaded in gray, and rates indicating performance below the minimum performance levels (MPLs) are bolded. ■ For measures with rates below the MPLs, DHCS requires MCPs to submit to DHCS
improvement plans (IPs) to address the rates below the MPLs (unless MCPs are reporting the rates for the first time).
■ For MCPs that meet DHCS’ Quality of Care CAP thresholds, DHCS issues a CAP; if an MCP’s performance is such that it may trigger a CAP in the following year, DHCS issues an advance warning letter.
2 Healthcare Effectiveness Data and Information Set (HEDIS®) is a registered trademark of the National Committee for Quality Assurance (NCQA).
3 NCQA HEDIS Compliance AuditTM is a trademark of NCQA.
Inland Empire Health Plan Performance Evaluation Report: July 1, 2017–June 30, 2018 California Department of Health Care Services
Page R-5 Health Services Advisory Group, Inc.
MANAGED CARE HEALTH PLAN PERFORMANCE MEASURES
■ IPs and CAPs consist of submission of Plan-Do-Study-Act (PDSA) Cycle Worksheets, Quality Improvement (QI) Summaries, or completion of Performance Improvement Projects (PIPs)—as determined by DHCS.
For RYs 2016, 2017, and 2018, the HPLs and MPLs represent the NCQA Quality Compass®4 Medicaid health maintenance organization (HMO) 90th and 25th percentiles, respectively. For RY 2015, the HPLs and MPLs represent the NCQA HEDIS Audit Means, Percentiles, and Ratios 90th and 25th percentiles, respectively. For the Comprehensive Diabetes Care—HbA1c Poor Control (>9.0 Percent) measure, for which a lower rate indicates more favorable performance, the HPL and MPL are based on the 10th and 75th percentiles, respectively. HSAG includes the specific HPL and MPL values for RY 2018 in Section 6 of the Medi-Cal Managed Care External Quality Review Technical Report, July 1, 2017–June 30, 2018 (“Managed Care Health Plan Performance Measures”).
Preventive Screening and Children’s Health
Table 3.1 presents the four-year trending information for the performance measures within the Preventive Screening and Children’s Health domain.
Note the following regarding Table 3.1:
Although HSAG includes information on the MCP’s performance related to the four Children and Adolescents’ Access to Primary Care measures, DHCS did not hold MCPs accountable to meet the MPLs for these measures for RYs 2015 through 2018 (i.e., DHCS did not require MCPs to submit IPs if rates for the measures were below the MPLs). DHCS made this decision due to the small range of variation between the HPL and MPL thresholds for each measure. Any comparison of RY 2018 performance to RY 2017 or to benchmarks related to the Immunizations for Adolescents—Combination 2 measure should be exercised with caution given the changes that NCQA made to the specification for this measure for RY 2018. NCQA released guidance that recommended a break in trending for this measure; however, DHCS determined to continue trending because the specification change should result in higher rates.
4 Quality Compass® is a registered trademark of NCQA.
Inland Empire Health Plan Performance Evaluation Report: July 1, 2017–June 30, 2018 California Department of Health Care Services
Page R-6 Health Services Advisory Group, Inc.

MANAGED CARE HEALTH PLAN PERFORMANCE MEASURES
Table 3.1—Preventive Screening and Children’s Health DomainMulti-Year Performance Measure Results IEHP—Riverside/San Bernardino Counties
H = Rate indicates performance above the HPL. Bolded Rate = Rate indicates performance below the MPL.
B = Statistical testing result indicates that the RY 2018 rate is significantly better than the RY 2017 rate.
W = Statistical testing result indicates that the RY 2018 rate is significantly worse than the RY 2017 rate.
Measure RY
2015 Rate1
RY 2016
Rate2
RY 2017
Rate3
RY 2018
Rate4
RYs 2017–18 Rate
Difference5
Childhood Immunization Status—Combination 3 75.46% 70.83% 72.45% 73.97% 1.52
Children and Adolescents’ Access to Primary Care Practitioners—12–24 Months
94.72% 91.90% 93.72% 93.78% 0.06
Children and Adolescents’ Access to Primary Care Practitioners— 25 Months–6 Years
84.75% 82.89% 83.28% 84.05% 0.77B
Children and Adolescents’ Access to Primary Care Practitioners—7–11 Years
84.36% 83.43% 82.59% 83.26% 0.67B
Children and Adolescents’ Access to Primary Care Practitioners—12–19 Years
83.06% 82.35% 81.72% 82.75% 1.03B
Immunizations for Adolescents— Combination 2^ -- -- 23.61% 29.44% 5.83
Weight Assessment and Counseling for Nutrition and Physical Activity for Children and Adolescents—Nutrition Counseling—Total
76.39% 80.09%H 80.09%H 80.29% 0.20
Weight Assessment and Counseling for Nutrition and Physical Activity for Children and Adolescents—Physical Activity Counseling—Total
65.05% 65.74% 68.06% 71.29% 3.23
Inland Empire Health Plan Performance Evaluation Report: July 1, 2017–June 30, 2018 California Department of Health Care Services
Page R-7 Health Services Advisory Group, Inc.

MANAGED CARE HEALTH PLAN PERFORMANCE MEASURES
Measure RY
2015 Rate1
RY 2016
Rate2
RY 2017
Rate3
RY 2018
Rate4
RYs 2017–18 Rate
Difference5
Well-Child Visits in the Third, Fourth, Fifth, and Sixth Years of Life
71.06% 68.06% 73.15% 75.43% 2.28
1 RY 2015 rates reflect MY data from January 1, 2014, through December 31, 2014. 2 RY 2016 rates reflect MY data from January 1, 2015, through December 31, 2015. 3 RY 2017 rates reflect MY data from January 1, 2016, through December 31, 2016. 4 RY 2018 rates reflect MY data from January 1, 2017, through December 31, 2017. 5 Performance comparisons are based on the Chi-square test of statistical significance, with a p value of <0.05. ^ Caution should be exercised when assessing MCP performance for this measure given the changes that NCQA made to the specification for this measure for RY 2018. -- Indicates that the rate is not available.
Table 3.2 presents findings for the RY 2018 performance measures within the Preventive Screening and Children’s Health domain.
Note the following regarding Table 3.2:
DHCS did not hold MCPs accountable to meet MPLs for all four Children and Adolescents’ Access to Primary Care measures within this domain; therefore, HSAG did not include these measures in its assessment of the MCP’s performance related to HPLs and MPLs. The Immunizations for Adolescents—Combination 2 measure was a first-year measure in RY 2017, and DHCS established no MPL for this measure for RY 2017 because no comparable benchmark existed; therefore, HSAG did not include this measure in the denominators for calculating the percentage of measures with rates that moved to above or below the MPLs in RY 2018.
Inland Empire Health Plan Performance Evaluation Report: July 1, 2017–June 30, 2018 California Department of Health Care Services
Page R-8 Health Services Advisory Group, Inc.

MANAGED CARE HEALTH PLAN PERFORMANCE MEASURES
Table 3.2—Preventive Screening and Children’s Health DomainRY 2018 (MY 2017) Performance Measure FindingsIEHP—Riverside/San Bernardino Counties
Criteria Number of Measures
MeetingCriteria
Total Number of Measures
Percentage of Measures
MeetingCriteria
RY 2018 Rates Above HPLs 0 5 0.00% Rates Above HPLs for the Last Three or More Consecutive Years 0 4 0.00%
RY 2018 Rates Significantly Better than RY 2017 Rates* 0 5 0.00%
Rates that Moved from Below MPLs in RY 2017 to Above MPLs in RY 2018 0 0 N/A
RY 2018 Rates Below MPLs 0 5 0.00% Rates Below MPLs for the Last Three or More Consecutive Years 0 4 0.00%
RY 2018 Rates Significantly Worse than RY 2017 Rates* 0 5 0.00%
Rates that Moved from Above MPLs in RY 2017 to Below MPLs in RY 2018 0 4 0.00%
* Performance comparisons are based on the Chi-square test of statistical significance, with a p value of <0.05. N/A = No rates above or below the MPLs from the previous year exist to include in the denominator for calculating whether or not rates moved to above or below MPLs in the most recent year.
Inland Empire Health Plan Performance Evaluation Report: July 1, 2017–June 30, 2018 California Department of Health Care Services
Page R-9 Health Services Advisory Group, Inc.

MANAGED CARE HEALTH PLAN PERFORMANCE MEASURES
Preventive Screening and Women’s Health
Table 3.3 presents the four-year trending information for the performance measures within the Preventive Screening and Women’s Health domain.
Note that any comparison of RY 2018 performance to RY 2017 or to benchmarks related to the Breast Cancer Screening measure should be exercised with caution given the changes that NCQA made to the specification for this measure for RY 2018. NCQA released guidance that recommended a break in trending for this measure; however, DHCS determined to continue trending because the specification change should result in higher rates.
Table 3.3—Preventive Screening and Women’s Health DomainMulti-Year Performance Measure Results IEHP—Riverside/San Bernardino Counties
H = Rate indicates performance above the HPL. Bolded Rate = Rate indicates performance below the MPL.
B = Statistical testing result indicates that the RY 2018 rate is significantly better than the RY 2017 rate.
W = Statistical testing result indicates that the RY 2018 rate is significantly worse than the RY 2017 rate.
Measure RY
2015 Rate1
RY 2016
Rate2
RY 2017
Rate3
RY 2018
Rate4
RYs 2017–18 Rate
Difference5
Breast Cancer Screening^ -- -- 64.17% 67.07% 2.90B
Cervical Cancer Screening 68.00% 54.12% 58.59% 62.04% 3.45 Prenatal and Postpartum Care— Postpartum Care 61.03% 59.67% 64.19% 61.31% -2.88
Prenatal and Postpartum Care— Timeliness of Prenatal Care 86.38% 83.68% 83.49% 79.08% -4.41
1 RY 2015 rates reflect MY data from January 1, 2014, through December 31, 2014. 2 RY 2016 rates reflect MY data from January 1, 2015, through December 31, 2015. 3 RY 2017 rates reflect MY data from January 1, 2016, through December 31, 2016. 4 RY 2018 rates reflect MY data from January 1, 2017, through December 31, 2017. 5 Performance comparisons are based on the Chi-square test of statistical significance, with a p value of <0.05. ^ Caution should be exercised when assessing MCP performance for this measure given the changes that NCQA made to the specification for this measure for RY 2018. -- Indicates that the rate is not available.
Inland Empire Health Plan Performance Evaluation Report: July 1, 2017–June 30, 2018 California Department of Health Care Services
Page R-10 Health Services Advisory Group, Inc.

MANAGED CARE HEALTH PLAN PERFORMANCE MEASURES
Table 3.4 presents findings for the RY 2018 performance measures within the Preventive Screening and Women’s Health domain. Note that the Breast Cancer Screening measure was a first-year measure in RY 2017, and DHCS did not hold MCPs accountable to meet an MPL for this measure in RY 2017; therefore, HSAG did not include this measure in the denominators for calculating the percentage of measures with rates that moved to above or below the MPLs in RY 2018.
Table 3.4—Preventive Screening and Women’s Health DomainRY 2018 (MY 2017) Performance Measure Findings IEHP—Riverside/San Bernardino Counties
Criteria Number of Measures
MeetingCriteria
Total Number of Measures
Percentage of Measures
MeetingCriteria
RY 2018 Rates Above HPLs 0 4 0.00% Rates Above HPLs for the Last Three or More Consecutive Years 0 3 0.00%
RY 2018 Rates Significantly Better than RY 2017 Rates* 1 4 25.00%
Rates that Moved from Below MPLs in RY 2017 to Above MPLs in RY 2018 0 0 N/A
RY 2018 Rates Below MPLs 0 4 0.00% Rates Below MPLs for the Last Three or More Consecutive Years 0 3 0.00%
RY 2018 Rates Significantly Worse than RY 2017 Rates* 0 4 0.00%
Rates that Moved from Above MPLs in RY 2017 to Below MPLs in RY 2018 0 3 0.00%
* Performance comparisons are based on the Chi-square test of statistical significance, with a p value of <0.05. N/A = No rates above or below the MPLs from the previous year exist to include in the denominator for calculating whether or not rates moved to above or below MPLs in the most recent year.
Care for Chronic Conditions
Table 3.5 presents the four-year trending information for the performance measures within the Care for Chronic Conditions domain.
Inland Empire Health Plan Performance Evaluation Report: July 1, 2017–June 30, 2018 California Department of Health Care Services
Page R-11 Health Services Advisory Group, Inc.

MANAGED CARE HEALTH PLAN PERFORMANCE MEASURES
Table 3.5—Care for Chronic Conditions Domain Multi-Year Performance Measure Results IEHP—Riverside/San Bernardino Counties
H = Rate indicates performance above the HPL. Bolded Rate = Rate indicates performance below the MPL.
B = Statistical testing result indicates that the RY 2018 rate is significantly better than the RY 2017 rate.
W = Statistical testing result indicates that the RY 2018 rate is significantly worse than the RY 2017 rate.
Measure RY
2015 Rate1
RY 2016
Rate2
RY 2017
Rate3
RY 2018
Rate4
RYs 2017–18 Rate
Difference5
Annual Monitoring for Patients on Persistent Medications— ACE Inhibitors or ARBs
87.85% 87.11% 87.67% 88.78% 1.11B
Annual Monitoring for Patients on Persistent Medications— Diuretics
86.93% 86.40% 86.94% 88.23% 1.29B
Asthma Medication Ratio -- -- 49.22% 55.41% 6.19B
Comprehensive Diabetes Care— Blood Pressure Control (<140/90 mm Hg)
64.35% 59.16% 66.82% 65.21% -1.61
Comprehensive Diabetes Care— Eye Exam (Retinal) Performed 57.41% 55.68% 60.56% 56.69% -3.87
Comprehensive Diabetes Care— HbA1c Control (<8.0 Percent) 50.23% 51.04% 52.90% 54.01% 1.11
Comprehensive Diabetes Care— HbA1c Poor Control (>9.0 Percent)*
36.57% 38.75% 37.12% 35.04% -2.08
Comprehensive Diabetes Care— HbA1c Testing 86.11% 86.77% 87.24% 84.91% -2.33
Comprehensive Diabetes Care— Medical Attention for Nephropathy
84.49% 92.58%H 90.49% 91.97% 1.48
Controlling High Blood Pressure 69.25% 58.85% 58.85% 58.64% -0.21 1 RY 2015 rates reflect MY data from January 1, 2014, through December 31, 2014. 2 RY 2016 rates reflect MY data from January 1, 2015, through December 31, 2015. 3 RY 2017 rates reflect MY data from January 1, 2016, through December 31, 2016.
Inland Empire Health Plan Performance Evaluation Report: July 1, 2017–June 30, 2018 California Department of Health Care Services
Page R-12 Health Services Advisory Group, Inc.
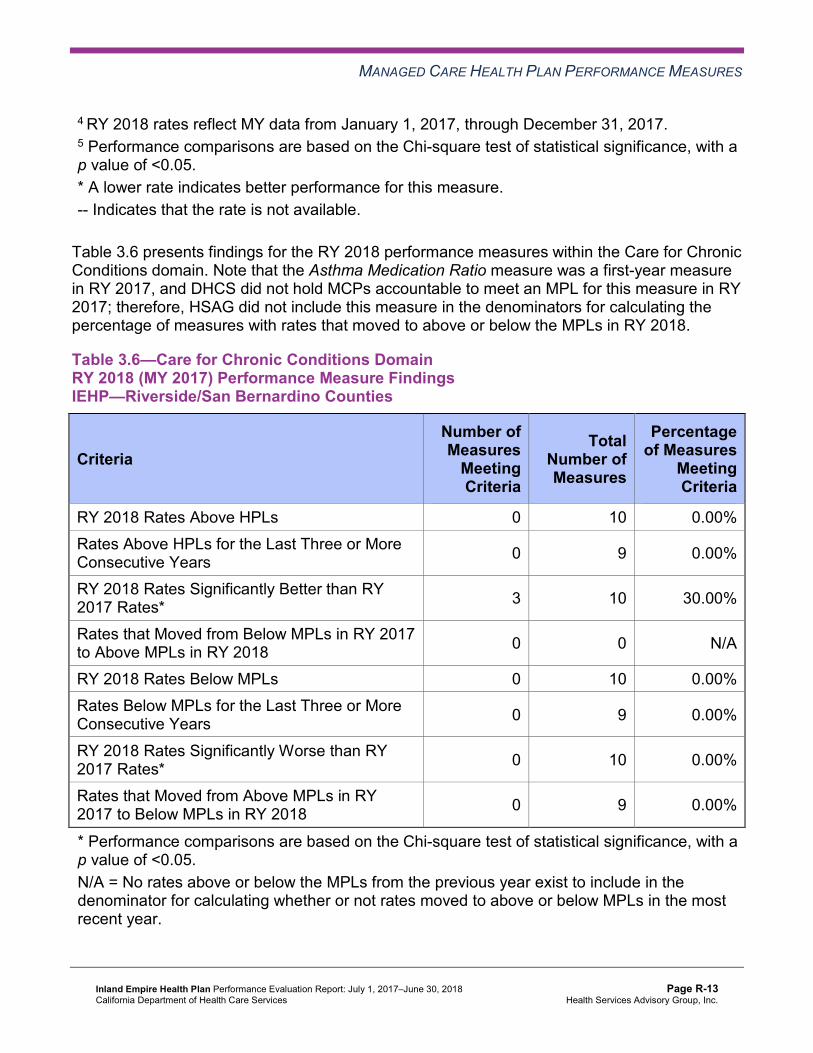
MANAGED CARE HEALTH PLAN PERFORMANCE MEASURES
4 RY 2018 rates reflect MY data from January 1, 2017, through December 31, 2017. 5 Performance comparisons are based on the Chi-square test of statistical significance, with a p value of <0.05. * A lower rate indicates better performance for this measure. -- Indicates that the rate is not available.
Table 3.6 presents findings for the RY 2018 performance measures within the Care for Chronic Conditions domain. Note that the Asthma Medication Ratio measure was a first-year measure in RY 2017, and DHCS did not hold MCPs accountable to meet an MPL for this measure in RY 2017; therefore, HSAG did not include this measure in the denominators for calculating the percentage of measures with rates that moved to above or below the MPLs in RY 2018.
Table 3.6—Care for Chronic Conditions Domain RY 2018 (MY 2017) Performance Measure Findings IEHP—Riverside/San Bernardino Counties
Criteria Number of Measures
MeetingCriteria
Total Number of Measures
Percentage of Measures
MeetingCriteria
RY 2018 Rates Above HPLs 0 10 0.00% Rates Above HPLs for the Last Three or More Consecutive Years 0 9 0.00%
RY 2018 Rates Significantly Better than RY 2017 Rates* 3 10 30.00%
Rates that Moved from Below MPLs in RY 2017 to Above MPLs in RY 2018 0 0 N/A
RY 2018 Rates Below MPLs 0 10 0.00% Rates Below MPLs for the Last Three or More Consecutive Years 0 9 0.00%
RY 2018 Rates Significantly Worse than RY 2017 Rates* 0 10 0.00%
Rates that Moved from Above MPLs in RY 2017 to Below MPLs in RY 2018 0 9 0.00%
* Performance comparisons are based on the Chi-square test of statistical significance, with a p value of <0.05. N/A = No rates above or below the MPLs from the previous year exist to include in the denominator for calculating whether or not rates moved to above or below MPLs in the most recent year.
Inland Empire Health Plan Performance Evaluation Report: July 1, 2017–June 30, 2018 California Department of Health Care Services
Page R-13 Health Services Advisory Group, Inc.
MANAGED CARE HEALTH PLAN PERFORMANCE MEASURES
Appropriate Treatment and Utilization
Table 3.7 presents the four-year trending information for the performance measures within the Appropriate Treatment and Utilization domain.
Note the following regarding Table 3.7:
The All-Cause Readmissions measure is a non-HEDIS measure originally developed for DHCS’ All-Cause Readmissions collaborative quality improvement project (QIP); therefore, DHCS does not establish an HPL or MPL for this measure. For the All-Cause Readmissions measure, a lower rate indicates better performance (i.e., fewer readmissions). The two Ambulatory Care measures are utilization measures, which measure the volume of services used. DHCS does not hold MCPs accountable to meet MPLs for utilization measures, and HSAG does not compare performance for these measures against HPLs and MPLs. Additionally, because high and low rates do not necessarily indicate better or worse performance, HSAG did not compare performance for these measures across years. DHCS established no HPL or MPL for the two Depression Screening and Follow-Up for Adolescents and Adults measures for RY 2018 because no comparable benchmarks exist. Additionally, although MCPs reported the two Depression Screening and Follow-Up for Adolescents and Adults measures for RY 2018, HSAG does not present the performance measure results for these measures in this report because the reported rates do not accurately represent services being provided. This is due to the Depression Screening and Follow-Up for Adolescents and Adults measures being new HEDIS measures for RY 2018, NCQA requiring MCPs to submit rates for these measures using the new Electronic Clinical Data Systems (ECDS) reporting methodology, and inconsistent data reporting processes by calculation vendors. Thus, MCPs experienced numerous challenges obtaining data sources to use for ECDS reporting. DHCS and HSAG, in consultation with NCQA, will work with MCPs to improve data capture for RY 2019. Note that due to changes that NCQA made to the specifications for the Use of Imaging Studies for Low Back Pain measure in RY 2018, NCQA released guidance to exercise caution when trending the results for this measure. Therefore, caution should be used when comparing MCP performance across years or when comparing MCP results to benchmarks related to the Use of Imaging Studies for Low Back Pain measure, as differences in rates may be a result of the specification changes rather than a reflection of performance.
Inland Empire Health Plan Performance Evaluation Report: July 1, 2017–June 30, 2018 California Department of Health Care Services
Page R-14 Health Services Advisory Group, Inc.

MANAGED CARE HEALTH PLAN PERFORMANCE MEASURES
Table 3.7—Appropriate Treatment and Utilization DomainMulti-Year Performance Measure Results IEHP—Riverside/San Bernardino Counties
H = Rate indicates performance above the HPL. Bolded Rate = Rate indicates performance below the MPL.
B = Statistical testing result indicates that the RY 2018 rate is significantly better than the RY 2017 rate.
W = Statistical testing result indicates that the RY 2018 rate is significantly worse than the RY 2017 rate.
Measure RY
2015 Rate1
RY 2016
Rate2
RY 2017
Rate3
RY 2018
Rate4
RYs 2017–18 Rate
Difference5
All-Cause Readmissions* 17.89% 18.12% 15.87% 15.54% -0.33 Ambulatory Care—Emergency Department (ED) Visits per 1,000 Member Months**
49.83 47.36 46.08 46.89 Not Tested
Ambulatory Care—Outpatient Visits per 1,000 Member Months**
244.43 230.67 238.56 247.87 Not Tested
Avoidance of Antibiotic Treatment in Adults With Acute Bronchitis
21.75% 23.13% 27.30% 31.74% 4.44B
Use of Imaging Studies for Low Back Pain^ 75.34% 73.96% 72.31% 71.83% -0.48
1 RY 2015 rates reflect MY data from January 1, 2014, through December 31, 2014. 2 RY 2016 rates reflect MY data from January 1, 2015, through December 31, 2015. 3 RY 2017 rates reflect MY data from January 1, 2016, through December 31, 2016. 4 RY 2018 rates reflect MY data from January 1, 2017, through December 31, 2017. 5 Performance comparisons are based on the Chi-square test of statistical significance, with a p value of <0.05. * A lower rate indicates better performance for this measure. ** Member months are a member's “contribution” to the total yearly membership. ^ Caution should be exercised when assessing MCP performance for this measure given the changes that NCQA made to the specification for this measure for RY 2018. Not Tested = An RY 2017–18 rate difference was not calculated because high and low rates do not necessarily indicate better or worse performance.
Inland Empire Health Plan Performance Evaluation Report: July 1, 2017–June 30, 2018 California Department of Health Care Services
Page R-15 Health Services Advisory Group, Inc.

MANAGED CARE HEALTH PLAN PERFORMANCE MEASURES
Table 3.8 presents findings for the RY 2018 performance measures within the Appropriate Treatment and Utilization domain. DHCS did not hold MCPs accountable to meet MPLs for the following measures within this domain; therefore, HSAG did not include these measures in its assessment of the MCP’s performance related to HPLs and MPLs:
All-Cause Readmissions Both Ambulatory Care measures
Table 3.8—Appropriate Treatment and Utilization DomainRY 2018 (MY 2017) Performance Measure Findings IEHP—Riverside/San Bernardino Counties
Criteria Number of Measures
MeetingCriteria
Total Number of Measures
Percentage of Measures
MeetingCriteria
RY 2018 Rates Above HPLs 0 2 0.00% Rates Above HPLs for the Last Three or More Consecutive Years 0 2 0.00%
RY 2018 Rates Significantly Better than RY 2017 Rates* 1 3 33.33%
Rates that Moved from Below MPLs in RY 2017 to Above MPLs in RY 2018 0 0 N/A
RY 2018 Rates Below MPLs 0 2 0.00% Rates Below MPLs for the Last Three or More Consecutive Years 0 2 0.00%
RY 2018 Rates Significantly Worse than RY 2017 Rates* 0 3 0.00%
Rates that Moved from Above MPLs in RY 2017 to Below MPLs in RY 2018 0 2 0.00%
* Performance comparisons are based on the Chi-square test of statistical significance, with a p value of <0.05. N/A = No rates above or below the MPLs from the previous year exist to include in the denominator for calculating whether or not rates moved to above or below MPLs in the most recent year.
Inland Empire Health Plan Performance Evaluation Report: July 1, 2017–June 30, 2018 California Department of Health Care Services
Page R-16 Health Services Advisory Group, Inc.

MANAGED CARE HEALTH PLAN PERFORMANCE MEASURES
Performance Measure Findings—All Domains
Table 3.9 presents a summary of IEHP’s RY 2018 performance across all External Accountability Set (EAS) measures.
Note the following regarding Table 3.9:
DHCS did not hold MCPs accountable to meet MPLs for the following measures; therefore, HSAG did not include these measures in its assessment of the MCP’s performance related to HPLs and MPLs: ■ All-Cause Readmissions ■ Both Ambulatory Care measures ■ All four Children and Adolescents’ Access to Primary Care measures DHCS did not hold MCPs accountable to meet MPLs for the following measures in RY 2017; therefore, HSAG did not include these measures in the denominators for calculating the percentage of measures with rates that moved to above or below the MPLs in RY 2018 and for calculating the percentage of measures with rates below MPLs for only the last two consecutive years: ■ Asthma Medication Ratio ■ Breast Cancer Screening ■ Immunizations for Adolescents—Combination 2
Table 3.9—RY 2018 (MY 2017) Performance Measure Findings for All Domains IEHP—Riverside/San Bernardino Counties
Criteria Number of Measures
MeetingCriteria
Total Number of Measures
Percentage of Measures
MeetingCriteria
RY 2018 Rates Above HPLs 0 21 0.00% Rates Above HPLs for the Last Three or More Consecutive Years 0 18 0.00%
RY 2018 Rates Significantly Better than RY 2017 Rates* 5 22 22.73%
Rates that Moved from Below MPLs in RY 2017 to Above MPLs in RY 2018 0 0 N/A
RY 2018 Rates Below MPLs 0 21 0.00% Rates Below MPLs for Only the Last Two Consecutive Years 0 18 0.00%
Inland Empire Health Plan Performance Evaluation Report: July 1, 2017–June 30, 2018 California Department of Health Care Services
Page R-17 Health Services Advisory Group, Inc.

MANAGED CARE HEALTH PLAN PERFORMANCE MEASURES
Criteria Number of Measures
MeetingCriteria
Total Number of Measures
Percentage of Measures
MeetingCriteria
Rates Below MPLs for the Last Three or More Consecutive Years 0 18 0.00%
RY 2018 Rates Significantly Worse than RY 2017 Rates* 0 22 0.00%
Rates that Moved from Above MPLs in RY 2017 to Below MPLs in RY 2018 0 18 0.00%
* Performance comparisons are based on the Chi-square test of statistical significance, with a p value of <0.05. N/A = No rates above or below the MPLs from the previous year exist to include in the denominator for calculating whether or not rates moved to above or below MPLs in the most recent year.
Seniors and Persons with Disabilities Performance Measure Results Table 3.10 presents the four-year trending information for the Seniors and Persons with Disabilities (SPD) population, and Table 3.11 presents the four-year trending information for the non-SPD population for the measures that DHCS required MCPs to stratify for the SPD and non-SPD populations. The tables also show the differences in rates between RY 2017 and RY 2018.
Table 3.12 presents the SPD and non-SPD rates, a comparison of the SPD and non-SPD rates,5 and the total combined rate for each measure.
5 HSAG calculated statistical significance between the SPD and non-SPD rates for each measure using a Chi-square test. This information is displayed in the “SPD/Non-SPD Rate Difference” column in Table 3.12.
Inland Empire Health Plan Performance Evaluation Report: July 1, 2017–June 30, 2018 California Department of Health Care Services
Page R-18 Health Services Advisory Group, Inc.

MANAGED CARE HEALTH PLAN PERFORMANCE MEASURES
Table 3.10—Multi-Year SPD Performance Measure Trend Table IEHP—Riverside/San Bernardino Counties
B = Statistical testing result indicates that the RY 2018 SPD rate is significantly better than the RY 2017 SPD rate.
W = Statistical testing result indicates that the RY 2018 SPD rate is significantly worse than the RY 2017 SPD rate.
Measure RY
2015 SPD
Rate1
RY 2016 SPD
Rate2
RY 2017 SPD
Rate3
RY 2018 SPD
Rate4
RYs 2017–18 Rate
Difference5
All-Cause Readmissions* 21.77% 23.99% 20.79% 19.91% -0.88 Ambulatory Care—Emergency Department (ED) Visits per 1,000 Member Months**
83.70 81.09 78.53 76.15 Not Tested
Ambulatory Care—Outpatient Visits per 1,000 Member Months**
452.07 472.31 508.82 539.19 Not Tested
Annual Monitoring for Patients on Persistent Medications— ACE Inhibitors or ARBs
89.54% 90.24% 91.51% 92.17% 0.66B
Annual Monitoring for Patients on Persistent Medications— Diuretics
88.93% 89.68% 91.58% 92.36% 0.78
Children and Adolescents' Access to Primary Care Practitioners—12–24 Months
93.81% 97.81% 98.39% 94.37% -4.02W
Children and Adolescents' Access to Primary Care Practitioners— 25 Months–6 Years
86.10% 86.27% 86.92% 87.77% 0.85
Children and Adolescents' Access to Primary Care Practitioners—7–11 Years
86.29% 86.53% 87.13% 86.68% -0.45
Children and Adolescents' Access to Primary Care Practitioners—12–19 Years
82.37% 81.53% 82.90% 83.22% 0.32
1 RY 2015 rates reflect MY data from January 1, 2014, through December 31, 2014. 2 RY 2016 rates reflect MY data from January 1, 2015, through December 31, 2015. 3 RY 2017 rates reflect MY data from January 1, 2016, through December 31, 2016.
Inland Empire Health Plan Performance Evaluation Report: July 1, 2017–June 30, 2018 California Department of Health Care Services
Page R-19 Health Services Advisory Group, Inc.
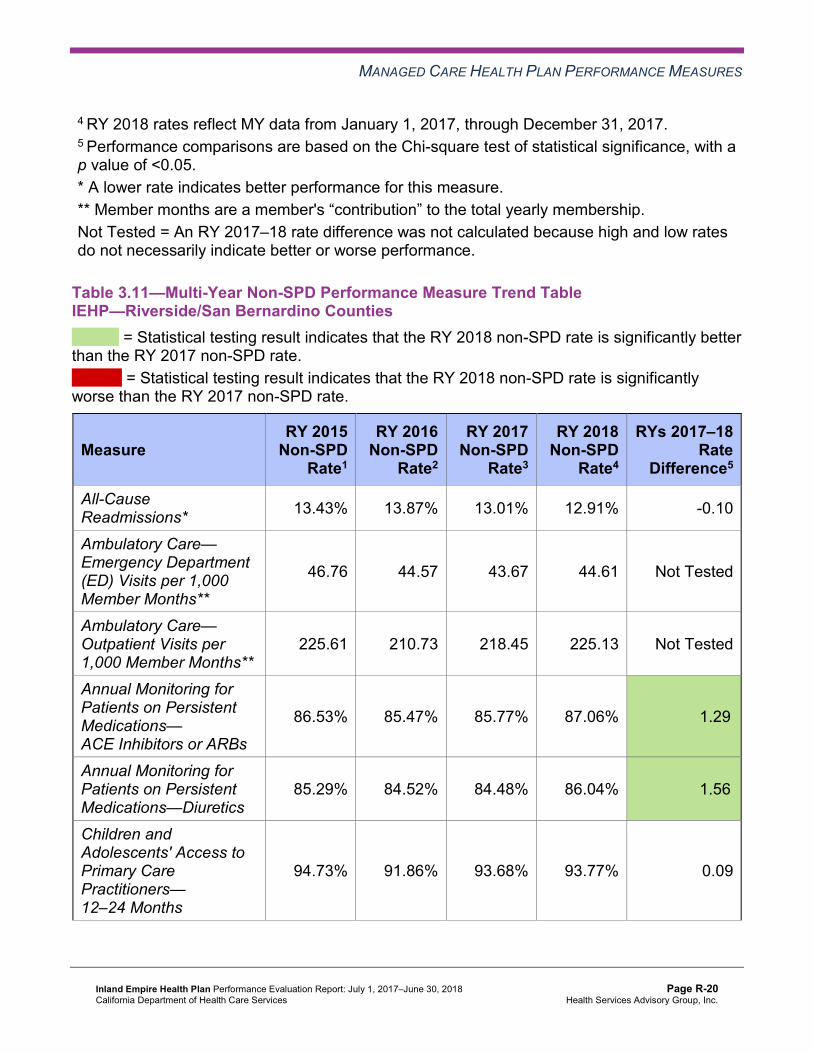
MANAGED CARE HEALTH PLAN PERFORMANCE MEASURES
4 RY 2018 rates reflect MY data from January 1, 2017, through December 31, 2017. 5 Performance comparisons are based on the Chi-square test of statistical significance, with a p value of <0.05. * A lower rate indicates better performance for this measure. ** Member months are a member's “contribution” to the total yearly membership. Not Tested = An RY 2017–18 rate difference was not calculated because high and low rates do not necessarily indicate better or worse performance.
Table 3.11—Multi-Year Non-SPD Performance Measure Trend Table IEHP—Riverside/San Bernardino Counties
B = Statistical testing result indicates that the RY 2018 non-SPD rate is significantly better than the RY 2017 non-SPD rate.
W = Statistical testing result indicates that the RY 2018 non-SPD rate is significantly worse than the RY 2017 non-SPD rate.
Measure RY 2015
Non-SPD Rate1
RY 2016 Non-SPD
Rate2
RY 2017 Non-SPD
Rate3
RY 2018 Non-SPD
Rate4
RYs 2017–18 Rate
Difference5
All-Cause Readmissions* 13.43% 13.87% 13.01% 12.91% -0.10
Ambulatory Care— Emergency Department (ED) Visits per 1,000 Member Months**
46.76 44.57 43.67 44.61 Not Tested
Ambulatory Care— Outpatient Visits per 1,000 Member Months**
225.61 210.73 218.45 225.13 Not Tested
Annual Monitoring for Patients on Persistent Medications— ACE Inhibitors or ARBs
86.53% 85.47% 85.77% 87.06% 1.29B
Annual Monitoring for Patients on Persistent Medications—Diuretics
85.29% 84.52% 84.48% 86.04% 1.56B
Children and Adolescents' Access to Primary Care Practitioners— 12–24 Months
94.73% 91.86% 93.68% 93.77% 0.09
Inland Empire Health Plan Performance Evaluation Report: July 1, 2017–June 30, 2018 California Department of Health Care Services
Page R-20 Health Services Advisory Group, Inc.

MANAGED CARE HEALTH PLAN PERFORMANCE MEASURES
Measure RY 2015
Non-SPD Rate1
RY 2016 Non-SPD
Rate2
RY 2017 Non-SPD
Rate3
RY 2018 Non-SPD
Rate4
RYs 2017–18 Rate
Difference5
Children and Adolescents' Access to Primary Care Practitioners— 25 Months–6 Years
84.71% 82.81% 83.20% 83.97% 0.77B
Children and Adolescents' Access to Primary Care Practitioners— 7–11 Years
84.26% 83.30% 82.42% 83.14% 0.72B
Children and Adolescents' Access to Primary Care Practitioners— 12–19 Years
83.10% 82.39% 81.67% 82.73% 1.06B
1 RY 2015 rates reflect MY data from January 1, 2014, through December 31, 2014. 2 RY 2016 rates reflect MY data from January 1, 2015, through December 31, 2015. 3 RY 2017 rates reflect MY data from January 1, 2016, through December 31, 2016. 4 RY 2018 rates reflect MY data from January 1, 2017, through December 31, 2017. 5 Performance comparisons are based on the Chi-square test of statistical significance, with a p value of <0.05. * A lower rate indicates better performance for this measure. ** Member months are a member's “contribution” to the total yearly membership. Not Tested = An RY 2017–18 rate difference was not calculated because high and low rates do not necessarily indicate better or worse performance.
Inland Empire Health Plan Performance Evaluation Report: July 1, 2017–June 30, 2018 California Department of Health Care Services
Page R-21 Health Services Advisory Group, Inc.

MANAGED CARE HEALTH PLAN PERFORMANCE MEASURES
Table 3.12—RY 2018 (MY 2017) Performance Measure Comparison and Results forMeasures Stratified by the SPD and Non-SPD PopulationsIEHP—Riverside/San Bernardino Counties
B = Statistical testing result indicates that the RY 2018 SPD rate is significantly better than the RY 2018 non-SPD rate.
W = Statistical testing result indicates that the RY 2018 SPD rate is significantly worse than the RY 2018 non-SPD rate.
Measure RY 2018
SPD Rate1
RY 2018 Non-SPD
Rate1
SPD/Non-SPDRate
Difference2
RY 2018 Total Rate3
All-Cause Readmissions* 19.91% 12.91% 7.00W 15.54% Ambulatory Care—Emergency Department (ED) Visits per 1,000 Member Months**
76.15 44.61 Not Tested 46.89
Ambulatory Care—Outpatient Visits per 1,000 Member Months** 539.19 225.13 Not Tested 247.87
Annual Monitoring for Patients on Persistent Medications— ACE Inhibitors or ARBs
92.17% 87.06% 5.11B 88.78%
Annual Monitoring for Patients on Persistent Medications—Diuretics 92.36% 86.04% 6.32B 88.23%
Children and Adolescents' Access to Primary Care Practitioners— 12–24 Months
94.37% 93.77% 0.60 93.78%
Children and Adolescents' Access to Primary Care Practitioners— 25 Months–6 Years
87.77% 83.97% 3.80B 84.05%
Children and Adolescents' Access to Primary Care Practitioners— 7–11 Years
86.68% 83.14% 3.54B 83.26%
Children and Adolescents' Access to Primary Care Practitioners— 12–19 Years
83.22% 82.73% 0.49 82.75%
1 RY 2018 rates reflect MY data from January 1, 2017, through December 31, 2017. 2 Performance comparisons are based on the Chi-square test of statistical significance, with a p value of <0.05. 3 Total rates are based on the MCP reporting unit’s total results, including the SPD and non-SPD populations. Please note, if data are not available for either the SPD or non-SPD population, the total rate is based on results reported for the available population.
Inland Empire Health Plan Performance Evaluation Report: July 1, 2017–June 30, 2018 California Department of Health Care Services
Page R-22 Health Services Advisory Group, Inc.
MANAGED CARE HEALTH PLAN PERFORMANCE MEASURES
* A lower rate indicates better performance for this measure. ** Member months are a member's “contribution” to the total yearly membership. Not Tested = An SPD/non-SPD rate difference was not calculated because high and low rates do not necessarily indicate better or worse performance.
Seniors and Persons with Disabilities Findings
HSAG observed the following notable results in RY 2018 for measures that IEHP stratified by the SPD and non-SPD populations:
The SPD rate improved significantly from RY 2017 to RY 2018 for the Annual Monitoring for Patients on Persistent Medications—ACE Inhibitors or ARBs measure. The non-SPD rate improved significantly from RY 2017 to RY 2018 for the following measures: ■ Both Annual Monitoring for Patients on Persistent Medications measures. ■ Children and Adolescents’ Access to Primary Care Practitioners—25 Months–6 Years,
7–11 Years, and 12–19 Years. The RY 2018 SPD rate was significantly worse than the RY 2017 SPD rate for the Children and Adolescents’ Access to Primary Care Practitioners—12–24 Months measure. The RY 2018 SPD rate was significantly better than the RY 2018 non-SPD rate for the following measures: ■ Both Annual Monitoring for Patients on Persistent Medications measures. ■ Children and Adolescents’ Access to Primary Care Practitioners—25 Months–6 Years
and 7–11 Years. The RY 2018 SPD rate was significantly worse than the RY 2018 non-SPD rate for the All-Cause Readmissions measure. Note that the higher rate of hospital readmissions for the SPD population is expected based on the greater and often more complicated health care needs of these beneficiaries.
Strengths—Performance Measures HSAG auditors determined that IEHP followed the appropriate specifications to produce valid rates, and identified no issues of concern.
HSAG identified the following notable RY 2018 performance measure results for IEHP across all domains:
All RY 2018 rates were above the MPLs. The rates for the following five of 22 measures (23 percent) improved significantly from RY 2017 to RY 2018: ■ Breast Cancer Screening ■ Both Annual Monitoring for Patients on Persistent Medications measures
Inland Empire Health Plan Performance Evaluation Report: July 1, 2017–June 30, 2018 California Department of Health Care Services
Page R-23 Health Services Advisory Group, Inc.

MANAGED CARE HEALTH PLAN PERFORMANCE MEASURES
■ Asthma Medication Ratio ■ Avoidance of Antibiotic Treatment in Adults With Acute Bronchitis
Opportunities for Improvement—Performance Measures Based on RY 2018 performance measure results, HSAG has no recommendations for IEHP in the area of performance measures.
Inland Empire Health Plan Performance Evaluation Report: July 1, 2017–June 30, 2018 California Department of Health Care Services
Page R-24 Health Services Advisory Group, Inc.

Medi-Cal Managed Care External Quality Review Technical ReportAppendix R: Performance Evaluation ReportInland Empire Health PlanJuly 1, 2017–June 30, 2018
4. MLTSSP Performance Measure Results
Due to IEHP’s participation in California’s Coordinated Care Initiative as a Managed Long-Term Services and Supports Plan (MLTSSP), DHCS required that IEHP report rates for three HEDIS measures for HSAG to validate as part of the NCQA HEDIS Compliance Audit.
Table 4.1 presents the rates for each required MLTSSP performance measure for RYs 2016, 2017, and 2018. The RY is the year in which the MLTSSP reported the rates. The RY rates reflect MY data from the previous calendar year. Note that the Ambulatory Care—Emergency Department Visits and Ambulatory Care—Outpatient Visits measures are utilization measures which measure the volume of services used. High and low rates do not necessarily indicate better or worse performance; therefore, for these measures, HSAG did not compare performance between RY 2017 and RY 2018.
Table 4.1—Multi-Year MLTSSP Performance Measure Results IEHP—Riverside County
B = Statistical testing result indicates that the RY 2018 rate is significantly better than the RY 2017 rate.
W = Statistical testing result indicates that the RY 2018 rate is significantly worse than the RY 2017 rate.
Measure RY 2016 MLTSS
Rate1
RY 2017 MLTSS
Rate2
RY 2018 MLTSS
Rate3
RYs 2017–18 Rate
Difference4
Ambulatory Care—Emergency Department (ED) Visits per 1,000 Member Months*
93.97 99.38 92.70 Not Tested
Ambulatory Care—Outpatient Visits per 1,000 Member Months* 573.50 689.51 717.44 Not Tested
Medication Reconciliation Post-Discharge 15.44% 41.94% 31.63% -10.31W
1 RY 2016 rates reflect MY data from January 1, 2015, through December 31, 2015. 2 RY 2017 rates reflect MY data from January 1, 2016, through December 31, 2016. 3 RY 2018 rates reflect MY data from January 1, 2017, through December 31, 2017. 4 Performance comparisons are based on the Chi-square test of statistical significance, with a p value of <0.05. * Member months are a member's “contribution” to the total yearly membership. Not Tested = An RY 2017–18 rate difference was not calculated because high and low rates do not necessarily indicate better or worse performance.
Inland Empire Health Plan Performance Evaluation Report: July 1, 2017–June 30, 2018 California Department of Health Care Services
Page R-25 Health Services Advisory Group, Inc.

MLTSSP PERFORMANCE MEASURE RESULTS
Managed Long-Term Services and Supports Plan PerformanceMeasure Findings The rate for the Medication Reconciliation Post-Discharge measure declined significantly from RY 2017 to RY 2018. IEHP may consider assessing the causes for the rate for this measure declining significantly to ensure that beneficiaries 18 years of age and older who are discharged from acute or nonacute inpatient care have their medications reconciled by 30 days after discharge.
Inland Empire Health Plan Performance Evaluation Report: July 1, 2017–June 30, 2018 California Department of Health Care Services
Page R-26 Health Services Advisory Group, Inc.

Medi-Cal Managed Care External Quality Review Technical ReportAppendix R: Performance Evaluation ReportInland Empire Health PlanJuly 1, 2017–June 30, 2018
5. Performance Improvement Projects
Performance Improvement Project Overview The key concepts of the rapid-cycle PIP framework include forming a PIP team, setting aims, establishing measures, determining interventions using quality improvement tools, conducting PDSA cycles to test interventions, and planning for the spread of successful changes. The core component of the rapid-cycle PIP approach involves testing changes on a small scale so that improvement can occur more efficiently and lead to long-term sustainability. The following modules guide MCPs through this rapid-cycle PIP process:
Module 1—PIP Initiation ■ MCPs outline the framework for the PIP, which includes:
○ The topic rationale. ○ Comparative data supporting the need to improve the selected topic. ○ A list of the PIP team members, which consists of internal and external stakeholders. ○ A completed key driver diagram that defines the theory of change for improvement,
including the SMART (Specific, Measurable, Achievable, Relevant, and Time-bound) Aim and Global Aim.
Module 2—SMART Aim Data Collection ■ MCPs define the SMART Aim measure and data collection methodology and develop
the SMART Aim data run chart. Module 3—Intervention Determination ■ MCPs use process mapping and failure modes and effects analysis to identify potential
interventions to test which may have direct effects on the SMART Aim. Module 4—Plan-Do-Study-Act (PDSA) ■ MCPs test and evaluate the interventions identified in Module 3 through a series of
PDSA cycles. Module 5—PIP Conclusions ■ MCPs interpret results and summarize:
○ Key findings and outcomes achieved. ○ Assessment of each tested intervention. ○ Lessons learned, including how demonstrated improvement can be shared and used
as a foundation for further improvement going forward. ○ Plan for sustained improvement.
Inland Empire Health Plan Performance Evaluation Report: July 1, 2017–June 30, 2018 California Department of Health Care Services
Page R-27 Health Services Advisory Group, Inc.

PERFORMANCE IMPROVEMENT PROJECTS
Based on the agreed-upon timeline, MCPs submit each module to HSAG for validation. Throughout the rapid-cycle PIP process, HSAG provides technical assistance to MCPs to ensure that PIPs are methodologically sound and to problem-solve with MCPs regarding how to address challenges that occur. Through an iterative process, MCPs have opportunities to make corrections to modules 1 through 3 to achieve all validation criteria.
Once MCPs achieve all validation criteria for modules 1 through 3 and receive feedback on the intervention Plan portion of Module 4, MCPs test interventions. During the intervention testing phase of the PIP, HSAG conducts periodic progress check-ins to ensure that MCPs have addressed HSAG’s feedback on the Plan portion of Module 4 and are making appropriate progress with intervention testing. Once MCPs complete testing an intervention, MCPs determine the next steps based on results and lessons learned—whether the intervention was successful and should be spread (adopt), whether modifications need to be made to the existing intervention (adapt), or whether the intervention was not successful and should be stopped (abandon).
In Module 5, MCPs summarize the overall PIP. When validating Module 5, HSAG assesses the validity and reliability of the results based on the Centers for Medicare & Medicaid Services (CMS) validation protocols to determine whether key stakeholders can have confidence in the reported PIP findings. HSAG assigns the following final confidence levels for each PIP:
High confidence—the PIP was methodologically sound and achieved the SMART Aim goal; the demonstrated improvement was clearly linked to the quality improvement processes conducted and intervention(s) tested; and, the MCP accurately summarized the key findings. Confidence—the PIP was methodologically sound and achieved the SMART Aim goal, and the MCP accurately summarized the key findings. However, some, but not all, of the quality improvement processes conducted and/or intervention(s) tested were clearly linked to the demonstrated improvement. Low confidence—either (A) the PIP was methodologically sound; however, the SMART Aim goal was not achieved; or (B) the SMART Aim goal was achieved; however, the quality improvement processes and/or intervention(s) tested were poorly executed and could not be linked to the improvement. Reported PIP results were not credible (referred to in this report as “not credible”)—the PIP methodology was not executed as approved.
Performance Improvement Project Results and Findings During the review period, IEHP submitted modules 4 and 5 for its 2015–17 DHCS-priority and MCP-specific PIPs. HSAG validated the modules and includes the final PIP validation findings in this report. Additionally, IEHP initiated a Disparity PIP and a DHCS-priority PIP during the review period. In this report, HSAG includes summaries of the MCP’s Disparity and DHCS-priority PIP module submissions as well as validation findings from the review period.
Inland Empire Health Plan Performance Evaluation Report: July 1, 2017–June 30, 2018 California Department of Health Care Services
Page R-28 Health Services Advisory Group, Inc.

PERFORMANCE IMPROVEMENT PROJECTS
2015–17 DHCS-Priority Performance Improvement Project
IEHP selected diabetes HbA1c Testing for its 2015–17 DHCS-priority PIP. While the MCP concluded its Diabetes HbA1c Testing PIP through the SMART Aim end date of June 30, 2017, IEHP submitted modules 4 and 5 for HSAG to validate during the review period for this report. HSAG provided final validation findings and encouraged IEHP to incorporate the experiences and lessons learned from the PIP into future quality improvement efforts.
Table 5.1 provides a summary of the SMART Aim measure results reported by the MCP.
Table 5.1—IEHP Diabetes HbA1c Testing PIP SMART Aim Measure Results
SMART Aim Measure Baseline Rate
SMART Aim Goal
Rate
SMART Aim Goal Achieved
Rate of HbA1c testing compliance among eligible beneficiaries with diabetes assigned to Provider A6 40.49% 45.49% Yes
Rate of HbA1c testing compliance among eligible beneficiaries with diabetes assigned to Provider B6 40.35% 45.35% Yes
Rate of HbA1c testing compliance among eligible beneficiaries with diabetes assigned to Provider C6 55.81% 60.81% Yes
Table 5.2 presents a description of the intervention that IEHP tested for its Diabetes HbA1c Testing PIP. The table also indicates the key driver that the intervention addressed as well as whether the MCP decided, based on intervention testing results, to adopt, adapt, or abandon the intervention.
Table 5.2—IEHP Diabetes HbA1c Testing PIP Intervention Testing Results
Intervention Key Drivers and/or Failure ModesAddressed
Adopt,Adapt, orAbandon
Standardized workflow for in-office HbA1c testing at providers A, B, and C.
Standardized diabetes care process Abandon
6 Provider names removed for confidentiality.
Inland Empire Health Plan Performance Evaluation Report: July 1, 2017–June 30, 2018 California Department of Health Care Services
Page R-29 Health Services Advisory Group, Inc.
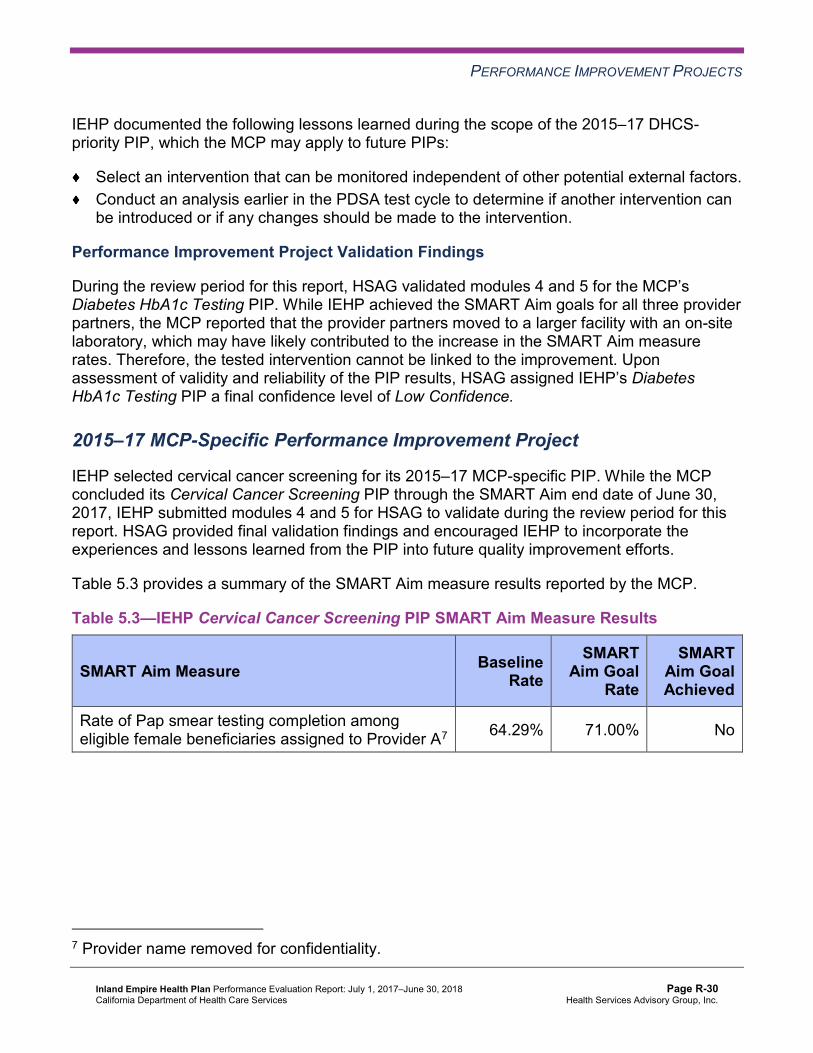
PERFORMANCE IMPROVEMENT PROJECTS
IEHP documented the following lessons learned during the scope of the 2015–17 DHCS-priority PIP, which the MCP may apply to future PIPs:
Select an intervention that can be monitored independent of other potential external factors. Conduct an analysis earlier in the PDSA test cycle to determine if another intervention can be introduced or if any changes should be made to the intervention.
Performance Improvement Project Validation Findings
During the review period for this report, HSAG validated modules 4 and 5 for the MCP’s Diabetes HbA1c Testing PIP. While IEHP achieved the SMART Aim goals for all three provider partners, the MCP reported that the provider partners moved to a larger facility with an on-site laboratory, which may have likely contributed to the increase in the SMART Aim measure rates. Therefore, the tested intervention cannot be linked to the improvement. Upon assessment of validity and reliability of the PIP results, HSAG assigned IEHP’s Diabetes HbA1c Testing PIP a final confidence level of Low Confidence.
2015–17 MCP-Specific Performance Improvement Project
IEHP selected cervical cancer screening for its 2015–17 MCP-specific PIP. While the MCP concluded its Cervical Cancer Screening PIP through the SMART Aim end date of June 30, 2017, IEHP submitted modules 4 and 5 for HSAG to validate during the review period for this report. HSAG provided final validation findings and encouraged IEHP to incorporate the experiences and lessons learned from the PIP into future quality improvement efforts.
Table 5.3 provides a summary of the SMART Aim measure results reported by the MCP.
Table 5.3—IEHP Cervical Cancer Screening PIP SMART Aim Measure Results
SMART Aim Measure Baseline Rate
SMART Aim Goal
Rate
SMART Aim Goal Achieved
Rate of Pap smear testing completion among eligible female beneficiaries assigned to Provider A7 64.29% 71.00% No
7 Provider name removed for confidentiality.
Inland Empire Health Plan Performance Evaluation Report: July 1, 2017–June 30, 2018 California Department of Health Care Services
Page R-30 Health Services Advisory Group, Inc.

PERFORMANCE IMPROVEMENT PROJECTS
Table 5.4 presents a description of the intervention that IEHP tested for its Cervical Cancer Screening PIP. The table also indicates the key driver that the intervention addressed as well as whether the MCP decided, based on intervention testing results, to adopt, adapt, or abandon the intervention.
Table 5.4—IEHP Cervical Cancer Screening PIP Intervention Testing Results
Intervention Key Driver Addressed Adopt,Adapt, orAbandon
Development of a protocol for provider and support staff members to identify beneficiaries who are due for Pap tests
Identification of beneficiaries who need screening and treatment Abandon
IEHP documented the following lessons learned during the scope of the 2015–17 MCP-specific PIP, which the MCP may apply to future PIPs:
Select an intervention that an external partner can accommodate based on staffing and workload. Clearly communicate with external partners about the resources required for the PIP process.
Performance Improvement Project Validation Findings
During the review period for this report, HSAG validated modules 4 and 5 for the MCP’s Cervical Cancer Screening PIP. Despite IEHP’s efforts, it did not achieve the SMART Aim goal and abandoned the tested intervention. Additionally, the MCP did not calculate the SMART Aim measure rates using the approved rolling 12-month measurement methodology. Upon assessment of validity and reliability of the PIP results, HSAG assigned IEHP’s Cervical Cancer Screening PIP a final confidence level of Not Credible.
2017–19 Disparity Performance Improvement Project
During the review period, DHCS required IEHP to initiate a PIP focusing on an identified health disparity based on, but not limited to, age, gender, race or ethnicity, language spoken, income, educational attainment, sexual orientation or gender identity, occupation, provider, or geographic area. IEHP selected immunizations among the African American children residing in Riverside Region as its 2017–19 Disparity PIP topic. Using its own MCP-specific data, the MCP provided evidence of the health disparity by demonstrating a statistically significant rate difference between two subgroups, with the disparate subgroup having the lower rate.
Inland Empire Health Plan Performance Evaluation Report: July 1, 2017–June 30, 2018 California Department of Health Care Services
Page R-31 Health Services Advisory Group, Inc.

PERFORMANCE IMPROVEMENT PROJECTS
Table 5.5 provides the SMART Aim measure description, baseline rate, and SMART Aim goal rate for the PIP. The SMART Aim end date for this PIP is June 30, 2019.
Table 5.5—IEHP Childhood Immunization Status—Combination 10 Disparity PIP SMART Aim Measure
SMART Aim Measure Baseline Rate
SMART Aim Goal
Rate
Rate of Childhood Immunization Status—Combination 10 measure among beneficiaries who identify as Black residing in Riverside Region
7.64% 15.98%
Performance Improvement Project Validation Findings
During the review period of this report, HSAG validated modules 1 and 2 for the MCP’s Childhood Immunization Status—Combination 10 Disparity PIP. Upon initial review of the modules, HSAG determined that IEHP met some required validation criteria; however, HSAG identified opportunities for improvement related to:
Supporting the topic selection with the MCP’s data. Including all required components of the: ■ SMART Aim, developed based on literature review, data, and/or experience. ■ SMART Aim measure. ■ SMART Aim data collection methodology. ■ Run/control chart. Aligning accurately the Global Aim, SMART Aim, key drivers, and potential interventions.
After receiving technical assistance from HSAG, IEHP incorporated HSAG’s feedback into the PIP modules. Upon HSAG’s final review, HSAG determined that the MCP met all validation criteria for modules 1 and 2.
2017–19 DHCS-Priority Performance Improvement Project
During the review period, DHCS required MCPs to initiate a PIP related to one of DHCS’ Quality Strategy focus areas: Childhood Immunization Status—Combination 3, Controlling High Blood Pressure, Comprehensive Diabetes Care, or Prenatal and Postpartum Care— Postpartum Care. However, based on IEHP demonstrating high performance on DHCS’ Quality Strategy focus areas, DHCS allowed the MCP to choose an alternative topic for its DHCS-priority PIP based on an identified area in need of improvement. IEHP selected asthma medication ratio as its 2017–19 DHCS-priority PIP topic based on its MCP-specific data.
Inland Empire Health Plan Performance Evaluation Report: July 1, 2017–June 30, 2018 California Department of Health Care Services
Page R-32 Health Services Advisory Group, Inc.

PERFORMANCE IMPROVEMENT PROJECTS
Table 5.6 provides the SMART Aim measure description, baseline rate, and SMART Aim goal rate for the PIP. The SMART Aim end date for this PIP is June 30, 2019.
Table 5.6—IEHP Asthma Medication Ratio PIP SMART Aim Measure
SMART Aim Measure Baseline Rate
SMART Aim Goal
Rate
Rate of Asthma Medication Ratio measure for partnering providers 23.47% 33.47%
Performance Improvement Project Validation Findings
During the review period of this report, HSAG validated modules 1 and 2 for the MCP’s Asthma Medication Ratio PIP. Upon initial review of the modules, HSAG determined that IEHP met some required validation criteria; however, HSAG identified opportunities for improvement related to:
Supporting the topic selection with the MCP’s data. Including all required components of the: ■ SMART Aim, developed based on literature review, data, and/or experience. ■ SMART Aim measure. ■ SMART Aim data collection methodology. ■ Run/control chart. Aligning accurately the Global Aim, SMART Aim, key drivers, and potential interventions.
After receiving technical assistance from HSAG, IEHP incorporated HSAG’s feedback into the PIP modules. Upon HSAG’s final review, HSAG determined that the MCP met all validation criteria for modules 1 and 2.
Strengths—Performance Improvement Projects Upon completion of the 2015–17 PIPs, IEHP identified actionable lessons learned that the MCP may apply to future PIPs.
Opportunities for Improvement—Performance Improvement Projects IEHP has the opportunity to apply the lessons learned from the 2015–17 Diabetes HbA1c Testing and Cervical Cancer Screening PIPs to facilitate improvement for future PIPs.
Inland Empire Health Plan Performance Evaluation Report: July 1, 2017–June 30, 2018 California Department of Health Care Services
Page R-33 Health Services Advisory Group, Inc.
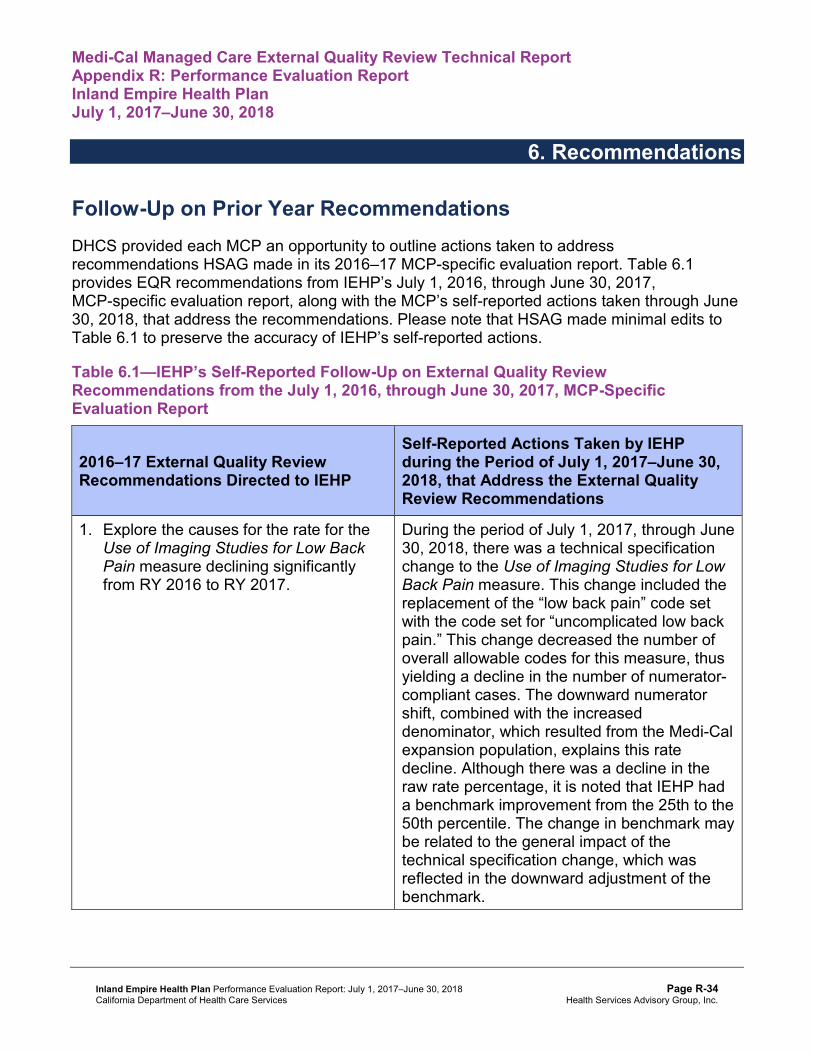
Medi-Cal Managed Care External Quality Review Technical ReportAppendix R: Performance Evaluation ReportInland Empire Health PlanJuly 1, 2017–June 30, 2018
6. Recommendations
Follow-Up on Prior Year Recommendations DHCS provided each MCP an opportunity to outline actions taken to address recommendations HSAG made in its 2016–17 MCP-specific evaluation report. Table 6.1 provides EQR recommendations from IEHP’s July 1, 2016, through June 30, 2017, MCP-specific evaluation report, along with the MCP’s self-reported actions taken through June 30, 2018, that address the recommendations. Please note that HSAG made minimal edits to Table 6.1 to preserve the accuracy of IEHP’s self-reported actions.
Table 6.1—IEHP’s Self-Reported Follow-Up on External Quality ReviewRecommendations from the July 1, 2016, through June 30, 2017, MCP-SpecificEvaluation Report
2016–17 External Quality ReviewRecommendations Directed to IEHP
Self-Reported Actions Taken by IEHPduring the Period of July 1, 2017–June 30,2018, that Address the External QualityReview Recommendations
1. Explore the causes for the rate for the Use of Imaging Studies for Low Back Pain measure declining significantly from RY 2016 to RY 2017.
During the period of July 1, 2017, through June 30, 2018, there was a technical specification change to the Use of Imaging Studies for Low Back Pain measure. This change included the replacement of the “low back pain” code set with the code set for “uncomplicated low back pain.” This change decreased the number of overall allowable codes for this measure, thus yielding a decline in the number of numerator-compliant cases. The downward numerator shift, combined with the increased denominator, which resulted from the Medi-Cal expansion population, explains this rate decline. Although there was a decline in the raw rate percentage, it is noted that IEHP had a benchmark improvement from the 25th to the 50th percentile. The change in benchmark may be related to the general impact of the technical specification change, which was reflected in the downward adjustment of the benchmark.
Inland Empire Health Plan Performance Evaluation Report: July 1, 2017–June 30, 2018 California Department of Health Care Services
Page R-34 Health Services Advisory Group, Inc.

RECOMMENDATIONS
2017–18 Recommendations Based on the overall assessment of IEHP’s delivery of quality, accessible, and timely care through the activities described in previous sections of this report, HSAG recommends the following to the MCP:
Apply the lessons learned from the 2015–17 Diabetes HbA1c Testing and Cervical Cancer Screening PIPs to facilitate improvement for future PIPs.
In the next annual review, HSAG will evaluate continued successes of IEHP as well as the MCP’s progress with these recommendations.
Inland Empire Health Plan Performance Evaluation Report: July 1, 2017–June 30, 2018 California Department of Health Care Services
Page R-35 Health Services Advisory Group, Inc.
Medi-Cal Managed CareExternal Quality Review Technical Report
Appendix S: Performance Evaluation Report
Kern Family Health Care July 1, 2017–June 30, 2018

Medi-Cal Managed Care External Quality Review Technical ReportAppendix S: Performance Evaluation ReportKern Family Health CareJuly 1, 2017–June 30, 2018
Table of Contents
1. Introduction.............................................................................................................S-1 Medi-Cal Managed Care Health Plan Overview .......................................................S-1
2. Managed Care Health Plan Compliance ...............................................................S-2Compliance Reviews Conducted..............................................................................S-2 Strengths—Compliance Reviews .............................................................................S-2 Opportunities for Improvement—Compliance Reviews ............................................S-3
3. Managed Care Health Plan Performance Measures ............................................S-4Performance Measure Validation Results ................................................................S-4 Performance Measure Results and Findings............................................................S-4
Preventive Screening and Children’s Health .........................................................S-5 Preventive Screening and Women’s Health ..........................................................S-8 Care for Chronic Conditions ................................................................................S-10 Appropriate Treatment and Utilization.................................................................S-13 Performance Measure Findings—All Domains....................................................S-16
Improvement Plan Requirements for 2018 .............................................................S-17 Seniors and Persons with Disabilities Performance Measure Results....................S-17
Seniors and Persons with Disabilities Findings ...................................................S-22 Strengths—Performance Measures .......................................................................S-23 Opportunities for Improvement—Performance Measures ......................................S-23
4. Performance Improvement Projects ...................................................................S-24Performance Improvement Project Overview .........................................................S-24 Performance Improvement Project Results and Findings.......................................S-25
2015–17 DHCS-Priority Performance Improvement Project ...............................S-26 2015–17 MCP-Specific Performance Improvement Project ................................S-27 2017–19 Disparity Performance Improvement Project ........................................S-29 2017–19 DHCS-Priority Performance Improvement Project ...............................S-30
Strengths—Performance Improvement Projects ....................................................S-31 Opportunities for Improvement—Performance Improvement Projects ...................S-31
5. Recommendations................................................................................................S-32 Follow-Up on Prior Year Recommendations ..........................................................S-32 2017–18 Recommendations...................................................................................S-33
Kern Family Health Care Performance Evaluation Report: July 1, 2017–June 30, 2018 California Department of Health Care Services
Page S-i Health Services Advisory Group, Inc.

TABLE OF CONTENTS
Table of Tables
Table 2.1—DHCS A&I Medical and State Supported Services Audits of KFHC Audit Review Period: August 1, 2016, through July 31, 2017 ...............................S-2
Table 3.1—Preventive Screening and Children’s Health Domain Multi-Year Performance Measure Results KFHC—Kern County........................................................S-6
Table 3.2—Preventive Screening and Children’s Health Domain RY 2018 (MY 2017) Performance Measure Findings KFHC—Kern County.................................S-8
Table 3.3—Preventive Screening and Women’s Health Domain Multi-Year Performance Measure Results KFHC—Kern County........................................................S-9
Table 3.4—Preventive Screening and Women’s Health Domain RY 2018 (MY 2017) Performance Measure Findings KFHC—Kern County...............................S-10
Table 3.5—Care for Chronic Conditions Domain Multi-Year Performance Measure Results KFHC—Kern County.....................................................................S-11
Table 3.6—Care for Chronic Conditions Domain RY 2018 (MY 2017) Performance Measure Findings KFHC—Kern County ....................................................S-12
Table 3.7—Appropriate Treatment and Utilization Domain Multi-Year Performance Measure Results KFHC—Kern County......................................................S-14
Table 3.8—Appropriate Treatment and Utilization Domain RY 2018 (MY 2017) Performance Measure Findings KFHC—Kern County...............................S-15
Table 3.9—RY 2018 (MY 2017) Performance Measure Findings for All Domains KFHC—Kern County..................................................................................S-16
Table 3.10—Multi-Year SPD Performance Measure Trend Table KFHC—Kern County .S-18 Table 3.11—Multi-Year Non-SPD Performance Measure Trend Table KFHC—
Kern County...............................................................................................S-19 Table 3.12—RY 2018 (MY 2017) Performance Measure Comparison and Results for
Measures Stratified by the SPD and Non-SPD Populations KFHC— Kern County...............................................................................................S-21
Table 4.1—KFHC Immunizations of Two-Year-Olds PIP SMART Aim Measure Results.S-26 Table 4.2—KFHC Immunizations of Two-Year-Olds PIP Intervention Testing Results S-26 Table 4.3—KFHC Medication Management for People With Asthma PIP SMART
Aim Measure Results.................................................................................S-27 Table 4.4—KFHC Medication Management for People With Asthma PIP Intervention
Testing Results ..........................................................................................S-28 Table 4.5—KFHC Childhood Immunization Status—Combination 3 Disparity PIP
SMART Aim Measure ................................................................................S-29 Table 4.6—KFHC Use of Imaging Studies for Lower Back Pain PIP SMART Aim Measure S-30 Table 6.1—KFHC’s Self-Reported Follow-Up on External Quality Review
Recommendations from the July 1, 2016, through June 30, 2017, MCP-Specific Evaluation Report................................................................S-32
Kern Family Health Care Performance Evaluation Report: July 1, 2017–June 30, 2018 California Department of Health Care Services
Page S-ii Health Services Advisory Group, Inc.
Medi-Cal Managed Care External Quality Review Technical ReportAppendix S: Performance Evaluation ReportKern Family Health CareJuly 1, 2017–June 30, 2018
1. Introduction
The California Department of Health Care Services (DHCS) contracted with Health Services Advisory Group, Inc. (HSAG), an external quality review organization (EQRO), to prepare the federally required Medi-Cal Managed Care External Quality Review Technical Report, July 1, 2017–June 30, 2018. The technical report provides an overview of the objectives and methodology for conducting the external quality review (EQR) activities, including requirements related to each activity. Additionally, the technical report provides aggregated results and recommendations for DHCS for each activity.
This appendix is specific to DHCS’ contracted Medi-Cal managed care health plan (MCP), Kern Family Health Care (“KFHC” or “the MCP”). The purpose of this appendix is to provide MCP-specific results of each activity and an assessment of the MCP’s strengths and opportunities for improvement with respect to the quality and timeliness of and access to health care services furnished to Medi-Cal Managed Care (MCMC) beneficiaries (referred to as “beneficiaries” in this report). The review period for this MCP-specific evaluation report is July 1, 2017, through June 30, 2018. HSAG will report on activities that take place beyond the review period in KFHC’s 2018–19 MCP-specific evaluation report. This MCP-specific evaluation report references activities and methodologies described in detail by HSAG in the technical report section.
The aggregate EQR technical report and all MCP- and specialty health plan (SHP)-specific performance evaluation reports reflect HSAG’s external, independent assessment of the quality and timeliness of, and access to, care that MCPs and SHPs are providing to beneficiaries.
Medi-Cal Managed Care Health Plan Overview KFHC is a full-scope MCP delivering services to beneficiaries as a “Local Initiative” (LI) MCP under the Two-Plan Model (TPM). Beneficiaries may enroll in KFHC, the LI MCP; or in Health Net Community Solutions, Inc., the alternative commercial plan (CP).
KFHC became operational in Kern County to provide MCMC services effective July 1996. As of June 30, 2018, KFHC had 254,889 beneficiaries in Kern County.1 This represents 78 percent of the beneficiaries enrolled in Kern County.
1 Medi-Cal Managed Care Enrollment Report—June 2018. Available at: http://www.dhcs.ca.gov/dataandstats/reports/Pages/MMCDMonthlyEnrollment.aspx. Accessed on: Jul 24, 2018.
Kern Family Health Care Performance Evaluation Report: July 1, 2017–June 30, 2018 California Department of Health Care Services
Page S-1 Health Services Advisory Group, Inc.
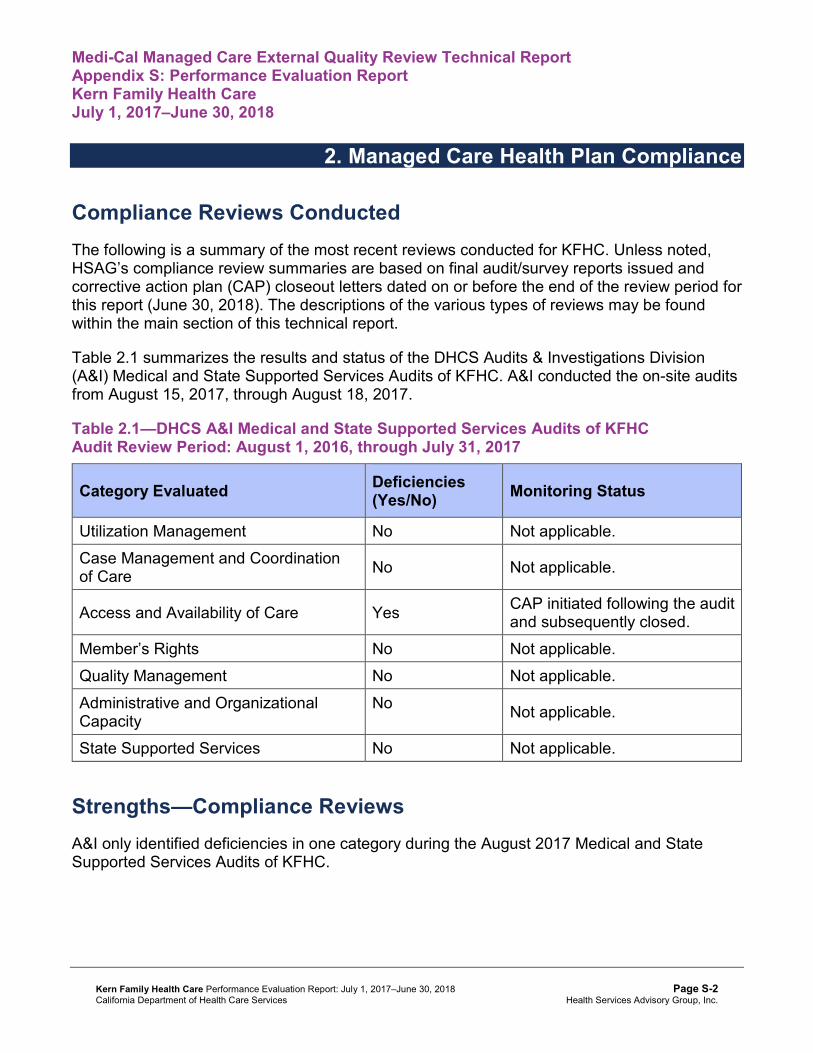
Medi-Cal Managed Care External Quality Review Technical ReportAppendix S: Performance Evaluation ReportKern Family Health CareJuly 1, 2017–June 30, 2018
2. Managed Care Health Plan Compliance
Compliance Reviews Conducted The following is a summary of the most recent reviews conducted for KFHC. Unless noted, HSAG’s compliance review summaries are based on final audit/survey reports issued and corrective action plan (CAP) closeout letters dated on or before the end of the review period for this report (June 30, 2018). The descriptions of the various types of reviews may be found within the main section of this technical report.
Table 2.1 summarizes the results and status of the DHCS Audits & Investigations Division (A&I) Medical and State Supported Services Audits of KFHC. A&I conducted the on-site audits from August 15, 2017, through August 18, 2017.
Table 2.1—DHCS A&I Medical and State Supported Services Audits of KFHCAudit Review Period: August 1, 2016, through July 31, 2017
Category Evaluated Deficiencies (Yes/No) Monitoring Status
Utilization Management No Not applicable. Case Management and Coordination of Care No Not applicable.
Access and Availability of Care Yes CAP initiated following the audit and subsequently closed.
Member’s Rights No Not applicable. Quality Management No Not applicable. Administrative and Organizational Capacity
No Not applicable.
State Supported Services No Not applicable.
Strengths—Compliance Reviews A&I only identified deficiencies in one category during the August 2017 Medical and State Supported Services Audits of KFHC.
Kern Family Health Care Performance Evaluation Report: July 1, 2017–June 30, 2018 California Department of Health Care Services
Page S-2 Health Services Advisory Group, Inc.

MANAGED CARE HEALTH PLAN COMPLIANCE
Opportunities for Improvement—Compliance Reviews KFHC has no outstanding deficiencies from the August 2017 A&I Medical and State Supported Services Audits; therefore, HSAG has no recommendations for the MCP in the area of compliance reviews.
Kern Family Health Care Performance Evaluation Report: July 1, 2017–June 30, 2018 California Department of Health Care Services
Page S-3 Health Services Advisory Group, Inc.

Medi-Cal Managed Care External Quality Review Technical ReportAppendix S: Performance Evaluation ReportKern Family Health CareJuly 1, 2017–June 30, 2018
3. Managed Care Health Plan Performance Measures
Performance Measure Validation Results The HEDIS®2 2018 Compliance Audit Final Report of Findings for Kern Family Health Care contains the detailed findings and recommendations from HSAG’s NCQA HEDIS Compliance Audit™.3 HSAG auditors determined that KFHC followed the appropriate specifications to produce valid rates.
During the audit process, HSAG recommended that KFHC increase efforts of encouraging providers to exchange data electronically via beneficiary portals and electronic medical records (EMRs). Encouraging providers to exchange data electronically will reduce the need for KFHC to review charts and improve opportunities for the MCP to report Electronic Clinical Data Systems (ECDS) measures. Note that KFHC provided information on actions that the MCP took during the review period to investigate opportunities for expanding the use of EMR data for HEDIS reporting. (See Table 5.1.)
Performance Measure Results and Findings After validating the MCP’s performance measure rates, HSAG assessed the results. See Table 3.1 through Table 3.9 for KFHC’s performance measure results for reporting years (RYs) 2015 through 2018 and performance measure findings for RY 2018. The RY is the year in which the MCP reported the rates. The RY rates reflect measurement year (MY) data from the previous calendar year. Note that data may not be available for all four years.
Note the following regarding Table 3.1 through Table 3.9:
♦ To allow HSAG to provide meaningful assessment of MCP performance and actionable recommendations, HSAG, in collaboration with DHCS, organized the measures into domains based on the health care areas each measure affects. Table 3.1 through Table 3.8 present the performance measure results and findings by domain, and Table 3.9 presents the RY 2018 performance measure findings for the domains combined.
♦ To assess performance for each MCP reporting unit, HSAG compares the rates to national benchmarks. Rates indicating performance above the high performance levels (HPLs) are shaded in gray, and rates indicating performance below the minimum performance levels (MPLs) are bolded.
2 Healthcare Effectiveness Data and Information Set (HEDIS®) is a registered trademark of the National Committee for Quality Assurance (NCQA).
3 NCQA HEDIS Compliance AuditTM is a trademark of NCQA.
Kern Family Health Care Performance Evaluation Report: July 1, 2017–June 30, 2018 California Department of Health Care Services
Page S-4 Health Services Advisory Group, Inc.
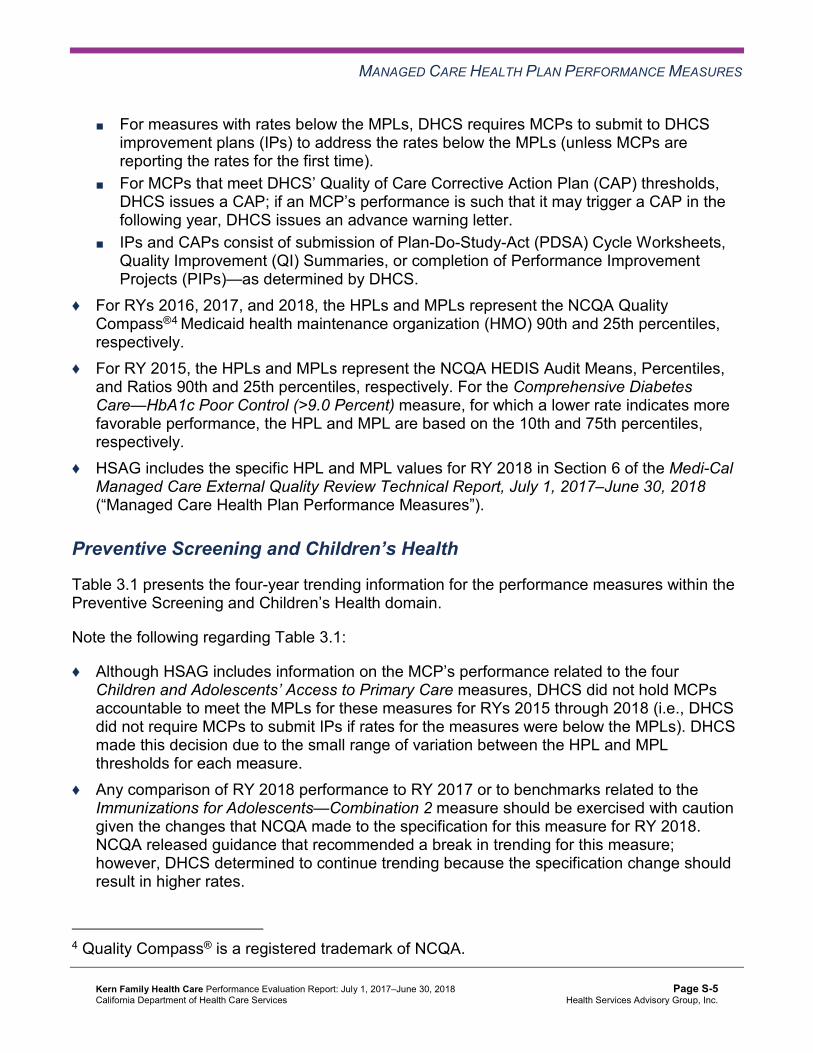
MANAGED CARE HEALTH PLAN PERFORMANCE MEASURES
■ For measures with rates below the MPLs, DHCS requires MCPs to submit to DHCS improvement plans (IPs) to address the rates below the MPLs (unless MCPs are reporting the rates for the first time).
■ For MCPs that meet DHCS’ Quality of Care Corrective Action Plan (CAP) thresholds, DHCS issues a CAP; if an MCP’s performance is such that it may trigger a CAP in the following year, DHCS issues an advance warning letter.
■ IPs and CAPs consist of submission of Plan-Do-Study-Act (PDSA) Cycle Worksheets, Quality Improvement (QI) Summaries, or completion of Performance Improvement Projects (PIPs)—as determined by DHCS.
♦ For RYs 2016, 2017, and 2018, the HPLs and MPLs represent the NCQA Quality Compass®4 Medicaid health maintenance organization (HMO) 90th and 25th percentiles, respectively.
♦ For RY 2015, the HPLs and MPLs represent the NCQA HEDIS Audit Means, Percentiles, and Ratios 90th and 25th percentiles, respectively. For the Comprehensive Diabetes Care—HbA1c Poor Control (>9.0 Percent) measure, for which a lower rate indicates more favorable performance, the HPL and MPL are based on the 10th and 75th percentiles, respectively.
♦ HSAG includes the specific HPL and MPL values for RY 2018 in Section 6 of the Medi-Cal Managed Care External Quality Review Technical Report, July 1, 2017–June 30, 2018 (“Managed Care Health Plan Performance Measures”).
Preventive Screening and Children’s Health
Table 3.1 presents the four-year trending information for the performance measures within the Preventive Screening and Children’s Health domain.
Note the following regarding Table 3.1:
♦ Although HSAG includes information on the MCP’s performance related to the four Children and Adolescents’ Access to Primary Care measures, DHCS did not hold MCPs accountable to meet the MPLs for these measures for RYs 2015 through 2018 (i.e., DHCS did not require MCPs to submit IPs if rates for the measures were below the MPLs). DHCS made this decision due to the small range of variation between the HPL and MPL thresholds for each measure.
♦ Any comparison of RY 2018 performance to RY 2017 or to benchmarks related to the Immunizations for Adolescents—Combination 2 measure should be exercised with caution given the changes that NCQA made to the specification for this measure for RY 2018. NCQA released guidance that recommended a break in trending for this measure; however, DHCS determined to continue trending because the specification change should result in higher rates.
4 Quality Compass® is a registered trademark of NCQA.
Kern Family Health Care Performance Evaluation Report: July 1, 2017–June 30, 2018 California Department of Health Care Services
Page S-5 Health Services Advisory Group, Inc.

MANAGED CARE HEALTH PLAN PERFORMANCE MEASURES
Table 3.1—Preventive Screening and Children’s Health DomainMulti-Year Performance Measure Results KFHC—Kern County
H = Rate indicates performance above the HPL. Bolded Rate = Rate indicates performance below the MPL.
B = Statistical testing result indicates that the RY 2018 rate is significantly better than the RY 2017 rate.
W = Statistical testing result indicates that the RY 2018 rate is significantly worse than the RY 2017 rate.
Measure RY
2015 Rate1
RY 2016
Rate2
RY 2017
Rate3
RY 2018
Rate4
RYs 2017–18 Rate
Difference5
Childhood Immunization Status—Combination 3 60.10% 66.91% 64.96% 68.86% 3.90
Children and Adolescents’ Access to Primary Care Practitioners—12–24 Months
92.78% 92.64% 89.65% 89.69% 0.04
Children and Adolescents’ Access to Primary Care Practitioners— 25 Months–6 Years
82.90% 82.43% 80.61% 81.44% 0.83B
Children and Adolescents’ Access to Primary Care Practitioners—7–11 Years
82.59% 82.70% 81.49% 80.88% -0.61
Children and Adolescents’ Access to Primary Care Practitioners—12–19 Years
81.10% 81.16% 80.21% 78.84% -1.37W
Immunizations for Adolescents— Combination 2^ -- -- 21.65% 36.74%H 15.09B
Weight Assessment and Counseling for Nutrition and Physical Activity for Children and Adolescents—Nutrition Counseling—Total
64.72% 66.67% 67.40% 63.02% -4.38
Weight Assessment and Counseling for Nutrition and Physical Activity for Children and Adolescents—Physical Activity Counseling—Total
52.80% 57.91% 61.56% 57.91% -3.65
Kern Family Health Care Performance Evaluation Report: July 1, 2017–June 30, 2018 California Department of Health Care Services
Page S-6 Health Services Advisory Group, Inc.
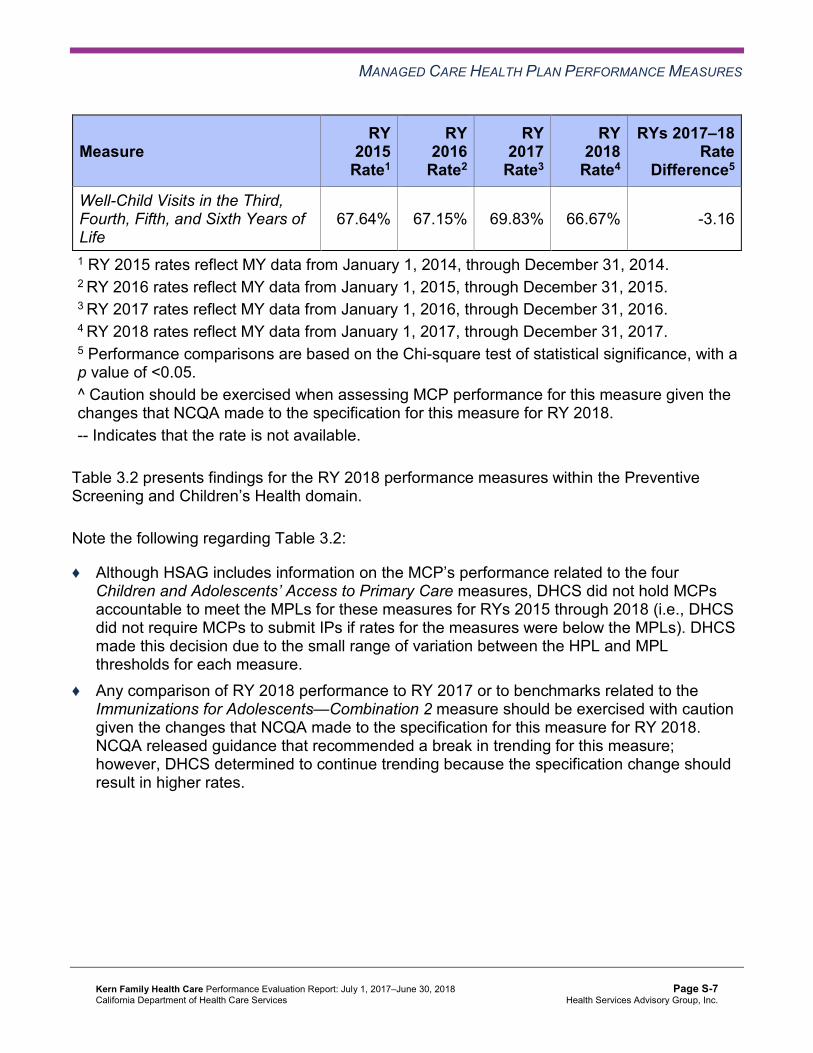
MANAGED CARE HEALTH PLAN PERFORMANCE MEASURES
Measure RY
2015 Rate1
RY 2016
Rate2
RY 2017
Rate3
RY 2018
Rate4
RYs 2017–18 Rate
Difference5
Well-Child Visits in the Third, Fourth, Fifth, and Sixth Years of Life
67.64% 67.15% 69.83% 66.67% -3.16
1 RY 2015 rates reflect MY data from January 1, 2014, through December 31, 2014. 2 RY 2016 rates reflect MY data from January 1, 2015, through December 31, 2015. 3 RY 2017 rates reflect MY data from January 1, 2016, through December 31, 2016. 4 RY 2018 rates reflect MY data from January 1, 2017, through December 31, 2017. 5 Performance comparisons are based on the Chi-square test of statistical significance, with a p value of <0.05. ^ Caution should be exercised when assessing MCP performance for this measure given the changes that NCQA made to the specification for this measure for RY 2018. -- Indicates that the rate is not available.
Table 3.2 presents findings for the RY 2018 performance measures within the Preventive Screening and Children’s Health domain.
Note the following regarding Table 3.2:
♦ Although HSAG includes information on the MCP’s performance related to the four Children and Adolescents’ Access to Primary Care measures, DHCS did not hold MCPs accountable to meet the MPLs for these measures for RYs 2015 through 2018 (i.e., DHCS did not require MCPs to submit IPs if rates for the measures were below the MPLs). DHCS made this decision due to the small range of variation between the HPL and MPL thresholds for each measure.
♦ Any comparison of RY 2018 performance to RY 2017 or to benchmarks related to the Immunizations for Adolescents—Combination 2 measure should be exercised with caution given the changes that NCQA made to the specification for this measure for RY 2018. NCQA released guidance that recommended a break in trending for this measure; however, DHCS determined to continue trending because the specification change should result in higher rates.
Kern Family Health Care Performance Evaluation Report: July 1, 2017–June 30, 2018 California Department of Health Care Services
Page S-7 Health Services Advisory Group, Inc.

MANAGED CARE HEALTH PLAN PERFORMANCE MEASURES
Table 3.2—Preventive Screening and Children’s Health DomainRY 2018 (MY 2017) Performance Measure Findings KFHC—Kern County
Criteria Number of Measures
MeetingCriteria
Total Number of Measures
Percentage of Measures
MeetingCriteria
RY 2018 Rates Above HPLs 1 5 20.00% Rates Above HPLs for the Last Three or More Consecutive Years 0 4 0.00%
RY 2018 Rates Significantly Better than RY 2017 Rates* 1 5 20.00%
Rates that Moved from Below MPLs in RY 2017 to Above MPLs in RY 2018 0 0 N/A
RY 2018 Rates Below MPLs 0 5 0.00% Rates Below MPLs for the Last Three or More Consecutive Years 0 4 0.00%
RY 2018 Rates Significantly Worse than RY 2017 Rates* 0 5 0.00%
Rates that Moved from Above MPLs in RY 2017 to Below MPLs in RY 2018 0 4 0.00%
* Performance comparisons are based on the Chi-square test of statistical significance, with a p value of <0.05. N/A = No rates above or below the MPLs from the previous year exist to include in the denominator for calculating whether or not rates moved to above or below MPLs in the most recent year.
Preventive Screening and Women’s Health
Table 3.3 presents the four-year trending information for the performance measures within the Preventive Screening and Women’s Health domain.
Note that any comparison of RY 2018 performance to RY 2017 or to benchmarks related to the Breast Cancer Screening measure should be exercised with caution given the changes that NCQA made to the specification for this measure for RY 2018. NCQA released guidance that recommended a break in trending for this measure; however, DHCS determined to continue trending because the specification change should result in higher rates.
Kern Family Health Care Performance Evaluation Report: July 1, 2017–June 30, 2018 California Department of Health Care Services
Page S-8 Health Services Advisory Group, Inc.

MANAGED CARE HEALTH PLAN PERFORMANCE MEASURES
Table 3.3—Preventive Screening and Women’s Health DomainMulti-Year Performance Measure Results KFHC—Kern County
H = Rate indicates performance above the HPL. Bolded Rate = Rate indicates performance below the MPL.
B = Statistical testing result indicates that the RY 2018 rate is significantly better than the RY 2017 rate.
W = Statistical testing result indicates that the RY 2018 rate is significantly worse than the RY 2017 rate.
Measure RY
2015 Rate1
RY 2016
Rate2
RY 2017
Rate3
RY 2018
Rate4
RYs 2017–18 Rate
Difference5
Breast Cancer Screening^ -- -- 50.48% 55.98% 5.50B
Cervical Cancer Screening 57.91% 52.07% 58.39% 58.39% 0.00 Prenatal and Postpartum Care— Postpartum Care 60.10% 56.45% 63.50% 66.67% 3.17
Prenatal and Postpartum Care— Timeliness of Prenatal Care 79.81% 79.08% 75.43% 82.48% 7.05B
1 RY 2015 rates reflect MY data from January 1, 2014, through December 31, 2014. 2 RY 2016 rates reflect MY data from January 1, 2015, through December 31, 2015. 3 RY 2017 rates reflect MY data from January 1, 2016, through December 31, 2016. 4 RY 2018 rates reflect MY data from January 1, 2017, through December 31, 2017. 5 Performance comparisons are based on the Chi-square test of statistical significance, with a p value of <0.05. ^ Caution should be exercised when assessing MCP performance for this measure given the changes that NCQA made to the specification for this measure for RY 2018. -- Indicates that the rate is not available.
Table 3.4 presents findings for the RY 2018 performance measures within the Preventive Screening and Women’s Health domain. Note that the Breast Cancer Screening measure was a first-year measure in RY 2017, and DHCS did not hold MCPs accountable to meet an MPL for this measure in RY 2017; therefore, HSAG did not include this measure in the denominators for calculating the percentage of measures with rates that moved to above or below the MPLs in RY 2018.
Kern Family Health Care Performance Evaluation Report: July 1, 2017–June 30, 2018 California Department of Health Care Services
Page S-9 Health Services Advisory Group, Inc.

MANAGED CARE HEALTH PLAN PERFORMANCE MEASURES
Table 3.4—Preventive Screening and Women’s Health DomainRY 2018 (MY 2017) Performance Measure Findings KFHC—Kern County
Criteria Number of Measures
MeetingCriteria
Total Number of Measures
Percentage of Measures
MeetingCriteria
RY 2018 Rates Above HPLs 0 4 0.00% Rates Above HPLs for the Last Three or More Consecutive Years 0 3 0.00%
RY 2018 Rates Significantly Better than RY 2017 Rates* 2 4 50.00%
Rates that Moved from Below MPLs in RY 2017 to Above MPLs in RY 2018 0 0 N/A
RY 2018 Rates Below MPLs 0 4 0.00% Rates Below MPLs for the Last Three or More Consecutive Years 0 3 0.00%
RY 2018 Rates Significantly Worse than RY 2017 Rates* 0 4 0.00%
Rates that Moved from Above MPLs in RY 2017 to Below MPLs in RY 2018 0 3 0.00%
* Performance comparisons are based on the Chi-square test of statistical significance, with a p value of <0.05. N/A = No rates above or below the MPLs from the previous year exist to include in the denominator for calculating whether or not rates moved to above or below MPLs in the most recent year.
Care for Chronic Conditions
Table 3.5 presents the four-year trending information for the performance measures within the Care for Chronic Conditions domain. Note that the Asthma Medication Ratio measure was a first-year measure in RY 2017, and DHCS did not hold MCPs accountable to meet an MPL for this measure in RY 2017; therefore, HSAG did not include this measure in the denominators for calculating the percentage of measures with rates that moved to above or below the MPLs in RY 2018.
Kern Family Health Care Performance Evaluation Report: July 1, 2017–June 30, 2018 California Department of Health Care Services
Page S-10 Health Services Advisory Group, Inc.

MANAGED CARE HEALTH PLAN PERFORMANCE MEASURES
Table 3.5—Care for Chronic Conditions Domain Multi-Year Performance Measure Results KFHC—Kern County
H = Rate indicates performance above the HPL. Bolded Rate = Rate indicates performance below the MPL.
B = Statistical testing result indicates that the RY 2018 rate is significantly better than the RY 2017 rate.
W = Statistical testing result indicates that the RY 2018 rate is significantly worse than the RY 2017 rate.
Measure RY
2015 Rate1
RY 2016
Rate2
RY 2017
Rate3
RY 2018
Rate4
RYs 2017–18 Rate
Difference5
Annual Monitoring for Patients on Persistent Medications— ACE Inhibitors or ARBs
88.78% 89.26% 88.40% 90.19% 1.79B
Annual Monitoring for Patients on Persistent Medications— Diuretics
87.85% 88.72% 87.61% 89.79% 2.18B
Asthma Medication Ratio -- -- 48.38% 49.80% 1.42 Comprehensive Diabetes Care— Blood Pressure Control (<140/90 mm Hg)
65.88% 61.86% 63.87% 69.89% 6.02B
Comprehensive Diabetes Care— Eye Exam (Retinal) Performed 49.45% 49.82% 48.36% 58.94% 10.58B
Comprehensive Diabetes Care— HbA1c Control (<8.0 Percent) 39.78% 40.88% 51.09% 58.21% 7.12B
Comprehensive Diabetes Care— HbA1c Poor Control (>9.0 Percent)*
51.64% 47.99% 39.60% 30.66% -8.94B
Comprehensive Diabetes Care— HbA1c Testing 83.03% 84.31% 84.49% 89.60% 5.11B
Comprehensive Diabetes Care— Medical Attention for Nephropathy
81.57% 90.51%H 88.87% 92.88% 4.01B
Controlling High Blood Pressure 53.53% 50.85% 57.91% 58.39% 0.48 1 RY 2015 rates reflect MY data from January 1, 2014, through December 31, 2014. 2 RY 2016 rates reflect MY data from January 1, 2015, through December 31, 2015. 3 RY 2017 rates reflect MY data from January 1, 2016, through December 31, 2016.
Kern Family Health Care Performance Evaluation Report: July 1, 2017–June 30, 2018 California Department of Health Care Services
Page S-11 Health Services Advisory Group, Inc.

MANAGED CARE HEALTH PLAN PERFORMANCE MEASURES
4 RY 2018 rates reflect MY data from January 1, 2017, through December 31, 2017. 5 Performance comparisons are based on the Chi-square test of statistical significance, with a p value of <0.05. * A lower rate indicates better performance for this measure. -- Indicates that the rate is not available.
Table 3.6 presents findings for the RY 2018 performance measures within the Care for Chronic Conditions domain.
Table 3.6—Care for Chronic Conditions Domain RY 2018 (MY 2017) Performance Measure Findings KFHC—Kern County
Criteria Number of Measures
MeetingCriteria
Total Number of Measures
Percentage of Measures
MeetingCriteria
RY 2018 Rates Above HPLs 0 10 0.00% Rates Above HPLs for the Last Three or More Consecutive Years 0 9 0.00%
RY 2018 Rates Significantly Better than RY 2017 Rates* 8 10 80.00%
Rates that Moved from Below MPLs in RY 2017 to Above MPLs in RY 2018 0 0 N/A
RY 2018 Rates Below MPLs 1 10 10.00% Rates Below MPLs for the Last Three or More Consecutive Years 0 9 0.00%
RY 2018 Rates Significantly Worse than RY 2017 Rates* 0 10 0.00%
Rates that Moved from Above MPLs in RY 2017 to Below MPLs in RY 2018 0 9 0.00%
* Performance comparisons are based on the Chi-square test of statistical significance, with a p value of <0.05. N/A = No rates above or below the MPLs from the previous year exist to include in the denominator for calculating whether or not rates moved to above or below MPLs in the most recent year.
Kern Family Health Care Performance Evaluation Report: July 1, 2017–June 30, 2018 California Department of Health Care Services
Page S-12 Health Services Advisory Group, Inc.

MANAGED CARE HEALTH PLAN PERFORMANCE MEASURES
Appropriate Treatment and Utilization
Table 3.7 presents the four-year trending information for the performance measures within the Appropriate Treatment and Utilization domain.
Note the following regarding Table 3.7:
♦ The All-Cause Readmissions measure is a non-HEDIS measure originally developed for DHCS’ All-Cause Readmissions collaborative quality improvement project (QIP); therefore, DHCS does not establish an HPL or MPL for this measure. For the All-Cause Readmissions measure, a lower rate indicates better performance (i.e., fewer readmissions).
♦ The two Ambulatory Care measures are utilization measures, which measure the volume of services used. DHCS does not hold MCPs accountable to meet MPLs for utilization measures, and HSAG does not compare performance for these measures against HPLs and MPLs. Additionally, because high and low rates do not necessarily indicate better or worse performance, HSAG did not compare performance for these measures across years.
♦ DHCS established no HPL or MPL for the two Depression Screening and Follow-Up for Adolescents and Adults measures for RY 2018 because no comparable benchmarks exist. Additionally, although MCPs reported the two Depression Screening and Follow-Up for Adolescents and Adults measures for RY 2018, HSAG does not present the performance measure results for these measures in this report because the reported rates do not accurately represent services being provided. This is due to the Depression Screening and Follow-Up for Adolescents and Adults measures being new HEDIS measures for RY 2018, NCQA requiring MCPs to submit rates for these measures using the new ECDS reporting methodology, and inconsistent data reporting processes by calculation vendors. Thus, MCPs experienced numerous challenges obtaining data sources to use for ECDS reporting. DHCS and HSAG, in consultation with NCQA, will work with MCPs to improve data capture for RY 2019.
♦ Note that due to changes that NCQA made to the specifications for the Use of Imaging Studies for Low Back Pain measure in RY 2018, NCQA released guidance to exercise caution when trending the results for this measure. Therefore, caution should be used when comparing MCP performance across years or when comparing MCP results to benchmarks related to the Use of Imaging Studies for Low Back Pain measure, as differences in rates may be a result of the specification changes rather than a reflection of performance.
Kern Family Health Care Performance Evaluation Report: July 1, 2017–June 30, 2018 California Department of Health Care Services
Page S-13 Health Services Advisory Group, Inc.

MANAGED CARE HEALTH PLAN PERFORMANCE MEASURES
Table 3.7—Appropriate Treatment and Utilization DomainMulti-Year Performance Measure Results KFHC—Kern County
H = Rate indicates performance above the HPL. Bolded Rate = Rate indicates performance below the MPL.
B = Statistical testing result indicates that the RY 2018 rate is significantly better than the RY 2017 rate.
W = Statistical testing result indicates that the RY 2018 rate is significantly worse than the RY 2017 rate.
Measure RY
2015 Rate1
RY 2016
Rate2
RY 2017
Rate3
RY 2018
Rate4
RYs 2017–18 Rate
Difference5
All-Cause Readmissions* 17.71% 14.74% 13.76% 14.36% 0.60 Ambulatory Care—Emergency Department (ED) Visits per 1,000 Member Months**
50.65 48.07 47.03 45.01 Not Tested
Ambulatory Care—Outpatient Visits per 1,000 Member Months**
272.48 256.00 286.04 328.16 Not Tested
Avoidance of Antibiotic Treatment in Adults With Acute Bronchitis
21.54% 21.22% 29.47% 27.63% -1.84
Use of Imaging Studies for Low Back Pain^ 79.35% 76.04% 66.25% 71.59% 5.34B
1 RY 2015 rates reflect MY data from January 1, 2014, through December 31, 2014. 2 RY 2016 rates reflect MY data from January 1, 2015, through December 31, 2015. 3 RY 2017 rates reflect MY data from January 1, 2016, through December 31, 2016. 4 RY 2018 rates reflect MY data from January 1, 2017, through December 31, 2017. 5 Performance comparisons are based on the Chi-square test of statistical significance, with a p value of <0.05. * A lower rate indicates better performance for this measure. ** Member months are a member's “contribution” to the total yearly membership. ^ Caution should be exercised when assessing MCP performance for this measure given the changes that NCQA made to the specification for this measure for RY 2018. -- Indicates that the rate is not available. Not Tested = An RY 2017–18 rate difference was not calculated because high and low rates do not necessarily indicate better or worse performance.
Kern Family Health Care Performance Evaluation Report: July 1, 2017–June 30, 2018 California Department of Health Care Services
Page S-14 Health Services Advisory Group, Inc.
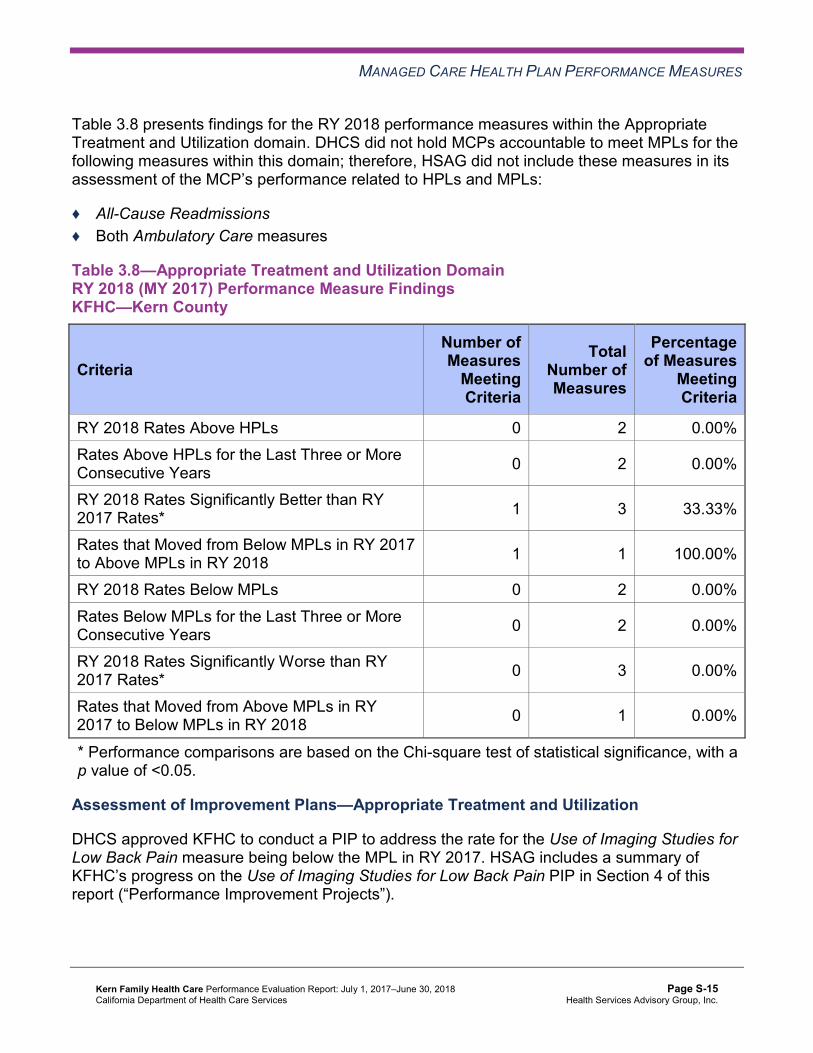
MANAGED CARE HEALTH PLAN PERFORMANCE MEASURES
Table 3.8 presents findings for the RY 2018 performance measures within the Appropriate Treatment and Utilization domain. DHCS did not hold MCPs accountable to meet MPLs for the following measures within this domain; therefore, HSAG did not include these measures in its assessment of the MCP’s performance related to HPLs and MPLs:
♦ All-Cause Readmissions ♦ Both Ambulatory Care measures
Table 3.8—Appropriate Treatment and Utilization DomainRY 2018 (MY 2017) Performance Measure Findings KFHC—Kern County
Criteria Number of Measures
MeetingCriteria
Total Number of Measures
Percentage of Measures
MeetingCriteria
RY 2018 Rates Above HPLs 0 2 0.00% Rates Above HPLs for the Last Three or More Consecutive Years 0 2 0.00%
RY 2018 Rates Significantly Better than RY 2017 Rates* 1 3 33.33%
Rates that Moved from Below MPLs in RY 2017 to Above MPLs in RY 2018 1 1 100.00%
RY 2018 Rates Below MPLs 0 2 0.00% Rates Below MPLs for the Last Three or More Consecutive Years 0 2 0.00%
RY 2018 Rates Significantly Worse than RY 2017 Rates* 0 3 0.00%
Rates that Moved from Above MPLs in RY 2017 to Below MPLs in RY 2018 0 1 0.00%
* Performance comparisons are based on the Chi-square test of statistical significance, with a p value of <0.05.
Assessment of Improvement Plans—Appropriate Treatment and Utilization
DHCS approved KFHC to conduct a PIP to address the rate for the Use of Imaging Studies for Low Back Pain measure being below the MPL in RY 2017. HSAG includes a summary of KFHC’s progress on the Use of Imaging Studies for Low Back Pain PIP in Section 4 of this report (“Performance Improvement Projects”).
Kern Family Health Care Performance Evaluation Report: July 1, 2017–June 30, 2018 California Department of Health Care Services
Page S-15 Health Services Advisory Group, Inc.

MANAGED CARE HEALTH PLAN PERFORMANCE MEASURES
Performance Measure Findings—All Domains
Table 3.9 presents a summary of KFHC’s RY 2018 performance across all External Accountability Set (EAS) measures.
Note the following regarding Table 3.9:
♦ DHCS did not hold MCPs accountable to meet MPLs for the following measures; therefore, HSAG did not include these measures in its assessment of the MCP’s performance related to HPLs and MPLs: ■ All-Cause Readmissions ■ Both Ambulatory Care measures ■ All four Children and Adolescents’ Access to Primary Care measures
♦ DHCS did not hold MCPs accountable to meet MPLs for the following measures in RY 2017; therefore, HSAG did not include these measures in the denominators for calculating the percentage of measures with rates that moved to above or below the MPLs in RY 2018 and for calculating the percentage of measures with rates below MPLs for only the last two consecutive years: ■ Asthma Medication Ratio ■ Breast Cancer Screening ■ Immunizations for Adolescents—Combination 2
Table 3.9—RY 2018 (MY 2017) Performance Measure Findings for All Domains KFHC—Kern County
Criteria Number of Measures
MeetingCriteria
Total Number of Measures
Percentage of Measures
MeetingCriteria
RY 2018 Rates Above HPLs 1 21 4.76% Rates Above HPLs for the Last Three or More Consecutive Years 0 18 0.00%
RY 2018 Rates Significantly Better than RY 2017 Rates* 12 22 54.55%
Rates that Moved from Below MPLs in RY 2017 to Above MPLs in RY 2018 1 1 100.00%
RY 2018 Rates Below MPLs 1 21 4.76% Rates Below MPLs for Only the Last Two Consecutive Years 0 18 0.00%
Kern Family Health Care Performance Evaluation Report: July 1, 2017–June 30, 2018 California Department of Health Care Services
Page S-16 Health Services Advisory Group, Inc.

MANAGED CARE HEALTH PLAN PERFORMANCE MEASURES
Criteria Number of Measures
MeetingCriteria
Total Number of Measures
Percentage of Measures
MeetingCriteria
Rates Below MPLs for the Last Three or More Consecutive Years 0 18 0.00%
RY 2018 Rates Significantly Worse than RY 2017 Rates* 0 22 0.00%
Rates that Moved from Above MPLs in RY 2017 to Below MPLs in RY 2018 0 17 0.00%
* Performance comparisons are based on the Chi-square test of statistical significance, with a p value of <0.05.
Improvement Plan Requirements for 2018 Based on RY 2018 performance measure results, KFHC will be required to submit an IP for the Asthma Medication Ratio measure.
Seniors and Persons with Disabilities Performance Measure Results Table 3.10 presents the four-year trending information for the Seniors and Persons with Disabilities (SPD) population, and Table 3.11 presents the four-year trending information for the non-SPD population for the measures that DHCS required MCPs to stratify for the SPD and non-SPD populations. The tables also show the differences in rates between RY 2017 and RY 2018.
Table 3.12 presents the SPD and non-SPD rates, a comparison of the SPD and non-SPD rates,5 and the total combined rate for each measure.
5 HSAG calculated statistical significance between the SPD and non-SPD rates for each measure using a Chi-square test. This information is displayed in the “SPD/Non-SPD Rate Difference” column in Table 3.12.
Kern Family Health Care Performance Evaluation Report: July 1, 2017–June 30, 2018 California Department of Health Care Services
Page S-17 Health Services Advisory Group, Inc.
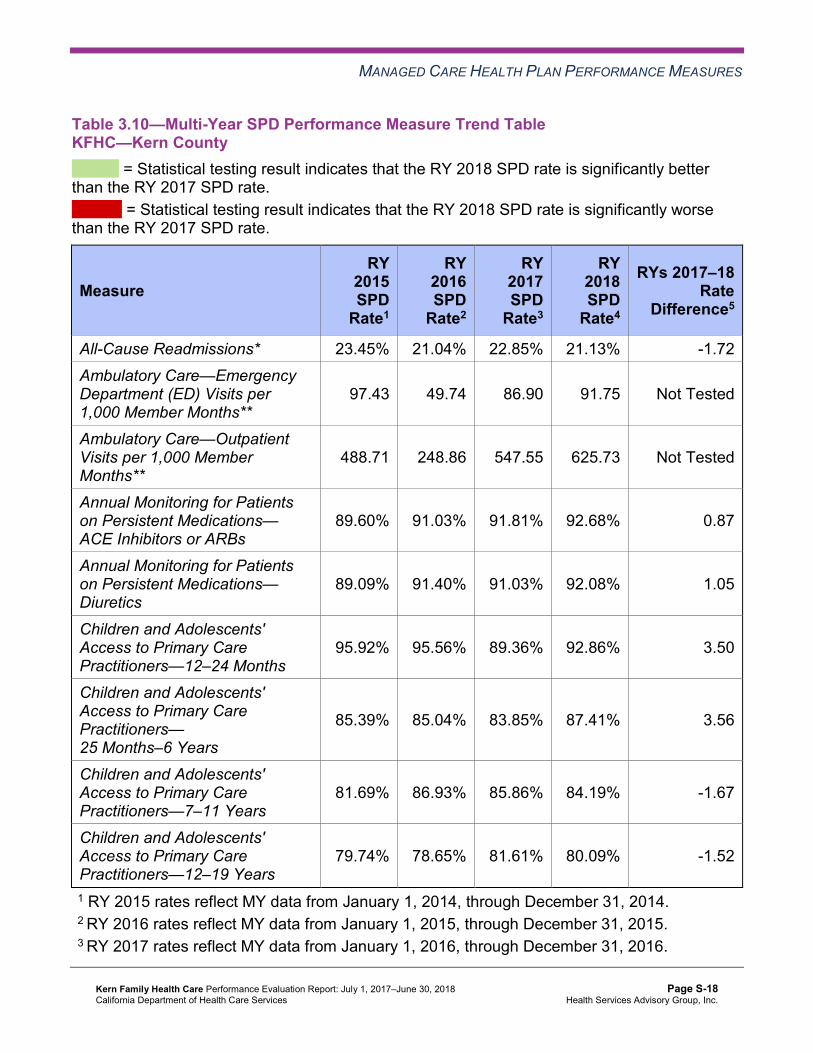
MANAGED CARE HEALTH PLAN PERFORMANCE MEASURES
Table 3.10—Multi-Year SPD Performance Measure Trend Table KFHC—Kern County
B = Statistical testing result indicates that the RY 2018 SPD rate is significantly better than the RY 2017 SPD rate.
W = Statistical testing result indicates that the RY 2018 SPD rate is significantly worse than the RY 2017 SPD rate.
Measure RY
2015 SPD
Rate1
RY 2016 SPD
Rate2
RY 2017 SPD
Rate3
RY 2018 SPD
Rate4
RYs 2017–18 Rate
Difference5
All-Cause Readmissions* 23.45% 21.04% 22.85% 21.13% -1.72 Ambulatory Care—Emergency Department (ED) Visits per 1,000 Member Months**
97.43 49.74 86.90 91.75 Not Tested
Ambulatory Care—Outpatient Visits per 1,000 Member Months**
488.71 248.86 547.55 625.73 Not Tested
Annual Monitoring for Patients on Persistent Medications— ACE Inhibitors or ARBs
89.60% 91.03% 91.81% 92.68% 0.87
Annual Monitoring for Patients on Persistent Medications— Diuretics
89.09% 91.40% 91.03% 92.08% 1.05
Children and Adolescents' Access to Primary Care Practitioners—12–24 Months
95.92% 95.56% 89.36% 92.86% 3.50
Children and Adolescents' Access to Primary Care Practitioners— 25 Months–6 Years
85.39% 85.04% 83.85% 87.41% 3.56
Children and Adolescents' Access to Primary Care Practitioners—7–11 Years
81.69% 86.93% 85.86% 84.19% -1.67
Children and Adolescents' Access to Primary Care Practitioners—12–19 Years
79.74% 78.65% 81.61% 80.09% -1.52
1 RY 2015 rates reflect MY data from January 1, 2014, through December 31, 2014. 2 RY 2016 rates reflect MY data from January 1, 2015, through December 31, 2015. 3 RY 2017 rates reflect MY data from January 1, 2016, through December 31, 2016.
Kern Family Health Care Performance Evaluation Report: July 1, 2017–June 30, 2018 California Department of Health Care Services
Page S-18 Health Services Advisory Group, Inc.

MANAGED CARE HEALTH PLAN PERFORMANCE MEASURES
4 RY 2018 rates reflect MY data from January 1, 2017, through December 31, 2017. 5 Performance comparisons are based on the Chi-square test of statistical significance, with a p value of <0.05. * A lower rate indicates better performance for this measure. ** Member months are a member's “contribution” to the total yearly membership. Not Tested = An RY 2017–18 rate difference was not calculated because high and low rates do not necessarily indicate better or worse performance.
Table 3.11—Multi-Year Non-SPD Performance Measure Trend Table KFHC—Kern County
B = Statistical testing result indicates that the RY 2018 non-SPD rate is significantly better than the RY 2017 non-SPD rate.
W = Statistical testing result indicates that the RY 2018 non-SPD rate is significantly worse than the RY 2017 non-SPD rate.
Measure RY 2015
Non-SPD Rate1
RY 2016 Non-SPD
Rate2
RY 2017 Non-SPD
Rate3
RY 2018 Non-SPD
Rate4
RYs 2017–18 Rate
Difference5
All-Cause Readmissions* 13.32% 10.46% 9.49% 10.90% 1.41W
Ambulatory Care— Emergency Department (ED) Visits per 1,000 Member Months**
47.95 47.96 44.70 42.26 Not Tested
Ambulatory Care— Outpatient Visits per 1,000 Member Months**
259.98 256.47 270.75 310.70 Not Tested
Annual Monitoring for Patients on Persistent Medications— ACE Inhibitors or ARBs
88.39% 88.57% 87.35% 89.37% 2.02B
Annual Monitoring for Patients on Persistent Medications—Diuretics
87.18% 87.39% 86.24% 88.87% 2.63B
Children and Adolescents' Access to Primary Care Practitioners— 12–24 Months
92.75% 92.62% 89.65% 89.67% 0.02
Kern Family Health Care Performance Evaluation Report: July 1, 2017–June 30, 2018 California Department of Health Care Services
Page S-19 Health Services Advisory Group, Inc.

MANAGED CARE HEALTH PLAN PERFORMANCE MEASURES
Measure RY 2015
Non-SPD Rate1
RY 2016 Non-SPD
Rate2
RY 2017 Non-SPD
Rate3
RY 2018 Non-SPD
Rate4
RYs 2017–18 Rate
Difference5
Children and Adolescents' Access to Primary Care Practitioners— 25 Months–6 Years
82.85% 82.38% 80.55% 81.32% 0.77B
Children and Adolescents' Access to Primary Care Practitioners— 7–11 Years
82.61% 82.54% 81.35% 80.78% -0.57
Children and Adolescents' Access to Primary Care Practitioners— 12–19 Years
81.14% 81.29% 80.15% 78.79% -1.36W
1 RY 2015 rates reflect MY data from January 1, 2014, through December 31, 2014. 2 RY 2016 rates reflect MY data from January 1, 2015, through December 31, 2015. 3 RY 2017 rates reflect MY data from January 1, 2016, through December 31, 2016. 4 RY 2018 rates reflect MY data from January 1, 2017, through December 31, 2017. 5 Performance comparisons are based on the Chi-square test of statistical significance, with a p value of <0.05. * A lower rate indicates better performance for this measure. ** Member months are a member's “contribution” to the total yearly membership. Not Tested = An RY 2017–18 rate difference was not calculated because high and low rates do not necessarily indicate better or worse performance.
Kern Family Health Care Performance Evaluation Report: July 1, 2017–June 30, 2018 California Department of Health Care Services
Page S-20 Health Services Advisory Group, Inc.
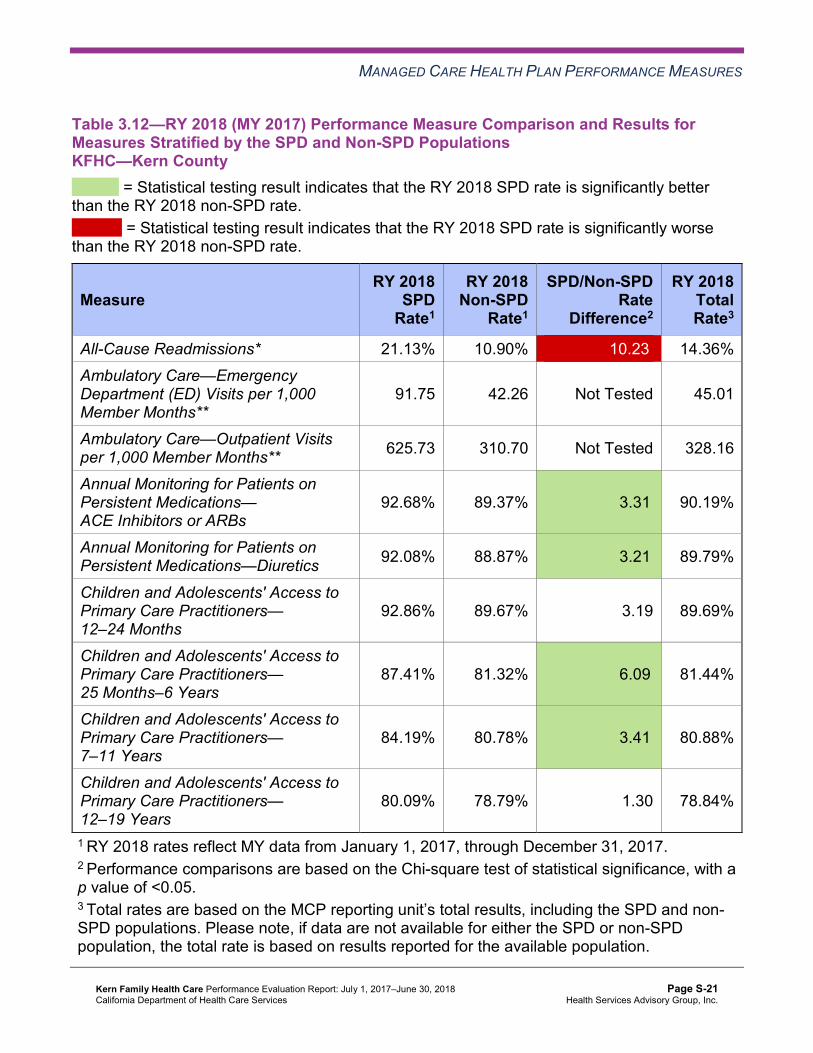
MANAGED CARE HEALTH PLAN PERFORMANCE MEASURES
Table 3.12—RY 2018 (MY 2017) Performance Measure Comparison and Results forMeasures Stratified by the SPD and Non-SPD PopulationsKFHC—Kern County
B = Statistical testing result indicates that the RY 2018 SPD rate is significantly better than the RY 2018 non-SPD rate.
W = Statistical testing result indicates that the RY 2018 SPD rate is significantly worse than the RY 2018 non-SPD rate.
Measure RY 2018
SPD Rate1
RY 2018 Non-SPD
Rate1
SPD/Non-SPDRate
Difference2
RY 2018 Total Rate3
All-Cause Readmissions* 21.13% 10.90% 10.23W 14.36% Ambulatory Care—Emergency Department (ED) Visits per 1,000 Member Months**
91.75 42.26 Not Tested 45.01
Ambulatory Care—Outpatient Visits per 1,000 Member Months** 625.73 310.70 Not Tested 328.16
Annual Monitoring for Patients on Persistent Medications— ACE Inhibitors or ARBs
92.68% 89.37% 3.31B 90.19%
Annual Monitoring for Patients on Persistent Medications—Diuretics 92.08% 88.87% 3.21B 89.79%
Children and Adolescents' Access to Primary Care Practitioners— 12–24 Months
92.86% 89.67% 3.19 89.69%
Children and Adolescents' Access to Primary Care Practitioners— 25 Months–6 Years
87.41% 81.32% 6.09B 81.44%
Children and Adolescents' Access to Primary Care Practitioners— 7–11 Years
84.19% 80.78% 3.41B 80.88%
Children and Adolescents' Access to Primary Care Practitioners— 12–19 Years
80.09% 78.79% 1.30 78.84%
1 RY 2018 rates reflect MY data from January 1, 2017, through December 31, 2017. 2 Performance comparisons are based on the Chi-square test of statistical significance, with a p value of <0.05. 3 Total rates are based on the MCP reporting unit’s total results, including the SPD and non-SPD populations. Please note, if data are not available for either the SPD or non-SPD population, the total rate is based on results reported for the available population.
Kern Family Health Care Performance Evaluation Report: July 1, 2017–June 30, 2018 California Department of Health Care Services
Page S-21 Health Services Advisory Group, Inc.

MANAGED CARE HEALTH PLAN PERFORMANCE MEASURES
* A lower rate indicates better performance for this measure. ** Member months are a member's “contribution” to the total yearly membership. Not Tested = An SPD/non-SPD rate difference was not calculated because high and low rates do not necessarily indicate better or worse performance.
Seniors and Persons with Disabilities Findings
HSAG observed the following notable results in RY 2018 for measures that KFHC stratified by the SPD and non-SPD populations:
♦ KFHC had no statistically significant variation in SPD rates from RY 2017 to RY 2018. ♦ The non-SPD rate improved significantly from RY 2017 to RY 2018 for the following
measures: ■ Both Annual Monitoring for Patients on Persistent Medications measures ■ Children and Adolescents’ Access to Primary Care Practitioners—25 Months–6 Years
♦ The RY 2018 non-SPD rate was significantly worse than the RY 2017 non-SPD rate for the following measures: ■ All-Cause Readmissions ■ Children and Adolescents' Access to Primary Care Practitioners—12–19 Years
♦ The RY 2018 SPD rates were significantly better than the RY 2018 non-SPD rates for the following measures: ■ Both Annual Monitoring for Patients on Persistent Medications measures ■ Children and Adolescents' Access to Primary Care Practitioners—25 Months–6 Years
and 7–11 Years ♦ The RY 2018 SPD rate was significantly worse than the RY 2018 non-SPD rate for the All-
Cause Readmissions measure. Note that the higher rate of hospital readmissions for the SPD population is expected based on the greater and often more complicated health care needs of these beneficiaries.
Kern Family Health Care Performance Evaluation Report: July 1, 2017–June 30, 2018 California Department of Health Care Services
Page S-22 Health Services Advisory Group, Inc.

MANAGED CARE HEALTH PLAN PERFORMANCE MEASURES
Strengths—Performance Measures HSAG auditors determined that KFHC followed the appropriate specifications to produce valid rates.
HSAG identified the following notable RY 2018 performance measure results for KFHC:
♦ Across all domains, 12 of 22 rates (55 percent) improved significantly from RY 2017 to RY 2018. ■ KFHC’s performance improved most within the Care for Chronic Conditions domain,
with eight of 10 rates within this domain (80 percent) improving significantly from RY 2017 to RY 2018.
■ The significant improvement in the rate for the Use of Imaging Studies for Low Back Pain measure resulted in the rate moving from below the MPL in RY 2017 to above the MPL in RY 2018.
■ The significant improvement in the rate for the Immunizations for Adolescents— Combination 2 measure resulted in the rate moving to above the HPL in RY 2018.
Opportunities for Improvement—Performance Measures KFHC has the opportunity to increase its efforts of encouraging providers to exchange data electronically via beneficiary portals and EMRs. KFHC also has the opportunity to assess the causes for the Asthma Medication Ratio measure rate being below the MPL in RY 2018 and to identify strategies to ensure that beneficiaries ages 5 to 64 who are identified as having persistent asthma have a ratio of controller medications to total asthma medications of 0.50 or greater.
Kern Family Health Care Performance Evaluation Report: July 1, 2017–June 30, 2018 California Department of Health Care Services
Page S-23 Health Services Advisory Group, Inc.

Medi-Cal Managed Care External Quality Review Technical ReportAppendix S: Performance Evaluation ReportKern Family Health CareJuly 1, 2017–June 30, 2018
4. Performance Improvement Projects
Performance Improvement Project Overview The key concepts of the rapid-cycle PIP framework include forming a PIP team, setting aims, establishing measures, determining interventions using quality improvement tools, conducting PDSA cycles to test interventions, and planning for the spread of successful changes. The core component of the rapid-cycle PIP approach involves testing changes on a small scale so that improvement can occur more efficiently and lead to long-term sustainability. The following modules guide MCPs through this rapid-cycle PIP process:
♦ Module 1—PIP Initiation ■ MCPs outline the framework for the PIP, which includes:
○ The topic rationale. ○ Comparative data supporting the need to improve the selected topic. ○ A list of the PIP team members, which consists of internal and external stakeholders. ○ A completed key driver diagram that defines the theory of change for improvement,
including the SMART (Specific, Measurable, Achievable, Relevant, and Time-bound) Aim and Global Aim.
♦ Module 2—SMART Aim Data Collection ■ MCPs define the SMART Aim measure and data collection methodology and develop
the SMART Aim data run chart. ♦ Module 3—Intervention Determination
■ MCPs use process mapping and failure modes and effects analysis to identify potential interventions to test which may have direct effects on the SMART Aim.
♦ Module 4—Plan-Do-Study-Act (PDSA) ■ MCPs test and evaluate the interventions identified in Module 3 through a series of
PDSA cycles. ♦ Module 5—PIP Conclusions
■ MCPs interpret results and summarize: ○ Key findings and outcomes achieved. ○ Assessment of each tested intervention. ○ Lessons learned, including how demonstrated improvement can be shared and used
as a foundation for further improvement going forward. ○ Plan for sustained improvement.
Kern Family Health Care Performance Evaluation Report: July 1, 2017–June 30, 2018 California Department of Health Care Services
Page S-24 Health Services Advisory Group, Inc.

PERFORMANCE IMPROVEMENT PROJECTS
Based on the agreed-upon timeline, MCPs submit each module to HSAG for validation. Throughout the rapid-cycle PIP process, HSAG provides technical assistance to MCPs to ensure that PIPs are methodologically sound and to problem-solve with MCPs regarding how to address challenges that occur. Through an iterative process, MCPs have opportunities to make corrections to modules 1 through 3 to achieve all validation criteria.
Once MCPs achieve all validation criteria for modules 1 through 3 and receive feedback on the intervention Plan portion of Module 4, MCPs test interventions. During the intervention testing phase of the PIP, HSAG conducts periodic progress check-ins to ensure that MCPs have addressed HSAG’s feedback on the Plan portion of Module 4 and are making appropriate progress with intervention testing. Once MCPs complete testing an intervention, MCPs determine the next steps based on results and lessons learned—whether the intervention was successful and should be spread (adopt), whether modifications need to be made to the existing intervention (adapt), or whether the intervention was not successful and should be stopped (abandon).
In Module 5, MCPs summarize the overall PIP. When validating Module 5, HSAG assesses the validity and reliability of the results based on the Centers for Medicare & Medicaid Services (CMS) validation protocols to determine whether key stakeholders can have confidence in the reported PIP findings. HSAG assigns the following final confidence levels for each PIP:
♦ High confidence—the PIP was methodologically sound and achieved the SMART Aim goal; the demonstrated improvement was clearly linked to the quality improvement processes conducted and intervention(s) tested; and, the MCP accurately summarized the key findings.
♦ Confidence—the PIP was methodologically sound and achieved the SMART Aim goal, and the MCP accurately summarized the key findings. However, some, but not all, of the quality improvement processes conducted and/or intervention(s) tested were clearly linked to the demonstrated improvement.
♦ Low confidence—either (A) the PIP was methodologically sound; however, the SMART Aim goal was not achieved; or (B) the SMART Aim goal was achieved; however, the quality improvement processes and/or intervention(s) tested were poorly executed and could not be linked to the improvement.
♦ Reported PIP results were not credible—the PIP methodology was not executed as approved.
Performance Improvement Project Results and Findings During the review period, KFHC submitted modules 4 and 5 for its 2015–17 DHCS-priority and MCP-specific PIPs. HSAG validated the modules and includes the final PIP validation findings in this report. Additionally, KFHC initiated a Disparity PIP and a DHCS-priority PIP during the review period. In this report, HSAG includes summaries of the MCP’s Disparity and DHCS-priority PIP module submissions as well as validation findings from the review period.
Kern Family Health Care Performance Evaluation Report: July 1, 2017–June 30, 2018 California Department of Health Care Services
Page S-25 Health Services Advisory Group, Inc.

PERFORMANCE IMPROVEMENT PROJECTS
2015–17 DHCS-Priority Performance Improvement Project
KFHC selected immunizations of two-year-olds for its 2015–17 DHCS-priority PIP. While the MCP concluded its Immunizations of Two-Year-Olds PIP through the SMART Aim end date of June 30, 2017, KFHC submitted modules 4 and 5 for HSAG to validate during the review period for this report. HSAG provided final validation findings and encouraged KFHC to incorporate the experiences and lessons learned from the PIP into future quality improvement efforts.
Table 4.1 provides a summary of the SMART Aim measure results reported by the MCP.
Table 4.1—KFHC Immunizations of Two-Year-Olds PIP SMART Aim Measure Results
SMART Aim Measure Baseline Rate
SMART Aim Goal
Rate
SMART Aim Goal Achieved
Rate of immunizations among two-year-olds assigned to Provider A6 21.23% 26.23% No
Table 4.2 presents a description of the interventions that KFHC tested for its Immunizations of Two-Year-Olds PIP. The table also indicates the failure modes that each intervention addressed as well as whether the MCP decided, based on intervention testing results, to adopt, adapt, or abandon the intervention.
Table 4.2—KFHC Immunizations of Two-Year-Olds PIP Intervention Testing Results
Intervention Failure Mode Addressed Adopt,Adapt, orAbandon
Using Modifier 25 to capture immunizations given during appropriate sick-child visits
Provider unwilling to give immunizations during sick-child visits. Adopt
Signing up and using the California Immunization Registry 2 (CAIR2) daily
Provider does not input all immunizations administered into the CAIR2 database.
Abandon
KFHC documented the following lessons learned during the scope of the 2015–17 DHCS-priority PIP, which the MCP may apply to future PIPs:
♦ Clearly share expectations with partnered providers and stakeholders. ♦ Propose project in writing to all stakeholders.
6 Provider name removed for confidentiality.
Kern Family Health Care Performance Evaluation Report: July 1, 2017–June 30, 2018 California Department of Health Care Services
Page S-26 Health Services Advisory Group, Inc.
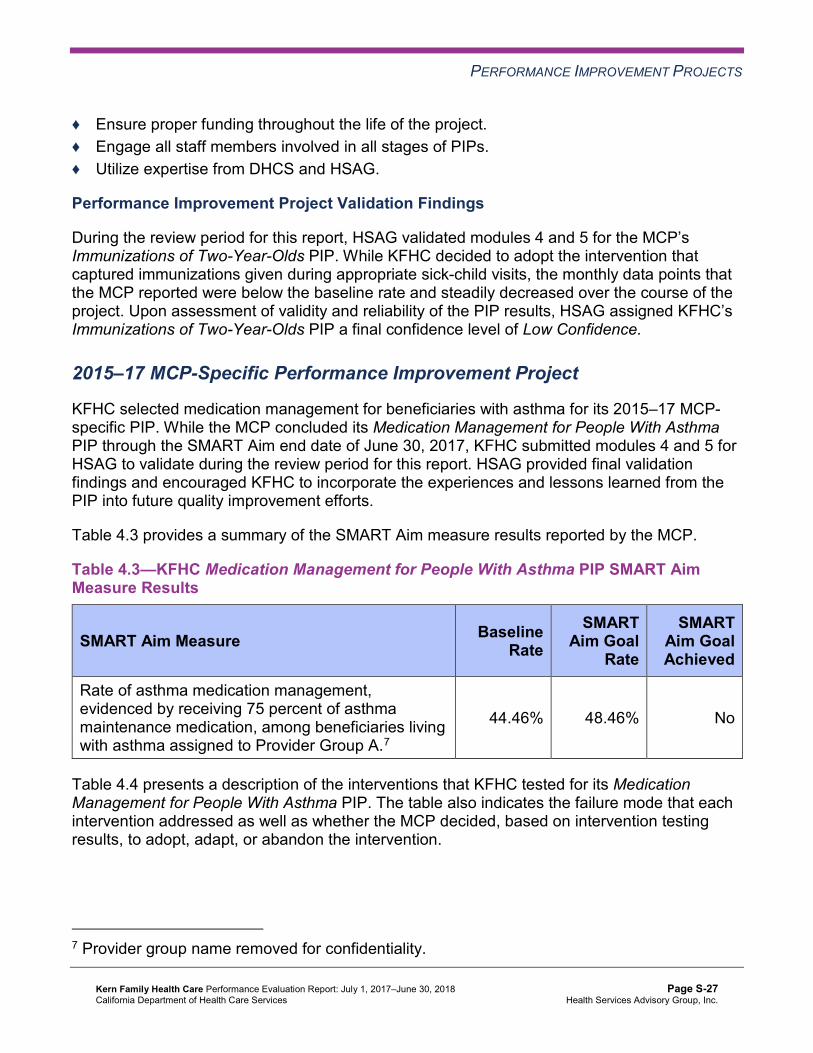
PERFORMANCE IMPROVEMENT PROJECTS
♦ Ensure proper funding throughout the life of the project. ♦ Engage all staff members involved in all stages of PIPs. ♦ Utilize expertise from DHCS and HSAG.
Performance Improvement Project Validation Findings
During the review period for this report, HSAG validated modules 4 and 5 for the MCP’s Immunizations of Two-Year-Olds PIP. While KFHC decided to adopt the intervention that captured immunizations given during appropriate sick-child visits, the monthly data points that the MCP reported were below the baseline rate and steadily decreased over the course of the project. Upon assessment of validity and reliability of the PIP results, HSAG assigned KFHC’s Immunizations of Two-Year-Olds PIP a final confidence level of Low Confidence.
2015–17 MCP-Specific Performance Improvement Project
KFHC selected medication management for beneficiaries with asthma for its 2015–17 MCP-specific PIP. While the MCP concluded its Medication Management for People With Asthma PIP through the SMART Aim end date of June 30, 2017, KFHC submitted modules 4 and 5 for HSAG to validate during the review period for this report. HSAG provided final validation findings and encouraged KFHC to incorporate the experiences and lessons learned from the PIP into future quality improvement efforts.
Table 4.3 provides a summary of the SMART Aim measure results reported by the MCP.
Table 4.3—KFHC Medication Management for People With Asthma PIP SMART Aim Measure Results
SMART Aim Measure Baseline Rate
SMART Aim Goal
Rate
SMART Aim Goal Achieved
Rate of asthma medication management, evidenced by receiving 75 percent of asthma maintenance medication, among beneficiaries living with asthma assigned to Provider Group A.7
44.46% 48.46% No
Table 4.4 presents a description of the interventions that KFHC tested for its Medication Management for People With Asthma PIP. The table also indicates the failure mode that each intervention addressed as well as whether the MCP decided, based on intervention testing results, to adopt, adapt, or abandon the intervention.
7 Provider group name removed for confidentiality.
Kern Family Health Care Performance Evaluation Report: July 1, 2017–June 30, 2018 California Department of Health Care Services
Page S-27 Health Services Advisory Group, Inc.

PERFORMANCE IMPROVEMENT PROJECTS
Table 4.4—KFHC Medication Management for People With Asthma PIP Intervention Testing Results
Intervention Failure Mode Addressed Adopt,Adapt, orAbandon
Provide patient education using the Asthma Action Plan.
Beneficiary does not understand the importance of asthma education and the role of medication.
Abandon
Increase referrals to the MCP’s Health Education Department’s asthma management classes by offering incentives to qualified beneficiaries.
Provider does not inform patients about acute asthma management and the importance of daily maintenance medication due to limited time spent with patients during office visits.
Adapt
KFHC documented the following lessons learned during the scope of the 2015–17 MCP-specific PIP, which the MCP may apply to future PIPs:
♦ Obtain buy-in from executive management. ♦ Keep everyone involved in the PIP informed regarding progress and expectations of the
PIP. ♦ Ensure that all stakeholders are involved when developing the PIP and assigning
responsibilities and deadlines. ♦ Offer gift cards as incentives.
Performance Improvement Project Validation Findings
During the review period for this report, HSAG validated modules 4 and 5 for the MCP’s Medication Management for People With Asthma PIP. KFHC documented that during the first three months of testing the patient education intervention only 4 percent of beneficiaries successfully received the intervention as intended. Based on these results, the MCP decided to abandon the intervention. The second intervention resulted in an increase in referrals to the asthma management classes; however, only four beneficiaries completed the classes. Although the intervention testing yielded some positive results, KFHC did not achieve the SMART Aim goal.
Upon assessment of validity and reliability of the PIP results, HSAG assigned KFHC’s Medication Management for People With Asthma PIP a final confidence level of Low Confidence.
Kern Family Health Care Performance Evaluation Report: July 1, 2017–June 30, 2018 California Department of Health Care Services
Page S-28 Health Services Advisory Group, Inc.
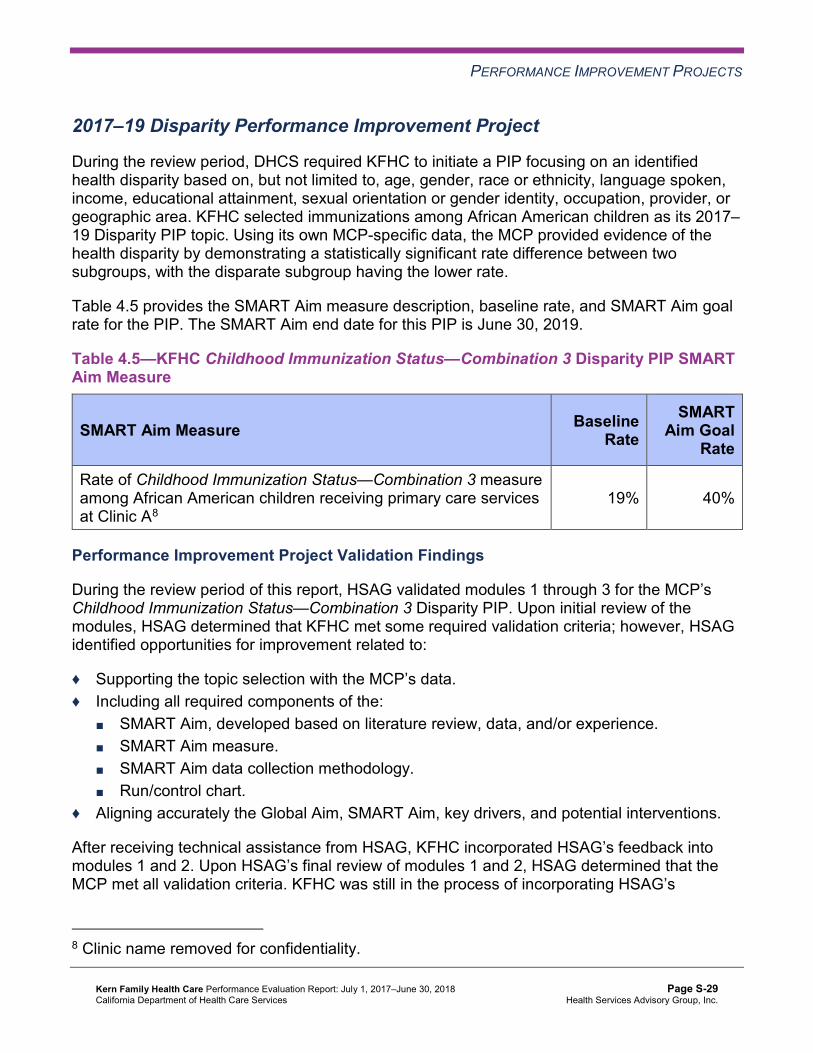
PERFORMANCE IMPROVEMENT PROJECTS
2017–19 Disparity Performance Improvement Project
During the review period, DHCS required KFHC to initiate a PIP focusing on an identified health disparity based on, but not limited to, age, gender, race or ethnicity, language spoken, income, educational attainment, sexual orientation or gender identity, occupation, provider, or geographic area. KFHC selected immunizations among African American children as its 2017– 19 Disparity PIP topic. Using its own MCP-specific data, the MCP provided evidence of the health disparity by demonstrating a statistically significant rate difference between two subgroups, with the disparate subgroup having the lower rate.
Table 4.5 provides the SMART Aim measure description, baseline rate, and SMART Aim goal rate for the PIP. The SMART Aim end date for this PIP is June 30, 2019.
Table 4.5—KFHC Childhood Immunization Status—Combination 3 Disparity PIP SMART Aim Measure
SMART Aim Measure Baseline Rate
SMART Aim Goal
Rate
Rate of Childhood Immunization Status—Combination 3 measure among African American children receiving primary care services at Clinic A8
19% 40%
Performance Improvement Project Validation Findings
During the review period of this report, HSAG validated modules 1 through 3 for the MCP’s Childhood Immunization Status—Combination 3 Disparity PIP. Upon initial review of the modules, HSAG determined that KFHC met some required validation criteria; however, HSAG identified opportunities for improvement related to:
♦ Supporting the topic selection with the MCP’s data. ♦ Including all required components of the:
■ SMART Aim, developed based on literature review, data, and/or experience. ■ SMART Aim measure. ■ SMART Aim data collection methodology. ■ Run/control chart.
♦ Aligning accurately the Global Aim, SMART Aim, key drivers, and potential interventions.
After receiving technical assistance from HSAG, KFHC incorporated HSAG’s feedback into modules 1 and 2. Upon HSAG’s final review of modules 1 and 2, HSAG determined that the MCP met all validation criteria. KFHC was still in the process of incorporating HSAG’s
8 Clinic name removed for confidentiality.
Kern Family Health Care Performance Evaluation Report: July 1, 2017–June 30, 2018 California Department of Health Care Services
Page S-29 Health Services Advisory Group, Inc.

PERFORMANCE IMPROVEMENT PROJECTS
feedback into Module 3 during the review period; therefore, HSAG includes no final validation results for Module 3 in this report.
2017–19 DHCS-Priority Performance Improvement Project
During the review period, DHCS required MCPs to initiate a PIP related to one of DHCS’ Quality Strategy focus areas: Childhood Immunization Status—Combination 3, Controlling High Blood Pressure, Comprehensive Diabetes Care, or Prenatal and Postpartum Care— Postpartum Care. However, based on KFHC demonstrating high performance on DHCS’ Quality Strategy focus areas, DHCS allowed the MCP to choose an alternative topic for its DHCS-priority PIP based on an identified area in need of improvement. KFHC selected use of imaging studies for lower back pain as its 2017–19 DHCS-priority PIP topic based on its MCP-specific data.
Table 4.6 provides the SMART Aim measure description, baseline rate, and SMART Aim goal rate for the PIP. The SMART Aim end date for this PIP is June 30, 2019.
Table 4.6—KFHC Use of Imaging Studies for Lower Back Pain PIP SMART Aim Measure
SMART Aim Measure Baseline Rate
SMART Aim Goal
Rate
Rate of beneficiaries diagnosed with uncomplicated lower back pain, ages 18 to 50, and assigned to Provider B9 who did not have an imaging study.
85.29% 95.29%
Performance Improvement Project Validation Findings
During the review period of this report, HSAG validated modules 1 and 2 for the MCP’s Use of Imaging Studies for Lower Back Pain PIP. KFHC completed modules 1 and 2 with its provider partner; however, the MCP experienced challenges with keeping the provider partner engaged due to competing priorities at the provider site. After several attempts, KFHC was unable to resolve the provider partner’s resource constraints. In May 2018, KFHC identified a new provider partner with whom to work and revised modules 1 and 2 based on the new provider partner’s data. Upon initial review of the revised modules 1 and 2, HSAG determined that the MCP met all required validation criteria.
9 Provider name removed for confidentiality.
Kern Family Health Care Performance Evaluation Report: July 1, 2017–June 30, 2018 California Department of Health Care Services
Page S-30 Health Services Advisory Group, Inc.

PERFORMANCE IMPROVEMENT PROJECTS
Strengths—Performance Improvement Projects Upon completion of the 2015–17 Immunizations of Two-Year-Olds PIP, KFHC developed an intervention that it can adopt to improve the rate of immunizations administered during appropriate sick-child visits. Additionally, through the 2015–17 Medication Management for People With Asthma PIP, KFHC identified an intervention that it can adapt to increase referrals for beneficiaries to attend the MCP’s asthma management classes.
Opportunities for Improvement—Performance Improvement Projects KFHC has the opportunity to monitor the adopted and adapted interventions to achieve optimal outcomes beyond the life of the 2015–17 Immunizations of Two-Year-Olds and Medication Management for People With Asthma PIPs. The MCP should incorporate lessons learned from the 2015–17 PIPs to facilitate improvement of the adopted and adapted interventions.
Additionally, KFHC has the opportunity to apply lessons learned from the 2015–17 Immunizations of Two-Year-Olds PIP to the MCP’s 2017–19 Childhood Immunization Status— Combination 3 Disparity PIP.
Kern Family Health Care Performance Evaluation Report: July 1, 2017–June 30, 2018 California Department of Health Care Services
Page S-31 Health Services Advisory Group, Inc.

Medi-Cal Managed Care External Quality Review Technical ReportAppendix S: Performance Evaluation ReportKern Family Health CareJuly 1, 2017–June 30, 2018
5. Recommendations
Follow-Up on Prior Year Recommendations DHCS provided each MCP an opportunity to outline actions taken to address recommendations HSAG made in its 2016–17 MCP-specific evaluation report. Table 5.1 provides EQR recommendations from KFHC’s July 1, 2016, through June 30, 2017, MCP-specific evaluation report, along with the MCP’s self-reported actions taken through June 30, 2018, that address the recommendations. Please note that HSAG made minimal edits to Table 5.1 to preserve the accuracy of KFHC’s self-reported actions.
Table 5.1—KFHC’s Self-Reported Follow-Up on External Quality ReviewRecommendations from the July 1, 2016, through June 30, 2017, MCP-SpecificEvaluation Report
2016–17 External Quality ReviewRecommendations Directed to KFHC
Self-Reported Actions Taken by KFHCduring the Period of July 1, 2017–June 30,2018, that Address the External QualityReview Recommendations
1. Identify opportunities to expand use of EMR data for future HEDIS reporting.
KFHC continues to investigate opportunities to expand EMR data for HEDIS reporting. ♦ Pilot to work with two high-volume
providers to extract ECDS from their EMRs is ongoing. This will be spread to other NextGen users.
♦ Met with early adopter, high-performing provider to explore use of technology in his clinic.
2. Investigate use of the PM 160 claim form, until DHCS phases out the form, to determine if data from the report would be beneficial for HEDIS reporting.
Evaluation of HEDIS data supports continued use of PM 160s. ♦ Project proposal submitted for development
of electronic PM 160 in 2019. ♦ PM 160s currently submitted to KFHC are
scanned and saved for use in HEDIS before submission to the Child Health and Disability Program (CHDP).
♦ HEDIS record retrieval and abstraction includes PM 160s.
Kern Family Health Care Performance Evaluation Report: July 1, 2017–June 30, 2018 California Department of Health Care Services
Page S-32 Health Services Advisory Group, Inc.

RECOMMENDATIONS
2016–17 External Quality ReviewRecommendations Directed to KFHC
Self-Reported Actions Taken by KFHCduring the Period of July 1, 2017–June 30,2018, that Address the External QualityReview Recommendations
3. Identify the causes for the MCP’s performance below the MPL in RY 2017 for the Use of Imaging Studies for Low Back Pain measure.
KFHC reviewed the Use of Imaging Studies for Low Back Pain measure technical specifications and KFHC’s HEDIS vendor’s interpretation of these specifications. The use of non-clinical determination of diagnosis produced many false-positive cases of low back pain in RY 2017. The vendor’s return to the previous (2016 and earlier) interpretation of the technical specifications resulted in the rate for the Use of Imaging Studies for Low Back Pain measure moving to above the MPL in RY 2018.
2017–18 Recommendations Based on the overall assessment of KFHC’s delivery of quality, accessible, and timely care through the activities described in previous sections of this report, HSAG recommends the following to the MCP:
♦ Increase efforts of encouraging providers to exchange data electronically via beneficiary portals and EMRs.
♦ Assess the causes for the Asthma Medication Ratio measure rate being below the MPL in RY 2018, and identify strategies to ensure that beneficiaries ages 5 to 64 who are identified as having persistent asthma have a ratio of controller medications to total asthma medications of 0.50 or greater.
♦ Monitor the adopted and adapted interventions to achieve optimal outcomes beyond the life of the 2015–17 Immunizations of Two-Year-Olds and Medication Management for People With Asthma PIPs. The MCP should incorporate lessons learned from the 2015–17 PIPs to facilitate improvement of the adopted and adapted interventions.
♦ Apply lessons learned from the 2015–17 Immunizations of Two-Year-Olds PIP to the MCP’s 2017–19 Childhood Immunization Status—Combination 3 Disparity PIP.
In the next annual review, HSAG will evaluate continued successes of KFHC as well as the MCP’s progress with these recommendations.
Kern Family Health Care Performance Evaluation Report: July 1, 2017–June 30, 2018 California Department of Health Care Services
Page S-33 Health Services Advisory Group, Inc.
Medi-Cal Managed CareExternal Quality Review Technical Report
Appendix T: Performance Evaluation Report Kaiser NorCal (KP Cal, LLC, in Amador, El Dorado, Placer, and
Sacramento Counties) July 1, 2017–June 30, 2018

Medi-Cal Managed Care External Quality Review Technical ReportAppendix T: Performance Evaluation ReportKaiser NorCal July 1, 2017–June 30, 2018
Table of Contents
1. Introduction.............................................................................................................T-1 Medi-Cal Managed Care Health Plan Overview .......................................................T-1
2. Managed Care Health Plan Compliance ...............................................................T-3Compliance Reviews Conducted..............................................................................T-3
Follow-Up on 2016 A&I Medical and State Supported Services Audits.................T-3 Strengths—Compliance Reviews .............................................................................T-4 Opportunities for Improvement—Compliance Reviews ............................................T-4
3. Managed Care Health Plan Performance Measures ............................................T-5Performance Measure Validation Results ................................................................T-5 Performance Measure Results and Findings............................................................T-5
Preventive Screening and Children’s Health .........................................................T-6 Preventive Screening and Women’s Health ........................................................T-10 Care for Chronic Conditions ................................................................................T-12 Appropriate Treatment and Utilization.................................................................T-14 Performance Measure Findings—All Domains....................................................T-17
Seniors and Persons with Disabilities Performance Measure Results....................T-18 Seniors and Persons with Disabilities Findings ...................................................T-23
Strengths—Performance Measures .......................................................................T-24 Opportunities for Improvement—Performance Measures ......................................T-24
4. Performance Improvement Projects ...................................................................T-25Performance Improvement Project Overview .........................................................T-25 Performance Improvement Project Results and Findings.......................................T-26
2015–17 DHCS-Priority Performance Improvement Project ...............................T-27 2015–17 MCP-Specific Performance Improvement Project ................................T-28 2017–19 Disparity Performance Improvement Project ........................................T-29 2017–19 DHCS-Priority Performance Improvement Project ...............................T-30
Strengths—Performance Improvement Projects ....................................................T-31 Opportunities for Improvement—Performance Improvement Projects ...................T-31
5. Recommendations................................................................................................T-32 Follow-Up on Prior Year Recommendations ..........................................................T-32 2017–18 Recommendations...................................................................................T-33
Kaiser NorCal Performance Evaluation Report: July 1, 2017–June 30, 2018 California Department of Health Care Services
Page T-i Health Services Advisory Group, Inc.

TABLE OF CONTENTS
Table of Tables
Table 2.1—DHCS A&I Medical Audit of Kaiser NorCal Audit Review Period: September 1, 2016, through August 31, 2017 .............................................T-3
Table 3.1—Preventive Screening and Children’s Health Domain Multi-Year Performance Measure Results Kaiser NorCal—KP North ...........................T-7
Table 3.2—Preventive Screening and Children’s Health Domain RY 2018 (MY 2017) Performance Measure Findings Kaiser NorCal—KP North..........................T-9
Table 3.3—Preventive Screening and Women’s Health Domain Multi-Year Performance Measure Results Kaiser NorCal—KP North .........................T-10
Table 3.4—Preventive Screening and Women’s Health Domain RY 2018 (MY 2017) Performance Measure Findings Kaiser NorCal—KP North........................T-11
Table 3.5—Care for Chronic Conditions Domain Multi-Year Performance Measure Results Kaiser NorCal—KP North..............................................................T-12
Table 3.6—Care for Chronic Conditions Domain RY 2018 (MY 2017) Performance Measure Findings Kaiser NorCal—KP North .............................................T-13
Table 3.7—Appropriate Treatment and Utilization Domain Multi-Year Performance Measure Results Kaiser NorCal—KP North...............................................T-15
Table 3.8—Appropriate Treatment and Utilization Domain RY 2018 (MY 2017) Performance Measure Findings Kaiser NorCal—KP North........................T-16
Table 3.9—RY 2018 (MY 2017) Performance Measure Findings for All Domains Kaiser NorCal—KP North ..........................................................................T-17
Table 3.10—Multi-Year SPD Performance Measure Trend Table Kaiser NorCal— KP North ....................................................................................................T-19
Table 3.11—Multi-Year Non-SPD Performance Measure Trend Table Kaiser NorCal—KP North......................................................................................T-20
Table 3.12—RY 2018 (MY 2017) Performance Measure Comparison and Results for Measures Stratified by the SPD and Non-SPD Populations Kaiser NorCal—KP North......................................................................................T-22
Table 4.1—Kaiser NorCal Postpartum Care PIP SMART Aim Measure Results .........T-27 Table 4.2—Kaiser NorCal Postpartum Care PIP Intervention Testing Results ............T-27 Table 4.3—Kaiser NorCal Initial Health Assessment PIP SMART Aim Measure Results T-28 Table 4.4—Kaiser NorCal Initial Health Assessment PIP Intervention Testing Results..T-28 Table 4.5—Kaiser NorCal Contraception Disparity PIP SMART Aim Measure ............T-29 Table 4.6—Kaiser NorCal Initial Health Assessment PIP SMART Aim Measure .........T-30 Table 5.1—Kaiser NorCal’s Self-Reported Follow-Up on External Quality Review
Recommendations from the July 1, 2016, through June 30, 2017, MCP-Specific Evaluation Report................................................................T-32
Kaiser NorCal Performance Evaluation Report: July 1, 2017–June 30, 2018 California Department of Health Care Services
Page T-ii Health Services Advisory Group, Inc.
Medi-Cal Managed Care External Quality Review Technical ReportAppendix T: Performance Evaluation ReportKaiser NorCal July 1, 2017–June 30, 2018
1. Introduction
The California Department of Health Care Services (DHCS) contracted with Health Services Advisory Group, Inc. (HSAG), an external quality review organization (EQRO), to prepare the federally required Medi-Cal Managed Care External Quality Review Technical Report, July 1, 2017–June 30, 2018. The technical report provides an overview of the objectives and methodology for conducting the external quality review (EQR) activities, including requirements related to each activity. Additionally, the technical report provides aggregated results and recommendations for DHCS for each activity.
This appendix is specific to DHCS’ contracted Medi-Cal managed care health plan (MCP), KP Cal, LLC, in Amador, El Dorado, Placer, and Sacramento counties (commonly known as “Kaiser Permanente North” and referred to in this report as “Kaiser NorCal” or “the MCP”). The purpose of this appendix is to provide MCP-specific results of each activity and an assessment of the MCP’s strengths and opportunities for improvement with respect to the quality and timeliness of and access to health care services furnished to Medi-Cal Managed Care (MCMC) beneficiaries (referred to as “beneficiaries” in this report). The review period for this MCP-specific evaluation report is July 1, 2017, through June 30, 2018. HSAG will report on activities that take place beyond the review period in Kaiser NorCal’s 2018–19 MCP-specific evaluation report. This MCP-specific evaluation report references activities and methodologies described in detail by HSAG in the technical report section.
The aggregate EQR technical report and all MCP- and specialty health plan (SHP)-specific performance evaluation reports reflect HSAG’s external, independent assessment of the quality and timeliness of, and access to, care that MCPs and SHPs are providing to beneficiaries.
Medi-Cal Managed Care Health Plan Overview Kaiser NorCal is a full-scope MCP delivering services to beneficiaries under two health care models. In Sacramento County, Kaiser NorCal serves beneficiaries under a Geographic Managed Care (GMC) model. The GMC model currently operates in the counties of San Diego and Sacramento. In this GMC model, DHCS allows beneficiaries to select from several commercial MCPs within the specified geographic service area (county).
In addition to Kaiser NorCal, Sacramento County’s beneficiaries may select from the following MCPs:
♦ Anthem Blue Cross Partnership Plan ♦ Health Net Community Solutions, Inc. ♦ Molina Healthcare of California Partner Plan, Inc.
Kaiser NorCal Performance Evaluation Report: July 1, 2017–June 30, 2018 California Department of Health Care Services
Page T-1 Health Services Advisory Group, Inc.

INTRODUCTION
In Amador, El Dorado, and Placer counties, Kaiser NorCal delivers services to its beneficiaries under the Regional Model. In all three counties, beneficiaries may enroll in Kaiser NorCal or in Anthem Blue Cross Partnership Plan or California Health & Wellness Plan, the other commercial plans.
Kaiser NorCal became operational in Sacramento County to provide MCMC services effective April 1994. As part of MCMC’s expansion under Section 1115 of the Social Security Act, Kaiser NorCal contracted to provide MCMC services in Amador, El Dorado, and Placer counties beginning November 1, 2013. As of June 30, 2018, Kaiser NorCal had 85,306 beneficiaries in Sacramento County, 96 in Amador County, 1,985 in El Dorado County, and 7,263 in Placer County.1 This represents 20 percent of the beneficiaries enrolled in Sacramento County, 2 percent in Amador County, 7 percent in El Dorado County, and 16 percent in Placer County.
DHCS allows Kaiser NorCal to combine the data from Sacramento, Amador, El Dorado, and Placer counties for reporting purposes. For this report, these four counties are considered a single reporting unit (KP North).
1 Medi-Cal Managed Care Enrollment Report—June 2018. Available at: http://www.dhcs.ca.gov/dataandstats/reports/Pages/MMCDMonthlyEnrollment.aspx. Accessed on: Aug 24, 2018.
Kaiser NorCal Performance Evaluation Report: July 1, 2017–June 30, 2018 California Department of Health Care Services
Page T-2 Health Services Advisory Group, Inc.
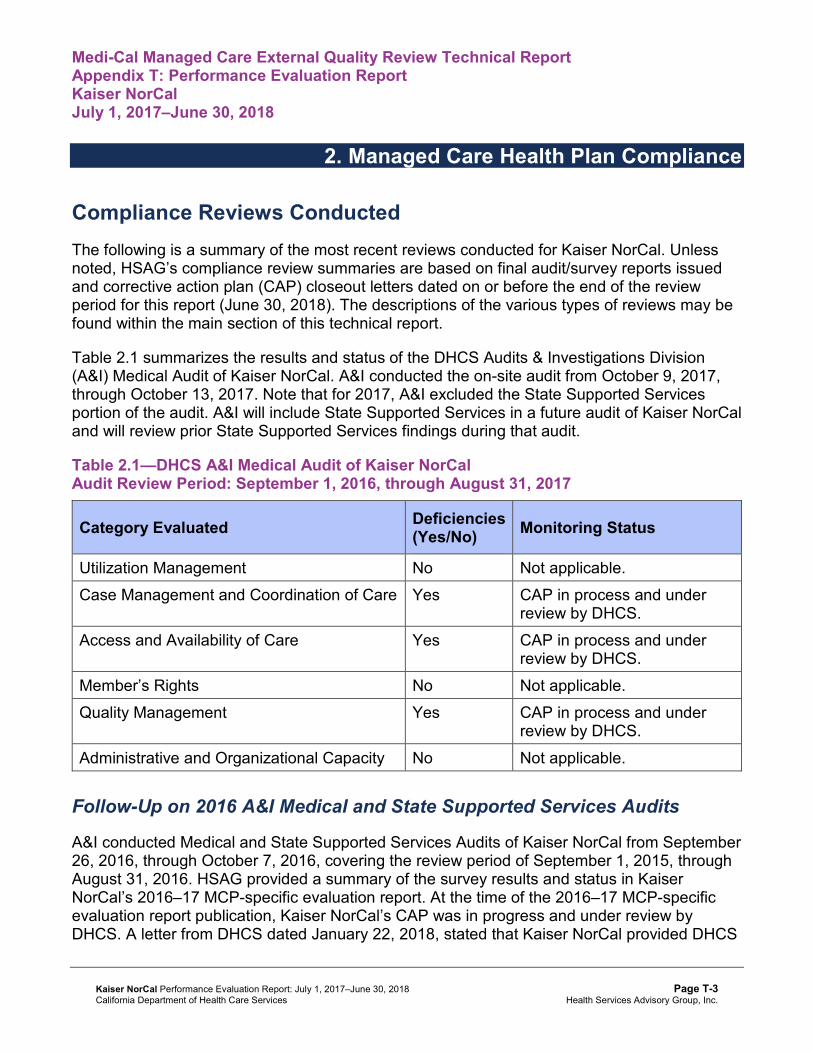
Medi-Cal Managed Care External Quality Review Technical ReportAppendix T: Performance Evaluation ReportKaiser NorCal July 1, 2017–June 30, 2018
2. Managed Care Health Plan Compliance
Compliance Reviews Conducted The following is a summary of the most recent reviews conducted for Kaiser NorCal. Unless noted, HSAG’s compliance review summaries are based on final audit/survey reports issued and corrective action plan (CAP) closeout letters dated on or before the end of the review period for this report (June 30, 2018). The descriptions of the various types of reviews may be found within the main section of this technical report.
Table 2.1 summarizes the results and status of the DHCS Audits & Investigations Division (A&I) Medical Audit of Kaiser NorCal. A&I conducted the on-site audit from October 9, 2017, through October 13, 2017. Note that for 2017, A&I excluded the State Supported Services portion of the audit. A&I will include State Supported Services in a future audit of Kaiser NorCal and will review prior State Supported Services findings during that audit.
Table 2.1—DHCS A&I Medical Audit of Kaiser NorCal Audit Review Period: September 1, 2016, through August 31, 2017
Category Evaluated Deficiencies (Yes/No) Monitoring Status
Utilization Management No Not applicable. Case Management and Coordination of Care Yes CAP in process and under
review by DHCS. Access and Availability of Care Yes CAP in process and under
review by DHCS. Member’s Rights No Not applicable. Quality Management Yes CAP in process and under
review by DHCS. Administrative and Organizational Capacity No Not applicable.
Follow-Up on 2016 A&I Medical and State Supported Services Audits
A&I conducted Medical and State Supported Services Audits of Kaiser NorCal from September 26, 2016, through October 7, 2016, covering the review period of September 1, 2015, through August 31, 2016. HSAG provided a summary of the survey results and status in Kaiser NorCal’s 2016–17 MCP-specific evaluation report. At the time of the 2016–17 MCP-specific evaluation report publication, Kaiser NorCal’s CAP was in progress and under review by DHCS. A letter from DHCS dated January 22, 2018, stated that Kaiser NorCal provided DHCS
Kaiser NorCal Performance Evaluation Report: July 1, 2017–June 30, 2018 California Department of Health Care Services
Page T-3 Health Services Advisory Group, Inc.

MANAGED CARE HEALTH PLAN COMPLIANCE
with additional information regarding the CAP and that DHCS had found all items to be in compliance; therefore, DHCS closed the CAP.
Strengths—Compliance Reviews A&I identified no deficiencies in the Utilization Management, Member’s Rights, or Administrative and Organizational Capacity categories during the October 2017 Medical Audit of Kaiser NorCal. Additionally, Kaiser NorCal fully resolved all outstanding deficiencies from the September 26, 2016, through October 7, 2016, A&I Medical and State Supported Services Audits.
Opportunities for Improvement—Compliance Reviews Kaiser NorCal has the opportunity to work with DHCS to ensure that the MCP resolves all deficiencies from the October 2017 A&I Medical Audit. The deficiencies cut across the areas of quality and timeliness of, and access to, health care.
Kaiser NorCal Performance Evaluation Report: July 1, 2017–June 30, 2018 California Department of Health Care Services
Page T-4 Health Services Advisory Group, Inc.

Medi-Cal Managed Care External Quality Review Technical ReportAppendix T: Performance Evaluation ReportKaiser NorCal July 1, 2017–June 30, 2018
3. Managed Care Health Plan Performance Measures
Performance Measure Validation Results The HEDIS®2 2018 Compliance Audit Final Report of Findings for Kaiser NorCal contains the detailed findings and recommendations from HSAG’s NCQA HEDIS Compliance Audit™.3
HSAG auditors determined that Kaiser NorCal followed the appropriate specifications to produce valid rates, and identified no issues of concern.
Performance Measure Results and Findings After validating the MCP’s performance measure rates, HSAG assessed the results. See Table 3.1 through Table 3.9 for Kaiser NorCal’s performance measure results for reporting years (RYs) 2015 through 2018 and performance measure findings for RY 2018. The RY is the year in which the MCP reported the rates. The RY rates reflect measurement year (MY) data from the previous calendar year. Note that data may not be available for all four years.
Note the following regarding Table 3.1 through Table 3.9:
♦ To allow HSAG to provide meaningful assessment of MCP performance and actionable recommendations, HSAG, in collaboration with DHCS, organized the measures into domains based on the health care areas each measure affects. Table 3.1 through Table 3.8 present the performance measure results and findings by domain, and Table 3.9 presents the RY 2018 performance measure findings for the domains combined.
♦ To assess performance for each MCP reporting unit, HSAG compares the rates to national benchmarks. Rates indicating performance above the high performance levels (HPLs) are shaded in gray, and rates indicating performance below the minimum performance levels (MPLs) are bolded. ■ For measures with rates below the MPLs, DHCS requires MCPs to submit to DHCS
improvement plans (IPs) to address the rates below the MPLs (unless MCPs are reporting the rates for the first time).
■ For MCPs that meet DHCS’ Quality of Care CAP thresholds, DHCS issues a CAP; if an MCP’s performance is such that it may trigger a CAP in the following year, DHCS issues an advance warning letter.
2 Healthcare Effectiveness Data and Information Set (HEDIS®) is a registered trademark of the National Committee for Quality Assurance (NCQA).
3 NCQA HEDIS Compliance AuditTM is a trademark of NCQA.
Kaiser NorCal Performance Evaluation Report: July 1, 2017–June 30, 2018 California Department of Health Care Services
Page T-5 Health Services Advisory Group, Inc.

MANAGED CARE HEALTH PLAN PERFORMANCE MEASURES
■ IPs and CAPs consist of submission of Plan-Do-Study-Act (PDSA) Cycle Worksheets, Quality Improvement (QI) Summaries, or completion of Performance Improvement Projects (PIPs)—as determined by DHCS.
♦ For RYs 2016, 2017, and 2018, the HPLs and MPLs represent the NCQA Quality Compass®4 Medicaid health maintenance organization (HMO) 90th and 25th percentiles, respectively.
♦ For RY 2015, the HPLs and MPLs represent the NCQA HEDIS Audit Means, Percentiles, and Ratios 90th and 25th percentiles, respectively. For the Comprehensive Diabetes Care—HbA1c Poor Control (>9.0 Percent) measure, for which a lower rate indicates more favorable performance, the HPL and MPL are based on the 10th and 75th percentiles, respectively.
♦ HSAG includes the specific HPL and MPL values for RY 2018 in Section 6 of the Medi-Cal Managed Care External Quality Review Technical Report, July 1, 2017–June 30, 2018 (“Managed Care Health Plan Performance Measures”).
Preventive Screening and Children’s Health
Table 3.1 presents the four-year trending information for the performance measures within the Preventive Screening and Children’s Health domain.
Note the following regarding Table 3.1:
♦ Although HSAG includes information on the MCP’s performance related to the four Children and Adolescents’ Access to Primary Care measures, DHCS did not hold MCPs accountable to meet the MPLs for these measures for RYs 2015 through 2018 (i.e., DHCS did not require MCPs to submit IPs if rates for the measures were below the MPLs). DHCS made this decision due to the small range of variation between the HPL and MPL thresholds for each measure.
♦ Any comparison of RY 2018 performance to RY 2017 or to benchmarks related to the Immunizations for Adolescents—Combination 2 measure should be exercised with caution given the changes that NCQA made to the specification for this measure for RY 2018. NCQA released guidance that recommended a break in trending for this measure; however, DHCS determined to continue trending because the specification change should result in higher rates.
4 Quality Compass® is a registered trademark of NCQA.
Kaiser NorCal Performance Evaluation Report: July 1, 2017–June 30, 2018 California Department of Health Care Services
Page T-6 Health Services Advisory Group, Inc.

MANAGED CARE HEALTH PLAN PERFORMANCE MEASURES
Table 3.1—Preventive Screening and Children’s Health DomainMulti-Year Performance Measure Results Kaiser NorCal—KP North
H = Rate indicates performance above the HPL. Bolded Rate = Rate indicates performance below the MPL.
B = Statistical testing result indicates that the RY 2018 rate is significantly better than the RY 2017 rate.
W = Statistical testing result indicates that the RY 2018 rate is significantly worse than the RY 2017 rate.
Measure RY
2015 Rate1
RY 2016
Rate2
RY 2017
Rate3
RY 2018
Rate4
RYs 2017–18 Rate
Difference5
Childhood Immunization Status—Combination 3 82.96%H 76.85% 79.35% 80.61%H 1.26
Children and Adolescents’ Access to Primary Care Practitioners—12–24 Months
98.81% 98.66% 98.49% 99.05% 0.56
Children and Adolescents’ Access to Primary Care Practitioners— 25 Months–6 Years
89.84% 90.60% 90.00% 86.79% -3.21W
Children and Adolescents’ Access to Primary Care Practitioners—7–11 Years
89.49% 91.71% 90.75% 88.87% -1.88W
Children and Adolescents’ Access to Primary Care Practitioners—12–19 Years
90.81% 93.15% 92.99% 90.24% -2.75W
Immunizations for Adolescents— Combination 2^ -- -- 33.90% 55.17%H 21.27B
Weight Assessment and Counseling for Nutrition and Physical Activity for Children and Adolescents—Nutrition Counseling—Total
93.57%H 91.64%H 92.52%H 91.48%H -1.04W
Weight Assessment and Counseling for Nutrition and Physical Activity for Children and Adolescents—Physical Activity Counseling—Total
93.52%H 91.54%H 92.63%H 91.54%H -1.09W
Kaiser NorCal Performance Evaluation Report: July 1, 2017–June 30, 2018 California Department of Health Care Services
Page T-7 Health Services Advisory Group, Inc.

MANAGED CARE HEALTH PLAN PERFORMANCE MEASURES
Measure RY
2015 Rate1
RY 2016
Rate2
RY 2017
Rate3
RY 2018
Rate4
RYs 2017–18 Rate
Difference5
Well-Child Visits in the Third, Fourth, Fifth, and Sixth Years of Life
81.15% 81.02% 81.65% 80.77% -0.88
1 RY 2015 rates reflect MY data from January 1, 2014, through December 31, 2014. 2 RY 2016 rates reflect MY data from January 1, 2015, through December 31, 2015. 3 RY 2017 rates reflect MY data from January 1, 2016, through December 31, 2016. 4 RY 2018 rates reflect MY data from January 1, 2017, through December 31, 2017. 5 Performance comparisons are based on the Chi-square test of statistical significance, with a p value of <0.05. ^ Caution should be exercised when assessing MCP performance for this measure given the changes that NCQA made to the specification for this measure for RY 2018. -- Indicates that the rate is not available.
Table 3.2 presents findings for the RY 2018 performance measures within the Preventive Screening and Children’s Health domain.
Note the following regarding Table 3.2:
♦ DHCS did not hold MCPs accountable to meet MPLs for all four Children and Adolescents’ Access to Primary Care measures within this domain; therefore, HSAG did not include these measures in its assessment of the MCP’s performance related to HPLs and MPLs.
♦ The Immunizations for Adolescents—Combination 2 measure was a first-year measure in RY 2017, and DHCS established no MPL for this measure for RY 2017 because no comparable benchmark existed; therefore, HSAG did not include this measure in the denominators for calculating the percentage of measures with rates that moved to above or below the MPLs in RY 2018.
Kaiser NorCal Performance Evaluation Report: July 1, 2017–June 30, 2018 California Department of Health Care Services
Page T-8 Health Services Advisory Group, Inc.

MANAGED CARE HEALTH PLAN PERFORMANCE MEASURES
Table 3.2—Preventive Screening and Children’s Health DomainRY 2018 (MY 2017) Performance Measure Findings Kaiser NorCal—KP North
Criteria Number of Measures
MeetingCriteria
Total Number of Measures
Percentage of Measures
MeetingCriteria
RY 2018 Rates Above HPLs 4 5 80.00% Rates Above HPLs for the Last Three or More Consecutive Years 2 4 50.00%
RY 2018 Rates Significantly Better than RY 2017 Rates* 1 5 20.00%
Rates that Moved from Below MPLs in RY 2017 to Above MPLs in RY 2018 0 0 N/A
RY 2018 Rates Below MPLs 0 5 0.00% Rates Below MPLs for the Last Three or More Consecutive Years 0 4 0.00%
RY 2018 Rates Significantly Worse than RY 2017 Rates* 2 5 40.00%
Rates that Moved from Above MPLs in RY 2017 to Below MPLs in RY 2018 0 4 0.00%
* Performance comparisons are based on the Chi-square test of statistical significance, with a p value of <0.05. N/A = No rates above or below the MPLs from the previous year exist to include in the denominator for calculating whether or not rates moved to above or below MPLs in the most recent year.
Kaiser NorCal Performance Evaluation Report: July 1, 2017–June 30, 2018 California Department of Health Care Services
Page T-9 Health Services Advisory Group, Inc.

MANAGED CARE HEALTH PLAN PERFORMANCE MEASURES
Preventive Screening and Women’s Health
Table 3.3 presents the four-year trending information for the performance measures within the Preventive Screening and Women’s Health domain.
Note that any comparison of RY 2018 performance to RY 2017 or to benchmarks related to the Breast Cancer Screening measure should be exercised with caution given the changes that NCQA made to the specification for this measure for RY 2018. NCQA released guidance that recommended a break in trending for this measure; however, DHCS determined to continue trending because the specification change should result in higher rates.
Table 3.3—Preventive Screening and Women’s Health DomainMulti-Year Performance Measure Results Kaiser NorCal—KP North
H = Rate indicates performance above the HPL. Bolded Rate = Rate indicates performance below the MPL.
B = Statistical testing result indicates that the RY 2018 rate is significantly better than the RY 2017 rate.
W = Statistical testing result indicates that the RY 2018 rate is significantly worse than the RY 2017 rate.
Measure RY
2015 Rate1
RY 2016
Rate2
RY 2017
Rate3
RY 2018
Rate4
RYs 2017–18 Rate
Difference5
Breast Cancer Screening^ -- -- 80.13%H 81.41%H 1.28 Cervical Cancer Screening 79.66%H 84.93%H 86.30%H 86.01%H -0.29 Prenatal and Postpartum Care— Postpartum Care 73.95% 75.67%H 73.28% 73.73%H 0.45
Prenatal and Postpartum Care— Timeliness of Prenatal Care 93.28%H 93.10%H 92.89%H 92.63%H -0.26
1 RY 2015 rates reflect MY data from January 1, 2014, through December 31, 2014. 2 RY 2016 rates reflect MY data from January 1, 2015, through December 31, 2015. 3 RY 2017 rates reflect MY data from January 1, 2016, through December 31, 2016. 4 RY 2018 rates reflect MY data from January 1, 2017, through December 31, 2017. 5 Performance comparisons are based on the Chi-square test of statistical significance, with a p value of <0.05. ^ Caution should be exercised when assessing MCP performance for this measure given the changes that NCQA made to the specification for this measure for RY 2018. -- Indicates that the rate is not available.
Kaiser NorCal Performance Evaluation Report: July 1, 2017–June 30, 2018 California Department of Health Care Services
Page T-10 Health Services Advisory Group, Inc.
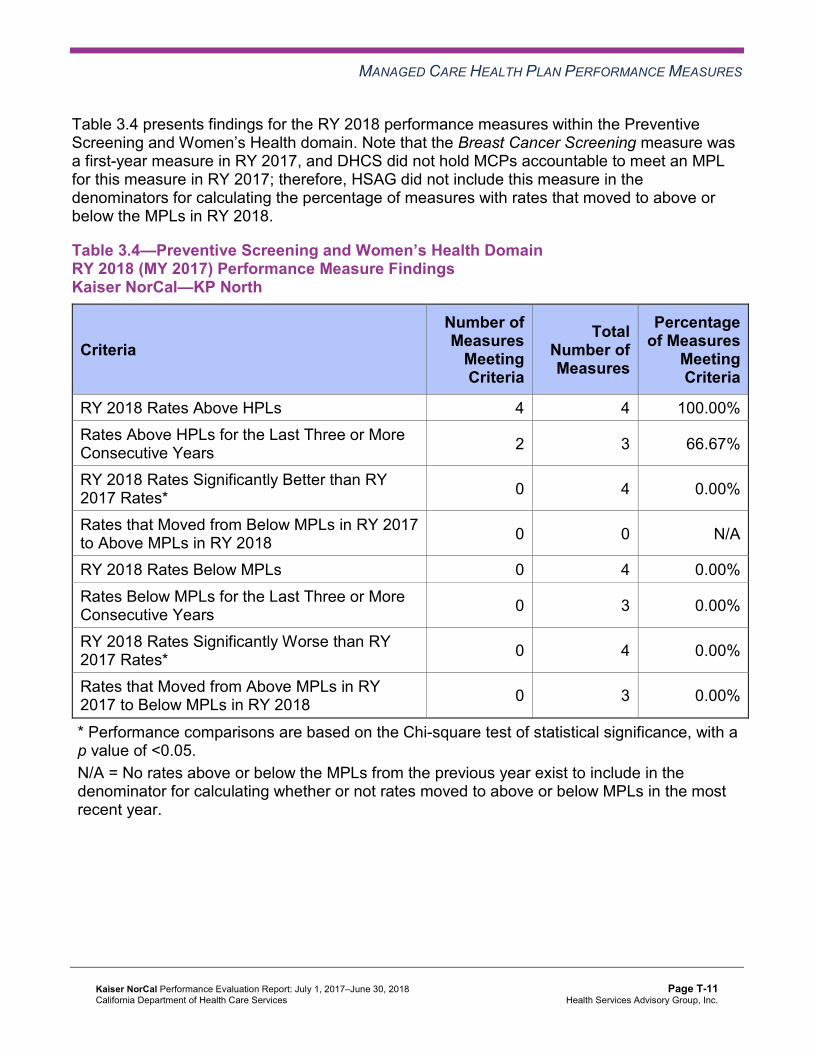
MANAGED CARE HEALTH PLAN PERFORMANCE MEASURES
Table 3.4 presents findings for the RY 2018 performance measures within the Preventive Screening and Women’s Health domain. Note that the Breast Cancer Screening measure was a first-year measure in RY 2017, and DHCS did not hold MCPs accountable to meet an MPL for this measure in RY 2017; therefore, HSAG did not include this measure in the denominators for calculating the percentage of measures with rates that moved to above or below the MPLs in RY 2018.
Table 3.4—Preventive Screening and Women’s Health DomainRY 2018 (MY 2017) Performance Measure Findings Kaiser NorCal—KP North
Criteria Number of Measures
MeetingCriteria
Total Number of Measures
Percentage of Measures
Meeting Criteria
RY 2018 Rates Above HPLs 4 4 100.00% Rates Above HPLs for the Last Three or More Consecutive Years 2 3 66.67%
RY 2018 Rates Significantly Better than RY 2017 Rates* 0 4 0.00%
Rates that Moved from Below MPLs in RY 2017 to Above MPLs in RY 2018 0 0 N/A
RY 2018 Rates Below MPLs 0 4 0.00% Rates Below MPLs for the Last Three or More Consecutive Years 0 3 0.00%
RY 2018 Rates Significantly Worse than RY 2017 Rates* 0 4 0.00%
Rates that Moved from Above MPLs in RY 2017 to Below MPLs in RY 2018 0 3 0.00%
* Performance comparisons are based on the Chi-square test of statistical significance, with a p value of <0.05. N/A = No rates above or below the MPLs from the previous year exist to include in the denominator for calculating whether or not rates moved to above or below MPLs in the most recent year.
Kaiser NorCal Performance Evaluation Report: July 1, 2017–June 30, 2018 California Department of Health Care Services
Page T-11 Health Services Advisory Group, Inc.

MANAGED CARE HEALTH PLAN PERFORMANCE MEASURES
Care for Chronic Conditions
Table 3.5 presents the four-year trending information for the performance measures within the Care for Chronic Conditions domain.
Table 3.5—Care for Chronic Conditions Domain Multi-Year Performance Measure Results Kaiser NorCal—KP North
H = Rate indicates performance above the HPL. Bolded Rate = Rate indicates performance below the MPL.
B = Statistical testing result indicates that the RY 2018 rate is significantly better than the RY 2017 rate.
W = Statistical testing result indicates that the RY 2018 rate is significantly worse than the RY 2017 rate.
Measure RY
2015 Rate1
RY 2016
Rate2
RY 2017
Rate3
RY 2018
Rate4
RYs 2017–18 Rate
Difference5
Annual Monitoring for Patients on Persistent Medications—ACE Inhibitors or ARBs
95.38%H 92.74%H 92.73%H 93.54%H 0.81
Annual Monitoring for Patients on Persistent Medications— Diuretics
93.78%H 90.98% 91.40% 92.05% 0.65
Asthma Medication Ratio -- -- 84.84%H 87.46%H 2.62 Comprehensive Diabetes Care— Blood Pressure Control (<140/90 mm Hg)
83.19%H 79.14%H 77.64%H 76.20%H -1.44
Comprehensive Diabetes Care— Eye Exam (Retinal) Performed 64.13% 68.11%H 73.08%H 75.11%H 2.03B
Comprehensive Diabetes Care— HbA1c Control (<8.0 Percent) 57.87% 61.39%H 62.98%H 62.60%H -0.38
Comprehensive Diabetes Care— HbA1c Poor Control (>9.0 Percent)*
27.96%H 27.15%H 24.54%H 24.18%H -0.36
Comprehensive Diabetes Care— HbA1c Testing 94.97%H 93.18%H 94.71%H 94.83%H 0.12
Comprehensive Diabetes Care— Medical Attention for Nephropathy
92.96%H 89.85%H 88.84% 92.05% 3.21B
Kaiser NorCal Performance Evaluation Report: July 1, 2017–June 30, 2018 California Department of Health Care Services
Page T-12 Health Services Advisory Group, Inc.
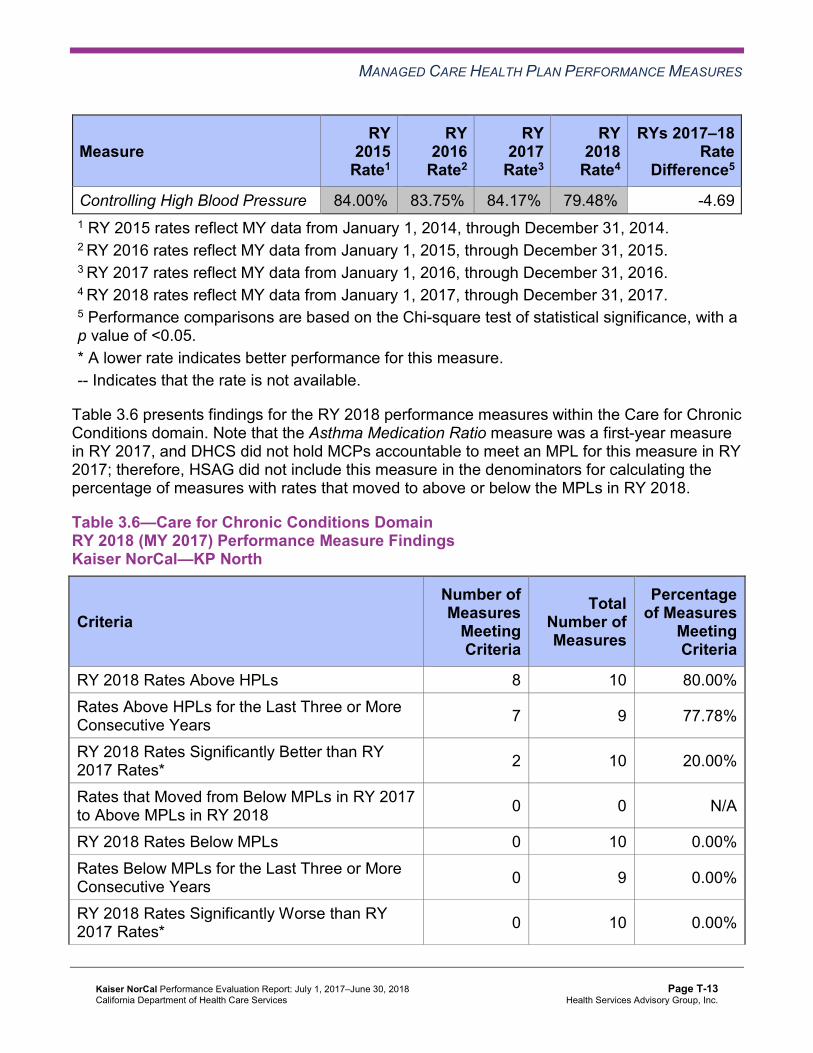
MANAGED CARE HEALTH PLAN PERFORMANCE MEASURES
Measure RY
2015 Rate1
RY 2016
Rate2
RY 2017
Rate3
RY 2018
Rate4
RYs 2017–18 Rate
Difference5
Controlling High Blood Pressure 84.00%H 83.75%H 84.17%H 79.48%H -4.69 1 RY 2015 rates reflect MY data from January 1, 2014, through December 31, 2014. 2 RY 2016 rates reflect MY data from January 1, 2015, through December 31, 2015. 3 RY 2017 rates reflect MY data from January 1, 2016, through December 31, 2016. 4 RY 2018 rates reflect MY data from January 1, 2017, through December 31, 2017. 5 Performance comparisons are based on the Chi-square test of statistical significance, with a p value of <0.05. * A lower rate indicates better performance for this measure. -- Indicates that the rate is not available.
Table 3.6 presents findings for the RY 2018 performance measures within the Care for Chronic Conditions domain. Note that the Asthma Medication Ratio measure was a first-year measure in RY 2017, and DHCS did not hold MCPs accountable to meet an MPL for this measure in RY 2017; therefore, HSAG did not include this measure in the denominators for calculating the percentage of measures with rates that moved to above or below the MPLs in RY 2018.
Table 3.6—Care for Chronic Conditions Domain RY 2018 (MY 2017) Performance Measure Findings Kaiser NorCal—KP North
Criteria Number of Measures
MeetingCriteria
Total Number of Measures
Percentage of Measures
MeetingCriteria
RY 2018 Rates Above HPLs 8 10 80.00% Rates Above HPLs for the Last Three or More Consecutive Years 7 9 77.78%
RY 2018 Rates Significantly Better than RY 2017 Rates* 2 10 20.00%
Rates that Moved from Below MPLs in RY 2017 to Above MPLs in RY 2018 0 0 N/A
RY 2018 Rates Below MPLs 0 10 0.00% Rates Below MPLs for the Last Three or More Consecutive Years 0 9 0.00%
RY 2018 Rates Significantly Worse than RY 2017 Rates* 0 10 0.00%
Kaiser NorCal Performance Evaluation Report: July 1, 2017–June 30, 2018 California Department of Health Care Services
Page T-13 Health Services Advisory Group, Inc.

MANAGED CARE HEALTH PLAN PERFORMANCE MEASURES
Criteria Number of Measures
MeetingCriteria
Total Number of Measures
Percentage of Measures
MeetingCriteria
Rates that Moved from Above MPLs in RY 2017 to Below MPLs in RY 2018 0 9 0.00%
* Performance comparisons are based on the Chi-square test of statistical significance, with a p value of <0.05. N/A = No rates above or below the MPLs from the previous year exist to include in the denominator for calculating whether or not rates moved to above or below MPLs in the most recent year.
Appropriate Treatment and Utilization
Table 3.7 presents the four-year trending information for the performance measures within the Appropriate Treatment and Utilization domain.
Note the following regarding Table 3.7:
♦ The All-Cause Readmissions measure is a non-HEDIS measure originally developed for DHCS’ All-Cause Readmissions collaborative quality improvement project (QIP); therefore, DHCS does not establish an HPL or MPL for this measure. For the All-Cause Readmissions measure, a lower rate indicates better performance (i.e., fewer readmissions).
♦ The two Ambulatory Care measures are utilization measures, which measure the volume of services used. DHCS does not hold MCPs accountable to meet MPLs for utilization measures, and HSAG does not compare performance for these measures against HPLs and MPLs. Additionally, because high and low rates do not necessarily indicate better or worse performance, HSAG did not compare performance for these measures across years.
♦ DHCS established no HPL or MPL for the two Depression Screening and Follow-Up for Adolescents and Adults measures for RY 2018 because no comparable benchmarks exist. Additionally, although MCPs reported the two Depression Screening and Follow-Up for Adolescents and Adults measures for RY 2018, HSAG does not present the performance measure results for these measures in this report because the reported rates do not accurately represent services being provided. This is due to the Depression Screening and Follow-Up for Adolescents and Adults measures being new HEDIS measures for RY 2018, NCQA requiring MCPs to submit rates for these measures using the new Electronic Clinical Data Systems (ECDS) reporting methodology, and inconsistent data reporting processes by calculation vendors. Thus, MCPs experienced numerous challenges obtaining data sources to use for ECDS reporting. DHCS and HSAG, in consultation with NCQA, will work with MCPs to improve data capture for RY 2019.
♦ Note that due to changes that NCQA made to the specifications for the Use of Imaging Studies for Low Back Pain measure in RY 2018, NCQA released guidance to exercise caution when trending the results for this measure. Therefore, caution should be used
Kaiser NorCal Performance Evaluation Report: July 1, 2017–June 30, 2018 California Department of Health Care Services
Page T-14 Health Services Advisory Group, Inc.

MANAGED CARE HEALTH PLAN PERFORMANCE MEASURES
when comparing MCP performance across years or when comparing MCP results to benchmarks related to the Use of Imaging Studies for Low Back Pain measure, as differences in rates may be a result of the specification changes rather than a reflection of performance.
Table 3.7—Appropriate Treatment and Utilization DomainMulti-Year Performance Measure Results Kaiser NorCal—KP North
H = Rate indicates performance above the HPL. Bolded Rate = Rate indicates performance below the MPL.
B = Statistical testing result indicates that the RY 2018 rate is significantly better than the RY 2017 rate.
W = Statistical testing result indicates that the RY 2018 rate is significantly worse than the RY 2017 rate.
Measure RY
2015 Rate1
RY 2016
Rate2
RY 2017
Rate3
RY 2018
Rate4
RYs 2017– 18 Rate
Difference5
All-Cause Readmissions* 14.84% 14.08% 14.82% 16.48% 1.66 Ambulatory Care—Emergency Department (ED) Visits per 1,000 Member Months**
49.65 47.19 44.67 44.28 Not Tested
Ambulatory Care—Outpatient Visits per 1,000 Member Months** 447.02 426.09 434.33 392.75 Not Tested
Avoidance of Antibiotic Treatment in Adults With Acute Bronchitis 42.86%H 37.81% 33.33% 45.86%H 12.53B
Use of Imaging Studies for Low Back Pain^ 88.07%H 85.82%H 82.35%H 79.51%H -2.84
1 RY 2015 rates reflect MY data from January 1, 2014, through December 31, 2014. 2 RY 2016 rates reflect MY data from January 1, 2015, through December 31, 2015. 3 RY 2017 rates reflect MY data from January 1, 2016, through December 31, 2016. 4 RY 2018 rates reflect MY data from January 1, 2017, through December 31, 2017. 5 Performance comparisons are based on the Chi-square test of statistical significance, with a p value of <0.05. * A lower rate indicates better performance for this measure. ** Member months are a member's “contribution” to the total yearly membership. ^ Caution should be exercised when assessing MCP performance for this measure given the changes that NCQA made to the specification for this measure for RY 2018. Not Tested = An RY 2017–18 rate difference was not calculated because high and low rates do not necessarily indicate better or worse performance.
Kaiser NorCal Performance Evaluation Report: July 1, 2017–June 30, 2018 California Department of Health Care Services
Page T-15 Health Services Advisory Group, Inc.

MANAGED CARE HEALTH PLAN PERFORMANCE MEASURES
Table 3.8 presents findings for the RY 2018 performance measures within the Appropriate Treatment and Utilization domain. DHCS did not hold MCPs accountable to meet MPLs for the following measures within this domain; therefore, HSAG did not include these measures in its assessment of the MCP’s performance related to HPLs and MPLs:
♦ All-Cause Readmissions ♦ Both Ambulatory Care measures
Table 3.8—Appropriate Treatment and Utilization DomainRY 2018 (MY 2017) Performance Measure Findings Kaiser NorCal—KP North
Criteria Number of Measures
MeetingCriteria
Total Number of Measures
Percentage of Measures
MeetingCriteria
RY 2018 Rates Above HPLs 2 2 100.00% Rates Above HPLs for the Last Three or More Consecutive Years 1 2 50.00%
RY 2018 Rates Significantly Better than RY 2017 Rates* 1 3 33.33%
Rates that Moved from Below MPLs in RY 2017 to Above MPLs in RY 2018 0 0 N/A
RY 2018 Rates Below MPLs 0 2 0.00% Rates Below MPLs for the Last Three or More Consecutive Years 0 2 0.00%
RY 2018 Rates Significantly Worse than RY 2017 Rates* 0 3 0.00%
Rates that Moved from Above MPLs in RY 2017 to Below MPLs in RY 2018 0 2 0.00%
* Performance comparisons are based on the Chi-square test of statistical significance, with a p value of <0.05. N/A = No rates above or below the MPLs from the previous year exist to include in the denominator for calculating whether or not rates moved to above or below MPLs in the most recent year.
Kaiser NorCal Performance Evaluation Report: July 1, 2017–June 30, 2018 California Department of Health Care Services
Page T-16 Health Services Advisory Group, Inc.

MANAGED CARE HEALTH PLAN PERFORMANCE MEASURES
Performance Measure Findings—All Domains
Table 3.9 presents a summary of Kaiser NorCal’s RY 2018 performance across all External Accountability Set (EAS) measures.
Note the following regarding Table 3.9:
♦ DHCS did not hold MCPs accountable to meet MPLs for the following measures; therefore, HSAG did not include these measures in its assessment of the MCP’s performance related to HPLs and MPLs: ■ All-Cause Readmissions ■ Both Ambulatory Care measures ■ All four Children and Adolescents’ Access to Primary Care measures
♦ DHCS did not hold MCPs accountable to meet MPLs for the following measures in RY 2017; therefore, HSAG did not include these measures in the denominators for calculating the percentage of measures with rates that moved to above or below the MPLs in RY 2018 and for calculating the percentage of measures with rates below MPLs for only the last two consecutive years: ■ Asthma Medication Ratio ■ Breast Cancer Screening ■ Immunizations for Adolescents—Combination 2
Table 3.9—RY 2018 (MY 2017) Performance Measure Findings for All Domains Kaiser NorCal—KP North
Criteria Number of Measures
MeetingCriteria
Total Number of Measures
Percentage of Measures
MeetingCriteria
RY 2018 Rates Above HPLs 18 21 85.71% Rates Above HPLs for the Last Three or More Consecutive Years 12 18 66.67%
RY 2018 Rates Significantly Better than RY 2017 Rates* 4 22 18.18%
Rates that Moved from Below MPLs in RY 2017 to Above MPLs in RY 2018 0 0 N/A
RY 2018 Rates Below MPLs 0 21 0.00% Rates Below MPLs for Only the Last Two Consecutive Years 0 18 0.00%
Kaiser NorCal Performance Evaluation Report: July 1, 2017–June 30, 2018 California Department of Health Care Services
Page T-17 Health Services Advisory Group, Inc.

MANAGED CARE HEALTH PLAN PERFORMANCE MEASURES
Criteria Number of Measures
MeetingCriteria
Total Number of Measures
Percentage of Measures
MeetingCriteria
Rates Below MPLs for the Last Three or More Consecutive Years 0 18 0.00%
RY 2018 Rates Significantly Worse than RY 2017 Rates* 2 22 9.09%
Rates that Moved from Above MPLs in RY 2017 to Below MPLs in RY 2018 0 18 0.00%
* Performance comparisons are based on the Chi-square test of statistical significance, with a p value of <0.05. N/A = No rates above or below the MPLs from the previous year exist to include in the denominator for calculating whether or not rates moved to above or below MPLs in the most recent year.
Seniors and Persons with Disabilities Performance Measure Results Table 3.10 presents the four-year trending information for the Seniors and Persons with Disabilities (SPD) population, and Table 3.11 presents the four-year trending information for the non-SPD population for the measures that DHCS required MCPs to stratify for the SPD and non-SPD populations. The tables also show the differences in rates between RY 2017 and RY 2018.
Table 3.12 presents the SPD and non-SPD rates, a comparison of the SPD and non-SPD rates,5 and the total combined rate for each measure.
5 HSAG calculated statistical significance between the SPD and non-SPD rates for each measure using a Chi-square test. This information is displayed in the “SPD/Non-SPD Rate Difference” column in Table 3.12.
Kaiser NorCal Performance Evaluation Report: July 1, 2017–June 30, 2018 California Department of Health Care Services
Page T-18 Health Services Advisory Group, Inc.

MANAGED CARE HEALTH PLAN PERFORMANCE MEASURES
Table 3.10—Multi-Year SPD Performance Measure Trend Table Kaiser NorCal—KP North
B = Statistical testing result indicates that the RY 2018 SPD rate is significantly better than the RY 2017 SPD rate.
W = Statistical testing result indicates that the RY 2018 SPD rate is significantly worse than the RY 2017 SPD rate.
Measure RY 2015
SPD Rate1
RY 2016 SPD
Rate2
RY 2017 SPD
Rate3
RY 2018 SPD
Rate4
RYs 2017–18 Rate
Difference5
All-Cause Readmissions* 15.01% 16.18% 19.27% 19.90% 0.63 Ambulatory Care—Emergency Department (ED) Visits per 1,000 Member Months**
87.64 78.94 74.15 71.60 Not Tested
Ambulatory Care—Outpatient Visits per 1,000 Member Months**
899.26 848.88 885.37 767.24 Not Tested
Annual Monitoring for Patients on Persistent Medications— ACE Inhibitors or ARBs
96.81% 95.70% 95.41% 96.01% 0.60
Annual Monitoring for Patients on Persistent Medications— Diuretics
95.86% 94.12% 94.79% 95.63% 0.84
Children and Adolescents' Access to Primary Care Practitioners—12–24 Months
NA NA NA NA Not Comparable
Children and Adolescents' Access to Primary Care Practitioners— 25 Months–6 Years
94.78% 100.00% 100.00% 100.00% 0.00
Children and Adolescents' Access to Primary Care Practitioners—7–11 Years
96.67% 100.00% 100.00% 100.00% 0.00
Children and Adolescents' Access to Primary Care Practitioners—12–19 Years
94.39% 100.00% 100.00% 100.00% 0.00
1 RY 2015 rates reflect MY data from January 1, 2014, through December 31, 2014. 2 RY 2016 rates reflect MY data from January 1, 2015, through December 31, 2015. 3 RY 2017 rates reflect MY data from January 1, 2016, through December 31, 2016.
Kaiser NorCal Performance Evaluation Report: July 1, 2017–June 30, 2018 California Department of Health Care Services
Page T-19 Health Services Advisory Group, Inc.

MANAGED CARE HEALTH PLAN PERFORMANCE MEASURES
4 RY 2018 rates reflect MY data from January 1, 2017, through December 31, 2017. 5 Performance comparisons are based on the Chi-square test of statistical significance, with a p value of <0.05. * A lower rate indicates better performance for this measure. ** Member months are a member's “contribution” to the total yearly membership. NA = The MCP followed the specifications, but the denominator was too small (less than 30) to report a valid rate. Not Comparable = An RY 2017–18 rate difference cannot be made because data are not available for both years or because significant methodology changes occurred between years, disallowing comparison. Not Tested = An RY 2017–18 rate difference was not calculated because high and low rates do not necessarily indicate better or worse performance.
Table 3.11—Multi-Year Non-SPD Performance Measure Trend Table Kaiser NorCal—KP North
B = Statistical testing result indicates that the RY 2018 non-SPD rate is significantly better than the RY 2017 non-SPD rate.
W = Statistical testing result indicates that the RY 2018 non-SPD rate is significantly worse than the RY 2017 non-SPD rate.
Measure RY 2015
Non-SPD Rate1
RY 2016 Non-SPD
Rate2
RY 2017 Non-SPD
Rate3
RY 2018 Non-SPD
Rate4
RYs 2017–18 Rate
Difference5
All-Cause Readmissions* 14.47% 11.45% 10.28% 11.69% 1.41
Ambulatory Care— Emergency Department (ED) Visits per 1,000 Member Months**
44.28 43.34 41.20 40.87 Not Tested
Ambulatory Care— Outpatient Visits per 1,000 Member Months**
383.06 374.84 381.15 346.00 Not Tested
Annual Monitoring for Patients on Persistent Medications— ACE Inhibitors or ARBs
93.34% 90.21% 90.46% 91.11% 0.65
Annual Monitoring for Patients on Persistent Medications—Diuretics
91.06% 88.44% 88.80% 88.67% -0.13
Kaiser NorCal Performance Evaluation Report: July 1, 2017–June 30, 2018 California Department of Health Care Services
Page T-20 Health Services Advisory Group, Inc.

MANAGED CARE HEALTH PLAN PERFORMANCE MEASURES
Measure RY 2015
Non-SPD Rate1
RY 2016 Non-SPD
Rate2
RY 2017 Non-SPD
Rate3
RY 2018 Non-SPD
Rate4
RYs 2017–18 Rate
Difference5
Children and Adolescents' Access to Primary Care Practitioners— 12–24 Months
98.80% 98.65% 98.48% 99.04% 0.56
Children and Adolescents' Access to Primary Care Practitioners— 25 Months–6 Years
89.69% 90.36% 89.73% 86.42% -3.31W
Children and Adolescents' Access to Primary Care Practitioners— 7–11 Years
89.15% 91.40% 90.37% 88.45% -1.92W
Children and Adolescents' Access to Primary Care Practitioners— 12–19 Years
90.57% 92.83% 92.68% 89.84% -2.84W
1 RY 2015 rates reflect MY data from January 1, 2014, through December 31, 2014. 2 RY 2016 rates reflect MY data from January 1, 2015, through December 31, 2015. 3 RY 2017 rates reflect MY data from January 1, 2016, through December 31, 2016. 4 RY 2018 rates reflect MY data from January 1, 2017, through December 31, 2017. 5 Performance comparisons are based on the Chi-square test of statistical significance, with a p value of <0.05. * A lower rate indicates better performance for this measure. ** Member months are a member's “contribution” to the total yearly membership. Not Tested = An RY 2017–18 rate difference was not calculated because high and low rates do not necessarily indicate better or worse performance.
Kaiser NorCal Performance Evaluation Report: July 1, 2017–June 30, 2018 California Department of Health Care Services
Page T-21 Health Services Advisory Group, Inc.

MANAGED CARE HEALTH PLAN PERFORMANCE MEASURES
Table 3.12—RY 2018 (MY 2017) Performance Measure Comparison and Results forMeasures Stratified by the SPD and Non-SPD PopulationsKaiser NorCal—KP North
B = Statistical testing result indicates that the RY 2018 SPD rate is significantly better than the RY 2018 non-SPD rate.
W = Statistical testing result indicates that the RY 2018 SPD rate is significantly worse than the RY 2018 non-SPD rate.
Measure RY 2018
SPD Rate1
RY 2018 Non-SPD
Rate1
SPD/Non-SPDRate
Difference2
RY 2018 Total Rate3
All-Cause Readmissions* 19.90% 11.69% 8.21W 16.48% Ambulatory Care—Emergency Department (ED) Visits per 1,000 Member Months**
71.60 40.87 Not Tested 44.28
Ambulatory Care—Outpatient Visits per 1,000 Member Months** 767.24 346.00 Not Tested 392.75
Annual Monitoring for Patients on Persistent Medications— ACE Inhibitors or ARBs
96.01% 91.11% 4.90B 93.54%
Annual Monitoring for Patients on Persistent Medications—Diuretics 95.63% 88.67% 6.96B 92.05%
Children and Adolescents' Access to Primary Care Practitioners— 12–24 Months
NA 99.04% Not Comparable 99.05%
Children and Adolescents' Access to Primary Care Practitioners— 25 Months–6 Years
100.00% 86.42% 13.58B 86.79%
Children and Adolescents' Access to Primary Care Practitioners— 7–11 Years
100.00% 88.45% 11.55B 88.87%
Children and Adolescents' Access to Primary Care Practitioners— 12–19 Years
100.00% 89.84% 10.16B 90.24%
1 RY 2018 rates reflect MY data from January 1, 2017, through December 31, 2017. 2 Performance comparisons are based on the Chi-square test of statistical significance, with a p value of <0.05. 3 Total rates are based on the MCP reporting unit’s total results, including the SPD and non-SPD populations. Please note, if data are not available for either the SPD or non-SPD population, the total rate is based on results reported for the available population.
Kaiser NorCal Performance Evaluation Report: July 1, 2017–June 30, 2018 California Department of Health Care Services
Page T-22 Health Services Advisory Group, Inc.

MANAGED CARE HEALTH PLAN PERFORMANCE MEASURES
* A lower rate indicates better performance for this measure. ** Member months are a member's “contribution” to the total yearly membership. NA = The MCP followed the specifications, but the denominator was too small (less than 30) to report a valid rate. Not Comparable = An SPD/non-SPD rate difference cannot be made because data are not available for both populations. Not Tested = An SPD/non-SPD rate difference was not calculated because high and low rates do not necessarily indicate better or worse performance.
Seniors and Persons with Disabilities Findings
HSAG observed the following notable results in RY 2018 for measures that Kaiser NorCal stratified by the SPD and non-SPD populations:
♦ For SPD rates for which HSAG could make a comparison between RY 2017 and RY 2018, Kaiser NorCal had no statistically significant variation in SPD rates from RY 2017 to RY 2018.
♦ The RY 2018 non-SPD rates were significantly worse than the RY 2017 non-SPD rates for the Children and Adolescents' Access to Primary Care Practitioners—25 Months–6 Years, 7–11 Years, and 12–19 Years measures.
♦ For measures for which HSAG could compare the RY 2018 SPD rates to the RY 2018 non-SPD rates: ■ The RY 2018 SPD rates were significantly better than the RY 2018 non-SPD rates for
the following measures: ○ Both Annual Monitoring for Patients on Persistent Medications measures ○ Children and Adolescents' Access to Primary Care Practitioners—25 Months–6
Years, 7–11 Years, and 12–19 Years measures ■ The RY 2018 SPD rate was significantly worse than the RY 2018 non-SPD rate for the
All-Cause Readmissions measure. Note that the higher rate of hospital readmissions for the SPD population is expected based on the greater and often more complicated health care needs of these beneficiaries.
Kaiser NorCal Performance Evaluation Report: July 1, 2017–June 30, 2018 California Department of Health Care Services
Page T-23 Health Services Advisory Group, Inc.

MANAGED CARE HEALTH PLAN PERFORMANCE MEASURES
Strengths—Performance Measures HSAG auditors determined that Kaiser NorCal followed the appropriate specifications to produce valid rates, and identified no issues of concern.
HSAG identified the following notable RY 2018 performance measure results for Kaiser NorCal:
♦ Across all measures and domains, Kaiser NorCal performed above the HPLs in RY 2018 for 18 of 21 measures (86 percent), and the MCP had no measures with rates below the MPLs. ■ Of the 18 measures for which the MCP reported rates for the last three or more
consecutive years, 12 measures (67 percent) were above the HPLs for the last three or more consecutive years.
■ The MCP performed above the HPLs for all measures within the Preventive Screening and Women’s Health domain in RY 2018.
♦ The rates for the following measures improved significantly from RY 2017 to RY 2018: ■ Avoidance of Antibiotic Treatment in Adults With Acute Bronchitis, resulting in the rate
moving to above the HPL in RY 2018. ■ Comprehensive Diabetes Care—Eye Exam (Retinal) Performed. ■ Comprehensive Diabetes Care—Medical Attention for Nephropathy. ■ Immunizations for Adolescents—Combination 2, resulting in the rate moving to above
the HPL in RY 2018.
Opportunities for Improvement—Performance Measures Based on RY 2018 performance measure results, HSAG has no recommendations for Kaiser NorCal in the area of performance measures.
Kaiser NorCal Performance Evaluation Report: July 1, 2017–June 30, 2018 California Department of Health Care Services
Page T-24 Health Services Advisory Group, Inc.

Medi-Cal Managed Care External Quality Review Technical ReportAppendix T: Performance Evaluation ReportKaiser NorCal July 1, 2017–June 30, 2018
4. Performance Improvement Projects
Performance Improvement Project Overview The key concepts of the rapid-cycle PIP framework include forming a PIP team, setting aims, establishing measures, determining interventions using quality improvement tools, conducting PDSA cycles to test interventions, and planning for the spread of successful changes. The core component of the rapid-cycle PIP approach involves testing changes on a small scale so that improvement can occur more efficiently and lead to long-term sustainability. The following modules guide MCPs through this rapid-cycle PIP process:
♦ Module 1—PIP Initiation ■ MCPs outline the framework for the PIP, which includes:
○ The topic rationale. ○ Comparative data supporting the need to improve the selected topic. ○ A list of the PIP team members, which consists of internal and external stakeholders. ○ A completed key driver diagram that defines the theory of change for improvement,
including the SMART (Specific, Measurable, Achievable, Relevant, and Time-bound) Aim and Global Aim.
♦ Module 2—SMART Aim Data Collection ■ MCPs define the SMART Aim measure and data collection methodology and develop
the SMART Aim data run chart. ♦ Module 3—Intervention Determination
■ MCPs use process mapping and failure modes and effects analysis (FMEA) to identify potential interventions to test which may have direct effects on the SMART Aim.
♦ Module 4—Plan-Do-Study-Act (PDSA) ■ MCPs test and evaluate the interventions identified in Module 3 through a series of
PDSA cycles. ♦ Module 5—PIP Conclusions
■ MCPs interpret results and summarize: ○ Key findings and outcomes achieved. ○ Assessment of each tested intervention. ○ Lessons learned, including how demonstrated improvement can be shared and used
as a foundation for further improvement going forward. ○ Plan for sustained improvement.
Kaiser NorCal Performance Evaluation Report: July 1, 2017–June 30, 2018 California Department of Health Care Services
Page T-25 Health Services Advisory Group, Inc.

PERFORMANCE IMPROVEMENT PROJECTS
Based on the agreed-upon timeline, MCPs submit each module to HSAG for validation. Throughout the rapid-cycle PIP process, HSAG provides technical assistance to MCPs to ensure that PIPs are methodologically sound and to problem-solve with MCPs regarding how to address challenges that occur. Through an iterative process, MCPs have opportunities to make corrections to modules 1 through 3 to achieve all validation criteria.
Once MCPs achieve all validation criteria for modules 1 through 3 and receive feedback on the intervention Plan portion of Module 4, MCPs test interventions. During the intervention testing phase of the PIP, HSAG conducts periodic progress check-ins to ensure that MCPs have addressed HSAG’s feedback on the Plan portion of Module 4 and are making appropriate progress with intervention testing. Once MCPs complete testing an intervention, MCPs determine the next steps based on results and lessons learned—whether the intervention was successful and should be spread (adopt), whether modifications need to be made to the existing intervention (adapt), or whether the intervention was not successful and should be stopped (abandon).
In Module 5, MCPs summarize the overall PIP. When validating Module 5, HSAG assesses the validity and reliability of the results based on the Centers for Medicare & Medicaid Services (CMS) validation protocols to determine whether key stakeholders can have confidence in the reported PIP findings. HSAG assigns the following final confidence levels for each PIP:
♦ High confidence—the PIP was methodologically sound and achieved the SMART Aim goal; the demonstrated improvement was clearly linked to the quality improvement processes conducted and intervention(s) tested; and, the MCP accurately summarized the key findings.
♦ Confidence—the PIP was methodologically sound and achieved the SMART Aim goal, and the MCP accurately summarized the key findings. However, some, but not all, of the quality improvement processes conducted and/or intervention(s) tested were clearly linked to the demonstrated improvement.
♦ Low confidence—either (A) the PIP was methodologically sound; however, the SMART Aim goal was not achieved; or (B) the SMART Aim goal was achieved; however, the quality improvement processes and/or intervention(s) tested were poorly executed and could not be linked to the improvement.
♦ Reported PIP results were not credible—the PIP methodology was not executed as approved.
Performance Improvement Project Results and Findings During the review period, Kaiser NorCal submitted modules 4 and 5 for its 2015–17 DHCS-priority and MCP-specific PIPs. HSAG validated the modules and includes the final PIP validation findings in this report. Additionally, Kaiser NorCal initiated a Disparity PIP and a DHCS-priority PIP during the review period. In this report, HSAG includes summaries of the MCP’s Disparity and DHCS-priority PIP module submissions as well as validation findings from the review period.
Kaiser NorCal Performance Evaluation Report: July 1, 2017–June 30, 2018 California Department of Health Care Services
Page T-26 Health Services Advisory Group, Inc.

PERFORMANCE IMPROVEMENT PROJECTS
2015–17 DHCS-Priority Performance Improvement Project
Kaiser NorCal selected postpartum care for its 2015–17 DHCS-priority PIP. While the MCP concluded its Postpartum Care PIP through the SMART Aim end date of June 30, 2017, Kaiser NorCal submitted modules 4 and 5 for HSAG to validate during the review period for this report. HSAG provided final validation findings and encouraged Kaiser NorCal to incorporate the experiences and lessons learned from the PIP into future quality improvement efforts.
Table 4.1 provides a summary of the SMART Aim measure results reported by the MCP.
Table 4.1—Kaiser NorCal Postpartum Care PIP SMART Aim Measure Results
SMART Aim Measure Baseline Rate
SMART Aim Goal
Rate
SMART Aim Goal Achieved
Rate of postpartum visits among beneficiaries who have delivered a baby at Kaiser Permanente Center A6
79.2% 84.2% No
Table 4.2 presents a description of the interventions that Kaiser NorCal tested for its Postpartum Care PIP. The table also indicates the key drivers that each intervention addressed as well as whether the MCP decided, based on intervention testing results, to adopt, adapt, or abandon the intervention.
Table 4.2—Kaiser NorCal Postpartum Care PIP Intervention Testing Results
Intervention Key Drivers Addressed Adopt,Adapt, orAbandon
Enrolling beneficiaries in the California Black Infant Health Program
♦ Beneficiary engagement through community programs Adopt
Texting beneficiaries to improve the postpartum visit show rate ♦ Beneficiary engagement Adapt
Making outreach calls to encourage beneficiaries to complete postpartum visits and providing free transportation to beneficiaries who indicate needing rides to their postpartum visits
♦ Beneficiary engagement ♦ Utilization of multidisciplinary case
management to address non-medical needs
Adapt
6 Center name removed for confidentiality.
Kaiser NorCal Performance Evaluation Report: July 1, 2017–June 30, 2018 California Department of Health Care Services
Page T-27 Health Services Advisory Group, Inc.

PERFORMANCE IMPROVEMENT PROJECTS
Performance Improvement Project Validation Findings
During the review period for this report, HSAG validated modules 4 and 5 for the MCP’s Postpartum Care PIP. Kaiser NorCal conducted a methodologically sound PIP and determined to adopt the California Black Infant Health Program enrollment intervention and adapt the texting and outreach call interventions; however, the MCP did not achieve the SMART Aim goal. Upon assessment of validity and reliability of the PIP results, HSAG assigned Kaiser NorCal’s Postpartum Care PIP a final confidence level of Low Confidence.
2015–17 MCP-Specific Performance Improvement Project
Kaiser NorCal selected initial health assessment completion for adults for its 2015–17 MCP-specific PIP. While the MCP concluded its Initial Health Assessment PIP through the SMART Aim end date of June 30, 2017, Kaiser NorCal submitted modules 4 and 5 for HSAG to validate during the review period for this report. HSAG provided final validation findings and encouraged Kaiser NorCal to incorporate the experiences and lessons learned from the PIP into future quality improvement efforts.
Table 4.3 provides a summary of the SMART Aim measure results reported by the MCP.
Table 4.3—Kaiser NorCal Initial Health Assessment PIP SMART Aim Measure Results
SMART Aim Measure Baseline Rate
SMART Aim Goal
Rate
SMART Aim Goal Achieved
Rate of initial health assessment (physical exam and health questionnaire) completion among new adult beneficiaries with Kaiser Permanente Center B7
19.3% 24.3% Yes
Table 4.4 presents a description of the interventions that Kaiser NorCal tested for its Initial Health Assessment PIP. The table also indicates the key drivers that each intervention addressed as well as whether the MCP decided, based on intervention testing results, to adopt, adapt, or abandon the intervention.
Table 4.4—Kaiser NorCal Initial Health Assessment PIP Intervention Testing Results
Intervention Key Drivers Addressed Adopt,Adapt, orAbandon
Conducting telephone skills training for customer service staff ♦ Beneficiary engagement Adapt
7 Center name removed for confidentiality.
Kaiser NorCal Performance Evaluation Report: July 1, 2017–June 30, 2018 California Department of Health Care Services
Page T-28 Health Services Advisory Group, Inc.

PERFORMANCE IMPROVEMENT PROJECTS
Intervention Key Drivers Addressed Adopt,Adapt, orAbandon
Developing and disseminating initial health assessment job aid for adult and family medicine providers
♦ Provider education awareness ♦ Correct coding of initial health
assessment Adopt
Making appointment reminder calls to beneficiaries at high risk for missing their initial health assessment physical exams
♦ Beneficiary engagement Adopt
Performance Improvement Project Validation Findings
During the review period for this report, HSAG validated modules 4 and 5 for the MCP’s Initial Health Assessment PIP. Kaiser NorCal achieved the SMART Aim goal for eight monthly data points on the SMART Aim run chart after the intervention testing began and clearly linked the tested interventions to the demonstrated improvement. Upon assessment of validity and reliability of the PIP results, HSAG assigned Kaiser NorCal’s Initial Health Assessment PIP a final confidence level of High Confidence.
2017–19 Disparity Performance Improvement Project
During the review period, DHCS required Kaiser NorCal to initiate a PIP focusing on an identified health disparity based on, but not limited to, age, gender, race or ethnicity, language spoken, income, educational attainment, sexual orientation or gender identity, occupation, provider, or geographic area. Kaiser NorCal selected contraception use among adolescents in South Sacramento as its 2017–19 Disparity PIP topic. Using its own MCP-specific data, the MCP provided evidence of the health disparity by demonstrating a statistically significant rate difference between two subgroups, with the disparate subgroup having the lower rate.
Table 4.5 provides the SMART Aim measure description, baseline rate, and SMART Aim goal rate for the PIP. The SMART Aim end date for this PIP is June 30, 2019.
Table 4.5—Kaiser NorCal Contraception Disparity PIP SMART Aim Measure
SMART Aim Measure Baseline Rate
SMART Aim Goal
Rate
Rate of most to moderately effective forms of contraception use among beneficiaries ages 12 to 18, who have had a chlamydia test and who have Provider A8 in the South Sacramento service area.
48.42% 56.30%
8 Provider name removed for confidentiality.
Kaiser NorCal Performance Evaluation Report: July 1, 2017–June 30, 2018 California Department of Health Care Services
Page T-29 Health Services Advisory Group, Inc.
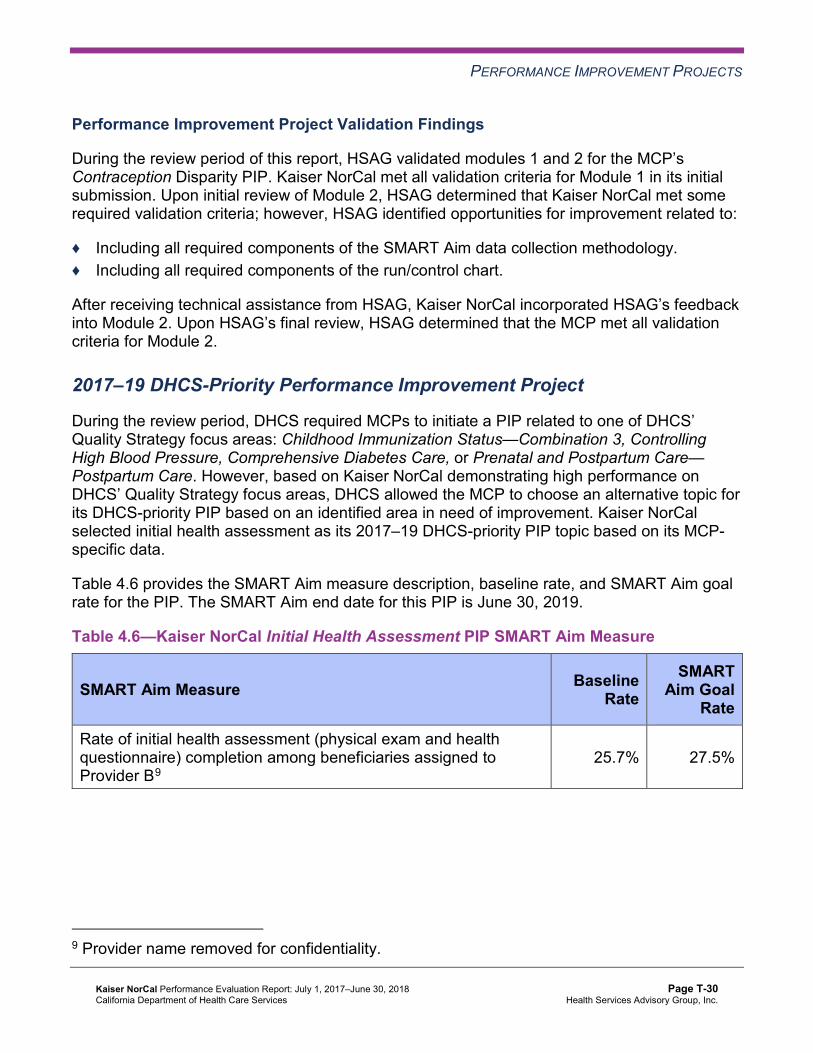
PERFORMANCE IMPROVEMENT PROJECTS
Performance Improvement Project Validation Findings
During the review period of this report, HSAG validated modules 1 and 2 for the MCP’s Contraception Disparity PIP. Kaiser NorCal met all validation criteria for Module 1 in its initial submission. Upon initial review of Module 2, HSAG determined that Kaiser NorCal met some required validation criteria; however, HSAG identified opportunities for improvement related to:
♦ Including all required components of the SMART Aim data collection methodology. ♦ Including all required components of the run/control chart.
After receiving technical assistance from HSAG, Kaiser NorCal incorporated HSAG’s feedback into Module 2. Upon HSAG’s final review, HSAG determined that the MCP met all validation criteria for Module 2.
2017–19 DHCS-Priority Performance Improvement Project
During the review period, DHCS required MCPs to initiate a PIP related to one of DHCS’ Quality Strategy focus areas: Childhood Immunization Status—Combination 3, Controlling High Blood Pressure, Comprehensive Diabetes Care, or Prenatal and Postpartum Care— Postpartum Care. However, based on Kaiser NorCal demonstrating high performance on DHCS’ Quality Strategy focus areas, DHCS allowed the MCP to choose an alternative topic for its DHCS-priority PIP based on an identified area in need of improvement. Kaiser NorCal selected initial health assessment as its 2017–19 DHCS-priority PIP topic based on its MCP-specific data.
Table 4.6 provides the SMART Aim measure description, baseline rate, and SMART Aim goal rate for the PIP. The SMART Aim end date for this PIP is June 30, 2019.
Table 4.6—Kaiser NorCal Initial Health Assessment PIP SMART Aim Measure
SMART Aim Measure Baseline Rate
SMART Aim Goal
Rate
Rate of initial health assessment (physical exam and health questionnaire) completion among beneficiaries assigned to Provider B9
25.7% 27.5%
9 Provider name removed for confidentiality.
Kaiser NorCal Performance Evaluation Report: July 1, 2017–June 30, 2018 California Department of Health Care Services
Page T-30 Health Services Advisory Group, Inc.

PERFORMANCE IMPROVEMENT PROJECTS
Performance Improvement Project Validation Findings
During the review period of this report, HSAG validated modules 1 through 3 for the MCP’s Initial Health Assessment PIP. Upon initial review of the modules, HSAG determined that Kaiser NorCal met some required validation criteria; however, HSAG identified opportunities for improvement related to:
♦ Supporting the topic selection with the MCP’s data. ♦ Including all required components of the:
■ SMART Aim, developed based on literature review, data, and/or experience. ■ SMART Aim measure. ■ FMEA table.
♦ Aligning accurately the Global Aim, SMART Aim, key drivers, and potential interventions. ♦ Including a step-by-step flow of the overall process in the process map. ♦ Supporting the sub-processes selection for the FMEA table. ♦ Describing the priority-ranking process.
After receiving technical assistance from HSAG, Kaiser NorCal incorporated HSAG’s feedback into the PIP modules. Upon HSAG’s final review, HSAG determined that the MCP met all validation criteria for all submitted modules.
Strengths—Performance Improvement Projects Kaiser NorCal achieved the SMART Aim goal for the 2015–17 Initial Health Assessment PIP and clearly linked the quality improvement activities to the demonstrated improvement. Based on HSAG’s assessment, HSAG assigned the 2015–17 Initial Health Assessment PIP a final confidence level of High Confidence.
Opportunities for Improvement—Performance Improvement Projects Kaiser NorCal has the opportunity to continue monitoring adapted and adopted interventions and outcomes to facilitate improvement beyond the life of the 2015–17 Postpartum Care and Initial Health Assessment PIPs. Ongoing monitoring will enable long-term evaluation of improvement and allow the MCP to continually refine interventions to achieve and sustain optimal outcomes.
Additionally, Kaiser NorCal has the opportunity to apply lessons learned from the 2015–17 Initial Health Assessment PIP to the MCP’s 2017–19 Initial Health Assessment PIP.
Kaiser NorCal Performance Evaluation Report: July 1, 2017–June 30, 2018 California Department of Health Care Services
Page T-31 Health Services Advisory Group, Inc.

Medi-Cal Managed Care External Quality Review Technical ReportAppendix T: Performance Evaluation ReportKaiser NorCal July 1, 2017–June 30, 2018
5. Recommendations
Follow-Up on Prior Year Recommendations DHCS provided each MCP an opportunity to outline actions taken to address recommendations HSAG made in its 2016–17 MCP-specific evaluation report. Table 5.1 provides EQR recommendations from Kaiser NorCal’s July 1, 2016, through June 30, 2017, MCP-specific evaluation report, along with the MCP’s self-reported actions taken through June 30, 2018, that address the recommendations. Please note that HSAG made minimal edits to Table 5.1 to preserve the accuracy of Kaiser NorCal’s self-reported actions.
Table 5.1—Kaiser NorCal’s Self-Reported Follow-Up on External Quality ReviewRecommendations from the July 1, 2016, through June 30, 2017, MCP-SpecificEvaluation Report
2016–17 External Quality ReviewRecommendations Directed to Kaiser NorCal
Self-Reported Actions Taken by KaiserNorCal during the Period of July 1, 2017–June 30, 2018, that Address the External Quality Review Recommendations
1. Ensure resolution of all deficiencies from the September 26, 2016, through October 7, 2016, A&I Medical and State Supported Services Audits.
On January 22, 2018, Kaiser NorCal received a letter from DHCS stating the following: a. A&I conducted an on-site Medical Audit of
Kaiser NorCal from September 26, 2016, through October 7, 2016. The survey covered the period of September 1, 2015, through August 31, 2016.
b. On January 11, 2018, the MCP provided DHCS with additional information regarding its CAP in response to the report originally issued on March 2, 2017.
c. All items have been reviewed and found to be in compliance. The CAP is hereby closed.
Kaiser NorCal Performance Evaluation Report: July 1, 2017–June 30, 2018 California Department of Health Care Services
Page T-32 Health Services Advisory Group, Inc.

RECOMMENDATIONS
2017–18 Recommendations Based on the overall assessment of Kaiser NorCal’s delivery of quality, accessible, and timely care through the activities described in previous sections of this report, HSAG recommends the following to the MCP:
♦ Work with DHCS to ensure that the MCP resolves all deficiencies from the October 2017 A&I Medical Audit.
♦ Continue monitoring adapted and adopted interventions and outcomes to facilitate improvement beyond the life of the 2015–17 Postpartum Care and Initial Health Assessment PIPs.
♦ Apply lessons learned from the 2015–17 Initial Health Assessment PIP to the MCP’s 2017– 19 Initial Health Assessment PIP.
In the next annual review, HSAG will evaluate continued successes of Kaiser NorCal as well as the MCP’s progress with these recommendations.
Kaiser NorCal Performance Evaluation Report: July 1, 2017–June 30, 2018 California Department of Health Care Services
Page T-33 Health Services Advisory Group, Inc.

Medi-Cal Managed CareExternal Quality Review Technical Report
Appendix U: Performance Evaluation Report
Kaiser SoCal (KP Cal, LLC, in San Diego County)
July 1, 2017–June 30, 2018

Medi-Cal Managed Care External Quality Review Technical ReportAppendix U: Performance Evaluation ReportKaiser SoCal July 1, 2017–June 30, 2018
Table of Contents
1. Introduction.............................................................................................................U-1 Medi-Cal Managed Care Health Plan Overview .......................................................U-1
2. Managed Care Health Plan Compliance ...............................................................U-3Compliance Reviews Conducted..............................................................................U-3
Follow-Up on 2016 A&I Medical and State Supported Services Audits.................U-3 Strengths—Compliance Reviews .............................................................................U-4 Opportunities for Improvement—Compliance Reviews ............................................U-4
3. Managed Care Health Plan Performance Measures ............................................U-5Performance Measure Validation Results ................................................................U-5 Performance Measure Results and Findings............................................................U-5
Preventive Screening and Children’s Health .........................................................U-6 Preventive Screening and Women’s Health ........................................................U-10 Care for Chronic Conditions ................................................................................U-12 Appropriate Treatment and Utilization.................................................................U-14 Performance Measure Findings—All Domains....................................................U-17
Seniors and Persons with Disabilities Performance Measure Results....................U-18 Seniors and Persons with Disabilities Findings ...................................................U-23
Strengths—Performance Measures .......................................................................U-23 Opportunities for Improvement—Performance Measures ......................................U-24
4. MLTSSP Performance Measure Results.............................................................U-25 Managed Long-Term Services and Supports Plan Performance Measure Findings U-26
5. Performance Improvement Projects ...................................................................U-27Performance Improvement Project Overview .........................................................U-27 Performance Improvement Project Results and Findings.......................................U-28
2015–17 DHCS-Priority Performance Improvement Project ...............................U-29 2015–17 MCP-Specific Performance Improvement Project ................................U-30 2017–19 Disparity Performance Improvement Project ........................................U-31 2017–19 DHCS-Priority Performance Improvement Project ...............................U-32
Strengths—Performance Improvement Projects ....................................................U-33 Opportunities for Improvement—Performance Improvement Projects ...................U-33
6. Recommendations................................................................................................U-34 Follow-Up on Prior Year Recommendations ..........................................................U-34 2017–18 Recommendations...................................................................................U-36
Kaiser SoCal Performance Evaluation Report: July 1, 2017–June 30, 2018 California Department of Health Care Services
Page U-i Health Services Advisory Group, Inc.

TABLE OF CONTENTS
Table of Tables
Table 2.1—DHCS A&I Medical Audit of Kaiser SoCal Audit Review Period: September 1, 2016, through August 31, 2017 .............................................U-3
Table 3.1—Preventive Screening and Children’s Health Domain Multi-Year Performance Measure Results Kaiser SoCal—San Diego County ..............U-7
Table 3.2—Preventive Screening and Children’s Health Domain RY 2018 (MY 2017) Performance Measure Findings Kaiser SoCal—San Diego County.............U-9
Table 3.3—Preventive Screening and Women’s Health Domain Multi-Year Performance Measure Results Kaiser SoCal—San Diego County ............U-10
Table 3.4—Preventive Screening and Women’s Health Domain RY 2018 (MY 2017) Performance Measure Findings Kaiser SoCal—San Diego County...........U-11
Table 3.5—Care for Chronic Conditions Domain Multi-Year Performance Measure Results Kaiser SoCal—San Diego County ................................................U-12
Table 3.6—Care for Chronic Conditions Domain RY 2018 (MY 2017) Performance Measure Findings Kaiser SoCal—San Diego County................................U-13
Table 3.7—Appropriate Treatment and Utilization Domain Multi-Year Performance Measure Results Kaiser SoCal—San Diego County..................................U-15
Table 3.8—Appropriate Treatment and Utilization Domain RY 2018 (MY 2017) Performance Measure Findings Kaiser SoCal—San Diego County...........U-16
Table 3.9—RY 2018 (MY 2017) Performance Measure Findings for All Domains Kaiser SoCal—San Diego County .............................................................U-17
Table 3.10—Multi-Year SPD Performance Measure Trend Table Kaiser SoCal— San Diego County......................................................................................U-19
Table 3.11—Multi-Year Non-SPD Performance Measure Trend Table Kaiser SoCal— San Diego County......................................................................................U-20
Table 3.12—RY 2018 (MY 2017) Performance Measure Comparison and Results for Measures Stratified by the SPD and Non-SPD Populations Kaiser SoCal— San Diego County......................................................................................U-22
Table 4.1—Multi-Year MLTSSP Performance Measure Results Kaiser SoCal— San Diego County......................................................................................U-25
Table 5.1—Kaiser SoCal Diabetes PIP SMART Aim Measure Results........................U-29 Table 5.2—Kaiser SoCal Diabetes PIP Intervention Testing Results...........................U-29 Table 5.3—Kaiser SoCal Initial Health Assessment Within 120 Days of Enrollment
PIP SMART Aim Measure Results.............................................................U-30 Table 5.4—Kaiser SoCal Initial Health Assessment Within 120 Days of Enrollment
PIP Intervention Testing Results................................................................U-30 Table 5.5—Kaiser SoCal Depression Screening Disparity PIP SMART Aim Measure.U-31 Table 5.6—Kaiser SoCal Adolescent Vaccinations PIP SMART Aim Measure............U-32
Kaiser SoCal Performance Evaluation Report: July 1, 2017–June 30, 2018 California Department of Health Care Services
Page U-ii Health Services Advisory Group, Inc.

TABLE OF CONTENTS
Table 6.1—Kaiser SoCal’s Self-Reported Follow-Up on External Quality Review Recommendations from the July 1, 2016, through June 30, 2017, MCP-Specific Evaluation Report................................................................U-34
Kaiser SoCal Performance Evaluation Report: July 1, 2017–June 30, 2018 California Department of Health Care Services
Page U-iii Health Services Advisory Group, Inc.
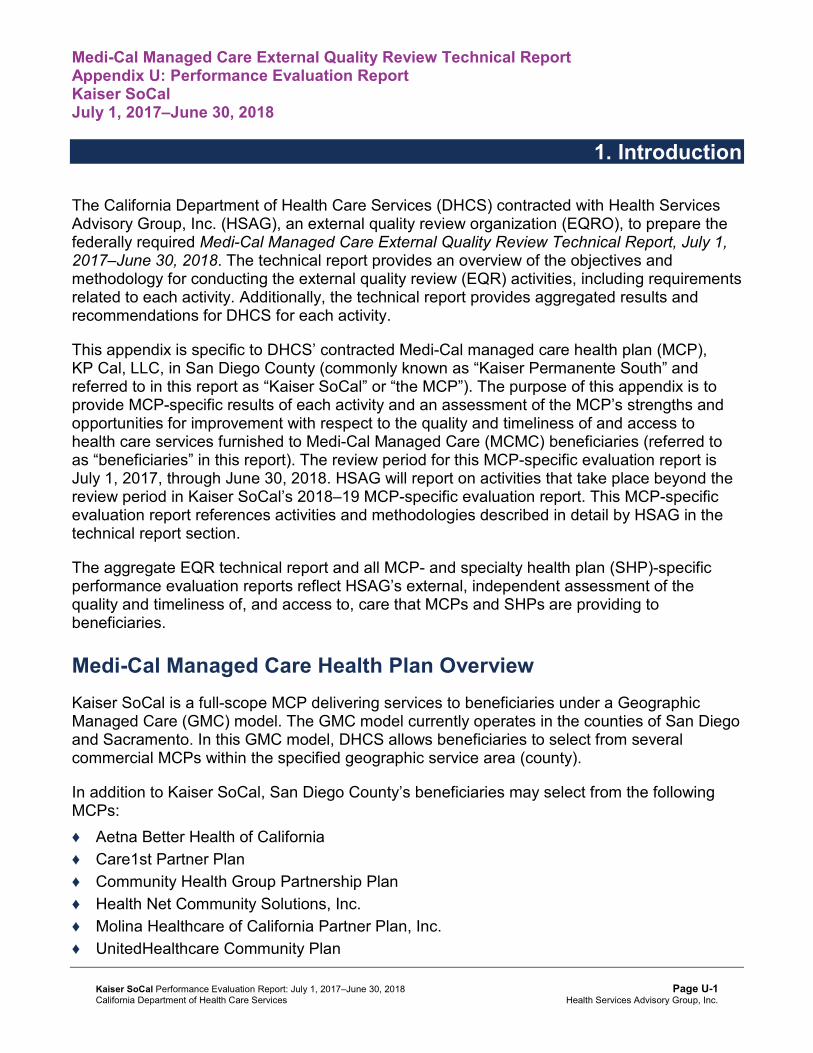
Medi-Cal Managed Care External Quality Review Technical ReportAppendix U: Performance Evaluation ReportKaiser SoCal July 1, 2017–June 30, 2018
1. Introduction
The California Department of Health Care Services (DHCS) contracted with Health Services Advisory Group, Inc. (HSAG), an external quality review organization (EQRO), to prepare the federally required Medi-Cal Managed Care External Quality Review Technical Report, July 1, 2017–June 30, 2018. The technical report provides an overview of the objectives and methodology for conducting the external quality review (EQR) activities, including requirements related to each activity. Additionally, the technical report provides aggregated results and recommendations for DHCS for each activity.
This appendix is specific to DHCS’ contracted Medi-Cal managed care health plan (MCP), KP Cal, LLC, in San Diego County (commonly known as “Kaiser Permanente South” and referred to in this report as “Kaiser SoCal” or “the MCP”). The purpose of this appendix is to provide MCP-specific results of each activity and an assessment of the MCP’s strengths and opportunities for improvement with respect to the quality and timeliness of and access to health care services furnished to Medi-Cal Managed Care (MCMC) beneficiaries (referred to as “beneficiaries” in this report). The review period for this MCP-specific evaluation report is July 1, 2017, through June 30, 2018. HSAG will report on activities that take place beyond the review period in Kaiser SoCal’s 2018–19 MCP-specific evaluation report. This MCP-specific evaluation report references activities and methodologies described in detail by HSAG in the technical report section.
The aggregate EQR technical report and all MCP- and specialty health plan (SHP)-specific performance evaluation reports reflect HSAG’s external, independent assessment of the quality and timeliness of, and access to, care that MCPs and SHPs are providing to beneficiaries.
Medi-Cal Managed Care Health Plan Overview Kaiser SoCal is a full-scope MCP delivering services to beneficiaries under a Geographic Managed Care (GMC) model. The GMC model currently operates in the counties of San Diego and Sacramento. In this GMC model, DHCS allows beneficiaries to select from several commercial MCPs within the specified geographic service area (county).
In addition to Kaiser SoCal, San Diego County’s beneficiaries may select from the following MCPs: ♦ Aetna Better Health of California ♦ Care1st Partner Plan ♦ Community Health Group Partnership Plan ♦ Health Net Community Solutions, Inc. ♦ Molina Healthcare of California Partner Plan, Inc. ♦ UnitedHealthcare Community Plan
Kaiser SoCal Performance Evaluation Report: July 1, 2017–June 30, 2018 California Department of Health Care Services
Page U-1 Health Services Advisory Group, Inc.

INTRODUCTION
Kaiser SoCal became operational in San Diego County to provide MCMC services effective January 1998. As of June 30, 2018, Kaiser SoCal had 51,619 beneficiaries.1 This represents 7 percent of the beneficiaries enrolled in San Diego County.
1 Medi-Cal Managed Care Enrollment Report—June 2018. Available at: http://www.dhcs.ca.gov/dataandstats/reports/Pages/MMCDMonthlyEnrollment.aspx. Accessed on: Aug 27, 2018.
Kaiser SoCal Performance Evaluation Report: July 1, 2017–June 30, 2018 California Department of Health Care Services
Page U-2 Health Services Advisory Group, Inc.
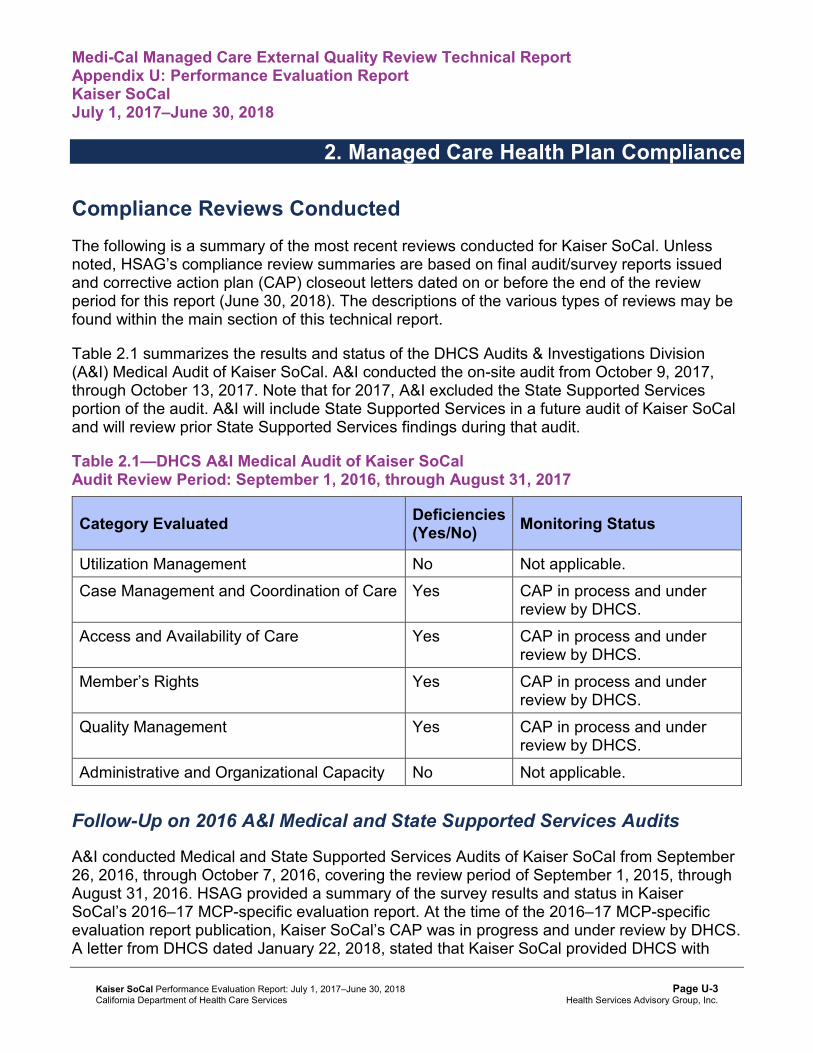
Medi-Cal Managed Care External Quality Review Technical ReportAppendix U: Performance Evaluation ReportKaiser SoCal July 1, 2017–June 30, 2018
2. Managed Care Health Plan Compliance
Compliance Reviews Conducted The following is a summary of the most recent reviews conducted for Kaiser SoCal. Unless noted, HSAG’s compliance review summaries are based on final audit/survey reports issued and corrective action plan (CAP) closeout letters dated on or before the end of the review period for this report (June 30, 2018). The descriptions of the various types of reviews may be found within the main section of this technical report.
Table 2.1 summarizes the results and status of the DHCS Audits & Investigations Division (A&I) Medical Audit of Kaiser SoCal. A&I conducted the on-site audit from October 9, 2017, through October 13, 2017. Note that for 2017, A&I excluded the State Supported Services portion of the audit. A&I will include State Supported Services in a future audit of Kaiser SoCal and will review prior State Supported Services findings during that audit.
Table 2.1—DHCS A&I Medical Audit of Kaiser SoCal Audit Review Period: September 1, 2016, through August 31, 2017
Category Evaluated Deficiencies (Yes/No) Monitoring Status
Utilization Management No Not applicable. Case Management and Coordination of Care Yes CAP in process and under
review by DHCS. Access and Availability of Care Yes CAP in process and under
review by DHCS. Member’s Rights Yes CAP in process and under
review by DHCS. Quality Management Yes CAP in process and under
review by DHCS. Administrative and Organizational Capacity No Not applicable.
Follow-Up on 2016 A&I Medical and State Supported Services Audits
A&I conducted Medical and State Supported Services Audits of Kaiser SoCal from September 26, 2016, through October 7, 2016, covering the review period of September 1, 2015, through August 31, 2016. HSAG provided a summary of the survey results and status in Kaiser SoCal’s 2016–17 MCP-specific evaluation report. At the time of the 2016–17 MCP-specific evaluation report publication, Kaiser SoCal’s CAP was in progress and under review by DHCS. A letter from DHCS dated January 22, 2018, stated that Kaiser SoCal provided DHCS with
Kaiser SoCal Performance Evaluation Report: July 1, 2017–June 30, 2018 California Department of Health Care Services
Page U-3 Health Services Advisory Group, Inc.

MANAGED CARE HEALTH PLAN COMPLIANCE
additional information regarding the CAP and that DHCS had found all items to be in compliance; therefore, DHCS closed the CAP.
Strengths—Compliance Reviews A&I identified no deficiencies in the Utilization Management and Administrative and Organizational Capacity categories during the October 2017 Medical Audit of Kaiser SoCal. Additionally, Kaiser SoCal fully resolved all outstanding deficiencies from the September 26, 2016, through October 7, 2016, A&I Medical and State Supported Services Audits.
Opportunities for Improvement—Compliance Reviews Kaiser SoCal has the opportunity to work with DHCS to ensure that the MCP resolves all deficiencies from the October 2017 A&I Medical Audit. The deficiencies cut across the areas of quality and timeliness of, and access to, health care.
Kaiser SoCal Performance Evaluation Report: July 1, 2017–June 30, 2018 California Department of Health Care Services
Page U-4 Health Services Advisory Group, Inc.
Medi-Cal Managed Care External Quality Review Technical ReportAppendix U: Performance Evaluation ReportKaiser SoCal July 1, 2017–June 30, 2018
3. Managed Care Health Plan Performance Measures
Performance Measure Validation Results The HEDIS®2 2018 Compliance Audit Final Report of Findings for Kaiser SoCal contains the detailed findings and recommendations from HSAG’s NCQA HEDIS Compliance Audit™.3
HSAG auditors determined that Kaiser SoCal followed the appropriate specifications to produce valid rates, and identified no issues of concern.
Performance Measure Results and Findings After validating the MCP’s performance measure rates, HSAG assessed the results. See Table 3.1 through Table 3.9 for Kaiser SoCal’s performance measure results for reporting years (RYs) 2015 through 2018 and performance measure findings for RY 2018. The RY is the year in which the MCP reported the rates. The RY rates reflect measurement year (MY) data from the previous calendar year. Note that data may not be available for all four years.
Note the following regarding Table 3.1 through Table 3.9:
♦ To allow HSAG to provide meaningful assessment of MCP performance and actionable recommendations, HSAG, in collaboration with DHCS, organized the measures into domains based on the health care areas each measure affects. Table 3.1 through Table 3.8 present the performance measure results and findings by domain, and Table 3.9 presents the RY 2018 performance measure findings for the domains combined.
♦ To assess performance for each MCP reporting unit, HSAG compares the rates to national benchmarks. Rates indicating performance above the high performance levels (HPLs) are shaded in gray, and rates indicating performance below the minimum performance levels (MPLs) are bolded. ■ For measures with rates below the MPLs, DHCS requires MCPs to submit to DHCS
improvement plans (IPs) to address the rates below the MPLs (unless MCPs are reporting the rates for the first time).
■ For MCPs that meet DHCS’ Quality of Care CAP thresholds, DHCS issues a CAP; if an MCP’s performance is such that it may trigger a CAP in the following year, DHCS issues an advance warning letter.
2 Healthcare Effectiveness Data and Information Set (HEDIS®) is a registered trademark of the National Committee for Quality Assurance (NCQA).
3 NCQA HEDIS Compliance AuditTM is a trademark of NCQA.
Kaiser SoCal Performance Evaluation Report: July 1, 2017–June 30, 2018 California Department of Health Care Services
Page U-5 Health Services Advisory Group, Inc.

MANAGED CARE HEALTH PLAN PERFORMANCE MEASURES
■ IPs and CAPs consist of submission of Plan-Do-Study-Act (PDSA) Cycle Worksheets, Quality Improvement (QI) Summaries, or completion of Performance Improvement Projects (PIPs)—as determined by DHCS.
♦ For RYs 2016, 2017, and 2018, the HPLs and MPLs represent the NCQA Quality Compass®4 Medicaid health maintenance organization (HMO) 90th and 25th percentiles, respectively.
♦ For RY 2015, the HPLs and MPLs represent the NCQA HEDIS Audit Means, Percentiles, and Ratios 90th and 25th percentiles, respectively. For the Comprehensive Diabetes Care—HbA1c Poor Control (>9.0 Percent) measure, for which a lower rate indicates more favorable performance, the HPL and MPL are based on the 10th and 75th percentiles, respectively.
♦ HSAG includes the specific HPL and MPL values for RY 2018 in Section 6 of the Medi-Cal Managed Care External Quality Review Technical Report, July 1, 2017–June 30, 2018 (“Managed Care Health Plan Performance Measures”).
Preventive Screening and Children’s Health
Table 3.1 presents the four-year trending information for the performance measures within the Preventive Screening and Children’s Health domain.
Note the following regarding Table 3.1:
♦ Although HSAG includes information on the MCP’s performance related to the four Children and Adolescents’ Access to Primary Care measures, DHCS did not hold MCPs accountable to meet the MPLs for these measures for RYs 2015 through 2018 (i.e., DHCS did not require MCPs to submit IPs if rates for the measures were below the MPLs). DHCS made this decision due to the small range of variation between the HPL and MPL thresholds for each measure.
♦ Any comparison of RY 2018 performance to RY 2017 or to benchmarks related to the Immunizations for Adolescents—Combination 2 measure should be exercised with caution given the changes that NCQA made to the specification for this measure for RY 2018. NCQA released guidance that recommended a break in trending for this measure; however, DHCS determined to continue trending because the specification change should result in higher rates.
4 Quality Compass® is a registered trademark of NCQA.
Kaiser SoCal Performance Evaluation Report: July 1, 2017–June 30, 2018 California Department of Health Care Services
Page U-6 Health Services Advisory Group, Inc.

MANAGED CARE HEALTH PLAN PERFORMANCE MEASURES
Table 3.1—Preventive Screening and Children’s Health DomainMulti-Year Performance Measure Results Kaiser SoCal—San Diego County
H = Rate indicates performance above the HPL. Bolded Rate = Rate indicates performance below the MPL.
B = Statistical testing result indicates that the RY 2018 rate is significantly better than the RY 2017 rate.
W = Statistical testing result indicates that the RY 2018 rate is significantly worse than the RY 2017 rate.
Measure RY
2015 Rate1
RY 2016
Rate2
RY 2017
Rate3
RY 2018
Rate4
RYs 2017–18 Rate
Difference5
Childhood Immunization Status—Combination 3 86.75%H 81.58%H 81.57%H 80.23%H -1.34
Children and Adolescents’ Access to Primary Care Practitioners—12–24 Months
97.84% 98.25% 98.29% 98.63% 0.34
Children and Adolescents’ Access to Primary Care Practitioners— 25 Months–6 Years
95.61% 93.77% 91.55% 90.44% -1.11
Children and Adolescents’ Access to Primary Care Practitioners—7–11 Years
93.09% 94.28% 93.77% 92.41% -1.36W
Children and Adolescents’ Access to Primary Care Practitioners—12–19 Years
93.00% 94.44% 94.33% 90.72% -3.61W
Immunizations for Adolescents— Combination 2^ -- -- 34.06% 49.00%H 14.94B
Weight Assessment and Counseling for Nutrition and Physical Activity for Children and Adolescents—Nutrition Counseling—Total
96.16%H 95.71%H 94.73%H 95.67%H 0.94B
Weight Assessment and Counseling for Nutrition and Physical Activity for Children and Adolescents—Physical Activity Counseling—Total
97.51%H 97.16%H 96.11%H 96.84%H 0.73B
Kaiser SoCal Performance Evaluation Report: July 1, 2017–June 30, 2018 California Department of Health Care Services
Page U-7 Health Services Advisory Group, Inc.

MANAGED CARE HEALTH PLAN PERFORMANCE MEASURES
Measure RY
2015 Rate1
RY 2016
Rate2
RY 2017
Rate3
RY 2018
Rate4
RYs 2017–18 Rate
Difference5
Well-Child Visits in the Third, Fourth, Fifth, and Sixth Years of Life
83.94%H 78.87% 71.68% 73.95% 2.27B
1 RY 2015 rates reflect MY data from January 1, 2014, through December 31, 2014. 2 RY 2016 rates reflect MY data from January 1, 2015, through December 31, 2015. 3 RY 2017 rates reflect MY data from January 1, 2016, through December 31, 2016. 4 RY 2018 rates reflect MY data from January 1, 2017, through December 31, 2017. 5 Performance comparisons are based on the Chi-square test of statistical significance, with a p value of <0.05. ^ Caution should be exercised when assessing MCP performance for this measure given the changes that NCQA made to the specification for this measure for RY 2018. -- Indicates that the rate is not available.
Table 3.2 presents findings for the RY 2018 performance measures within the Preventive Screening and Children’s Health domain.
Note the following regarding Table 3.2:
♦ DHCS did not hold MCPs accountable to meet MPLs for all four Children and Adolescents’ Access to Primary Care measures within this domain; therefore, HSAG did not include these measures in its assessment of the MCP’s performance related to HPLs and MPLs.
♦ The Immunizations for Adolescents—Combination 2 measure was a first-year measure in RY 2017, and DHCS established no MPL for this measure for RY 2017 because no comparable benchmark existed; therefore, HSAG did not include this measure in the denominators for calculating the percentage of measures with rates that moved to above or below the MPLs in RY 2018.
Kaiser SoCal Performance Evaluation Report: July 1, 2017–June 30, 2018 California Department of Health Care Services
Page U-8 Health Services Advisory Group, Inc.

MANAGED CARE HEALTH PLAN PERFORMANCE MEASURES
Table 3.2—Preventive Screening and Children’s Health DomainRY 2018 (MY 2017) Performance Measure Findings Kaiser SoCal—San Diego County
Criteria Number of Measures
MeetingCriteria
Total Number of Measures
Percentage of Measures
MeetingCriteria
RY 2018 Rates Above HPLs 4 5 80.00% Rates Above HPLs for the Last Three or More Consecutive Years 3 4 75.00%
RY 2018 Rates Significantly Better than RY 2017 Rates* 4 5 80.00%
Rates that Moved from Below MPLs in RY 2017 to Above MPLs in RY 2018 0 0 N/A
RY 2018 Rates Below MPLs 0 5 0.00% Rates Below MPLs for the Last Three or More Consecutive Years 0 4 0.00%
RY 2018 Rates Significantly Worse than RY 2017 Rates* 0 5 0.00%
Rates that Moved from Above MPLs in RY 2017 to Below MPLs in RY 2018 0 4 0.00%
* Performance comparisons are based on the Chi-square test of statistical significance, with a p value of <0.05. N/A = No rates above or below the MPLs from the previous year exist to include in the denominator for calculating whether or not rates moved to above or below MPLs in the most recent year.
Kaiser SoCal Performance Evaluation Report: July 1, 2017–June 30, 2018 California Department of Health Care Services
Page U-9 Health Services Advisory Group, Inc.
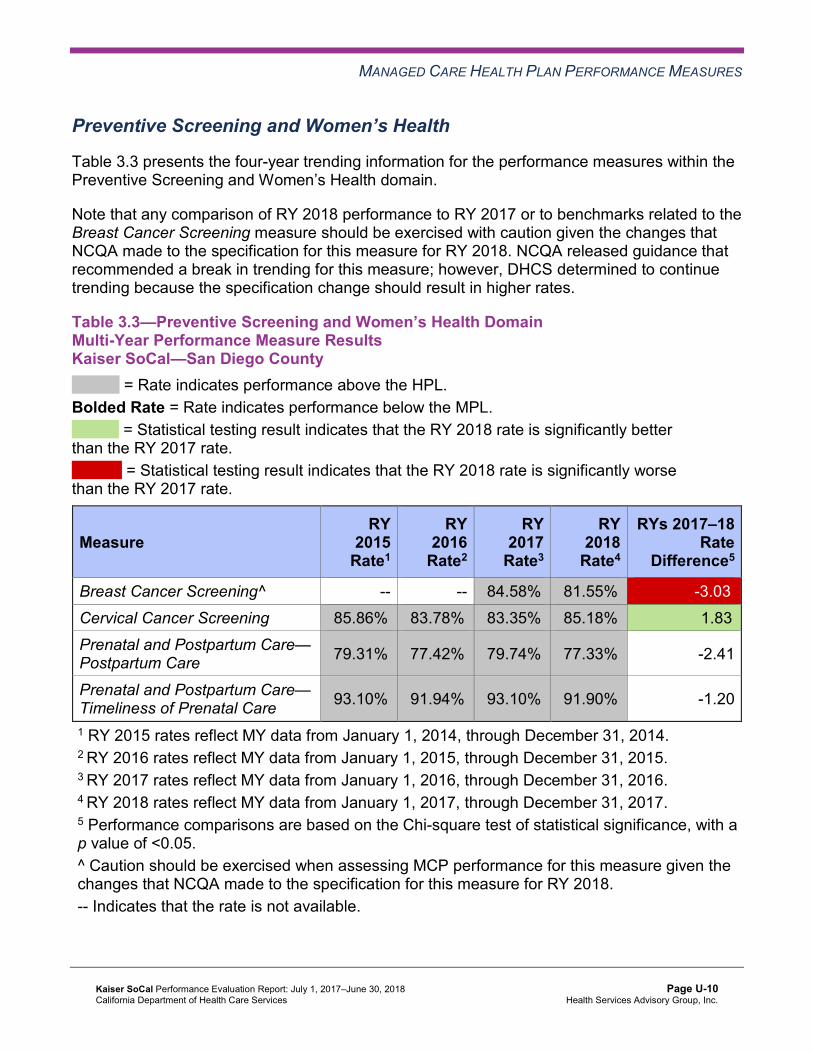
MANAGED CARE HEALTH PLAN PERFORMANCE MEASURES
Preventive Screening and Women’s Health
Table 3.3 presents the four-year trending information for the performance measures within the Preventive Screening and Women’s Health domain.
Note that any comparison of RY 2018 performance to RY 2017 or to benchmarks related to the Breast Cancer Screening measure should be exercised with caution given the changes that NCQA made to the specification for this measure for RY 2018. NCQA released guidance that recommended a break in trending for this measure; however, DHCS determined to continue trending because the specification change should result in higher rates.
Table 3.3—Preventive Screening and Women’s Health DomainMulti-Year Performance Measure Results Kaiser SoCal—San Diego County
H = Rate indicates performance above the HPL. Bolded Rate = Rate indicates performance below the MPL.
B = Statistical testing result indicates that the RY 2018 rate is significantly better than the RY 2017 rate.
W = Statistical testing result indicates that the RY 2018 rate is significantly worse than the RY 2017 rate.
Measure RY
2015 Rate1
RY 2016
Rate2
RY 2017
Rate3
RY 2018
Rate4
RYs 2017–18 Rate
Difference5
Breast Cancer Screening^ -- -- 84.58%H 81.55%H -3.03W
Cervical Cancer Screening 85.86%H 83.78%H 83.35%H 85.18%H 1.83B
Prenatal and Postpartum Care— Postpartum Care 79.31%H 77.42%H 79.74%H 77.33%H -2.41
Prenatal and Postpartum Care— Timeliness of Prenatal Care 93.10%H 91.94%H 93.10%H 91.90%H -1.20
1 RY 2015 rates reflect MY data from January 1, 2014, through December 31, 2014. 2 RY 2016 rates reflect MY data from January 1, 2015, through December 31, 2015. 3 RY 2017 rates reflect MY data from January 1, 2016, through December 31, 2016. 4 RY 2018 rates reflect MY data from January 1, 2017, through December 31, 2017. 5 Performance comparisons are based on the Chi-square test of statistical significance, with a p value of <0.05. ^ Caution should be exercised when assessing MCP performance for this measure given the changes that NCQA made to the specification for this measure for RY 2018. -- Indicates that the rate is not available.
Kaiser SoCal Performance Evaluation Report: July 1, 2017–June 30, 2018 California Department of Health Care Services
Page U-10 Health Services Advisory Group, Inc.

MANAGED CARE HEALTH PLAN PERFORMANCE MEASURES
Table 3.4 presents findings for the RY 2018 performance measures within the Preventive Screening and Women’s Health domain. Note that the Breast Cancer Screening measure was a first-year measure in RY 2017, and DHCS did not hold MCPs accountable to meet an MPL for this measure in RY 2017; therefore, HSAG did not include this measure in the denominators for calculating the percentage of measures with rates that moved to above or below the MPLs in RY 2018.
Table 3.4—Preventive Screening and Women’s Health DomainRY 2018 (MY 2017) Performance Measure Findings Kaiser SoCal—San Diego County
Criteria Number of Measures
MeetingCriteria
Total Number of Measures
Percentage of Measures
MeetingCriteria
RY 2018 Rates Above HPLs 4 4 100.00% Rates Above HPLs for the Last Three or More Consecutive Years 3 3 100.00%
RY 2018 Rates Significantly Better than RY 2017 Rates* 1 4 25.00%
Rates that Moved from Below MPLs in RY 2017 to Above MPLs in RY 2018 0 0 N/A
RY 2018 Rates Below MPLs 0 4 0.00% Rates Below MPLs for the Last Three or More Consecutive Years 0 3 0.00%
RY 2018 Rates Significantly Worse than RY 2017 Rates* 1 4 25.00%
Rates that Moved from Above MPLs in RY 2017 to Below MPLs in RY 2018 0 3 0.00%
* Performance comparisons are based on the Chi-square test of statistical significance, with a p value of <0.05. N/A = No rates above or below the MPLs from the previous year exist to include in the denominator for calculating whether or not rates moved to above or below MPLs in the most recent year.
Kaiser SoCal Performance Evaluation Report: July 1, 2017–June 30, 2018 California Department of Health Care Services
Page U-11 Health Services Advisory Group, Inc.

MANAGED CARE HEALTH PLAN PERFORMANCE MEASURES
Care for Chronic Conditions
Table 3.5 presents the four-year trending information for the performance measures within the Care for Chronic Conditions domain.
Table 3.5—Care for Chronic Conditions Domain Multi-Year Performance Measure Results Kaiser SoCal—San Diego County
H = Rate indicates performance above the HPL. Bolded Rate = Rate indicates performance below the MPL.
B = Statistical testing result indicates that the RY 2018 rate is significantly better than the RY 2017 rate.
W = Statistical testing result indicates that the RY 2018 rate is significantly worse than the RY 2017 rate.
Measure RY
2015 Rate1
RY 2016
Rate2
RY 2017
Rate3
RY 2018
Rate4
RYs 2017–18 Rate
Difference5
Annual Monitoring for Patients on Persistent Medications—ACE Inhibitors or ARBs
93.73%H 91.49% 94.06%H 93.00%H -1.06
Annual Monitoring for Patients on Persistent Medications— Diuretics
93.62%H 90.73% 93.65%H 93.27%H -0.38
Asthma Medication Ratio -- -- 87.76%H 88.70%H 0.94 Comprehensive Diabetes Care— Blood Pressure Control (<140/90 mm Hg)
86.34%H 84.49%H 82.82%H 85.01%H 2.19B
Comprehensive Diabetes Care— Eye Exam (Retinal) Performed 85.70%H 84.56%H 85.69%H 83.67%H -2.02W
Comprehensive Diabetes Care— HbA1c Control (<8.0 Percent) 65.85%H 67.21%H 65.54%H 70.66%H 5.12B
Comprehensive Diabetes Care— HbA1c Poor Control (>9.0 Percent)*
21.04%H 19.85%H 20.49%H 18.52%H -1.97
Comprehensive Diabetes Care— HbA1c Testing 95.72%H 95.55%H 95.36%H 95.19%H -0.17
Comprehensive Diabetes Care— Medical Attention for Nephropathy
92.71%H 95.33%H 94.91%H 94.02%H -0.89
Kaiser SoCal Performance Evaluation Report: July 1, 2017–June 30, 2018 California Department of Health Care Services
Page U-12 Health Services Advisory Group, Inc.

MANAGED CARE HEALTH PLAN PERFORMANCE MEASURES
Measure RY
2015 Rate1
RY 2016
Rate2
RY 2017
Rate3
RY 2018
Rate4
RYs 2017–18 Rate
Difference5
Controlling High Blood Pressure 87.59%H 86.62%H 88.56%H 85.40%H -3.16 1 RY 2015 rates reflect MY data from January 1, 2014, through December 31, 2014. 2 RY 2016 rates reflect MY data from January 1, 2015, through December 31, 2015. 3 RY 2017 rates reflect MY data from January 1, 2016, through December 31, 2016. 4 RY 2018 rates reflect MY data from January 1, 2017, through December 31, 2017. 5 Performance comparisons are based on the Chi-square test of statistical significance, with a p value of <0.05. * A lower rate indicates better performance for this measure. -- Indicates that the rate is not available.
Table 3.6 presents findings for the RY 2018 performance measures within the Care for Chronic Conditions domain. Note that the Asthma Medication Ratio measure was a first-year measure in RY 2017, and DHCS did not hold MCPs accountable to meet an MPL for this measure in RY 2017; therefore, HSAG did not include this measure in the denominators for calculating the percentage of measures with rates that moved to above or below the MPLs in RY 2018.
Table 3.6—Care for Chronic Conditions Domain RY 2018 (MY 2017) Performance Measure Findings Kaiser SoCal—San Diego County
Criteria Number of Measures
MeetingCriteria
Total Number of Measures
Percentage of Measures
MeetingCriteria
RY 2018 Rates Above HPLs 10 10 100.00% Rates Above HPLs for the Last Three or More Consecutive Years 7 9 77.78%
RY 2018 Rates Significantly Better than RY 2017 Rates* 2 10 20.00%
Rates that Moved from Below MPLs in RY 2017 to Above MPLs in RY 2018 0 0 N/A
RY 2018 Rates Below MPLs 0 10 0.00% Rates Below MPLs for the Last Three or More Consecutive Years 0 9 0.00%
RY 2018 Rates Significantly Worse than RY 2017 Rates* 1 10 10.00%
Kaiser SoCal Performance Evaluation Report: July 1, 2017–June 30, 2018 California Department of Health Care Services
Page U-13 Health Services Advisory Group, Inc.
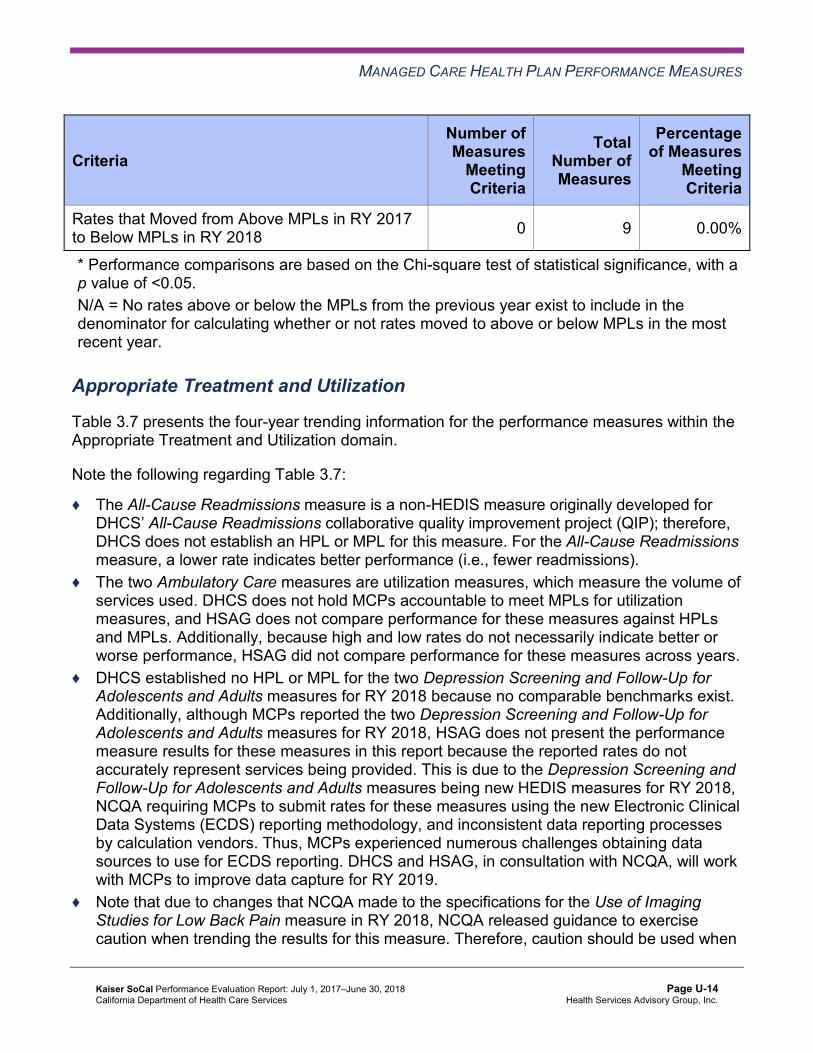
MANAGED CARE HEALTH PLAN PERFORMANCE MEASURES
Criteria Number of Measures
MeetingCriteria
Total Number of Measures
Percentage of Measures
MeetingCriteria
Rates that Moved from Above MPLs in RY 2017 to Below MPLs in RY 2018 0 9 0.00%
* Performance comparisons are based on the Chi-square test of statistical significance, with a p value of <0.05. N/A = No rates above or below the MPLs from the previous year exist to include in the denominator for calculating whether or not rates moved to above or below MPLs in the most recent year.
Appropriate Treatment and Utilization
Table 3.7 presents the four-year trending information for the performance measures within the Appropriate Treatment and Utilization domain.
Note the following regarding Table 3.7:
♦ The All-Cause Readmissions measure is a non-HEDIS measure originally developed for DHCS’ All-Cause Readmissions collaborative quality improvement project (QIP); therefore, DHCS does not establish an HPL or MPL for this measure. For the All-Cause Readmissions measure, a lower rate indicates better performance (i.e., fewer readmissions).
♦ The two Ambulatory Care measures are utilization measures, which measure the volume of services used. DHCS does not hold MCPs accountable to meet MPLs for utilization measures, and HSAG does not compare performance for these measures against HPLs and MPLs. Additionally, because high and low rates do not necessarily indicate better or worse performance, HSAG did not compare performance for these measures across years.
♦ DHCS established no HPL or MPL for the two Depression Screening and Follow-Up for Adolescents and Adults measures for RY 2018 because no comparable benchmarks exist. Additionally, although MCPs reported the two Depression Screening and Follow-Up for Adolescents and Adults measures for RY 2018, HSAG does not present the performance measure results for these measures in this report because the reported rates do not accurately represent services being provided. This is due to the Depression Screening and Follow-Up for Adolescents and Adults measures being new HEDIS measures for RY 2018, NCQA requiring MCPs to submit rates for these measures using the new Electronic Clinical Data Systems (ECDS) reporting methodology, and inconsistent data reporting processes by calculation vendors. Thus, MCPs experienced numerous challenges obtaining data sources to use for ECDS reporting. DHCS and HSAG, in consultation with NCQA, will work with MCPs to improve data capture for RY 2019.
♦ Note that due to changes that NCQA made to the specifications for the Use of Imaging Studies for Low Back Pain measure in RY 2018, NCQA released guidance to exercise caution when trending the results for this measure. Therefore, caution should be used when
Kaiser SoCal Performance Evaluation Report: July 1, 2017–June 30, 2018 California Department of Health Care Services
Page U-14 Health Services Advisory Group, Inc.

MANAGED CARE HEALTH PLAN PERFORMANCE MEASURES
comparing MCP performance across years or when comparing MCP results to benchmarks related to the Use of Imaging Studies for Low Back Pain measure, as differences in rates may be a result of the specification changes rather than a reflection of performance.
Table 3.7—Appropriate Treatment and Utilization DomainMulti-Year Performance Measure Results Kaiser SoCal—San Diego County
H = Rate indicates performance above the HPL. Bolded Rate = Rate indicates performance below the MPL.
B = Statistical testing result indicates that the RY 2018 rate is significantly better than the RY 2017 rate.
W = Statistical testing result indicates that the RY 2018 rate is significantly worse than the RY 2017 rate.
Measure RY
2015 Rate1
RY 2016
Rate2
RY 2017
Rate3
RY 2018
Rate4
RYs 2017–18 Rate
Difference5
All-Cause Readmissions* 16.14% 15.03% 15.52% 14.17% -1.35 Ambulatory Care—Emergency Department (ED) Visits per 1,000 Member Months**
33.00 32.50 28.81 29.99 Not Tested
Ambulatory Care—Outpatient Visits per 1,000 Member Months** 469.28 490.40 489.16 499.73 Not Tested
Avoidance of Antibiotic Treatment in Adults With Acute Bronchitis NA 51.67%H 65.15%H 76.54%H 11.39
Use of Imaging Studies for Low Back Pain^ 89.89%H 84.88%H 82.38%H 87.05%H 4.67
1 RY 2015 rates reflect MY data from January 1, 2014, through December 31, 2014. 2 RY 2016 rates reflect MY data from January 1, 2015, through December 31, 2015. 3 RY 2017 rates reflect MY data from January 1, 2016, through December 31, 2016. 4 RY 2018 rates reflect MY data from January 1, 2017, through December 31, 2017. 5 Performance comparisons are based on the Chi-square test of statistical significance, with a p value of <0.05. * A lower rate indicates better performance for this measure. ** Member months are a member's “contribution” to the total yearly membership. ^ Caution should be exercised when assessing MCP performance for this measure given the changes that NCQA made to the specification for this measure for RY 2018. NA = The MCP followed the specifications, but the denominator was too small (less than 30) to report a valid rate. Not Tested = An RY 2017–18 rate difference was not calculated because high and low rates do not necessarily indicate better or worse performance.
Kaiser SoCal Performance Evaluation Report: July 1, 2017–June 30, 2018 California Department of Health Care Services
Page U-15 Health Services Advisory Group, Inc.

MANAGED CARE HEALTH PLAN PERFORMANCE MEASURES
Table 3.8 presents findings for the RY 2018 performance measures within the Appropriate Treatment and Utilization domain. DHCS did not hold MCPs accountable to meet MPLs for the following measures within this domain; therefore, HSAG did not include these measures in its assessment of the MCP’s performance related to HPLs and MPLs:
♦ All-Cause Readmissions ♦ Both Ambulatory Care measures
Table 3.8—Appropriate Treatment and Utilization DomainRY 2018 (MY 2017) Performance Measure Findings Kaiser SoCal—San Diego County
Criteria Number of Measures
MeetingCriteria
Total Number of Measures
Percentage of Measures
MeetingCriteria
RY 2018 Rates Above HPLs 2 2 100.00% Rates Above HPLs for the Last Three or More Consecutive Years 2 2 100.00%
RY 2018 Rates Significantly Better than RY 2017 Rates* 0 3 0.00%
Rates that Moved from Below MPLs in RY 2017 to Above MPLs in RY 2018 0 0 N/A
RY 2018 Rates Below MPLs 0 2 0.00% Rates Below MPLs for the Last Three or More Consecutive Years 0 2 0.00%
RY 2018 Rates Significantly Worse than RY 2017 Rates* 0 3 0.00%
Rates that Moved from Above MPLs in RY 2017 to Below MPLs in RY 2018 0 2 0.00%
* Performance comparisons are based on the Chi-square test of statistical significance, with a p value of <0.05. N/A = No rates above or below the MPLs from the previous year exist to include in the denominator for calculating whether or not rates moved to above or below MPLs in the most recent year.
Kaiser SoCal Performance Evaluation Report: July 1, 2017–June 30, 2018 California Department of Health Care Services
Page U-16 Health Services Advisory Group, Inc.
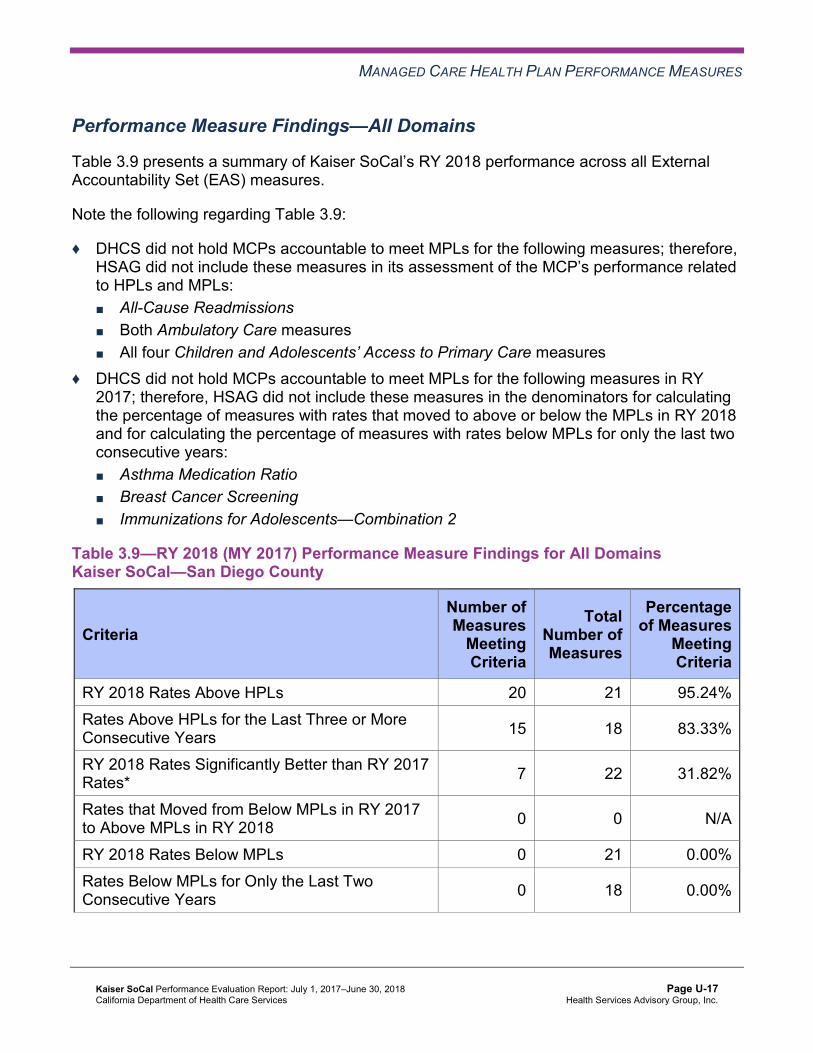
MANAGED CARE HEALTH PLAN PERFORMANCE MEASURES
Performance Measure Findings—All Domains
Table 3.9 presents a summary of Kaiser SoCal’s RY 2018 performance across all External Accountability Set (EAS) measures.
Note the following regarding Table 3.9:
♦ DHCS did not hold MCPs accountable to meet MPLs for the following measures; therefore, HSAG did not include these measures in its assessment of the MCP’s performance related to HPLs and MPLs: ■ All-Cause Readmissions ■ Both Ambulatory Care measures ■ All four Children and Adolescents’ Access to Primary Care measures
♦ DHCS did not hold MCPs accountable to meet MPLs for the following measures in RY 2017; therefore, HSAG did not include these measures in the denominators for calculating the percentage of measures with rates that moved to above or below the MPLs in RY 2018 and for calculating the percentage of measures with rates below MPLs for only the last two consecutive years: ■ Asthma Medication Ratio ■ Breast Cancer Screening ■ Immunizations for Adolescents—Combination 2
Table 3.9—RY 2018 (MY 2017) Performance Measure Findings for All Domains Kaiser SoCal—San Diego County
Criteria Number of Measures
MeetingCriteria
Total Number of Measures
Percentage of Measures
MeetingCriteria
RY 2018 Rates Above HPLs 20 21 95.24% Rates Above HPLs for the Last Three or More Consecutive Years 15 18 83.33%
RY 2018 Rates Significantly Better than RY 2017 Rates* 7 22 31.82%
Rates that Moved from Below MPLs in RY 2017 to Above MPLs in RY 2018 0 0 N/A
RY 2018 Rates Below MPLs 0 21 0.00% Rates Below MPLs for Only the Last Two Consecutive Years 0 18 0.00%
Kaiser SoCal Performance Evaluation Report: July 1, 2017–June 30, 2018 California Department of Health Care Services
Page U-17 Health Services Advisory Group, Inc.

MANAGED CARE HEALTH PLAN PERFORMANCE MEASURES
Criteria Number of Measures
MeetingCriteria
Total Number of Measures
Percentage of Measures
MeetingCriteria
Rates Below MPLs for the Last Three or More Consecutive Years 0 18 0.00%
RY 2018 Rates Significantly Worse than RY 2017 Rates* 2 22 9.09%
Rates that Moved from Above MPLs in RY 2017 to Below MPLs in RY 2018 0 18 0.00%
* Performance comparisons are based on the Chi-square test of statistical significance, with a p value of <0.05. N/A = No rates above or below the MPLs from the previous year exist to include in the denominator for calculating whether or not rates moved to above or below MPLs in the most recent year.
Seniors and Persons with Disabilities Performance Measure Results Table 3.10 presents the four-year trending information for the Seniors and Persons with Disabilities (SPD) population, and Table 3.11 presents the four-year trending information for the non-SPD population for the measures that DHCS required MCPs to stratify for the SPD and non-SPD populations. The tables also show the differences in rates between RY 2017 and RY 2018.
Table 3.12 presents the SPD and non-SPD rates, a comparison of the SPD and non-SPD rates,5 and the total combined rate for each measure.
5 HSAG calculated statistical significance between the SPD and non-SPD rates for each measure using a Chi-square test. This information is displayed in the “SPD/Non-SPD Rate Difference” column in Table 3.12.
Kaiser SoCal Performance Evaluation Report: July 1, 2017–June 30, 2018 California Department of Health Care Services
Page U-18 Health Services Advisory Group, Inc.
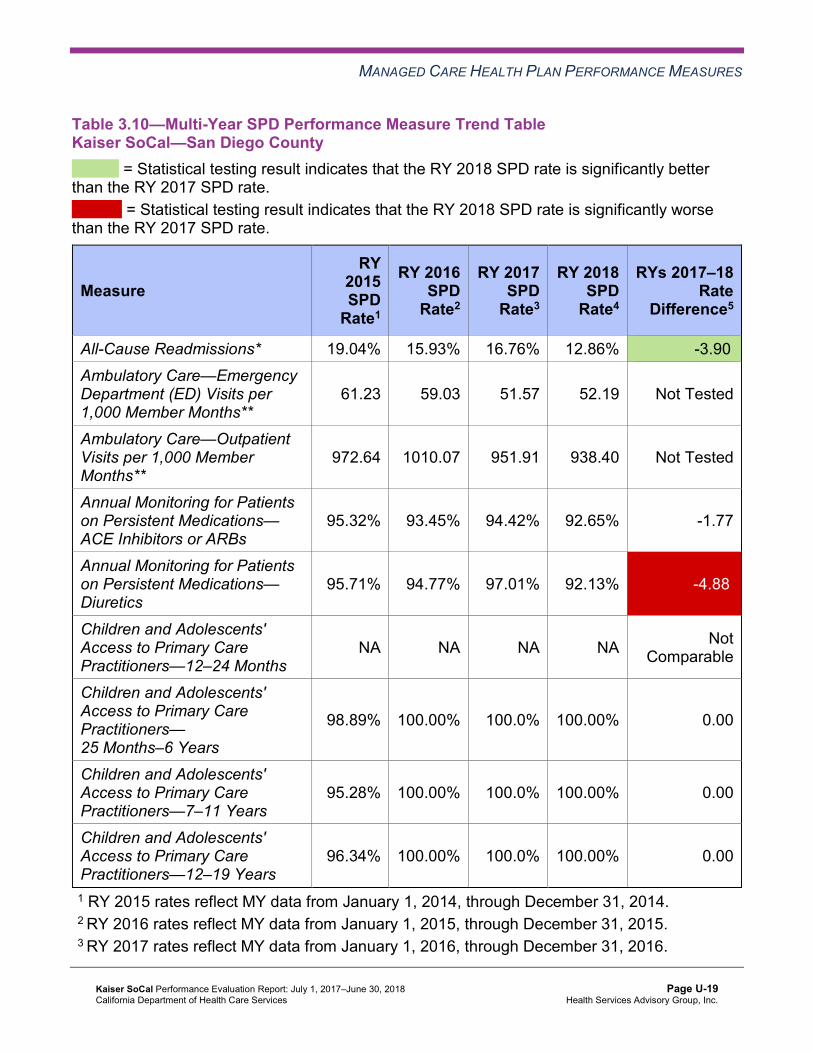
MANAGED CARE HEALTH PLAN PERFORMANCE MEASURES
Table 3.10—Multi-Year SPD Performance Measure Trend Table Kaiser SoCal—San Diego County
B = Statistical testing result indicates that the RY 2018 SPD rate is significantly better than the RY 2017 SPD rate.
W = Statistical testing result indicates that the RY 2018 SPD rate is significantly worse than the RY 2017 SPD rate.
Measure RY
2015 SPD
Rate1
RY 2016 SPD
Rate2
RY 2017 SPD
Rate3
RY 2018 SPD
Rate4
RYs 2017–18 Rate
Difference5
All-Cause Readmissions* 19.04% 15.93% 16.76% 12.86% -3.90B
Ambulatory Care—Emergency Department (ED) Visits per 1,000 Member Months**
61.23 59.03 51.57 52.19 Not Tested
Ambulatory Care—Outpatient Visits per 1,000 Member Months**
972.64 1010.07 951.91 938.40 Not Tested
Annual Monitoring for Patients on Persistent Medications— ACE Inhibitors or ARBs
95.32% 93.45% 94.42% 92.65% -1.77
Annual Monitoring for Patients on Persistent Medications— Diuretics
95.71% 94.77% 97.01% 92.13% -4.88W
Children and Adolescents' Access to Primary Care Practitioners—12–24 Months
NA NA NA NA Not Comparable
Children and Adolescents' Access to Primary Care Practitioners— 25 Months–6 Years
98.89% 100.00% 100.0% 100.00% 0.00
Children and Adolescents' Access to Primary Care Practitioners—7–11 Years
95.28% 100.00% 100.0% 100.00% 0.00
Children and Adolescents' Access to Primary Care Practitioners—12–19 Years
96.34% 100.00% 100.0% 100.00% 0.00
1 RY 2015 rates reflect MY data from January 1, 2014, through December 31, 2014. 2 RY 2016 rates reflect MY data from January 1, 2015, through December 31, 2015. 3 RY 2017 rates reflect MY data from January 1, 2016, through December 31, 2016.
Kaiser SoCal Performance Evaluation Report: July 1, 2017–June 30, 2018 California Department of Health Care Services
Page U-19 Health Services Advisory Group, Inc.

MANAGED CARE HEALTH PLAN PERFORMANCE MEASURES
4 RY 2018 rates reflect MY data from January 1, 2017, through December 31, 2017. 5 Performance comparisons are based on the Chi-square test of statistical significance, with a p value of <0.05. * A lower rate indicates better performance for this measure. ** Member months are a member's “contribution” to the total yearly membership. NA = The MCP followed the specifications, but the denominator was too small (less than 30) to report a valid rate. Not Comparable = An RY 2017–18 rate difference cannot be made because data are not available for both years or because significant methodology changes occurred between years, disallowing comparison. Not Tested = An RY 2017–18 rate difference was not calculated because high and low rates do not necessarily indicate better or worse performance.
Table 3.11—Multi-Year Non-SPD Performance Measure Trend Table Kaiser SoCal—San Diego County
B = Statistical testing result indicates that the RY 2018 non-SPD rate is significantly better than the RY 2017 non-SPD rate.
W = Statistical testing result indicates that the RY 2018 non-SPD rate is significantly worse than the RY 2017 non-SPD rate.
Measure RY 2015
Non-SPD Rate1
RY 2016 Non-SPD
Rate2
RY 2017 Non-SPD
Rate3
RY 2018 Non-SPD
Rate4
RYs 2017–18 Rate
Difference5
All-Cause Readmissions* 9.91% 13.16% 13.64% 16.00% 2.36
Ambulatory Care— Emergency Department (ED) Visits per 1,000 Member Months**
29.60 27.81 25.02 26.22 Not Tested
Ambulatory Care— Outpatient Visits per 1,000 Member Months**
408.75 398.43 412.14 425.13 Not Tested
Annual Monitoring for Patients on Persistent Medications— ACE Inhibitors or ARBs
91.89% 91.14% 94.04% 93.02% -1.02
Annual Monitoring for Patients on Persistent Medications—Diuretics
91.36% 89.98% 93.39% 93.37% -0.02
Kaiser SoCal Performance Evaluation Report: July 1, 2017–June 30, 2018 California Department of Health Care Services
Page U-20 Health Services Advisory Group, Inc.
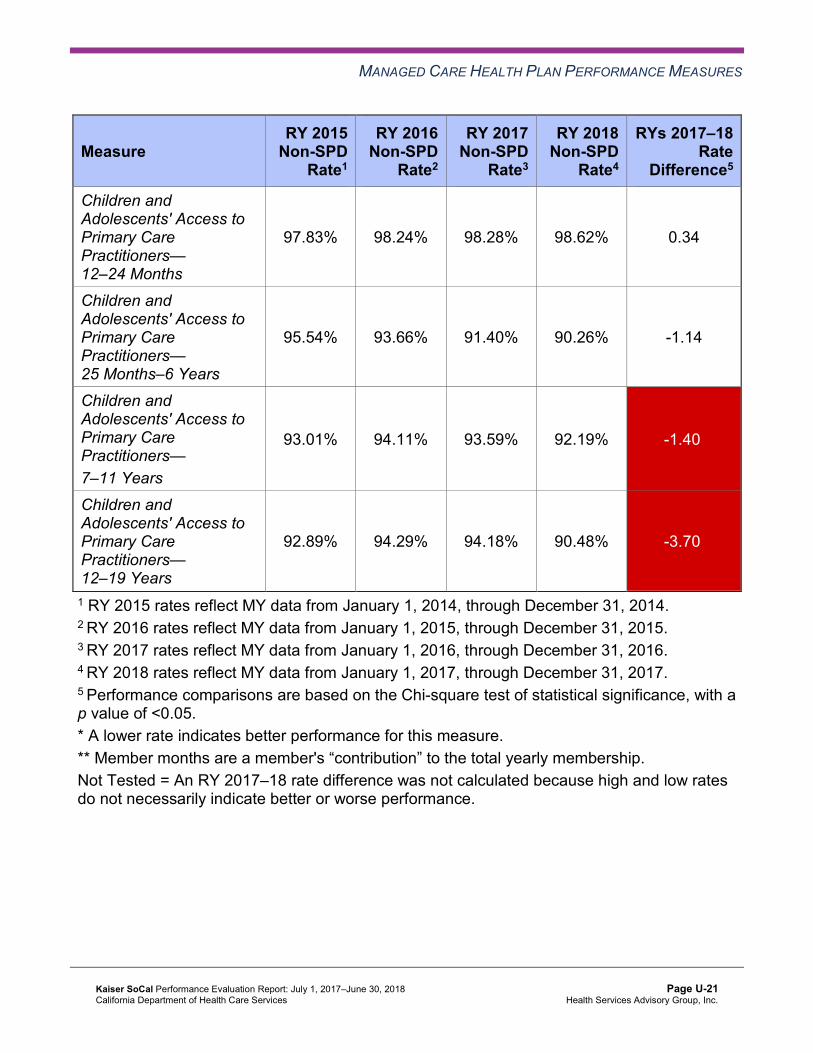
MANAGED CARE HEALTH PLAN PERFORMANCE MEASURES
Measure RY 2015
Non-SPD Rate1
RY 2016 Non-SPD
Rate2
RY 2017 Non-SPD
Rate3
RY 2018 Non-SPD
Rate4
RYs 2017–18 Rate
Difference5
Children and Adolescents' Access to Primary Care Practitioners— 12–24 Months
97.83% 98.24% 98.28% 98.62% 0.34
Children and Adolescents' Access to Primary Care Practitioners— 25 Months–6 Years
95.54% 93.66% 91.40% 90.26% -1.14
Children and Adolescents' Access to Primary Care Practitioners— 7–11 Years
93.01% 94.11% 93.59% 92.19% -1.40W
Children and Adolescents' Access to Primary Care Practitioners— 12–19 Years
92.89% 94.29% 94.18% 90.48% -3.70W
1 RY 2015 rates reflect MY data from January 1, 2014, through December 31, 2014. 2 RY 2016 rates reflect MY data from January 1, 2015, through December 31, 2015. 3 RY 2017 rates reflect MY data from January 1, 2016, through December 31, 2016. 4 RY 2018 rates reflect MY data from January 1, 2017, through December 31, 2017. 5 Performance comparisons are based on the Chi-square test of statistical significance, with a p value of <0.05. * A lower rate indicates better performance for this measure. ** Member months are a member's “contribution” to the total yearly membership. Not Tested = An RY 2017–18 rate difference was not calculated because high and low rates do not necessarily indicate better or worse performance.
Kaiser SoCal Performance Evaluation Report: July 1, 2017–June 30, 2018 California Department of Health Care Services
Page U-21 Health Services Advisory Group, Inc.

MANAGED CARE HEALTH PLAN PERFORMANCE MEASURES
Table 3.12—RY 2018 (MY 2017) Performance Measure Comparison and Results forMeasures Stratified by the SPD and Non-SPD PopulationsKaiser SoCal—San Diego County
B = Statistical testing result indicates that the RY 2018 SPD rate is significantly better than the RY 2018 non-SPD rate.
W = Statistical testing result indicates that the RY 2018 SPD rate is significantly worse than the RY 2018 non-SPD rate.
Measure RY 2018
SPD Rate1
RY 2018 Non-SPD
Rate1
SPD/Non-SPDRate
Difference2
RY 2018 Total Rate3
All-Cause Readmissions* 12.86% 16.00% -3.14 14.17% Ambulatory Care—Emergency Department (ED) Visits per 1,000 Member Months**
52.19 26.22 Not Tested 29.99
Ambulatory Care—Outpatient Visits per 1,000 Member Months** 938.40 425.13 Not Tested 499.73
Annual Monitoring for Patients on Persistent Medications— ACE Inhibitors or ARBs
92.65% 93.02% -0.37 93.00%
Annual Monitoring for Patients on Persistent Medications—Diuretics 92.13% 93.37% -1.24 93.27%
Children and Adolescents' Access to Primary Care Practitioners— 12–24 Months
NA 98.62% Not Comparable 98.63%
Children and Adolescents' Access to Primary Care Practitioners— 25 Months–6 Years
100.00% 90.26% 9.74B 90.44%
Children and Adolescents' Access to Primary Care Practitioners— 7–11 Years
100.00% 92.19% 7.81B 92.41%
Children and Adolescents' Access to Primary Care Practitioners— 12–19 Years
100.00% 90.48% 9.52B 90.72%
1 RY 2018 rates reflect MY data from January 1, 2017, through December 31, 2017. 2 Performance comparisons are based on the Chi-square test of statistical significance, with a p value of <0.05. 3 Total rates are based on the MCP reporting unit’s total results, including the SPD and non-SPD populations. Please note, if data are not available for either the SPD or non-SPD population, the total rate is based on results reported for the available population.
Kaiser SoCal Performance Evaluation Report: July 1, 2017–June 30, 2018 California Department of Health Care Services
Page U-22 Health Services Advisory Group, Inc.

MANAGED CARE HEALTH PLAN PERFORMANCE MEASURES
* A lower rate indicates better performance for this measure. ** Member months are a member's “contribution” to the total yearly membership. NA = The MCP followed the specifications, but the denominator was too small (less than 30) to report a valid rate. Not Comparable = An SPD/non-SPD rate difference cannot be made because data are not available for both populations. Not Tested = An SPD/non-SPD rate difference was not calculated because high and low rates do not necessarily indicate better or worse performance.
Seniors and Persons with Disabilities Findings
HSAG observed the following notable results in RY 2018 for measures that Kaiser SoCal stratified by the SPD and non-SPD populations:
♦ For SPD rates for which HSAG could make a comparison between RY 2017 and RY 2018: ■ The SPD rate improved significantly from RY 2017 to RY 2018 for the All-Cause
Readmissions measure. ■ The RY 2018 SPD rate was significantly worse than the RY 2017 SPD rate for the
Annual Monitoring for Patients on Persistent Medications—Diuretics measure. ♦ The RY 2018 non-SPD rates were significantly worse than the RY 2017 non-SPD rates for
the Children and Adolescents’ Access to Primary Care Practitioners—7–11 Years and 12– 19 Years measures.
♦ For measures for which HSAG could compare the RY 2018 SPD rates to the RY 2018 non-SPD rates, the SPD rates were significantly better than the non-SPD rates for the Children and Adolescents’ Access to Primary Care Practitioners—25 Months–6 Years, 7–11 Years, and 12–19 Years measures.
Strengths—Performance Measures HSAG auditors determined that Kaiser SoCal followed the appropriate specifications to produce valid rates, and identified no issues of concern.
HSAG identified the following notable RY 2018 performance measure results for Kaiser SoCal:
♦ Across all measures and domains, Kaiser SoCal performed above the HPLs in RY 2018 for 20 of 21 measures (95 percent), and the MCP had no measures with rates below the MPLs. ■ Of the 18 measures for which the MCP reported rates for the last three or more
consecutive years, 15 measures (83 percent) were above the HPLs for the last three or more consecutive years.
■ The MCP performed above the HPLs for all measures within the Preventive Screening and Women’s Health and Care for Chronic Conditions domains in RY 2018.
Kaiser SoCal Performance Evaluation Report: July 1, 2017–June 30, 2018 California Department of Health Care Services
Page U-23 Health Services Advisory Group, Inc.
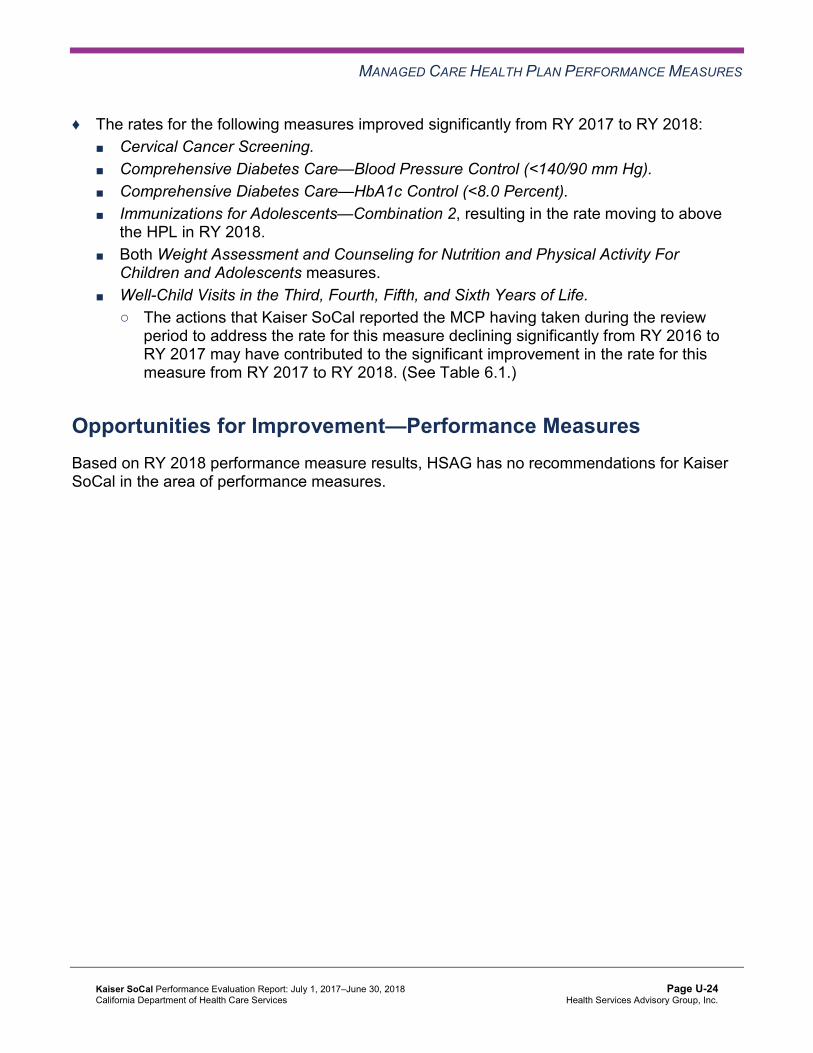
MANAGED CARE HEALTH PLAN PERFORMANCE MEASURES
♦ The rates for the following measures improved significantly from RY 2017 to RY 2018: ■ Cervical Cancer Screening. ■ Comprehensive Diabetes Care—Blood Pressure Control (<140/90 mm Hg). ■ Comprehensive Diabetes Care—HbA1c Control (<8.0 Percent). ■ Immunizations for Adolescents—Combination 2, resulting in the rate moving to above
the HPL in RY 2018. ■ Both Weight Assessment and Counseling for Nutrition and Physical Activity For
Children and Adolescents measures. ■ Well-Child Visits in the Third, Fourth, Fifth, and Sixth Years of Life.
○ The actions that Kaiser SoCal reported the MCP having taken during the review period to address the rate for this measure declining significantly from RY 2016 to RY 2017 may have contributed to the significant improvement in the rate for this measure from RY 2017 to RY 2018. (See Table 6.1.)
Opportunities for Improvement—Performance Measures Based on RY 2018 performance measure results, HSAG has no recommendations for Kaiser SoCal in the area of performance measures.
Kaiser SoCal Performance Evaluation Report: July 1, 2017–June 30, 2018 California Department of Health Care Services
Page U-24 Health Services Advisory Group, Inc.

Medi-Cal Managed Care External Quality Review Technical ReportAppendix U: Performance Evaluation ReportKaiser SoCal July 1, 2017–June 30, 2018
4. MLTSSP Performance Measure Results
Due to Kaiser SoCal’s participation in California’s Coordinated Care Initiative as a Managed Long-Term Services and Supports Plan (MLTSSP), DHCS required that Kaiser SoCal report rates for three HEDIS measures for HSAG to validate as part of the NCQA HEDIS Compliance Audit.
Table 4.1 presents the rates for each required MLTSSP performance measure for RYs 2016, 2017, and 2018. The RY is the year in which the MLTSSP reported the rates. The RY rates reflect MY data from the previous calendar year. Note that the Ambulatory Care—Emergency Department Visits and Ambulatory Care—Outpatient Visits measures are utilization measures which measure the volume of services used. High and low rates do not necessarily indicate better or worse performance; therefore, for these measures, HSAG did not compare performance between RY 2017 and RY 2018.
Table 4.1—Multi-Year MLTSSP Performance Measure Results Kaiser SoCal—San Diego County
B = Statistical testing result indicates that the RY 2018 rate is significantly better than the RY 2017 rate.
W = Statistical testing result indicates that the RY 2018 rate is significantly worse than the RY 2017 rate.
Measure RY 2016 MLTSS
Rate1
RY 2017 MLTSS
Rate2
RY 2018 MLTSS
Rate3
RYs 2017–18 Rate
Difference4
Ambulatory Care—Emergency Department (ED) Visits per 1,000 Member Months*
50.03 42.87 33.26 Not Tested
Ambulatory Care—Outpatient Visits per 1,000 Member Months* 731.40 699.80 562.40 Not Tested
Medication Reconciliation Post-Discharge 89.58% 93.71% 86.82% -6.89W
1 RY 2016 rates reflect MY data from January 1, 2015, through December 31, 2015. 2 RY 2017 rates reflect MY data from January 1, 2016, through December 31, 2016. 3 RY 2018 rates reflect MY data from January 1, 2017, through December 31, 2017. 4 Performance comparisons are based on the Chi-square test of statistical significance, with a p value of <0.05. * Member months are a member's “contribution” to the total yearly membership. Not Tested = An RY 2017–18 rate difference was not calculated because high and low rates do not necessarily indicate better or worse performance.
Kaiser SoCal Performance Evaluation Report: July 1, 2017–June 30, 2018 California Department of Health Care Services
Page U-25 Health Services Advisory Group, Inc.

MLTSSP PERFORMANCE MEASURE RESULTS
Managed Long-Term Services and Supports Plan PerformanceMeasure Findings The rate for the Medication Reconciliation Post-Discharge measure declined significantly from RY 2017 to RY 2018. Kaiser SoCal may consider assessing the causes for the rate for this measure declining significantly to ensure that beneficiaries 18 years of age and older who are discharged from acute or nonacute inpatient care have their medications reconciled by 30 days after discharge.
Kaiser SoCal Performance Evaluation Report: July 1, 2017–June 30, 2018 California Department of Health Care Services
Page U-26 Health Services Advisory Group, Inc.
Medi-Cal Managed Care External Quality Review Technical ReportAppendix U: Performance Evaluation ReportKaiser SoCal July 1, 2017–June 30, 2018
5. Performance Improvement Projects
Performance Improvement Project Overview The key concepts of the rapid-cycle PIP framework include forming a PIP team, setting aims, establishing measures, determining interventions using quality improvement tools, conducting PDSA cycles to test interventions, and planning for the spread of successful changes. The core component of the rapid-cycle PIP approach involves testing changes on a small scale so that improvement can occur more efficiently and lead to long-term sustainability. The following modules guide MCPs through this rapid-cycle PIP process:
♦ Module 1—PIP Initiation ■ MCPs outline the framework for the PIP, which includes:
○ The topic rationale. ○ Comparative data supporting the need to improve the selected topic. ○ A list of the PIP team members, which consists of internal and external stakeholders. ○ A completed key driver diagram that defines the theory of change for improvement,
including the SMART (Specific, Measurable, Achievable, Relevant, and Time-bound) Aim and Global Aim.
♦ Module 2—SMART Aim Data Collection ■ MCPs define the SMART Aim measure and data collection methodology and develop
the SMART Aim data run chart. ♦ Module 3—Intervention Determination
■ MCPs use process mapping and failure modes and effects analysis to identify potential interventions to test which may have direct effects on the SMART Aim.
♦ Module 4—Plan-Do-Study-Act (PDSA) ■ MCPs test and evaluate the interventions identified in Module 3 through a series of
PDSA cycles. ♦ Module 5—PIP Conclusions
■ MCPs interpret results and summarize: ○ Key findings and outcomes achieved. ○ Assessment of each tested intervention. ○ Lessons learned, including how demonstrated improvement can be shared and used
as a foundation for further improvement going forward. ○ Plan for sustained improvement.
Kaiser SoCal Performance Evaluation Report: July 1, 2017–June 30, 2018 California Department of Health Care Services
Page U-27 Health Services Advisory Group, Inc.

PERFORMANCE IMPROVEMENT PROJECTS
Based on the agreed-upon timeline, MCPs submit each module to HSAG for validation. Throughout the rapid-cycle PIP process, HSAG provides technical assistance to MCPs to ensure that PIPs are methodologically sound and to problem-solve with MCPs regarding how to address challenges that occur. Through an iterative process, MCPs have opportunities to make corrections to modules 1 through 3 to achieve all validation criteria.
Once MCPs achieve all validation criteria for modules 1 through 3 and receive feedback on the intervention Plan portion of Module 4, MCPs test interventions. During the intervention testing phase of the PIP, HSAG conducts periodic progress check-ins to ensure that MCPs have addressed HSAG’s feedback on the Plan portion of Module 4 and are making appropriate progress with intervention testing. Once MCPs complete testing an intervention, MCPs determine the next steps based on results and lessons learned—whether the intervention was successful and should be spread (adopt), whether modifications need to be made to the existing intervention (adapt), or whether the intervention was not successful and should be stopped (abandon).
In Module 5, MCPs summarize the overall PIP. When validating Module 5, HSAG assesses the validity and reliability of the results based on the Centers for Medicare & Medicaid Services (CMS) validation protocols to determine whether key stakeholders can have confidence in the reported PIP findings. HSAG assigns the following final confidence levels for each PIP:
♦ High confidence—the PIP was methodologically sound and achieved the SMART Aim goal; the demonstrated improvement was clearly linked to the quality improvement processes conducted and intervention(s) tested; and, the MCP accurately summarized the key findings.
♦ Confidence—the PIP was methodologically sound and achieved the SMART Aim goal, and the MCP accurately summarized the key findings. However, some, but not all, of the quality improvement processes conducted and/or intervention(s) tested were clearly linked to the demonstrated improvement.
♦ Low confidence—either (A) the PIP was methodologically sound; however, the SMART Aim goal was not achieved; or (B) the SMART Aim goal was achieved; however, the quality improvement processes and/or intervention(s) tested were poorly executed and could not be linked to the improvement.
♦ Reported PIP results were not credible—the PIP methodology was not executed as approved.
Performance Improvement Project Results and Findings During the review period, Kaiser SoCal submitted modules 4 and 5 for its 2015–17 DHCS-priority and MCP-specific PIPs. HSAG validated the modules and includes the final PIP validation findings in this report. Additionally, Kaiser SoCal initiated a Disparity PIP and a DHCS-priority PIP during the review period. In this report, HSAG includes summaries of the MCP’s Disparity and DHCS-priority PIP module submissions as well as validation findings from the review period.
Kaiser SoCal Performance Evaluation Report: July 1, 2017–June 30, 2018 California Department of Health Care Services
Page U-28 Health Services Advisory Group, Inc.
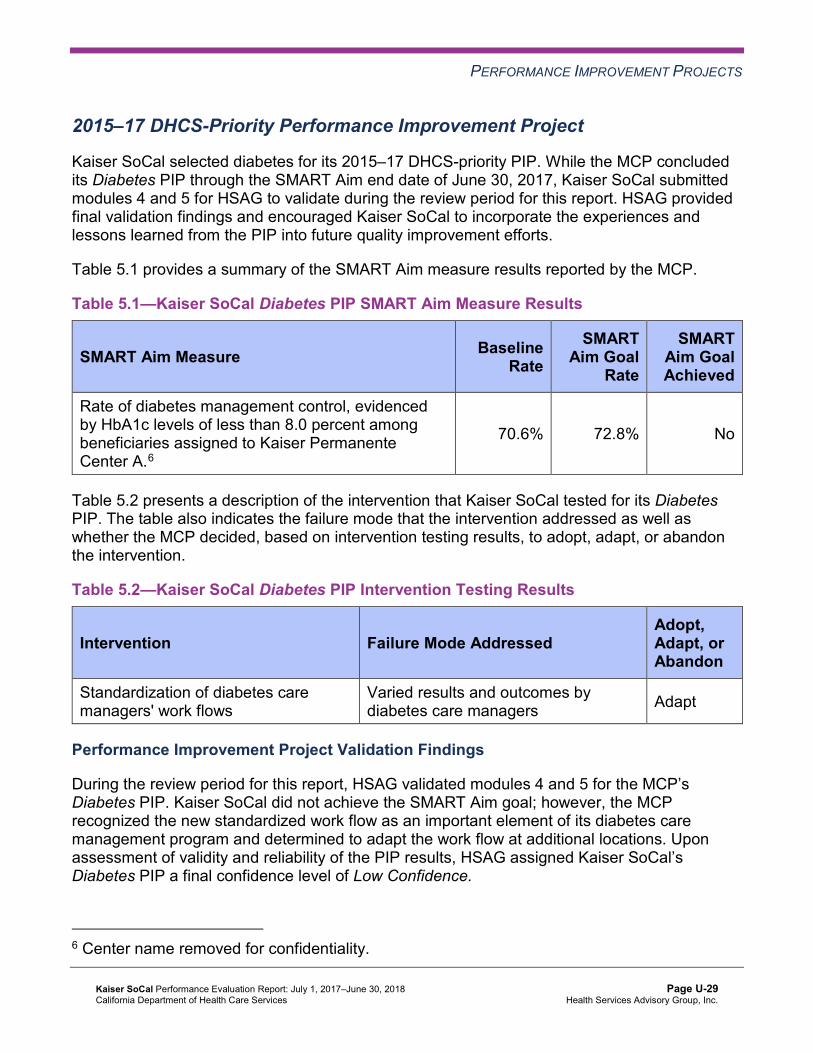
PERFORMANCE IMPROVEMENT PROJECTS
2015–17 DHCS-Priority Performance Improvement Project
Kaiser SoCal selected diabetes for its 2015–17 DHCS-priority PIP. While the MCP concluded its Diabetes PIP through the SMART Aim end date of June 30, 2017, Kaiser SoCal submitted modules 4 and 5 for HSAG to validate during the review period for this report. HSAG provided final validation findings and encouraged Kaiser SoCal to incorporate the experiences and lessons learned from the PIP into future quality improvement efforts.
Table 5.1 provides a summary of the SMART Aim measure results reported by the MCP.
Table 5.1—Kaiser SoCal Diabetes PIP SMART Aim Measure Results
SMART Aim Measure Baseline Rate
SMART Aim Goal
Rate
SMART Aim Goal Achieved
Rate of diabetes management control, evidenced by HbA1c levels of less than 8.0 percent among beneficiaries assigned to Kaiser Permanente Center A.6
70.6% 72.8% No
Table 5.2 presents a description of the intervention that Kaiser SoCal tested for its Diabetes PIP. The table also indicates the failure mode that the intervention addressed as well as whether the MCP decided, based on intervention testing results, to adopt, adapt, or abandon the intervention.
Table 5.2—Kaiser SoCal Diabetes PIP Intervention Testing Results
Intervention Failure Mode Addressed Adopt,Adapt, orAbandon
Standardization of diabetes care managers' work flows
Varied results and outcomes by diabetes care managers Adapt
Performance Improvement Project Validation Findings
During the review period for this report, HSAG validated modules 4 and 5 for the MCP’s Diabetes PIP. Kaiser SoCal did not achieve the SMART Aim goal; however, the MCP recognized the new standardized work flow as an important element of its diabetes care management program and determined to adapt the work flow at additional locations. Upon assessment of validity and reliability of the PIP results, HSAG assigned Kaiser SoCal’s Diabetes PIP a final confidence level of Low Confidence.
6 Center name removed for confidentiality.
Kaiser SoCal Performance Evaluation Report: July 1, 2017–June 30, 2018 California Department of Health Care Services
Page U-29 Health Services Advisory Group, Inc.

PERFORMANCE IMPROVEMENT PROJECTS
2015–17 MCP-Specific Performance Improvement Project
Kaiser SoCal selected initial health assessment within 120 days of enrollment for its 2015–17 MCP-specific PIP. While the MCP concluded its Initial Health Assessment Within 120 Days of Enrollment PIP through the SMART Aim end date of June 30, 2017, Kaiser SoCal submitted modules 4 and 5 for HSAG to validate during the review period for this report. HSAG provided final validation findings and encouraged Kaiser SoCal to incorporate the experiences and lessons learned from the PIP into future quality improvement efforts.
Table 5.3 provides a summary of the SMART Aim measure results reported by the MCP.
Table 5.3—Kaiser SoCal Initial Health Assessment Within 120 Days of Enrollment PIP SMART Aim Measure Results
SMART Aim Measure Baseline Rate
SMART Aim Goal
Rate
SMART Aim Goal Achieved
Rate of initial health assessment completion within 120 days of enrollment among all Kaiser SoCal beneficiaries
23% 53% No
Table 5.4 presents a description of the interventions that Kaiser SoCal tested for its Initial Health Assessment Within 120 Days of Enrollment PIP. The table also indicates the failure modes that each intervention addressed as well as whether the MCP decided, based on intervention testing results, to adopt, adapt, or abandon the intervention.
Table 5.4—Kaiser SoCal Initial Health Assessment Within 120 Days of Enrollment PIP Intervention Testing Results
Intervention Failure Modes Addressed Adopt,Adapt, orAbandon
Documenting telephonic outreach efforts in electronic medical record system
Outreach efforts are not captured in electronic medical record system. Adopt
Assigning a staff member to conduct outreach specifically to children ages 0 to 2 years
Children ages 0 to 18 months are not identified for priority outreach. Adopt
Making a first call attempt for the initial health assessment at the same time as assigning the beneficiary’s primary care provider
Beneficiary is not contacted timely to complete the initial health assessment.
Adopt
Kaiser SoCal Performance Evaluation Report: July 1, 2017–June 30, 2018 California Department of Health Care Services
Page U-30 Health Services Advisory Group, Inc.

PERFORMANCE IMPROVEMENT PROJECTS
Performance Improvement Project Validation Findings
During the review period for this report, HSAG validated modules 4 and 5 for the MCP’s Initial Health Assessment Within 120 Days of Enrollment PIP. Although Kaiser SoCal successfully tested and determined to adopt all three interventions into its standard call center procedures, the MCP did not achieve the SMART Aim goal. Upon assessment of validity and reliability of the PIP results, HSAG assigned Kaiser SoCal’s Initial Health Assessment Within 120 Days of Enrollment PIP a final confidence level of Low Confidence.
2017–19 Disparity Performance Improvement Project
During the review period, DHCS required Kaiser SoCal to initiate a PIP focusing on an identified health disparity based on, but not limited to, age, gender, race or ethnicity, language spoken, income, educational attainment, sexual orientation or gender identity, occupation, provider, or geographic area. Kaiser SoCal selected depression screening among Hispanic and Latino beneficiaries ages 18 and older as its 2017–19 Disparity PIP topic. Using its own MCP-specific data, the MCP provided evidence of the health disparity by demonstrating a statistically significant rate difference between two subgroups, with the disparate subgroup having the lower rate.
Table 5.5 provides the SMART Aim measure description, baseline rate, and SMART Aim goal rate for the PIP. The SMART Aim end date for this PIP is June 30, 2019.
Table 5.5—Kaiser SoCal Depression Screening Disparity PIP SMART Aim Measure
SMART Aim Measure Baseline Rate
SMART Aim Goal
Rate
Rate of clinical depression screenings completed using an age-appropriate standardized tool among Hispanic or Latino beneficiaries ages 18 and older assigned to Kaiser Permanente Center B7
16.28% 33.00%
Performance Improvement Project Validation Findings
During the review period of this report, HSAG validated modules 1 and 2 for the MCP’s Depression Screening Disparity PIP. Kaiser SoCal initially used the National Quality Forum’s Preventive Care and Screening for Clinical Depression and Follow-Up Plan measure specification for the SMART Aim data collection methodology; however, due to DHCS replacing the Preventive Care and Screening for Clinical Depression and Follow-Up Plan measure with the HEDIS Depression Screening and Follow-up for Adolescents and Adults measure in the RY 2018 EAS, DHCS approved Kaiser SoCal’s use of the HEDIS Depression Screening and Follow-up for Adolescents and Adults measure specification in April 2018. Upon
7 Center name removed for confidentiality.
Kaiser SoCal Performance Evaluation Report: July 1, 2017–June 30, 2018 California Department of Health Care Services
Page U-31 Health Services Advisory Group, Inc.
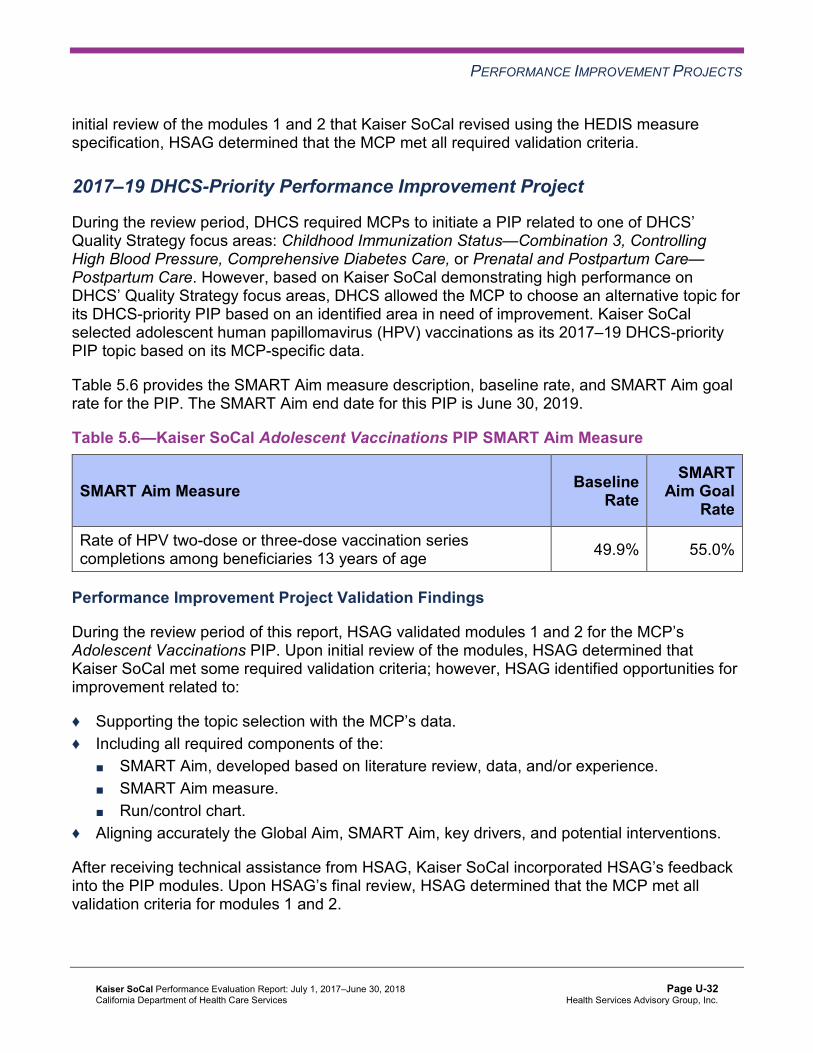
PERFORMANCE IMPROVEMENT PROJECTS
initial review of the modules 1 and 2 that Kaiser SoCal revised using the HEDIS measure specification, HSAG determined that the MCP met all required validation criteria.
2017–19 DHCS-Priority Performance Improvement Project
During the review period, DHCS required MCPs to initiate a PIP related to one of DHCS’ Quality Strategy focus areas: Childhood Immunization Status—Combination 3, Controlling High Blood Pressure, Comprehensive Diabetes Care, or Prenatal and Postpartum Care— Postpartum Care. However, based on Kaiser SoCal demonstrating high performance on DHCS’ Quality Strategy focus areas, DHCS allowed the MCP to choose an alternative topic for its DHCS-priority PIP based on an identified area in need of improvement. Kaiser SoCal selected adolescent human papillomavirus (HPV) vaccinations as its 2017–19 DHCS-priority PIP topic based on its MCP-specific data.
Table 5.6 provides the SMART Aim measure description, baseline rate, and SMART Aim goal rate for the PIP. The SMART Aim end date for this PIP is June 30, 2019.
Table 5.6—Kaiser SoCal Adolescent Vaccinations PIP SMART Aim Measure
SMART Aim Measure Baseline Rate
SMART Aim Goal
Rate
Rate of HPV two-dose or three-dose vaccination series completions among beneficiaries 13 years of age 49.9% 55.0%
Performance Improvement Project Validation Findings
During the review period of this report, HSAG validated modules 1 and 2 for the MCP’s Adolescent Vaccinations PIP. Upon initial review of the modules, HSAG determined that Kaiser SoCal met some required validation criteria; however, HSAG identified opportunities for improvement related to:
♦ Supporting the topic selection with the MCP’s data. ♦ Including all required components of the:
■ SMART Aim, developed based on literature review, data, and/or experience. ■ SMART Aim measure. ■ Run/control chart.
♦ Aligning accurately the Global Aim, SMART Aim, key drivers, and potential interventions.
After receiving technical assistance from HSAG, Kaiser SoCal incorporated HSAG’s feedback into the PIP modules. Upon HSAG’s final review, HSAG determined that the MCP met all validation criteria for modules 1 and 2.
Kaiser SoCal Performance Evaluation Report: July 1, 2017–June 30, 2018 California Department of Health Care Services
Page U-32 Health Services Advisory Group, Inc.

PERFORMANCE IMPROVEMENT PROJECTS
Strengths—Performance Improvement Projects Upon completion of the 2015–17 Diabetes PIP, Kaiser SoCal identified a new standardized work flow for diabetes care managers that the MCP can adapt at other Kaiser health centers. Additionally, as a result of the 2015–17 Initial Health Assessment Within 120 Days of Enrollment PIP, Kaiser SoCal identified processes that it can adopt in the MCP’s standard call center procedures.
Opportunities for Improvement—Performance Improvement Projects Kaiser SoCal has the opportunity to monitor the adapted and adopted interventions to achieve optimal outcomes beyond the life of the 2015–17 Diabetes and Initial Health Assessment Within 120 Days of Enrollment PIPs. The MCP should apply lessons learned from the 2015–17 PIPs to facilitate improvement of the adapted and adopted interventions.
Kaiser SoCal Performance Evaluation Report: July 1, 2017–June 30, 2018 California Department of Health Care Services
Page U-33 Health Services Advisory Group, Inc.

Medi-Cal Managed Care External Quality Review Technical ReportAppendix U: Performance Evaluation ReportKaiser SoCal July 1, 2017–June 30, 2018
6. Recommendations
Follow-Up on Prior Year Recommendations DHCS provided each MCP an opportunity to outline actions taken to address recommendations HSAG made in its 2016–17 MCP-specific evaluation report. Table 6.1 provides EQR recommendations from Kaiser SoCal’s July 1, 2016, through June 30, 2017, MCP-specific evaluation report, along with the MCP’s self-reported actions taken through June 30, 2018, that address the recommendations. Please note that HSAG made minimal edits to Table 6.1 to preserve the accuracy of Kaiser SoCal’s self-reported actions.
Table 6.1—Kaiser SoCal’s Self-Reported Follow-Up on External Quality ReviewRecommendations from the July 1, 2016, through June 30, 2017, MCP-SpecificEvaluation Report
2016–17 External Quality ReviewRecommendations Directed to Kaiser SoCal
Self-Reported Actions Taken by KaiserSoCal during the Period of July 1, 2017–June 30, 2018, that Address the External Quality Review Recommendations
1. Ensure resolution of all deficiencies from the September 26, 2016, through October 7, 2016, A&I Medical and State Supported Services Audits.
On January 22, 2018, Kaiser SoCal received a letter from DHCS stating the following: a. A&I conducted an on-site Medical Audit of
Kaiser SoCal, from September 26, 2016, through October 7, 2016. The survey covered the period of September 1, 2015, through August 31, 2016.
b. On January 11, 2018, the MCP provided DHCS with additional information regarding its CAP in response to the report originally issued on March 2, 2017.
c. All items have been reviewed and found to be in compliance. The CAP is hereby closed.
Kaiser SoCal Performance Evaluation Report: July 1, 2017–June 30, 2018 California Department of Health Care Services
Page U-34 Health Services Advisory Group, Inc.

RECOMMENDATIONS
2016–17 External Quality ReviewRecommendations Directed to Kaiser SoCal
Self-Reported Actions Taken by KaiserSoCal during the Period of July 1, 2017–June 30, 2018, that Address the External Quality Review Recommendations
2. Assess whether or not the MCP’s outreach efforts are resulting in an increased percentage of beneficiaries ages 3 to 6 being seen for one or more well-child visit(s) with a PCP. If the outreach efforts do not result in improvement, identify the causes and develop new strategies to ensure that beneficiaries ages 3 to 6 are seen for well-child visits.
For RY 2018, the rate for the Well-Child Visits in the Third, Fourth, Fifth, and Sixth Years of Life measure rose to 73.98 percent, demonstrating an improvement over the RY 2017 rate of 71.68 percent. The improvement in this measure continued with a further increase to 76.18 percent as of April 30, 2018. The Kaiser Permanente San Diego Ambulatory Pediatric Department utilizes a three-pronged approach that contributed to improvement in this measure: a. During pediatric office visits, the Proactive
Office Encounter (an automated electronic medical record workflow) drives the provider and staff to schedule the next well-care visit.
b. Member outreach phone calls are conducted to schedule well-care appointment visits. Appointment profiles were updated to facilitate booking a well-care visit when an immunization appointment is scheduled.
c. Member outreach is conducted to reschedule no-show well-care visit appointments.
Kaiser SoCal Performance Evaluation Report: July 1, 2017–June 30, 2018 California Department of Health Care Services
Page U-35 Health Services Advisory Group, Inc.

RECOMMENDATIONS
2017–18 Recommendations Based on the overall assessment of Kaiser SoCal’s delivery of quality, accessible, and timely care through the activities described in previous sections of this report, HSAG recommends the following to the MCP:
♦ Work with DHCS to ensure that the MCP resolves all deficiencies from the October 2017 A&I Medical Audit.
♦ Monitor the adapted and adopted interventions to achieve optimal outcomes beyond the life of the 2015–17 Diabetes and Initial Health Assessment Within 120 Days of Enrollment PIPs, and apply lessons learned from these PIPs to facilitate improvement of the adapted and adopted interventions.
In the next annual review, HSAG will evaluate continued successes of Kaiser SoCal as well as the MCP’s progress with these recommendations.
Kaiser SoCal Performance Evaluation Report: July 1, 2017–June 30, 2018 California Department of Health Care Services
Page U-36 Health Services Advisory Group, Inc.

Medi-Cal Managed CareExternal Quality Review Technical Report
Appendix V: Performance Evaluation Report
L.A. Care Health Plan July 1, 2017–June 30, 2018
Medi-Cal Managed Care External Quality Review Technical ReportAppendix V: Performance Evaluation ReportL.A. Care Health Plan July 1, 2017–June 30, 2018
Table of Contents
1. Introduction.............................................................................................................V-1 Medi-Cal Managed Care Health Plan Overview .......................................................V-1
2. Managed Care Health Plan Compliance ...............................................................V-2Compliance Reviews Conducted..............................................................................V-2 Strengths—Compliance Reviews .............................................................................V-2 Opportunities for Improvement—Compliance Reviews ............................................V-3
3. Managed Care Health Plan Performance Measures ............................................V-4Performance Measure Validation Results ................................................................V-4 Performance Measure Results and Findings............................................................V-4
Preventive Screening and Children’s Health .........................................................V-5 Preventive Screening and Women’s Health ..........................................................V-9 Care for Chronic Conditions ................................................................................V-11 Appropriate Treatment and Utilization.................................................................V-13 Performance Measure Findings—All Domains....................................................V-16
Improvement Plan Requirements for 2018 .............................................................V-17 Seniors and Persons with Disabilities Performance Measure Results....................V-17
Seniors and Persons with Disabilities Findings ...................................................V-22 Strengths—Performance Measures .......................................................................V-23 Opportunities for Improvement—Performance Measures ......................................V-23
4. MLTSSP Performance Measure Results.............................................................V-25 Managed Long-Term Services and Supports Plan Performance Measure Findings .V-26
5. Performance Improvement Projects ...................................................................V-27Performance Improvement Project Overview .........................................................V-27 Performance Improvement Project Results and Findings.......................................V-29
2015–17 DHCS-Priority Performance Improvement Project ...............................V-29 2015–17 MCP-Specific Performance Improvement Project ................................V-31 2017–19 Disparity Performance Improvement Project ........................................V-32 2017–19 DHCS-Priority Performance Improvement Project ...............................V-34
Strengths—Performance Improvement Projects ....................................................V-35 Opportunities for Improvement—Performance Improvement Projects ...................V-36
6. Recommendations................................................................................................V-37 Follow-Up on Prior Year Recommendations ..........................................................V-37 2017–18 Recommendations...................................................................................V-38
L.A. Care Health Plan Performance Evaluation Report: July 1, 2017–June 30, 2018 California Department of Health Care Services
Page V-i Health Services Advisory Group, Inc.

TABLE OF CONTENTS
Table of Tables
Table 2.1—DHCS A&I Medical and State Supported Services Audits of L.A. Care Audit Review Period: July 1, 2016, through June 30, 2017...................................V-2
Table 3.1—Preventive Screening and Children’s Health Domain Multi-Year Performance Measure Results L.A. Care—Los Angeles County.................V-6
Table 3.2—Preventive Screening and Children’s Health Domain RY 2018 (MY 2017) Performance Measure Findings L.A. Care—Los Angeles County ...............V-8
Table 3.3—Preventive Screening and Women’s Health Domain Multi-Year Performance Measure Results L.A. Care—Los Angeles County.................V-9
Table 3.4—Preventive Screening and Women’s Health Domain RY 2018 (MY 2017) Performance Measure Findings L.A. Care—Los Angeles County .............V-10
Table 3.5—Care for Chronic Conditions Domain Multi-Year Performance Measure Results L.A. Care—Los Angeles County ...................................................V-11
Table 3.6—Care for Chronic Conditions Domain RY 2018 (MY 2017) Performance Measure Findings L.A. Care—Los Angeles County...................................V-12
Table 3.7—Appropriate Treatment and Utilization Domain Multi-Year Performance Measure Results L.A. Care—Los Angeles County ....................................V-14
Table 3.8—Appropriate Treatment and Utilization Domain RY 2018 (MY 2017) Performance Measure Findings L.A. Care—Los Angeles County .............V-15
Table 3.9—RY 2018 (MY 2017) Performance Measure Findings for All Domains L.A. Care—Los Angeles County .......................................................................V-16
Table 3.10—Multi-Year SPD Performance Measure Trend Table L.A. Care— Los Angeles County...................................................................................V-18
Table 3.11—Multi-Year Non-SPD Performance Measure Trend Table L.A. Care— Los Angeles County...................................................................................V-19
Table 3.12—RY 2018 (MY 2017) Performance Measure Comparison and Results for Measures Stratified by the SPD and Non-SPD Populations L.A. Care— Los Angeles County...................................................................................V-21
Table 4.1—Multi-Year MLTSSP Performance Measure Results L.A. Care— Los Angeles County...................................................................................V-25
Table 5.1—L.A. Care Immunizations of Two-Year-Olds PIP SMART Aim Measure Results.......................................................................................................V-29
Table 5.2—L.A. Care Immunizations of Two-Year-Olds PIP Intervention Testing Results V-30 Table 5.3—L.A. Care Medication Management for People With Asthma PIP SMART
Aim Measure Results.................................................................................V-31 Table 5.4—L.A. Care Medication Management for People With Asthma PIP
Intervention Testing Results .....................................................................V-32 Table 5.5—L.A. Care Diabetes Medication Adherence Disparity PIP SMART Aim
Measure.....................................................................................................V-33 Table 5.6—L.A. Care Diabetes Medication Adherence Disparity PIP Intervention Testing V-34
L.A. Care Health Plan Performance Evaluation Report: July 1, 2017–June 30, 2018 California Department of Health Care Services
Page V-ii Health Services Advisory Group, Inc.

TABLE OF CONTENTS
Table 5.7—L.A. Care Childhood Immunization Status—Combination 3 PIP SMART Aim Measure..............................................................................................V-34
Table 5.8—L.A. Care Childhood Immunization Status—Combination 3 PIP Intervention Testing ...................................................................................V-35
Table 6.1—L.A. Care’s Self-Reported Follow-Up on External Quality Review Recommendations from the July 1, 2016, through June 30, 2017, MCP-Specific Evaluation Report................................................................V-37
L.A. Care Health Plan Performance Evaluation Report: July 1, 2017–June 30, 2018 California Department of Health Care Services
Page V-iii Health Services Advisory Group, Inc.

Medi-Cal Managed Care External Quality Review Technical ReportAppendix V: Performance Evaluation ReportL.A. Care Health Plan July 1, 2017–June 30, 2018
1. Introduction
The California Department of Health Care Services (DHCS) contracted with Health Services Advisory Group, Inc. (HSAG), an external quality review organization (EQRO), to prepare the federally required Medi-Cal Managed Care External Quality Review Technical Report, July 1, 2017–June 30, 2018. The technical report provides an overview of the objectives and methodology for conducting the external quality review (EQR) activities, including requirements related to each activity. Additionally, the technical report provides aggregated results and recommendations for DHCS for each activity.
This appendix is specific to DHCS’ contracted Medi-Cal managed care health plan (MCP), L.A. Care Health Plan (“L.A. Care” or “the MCP”). The purpose of this appendix is to provide MCP-specific results of each activity and an assessment of the MCP’s strengths and opportunities for improvement with respect to the quality and timeliness of and access to health care services furnished to Medi-Cal Managed Care (MCMC) beneficiaries (referred to as “beneficiaries” in this report). The review period for this MCP-specific evaluation report is July 1, 2017, through June 30, 2018. HSAG will report on activities that take place beyond the review period in L.A. Care’s 2018–19 MCP-specific evaluation report. This MCP-specific evaluation report references activities and methodologies described in detail by HSAG in the technical report section.
The aggregate EQR technical report and all MCP- and specialty health plan (SHP)-specific performance evaluation reports reflect HSAG’s external, independent assessment of the quality and timeliness of, and access to, care that MCPs and SHPs are providing to beneficiaries.
Medi-Cal Managed Care Health Plan Overview L.A. Care is a full-scope MCP delivering services to beneficiaries as a “Local Initiative” (LI) MCP under the Two-Plan Model (TPM). Beneficiaries may enroll in L.A. Care, the LI MCP; or in Health Net Community Solutions, Inc., the alternative commercial plan (CP).
L.A. Care became operational in Los Angeles County to provide MCMC services effective March 1997. As of June 30, 2018, L.A. Care had 2,066,390 beneficiaries in Los Angeles County.1 This represents 67 percent of the beneficiaries enrolled in Los Angeles County.
1 Medi-Cal Managed Care Enrollment Report—June 2018. Available at: http://www.dhcs.ca.gov/dataandstats/reports/Pages/MMCDMonthlyEnrollment.aspx. Accessed on: Sep 05, 2018.
L.A. Care Health Plan Performance Evaluation Report: July 1, 2017–June 30, 2018 California Department of Health Care Services
Page V-1 Health Services Advisory Group, Inc.

Medi-Cal Managed Care External Quality Review Technical ReportAppendix V: Performance Evaluation ReportL.A. Care Health Plan July 1, 2017–June 30, 2018
2. Managed Care Health Plan Compliance
Compliance Reviews Conducted The following is a summary of the most recent reviews conducted for L.A. Care. Unless noted, HSAG’s compliance review summaries are based on final audit/survey reports issued and corrective action plan (CAP) closeout letters dated on or before the end of the review period for this report (June 30, 2018). The descriptions of the various types of reviews may be found within the main section of this technical report.
Table 2.1 summarizes the results and status of the DHCS Audits & Investigations Division (A&I) Medical and State Supported Services Audits of L.A. Care. A&I conducted the on-site audits from September 18, 2017, through September 29, 2017.
Table 2.1—DHCS A&I Medical and State Supported Services Audits of L.A. CareAudit Review Period: July 1, 2016, through June 30, 2017
Category Evaluated Deficiencies (Yes/No) Monitoring Status
Utilization Management No Not applicable. Case Management and Coordination of Care Yes CAP in process and under
review by DHCS.
Access and Availability of Care Yes CAP in process and under review by DHCS.
Member’s Rights Yes CAP in process and under review by DHCS.
Quality Management No Not applicable. Administrative and Organizational Capacity Yes CAP in process and under
review by DHCS. State Supported Services No Not applicable.
Strengths—Compliance Reviews A&I identified no deficiencies in the Utilization Management, Quality Management, and State Supported Services categories during the September 2017 Medical and State Supported Services Audits of L.A. Care.
L.A. Care Health Plan Performance Evaluation Report: July 1, 2017–June 30, 2018 California Department of Health Care Services
Page V-2 Health Services Advisory Group, Inc.

MANAGED CARE HEALTH PLAN COMPLIANCE
Opportunities for Improvement—Compliance Reviews L.A. Care has the opportunity to work with DHCS to ensure that the MCP resolves all deficiencies from the September 2017 A&I Medical and State Supported Services Audits. The deficiencies cut across the areas of quality and timeliness of, and access to, health care.
L.A. Care Health Plan Performance Evaluation Report: July 1, 2017–June 30, 2018 California Department of Health Care Services
Page V-3 Health Services Advisory Group, Inc.

Medi-Cal Managed Care External Quality Review Technical ReportAppendix V: Performance Evaluation ReportL.A. Care Health Plan July 1, 2017–June 30, 2018
3. Managed Care Health Plan Performance Measures
Performance Measure Validation Results The HEDIS®2 2018 Compliance Audit Final Report of Findings for L.A. Care Health Plan contains the detailed findings and recommendations from HSAG’s NCQA HEDIS Compliance Audit™.3 HSAG auditors determined that L.A. Care followed the appropriate specifications to produce valid rates; however, the auditors identified that the MCP had a gap in its medical record abstraction oversight processes. HSAG recommended that L.A. Care increase oversight to ensure medical record abstraction accuracy.
Performance Measure Results and Findings After validating the MCP’s performance measure rates, HSAG assessed the results. See Table 3.1 through Table 3.9 for L.A. Care’s performance measure results for reporting years (RYs) 2015 through 2018 and performance measure findings for RY 2018. The RY is the year in which the MCP reported the rates. The RY rates reflect measurement year (MY) data from the previous calendar year. Note that data may not be available for all four years.
Note the following regarding Table 3.1 through Table 3.9:
To allow HSAG to provide meaningful assessment of MCP performance and actionable recommendations, HSAG, in collaboration with DHCS, organized the measures into domains based on the health care areas each measure affects. Table 3.1 through Table 3.8 present the performance measure results and findings by domain, and Table 3.9 presents the RY 2018 performance measure findings for the domains combined. To assess performance for each MCP reporting unit, HSAG compares the rates to national benchmarks. Rates indicating performance above the high performance levels (HPLs) are shaded in gray, and rates indicating performance below the minimum performance levels (MPLs) are bolded. ■ For measures with rates below the MPLs, DHCS requires MCPs to submit to DHCS
improvement plans (IPs) to address the rates below the MPLs (unless MCPs are reporting the rates for the first time).
■ For MCPs that meet DHCS’ Quality of Care CAP thresholds, DHCS issues a CAP; if an MCP’s performance is such that it may trigger a CAP in the following year, DHCS issues an advance warning letter.
2 Healthcare Effectiveness Data and Information Set (HEDIS®) is a registered trademark of the National Committee for Quality Assurance (NCQA).
3 NCQA HEDIS Compliance AuditTM is a trademark of NCQA.
L.A. Care Health Plan Performance Evaluation Report: July 1, 2017–June 30, 2018 California Department of Health Care Services
Page V-4 Health Services Advisory Group, Inc.

MANAGED CARE HEALTH PLAN PERFORMANCE MEASURES
■ IPs and CAPs consist of submission of Plan-Do-Study-Act (PDSA) Cycle Worksheets, Quality Improvement (QI) Summaries, or completion of Performance Improvement Projects (PIPs)—as determined by DHCS.
For RYs 2016, 2017, and 2018, the HPLs and MPLs represent the NCQA Quality Compass®4 Medicaid health maintenance organization (HMO) 90th and 25th percentiles, respectively. For RY 2015, the HPLs and MPLs represent the NCQA HEDIS Audit Means, Percentiles, and Ratios 90th and 25th percentiles, respectively. For the Comprehensive Diabetes Care—HbA1c Poor Control (>9.0 Percent) measure, for which a lower rate indicates more favorable performance the HPL and MPL are based on the 10th and 75th percentiles, respectively. HSAG includes the specific HPL and MPL values for RY 2018 in Section 6 of the Medi-Cal Managed Care External Quality Review Technical Report, July 1, 2017–June 30, 2018 (“Managed Care Health Plan Performance Measures”).
Preventive Screening and Children’s Health
Table 3.1 presents the four-year trending information for the performance measures within the Preventive Screening and Children’s Health domain.
Note the following regarding Table 3.1:
Although HSAG includes information on the MCP’s performance related to the four Children and Adolescents’ Access to Primary Care measures, DHCS did not hold MCPs accountable to meet the MPLs for these measures for RYs 2015 through 2018 (i.e., DHCS did not require MCPs to submit IPs if rates for the measures were below the MPLs). DHCS made this decision due to the small range of variation between the HPL and MPL thresholds for each measure. Any comparison of RY 2018 performance to RY 2017 or to benchmarks related to the Immunizations for Adolescents—Combination 2 measure should be exercised with caution given the changes that NCQA made to the specification for this measure for RY 2018. NCQA released guidance that recommended a break in trending for this measure; however, DHCS determined to continue trending because the specification change should result in higher rates.
4 Quality Compass® is a registered trademark of NCQA.
L.A. Care Health Plan Performance Evaluation Report: July 1, 2017–June 30, 2018 California Department of Health Care Services
Page V-5 Health Services Advisory Group, Inc.

MANAGED CARE HEALTH PLAN PERFORMANCE MEASURES
Table 3.1—Preventive Screening and Children’s Health DomainMulti-Year Performance Measure Results L.A. Care—Los Angeles County
H = Rate indicates performance above the HPL. Bolded Rate = Rate indicates performance below the MPL.
B = Statistical testing result indicates that the RY 2018 rate is significantly better than the RY 2017 rate.
W = Statistical testing result indicates that the RY 2018 rate is significantly worse than the RY 2017 rate.
Measure RY
2015 Rate1
RY 2016
Rate2
RY 2017
Rate3
RY 2018
Rate4
RYs 2017–18 Rate
Difference5
Childhood Immunization Status—Combination 3 77.65% 73.61% 71.50% 70.56% -0.94
Children and Adolescents’ Access to Primary Care Practitioners—12–24 Months
92.26% 90.11% 93.04% 91.44% -1.60W
Children and Adolescents’ Access to Primary Care Practitioners— 25 Months–6 Years
84.21% 83.75% 83.69% 83.94% 0.25B
Children and Adolescents’ Access to Primary Care Practitioners—7–11 Years
86.49% 88.59% 87.35% 89.14% 1.79B
Children and Adolescents’ Access to Primary Care Practitioners—12–19 Years
82.39% 85.04% 83.80% 86.49% 2.69B
Immunizations for Adolescents— Combination 2^ -- -- 28.26% 39.66%H 11.40B
Weight Assessment and Counseling for Nutrition and Physical Activity for Children and Adolescents—Nutrition Counseling—Total
80.15%H 76.76% 77.69% 83.61%H 5.92B
Weight Assessment and Counseling for Nutrition and Physical Activity for Children and Adolescents—Physical Activity Counseling—Total
69.35% 68.52% 68.04% 74.44% 6.40
L.A. Care Health Plan Performance Evaluation Report: July 1, 2017–June 30, 2018 California Department of Health Care Services
Page V-6 Health Services Advisory Group, Inc.

MANAGED CARE HEALTH PLAN PERFORMANCE MEASURES
Measure RY
2015 Rate1
RY 2016
Rate2
RY 2017
Rate3
RY 2018
Rate4
RYs 2017–18 Rate
Difference5
Well-Child Visits in the Third, Fourth, Fifth, and Sixth Years of Life
69.52% 71.43% 78.49% 74.65% -3.84
1 RY 2015 rates reflect MY data from January 1, 2014, through December 31, 2014. 2 RY 2016 rates reflect MY data from January 1, 2015, through December 31, 2015. 3 RY 2017 rates reflect MY data from January 1, 2016, through December 31, 2016. 4 RY 2018 rates reflect MY data from January 1, 2017, through December 31, 2017. 5 Performance comparisons are based on the Chi-square test of statistical significance, with a p value of <0.05. ^ Caution should be exercised when assessing MCP performance for this measure given the changes that NCQA made to the specification for this measure for RY 2018. -- Indicates that the rate is not available.
Table 3.2 presents findings for the RY 2018 performance measures within the Preventive Screening and Children’s Health domain.
Note the following regarding Table 3.2:
DHCS did not hold MCPs accountable to meet MPLs for all four Children and Adolescents’ Access to Primary Care measures within this domain; therefore, HSAG did not include these measures in its assessment of the MCP’s performance related to HPLs and MPLs. The Immunizations for Adolescents—Combination 2 measure was a first-year measure in RY 2017, and DHCS established no MPL for this measure for RY 2017 because no comparable benchmark existed; therefore, HSAG did not include this measure in the denominators for calculating the percentage of measures with rates that moved to above or below the MPLs in RY 2018.
L.A. Care Health Plan Performance Evaluation Report: July 1, 2017–June 30, 2018 California Department of Health Care Services
Page V-7 Health Services Advisory Group, Inc.

MANAGED CARE HEALTH PLAN PERFORMANCE MEASURES
Table 3.2—Preventive Screening and Children’s Health DomainRY 2018 (MY 2017) Performance Measure Findings L.A. Care—Los Angeles County
Criteria Number of Measures
Meeting Criteria
Total Number of Measures
Percentage of Measures
MeetingCriteria
RY 2018 Rates Above HPLs 2 5 40.00% Rates Above HPLs for the Last Three or More Consecutive Years 0 4 0.00%
RY 2018 Rates Significantly Better than RY 2017 Rates* 2 5 40.00%
Rates that Moved from Below MPLs in RY 2017 to Above MPLs in RY 2018 0 0 N/A
RY 2018 Rates Below MPLs 0 5 0.00% Rates Below MPLs for the Last Three or More Consecutive Years 0 4 0.00%
RY 2018 Rates Significantly Worse than RY 2017 Rates* 0 5 0.00%
Rates that Moved from Above MPLs in RY 2017 to Below MPLs in RY 2018 0 4 0.00%
* Performance comparisons are based on the Chi-square test of statistical significance, with a p value of <0.05. N/A = No rates above or below the MPLs from the previous year exist to include in the denominator for calculating whether or not rates moved to above or below MPLs in the most recent year.
L.A. Care Health Plan Performance Evaluation Report: July 1, 2017–June 30, 2018 California Department of Health Care Services
Page V-8 Health Services Advisory Group, Inc.
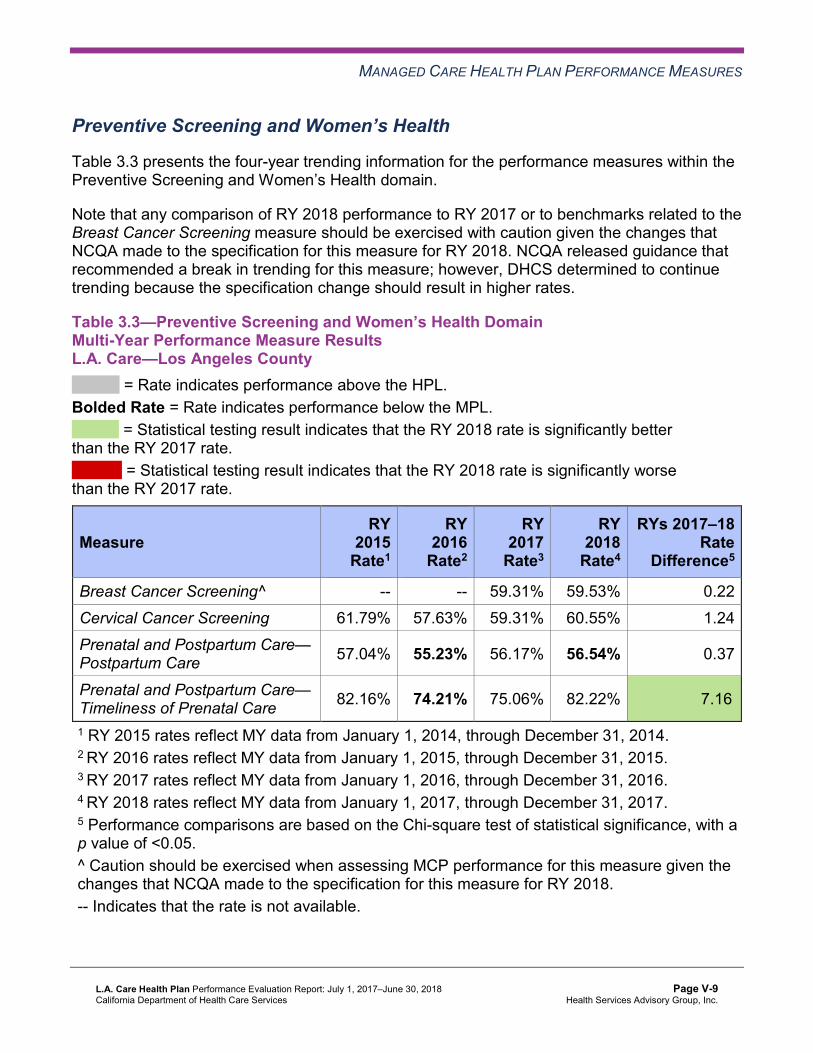
MANAGED CARE HEALTH PLAN PERFORMANCE MEASURES
Preventive Screening and Women’s Health
Table 3.3 presents the four-year trending information for the performance measures within the Preventive Screening and Women’s Health domain.
Note that any comparison of RY 2018 performance to RY 2017 or to benchmarks related to the Breast Cancer Screening measure should be exercised with caution given the changes that NCQA made to the specification for this measure for RY 2018. NCQA released guidance that recommended a break in trending for this measure; however, DHCS determined to continue trending because the specification change should result in higher rates.
Table 3.3—Preventive Screening and Women’s Health DomainMulti-Year Performance Measure Results L.A. Care—Los Angeles County
H = Rate indicates performance above the HPL. Bolded Rate = Rate indicates performance below the MPL.
B = Statistical testing result indicates that the RY 2018 rate is significantly better than the RY 2017 rate.
W = Statistical testing result indicates that the RY 2018 rate is significantly worse than the RY 2017 rate.
Measure RY
2015 Rate1
RY 2016
Rate2
RY 2017
Rate3
RY 2018
Rate4
RYs 2017–18 Rate
Difference5
Breast Cancer Screening^ -- -- 59.31% 59.53% 0.22 Cervical Cancer Screening 61.79% 57.63% 59.31% 60.55% 1.24 Prenatal and Postpartum Care— Postpartum Care 57.04% 55.23% 56.17% 56.54% 0.37
Prenatal and Postpartum Care— Timeliness of Prenatal Care 82.16% 74.21% 75.06% 82.22% 7.16B
1 RY 2015 rates reflect MY data from January 1, 2014, through December 31, 2014. 2 RY 2016 rates reflect MY data from January 1, 2015, through December 31, 2015. 3 RY 2017 rates reflect MY data from January 1, 2016, through December 31, 2016. 4 RY 2018 rates reflect MY data from January 1, 2017, through December 31, 2017. 5 Performance comparisons are based on the Chi-square test of statistical significance, with a p value of <0.05. ^ Caution should be exercised when assessing MCP performance for this measure given the changes that NCQA made to the specification for this measure for RY 2018. -- Indicates that the rate is not available.
L.A. Care Health Plan Performance Evaluation Report: July 1, 2017–June 30, 2018 California Department of Health Care Services
Page V-9 Health Services Advisory Group, Inc.

MANAGED CARE HEALTH PLAN PERFORMANCE MEASURES
Table 3.4 presents findings for the RY 2018 performance measures within the Preventive Screening and Women’s Health domain. Note that the Breast Cancer Screening measure was a first-year measure in RY 2017, and DHCS did not hold MCPs accountable to meet an MPL for this measure in RY 2017; therefore, HSAG did not include this measure in the denominators for calculating the percentage of measures with rates that moved to above or below the MPLs in RY 2018.
Table 3.4—Preventive Screening and Women’s Health DomainRY 2018 (MY 2017) Performance Measure Findings L.A. Care—Los Angeles County
Criteria Number of Measures
MeetingCriteria
Total Number of Measures
Percentage of Measures
MeetingCriteria
RY 2018 Rates Above HPLs 0 4 0.00% Rates Above HPLs for the Last Three or More Consecutive Years 0 3 0.00%
RY 2018 Rates Significantly Better than RY 2017 Rates* 1 4 25.00%
Rates that Moved from Below MPLs in RY 2017 to Above MPLs in RY 2018 0 0 N/A
RY 2018 Rates Below MPLs 1 4 25.00% Rates Below MPLs for the Last Three or More Consecutive Years 0 3 0.00%
RY 2018 Rates Significantly Worse than RY 2017 Rates* 0 4 0.00%
Rates that Moved from Above MPLs in RY 2017 to Below MPLs in RY 2018 1 3 33.33%
* Performance comparisons are based on the Chi-square test of statistical significance, with a p value of <0.05. N/A = No rates above or below the MPLs from the previous year exist to include in the denominator for calculating whether or not rates moved to above or below MPLs in the most recent year.
L.A. Care Health Plan Performance Evaluation Report: July 1, 2017–June 30, 2018 California Department of Health Care Services
Page V-10 Health Services Advisory Group, Inc.

MANAGED CARE HEALTH PLAN PERFORMANCE MEASURES
Care for Chronic Conditions
Table 3.5 presents the four-year trending information for the performance measures within the Care for Chronic Conditions domain.
Table 3.5—Care for Chronic Conditions Domain Multi-Year Performance Measure Results L.A. Care—Los Angeles County
H = Rate indicates performance above the HPL. Bolded Rate = Rate indicates performance below the MPL.
B = Statistical testing result indicates that the RY 2018 rate is significantly better than the RY 2017 rate.
W = Statistical testing result indicates that the RY 2018 rate is significantly worse than the RY 2017 rate.
Measure RY
2015 Rate1
RY 2016
Rate2
RY 2017
Rate3
RY 2018
Rate4
RYs 2017–18 Rate
Difference5
Annual Monitoring for Patients on Persistent Medications— ACE Inhibitors or ARBs
86.55% 87.12% 88.17% 88.96% 0.79B
Annual Monitoring for Patients on Persistent Medications— Diuretics
85.67% 86.40% 87.67% 88.33% 0.66B
Asthma Medication Ratio -- -- 57.58% 62.09% 4.51B
Comprehensive Diabetes Care— Blood Pressure Control (<140/90 mm Hg)
65.13% 58.55% 60.04% 65.21% 5.17
Comprehensive Diabetes Care— Eye Exam (Retinal) Performed 49.65% 58.00% 54.74% 63.26% 8.52B
Comprehensive Diabetes Care— HbA1c Control (<8.0 Percent) 45.96% 47.09% 48.72% 51.09% 2.37
Comprehensive Diabetes Care— HbA1c Poor Control (>9.0 Percent)*
41.80% 41.64% 39.96% 35.52% -4.44
Comprehensive Diabetes Care— HbA1c Testing 83.14% 86.00% 87.77% 86.37% -1.40
Comprehensive Diabetes Care— Medical Attention for Nephropathy
86.61% 94.36%H 92.15% 92.70% 0.55
L.A. Care Health Plan Performance Evaluation Report: July 1, 2017–June 30, 2018 California Department of Health Care Services
Page V-11 Health Services Advisory Group, Inc.
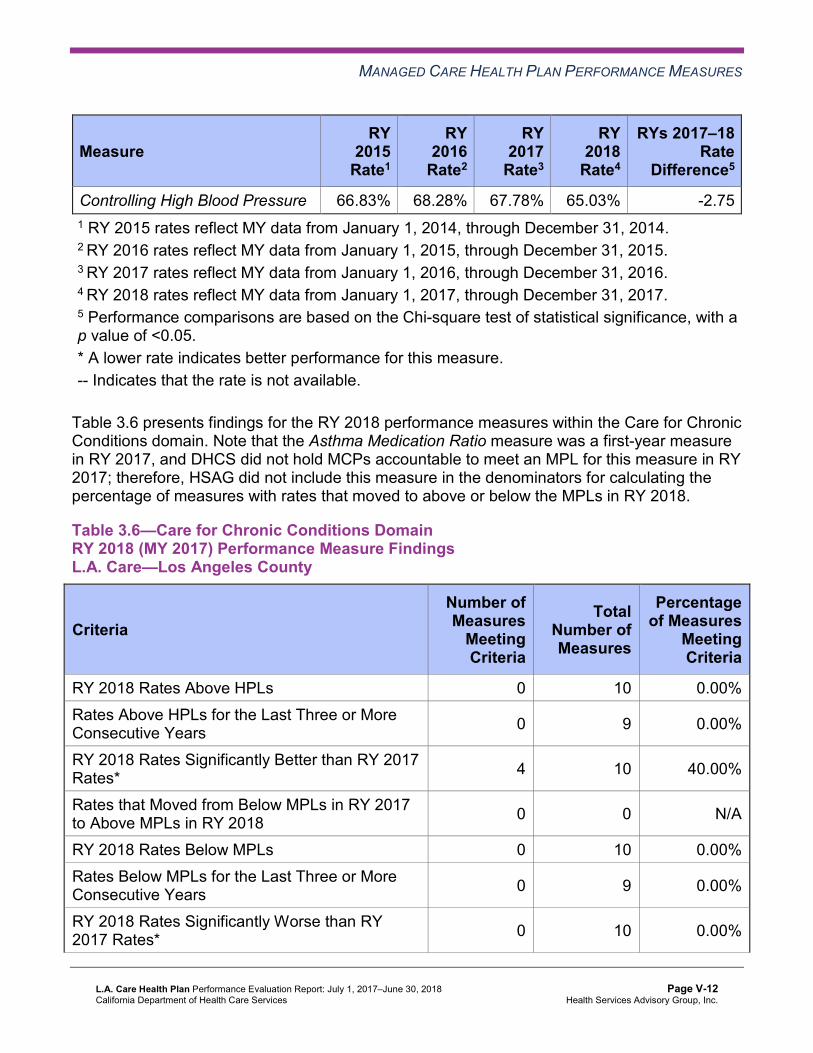
MANAGED CARE HEALTH PLAN PERFORMANCE MEASURES
Measure RY
2015 Rate1
RY 2016
Rate2
RY 2017
Rate3
RY 2018
Rate4
RYs 2017–18 Rate
Difference5
Controlling High Blood Pressure 66.83% 68.28% 67.78% 65.03% -2.75 1 RY 2015 rates reflect MY data from January 1, 2014, through December 31, 2014. 2 RY 2016 rates reflect MY data from January 1, 2015, through December 31, 2015. 3 RY 2017 rates reflect MY data from January 1, 2016, through December 31, 2016. 4 RY 2018 rates reflect MY data from January 1, 2017, through December 31, 2017. 5 Performance comparisons are based on the Chi-square test of statistical significance, with a p value of <0.05. * A lower rate indicates better performance for this measure. -- Indicates that the rate is not available.
Table 3.6 presents findings for the RY 2018 performance measures within the Care for Chronic Conditions domain. Note that the Asthma Medication Ratio measure was a first-year measure in RY 2017, and DHCS did not hold MCPs accountable to meet an MPL for this measure in RY 2017; therefore, HSAG did not include this measure in the denominators for calculating the percentage of measures with rates that moved to above or below the MPLs in RY 2018.
Table 3.6—Care for Chronic Conditions Domain RY 2018 (MY 2017) Performance Measure Findings L.A. Care—Los Angeles County
Criteria Number of Measures
MeetingCriteria
Total Number of Measures
Percentage of Measures
MeetingCriteria
RY 2018 Rates Above HPLs 0 10 0.00% Rates Above HPLs for the Last Three or More Consecutive Years 0 9 0.00%
RY 2018 Rates Significantly Better than RY 2017 Rates* 4 10 40.00%
Rates that Moved from Below MPLs in RY 2017 to Above MPLs in RY 2018 0 0 N/A
RY 2018 Rates Below MPLs 0 10 0.00% Rates Below MPLs for the Last Three or More Consecutive Years 0 9 0.00%
RY 2018 Rates Significantly Worse than RY 2017 Rates* 0 10 0.00%
L.A. Care Health Plan Performance Evaluation Report: July 1, 2017–June 30, 2018 California Department of Health Care Services
Page V-12 Health Services Advisory Group, Inc.

MANAGED CARE HEALTH PLAN PERFORMANCE MEASURES
Criteria Number of Measures
MeetingCriteria
Total Number of Measures
Percentage of Measures
MeetingCriteria
Rates that Moved from Above MPLs in RY 2017 to Below MPLs in RY 2018 0 9 0.00%
* Performance comparisons are based on the Chi-square test of statistical significance, with a p value of <0.05. N/A = No rates above or below the MPLs from the previous year exist to include in the denominator for calculating whether or not rates moved to above or below MPLs in the most recent year.
Appropriate Treatment and Utilization
Table 3.7 presents the four-year trending information for the performance measures within the Appropriate Treatment and Utilization domain.
Note the following regarding Table 3.7:
The All-Cause Readmissions measure is a non-HEDIS measure originally developed for DHCS’ All-Cause Readmissions collaborative quality improvement project (QIP); therefore, DHCS does not establish an HPL or MPL for this measure. For the All-Cause Readmissions measure, a lower rate indicates better performance (i.e., fewer readmissions). The two Ambulatory Care measures are utilization measures, which measure the volume of services used. DHCS does not hold MCPs accountable to meet MPLs for utilization measures, and HSAG does not compare performance for these measures against HPLs and MPLs. Additionally, because high and low rates do not necessarily indicate better or worse performance, HSAG did not compare performance for these measures across years. DHCS established no HPL or MPL for the two Depression Screening and Follow-Up for Adolescents and Adults measures for RY 2018 because no comparable benchmarks exist. Additionally, although MCPs reported the two Depression Screening and Follow-Up for Adolescents and Adults measures for RY 2018, HSAG does not present the performance measure results for these measures in this report because the reported rates do not accurately represent services being provided. This is due to the Depression Screening and Follow-Up for Adolescents and Adults measures being new HEDIS measures for RY 2018, NCQA requiring MCPs to submit rates for these measures using the new Electronic Clinical Data Systems (ECDS) reporting methodology, and inconsistent data reporting processes by calculation vendors. Thus, MCPs experienced numerous challenges obtaining data sources to use for ECDS reporting. DHCS and HSAG, in consultation with NCQA, will work with MCPs to improve data capture for RY 2019.
L.A. Care Health Plan Performance Evaluation Report: July 1, 2017–June 30, 2018 California Department of Health Care Services
Page V-13 Health Services Advisory Group, Inc.
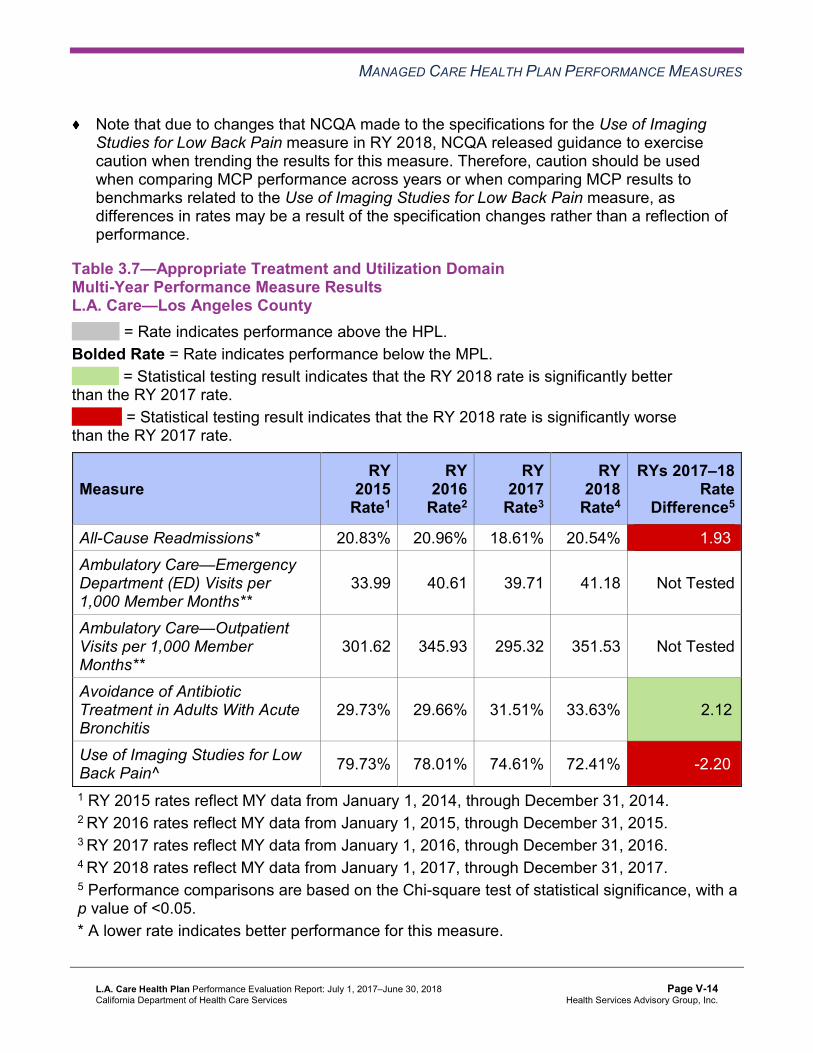
MANAGED CARE HEALTH PLAN PERFORMANCE MEASURES
Note that due to changes that NCQA made to the specifications for the Use of Imaging Studies for Low Back Pain measure in RY 2018, NCQA released guidance to exercise caution when trending the results for this measure. Therefore, caution should be used when comparing MCP performance across years or when comparing MCP results to benchmarks related to the Use of Imaging Studies for Low Back Pain measure, as differences in rates may be a result of the specification changes rather than a reflection of performance.
Table 3.7—Appropriate Treatment and Utilization DomainMulti-Year Performance Measure Results L.A. Care—Los Angeles County
H = Rate indicates performance above the HPL. Bolded Rate = Rate indicates performance below the MPL.
B = Statistical testing result indicates that the RY 2018 rate is significantly better than the RY 2017 rate.
W = Statistical testing result indicates that the RY 2018 rate is significantly worse than the RY 2017 rate.
Measure RY
2015 Rate1
RY 2016
Rate2
RY 2017
Rate3
RY 2018
Rate4
RYs 2017–18 Rate
Difference5
All-Cause Readmissions* 20.83% 20.96% 18.61% 20.54% 1.93W
Ambulatory Care—Emergency Department (ED) Visits per 1,000 Member Months**
33.99 40.61 39.71 41.18 Not Tested
Ambulatory Care—Outpatient Visits per 1,000 Member Months**
301.62 345.93 295.32 351.53 Not Tested
Avoidance of Antibiotic Treatment in Adults With Acute Bronchitis
29.73% 29.66% 31.51% 33.63% 2.12B
Use of Imaging Studies for Low Back Pain^ 79.73% 78.01% 74.61% 72.41% -2.20W
1 RY 2015 rates reflect MY data from January 1, 2014, through December 31, 2014. 2 RY 2016 rates reflect MY data from January 1, 2015, through December 31, 2015. 3 RY 2017 rates reflect MY data from January 1, 2016, through December 31, 2016. 4 RY 2018 rates reflect MY data from January 1, 2017, through December 31, 2017. 5 Performance comparisons are based on the Chi-square test of statistical significance, with a p value of <0.05. * A lower rate indicates better performance for this measure.
L.A. Care Health Plan Performance Evaluation Report: July 1, 2017–June 30, 2018 California Department of Health Care Services
Page V-14 Health Services Advisory Group, Inc.
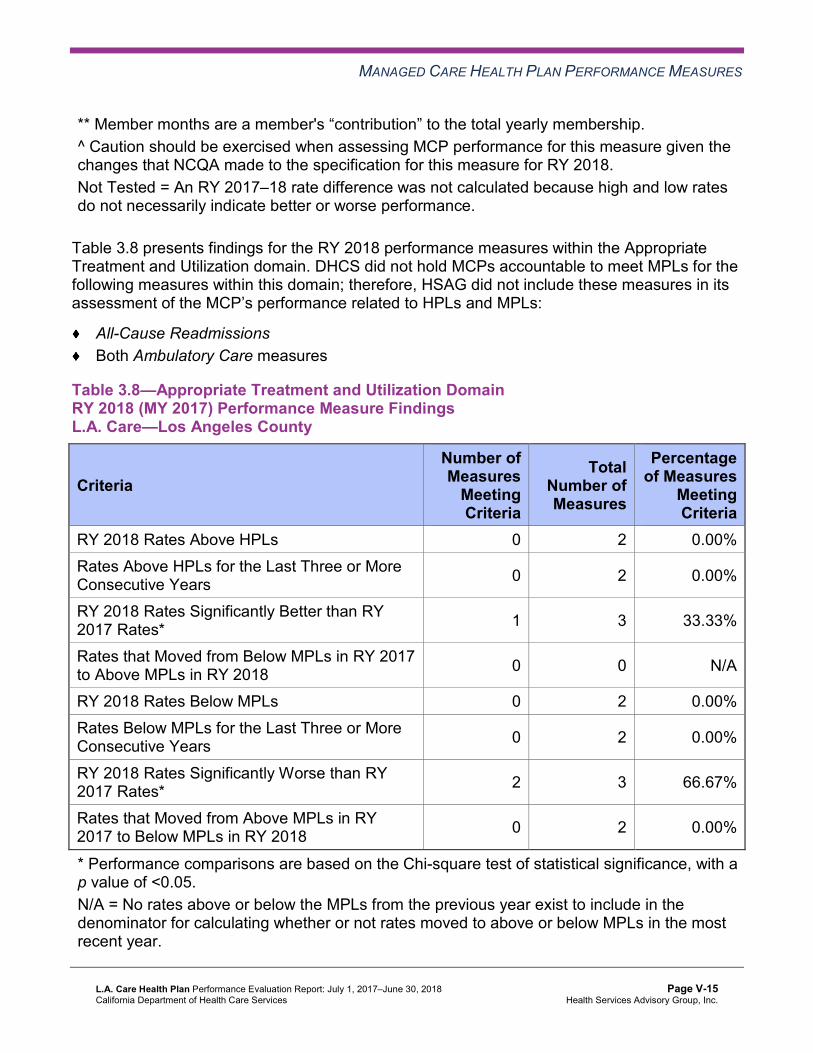
MANAGED CARE HEALTH PLAN PERFORMANCE MEASURES
** Member months are a member's “contribution” to the total yearly membership. ^ Caution should be exercised when assessing MCP performance for this measure given the changes that NCQA made to the specification for this measure for RY 2018. Not Tested = An RY 2017–18 rate difference was not calculated because high and low rates do not necessarily indicate better or worse performance.
Table 3.8 presents findings for the RY 2018 performance measures within the Appropriate Treatment and Utilization domain. DHCS did not hold MCPs accountable to meet MPLs for the following measures within this domain; therefore, HSAG did not include these measures in its assessment of the MCP’s performance related to HPLs and MPLs:
All-Cause Readmissions Both Ambulatory Care measures
Table 3.8—Appropriate Treatment and Utilization DomainRY 2018 (MY 2017) Performance Measure Findings L.A. Care—Los Angeles County
Criteria Number of Measures
MeetingCriteria
Total Number of Measures
Percentage of Measures
MeetingCriteria
RY 2018 Rates Above HPLs 0 2 0.00% Rates Above HPLs for the Last Three or More Consecutive Years 0 2 0.00%
RY 2018 Rates Significantly Better than RY 2017 Rates* 1 3 33.33%
Rates that Moved from Below MPLs in RY 2017 to Above MPLs in RY 2018 0 0 N/A
RY 2018 Rates Below MPLs 0 2 0.00% Rates Below MPLs for the Last Three or More Consecutive Years 0 2 0.00%
RY 2018 Rates Significantly Worse than RY 2017 Rates* 2 3 66.67%
Rates that Moved from Above MPLs in RY 2017 to Below MPLs in RY 2018 0 2 0.00%
* Performance comparisons are based on the Chi-square test of statistical significance, with a p value of <0.05. N/A = No rates above or below the MPLs from the previous year exist to include in the denominator for calculating whether or not rates moved to above or below MPLs in the most recent year.
L.A. Care Health Plan Performance Evaluation Report: July 1, 2017–June 30, 2018 California Department of Health Care Services
Page V-15 Health Services Advisory Group, Inc.

MANAGED CARE HEALTH PLAN PERFORMANCE MEASURES
Performance Measure Findings—All Domains
Table 3.9 presents a summary of L.A. Care’s RY 2018 performance across all External Accountability Set (EAS) measures.
Note the following regarding Table 3.9:
DHCS did not hold MCPs accountable to meet MPLs for the following measures; therefore, HSAG did not include these measures in its assessment of the MCP’s performance related to HPLs and MPLs: ■ All-Cause Readmissions ■ Both Ambulatory Care measures ■ All four Children and Adolescents’ Access to Primary Care measures DHCS did not hold MCPs accountable to meet MPLs for the following measures in RY 2017; therefore, HSAG did not include these measures in the denominators for calculating the percentage of measures with rates that moved to above or below the MPLs in RY 2018 and for calculating the percentage of measures with rates below MPLs for only the last two consecutive years: ■ Asthma Medication Ratio ■ Breast Cancer Screening ■ Immunizations for Adolescents—Combination 2
Table 3.9—RY 2018 (MY 2017) Performance Measure Findings for All Domains L.A. Care—Los Angeles County
Criteria Number of Measures
MeetingCriteria
Total Number of Measures
Percentage of Measures
MeetingCriteria
RY 2018 Rates Above HPLs 2 21 9.52% Rates Above HPLs for the Last Three or More Consecutive Years 0 18 0.00%
RY 2018 Rates Significantly Better than RY 2017 Rates* 8 22 36.36%
Rates that Moved from Below MPLs in RY 2017 to Above MPLs in RY 2018 0 0 N/A
RY 2018 Rates Below MPLs 1 21 4.76% Rates Below MPLs for Only the Last Two Consecutive Years 0 18 0.00%
L.A. Care Health Plan Performance Evaluation Report: July 1, 2017–June 30, 2018 California Department of Health Care Services
Page V-16 Health Services Advisory Group, Inc.
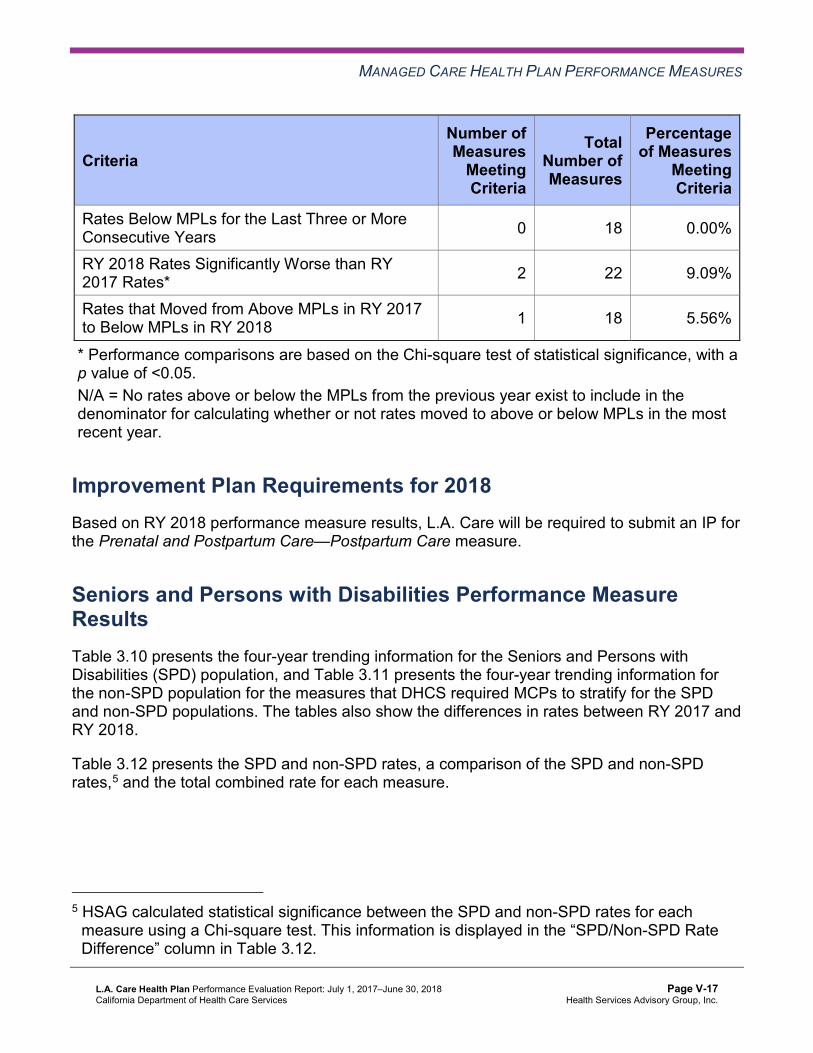
MANAGED CARE HEALTH PLAN PERFORMANCE MEASURES
Criteria Number of Measures
MeetingCriteria
Total Number of Measures
Percentage of Measures
MeetingCriteria
Rates Below MPLs for the Last Three or More Consecutive Years 0 18 0.00%
RY 2018 Rates Significantly Worse than RY 2017 Rates* 2 22 9.09%
Rates that Moved from Above MPLs in RY 2017 to Below MPLs in RY 2018 1 18 5.56%
* Performance comparisons are based on the Chi-square test of statistical significance, with a p value of <0.05. N/A = No rates above or below the MPLs from the previous year exist to include in the denominator for calculating whether or not rates moved to above or below MPLs in the most recent year.
Improvement Plan Requirements for 2018 Based on RY 2018 performance measure results, L.A. Care will be required to submit an IP for the Prenatal and Postpartum Care—Postpartum Care measure.
Seniors and Persons with Disabilities Performance Measure Results Table 3.10 presents the four-year trending information for the Seniors and Persons with Disabilities (SPD) population, and Table 3.11 presents the four-year trending information for the non-SPD population for the measures that DHCS required MCPs to stratify for the SPD and non-SPD populations. The tables also show the differences in rates between RY 2017 and RY 2018.
Table 3.12 presents the SPD and non-SPD rates, a comparison of the SPD and non-SPD rates,5 and the total combined rate for each measure.
5 HSAG calculated statistical significance between the SPD and non-SPD rates for each measure using a Chi-square test. This information is displayed in the “SPD/Non-SPD Rate Difference” column in Table 3.12.
L.A. Care Health Plan Performance Evaluation Report: July 1, 2017–June 30, 2018 California Department of Health Care Services
Page V-17 Health Services Advisory Group, Inc.

MANAGED CARE HEALTH PLAN PERFORMANCE MEASURES
Table 3.10—Multi-Year SPD Performance Measure Trend Table L.A. Care—Los Angeles County
B = Statistical testing result indicates that the RY 2018 SPD rate is significantly better than the RY 2017 SPD rate.
W = Statistical testing result indicates that the RY 2018 SPD rate is significantly worse than the RY 2017 SPD rate.
Measure RY
2015 SPD
Rate1
RY 2016 SPD
Rate2
RY 2017 SPD
Rate3
RY 2018 SPD
Rate4
RYs 2017–18 Rate
Difference5
All-Cause Readmissions* 25.53% 26.90% 24.68% 26.86% 2.18W
Ambulatory Care—Emergency Department (ED) Visits per 1,000 Member Months**
58.66 70.03 68.17 60.66 Not Tested
Ambulatory Care—Outpatient Visits per 1,000 Member Months**
450.94 621.22 557.34 583.04 Not Tested
Annual Monitoring for Patients on Persistent Medications— ACE Inhibitors or ARBs
87.63% 88.33% 89.83% 90.94% 1.11B
Annual Monitoring for Patients on Persistent Medications— Diuretics
87.55% 88.32% 90.16% 90.95% 0.79B
Children and Adolescents' Access to Primary Care Practitioners—12–24 Months
83.56% 92.16% 93.85% 80.85% -13.00W
Children and Adolescents' Access to Primary Care Practitioners— 25 Months–6 Years
84.22% 84.06% 86.06% 86.00% -0.06
Children and Adolescents' Access to Primary Care Practitioners—7–11 Years
86.87% 88.15% 88.49% 91.86% 3.37B
Children and Adolescents' Access to Primary Care Practitioners—12–19 Years
81.92% 83.04% 83.44% 87.05% 3.61B
1 RY 2015 rates reflect MY data from January 1, 2014, through December 31, 2014. 2 RY 2016 rates reflect MY data from January 1, 2015, through December 31, 2015. 3 RY 2017 rates reflect MY data from January 1, 2016, through December 31, 2016.
L.A. Care Health Plan Performance Evaluation Report: July 1, 2017–June 30, 2018 California Department of Health Care Services
Page V-18 Health Services Advisory Group, Inc.

MANAGED CARE HEALTH PLAN PERFORMANCE MEASURES
4 RY 2018 rates reflect MY data from January 1, 2017, through December 31, 2017. 5 Performance comparisons are based on the Chi-square test of statistical significance, with a p value of <0.05. * A lower rate indicates better performance for this measure. ** Member months are a member's “contribution” to the total yearly membership. Not Tested = An RY 2017–18 rate difference was not calculated because high and low rates do not necessarily indicate better or worse performance.
Table 3.11—Multi-Year Non-SPD Performance Measure Trend Table L.A. Care—Los Angeles County
B = Statistical testing result indicates that the RY 2018 non-SPD rate is significantly better than the RY 2017 non-SPD rate.
W = Statistical testing result indicates that the RY 2018 non-SPD rate is significantly worse than the RY 2017 non-SPD rate.
Measure RY 2015
Non-SPD Rate1
RY 2016 Non-SPD
Rate2
RY 2017 Non-SPD
Rate3
RY 2018 Non-SPD
Rate4
RYs 2017–18 Rate
Difference5
All-Cause Readmissions* 13.55% 14.98% 13.58% 14.94% 1.36W
Ambulatory Care— Emergency Department (ED) Visits per 1,000 Member Months**
31.16 37.56 37.14 39.16 Not Tested
Ambulatory Care— Outpatient Visits per 1,000 Member Months**
284.50 317.46 271.67 327.50 Not Tested
Annual Monitoring for Patients on Persistent Medications— ACE Inhibitors or ARBs
85.50% 86.35% 87.21% 87.95% 0.74B
Annual Monitoring for Patients on Persistent Medications—Diuretics
83.81% 85.13% 86.13% 86.93% 0.80B
Children and Adolescents' Access to Primary Care Practitioners— 12–24 Months
92.33% 90.09% 93.04% 91.52% -1.52W
L.A. Care Health Plan Performance Evaluation Report: July 1, 2017–June 30, 2018 California Department of Health Care Services
Page V-19 Health Services Advisory Group, Inc.
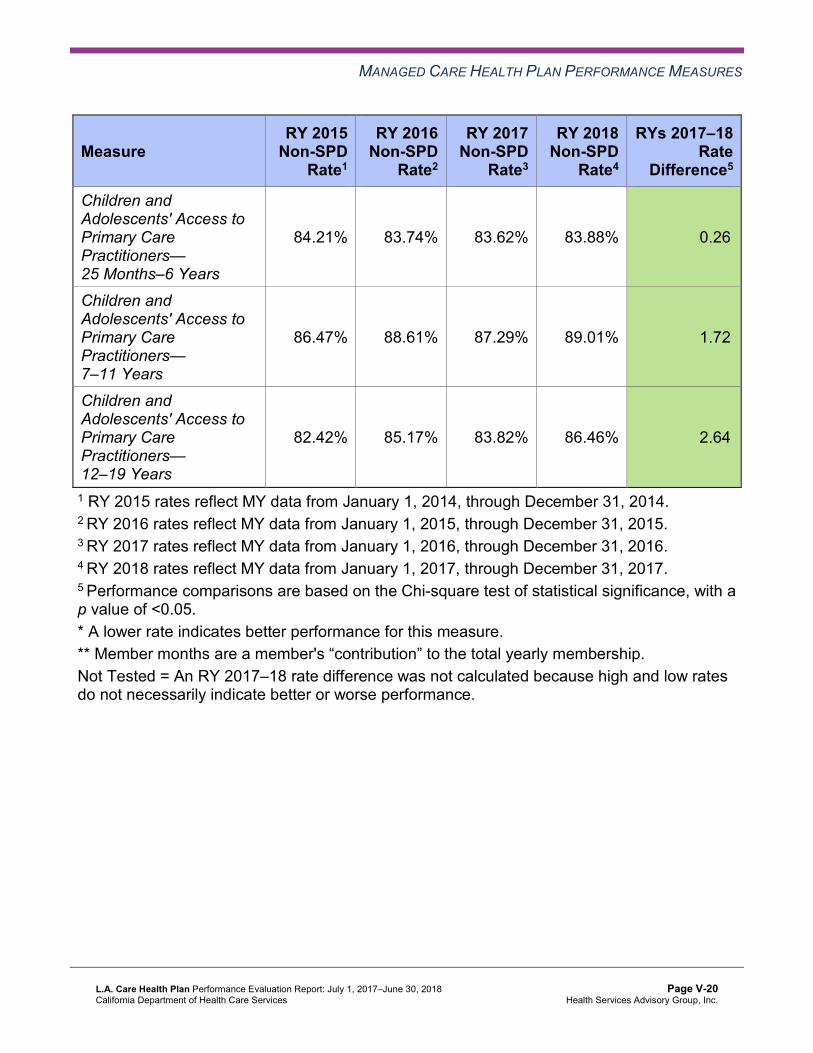
MANAGED CARE HEALTH PLAN PERFORMANCE MEASURES
Measure RY 2015
Non-SPD Rate1
RY 2016 Non-SPD
Rate2
RY 2017 Non-SPD
Rate3
RY 2018 Non-SPD
Rate4
RYs 2017–18 Rate
Difference5
Children and Adolescents' Access to Primary Care Practitioners— 25 Months–6 Years
84.21% 83.74% 83.62% 83.88% 0.26B
Children and Adolescents' Access to Primary Care Practitioners— 7–11 Years
86.47% 88.61% 87.29% 89.01% 1.72B
Children and Adolescents' Access to Primary Care Practitioners— 12–19 Years
82.42% 85.17% 83.82% 86.46% 2.64B
1 RY 2015 rates reflect MY data from January 1, 2014, through December 31, 2014. 2 RY 2016 rates reflect MY data from January 1, 2015, through December 31, 2015. 3 RY 2017 rates reflect MY data from January 1, 2016, through December 31, 2016. 4 RY 2018 rates reflect MY data from January 1, 2017, through December 31, 2017. 5 Performance comparisons are based on the Chi-square test of statistical significance, with a p value of <0.05. * A lower rate indicates better performance for this measure. ** Member months are a member's “contribution” to the total yearly membership. Not Tested = An RY 2017–18 rate difference was not calculated because high and low rates do not necessarily indicate better or worse performance.
L.A. Care Health Plan Performance Evaluation Report: July 1, 2017–June 30, 2018 California Department of Health Care Services
Page V-20 Health Services Advisory Group, Inc.
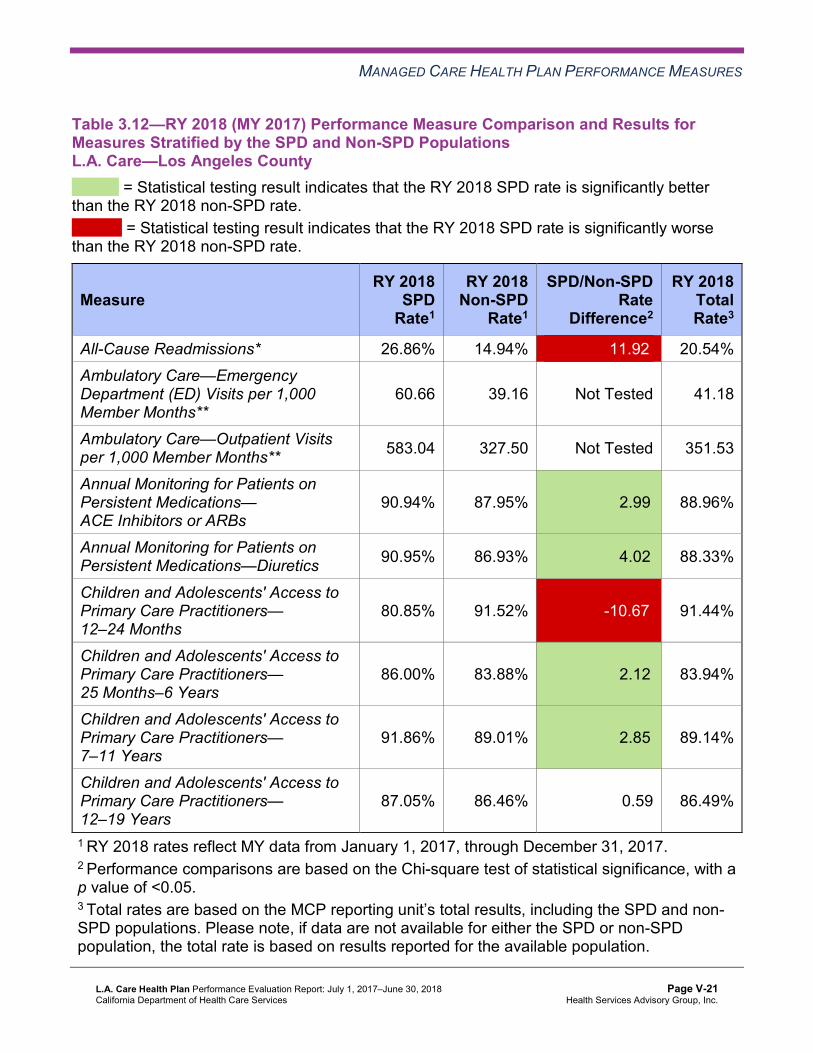
MANAGED CARE HEALTH PLAN PERFORMANCE MEASURES
Table 3.12—RY 2018 (MY 2017) Performance Measure Comparison and Results forMeasures Stratified by the SPD and Non-SPD PopulationsL.A. Care—Los Angeles County
B = Statistical testing result indicates that the RY 2018 SPD rate is significantly better than the RY 2018 non-SPD rate.
W = Statistical testing result indicates that the RY 2018 SPD rate is significantly worse than the RY 2018 non-SPD rate.
Measure RY 2018
SPD Rate1
RY 2018 Non-SPD
Rate1
SPD/Non-SPDRate
Difference2
RY 2018 Total Rate3
All-Cause Readmissions* 26.86% 14.94% 11.92W 20.54% Ambulatory Care—Emergency Department (ED) Visits per 1,000 Member Months**
60.66 39.16 Not Tested 41.18
Ambulatory Care—Outpatient Visits per 1,000 Member Months** 583.04 327.50 Not Tested 351.53
Annual Monitoring for Patients on Persistent Medications— ACE Inhibitors or ARBs
90.94% 87.95% 2.99B 88.96%
Annual Monitoring for Patients on Persistent Medications—Diuretics 90.95% 86.93% 4.02B 88.33%
Children and Adolescents' Access to Primary Care Practitioners— 12–24 Months
80.85% 91.52% -10.67W 91.44%
Children and Adolescents' Access to Primary Care Practitioners— 25 Months–6 Years
86.00% 83.88% 2.12B 83.94%
Children and Adolescents' Access to Primary Care Practitioners— 7–11 Years
91.86% 89.01% 2.85B 89.14%
Children and Adolescents' Access to Primary Care Practitioners— 12–19 Years
87.05% 86.46% 0.59 86.49%
1 RY 2018 rates reflect MY data from January 1, 2017, through December 31, 2017. 2 Performance comparisons are based on the Chi-square test of statistical significance, with a p value of <0.05. 3 Total rates are based on the MCP reporting unit’s total results, including the SPD and non-SPD populations. Please note, if data are not available for either the SPD or non-SPD population, the total rate is based on results reported for the available population.
L.A. Care Health Plan Performance Evaluation Report: July 1, 2017–June 30, 2018 California Department of Health Care Services
Page V-21 Health Services Advisory Group, Inc.

MANAGED CARE HEALTH PLAN PERFORMANCE MEASURES
* A lower rate indicates better performance for this measure. ** Member months are a member's “contribution” to the total yearly membership. Not Tested = An SPD/non-SPD rate difference was not calculated because high and low rates do not necessarily indicate better or worse performance.
Seniors and Persons with Disabilities Findings
HSAG observed the following notable results in RY 2018 for measures that L.A. Care stratified by the SPD and non-SPD populations:
The RY 2018 SPD rates improved significantly from RY 2017 to RY 2018 for the following measures: ■ Both Annual Monitoring for Patients on Persistent Medications measures ■ Children and Adolescents’ Access to Primary Care Practitioners—7–11 Years and 12–
19 Years The non-SPD rates improved significantly from RY 2017 to RY 2018 for the following measures: ■ Both Annual Monitoring for Patients on Persistent Medications measures ■ Children and Adolescents’ Access to Primary Care Practitioners—25 Months–6 Years,
7–11 Years, and 12–19 Years The RY 2018 SPD rates were significantly better than the RY 2018 non-SPD rates for the following measures: ■ Both Annual Monitoring for Patients on Persistent Medications measures ■ Children and Adolescents’ Access to Primary Care Practitioners—25 Months–6 Years
and 7–11 Years The RY 2018 SPD and RY 2018 non-SPD rates were significantly worse than the RY 2017 SPD and RY 2017 non-SPD rates, respectively, for the following measures: ■ All-Cause Readmissions ■ Children and Adolescents’ Access to Primary Care Practitioners—12–24 Months The RY 2018 SPD rates were significantly worse than the RY 2018 non-SPD rates for the following measures: ■ All-Cause Readmissions. Note that the higher rate of hospital readmissions for the SPD
population is expected based on the greater and often more complicated health care needs of these beneficiaries.
■ Children and Adolescents’ Access to Primary Care Practitioners—12–24 Months. The significant difference in the rates for this measure may be attributed to beneficiaries in this age group in the SPD population choosing to receive all health care services from specialist providers due to their complicated health care needs, rather than accessing care from primary care providers (PCPs).
L.A. Care Health Plan Performance Evaluation Report: July 1, 2017–June 30, 2018 California Department of Health Care Services
Page V-22 Health Services Advisory Group, Inc.

MANAGED CARE HEALTH PLAN PERFORMANCE MEASURES
Strengths—Performance Measures HSAG auditors determined that L.A. Care followed the appropriate specifications to produce valid rates.
HSAG identified the following notable RY 2018 performance measure results for L.A. Care:
Across all domains, the rates for the following eight of 22 measures (36 percent) improved significantly from RY 2017 to RY 2018: ■ Both Annual Monitoring for Patients on Persistent Medications measures ■ Asthma Medication Ratio ■ Avoidance of Antibiotic Treatment in Adults With Acute Bronchitis ■ Comprehensive Diabetes Care—Eye Exam (Retinal) Performed ■ Immunizations for Adolescents—Combination 2—The rate for this measure was above
the HPL in RY 2018. ■ Prenatal and Postpartum Care—Timeliness of Prenatal Care ■ Weight Assessment and Counseling for Nutrition and Physical Activity for Children and
Adolescents—Nutrition Counseling—Total—The rate for this measure was above the HPL in RY 2018.
Opportunities for Improvement—Performance Measures L.A. Care has the opportunity to increase the MCP’s medical record abstraction oversight to ensure medical record abstraction accuracy.
Although the rate for the Prenatal and Postpartum Care—Postpartum Care measure did not decline from RY 2017 to RY 2018, the rate moved from above the MPL in RY 2017 to below the MPL in RY 2018 because the MPL increased by 4.12 percentage points from RY 2017 to RY 2018. Additionally, the rates for the following measures declined significantly from RY 2017 to RY 2018:
All-Cause Readmissions Use of Imaging Studies for Low Back Pain. Note that the significant decline in the rate for this measure may be due to NCQA’s RY 2018 specification changes for this measure and therefore may not be related to L.A. Care’s performance.
Based on RY 2018 performance measure results, L.A. Care has the opportunity to:
Identify strategies to increase the percentage of female beneficiaries who deliver a live birth and complete a postpartum visit on or between 21 and 56 days after delivery. Assess the causes for the rate declining significantly from RY 2017 to RY 2018 for the All-Cause Readmissions measure; and identify strategies to prevent, to the highest degree
L.A. Care Health Plan Performance Evaluation Report: July 1, 2017–June 30, 2018 California Department of Health Care Services
Page V-23 Health Services Advisory Group, Inc.

MANAGED CARE HEALTH PLAN PERFORMANCE MEASURES
possible, unplanned acute readmissions within 30 days of discharge for beneficiaries 21 years and older. Evaluate the effect that the low back pain tools described in Table 6.1 had on the rate for the Use of Imaging Studies for Low Back Pain measure; and, if applicable, modify improvement strategies to address the MCP’s continued declining performance on this measure.
L.A. Care Health Plan Performance Evaluation Report: July 1, 2017–June 30, 2018 California Department of Health Care Services
Page V-24 Health Services Advisory Group, Inc.
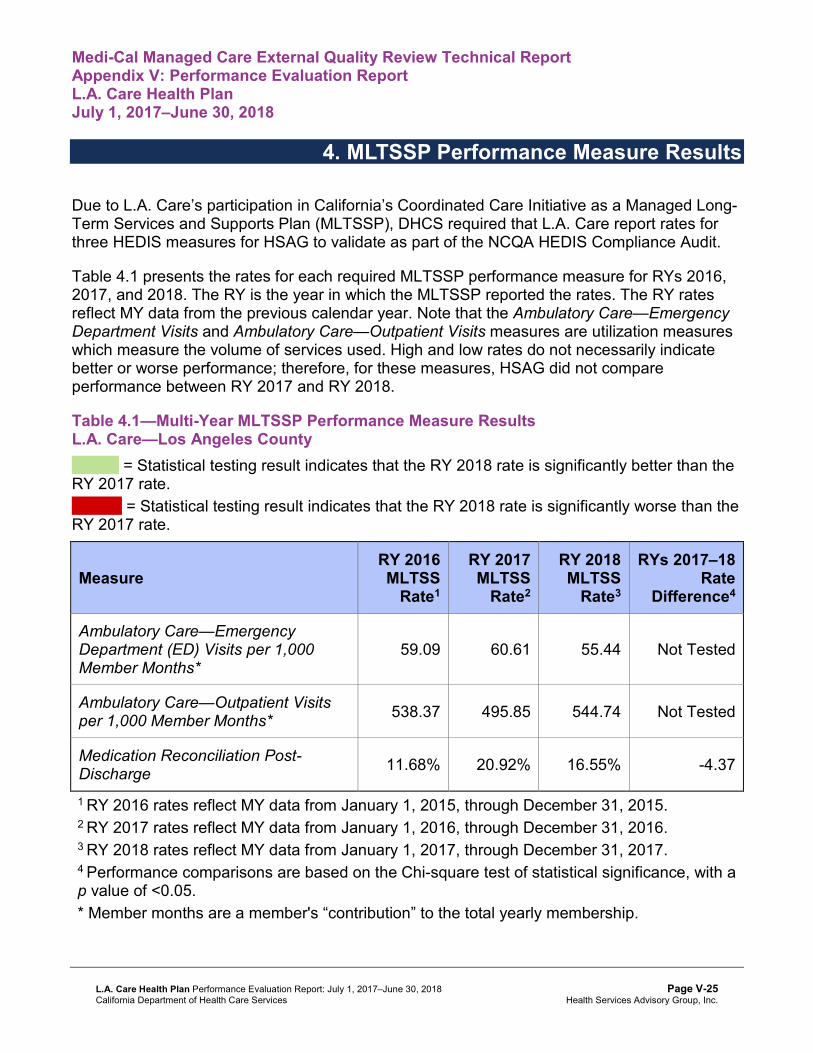
Medi-Cal Managed Care External Quality Review Technical ReportAppendix V: Performance Evaluation ReportL.A. Care Health Plan July 1, 2017–June 30, 2018
4. MLTSSP Performance Measure Results
Due to L.A. Care’s participation in California’s Coordinated Care Initiative as a Managed Long-Term Services and Supports Plan (MLTSSP), DHCS required that L.A. Care report rates for three HEDIS measures for HSAG to validate as part of the NCQA HEDIS Compliance Audit.
Table 4.1 presents the rates for each required MLTSSP performance measure for RYs 2016, 2017, and 2018. The RY is the year in which the MLTSSP reported the rates. The RY rates reflect MY data from the previous calendar year. Note that the Ambulatory Care—Emergency Department Visits and Ambulatory Care—Outpatient Visits measures are utilization measures which measure the volume of services used. High and low rates do not necessarily indicate better or worse performance; therefore, for these measures, HSAG did not compare performance between RY 2017 and RY 2018.
Table 4.1—Multi-Year MLTSSP Performance Measure Results L.A. Care—Los Angeles County
B = Statistical testing result indicates that the RY 2018 rate is significantly better than the RY 2017 rate.
W = Statistical testing result indicates that the RY 2018 rate is significantly worse than the RY 2017 rate.
Measure RY 2016 MLTSS
Rate1
RY 2017 MLTSS
Rate2
RY 2018 MLTSS
Rate3
RYs 2017–18 Rate
Difference4
Ambulatory Care—Emergency Department (ED) Visits per 1,000 Member Months*
59.09 60.61 55.44 Not Tested
Ambulatory Care—Outpatient Visits per 1,000 Member Months* 538.37 495.85 544.74 Not Tested
Medication Reconciliation Post-Discharge 11.68% 20.92% 16.55% -4.37
1 RY 2016 rates reflect MY data from January 1, 2015, through December 31, 2015. 2 RY 2017 rates reflect MY data from January 1, 2016, through December 31, 2016. 3 RY 2018 rates reflect MY data from January 1, 2017, through December 31, 2017. 4 Performance comparisons are based on the Chi-square test of statistical significance, with a p value of <0.05. * Member months are a member's “contribution” to the total yearly membership.
L.A. Care Health Plan Performance Evaluation Report: July 1, 2017–June 30, 2018 California Department of Health Care Services
Page V-25 Health Services Advisory Group, Inc.
MLTSSP PERFORMANCE MEASURE RESULTS
Not Tested = An RY 2017–18 rate difference was not calculated because high and low rates do not necessarily indicate better or worse performance.
Managed Long-Term Services and Supports Plan PerformanceMeasure Findings The rate for the Medication Reconciliation Post-Discharge measure showed no statistically significant change from RY 2017 to RY 2018.
L.A. Care Health Plan Performance Evaluation Report: July 1, 2017–June 30, 2018 California Department of Health Care Services
Page V-26 Health Services Advisory Group, Inc.

Medi-Cal Managed Care External Quality Review Technical ReportAppendix V: Performance Evaluation ReportL.A. Care Health Plan July 1, 2017–June 30, 2018
5. Performance Improvement Projects
Performance Improvement Project Overview The key concepts of the rapid-cycle PIP framework include forming a PIP team, setting aims, establishing measures, determining interventions using quality improvement tools, conducting PDSA cycles to test interventions, and planning for the spread of successful changes. The core component of the rapid-cycle PIP approach involves testing changes on a small scale so that improvement can occur more efficiently and lead to long-term sustainability. The following modules guide MCPs through this rapid-cycle PIP process:
Module 1—PIP Initiation ■ MCPs outline the framework for the PIP, which includes:
○ The topic rationale. ○ Comparative data supporting the need to improve the selected topic. ○ A list of the PIP team members, which consists of internal and external stakeholders. ○ A completed key driver diagram that defines the theory of change for improvement,
including the SMART (Specific, Measurable, Achievable, Relevant, and Time-bound) Aim and Global Aim.
Module 2—SMART Aim Data Collection ■ MCPs define the SMART Aim measure and data collection methodology and develop
the SMART Aim data run chart. Module 3—Intervention Determination ■ MCPs use process mapping and failure modes and effects analysis to identify potential
interventions to test which may have direct effects on the SMART Aim. Module 4—Plan-Do-Study-Act (PDSA) ■ MCPs test and evaluate the interventions identified in Module 3 through a series of
PDSA cycles. Module 5—PIP Conclusions ■ MCPs interpret results and summarize:
○ Key findings and outcomes achieved. ○ Assessment of each tested intervention. ○ Lessons learned, including how demonstrated improvement can be shared and used
as a foundation for further improvement going forward. ○ Plan for sustained improvement.
L.A. Care Health Plan Performance Evaluation Report: July 1, 2017–June 30, 2018 California Department of Health Care Services
Page V-27 Health Services Advisory Group, Inc.
PERFORMANCE IMPROVEMENT PROJECTS
Based on the agreed-upon timeline, MCPs submit each module to HSAG for validation. Throughout the rapid-cycle PIP process, HSAG provides technical assistance to MCPs to ensure that PIPs are methodologically sound and to problem-solve with MCPs regarding how to address challenges that occur. Through an iterative process, MCPs have opportunities to make corrections to modules 1 through 3 to achieve all validation criteria.
Once MCPs achieve all validation criteria for modules 1 through 3 and receive feedback on the intervention Plan portion of Module 4, MCPs test interventions. During the intervention testing phase of the PIP, HSAG conducts periodic progress check-ins to ensure that MCPs have addressed HSAG’s feedback on the Plan portion of Module 4 and are making appropriate progress with intervention testing. Once MCPs complete testing an intervention, MCPs determine the next steps based on results and lessons learned—whether the intervention was successful and should be spread (adopt), whether modifications need to be made to the existing intervention (adapt), or whether the intervention was not successful and should be stopped (abandon).
In Module 5, MCPs summarize the overall PIP. When validating Module 5, HSAG assesses the validity and reliability of the results based on the Centers for Medicare & Medicaid Services (CMS) validation protocols to determine whether key stakeholders can have confidence in the reported PIP findings. HSAG assigns the following final confidence levels for each PIP:
High confidence—the PIP was methodologically sound and achieved the SMART Aim goal; the demonstrated improvement was clearly linked to the quality improvement processes conducted and intervention(s) tested; and, the MCP accurately summarized the key findings. Confidence—the PIP was methodologically sound and achieved the SMART Aim goal, and the MCP accurately summarized the key findings. However, some, but not all, of the quality improvement processes conducted and/or intervention(s) tested were clearly linked to the demonstrated improvement. Low confidence—either (A) the PIP was methodologically sound; however, the SMART Aim goal was not achieved; or (B) the SMART Aim goal was achieved; however, the quality improvement processes and/or intervention(s) tested were poorly executed and could not be linked to the improvement. Reported PIP results were not credible—the PIP methodology was not executed as approved.
L.A. Care Health Plan Performance Evaluation Report: July 1, 2017–June 30, 2018 California Department of Health Care Services
Page V-28 Health Services Advisory Group, Inc.
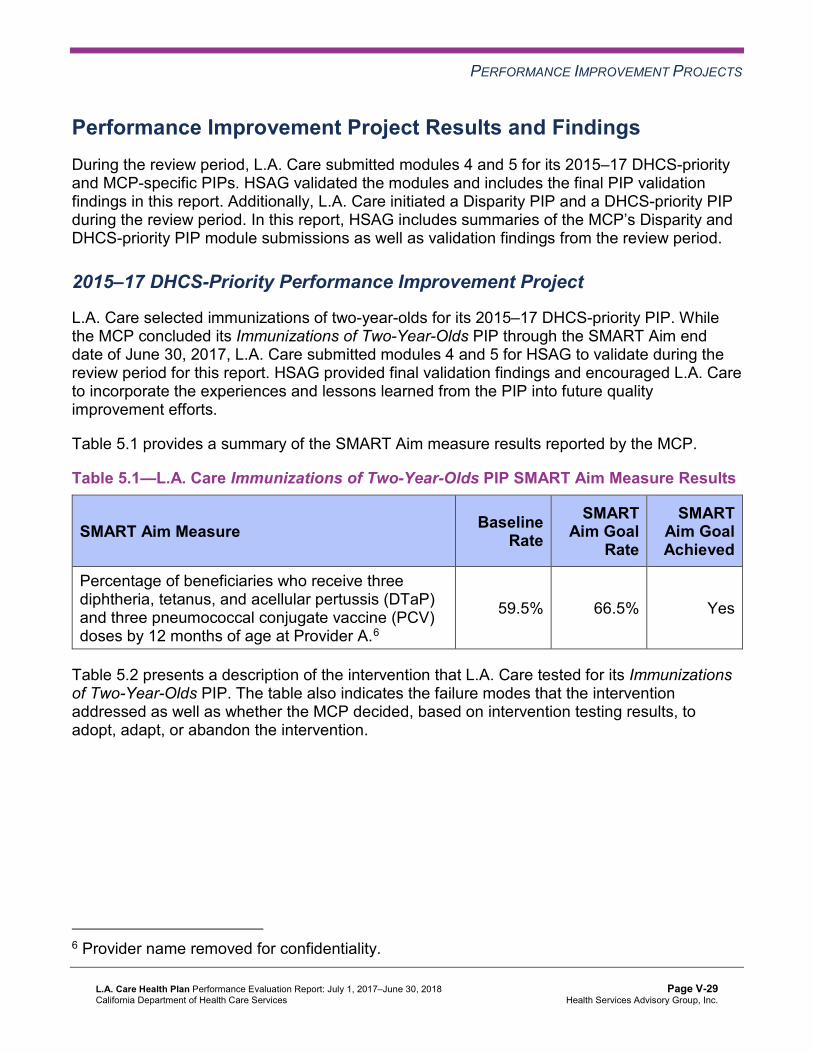
PERFORMANCE IMPROVEMENT PROJECTS
Performance Improvement Project Results and Findings During the review period, L.A. Care submitted modules 4 and 5 for its 2015–17 DHCS-priority and MCP-specific PIPs. HSAG validated the modules and includes the final PIP validation findings in this report. Additionally, L.A. Care initiated a Disparity PIP and a DHCS-priority PIP during the review period. In this report, HSAG includes summaries of the MCP’s Disparity and DHCS-priority PIP module submissions as well as validation findings from the review period.
2015–17 DHCS-Priority Performance Improvement Project
L.A. Care selected immunizations of two-year-olds for its 2015–17 DHCS-priority PIP. While the MCP concluded its Immunizations of Two-Year-Olds PIP through the SMART Aim end date of June 30, 2017, L.A. Care submitted modules 4 and 5 for HSAG to validate during the review period for this report. HSAG provided final validation findings and encouraged L.A. Care to incorporate the experiences and lessons learned from the PIP into future quality improvement efforts.
Table 5.1 provides a summary of the SMART Aim measure results reported by the MCP.
Table 5.1—L.A. Care Immunizations of Two-Year-Olds PIP SMART Aim Measure Results
SMART Aim Measure Baseline Rate
SMART Aim Goal
Rate
SMART Aim Goal Achieved
Percentage of beneficiaries who receive three diphtheria, tetanus, and acellular pertussis (DTaP) and three pneumococcal conjugate vaccine (PCV) doses by 12 months of age at Provider A.6
59.5% 66.5% Yes
Table 5.2 presents a description of the intervention that L.A. Care tested for its Immunizations of Two-Year-Olds PIP. The table also indicates the failure modes that the intervention addressed as well as whether the MCP decided, based on intervention testing results, to adopt, adapt, or abandon the intervention.
6 Provider name removed for confidentiality.
L.A. Care Health Plan Performance Evaluation Report: July 1, 2017–June 30, 2018 California Department of Health Care Services
Page V-29 Health Services Advisory Group, Inc.
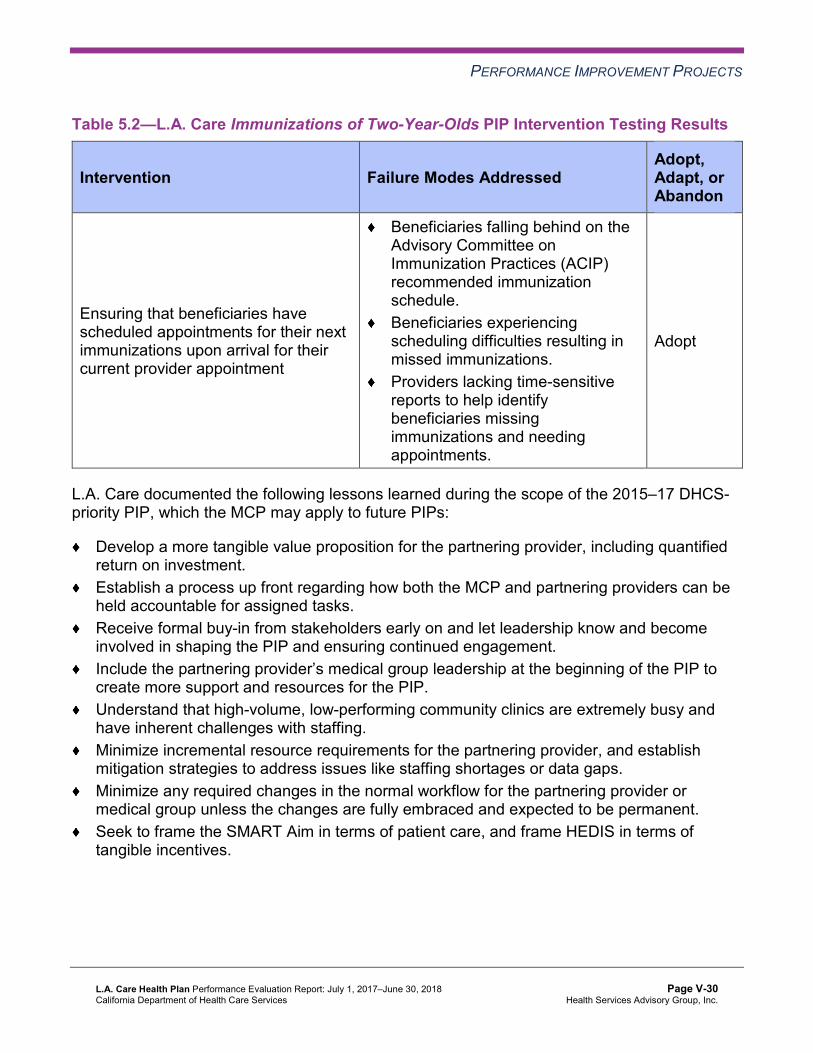
PERFORMANCE IMPROVEMENT PROJECTS
Table 5.2—L.A. Care Immunizations of Two-Year-Olds PIP Intervention Testing Results
Intervention Failure Modes Addressed Adopt,Adapt, orAbandon
Ensuring that beneficiaries have scheduled appointments for their next immunizations upon arrival for their current provider appointment
Beneficiaries falling behind on the Advisory Committee on Immunization Practices (ACIP) recommended immunization schedule. Beneficiaries experiencing scheduling difficulties resulting in missed immunizations. Providers lacking time-sensitive reports to help identify beneficiaries missing immunizations and needing appointments.
Adopt
L.A. Care documented the following lessons learned during the scope of the 2015–17 DHCS-priority PIP, which the MCP may apply to future PIPs:
Develop a more tangible value proposition for the partnering provider, including quantified return on investment. Establish a process up front regarding how both the MCP and partnering providers can be held accountable for assigned tasks. Receive formal buy-in from stakeholders early on and let leadership know and become involved in shaping the PIP and ensuring continued engagement. Include the partnering provider’s medical group leadership at the beginning of the PIP to create more support and resources for the PIP. Understand that high-volume, low-performing community clinics are extremely busy and have inherent challenges with staffing. Minimize incremental resource requirements for the partnering provider, and establish mitigation strategies to address issues like staffing shortages or data gaps. Minimize any required changes in the normal workflow for the partnering provider or medical group unless the changes are fully embraced and expected to be permanent. Seek to frame the SMART Aim in terms of patient care, and frame HEDIS in terms of tangible incentives.
L.A. Care Health Plan Performance Evaluation Report: July 1, 2017–June 30, 2018 California Department of Health Care Services
Page V-30 Health Services Advisory Group, Inc.
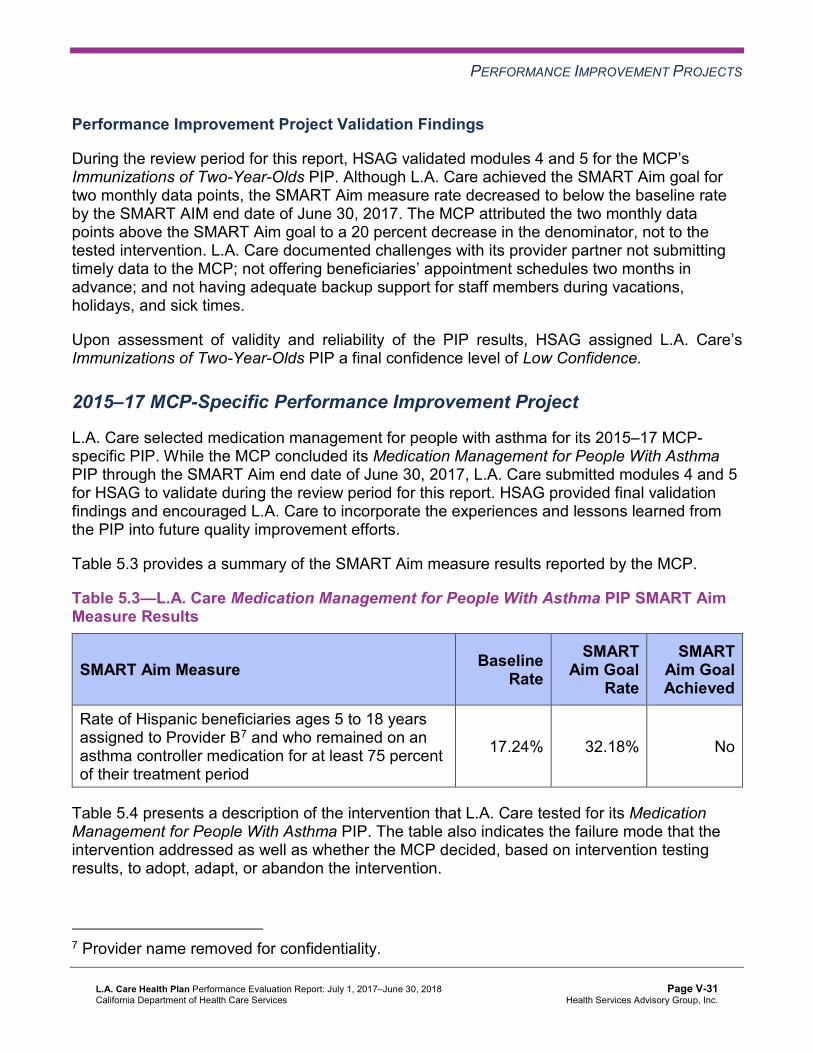
PERFORMANCE IMPROVEMENT PROJECTS
Performance Improvement Project Validation Findings
During the review period for this report, HSAG validated modules 4 and 5 for the MCP’s Immunizations of Two-Year-Olds PIP. Although L.A. Care achieved the SMART Aim goal for two monthly data points, the SMART Aim measure rate decreased to below the baseline rate by the SMART AIM end date of June 30, 2017. The MCP attributed the two monthly data points above the SMART Aim goal to a 20 percent decrease in the denominator, not to the tested intervention. L.A. Care documented challenges with its provider partner not submitting timely data to the MCP; not offering beneficiaries’ appointment schedules two months in advance; and not having adequate backup support for staff members during vacations, holidays, and sick times.
Upon assessment of validity and reliability of the PIP results, HSAG assigned L.A. Care’s Immunizations of Two-Year-Olds PIP a final confidence level of Low Confidence.
2015–17 MCP-Specific Performance Improvement Project
L.A. Care selected medication management for people with asthma for its 2015–17 MCP-specific PIP. While the MCP concluded its Medication Management for People With Asthma PIP through the SMART Aim end date of June 30, 2017, L.A. Care submitted modules 4 and 5 for HSAG to validate during the review period for this report. HSAG provided final validation findings and encouraged L.A. Care to incorporate the experiences and lessons learned from the PIP into future quality improvement efforts.
Table 5.3 provides a summary of the SMART Aim measure results reported by the MCP.
Table 5.3—L.A. Care Medication Management for People With Asthma PIP SMART Aim Measure Results
SMART Aim Measure Baseline Rate
SMART Aim Goal
Rate
SMART Aim Goal Achieved
Rate of Hispanic beneficiaries ages 5 to 18 years assigned to Provider B7 and who remained on an asthma controller medication for at least 75 percent of their treatment period
17.24% 32.18% No
Table 5.4 presents a description of the intervention that L.A. Care tested for its Medication Management for People With Asthma PIP. The table also indicates the failure mode that the intervention addressed as well as whether the MCP decided, based on intervention testing results, to adopt, adapt, or abandon the intervention.
7 Provider name removed for confidentiality.
L.A. Care Health Plan Performance Evaluation Report: July 1, 2017–June 30, 2018 California Department of Health Care Services
Page V-31 Health Services Advisory Group, Inc.

PERFORMANCE IMPROVEMENT PROJECTS
Table 5.4—L.A. Care Medication Management for People With Asthma PIP Intervention Testing Results
Intervention Failure Mode Addressed Adopt,Adapt, orAbandon
Automatic medication refill program Beneficiary does not collect asthma controller medication. Abandon
L.A. Care documented the following lessons learned during the scope of the 2015–17 MCP-specific PIP, which the MCP may apply to future PIPs:
Create a charter or contract with the partnering provider to ensure that all expectations and deliverables are clearly set from the beginning of the PIP. Obtain formal buy-in from the partnering provider and its leadership to ensure provider allocation of resources, and address challenges timely. Consider a modest incentive for partnering provider staff, such as providing food, to promote the partnership during the PIP process.
Performance Improvement Project Validation Findings
During the review period for this report, HSAG validated modules 4 and 5 for the MCP’s Medication Management for People With Asthma PIP. Despite L.A. Care’s efforts, the MCP did not achieve the SMART Aim goal and documented that the tested intervention was not effective in improving the SMART Aim measure rate. Upon assessment of validity and reliability of the PIP results, HSAG assigned L.A. Care’s Medication Management for People With Asthma PIP a final confidence level of Low-Confidence.
2017–19 Disparity Performance Improvement Project
During the review period, DHCS required L.A. Care to initiate a PIP focusing on an identified health disparity based on, but not limited to, age, gender, race or ethnicity, language spoken, income, educational attainment, sexual orientation or gender identity, occupation, provider, or geographic area. L.A. Care selected diabetes medication adherence among African American beneficiaries as its 2017–19 Disparity PIP topic. Using its own MCP-specific data, the MCP provided evidence of the health disparity by demonstrating a statistically significant rate difference between two subgroups, with the disparate subgroup having the lower rate.
Table 5.5 provides the SMART Aim measure description, baseline rate, and SMART Aim goal rate for the PIP. The SMART Aim end date for this PIP is June 30, 2019.
L.A. Care Health Plan Performance Evaluation Report: July 1, 2017–June 30, 2018 California Department of Health Care Services
Page V-32 Health Services Advisory Group, Inc.
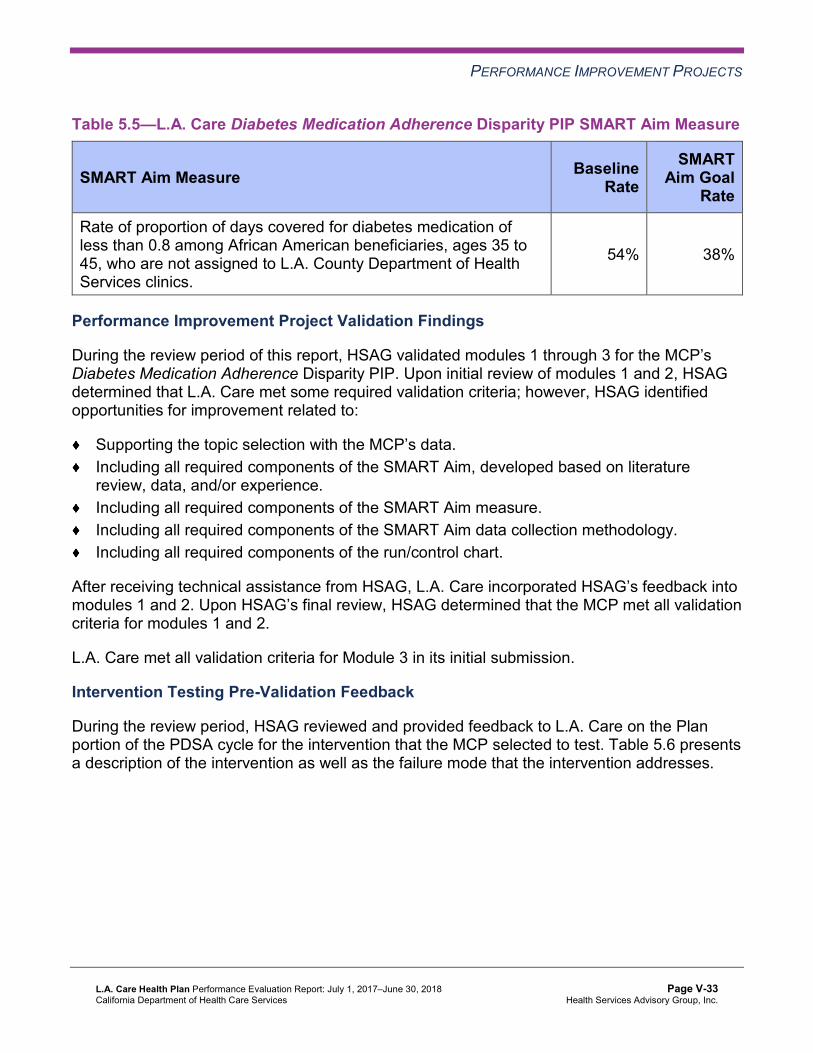
PERFORMANCE IMPROVEMENT PROJECTS
Table 5.5—L.A. Care Diabetes Medication Adherence Disparity PIP SMART Aim Measure
SMART Aim Measure Baseline Rate
SMART Aim Goal
Rate
Rate of proportion of days covered for diabetes medication of less than 0.8 among African American beneficiaries, ages 35 to 45, who are not assigned to L.A. County Department of Health Services clinics.
54% 38%
Performance Improvement Project Validation Findings
During the review period of this report, HSAG validated modules 1 through 3 for the MCP’s Diabetes Medication Adherence Disparity PIP. Upon initial review of modules 1 and 2, HSAG determined that L.A. Care met some required validation criteria; however, HSAG identified opportunities for improvement related to:
Supporting the topic selection with the MCP’s data. Including all required components of the SMART Aim, developed based on literature review, data, and/or experience. Including all required components of the SMART Aim measure. Including all required components of the SMART Aim data collection methodology. Including all required components of the run/control chart.
After receiving technical assistance from HSAG, L.A. Care incorporated HSAG’s feedback into modules 1 and 2. Upon HSAG’s final review, HSAG determined that the MCP met all validation criteria for modules 1 and 2.
L.A. Care met all validation criteria for Module 3 in its initial submission.
Intervention Testing Pre-Validation Feedback
During the review period, HSAG reviewed and provided feedback to L.A. Care on the Plan portion of the PDSA cycle for the intervention that the MCP selected to test. Table 5.6 presents a description of the intervention as well as the failure mode that the intervention addresses.
L.A. Care Health Plan Performance Evaluation Report: July 1, 2017–June 30, 2018 California Department of Health Care Services
Page V-33 Health Services Advisory Group, Inc.

PERFORMANCE IMPROVEMENT PROJECTS
Table 5.6—L.A. Care Diabetes Medication Adherence Disparity PIP Intervention Testing
Intervention Failure Mode Addressed
Contacting beneficiaries by phone who have missed at least one refill to:
Address any barriers. Inform them about the mail order program in which beneficiaries can receive a 90-day supply of medication. Attempt to secure refills.
Beneficiaries not aware of what to do when they reach the maximum number of refills.
HSAG expects L.A. Care to incorporate HSAG’s feedback prior to testing the intervention and to contact HSAG related to any issues throughout the Intervention Testing phase of the PIP process.
2017–19 DHCS-Priority Performance Improvement Project
During the review period, DHCS required L.A. Care to initiate a PIP related to one of DHCS’ Quality Strategy focus areas: Childhood Immunization Status—Combination 3, Controlling High Blood Pressure, Comprehensive Diabetes Care, or Prenatal and Postpartum Care— Postpartum Care. Based on the MCP’s performance measure results, L.A. Care selected childhood immunizations as its 2017–19 DHCS-priority PIP topic.
Table 5.7 provides the SMART Aim measure description, baseline rate, and SMART Aim goal rate for the PIP. The SMART Aim end date for this PIP is June 30, 2019.
Table 5.7—L.A. Care Childhood Immunization Status—Combination 3 PIP SMART Aim Measure
SMART Aim Measure Baseline Rate
SMART Aim Goal
Rate
Rate of Childhood Immunization Status—Combination 3 measure in San Gabriel Valley 40.9% 51.0%
L.A. Care Health Plan Performance Evaluation Report: July 1, 2017–June 30, 2018 California Department of Health Care Services
Page V-34 Health Services Advisory Group, Inc.

PERFORMANCE IMPROVEMENT PROJECTS
Performance Improvement Project Validation Findings
During the review period of this report, HSAG validated modules 1 through 3 for the MCP’s Childhood Immunization Status—Combination 3 PIP. L.A. Care met all validation criteria for modules 1 and 3 in its initial submission. Upon initial review of Module 2, HSAG determined that L.A. Care met some required validation criteria; however, HSAG identified opportunities for improvement related to including all required components of the following:
SMART Aim measure SMART Aim data collection methodology Run/control chart
After receiving technical assistance from HSAG, L.A. Care incorporated HSAG’s feedback into the PIP module. Upon HSAG’s final review, HSAG determined that the MCP met all validation criteria for Module 2.
Intervention Testing Pre-Validation Feedback
During the review period, HSAG reviewed and provided feedback to L.A. Care on the Plan portion of the PDSA cycle for the intervention that the MCP selected to test. Table 5.8 presents a description of the intervention as well as the failure modes that the intervention addresses.
Table 5.8—L.A. Care Childhood Immunization Status—Combination 3 PIP Intervention Testing
Intervention Failure Modes Addressed
Offering assistance to provider offices that do not actively use the California Immunization Registry (CAIR)—focusing on connecting electronic health record systems to CAIR and/or coaching staff members on data entry and use of CAIR
Provider does not enter data into CAIR. Provider does not participate in CAIR.
HSAG expects L.A. Care to incorporate HSAG’s feedback prior to testing the intervention and to contact HSAG related to any issues throughout the Intervention Testing phase of the PIP process.
Strengths—Performance Improvement Projects Upon completion of the 2015–17 Immunizations of Two-Year-Olds PIP, L.A. Care identified an intervention that it can adopt to improve appointment scheduling for childhood immunizations.
L.A. Care Health Plan Performance Evaluation Report: July 1, 2017–June 30, 2018 California Department of Health Care Services
Page V-35 Health Services Advisory Group, Inc.
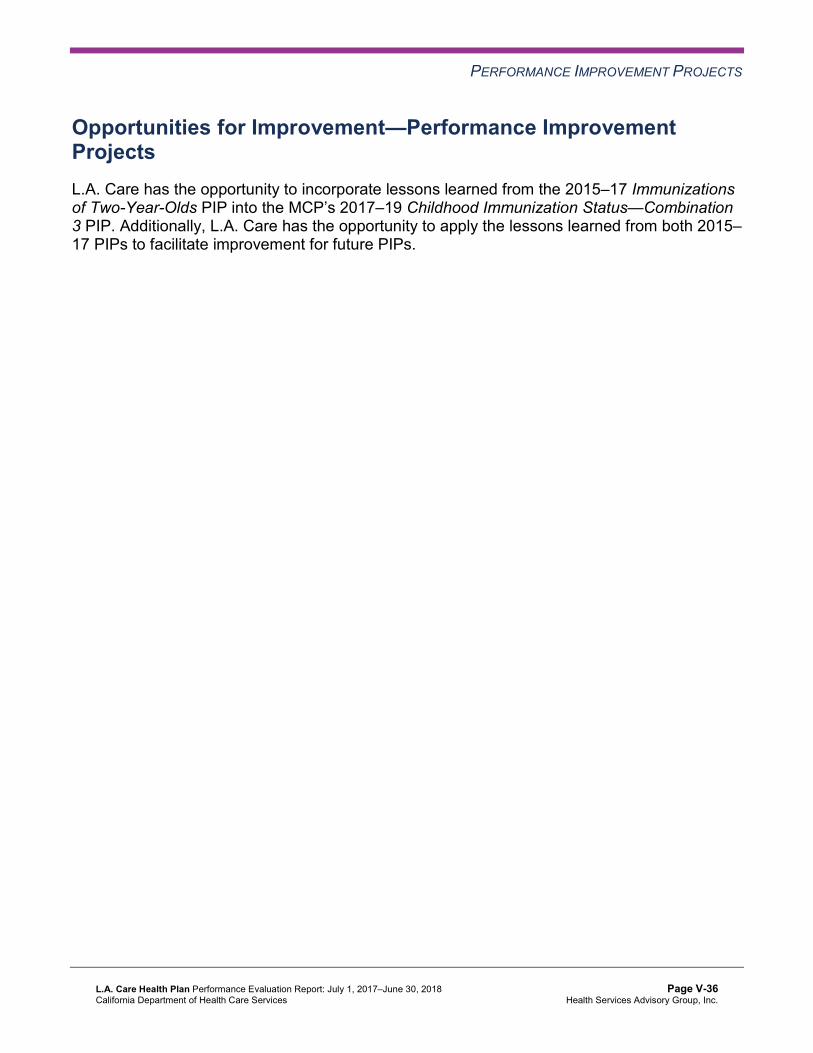
PERFORMANCE IMPROVEMENT PROJECTS
Opportunities for Improvement—Performance Improvement Projects L.A. Care has the opportunity to incorporate lessons learned from the 2015–17 Immunizations of Two-Year-Olds PIP into the MCP’s 2017–19 Childhood Immunization Status—Combination 3 PIP. Additionally, L.A. Care has the opportunity to apply the lessons learned from both 2015– 17 PIPs to facilitate improvement for future PIPs.
L.A. Care Health Plan Performance Evaluation Report: July 1, 2017–June 30, 2018 California Department of Health Care Services
Page V-36 Health Services Advisory Group, Inc.

Medi-Cal Managed Care External Quality Review Technical ReportAppendix V: Performance Evaluation ReportL.A. Care Health Plan July 1, 2017–June 30, 2018
6. Recommendations
Follow-Up on Prior Year Recommendations DHCS provided each MCP an opportunity to outline actions taken to address recommendations HSAG made in its 2016–17 MCP-specific evaluation report. Table 6.1 provides EQR recommendations from L.A. Care’s July 1, 2016, through June 30, 2017, MCP-specific evaluation report, along with the MCP’s self-reported actions taken through June 30, 2018, that address the recommendations. Please note that HSAG made minimal edits to Table 6.1 to preserve the accuracy of L.A. Care’s self-reported actions.
Table 6.1—L.A. Care’s Self-Reported Follow-Up on External Quality ReviewRecommendations from the July 1, 2016, through June 30, 2017, MCP-SpecificEvaluation Report
2016–17 External Quality ReviewRecommendations Directed to L.A. Care
Self-Reported Actions Taken by L.A. Careduring the Period of July 1, 2017–June 30,2018, that Address the External QualityReview Recommendations
1. Determine the percentage of retroactive enrollment that occurs for the MCP; determine the impact on the rates; and consider removing these beneficiaries for future HEDIS reporting, as allowed by NCQA.
As part of NCQA’s Information System Grid requirements, L.A. Care performed analysis on members with retroactive enrollment during 2017 and found that approximately 9 percent of members have at least one month of retro eligibility. The aggregated HEDIS administrative rates for measures analyzed for those members were approximately 41 percent as compared to an aggregated rate of approximately 42 percent for all members in the HEDIS eligible population. Due to this minimal impact found during our analysis, no action was taken to remove members for HEDIS 2018 reporting.
2. Determine the causes for the MCP’s continued declining performance for the Use of Imaging Studies for Low Back Pain measure.
In Quarter 3 of 2017, the QI department added the Use of Imaging Studies for Low Back Pain measure to the Chronic Care Work Group to determine some of the causes for the low rate and to develop interventions. The workgroup decided that providing doctors with evidence-based screening and treatment guidelines would be beneficial to improving the rate by educating the providers on the appropriate
L.A. Care Health Plan Performance Evaluation Report: July 1, 2017–June 30, 2018 California Department of Health Care Services
Page V-37 Health Services Advisory Group, Inc.
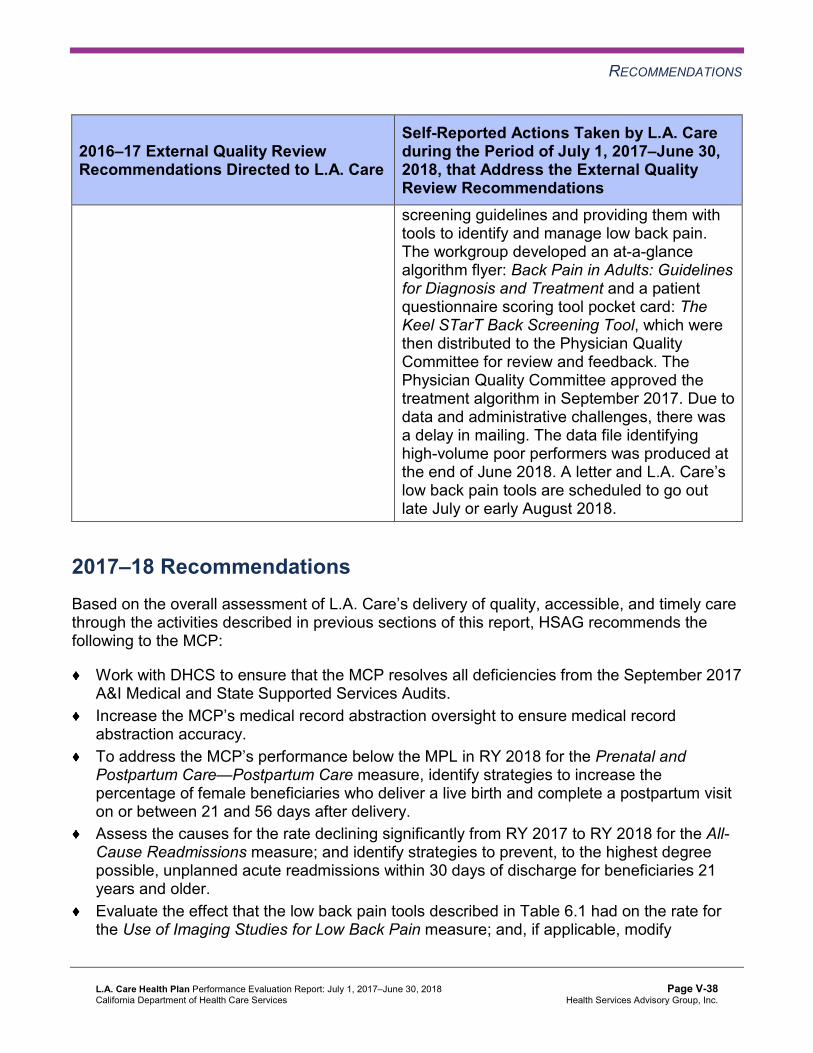
RECOMMENDATIONS
2016–17 External Quality ReviewRecommendations Directed to L.A. Care
Self-Reported Actions Taken by L.A. Careduring the Period of July 1, 2017–June 30,2018, that Address the External QualityReview Recommendations screening guidelines and providing them with tools to identify and manage low back pain. The workgroup developed an at-a-glance algorithm flyer: Back Pain in Adults: Guidelines for Diagnosis and Treatment and a patient questionnaire scoring tool pocket card: The Keel STarT Back Screening Tool, which were then distributed to the Physician Quality Committee for review and feedback. The Physician Quality Committee approved the treatment algorithm in September 2017. Due to data and administrative challenges, there was a delay in mailing. The data file identifying high-volume poor performers was produced at the end of June 2018. A letter and L.A. Care’s low back pain tools are scheduled to go out late July or early August 2018.
2017–18 Recommendations Based on the overall assessment of L.A. Care’s delivery of quality, accessible, and timely care through the activities described in previous sections of this report, HSAG recommends the following to the MCP:
Work with DHCS to ensure that the MCP resolves all deficiencies from the September 2017 A&I Medical and State Supported Services Audits. Increase the MCP’s medical record abstraction oversight to ensure medical record abstraction accuracy. To address the MCP’s performance below the MPL in RY 2018 for the Prenatal and Postpartum Care—Postpartum Care measure, identify strategies to increase the percentage of female beneficiaries who deliver a live birth and complete a postpartum visit on or between 21 and 56 days after delivery. Assess the causes for the rate declining significantly from RY 2017 to RY 2018 for the All-Cause Readmissions measure; and identify strategies to prevent, to the highest degree possible, unplanned acute readmissions within 30 days of discharge for beneficiaries 21 years and older. Evaluate the effect that the low back pain tools described in Table 6.1 had on the rate for the Use of Imaging Studies for Low Back Pain measure; and, if applicable, modify
L.A. Care Health Plan Performance Evaluation Report: July 1, 2017–June 30, 2018 California Department of Health Care Services
Page V-38 Health Services Advisory Group, Inc.

RECOMMENDATIONS
improvement strategies to address the MCP’s continued declining performance on this measure. Incorporate lessons learned from the 2015–17 Immunizations of Two-Year-Olds PIP into the MCP’s 2017–19 Childhood Immunization Status—Combination 3 PIP. Apply the lessons learned from both 2015–17 PIPs to facilitate improvement for future PIPs.
In the next annual review, HSAG will evaluate continued successes of L.A. Care as well as the MCP’s progress with these recommendations.
L.A. Care Health Plan Performance Evaluation Report: July 1, 2017–June 30, 2018 California Department of Health Care Services
Page V-39 Health Services Advisory Group, Inc.

Medi-Cal Managed CareExternal Quality Review Technical Report
Appendix W: Performance Evaluation Report Molina Healthcare of California
Partner Plan, Inc. July 1, 2017–June 30, 2018

Medi-Cal Managed Care External Quality Review Technical ReportAppendix W: Performance Evaluation ReportMolina Healthcare of California Partner Plan, Inc. July 1, 2017–June 30, 2018
Table of Contents
1. Introduction............................................................................................................W-1 Medi-Cal Managed Care Health Plan Overview ......................................................W-1
2. Managed Care Health Plan Compliance ..............................................................W-4Compliance Reviews Conducted.............................................................................W-4 Strengths—Compliance Reviews ............................................................................W-4 Opportunities for Improvement—Compliance Reviews ...........................................W-5
3. Managed Care Health Plan Performance Measures ...........................................W-6Performance Measure Validation Results ...............................................................W-6 Performance Measure Results and Findings...........................................................W-6
Preventive Screening and Children’s Health ........................................................W-7 Preventive Screening and Women’s Health .......................................................W-18 Care for Chronic Conditions ...............................................................................W-26 Appropriate Treatment and Utilization................................................................W-36 Performance Measure Findings—All Domains...................................................W-45
Improvement Plan Requirements for 2018 ............................................................W-48 Corrective Action Plan Requirements for 2018......................................................W-49 Seniors and Persons with Disabilities Performance Measure Results...................W-49
Seniors and Persons with Disabilities Findings ..................................................W-67 Strengths—Performance Measures ......................................................................W-68 Opportunities for Improvement—Performance Measures .....................................W-68
4. MLTSSP Performance Measure Results............................................................W-70 Managed Long-Term Services and Supports Plan Performance Measure Findings..W-71
5. Performance Improvement Projects ..................................................................W-72Performance Improvement Project Overview ........................................................W-72 Performance Improvement Project Results and Findings......................................W-73
2015–17 DHCS-Priority Performance Improvement Project ..............................W-74 2015–17 MCP-Specific Performance Improvement Project ...............................W-75 2017–19 Disparity Performance Improvement Project .......................................W-76 2017–19 DHCS-Priority Performance Improvement Project ..............................W-77
Strengths—Performance Improvement Projects ...................................................W-78 Opportunities for Improvement—Performance Improvement Projects ..................W-79
6. Recommendations...............................................................................................W-80 Follow-Up on Prior Year Recommendations .........................................................W-80 2017–18 Recommendations..................................................................................W-87
Molina Healthcare of California Partner Plan, Inc. Performance Evaluation Report: July 1, 2017–June 30, 2018 California Department of Health Care Services
Page W-i Health Services Advisory Group, Inc.

TABLE OF CONTENTS
Table of Tables
Table 1.1—Molina Enrollment as of June 30, 2018.......................................................W-3 Table 2.1—DHCS A&I Medical Audit of Molina Audit Review Period: August 1, 2016,
through July 31, 2017 .................................................................................W-4 Table 3.1—Preventive Screening and Children’s Health Domain Multi-Year
Performance Measure Results Molina—Imperial County ...........................W-8 Table 3.2—Preventive Screening and Children’s Health Domain Multi-Year
Performance Measure Results Molina—Riverside/San Bernardino Counties.W-9 Table 3.3—Preventive Screening and Children’s Health Domain Multi-Year
Performance Measure Results Molina—Sacramento County...................W-11 Table 3.4—Preventive Screening and Children’s Health Domain Multi-Year
Performance Measure Results Molina—San Diego County .....................W-12 Table 3.5—Preventive Screening and Children’s Health Domain RY 2018 (MY 2017)
Performance Measure Findings Molina—Imperial County........................W-14 Table 3.6—Preventive Screening and Children’s Health Domain RY 2018 (MY 2017)
Performance Measure Findings Molina—Riverside/San Bernardino Counties.W-15 Table 3.7—Preventive Screening and Children’s Health Domain RY 2018 (MY 2017)
Performance Measure Findings Molina—Sacramento County .................W-16 Table 3.8—Preventive Screening and Children’s Health Domain RY 2018 (MY 2017)
Performance Measure Findings Molina—San Diego County....................W-17 Table 3.9—Preventive Screening and Women’s Health Domain Multi-Year
Performance Measure Results Molina—Imperial County .........................W-18 Table 3.10—Preventive Screening and Women’s Health Domain Multi-Year
Performance Measure Results Molina—Riverside/San Bernardino Counties W-19 Table 3.11—Preventive Screening and Women’s Health Domain Multi-Year
Performance Measure Results Molina—Sacramento County...................W-20 Table 3.12—Preventive Screening and Women’s Health Domain Multi-Year
Performance Measure Results Molina—San Diego County .....................W-21 Table 3.13—Preventive Screening and Women’s Health Domain RY 2018 (MY 2017)
Performance Measure Findings Molina—Imperial County........................W-22 Table 3.14—Preventive Screening and Women’s Health Domain RY 2018 (MY 2017)
Performance Measure Findings Molina—Riverside/San Bernardino Counties W-23 Table 3.15—Preventive Screening and Women’s Health Domain RY 2018 (MY 2017)
Performance Measure Findings Molina—Sacramento County .................W-24 Table 3.16—Preventive Screening and Women’s Health Domain RY 2018 (MY 2017)
Performance Measure Findings Molina—San Diego County....................W-25 Table 3.17—Care for Chronic Conditions Domain Multi-Year Performance Measure
Results Molina—Imperial County..............................................................W-26 Table 3.18—Care for Chronic Conditions Domain Multi-Year Performance Measure
Results Molina—Riverside/San Bernardino Counties ...............................W-28
Molina Healthcare of California Partner Plan, Inc. Performance Evaluation Report: July 1, 2017–June 30, 2018 California Department of Health Care Services
Page W-ii Health Services Advisory Group, Inc.
TABLE OF CONTENTS
Table 3.19—Care for Chronic Conditions Domain Multi-Year Performance Measure Results Molina—Sacramento County .......................................................W-29
Table 3.20—Care for Chronic Conditions Domain Multi-Year Performance Measure Results Molina—San Diego County..........................................................W-30
Table 3.21—Care for Chronic Conditions Domain RY 2018 (MY 2017) Performance Measure Findings Molina—Imperial County .............................................W-32
Table 3.22—Care for Chronic Conditions Domain RY 2018 (MY 2017) Performance Measure Findings Molina—Riverside/San Bernardino Counties ..............W-33
Table 3.23—Care for Chronic Conditions Domain RY 2018 (MY 2017) Performance Measure Findings Molina—Sacramento County.......................................W-34
Table 3.24—Care for Chronic Conditions Domain RY 2018 (MY 2017) Performance Measure Findings Molina—San Diego County .........................................W-35
Table 3.25—Appropriate Treatment and Utilization Domain Multi-Year Performance Measure Results Molina—Imperial County...............................................W-37
Table 3.26—Appropriate Treatment and Utilization Domain Multi-Year Performance Measure Results Molina—Riverside/San Bernardino Counties ................W-38
Table 3.27—Appropriate Treatment and Utilization Domain Multi-Year Performance Measure Results Molina—Sacramento County ........................................W-39
Table 3.28—Appropriate Treatment and Utilization Domain Multi-Year Performance Measure Results Molina—San Diego County...........................................W-40
Table 3.29—Appropriate Treatment and Utilization Domain RY 2018 (MY 2017) Performance Measure Findings Molina—Imperial County........................W-41
Table 3.30—Appropriate Treatment and Utilization Domain RY 2018 (MY 2017) Performance Measure Findings Molina—Riverside/San Bernardino Counties W-42
Table 3.31—Appropriate Treatment and Utilization Domain RY 2018 (MY 2017) Performance Measure Findings Molina—Sacramento County .................W-43
Table 3.32—Appropriate Treatment and Utilization Domain RY 2018 (MY 2017) Performance Measure Findings Molina—San Diego County....................W-44
Table 3.33—RY 2018 (MY 2017) Performance Measure Findings for All Domains Molina—Imperial County...........................................................................W-45
Table 3.34—RY 2018 (MY 2017) Performance Measure Findings for All Domains Molina—Riverside/San Bernardino Counties............................................W-46
Table 3.35—RY 2018 (MY 2017) Performance Measure Findings for All Domains Molina—Sacramento County ....................................................................W-47
Table 3.36—RY 2018 (MY 2017) Performance Measure Findings for All Domains Molina—San Diego County.......................................................................W-48
Table 3.37—Multi-Year SPD Performance Measure Trend Table Molina—Imperial County ......................................................................................................W-49
Table 3.38—Multi-Year SPD Performance Measure Trend Table Molina— Riverside/San Bernardino Counties..........................................................W-51
Molina Healthcare of California Partner Plan, Inc. Performance Evaluation Report: July 1, 2017–June 30, 2018 California Department of Health Care Services
Page W-iii Health Services Advisory Group, Inc.
TABLE OF CONTENTS
Table 3.39—Multi-Year SPD Performance Measure Trend Table Molina— Sacramento County ..................................................................................W-52
Table 3.40—Multi-Year SPD Performance Measure Trend Table Molina— San Diego County.....................................................................................W-54
Table 3.41—Multi-Year Non-SPD Performance Measure Trend Table Molina— Imperial County.........................................................................................W-55
Table 3.42—Multi-Year Non-SPD Performance Measure Trend Table Molina— Riverside/San Bernardino Counties..........................................................W-57
Table 3.43—Multi-Year Non-SPD Performance Measure Trend Table Molina— Sacramento County ..................................................................................W-58
San Diego County.....................................................................................W-60 Table 3.45—RY 2018 (MY 2017) Performance Measure Comparison and Results for
Measures Stratified by the SPD and Non-SPD Populations Molina— Imperial County.........................................................................................W-61
Table 3.46—RY 2018 (MY 2017) Performance Measure Comparison and Results for Measures Stratified by the SPD and Non-SPD Populations Molina— Riverside/San Bernardino Counties..........................................................W-63
Table 3.47—RY 2018 (MY 2017) Performance Measure Comparison and Results for Measures Stratified by the SPD and Non-SPD Populations Molina— Sacramento County ..................................................................................W-64
Table 3.48—RY 2018 (MY 2017) Performance Measure Comparison and Results for Measures Stratified by the SPD and Non-SPD Populations Molina— San Diego County.....................................................................................W-65
Table 4.1—Multi-Year MLTSSP Performance Measure Results Molina— Riverside/San Bernardino Counties..........................................................W-70
Table 4.2—Multi-Year MLTSSP Performance Measure Results Molina— San Diego County.....................................................................................W-71
Table 5.1—Molina Postpartum Care PIP SMART Aim Measure Results ....................W-74 Table 5.2—Molina Postpartum Care PIP Intervention Testing Results .......................W-74 Table 5.3—Molina Annual Monitoring of Patients on Persistent Medications PIP
SMART Aim Measure Results ..................................................................W-75 Table 5.4—Molina Annual Monitoring of Patients on Persistent Medications PIP
Intervention Testing Results .....................................................................W-76 Table 5.5—Molina Postpartum Care Disparity PIP SMART Aim Measure ..................W-77 Table 5.6—Molina Childhood Immunization Status—Combination 3 PIP SMART
Aim Measure.............................................................................................W-78 Table 6.1—Molina’s Self-Reported Follow-Up on External Quality Review
Recommendations from the July 1, 2016, through June 30, 2017, MCP-Specific Evaluation Report...............................................................W-80
Table 3.44—Multi-Year Non-SPD Performance Measure Trend Table Molina—
Molina Healthcare of California Partner Plan, Inc. Performance Evaluation Report: July 1, 2017–June 30, 2018 California Department of Health Care Services
Page W-iv Health Services Advisory Group, Inc.

Medi-Cal Managed Care External Quality Review Technical ReportAppendix W: Performance Evaluation ReportMolina Healthcare of California Partner Plan, Inc. July 1, 2017–June 30, 2018
1. Introduction
The California Department of Health Care Services (DHCS) contracted with Health Services Advisory Group, Inc. (HSAG), an external quality review organization (EQRO), to prepare the federally required Medi-Cal Managed Care External Quality Review Technical Report, July 1, 2017–June 30, 2018. The technical report provides an overview of the objectives and methodology for conducting the external quality review (EQR) activities, including requirements related to each activity. Additionally, the technical report provides aggregated results and recommendations for DHCS for each activity.
This appendix is specific to DHCS’ contracted Medi-Cal managed care health plan (MCP), Molina Healthcare of California Partner Plan, Inc. (“Molina” or “the MCP”). The purpose of this appendix is to provide MCP-specific results of each activity and an assessment of the MCP’s strengths and opportunities for improvement with respect to the quality and timeliness of and access to health care services furnished to Medi-Cal Managed Care (MCMC) beneficiaries (referred to as “beneficiaries” in this report). The review period for this MCP-specific evaluation report is July 1, 2017, through June 30, 2018. HSAG will report on activities that take place beyond the review period in Molina’s 2018–19 MCP-specific evaluation report. This MCP-specific evaluation report references activities and methodologies described in detail by HSAG in the technical report section.
The aggregate EQR technical report and all MCP- and specialty health plan (SHP)-specific performance evaluation reports reflect HSAG’s external, independent assessment of the quality and timeliness of, and access to, care that MCPs and SHPs are providing to beneficiaries.
Medi-Cal Managed Care Health Plan Overview In Riverside and San Bernardino counties, Molina is a full-scope MCP delivering services to beneficiaries as a commercial plan (CP) under the Two-Plan Model (TPM). Beneficiaries may enroll in Molina, the CP; or in Inland Empire Health Plan, the alternative “local initiative.”
In Sacramento and San Diego counties, Molina delivers services to beneficiaries under a Geographic Managed Care (GMC) model. The GMC model currently operates in the counties of San Diego and Sacramento. In this GMC model, DHCS allows beneficiaries to select from several commercial MCPs within the specified geographic service area (county).
Molina Healthcare of California Partner Plan, Inc. Performance Evaluation Report: July 1, 2017–June 30, 2018 California Department of Health Care Services
Page W-1 Health Services Advisory Group, Inc.
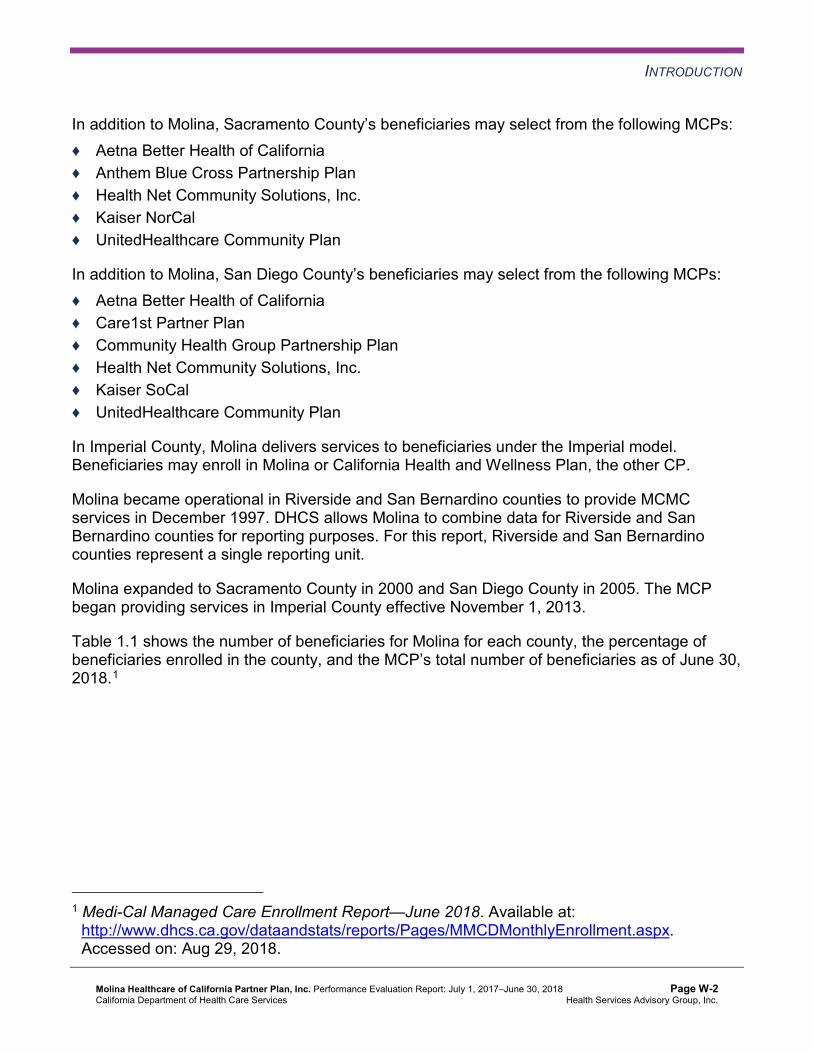
INTRODUCTION
In addition to Molina, Sacramento County’s beneficiaries may select from the following MCPs: ♦ Aetna Better Health of California ♦ Anthem Blue Cross Partnership Plan ♦ Health Net Community Solutions, Inc. ♦ Kaiser NorCal ♦ UnitedHealthcare Community Plan
In addition to Molina, San Diego County’s beneficiaries may select from the following MCPs: ♦ Aetna Better Health of California ♦ Care1st Partner Plan ♦ Community Health Group Partnership Plan ♦ Health Net Community Solutions, Inc. ♦ Kaiser SoCal ♦ UnitedHealthcare Community Plan
In Imperial County, Molina delivers services to beneficiaries under the Imperial model. Beneficiaries may enroll in Molina or California Health and Wellness Plan, the other CP.
Molina became operational in Riverside and San Bernardino counties to provide MCMC services in December 1997. DHCS allows Molina to combine data for Riverside and San Bernardino counties for reporting purposes. For this report, Riverside and San Bernardino counties represent a single reporting unit.
Molina expanded to Sacramento County in 2000 and San Diego County in 2005. The MCP began providing services in Imperial County effective November 1, 2013.
Table 1.1 shows the number of beneficiaries for Molina for each county, the percentage of beneficiaries enrolled in the county, and the MCP’s total number of beneficiaries as of June 30, 2018.1
1 Medi-Cal Managed Care Enrollment Report—June 2018. Available at: http://www.dhcs.ca.gov/dataandstats/reports/Pages/MMCDMonthlyEnrollment.aspx. Accessed on: Aug 29, 2018.
Molina Healthcare of California Partner Plan, Inc. Performance Evaluation Report: July 1, 2017–June 30, 2018 California Department of Health Care Services
Page W-2 Health Services Advisory Group, Inc.

INTRODUCTION
Table 1.1—Molina Enrollment as of June 30, 2018
County Enrollment as of June 30, 2018
Percentage ofBeneficiaries Enrolled
in the County
Imperial 14,836 19% Riverside* 84,220 12% Sacramento 56,608 13% San Bernardino* 72,215 10% San Diego 226,615 32%
Total 454,494 * Note that DHCS allows Molina to report Riverside and San Bernardino counties as a combined (i.e., single reporting unit) rate.
Molina Healthcare of California Partner Plan, Inc. Performance Evaluation Report: July 1, 2017–June 30, 2018 California Department of Health Care Services
Page W-3 Health Services Advisory Group, Inc.
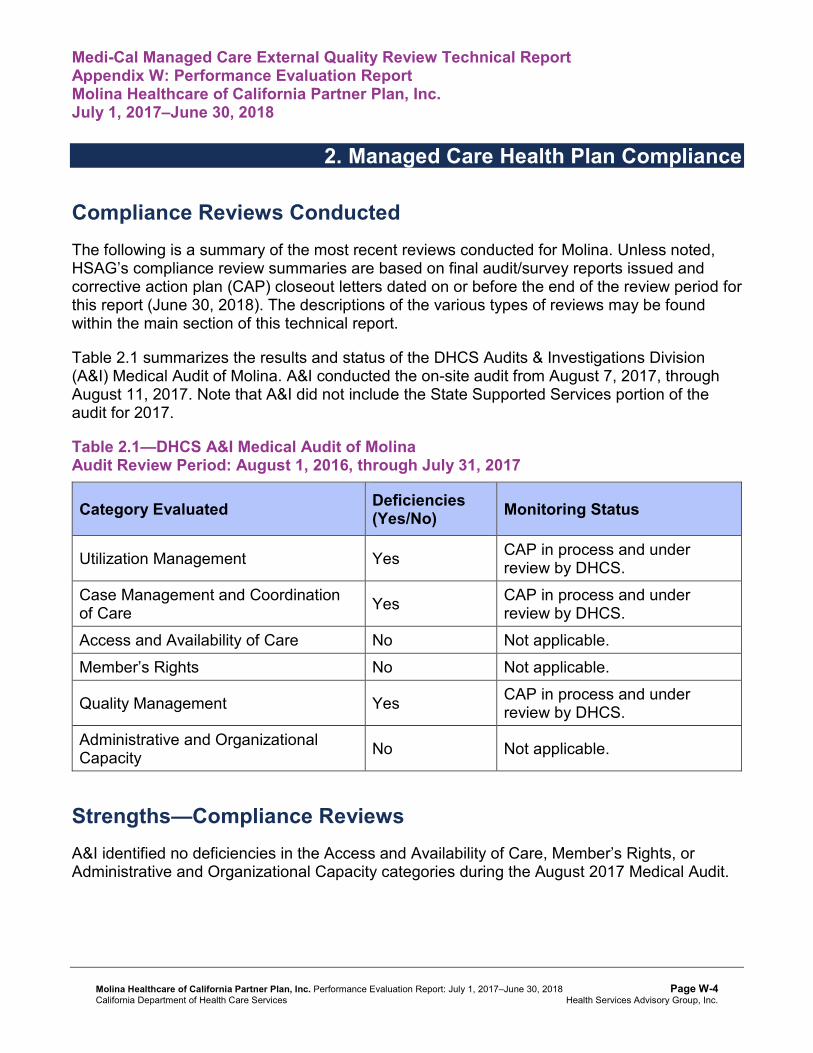
Medi-Cal Managed Care External Quality Review Technical ReportAppendix W: Performance Evaluation ReportMolina Healthcare of California Partner Plan, Inc. July 1, 2017–June 30, 2018
2. Managed Care Health Plan Compliance
Compliance Reviews Conducted The following is a summary of the most recent reviews conducted for Molina. Unless noted, HSAG’s compliance review summaries are based on final audit/survey reports issued and corrective action plan (CAP) closeout letters dated on or before the end of the review period for this report (June 30, 2018). The descriptions of the various types of reviews may be found within the main section of this technical report.
Table 2.1 summarizes the results and status of the DHCS Audits & Investigations Division (A&I) Medical Audit of Molina. A&I conducted the on-site audit from August 7, 2017, through August 11, 2017. Note that A&I did not include the State Supported Services portion of the audit for 2017.
Table 2.1—DHCS A&I Medical Audit of Molina Audit Review Period: August 1, 2016, through July 31, 2017
Category Evaluated Deficiencies (Yes/No) Monitoring Status
Utilization Management Yes CAP in process and under review by DHCS.
Case Management and Coordination of Care Yes CAP in process and under
review by DHCS. Access and Availability of Care No Not applicable. Member’s Rights No Not applicable.
Quality Management Yes CAP in process and under review by DHCS.
Administrative and Organizational Capacity No Not applicable.
Strengths—Compliance Reviews A&I identified no deficiencies in the Access and Availability of Care, Member’s Rights, or Administrative and Organizational Capacity categories during the August 2017 Medical Audit.
Molina Healthcare of California Partner Plan, Inc. Performance Evaluation Report: July 1, 2017–June 30, 2018 California Department of Health Care Services
Page W-4 Health Services Advisory Group, Inc.
MANAGED CARE HEALTH PLAN COMPLIANCE
Opportunities for Improvement—Compliance Reviews Molina has the opportunity to work with DHCS to ensure that the MCP resolves all deficiencies from the August 2017 A&I Medical Audit. The deficiencies cut across the areas of quality and timeliness of, and access to, health care.
Molina Healthcare of California Partner Plan, Inc. Performance Evaluation Report: July 1, 2017–June 30, 2018 California Department of Health Care Services
Page W-5 Health Services Advisory Group, Inc.

Medi-Cal Managed Care External Quality Review Technical ReportAppendix W: Performance Evaluation ReportMolina Healthcare of California Partner Plan, Inc. July 1, 2017–June 30, 2018
3. Managed Care Health Plan Performance Measures
Performance Measure Validation Results The HEDIS®2 2018 Compliance Audit Final Report of Findings for Molina Healthcare of California Partner Plan, Inc. contains the detailed findings and recommendations from HSAG’s NCQA HEDIS Compliance Audit™.3 HSAG auditors determined that Molina followed the appropriate specifications to produce valid rates, and identified no issues of concern.
Performance Measure Results and Findings After validating the MCP’s performance measure rates, HSAG assessed the results. See Table 3.1 through Table 3.36 for Molina’s performance measure results for reporting years (RYs) 2015 through 2018 and performance measure findings for RY 2018. The RY is the year in which the MCP reported the rates. The RY rates reflect measurement year (MY) data from the previous calendar year. Note that data may not be available for all four years.
Note the following regarding Table 3.1 through Table 3.36:
♦ To allow HSAG to provide meaningful assessment of MCP performance and actionable recommendations, HSAG, in collaboration with DHCS, organized the measures into domains based on the health care areas each measure affects. Table 3.1 through Table 3.32 present the performance measure results and findings by domain, and Table 3.33 through Table 3.36 present the RY 2018 performance measure findings for the domains combined.
♦ To assess performance for each MCP reporting unit, HSAG compares the rates to national benchmarks. Rates indicating performance above the high performance levels (HPLs) are shaded in gray, and rates indicating performance below the minimum performance levels (MPLs) are bolded. ■ For measures with rates below the MPLs, DHCS requires MCPs to submit to DHCS
improvement plans (IPs) to address the rates below the MPLs (unless MCPs are reporting the rates for the first time).
■ For MCPs that meet DHCS’ Quality of Care CAP thresholds, DHCS issues a CAP; if an MCP’s performance is such that it may trigger a CAP in the following year, DHCS issues an advance warning letter.
2 Healthcare Effectiveness Data and Information Set (HEDIS®) is a registered trademark of the National Committee for Quality Assurance (NCQA).
3 NCQA HEDIS Compliance AuditTM is a trademark of NCQA.
Molina Healthcare of California Partner Plan, Inc. Performance Evaluation Report: July 1, 2017–June 30, 2018 California Department of Health Care Services
Page W-6 Health Services Advisory Group, Inc.
MANAGED CARE HEALTH PLAN PERFORMANCE MEASURES
■ IPs and CAPs consist of submission of Plan-Do-Study-Act (PDSA) Cycle Worksheets, Quality Improvement (QI) Summaries, or completion of Performance Improvement Projects (PIPs)—as determined by DHCS.
♦ For RYs 2016, 2017, and 2018, the HPLs and MPLs represent the NCQA Quality Compass®4 Medicaid health maintenance organization (HMO) 90th and 25th percentiles, respectively.
♦ For RY 2015, the HPLs and MPLs represent the NCQA HEDIS Audit Means, Percentiles, and Ratios 90th and 25th percentiles, respectively. For the Comprehensive Diabetes Care—HbA1c Poor Control (>9.0 Percent) measure, for which a lower rate indicates more favorable performance, the HPL and MPL are based on the 10th and 75th percentiles, respectively.
♦ HSAG includes the specific HPL and MPL values for RY 2018 in Section 6 of the Medi-Cal Managed Care External Quality Review Technical Report, July 1, 2017–June 30, 2018 (“Managed Care Health Plan Performance Measures”).
Preventive Screening and Children’s Health
Table 3.1 through Table 3.4 present the four-year trending information for the performance measures within the Preventive Screening and Children’s Health domain.
Note the following regarding Table 3.1 through Table 3.4:
♦ Although HSAG includes information on the MCP’s performance related to the four Children and Adolescents’ Access to Primary Care measures, DHCS did not hold MCPs accountable to meet the MPLs for these measures for RYs 2015 through 2018 (i.e., DHCS did not require MCPs to submit IPs if rates for the measures were below the MPLs). DHCS made this decision due to the small range of variation between the HPL and MPL thresholds for each measure.
♦ Any comparison of RY 2018 performance to RY 2017 or to benchmarks related to the Immunizations for Adolescents—Combination 2 measure should be exercised with caution given the changes that NCQA made to the specification for this measure for RY 2018. NCQA released guidance that recommended a break in trending for this measure; however, DHCS determined to continue trending because the specification change should result in higher rates.
4 Quality Compass® is a registered trademark of NCQA.
Molina Healthcare of California Partner Plan, Inc. Performance Evaluation Report: July 1, 2017–June 30, 2018 California Department of Health Care Services
Page W-7 Health Services Advisory Group, Inc.
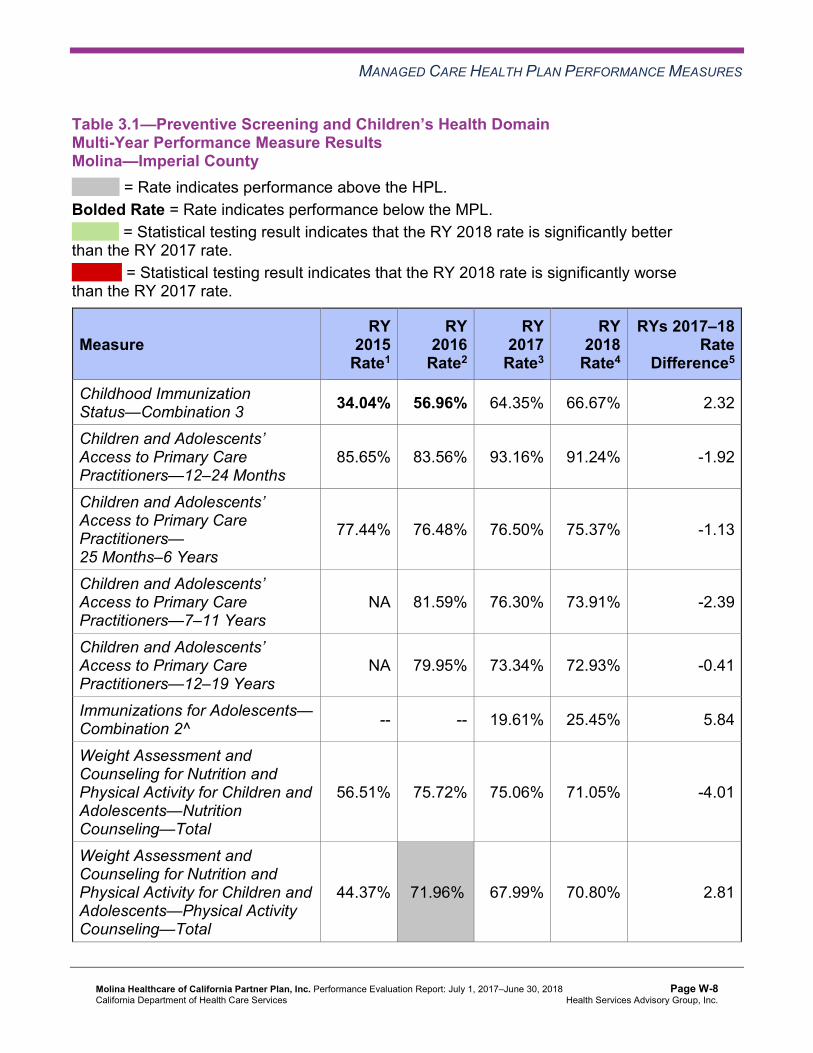
MANAGED CARE HEALTH PLAN PERFORMANCE MEASURES
Table 3.1—Preventive Screening and Children’s Health DomainMulti-Year Performance Measure Results Molina—Imperial County
H = Rate indicates performance above the HPL. Bolded Rate = Rate indicates performance below the MPL.
B = Statistical testing result indicates that the RY 2018 rate is significantly better than the RY 2017 rate.
W = Statistical testing result indicates that the RY 2018 rate is significantly worse than the RY 2017 rate.
Measure RY
2015 Rate1
RY 2016
Rate2
RY 2017
Rate3
RY 2018
Rate4
RYs 2017–18 Rate
Difference5
Childhood Immunization Status—Combination 3 34.04% 56.96% 64.35% 66.67% 2.32
Children and Adolescents’ Access to Primary Care Practitioners—12–24 Months
85.65% 83.56% 93.16% 91.24% -1.92
Children and Adolescents’ Access to Primary Care Practitioners— 25 Months–6 Years
77.44% 76.48% 76.50% 75.37% -1.13
Children and Adolescents’ Access to Primary Care Practitioners—7–11 Years
NA 81.59% 76.30% 73.91% -2.39
Children and Adolescents’ Access to Primary Care Practitioners—12–19 Years
NA 79.95% 73.34% 72.93% -0.41
Immunizations for Adolescents— Combination 2^ -- -- 19.61% 25.45% 5.84
Weight Assessment and Counseling for Nutrition and Physical Activity for Children and Adolescents—Nutrition Counseling—Total
56.51% 75.72% 75.06% 71.05% -4.01
Weight Assessment and Counseling for Nutrition and Physical Activity for Children and Adolescents—Physical Activity Counseling—Total
44.37% 71.96%H 67.99% 70.80% 2.81
Molina Healthcare of California Partner Plan, Inc. Performance Evaluation Report: July 1, 2017–June 30, 2018 California Department of Health Care Services
Page W-8 Health Services Advisory Group, Inc.
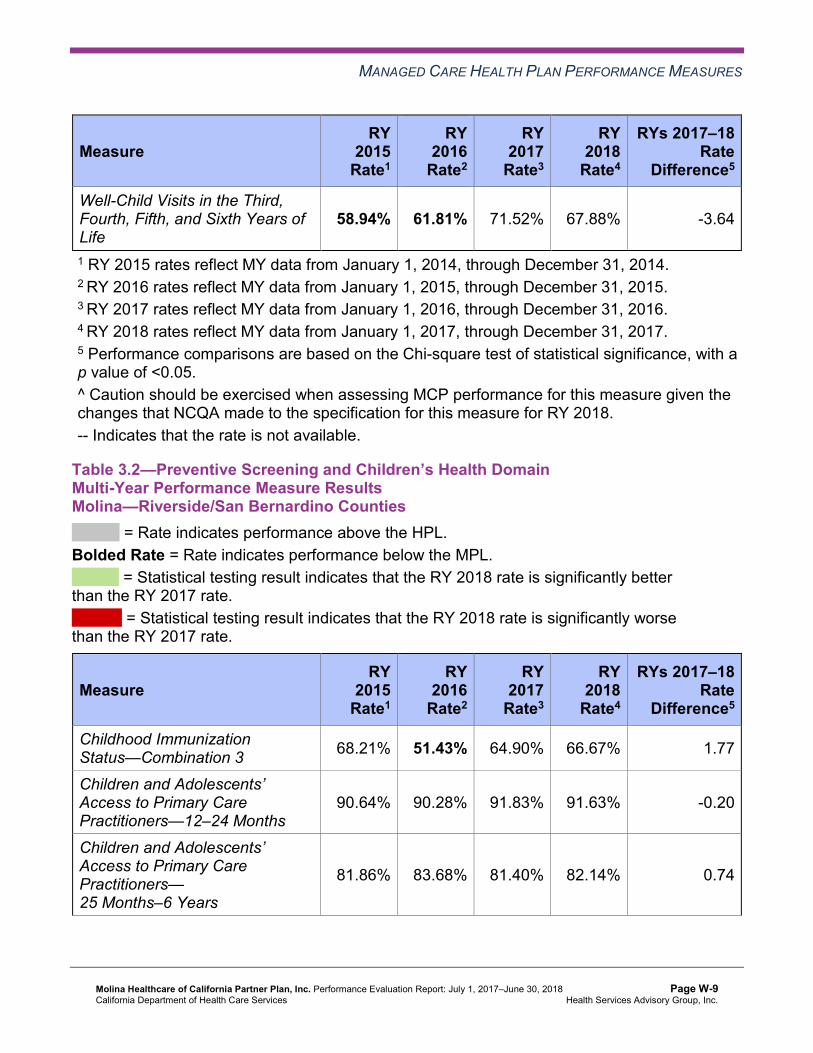
MANAGED CARE HEALTH PLAN PERFORMANCE MEASURES
Measure RY
2015 Rate1
RY 2016
Rate2
RY 2017
Rate3
RY 2018
Rate4
RYs 2017–18 Rate
Difference5
Well-Child Visits in the Third, Fourth, Fifth, and Sixth Years of Life
58.94% 61.81% 71.52% 67.88% -3.64
1 RY 2015 rates reflect MY data from January 1, 2014, through December 31, 2014. 2 RY 2016 rates reflect MY data from January 1, 2015, through December 31, 2015. 3 RY 2017 rates reflect MY data from January 1, 2016, through December 31, 2016. 4 RY 2018 rates reflect MY data from January 1, 2017, through December 31, 2017. 5 Performance comparisons are based on the Chi-square test of statistical significance, with a p value of <0.05. ^ Caution should be exercised when assessing MCP performance for this measure given the changes that NCQA made to the specification for this measure for RY 2018. -- Indicates that the rate is not available.
Table 3.2—Preventive Screening and Children’s Health DomainMulti-Year Performance Measure Results Molina—Riverside/San Bernardino Counties
H = Rate indicates performance above the HPL. Bolded Rate = Rate indicates performance below the MPL.
B = Statistical testing result indicates that the RY 2018 rate is significantly better than the RY 2017 rate.
W = Statistical testing result indicates that the RY 2018 rate is significantly worse than the RY 2017 rate.
Measure RY
2015 Rate1
RY 2016
Rate2
RY 2017
Rate3
RY 2018
Rate4
RYs 2017–18 Rate
Difference5
Childhood Immunization Status—Combination 3 68.21% 51.43% 64.90% 66.67% 1.77
Children and Adolescents’ Access to Primary Care Practitioners—12–24 Months
90.64% 90.28% 91.83% 91.63% -0.20
Children and Adolescents’ Access to Primary Care Practitioners— 25 Months–6 Years
81.86% 83.68% 81.40% 82.14% 0.74
Molina Healthcare of California Partner Plan, Inc. Performance Evaluation Report: July 1, 2017–June 30, 2018 California Department of Health Care Services
Page W-9 Health Services Advisory Group, Inc.

MANAGED CARE HEALTH PLAN PERFORMANCE MEASURES
Measure RY
2015 Rate1
RY 2016
Rate2
RY 2017
Rate3
RY 2018
Rate4
RYs 2017–18 Rate
Difference5
Children and Adolescents’ Access to Primary Care Practitioners—7–11 Years
84.29% 84.53% 84.56% 84.38% -0.18
Children and Adolescents’ Access to Primary Care Practitioners—12–19 Years
83.18% 83.42% 82.64% 82.39% -0.25
Immunizations for Adolescents— Combination 2^ -- -- 22.08% 35.04%H 12.96B
Weight Assessment and Counseling for Nutrition and Physical Activity for Children and Adolescents—Nutrition Counseling—Total
69.35% 67.11% 73.95% 74.45% 0.50
Weight Assessment and Counseling for Nutrition and Physical Activity for Children and Adolescents—Physical Activity Counseling—Total
52.13% 49.89% 62.25% 59.61% -2.64
Well-Child Visits in the Third, Fourth, Fifth, and Sixth Years of Life
66.67% 65.78% 69.09% 66.67% -2.42
1 RY 2015 rates reflect MY data from January 1, 2014, through December 31, 2014. 2 RY 2016 rates reflect MY data from January 1, 2015, through December 31, 2015. 3 RY 2017 rates reflect MY data from January 1, 2016, through December 31, 2016. 4 RY 2018 rates reflect MY data from January 1, 2017, through December 31, 2017. 5 Performance comparisons are based on the Chi-square test of statistical significance, with a p value of <0.05. ^ Caution should be exercised when assessing MCP performance for this measure given the changes that NCQA made to the specification for this measure for RY 2018. -- Indicates that the rate is not available.
Molina Healthcare of California Partner Plan, Inc. Performance Evaluation Report: July 1, 2017–June 30, 2018 California Department of Health Care Services
Page W-10 Health Services Advisory Group, Inc.

MANAGED CARE HEALTH PLAN PERFORMANCE MEASURES
Table 3.3—Preventive Screening and Children’s Health DomainMulti-Year Performance Measure Results Molina—Sacramento County
H = Rate indicates performance above the HPL. Bolded Rate = Rate indicates performance below the MPL.
B = Statistical testing result indicates that the RY 2018 rate is significantly better than the RY 2017 rate.
W = Statistical testing result indicates that the RY 2018 rate is significantly worse than the RY 2017 rate.
Measure RY
2015 Rate1
RY 2016
Rate2
RY 2017
Rate3
RY 2018
Rate4
RYs 2017–18 Rate
Difference5
Childhood Immunization Status—Combination 3 59.29% 41.06% 58.94% 61.56% 2.62
Children and Adolescents’ Access to Primary Care Practitioners—12–24 Months
89.13% 89.09% 88.98% 91.10% 2.12
Children and Adolescents’ Access to Primary Care Practitioners— 25 Months–6 Years
80.42% 80.68% 76.64% 79.98% 3.34B
Children and Adolescents’ Access to Primary Care Practitioners—7–11 Years
80.44% 81.84% 82.53% 82.50% -0.03
Children and Adolescents’ Access to Primary Care Practitioners—12–19 Years
79.99% 79.68% 78.83% 77.91% -0.92
Immunizations for Adolescents— Combination 2^ -- -- 18.98% 40.39%H 21.41B
Weight Assessment and Counseling for Nutrition and Physical Activity for Children and Adolescents—Nutrition Counseling—Total
79.33%H 70.64% 74.83% 79.81% 4.98
Weight Assessment and Counseling for Nutrition and Physical Activity for Children and Adolescents—Physical Activity Counseling—Total
55.11% 53.42% 59.60% 66.67% 7.07B
Molina Healthcare of California Partner Plan, Inc. Performance Evaluation Report: July 1, 2017–June 30, 2018 California Department of Health Care Services
Page W-11 Health Services Advisory Group, Inc.

MANAGED CARE HEALTH PLAN PERFORMANCE MEASURES
Measure RY
2015 Rate1
RY 2016
Rate2
RY 2017
Rate3
RY 2018
Rate4
RYs 2017–18 Rate
Difference5
Well-Child Visits in the Third, Fourth, Fifth, and Sixth Years of Life
70.97% 68.87% 61.59% 71.78% 10.19B
1 RY 2015 rates reflect MY data from January 1, 2014, through December 31, 2014. 2 RY 2016 rates reflect MY data from January 1, 2015, through December 31, 2015. 3 RY 2017 rates reflect MY data from January 1, 2016, through December 31, 2016. 4 RY 2018 rates reflect MY data from January 1, 2017, through December 31, 2017. 5 Performance comparisons are based on the Chi-square test of statistical significance, with a p value of <0.05. ^ Caution should be exercised when assessing MCP performance for this measure given the changes that NCQA made to the specification for this measure for RY 2018. -- Indicates that the rate is not available.
Table 3.4—Preventive Screening and Children’s Health DomainMulti-Year Performance Measure Results Molina—San Diego County
H = Rate indicates performance above the HPL. Bolded Rate = Rate indicates performance below the MPL.
B = Statistical testing result indicates that the RY 2018 rate is significantly better than the RY 2017 rate.
W = Statistical testing result indicates that the RY 2018 rate is significantly worse than the RY 2017 rate.
Measure RY
2015 Rate1
RY 2016
Rate2
RY 2017
Rate3
RY 2018
Rate4
RYs 2017–18 Rate
Difference5
Childhood Immunization Status—Combination 3 74.61% 65.12% 65.56% 73.72% 8.16B
Children and Adolescents’ Access to Primary Care Practitioners—12–24 Months
93.95% 90.89% 92.95% 93.29% 0.34
Children and Adolescents’ Access to Primary Care Practitioners— 25 Months–6 Years
86.38% 85.76% 84.93% 85.67% 0.74B
Molina Healthcare of California Partner Plan, Inc. Performance Evaluation Report: July 1, 2017–June 30, 2018 California Department of Health Care Services
Page W-12 Health Services Advisory Group, Inc.

MANAGED CARE HEALTH PLAN PERFORMANCE MEASURES
Measure RY
2015 Rate1
RY 2016
Rate2
RY 2017
Rate3
RY 2018
Rate4
RYs 2017–18 Rate
Difference5
Children and Adolescents’ Access to Primary Care Practitioners—7–11 Years
89.81% 89.38% 88.60% 88.56% -0.04
Children and Adolescents’ Access to Primary Care Practitioners—12–19 Years
87.03% 87.44% 85.93% 85.89% -0.04
Immunizations for Adolescents— Combination 2^ -- -- 22.74% 36.50%H 13.76B
Weight Assessment and Counseling for Nutrition and Physical Activity for Children and Adolescents—Nutrition Counseling—Total
72.41% 72.41% 76.82% 79.56% 2.74
Weight Assessment and Counseling for Nutrition and Physical Activity for Children and Adolescents—Physical Activity Counseling—Total
56.51% 59.16% 64.90% 68.86% 3.96
Well-Child Visits in the Third, Fourth, Fifth, and Sixth Years of Life
70.06% 74.39% 69.32% 72.02% 2.70
1 RY 2015 rates reflect MY data from January 1, 2014, through December 31, 2014. 2 RY 2016 rates reflect MY data from January 1, 2015, through December 31, 2015. 3 RY 2017 rates reflect MY data from January 1, 2016, through December 31, 2016. 4 RY 2018 rates reflect MY data from January 1, 2017, through December 31, 2017. 5 Performance comparisons are based on the Chi-square test of statistical significance, with a p value of <0.05. ^ Caution should be exercised when assessing MCP performance for this measure given the changes that NCQA made to the specification for this measure for RY 2018. -- Indicates that the rate is not available.
Molina Healthcare of California Partner Plan, Inc. Performance Evaluation Report: July 1, 2017–June 30, 2018 California Department of Health Care Services
Page W-13 Health Services Advisory Group, Inc.

MANAGED CARE HEALTH PLAN PERFORMANCE MEASURES
Table 3.5 through Table 3.8 present findings for the RY 2018 performance measures within the Preventive Screening and Children’s Health domain.
Note the following regarding Table 3.5 through Table 3.8:
♦ DHCS did not hold MCPs accountable to meet MPLs for all four Children and Adolescents’ Access to Primary Care measures within this domain; therefore, HSAG did not include these measures in its assessment of the MCP’s performance related to HPLs and MPLs.
♦ The Immunizations for Adolescents—Combination 2 measure was a first-year measure in RY 2017, and DHCS established no MPL for this measure for RY 2017 because no comparable benchmark existed; therefore, HSAG did not include this measure in the denominators for calculating the percentage of measures with rates that moved to above or below the MPLs in RY 2018.
Table 3.5—Preventive Screening and Children’s Health DomainRY 2018 (MY 2017) Performance Measure Findings Molina—Imperial County
Criteria Number of Measures
MeetingCriteria
Total Number of Measures
Percentage of Measures
MeetingCriteria
RY 2018 Rates Above HPLs 0 5 0.00% Rates Above HPLs for the Last Three or More Consecutive Years 0 4 0.00%
RY 2018 Rates Significantly Better than RY 2017 Rates* 0 5 0.00%
Rates that Moved from Below MPLs in RY 2017 to Above MPLs in RY 2018 0 0 N/A
RY 2018 Rates Below MPLs 0 5 0.00% Rates Below MPLs for the Last Three or More Consecutive Years 0 4 0.00%
RY 2018 Rates Significantly Worse than RY 2017 Rates* 0 5 0.00%
Rates that Moved from Above MPLs in RY 2017 to Below MPLs in RY 2018 0 4 0.00%
* Performance comparisons are based on the Chi-square test of statistical significance, with a p value of <0.05. N/A = No rates above or below the MPLs from the previous year exist to include in the denominator for calculating whether or not rates moved to above or below MPLs in the most recent year.
Molina Healthcare of California Partner Plan, Inc. Performance Evaluation Report: July 1, 2017–June 30, 2018 California Department of Health Care Services
Page W-14 Health Services Advisory Group, Inc.

MANAGED CARE HEALTH PLAN PERFORMANCE MEASURES
Table 3.6—Preventive Screening and Children’s Health DomainRY 2018 (MY 2017) Performance Measure Findings Molina—Riverside/San Bernardino Counties
Criteria Number of Measures
MeetingCriteria
Total Number of Measures
Percentage of Measures
MeetingCriteria
RY 2018 Rates Above HPLs 1 5 20.00% Rates Above HPLs for the Last Three or More Consecutive Years 0 4 0.00%
RY 2018 Rates Significantly Better than RY 2017 Rates* 1 5 20.00%
Rates that Moved from Below MPLs in RY 2017 to Above MPLs in RY 2018 0 0 N/A
RY 2018 Rates Below MPLs 0 5 0.00% Rates Below MPLs for the Last Three or More Consecutive Years 0 4 0.00%
RY 2018 Rates Significantly Worse than RY 2017 Rates* 0 5 0.00%
Rates that Moved from Above MPLs in RY 2017 to Below MPLs in RY 2018 0 4 0.00%
* Performance comparisons are based on the Chi-square test of statistical significance, with a p value of <0.05. N/A = No rates above or below the MPLs from the previous year exist to include in the denominator for calculating whether or not rates moved to above or below MPLs in the most recent year.
Molina Healthcare of California Partner Plan, Inc. Performance Evaluation Report: July 1, 2017–June 30, 2018 California Department of Health Care Services
Page W-15 Health Services Advisory Group, Inc.
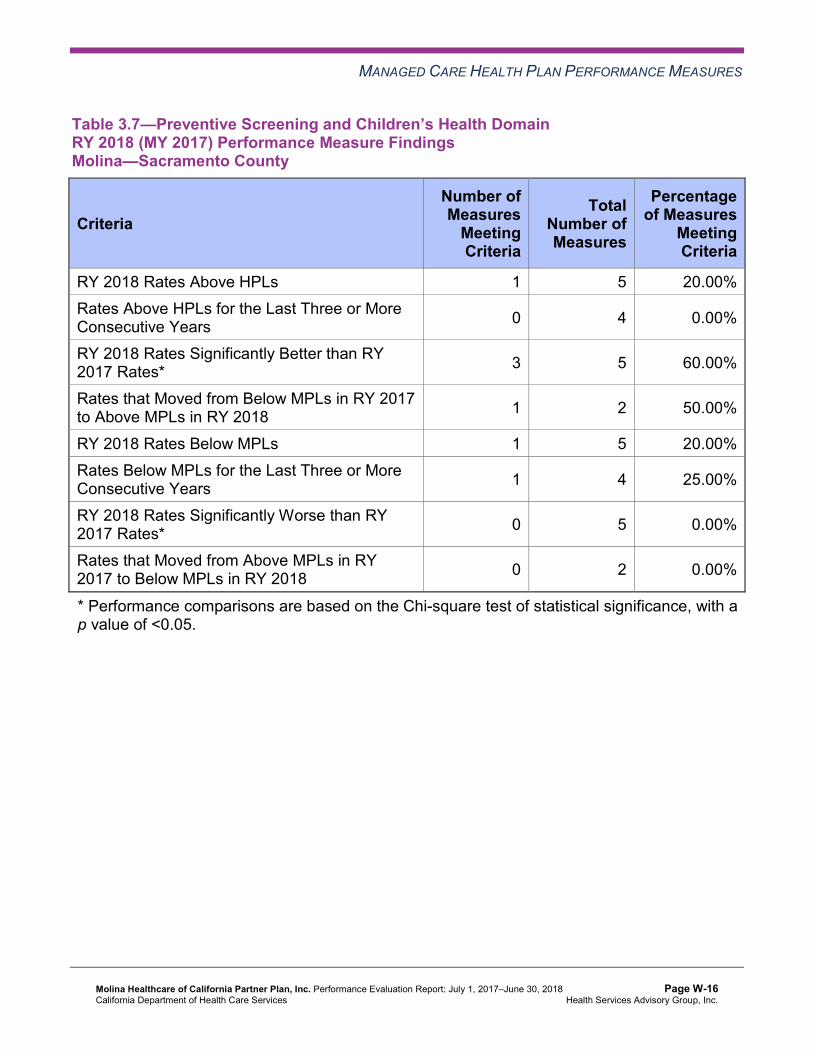
MANAGED CARE HEALTH PLAN PERFORMANCE MEASURES
Table 3.7—Preventive Screening and Children’s Health DomainRY 2018 (MY 2017) Performance Measure Findings Molina—Sacramento County
Criteria Number of Measures
MeetingCriteria
Total Number of Measures
Percentage of Measures
MeetingCriteria
RY 2018 Rates Above HPLs 1 5 20.00% Rates Above HPLs for the Last Three or More Consecutive Years 0 4 0.00%
RY 2018 Rates Significantly Better than RY 2017 Rates* 3 5 60.00%
Rates that Moved from Below MPLs in RY 2017 to Above MPLs in RY 2018 1 2 50.00%
RY 2018 Rates Below MPLs 1 5 20.00% Rates Below MPLs for the Last Three or More Consecutive Years 1 4 25.00%
RY 2018 Rates Significantly Worse than RY 2017 Rates* 0 5 0.00%
Rates that Moved from Above MPLs in RY 2017 to Below MPLs in RY 2018 0 2 0.00%
* Performance comparisons are based on the Chi-square test of statistical significance, with a p value of <0.05.
Molina Healthcare of California Partner Plan, Inc. Performance Evaluation Report: July 1, 2017–June 30, 2018 California Department of Health Care Services
Page W-16 Health Services Advisory Group, Inc.

MANAGED CARE HEALTH PLAN PERFORMANCE MEASURES
Table 3.8—Preventive Screening and Children’s Health DomainRY 2018 (MY 2017) Performance Measure FindingsMolina—San Diego County
Criteria Number of Measures
MeetingCriteria
Total Number of Measures
Percentage of Measures
MeetingCriteria
RY 2018 Rates Above HPLs 1 5 20.00% Rates Above HPLs for the Last Three or More Consecutive Years 0 4 0.00%
RY 2018 Rates Significantly Better than RY 2017 Rates* 2 5 40.00%
Rates that Moved from Below MPLs in RY 2017 to Above MPLs in RY 2018 0 0 N/A
RY 2018 Rates Below MPLs 0 5 0.00% Rates Below MPLs for the Last Three or More Consecutive Years 0 4 0.00%
RY 2018 Rates Significantly Worse than RY 2017 Rates* 0 5 0.00%
Rates that Moved from Above MPLs in RY 2017 to Below MPLs in RY 2018 0 4 0.00%
* Performance comparisons are based on the Chi-square test of statistical significance, with a p value of <0.05. N/A = No rates above or below the MPLs from the previous year exist to include in the denominator for calculating whether or not rates moved to above or below MPLs in the most recent year.
Assessment of Improvement Plan and Corrective Action Plan Efforts—Preventive Screening and Children’s Health
Well-Child Visits
DHCS required Molina to submit QI Summaries describing the MCP’s efforts to address the rate being below the MPL in RY 2017 for the Well-Child Visits in the Third, Fourth, Fifth, and Sixth Years of Life measure in Sacramento County. Molina indicated that targeted beneficiary outreach resulted in more children being seen for their well-child visits. Additionally, modifying the billing process helped the MCP capture more data.
The rate for the Well-Child Visits in the Third, Fourth, Fifth, and Sixth Years of Life measure in Sacramento County improved to above the MPL in RY 2018.
Molina Healthcare of California Partner Plan, Inc. Performance Evaluation Report: July 1, 2017–June 30, 2018 California Department of Health Care Services
Page W-17 Health Services Advisory Group, Inc.

MANAGED CARE HEALTH PLAN PERFORMANCE MEASURES
Childhood Immunizations
In RY 2017, as part of Molina’s CAP, DHCS approved Molina to conduct a PIP to address the MCP’s continued performance below the MPL for the Childhood Immunization Status— Combination 3 measure in Sacramento County. HSAG includes a summary of Molina’s progress on the Childhood Immunization Status—Combination 3 PIP in Section 4 of this report (“Performance Improvement Projects”).
The rate for the Childhood Immunization Status—Combination 3 measure in Sacramento County remained below the MPL in RY 2018.
Preventive Screening and Women’s Health
Table 3.9 through Table 3.12 present the four-year trending information for the performance measures within the Preventive Screening and Women’s Health domain.
Note that any comparison of RY 2018 performance to RY 2017 or to benchmarks related to the Breast Cancer Screening measure should be exercised with caution given the changes that NCQA made to the specification for this measure for RY 2018. NCQA released guidance that recommended a break in trending for this measure; however, DHCS determined to continue trending because the specification change should result in higher rates.
Table 3.9—Preventive Screening and Women’s Health DomainMulti-Year Performance Measure Results Molina—Imperial County
H = Rate indicates performance above the HPL. Bolded Rate = Rate indicates performance below the MPL.
B = Statistical testing result indicates that the RY 2018 rate is significantly better than the RY 2017 rate.
W = Statistical testing result indicates that the RY 2018 rate is significantly worse than the RY 2017 rate.
Measure RY
2015 Rate1
RY 2016
Rate2
RY 2017
Rate3
RY 2018
Rate4
RYs 2017–18 Rate
Difference5
Breast Cancer Screening^ -- -- 56.05% 50.28% -5.77 Cervical Cancer Screening 40.22% 41.00% 49.55% 55.72% 6.17 Prenatal and Postpartum Care— Postpartum Care 51.89% 54.18% 52.54% 56.28% 3.74
Prenatal and Postpartum Care— Timeliness of Prenatal Care 76.22% 73.58% 76.27% 74.46% -1.81
1 RY 2015 rates reflect MY data from January 1, 2014, through December 31, 2014.
Molina Healthcare of California Partner Plan, Inc. Performance Evaluation Report: July 1, 2017–June 30, 2018 California Department of Health Care Services
Page W-18 Health Services Advisory Group, Inc.

MANAGED CARE HEALTH PLAN PERFORMANCE MEASURES
2 RY 2016 rates reflect MY data from January 1, 2015, through December 31, 2015. 3 RY 2017 rates reflect MY data from January 1, 2016, through December 31, 2016. 4 RY 2018 rates reflect MY data from January 1, 2017, through December 31, 2017. 5 Performance comparisons are based on the Chi-square test of statistical significance, with a p value of <0.05. ^ Caution should be exercised when assessing MCP performance for this measure given the changes that NCQA made to the specification for this measure for RY 2018. -- Indicates that the rate is not available.
Table 3.10—Preventive Screening and Women’s Health DomainMulti-Year Performance Measure Results Molina—Riverside/San Bernardino Counties
H = Rate indicates performance above the HPL. Bolded Rate = Rate indicates performance below the MPL.
B = Statistical testing result indicates that the RY 2018 rate is significantly better than the RY 2017 rate.
W = Statistical testing result indicates that the RY 2018 rate is significantly worse than the RY 2017 rate.
Measure RY
2015 Rate1
RY 2016
Rate2
RY 2017
Rate3
RY 2018
Rate4
RYs 2017–18 Rate
Difference5
Breast Cancer Screening^ -- -- 59.22% 61.48% 2.26B
Cervical Cancer Screening 58.53% 50.00% 50.11% 58.64% 8.53B
Prenatal and Postpartum Care— Postpartum Care 43.68% 46.89% 52.67% 57.18% 4.51
Prenatal and Postpartum Care— Timeliness of Prenatal Care 68.96% 73.33% 77.78% 78.59% 0.81
1 RY 2015 rates reflect MY data from January 1, 2014, through December 31, 2014. 2 RY 2016 rates reflect MY data from January 1, 2015, through December 31, 2015. 3 RY 2017 rates reflect MY data from January 1, 2016, through December 31, 2016. 4 RY 2018 rates reflect MY data from January 1, 2017, through December 31, 2017. 5 Performance comparisons are based on the Chi-square test of statistical significance, with a p value of <0.05. ^ Caution should be exercised when assessing MCP performance for this measure given the changes that NCQA made to the specification for this measure for RY 2018. -- Indicates that the rate is not available.
Molina Healthcare of California Partner Plan, Inc. Performance Evaluation Report: July 1, 2017–June 30, 2018 California Department of Health Care Services
Page W-19 Health Services Advisory Group, Inc.

MANAGED CARE HEALTH PLAN PERFORMANCE MEASURES
Table 3.11—Preventive Screening and Women’s Health DomainMulti-Year Performance Measure Results Molina—Sacramento County
H = Rate indicates performance above the HPL. Bolded Rate = Rate indicates performance below the MPL.
B = Statistical testing result indicates that the RY 2018 rate is significantly better than the RY 2017 rate.
W = Statistical testing result indicates that the RY 2018 rate is significantly worse than the RY 2017 rate.
Measure RY
2015 Rate1
RY 2016
Rate2
RY 2017
Rate3
RY 2018
Rate4
RYs 2017–18 Rate
Difference5
Breast Cancer Screening^ -- -- 60.24% 63.21% 2.97B
Cervical Cancer Screening 57.27% 55.11% 50.77% 54.99% 4.22 Prenatal and Postpartum Care— Postpartum Care 39.96% 53.44% 50.68% 63.50% 12.82B
Prenatal and Postpartum Care— Timeliness of Prenatal Care 69.54% 76.05% 75.34% 78.83% 3.49
1 RY 2015 rates reflect MY data from January 1, 2014, through December 31, 2014. 2 RY 2016 rates reflect MY data from January 1, 2015, through December 31, 2015. 3 RY 2017 rates reflect MY data from January 1, 2016, through December 31, 2016. 4 RY 2018 rates reflect MY data from January 1, 2017, through December 31, 2017. 5 Performance comparisons are based on the Chi-square test of statistical significance, with a p value of <0.05. ^ Caution should be exercised when assessing MCP performance for this measure given the changes that NCQA made to the specification for this measure for RY 2018. -- Indicates that the rate is not available.
Molina Healthcare of California Partner Plan, Inc. Performance Evaluation Report: July 1, 2017–June 30, 2018 California Department of Health Care Services
Page W-20 Health Services Advisory Group, Inc.

MANAGED CARE HEALTH PLAN PERFORMANCE MEASURES
Table 3.12—Preventive Screening and Women’s Health DomainMulti-Year Performance Measure Results Molina—San Diego County
H = Rate indicates performance above the HPL. Bolded Rate = Rate indicates performance below the MPL.
B = Statistical testing result indicates that the RY 2018 rate is significantly better than the RY 2017 rate.
W = Statistical testing result indicates that the RY 2018 rate is significantly worse than the RY 2017 rate.
Measure RY
2015 Rate1
RY 2016
Rate2
RY 2017
Rate3
RY 2018
Rate4
RYs 2017–18 Rate
Difference5
Breast Cancer Screening^ -- -- 63.55% 64.23% 0.68 Cervical Cancer Screening 51.02% 50.89% 59.51% 61.56% 2.05 Prenatal and Postpartum Care— Postpartum Care 54.20% 56.44% 69.11% 67.88% -1.23
Prenatal and Postpartum Care— Timeliness of Prenatal Care 83.21% 83.78% 83.33% 85.64% 2.31
1 RY 2015 rates reflect MY data from January 1, 2014, through December 31, 2014. 2 RY 2016 rates reflect MY data from January 1, 2015, through December 31, 2015. 3 RY 2017 rates reflect MY data from January 1, 2016, through December 31, 2016. 4 RY 2018 rates reflect MY data from January 1, 2017, through December 31, 2017. 5 Performance comparisons are based on the Chi-square test of statistical significance, with a p value of <0.05. ^ Caution should be exercised when assessing MCP performance for this measure given the changes that NCQA made to the specification for this measure for RY 2018. -- Indicates that the rate is not available.
Molina Healthcare of California Partner Plan, Inc. Performance Evaluation Report: July 1, 2017–June 30, 2018 California Department of Health Care Services
Page W-21 Health Services Advisory Group, Inc.

MANAGED CARE HEALTH PLAN PERFORMANCE MEASURES
Table 3.13 through Table 3.16 present findings for the RY 2018 performance measures within the Preventive Screening and Women’s Health domain. Note that the Breast Cancer Screening measure was a first-year measure in RY 2017, and DHCS did not hold MCPs accountable to meet an MPL for this measure in RY 2017; therefore, HSAG did not include this measure in the denominators for calculating the percentage of measures with rates that moved to above or below the MPLs in RY 2018.
Table 3.13—Preventive Screening and Women’s Health DomainRY 2018 (MY 2017) Performance Measure Findings Molina—Imperial County
Criteria Number of Measures
MeetingCriteria
Total Number of Measures
Percentage of Measures
MeetingCriteria
RY 2018 Rates Above HPLs 0 4 0.00% Rates Above HPLs for the Last Three or More Consecutive Years 0 3 0.00%
RY 2018 Rates Significantly Better than RY 2017 Rates* 0 4 0.00%
Rates that Moved from Below MPLs in RY 2017 to Above MPLs in RY 2018 0 1 0.00%
RY 2018 Rates Below MPLs 3 4 75.00% Rates Below MPLs for the Last Three or More Consecutive Years 1 3 33.33%
RY 2018 Rates Significantly Worse than RY 2017 Rates* 0 4 0.00%
Rates that Moved from Above MPLs in RY 2017 to Below MPLs in RY 2018 1 2 50.00%
* Performance comparisons are based on the Chi-square test of statistical significance, with a p value of <0.05.
Molina Healthcare of California Partner Plan, Inc. Performance Evaluation Report: July 1, 2017–June 30, 2018 California Department of Health Care Services
Page W-22 Health Services Advisory Group, Inc.

MANAGED CARE HEALTH PLAN PERFORMANCE MEASURES
Table 3.14—Preventive Screening and Women’s Health DomainRY 2018 (MY 2017) Performance Measure FindingsMolina—Riverside/San Bernardino Counties
Criteria Number of Measures
MeetingCriteria
Total Number of Measures
Percentage of Measures
MeetingCriteria
RY 2018 Rates Above HPLs 0 4 0.00% Rates Above HPLs for the Last Three or More Consecutive Years 0 3 0.00%
RY 2018 Rates Significantly Better than RY 2017 Rates* 2 4 50.00%
Rates that Moved from Below MPLs in RY 2017 to Above MPLs in RY 2018 0 1 0.00%
RY 2018 Rates Below MPLs 1 4 25.00% Rates Below MPLs for the Last Three or More Consecutive Years 1 3 33.33%
RY 2018 Rates Significantly Worse than RY 2017 Rates* 0 4 0.00%
Rates that Moved from Above MPLs in RY 2017 to Below MPLs in RY 2018 0 2 0.00%
* Performance comparisons are based on the Chi-square test of statistical significance, with a p value of <0.05.
Molina Healthcare of California Partner Plan, Inc. Performance Evaluation Report: July 1, 2017–June 30, 2018 California Department of Health Care Services
Page W-23 Health Services Advisory Group, Inc.

MANAGED CARE HEALTH PLAN PERFORMANCE MEASURES
Table 3.15—Preventive Screening and Women’s Health DomainRY 2018 (MY 2017) Performance Measure FindingsMolina—Sacramento County
Criteria Number of Measures
MeetingCriteria
Total Number of Measures
Percentage of Measures
MeetingCriteria
RY 2018 Rates Above HPLs 0 4 0.00% Rates Above HPLs for the Last Three or More Consecutive Years 0 3 0.00%
RY 2018 Rates Significantly Better than RY 2017 Rates* 2 4 50.00%
Rates that Moved from Below MPLs in RY 2017 to Above MPLs in RY 2018 1 1 100.00%
RY 2018 Rates Below MPLs 0 4 0.00% Rates Below MPLs for the Last Three or More Consecutive Years 0 3 0.00%
RY 2018 Rates Significantly Worse than RY 2017 Rates* 0 4 0.00%
Rates that Moved from Above MPLs in RY 2017 to Below MPLs in RY 2018 0 2 0.00%
* Performance comparisons are based on the Chi-square test of statistical significance, with a p value of <0.05.
Molina Healthcare of California Partner Plan, Inc. Performance Evaluation Report: July 1, 2017–June 30, 2018 California Department of Health Care Services
Page W-24 Health Services Advisory Group, Inc.
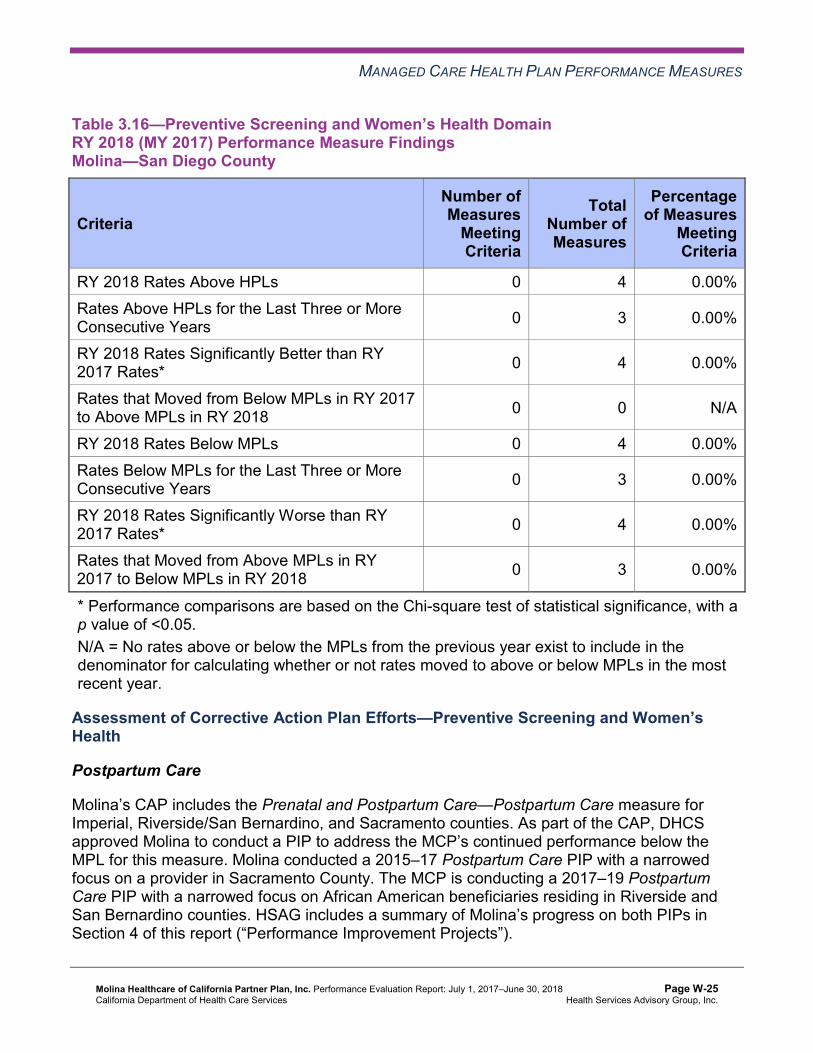
MANAGED CARE HEALTH PLAN PERFORMANCE MEASURES
Table 3.16—Preventive Screening and Women’s Health DomainRY 2018 (MY 2017) Performance Measure FindingsMolina—San Diego County
Criteria Number of Measures
MeetingCriteria
Total Number of Measures
Percentage of Measures
MeetingCriteria
RY 2018 Rates Above HPLs 0 4 0.00% Rates Above HPLs for the Last Three or More Consecutive Years 0 3 0.00%
RY 2018 Rates Significantly Better than RY 2017 Rates* 0 4 0.00%
Rates that Moved from Below MPLs in RY 2017 to Above MPLs in RY 2018 0 0 N/A
RY 2018 Rates Below MPLs 0 4 0.00% Rates Below MPLs for the Last Three or More Consecutive Years 0 3 0.00%
RY 2018 Rates Significantly Worse than RY 2017 Rates* 0 4 0.00%
Rates that Moved from Above MPLs in RY 2017 to Below MPLs in RY 2018 0 3 0.00%
* Performance comparisons are based on the Chi-square test of statistical significance, with a p value of <0.05. N/A = No rates above or below the MPLs from the previous year exist to include in the denominator for calculating whether or not rates moved to above or below MPLs in the most recent year.
Assessment of Corrective Action Plan Efforts—Preventive Screening and Women’sHealth
Postpartum Care
Molina’s CAP includes the Prenatal and Postpartum Care—Postpartum Care measure for Imperial, Riverside/San Bernardino, and Sacramento counties. As part of the CAP, DHCS approved Molina to conduct a PIP to address the MCP’s continued performance below the MPL for this measure. Molina conducted a 2015–17 Postpartum Care PIP with a narrowed focus on a provider in Sacramento County. The MCP is conducting a 2017–19 Postpartum Care PIP with a narrowed focus on African American beneficiaries residing in Riverside and San Bernardino counties. HSAG includes a summary of Molina’s progress on both PIPs in Section 4 of this report (“Performance Improvement Projects”).
Molina Healthcare of California Partner Plan, Inc. Performance Evaluation Report: July 1, 2017–June 30, 2018 California Department of Health Care Services
Page W-25 Health Services Advisory Group, Inc.

MANAGED CARE HEALTH PLAN PERFORMANCE MEASURES
The rates for the Prenatal and Postpartum Care—Postpartum Care measure remained below the MPL in RY 2018 in Imperial and Riverside/San Bernardino counties; however, the rate improved significantly from RY 2017 to RY 2018 in Sacramento County, resulting in the rate moving to above the MPL in this county in RY 2018. The intervention that the MCP tested as part of its 2015–17 Postpartum Care PIP may have contributed to the improvement in the Prenatal and Postpartum Care—Postpartum Care measure’s rate in Sacramento County.
Prenatal Care
As part of Molina’s CAP, DHCS required Molina to submit QI Summaries describing the MCP’s efforts to sustain the improvement that the MCP achieved in previous years for the Prenatal and Postpartum Care—Timeliness of Prenatal Care measure in Riverside/San Bernardino and Sacramento counties. Molina reported that updating the MCP’s pregnancy notification form and pay-for-performance (P4P) program resulted in improved provider documentation and coding of prenatal care services.
The rates remained above the MPL in RY 2018 for the Prenatal and Postpartum Care— Timeliness of Prenatal Care measure in Riverside/San Bernardino and Sacramento counties.
Care for Chronic Conditions
Table 3.17 through Table 3.20 present the four-year trending information for the performance measures within the Care for Chronic Conditions domain.
Table 3.17—Care for Chronic Conditions Domain Multi-Year Performance Measure Results Molina—Imperial County
H = Rate indicates performance above the HPL. Bolded Rate = Rate indicates performance below the MPL.
B = Statistical testing result indicates that the RY 2018 rate is significantly better than the RY 2017 rate.
W = Statistical testing result indicates that the RY 2018 rate is significantly worse than the RY 2017 rate.
Measure RY
2015 Rate1
RY 2016
Rate2
RY 2017
Rate3
RY 2018
Rate4
RYs 2017–18 Rate
Difference5
Annual Monitoring for Patients on Persistent Medications— ACE Inhibitors or ARBs
90.05% 89.47% 91.45% 92.06% 0.61
Annual Monitoring for Patients on Persistent Medications— Diuretics
91.03% 95.00%H 90.98% 93.40%H 2.42
Molina Healthcare of California Partner Plan, Inc. Performance Evaluation Report: July 1, 2017–June 30, 2018 California Department of Health Care Services
Page W-26 Health Services Advisory Group, Inc.
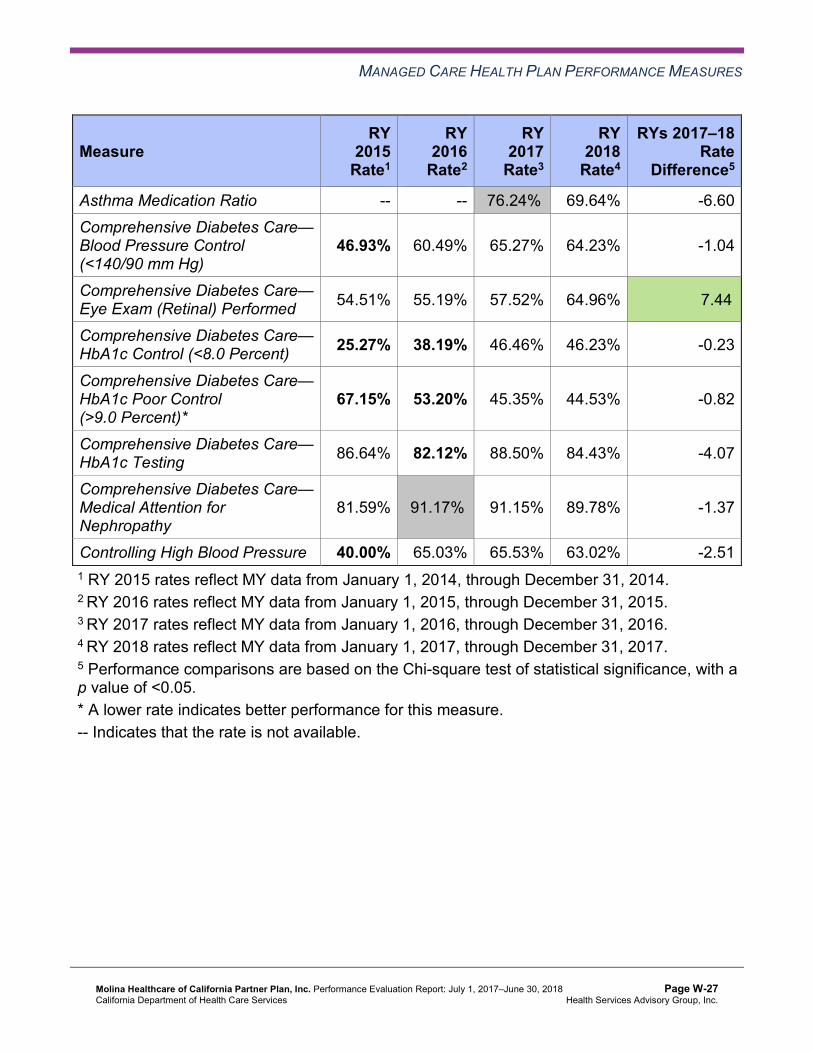
MANAGED CARE HEALTH PLAN PERFORMANCE MEASURES
Measure RY
2015 Rate1
RY 2016
Rate2
RY 2017
Rate3
RY 2018
Rate4
RYs 2017–18 Rate
Difference5
Asthma Medication Ratio -- -- 76.24%H 69.64% -6.60 Comprehensive Diabetes Care— Blood Pressure Control (<140/90 mm Hg)
46.93% 60.49% 65.27% 64.23% -1.04
Comprehensive Diabetes Care— Eye Exam (Retinal) Performed 54.51% 55.19% 57.52% 64.96% 7.44B
Comprehensive Diabetes Care— HbA1c Control (<8.0 Percent) 25.27% 38.19% 46.46% 46.23% -0.23
Comprehensive Diabetes Care— HbA1c Poor Control (>9.0 Percent)*
67.15% 53.20% 45.35% 44.53% -0.82
Comprehensive Diabetes Care— HbA1c Testing 86.64% 82.12% 88.50% 84.43% -4.07
Comprehensive Diabetes Care— Medical Attention for Nephropathy
81.59% 91.17%H 91.15% 89.78% -1.37
Controlling High Blood Pressure 40.00% 65.03% 65.53% 63.02% -2.51 1 RY 2015 rates reflect MY data from January 1, 2014, through December 31, 2014. 2 RY 2016 rates reflect MY data from January 1, 2015, through December 31, 2015. 3 RY 2017 rates reflect MY data from January 1, 2016, through December 31, 2016. 4 RY 2018 rates reflect MY data from January 1, 2017, through December 31, 2017. 5 Performance comparisons are based on the Chi-square test of statistical significance, with a p value of <0.05. * A lower rate indicates better performance for this measure. -- Indicates that the rate is not available.
Molina Healthcare of California Partner Plan, Inc. Performance Evaluation Report: July 1, 2017–June 30, 2018 California Department of Health Care Services
Page W-27 Health Services Advisory Group, Inc.

MANAGED CARE HEALTH PLAN PERFORMANCE MEASURES
Table 3.18—Care for Chronic Conditions Domain Multi-Year Performance Measure Results Molina—Riverside/San Bernardino Counties
H = Rate indicates performance above the HPL. Bolded Rate = Rate indicates performance below the MPL.
B = Statistical testing result indicates that the RY 2018 rate is significantly better than the RY 2017 rate.
W = Statistical testing result indicates that the RY 2018 rate is significantly worse than the RY 2017 rate.
Measure RY
2015 Rate1
RY 2016
Rate2
RY 2017
Rate3
RY 2018
Rate4
RYs 2017–18 Rate
Difference5
Annual Monitoring for Patients on Persistent Medications— ACE Inhibitors or ARBs
85.10% 85.20% 87.58% 86.19% -1.39
Annual Monitoring for Patients on Persistent Medications— Diuretics
84.02% 82.89% 86.99% 86.04% -0.95
Asthma Medication Ratio -- -- 63.36% 55.88% -7.48W
Comprehensive Diabetes Care— Blood Pressure Control (<140/90 mm Hg)
54.75% 51.21% 59.51% 57.42% -2.09
Comprehensive Diabetes Care— Eye Exam (Retinal) Performed 43.93% 48.79% 56.86% 55.96% -0.90
Comprehensive Diabetes Care— HbA1c Control (<8.0 Percent) 37.75% 41.94% 52.21% 46.72% -5.49
Comprehensive Diabetes Care— HbA1c Poor Control (>9.0 Percent)*
51.43% 47.46% 37.17% 42.09% 4.92
Comprehensive Diabetes Care— HbA1c Testing 81.68% 83.22% 89.82% 88.32% -1.50
Comprehensive Diabetes Care— Medical Attention for Nephropathy
86.31% 88.52%H 92.48% 93.67%H 1.19
Controlling High Blood Pressure 39.82% 49.47% 50.64% 53.77% 3.13 1 RY 2015 rates reflect MY data from January 1, 2014, through December 31, 2014. 2 RY 2016 rates reflect MY data from January 1, 2015, through December 31, 2015. 3 RY 2017 rates reflect MY data from January 1, 2016, through December 31, 2016.
Molina Healthcare of California Partner Plan, Inc. Performance Evaluation Report: July 1, 2017–June 30, 2018 California Department of Health Care Services
Page W-28 Health Services Advisory Group, Inc.

MANAGED CARE HEALTH PLAN PERFORMANCE MEASURES
4 RY 2018 rates reflect MY data from January 1, 2017, through December 31, 2017. 5 Performance comparisons are based on the Chi-square test of statistical significance, with a p value of <0.05. * A lower rate indicates better performance for this measure. -- Indicates that the rate is not available.
Table 3.19—Care for Chronic Conditions Domain Multi-Year Performance Measure Results Molina—Sacramento County
H = Rate indicates performance above the HPL. Bolded Rate = Rate indicates performance below the MPL.
B = Statistical testing result indicates that the RY 2018 rate is significantly better than the RY 2017 rate.
W = Statistical testing result indicates that the RY 2018 rate is significantly worse than the RY 2017 rate.
Measure RY
2015 Rate1
RY 2016
Rate2
RY 2017
Rate3
RY 2018
Rate4
RYs 2017–18 Rate
Difference5
Annual Monitoring for Patients on Persistent Medications— ACE Inhibitors or ARBs
83.95% 87.38% 86.33% 87.65% 1.32
Annual Monitoring for Patients on Persistent Medications— Diuretics
82.45% 87.37% 85.58% 87.38% 1.80
Asthma Medication Ratio -- -- 68.58% 58.06% -10.52W
Comprehensive Diabetes Care— Blood Pressure Control (<140/90 mm Hg)
53.64% 57.17% 55.43% 66.67% 11.24B
Comprehensive Diabetes Care— Eye Exam (Retinal) Performed 48.79% 48.34% 54.77% 55.23% 0.46
Comprehensive Diabetes Care— HbA1c Control (<8.0 Percent) 44.81% 46.58% 54.99% 55.96% 0.97
Comprehensive Diabetes Care— HbA1c Poor Control (>9.0 Percent)*
43.93% 42.38% 31.93% 34.31% 2.38
Comprehensive Diabetes Care— HbA1c Testing 77.04% 81.24% 86.92% 85.64% -1.28
Molina Healthcare of California Partner Plan, Inc. Performance Evaluation Report: July 1, 2017–June 30, 2018 California Department of Health Care Services
Page W-29 Health Services Advisory Group, Inc.

MANAGED CARE HEALTH PLAN PERFORMANCE MEASURES
Measure RY
2015 Rate1
RY 2016
Rate2
RY 2017
Rate3
RY 2018
Rate4
RYs 2017–18 Rate
Difference5
Comprehensive Diabetes Care— Medical Attention for Nephropathy
80.57% 89.85%H 91.35% 88.81% -2.54
Controlling High Blood Pressure 50.99% 54.39% 58.05% 54.74% -3.31 1 RY 2015 rates reflect MY data from January 1, 2014, through December 31, 2014. 2 RY 2016 rates reflect MY data from January 1, 2015, through December 31, 2015. 3 RY 2017 rates reflect MY data from January 1, 2016, through December 31, 2016. 4 RY 2018 rates reflect MY data from January 1, 2017, through December 31, 2017. 5 Performance comparisons are based on the Chi-square test of statistical significance, with a p value of <0.05. * A lower rate indicates better performance for this measure. -- Indicates that the rate is not available.
Table 3.20—Care for Chronic Conditions Domain Multi-Year Performance Measure Results Molina—San Diego County
H = Rate indicates performance above the HPL. Bolded Rate = Rate indicates performance below the MPL.
B = Statistical testing result indicates that the RY 2018 rate is significantly better than the RY 2017 rate.
W = Statistical testing result indicates that the RY 2018 rate is significantly worse than the RY 2017 rate.
Measure RY
2015 Rate1
RY 2016
Rate2
RY 2017
Rate3
RY 2018
Rate4
RYs 2017–18 Rate
Difference5
Annual Monitoring for Patients on Persistent Medications—ACE Inhibitors or ARBs
84.41% 89.39% 91.61% 90.40% -1.21W
Annual Monitoring for Patients on Persistent Medications— Diuretics
84.90% 89.67% 91.59% 90.38% -1.21W
Asthma Medication Ratio -- -- 69.03% 62.55% -6.48W
Comprehensive Diabetes Care— Blood Pressure Control (<140/90 mm Hg)
58.72% 55.85% 59.91% 70.80% 10.89B
Molina Healthcare of California Partner Plan, Inc. Performance Evaluation Report: July 1, 2017–June 30, 2018 California Department of Health Care Services
Page W-30 Health Services Advisory Group, Inc.
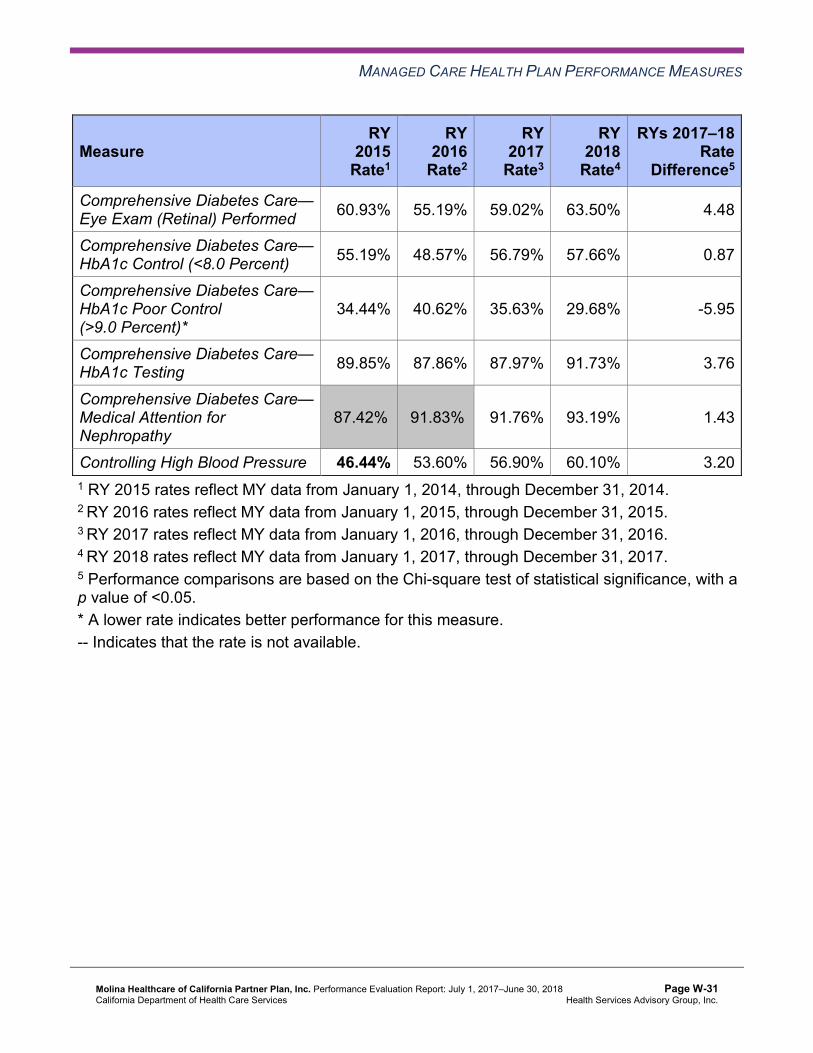
MANAGED CARE HEALTH PLAN PERFORMANCE MEASURES
Measure RY
2015 Rate1
RY 2016
Rate2
RY 2017
Rate3
RY 2018
Rate4
RYs 2017–18 Rate
Difference5
Comprehensive Diabetes Care— Eye Exam (Retinal) Performed 60.93% 55.19% 59.02% 63.50% 4.48
Comprehensive Diabetes Care— HbA1c Control (<8.0 Percent) 55.19% 48.57% 56.79% 57.66% 0.87
Comprehensive Diabetes Care— HbA1c Poor Control (>9.0 Percent)*
34.44% 40.62% 35.63% 29.68% -5.95
Comprehensive Diabetes Care— HbA1c Testing 89.85% 87.86% 87.97% 91.73% 3.76
Comprehensive Diabetes Care— Medical Attention for Nephropathy
87.42%H 91.83%H 91.76% 93.19% 1.43
Controlling High Blood Pressure 46.44% 53.60% 56.90% 60.10% 3.20 1 RY 2015 rates reflect MY data from January 1, 2014, through December 31, 2014. 2 RY 2016 rates reflect MY data from January 1, 2015, through December 31, 2015. 3 RY 2017 rates reflect MY data from January 1, 2016, through December 31, 2016. 4 RY 2018 rates reflect MY data from January 1, 2017, through December 31, 2017. 5 Performance comparisons are based on the Chi-square test of statistical significance, with a p value of <0.05. * A lower rate indicates better performance for this measure. -- Indicates that the rate is not available.
Molina Healthcare of California Partner Plan, Inc. Performance Evaluation Report: July 1, 2017–June 30, 2018 California Department of Health Care Services
Page W-31 Health Services Advisory Group, Inc.

MANAGED CARE HEALTH PLAN PERFORMANCE MEASURES
Table 3.21 through Table 3.24 present findings for the RY 2018 performance measures within the Care for Chronic Conditions domain. Note that the Asthma Medication Ratio measure was a first-year measure in RY 2017, and DHCS did not hold MCPs accountable to meet an MPL for this measure in RY 2017; therefore, HSAG did not include this measure in the denominators for calculating the percentage of measures with rates that moved to above or below the MPLs in RY 2018.
Table 3.21—Care for Chronic Conditions Domain RY 2018 (MY 2017) Performance Measure Findings Molina—Imperial County
Criteria Number of Measures
MeetingCriteria
Total Number of Measures
Percentage of Measures
MeetingCriteria
RY 2018 Rates Above HPLs 1 10 10.00% Rates Above HPLs for the Last Three or More Consecutive Years 0 9 0.00%
RY 2018 Rates Significantly Better than RY 2017 Rates* 1 10 10.00%
Rates that Moved from Below MPLs in RY 2017 to Above MPLs in RY 2018 0 0 N/A
RY 2018 Rates Below MPLs 0 10 0.00% Rates Below MPLs for the Last Three or More Consecutive Years 0 9 0.00%
RY 2018 Rates Significantly Worse than RY 2017 Rates* 0 10 0.00%
Rates that Moved from Above MPLs in RY 2017 to Below MPLs in RY 2018 0 9 0.00%
* Performance comparisons are based on the Chi-square test of statistical significance, with a p value of <0.05. N/A = No rates above or below the MPLs from the previous year exist to include in the denominator for calculating whether or not rates moved to above or below MPLs in the most recent year.
Molina Healthcare of California Partner Plan, Inc. Performance Evaluation Report: July 1, 2017–June 30, 2018 California Department of Health Care Services
Page W-32 Health Services Advisory Group, Inc.
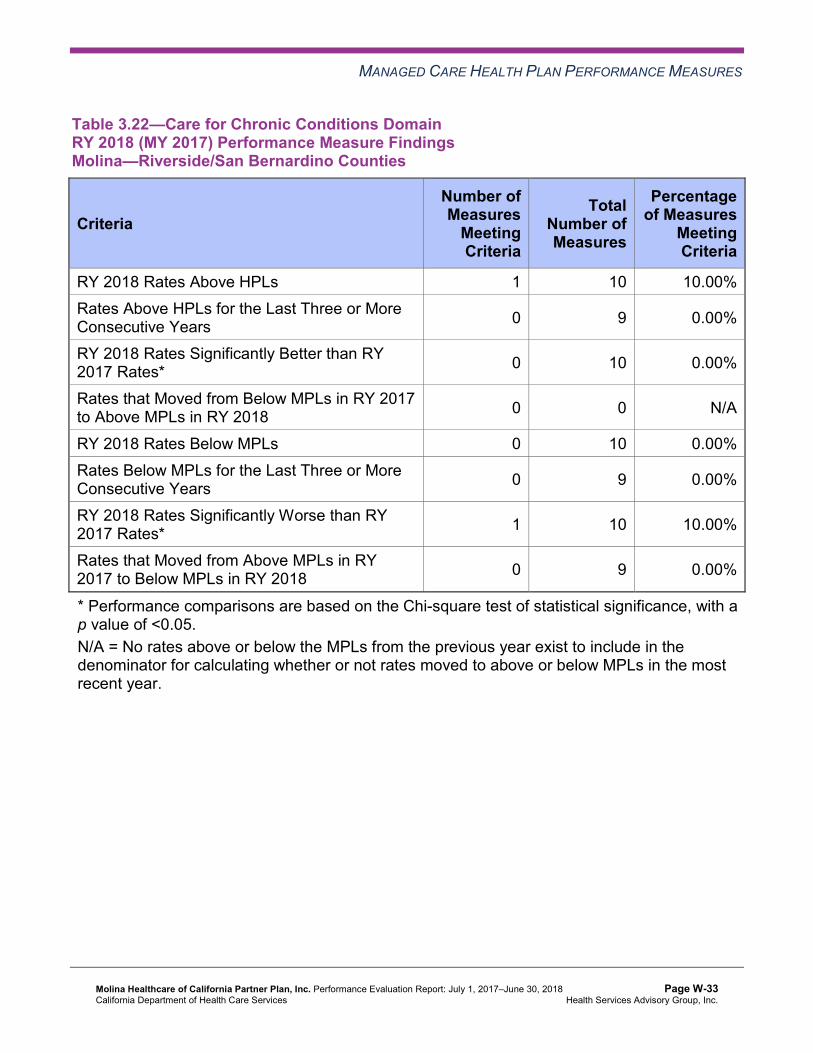
MANAGED CARE HEALTH PLAN PERFORMANCE MEASURES
Table 3.22—Care for Chronic Conditions Domain RY 2018 (MY 2017) Performance Measure Findings Molina—Riverside/San Bernardino Counties
Criteria Number of Measures
MeetingCriteria
Total Number of Measures
Percentage of Measures
MeetingCriteria
RY 2018 Rates Above HPLs 1 10 10.00% Rates Above HPLs for the Last Three or More Consecutive Years 0 9 0.00%
RY 2018 Rates Significantly Better than RY 2017 Rates* 0 10 0.00%
Rates that Moved from Below MPLs in RY 2017 to Above MPLs in RY 2018 0 0 N/A
RY 2018 Rates Below MPLs 0 10 0.00% Rates Below MPLs for the Last Three or More Consecutive Years 0 9 0.00%
RY 2018 Rates Significantly Worse than RY 2017 Rates* 1 10 10.00%
Rates that Moved from Above MPLs in RY 2017 to Below MPLs in RY 2018 0 9 0.00%
* Performance comparisons are based on the Chi-square test of statistical significance, with a p value of <0.05. N/A = No rates above or below the MPLs from the previous year exist to include in the denominator for calculating whether or not rates moved to above or below MPLs in the most recent year.
Molina Healthcare of California Partner Plan, Inc. Performance Evaluation Report: July 1, 2017–June 30, 2018 California Department of Health Care Services
Page W-33 Health Services Advisory Group, Inc.

MANAGED CARE HEALTH PLAN PERFORMANCE MEASURES
Table 3.23—Care for Chronic Conditions Domain RY 2018 (MY 2017) Performance Measure Findings Molina—Sacramento County
Criteria Number of Measures
MeetingCriteria
Total Number of Measures
Percentage of Measures
MeetingCriteria
RY 2018 Rates Above HPLs 0 10 0.00% Rates Above HPLs for the Last Three or More Consecutive Years 0 9 0.00%
RY 2018 Rates Significantly Better than RY 2017 Rates* 1 10 10.00%
Rates that Moved from Below MPLs in RY 2017 to Above MPLs in RY 2018 0 0 N/A
RY 2018 Rates Below MPLs 0 10 0.00% Rates Below MPLs for the Last Three or More Consecutive Years 0 9 0.00%
RY 2018 Rates Significantly Worse than RY 2017 Rates* 1 10 10.00%
Rates that Moved from Above MPLs in RY 2017 to Below MPLs in RY 2018 0 9 0.00%
* Performance comparisons are based on the Chi-square test of statistical significance, with a p value of <0.05. N/A = No rates above or below the MPLs from the previous year exist to include in the denominator for calculating whether or not rates moved to above or below MPLs in the most recent year.
Molina Healthcare of California Partner Plan, Inc. Performance Evaluation Report: July 1, 2017–June 30, 2018 California Department of Health Care Services
Page W-34 Health Services Advisory Group, Inc.

MANAGED CARE HEALTH PLAN PERFORMANCE MEASURES
Table 3.24—Care for Chronic Conditions Domain RY 2018 (MY 2017) Performance Measure Findings Molina—San Diego County
Criteria Number of Measures
MeetingCriteria
Total Number of Measures
Percentage of Measures
MeetingCriteria
RY 2018 Rates Above HPLs 0 10 0.00% Rates Above HPLs for the Last Three or More Consecutive Years 0 9 0.00%
RY 2018 Rates Significantly Better than RY 2017 Rates* 1 10 10.00%
Rates that Moved from Below MPLs in RY 2017 to Above MPLs in RY 2018 0 0 N/A
RY 2018 Rates Below MPLs 0 10 0.00% Rates Below MPLs for the Last Three or More Consecutive Years 0 9 0.00%
RY 2018 Rates Significantly Worse than RY 2017 Rates* 3 10 30.00%
Rates that Moved from Above MPLs in RY 2017 to Below MPLs in RY 2018 0 9 0.00%
* Performance comparisons are based on the Chi-square test of statistical significance, with a p value of <0.05. N/A = No rates above or below the MPLs from the previous year exist to include in the denominator for calculating whether or not rates moved to above or below MPLs in the most recent year.
Assessment of Corrective Action Plan Efforts—Care for Chronic Conditions
As part of Molina’s CAP, DHCS required Molina to submit QI Summaries describing the MCP’s efforts to sustain the improvement that the MCP achieved in previous years for the Controlling High Blood Pressure measure in Riverside/San Bernardino counties. Molina reported that implementing a beneficiary incentive program and conducting provider training on blood pressure monitoring and correct coding for blood pressure readings resulted in improved beneficiary and provider compliance.
The rates remained above the MPL in RY 2018 for the Controlling High Blood Pressure measure in Riverside/San Bernardino counties.
Molina Healthcare of California Partner Plan, Inc. Performance Evaluation Report: July 1, 2017–June 30, 2018 California Department of Health Care Services
Page W-35 Health Services Advisory Group, Inc.
MANAGED CARE HEALTH PLAN PERFORMANCE MEASURES
Appropriate Treatment and Utilization
Table 3.25 through Table 3.28 present the four-year trending information for the performance measures within the Appropriate Treatment and Utilization domain.
Note the following regarding Table 3.25 through Table 3.28:
♦ The All-Cause Readmissions measure is a non-HEDIS measure originally developed for DHCS’ All-Cause Readmissions collaborative quality improvement project (QIP); therefore, DHCS does not establish an HPL or MPL for this measure. For the All-Cause Readmissions measure, a lower rate indicates better performance (i.e., fewer readmissions).
♦ The two Ambulatory Care measures are utilization measures, which measure the volume of services used. DHCS does not hold MCPs accountable to meet MPLs for utilization measures, and HSAG does not compare performance for these measures against HPLs and MPLs. Additionally, because high and low rates do not necessarily indicate better or worse performance, HSAG did not compare performance for these measures across years.
♦ DHCS established no HPL or MPL for the two Depression Screening and Follow-Up for Adolescents and Adults measures for RY 2018 because no comparable benchmarks exist. Additionally, although MCPs reported the two Depression Screening and Follow-Up for Adolescents and Adults measures for RY 2018, HSAG does not present the performance measure results for these measures in this report because the reported rates do not accurately represent services being provided. This is due to the Depression Screening and Follow-Up for Adolescents and Adults measures being new HEDIS measures for RY 2018, NCQA requiring MCPs to submit rates for these measures using the new Electronic Clinical Data Systems (ECDS) reporting methodology, and inconsistent data reporting processes by calculation vendors. Thus, MCPs experienced numerous challenges obtaining data sources to use for ECDS reporting. DHCS and HSAG, in consultation with NCQA, will work with MCPs to improve data capture for RY 2019.
♦ Note that due to changes that NCQA made to the specifications for the Use of Imaging Studies for Low Back Pain measure in RY 2018, NCQA released guidance to exercise caution when trending the results for this measure. Therefore, caution should be used when comparing MCP performance across years or when comparing MCP results to benchmarks related to the Use of Imaging Studies for Low Back Pain measure, as differences in rates may be a result of the specification changes rather than a reflection of performance.
Molina Healthcare of California Partner Plan, Inc. Performance Evaluation Report: July 1, 2017–June 30, 2018 California Department of Health Care Services
Page W-36 Health Services Advisory Group, Inc.

MANAGED CARE HEALTH PLAN PERFORMANCE MEASURES
Table 3.25—Appropriate Treatment and Utilization DomainMulti-Year Performance Measure Results Molina—Imperial County
H = Rate indicates performance above the HPL. Bolded Rate = Rate indicates performance below the MPL.
B = Statistical testing result indicates that the RY 2018 rate is significantly better than the RY 2017 rate.
W = Statistical testing result indicates that the RY 2018 rate is significantly worse than the RY 2017 rate.
Measure RY
2015 Rate1
RY 2016
Rate2
RY 2017
Rate3
RY 2018
Rate4
RYs 2017–18 Rate
Difference5
All-Cause Readmissions* S 13.70% 11.85% 14.50% 2.65 Ambulatory Care—Emergency Department (ED) Visits per 1,000 Member Months**
56.81 54.35 52.35 50.02 Not Tested
Ambulatory Care—Outpatient Visits per 1,000 Member Months**
446.79 238.30 221.57 253.91 Not Tested
Avoidance of Antibiotic Treatment in Adults With Acute Bronchitis
NA 34.04% 35.62% 33.33% -2.29
Use of Imaging Studies for Low Back Pain^ 59.18% 54.62% 62.13% 53.99% -8.14
1 RY 2015 rates reflect MY data from January 1, 2014, through December 31, 2014. 2 RY 2016 rates reflect MY data from January 1, 2015, through December 31, 2015. 3 RY 2017 rates reflect MY data from January 1, 2016, through December 31, 2016. 4 RY 2018 rates reflect MY data from January 1, 2017, through December 31, 2017. 5 Performance comparisons are based on the Chi-square test of statistical significance, with a p value of <0.05. * A lower rate indicates better performance for this measure. ** Member months are a member's “contribution” to the total yearly membership. ^ Caution should be exercised when assessing MCP performance for this measure given the changes that NCQA made to the specification for this measure for RY 2018. NA = The MCP followed the specifications, but the denominator was too small (less than 30) to report a valid rate. S = The MCP’s measure is publicly reported based on NCQA HEDIS Compliance Audit results; however, since fewer than 11 cases exist in the numerator of this measure, HSAG
Molina Healthcare of California Partner Plan, Inc. Performance Evaluation Report: July 1, 2017–June 30, 2018 California Department of Health Care Services
Page W-37 Health Services Advisory Group, Inc.
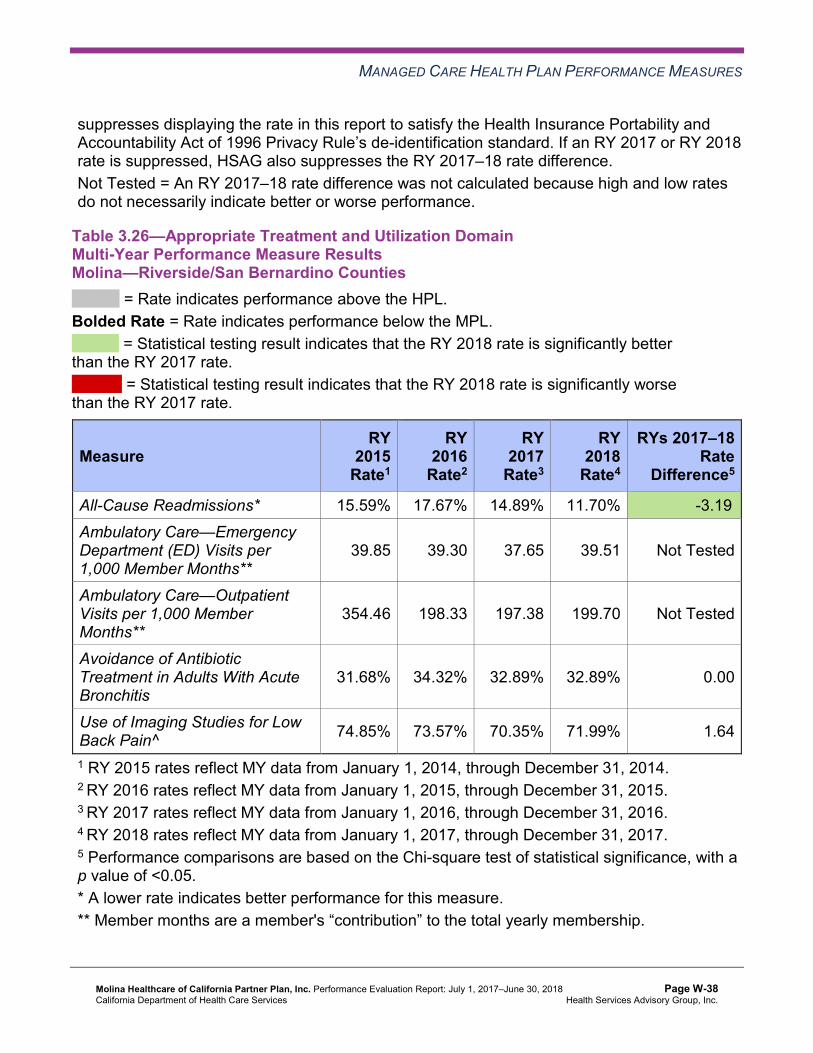
MANAGED CARE HEALTH PLAN PERFORMANCE MEASURES
suppresses displaying the rate in this report to satisfy the Health Insurance Portability and Accountability Act of 1996 Privacy Rule’s de-identification standard. If an RY 2017 or RY 2018 rate is suppressed, HSAG also suppresses the RY 2017–18 rate difference. Not Tested = An RY 2017–18 rate difference was not calculated because high and low rates do not necessarily indicate better or worse performance.
Table 3.26—Appropriate Treatment and Utilization DomainMulti-Year Performance Measure Results Molina—Riverside/San Bernardino Counties
H = Rate indicates performance above the HPL. Bolded Rate = Rate indicates performance below the MPL.
B = Statistical testing result indicates that the RY 2018 rate is significantly better than the RY 2017 rate.
W = Statistical testing result indicates that the RY 2018 rate is significantly worse than the RY 2017 rate.
Measure RY
2015 Rate1
RY 2016
Rate2
RY 2017
Rate3
RY 2018
Rate4
RYs 2017–18 Rate
Difference5
All-Cause Readmissions* 15.59% 17.67% 14.89% 11.70% -3.19B
Ambulatory Care—Emergency Department (ED) Visits per 1,000 Member Months**
39.85 39.30 37.65 39.51 Not Tested
Ambulatory Care—Outpatient Visits per 1,000 Member Months**
354.46 198.33 197.38 199.70 Not Tested
Avoidance of Antibiotic Treatment in Adults With Acute Bronchitis
31.68% 34.32% 32.89% 32.89% 0.00
Use of Imaging Studies for Low Back Pain^ 74.85% 73.57% 70.35% 71.99% 1.64
1 RY 2015 rates reflect MY data from January 1, 2014, through December 31, 2014. 2 RY 2016 rates reflect MY data from January 1, 2015, through December 31, 2015. 3 RY 2017 rates reflect MY data from January 1, 2016, through December 31, 2016. 4 RY 2018 rates reflect MY data from January 1, 2017, through December 31, 2017. 5 Performance comparisons are based on the Chi-square test of statistical significance, with a p value of <0.05. * A lower rate indicates better performance for this measure. ** Member months are a member's “contribution” to the total yearly membership.
Molina Healthcare of California Partner Plan, Inc. Performance Evaluation Report: July 1, 2017–June 30, 2018 California Department of Health Care Services
Page W-38 Health Services Advisory Group, Inc.

MANAGED CARE HEALTH PLAN PERFORMANCE MEASURES
^ Caution should be exercised when assessing MCP performance for this measure given the changes that NCQA made to the specification for this measure for RY 2018. Not Tested = An RY 2017–18 rate difference was not calculated because high and low rates do not necessarily indicate better or worse performance.
Table 3.27—Appropriate Treatment and Utilization DomainMulti-Year Performance Measure Results Molina—Sacramento County
H = Rate indicates performance above the HPL. Bolded Rate = Rate indicates performance below the MPL.
B = Statistical testing result indicates that the RY 2018 rate is significantly better than the RY 2017 rate.
W = Statistical testing result indicates that the RY 2018 rate is significantly worse than the RY 2017 rate.
Measure RY
2015 Rate1
RY 2016
Rate2
RY 2017
Rate3
RY 2018
Rate4
RYs 2017–18 Rate
Difference5
All-Cause Readmissions* 15.15% 14.80% 16.40% 16.40% 0.00 Ambulatory Care—Emergency Department (ED) Visits per 1,000 Member Months**
58.83 60.04 56.32 56.25 Not Tested
Ambulatory Care—Outpatient Visits per 1,000 Member Months**
454.21 277.80 220.47 242.36 Not Tested
Avoidance of Antibiotic Treatment in Adults With Acute Bronchitis
27.23% 22.32% 35.20% 36.15% 0.95
Use of Imaging Studies for Low Back Pain^ 80.60% 78.59% 76.04% 75.54% -0.50
1 RY 2015 rates reflect MY data from January 1, 2014, through December 31, 2014. 2 RY 2016 rates reflect MY data from January 1, 2015, through December 31, 2015. 3 RY 2017 rates reflect MY data from January 1, 2016, through December 31, 2016. 4 RY 2018 rates reflect MY data from January 1, 2017, through December 31, 2017. 5 Performance comparisons are based on the Chi-square test of statistical significance, with a p value of <0.05. * A lower rate indicates better performance for this measure. ** Member months are a member's “contribution” to the total yearly membership. ^ Caution should be exercised when assessing MCP performance for this measure given the changes that NCQA made to the specification for this measure for RY 2018.
Molina Healthcare of California Partner Plan, Inc. Performance Evaluation Report: July 1, 2017–June 30, 2018 California Department of Health Care Services
Page W-39 Health Services Advisory Group, Inc.

MANAGED CARE HEALTH PLAN PERFORMANCE MEASURES
Not Tested = An RY 2017–18 rate difference was not calculated because high and low rates do not necessarily indicate better or worse performance.
Table 3.28—Appropriate Treatment and Utilization DomainMulti-Year Performance Measure Results Molina—San Diego County
H = Rate indicates performance above the HPL. Bolded Rate = Rate indicates performance below the MPL.
B = Statistical testing result indicates that the RY 2018 rate is significantly better than the RY 2017 rate.
W = Statistical testing result indicates that the RY 2018 rate is significantly worse than the RY 2017 rate.
Measure RY
2015 Rate1
RY 2016
Rate2
RY 2017
Rate3
RY 2018
Rate4
RYs 2017–18 Rate
Difference5
All-Cause Readmissions* 16.01% 16.41% 13.82% 16.09% 2.27W
Ambulatory Care—Emergency Department (ED) Visits per 1,000 Member Months**
41.47 41.62 40.57 41.35 Not Tested
Ambulatory Care—Outpatient Visits per 1,000 Member Months**
443.05 265.05 266.96 295.72 Not Tested
Avoidance of Antibiotic Treatment in Adults With Acute Bronchitis
28.90% 30.20% 33.18% 37.45% 4.27
Use of Imaging Studies for Low Back Pain^ 68.42% 70.74% 69.79% 70.49% 0.70
1 RY 2015 rates reflect MY data from January 1, 2014, through December 31, 2014. 2 RY 2016 rates reflect MY data from January 1, 2015, through December 31, 2015. 3 RY 2017 rates reflect MY data from January 1, 2016, through December 31, 2016. 4 RY 2018 rates reflect MY data from January 1, 2017, through December 31, 2017. 5 Performance comparisons are based on the Chi-square test of statistical significance, with a p value of <0.05. * A lower rate indicates better performance for this measure. ** Member months are a member's “contribution” to the total yearly membership. ^ Caution should be exercised when assessing MCP performance for this measure given the changes that NCQA made to the specification for this measure for RY 2018. Not Tested = An RY 2017–18 rate difference was not calculated because high and low rates do not necessarily indicate better or worse performance.
Molina Healthcare of California Partner Plan, Inc. Performance Evaluation Report: July 1, 2017–June 30, 2018 California Department of Health Care Services
Page W-40 Health Services Advisory Group, Inc.

MANAGED CARE HEALTH PLAN PERFORMANCE MEASURES
Table 3.29 through Table 3.32 present findings for the RY 2018 performance measures within the Appropriate Treatment and Utilization domain. DHCS did not hold MCPs accountable to meet MPLs for the following measures within this domain; therefore, HSAG did not include these measures in its assessment of the MCP’s performance related to HPLs and MPLs:
♦ All-Cause Readmissions ♦ Both Ambulatory Care measures
Table 3.29—Appropriate Treatment and Utilization DomainRY 2018 (MY 2017) Performance Measure Findings Molina—Imperial County
Criteria Number of Measures
MeetingCriteria
Total Number of Measures
Percentage of Measures
MeetingCriteria
RY 2018 Rates Above HPLs 0 2 0.00% Rates Above HPLs for the Last Three or More Consecutive Years 0 2 0.00%
RY 2018 Rates Significantly Better than RY 2017 Rates* 0 3 0.00%
Rates that Moved from Below MPLs in RY 2017 to Above MPLs in RY 2018 0 1 0.00%
RY 2018 Rates Below MPLs 1 2 50.00% Rates Below MPLs for the Last Three or More Consecutive Years 1 2 50.00%
RY 2018 Rates Significantly Worse than RY 2017 Rates* 0 3 0.00%
Rates that Moved from Above MPLs in RY 2017 to Below MPLs in RY 2018 0 1 0.00%
* Performance comparisons are based on the Chi-square test of statistical significance, with a p value of <0.05.
Molina Healthcare of California Partner Plan, Inc. Performance Evaluation Report: July 1, 2017–June 30, 2018 California Department of Health Care Services
Page W-41 Health Services Advisory Group, Inc.
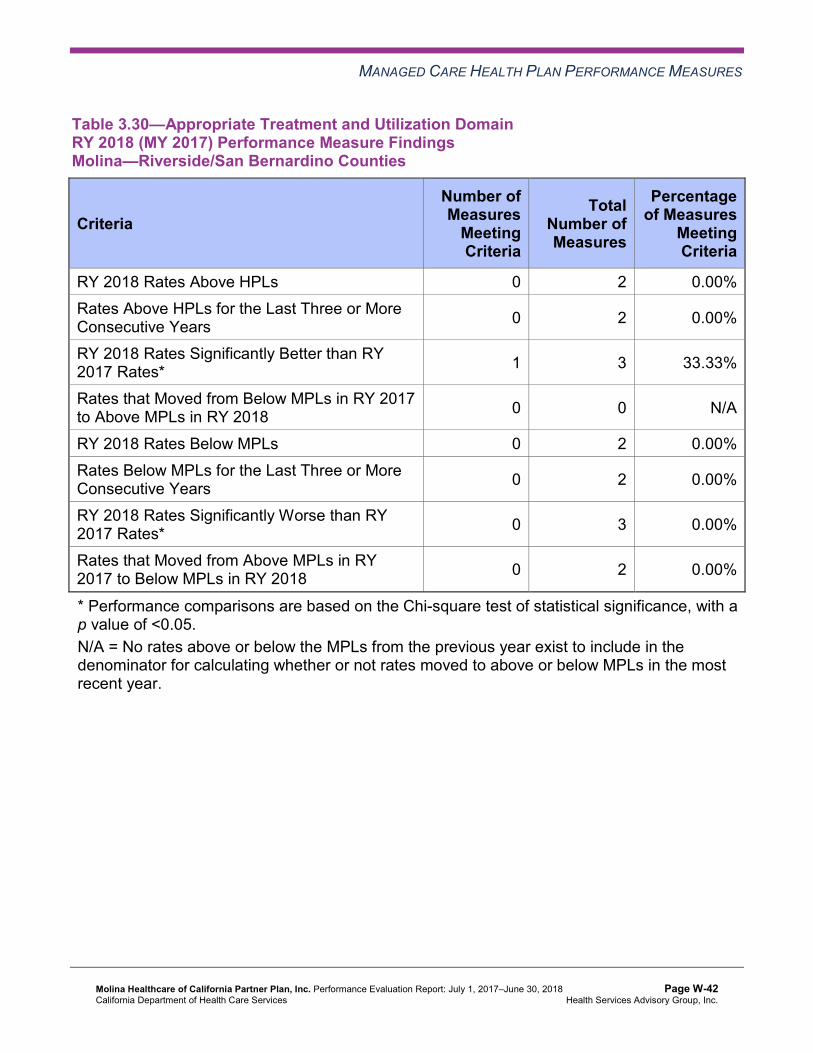
MANAGED CARE HEALTH PLAN PERFORMANCE MEASURES
Table 3.30—Appropriate Treatment and Utilization DomainRY 2018 (MY 2017) Performance Measure Findings Molina—Riverside/San Bernardino Counties
Criteria Number of Measures
MeetingCriteria
Total Number of Measures
Percentage of Measures
MeetingCriteria
RY 2018 Rates Above HPLs 0 2 0.00% Rates Above HPLs for the Last Three or More Consecutive Years 0 2 0.00%
RY 2018 Rates Significantly Better than RY 2017 Rates* 1 3 33.33%
Rates that Moved from Below MPLs in RY 2017 to Above MPLs in RY 2018 0 0 N/A
RY 2018 Rates Below MPLs 0 2 0.00% Rates Below MPLs for the Last Three or More Consecutive Years 0 2 0.00%
RY 2018 Rates Significantly Worse than RY 2017 Rates* 0 3 0.00%
Rates that Moved from Above MPLs in RY 2017 to Below MPLs in RY 2018 0 2 0.00%
* Performance comparisons are based on the Chi-square test of statistical significance, with a p value of <0.05. N/A = No rates above or below the MPLs from the previous year exist to include in the denominator for calculating whether or not rates moved to above or below MPLs in the most recent year.
Molina Healthcare of California Partner Plan, Inc. Performance Evaluation Report: July 1, 2017–June 30, 2018 California Department of Health Care Services
Page W-42 Health Services Advisory Group, Inc.

MANAGED CARE HEALTH PLAN PERFORMANCE MEASURES
Table 3.31—Appropriate Treatment and Utilization DomainRY 2018 (MY 2017) Performance Measure Findings Molina—Sacramento County
Criteria Number of Measures
MeetingCriteria
Total Number of Measures
Percentage of Measures
MeetingCriteria
RY 2018 Rates Above HPLs 0 2 0.00% Rates Above HPLs for the Last Three or More Consecutive Years 0 2 0.00%
RY 2018 Rates Significantly Better than RY 2017 Rates* 0 3 0.00%
Rates that Moved from Below MPLs in RY 2017 to Above MPLs in RY 2018 0 0 N/A
RY 2018 Rates Below MPLs 0 2 0.00% Rates Below MPLs for the Last Three or More Consecutive Years 0 2 0.00%
RY 2018 Rates Significantly Worse than RY 2017 Rates* 0 3 0.00%
Rates that Moved from Above MPLs in RY 2017 to Below MPLs in RY 2018 0 2 0.00%
* Performance comparisons are based on the Chi-square test of statistical significance, with a p value of <0.05. N/A = No rates above or below the MPLs from the previous year exist to include in the denominator for calculating whether or not rates moved to above or below MPLs in the most recent year.
Molina Healthcare of California Partner Plan, Inc. Performance Evaluation Report: July 1, 2017–June 30, 2018 California Department of Health Care Services
Page W-43 Health Services Advisory Group, Inc.
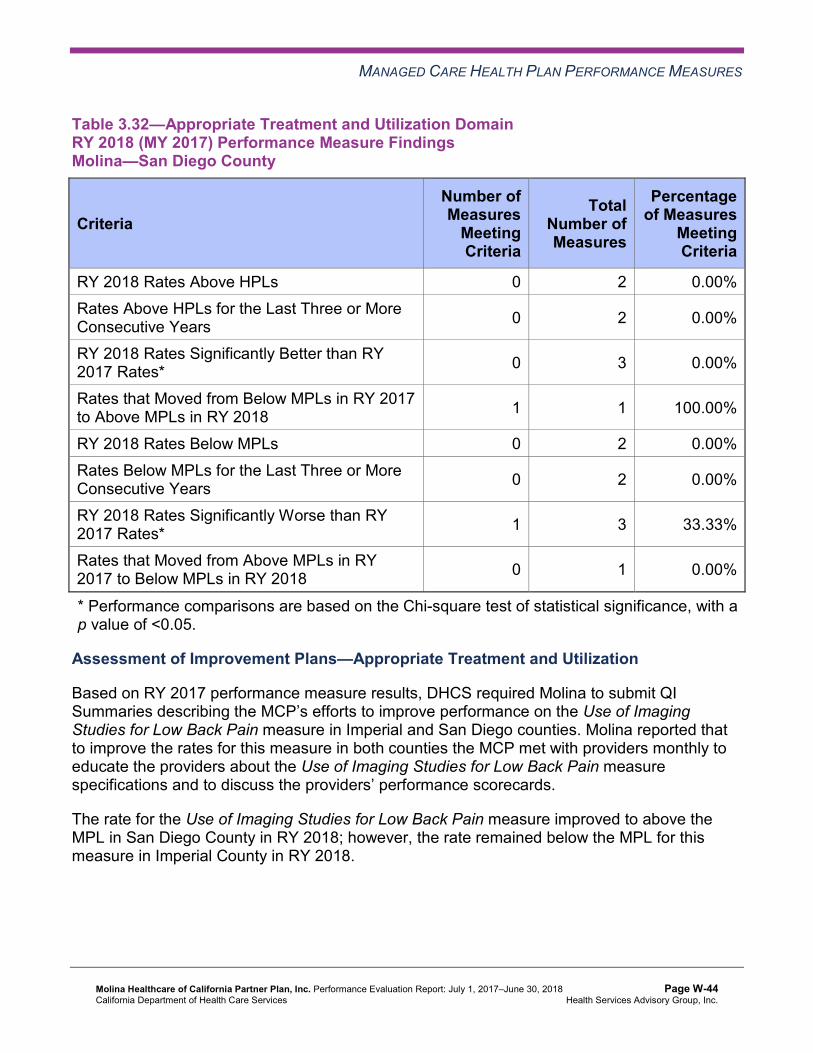
MANAGED CARE HEALTH PLAN PERFORMANCE MEASURES
Table 3.32—Appropriate Treatment and Utilization DomainRY 2018 (MY 2017) Performance Measure Findings Molina—San Diego County
Criteria Number of Measures
MeetingCriteria
Total Number of Measures
Percentage of Measures
MeetingCriteria
RY 2018 Rates Above HPLs 0 2 0.00% Rates Above HPLs for the Last Three or More Consecutive Years 0 2 0.00%
RY 2018 Rates Significantly Better than RY 2017 Rates* 0 3 0.00%
Rates that Moved from Below MPLs in RY 2017 to Above MPLs in RY 2018 1 1 100.00%
RY 2018 Rates Below MPLs 0 2 0.00% Rates Below MPLs for the Last Three or More Consecutive Years 0 2 0.00%
RY 2018 Rates Significantly Worse than RY 2017 Rates* 1 3 33.33%
Rates that Moved from Above MPLs in RY 2017 to Below MPLs in RY 2018 0 1 0.00%
* Performance comparisons are based on the Chi-square test of statistical significance, with a p value of <0.05.
Assessment of Improvement Plans—Appropriate Treatment and Utilization
Based on RY 2017 performance measure results, DHCS required Molina to submit QI Summaries describing the MCP’s efforts to improve performance on the Use of Imaging Studies for Low Back Pain measure in Imperial and San Diego counties. Molina reported that to improve the rates for this measure in both counties the MCP met with providers monthly to educate the providers about the Use of Imaging Studies for Low Back Pain measure specifications and to discuss the providers’ performance scorecards.
The rate for the Use of Imaging Studies for Low Back Pain measure improved to above the MPL in San Diego County in RY 2018; however, the rate remained below the MPL for this measure in Imperial County in RY 2018.
Molina Healthcare of California Partner Plan, Inc. Performance Evaluation Report: July 1, 2017–June 30, 2018 California Department of Health Care Services
Page W-44 Health Services Advisory Group, Inc.

MANAGED CARE HEALTH PLAN PERFORMANCE MEASURES
Performance Measure Findings—All Domains
Table 3.33 through Table 3.36 present a summary of Molina’s RY 2018 performance across all External Accountability Set (EAS) measures.
Note the following regarding Table 3.33 through Table 3.36:
♦ DHCS did not hold MCPs accountable to meet MPLs for the following measures; therefore, HSAG did not include these measures in its assessment of the MCP’s performance related to HPLs and MPLs: ■ All-Cause Readmissions ■ Both Ambulatory Care measures ■ All four Children and Adolescents’ Access to Primary Care measures
♦ DHCS did not hold MCPs accountable to meet MPLs for the following measures in RY 2017; therefore, HSAG did not include these measures in the denominators for calculating the percentage of measures with rates that moved to above or below the MPLs in RY 2018 and for calculating the percentage of measures with rates below MPLs for only the last two consecutive years: ■ Asthma Medication Ratio ■ Breast Cancer Screening ■ Immunizations for Adolescents—Combination 2
Table 3.33—RY 2018 (MY 2017) Performance Measure Findings for All Domains Molina—Imperial County
Criteria Number of Measures
MeetingCriteria
Total Number of Measures
Percentage of Measures
MeetingCriteria
RY 2018 Rates Above HPLs 1 21 4.76% Rates Above HPLs for the Last Three or More Consecutive Years 0 18 0.00%
RY 2018 Rates Significantly Better than RY 2017 Rates* 1 22 4.55%
Rates that Moved from Below MPLs in RY 2017 to Above MPLs in RY 2018 0 2 0.00%
RY 2018 Rates Below MPLs 4 21 19.05% Rates Below MPLs for Only the Last Two Consecutive Years 0 18 0.00%
Molina Healthcare of California Partner Plan, Inc. Performance Evaluation Report: July 1, 2017–June 30, 2018 California Department of Health Care Services
Page W-45 Health Services Advisory Group, Inc.

MANAGED CARE HEALTH PLAN PERFORMANCE MEASURES
Criteria Number of Measures
MeetingCriteria
Total Number of Measures
Percentage of Measures
MeetingCriteria
Rates Below MPLs for the Last Three or More Consecutive Years 2 18 11.11%
RY 2018 Rates Significantly Worse than RY 2017 Rates* 0 22 0.00%
Rates that Moved from Above MPLs in RY 2017 to Below MPLs in RY 2018 1 16 6.25%
* Performance comparisons are based on the Chi-square test of statistical significance, with a p value of <0.05.
Table 3.34—RY 2018 (MY 2017) Performance Measure Findings for All Domains Molina—Riverside/San Bernardino Counties
Criteria Number of Measures
MeetingCriteria
Total Number of Measures
Percentage of Measures
MeetingCriteria
RY 2018 Rates Above HPLs 2 21 9.52% Rates Above HPLs for the Last Three or More Consecutive Years 0 18 0.00%
RY 2018 Rates Significantly Better than RY 2017 Rates* 4 22 18.18%
Rates that Moved from Below MPLs in RY 2017 to Above MPLs in RY 2018 0 1 0.00%
RY 2018 Rates Below MPLs 1 21 4.76% Rates Below MPLs for Only the Last Two Consecutive Years 0 18 0.00%
Rates Below MPLs for the Last Three or More Consecutive Years 1 18 5.56%
RY 2018 Rates Significantly Worse than RY 2017 Rates* 1 22 4.55%
Rates that Moved from Above MPLs in RY 2017 to Below MPLs in RY 2018 0 17 0.00%
* Performance comparisons are based on the Chi-square test of statistical significance, with a p value of <0.05.
Molina Healthcare of California Partner Plan, Inc. Performance Evaluation Report: July 1, 2017–June 30, 2018 California Department of Health Care Services
Page W-46 Health Services Advisory Group, Inc.
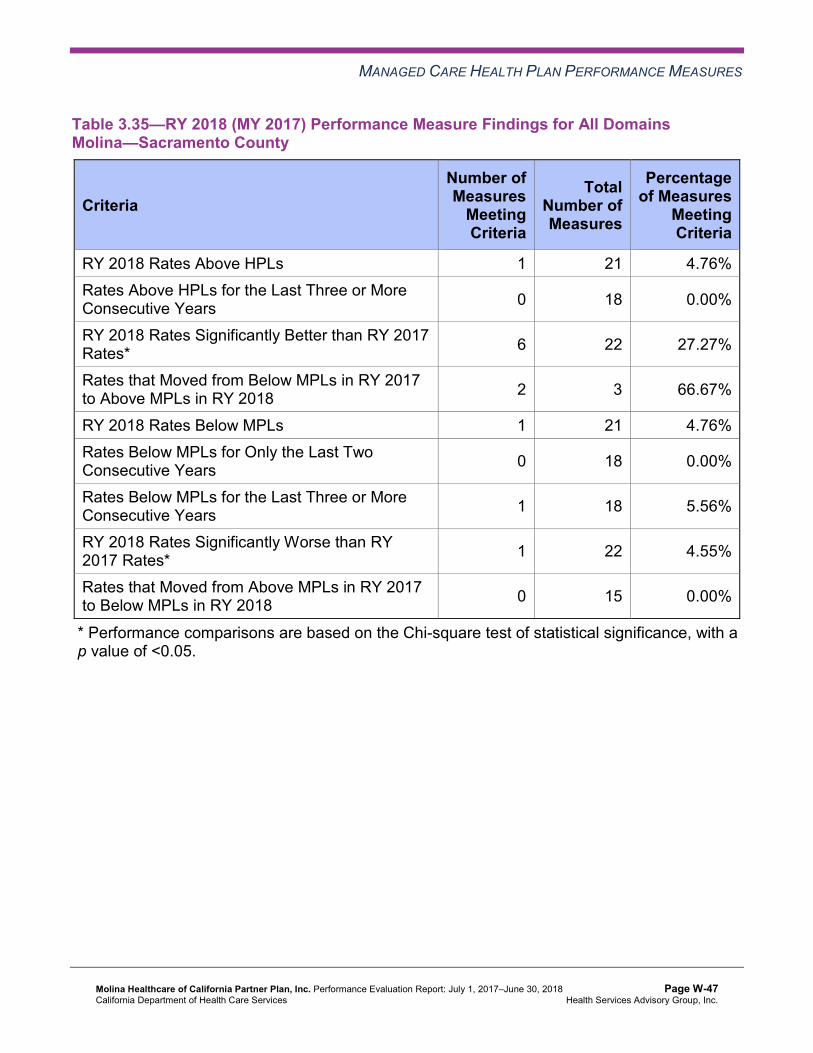
MANAGED CARE HEALTH PLAN PERFORMANCE MEASURES
Table 3.35—RY 2018 (MY 2017) Performance Measure Findings for All Domains Molina—Sacramento County
Criteria Number of Measures
MeetingCriteria
Total Number of Measures
Percentage of Measures
MeetingCriteria
RY 2018 Rates Above HPLs 1 21 4.76% Rates Above HPLs for the Last Three or More Consecutive Years 0 18 0.00%
RY 2018 Rates Significantly Better than RY 2017 Rates* 6 22 27.27%
Rates that Moved from Below MPLs in RY 2017 to Above MPLs in RY 2018 2 3 66.67%
RY 2018 Rates Below MPLs 1 21 4.76% Rates Below MPLs for Only the Last Two Consecutive Years 0 18 0.00%
Rates Below MPLs for the Last Three or More Consecutive Years 1 18 5.56%
RY 2018 Rates Significantly Worse than RY 2017 Rates* 1 22 4.55%
Rates that Moved from Above MPLs in RY 2017 to Below MPLs in RY 2018 0 15 0.00%
* Performance comparisons are based on the Chi-square test of statistical significance, with a p value of <0.05.
Molina Healthcare of California Partner Plan, Inc. Performance Evaluation Report: July 1, 2017–June 30, 2018 California Department of Health Care Services
Page W-47 Health Services Advisory Group, Inc.
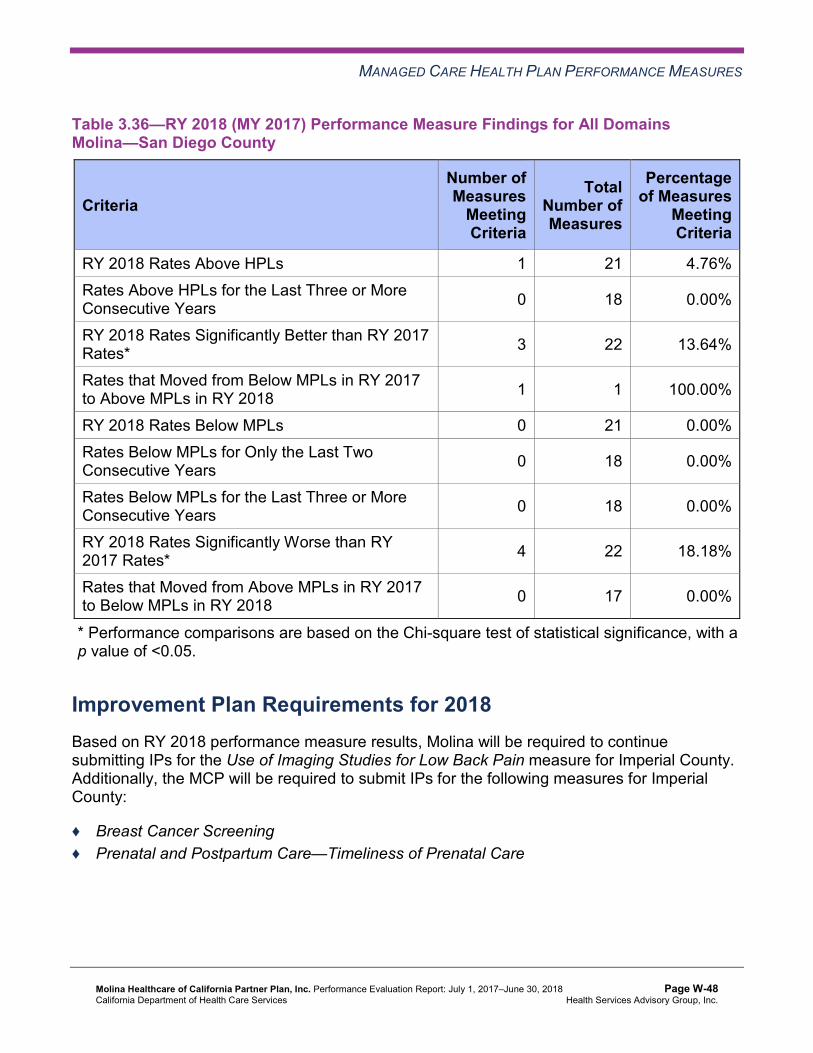
MANAGED CARE HEALTH PLAN PERFORMANCE MEASURES
Table 3.36—RY 2018 (MY 2017) Performance Measure Findings for All Domains Molina—San Diego County
Criteria Number of Measures
MeetingCriteria
Total Number of Measures
Percentage of Measures
MeetingCriteria
RY 2018 Rates Above HPLs 1 21 4.76% Rates Above HPLs for the Last Three or More Consecutive Years 0 18 0.00%
RY 2018 Rates Significantly Better than RY 2017 Rates* 3 22 13.64%
Rates that Moved from Below MPLs in RY 2017 to Above MPLs in RY 2018 1 1 100.00%
RY 2018 Rates Below MPLs 0 21 0.00% Rates Below MPLs for Only the Last Two Consecutive Years 0 18 0.00%
Rates Below MPLs for the Last Three or More Consecutive Years 0 18 0.00%
RY 2018 Rates Significantly Worse than RY 2017 Rates* 4 22 18.18%
Rates that Moved from Above MPLs in RY 2017 to Below MPLs in RY 2018 0 17 0.00%
* Performance comparisons are based on the Chi-square test of statistical significance, with a p value of <0.05.
Improvement Plan Requirements for 2018 Based on RY 2018 performance measure results, Molina will be required to continue submitting IPs for the Use of Imaging Studies for Low Back Pain measure for Imperial County. Additionally, the MCP will be required to submit IPs for the following measures for Imperial County:
♦ Breast Cancer Screening ♦ Prenatal and Postpartum Care—Timeliness of Prenatal Care
Molina Healthcare of California Partner Plan, Inc. Performance Evaluation Report: July 1, 2017–June 30, 2018 California Department of Health Care Services
Page W-48 Health Services Advisory Group, Inc.

MANAGED CARE HEALTH PLAN PERFORMANCE MEASURES
Corrective Action Plan Requirements for 2018 Based on RY 2018 performance measure results, Molina met the required CAP milestones and was in compliance with the external quality review requirements in its MCMC contract with DHCS; therefore, DHCS closed the CAP effective September 1, 2018. Note that DHCS closed Molina’s CAP outside of the review period for this report; however, HSAG includes the information because it was available at the time this report was produced.
Seniors and Persons with Disabilities Performance Measure Results Table 3.37 through Table 3.40 present the four-year trending information for the Seniors and Persons with Disabilities (SPD) population, and Table 3.41 through Table 3.44 present the four-year trending information for the non-SPD population for the measures that DHCS required MCPs to stratify for the SPD and non-SPD populations. The tables also show the differences in rates between RY 2017 and RY 2018.
Table 3.45 through Table 3.48 present the SPD and non-SPD rates, a comparison of the SPD and non-SPD rates,5 and the total combined rate for each measure.
Table 3.37—Multi-Year SPD Performance Measure Trend Table Molina—Imperial County
B = Statistical testing result indicates that the RY 2018 SPD rate is significantly better than the RY 2017 SPD rate.
W = Statistical testing result indicates that the RY 2018 SPD rate is significantly worse than the RY 2017 SPD rate.
Measure RY 2015
SPD Rate1
RY 2016 SPD
Rate2
RY 2017 SPD
Rate3
RY 2018 SPD
Rate4
RYs 2017–18 Rate
Difference5
All-Cause Readmissions* NA 18.97% 17.83% 21.85% 4.02 Ambulatory Care—Emergency Department (ED) Visits per 1,000 Member Months**
132.65 114.05 96.92 94.59 Not Tested
Ambulatory Care—Outpatient Visits per 1,000 Member Months**
899.94 567.98 506.57 587.99 Not Tested
5 HSAG calculated statistical significance between the SPD and non-SPD rates for each measure using a Chi-square test. This information is displayed in the “SPD/Non-SPD Rate Difference” column in Table 3.45 through Table 3.48.
Molina Healthcare of California Partner Plan, Inc. Performance Evaluation Report: July 1, 2017–June 30, 2018 California Department of Health Care Services
Page W-49 Health Services Advisory Group, Inc.

MANAGED CARE HEALTH PLAN PERFORMANCE MEASURES
Measure RY 2015
SPD Rate1
RY 2016 SPD
Rate2
RY 2017 SPD
Rate3
RY 2018 SPD
Rate4
RYs 2017–18 Rate
Difference5
Annual Monitoring for Patients on Persistent Medications— ACE Inhibitors or ARBs
NA 96.21% 97.10% 96.55% -0.55
Annual Monitoring for Patients on Persistent Medications— Diuretics
NA 100.00% 97.78% 97.92% 0.14
Children and Adolescents' Access to Primary Care Practitioners—12–24 Months
NA NA NA NA Not Comparable
Children and Adolescents' Access to Primary Care Practitioners— 25 Months–6 Years
NA NA NA NA Not Comparable
Children and Adolescents' Access to Primary Care Practitioners—7–11 Years
NA NA 76.67% NA Not Comparable
Children and Adolescents' Access to Primary Care Practitioners—12–19 Years
NA NA 78.18% 84.31% 6.13
1 RY 2015 rates reflect MY data from January 1, 2014, through December 31, 2014. 2 RY 2016 rates reflect MY data from January 1, 2015, through December 31, 2015. 3 RY 2017 rates reflect MY data from January 1, 2016, through December 31, 2016. 4 RY 2018 rates reflect MY data from January 1, 2017, through December 31, 2017. 5 Performance comparisons are based on the Chi-square test of statistical significance, with a p value of <0.05. * A lower rate indicates better performance for this measure. ** Member months are a member's “contribution” to the total yearly membership. NA = The MCP followed the specifications, but the denominator was too small (less than 30) to report a valid rate. Not Comparable = An RY 2017–18 rate difference cannot be made because data are not available for both years or because significant methodology changes occurred between years, disallowing comparison. Not Tested = An RY 2017–18 rate difference was not calculated because high and low rates do not necessarily indicate better or worse performance.
Molina Healthcare of California Partner Plan, Inc. Performance Evaluation Report: July 1, 2017–June 30, 2018 California Department of Health Care Services
Page W-50 Health Services Advisory Group, Inc.

MANAGED CARE HEALTH PLAN PERFORMANCE MEASURES
Table 3.38—Multi-Year SPD Performance Measure Trend Table Molina—Riverside/San Bernardino Counties
B = Statistical testing result indicates that the RY 2018 SPD rate is significantly better than the RY 2017 SPD rate.
W = Statistical testing result indicates that the RY 2018 SPD rate is significantly worse than the RY 2017 SPD rate.
Measure RY
2015 SPD
Rate1
RY 2016 SPD
Rate2
RY 2017 SPD
Rate3
RY 2018 SPD
Rate4
RYs 2017–18 Rate
Difference5
All-Cause Readmissions* 19.55% 26.38% 21.70% 17.26% -4.44B
Ambulatory Care—Emergency Department (ED) Visits per 1,000 Member Months**
71.10 74.73 74.01 72.60 Not Tested
Ambulatory Care—Outpatient Visits per 1,000 Member Months**
571.37 341.18 352.50 357.88 Not Tested
Annual Monitoring for Patients on Persistent Medications— ACE Inhibitors or ARBs
85.53% 88.40% 91.17% 90.35% -0.82
Annual Monitoring for Patients on Persistent Medications— Diuretics
84.93% 87.26% 91.47% 90.83% -0.64
Children and Adolescents' Access to Primary Care Practitioners—12–24 Months
NA NA NA NA Not Comparable
Children and Adolescents' Access to Primary Care Practitioners— 25 Months–6 Years
80.74% 81.29% 83.33% 84.75% 1.42
Children and Adolescents' Access to Primary Care Practitioners—7–11 Years
83.99% 84.29% 85.75% 88.09% 2.34
Children and Adolescents' Access to Primary Care Practitioners—12–19 Years
75.52% 78.99% 83.33% 84.13% 0.80
1 RY 2015 rates reflect MY data from January 1, 2014, through December 31, 2014. 2 RY 2016 rates reflect MY data from January 1, 2015, through December 31, 2015. 3 RY 2017 rates reflect MY data from January 1, 2016, through December 31, 2016.
Molina Healthcare of California Partner Plan, Inc. Performance Evaluation Report: July 1, 2017–June 30, 2018 California Department of Health Care Services
Page W-51 Health Services Advisory Group, Inc.

MANAGED CARE HEALTH PLAN PERFORMANCE MEASURES
4 RY 2018 rates reflect MY data from January 1, 2017, through December 31, 2017. 5 Performance comparisons are based on the Chi-square test of statistical significance, with a p value of <0.05. * A lower rate indicates better performance for this measure. ** Member months are a member's “contribution” to the total yearly membership. NA = The MCP followed the specifications, but the denominator was too small (less than 30) to report a valid rate. Not Comparable = An RY 2017–18 rate difference cannot be made because data are not available for both years or because significant methodology changes occurred between years, disallowing comparison. Not Tested = An RY 2017–18 rate difference was not calculated because high and low rates do not necessarily indicate better or worse performance.
Table 3.39—Multi-Year SPD Performance Measure Trend Table Molina—Sacramento County
B = Statistical testing result indicates that the RY 2018 SPD rate is significantly better than the RY 2017 SPD rate.
W = Statistical testing result indicates that the RY 2018 SPD rate is significantly worse than the RY 2017 SPD rate.
Measure RY
2015 SPD
Rate1
RY 2016 SPD
Rate2
RY 2017 SPD
Rate3
RY 2018 SPD
Rate4
RYs 2017–18 Rate
Difference5
All-Cause Readmissions* 16.14% 17.87% 21.92% 20.96% -0.96 Ambulatory Care—Emergency Department (ED) Visits per 1,000 Member Months**
80.14 86.33 92.84 88.97 Not Tested
Ambulatory Care—Outpatient Visits per 1,000 Member Months**
799.21 509.35 420.83 459.41 Not Tested
Annual Monitoring for Patients on Persistent Medications— ACE Inhibitors or ARBs
84.69% 87.30% 86.38% 89.08% 2.70B
Annual Monitoring for Patients on Persistent Medications— Diuretics
85.01% 88.41% 87.07% 89.72% 2.65
Children and Adolescents' Access to Primary Care Practitioners—12–24 Months
NA NA NA NA Not Comparable
Molina Healthcare of California Partner Plan, Inc. Performance Evaluation Report: July 1, 2017–June 30, 2018 California Department of Health Care Services
Page W-52 Health Services Advisory Group, Inc.
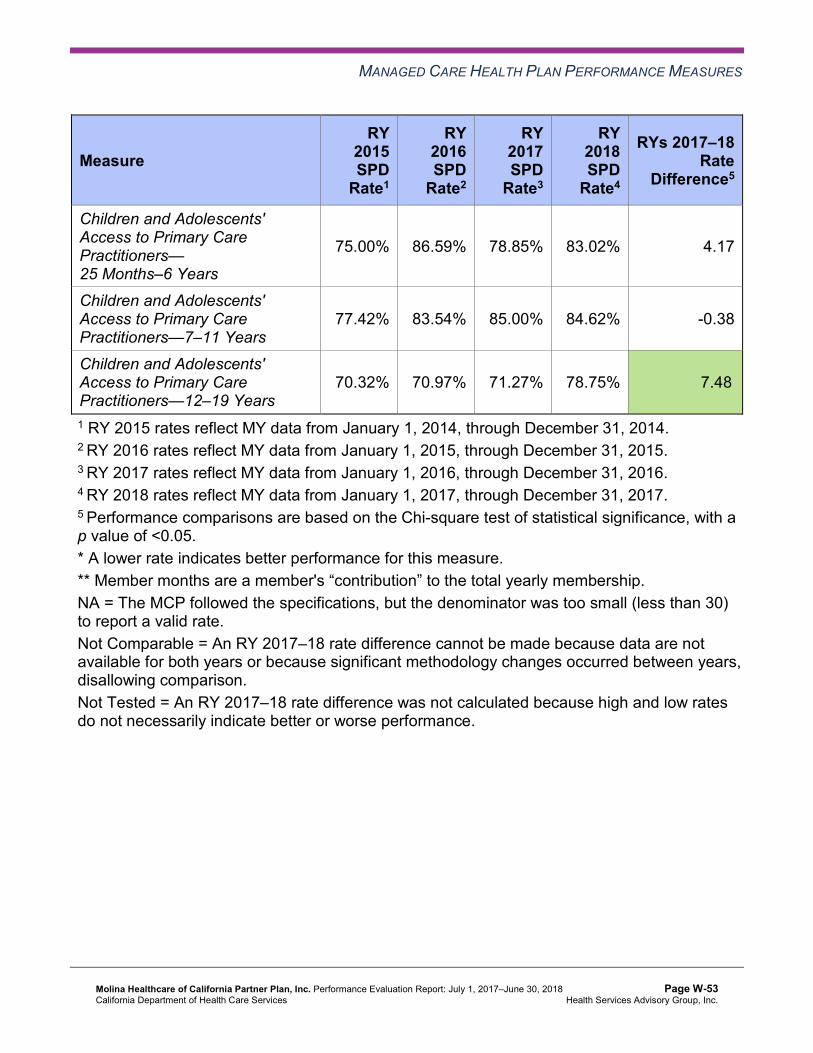
MANAGED CARE HEALTH PLAN PERFORMANCE MEASURES
Measure RY
2015 SPD
Rate1
RY 2016 SPD
Rate2
RY 2017 SPD
Rate3
RY 2018 SPD
Rate4
RYs 2017–18 Rate
Difference5
Children and Adolescents' Access to Primary Care Practitioners— 25 Months–6 Years
75.00% 86.59% 78.85% 83.02% 4.17
Children and Adolescents' Access to Primary Care Practitioners—7–11 Years
77.42% 83.54% 85.00% 84.62% -0.38
Children and Adolescents' Access to Primary Care Practitioners—12–19 Years
70.32% 70.97% 71.27% 78.75% 7.48B
1 RY 2015 rates reflect MY data from January 1, 2014, through December 31, 2014. 2 RY 2016 rates reflect MY data from January 1, 2015, through December 31, 2015. 3 RY 2017 rates reflect MY data from January 1, 2016, through December 31, 2016. 4 RY 2018 rates reflect MY data from January 1, 2017, through December 31, 2017. 5 Performance comparisons are based on the Chi-square test of statistical significance, with a p value of <0.05. * A lower rate indicates better performance for this measure. ** Member months are a member's “contribution” to the total yearly membership. NA = The MCP followed the specifications, but the denominator was too small (less than 30) to report a valid rate. Not Comparable = An RY 2017–18 rate difference cannot be made because data are not available for both years or because significant methodology changes occurred between years, disallowing comparison. Not Tested = An RY 2017–18 rate difference was not calculated because high and low rates do not necessarily indicate better or worse performance.
Molina Healthcare of California Partner Plan, Inc. Performance Evaluation Report: July 1, 2017–June 30, 2018 California Department of Health Care Services
Page W-53 Health Services Advisory Group, Inc.
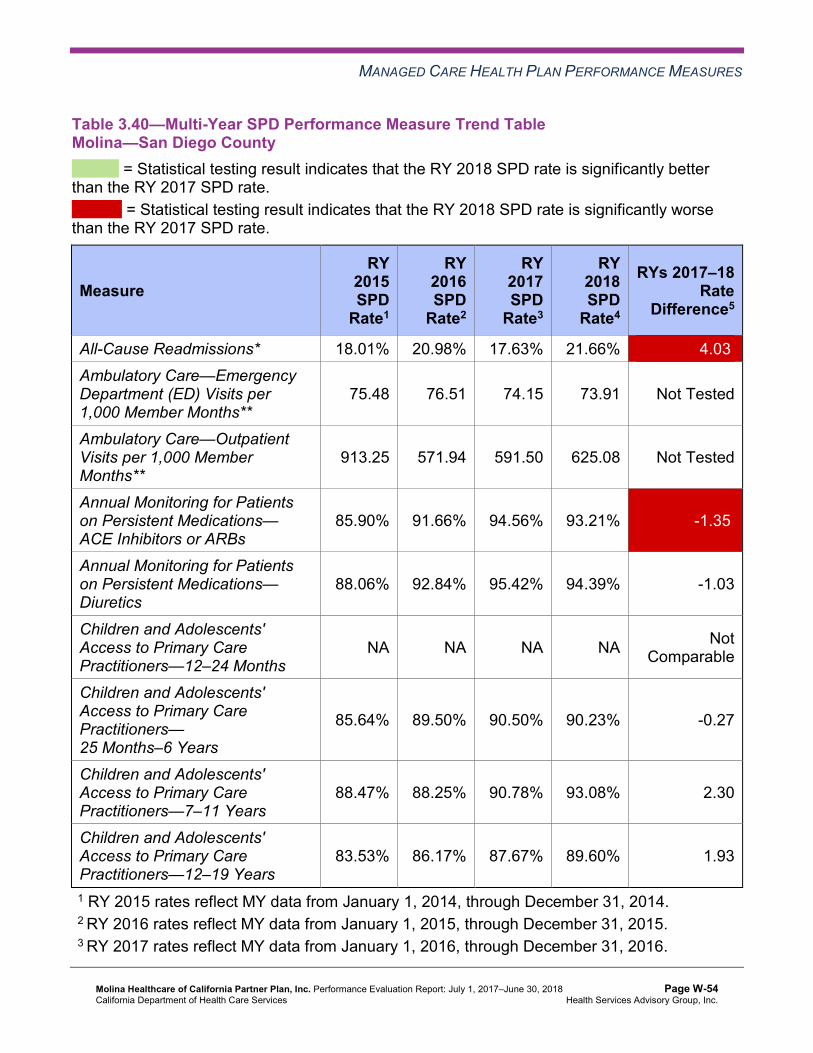
MANAGED CARE HEALTH PLAN PERFORMANCE MEASURES
Table 3.40—Multi-Year SPD Performance Measure Trend Table Molina—San Diego County
B = Statistical testing result indicates that the RY 2018 SPD rate is significantly better than the RY 2017 SPD rate.
W = Statistical testing result indicates that the RY 2018 SPD rate is significantly worse than the RY 2017 SPD rate.
Measure RY
2015 SPD
Rate1
RY 2016 SPD
Rate2
RY 2017 SPD
Rate3
RY 2018 SPD
Rate4
RYs 2017–18 Rate
Difference5
All-Cause Readmissions* 18.01% 20.98% 17.63% 21.66% 4.03W
Ambulatory Care—Emergency Department (ED) Visits per 1,000 Member Months**
75.48 76.51 74.15 73.91 Not Tested
Ambulatory Care—Outpatient Visits per 1,000 Member Months**
913.25 571.94 591.50 625.08 Not Tested
Annual Monitoring for Patients on Persistent Medications— ACE Inhibitors or ARBs
85.90% 91.66% 94.56% 93.21% -1.35W
Annual Monitoring for Patients on Persistent Medications— Diuretics
88.06% 92.84% 95.42% 94.39% -1.03
Children and Adolescents' Access to Primary Care Practitioners—12–24 Months
NA NA NA NA Not Comparable
Children and Adolescents' Access to Primary Care Practitioners— 25 Months–6 Years
85.64% 89.50% 90.50% 90.23% -0.27
Children and Adolescents' Access to Primary Care Practitioners—7–11 Years
88.47% 88.25% 90.78% 93.08% 2.30
Children and Adolescents' Access to Primary Care Practitioners—12–19 Years
83.53% 86.17% 87.67% 89.60% 1.93
1 RY 2015 rates reflect MY data from January 1, 2014, through December 31, 2014. 2 RY 2016 rates reflect MY data from January 1, 2015, through December 31, 2015. 3 RY 2017 rates reflect MY data from January 1, 2016, through December 31, 2016.
Molina Healthcare of California Partner Plan, Inc. Performance Evaluation Report: July 1, 2017–June 30, 2018 California Department of Health Care Services
Page W-54 Health Services Advisory Group, Inc.

MANAGED CARE HEALTH PLAN PERFORMANCE MEASURES
4 RY 2018 rates reflect MY data from January 1, 2017, through December 31, 2017. 5 Performance comparisons are based on the Chi-square test of statistical significance, with a p value of <0.05. * A lower rate indicates better performance for this measure. ** Member months are a member's “contribution” to the total yearly membership. NA = The MCP followed the specifications, but the denominator was too small (less than 30) to report a valid rate. Not Comparable = An RY 2017–18 rate difference cannot be made because data are not available for both years or because significant methodology changes occurred between years, disallowing comparison. Not Tested = An RY 2017–18 rate difference was not calculated because high and low rates do not necessarily indicate better or worse performance.
Table 3.41—Multi-Year Non-SPD Performance Measure Trend Table Molina—Imperial County
B = Statistical testing result indicates that the RY 2018 non-SPD rate is significantly better than the RY 2017 non-SPD rate.
W = Statistical testing result indicates that the RY 2018 non-SPD rate is significantly worse than the RY 2017 non-SPD rate.
Measure RY 2015
Non-SPD Rate1
RY 2016 Non-SPD
Rate2
RY 2017 Non-SPD
Rate3
RY 2018 Non-SPD
Rate4
RYs 2017–18 Rate
Difference5
All-Cause Readmissions* S 11.24% 9.06% 11.39% 2.33
Ambulatory Care— Emergency Department (ED) Visits per 1,000 Member Months**
55.82 50.01 49.49 24.58 Not Tested
Ambulatory Care— Outpatient Visits per 1,000 Member Months**
440.92 214.32 203.30 121.70 Not Tested
Annual Monitoring for Patients on Persistent Medications— ACE Inhibitors or ARBs
90.37% 87.02% 89.66% 90.68% 1.02
Annual Monitoring for Patients on Persistent Medications—Diuretics
90.07% 92.68% 87.50% 91.15% 3.65
Molina Healthcare of California Partner Plan, Inc. Performance Evaluation Report: July 1, 2017–June 30, 2018 California Department of Health Care Services
Page W-55 Health Services Advisory Group, Inc.

MANAGED CARE HEALTH PLAN PERFORMANCE MEASURES
Measure RY 2015
Non-SPD Rate1
RY 2016 Non-SPD
Rate2
RY 2017 Non-SPD
Rate3
RY 2018 Non-SPD
Rate4
RYs 2017–18 Rate
Difference5
Children and Adolescents' Access to Primary Care Practitioners— 12–24 Months
85.65% 83.56% 93.16% 89.80% -3.36
Children and Adolescents' Access to Primary Care Practitioners— 25 Months–6 Years
77.36% 76.10% 76.39% 74.59% -1.80
Children and Adolescents' Access to Primary Care Practitioners— 7–11 Years
NA 81.56% 76.29% 73.77% -2.52
Children and Adolescents' Access to Primary Care Practitioners— 12–19 Years
NA 79.87% 73.12% 72.48% -0.64
1 RY 2015 rates reflect MY data from January 1, 2014, through December 31, 2014. 2 RY 2016 rates reflect MY data from January 1, 2015, through December 31, 2015. 3 RY 2017 rates reflect MY data from January 1, 2016, through December 31, 2016. 4 RY 2018 rates reflect MY data from January 1, 2017, through December 31, 2017. 5 Performance comparisons are based on the Chi-square test of statistical significance, with a p value of <0.05. * A lower rate indicates better performance for this measure. ** Member months are a member's “contribution” to the total yearly membership. NA = The MCP followed the specifications, but the denominator was too small (less than 30) to report a valid rate. S = The MCP’s measure is publicly reported based on NCQA HEDIS Compliance Audit results; however, since fewer than 11 cases exist in the numerator of this measure, HSAG suppresses displaying the rate in this report to satisfy the Health Insurance Portability and Accountability Act of 1996 Privacy Rule’s de-identification standard. If an RY 2017 or RY 2018 non-SPD rate is suppressed, HSAG also suppresses the RY 2017–18 rate difference. Not Tested = An RY 2017–18 rate difference was not calculated because high and low rates do not necessarily indicate better or worse performance.
Molina Healthcare of California Partner Plan, Inc. Performance Evaluation Report: July 1, 2017–June 30, 2018 California Department of Health Care Services
Page W-56 Health Services Advisory Group, Inc.
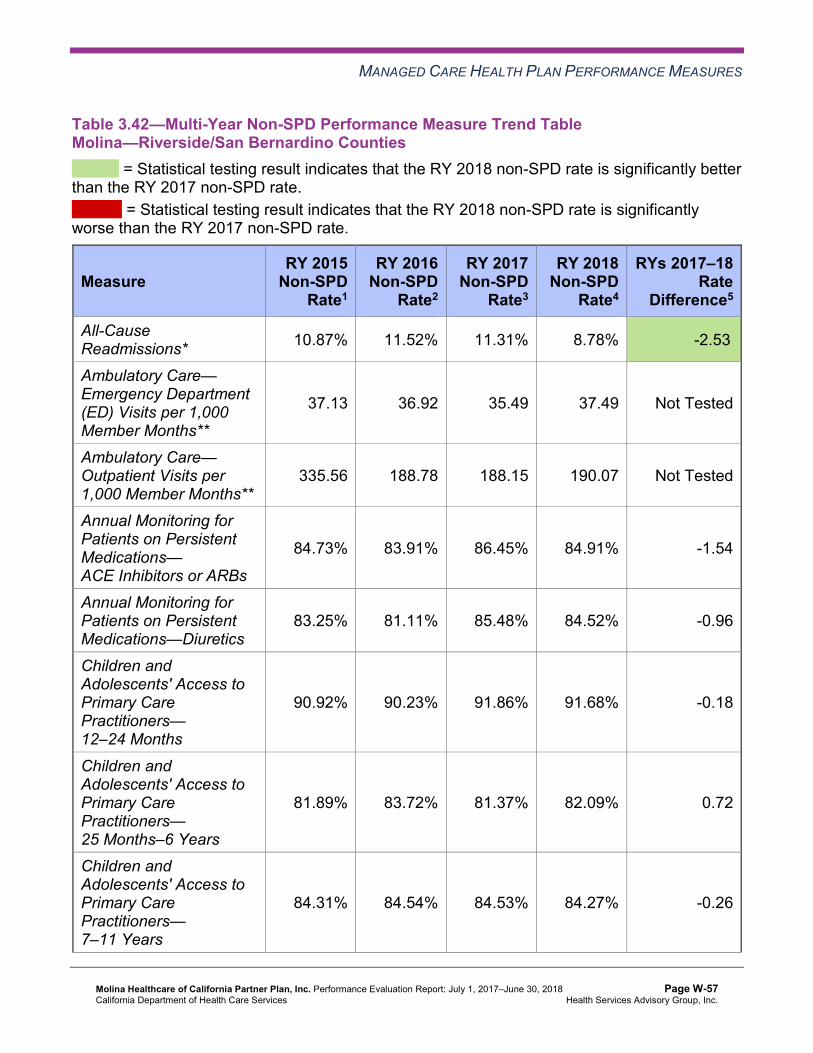
MANAGED CARE HEALTH PLAN PERFORMANCE MEASURES
Table 3.42—Multi-Year Non-SPD Performance Measure Trend Table Molina—Riverside/San Bernardino Counties
B = Statistical testing result indicates that the RY 2018 non-SPD rate is significantly better than the RY 2017 non-SPD rate.
W = Statistical testing result indicates that the RY 2018 non-SPD rate is significantly worse than the RY 2017 non-SPD rate.
Measure RY 2015
Non-SPD Rate1
RY 2016 Non-SPD
Rate2
RY 2017 Non-SPD
Rate3
RY 2018 Non-SPD
Rate4
RYs 2017–18 Rate
Difference5
All-Cause Readmissions* 10.87% 11.52% 11.31% 8.78% -2.53B
Ambulatory Care— Emergency Department (ED) Visits per 1,000 Member Months**
37.13 36.92 35.49 37.49 Not Tested
Ambulatory Care— Outpatient Visits per 1,000 Member Months**
335.56 188.78 188.15 190.07 Not Tested
Annual Monitoring for Patients on Persistent Medications— ACE Inhibitors or ARBs
84.73% 83.91% 86.45% 84.91% -1.54
Annual Monitoring for Patients on Persistent Medications—Diuretics
83.25% 81.11% 85.48% 84.52% -0.96
Children and Adolescents' Access to Primary Care Practitioners— 12–24 Months
90.92% 90.23% 91.86% 91.68% -0.18
Children and Adolescents' Access to Primary Care Practitioners— 25 Months–6 Years
81.89% 83.72% 81.37% 82.09% 0.72
Children and Adolescents' Access to Primary Care Practitioners— 7–11 Years
84.31% 84.54% 84.53% 84.27% -0.26
Molina Healthcare of California Partner Plan, Inc. Performance Evaluation Report: July 1, 2017–June 30, 2018 California Department of Health Care Services
Page W-57 Health Services Advisory Group, Inc.

MANAGED CARE HEALTH PLAN PERFORMANCE MEASURES
Measure RY 2015
Non-SPD Rate1
RY 2016 Non-SPD
Rate2
RY 2017 Non-SPD
Rate3
RY 2018 Non-SPD
Rate4
RYs 2017–18 Rate
Difference5
Children and Adolescents' Access to Primary Care Practitioners— 12–19 Years
83.65% 83.62% 82.62% 82.33% -0.29
1 RY 2015 rates reflect MY data from January 1, 2014, through December 31, 2014. 2 RY 2016 rates reflect MY data from January 1, 2015, through December 31, 2015. 3 RY 2017 rates reflect MY data from January 1, 2016, through December 31, 2016. 4 RY 2018 rates reflect MY data from January 1, 2017, through December 31, 2017. 5 Performance comparisons are based on the Chi-square test of statistical significance, with a p value of <0.05. * A lower rate indicates better performance for this measure. ** Member months are a member's “contribution” to the total yearly membership. Not Tested = An RY 2017–18 rate difference was not calculated because high and low rates do not necessarily indicate better or worse performance.
Table 3.43—Multi-Year Non-SPD Performance Measure Trend Table Molina—Sacramento County
B = Statistical testing result indicates that the RY 2018 non-SPD rate is significantly better than the RY 2017 non-SPD rate.
W = Statistical testing result indicates that the RY 2018 non-SPD rate is significantly worse than the RY 2017 non-SPD rate.
Measure RY 2015
Non-SPD Rate1
RY 2016 Non-SPD
Rate2
RY 2017 Non-SPD
Rate3
RY 2018 Non-SPD
Rate4
RYs 2017–18 Rate
Difference5
All-Cause Readmissions* 10.98% 11.63% 11.37% 12.05% 0.68
Ambulatory Care— Emergency Department (ED) Visits per 1,000 Member Months**
54.54 55.21 51.16 40.94 Not Tested
Ambulatory Care— Outpatient Visits per 1,000 Member Months**
384.77 235.22 192.13 168.18 Not Tested
Molina Healthcare of California Partner Plan, Inc. Performance Evaluation Report: July 1, 2017–June 30, 2018 California Department of Health Care Services
Page W-58 Health Services Advisory Group, Inc.

MANAGED CARE HEALTH PLAN PERFORMANCE MEASURES
Measure RY 2015
Non-SPD Rate1
RY 2016 Non-SPD
Rate2
RY 2017 Non-SPD
Rate3
RY 2018 Non-SPD
Rate4
RYs 2017–18 Rate
Difference5
Annual Monitoring for Patients on Persistent Medications— ACE Inhibitors or ARBs
83.15% 87.47% 86.29% 87.18% 0.89
Annual Monitoring for Patients on Persistent Medications—Diuretics
80.02% 86.28% 84.49% 85.48% 0.99
Children and Adolescents' Access to Primary Care Practitioners— 12–24 Months
89.21% 89.41% 89.40% 90.76% 1.36
Children and Adolescents' Access to Primary Care Practitioners— 25 Months–6 Years
80.54% 80.57% 76.59% 79.74% 3.15B
Children and Adolescents' Access to Primary Care Practitioners— 7–11 Years
80.57% 81.76% 82.44% 82.42% -0.02
Children and Adolescents' Access to Primary Care Practitioners— 12–19 Years
80.93% 80.32% 79.29% 77.87% -1.42
1 RY 2015 rates reflect MY data from January 1, 2014, through December 31, 2014. 2 RY 2016 rates reflect MY data from January 1, 2015, through December 31, 2015. 3 RY 2017 rates reflect MY data from January 1, 2016, through December 31, 2016. 4 RY 2018 rates reflect MY data from January 1, 2017, through December 31, 2017. 5 Performance comparisons are based on the Chi-square test of statistical significance, with a p value of <0.05. * A lower rate indicates better performance for this measure. ** Member months are a member's “contribution” to the total yearly membership. Not Tested = An RY 2017–18 rate difference was not calculated because high and low rates do not necessarily indicate better or worse performance.
Molina Healthcare of California Partner Plan, Inc. Performance Evaluation Report: July 1, 2017–June 30, 2018 California Department of Health Care Services
Page W-59 Health Services Advisory Group, Inc.
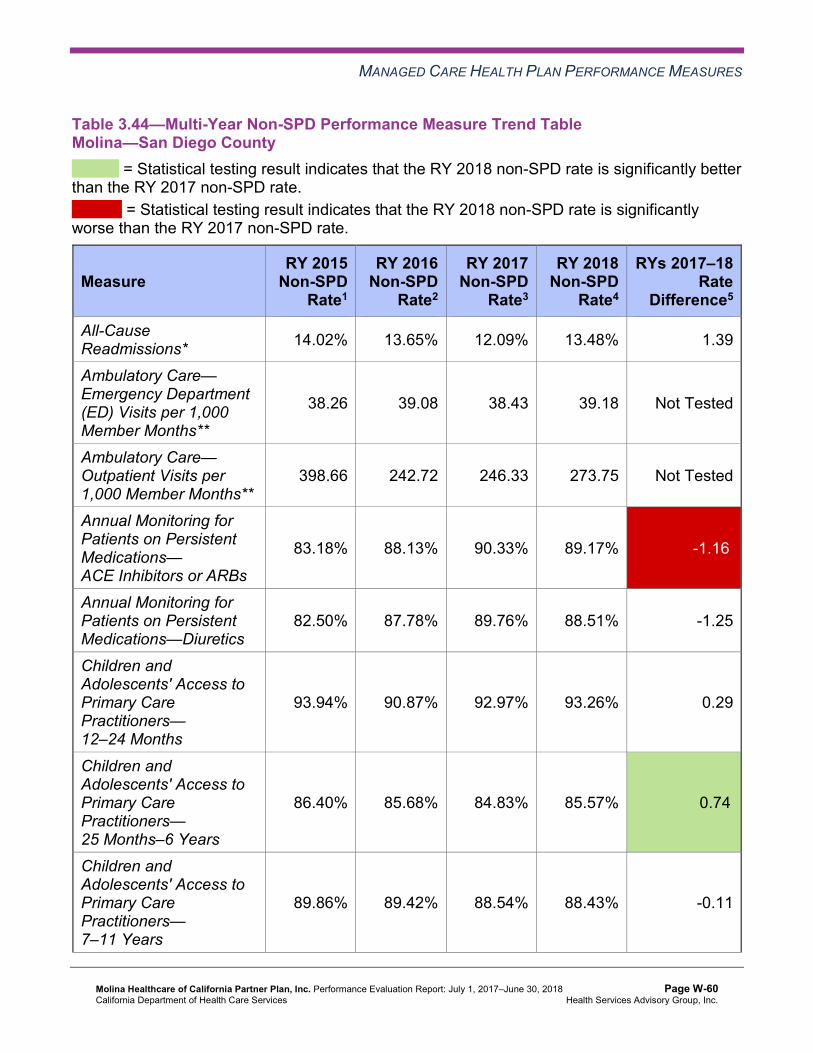
MANAGED CARE HEALTH PLAN PERFORMANCE MEASURES
Table 3.44—Multi-Year Non-SPD Performance Measure Trend Table Molina—San Diego County
B = Statistical testing result indicates that the RY 2018 non-SPD rate is significantly better than the RY 2017 non-SPD rate.
W = Statistical testing result indicates that the RY 2018 non-SPD rate is significantly worse than the RY 2017 non-SPD rate.
Measure RY 2015
Non-SPD Rate1
RY 2016 Non-SPD
Rate2
RY 2017 Non-SPD
Rate3
RY 2018 Non-SPD
Rate4
RYs 2017–18 Rate
Difference5
All-Cause Readmissions* 14.02% 13.65% 12.09% 13.48% 1.39
Ambulatory Care— Emergency Department (ED) Visits per 1,000 Member Months**
38.26 39.08 38.43 39.18 Not Tested
Ambulatory Care— Outpatient Visits per 1,000 Member Months**
398.66 242.72 246.33 273.75 Not Tested
Annual Monitoring for Patients on Persistent Medications— ACE Inhibitors or ARBs
83.18% 88.13% 90.33% 89.17% -1.16W
Annual Monitoring for Patients on Persistent Medications—Diuretics
82.50% 87.78% 89.76% 88.51% -1.25
Children and Adolescents' Access to Primary Care Practitioners— 12–24 Months
93.94% 90.87% 92.97% 93.26% 0.29
Children and Adolescents' Access to Primary Care Practitioners— 25 Months–6 Years
86.40% 85.68% 84.83% 85.57% 0.74B
Children and Adolescents' Access to Primary Care Practitioners— 7–11 Years
89.86% 89.42% 88.54% 88.43% -0.11
Molina Healthcare of California Partner Plan, Inc. Performance Evaluation Report: July 1, 2017–June 30, 2018 California Department of Health Care Services
Page W-60 Health Services Advisory Group, Inc.
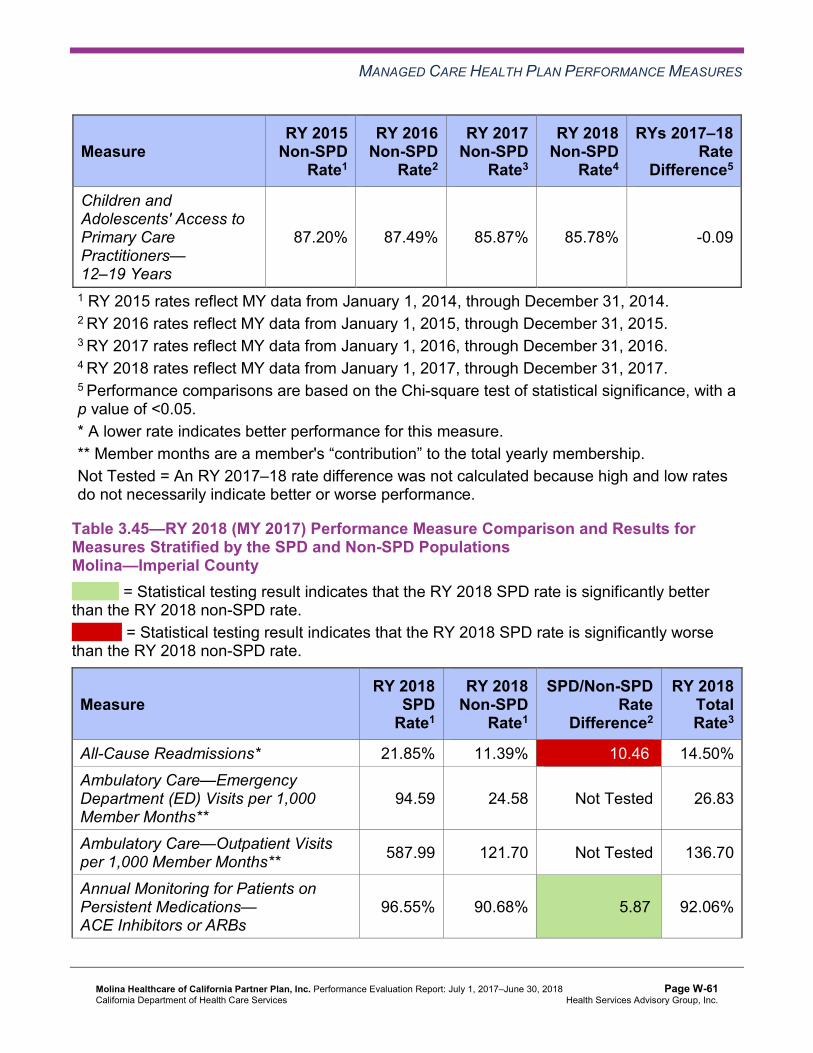
MANAGED CARE HEALTH PLAN PERFORMANCE MEASURES
Measure RY 2015
Non-SPD Rate1
RY 2016 Non-SPD
Rate2
RY 2017 Non-SPD
Rate3
RY 2018 Non-SPD
Rate4
RYs 2017–18 Rate
Difference5
Children and Adolescents' Access to Primary Care Practitioners— 12–19 Years
87.20% 87.49% 85.87% 85.78% -0.09
1 RY 2015 rates reflect MY data from January 1, 2014, through December 31, 2014. 2 RY 2016 rates reflect MY data from January 1, 2015, through December 31, 2015. 3 RY 2017 rates reflect MY data from January 1, 2016, through December 31, 2016. 4 RY 2018 rates reflect MY data from January 1, 2017, through December 31, 2017. 5 Performance comparisons are based on the Chi-square test of statistical significance, with a p value of <0.05. * A lower rate indicates better performance for this measure. ** Member months are a member's “contribution” to the total yearly membership. Not Tested = An RY 2017–18 rate difference was not calculated because high and low rates do not necessarily indicate better or worse performance.
Table 3.45—RY 2018 (MY 2017) Performance Measure Comparison and Results forMeasures Stratified by the SPD and Non-SPD PopulationsMolina—Imperial County
B = Statistical testing result indicates that the RY 2018 SPD rate is significantly better than the RY 2018 non-SPD rate.
W = Statistical testing result indicates that the RY 2018 SPD rate is significantly worse than the RY 2018 non-SPD rate.
Measure RY 2018
SPD Rate1
RY 2018 Non-SPD
Rate1
SPD/Non-SPDRate
Difference2
RY 2018 Total Rate3
All-Cause Readmissions* 21.85% 11.39% 10.46W 14.50% Ambulatory Care—Emergency Department (ED) Visits per 1,000 Member Months**
94.59 24.58 Not Tested 26.83
Ambulatory Care—Outpatient Visits per 1,000 Member Months** 587.99 121.70 Not Tested 136.70
Annual Monitoring for Patients on Persistent Medications— ACE Inhibitors or ARBs
96.55% 90.68% 5.87B 92.06%
Molina Healthcare of California Partner Plan, Inc. Performance Evaluation Report: July 1, 2017–June 30, 2018 California Department of Health Care Services
Page W-61 Health Services Advisory Group, Inc.

MANAGED CARE HEALTH PLAN PERFORMANCE MEASURES
Measure RY 2018
SPD Rate1
RY 2018 Non-SPD
Rate1
SPD/Non-SPDRate
Difference2
RY 2018 Total Rate3
Annual Monitoring for Patients on Persistent Medications—Diuretics 97.92% 91.15% 6.77B 93.40%
Children and Adolescents' Access to Primary Care Practitioners— 12–24 Months
NA 89.80% Not Comparable 89.85%
Children and Adolescents' Access to Primary Care Practitioners— 25 Months–6 Years
NA 74.59% Not Comparable 74.79%
Children and Adolescents' Access to Primary Care Practitioners— 7–11 Years
NA 73.77% Not Comparable 73.91%
Children and Adolescents' Access to Primary Care Practitioners— 12–19 Years
84.31% 72.48% 11.83 72.93%
1 RY 2018 rates reflect MY data from January 1, 2017, through December 31, 2017. 2 Performance comparisons are based on the Chi-square test of statistical significance, with a p value of <0.05. 3 Total rates are based on the MCP reporting unit’s total results, including the SPD and non-SPD populations. Please note, if data are not available for either the SPD or non-SPD population, the total rate is based on results reported for the available population. * A lower rate indicates better performance for this measure. ** Member months are a member's “contribution” to the total yearly membership. NA = The MCP followed the specifications, but the denominator was too small (less than 30) to report a valid rate. Not Comparable = An SPD/non-SPD rate difference cannot be made because data are not available for both populations. Not Tested = An SPD/non-SPD rate difference was not calculated because high and low rates do not necessarily indicate better or worse performance.
Molina Healthcare of California Partner Plan, Inc. Performance Evaluation Report: July 1, 2017–June 30, 2018 California Department of Health Care Services
Page W-62 Health Services Advisory Group, Inc.
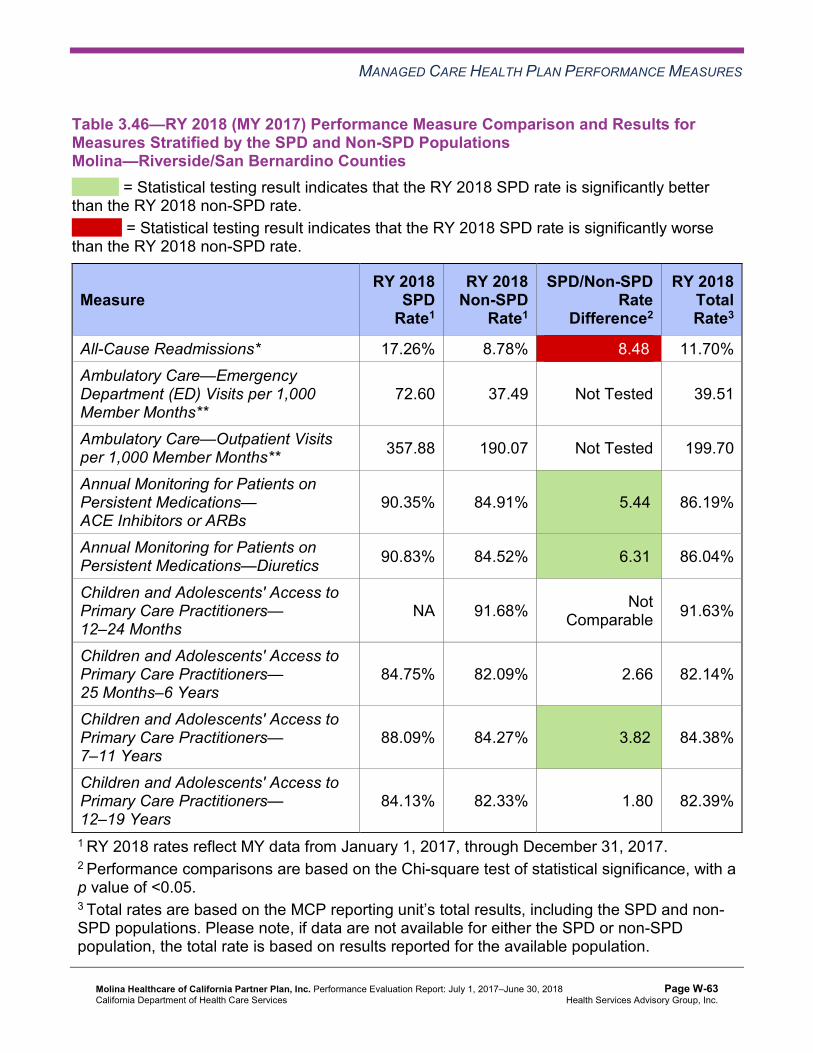
MANAGED CARE HEALTH PLAN PERFORMANCE MEASURES
Table 3.46—RY 2018 (MY 2017) Performance Measure Comparison and Results forMeasures Stratified by the SPD and Non-SPD PopulationsMolina—Riverside/San Bernardino Counties
B = Statistical testing result indicates that the RY 2018 SPD rate is significantly better than the RY 2018 non-SPD rate.
W = Statistical testing result indicates that the RY 2018 SPD rate is significantly worse than the RY 2018 non-SPD rate.
Measure RY 2018
SPD Rate1
RY 2018 Non-SPD
Rate1
SPD/Non-SPDRate
Difference2
RY 2018 Total Rate3
All-Cause Readmissions* 17.26% 8.78% 8.48W 11.70% Ambulatory Care—Emergency Department (ED) Visits per 1,000 Member Months**
72.60 37.49 Not Tested 39.51
Ambulatory Care—Outpatient Visits per 1,000 Member Months** 357.88 190.07 Not Tested 199.70
Annual Monitoring for Patients on Persistent Medications— ACE Inhibitors or ARBs
90.35% 84.91% 5.44B 86.19%
Annual Monitoring for Patients on Persistent Medications—Diuretics 90.83% 84.52% 6.31B 86.04%
Children and Adolescents' Access to Primary Care Practitioners— 12–24 Months
NA 91.68% Not Comparable 91.63%
Children and Adolescents' Access to Primary Care Practitioners— 25 Months–6 Years
84.75% 82.09% 2.66 82.14%
Children and Adolescents' Access to Primary Care Practitioners— 7–11 Years
88.09% 84.27% 3.82B 84.38%
Children and Adolescents' Access to Primary Care Practitioners— 12–19 Years
84.13% 82.33% 1.80 82.39%
1 RY 2018 rates reflect MY data from January 1, 2017, through December 31, 2017. 2 Performance comparisons are based on the Chi-square test of statistical significance, with a p value of <0.05. 3 Total rates are based on the MCP reporting unit’s total results, including the SPD and non-SPD populations. Please note, if data are not available for either the SPD or non-SPD population, the total rate is based on results reported for the available population.
Molina Healthcare of California Partner Plan, Inc. Performance Evaluation Report: July 1, 2017–June 30, 2018 California Department of Health Care Services
Page W-63 Health Services Advisory Group, Inc.

MANAGED CARE HEALTH PLAN PERFORMANCE MEASURES
* A lower rate indicates better performance for this measure. ** Member months are a member's “contribution” to the total yearly membership. NA = The MCP followed the specifications, but the denominator was too small (less than 30) to report a valid rate. Not Comparable = An SPD/non-SPD rate difference cannot be made because data are not available for both populations. Not Tested = An SPD/non-SPD rate difference was not calculated because high and low rates do not necessarily indicate better or worse performance.
Table 3.47—RY 2018 (MY 2017) Performance Measure Comparison and Results forMeasures Stratified by the SPD and Non-SPD PopulationsMolina—Sacramento County
B = Statistical testing result indicates that the RY 2018 SPD rate is significantly better than the RY 2018 non-SPD rate.
W = Statistical testing result indicates that the RY 2018 SPD rate is significantly worse than the RY 2018 non-SPD rate.
Measure RY 2018
SPD Rate1
RY 2018 Non-SPD
Rate1
SPD/Non-SPDRate
Difference2
RY 2018 Total Rate3
All-Cause Readmissions* 20.96% 12.05% 8.91W 16.40% Ambulatory Care—Emergency Department (ED) Visits per 1,000 Member Months**
88.97 40.94 Not Tested 45.62
Ambulatory Care—Outpatient Visits per 1,000 Member Months** 459.41 168.18 Not Tested 196.57
Annual Monitoring for Patients on Persistent Medications— ACE Inhibitors or ARBs
89.08% 87.18% 1.90 88.00%
Annual Monitoring for Patients on Persistent Medications—Diuretics 89.72% 85.48% 4.24B 87.38%
Children and Adolescents' Access to Primary Care Practitioners— 12–24 Months
NA 90.76% Not Comparable 90.69%
Children and Adolescents' Access to Primary Care Practitioners— 25 Months–6 Years
83.02% 79.74% 3.28 79.82%
Children and Adolescents' Access to Primary Care Practitioners— 7–11 Years
84.62% 82.42% 2.20 82.50%
Molina Healthcare of California Partner Plan, Inc. Performance Evaluation Report: July 1, 2017–June 30, 2018 California Department of Health Care Services
Page W-64 Health Services Advisory Group, Inc.
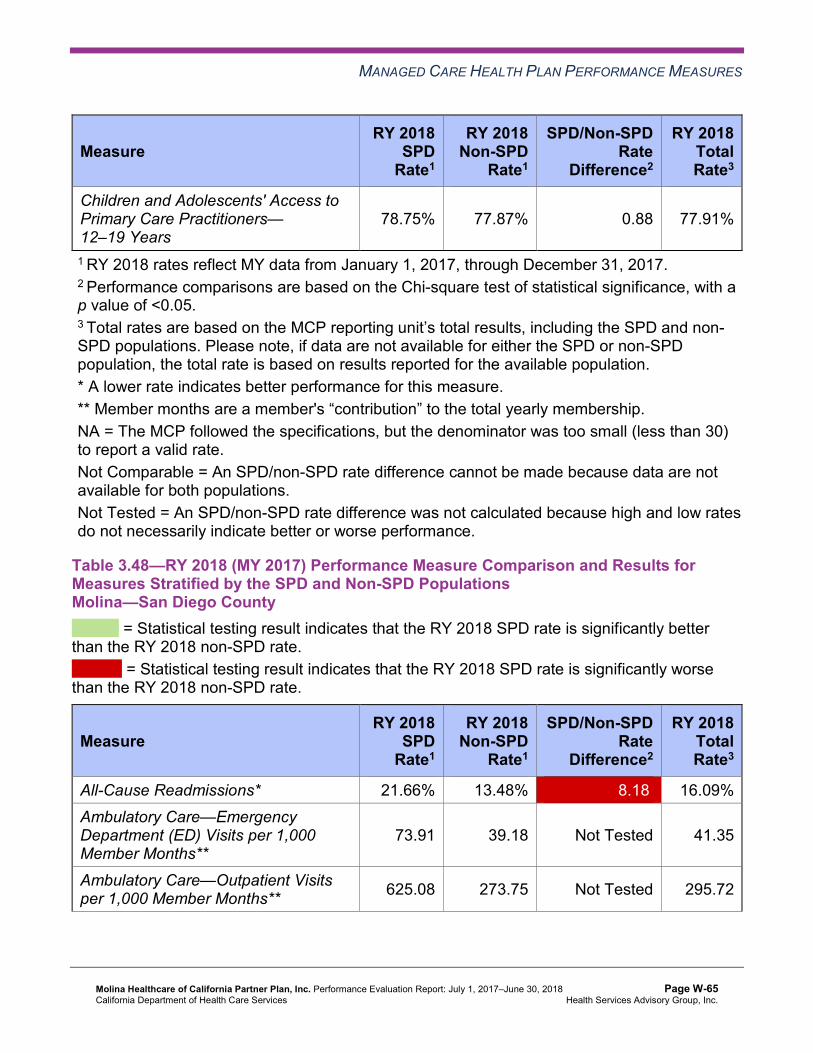
MANAGED CARE HEALTH PLAN PERFORMANCE MEASURES
Measure RY 2018
SPD Rate1
RY 2018 Non-SPD
Rate1
SPD/Non-SPDRate
Difference2
RY 2018 Total Rate3
Children and Adolescents' Access to Primary Care Practitioners— 12–19 Years
78.75% 77.87% 0.88 77.91%
1 RY 2018 rates reflect MY data from January 1, 2017, through December 31, 2017. 2 Performance comparisons are based on the Chi-square test of statistical significance, with a p value of <0.05. 3 Total rates are based on the MCP reporting unit’s total results, including the SPD and non-SPD populations. Please note, if data are not available for either the SPD or non-SPD population, the total rate is based on results reported for the available population. * A lower rate indicates better performance for this measure. ** Member months are a member's “contribution” to the total yearly membership. NA = The MCP followed the specifications, but the denominator was too small (less than 30) to report a valid rate. Not Comparable = An SPD/non-SPD rate difference cannot be made because data are not available for both populations. Not Tested = An SPD/non-SPD rate difference was not calculated because high and low rates do not necessarily indicate better or worse performance.
Table 3.48—RY 2018 (MY 2017) Performance Measure Comparison and Results forMeasures Stratified by the SPD and Non-SPD PopulationsMolina—San Diego County
B = Statistical testing result indicates that the RY 2018 SPD rate is significantly better than the RY 2018 non-SPD rate.
W = Statistical testing result indicates that the RY 2018 SPD rate is significantly worse than the RY 2018 non-SPD rate.
Measure RY 2018
SPD Rate1
RY 2018 Non-SPD
Rate1
SPD/Non-SPDRate
Difference2
RY 2018 Total Rate3
All-Cause Readmissions* 21.66% 13.48% 8.18W 16.09% Ambulatory Care—Emergency Department (ED) Visits per 1,000 Member Months**
73.91 39.18 Not Tested 41.35
Ambulatory Care—Outpatient Visits per 1,000 Member Months** 625.08 273.75 Not Tested 295.72
Molina Healthcare of California Partner Plan, Inc. Performance Evaluation Report: July 1, 2017–June 30, 2018 California Department of Health Care Services
Page W-65 Health Services Advisory Group, Inc.

MANAGED CARE HEALTH PLAN PERFORMANCE MEASURES
Measure RY 2018
SPD Rate1
RY 2018 Non-SPD
Rate1
SPD/Non-SPDRate
Difference2
RY 2018 Total Rate3
Annual Monitoring for Patients on Persistent Medications— ACE Inhibitors or ARBs
93.21% 89.17% 4.04B 90.40%
Annual Monitoring for Patients on Persistent Medications—Diuretics 94.39% 88.51% 5.88B 90.38%
Children and Adolescents' Access to Primary Care Practitioners— 12–24 Months
NA 93.26% Not Comparable 93.29%
Children and Adolescents' Access to Primary Care Practitioners— 25 Months–6 Years
90.23% 85.57% 4.66B 85.67%
Children and Adolescents' Access to Primary Care Practitioners— 7–11 Years
93.08% 88.43% 4.65B 88.56%
Children and Adolescents' Access to Primary Care Practitioners— 12–19 Years
89.60% 85.78% 3.82B 85.89%
1 RY 2018 rates reflect MY data from January 1, 2017, through December 31, 2017. 2 Performance comparisons are based on the Chi-square test of statistical significance, with a p value of <0.05. 3 Total rates are based on the MCP reporting unit’s total results, including the SPD and non-SPD populations. Please note, if data are not available for either the SPD or non-SPD population, the total rate is based on results reported for the available population. * A lower rate indicates better performance for this measure. ** Member months are a member's “contribution” to the total yearly membership. NA = The MCP followed the specifications, but the denominator was too small (less than 30) to report a valid rate. Not Comparable = An SPD/non-SPD rate difference cannot be made because data are not available for both populations. Not Tested = An SPD/non-SPD rate difference was not calculated because high and low rates do not necessarily indicate better or worse performance.
Molina Healthcare of California Partner Plan, Inc. Performance Evaluation Report: July 1, 2017–June 30, 2018 California Department of Health Care Services
Page W-66 Health Services Advisory Group, Inc.

MANAGED CARE HEALTH PLAN PERFORMANCE MEASURES
Seniors and Persons with Disabilities Findings
HSAG observed the following notable results in RY 2018 for measures that Molina stratified by the SPD and non-SPD populations:
♦ For SPD rates for which HSAG could make a comparison between RY 2017 and RY 2018: ■ The RY 2018 SPD rates were significantly better than the RY 2017 SPD rates for the
following measures: ○ All-Cause Readmissions in Riverside/San Bernardino counties ○ Annual Monitoring for Patients on Persistent Medications—ACE Inhibitors or ARBs
in Sacramento County ○ Children and Adolescents’ Access to Primary Care Practitioners—12–19 Years in
Sacramento County ■ The RY 2018 SPD rates were significantly worse than the RY 2017 SPD rates for the
following measures in San Diego County: ○ All-Cause Readmissions ○ Annual Monitoring for Patients on Persistent Medications—ACE Inhibitors or ARBs
♦ The RY 2018 non-SPD rates were significantly better than the RY 2017 non-SPD rates for the following measures: ■ All-Cause Readmissions in Riverside/San Bernardino counties ■ Children and Adolescents’ Access to Primary Care Practitioners—25 Months–6 Years in
Sacramento and San Diego counties ♦ The RY 2018 non-SPD rate was significantly worse than the 2017 non-SPD rate for the
Annual Monitoring for Patients on Persistent Medications—ACE Inhibitors or ARBs measure in San Diego County.
♦ For measures for which HSAG could compare the RY 2018 SPD rates to the RY 2018 non-SPD rates: ■ The RY 2018 SPD rates were significantly better than the RY 2018 non-SPD rates for
the following measures: ○ Annual Monitoring for Patients on Persistent Medications—ACE Inhibitors or ARBs
in Imperial, Riverside/San Bernardino, and San Diego counties ○ Annual Monitoring for Patients on Persistent Medications—Diuretics in all four
reporting units ○ Children and Adolescents’ Access to Primary Care Practitioners—25 Months–6
Years in San Diego County ○ Children and Adolescents’ Access to Primary Care Practitioners—7–11 Years in
Riverside/San Bernardino and San Diego counties ○ Children and Adolescents’ Access to Primary Care Practitioners—12–19 Years in
San Diego County ■ The RY 2018 SPD rate was significantly worse than the RY 2018 non-SPD rate for the
All-Cause Readmissions measure in all four reporting units. Note that the higher rate of
Molina Healthcare of California Partner Plan, Inc. Performance Evaluation Report: July 1, 2017–June 30, 2018 California Department of Health Care Services
Page W-67 Health Services Advisory Group, Inc.
MANAGED CARE HEALTH PLAN PERFORMANCE MEASURES
hospital readmissions for the SPD population is expected based on the greater and often more complicated health care needs of these beneficiaries.
Strengths—Performance Measures HSAG auditors determined that Molina followed the appropriate specifications to produce valid rates, and identified no issues of concern.
Across all domains and reporting units, HSAG identified the following notable RY 2018 performance measure results for Molina:
♦ The rates for the following measures were above the HPLs: ■ Annual Monitoring for Patients on Persistent Medications—Diuretics in Imperial County ■ Comprehensive Diabetes Care—Medical Attention for Nephropathy in Riverside/San
Bernardino counties ■ Immunizations for Adolescents—Combination 2 in Riverside/San Bernardino,
Sacramento, and San Diego counties ♦ The MCP had no rates below the MPLs within the Care for Chronic Conditions domain
across all four reporting units, and San Diego County had no rates below the MPLs in any domain.
♦ The rates for the following measures improved from below the MPLs in RY 2017 to above the MPLs in RY 2018: ■ Prenatal and Postpartum Care—Postpartum Care in Sacramento County ■ Use of Imaging Studies for Low Back Pain in San Diego County ■ Well-Child Visits in the Third, Fourth, Fifth, and Sixth Years of Life in Sacramento
County
Opportunities for Improvement—Performance Measures Across all domains and reporting units in RY 2018, Imperial County had the highest percentage of rates below the MPLs for the measures for which DHCS held MCPs accountable to meet the MPLs, with four of 21 rates (19 percent) being below the MPLs. Two of these rates were below the MPLs for at least four consecutive years. San Diego County had the highest percentage of RY 2018 rates that were significantly worse than RY 2017 rates, with four of 22 rates (18 percent) declining significantly from RY 2017 to RY 2018.
Across all domains and reporting units, Molina has opportunities to improve performance for measures with rates that were below the MPLs in RY 2018 and measures with rates that declined significantly from RY 2017 to RY 2018.
♦ The rates for the following measures were below the MPLs in RY 2018: ■ Breast Cancer Screening in Imperial County.
Molina Healthcare of California Partner Plan, Inc. Performance Evaluation Report: July 1, 2017–June 30, 2018 California Department of Health Care Services
Page W-68 Health Services Advisory Group, Inc.
MANAGED CARE HEALTH PLAN PERFORMANCE MEASURES
■ Childhood Immunization Status—Combination 3 in Sacramento County—The rate has been below the MPL for at least four consecutive years.
■ Prenatal and Postpartum Care—Postpartum Care in Imperial and Riverside/San Bernardino counties—The rates for both reporting units have been below the MPL for at least four consecutive years.
■ Prenatal and Postpartum Care—Timeliness of Prenatal Care in Imperial County. ■ Use of Imaging Studies for Low Back Pain in Imperial County—The rate has been
below the MPL for at least four consecutive years. ♦ The rates for the following measures declined significantly from RY 2017 to RY 2018:
■ All-Cause Readmissions in San Diego County ■ Both Annual Monitoring for Patients on Persistent Medications measures in San Diego
County ■ Asthma Medication Ratio in Riverside/San Bernardino, Sacramento, and San Diego
counties
Molina Healthcare of California Partner Plan, Inc. Performance Evaluation Report: July 1, 2017–June 30, 2018 California Department of Health Care Services
Page W-69 Health Services Advisory Group, Inc.

Medi-Cal Managed Care External Quality Review Technical ReportAppendix W: Performance Evaluation ReportMolina Healthcare of California Partner Plan, Inc. July 1, 2017–June 30, 2018
4. MLTSSP Performance Measure Results
Due to Molina’s participation in California’s Coordinated Care Initiative as a Managed Long-Term Services and Supports Plan (MLTSSP), DHCS required that Molina report rates for three HEDIS measures for HSAG to validate as part of the NCQA HEDIS Compliance Audit.
Table 4.1 and Table 4.2 present the rates for each required MLTSSP performance measure for RYs 2016, 2017, and 2018. The RY is the year in which the MLTSSP reported the rates. The RY rates reflect MY data from the previous calendar year. Note that the Ambulatory Care— Emergency Department Visits and Ambulatory Care—Outpatient Visits measures are utilization measures which measure the volume of services used. High and low rates do not necessarily indicate better or worse performance; therefore, for these measures, HSAG did not compare performance between RY 2017 and RY 2018.
Table 4.1—Multi-Year MLTSSP Performance Measure Results Molina—Riverside/San Bernardino Counties
B = Statistical testing result indicates that the RY 2018 rate is significantly better than the RY 2017 rate.
W = Statistical testing result indicates that the RY 2018 rate is significantly worse than the RY 2017 rate.
Measure RY 2016 MLTSS
Rate1
RY 2017 MLTSS
Rate2
RY 2018 MLTSS
Rate3
RYs 2017–18 Rate
Difference4
Ambulatory Care—Emergency Department (ED) Visits per 1,000 Member Months*
91.97 94.18 101.91 Not Tested
Ambulatory Care—Outpatient Visits per 1,000 Member Months* 536.26 565.48 690.91 Not Tested
Medication Reconciliation Post-Discharge 3.39% 27.54% 29.68% 2.14
1 RY 2016 rates reflect MY data from January 1, 2015, through December 31, 2015. 2 RY 2017 rates reflect MY data from January 1, 2016, through December 31, 2016. 3 RY 2018 rates reflect MY data from January 1, 2017, through December 31, 2017. 4 Performance comparisons are based on the Chi-square test of statistical significance, with a p value of <0.05. * Member months are a member's “contribution” to the total yearly membership. Not Tested = An RY 2017–18 rate difference was not calculated because high and low rates do not necessarily indicate better or worse performance.
Molina Healthcare of California Partner Plan, Inc. Performance Evaluation Report: July 1, 2017–June 30, 2018 California Department of Health Care Services
Page W-70 Health Services Advisory Group, Inc.
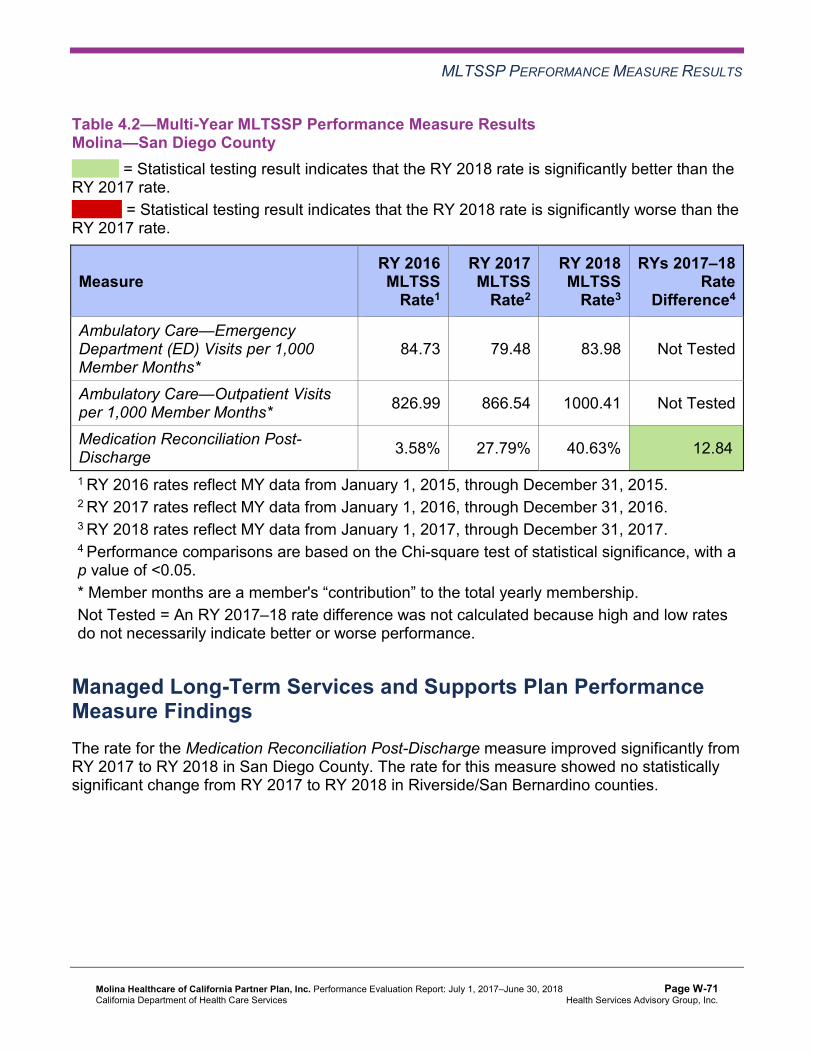
MLTSSP PERFORMANCE MEASURE RESULTS
Table 4.2—Multi-Year MLTSSP Performance Measure Results Molina—San Diego County
B = Statistical testing result indicates that the RY 2018 rate is significantly better than the RY 2017 rate.
W = Statistical testing result indicates that the RY 2018 rate is significantly worse than the RY 2017 rate.
Measure RY 2016 MLTSS
Rate1
RY 2017 MLTSS
Rate2
RY 2018 MLTSS
Rate3
RYs 2017–18 Rate
Difference4
Ambulatory Care—Emergency Department (ED) Visits per 1,000 Member Months*
84.73 79.48 83.98 Not Tested
Ambulatory Care—Outpatient Visits per 1,000 Member Months* 826.99 866.54 1000.41 Not Tested
Medication Reconciliation Post-Discharge 3.58% 27.79% 40.63% 12.84B
1 RY 2016 rates reflect MY data from January 1, 2015, through December 31, 2015. 2 RY 2017 rates reflect MY data from January 1, 2016, through December 31, 2016. 3 RY 2018 rates reflect MY data from January 1, 2017, through December 31, 2017. 4 Performance comparisons are based on the Chi-square test of statistical significance, with a p value of <0.05. * Member months are a member's “contribution” to the total yearly membership. Not Tested = An RY 2017–18 rate difference was not calculated because high and low rates do not necessarily indicate better or worse performance.
Managed Long-Term Services and Supports Plan PerformanceMeasure Findings The rate for the Medication Reconciliation Post-Discharge measure improved significantly from RY 2017 to RY 2018 in San Diego County. The rate for this measure showed no statistically significant change from RY 2017 to RY 2018 in Riverside/San Bernardino counties.
Molina Healthcare of California Partner Plan, Inc. Performance Evaluation Report: July 1, 2017–June 30, 2018 California Department of Health Care Services
Page W-71 Health Services Advisory Group, Inc.

Medi-Cal Managed Care External Quality Review Technical ReportAppendix W: Performance Evaluation ReportMolina Healthcare of California Partner Plan, Inc. July 1, 2017–June 30, 2018
5. Performance Improvement Projects
Performance Improvement Project Overview The key concepts of the rapid-cycle PIP framework include forming a PIP team, setting aims, establishing measures, determining interventions using quality improvement tools, conducting PDSA cycles to test interventions, and planning for the spread of successful changes. The core component of the rapid-cycle PIP approach involves testing changes on a small scale so that improvement can occur more efficiently and lead to long-term sustainability. The following modules guide MCPs through this rapid-cycle PIP process:
♦ Module 1—PIP Initiation ■ MCPs outline the framework for the PIP, which includes:
○ The topic rationale. ○ Comparative data supporting the need to improve the selected topic. ○ A list of the PIP team members, which consists of internal and external stakeholders. ○ A completed key driver diagram that defines the theory of change for improvement,
including the SMART (Specific, Measurable, Achievable, Relevant, and Time-bound) Aim and Global Aim.
♦ Module 2—SMART Aim Data Collection ■ MCPs define the SMART Aim measure and data collection methodology and develop
the SMART Aim data run chart. ♦ Module 3—Intervention Determination
■ MCPs use process mapping and failure modes and effects analysis (FMEA) to identify potential interventions to test which may have direct effects on the SMART Aim.
♦ Module 4—Plan-Do-Study-Act (PDSA) ■ MCPs test and evaluate the interventions identified in Module 3 through a series of
PDSA cycles. ♦ Module 5—PIP Conclusions
■ MCPs interpret results and summarize: ○ Key findings and outcomes achieved. ○ Assessment of each tested intervention. ○ Lessons learned, including how demonstrated improvement can be shared and used
as a foundation for further improvement going forward. ○ Plan for sustained improvement.
Molina Healthcare of California Partner Plan, Inc. Performance Evaluation Report: July 1, 2017–June 30, 2018 California Department of Health Care Services
Page W-72 Health Services Advisory Group, Inc.

PERFORMANCE IMPROVEMENT PROJECTS
Based on the agreed-upon timeline, MCPs submit each module to HSAG for validation. Throughout the rapid-cycle PIP process, HSAG provides technical assistance to MCPs to ensure that PIPs are methodologically sound and to problem-solve with MCPs regarding how to address challenges that occur. Through an iterative process, MCPs have opportunities to make corrections to modules 1 through 3 to achieve all validation criteria.
Once MCPs achieve all validation criteria for modules 1 through 3 and receive feedback on the intervention Plan portion of Module 4, MCPs test interventions. During the intervention testing phase of the PIP, HSAG conducts periodic progress check-ins to ensure that MCPs have addressed HSAG’s feedback on the Plan portion of Module 4 and are making appropriate progress with intervention testing. Once MCPs complete testing an intervention, MCPs determine the next steps based on results and lessons learned—whether the intervention was successful and should be spread (adopt), whether modifications need to be made to the existing intervention (adapt), or whether the intervention was not successful and should be stopped (abandon).
In Module 5, MCPs summarize the overall PIP. When validating Module 5, HSAG assesses the validity and reliability of the results based on the Centers for Medicare & Medicaid Services (CMS) validation protocols to determine whether key stakeholders can have confidence in the reported PIP findings. HSAG assigns the following final confidence levels for each PIP:
♦ High confidence—the PIP was methodologically sound and achieved the SMART Aim goal; the demonstrated improvement was clearly linked to the quality improvement processes conducted and intervention(s) tested; and, the MCP accurately summarized the key findings.
♦ Confidence—the PIP was methodologically sound and achieved the SMART Aim goal, and the MCP accurately summarized the key findings. However, some, but not all, of the quality improvement processes conducted and/or intervention(s) tested were clearly linked to the demonstrated improvement.
♦ Low confidence—either (A) the PIP was methodologically sound; however, the SMART Aim goal was not achieved; or (B) the SMART Aim goal was achieved; however, the quality improvement processes and/or intervention(s) tested were poorly executed and could not be linked to the improvement.
♦ Reported PIP results were not credible—the PIP methodology was not executed as approved.
Performance Improvement Project Results and Findings During the review period, Molina submitted modules 4 and 5 for its 2015–17 DHCS-priority and MCP-specific PIPs. HSAG validated the modules and includes the final PIP validation findings in this report. Additionally, Molina initiated a Disparity PIP and a DHCS-priority PIP during the review period. In this report, HSAG includes summaries of the MCP’s Disparity and DHCS-priority PIP module submissions as well as validation findings from the review period.
Molina Healthcare of California Partner Plan, Inc. Performance Evaluation Report: July 1, 2017–June 30, 2018 California Department of Health Care Services
Page W-73 Health Services Advisory Group, Inc.

PERFORMANCE IMPROVEMENT PROJECTS
2015–17 DHCS-Priority Performance Improvement Project
Molina selected postpartum care for its 2015–17 DHCS-priority PIP. While the MCP concluded its Postpartum Care PIP through the SMART Aim end date of June 30, 2017, Molina submitted modules 4 and 5 for HSAG to validate during the review period for this report. HSAG provided final validation findings and encouraged Molina to incorporate the experiences and lessons learned from the PIP into future quality improvement efforts.
Table 5.1 provides a summary of the SMART Aim measure results reported by the MCP.
Table 5.1—Molina Postpartum Care PIP SMART Aim Measure Results
SMART Aim Measure Baseline Rate
SMART Aim Goal
Rate
SMART Aim Goal Achieved
Rate of postpartum visits among eligible beneficiaries in a high-volume, low-performing provider office in Sacramento County.
39.1% 44.1% Yes
Table 5.2 presents a description of the intervention that Molina tested for its Postpartum Care PIP. The table also indicates the failure mode that the intervention addressed as well as whether the MCP decided, based on intervention testing results, to adopt, adapt, or abandon the intervention.
Table 5.2—Molina Postpartum Care PIP Intervention Testing Results
Intervention Failure Mode Addressed Adopt,Adapt, orAbandon
In-home postpartum assessments within 21 to 56 days post delivery
Beneficiaries’ lack of motivation for seeking timely postpartum care Adopt
Molina documented the following lessons learned during the scope of the 2015–17 DHCS-priority PIP, which the MCP may apply to future PIPs:
♦ Ensure continuous communication with all stakeholders. ♦ Follow up with appropriate documentation for key decisions.
Performance Improvement Project Validation Findings
During the review period for this report, HSAG validated modules 4 and 5 for the MCP’s Postpartum Care PIP. The MCP demonstrated the effectiveness of the intervention as the project progressed and determined that the intervention should be adopted in another clinic within the county. Molina reported that it achieved the SMART Aim goal; however, the total number of beneficiaries reached by the intervention each month appeared small in relation to
Molina Healthcare of California Partner Plan, Inc. Performance Evaluation Report: July 1, 2017–June 30, 2018 California Department of Health Care Services
Page W-74 Health Services Advisory Group, Inc.
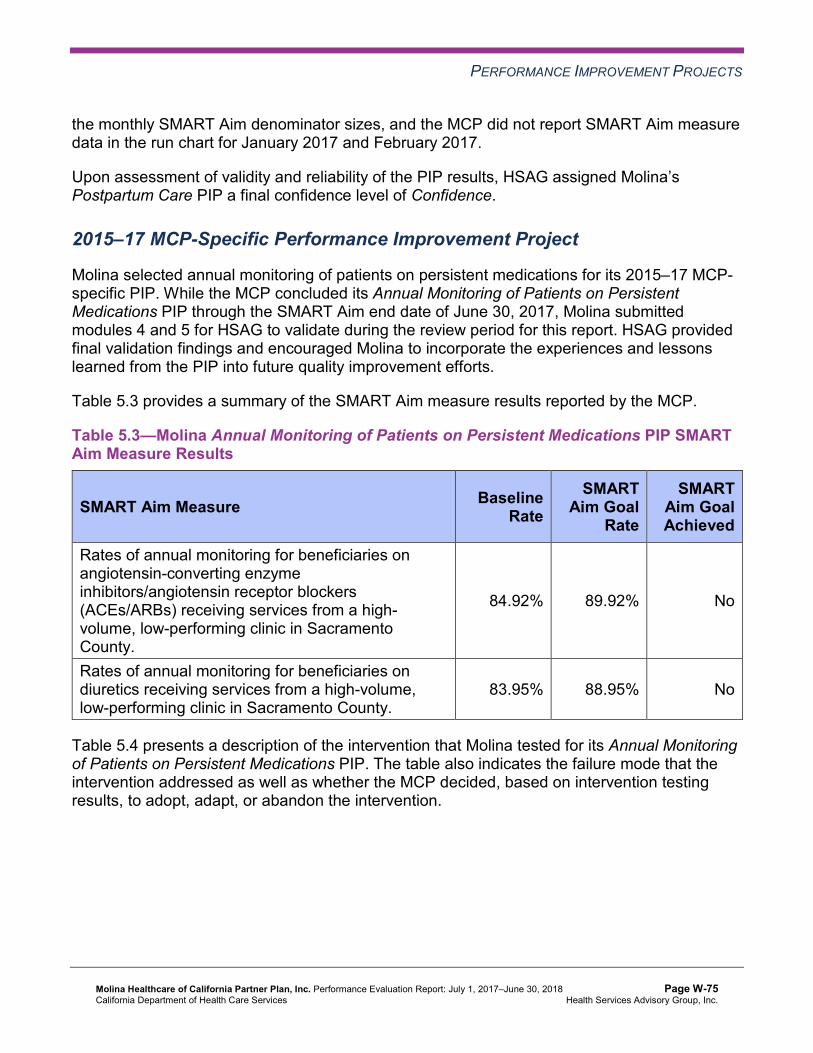
PERFORMANCE IMPROVEMENT PROJECTS
the monthly SMART Aim denominator sizes, and the MCP did not report SMART Aim measure data in the run chart for January 2017 and February 2017.
Upon assessment of validity and reliability of the PIP results, HSAG assigned Molina’s Postpartum Care PIP a final confidence level of Confidence.
2015–17 MCP-Specific Performance Improvement Project
Molina selected annual monitoring of patients on persistent medications for its 2015–17 MCP-specific PIP. While the MCP concluded its Annual Monitoring of Patients on Persistent Medications PIP through the SMART Aim end date of June 30, 2017, Molina submitted modules 4 and 5 for HSAG to validate during the review period for this report. HSAG provided final validation findings and encouraged Molina to incorporate the experiences and lessons learned from the PIP into future quality improvement efforts.
Table 5.3 provides a summary of the SMART Aim measure results reported by the MCP.
Table 5.3—Molina Annual Monitoring of Patients on Persistent Medications PIP SMART Aim Measure Results
SMART Aim Measure Baseline Rate
SMART Aim Goal
Rate
SMART Aim Goal Achieved
Rates of annual monitoring for beneficiaries on angiotensin-converting enzyme inhibitors/angiotensin receptor blockers (ACEs/ARBs) receiving services from a high-volume, low-performing clinic in Sacramento County.
84.92% 89.92% No
Rates of annual monitoring for beneficiaries on diuretics receiving services from a high-volume, low-performing clinic in Sacramento County.
83.95% 88.95% No
Table 5.4 presents a description of the intervention that Molina tested for its Annual Monitoring of Patients on Persistent Medications PIP. The table also indicates the failure mode that the intervention addressed as well as whether the MCP decided, based on intervention testing results, to adopt, adapt, or abandon the intervention.
Molina Healthcare of California Partner Plan, Inc. Performance Evaluation Report: July 1, 2017–June 30, 2018 California Department of Health Care Services
Page W-75 Health Services Advisory Group, Inc.

PERFORMANCE IMPROVEMENT PROJECTS
Table 5.4—Molina Annual Monitoring of Patients on Persistent Medications PIP Intervention Testing Results
Intervention Key Drivers and/or Failure ModesAddressed
Adopt,Adapt, orAbandon
Send a monthly list of beneficiaries on persistent medications who need a monitoring lab test to a selected high-volume, low-performing clinic via secure email. The clinic will use the list to identify beneficiaries with whom to target outreach efforts and with whom to schedule appointments.
Providers are not aware of which beneficiaries need services. Adapt
Performance Improvement Project Validation Findings
During the review period for this report, HSAG validated modules 4 and 5 for the MCP’s Annual Monitoring of Patients on Persistent Medications PIP.
Molina reported delays in receiving the necessary data to begin testing the intervention. Although the intervention evaluation data demonstrated improvement over the course of testing starting in February 2017 and ending in June 2017, Molina did not achieve the SMART Aim goal. Upon assessment of validity and reliability of the PIP results, HSAG assigned Molina’s Annual Monitoring of Patients on Persistent Medications PIP a final confidence level of Low Confidence.
2017–19 Disparity Performance Improvement Project
During the review period, DHCS required Molina to initiate a PIP focusing on an identified health disparity based on, but not limited to, age, gender, race or ethnicity, language spoken, income, educational attainment, sexual orientation or gender identity, occupation, provider, or geographic area. Molina selected postpartum care among African American beneficiaries residing in Riverside and San Bernardino counties as its 2017–19 Disparity PIP topic. Using its own MCP-specific data, the MCP provided evidence of the health disparity by demonstrating a statistically significant rate difference between two subgroups, with the disparate subgroup having the lower rate.
Table 5.5 provides the SMART Aim measure description, baseline rate, and SMART Aim goal rate for the PIP. The SMART Aim end date for this PIP is June 30, 2019.
Molina Healthcare of California Partner Plan, Inc. Performance Evaluation Report: July 1, 2017–June 30, 2018 California Department of Health Care Services
Page W-76 Health Services Advisory Group, Inc.
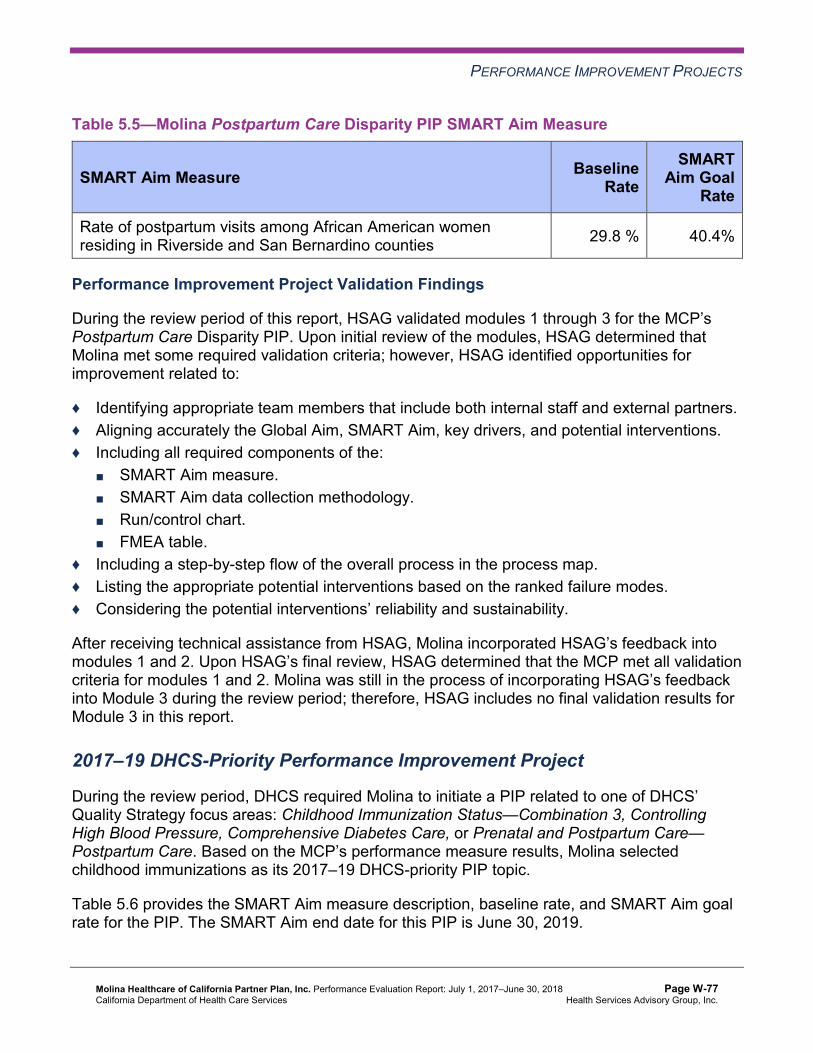
PERFORMANCE IMPROVEMENT PROJECTS
Table 5.5—Molina Postpartum Care Disparity PIP SMART Aim Measure
SMART Aim Measure Baseline Rate
SMART Aim Goal
Rate
Rate of postpartum visits among African American women residing in Riverside and San Bernardino counties 29.8 % 40.4%
Performance Improvement Project Validation Findings
During the review period of this report, HSAG validated modules 1 through 3 for the MCP’s Postpartum Care Disparity PIP. Upon initial review of the modules, HSAG determined that Molina met some required validation criteria; however, HSAG identified opportunities for improvement related to:
♦ Identifying appropriate team members that include both internal staff and external partners. ♦ Aligning accurately the Global Aim, SMART Aim, key drivers, and potential interventions. ♦ Including all required components of the:
■ SMART Aim measure. ■ SMART Aim data collection methodology. ■ Run/control chart. ■ FMEA table.
♦ Including a step-by-step flow of the overall process in the process map. ♦ Listing the appropriate potential interventions based on the ranked failure modes. ♦ Considering the potential interventions’ reliability and sustainability.
After receiving technical assistance from HSAG, Molina incorporated HSAG’s feedback into modules 1 and 2. Upon HSAG’s final review, HSAG determined that the MCP met all validation criteria for modules 1 and 2. Molina was still in the process of incorporating HSAG’s feedback into Module 3 during the review period; therefore, HSAG includes no final validation results for Module 3 in this report.
2017–19 DHCS-Priority Performance Improvement Project
During the review period, DHCS required Molina to initiate a PIP related to one of DHCS’ Quality Strategy focus areas: Childhood Immunization Status—Combination 3, Controlling High Blood Pressure, Comprehensive Diabetes Care, or Prenatal and Postpartum Care— Postpartum Care. Based on the MCP’s performance measure results, Molina selected childhood immunizations as its 2017–19 DHCS-priority PIP topic.
Table 5.6 provides the SMART Aim measure description, baseline rate, and SMART Aim goal rate for the PIP. The SMART Aim end date for this PIP is June 30, 2019.
Molina Healthcare of California Partner Plan, Inc. Performance Evaluation Report: July 1, 2017–June 30, 2018 California Department of Health Care Services
Page W-77 Health Services Advisory Group, Inc.
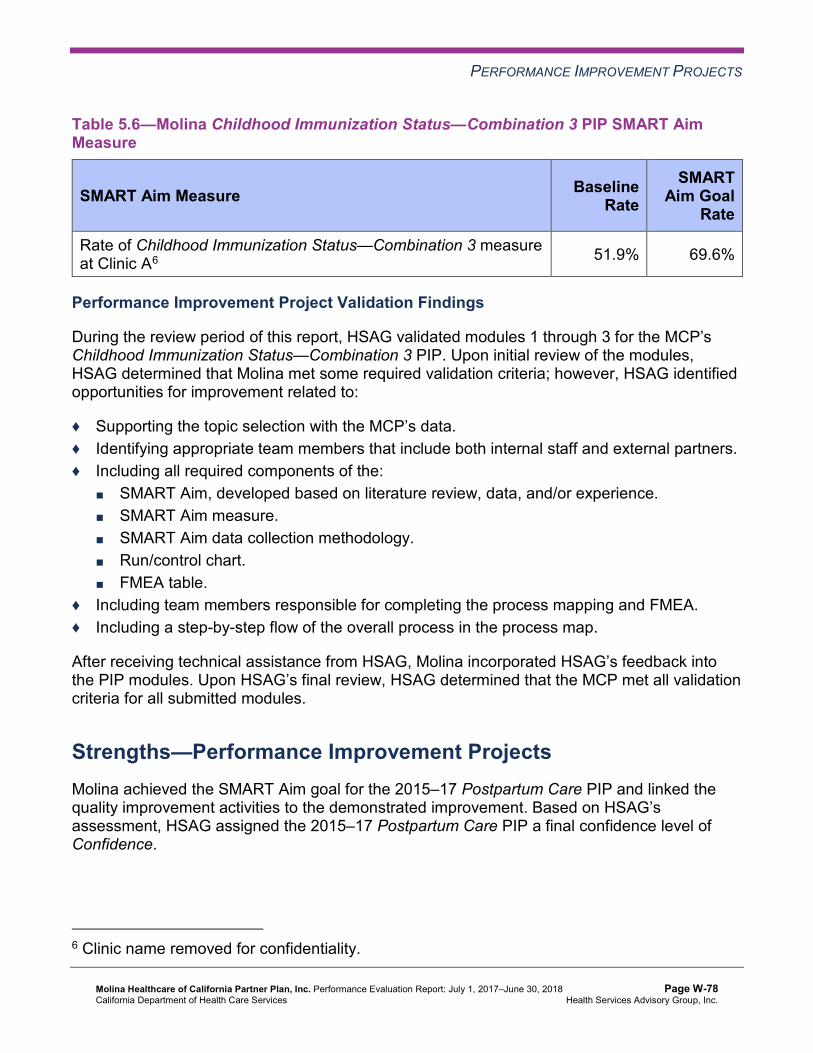
PERFORMANCE IMPROVEMENT PROJECTS
Table 5.6—Molina Childhood Immunization Status—Combination 3 PIP SMART Aim Measure
SMART Aim Measure Baseline Rate
SMART Aim Goal
Rate
Rate of Childhood Immunization Status—Combination 3 measure at Clinic A6 51.9% 69.6%
Performance Improvement Project Validation Findings
During the review period of this report, HSAG validated modules 1 through 3 for the MCP’s Childhood Immunization Status—Combination 3 PIP. Upon initial review of the modules, HSAG determined that Molina met some required validation criteria; however, HSAG identified opportunities for improvement related to:
♦ Supporting the topic selection with the MCP’s data. ♦ Identifying appropriate team members that include both internal staff and external partners. ♦ Including all required components of the:
■ SMART Aim, developed based on literature review, data, and/or experience. ■ SMART Aim measure. ■ SMART Aim data collection methodology. ■ Run/control chart. ■ FMEA table.
♦ Including team members responsible for completing the process mapping and FMEA. ♦ Including a step-by-step flow of the overall process in the process map.
After receiving technical assistance from HSAG, Molina incorporated HSAG’s feedback into the PIP modules. Upon HSAG’s final review, HSAG determined that the MCP met all validation criteria for all submitted modules.
Strengths—Performance Improvement Projects Molina achieved the SMART Aim goal for the 2015–17 Postpartum Care PIP and linked the quality improvement activities to the demonstrated improvement. Based on HSAG’s assessment, HSAG assigned the 2015–17 Postpartum Care PIP a final confidence level of Confidence.
6 Clinic name removed for confidentiality.
Molina Healthcare of California Partner Plan, Inc. Performance Evaluation Report: July 1, 2017–June 30, 2018 California Department of Health Care Services
Page W-78 Health Services Advisory Group, Inc.

PERFORMANCE IMPROVEMENT PROJECTS
Opportunities for Improvement—Performance Improvement Projects Molina has the opportunity to continue monitoring adopted and adapted interventions and outcomes to facilitate improvement beyond the life of the 2015–17 Postpartum Care and Annual Monitoring of Patients on Persistent Medications PIPs. Ongoing monitoring will enable long-term evaluation of improvement and allow the MCP to continually refine interventions to achieve and sustain optimal outcomes.
Additionally, Molina has the opportunity to apply lessons learned from the 2015–17 Postpartum Care PIP to the MCP’s 2017–19 Postpartum Care Disparity PIP.
Molina Healthcare of California Partner Plan, Inc. Performance Evaluation Report: July 1, 2017–June 30, 2018 California Department of Health Care Services
Page W-79 Health Services Advisory Group, Inc.
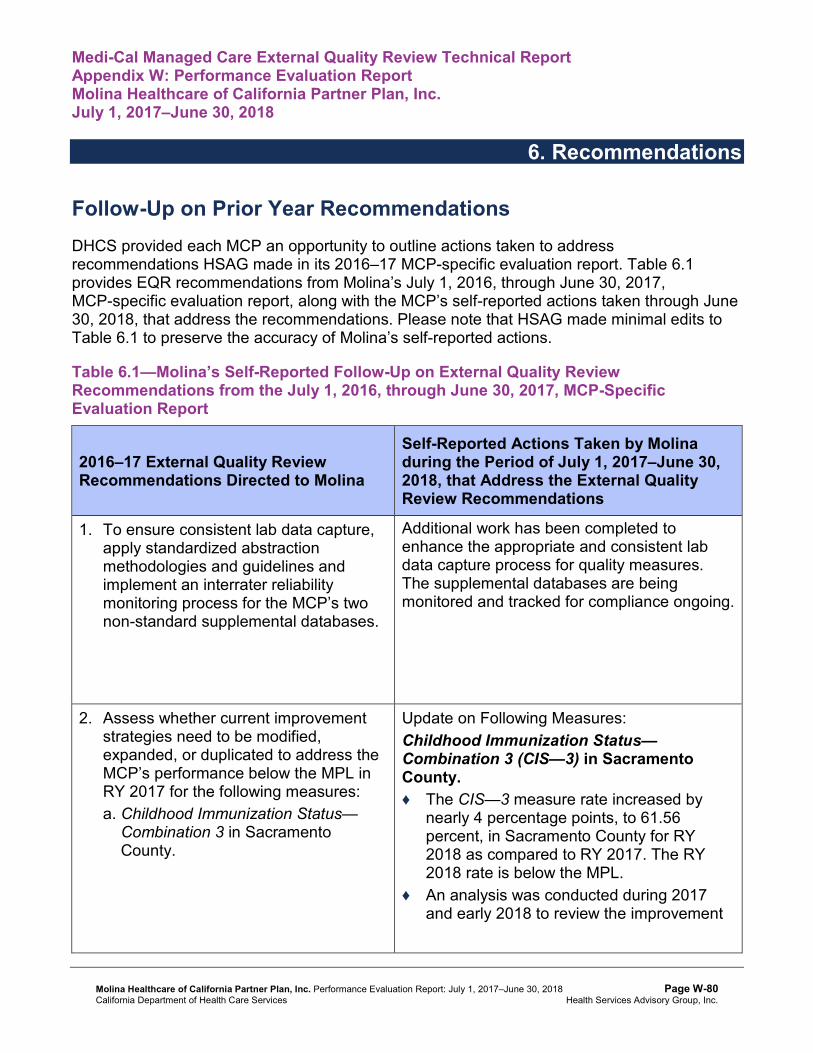
Medi-Cal Managed Care External Quality Review Technical ReportAppendix W: Performance Evaluation ReportMolina Healthcare of California Partner Plan, Inc. July 1, 2017–June 30, 2018
6. Recommendations
Follow-Up on Prior Year Recommendations DHCS provided each MCP an opportunity to outline actions taken to address recommendations HSAG made in its 2016–17 MCP-specific evaluation report. Table 6.1 provides EQR recommendations from Molina’s July 1, 2016, through June 30, 2017, MCP-specific evaluation report, along with the MCP’s self-reported actions taken through June 30, 2018, that address the recommendations. Please note that HSAG made minimal edits to Table 6.1 to preserve the accuracy of Molina’s self-reported actions.
Table 6.1—Molina’s Self-Reported Follow-Up on External Quality ReviewRecommendations from the July 1, 2016, through June 30, 2017, MCP-SpecificEvaluation Report
2016–17 External Quality ReviewRecommendations Directed to Molina
Self-Reported Actions Taken by Molinaduring the Period of July 1, 2017–June 30,2018, that Address the External QualityReview Recommendations
1. To ensure consistent lab data capture, apply standardized abstraction methodologies and guidelines and implement an interrater reliability monitoring process for the MCP’s two non-standard supplemental databases.
Additional work has been completed to enhance the appropriate and consistent lab data capture process for quality measures. The supplemental databases are being monitored and tracked for compliance ongoing.
2. Assess whether current improvement strategies need to be modified, expanded, or duplicated to address the MCP’s performance below the MPL in RY 2017 for the following measures: a. Childhood Immunization Status—
Combination 3 in Sacramento County.
Update on Following Measures: Childhood Immunization Status— Combination 3 (CIS—3) in Sacramento County. ♦ The CIS—3 measure rate increased by
nearly 4 percentage points, to 61.56 percent, in Sacramento County for RY 2018 as compared to RY 2017. The RY 2018 rate is below the MPL.
♦ An analysis was conducted during 2017 and early 2018 to review the improvement
Molina Healthcare of California Partner Plan, Inc. Performance Evaluation Report: July 1, 2017–June 30, 2018 California Department of Health Care Services
Page W-80 Health Services Advisory Group, Inc.

RECOMMENDATIONS
2016–17 External Quality ReviewRecommendations Directed to Molina
Self-Reported Actions Taken by Molinaduring the Period of July 1, 2017–June 30,2018, that Address the External QualityReview Recommendations
strategies put into place to address this topic.
2017 Improvement Strategies that worked well and that will be kept going forward: ♦ Distributed report including missing
immunizations within the next 30 days so that large clinics can get children in before those clinics are non-compliant with the measure.
♦ Rewarded over 400 members who were compliant with all immunizations.
♦ Worked with staff model clinics to hold weekend vaccination clinics as well as immunization walk-in days.
♦ Used outreach team to call large medical group patients to ensure compliance with immunizations and all child health measures.
Additional 2018 Improvement Strategies— Enhancements from Previous Year ♦ Well-child provider incentive program
focused on correct coding and claims submissions was implemented in 2017. This program will be enhanced in 2018 to focus on completion of key childhood immunizations and well-child visits.
♦ Work with provider services to focus on improving rates for low performing providers.
♦ Work with Sacramento clinic to distribute incentives to members at the provider’s office in order to increase satisfaction.
Molina Healthcare of California Partner Plan, Inc. Performance Evaluation Report: July 1, 2017–June 30, 2018 California Department of Health Care Services
Page W-81 Health Services Advisory Group, Inc.
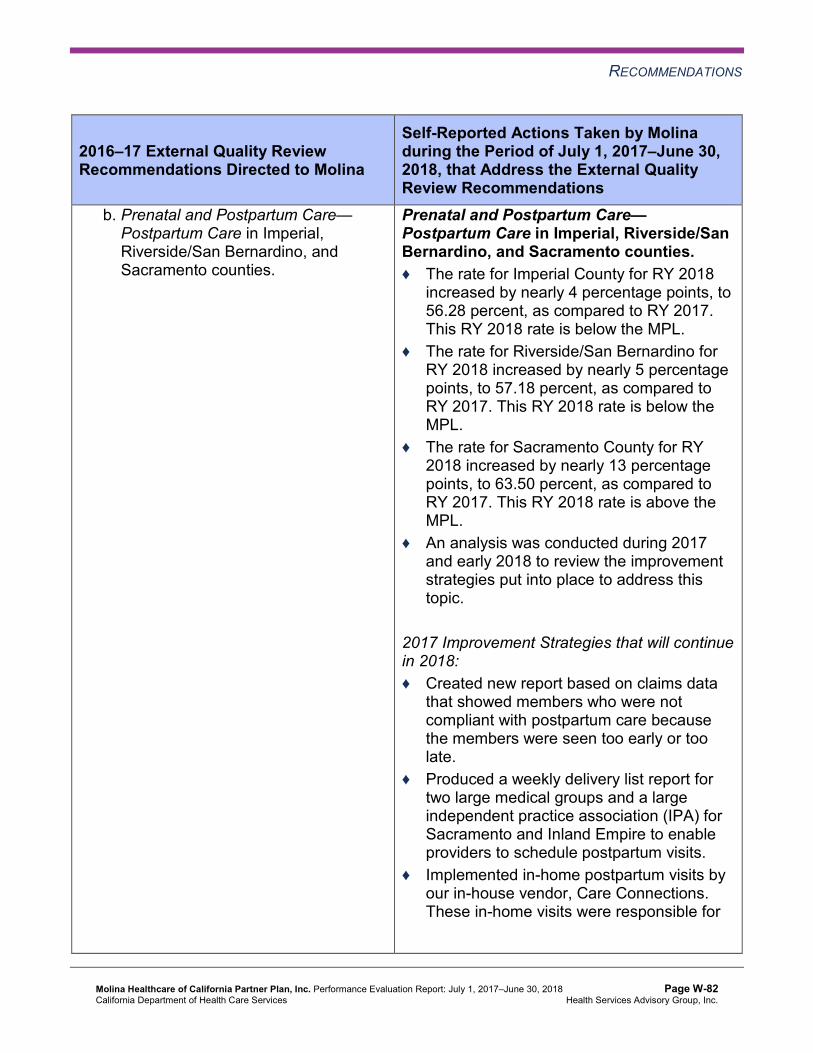
RECOMMENDATIONS
2016–17 External Quality ReviewRecommendations Directed to Molina
Self-Reported Actions Taken by Molinaduring the Period of July 1, 2017–June 30,2018, that Address the External QualityReview Recommendations
b. Prenatal and Postpartum Care— Postpartum Care in Imperial, Riverside/San Bernardino, and Sacramento counties.
Prenatal and Postpartum Care— Postpartum Care in Imperial, Riverside/SanBernardino, and Sacramento counties. ♦ The rate for Imperial County for RY 2018
increased by nearly 4 percentage points, to 56.28 percent, as compared to RY 2017. This RY 2018 rate is below the MPL.
♦ The rate for Riverside/San Bernardino for RY 2018 increased by nearly 5 percentage points, to 57.18 percent, as compared to RY 2017. This RY 2018 rate is below the MPL.
♦ The rate for Sacramento County for RY 2018 increased by nearly 13 percentage points, to 63.50 percent, as compared to RY 2017. This RY 2018 rate is above the MPL.
♦ An analysis was conducted during 2017 and early 2018 to review the improvement strategies put into place to address this topic.
2017 Improvement Strategies that will continue in 2018: ♦ Created new report based on claims data
that showed members who were not compliant with postpartum care because the members were seen too early or too late.
♦ Produced a weekly delivery list report for two large medical groups and a large independent practice association (IPA) for Sacramento and Inland Empire to enable providers to schedule postpartum visits.
♦ Implemented in-home postpartum visits by our in-house vendor, Care Connections. These in-home visits were responsible for
Molina Healthcare of California Partner Plan, Inc. Performance Evaluation Report: July 1, 2017–June 30, 2018 California Department of Health Care Services
Page W-82 Health Services Advisory Group, Inc.

RECOMMENDATIONS
2016–17 External Quality ReviewRecommendations Directed to Molina
Self-Reported Actions Taken by Molinaduring the Period of July 1, 2017–June 30,2018, that Address the External QualityReview Recommendations
c. Use of Imaging Studies for Low Back Pain in Imperial and San Diego counties.
20 percent of our compliant rates throughout all counties.
Additional 2018 Improvement Strategies— Enhancements from Previous Year: ♦ Work in Imperial County to expand in-home
postpartum visits and hiring of three new nurse practitioners to provide enhanced services in high desert and Palm Springs.
♦ Offer additional provider incentives for postpartum care in key counties.
♦ Partner with community engagement team to host neighborhood events delivering postpartum care education and highlighting importance of depression screening.
Use of Imaging Studies for Low Back Pain(LBP) in Imperial and San Diego counties. ♦ The rate for Imperial County for RY 2018
decreased by nearly 8 percentage points, to 53.99 percent, as compared to RY 2017. This RY rate is below the MPL.
♦ The rate for San Diego County for RY 2018 increased by less than 1 percentage point, to 70.49 percent, as compared to RY 2017. This RY 2018 rate is above the MPL.
2017 Improvement Strategies that will continue in 2018: ♦ Created LBP Imaging Studies report
showing highest utilizers of magnetic resonance imaging (MRI) and X-ray for back pain. Molina then scheduled meetings with provider groups on the list of offenders and discussed which members were inappropriately referred to imaging within 28 days of their initial complaint of low back pain. Practices can see which providers are not in compliance and provide education.
Molina Healthcare of California Partner Plan, Inc. Performance Evaluation Report: July 1, 2017–June 30, 2018 California Department of Health Care Services
Page W-83 Health Services Advisory Group, Inc.
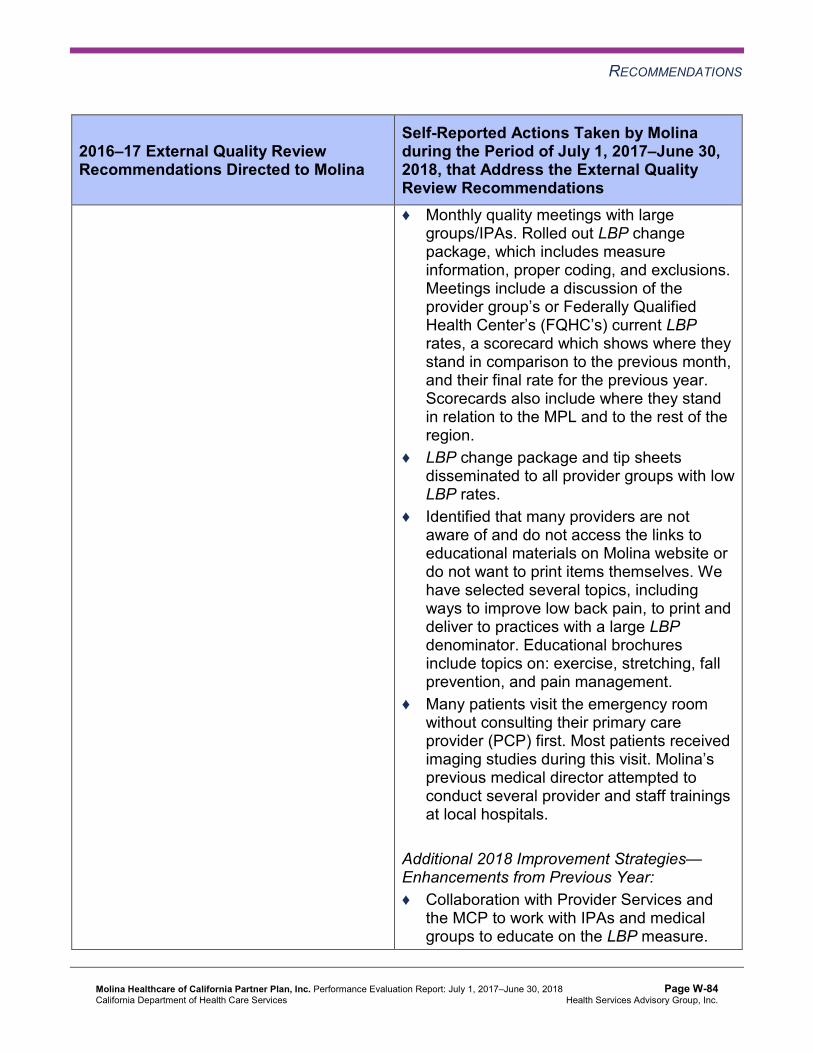
RECOMMENDATIONS
2016–17 External Quality ReviewRecommendations Directed to Molina
Self-Reported Actions Taken by Molinaduring the Period of July 1, 2017–June 30,2018, that Address the External QualityReview Recommendations ♦ Monthly quality meetings with large
groups/IPAs. Rolled out LBP change package, which includes measure information, proper coding, and exclusions. Meetings include a discussion of the provider group’s or Federally Qualified Health Center’s (FQHC’s) current LBP rates, a scorecard which shows where they stand in comparison to the previous month, and their final rate for the previous year. Scorecards also include where they stand in relation to the MPL and to the rest of the region.
♦ LBP change package and tip sheets disseminated to all provider groups with low LBP rates.
♦ Identified that many providers are not aware of and do not access the links to educational materials on Molina website or do not want to print items themselves. We have selected several topics, including ways to improve low back pain, to print and deliver to practices with a large LBP denominator. Educational brochures include topics on: exercise, stretching, fall prevention, and pain management.
♦ Many patients visit the emergency room without consulting their primary care provider (PCP) first. Most patients received imaging studies during this visit. Molina’s previous medical director attempted to conduct several provider and staff trainings at local hospitals.
Additional 2018 Improvement Strategies— Enhancements from Previous Year: ♦ Collaboration with Provider Services and
the MCP to work with IPAs and medical groups to educate on the LBP measure.
Molina Healthcare of California Partner Plan, Inc. Performance Evaluation Report: July 1, 2017–June 30, 2018 California Department of Health Care Services
Page W-84 Health Services Advisory Group, Inc.
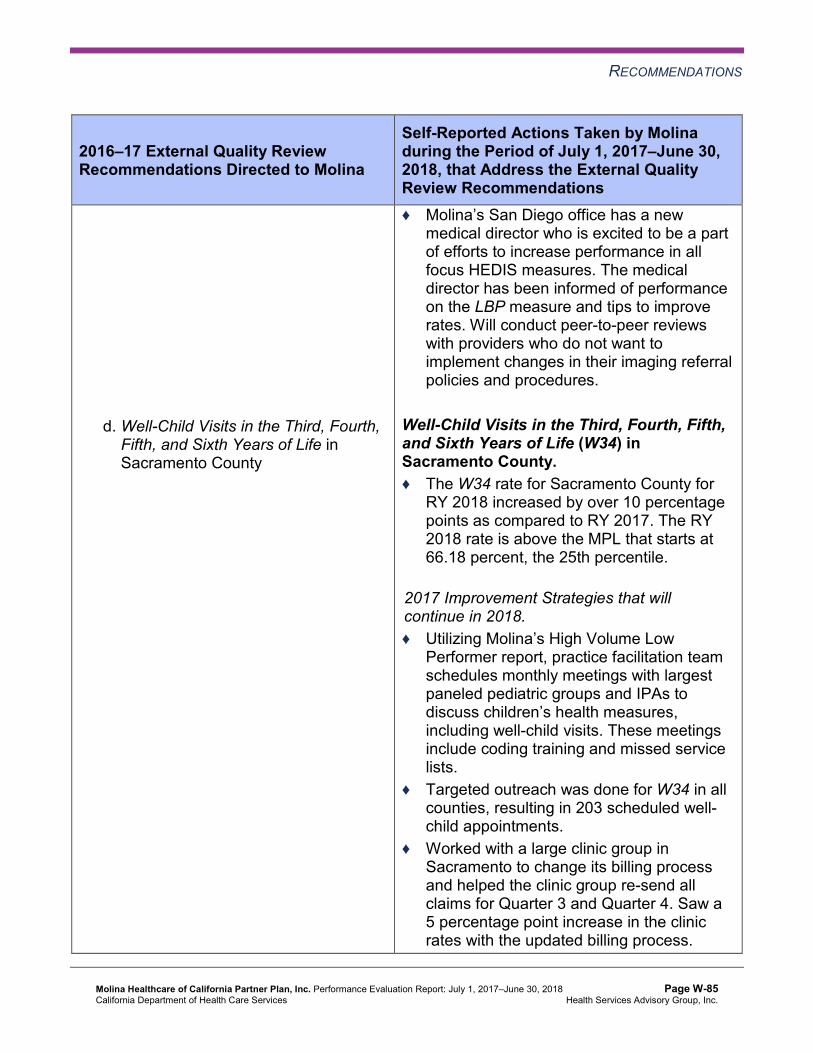
RECOMMENDATIONS
2016–17 External Quality ReviewRecommendations Directed to Molina
Self-Reported Actions Taken by Molinaduring the Period of July 1, 2017–June 30,2018, that Address the External QualityReview Recommendations
d. Well-Child Visits in the Third, Fourth, Fifth, and Sixth Years of Life in Sacramento County
♦ Molina’s San Diego office has a new medical director who is excited to be a part of efforts to increase performance in all focus HEDIS measures. The medical director has been informed of performance on the LBP measure and tips to improve rates. Will conduct peer-to-peer reviews with providers who do not want to implement changes in their imaging referral policies and procedures.
Well-Child Visits in the Third, Fourth, Fifth, and Sixth Years of Life (W34) in Sacramento County. ♦ The W34 rate for Sacramento County for
RY 2018 increased by over 10 percentage points as compared to RY 2017. The RY 2018 rate is above the MPL that starts at 66.18 percent, the 25th percentile.
2017 Improvement Strategies that will continue in 2018. ♦ Utilizing Molina’s High Volume Low
Performer report, practice facilitation team schedules monthly meetings with largest paneled pediatric groups and IPAs to discuss children’s health measures, including well-child visits. These meetings include coding training and missed service lists.
♦ Targeted outreach was done for W34 in all counties, resulting in 203 scheduled well-child appointments.
♦ Worked with a large clinic group in Sacramento to change its billing process and helped the clinic group re-send all claims for Quarter 3 and Quarter 4. Saw a 5 percentage point increase in the clinic rates with the updated billing process.
Molina Healthcare of California Partner Plan, Inc. Performance Evaluation Report: July 1, 2017–June 30, 2018 California Department of Health Care Services
Page W-85 Health Services Advisory Group, Inc.

RECOMMENDATIONS
2016–17 External Quality ReviewRecommendations Directed to Molina
Self-Reported Actions Taken by Molinaduring the Period of July 1, 2017–June 30,2018, that Address the External QualityReview Recommendations
Additional 2018 Improvement Strategies: Enhancements from Previous Year ♦ Added W34 codes to the Well-Child Child
Health and Disability Prevention (CHDP) Program incentive. Molina ended the use of the PM160 form Quarter 1 2018. The new Well-Child incentive comes directly from proper provider coding.
♦ Added W34 codes to the provider HEDIS P4P program in Quarter 1 2018.
♦ Trained more than 200 pediatrician groups on in-depth, well-child coding.
♦ Working with our in-home nurse practitioner group, Vitalis, we were able to “hot-spot” concentrations of membership in each county. With these new data, we are looking into the possibility of well-child summer and fall pop-up clinics.
3. To help sustain the improvement achieved from RY 2016 to RY 2017 for the Prenatal and Postpartum Care— Timeliness of Prenatal Care measure in Riverside/San Bernardino and Sacramento counties, identify which strategies were successful and expand them, as applicable, to other partner providers.
♦ The Prenatal and Postpartum Care— Timeliness of Prenatal Care rate for Riverside/San Bernardino counties for RY 2018 increased by less than 1 percentage point, to 78.59 percent, as compared to RY 2017. The RY 2018 rate is above the MPL that starts at 77.66 percent, the 25th percentile. This rate has sustained improvement from reporting year 2016 to reporting year 2017.
♦ The Prenatal and Postpartum Care— Timeliness of Prenatal Care rate for Sacramento County for RY 2018 increased by nearly 4 percentage points, to 78.83 percent, as compared to RY 2017. The RY 2018 rate is above the MPL that starts at 77.66 percent, the 25th percentile.
Molina Healthcare of California Partner Plan, Inc. Performance Evaluation Report: July 1, 2017–June 30, 2018 California Department of Health Care Services
Page W-86 Health Services Advisory Group, Inc.
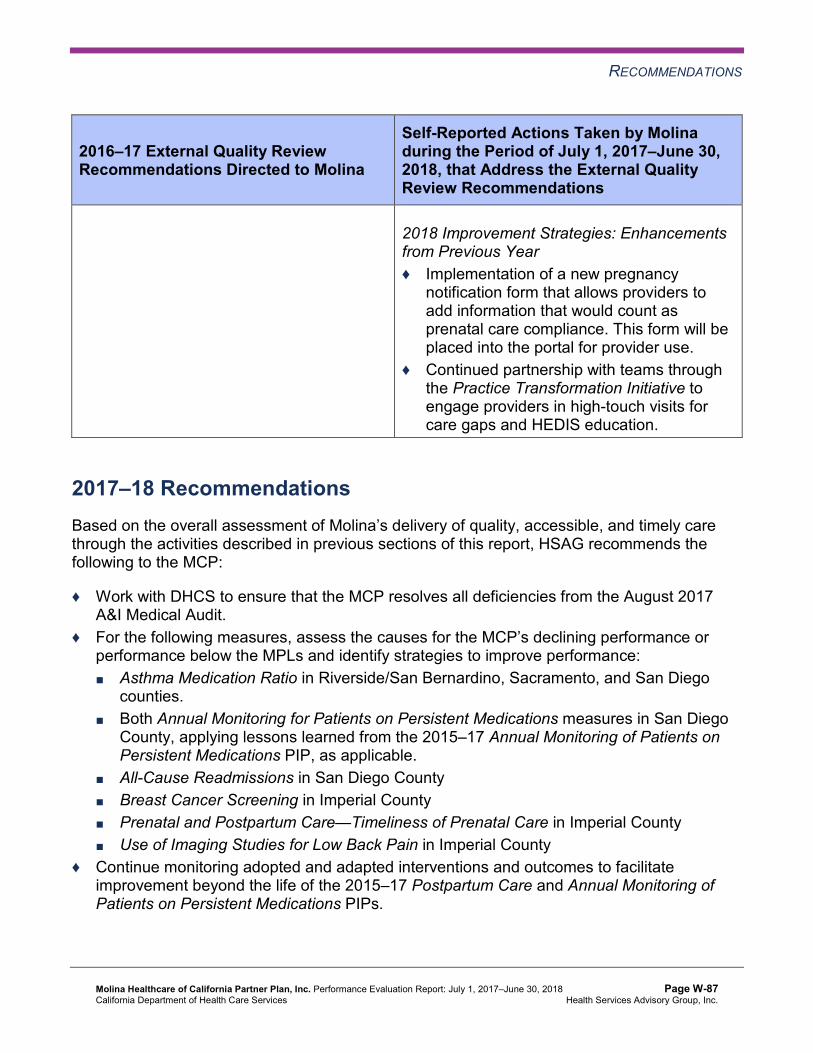
RECOMMENDATIONS
2016–17 External Quality ReviewRecommendations Directed to Molina
Self-Reported Actions Taken by Molinaduring the Period of July 1, 2017–June 30,2018, that Address the External QualityReview Recommendations
2018 Improvement Strategies: Enhancements from Previous Year ♦ Implementation of a new pregnancy
notification form that allows providers to add information that would count as prenatal care compliance. This form will be placed into the portal for provider use.
♦ Continued partnership with teams through the Practice Transformation Initiative to engage providers in high-touch visits for care gaps and HEDIS education.
2017–18 Recommendations Based on the overall assessment of Molina’s delivery of quality, accessible, and timely care through the activities described in previous sections of this report, HSAG recommends the following to the MCP:
♦ Work with DHCS to ensure that the MCP resolves all deficiencies from the August 2017 A&I Medical Audit.
♦ For the following measures, assess the causes for the MCP’s declining performance or performance below the MPLs and identify strategies to improve performance: ■ Asthma Medication Ratio in Riverside/San Bernardino, Sacramento, and San Diego
counties. ■ Both Annual Monitoring for Patients on Persistent Medications measures in San Diego
County, applying lessons learned from the 2015–17 Annual Monitoring of Patients on Persistent Medications PIP, as applicable.
■ All-Cause Readmissions in San Diego County ■ Breast Cancer Screening in Imperial County ■ Prenatal and Postpartum Care—Timeliness of Prenatal Care in Imperial County ■ Use of Imaging Studies for Low Back Pain in Imperial County
♦ Continue monitoring adopted and adapted interventions and outcomes to facilitate improvement beyond the life of the 2015–17 Postpartum Care and Annual Monitoring of Patients on Persistent Medications PIPs.
Molina Healthcare of California Partner Plan, Inc. Performance Evaluation Report: July 1, 2017–June 30, 2018 California Department of Health Care Services
Page W-87 Health Services Advisory Group, Inc.
RECOMMENDATIONS
♦ Apply lessons learned from the 2015–17 Postpartum Care PIP to the MCP’s 2017–19 Postpartum Care Disparity PIP to address the rate for the Prenatal and Postpartum Care— Postpartum Care measure being below the MPL in Riverside/San Bernardino counties for at least four consecutive years. Additionally, use applicable lessons learned in Imperial County to address the rate for the Prenatal and Postpartum Care—Postpartum Care measure being below the MPL in Imperial County for at least four consecutive years.
♦ Conduct the MCP’s Childhood Immunization Status—Combination 3 PIP according to the methodology validated and approved by HSAG to improve the rate for the Childhood Immunization Status—Combination 3 measure in Sacramento County.
In the next annual review, HSAG will evaluate continued successes of Molina as well as the MCP’s progress with these recommendations.
Molina Healthcare of California Partner Plan, Inc. Performance Evaluation Report: July 1, 2017–June 30, 2018 California Department of Health Care Services
Page W-88 Health Services Advisory Group, Inc.

Medi-Cal Managed CareExternal Quality Review Technical Report
Appendix X: Performance Evaluation Report
Partnership HealthPlan of California July 1, 2017–June 30, 2018

Medi-Cal Managed Care External Quality Review Technical ReportAppendix X: Performance Evaluation ReportPartnership HealthPlan of CaliforniaJuly 1, 2017–June 30, 2018
Table of Contents
1. Introduction.............................................................................................................X-1 Medi-Cal Managed Care Health Plan Overview .......................................................X-1
2. Managed Care Health Plan Compliance ...............................................................X-3Compliance Reviews Conducted..............................................................................X-3 Strengths—Compliance Reviews .............................................................................X-4 Opportunities for Improvement—Compliance Reviews ............................................X-4
3. Managed Care Health Plan Performance Measures ............................................X-5Performance Measure Validation Results ................................................................X-5 Performance Measure Results and Findings............................................................X-5
Preventive Screening and Children’s Health .........................................................X-6 Preventive Screening and Women’s Health ........................................................X-17 Care for Chronic Conditions ................................................................................X-25 Appropriate Treatment and Utilization.................................................................X-34 Performance Measure Findings—All Domains....................................................X-43
Corrective Action Plan Requirements for 2018.......................................................X-47 Seniors and Persons with Disabilities Performance Measure Results....................X-48
Seniors and Persons with Disabilities Findings ...................................................X-66 Strengths—Performance Measures .......................................................................X-67 Opportunities for Improvement—Performance Measures ......................................X-67
4. Performance Improvement Projects ...................................................................X-69Performance Improvement Project Overview .........................................................X-69 Performance Improvement Project Results and Findings.......................................X-70
2015–17 DHCS-Priority Performance Improvement Project ...............................X-71 2015–17 MCP-Specific Performance Improvement Project ................................X-72 2017–19 Disparity Performance Improvement Project ........................................X-73 2017–19 DHCS-Priority Performance Improvement Project ...............................X-74
Strengths—Performance Improvement Projects ....................................................X-75 Opportunities for Improvement—Performance Improvement Projects ...................X-76
5. Recommendations................................................................................................X-77 Follow-Up on Prior Year Recommendations ..........................................................X-77 2017–18 Recommendations...................................................................................X-86
Partnership HealthPlan of California Performance Evaluation Report: July 1, 2017–June 30, 2018 California Department of Health Care Services
Page X-i Health Services Advisory Group, Inc.

TABLE OF CONTENTS
Table of Tables
Table 1.1—Partnership Enrollment as of June 30, 2018 ................................................X-2 Table 2.1—DHCS A&I Medical and State Supported Services Audits of Partnership
Audit Review Period: January 1, 2017, through December 31, 2018...........X-3 Table 3.1—Preventive Screening and Children’s Health Domain Multi-Year
Performance Measure Results Partnership—Northeast (Lassen, Modoc, Shasta, Siskiyou, and Trinity Counties) .......................................................X-7
Table 3.2—Preventive Screening and Children’s Health Domain Multi-Year Performance Measure Results Partnership—Northwest (Del Norte and Humboldt Counties) .....................................................................................X-8
Table 3.3—Preventive Screening and Children’s Health Domain Multi-Year Performance Measure Results Partnership—Southeast (Napa, Solano, and Yolo Counties) X-10
Table 3.4—Preventive Screening and Children’s Health Domain Multi-Year Performance Measure Results Partnership—Southwest (Lake, Marin, Mendocino, and Sonoma Counties) .....................................................................................X-11
Table 3.5—Preventive Screening and Children’s Health Domain RY 2018 (MY 2017) Performance Measure Findings Partnership—Northeast (Lassen, Modoc, Shasta, Siskiyou, and Trinity Counties) .....................................................X-13
Table 3.6—Preventive Screening and Children’s Health Domain RY 2018 (MY 2017) Performance Measure Findings Partnership—Northwest (Del Norte and Humboldt Counties) ...................................................................................X-14
Table 3.7—Preventive Screening and Children’s Health Domain RY 2018 (MY 2017) Performance Measure Findings Partnership—Southeast (Napa, Solano, and Yolo Counties) ....................................................................................X-15
Table 3.8—Preventive Screening and Children’s Health Domain RY 2018 (MY 2017) Performance Measure Findings Partnership—Southwest (Lake, Marin, Mendocino, and Sonoma Counties)...........................................................X-16
Table 3.9—Preventive Screening and Women’s Health Domain Multi-Year Performance Measure Results Partnership—Northeast (Lassen, Modoc, Shasta, Siskiyou, and Trinity Counties)..........................................................................................X-17
Table 3.10—Preventive Screening and Women’s Health Domain Multi-Year Performance Measure Results Partnership—Northwest (Del Norte and Humboldt Counties)X-18
Table 3.11—Preventive Screening and Women’s Health Domain Multi-Year Performance Measure Results Partnership—Southeast (Napa, Solano, and Yolo Counties) X-19
Table 3.12—Preventive Screening and Women’s Health Domain Multi-Year Performance Measure Results Partnership—Southwest (Lake, Marin, Mendocino, and Sonoma Counties).............................................................................................X-20
Table 3.13—Preventive Screening and Women’s Health Domain RY 2018 (MY 2017) Performance Measure Findings Partnership—Northeast (Lassen, Modoc, Shasta, Siskiyou, and Trinity Counties) .....................................................X-21
Partnership HealthPlan of California Performance Evaluation Report: July 1, 2017–June 30, 2018 California Department of Health Care Services
Page X-ii Health Services Advisory Group, Inc.
TABLE OF CONTENTS
Table 3.14—Preventive Screening and Women’s Health Domain RY 2018 (MY 2017) Performance Measure Findings Partnership—Northwest (Del Norte and Humboldt Counties) ...................................................................................X-22
Table 3.15—Preventive Screening and Women’s Health Domain RY 2018 (MY 2017) Performance Measure Findings Partnership—Southeast (Napa, Solano, and Yolo Counties) ....................................................................................X-23
Table 3.16—Preventive Screening and Women’s Health Domain RY 2018 (MY 2017) Performance Measure Findings Partnership—Southwest (Lake, Marin, Mendocino, and Sonoma Counties)...........................................................X-24
Table 3.17—Care for Chronic Conditions Domain Multi-Year Performance Measure Results Partnership—Northeast (Lassen, Modoc, Shasta, Siskiyou, and Trinity Counties).........................................................................................X-25
Table 3.18—Care for Chronic Conditions Domain Multi-Year Performance Measure Results Partnership—Northwest (Del Norte and Humboldt Counties) .......X-26
Table 3.19—Care for Chronic Conditions Domain Multi-Year Performance Measure Results Partnership—Southeast (Napa, Solano, and Yolo Counties)........X-27
Table 3.20—Care for Chronic Conditions Domain Multi-Year Performance Measure Results Partnership—Southwest (Lake, Marin, Mendocino, and Sonoma Counties) ...................................................................................................X-29
Table 3.21—Care for Chronic Conditions Domain RY 2018 (MY 2017) Performance Measure Findings Partnership—Northeast (Lassen, Modoc, Shasta, Siskiyou, and Trinity Counties) ..................................................................X-30
Table 3.22—Care for Chronic Conditions Domain RY 2018 (MY 2017) Performance Measure Findings Partnership—Northwest (Del Norte and Humboldt Counties) ...................................................................................................X-31
Table 3.23—Care for Chronic Conditions Domain RY 2018 (MY 2017) Performance Measure Findings Partnership—Southeast (Napa, Solano, and Yolo Counties) ...................................................................................................X-32
Table 3.24—Care for Chronic Conditions Domain RY 2018 (MY 2017) Performance Measure Findings Partnership—Southwest (Lake, Marin, Mendocino, and Sonoma Counties) ..............................................................................X-33
Table 3.25—Appropriate Treatment and Utilization Domain Multi-Year Performance Measure Results Partnership—Northeast (Lassen, Modoc, Shasta, Siskiyou, and Trinity Counties) ..................................................................X-35
Table 3.26—Appropriate Treatment and Utilization Domain Multi-Year Performance Measure Results Partnership—Northwest (Del Norte and Humboldt Counties)X-37
Table 3.27—Appropriate Treatment and Utilization Domain Multi-Year Performance Measure Results Partnership—Southeast (Napa, Solano, and Yolo Counties).X-38
Table 3.28—Appropriate Treatment and Utilization Domain Multi-Year Performance Measure Results Partnership—Southwest (Lake, Marin, Mendocino, and Sonoma Counties) .....................................................................................X-39
Partnership HealthPlan of California Performance Evaluation Report: July 1, 2017–June 30, 2018 California Department of Health Care Services
Page X-iii Health Services Advisory Group, Inc.
TABLE OF CONTENTS
Table 3.29—Appropriate Treatment and Utilization Domain RY 2018 (MY 2017) Performance Measure Findings Partnership—Northeast (Lassen, Modoc, Shasta, Siskiyou, and Trinity Counties) .....................................................X-40
Table 3.30—Appropriate Treatment and Utilization Domain RY 2018 (MY 2017) Performance Measure Findings Partnership—Northwest (Del Norte and Humboldt Counties) ...................................................................................X-41
Table 3.31—Appropriate Treatment and Utilization Domain RY 2018 (MY 2017) Performance Measure Findings Partnership—Southeast (Napa, Solano, and Yolo Counties) ....................................................................................X-42
Table 3.32—Appropriate Treatment and Utilization Domain RY 2018 (MY 2017) Performance Measure Findings Partnership—Southwest (Lake, Marin, Mendocino, and Sonoma Counties)...........................................................X-43
Table 3.33—RY 2018 (MY 2017) Performance Measure Findings for All Domains Partnership—Northeast (Lassen, Modoc, Shasta, Siskiyou, and Trinity Counties) ...................................................................................................X-44
Table 3.34—RY 2018 (MY 2017) Performance Measure Findings for All Domains Partnership—Northwest (Del Norte and Humboldt Counties) ....................X-45
Table 3.35—RY 2018 (MY 2017) Performance Measure Findings for All Domains Partnership—Southeast (Napa, Solano, and Yolo Counties).....................X-46
Table 3.36—RY 2018 (MY 2017) Performance Measure Findings for All Domains Partnership—Southwest (Lake, Marin, Mendocino, and Sonoma Counties) .X-47
Table 3.37—Multi-Year SPD Performance Measure Trend Table Partnership— Northeast (Lassen, Modoc, Shasta, Siskiyou, and Trinity Counties) .........X-49
Table 3.38—Multi-Year SPD Performance Measure Trend Table Partnership— Northwest (Del Norte and Humboldt Counties)..........................................X-50
Table 3.39—Multi-Year SPD Performance Measure Trend Table Partnership— Southeast (Napa, Solano, and Yolo Counties) ..........................................X-52
Table 3.40—Multi-Year SPD Performance Measure Trend Table Partnership— Southwest (Lake, Marin, Mendocino, and Sonoma Counties) ...................X-53
Table 3.41—Multi-Year Non-SPD Performance Measure Trend Table Partnership— Northeast (Lassen, Modoc, Shasta, Siskiyou, and Trinity Counties) .........X-55
Table 3.42—Multi-Year Non-SPD Performance Measure Trend Table Partnership— Northwest (Del Norte and Humboldt Counties)..........................................X-56
Table 3.43—Multi-Year Non-SPD Performance Measure Trend Table Partnership— Southeast (Napa, Solano, and Yolo Counties) ..........................................X-58
Table 3.44—Multi-Year Non-SPD Performance Measure Trend Table Partnership— Southwest (Lake, Marin, Mendocino, and Sonoma Counties) ...................X-59
Table 3.45—RY 2018 (MY 2017) Performance Measure Comparison and Results for Measures Stratified by the SPD and Non-SPD Populations Partnership— Northeast (Lassen, Modoc, Shasta, Siskiyou, and Trinity Counties) .........X-61
Partnership HealthPlan of California Performance Evaluation Report: July 1, 2017–June 30, 2018 California Department of Health Care Services
Page X-iv Health Services Advisory Group, Inc.
TABLE OF CONTENTS
Table 3.46—RY 2018 (MY 2017) Performance Measure Comparison and Results for Measures Stratified by the SPD and Non-SPD Populations Partnership— Northwest (Del Norte and Humboldt Counties)..........................................X-62
Table 3.47—RY 2018 (MY 2017) Performance Measure Comparison and Results for Measures Stratified by the SPD and Non-SPD Populations Partnership— Southeast (Napa, Solano, and Yolo Counties) ..........................................X-63
Table 3.48—RY 2018 (MY 2017) Performance Measure Comparison and Results for Measures Stratified by the SPD and Non-SPD Populations Partnership— Southwest (Lake, Marin, Mendocino, and Sonoma Counties) ...................X-65
Table 4.1—Partnership Hypertension PIP SMART Aim Measure Results ...................X-71 Table 4.2—Partnership Hypertension PIP Intervention Testing Results ......................X-71 Table 4.3—Partnership Diabetes Retinal Eye Exam PIP SMART Aim Measure Results.X-72 Table 4.4—Partnership Diabetes Eye Exam PIP Intervention Testing Results ............X-73 Table 4.5—Partnership Diabetes Nephropathy Screening Disparity PIP SMART
Aim Measure..............................................................................................X-74 Table 4.6—Partnership Childhood Immunization Status—Combination 3 PIP
SMART Aim Measure ................................................................................X-75 Table 5.1—Partnership’s Self-Reported Follow-Up on External Quality Review
Recommendations from the July 1, 2016, through June 30, 2017, MCP-Specific Evaluation Report................................................................X-77
Partnership HealthPlan of California Performance Evaluation Report: July 1, 2017–June 30, 2018 California Department of Health Care Services
Page X-v Health Services Advisory Group, Inc.

Medi-Cal Managed Care External Quality Review Technical ReportAppendix X: Performance Evaluation ReportPartnership HealthPlan of CaliforniaJuly 1, 2017–June 30, 2018
1. Introduction
The California Department of Health Care Services (DHCS) contracted with Health Services Advisory Group, Inc. (HSAG), an external quality review organization (EQRO), to prepare the federally required Medi-Cal Managed Care External Quality Review Technical Report, July 1, 2017–June 30, 2018. The technical report provides an overview of the objectives and methodology for conducting the external quality review (EQR) activities, including requirements related to each activity. Additionally, the technical report provides aggregated results and recommendations for DHCS for each activity.
This appendix is specific to DHCS’ contracted Medi-Cal managed care health plan (MCP), Partnership HealthPlan of California (“Partnership” or “the MCP”). The purpose of this appendix is to provide MCP-specific results of each activity and an assessment of the MCP’s strengths and opportunities for improvement with respect to the quality and timeliness of and access to health care services furnished to Medi-Cal Managed Care (MCMC) beneficiaries (referred to as “beneficiaries” in this report). The review period for this MCP-specific evaluation report is July 1, 2017, through June 30, 2018. HSAG will report on activities that take place beyond the review period in Partnership’s 2018–19 MCP-specific evaluation report. This MCP-specific evaluation report references activities and methodologies described in detail by HSAG in the technical report section.
The aggregate EQR technical report and all MCP- and specialty health plan (SHP)-specific performance evaluation reports reflect HSAG’s external, independent assessment of the quality and timeliness of, and access to, care that MCPs and SHPs are providing to beneficiaries.
Medi-Cal Managed Care Health Plan Overview Partnership is a full-scope MCP delivering services to beneficiaries in the County Organized Health System (COHS) model.
Partnership became operational to provide MCMC services in Solano County effective May 1994, in Napa County in March 1998, in Yolo County in March 2001, in Sonoma County in October 2009, and in Marin and Mendocino counties in July 2011. As part of the expansion authority under Section 1115 of the Social Security Act, MCMC expanded into several rural northern counties of California in 2013. Under the expansion, Partnership contracted with DHCS to provide MCMC services in Del Norte, Humboldt, Lake, Lassen, Modoc, Shasta, Siskiyou, and Trinity counties beginning November 1, 2013.
Partnership HealthPlan of California Performance Evaluation Report: July 1, 2017–June 30, 2018 California Department of Health Care Services
Page X-1 Health Services Advisory Group, Inc.

INTRODUCTION
Table 1.1 shows the number of beneficiaries for Partnership for each county and the MCP’s total number of beneficiaries as of June 30, 2018.1
Table 1.1—Partnership Enrollment as of June 30, 2018
County Enrollment as of June 30, 2018
Del Norte 11,444 Humboldt 52,106 Lake 30,691 Lassen 7,273 Marin 38,015 Mendocino 38,616 Modoc 3,117 Napa 28,120 Shasta 59,559 Siskiyou 17,533 Solano 108,376 Sonoma 107,709 Trinity 4,302 Yolo 52,588
Total 559,449
DHCS allows Partnership to combine data into four regions for reporting purposes. Partnership’s regions are as follows:
♦ Northeast—Lassen, Modoc, Shasta, Siskiyou, and Trinity counties ♦ Northwest—Del Norte and Humboldt counties ♦ Southeast—Napa, Solano, and Yolo counties ♦ Southwest—Lake, Marin, Mendocino, and Sonoma counties
1 Medi-Cal Managed Care Enrollment Report—June 2018. Available at: http://www.dhcs.ca.gov/dataandstats/reports/Pages/MMCDMonthlyEnrollment.aspx. Accessed on: Sep 20, 2018.
Partnership HealthPlan of California Performance Evaluation Report: July 1, 2017–June 30, 2018 California Department of Health Care Services
Page X-2 Health Services Advisory Group, Inc.

Medi-Cal Managed Care External Quality Review Technical ReportAppendix X: Performance Evaluation ReportPartnership HealthPlan of CaliforniaJuly 1, 2017–June 30, 2018
2. Managed Care Health Plan Compliance
Compliance Reviews Conducted The following is a summary of the most recent reviews conducted for Partnership. The descriptions of the various types of reviews may be found within the main section of this technical report.
Table 2.1 summarizes the results and status of the DHCS Audits & Investigations Division (A&I) Medical and State Supported Services Audits of Partnership. A&I conducted the on-site audits from January 29, 2018, through February 8, 2018. To ensure parity in services, A&I reviewed coverage for the MCP’s Medi-Cal only Seniors and Persons with Disabilities (SPD) and non-SPD populations. Note that while the reports were issued on August 10, 2018, which is outside the review period for this MCP-specific evaluation report, HSAG includes the audit results and status because A&I conducted the on-site audits during the review period for this report. Additionally, DHCS issued the final closeout letter on October 1, 2018, which is outside the review period for this report; however, HSAG includes the information from the letter because it reflects full resolution of all deficiencies from the January 29, 2018, through February 8, 2018, audits.
Table 2.1—DHCS A&I Medical and State Supported Services Audits of PartnershipAudit Review Period: January 1, 2017, through December 31, 2018
Category Evaluated Deficiencies (Yes/No) Monitoring Status
Utilization Management No Not applicable. Case Management and Coordination of Care No Not applicable.
Access and Availability of Care No Not applicable.
Member’s Rights Yes Corrective Action Plan (CAP) initiated following the audit and subsequently closed.
Quality Management No Not applicable. Administrative and Organizational Capacity No Not applicable.
State Supported Services No Not applicable.
Partnership HealthPlan of California Performance Evaluation Report: July 1, 2017–June 30, 2018 California Department of Health Care Services
Page X-3 Health Services Advisory Group, Inc.

MANAGED CARE HEALTH PLAN COMPLIANCE
Strengths—Compliance Reviews A&I identified no deficiencies in six of the seven categories during the January 29, 2018, through February 8, 2018, Medical and State Supported Services Audits of Partnership. Additionally, A&I identified no significant variance in coverage for the SPD and non-SPD populations. Finally, Partnership’s CAP response regarding the deficiency in the Member’s Rights category resulted in DHCS closing the CAP.
Opportunities for Improvement—Compliance Reviews Partnership has no outstanding deficiencies from the January 29, 2018, through February 8, 2018, A&I Medical and State Supported Services Audits of the MCP; therefore, HSAG has no recommendations for the MCP in the area of compliance reviews.
Partnership HealthPlan of California Performance Evaluation Report: July 1, 2017–June 30, 2018 California Department of Health Care Services
Page X-4 Health Services Advisory Group, Inc.
Medi-Cal Managed Care External Quality Review Technical ReportAppendix X: Performance Evaluation ReportPartnership HealthPlan of CaliforniaJuly 1, 2017–June 30, 2018
3. Managed Care Health Plan Performance Measures
Performance Measure Validation Results The HEDIS®2 2018 Compliance Audit Final Report of Findings for Partnership HealthPlan of California contains the detailed findings and recommendations from HSAG’s NCQA HEDIS Compliance Audit™.3 HSAG auditors determined that Partnership followed the appropriate specifications to produce valid rates, and identified no issues of concern. The auditors noted that Partnership improved its data monitoring processes based on recommendations made by the auditors during the previous audit.
Performance Measure Results and Findings After validating the MCP’s performance measure rates, HSAG assessed the results. See Table 3.1 through Table 3.36 for Partnership’s performance measure results for reporting years (RYs) 2015 through 2018 and performance measure findings for RY 2018. The RY is the year in which the MCP reported the rates. The RY rates reflect measurement year (MY) data from the previous calendar year. Note that data may not be available for all four years.
Note the following regarding Table 3.1 through Table 3.36:
♦ To allow HSAG to provide meaningful assessment of MCP performance and actionable recommendations, HSAG, in collaboration with DHCS, organized the measures into domains based on the health care areas each measure affects. Table 3.1 through Table 3.32 present the performance measure results and findings by domain, and Table 3.33 through Table 3.36 present the RY 2018 performance measure findings for the domains combined.
♦ To assess performance for each MCP reporting unit, HSAG compares the rates to national benchmarks. Rates indicating performance above the high performance levels (HPLs) are shaded in gray, and rates indicating performance below the minimum performance levels (MPLs) are bolded. ■ For measures with rates below the MPLs, DHCS requires MCPs to submit to DHCS
improvement plans (IPs) to address the rates below the MPLs (unless MCPs are reporting the rates for the first time).
■ For MCPs that meet DHCS’ Quality of Care CAP thresholds, DHCS issues a CAP; if an MCP’s performance is such that it may trigger a CAP in the following year, DHCS issues an advance warning letter.
2 Healthcare Effectiveness Data and Information Set (HEDIS®) is a registered trademark of the National Committee for Quality Assurance (NCQA).
3 NCQA HEDIS Compliance AuditTM is a trademark of NCQA.
Partnership HealthPlan of California Performance Evaluation Report: July 1, 2017–June 30, 2018 California Department of Health Care Services
Page X-5 Health Services Advisory Group, Inc.

MANAGED CARE HEALTH PLAN PERFORMANCE MEASURES
■ IPs and CAPs consist of submission of Plan-Do-Study-Act (PDSA) Cycle Worksheets, Quality Improvement (QI) Summaries, or completion of Performance Improvement Projects (PIPs)—as determined by DHCS.
♦ For RYs 2016, 2017, and 2018, the HPLs and MPLs represent the NCQA Quality Compass®4 Medicaid health maintenance organization (HMO) 90th and 25th percentiles, respectively.
♦ For RY 2015, the HPLs and MPLs represent the NCQA HEDIS Audit Means, Percentiles, and Ratios 90th and 25th percentiles, respectively. For the Comprehensive Diabetes Care—HbA1c Poor Control (>9.0 Percent) measure, for which a lower rate indicates more favorable performance, the HPL and MPL are based on the 10th and 75th percentiles, respectively.
♦ HSAG includes the specific HPL and MPL values for RY 2018 in Section 6 of the Medi-Cal Managed Care External Quality Review Technical Report, July 1, 2017–June 30, 2018 (“Managed Care Health Plan Performance Measures”).
Preventive Screening and Children’s Health
Table 3.1 through Table 3.4 present the four-year trending information for the performance measures within the Preventive Screening and Children’s Health domain.
Note the following regarding Table 3.1 through Table 3.4:
♦ Although HSAG includes information on the MCP’s performance related to the four Children and Adolescents’ Access to Primary Care measures, DHCS did not hold MCPs accountable to meet the MPLs for these measures for RYs 2015 through 2018 (i.e., DHCS did not require MCPs to submit IPs if rates for the measures were below the MPLs). DHCS made this decision due to the small range of variation between the HPL and MPL thresholds for each measure.
♦ Any comparison of RY 2018 performance to RY 2017 or to benchmarks related to the Immunizations for Adolescents—Combination 2 measure should be exercised with caution given the changes that NCQA made to the specification for this measure for RY 2018. NCQA released guidance that recommended a break in trending for this measure; however, DHCS determined to continue trending because the specification change should result in higher rates.
4 Quality Compass® is a registered trademark of NCQA.
Partnership HealthPlan of California Performance Evaluation Report: July 1, 2017–June 30, 2018 California Department of Health Care Services
Page X-6 Health Services Advisory Group, Inc.

MANAGED CARE HEALTH PLAN PERFORMANCE MEASURES
Table 3.1—Preventive Screening and Children’s Health DomainMulti-Year Performance Measure Results Partnership—Northeast (Lassen, Modoc, Shasta, Siskiyou, and Trinity Counties)
H = Rate indicates performance above the HPL. Bolded Rate = Rate indicates performance below the MPL.
B = Statistical testing result indicates that the RY 2018 rate is significantly better than the RY 2017 rate.
W = Statistical testing result indicates that the RY 2018 rate is significantly worse than the RY 2017 rate.
Measure RY
2015 Rate1
RY 2016
Rate2
RY 2017
Rate3
RY 2018
Rate4
RYs 2017–18 Rate
Difference5
Childhood Immunization Status—Combination 3 58.64% 56.61% 56.54% 58.02% 1.48
Children and Adolescents’ Access to Primary Care Practitioners—12–24 Months
94.08% 91.69% 91.93% 93.13% 1.20
Children and Adolescents’ Access to Primary Care Practitioners— 25 Months–6 Years
80.79% 81.83% 80.44% 82.20% 1.76B
Children and Adolescents’ Access to Primary Care Practitioners—7–11 Years
NA 80.72% 80.69% 82.03% 1.34B
Children and Adolescents’ Access to Primary Care Practitioners—12–19 Years
NA 83.31% 81.74% 82.44% 0.70
Immunizations for Adolescents— Combination 2^ -- -- 11.19% 14.60% 3.41
Weight Assessment and Counseling for Nutrition and Physical Activity for Children and Adolescents—Nutrition Counseling—Total
55.96% 58.64% 58.88% 62.53% 3.65
Weight Assessment and Counseling for Nutrition and Physical Activity for Children and Adolescents—Physical Activity Counseling—Total
40.39% 51.58% 51.82% 57.91% 6.09
Partnership HealthPlan of California Performance Evaluation Report: July 1, 2017–June 30, 2018 California Department of Health Care Services
Page X-7 Health Services Advisory Group, Inc.

MANAGED CARE HEALTH PLAN PERFORMANCE MEASURES
Measure RY
2015 Rate1
RY 2016
Rate2
RY 2017
Rate3
RY 2018
Rate4
RYs 2017–18 Rate
Difference5
Well-Child Visits in the Third, Fourth, Fifth, and Sixth Years of Life
62.04% 63.66% 65.10% 67.29% 2.19
1 RY 2015 rates reflect MY data from January 1, 2014, through December 31, 2014. 2 RY 2016 rates reflect MY data from January 1, 2015, through December 31, 2015. 3 RY 2017 rates reflect MY data from January 1, 2016, through December 31, 2016. 4 RY 2018 rates reflect MY data from January 1, 2017, through December 31, 2017. 5 Performance comparisons are based on the Chi-square test of statistical significance, with a p value of <0.05. ^ Caution should be exercised when assessing MCP performance for this measure given the changes that NCQA made to the specification for this measure for RY 2018. -- Indicates that the rate is not available. NA = The MCP followed the specifications, but the denominator was too small (less than 30) to report a valid rate.
Table 3.2—Preventive Screening and Children’s Health DomainMulti-Year Performance Measure Results Partnership—Northwest (Del Norte and Humboldt Counties)
H = Rate indicates performance above the HPL. Bolded Rate = Rate indicates performance below the MPL.
B = Statistical testing result indicates that the RY 2018 rate is significantly better than the RY 2017 rate.
W = Statistical testing result indicates that the RY 2018 rate is significantly worse than the RY 2017 rate.
Measure RY
2015 Rate1
RY 2016
Rate2
RY 2017
Rate3
RY 2018
Rate4
RYs 2017–18 Rate
Difference5
Childhood Immunization Status—Combination 3 56.13% 56.54% 60.00% 55.44% -4.56
Children and Adolescents’ Access to Primary Care Practitioners—12–24 Months
96.54% 95.06% 95.33% 94.58% -0.75
Children and Adolescents’ Access to Primary Care Practitioners— 25 Months–6 Years
87.40% 85.80% 86.14% 84.85% -1.29
Partnership HealthPlan of California Performance Evaluation Report: July 1, 2017–June 30, 2018 California Department of Health Care Services
Page X-8 Health Services Advisory Group, Inc.

MANAGED CARE HEALTH PLAN PERFORMANCE MEASURES
Measure RY
2015 Rate1
RY 2016
Rate2
RY 2017
Rate3
RY 2018
Rate4
RYs 2017–18 Rate
Difference5
Children and Adolescents’ Access to Primary Care Practitioners—7–11 Years
NA 86.57% 84.48% 84.55% 0.07
Children and Adolescents’ Access to Primary Care Practitioners—12–19 Years
NA 87.00% 85.83% 85.17% -0.66
Immunizations for Adolescents— Combination 2^ -- -- 17.52% 27.98% 10.46B
Weight Assessment and Counseling for Nutrition and Physical Activity for Children and Adolescents—Nutrition Counseling—Total
46.47% 57.18% 63.41% 68.40% 4.99
Weight Assessment and Counseling for Nutrition and Physical Activity for Children and Adolescents—Physical Activity Counseling—Total
36.25% 56.20% 59.51% 65.68% 6.17
Well-Child Visits in the Third, Fourth, Fifth, and Sixth Years of Life
62.53% 60.05% 71.65% 63.45% -8.20W
1 RY 2015 rates reflect MY data from January 1, 2014, through December 31, 2014. 2 RY 2016 rates reflect MY data from January 1, 2015, through December 31, 2015. 3 RY 2017 rates reflect MY data from January 1, 2016, through December 31, 2016. 4 RY 2018 rates reflect MY data from January 1, 2017, through December 31, 2017. 5 Performance comparisons are based on the Chi-square test of statistical significance, with a p value of <0.05. ^ Caution should be exercised when assessing MCP performance for this measure given the changes that NCQA made to the specification for this measure for RY 2018. -- Indicates that the rate is not available. NA = The MCP followed the specifications, but the denominator was too small (less than 30) to report a valid rate.
Partnership HealthPlan of California Performance Evaluation Report: July 1, 2017–June 30, 2018 California Department of Health Care Services
Page X-9 Health Services Advisory Group, Inc.
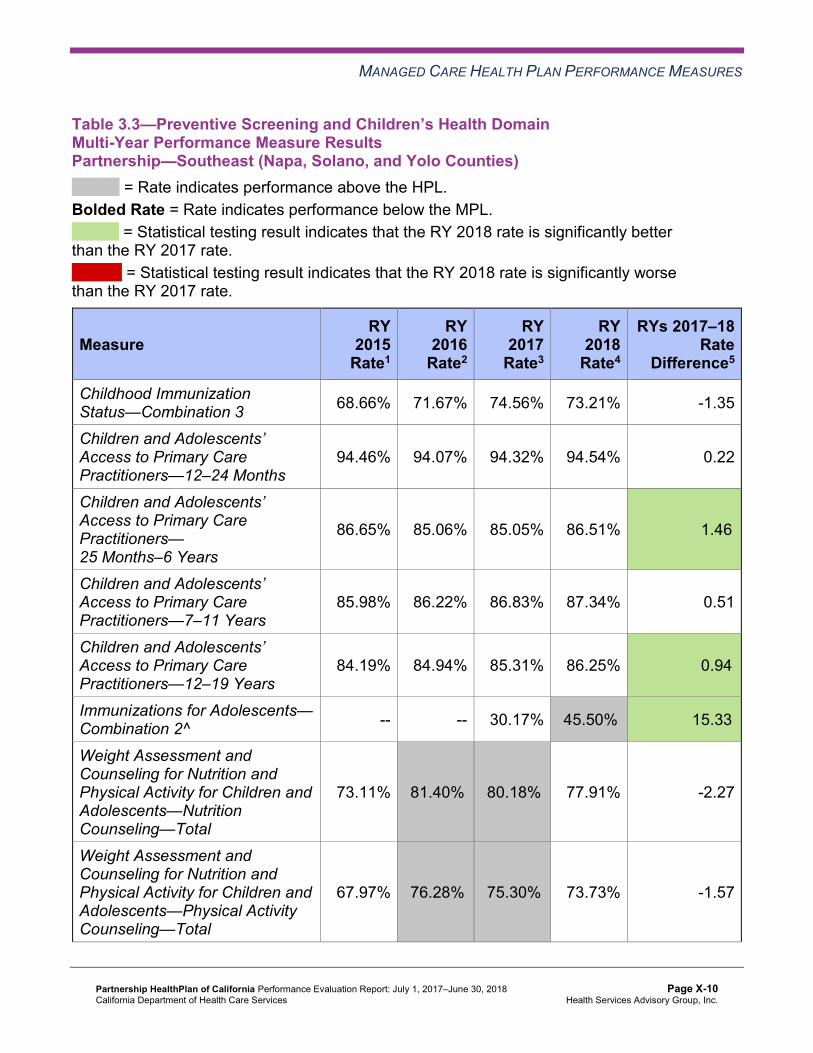
MANAGED CARE HEALTH PLAN PERFORMANCE MEASURES
Table 3.3—Preventive Screening and Children’s Health DomainMulti-Year Performance Measure Results Partnership—Southeast (Napa, Solano, and Yolo Counties)
H = Rate indicates performance above the HPL. Bolded Rate = Rate indicates performance below the MPL.
B = Statistical testing result indicates that the RY 2018 rate is significantly better than the RY 2017 rate.
W = Statistical testing result indicates that the RY 2018 rate is significantly worse than the RY 2017 rate.
Measure RY
2015 Rate1
RY 2016
Rate2
RY 2017
Rate3
RY 2018
Rate4
RYs 2017–18 Rate
Difference5
Childhood Immunization Status—Combination 3 68.66% 71.67% 74.56% 73.21% -1.35
Children and Adolescents’ Access to Primary Care Practitioners—12–24 Months
94.46% 94.07% 94.32% 94.54% 0.22
Children and Adolescents’ Access to Primary Care Practitioners— 25 Months–6 Years
86.65% 85.06% 85.05% 86.51% 1.46B
Children and Adolescents’ Access to Primary Care Practitioners—7–11 Years
85.98% 86.22% 86.83% 87.34% 0.51
Children and Adolescents’ Access to Primary Care Practitioners—12–19 Years
84.19% 84.94% 85.31% 86.25% 0.94B
Immunizations for Adolescents— Combination 2^ -- -- 30.17% 45.50%H 15.33B
Weight Assessment and Counseling for Nutrition and Physical Activity for Children and Adolescents—Nutrition Counseling—Total
73.11% 81.40%H 80.18%H 77.91% -2.27
Weight Assessment and Counseling for Nutrition and Physical Activity for Children and Adolescents—Physical Activity Counseling—Total
67.97% 76.28%H 75.30%H 73.73% -1.57
Partnership HealthPlan of California Performance Evaluation Report: July 1, 2017–June 30, 2018 California Department of Health Care Services
Page X-10 Health Services Advisory Group, Inc.

MANAGED CARE HEALTH PLAN PERFORMANCE MEASURES
Measure RY
2015 Rate1
RY 2016
Rate2
RY 2017
Rate3
RY 2018
Rate4
RYs 2017–18 Rate
Difference5
Well-Child Visits in the Third, Fourth, Fifth, and Sixth Years of Life
75.30% 77.64% 78.04% 75.00% -3.04
1 RY 2015 rates reflect MY data from January 1, 2014, through December 31, 2014. 2 RY 2016 rates reflect MY data from January 1, 2015, through December 31, 2015. 3 RY 2017 rates reflect MY data from January 1, 2016, through December 31, 2016. 4 RY 2018 rates reflect MY data from January 1, 2017, through December 31, 2017. 5 Performance comparisons are based on the Chi-square test of statistical significance, with a p value of <0.05. ^ Caution should be exercised when assessing MCP performance for this measure given the changes that NCQA made to the specification for this measure for RY 2018. -- Indicates that the rate is not available.
Table 3.4—Preventive Screening and Children’s Health DomainMulti-Year Performance Measure Results Partnership—Southwest (Lake, Marin, Mendocino, and Sonoma Counties)
H = Rate indicates performance above the HPL. Bolded Rate = Rate indicates performance below the MPL.
B = Statistical testing result indicates that the RY 2018 rate is significantly better than the RY 2017 rate.
W = Statistical testing result indicates that the RY 2018 rate is significantly worse than the RY 2017 rate.
Measure RY
2015 Rate1
RY 2016
Rate2
RY 2017
Rate3
RY 2018
Rate4
RYs 2017–18 Rate
Difference5
Childhood Immunization Status—Combination 3 73.72% 66.77% 66.85% 64.42% -2.43
Children and Adolescents’ Access to Primary Care Practitioners—12–24 Months
95.78% 95.62% 95.15% 95.19% 0.04
Children and Adolescents’ Access to Primary Care Practitioners— 25 Months–6 Years
88.92% 87.55% 87.74% 87.85% 0.11
Partnership HealthPlan of California Performance Evaluation Report: July 1, 2017–June 30, 2018 California Department of Health Care Services
Page X-11 Health Services Advisory Group, Inc.

MANAGED CARE HEALTH PLAN PERFORMANCE MEASURES
Measure RY
2015 Rate1
RY 2016
Rate2
RY 2017
Rate3
RY 2018
Rate4
RYs 2017–18 Rate
Difference5
Children and Adolescents’ Access to Primary Care Practitioners—7–11 Years
89.77% 89.30% 88.34% 88.96% 0.62
Children and Adolescents’ Access to Primary Care Practitioners—12–19 Years
87.86% 88.67% 87.92% 88.66% 0.74B
Immunizations for Adolescents— Combination 2^ -- -- 28.22% 36.98%H 8.76B
Weight Assessment and Counseling for Nutrition and Physical Activity for Children and Adolescents—Nutrition Counseling—Total
62.77% 72.99% 76.56% 77.40% 0.84
Weight Assessment and Counseling for Nutrition and Physical Activity for Children and Adolescents—Physical Activity Counseling—Total
53.77% 63.75% 72.07%H 70.90% -1.17
Well-Child Visits in the Third, Fourth, Fifth, and Sixth Years of Life
72.02% 73.13% 75.61% 84.03%H 8.42B
1 RY 2015 rates reflect MY data from January 1, 2014, through December 31, 2014. 2 RY 2016 rates reflect MY data from January 1, 2015, through December 31, 2015. 3 RY 2017 rates reflect MY data from January 1, 2016, through December 31, 2016. 4 RY 2018 rates reflect MY data from January 1, 2017, through December 31, 2017. 5 Performance comparisons are based on the Chi-square test of statistical significance, with a p value of <0.05. ^ Caution should be exercised when assessing MCP performance for this measure given the changes that NCQA made to the specification for this measure for RY 2018. -- Indicates that the rate is not available.
Partnership HealthPlan of California Performance Evaluation Report: July 1, 2017–June 30, 2018 California Department of Health Care Services
Page X-12 Health Services Advisory Group, Inc.

MANAGED CARE HEALTH PLAN PERFORMANCE MEASURES
Table 3.5 through Table 3.8 present findings for the RY 2018 performance measures within the Preventive Screening and Children’s Health domain.
Note the following regarding Table 3.5 through Table 3.8:
♦ DHCS did not hold MCPs accountable to meet MPLs for all four Children and Adolescents’ Access to Primary Care measures within this domain; therefore, HSAG did not include these measures in its assessment of the MCP’s performance related to HPLs and MPLs.
♦ The Immunizations for Adolescents—Combination 2 measure was a first-year measure in RY 2017, and DHCS established no MPL for this measure for RY 2017 because no comparable benchmark existed; therefore, HSAG did not include this measure in the denominators for calculating the percentage of measures with rates that moved to above or below the MPLs in RY 2018.
Table 3.5—Preventive Screening and Children’s Health DomainRY 2018 (MY 2017) Performance Measure Findings Partnership—Northeast (Lassen, Modoc, Shasta, Siskiyou, and Trinity Counties)
Criteria Number of Measures
MeetingCriteria
Total Number of Measures
Percentage of Measures
MeetingCriteria
RY 2018 Rates Above HPLs 0 5 0.00% Rates Above HPLs for the Last Three or More Consecutive Years 0 4 0.00%
RY 2018 Rates Significantly Better than RY 2017 Rates* 0 5 0.00%
Rates that Moved from Below MPLs in RY 2017 to Above MPLs in RY 2018 0 1 0.00%
RY 2018 Rates Below MPLs 2 5 40.00% Rates Below MPLs for the Last Three or More Consecutive Years 1 4 25.00%
RY 2018 Rates Significantly Worse than RY 2017 Rates* 0 5 0.00%
Rates that Moved from Above MPLs in RY 2017 to Below MPLs in RY 2018 0 3 0.00%
* Performance comparisons are based on the Chi-square test of statistical significance, with a p value of <0.05.
Partnership HealthPlan of California Performance Evaluation Report: July 1, 2017–June 30, 2018 California Department of Health Care Services
Page X-13 Health Services Advisory Group, Inc.

MANAGED CARE HEALTH PLAN PERFORMANCE MEASURES
Table 3.6—Preventive Screening and Children’s Health DomainRY 2018 (MY 2017) Performance Measure Findings Partnership—Northwest (Del Norte and Humboldt Counties)
Criteria Number of Measures
MeetingCriteria
Total Number of Measures
Percentage of Measures
MeetingCriteria
RY 2018 Rates Above HPLs 0 5 0.00% Rates Above HPLs for the Last Three or More Consecutive Years 0 4 0.00%
RY 2018 Rates Significantly Better than RY 2017 Rates* 1 5 20.00%
Rates that Moved from Below MPLs in RY 2017 to Above MPLs in RY 2018 0 1 0.00%
RY 2018 Rates Below MPLs 2 5 40.00% Rates Below MPLs for the Last Three or More Consecutive Years 1 4 25.00%
RY 2018 Rates Significantly Worse than RY 2017 Rates* 1 5 20.00%
Rates that Moved from Above MPLs in RY 2017 to Below MPLs in RY 2018 1 3 33.33%
* Performance comparisons are based on the Chi-square test of statistical significance, with a p value of <0.05.
Partnership HealthPlan of California Performance Evaluation Report: July 1, 2017–June 30, 2018 California Department of Health Care Services
Page X-14 Health Services Advisory Group, Inc.

MANAGED CARE HEALTH PLAN PERFORMANCE MEASURES
Table 3.7—Preventive Screening and Children’s Health DomainRY 2018 (MY 2017) Performance Measure Findings Partnership—Southeast (Napa, Solano, and Yolo Counties)
Criteria Number of Measures
MeetingCriteria
Total Number of Measures
Percentage of Measures
MeetingCriteria
RY 2018 Rates Above HPLs 1 5 20.00% Rates Above HPLs for the Last Three or More Consecutive Years 0 4 0.00%
RY 2018 Rates Significantly Better than RY 2017 Rates* 1 5 20.00%
Rates that Moved from Below MPLs in RY 2017 to Above MPLs in RY 2018 0 0 N/A
RY 2018 Rates Below MPLs 0 5 0.00% Rates Below MPLs for the Last Three or More Consecutive Years 0 4 0.00%
RY 2018 Rates Significantly Worse than RY 2017 Rates* 0 5 0.00%
Rates that Moved from Above MPLs in RY 2017 to Below MPLs in RY 2018 0 4 0.00%
* Performance comparisons are based on the Chi-square test of statistical significance, with a p value of <0.05. N/A = No rates above or below the MPLs from the previous year exist to include in the denominator for calculating whether or not rates moved to above or below MPLs in the most recent year.
Partnership HealthPlan of California Performance Evaluation Report: July 1, 2017–June 30, 2018 California Department of Health Care Services
Page X-15 Health Services Advisory Group, Inc.
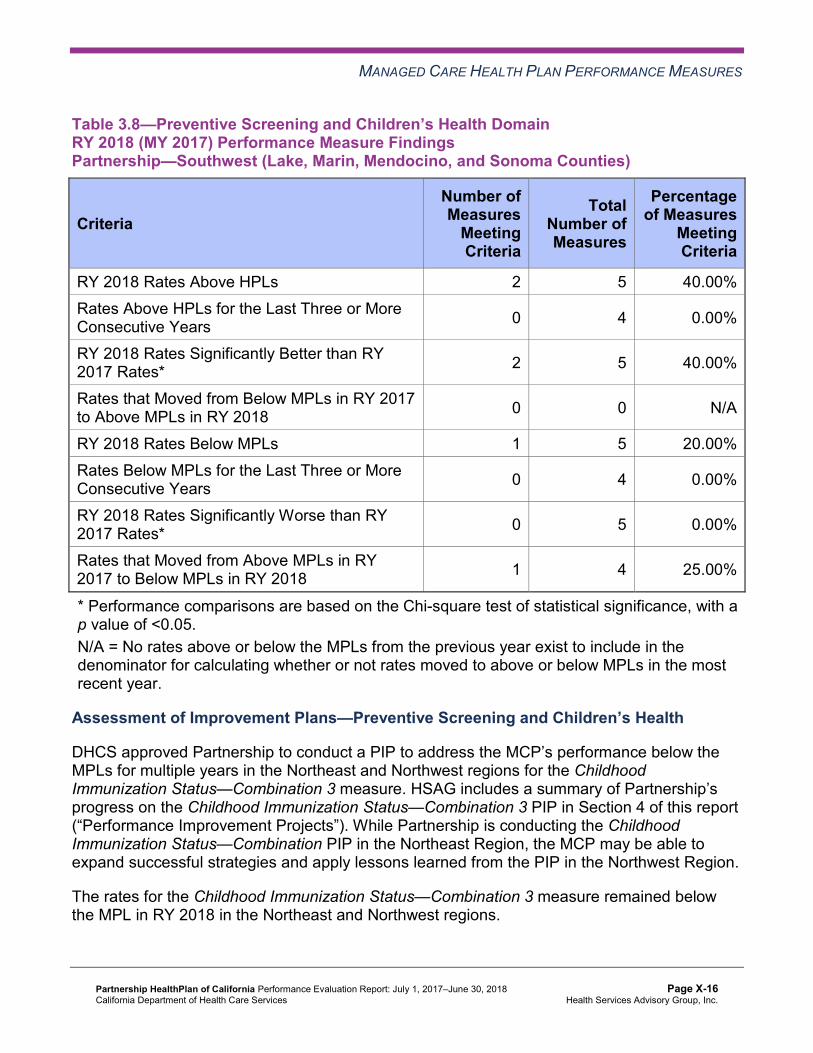
MANAGED CARE HEALTH PLAN PERFORMANCE MEASURES
Table 3.8—Preventive Screening and Children’s Health DomainRY 2018 (MY 2017) Performance Measure Findings Partnership—Southwest (Lake, Marin, Mendocino, and Sonoma Counties)
Criteria Number of Measures
MeetingCriteria
Total Number of Measures
Percentage of Measures
MeetingCriteria
RY 2018 Rates Above HPLs 2 5 40.00% Rates Above HPLs for the Last Three or More Consecutive Years 0 4 0.00%
RY 2018 Rates Significantly Better than RY 2017 Rates* 2 5 40.00%
Rates that Moved from Below MPLs in RY 2017 to Above MPLs in RY 2018 0 0 N/A
RY 2018 Rates Below MPLs 1 5 20.00% Rates Below MPLs for the Last Three or More Consecutive Years 0 4 0.00%
RY 2018 Rates Significantly Worse than RY 2017 Rates* 0 5 0.00%
Rates that Moved from Above MPLs in RY 2017 to Below MPLs in RY 2018 1 4 25.00%
* Performance comparisons are based on the Chi-square test of statistical significance, with a p value of <0.05. N/A = No rates above or below the MPLs from the previous year exist to include in the denominator for calculating whether or not rates moved to above or below MPLs in the most recent year.
Assessment of Improvement Plans—Preventive Screening and Children’s Health
DHCS approved Partnership to conduct a PIP to address the MCP’s performance below the MPLs for multiple years in the Northeast and Northwest regions for the Childhood Immunization Status—Combination 3 measure. HSAG includes a summary of Partnership’s progress on the Childhood Immunization Status—Combination 3 PIP in Section 4 of this report (“Performance Improvement Projects”). While Partnership is conducting the Childhood Immunization Status—Combination PIP in the Northeast Region, the MCP may be able to expand successful strategies and apply lessons learned from the PIP in the Northwest Region.
The rates for the Childhood Immunization Status—Combination 3 measure remained below the MPL in RY 2018 in the Northeast and Northwest regions.
Partnership HealthPlan of California Performance Evaluation Report: July 1, 2017–June 30, 2018 California Department of Health Care Services
Page X-16 Health Services Advisory Group, Inc.

MANAGED CARE HEALTH PLAN PERFORMANCE MEASURES
Preventive Screening and Women’s Health
Table 3.9 through Table 3.12 present the four-year trending information for the performance measures within the Preventive Screening and Women’s Health domain.
Note that any comparison of RY 2018 performance to RY 2017 or to benchmarks related to the Breast Cancer Screening measure should be exercised with caution given the changes that NCQA made to the specification for this measure for RY 2018. NCQA released guidance that recommended a break in trending for this measure; however, DHCS determined to continue trending because the specification change should result in higher rates.
Table 3.9—Preventive Screening and Women’s Health DomainMulti-Year Performance Measure Results Partnership—Northeast (Lassen, Modoc, Shasta, Siskiyou, and Trinity Counties)
H = Rate indicates performance above the HPL. Bolded Rate = Rate indicates performance below the MPL.
B = Statistical testing result indicates that the RY 2018 rate is significantly better than the RY 2017 rate.
W = Statistical testing result indicates that the RY 2018 rate is significantly worse than the RY 2017 rate.
Measure RY
2015 Rate1
RY 2016
Rate2
RY 2017
Rate3
RY 2018
Rate4
RYs 2017–18 Rate
Difference5
Breast Cancer Screening^ -- -- 50.67% 51.53% 0.86 Cervical Cancer Screening 45.99% 42.09% 52.07% 55.61% 3.54 Prenatal and Postpartum Care— Postpartum Care 52.80% 49.27% 61.56% 60.71% -0.85
Prenatal and Postpartum Care— Timeliness of Prenatal Care 78.83% 72.44% 81.27% 79.59% -1.68
1 RY 2015 rates reflect MY data from January 1, 2014, through December 31, 2014. 2 RY 2016 rates reflect MY data from January 1, 2015, through December 31, 2015. 3 RY 2017 rates reflect MY data from January 1, 2016, through December 31, 2016. 4 RY 2018 rates reflect MY data from January 1, 2017, through December 31, 2017. 5 Performance comparisons are based on the Chi-square test of statistical significance, with a p value of <0.05. ^ Caution should be exercised when assessing MCP performance for this measure given the changes that NCQA made to the specification for this measure for RY 2018. -- Indicates that the rate is not available.
Partnership HealthPlan of California Performance Evaluation Report: July 1, 2017–June 30, 2018 California Department of Health Care Services
Page X-17 Health Services Advisory Group, Inc.

MANAGED CARE HEALTH PLAN PERFORMANCE MEASURES
Table 3.10—Preventive Screening and Women’s Health DomainMulti-Year Performance Measure Results Partnership—Northwest (Del Norte and Humboldt Counties)
H = Rate indicates performance above the HPL. Bolded Rate = Rate indicates performance below the MPL.
B = Statistical testing result indicates that the RY 2018 rate is significantly better than the RY 2017 rate.
W = Statistical testing result indicates that the RY 2018 rate is significantly worse than the RY 2017 rate.
Measure RY
2015 Rate1
RY 2016
Rate2
RY 2017
Rate3
RY 2018
Rate4
RYs 2017–18 Rate
Difference5
Breast Cancer Screening^ -- -- 46.04% 47.31% 1.27 Cervical Cancer Screening 49.64% 44.04% 49.15% 54.99% 5.84 Prenatal and Postpartum Care— Postpartum Care 50.36% 59.37% 65.08% 60.11% -4.97
Prenatal and Postpartum Care— Timeliness of Prenatal Care 82.97% 80.54% 84.42% 80.32% -4.10
1 RY 2015 rates reflect MY data from January 1, 2014, through December 31, 2014. 2 RY 2016 rates reflect MY data from January 1, 2015, through December 31, 2015. 3 RY 2017 rates reflect MY data from January 1, 2016, through December 31, 2016. 4 RY 2018 rates reflect MY data from January 1, 2017, through December 31, 2017. 5 Performance comparisons are based on the Chi-square test of statistical significance, with a p value of <0.05. ^ Caution should be exercised when assessing MCP performance for this measure given the changes that NCQA made to the specification for this measure for RY 2018. -- Indicates that the rate is not available.
Partnership HealthPlan of California Performance Evaluation Report: July 1, 2017–June 30, 2018 California Department of Health Care Services
Page X-18 Health Services Advisory Group, Inc.

MANAGED CARE HEALTH PLAN PERFORMANCE MEASURES
Table 3.11—Preventive Screening and Women’s Health DomainMulti-Year Performance Measure Results Partnership—Southeast (Napa, Solano, and Yolo Counties)
H = Rate indicates performance above the HPL. Bolded Rate = Rate indicates performance below the MPL.
B = Statistical testing result indicates that the RY 2018 rate is significantly better than the RY 2017 rate.
W = Statistical testing result indicates that the RY 2018 rate is significantly worse than the RY 2017 rate.
Measure RY
2015 Rate1
RY 2016
Rate2
RY 2017
Rate3
RY 2018
Rate4
RYs 2017–18 Rate
Difference5
Breast Cancer Screening^ -- -- 57.20% 56.96% -0.24 Cervical Cancer Screening 58.19% 60.10% 67.09% 66.39% -0.70 Prenatal and Postpartum Care— Postpartum Care 69.17% 66.38% 72.51% 67.76% -4.75
Prenatal and Postpartum Care— Timeliness of Prenatal Care 87.50% 84.46% 85.44% 83.88% -1.56
1 RY 2015 rates reflect MY data from January 1, 2014, through December 31, 2014. 2 RY 2016 rates reflect MY data from January 1, 2015, through December 31, 2015. 3 RY 2017 rates reflect MY data from January 1, 2016, through December 31, 2016. 4 RY 2018 rates reflect MY data from January 1, 2017, through December 31, 2017. 5 Performance comparisons are based on the Chi-square test of statistical significance, with a p value of <0.05. ^ Caution should be exercised when assessing MCP performance for this measure given the changes that NCQA made to the specification for this measure for RY 2018. -- Indicates that the rate is not available.
Partnership HealthPlan of California Performance Evaluation Report: July 1, 2017–June 30, 2018 California Department of Health Care Services
Page X-19 Health Services Advisory Group, Inc.

MANAGED CARE HEALTH PLAN PERFORMANCE MEASURES
Table 3.12—Preventive Screening and Women’s Health DomainMulti-Year Performance Measure Results Partnership—Southwest (Lake, Marin, Mendocino, and Sonoma Counties)
H = Rate indicates performance above the HPL. Bolded Rate = Rate indicates performance below the MPL.
B = Statistical testing result indicates that the RY 2018 rate is significantly better than the RY 2017 rate.
W = Statistical testing result indicates that the RY 2018 rate is significantly worse than the RY 2017 rate.
Measure RY
2015 Rate1
RY 2016
Rate2
RY 2017
Rate3
RY 2018
Rate4
RYs 2017–18 Rate
Difference5
Breast Cancer Screening^ -- -- 52.06% 52.85% 0.79 Cervical Cancer Screening 56.20% 57.78% 59.06% 57.79% -1.27 Prenatal and Postpartum Care— Postpartum Care 68.37% 68.33% 69.17% 73.73%H 4.56
Prenatal and Postpartum Care— Timeliness of Prenatal Care 86.13% 91.94%H 89.44% 87.01% -2.43
1 RY 2015 rates reflect MY data from January 1, 2014, through December 31, 2014. 2 RY 2016 rates reflect MY data from January 1, 2015, through December 31, 2015. 3 RY 2017 rates reflect MY data from January 1, 2016, through December 31, 2016. 4 RY 2018 rates reflect MY data from January 1, 2017, through December 31, 2017. 5 Performance comparisons are based on the Chi-square test of statistical significance, with a p value of <0.05. ^ Caution should be exercised when assessing MCP performance for this measure given the changes that NCQA made to the specification for this measure for RY 2018. -- Indicates that the rate is not available.
Partnership HealthPlan of California Performance Evaluation Report: July 1, 2017–June 30, 2018 California Department of Health Care Services
Page X-20 Health Services Advisory Group, Inc.

MANAGED CARE HEALTH PLAN PERFORMANCE MEASURES
Table 3.13 through Table 3.16 present findings for the RY 2018 performance measures within the Preventive Screening and Women’s Health domain. Note that the Breast Cancer Screening measure was a first-year measure in RY 2017, and DHCS did not hold MCPs accountable to meet an MPL for this measure in RY 2017; therefore, HSAG did not include this measure in the denominators for calculating the percentage of measures with rates that moved to above or below the MPLs in RY 2018.
Table 3.13—Preventive Screening and Women’s Health DomainRY 2018 (MY 2017) Performance Measure FindingsPartnership—Northeast (Lassen, Modoc, Shasta, Siskiyou, and Trinity Counties)
Criteria Number of Measures
MeetingCriteria
Total Number of Measures
Percentage of Measures
MeetingCriteria
RY 2018 Rates Above HPLs 0 4 0.00% Rates Above HPLs for the Last Three or More Consecutive Years 0 3 0.00%
RY 2018 Rates Significantly Better than RY 2017 Rates* 0 4 0.00%
Rates that Moved from Below MPLs in RY 2017 to Above MPLs in RY 2018 0 0 N/A
RY 2018 Rates Below MPLs 1 4 25.00% Rates Below MPLs for the Last Three or More Consecutive Years 0 3 0.00%
RY 2018 Rates Significantly Worse than RY 2017 Rates* 0 4 0.00%
Rates that Moved from Above MPLs in RY 2017 to Below MPLs in RY 2018 0 3 0.00%
* Performance comparisons are based on the Chi-square test of statistical significance, with a p value of <0.05. N/A = No rates above or below the MPLs from the previous year exist to include in the denominator for calculating whether or not rates moved to above or below MPLs in the most recent year.
Partnership HealthPlan of California Performance Evaluation Report: July 1, 2017–June 30, 2018 California Department of Health Care Services
Page X-21 Health Services Advisory Group, Inc.

MANAGED CARE HEALTH PLAN PERFORMANCE MEASURES
Table 3.14—Preventive Screening and Women’s Health DomainRY 2018 (MY 2017) Performance Measure Findings Partnership—Northwest (Del Norte and Humboldt Counties)
Criteria Number of Measures
MeetingCriteria
Total Number of Measures
Percentage of Measures
MeetingCriteria
RY 2018 Rates Above HPLs 0 4 0.00% Rates Above HPLs for the Last Three or More Consecutive Years 0 3 0.00%
RY 2018 Rates Significantly Better than RY 2017 Rates* 0 4 0.00%
Rates that Moved from Below MPLs in RY 2017 to Above MPLs in RY 2018 0 0 N/A
RY 2018 Rates Below MPLs 1 4 25.00% Rates Below MPLs for the Last Three or More Consecutive Years 0 3 0.00%
RY 2018 Rates Significantly Worse than RY 2017 Rates* 0 4 0.00%
Rates that Moved from Above MPLs in RY 2017 to Below MPLs in RY 2018 0 3 0.00%
* Performance comparisons are based on the Chi-square test of statistical significance, with a p value of <0.05. N/A = No rates above or below the MPLs from the previous year exist to include in the denominator for calculating whether or not rates moved to above or below MPLs in the most recent year.
Partnership HealthPlan of California Performance Evaluation Report: July 1, 2017–June 30, 2018 California Department of Health Care Services
Page X-22 Health Services Advisory Group, Inc.

MANAGED CARE HEALTH PLAN PERFORMANCE MEASURES
Table 3.15—Preventive Screening and Women’s Health DomainRY 2018 (MY 2017) Performance Measure Findings Partnership—Southeast (Napa, Solano, and Yolo Counties)
Criteria Number of Measures
MeetingCriteria
Total Number of Measures
Percentage of Measures
MeetingCriteria
RY 2018 Rates Above HPLs 0 4 0.00% Rates Above HPLs for the Last Three or More Consecutive Years 0 3 0.00%
RY 2018 Rates Significantly Better than RY 2017 Rates* 0 4 0.00%
Rates that Moved from Below MPLs in RY 2017 to Above MPLs in RY 2018 0 0 N/A
RY 2018 Rates Below MPLs 0 4 0.00% Rates Below MPLs for the Last Three or More Consecutive Years 0 3 0.00%
RY 2018 Rates Significantly Worse than RY 2017 Rates* 0 4 0.00%
Rates that Moved from Above MPLs in RY 2017 to Below MPLs in RY 2018 0 3 0.00%
* Performance comparisons are based on the Chi-square test of statistical significance, with a p value of <0.05. N/A = No rates above or below the MPLs from the previous year exist to include in the denominator for calculating whether or not rates moved to above or below MPLs in the most recent year.
Partnership HealthPlan of California Performance Evaluation Report: July 1, 2017–June 30, 2018 California Department of Health Care Services
Page X-23 Health Services Advisory Group, Inc.

MANAGED CARE HEALTH PLAN PERFORMANCE MEASURES
Table 3.16—Preventive Screening and Women’s Health DomainRY 2018 (MY 2017) Performance Measure Findings Partnership—Southwest (Lake, Marin, Mendocino, and Sonoma Counties)
Criteria Number of Measures
MeetingCriteria
Total Number of Measures
Percentage of Measures
MeetingCriteria
RY 2018 Rates Above HPLs 1 4 25.00% Rates Above HPLs for the Last Three or More Consecutive Years 0 3 0.00%
RY 2018 Rates Significantly Better than RY 2017 Rates* 0 4 0.00%
Rates that Moved from Below MPLs in RY 2017 to Above MPLs in RY 2018 0 0 N/A
RY 2018 Rates Below MPLs 0 4 0.00% Rates Below MPLs for the Last Three or More Consecutive Years 0 3 0.00%
RY 2018 Rates Significantly Worse than RY 2017 Rates* 0 4 0.00%
Rates that Moved from Above MPLs in RY 2017 to Below MPLs in RY 2018 0 3 0.00%
* Performance comparisons are based on the Chi-square test of statistical significance, with a p value of <0.05. N/A = No rates above or below the MPLs from the previous year exist to include in the denominator for calculating whether or not rates moved to above or below MPLs in the most recent year.
Partnership HealthPlan of California Performance Evaluation Report: July 1, 2017–June 30, 2018 California Department of Health Care Services
Page X-24 Health Services Advisory Group, Inc.

MANAGED CARE HEALTH PLAN PERFORMANCE MEASURES
Care for Chronic Conditions
Table 3.17 through Table 3.20 present the four-year trending information for the performance measures within the Care for Chronic Conditions domain.
Table 3.17—Care for Chronic Conditions Domain Multi-Year Performance Measure Results Partnership—Northeast (Lassen, Modoc, Shasta, Siskiyou, and Trinity Counties)
H = Rate indicates performance above the HPL. Bolded Rate = Rate indicates performance below the MPL.
B = Statistical testing result indicates that the RY 2018 rate is significantly better than the RY 2017 rate.
W = Statistical testing result indicates that the RY 2018 rate is significantly worse than the RY 2017 rate.
Measure RY
2015 Rate1
RY 2016
Rate2
RY 2017
Rate3
RY 2018
Rate4
RYs 2017–18 Rate
Difference5
Annual Monitoring for Patients on Persistent Medications— ACE Inhibitors or ARBs
82.11% 81.68% 82.40% 83.80% 1.40
Annual Monitoring for Patients on Persistent Medications— Diuretics
83.23% 83.40% 84.77% 84.51% -0.26
Asthma Medication Ratio -- -- 50.89% 52.02% 1.13 Comprehensive Diabetes Care— Blood Pressure Control (<140/90 mm Hg)
56.69% 64.23% 70.32% 68.37% -1.95
Comprehensive Diabetes Care— Eye Exam (Retinal) Performed 34.79% 43.07% 49.64% 55.72% 6.08
Comprehensive Diabetes Care— HbA1c Control (<8.0 Percent) 48.91% 44.04% 52.07% 50.36% -1.71
Comprehensive Diabetes Care— HbA1c Poor Control (>9.0 Percent)*
42.58% 46.96% 38.69% 38.69% 0.00
Comprehensive Diabetes Care— HbA1c Testing 87.35% 86.86% 85.89% 87.10% 1.21
Comprehensive Diabetes Care— Medical Attention for Nephropathy
76.16% 87.35% 89.78% 90.02% 0.24
Partnership HealthPlan of California Performance Evaluation Report: July 1, 2017–June 30, 2018 California Department of Health Care Services
Page X-25 Health Services Advisory Group, Inc.

MANAGED CARE HEALTH PLAN PERFORMANCE MEASURES
Measure RY
2015 Rate1
RY 2016
Rate2
RY 2017
Rate3
RY 2018
Rate4
RYs 2017–18 Rate
Difference5
Controlling High Blood Pressure 48.42% 54.74% 64.30% 65.26% 0.96 1 RY 2015 rates reflect MY data from January 1, 2014, through December 31, 2014. 2 RY 2016 rates reflect MY data from January 1, 2015, through December 31, 2015. 3 RY 2017 rates reflect MY data from January 1, 2016, through December 31, 2016. 4 RY 2018 rates reflect MY data from January 1, 2017, through December 31, 2017. 5 Performance comparisons are based on the Chi-square test of statistical significance, with a p value of <0.05. * A lower rate indicates better performance for this measure. -- Indicates that the rate is not available.
Table 3.18—Care for Chronic Conditions Domain Multi-Year Performance Measure Results Partnership—Northwest (Del Norte and Humboldt Counties)
H = Rate indicates performance above the HPL. Bolded Rate = Rate indicates performance below the MPL.
B = Statistical testing result indicates that the RY 2018 rate is significantly better than the RY 2017 rate.
W = Statistical testing result indicates that the RY 2018 rate is significantly worse than the RY 2017 rate.
Measure RY
2015 Rate1
RY 2016
Rate2
RY 2017
Rate3
RY 2018
Rate4
RYs 2017–18 Rate
Difference5
Annual Monitoring for Patients on Persistent Medications— ACE Inhibitors or ARBs
80.41% 78.82% 85.55% 84.45% -1.10
Annual Monitoring for Patients on Persistent Medications— Diuretics
83.65% 80.46% 86.06% 86.10% 0.04
Asthma Medication Ratio -- -- 50.39% 50.44% 0.05 Comprehensive Diabetes Care— Blood Pressure Control (<140/90 mm Hg)
58.39% 60.58% 63.26% 61.80% -1.46
Comprehensive Diabetes Care— Eye Exam (Retinal) Performed 39.17% 42.82% 47.93% 47.93% 0.00
Partnership HealthPlan of California Performance Evaluation Report: July 1, 2017–June 30, 2018 California Department of Health Care Services
Page X-26 Health Services Advisory Group, Inc.
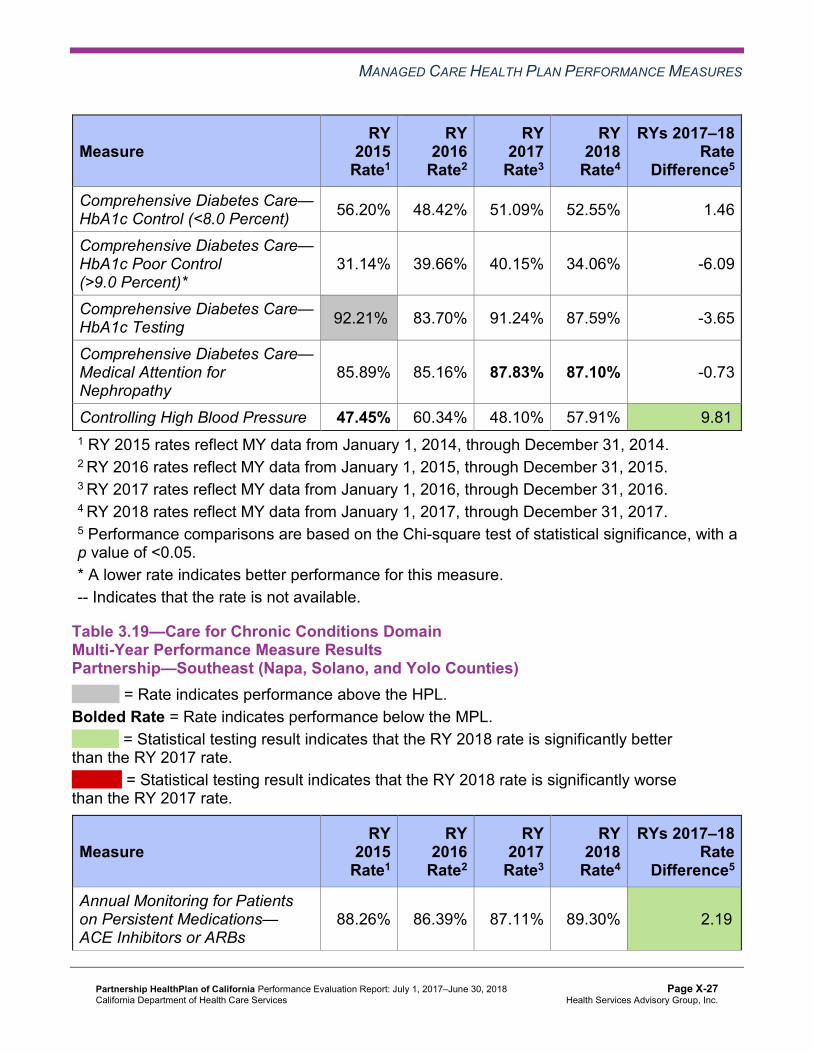
MANAGED CARE HEALTH PLAN PERFORMANCE MEASURES
Measure RY
2015 Rate1
RY 2016
Rate2
RY 2017
Rate3
RY 2018
Rate4
RYs 2017–18 Rate
Difference5
Comprehensive Diabetes Care— HbA1c Control (<8.0 Percent) 56.20% 48.42% 51.09% 52.55% 1.46
Comprehensive Diabetes Care— HbA1c Poor Control (>9.0 Percent)*
31.14% 39.66% 40.15% 34.06% -6.09
Comprehensive Diabetes Care— HbA1c Testing 92.21%H 83.70% 91.24% 87.59% -3.65
Comprehensive Diabetes Care— Medical Attention for Nephropathy
85.89% 85.16% 87.83% 87.10% -0.73
Controlling High Blood Pressure 47.45% 60.34% 48.10% 57.91% 9.81B
1 RY 2015 rates reflect MY data from January 1, 2014, through December 31, 2014. 2 RY 2016 rates reflect MY data from January 1, 2015, through December 31, 2015. 3 RY 2017 rates reflect MY data from January 1, 2016, through December 31, 2016. 4 RY 2018 rates reflect MY data from January 1, 2017, through December 31, 2017. 5 Performance comparisons are based on the Chi-square test of statistical significance, with a p value of <0.05. * A lower rate indicates better performance for this measure. -- Indicates that the rate is not available.
Table 3.19—Care for Chronic Conditions Domain Multi-Year Performance Measure Results Partnership—Southeast (Napa, Solano, and Yolo Counties)
H = Rate indicates performance above the HPL. Bolded Rate = Rate indicates performance below the MPL.
B = Statistical testing result indicates that the RY 2018 rate is significantly better than the RY 2017 rate.
W = Statistical testing result indicates that the RY 2018 rate is significantly worse than the RY 2017 rate.
Measure RY
2015 Rate1
RY 2016
Rate2
RY 2017
Rate3
RY 2018
Rate4
RYs 2017–18 Rate
Difference5
Annual Monitoring for Patients on Persistent Medications— ACE Inhibitors or ARBs
88.26% 86.39% 87.11% 89.30% 2.19B
Partnership HealthPlan of California Performance Evaluation Report: July 1, 2017–June 30, 2018 California Department of Health Care Services
Page X-27 Health Services Advisory Group, Inc.

MANAGED CARE HEALTH PLAN PERFORMANCE MEASURES
Measure RY
2015 Rate1
RY 2016
Rate2
RY 2017
Rate3
RY 2018
Rate4
RYs 2017–18 Rate
Difference5
Annual Monitoring for Patients on Persistent Medications— Diuretics
88.88% 85.33% 86.20% 88.77% 2.57B
Asthma Medication Ratio -- -- 66.67% 65.41% -1.26 Comprehensive Diabetes Care— Blood Pressure Control (<140/90 mm Hg)
61.95% 63.66% 63.81% 68.95% 5.14
Comprehensive Diabetes Care— Eye Exam (Retinal) Performed 54.15% 60.98% 59.41% 62.59% 3.18
Comprehensive Diabetes Care— HbA1c Control (<8.0 Percent) 53.66% 54.15% 54.03% 57.21% 3.18
Comprehensive Diabetes Care— HbA1c Poor Control (>9.0 Percent)*
35.37% 35.61% 34.72% 31.78% -2.94
Comprehensive Diabetes Care— HbA1c Testing 88.05% 85.12% 84.35% 93.15%H 8.80B
Comprehensive Diabetes Care— Medical Attention for Nephropathy
84.88% 87.56% 90.46% 93.40%H 2.94
Controlling High Blood Pressure 58.52% 65.59% 61.70% 61.73% 0.03 1 RY 2015 rates reflect MY data from January 1, 2014, through December 31, 2014. 2 RY 2016 rates reflect MY data from January 1, 2015, through December 31, 2015. 3 RY 2017 rates reflect MY data from January 1, 2016, through December 31, 2016. 4 RY 2018 rates reflect MY data from January 1, 2017, through December 31, 2017. 5 Performance comparisons are based on the Chi-square test of statistical significance, with a p value of <0.05. * A lower rate indicates better performance for this measure. -- Indicates that the rate is not available.
Partnership HealthPlan of California Performance Evaluation Report: July 1, 2017–June 30, 2018 California Department of Health Care Services
Page X-28 Health Services Advisory Group, Inc.

MANAGED CARE HEALTH PLAN PERFORMANCE MEASURES
Table 3.20—Care for Chronic Conditions Domain Multi-Year Performance Measure Results Partnership—Southwest (Lake, Marin, Mendocino, and Sonoma Counties)
H = Rate indicates performance above the HPL. Bolded Rate = Rate indicates performance below the MPL.
B = Statistical testing result indicates that the RY 2018 rate is significantly better than the RY 2017 rate.
W = Statistical testing result indicates that the RY 2018 rate is significantly worse than the RY 2017 rate.
Measure RY
2015 Rate1
RY 2016
Rate2
RY 2017
Rate3
RY 2018
Rate4
RYs 2017–18 Rate
Difference5
Annual Monitoring for Patients on Persistent Medications— ACE Inhibitors or ARBs
83.20% 83.40% 84.92% 86.68% 1.76B
Annual Monitoring for Patients on Persistent Medications— Diuretics
83.30% 85.03% 84.85% 87.01% 2.16B
Asthma Medication Ratio -- -- 59.74% 57.37% -2.37 Comprehensive Diabetes Care— Blood Pressure Control (<140/90 mm Hg)
64.48% 71.29% 68.61% 69.34% 0.73
Comprehensive Diabetes Care— Eye Exam (Retinal) Performed 49.15% 54.01% 57.42% 60.34% 2.92
Comprehensive Diabetes Care— HbA1c Control (<8.0 Percent) 46.72% 48.91% 51.34% 52.07% 0.73
Comprehensive Diabetes Care— HbA1c Poor Control (>9.0 Percent)*
43.31% 40.15% 37.71% 37.96% 0.25
Comprehensive Diabetes Care— HbA1c Testing 87.10% 87.10% 89.29% 88.81% -0.48
Comprehensive Diabetes Care— Medical Attention for Nephropathy
76.64% 86.62% 84.67% 86.13% 1.46
Controlling High Blood Pressure 54.01% 65.53% 64.89% 61.84% -3.05 1 RY 2015 rates reflect MY data from January 1, 2014, through December 31, 2014. 2 RY 2016 rates reflect MY data from January 1, 2015, through December 31, 2015. 3 RY 2017 rates reflect MY data from January 1, 2016, through December 31, 2016.
Partnership HealthPlan of California Performance Evaluation Report: July 1, 2017–June 30, 2018 California Department of Health Care Services
Page X-29 Health Services Advisory Group, Inc.

MANAGED CARE HEALTH PLAN PERFORMANCE MEASURES
4 RY 2018 rates reflect MY data from January 1, 2017, through December 31, 2017. 5 Performance comparisons are based on the Chi-square test of statistical significance, with a p value of <0.05. * A lower rate indicates better performance for this measure. -- Indicates that the rate is not available.
Table 3.21 through Table 3.24 present findings for the RY 2018 performance measures within the Care for Chronic Conditions domain. Note that the Asthma Medication Ratio measure was a first-year measure in RY 2017, and DHCS did not hold MCPs accountable to meet an MPL for this measure in RY 2017; therefore, HSAG did not include this measure in the denominators for calculating the percentage of measures with rates that moved to above or below the MPLs in RY 2018.
Table 3.21—Care for Chronic Conditions Domain RY 2018 (MY 2017) Performance Measure Findings Partnership—Northeast (Lassen, Modoc, Shasta, Siskiyou, and Trinity Counties)
Criteria Number of Measures
MeetingCriteria
Total Number of Measures
Percentage of Measures
MeetingCriteria
RY 2018 Rates Above HPLs 0 10 0.00% Rates Above HPLs for the Last Three or More Consecutive Years 0 9 0.00%
RY 2018 Rates Significantly Better than RY 2017 Rates* 0 10 0.00%
Rates that Moved from Below MPLs in RY 2017 to Above MPLs in RY 2018 0 2 0.00%
RY 2018 Rates Below MPLs 3 10 30.00% Rates Below MPLs for the Last Three or More Consecutive Years 2 9 22.22%
RY 2018 Rates Significantly Worse than RY 2017 Rates* 0 10 0.00%
Rates that Moved from Above MPLs in RY 2017 to Below MPLs in RY 2018 0 7 0.00%
* Performance comparisons are based on the Chi-square test of statistical significance, with a p value of <0.05.
Partnership HealthPlan of California Performance Evaluation Report: July 1, 2017–June 30, 2018 California Department of Health Care Services
Page X-30 Health Services Advisory Group, Inc.
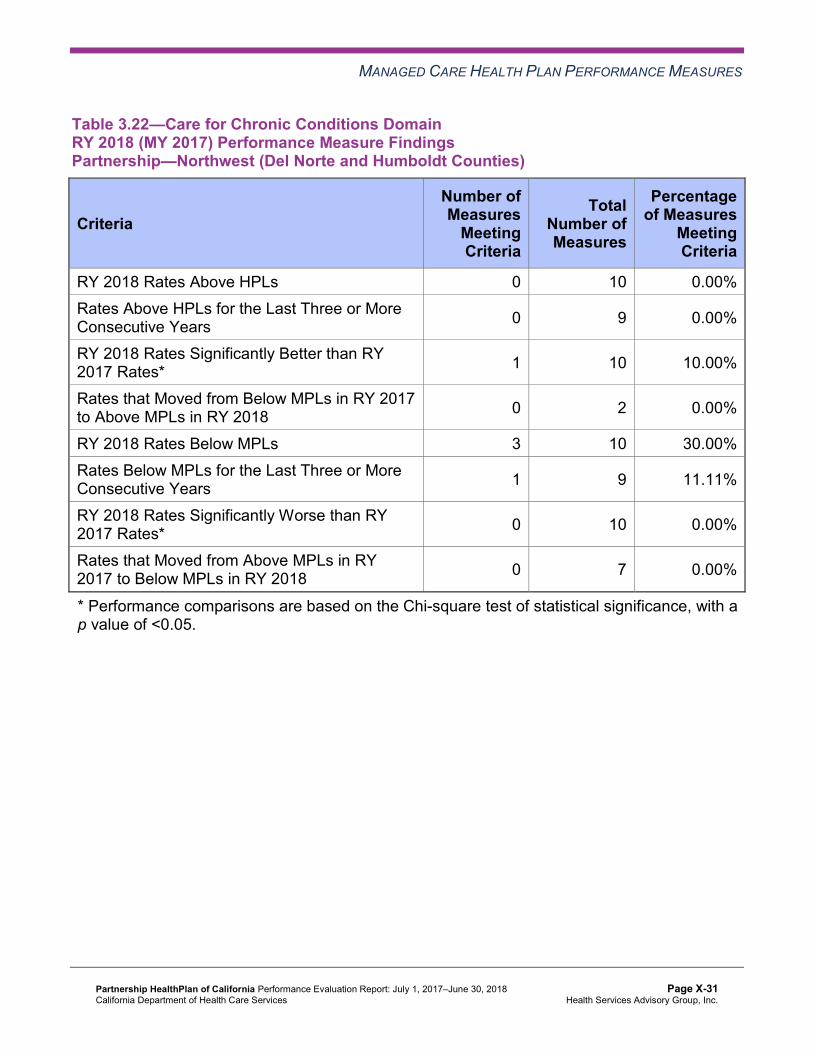
MANAGED CARE HEALTH PLAN PERFORMANCE MEASURES
Table 3.22—Care for Chronic Conditions Domain RY 2018 (MY 2017) Performance Measure Findings Partnership—Northwest (Del Norte and Humboldt Counties)
Criteria Number of Measures
MeetingCriteria
Total Number of Measures
Percentage of Measures
MeetingCriteria
RY 2018 Rates Above HPLs 0 10 0.00% Rates Above HPLs for the Last Three or More Consecutive Years 0 9 0.00%
RY 2018 Rates Significantly Better than RY 2017 Rates* 1 10 10.00%
Rates that Moved from Below MPLs in RY 2017 to Above MPLs in RY 2018 0 2 0.00%
RY 2018 Rates Below MPLs 3 10 30.00% Rates Below MPLs for the Last Three or More Consecutive Years 1 9 11.11%
RY 2018 Rates Significantly Worse than RY 2017 Rates* 0 10 0.00%
Rates that Moved from Above MPLs in RY 2017 to Below MPLs in RY 2018 0 7 0.00%
* Performance comparisons are based on the Chi-square test of statistical significance, with a p value of <0.05.
Partnership HealthPlan of California Performance Evaluation Report: July 1, 2017–June 30, 2018 California Department of Health Care Services
Page X-31 Health Services Advisory Group, Inc.
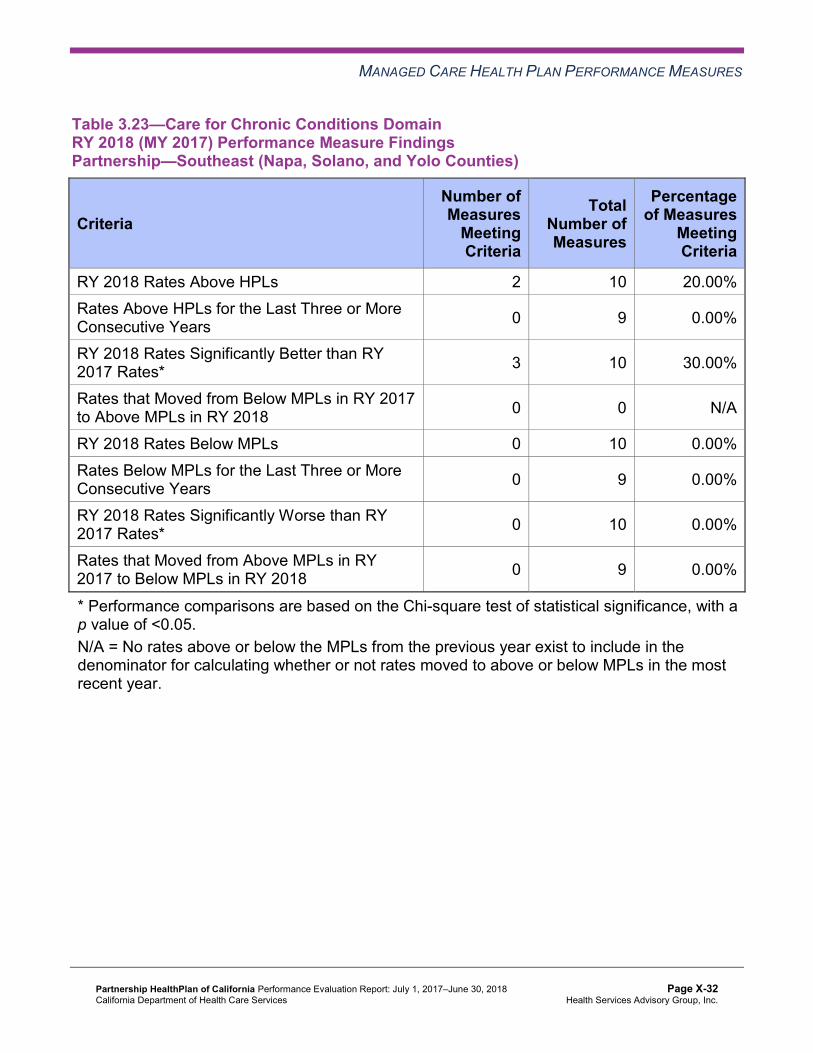
MANAGED CARE HEALTH PLAN PERFORMANCE MEASURES
Table 3.23—Care for Chronic Conditions Domain RY 2018 (MY 2017) Performance Measure Findings Partnership—Southeast (Napa, Solano, and Yolo Counties)
Criteria Number of Measures
MeetingCriteria
Total Number of Measures
Percentage of Measures
MeetingCriteria
RY 2018 Rates Above HPLs 2 10 20.00% Rates Above HPLs for the Last Three or More Consecutive Years 0 9 0.00%
RY 2018 Rates Significantly Better than RY 2017 Rates* 3 10 30.00%
Rates that Moved from Below MPLs in RY 2017 to Above MPLs in RY 2018 0 0 N/A
RY 2018 Rates Below MPLs 0 10 0.00% Rates Below MPLs for the Last Three or More Consecutive Years 0 9 0.00%
RY 2018 Rates Significantly Worse than RY 2017 Rates* 0 10 0.00%
Rates that Moved from Above MPLs in RY 2017 to Below MPLs in RY 2018 0 9 0.00%
* Performance comparisons are based on the Chi-square test of statistical significance, with a p value of <0.05. N/A = No rates above or below the MPLs from the previous year exist to include in the denominator for calculating whether or not rates moved to above or below MPLs in the most recent year.
Partnership HealthPlan of California Performance Evaluation Report: July 1, 2017–June 30, 2018 California Department of Health Care Services
Page X-32 Health Services Advisory Group, Inc.

MANAGED CARE HEALTH PLAN PERFORMANCE MEASURES
Table 3.24—Care for Chronic Conditions Domain RY 2018 (MY 2017) Performance Measure Findings Partnership—Southwest (Lake, Marin, Mendocino, and Sonoma Counties)
Criteria Number of Measures
MeetingCriteria
Total Number of Measures
Percentage of Measures
MeetingCriteria
RY 2018 Rates Above HPLs 0 10 0.00% Rates Above HPLs for the Last Three or More Consecutive Years 0 9 0.00%
RY 2018 Rates Significantly Better than RY 2017 Rates* 2 10 20.00%
Rates that Moved from Below MPLs in RY 2017 to Above MPLs in RY 2018 2 3 66.67%
RY 2018 Rates Below MPLs 1 10 10.00% Rates Below MPLs for the Last Three or More Consecutive Years 0 9 0.00%
RY 2018 Rates Significantly Worse than RY 2017 Rates* 0 10 0.00%
Rates that Moved from Above MPLs in RY 2017 to Below MPLs in RY 2018 0 6 0.00%
* Performance comparisons are based on the Chi-square test of statistical significance, with a p value of <0.05.
Assessment of Improvement Plans—Care for Chronic Conditions
Based on RY 2017 performance measure results, Partnership was required to submit IPs for the following measures within the Care for Chronic Conditions domain:
♦ Annual Monitoring for Patients on Persistent Medications—ACE Inhibitors or ARBs in the Northeast, Northwest, and Southwest regions.
♦ Annual Monitoring for Patients on Persistent Medications—Diuretics in the Northeast and Southwest regions
♦ Comprehensive Diabetes Care—Medical Attention for Nephropathy in the Northwest and Southwest regions
Annual Monitoring for Patients on Persistent Medications
Partnership conducted two PDSA cycles to help improve the MCP’s performance on the Annual Monitoring for Patients on Persistent Medications measures. Partnership tested
Partnership HealthPlan of California Performance Evaluation Report: July 1, 2017–June 30, 2018 California Department of Health Care Services
Page X-33 Health Services Advisory Group, Inc.

MANAGED CARE HEALTH PLAN PERFORMANCE MEASURES
whether or not conducting outreach calls and/or sending mailings with lab order slips attached would result in more beneficiaries having their labs completed. The MCP indicated having learned that combining the mailing with the outreach call is more effective than the MCP sending out the mailings without the call. Additionally, speaking on the phone with beneficiaries yielded better outcomes than leaving voicemail messages for beneficiaries.
The rates improved to above the MPLs in RY 2018 for both Annual Monitoring for Patients on Persistent Medications measures in the Southwest Region. The rates remained below the MPL in RY 2018 for the Annual Monitoring for Patients on Persistent Medications—ACE Inhibitors or ARBs measure in the Northeast and Northwest regions. Additionally, the rate remained below the MPL for the Annual Monitoring for Patients on Persistent Medications—Diuretics measure in the Northeast Region.
Medical Attention for Nephropathy
DHCS approved Partnership to conduct a PIP to address the rates in the Northwest and Southwest regions being below the MPL for the Comprehensive Diabetes Care—Medical Attention for Nephropathy measure. HSAG includes a summary of Partnership’s progress on the Diabetes Nephropathy Screening Disparity PIP in Section 4 of this report (“Performance Improvement Projects”). While the Diabetes Nephropathy Screening Disparity PIP will be conducted in the Southwest Region, the MCP may be able to expand successful strategies and apply lessons learned from the PIP in the Northwest Region.
The rates for the Comprehensive Diabetes Care—Medical Attention for Nephropathy measure remained below the MPL in RY 2018 in the Northwest and Southwest regions.
Appropriate Treatment and Utilization
Table 3.25 through Table 3.28 present the four-year trending information for the performance measures within the Appropriate Treatment and Utilization domain.
Note the following regarding Table 3.25 through Table 3.28:
♦ The All-Cause Readmissions measure is a non-HEDIS measure originally developed for DHCS’ All-Cause Readmissions collaborative quality improvement project (QIP); therefore, DHCS does not establish an HPL or MPL for this measure. For the All-Cause Readmissions measure, a lower rate indicates better performance (i.e., fewer readmissions).
♦ The two Ambulatory Care measures are utilization measures, which measure the volume of services used. DHCS does not hold MCPs accountable to meet MPLs for utilization measures, and HSAG does not compare performance for these measures against HPLs and MPLs. Additionally, because high and low rates do not necessarily indicate better or worse performance, HSAG did not compare performance for these measures across years.
♦ DHCS established no HPL or MPL for the two Depression Screening and Follow-Up for Adolescents and Adults measures for RY 2018 because no comparable benchmarks exist.
Partnership HealthPlan of California Performance Evaluation Report: July 1, 2017–June 30, 2018 California Department of Health Care Services
Page X-34 Health Services Advisory Group, Inc.

MANAGED CARE HEALTH PLAN PERFORMANCE MEASURES
Additionally, although MCPs reported the two Depression Screening and Follow-Up for Adolescents and Adults measures for RY 2018, HSAG does not present the performance measure results for these measures in this report because the reported rates do not accurately represent services being provided. This is due to the Depression Screening and Follow-Up for Adolescents and Adults measures being new HEDIS measures for RY 2018, NCQA requiring MCPs to submit rates for these measures using the new Electronic Clinical Data Systems (ECDS) reporting methodology, and inconsistent data reporting processes by calculation vendors. Thus, MCPs experienced numerous challenges obtaining data sources to use for ECDS reporting. DHCS and HSAG, in consultation with NCQA, will work with MCPs to improve data capture for RY 2019.
♦ Note that due to changes that NCQA made to the specifications for the Use of Imaging Studies for Low Back Pain measure in RY 2018, NCQA released guidance to exercise caution when trending the results for this measure. Therefore, caution should be used when comparing MCP performance across years or when comparing MCP results to benchmarks related to the Use of Imaging Studies for Low Back Pain measure, as differences in rates may be a result of the specification changes rather than a reflection of performance.
Table 3.25—Appropriate Treatment and Utilization DomainMulti-Year Performance Measure Results Partnership—Northeast (Lassen, Modoc, Shasta, Siskiyou, and Trinity Counties)
H = Rate indicates performance above the HPL. Bolded Rate = Rate indicates performance below the MPL.
B = Statistical testing result indicates that the RY 2018 rate is significantly better than the RY 2017 rate.
W = Statistical testing result indicates that the RY 2018 rate is significantly worse than the RY 2017 rate.
Measure RY
2015 Rate1
RY 2016
Rate2
RY 2017
Rate3
RY 2018
Rate4
RYs 2017–18 Rate
Difference5
All-Cause Readmissions* 14.55% 15.25% 12.47% 12.12% -0.35 Ambulatory Care—Emergency Department (ED) Visits per 1,000 Member Months**
68.85 73.36 58.66 57.51 Not Tested
Ambulatory Care—Outpatient Visits per 1,000 Member Months**
248.98 239.00 227.19 239.56 Not Tested
Avoidance of Antibiotic Treatment in Adults With Acute Bronchitis
22.31% 27.22% 36.13% 35.93% -0.20
Partnership HealthPlan of California Performance Evaluation Report: July 1, 2017–June 30, 2018 California Department of Health Care Services
Page X-35 Health Services Advisory Group, Inc.
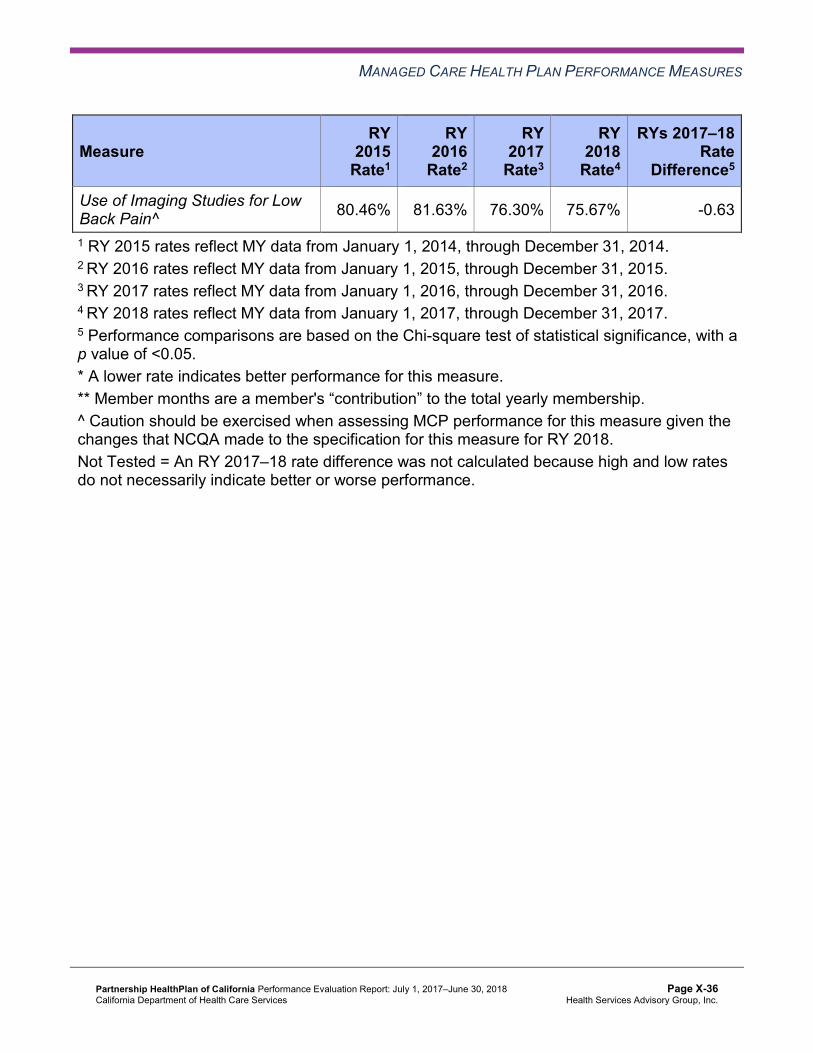
MANAGED CARE HEALTH PLAN PERFORMANCE MEASURES
Measure RY
2015 Rate1
RY 2016
Rate2
RY 2017
Rate3
RY 2018
Rate4
RYs 2017–18 Rate
Difference5
Use of Imaging Studies for Low Back Pain^ 80.46% 81.63% 76.30% 75.67% -0.63
1 RY 2015 rates reflect MY data from January 1, 2014, through December 31, 2014. 2 RY 2016 rates reflect MY data from January 1, 2015, through December 31, 2015. 3 RY 2017 rates reflect MY data from January 1, 2016, through December 31, 2016. 4 RY 2018 rates reflect MY data from January 1, 2017, through December 31, 2017. 5 Performance comparisons are based on the Chi-square test of statistical significance, with a p value of <0.05. * A lower rate indicates better performance for this measure. ** Member months are a member's “contribution” to the total yearly membership. ^ Caution should be exercised when assessing MCP performance for this measure given the changes that NCQA made to the specification for this measure for RY 2018. Not Tested = An RY 2017–18 rate difference was not calculated because high and low rates do not necessarily indicate better or worse performance.
Partnership HealthPlan of California Performance Evaluation Report: July 1, 2017–June 30, 2018 California Department of Health Care Services
Page X-36 Health Services Advisory Group, Inc.

MANAGED CARE HEALTH PLAN PERFORMANCE MEASURES
Table 3.26—Appropriate Treatment and Utilization DomainMulti-Year Performance Measure Results Partnership—Northwest (Del Norte and Humboldt Counties)
H = Rate indicates performance above the HPL. Bolded Rate = Rate indicates performance below the MPL.
B = Statistical testing result indicates that the RY 2018 rate is significantly better than the RY 2017 rate.
W = Statistical testing result indicates that the RY 2018 rate is significantly worse than the RY 2017 rate.
Measure RY
2015 Rate1
RY 2016
Rate2
RY 2017
Rate3
RY 2018
Rate4
RYs 2017–18 Rate
Difference5
All-Cause Readmissions* 13.22% 11.45% 10.91% 11.17% 0.26 Ambulatory Care—Emergency Department (ED) Visits per 1,000 Member Months**
55.74 57.05 46.87 46.15 Not Tested
Ambulatory Care—Outpatient Visits per 1,000 Member Months**
251.63 228.31 214.55 210.39 Not Tested
Avoidance of Antibiotic Treatment in Adults With Acute Bronchitis
29.35% 34.43% 32.51% 34.87% 2.36
Use of Imaging Studies for Low Back Pain^ 84.26%H 85.71%H 81.16% 80.33%H -0.83
1 RY 2015 rates reflect MY data from January 1, 2014, through December 31, 2014. 2 RY 2016 rates reflect MY data from January 1, 2015, through December 31, 2015. 3 RY 2017 rates reflect MY data from January 1, 2016, through December 31, 2016. 4 RY 2018 rates reflect MY data from January 1, 2017, through December 31, 2017. 5 Performance comparisons are based on the Chi-square test of statistical significance, with a p value of <0.05. * A lower rate indicates better performance for this measure. ** Member months are a member's “contribution” to the total yearly membership. ^ Caution should be exercised when assessing MCP performance for this measure given the changes that NCQA made to the specification for this measure for RY 2018. Not Tested = An RY 2017–18 rate difference was not calculated because high and low rates do not necessarily indicate better or worse performance.
Partnership HealthPlan of California Performance Evaluation Report: July 1, 2017–June 30, 2018 California Department of Health Care Services
Page X-37 Health Services Advisory Group, Inc.

MANAGED CARE HEALTH PLAN PERFORMANCE MEASURES
Table 3.27—Appropriate Treatment and Utilization DomainMulti-Year Performance Measure Results Partnership—Southeast (Napa, Solano, and Yolo Counties)
H = Rate indicates performance above the HPL. Bolded Rate = Rate indicates performance below the MPL.
B = Statistical testing result indicates that the RY 2018 rate is significantly better than the RY 2017 rate.
W = Statistical testing result indicates that the RY 2018 rate is significantly worse than the RY 2017 rate.
Measure RY
2015 Rate1
RY 2016
Rate2
RY 2017
Rate3
RY 2018
Rate4
RYs 2017–18 Rate
Difference5
All-Cause Readmissions* 15.07% 14.81% 13.83% 13.24% -0.59 Ambulatory Care—Emergency Department (ED) Visits per 1,000 Member Months**
58.01 59.17 50.03 49.36 Not Tested
Ambulatory Care—Outpatient Visits per 1,000 Member Months**
331.00 281.18 235.96 242.27 Not Tested
Avoidance of Antibiotic Treatment in Adults With Acute Bronchitis
34.83% 34.81% 42.55%H 41.20%H -1.35
Use of Imaging Studies for Low Back Pain^ 87.12%H 86.27%H 83.03%H 82.29%H -0.74
1 RY 2015 rates reflect MY data from January 1, 2014, through December 31, 2014. 2 RY 2016 rates reflect MY data from January 1, 2015, through December 31, 2015. 3 RY 2017 rates reflect MY data from January 1, 2016, through December 31, 2016. 4 RY 2018 rates reflect MY data from January 1, 2017, through December 31, 2017. 5 Performance comparisons are based on the Chi-square test of statistical significance, with a p value of <0.05. * A lower rate indicates better performance for this measure. ** Member months are a member's “contribution” to the total yearly membership. ^ Caution should be exercised when assessing MCP performance for this measure given the changes that NCQA made to the specification for this measure for RY 2018. Not Tested = An RY 2017–18 rate difference was not calculated because high and low rates do not necessarily indicate better or worse performance.
Partnership HealthPlan of California Performance Evaluation Report: July 1, 2017–June 30, 2018 California Department of Health Care Services
Page X-38 Health Services Advisory Group, Inc.

MANAGED CARE HEALTH PLAN PERFORMANCE MEASURES
Table 3.28—Appropriate Treatment and Utilization DomainMulti-Year Performance Measure Results Partnership—Southwest (Lake, Marin, Mendocino, and Sonoma Counties)
H = Rate indicates performance above the HPL. Bolded Rate = Rate indicates performance below the MPL.
B = Statistical testing result indicates that the RY 2018 rate is significantly better than the RY 2017 rate.
W = Statistical testing result indicates that the RY 2018 rate is significantly worse than the RY 2017 rate.
Measure RY
2015 Rate1
RY 2016
Rate2
RY 2017
Rate3
RY 2018
Rate4
RYs 2017–18 Rate
Difference5
All-Cause Readmissions* 14.24% 12.44% 11.40% 11.89% 0.49 Ambulatory Care—Emergency Department (ED) Visits per 1,000 Member Months**
50.01 52.36 45.42 45.12 Not Tested
Ambulatory Care—Outpatient Visits per 1,000 Member Months**
333.19 302.06 253.48 260.68 Not Tested
Avoidance of Antibiotic Treatment in Adults With Acute Bronchitis
40.97%H 41.15%H 44.06%H 44.46%H 0.40
Use of Imaging Studies for Low Back Pain^ 88.00%H 87.86%H 83.84%H 82.95%H -0.89
1 RY 2015 rates reflect MY data from January 1, 2014, through December 31, 2014. 2 RY 2016 rates reflect MY data from January 1, 2015, through December 31, 2015. 3 RY 2017 rates reflect MY data from January 1, 2016, through December 31, 2016. 4 RY 2018 rates reflect MY data from January 1, 2017, through December 31, 2017. 5 Performance comparisons are based on the Chi-square test of statistical significance, with a p value of <0.05. * A lower rate indicates better performance for this measure. ** Member months are a member's “contribution” to the total yearly membership. ^ Caution should be exercised when assessing MCP performance for this measure given the changes that NCQA made to the specification for this measure for RY 2018. Not Tested = An RY 2017–18 rate difference was not calculated because high and low rates do not necessarily indicate better or worse performance.
Partnership HealthPlan of California Performance Evaluation Report: July 1, 2017–June 30, 2018 California Department of Health Care Services
Page X-39 Health Services Advisory Group, Inc.
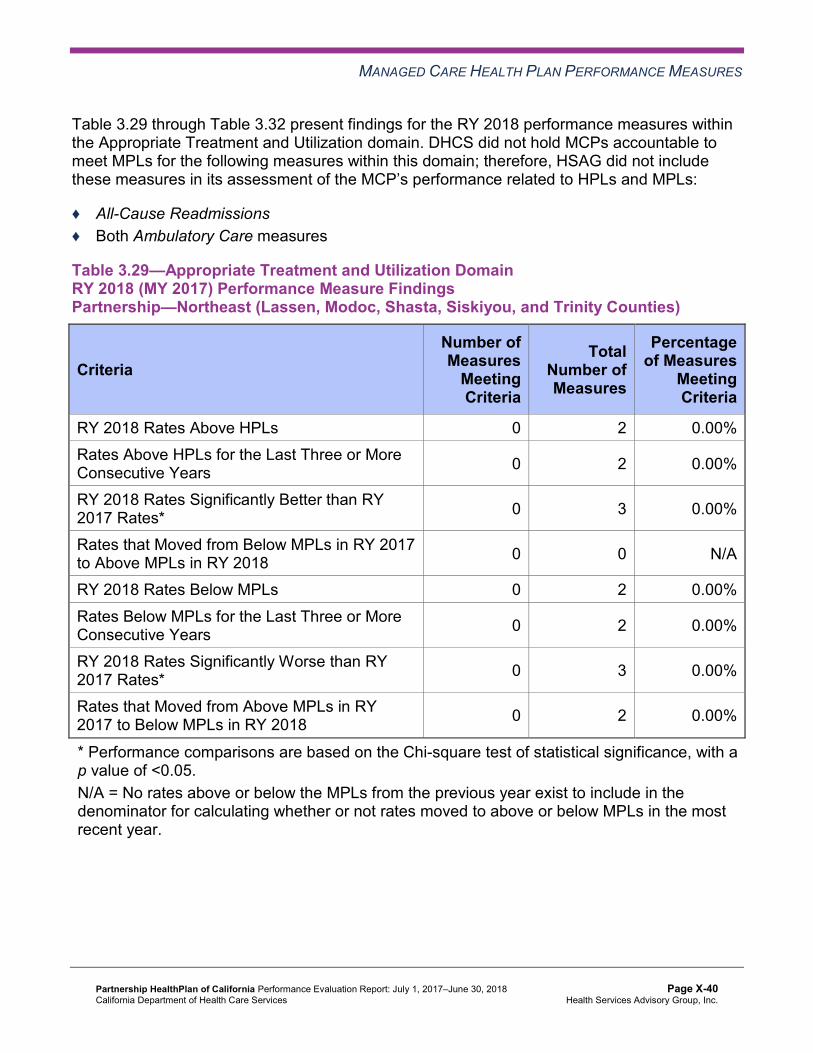
MANAGED CARE HEALTH PLAN PERFORMANCE MEASURES
Table 3.29 through Table 3.32 present findings for the RY 2018 performance measures within the Appropriate Treatment and Utilization domain. DHCS did not hold MCPs accountable to meet MPLs for the following measures within this domain; therefore, HSAG did not include these measures in its assessment of the MCP’s performance related to HPLs and MPLs:
♦ All-Cause Readmissions ♦ Both Ambulatory Care measures
Table 3.29—Appropriate Treatment and Utilization DomainRY 2018 (MY 2017) Performance Measure Findings Partnership—Northeast (Lassen, Modoc, Shasta, Siskiyou, and Trinity Counties)
Criteria Number of Measures
MeetingCriteria
Total Number of Measures
Percentage of Measures
MeetingCriteria
RY 2018 Rates Above HPLs 0 2 0.00% Rates Above HPLs for the Last Three or More Consecutive Years 0 2 0.00%
RY 2018 Rates Significantly Better than RY 2017 Rates* 0 3 0.00%
Rates that Moved from Below MPLs in RY 2017 to Above MPLs in RY 2018 0 0 N/A
RY 2018 Rates Below MPLs 0 2 0.00% Rates Below MPLs for the Last Three or More Consecutive Years 0 2 0.00%
RY 2018 Rates Significantly Worse than RY 2017 Rates* 0 3 0.00%
Rates that Moved from Above MPLs in RY 2017 to Below MPLs in RY 2018 0 2 0.00%
* Performance comparisons are based on the Chi-square test of statistical significance, with a p value of <0.05. N/A = No rates above or below the MPLs from the previous year exist to include in the denominator for calculating whether or not rates moved to above or below MPLs in the most recent year.
Partnership HealthPlan of California Performance Evaluation Report: July 1, 2017–June 30, 2018 California Department of Health Care Services
Page X-40 Health Services Advisory Group, Inc.

MANAGED CARE HEALTH PLAN PERFORMANCE MEASURES
Table 3.30—Appropriate Treatment and Utilization DomainRY 2018 (MY 2017) Performance Measure Findings Partnership—Northwest (Del Norte and Humboldt Counties)
Criteria Number of Measures
MeetingCriteria
Total Number of Measures
Percentage of Measures
MeetingCriteria
RY 2018 Rates Above HPLs 1 2 50.00% Rates Above HPLs for the Last Three or More Consecutive Years 0 2 0.00%
RY 2018 Rates Significantly Better than RY 2017 Rates* 0 3 0.00%
Rates that Moved from Below MPLs in RY 2017 to Above MPLs in RY 2018 0 0 N/A
RY 2018 Rates Below MPLs 0 2 0.00% Rates Below MPLs for the Last Three or More Consecutive Years 0 2 0.00%
RY 2018 Rates Significantly Worse than RY 2017 Rates* 0 3 0.00%
Rates that Moved from Above MPLs in RY 2017 to Below MPLs in RY 2018 0 2 0.00%
* Performance comparisons are based on the Chi-square test of statistical significance, with a p value of <0.05. N/A = No rates above or below the MPLs from the previous year exist to include in the denominator for calculating whether or not rates moved to above or below MPLs in the most recent year.
Partnership HealthPlan of California Performance Evaluation Report: July 1, 2017–June 30, 2018 California Department of Health Care Services
Page X-41 Health Services Advisory Group, Inc.

MANAGED CARE HEALTH PLAN PERFORMANCE MEASURES
Table 3.31—Appropriate Treatment and Utilization DomainRY 2018 (MY 2017) Performance Measure Findings Partnership—Southeast (Napa, Solano, and Yolo Counties)
Criteria Number of Measures
MeetingCriteria
Total Number of Measures
Percentage of Measures
MeetingCriteria
RY 2018 Rates Above HPLs 2 2 100.00% Rates Above HPLs for the Last Three or More Consecutive Years 1 2 50.00%
RY 2018 Rates Significantly Better than RY 2017 Rates* 0 3 0.00%
Rates that Moved from Below MPLs in RY 2017 to Above MPLs in RY 2018 0 0 N/A
RY 2018 Rates Below MPLs 0 2 0.00% Rates Below MPLs for the Last Three or More Consecutive Years 0 2 0.00%
RY 2018 Rates Significantly Worse than RY 2017 Rates* 0 3 0.00%
Rates that Moved from Above MPLs in RY 2017 to Below MPLs in RY 2018 0 2 0.00%
* Performance comparisons are based on the Chi-square test of statistical significance, with a p value of <0.05. N/A = No rates above or below the MPLs from the previous year exist to include in the denominator for calculating whether or not rates moved to above or below MPLs in the most recent year.
Partnership HealthPlan of California Performance Evaluation Report: July 1, 2017–June 30, 2018 California Department of Health Care Services
Page X-42 Health Services Advisory Group, Inc.

MANAGED CARE HEALTH PLAN PERFORMANCE MEASURES
Table 3.32—Appropriate Treatment and Utilization DomainRY 2018 (MY 2017) Performance Measure Findings Partnership—Southwest (Lake, Marin, Mendocino, and Sonoma Counties)
Criteria Number of Measures
MeetingCriteria
Total Number of Measures
Percentage of Measures
MeetingCriteria
RY 2018 Rates Above HPLs 2 2 100.00% Rates Above HPLs for the Last Three or More Consecutive Years 2 2 100.00%
RY 2018 Rates Significantly Better than RY 2017 Rates* 0 3 0.00%
Rates that Moved from Below MPLs in RY 2017 to Above MPLs in RY 2018 0 0 N/A
RY 2018 Rates Below MPLs 0 2 0.00% Rates Below MPLs for the Last Three or More Consecutive Years 0 2 0.00%
RY 2018 Rates Significantly Worse than RY 2017 Rates* 0 3 0.00%
Rates that Moved from Above MPLs in RY 2017 to Below MPLs in RY 2018 0 2 0.00%
* Performance comparisons are based on the Chi-square test of statistical significance, with a p value of <0.05. N/A = No rates above or below the MPLs from the previous year exist to include in the denominator for calculating whether or not rates moved to above or below MPLs in the most recent year.
Performance Measure Findings—All Domains
Table 3.33 through Table 3.36 present a summary of Partnership’s RY 2018 performance across all External Accountability Set (EAS) measures.
Note the following regarding Table 3.33 through Table 3.36:
♦ DHCS did not hold MCPs accountable to meet MPLs for the following measures; therefore, HSAG did not include these measures in its assessment of the MCP’s performance related to HPLs and MPLs: ■ All-Cause Readmissions ■ Both Ambulatory Care measures ■ All four Children and Adolescents’ Access to Primary Care measures
Partnership HealthPlan of California Performance Evaluation Report: July 1, 2017–June 30, 2018 California Department of Health Care Services
Page X-43 Health Services Advisory Group, Inc.

MANAGED CARE HEALTH PLAN PERFORMANCE MEASURES
♦ DHCS did not hold MCPs accountable to meet MPLs for the following measures in RY 2017; therefore, HSAG did not include these measures in the denominators for calculating the percentage of measures with rates that moved to above or below the MPLs in RY 2018 and for calculating the percentage of measures with rates below MPLs for only the last two consecutive years: ■ Asthma Medication Ratio ■ Breast Cancer Screening ■ Immunizations for Adolescents—Combination 2
Table 3.33—RY 2018 (MY 2017) Performance Measure Findings for All Domains Partnership—Northeast (Lassen, Modoc, Shasta, Siskiyou, and Trinity Counties)
C = For this reporting unit, DHCS issued a CAP to the MCP due to either (1) three or more EAS measures for which MCPs are held accountable to meet the MPLs having rates below the MPLs for the last three or more consecutive years, or (2) greater than 50 percent of EAS measures for which MCPs are held accountable to meet the MPLs having rates below the MPLs in the most recent year.
Criteria Number of Measures
MeetingCriteria
Total Number of Measures
Percentage of Measures
MeetingCriteria
RY 2018 Rates Above HPLs 0 21 0.00% Rates Above HPLs for the Last Three or More Consecutive Years 0 18 0.00%
RY 2018 Rates Significantly Better than RY 2017 Rates* 0 22 0.00%
Rates that Moved from Below MPLs in RY 2017 to Above MPLs in RY 2018 0 3 0.00%
RY 2018 Rates Below MPLs 6 21 28.57% Rates Below MPLs for Only the Last Two Consecutive Years 0 18 0.00%
Rates Below MPLs for the Last Three or More Consecutive Years 3 18 16.67%C
RY 2018 Rates Significantly Worse than RY 2017 Rates* 0 22 0.00%
Rates that Moved from Above MPLs in RY 2017 to Below MPLs in RY 2018 0 15 0.00%
* Performance comparisons are based on the Chi-square test of statistical significance, with a p value of <0.05.
Partnership HealthPlan of California Performance Evaluation Report: July 1, 2017–June 30, 2018 California Department of Health Care Services
Page X-44 Health Services Advisory Group, Inc.

MANAGED CARE HEALTH PLAN PERFORMANCE MEASURES
Table 3.34—RY 2018 (MY 2017) Performance Measure Findings for All Domains Partnership—Northwest (Del Norte and Humboldt Counties)
Criteria Number of Measures
MeetingCriteria
Total Number of Measures
Percentage of Measures
MeetingCriteria
RY 2018 Rates Above HPLs 1 21 4.76% Rates Above HPLs for the Last Three or More Consecutive Years 0 18 0.00%
RY 2018 Rates Significantly Better than RY 2017 Rates* 2 22 9.09%
Rates that Moved from Below MPLs in RY 2017 to Above MPLs in RY 2018 0 3 0.00%
RY 2018 Rates Below MPLs 6 21 28.57% Rates Below MPLs for Only the Last Two Consecutive Years 1 18 5.56%
Rates Below MPLs for the Last Three or More Consecutive Years 2 18 11.11%
RY 2018 Rates Significantly Worse than RY 2017 Rates* 1 22 4.55%
Rates that Moved from Above MPLs in RY 2017 to Below MPLs in RY 2018 1 15 6.67%
* Performance comparisons are based on the Chi-square test of statistical significance, with a p value of <0.05.
Partnership HealthPlan of California Performance Evaluation Report: July 1, 2017–June 30, 2018 California Department of Health Care Services
Page X-45 Health Services Advisory Group, Inc.
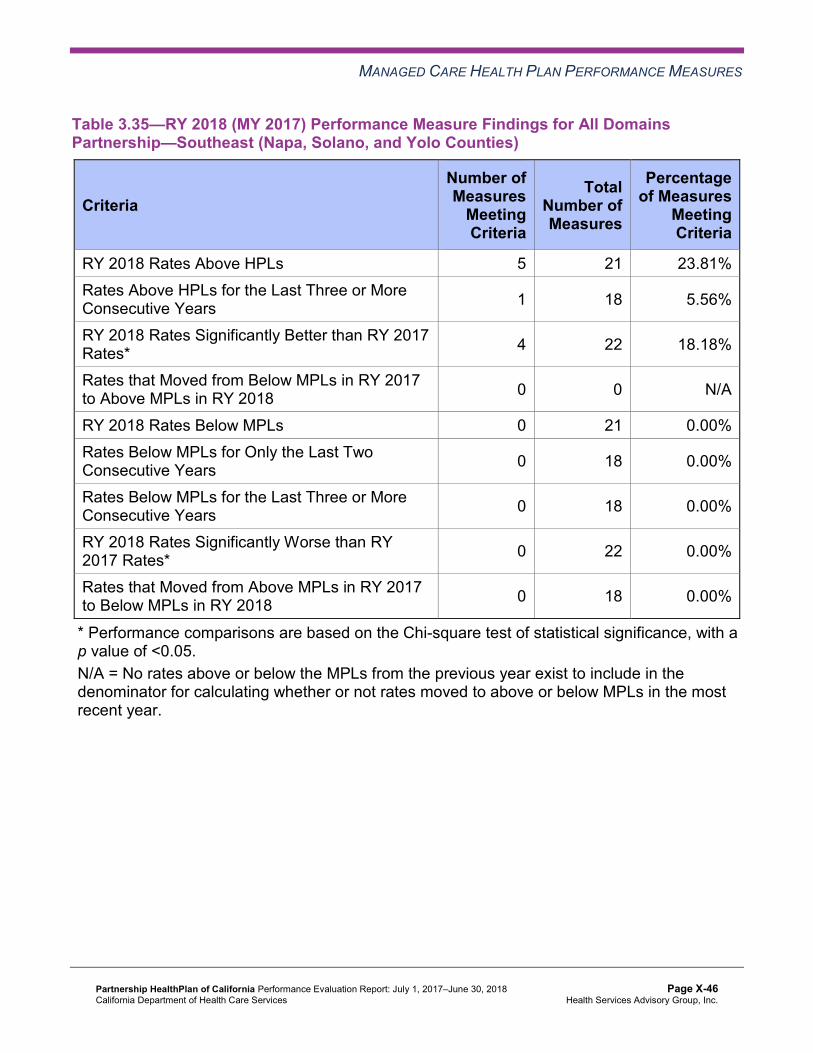
MANAGED CARE HEALTH PLAN PERFORMANCE MEASURES
Table 3.35—RY 2018 (MY 2017) Performance Measure Findings for All Domains Partnership—Southeast (Napa, Solano, and Yolo Counties)
Criteria Number of Measures
MeetingCriteria
Total Number of Measures
Percentage of Measures
MeetingCriteria
RY 2018 Rates Above HPLs 5 21 23.81% Rates Above HPLs for the Last Three or More Consecutive Years 1 18 5.56%
RY 2018 Rates Significantly Better than RY 2017 Rates* 4 22 18.18%
Rates that Moved from Below MPLs in RY 2017 to Above MPLs in RY 2018 0 0 N/A
RY 2018 Rates Below MPLs 0 21 0.00% Rates Below MPLs for Only the Last Two Consecutive Years 0 18 0.00%
Rates Below MPLs for the Last Three or More Consecutive Years 0 18 0.00%
RY 2018 Rates Significantly Worse than RY 2017 Rates* 0 22 0.00%
Rates that Moved from Above MPLs in RY 2017 to Below MPLs in RY 2018 0 18 0.00%
* Performance comparisons are based on the Chi-square test of statistical significance, with a p value of <0.05. N/A = No rates above or below the MPLs from the previous year exist to include in the denominator for calculating whether or not rates moved to above or below MPLs in the most recent year.
Partnership HealthPlan of California Performance Evaluation Report: July 1, 2017–June 30, 2018 California Department of Health Care Services
Page X-46 Health Services Advisory Group, Inc.

MANAGED CARE HEALTH PLAN PERFORMANCE MEASURES
Table 3.36—RY 2018 (MY 2017) Performance Measure Findings for All Domains Partnership—Southwest (Lake, Marin, Mendocino, and Sonoma Counties)
Criteria Number of Measures
MeetingCriteria
Total Number of Measures
Percentage of Measures
MeetingCriteria
RY 2018 Rates Above HPLs 5 21 23.81%
Rates Above HPLs for the Last Three or More Consecutive Years 2 18 11.11%
RY 2018 Rates Significantly Better than RY 2017 Rates* 4 22 18.18%
Rates that Moved from Below MPLs in RY 2017 to Above MPLs in RY 2018 2 3 66.67%
RY 2018 Rates Below MPLs 2 21 9.52%
Rates Below MPLs for Only the Last Two Consecutive Years 1 18 5.56%
Rates Below MPLs for the Last Three or More Consecutive Years 0 18 0.00%
RY 2018 Rates Significantly Worse than RY 2017 Rates* 0 22 0.00%
Rates that Moved from Above MPLs in RY 2017 to Below MPLs in RY 2018 1 15 6.67%
* Performance comparisons are based on the Chi-square test of statistical significance, with a p value of <0.05.
Corrective Action Plan Requirements for 2018 Based on the rates for the following three measures in the Northeast Region being below the MPLs for the last three or more consecutive years, DHCS issued to Partnership an MCP-wide CAP which includes all the MCP’s reporting units:
♦ Both Annual Monitoring for Patients on Persistent Medications measures ♦ Childhood Immunization Status—Combination 3
DHCS will assess Partnership’s progress on CAP milestones based on the MCP’s performance related to all measures. In addition to the three measures listed above for the
Partnership HealthPlan of California Performance Evaluation Report: July 1, 2017–June 30, 2018 California Department of Health Care Services
Page X-47 Health Services Advisory Group, Inc.

MANAGED CARE HEALTH PLAN PERFORMANCE MEASURES
Northeast Region, based on RY 2018 performance measure results, the following measures are also included in Partnership’s CAP:
♦ Annual Monitoring for Patients on Persistent Medications—ACE Inhibitors or ARBs in the Northwest Region
♦ Asthma Medication Ratio in the Northeast and Northwest regions ♦ Breast Cancer Screening in the Northeast and Northwest regions ♦ Childhood Immunization Status—Combination 3 in the Northwest and Southwest regions ♦ Comprehensive Diabetes Care—Medical Attention for Nephropathy in the Northwest and
Southwest regions ♦ Immunizations for Adolescents—Combination 2 in the Northeast Region ♦ Well-Child Visits in the Third, Fourth, Fifth, and Sixth Years of Life in the Northwest Region
Seniors and Persons with Disabilities Performance Measure Results Table 3.37 through Table 3.40 present the four-year trending information for the Seniors and Persons with Disabilities (SPD) population, and Table 3.41 through Table 3.44 present the four-year trending information for the non-SPD population for the measures that DHCS required MCPs to stratify for the SPD and non-SPD populations. The tables also show the differences in rates between RY 2017 and RY 2018.
Table 3.45 through Table 3.48 present the SPD and non-SPD rates, a comparison of the SPD and non-SPD rates,5 and the total combined rate for each measure.
5 HSAG calculated statistical significance between the SPD and non-SPD rates for each measure using a Chi-square test. This information is displayed in the “SPD/Non-SPD Rate Difference” column in Table 3.45 through Table 3.48.
Partnership HealthPlan of California Performance Evaluation Report: July 1, 2017–June 30, 2018 California Department of Health Care Services
Page X-48 Health Services Advisory Group, Inc.

MANAGED CARE HEALTH PLAN PERFORMANCE MEASURES
Table 3.37—Multi-Year SPD Performance Measure Trend Table Partnership—Northeast (Lassen, Modoc, Shasta, Siskiyou, and Trinity Counties)
B = Statistical testing result indicates that the RY 2018 SPD rate is significantly better than the RY 2017 SPD rate.
W = Statistical testing result indicates that the RY 2018 SPD rate is significantly worse than the RY 2017 SPD rate.
Measure RY
2015 SPD
Rate1
RY 2016 SPD
Rate2
RY 2017 SPD
Rate3
RY 2018 SPD
Rate4
RYs 2017–18 Rate
Difference5
All-Cause Readmissions* 16.60% 17.81% 16.15% 15.33% -0.82 Ambulatory Care—Emergency Department (ED) Visits per 1,000 Member Months**
109.59 127.31 97.28 94.48 Not Tested
Ambulatory Care—Outpatient Visits per 1,000 Member Months**
413.55 431.95 413.11 428.15 Not Tested
Annual Monitoring for Patients on Persistent Medications— ACE Inhibitors or ARBs
85.14% 86.51% 87.04% 87.01% -0.03
Annual Monitoring for Patients on Persistent Medications— Diuretics
85.41% 87.57% 89.89% 88.35% -1.54
Children and Adolescents' Access to Primary Care Practitioners—12–24 Months
NA NA NA NA Not Comparable
Children and Adolescents' Access to Primary Care Practitioners— 25 Months–6 Years
88.41% 87.20% 87.05% 86.29% -0.76
Children and Adolescents' Access to Primary Care Practitioners—7–11 Years
NA 87.50% 87.50% 88.36% 0.86
Children and Adolescents' Access to Primary Care Practitioners—12–19 Years
NA 84.84% 83.76% 85.45% 1.69
1 RY 2015 rates reflect MY data from January 1, 2014, through December 31, 2014. 2 RY 2016 rates reflect MY data from January 1, 2015, through December 31, 2015. 3 RY 2017 rates reflect MY data from January 1, 2016, through December 31, 2016.
Partnership HealthPlan of California Performance Evaluation Report: July 1, 2017–June 30, 2018 California Department of Health Care Services
Page X-49 Health Services Advisory Group, Inc.

MANAGED CARE HEALTH PLAN PERFORMANCE MEASURES
4 RY 2018 rates reflect MY data from January 1, 2017, through December 31, 2017. 5 Performance comparisons are based on the Chi-square test of statistical significance, with a p value of <0.05. * A lower rate indicates better performance for this measure. ** Member months are a member's “contribution” to the total yearly membership. NA = The MCP followed the specifications, but the denominator was too small (less than 30) to report a valid rate. Not Comparable = An RY 2017–18 rate difference cannot be made because data are not available for both years or because significant methodology changes occurred between years, disallowing comparison. Not Tested = An RY 2017–18 rate difference was not calculated because high and low rates do not necessarily indicate better or worse performance.
Table 3.38—Multi-Year SPD Performance Measure Trend Table Partnership—Northwest (Del Norte and Humboldt Counties)
B = Statistical testing result indicates that the RY 2018 SPD rate is significantly better than the RY 2017 SPD rate.
W = Statistical testing result indicates that the RY 2018 SPD rate is significantly worse than the RY 2017 SPD rate.
Measure RY
2015 SPD
Rate1
RY 2016 SPD
Rate2
RY 2017 SPD
Rate3
RY 2018 SPD
Rate4
RYs 2017–18 Rate
Difference5
All-Cause Readmissions* 14.92% 14.76% 15.09% 13.17% -1.92 Ambulatory Care—Emergency Department (ED) Visits per 1,000 Member Months**
98.00 106.26 86.42 86.57 Not Tested
Ambulatory Care—Outpatient Visits per 1,000 Member Months**
420.22 405.91 383.59 365.23 Not Tested
Annual Monitoring for Patients on Persistent Medications— ACE Inhibitors or ARBs
83.83% 83.62% 90.38% 88.52% -1.86
Annual Monitoring for Patients on Persistent Medications— Diuretics
87.36% 85.64% 91.19% 90.43% -0.76
Children and Adolescents' Access to Primary Care Practitioners—12–24 Months
NA NA NA NA Not Comparable
Partnership HealthPlan of California Performance Evaluation Report: July 1, 2017–June 30, 2018 California Department of Health Care Services
Page X-50 Health Services Advisory Group, Inc.

MANAGED CARE HEALTH PLAN PERFORMANCE MEASURES
Measure RY
2015 SPD
Rate1
RY 2016 SPD
Rate2
RY 2017 SPD
Rate3
RY 2018 SPD
Rate4
RYs 2017–18 Rate
Difference5
Children and Adolescents' Access to Primary Care Practitioners— 25 Months–6 Years
90.63% 97.25% 92.25% 89.43% -2.82
Children and Adolescents' Access to Primary Care Practitioners—7–11 Years
NA 93.02% 91.52% 90.51% -1.01
Children and Adolescents' Access to Primary Care Practitioners—12–19 Years
NA 89.67% 88.93% 89.39% 0.46
1 RY 2015 rates reflect MY data from January 1, 2014, through December 31, 2014. 2 RY 2016 rates reflect MY data from January 1, 2015, through December 31, 2015. 3 RY 2017 rates reflect MY data from January 1, 2016, through December 31, 2016. 4 RY 2018 rates reflect MY data from January 1, 2017, through December 31, 2017. 5 Performance comparisons are based on the Chi-square test of statistical significance, with a p value of <0.05. * A lower rate indicates better performance for this measure. ** Member months are a member's “contribution” to the total yearly membership. NA = The MCP followed the specifications, but the denominator was too small (less than 30) to report a valid rate. Not Comparable = An RY 2017–18 rate difference cannot be made because data are not available for both years or because significant methodology changes occurred between years, disallowing comparison. Not Tested = An RY 2017–18 rate difference was not calculated because high and low rates do not necessarily indicate better or worse performance.
Partnership HealthPlan of California Performance Evaluation Report: July 1, 2017–June 30, 2018 California Department of Health Care Services
Page X-51 Health Services Advisory Group, Inc.

MANAGED CARE HEALTH PLAN PERFORMANCE MEASURES
Table 3.39—Multi-Year SPD Performance Measure Trend Table Partnership—Southeast (Napa, Solano, and Yolo Counties)
B = Statistical testing result indicates that the RY 2018 SPD rate is significantly better than the RY 2017 SPD rate.
W = Statistical testing result indicates that the RY 2018 SPD rate is significantly worse than the RY 2017 SPD rate.
Measure RY
2015 SPD
Rate1
RY 2016 SPD
Rate2
RY 2017 SPD
Rate3
RY 2018 SPD
Rate4
RYs 2017–18 Rate
Difference5
All-Cause Readmissions* 16.32% 19.17% 16.92% 15.98% -0.94 Ambulatory Care—Emergency Department (ED) Visits per 1,000 Member Months**
89.77 104.12 88.36 90.16 Not Tested
Ambulatory Care—Outpatient Visits per 1,000 Member Months**
602.57 488.22 425.85 433.31 Not Tested
Annual Monitoring for Patients on Persistent Medications— ACE Inhibitors or ARBs
89.41% 88.74% 90.21% 90.89% 0.68
Annual Monitoring for Patients on Persistent Medications— Diuretics
90.76% 89.42% 90.69% 90.88% 0.19
Children and Adolescents' Access to Primary Care Practitioners—12–24 Months
95.35% 93.55% NA 87.88% Not Comparable
Children and Adolescents' Access to Primary Care Practitioners— 25 Months–6 Years
84.08% 86.02% 84.52% 91.29% 6.77B
Children and Adolescents' Access to Primary Care Practitioners—7–11 Years
85.40% 86.19% 89.80% 90.99% 1.19
Children and Adolescents' Access to Primary Care Practitioners—12–19 Years
81.39% 81.49% 83.48% 86.02% 2.54
1 RY 2015 rates reflect MY data from January 1, 2014, through December 31, 2014. 2 RY 2016 rates reflect MY data from January 1, 2015, through December 31, 2015. 3 RY 2017 rates reflect MY data from January 1, 2016, through December 31, 2016.
Partnership HealthPlan of California Performance Evaluation Report: July 1, 2017–June 30, 2018 California Department of Health Care Services
Page X-52 Health Services Advisory Group, Inc.

MANAGED CARE HEALTH PLAN PERFORMANCE MEASURES
4 RY 2018 rates reflect MY data from January 1, 2017, through December 31, 2017. 5 Performance comparisons are based on the Chi-square test of statistical significance, with a p value of <0.05. * A lower rate indicates better performance for this measure. ** Member months are a member's “contribution” to the total yearly membership. NA = The MCP followed the specifications, but the denominator was too small (less than 30) to report a valid rate. Not Comparable = An RY 2017–18 rate difference cannot be made because data are not available for both years or because significant methodology changes occurred between years, disallowing comparison. Not Tested = An RY 2017–18 rate difference was not calculated because high and low rates do not necessarily indicate better or worse performance.
Table 3.40—Multi-Year SPD Performance Measure Trend Table Partnership—Southwest (Lake, Marin, Mendocino, and Sonoma Counties)
B = Statistical testing result indicates that the RY 2018 SPD rate is significantly better than the RY 2017 SPD rate.
W = Statistical testing result indicates that the RY 2018 SPD rate is significantly worse than the RY 2017 SPD rate.
Measure RY
2015 SPD
Rate1
RY 2016 SPD
Rate2
RY 2017 SPD
Rate3
RY 2018 SPD
Rate4
RYs 2017–18 Rate
Difference5
All-Cause Readmissions* 16.07% 15.53% 16.13% 15.13% -1.00 Ambulatory Care—Emergency Department (ED) Visits per 1,000 Member Months**
91.33 98.56 90.11 85.96 Not Tested
Ambulatory Care—Outpatient Visits per 1,000 Member Months**
590.09 553.37 484.79 489.42 Not Tested
Annual Monitoring for Patients on Persistent Medications— ACE Inhibitors or ARBs
84.83% 87.28% 88.40% 90.40% 2.00
Annual Monitoring for Patients on Persistent Medications— Diuretics
86.29% 89.81% 87.62% 90.12% 2.50
Children and Adolescents' Access to Primary Care Practitioners—12–24 Months
NA NA NA NA Not Comparable
Partnership HealthPlan of California Performance Evaluation Report: July 1, 2017–June 30, 2018 California Department of Health Care Services
Page X-53 Health Services Advisory Group, Inc.

MANAGED CARE HEALTH PLAN PERFORMANCE MEASURES
Measure RY
2015 SPD
Rate1
RY 2016 SPD
Rate2
RY 2017 SPD
Rate3
RY 2018 SPD
Rate4
RYs 2017–18 Rate
Difference5
Children and Adolescents' Access to Primary Care Practitioners— 25 Months–6 Years
91.02% 88.15% 90.45% 90.40% -0.05
Children and Adolescents' Access to Primary Care Practitioners—7–11 Years
87.14% 91.49% 89.74% 94.38% 4.64B
Children and Adolescents' Access to Primary Care Practitioners—12–19 Years
84.88% 87.67% 88.30% 91.27% 2.97B
1 RY 2015 rates reflect MY data from January 1, 2014, through December 31, 2014. 2 RY 2016 rates reflect MY data from January 1, 2015, through December 31, 2015. 3 RY 2017 rates reflect MY data from January 1, 2016, through December 31, 2016. 4 RY 2018 rates reflect MY data from January 1, 2017, through December 31, 2017. 5 Performance comparisons are based on the Chi-square test of statistical significance, with a p value of <0.05. * A lower rate indicates better performance for this measure. ** Member months are a member's “contribution” to the total yearly membership. NA = The MCP followed the specifications, but the denominator was too small (less than 30) to report a valid rate. Not Comparable = An RY 2017–18 rate difference cannot be made because data are not available for both years or because significant methodology changes occurred between years, disallowing comparison. Not Tested = An RY 2017–18 rate difference was not calculated because high and low rates do not necessarily indicate better or worse performance.
Partnership HealthPlan of California Performance Evaluation Report: July 1, 2017–June 30, 2018 California Department of Health Care Services
Page X-54 Health Services Advisory Group, Inc.

MANAGED CARE HEALTH PLAN PERFORMANCE MEASURES
Table 3.41—Multi-Year Non-SPD Performance Measure Trend Table Partnership—Northeast (Lassen, Modoc, Shasta, Siskiyou, and Trinity Counties)
B = Statistical testing result indicates that the RY 2018 non-SPD rate is significantly better than the RY 2017 non-SPD rate.
W = Statistical testing result indicates that the RY 2018 non-SPD rate is significantly worse than the RY 2017 non-SPD rate.
Measure RY 2015
Non-SPD Rate1
RY 2016 Non-SPD
Rate2
RY 2017 Non-SPD
Rate3
RY 2018 Non-SPD
Rate4
RYs 2017–18 Rate
Difference5
All-Cause Readmissions* 11.25% 13.05% 9.61% 9.78% 0.17
Ambulatory Care— Emergency Department (ED) Visits per 1,000 Member Months**
62.01 66.30 54.02 53.17 Not Tested
Ambulatory Care— Outpatient Visits per 1,000 Member Months**
221.32 213.75 204.85 217.40 Not Tested
Annual Monitoring for Patients on Persistent Medications— ACE Inhibitors or ARBs
78.60% 78.33% 79.41% 81.73% 2.32
Annual Monitoring for Patients on Persistent Medications—Diuretics
80.40% 80.00% 81.31% 81.91% 0.60
Children and Adolescents' Access to Primary Care Practitioners— 12–24 Months
94.10% 91.63% 91.84% 93.05% 1.21
Children and Adolescents' Access to Primary Care Practitioners— 25 Months–6 Years
80.61% 81.68% 80.27% 82.10% 1.83B
Children and Adolescents' Access to Primary Care Practitioners— 7–11 Years
NA 80.43% 80.43% 81.80% 1.37B
Partnership HealthPlan of California Performance Evaluation Report: July 1, 2017–June 30, 2018 California Department of Health Care Services
Page X-55 Health Services Advisory Group, Inc.
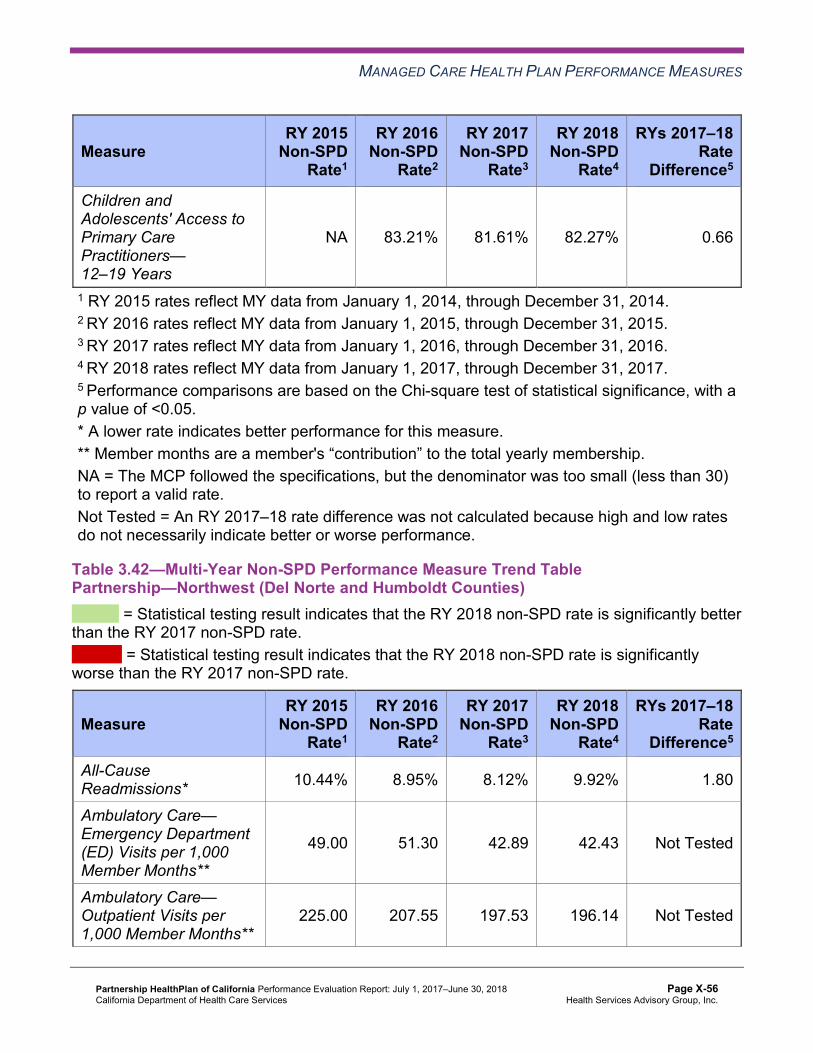
MANAGED CARE HEALTH PLAN PERFORMANCE MEASURES
Measure RY 2015
Non-SPD Rate1
RY 2016 Non-SPD
Rate2
RY 2017 Non-SPD
Rate3
RY 2018 Non-SPD
Rate4
RYs 2017–18 Rate
Difference5
Children and Adolescents' Access to Primary Care Practitioners— 12–19 Years
NA 83.21% 81.61% 82.27% 0.66
1 RY 2015 rates reflect MY data from January 1, 2014, through December 31, 2014. 2 RY 2016 rates reflect MY data from January 1, 2015, through December 31, 2015. 3 RY 2017 rates reflect MY data from January 1, 2016, through December 31, 2016. 4 RY 2018 rates reflect MY data from January 1, 2017, through December 31, 2017. 5 Performance comparisons are based on the Chi-square test of statistical significance, with a p value of <0.05. * A lower rate indicates better performance for this measure. ** Member months are a member's “contribution” to the total yearly membership. NA = The MCP followed the specifications, but the denominator was too small (less than 30) to report a valid rate. Not Tested = An RY 2017–18 rate difference was not calculated because high and low rates do not necessarily indicate better or worse performance.
Table 3.42—Multi-Year Non-SPD Performance Measure Trend Table Partnership—Northwest (Del Norte and Humboldt Counties)
B = Statistical testing result indicates that the RY 2018 non-SPD rate is significantly better than the RY 2017 non-SPD rate.
W = Statistical testing result indicates that the RY 2018 non-SPD rate is significantly worse than the RY 2017 non-SPD rate.
Measure RY 2015
Non-SPD Rate1
RY 2016 Non-SPD
Rate2
RY 2017 Non-SPD
Rate3
RY 2018 Non-SPD
Rate4
RYs 2017–18 Rate
Difference5
All-Cause Readmissions* 10.44% 8.95% 8.12% 9.92% 1.80
Ambulatory Care— Emergency Department (ED) Visits per 1,000 Member Months**
49.00 51.30 42.89 42.43 Not Tested
Ambulatory Care— Outpatient Visits per 1,000 Member Months**
225.00 207.55 197.53 196.14 Not Tested
Partnership HealthPlan of California Performance Evaluation Report: July 1, 2017–June 30, 2018 California Department of Health Care Services
Page X-56 Health Services Advisory Group, Inc.

MANAGED CARE HEALTH PLAN PERFORMANCE MEASURES
Measure RY 2015
Non-SPD Rate1
RY 2016 Non-SPD
Rate2
RY 2017 Non-SPD
Rate3
RY 2018 Non-SPD
Rate4
RYs 2017–18 Rate
Difference5
Annual Monitoring for Patients on Persistent Medications— ACE Inhibitors or ARBs
76.35% 75.62% 83.02% 82.58% -0.44
Annual Monitoring for Patients on Persistent Medications—Diuretics
78.86% 77.21% 83.10% 83.82% 0.72
Children and Adolescents' Access to Primary Care Practitioners— 12–24 Months
96.54% 95.04% 95.30% 94.55% -0.75
Children and Adolescents' Access to Primary Care Practitioners— 25 Months–6 Years
87.34% 85.56% 85.99% 84.74% -1.25
Children and Adolescents' Access to Primary Care Practitioners— 7–11 Years
NA 86.27% 84.23% 84.35% 0.12
Children and Adolescents' Access to Primary Care Practitioners— 12–19 Years
NA 86.82% 85.67% 84.97% -0.70
1 RY 2015 rates reflect MY data from January 1, 2014, through December 31, 2014. 2 RY 2016 rates reflect MY data from January 1, 2015, through December 31, 2015. 3 RY 2017 rates reflect MY data from January 1, 2016, through December 31, 2016. 4 RY 2018 rates reflect MY data from January 1, 2017, through December 31, 2017. 5 Performance comparisons are based on the Chi-square test of statistical significance, with a p value of <0.05. * A lower rate indicates better performance for this measure. ** Member months are a member's “contribution” to the total yearly membership. NA = The MCP followed the specifications, but the denominator was too small (less than 30) to report a valid rate. Not Tested = An RY 2017–18 rate difference was not calculated because high and low rates do not necessarily indicate better or worse performance.
Partnership HealthPlan of California Performance Evaluation Report: July 1, 2017–June 30, 2018 California Department of Health Care Services
Page X-57 Health Services Advisory Group, Inc.

MANAGED CARE HEALTH PLAN PERFORMANCE MEASURES
Table 3.43—Multi-Year Non-SPD Performance Measure Trend Table Partnership—Southeast (Napa, Solano, and Yolo Counties)
B = Statistical testing result indicates that the RY 2018 non-SPD rate is significantly better than the RY 2017 non-SPD rate.
W = Statistical testing result indicates that the RY 2018 non-SPD rate is significantly worse than the RY 2017 non-SPD rate.
Measure RY 2015
Non-SPD Rate1
RY 2016 Non-SPD
Rate2
RY 2017 Non-SPD
Rate3
RY 2018 Non-SPD
Rate4
RYs 2017–18 Rate
Difference5
All-Cause Readmissions* 10.71% 11.49% 11.78% 11.59% -0.19
Ambulatory Care— Emergency Department (ED) Visits per 1,000 Member Months**
51.68 54.90 46.75 46.07 Not Tested
Ambulatory Care— Outpatient Visits per 1,000 Member Months**
276.89 261.52 219.72 226.85 Not Tested
Annual Monitoring for Patients on Persistent Medications— ACE Inhibitors or ARBs
85.52% 85.13% 85.68% 88.58% 2.90B
Annual Monitoring for Patients on Persistent Medications—Diuretics
84.59% 82.98% 83.96% 87.68% 3.72B
Children and Adolescents' Access to Primary Care Practitioners— 12–24 Months
94.45% 94.08% 94.34% 94.60% 0.26
Children and Adolescents' Access to Primary Care Practitioners— 25 Months–6 Years
86.73% 85.03% 85.06% 86.40% 1.34B
Children and Adolescents' Access to Primary Care Practitioners— 7–11 Years
86.02% 86.22% 86.70% 87.21% 0.51
Partnership HealthPlan of California Performance Evaluation Report: July 1, 2017–June 30, 2018 California Department of Health Care Services
Page X-58 Health Services Advisory Group, Inc.

MANAGED CARE HEALTH PLAN PERFORMANCE MEASURES
Measure RY 2015
Non-SPD Rate1
RY 2016 Non-SPD
Rate2
RY 2017 Non-SPD
Rate3
RY 2018 Non-SPD
Rate4
RYs 2017–18 Rate
Difference5
Children and Adolescents' Access to Primary Care Practitioners— 12–19 Years
84.52% 85.18% 85.41% 86.27% 0.86B
1 RY 2015 rates reflect MY data from January 1, 2014, through December 31, 2014. 2 RY 2016 rates reflect MY data from January 1, 2015, through December 31, 2015. 3 RY 2017 rates reflect MY data from January 1, 2016, through December 31, 2016. 4 RY 2018 rates reflect MY data from January 1, 2017, through December 31, 2017. 5 Performance comparisons are based on the Chi-square test of statistical significance, with a p value of <0.05. * A lower rate indicates better performance for this measure. ** Member months are a member's “contribution” to the total yearly membership. Not Tested = An RY 2017–18 rate difference was not calculated because high and low rates do not necessarily indicate better or worse performance.
Table 3.44—Multi-Year Non-SPD Performance Measure Trend Table Partnership—Southwest (Lake, Marin, Mendocino, and Sonoma Counties)
B = Statistical testing result indicates that the RY 2018 non-SPD rate is significantly better than the RY 2017 non-SPD rate.
W = Statistical testing result indicates that the RY 2018 non-SPD rate is significantly worse than the RY 2017 non-SPD rate.
Measure RY 2015
Non-SPD Rate1
RY 2016 Non-SPD
Rate2
RY 2017 Non-SPD
Rate3
RY 2018 Non-SPD
Rate4
RYs 2017–18 Rate
Difference5
All-Cause Readmissions* 11.99% 10.64% 9.07% 10.40% 1.33
Ambulatory Care— Emergency Department (ED) Visits per 1,000 Member Months**
45.75 48.71 42.23 42.45 Not Tested
Ambulatory Care— Outpatient Visits per 1,000 Member Months**
306.70 282.20 237.01 245.73 Not Tested
Partnership HealthPlan of California Performance Evaluation Report: July 1, 2017–June 30, 2018 California Department of Health Care Services
Page X-59 Health Services Advisory Group, Inc.
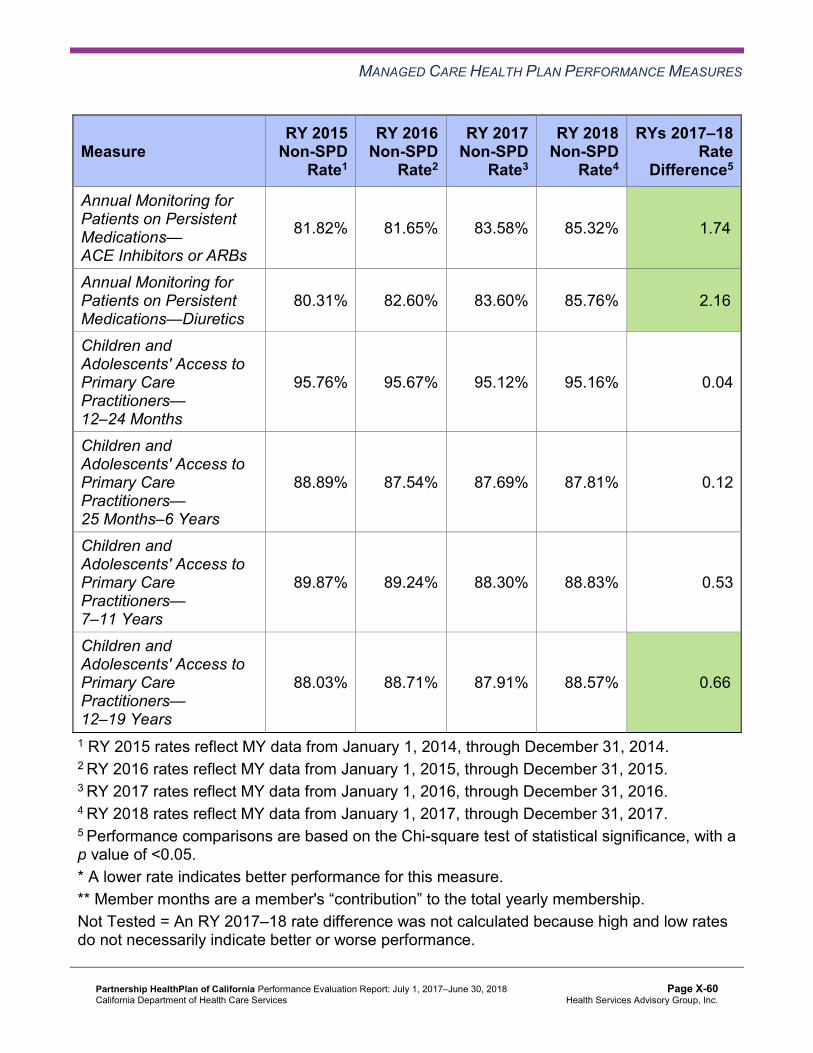
MANAGED CARE HEALTH PLAN PERFORMANCE MEASURES
Measure RY 2015
Non-SPD Rate1
RY 2016 Non-SPD
Rate2
RY 2017 Non-SPD
Rate3
RY 2018 Non-SPD
Rate4
RYs 2017–18 Rate
Difference5
Annual Monitoring for Patients on Persistent Medications— ACE Inhibitors or ARBs
81.82% 81.65% 83.58% 85.32% 1.74B
Annual Monitoring for Patients on Persistent Medications—Diuretics
80.31% 82.60% 83.60% 85.76% 2.16B
Children and Adolescents' Access to Primary Care Practitioners— 12–24 Months
95.76% 95.67% 95.12% 95.16% 0.04
Children and Adolescents' Access to Primary Care Practitioners— 25 Months–6 Years
88.89% 87.54% 87.69% 87.81% 0.12
Children and Adolescents' Access to Primary Care Practitioners— 7–11 Years
89.87% 89.24% 88.30% 88.83% 0.53
Children and Adolescents' Access to Primary Care Practitioners— 12–19 Years
88.03% 88.71% 87.91% 88.57% 0.66B
1 RY 2015 rates reflect MY data from January 1, 2014, through December 31, 2014. 2 RY 2016 rates reflect MY data from January 1, 2015, through December 31, 2015. 3 RY 2017 rates reflect MY data from January 1, 2016, through December 31, 2016. 4 RY 2018 rates reflect MY data from January 1, 2017, through December 31, 2017. 5 Performance comparisons are based on the Chi-square test of statistical significance, with a p value of <0.05. * A lower rate indicates better performance for this measure. ** Member months are a member's “contribution” to the total yearly membership. Not Tested = An RY 2017–18 rate difference was not calculated because high and low rates do not necessarily indicate better or worse performance.
Partnership HealthPlan of California Performance Evaluation Report: July 1, 2017–June 30, 2018 California Department of Health Care Services
Page X-60 Health Services Advisory Group, Inc.
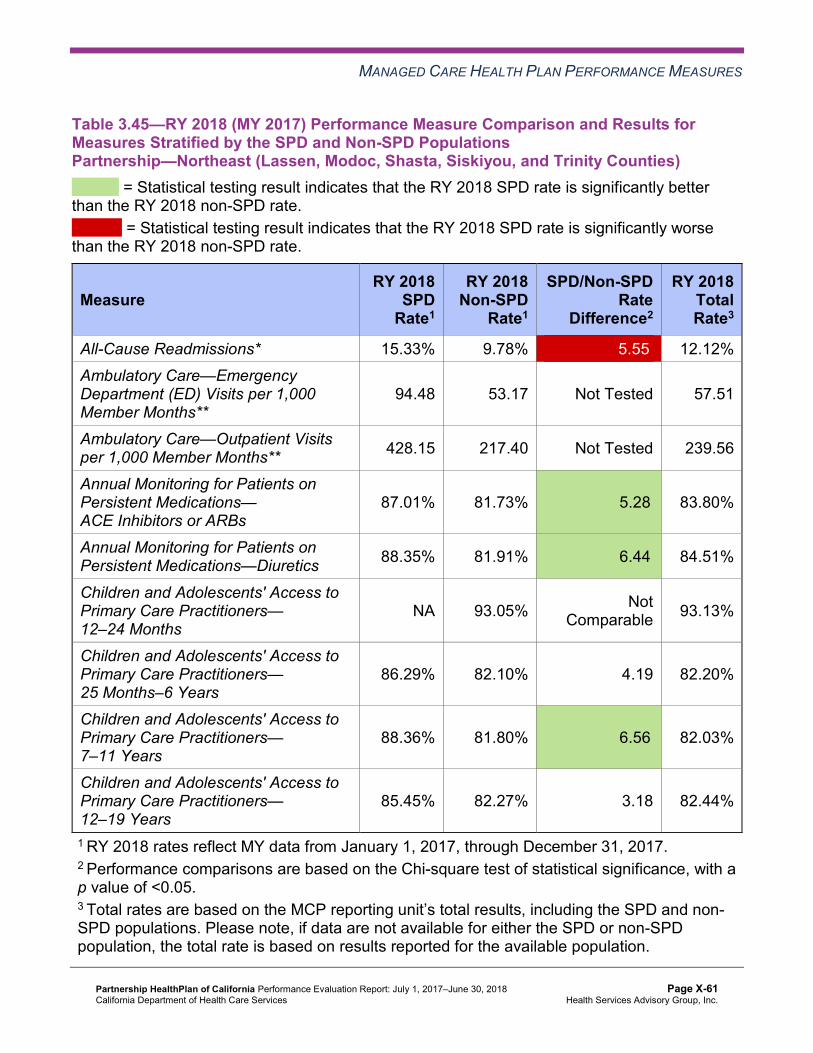
MANAGED CARE HEALTH PLAN PERFORMANCE MEASURES
Table 3.45—RY 2018 (MY 2017) Performance Measure Comparison and Results forMeasures Stratified by the SPD and Non-SPD PopulationsPartnership—Northeast (Lassen, Modoc, Shasta, Siskiyou, and Trinity Counties)
B = Statistical testing result indicates that the RY 2018 SPD rate is significantly better than the RY 2018 non-SPD rate.
W = Statistical testing result indicates that the RY 2018 SPD rate is significantly worse than the RY 2018 non-SPD rate.
Measure RY 2018
SPD Rate1
RY 2018 Non-SPD
Rate1
SPD/Non-SPDRate
Difference2
RY 2018 Total Rate3
All-Cause Readmissions* 15.33% 9.78% 5.55W 12.12% Ambulatory Care—Emergency Department (ED) Visits per 1,000 Member Months**
94.48 53.17 Not Tested 57.51
Ambulatory Care—Outpatient Visits per 1,000 Member Months** 428.15 217.40 Not Tested 239.56
Annual Monitoring for Patients on Persistent Medications— ACE Inhibitors or ARBs
87.01% 81.73% 5.28B 83.80%
Annual Monitoring for Patients on Persistent Medications—Diuretics 88.35% 81.91% 6.44B 84.51%
Children and Adolescents' Access to Primary Care Practitioners— 12–24 Months
NA 93.05% Not Comparable 93.13%
Children and Adolescents' Access to Primary Care Practitioners— 25 Months–6 Years
86.29% 82.10% 4.19 82.20%
Children and Adolescents' Access to Primary Care Practitioners— 7–11 Years
88.36% 81.80% 6.56B 82.03%
Children and Adolescents' Access to Primary Care Practitioners— 12–19 Years
85.45% 82.27% 3.18 82.44%
1 RY 2018 rates reflect MY data from January 1, 2017, through December 31, 2017. 2 Performance comparisons are based on the Chi-square test of statistical significance, with a p value of <0.05. 3 Total rates are based on the MCP reporting unit’s total results, including the SPD and non-SPD populations. Please note, if data are not available for either the SPD or non-SPD population, the total rate is based on results reported for the available population.
Partnership HealthPlan of California Performance Evaluation Report: July 1, 2017–June 30, 2018 California Department of Health Care Services
Page X-61 Health Services Advisory Group, Inc.
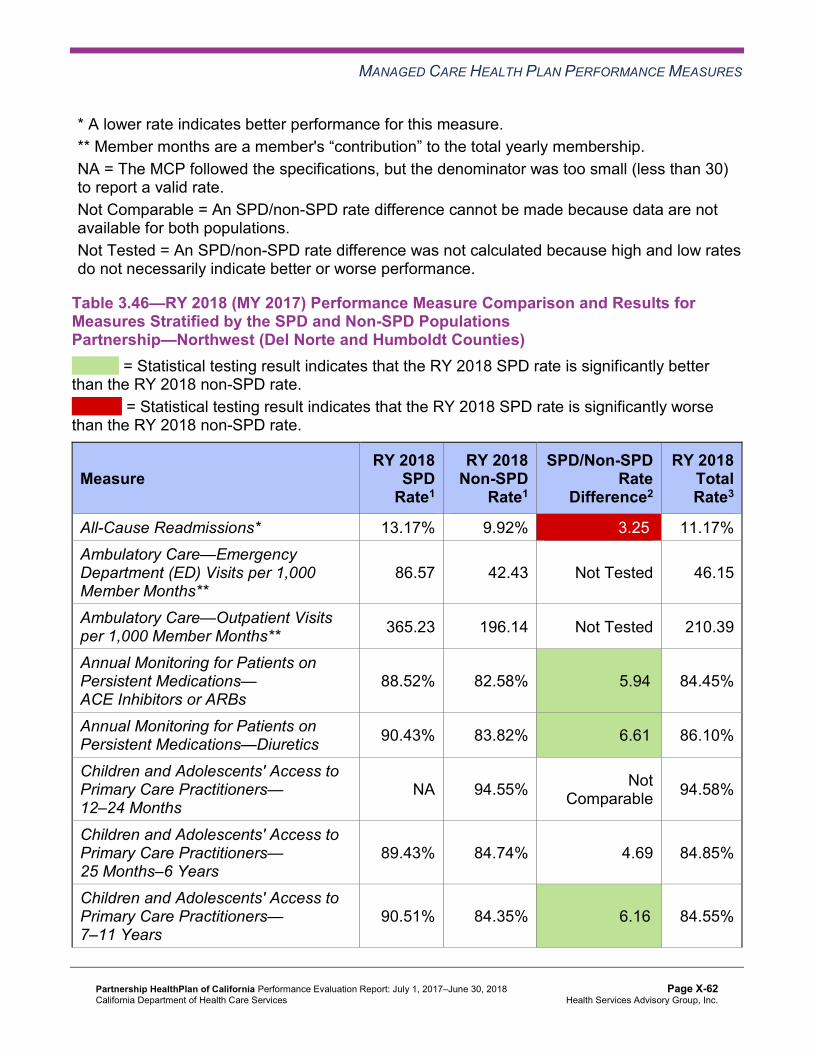
MANAGED CARE HEALTH PLAN PERFORMANCE MEASURES
* A lower rate indicates better performance for this measure. ** Member months are a member's “contribution” to the total yearly membership. NA = The MCP followed the specifications, but the denominator was too small (less than 30) to report a valid rate. Not Comparable = An SPD/non-SPD rate difference cannot be made because data are not available for both populations. Not Tested = An SPD/non-SPD rate difference was not calculated because high and low rates do not necessarily indicate better or worse performance.
Table 3.46—RY 2018 (MY 2017) Performance Measure Comparison and Results forMeasures Stratified by the SPD and Non-SPD PopulationsPartnership—Northwest (Del Norte and Humboldt Counties)
B = Statistical testing result indicates that the RY 2018 SPD rate is significantly better than the RY 2018 non-SPD rate.
W = Statistical testing result indicates that the RY 2018 SPD rate is significantly worse than the RY 2018 non-SPD rate.
Measure RY 2018
SPD Rate1
RY 2018 Non-SPD
Rate1
SPD/Non-SPDRate
Difference2
RY 2018 Total Rate3
All-Cause Readmissions* 13.17% 9.92% 3.25W 11.17% Ambulatory Care—Emergency Department (ED) Visits per 1,000 Member Months**
86.57 42.43 Not Tested 46.15
Ambulatory Care—Outpatient Visits per 1,000 Member Months** 365.23 196.14 Not Tested 210.39
Annual Monitoring for Patients on Persistent Medications— ACE Inhibitors or ARBs
88.52% 82.58% 5.94B 84.45%
Annual Monitoring for Patients on Persistent Medications—Diuretics 90.43% 83.82% 6.61B 86.10%
Children and Adolescents' Access to Primary Care Practitioners— 12–24 Months
NA 94.55% Not Comparable 94.58%
Children and Adolescents' Access to Primary Care Practitioners— 25 Months–6 Years
89.43% 84.74% 4.69 84.85%
Children and Adolescents' Access to Primary Care Practitioners— 7–11 Years
90.51% 84.35% 6.16B 84.55%
Partnership HealthPlan of California Performance Evaluation Report: July 1, 2017–June 30, 2018 California Department of Health Care Services
Page X-62 Health Services Advisory Group, Inc.

MANAGED CARE HEALTH PLAN PERFORMANCE MEASURES
Measure RY 2018
SPD Rate1
RY 2018 Non-SPD
Rate1
SPD/Non-SPDRate
Difference2
RY 2018 Total Rate3
Children and Adolescents' Access to Primary Care Practitioners— 12–19 Years
89.39% 84.97% 4.42B 85.17%
1 RY 2018 rates reflect MY data from January 1, 2017, through December 31, 2017. 2 Performance comparisons are based on the Chi-square test of statistical significance, with a p value of <0.05. 3 Total rates are based on the MCP reporting unit’s total results, including the SPD and non-SPD populations. Please note, if data are not available for either the SPD or non-SPD population, the total rate is based on results reported for the available population. * A lower rate indicates better performance for this measure. ** Member months are a member's “contribution” to the total yearly membership. NA = The MCP followed the specifications, but the denominator was too small (less than 30) to report a valid rate. Not Comparable = An SPD/non-SPD rate difference cannot be made because data are not available for both populations. Not Tested = An SPD/non-SPD rate difference was not calculated because high and low rates do not necessarily indicate better or worse performance.
Table 3.47—RY 2018 (MY 2017) Performance Measure Comparison and Results forMeasures Stratified by the SPD and Non-SPD PopulationsPartnership—Southeast (Napa, Solano, and Yolo Counties)
B = Statistical testing result indicates that the RY 2018 SPD rate is significantly better than the RY 2018 non-SPD rate.
W = Statistical testing result indicates that the RY 2018 SPD rate is significantly worse than the RY 2018 non-SPD rate.
Measure RY 2018
SPD Rate1
RY 2018 Non-SPD
Rate1
SPD/Non-SPDRate
Difference2
RY 2018 Total Rate3
All-Cause Readmissions* 15.98% 11.59% 4.39W 13.24% Ambulatory Care—Emergency Department (ED) Visits per 1,000 Member Months**
90.16 46.07 Not Tested 49.36
Ambulatory Care—Outpatient Visits per 1,000 Member Months** 433.31 226.85 Not Tested 242.27
Partnership HealthPlan of California Performance Evaluation Report: July 1, 2017–June 30, 2018 California Department of Health Care Services
Page X-63 Health Services Advisory Group, Inc.

MANAGED CARE HEALTH PLAN PERFORMANCE MEASURES
Measure RY 2018
SPD Rate1
RY 2018 Non-SPD
Rate1
SPD/Non-SPDRate
Difference2
RY 2018 Total Rate3
Annual Monitoring for Patients on Persistent Medications— ACE Inhibitors or ARBs
90.89% 88.58% 2.31B 89.30%
Annual Monitoring for Patients on Persistent Medications—Diuretics 90.88% 87.68% 3.20B 88.77%
Children and Adolescents' Access to Primary Care Practitioners— 12–24 Months
87.88% 94.60% -6.72 94.54%
Children and Adolescents' Access to Primary Care Practitioners— 25 Months–6 Years
91.29% 86.40% 4.89B 86.51%
Children and Adolescents' Access to Primary Care Practitioners— 7–11 Years
90.99% 87.21% 3.78B 87.34%
Children and Adolescents' Access to Primary Care Practitioners— 12–19 Years
86.02% 86.27% -0.25 86.25%
1 RY 2018 rates reflect MY data from January 1, 2017, through December 31, 2017. 2 Performance comparisons are based on the Chi-square test of statistical significance, with a p value of <0.05. 3 Total rates are based on the MCP reporting unit’s total results, including the SPD and non-SPD populations. Please note, if data are not available for either the SPD or non-SPD population, the total rate is based on results reported for the available population. * A lower rate indicates better performance for this measure. ** Member months are a member's “contribution” to the total yearly membership. Not Tested = An SPD/non-SPD rate difference was not calculated because high and low rates do not necessarily indicate better or worse performance.
Partnership HealthPlan of California Performance Evaluation Report: July 1, 2017–June 30, 2018 California Department of Health Care Services
Page X-64 Health Services Advisory Group, Inc.
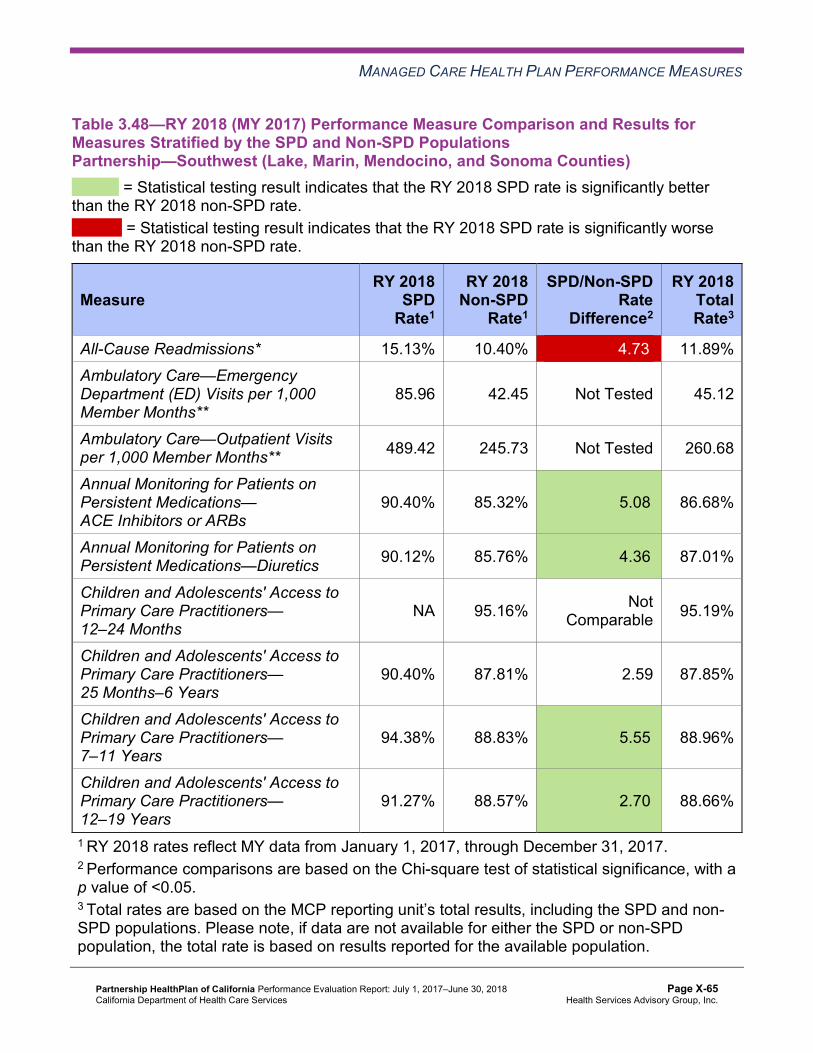
MANAGED CARE HEALTH PLAN PERFORMANCE MEASURES
Table 3.48—RY 2018 (MY 2017) Performance Measure Comparison and Results forMeasures Stratified by the SPD and Non-SPD PopulationsPartnership—Southwest (Lake, Marin, Mendocino, and Sonoma Counties)
B = Statistical testing result indicates that the RY 2018 SPD rate is significantly better than the RY 2018 non-SPD rate.
W = Statistical testing result indicates that the RY 2018 SPD rate is significantly worse than the RY 2018 non-SPD rate.
Measure RY 2018
SPD Rate1
RY 2018 Non-SPD
Rate1
SPD/Non-SPDRate
Difference2
RY 2018 Total Rate3
All-Cause Readmissions* 15.13% 10.40% 4.73W 11.89% Ambulatory Care—Emergency Department (ED) Visits per 1,000 Member Months**
85.96 42.45 Not Tested 45.12
Ambulatory Care—Outpatient Visits per 1,000 Member Months** 489.42 245.73 Not Tested 260.68
Annual Monitoring for Patients on Persistent Medications— ACE Inhibitors or ARBs
90.40% 85.32% 5.08B 86.68%
Annual Monitoring for Patients on Persistent Medications—Diuretics 90.12% 85.76% 4.36B 87.01%
Children and Adolescents' Access to Primary Care Practitioners— 12–24 Months
NA 95.16% Not Comparable 95.19%
Children and Adolescents' Access to Primary Care Practitioners— 25 Months–6 Years
90.40% 87.81% 2.59 87.85%
Children and Adolescents' Access to Primary Care Practitioners— 7–11 Years
94.38% 88.83% 5.55B 88.96%
Children and Adolescents' Access to Primary Care Practitioners— 12–19 Years
91.27% 88.57% 2.70B 88.66%
1 RY 2018 rates reflect MY data from January 1, 2017, through December 31, 2017. 2 Performance comparisons are based on the Chi-square test of statistical significance, with a p value of <0.05. 3 Total rates are based on the MCP reporting unit’s total results, including the SPD and non-SPD populations. Please note, if data are not available for either the SPD or non-SPD population, the total rate is based on results reported for the available population.
Partnership HealthPlan of California Performance Evaluation Report: July 1, 2017–June 30, 2018 California Department of Health Care Services
Page X-65 Health Services Advisory Group, Inc.
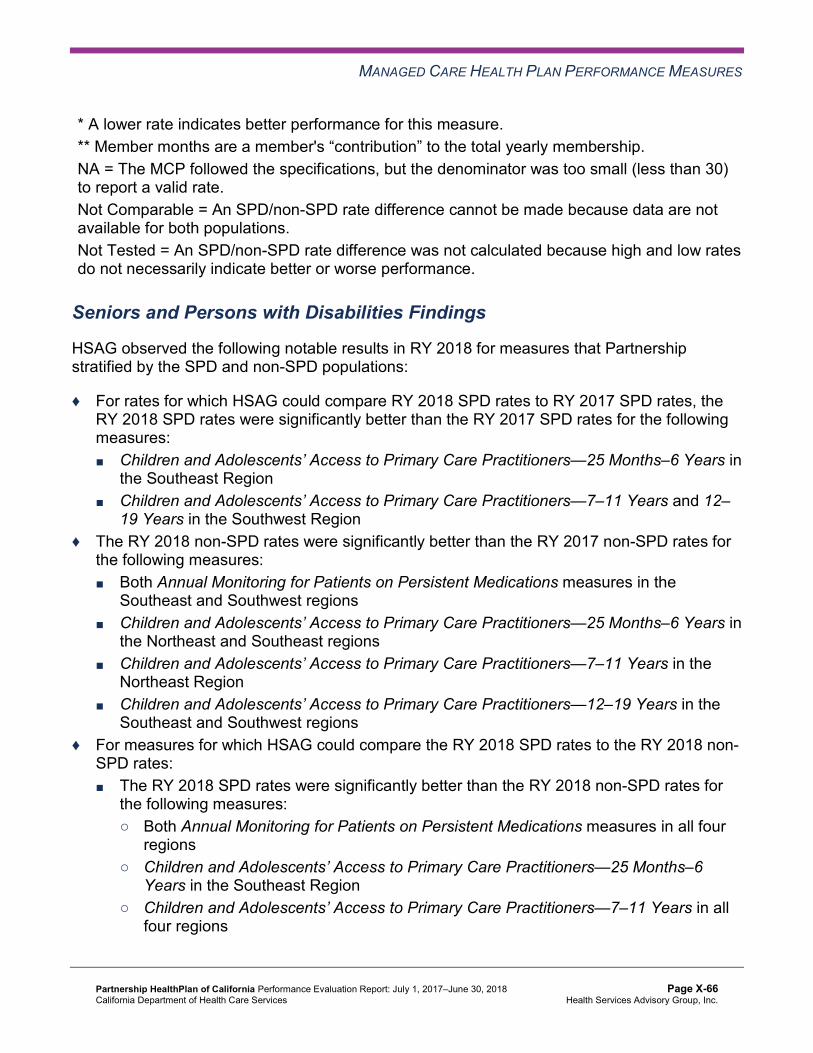
MANAGED CARE HEALTH PLAN PERFORMANCE MEASURES
* A lower rate indicates better performance for this measure. ** Member months are a member's “contribution” to the total yearly membership. NA = The MCP followed the specifications, but the denominator was too small (less than 30) to report a valid rate. Not Comparable = An SPD/non-SPD rate difference cannot be made because data are not available for both populations. Not Tested = An SPD/non-SPD rate difference was not calculated because high and low rates do not necessarily indicate better or worse performance.
Seniors and Persons with Disabilities Findings
HSAG observed the following notable results in RY 2018 for measures that Partnership stratified by the SPD and non-SPD populations:
♦ For rates for which HSAG could compare RY 2018 SPD rates to RY 2017 SPD rates, the RY 2018 SPD rates were significantly better than the RY 2017 SPD rates for the following measures: ■ Children and Adolescents’ Access to Primary Care Practitioners—25 Months–6 Years in
the Southeast Region ■ Children and Adolescents’ Access to Primary Care Practitioners—7–11 Years and 12–
19 Years in the Southwest Region ♦ The RY 2018 non-SPD rates were significantly better than the RY 2017 non-SPD rates for
the following measures: ■ Both Annual Monitoring for Patients on Persistent Medications measures in the
Southeast and Southwest regions ■ Children and Adolescents’ Access to Primary Care Practitioners—25 Months–6 Years in
the Northeast and Southeast regions ■ Children and Adolescents’ Access to Primary Care Practitioners—7–11 Years in the
Northeast Region ■ Children and Adolescents’ Access to Primary Care Practitioners—12–19 Years in the
Southeast and Southwest regions ♦ For measures for which HSAG could compare the RY 2018 SPD rates to the RY 2018 non-
SPD rates: ■ The RY 2018 SPD rates were significantly better than the RY 2018 non-SPD rates for
the following measures: ○ Both Annual Monitoring for Patients on Persistent Medications measures in all four
regions ○ Children and Adolescents’ Access to Primary Care Practitioners—25 Months–6
Years in the Southeast Region ○ Children and Adolescents’ Access to Primary Care Practitioners—7–11 Years in all
four regions
Partnership HealthPlan of California Performance Evaluation Report: July 1, 2017–June 30, 2018 California Department of Health Care Services
Page X-66 Health Services Advisory Group, Inc.

MANAGED CARE HEALTH PLAN PERFORMANCE MEASURES
○ Children and Adolescents’ Access to Primary Care Practitioners—12–19 Years in the Northwest and Southwest regions
■ In all four regions, the RY 2018 SPD rates were significantly worse than the RY 2018 non-SPD rates for the All-Cause Readmissions measure. Note that the higher rate of hospital readmissions for the SPD population is expected based on the greater and often more complicated health care needs of these beneficiaries.
Strengths—Performance Measures HSAG auditors determined that Partnership followed the appropriate specifications to produce valid rates, and identified no issues of concern. Based on recommendations that the auditors made during the previous audit, the MCP improved its data monitoring processes.
HSAG identified the following notable RY 2018 performance measure results for Partnership:
♦ Across all domains and regions, 11 of 84 rates (13 percent) were above the HPLs in RY 2018. ■ In the Southeast Region, Partnership had no measures with rates below the MPLs. In
this region, the MCP performed above the HPLs for five of 21 measures (24 percent), with the rate for the Use of Imaging Studies for Low Back Pain measure being above the HPL for at least four consecutive years. Additionally, for measures for which HSAG made comparisons between RY 2017 and RY 2018, the rates improved significantly from RY 2017 to RY 2018 for four of 22 measures in this region (18 percent).
■ In the Southwest Region, the MCP performed above the HPLs for five of 21 measures (24 percent), with the rates for the Avoidance of Antibiotic Treatment in Adults With Acute Bronchitis and Use of Imaging Studies for Low Back Pain measures being above the HPLs for at least four consecutive years. For measures for which HSAG made comparisons between RY 2017 and RY 2018, the rates improved significantly from RY 2017 to RY 2018 for four of 22 measures (18 percent). Additionally, for measures for which MCPs were held accountable to meet the MPLs in RY 2017, the rates for two of three measures in this region (67 percent) improved from below the MPLs in RY 2017 to above the MPLs in RY 2018.
■ In the Northwest Region, Partnership performed above the HPL for one measure and the rates for two measures improved significantly from RY 2017 to RY 2018.
Opportunities for Improvement—Performance Measures Across all domains and regions, 14 of 84 rates (17 percent) were below the MPLs in RY 2018. Partnership has opportunities to improve performance for the following measures with rates that were below the MPLs in RY 2018:
♦ Annual Monitoring for Patients on Persistent Medications—ACE Inhibitors or ARBs in the Northeast and Northwest regions.
Partnership HealthPlan of California Performance Evaluation Report: July 1, 2017–June 30, 2018 California Department of Health Care Services
Page X-67 Health Services Advisory Group, Inc.

MANAGED CARE HEALTH PLAN PERFORMANCE MEASURES
♦ Annual Monitoring for Patients on Persistent Medications—Diuretics in the Northeast Region.
♦ Asthma Medication Ratio in the Northeast and Northwest regions. ♦ Breast Cancer Screening below the MPL in the Northeast and Northwest regions. ♦ Childhood Immunization Status—Combination 3 in the Northeast, Northwest, and
Southwest regions. ■ The rates were below the MPLs for the last three consecutive years in the Northeast
and Northwest regions. ♦ Comprehensive Diabetes Care—Medical Attention for Nephropathy in the Northwest and
Southwest regions. ♦ Immunizations for Adolescents—Combination 2 in the Northeast Region. ♦ Well-Child Visits in the Third, Fourth, Fifth, and Sixth Years of Life in the Northwest Region.
■ The rate for this measure in the Northwest Region declined significantly from RY 2017 to RY 2018, resulting in the rate moving from above the MPL in RY 2017 to below the MPL in RY 2018.
Partnership HealthPlan of California Performance Evaluation Report: July 1, 2017–June 30, 2018 California Department of Health Care Services
Page X-68 Health Services Advisory Group, Inc.

Medi-Cal Managed Care External Quality Review Technical ReportAppendix X: Performance Evaluation ReportPartnership HealthPlan of CaliforniaJuly 1, 2017–June 30, 2018
4. Performance Improvement Projects
Performance Improvement Project Overview The key concepts of the rapid-cycle PIP framework include forming a PIP team, setting aims, establishing measures, determining interventions using quality improvement tools, conducting PDSA cycles to test interventions, and planning for the spread of successful changes. The core component of the rapid-cycle PIP approach involves testing changes on a small scale so that improvement can occur more efficiently and lead to long-term sustainability. The following modules guide MCPs through this rapid-cycle PIP process:
♦ Module 1—PIP Initiation ■ MCPs outline the framework for the PIP, which includes:
○ The topic rationale. ○ Comparative data supporting the need to improve the selected topic. ○ A list of the PIP team members, which consists of internal and external stakeholders. ○ A completed key driver diagram that defines the theory of change for improvement,
including the SMART (Specific, Measurable, Achievable, Relevant, and Time-bound) Aim and Global Aim.
♦ Module 2—SMART Aim Data Collection ■ MCPs define the SMART Aim measure and data collection methodology and develop
the SMART Aim data run chart. ♦ Module 3—Intervention Determination
■ MCPs use process mapping and failure modes and effects analysis (FMEA) to identify potential interventions to test which may have direct effects on the SMART Aim.
♦ Module 4—Plan-Do-Study-Act (PDSA) ■ MCPs test and evaluate the interventions identified in Module 3 through a series of
PDSA cycles. ♦ Module 5—PIP Conclusions
■ MCPs interpret results and summarize: ○ Key findings and outcomes achieved. ○ Assessment of each tested intervention. ○ Lessons learned, including how demonstrated improvement can be shared and used
as a foundation for further improvement going forward. ○ Plan for sustained improvement.
Partnership HealthPlan of California Performance Evaluation Report: July 1, 2017–June 30, 2018 California Department of Health Care Services
Page X-69 Health Services Advisory Group, Inc.

PERFORMANCE IMPROVEMENT PROJECTS
Based on the agreed-upon timeline, MCPs submit each module to HSAG for validation. Throughout the rapid-cycle PIP process, HSAG provides technical assistance to MCPs to ensure that PIPs are methodologically sound and to problem-solve with MCPs regarding how to address challenges that occur. Through an iterative process, MCPs have opportunities to make corrections to modules 1 through 3 to achieve all validation criteria.
Once MCPs achieve all validation criteria for modules 1 through 3 and receive feedback on the intervention Plan portion of Module 4, MCPs test interventions. During the intervention testing phase of the PIP, HSAG conducts periodic progress check-ins to ensure that MCPs have addressed HSAG’s feedback on the Plan portion of Module 4 and are making appropriate progress with intervention testing. Once MCPs complete testing an intervention, MCPs determine the next steps based on results and lessons learned—whether the intervention was successful and should be spread (adopt), whether modifications need to be made to the existing intervention (adapt), or whether the intervention was not successful and should be stopped (abandon).
In Module 5, MCPs summarize the overall PIP. When validating Module 5, HSAG assesses the validity and reliability of the results based on the Centers for Medicare & Medicaid Services (CMS) validation protocols to determine whether key stakeholders can have confidence in the reported PIP findings. HSAG assigns the following final confidence levels for each PIP:
♦ High confidence—the PIP was methodologically sound and achieved the SMART Aim goal; the demonstrated improvement was clearly linked to the quality improvement processes conducted and intervention(s) tested; and, the MCP accurately summarized the key findings.
♦ Confidence—the PIP was methodologically sound and achieved the SMART Aim goal, and the MCP accurately summarized the key findings. However, some, but not all, of the quality improvement processes conducted and/or intervention(s) tested were clearly linked to the demonstrated improvement.
♦ Low confidence—either (A) the PIP was methodologically sound; however, the SMART Aim goal was not achieved; or (B) the SMART Aim goal was achieved; however, the quality improvement processes and/or intervention(s) tested were poorly executed and could not be linked to the improvement.
♦ Reported PIP results were not credible—the PIP methodology was not executed as approved.
Performance Improvement Project Results and Findings During the review period, Partnership submitted modules 4 and 5 for its 2015–17 DHCS-priority and MCP-specific PIPs. HSAG validated the modules and includes the final PIP validation findings in this report. Additionally, Partnership initiated a Disparity PIP and a DHCS-priority PIP during the review period. In this report, HSAG includes summaries of the MCP’s Disparity and DHCS-priority PIP module submissions as well as validation findings from the review period.
Partnership HealthPlan of California Performance Evaluation Report: July 1, 2017–June 30, 2018 California Department of Health Care Services
Page X-70 Health Services Advisory Group, Inc.

PERFORMANCE IMPROVEMENT PROJECTS
2015–17 DHCS-Priority Performance Improvement Project
Partnership selected hypertension for its 2015–17 DHCS-priority PIP. While the MCP concluded its Hypertension PIP through the SMART Aim end date of June 30, 2017, Partnership submitted modules 4 and 5 for HSAG to validate during the review period for this report. HSAG provided final validation findings and encouraged Partnership to incorporate the experiences and lessons learned from the PIP into future quality improvement efforts.
Table 4.1 provides a summary of the SMART Aim measure results reported by the MCP.
Table 4.1—Partnership Hypertension PIP SMART Aim Measure Results
SMART Aim Measure Baseline Rate
SMART Aim Goal
Rate
SMART Aim Goal Achieved
Rate of blood pressure control among beneficiaries living with hypertension who are assigned to Provider A6 in Humboldt County
41.95% 56.20% Yes
Table 4.2 presents a description of the interventions that Partnership tested for its Hypertension PIP. The table also indicates the key drivers and/or failure modes that each intervention addressed as well as whether the MCP decided, based on intervention testing results, to adopt, adapt, or abandon the intervention.
Table 4.2—Partnership Hypertension PIP Intervention Testing Results
Intervention Key Drivers and/or Failure ModesAddressed
Adopt,Adapt, orAbandon
Set blood pressure targets for beneficiaries on the Epic electronic health record (EHR) system.
♦ Lack of pre-defined blood pressure thresholds when the medical assistant discusses beneficiaries’ blood pressure measurements with the provider
Adopt
Provide medical assistants with training on hypertension best practices and blood pressure monitoring protocols.
♦ Improper technique for taking blood pressure measurements Adopt
6 Provider name removed for confidentiality.
Partnership HealthPlan of California Performance Evaluation Report: July 1, 2017–June 30, 2018 California Department of Health Care Services
Page X-71 Health Services Advisory Group, Inc.

PERFORMANCE IMPROVEMENT PROJECTS
Intervention Key Drivers and/or Failure ModesAddressed
Adopt,Adapt, orAbandon
Standardize nurse visit processes for interacting with beneficiaries who are newly diagnosed with hypertension, have medication changes, or have controlled hypertension.
♦ Beneficiary engagement ♦ Health education for hypertension
management Adopt
Performance Improvement Project Validation Findings
During the review period for this report, HSAG validated modules 4 and 5 for the MCP’s Hypertension PIP. Partnership achieved the SMART Aim goal and sustained the improvement for seven consecutive months. The MCP documented the success of all three interventions and determined to expand the interventions beyond the initial scope of the PIP. Upon assessment of validity and reliability of the PIP results, HSAG assigned Partnership’s Hypertension PIP a final confidence level of High Confidence.
2015–17 MCP-Specific Performance Improvement Project
Partnership selected diabetes retinal eye exam for its 2015–17 MCP-specific PIP. While the MCP concluded its Diabetes Retinal Eye Exam PIP through the SMART Aim end date of June 30, 2017, Partnership submitted modules 4 and 5 for HSAG to validate during the review period for this report. HSAG provided final validation findings and encouraged Partnership to incorporate the experiences and lessons learned from the PIP into future quality improvement efforts.
Table 4.3 provides a summary of the SMART Aim measure results reported by the MCP.
Table 4.3—Partnership Diabetes Retinal Eye Exam PIP SMART Aim Measure Results
SMART Aim Measure Baseline Rate
SMART Aim Goal
Rate
SMART Aim Goal Achieved
Rate of Comprehensive Diabetes Care―Eye Exam(Retinopathy) Performed measure among beneficiaries living with diabetes who are assigned to Provider B7
25.00% 68.00% Yes
7 Provider name removed for confidentiality.
Partnership HealthPlan of California Performance Evaluation Report: July 1, 2017–June 30, 2018 California Department of Health Care Services
Page X-72 Health Services Advisory Group, Inc.
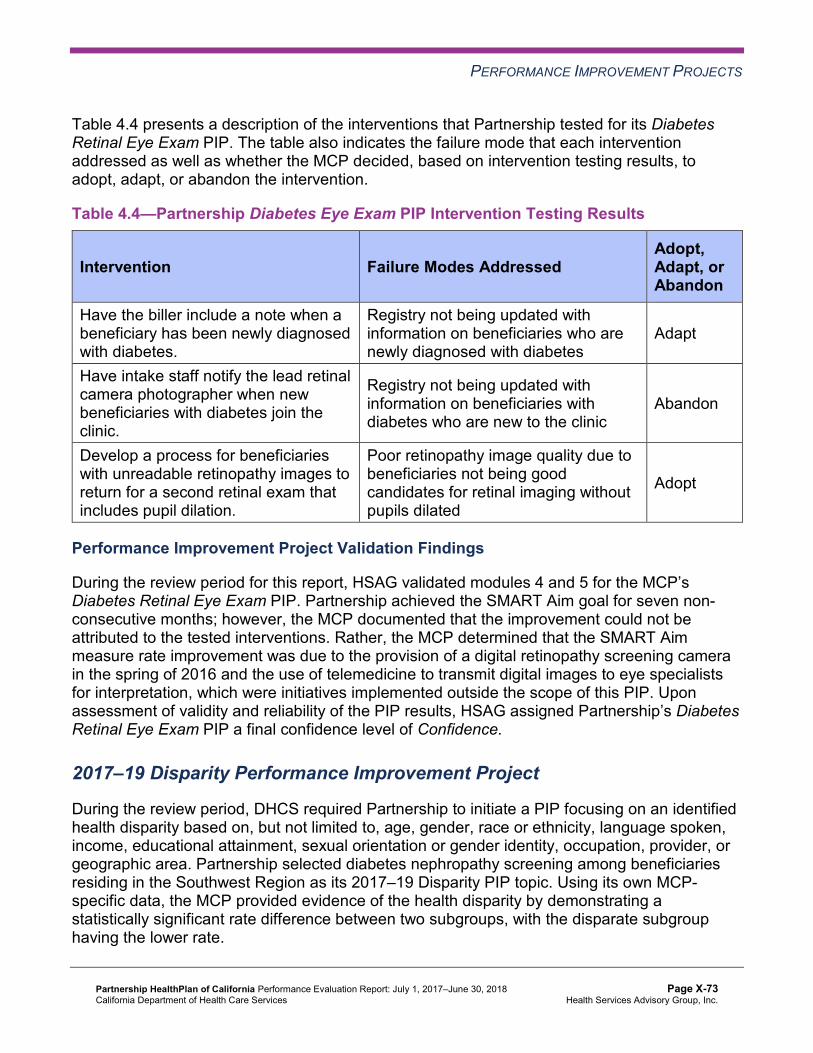
PERFORMANCE IMPROVEMENT PROJECTS
Table 4.4 presents a description of the interventions that Partnership tested for its Diabetes Retinal Eye Exam PIP. The table also indicates the failure mode that each intervention addressed as well as whether the MCP decided, based on intervention testing results, to adopt, adapt, or abandon the intervention.
Table 4.4—Partnership Diabetes Eye Exam PIP Intervention Testing Results
Intervention Failure Modes Addressed Adopt,Adapt, orAbandon
Have the biller include a note when a beneficiary has been newly diagnosed with diabetes.
Registry not being updated with information on beneficiaries who are newly diagnosed with diabetes
Adapt
Have intake staff notify the lead retinal camera photographer when new beneficiaries with diabetes join the clinic.
Registry not being updated with information on beneficiaries with diabetes who are new to the clinic
Abandon
Develop a process for beneficiaries with unreadable retinopathy images to return for a second retinal exam that includes pupil dilation.
Poor retinopathy image quality due to beneficiaries not being good candidates for retinal imaging without pupils dilated
Adopt
Performance Improvement Project Validation Findings
During the review period for this report, HSAG validated modules 4 and 5 for the MCP’s Diabetes Retinal Eye Exam PIP. Partnership achieved the SMART Aim goal for seven non-consecutive months; however, the MCP documented that the improvement could not be attributed to the tested interventions. Rather, the MCP determined that the SMART Aim measure rate improvement was due to the provision of a digital retinopathy screening camera in the spring of 2016 and the use of telemedicine to transmit digital images to eye specialists for interpretation, which were initiatives implemented outside the scope of this PIP. Upon assessment of validity and reliability of the PIP results, HSAG assigned Partnership’s Diabetes Retinal Eye Exam PIP a final confidence level of Confidence.
2017–19 Disparity Performance Improvement Project
During the review period, DHCS required Partnership to initiate a PIP focusing on an identified health disparity based on, but not limited to, age, gender, race or ethnicity, language spoken, income, educational attainment, sexual orientation or gender identity, occupation, provider, or geographic area. Partnership selected diabetes nephropathy screening among beneficiaries residing in the Southwest Region as its 2017–19 Disparity PIP topic. Using its own MCP-specific data, the MCP provided evidence of the health disparity by demonstrating a statistically significant rate difference between two subgroups, with the disparate subgroup having the lower rate.
Partnership HealthPlan of California Performance Evaluation Report: July 1, 2017–June 30, 2018 California Department of Health Care Services
Page X-73 Health Services Advisory Group, Inc.
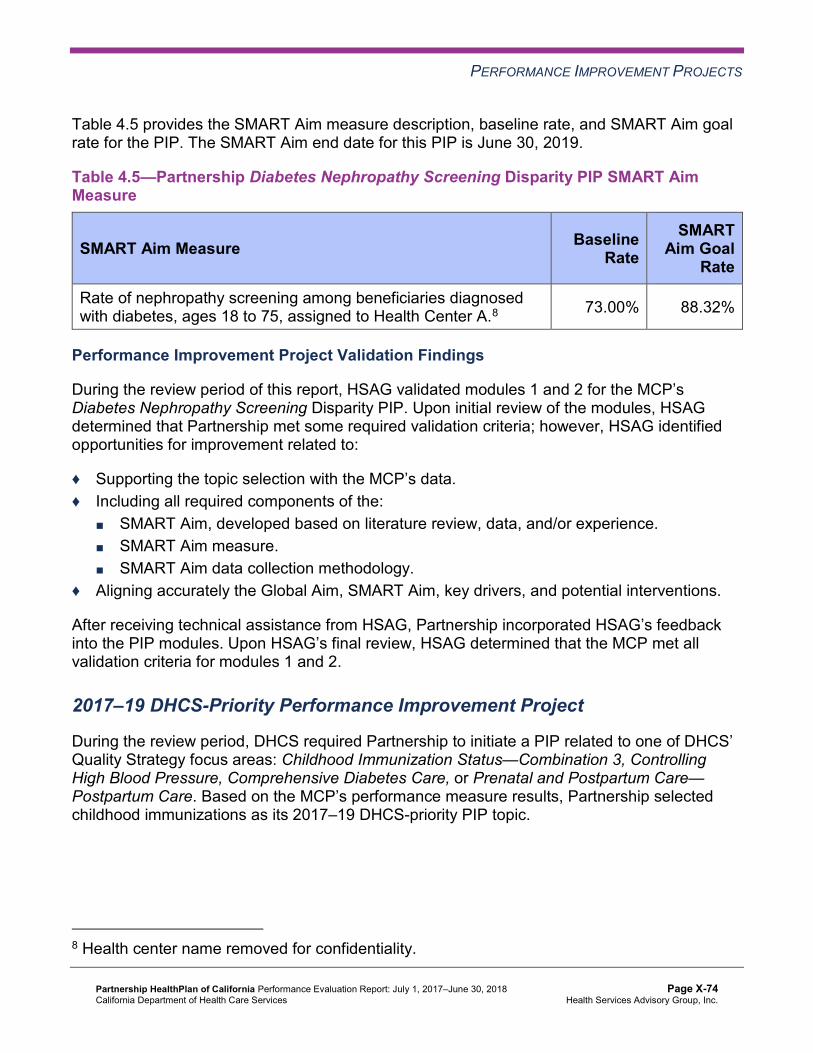
PERFORMANCE IMPROVEMENT PROJECTS
Table 4.5 provides the SMART Aim measure description, baseline rate, and SMART Aim goal rate for the PIP. The SMART Aim end date for this PIP is June 30, 2019.
Table 4.5—Partnership Diabetes Nephropathy Screening Disparity PIP SMART Aim Measure
SMART Aim Measure Baseline Rate
SMART Aim Goal
Rate
Rate of nephropathy screening among beneficiaries diagnosed with diabetes, ages 18 to 75, assigned to Health Center A.8 73.00% 88.32%
Performance Improvement Project Validation Findings
During the review period of this report, HSAG validated modules 1 and 2 for the MCP’s Diabetes Nephropathy Screening Disparity PIP. Upon initial review of the modules, HSAG determined that Partnership met some required validation criteria; however, HSAG identified opportunities for improvement related to:
♦ Supporting the topic selection with the MCP’s data. ♦ Including all required components of the:
■ SMART Aim, developed based on literature review, data, and/or experience. ■ SMART Aim measure. ■ SMART Aim data collection methodology.
♦ Aligning accurately the Global Aim, SMART Aim, key drivers, and potential interventions.
After receiving technical assistance from HSAG, Partnership incorporated HSAG’s feedback into the PIP modules. Upon HSAG’s final review, HSAG determined that the MCP met all validation criteria for modules 1 and 2.
2017–19 DHCS-Priority Performance Improvement Project
During the review period, DHCS required Partnership to initiate a PIP related to one of DHCS’ Quality Strategy focus areas: Childhood Immunization Status—Combination 3, Controlling High Blood Pressure, Comprehensive Diabetes Care, or Prenatal and Postpartum Care— Postpartum Care. Based on the MCP’s performance measure results, Partnership selected childhood immunizations as its 2017–19 DHCS-priority PIP topic.
8 Health center name removed for confidentiality.
Partnership HealthPlan of California Performance Evaluation Report: July 1, 2017–June 30, 2018 California Department of Health Care Services
Page X-74 Health Services Advisory Group, Inc.

PERFORMANCE IMPROVEMENT PROJECTS
Table 4.6 provides the SMART Aim measure description, baseline rate, and SMART Aim goal rate for the PIP. The SMART Aim end date for this PIP is June 30, 2019.
Table 4.6—Partnership Childhood Immunization Status—Combination 3 PIP SMART Aim Measure
SMART Aim Measure Baseline Rate
SMART Aim Goal
Rate
Rate of Childhood Immunization Status—Combination 3 measure among beneficiaries residing in Lassen County 35.51% 52.17%
Performance Improvement Project Validation Findings
During the review period of this report, HSAG validated modules 1 through 3 for the MCP’s Childhood Immunization Status—Combination 3 PIP. Upon initial review of the modules, HSAG determined that Partnership met some required validation criteria; however, HSAG identified opportunities for improvement related to:
♦ Supporting the topic selection with the MCP’s data. ♦ Identifying appropriate team members that include both internal staff and external partners. ♦ Including all required components of the:
■ SMART Aim, developed based on literature review, data, and/or experience. ■ SMART Aim measure. ■ SMART Aim data collection methodology. ■ Run/control chart. ■ FMEA table.
♦ Aligning accurately the Global Aim, SMART Aim, key drivers, and potential interventions. ♦ Including a step-by-step flow of the overall process in the process map. ♦ Listing the appropriate potential interventions based on the ranked failure modes.
After receiving technical assistance from HSAG, Partnership incorporated HSAG’s feedback into the PIP modules. Upon HSAG’s final review, HSAG determined that the MCP met all validation criteria for all submitted modules.
Strengths—Performance Improvement Projects Partnership achieved the SMART Aim goals for both 2015–17 PIPs and linked the quality improvement activities to the demonstrated improvements. Based on HSAG’s assessment, HSAG assigned the 2015–17 Hypertension PIP a final confidence level of High Confidence and the 2015–17 Diabetes Retinal Eye Exam PIP a final confidence level of Confidence.
Partnership HealthPlan of California Performance Evaluation Report: July 1, 2017–June 30, 2018 California Department of Health Care Services
Page X-75 Health Services Advisory Group, Inc.
PERFORMANCE IMPROVEMENT PROJECTS
Opportunities for Improvement—Performance Improvement ProjectsPartnership has the opportunity to continue monitoring adopted and adapted interventions and outcomes to facilitate long-term, sustained improvement beyond the life of the 2015–17 Hypertension and Diabetes Retinal Eye Exam PIPs. Ongoing monitoring will enable long-term evaluation of sustained improvement and allow the MCP to continually refine interventions to achieve and sustain optimal outcomes.
Partnership HealthPlan of California Performance Evaluation Report: July 1, 2017–June 30, 2018 California Department of Health Care Services
Page X-76 Health Services Advisory Group, Inc.

Medi-Cal Managed Care External Quality Review Technical ReportAppendix X: Performance Evaluation ReportPartnership HealthPlan of CaliforniaJuly 1, 2017–June 30, 2018
5. Recommendations
Follow-Up on Prior Year Recommendations DHCS provided each MCP an opportunity to outline actions taken to address recommendations HSAG made in its 2016–17 MCP-specific evaluation report. Table 5.1 provides EQR recommendations from Partnership’s July 1, 2016, through June 30, 2017, MCP-specific evaluation report, along with the MCP’s self-reported actions taken through June 30, 2018, that address the recommendations. Please note that HSAG made minimal edits to Table 5.1 to preserve the accuracy of Partnership’s self-reported actions.
Table 5.1—Partnership’s Self-Reported Follow-Up on External Quality ReviewRecommendations from the July 1, 2016, through June 30, 2017, MCP-SpecificEvaluation Report
2016–17 External Quality ReviewRecommendations Directed to Partnership
Self-Reported Actions Taken byPartnership during the Period of July 1,2017–June 30, 2018, that Address the External Quality Review Recommendations
1. Assess whether or not current strategies need to be modified or expanded to improve the MCP’s performance to above the MPLs for the following measures: a. Annual Monitoring for Patients on
Persistent Medications—ACE Inhibitors or ARBs in the Northeast, Northwest, and Southwest regions
b. Annual Monitoring for Patients on Persistent Medications—Diuretics in the Northeast and Southwest regions
c. Childhood Immunization Status— Combination 3 in the Northeast and Northwest regions
1a. and 1b. The Annual Monitoring for Patients on Persistent Medications (MPM) indicators continue to demand high performance per the posted benchmarks. Between RY 2016 and RY 2017, the MPLs increased from 84.88 percent to 85.63 percent for the ACE Inhibitors or ARBs indicator and from 84.70 percent to 85.18 percent for the Diuretics indicator.
♦ Performance improved for the ACE Inhibitors or ARBs indicator for the Northeast, Northwest, and Southwest regions from RY 2016 to RY 2017. These gains, combined with increasing MPLs however, still resulted in below MPL performance in RY 2017 for all three regions. The gap in performance ranged between 0.08 percentage points (Northwest Region) and 3.23 percentage points (Northeast Region) from the MPL. The Southwest Region performance fell within
Partnership HealthPlan of California Performance Evaluation Report: July 1, 2017–June 30, 2018 California Department of Health Care Services
Page X-77 Health Services Advisory Group, Inc.

RECOMMENDATIONS
2016–17 External Quality ReviewRecommendations Directed to Partnership
Self-Reported Actions Taken byPartnership during the Period of July 1,2017–June 30, 2018, that Address the External Quality Review Recommendations
this range, reporting a gap of 0.71 percentage points from the MPL.
♦ In the Southwest Region, performance for the Diuretics indicator declined 0.18 percentage points from RY 2016 to RY 2017, and performance in the Northwest Region improved by 1.37 percentage points. This performance reporting combined with the increasing MPLs resulted in below MPL performance in RY 2017 in both the Southwest and Northwest regions. The gap in performance ranged from 0.33 percentage points (Southwest Region) to 0.41 percentage points (Northwest Region) from the MPL.
The following actions were taken to improve performance. Southern Region: ♦ During RY 2017/18, three PDSA cycles for
this measure were conducted by partnering with two provider clinics. The first PDSA cycle was conducted with one provider, in which outreach was tested. Key lessons learned were that live calls with an educational component to members and a follow-up mailer to reinforce the importance of completing annual labs were the most effective approaches.
♦ Note: While Partnership made an effort to work with a large provider and saw positive results, the provider did not have sufficient staff to continue with PDSA cycles and, as a result, discontinued work.
♦ Partnership conducted two additional PDSA cycles with the second provider in which outreach was tested. Key lessons learned were that live calls to members from a clinical staff member with an
Partnership HealthPlan of California Performance Evaluation Report: July 1, 2017–June 30, 2018 California Department of Health Care Services
Page X-78 Health Services Advisory Group, Inc.

RECOMMENDATIONS
2016–17 External Quality ReviewRecommendations Directed to Partnership
Self-Reported Actions Taken byPartnership during the Period of July 1,2017–June 30, 2018, that Address the External Quality Review Recommendations
educational component were effective in getting members to complete labs. A follow-up mailer with lab slip was a good reinforcement.
Northern Region: ♦ In partnership with a health center in the
Northwest Region, a Partnership performance improvement clinical specialist (registered nurse) called 53 members on a pre-defined gap list during November 2017 and provided one-on-one education about the importance of the members completing their annual labs. The gap list was comprised of members ages 35 to 65 residing in zip code 95503 (Humboldt County). Before the intervention, baseline performance for both MPM indicators for these members was 13 percent. By January 2018, 54 percent were compliant, which grew to 71 percent compliance by May 2018.
♦ The targeted member outreach and one-on-one education intervention from the Northwest Region was adapted and spread to a clinic in the Northeast Region in June 2018. The intervention was adapted to study effects of outreach conducted by non-nursing Partnership staff and to assess the value of incorporating a warm handoff to the provider for ease in scheduling. Initial results from these calls showed that 72 percent of members reached were unaware of recommended annual labs until reached by Partnership. This intervention strategy and the results of this specific PDSA cycle will continue to be studied and evaluated through the remainder of 2018.
♦ The Partnership team highlighted the narrow gap between Northeast, Southwest, and Northwest Region performance and
Partnership HealthPlan of California Performance Evaluation Report: July 1, 2017–June 30, 2018 California Department of Health Care Services
Page X-79 Health Services Advisory Group, Inc.
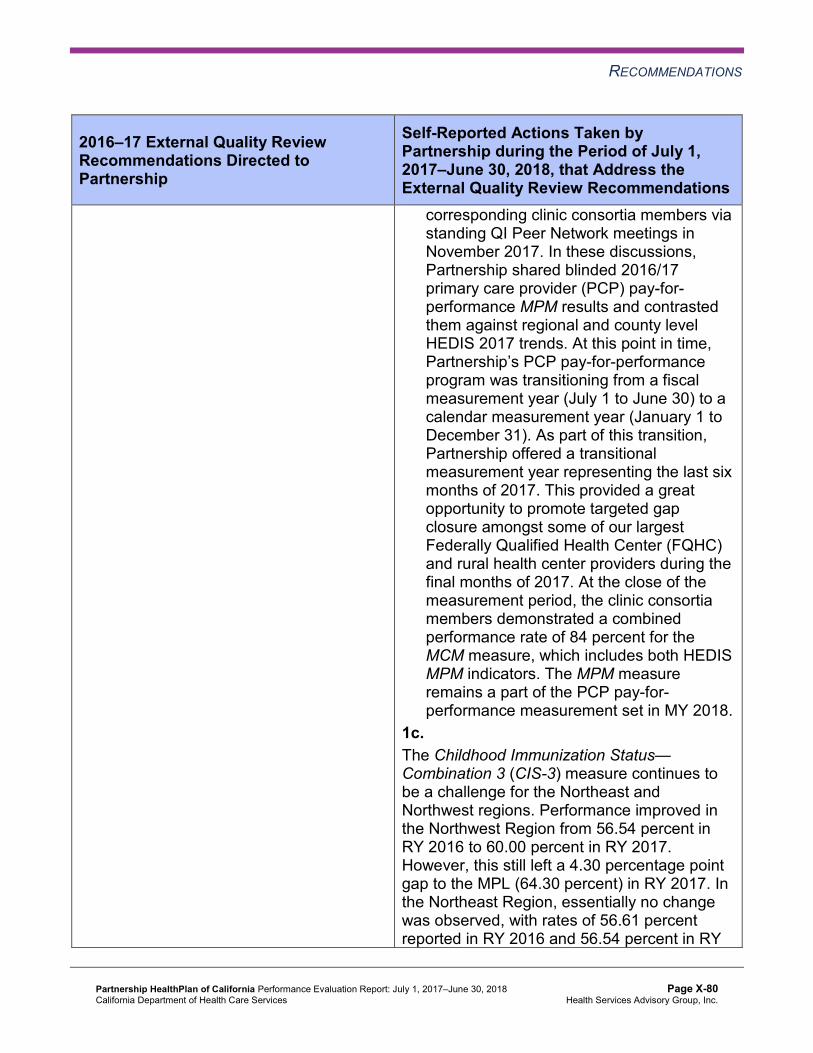
RECOMMENDATIONS
2016–17 External Quality ReviewRecommendations Directed to Partnership
Self-Reported Actions Taken byPartnership during the Period of July 1,2017–June 30, 2018, that Address the External Quality Review Recommendations
corresponding clinic consortia members via standing QI Peer Network meetings in November 2017. In these discussions, Partnership shared blinded 2016/17 primary care provider (PCP) pay-for-performance MPM results and contrasted them against regional and county level HEDIS 2017 trends. At this point in time, Partnership’s PCP pay-for-performance program was transitioning from a fiscal measurement year (July 1 to June 30) to a calendar measurement year (January 1 to December 31). As part of this transition, Partnership offered a transitional measurement year representing the last six months of 2017. This provided a great opportunity to promote targeted gap closure amongst some of our largest Federally Qualified Health Center (FQHC) and rural health center providers during the final months of 2017. At the close of the measurement period, the clinic consortia members demonstrated a combined performance rate of 84 percent for the MCM measure, which includes both HEDIS MPM indicators. The MPM measure remains a part of the PCP pay-for-performance measurement set in MY 2018.
1c. The Childhood Immunization Status— Combination 3 (CIS-3) measure continues to be a challenge for the Northeast and Northwest regions. Performance improved in the Northwest Region from 56.54 percent in RY 2016 to 60.00 percent in RY 2017. However, this still left a 4.30 percentage point gap to the MPL (64.30 percent) in RY 2017. In the Northeast Region, essentially no change was observed, with rates of 56.61 percent reported in RY 2016 and 56.54 percent in RY
Partnership HealthPlan of California Performance Evaluation Report: July 1, 2017–June 30, 2018 California Department of Health Care Services
Page X-80 Health Services Advisory Group, Inc.

RECOMMENDATIONS
2016–17 External Quality ReviewRecommendations Directed to Partnership
Self-Reported Actions Taken byPartnership during the Period of July 1,2017–June 30, 2018, that Address the External Quality Review Recommendations 2017. This represents a gap to the MPL in RY 2017 of 7.76 percentage points.
In response to the RY 2017 performance, the following actions were taken: ♦ As part of DHCS-mandated PDSA activities
in 2016–17, a select health center in the Northeast Region shared the scheduling and appointment workflow change the center had adopted with other Northern Region consortia members in a rural roundtable storyboard presentation in September 2017. This presentation and Q&A included representatives from most of the FQHCs located in the Northeast, Northwest, and Southwest regions. In this discussion, the health center’s Chief Medical Officer (CMO) outlined how optimization of the health center’s workflow improved provider capacity and visit efficiency within well-child visits to increase immunization opportunities amongst the 0-to-2-year-old member population. This resulted in an increase in immunization rates of 33 percent and adoption within the health center’s PCP sites. The CMO shared the significant challenges that the health center experienced with member disgruntlement with providers’ increased immunization promotion during these visits. As a result, concerns were shared by many about the impact this improvement strategy may have on member experience and engagement in preventive visits going forward.
♦ Given concerns raised in recent PDSA work in the Northeast region, Partnership focused on analyzing members who initiate the series but remain noncompliant as of the member’s second birthday. In this
Partnership HealthPlan of California Performance Evaluation Report: July 1, 2017–June 30, 2018 California Department of Health Care Services
Page X-81 Health Services Advisory Group, Inc.
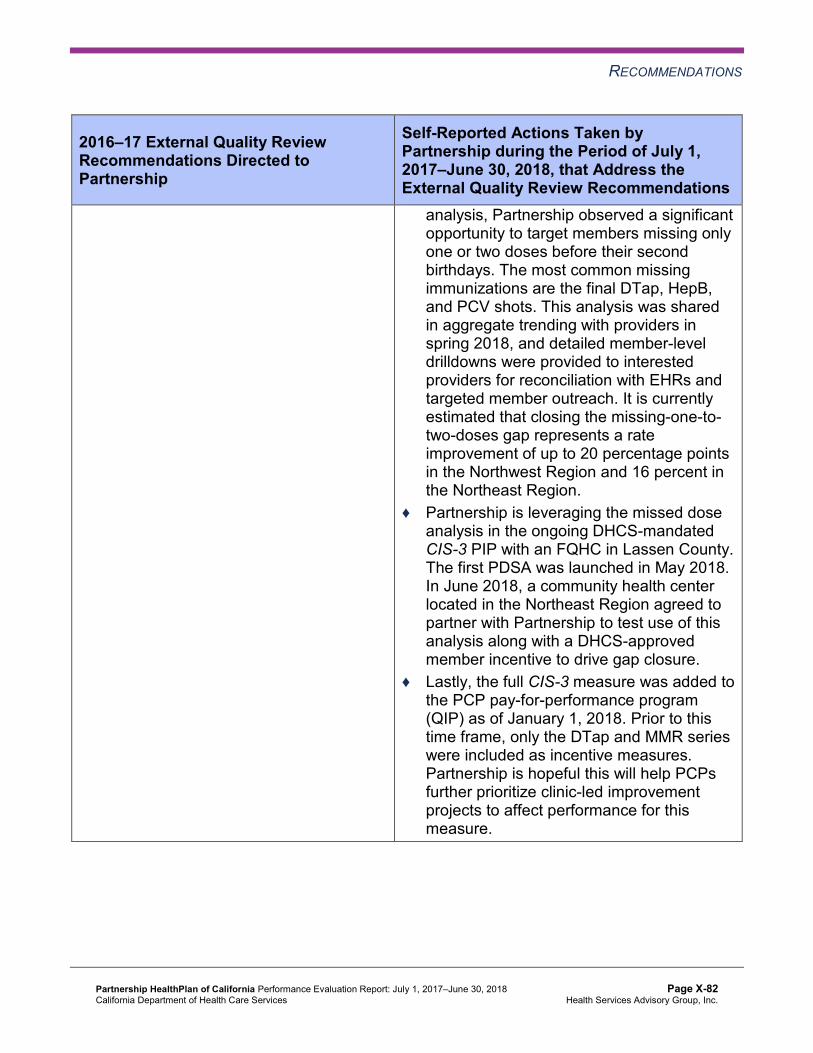
RECOMMENDATIONS
2016–17 External Quality ReviewRecommendations Directed to Partnership
Self-Reported Actions Taken byPartnership during the Period of July 1,2017–June 30, 2018, that Address the External Quality Review Recommendations
analysis, Partnership observed a significant opportunity to target members missing only one or two doses before their second birthdays. The most common missing immunizations are the final DTap, HepB, and PCV shots. This analysis was shared in aggregate trending with providers in spring 2018, and detailed member-level drilldowns were provided to interested providers for reconciliation with EHRs and targeted member outreach. It is currently estimated that closing the missing-one-to-two-doses gap represents a rate improvement of up to 20 percentage points in the Northwest Region and 16 percent in the Northeast Region.
♦ Partnership is leveraging the missed dose analysis in the ongoing DHCS-mandated CIS-3 PIP with an FQHC in Lassen County. The first PDSA was launched in May 2018. In June 2018, a community health center located in the Northeast Region agreed to partner with Partnership to test use of this analysis along with a DHCS-approved member incentive to drive gap closure.
♦ Lastly, the full CIS-3 measure was added to the PCP pay-for-performance program (QIP) as of January 1, 2018. Prior to this time frame, only the DTap and MMR series were included as incentive measures. Partnership is hopeful this will help PCPs further prioritize clinic-led improvement projects to affect performance for this measure.
Partnership HealthPlan of California Performance Evaluation Report: July 1, 2017–June 30, 2018 California Department of Health Care Services
Page X-82 Health Services Advisory Group, Inc.

RECOMMENDATIONS
2016–17 External Quality ReviewRecommendations Directed to Partnership
Self-Reported Actions Taken byPartnership during the Period of July 1,2017–June 30, 2018, that Address the External Quality Review Recommendations
2. To assist the MCP with developingstrategies to improve its performance to above the MPL for the Comprehensive Diabetes Care—Medical Attention for Nephropathy measure in the Northwest and Southwest regions, identify the causes for the rates for this measure being below the MPL in RY 2017 in these regions.
For the Comprehensive Diabetes Care— Medical Attention for Nephropathy measure, the most significant factor for the performance below the MPL in the Northwest and Southwest regions was the increase of the MPL benchmark from RY 2016 to RY 2017. The Northwest Region performance improved from 85.16 percent to 87.83 percent between RY 2016 and RY 2017; yet, this unexpectedly was below the MPL.
The following actions were taken to raise the performance: ♦ Since August 2017, in partnership with
health centers in the Northwest Region, Partnership has targeted member-level engagement and education for diabetic members in poor control.
♦ In partnership with a health center in the Northeast Region, the pre-planning visit process in the EHR was enhanced to integrate health guidelines and custom QUEST panel to bring visibility to various lab panels and tests needed by members diagnosed with diabetes.
♦ Another select provider agreed to partner with us to focus on nephropathy screening, having expressed interest in early fall of 2017; then, the Santa Rosa fires occurred in October 2017. The project start was delayed until February 2018, with a focus on standardizing and streamlining the nephropathy screening process.
Partnership HealthPlan of California Performance Evaluation Report: July 1, 2017–June 30, 2018 California Department of Health Care Services
Page X-83 Health Services Advisory Group, Inc.

RECOMMENDATIONS
2016–17 External Quality ReviewRecommendations Directed to Partnership
Self-Reported Actions Taken byPartnership during the Period of July 1,2017–June 30, 2018, that Address the External Quality Review Recommendations
3. Identify the causes for the rate for the Controlling High Blood Pressure measure declining significantly from RY 2016 to RY 2017 in the Northwest Region, and assess whether or not the interventions tested as part of the MCP’s Hypertension PIP could be adapted or adopted to help prevent the rate for the Controlling High Blood Pressure measure from continuing to decline in the Northwest Region.
Partnership’s PIP on the Controlling High Blood Pressure (CBP) measure involved a close partnership with select health clinics in Eureka. A total of three PDSA cycles were completed over 2016–17, with testing concluding as of June 30, 2017. The implemented interventions included the following primary goals: 1. Achieve a documented blood pressure
target within appropriate guidelines in a standard entry location within the electronic medical record for 100 percent of all hypertensive patients ages 18 or older.
2. Increase medical assistant competency in accurate blood pressure technique and assessment.
3. Increase and standardize registered nurse visits for hypertensive members who are newly diagnosed, undergoing a recent medication change, or demonstrating uncontrolled hypertension.
Overall, as a result of these interventions, the percentage of hypertensive members with controlled blood pressure steadily grew—from 50.94 percent on November 1, 2016, to 58.60 percent as of April 1, 2017. Over the last three months of the PIP (April 1, 2017, through June 30, 2017), steady state performance was achieved, with the compliance rate varying from 56.27 percent to 58.89 percent. In conclusion, the PIP team determined that focus on the measure, along with training and education of members and care team staff, proved to be effective in increasing compliance for this measure. The clinic leadership spread all interventions across its sites at the conclusion of this PIP in August 2017. The interventions were also
Partnership HealthPlan of California Performance Evaluation Report: July 1, 2017–June 30, 2018 California Department of Health Care Services
Page X-84 Health Services Advisory Group, Inc.

RECOMMENDATIONS
2016–17 External Quality ReviewRecommendations Directed to Partnership
Self-Reported Actions Taken byPartnership during the Period of July 1,2017–June 30, 2018, that Address the External Quality Review Recommendations summarized via storyboards and presented broadly amongst Partnership’s Northern Region clinic consortia members.
4. Identify the causes for the rates in all four regions declining significantly from RY 2016 to RY 2017 for the Use of Imaging Studies for Low Back Pain, and determine whether or not the MCP needs to develop strategies to prevent the rates from continuing to decline.
The decline in rates across all four regions for the Use of Imaging Studies for Low Back Pain measure was primarily due to significant changes in the NCQA specifications for this measure in RY 2017, which caused a greater than 20 percent increase in the eligible populations per region. Specifically, the change to the exclusion criteria and the addition of value sets used to identify the eligible population were the main drivers. This resulted in the performance in the Northeast and Northwest regions declining a percentile, while the Southeast and Southwest regions remained stable.
Based on the outcomes of RY 2018, we were excited to note that the Northeast and Northwest regions gained a percentile, while the Southeast and Southwest regions remained stable.
Partnership HealthPlan of California Performance Evaluation Report: July 1, 2017–June 30, 2018 California Department of Health Care Services
Page X-85 Health Services Advisory Group, Inc.
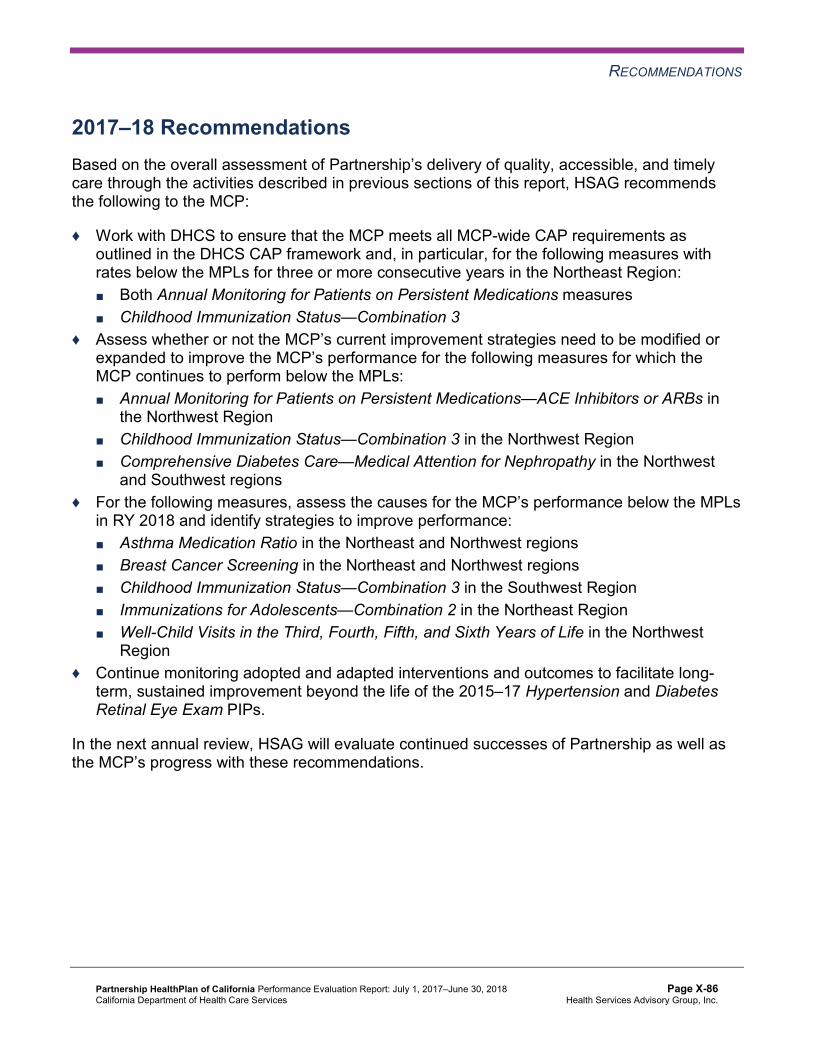
RECOMMENDATIONS
2017–18 Recommendations Based on the overall assessment of Partnership’s delivery of quality, accessible, and timely care through the activities described in previous sections of this report, HSAG recommends the following to the MCP:
♦ Work with DHCS to ensure that the MCP meets all MCP-wide CAP requirements as outlined in the DHCS CAP framework and, in particular, for the following measures with rates below the MPLs for three or more consecutive years in the Northeast Region: ■ Both Annual Monitoring for Patients on Persistent Medications measures ■ Childhood Immunization Status—Combination 3
♦ Assess whether or not the MCP’s current improvement strategies need to be modified or expanded to improve the MCP’s performance for the following measures for which the MCP continues to perform below the MPLs: ■ Annual Monitoring for Patients on Persistent Medications—ACE Inhibitors or ARBs in
the Northwest Region ■ Childhood Immunization Status—Combination 3 in the Northwest Region ■ Comprehensive Diabetes Care—Medical Attention for Nephropathy in the Northwest
and Southwest regions ♦ For the following measures, assess the causes for the MCP’s performance below the MPLs
in RY 2018 and identify strategies to improve performance: ■ Asthma Medication Ratio in the Northeast and Northwest regions ■ Breast Cancer Screening in the Northeast and Northwest regions ■ Childhood Immunization Status—Combination 3 in the Southwest Region ■ Immunizations for Adolescents—Combination 2 in the Northeast Region ■ Well-Child Visits in the Third, Fourth, Fifth, and Sixth Years of Life in the Northwest
Region ♦ Continue monitoring adopted and adapted interventions and outcomes to facilitate long-
term, sustained improvement beyond the life of the 2015–17 Hypertension and Diabetes Retinal Eye Exam PIPs.
In the next annual review, HSAG will evaluate continued successes of Partnership as well as the MCP’s progress with these recommendations.
Partnership HealthPlan of California Performance Evaluation Report: July 1, 2017–June 30, 2018 California Department of Health Care Services
Page X-86 Health Services Advisory Group, Inc.

Medi-Cal Managed CareExternal Quality Review Technical Report
Appendix Y: Performance Evaluation Report
San Francisco Health Plan July 1, 2017–June 30, 2018

Medi-Cal Managed Care External Quality Review Technical ReportAppendix Y: Performance Evaluation ReportSan Francisco Health Plan July 1, 2017–June 30, 2018
Table of Contents
1. Introduction.............................................................................................................Y-1 Medi-Cal Managed Care Health Plan Overview .......................................................Y-1
2. Managed Care Health Plan Compliance ...............................................................Y-2Compliance Reviews Conducted..............................................................................Y-2 Strengths—Compliance Reviews .............................................................................Y-2 Opportunities for Improvement—Compliance Reviews ............................................Y-3
3. Managed Care Health Plan Performance Measures ............................................Y-4Performance Measure Validation Results ................................................................Y-4 Performance Measure Results and Findings............................................................Y-4
Preventive Screening and Children’s Health .........................................................Y-5 Preventive Screening and Women’s Health ..........................................................Y-9 Care for Chronic Conditions ................................................................................Y-11 Appropriate Treatment and Utilization.................................................................Y-13 Performance Measure Findings—All Domains....................................................Y-16
Seniors and Persons with Disabilities Performance Measure Results....................Y-18 Seniors and Persons with Disabilities Findings ...................................................Y-22
Strengths—Performance Measures .......................................................................Y-23 Opportunities for Improvement—Performance Measures ......................................Y-24
4. Performance Improvement Projects ...................................................................Y-25Performance Improvement Project Overview .........................................................Y-25 Performance Improvement Project Results and Findings.......................................Y-26
2015–17 DHCS-Priority Performance Improvement Project ...............................Y-27 2015–17 MCP-Specific Performance Improvement Project ................................Y-28 2017–19 Disparity Performance Improvement Project ........................................Y-30 2017–19 DHCS-Priority Performance Improvement Project ...............................Y-31
Strengths—Performance Improvement Projects ....................................................Y-32 Opportunities for Improvement—Performance Improvement Projects ...................Y-32
5. Recommendations................................................................................................Y-33 Follow-Up on Prior Year Recommendations ..........................................................Y-33 2017–18 Recommendations...................................................................................Y-34
San Francisco Health Plan Performance Evaluation Report: July 1, 2017–June 30, 2018 California Department of Health Care Services
Page Y-i Health Services Advisory Group, Inc.

TABLE OF CONTENTS
Table of Tables
Table 2.1—DHCS A&I Medical Audit of SFHP Audit Review Period: March 1, 2016, through February 28, 2017 ..........................................................................Y-2
Table 3.1—Preventive Screening and Children’s Health Domain Multi-Year Performance Measure Results SFHP—San Francisco County.........................................Y-6
Table 3.2—Preventive Screening and Children’s Health Domain RY 2018 (MY 2017) Performance Measure Findings SFHP—San Francisco County.................Y-8
Table 3.3—Preventive Screening and Women’s Health Domain Multi-Year Performance Measure Results SFHP—San Francisco County.........................................Y-9
Table 3.4—Preventive Screening and Women’s Health Domain RY 2018 (MY 2017) Performance Measure Findings SFHP—San Francisco County...............Y-10
Table 3.5—Care for Chronic Conditions Domain Multi-Year Performance Measure Results SFHP—San Francisco County......................................................Y-11
Table 3.6—Care for Chronic Conditions Domain RY 2018 (MY 2017) Performance Measure Findings SFHP—San Francisco County ....................................Y-12
Table 3.7—Appropriate Treatment and Utilization Domain Multi-Year Performance Measure Results SFHP—San Francisco County.......................................Y-14
Table 3.8—Appropriate Treatment and Utilization Domain RY 2018 (MY 2017) Performance Measure Findings SFHP—San Francisco County...............Y-15
Table 3.9—RY 2018 (MY 2017) Performance Measure Findings for All Domains SFHP—San Francisco County ..................................................................Y-16
Table 3.10—Multi-Year SPD Performance Measure Trend Table SFHP— San Francisco County................................................................................Y-18
Table 3.11—Multi-Year Non-SPD Performance Measure Trend Table SFHP— San Francisco County................................................................................Y-20
Table 3.12—RY 2018 (MY 2017) Performance Measure Comparison and Results for Measures Stratified by the SPD and Non-SPD Populations SFHP— San Francisco County................................................................................Y-21
Table 4.1—SFHP Postpartum Care PIP SMART Aim Measure Results ......................Y-27 Table 4.2—SFHP Postpartum Care PIP Intervention Testing Results .........................Y-27 Table 4.3—SFHP Patient Experience PIP SMART Aim Measure Results ...................Y-29 Table 4.4—SFHP Patient Experience PIP Intervention Testing Results ......................Y-29 Table 4.5—SFHP Postpartum Care Disparity PIP SMART Aim Measure ....................Y-30 Table 4.6—SFHP Immunizations for Adolescents—Combination 2 PIP SMART Aim
Measure.....................................................................................................Y-31 Table 5.1—SFHP’s Self-Reported Follow-Up on External Quality Review
Recommendations from the July 1, 2016, through June 30, 2017, MCP-Specific Evaluation Report................................................................Y-33
San Francisco Health Plan Performance Evaluation Report: July 1, 2017–June 30, 2018 California Department of Health Care Services
Page Y-ii Health Services Advisory Group, Inc.

Medi-Cal Managed Care External Quality Review Technical ReportAppendix Y: Performance Evaluation ReportSan Francisco Health Plan July 1, 2017–June 30, 2018
1. Introduction
The California Department of Health Care Services (DHCS) contracted with Health Services Advisory Group, Inc. (HSAG), an external quality review organization (EQRO), to prepare the federally required Medi-Cal Managed Care External Quality Review Technical Report, July 1, 2017–June 30, 2018. The technical report provides an overview of the objectives and methodology for conducting the external quality review (EQR) activities, including requirements related to each activity. Additionally, the technical report provides aggregated results and recommendations for DHCS for each activity.
This appendix is specific to DHCS’ contracted Medi-Cal managed care health plan (MCP), San Francisco Health Plan (“SFHP” or “the MCP”). The purpose of this appendix is to provide MCP-specific results of each activity and an assessment of the MCP’s strengths and opportunities for improvement with respect to the quality and timeliness of and access to health care services furnished to Medi-Cal Managed Care (MCMC) beneficiaries (referred to as “beneficiaries” in this report). The review period for this MCP-specific evaluation report is July 1, 2017, through June 30, 2018. HSAG will report on activities that take place beyond the review period in SFHP’s 2018–19 MCP-specific evaluation report. This MCP-specific evaluation report references activities and methodologies described in detail by HSAG in the technical report section.
The aggregate EQR technical report and all MCP- and specialty health plan (SHP)-specific performance evaluation reports reflect HSAG’s external, independent assessment of the quality and timeliness of, and access to, care that MCPs and SHPs are providing to beneficiaries.
Medi-Cal Managed Care Health Plan Overview SFHP is a full-scope MCP delivering services to beneficiaries as a “Local Initiative” (LI) MCP under the Two-Plan Model (TPM). Beneficiaries may enroll in SFHP, the LI MCP; or in Anthem Blue Cross Partnership Plan, the alternative commercial plan (CP).
SFHP became operational in San Francisco County to provide MCMC services effective January 1997. As of June 30, 2018, SFHP had 128,957 beneficiaries in San Francisco County.1 This represents 87 percent of the beneficiaries enrolled in San Francisco County.
1 Medi-Cal Managed Care Enrollment Report—June 2018. Available at: http://www.dhcs.ca.gov/dataandstats/reports/Pages/MMCDMonthlyEnrollment.aspx. Accessed on: Jul 24, 2018.
San Francisco Health Plan Performance Evaluation Report: July 1, 2017–June 30, 2018 California Department of Health Care Services
Page Y-1 Health Services Advisory Group, Inc.
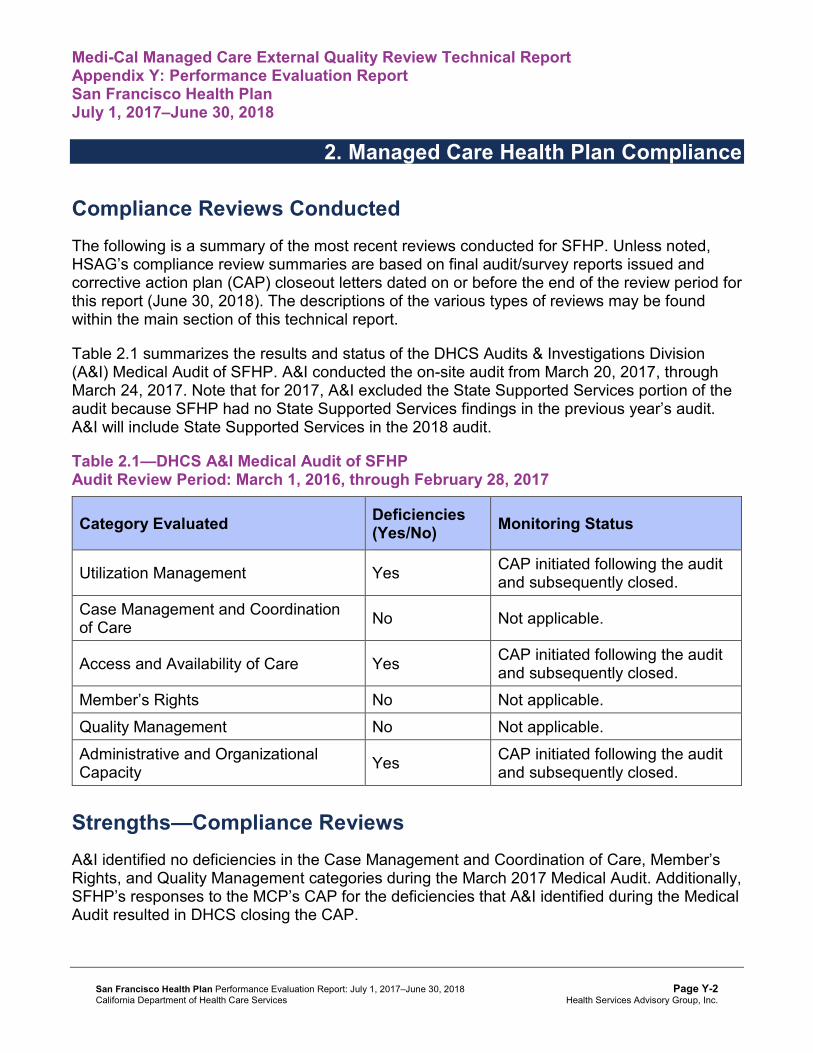
Medi-Cal Managed Care External Quality Review Technical ReportAppendix Y: Performance Evaluation ReportSan Francisco Health Plan July 1, 2017–June 30, 2018
2. Managed Care Health Plan Compliance
Compliance Reviews Conducted The following is a summary of the most recent reviews conducted for SFHP. Unless noted, HSAG’s compliance review summaries are based on final audit/survey reports issued and corrective action plan (CAP) closeout letters dated on or before the end of the review period for this report (June 30, 2018). The descriptions of the various types of reviews may be found within the main section of this technical report.
Table 2.1 summarizes the results and status of the DHCS Audits & Investigations Division (A&I) Medical Audit of SFHP. A&I conducted the on-site audit from March 20, 2017, through March 24, 2017. Note that for 2017, A&I excluded the State Supported Services portion of the audit because SFHP had no State Supported Services findings in the previous year’s audit. A&I will include State Supported Services in the 2018 audit.
Table 2.1—DHCS A&I Medical Audit of SFHP Audit Review Period: March 1, 2016, through February 28, 2017
Category Evaluated Deficiencies (Yes/No) Monitoring Status
Utilization Management Yes CAP initiated following the audit and subsequently closed.
Case Management and Coordination of Care No Not applicable.
Access and Availability of Care Yes CAP initiated following the audit and subsequently closed.
Member’s Rights No Not applicable. Quality Management No Not applicable. Administrative and Organizational Capacity Yes CAP initiated following the audit
and subsequently closed.
Strengths—Compliance Reviews A&I identified no deficiencies in the Case Management and Coordination of Care, Member’s Rights, and Quality Management categories during the March 2017 Medical Audit. Additionally, SFHP’s responses to the MCP’s CAP for the deficiencies that A&I identified during the Medical Audit resulted in DHCS closing the CAP.
San Francisco Health Plan Performance Evaluation Report: July 1, 2017–June 30, 2018 California Department of Health Care Services
Page Y-2 Health Services Advisory Group, Inc.

MANAGED CARE HEALTH PLAN COMPLIANCE
Opportunities for Improvement—Compliance Reviews SFHP has no outstanding deficiencies from the March 2017 A&I Medical Audit; therefore, HSAG has no recommendations for the MCP in the area of compliance reviews.
San Francisco Health Plan Performance Evaluation Report: July 1, 2017–June 30, 2018 California Department of Health Care Services
Page Y-3 Health Services Advisory Group, Inc.

Medi-Cal Managed Care External Quality Review Technical ReportAppendix Y: Performance Evaluation ReportSan Francisco Health Plan July 1, 2017–June 30, 2018
3. Managed Care Health Plan Performance Measures
Performance Measure Validation Results The HEDIS®2 2018 Compliance Audit Final Report of Findings for San Francisco Health Plan contains the detailed findings and recommendations from HSAG’s NCQA HEDIS Compliance Audit™.3 HSAG auditors determined that SFHP followed the appropriate specifications to produce valid rates, and identified no issues of concern.
Performance Measure Results and Findings After validating the MCP’s performance measure rates, HSAG assessed the results. See Table 3.1 through Table 3.9 for SFHP’s performance measure results for reporting years (RYs) 2015 through 2018 and performance measure findings for RY 2018. The RY is the year in which the MCP reported the rates. The RY rates reflect measurement year (MY) data from the previous calendar year. Note that data may not be available for all four years.
Note the following regarding Table 3.1 through Table 3.9:
♦ To allow HSAG to provide meaningful assessment of MCP performance and actionable recommendations, HSAG, in collaboration with DHCS, organized the measures into domains based on the health care areas each measure affects. Table 3.1 through Table 3.8 present the performance measure results and findings by domain, and Table 3.9 presents the RY 2018 performance measure findings for the domains combined.
♦ To assess performance for each MCP reporting unit, HSAG compares the rates to national benchmarks. Rates indicating performance above the high performance levels (HPLs) are shaded in gray, and rates indicating performance below the minimum performance levels (MPLs) are bolded. ■ For measures with rates below the MPLs, DHCS requires MCPs to submit to DHCS
improvement plans (IPs) to address the rates below the MPLs (unless MCPs are reporting the rates for the first time).
■ For MCPs that meet DHCS’ Quality of Care CAP thresholds, DHCS issues a CAP; if an MCP’s performance is such that it may trigger a CAP in the following year, DHCS issues an advance warning letter.
2 Healthcare Effectiveness Data and Information Set (HEDIS®) is a registered trademark of the National Committee for Quality Assurance (NCQA).
3 NCQA HEDIS Compliance AuditTM is a trademark of NCQA.
San Francisco Health Plan Performance Evaluation Report: July 1, 2017–June 30, 2018 California Department of Health Care Services
Page Y-4 Health Services Advisory Group, Inc.

MANAGED CARE HEALTH PLAN PERFORMANCE MEASURES
■ IPs and CAPs consist of submission of Plan-Do-Study-Act (PDSA) Cycle Worksheets, Quality Improvement (QI) Summaries, or completion of Performance Improvement Projects (PIPs)—as determined by DHCS.
♦ For RYs 2016, 2017, and 2018, the HPLs and MPLs represent the NCQA Quality Compass®4 Medicaid health maintenance organization (HMO) 90th and 25th percentiles, respectively.
♦ For RY 2015, the HPLs and MPLs represent the NCQA HEDIS Audit Means, Percentiles, and Ratios 90th and 25th percentiles, respectively. For the Comprehensive Diabetes Care—HbA1c Poor Control (>9.0 Percent) measure, for which a lower rate indicates more favorable performance, the HPL and MPL are based on the 10th and 75th percentiles, respectively.
♦ HSAG includes the specific HPL and MPL values for RY 2018 in Section 6 of the Medi-Cal Managed Care External Quality Review Technical Report, July 1, 2017–June 30, 2018 (“Managed Care Health Plan Performance Measures”).
Preventive Screening and Children’s Health
Table 3.1 presents the four-year trending information for the performance measures within the Preventive Screening and Children’s Health domain.
Note the following regarding Table 3.1:
♦ Although HSAG includes information on the MCP’s performance related to the four Children and Adolescents’ Access to Primary Care measures, DHCS did not hold MCPs accountable to meet the MPLs for these measures for RYs 2015 through 2018 (i.e., DHCS did not require MCPs to submit IPs if rates for the measures were below the MPLs). DHCS made this decision due to the small range of variation between the HPL and MPL thresholds for each measure.
♦ Any comparison of RY 2018 performance to RY 2017 or to benchmarks related to the Immunizations for Adolescents—Combination 2 measure should be exercised with caution given the changes that NCQA made to the specification for this measure for RY 2018. NCQA released guidance that recommended a break in trending for this measure; however, DHCS determined to continue trending because the specification change should result in higher rates.
4 Quality Compass® is a registered trademark of NCQA.
San Francisco Health Plan Performance Evaluation Report: July 1, 2017–June 30, 2018 California Department of Health Care Services
Page Y-5 Health Services Advisory Group, Inc.
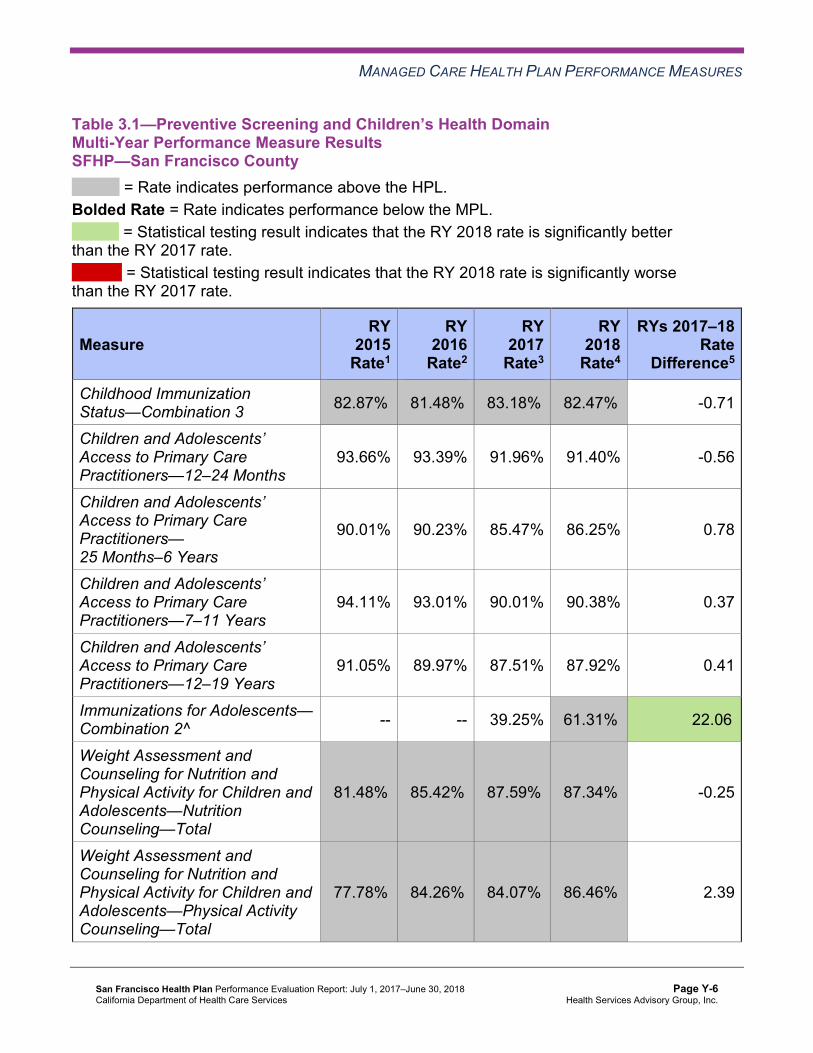
MANAGED CARE HEALTH PLAN PERFORMANCE MEASURES
Table 3.1—Preventive Screening and Children’s Health DomainMulti-Year Performance Measure Results SFHP—San Francisco County
H = Rate indicates performance above the HPL. Bolded Rate = Rate indicates performance below the MPL.
B = Statistical testing result indicates that the RY 2018 rate is significantly better than the RY 2017 rate.
W = Statistical testing result indicates that the RY 2018 rate is significantly worse than the RY 2017 rate.
Measure RY
2015 Rate1
RY 2016
Rate2
RY 2017
Rate3
RY 2018
Rate4
RYs 2017–18 Rate
Difference5
Childhood Immunization Status—Combination 3 82.87%H 81.48%H 83.18%H 82.47%H -0.71
Children and Adolescents’ Access to Primary Care Practitioners—12–24 Months
93.66% 93.39% 91.96% 91.40% -0.56
Children and Adolescents’ Access to Primary Care Practitioners— 25 Months–6 Years
90.01% 90.23% 85.47% 86.25% 0.78
Children and Adolescents’ Access to Primary Care Practitioners—7–11 Years
94.11% 93.01% 90.01% 90.38% 0.37
Children and Adolescents’ Access to Primary Care Practitioners—12–19 Years
91.05% 89.97% 87.51% 87.92% 0.41
Immunizations for Adolescents— Combination 2^ -- -- 39.25% 61.31%H 22.06B
Weight Assessment and Counseling for Nutrition and Physical Activity for Children and Adolescents—Nutrition Counseling—Total
81.48%H 85.42%H 87.59%H 87.34%H -0.25
Weight Assessment and Counseling for Nutrition and Physical Activity for Children and Adolescents—Physical Activity Counseling—Total
77.78%H 84.26%H 84.07%H 86.46%H 2.39
San Francisco Health Plan Performance Evaluation Report: July 1, 2017–June 30, 2018 California Department of Health Care Services
Page Y-6 Health Services Advisory Group, Inc.

MANAGED CARE HEALTH PLAN PERFORMANCE MEASURES
Measure RY
2015 Rate1
RY 2016
Rate2
RY 2017
Rate3
RY 2018
Rate4
RYs 2017–18 Rate
Difference5
Well-Child Visits in the Third, Fourth, Fifth, and Sixth Years of Life
85.42%H 82.18% 82.18% 82.40% 0.22
1 RY 2015 rates reflect MY data from January 1, 2014, through December 31, 2014. 2 RY 2016 rates reflect MY data from January 1, 2015, through December 31, 2015. 3 RY 2017 rates reflect MY data from January 1, 2016, through December 31, 2016. 4 RY 2018 rates reflect MY data from January 1, 2017, through December 31, 2017. 5 Performance comparisons are based on the Chi-square test of statistical significance, with a p value of <0.05. ^ Caution should be exercised when assessing MCP performance for this measure given the changes that NCQA made to the specification for this measure for RY 2018. -- Indicates that the rate is not available.
Table 3.2 presents findings for the RY 2018 performance measures within the Preventive Screening and Children’s Health domain.
Note the following regarding Table 3.2:
♦ DHCS did not hold MCPs accountable to meet MPLs for all four Children and Adolescents’ Access to Primary Care measures within this domain; therefore, HSAG did not include these measures in its assessment of the MCP’s performance related to HPLs and MPLs.
♦ The Immunizations for Adolescents—Combination 2 measure was a first-year measure in RY 2017, and DHCS established no MPL for this measure for RY 2017 because no comparable benchmark existed; therefore, HSAG did not include this measure in the denominators for calculating the percentage of measures with rates that moved to above or below the MPLs in RY 2018.
San Francisco Health Plan Performance Evaluation Report: July 1, 2017–June 30, 2018 California Department of Health Care Services
Page Y-7 Health Services Advisory Group, Inc.

MANAGED CARE HEALTH PLAN PERFORMANCE MEASURES
Table 3.2—Preventive Screening and Children’s Health DomainRY 2018 (MY 2017) Performance Measure Findings SFHP—San Francisco County
Criteria Number of Measures
MeetingCriteria
Total Number of Measures
Percentage of Measures
MeetingCriteria
RY 2018 Rates Above HPLs 4 5 80.00% Rates Above HPLs for the Last Three or More Consecutive Years 3 4 75.00%
RY 2018 Rates Significantly Better than RY 2017 Rates* 1 5 20.00%
Rates that Moved from Below MPLs in RY 2017 to Above MPLs in RY 2018 0 0 N/A
RY 2018 Rates Below MPLs 0 5 0.00% Rates Below MPLs for the Last Three or More Consecutive Years 0 4 0.00%
RY 2018 Rates Significantly Worse than RY 2017 Rates* 0 5 0.00%
Rates that Moved from Above MPLs in RY 2017 to Below MPLs in RY 2018 0 4 0.00%
* Performance comparisons are based on the Chi-square test of statistical significance, with a p value of <0.05. N/A = No rates above or below the MPLs from the previous year exist to include in the denominator for calculating whether or not rates moved to above or below MPLs in the most recent year.
San Francisco Health Plan Performance Evaluation Report: July 1, 2017–June 30, 2018 California Department of Health Care Services
Page Y-8 Health Services Advisory Group, Inc.
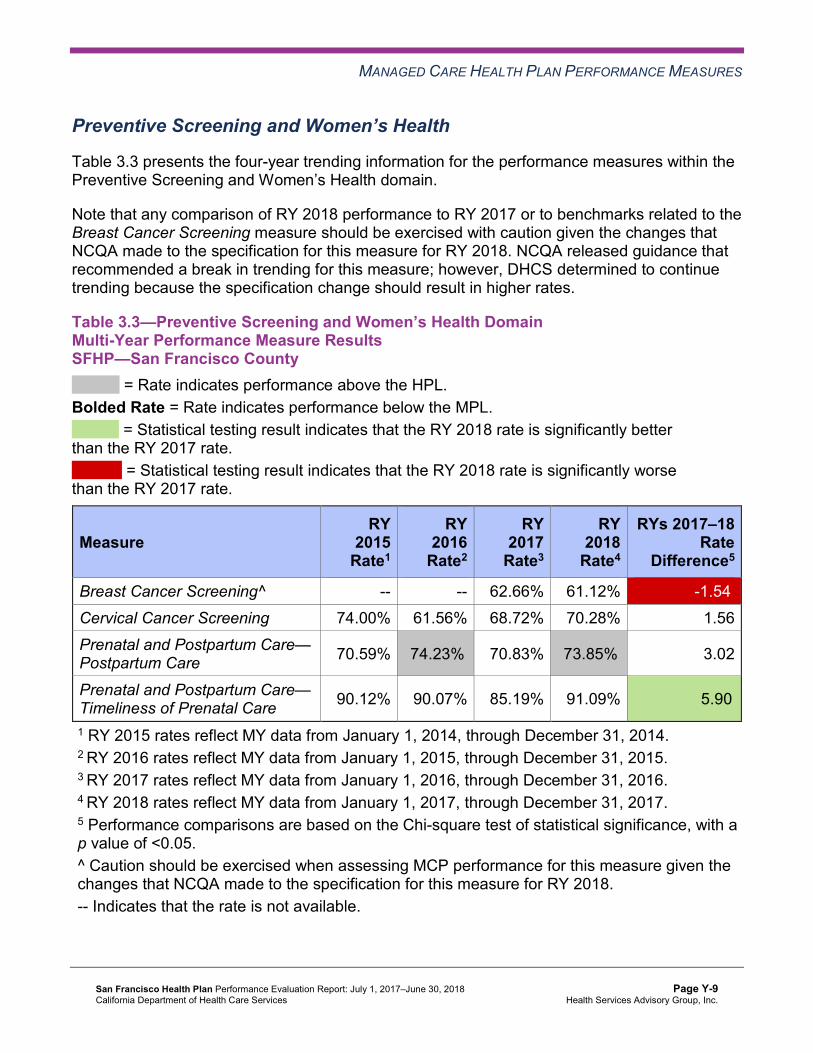
MANAGED CARE HEALTH PLAN PERFORMANCE MEASURES
Preventive Screening and Women’s Health
Table 3.3 presents the four-year trending information for the performance measures within the Preventive Screening and Women’s Health domain.
Note that any comparison of RY 2018 performance to RY 2017 or to benchmarks related to the Breast Cancer Screening measure should be exercised with caution given the changes that NCQA made to the specification for this measure for RY 2018. NCQA released guidance that recommended a break in trending for this measure; however, DHCS determined to continue trending because the specification change should result in higher rates.
Table 3.3—Preventive Screening and Women’s Health DomainMulti-Year Performance Measure Results SFHP—San Francisco County
H = Rate indicates performance above the HPL. Bolded Rate = Rate indicates performance below the MPL.
B = Statistical testing result indicates that the RY 2018 rate is significantly better than the RY 2017 rate.
W = Statistical testing result indicates that the RY 2018 rate is significantly worse than the RY 2017 rate.
Measure RY
2015 Rate1
RY 2016
Rate2
RY 2017
Rate3
RY 2018
Rate4
RYs 2017–18 Rate
Difference5
Breast Cancer Screening^ -- -- 62.66% 61.12% -1.54W
Cervical Cancer Screening 74.00% 61.56% 68.72% 70.28% 1.56 Prenatal and Postpartum Care— Postpartum Care 70.59% 74.23%H 70.83% 73.85%H 3.02
Prenatal and Postpartum Care— Timeliness of Prenatal Care 90.12% 90.07% 85.19% 91.09% 5.90B
1 RY 2015 rates reflect MY data from January 1, 2014, through December 31, 2014. 2 RY 2016 rates reflect MY data from January 1, 2015, through December 31, 2015. 3 RY 2017 rates reflect MY data from January 1, 2016, through December 31, 2016. 4 RY 2018 rates reflect MY data from January 1, 2017, through December 31, 2017. 5 Performance comparisons are based on the Chi-square test of statistical significance, with a p value of <0.05. ^ Caution should be exercised when assessing MCP performance for this measure given the changes that NCQA made to the specification for this measure for RY 2018. -- Indicates that the rate is not available.
San Francisco Health Plan Performance Evaluation Report: July 1, 2017–June 30, 2018 California Department of Health Care Services
Page Y-9 Health Services Advisory Group, Inc.
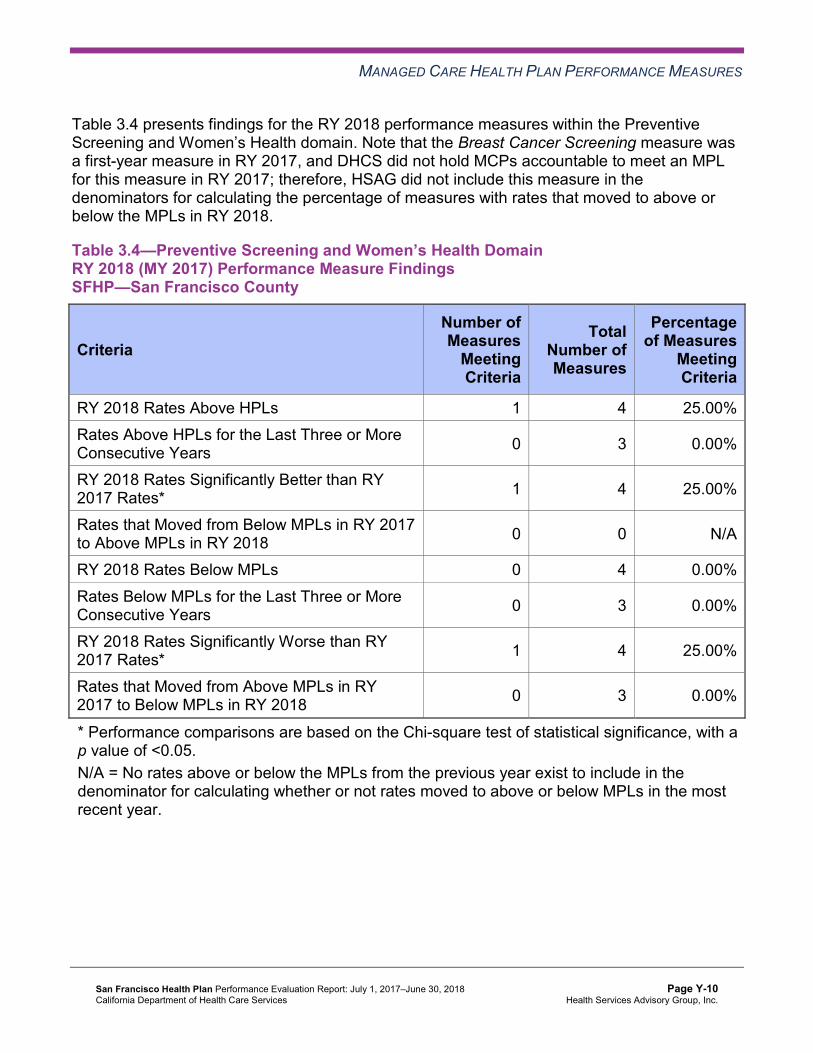
MANAGED CARE HEALTH PLAN PERFORMANCE MEASURES
Table 3.4 presents findings for the RY 2018 performance measures within the Preventive Screening and Women’s Health domain. Note that the Breast Cancer Screening measure was a first-year measure in RY 2017, and DHCS did not hold MCPs accountable to meet an MPL for this measure in RY 2017; therefore, HSAG did not include this measure in the denominators for calculating the percentage of measures with rates that moved to above or below the MPLs in RY 2018.
Table 3.4—Preventive Screening and Women’s Health DomainRY 2018 (MY 2017) Performance Measure Findings SFHP—San Francisco County
Criteria Number of Measures
MeetingCriteria
Total Number of Measures
Percentage of Measures
MeetingCriteria
RY 2018 Rates Above HPLs 1 4 25.00% Rates Above HPLs for the Last Three or More Consecutive Years 0 3 0.00%
RY 2018 Rates Significantly Better than RY 2017 Rates* 1 4 25.00%
Rates that Moved from Below MPLs in RY 2017 to Above MPLs in RY 2018 0 0 N/A
RY 2018 Rates Below MPLs 0 4 0.00% Rates Below MPLs for the Last Three or More Consecutive Years 0 3 0.00%
RY 2018 Rates Significantly Worse than RY 2017 Rates* 1 4 25.00%
Rates that Moved from Above MPLs in RY 2017 to Below MPLs in RY 2018 0 3 0.00%
* Performance comparisons are based on the Chi-square test of statistical significance, with a p value of <0.05. N/A = No rates above or below the MPLs from the previous year exist to include in the denominator for calculating whether or not rates moved to above or below MPLs in the most recent year.
San Francisco Health Plan Performance Evaluation Report: July 1, 2017–June 30, 2018 California Department of Health Care Services
Page Y-10 Health Services Advisory Group, Inc.

MANAGED CARE HEALTH PLAN PERFORMANCE MEASURES
Care for Chronic Conditions
Table 3.5 presents the four-year trending information for the performance measures within the Care for Chronic Conditions domain. Note that the Asthma Medication Ratio measure was a first-year measure in RY 2017, and DHCS did not hold MCPs accountable to meet an MPL for this measure in RY 2017; therefore, HSAG did not include this measure in the denominators for calculating the percentage of measures with rates that moved to above or below the MPLs in RY 2018.
Table 3.5—Care for Chronic Conditions Domain Multi-Year Performance Measure Results SFHP—San Francisco County
H = Rate indicates performance above the HPL. Bolded Rate = Rate indicates performance below the MPL.
B = Statistical testing result indicates that the RY 2018 rate is significantly better than the RY 2017 rate.
W = Statistical testing result indicates that the RY 2018 rate is significantly worse than the RY 2017 rate.
Measure RY
2015 Rate1
RY 2016
Rate2
RY 2017
Rate3
RY 2018
Rate4
RYs 2017–18 Rate
Difference5
Annual Monitoring for Patients on Persistent Medications— ACE Inhibitors or ARBs
86.47% 87.75% 87.85% 87.37% -0.48
Annual Monitoring for Patients on Persistent Medications— Diuretics
86.94% 87.00% 86.85% 86.88% 0.03
Asthma Medication Ratio -- -- 80.02%H 79.19%H -0.83
Comprehensive Diabetes Care— Blood Pressure Control (<140/90 mm Hg)
75.41%H 71.30% 74.71% 72.14% -2.57
Comprehensive Diabetes Care— Eye Exam (Retinal) Performed 68.91%H 74.07%H 70.53%H 76.82%H 6.29B
Comprehensive Diabetes Care— HbA1c Control (<8.0 Percent) 62.41%H 68.29%H 63.11%H 64.84%H 1.73
Comprehensive Diabetes Care— HbA1c Poor Control (>9.0 Percent)*
25.06%H 18.98%H 26.68%H 30.99% 4.31
San Francisco Health Plan Performance Evaluation Report: July 1, 2017–June 30, 2018 California Department of Health Care Services
Page Y-11 Health Services Advisory Group, Inc.
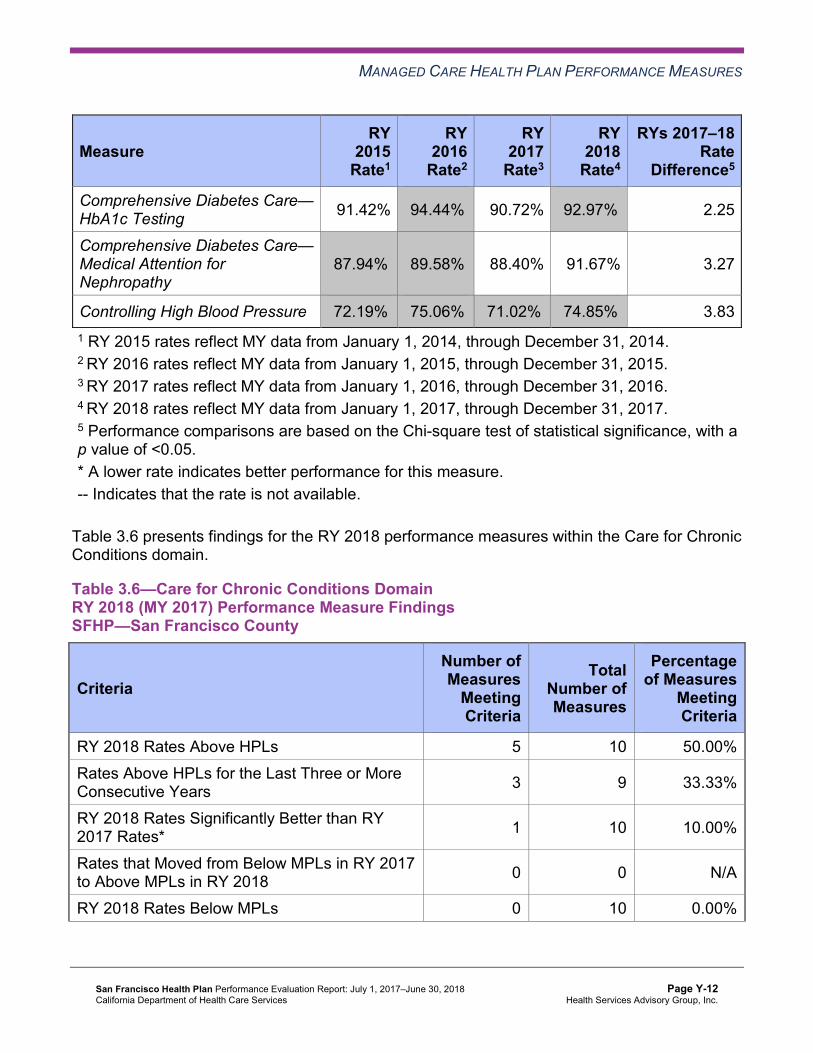
MANAGED CARE HEALTH PLAN PERFORMANCE MEASURES
Measure RY
2015 Rate1
RY 2016
Rate2
RY 2017
Rate3
RY 2018
Rate4
RYs 2017–18 Rate
Difference5
Comprehensive Diabetes Care— HbA1c Testing 91.42% 94.44%H 90.72% 92.97%H 2.25
Comprehensive Diabetes Care— Medical Attention for Nephropathy
87.94%H 89.58%H 88.40% 91.67% 3.27
Controlling High Blood Pressure 72.19%H 75.06%H 71.02%H 74.85%H 3.83 1 RY 2015 rates reflect MY data from January 1, 2014, through December 31, 2014. 2 RY 2016 rates reflect MY data from January 1, 2015, through December 31, 2015. 3 RY 2017 rates reflect MY data from January 1, 2016, through December 31, 2016. 4 RY 2018 rates reflect MY data from January 1, 2017, through December 31, 2017. 5 Performance comparisons are based on the Chi-square test of statistical significance, with a p value of <0.05. * A lower rate indicates better performance for this measure. -- Indicates that the rate is not available.
Table 3.6 presents findings for the RY 2018 performance measures within the Care for Chronic Conditions domain.
Table 3.6—Care for Chronic Conditions Domain RY 2018 (MY 2017) Performance Measure Findings SFHP—San Francisco County
Criteria Number of Measures
MeetingCriteria
Total Number of Measures
Percentage of Measures
MeetingCriteria
RY 2018 Rates Above HPLs 5 10 50.00% Rates Above HPLs for the Last Three or More Consecutive Years 3 9 33.33%
RY 2018 Rates Significantly Better than RY 2017 Rates* 1 10 10.00%
Rates that Moved from Below MPLs in RY 2017 to Above MPLs in RY 2018 0 0 N/A
RY 2018 Rates Below MPLs 0 10 0.00%
San Francisco Health Plan Performance Evaluation Report: July 1, 2017–June 30, 2018 California Department of Health Care Services
Page Y-12 Health Services Advisory Group, Inc.

MANAGED CARE HEALTH PLAN PERFORMANCE MEASURES
Criteria Number of Measures
MeetingCriteria
Total Number of Measures
Percentage of Measures
MeetingCriteria
Rates Below MPLs for the Last Three or More Consecutive Years 0 9 0.00%
RY 2018 Rates Significantly Worse than RY 2017 Rates* 0 10 0.00%
Rates that Moved from Above MPLs in RY 2017 to Below MPLs in RY 2018 0 9 0.00%
* Performance comparisons are based on the Chi-square test of statistical significance, with a p value of <0.05. N/A = No rates above or below the MPLs from the previous year exist to include in the denominator for calculating whether or not rates moved to above or below MPLs in the most recent year.
Appropriate Treatment and Utilization
Table 3.7 presents the four-year trending information for the performance measures within the Appropriate Treatment and Utilization domain.
Note the following regarding Table 3.7:
♦ The All-Cause Readmissions measure is a non-HEDIS measure originally developed for DHCS’ All-Cause Readmissions collaborative quality improvement project (QIP); therefore, DHCS does not establish an HPL or MPL for this measure. For the All-Cause Readmissions measure, a lower rate indicates better performance (i.e., fewer readmissions).
♦ The two Ambulatory Care measures are utilization measures, which measure the volume of services used. DHCS does not hold MCPs accountable to meet MPLs for utilization measures, and HSAG does not compare performance for these measures against HPLs and MPLs. Additionally, because high and low rates do not necessarily indicate better or worse performance, HSAG did not compare performance for these measures across years.
♦ DHCS established no HPL or MPL for the two Depression Screening and Follow-Up for Adolescents and Adults measures for RY 2018 because no comparable benchmarks exist. Additionally, although MCPs reported the two Depression Screening and Follow-Up for Adolescents and Adults measures for RY 2018, HSAG does not present the performance measure results for these measures in this report because the reported rates do not accurately represent services being provided. This is due to the Depression Screening and Follow-Up for Adolescents and Adults measures being new HEDIS measures for RY 2018, NCQA requiring MCPs to submit rates for these measures using the new Electronic Clinical Data Systems (ECDS) reporting methodology, and inconsistent data reporting processes
San Francisco Health Plan Performance Evaluation Report: July 1, 2017–June 30, 2018 California Department of Health Care Services
Page Y-13 Health Services Advisory Group, Inc.
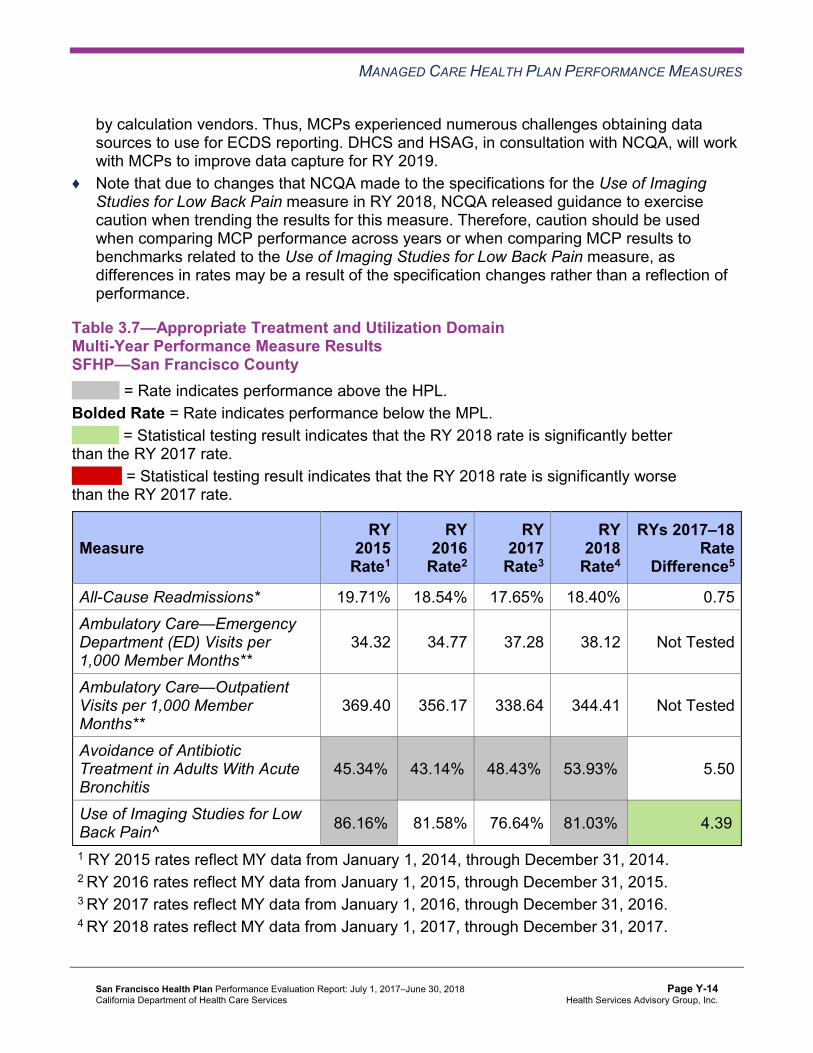
MANAGED CARE HEALTH PLAN PERFORMANCE MEASURES
by calculation vendors. Thus, MCPs experienced numerous challenges obtaining data sources to use for ECDS reporting. DHCS and HSAG, in consultation with NCQA, will work with MCPs to improve data capture for RY 2019.
♦ Note that due to changes that NCQA made to the specifications for the Use of Imaging Studies for Low Back Pain measure in RY 2018, NCQA released guidance to exercise caution when trending the results for this measure. Therefore, caution should be used when comparing MCP performance across years or when comparing MCP results to benchmarks related to the Use of Imaging Studies for Low Back Pain measure, as differences in rates may be a result of the specification changes rather than a reflection of performance.
Table 3.7—Appropriate Treatment and Utilization DomainMulti-Year Performance Measure Results SFHP—San Francisco County
H = Rate indicates performance above the HPL. Bolded Rate = Rate indicates performance below the MPL.
B = Statistical testing result indicates that the RY 2018 rate is significantly better than the RY 2017 rate.
W = Statistical testing result indicates that the RY 2018 rate is significantly worse than the RY 2017 rate.
Measure RY
2015 Rate1
RY 2016
Rate2
RY 2017
Rate3
RY 2018
Rate4
RYs 2017–18 Rate
Difference5
All-Cause Readmissions* 19.71% 18.54% 17.65% 18.40% 0.75 Ambulatory Care—Emergency Department (ED) Visits per 1,000 Member Months**
34.32 34.77 37.28 38.12 Not Tested
Ambulatory Care—Outpatient Visits per 1,000 Member Months**
369.40 356.17 338.64 344.41 Not Tested
Avoidance of Antibiotic Treatment in Adults With Acute Bronchitis
45.34%H 43.14%H 48.43%H 53.93%H 5.50
Use of Imaging Studies for Low Back Pain^ 86.16%H 81.58% 76.64% 81.03%H 4.39B
1 RY 2015 rates reflect MY data from January 1, 2014, through December 31, 2014. 2 RY 2016 rates reflect MY data from January 1, 2015, through December 31, 2015. 3 RY 2017 rates reflect MY data from January 1, 2016, through December 31, 2016. 4 RY 2018 rates reflect MY data from January 1, 2017, through December 31, 2017.
San Francisco Health Plan Performance Evaluation Report: July 1, 2017–June 30, 2018 California Department of Health Care Services
Page Y-14 Health Services Advisory Group, Inc.
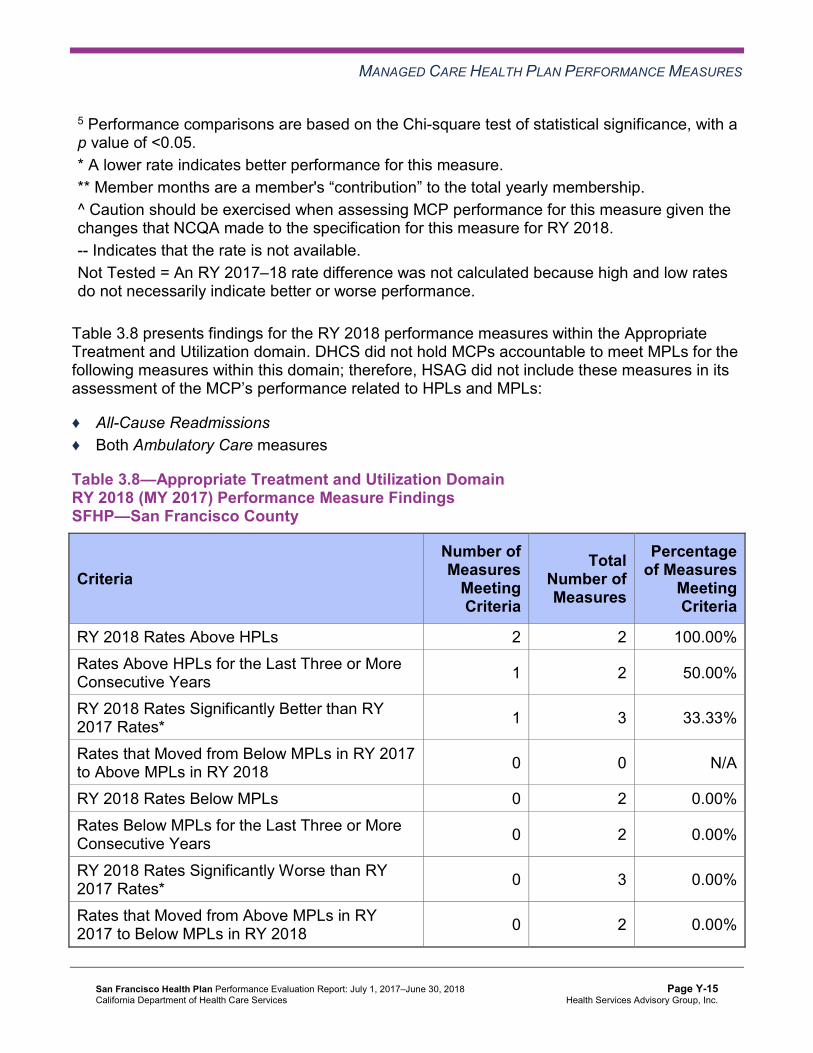
MANAGED CARE HEALTH PLAN PERFORMANCE MEASURES
5 Performance comparisons are based on the Chi-square test of statistical significance, with a p value of <0.05. * A lower rate indicates better performance for this measure. ** Member months are a member's “contribution” to the total yearly membership. ^ Caution should be exercised when assessing MCP performance for this measure given the changes that NCQA made to the specification for this measure for RY 2018. -- Indicates that the rate is not available. Not Tested = An RY 2017–18 rate difference was not calculated because high and low rates do not necessarily indicate better or worse performance.
Table 3.8 presents findings for the RY 2018 performance measures within the Appropriate Treatment and Utilization domain. DHCS did not hold MCPs accountable to meet MPLs for the following measures within this domain; therefore, HSAG did not include these measures in its assessment of the MCP’s performance related to HPLs and MPLs:
♦ All-Cause Readmissions ♦ Both Ambulatory Care measures
Table 3.8—Appropriate Treatment and Utilization DomainRY 2018 (MY 2017) Performance Measure Findings SFHP—San Francisco County
Criteria Number of Measures
MeetingCriteria
Total Number of Measures
Percentage of Measures
MeetingCriteria
RY 2018 Rates Above HPLs 2 2 100.00% Rates Above HPLs for the Last Three or More Consecutive Years 1 2 50.00%
RY 2018 Rates Significantly Better than RY 2017 Rates* 1 3 33.33%
Rates that Moved from Below MPLs in RY 2017 to Above MPLs in RY 2018 0 0 N/A
RY 2018 Rates Below MPLs 0 2 0.00% Rates Below MPLs for the Last Three or More Consecutive Years 0 2 0.00%
RY 2018 Rates Significantly Worse than RY 2017 Rates* 0 3 0.00%
Rates that Moved from Above MPLs in RY 2017 to Below MPLs in RY 2018 0 2 0.00%
San Francisco Health Plan Performance Evaluation Report: July 1, 2017–June 30, 2018 California Department of Health Care Services
Page Y-15 Health Services Advisory Group, Inc.

MANAGED CARE HEALTH PLAN PERFORMANCE MEASURES
* Performance comparisons are based on the Chi-square test of statistical significance, with a p value of <0.05. N/A = No rates above or below the MPLs from the previous year exist to include in the denominator for calculating whether or not rates moved to above or below MPLs in the most recent year.
Performance Measure Findings—All Domains
Table 3.9 presents a summary of SFHP’s RY 2018 performance across all External Accountability Set (EAS) measures.
Note the following regarding Table 3.9:
♦ DHCS did not hold MCPs accountable to meet MPLs for the following measures; therefore, HSAG did not include these measures in its assessment of the MCP’s performance related to HPLs and MPLs: ■ All-Cause Readmissions ■ Both Ambulatory Care measures ■ All four Children and Adolescents’ Access to Primary Care measures
♦ DHCS did not hold MCPs accountable to meet MPLs for the following measures in RY 2017; therefore, HSAG did not include these measures in the denominators for calculating the percentage of measures with rates that moved to above or below the MPLs in RY 2018 and for calculating the percentage of measures with rates below MPLs for only the last two consecutive years: ■ Asthma Medication Ratio ■ Breast Cancer Screening ■ Immunizations for Adolescents—Combination 2
San Francisco Health Plan Performance Evaluation Report: July 1, 2017–June 30, 2018 California Department of Health Care Services
Page Y-16 Health Services Advisory Group, Inc.

MANAGED CARE HEALTH PLAN PERFORMANCE MEASURES
Table 3.9—RY 2018 (MY 2017) Performance Measure Findings for All Domains SFHP—San Francisco County
Criteria Number of Measures
MeetingCriteria
Total Number of Measures
Percentage of Measures
MeetingCriteria
RY 2018 Rates Above HPLs 12 21 57.14% Rates Above HPLs for the Last Three or More Consecutive Years 7 18 38.89%
RY 2018 Rates Significantly Better than RY 2017 Rates* 4 22 18.18%
Rates that Moved from Below MPLs in RY 2017 to Above MPLs in RY 2018 0 0 N/A
RY 2018 Rates Below MPLs 0 21 0.00% Rates Below MPLs for Only the Last Two Consecutive Years 0 18 0.00%
Rates Below MPLs for the Last Three or More Consecutive Years 0 18 0.00%
RY 2018 Rates Significantly Worse than RY 2017 Rates* 1 22 4.55%
Rates that Moved from Above MPLs in RY 2017 to Below MPLs in RY 2018 0 18 0.00%
* Performance comparisons are based on the Chi-square test of statistical significance, with a p value of <0.05. N/A = No rates above or below the MPLs from the previous year exist to include in the denominator for calculating whether or not rates moved to above or below MPLs in the most recent year.
San Francisco Health Plan Performance Evaluation Report: July 1, 2017–June 30, 2018 California Department of Health Care Services
Page Y-17 Health Services Advisory Group, Inc.
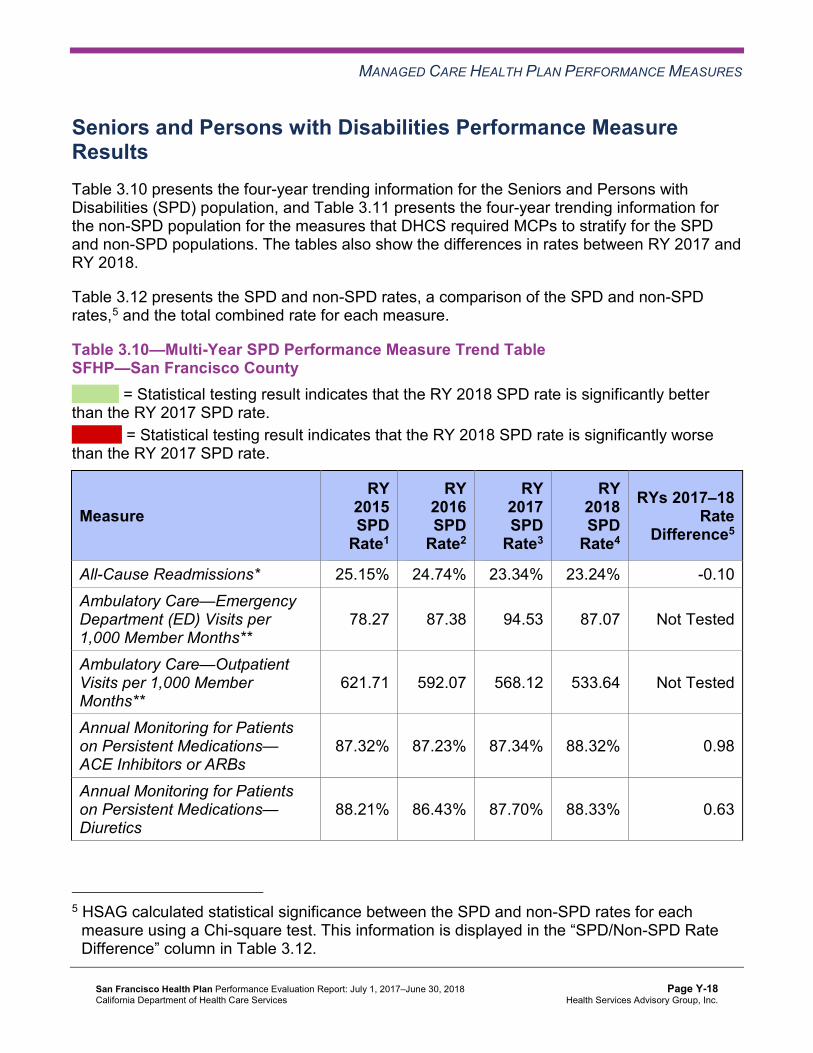
MANAGED CARE HEALTH PLAN PERFORMANCE MEASURES
Seniors and Persons with Disabilities Performance Measure Results Table 3.10 presents the four-year trending information for the Seniors and Persons with Disabilities (SPD) population, and Table 3.11 presents the four-year trending information for the non-SPD population for the measures that DHCS required MCPs to stratify for the SPD and non-SPD populations. The tables also show the differences in rates between RY 2017 and RY 2018.
Table 3.12 presents the SPD and non-SPD rates, a comparison of the SPD and non-SPD rates,5 and the total combined rate for each measure.
Table 3.10—Multi-Year SPD Performance Measure Trend Table SFHP—San Francisco County
B = Statistical testing result indicates that the RY 2018 SPD rate is significantly better than the RY 2017 SPD rate.
W = Statistical testing result indicates that the RY 2018 SPD rate is significantly worse than the RY 2017 SPD rate.
Measure RY
2015 SPD
Rate1
RY 2016 SPD
Rate2
RY 2017 SPD
Rate3
RY 2018 SPD
Rate4
RYs 2017–18 Rate
Difference5
All-Cause Readmissions* 25.15% 24.74% 23.34% 23.24% -0.10 Ambulatory Care—Emergency Department (ED) Visits per 1,000 Member Months**
78.27 87.38 94.53 87.07 Not Tested
Ambulatory Care—Outpatient Visits per 1,000 Member Months**
621.71 592.07 568.12 533.64 Not Tested
Annual Monitoring for Patients on Persistent Medications— ACE Inhibitors or ARBs
87.32% 87.23% 87.34% 88.32% 0.98
Annual Monitoring for Patients on Persistent Medications— Diuretics
88.21% 86.43% 87.70% 88.33% 0.63
5 HSAG calculated statistical significance between the SPD and non-SPD rates for each measure using a Chi-square test. This information is displayed in the “SPD/Non-SPD Rate Difference” column in Table 3.12.
San Francisco Health Plan Performance Evaluation Report: July 1, 2017–June 30, 2018 California Department of Health Care Services
Page Y-18 Health Services Advisory Group, Inc.

MANAGED CARE HEALTH PLAN PERFORMANCE MEASURES
Measure RY
2015 SPD
Rate1
RY 2016 SPD
Rate2
RY 2017 SPD
Rate3
RY 2018 SPD
Rate4
RYs 2017–18 Rate
Difference5
Children and Adolescents' Access to Primary Care Practitioners—12–24 Months
NA NA NA NA Not Comparable
Children and Adolescents' Access to Primary Care Practitioners— 25 Months–6 Years
84.00% 84.80% 80.70% 84.34% 3.64
Children and Adolescents' Access to Primary Care Practitioners—7–11 Years
88.38% 88.52% 84.57% 85.80% 1.23
Children and Adolescents' Access to Primary Care Practitioners—12–19 Years
82.37% 84.69% 81.19% 76.00% -5.19
1 RY 2015 rates reflect MY data from January 1, 2014, through December 31, 2014. 2 RY 2016 rates reflect MY data from January 1, 2015, through December 31, 2015. 3 RY 2017 rates reflect MY data from January 1, 2016, through December 31, 2016. 4 RY 2018 rates reflect MY data from January 1, 2017, through December 31, 2017. 5 Performance comparisons are based on the Chi-square test of statistical significance, with a p value of <0.05. * A lower rate indicates better performance for this measure. ** Member months are a member's “contribution” to the total yearly membership. NA = The MCP followed the specifications, but the denominator is too small (less than 30) to report a valid rate. Not Comparable = An RY 2017–18 rate difference cannot be made because data are not available for both years or because significant methodology changes occurred between years, disallowing comparison. Not Tested = An RY 2017–18 rate difference was not calculated because high and low rates do not necessarily indicate better or worse performance.
San Francisco Health Plan Performance Evaluation Report: July 1, 2017–June 30, 2018 California Department of Health Care Services
Page Y-19 Health Services Advisory Group, Inc.
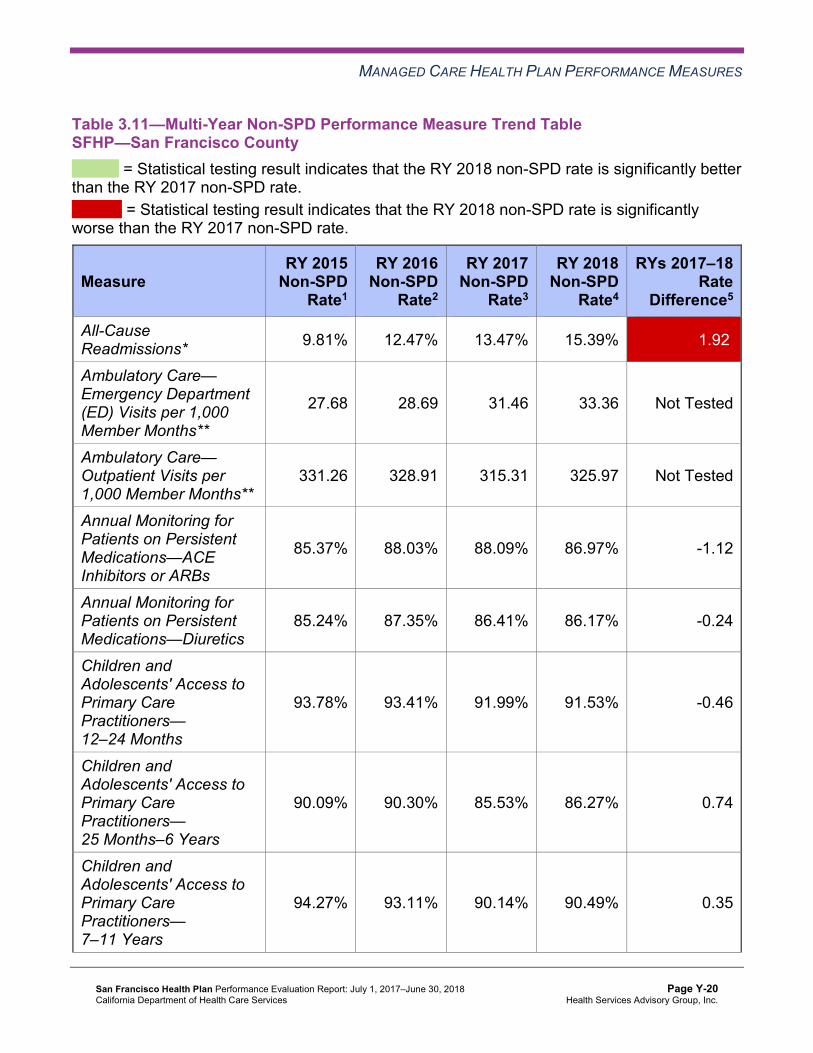
MANAGED CARE HEALTH PLAN PERFORMANCE MEASURES
Table 3.11—Multi-Year Non-SPD Performance Measure Trend Table SFHP—San Francisco County
B = Statistical testing result indicates that the RY 2018 non-SPD rate is significantly better than the RY 2017 non-SPD rate.
W = Statistical testing result indicates that the RY 2018 non-SPD rate is significantly worse than the RY 2017 non-SPD rate.
Measure RY 2015
Non-SPD Rate1
RY 2016 Non-SPD
Rate2
RY 2017 Non-SPD
Rate3
RY 2018 Non-SPD
Rate4
RYs 2017–18 Rate
Difference5
All-Cause Readmissions* 9.81% 12.47% 13.47% 15.39% 1.92W
Ambulatory Care— Emergency Department (ED) Visits per 1,000 Member Months**
27.68 28.69 31.46 33.36 Not Tested
Ambulatory Care— Outpatient Visits per 1,000 Member Months**
331.26 328.91 315.31 325.97 Not Tested
Annual Monitoring for Patients on Persistent Medications—ACE Inhibitors or ARBs
85.37% 88.03% 88.09% 86.97% -1.12
Annual Monitoring for Patients on Persistent Medications—Diuretics
85.24% 87.35% 86.41% 86.17% -0.24
Children and Adolescents' Access to Primary Care Practitioners— 12–24 Months
93.78% 93.41% 91.99% 91.53% -0.46
Children and Adolescents' Access to Primary Care Practitioners— 25 Months–6 Years
90.09% 90.30% 85.53% 86.27% 0.74
Children and Adolescents' Access to Primary Care Practitioners— 7–11 Years
94.27% 93.11% 90.14% 90.49% 0.35
San Francisco Health Plan Performance Evaluation Report: July 1, 2017–June 30, 2018 California Department of Health Care Services
Page Y-20 Health Services Advisory Group, Inc.
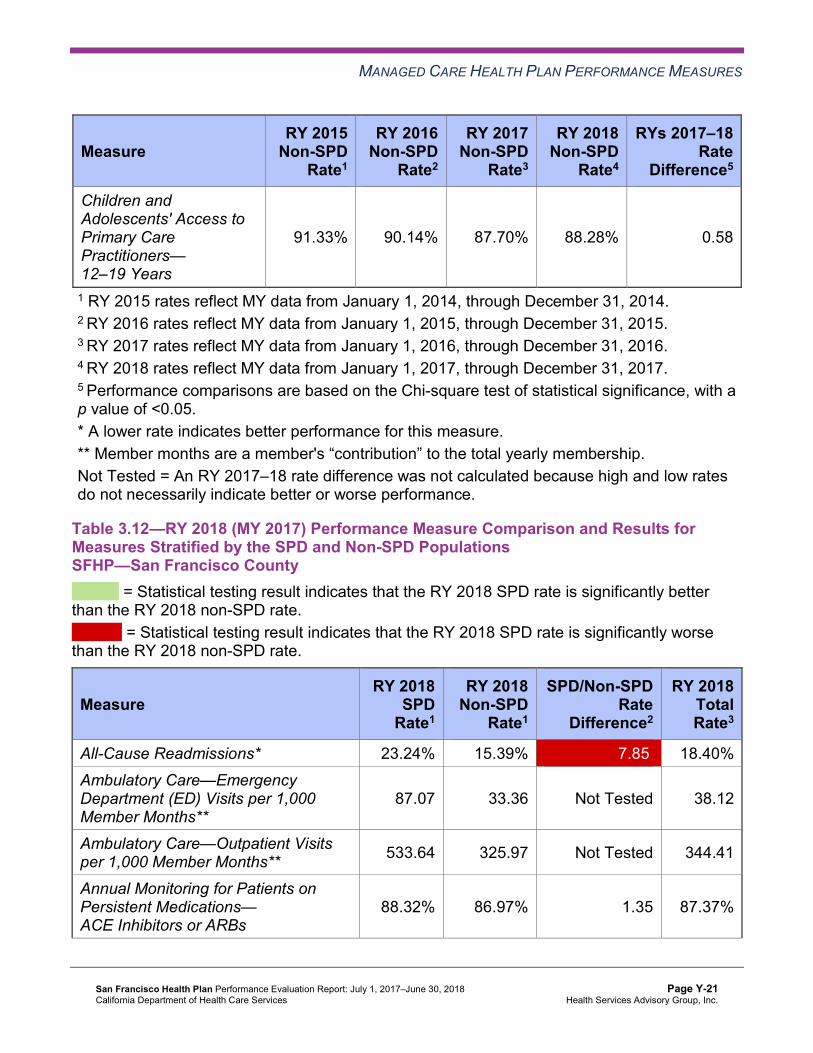
MANAGED CARE HEALTH PLAN PERFORMANCE MEASURES
Measure RY 2015
Non-SPD Rate1
RY 2016 Non-SPD
Rate2
RY 2017 Non-SPD
Rate3
RY 2018 Non-SPD
Rate4
RYs 2017–18 Rate
Difference5
Children and Adolescents' Access to Primary Care Practitioners— 12–19 Years
91.33% 90.14% 87.70% 88.28% 0.58
1 RY 2015 rates reflect MY data from January 1, 2014, through December 31, 2014. 2 RY 2016 rates reflect MY data from January 1, 2015, through December 31, 2015. 3 RY 2017 rates reflect MY data from January 1, 2016, through December 31, 2016. 4 RY 2018 rates reflect MY data from January 1, 2017, through December 31, 2017. 5 Performance comparisons are based on the Chi-square test of statistical significance, with a p value of <0.05. * A lower rate indicates better performance for this measure. ** Member months are a member's “contribution” to the total yearly membership. Not Tested = An RY 2017–18 rate difference was not calculated because high and low rates do not necessarily indicate better or worse performance.
Table 3.12—RY 2018 (MY 2017) Performance Measure Comparison and Results forMeasures Stratified by the SPD and Non-SPD PopulationsSFHP—San Francisco County
B = Statistical testing result indicates that the RY 2018 SPD rate is significantly better than the RY 2018 non-SPD rate.
W = Statistical testing result indicates that the RY 2018 SPD rate is significantly worse than the RY 2018 non-SPD rate.
Measure RY 2018
SPD Rate1
RY 2018 Non-SPD
Rate1
SPD/Non-SPDRate
Difference2
RY 2018 Total Rate3
All-Cause Readmissions* 23.24% 15.39% 7.85W 18.40% Ambulatory Care—Emergency Department (ED) Visits per 1,000 Member Months**
87.07 33.36 Not Tested 38.12
Ambulatory Care—Outpatient Visits per 1,000 Member Months** 533.64 325.97 Not Tested 344.41
Annual Monitoring for Patients on Persistent Medications— ACE Inhibitors or ARBs
88.32% 86.97% 1.35 87.37%
San Francisco Health Plan Performance Evaluation Report: July 1, 2017–June 30, 2018 California Department of Health Care Services
Page Y-21 Health Services Advisory Group, Inc.

MANAGED CARE HEALTH PLAN PERFORMANCE MEASURES
Measure RY 2018
SPD Rate1
RY 2018 Non-SPD
Rate1
SPD/Non-SPDRate
Difference2
RY 2018 Total Rate3
Annual Monitoring for Patients on Persistent Medications—Diuretics 88.33% 86.17% 2.16 86.88%
Children and Adolescents' Access to Primary Care Practitioners— 12–24 Months
NA 91.53% Not Comparable 91.40%
Children and Adolescents' Access to Primary Care Practitioners— 25 Months–6 Years
84.34% 86.27% -1.93 86.25%
Children and Adolescents' Access to Primary Care Practitioners— 7–11 Years
85.80% 90.49% -4.69W 90.38%
Children and Adolescents' Access to Primary Care Practitioners— 12–19 Years
76.00% 88.28% -12.28W 87.92%
1 RY 2018 rates reflect MY data from January 1, 2017, through December 31, 2017. 2 Performance comparisons are based on the Chi-square test of statistical significance, with a p value of <0.05. 3 Total rates are based on the MCP reporting unit’s total results, including the SPD and non-SPD populations. Please note, if data are not available for either the SPD or non-SPD population, the total rate is based on results reported for the available population. * A lower rate indicates better performance for this measure. ** Member months are a member's “contribution” to the total yearly membership. NA = The MCP followed the specifications, but the denominator is too small (less than 30) to report a valid rate. Not Comparable = An SPD/non-SPD rate difference cannot be made because data are not available for both populations. Not Tested = An SPD/non-SPD rate difference was not calculated because high and low rates do not necessarily indicate better or worse performance.
Seniors and Persons with Disabilities Findings
HSAG observed the following notable results in RY 2018 for measures that SFHP stratified by the SPD and non-SPD populations:
♦ For SPD rates for which HSAG could make a comparison between RY 2017 and RY 2018, SFHP had no statistically significant variation in SPD rates from RY 2017 to RY 2018.
San Francisco Health Plan Performance Evaluation Report: July 1, 2017–June 30, 2018 California Department of Health Care Services
Page Y-22 Health Services Advisory Group, Inc.

MANAGED CARE HEALTH PLAN PERFORMANCE MEASURES
♦ The RY 2018 non-SPD rate was significantly worse than the RY 2017 non-SPD rate for the All-Cause Readmissions measure.
♦ For measures for which HSAG could compare the RY 2018 SPD rates and RY 2018 non-SPD rates, the RY 2018 SPD rates were significantly worse than the RY 2018 non-SPD rates for the following measures: ■ All-Cause Readmissions. Note that the higher rate of hospital readmissions for the SPD
population is expected based on the greater and often more complicated health care needs of these beneficiaries.
■ Children and Adolescents’ Access to Primary Care Practitioners—7–11 Years and 12– 19 Years. The significant differences in rates for these measures may be attributed to beneficiaries in these age groups in the SPD population choosing to receive all health care services from specialist providers due to their complicated health care needs, rather than accessing care from primary care providers (PCPs).
Strengths—Performance Measures HSAG auditors determined that SFHP followed the appropriate specifications to produce valid rates and identified no issues of concern.
HSAG identified the following notable RY 2018 performance measure results for SFHP:
♦ Across all domains, SFHP performed above the HPLs for 12 of 21 measures (57 percent) and had no rates below the MPLs.
♦ The rates for the following seven measures were above the HPLs for at least three consecutive years: ■ Avoidance of Antibiotic Treatment in Adults With Acute Bronchitis ■ Childhood Immunization Status—Combination 3 ■ Comprehensive Diabetes Care—Eye Exam (Retinal) Performed ■ Comprehensive Diabetes Care—HbA1cControl (<8.0 Percent) ■ Controlling High Blood Pressure ■ Both Weight Assessment and Counseling for Nutrition and Physical Activity for Children
and Adolescents measures ♦ The rates for the following four measures improved significantly from RY 2017 to RY 2018:
■ Comprehensive Diabetes Care—Eye Exam (Retinal) Performed ■ Immunizations for Adolescents—Combination 2, resulting in the rate moving to above
the HPL in RY 2018. ■ Prenatal and Postpartum Care—Timeliness of Prenatal Care ■ Use of Imaging Studies for Low Back Pain, resulting in the rate moving to above the
HPL in RY 2018.
San Francisco Health Plan Performance Evaluation Report: July 1, 2017–June 30, 2018 California Department of Health Care Services
Page Y-23 Health Services Advisory Group, Inc.

MANAGED CARE HEALTH PLAN PERFORMANCE MEASURES
Opportunities for Improvement—Performance Measures SFHP has the opportunity to assess the causes for the Breast Cancer Screening measure rate declining significantly from RY 2017 to RY 2018 and to identify strategies to ensure that female beneficiaries ages 50 to 74 have a mammogram to screen for breast cancer within the appropriate time frame. Note that the significant decline in the Breast Cancer Screening rate from RY 2017 to RY 2018 may be due to NCQA’s RY 2018 specification changes for this measure and therefore may not be related to SFHP’s performance.
San Francisco Health Plan Performance Evaluation Report: July 1, 2017–June 30, 2018 California Department of Health Care Services
Page Y-24 Health Services Advisory Group, Inc.

Medi-Cal Managed Care External Quality Review Technical ReportAppendix Y: Performance Evaluation ReportSan Francisco Health Plan July 1, 2017–June 30, 2018
4. Performance Improvement Projects
Performance Improvement Project Overview The key concepts of the rapid-cycle performance improvement project (PIP) framework include forming a PIP team, setting aims, establishing measures, determining interventions using quality improvement tools, conducting PDSA cycles to test interventions, and planning for the spread of successful changes. The core component of the rapid-cycle PIP approach involves testing changes on a small scale so that improvement can occur more efficiently and lead to long-term sustainability. The following modules guide MCPs through this rapid-cycle PIP process:
♦ Module 1—PIP Initiation ■ MCPs outline the framework for the PIP, which includes:
○ The topic rationale. ○ Comparative data supporting the need to improve the selected topic. ○ A list of the PIP team members, which consists of internal and external stakeholders. ○ A completed key driver diagram that defines the theory of change for improvement,
including the SMART (Specific, Measurable, Achievable, Relevant, and Time-bound) Aim and Global Aim.
♦ Module 2—SMART Aim Data Collection ■ MCPs define the SMART Aim measure and data collection methodology and develop
the SMART Aim data run chart. ♦ Module 3—Intervention Determination
■ MCPs use process mapping and failure modes and effects analysis (FMEA) to identify potential interventions to test which may have direct effects on the SMART Aim.
♦ Module 4—Plan-Do-Study-Act (PDSA) ■ MCPs test and evaluate the interventions identified in Module 3 through a series of
PDSA cycles. ♦ Module 5—PIP Conclusions
■ MCPs interpret results and summarize: ○ Key findings and outcomes achieved. ○ Assessment of each tested intervention. ○ Lessons learned, including how demonstrated improvement can be shared and used
as a foundation for further improvement going forward. ○ Plan for sustained improvement.
San Francisco Health Plan Performance Evaluation Report: July 1, 2017–June 30, 2018 California Department of Health Care Services
Page Y-25 Health Services Advisory Group, Inc.
PERFORMANCE IMPROVEMENT PROJECTS
Based on the agreed-upon timeline, MCPs submit each module to HSAG for validation. Throughout the rapid-cycle PIP process, HSAG provides technical assistance to MCPs to ensure that PIPs are methodologically sound and to problem-solve with MCPs regarding how to address challenges that occur. Through an iterative process, MCPs have opportunities to make corrections to modules 1 through 3 to achieve all validation criteria.
Once MCPs achieve all validation criteria for modules 1 through 3 and receive feedback on the intervention Plan portion of Module 4, MCPs test interventions. During the intervention testing phase of the PIP, HSAG conducts periodic progress check-ins to ensure that MCPs have addressed HSAG’s feedback on the Plan portion of Module 4 and are making appropriate progress with intervention testing. Once MCPs complete testing an intervention, MCPs determine the next steps based on results and lessons learned—whether the intervention was successful and should be spread (adopt), whether modifications need to be made to the existing intervention (adapt), or whether the intervention was not successful and should be stopped (abandon).
In Module 5, MCPs summarize the overall PIP. When validating Module 5, HSAG assesses the validity and reliability of the results based on the Centers for Medicare & Medicaid Services (CMS) validation protocols to determine whether key stakeholders can have confidence in the reported PIP findings. HSAG assigns the following final confidence levels for each PIP:
♦ High confidence—the PIP was methodologically sound and achieved the SMART Aim goal; the demonstrated improvement was clearly linked to the quality improvement processes conducted and intervention(s) tested; and, the MCP accurately summarized the key findings.
♦ Confidence—the PIP was methodologically sound and achieved the SMART Aim goal, and the MCP accurately summarized the key findings. However, some, but not all, of the quality improvement processes conducted and/or intervention(s) tested were clearly linked to the demonstrated improvement.
♦ Low confidence—either (A) the PIP was methodologically sound; however, the SMART Aim goal was not achieved; or (B) the SMART Aim goal was achieved; however, the quality improvement processes and/or intervention(s) tested were poorly executed and could not be linked to the improvement.
♦ Reported PIP results were not credible—the PIP methodology was not executed as approved.
Performance Improvement Project Results and Findings During the review period, SFHP submitted modules 4 and 5 for its 2015–17 DHCS-priority and MCP-specific PIPs. HSAG validated the modules and includes the final PIP validation findings in this report. Additionally, SFHP initiated a Disparity PIP and a DHCS-priority PIP during the review period. In this report, HSAG includes summaries of the MCP’s Disparity and DHCS-priority PIP module submissions as well as validation findings from the review period.
San Francisco Health Plan Performance Evaluation Report: July 1, 2017–June 30, 2018 California Department of Health Care Services
Page Y-26 Health Services Advisory Group, Inc.

PERFORMANCE IMPROVEMENT PROJECTS
2015–17 DHCS-Priority Performance Improvement Project
SFHP selected postpartum care for its 2015–17 DHCS-priority PIP. While the MCP concluded its Postpartum Care PIP through the SMART Aim end date of June 30, 2017, SFHP submitted modules 4 and 5 for HSAG to validate during the review period for this report. HSAG provided final validation findings and encouraged SFHP to incorporate the experiences and lessons learned from the PIP into future quality improvement efforts.
Table 4.1 provides a summary of the SMART Aim measure results reported by the MCP.
Table 4.1—SFHP Postpartum Care PIP SMART Aim Measure Results
SMART Aim Measure Baseline Rate
SMART Aim Goal
Rate
SMART Aim Goal Achieved
Rate of postpartum visits that occur with an obstetrician/gynecologist (OB/GYN) or PCP within three to eight weeks of delivery among beneficiaries who deliver at Hospital A6
57% 70% No
Table 4.2 presents a description of the interventions that SFHP tested for its Postpartum Care PIP. The table also indicates the key drivers and/or failure modes that each intervention addressed as well as whether the MCP decided, based on intervention testing results, to adopt, adapt, or abandon the intervention.
Table 4.2—SFHP Postpartum Care PIP Intervention Testing Results
Intervention Key Drivers and/or Failure ModesAddressed
Adopt,Adapt, orAbandon
Provider training to OB/GYN clinical staff on the importance of postpartum care, disparities in care, and motivational interviewing.
♦ Quality of care concerns, including beneficiary satisfaction, experience of care, and customer service.
♦ Beneficiary education. ♦ Appropriate beneficiary care
following delivery. ♦ Continuity of care among the
hospital, PCP, and OB/GYN. ♦ Concerns with discharge planning. ♦ Poor provider communication.
Abandon
6 Hospital name removed for confidentiality.
San Francisco Health Plan Performance Evaluation Report: July 1, 2017–June 30, 2018 California Department of Health Care Services
Page Y-27 Health Services Advisory Group, Inc.

PERFORMANCE IMPROVEMENT PROJECTS
Intervention Key Drivers and/or Failure ModesAddressed
Adopt,Adapt, orAbandon
New postpartum registry report which allows prenatal care sites to track beneficiaries through deliveries and schedule postpartum visits in the appropriate time frame
♦ Referral process is confusing or does not exist.
♦ Care coordination for postpartum women is lacking.
Adapt
SFHP documented the following lessons learned during the scope of the 2015–17 DHCS-priority PIP, which the MCP may apply to future PIPs:
♦ If possible, budget planning should be done in advance to allocate resources, which will provide more influence on setting of timelines and adherence to goals.
♦ It is important to be flexible in order to leverage opportunities as they arise.
Performance Improvement Project Validation Findings
During the review period for this report, HSAG validated modules 4 and 5 for the MCP’s Postpartum Care PIP. SFHP completed testing the provider training intervention in September 2016 and determined that it was not effective in improving the SMART Aim measure rate, resulting in the MCP abandoning the intervention. The MCP documented that the postpartum registry report intervention impacted the SMART Aim measure rate and adapted the intervention to include a weekly worklist. While the SMART Aim measure rate improved from the baseline rate, the MCP did not achieve the SMART Aim goal. Upon assessment of validity and reliability of the PIP results, HSAG assigned SFHP’s Postpartum Care PIP a final confidence level of Low Confidence.
2015–17 MCP-Specific Performance Improvement Project
SFHP selected patient experience for its 2015–17 MCP-specific PIP. While the MCP concluded its Patient Experience PIP through the SMART Aim end date of June 30, 2017, SFHP submitted modules 4 and 5 for HSAG to validate during the review period for this report. HSAG provided final validation findings and encouraged SFHP to incorporate the experiences and lessons learned from the PIP into future quality improvement efforts.
Table 4.3 provides a summary of the SMART Aim measure results reported by the MCP.
San Francisco Health Plan Performance Evaluation Report: July 1, 2017–June 30, 2018 California Department of Health Care Services
Page Y-28 Health Services Advisory Group, Inc.

PERFORMANCE IMPROVEMENT PROJECTS
Table 4.3—SFHP Patient Experience PIP SMART Aim Measure Results
SMART Aim Measure Baseline Rate
SMART Aim Goal
Rate
SMART Aim Goal Achieved
Rate of beneficiaries responding “always” in getting the information they need from Customer Service on the San Francisco Health Plan Customer Service Survey
78% 83% Yes
Table 4.4 presents a description of the interventions that SFHP tested for its Patient Experience PIP. The table also indicates the failure modes that each intervention addressed as well as whether the MCP decided, based on intervention testing results, to adopt, adapt, or abandon the intervention.
Table 4.4—SFHP Patient Experience PIP Intervention Testing Results
Intervention Failure Modes Addressed Adopt,Adapt, orAbandon
Conduct three-way phone calls occurring among the beneficiary, the MCP, and the MCMC representative.
♦ Beneficiaries’ issues can only be resolved by an external health care entity.
♦ Beneficiaries do not understand the difference between MCMC and the MCP.
♦ Beneficiaries are unaware of how to navigate various health care systems.
Abandon
Have customer service representatives use key words at key times to increase beneficiary satisfaction.
♦ The MCP’s customer service representatives are not using evidence-based practices in reaching mutual understanding with beneficiaries.
Adopt
SFHP documented that the main lesson the MCP learned during the scope of the 2015–17 MCP-specific PIP which can be applied to future PIPs is to prioritize small scale interventions that are easier to implement and which measure impact.
San Francisco Health Plan Performance Evaluation Report: July 1, 2017–June 30, 2018 California Department of Health Care Services
Page Y-29 Health Services Advisory Group, Inc.

PERFORMANCE IMPROVEMENT PROJECTS
Performance Improvement Project Validation Findings
During the review period for this report, HSAG validated modules 4 and 5 for the MCP’s Patient Experience PIP. SFHP abandoned the three-way phone call intervention in February 2017 due to the MCP being understaffed and the time-intensive nature of the intervention. Thereafter, SFHP tested a second intervention that included having the MCP’s customer service representatives use key words at key times to solicit feedback from beneficiaries. This second intervention was effective in improving the SMART Aim measure rate, and SFHP achieved the SMART Aim goal. Upon assessment of validity and reliability of the PIP results, HSAG assigned SFHP’s Patient Experience PIP a final confidence level of Confidence.
2017–19 Disparity Performance Improvement Project
During the review period, DHCS required SFHP to initiate a PIP focusing on an identified health disparity based on, but not limited to, age, gender, race or ethnicity, language spoken, income, educational attainment, sexual orientation or gender identity, occupation, provider, or geographic area. SFHP selected postpartum care among African American beneficiaries as its 2017–19 Disparity PIP topic. Using its own MCP-specific data, the MCP provided evidence of the health disparity by demonstrating a statistically significant rate difference between two subgroups, with the disparate subgroup having the lower rate.
Table 4.5 provides the SMART Aim measure description, baseline rate, and SMART Aim goal rate for the PIP. The SMART Aim end date for this PIP is June 30, 2019.
Table 4.5—SFHP Postpartum Care Disparity PIP SMART Aim Measure
SMART Aim Measure Baseline Rate
SMART Aim Goal
Rate
Rate of postpartum visits that occur with an OB/GYN or PCP within three to eight weeks of delivery among African American beneficiaries who deliver at Hospital B7
62% 91%
Performance Improvement Project Validation Findings
During the review period of this report, HSAG validated modules 1 and 2 for the MCP’s Postpartum Care Disparity PIP. Upon initial review of the modules, HSAG determined that SFHP met some required validation criteria; however, HSAG identified opportunities for improvement related to:
♦ Supporting the topic selection with the MCP’s data. ♦ Identifying appropriate team members, to include both internal staff and external partners.
7 Hospital name removed for confidentiality.
San Francisco Health Plan Performance Evaluation Report: July 1, 2017–June 30, 2018 California Department of Health Care Services
Page Y-30 Health Services Advisory Group, Inc.
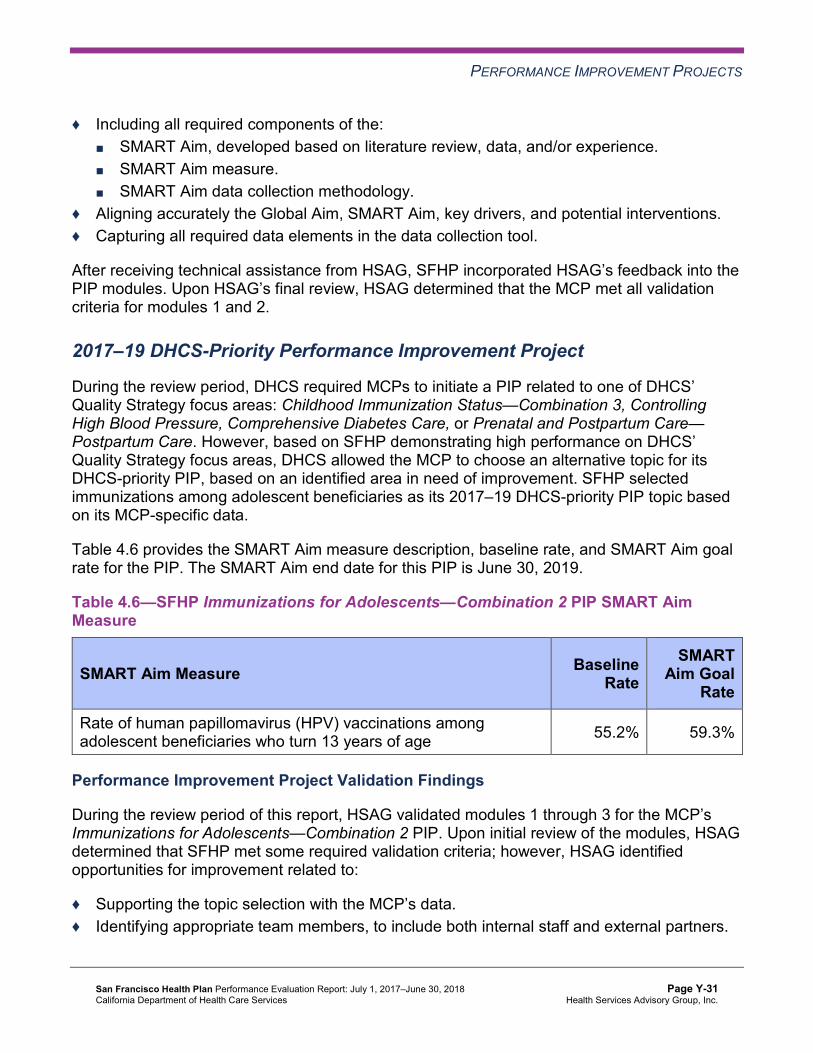
PERFORMANCE IMPROVEMENT PROJECTS
♦ Including all required components of the: ■ SMART Aim, developed based on literature review, data, and/or experience. ■ SMART Aim measure. ■ SMART Aim data collection methodology.
♦ Aligning accurately the Global Aim, SMART Aim, key drivers, and potential interventions. ♦ Capturing all required data elements in the data collection tool.
After receiving technical assistance from HSAG, SFHP incorporated HSAG’s feedback into the PIP modules. Upon HSAG’s final review, HSAG determined that the MCP met all validation criteria for modules 1 and 2.
2017–19 DHCS-Priority Performance Improvement Project
During the review period, DHCS required MCPs to initiate a PIP related to one of DHCS’ Quality Strategy focus areas: Childhood Immunization Status—Combination 3, Controlling High Blood Pressure, Comprehensive Diabetes Care, or Prenatal and Postpartum Care— Postpartum Care. However, based on SFHP demonstrating high performance on DHCS’ Quality Strategy focus areas, DHCS allowed the MCP to choose an alternative topic for its DHCS-priority PIP, based on an identified area in need of improvement. SFHP selected immunizations among adolescent beneficiaries as its 2017–19 DHCS-priority PIP topic based on its MCP-specific data.
Table 4.6 provides the SMART Aim measure description, baseline rate, and SMART Aim goal rate for the PIP. The SMART Aim end date for this PIP is June 30, 2019.
Table 4.6—SFHP Immunizations for Adolescents—Combination 2 PIP SMART Aim Measure
SMART Aim Measure Baseline Rate
SMART Aim Goal
Rate
Rate of human papillomavirus (HPV) vaccinations among adolescent beneficiaries who turn 13 years of age 55.2% 59.3%
Performance Improvement Project Validation Findings
During the review period of this report, HSAG validated modules 1 through 3 for the MCP’s Immunizations for Adolescents—Combination 2 PIP. Upon initial review of the modules, HSAG determined that SFHP met some required validation criteria; however, HSAG identified opportunities for improvement related to:
♦ Supporting the topic selection with the MCP’s data. ♦ Identifying appropriate team members, to include both internal staff and external partners.
San Francisco Health Plan Performance Evaluation Report: July 1, 2017–June 30, 2018 California Department of Health Care Services
Page Y-31 Health Services Advisory Group, Inc.

PERFORMANCE IMPROVEMENT PROJECTS
♦ Including all required components of the: ■ SMART Aim, developed based on literature review, data, and/or experience. ■ SMART Aim measure. ■ SMART Aim data collection methodology. ■ FMEA table.
♦ Aligning accurately the Global Aim, SMART Aim, key drivers, and potential interventions. ♦ Including a step-by-step flow of the overall process in the process map. ♦ Describing the priority-ranking process. ♦ Listing the appropriate potential interventions based on the ranked failure modes. ♦ Considering the potential interventions’ reliability and sustainability.
After receiving technical assistance from HSAG, SFHP incorporated HSAG’s feedback into modules 1 and 2. Upon HSAG’s final review, HSAG determined that the MCP met all validation criteria for modules 1 and 2. SFHP was still in the process of incorporating HSAG’s feedback into Module 3 during the review period; therefore, HSAG includes no final validation results for Module 3 in this report.
Strengths—Performance Improvement Projects SFHP achieved the SMART Aim goal for the 2015–17 Patient Experience PIP, and some of the quality improvement activities could be linked to the demonstrated improvement. Based on HSAG’s assessment, HSAG assigned the 2015–17 Patient Experience PIP a final confidence level of Confidence.
Opportunities for Improvement—Performance Improvement Projects SFHP has the opportunity to continue monitoring adopted and adapted interventions and outcomes to facilitate improvement beyond the life of the 2015–17 Postpartum Care and Patient Experience PIPs. Ongoing monitoring will enable long-term evaluation of improvement and allow the MCP to continually refine interventions to achieve and sustain optimal outcomes.
Additionally, SFHP has the opportunity to apply lessons learned from the 2015–17 Postpartum Care PIP to the MCP’s 2017–19 Postpartum Care Disparity PIP.
San Francisco Health Plan Performance Evaluation Report: July 1, 2017–June 30, 2018 California Department of Health Care Services
Page Y-32 Health Services Advisory Group, Inc.

Medi-Cal Managed Care External Quality Review Technical ReportAppendix Y: Performance Evaluation ReportSan Francisco Health Plan July 1, 2017–June 30, 2018
5. Recommendations
Follow-Up on Prior Year Recommendations DHCS provided each MCP an opportunity to outline actions taken to address recommendations HSAG made in its 2016–17 MCP-specific evaluation report. Table 5.1 provides EQR recommendations from SFHP’s July 1, 2016, through June 30, 2017, MCP-specific evaluation report, along with the MCP’s self-reported actions taken through June 30, 2018, that address the recommendations. Please note that HSAG made minimal edits to Table 5.1 to preserve the accuracy of SFHP’s self-reported actions.
Table 5.1—SFHP’s Self-Reported Follow-Up on External Quality ReviewRecommendations from the July 1, 2016, through June 30, 2017, MCP-SpecificEvaluation Report
2016–17 External Quality ReviewRecommendations Directed to SFHP
Self-Reported Actions Taken by SFHP during the Period of July 1, 2017–June 30, 2018, thatAddress the External Quality ReviewRecommendations
1. To prevent further decline in performance, identify the causes for the rates declining significantly from RY 2016 to RY 2017 for the following measures: a. Comprehensive Diabetes Care—
HbA1c Testing b. Prenatal and Postpartum Care—
Timeliness of Prenatal Care
1.a. SFHP attributes the decline in performance for the Comprehensive Diabetes Care—HbA1c Testing measure to a significant increase in the eligible population. Between RY 2016 and RY 2017, the eligible population grew by 636 members, or 9.4 percent. SFHP saw another increase, of 5 percent, between RY 2017 and RY 2018. That being said, SFHP’s performance increased to 93 percent in RY 2018, placing the rate in the 90th percentile. There may be valid clinical reasons for the small percentage of the diabetes population who did not undergo testing, such as emerging or progressive life-jeopardizing illness or patient preference or refusal.
1.b. SFHP attributes the decline in performance for the Timeliness of Prenatal Care measure to a sampling error. SFHP’s performance over the last four years has been relatively stable. RY 2017 was significantly lower, though RYs 2015, 2016, and 2018 performance rates range from 90.07 percent to 91.09 percent. These are not clinically significant differences.
San Francisco Health Plan Performance Evaluation Report: July 1, 2017–June 30, 2018 California Department of Health Care Services
Page Y-33 Health Services Advisory Group, Inc.

RECOMMENDATIONS
2016–17 External Quality ReviewRecommendations Directed to SFHP
Self-Reported Actions Taken by SFHP during the Period of July 1, 2017–June 30, 2018, thatAddress the External Quality ReviewRecommendations
2. Identify the causes for the continued decline in performance for the Use of Imaging Studies for Low Back Pain measure.
SFHP attributes the decline in performance for the Use of Imaging Studies for Low Back Pain measure to lack of provider understanding of appropriate use of the imaging study and increased provider pressure to decrease utilization of opioid pain medication. SFHP has undertaken a variety of initiatives over the last few years to curb provider prescriptions for opioids. Our hypothesis is that demonstrating an absence of observable pathology on an imaging study makes it easier for providers to promote non-opiate treatment options such as exercise, physical therapy, acupuncture, yoga, and the like.
2017–18 Recommendations Based on the overall assessment of SFHP’s delivery of quality, accessible, and timely care through the activities described in previous sections of this report, HSAG recommends the following to the MCP:
♦ Assess the causes for the Breast Cancer Screening measure rate declining significantly from RY 2017 to RY 2018, and identify strategies to ensure that female beneficiaries ages 50 to 74 have a mammogram to screen for breast cancer within the appropriate time frame.
♦ Continue monitoring adopted and adapted interventions and outcomes to facilitate improvement beyond the life of the 2015–17 Postpartum Care and Patient Experience PIPs.
♦ Apply lessons learned from the 2015–17 Postpartum Care PIP to the 2017–19 Postpartum Care Disparity PIP.
In the next annual review, HSAG will evaluate continued successes of SFHP as well as the MCP’s progress with these recommendations.
San Francisco Health Plan Performance Evaluation Report: July 1, 2017–June 30, 2018 California Department of Health Care Services
Page Y-34 Health Services Advisory Group, Inc.
Medi-Cal Managed CareExternal Quality Review Technical Report
Appendix Z: Performance Evaluation Report Santa Clara Family Health Plan
July 1, 2017–June 30, 2018

Medi-Cal Managed Care External Quality Review Technical ReportAppendix Z: Performance Evaluation ReportSanta Clara Family Health PlanJuly 1, 2017–June 30, 2018
Table of Contents
1. Introduction.............................................................................................................Z-1 Medi-Cal Managed Care Health Plan Overview .......................................................Z-1
2. Managed Care Health Plan Compliance ...............................................................Z-2Compliance Reviews Conducted..............................................................................Z-2 Strengths—Compliance Reviews .............................................................................Z-3 Opportunities for Improvement—Compliance Reviews ............................................Z-3
3. Managed Care Health Plan Performance Measures ............................................Z-4Performance Measure Validation Results ................................................................Z-4 Performance Measure Results and Findings............................................................Z-4
Preventive Screening and Children’s Health .........................................................Z-5 Preventive Screening and Women’s Health ..........................................................Z-9 Care for Chronic Conditions ................................................................................Z-11 Appropriate Treatment and Utilization.................................................................Z-13 Performance Measure Findings—All Domains....................................................Z-16
Improvement Plan Requirements for 2018 .............................................................Z-17 Seniors and Persons with Disabilities Performance Measure Results....................Z-17
Seniors and Persons with Disabilities Findings ...................................................Z-22 Strengths—Performance Measures .......................................................................Z-23 Opportunities for Improvement—Performance Measures ......................................Z-23
4. MLTSSP Performance Measure Results.............................................................Z-24 Managed Long-Term Services and Supports Plan Performance Measure Findings ..Z-25
5. Performance Improvement Projects ...................................................................Z-26Performance Improvement Project Overview .........................................................Z-26 Performance Improvement Project Results and Findings.......................................Z-27
2015–17 DHCS-Priority Performance Improvement Project ...............................Z-28 2015–17 MCP-Specific Performance Improvement Project ................................Z-29 2017–19 Disparity Performance Improvement Project ........................................Z-30 2017–19 DHCS-Priority Performance Improvement Project ...............................Z-31
Strengths—Performance Improvement Projects ....................................................Z-32 Opportunities for Improvement—Performance Improvement Projects ...................Z-32
6. Recommendations................................................................................................Z-33 Follow-Up on Prior Year Recommendations ..........................................................Z-33 2017–18 Recommendations...................................................................................Z-33
Santa Clara Family Health Plan Performance Evaluation Report: July 1, 2017–June 30, 2018 California Department of Health Care Services
Page Z-i Health Services Advisory Group, Inc.
TABLE OF CONTENTS
Table of Tables
Table 2.1—DHCS A&I Medical and State Supported Services Audits of SCFHP Audit Review Period: April 1, 2016, through March 31, 2017................................Z-2
Table 3.1—Preventive Screening and Children’s Health Domain Multi-Year Performance Measure Results SCFHP—Santa Clara County ..........................................Z-6
Table 3.2—Preventive Screening and Children’s Health Domain RY 2018 (MY 2017) Performance Measure Findings SCFHP—Santa Clara County ...................Z-8
Table 3.3—Preventive Screening and Women’s Health Domain Multi-Year Performance Measure Results SCFHP—Santa Clara County ..........................................Z-9
Table 3.4—Preventive Screening and Women’s Health Domain RY 2018 (MY 2017) Performance Measure Findings SCFHP—Santa Clara County .................Z-10
Table 3.5—Care for Chronic Conditions Domain Multi-Year Performance Measure Results SCFHP—Santa Clara County .......................................................Z-11
Table 3.6—Care for Chronic Conditions Domain RY 2018 (MY 2017) Performance Measure Findings SCFHP—Santa Clara County.......................................Z-12
Table 3.7—Appropriate Treatment and Utilization Domain Multi-Year Performance Measure Results SCFHP—Santa Clara County ........................................Z-14
Table 3.8—Appropriate Treatment and Utilization Domain RY 2018 (MY 2017) Performance Measure Findings SCFHP—Santa Clara County .................Z-15
Table 3.9—RY 2018 (MY 2017) Performance Measure Findings for All Domains SCFHP—Santa Clara County....................................................................Z-16
Table 3.10—Multi-Year SPD Performance Measure Trend Table SCFHP— Santa Clara County....................................................................................Z-18
Table 3.11—Multi-Year Non-SPD Performance Measure Trend Table SCFHP— Santa Clara County....................................................................................Z-19
Table 3.12—RY 2018 (MY 2017) Performance Measure Comparison and Results for Measures Stratified by the SPD and Non-SPD Populations SCFHP— Santa Clara County....................................................................................Z-21
Table 4.1—Multi-Year MLTSSP Performance Measure Results SCFHP— Santa Clara County....................................................................................Z-24
Table 5.1—SCFHP Diabetes Retinal Eye Exam PIP SMART Aim Measure Results ...Z-28 Table 5.2—SCFHP Diabetes Retinal Eye Exam PIP Intervention Testing Results ......Z-28 Table 5.3—SCFHP Controlling High Blood Pressure PIP SMART Aim Measure Results.Z-29 Table 5.4—SCFHP Controlling High Blood Pressure PIP Intervention Testing Results ...Z-30 Table 5.5—SCFHP Childhood Immunization Status—Combination 3 Disparity PIP
SMART Aim Measure ................................................................................Z-30 Table 5.6—SCFHP Controlling High Blood Pressure PIP SMART Aim Measure ........Z-31 Table 6.1—SCFHP’s Self-Reported Follow-Up on External Quality Review
Recommendations from the July 1, 2016, through June 30, 2017, MCP-Specific Evaluation Report................................................................Z-33
Santa Clara Family Health Plan Performance Evaluation Report: July 1, 2017–June 30, 2018 California Department of Health Care Services
Page Z-ii Health Services Advisory Group, Inc.

Medi-Cal Managed Care External Quality Review Technical ReportAppendix Z: Performance Evaluation ReportSanta Clara Family Health PlanJuly 1, 2017–June 30, 2018
1. Introduction
The California Department of Health Care Services (DHCS) contracted with Health Services Advisory Group, Inc. (HSAG), an external quality review organization (EQRO), to prepare the federally required Medi-Cal Managed Care External Quality Review Technical Report, July 1, 2017–June 30, 2018. The technical report provides an overview of the objectives and methodology for conducting the external quality review (EQR) activities, including requirements related to each activity. Additionally, the technical report provides aggregated results and recommendations for DHCS for each activity.
This appendix is specific to DHCS’ contracted Medi-Cal managed care health plan (MCP), Santa Clara Family Health Plan (“SCFHP” or “the MCP”). The purpose of this appendix is to provide MCP-specific results of each activity and an assessment of the MCP’s strengths and opportunities for improvement with respect to the quality and timeliness of and access to health care services furnished to Medi-Cal Managed Care (MCMC) beneficiaries (referred to as “beneficiaries” in this report). The review period for this MCP-specific evaluation report is July 1, 2017, through June 30, 2018. HSAG will report on activities that take place beyond the review period in SCFHP’s 2018–19 MCP-specific evaluation report. This MCP-specific evaluation report references activities and methodologies described in detail by HSAG in the technical report section.
The aggregate EQR technical report and all MCP- and specialty health plan (SHP)-specific performance evaluation reports reflect HSAG’s external, independent assessment of the quality and timeliness of, and access to, care that MCPs and SHPs are providing to beneficiaries.
Medi-Cal Managed Care Health Plan Overview SCFHP is a full-scope MCP delivering services to beneficiaries as a “Local Initiative” (LI) MCP under the Two-Plan Model (TPM). Beneficiaries may enroll in SCFHP, the LI MCP; or in Anthem Blue Cross Partnership Plan, the alternative commercial plan (CP).
SCFHP became operational in Santa Clara County to provide MCMC services effective February 1997. As of June 30, 2018, SCFHP had 250,627 beneficiaries.1 This represents 78 percent of the beneficiaries enrolled Santa Clara County.
1 Medi-Cal Managed Care Enrollment Report—June 2018. Available at: http://www.dhcs.ca.gov/dataandstats/reports/Pages/MMCDMonthlyEnrollment.aspx. Accessed on: Oct 19, 2018.
Santa Clara Family Health Plan Performance Evaluation Report: July 1, 2017–June 30, 2018 California Department of Health Care Services
Page Z-1 Health Services Advisory Group, Inc.

Medi-Cal Managed Care External Quality Review Technical ReportAppendix Z: Performance Evaluation ReportSanta Clara Family Health PlanJuly 1, 2017–June 30, 2018
2. Managed Care Health Plan Compliance
Compliance Reviews Conducted The following is a summary of the most recent reviews conducted for SCFHP. Unless noted, HSAG’s compliance review summaries are based on final audit/survey reports issued and corrective action plan (CAP) closeout letters dated on or before the end of the review period for this report (June 30, 2018). The descriptions of the various types of reviews may be found within the main section of this technical report.
Table 2.1 summarizes the results and status of the DHCS Audits & Investigations Division (A&I) Medical and State Supported Services Audits of SCFHP. A&I conducted the on-site audits from April 3, 2017, through April 14, 2017. During the April 2017 audits, A&I determined the extent to which SCFHP had operationalized its CAP from the April 2016 Medical and State Supported Services Audits.
Table 2.1—DHCS A&I Medical and State Supported Services Audits of SCFHPAudit Review Period: April 1, 2016, through March 31, 2017
Category Evaluated Deficiencies (Yes/No) Monitoring Status
Utilization Management Yes CAP initiated following the audit and subsequently closed.
Case Management and Coordination of Care Yes CAP initiated following the audit
and subsequently closed.
Access and Availability of Care Yes CAP initiated following the audit and subsequently closed.
Member’s Rights Yes CAP initiated following the audit and subsequently closed.
Quality Management Yes CAP initiated following the audit and subsequently closed.
Administrative and Organizational Capacity Yes CAP initiated following the audit
and subsequently closed.
State Supported Services Yes CAP initiated following the audit and subsequently closed.
Santa Clara Family Health Plan Performance Evaluation Report: July 1, 2017–June 30, 2018 California Department of Health Care Services
Page Z-2 Health Services Advisory Group, Inc.

MANAGED CARE HEALTH PLAN COMPLIANCE
Strengths—Compliance Reviews SCFHP’s responses to the MCP’s CAP for the deficiencies that A&I identified during the April 2017 Medical and State Supported Services Audits resulted in DHCS closing the CAP.
Opportunities for Improvement—Compliance Reviews SCFHP has no outstanding deficiencies from the April 2017 A&I Medical and State Supported Services Audits; therefore, HSAG has no recommendations for the MCP in the area of compliance reviews.
Santa Clara Family Health Plan Performance Evaluation Report: July 1, 2017–June 30, 2018 California Department of Health Care Services
Page Z-3 Health Services Advisory Group, Inc.

Medi-Cal Managed Care External Quality Review Technical ReportAppendix Z: Performance Evaluation ReportSanta Clara Family Health PlanJuly 1, 2017–June 30, 2018
3. Managed Care Health Plan Performance Measures
Performance Measure Validation Results The HEDIS®2 2018 Compliance Audit Final Report of Findings for Santa Clara Family Health Plan contains the detailed findings and recommendations from HSAG’s NCQA HEDIS Compliance Audit™.3 HSAG auditors determined that SCFHP followed the appropriate specifications to produce valid rates, and identified no issues of concern.
Performance Measure Results and Findings After validating the MCP’s performance measure rates, HSAG assessed the results. See Table 3.1 through Table 3.9 for SCFHP’s performance measure results for reporting years (RYs) 2015 through 2018 and performance measure findings for RY 2018. The RY is the year in which the MCP reported the rates. The RY rates reflect measurement year (MY) data from the previous calendar year. Note that data may not be available for all four years.
Note the following regarding Table 3.1 through Table 3.9:
♦ To allow HSAG to provide meaningful assessment of MCP performance and actionable recommendations, HSAG, in collaboration with DHCS, organized the measures into domains based on the health care areas each measure affects. Table 3.1 through Table 3.8 present the performance measure results and findings by domain, and Table 3.9 presents the RY 2018 performance measure findings for the domains combined.
♦ To assess performance for each MCP reporting unit, HSAG compares the rates to national benchmarks. Rates indicating performance above the high performance levels (HPLs) are shaded in gray, and rates indicating performance below the minimum performance levels (MPLs) are bolded. ■ For measures with rates below the MPLs, DHCS requires MCPs to submit to DHCS
improvement plans (IPs) to address the rates below the MPLs (unless MCPs are reporting the rates for the first time).
■ For MCPs that meet DHCS’ Quality of Care CAP thresholds, DHCS issues a CAP; if an MCP’s performance is such that it may trigger a CAP in the following year, DHCS issues an advance warning letter.
■ IPs and CAPs consist of submission of Plan-Do-Study-Act (PDSA) Cycle Worksheets, Quality Improvement (QI) Summaries, or completion of Performance Improvement Projects (PIPs)—as determined by DHCS.
2 Healthcare Effectiveness Data and Information Set (HEDIS®) is a registered trademark of the National Committee for Quality Assurance (NCQA).
3 NCQA HEDIS Compliance AuditTM is a trademark of NCQA.
Santa Clara Family Health Plan Performance Evaluation Report: July 1, 2017–June 30, 2018 California Department of Health Care Services
Page Z-4 Health Services Advisory Group, Inc.

MANAGED CARE HEALTH PLAN PERFORMANCE MEASURES
♦ For RYs 2016, 2017, and 2018, the HPLs and MPLs represent the NCQA Quality Compass®4 Medicaid health maintenance organization (HMO) 90th and 25th percentiles, respectively.
♦ For RY 2015, the HPLs and MPLs represent the NCQA HEDIS Audit Means, Percentiles, and Ratios 90th and 25th percentiles, respectively. For the Comprehensive Diabetes Care—HbA1c Poor Control (>9.0 Percent) measure, for which a lower rate indicates more favorable performance, the HPL and MPL are based on the 10th and 75th percentiles, respectively.
♦ HSAG includes the specific HPL and MPL values for RY 2018 in Section 6 of the Medi-Cal Managed Care External Quality Review Technical Report, July 1, 2017–June 30, 2018 (“Managed Care Health Plan Performance Measures”).
Preventive Screening and Children’s Health
Table 3.1 presents the four-year trending information for the performance measures within the Preventive Screening and Children’s Health domain.
Note the following regarding Table 3.1:
♦ Although HSAG includes information on the MCP’s performance related to the four Children and Adolescents’ Access to Primary Care measures, DHCS did not hold MCPs accountable to meet the MPLs for these measures for RYs 2015 through 2018 (i.e., DHCS did not require MCPs to submit IPs if rates for the measures were below the MPLs). DHCS made this decision due to the small range of variation between the HPL and MPL thresholds for each measure.
♦ Any comparison of RY 2018 performance to RY 2017 or to benchmarks related to the Immunizations for Adolescents—Combination 2 measure should be exercised with caution given the changes that NCQA made to the specification for this measure for RY 2018. NCQA released guidance that recommended a break in trending for this measure; however, DHCS determined to continue trending because the specification change should result in higher rates.
4 Quality Compass® is a registered trademark of NCQA.
Santa Clara Family Health Plan Performance Evaluation Report: July 1, 2017–June 30, 2018 California Department of Health Care Services
Page Z-5 Health Services Advisory Group, Inc.

MANAGED CARE HEALTH PLAN PERFORMANCE MEASURES
Table 3.1—Preventive Screening and Children’s Health DomainMulti-Year Performance Measure Results SCFHP—Santa Clara County
H = Rate indicates performance above the HPL. Bolded Rate = Rate indicates performance below the MPL.
B = Statistical testing result indicates that the RY 2018 rate is significantly better than the RY 2017 rate.
W = Statistical testing result indicates that the RY 2018 rate is significantly worse than the RY 2017 rate.
Measure RY
2015 Rate1
RY 2016
Rate2
RY 2017
Rate3
RY 2018
Rate4
RYs 2017–18 Rate
Difference5
Childhood Immunization Status—Combination 3 71.53% 72.02% 77.37% 77.62% 0.25
Children and Adolescents’ Access to Primary Care Practitioners—12–24 Months
94.65% 92.58% 92.60% 87.74% -4.86W
Children and Adolescents’ Access to Primary Care Practitioners— 25 Months–6 Years
87.69% 85.58% 84.66% 78.55% -6.11W
Children and Adolescents’ Access to Primary Care Practitioners—7–11 Years
90.15% 89.47% 88.98% 86.12% -2.86W
Children and Adolescents’ Access to Primary Care Practitioners—12–19 Years
86.77% 86.09% 85.25% 82.85% -2.40W
Immunizations for Adolescents— Combination 2^ -- -- 36.50% 50.36%H 13.86B
Weight Assessment and Counseling for Nutrition and Physical Activity for Children and Adolescents—Nutrition Counseling—Total
74.94% 63.50% 68.13% 71.78% 3.65
Weight Assessment and Counseling for Nutrition and Physical Activity for Children and Adolescents—Physical Activity Counseling—Total
61.80% 53.04% 65.45% 66.67% 1.22
Santa Clara Family Health Plan Performance Evaluation Report: July 1, 2017–June 30, 2018 California Department of Health Care Services
Page Z-6 Health Services Advisory Group, Inc.

MANAGED CARE HEALTH PLAN PERFORMANCE MEASURES
Measure RY
2015 Rate1
RY 2016
Rate2
RY 2017
Rate3
RY 2018
Rate4
RYs 2017–18 Rate
Difference5
Well-Child Visits in the Third, Fourth, Fifth, and Sixth Years of Life
78.35% 74.45% 73.97% 72.75% -1.22
1 RY 2015 rates reflect MY data from January 1, 2014, through December 31, 2014. 2 RY 2016 rates reflect MY data from January 1, 2015, through December 31, 2015. 3 RY 2017 rates reflect MY data from January 1, 2016, through December 31, 2016. 4 RY 2018 rates reflect MY data from January 1, 2017, through December 31, 2017. 5 Performance comparisons are based on the Chi-square test of statistical significance, with a p value of <0.05. ^ Caution should be exercised when assessing MCP performance for this measure given the changes that NCQA made to the specification for this measure for RY 2018. -- Indicates that the rate is not available.
Table 3.2 presents findings for the RY 2018 performance measures within the Preventive Screening and Children’s Health domain.
Note the following regarding Table 3.2:
♦ DHCS did not hold MCPs accountable to meet MPLs for all four Children and Adolescents’ Access to Primary Care measures within this domain; therefore, HSAG did not include these measures in its assessment of the MCP’s performance related to HPLs and MPLs.
♦ The Immunizations for Adolescents—Combination 2 measure was a first-year measure in RY 2017, and DHCS established no MPL for this measure for RY 2017 because no comparable benchmark existed; therefore, HSAG did not include this measure in the denominators for calculating the percentage of measures with rates that moved to above or below the MPLs in RY 2018.
Santa Clara Family Health Plan Performance Evaluation Report: July 1, 2017–June 30, 2018 California Department of Health Care Services
Page Z-7 Health Services Advisory Group, Inc.

MANAGED CARE HEALTH PLAN PERFORMANCE MEASURES
Table 3.2—Preventive Screening and Children’s Health DomainRY 2018 (MY 2017) Performance Measure Findings SCFHP—Santa Clara County
Criteria Number of Measures
MeetingCriteria
Total Number of Measures
Percentage of Measures
MeetingCriteria
RY 2018 Rates Above HPLs 1 5 20.00% Rates Above HPLs for the Last Three or More Consecutive Years 0 4 0.00%
RY 2018 Rates Significantly Better than RY 2017 Rates* 1 5 20.00%
Rates that Moved from Below MPLs in RY 2017 to Above MPLs in RY 2018 0 0 N/A
RY 2018 Rates Below MPLs 0 5 0.00% Rates Below MPLs for the Last Three or More Consecutive Years 0 4 0.00%
RY 2018 Rates Significantly Worse than RY 2017 Rates* 0 5 0.00%
Rates that Moved from Above MPLs in RY 2017 to Below MPLs in RY 2018 0 4 0.00%
* Performance comparisons are based on the Chi-square test of statistical significance, with a p value of <0.05. N/A = No rates above or below the MPLs from the previous year exist to include in the denominator for calculating whether or not rates moved to above or below MPLs in the most recent year.
Santa Clara Family Health Plan Performance Evaluation Report: July 1, 2017–June 30, 2018 California Department of Health Care Services
Page Z-8 Health Services Advisory Group, Inc.

MANAGED CARE HEALTH PLAN PERFORMANCE MEASURES
Preventive Screening and Women’s Health
Table 3.3 presents the four-year trending information for the performance measures within the Preventive Screening and Women’s Health domain.
Note that any comparison of RY 2018 performance to RY 2017 or to benchmarks related to the Breast Cancer Screening measure should be exercised with caution given the changes that NCQA made to the specification for this measure for RY 2018. NCQA released guidance that recommended a break in trending for this measure; however, DHCS determined to continue trending because the specification change should result in higher rates.
Table 3.3—Preventive Screening and Women’s Health DomainMulti-Year Performance Measure Results SCFHP—Santa Clara County
H = Rate indicates performance above the HPL. Bolded Rate = Rate indicates performance below the MPL.
B = Statistical testing result indicates that the RY 2018 rate is significantly better than the RY 2017 rate.
W = Statistical testing result indicates that the RY 2018 rate is significantly worse than the RY 2017 rate.
Measure RY
2015 Rate1
RY 2016
Rate2
RY 2017
Rate3
RY 2018
Rate4
RYs 2017–18 Rate
Difference5
Breast Cancer Screening^ -- -- 60.25% 60.74% 0.49 Cervical Cancer Screening 57.18% 50.36% 57.42% 54.26% -3.16 Prenatal and Postpartum Care— Postpartum Care 61.07% 64.23% 68.61% 69.10% 0.49
Prenatal and Postpartum Care— Timeliness of Prenatal Care 82.24% 79.56% 82.48% 83.70% 1.22
1 RY 2015 rates reflect MY data from January 1, 2014, through December 31, 2014. 2 RY 2016 rates reflect MY data from January 1, 2015, through December 31, 2015. 3 RY 2017 rates reflect MY data from January 1, 2016, through December 31, 2016. 4 RY 2018 rates reflect MY data from January 1, 2017, through December 31, 2017. 5 Performance comparisons are based on the Chi-square test of statistical significance, with a p value of <0.05. ^ Caution should be exercised when assessing MCP performance for this measure given the changes that NCQA made to the specification for this measure for RY 2018. -- Indicates that the rate is not available.
Santa Clara Family Health Plan Performance Evaluation Report: July 1, 2017–June 30, 2018 California Department of Health Care Services
Page Z-9 Health Services Advisory Group, Inc.

MANAGED CARE HEALTH PLAN PERFORMANCE MEASURES
Table 3.4 presents findings for the RY 2018 performance measures within the Preventive Screening and Women’s Health domain. Note that the Breast Cancer Screening measure was a first-year measure in RY 2017, and DHCS did not hold MCPs accountable to meet an MPL for this measure in RY 2017; therefore, HSAG did not include this measure in the denominators for calculating the percentage of measures with rates that moved to above or below the MPLs in RY 2018.
Table 3.4—Preventive Screening and Women’s Health DomainRY 2018 (MY 2017) Performance Measure Findings SCFHP—Santa Clara County
Criteria Number of Measures
MeetingCriteria
Total Number of Measures
Percentage of Measures
MeetingCriteria
RY 2018 Rates Above HPLs 0 4 0.00% Rates Above HPLs for the Last Three or More Consecutive Years 0 3 0.00%
RY 2018 Rates Significantly Better than RY 2017 Rates* 0 4 0.00%
Rates that Moved from Below MPLs in RY 2017 to Above MPLs in RY 2018 0 0 N/A
RY 2018 Rates Below MPLs 0 4 0.00% Rates Below MPLs for the Last Three or More Consecutive Years 0 3 0.00%
RY 2018 Rates Significantly Worse than RY 2017 Rates* 0 4 0.00%
Rates that Moved from Above MPLs in RY 2017 to Below MPLs in RY 2018 0 3 0.00%
* Performance comparisons are based on the Chi-square test of statistical significance, with a p value of <0.05. N/A = No rates above or below the MPLs from the previous year exist to include in the denominator for calculating whether or not rates moved to above or below MPLs in the most recent year.
Santa Clara Family Health Plan Performance Evaluation Report: July 1, 2017–June 30, 2018 California Department of Health Care Services
Page Z-10 Health Services Advisory Group, Inc.

MANAGED CARE HEALTH PLAN PERFORMANCE MEASURES
Care for Chronic Conditions
Table 3.5 presents the four-year trending information for the performance measures within the Care for Chronic Conditions domain.
Table 3.5—Care for Chronic Conditions Domain Multi-Year Performance Measure Results SCFHP—Santa Clara County
H = Rate indicates performance above the HPL. Bolded Rate = Rate indicates performance below the MPL.
B = Statistical testing result indicates that the RY 2018 rate is significantly better than the RY 2017 rate.
W = Statistical testing result indicates that the RY 2018 rate is significantly worse than the RY 2017 rate.
Measure RY
2015 Rate1
RY 2016
Rate2
RY 2017
Rate3
RY 2018
Rate4
RYs 2017–18 Rate
Difference5
Annual Monitoring for Patients on Persistent Medications— ACE Inhibitors or ARBs
87.74% 87.01% 86.42% 88.59% 2.17B
Annual Monitoring for Patients on Persistent Medications— Diuretics
86.65% 86.39% 86.00% 88.90% 2.90B
Asthma Medication Ratio -- -- 44.94% 67.48% 22.54B
Comprehensive Diabetes Care— Blood Pressure Control (<140/90 mm Hg)
60.58% 37.96% 59.37% 62.53% 3.16
Comprehensive Diabetes Care— Eye Exam (Retinal) Performed 48.66% 51.09% 62.29% 63.02% 0.73
Comprehensive Diabetes Care— HbA1c Control (<8.0 Percent) 58.15% 60.10%H 53.77% 54.50% 0.73
Comprehensive Diabetes Care— HbA1c Poor Control (>9.0 Percent)*
29.68%H 32.36% 37.23% 34.06% -3.17
Comprehensive Diabetes Care— HbA1c Testing 91.48% 86.37% 88.32% 88.32% 0.00
Comprehensive Diabetes Care— Medical Attention for Nephropathy
90.51%H 85.64% 88.81% 86.62% -2.19
Santa Clara Family Health Plan Performance Evaluation Report: July 1, 2017–June 30, 2018 California Department of Health Care Services
Page Z-11 Health Services Advisory Group, Inc.

MANAGED CARE HEALTH PLAN PERFORMANCE MEASURES
Measure RY
2015 Rate1
RY 2016
Rate2
RY 2017
Rate3
RY 2018
Rate4
RYs 2017–18 Rate
Difference5
Controlling High Blood Pressure 54.99% 36.01% 66.91% 65.94% -0.97 1 RY 2015 rates reflect MY data from January 1, 2014, through December 31, 2014. 2 RY 2016 rates reflect MY data from January 1, 2015, through December 31, 2015. 3 RY 2017 rates reflect MY data from January 1, 2016, through December 31, 2016. 4 RY 2018 rates reflect MY data from January 1, 2017, through December 31, 2017. 5 Performance comparisons are based on the Chi-square test of statistical significance, with a p value of <0.05. * A lower rate indicates better performance for this measure. -- Indicates that the rate is not available.
Table 3.6 presents findings for the RY 2018 performance measures within the Care for Chronic Conditions domain. Note that the Asthma Medication Ratio measure was a first-year measure in RY 2017, and DHCS did not hold MCPs accountable to meet an MPL for this measure in RY 2017; therefore, HSAG did not include this measure in the denominators for calculating the percentage of measures with rates that moved to above or below the MPLs in RY 2018.
Table 3.6—Care for Chronic Conditions Domain RY 2018 (MY 2017) Performance Measure Findings SCFHP—Santa Clara County
Criteria Number of Measures
MeetingCriteria
Total Number of Measures
Percentage of Measures
MeetingCriteria
RY 2018 Rates Above HPLs 0 10 0.00% Rates Above HPLs for the Last Three or More Consecutive Years 0 9 0.00%
RY 2018 Rates Significantly Better than RY 2017 Rates* 3 10 30.00%
Rates that Moved from Below MPLs in RY 2017 to Above MPLs in RY 2018 0 0 N/A
RY 2018 Rates Below MPLs 1 10 10.00% Rates Below MPLs for the Last Three or More Consecutive Years 0 9 0.00%
RY 2018 Rates Significantly Worse than RY 2017 Rates* 0 10 0.00%
Santa Clara Family Health Plan Performance Evaluation Report: July 1, 2017–June 30, 2018 California Department of Health Care Services
Page Z-12 Health Services Advisory Group, Inc.

MANAGED CARE HEALTH PLAN PERFORMANCE MEASURES
Criteria Number of Measures
MeetingCriteria
Total Number of Measures
Percentage of Measures
MeetingCriteria
Rates that Moved from Above MPLs in RY 2017 to Below MPLs in RY 2018 1 9 11.11%
* Performance comparisons are based on the Chi-square test of statistical significance, with a p value of <0.05. N/A = No rates above or below the MPLs from the previous year exist to include in the denominator for calculating whether or not rates moved to above or below MPLs in the most recent year.
Appropriate Treatment and Utilization
Table 3.7 presents the four-year trending information for the performance measures within the Appropriate Treatment and Utilization domain.
Note the following regarding Table 3.7:
♦ The All-Cause Readmissions measure is a non-HEDIS measure originally developed for DHCS’ All-Cause Readmissions collaborative quality improvement project (QIP); therefore, DHCS does not establish an HPL or MPL for this measure. For the All-Cause Readmissions measure, a lower rate indicates better performance (i.e., fewer readmissions).
♦ The two Ambulatory Care measures are utilization measures, which measure the volume of services used. DHCS does not hold MCPs accountable to meet MPLs for utilization measures, and HSAG does not compare performance for these measures against HPLs and MPLs. Additionally, because high and low rates do not necessarily indicate better or worse performance, HSAG did not compare performance for these measures across years.
♦ DHCS established no HPL or MPL for the two Depression Screening and Follow-Up for Adolescents and Adults measures for RY 2018 because no comparable benchmarks exist. Additionally, although MCPs reported the two Depression Screening and Follow-Up for Adolescents and Adults measures for RY 2018, HSAG does not present the performance measure results for these measures in this report because the reported rates do not accurately represent services being provided. This is due to the Depression Screening and Follow-Up for Adolescents and Adults measures being new HEDIS measures for RY 2018, NCQA requiring MCPs to submit rates for these measures using the new Electronic Clinical Data Systems (ECDS) reporting methodology, and inconsistent data reporting processes by calculation vendors. Thus, MCPs experienced numerous challenges obtaining data sources to use for ECDS reporting. DHCS and HSAG, in consultation with NCQA, will work with MCPs to improve data capture for RY 2019.
Santa Clara Family Health Plan Performance Evaluation Report: July 1, 2017–June 30, 2018 California Department of Health Care Services
Page Z-13 Health Services Advisory Group, Inc.

MANAGED CARE HEALTH PLAN PERFORMANCE MEASURES
♦ Note that due to changes that NCQA made to the specifications for the Use of Imaging Studies for Low Back Pain measure in RY 2018, NCQA released guidance to exercise caution when trending the results for this measure. Therefore, caution should be used when comparing MCP performance across years or when comparing MCP results to benchmarks related to the Use of Imaging Studies for Low Back Pain measure, as differences in rates may be a result of the specification changes rather than a reflection of performance.
Table 3.7—Appropriate Treatment and Utilization DomainMulti-Year Performance Measure Results SCFHP—Santa Clara County
H = Rate indicates performance above the HPL. Bolded Rate = Rate indicates performance below the MPL.
B = Statistical testing result indicates that the RY 2018 rate is significantly better than the RY 2017 rate.
W = Statistical testing result indicates that the RY 2018 rate is significantly worse than the RY 2017 rate.
Measure RY
2015 Rate1
RY 2016
Rate2
RY 2017
Rate3
RY 2018
Rate4
RYs 2017–18 Rate
Difference5
All-Cause Readmissions* 16.92% 18.60% 18.95% 17.21% -1.74B
Ambulatory Care—Emergency Department (ED) Visits per 1,000 Member Months**
34.98 35.65 34.12 38.00 Not Tested
Ambulatory Care—Outpatient Visits per 1,000 Member Months**
233.52 262.31 240.19 224.59 Not Tested
Avoidance of Antibiotic Treatment in Adults With Acute Bronchitis
30.94% 30.99% 31.93% 38.52% 6.59B
Use of Imaging Studies for Low Back Pain^ 85.52%H 78.86% 74.40% 76.03% 1.63
1 RY 2015 rates reflect MY data from January 1, 2014, through December 31, 2014. 2 RY 2016 rates reflect MY data from January 1, 2015, through December 31, 2015. 3 RY 2017 rates reflect MY data from January 1, 2016, through December 31, 2016. 4 RY 2018 rates reflect MY data from January 1, 2017, through December 31, 2017. 5 Performance comparisons are based on the Chi-square test of statistical significance, with a p value of <0.05. * A lower rate indicates better performance for this measure.
Santa Clara Family Health Plan Performance Evaluation Report: July 1, 2017–June 30, 2018 California Department of Health Care Services
Page Z-14 Health Services Advisory Group, Inc.

MANAGED CARE HEALTH PLAN PERFORMANCE MEASURES
** Member months are a member's “contribution” to the total yearly membership. ^ Caution should be exercised when assessing MCP performance for this measure given the changes that NCQA made to the specification for this measure for RY 2018. Not Tested = An RY 2017–18 rate difference was not calculated because high and low rates do not necessarily indicate better or worse performance.
Table 3.8 presents findings for the RY 2018 performance measures within the Appropriate Treatment and Utilization domain. DHCS did not hold MCPs accountable to meet MPLs for the following measures within this domain; therefore, HSAG did not include these measures in its assessment of the MCP’s performance related to HPLs and MPLs:
♦ All-Cause Readmissions ♦ Both Ambulatory Care measures
Table 3.8—Appropriate Treatment and Utilization DomainRY 2018 (MY 2017) Performance Measure Findings SCFHP—Santa Clara County
Criteria Number of Measures
MeetingCriteria
Total Number of Measures
Percentage of Measures
MeetingCriteria
RY 2018 Rates Above HPLs 0 2 0.00% Rates Above HPLs for the Last Three or More Consecutive Years 0 2 0.00%
RY 2018 Rates Significantly Better than RY 2017 Rates* 2 3 66.67%
Rates that Moved from Below MPLs in RY 2017 to Above MPLs in RY 2018 0 0 N/A
RY 2018 Rates Below MPLs 0 2 0.00% Rates Below MPLs for the Last Three or More Consecutive Years 0 2 0.00%
RY 2018 Rates Significantly Worse than RY 2017 Rates* 0 3 0.00%
Rates that Moved from Above MPLs in RY 2017 to Below MPLs in RY 2018 0 2 0.00%
* Performance comparisons are based on the Chi-square test of statistical significance, with a p value of <0.05. N/A = No rates above or below the MPLs from the previous year exist to include in the denominator for calculating whether or not rates moved to above or below MPLs in the most recent year.
Santa Clara Family Health Plan Performance Evaluation Report: July 1, 2017–June 30, 2018 California Department of Health Care Services
Page Z-15 Health Services Advisory Group, Inc.

MANAGED CARE HEALTH PLAN PERFORMANCE MEASURES
Performance Measure Findings—All Domains
Table 3.9 presents a summary of SCFHP’s RY 2018 performance across all External Accountability Set (EAS) measures.
Note the following regarding Table 3.9:
♦ DHCS did not hold MCPs accountable to meet MPLs for the following measures; therefore, HSAG did not include these measures in its assessment of the MCP’s performance related to HPLs and MPLs: ■ All-Cause Readmissions ■ Both Ambulatory Care measures ■ All four Children and Adolescents’ Access to Primary Care measures
♦ DHCS did not hold MCPs accountable to meet MPLs for the following measures in RY 2017; therefore, HSAG did not include these measures in the denominators for calculating the percentage of measures with rates that moved to above or below the MPLs in RY 2018 and for calculating the percentage of measures with rates below MPLs for only the last two consecutive years: ■ Asthma Medication Ratio ■ Breast Cancer Screening ■ Immunizations for Adolescents—Combination 2
Table 3.9—RY 2018 (MY 2017) Performance Measure Findings for All Domains SCFHP—Santa Clara County
Criteria Number of Measures
MeetingCriteria
Total Number of Measures
Percentage of Measures
MeetingCriteria
RY 2018 Rates Above HPLs 1 21 4.76% Rates Above HPLs for the Last Three or More Consecutive Years 0 18 0.00%
RY 2018 Rates Significantly Better than RY 2017 Rates* 6 22 27.27%
Rates that Moved from Below MPLs in RY 2017 to Above MPLs in RY 2018 0 0 N/A
RY 2018 Rates Below MPLs 1 21 4.76% Rates Below MPLs for Only the Last Two Consecutive Years 0 18 0.00%
Santa Clara Family Health Plan Performance Evaluation Report: July 1, 2017–June 30, 2018 California Department of Health Care Services
Page Z-16 Health Services Advisory Group, Inc.
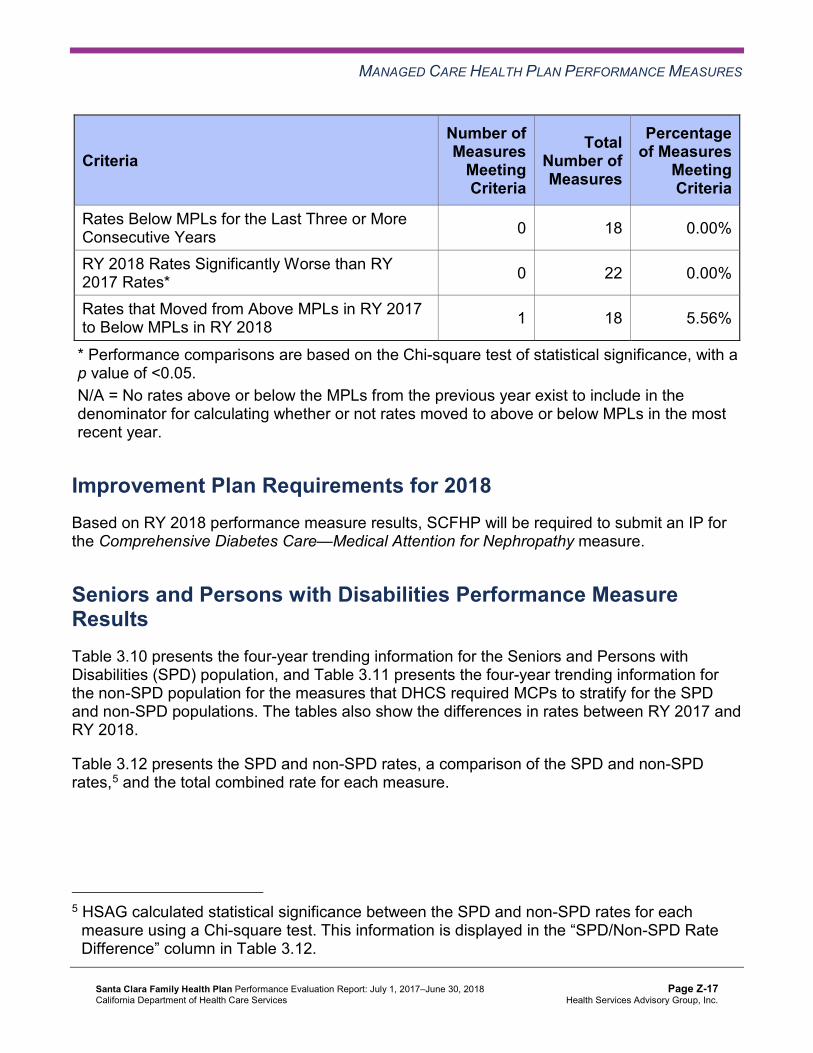
MANAGED CARE HEALTH PLAN PERFORMANCE MEASURES
Criteria Number of Measures
MeetingCriteria
Total Number of Measures
Percentage of Measures
MeetingCriteria
Rates Below MPLs for the Last Three or More Consecutive Years 0 18 0.00%
RY 2018 Rates Significantly Worse than RY 2017 Rates* 0 22 0.00%
Rates that Moved from Above MPLs in RY 2017 to Below MPLs in RY 2018 1 18 5.56%
* Performance comparisons are based on the Chi-square test of statistical significance, with a p value of <0.05. N/A = No rates above or below the MPLs from the previous year exist to include in the denominator for calculating whether or not rates moved to above or below MPLs in the most recent year.
Improvement Plan Requirements for 2018 Based on RY 2018 performance measure results, SCFHP will be required to submit an IP for the Comprehensive Diabetes Care—Medical Attention for Nephropathy measure.
Seniors and Persons with Disabilities Performance Measure Results Table 3.10 presents the four-year trending information for the Seniors and Persons with Disabilities (SPD) population, and Table 3.11 presents the four-year trending information for the non-SPD population for the measures that DHCS required MCPs to stratify for the SPD and non-SPD populations. The tables also show the differences in rates between RY 2017 and RY 2018.
Table 3.12 presents the SPD and non-SPD rates, a comparison of the SPD and non-SPD rates,5 and the total combined rate for each measure.
5 HSAG calculated statistical significance between the SPD and non-SPD rates for each measure using a Chi-square test. This information is displayed in the “SPD/Non-SPD Rate Difference” column in Table 3.12.
Santa Clara Family Health Plan Performance Evaluation Report: July 1, 2017–June 30, 2018 California Department of Health Care Services
Page Z-17 Health Services Advisory Group, Inc.

MANAGED CARE HEALTH PLAN PERFORMANCE MEASURES
Table 3.10—Multi-Year SPD Performance Measure Trend Table SCFHP—Santa Clara County
B = Statistical testing result indicates that the RY 2018 SPD rate is significantly better than the RY 2017 SPD rate.
W = Statistical testing result indicates that the RY 2018 SPD rate is significantly worse than the RY 2017 SPD rate.
Measure RY
2015 SPD
Rate1
RY 2016 SPD
Rate2
RY 2017 SPD
Rate3
RY 2018 SPD
Rate4
RYs 2017–18 Rate
Difference5
All-Cause Readmissions* 21.25% 23.40% 24.31% 23.20% -1.11 Ambulatory Care—Emergency Department (ED) Visits per 1,000 Member Months**
44.71 45.34 46.23 49.68 Not Tested
Ambulatory Care—Outpatient Visits per 1,000 Member Months**
399.37 446.55 436.74 395.48 Not Tested
Annual Monitoring for Patients on Persistent Medications— ACE Inhibitors or ARBs
88.66% 88.83% 88.66% 90.52% 1.86B
Annual Monitoring for Patients on Persistent Medications— Diuretics
88.35% 89.19% 90.05% 92.03% 1.98B
Children and Adolescents' Access to Primary Care Practitioners—12–24 Months
67.31% NA NA NA Not Comparable
Children and Adolescents' Access to Primary Care Practitioners— 25 Months–6 Years
84.40% 80.76% 80.54% 78.13% -2.41
Children and Adolescents' Access to Primary Care Practitioners—7–11 Years
86.37% 86.10% 88.26% 82.34% -5.92W
Children and Adolescents' Access to Primary Care Practitioners—12–19 Years
81.33% 78.28% 78.80% 76.41% -2.39
1 RY 2015 rates reflect MY data from January 1, 2014, through December 31, 2014. 2 RY 2016 rates reflect MY data from January 1, 2015, through December 31, 2015. 3 RY 2017 rates reflect MY data from January 1, 2016, through December 31, 2016.
Santa Clara Family Health Plan Performance Evaluation Report: July 1, 2017–June 30, 2018 California Department of Health Care Services
Page Z-18 Health Services Advisory Group, Inc.
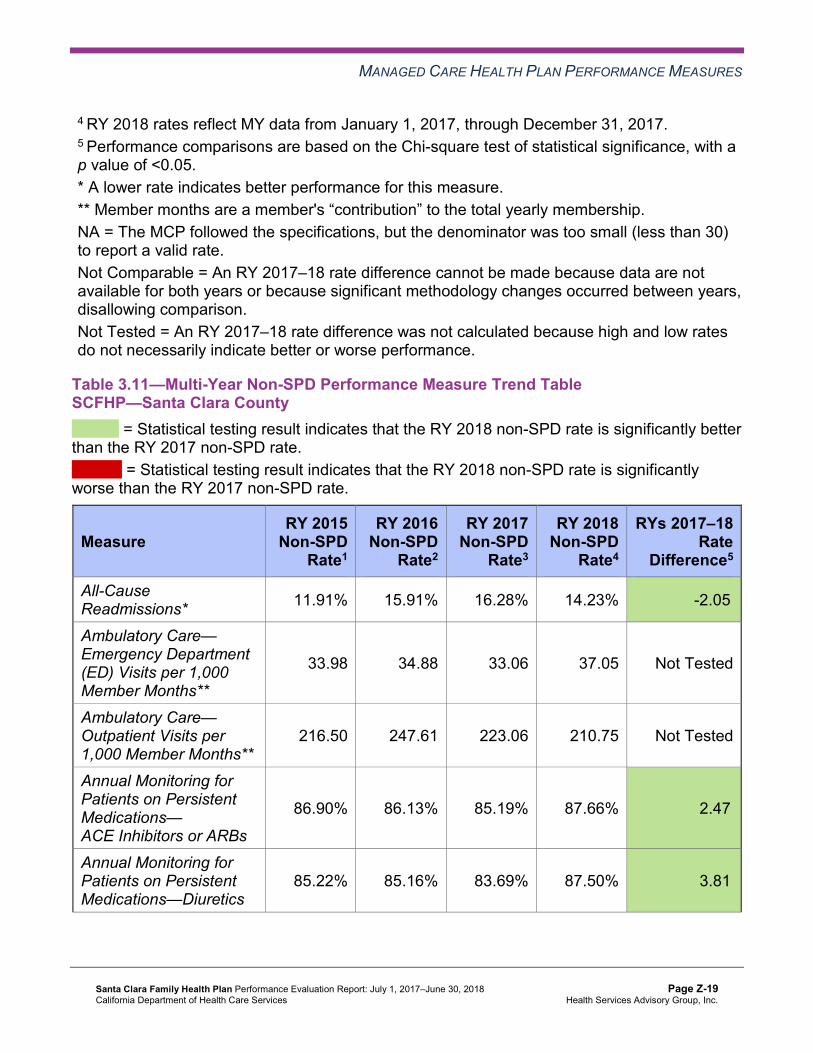
MANAGED CARE HEALTH PLAN PERFORMANCE MEASURES
4 RY 2018 rates reflect MY data from January 1, 2017, through December 31, 2017. 5 Performance comparisons are based on the Chi-square test of statistical significance, with a p value of <0.05. * A lower rate indicates better performance for this measure. ** Member months are a member's “contribution” to the total yearly membership. NA = The MCP followed the specifications, but the denominator was too small (less than 30) to report a valid rate. Not Comparable = An RY 2017–18 rate difference cannot be made because data are not available for both years or because significant methodology changes occurred between years, disallowing comparison. Not Tested = An RY 2017–18 rate difference was not calculated because high and low rates do not necessarily indicate better or worse performance.
Table 3.11—Multi-Year Non-SPD Performance Measure Trend Table SCFHP—Santa Clara County
B = Statistical testing result indicates that the RY 2018 non-SPD rate is significantly better than the RY 2017 non-SPD rate.
W = Statistical testing result indicates that the RY 2018 non-SPD rate is significantly worse than the RY 2017 non-SPD rate.
Measure RY 2015
Non-SPD Rate1
RY 2016 Non-SPD
Rate2
RY 2017 Non-SPD
Rate3
RY 2018 Non-SPD
Rate4
RYs 2017–18 Rate
Difference5
All-Cause Readmissions* 11.91% 15.91% 16.28% 14.23% -2.05B
Ambulatory Care— Emergency Department (ED) Visits per 1,000 Member Months**
33.98 34.88 33.06 37.05 Not Tested
Ambulatory Care— Outpatient Visits per 1,000 Member Months**
216.50 247.61 223.06 210.75 Not Tested
Annual Monitoring for Patients on Persistent Medications— ACE Inhibitors or ARBs
86.90% 86.13% 85.19% 87.66% 2.47B
Annual Monitoring for Patients on Persistent Medications—Diuretics
85.22% 85.16% 83.69% 87.50% 3.81B
Santa Clara Family Health Plan Performance Evaluation Report: July 1, 2017–June 30, 2018 California Department of Health Care Services
Page Z-19 Health Services Advisory Group, Inc.

MANAGED CARE HEALTH PLAN PERFORMANCE MEASURES
Measure RY 2015
Non-SPD Rate1
RY 2016 Non-SPD
Rate2
RY 2017 Non-SPD
Rate3
RY 2018 Non-SPD
Rate4
RYs 2017–18 Rate
Difference5
Children and Adolescents' Access to Primary Care Practitioners— 12–24 Months
94.97% 92.60% 92.63% 87.78% -4.85W
Children and Adolescents' Access to Primary Care Practitioners— 25 Months–6 Years
87.77% 85.64% 84.73% 78.56% -6.17W
Children and Adolescents' Access to Primary Care Practitioners— 7–11 Years
90.30% 89.57% 89.00% 86.23% -2.77W
Children and Adolescents' Access to Primary Care Practitioners— 12–19 Years
87.02% 86.40% 85.48% 83.07% -2.41W
1 RY 2015 rates reflect MY data from January 1, 2014, through December 31, 2014. 2 RY 2016 rates reflect MY data from January 1, 2015, through December 31, 2015. 3 RY 2017 rates reflect MY data from January 1, 2016, through December 31, 2016. 4 RY 2018 rates reflect MY data from January 1, 2017, through December 31, 2017. 5 Performance comparisons are based on the Chi-square test of statistical significance, with a p value of <0.05. * A lower rate indicates better performance for this measure. ** Member months are a member's “contribution” to the total yearly membership. Not Tested = An RY 2017–18 rate difference was not calculated because high and low rates do not necessarily indicate better or worse performance.
Santa Clara Family Health Plan Performance Evaluation Report: July 1, 2017–June 30, 2018 California Department of Health Care Services
Page Z-20 Health Services Advisory Group, Inc.

MANAGED CARE HEALTH PLAN PERFORMANCE MEASURES
Table 3.12—RY 2018 (MY 2017) Performance Measure Comparison and Results forMeasures Stratified by the SPD and Non-SPD PopulationsSCFHP—Santa Clara County
B = Statistical testing result indicates that the RY 2018 SPD rate is significantly better than the RY 2018 non-SPD rate.
W = Statistical testing result indicates that the RY 2018 SPD rate is significantly worse than the RY 2018 non-SPD rate.
Measure RY 2018
SPD Rate1
RY 2018 Non-SPD
Rate1
SPD/Non-SPDRate
Difference2
RY 2018 Total Rate3
All-Cause Readmissions* 23.20% 14.23% 8.97W 17.21% Ambulatory Care—Emergency Department (ED) Visits per 1,000 Member Months**
49.68 37.05 Not Tested 38.00
Ambulatory Care—Outpatient Visits per 1,000 Member Months** 395.48 210.75 Not Tested 224.59
Annual Monitoring for Patients on Persistent Medications— ACE Inhibitors or ARBs
90.52% 87.66% 2.86B 88.59%
Annual Monitoring for Patients on Persistent Medications—Diuretics 92.03% 87.50% 4.53B 88.90%
Children and Adolescents' Access to Primary Care Practitioners— 12–24 Months
NA 87.78% Not Comparable 87.74%
Children and Adolescents' Access to Primary Care Practitioners— 25 Months–6 Years
78.13% 78.56% -0.43 78.55%
Children and Adolescents' Access to Primary Care Practitioners— 7–11 Years
82.34% 86.23% -3.89W 86.12%
Children and Adolescents' Access to Primary Care Practitioners— 12–19 Years
76.41% 83.07% -6.66W 82.85%
1 RY 2018 rates reflect MY data from January 1, 2017, through December 31, 2017. 2 Performance comparisons are based on the Chi-square test of statistical significance, with a p value of <0.05. 3 Total rates are based on the MCP reporting unit’s total results, including the SPD and non-SPD populations. Please note, if data are not available for either the SPD or non-SPD population, the total rate is based on results reported for the available population.
Santa Clara Family Health Plan Performance Evaluation Report: July 1, 2017–June 30, 2018 California Department of Health Care Services
Page Z-21 Health Services Advisory Group, Inc.
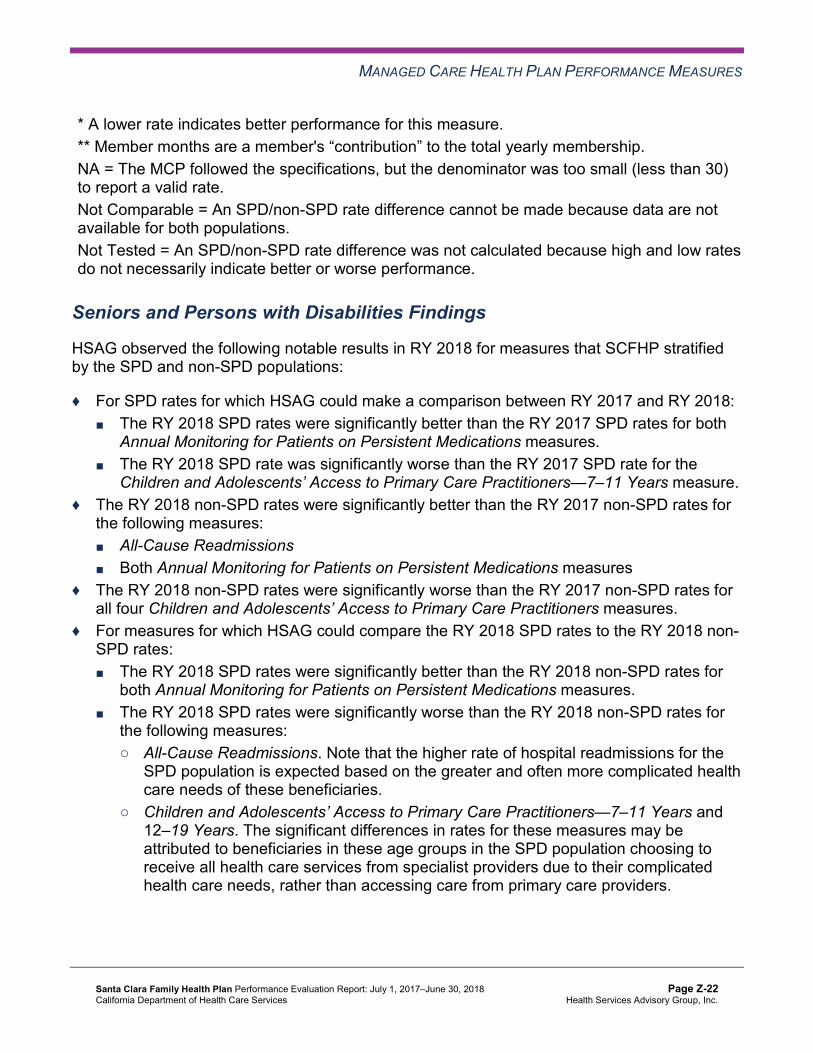
MANAGED CARE HEALTH PLAN PERFORMANCE MEASURES
* A lower rate indicates better performance for this measure. ** Member months are a member's “contribution” to the total yearly membership. NA = The MCP followed the specifications, but the denominator was too small (less than 30) to report a valid rate. Not Comparable = An SPD/non-SPD rate difference cannot be made because data are not available for both populations. Not Tested = An SPD/non-SPD rate difference was not calculated because high and low rates do not necessarily indicate better or worse performance.
Seniors and Persons with Disabilities Findings
HSAG observed the following notable results in RY 2018 for measures that SCFHP stratified by the SPD and non-SPD populations:
♦ For SPD rates for which HSAG could make a comparison between RY 2017 and RY 2018: ■ The RY 2018 SPD rates were significantly better than the RY 2017 SPD rates for both
Annual Monitoring for Patients on Persistent Medications measures. ■ The RY 2018 SPD rate was significantly worse than the RY 2017 SPD rate for the
Children and Adolescents’ Access to Primary Care Practitioners—7–11 Years measure. ♦ The RY 2018 non-SPD rates were significantly better than the RY 2017 non-SPD rates for
the following measures: ■ All-Cause Readmissions ■ Both Annual Monitoring for Patients on Persistent Medications measures
♦ The RY 2018 non-SPD rates were significantly worse than the RY 2017 non-SPD rates for all four Children and Adolescents’ Access to Primary Care Practitioners measures.
♦ For measures for which HSAG could compare the RY 2018 SPD rates to the RY 2018 non-SPD rates: ■ The RY 2018 SPD rates were significantly better than the RY 2018 non-SPD rates for
both Annual Monitoring for Patients on Persistent Medications measures. ■ The RY 2018 SPD rates were significantly worse than the RY 2018 non-SPD rates for
the following measures: ○ All-Cause Readmissions. Note that the higher rate of hospital readmissions for the
SPD population is expected based on the greater and often more complicated health care needs of these beneficiaries.
○ Children and Adolescents’ Access to Primary Care Practitioners—7–11 Years and 12–19 Years. The significant differences in rates for these measures may be attributed to beneficiaries in these age groups in the SPD population choosing to receive all health care services from specialist providers due to their complicated health care needs, rather than accessing care from primary care providers.
Santa Clara Family Health Plan Performance Evaluation Report: July 1, 2017–June 30, 2018 California Department of Health Care Services
Page Z-22 Health Services Advisory Group, Inc.

MANAGED CARE HEALTH PLAN PERFORMANCE MEASURES
Strengths—Performance Measures HSAG auditors determined that SCFHP followed the appropriate specifications to produce valid rates, and identified no issues of concern.
The rates for the following six of 22 measures (27 percent) improved significantly from RY 2017 to RY 2018:
♦ All-Cause Readmissions. ♦ Both Annual Monitoring for Patients on Persistent Medications measures. ♦ Asthma Medication Ratio. ♦ Avoidance of Antibiotic Treatment in Adults With Acute Bronchitis. ♦ Immunizations for Adolescents—Combination 2. Additionally, the rate for this measure was
above the HPL in RY 2018.
Opportunities for Improvement—Performance Measures The rate for the Comprehensive Diabetes Care—Medical Attention for Nephropathy measure declined from RY 2017 to RY 2018. Although the decline was not statistically significant, the change resulted in the rate moving from above the MPL in RY 2017 to below the MPL in RY 2018. SCFHP has the opportunity to identify the causes for the rate for the Comprehensive Diabetes Care—Medical Attention for Nephropathy measure moving to below the MPL in RY 2018 and to identify strategies to increase the percentage of beneficiaries ages 18 to 75 with diabetes (type 1 and type 2) receiving nephropathy screenings or monitoring tests.
Santa Clara Family Health Plan Performance Evaluation Report: July 1, 2017–June 30, 2018 California Department of Health Care Services
Page Z-23 Health Services Advisory Group, Inc.

Medi-Cal Managed Care External Quality Review Technical ReportAppendix Z: Performance Evaluation ReportSanta Clara Family Health PlanJuly 1, 2017–June 30, 2018
4. MLTSSP Performance Measure Results
Due to SCFHP’s participation in California’s Coordinated Care Initiative as a Managed Long-Term Services and Supports Plan (MLTSSP), DHCS required that SCFHP report rates for three HEDIS measures for HSAG to validate as part of the NCQA HEDIS Compliance Audit.
Table 4.1 presents the rates for each required MLTSSP performance measure for RYs 2016, 2017, and 2018. The RY is the year in which the MLTSSP reported the rates. The RY rates reflect MY data from the previous calendar year. Note that the Ambulatory Care—Emergency Department Visits and Ambulatory Care—Outpatient Visits measures are utilization measures which measure the volume of services used. High and low rates do not necessarily indicate better or worse performance; therefore, for these measures, HSAG did not compare performance between RY 2017 and RY 2018.
Table 4.1—Multi-Year MLTSSP Performance Measure Results SCFHP—Santa Clara County
B = Statistical testing result indicates that the RY 2018 rate is significantly better than the RY 2017 rate.
W = Statistical testing result indicates that the RY 2018 rate is significantly worse than the RY 2017 rate.
Measure RY 2016 MLTSS
Rate1
RY 2017 MLTSS
Rate2
RY 2018 MLTSS
Rate3
RYs 2017–18 Rate
Difference4
Ambulatory Care—Emergency Department (ED) Visits per 1,000 Member Months*
46.68 46.30 51.66 Not Tested
Ambulatory Care—Outpatient Visits per 1,000 Member Months* 351.61 347.94 343.24 Not Tested
Medication Reconciliation Post-Discharge 20.44% 44.28% 42.09% -2.19
1 RY 2016 rates reflect MY data from January 1, 2015, through December 31, 2015. 2 RY 2017 rates reflect MY data from January 1, 2016, through December 31, 2016. 3 RY 2018 rates reflect MY data from January 1, 2017, through December 31, 2017. 4 Performance comparisons are based on the Chi-square test of statistical significance, with a p value of <0.05. * Member months are a member's “contribution” to the total yearly membership. Not Tested = An RY 2017–18 rate difference was not calculated because high and low rates do not necessarily indicate better or worse performance.
Santa Clara Family Health Plan Performance Evaluation Report: July 1, 2017–June 30, 2018 California Department of Health Care Services
Page Z-24 Health Services Advisory Group, Inc.

MLTSSP PERFORMANCE MEASURE RESULTS
Managed Long-Term Services and Supports Plan PerformanceMeasure Findings The rate for the Medication Reconciliation Post-Discharge measure showed no statistically significant change from RY 2017 to RY 2018.
Santa Clara Family Health Plan Performance Evaluation Report: July 1, 2017–June 30, 2018 California Department of Health Care Services
Page Z-25 Health Services Advisory Group, Inc.

Medi-Cal Managed Care External Quality Review Technical ReportAppendix Z: Performance Evaluation ReportSanta Clara Family Health PlanJuly 1, 2017–June 30, 2018
5. Performance Improvement Projects
Performance Improvement Project Overview The key concepts of the rapid-cycle PIP framework include forming a PIP team, setting aims, establishing measures, determining interventions using quality improvement tools, conducting PDSA cycles to test interventions, and planning for the spread of successful changes. The core component of the rapid-cycle PIP approach involves testing changes on a small scale so that improvement can occur more efficiently and lead to long-term sustainability. The following modules guide MCPs through this rapid-cycle PIP process:
♦ Module 1—PIP Initiation ■ MCPs outline the framework for the PIP, which includes:
○ The topic rationale. ○ Comparative data supporting the need to improve the selected topic. ○ A list of the PIP team members, which consists of internal and external stakeholders. ○ A completed key driver diagram that defines the theory of change for improvement,
including the SMART (Specific, Measurable, Achievable, Relevant, and Time-bound) Aim and Global Aim.
♦ Module 2—SMART Aim Data Collection ■ MCPs define the SMART Aim measure and data collection methodology and develop
the SMART Aim data run chart. ♦ Module 3—Intervention Determination
■ MCPs use process mapping and failure modes and effects analysis to identify potential interventions to test which may have direct effects on the SMART Aim.
♦ Module 4—Plan-Do-Study-Act (PDSA) ■ MCPs test and evaluate the interventions identified in Module 3 through a series of
PDSA cycles. ♦ Module 5—PIP Conclusions
■ MCPs interpret results and summarize: ○ Key findings and outcomes achieved. ○ Assessment of each tested intervention. ○ Lessons learned, including how demonstrated improvement can be shared and used
as a foundation for further improvement going forward. ○ Plan for sustained improvement.
Santa Clara Family Health Plan Performance Evaluation Report: July 1, 2017–June 30, 2018 California Department of Health Care Services
Page Z-26 Health Services Advisory Group, Inc.

PERFORMANCE IMPROVEMENT PROJECTS
Based on the agreed-upon timeline, MCPs submit each module to HSAG for validation. Throughout the rapid-cycle PIP process, HSAG provides technical assistance to MCPs to ensure that PIPs are methodologically sound and to problem-solve with MCPs regarding how to address challenges that occur. Through an iterative process, MCPs have opportunities to make corrections to modules 1 through 3 to achieve all validation criteria.
Once MCPs achieve all validation criteria for modules 1 through 3 and receive feedback on the intervention Plan portion of Module 4, MCPs test interventions. During the intervention testing phase of the PIP, HSAG conducts periodic progress check-ins to ensure that MCPs have addressed HSAG’s feedback on the Plan portion of Module 4 and are making appropriate progress with intervention testing. Once MCPs complete testing an intervention, MCPs determine the next steps based on results and lessons learned—whether the intervention was successful and should be spread (adopt), whether modifications need to be made to the existing intervention (adapt), or whether the intervention was not successful and should be stopped (abandon).
In Module 5, MCPs summarize the overall PIP. When validating Module 5, HSAG assesses the validity and reliability of the results based on the Centers for Medicare & Medicaid Services (CMS) validation protocols to determine whether key stakeholders can have confidence in the reported PIP findings. HSAG assigns the following final confidence levels for each PIP:
♦ High confidence—the PIP was methodologically sound and achieved the SMART Aim goal; the demonstrated improvement was clearly linked to the quality improvement processes conducted and intervention(s) tested; and, the MCP accurately summarized the key findings.
♦ Confidence—the PIP was methodologically sound and achieved the SMART Aim goal, and the MCP accurately summarized the key findings. However, some, but not all, of the quality improvement processes conducted and/or intervention(s) tested were clearly linked to the demonstrated improvement.
♦ Low confidence—either (A) the PIP was methodologically sound; however, the SMART Aim goal was not achieved; or (B) the SMART Aim goal was achieved; however, the quality improvement processes and/or intervention(s) tested were poorly executed and could not be linked to the improvement.
♦ Reported PIP results were not credible—the PIP methodology was not executed as approved.
Performance Improvement Project Results and Findings During the review period, SCFHP submitted modules 4 and 5 for its 2015–17 DHCS-priority and MCP-specific PIPs. HSAG validated the modules and includes the final PIP validation findings in this report. Additionally, SCFHP initiated a Disparity PIP and a DHCS-priority PIP during the review period. In this report, HSAG includes summaries of the MCP’s Disparity and DHCS-priority PIP module submissions as well as validation findings from the review period.
Santa Clara Family Health Plan Performance Evaluation Report: July 1, 2017–June 30, 2018 California Department of Health Care Services
Page Z-27 Health Services Advisory Group, Inc.

PERFORMANCE IMPROVEMENT PROJECTS
2015–17 DHCS-Priority Performance Improvement Project
SCFHP selected diabetes retinal eye exam for its 2015–17 DHCS-priority PIP. While the MCP concluded its Diabetes Retinal Eye Exam PIP through the SMART Aim end date of June 30, 2017, SCFHP submitted modules 4 and 5 for HSAG to validate during the review period for this report. HSAG provided final validation findings and encouraged SCFHP to incorporate the experiences and lessons learned from the PIP into future quality improvement efforts.
Table 5.1 provides a summary of the SMART Aim measure results reported by the MCP.
Table 5.1—SCFHP Diabetes Retinal Eye Exam PIP SMART Aim Measure Results
SMART Aim Measure Baseline Rate
SMART Aim Goal
Rate
SMART Aim Goal Achieved
Rate of diabetic eye exam completion among beneficiaries living with diabetes ages 18 to 75 years, who reside in Santa Clara County, who have Provider Network A,6 and who have had a diagnosis of retinopathy in the previous rolling 12-month period.
44.89% 49.89% Yes
Table 5.2 presents a description of the intervention that SCFHP tested for its Diabetes Retinal Eye Exam PIP. The table also indicates the failure mode that the intervention addressed as well as whether the MCP decided, based on intervention testing results, to adopt, adapt, or abandon the intervention.
Table 5.2—SCFHP Diabetes Retinal Eye Exam PIP Intervention Testing Results
Intervention Failure Mode Addressed Adopt,Adapt, orAbandon
Beneficiary incentive ($15) for completing eye exams.
Beneficiary is not motivated to follow through with the scheduled eye exam appointment.
Abandon
6 Provider network name removed for confidentiality.
Santa Clara Family Health Plan Performance Evaluation Report: July 1, 2017–June 30, 2018 California Department of Health Care Services
Page Z-28 Health Services Advisory Group, Inc.

PERFORMANCE IMPROVEMENT PROJECTS
SCFHP documented the following lessons learned during the scope of the 2015–17 DHCS-priority PIP, which the MCP may apply to future PIPs:
♦ Consider higher incentive amounts for future beneficiary incentive programs. ♦ Engage the partnered provider more when designing interventions to increase provider
buy-in. ♦ Use additional channels beyond mailings to engage beneficiaries.
Performance Improvement Project Validation Findings
During the review period for this report, HSAG validated modules 4 and 5 for the MCP’s Diabetes Retinal Eye Exam PIP. Although SCFHP achieved the SMART Aim goal for seven non-consecutive months, the MCP was not able to clearly link the reported improvement to the tested intervention. Upon assessment of validity and reliability of the PIP results, HSAG assigned SCFHP’s Diabetes Retinal Eye Exam PIP a final confidence level of Low Confidence.
2015–17 MCP-Specific Performance Improvement Project
SCFHP selected controlling high blood pressure for its 2015–17 MCP-specific PIP topic. While the MCP concluded its Controlling High Blood Pressure PIP through the SMART Aim end date of June 30, 2017, SCFHP submitted modules 4 and 5 for HSAG to validate during the review period for this report. HSAG provided final validation findings and encouraged SCFHP to incorporate the experiences and lessons learned from the PIP into future quality improvement efforts.
Table 5.3 provides a summary of the SMART Aim measure results reported by the MCP.
Table 5.3—SCFHP Controlling High Blood Pressure PIP SMART Aim Measure Results
SMART Aim Measure Baseline Rate
SMART Aim Goal
Rate
SMART Aim Goal Achieved
Rate of adequately controlled blood pressure during the previous rolling 12 months among beneficiaries ages 18 to 85 years, with a diagnosis of hypertension, assigned to Provider Network B.7
45.8% 50.0% No
Table 5.4 presents a description of the intervention that SCFHP tested for its Controlling High Blood Pressure PIP. The table also indicates the failure mode that the intervention addressed as well as whether the MCP decided, based on intervention testing results, to adopt, adapt, or abandon the intervention.
7 Provider network name removed for confidentiality.
Santa Clara Family Health Plan Performance Evaluation Report: July 1, 2017–June 30, 2018 California Department of Health Care Services
Page Z-29 Health Services Advisory Group, Inc.
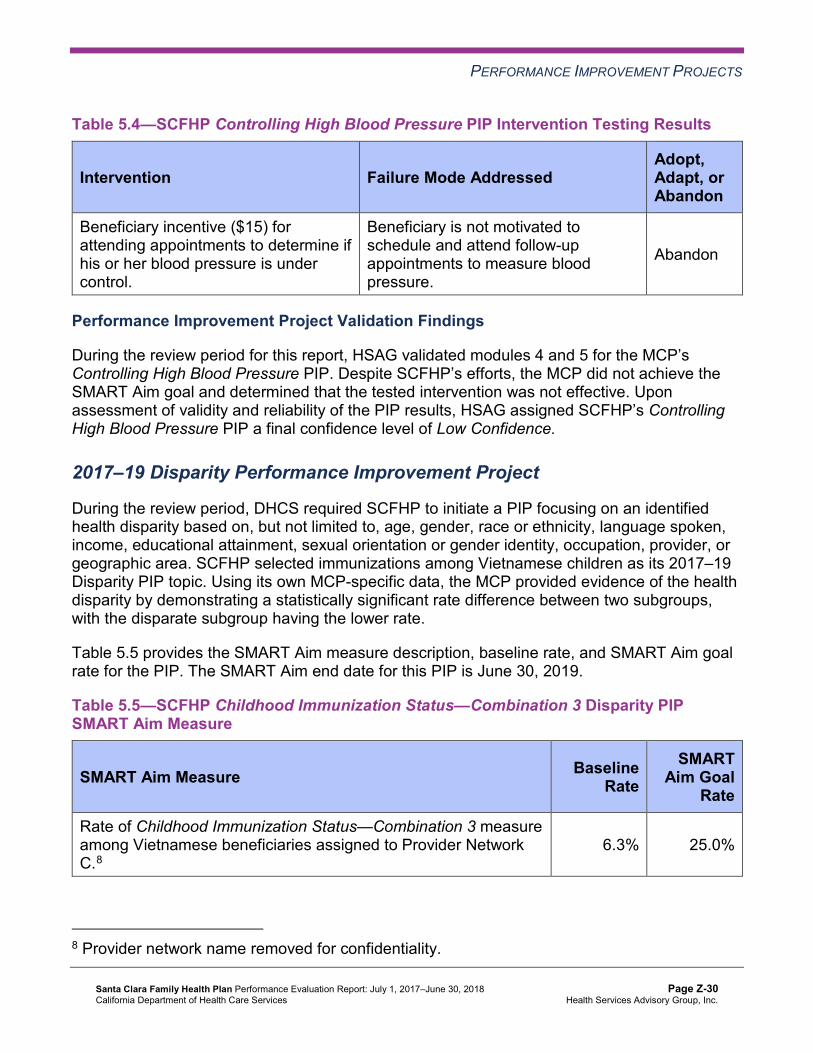
PERFORMANCE IMPROVEMENT PROJECTS
Table 5.4—SCFHP Controlling High Blood Pressure PIP Intervention Testing Results
Intervention Failure Mode Addressed Adopt,Adapt, orAbandon
Beneficiary incentive ($15) for attending appointments to determine if his or her blood pressure is under control.
Beneficiary is not motivated to schedule and attend follow-up appointments to measure blood pressure.
Abandon
Performance Improvement Project Validation Findings
During the review period for this report, HSAG validated modules 4 and 5 for the MCP’s Controlling High Blood Pressure PIP. Despite SCFHP’s efforts, the MCP did not achieve the SMART Aim goal and determined that the tested intervention was not effective. Upon assessment of validity and reliability of the PIP results, HSAG assigned SCFHP’s Controlling High Blood Pressure PIP a final confidence level of Low Confidence.
2017–19 Disparity Performance Improvement Project
During the review period, DHCS required SCFHP to initiate a PIP focusing on an identified health disparity based on, but not limited to, age, gender, race or ethnicity, language spoken, income, educational attainment, sexual orientation or gender identity, occupation, provider, or geographic area. SCFHP selected immunizations among Vietnamese children as its 2017–19 Disparity PIP topic. Using its own MCP-specific data, the MCP provided evidence of the health disparity by demonstrating a statistically significant rate difference between two subgroups, with the disparate subgroup having the lower rate.
Table 5.5 provides the SMART Aim measure description, baseline rate, and SMART Aim goal rate for the PIP. The SMART Aim end date for this PIP is June 30, 2019.
Table 5.5—SCFHP Childhood Immunization Status—Combination 3 Disparity PIP SMART Aim Measure
SMART Aim Measure Baseline Rate
SMART Aim Goal
Rate
Rate of Childhood Immunization Status—Combination 3 measure among Vietnamese beneficiaries assigned to Provider Network C.8
6.3% 25.0%
8 Provider network name removed for confidentiality.
Santa Clara Family Health Plan Performance Evaluation Report: July 1, 2017–June 30, 2018 California Department of Health Care Services
Page Z-30 Health Services Advisory Group, Inc.

PERFORMANCE IMPROVEMENT PROJECTS
Performance Improvement Project Validation Findings
During the review period of this report, HSAG validated modules 1 and 2 for the MCP’s Childhood Immunization Status—Combination 3 Disparity PIP. Upon initial review, HSAG determined that SCFHP met some required validation criteria; however, HSAG identified opportunities for improvement related to:
♦ Supporting the topic selection with the MCP’s data. ♦ Identifying appropriate team members, to include both internal staff and external partners. ♦ Including all required components of the:
■ SMART Aim, developed based on literature review, data, and/or experience. ■ SMART Aim measure. ■ SMART Aim data collection methodology.
♦ Aligning accurately the Global Aim, SMART Aim, key drivers, and potential interventions.
After receiving technical assistance from HSAG, SCFHP incorporated HSAG’s feedback into the PIP modules. Upon HSAG’s final review, HSAG determined that the MCP met all validation criteria for modules 1 and 2.
2017–19 DHCS-Priority Performance Improvement Project
During the review period, DHCS required SCFHP to initiate a PIP related to one of DHCS’ Quality Strategy focus areas: Childhood Immunization Status—Combination 3, Controlling High Blood Pressure, Comprehensive Diabetes Care, or Prenatal and Postpartum Care— Postpartum Care. Based on the MCP’s performance measure results, SCFHP selected controlling high blood pressure as its 2017–19 DHCS-priority PIP topic.
Table 5.6 provides the SMART Aim measure description, baseline rate, and SMART Aim goal rate for the PIP. The SMART Aim end date for this PIP is June 30, 2019.
Table 5.6—SCFHP Controlling High Blood Pressure PIP SMART Aim Measure
SMART Aim Measure Baseline Rate
SMART Aim Goal
Rate
Rate of adequately controlled blood pressure during the previous rolling 12-month period among beneficiaries ages 18 to 85, diagnosed with hypertension, and assigned to Clinic A.9
26.47% 50.00%
9 Clinic name removed for confidentiality.
Santa Clara Family Health Plan Performance Evaluation Report: July 1, 2017–June 30, 2018 California Department of Health Care Services
Page Z-31 Health Services Advisory Group, Inc.

PERFORMANCE IMPROVEMENT PROJECTS
Performance Improvement Project Validation Findings
During the review period of this report, HSAG validated modules 1 and 2 for the MCP’s Controlling High Blood Pressure PIP. Upon initial review of the modules, HSAG determined that SCFHP met some required validation criteria; however, HSAG identified opportunities for improvement related to:
♦ Supporting the topic selection with the MCP’s data. ♦ Identifying appropriate team members, to include both internal staff and external partners. ♦ Including all required components of the:
■ SMART Aim, developed based on literature review, data, and/or experience. ■ SMART Aim measure. ■ SMART Aim data collection methodology.
♦ Aligning accurately the Global Aim, SMART Aim, key drivers, and potential interventions.
After receiving technical assistance from HSAG, SCFHP incorporated HSAG’s feedback into the PIP modules. Upon HSAG’s final review, HSAG determined that the MCP met all validation criteria for modules 1 and 2.
Strengths—Performance Improvement Projects Upon completion of the 2015–17 PIPs, SCFHP identified lessons learned that it can apply to future PIPs.
Opportunities for Improvement—Performance Improvement Projects SCFHP has the opportunity to apply the lessons learned from the 2015–17 Diabetes Retinal Eye Exam and Controlling High Blood Pressure PIPs to facilitate improvement for future PIPs.
Santa Clara Family Health Plan Performance Evaluation Report: July 1, 2017–June 30, 2018 California Department of Health Care Services
Page Z-32 Health Services Advisory Group, Inc.

Medi-Cal Managed Care External Quality Review Technical ReportAppendix Z: Performance Evaluation ReportSanta Clara Family Health PlanJuly 1, 2017–June 30, 2018
6. Recommendations
Follow-Up on Prior Year Recommendations DHCS provided each MCP an opportunity to outline actions taken to address recommendations HSAG made in its 2016–17 MCP-specific evaluation report. Table 6.1 provides EQR recommendations from SCFHP’s July 1, 2016, through June 30, 2017, MCP-specific evaluation report, along with the MCP’s self-reported actions taken through June 30, 2018, that address the recommendations. Please note that HSAG made minimal edits to Table 6.1 to preserve the accuracy of SCFHP’s self-reported actions.
Table 6.1—SCFHP’s Self-Reported Follow-Up on External Quality ReviewRecommendations from the July 1, 2016, through June 30, 2017, MCP-SpecificEvaluation Report
2016–17 External Quality ReviewRecommendations Directed to SCFHP
Self-Reported Actions Taken by SCFHPduring the Period of July 1, 2017–June 30,2018, that Address the External QualityReview Recommendations
1. Identify the causes for the rate declining significantly from RY 2016 to RY 2017 for the Use of Imaging Studies for Low Back Pain measure.
SCFHP’s decline in the Use of Imaging Studies for Low Back Pain measure rate is likely due to a change in the specifications made by NCQA between RY 2016 and RY 2017.
2017–18 Recommendations Based on the overall assessment of SCFHP’s delivery of quality, accessible, and timely care through the activities described in previous sections of this report, HSAG recommends the following to the MCP:
♦ Identify the causes for the rate for the Comprehensive Diabetes Care—Medical Attention for Nephropathy measure moving to below the MPL in RY 2018, and identify strategies to increase the percentage of beneficiaries ages 18 to 75 with diabetes (type 1 and type 2) receiving nephropathy screenings or monitoring tests.
♦ Apply the lessons learned from the 2015–17 Diabetes Retinal Eye Exam and Controlling High Blood Pressure PIPs to facilitate improvement for future PIPs.
In the next annual review, HSAG will evaluate continued successes of SCFHP as well as the MCP’s progress with these recommendations.
Santa Clara Family Health Plan Performance Evaluation Report: July 1, 2017–June 30, 2018 California Department of Health Care Services
Page Z-33 Health Services Advisory Group, Inc.

Medi-Cal Managed CareExternal Quality Review Technical Report
Appendix AA: Performance Evaluation Report
SCAN Health Plan July 1, 2017–June 30, 2018
Medi-Cal Managed Care External Quality Review Technical ReportAppendix AA: Performance Evaluation ReportSCAN Health Plan July 1, 2017–June 30, 2018
Table of Contents
1. Introduction..........................................................................................................AA-1 Medi-Cal Managed Care Specialty Health Plan Overview..................................... AA-1
2. Specialty Health Plan Compliance .....................................................................AA-3Compliance Reviews Conducted........................................................................... AA-3
Follow-Up on 2017 DHCS Audits & Investigations Division Medical Audit ......... AA-3 Strengths—Compliance Reviews .......................................................................... AA-4 Opportunities for Improvement—Compliance Reviews ......................................... AA-4
3. Performance Measures .......................................................................................AA-5 Performance Measure Validation Results ............................................................. AA-5 Performance Measure Results and Findings......................................................... AA-5
Performance Measure Findings ......................................................................... AA-6 Strengths—Performance Measures ...................................................................... AA-7 Opportunities for Improvement—Performance Measures ..................................... AA-7
4. Performance Improvement Projects ..................................................................AA-8Performance Improvement Project Overview ........................................................ AA-8 Performance Improvement Project Results and Findings...................................... AA-9
2015–17 DHCS-Priority Performance Improvement Project ............................ AA-10 2015–17 SHP-Specific Performance Improvement Project.............................. AA-11 2017–19 Disparity Performance Improvement Project ..................................... AA-12 2017–19 Medication Adherence for Cholesterol Performance Improvement Project ............................................................................................... AA-13
Strengths—Performance Improvement Projects ................................................. AA-14 Opportunities for Improvement—Performance Improvement Projects ................ AA-14
5. Recommendations.............................................................................................AA-15 Follow-Up on Prior Year Recommendations ....................................................... AA-15 2017–18 Recommendations................................................................................ AA-16
SCAN Health Plan Performance Evaluation Report: July 1, 2017–June 30, 2018 California Department of Health Care Services
Page AA-i Health Services Advisory Group, Inc.

TABLE OF CONTENTS
Table of Tables
Table 2.1—DHCS A&I Medical Audit of SCAN Audit Review Period: March 1, 2017, through February 28, 2018 ....................................................................... AA-3
Table 3.1—Multi-Year Performance Measure Results SCAN—Los Angeles/ Riverside/San Bernardino Counties.......................................................... AA-6
Table 4.1—SCAN Diabetes Medication Adherence PIP SMART Aim Measure Results AA-10 Table 4.2—SCAN Diabetes Medication Adherence PIP Intervention Testing Results AA-10 Table 4.3—SCAN Statin Use in Persons with Diabetes PIP SMART Aim Measure
Results.................................................................................................... AA-11 Table 4.4—SCAN Statin Use in Persons with Diabetes PIP Intervention Testing Results.AA-12 Table 4.5—SCAN Statin Use in Persons with Diabetes Disparity PIP SMART Aim
Measure.................................................................................................. AA-12 Table 4.6—SCAN Cholesterol Medication Adherence PIP SMART Aim Measure.... AA-13 Table 5.1—SCAN’s Self-Reported Follow-Up on External Quality Review
Recommendations from the July 1, 2016, through June 30, 2017, SHP-Specific Evaluation Report ............................................................. AA-15
SCAN Health Plan Performance Evaluation Report: July 1, 2017–June 30, 2018 California Department of Health Care Services
Page AA-ii Health Services Advisory Group, Inc.

Medi-Cal Managed Care External Quality Review Technical ReportAppendix AA: Performance Evaluation ReportSCAN Health Plan July 1, 2017–June 30, 2018
1. Introduction
The California Department of Health Care Services (DHCS) contracted with Health Services Advisory Group, Inc. (HSAG), an external quality review organization (EQRO), to prepare the federally required Medi-Cal Managed Care External Quality Review Technical Report, July 1, 2017–June 30, 2018. The technical report provides an overview of the objectives and methodology for conducting the external quality review (EQR) activities, including requirements related to each activity. Additionally, the technical report provides aggregated results and recommendations for DHCS for each activity.
This appendix is specific to DHCS’ contracted Medi-Cal managed care specialty plan (SHP), SCAN Health Plan (“SCAN” or “the SHP”). The purpose of this appendix is to provide SHP-specific results of each activity and an assessment of the SHP’s strengths and opportunities for improvement with respect to the quality and timeliness of and access to health care services furnished to Medi-Cal Managed Care (MCMC) beneficiaries (referred to as “beneficiaries” in this report). The review period for this SHP-specific evaluation report is July 1, 2017, through June 30, 2018. HSAG will report on activities that take place beyond the review period in SCAN’s 2018–19 SHP-specific evaluation report. This SHP-specific evaluation report references activities and methodologies described in detail by HSAG in the technical report section.
The aggregate EQR technical report and all Medi-Cal full-scope managed care health plan (MCP)- and SHP-specific performance evaluation reports reflect HSAG’s external, independent assessment of the quality and timeliness of, and access to, care that MCPs and SHPs are providing to beneficiaries.
Medi-Cal Managed Care Specialty Health Plan Overview SCAN is a Medicare Advantage Fully Integrated Dual Eligible (FIDE) Special Needs Plan (SNP) that contracts with DHCS as an SHP to provide services for the dual-eligible Medicare/Medi-Cal population subset residing in Los Angeles, Riverside, and San Bernardino counties.
SCAN provides all services in the Medi-Cal State Plan, including home- and community-based services, to SCAN beneficiaries assessed at the nursing facility-level of care and in nursing home custodial care. SCAN beneficiaries must be at least 65 years of age, live in the service area, have Medicare Parts A and B, and have full-scope Medi-Cal with no share of cost. SCAN does not enroll individuals with end-stage renal disease.
SCAN has been licensed in California since November 30, 1984, in accordance with the provisions of the Knox-Keene Health Care Service Plan Act of 1975, and became operational to provide MCMC services in Los Angeles County effective 1985. The SHP expanded into Riverside and San Bernardino counties in 1997. In 2006, DHCS, at the direction of the Centers
SCAN Health Plan Performance Evaluation Report: July 1, 2017–June 30, 2018 California Department of Health Care Services
Page AA-1 Health Services Advisory Group, Inc.
INTRODUCTION
for Medicare & Medicaid Services (CMS), designated SCAN as an MCP. SCAN then functioned as a social health maintenance organization under a federal waiver which expired at the end of 2007.
In 2008, SCAN entered a comprehensive risk contract with the State. SCAN receives monthly capitation from both Medicare and Medi-Cal, pooling its financing to pay for all services as a full-risk, social SHP.
DHCS amended SCAN’s contract in 2008 to include the same federal and State requirements as exist for MCPs. Among these requirements, DHCS specifies that SHPs participating in MCMC report on two performance measures annually and maintain two performance improvement projects (PIPs).
According to DHCS, as of June 30, 2018, SCAN had 9,099 beneficiaries in Los Angeles County, 2,543 beneficiaries in Riverside County, and 1,669 beneficiaries in San Bernardino County—for a total of 13,311 beneficiaries in the three counties combined.
DHCS allows SCAN to combine data for Los Angeles, Riverside, and San Bernardino counties for reporting purposes. For this report, these three counties are considered a single reporting unit.
SCAN Health Plan Performance Evaluation Report: July 1, 2017–June 30, 2018 California Department of Health Care Services
Page AA-2 Health Services Advisory Group, Inc.

Medi-Cal Managed Care External Quality Review Technical ReportAppendix AA: Performance Evaluation ReportSCAN Health Plan July 1, 2017–June 30, 2018
2. Specialty Health Plan Compliance
Compliance Reviews Conducted The following is a summary of the most recent reviews conducted for SCAN. The descriptions of the various types of reviews may be found within the main section of this technical report.
Table 2.1 summarizes the results and status of the DHCS Audits & Investigations Division (A&I) Medical Audit of SCAN. A&I conducted the on-site audit from March 19, 2018, through March 23, 2018. Note that DHCS issued the final closeout letter on September 18, 2018, which is outside the review period for this report; however, HSAG includes the information from the letter because it reflects full resolution of all deficiencies from the March 19, 2018, through March 23, 2018, Medical Audit of SCAN.
Table 2.1—DHCS A&I Medical Audit of SCAN Audit Review Period: March 1, 2017, through February 28, 2018
Category Evaluated Deficiencies (Yes/No) Monitoring Status
Utilization Management No Not applicable.
Case Management and Coordination of Care Yes Corrective action plan (CAP) initiated following the audit and subsequently closed.
Access and Availability of Care No Not applicable. Member’s Rights No Not applicable. Quality Management No Not applicable.
Follow-Up on 2017 DHCS Audits & Investigations Division Medical Audit
A&I conducted an on-site Medical Audit of SCAN from March 13, 2017, through March 24, 2017, covering the review period of March 1, 2016, through February 28, 2017.
HSAG provided a summary of the survey results and status in SCAN’s 2016–17 SHP-specific evaluation report. At the time of the 2016–17 SHP-specific evaluation report publication, SCAN’s CAP was in progress and under review by DHCS. A letter from DHCS dated March 30, 2018, stated that SCAN provided DHCS with additional information regarding the SHP’s CAP and that DHCS accepted the SHP’s submitted CAP; therefore, DHCS closed the CAP. The letter also stated that DHCS will monitor SCAN’s full implementation of the CAP during the subsequent audit.
SCAN Health Plan Performance Evaluation Report: July 1, 2017–June 30, 2018 California Department of Health Care Services
Page AA-3 Health Services Advisory Group, Inc.

SPECIALTY HEALTH PLAN COMPLIANCE
Strengths—Compliance Reviews A&I identified deficiencies in only one category (Case Management and Coordination of Care) during the March 2018 Medical Audit of SCAN. The SHP subsequently resolved all deficiencies in that category resulting in DHCS closing the CAP from the 2018 audit. Additionally, SCAN’s CAP response for the March 2017 A&I Medical Audit resulted in DHCS closing the CAP for the 2017 audit.
Opportunities for Improvement—Compliance Reviews SCAN has no outstanding deficiencies from the March 2018 A& I Medical Audit of the SHP; therefore, HSAG has no recommendations for the SHP in the area of compliance reviews.
SCAN Health Plan Performance Evaluation Report: July 1, 2017–June 30, 2018 California Department of Health Care Services
Page AA-4 Health Services Advisory Group, Inc.

Medi-Cal Managed Care External Quality Review Technical ReportAppendix AA: Performance Evaluation ReportSCAN Health Plan July 1, 2017–June 30, 2018
3. Performance Measures
Performance Measure Validation Results The HEDIS®1 2018 Compliance Audit Final Report of Findings for SCAN Health Plan contains the detailed findings and recommendations from HSAG’s NCQA HEDIS Compliance Audit™2
HSAG auditors determined that SCAN followed the appropriate specifications to produce valid rates, and identified no issues of concern.
Performance Measure Results and Findings After validating the SHP’s performance measure rates, HSAG assessed the results. See Table 3.1 for SCAN’s performance measure results for reporting year (RY) 2017 and RY 2018. The RY is the year in which the SHP reported the rates. The RY rates reflect measurement year (MY) data from the previous calendar year. Note that data may not be available for both years.
To assess performance, HSAG compares the performance measure rates to national benchmarks. Rates indicating performance above the high performance levels (HPLs) are shaded in gray, and rates indicating performance below the minimum performance levels (MPLs) are bolded.
♦ For measures with rates below the MPLs, DHCS requires SHPs to submit to DHCS improvement plans (IPs) to address the rates below the MPLs (unless SHPs are reporting the rates for the first time).
♦ IPs and CAPs consist of submission of Plan-Do-Study-Act (PDSA) Cycle Worksheets, Quality Improvement (QI) Summaries, or completion of Performance Improvement Projects (PIPs)—as determined by DHCS.
Note that SCAN began reporting the Colorectal Cancer Screening measure in RY 2017. Additionally, although SCAN reported rates for the Osteoporosis Management in Women Who Had a Fracture measure in prior years, HSAG only displays the RY 2018 rate for the Osteoporosis Management in Women Who Had a Fracture measure in Table 3.1. This is due to specification changes that NCQA made to the Osteoporosis Management in Women Who Had a Fracture measure in RY 2018, resulting in NCQA recommending a break in trending for this measure. The Osteoporosis Management in Women Who Had a Fracture measure was considered a first year measure; therefore, DHCS established no HPL or MPL for the measure.
1 Healthcare Effectiveness Data and Information Set (HEDIS®) is a registered trademark of the National Committee for Quality Assurance (NCQA).
2 NCQA HEDIS Compliance AuditTM is a trademark of NCQA.
SCAN Health Plan Performance Evaluation Report: July 1, 2017–June 30, 2018 California Department of Health Care Services
Page AA-5 Health Services Advisory Group, Inc.

PERFORMANCE MEASURES
Table 3.1—Multi-Year Performance Measure Results SCAN—Los Angeles/Riverside/San Bernardino Counties
H = Rate indicates performance above the HPL. Bolded Rate = Rate indicates performance below the MPL.
B = Statistical testing result indicates that the RY 2018 rate is significantly better than the RY 2017 rate.
W = Statistical testing result indicates that the RY 2018 rate is significantly worse than the RY 2017 rate.
Measure RY
2017 Rate1
RY 2018
Rate2
RYs 2017–18 Rate
Difference3
Colorectal Cancer Screening* 73.24% 77.44% 4.20
Osteoporosis Management in Women Who Had a Fracture -- 51.72% Not
Comparable
1 RY 2017 rates reflect MY data from January 1, 2016, through December 31, 2016. 2 RY 2018 rates reflect MY data from January 1, 2017, through December 31, 2017. 3 Performance comparisons are based on the Chi-square test of statistical significance, with a p value of <0.05. * The HPL and MPL for this measure represent the NCQA Quality Compass®3 Commercial 90th and 25th percentiles, respectively. -- Indicates that the rate is not available. Not Comparable = An RY 2017–18 rate difference cannot be made because data are not available for both years or because significant methodology changes occurred between years, disallowing comparison.
Performance Measure Findings
The rate for the Colorectal Cancer Screening measure showed no statistically significant changes from RY 2017 to RY 2018, and the rate was between the HPL and MPL in RY 2018.
3 Quality Compass® is a registered trademark of NCQA.
SCAN Health Plan Performance Evaluation Report: July 1, 2017–June 30, 2018 California Department of Health Care Services
Page AA-6 Health Services Advisory Group, Inc.

PERFORMANCE MEASURES
Strengths—Performance Measures HSAG auditors determined that SCAN followed the appropriate specifications to produce valid rates, and identified no issues of concern.
Opportunities for Improvement—Performance Measures Based on SCAN’s RY 2018 performance measure results, HSAG has no recommendations for the SHP in the area of performance measures.
SCAN Health Plan Performance Evaluation Report: July 1, 2017–June 30, 2018 California Department of Health Care Services
Page AA-7 Health Services Advisory Group, Inc.

Medi-Cal Managed Care External Quality Review Technical ReportAppendix AA: Performance Evaluation ReportSCAN Health Plan July 1, 2017–June 30, 2018
4. Performance Improvement Projects
Performance Improvement Project Overview The key concepts of the rapid-cycle PIP framework include forming a PIP team, setting aims, establishing measures, determining interventions using quality improvement tools, conducting PDSA cycles to test interventions, and planning for the spread of successful changes. The core component of the rapid-cycle PIP approach involves testing changes on a small scale so that improvement can occur more efficiently and lead to long-term sustainability. The following modules guide MCPs and SHPs through this rapid-cycle PIP process:
♦ Module 1—PIP Initiation ■ MCPs and SHPs outline the framework for the PIP, which includes:
○ The topic rationale. ○ Comparative data supporting the need to improve the selected topic. ○ A list of the PIP team members, which consists of internal and external stakeholders. ○ A completed key driver diagram that defines the theory of change for improvement,
including the SMART (Specific, Measurable, Achievable, Relevant, and Time-bound) Aim and Global Aim.
♦ Module 2—SMART Aim Data Collection ■ MCPs and SHPs define the SMART Aim measure and data collection methodology and
develop the SMART Aim data run chart. ♦ Module 3—Intervention Determination
■ MCPs and SHPs use process mapping and failure modes and effects analysis to identify potential interventions to test which may have direct effects on the SMART Aim.
♦ Module 4—Plan-Do-Study-Act (PDSA) ■ MCPs and SHPs test and evaluate the interventions identified in Module 3 through a
series of PDSA cycles. ♦ Module 5—PIP Conclusions
■ MCPs and SHPs interpret results and summarize: ○ Key findings and outcomes achieved. ○ Assessment of each tested intervention. ○ Lessons learned, including how demonstrated improvement can be shared and used
as a foundation for further improvement going forward. ○ Plan for sustained improvement.
SCAN Health Plan Performance Evaluation Report: July 1, 2017–June 30, 2018 California Department of Health Care Services
Page AA-8 Health Services Advisory Group, Inc.

PERFORMANCE IMPROVEMENT PROJECTS
Based on the agreed-upon timeline, MCPs and SHPs submit each module to HSAG for validation. Throughout the rapid-cycle PIP process, HSAG provides technical assistance to MCPs and SHPs to ensure that PIPs are methodologically sound and to problem-solve with MCPs and SHPs regarding how to address challenges that occur. Through an iterative process, MCPs and SHPs have opportunities to make corrections to modules 1 through 3 to achieve all validation criteria.
Once MCPs and SHPs achieve all validation criteria for modules 1 through 3 and receive feedback on the intervention Plan portion of Module 4, MCPs and SHPs test interventions. During the intervention testing phase of the PIP, HSAG conducts periodic progress check-ins to ensure that MCPs and SHPs have addressed HSAG’s feedback on the Plan portion of Module 4 and are making appropriate progress with intervention testing. Once MCPs and SHPs complete testing an intervention, MCPs and SHPs determine the next steps based on results and lessons learned—whether the intervention was successful and should be spread (adopt), whether modifications need to be made to the existing intervention (adapt), or whether the intervention was not successful and should be stopped (abandon).
In Module 5, MCPs and SHPs summarize the overall PIP. When validating Module 5, HSAG assesses the validity and reliability of the results based on the Centers for Medicare & Medicaid Services (CMS) validation protocols to determine whether key stakeholders can have confidence in the reported PIP findings. HSAG assigns the following final confidence levels for each PIP:
♦ High confidence—the PIP was methodologically sound and achieved the SMART Aim goal; the demonstrated improvement was clearly linked to the quality improvement processes conducted and intervention(s) tested; and, the MCP/SHP accurately summarized the key findings.
♦ Confidence—the PIP was methodologically sound and achieved the SMART Aim goal, and the MCP or SHP accurately summarized the key findings; however, some, but not all, of the quality improvement processes conducted and/or intervention(s) tested were clearly linked to the demonstrated improvement.
♦ Low confidence—either (A) the PIP was methodologically sound; however, the SMART Aim goal was not achieved; or (B) the SMART Aim goal was achieved; however, the quality improvement processes and/or intervention(s) tested were poorly executed and could not be linked to the improvement.
♦ Reported PIP results were not credible—the PIP methodology was not executed as approved.
Performance Improvement Project Results and Findings During the review period, SCAN submitted modules 4 and 5 for its 2015–17 DHCS-priority and SHP-specific PIPs. HSAG validated the modules and includes the final PIP validation findings in this report. Additionally, SCAN initiated a Disparity PIP and an SHP-specific PIP during the
SCAN Health Plan Performance Evaluation Report: July 1, 2017–June 30, 2018 California Department of Health Care Services
Page AA-9 Health Services Advisory Group, Inc.

PERFORMANCE IMPROVEMENT PROJECTS
review period. In this report, HSAG includes summaries of the SHP’s Disparity and SHP-specific PIP module submissions as well as validation findings from the review period.
2015–17 DHCS-Priority Performance Improvement Project
SCAN selected diabetes medication adherence for its 2015–17 DHCS-priority PIP. While the SHP concluded its Diabetes Medication Adherence PIP through the SMART Aim end date of June 30, 2017, SCAN submitted modules 4 and 5 for HSAG to validate during the review period for this report. HSAG provided final validation findings and encouraged SCAN to incorporate the experiences and lessons learned from the PIP into future quality improvement efforts.
Table 4.1 provides a summary of the SMART Aim measure results reported by the SHP.
Table 4.1—SCAN Diabetes Medication Adherence PIP SMART Aim Measure Results
SMART Aim Measure Baseline Rate
SMART Aim Goal
Rate
SMART Aim Goal Achieved
Rate of diabetes medication adherence for oral anti-diabetic agent utilization among the dually-enrolled beneficiaries diagnosed with diabetes and assigned to Provider Group A4
67.21% 82.21% Yes
Table 4.2 presents a description of the intervention that SCAN tested for its Diabetes Medication Adherence PIP. The table also indicates the key driver that the intervention addressed as well as whether the SHP decided, based on intervention testing results, to adopt, adapt, or abandon the intervention.
Table 4.2—SCAN Diabetes Medication Adherence PIP Intervention Testing Results
Intervention Key Drivers and/or Failure ModesAddressed
Adopt,Adapt, orAbandon
Providing the partnered provider group a list of beneficiaries on 30-day supplies, but not 90-day supplies, of diabetic medications. The provider group will send 90-day supply prescriptions to physicians to authorize and then send the prescriptions to pharmacies on behalf of the physicians.
Beneficiary compliance with the treatment plan for medication management and adherence
Adopt
4 Provider group name removed for confidentiality.
SCAN Health Plan Performance Evaluation Report: July 1, 2017–June 30, 2018 California Department of Health Care Services
Page AA-10 Health Services Advisory Group, Inc.
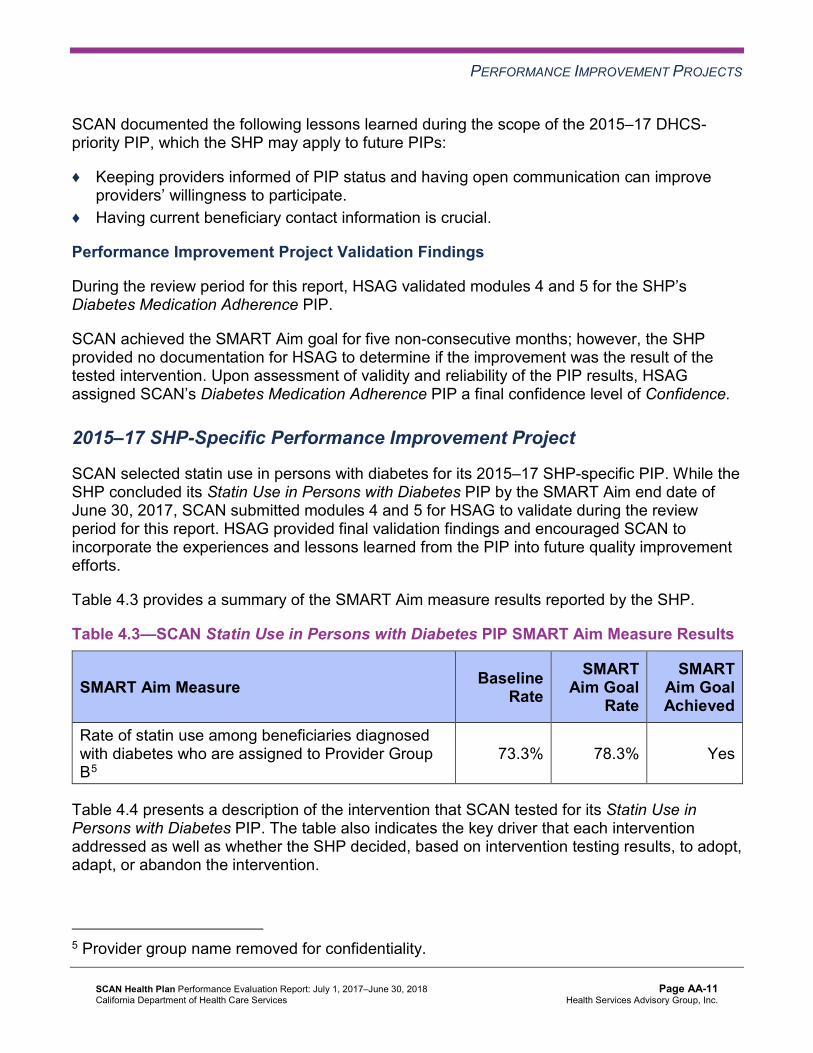
PERFORMANCE IMPROVEMENT PROJECTS
SCAN documented the following lessons learned during the scope of the 2015–17 DHCS-priority PIP, which the SHP may apply to future PIPs:
♦ Keeping providers informed of PIP status and having open communication can improve providers’ willingness to participate.
♦ Having current beneficiary contact information is crucial.
Performance Improvement Project Validation Findings
During the review period for this report, HSAG validated modules 4 and 5 for the SHP’s Diabetes Medication Adherence PIP.
SCAN achieved the SMART Aim goal for five non-consecutive months; however, the SHP provided no documentation for HSAG to determine if the improvement was the result of the tested intervention. Upon assessment of validity and reliability of the PIP results, HSAG assigned SCAN’s Diabetes Medication Adherence PIP a final confidence level of Confidence.
2015–17 SHP-Specific Performance Improvement Project
SCAN selected statin use in persons with diabetes for its 2015–17 SHP-specific PIP. While the SHP concluded its Statin Use in Persons with Diabetes PIP by the SMART Aim end date of June 30, 2017, SCAN submitted modules 4 and 5 for HSAG to validate during the review period for this report. HSAG provided final validation findings and encouraged SCAN to incorporate the experiences and lessons learned from the PIP into future quality improvement efforts.
Table 4.3 provides a summary of the SMART Aim measure results reported by the SHP.
Table 4.3—SCAN Statin Use in Persons with Diabetes PIP SMART Aim Measure Results
SMART Aim Measure Baseline Rate
SMART Aim Goal
Rate
SMART Aim Goal Achieved
Rate of statin use among beneficiaries diagnosed with diabetes who are assigned to Provider Group B5
73.3% 78.3% Yes
Table 4.4 presents a description of the intervention that SCAN tested for its Statin Use in Persons with Diabetes PIP. The table also indicates the key driver that each intervention addressed as well as whether the SHP decided, based on intervention testing results, to adopt, adapt, or abandon the intervention.
5 Provider group name removed for confidentiality.
SCAN Health Plan Performance Evaluation Report: July 1, 2017–June 30, 2018 California Department of Health Care Services
Page AA-11 Health Services Advisory Group, Inc.

PERFORMANCE IMPROVEMENT PROJECTS
Table 4.4—SCAN Statin Use in Persons with Diabetes PIP Intervention Testing Results
Intervention Key Driver Addressed Adopt,Adapt, orAbandon
Supply the provider group with monthly beneficiary data for those beneficiaries with gaps in statin therapy so that the provider group could conduct targeted outreach to physicians to ensure that prescriptions for statins are sent to the beneficiaries’ pharmacies.
Beneficiary compliance with treatment plan for medication management and adherence
Adopt
Performance Improvement Project Validation Findings
During the review period for this report, HSAG validated modules 4 and 5 for the SHP’s Statin Use in Persons with Diabetes PIP. Although SCAN achieved the SMART Aim goal, the SHP provided no documentation for HSAG to determine if the improvement was the result of the tested intervention. Upon assessment of validity and reliability of the PIP results, HSAG assigned SCAN’s Statin Use in Persons with Diabetes PIP a final confidence level of Confidence.
2017–19 Disparity Performance Improvement Project
During the review period, DHCS required SCAN to initiate a PIP focusing on an identified health disparity based on, but not limited to, age, gender, race or ethnicity, language spoken, income, educational attainment, sexual orientation or gender identity, occupation, provider, or geographic area. SCAN selected statin use among beneficiaries living with diabetes in San Bernardino County as its 2017–19 Disparity PIP topic. Using its own SHP-specific data, the SHP provided evidence of the health disparity by demonstrating a statistically significant rate difference between two subgroups, with the disparate subgroup having the lower rate.
Table 4.5 provides the SMART Aim measure description, baseline rate, and SMART Aim goal rate for the PIP. The SMART Aim end date for this PIP is June 30, 2019.
Table 4.5—SCAN Statin Use in Persons with Diabetes Disparity PIP SMART Aim Measure
SMART Aim Measure Baseline Rate
SMART Aim Goal
Rate
Rate of statin utilization among beneficiaries ages 40 to 75 diagnosed with diabetes and residing in San Bernardino 77.02% 82.46%
SCAN Health Plan Performance Evaluation Report: July 1, 2017–June 30, 2018 California Department of Health Care Services
Page AA-12 Health Services Advisory Group, Inc.

PERFORMANCE IMPROVEMENT PROJECTS
Performance Improvement Project Validation Findings
During the review period of this report, HSAG validated modules 1 and 2 for the SHP’s Statin Use in Persons with Diabetes Disparity PIP. Upon initial review of the modules, HSAG determined that SCAN met some required validation criteria; however, HSAG identified opportunities for improvement related to:
♦ Including all required components of the: ■ SMART Aim, developed based on literature review, data, and/or experience. ■ SMART Aim measure. ■ SMART Aim data collection methodology. ■ Run/control chart.
♦ Aligning accurately the Global Aim, SMART Aim, key drivers, and potential interventions.
After receiving technical assistance from HSAG, SCAN incorporated HSAG’s feedback into the PIP modules. Upon HSAG’s final review, HSAG determined that the SHP met all validation criteria for modules 1 and 2.
2017–19 Medication Adherence for Cholesterol Performance Improvement Project
SCAN selected medication adherence for cholesterol for its 2017–19 SHP-specific PIP topic based on its SHP-specific data.
Table 4.6 provides the SMART Aim measure description, baseline rate, and SMART Aim goal rate for the PIP. The SMART Aim end date for this PIP is June 30, 2019.
Table 4.6—SCAN Cholesterol Medication Adherence PIP SMART Aim Measure
SMART Aim Measure Baseline Rate
SMART Aim Goal
Rate
Rate of statin medication adherence among beneficiaries ages 18 and older who are prescribed statin medications and assigned to Provider A6
80.26% 84.16%
6 Provider name removed for confidentiality.
SCAN Health Plan Performance Evaluation Report: July 1, 2017–June 30, 2018 California Department of Health Care Services
Page AA-13 Health Services Advisory Group, Inc.
PERFORMANCE IMPROVEMENT PROJECTS
Performance Improvement Project Validation Findings
During the review period of this report, HSAG validated modules 1 and 2 for the SHP’s Cholesterol Medication Adherence PIP. Upon initial review of the modules, HSAG determined that SCAN met some required validation criteria; however, HSAG identified opportunities for improvement related to:
♦ Supporting the topic selection with the SHP’s data. ♦ Including all required components of the:
■ SMART Aim, developed based on literature review, data, and/or experience. ■ SMART Aim measure. ■ Run/control chart.
♦ Aligning accurately the Global Aim, SMART Aim, key drivers, and potential interventions.
After receiving technical assistance from HSAG, SCAN incorporated HSAG’s feedback into the PIP modules. Upon HSAG’s final review, HSAG determined that the SHP met all validation criteria for modules 1 and 2.
Strengths—Performance Improvement Projects SCAN achieved the SMART Aim goals for both 2015–17 PIPs and linked some of the quality improvement activities to the demonstrated improvements. Based on HSAG’s assessment, HSAG assigned each 2015–17 Diabetes Medication Adherence PIP and Statin Use in Persons with Diabetes PIP a final confidence level of Confidence.
Opportunities for Improvement—Performance Improvement Projects SCAN has the opportunity to continue monitoring adopted interventions and outcomes to facilitate long-term, sustained improvement beyond the life of the 2015–17 Diabetes Medication Adherence and Statin Use in Persons with Diabetes PIPs. Ongoing monitoring will enable long-term evaluation of sustained improvement and allow the SHP to continually refine interventions to achieve and sustain optimal outcomes.
Additionally, SCAN has the opportunity to apply lessons learned from the 2015–17 Statin Use in Persons with Diabetes PIP to the SHP’s 2017–19 Statin Use in Persons with Diabetes Disparity PIP.
SCAN Health Plan Performance Evaluation Report: July 1, 2017–June 30, 2018 California Department of Health Care Services
Page AA-14 Health Services Advisory Group, Inc.

Medi-Cal Managed Care External Quality Review Technical ReportAppendix AA: Performance Evaluation ReportSCAN Health Plan July 1, 2017–June 30, 2018
5. Recommendations
Follow-Up on Prior Year Recommendations DHCS provided each MCP and SHP an opportunity to outline actions taken to address recommendations HSAG made in its 2016–17 MCP/SHP-specific evaluation report. Table 5.1 provides EQR recommendations from SCAN’s July 1, 2016, through June 30, 2017, SHP-specific evaluation report, along with the SHP’s self-reported actions taken through June 30, 2018, that address the recommendations. Please note that HSAG made minimal edits to Table 5.1 to preserve the accuracy of SCAN’s self-reported actions.
Table 5.1—SCAN’s Self-Reported Follow-Up on External Quality ReviewRecommendations from the July 1, 2016, through June 30, 2017, SHP-SpecificEvaluation Report
2016–17 External Quality ReviewRecommendations Directed to SCAN
Self-Reported Actions Taken by SCANduring the Period of July 1, 2017–June 30,2018, that Address the External QualityReview Recommendations
1. Work with DHCS to resolve all deficiencies from the March 2017 A&I Medical Audit.
SCAN has evaluated our performance, developed and implemented corrective actions, and implemented controls in response to the March 2017 A&I Medical Audit findings as follows: Category 1: Utilization Management
Category 2: Case Management and Coordination of Care
Category 3: Access and Availability of Care
Category 4: Member’s Rights
Category 5: Quality Management
SCAN will continue to work closely with DHCS to resolve deficiencies and ensure that all regulatory requirements are met.
SCAN Health Plan Performance Evaluation Report: July 1, 2017–June 30, 2018 California Department of Health Care Services
Page AA-15 Health Services Advisory Group, Inc.

RECOMMENDATIONS
2017–18 Recommendations Based on the overall assessment of SCAN’s delivery of quality, accessible, and timely care through the activities described in previous sections of this report, HSAG recommends the following to the SHP:
♦ Continue monitoring adopted interventions and outcomes to facilitate long-term, sustained improvement beyond the life of the 2015–17 Diabetes Medication Adherence and Statin Use in Persons with Diabetes PIPs.
♦ Apply lessons learned from the 2015–17 Statin Use in Persons with Diabetes PIP to the SHP’s 2017–19 Statin Use in Persons with Diabetes Disparity PIP.
In the next annual review, HSAG will evaluate continued successes of SCAN as well as the SHP’s progress with these recommendations.
SCAN Health Plan Performance Evaluation Report: July 1, 2017–June 30, 2018 California Department of Health Care Services
Page AA-16 Health Services Advisory Group, Inc.

Medi-Cal Managed CareExternal Quality Review Technical Report
Appendix BB: Performance Evaluation Report
UnitedHealthcare Community Plan July 1, 2017–June 30, 2018
Medi-Cal Managed Care External Quality Review Technical ReportAppendix BB: Performance Evaluation ReportUnitedHealthcare Community PlanJuly 1, 2017–June 30, 2018
Table of Contents
1. Introduction..........................................................................................................BB-1 Medi-Cal Managed Care Health Plan Overview .................................................... BB-1
2. Managed Care Health Plan Compliance ............................................................BB-3Compliance Reviews Conducted........................................................................... BB-3 Strengths—Compliance Reviews .......................................................................... BB-3 Opportunities for Improvement—Compliance Reviews ......................................... BB-3
3. Managed Care Health Plan Performance Measures ......................................... BB-4 4. Performance Improvement Projects .................................................................. BB-5 5. Recommendations...............................................................................................BB-6
Table of Tables
Table 2.1—DHCS A&I Focused Medical Audit of UHC Audit Review Period: October 1, 2017, through March 31, 2018 ................................................ BB-3
UnitedHealthcare Community Plan Performance Evaluation Report: July 1, 2017–June 30, 2018 California Department of Health Care Services
Page BB-i Health Services Advisory Group, Inc.

Medi-Cal Managed Care External Quality Review Technical ReportAppendix BB: Performance Evaluation ReportUnitedHealthcare Community PlanJuly 1, 2017–June 30, 2018
1. Introduction
The California Department of Health Care Services (DHCS) contracted with Health Services Advisory Group, Inc. (HSAG), an external quality review organization (EQRO), to prepare the federally required Medi-Cal Managed Care External Quality Review Technical Report, July 1, 2017–June 30, 2018. The technical report provides an overview of the objectives and methodology for conducting the external quality review (EQR) activities, including requirements related to each activity. Additionally, the technical report provides aggregated results and recommendations for DHCS for each activity.
This appendix is specific to DHCS’ contracted Medi-Cal managed care health plan (MCP), UnitedHealthcare Community Plan (“UHC” or “the MCP”). The purpose of this appendix is to provide MCP-specific results of each activity and an assessment of the MCP’s strengths and opportunities for improvement with respect to the quality and timeliness of and access to health care services furnished to Medi-Cal Managed Care (MCMC) beneficiaries (referred to as “beneficiaries” in this report). The review period for this MCP-specific evaluation report is July 1, 2017, through June 30, 2018. HSAG will report on activities that take place beyond the review period in UHC’s 2018–19 MCP-specific evaluation report. This MCP-specific evaluation report references activities and methodologies described in detail by HSAG in the technical report section.
The aggregate EQR technical report and all MCP- and specialty health plan (SHP)-specific performance evaluation reports reflect HSAG’s external, independent assessment of the quality and timeliness of, and access to, care that MCPs and SHPs are providing to beneficiaries.
Medi-Cal Managed Care Health Plan Overview UHC is a full-scope MCP delivering services to beneficiaries under a Geographic Managed Care (GMC) model. The GMC model currently operates in the counties of San Diego and Sacramento. In this GMC model, DHCS allows beneficiaries to select from several commercial MCPs within the specified geographic service area (county).
In addition to UHC, Sacramento County’s beneficiaries may select from the following MCPs: ♦ Aetna Better Health of California ♦ Anthem Blue Cross Partnership Plan ♦ Health Net Community Solutions, Inc. ♦ Kaiser NorCal ♦ Molina Healthcare of California Partner Plan, Inc.
UnitedHealthcare Community Plan Performance Evaluation Report: July 1, 2017–June 30, 2018 California Department of Health Care Services
Page BB-1 Health Services Advisory Group, Inc.
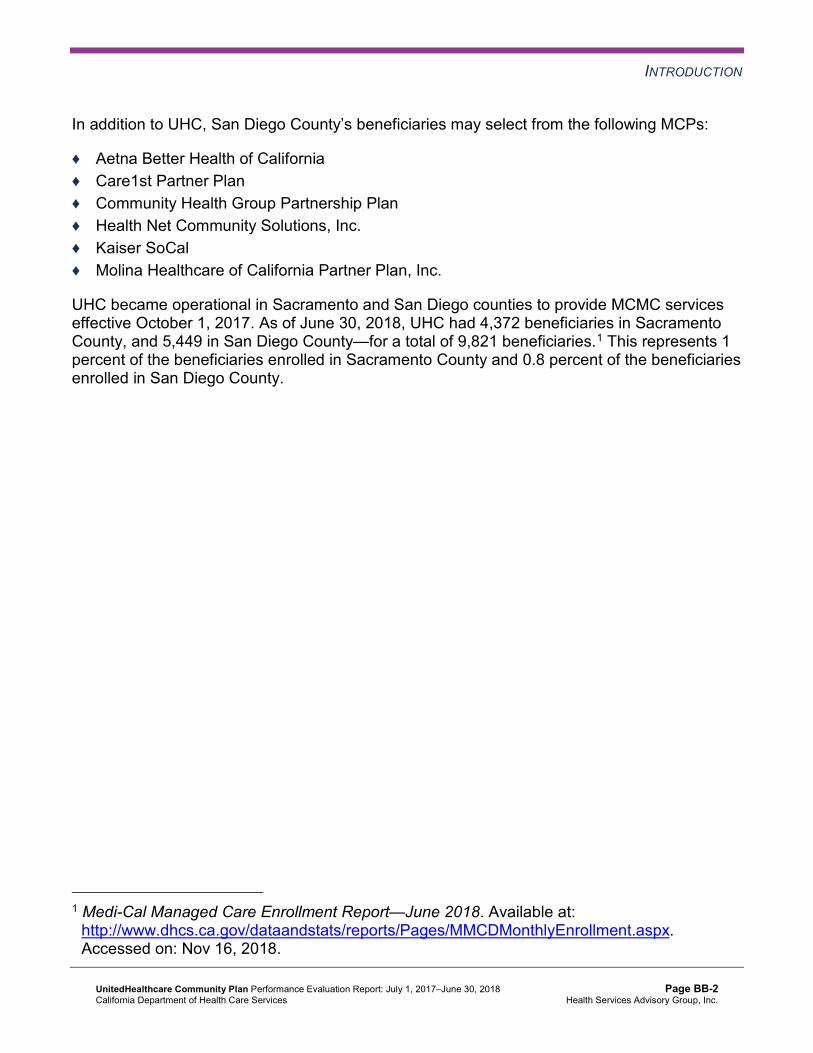
INTRODUCTION
In addition to UHC, San Diego County’s beneficiaries may select from the following MCPs:
♦ Aetna Better Health of California ♦ Care1st Partner Plan ♦ Community Health Group Partnership Plan ♦ Health Net Community Solutions, Inc. ♦ Kaiser SoCal ♦ Molina Healthcare of California Partner Plan, Inc.
UHC became operational in Sacramento and San Diego counties to provide MCMC services effective October 1, 2017. As of June 30, 2018, UHC had 4,372 beneficiaries in Sacramento County, and 5,449 in San Diego County—for a total of 9,821 beneficiaries.1 This represents 1 percent of the beneficiaries enrolled in Sacramento County and 0.8 percent of the beneficiaries enrolled in San Diego County.
1 Medi-Cal Managed Care Enrollment Report—June 2018. Available at: http://www.dhcs.ca.gov/dataandstats/reports/Pages/MMCDMonthlyEnrollment.aspx. Accessed on: Nov 16, 2018.
UnitedHealthcare Community Plan Performance Evaluation Report: July 1, 2017–June 30, 2018 California Department of Health Care Services
Page BB-2 Health Services Advisory Group, Inc.

Medi-Cal Managed Care External Quality Review Technical ReportAppendix BB: Performance Evaluation ReportUnitedHealthcare Community PlanJuly 1, 2017–June 30, 2018
2. Managed Care Health Plan Compliance
Compliance Reviews Conducted The following is a summary of the most recent reviews conducted for UHC. Unless noted, HSAG’s compliance review summaries are based on final audit/survey reports issued and corrective action plan (CAP) closeout letters dated on or before the end of the review period for this report (June 30, 2018). The descriptions of the various types of reviews may be found within the main section of this technical report.
Table 2.1 summarizes the results and status of the DHCS Audits & Investigations Division (A&I) Focused Medical Audit of UHC. A&I conducted the on-site audit from May 8, 2018, through May 9, 2018. A&I focused on three categories—Utilization Management, Member’s Rights, and Quality Management.
Table 2.1—DHCS A&I Focused Medical Audit of UHC Audit Review Period: October 1, 2017, through March 31, 2018
Category Evaluated Deficiencies (Yes/No) Monitoring Status
Utilization Management Yes CAP initiated following the audit and subsequently closed.
Member’s Rights Yes CAP initiated following the audit and subsequently closed.
Quality Management No Not applicable.
Strengths—Compliance Reviews A&I identified no deficiencies in the Quality Management category during the May 2018 Focused Medical Audit of UHC. Additionally, UHC’s responses to the MCP’s CAP for the deficiencies that A&I identified in the Utilization Management and Member’s Rights categories during the audit resulted in DHCS closing the CAP.
Opportunities for Improvement—Compliance Reviews UHC has no outstanding deficiencies from the May 2018 A&I Focused Medical Audit; therefore, HSAG has no recommendations for the MCP in the area of compliance reviews.
UnitedHealthcare Community Plan Performance Evaluation Report: July 1, 2017–June 30, 2018 California Department of Health Care Services
Page BB-3 Health Services Advisory Group, Inc.

Medi-Cal Managed Care External Quality Review Technical ReportAppendix BB: Performance Evaluation ReportUnitedHealthcare Community PlanJuly 1, 2017–June 30, 2018
3. Managed Care Health Plan Performance Measures
To comply with federal requirements, DHCS selects a set of performance measures through which to evaluate the quality of care delivered by the contracted MCPs and SHPs to beneficiaries. MCPs and SHPs must report county or regional rates unless otherwise approved by DHCS. DHCS refers to the DHCS-selected performance measures for MCPs as the External Accountability Set (EAS). MCPs’ reporting of EAS rates provides DHCS with a standardized method for objectively evaluating MCPs’ delivery of services to beneficiaries.
In order to report performance measure rates, an MCP’s beneficiaries must meet continuous enrollment requirements for each measure that the MCP is reporting, which means that beneficiaries need to be enrolled in the MCP for 11 of 12 months during the measurement year (MY). Reporting year (RY) 2018 performance measure rates reflect data from MY 2017 (January 1, 2017, through December 31, 2017). UHC began providing MCMC services October 1, 2017; therefore, no UHC MCMC beneficiaries had continuous enrollment during MY 2017. Consequently, UHC reported no performance measure results and HSAG did not conduct an NCQA HEDIS Compliance Audit™2 of UHC for RY 2018.
UHC will report performance measure rates for the first time in RY 2019 (MY 2018).
2 NCQA HEDIS Compliance AuditTM is a trademark of NCQA.
UnitedHealthcare Community Plan Performance Evaluation Report: July 1, 2017–June 30, 2018 California Department of Health Care Services
Page BB-4 Health Services Advisory Group, Inc.

Medi-Cal Managed Care External Quality Review Technical ReportAppendix BB: Performance Evaluation ReportUnitedHealthcare Community PlanJuly 1, 2017–June 30, 2018
4. Performance Improvement Projects
DHCS requires that each MCP and SHP conduct a minimum of two DHCS-approved performance improvement projects (PIPs) per each Medi-Cal contract held with DHCS. If an MCP or SHP holds multiple contracts with DHCS and the areas in need of improvement are similar across contracts, DHCS may approve the MCP or SHP to conduct the same two PIPs across all contracts (i.e., conduct two PIPs total).
Based on UHC providing services starting October 1, 2017, DHCS waived the requirement for the MCP to conduct PIPs during the review period for this MCP-specific evaluation report. HSAG will provide training to UHC on the PIP process and requirements beginning in April 2019 so that the MCP will be prepared to conduct PIPs, beginning with the PIP topic selection process in July 2019.
UnitedHealthcare Community Plan Performance Evaluation Report: July 1, 2017–June 30, 2018 California Department of Health Care Services
Page BB-5 Health Services Advisory Group, Inc.

Medi-Cal Managed Care External Quality Review Technical ReportAppendix BB: Performance Evaluation ReportUnitedHealthcare Community PlanJuly 1, 2017–June 30, 2018
5. Recommendations
HSAG recommends that UHC work with DHCS and HSAG to ensure that the MCP fully understands all EQRO activities and DHCS’ requirements of the MCP related to each activity.
In the next annual review, HSAG will evaluate UHC’s successes related to conducting the required activities as well as how the MCP addressed this recommendation.
UnitedHealthcare Community Plan Performance Evaluation Report: July 1, 2017–June 30, 2018 California Department of Health Care Services
Page BB-6 Health Services Advisory Group, Inc.
Copyright © 2022 FDOKUMEN