20140428-Baidoa Assessment Report 4 0
13
Page | 1 BAIDOA WASH ASSESSMENT IDPS FROM LOWER SHABELLE AND BAKOOL REGION APRIL 2014 1. INTRODUCTION Between the 13 th and 17 th April 2014, INTERSOS (as assessment lead-agency), ACTED, GREDO, DRC, PANA-AID and SYPD conducted a WASH assessment among IDPs in camps in Baidoa in order to have a greater understanding about the WASH facilities currently in place and if there is any gap to be addressed looking at the new arrival of IDPs in Baidoa due to the AMISOM/SNG offensive. The assessment was planned, after extensive discussion with the WASH cluster coordinator who mobilized the aforementioned WASH partners in Baidoa. The Assessment was carried out in 72 different IDP camps in Baidoa (see paragraph 3). This report is a product of INTERSOS Humanitarian Aid Organization, Somalia Mission, and is documentation of the findings of this assessment. 2. BACKGROUND The anticipated military offensive by the Somali National Armed Forces (SNAF) and the African Union Mission in Somalia (AMISOM) to recover Al Shabaab controlled areas in Southern and Central Somalia has begun. In Lower Shabelle, SNAF/AMISOM troops moved towards Qoryooley en route to Baraawe. Some locations on the way were reportedly vacated without resistance. In Bakool, SNAF/AMISOM forces started moving to key towns including RabDhuure, Xudur and Waajid around 5 March. It is estimated that 3 million people live in the Districts and Regions, which may be directly affected by the military operation. The movements were mostly preemptive and people moved due to fear of attacks. By March, displaced people, mainly from Waajid and Xudur in Bakool and Qoryoley of Lower Shabelle, were reported to have arrived in Baidoa. Those arriving in Baidoa said that threats by Al Shabaab were prime motives for moving. 3. METHODOLOGY The assessment was carried out using a revised version of the WASH cluster Rapid Needs Assessment Form.
-
Upload
independent -
Category
Documents
-
view
0 -
download
0
Transcript of 20140428-Baidoa Assessment Report 4 0
Page | 1
BAIDOA WASH ASSESSMENT
IDPS FROM LOWER SHABELLE AND BAKOOL REGION
APRIL 2014
1. INTRODUCTION Between the 13th and 17th April 2014, INTERSOS (as assessment lead-agency), ACTED, GREDO, DRC,
PANA-AID and SYPD conducted a WASH assessment among IDPs in camps in Baidoa in order to have a
greater understanding about the WASH facilities currently in place and if there is any gap to be
addressed looking at the new arrival of IDPs in Baidoa due to the AMISOM/SNG offensive. The
assessment was planned, after extensive discussion with the WASH cluster coordinator who mobilized
the aforementioned WASH partners in Baidoa. The Assessment was carried out in 72 different IDP
camps in Baidoa (see paragraph 3). This report is a product of INTERSOS Humanitarian Aid Organization,
Somalia Mission, and is documentation of the findings of this assessment.
2. BACKGROUND The anticipated military offensive by the Somali National Armed Forces (SNAF) and the African Union
Mission in Somalia (AMISOM) to recover Al Shabaab controlled areas in Southern and Central Somalia
has begun. In Lower Shabelle, SNAF/AMISOM troops moved towards Qoryooley en route to Baraawe.
Some locations on the way were reportedly vacated without resistance. In Bakool, SNAF/AMISOM forces
started moving to key towns including RabDhuure, Xudur and Waajid around 5 March.
It is estimated that 3 million people live in the Districts and Regions, which may be directly affected by
the military operation. The movements were mostly preemptive and people moved due to fear of
attacks. By March, displaced people, mainly from Waajid and Xudur in Bakool and Qoryoley of Lower
Shabelle, were reported to have arrived in Baidoa. Those arriving in Baidoa said that threats by Al
Shabaab were prime motives for moving.
3. METHODOLOGY The assessment was carried out using a revised version of the WASH cluster Rapid Needs Assessment
Form.
Page | 2
The questionnaire was revised to better capture the data related to the new arrival of IDPs in Baidoa
since the aim of the exercise was to understand if the existing WASH facilities are enough to cover water
and sanitation needs of the newly arrived IDPs.
For the aforementioned reasons the questionnaire was divided in 4 different sections:
1. Demography and Background
2. WASH
3. Sanitation
4. Hygiene
For the sake of clarity we would like to point out that we use the aforementioned terms as follows:
WASH: water supply is more appropriated. In this case we refers the access to water,
considering the quantity of water, the sources, the distance from the household to nearest
water point, queuing time at a water source and the quality of water.
Sanitation: is defined as the way in which humans promote healthy living and good health by
preventing human contact with waste and other forms of microorganisms that cause disease.
Sanitation is for human waste, environmental waste, and other forms of waste. There are
different types of sanitation, we refers to basic sanitation which is the management of human
feces.
Hygiene: is defined as a cumulative group of practices that is perceived by groups of people to
be a way towards healthy living or good health. Hygiene is often associated with the human
body. We use the word “hygiene” for our body by brushing our teeth, taking a bath, and so on
and so forth. Hand washing is part of hygiene and is considered as the universal precaution in
preventing the transmission of microorganisms.
The questionnaire was designed for Focus Groups discussion with IDP and Key-Informants. In order to
have verification, especially on the information about the existing facilities, verification through
observation has been carried out for each IDP camp.
Before the assessment a meeting was organized at INTERSOS Way Station in Baidoa in order to clarify
the methodology of the assessment and to organize the team.
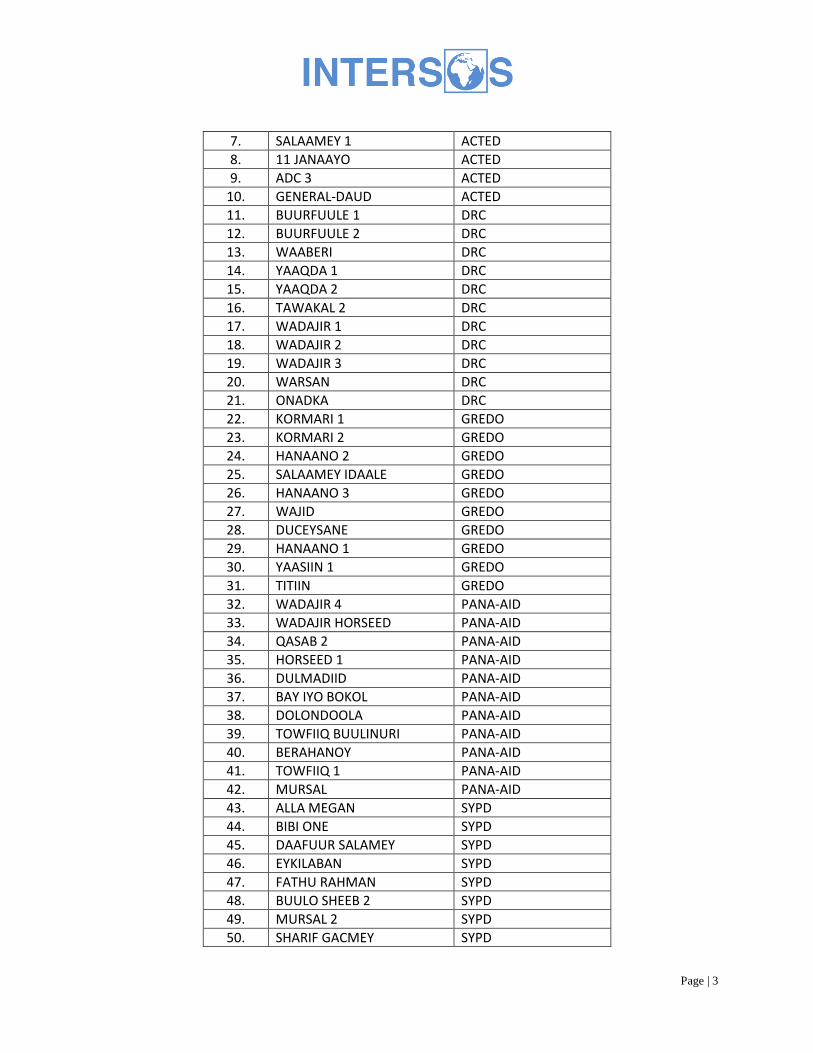
The assessment targeted 72 IDP camps in Baidoa. Below the list of camp and the allocation for each
NGO.
1. ADC 1 ACTED
2. ADC 2 ACTED
3. ADC 2 TOWFIIQ ACTED
4. BALADUL-AMIN 2 ACTED
5. IDAALE 1 ACTED
6. IDAALEWYN ACTED
Page | 3
7. SALAAMEY 1 ACTED
8. 11 JANAAYO ACTED
9. ADC 3 ACTED
10. GENERAL-DAUD ACTED
11. BUURFUULE 1 DRC
12. BUURFUULE 2 DRC
13. WAABERI DRC
14. YAAQDA 1 DRC
15. YAAQDA 2 DRC
16. TAWAKAL 2 DRC
17. WADAJIR 1 DRC
18. WADAJIR 2 DRC
19. WADAJIR 3 DRC
20. WARSAN DRC
21. ONADKA DRC
22. KORMARI 1 GREDO
23. KORMARI 2 GREDO
24. HANAANO 2 GREDO
25. SALAAMEY IDAALE GREDO
26. HANAANO 3 GREDO
27. WAJID GREDO
28. DUCEYSANE GREDO
29. HANAANO 1 GREDO
30. YAASIIN 1 GREDO
31. TITIIN GREDO
32. WADAJIR 4 PANA-AID
33. WADAJIR HORSEED PANA-AID
34. QASAB 2 PANA-AID
35. HORSEED 1 PANA-AID
36. DULMADIID PANA-AID
37. BAY IYO BOKOL PANA-AID
38. DOLONDOOLA PANA-AID
39. TOWFIIQ BUULINURI PANA-AID
40. BERAHANOY PANA-AID
41. TOWFIIQ 1 PANA-AID
42. MURSAL PANA-AID
43. ALLA MEGAN SYPD
44. BIBI ONE SYPD
45. DAAFUUR SALAMEY SYPD
46. EYKILABAN SYPD
47. FATHU RAHMAN SYPD
48. BUULO SHEEB 2 SYPD
49. MURSAL 2 SYPD
50. SHARIF GACMEY SYPD
Page | 4
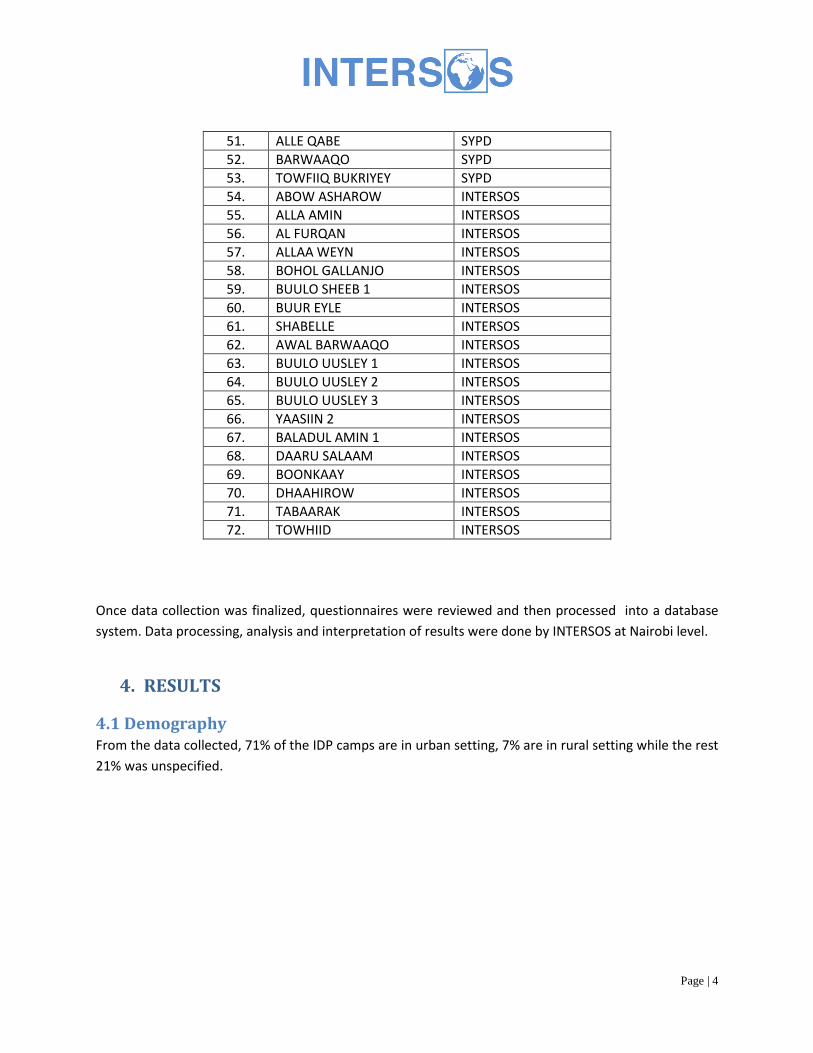
51. ALLE QABE SYPD
52. BARWAAQO SYPD
53. TOWFIIQ BUKRIYEY SYPD
54. ABOW ASHAROW INTERSOS
55. ALLA AMIN INTERSOS
56. AL FURQAN INTERSOS
57. ALLAA WEYN INTERSOS
58. BOHOL GALLANJO INTERSOS
59. BUULO SHEEB 1 INTERSOS
60. BUUR EYLE INTERSOS
61. SHABELLE INTERSOS
62. AWAL BARWAAQO INTERSOS
63. BUULO UUSLEY 1 INTERSOS
64. BUULO UUSLEY 2 INTERSOS
65. BUULO UUSLEY 3 INTERSOS
66. YAASIIN 2 INTERSOS
67. BALADUL AMIN 1 INTERSOS
68. DAARU SALAAM INTERSOS
69. BOONKAAY INTERSOS
70. DHAAHIROW INTERSOS
71. TABAARAK INTERSOS
72. TOWHIID INTERSOS
Once data collection was finalized, questionnaires were reviewed and then processed into a database
system. Data processing, analysis and interpretation of results were done by INTERSOS at Nairobi level.
4. RESULTS
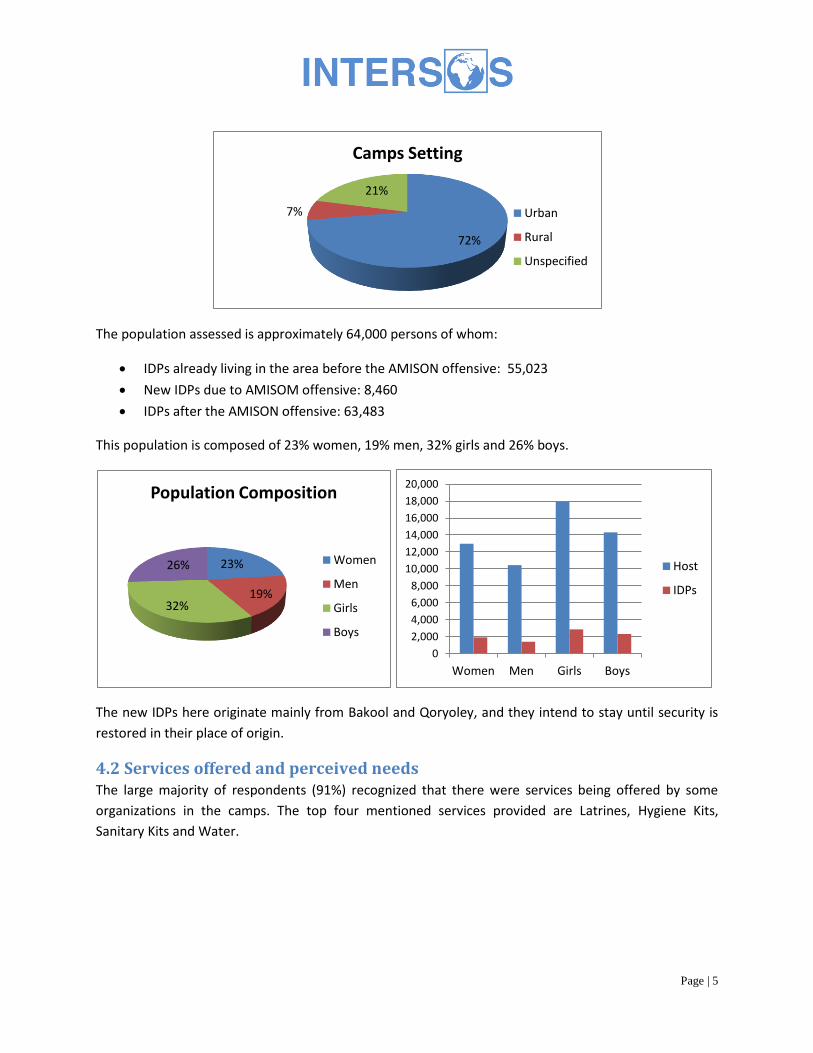
4.1 Demography From the data collected, 71% of the IDP camps are in urban setting, 7% are in rural setting while the rest
21% was unspecified.
Page | 5
The population assessed is approximately 64,000 persons of whom:
IDPs already living in the area before the AMISON offensive: 55,023
New IDPs due to AMISOM offensive: 8,460
IDPs after the AMISON offensive: 63,483
This population is composed of 23% women, 19% men, 32% girls and 26% boys.
The new IDPs here originate mainly from Bakool and Qoryoley, and they intend to stay until security is
restored in their place of origin.
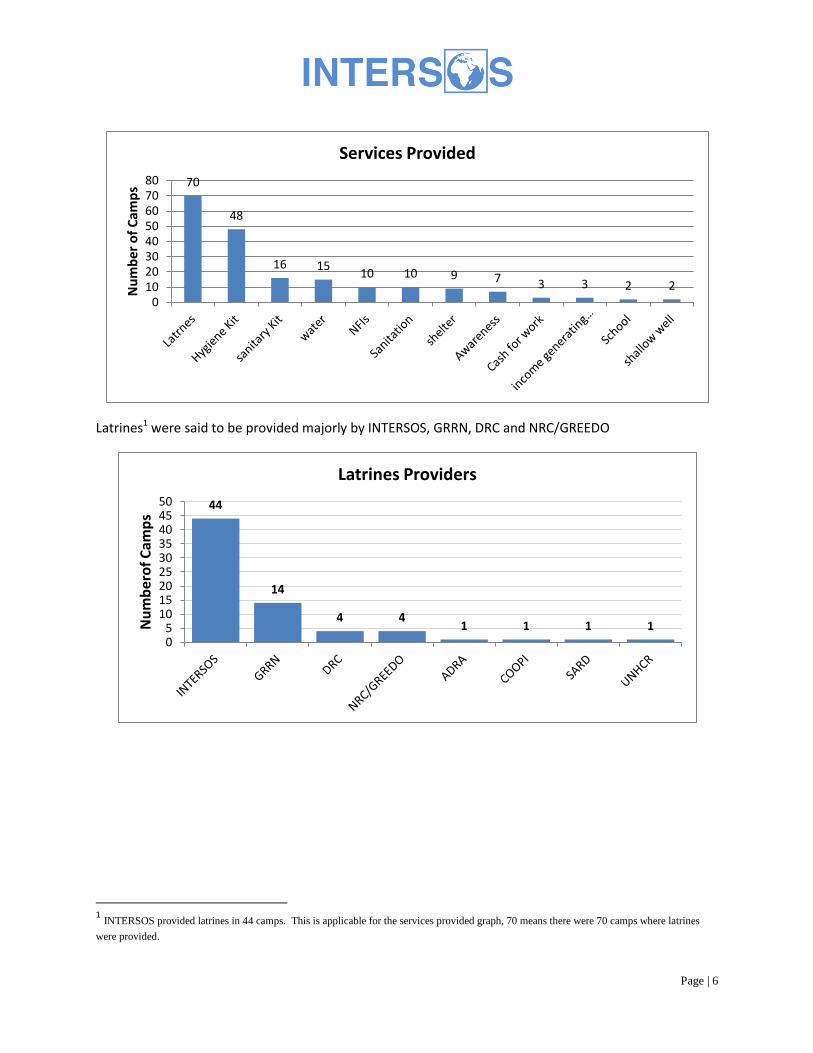
4.2 Services offered and perceived needs The large majority of respondents (91%) recognized that there were services being offered by some
organizations in the camps. The top four mentioned services provided are Latrines, Hygiene Kits,
Sanitary Kits and Water.
72%
7%
21%
Camps Setting
Urban
Rural
Unspecified
23%
19% 32%
26%
Population Composition
Women
Men
Girls
Boys
0
2,000
4,000
6,000
8,000
10,000
12,000
14,000
16,000
18,000
20,000
Women Men Girls Boys
Host
IDPs
Page | 6
Latrines1 were said to be provided majorly by INTERSOS, GRRN, DRC and NRC/GREEDO
1 INTERSOS provided latrines in 44 camps. This is applicable for the services provided graph, 70 means there were 70 camps where latrines
were provided.
70
48
16 15 10 10 9 7 3 3 2 2
0 10 20 30 40 50 60 70 80
Nu
mb
er o
f C
amp
s
Services Provided
44
14
4 4 1 1 1 1
0 5
10 15 20 25 30 35 40 45 50
Nu
mb
ero
f C
amp
s
Latrines Providers
Page | 7
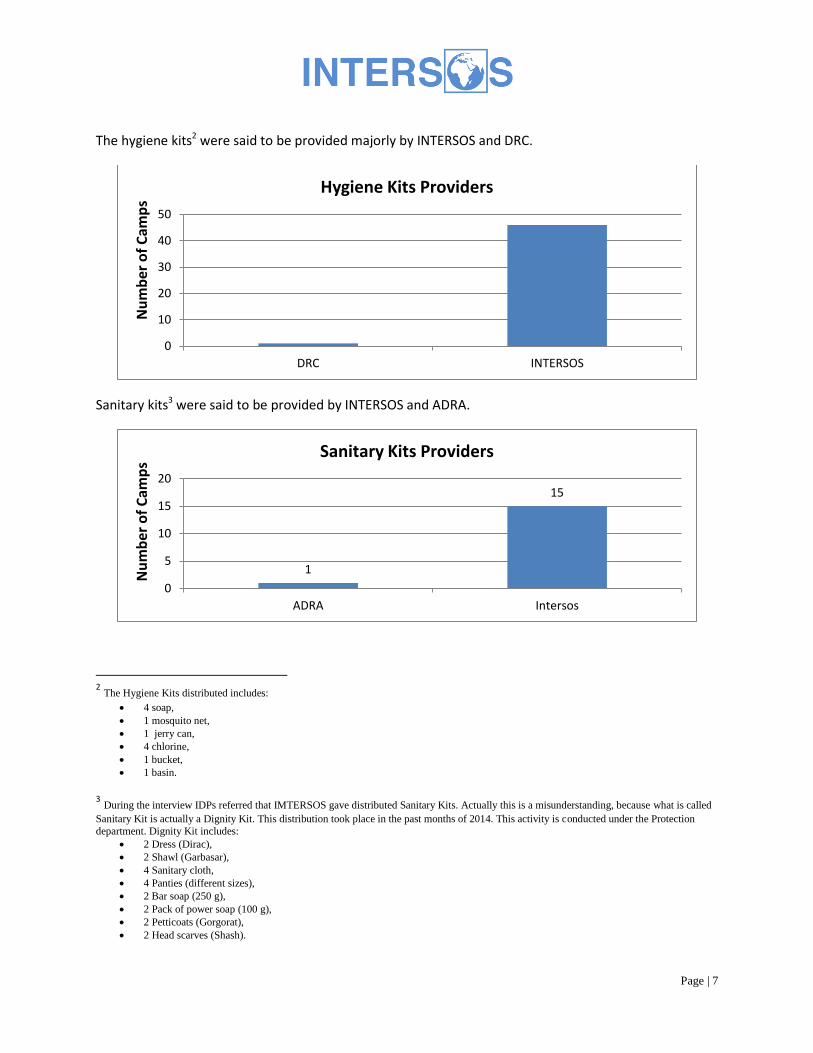
The hygiene kits2 were said to be provided majorly by INTERSOS and DRC.
Sanitary kits3 were said to be provided by INTERSOS and ADRA.
2 The Hygiene Kits distributed includes:
4 soap,
1 mosquito net,
1 jerry can,
4 chlorine,
1 bucket,
1 basin.
3 During the interview IDPs referred that IMTERSOS gave distributed Sanitary Kits. Actually this is a misunderstanding, because what is called
Sanitary Kit is actually a Dignity Kit. This distribution took place in the past months of 2014. This activity is conducted under the Protection
department. Dignity Kit includes:
2 Dress (Dirac),
2 Shawl (Garbasar),
4 Sanitary cloth,
4 Panties (different sizes),
2 Bar soap (250 g),
2 Pack of power soap (100 g),
2 Petticoats (Gorgorat),
2 Head scarves (Shash).
0
10
20
30
40
50
DRC INTERSOS
Nu
mb
er o
f C
amp
s
Hygiene Kits Providers
1
15
0
5
10
15
20
ADRA Intersos
Nu
mb
er o
f C
amp
s
Sanitary Kits Providers
Page | 8
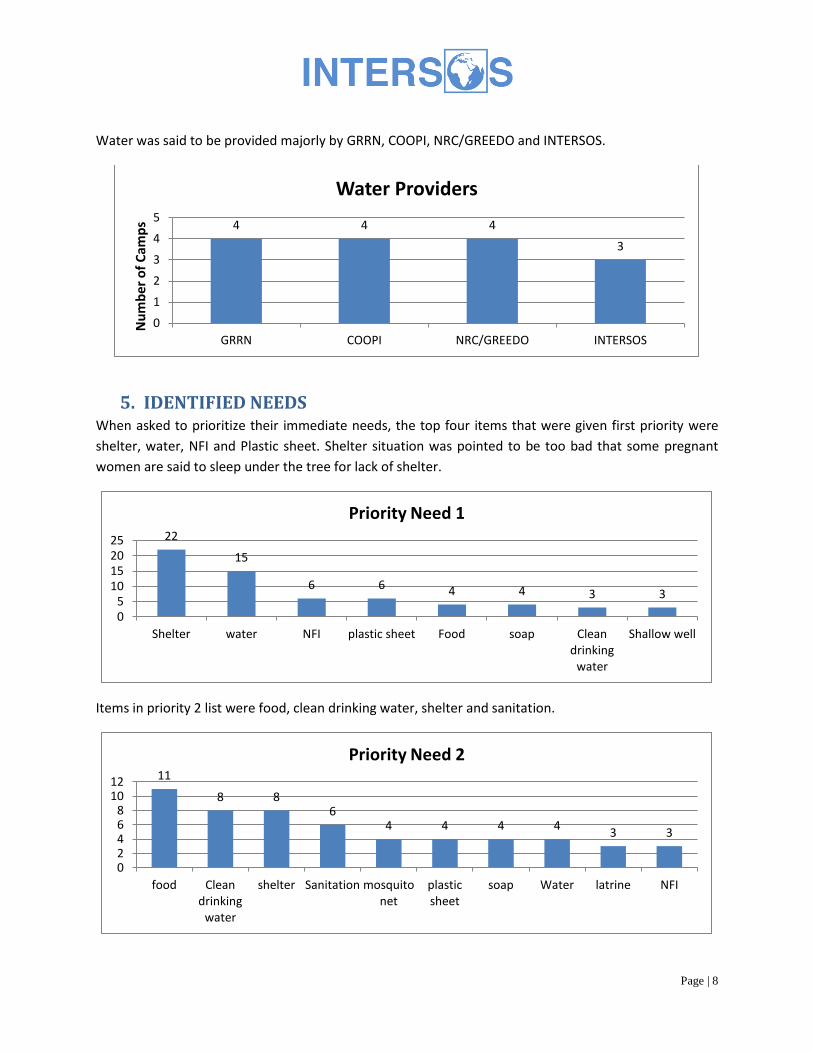
Water was said to be provided majorly by GRRN, COOPI, NRC/GREEDO and INTERSOS.
5. IDENTIFIED NEEDS When asked to prioritize their immediate needs, the top four items that were given first priority were
shelter, water, NFI and Plastic sheet. Shelter situation was pointed to be too bad that some pregnant
women are said to sleep under the tree for lack of shelter.
Items in priority 2 list were food, clean drinking water, shelter and sanitation.
4 4 4
3
0
1
2
3
4
5
GRRN COOPI NRC/GREEDO INTERSOS
Nu
mb
er o
f C
amp
s
Water Providers
22
15
6 6 4 4 3 3
0 5
10 15 20 25
Shelter water NFI plastic sheet Food soap Clean drinking
water
Shallow well
Priority Need 1
11
8 8 6
4 4 4 4 3 3
0 2 4 6 8
10 12
food Clean drinking
water
shelter Sanitation mosquito net
plastic sheet
soap Water latrine NFI
Priority Need 2
Page | 9
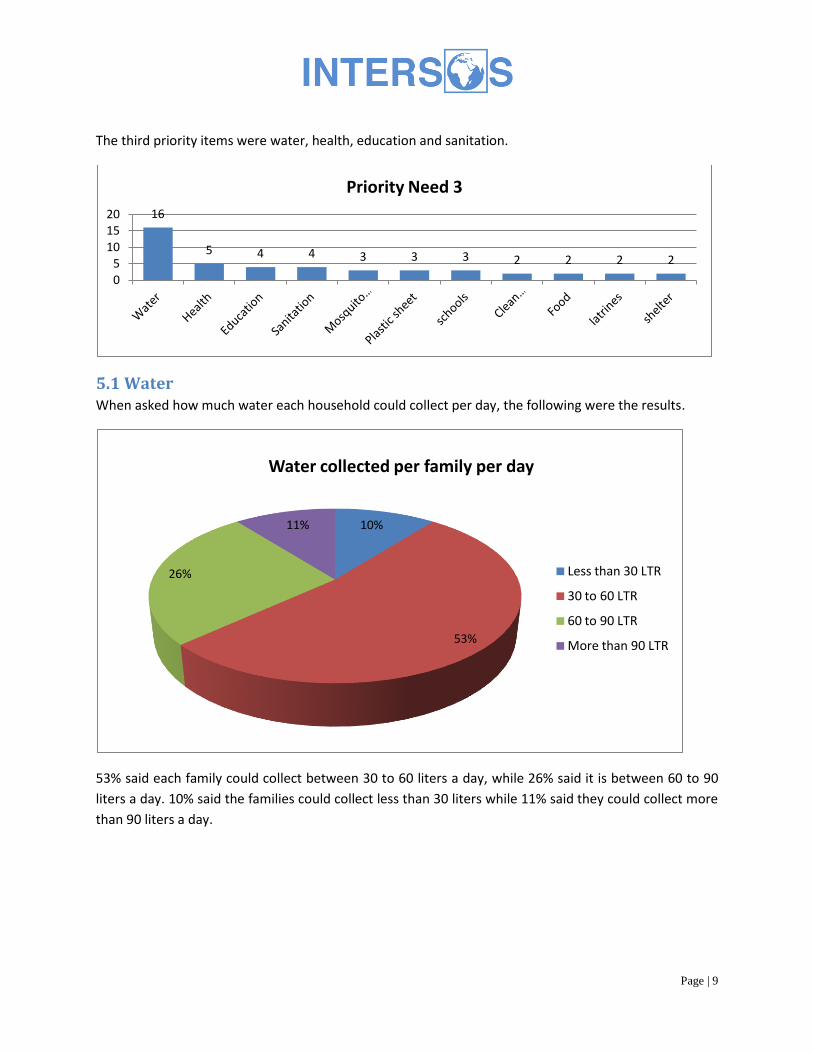
The third priority items were water, health, education and sanitation.
5.1 Water When asked how much water each household could collect per day, the following were the results.
53% said each family could collect between 30 to 60 liters a day, while 26% said it is between 60 to 90
liters a day. 10% said the families could collect less than 30 liters while 11% said they could collect more
than 90 liters a day.
16
5 4 4 3 3 3 2 2 2 2
0 5
10 15 20
Priority Need 3
10%
53%
26%
11%
Water collected per family per day
Less than 30 LTR
30 to 60 LTR
60 to 90 LTR
More than 90 LTR
Page | 10
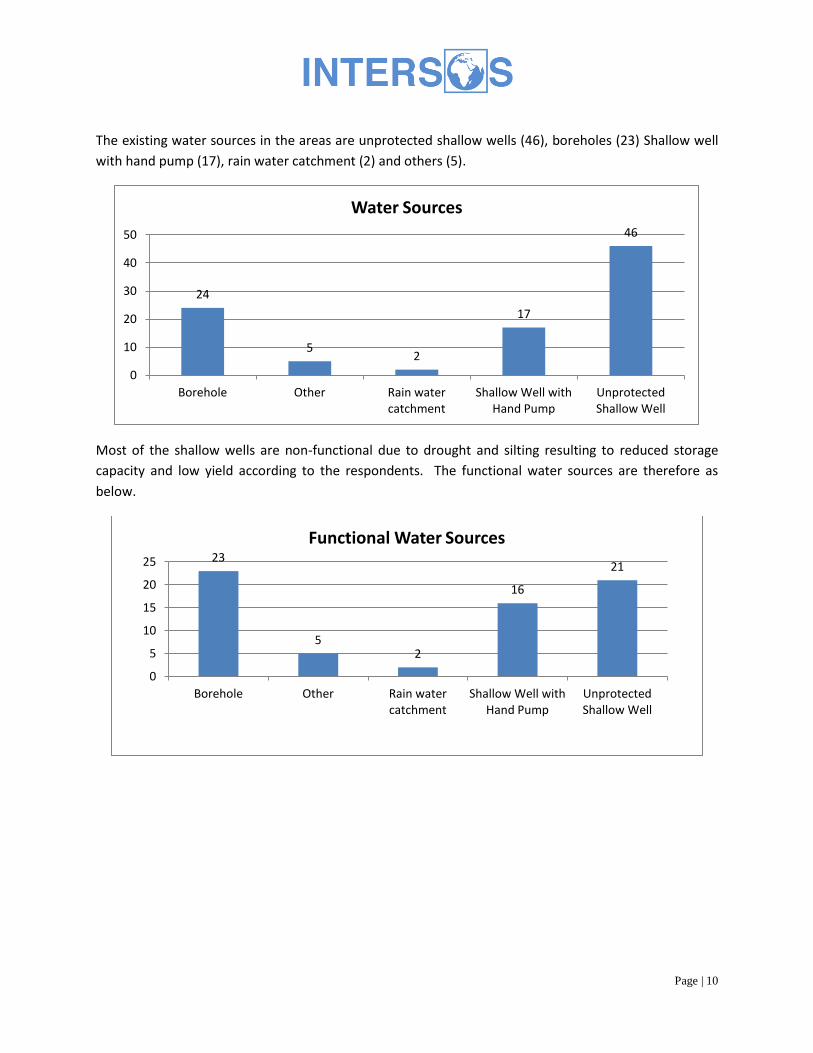
The existing water sources in the areas are unprotected shallow wells (46), boreholes (23) Shallow well
with hand pump (17), rain water catchment (2) and others (5).
Most of the shallow wells are non-functional due to drought and silting resulting to reduced storage
capacity and low yield according to the respondents. The functional water sources are therefore as
below.
24
5 2
17
46
0
10
20
30
40
50
Borehole Other Rain water catchment
Shallow Well with Hand Pump
Unprotected Shallow Well
Water Sources
23
5 2
16
21
0
5
10
15
20
25
Borehole Other Rain water catchment
Shallow Well with Hand Pump
Unprotected Shallow Well
Functional Water Sources
Page | 11
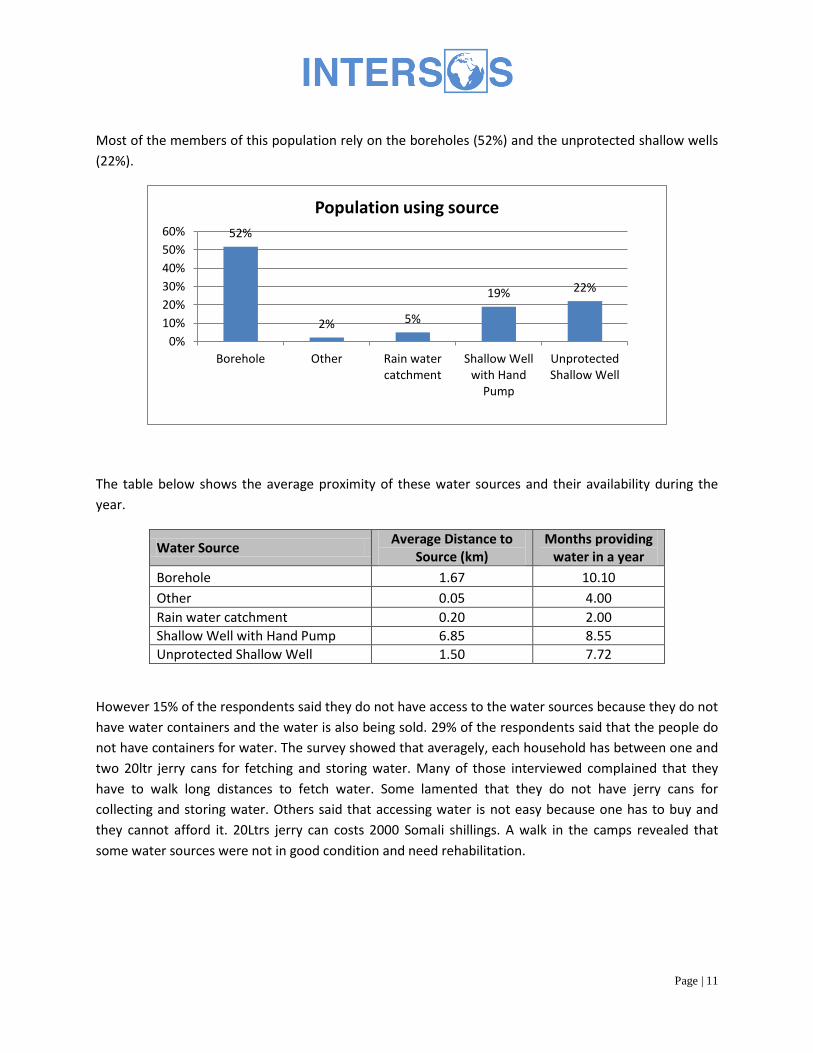
Most of the members of this population rely on the boreholes (52%) and the unprotected shallow wells
(22%).
The table below shows the average proximity of these water sources and their availability during the
year.
Water Source Average Distance to
Source (km) Months providing
water in a year
Borehole 1.67 10.10
Other 0.05 4.00
Rain water catchment 0.20 2.00
Shallow Well with Hand Pump 6.85 8.55
Unprotected Shallow Well 1.50 7.72
However 15% of the respondents said they do not have access to the water sources because they do not
have water containers and the water is also being sold. 29% of the respondents said that the people do
not have containers for water. The survey showed that averagely, each household has between one and
two 20ltr jerry cans for fetching and storing water. Many of those interviewed complained that they
have to walk long distances to fetch water. Some lamented that they do not have jerry cans for
collecting and storing water. Others said that accessing water is not easy because one has to buy and
they cannot afford it. 20Ltrs jerry can costs 2000 Somali shillings. A walk in the camps revealed that
some water sources were not in good condition and need rehabilitation.
52%
2% 5%
19% 22%
0%
10%
20%
30%
40%
50%
60%
Borehole Other Rain water catchment
Shallow Well with Hand
Pump
Unprotected Shallow Well
Population using source
Page | 12
5.2 Hygiene and Sanitation Only 26% of respondents said the population has access to chlorinated water while only 17% of the
respondents said the people make effort to improve the quality of their drinking water. Among those
who improve the drinking water quality, 64% use Chlorination, 73% boil water, 18% use sedimentation
and 9% use the sun. None is reported to be using any form of filtration. Interestingly, only 11% of the
respondents said they have water treatment chemicals available to them, and this is the same that use
chlorination.
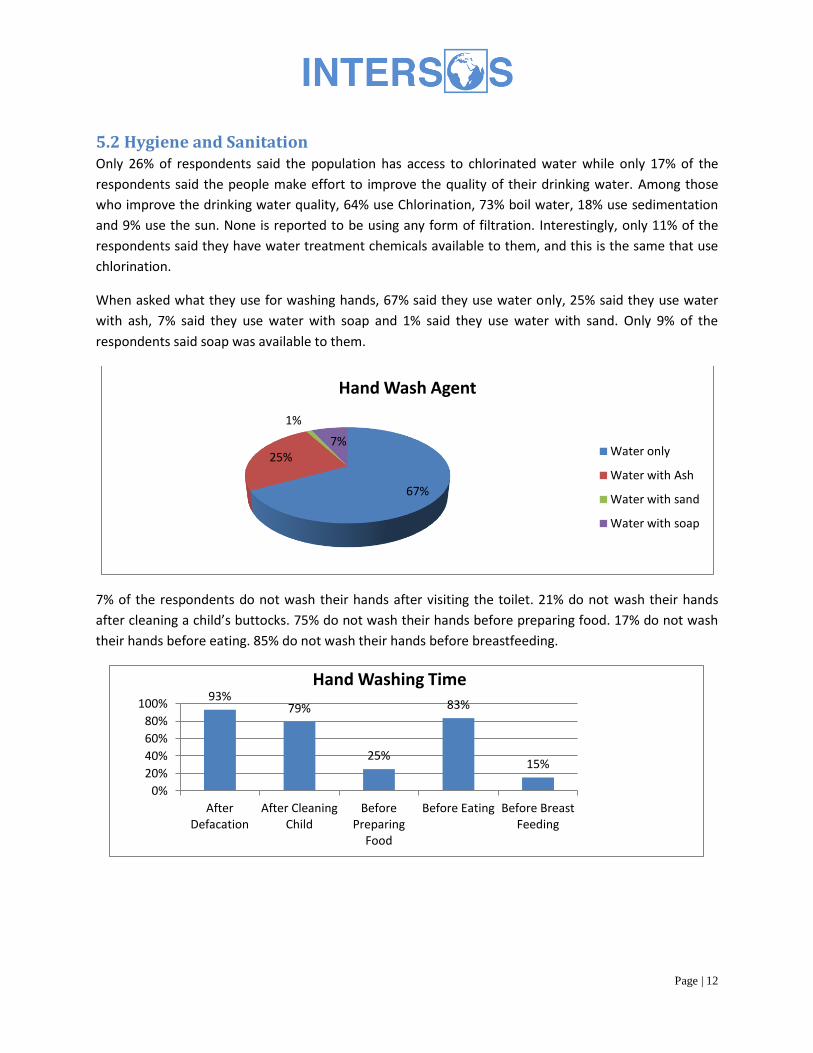
When asked what they use for washing hands, 67% said they use water only, 25% said they use water
with ash, 7% said they use water with soap and 1% said they use water with sand. Only 9% of the
respondents said soap was available to them.
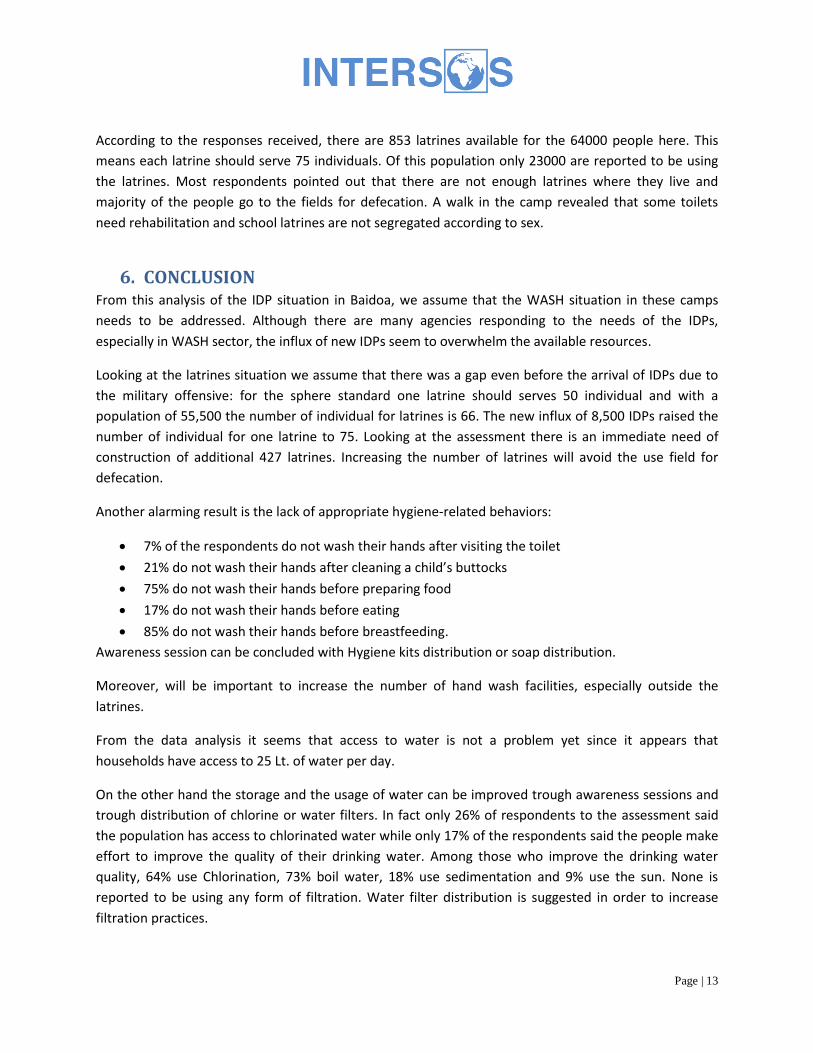
7% of the respondents do not wash their hands after visiting the toilet. 21% do not wash their hands
after cleaning a child’s buttocks. 75% do not wash their hands before preparing food. 17% do not wash
their hands before eating. 85% do not wash their hands before breastfeeding.
67%
25%
1%
7%
Hand Wash Agent
Water only
Water with Ash
Water with sand
Water with soap
93% 79%
25%
83%
15%
0%
20%
40%
60%
80%
100%
After Defacation
After Cleaning Child
Before Preparing
Food
Before Eating Before Breast Feeding
Hand Washing Time
Page | 13
According to the responses received, there are 853 latrines available for the 64000 people here. This
means each latrine should serve 75 individuals. Of this population only 23000 are reported to be using
the latrines. Most respondents pointed out that there are not enough latrines where they live and
majority of the people go to the fields for defecation. A walk in the camp revealed that some toilets
need rehabilitation and school latrines are not segregated according to sex.
6. CONCLUSION From this analysis of the IDP situation in Baidoa, we assume that the WASH situation in these camps
needs to be addressed. Although there are many agencies responding to the needs of the IDPs,
especially in WASH sector, the influx of new IDPs seem to overwhelm the available resources.
Looking at the latrines situation we assume that there was a gap even before the arrival of IDPs due to
the military offensive: for the sphere standard one latrine should serves 50 individual and with a
population of 55,500 the number of individual for latrines is 66. The new influx of 8,500 IDPs raised the
number of individual for one latrine to 75. Looking at the assessment there is an immediate need of
construction of additional 427 latrines. Increasing the number of latrines will avoid the use field for
defecation.
Another alarming result is the lack of appropriate hygiene-related behaviors:
7% of the respondents do not wash their hands after visiting the toilet
21% do not wash their hands after cleaning a child’s buttocks
75% do not wash their hands before preparing food
17% do not wash their hands before eating
85% do not wash their hands before breastfeeding.
Awareness session can be concluded with Hygiene kits distribution or soap distribution.
Moreover, will be important to increase the number of hand wash facilities, especially outside the
latrines.
From the data analysis it seems that access to water is not a problem yet since it appears that
households have access to 25 Lt. of water per day.
On the other hand the storage and the usage of water can be improved trough awareness sessions and
trough distribution of chlorine or water filters. In fact only 26% of respondents to the assessment said
the population has access to chlorinated water while only 17% of the respondents said the people make
effort to improve the quality of their drinking water. Among those who improve the drinking water
quality, 64% use Chlorination, 73% boil water, 18% use sedimentation and 9% use the sun. None is
reported to be using any form of filtration. Water filter distribution is suggested in order to increase
filtration practices.