2014 Budget, Volume 1 - Department of Treasury
192
i 2022 NATIONAL BUDGET VOLUME 1 ECONOMIC AND DEVELOPMENT POLICIES “Preliminary” For the year ending 31 st December 2022 PRESENTED BY HON. IAN LING-STUCKEY, CMG, MP MINISTER FOR TREASURY ON THE OCCASION OF THE PRESENTATION OF THE 2022 NATIONAL BUDGET
-
Upload
khangminh22 -
Category
Documents
-
view
1 -
download
0
Transcript of 2014 Budget, Volume 1 - Department of Treasury

i
2022 NATIONAL BUDGET
VOLUME 1 ECONOMIC AND DEVELOPMENT POLICIES
“Preliminary”
For the year ending 31st December 2022
PRESENTED BY
HON. IAN LING-STUCKEY, CMG, MP
MINISTER FOR TREASURY
ON THE OCCASION OF THE PRESENTATION OF THE 2022 NATIONAL BUDGET

2022 National Budget, Volume 1
ii
FOREWORD
On behalf of the Marape Government, I am honoured to present the 2022 National Budget
under the theme: “Lightening the burden”.
The Budget reflects the Government’s strategy of repair and reconstruction to get the PNG
economy back on a growth track, a consistent plan of the Marape Government since taking
the office in 2019. It is a fiscally sensible and responsible budget designed for our times,
continuing the task of consolidation we commenced in 2019 and at the same time supporting
families and businesses.
I am proud that this Budget also publishes our 13 year fiscal plan.
The 13 year fiscal plan shows that, for the first time since 2010, PNG has the option to finally
move to a surplus budget in 2027. This shows the benefits of our responsible budget repair
approach over the last three years. Further, by 2028 we will have the ability to reduce our debt
to GDP ratio back below 40 percent of GDP, the level set out in the Fiscal Responsibility Act.
This can be delivered 2 years earlier than originally set out when we said the debt ratio would
be back under 40 per cent within 10 years. For the first time in our history, we have the option
of having zero debt, available by 2034. This is why I have chosen a 13 year fiscal plan
framework. In 13 years, we have the choice to have zero debt for the first time ever.
But this is not our only option. If governments maintain the steady path of budget repair and
reconstruction, then the 12th Parliament elected by the people in 2027 has profound choices.
For example, it could decide to build the budget surplus to 1 per cent of GDP, then the debt
to GDP ratio would fall down to 19% of GDP and the debt level would drop to below K50 billion.
But there would be an additional K0.9 billion available for additional capital projects in 2028,
growing to an extra K20.6 billion by 2034. Of course inflation affects the spending values of
these funds, but from the years 2028 to 2034, there would be over K65 billion available for
increased capital expenditure. Imagine the transformative impact of a such a program on our
country
The 13 year fiscal plan is based on moving to a reasonable growth rate of the non-resource
parts of our economy of 5 per cent in real terms. This in turn helps drive realistic revenue
estimates based on GDP growth, higher returns from the PNG LNG project when the
repayment of loans and depreciation finally finish in 2030, and compliance work to stamp down
on the black economy. Indeed, the revenue estimates are conservative in that the plan does
not include a single toea of revenue from any of the planned major resource investments that
are very likely to go ahead. When confirmed by the Final Investment Decision, such
investments will provide an upside shock.
Crucial to having this credible 13 year fiscal plan is having the credible economic team that
can actually deliver the plan for our great country of PNG. Getting to these powerful options
will require fiscal discipline. It will require a government committed to getting the budget basics
right, getting more into our capital programs, supporting provinces, supporting more teachers
and police and nurses.
Looking to our immediate future, the economy is expected to grow from K93 billion to K101.7
billion. Finally breaking the K100 billion barrier. Our vital non-resource economy is expected
to increase by 3.5% in real terms, with election related spending expected to provide a boost

2022 National Budget, Volume 1
iii
to activity in the non-resource economy. Including the mining sector, growth is estimated to
be 5.4%. This reflects the expected recommencement of Porgera and improvements in Ok
Tedi production. Inflation in 2022 is expected to be 5.6 percent.
The Government remains committed to advancing development across the country,
particularly through its continued efforts to Connect PNG. This Budget sees a massive
increase in the PIP capital budget of 19%, from K4,824m to K5,758m. Through Connect PNG
2,242 km of roads are already being improved and 323 projects, most of them at local level
generating jobs and incomes for our people, are ongoing.
The Marape Government is lightening the burden on families through major health and
education programmes. This Budget sees massive increases in health spending lifting from
K1,745m in 2021 to K2,594m in 2022, a 46% increase. We are moving an estimated 6,000
extra nurses from the Catholic and Church Health Service system onto the Alesco payroll
giving them more certainty and often higher levels of pay. On education, we are increasing
spending from K1,095 million to K1,470 million, an increase of 34%. This includes K632 million
for full government tuition-fee subsidies making 2022 the highest level of support ever
provided. I am proud that this Budget invests more in our community services with an increase
in funding by 52%, up from K102 million to K156 million. This includes full funding for
establishing the Gender-Based Violence Secretariat and support to important NGOs working
to address domestic violence.
The Marape Government is conducting this vital spending in our human resources, and into
our physical resources, while continuing the process of budget repair and reconstruction. The
deficit will reduce from the high point of 8.9% of GDP during the worst of the COVID-19 crisis
in 2020 to 5.9% in 2022. This is a substantial pace of fiscal consolidation, especially in the
context of funding the 2022 election with K600 million.
I thank all those who have worked so tirelessly to prepare yet another National Budget. The
ransomware attack on the IFMIS has proved particularly problematic.
I commend the 2022 National Budget to the Honourable Members and to the people of Papua
New Guinea.
…………………………………………………………..
HON. IAN LING-STUCKEY, CMG. MP
Minister for Treasury

2022 National Budget, Volume 1
iv
Contents CHAPTER 1: BUDGET OVERVIEW ........................................................................................... 8
1.1 BUDGET THEME AND GUIDING PRINCIPLES ......................................................................... 8
1.2 INVESTMENTS FOR SUSTAINED ECONOMIC GROWTH AND JOB CREATION ............................... 11
1.3 STRATEGIC ACTIONS BY 2034 ................................................................................. 13
CHAPTER 2: ECONOMIC DEVELOPMENTS AND OUTLOOK ................................................... 20
2.1 WORLD ECONOMIC GROWTH OUTLOOK ................................................................ 20
2.2 EXCHANGE RATE DEVELOPMENTS ......................................................................... 30
2.3 DOMESTIC ECONOMIC DEVELOPMENTS AND OUTLOOK ................................. 32
2.4 2022 ECONOMIC OUTLOOK ........................................................................................ 35
2.5 LABOUR MARKET .................................................................................................. 39
2.6 MONETARY DEVELOPMENTS .............................................................................. 41
2.7 CONSUMER PRICE INDEX .................................................................................... 42
2.8 BALANCE OF PAYMENTS AND INTERNATIONAL RESERVES ............................ 45
2.9 RISKS TO MACROECONOMIC STABILITY ............................................................ 47
CHAPTER 3: FISCAL STRATEGY AND OUTLOOK .................................................................. 50
3.1 FISCAL BACKGROUND – 2021 BUDGET UPDATE ............................................... 50
3.2 2021 SUPPLEMENTARY BUDGET ......................................................................... 50
3.3 THE 2022 BUDGET STRATEGY ............................................................................. 52
3.4 THE MEDIUM-TERM FISCAL OUTLOOK ............................................................... 56
CHAPTER 4: REVENUE ....................................................................................................... 59
4.1 REVENUE DEVELOPMENTS AND OUTLOOK 2021 AND 2022 ............................. 59
4.2 TAX REVENUE ....................................................................................................... 60
4.3 OTHER REVENUE .................................................................................................. 64
4.4 GRANTS ................................................................................................................. 65
4.5 MEDIUM TERM REVENUE OUTLOOK ................................................................... 66
CHAPTER 5: TAX AND NON-TAX MEASURES AND DEVELOPMENTS ...................................... 69
5.1 OVERVIEW ............................................................................................................. 69
5.2 MAJOR REVENUE POLICY MEASURES ............................................................... 70
5.3 COMPLIANCE MEASURES .................................................................................... 74
5.4 NON-TAX REVENUE MEASURE ............................................................................ 75
5.5 NEW POLICY DEVELOPEMENT AREAS ............................................................... 77
CHAPTER 6: EXPENDITURE ................................................................................................ 81
6.1 OVERVIEW ............................................................................................................. 81
6.2 2022 AGGREGATE EXPENDITURE ....................................................................... 82
6.3 SECTOR EXPENDITURE .......................................................................................... 84
6.4 EXPENDITURE EFFICIENCY MEASURES ................................................................. 95
6.5 DONOR FUNDING FROM DEVELOPMENT PARTNERS ........................................................... 99
6.6 STATUS OF TRUST ACCOUNTS ......................................................................... 101

2022 National Budget, Volume 1
v
CHAPTER 7: TAX EXPENDITURE ........................................................................................ 109
7.1 OVERVIEW ........................................................................................................... 109
7.2 TAX INCENTIVES IN THE INCOME TAX ACT (ITA) 1959 ..................................... 110
7.3 GOODS AND SERVICES TAX ACT 2003 .............................................................. 115
7.4 TAX INCENTIVES IN THE CUSTOMS TARIFF ACT 1990 ..................................... 116
CHAPTER 8: FINANCING AND DEBT MANAGEMENT STRATEGY ....................................... 117
8.1 FINANCING BACKGROUND TO THE 2021 BUDGET ........................................... 117
8.2 FINANCING REQUIREMENTS 2021 BUDGET ..................................................... 118
8.3 UPDATE ON DOMESTIC MARKET CONDITIONS FOR FINANCING DEFICIT ..... 119
8.4 MEDIUM TERM DEBT STRATEGY AND OPERATIONAL PLAN 2021-2025 ......... 120
8.5 MANAGING PORTFOLIO RISK 2020-2025 ........................................................... 123
CHAPTER 9: NATIONAL REFORM AGENDA ....................................................................... 125
9.1 OVERVIEW ........................................................................................................... 125
9.2 KEY REFORMS .................................................................................................... 126
9.3 PUBLIC SECTOR REFORM .................................................................................. 127
9.4 A COMPETITIVE AND DYNAMIC PRIVATE SECTOR .......................................... 128
9.5 ASIA-PACIFIC ECONOMIC COOPERATION (APEC) ........................................... 142
9.6 IMPLEMENTATION OF THE SOVEREIGN WEALTH FUND OF PAPUA NEW
GUINEA ................................................................................................................ 143
9.7 CENTRAL BANKING ACT REVIEW ............................................................................... 146
CHAPTER 10: ENHANCING STATE’S INVESTMENTS ............................................................ 148
10.1 OVERVIEW ........................................................................................................... 148
10.2 STATE’S INVESTMENT PERFORMANCE ............................................................ 148
10.3 BROADER REFORMS .......................................................................................... 151
10.4 PUBLIC PRIVATE PARTNERSHIPS (PPP) ........................................................... 152
10.5 MANAGING THE NON-RENEWABLE RESOURCE SECTOR ............................... 153
10.6 EXTRACTIVE SECTOR PROJECT UPDATES ...................................................... 154
10.7 PETROLEUM PROJECTS .................................................................................... 156
10.8 PNG EXTRACTIVE INDUSTRIES TRANSPARENCY INITIATIVE (PNGEITI) ....... 157
10.9 REFORMING THE RENEWABLE RESOURCE SECTOR ..................................... 162
10.10 STATE PARTICIPATION AND INVESTMENTS IN AGRICULTURE SECTOR .... 169

2022 National Budget, Volume 1
vi
Tables
Table 1: The 13year Fiscal Strategy for Budget Repair and Reconstruction ......................................................... 10
Table 2: Strategic Action Items ............................................................................................................................. 12
Table 3: 2021 Supplementary Budget (Kina, million) ........................................................................................... 51
Table 4: Expenditure Summary (Kina, million) ..................................................................................................... 51
Table 5: 2022 and Medium Term Revenue Projections (Kina, million) ................................................................ 53
Table 6: 2022 and Medium Term Expenditure Estimates (Kina, million) ............................................................. 54
Table 7: Budget Balance 2020-2022 (Kina, million) .............................................................................................. 55
Table 8: Budget Balance 2021–2027 (% of GDP) .................................................................................................. 56
Table 9: Key Anchors of the MTFS 2021-2027 (% of GDP) .................................................................................... 57
Table 10: Total Revenue and Grants 2021-2022 (Kina, million) ........................................................................... 59
Table 11: Taxes on Income and Profits 2021-2022 (Kina, million) ....................................................................... 60
Table 12: Taxes on Payroll and Workforce 2021-2022 (Kina, million) .................................................................. 61
Table 13: Taxes on Goods and Services 2021-2022(Kina, million) ....................................................................... 62
Table 14: Taxes on International Trade and Transactions 2021-2022(Kina, million) ........................................... 64
Table 15: Other Revenue 2021-2022 (Kina, million) ............................................................................................. 64
Table 16: Donor Grants 2021- 2022 (Kina, million) .............................................................................................. 66
Table 17: 2022 Aggregate Expenditure (Kina, million) ......................................................................................... 82
Table 18: Fixed Commitments of the Government in 2022 (Kina, million). ......................................................... 83
Table 19: 2022 Expenditure by Sector (Kina, million) ........................................................................................... 84
Table 20: Big ticket items under each sector (Kina, millions). .............................................................................. 86
Table 21: 2021 Loans, Grants and Government Counterpart funding (Kina, Million) ........................................ 100
Table 22: Movement of Funds in Budget Funded Trust Accounts from 1st January – 30th September 2021 (Kina,
million). ...................................................................................................................................................... 101
Table 23: List for the 22 COVID-19 Provincial Subsidiary Trust Accounts and the movement of funds from 1st
Jan to 30th September 2021 (Kina, millions) ............................................................................................. 103
Table 24: List for the 89 COVID -19 District Subsidiary Trust Accounts and the movement of funds from 1st Jan
to 30th September 2021 (Kina, millions) ................................................................................................... 105
Table 25: Composition of Financing by Instrument for 2022 (Kina, million) ...................................................... 118
Table 26: Debt Outstanding Debt Instruments 2020-2027 (Kina, million) ......................................................... 119
Table 27: Government Securities Issuance - End of September 2021 ................................................................ 120
Table 28: Percentage of Debt to GDP ................................................................................................................. 121
Table 29: Percentage of Foreign Currency Debt to Total Central Government Debt ......................................... 121
Table 30: Average Maturity of the Domestic Debt Portfolio .............................................................................. 122
Table 31: Deficit Financing Projections by Instrument 2020-2027 ( Kina, million) ............................................. 123
Table 32: Debt stock as a share of GDP 2020-2027 (Kina, million) ..................................................................... 123
Table 33: Calculation of the NNR Amount for the 2022 Budget (K000, Million) ................................................ 127
Table 34: Status Update of Access and Usage – Financial Inclusion ................................................................... 139
Table 35: General Business Trust (GBT Assets) as at 31st December 2020 ........................................................ 149
Table 36: Dividends Paid to State (Kina, million) ................................................................................................ 150
2022 National Budget, Volume 1
vii
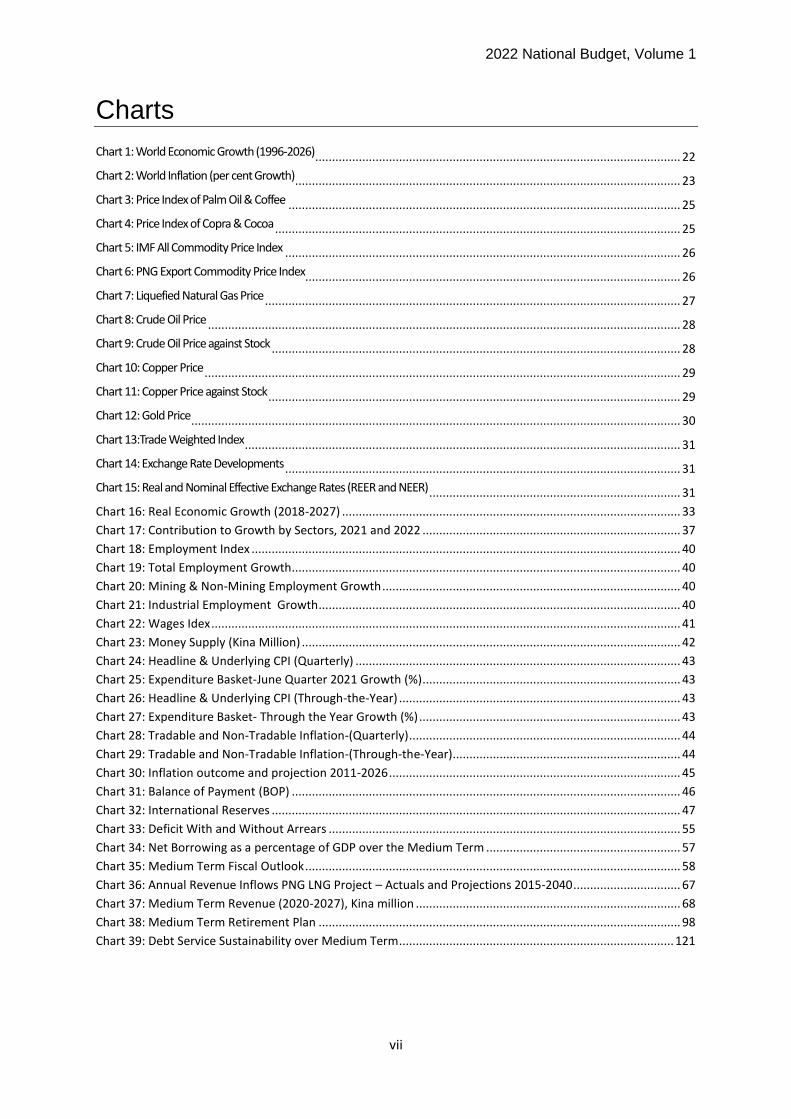
Charts Chart 1: World Economic Growth (1996-2026) ............................................................................................................. 22
Chart 2: World Inflation (per cent Growth) ................................................................................................................... 23
Chart 3: Price Index of Palm Oil & Coffee ..................................................................................................................... 25
Chart 4: Price Index of Copra & Cocoa ......................................................................................................................... 25
Chart 5: IMF All Commodity Price Index ...................................................................................................................... 26
Chart 6: PNG Export Commodity Price Index ................................................................................................................ 26
Chart 7: Liquefied Natural Gas Price ............................................................................................................................ 27
Chart 8: Crude Oil Price ............................................................................................................................................. 28
Chart 9: Crude Oil Price against Stock .......................................................................................................................... 28
Chart 10: Copper Price .............................................................................................................................................. 29
Chart 11: Copper Price against Stock ........................................................................................................................... 29
Chart 12: Gold Price .................................................................................................................................................. 30
Chart 13:Trade Weighted Index .................................................................................................................................. 31
Chart 14: Exchange Rate Developments ...................................................................................................................... 31
Chart 15: Real and Nominal Effective Exchange Rates (REER and NEER) ........................................................................... 31
Chart 16: Real Economic Growth (2018-2027) ..................................................................................................... 33
Chart 17: Contribution to Growth by Sectors, 2021 and 2022 ............................................................................. 37
Chart 18: Employment Index ................................................................................................................................ 40
Chart 19: Total Employment Growth.................................................................................................................... 40
Chart 20: Mining & Non-Mining Employment Growth ......................................................................................... 40
Chart 21: Industrial Employment Growth............................................................................................................ 40
Chart 22: Wages Idex ............................................................................................................................................ 41
Chart 23: Money Supply (Kina Million) ................................................................................................................. 42
Chart 24: Headline & Underlying CPI (Quarterly) ................................................................................................. 43
Chart 25: Expenditure Basket-June Quarter 2021 Growth (%) ............................................................................. 43
Chart 26: Headline & Underlying CPI (Through-the-Year) .................................................................................... 43
Chart 27: Expenditure Basket- Through the Year Growth (%) .............................................................................. 43
Chart 28: Tradable and Non-Tradable Inflation-(Quarterly) ................................................................................. 44
Chart 29: Tradable and Non-Tradable Inflation-(Through-the-Year).................................................................... 44
Chart 30: Inflation outcome and projection 2011-2026 ....................................................................................... 45
Chart 31: Balance of Payment (BOP) .................................................................................................................... 46
Chart 32: International Reserves .......................................................................................................................... 47
Chart 33: Deficit With and Without Arrears ......................................................................................................... 55
Chart 34: Net Borrowing as a percentage of GDP over the Medium Term .......................................................... 57
Chart 35: Medium Term Fiscal Outlook ................................................................................................................ 58
Chart 36: Annual Revenue Inflows PNG LNG Project – Actuals and Projections 2015-2040 ................................ 67
Chart 37: Medium Term Revenue (2020-2027), Kina million ............................................................................... 68
Chart 38: Medium Term Retirement Plan ............................................................................................................ 98
Chart 39: Debt Service Sustainability over Medium Term .................................................................................. 121

2022 National Budget, Volume 1
8
CHAPTER 1: BUDGET OVERVIEW 1.1 Budget Theme and Guiding Principles
1.1.1 Budget Theme and Guiding Principles Sustainability and inclusivity principles of production and consumption are in many PNG traditional practices. At independence, these were incorporated in the preamble of the National Constitution as the Five National Goals and Directive Principles (5NGDP’s) as guiding principles for the country’s development. These are: 1. Integral human development: for every person to be dynamically involved in the process
of freeing himself or herself from every form of domination or oppression so that each man or woman will have the opportunity to develop as a whole person in relationship with others.
2. Equality and participation: for all citizens to have an equal opportunity to participate in, and benefit from, the development of our country.
3. National sovereignty and self-reliance: Papua New Guinea to be politically and economically independent, and our economy basically self-reliant.
4. Natural resources and environment: for Papua New Guinea's natural resources and environment to be conserved and used for the collective benefit of us all, and be replenished for the benefit of future generations.
5. Papua New Guinean ways: to achieve development primarily through the use of Papua New Guinean forms of social, political and economic organisation.
The 4th Goal in particular asserts; “We declare our fourth goal to be for Papua New Guinea's natural resources and environment to be conserved and used for the collective benefit of us all, and be replenished for the benefit of future generations”. Vision 2050, DSP 2030, StaRS, and MTDP’s including sector plans have all endeavored to incorporate sustainability as their theme. Development policies and plans of all successive governments since have endeavored to deliver on inclusive and sustainable outcomes with mixed results. The years leading up to the 2019 change in government in particular were unsustainable with increased budget deficits, expensive loans and Port Moresby centric infrastructure expenditure, including excessive wastage in APEC, UBS and SABL’s etc. When Prime Minister Marape assumed leadership in May 2019, the budget deficit was K 4.5b. The Due Diligence (DD) exercise undertaken in mid-2019, established the K4.5b deficit, up from the MYEFO reported K2.3b, and clearly indicated that the budget needed repairing and the reconstruction strategy built on a correct fiscal platform. The agreement of the IMF Article IV visit report validated the findings of the DD exercise and the NEC adopted the new figures as the platform for reconstruction and growth. The 2019 Supplementary Budget, the 2020 Budget and supplementary budgets and 2021 Budget were predicated on the repair and reconstruction theme. The negative impacts of COVID-19 in 2020 and 2021 budget years further added to the fiscal stress with scale down of businesses and even shut downs resulting in decline in tax revenue of K2.7b in 2020 and K2.0b in 2021. Government responded with a stimulus package in 2020 principally to protect the budget from the K2.7b shock. This was essentially the continuation of the repair strategy given that COVID-19 shock delayed the planned recovery by
2022 National Budget, Volume 1
9
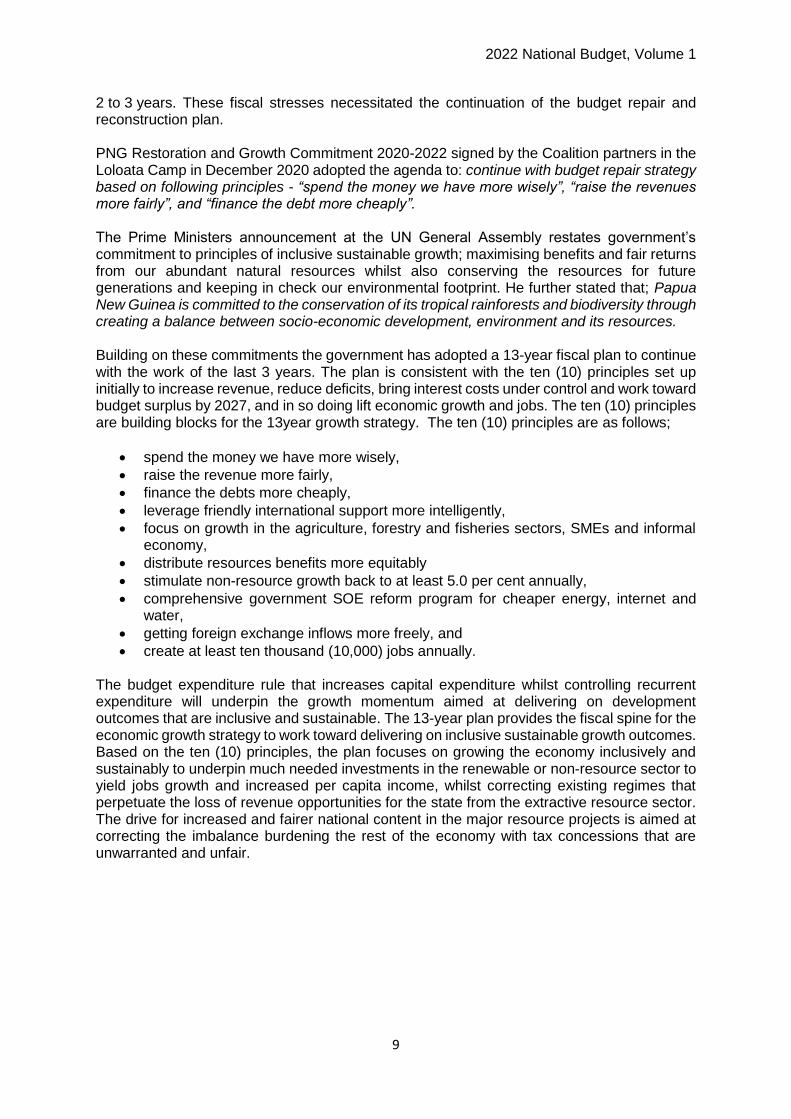
2 to 3 years. These fiscal stresses necessitated the continuation of the budget repair and reconstruction plan. PNG Restoration and Growth Commitment 2020-2022 signed by the Coalition partners in the Loloata Camp in December 2020 adopted the agenda to: continue with budget repair strategy based on following principles - “spend the money we have more wisely”, “raise the revenues more fairly”, and “finance the debt more cheaply”. The Prime Ministers announcement at the UN General Assembly restates government’s commitment to principles of inclusive sustainable growth; maximising benefits and fair returns from our abundant natural resources whilst also conserving the resources for future generations and keeping in check our environmental footprint. He further stated that; Papua New Guinea is committed to the conservation of its tropical rainforests and biodiversity through creating a balance between socio-economic development, environment and its resources. Building on these commitments the government has adopted a 13-year fiscal plan to continue with the work of the last 3 years. The plan is consistent with the ten (10) principles set up initially to increase revenue, reduce deficits, bring interest costs under control and work toward budget surplus by 2027, and in so doing lift economic growth and jobs. The ten (10) principles are building blocks for the 13year growth strategy. The ten (10) principles are as follows;
spend the money we have more wisely,
raise the revenue more fairly,
finance the debts more cheaply,
leverage friendly international support more intelligently,
focus on growth in the agriculture, forestry and fisheries sectors, SMEs and informal economy,
distribute resources benefits more equitably
stimulate non-resource growth back to at least 5.0 per cent annually,
comprehensive government SOE reform program for cheaper energy, internet and water,
getting foreign exchange inflows more freely, and
create at least ten thousand (10,000) jobs annually. The budget expenditure rule that increases capital expenditure whilst controlling recurrent expenditure will underpin the growth momentum aimed at delivering on development outcomes that are inclusive and sustainable. The 13-year plan provides the fiscal spine for the economic growth strategy to work toward delivering on inclusive sustainable growth outcomes. Based on the ten (10) principles, the plan focuses on growing the economy inclusively and sustainably to underpin much needed investments in the renewable or non-resource sector to yield jobs growth and increased per capita income, whilst correcting existing regimes that perpetuate the loss of revenue opportunities for the state from the extractive resource sector. The drive for increased and fairer national content in the major resource projects is aimed at correcting the imbalance burdening the rest of the economy with tax concessions that are unwarranted and unfair.

2022 National Budget, Volume 1
10
Table 1: The 13-year Fiscal Strategy for Budget Repair and Reconstruction
2019 FBO 2020 FBO 2021 Budget 2021 MYEFO 2022 2023 2024 2025 2026 2027 2028 2029 2030 2031 2032 2033 2034
GDP 83,845.18 85,348.40 90,265.49 93,314.40 101,696 109,555.25 116,743.81 125,451.55 134,080.15 145,407.87 157,469.63 170,767.72 185,428.86 201,592.77 219,413.48 239,061 260,722
Non-Resource GDP 60086.8 62896.4 67,132 69,348 74,550 81,899 89,008 97,377 106,918 117,676 129,737 143,036 157,697 173,861 191,681 211,329 232,990
Resource GDP 23,758 22,452 23,133 23,133 27,146 27,656 27,736 28,074 27,162 27,732 27,732 27,732 27,732 27,732 27,732 27,732 27,732
GDP Non-resource Nominal Growth (%) 4.9% 4.7% 6.7% 10.3% 7.5% 9.9% 8.7% 9.4% 9.8% 10.1% 10.3% 10.3% 10.3% 10.3% 10.3% 10.3% 10.3%
GDP Non-resource Real Growth (%) (less inflation) 1.6% -1.2% 3.9% 3.5% 4.9% 3.8% 4.5% 4.8% 5.0% 5.0% 5.0% 5.0% 5.0% 5.0% 5.0% 5.0%
GDP Nominal Growth (%) 5.6% 1.8% 5.8% 9.3% 9.0% 7.7% 6.6% 7.5% 6.9% 8.4% 8.3% 8.4% 8.6% 8.7% 8.8% 9.0% 9.1%
GDP Real Growth (%) 4.5% -3.5% 1.5% 5.4% 3.8% 2.8% 3.3% 3.5% 3.7% 3.7% 3.7% 3.7% 3.7% 3.7% 3.7% 3.7%
Total Revenue 13,680 12,093 12,995 13,675 16,190 17,686 19,556 21,847 24,606 27,768 31,130 35,565 40,476 45,449 51,049 57,359 64,467
% of GDP 16.3% 14.2% 14.4% 14.7% 15.9% 16.1% 16.8% 17.4% 18.4% 19.1% 19.8% 20.8% 21.8% 22.5% 23.3% 24.0% 24.7%
GoPNG Revenue (Total Revenue less Grants) 11,905 10,668 11,987 12,032 14,365 15,961 17,781 20,022 22,631 25,593 28,852 33,178 37,974 42,826 48,301 54,478 61,448
% of GDP 14.2% 12.5% 13.3% 12.9% 14.1% 14.6% 15.2% 16.0% 16.9% 17.6% 18.3% 19.4% 20.5% 21.2% 22.0% 22.8% 23.6%
Tax Revenue 10,918 9,802 11,110 10,868 12,511 14,369 16,167 18,361 20,669 23,328 26,361 30,538 35,160 39,731 44,896 50,733 57,328
Other Revenue (Non-Tax) 987 866 877 1,163 1,854 1,592 1,614 1,661 1,962 2,264 2,491 2,640 2,814 3,095 3,405 3,745 4,120
Grants 1,776 1,425 1,008 1,643 1,825 1,725 1,775 1,825 1,975 2,175 2,279 2,388 2,502 2,622 2,748 2,881 3,020
Total Expenditure 18,956 19,398 19,608 20,287 22,175 22,351 23,229 24,424 25,911 27,574 28,493 30,115 31,744 33,649 35,670 36,705 38,307
% of GDP 22.6% 22.7% 21.7% 21.7% 21.8% 20.4% 19.9% 19.5% 19.3% 19.0% 18.1% 17.6% 17.1% 16.7% 16.3% 15.4% 14.7%
GoPNG Expenditure (Total Expenditure less Grants) 17,180 17,973 18,600 18,862 20,600 20,826 21,604 22,699 24,036 25,500 26,314 27,827 29,342 31,127 33,022 33,925 35,388
% of GDP 20.5% 21.1% 20.6% 20.2% 20.3% 19.0% 18.5% 18.1% 17.9% 17.5% 16.7% 16.3% 15.8% 15.4% 15.1% 14.2% 13.6%
Operational Component (PE and G&S) 10,721 10,331 9,866 10,299 11,099 11,094 11,520 12,307 13,401 14,667 15,216 16,345 17,561 19,119 20,878 21,794 23,426
% of Total Expenditure 53.3% 50.3% 50.8% 50.1% 49.6% 49.6% 50.4% 51.7% 53.2% 53.4% 54.3% 55.3% 56.8% 58.5% 59.4% 61.2%
Compensation of Employees 5,423 5,831 5,764 6,030 6,050 6,337 6,433 6,867 7,389 7,954 8,568 9,231 9,949 10,724 11,562 12,469 13,448
Goods and Services 4,193 3,325 2,789 3,058 3,696 3,260 3,430 3,605 3,985 4,474 4,252 4,550 4,868 5,459 6,174 5,964 6,381
GTFS 392 339 489 632 670 712 756 801 849 909 972 1,040 1,113 1,191 1,274 1,364
HELP 61 100 65 69 74 78 83 86 92 99 106 113 121 130 139
Medical Supplies 234 217 121 200 206 212 219 225 232 248 265 284 304 325 348 372
Elections 0 600 200 500 250 600
Residual 3,568 2,709 2,349 2,199 2,315 2,432 2,552 2,675 2,807 3,003 3,213 3,438 3,679 3,936 4,212 4,507
CoE and G&S % of Total Expenditure 50.7% 47.2% 43.6% 44.8% 44.0% 42.9% 42.5% 42.9% 43.9% 45.1% 45.0% 45.8% 46.7% 48.1% 49.7% 50.2% 51.8%
Provincial Component (Funds capital and operational) 1,104 1,175 1,313 1,210 1,352.6 1,497 1,657 1,836 2,027 2,240 2,397 2,564 2,744 2,936 3,141 3,361 3,597
Provincial Functional Grants 490 588 584 584 631 681 736 795 850 910 973 1,041 1,114 1,192 1,276 1,365 1,461
GST & BTT Transfers 614 587 729 626 722 816 922 1,042 1,177 1,330 1,423 1,523 1,629 1,743 1,865 1,996 2,136
% of Total Expenditure 5.8% 6.1% 6.7% 6.0% 6.1% 6.7% 7.1% 7.5% 7.8% 8.1% 8.4% 8.5% 8.6% 8.7% 8.8% 9.2% 9.4%
Interest Payment (Debt Service) 2,147 2,165 2,271 2,101 2,324 2,431 2,536 2,588 2,567 2,491 2,406 2,217 1,905 1,479 920 163 -798
% of Total Expenditure 11.3% 11.2% 11.6% 10.4% 10.5% 10.9% 10.9% 10.6% 9.9% 9.0% 8.4% 7.4% 6.0% 4.4% 2.6% 0.4% -2.1%
Capital Investment Component 6,088 6,901 7,471 7,888 8,752 8,826 9,173 9,528 9,943 10,416 10,870 11,552 12,278 13,051 13,873 14,748 15,680
% of Total Expenditure 32.1% 35.6% 38.1% 38.9% 39.5% 39.5% 39.5% 39.0% 38.4% 37.8% 38.2% 38.4% 38.7% 38.8% 38.9% 40.2% 40.9%
GoPNG PIP 3,001 3,909 4,824 4,824 5,858 5,917 6,094 6,277 6,466 6,659 6,925 7,410 7,928 8,483 9,077 9,712 10,392
PIP as share of Budget 15.8% 20.2% 24.6% 23.8% 26.4% 26.5% 26.2% 25.7% 25.0% 24.1% 24.3% 24.6% 25.0% 25.2% 25.4% 26.5% 27.1%
Concessional Loans 1,312 1,568 1,638 1,638 1,318 1,384 1,454 1,526 1,603 1,683 1,767 1,855 1,948 2,045 2,148 2,255 2,368
Donor Support Grants 1,776 1,425 1,008 1,425 1,575 1,525 1,625 1,725 1,875 2,075 2,179 2,288 2,402 2,522 2,648 2,781 2,920
BUDGET BALANCE -5,275 -7,304 -6,613 -6,613 -5,985 -4,666 -3,673 -2,576 -1,305 193 2,638 5,451 8,732 11,800 15,379 20,653 26,160
% of GDP -6.3% -8.6% -7.3% -7.1% -5.9% -4.3% -3.1% -2.1% -1.0% 0.1% 1.7% 3.2% 4.7% 5.9% 7.0% 8.6% 10.0%
Fiscal Parameters
Budget Balance (% of GDP) -6.3% -8.6% -7.3% -7.1% -5.9% -4.3% -3.1% -2.1% -1.0% 0.1% 1.7% 3.2% 4.7% 5.9% 7.0% 8.6% 10.0%
Consolidation 1.5% 1.2% 1.6% 1.1% 1.1% 1.1% 1.1% 1.5% 1.5% 1.5% 1.1% 1.2% 1.6% 1.4%
Expenditure Rule (operating budget as % of non-resource GDP)17.8% 16.4% 14.7% 14.9% 14.9% 13.5% 12.9% 12.6% 12.5% 12.5% 11.7% 11.4% 11.1% 11.0% 10.9% 10.3% 10.1%
Average Interest Cost 6.5% 5.4% 4.9% 4.5% 4.4% 4.2% 4.2% 4.1% 3.9% 3.8% 3.9% 3.9% 4.0% 4.1% 4.4% 116.5% 3.1%
Debt
Debt 32,863.9 40168.4 46,781.2 46,781.2 52,766.0 57,431.5 61,104.9 63,681.2 64,986.1 64,793.0 62,155.4 56,704.6 47,972.5 36,172.9 20,793.7 140.2 -26,019.9
Debt/GDP 39.2% 47.1% 51.8% 50.1% 51.9% 52.4% 52.3% 50.8% 48.5% 44.6% 39.5% 33.2% 25.9% 17.9% 9.5% 0.1% -10.0%
Growth - 5% real in non-resource, 5% inflation, conservative assumption of not including new resource projects until a FID - so considerable upside, although revenue from any new projects likely many years away.
Revenue - General growth rate from 2025 based on nominal growth plus compliance gains of 3 to 5% per year. Average growth rate is 12.5%. Revenue growth over the last 40 years has averaged 10.9%, with many lengthy periods of over 13%
PNG LNG - K750m extra MPT in 29 rising to K1500m in 30 - general growth of 10% nominal and 3% compliance
PNG LNG - K300m PNG extra dividends in 26, K600m in 27, reduced to K500m in 29 and to K400m in 30 as the MPT increases
Wages - 10% for core services, 5% for non-core Depts and Prov admin. 10% growth for core services covers 3.1% population growth rate, 5% wage growth in line with inflation, and a 1.9% "quality" gain. This "quality" gain in terms of coverage so over 5 years, there is a 10% improvement in coverage ratios for core services
eg reduces teacher ratio from 40 students per teacher to 36, or one doctor per 9,000 people rather than 10,000 people - improvements continue each year.
Non core services (National Depts and Prov Admin) grow at 5% per year in line with inflation
Slower growth planned in G&S in expectation of more efficient procurement systems and less wastage. Growth rate at 7% allows for inflation and population growth rate and improved efficiencies.
Funding for GoPIP capital programs also continues to grow at 7% from 2028 - building on the strong growth from 2020 to 2027 averaging 8%. The funding share will increase from 20% of the budget to 27% of the budget.
There is slower planned growth in the concessional project loans after very strong growth in 2019 to 2021. Following a major cut in 2022, the outyears grow at 5%. Donor grants also expected to grow by 5% in the outyears.
10th Parliament Budgets 11th Parliament Budgets 12th Parliament Budgets 13th Parliament Budgets

2022 National Budget, Volume 1
11
2022 Budget Theme: The 2022 Budget theme is predicated on the doctrine that empowered and able citizenry participation collectively build countries. Social and economic advancements are achieved when citizens are empowered to take ownership and contribute to nation building. The 13-year fiscal consolidation plan is underpinned by this doctrine beginning with the continuation of repair and reconstruction in the 2022 Budget. It sets out to lighten social hardships to households and economic burden to businesses, in particular MSME’s and the corporate citizenry that provide sustained employment for the people as well as assist the governments to carry the burden of it national fiscal responsibility. Giving the domestic economy much needed stimulus for robust growth, requires enabling policies. Fairer taxation regimes to lighten the load on industry, businesses and workers alike. Availability of affordable credit and appropriate local financial products, especially for MSME’s and SME’s can lessen the burden on small businesses and stimulate growth and employment. The local manufacturing sector need tax regimes that incentivise and at the same time lighten their burden to stimulate local downstream processing for value-added products for domestic market and competitive export markets. This will drive further growth in the manufacturing and services sector and lead to creation of more skilled jobs and employment. The long-term fiscal strategy for budget repair and reconstruction aims to lighten the burden on the economy from falling revenue and the legacy of servicing increasing debt levels. The government focus on the growth strategy and job creation can in turn increase the revenue base and lighten the burden on the economy and society. 1.2 Investments for Sustained Economic Growth and Job Creation
The long-term fiscal strategy 2022-2034 for budget repair and reconstruction is closely linked to Goal 8 of the 17 Sustainable Development Goals (SDGs). Goal 8 is aimed at promoting sustained, inclusive and sustainable economic growth, full and productive employment and decent work for all. The focus on SDG 8 is part of the Marape Government’s strategy to make up for lost opportunities in past budgets over the last10-12years where huge investments in the development budgets had little to show for in terms of tangible economic growth and jobs creation for full and productive employment of Papua New Guineans. Further, the impacts of the COVID-19 pandemic in the immediate term and effects of climate change and population growth in the longer term all require a more dedicated approach to smart capital investments for inclusive and sustainable economic growth to ‘Take Back PNG’ and return it on to the road to prosperity Leaving No Child Behind. Hence, the long - term fiscal budget strategy emphasises the capital budget rather than the operating budget in order to increase investment to sustain and boost the economic growth momentum. The budget focus on SDG 8 also aligns well with all programs and long-term plans including the other SDGs and the PNGSDP-2030, StaRs and PNG Vision-2050 in particular, with tangible strategic investments and actions. These are the Marape Government commitments of Nine Strategic Action items in key sector interventions and capital investments (see Table 1). The Nine Action Items are all necessary and sufficient to deliver on the long-term budget repair and reconstruction strategy for sustained economic growth and decent work for all, and are consistent with the ten (10) principles of prudent fiscal management.

2022 National Budget, Volume 1
12
Table 2: Strategic Action Items Strategic Action Item Budget Investment Actions Sector Strategies & Related SDGs
1. Prudent, Responsible and Sustainable Fiscal and Monetary Regimes
- Internal Revenue Reforms (MTRS); - Fair and equitable taxes - reduce concessions - eliminate tax holidays - Monetary Policy Reforms (MTDS); - Independent Review of BPNG - Affordable debt strategy & repayments - Anti-Corruption legislation
Good Governance & Prudent Management, Law and Justice SDG 8 – Decent work and economic growth, SDG 16 – Peace, justice and strong institutions
2. Economic Enablers – Transport Infrastructure
- Connect PNG Transport Infrastructure Network
- Economic Corridors
Enabling Infrastructure SDG 8, SDG 9 – Industry innovation and infrastructure, SDG 10 – Reduce inequalities, SDG 11 – Sustainable cities and communities, SDG 12 – Responsible consumption and production, SDG 13 – Climate action
3. Economic Enablers – Reliable and Efficient ICT & Communications Network
- ICT Policy - Communications Network - e-Commerce Platforms
Enabling Infrastructure SDG 4 – Quality education, SDG 6 – Clean water and sanitation, SDG 7 – Affordable and clean energy, SDG 8, SDG 9
4. Economic Enablers – Clean Renewable Energy and Safe Water and Sanitation
- Clean, Green Renewable Energy - Clean, Safe Water and Sanitation
Enabling Infrastructure Climate Change Urbanisation and Industrialisation SDG 1- No poverty, SGG 2 – Zero hunger, SDG 3- Good health and well – being, 5 – Gender equality, SDG 6, SDG 7, SDG 8, SDG 9, SDG 13
5. Renewable Resources - Enhance Revenue in Increased Production, Diversification and Value-Addition
- Increase production and export revenue
- Downstream Processing, Value-addition, new markets
- Economic and Livelihood Diversification
- Environment & Cultural Asset Protection, Management and Services
- Local Labour Mobilisation, skilled jobs and employment
Agriculture, Fisheries, Forestry, Tourism, Manufacturing, Labour & Employment SDG 1, SGG 2, SDG 3, SDG 4, SDG 5, SDG 7, SDG 8, SDG 9, SDG 10, SDG 11, SDG 12, SDG 13, SDG 14 – Life below water, SDG 15 – Life on land
6. Extractive Resources - Enhance Benefits in local business participation, employment and community and environment services.
- FID - National & Local Content - PPP, CSO,
Mining, Oil & Gas Environment, Law and Social Justice SDG 5, SDG 7, SDG 8, SDG 9, SDG 10, SDG 11, SDG 12, SDG 16 – Peace, justice and strong institutions
7. Local Entrepreneurship – MSME’s, SME’s and Commerce
- MSME’s & SME’s, Local Financial Institutions & Banks
Mining, Oil & Gas Environment, Law and Social Justice SDG 5, SDG 8, SDG 9, SDG 10, SDG 12, SDG 14, SDG 15, SDG 16
8. Education for Innovation, Human Talent Development, Labour Mobilisation and Employment
- National Education Plan - STEM Curriculum and School of
Excellence - Human Talent Development - Labour mobilisation and decent work
for all
Education, Science, Technology, Innovation and Human Resource SDG 3, SDG 4, SDG 5, SDG 8, SDG 10
9. Women Empowerment & Equality for All – Fight against Anti-discrimination, gender and ethnic violence, domestic violence, family and sexual violence.
- Women Empowerment - Gender Equality - Anti-Discrimination
Community and Social Empowerment and Justice SDG 5, SDG 8, SDG 9, SDG 10, SDG 16

2022 National Budget, Volume 1
13
1.3 STRATEGIC ACTIONS BY 2034
The strategies under these critical actions are in responses to the decline in the many aspects of good governance, the erosion in our social and economic development enablers and basically our stagnant economy and approach to achieving our national and global human development targets. Chapter 9 gives detail on the broad high-level reforms. Action 1: Prudent, Responsible and Sustainable Fiscal and Monetary Regimes With the downward revenue trend that the country inherited under the previous government and the need to arrest the decline in total revenue as a percent of GDP, the Marape Government is focused on the legislative, structural, administrative and policy reviews to achieving a more stable and sustainable revenue and debt management. The Government aims at a modernised tax administration to cope with the changing structure of the economy through the review and reforms of the tax systems. This is to encourage fair and equitable taxes. The country’s debt servicing and management through the Medium Term Debt Strategy is a critical function of government. It is important to maintain debt and financial risk at sustainable and prudent levels. The government is also focusing on developing and efficiently managing the domestic debt markets as well as offshore markets. Our monetary policy reforms also include the independent review of the Central Banking Act in the phase one and review in the commercial banks in the second phase. Action 2: Economic Enablers – Transport Infrastructure Major national infrastructure development as the critical economic enablers (SDG 7), opening up and connecting economic corridors for industrial clusters (SDG 9) in the economic sector in its drive to stimulate inclusive and sustainable economic growth to Take back PNG and Leaving No Child Behind (SDG 1, 2 & 3). The current impediment to sustainable economic growth as highlighted by the World Bank’s PNG Economic Update 2020 concerns the state of the national infrastructure. The country’s 8,738km of national roads consist of 12 separate road networks (not interconnected), and roughly 21,000km of provincial and district roads are mostly unsealed. About 35 percent of the population live more than 10 km from a national road, and 17.0 per cent have no access to roads at all, making aviation and maritime shipping crucial transport modes but are very costly too. Similarly, the PNG national electricity supply is carried across three major grids separately and serving less 13.0 per cent of the population while 25.0 per cent rely on off-grid power. The national infrastructure for telecommunications and water and sanitation system also lack national coverage and only cater for a small but growing urban population. These infrastructure concerns are addressed by the Marape Government’s signature program, the Connect PNG Economic Transport Infrastructure Development Program 2020-2040. This program has committed to building 16,209km of priority road links and road corridors for a total investment equivalent to K21 billion. The funding for this signature initiative is a responsible mix of national budget support, (a minimum K500.0 million annually) and concessional loans from a variety of external sources at the lowest interest rates (1.2 – 2.0 per cent) and up to 30-year payment periods. This program will physically connect all the provinces and economic corridors on the mainland and the New Britain and Bougainville Island corridors.

2022 National Budget, Volume 1
14
Action 3: Economic Enablers – Reliable and Efficient ICT & Communications Network
The Connect PNG road corridor also provides the backbone enabling the expansion of the electricity grid and the telecommunications network. This is a clear link to SDG 9 agenda on industry, innovation and infrastructure. The PNG DataCo has had a successful program of connecting major ports, towns and cities with their roll out of the fibre optic cables in the sea and on land along the power transmission lines and the LNG pipeline. The EU STREIT Project is using the local ICT infrastructure network developments to build e-agriculture infrastructure and service platforms, in the East and West Sepik Provinces, to assist subsistence fishers, cocoa and vanilla farmers, to transition to agri-enterprises and traders along the respective value chains. The PNG ICT-Cluster is local initiative that is bringing together local talent in the ICT space and is fostering partnership with government, private sector and international investors to introduce e-commerce platforms and innovations. These are two examples of initiatives made possible due to the economic enabler of provision of reliable and efficient ICT and Communications Network. Action 4: Economic Enablers – Clean Renewable Energy and Safe Water and
Sanitation The energy and electricity infrastructure sector development has not escaped the Marape Government list of priorities, with the establishment of the National Energy Authority (NEA) based on a comprehensive National Energy Policy. This includes the National Electricity Roll Out Plan (NEROP) to spearhead and coordinate the national electricity infrastructure development, leaning towards clean green renewable energy sources, and accessing 70.0 per cent of the population to grid power by 2030. Investments in national institutional capacity is essential to driving and achieving the government’s infrastructure development agenda as well as the SDG agenda number 7 to ensure access to clean, reliable, affordable and sustainable modern energy for all.
The Marape Government’s commitment to sustainable green growth was given a boost just recently in October 2021 with the signing of an agreement with the Fortescue Future Industries (FFI) of Australia to carry out feasibility studies over seven hydro and eleven (11) geothermal projects to produce green hydrogen as a universal fuel source. This will transform PNG into an energy transition leader in the global drive to decarbonise energy production and utilisation. This is also an achievement of this government toward taking an urgent action to combat climate change and its impacts under SDG 13.
The Government has further embraced the AUD2.3 billion APEC 2018 commitment by Australia, NZ, US and Japan to improve access to electricity and also the internet by running fibre optic cables along the expanded power transmission grid. Assistance from our other development partners in the energy, electricity and ICT infrastructure sector, especially from China and India is well acknowledged. The government’s capital investment in water and sanitation is also significant not only for the urban centres, but reaching out to schools and health facilities in rural PNG as well. This is with the support of partners such as the European Union and JICA of Japan, working in close collaboration with national agencies.
2022 National Budget, Volume 1
15
Action 5: Renewable Resources - Enhance Revenue through increased Production, Diversification and Value-Addition
Capital investments connecting people, land and services for productive engagement in building sustainable livelihood and job creation in rural PNG is a priority. Over 85.0 per cent of PNG’s population are rural based where the majority of the people are self-employed and depend mainly on their traditional subsistence agriculture systems for their food with limited cash income opportunities to meet their basic needs. However, the productivity of subsistence agriculture and fisheries is inherently limited due to its rudimentary nature against a backdrop of increasing population and pressure on land use with its social conflicts and challenges. The current challenges and risks due to the adverse impacts of climate change are also exposing the limitations of the traditional subsistence agriculture, food and livelihood systems, especially for remote isolated communities. Added to all these are the poor education, health and nutrition outcomes of the rural population, which further exacerbate the vulnerability of these communities. Nevertheless, the major constraint facing agriculture and the rural communities identified in the National Agriculture Development Plan (NADP 2007-2016) still remain. The high transportation costs or lack of any transport infrastructure such as roads, bridges, wharves and jetties and airstrips to bring produce to markets and provide much needed government services into rural areas. This situation has not changed much and has not encouraged investments in commercial agriculture. These infrastructure constraints are being addressed now, opening up and connecting new areas across the country to economic investments and increased production. For example, it informed the 2018-2037 National Road Network Strategy and subsequently the Connect PNG Transport Infrastructure Program 2020-2040 for major capital investments to support the development of economic corridors identified in the PNGDSP 2020-2030 Plan. The importance of this sector is paramount as announced through the Prime Minister’s 2021 UNGA statement where he mentioned that PNG can be the Food Hub for the Asia Pacific Region contributing to the global food security agenda under SDG 2 and alleviating poverty in all its forms. Based on these capital investments and expectations, the Marape Government is projecting increased agriculture production of 30.0 per cent for food crops and livestock production, and 30.0 per cent increase in downstream processing and value-adding. This is further supported by major funding commitments to the sector such as the commodity price support scheme, transport subsidies and the COVID-19 stimulus packages for specific commodities. The government’s plans are to build a modern and internationally competitive agriculture sector over the next few decades. Investments in agriculture, forestry and fisheries are critical for large-scale labour mobilisation and employment creation, generating cash income and inclusive economic growth for the majority of PNG’s rural population. Otherwise, if neglected further, it will constitute a major structural weakness in our national economy with a significant underutilisation of our human and land resources, as our rural people traditionally own over 90.0 per cent of land. The 2021 MYEFO reported that the agriculture, forestry and fishery sector accounts for 17.0 per cent of GDP and was projected to grow by 4.0 per cent, supported by increased cocoa and palm oil production on improved mobility and favourable commodity prices. However, a focused capital budget to drive investments in infrastructure and the renewable resource sector can drive production increases of 30% given the huge potential that is yet to

2022 National Budget, Volume 1
16
develop with the roll out of the Connect PNG Transport Infrastructure and attracting investments in dedicated economic corridors. Downstream processing and value-addition of agriculture crops, forestry and fishery products provides for employment in value-added skilled jobs. In agriculture, the AMTDP 2022 estimated the major export crops produced a total export volume of 7.4 billion tonnes and generated around K20.5 billion in export revenue, or a value of K2.1 billion annually. An increase of 30.0 per cent in production and value-adding by 2025 according to the Marape Government’s expectation from its investments will add an additional K600.0 million to export revenue. Currently, the Oil Palm industry contributes the largest share of export earnings with over K1.1 billion annual receipts and is the largest formal employer in the agriculture sector with 20,000 employees. A 30.0 per cent expansion in agriculture production coupled with a 30% increase in downstream procession and value-addition of agriculture produce will see multiplier effects on businesses and further job creation. The Fisheries sector through domestic fishing and canning operations employs a work workforce of 40,000, with woman making up 90.0 per cent of employees. PNG is the third largest tuna exporting nation, landing on average 500,000 metric tons of tuna a year and earning about K1.6 billion. The fisheries sector can more than double employment and its export earnings with a 30.0 per cent increase in domestic processing and value-addition. The forestry sector with the impending ban on log exports is also bound to see substantial increase in domestic investment and production of high value forestry and timber products, providing ever-greater employment opportunities. Investment in these three primary sectors of agriculture, forestry and fisheries in particular, can combine to generate substantial local employment opportunities, income and government revenue. Action 6: Extractive Resources - Enhance Benefits through national content in local business participation, employment and community and environment services. The extractive resources sector comprises of mining, oil and gas as the major primary production activity and the largest contributor of export revenue and account for 60.0 per cent of national GDP. There have been huge investments in the mining, oil and gas projects but these are enclave industries with limited impact on the majority of Papua New Guineans who live agriculture and related activities. The focus of the government is to invest in sustainable economic growth based on the renewable resources sector of agriculture, fisheries, forestry, environment and tourism. The intention is to increase production of our major crops and export commodities, in volume and value-addition, to increase the GDP growth and contribution of the renewable resources sector and to reduce dependency on the extractive resources sector. This is important as the budget framework for repair and reconstruction is based solely on the growth in GDP from the non-resources (or renewable resources) sector consisting largely of primary production from Agriculture, Fisheries and Forestry. The extractive resources sector comprising of mining, oil and gas production’s contribution is not factored by taking a conservative approach to only include in the budget up on final investment decision (FID). Action 7: Local Entrepreneurship – MSME’s, SME’s and Commercial Services The informal economy is central to the livelihoods of approximately 80.0 to 90.0 per cent of the population in rural and peri-urban PNG. It is imperative now to transform agriculture from its traditional subsistence culture and semi-commercial system to a modern culture of agri-business-oriented micro, small to medium and small to medium sized household enterprises

2022 National Budget, Volume 1
17
(MSMEs and SMEs), as espoused in the Agriculture Medium Term Development Plan 2020-2022. The PNG SME Policy states that, the SMEs are expected to grow from current 49,500 to 500,000 by 2030. The employment opportunities in the employment sector would increase from the current 291,348 jobs to 2,000,000 jobs in 2030. This is anticipated to cause the formal unemployment level to fall from the current level of 84.1 per cent to below half of the population in 2030. Larger proportion of the PNG’s informal SMEs are owned and operated by PNG women and the Marape Government’s support of SMEs is a clear indication of the government’s focus to reduce inequality according to SDG 10. Action 8: Education for Innovation and Human Talent Development Building Institutional Capacity and Human Talent is essential to driving innovation in science, technology and commerce. The Marape Government through its education reforms is introducing the STEM curriculum into its School of Excellence programs and increasing its support to Technical Institutions and Universities. Investments in STEM education and technological innovations in science, engineering, ICT and AI, medicine, agriculture, food and health industries, etc. will all create highly skilled and high value jobs and employment. The Science and Technology Secretariat under the Ministry of Higher Education, Research, Science and Technology (DHERST) is developing the policy platform and programs to drive innovation in the nation to achieve the aspirations of the nation as espoused in the DSP 2030 and Vision 2050. Existing institutions like NARI and NRI require substantial investments in their institutional capacity and research professionals to lead innovations in public policy, technology and organisational competence to underpin sustained economic growth. The Government’s focus to improve Quality through the National Education Plan is being implemented. More and greater innovations in science, technology, engineering and math (STEM) will follow as the young talent come through the new STEM school curriculum. This agenda of government links to quality education under SDG 4 including the agenda to build resilient infrastructure, promote inclusive and sustainable industrialisation and foster innovation. An important investment to underpin sustainable development modes of growth is the development of human capital stock at the professional and skill level to development. Existing courses in universities dedicated to teaching sustainable principles need to be encouraged and resourced to produce the need human resource to oversee the transition to greener modes of growth. Networking is also important in linking institutions and professionals for more effective collaboration. An initiative in the renewable resources is a consortium of PNG Universities and NGO Research and Conservation Organisations banding together to develop the National Biotechnology Network (NBN) and supported by the Conservation and Environment Protection Authority (CEPA) and the PNG Forest Authority (PNGFA) to harness the countries rich biodiversity for potential new natural products for use in modern science, agriculture and health. Action 9: Women Empowerment, Equality for All and Anti-Discrimination Women’s economic empowerment is especially necessary for reducing poverty in families. It is also important that women have access to employment, markets, resources and a fair regulatory environment for businesses. Recent indicators on inequality affirm the need for inclusive economic development across different classes of the population. The progress on Gender equality in PNG is mixed. We have made progress in certain areas such as policies and legislations for women empowerment especially in education, leadership
2022 National Budget, Volume 1
18
positions in formal employment and GBV. Other opportunities in leadership positions in the National Parliament and Provincial Governments needs more support. The Marape Government is focused on addressing GBV and will ensure consistent funding from 2022 on-wards. PNG’s social sector is currently the largest and expensive expenditure sector, however with the shift of focus to growth and job creation, the ability of the population to afford the quality social sector services will increase over the fiscal period. Data obtained on wage employment shows that there are more men (66%) than women (38%) in wage employment in the formal sector, whereas there are more women (46%) compared to men (15%) in the informal sector with only a small proportion of women (eight percent) engaged in the SME sector in PNG. Furthermore, there are fewer women (12.5%) with bank accounts than men (37%) with bank accounts. It is projected that narrowing the gender gap in formal sector employment will increase household income in PNG. Higher incomes for women lead to increased spending on household needs and welfare. The trend noted here is an indication of gender equality and also contributes towards the need to reduce inequalities within the country. Building and maintaining quality national infrastructure and services can work toward reducing poverty and better living standards for its citizens, reduce inequalities in service delivery and economic opportunities within country, and ensure a more inclusive and sustainable economic growth. 4. Summary PNG is currently facing the once in a century global pandemic and its stifling impact on global growth estimated to be the worst since World War 2. The government responded by putting in a plan in the 2021 budget to deal with the economic impacts of the Covid-19 pandemic while positioning the country into a path of reducing deficits, debts, and bringing interest costs under control. The plan was endorsed by our Parliament and international partners. The 2021 MYEFO report projected that the economy will recover at a slower phase than originally expected. It projected the PNG economy to grow at 1.3 per cent in real terms. The major drivers underpinning the revision were; removal of the Porgera Mine 6 months’ production assumption; the withdrawal of Simberi Mine 2021 annual production forecast following environmental concerns and subsequent indefinite closure of the mine; and 32.5 per cent downward revision of the Ok Tedi Mine (copper) production, due to destruction by fire of the production facility and increased transmission incidence of COVID 19 pandemic at the production site early in the year. The shocks to the economy and government revenue due to the issues in the extractive resources sector was cushioned slightly by some small but definite upturn in the renewable resource sector. In particular the agriculture sector is projected to grow at 4.0 per cent in real terms, an upward revision of 0.6 percentage points against the Budget. This is expected to contribute to the expected nominal increase in the non-mining sector at 8.0 per cent, an increase of 0.8 percentage points against the 2021 Budget estimate. The two (2) primary resource sectors performance provide the backdrop to framing the 2022 Budget and the long-term goal for the fiscal repair and reconstruction strategy from 2022- 2034. The uncertainties and risks of investments and returns in the extractive resources sector provides for very conservative GDP growth projections. On the upside, the increased capital investments for the long term, focused on the primary resources sector of agriculture, forestry and fisheries will yield good returns on investment.

2022 National Budget, Volume 1
19
The renewable resource GDP growth will be further boosted with the enabling infrastructures in the Connect PNG Transport road network, investments in renewable energy, ICT and innovations in science and technology. Stepping up capital investments in institutional capacity and human talent development sets a secure foundation for confidence in the long-term fiscal strategy for budget repair and reconstruction. PNG’s growth commitment 2020-2022, is on budget restoration, aimed at Prudent Budget Repair and Management based on following principle, ‘Spend the money we have more wisely’, raise the revenues more fairly’, and finance the debt more cheaply’.

2022 National Budget, Volume 1
20
CHAPTER 2: ECONOMIC DEVELOPMENTS AND OUTLOOK
2.1 WORLD ECONOMIC GROWTH OUTLOOK
2.1.0 Overview The global economic recovery continues, but at a much weaker pace as the pandemic resurges. The mutated Delta variant has amplified the economic shocks and health risks, causing distortion to critical links in supply chains and lifting inflation rates higher in many countries. Overall, risks to economic prospects have increased, and fiscal and monetary policy trade-offs have become more complex. While vaccine access and early policy support are the principal drivers, rapid spread of Delta and the threat of new variants have increased uncertainty about how quickly the pandemic can be overcome. Policy choices have become more difficult, confronting multidimensional challenges such as subdued employment growth, rising inflation and interest rates, food insecurity, setback to human capital accumulation, and climate change—with limited room to manoeuvre and achieve recovery and restore normalcy. PNG’s economic growth and outlook are greatly affected by the developments in the global economy given its exposure and dependency to the global economy through its primary export commodities, capital inflows, trade relations and supply chains. PNG has been presented with an uncertain global market appetite for its main commodity exports regardless of the rising commodity prices. While PNG has benefitted from the prevailing high commodity prices through improvements in foreign exchange inflows, and increased Government revenue, the future prospect for prices remains uncertain given the divergence of growth prospects across countries and the underlying pandemic-related risks. In addition, domestic supply chain disruptions due to the pandemic related lockdowns in contact intensive sectors especially in the mining sector have affected employment, consumption, spending, investment and overall production. Should this trend continue in 2022, it will continue to adversely affect domestic revenue collections and economic growth. The global updates on these variables, presented in the World Economic Outlook (WEO) report, present a conservative, rather than an optimistic recovery scenario for the 2022 Budget framework. 2.1.1 Economic Activity
Global economic growth is projected at 5.9 per cent in 2021, a marginal downward revision of 0.1 percentage points from the July 2021 WEO forecast. The moderate revision reflects more difficult near-term prospects for the advanced economies partly due to supply chain disruptions and rising inflation and, for low income developing countries, largely due to worsening pandemic dynamics. In contrast, rising commodity prices have upgraded projections for some commodity exporting countries while pandemic related disruptions to labour intensive sectors have caused the labour market recovery to significantly lag the output recovery in most countries. This divergence in economic prospects across countries remains a major concern. In 2022, global growth is projected at 4.9 per cent, unchanged from the July 2021 WEO forecast. Unlocking pent-up demand for consumer spending and business investment especially in advanced economies is viewed as an important driver of growth in 2022.

2022 National Budget, Volume 1
21
2.1.2 Advanced Economies Growth in the advanced economies is projected at 5.2 per cent in 2021, 0.4 percentage points weaker than the July WEO update. The downward revision is due to downgrades to the United States – due to inventory drawdowns, supply disruptions and softening of consumption in the second and third quarters; Germany – partly due to shortage of key inputs and higher energy prices affecting manufacturing output; and Japan – reflecting the effect of the fourth state of emergency from July to September as infections hit record high levels in the current wave. In 2022, the advanced economies are expected to maintain strong growth of 4.5 per cent, an improvement of 0.1 percentage points from the July WEO update. This reflects the anticipated positive outcome from the vaccination of the majority of the population to support normalcy in economic activities. In addition, expansionary policy support in the US will help boost growth momentum going forward, although rising inflation rates and interest rates could dampen this momentum. Growth in the United States in 2021 is expected to be 6.0 per cent, moderating to 5.2 per cent in 2022. The Euro area is expected to experience a growth rate of 5.0 per cent in 2021 before moderating to 4.3 per cent in 2022. The 2021 growth forecast reflects positive baseline projections including the Next Generation European Union (EU) grants and loans for EU economies. 2.1.3 Emerging Markets and Developing Economies In the Emerging Markets and Developing Economies (EMDEs), a strong growth rate of 6.4 per cent is estimated for 2021, 0.1 percentage points stronger than the July WEO Update. The slight mark up to the 2021 growth estimate is due to upgrades across most regions. These upgrades reflect an improved outlook for commodity exporting countries in the regions of the Latin America, Caribbean, Central Asia and Sub–Saharan Africa which outweighs the impact of the pandemic developments. This is further supported by stronger than anticipated domestic demand in key regional economies especially emerging and developing Europe. In 2022, the EMDEs are expected to grow at a moderate rate of 5.1 per cent. While this is a downward revision of 0.1 percentage point from the July WEO update, it is still a strong growth rate. China’s growth outlook for 2021 has been marked down slightly than initially expected to 8.0 per cent and 5.6 per cent in 2022. The slight downgrade in growth reflects a stronger than anticipated pull-back in public spending and warning of a further blow from the current weakening property market. Growth in India is projected to be maintained at its July WEO forecast of 9.5 per cent for 2021 and 8.5 per cent for 2022. The forecast assumes a relatively limited economic impact from the pandemic going forward as the economy shows signs of better preparedness from businesses, households and the health sector, complemented by an accelerated vaccination campaign, a new fiscal stimulus package, and initiatives to free more resources for infrastructure development, along with measures to strengthen health-related interventions.

2022 National Budget, Volume 1
22
Chart 1: World Economic Growth (1996-2026)
Source: International Monetary Fund (IMF), World Economic Outlook (WEO) October 2021
Beyond 2022 and over the medium term, global growth is projected to moderate to about 3.3 per cent. Advanced economies’ projections are expected to exceed pre-pandemic medium term projections due to sizable anticipated fiscal policy support. However, EMDEs are expected to experience persistent output losses due to slower vaccine rollouts and generally less policy support compared to advanced economies. 2.1.4 Risks The global growth baseline forecast is subject to substantial uncertainty due to the:
emergence of more transmissible and deadlier COVID-19 variants that could further re-energise the pandemic spread and intensity that could prolong the impact of the pandemic on economic activity and growth;
prolonged pandemic related supply–demand mismatches that could lead to sustained price pressures and rising inflation expectations. This could in turn pressure faster than anticipated monetary normalisation in advanced economies that could lead to a sudden tightening of global financial conditions;
stretched asset valuation scenarios could shift investors’ sentiment because of adverse news of the pandemic and policy developments. This could have serious implications for financial markets;
changes in the magnitude and composition of fiscal packages in the recently passed infrastructure bill for the US could have repercussions for US growth and those of its trading partners;
a further intensification on the handling of the pandemic in relation to increased food prices, slow employment growth, and erosion of trust in government institutions could lead to social unrest and weigh on sentiment for recovery in countries; and
the imminent climate change shocks may pose further challenges to the global recovery against the backdrop of the ongoing pandemic.
-6
-4
-2
0
2
4
6
8
10
-6
-4
-2
0
2
4
6
8
10
1996 2001 2006 2011 2016 2021 2026
World Real GDP Growth Advanced Economies Emerg & Dev Economies
Per cent Per cent
Projection

2022 National Budget, Volume 1
23
2.1.5 World Inflation Global inflation has increased in advanced and emerging market economies since the beginning of 2021 driven by strong demand, input shortages and higher commodity prices. This is despite employment trending below pre-pandemic levels in many economies, forcing difficult choices on policy makers. Inflation is expected to revert to pre-pandemic levels by mid-2022 as COVID-19 related supply-demand mismatches improve. In the advanced economies, inflation is projected at 2.8 per cent in 2021, 2.1 percentage points higher than the 2020 outcome and 0.4 percentage points higher than the July WEO update. Inflation is expected to ease to 2.3 per cent in 2022. Chart 2: World Inflation (per cent Growth)
Source: International Monetary Fund (IMF), World Economic Outlook (WEO) October 2021 Note: Advance Economies inflation in 2009 was 0.2 per cent.
Inflation in EMDEs is projected to increase by 5.5 per cent in 2021, 0.4 percentage points higher than the 2020 outcome. In 2022, inflation is expected to moderate to 4.9 per cent. However, the lag in the broader inflation measures from higher food and oil prices for importers means that price pressures are anticipated to stay elevated into 2022 in some EMDEs. Risk to the inflation projection is more on the upside and could occur if pandemic-related supply-demand mismatches continue longer than expected leading to more sustained price pressures and rising inflationary expectations. 2.1.6 Agriculture Commodities Prices for all PNG’s key agricultural export commodities have traded higher in the first half of the year and continues into the third quarter. The rally in prices has been driven by tight supply reflecting adverse weather conditions and the COVID-19 related supply disruptions, while the demand has continued to rise reflecting the global economic recovery. Coffee Global coffee prices have increased sharply throughout the first half of 2021 and has continued into the third quarter. Coffee prices averaged at US$5,179.7 per tonne in the third quarter,
0
1
2
3
4
5
6
7
8
9
10
0
1
2
3
4
5
6
7
8
9
10
2004 2006 2008 2010 2012 2014 2016 2018 2020 2022 2024 2026
World Inflation Growth
Advanced Economies
Emerg & Dev Economies
Per cent Per cent

2022 National Budget, Volume 1
24
16.3 per cent higher than the previous quarter, and is nearly 40.0 per cent higher than a year ago. The surge in coffee prices has been driven by increasing demand and limited supply. The limited supply reflects the production shortfall in Brazil due to an extreme frost that adversely affected the country’s coffee producing regions. In fact, larger parts of the plantations have been devastated after a prolonged drought, which had already weakened the coffee trees. The frost has killed 150,000 to 200,000 hectares, about 11.0 per cent of the country’s total Arabica coffee supply. Likewise, global supply was also disrupted by a dry weather in Southern Vietnam and civil unrest in Colombia. In 2021, prices are projected to average US$4,200.0 per tonne, 2.2 per cent higher than the 2021 MYEFO projection and 15.8 per cent higher than 2020 levels reflecting the current coffee market developments. Prices are expected to increase further as concerns about the weather, the COVID-19 pandemic and civil unrests continue to affect the coffee market. Supply bottlenecks, and the expected recovery of demand post COVID-19 will continue to support higher prices in the near term. While Brazil will replace the coffee trees, it would take 3-4 years for trees to mature. Hence, supplies are expected to be in lower bound. With these developments, the coffee price assumption underpinning the 2022 Budget is projected to average at US$4,601.0 per tonne. Cocoa Cocoa prices have increased in the third quarter after being broadly stable in the first half of the year. The rise in prices depicts tight supply and increasing demand. Adverse weather conditions in Ghana, the second largest cocoa producer, reduced its supply significantly. Although the Ivory Coast has reported a period of favourable weather conditions, production was still lower than expected. On the demand side, demand has been more robust for cocoa products especially chocolate across Europe and the US. Global grindings, a measure of demand which picked up in 2021, following a decline in the initial stages of the pandemic, are projected to increase more than 3.0 per cent in October. As demand persists, prices are projected to average around US$2,439.0 per tonne in 2021, 3.0 per cent higher than the 2021 MYEFO projection. In 2022, higher cocoa grindings data in Europe, North America and Asia, coupled with the supply deficit outlook attributed to adverse weather conditions and expectations of continued strong demand across the globe will keep prices higher. Furthermore, higher shipping freight and delay in plantation resumptions in Africa due to strict COVID-19 guidelines will provide more support. With markets not well supplied in 2021, together with higher consumption, prices are expected to average at a higher level than the 2021 projection. The cocoa price underpinning the 2022 Budget assumption is projected to average around US$2,514.0 per tonne. Palm Oil The palm oil price increased significantly in 2021 as demand recovered faster than the supply response. Up to October, prices averaged around US$966.7 per tonne, a gain of 60.0 per cent from the same period in 2020. This was attributed to tight supply as La Nina induced heavy rains in Indonesia and Malaysia, together with the COVID-19 induced labour shortages. Bolstering the price rally was the supply disruptions in soybean oil, the closest substitute for crude palm oil due to extreme drought in soybean arable lands in Brazil. Price spike in soybeans forced consumers towards palm oil for consumption, lifting prices higher.

2022 National Budget, Volume 1
25
In 2021, prices are projected to be US$1,012.0 per tonne, 23.4 per cent higher than the 2021 MYEFO price projection as these dominating factors continued to influence the palm oil market. Malaysian warehouses reported depleted stocks, lower compared to last year and this trend is expected to go beyond 2021. Coinciding with increased export levies in Indonesia and Indonesia’s biofuel mandate, prices are expected to move higher as a consequence. The COVID-19 labour mobility restrictions together with unfavourable weather conditions in Malaysia causing supply shortages are expected to keep prices higher in 2022. Limited soybean supply will also provide some support. In 2022, the palm oil price assumption underpinning the 2022 Budget is projected to average around US$907.0 per tonne. Copra Oil In 2021, copra oil prices were generally increasing with minimal falls. This was driven by the increased demand for coconut oil uses in the health, cooking and cosmetic industries. On the supply side, the top producer, Philippines, has been constrained due to the pandemic related travel restrictions reducing labour input, coupled with aging palm trees not producing as expected. In recent months, prices have been weighed down by several measures to boost domestic supply and curb hoarding. The decline, however, is minimal compared to the same period in 2020. Coinciding with these developments, prices are expected to average around US$1,470.0 per tonne in 2021, 19.1 per cent higher than the 2021 MYEFO price projections. Going forward, prices are expected to rise on the back of faster demand growth as the global economy recovers and expectations of low supply conditions persist. The copra oil assumption for the 2022 Budget is projected to average around US$1,470.0 per tonne.
Chart 3: Price Index of Palm Oil & Coffee Chart 4: Price Index of Copra & Cocoa
Source: International Monetary Fund (IMF) and Reuters Source: International Monetary Fund (IMF) and Reuters
In general, up to October, coffee prices averaged around US$4,586.3 per tonne, cocoa prices averaged US$2,442.9 per tonne, copra oil prices averaged US$1,522.9 per tonne and palm oil prices averaged US$966.7 per tonne. The supply disruptions due to the COVID-19 pandemic and adverse weather conditions and the recovery in demand are expected to benefit most agricultural commodities over the reminder of 2021 and beyond. Reflecting these developments, most of PNG’s key agricultural export prices are expected to remain high in 2022.

2022 National Budget, Volume 1
26
2.1.7 Mineral and Petroleum Commodities
Developments in the global economy in 2021 continued to dictate price trends for PNG’s petroleum and mineral export commodities. Oil and LNG prices rose sharply, and copper has plateaued at elevated levels, while precious metals have showed a weaker performance. Following the release of the 2021 MYEFO report in July, prices for PNG’s petroleum and mineral export commodities continued to increase as global demand recovered faster than supply. The strong recovery in commodity demand is driven by the ongoing vaccine rollout especially in advanced economies, easing COVID-19 travel restrictions, accommodative financial conditions, stronger growth in China and strong prospects for the global economic outlook. Supply of commodities, in contrast, has been tight due to the COVID-19 restrictions, adverse weather conditions and supply cuts from the Organisation of the Petroleum and Exporting Counties including Russian-led allies (OPEC+). Over the year to early October 2021, the gains in the oil price have more than offset the losses from the COVID-19 pandemic. This is due to production cuts and a recovery in demand. In contrast, LNG prices have increased on stronger demand. Copper has trended higher and plateaued at elevated levels reflecting the slowdown in China’s growth, Delta variant surge and on US monetary policy-tightening concerns. Gold has been under some price pressures reflecting lower world interest rates but remains not far from historically high levels. Gold demand has also been adversely affected by the substantial rise in demand for alternative crypto currencies. The Bank of Papua New Guinea’s (BPNG) Export Price Index1 increased by 19.4 per cent in the first half of 2021 compared to the same period in 2020, reflecting increases in most commodity prices. Recent data showed the prices of crude oil recovering well, reaching a 7- year high of over US$80.0 per barrel. Copper has also performed well and beyond expectations while gold has stabilised above the US$1,800.0 per ounce level. On agricultural commodities, almost all prices have increased driven by higher world demand and tight supply.
Chart 5: IMF All Commodity Price Index Chart 6: PNG Export Commodity Price Index
Source: International Monetary Fund (IMF) October WEO Source: Bank of PNG
Liquefied Natural Gas (LNG)
PNG LNG accounted for about 38.7 per cent of 2020 total exports and is expected to contribute 41.8 per cent in 2021 and 37.0 per cent in 2022.
1 PNG Export Price Index is calculated based on weighting of a basket of PNG commodity exports with weights determined on a
four (4) quarter moving average. The basket up to June 2021 excludes LNG (PNG’s largest exported commodity), condensate,
nickel and cobalt. Therefore, the current index is driven largely by gold, which is the reason why impact of COVID is not depicted
by the index chart.

2022 National Budget, Volume 1
27
The LNG price assumption is linked to the Asian LNG market price benchmark given LNG exports main market is the Asian countries. Almost 75.0 per cent of the LNG traded in the Asian market is sold on long-term contracts which links the price of LNG to the price of crude oil (commonly the Japanese Customs-cleared Crude (JCC)) with a lag of several months. Therefore, the oil price is used as an indicator in tracking trends in the LNG price and making informed projections complemented by the publicly released LNG price estimates by the World Bank, Petroleum Associate of Japan and Japanese customs. Over the year to October 2021, LNG prices have increased sharply reflecting the earlier peaks in crude oil prices but have increased much faster than the rise in oil prices. The World Bank Pink Sheet update shows LNG prices reached US$12.4 per barrel equivalent in October 2021 from a low of US$5.9 per barrel in October 2020. The rise in LNG prices is driven by increased demand from Asia due to hotter-than-expected summer conditions as the need for LNG rose for cooling purposes and rebounding industrial activity. Furthermore, prices were backed by low gas storage stocks, high European carbon prices, low liquefied natural gas tanker deliveries due to higher demand from Asia, low gas supplies from Russia than usual, low renewable output, and gas and nuclear outages. Asian buyers are now competing with European buyers in raising bids for LNG cargo deliveries, as they sought to raise gas storage levels following an unusual cold winter. The US supply disruption was attributed to extreme winter storms in the Gulf of Mexico that provided additional support to higher LNG prices. LNG prices are anticipated to increase over the fourth quarter of 2021 in line with oil price movements and higher demand for LNG from the northern hemisphere winter. With these developments, the LNG price is expected to increase to US$10.3 per MMBtu in 2021 from US$8.3 per MMBtu recorded in 2020. Looking ahead into 2022, the LNG price is projected to moderate to US$9.6 per MMBtu and trade at an average of US$9.1 per MMBtu
Chart 7: Liquefied Natural Gas Price
Source: World Bank Pink Sheet
5.3
7.9
10.5
13.1
5.3
7.9
10.5
13.1
Oct-17 Oct-18 Oct-19 Oct-20 Oct-21
2022 Budget =US$9.8 per MMBtu
US$ per mmbtu US$ per mmbtu
Long-run average=US$7.0 per mmbtu

2022 National Budget, Volume 1
28
Crude Oil Oil prices have increased sharply throughout the third quarter 2021 and continued increasing into October (see Chart 6). The increase in prices was driven by the higher OPEC+ supply compliance, uptick in global demand due to easing of the COVID-19 travel restrictions and the limited recovery in production from the non-OPEC major producers, especially the US. Oil prices averaged US$70.6 per barrel in the third quarter, 6.7 per cent higher than the previous quarter. At end October, spot WTI was trading at around US$84.0 per barrel driven by OPEC+ agreement to supply only 400,000.0 barrels a day. According to oil market analysts, supplying below 600,000.0 barrel per day will eventually boost prices to reach US$90.0 per barrel. Throughout late July and early August, prices were also weighed down by a rapid rise in the Delta variant COVID-19 cases across the globe but these were offset later in the quarter by supply disruptions in the US due to Hurricane Ida as well as the surge in energy prices. Over the year to October 2021, oil prices averaged at around US$66.1 per barrel, 67.5 per cent higher than average 2020 prices. In line with global developments including supply-demand mismatches and OPEC+ sticking to its agreed production cut of only 400,000.0 barrels a day for the reminder of the year, prices are expected to average US$65.0 per barrel in 2021.
Chart 8: Crude Oil Price
Chart 9: Crude Oil Price against Stock
Source: International Monetary Fund (IMF) & US Energy Information Administration (EIA)
Looking beyond 2022, the OPEC+ plan for production increases, increased global economic activity, further easing of the COVID-19 restrictions, the geopolitical tensions in major production hubs and the recent energy crunch in Europe and Asia coupled with growing US shale production will likely to ease prices. Considering these developments, the oil price assumption underpinning the 2022 Budget is projected to average around US$63.9 per barrel. Copper Copper prices performed well and beyond expectations in 2021. Prices rose to an all-time high of US$10,720.0 per tonne in May after reaching a decade high of US$9,000.0 per tonne in March. Supporting prices were rising metal demand particularly from electric vehicle production, supply disruptions, rising industrial activity in China, fear of shortages and the prospects of infrastructure rollouts in the U.S. The significant copper supply disruption in Chile (the world’s largest producing region for copper) due to policy interventions also contributed to the surge in prices.
12
36
60
84
12
36
60
84
Oct-17 Oct-18 Oct-19 Oct-20 Oct-21
US$ per barrel
2022 Budget=US$64 per barrel
Longrunaverage=US$50 per barrel
US$ per barrel
0
50
100
150
300000
404000
508000
612000
Oct-17 Oct-18 Oct-19 Oct-20 Oct-21
Thousand barrels US$ per barrel
Oil Stock(LHS)
Oil Price(RHS)

2022 National Budget, Volume 1
29
Prices, however, have retreated somewhat in the third quarter reflecting a fall in demand from China due to a rise in COVID-19 infections, the power crisis and debt distress from China’s largest property developer Evergrande. The rise in supply due to release of China’s strategic reserve of copper in response to price hikes and stronger US dollar also weighed on prices. Over the year to October, copper prices averaged around US$9,177.0 per tonne which is 55.0 per cent higher than US$5,921.0 per tonne recorded in the same period of 2020. Looking ahead, prices are expected to remain relatively well supported over the remainder of 2021 and into 2022, reflecting high demand and tight supply as the world reopens. However, China’s announcement that more copper reserves could be released in the event of price spikes as well as recent increases in COVID-19 pandemic cases may moderate upward price effects over the reminder of 2021. Considering these developments, the copper price forecast for 2021 has been revised down to US$9,117 per tonne, 6.0 per cent lower than the 2021 MYEFO price forecast but well above 2020 average prices. Chart 10: Copper Price
Chart 11: Copper Price against Stock
Source: London Metal Exchange Source: London Metal Exchange
Looking beyond 2022, the continued vaccine roll-out, stronger global growth and persistent demand from China and US industrial activities including potential supply disruptions from Chile and the impact of the COVID-19 pandemic are expected to keep prices on the higher side. On the downside, renewed COVID-19 pandemic outbreaks, faster than expected moderation in Chinese demand, uneven distribution of vaccine and the ramp-up in production in Chile and other copper producing regions globally would push prices lower. Balancing these factors, the copper price assumption underpinning the 2022 Budget is projected to average around US$9,058.8 per tonne in 2022, still at historically high levels. Gold Gold prices continued to be under some pressure in the third quarter but continued to remain at a relatively high level as the global economy continued to recover. Gold prices fell by 1.4 per cent in the third quarter driven by a slump in safe haven demand amid the rise in interest rates and the US dollar. The US 10-year Treasury Bond yield increased by 10 basis points in September and the US dollar strengthened after the U.S. Federal Reserve hinted that it would start to taper off its bond purchases before the end of the year. Central Banks have also reduced gold purchases in the recent months. On the upside, firm jewellery demand in China and India provided some reprieve to gold prices.
3500
5852
8204
10556
3500
5852
8204
10556
Oct-17 Oct-18 Oct-19 Oct-20 Oct-21
2022 Budget=US$9,059 per tonne
US$ per tonne US$ per tonne
Long-run average = US$4000/tonne
0
4000
8000
12000
0
200000
400000
Oct-17 Oct-18 Oct-19 Oct-20 Oct-21
US$ per tonne
Copper Stock (LHS)
Copper Price (RHS)
tonnes

2022 National Budget, Volume 1
30
Up to October 2021, gold prices have averaged US$1,796.8 per ounce, 2.6 per cent higher than average prices of the corresponding period last year. Gold prices are expected to remain high for the remainder of 2021, reflecting the slow rollout of the COVID-19 vaccines, persistent high cases of the COVID-19 pandemic in many parts of the world and continued stimulatory monetary policy, as well as geopolitical tensions. Against this backdrop, the gold price is projected to average around US$1,794.7 per ounce in 2021, a rise of 1.5 per cent from 2020. Chart 12: Gold Price
Source: IMF and Bank of England
Looking beyond 2022, gold price is expected to fall, due to the recovery of the global economy and a higher interest rate environment. The gold price assumption underpinning the 2022 Budget is projected to average around US$1,788.1 per ounce in 2022. 2.2 EXCHANGE RATE DEVELOPMENTS PNG’s Trade Weighted Index2 (TWI) continued to increase following a decline in the last quarter of 2020. Between end 2020 and October 2021, the PNG TWI rose by 1.5 per cent, reflecting the appreciation of the Kina against its major trading partner currencies particularly against the Australian Dollar. The Kina was stable (flat) against the US Dollar and appreciated by 1.2 per cent against the Australian Dollar over the same period.
2 The Trade Weighted Index (TWI) measures the value of the Kina against a basket of currencies of PNG’s major trading partners
911
1294
1677
2060
911
1294
1677
2060
Oct-17 Oct-18 Oct-19 Oct-20 Oct-21
2022 Budget=US$1,788 per ounce
US$ per ounce US$ per ounce
Long-run average=US$700 per ounce

2022 National Budget, Volume 1
31
Chart 13:Trade Weighted Index Chart 14: Exchange Rate Developments
Source: Bank of Papua New Guinea Source: Bank of Papua New Guinea
Between end 2020 and end October 2021, the Kina also appreciated against the Singapore Dollar (1.4 per cent), Malaysian Ringgit (2.7 per cent), New Zealand Dollar (0.7 per cent), Hong Kong Dollar (0.4 per cent) and the Japanese Yen (9.0 per cent). The appreciation of the Kina against the Australian Dollar reflects cross currency movements as the Australian Dollar weakened against the strengthening US Dollar. The faster recovery in the US economy, and higher US bond yields have seen the US Dollar strengthening in recent months against major currencies including the Australian dollar. The stabilisation of the Kina against the US dollar for a prolonged period reflects the BPNG’s continued intervention in the foreign exchange market citing inflation as the main concern. In 2021, higher export commodity prices and higher Government external borrowing have increased inflows of foreign exchange which has supported foreign exchange reserves. The inflows are mainly from the mineral sector which have been predominately used to meet import demand. Chart 15: Real and Nominal Effective Exchange Rates (REER and NEER)
Source: Department of Treasury
The nominal effective exchange rates show a continued steady estimated decline against
35
39
43
47
35
39
43
47
Oct-15 Oct-17 Oct-19 Oct-21
Index: 1995=100 Index: 1995=100
0.2800
0.3560
0.4320
0.5080
0.2800
0.3560
0.4320
0.5080
Oct-15 Oct-17 Oct-19 Oct-21
Dollar per Kina Dollar per Kina
US Dollar per Kina
AUS Dollarper Kina
30
50
70
90
110
130
150
2007 2009 2011 2013 2015 2017 2019 2021
Index, 2010=100
REER NEER
2022 National Budget, Volume 1
32
partner (trade weighted) exchange rates. The real effective index, adjusted for differential inflation rates across partners, shows a little decline which means our exports have been less competitive on the world market. 2.3 DOMESTIC ECONOMIC DEVELOPMENTS AND OUTLOOK
2.3.1 Summary of Developments in 2021 and Outlook The resurgence of the COVID-19 with its Delta Variant in 2021, combined with a contraction in the resource sector3 has had a negative impact on the PNG economy derailing it from the prospects of a strong recovery projected in the 2021 Budget.
The non-resource sector is expected to grow on average by 4.6 per cent over the medium
term. The positive outlook is driven by the Government’s broad-based inclusive growth agenda where emphasis is on empowering Small Medium Enterprises (SME), improving connectivity/access to markets through the Connect PNG initiative, improving the ease of doing business through the simplification of tax administration and bolstering structural reforms.
The real and nominal Gross Domestic Product (GDP) for the 2022 Budget builds on the recently released 2019 actual GDP statistics published by the National Statistical Office (NSO) on the 4th of November 2021. Growth in the resource sector is expected to contract by 4.1 per cent in 2021. This is driven by a sharp contraction of 12.5 per cent in the mining and quarrying sector and a mild contraction of 0.1 per cent in the oil and gas sector. The contraction is attributed to the ongoing impact of the COVID-19, continuation of the Porgera Shutdown and an autoclave failure at the Lihir mine in June. Despite the contraction in the resource sector, the non-resource sector4 remains on track with its recovery from a disruptive 2020 with growth estimated at 3.9 per cent. Growth in this sector tracks closely to the recovery in the world economy and continues to also benefit from the prevailing high commodity prices. It also reflects the adaptive capacity of businesses to adjust to the ‘niupla pasin’ measures since the onset of the pandemic in 2020. Overall, the domestic economy is estimated to grow in real terms by 1.5 per cent in 2021, 0.3 percentage points lower than the 2021 MYEFO estimate and 2.0 percentage points lower than the 2021 Budget estimate. This is mainly driven by the contraction in the resource sector despite the recovery in the non-resource sector. In 2022, the PNG economy is expected to rebound and grow strongly at 5.4 per cent. This strong growth is expected to be driven by the resource sector with the resumption of the Porgera and Simberi mines including other mines operating at full capacity. Supporting this growth in 2022 is the election-related spending. The spill-over effects of the resource sector growth are also expected to drive growth in the non-resource sectors. Over the medium-term, the PNG economy is expected to grow at an annual average real growth rate of 3.4 per cent, driven essentially by the growth in the non-resource sector.
3 The resource sector (also referred to as mining sector) include mining and quarrying, and oil and gas. 4 The non-resource sector (also referred to as non-mining sector) include Agriculture, Forestry and Fishing and the BLS (Business Liaison Sectors or
tertiary sector). BLS sectors are retail and wholesale, manufacturing, construction among others.

2022 National Budget, Volume 1
33
2.3.2 2021 Domestic Economic Update The domestic economy is estimated to grow in real terms by 1.5 per cent in 2021, a downward revision of 0.3 percentage points from the 2021 MYEFO estimate of 1.8 per cent. This is mainly driven by further downgrade in activity in the resource sector as a result of operational drawbacks such as the auto-clave failure at the Lihir gold mine and the impact of COVID-19 on OK Tedi’s production. The growth in 2021 will be mainly driven by the non-mining sector especially in Agriculture, Forestry and Fishing sector. At the time of the 2021 Budget, prospects for recovery looked promising hence the PNG economy was expected to strongly recover in 2021, with a real growth of 3.5 per cent projected. However, the resurgence of the COVID-19 pandemic and the incursion of the Delta Variant in 2021 derailed growth outcomes as the number of infections and death toll increased, causing panic, uncertainty and placing the health system and the Government under pressure. This dented confidence and halted progress and economic activity. While, most sectors have adopted the ‘niupla pasin’ strategy with strict measures in place to stop COVID-19 transmission the threat of the COVID-19, the ‘Delta Variant’ and new variant continue to constrain the dynamics of the business environment and primarily the recovery of the economy. Chart 16: Real Economic Growth (2018-2027)
Source: Department of Treasury
The non-resource sector is expected to recover and grow in real terms by 3.9 per cent in 2021, an increase of 0.6 percentage points from the 2021 Budget projection of 3.3 per cent and 0.5 percentage points from the 2021 MYEFO projection of 3.4 per cent. This growth reflects: a strong recovery in the Agriculture, Forestry and Fisheries sector (AFF); increased spending in the Health and Social Work Activities sector to combat the spread of the COVID-19 and the Delta Variant; increased activity in the Accommodation and Transport sector than earlier anticipated; and strong growth in the Wholesale and Retail Sector.
The Agriculture, Forestry and Fisheries sector (AFF) is expected to grow by 3.9 per cent in 2021, a slight decline of 0.1 percentage points from the 2021 MYEFO estimate of 4.0 per cent. Nonetheless, this strong growth is driven by increased labour mobility; higher commodity
-10.0
-5.0
0.0
5.0
10.0
15.0
-4.0
-3.0
-2.0
-1.0
0.0
1.0
2.0
3.0
4.0
5.0
6.0
2018 2019 2020 2021 2022 2023 2024 2025 2026 2027
Per cent
Total GDP Total Non-Resource GDP Total Resource GDP (RHS)
COVID-19 Impact
Percent
Earthquake
2022 National Budget, Volume 1
34
prices; price support and freight subsidies. Consequently, palm oil, cocoa and coffee production are expected to be higher than the previous year; In particular:
Palm oil production for 2021 is expected to increase by 1.2 per cent from the first half of the year with increased production from most of the New Britain Palm Oil Limited (NBPOL) estates. The newly established subsidiary, Markham Farming Company Limited, is anticipated to ramp up production in 2021, while Hargy and NBPOL reported no significant disruptions to their operations with strict standard operating procedures instituted to mitigate the existing threat of the COVID-19 and Delta Variant.
Cocoa output decelerated in recent months by 4.8 per cent from an impressive level registered at the 2021 MYEFO. Despite this recent decline, output is estimated to increase by 26.8 per cent from the 2020 production outcome. The PNG Cocoa Board continues to strive towards improving the quality and production of cocoa with its District Cocoa Nurseries, freight subsidy, and quality and control improvement projects.
The coffee production profile for 2021 remains the same as the 2021 MYEFO projections. Production is estimated to increase by 17.3 per cent from the 2020 production outcome. The projected increase indicates a recovery phase in the coffee industry after the shocks precipitated by the COVID-19 pandemic. The coffee industry is still faced with challenges of ageing stock of coffee trees in the smallholder and plantation sectors, breakdown in rural infrastructure, rural-urban migration and continual threat of quality problems.
The Business Liaison Sector (BLS) remains quite resilient driven by revised growth mainly in the Health and Social activities sector and Wholesale and Retail sector. Even so, the BLS sector as reported in the 2021 MYEFO is strained by the increasing cost of operations attributed to law &order problems, increased shipping costs, deteriorating infrastructure and adverse business conditions induced by the resurgence of the COVID-19 pandemic and social partitioning due to vaccination misinformation. Vaccination rates are still low which has filtered any form of immediate recovery for most sectors for the year. Assessing the sectors, performance has been mixed:
The Health and Social Activities sector is expected to grow by 9.0 per cent in 2021, revised up from the 2021 MYEFO estimated growth of 4.0 per cent. This is mainly driven by increased government and donor support in curbing the present threat of the COVID-19 pandemic in 2021. The Wholesale and Retail Trade sector is estimated to grow by 3.4 per cent, revised up from 1.4 per cent in the 2021 MYEFO, reflecting the spill-over benefits from the increased support in the Health and Social Activities sector;
The Accommodation and Food Services sector is expected to grow by 1.8 per cent, an upward revision from 1.2 per cent from the 2021 MYEFO, while the Transport and Storage sector is estimated to grow by 2.0 per cent, a 1.0 per cent increase from the 2021 MYEFO estimate of 1.0 per cent. This is mainly driven by increased activity in these sectors than earlier anticipated citing domestic travel and charter flights from moderate mobility in alignment with the COVID-19 measures and vaccination roll-outs for the respective service providers for these sectors;
The Oil & Gas sector is estimated to contract by 0.1 per cent, a decline from the 2021 MYEFO growth estimate of 1.0 per cent. This is mainly attributed to a slight reduction in the LNG and condensate production profile; and

2022 National Budget, Volume 1
35
The mining and quarrying sector is estimated to contract substantially by 12.5 per cent in 2021, deeper than the 2021 MYEFO estimated contraction of 8.4 per cent. In addition to the known underlying factors such as the Simberi mine closure and the removal of the Porgera mine production assumptions in 2021, the main drivers behind this contraction includes further reduction in the Ok Tedi mine output than earlier estimated and lower output from the Lihir mine due to an autoclave failure in June. The combined impact led to a total contraction of real GDP by 0.4 percentage points in 2021.
2.4 2022 Economic Outlook
In 2022, the PNG economy is expected to strongly recover and grow at 5.4 per cent in real terms. This is largely driven by a rebound in growth in the resource sector reflecting the anticipated resumption of the Porgera and Simberi mines as well as the normalisation of activities in the other mines after the disruptions encountered in 2021. In addition, the non-resource sector is expected to remain strong supported by the spill-over benefits from the resource sector and the 2022 Election related spending in the economy. Growth in the non-resource sector is expected to increase in real terms by 3.5 per cent in 2022. This is attributed to growth in the AFF sector supported by the strong growth in the BLS sector as the resumption of both the Porgera and Simberi gold mines is anticipated to have spill-over benefits to most of the BLS sectors. In addition, stepping up of vaccination awareness and advocacy is important in increasing rates of vaccination which is vital in restoring confidence hence boosting activity in the BLS sector. Furthermore election - related spending is expected to drive activities providing further impetus for growth in 2022. The non-resource sectors performance in 2022 will be underpinned by the underlying factors highlighted above and are as follows:
The Transport and Storage sector is expected to grow strongly by 6.0 per cent in 2022. Apart from the assumed increase in vaccination roll-outs, the main underlying assumption driving this growth is the resumption of the Porgera mine as the operations of the mine are anticipated to increase activity for trucking and logistic companies and the overall movement of goods to the mining site;
The Accommodation and Food services sector is expected to grow by 6.1 per cent in 2022. The strong growth is mainly driven by the anticipated increase of vaccination roll-outs that will allow greater movement, supported by the recovery in the global economy. In addition, Government spending on the elections will also aid growth in the sector with increased movement of people which is expected to translate into some activity for the sector;
The Electricity, Gas and Air-conditioning sector is expected to grow by 6.2 per cent in 2022. This growth rate reflects the ramp-up of operations from the new electricity generators, namely Dirio and Niupower in 2022;
The Health sector is expected to grow by 6.0 per cent in 2022. The strong growth rate reflects ongoing support from the Government including from donor agencies to curb the threat of the COVID-19. The Public Administration and Defence sector is projected to grow by 6.0 per cent in 2022. The 2022 National Elections will see increased activity in this sector; and
The Wholesale and Retail sector is expected to grow by 5.0 per cent while the Manufacturing sector in 2022 is expected to grow by 3.5 per cent. Growth in these

2022 National Budget, Volume 1
36
sectors is mainly attributed to the trickle-down effects from the resumption of Porgera and Simberi gold mines and the 2022 Election-related spending. The resumption of the mines is also expected to cushion the overall forex imbalances and assist the sector’s growth.
Growth in the Mining and Quarrying sector is projected to rebound and grow strongly by 35.8 per cent in 2022. The strong rebound in growth for the sector reflects the resumption of the Porgera mine expected in the second quarter of 2022 since the shut-down in April 2020. In addition, production from the Ok Tedi mine is expected to increase as a result of better access to high grade ores while the Lihir mine is expecting its production to return to normal following the disruptions encountered in 2021. Further supporting the strong growth outlook in 2022 is the resumption of the Simberi mine operations following its shut down in June 2021 due to environmental and regulatory concerns. The Oil and Gas sector is projected to contract by 0.9 per cent in 2022. This is due to a downgrade in condensate production and is mainly associated with the production systems. Despite the contraction in the Oil and Gas sector, the projected strong growth in the Mining and Quarrying sector is expected to offset the decline in the Oil and Gas sector. The AFF sector is projected to grow at 2.9 per cent in 2022. This growth is driven by increased yields across most cash crops particularly Copra and Cocoa. Copra production is expected to increase as its replanting exercise undertaken in 2014 is expected to increase the output in 2022. For Cocoa production, the continued efforts by the PNG Cocoa Board through its replanting programme supported by the freight subsidy programme and its quality control improvement projects are expected to bolster cocoa yields in 2022. Furthermore, growth in the AFF sector captures the projected increase in New Britain Palm Oil Limited production and increased coffee yields given that 2022 is expected to be a good-year for coffee in the growing cycle for coffee. Despite the favourable conditions, growth within the sector is expected to be constrained by the COVID-19 restrictions/guidelines imposed on movement of tonnage for shipment from farm gate to export terminals and infrastructure bottlenecks.

2022 National Budget, Volume 1
37
Chart 17: Contribution to Growth by Sectors, 2021 and 2022
Source: Department of Treasury
In general, the PNG economy is expected to grow strongly with a real growth rate of 5.4 per cent in 2022 mostly reflecting strong growth in the Mining and Quarrying sector. The anticipation of an increased vaccination roll-out and gradual pick-up of the global economy is expected to provide a boost to the non-resource sector. The non-resource sector is expected to be supported by election-related spending and the resumption of the operations of major mines. In line with this, the non-resource sector is projected to grow by 3.5 per cent in 2022.
Source: Department of Treasury
-1.5 -1.0 -0.5 0.0 0.5 1.0 1.5 2.0 2.5 3.0 3.5
Agriculture, Forestry and Fishing
Oil and Gas Extraction
Mining and Quarrying
Manufacturing
Electricity Gas & Airconditioning
Water Supply & Waste Management
Construction
Wholesale and retail trade
Transport and Storage
Accomodation and Food Services
Information and Communication
Financial and Insurance Activities
Real Estate Activities
Professional and Scientific
Administrative and Support Services
Public Administration and Defence
Education
Health and Social Work Activities
Other Service Activities
2022 2021
Box 1: Main Factors Driving Growth in 2022 The resurgence of the COVID-19 virus and its Delta-Variant and the unexpected contraction of the resource sector drove the lower real GDP growth rate in 2021. 2022 is expected to be a stronger recovery year given the factors discussed and noted in the table below.
Major factors Driving Growth in 2022 Real Growth (%) Real Absolute Value
(Kina millions)
2021 1.5 64,343.9
1.1 Porgera resumption 1.7 1,067.2
1.2 OK Tedi normal/increased production 0.9 593.2
1.3 Lihir normal production 0.1 89.5
1.4 Simberi Resumption 0.3 177.2
1.5 Agriculture, Fisheries & Forestry growth 0.5 314.8
1.6 Others (BLS recovery) 2.0 1,322.4
1.7 Oil & Gas decline -0.2 -112.1
Total Impact on real growth* 5.4 3,452.3
2022 5.4 67,796.2
*Numbers may not add up due to rounding
The ‘1.6 Others (BLS recovery)’ covers the recovery and increased activity of key sectors given the vaccination roll-outs, global economy recovery, election related spending and strong resource sector growth.

2022 National Budget, Volume 1
38
2.4.1 Medium Term Outlook (2023-2027) Over the medium-term, the PNG economy is expected to grow at an annual average growth rate of 3.4 per cent which is driven essentially by growth in the non-resource sector as the economy continues to recover from the scaring impacts of the COVID-19. On average, the
non-resource sector is expected to grow by 4.6 per cent per annum over the medium term. This is a positive outlook in line with Government’s plan to drive a broad-based inclusive growth agenda with strong emphasis on SMEs, infrastructure connectivity and structural reforms to ease business restraints. The AFF sector predominantly supports the non-resource sector. Over the medium-term, the AFF sector is projected to have an average annual real growth rate of 3.2 per cent. This growth reflects the full recovery of the economy with no restrictions on the movement of labour across domestic and international borders over the medium term. Agricultural commodities remain sensitive to world market prices and the recovery of the global economy and global supplies will see a steady decline in prices. This will be an issue for local farmers as they are price-takers hence market forces will continue to influence their production decisions. The rolling out of key projects in the sector will remain key in driving growth going forward. The Governments ‘Connect PNG’ policy is expected to facilitate greater development within the AFF sector with road linkages to cocoa, coffee and copra plantations that will prove cost-efficient for the farmers and retain more money back in their pockets. In addition, the continued roll out of the PNG Cocoa Board’s major projects such as the nursery project will continue to support growth and development in the cocoa industry. Palm oil production is anticipated to increase over the medium-term aided by the uplifting of border restrictions that should facilitate the need of specialised labour. This coupled with the anticipated ramping-up of the Markham Farming Company Limited production, palm oil production over the medium-term is expected to remain high, contributing strongly to the AFF sectors’ growth. Furthermore, the expected recovery of the global economy from the adverse impacts of the COVID-19 and the continuing advocacy on the importance of vaccination to the health system, lives and the economy, confidence which has been battered by the COVID-19 is expected to be restored, hence drive business activity in the non-resource sector over the medium-term. The Transport and Storage, Accommodation and Food services, Manufacturing and Wholesale and Retail Sectors are expected to recover and grow strongly over the medium term as the recovery of the global economy is expected to improve global supply lines and see much freer flow of trade and labour mobility. This coupled with government investment on road networks to connect PNG and its emphasis on Small Medium Enterprises (SME) will see improvement in domestic supply lines and trade for the respective sectors. Growth in the Electricity, Gas and Air-conditioning sector over the medium term is driven by operations of the Dirio and Niupower and the PNG Energy Utility Performance and Reliability Improvement Project that aims to improve, rehabilitate, and upgrade infrastructure on the Port Moresby, Gazelle and Ramu grids owned by PNG Power. To further support non-resource growth, the Government over the medium term will continue its efforts to encourage downstream processing of resources and strengthen its compliance reforms aimed at increasing revenue supported by financial sector reforms focused on encouraging international trade and reducing the foreign exchange imbalance. This is expected to provide a conducive business environment to drive trade and enhanced activity. These reforms are expected to have a positive impact over the medium-term.

2022 National Budget, Volume 1
39
Further, the mining and quarrying sector is projected to grow by 7.3 per cent in 2023 driven by the full-year of production from the Porgera mine, and supported by the expectation of higher production from Ok Tedi due to increased access to high-grade ore. However, the sector is projected to slow down over the medium term. The sector is expected to expand by 1.2 and 0.2 per cent in 2024 and 2025, respectively, before plateauing in 2026-27. This projected growth profile is underpinned by an expected flattening in output on the assumption that mines are maturing. However, this outlook does not include projects in the pipeline where additional mines are likely to come online, which would change the growth profile of the sector. The oil and gas sector, is projected to contract by 2.5 per cent in 2023 driven by downgrades in gas and condensate production. From 2024 to 2027, the sector is expected to grow at an average growth rate of zero per cent as gas, condensate and oil production is expected to plateau. This outlook does not capture the pipeline projects such as the Papua LNG project. The pipeline projects will be captured once they reach the final investment stages and Final Investment Decisions (FID) are confirmed. 2.5 LABOUR MARKET
Total employment in the formal private sector continues to fall in 2021 with the ongoing impact of COVID-19 pandemic. According to the BPNG’s provisional employment statistics for the June quarter 2021, total employment contracted by 4.1 per cent (See Chart 19) through the year from June 2020 to June 2021 driven by a decline in the mining sector by 19.3 per cent. The decline in the mining sector largely reflects the impact of the COVID-19 pandemic on the Ok Tedi mine and the unexpected closure of the Simberi mine in June. The continued closure of the Porgera mine and the reduced activity in the exploration sector due to the COVID-19 pandemic also contributed to negative employment growth. While the mining sector has decline, the non-mining sector has recorded a stronger growth of 9.7 per cent reflecting increased activity in the manufacturing and wholesale sectors. The pickup in manufacturing and wholesale sector is driven by improvement in foreign exchange supply and the spillover effect of the COVID-19 related spending in the Health sector. The manufacturing and wholesale sector grew by 8.0 per cent and 0.9 per cent respectively. These more than offset the fall in employment in other non-mining sectors (See Chart 20). Through the year to the June quarter 2021, the non-mining sectors that have reported contractions in employment were Building & Construction (down 21.1 per cent), Retail (down 4.7 per cent), transportation (down 4.5 per cent), Agriculture, Forestry and Fisheries (down 3.9 per cent), and Financial, Business & Other Services (down 0.2 per cent) (See Chart 21).

2022 National Budget, Volume 1
40
Chart 18: Employment Index
Chart 19: Total Employment Growth
Source: Department of Treasury and Bank of PNG Source: Department of Treasury and Bank of PNG
Chart 20: Mining & Non-Mining Employment
Growth
Source: Bank of PNG
Chart 21: Industrial Employment Growth
Source: Bank of PNG
2.4.2 Nominal Salary and Wages The last Minimum Wage Board (MWB) Determination was in July 2016 that remains in effect with the nominal salary and wages index in PNG set at K140.8 per week.
148
160
172
184
148
160
172
184
Jun-13 Jun-15 Jun-17 Jun-19 Jun-21
June 2022=100
-10
-5
0
5
10
-10
-5
0
5
10
Jun-13 Jun-15 Jun-17 Jun-19 Jun-21
Per cent Per cent
-33
-11
11
33
55
-33
-12
9
30
51
72
Jun-13 Jun-15 Jun-17 Jun-19 Jun-21
Per cent, tty Per cent, tty
Mining Employment
Non-Mining Employment -32
-20
-8
4
16
-32
-20
-8
4
16
Industrial Employment Growth Long Run Non-Mining Average
Per cent, tty Per cent, tty
Retail
Wholesale
Manufacturing
Building & Construction
TransportationAgriculture,
Forestry & Fisheries
Finance, Business & Other services
Mining

2022 National Budget, Volume 1
41
Chart 22: Wages Idex
Source: Department of Treasury, Bank of PNG and National Statistical Office (NSO)
The MWB Determination in July 2016 was the third and final phase of an increase to the minimum wage hourly rate with the rate increasing to K3.50 per hour from K3.36 per hour in July 2015 and K3.20 per hour in July 2014. This increase was to accommodate inflationary pressures on minimum wage earners’ income since the last determination. According to the Department of Labour and Industrial Relations, the new rate of K3.50 per hour (or K140.80 per week) will remain in operation until superseded by a new Determination. 2.6 MONETARY DEVELOPMENTS
The Bank of PNG continued with its accommodative stance of monetary policy by maintaining its Kina Facility Rate (KFR) at 3.0 per cent in its November KFR announcement. In the first half of 2021, the money supply increased by 9.0 per cent to an average of K24,268.2 million from an average of K22,268.4 million over the same period last year as net domestic borrowing by the Government and net earnings from foreign assets increased by 22.9 per cent and 18.5 per cent, respectively.
0
50
100
150
0
50
100
150
Jun-07 Jun-09 Jun-11 Jun-13 Jun-15 Jun-17 Jun-19 Jun-21
Real Wage Nominal Wage
March 2000=100 March 2000=100
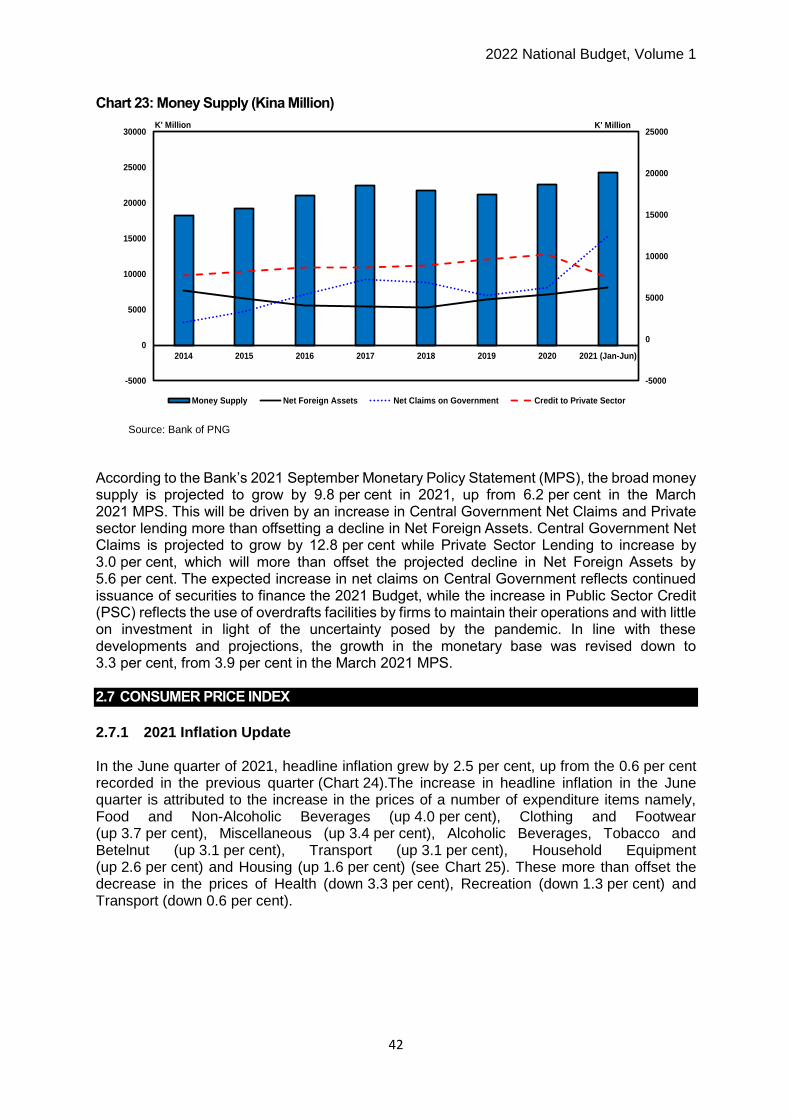
2022 National Budget, Volume 1
42
Chart 23: Money Supply (Kina Million)
Source: Bank of PNG According to the Bank’s 2021 September Monetary Policy Statement (MPS), the broad money supply is projected to grow by 9.8 per cent in 2021, up from 6.2 per cent in the March 2021 MPS. This will be driven by an increase in Central Government Net Claims and Private sector lending more than offsetting a decline in Net Foreign Assets. Central Government Net Claims is projected to grow by 12.8 per cent while Private Sector Lending to increase by 3.0 per cent, which will more than offset the projected decline in Net Foreign Assets by 5.6 per cent. The expected increase in net claims on Central Government reflects continued issuance of securities to finance the 2021 Budget, while the increase in Public Sector Credit (PSC) reflects the use of overdrafts facilities by firms to maintain their operations and with little on investment in light of the uncertainty posed by the pandemic. In line with these developments and projections, the growth in the monetary base was revised down to 3.3 per cent, from 3.9 per cent in the March 2021 MPS. 2.7 CONSUMER PRICE INDEX
2.7.1 2021 Inflation Update In the June quarter of 2021, headline inflation grew by 2.5 per cent, up from the 0.6 per cent recorded in the previous quarter (Chart 24).The increase in headline inflation in the June quarter is attributed to the increase in the prices of a number of expenditure items namely, Food and Non-Alcoholic Beverages (up 4.0 per cent), Clothing and Footwear (up 3.7 per cent), Miscellaneous (up 3.4 per cent), Alcoholic Beverages, Tobacco and Betelnut (up 3.1 per cent), Transport (up 3.1 per cent), Household Equipment (up 2.6 per cent) and Housing (up 1.6 per cent) (see Chart 25). These more than offset the decrease in the prices of Health (down 3.3 per cent), Recreation (down 1.3 per cent) and Transport (down 0.6 per cent).
-5000
0
5000
10000
15000
20000
25000
-5000
0
5000
10000
15000
20000
25000
30000
2014 2015 2016 2017 2018 2019 2020 2021 (Jan-Jun)
Money Supply Net Foreign Assets Net Claims on Government Credit to Private Sector
K' Million K' Million

2022 National Budget, Volume 1
43
Chart 24: Headline & Underlying CPI
(Quarterly)
Chart 25: Expenditure Basket-June Quarter 2021
Growth (%)
Source: National Statistical Office
The Headline inflation outcome continues to moderate after increasing sharply in the first half of 2020. Through the year to June quarter 2021, headline inflation grew at 3.3 per cent, 2.7 percentage points lower than the 6.0 per cent inflation recorded in the June quarter 2020. (see Chart 26). The moderation in through the year inflation reflected the moderate increase in the prices of, Education (up 20.0 per cent), Health (up 15.5 per cent), Clothing and Footwear (up 7.1 per cent), Transport (up 6.2 per cent), Food and Non-Alcoholic Beverages (up 4.9 per cent), Restaurant and Hotels (up 4.1 per cent), Miscellaneous (up 3.3 per cent), Recreation (up 3.2 per cent) and Household Equipment (up 2.7 per cent). These more than offset the fall in the prices of Alcoholic Beverages, Tobacco and Betelnut (down 6.7 per cent) (see Chart 27).
Chart 26: Headline & Underlying CPI
(Through-the-Year)
Chart 27: Expenditure Basket- Through the
Year Growth (%)
Source: National Statistical Office
The underlying inflation rate increased by 1.6 per cent in the June quarter to be 5.1 per cent higher in through the year terms (see Chart 25). The underlying inflation rate in this quarter has stabilised after rising in the last two (2) quarters. 2.7.2 Tradable and Non-Tradable Goods Prices of tradable goods increased by 5.0 per cent through the year to the June quarter 2021 compared to a 2.0 per cent increase in the corresponding quarter last year (see Chart 27). This is a sharp increase and reflects increases in the prices of most imported items flowing from higher international oil prices, higher shipping costs and higher Australian CPI.
-1.2
-0.2
0.7
1.7
2.6
3.6
-1.2
-0.2
0.7
1.7
2.6
3.6
Jun-16 Jun-17 Jun-18 Jun-19 Jun-20 Jun-21
P
Headline
Underlying
Per cent Per cent
-6.0
1.0
8.0
15.0
22.0
-6.0
1.0
8.0
15.0
22.0
Fo
od
*
To
b/B
et
Clo
th
Ho
u
H/E
qu
ip
Tran
s
Co
mm
.
Healt
h
Re
c
Ed
u
R&
H
Mis
c
Jun-21 Mar-21
Per cent Per cent
0.0
1.3
2.6
3.9
5.2
6.5
7.8
0.0
1.3
2.6
3.9
5.2
6.5
7.8
Jun-16 Jun-17 Jun-18 Jun-19 Jun-20 Jun-21
Per cent
UnderlyingHeadline
Per cent
-3.0
2.0
7.0
12.0
17.0
22.0
-3.0
2.0
7.0
12.0
17.0
22.0
Food* Tob/Bet Cloth Hou H/Equip Trans Comm. Health Rec Edu R&H Misc
20-Jun 21-Jun
Per centPer cent

2022 National Budget, Volume 1
44
Chart 28: Tradable and Non-Tradable Inflation-
(Quarterly)
Chart 29: Tradable and Non-Tradable
Inflation-(Through-the-Year)
Source: NSO and Department of Treasury
While tradable inflation appears to pick up strongly, non-tradable (or domestic) inflation has fallen, by 2.8 per cent through the year to June quarter 2021, compared to the through the year growth rate of 8.2 per cent in the corresponding quarter last year. This is due largely to the fall in the prices of betel nut and rentals which more than offset the rise in the prices of other domestic items. 2.7.3 Inflation Outlook Inflation in 2021 is expected to be 5.0 per cent, unchanged against the 2021 MYEFO update and 0.2 percentage points higher than the 2021 Budget. The upward revision from the 2021 Budget is due largely to inflationary pressures from abroad including higher trading partner inflation especially in Australia, higher oil prices and higher shipping freight charges. In 2022, inflation is projected to increase to around 5.6 per cent reflecting higher import price pressures, election related spending and rebound in overall domestic economic growth. Apart from import price pressures, the Government, has a Budget of approximately K600.0 million to spend on the 2022 National Elections. This is expected to translate into increased activity and may put upward pressure on prices in 2022. Some of the downward price pressures include the free education policy and expected reduction in interest cost Over the medium term, inflation is projected to average around 5.1 per cent in line with the Government’s macroeconomic objective of low and stable prices. The upside risk to the inflation forecast includes faster exchange rate depreciation and resource projects coming online earlier than expected.
-2.0
0.0
2.0
4.0
6.0
-2.0
0.0
2.0
4.0
6.0
Jun-16 Jun-17 Jun-18 Jun-19 Jun-20 Jun-21
Per cent Per cent
Tradeable
Non-Tradeable
0.0
3.0
6.0
9.0
12.0
0.0
3.0
6.0
9.0
12.0
Jun-16 Jun-17 Jun-18 Jun-19 Jun-20 Jun-21
Per cent
Non-Tradeable
Tradeable
Per cent

2022 National Budget, Volume 1
45
Chart 30: Inflation outcome and projection 2011-2026
Source: Actuals from National Statistical Office (NSO). Projections from Department of Treasury
2.8 BALANCE OF PAYMENTS AND INTERNATIONAL RESERVES
2.8.1 2021 Update In the first half of 2021, the ongoing improvement in global and domestic economic conditions including the improvement in foreign exchange supply and improved mobility have underpinned movements in PNG’s overall balance of payments. The current account recorded a surplus of K9,602.2 million in the first half of 2021, driven by a positive trade balance of K10,568.4 million reflecting higher export values for nickel, cobalt, copper, crude oil, palm oil and cocoa commodities driven by higher prices and higher palm oil and cocoa production. Gains from those commodities more than offset lower export values recorded by LNG, gold and logs due to lower volumes. On the import side, the easing of the pandemic restrictions due to the COVID-19 vaccines and improvement in foreign exchange supplies have allowed trade activities to happen smoothly resulting in higher import payments for general imports in the second quarter of the year. With the prevailing high commodity prices and the expectation for prices to remain higher across all commodities including higher export volumes for LNG, nickel, cobalt, palm oil and cocoa, and with slower import activity expected for the remainder of 2021, this will translate into an expected trade surplus of K20,408.2 million and a current account surplus of K20,249.6 million by end of 2021. Overall, the trade surplus and current account surplus are higher than the 2020 levels reflecting the moderate easing of the COVID-19 pandemic and the sharp rise in the prices of most of the export commodities. The income account recorded a deficit of K1,696.2 million in the first six (6) months of the year, up 81.6 per cent from the corresponding period of 2020. The higher deficit is due to higher income and dividend payments to non-residents driven by a continued improvement of the foreign exchange imbalance, which more than offset the lower increase in interest receipts in the first six (6) months of the year. This condition is expected to continue in the second half of the year with the income account projected to record a deficit of K1,031.1 million by year end.
0
2
4
6
8
2011 2012 2013 2014 2015 2016 2017 2018 2019 2020 2021 2022 2023 2024 2025 2026
Actuals
Per cent
Forecast

2022 National Budget, Volume 1
46
The transfer account recorded a surplus of K729.9 million in the first six (6) months of the year, higher than the K398.1 million surplus recorded over the same period a year ago. The higher increase is due to higher inflows of gifts and grants, superannuation funds, licensing fees, tax payments, family maintenance and immigration funds compared to last year’s inflows, while lower than the 2019 levels (pre-pandemic levels). With the expectation that gift and grant inflows will moderately increase, sufficient to offset the total outflows in the second half of the year, the transfer account is expected to record a surplus of K872.5 million by the end of 2021. The capital and financial account recorded a deficit of K10,409.1 million in the first half of the year, 46.8 per cent higher than the corresponding period of 2020. The higher deficit reflects a strong increase in other financial capital outflows, which offset an increase in portfolio investment during the period. Overall, this account is expected to record a deficit of K20,249.6 million in 2021. Chart 31: Balance of Payment (BOP)
Source: Bank of BPNG
2.8.2 2022 Balance of Payment Outlook In 2022, the current account surplus is expected to be K22,679.2 million (22.3 per cent of GDP), a 12.0 per cent increase from the 2021 estimate. The higher surplus in the current account reflects higher mineral production supported by the resumption of the Porgera mine. In addition, the expected increase in production and prices for agricultural commodities including coffee and cocoa would also support the current account surplus. 2.8.3 Medium Term Outlook (2023-2026) The current account surplus is expected to increase slightly in 2023 and then moderate over the medium-term reflecting a decrease in most commodity prices. The expected flow of LNG in the medium term is also expected to provide some support to the financial account and the current account.
-10000
-5000
0
5000
10000
15000
20000
25000
30000
35000
-15000
-10000
-5000
0
5000
10000
15000
20000
25000
30000
35000
2012 2013 2014 2015 2016 2017 2018 2019 2020 2021 2022 2023 2024 2025 2026
CURRENT ACCOUNT BALANCE
Income Balance
Transfers Balance
Trade Balance
Projection
Kina Million
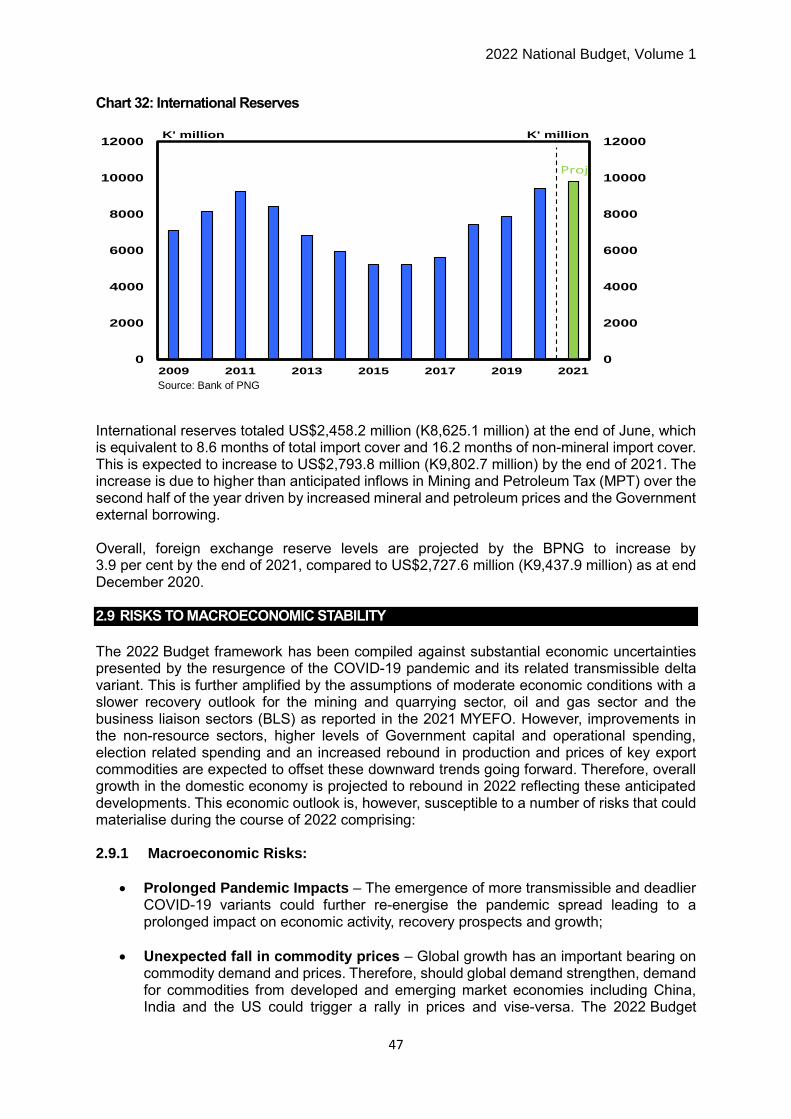
2022 National Budget, Volume 1
47
Chart 32: International Reserves
Source: Bank of PNG
International reserves totaled US$2,458.2 million (K8,625.1 million) at the end of June, which is equivalent to 8.6 months of total import cover and 16.2 months of non-mineral import cover. This is expected to increase to US$2,793.8 million (K9,802.7 million) by the end of 2021. The increase is due to higher than anticipated inflows in Mining and Petroleum Tax (MPT) over the second half of the year driven by increased mineral and petroleum prices and the Government external borrowing. Overall, foreign exchange reserve levels are projected by the BPNG to increase by 3.9 per cent by the end of 2021, compared to US$2,727.6 million (K9,437.9 million) as at end December 2020. 2.9 RISKS TO MACROECONOMIC STABILITY
The 2022 Budget framework has been compiled against substantial economic uncertainties presented by the resurgence of the COVID-19 pandemic and its related transmissible delta variant. This is further amplified by the assumptions of moderate economic conditions with a slower recovery outlook for the mining and quarrying sector, oil and gas sector and the business liaison sectors (BLS) as reported in the 2021 MYEFO. However, improvements in the non-resource sectors, higher levels of Government capital and operational spending, election related spending and an increased rebound in production and prices of key export commodities are expected to offset these downward trends going forward. Therefore, overall growth in the domestic economy is projected to rebound in 2022 reflecting these anticipated developments. This economic outlook is, however, susceptible to a number of risks that could materialise during the course of 2022 comprising: 2.9.1 Macroeconomic Risks:
Prolonged Pandemic Impacts – The emergence of more transmissible and deadlier COVID-19 variants could further re-energise the pandemic spread leading to a prolonged impact on economic activity, recovery prospects and growth;
Unexpected fall in commodity prices – Global growth has an important bearing on commodity demand and prices. Therefore, should global demand strengthen, demand for commodities from developed and emerging market economies including China, India and the US could trigger a rally in prices and vise-versa. The 2022 Budget
0
2000
4000
6000
8000
10000
12000
0
2000
4000
6000
8000
10000
12000
2009 2011 2013 2015 2017 2019 2021
K' million K' million
Proj

2022 National Budget, Volume 1
48
projections and growth depends on the projected increase in commodity prices going forward, driven by demand from these major global consumers. Therefore, any unplanned shifts in their economic growth prospects and policy directives will alter their market appetite for commodities thus having a direct impact on commodity demand and prices. This will further have a direct impact on FX inflows and revenue collections and overall economic growth;
Tighter financial conditions – Prolonged pandemic related mismatches in supply and demand could lead to sustained price pressures and rising inflation. This could in turn pressure developed economies to adjust to monetary normalisation faster than anticipated thus leading to a sudden tightening of financial markets;
Resurgence of imbalance in the supply and demand of foreign exchange – This imbalance could resurge if the Government maintains spending without accessing sufficient levels of external financing and if balance of payments net inflows fails to materialise. Should these trends re-emerge in 2022, there is a risk that economic growth projections will not be achieved, impacting business sentiment, income and employment levels and service delivery;
Commencement and resumption of large investment projects and major mines respectively – The 2022 Budget growth forecast only includes the resumption of the major mines that were closed in 2020 and 2021 due to operational issues at respective mine sites. It excludes any developments from the proposed investment projects until the ongoing discussions reach the Final Investment Decision (FID) stage. If there is a major announcement, this would assist growth but significant revisions are unlikely until mid-2022 or beginning 2023 for major projects, especially in the oil and gas sector. However, any changes in the decision of the operational resumption of existing major mines in the country will have a significant drawback effect on the growth forecast with subsequent knock-on ramifications across sectors;
Natural Disasters –Recent experiences of the drought in 2015 and the 2018 earthquake are evident of the looming threats that related natural disasters can have on economic activity, growth, and development. It is therefore essential for the government and responsible agencies to incorporate mitigation strategies into their operational plans. Climate change still remains an imminent global challenge regardless of the COVID-19 pandemic that could affect economic development and people’s lives if it is not addressed;
Social unrest due to prolonged pandemic frustration – Further intensification on the frustration with the handling of the pandemic in relation to increases in food prices, slow employment growth, new policies towards slowing the spread of the COVID-19 in terms of vaccination and related restrictions could lead to social unrest and weigh on sentiment for recovery prospects. This is a risk more likely to eventuate as citizens become divided in their views on government’s intervention given the long existing erosion of trust in government institutions and policies.
2.9.2 Fiscal Risks:
Unbudgeted Expenditures/Commitments – The Government encourages all Departments, SOEs, Provincial Governments and Ministers to live within their means as any unbudgeted expenditures undertaken in 2022 will have fiscal implications and jeopardise the credibility of the Government’s MTFS. In particular, Personnel Emolument (PE) overruns in health and teacher salaries continue to remain a major issue with fiscal implications and the Government has put in place further controls over

2022 National Budget, Volume 1
49
Compensation of employees overruns in health and teachers’ salaries in the 2022 Budget, but failure to adhere to these restrictions will undermine the Budget forcing likely reductions in the capital budget;
Dividend revenue projections not meeting the Budget estimates – The collections of dividend payments from respective government agencies and authorities caters for almost 5.8 per cent of the total revenue projections in 2022. Any drop-in collections due to agencies not paying their portion of dividends will impact the total revenue collections thus having an adverse effect on the budget fiscal position and financing plans; and
The prolonged delay in passing of the Non-Tax Revenue Administration (NTRA) Bill – The delay in passing the NTRA bill has affected revenue projections and collections to date. The continued delay in passing and implementation of the bill will have a significant side effect on revenue projections, collections, expenditure and financing plans in 2022.
2.9.3 Financing Risks:
Exposure through debt guarantees and contingent liabilities – Exposure through debt guarantees and contingent liabilities is a concern in determining the net worth of the State, thus has implications on the statutory debt ratio ceiling in the FRA and PNG’s credit ratings;
Heavy reliance on domestic borrowing results in high interest costs – Whilst the Government has had some success in rebalancing its debt portfolio much more toward longer term external debt, there has been an over reliance on the domestic debt market and if this continues, could result in upward pressure on interest rates and debt servicing costs; and
Exchange rate risks on the external loans – With access to more external debt for budget financing, despite the concessional rates, exchange rate risk still needs to be managed carefully.
With all these risks being finally balanced at this point, escalation of any one of them could have serious implications for the 2022 Budget and medium-term fiscal targets. The Government remains mindful of such risks and will closely monitor developments. It will continue to aggressively implement its revised medium-term fiscal, revenue and debt strategies included in the 2022 Budget with mitigation strategies employed should any significant risks materialise going forward.

2022 National Budget, Volume 1
50
CHAPTER 3: FISCAL STRATEGY AND OUTLOOK 3.1 FISCAL BACKGROUND – 2021 BUDGET UPDATE
The 2021 National Budget was the second annual budget framed under the Marape Government during times of unprecedented economic adversity exacerbated by the COVID-19 pandemic. The execution of the 2021 Budget was constrained especially in the first half of the year as the business community and consumers adapted to firm’s operational restrictions imposed through the COVID-19 ‘niupla pasin’ strategy. Despite these challenges, revenue in 2021 is expected to exceed budgeted projection as the economy learnt to live with COVID-19, and as the mineral sector receipts improved and international donor assistance was lifted. The 2021 Mid-Year Economic Outlook (MYEFO) report projected Total Revenue and Grants at K13,674.5 million, an upward revision of K679.5 million from the 2021 Budget estimate of K12,995.0 million. The upward revision is mainly attributed to an increase in Mining and Petroleum Taxes (MPT) and Dividends driven by significant improvements in the international prices of key export commodities particularly in the oil and gas sector. In addition, total grants have been revised upwards based on the 2020 outcome, and the trend in the first half of the year, including the K137.5 million Budget Support Grant received from Australia. However, the downside risk to the improved revenue projection includes the unexpected delay in the passing of the Non-Tax Revenue Administration (NTRA) Bill, dividends not materialising and company income taxes remaining subdued. The Government, in its efforts to contain the third wave of the COVID-19 outbreak of the dangerous strain - the ‘Delta Variant’, introduced a number of measures under its ‘niupla pasin’ strategy to ensure normal business activity continues with strict compliance to COVID-19 protocols. Despite a fairly tight cash flow, the Government managed to ensure goods and service delivery mechanisms functioned with funding for essential goods and services in health and education being frontloaded into the first half of the year. Government expenses during the first and early second half of the year were funded by GoPNG revenue, the Australian Budget Support Grant and financing from both domestic (Treasury Bills and Treasury Bonds) and external loans (JICA Budget Support Loan and the World Bank Group Emergency DPO). The 2021 MYEFO report projected an expenditure envelope of K20,287.3 million, an increase of K679.5 million from the 2021 Budget estimate of K19,607.8 million. The increase is driven by a projected overrun in Compensation of Employees (CoE), increase in Government Tuition Fee Subsidy (GTFS) and Donor Support Grants. Total public debt in the 2021 MYEFO report was projected to be K46,781.3 million, or 51.1 per cent of GDP, slightly lower than the 2021 Budget estimate of 51.5 per cent, but higher than the 47.1 per cent outcome for 2020. This debt to GDP ratio is within the prescribed debt-to-GDP ratio of 60.0 per cent as per the FRA (amended 2020). The slightly lower projection reflects an upward revision to the nominal GDP growth rate in the 2021 MYEFO report.
3.2 2021 SUPPLEMENTARY BUDGET
Based on the outcome of the 2021 MYEFO report, the Government is undertaking corrective policy measures by tabling the 2021 Supplementary Budget together with the 2022 Budget National Budget to maintain the integrity of the 2021 Budget that is consistent with overarching

2022 National Budget, Volume 1
51
theme of budget repair and economic recovery. The 2021 Supplementary Budget therefore maintains planned deficit at K6,612.8 million with Total expenditure and Net Lending at K20,287.4 million and Total Revenue and Grants of K13,674.5 million. Table 3: 2021 Supplementary Budget (Kina, million)
Details 2021
Budget 2021
MYEFO 2021
Supp. Budget
Total Revenue and Grants 12,995.0 13,675.5 13,675.5
Total Expenditure and Net Lending 19,607.8 20,287.3 20,287.3
Net Lending (+)/Net Borrowing (-) -6,612.8 -6,612.8 -6,612.8
% of GDP -7.3 -7.2 -7.1 Source: Department of Treasury
The 2021 Supplementary Budget is necessary to validate the movement of funds to be consistent with the Public Finance management Act (PFMA) 1995 as well as the Appropriations Act. Further, there are slight increases expected in the 2021 revenue estimates which should offset pressures coming from key Government programs like GTFS and CoE as identified in the 2021 MYEFO report. The Government’s execution of the 2021 Budget came under pressure in the face of challenges exerted by the global pandemic, COVID-19 and its Delta Variant. As a responsible government, it responded swiftly to ensure the safety and welfare of its people were prioritised as well as limiting the impact of the pandemic on the economy. The 2021 Supplementary Budget is critical to provide for under-funded and unbudgeted priority programs such as the GTFS, CoE, Court House, Regional Roads Projects, COVID-19 Emergency Response, and Life and Health Insurance Premiums for Nurses. Majority of these increases will be funded through reallocation within the 2021 Budget appropriations together with slight increase in the revenue and grants envelope.
Table 4: Expenditure Summary (Kina, million)
Details 2021
Budget 2021
Supp. Budget
TOTAL EXPENDITURE 19,607.8 20,287.3
Operating/Recurrent Budget 12,863.6 12,399.6
Compensation of Employees 5,763.8 6,030.4
Debt Service (Interest payment & fees and charges) 2,270.8 2,100.8
Other Operating (Goods & Services) 4,859.0 4,268.4
Capital Budget/PIP 6,714.2 7,887.7
GoPNG Funded 4,067.5 4,824.4
Donor Funded 1,008.3 1,424.9
Loan Funded 1,638.4 1,638.4 Source: Department of Treasury
3.2.1 Financing and Debt The 2021 Supplementary Budget deficit remains unchanged at K6,612.8 million and therefore budget financing plan remains unchanged, and as estimated will be financed through net external borrowing of K4,612.8 million and net domestic borrowing of K2,000.0 million. The external financing includes budget support loan from the international agencies both multilateral and bilateral partners. Timely negotiations of new concessional financing from multilateral agencies and bilateral partners for the global response to the COVID-19 pandemic and its economic impact are critical to budget implementation. In 2021, additional financing sources were: the IMF Special Drawing Rights (SDR) of SDR252.5 million (K1,259.4 million);

2022 National Budget, Volume 1
52
second tranche of ADB SOE Reform policy based loan of USD150.0 million (K526.3 million) and possible bilateral budget support loan of USD411.5 million (K1,443.9 million). Of the initial planned financing requirement (K6,612.8 million) for the 2021 Budget, the Government has successfully raised 22.8 per cent in concessional financing with the JICA Budget Support loan of K949.5 million and the World Bank Emergency Development Policy Operations (DPO) of K345.0 million while around K2,000.0 million is from domestic market sources. No Central Bank financing of the deficit is expected in 2021. 3.3 THE 2022 BUDGET STRATEGY
The 2022 Budget will be the third budget under the Marape Government. This budget has been framed amidst immense pressure and continued economic uncertainties brought about as a result of the COVID-19 pandemic and its Delta Variant strain. Despite these economic uncertainties, the 2022 Budget will continue to be guided by the overarching development frameworks espoused by the Five (5) National Goals and Directive Principles, the National Strategy of Responsible Sustainable Development (StaRS), and Papua New Guinea’s commitment to the 17 United Nations Sustainable Development Goals (SDGs), that have been captured in the development principles defined by the Vision 2050, and the Development Strategic Plan 2030, as prescribed in the Medium Term Development Plans (MTDPs) II and III. The 2022 Budget is consistent with the revised Medium Term Fiscal Strategy (MTFS) that sets out the key elements of the Government’s ongoing plan of budget repair and reconstruction from 2022 to 2027, guided by the principles of ‘spend the money we have more wisely’, ‘raise the revenues more fairly’ and ‘finance the debt more cheaply’. This is a longer timeframe that was required under the FRA (amended) 2020. This is been done to help inform decision making over the full life of the next Parliament. The strategy continues the path of budget repair and reconstruction taking into account the impact of the COVID-19 pandemic and the 2022 National General Elections related funding. Supporting the MTFS 2022-2027 will be an updated Medium Term Debt Strategy (MTdS) and the Medium Term Revenue Strategy (MTRS) - all working in tandem towards the implementation of the Government’s reform agenda. Consistent with the 2021 Budget strategy, the broad objectives of the continued budget repair and reconstruction programme under the 2022 Budget are to provide the platform for fiscal consolidation whilst, continuing with strategic capital formation necessary to enable the private sector and the community at large to grow the economy. The 2022 Budget will continue to provide support towards economic recovery from the COVID- 19 pandemic, continue the focus on strengthening the revenue base, improve the quality of expenditure and obtain cheap responsible financing within prudent risk levels, lowering interest costs on debt and shift to reduce the debt to GDP ratio, while ensuring macroeconomic stability over the medium term. The overall fiscal parameters of the 2022 Budget are reduced from the 2021 Supplementary Budget levels except the Debt-to-GDP ratio which will increase slightly from 51.5 per cent in 2021 to 51.9 per cent in the 2022 Budget and the FRA Deficit which remains at 5.3 per cent of non-resource GDP. The 2022 fiscal parameters are:
i. Budget Deficit at 5.9 per cent of GDP vs 7.1 per cent (2021 Supplementary Budget); ii. FRA Deficit (ex. Concessional loans) at 5.3 per cent of non-resource GDP vs
5.3 per cent (2021 Supplementary Budget);

2022 National Budget, Volume 1
53
iii. Non-Resource Primary Balance at 7.1 per cent of non-resource GDP vs 7.7 per cent (2021 Budget); and
iv. Debt Target at 51.9 per cent of GDP vs 51.5 per cent (2021 Budget). Consistent with the 2021 Budget, this framework will continue to strike an appropriate balance between the challenges of stimulating the economy and meeting the requirement of fiscal sustainability and discipline. The major risks to the fiscal strategy come from a potential revenue and financing shortfall. The effects of the COVID-19 pandemic are expected to continue to impact domestic economic activity and consequently revenue in 2022 fiscal year. Another major challenge is securing the required financing early in the budget execution cycle. Total Revenue and Grants for 2022 has been projected at K16,190.2 million (15.9 per cent of GDP). This is higher by K2,515.7 million when compared against the 2021 Supplementary Budget and K3,195.2 million when compared against the 2021 Budget estimates. Table 5: 2022 and Medium Term Revenue Projections (Kina, million)
Kina Million 2021
Suppl. Budget
2022 Budget
2023 2024 2025 2026 2027
Tax Revenue 10,868.3 12,522.8 14,369.2 16,166.8 18,361.3 20,668.8 23,328.5
Taxes on Income, profits, and capital gains 6,010.8 6,579.1 7,506.4 8,413.4 9,385.8 10,594.4 12,051.8
Taxes on payroll and workforce 0.5 0.0 0.0 0.0 0.0 0.0 0.0
Taxes on goods and services 4,127.1 5,095.2 5,816.8 6,561.9 7,604.9 8,669.4 9,835.4
Taxes on international trade and transactions 730.0 848.4 1,046.0 1,191.4 1,370.6 1,404.9 1,441.4
Grants 1,643.0 1,824.9 1,724.9 1,774.9 1,824.9 1,975.0 2,175.0
Other Revenue (Non-Tax) 1,163.2 1,842.5 1,591.5 1,613.9 1,661.0 1,962.3 2,264.5
Total Revenue and Grants 13,674.5 16,190.2 17,685.7 19,555.5 21,847.2 24,606.0 27,768.0
% of GDP 14.7% 15.9% 16.1% 16.8% 17.4% 18.4% 19.1%
Source: Department of Treasury
The expenditure for 2022 Budget will be driven by the government’s objective to increase investment in Public Investment Programs (PIP) to stimulate economic activity and growth, especially in the rural areas, following the impact of the COVID-19 pandemic. Also, the increase reflects the need to commit counterpart funding for loan-funded programs to allow the Government to drawdown on the loan funds to support development programs. The 2022 Budget expenditure envelope took into account the 2022 National General Election costs. This budget endeavours to carry forward the implementation of some of the key 2021 capital projects into 2022 to ensure continuation in the delivery of programs, especially those that are considered essential and are able to stimulate economic activities and growth in rural communities. The Government, in 2022, will continue to focus on protecting and sufficiently supporting essential and priority social sector areas such as: health; education; and law and order. The 2022 Budget also focuses on investing in MSMEs e-Commerce training and support platforms to expand and formalise the current 50,000 or so companies in this sector. This will be achieved by providing business start-up programs nationwide with the support of the World Economic Forum (WEF). Further, this budget supports downstream processing in agriculture, fisheries, forestry and promoting tourism. The 2022 Budget expenditure is projected at K22,174.8 million, representing an increase of K1,887.5 million from the 2021 Supplementary Budget. This expenditure envelope will continue to support the key policy reforms introduced by this Government in 2020 and 2021, supporting the key reforms consistent with the principles of the ‘Marape Manifesto’ and the ‘Loloata Commitment, focusing on Connecting PNG, supporting rural communities, supporting

2022 National Budget, Volume 1
54
SMEs, providing responsible government tuition fees (GTFS); and strengthening State Own Enterprise (SOE) through smarter and targeted reforms. Table 6: 2022 and Medium Term Expenditure Estimates (Kina, million)
2021
Suppl.
Budget
2022
Budget 2023 2024 2025 2026 2027
Total Expenditure 20,287.3 22,174.8 22,470.8 23,354.2 24,555.0 26,048.5 27,719.8
Operating Budget 10,298.8 11,098.8 11,199.2 11,630.9 12,423.7 13,523.1 14,795.8
CoE 6,030.4 6,050.2 6,336.8 6,433.1 6,866.6 7,389.0 7,953.7
Other Operating G&S 4,268.4 5,048.7 4,862.4 5,197.8 5,557.2 6,134.2 6,842.1
Share of Operating Budget to total
expenditure 50.8% 50.1% 49.8% 49.8% 50.6% 51.9% 53.4%
Capital Budget/PIP 7,887.7 8,751.6 8,840.3 9,187.4 9,543.3 9,958.4 10,433.0
GoPNG Funded 4,824.4 5,858.3 5,931.0 6,109.0 6,292.2 6,481.0 6,675.4
Grant Funded 1,424.9 1,574.9 1,524.9 1,624.9 1,724.9 1,874.9 2,074.9
Loan Funded 1,638.4 1,318.4 1,384.3 1,453.5 1,526.2 1,602.5 1,682.6
Share of Capital (PIP) to total
expenditure 38.9% 39.% 39.3% 39.3% 38.9% 38.2% 37.6%
Debt Service 2,100.8 2,324.4 2,431.3 2,535.9 2,587.9 2,566.9 2,491.0
Share of Debt Service to total
expenditure 10.4% 10.5% 10.8% 10.9% 10.5% 9.9% 9.0%
Source: Department of Treasury
The Government will continue to focus on achieving efficiency in its spending and value for money by addressing legacy and structural issues that result in wastages. In the 2022 Budget, the Government will continue to execute its expenditure efficiency measures through the Non-Financial Instructions (NFIs), the Organisational Staffing Personnel Emoluments Audit Committee (OSPEAC), and the Arrears Verification Committee (AVC). CoE allocation for 2022 is slightly adjusted up taking into account the 2021 Supplementary Budget estimates, which was mainly driven by estimated increases in the number of new teachers and the State-Share Contributions (8.4 per cent) for Superannuation, while the reductions in retirement arrears partly offsets those increases. Interest cost is also revised upwards from the 2021 Supplementary Budget to K2,324.4 million reflecting the ending of the Paris Club deferrals. The operational expenditure ceiling is largely maintained at the 2021 Budget levels for 2022, with the aim to protect and sufficiently support essential and priority social sectors areas such as education, health and law and order. This is to ensure that the Government’s recurrent budget is controlled to make space for the 2022 National General Election while increasing its capital investment budget to stimulate economic activity and growth. This is consistent with the Government’s expenditure rule to reduce the combined CoE and Goods & Services recurrent budget, as a share of non-resource GDP, until the long-term debt target of 40.0 per cent of GDP is reached, while increasing public investment as a share of non-resource GDP. Interest payments, as a proportion of revenue, have increased in recent years. This reflects the increase in the use of longer-term domestic sources of debt (COVID-19 bonds), but also the inclusion of interest payments on Government guarantees (explicit contingent liabilities). It also reflects a decline in the revenue denominator. However, this is expected to stabilise as MTRS implementation lifts revenues, debt management reforms continue to lower international interest costs significantly and also lower domestic interest rates through capital market reforms. The predominant cause of the rise in interest costs is due to increased debt levels.
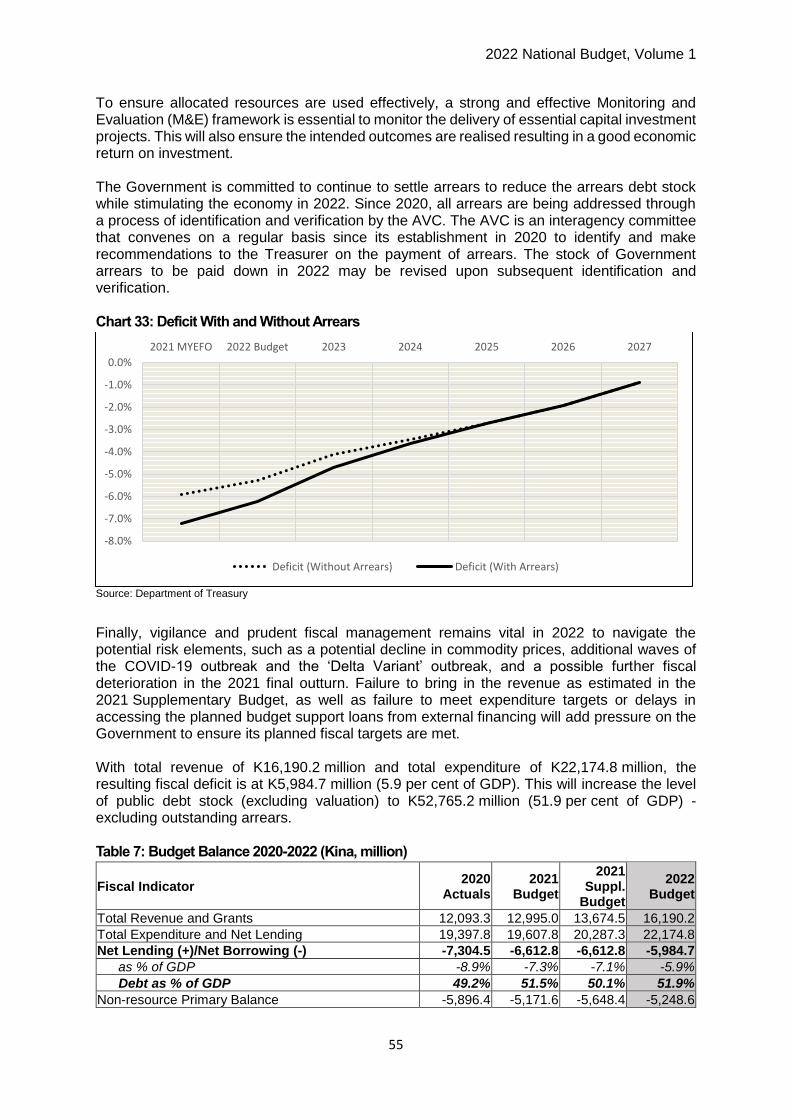
2022 National Budget, Volume 1
55
To ensure allocated resources are used effectively, a strong and effective Monitoring and Evaluation (M&E) framework is essential to monitor the delivery of essential capital investment projects. This will also ensure the intended outcomes are realised resulting in a good economic return on investment. The Government is committed to continue to settle arrears to reduce the arrears debt stock while stimulating the economy in 2022. Since 2020, all arrears are being addressed through a process of identification and verification by the AVC. The AVC is an interagency committee that convenes on a regular basis since its establishment in 2020 to identify and make recommendations to the Treasurer on the payment of arrears. The stock of Government arrears to be paid down in 2022 may be revised upon subsequent identification and verification. Chart 33: Deficit With and Without Arrears
Source: Department of Treasury
Finally, vigilance and prudent fiscal management remains vital in 2022 to navigate the potential risk elements, such as a potential decline in commodity prices, additional waves of the COVID-19 outbreak and the ‘Delta Variant’ outbreak, and a possible further fiscal deterioration in the 2021 final outturn. Failure to bring in the revenue as estimated in the 2021 Supplementary Budget, as well as failure to meet expenditure targets or delays in accessing the planned budget support loans from external financing will add pressure on the Government to ensure its planned fiscal targets are met. With total revenue of K16,190.2 million and total expenditure of K22,174.8 million, the resulting fiscal deficit is at K5,984.7 million (5.9 per cent of GDP). This will increase the level of public debt stock (excluding valuation) to K52,765.2 million (51.9 per cent of GDP) - excluding outstanding arrears. Table 7: Budget Balance 2020-2022 (Kina, million)
Fiscal Indicator 2020
Actuals 2021
Budget
2021 Suppl.
Budget
2022 Budget
Total Revenue and Grants 12,093.3 12,995.0 13,674.5 16,190.2
Total Expenditure and Net Lending 19,397.8 19,607.8 20,287.3 22,174.8
Net Lending (+)/Net Borrowing (-) -7,304.5 -6,612.8 -6,612.8 -5,984.7
as % of GDP -8.9% -7.3% -7.1% -5.9%
Debt as % of GDP 49.2% 51.5% 50.1% 51.9%
Non-resource Primary Balance -5,896.4 -5,171.6 -5,648.4 -5,248.6
-8.0%
-7.0%
-6.0%
-5.0%
-4.0%
-3.0%
-2.0%
-1.0%
0.0%
2021 MYEFO 2022 Budget 2023 2024 2025 2026 2027
Deficit (Without Arrears) Deficit (With Arrears)

2022 National Budget, Volume 1
56
as % of non-resource GDP -9.4% -7.7% -8.2% -7.1% Source: Department of Treasury
The Government will finance the 2022 Budget deficit of K5,984.7 million through a mix of domestic and external financing. The Government expects to finance K3,744.7 million of the K5,984.7 million through external borrowing while the other K2,240.0 million will be financed by domestic borrowing through the issuance of Government Securities (Treasury Bills & Bonds). The Government will continue to exploit cheap and concessional avenues of financing by engaging actively with our multilateral and bilateral partners. In 2022, the Government is seeking release of the third tranche of the ADB SOE Budget Support loan of USD250.0 million (K877.2 million) and will continue to pursue negotiations with other friendly bilateral partners for additional budget support. In addition, a number of concessional project loans have already been signed and are on queue for disbursement in 2022. Support from other bilateral multilateral partners will be sought to continue to roll out its infrastructure projects in 2022 and over the medium term and its yearly drawdowns will be captured under concessional loans. 3.4 THE MEDIUM-TERM FISCAL OUTLOOK
The medium-term fiscal outlook sets out the key elements of the Government’s ongoing plan of budget repair and reconstruction from 2022 to 2027, as set out by the Marape Government back in the 2020 Budget. The Government’s main focus will be to maintain fiscal support for economic recovery efforts from the COVID-19 pandemic, continue the focus on strengthening the revenue base, improve the quality of spending and obtain cheap responsible financing within prudent risk levels thereby ensure macroeconomic stability over the medium term. The process of fiscal consolidation is expected to form the basis for a renewal of growth performance in the economy. Table 8: Budget Balance 2021–2027 (% of GDP)
2021
Suppl.
Budget
2022
Budget 2023 2024 2025 2026 2027
Revenues and Grants 13,674.5 16,190.2 17,685.7 19,555.5 21,847.2 24,606.0 27,768.0
Expenditure (excluding arrears provision) 19,087.3 20,895.8 21,706.7 22,961.7 24,308.3 25,839.5 27,410.1
Net Lending/Borrowing (Cash Deficit) -5,412.8 -4,705.7 -4,021.0 -3,406.2 -2,461.1 -1,233.4 357.9
Deficit (Without Arrears) -5.8% -4.6% -3.7% -2.9% -2.0% -0.9% 0.2%
Expenditure (including arrears provision) 20,287.3 22,174.8 22,470.8 23,354.2 24,555.0 26,048.5 27,719.8
Net Lending/Borrowing (Cash Deficit) -6,612.8 -5,984.7 -4,785.1 -3,798.7 -2,707.8 -1,442.4 48.2
Deficit (With Arrears) -7.1% -5.9% -4.4% -3.3% -2.2% -1.1% 0.0%
Debt-to-GDP 50.1% 51.9% 52.5% 52.6% 51.1% 48.9% 45.0%
Source: Department of Treasury. Note: Net Borrowing/Net Lending under GFS 2014 differs from the deficit/surplus reported under GFS 1986. See Appendix 3 for an outline of these changes and a detailed set of fiscal tables. Arrears: K1,200.0m for 2021 (Operation – K770.0m & Capital – K430.0m)
Under the revised framework, the revenue envelope for 2022 is projected to be K16,190.2 million with a target revenue amount of K27,768.0 million by 2027. This is mainly driven by the continued growth in the economy and improvements in tax administration and compliance. A significant increase in dividend and Mineral and Petroleum Tax (MPT) flows from the PNG LNG project are expected to commence from 2026. The expenditure envelope for 2022 has been revised upwards. Total expenditure for 2022 is projected at K22,174.8 million with an estimated expenditure of K27,719.8 million by 2027.

2022 National Budget, Volume 1
57
The deficit is expected to reduce over the medium term to a net positive amount (surplus of K48.2 million by 2027). This reflects the on-going budget repair strategy and program, while also protecting the economy. Table 9: Key Anchors of the MTFS 2021-2027 (% of GDP)
2021 Suppl.
Budget
2022
Budget 2023 2024 2025 2026 2027
Budget Balance (% of GDP) -7.1% -5.9% -4.4% -3.3% -2.2% -1.1% 0.0%
Expenditure Rule (Operating Budget as % of
Non-resource GDP) 17.9% 18.2% 16.9% 16.1% 15.7% 15.3% 15.0%
Non-resource primary balance (% of Non-
resource GDP) -8.2% -7.1% -4.6% -3.1% -1.7% -0.7% -0.2%
FRA deficit (% of Non-resource GDP) -5.8% -5.3% 1.7% 1.6% 1.6% 1.5% 1.5%
Debt ex. arrears (% of GDP) 50.1% 51.9% 52.5% 52.6% 51.1% 48.9% 45.0%
Debt incl. arrears (% of GDP) 50.1% 52.8% 53.1% 52.7% 51.1% 48.9% 45.0%
Source: Department of Treasury
The MTFS up to 2027 targets a debt-to-GDP ratio of 45.0 per cent, which is within the Government’s debt target of 60.0 per cent of GDP with the downward trend to under 40.0 per cent in ten (10) years (by 2030) as per the FRA (2020) amendment. Chart 34: Net Borrowing as a percentage of GDP over the Medium Term
Source: Department of Treasury
The 2022 Budget and associated medium term fiscal framework was framed with a debt-to-GDP ceiling range of 45.0 per cent to 60.0 per cent with a trajectory to bring down the debt-to-GDP ratio to 40.0 per cent in ten (10) years in line with the amended FRA 2020. The total debt-to-GDP ratio including arrears is expected to fall from 53.1 per cent from the 2021 Budget down to 50.1 per cent towards the end of 2021 as projected in the 2021 Supplementary Budget. In 2022 Budget, it is projected at 52.8 per cent. Excluding arrears, total debt-to-GDP is expected to slightly decrease from 51.5 per cent at the time of the 2021 Budget to 50.1 per cent towards the end of 2021 as projected in the 2021 Supplementary Budget and increase to 51.9 per cent in the 2022 Budget. This highlights the importance of tracking the repayment of arrears in PNG’s current debt calculations. The debt to GDP ratio is expected to track slightly above the 50.0 per cent mark over the medium term with a target to reach 45.0 per cent in 2027, and below 50.0 per cent mark thereafter in line with the amended FRA (2020). The potential upside in growth performance from higher mineral investment than
-8.6%
-7.1% -7.1%
-5.9%
-4.4%
-3.3%
-2.2%
-1.1%
0.0%
-10.0%
-8.0%
-6.0%
-4.0%
-2.0%
0.0%
2.0%
2020Actual
2021Budget
2021Suppl.Budget
2022Budget 2023 2024 2025 2026 2027
% O
F G
DP

2022 National Budget, Volume 1
58
programmed could rapidly move the debt-to-GDP ratio back to 40.0 per cent within ten (10) years. The non-resource primary balance will be on a declining path towards a net 0.0 per cent of non-resource GDP at the end of the medium-term (ending in 2027). This means if resource revenues pick up over the medium-term, funds will start to accumulate in the Sovereign Wealth Fund (SWF). Chart 35: Medium Term Fiscal Outlook
Source: Department of Treasury
47.1%49.8% 50.1% 51.9% 52.5% 52.6% 51.1%
48.9%45.0%
-30.0%
-20.0%
-10.0%
0.0%
10.0%
20.0%
30.0%
40.0%
50.0%
60.0%
-8,000.0
-5,500.0
-3,000.0
-500.0
2,000.0
4,500.0
7,000.0
9,500.0
12,000.0
14,500.0
17,000.0
19,500.0
22,000.0
24,500.0
27,000.0
29,500.0
32,000.0
2020Actual
2021Budget
2021Suppl.
Budget.
2022Budget.
2023 2024 2025 2026 2027
% o
f G
DP
Kin
a, M
illio
n
Revenue and Grants Expenditure Deficit Debt to GDP ratio (excluding arrears)

2022 National Budget, Volume 1
59
CHAPTER 4: REVENUE 4.1 REVENUE DEVELOPMENTS AND OUTLOOK 2021 AND 2022
In the 2021 Supplementary Budget, Total Revenue and Grants for 2021 were revised up considerably by K679.5 million to K13,674.5 million compared to the 2021 Budget projection of K12,995.0 million reflecting expected increases in a number of major tax heads, grants and non-tax revenue heads. The Supplementary Budget revenue estimates reflected expected increases in a number of major tax heads, particularly: Mining & Petroleum Tax (MPT); Goods and Service Tax (GST); Statutory Authority collections and dividends. The higher MPT collection was driven by the significant improvement in the international prices of the key export commodities particularly the oil and gas. GST transfers to the Consolidated Revenue Fund (CRF) are projected to increase against the 2021 Budget estimate due to a decline in GST refunds to businesses which reflects more stringent supplier verification processes. The higher-than-expected statutory authorities projections reflects the significant amount of funds that statutory authorities are accumulating which needs to be collected in to support the Budget. This will be fast tracked by the enactment of the Non-Tax Revenue Administration Bill. Total collections of Dividends were revised up to K860.0 million from K600.0 million projected at the time of the 2021 Budget. Fees & Charges are likely to meet their 2021 Supplementary Budget targets by year-end. The outstanding Dividend amount is K679.5 million and remains a risk to date as there is no clear indication of payment timing. For the 2022 Budget year, Total Revenue and Grants is projected to increase by K2,515.7 million to K16,190.2 million, or 18.4 per cent higher than the 2021 Supplementary Budget projection. This mainly comprises K12,522.8 million in Tax Revenue, K1,842.5 million in Other Revenue and K1,824.9 million in Donor Grants. Revenues in 2022 are expected to be supported by a rebound in economic growth (in both the mining and non-mining sector). Specifically, higher Government spending, public injections to private sector credit growth, an expected broad-based recovery in export commodity prices, higher anticipated growth in the Agriculture, Forestry and Fishing sector and continued implementation of the Medium Term Revenue Strategy (MTRS) initiatives. Table 10: Total Revenue and Grants 2021-2022 (Kina, million)
2020
Outcome 2021
Budget 2021 Supp.
2022 Budget
Variation
Tax Revenue 9,802.2 11,109.7 10,868.3 12,522.8 1,654.5
Per cent of GDP 11.6% 11.9% 11.6% 12.3% 0.0
Grants 1,425.0 1,008.3 1,643.0 1,824.9 181.9
Per cent of GDP 1.7% 1.1% 1.8% 1.8% 0.0
Other Revenue 866.1 877.1 1163.2 1842.5 679.3
Per cent of GDP 1.0% 0.9% 1.2% 1.8% 0.0
Total Revenue & Grants 12,093.3 12,995.1 13,674.5 16,190.2 2,515.7
Per cent of GDP 14.3% 13.9% 14.7% 15.9% 0.0 Source: Department of Treasury

2022 National Budget, Volume 1
60
4.2 TAX REVENUE
4.2.1 Taxes on Income and Profits Taxes on Income and Profits are projected at K6,579.2 million in 2022, comprising mainly of K3,608.3 million in personnel income tax (PIT), K1,763.2 million in company income tax (CIT), K738.4 million in MPT, K234.3 million in Dividend Withholding Tax (DWT), K160.0 million in Interest Withholding Tax (IWT), K67.9 million in Royalties and Management Taxes and K7.0 million in Non-Resident Insurers Withholding Tax (see Table 11). PIT collection has been tracking well against target collections for 2021 with 71.2 per cent of the 2021 Supplementary Budget projection collected up to end September. This is attributed to large companies maintaining their workforce in the taxable income brackets despite the COVID-19 pandemic. The negative impact of the COVID-19 pandemic on formal employment is on employees earning below the tax-free threshold. However, the level of Salary and Wages Tax (SWT) received monthly is not the same as the pre-COVID level and that continues to pose a risk for PIT. In 2022, PIT is estimated to increase to K3,608.3 million from K3,360.0 million, or higher by 7.4 per cent in 2022, as businesses reinstate hiring (or recommence furloughed employees) as a result of the expected rebound in the economy activities. This will also be supported by the compliance activities undertaken by IRC and the anticipated restart of the Porgera and Simberi mines. Further, GST credit offsets against PIT liabilities will continue to be disallowed to support PIT collections in 2022. Table 11: Taxes on Income and Profits 2021-2022 (Kina, million)
2020
Outcome 2021
Budget 2021 Supp.
2022 Budget
Variation
Taxes on Income and Profits 5,668.7 5,945.3 6,010.8 6,579.2 568.4
Personal Income Tax 3,517.3 3,455.7 3,360.0 3,608.3 248.3
Company Tax 1,554.2 1,724.0 1,698.6 1,763.2 64.7
Mining and Petroleum Taxes 183.4 313.6 520.6 738.4 217.8
Royalties & Management Tax 50.2 62.8 62.8 67.9 5.1
Dividend Withholding Tax 215.9 218.4 218.4 234.3 16.0
Interest Withholding Tax 134.9 131.9 144.0 160.0 16.0
Non-Resident Insurers Withholding Tax 12.6 38.8 6.3 7.0 0.7
Tax Related Court Fines 0.0 0.0 0.0 0.0 0.0
Sundry IRC Taxes & Income 0.0 0.2 0.2 0.0 -0.2 Source: Department of Treasury
CIT collections up to end September 2021 amounted to 61.6 per cent of the 2021 Supplementary Budget estimate, 4.4 per cent lower than collections in the same period of 2020. This downward trend is a strong indication that the CIT outcome for 2021 will likely be lower than the 2021 Supplementary Budget estimate which reflects the adverse implications of the pandemic on business profitability, CIT filling monitoring and CIT administration efforts to improve CIT revenue collections. Most Large Tax Payers (LTO) accounting year ends June 30th and begins on July 1st. This means CIT paid in 2021 reflects the companies’ immediate prior year’s (2020) performance. In this case, the COVID-19 pandemic outbreak in 2020 and the containment measures implemented globally and domestically have significantly reduced demand, and so translated to lower CIT collections in 2021. Further, due to the COVID-19 restrictions, there have been no inspections and compliance activities undertaken by the IRC other than desk audits, and therefore, additional revenue from compliance measures have not materialised. However, IRC has indicated that it will generate additional revenues from CIT through resumption of compliance activities in 2022.

2022 National Budget, Volume 1
61
In 2022, CIT is projected at K1,763.2 million. The 3.8 per cent increase above the supplementary budget estimate is based on a lift in compliance activities. In addition, the ongoing easing of restrictions and reopening of businesses in line with the “niupla pasin” business practices will have a moderate positive impact on companies. This should result in a mild improvement in CIT collections going forward. MPT receipts have performed well and are on track with the 2021 Supplementary Budget projection so far, reflecting the rise in oil and gas prices. MPT collections up to end September were 95.5 per cent of the 2021 Supplementary Budget estimate. More importantly, MPT collections are mostly contributed by resource companies in the oil and gas industry rather than mining industry. In 2022, MPT collections are estimated at K738.4 million, or 41.8 per cent above the 2021 Supplementary Budget projection. This reflects a gradual improvement in the international price expectations for oil and gas in 2022. The DWT collection has been performing well with 79.2 per cent of the 2021 estimate collected up to end September. If this trend continues, DWT is estimated to meet the 2021 Supplementary Budget projection by end 2021. In 2022, it is estimated that DWT will increase to K234.3 million, or 7.3 per cent above the 2021 Supplementary Budget projection. This is largely because of the strong recovery in nominal GDP growth and expected dividend payment flows from statutory authorities. However, the unexpected re-emergence of the foreign exchange imbalance remains a high risk for collections including the uncertainties surrounding investment opportunities in 2022. IWT has been tracking below its supplementary budget projection with 67.6 per cent of the Supplementary Budget target collected to end September. Administrative measures planned for 2021 to tighten scrutiny over IWT exemptions for foreign lenders were slow to be implemented due to the COVID-19. The IWT estimate for 2022 is K160.0 million or 11.1 per cent above the 2021 Supplementary Budget projection. Royalties and Management Tax (RMT) collections performed below the 2021 Supplementary Budget projection by K41.4 million, or 65.9 per cent collected up to end September. RMT collections are expected to increase to K67.9 million in 2022, or 8.1 per cent above the 2021 Supplementary Budget projection. 4.2.2 Taxes on Payroll and Workforce Collections on Payroll and Workforce are from the Training Levy, which amounted to K0.8 million by end September due to the incoming streams of delayed filings from 2019 after the tax was repealed in the 2018 Budget. The 2021 Budget projected zero estimate, however was revised up to K0.5 million in the 2021 Supplementary Budget based on evidence of some delayed collections being realised. The 2022 Budget projects zero. Table 12: Taxes on Payroll and Workforce 2021-2022 (Kina, million)
2020
Outcome 2021
Budget 2021
Supp. 2022
Budget Variation
Training Levy 0.4 0.0 0.5 0.0 0.5
Total 0.4 0.0 0.5 0.0 0.5 Source: Department of Treasury

2022 National Budget, Volume 1
62
4.2.3 Taxes on Goods and Services Taxes on Goods and Services is projected to be K4,127.1 million in 2021, comprising mainly of K2,517.1 million in GST, K1,009.0 million in Excise Duty, K270.0 million in Import Excise, K255.1 million in Gaming Machine Tax, K43.3 million in Stamp Duties, K21.2 million in Bookmakers Turnover Tax (BTT) and K3.2 million in Other taxes on goods and services (see Table 13). Table 13: Taxes on Goods and Services 2021-2022(Kina, million)
2020
Outcome 2021
Budget 2021 Supp.
2022 Budget
Variation
Taxes on Goods and Services 3,372.7 4,351.1 4,127.1 5,095.2 968.1
GST1 2,079.2 2,494.8 2,517.1 3,223.4 706.3
Sales taxes 0.0 0.0 0.0 0.0 0.0
Bank Account Debit Fees 0.0 0.0 0.0 0.0 0.0
Stamp Duties 43.3 96.2 43.3 51.8 8.5
Excise Duty 817.0 1,175.1 1,009.0 1,192.9 183.9
Import Excise 257.6 294.5 270.0 314.7 44.7
Bookmakers' Turnover Tax 8.9 21.2 21.2 23.0 1.8
Gaming Machine Turnover Tax 157.7 255.1 255.1 265.7 10.5
Departure Tax 5.4 8.2 3.5 3.8 0.3
Motor Vehicle Tax 0.0 2.3 3.5 15.0 11.5
Other taxes on use of goods and on permission to use goods or perform activities
0.4 1.2 1.2 1.5 0.3
Other taxes on goods and services 3.2 2.6 3.2 3.4 0.2 Source: Department of Treasury
1. GST represents the total of collections by Provinces, PNG Ports and Refunds.
By end September 2021, Inland and Ports GST collections have recorded 62.2 per cent and 65.3 per cent, respectively against the 2021 Supplementary Budget projections of K1,706.2 million and K1,128.2 million. Inland and Ports GST have increased from the Budget level. Improvement in collection is expected to be driven by the easing of the COVID-19 restrictions and compliance activities carried out by the IRC staff. The decline in GST refunds reflects the stringent supplier verification process less to refunds done in 2021. Overall, GST collections have been tracking the estimated consumption and spending patterns in the economy subject to the lockdowns and travel restrictions. Given the resumption of business activity and easing of COVID-19 related restrictions, GST is expected to improve in the last quarter of 2021. In 2022, net GST transferred to CRF is projected to increase to K3,223.4 million. The increase is attributed to the expected full recovery in business activity. This will be supported by Inland GST compliance efforts by the IRC to increase (by 10.0 per cent) the number of companies registered with IRC. Also, GST will increase as consumption and spending relating to the election increases in 2022. Further, the roll out of the GST Section 65A to the extractive and financial sector is also expected to increase GST. This GST monitoring system is the trigger that will drive that increase in GST in the next 5 years while, refunds are projected to rise marginally by 3.7 per cent from 2022. Inland Excise (Duty) has underperformed against the 2021 Supplementary Budget projection with collections amounting to 65.4 per cent of the Supplementary Budget estimate by end September. This is due to subdued pandemic impacted economic conditions. While the 2021 Supplementary Budget expected a fair rebound in the economy, with collections returning to 2019 levels, the September outcome collection demonstrates otherwise. This reflects the one-month Nation-wide Isolation on domestic activities and the limitation imposed on alcohol
2022 National Budget, Volume 1
63
sales that disrupted spending and consumption. There is a high risk for this tax head not to meet its supplementary budget estimates by year end. However, PNG Customs is undertaking a ‘run home revenue collection’ program to increase compliance which is expected to meet the Supplementary Budget estimate for inland excise. In 2022, Inland Excise (Duty) is projected to increase to K1,192.9 million. Consumption of excisable items is expected to continue to pick-up on easing COVID-19 measures and the rebound in the economy, further, supported by administrative efforts to improve compliance going forward. Tax revenue from Import Excise has been tracking well with the 2021 Supplementary Budget estimate of K270.0 million with collections of 75.9 per cent up to end September 2021. The higher-than-expected collections reflect the recovery in the demand of imported volumes for excisable products and trade activity from the impact of the COVID-19 pandemic. The 2022 Budget projection of Import Excise is K314.7 million, higher by K44.7 million from the 2021 Supplementary Budget estimate. The increase reflects mainly the assumptions of a rebound in business activity and consumption in 2022 as restrictions are lifted and external trade activities improve. Gaming Machine Tax (GMT) revenue is trending below the 2021 Supplementary Budget estimate with 60.3 per cent of collections up to end September 2021. This tax head had a direct hit from the COVID-19 preventive measures and is likely to rebound under the ‘niupla pasin’ measures. The GMT collection is forecast to improve in the second part of the year with resumptions of games and also, new gaming and betting methods that have attracted more participants to gamble. In 2022, the GMT collection is projected to increase to K265.7 million reflecting normal gaming operations for gaming venues trading days and supported by increased gaming participants as new gaming and betting methods attract more participants to gamble. In 2021, Departure Tax collections have performed below the 2021 Supplementary Budget estimate amounting to only 36.7 per cent by end September. This is mainly due to the closure of airports and suspension of flights due to the COVID-19 pandemic border controls and movement restrictions on international flights. These restrictions are expected to continue. Also, the confirmation of new ‘delta variant’ cases of COVID-19 pandemic is posing increased risk for the Departure Tax collections. For 2022, the gradual easing of travel restrictions domestically and reopening of overseas flights are expected to increase Departure Tax collections up to K3.8 million, an increase of 8.6 per cent above the 2021 Supplementary Budget estimate. Stamp Duty collections were substantially lower amounting to only 3.1 per cent of the 2021 Supplementary Budget estimates. The lower collection trend is attributed to administrative issues surrounding stamp duty stamping machines. Once the machine is replaced, Stamp Duty is expected to meet its Supplementary Budget estimates by year-end as Stamp and payments are done at the same time Stamp Duties are expected to collect K51.8 million in 2022 which is 19.7 per cent higher than the 2021 Supplementary Budget. 4.2.4 Taxes on International Trade and Transactions Total tax collections from International Trade and Transactions in 2022 is projected at K848.4 million, comprising K428.5 million in Export Duty and K419.9 million in Import Duty.

2022 National Budget, Volume 1
64
Revenue from Import Duties is on track against the 2021 Supplementary Budget estimate of K370.0 million or 75.9 per cent of the Supplementary Budget estimate collected by end September. The positive collection trend reflects improvement in trade activities in the second half of the year. In 2022, Import Duty is projected to increase by 13.5 per cent from the 2021 estimate to K419.9 million on the back of the projected rebound in the economy. In addition, as restrictions and lockdown measures are eased and domestic businesses return to normalcy, imports levels are expected to increase thus, improving Import Duty collections. In addition, the easing of trade restrictions in other trading partner countries and domestic trade destinations will also lead to improvement in Import Duty collections going forward. Table 14: Taxes on International Trade and Transactions 2021-2022(Kina, million)
2020
Outcome 2021
Budget 2021
Supp. 2022
Budget Variation
Taxes on International Trade & Transactions 760.4 813.3 730.0 848.4 118.4
Import Duty 359.5 417.7 370.0 419.9 49.9
Other Import Taxes 0.0 0.0 0.0 0.0 0.0
Export Tax 400.9 395.6 360.0 428.5 68.5 Source: Department of Treasury
Revenues from Export Duty have trended well with the 2021 Supplementary Budget target of K360.0 million, with 77.2 per cent revenue being collected up to end September. Recent collection trend indicates a pick-up driven by the easing of trade restrictions as well as the implementation of compliance enforcement of the new duty rates on log exporters from 32.0 per cent to 50.0 per cent. The trade restrictions in major trading countries have slowed exports in terms of volumes. In 2022, export tax is projected to increase marginally to K428.5 million, above the 2021 Supplementary Budget estimated outcome by K68.5 million. This increase reflects expectations on the rebound of economic activity and log exports supported by improved economic growth in other major consumer countries of PNG log exports. The lifting of trade restrictions and strict border surveillance will help spur improvement in Export Tax collections. 4.3 OTHER REVENUE
Expected receipts from the Other Revenue category were revised to K1,163.2 million in the 2021 Supplementary Budget with K199.7 million expected from statutory authorities, K860.0 million expected in dividends and the remaining K103.5 million from Departmental Fees & Charges. In 2022, the Other Revenue category is projected to increase to K1,842.5 million comprising mainly of K1,270.0 million in Dividends, K388.7 million to be raised through the implementation of the Non-Tax Revenue Administration (NTRA) Bill expected to be passed as part of the 2022 Budget and K183.8 million in Departmental Fees & Charges. Table 15: Other Revenue 2021-2022 (Kina, million)
2020 Outcome 2021
Budget 2021 Supp.
2022 Budget
Variation
OTHER REVENUE 866.1 877.1 1,163.2 1,842.5 679.3
Property Income 741.1 703.7 912.8 1,305.8 393.0
Interest - 0.7 0.7 0.7 0.0
Dividends 718.5 650.0 860.0 1,270.0 410.0
Mining Petroleum and Gas Dividends 568.5 500.0 600.0 850.0 250.0
Dividends from Statutory Authorities 150.0 150.0 260.0 400.0 140.0
Dividends from State Owned Enterprises - - - 20.0 20.0

2022 National Budget, Volume 1
65
Withdrawals from income of quasi-corporations - - - 0.0 0.0
Property income from investment income disbursements - - - 0.0 0.0
Rent 22.6 53.0 52.1 35.1 -17.0
Sales of goods and services 9.3 35.0 35.0 132.5 97.5
Sales by market establishments - - - 0.0 0.0
Administrative fees 4.5 4.7 4.6 99.9 97.3
Incidental sales by nonmarket establishments 4.8 30.4 30.4 32.6 2.2
Imputed sales of goods and services - - - 0.0 0.0
Fines, penalties, and forfeits 2.8 1.8 1.8 1.1 -0.8
Transfers not elsewhere classified 113.0 136.6 213.6 403.2 189.6
Current transfers not elsewhere classified 113.0 136.6 213.6 403.2 189.6
Source: Department of Treasury
In 2021, of the total Dividends of K860 million, K400.0 million is expected from KPHL, K200.0 million from Ok Tedi and K260.0 million from BPNG. For 2022, K400.0 million is expected from KPHL, K450.0 million from Ok Tedi, K200.0 million from BPNG, K20.0 million from KCHL and K200.0 million from NFA. The Government expects its current SOE dividend policy to be enforced and the funds repatriated to the Consolidated Revenue Fund (CRF) on a timely basis. The Government expects statutory authorities to contribute fairly to support the Budget in these challenging times amid the COVID-19 pandemic. Revenue from Statutory Authorities is trending very low with only 8.5 per cent collected up to end September. The Government expects K199.7 million from statutory authorities which is a conservative estimate. This comprises of K146.3 million from the National Fisheries Authorities, K8.2 million, National Maritime & Safety Authority (NMSA), K5.5 million, Mineral Resource Authority (MRA), K2.5 million, National Agriculture Quarantine and Inspection Authority (NAQIA), K18.1 million, Department of Labour and Industrial Relations, K9.1 million, Immigration & Citizenship Service Authority (ICSA) and K10.0 million from the National Gaming Board. For 2022, K388.7 million is expected from the implementation of the NTRA bill which is expected to be passed as part of the 2022 Budget. The amount comprises of K256.0 million from the National Fisheries Authorities, K18.0 million from the NMSA, K12.0 million from the MRA, K5.0 million from the NAQIA, K35.6 million from the Department of Labour and Industrial Relations, K42.0 million from the ICSA and K20.0 million from the National Gaming Board. Revenues from Departmental Fees and Charges have trended low in 2021. In the 2021 Supplementary Budget, a total of K103.5 million was projected; with key contributors such as revenue from land rental collections picking up due to the new Go-Lands and e-Lands online payment system for land rentals being implemented. In 2022, a total of K30.0 million is expected from compliance collections for land lease rentals by the Department of Lands, K84.0 million, work permits and K27.1 million, from migration services. The remaining balance is expected from the other departments once revenue collection reviews are finalised. 4.4 GRANTS
Total Donor Grants are unchanged against the 2021 Supplementary Budget projection of K1,643.0 million. The initial projection of K1,008.3 million was revised up as per the 2021 Supplementary Budget basing on the higher 2020 FBO outcome and as new information was made available by development partners on the size of grant funding likely to be expended in 2021. In 2022, there is an expectation of additional development partners’ contributions and other major infrastructure and project developments. Development partners, such as the Asian Development Bank (ADB), European Union (EU), Australian Aid and other partners are
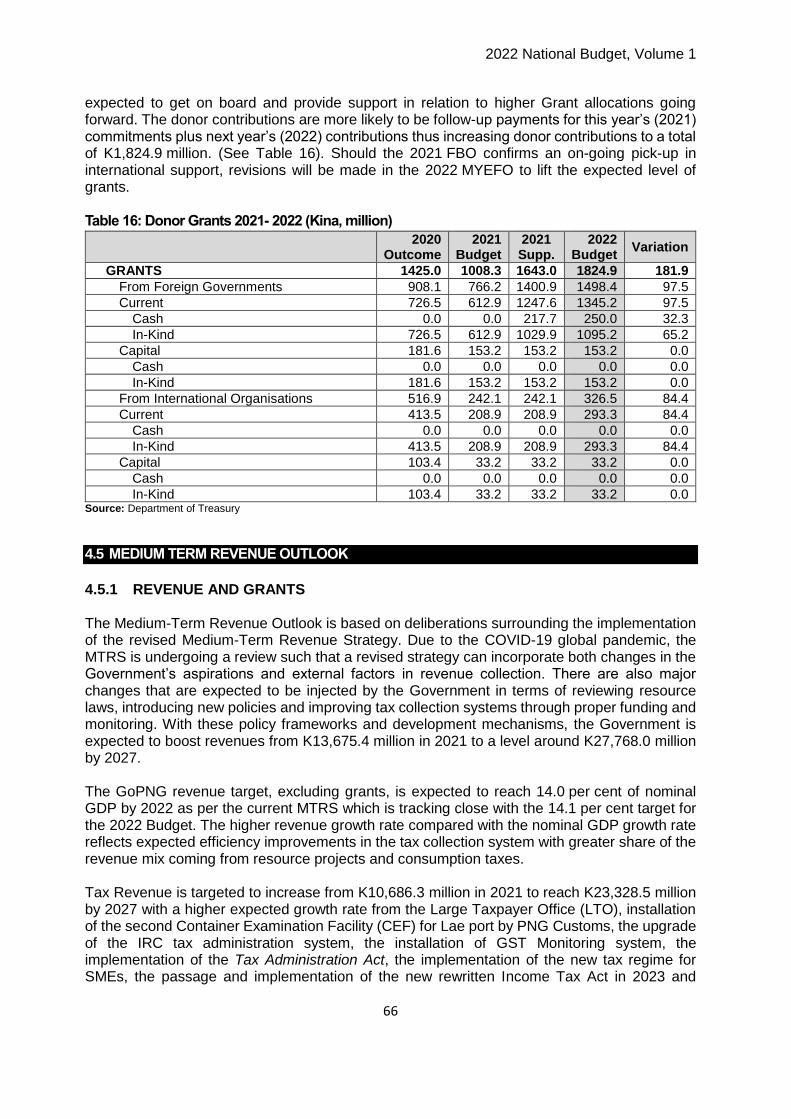
2022 National Budget, Volume 1
66
expected to get on board and provide support in relation to higher Grant allocations going forward. The donor contributions are more likely to be follow-up payments for this year’s (2021) commitments plus next year’s (2022) contributions thus increasing donor contributions to a total of K1,824.9 million. (See Table 16). Should the 2021 FBO confirms an on-going pick-up in international support, revisions will be made in the 2022 MYEFO to lift the expected level of grants. Table 16: Donor Grants 2021- 2022 (Kina, million)
2020
Outcome 2021
Budget 2021 Supp.
2022 Budget
Variation
GRANTS 1425.0 1008.3 1643.0 1824.9 181.9
From Foreign Governments 908.1 766.2 1400.9 1498.4 97.5
Current 726.5 612.9 1247.6 1345.2 97.5
Cash 0.0 0.0 217.7 250.0 32.3
In-Kind 726.5 612.9 1029.9 1095.2 65.2
Capital 181.6 153.2 153.2 153.2 0.0
Cash 0.0 0.0 0.0 0.0 0.0
In-Kind 181.6 153.2 153.2 153.2 0.0
From International Organisations 516.9 242.1 242.1 326.5 84.4
Current 413.5 208.9 208.9 293.3 84.4
Cash 0.0 0.0 0.0 0.0 0.0
In-Kind 413.5 208.9 208.9 293.3 84.4
Capital 103.4 33.2 33.2 33.2 0.0
Cash 0.0 0.0 0.0 0.0 0.0
In-Kind 103.4 33.2 33.2 33.2 0.0 Source: Department of Treasury
4.5 MEDIUM TERM REVENUE OUTLOOK
4.5.1 REVENUE AND GRANTS The Medium-Term Revenue Outlook is based on deliberations surrounding the implementation of the revised Medium-Term Revenue Strategy. Due to the COVID-19 global pandemic, the MTRS is undergoing a review such that a revised strategy can incorporate both changes in the Government’s aspirations and external factors in revenue collection. There are also major changes that are expected to be injected by the Government in terms of reviewing resource laws, introducing new policies and improving tax collection systems through proper funding and monitoring. With these policy frameworks and development mechanisms, the Government is expected to boost revenues from K13,675.4 million in 2021 to a level around K27,768.0 million by 2027. The GoPNG revenue target, excluding grants, is expected to reach 14.0 per cent of nominal GDP by 2022 as per the current MTRS which is tracking close with the 14.1 per cent target for the 2022 Budget. The higher revenue growth rate compared with the nominal GDP growth rate reflects expected efficiency improvements in the tax collection system with greater share of the revenue mix coming from resource projects and consumption taxes. Tax Revenue is targeted to increase from K10,686.3 million in 2021 to reach K23,328.5 million by 2027 with a higher expected growth rate from the Large Taxpayer Office (LTO), installation of the second Container Examination Facility (CEF) for Lae port by PNG Customs, the upgrade of the IRC tax administration system, the installation of GST Monitoring system, the implementation of the Tax Administration Act, the implementation of the new tax regime for SMEs, the passage and implementation of the new rewritten Income Tax Act in 2023 and

2022 National Budget, Volume 1
67
improved compliance especially in the GST area, all of which are expected to drive strong growth over the medium term. The procurement and installation of CEF in Lae port is expected to be completed in 2022 and operationalised by 2023. This is expected to boost trade tax collections over the medium term. Also, the procurement and installation of the GST monitoring system is expected to be completed in 2022 and implemented in 2023. Overall, strong tax collections are also underpinned by the expected higher growth rates in the resource and non-resource sectors over the medium term. This will further be supported by the improved revenue collection mechanisms and strategies from respective departments, which are currently undergoing review. The newly introduced electronic payment system for the Department of Lands and Physical Planning is the start and will see improved revenue collections going forward from other departments. The Supreme Court nullified the PMMR Act 2017 on 27th May 2020, which infers no guarantee that the budget projections of statutory transfers be remitted to the Consolidated Revenue Account. Other Revenue is targeted to increase from K1,163.0 million in 2021 to K2,264.5 million in 2027, an increase of K1.1 billion over the medium-term and which will be supported by the implementation of the NTRA bill. The Other Revenue category includes projections of SWF receipts; however, since the Fund is yet to be operationalised, the figures are indicative only. The projections account for 50.0 per cent of mineral and petroleum tax being channelled to the SWF Stabilisation Fund (but will still be available for Government expenditure in accordance with the drawdown thresholds) while the other 50.0 per cent flows directly to the CRF to finance Government expenditure. In the interim, all mineral and petroleum dividends are directed to the National Budget until the SWF arrangements are in place that cover the dividends and other proceeds stipulated in the SWF Organic Law. Chart 36: Annual Revenue Inflows PNG LNG Project – Actuals and Projections 2015-20405
Source: Department of Treasury
5 Data is based on 2021 average prices. In estimated total revenues, the dividend estimate is the full amount estimated to flow to KPHL prior
to the transfer to the public revenue account. The revenue figures for 2015 to 2020 are actuals based on the outcome. Production volume and
price assumptions are based on recent updates (as published in this volume) for 2021 to 2027. The data has been produced from internal
models of the Government. For 2028 onwards, a five-year moving average price is used. PNG has yet to be able to fully benefit in terms of
foreign exchange inflows as (i) most of the revenue from the PNG LNG Project has been held in offshore accounts for the servicing of project

2022 National Budget, Volume 1
68
Chart 37: Medium Term Revenue (2020-2027), Kina million
Source: Department of Treasury
Donor Grants are provided at the discretion of donors in accordance with their internal budget policies and depends on the successful delivery of outcomes from existing projects, as well as exchange rate fluctuations. The current donor grants projection for the medium term is expected to increase gradually reaching K2,175.0 in 2027. This reflects an anticipated increase in current grants received from Foreign Governments and international organisations driven by expected increased partnerships between the Government and international organisations.
finance debt, (ii) the Government’s tax receipts in the near term remain reduced due to amortisation of the PNG LNG Project’s loans, which is
expected to end in 2025 and (iii) high (accelerated) depreciation expenses, which are expected to fall off substantially after 2025 but this is
dependent on certain provisions related to rates of return and may be extended under the agreement for additional years. Between 2014 and
2040, on the assumptions outlined in the notes to the graph above, it is estimated that the Government will receive approximately US$13.2
billion in revenue receipts. This excludes any revenue received by the Government from the other joint venture partners from the flow-through
of dividends from the project. Total revenue inflows to the national budget are estimated to be US$9.6 billion between 2014 and 2040. There
is no public debt tied to the project, and all revenue is expected to flow through into the public account or through government entities such
as KPHL or the PNG SWF (once established) that will assist in servicing public debt. In 2018 and 2019, the tax revenue contribution from the
PNG LNG Project was above K760.0 million; however, dividends passed through to the Government from KPHL were K452.0 million and K250.0
million respectively over the same period. The Government expects receipts from the PNG LNG Project to increase beginning in 2021 and
accelerate significantly from 2025 onwards.
0.0
5000.0
10000.0
15000.0
20000.0
25000.0
30000.0
2020 2021 2022 2023 2024 2025 2026 2027Tax Revenue Donor Grants Other Revenue
2022 National Budget, Volume 1
69
CHAPTER 5: TAX AND NON-TAX MEASURES AND DEVELOPMENTS
5.1 OVERVIEW The loss in business and employment due to COVID-19 has posed a significant challenge for the Government to raise adequate revenue to fund the delivery of goods and services. It is anticipated that it will take time for individuals to be employed again and businesses to revive. The 2022 Budget tax measures aims to strike an appropriate balance between the need to raise revenue and to stimulate economic activities. The measures are consistent with the Medium- Term Revenue Strategy (MTRS) 2018-2022 and focuses on improving compliance, encouraging competition in the fuel industry, encouraging infrastructure development in rural areas and broadening the tax base. These measures include:
i. introduction of a bank levy; ii. introduction of a telecommunication tax; iii. repealing of the 10 toea import tariff on imported refined petroleum products (diesel
and petrol) over two (2) years; iv. increase in excise rate for anti-Social Drinks; v. increase in Infrastructure Tax Credit (ITC) rates to 2.0 per cent; vi. continued pilot on Second Tier excise on cigarette products to counter illicit tobacco; vii. reducing bi-annual excise indexation rate for tobacco and alcohol from 5.0 per cent to
2.5 per cent and viii. green economy excise measure – applying no import taxes on electric vehicles.
While improving revenue policy as a potential to raise revenue, increasing the revenue collection depends on the effectiveness and efficiency of revenue administration. This budget supports the critical administrative initiatives of the Internal Revenue Commission (IRC) and PNG Customs Service (PNGCS). This will enhance the effectiveness of its administrations thus leading to a higher level of compliance and higher revenue collections. These initiatives include the procurement and installation of tax administrative systems and facilities in 2022 and implementation in 2023. These include:
i. procurement and installation of Goods and Services Tax Monitoring System (GMS) Software at the retail sector to remit GST directly to IRC at the point of sale in real time;
ii. supporting IRC to upgrade the tax administration system to the New Integrated Tax Administration System (ITAS) to replace the Standard Integrated Government Tax Administration System (SIGTAS) to increase efficiency; and
iii. supporting the procurement of a new Container Examination Facility (CEF) at Lae Port by PNGCS.
The minor proposed tax measures are intended to promote compliance and efficiency in tax administration and this includes the consequential amendments to facilitate the implementation of the Tax Administration Act (TAA) 2017. Also, included is the ratification of the Ultra High Technology (UHT) milk import duty rate from 25.0 per cent to free to formalise the administrative arrangement.

2022 National Budget, Volume 1
70
5.2 MAJOR REVENUE POLICY MEASURES
5.2.1 INTRODUCTION OF A BANK LEVY
In the 2022 Budget, the Government is introducing a bank levy on commercial banking institutions with a very high level of market concentration (market share) in the banking sector. There is a significant risk that a dominant player in the market is able to collect super-normal profits and therefore the levy will claw back the super-normal profit to the budget. This appears to be presented in the PNG banking sector. As announced over the last two budgets, the super-normal profits will now receive a higher rate of tax. In this Budget, Government introduce a flat rate market concentration levy which will apply to licensed holders in the commercial banking sector with market centration over of 40.0 per cent. At the initial stage, this would apply only on one commercial bank based on the current market information. The Government has set the market concentration levy rate at a specific payment of K190.0 million as long as the after-tax (not including the levy) income of the firm exceeds the levy. The levy would be set through the Income Tax Act 1959. It will be non-deductible payment made in line with the usual quarterly company tax returns. As the flat rate levy will be applied to only the dominant firm, that firm will face pressures not to pass the levy onto consumers as it will lose market share to competitors who are not paying the levy. This measure is expected to be implemented in 2022 fiscal year. 5.2.2 INTRODUCTION OF A TELECOMMUNICATION TAX In this budget, the Government is introducing a new tax on the telecommunication sector. Given the high level of concentration in the market, there is also a risk that a dominant player can collect super-normal profits. This is the case for the telecommunication industry in PNG. Given the need to raise revenues and thereby fund vital government services in health, education, policing, defence and infrastructure, the Government has decided to impose a tax directly on the parts of the industry that have the most market concentration. The tax is designed to minimise risk that pass through to consumers. The tax is being imposed on shareholders through the Income Tax Act 1959. It is not based on the "consumer' base of card sales or top-ups or turnover. In the 2022 Budget, the Government introduce a flat rate market concentration levy which will apply to licensed holders in the Telecommunication sector with market concentrations over 40.0 per cent This partially limits the ability to respond by raising prices, as they will then lose market share as their competitors are not paying the levy. There is no levy if improved competition means there is no longer just one single player. The flat market concentration levy is set at K95.0 million for 2022 and have the same structure as the banking sector levy with administration through the Income Tax Act. This measure is expected to be implemented in 2022.

2022 National Budget, Volume 1
71
5.2.3 ADDRESSING COMPETITION ISSUE IN THE FUEL INDUSTRY BY REMOVING THE TARIFF ON IMPORTED REFINED PETROLEUM PRODUCTS (DIESEL AND PETROL)
Following the imposition of the 10 toea tariff in the 2018 Budget, the Independent Consumer and Competition Commission (ICCC) and fuel importers have raised concern that the tariff disadvantaged the fuel importers and reinforced Puma Energy’s dominance in the fuel industry. This was also proven by ICCC in a report published in 2019. Under the tariff regime, import duty or tariff tax is only applied on imported goods and not on locally produced goods. When the 10 toea tariff is imposed on the imported fuel products, the local producer is better off. In this budget, the Government repeals the 10 toea tariff on imported diesel and petrol over two years. The tariff on imported Diesel and Petrol will be reduced by 5 toea in each year starting 2022. This measure will encourage competition in the fuel industry while minimising the impact on Government revenue. In this way, the impact on revenue can be minimised and spread across for two (2) years and reduce tariff by 5 toea in each year starting 2022. This measure will reduce revenue by K24.0 million in 2022 and the same amount in 2023. The Government will implement this measure to increase competition in the market. 5.2.4 INCREASE IN EXCISE RATE FOR ANTI-SOCIAL DRINKS In the 2020 National Budget, the Government increased excise rates for anti-social drinks or spirituous beverages to lower the high level of consumption of high alcoholic products which lead to social issues. However, the measure has not reduced anti-social drinking. There are also reports on failure by some producers and importers to report the volume of production or imports or having used the wrong tariff codes.
To address these pressing issues, Government continues to lift the tax rate on mixed drinks of strength greater than 10.0 per cent of alcohol content by a further K100.0 per litre of alcohol on excise tariff item 2208.90.40 “mixed drinks more than 10.0 per cent alcohol by volume, not for medicinal purposes”. While more tax will be collected per sale, it is expected that the volume of sales will decrease. As a result, there will be no net revenue change in 2022 but a decrease in the level of anti-social drinking. This measure is expected to be effective on 1st December 2021. 5.2.5 INCREASE THE ITC RATES TO 2.0 PER CENT FOR ALL SECTORS
In this budget, the Government is taking a bold stand to increase the current ITC rates (0.75 per cent for Extractive sector and 1.5 per cent for Agriculture and Tourism sector) to 2.0 per cent. The rationale is to encourage more infrastructure development in the project affected areas consistent with the Provincial and National Government’s development plans. To

2022 National Budget, Volume 1
72
strengthen the integrity of the Tax Credit Scheme, several supplementary measures are also introduced and these include:
i. making it mandatory for the developers to submit their expenditure reports directly to IRC;
ii. limit the indefinite carry-forward period of excess expenditure to be offset against future tax labilities from the indefinite period to seven (7) years, to be consistent with the loss carry forward provision under the Income Tax Act 1959;
iii. claiming tax credits for only completed projects; and iv. allow companies only in taxable position to participate.
This reform is packaged in a way to encourage rolling out of infrastructure projects and at the same time improve administration, monitoring and reporting of the scheme. The measures are expected to be effective on 1st January 2022 and it will reduce the corporate income taxes paid by these affected sectors to support the National Budget. 5.2.6 EXTEND THE TOBACCO SECOND EXCISE TIER TO COUNTER ILLICIT TOBACCO
There are two categories of excisable tobacco products. The first tier is comprised of all tobacco products except Rothman and it is indexed every six (6) months on the 31st May and 30th November annually. The second tier was introduced in 2019, and is made up of Rothman only and it is not indexed. This policy was intended to allow legit tobacco to compete against cheap illicit tobacco products and to reduce the market share of the illicit tobacco product overtime. The first-tier products like Cambridge are selling at K1.20 per stick while illicit tobacco products are sold at the price ranging from 50 toea to K1.0 per stick which are cheap and more affordable than the legitimate product. Therefore, Rothman in the second-tier sells at 80 toea to K1.0 per stick to compete against illicit products. This measure was intended to expire at the end of November 2021. However, given the second-tier excise on tobacco has performed well in raising additional revenue for the Government and fairly limiting the level of illicit tobacco in PNG. It will continue to apply for the next two years (2022 and 2023) while Treasury and PNG Customs will monitor its performance and advise the Government on the next policy action. This measure is not expected to change revenue forecast in 2022 and will be effective 1st December 2021.
5.2.7 ASSISTING THE TOBACCO AND ALCOHOL INDUSTRY BY REDUCING BI-ANNUAL
EXCISE INDEXATION RATE FROM 5 PER CENT TO 2.5 PER CENT
This measure is expected to assist tobacco and alcohol Industry to cushion the impact of the COVID-19 pandemic on the industry. The alcohol and tobacco industries have expressed serious concerns on negative effect on higher excise rate coupled with the effect of COVID-19 on the industry. As a measure to assist the local tobacco and alcohol industry, the Government reduces the six-monthly adjustment rate from 5.0 per cent to 2.5 per cent. This reform is expected to reduce revenue by K40.0 million and will be effective starting 1st December 2021.

2022 National Budget, Volume 1
73
5.2.8 REMOVE IMPORT TAXES ON IMPORT OF ELECTRIC VEHICLES.
The world is moving towards electric cars. This is due to concerns on global climate change as well as improving technologies. The government encourages the uptake of electric cars in PNG by imposing no import tariff on fully kitted electric vehicles to support the green economy. This measure is revenue neutral and will be effective on 1st January 2022. 5.2.9 CONSEQUENTIAL AMENDMENTS TO FACILITATE THE COMMENCEMENT OF THE TAA
This reform is to ensure the TAA (2017) does not contravene with administrative provisions in the other tax laws. This amendment is necessary to ensure consistency and commencement of TAA. The TAA was one of the MTRS legislative reforms introduced in the 2018 Budget. This reform was intended to improve tax administration in the Internal Revenue Commission (IRC) through improving tax compliance and increasing efficiency by reducing unit costs resulting in higher revenue yields. The TAA requires consequential amendments in other tax Acts to prevent conflict of tax administrative roles provided in those tax Acts when TAA comes into operation. A series of consequential amendments are required to the existing Income Tax Act 1959, Goods and Services Act 2003, Stamp Duties Act 1952, Departure Tax Act 1980, Gaming Control Act 2007, which relate to the administrative provisions of such taxes that are now captured in the new TAA. Such existing provisions will need to be repealed in order to ensure there is no legal loophole and duplication of tax administration roles when the TAA commences. The TAA is expected to improve tax administration and will be effective on the date of issuance of National Gazette. 5.2.10 REVERT IMPORT DUTY RATE FOR ULTRA HIGH TEMPERATURE (UHT) MILK TO FREE
This change is to formalise the administrative arrangement made earlier by reverting the duty rate for UHT milk to Free. In 2019, the tariff duty for Ultra High Temperature (UHT) milk products was increased to 25 per cent. The rationale was to assist the infant local producer to compete effectively with the UHT import products such as Paul’s and Anchor milks and provide local employment opportunities. However, this rate was not implemented as the local producer does not have the capacity to meet the nation’s demand. Therefore, the tariff rate for UHT milk product was administratively applied at the free duty rate. In this Budget, this Government formalises this administrative arrangement by reverting the duty rate for UHT Milk to its initial free duty rate. This measure will be revenue neutral and will come into operation retrospectively from 1st January 2022.

2022 National Budget, Volume 1
74
5.3 COMPLIANCE MEASURES
5.3.1 THE PROCUREMENT OF THE GMS SOFTWARE The GMS is an initiative to monitor the sale of all goods and services on which GST is charged. The GST registered taxpayers have been collecting GST on behalf of the Government and remitting to IRC. However, some registered businesses have not been correctly declaring the amount of GST collected. Therefore, Government will work closely with IRC to install GMS in all counters of wholesale and retail shops and is expected to capture GST collections at the point of sale and remit GST revenue directly to IRC in real time. This system will greatly enhance the ability of IRC to monitor sales transactions on retail outlets and accurately confirm the monthly GST collections against the actual transfer using the GST data. GST revenue from any sale debits the taxpayer account and credits the IRC's account instantly in real-time. The GMS is expected to be procured, installed and trialled in 2022 beginning with the retail sector which currently contributes 50.0 per cent of the total inland GST collection. The implementation of the GMS is expected to be executed in 2023. Funding of K10.0 million is allocated to start this project in 2022. The completion and implementation of this project is expected to improve GST compliance and GST collection.
5.3.2 SUPPORTING IRC TO UPGRADE TO ITAS FOR EFFICIENT TAX ADMINISTRATION The Standard Integrated Government Tax Administration System (SIGTAS) is the current Revenue Administration System used by IRC. Although it is reliable, it has become outdated and unsupportive in performing the essential core tax administration functions such as registration, processing, payment including accounting and reporting. The SIGTAS does not provide modern services such as online filing and payment that needs to streamline the process, reduce compliance costs, and minimise manual activities. The recent changes in technology have advanced the way of doing business. Therefore, the Government is determined to support the IRC in this Budget to procure and install a 'next generation' revenue administration system to improve efficiency in tax administration. The 'next generation' revenue administration system called the Integrated Tax Administration System (ITAS) is a digital system developed to automate inland revenue manual tax processes. The ITAS provides free, convenient, simple and secure ways of interacting with IRC and taxpayers to improve services and efficiencies in administering taxes. The ITAS will improve service delivery to taxpayers and provides many online benefits such as 24/7 real time access to a taxpayer tax account, taxpayer services, online filing of tax returns, online registration, online payments, case management and workflow, business intelligence function and the capability to interface with other data sources such as Investment Promotion Authority (IPA), PNG Customs Service and Banks. Currently, IRC manually processes 24,000 registrations annually, processes (receive, register, record, and enter manually) over 500,000 returns and processes (receipts, update an account, bank) 10,000 payments annually. This takes over 300 staff to do this annually. The ITAS is expected to automate most of this process and functions through online functions and frees up around 300 IRC staff who can be better utilised in risk and audit areas.

2022 National Budget, Volume 1
75
In the 2022 Budget, the government allocates K25.0 million to enable IRC to start the ITAS project. The Government will continue to support this initiative to completion and implementation of this project to increase efficiency in tax administration, increase compliance and broaden the revenue base.
5.3.3 CONTAINER EXAMINATION FACILITY IN LAE The Container Examination Facility (CEF) combines advanced x-ray technology and physical inspections to allow PNGCS to examine containers entering PNG. The specific aims of the facilities are to:
prohibit the flow of contraband such as illicit drugs and weapons;
minimise revenue losses through tax evasion and smuggling;
protect industry through detection of non-compliant importers and exporters;
improve the security of sea cargo; and
assist in the verification of compliance with import and export requirements. The installation of the CEF in Port Moresby Port recorded a significant increase in revenue collections. In 2018 revenue collections increased by K264.3 million or 16.0 per cent and K341.4 million or 17.7 per cent in 2019. The deployment of this technology was able to support steady increase in revenue collections for the subsequent years. The CEF in Lae is expected to significantly improve administration, reduce the flow of contraband goods such as illicit drugs and weapons, improve compliance and broaden the revenue base. In this Budget, K20.0 million is allocated to start this project in 2022. The Government will continue to support this initiative to completion in order to increase surveillance and tax administration efficiency, increase compliance and broaden the revenue base. 5.4 NON-TAX REVENUE MEASURE
5.4.1 INTRODUCTION OF NON-TAX REVENUE ADMINISTRATION (NTRA) BILL 2021
In the 2018 Budget, the Government introduced the Public Money Management Regularisation Act (PMMRA) 2017. This was a measure to ensure excess public funds generated by Government Agencies are brought back to the Consolidated Revenue Fund (CRF) and fairly distributed through the annual budgetary process consistent with the Public Finance Management Act Amended 2016. The PMMR Act was applied using the 90/10 revenue sharing rule. That is, 90.0 per cent of the total fees and charges revenue collected by the agencies was remitted to Department of Finance (DoF) while 10.0 per cent was withheld by respective agencies to meet their operational needs. Since the implementation in mid-2018, over K1.0 billion was collected and remitted to CRF to support the National Budget. However, on the 27th May, 2020, the Supreme Court in its Decision declared the PMMR Act 2017 unconstitutional, invalid and ineffective due to issues relating to rights to ownership of property, (broad definition of public money, public bodies, statutory body, property), constitutional status of constitutional institutions, removal of jurisdiction of the courts, parliamentary control of public finances, harsh and oppressive penalties, protection of the law, constitution as supreme law, and freedom of expression.

2022 National Budget, Volume 1
76
Following the Supreme Court’s Decision, Department of Finance in close consultation with the State Solicitor’s Office, Departments of National Planning and Monitoring and Treasury reviewed the PMMR Act. The purpose of this review was to develop a new Revenue Act to replace PMMR Act while at the same time ensuring the issues which caused the invalidity of the PMMR Act are adequately addressed. The outcome of this review and consultation with relevant stakeholders has resulted in the creation of the new Non-Tax Revenue Administration (NTRA) Bill. The NTRA bill is expected to address all issues that caused the invalidity of the PMMR Act. The intention of the new NTRA Bill 2021 is to ensure all non-tax revenues are remitted to the CRF to support the National Budget. The ultimate goal is any funding requirement by all Government Agencies should be done through the annual Budgetary process to promote accountability and transparency in the raising and using of public funds consistent with the Section 204 of the constitution. The NTRA is expected to improve non-tax revenue and will be implemented in 2022. 5.4.2 CONVERSION OF LAND LEASE DATA INTO DIGITAL FORMAT AND SECURING
ELECTONIC PAYMENT OF LAND RENTALS The Department of Lands and Physical Planning (DLPP) has been introducing different Land Management software. Its legacy system was known as LAGIS that was mainly used for recording Alienated Land Data was obsolete and needed replacement. This legacy system was replaced by Technology One’s Property & Rating (P&R) and Enterprise Content Management (ECM) Systems. However, this system was not able to Go Live as Technology One withdrew its services from DLPP over outstanding bills and did not provide the support services. The P&R and ECM systems were not used for over four (4) years. Upon settlement of bills with Technology One, the system was switched on and reconfigured to come on Live and since 2020, all the backlogs are being processed. However, non-payment of bills for 2020 and 2021 prompted Technology One to withdraw its support service once again. The company has also closed its office in PNG as well. Technology One recently advised they will not support the P&R application as of 1st October 2024. The Technology One fees are exorbitant with ASM fees and additional consulting fees. Its withdrawal of support services with no regard to disruption of business compel DLPP to resort to another company able to provide more modern and tailor-made software system that can meet DLPP specifications. Niu Pay Limited is a local company based in Port Moresby and is able to meet DLPP requirements in terms of a system that is modern, online, cyber secure, easy to use, highly automated and fit-for-purpose. This company has several SOE’s as customers with similar products. The products from Niu Pay do not have any ‘upfront costs’ to DLPP and there are no consulting or annual license or ASM fees. The DLPP has entered into an agreement with Niu Pay Limited and have developed Go-Land and e-Lands systems where all registered customers can view their property details and financial transactions (Bills and Receipts). The processes from Physical Planning, Customary Land Valuations and National Mapping will be incorporated into e-Lands after the transition of P&R processes and P&R retired. The e-Lands will be the ‘single point of truth’ for land management.

2022 National Budget, Volume 1
77
The Go-Lands system is the complete system and has inbuilt cyber security with high degree automation. Importantly it is built specifically to meet DLPP requirements, unlike the Technology One systems (P&R and ECM) that needed to be reconfigured. The Go-Lands is online and includes new DLPP website, temporary repository for P&R data, and Revenue Billing and Debt Management that are highly automated. The e-Lands system has levied K305.0 million in land rental revenue from 2014 to 2021. This new system is able to collect K15.2 million to date and it is capable of generating significant amount of revenue if the Department of Finance stops receipting Land Lease Rental Payments as per the NEC Decision 171/2021. In addition, the revenue could additionally pick up as the Department of lands and Physical Planning is able to roll out the installation of e-Lands Kiosks in the selected Departments and Provinces in 2022. The e-Lands Kiosks will allow all existing cards available including the BSP Kundu Cards to be accepted and the e-Land System will interface with Kiosks so that DLPP will no longer need extract land lease rental receipts from the IFMS and PGAS systems and manually input it to the e-Land system. The installation of 42 Kiosks at K30,000.00 each will cost K1.3 million in 2022. The further development of e-Lands and Go-Lands systems, rolling out of elands Kiosks and the implementation of the NEC Decision 171/2021 by the Department of Finance not to accept land rental payments through the IFMS system will generate some revenue to support the 2022 Budget. 5.5 NEW POLICY DEVELOPEMENT AREAS The Government will continue to work on policy development areas on the revenue side to strengthen the revenue system and broaden the GoPNG revenue base. 5.5.1 Review of the Medium-Term Revenue Strategy 2018-2022 The Government with the Technical Assistance from the International Monetary Fund (IMF) developed and introduced PNG’s Medium-Term Revenue Strategy (MTRS) 2018-2022 in 2017. The strategy incorporated recommendations from both the Tax Review in 2015 and IMF Mission Report on PNG’s Tax Administration, Policy and Legislation. The MTRS was adopted and first implemented in the 2018 Budget. This was than reviewed and adopted by the Marape Government in 2019. The Department of Treasury, IRC, PNGCS and the Department of Finance are responsible for implementing the Strategy. There are a total of 223 specific reforms priorities under MTRS. Of which 62 policy reforms currently implemented by the Department of Treasury; 7 non-tax reforms currently implemented by the Department of Finance, 116 and 38 tax administrative reforms are implemented by IRC and PNGCS respectively. Solid progress has been made since the 2018 Budget with most measures implemented while others are work in progress and not supported for implementation. Given the positive outcome and the value added by the implementation of the MTRS, the Government is fully supportive of the MTRS to continue in the next five years. Therefore, the current MTRS 2018–2022 will be reviewed in 2022, to develop a new one for the next medium term (2023-2027.

2022 National Budget, Volume 1
78
The Department of Treasury will take the lead in close consultation with the Department of Finance, PNGCS, IRC and other relevant Government agencies to develop a new Medium - Term Revenue Strategy (2023–2027), to guide revenue reforms. 5.5.2 REVIEW OF THE CORPORATE TAX RURAL DEVELOPMENT INCENTIVE Rural Development Incentives (RDI) is a 10-year tax holiday provided to new business that wants to carry out business activities in mostly the agricultural sector. The business must be situated in the remote rural districts of PNG prescribed in the Income Tax Act 1959 to be eligible. The incentive exempts the eligible business (company) from paying company income tax for 10 years starting from the commencement date of the project. Over time, the list of prescribed areas in the ITA has become outdated. The least developed areas prescribed for businesses operating in those areas to access the RDI have developed over time and have become urban areas. Hence, there is a need to review the prescribed areas to ensure the list of prescribed areas is updated so that the RDI is targeted towards developing least developed areas of the country. A review will be conducted in early 2022 led by the Department of Treasury with close collaboration with relevant stakeholders including the National Economic and Fiscal Commission and IRC. The review will ensure that the incentive is policy targeted to encourage development and economic activities but it also protects the corporate tax revenue base. 5.5.3 REVIEW OF THE REGULATORY ENVIRONMENT AND FISCAL INCENTIVES TO
ENCOURAGE INVESTMENT IN INFORMATION AND TECHNOLOGY (IT) SECTOR It is envisaged that attracting investment in Information Technology (IT) will empower both the local and foreign investors to invest in new technology and spur creativity in the IT space. Government and businesses in PNG should be in par with latest advances in information technology thus bringing solutions to some of the critical areas of doing businesses in the country thus reducing costs, enhancing efficiency and promoting economic growth. It is time that Government should introduce policies and provide regulatory environment to boost sector-based economic growth so that it has multiplier effect on other sectors of the economy. Investment in Information Technology (IT) will definitely provide impetus for other sectors to grow though using advanced IT technology and products in the likes of GPS Tracking, Facial Recognition, Block chain Technology and more innovative products that are continuing to be sold at the market. Eighty of the world’s top 100 technology companies have a presence in Singapore, a city-state that has been described as a miniature Silicon Valley. It was possible through a culture of innovation, strong intellectual property protection laws, and its status as a financial center. These factors, along with nationwide initiatives to support new businesses have positioned Singapore as a regional technology hub of Asia. Moreover, Israel is becoming a country with high status in new technologies as a result of creating policy and regulatory environment coupled with sufficient funding in higher education and research in Information and Technology (IT) Sector. As a result, Israel companies are able to develop innovative IT products that are at the high end of the market. Similarly, most African countries are developing and utilising IT products that are efficient to help drive the economic growth at low cost and limited time span.

2022 National Budget, Volume 1
79
PNG is no different from the rest of the world. Investing in healthier and robust IT system and technology has the greatest potential to uplift PNG image, attract more investment and making it an IT hub in the Pacific. In 2022, the Department of Treasury on behalf of the Government will take a lead with relevant stakeholders such as the Department of Information, Communication and Technology, NICTA, PNGCS, IRC and others to examine the current policies, regulatory environment and tax incentives that can support the information technology sector in PNG to grow and become innovative. This policy initiative is in consistent with the Government’s Digital Transformation Policy relating to standardising data governance, network, cyber security, digital services and website. 5.5.4 REWRITING OF THE INCOME TAX ACT 1959
Rewriting the PNG Income Tax Act (ITA) is one of the major tax legislative reforms. The aim is to modernise and simplify the ITA so that tax provisions are easily read, understand and tax liabilities are paid accordingly, with the objective of reducing the room for individual interpretation or challenge. This also creates a smooth pathway for taxpayers to adopt self-assessment. The complexity of the current ITA can act as a barrier to small and medium sized taxpayers complying with the legislation. The aim is for all taxpayers to be able to easily understand the rewritten ITA to determine their tax liability. The rewritten ITA will retain the existing fundamentals of the income tax. In broad terms, the revenue or capital distinction is maintained. The basic principles for the deduction of expenditures remain unchanged despite the simplification of the drafting of the deduction rules. As with the rewrite of any tax legislation in any country, interpretation issues will arise with the new simplified language in the legislation. Importantly, this is only a transitional issue, however the Government intends to work carefully on this process to limit any interpretation issues as this would run against the objective of simplification. There are several processes in place to deal with transitional issues:
First, the rewritten ITA provides that transitional issues can be dealt under regulations which are being
developed and will also be subject to public consultation and feedbacks;
Second, it is intended that a binding ruling system is included in the Tax Administration Act (TAA) that
can be used to deal with interpretation issues.
Third, for a small number of issues that cannot be dealt with by regulation or ruling, it may be
necessary to make technical corrections to the Act in the first couple of years of operation.
This is a common occurrence in any country that undertakes a rewrite of tax legislation. Drafts of the rewritten ITA were released for public consultation in mid-2020 and again in October 2021. Many detailed written submissions were received in both consultations and the draft has been revised based on the submissions. The public consultations have ensured that the rewriting of the ITA has been a transparent process. The passage of the rewritten ITA is delayed to undertake further work on tax regulations and tax rulings and also to ensure that IRC’s business processes are in order. This will also give
2022 National Budget, Volume 1
80
time to further address the concerns raised by any in the business community on any parts of the ITA that may not meet the objective of the simplification of rules, in 2022 before the introduction of the rewritten Income Tax Bill in 2023. 5.5.5 REVIEW OF THE REGULATORY ENVIRONMENT AND FISCAL. INCENTIVES TO
ENCOURAGE INVESTMENT IN INFORMATION AND TECHNOLOGY (IT) SECTOR OF PNG
It is envisaged that attracting investment in IT will empower both the local and foreign investors to invest in new technology and spur creativity in the IT space of PNG. Government and businesses in PNG should be on par with latest advances in information technology thus bringing solutions to some of the critical areas of doing business in the country. This will reduce costs, enhance efficiency and promote economic growth. A good example is Singapore. Eighty of the world’s top 100 technology companies have a presence in Singapore, a city-state that has been described as a miniature Silicon Valley. It was possible through a culture of innovation, strong intellectual property protection laws, and its status as a financial centre. These factors, along with nationwide initiatives to support new businesses, have positioned Singapore as a regional technology hub of Asia. Moreover, Israel is becoming a country with high status in new technologies as a result of empowering higher education and funding research and development in the IT sector. The Israel Government is very supportive to ensure positive growth. In most African countries, efficient and high technology systems are helping to drive economic growth at low cost and limited time span. Investing in healthier and robust IT systems has great potential to lift PNG’s image and attract more investment. In 2022, the Department of Treasury on behalf of the Government will take a lead with relevant stakeholders such as the Department of Information, Communication and Technology, NICTA, PNGCS, IRC and others to examine the current policies to support the PNG information technology sector and develop a taxation and fiscal concessional pathway that will encourage investment in Information and Technology.

2022 National Budget, Volume 1
81
CHAPTER 6: EXPENDITURE
6.1 OVERVIEW
The 2022 Budget will continue to fund the policy priorities of the Government as enshrined in the Medium-Term Development Plan III (2018-2022) while adhering to fiscal parameters of the Medium-Term Fiscal Strategies (MTFS). The 2022 Budget is the fifth and final budget to implement the MTDP III priorities with more focus on Connecting PNG. The allocation of the 2022 Budget is guided by the 2022 Budget Strategy Paper (BSP) which translates the MTDPIII (2018-2022) sector priorities to be funded in the 2022 Budget thereof. The BSP ensures that the policy priorities of the Government as enshrined in the MTDP III are funded and policy objectives are realised with an aim to achieve the development aspirations of Vision 2050. Ongoing programs and projects are funded based on their performances and outcomes in the previous years and the anticipated impact it will have on the economy when completed. Allocation of the 2022 expenditure budget follows the similar approach from the 2021 Budget by;
funding development priorities and targets set in the MTDPIII for each sector;
funding policy interventions that are anticipated to have a positive return on government investments and improve people’s lives;
investing in programs that will promote sustainable economic growth;
ensuring that GoPNG provides their counterpart funding to secure loan funding in a timely manner to avoid costs associated with delays in loan drawdowns;
critically analysing capacity issues within implementing agencies to avoid delays to project implementation; and
adequately funding the operational budget to effectively support the implementation of the capital budget.
The Government will support the 2022 National General Election to ensure a safe, fair and just election process, provide SME loans to assist individuals and small to medium size businesses from the effects of COVID-19, as well as funding expenditures related to the COVID-19 pandemic which cut across all the sectors. Critical infrastructure projects such as the Connect PNG projects will be funded to open up economic corridors to stimulate economic activities. Ongoing priority programs such as the Higher Education Loan Program (HELP), Government Tuition Fee Subsidies (GTFS) and Free Primary Heath Care will be maintained in 2022 Budget. The Government will continue to promote expenditure efficiency measures through the following:
conducting retirement exercise to relieve public servants and reduce Government liabilities;
identification payment of arrears and liabilities by the Arrears Verification Committee (AVC);
issuance and implementation of Non-Financial Instructions (NFI); and
activities that will be undertaken by the Organisational Staffing Personnel Emoluments Audit Committee (OSPEAC) in 2022 to manage and control the public services personnel and wage bill issues;

2022 National Budget, Volume 1
82
6.2 2022 AGGREGATE EXPENDITURE
The 2022 Budget expenditure envelope is set at K22,174.8 million against a revenue projection of K16,190.2 million, which will be funded through internal revenue, grants and loans. The short fall or deficit of K5,984.7 million will be financed through external (K3,744.6 million) and domestic (K2,240.1 million) borrowings to meet the total funding requirement for the 2022 Budget. Table 17 below shows the 2022 aggregate expenditure. Table 17: 2022 Aggregate Expenditure (Kina, million)
Funding Source 2021
Budget 2021 Suppl.
Budget 2022
Budget As % of Total
Budget
Operational Component 12,137.0 12,399.6 13,423.2 60.5%
Compensation of Employees* 5,763.8 6,030.4 6,050.2 27.3%
Goods and Services 2,789.2 3,058.4 3,732.8 16.8%
Interest Payment 2,270.8 2,100.8 2,324.4 10.5%
Provincial Functional grants 584.0 584.0 593.9 2.7%
GST & Book Makers Transfers 729.2 626.0 721.9 3.3%
Capital Investment Component 7,470.8 7,887.9 8,751.6 39.5%
GoPNG 4,824.4 4,824.4 5,858.3 26.4%
Donor Support Grants* 1,008.0 1,425.0 1,574.9 7.1%
Loans 1,638.4 1,638.4 1,318.4 5.9%
Total Expenditure & Net Lending
19,607.8 20,287.5 22,174.8 100.0%
Source: Department of Treasury *Excluding K250 million Australian Budget Support Grants given the nature of transaction.
The total estimated expenditure of K22,174.8 million is comprised of K19,281.5 million GoPNG component, K1,318.4 million concessional loans and K1,574.9 million donor support grants. The 2022 expenditure estimate has increased by K2,566.6 million (13.1 per cent) from the 2021 Budget. The 2022 total expenditure estimate of K22,174.8 million is comprised of K13,423.2 million for Operational Expenditure, including debt service (K2,324.4 million) and K8,751.6 million for Capital Investment expenditure. The total Operational Budget takes up 60.5 per cent of the total budget while the Capital Budget takes up the remaining 39.5 per cent of the total budget. The Operational Budget has been increased by K1,023.6 million (8.3 per cent) from the 2021 Supplementary Budget. The increase in the Operational Budget is mainly driven by a significant increase in the Goods and Services (G&S) budget by 22.1 per cent. Other components of the operational budget have also been increased which are Compensation of Employees (CoE), Functional Grants and Interest Payment. The G&S Budget caters for Government arrears such as utility bills, rentals, superannuation payments and retirement costs. Funding for all arrears has been centralised and parked under the Treasury and Finance Miscellaneous Vote (207). The increase also captures the cost associated with the 2022 National General Election. The CoE budget has been increased by 0.3 per cent from the 2021 Supplementary Budget. It is the largest component of the 2022 Budget expenditure with K6,050.2 million or 45.1 per cent of the Operational Budget and 27.3 per cent of the total 2022 Budget expenditure. The CoE budget includes salaries and allowances but does not capture the social benefits (retirement, retrenchment, gratuities and superannuation) expenditures.

2022 National Budget, Volume 1
83
Funding for social benefits expenditure is captured under the Treasury and Finance Miscellaneous Vote for better coordination in terms of expending the funds. The Provincial Functional Grants budget was increased by 1.7 per cent to support service delivery in the provinces while Interest Payment has been increased by 10.6 per cent to support the Government’s debt repayment obligations. The 2022 Capital Investment Budget of K8,751.6 million comprises of K5,858.3 million for the Public Investment Program (GoPNG PIP) and K2,893.3 million in grants and concessional loans from PNG’s Development Partners. The Public Investment Program (GoPNG PIP) is inclusive of the K888.0 million for Provincial and District Support Improvement Programs (PSIP and DSIP). The Development Partner’s component of K2,893.3 million comprises of K1,318.4 million in concessional loans and K1,574.9 million in donor grant funding. The 2022 Capital Budget has been increased by K863.8 million or 11.0 per cent from the 2021 Supplementary Budget. This increase is to ensure ongoing projects are sufficiently funded and completed in 2022, to maintain funding for Government’s fixed commitments such as the Support Improvement Programs (SIPs) and the Connect PNG policy, as well other key policy priorities. The Government has also taken on board new projects in 2022 which are seen as critical for PNG’s social and economic development. The 2022 Capital Budget will also focus on funding ongoing projects and programs that have performed well in 2021, projects that are critical and require urgent support from the Government, priority projects that will broaden the base for internal revenue generation in a sustainable manner, and projects that promote inclusive economic growth. Table 18 below shows the Government’s fixed commitments. Fixed commitments reflect the strong the policy commitments of the Government. Table 18: Fixed Commitments of the Government in 2022 (Kina, million).
No. Priority Program 2022 GoPNG
1 PSIP 176.0
2 DSIP 712.0
3 DSG 55.5
4 SSG 45.5
5 Connect PNG 522.0
6 Bougainville 200.0
7 SME Funding 200.0
8 National Government Commitments 70.0
9 Foundation Programs 274.0
10 IDG (PNG LNG) 120.0
11 High Impact Infrastructure Projects (PNG LNG) 50.0
12 IDG (Wafi Golpu) 50.0
13 IDG (Porgera) 50.0
14 Provincial Roads 188.0
15 District Roads 720.0
16 Wharves and Jetties 24.0
17 Education Projects/Programs 129.0
18 Provincial Hospitals Development Program 315.0
19 District Hospitals Development Program 100.0
20 Port Moresby General Hospital 62.0

2022 National Budget, Volume 1
84
No. Priority Program 2022 GoPNG
21 Mining and Petroleum MoAs 43.5
22 Tax Credit Infrastructure Support 10.0
23 Waigani Court Complex 50.0
24 Seat of Government 40.0
25 Pacific Marine Industrial Zone 100
26 Church Heritage Redevelopment Program 25.0
27 Women's Financial Inclusion Program 10.0
28 Blockchain Government 30.0
29 Government Monitoring and Evaluation 10.0
30 Smart City Development Program 5.0
31 Kumul Satellite Project 10.0
32 National Specialist Hospital and Medical University 10.0
33 National Orphanage Development Program 10.0
35 Internal Revenue Commission 25.0
36 PNG Customs 25.0
37 Grant Counterpart 26.5
38 Loan Counterpart 181.0
Total 4,674.0 Source: Department of National Planning and Monitoring
6.3 SECTOR EXPENDITURE
Sectoral allocation for the 2022 Budget is guided by the strategy of identifying policy issues in each sector and funding policy interventions that will address those issues to achieve the sector goals and targets captured in the MTDP III. Government agencies are categorised into nine (9) sectors, however, for budgeting and accounting purposes, interest payment and miscellaneous items are included to show total expenditure as depicted in Table 19 below. Table 19: 2022 Expenditure by Sector (Kina, million)
Sector
Operational (K ’Million) Capital (K ‘Million) 2022 Total (K ‘Million)
Compensation of Employees
Goods and
Services
Total Operational
Budget GoPNG Grants Loans
Total Capital Budget
Total Expenditure
Administration 600.0 205.2 805.2 2,064.7 778.6 234.4 3,077.7 3,882.9
Community & Culture 44.1 26.6 70.7 48.5 41.8 0.0 90.3 161.0
Debt Services 0.0 2,324.4 2,324.4 0.0 0.0 0.0 0.0- 2,324.4
Economic 197.0 60.6 257.6 530.1 63.8 96.1 690.0 947.6
Education 403.3 817.3 1,220.6 135.0 58.4 3.5 196.9 1,417.5
Health 907.7 570.0 1,477.7 490.0 288.9 298.0 1,076.9 2,554.6
Law and Justice 909.4 251.5 1,160.9 186.8 38.0 0.0- 224.8 1,385.7
Miscellaneous 813.7 1,791.8 2,605.5 0.0 0.0 0.0 0.0 2,605.5
Provinces 2,018.6 522.5 2,541.1 1,595.5 94.8 17.5 1,707.8 4,248.9
Transport 124.6 76.2 200.8 733.5 177.8 326.8 1,238.1 1,438.9
Utilities 31.7 5.7 37.4 74.5 32.8 342.0 449.3 486.7
Total 6,050.1 6,651.8 12,701.9 5,858.6 1,574.9 1,318.3 8,751.8 21,453.7
GST & BMT* 0.0 721.1 721.1 0/0 0.0 0.0 0.0 721.1
Grand Total 6,050.1 7,372.9 13,423.0 5,858.6 1,574.9 1,318.3 8,751.8 22,174.8
Source: Departments of Treasury and National Planning and Monitoring *Goods and Services and Book Makers Transfers

2022 National Budget, Volume 1
85
6.3.1 Administration Sector Good governance and prudent administration are essential for effective service delivery. The Administration Sector is the primary sector that focuses on: governance; administrative system reforms; wealth creation; public sector management; national statistical and population data systems; foreign policy; immigration; and development cooperation in the public sector6. This sector is relatively large comprising thirty-one (31) Government agencies, of which eight (8) are Central Agencies, seven (7) are Statutory Authorities and fourteen (14) are Line Agencies. The two (2) key revenue collecting agencies in this sector are the Internal Revenue Commission (IRC) and PNG Customs Service (PNGCS). The sector aims to coordinate and create mechanisms to promote public service ethics, enforce legislation, and promote transparency through best financial management and accountability practices. These ethics and practices are promoted through the Open Government Partnership (OGP) platform. The Sector has made significant progress in coordinating and managing service delivery mechanisms and processes across the country. It has managed and coordinated the review and implementation of national policies, strategies and programs to ensure that the MTDP priorities are aligned, integrated and achieved. However, the sector continues to face recurring challenges on reporting and compliance, corruption, lack of capacity to monitor and report on the programs/projects and issues surrounding tax collection and compliance, which require Government intervention to resolve them. The current COVID-19 challenging issue has caused the Government to create an additional administrative unit to fight against the spread of the pandemic in the country. In the 2021 Budget the Government appropriated K1,484.1 million to Administration sector programmes, a large slice of the total budget, focusing on Governance and Public Sector Management, National Statistical System, Foreign Policy and Development Cooperation, Immigration, Natural Disaster Management and Structural Reforms. However, little has been done due to the unintended interruptions by the COVID-19 pandemic. Some work is on hold while other progress has been sluggish. The COVID-19 situation is likely to be addressed over time with the availability of vaccination programs, and the sector is anticipated to undertake some significant measures particularly on governance issues. In 2022, the Government will continue to fund the ongoing key programs and projects such as the Financial Management Information Program (K10.0 million), District and Provincial Treasury Roll out Program (K4.0 million), Rural Electrification Program (K10.0 million), WaSH Program (K10.0 million), 2022 National Population Census (K25.0 million), Integrated Tax Administration System (K25.0 million). PILAG infrastructure rehabilitation (K5.0 million)7 and District Town Development Program (K10.0 million) amongst others will also be funded as part of the government institutional infrastructural development program. A total of K3,882.2 million has been allocated for the Administration Sector in the 2022 Budget comprising of K804.8 million in Operational Expenditure and K3,077.5 million in Capital Investment expenditure. The total Operational Budget for the sector consists of K600.0 million for CoE and K204.8 million for G&S. Total Capital Budget for the sector consists of GoPNG direct financing worth K2,064.5 million with K234.4 million loans and K778.6 million grants.
6 MTDP III 2018-2022 7 Pacific Institute of Leadership and Governance

2022 National Budget, Volume 1
86
Funding for big-ticket items classified under the Administration sector, as well as other sectors are captured under the Finance and Treasury Miscellaneous vote. The budget for Miscellaneous expenditures for 2022 totals K2,605.5 million. Table 20 below shows the large items under each sector which are captured under the Finance and Treasury Miscellaneous vote. Table 20: Big ticket items under each sector (Kina, millions).
Sector Kina, millions
Administration and Miscellaneous 2,173.6
2020 National Election 600.0
Multi-Departmental Rentals 150.0
Multi-Departmental Utilities 150.0
Goods and Services Arrears 300.0
Retirement Fund 200.0
Foreign Missions 20.0
Contingency Fund 150.0
Sustainable Development Goal 8 97.0
District Maintenance 86.0
Inter-Government Financing Arrangement Review 3.0
State Share Automation 325.0
Transitional Budget 11.1
Mining Negotiations 3.0
Prime Minister’s Commitment 30.0
LLG Official Allowances 40.0
Lae City Authority 8.5
Health 327.5
Free Primary Health Care 10.0
Health Function Grants 109.6
COVID-19 Support 7.9
Medical Supplies 200.0
Education 761.6
HELP 65.1
GTFS 632.0
Curriculum Development 15.6
Secondary School Equipment 9.9
TESAS 39.0
Law and order 74.4
ICAC 3.0
Police Fuel 12.0
Defense Catering 38.0
Police Service Allowances 17.6
Police Repatriation 3.8
Provinces 2,206.2
Teachers’ Salaries 1,563.1
Teachers Leave Fares 49.1
Function Grants 594.0 Source: Department of Treasury

2022 National Budget, Volume 1
87
6.3.2 Community and Culture Sector The Community and Culture Sector is an important segment of Government and aims to empower children, youth, women, elderly, persons living with disabilities and other vulnerable groups of people. The primary role of the sector is to safeguard and protect our cultural heritage, empower and support the segmented population to alleviate poverty and maximise social returns. The sector is comprised of the Department for Community Development and Religion as the lead agency; the Office of Censorship; PNG Sports Foundation; National Youth Development Authority; National Cultural Commission; National Museum and Art Gallery; National Office of Child and Family Services; and National Volunteer Services. These agencies have made significant progress in undertaking structural reforms, developing legislation and enabling policies to strengthen their establishment to enhance delivery of Government priorities within the sector. The sector upholds the Universal Declaration of Human Rights that recognises the fundamental human rights, dignity and worth of every human being towards collectively achieving social progress and a high quality of life. The United Nation Sustainability Development Goals (UNSDG) 2030 theme of “leave no one behind” and the principle of inclusive growth is featured at the forefront of service delivery. The MTDP III indicators and targets are also addressed through implementing the following flagship programs in the 2021 Development Budget and those will be continued in 2022. The Government has made some progress in investing in a number of development programs to improve social indicators. Notable examples include: Empowerment and Protection Programs under the District Community Development Centers; Sports and Recreational activities under the PNG Sports Foundation; National School Awareness Program; and promoting the responsible use of the internet, mass media and sexual content. The sector continues to be challenged by issues such as sexual harassment and gender-based and sorcery-related violence. As such there is a need for effective coordination within and across sectors, stronger leadership and administrative capacities and improved monitoring and reporting systems. In 2022, the Government will continue to fund the following flagship programs and projects which are District Community Development Centers (K10.0 million), Child Protection (K3.0million), National Youth Development (K5.0 million), National Volunteers Intervention (K10.0 million), Censorship Information (K2.5 million) and National Museum and Art Gallery Rehabilitation. A total of K161.0 million has been allocated for the Community and Culture sector in the 2022 Budget of which K70.8 million is for Operational and K90.3 million is for Capital Investment expenditure. The total Operational Budget for this sector consists of K44.1 million for COE and K26.6 million for G&S. For the Capital component, GoPNG direct financing is K48.5 million with K41.8 million in grants. Key gender and inclusion considerations are set out in box 3 below

2022 National Budget, Volume 1
88
Box 3: Gender and Inclusion Considerations
6.3.3 Economic Sector The country's economy remains dominated by two broad sectors: the renewable and non-renewable subsectors. These subsectors employ a large segment of the total labor force in the country after the public service. The agriculture, forestry, mining and petroleum sectors contribute a significant portion to the country’s GDP. In 2022, the Economic sector was allocated K823.7 million to address the impediments in accessing markets and land development, empower SMEs, support innovative activities in the agriculture sector to increase production, and provide support to the development of new mining and petroleum projects. These are translated into programmes and projects such as the rural jetties and fisheries wharf program; coffee, cocoa and palm oil roads rehabilitation programme; national land development programme; MSME and SME funding for agriculture; development of new petroleum projects; and support for the negotiation and development forums for mining projects. The main objectives of funding programmes in the 2022 sector allocations are to ensure that there is continuity in production of agriculture commodities, to assist SMEs to recover from the effects of COVID-19, and to ensure there is continued dialogue with the private sector on major mining and petroleum developments in the country.

2022 National Budget, Volume 1
89
6.3.4 Renewable sector The primary aim of the Renewable Resource Sector is to increase exports of major commodities, substitute imports and promote downstream processing. The sector comprises of lead agencies such as the Department of Agriculture & Livestock (DAL), PNG National Forest Authority PNGNFA) and National Fisheries Authority (NFA) who provide the overarching policy and legal frameworks and coordinate investments. The commodity boards and agencies in the fisheries and forestry sectors implement these investments to realise the targets set against the indicators in the MTDP III. Climate change and environmental issues are also embedded in the implementation of activities in the renewable resource sector and are addressed through the Climate Change Development Authority (CCDA) and Conservation and Environment Protection Authority (CEPA). The agriculture, forestry and fisheries sector has constituted between 25.0 per cent and 40.0 per cent of GDP over the last four (4) decades, while supporting the livelihoods of around 85.0 per cent of the population. Despite the sector’s importance, the evolution of farming has long been restricted by insufficient investment, ambiguous land policies, major infrastructure gaps and a lack of access to credit at the smallholder level. However, the Government has made a strong commitment to address these fundamental issues through amicable development policies, national budgets and other fiscal measures. The 2022 Budget will continue the same level of investment with particular focus on growing a rural-based economy that withstands any financial and economic shocks. The Government will make key investments through the following programs and projects in the 2022 Budget. These investments include, the infrastructure improvement programme for the cocoa research centre – K3.0 million; Reforestation Program – K2.0 million; Bulb Onion Program – K3.0 million; Rehabilitation of Cocoa plantations – K1.0 million; PNG Agriculture Commercialisation and Diversification Project – K19.5 million; and Tree Planting Program – K5.0 million. 6.3.5 Non-Renewable Sector The aim of the non-renewable sector is to maximise socio-economic and environment benefits from the mining and petroleum industry and promote downstream processing. The sector comprises of the Department of Petroleum and Energy, Department of Mineral Policy & Geo-hazards Management and Mineral Resource Authority. Although mineral commodity prices have improved in 2021, the temporary closure of the Porgera Gold Mine and the ongoing impact of COVID-19 on the operations of other major mines have adversely affected Government revenues from the resource sectors. In light of these challenges, the Government intends to provide the enabling environment for the development of the new mining projects namely, Wafi Golpu and Frieda River projects with substantial efforts expended to reopen the Porgera Gold Mine, and new petroleum projects namely Papua, Pasca and P’nyang. 6.3.6 Trade and Investment The goal of this subsector is to increase exports, reduce imports and increase Foreign Direct Investment (FDI) that can generate wealth and stimulate economic growth.

2022 National Budget, Volume 1
90
The Trade and Investment subsector includes Commerce, Tourism and SME with lead agencies being the Department of Commerce and Industry, Tourism Promotion Authority and Small Medium Enterprise Corporation. The development of the subsector is guided by the SME Policy & Master Plan 2016-2030, National Trade Policy 2017-2030, Tourism Master Plan 2010-2030 and other relevant policies. The Government has made significant progress in the implementation of these policies in promoting international trade, SMEs and tourism with investments to increase export revenue and wealth creation. However, the preventive measures in response to COVID-19, such as travel restrictions have adversely affected the tourism industry and revenue generation in the SME sector. In 2022, investments in the subsector will focus on SME funding (K200.0 million), revitalising cooperative societies, industrial centres, online registration, development of incubation centres, and construction of tourism hubs and economic zones. In 2022, a total of K947.7 million is allocated for the Economic sector of which K257.7 million is for Operational and K690.0 million is for Capital. The total Operational Budget for this sector consists of K197.0 million for COE and K60.6 million for GS. The total Capital Budget consists of direct financing from GoPNG worth K530.1 million, K63.8 million in grants, and K96.1 million in loans. 6.3.7 Education Sector The delivery of sustainable social services is critical to improve education outcomes for the country. Having a literate population as enshrined in the preamble of the National Constitution and the 8 Goals (Integral Human Development) are critical to PNG’s socio-economic development. It enhances human capacity, increases productivity and improves living standards. The sector aims to provide access to universal education for all and provide quality tertiary education and skilled human resources. This is achieved through the delivery of primary, secondary, TVET and tertiary education through the National Department of Education (NDoE), Department of Higher Education, Research, Science and Technology (DHERST), national universities and colleges. These development efforts are guided by the country’s national development plans8
, the National Education Plan 2020-20299 and other relevant sector policies, strategies and plans. The sector has made significant progress in achieving the goal of increased enrollment of students and improving access to education over the last decade. However, the quality of education is the main issue that needs to be addressed at all levels from basic elementary, primary and secondary education to TVET institutions, colleges and the universities. The Government will continue to focus on improving access, quality and affordability of education10 at all levels from primary and secondary education to TVET institutions, colleges, universities and other higher education institutions. The Government aims to increase accessibility and retention rates in primary and secondary schools through subsidies and giving more emphasis to school infrastructure development at all levels of education to cater for the
8 PNG Vision 2050, PNG Development Strategic Plan 2010-2030, National Strategy for Responsible Sustainable Development, Medium Term Development Plan III (2018-2022) 9 National Education Plan currently under review by National Department of Education 10
This will be achieved through providing of adequate infrastructure, improving quality of teaching and learning materials in
mathematics and science, up-skill teachers through trainings

2022 National Budget, Volume 1
91
increase in student population. Alternate pathways such as FODE and TVET will be supported to provide better opportunities for students leaving school. Investments11 in infrastructure for colleges and universities will continue to be funded to address the capacity needs for graduating competent and skilled labours to meet the industrial demands. Moreover, the introduction of structural reforms and new policy interventions through the implementation of relevant programs/projects will assist in addressing the legacy issues within the Sector and propel the agencies to achieve the policy objectives. The sector’s major investments include the GTFS program (K632.0 million), Teachers College Rehabilitation (K20.0 million), UPNG infrastructure maintenance (K10.0 million), Schools of Excellence Infrastructure Program (K10.0 million), National TVET Development Program (K5.0 million), Nursing College Rehabilitation (K5.0 million), and the Western Pacific University (K25.0 million). The sector’s on-going investments include community education initiatives, nursing education and training, teachers and teacher training institutions, technical and business colleges, the transition from Outcome-Based Education to Standard-Based Education curriculum, and the PNG Higher Education Loan Program (HELP). There are also significant contributions to this sector through other Development Partners, churches and privately-run schools. A total of K1,417.5 million has been allocated to the Education sector in the 2022 Budget comprising of K1,220.7 million for Operational and K196.9 million for Capital expenditure. The total Operational Budget consists of K403.3 million for CoE and K817.3 million for G&S. The total Capital Budget consists of GoPNG direct financing worth K135.0 million, K3.5 million in loans, and K58.4 million in grants. 6.3.8 Health Sector Health is a key determinant of economic growth and is essential to the country’s development agenda12. Delivering an accessible, affordable, efficient, equitable and quality health services to address health issues is a chronic challenge for PNG. The Sector comprises of Provincial Health Authorities (PHA); Hospital Management Services (HMS); National AIDs Council Secretariat; and the PNG Institute of Medical Research PNG IMR) with the National Department of Health (NDoH) as the lead agency. The sector aims to provide an efficient and effective health system that delivers an internationally acceptable standard of health services that is accessible throughout the country. The Sector pursues its objectives guided by the overarching government policies, the National Health Plan 2021-2030 and other relevant sector policies, strategies and plans. The sector has made significant progress over recent years in achieving targets and improving indicators. It has made gains in health outcomes on primary and preventative health care as well as bringing specialised health services closer to the people. The foundation of the Health System in the country was shaken by the second and third wave of the COVID-19 pandemic, posing a potential risk to the Sector. Most provincial and district rural hospitals are faced with a shortage of oxygen gas cylinders and the number of deaths has reached an unprecedented record in the country’s short history. COVID-19 isolation, partial lockdowns, COVID-19 vaccination, and hygiene measures are part of the intervention programs
11Within the Sector prescribes some of the traditional financing of projects/programs, which calls for infrastructure development of both the State and Privately-run learning institutions due to a higher intake rate because of a rapid population growth and emigration within the country from one province to another.
12 Health is a key determinant of economic growth.

2022 National Budget, Volume 1
92
carried out by the sector to curb the spread of COVID-19. The hospitals and health clinics have adjusted their outpatient approach to attending to patients due to COVID-19 pandemic. The 2022 Budget aims to address the spread of COVID-19 and reduce the death rate caused by COVID-19 and other related deaths. Government also undertaken a ‘back to basics’ approach in improving access to health, investing in human resources and infrastructure at all levels of health services. The Government will continue to fund PHAs to maintain Free Primary Health Care and Subsidised Specialist Services and improve health systems13 in the districts and provinces. The Government will also continue to support public health including environmental health, good Water, Sanitation and Hygiene (WaSH) practices and the promotion of Nutrition Initiatives and Healthy Island Concept or Smart Community Concept. The key indicators of reducing child and maternal mortality, improving measures against preventable diseases, increasing the rate of immunisation coverage, and improving nutritional diets for children and strengthening the national fight against TB14, malaria, measles and HIV/AIDS15 will continue to be the focus of the Government. The Government will also support the implementation of the priorities in the National Emergency Preparedness and Response Plans 2020-202216 to address COVID-19 in the country. The flagship programs and projects in the 2022 Budget include: New Enga Hospital (K156.0 million); 19 Provincial Hospitals Development (K285.0 million), Gerehu New NCD Hospital Development (K10.0 million); PMGH Cancer Facilities Upgrade Project (K50.0 million), and National Health Reference Laboratory (K3.0 million). The Health sector’s total Budget for 2022 is K2,554.6 million comprising of K1,477.7 million for the Operational and K1,076.9 million for the Capital expenditure. Operational Budget consists of K907.7 million for CoE and K570.0 million for G&S. Capital Budget consists of GoPNG direct financing worth K490.0 million with K298.0 million in loans and K288.9 million in grants. 6.3.9 Law, Justice and National Security Sector The Government continues to prioritise investments in the law and justice sector to improve law and order in the country with a vision to have a Just, Safe and Secure Society for all. The Law & Justice Sector has been given prominence in the MTDP III and is identified as one of the eight KRAs to be pursued over the medium term. Improvements in law and order will create a safe and conducive environment for the private sector to flourish. The Law and Justice Sector is further categorised into two subsectors to give prominence to both Law & Justice and the National Security and Defense as per the MTDP III. 6.3.9.1 Law and Justice Sector Reducing crime, corrupt practices, and the promotion of good governance across all sectors is the overall goal of the Law and Justice Sector. These are emphasised by improving policing, safety and crime prevention, improving access to justice, improving reconciliation, reintegration
13 Strengthening of Health systems through rehabilitation of district hospitals and Establishment of Community Health Posts to enhance frontline health
service delivery, thus bringing specialised health services close to the people to support the rural health facilities 14 Implementation of the TB Strategy, which aims to address cross-infection and air borne diseases. 15 HIV prevalence rate has increased from 0.65% in 2013 to 0.9% in 2017, which is now an epidemic. 16 The Strategic Service Delivery Model of this National Emergency Preparedness and Response Plan comprises of seven (5) essential scopes of
activities that includes, (1) Surveillance, (2) Triaging / Testing, (3) Quarantine, (4) Isolation, (5) Treatment ICU/CCU.

2022 National Budget, Volume 1
93
and deterrence, improving accountability, reducing corruption and improving the ability to provide law and justice services. The sector comprises of twelve (12) agencies with the lead agency being the Department of Justice and Attorney General. The sector agencies include: the Royal PNG Constabulary; National Judiciary Services; Correctional Services; Public Solicitors Office; Magisterial Services; Legal Training Institute; Public Prosecutors Office; Constitutional & Law Reform Commission; and the Ombudsmen Commission. The sector strives to reduce and prevent crime, corrupt practices and promote good governance across all other sectors. The 2022 Budget will focus on the construction of new State of the Art Complex Waigani National Court (K50.0 million); Police Infrastructure Program (K23.0 million); New Hela Military Barracks (K30.0 million); and CS Infrastructure (K20.0 million). The sector will continue to benefit from the Justice Services and Stability for Development (JSS4D) grant support from DFAT-AU. The Royal Papua New Guinea Constabulary (RPNGC) is also being supported by the Australian Federal Police under a separate policing arrangement (Australia – PNG Policing Program/ PNG-APP). 6.3.9.2 National Security and Defence The PNG Defense Force is the security agency with the strategic platform on which the other national security agencies can launch their operations. The objective of the sector in line with KRA417 of the MTDP III is to enhance national security and strengthen PNG Defence Force air, land and naval capabilities. The key indicators to achieve this are military manpower, fully manned and guarded PNG international boarders, surveillance system capability, and standard response time for civil humanitarian assistance. The National Security and Defence Agencies include: the PNG Defence Force (PNGDF); Department of Defence; PNG National Intelligence Organisation; PM & NEC (OSCA); and the PNG Correctional Services, assisted by PNG Customs Service; Immigration and Citizenship Authority (ICA); NAQIA; Department of Foreign Affairs and International Trade (DFAIT); and PNG Royal Constabulary. The key priority programs for Defence in 2022 are Air Capability, new Hela Military Barracks (K30.0 million) and Defence Infrastructure (K5.0 million). The PNGDF will continue to deliver the Baiyer-Madang Road project in collaboration with the Department of Works (DoW). Other investment in this sector is the NIO Infrastructure Program (K3.0 million) and the National Security Program (K2.0 million). In the 2022 Budget the Law, Justice and National Security sector receives K1,385.7 million, of which K1,160.9 million Operational and K224.8 million Capital expenditure. Operational Budget consists of K909.4 million for CoE and K251.5 million for G&S. The Capital Budget consists of GoPNG direct financing worth K186.8 million and K38.0 million in grants. 6.3.11 Provincial Sector As emphasised in the 2022 BSP, the primary intent of the decentralisation policy was for the Government to reach out to its people as much as possible, especially those in the most remote parts. The creation of the Provincial and Local Level Government continues to realise this ambition despite challenges and issues souring the policy intention. The provinces are the
17 MTDPIII 2018, Vol.1, p.40.

2022 National Budget, Volume 1
94
central conduit of delivering public goods and services to the bulk of the population living in rural areas, thus plays a crucial role in development efforts of the Government. The Sector implements government policies, strategies, plans, and legislation and contributes to the development outcomes as enshrined in the MTDP III and other supporting policies and sectoral plans. The current Government focuses on key investments that underpin rural development to achieve broad-based economic growth. The investments include: rehabilitation of health and education facilities; construction of climate resilient inter-provincial and district roads; rural electrification; water and sanitation; and communication and information network that boosts business activities. The total budget appropriation for provinces in 2022 is K4,249.0 million which equates to 19.2 per cent of the total budget. It comprises of K2,541.1 million for Operational and K1,707.9 million in Capital expenditure. The Operational consists of K2,018.6 million in CoE and K522.5 million in G&S. Each provincial administration receives K8.0 million from the total allocation of K178.0 million whilst each district administration receives K8.0 million from the total allocation of K712.0 million.
6.3.12 Transport Sector The Transport Sector is key to advancing PNG’s socio-economic development aspirations into the future. Transport infrastructure of the country is the arteries for economic pulse. The effective transport system and networks with quality infrastructure fosters the efficient flow of goods and services and enhances inclusive and sustainable economic growth. The sector consists of: the Department of Transport (DoT) as the lead agency; Department of Works (DoW); Road Traffic Authority (RTA); National Maritime Safety Authority (NMSA); PNG Ports Corporation Limited (PNGPCL); National Airports Corporation (NAC); Rural Airstrips Authority (RAA); Civil Aviation Safety Authority (CASA); Accident Investigation Commission (AIC); and PNG Air Services Limited (ASL). The major policies that guide the transport sector in achieving the MTDP III goals are: the Medium Term Transport Plan II (2019-2020); National Road Network Strategy 2018-2037; Air Service Policy; Air Transport Policy; International Air Safety and Security Compliance (ICAO); Road Traffic Act; Road Fund Act; National Ports Act; Civil Aviation Safety Act (CASA); National Maritime Act; etc. Furthermore, the current Government has given prominence to the development in the transport sector through NEC Decision No.113/2020 to connect the whole of PNG to provide access to rural communities. The Connect PNG Agenda packages construction and maintenance of roads/missing links, wharfs with electricity and telecommunications lines supported by conducive policy reforms of the state-owned enterprises. The Government will proceed to lock in certain strategic high impact programmes and projects in partnership with development partners. A significant amount of a funding has been expended on the transport sector to unlock potential economic corridors. In the 2022 Budget, the sector will continue to pursue its development aspiration in the transport sector by making strategic investments on missing link roads that cuts through economic potential areas and poverty hotspot zones. Government will also invest in provincial and district roads bridges, wharfs, and airports which are enablers to sustainable economic growth and social developments. The key priority programs/projects for 2022 include the major Connect PNG Roads Program (K500.0 million), Nazab Airport Terminal Redevelopment K181.7 million, and other significant projects including rollout of district and provincial roads.

2022 National Budget, Volume 1
95
The Transport sector receives a total of K1,438.9 million for the 2022 Budget of which K200.8 million is for Operational and K1,238.1 million for Capital expenditure. The total Operational Budget consists of K124.6 million for CoE and K76.2 million for G&S. Total Capital Budget consists of GoPNG direct financing worth K733.5 million whilst K177.8 million in grants and K326.8 million in loans from development partners. 6.3.13 Utilities Sector The Utilities sector is another key connectivity sector. It plays a critical role in facilitating and enabling other sectors’ growth. The Sector comprises: Department of Communication Information Technology; National Broadcasting Corporation (NBC); National Information Communication Technology Authority (NICTA); the Department of Energy; National Housing Corporation (NHC); WaSH Project Management Unit; and State-Owned Enterprises such as PNG Power Limited (PPL); Telikom Limited; PNG DataCo Limited; Water PNG Limited (WPNG); Kumul Consolidated Holdings Limited; and Kumul Telikom Holdings Limited. The major ongoing impact programs and projects for the sector are: National Energy Rollout Plan (NEROP) Generation; Transmission Program; National Broadband Network (NBN) Project; Rural Electrification Program; Hagen Mendi Tari Grid Development Project; Ramu Transmission System Reinforcement Project; and Town Electrification Investment Program (TEIP). The Provincial and District Water Supply & Sanitation Program and National Affordable Land & Housing. The Utilities sector has been allocated K486.8 million in the 2022 Budget of which K37.4 million for Operational expenditure and K449.4 million for Capital expenditure. The Operational Budget consists of K31.7 million in CoE and K5.7 million in G&S. Total Capital Budget comprises of GoPNG direct financing worth K74.5 million whilst K32.8 million grants and K342.0 million loans from development partners. 6.4 EXPENDITURE EFFICIENCY MEASURES
Expenditure efficiency measures will continue to be implemented in the 2022 Budget through the issuance an implementation of Non-Financial Instructions (NFIs) and thorough the activities that will be undertaken by the OSPEAC and AVC. 6.4.1 Non-Financial Instructions All government-funded agencies are expected to report on the implementation status of their 2022 Budgets respectively as part of the Quarterly Budget review process conducted under the Public Finance (Management) Act 1995 every year. NFIs are issued to address inefficiencies associated to a specific agency or to the whole of public services. Below are NFIs issued to specific agencies in 2022.
- National Department of Health (NDoH): To do a policy submission for a new entity to be set
up for procurement of drugs and medical supplies. This is to ensure quality and standards of
drugs and medical supplies are controlled and maintained.
- Conservation and Environment Protection Authority (CEPA): In compliance with the
amended PMMR/NTRA Bill, CEPA, to remit access revenue collected from fees and charges to
the Consolidated Revenue Fund, after adequately funding their cost of operations.

2022 National Budget, Volume 1
96
- National Agriculture Quarantine Inspection Authority (NAQIA): To improve on its
compliance and account for funds it is responsible for.
- Department of Finance (DoF): To cost out the sustainability of the Integrated Financial
Management System (IFMS) and PICAP rollout programmes once they come to completion.
DoF to prepare a sustainability Plan for IFMS and the PCaB under the Financial Monitoring
Improvement Program (FMIP) in anticipation for the closure of the FMIP so that the program is
fully planned and incorporated into their Operational Budget.
- Department of Provincial and Local Level Government Authority (DPLGA): to established
an efficient administration process for payment to councillors and to ensure that allowances are
paid to councillors on time.
6.4.2 Organisational Staffing Personnel Emoluments Audit Committee (OSPEAC) The Government will continue to undertake activities for payroll efficiency in 2022.Through OSPEAC, the Government will scrutinise the public service pay bill, determine causes of the over expenditure in the public service pay bill and recommend and implement corrective measures. OSPEAC has undertaken the whole of Government Staffing and Establishment (S&E) Review, Retirement and the Retrenchment Exercise in 2021.
a) 2021 Staffing and establishment Reviews
The 2021 Staffing and Establishment Reviews were undertaken to identify anomalies against the Ascender Integrated Human Resource (HR) Payroll System, take corrective actions and or recommend corrective actions on the Ascender Integrated HR Payroll System and the agencies manual records and verifying and reporting accurate data in efforts towards setting the 2022 Budget Ceiling. OSPEAC continued the government strategy of bringing the public sector funded pay bill under close scrutiny and control. OSPEAC set out to review inefficiencies in the process that prepares, executes and assures the Personnel Emolument budget. Further to this, concerted effort was placed on validating budget estimates, detailing personnel emolument projections and assessing these estimates against the government’s medium-term fiscal personnel emolument projections. In 2022 OSPEAC will further progress consolidating public service payroll data, with the intent of coordinating whole of government workforce planning. Workforce planning sets benchmarks and in so doing aligns personnel emolument expenditure with specific government deliverables. A coordinated whole of government workforce plan will systematically regulate the growth of the public service. This will provide benchmarks through which estimates for progressive personnel emolument budgets can be developed, project retirement numbers and associated costs, and foresee possible payroll arrears. This in turn provides a basis for assurance, compliance, and ensures that the growth and maintenance of the public service’s manpower provides for and enables the government’s development agenda and service delivery obligations. Furthermore, work will continue to project the growth and cost of the public service workforce (pay roll), define the scale for aligning manpower growth with specific government priorities, the service sector and provide a basis for diagnosing payroll management inefficiencies.

2022 National Budget, Volume 1
97
Work will also review the process that links the budgeting and execution of the government payroll to ensure there is correlation between human resource management functions and processes with the budgeting components of the government payroll. These processes will validate actual manpower numbers against the government payroll and provide basis through which policies, the system and stakeholders are in harmony for the progressive improvement of government payroll management.
b) Public Service Retirement Exercise
In 2021, K430.0 million was allocated for the retirement exercise. The government, through Organisational Staffing and Personnel Emolument Audit Committee (OSPEAC) successfully facilitated three (3) sets of retirement batches at the cost of K217.08 million for 1,941 retirees on compulsory, voluntary, normal and medical grounds. The retirement exercise aimed to retire public servants who have reached the compulsory retirement age and public servants who need to leave the public service on medical grounds. While undertaking the retirement exercise, new initiatives were established for more efficient and effective implementation of the retirement process. These new initiatives include the payout of final entitlements through the ascender payroll and the immediate release of the funding of state component of 8.4 per cent to the superannuation funds. The payment of the state’s portion to Nambawan Super Limited (NSL) and Comrade Trustee Services Limited (CTSL) for the PNG Defence Force retirees was made available after the retirees were terminated from the payroll. The retirement exercise of 2021 is the first to ensure the state’s portion is paid alongside the final entitlement. This initiative was established to avoid legal implications of non-compliance, penalty charges and minimise the accumulation of states liabilities going into the future. This will be rolled out in upcoming retirement exercises. In 2022, K200.0 million is allocated for the retirement exercise. This funding will be utilised to facilitate the payment of final entitlements and the state’s share (8.4 per cent) for the projected 575 public servants who will be reaching the compulsory retirement ages in 2022. The graph below shows that the looming highest number of retirees is in 2025 and lowest is in 2022. This is because, in 2025, an estimated total of 5,489 officers will reach the compulsory retirement ages (61-65+ years) compared to 2022 with the lowest number of officers projected to be in the compulsory retirement ages. The projection excludes early retirement (50-54 years), normal retirement (55-60 years), medical retirement, and part of the compulsory retirement ages (61-64 years) category. It is imminent that there will be a spike for each age’s category inclusive of medical retirement and aggregate is expected to increase by the same magnitude. Further to this, following the 2021 Staffing and Establishment review the number of officers that will have reached the compulsory retirement age may potentially rise as agencies have begun to periodically correct their payroll data (specifically officers correct dates of birth).

2022 National Budget, Volume 1
98
Chart 38: Medium Term Retirement Plan
Source: Ascender payroll
Concerted effort was made by all departments involved in the retirement process to expedite outstanding retirement and ensure the processing of current retirees was managed and executed through an efficient process. In doing so the rate of retirement of public servants versus retirement submissions has had marked improvement. Between 2017 and 2019 the rate of servicing retirement was consistently below 20.0 per cent. However, with the combined efforts of partner OSPEAC agencies the success of servicing retirement rose to 25.0 per cent and 36.0 per cent in the 2020 and 2021 Budgets. In 2021, OPEAC developed new workable initiatives that will contribute towards the efficiency of the retirement process. These new initiatives include;
payout of final entitlements through the payroll,
making available the state component of 8.4 per cent to the superannuation funds,
creation of a repatriation port on the payroll and
ensuring the personnel emoluments liabilities for the retirees are captured together with the final entitlement.
In 2022 OSPEAC will look to maintain efforts to service the retirement of public servants that have reached the compulsory retirement age. OSPEAC will look to service retirement for the service sector, specifically the Health and Education sectors in the first half of the year and attend to the Law and Justice, Economic and Infrastructure sectors in the final two quarters of the year. The management of other human resource inefficiencies will ensue OSPEAC’s drive in retirement. Retirement progresses staff movement and, on the whole, will have incremental effects on the overall government management of cost implications. 6.4.3 Industrial Awards The Memorandum of Agreements between the Government and Public Sector Unions is currently undergoing negotiation.
575 663 945
5,489
1,204 1,000
1,688 1,854 1,812
1,188
-
1,000
2,000
3,000
4,000
5,000
6,000
2022 2023 2024 2025 2026 2027 2028 2029 2030 2031
Nu
mb
er o
f R
etir
ees
(65
+)
Projected years
10 year retiree Projection by Count
2022 National Budget, Volume 1
99
The Industrial awards for Public Sector Unions expired in 2019. Discussion is underway to capture and accommodate wage increments within the 2022 Budget framework. In 2021, the Government received submissions from the following Unions:
1. PNG Nurses Association (PNGNA); 2. Public Service Employees Association (PEA); 3. Medical Laboratory Technical Personnel Association (MLTPA); 4. PNG Health Extension Association (PNGHEA); and 5. National Doctors Association (NDA).
Treasury in partnership with the Department of Personnel Management will be assessing the cost implications of Union submissions in regards to the growth of their respective manpower in line with the governments service delivery priorities and set performance standards.
6.4.4 Arrears Verification Committee The objective of the Arrears Verification Program is to identify, verify, clear, mitigate and manage incurrence of future arrears. The current estimated stock of Government Arrears is around K5.2 billion. Through the course of implementing the arrears program in 2020 and 2021, the AVC has identified numerous flaws in the procurement of goods, works and services by Government agencies. To date, about 80.0 per cent of the arrear claims channelled through the Arrears Program for settlement are either ‘partially compliant’ or ‘non-compliant’ to the procurement processes. The claims are either: in breach of the Public Financial (Management) Act 1995; in breach of the National Procurement Act 2018; claims by and against the State Act 1996; or non-compliant to the AVC criteria To address these compliance issues, a number of NFI relating to arrears are issued to address inefficiencies leading to arrears build up. This includes:
- Department of Treasury and Finance to complete Arrears Verification and Management
Strategy paper.
- Department of Finance to conduct awareness to re-emphasise the importance of procurement
processes and the penalties for breach of the National Procurement Act 2018 and the Public
Financial Management Act 1995 and other related legislations around procurement.
- All agencies still utilising independent accounting systems to immediately transit onto IFMS.
- Government agencies must enter into contracts to hire vehicles when engaged for indefinite
periods of time, which could potentially increase bills above the departmental head threshold.
- All legal bills (from private law firms) need to be vetted and taxed by Office of Solicitor General
prior to payments.
6.5 Donor Funding from Development Partners
The Government of PNG has been receiving development cooperation assistance through its partner countries through different development aid modalities since independence in 1975. These are done through loans, grants, technical assistance, budget support, blended financing, south-south and triangular cooperation. The development cooperation support comes from PNG’s Bilateral & Multilateral Partners, International NGOs, Regional Organisations through South-South Cooperation, Private Sector Foundations and Climate Finances. The grants and loans are significant sources of revenue

2022 National Budget, Volume 1
100
that support the operational and capital investment budget. With the formulation of MTDP III in 2018, most development partners have aligned their country strategies to the priorities of the Government. The Marape Government will continue to rely on development cooperation to pursue cheap concessional financing from development partners to support its key investment initiatives such as Connect PNG, SME Support Program, Agriculture Commodities Support and Expansion Program, and National Electrification and Communication Rollout Program. The total Development Partner assistance in 2022 (Grants and Loans) is K2,893.3 million which makes up 33.0 per cent of the total 2022 capital expenditure amount of K8,751.6 million. The total grants and loans figures for 2022 represent an increase of K246.6 million or 9.3 per cent compared to grants/loan figures in 2021 Capital Investment Budget (CIB)18. Despite the challenges of COVID-19, the loans and grants continue to provide key support to transport infrastructure, health, education, law and justice, technical support, capacity building, climate change and environmental support, and addressing cross-cutting issues. The total Development Partners grants for 2022 is K1,574.9 million which makes up 18.0 per cent of the total 2022 capital budget of K8,751.6 million. This is an increase of K566.6 million increase from the 2021 grants allocation of K1,008.0 million. The Government of Australia through its Department of Foreign Affairs and Trade (DFAT) provides the largest share of grants totaling up to K1,093.3 million. The other Development Partners that are also providing grants in 2022 include the EU, UNS, JICA, PRC, NZAID, USAID and GPE. The acquired, as well as new loans to be drawn down in 2022, totals K1,318.4 million which is 15.0 per cent of the 2021 CIB of K8,751.6 million. This is a decrease of K320.0 million from the 2021 total loan budgeted. The World Bank is the largest loan financier for PNG in 2022 followed by ADB, China and Japan. Other financiers include DFAT-Australia, IFAD and Korean EXMIN. An overview of funding from PNG’s Development Partners are shown below. Table 21: 2021 Loans, Grants and Government Counterpart funding (Kina, Million)
Development Partners Grants Loans Counterpart
2022 Total (G+L+CP)
Australia 1,004.85 88.42 19.0 1,222.30
EU 92.47 2.5 95.0
UN 220.21 220.2
NZ 18.17 18.2
China 122.0 202.0 35.5 479.5
ADB 35.09 237.59 35.5 308.2
World Bank 318.6 12.0 330.6
Japan 61.62 134.69 24.5 270.80
Ceska/Erste 5.0 5.0
EIB 5.0
Korean EXMIN 7.20 7.0 14.0
IFAD 1.75 45.08 2.0 48.9
USA 13.74 13.7
GPE 5.0 5.0 10.0
Total 1,574.9 1,318.4 143.5 3,036.8 Source: Department of National Planning & Monitoring
18 2021 CIB is K6,713.91m

2022 National Budget, Volume 1
101
6.6 STATUS OF TRUST ACCOUNTS
Pursuant to Section 15 of the Public Finance Management Act (PFMA), (Amended 2016), the Department of Finance (DoF) gives authorisation to any government institution, whether it be Statutory Authority or National Department, to establish and operate trust accounts, either, National Budget, Donor Funded or Counter Funded. The purpose of holding funds in Trust Accounts is to spread spending over time to help manage inflationary pressures in the economy and to give time to government agencies to properly plan and implement their priority projects. A total of K13,625.1 million (K13,167.2 million from 2020 FBO + K457.9 million in 2021), up to and including the 2021 Budget appropriations has been expended through the Budget Funded Trust Accounts since 2005 for the implementation of government’s various priority programs. These trust accounts have largely been funded from additional mineral revenue in Supplementary Budgets and Annual Budgets. The following is the expenditure report for all the budget funded trust accounts from 1st January to 30th September, 2021. As at the reporting date, the trust account appropriations for the 2021 Budget cannot be highlighted as all these funds were and could still be issued directly to the department and agencies concerned. Including the 2021 appropriations for trust accounts in 2021 Budget a total of K457.9 million have being expended from January up to September 2020.
Table 22: Movement of Funds in Budget Funded Trust Accounts from 1st January – 30th September
2021 (Kina, million).
Trust Account Name
Balance as at
01-Jan-2021
Debit (Receipts)
Credit (Payments)
Balance as at
30-Sep-2021
Flexible, Open and Distance Education (FODE) Rehabilitation - GoPNG
0.0 0.5 0.3 0.3
Tuition Fee Free Education Trust Account (Main) 86.9 311.0 269.0 128.9
Tuition Fee Free Education - Commodity Component Trust
25.7 49.0 0.1 74.6
PNG Rural Communications Project GOPNG 0.7 0.0 0.5 0.3
PNG Fire Service Infrastructure Rehabilitation Program - (PIP) T/A
0.0 0.4 0.4 0.0
National Road Maintenance Policy TA 0.0 0.0 0.0 0.0
Highlands Highway Rehabilitation T/A Subsidiary 0.0 0.0 0.0 0.0
Port Moresby Roads Trust Account 0.1 0.0 0.0 0.1
Lae City Roads Rehabilitation Trust Subsidiary 2 0.0 0.0 0.0 0.0
Small Medium Enterprise (SME) Risk Sharing Facility (GoPNG)
2.0 0.0 1.8 0.2
Central City Trust Account 26.9 0.0 0.0 26.9
Restoration and Development Grant Trust 0.0 0.0 0.0 0.0
Restoration and Development Grant Subsidiary Account
0.0 0.0 0.00 0.0
Special Intervention Funds (Established on 28 Feb 2014)
0.0 0.0 0.0 0.0
PNG LNG Additional State Equity Financing Trust Account
0.7 0.0 0.0 0.7
Financial Management Improvement Programme (FMIP) - GoPNG
2.0 10.2 9.8 2.3

2022 National Budget, Volume 1
102
Trust Account Name
Balance as at
01-Jan-2021
Debit (Receipts)
Credit (Payments)
Balance as at
30-Sep-2021
Infrastructure Development (UBSA) Grant (IDG) Account - Main
7.9 0.0 0.0 7.9
Infrastructure Development (UBSA) Grant Account (IDG) Sub
1.4 0.0 0.0 1.4
PNG High Impact Infrastructure Projects 0.0 0.0 0.0 0.0
PNG High Impact Infrastructure Projects Sub 0.7 0.0 0.0 0.7
Public Service Audit Program 0.6 0.1 0.1 0.6
2017 PNG National General Election - Finance, Procurement, Personnel and Logistic Trust
0.0 0.0 0.0 0.0
NAOSPIII GoPNG Counterpart Funds (European Union)*
0.0 0.0 0.0 0.0
Department of Prime Minister & NEC APEC Operations (OP) Plan 2018 TA
0.0 0.0 0.0 0.0
APEC – Authority 0.0 0.0 0.0 0.0
APEC - Joint Securities Task Force (JSTF) 0.0 0.0 0.0 0.0
Highlands Region Road Improvement Investment Program (HRRIP) Project 2 - GoPNG Counterpart Funding TA
6.5 0.0 0.0 6.5
Productive Partnership in Agriculture Project (PPAP) GoPNG TA*
4.7 1.4 0.0 6.1
Multiple LNG Development Trust Account 1.0 1.1 1.7 0.4
Resettlement of Volcano Victims TA 0.0 0.0 0.0 0.0
Regional, Provincial Treasury and District Admin. Offices
0.0 0.0 0.0 0.0
Coastal Vessels Account 0.1 0.0 0.0 0.1
Water Supply Sanitation Development Project – GoPNG
2.7 0.0 0.0 2.7
Rural Service Delivery and Local Governance Project
0.1 2.1 2.1 0.1
Bougainville Referendum Non-Electoral Support Funds Operating Account
1.0 0.0 0.0 1.0
Land Reform Trust Account 0.0 0.0 0.0 0.0
Department of Justice & Attorney General PILON Trust Account
1.0 2.1 1.7 1.4
Search & Rescue Operation Trust Account 15.0 10.0 0.0 25.0
Oil Spill Response Emergency Trust Account 15.0 10.0 0.0 25.0
Southern Highlands Province Airport Development Trust Account
0.0 0.0 0.0 0.0
Dept. of Finance Infrastructure Project 2.7 0.0 0.1 2.7
Jiwaka Provincial Headquarter Project Trust Account 5.0 2.0 0.0 7.0
Tsak Valley Electrification Project - GoPNG Counterpart Fund
9.5 0.0 6.0 3.5
Mendi Provincial HRRIIP Project 2 - GoPNG C/part Fund
0.0 0.0 0.0 0.0
Mt Hagen Provincial HRRIIP Project 2 - GoPNG C/part Fund
0.0 0.0 0.0 0.0
2020 National Population and Housing Census Trust Account
6.4 0.0 5.2 1.2
Kokopau to Arawa Road 0.0 0.0 0.0 0.0
Sports Infrastructure Trust Account 0.1 0.0 0.0 0.1
Higher Education Loan Program 1.4 27.5 2.9 26.1
Trans East West New Britain Highway 0.1 0.0 0.0 0.1
Mukurumanda Jail Project Trust Account 4.3 0.0 0.5 3.8

2022 National Budget, Volume 1
103
Trust Account Name
Balance as at
01-Jan-2021
Debit (Receipts)
Credit (Payments)
Balance as at
30-Sep-2021
Markets for Village Farmers TA 0.6 2.9 0.1 3.4
Connect PNG Economic Road Transport Infrastructure Dev. Prog. TA
133.1 31.3 103.1 61.3
Total 366.0 461.5 405.1 422.6 Source: Department of Finance. Note:
1. The total January opening balance of all Budget Funded trust accounts has changed from the one previously reported in the 2021 MYEFO Report because some new budget funded trust accounts has being added onto the list.
2. The Tuition Fee Free (TFF) Education trust accounts receipts and expenses are inclusive of both the TFF Fee component and the Commodity component of Free Education Policy initiated by the previous O’Neil-Abel Government. The receipt and expenditure also reflects all its subsidiary accounts.
3. Trust Accounts that has balances below K20 000 are represented by K0.01 million and below K10 000 are reflected as zero balance.
4. * - The balances and fund movements of the trust accounts with asterisk could not be fully determined due to non – availability of bank statements at the time of MYEFO Report preparation.
The opening balance of the Budget Funded Trust Accounts as at 1st January 2021 was K495.9 million (inclusive of COVID-19 Trust balances). Expenditure incurred in this period totalled K457.9 million with K464.3 million as receipts within the same period and the closing balance as at 30th September 2021 was K502.5 million. Following is a summary of expenditures above K5.0 million from Budget Funded Trust Accounts for the period 1st January to 30th September 2021
K268.9 million was expended on the Government Tuition Fee Subsidy (GTFS) program;
K103.1 million was expended on the Connect PNG Economic Road Transport Infrastructure Development Program.
K52.8 million was expended on the COVID-19 related expenses.
K9.8 million was expended on the Financial Management Improvement Program (FMIP) project.
K5.2 million was expended on the 2020 National Population and Housing Census Trust Account to prepare for the 2022 National Elections.
Many Trust Accounts above did not incur expenses and it is assumed the operations of the trust accounts might have been affected by the recent impact of COVID-19 pandemic thus, a decrease in expenses including the receipts into trust accounts. A total of only K2.8 million was paid to three (3) districts from the COVID-19 Emergency Trust Accounts during the third quarter of 2021. The total funds expended for the COVID-19 related activities for both the districts and provincial accounts amounted to K52.8 million from an opening balance of K129.9 million as at 1st January 2021, thus having K79.9 million balance as at 30th September 2021. The funds in those COVID-19 Trust Accounts could still be accessed and used throughout the year by the respective provinces and districts.
Table 23: List for the 22 COVID-19 Provincial Subsidiary Trust Accounts and the movement of
funds from 1st Jan to 30th September 2021 (Kina, millions)
NO: COVID-19 Emergency, Provincial
Subsidiary Account Names
Opening Bal as at 01
Jan 2021 Receipts Payments
Closing Bal as at 30
Sept 2021
1 COVID -19 Emergency Trust Account – Enga Province
2.2 0.0 1.3 0.9

2022 National Budget, Volume 1
104
NO: COVID-19 Emergency, Provincial
Subsidiary Account Names
Opening Bal as at 01
Jan 2021 Receipts Payments
Closing Bal as at 30
Sept 2021
2 COVID -19 Emergency Trust Account – Hela Province
0.8 0.0 0.0 0.8
3 COVID -19 Emergency Trust Account – Southern Highlands Province
1.1 0.0 0.8 0.2
4 COVID -19 Emergency Trust Account – Western Province
1.5 0.0 0.0 1.5
5 COVID -19 Emergency Trust Account – Western Highlands Province
0.9 0.0 0.0 0.9
6 COVID -19 Emergency Trust Account – Eastern Highlands Province
1.0 0.0 0.9 0.2
7 COVID -19 Emergency Trust Account – Morobe Province
1.1 0.0 0.0 1.1
8 COVID -19 Emergency Trust Account – Madang Province
0.0 0.0 0.0 0.0
9 COVID -19 Emergency Trust Account – East Sepik Province
1.3 0.0 1.1 0.2
10 COVID -19 Emergency Trust Account – West Sepik Province
1.2 0.0 1.1 0.2
11 COVID -19 Emergency Trust Account – Milne Bay Province
1.2 0.0 0.8 0.4
12 COVID -19 Emergency Trust Account – Oro Province
0.4 0.0 0.4 0.0
13 COVID -19 Emergency Trust Account – National Capital District
1.3 0.0 0.2 1.1
14 COVID -19 Emergency Trust Account – Central Province
1.3 0.0 -0.7 2.0
15 COVID -19 Emergency Trust Account – East New Britain
1.5 0.0 1.4 0.2
16 COVID -19 Emergency Trust Account – West New Britain
1.5 0.0 0.5 1.0
17 COVID -19 Emergency Trust Account – New Ireland Province
1.5 0.0 0.2 1.4
18 COVID -19 Emergency Trust Account – Jiwaka Province
1.2 0.0 1.2 0.0
19 COVID -19 Emergency Trust Account – Simbu Province
0.4 0.0 0.4 0.0
20 COVID -19 Emergency Trust Account – Manus Province
2.5 0.0 0.0 2.5
21 COVID -19 Emergency Trust Account – Gulf Province
1.2 0.0 0.1 1.1
22 COVID -19 Emergency Trust Account – Autonomous Region of Bougainville
0.4 0.0 -0.8 1.2
TOTAL 25.8 0.0 8.9 16.9
Source: Department of Finance
Table 24 below shows List for the 89 COVID-19 District Subsidiary Trust Accounts and the movement of funds from 1st July to 30th September 2021.

2022 National Budget, Volume 1
105
Table 24: List for the 89 COVID -19 District Subsidiary Trust Accounts and the movement of funds
from 1st Jan to 30th September 2021 (Kina, millions)
NO: COVID – 19 Emergency, District
Subsidiary Account Names
Opening Bal as at 01
Jan 2021 Receipts Payments
Closing Bal as at 30
Sept 2021
1 COVID -19 Emergency Trust Account – Middle Fly District
2.0 0.0 0.2 1.8
2 COVID -19 Emergency Trust Account – North Fly District
2.0 0.0 0.4 1.5
3 COVID -19 Emergency Trust Account – South Fly District
1.6 0.0 1.1 0.5
4 COVID -19 Emergency Trust Account – Kerema District
1.5 0.0 1.0 0.5
5 COVID -19 Emergency Trust Account – Kikori District
1.8 0.0 0.9 1.0
6 COVID -19 Emergency Trust Account – Goilala District
1.4 0.0 1.3 0.1
7 COVID -19 Emergency Trust Account – Rigo District
0.7 0.0 0.6 0.0
8 COVID -19 Emergency Trust Account – Abau District
0.0 0.0 0.0 0.0
9 COVID -19 Emergency Trust Account – Kairuku Hiri District
0.0 0.0 0.0 0.0
10 COVID -19 Emergency Trust Account – Moresby South District
0.4 0.0 0.4 0.0
11 COVID - 19 Emergency Trust Account – Moresby North East
2.1 0.0 2.0 0.1
12 COVID -19 Emergency Trust Account – Moresby North West
1.7 0.0 0.0 1.7
13 COVID -19 Emergency Trust Account – Kiriwina Goodenough District
0.0 0.0 0.0 0.0
14 COVID -19 Emergency Trust Account – Central Bougainville District
1.9 0.0 0.5 1.5
15 COVID -19 Emergency Trust Account – Esa’ala District
2.0 0.0 1.7 0.4
16 COVID -19 Emergency Trust Account – Samarai Murua District
0.9 0.0 0.9 0.0
17 COVID -19 Emergency Trust Account – Ijivitari District
0.9 0.0 0.9 0.0
18 COVID -19 Emergency Trust Account – Kagua Erave District
1.5 0.0 0.8 0.7
19 COVID -19 Emergency Trust Account – Imbongu District
2.0 0.0 1.5 0.5
20 COVID -19 Emergency Trust Account – Mendi District
0.6 0.0 0.1 0.5
21 COVID -19 Emergency Trust Account – Ialibu Pangia District
2.0 0.0 0.1 2.0
22 COVID -19 Emergency Trust Account – Nipa Kutubu District
0.0 0.0 0.0 0.0
23 COVID -19 Emergency Trust Account – Tari Pori District
2.0 0.0 0.0 2.0
24 COVID -19 Emergency Trust Account – Komo Magarima District
2.0 0.0 0.7 1.4
25 COVID -19 Emergency Trust Account – Koroba Kopiago District
2.0 0.0 0.5 1.6
26 COVID -19 Emergency Trust Account – South Bougainville District
0.7 0.0 0.7 0.0

2022 National Budget, Volume 1
106
NO: COVID – 19 Emergency, District
Subsidiary Account Names
Opening Bal as at 01
Jan 2021 Receipts Payments
Closing Bal as at 30
Sept 2021
27 COVID -19 Emergency Trust Account – Wabag District
1.7 0.0 0.7 1.0
28 COVID -19 Emergency Trust Account – Kandep District
1.8 2.0 0.7 1.1
29 COVID -19 Emergency Trust Account – Laiagap Pogera District
2.5 0.0 0.0 2.5
30 COVID -19 Emergency Trust Account – Wapenamanda District
2.0 0.0 1.5 0.6
31 COVID -19 Emergency Trust Account – Kompiam Ambum District
1.8 0.0 0.1 1.7
32 COVID -19 Emergency Trust Account – Tambul Nebilyer District
0.3 0.0 0.2 0.1
33 COVID -19 Emergency Trust Account – Mul Baiyer District
0.3 0.0 0.3 0.0
34 COVID -19 Emergency Trust Account – Dei District
2.0 0.0 0.4 1.7
35 COVID -19 Emergency Trust Account - Hagen District
0.1 0.0 0.0 0.1
36 COVID -19 Emergency Trust Account - North Waghi District
1.8 0.0 0.6 1.2
37 COVID -19 Emergency Trust Account – Anglip South Waghi District
1.1 0.0 1.1 0.0
38 COVID -19 Emergency Trust Account – Jimi District
0.5 0.0 0.5 0.0
39 COVID -19 Emergency Trust Account – Kerawagi District
0.3 0.0 0.3 0.0
40 COVID -19 Emergency Trust Account – Kundiawa/ Gembogle District
0.7 0.0 0.4 0.2
41 COVID -19 Emergency Trust Account – Sinesine Yongomul District
1.5 0.0 0.6 0.9
42 COVID -19 Emergency Trust Account – Karamui Nomane District
0.6 0.0 0.6 0.0
43 COVID -19 Emergency Trust Account – Gumini District
1.0 0.0 0.8 0.2
44 COVID -19 Emergency Trust Account – Chuave District
0.0 0.0 0.0 0.0
45 COVID -19 Emergency Trust Account – Daulo District
1.0 0.0 1.0 0.0
46 COVID -19 Emergency Trust Account – Goroka District
1.6 0.0 1.2 0.4
47 COVID -19 Emergency Trust Account – Ungai Bena District
2.0 0.0 1.8 0.2
48 COVID -19 Emergency Trust Account – Henganofi District
0.7 0.0 0.7 0.0
49 COVID -19 Emergency Trust Account – Lufa District
0.4 0.0 0.1 0.3
50 COVID -19 Emergency Trust Account – Okapa District
2.0 0.0 2.0 0.0
51 COVID -19 Emergency Trust Account – Kainantu District
0.7 0.0 0.7 0.0
52 COVID -19 Emergency Trust Account – Obura Wonenara District
0.6 0.0 0.4 0.2
53 COVID -19 Emergency Trust Account – Tewai Siasi District
0.9 0.7 1.4 0.2
54 COVID -19 Emergency Trust Account – 1.0 0.0 0.7 0.3

2022 National Budget, Volume 1
107
NO: COVID – 19 Emergency, District
Subsidiary Account Names
Opening Bal as at 01
Jan 2021 Receipts Payments
Closing Bal as at 30
Sept 2021 Markham District
55 COVID -19 Emergency Trust Account – Huon Gulf District
1.1 0.0 1.0 0.1
56 COVID -19 Emergency Trust Account – Lae District
1.6 0.0 1.1 0.5
57 COVID -19 Emergency Trust Account – Kabwum District
0.7 0.0 0.2 0.5
58 COVID -19 Emergency Trust Account – Bulolo District
0.0 0.0 0.0 0.0
59 COVID -19 Emergency Trust Account - Minyamya District
1.5 0.0 1.5 0.0
60 COVID -19 Emergency Trust Account – Finchafen District
0.1 0.0 -3.0 3.0
61 COVID -19 Emergency Trust Account – Nawaeb District
0.4 0.0 0.3 0.1
62 COVID -19 Emergency Trust Account – Middle Ramu District
7.0 0.0 0.4 6.7
63 COVID -19 Emergency Trust Account – Rai Coast District
0.1 0.0 0.0 0.1
64 COVID -19 Emergency Trust Account – Madang District
2.0 0.0 0.0 2.0
65 COVID -19 Emergency Trust Account – Bogia District
0.1 0.1 0.1 0.0
66 COVID -19 Emergency Trust Account – Usino Bundi District
0.6 0.0 0.6 0.0
67 COVID -19 Emergency Trust Account – Sumkar District
0.1 0.0 0.1 0.0
68 COVID -19 Emergency Trust Account – Yangoru Saussia District
0.9 0.0 0.6 0.3
69 COVID -19 Emergency Trust Account – Wewak District
0.1 0.0 0.1 0.0
70 COVID -19 Emergency Trust Account – Wosera Gawi District
0.5 0.0 0.4 0.1
71 COVID -19 Emergency Trust Account - Ambunti Drekikir District
0.8 0.0 0.0 0.8
72 COVID -19 Emergency Trust Account – Maprik District
0.3 0.0 0.1 0.2
73 COVID -19 Emergency Trust Account – Angoram District
2.0 0.0 1.1 1.0
74 COVID -19 Emergency Trust Account – Telefomin District
0.4 0.0 0.2 0.2
75 COVID -19 Emergency Trust Account – Vanimo Green District
0.8 0.0 0.6 0.1
76 COVID -19 Emergency Trust Account – Nuku District
0.8 0.0 0.4 0.4
77 COVID -19 Emergency Trust Account – Aitape Lumi District
1.5 0.0 0.3 1.2
78 COVID -19 Emergency Trust Account – Manus District
2.0 0.0 0.9 1.2
79 COVID -19 Emergency Trust Account – Kavieng District
1.0 0.0 -0.3 1.3
80 COVID -19 Emergency Trust Account – Namatanai District
0.0 0.0 -1.0 1.0
81 COVID -19 Emergency Trust Account – Pomio District
1.9 0.0 1.1 0.8

2022 National Budget, Volume 1
108
NO: COVID – 19 Emergency, District
Subsidiary Account Names
Opening Bal as at 01
Jan 2021 Receipts Payments
Closing Bal as at 30
Sept 2021
82 COVID -19 Emergency Trust Account – Rabaul District
2.0 0.0 0.0 2.0
83 COVID -19 Emergency Trust Account – Gazelle District
2.0 0.0 0.5 1.6
84 COVID -19 Emergency Trust Account – Kokopo District
0.7 0.0 0.6 0.1
85 COVID -19 Emergency Trust Account – Talasea District
2.0 0.0 -3.0 5.0
86 COVID -19 Emergency Trust Account – Kandrian Gloucester District
1.7 0.0 0.6 1.1
87 COVID -19 Emergency Trust Account – North Bougainville District
1.0 0.0 1.0 0.0
88 COVID-19 Emergency Trust Account – Sohe District
0.4 0.0 0.4 0.0
89 COVID-19 Emergency Trust Account – Alotau District
1.2 0.0 0.8 0.5
TOTAL 104.1 2.8 43.9 63.0 Source: Department of Finance. Note:
1. All the figures above are reported to the nearest millions. 2. N/A – The banks statements of the two trust accounts were not available at the time the report was compiled but could
still be reported in 2021 Final Budget Outcome (FBO).

2022 National Budget, Volume 1
109
CHAPTER 7: TAX EXPENDITURE 7.1 OVERVIEW
7.1.0 Tax Expenditure The Government provides tax incentives in order to achieve a particular public policy objective. Tax incentives are provided through the tax system to attract and retain investments in the domestic economy, develop the private sector, encourage employment and support social welfare. Such incentives can potentially result in foregone revenue and deemed as tax expenditure. Tax expenditures may be defined as redirected government spending through the tax system such as tax holidays, additional deductions, tax credits and reduced tax rates, in pursuit of specific government policy. Tax incentives are classified into cost-based and profit-based incentives. Incentives provided in relation to actual investment expenditure, which do not result in direct revenue foregone are considered as cost-based incentives such as accelerated depreciation allowances, tax investment credits, and allowances. The profit-based incentives have direct impact on the level of income tax paid by the taxpayers such as the 10-year tax holiday and tax rates reduction. Many international and domestic reports on tax incentives recommended to favour the use of cost-based incentives. Data Authenticity The data presented below are statistics as reported by the taxpayer. The self-reported figures may suffer from gross inaccuracies because of human errors and omissions. The calculation of actual revenue foregone from these incentives is an exercise in micro-simulation. Each subsequent issue of the TES will also revisit the models previously made and try to improve the accuracy of the estimates. 7.1.1 Tax Incentives in PNG Although the Government provides a number of tax incentives to taxpayers, to achieve certain policy objectives, such incentives often imply ‘revenue foregone’ or expenditure operating outside of the normal budget. Therefore, these tax expenditures are not subject to budget scrutiny and are not accounted for and transparent. The reporting of the tax incentives as the Government tax expenditure provides the visibility to the policy makers to make better decisions on the granting of the tax incentives. The data presented below are statistics as reported by the taxpayers when lodging tax returns with the IRC. The 2022 Budget coverage of the Tax Expenditure Statement captures tax incentives provided in the Income Tax Act 1959, Goods and Services Act 2003, Customs Tariff Act 1990 and Excise Tariff Act 1956. The Government, in the recent budgets, repealed some tax incentives in the Income Tax Act 1959 (ITA). These incentives will no longer be reported in the Tax Expenditure Statement and they include:

2022 National Budget, Volume 1
110
Bougainville Incentives, Section 45N of ITA 1959;
Double deduction on educational expenses, Section 70A of ITA 1959;
Double deduction for staff training, Section 72(A) of ITA 1959;
Research and Development expenditure, Section 95(1) of ITA 1959; and
Double deduction on exploration expenditure (Mining), Section 156E of ITA 1959. The tax expenditure statement is divided into two (2) sections – non-resource and resource sector. For 2020, only revenue forgone for the non-resource sector is reported. The revenue forgone for the resource sector is not reported due to the unavailability of the tax incentive data. This is due to extension of lodgement period as part of the COVID-19 tax administrative relief measure which has affected timely reporting. The missing information will be included in the subsequent budget. 7.2 TAX INCENTIVES IN THE INCOME TAX ACT (ITA) 1959
7.2.1 Interest
Revenue Forgone (Kina, million)
2018 2019 2020
Non- Resource 5.2 3.2 4.4
Resource 2.1 11.8 N/A
Legislative Reference Section 35 of ITA 1959 Note: Data for resource sector is not available at the time of reporting. This will be reported in the proceeding Budget.
This incentive allows certain interest earning entities and assets to be exempted from the interest withholding tax (IWT) of 15.0 per cent. This includes interest earned on long term bonds, Central Bank authorised foreign currency deposits and the participants and lender of the PNG LNG project. In 2019, total IWT exempted was K3,231,977.0. Twelve (12) taxpayers were exempted from IWT from interest earned. In 2020, total IWT exempted was K4,421,339.3, a 37.0 per cent increase from 2019. Six (6) taxpayers were exempted from IWT from interest earned. 7.2.2 Dividends
Revenue Forgone (Kina, million)
2018 2019 2020
Non- Resource 4.0 0.0 0.5
Resource 0.0 0.0 N/A
Legislative Reference Section 42(3) of ITA 1959
Income from petroleum or gas operations earned by shareholders paid as dividends, is exempt from income tax. In other words, such income does not form part of the assessable income of the taxpayers if the income was paid as dividends which originated from a petroleum or gas operation. In 2019, total dividends earned by shareholders exempted from the DWT was K5,320.0. Four (4) taxpayers were exempted from DWT.

2022 National Budget, Volume 1
111
In 2020, total interest withholding tax exempted was K474,056.0. Eight (8) taxpayers were exempted from interest withholding tax from interest earned.
7.2.3 Rural Development Incentive
Revenue Forgone (Kina, million)
2018 2019 2020
Non- Resource 0.1 0.1 0.0
Resource 0.0 0.0 N/A
Legislative Reference Section 45I of ITA 1959
This incentive provides a 10-year tax holiday to new businesses set up in designated under-developed districts prescribed in the ITA, that are not dependent on the exploitation of natural resources. Income earned by those businesses are exempted from income tax for ten (10) years upon the date of commencement to the last day of the tenth year. Losses arising from the exempted activities may be deducted against taxable income from other activities. This incentive is to encourage investment in those least developed prescribed Districts. RDI will be reviewed in 2022 to determine its relevance in some of the prescribed districts 7.2.4 Gifts
Revenue Forgone (Kina, million)
2018 2019 2020
Non- Resource 0.3 1.7 0.2
Resource 0.0 10.2 N/A
Legislative Reference Section 69 of ITA 1959 Note: Data for resource sector is not available at the time of reporting. This will be reported in the proceeding Budget.
Expenditures to charitable organisations and other humanitarian foundations, including political parties are allowed as a direct deduction or in some cases a double deduction. Some of these organisations include: political parties; sporting bodies; South Pacific Games 1991 (repealed); foundations for law, order and justice; charitable bodies; national day celebrations; Pacific Games 2015; relief aid for natural disasters; and national day celebrations. The deductions allowed to Charitable Bodies or Organisations will be reviewed in 2022 to assess its relevant. In 2019, total deductions from expenditure to charitable organisations and other humanitarian foundations was K1,698,192.0. Twenty (20) firms participated in this incentive. In 2020, total deductions for expenditure to charitable organisations and other humanitarian foundations were K169,271.4. Thirteen (13) firms participated in this incentive. 7.2.5 Double Deduction – Export Market Development
Revenue Forgone (Kina, million)
2018 2019 2020
Non- Resource 0.1 0.0 0.0
Resource 0.0 0.0 N/A
Legislative Reference Section 72(C) of ITA 1959
This incentive is to encourage and promote export of goods manufactured in PNG.

2022 National Budget, Volume 1
112
Subject to Commissioner General’s (CG) determination, an expenditure incurred by a taxpayer on export market development (i.e. expenditure incurred in the production or manufacture of goods and services for export) is allowed twice the amount of expenditure as deduction but only to the extent that the tax savings from such additional deduction is up to 75.0 per cent of the expenditure and not more. This is done to encourage PNG’s products to be exported. This incentive will be reviewed in 2022 to determine its relevance. In 2019, total deductions from expenditures incurred in the production of goods and services for export was K27,371.5. Four (4) firms participated in this incentive. These firms were operating under the manufacturing sector. In 2020, total deductions from expenditures relating to export market development was K26,430.3. Three (3) firms participated in this incentive. 7.2.6 Double Deduction – Tourism
Revenue Forgone (Kina, million)
2018 2019 2020
Non- Resource 0.2 0.1 0.0
Resource 0.0 0.0 N/A
Legislative Reference Section 72(C) of ITA 1959
This incentive is to encourage and promote development of tourism in PNG.
Subject to the CG’s determination, an expenditure incurred by a tax payer for the development of tourism (i.e. expenditure incurred towards promoting tourism) is allowed twice the amount of expenditure as deduction but only to the extent that the tax savings for such additional deduction is up to 75.0 per cent of the expenditure. In 2019, total deductions from expenditures incurred towards promoting tourism was K79, 814.0. Four (4) firms participated in this incentive. In 2020, total deductions from expenditures relating to tourism is K25,386.1. Two (2) firms under Forestry sector were using this incentive. 7.2.7 Additional Depreciation – Non-oil fired plant (acquired)
Revenue Forgone (Kina, million)
2018 2019 2020
Non- Resource 0.0 0.2 0.0
Resource 0.0 0.0 N/A
Legislative Reference Section 73(6) of ITA 1959
This deduction allows for an additional 30.0 per cent depreciation in the initial year when the cost of capital was incurred, when a non-oil-fired plant or equipment is acquired (purchased) for production.
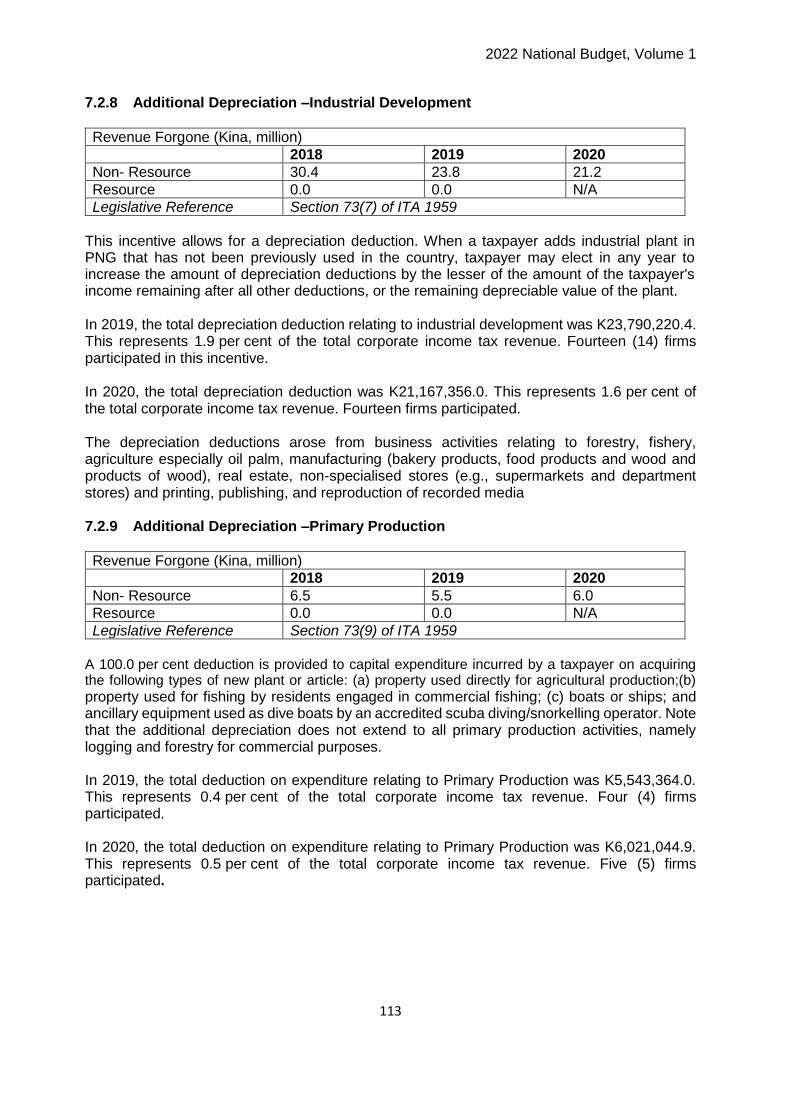
2022 National Budget, Volume 1
113
7.2.8 Additional Depreciation –Industrial Development
Revenue Forgone (Kina, million)
2018 2019 2020
Non- Resource 30.4 23.8 21.2
Resource 0.0 0.0 N/A
Legislative Reference Section 73(7) of ITA 1959
This incentive allows for a depreciation deduction. When a taxpayer adds industrial plant in PNG that has not been previously used in the country, taxpayer may elect in any year to increase the amount of depreciation deductions by the lesser of the amount of the taxpayer's income remaining after all other deductions, or the remaining depreciable value of the plant. In 2019, the total depreciation deduction relating to industrial development was K23,790,220.4. This represents 1.9 per cent of the total corporate income tax revenue. Fourteen (14) firms participated in this incentive. In 2020, the total depreciation deduction was K21,167,356.0. This represents 1.6 per cent of the total corporate income tax revenue. Fourteen firms participated. The depreciation deductions arose from business activities relating to forestry, fishery, agriculture especially oil palm, manufacturing (bakery products, food products and wood and products of wood), real estate, non-specialised stores (e.g., supermarkets and department stores) and printing, publishing, and reproduction of recorded media 7.2.9 Additional Depreciation –Primary Production
Revenue Forgone (Kina, million)
2018 2019 2020
Non- Resource 6.5 5.5 6.0
Resource 0.0 0.0 N/A
Legislative Reference Section 73(9) of ITA 1959
A 100.0 per cent deduction is provided to capital expenditure incurred by a taxpayer on acquiring the following types of new plant or article: (a) property used directly for agricultural production;(b)
property used for fishing by residents engaged in commercial fishing; (c) boats or ships; and ancillary equipment used as dive boats by an accredited scuba diving/snorkelling operator. Note that the additional depreciation does not extend to all primary production activities, namely logging and forestry for commercial purposes. In 2019, the total deduction on expenditure relating to Primary Production was K5,543,364.0. This represents 0.4 per cent of the total corporate income tax revenue. Four (4) firms participated. In 2020, the total deduction on expenditure relating to Primary Production was K6,021,044.9. This represents 0.5 per cent of the total corporate income tax revenue. Five (5) firms participated.

2022 National Budget, Volume 1
114
7.2.10 Primary Production Development Expenditure
Revenue Forgone (Kina, million)
2018 2019 2020
Non- Resource 2.0 0.6 3.9
Resource 0.0 0.0 N/A
Legislative Reference Section 97A of ITA 1959
This incentive is to encourage primary production such as agricultural development in PNG. Any expenditure incurred in primary production is an allowable deduction for tax purposes. For instance, if a taxpayer spends K100.0 on agriculture development, K100.0 is allowed to be deducted for tax purposes.
A 100.0 per cent deduction under Section 97A of ITA for expenditure of a taxpayer engaged in primary production (definition of primary production provided in the ITA regulation). In 2019, the total deduction on expenditure relating to agricultural development was K590,773.8. In 2020, the total deduction on expenditure relating to agriculture development was K3,878,315.3. This represents 0.3 per cent of the total corporate income tax revenue. Two (2) firms are currently using this incentive. 7.2.11 Primary Production 150.0 per cent extension services
Revenue Forgone (Kina, million)
2018 2019 2020
Non- Resource 0.2 0.1 0.2
Resource 0.0 0.0 N/A
Legislative Reference Section 97B (1) of ITA 1959
This incentive is to promote agriculture extension services.
A 150.0 per cent deduction is provided for expenditure on agricultural extension services undertaken under an approved plan. Extension services must be undertaken under a plan approved by a committee chaired by the Department of Agriculture and Livestock (DAL). In 2019, the total deduction on expenditure relating to agricultural extension services was K68,498.0. In 2020, the total deduction on expenditure relating to agricultural extension services was K159,486.0. The incentive was utilised by three (3) firms. The expenditure was incurred in agriculture extension services particularly in planting and growing of oil palm. 7.2.12 Double Deduction – Unit of Property
Revenue Forgone (Kina, million)
2018 2019 2020
Non- Resource 0.0 0.1 0.0
Resource 0.0 0.0 N/A
Legislative Reference Section 155J of ITA 1959
Property unit trusts are taxed at the rate of 30.0 per cent on the income of the trust. The tax is payable by the trustee.

2022 National Budget, Volume 1
115
7.2.13 Amortisation – Exploration Expenditure
Revenue Forgone (Kina, million)
2018 2019 2020
Non- Resource 0.0 0.0 0.0
Resource 21.8 62.1 N/A
Legislative Reference Section 155N of ITA 1959 Note: Data for resource sector is not available at the time of reporting. This will be reported in the proceeding Budget.
Mining, petroleum and gas companies can elect at the end of each year of income to bring in exploration expenditure incurred outside of the project operation during that same year of income and claim this expenditure as a deduction against the project income. Amount allowed as a tax deduction should not exceed the lesser of 25.0 per cent of the un-deducted pool balance or such amount that would reduce income tax payable by 10.0 per cent. 7.2.14 Additional Deduction for PNG LNG project participants
Revenue Forgone (Kina, million)
2018 2019 2020
Non- Resource 0.0 0.0 0.0
Resource 41.4 0.0 N/A
Legislative Reference Section 158J of ITA 1959 Note: Data for resource sector is not available at the time of reporting. This will be reported in the proceeding Budget.
This is an additional deduction provided to PNG LNG Project participants. If the project has not reached an R-factor of between 1.91 and 2.36 at the end of year 10 of production, additional deductions of between 10.0 per cent and 50.0 per cent of original capital expenditures can be allowed. 7.3 GOODS AND SERVICES TAX ACT 2003
7.3.1 Zero Rating of GST
Revenue Forgone (Kina, million)
2018 2019 2020
GST exempt sales (output debit) 36.9 4.0 3.3
GST zero rated sales 110.9 25.2 17.1
Deferred import liabilities 0.6 5.2 0.0
GST exempt sales (input Credit) 30.6 48.8 41.9
Legislative Reference: Division 6, Section 19 of the GST Act 2003
Suppliers to be exempted from the GST or may be eligible to get refunds on certain amounts of the GST payment depends on the type of sale and purchase made. There are two (2) kinds of GST incentives in the GST law: Zero rated sales (i.e. sales of goods that are charged GST at 0.0 per cent of the sale price but claim credits for GST paid on the inputs); and GST exempt sales.
The sales that fall under the zero-rating regime are: exported goods and services; perishable goods bought for consumption outside of PNG; supply of prescription medical equipment, prescription drugs and lenses; supply of goods and services to a mining, petroleum or gas company (exception: cars); and supply of unprocessed crude oil.

2022 National Budget, Volume 1
116
In addition, a small category of sales is exempt from applying GST. As opposed to zero rating,
the exempted sales are not eligible to reclaim input tax paid at the time of purchase. These
include: supply of financial services; supply of educational services; supply of medical services;
and supply of housing or a motor vehicle to an employee as part of an employment contract.
7.4 TAX INCENTIVES IN THE CUSTOMS TARIFF ACT 1990
7.4.1 Import Duty
Revenue Forgone (Kina, million)
2018 2019 2020
Estimate 33.3 50.6 22.5
Legislative Reference Part IV, section 9 of the Import Tariff Act 1990
The Head of State, acting on advice, may, by notice in the National Gazette – exempt taxpayers from import duty goods or substitute a reduced rate of duty in respect of any imported goods. 7.4.2 Import Excise
Revenue Forgone (Kina, million)
2018 2019 2020
Estimate 105.1 7.1 5.5
Legislative Reference Section 3 of the Excise Tariff Act 1956
The Head of State, acting on advice, may, by notice in the National Gazette – exempt taxpayers from excise duty goods or substitute a reduced rate of duty in respect of any import of excisable goods.

2022 National Budget, Volume 1
117
CHAPTER 8: FINANCING AND DEBT MANAGEMENT STRATEGY
8.1 FINANCING BACKGROUND TO THE 2021 BUDGET
The government’s financing and debt management strategy in 2022 and over the medium term will be focused on debt sustainability amid challenging circumstances brought about by the COVID-19 pandemic. The Government will to continue to explore concessional sources of external financing and using the domestic debt instruments to maintain a healthy amortisation and interest profile. The COVID-19 has had profound impact on debt stock profile as government embarked on expanding the fiscal stimulus to help protect domestic economy from slipping into deep recession, and as expected, a sharp increase in debt stock since 2020. Despite, these challenges, PNG continues to be an ideal investment destination for investors because of potential new resource projects prospects in the immediate future. The 2021 budget deficit was K6,612.8 million and proposed to be financed through a net external borrowing of K4,612.8 million and net domestic borrowing of K2,000.0 million. The external financing could be mainly through budget support loans and project loan financing from the international agencies including PNG’s multilateral and bilateral partners. In second quarter of 2021, the Government received a sum of K949.5 million budget support loan from the Japanese International Corporation Agency (JICA) a Crisis Response Emergency Support Loan. The remaining external budget support loans from the ADB’s SOE reform loan, World Bank Emergency Development Policy Operations (EDPO) loans were received in the quarter while rest from other multilateral and bilateral partners were expected to be collected in the final quarter. Domestically, the Government issued K2,183.2 million in Treasury Bonds in the first half of the year to fund priority programs in the budget. The 2021 MYEFO maintained budget deficit as planned at K6,612.8 million. The Government identified additional sources of external financing through various budget support facilities linked to the COVID-19 pandemic from IMF Special Drawing Right (SDR) allocation to PNG and bilateral development partners such as the Australian Government’s budget support facility to sufficiently fund the 2021 Budget expenditures. The 2021 Budget financing sources comprised:
(a) the general increase in SDR allocation financing from the IMF, SDR252.5 million (K1,253.7 million);
(b) second tranche of the ADB SOE Link Reform loan of USD150.0 million (K526.3 million); (c) the JICA budget support loan of K949.5 million; (d) the World Bank Group EDPO budget support of K526.3 million (e) concessional loan drawdowns of K1,638.4 million linked to capital investment projects;
and (f) net issuance of K2,100.6 million in domestic security debt comprised of K500.0 million
in net new issuance of Treasury Bills, a net new issuance of K1,600.6 million in Treasury Bonds and a net amortisation of K100.5 million in domestic loans.

2022 National Budget, Volume 1
118
Of the total net financing requirement (K6,612.8 million) for the 2021 Budget, the Government has successfully received K949.5 million from JICA Budget Support loan, K526.3 million from the World Bank EDPO, and K2,000.0 million through Treasury Bonds domestic market sources. The K1,250.2 million is expected to be covered by the IMF SDR general allocation, possible further domestic security and loan support from bilateral or multilateral agencies. The 2021 net financing profile also includes the amortisation of K100.5 million in domestic loans, K983.2 million in commercial loans, K534.8 million in external concessional loans and K15.9 million external extraordinary loans19. 8.2 2022 BUDGET FINANCING REQUIREMENTS
The total net financing requirement for 2022 is set at K5,945.9 million and will financed through a similar strategy employed for the 2021 Budget deficit. The external financing will comprise of budget support loans from our multilateral and bilateral creditors and concessional loans from drawdowns of secured concessional project loans. The domestic financing will include Treasury Bonds and Treasury Bills, including a recently approved new commercial loan earmarked for infrastructure development. The Government will continue to utilise cheap and concessional avenues of financing by engaging actively with our multilateral and bilateral partners. A number of concessional project loans have already been signed and are on queue for disbursement in 2022. The Australian Infrastructure Financing Facility for Pacific (AIFFP) will continue to roll out its infrastructure development loan projects next year and over the medium term. The Government is embarking on the third tranche of the ADB SOE Budget Support of USD250.0 million (K877.2 million) in 2022 and will continue to pursue negotiations with other bilateral and multilateral partners for additional budget support. The Government plans to drawdown K1,318.4 million from concessional loan facilities already available on planned projects. The concessional financing takes care of up to 16.2 per cent of the government’s direct capital funding requirement for 2022. The amortisation commitments for 2022 includes: K70.0 million for domestic commercial loans and K232.6 million from the external extraordinary loans. The Government also plans to amortise K610.3 million in external concessional liabilities to reduce interest obligations and exposure to expensive forms of debt. With the amortisation and concessional financing planned for 2022, the Government is anticipated to save some interest costs over the medium term on these loans. Together with the amortisation, the Government’s exposure to the domestic securities market for 2022 is estimated to be a net addition of K2,201.2 million which includes K1,750.0 million in net issuance of Treasury Bonds, K421.3 million in Treasury Bills and net issuance of K29.9 million on domestic loans on infrastructure project. Table 25: Composition of Financing by Instrument for 2022 (Kina, million)
Financing Instrument 2022
External Loans FX = USD ‘million PGK ‘million
Disbursements 2,217.8
World Bank (Fiscal) DPO
19 Extraordinary loans include budget support facilities and program (on-project) facilities from bilateral and multilateral
development partners.

2022 National Budget, Volume 1
119
World Bank (Emergency) DPO
ADB SOE Budget Support 250.0 877.2
Bilateral Support
Concessional Project Loans 1,318.4
Commercial Loans 22.2
Domestic Disbursements 3,269.4
Repayments -884.8
Concessional Project Loans -610.3
Other External Repayments -274.5
Domestic Repayments -1,029.4
External Net 1,333.0
Domestic Net 2,240.0
Financing Gap (Other Possible External) 2,522.0 Source: Department of Treasury
The financing requirement for 2022 Budget will result in total Government debt reaching K52,726.3 million by end of the year, equivalent to 51.8 per cent of GDP. This is below 60.0 per cent of GDP as per the 2020 amended FRA. Moreover, the planned debt portfolio maintains the domestic share of financing at 50.1 per cent of total debt stock. The external financing mix in 2022 is planned to improve with concessional sources of financing accounting for at least 49.9 per cent of total debt stock. Table 26: Debt Outstanding Debt Instruments 2020-2027 (Kina, million)
Debt Instruments 2020
Actual 2021 2022 2023 2024 2025 2026 2027
Domestic Debt 22,215.5 23,256.5 26,455.6 28,804.5 30,145.1 30,145.1 29,687.8 29,289.4
Treasury Bills 11,901.8 11,019.4 12,661.9 13,480.9 14,271.1 13,666.1 12,014.9 11,111.5
Treasury Bond 9,232.8 11,262.6 12,583.4 14,083.4 14,728.8 15,428.7 16,717.7 17,317.8
Loans 1,080.9 974.5 1,210.3 1,240.2 1,145.2 1,050.2 955.2 860.2
External Debt 17,952.8 23,206.8 26,309.5 28,745.6 31,203.9 33,911.6 35,811.2 36,161.4
Debt securities 1,700.7 1,700.7 1,700.0 1,700.0 1,700.0 1,700.0 1,700.0 1,700.0
Concessional 9,831.6 10,772.4 11,643.3 12,505.2 13,435.9 14,495.5 15,306.5 15,596.6
Commercial 1,094.1 149.4 135.5 93.7 51.8 10.0 -31.9 -71.8
Extraordinary 5,326.4 10,584.3 12,830.6 14,446.8 16,016.2 17,706.2 18,836.7 18,936.7
Gross Debt* (ex. Arrears)
40,168.3 46,463.3 52,765.1 57,550.2 61,348.9 64,056.7 65,499.1 65,450.8
% of GDP (without Arrears)
49.20% 51.5% 51.9% 52.5% 52.6% 51.1% 48.9% 45.0%
Source: Department of Treasury.
8.3 UPDATE ON DOMESTIC MARKET CONDITIONS FOR FINANCING DEFICIT
Despite the COVID-19 pandemic persistence through 2021, the domestic debt market continued to provide the much-needed liquidity throughout the year. The domestic market participants, continued to have limits on lending to the Government. The main players of the securities market were the commercial banks and the two superfunds including few corporate and individual investors in the weekly auctions absorbing much of the Government’s debt issuance. The short-term Treasury Bills experienced an increased appetite in the first and third quarters of the year while the second quarter saw a plunge due to the issuance of a large volume of Treasury Bond over a three-month period. Most retail investors, however, redeemed their funds, particularly in the first half of the year to meet cash needs. As at the end of September 2021, the longer tenor of the Treasury bills (364-days) accounted for 89.0 per cent of the total issuance in Treasury Bills. Under Treasury Bond portfolio, just under

2022 National Budget, Volume 1
120
50.0 per cent of the issuance was covered by the mid-term tenors (5-6 year-bonds). Refer to Table 27. Although the Government saw a large net issuance (higher borrowings than repayments), periodic under-subscriptions were still an on-going feature of the Government Securities auctions in 2021 fiscal year. The Government is anticipating to receive further external funding through Budget Support facility from the World Bank, the ADB SOE Reform Program and Sub-program 2 and the IMF’s SDR allocation. This will help to relieve the pressure on the domestic market and also help to smoothen out foreign exchange imbalances
Table 27: Government Securities Issuance - End of September 2021
Treasury Bills
Tenor Volume (K’Millions) %
182-days 330.3 3%
273-days 1,075.8 8%
364-days 11,605.1 89%
13,011.2
Treasury Bonds
Tenor Volume %
2 years 152.9 6%
3 years 501.3 19%
5 years 672.0 25%
6 years 624.0 24%
8 years 125.0 5%
9 years 275.7 10%
10 years 295.8 11%
2,646.7
Source: Department of Treasury
8.4 MEDIUM TERM DEBT STRATEGY AND OPERATIONAL PLAN 2022-2027
Despite the challenging economic conditions driven by the COVID-19 and Delta Variant pandemic, the Government will continue to maintain its 2020 revised MTdS 2018-2022 (Debt Strategy). The overall objective is to maintain debt at sustainable levels and to maintain financial risks at prudent levels in order to maintain macroeconomic stability and build confidence in the PNG economy. The broad strategies to meet the objectives are as follows:
Maintaining debt at sustainable levels. The FRA target band for Debt to GDP ratio of 45-60.0 per cent applies to General Government debt (including the state’s contingent liabilities) at book value but includes valuation changes from exchange rate movements and explicit state guaranteed debt. The Government will contain budget spending in order remain in compliance with the prescribed band over the medium term 2022-2026.

2022 National Budget, Volume 1
121
Table 28: Percentage of Debt to GDP
Source: Department of Treasury
Maintaining financial risk at prudent levels. Since the introduction of the original MTdS 2018-2022, the composition of the debt portfolio has changed. The limit on the share of foreign currency debt to total Government debt has increased from 30.0 per cent in the previous strategy to 50.0 per cent. The reduction in the domestic debt target relative to foreign debt is a trade-off between domestic liquidity and interest rate risk against foreign currency risk and the current concessional lending offered by both multilateral and bilateral lenders.
Table 29: Percentage of Foreign Currency Debt to Total Central Government Debt
Target 2018
Actual 2019
Actual 2020
Actual 2021 Est.
2022 Est.
2023 Est.
2024 Est.
2025 Est.
2026 Est.
2027 Est.
50% 39% 43% 50% 51% 50.0% 50% 53% 51% 49% 45% Source: Department of Treasury
The Government’s heavy reliance on the domestic debt market continues which has been exacerbated by COVID-19 pandemic as evident on the domestic interest rates. The current weighted average interest paid on external loans is 2.8 per cent while domestic weighted average interest is 8.5 per cent. Total interest cost as a share of the Government revenue for 2022 Budget is estimated to be 17.5 per cent. The Government will remain committed to maintaining its strategy by capitalising on low interest rate external loans, and in doing so, it is anticipated that interest rate as a share of the Government Revenue (excluding grants) will remain around 17.0 per cent from 2021-2022 then decline gradually over the medium term, as shown in chart 39. Since 2016, the share of interest as a percentage of revenue had previously been steadily increasing. Maintaining this strategy will continue to ease the rise in cost of debt. Chart 39: Debt Service Sustainability over Medium Term
Source: Department of Treasury
Refinancing and rollover risks are the immediate concerns of the current MTdS. The repayment profile shows that the bulk of the debt will mature in the next five years, and therefore will require
FRA Target Band2018
Actual
2019
Actual
2020
Actual2021 Est. 2022 Est. 2023 Est. 2024 Est. 2025 Est. 2026 Est. 2027 Est.
45-60% 31% 40% 49% 51% 52% 53% 53% 51% 49% 45%
14.0%
16.2% 15.8%
18.0%
20.3%
17.5%16.2%
15.2%14.3%
12.9%11.3%
9.7%
0.0%
5.0%
10.0%
15.0%
20.0%
25.0%
2016 2017 2018 2019 2020 2021 2022 2023 2024 2025 2026 2027
Interest as % of Total Revenue (excl. grants)

2022 National Budget, Volume 1
122
substantial level of refinancing, pertains to the costly domestic debt. Given this, the Government will consider among other prospects the avenue of undertaking debt switches at competitive or negotiated yields possibly with the institutional investors to smooth out the domestic maturity profile.
Table 30: Average Maturity of the Domestic Debt Portfolio
Target 2018 Actual
2019 Actual
2020 Actual
2021 Est.
2022 Est.
2023 Est.
2024 Est.
2025 Est.
2026 Est.
2027 Est.
5 Years 3.0 3.1 3.0 3 3.3 3.4 4.0 4.3 5.0 5.0
Source: Department of Treasury
Debt strategy will continue to focus on broadening and deepening the market in domestic securities and improving the market infrastructure to achieve effective and efficient domestic debt market. That would entail:
(a) Addressing a number of preconditions for the development of the domestic bond market. These include: (i) improving the efficiency of the primary market (the current manual and
cumbersome processes will need to be changed to attract non-resident investors and encourage secondary trading);
(ii) promoting money market and inter-bank transactions through repurchase agreements;
(iii) developing automated clearing, settlement and custody facilities; (iv) establishing a bond market code of conduct with effective oversight by BPNG; (v) promoting the establishment of pools of liquidity to allow small investors access to
the market; (vi) improving coordination between monetary, fiscal and regulatory authorities and
market participants; and (vii) developing and maintaining a centralised source for bond market information and
data.

2022 National Budget, Volume 1
123
Table 31: Deficit Financing Projections by Instrument 2020-2027 ( Kina, million)
Debt Instruments 2020
Actuals 2021
Budget 2022
Budget 2023
Est 2024
Est 2025
Est 2026
Est 2027
Est
Net Acquisition of Financial Assets
-802.9 -
Net Incurrence of Liabilities
6,501.5 6,612.8 5,984.7 4,785.1 3,798.7 2,707.8 1,442.4 (48.2)
Domestic Net Financing 2,882.0 2,000.0 2,240.0 2,348.9 1,340.5 0.0 (457.2) (398.4)
Treasury Bills 1,710.5 500.0 260.1 819.0 790.2 (604.9) (1,651.2) (903.4)
Treasury Bond 1,266.20 1,600.5 1750.0 1,500.0 645.4 700.0 1,289.0 600.0
Loans -94.70 -100.5 229.9 29.9 -95.0 -95.0 -95.0 -95.0
Borrowing - - 300.0 100.0 - - - -
Amortisation -94.7 -100.5 -70.1 -70.1 -95.0 -95.0 -95.0 -95.0
External Net Financing 3,619.5 4,612.8 3,744.7 2,436.1 2,458.2 2,707.7 1,899.6 350.2
Debt securities - - -
Sovereign Bond - - -
Concessional 1,154.9 1,103.6 708.1 861.8 930.7 1,059.6 811.0 290.1
Borrowing 1,567.8 1,638.4 1,318.4 1,601.6 1,723.1 1,915.5 1,673.5 1,152.0
Amortisation -412.9 -534.8 -610.3 -739.8 -792.4 -855.9 -862.5 -861.9
Commercial -876.3 -938.8 -19.7 -41.9 -41.9 -41.9 -41.9 -39.9
Borrowing 18.1 44.4 22.2 0.0 0.0 0.0 0.0 0.0
Amortisation -894.4 -983.2 -41.9 -41.9 -41.9 -41.9 -41.9 -39.9
Extraordinary 3,340.8 4,446.9 3,056.2 1,616.2 1,569.4 1,690.0 1,130.6 100.0
Borrowing 4,396.1 4,462.8 3,288.8 1,754.5 1,888.9 2,114.1 1,627.2 596.6
Amortisation -1,055.3 -15.9 -232.6 -138.3 -319.5 -424.1 -496.6 -496.6 Source: Department of Treasury 1. The 2021 debt flow provided above is the best approximation of the financing profile as expected at the time of drafting the volume 1.
The projected deficit profile as shown above in Table 31, depicts Government’s efforts to curb debt at sustainable levels. Over the medium term, the deficit levels are expected to decline by about 20.0 per cent on average yearly. The debt to GDP ratio peaks at 52.6 per cent in 2024 and then starts declining to 45-0 per cent by 2027. The nominal debt stock is expected to peak in 2026, and then start to decline as the budget moves into surplus. The debt stock, however, will continue to increase while debt as a share of GPD is estimated to remain within the FRA band. Refer to Table 32. Table 32: Debt stock as a share of GDP 2020-2027 (Kina, million)
Debt Instruments 2020
Actuals 2021
Budget 2022
Budget 2023
Est 2024
Est 2025
Est 2026
Est 2027
Est
Gross Government Debt
40,168.4 46,464.3 52,765.1 57,550.2 61,348.9 64,056.7 65,499.1 65,450.8
Debt to GDP % 49.2% 51.5% 51.9% 52.5% 52.6% 51.1% 48.9% 45.0%
Domestic 22,215.6 23,256.5 26,455.6 28,804.5 30,145.1 30,145.1 29,687.8 29,289.4
% of gross 55.3% 50.1% 50.1% 50.1% 49.1% 47.1% 45.3% 44.8%
External 17,952.8 23,207.8 26,309.5 28,745.6 31,203.9 33,911.6 35,811.2 36,161.4
% of gross 44.7% 49.9% 49.9% 49.9% 50.9% 52.9% 54.7% 55.2%
Gross Government Debt - without arrears
40,168.4 46,464.3 52,765.1 57,550.2 61,348.9 64,056.7 65,499.1 65,450.8
Debt to GDP % 49.2% 51.5% 51.9% 52.5% 52.6% 51.1% 48.9% 45.0% Source: Department of Treasury
8.5 MANAGING PORTFOLIO RISK 2020-2025
Treasury deploys the MTdS analytical toolkit developed by the IMF and the World Bank to support the Debt Strategy operations. This is to manage and monitor the debt portfolio and evaluate the costs and risks of competing financing options for the government.

2022 National Budget, Volume 1
124
The MTdS framework aims to support the development of a debt management strategy that is consistent with preserving debt sustainability. By considering linkages to key macroeconomic policies and debt sustainability, the framework highlights the appropriate debt management strategy that meets debt management objectives (such as developing the domestic debt market) while maintaining debt sustainability20. The aim of the analysis undertaken is to measure the cost and risk of the government which veers away from heavy reliance on domestic borrowing by increasing the share of external financing. This strategy will assist in managing a number of risks such as the exchange rate risk, the liquidity risk, the interest rate risk and the refinancing risk. Funding sources identified for the 2022 Budget maintained that 69.0 per cent will be sourced from external financing through multilateral and bilateral loans with the remaining 31.0 per cent to be domestically financed through the issuance of government securities. Timing of the inflow of external financing is important and will need to be managed more appropriately. Delays in the inflow of external funds usually results in issuing more domestic debt particularly T-Bills to cover the financing gap. This can increase the refinancing risk with the continuous rolling over of debt. Therefore, the Government has to be vigilant and endeavor to monitor and minimise this risk through a prudent execution of a comprehensive annual borrowing plan. By pursuing the current strategy, we anticipated that by 2027, interest cost as a share of GDP and the implied interest rate of the debt portfolio will have improved from 10.5 per cent of total expenditure in 2022 down to 9.0 per cent by 2027. The Average term to Maturity in years for the external portfolio is estimated to reduce if the updated strategy is not being implemented. Hence, concerted commitment is required to implement the strategy. It is important that longer-term maturity strategy is considered to be better indicator to manage refinancing risk on external front. The updated strategy should be pursued to ease pressure likely to be exerted by the existing disbursements and new borrowings over medium term. The Government is also mindful that taking on more external loans increases its foreign currency risk. According to Treasury’s analysis, the share of external debt as a percentage of the total debt stock will increase over the medium term thereby posing a foreign currency risk. This makes PNG susceptible to higher exchange rate risks and adverse external shocks. The Government has to adhere to the debt strategy by committing to limit the volume of non- concessional borrowing in line with IMF guidelines in order to mitigate foreign currency risk.
The Government also needs to consider the composition of the external debt portfolio including exposure to US dollars. Balanced with the risks are the lower interest cost saving from highly concessional loans. Commercial external financing caries both exchange rate risk and moderate to high interest cost and fees.
2020 World Bank & IMF MTDS Guidance Notes for Country Authorities, 2019.

2022 National Budget, Volume 1
125
CHAPTER 9: NATIONAL REFORM AGENDA 9.1 OVERVIEW
Papua New Guinea aims to be globally competitive by 2050 as set out in the Strategic Growth Plan (SGP). This strategy underpins the Government's commitment for a responsible and sustainable economic growth for PNG. The SGP focuses on microeconomic reform to improve economic productivity and efficiency by:
facilitating competition;
protecting consumer's welfare;
enhancing the operation of markets;
improving the effectiveness of government services relied upon by the private sector; and
removing business impediments. In 2020, the Government under the mandate of ‘taking back PNG,’ introduced several reforms consistent with the Government’s plan to connect PNG through better infrastructure such as roads, wharfs-jetties and airstrips in boosting economic activities, and ensuring that the key development aspirations of PNG are achieved. Those reforms are guided by the objectives of Vision 2050, National Strategy for Responsible Sustainable Development (STaRs) and Papua New Guinea’s Development Strategic Plan 2010 – 2030 (DSP). The implementation of most reforms have been delayed due to the global COVID-19 pandemic and its impact on the PNG’s economy. The Government will continue to progress current reforms including new reform initiatives in 2022 to assist in the economic recovery and development for a better PNG. The Government is committed to address the underlying issues that affect service delivery and impede private sector investment and growth. The Government will continue to refocus on accomplishing new service delivery standards by trimming excessive spending, resource wastage, and redirecting funds to key priority impact projects at all levels of Government in the areas of Health, Education, Infrastructure and Law and Order. Another key area is strengthening the government systems to support women and disadvantaged groups to benefit from overseas employment opportunities under the labour mobility program. This program was significantly delayed by COVID-19 pandemic resulting in the closure of international borders. Nevertheless, the Government will continue employer awareness in Australia and New Zealand to the promote depths of skills and availability of employment-ready workers in PNG. Improving the effectiveness and efficiency of the superannuation and life insurance industries. The Central Bank and the Department of Treasury have established a Superannuation and Life Insurance Review Committee to examine specific areas of the superannuation and life insurance legal framework. Further, the Government is still committed to establishing the Sovereign Wealth Fund (SWF) of Papua New Guinea, as it is an important part of its macroeconomic management tool to manage and invest the revenues generated by resource projects in the future. The progress of this work will be in line with the timing of the future revenue flows from the new projects.

2022 National Budget, Volume 1
126
9.2 KEY REFORMS
9.2.1 Increasing employment opportunity from labour mobility
The labour mobility program is a key initiative of the Marape Government that aims to strengthen government systems to enable Papua New Guineans especially women and disadvantaged groups employment opportunities overseas, especially Australia. This Government is determined to promote the labor mobility program with Australia and New Zealand despite the setbacks by the COVID-19 pandemic and Delta Variant impact leading to the closure of international borders. The Labour Mobility Unit (LMU) was set up in 2019, to address the large demand for workers, especially in Australia. It is critically important to build an employer-responsive system for increased participation and equitable access across the country. Currently the program focuses on: East Sepik; Enga; Esa’ala; Hela; Huon Gulf; Kariku-Hiri; Kavieng; Lae; Madang; Namatanai; Sinesine; Southern Highlands; and North Fly. The program will extend to the rest of the country over the medium term. The Government took decisive steps in 2020 to improve its performance in labor mobility. While COVID-19 shut down international movement, in March 2020, PNG had over 300 workers overseas – more than the total number mobilised in 2019. In 2021, the LMU had begun a K1.0 million pilot projects to prepare a group of 200 Engan women for employment in Australia under the PNG Work Readiness Pathway Pilot Project. This project is a joint effort by the PNG and Australia Governments, which was launched in September and work is expected to commence in early December. The work readiness program will focus on life skills development such as, self-care, nutrition, family planning, health and wellness, and social skills. It will also teach conversational and vocational English, numeracy, financial literacy, and living and working conditions in Australia. If successful, the K1.0 million pilot will be expanded to other districts and provinces, covering both men and women. Work Ready Pools have been built in Madang, Enga, Esa'ala, Lae, and New Ireland, and work is ongoing in other regions including Central Bougainville, East Sepik, Hela, Morobe, Mt Hagen, Oro, Southern Highlands Province, and North Fly with other regions to follow in 2022. PNG was able to mobilise fifteen (15) workers across to Australia before borders closed again on the 17th of March 2021. There were over 350 workers affected by this closure, one hundred and eighty-four (184) of whom had signed three (3) year Australian Contracts. These contracts will be honoured once borders reopen. The Government expects positive interactions with approved employers. More than 200 skilled Papua New Guineans have been vaccinated and are ready for immediate travel to Australia and New Zealand. A further 800 are to receive their vaccinations by end of this year to bring total travel-ready workers to 1000. The Government through the LMU will continue the employer awareness in Australia of the depth of skills and availability of employment-ready workers in PNG and promote PNG workers through Business-to-Business connections between Australian and PNG companies. The Government has requested World Bank financing to assist with the expansion of PNG's participation in labour mobility.

2022 National Budget, Volume 1
127
9.3 PUBLIC SECTOR REFORM
9.3.1 Equitable Resource Allocations to Provincial Governments Financing service delivery in PNG has always been a major concern given the lack of financial services in various parts of the country. The Government through the inter-governmental financial relations framework embarks to ensure there is fair and adequate distribution of financial services taking into account the social and economic scale of each provinces. PNG has a three-tier government system but a highly centralised system, the national government raises approximately 95 per cent of the total government’s revenue. Provincial governments, in their own capacity, do raise their own revenues but insufficient to meet their provincial development needs. The government through National Economic and Fiscal Commission (NEFC) uses the equalisation rate of 6.57 per cent of Net National Revenues (NNR) to determine the provincial and local level governments funding. The funding for Provincial and Local Level Governments increases or decreases as a proportion of the NNR. The NNR is the total tax revenue received by the National Government excluding mining and petroleum tax revenue. The NNR calculations since 2019 excluded GST and Bookmakers Tax transfers to provinces since these revenues are already assessed as part of provinces fiscal capacities in the NEFC calculations. The Equalisation Amount for the 2022 Fiscal year decreased by K33.1 million, a reduction from K627.0 million in 2021 to K593.9 million, reflecting the significant impact the COVID-19 pandemic had on tax revenue in 2020. The equalisation amount is determined based on prior year GoPNG revenue outcome. Hence, 2022 Equalisation amount is based on the 2020 FBO as shown in the table below. Table 33: Calculation of the NNR Amount for the 2022 Budget (K000, Million)
Act Definition 2019 FBO 2020 FBO Variance
General tax revenue* 10,304.3 9,223.7 -1,080.6
Less: Mining and petroleum tax revenue 760.7 183.4 -577.3
Net National Revenue 9,543.6 9,040.3 -503.3
2021
Budget 2022
Budget Variance
Net National Revenue (NNR) 9,543.6 9,040.3 -503.3
Multiplied by (*) 6.57% 6.57% 6.57%
Equalisation Amount (NNR X 6.5%) 627.0 593.9 -33.1 Source: NEFC 2022 Annual Budget Fiscal Report.
9.3.2 Superannuation Reforms
Under Sections 76 of the Superannuation (General Provisions) Act 2000, the State is obliged to make a mandatory employer superannuation contribution of 8.4 per cent of the base salary, of its employees to an Authorised Superannuation Fund, after the employee’s has been employed for more than three (3) months. Also, it is mandatory for individual employees to contribute 6.0 per cent as well from their base salary and make voluntary contribution consistent with the Superannuation Act.

2022 National Budget, Volume 1
128
The Government provides this funding to the Nambawan Super Limited (NSL) and the Comrade Trustee Services Limited (CTSL) on a fortnightly basis for its employer and employee contribution to meet its superannuation obligations. Prior to fully automating this payment in 2012, the State carries a significant portion of the unfunded liability which the State will need to pay when those employees who joined workforce prior to 2012 exit the public service. The COVID-19 pandemic and its adverse impact on the economy including the 2022 National General elections is beginning to cause more members coming forward to claim their employer’s portion of their superannuation contribution, especially those with high net balances. Hence, there has been a spike in the exit liability, which the State needs to pay. Despite the challenging times, the Government is committed to addressing this issue and will continue to provide funding in the National Budget to meet this liability owed to both the NSL and the CTSL including the Defence pension in 2022. The Government addresses this issue through an annual specific budget allocation for exit payment. Due to the significant accumulation of this liability and the associated costs, the Government has met part of the exit liability through the public service retirement exercise in 2021 and will continue with this strategy in 2022. Considering the superannuation liabilities incurred prior to the Automation of the State's employer superannuation contribution in 2012, the Government is currently in the final stages of quantifying the stock of the unfunded liability and will plan how best this liability can be addressed going forward. Review of the Superannuation and Life Insurance Industries While PNG has a well-established policy framework for superannuation, there is still room for more improvement to keep up with the changes in the industry. Issues persist such as: employers not making contributions on behalf of their employees; members of funds withdrawing lump sums on their savings; and the treatment of compulsory life insurance component of the funds. The Minister for Treasury sanctioned a review in August 2020 to look into these matters by establishing a Superannuation and Life Insurance Review Committee and its Secretariat. An issues paper has been released and the team had initiated the public consultations across the four regions that began in August 2021. However, the public consultations in most parts of the regions were halted due to the third wave of COVID-19 pandemic. This work will be continued in 2022 and the final report from the Committee is expected to be completed in mid- 2022. 9.4 A COMPETITIVE AND DYNAMIC PRIVATE SECTOR
9.4.1 OVERVIEW
The COVID-19 pandemic, the Delta Variant and the possible new variants increased uncertainty about how quickly the pandemic will be overcome. This threat coupled with the confronting multidimensional challenges such as subdued employment growth, rising inflation, food insecurity, the setback to human capital accumulation, and climate change continue to present challenges to maneuver within limited resources.
2022 National Budget, Volume 1
129
The Government is doing its best to uphold its duty to protect its citizen from adverse impact of COVID-19 pandemic and its new variant threat while stimulating the economy toward a strong, resilient and sustainable recovery. To support this effort, the Government had initiated various projects and reform exercises at the micro level aimed at: creating an environment conducive for private sector growth; particularly on improving access to markets, improving accesses to credits; expanding and improving financial services; removing regulatory barriers to competition; and more importantly, improving the enabling policies, legislative and regulatory environment for the private sector to thrive, especially the Micro Small Medium Enterprises. In 2022, the Government will continue the existing programs aimed at:
i. reducing the cost of doing business by removing regulatory impediments to private sector growth and facilitating the development of small and medium-sized enterprises (SMEs);
ii. increasing efficiency and competition for State Owned Enterprises (SOEs) to deliver high standard telecommunication, electricity and transport sectors services;
iii. ensuring strong regulatory enforcement of the competition and consumer protection law so that markets operate competitively and ethically to safeguard small businesses and consumers against unfair treatment;
iv. improving the productivity of tourism and agriculture sectors in the remote areas; and v. encouraging the transition of informal economy participants to the formal economy.
9.4.2 Consumer and Competition Framework Reform
Having a competitive and dynamic business environment encourages innovation, productivity, consumer welfare, and inclusive growth to keep pace with the changing business environment and global market developments including the recent global pandemic caused by COVID-19 pandemic and threat of new variants. In 2014, the PNG government sanctioned a Consumer and Competition Framework Review (CCFR) to assess and examine whether existing consumer and competition frameworks are reliable and meet the markets’ needs and trends going into the future. The review was undertaken from 2015-2017 and a final report containing 192 reform recommendations were proposed and approved by the government for the full implementation. These reform recommendations were grouped into policy, legislative, and administrative reforms to update and improve existing consumer and competition frameworks. On the Policy Reforms Work stream, a new 'National Competition Policy’ was approved in 2020. The policy features pro-competitive policy objectives, principles, and elements that seek to facilitate effective competition to promote efficient economic growth without social objective considerations. It is being implemented partially because other reforms will need to be completed before it can be fully effective and enforced through a new Competition law. The Legislative Reforms will modernise and simplify the current fragmented laws of consumer protection and competition. The Department of Treasury is currently reviewing this reform and it is expected to be completed by 2022. The Administrative Reforms program relates to the regulator operational changes or improvements, regulator capacity development and coordination, and government policy coordination. This is planned to be undertaken after the legislative reforms are completed.

2022 National Budget, Volume 1
130
9.4.3 National Competition Policy The Consumer and Competition Policy has a central role to play in creating a fair and effective market economy. Competition policies are crucial in driving innovation, productivity and growth, and creating the right conditions for healthy competition between traders in the markets while consumer policies are vital in underpinning consumer confidence so that they can engage in those markets in an assured manner, confidently knowing that they have a strong set of legal rights that will be respected and enforced. These policies work together to deliver a whole range of economic benefits because the focus of any competitive market is the consumer. Following a review into the Consumer and Competition Framework in 2017, the Government developed the National Competition Policy (NCP) for PNG. to guide decision-making around competition matters and protect consumers. The NCP is designed to respond to the current and foreseeable future needs of PNG’s businesses, consumers and the overall competition environment. It was formulated to improve economic productivity and efficiency through facilitating competition, enhancing the operation of markets, improving the effectiveness of government services relied upon by the private sector and consumers/public, removing impediments to businesses and most importantly, encourage consumer and social welfare. Overall, it outlines the broader pro-competitive policies and intentions of the Government of Papua New Guinea on how markets should operate. In 2022 and going forward, the Department of Treasury will work in collaboration with relevant government agencies and stakeholders to create awareness of the policy and develop an action plan to ensure that the policy principles are applied and implemented appropriately. 9.4.4 Competition Regulation and Consumer Protection Operations
The Independent Consumer and Competition Commission (ICCC) is responsible for the enforcement of competition and consumer law of PNG to ensure markets are competitive and consumers’ interests are protected. It will continue to implement its strategies to promote and foster effective competition amongst businesses at all levels; undertake market studies and inquiries and propose remedies where there are failures in the market structures; and take steps to protect the safety and interest of consumers and businesses consistent with the Independent Consumer and Competition Commission Act 2002 (ICCC Act) and other enabling legislations. The ICCC will continue to provide regulatory oversight to markets where there is limited competition in the market of basic goods and services critical for individuals and businesses. This will enable ICCC to opportunities to assess and introduce some form of regulation, if required. This includes continuation of current regulatory oversight concerning the supply of water and sewerage, compulsory third-party motor vehicle insurance, and essential port services, and for specific regulated products like rice, sugar, flour and refined petroleum products. Any form of additional regulation will be assessed carefully to weigh the benefits and effects of such regulation on businesses and consumers. In 2022, the ICCC intends work to amend certain parts of its competition law that deals with business cartel activities. This is one of the priority work programs that the ICCC is targeting to achieve during the term of its current 2020-2025 Corporate Plan. Currently, the ICCC Act

2022 National Budget, Volume 1
131
does not have explicit provisions that deal with cartel activities such as bid rigging and market sharing. The ICCC will also undertake a study into the public tendering process to see if the established process encourages competitive bidding in public procurement. In the space of economic regulation, the ICCC will be undertaking a review into the existing Motor Vehicle Insurance Limited (MVIL) CTP Regulatory Contract in 2022. The regulatory contract outlines the pricing mechanism and service standards requirements pertaining to the provision of compulsory third-party insurance, and associated regulated services. Given that the existing regulatory contract will expire on 31st December, 2022, an industry review is required to determine the appropriate regulatory framework including the maximum allowable price path for the next regulatory period. The ICCC also has plans to undertake productive reviews into highly concentrated and inefficient industries to establish the level of competition (if any) and recommend appropriate form of regulation based on international best practice. Further, the ICCC plans to conduct an inquiry into the Stevedoring and Handling Industry in 2022. This is to determine whether there is a need for price regulation; since the last regulatory oversight expired in 2013. Both Stevedoring and Handling play an essential role in the movement of goods and services in the economy and their costs are factored into the final price of goods and services. The ICCC will renew the market to determine the level of competition and establish if regulation is warranted. Some other periodic reviews that will be undertaken in 2022 are as follows:
Review of rice, flour and water and sewerage services. The Rice and Flour Industry
pricing reviews scheduled to be undertaken in 2020 did not occur due to the COVID-19 Pandemic and State of Emergency in PNG. The ICCC had to reallocate funding for these reviews to enforce the National Emergency Order 19 (Price Regulation) throughout PNG. These two (2) pricing reviews will be conducted in 2022. The water and sewerage services pricing review will be done in 2022 now that the merger of Eda Ranu Limited (Eda Ranu) and Water PNG Limited (Water PNG) is completed in June 2021 when the NCD Water and Sewerage Supply Act 1996 (NWSS Act) was repealed and the National Water and Sanitation Act 2016 (NWS Act) was enacted by the Parliament.
Reviewing the Aviation industry to ensure there is appropriate economic regulatory
framework in place to prevent any form of monopolistic or anticompetitive market behaviour in the industry. The ICCC will implement market interventions through economic regulation to promote competition and fair trading in the aviation industry, protect consumer interest and apply effective regulation of prices and service standards of aviation and air navigation service providers, including the National Airport Cooperation (NAC).
Review of the Harbours Act. The ICCC will identify and develop appropriate regulatory tools such as standards, codes and regulations to foster competitive markets and promote consumer interest in concentrated markets. This includes developing thresholds to be used as service standards requirements for the new declared private ports, licences, for the provision of declared essential port services.
The ICCC has progressed with amending the packaging and labelling fee prescribed under the Packaging Act 1975. A public consultation on the amendment was undertaken in 2021 and will be concluded in 2022 in consultation with the State Solicitor Office. Similar to this

2022 National Budget, Volume 1
132
amendment, the ICCC also proceeded with amending the Trade Measurement fees prescribed under the Trade Measurement Act 1973 and Weights and Measures Regulation 1974. These amendments will be completed in 2022 amongst other legislative amendments consistent with the Consumer and Competition Framework Review (CCFR). The ICCC will expand its consumer protection roles and functions throughout PNG by renewing its Memorandum of Understandings (MoU) with the existing Provincial Governments and Administrations by including three or four other provincial administrations. This includes East Sepik, Autonomous Region of Bougainville (AROB-ABG), West New Britain, and Oro. 9.4.5 Transport Sector Efficiency
Transportation is critical for movement of people and for provision of goods and services. Transportation costs are an important input into the final price of goods and services. High prices for transportation services in PNG have been a concern for some time. The ICCC recently completed its review of the PMV and Taxi fares. The release of the ICCC’s determination in the 2019 PMV and Taxi fare review Final Report and new PMV and taxi fares for 2020 were delayed due to the COVID-19 pandemic. However, the new fares were eventually released through Gazettal Notice G727 of 2020. This is an important exercise ICCC has undertaken with the support of the Road Traffic Authority and the Police Traffic Directorate. These fares will be adjusted against annual CPI movements and movements in fuel prices each year during the five-year regulatory period (2020-2024). In reforming transport sector in PNG, the Road Traffic Authority (RTA) has taken on the delegated function of inspecting and certification of taxi meters. The ICCC and the RTA have been working together to transfer the function to RTA to perform whilst ICCC will only concentrate on setting taxi and PMV fares. RTA is now performing the taxi meter inspection and certification which commenced on 1st January 2021. 9.4.6 Information and Communications Technology (ICT) Industry
The National Information and Communications Technology Authority (NICTA) is the Government agency responsible for the technical regulation of the Information and Communication Technology (ICT) industry in PNG. This requirement is specified under the National Information and Communications Technology Act 2009. Its primary objective is to ensure that ICT industry contributes to the greatest extent possible to the long-term economic and social development of PNG. NICTA will continue with its administrative roles to ensure the ICT services and infrastructures benefits the private and public sector and contributes to the economic and social development of PNG.
The following programs will continue into 2022:
Economic and Tariff Regulations
Wholesale Broadband Services
NICTA declared a number of wholesale services in 2019, including wholesale broadband capacity services, submarine cable transmission capacity services, submarine cable gateway excess services, and submarine cable duct access services. The providers of these wholesale

2022 National Budget, Volume 1
133
services are therefore required to supply the services in line with the terms and conditions of the determinations. In 2021, NICTA conducted a public consultation on DataCo’s reference interconnection offer (RIO) relating to the supply of DataCo’s wholesale broadband services via its submarine cable systems. The RIO, although not mandatory, is a written undertaking submitted to NICTA setting out the terms and conditions under which the DataCo will supply access seekers with the wholesale broadband services. NICTA has, through the consultation process, ensured that the wholesale broadband services supplied by DataCo captured under the proposed RIO meets the requirements of the Act including the specific pricing principles and the fulfilment of its non-discrimination obligations. NICTA intends to complete the consultation before end of 2021. NICTA will continue to monitor compliance of DataCo’s wholesale broadband services supplied to ensure it meets the requirements of the general and specific pricing principles, the terms of these services are non-discriminatory, and supplied as per the RIO and other referenced regulations.
Wholesale Voice Services Fixed and mobile termination services are other declared wholesale sales that NICTA continues to monitor and assess, including the price levels, and the affordability and the accessibility of these services when requested by consumers. NICTA ensures that these important services are offered in line with the requirements of the Act, particularly the general pricing principles, specific pricing principles, the non-discriminatory obligations and any to any connectivity obligations.
Retail Services Determination It is NICTA’s general position not to regulate the retail market as heavy-handed regulatory tactics at retail market can result in price distortion and counter-productive to market operations. However, on exceptional circumstances, NICTA is required to intervene at the retail market when there is a significant level of market distortion or where competitive pressure is lacking to address price and quality of service issues. After observing the retail market since NICTA’s last retail service determination (2012) which ended in 2017, NICTA has formed the view that the prices for both the retail voice and broadband services have remained relatively higher than it has anticipated. Hence, NICTA is prepared to conduct a public consultation with the industry and consumers in the first quarter of 2022. The retail services that will be subject of this public inquiry will be off-net voice calls and on-net voice calls. Retail broadband services will be looked at in a later period.
Consumer Protection and Quality of Service
Bill Shock and Advertising Guidelines
In collaboration with ITU, the Telecommunication Authority of India (TRAI) has agreed to assist NICTA in developing Consumer Protection Regulations. This is to develop rules/procedures/policies to promote information transparency and create awareness and protect ICT users in PNG. Although there are many issues that need to be addressed, this
2022 National Budget, Volume 1
134
collaboration will start by addressing two main problems: (i) Bill Shock and (ii) Rules for advertisement. Both tasks are complementary as many instances of bill shock are due to the tariff information that is not highlighted and is usually written as a footnote or in small script and mentioned in passing remarks in television advertisements.
Review of ICT Consumer Protection Framework In collaboration with ITU, NICTA proposes to undertake a review of the Policy and Legal Framework of Consumer Protection for ICT services in Papua New Guinea. This will require the review of relevant laws and regulations, assessing adequacy of policy and regulatory systems with a view to strengthening consumer protection and enhancing consumer welfare. Key outcome of this exercise is to recommend legal and policy reforms to laws, policies and regulations.
Quality of Service Framework The rationale to establishing new form of QoS standards in PNG primarily to enable NICTA to inform consumers on various services; and, to provide NICTA with objective points of reference for assessing and comparing the QoS provided by service providers; to give NICTA objective insight into the QoS of telecommunications services in PNG. The proposed framework will be applicable to providers of fixed and mobile voice and broadband services.
Consumer Awareness The awareness initiatives will encompass, consumer rights and responsibilities; consumer complaints redress; QoS, bill shock, and advertising guidelines. Further, an annual campaign is anticipated to raise awareness on the importance of both a safer and a better internet, where everyone is empowered to use technology responsibly, respectfully, critically and creatively. It aims to reach out to children and young people, parents and carers, teachers, educators and social workers, as well as industry, decision makers to encourage everyone to play their part in creating a better internet.
Universal Access Services and Connectivity
Universal Access Service programs The aim of the UAS program is to roll out ICT Services to remote and unserved areas of PNG. Adopting the approach of following the main economic corridors as identified by the Connect PNG program will ensure that Government services of building roads, ports Jetties, air-ports and airstrips are complemented and further enhanced by having infrastructures such as power and telecommunication. Key programs for 2022 include facilitating the expansion of broadband mobile telephony network coverage throughout all unserved areas of PNG by upgrading 2G towers to 3G or 4G and by constructing new 4G sites. Broadcasting services are also considered for funding under the UAS scheme to increase coverage for both TV and radio in unserved communities. Further, in 2022 and beyond, the NICTA through the UAS secretariat is preparing programs to connect communities in PNG through its Public Community Broadband initiatives, which include connecting public institutions, schools, community-based learning institutions, and public access facilities to help broadband internet access and utilisation.

2022 National Budget, Volume 1
135
The effective delivery of these UAS programs will require close cooperation and collaboration with other government agencies. In, 2022 NICTA will work closely with the Department of National Planning and Monitoring and other agencies through the current Government initiative of Connect PNG Development Infrastructure program. Mobile Coverage Obligations It is part of the mobile spectrum license condition that every mobile service provider is required to cover certain geographical locations and population within a certain time space. Digicel, Bemobile and new entrant Digitec who hold the license have shown considerable effort to meet this license conditions. Mobile coverage by population has increased from 43.0 per cent in 2009 to 82.0 per cent in 2020. NICTA will continue to work with the industry in 2022 to ensure these improvements in coverage is extended to all pockets of rural dwellings in PNG. With the entrant of the new mobile operator and NICTA’s effort in the UAS programs, coverage is expected to extended further to uncovered areas.
Technical Regulations and Enforcement
Electromagnetic Radiation NICTA as the ICT regulator is responsible to provide appropriate ICT consumers safeguard in relation to ICT activities. With ongoing general public concerns about the possible health effects from Electro-Magnetic Field (EMF) radiation from Mobile Communication Towers, the existing EMF Exposure Limits Guideline will be revised to establish monitoring framework to ensure public safety is protected. There is also a need to consolidate best practice from ITU/WHO for development of an EMF Consumer Guide for the purpose of public awareness. This being in light of public misconception regarding the effects of EMF in some cases causing hysteria and anxiety, hence more awareness needs to be conducted to the wider public based on accredited information from ITU/WHO.
Number Portability NICTA has considered to revisit the possibility of conducting another consultation with the public and industry whether we should allow number portability. NICTA undertook a similar review of the costs and benefits of mobile number portability in 2016 and 2017. The recommendation made to the Minister then was to hold number portability until certain underlying market conditions improve, such conditions include effective competition within the market and new entrants entering the market, amongst others. Engineering and Resource Planning Department is currently preparing the technical guidelines for the implementation of mobile number portability.
Implement outcomes of ITU World Radio Conference, 2019 As part of the Radio Spectrum management, NICTA is required to implement changes in the PNG National Frequency Allocation Table and update the PNG Radiofrequency Spectrum Allocation chart. This is to align with the revised Radio Regulations of the International Telecommunications Union pursuant to outcomes of World Radio Conference 2019 (WRC-19). These changes are necessary under treaty obligations and will keep PNG abreast of Technological developments. NICTA’s activities include but not limited to, amendments to the PNG National Frequency Allocation Table, amendment to the PNG Radiofrequency spectrum

2022 National Budget, Volume 1
136
allocation chart, formulating New Frequency Band Plans, review of Existing Band Plans, satellite orbital plans and review of Frequency Coordination agreements.
International and Regional Radiocommunication Work Programs (ITU and APT Cycles)
As part of treaty obligation, PNG is expected to contribute to Technical work programs of the new cycle of ITU World Radio Conference 2023 (WRC-23). PNG’s participation and contribution will be through Asia Pacific Telecommunity and the International Telecommunications Union’s global programs. NICTA will continue to represent PNG in these work programs to ensure protection of vital Radiocommunication services and country’s development goals in the ICT space.
National Cybersecurity Capacity Review
NICTA with the support of ITU and the Oceania Cyber Security Centre (OCSC) undertook a review of the maturity of cybersecurity capacity in Papua New Guinea (PNG) in 2019. This review was to enable PNG to determine areas of capacity in which the government might strategically invest in, in order to improve our national cybersecurity position. The work of this important review was disrupted in the subsequent years due to COVID-19 restrictions and related lockdowns. NICTA have started revisiting this project this year and hope to complete it next year 2022.
Radiofrequency Planning and Digital Transformation Policy
Access to radio frequency spectrum is critical to government Digital Transformation Policy. NICTA has commenced replanning of the Radio Frequency Spectrum to accommodate and allow additional spectrum for mobile data services.
Radio Spectrum Monitoring Project
A major project to be commenced in 2022 is the Radio Spectrum Monitoring Project. A key component of the project is to enable an automated state of the art radio frequency spectrum monitoring system with specialising software and hardware (including radio monitoring equipment) for the purpose of radio frequency monitoring, compliance, interference investigations which is key statutory responsibility of NICTA. The Project is intended to be rollout in Port Moresby before replication in other regions.
Regional presence and extension Program
NICTA currently has regional presences in the 4 regions with offices in Port Moresby which serves the southern region, Mt Hagen (Highlands region), Kokopo (New Guinea Islands Region) and Lae (Momase). Subject to technical and economic feasibility, in 2022 offices are also planned for other areas particularly in the border and maritime areas. 9.4.7 Small-Medium Enterprises (SMEs) Policy Review and Development In 2020, the Government announced the review of the SME Policy 2016 and the SME Master Plan 2016-2030. The Review Coordinating Committee comprising of Small Medium Enterprises Cooperation (SMEC) and the Department of Commerce and Industry amongst other stakeholders had rolled out regional consultation workshops throughout the regional centres around the country.

2022 National Budget, Volume 1
137
The main objective of these regional consultative workshops was to gauge stakeholders’ views on issues affecting SME for consideration by the Review Team in the SME Policy and SME Development Master Plan. Key areas that were covered during the review consultations include:
reviewing and redefining the current SME definition;
development of a new definition for informal sector businesses;
review and amendment of the SME Corporation Act 2014 to broaden the functional and regulatory powers of SMEC as a mandated SME Development agency; and
SME Policy alignment, integration and development of Provincial and District SME Policies.
The current Policy has set some ambitious goals by 2030 including growing SME numbers, creating formal employment and reducing unemployment. Through this consultative review process, these targets will be revised so that measurable targets are set that can be achieved accordingly using resources provided by the Government. The Government will continue working towards achieving its objectives by adopting strategies across the key areas of entrepreneurial development, innovation, legislative framework, catalyst projects, infrastructure development, integrated coordination structure and providing adequate resources and support accordingly. The development of the revised SME Policy and SME Master Plan is in its final stages of development. It is expected that these revised documents will be endorsed and launched for implementation in 2022 and beyond.
9.4.8 Financial Services Sector Development Reforms
The COVID-19 pandemic has also imposed significant challenges to many economies and their financial systems. It is anticipated that it will take some time before economies fully recover from the shocks caused by the pandemic. PNG’s immediate operational challenges for the financial sector have been relatively well managed and the system has proved rather resilient so far, but there is still a lot of room for improvement and readjustment. As PNG focuses on moving past the challenges currently facing the banking sector, it is expected that issues such as accelerating digitisation, monetary policy, innovation, inclusive growth, and new competitive challenges will continue to shape the banking sector in the years to come. Advancing structural reforms continue to be a cornerstone to support economic recovery and reverse the socio-economic decline associated with the COVID-19 pandemic. Although the pandemic has caused a shift in the development focus areas of many economies, PNG’s current financial sector reforms will support PNG’s economic recovery and foster resilience. The Financial Sector Development Strategy 2018-2030 (FSDS) which was launched in January 2019 will continued to be implemented in 2022. The FSDS contains a prioritised list of reform recommendations that will be implemented till 2030 and this includes:
the architecture of PNG’s financial sector regulatory and supervisory arrangements;
development of PNG’s Government bond and capital markets;
development of the national payment system; and
expanding financial inclusion in PNG.

2022 National Budget, Volume 1
138
PNG Securities Commission (PNGSC) and PNG Insurance Commission (PNGIC) PNGSC is required to be fully established as a stand-alone regulatory agency to administer the three legislations (Securities Commission Act, Capital Markets Act, and Central Depository Act). Once fully established, its capacity will be strengthened and reporting line be carefully considered for best placement. This will further expand its internal administrative functions and enable PNGSC to formulate a strategic roadmap for its effective and strengthened regulatory functions in the future. Currently BPNG regulates life insurance while PNGIC regulates general insurance. There are challenges with effective and efficient coordination and information sharing between these two regulators, which is obviously unhealthy for the industry. Over the years, life insurance has evolved and is now similar to general insurance. The FSSR found that it would be in the best interest of the industry that supervision is provided by one regulator instead of multiple regulators given the size and scope of the industry as well as the country’s economic conditions. This reform recommendation under the FSDS will see the PNGIC being subsumed into BPNG, as well as its regulatory function of general insurance. The restructure of the PNGIC (i.e. general insurance) to be merged into the Central Bank regulatory function with life insurance will be continued into 2022. Primary and Secondary Capital Market Development PNG now being an emerging economy, the financial and capital markets play a critical role in terms of providing an alternate platform for financing through a broad range of securities at both the primary and secondary markets. The primary market for trading government securities still remains manual and physical where registered bidders, primarily commercial banks place bids, usually through e-mail, without accompanying payment instructions, while other non-registered bidders submit physical cheques at the central bank along with the bidding documents. However, it is aimed that with the introduction of repurchase agreements and settlement infrastructures for the secondary market, bidders would be willing to purchase longer term Treasury bills and short to medium term Government Inscribed Stocks. This means that liquidating securities for cash will be quicker. The intended outcome of this project is to see improved efficiencies through simplification of the processes for trading in the primary market. While conducting the Financial Services Sector Review, institutional holders of government bonds have also clearly indicated that they have an appetite for trading government securities from time to time, for portfolio and liquidity management purposes. A more liquid government securities market can also assist with monetary transmission, by way of BPNG open market operations. This reform project is part of the Government’s FSDS implementation in 2018 – 2030. Work is in progress to firstly build up the capacity of the regulator (Securities Commission) and will continue into the next short to medium term to develop the capital market in PNG. Implementation of the financial inclusion programs will continue as a high priority area into 2022. Through the continued implementation of the National Financial Inclusion Policy (NFIP) and review of the Second National Financial Inclusion Strategy (2016-2020), it is expected that a Third Strategy will I be completed in 2021 and implemented in 2022.

2022 National Budget, Volume 1
139
The NFIP is an overarching policy that will effectively guide the financial inclusion policy reforms and ensure an organisational structure and strategic framework to progress the financial inclusion ambitions in the country. All financial inclusion activities will be coordinated by the Center for Excellence in Financial Inclusion (CEFI) with support from the Bank of PNG and the Department of Treasury. The Government continues to see financial inclusion as a high priority in its development agenda. Below is a snap shot from the Centre for Excellence in Financial Inclusion (CEFI) on access and usage progress. Table 34: Status Update of Access and Usage – Financial Inclusion
Source: Centre for Excellency in Financial Inclusion 2021 Q1 & Q2 data, www.thecefi.org
Microfinance Expansion Program
The Microfinance Expansion Project (MEP) is also an important Government initiative which started in 2012 and concluded its second phase activities in 2019. The third phase of this project is under discussion. The Project is co-financed by the ADB, the Government of Australia and the GoPNG. Bank of PNG has been the executing agency of the past two phases of this project. The ADB conducted a reconnaissance mission in 2020 and virtual meetings in 2021 with the aim of discussing and finalising the Concept Design for the next third phase of the MEP. The MEP began as an initiative of the Government of PNG to promote the expansion of the microfinance sector. The project scope further developed into extending financial services and providing financial literacy training to the people in the rural areas of the country. MEP phase 2 ended in October 2019. The proposed third phase of the microfinance expansion project will be focusing on “Improving Financial Access and Entrepreneurship Development” (IFAEDP). A preliminary discussion on the design options for the IFAED Project was to broaden the scope of the project. Relevant government agencies are in the process of reviewing the MoU and are finalising discussions with ADB on the project outputs in the Concept Design, which if approved, will be implemented starting 2022.

2022 National Budget, Volume 1
140
Secured Lending
This legal reform was completed with the launching of the on-line registry in May of 2016. The Personal Property Security (PPS) Registry is housed at the IPA. The reform has enabled all laws concerned with collaterals into one unified PPS Law and an online platform to provide lending institutions the assurance on who has first right over a collateral should a default occur. The use of the registries like the PPS housed at the IPA is to do positive reporting of a borrowers’ credit history. This would enable or aid access to finance for individuals and particularly small businesses. In 2022, the performance of the Personal Property Securities Act and Registry will be assessed alongside the current usage and uptake of the Registry. The assessment should identify any weaknesses in the uptake and usage and also provide insights into further strengthening and expanding awareness and delivery of the PPSR. Financial Education With the experience from PNG’s financial inclusion efforts, it is evident that an effective way to promote financial inclusion is through financial education. There have been good successes in providing financial literacy in the traditional outreach programs, which proofed to be far more effective to impart the financial knowledge to the next generation when they are still young. A MoU partnership was signed in January 2021 for the collaboration on a National Financial Education Curriculum for preparatory level up to Grade 12 students in the country. The financial education initiative is to integrate financial education as a Relevant Needs-Based Curriculum to be integrated into the existing Standard Based Curriculum (SBC), with the objective of educating school children about money management, income generation, saving and budgeting, investments and credit. This reform to incorporate Financial Education into PNG’s education curriculum will be continued into 2022 till it is fully rolled out in the schools. 9.4.9 Financial Consumer Protection framework
Consumer welfare and well-being is of paramount importance to the Government as it is directly linked with the people’s standard of living. Several Government sanctioned diagnostic reviews including, the Financial Services Sector Review and the Consumer and Competition Framework Review identified the need to strengthen consumer protection in the financial sector, particularly for small and new customers of the financial sector who are vulnerable to abusive conduct. In addressing this gap, the National Financial Inclusion Strategy and the Financial Services Sector Development Strategy calls for the establishment of a proportionate Financial Consumer Protection (FCP) framework for fair treatment of individual consumers of financial product and services. Building on from the previous work done on FCP, a further diagnostic review was undertaken in 2018 on the existing FCP regulatory and supervisory framework in PNG. This review of the FCP Framework found that there were a range of issues with financial products including a lack of transparency of information on rates, fees, terms and conditions, with significant gaps in financial consumer protection as compared to international best practices and

2022 National Budget, Volume 1
141
recommended the development of a financial consumer protection regulatory framework for PNG. The BPNG together with technical support from the IFC, has concluded this review and developed a draft bill, the Financial Consumer Protection Bill, that looks at fair and equitable treatment of consumers who use financial services. The Bill is now in its consultation phase. Due to COVID-19 restrictions, the progress of the Bill was protected. However, it is expected to be progressed in 2022. The FCP Bill once approved will ensure that PNG has a strong framework with expanded access to financial services benefiting consumers, enabling them to make well-informed decisions on how best to use financial services, building trust in the formal financial sector, and contributing to healthy and competitive financial markets. Access to secured land drives economic growth hence reforming land remains one of the top priorities of the Government. The National Land Development Program (NLDP) Phase I in the mid-2000s sets the basis for land reform in PNG. Considerable strides were made under NLDP Phase I. It focused mainly on three (3) key areas and these were: land administration land dispute settlement; and to unlock customary land to address chronic shortages in state land. Notable achievement being legislative amendments made to the Customary Land Registration and Land Groups Incorporation Acts which sets the basis to unlock customary land through the voluntary customary land registration process. This enables the migration of customary land into the formal land market system for commercial use. The second land summit was conducted in 2019 and was mainly focused on customary land to further reinforce strides already made under NLDP Phase I. The Summit arrived with 17 recommendations and was endorsed by the Cabinet for implementation commencing 2020 as NLDP Phase II 2020-2024. One notable recommendation being the establishment of the customary land authority in PNG to administer all customary land in PNG and is a top priority of the program. Currently, the program’s administrative set-up including recruitment of staff for the Program Management Unit are being finalised. The program has an operational technical working group and a management committee administering the program. It has identified priority activities that will continue to be implemented going forward. One of the key priority activities is to explore ideas on how the Government can assist providing state guarantees to customary land titles obtained through the reform’s voluntary customary land registration (VCLR) processes. The customary land titles were envisioned to be as good as a state land title however commercial banks are still reluctant to accept the land title as a collateral. The state guarantee on customary land title (VCLR) will serve as a triggering process that will enable confidence building in commercial banks and commercial investors to accept the title and invest in customary land. In addition, the NLDP program also has a pilot project implemented in partnership with the Coffee Industry Corporation. The land reform is important in the coffee industry particularly rehabilitating of run-down plantations and register customary land “en masse” to develop large scale coffee plantations using the voluntary customary land registration process. The pilot project also aims to generate policy thinking particularly linking government incentives including financing and access to private credit facilities to registered customary land. So far the pilot project is progressing well and will continue into 2022 as planned.

2022 National Budget, Volume 1
142
9.4.10 Commodity Price Stabilisation
The Government is re-focussing on the agriculture. The sector requires a whole of Government approach to grow the sector to support the economy. Most commodities exported by PNG are price dependent and driven by external market forces. In addition, majority of our population depend on these commodities for their income and low commodity prices has a discouraging effect on production. A team of specialists will be mobilised to work on an initial conceptual note with a view to generate discussions with relevant partners to develop a comprehensive commodity price stabilisation policy for the Government to consider. The Government through the Department of Agriculture & Livestock (DAL) initiated a commodity price support program for the agriculture sector in 2020. In 2022, the program is assessed in conjunction with the concept note to advise the Government on its sustainability. 9.4.11 Minimum Wages
The Minimum Wages plays a vital role in the economy by protecting low-skilled workers from exploitation and providing certainty to firms’ business decisions, particularly mobilisation of labour inputs as it constitute substantial costs to a firm. Minimum Wages targets employment and is set through the Minimum Wages Board of PNG. It is set after consulting all players such as the workers unions, State and the employers’ body representing the private sector. The last minimum wage was set in 2016 and is due for review. Generally, increasing Minimum Wages will impact the wage bills for employers of low skilled workers in sectors such as manufacturing, retail and wholesale, and agriculture and construction sectors. Workers in these sectors constitute a larger size of PNG’s workforce. Over the last two years, the Department of Treasury has been supporting the Department of Labour and Industrial Relations (DLIR) in developing the National Employment Policy (NEP) and a sub-set policy the Labour Market Information Policy. The NEP is an overarching labour policy and its key recommendations are: improving minimum wages setting; and developing labour data information system in PNG. The proposed policy provides the mandate to commence work on improving minimum wages setting as currently minimum wages is set an ad-hoc basis and also improving labour data record management system in PNG. The ongoing COVID-19 pandemic had imposed a huge challenge in completing the above policies as they require wider consultations with employers, workers unions and regional provinces. Consequently, work has come to a standstill in 2021. More progress is expected in 2022 and again is subject to the COVID-19 pandemic, Delta Variant and the new threat of other variants. 9.5 ASIA-PACIFIC ECONOMIC COOPERATION (APEC)
APEC is a regional economic forum established in 1989 that aims to create greater prosperity for the people of the region by promoting balanced, inclusive, sustainable, innovative and secure growth and by accelerating regional economic integration. As an APEC member economy, PNG will continue to engage in the APEC meetings next year and going forward. In 2021, all of the APEC meetings were hosted virtually by New Zealand due to the COVID-19 pandemic. PNG participated in most of those virtual meetings. Under the APEC's three main pillars of Trade and Investment Liberalisation; Business Facilitation; and Economic and

2022 National Budget, Volume 1
143
Technical Cooperation, PNG was able to achieve a number of deliverables in the various APEC fora including the Committee on Trade and Investment, Steering Committee on Economic and Technical Cooperation, Economic Committee and the Finance Ministers’ Process. For PNG to further leverage on the above mentioned three (3) APEC pillars from the forum, the Government has developed a PNG Foreign Policy on APEC (PNGFPA) which was endorsed by NEC in February 2020. This will serve as a roadmap to pursue the implementation and domestication of the 2018 APEC Chair’s Statement and realign PNG’s participation in the APEC process to achieve more tangible outcomes for PNG. The PNGFPA positioned PNG to leverage from APEC forum by aligning PNG’s key domestic deliverables identified in our development goals of the PNG Vision 2050, Medium Term Development Plan III 2018-2022, and the Domestic Strategic Plan 2010-2030 with the broader APEC pillars. This will aid PNG to tap into the wealth of expertise, experiences and capacity building initiatives within the APEC forum to grow our domestic economy. Domestically, a committee on APEC Policy Issues comprising all the relevant government agencies and institutions that had work together to deliver the 2018 PNG APEC were re-gathered to form a Committee on APEC Policy Implementation (CAPi). CAPi convened its first meeting in 2020. Much of the work to date, has been stalled due to COVID19 restrictions. In 2022, the CAPi will re-strategise using “Niupela Pasin” or the new way of doing business to advance the policy initiatives under the “Roadmap” to implement the domestication of the APEC 2018 Leaders’ Chair’s Era Kone Statement” to drive the PNGFPA. The ultimate objective of the Roadmap and the PNGFPA is to advance PNG’s efforts towards achieving its Development Strategic Policy (2010-2030) aim of becoming a middle-income economy by 2030. The three (3) key policy priorities under the APEC 2018 Leaders’ Chair’s Era Kone Statement” to drive this objective are: deepening Regional Economic Integration and improving Connectivity; Promoting Sustainable and Inclusive Economic Growth: and Strengthening Economic Growth through Structural Reform. PNG will also continue to engage with other APEC member economies to leverage on the available opportunities to achieve our domestic priorities as well as to drive the broader APEC initiatives at the international level. In 2022, PNG as a member of the APEC forum will continue to participate in the APEC meetings that will be hosted by Thailand. The Government remains committed to achieve further benefits and tangible outcomes for the country through the APEC. 9.6 IMPLEMENTATION OF THE SOVEREIGN WEALTH FUND OF PAPUA NEW GUINEA
The Government’s policy intention to establish the SWF of Papua New Guinea (PNG) was to manage and invest the anticipated windfall revenue flows from the PNG Liquefied Natural Gas (LNG) Project. This led to the enactment of the Organic Law on the Sovereign Wealth Fund (OLSWF) by the National Parliament on July 30, 2015. The Speaker of Parliament certified the legislation on January 20, 2016. The provisions of the OLSWF are required to come into operation in two phases. The first phase came into operation upon certification of the legislation including the parts of the law relating to the preliminary matters, the establishment of the SWF Board, and the duties and responsibilities of Board members. The remaining parts of the OLSWF will come into operation

2022 National Budget, Volume 1
144
upon the publication of a notice in the National Gazette by the Head of State, in accordance with the advice of the National Executive Council (NEC). The Government has proceeded with several key actions in preparing for the establishment of the SWF in line with the requirements of the OLSWF. The Government proceeded with the establishment of the inaugural SWF Board with requisite diligence to ensure probity, impartiality and integrity of the Board appointment process. The Board appointment assignment was outsourced to the most competitive and competent professional firm following the invitation of bids for this work, taking into account all the requirements and qualifications for Board members and the chairman, prescribed by the OLSWF. This particular work has been completed and the Final Report has been presented to the Government. In order to maintain impartiality and integrity of the Board appointment process, the Government re-engaged an independent firm to proceed with a further screening of the identified candidates and to provide a shortlist of candidates in line with the skill sets required under the agreed skills matrix, gender balance, and balance between local and international candidates for consideration by the Screening Committee.Under this process, the next step requires the convening of the Screening Committee to screen the shortlist and to make recommendations for the appointment of candidates, to the Appointments Committee for a final decision on candidate appointments. The Government has proceeded to establish the remuneration benchmarking and framework for remuneration for the Chair and Members of the SWF Board. A remuneration benchmarking study on comparable SWF boards was undertaken, with particular emphasis on natural resource-oriented SWFs and superannuation funds within PNG, Australia, New Zealand, and the Asia-Pacific region. Base on the final reports submissions were subsequently lodged with the Salaries and Remunerations Commission (SRC) and the Salaries and Conditions Monitoring Committee (SCMC) seeking approval for the remunerations for the Chair and Members of the SWF Board respectively. The approval decisions are still pending. The Government has also proceeded with the development of an Investment Mandate for the SWF. Further work has also been undertaken with the Commonwealth Secretariat on the SWF Investment Mandate. In preparation for the establishment of the SWF, the Government in collaboration with the Commonwealth Secretariat has produced reports on Organisational Structure and Roles and Responsibilities of Sovereign Wealth Fund Departments for Papua New Guinea, Profit Maximisation Model, SWF Fiscal Model, and PNG SWF Corporate Governance Principles. These reports are aimed at supporting the inaugural Board which is responsible for the establishment of the SWF Secretariat and operationalisation of the SWF. Since the enactment of the OLSWF, the Government has maintained its commitment to the establishment of the PNG SWF. However, the Government has also faced the issue of the timing of SWF establishment, as the SWF must be properly financed and sustained once it is created. PNG’s SWF is a Natural Resource SWF. The principal source of financing natural resource SWFs are revenues resulting from the exploitation of oil, gas and mineral resources. Natural Resource SWFs are usually established to manage and invest the surplus revenues produced by the natural resources sector. Given the country’s economic situation in terms of the revenue flows from the natural resources, the Government recognises that the timing of the full

2022 National Budget, Volume 1
145
establishment of the SWF is dependent on the prospective revenue flows to the State from the natural resource sector. The Government’s policy decision to establish the SWF was based on the anticipated surplus revenue gains from the PNG LNG Project creating overall fiscal surplus conditions for the Government resulting in the build-up of fund balances, which the SWF would manage, invest and fund its operations. However, the anticipated windfall revenues from the PNG LNG Project have not occurred as expected to date. The fall in commodity prices in late 2014, the project loan repayments, and accelerated depreciation provisions in the PNG LNG Project Agreements have affected the payment of LNG tax revenues to the State, and in turn, have affected the establishment of the Sovereign Wealth Fund. This has also affected the Board appointment process. The low levels of resource revenue flows to the State to date have been a serious concern for the Government in advancing the establishment of the SWF Board and the SWF. Consequently, the decision regarding when to establish the Board is finely balanced. The Government is fully aware of the implications regarding the timing of the establishment of the SWF Board and resource revenue prospects for the State. The OLSWF provides for deposits into and withdrawals from the Stabilisation Fund to support the Budget in each year of the operation of the SWF. The withdrawals from the Stabilisation Fund cannot exceed the five-year moving average of the product of the yearly ratio of actual mineral and petroleum receipts to actual non-mineral and non-petroleum receipts, and the actual non-mineral and non-petroleum receipts of the State ending two years before the drawdown of fiscal year. This figure represents the maximum allowable withdrawal from the Stabilisation Fund. The assessment has shown that for the period covered (2012-2021), the level of deposits of mineral and petroleum receipts have been below the maximum allowable withdrawals from the Stabilisation Fund for the concerned fiscal years, meaning that those deposits would have been subsequently withdrawn to support the budget, leaving no balance in the Stabilisation Fund. For example, in 2019 the total of mineral and petroleum receipts eligible for deposit into the Stabilisation Fund was K761.6 million compared to a higher level of the maximum allowable drawdown for that fiscal year calculated at K856.4 million, meaning that the former amount would have been subsequently withdrawn to support the budget leaving no balance in the Stabilisation Fund. Similarly, the assessment shows deposits of mining and petroleum receipts into the Stabilisation Fund in 2020 and 2021 at K660.2 million and K860.3 million respectively with the corresponding maximum allowable drawdowns amounts much higher at K787.5 million and K990.2 million meaning that the deposited amounts would have been subsequently withdrawn to support the budget leaving no balance in the Stabilisation Fund. Therefore, the assessment demonstrates that for the Stabilisation Fund to start building up its balances, the State will need to receive resource revenues far over the historical five-year moving average calculation of revenue flows for each concerned fiscal year. Such a situation can be achieved either through a significant recovery in mineral and petroleum prices or increased revenues derived from new resource projects in the pipeline that come on stream in the future. In the above assessment, if the Government had decided to set aside the eligible deposits into the Stabilisation Fund to build up the fund balances instead of withdrawing them to support the budget each year as allowed by the OLSWF, then the Government would have had to
2022 National Budget, Volume 1
146
borrow or cut budget expenditure by the corresponding amount of the concerned deposits set aside in the Stabilisation Fund for each fiscal year concerned. While the resource projects in the pipeline are being processed by the Government, it is emphasised that there is a clear distinction between when a particular resource project has been negotiated and commissioned, and when the actual revenue benefits to the State start to materialise from that project. The actual payment and magnitude of resource revenues to the State by the resource projects are governed by the fiscal terms in the project agreements and have an important and direct effect on the establishment of the SWF. The Government recognises that the SWF must be properly functional and sustainable once it has been established. The assessment only proves the Government’s position that the low prices of commodities do not allow putting aside savings for use in future times of need in the short term, and that under present conditions, the Government would require all resource revenues to reduce the effect on the levels of Government debt. In addition, the prevailing adverse economic and financial conditions have required the Government not only to run annual budget deficits in line with its Medium-Term Fiscal Strategy but also to use resource revenues for budgetary support. Nevertheless, the Government is still committed to the establishment of the SWF as an important part of its macroeconomic management policies to manage and invest the revenues generated by resource projects in the future. These resource projects include the PNG LNG Project Expansion (P'ynyang) Project, Papua LNG Project, Pasca A Gas Condensate Project, Wafi-Golpu Copper, and Gold Project, and Frieda River Copper and Gold Project. The plan for the full implementation of the SWF when new natural gas and other projects come on stream in the future is in line with the requirements of the Organic Law on the Sovereign Wealth Fund and includes consistency of the current arrangements with PNG's long-term development interests and alignment with the implementation of the medium-term fiscal framework to manage natural resource project revenues and reduce pro-cyclicality of fiscal policy. 9.7 Central Banking act review
The Minister for Treasury, in consultation with the Prime Minister and the Ministerial Economic Committee of the National Executive Council, commissioned a review of the Central Banking Act 2000 (CBA) earlier in 2021. The Terms of Reference for the review were issued on 13 May 2021. The objective of the Review was to modernise the CBA in line with international developments over the last 20 years while continuing to ensure the independence of the central bank in line with international norms. To ensure independence, the Review was conducted by an Independent Advisory Group (IAG). A similar group was established by the late Sir Mekere Morauta when initially drafting the CBA. The IAG was chaired by Robert Igara, Chancellor of UPNG and formerly Chief Secretary to the Government of Papua New Guinea when the Central Banking Act was introduced in 2000. Other members include former Bank Governor from 1999 to 2009, Sir Wilson Kamit, and Dr Stephen Howes, Professor of Economics at the Australian National University.

2022 National Budget, Volume 1
147
On 11 November 2021, the IAG presented their Phase One Report into the Review of the CBA and released it for public view online21. This report evaluates in detail various aspects of the reserve bank. The IAG’s review finds that while BPNG have done well in some regards, there exist significant problems that must be addressed to prevent reoccurrence in the future. In total, the Phase One Report made 31 recommendations to Government. It is expected that the IAG’s review will continue into a more detailed second phase in 2022. Topics that the IAG will review include: the regulation of commercial banks and other financial institutions, with an emphasis on how to encourage new, low-risk entrants; BPNG’s financial performance and management; and a broader consideration of the legislation by which BPNG is governed. Government will evaluate the Review’s recommendations and seek to amend legislation accordingly.
21https://pngcentralbankactiag.org.

2022 National Budget, Volume 1
148
CHAPTER 10: ENHANCING STATE’S INVESTMENTS 10.1 OVERVIEW
State’s investments are consolidated into the three (3) Kumul Holding Entities: the Kumul Consolidated Holdings (KCHL); Kumul Petroleum Holdings Limited (KPHL) and the Kumul Mineral Holdings Limited (KMHL). These entities are incorporated under the Company’s Act 1997 to operate commercially in managing the state investment portfolio. The majority of the State-Owned Enterprises (SOEs) investments are in the utilities and infrastructure sectors and managed by KCHL. These include investments in the electricity, telecommunications, water and sanitation, ports, airports and banking. The agriculture sector investments will be managed by the recently established KAHL which is subsidiary of KCHL. The KPHL and the KMHL manage the State’s investments in the extractive sector with KPHL managing the oil and gas sector and KMHL managing the mineral sector. The State continues to develop policies to encourage and guide these entities commercial decisions, promote transparency, good governance, add value and enhance competition in their roles in delivering public goods and services across the country. As the sole shareholder, the State’s expectation is to increase efficiency in service delivery of key services in supporting economic activities and promote broad based sustained and inclusive economic growth. With improved efficiency, the State’s expectation is for sustained dividends to support its annual National Budget. The Government continues to initiate reforms in various sectors to assist its investments to achieve strong and healthy performances. 10.2 STATE’S INVESTMENT PERFORMANCE
The Kumul Holding Entities focus on industry expertise to support viable commercial investment decisions for positive returns. Financial performance reports for the last several years revealed mixed outcomes with some SOE’s performing well while others continue to perform well below expectations. This necessitated a holistic institutional reform of SOEs with the view to improving financial performance and key service delivery to which the Government commenced in 2020 and continued in 2021. One of the key reform initiatives delivered in 2021 is the passing of the Kumul Consolidated Holdings Authorisation (Amendment) Act 2021 in August 2021. This reform initiative was led by KCHL with technical support from the Asian Development Bank. Also tabled in Parliament with the KCH Bill was the Government’s SOE’s Ownership and Reform Policy which was endorsed by Cabinet in 2020. The amended KCH Act legislation provides the overarching legal parameters within which all SOEs are expected to operate. The amended KCH Act 2021:
1. clearly defines the roles of ministers, SOE boards and management; 2. refocuses KCH’s role on monitoring SOE performance; 3. requires the timely preparation and public release of statements of corporate intent
and audited annual financial accounts to improve SOE transparency; 4. establishes a transparent, skills-based process for SOE director selection and
appointment (that supports KCH’s goal of having at least 30.0 per cent representation of women on PNG’s SOE boards); and
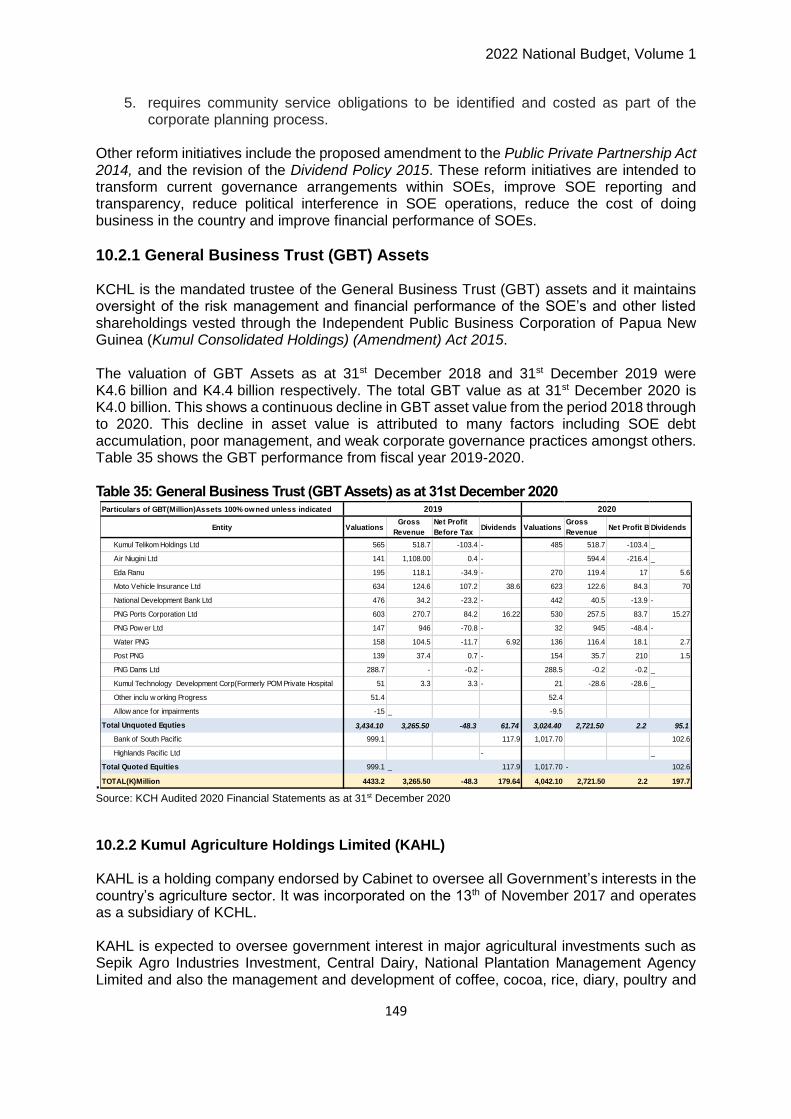
2022 National Budget, Volume 1
149
5. requires community service obligations to be identified and costed as part of the corporate planning process.
Other reform initiatives include the proposed amendment to the Public Private Partnership Act 2014, and the revision of the Dividend Policy 2015. These reform initiatives are intended to transform current governance arrangements within SOEs, improve SOE reporting and transparency, reduce political interference in SOE operations, reduce the cost of doing business in the country and improve financial performance of SOEs.
10.2.1 General Business Trust (GBT) Assets KCHL is the mandated trustee of the General Business Trust (GBT) assets and it maintains oversight of the risk management and financial performance of the SOE’s and other listed shareholdings vested through the Independent Public Business Corporation of Papua New Guinea (Kumul Consolidated Holdings) (Amendment) Act 2015. The valuation of GBT Assets as at 31st December 2018 and 31st December 2019 were K4.6 billion and K4.4 billion respectively. The total GBT value as at 31st December 2020 is K4.0 billion. This shows a continuous decline in GBT asset value from the period 2018 through to 2020. This decline in asset value is attributed to many factors including SOE debt accumulation, poor management, and weak corporate governance practices amongst others. Table 35 shows the GBT performance from fiscal year 2019-2020. Table 35: General Business Trust (GBT Assets) as at 31st December 2020
.Source: KCH Audited 2020 Financial Statements as at 31st December 2020
10.2.2 Kumul Agriculture Holdings Limited (KAHL) KAHL is a holding company endorsed by Cabinet to oversee all Government’s interests in the country’s agriculture sector. It was incorporated on the 13th of November 2017 and operates as a subsidiary of KCHL. KAHL is expected to oversee government interest in major agricultural investments such as Sepik Agro Industries Investment, Central Dairy, National Plantation Management Agency Limited and also the management and development of coffee, cocoa, rice, diary, poultry and
Particulars of GBT(Million)Assets 100% owned unless indicated
Entity ValuationsGross
Revenue
Net Profit
Before TaxDividends Valuations
Gross
RevenueNet Profit Before TaxDividends
Kumul Telikom Holdings Ltd 565 518.7 -103.4 - 485 518.7 -103.4 _
Air Niugini Ltd 141 1,108.00 0.4 - 594.4 -216.4 _
Eda Ranu 195 118.1 -34.9 - 270 119.4 17 5.6
Moto Vehicle Insurance Ltd 634 124.6 107.2 38.6 623 122.6 84.3 70
National Development Bank Ltd 476 34.2 -23.2 - 442 40.5 -13.9 -
PNG Ports Corporation Ltd 603 270.7 84.2 16.22 530 257.5 83.7 15.27
PNG Pow er Ltd 147 946 -70.8 - 32 945 -48.4 -
Water PNG 158 104.5 -11.7 6.92 136 116.4 18.1 2.7
Post PNG 139 37.4 0.7 - 154 35.7 210 1.5
PNG Dams Ltd 288.7 - -0.2 - 288.5 -0.2 -0.2 _
Kumul Technology Development Corp(Formerly POM Private Hospital 51 3.3 3.3 - 21 -28.6 -28.6 _
Other inclu w orking Progress 51.4 52.4
Allow ance for impairments -15 _ -9.5
Total Unquoted Equties 3,434.10 3,265.50 -48.3 61.74 3,024.40 2,721.50 2.2 95.1
Bank of South Pacif ic 999.1 117.9 1,017.70 102.6
Highlands Pacif ic Ltd - _
Total Quoted Equities 999.1 _ 117.9 1,017.70 - 102.6
TOTAL(K)Million 4433.2 3,265.50 -48.3 179.64 4,042.10 2,721.50 2.2 197.7
2019 2020
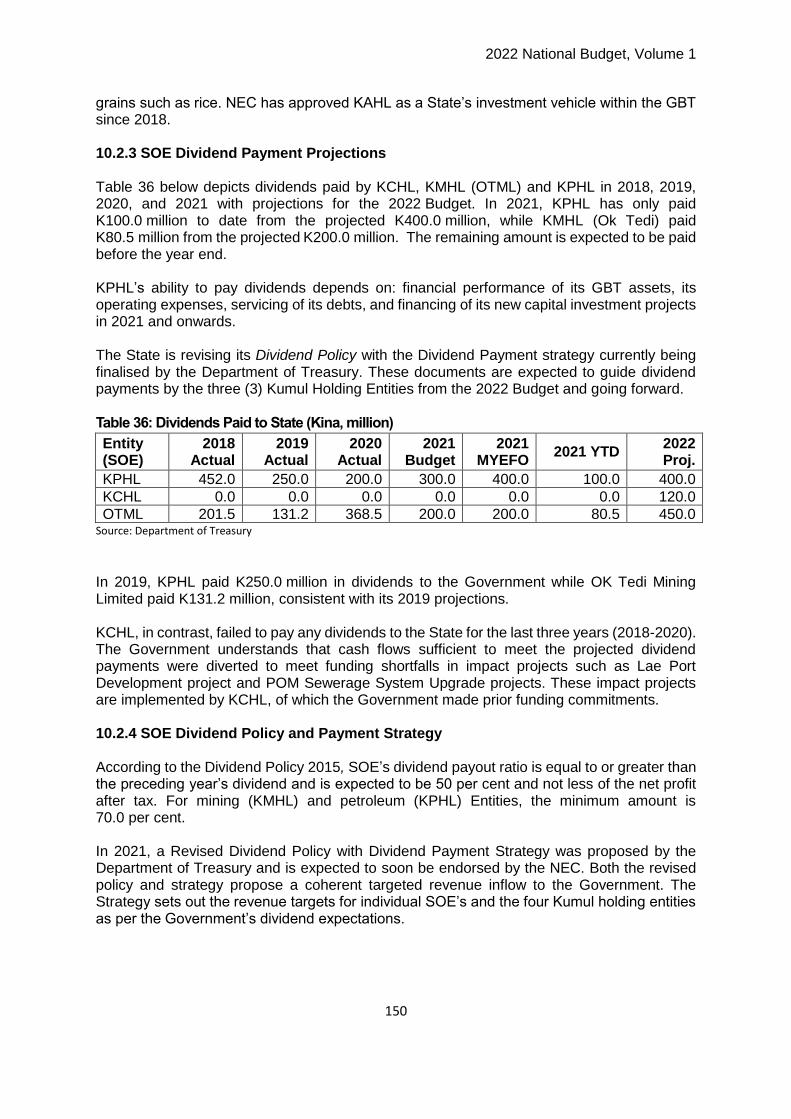
2022 National Budget, Volume 1
150
grains such as rice. NEC has approved KAHL as a State’s investment vehicle within the GBT since 2018. 10.2.3 SOE Dividend Payment Projections Table 36 below depicts dividends paid by KCHL, KMHL (OTML) and KPHL in 2018, 2019, 2020, and 2021 with projections for the 2022 Budget. In 2021, KPHL has only paid K100.0 million to date from the projected K400.0 million, while KMHL (Ok Tedi) paid K80.5 million from the projected K200.0 million. The remaining amount is expected to be paid before the year end. KPHL’s ability to pay dividends depends on: financial performance of its GBT assets, its operating expenses, servicing of its debts, and financing of its new capital investment projects in 2021 and onwards. The State is revising its Dividend Policy with the Dividend Payment strategy currently being finalised by the Department of Treasury. These documents are expected to guide dividend payments by the three (3) Kumul Holding Entities from the 2022 Budget and going forward. Table 36: Dividends Paid to State (Kina, million)
Entity (SOE)
2018 Actual
2019 Actual
2020 Actual
2021 Budget
2021 MYEFO
2021 YTD 2022 Proj.
KPHL 452.0 250.0 200.0 300.0 400.0 100.0 400.0
KCHL 0.0 0.0 0.0 0.0 0.0 0.0 120.0
OTML 201.5 131.2 368.5 200.0 200.0 80.5 450.0 Source: Department of Treasury
In 2019, KPHL paid K250.0 million in dividends to the Government while OK Tedi Mining Limited paid K131.2 million, consistent with its 2019 projections. KCHL, in contrast, failed to pay any dividends to the State for the last three years (2018-2020). The Government understands that cash flows sufficient to meet the projected dividend payments were diverted to meet funding shortfalls in impact projects such as Lae Port Development project and POM Sewerage System Upgrade projects. These impact projects are implemented by KCHL, of which the Government made prior funding commitments. 10.2.4 SOE Dividend Policy and Payment Strategy According to the Dividend Policy 2015, SOE’s dividend payout ratio is equal to or greater than the preceding year’s dividend and is expected to be 50 per cent and not less of the net profit after tax. For mining (KMHL) and petroleum (KPHL) Entities, the minimum amount is 70.0 per cent. In 2021, a Revised Dividend Policy with Dividend Payment Strategy was proposed by the Department of Treasury and is expected to soon be endorsed by the NEC. Both the revised policy and strategy propose a coherent targeted revenue inflow to the Government. The Strategy sets out the revenue targets for individual SOE’s and the four Kumul holding entities as per the Government’s dividend expectations.

2022 National Budget, Volume 1
151
10.3 BROADER REFORMS
10.3.1 Sectoral Policy Reforms
The Government’s sectoral reform programs aim to enhance and add value to all its investments in all sectors of the economy. There is a need for the Government policy intervention to review the performance of its current investment portfolio, take stock and assess the value of these investments to fully understand their potential for growing the economy and to ensure proper and timely reporting to assist the Government make informed decisions. In 2021, the Government through the Department of Treasury, initiated the following policy reform initiatives:
State Investment Review;
development of an Investment Registry Reporting Framework; and,
development of a medium-term Sectoral Investment Plan.
Implementation of the initiatives were impacted by the COVID-19 pandemic; hence the scheduled activities were not progressed in 2021 which majority are earmarked to be progressed in 2022. The policy directive to review all State’s investments aims to capture and maintain a robust and consolidated reporting framework at the National Government level for all State investments. This initiative will provide the State oversight on all fiscal operations of its investment. The Department of Treasury, in collaboration with other Government agencies, will lead these reform initiatives to promote transparency, accountability, and good governance practices for all Government investments.
10.3.2 Non-Tax Revenue Administration (NTRA) Bill 2021 The NTRA Bill 2021 is a reworked bill after the Public Money Management Regularisation (PMMR) Act 2017 was nullified by the Supreme Court in mid-2020. This initiative is part of the broader Public Finance Management (PFM) reform activities intended to address the declining non-tax revenue base of the government by bringing all government agencies financial dealings tied into the National Budget process. The bill is also intended to bring greater level of transparency and accountability in the management of public funds that Statutory Authorities collect. The implementation of the PMMR Act was a huge success where more than K1.0 billion of excess revenue was collected from various State Agencies to support the National Budget in 2018 and 2019. It also expected all State agencies to operate more in synchronisation with the whole of Government financial management practices and minimise unnecessary expenditure outside of the budget process. The Supreme Court nullification ruling significantly affected the Government’s revenue forecast for 2020 and 2021 fiscal years. The Ombudsman Commission filed the Reference under Section 19 of the Constitution seeking the opinion of the Supreme Court on the interpretation and application of the provisions of the Constitution and the Public Money Management Regularisation Act 2017, a law that came into operation on 14th February 2018.

2022 National Budget, Volume 1
152
The Ombudsman Commission filed the Reference in 2018 and the constitutional issues relate to:
right to ownership of property;
constitutional status of constitutional institutions;
removal of jurisdiction of the courts; Parliamentary control of public finance;
harsh and oppressive penalties;
protection of the law;
constitution as Supreme law; and
freedom of Expression.
The summary of the decision reading in court declared “the whole Act is deemed constitutionally invalid and unenforceable, and in which case, all other questions requiring answers are rendered redundant”. Thus, the reworked NTRA Bill was workshopped with relevant stakeholders in 2021, led by the Department of Finance. The draft NTRA bill is proposed to address the Supreme Court invalidities and continue the Government policy intent on increasing the collection of Non-Tax revenue in 2022 onwards.
10.3.3 Review of the Board (Fees & Allowances) Act 1955.
The review of the current board fees and allowances schedule, following the 2006 Treasurer’s Determination was completed in July 2020. The review recommended for the revision of the current 2006 Determinations set by the former government. It also recommended the review and amendment of the principal Act (Board (Fees and Allowance) Act 1955). The recommended review findings are briefly summarised below:
the current 2006 board fee structure was not reviewed for the last fourteen years. Furthermore, the fee structure needs to be adjusted to capture changing cost of goods and services.
high performing Boards/agencies to be rewarded for their contributions to growing the economy.
it is imperative that different fee structures be proposed for different government agencies that are operating in different sectors/industries.
these fee structures should reflect the level of decision making that is required by the board and is to be determined consistent with the annual performance of the agency and its contribution to the economy as a whole.
Furthermore, given the absence of a policy or regulatory framework for the Board Act 1955, the review proposed for the government to formulate a Directors Remuneration Policy to guide all Government agencies. These reform activities were initiated in 2021 and will continue going forward. 10.4 PUBLIC PRIVATE PARTNERSHIPS (PPP)
Provision of public infrastructure and Government services to its citizens is one of the prime mandates of governments all over the world. There are different ways in which the Government can provide these infrastructure and essential services. One of the commonly

2022 National Budget, Volume 1
153
used procurement and delivery modalities utilised by many countries around the world is the PPP model. PPP arrangements aim to maximise value and increase the quality and competitiveness of the public services/infrastructure provision. It supplements limited public sector capacities and raise additional capital in an environment of budgetary constraints and fiscal decline. Having realised the opportunities PPPs present, the Government adopted the PPP concept through formulation of a National PPP Policy and subsequent enactment of the PPP Law in 2014. The implementation of the PPP Act in the preceding years took off to a slow start due to Government’s differing policy preference and initiatives although there was some initial work done to kick-start the implementation process. In 2021, the NEC approved amendments to the PPP Act to allow for its full implementation. Should the proposed amendments be approved by Parliament, a PPP Steering Committee, chaired by the Departmental Head of the Department under the portfolio of the Minister responsible (currently Minister for National Planning & Monitoring), will oversee the establishment of the PPP Centre and recruitment of a CEO for the centre. 10.5 MANAGING THE NON-RENEWABLE RESOURCE SECTOR
The mining and petroleum sector make significant contribution to the economy. The sector on average contributes 30.0 per cent to the economy and makes up 90.0 per cent of the country’s export. The sector attracts major foreign direct investment (FDI) and contribute directly and indirectly to Government revenue and socio-economic development aspirations of the country, and therefore effective management of the Mining and Petroleum Sector is crucial to the economy. This has been a major challenge faced over the years. Government has undertaken major reforms to effectively manage the mining and petroleum sector, these include the reforms for KPHL and KMHL, review of the mining legislation and the intention of reviewing the Oil and Gas Act 1998. Under recent project negotiations, the Government has focused on negotiating for additional revenue measures, including a new production levy for Papua LNG, equity participation in Porgera and Government’s position on taking in any resource project to be no less than 50.0 per cent. The Government has also focused on the benefits of the resource project to flow directly to the impacted landowners and Provincial Governments by reviewing a number of Memorandum of Agreements (MOA) with intention to improve equitable benefit sharing between the impacted stakeholders. 10.5.1 Sustainable Benefits Management Policy Department of Treasury is developing a Sustainable Benefits Distribution & Management Policy to set the framework for equitable distribution and sustainable use of benefits that landowners and sub-national governments receive from resource projects. Work has already been initiated and progressed. In 2022, Department of Treasury expects to have the draft policy finalised for consultation.

2022 National Budget, Volume 1
154
10.5.2 State Equity Participation Work on a State Equity Participation Policy was initiated and progressed by the Department of Treasury in 2018. The Policy aims to provide a framework to guide government investment decision in relation to equity acquisition in extractive resource projects. The policy further aims to make the equity participation decision more transparent and ensure good governance. Department of Treasury targets to finalise and implement the policy by end of 2022 or second quarter of 2023 fiscal year. 10.5.2 Napa Napa Project Agreement In 1997, the PNG Government entered into a Project Agreement (PA) with the developer of the Napa Napa oil refinery to encourage downstream processing of petroleum products, making available cheaper petroleum products for local consumption. The Agreement provided fiscal incentives including the consideration for the refinery to have a monopoly market on the importation and supply of petroleum productions in the local economy. The Government and the Developer agreed on an ‘Import Parity Pricing’ (IPP) formula that sets the benchmark price for which the wholesale price of the landed cost and the locally produced petroleum products pricing mechanism were set. The IPP was changed without the consensus of the Government in 2007 which lead to NEC agreeing to a to three months temporary reprieve so the Government and developer can review and agree on a permanent IPP formula. However, since then, the Government and Developer has not agreed to a permanent IPP formula. It has become evident to the Government, that there is an apparent need to review the temporary pricing formula currently in use, and thus; the review of the PA in its entirety. Preliminary work for the review process has been started in 2021. Review of the Napa Napa Project Agreement will commence in 2022. 10.6 EXTRACTIVE SECTOR PROJECT UPDATES
The country’s Extractive Sector projects consist of existing and upcoming projects. The Government will monitor and evaluate both categories of projects on an on-going basis through line agencies ensuring business operations are within PNG laws and regulations. 10.6.1 MINING PROJECTS 10.6.1.1 Operating Mines The Ok Tedi mine picked up well after the initial COVID-19 pandemic shutdown from 5th August to 14th September 2020. The current resource envelope indicates potential extension of production for another 10 years (2021-2031). The mine holds a large portfolio of exploration leases near its current operations and continues to undertake exploration activities near the current mine. Lihir gold mine is the largest gold producing mine in the country producing over one million ounces of gold per annum. Its Mining Development Contract (MDC) is due for review. Government intends to use the review to address long outstanding issues of the mine, including socio-economic and fiscal issues. The Government will continue to provide its support where necessary to ensure the smooth operation of the mine.

2022 National Budget, Volume 1
155
The Ramu Nickel mine is a project that integrates mining beneficiation and refining. The project’s MDC grants the developer a 10-year tax holiday, commencing in 2016 and expires in 2026 where the Government anticipates the project to start paying taxes. This was somewhat an overly generous agreement and the National Government will ensure future MDC are carefully thought through to ensure fair returns for the people of Papua New Guinea and people of the impacted area. The Hidden Valley mine is an open-pit, gold-silver mine in Morobe Province. Construction of the mine started in 2007 and commercial production began in September 2010. A pre-feasibility of the life of mine extension study is underway, to evaluate the economic potential to extend the mine’s life by three years. The project has positively impacted the province as well as the nation economically and if the pre-feasibility study is successful, it will continue to bring the same level or more economic benefits to the country. Kainantu mine’s life span is about ten (10) years and the mine is in its fourth year of production. It is a medium sized underground mining project. The mine operator declared the mine profitable and anticipated mine life of over fifteen (15) years. The Porgera Gold Mine in Enga was put under care and maintenance in 2020. In July 2021, the Government reached a Framework Agreement with Barrick Niugini Limited (BNL) that set the high-level objectives and obligations of the stakeholders of the project. Subsequently, a Commencement Agreement was signed in October 2021 which detailed specific obligations and milestones for the reopening of the mine. The mine is targeted to be reopened in April 2022. Simberi Gold Mine is located on Simberi Island, New Ireland Province. The open cut mine contains epithermal gold in oxide and sulphide deposits. Current operations include mining of gold oxide with plans to expand to mining the gold sulphide deposit. The expansion of mining operation will increase the life of mine by 10 years. The State granted the extension of the Mining License (ML) in 2018. 10.6.1.2 Mining Prospects The proposed Wafi-Golpu project in Morobe if developed has the potential to make a significant economic and social contribution to Papua New Guinea’s economy over a long period. The mine will be producing copper and gold for an estimated mine life of 28 years and an annual production rate of 16 million tonnes per annum (mpta). The project developer submitted its application for a Special Mining Lease (SML) in 2016. Initial investment cost is estimated at US$2.8 billion with an additional US$1.9 billion project expansionary capital expenditure and US$0.7 billion sustaining capital expenditure for the mine life. In early 2021, the Morobe Provincial Government took out court a order to stop the developer, Wafi Golpu Joint Venture, from using a deep sea tailings placement (DSTP) system which has delayed the progress of consultations, negotiations and issuance of relevant development licenses. The National Government is committed to ensure that any disagreements between proponents are resolved on mutually beneficial terms. The proposed Frieda River Copper-Gold project located in the West and East Sepik Provinces. The project developer, PanAust, submitted an SML application in 2018 together with its revised feasibility study report. The 2018 feasibility study adopts a fundamentally different approach to the project, considering the project within a broader regional development context and requiring extensive third-party or government investment in regional infrastructure as a prerequisite. Given the remoteness of the project’s location and impacted communities’

2022 National Budget, Volume 1
156
concerns on the 2018 proposal for development, the developer is still investigating a number of options to mitigate the technical challenges and project impact communities’ concerns. The proposed Woodlark Gold Project is located on Woodlark Island in the Milne Bay Province. Mining Lease (ML) 508 was initially issued to Kula Gold Limited (KGL) in 2014. Geopacific Resources Limited (Geopacific) acquired a majority of shares in KGL in 2016 and is now the developer of Woodlark mine. Geopacific applied for variation in its mine development plan and further conducted drilling work to upgrade resources. Given the change in project configuration, a revised Definitive Feasibility Study (DFS) was submitted to the Government in 2018. The project will involve open-cut mining with a gold processing plant capacity of 2.4 million tonnes per annum, producing a total of 980,000 ounces of gold over a 13-year production life. Review of the project MOA on benefit distribution was initialled in September 2020 and construction commenced in quarter one (1) of 2021 and is anticipated to take two (2) years, with first gold production expected in December of 2022 fiscal year. 10.7 PETROLEUM PROJECTS
10.7.1 Existing Petroleum Project The PNG LNG Project is the only existing and producing gas project and it’s into its seventh year of production. Production has been above its name plate capacity of 6.9 million tonnes per annum (mtpa), averaging above 8 mtpa since 2016. The project is expected to complete repayment of its debt financing by 2027, which should also result in increased revenue to its shareholders including the State. 10.7.2 Proposed Petroleum Projects The Papua LNG Project is a gas project to be developed in Gulf Province. The Government expects the proposed project to produce 10.3 trillion cubic feet (tcf) of gas and 92 million barrels of condensate that will generate an estimated total revenue of US$40.0 billion over 25 years. The Government will ensure a national content plan is developed, negotiated and executed during its Development Forum. Papua LNG FEED work to start in 2022 as per the Head of Agreement signed in October 2021. Pasca-A Gas Project would be the first offshore gas project in PNG, which will be developed in two phases. The first phase will be gas re-cycling or liquid stripping where production and sale of natural gas liquids will take place (including propane, butane and condensate streams). The second phase will be gas blowdown where production and export of natural gas (LNG) and continued production and sale of natural gas liquids will take place. The project is expected to have a life span of 26 years. The projects agreement negotiation is in progress and yet to be signed off by all parties. The P’nyang Gas project had a recoverable resource reserve of 1.1-2.3 trillion cubic feet (tcf) of dry and condensate of 9-15 million barrels according to the last appraisal in 2012. The updated appraisal had indicated an increase of gas reserve to 4.36 tcf and the increased figure was also included in its Application for Petroleum Development Licence (APDL). The Government has ensured that the P’nyang Gas project is a stand-alone project and will have a separate Gas Agreement (GA). The Government signed a Heads of Agreement with

2022 National Budget, Volume 1
157
the Developer in October 2021. This agreement outlines the headline agreements on main fiscal terms of the project that will guide negotiations for its GA. The proposed Stanley Gas project is located in the Western Province. The Government signed a GA for its development and issued a Petroleum Development Licence (PDL10) in 2014. However, the project did not reach development and production stages due to unfavourable oil prices that deemed the economics of the project unviable. The delay to develop the project prompted the Government to issue a Letter of Show Case to the developer and is yet to get feedback. 10.8 PNG EXTRACTIVE INDUSTRIES TRANSPARENCY INITIATIVE (PNGEITI)
Papua New Guinea is currently amongst 52 countries implementing the EITI Global Best Practice Standard. The Government of PNG signed up to the EITI initiative with the objective of promoting transparency and accountability within the oil, gas and mining sectors. The Government has remained committed to achieving this objective in the last 7 years of its implementation. This has culminated in identifying a number of critical weaknesses in government systems through the EITI reporting process. These weaknesses required policy and legislative reforms for greater transparency and accountability to achieve good governance in the extractive sector. As an EITI implementing country, it is a requirement for PNG to disclose information along the extractives sector value chain from the point of granting licenses and contracts to how the various revenue streams make their way into government accounts, and how these revenues and other benefits are distributed to benefit the public. The intent is to strengthen public and corporate governance, promote better management of natural resources and provide reliable and timely data for informed decisions for public policy and legislative reforms for the sector. PNGEITI has produced eight (8) country reports covering the financial years from 2013 to 2019. It is expected to produce its ninth (9) report covering the financial year 2020 by early 2022. All EITI countries undergo an independent assessment (validation) after its implementation as required by the Standard. Papua New Guinea underwent its first validation in 2018 and was assessed as having made “Meaningful Progress”. This meant that whilst the country has made notable progress in meeting many of the requirements of the EITI Standard, there were a number of critical areas or key gaps that existed and these needed to be acted upon for PNG to meet all the requirements of the Standard. Such areas included; revenue collection and allocation, production and export data, license allocation and transfers, and direct sub-national payments and transfers, data quality, SOEs quasi-fiscal expenditures, contracts transparency and beneficial ownership disclosure among others. These areas were recommended for ‘corrective actions’ in the validation report. The PNGEITI, in consultation with respective government departments and agencies has been working in collaboration to ensure corrective actions are taken before the second validation in 2022. 10.8.1 PNGEITI on-going Reforms to Improve Sector Governance EITI implementation in PNG has given rise to some critical reforms to improve sector governance. These reforms culminated from the recommendations made from the PNGEITI reports that have been published and the outcome of the first validation. This is also coupled with mandatory actions required from PNG to meet a number of new requirements of the recent 2019 EITI Standard. These ongoing reform-oriented programs and activities are outlined below:

2022 National Budget, Volume 1
158
10.8.2. Disclosure of Beneficial Ownership (BO) Information A beneficial owner in respect of a company means the natural person or persons who directly or indirectly ultimately own or control the corporate entity. The EITI Standard 2019 requires that EITI reports from 2020 onwards include information relating to the Beneficial Ownership of corporate entities that bid for, operate or invest in extractive assets. The PNGEITI commissioned a scoping study on Beneficial Ownership that was completed in November 2016 and a Beneficial Ownership Roadmap report was published in 2017. The Roadmap included a costing and a work plan which was implemented from 2017 to 2019. The PNGEITI defined the following in the context of PNG:
beneficial ownership (BO);
politically exposed person(s) in line with the PNG Anti-Money Laundering and Counter Terrorist Financing Act 2015;
a materiality threshold for beneficial ownership set at 5.0 per cent, but which also considers the corporate structure of the companies operating in the country, an individual’s full aggregated interest as well as different means of exercising ownership and control.
A template was developed to capture beneficial ownership information at the point at which companies are registered with the Investment Promotion Authority (IPA), and this will be piloted with future company registrations. Additionally, a pilot project was undertaken to make beneficial ownership maps searchable on an online portal open to the public. A beneficial ownership report was published in 2020 which included a description of the approach, definitions and scope of the BO data collection and provided recommendations on issues that needed to be addressed. The PNGEITI will continue to work with the IPA, BPNG and other relevant entities in 2022 to consider if there are grounds for amendments to the Companies Act and other associated legislations for a mandatory BO disclosure regime and the creation of a BO data registry at the IPA office. 10.8.3 Transparency in the operations of Extractives State-Owned Enterprises SOEs and Trustees play a key role in managing and distributing PNG’s wealth from extractive activities. Transparent disclosure of their processes for managing and transferring funds to beneficiaries (landowners, sub-national governments, national governments among others) is critical for a comprehensive EITI report. Material SOEs and trustees are those with interests in (or responsibile for managing Government interests) extractive projects that are producing saleable commodities during the production period. National Government participation in the extractive industries contributes to government revenues through equity distribution receipts, dividends and tax payments to the Internal Revenue Commission (IRC). Where the SOE is also the operator of the project (as in the case with Ok Tedi), the SOE pays a production levy to the Mineral Resources Authority (MRA). Royalty payments are also distributed to local governments and landowners through the Mineral Resources Development Company (MRDC). Each SOE and associated subsidiary companies is considered material for reporting purposes regardless of whether the qualitative thresholds are met. This is due to the requirement of the EITI Standard to transparently report the management of funds through these entities. Each SOE, its structure, subsidiaries and its contribution to extractive industry revenues are

2022 National Budget, Volume 1
159
discussed in more detail in the 2019 PNGEITI Report and the SOE Scoping Study Report that were published in 2021. The SOE Scoping Study Report proposes definitions for ‘state owned enterprises’ and ‘quasi-fiscal expenditures’ which are consistent with the definitions in the EITI Standard. Extractive sector SOEs are governed by laws that are specific to the sector, to each of the government’s holding companies and to general legislation covering commercial activities. This legal framework makes it clear that SOEs are subject to an independent board and management and their operations must be conducted on a commercial basis and they are subject to external audit under international accounting standards. The SOEs Scoping Study Report contains information describing the relationship between each SOE holding company and its subsidiaries. These include legal structures showing SOEs and their subsidiaries as well as functional diagrams showing flow of taxes and dividends. The key findings concern the lack of readily available information in the public domain despite SOEs producing annual reports and financial statements. In most cases, it was found that this information is available internally in each of these entities but there is general reluctance to disclose the information. The study makes recommendations to increase the availability of information, including a recommendation that the PNGEITI advocates for a legal obligation for disclosure of annual reports and audited financial statements to be made public. The key recommendations focus on the need for extractive sector SOEs to adopt a more proactive approach to information disclosure and transparency. There is also a recommendation for specific matters affecting the operations of the extractive sector and also for PNGEITI to undertake a pilot project on commodity trading transparency for SOEs. The Scoping Study documents the operations of the SOEs in the extractive sector, their challenges and other structural issues that needed to be addressed for greater transparency and accountability. These entities have been operating under opaque environment and therefore critical recommendations were made in this study to undertaking policy and legislative reforms to improve corporate governance and increase transparency within these entities. 10.8.4 Disclosure of Contracts (Contracts Transparency) The details of contracts (resources project agreements) and licences are protected by confidentiality provisions in Section 163 of the Mining Act, Section 52 of the MRA Act and Section 149 of the Oil and Gas Act. Contracts or agreements (MoAs, MoUs, UBSAs, LBSAs, etc) are held and maintained by the Office of the Solicitor General. Without legislative amendments, agreements could only be made public with the approval of both the company and the Department of Petroleum and Energy (DPE) or MRA (as appropriate). To date no contracts have been made publicly available, not even a list of all current contracts or project agreements. Broader benefit sharing agreements related to mining and oil and gas projects are also currently not publicly disclosed. Despite these challenges, the PNGEITI had continued to make progress with responsible stakeholder entities. The MRA is seeking legal advice on making all mining project Memorandum of Agreements (MoAs) publicly available. The PNGEITI has been engaging with the State Solicitor and other Government entities to explore solutions to non-disclosure of contracts. It has now become mandatory (as of early 2021) for PNG to disclose details of contracts or project agreements, consistent with the EITI Standard. To support the PNGEITI in pursuing

2022 National Budget, Volume 1
160
this matter, a scoping study is currently being undertaken, jointly commissioned by PNGEITI and the EITI International Secretariat. The study commenced in September and is anticipated to be completed in December 2021. The study is intended to describe the legal framework for contracts disclosure in PNG, and evaluating the risks and challenges as well as the opportunities and benefits associated with disclosing extractive sector contracts. The outcome of this study is expected to enhance stakeholders understanding on any potential risks and offer practical solutions on how to address such risks and reap the benefits of public disclosure. 10.8.5 Sub-National Payments and Transfers in Extractives Sector Through the EITI reporting process, much progress has been made on the reporting of extractive revenues to the national government. Yet payment data at the sub-national level is non-existent, too aggregated to be meaningful, inconsistent across projects, or difficult to obtain. The lack of clear, reliable, timely and useful reporting on sub-national payments and transfers is particularly problematic in PNG where landowners, affected communities and subnational government entities receive a broad range of payments and transfers. There is a ‘closeness’ about sub-national extractive payments in PNG’s extractive provinces – they connect to peoples’ land, their families and their communities in a way that is meaningfully different to payments at the national level. More effective reporting of sub-national payments and transfers through the EITI reporting process can provide local stakeholders access to relevant and timely information on the extractive revenue flows that affect them most. Strengthening PNGEITI sub-national reporting can also drive transparency and accountability in PNG’s extractive provinces, contribute to decentralisation efforts, and potentially improve social licence to operate for extractive companies. A scoping study on sub-national payments and transfers in PNG’s mining, oil and gas sector was undertaken in 2018 by the PNGEITI. The purpose of the study was to:
identify and map the sub-national payments and transfers in PNG’s extractive sector;
document stakeholder views on enhanced sub-national reporting through PNGEITI; and
develop a reporting framework and roadmap for PNGEITI sub-national reporting. Based on a review of global best practice, stakeholder interviews, case studies, and analysis of sub-national payment data, a series of key questions were considered in the development of a proposed framework for PNGEITI sub-national reporting. One key recommendation proposed in the scoping study report was that rather than attempting a country wide implementation of sub-national reporting, PNGEITI pilots subnational reporting in three extractive provinces. Piloting sub-national reporting will help the PNGEITI and their provincial counterparts learn lessons about what works and what does not work prior to a wider roll out of EITI sub-national reporting in PNG. Involving key stakeholders from extractive provinces in an ‘adaptive’ implementation of subnational reporting will also mean a greater chance of ownership over the process. This, will in turn generate on the ground learnings that can be taken into-account in the final design of a PNGEITI subnational operating framework.

2022 National Budget, Volume 1
161
Piloting sub-national reporting in extractive provinces was shelved in 2020 due to the onset of the COVID-19 Pandemic and the project has been pending since. The PNGEITI had prioritised this project in its Annual Work Plan to be continued in 2022. 10.8.6 Improvement in Resource Related Revenue Management This project commenced in January 2018. The primary goal of the project is to promote resource related revenue management and reporting in accordance with the EITI Standard. The project aims to achieve a number of outputs including:
improving management of relevant data and information at the Department of Petroleum and Energy;
enhancing reporting mechanisms among extractive sector companies and government agencies; and
enhancing awareness and implementation structure for PNGEITI in the country. The project was to be concluded in December 2020. However due to the COVID-19 pandemic disruptions, it was extended to end in December 2021. The project was funded under the JICA Technical Cooperation Programme and the PNGEITI is currently in liaising with JICA to secure Phase II of the project going forward. 10.8.7 Scoping Studies on Education Mainstreaming, Electronic Data Reporting
Platform and CSO Capacity Assessment Projects The PNGEITI in partnership with the World Bank jointly commissioned the publication of three scoping studies in 2020. The purpose of embarking on these studies was basically to enhance the outputs of the PNGEITI in accordance with EITI implementation in the country. These reports were on:
mainstreaming the PNGEITI reports and standards in the formal education sector;
digitising the PNGEITI reporting process through an Electronic Reporting Platform; and
conducting Capacity Assessment of Civil Society Organisations (CSOs) participation in the EITI implementation process.
The three reports were reviewed and assessed on both their relevance to PNGEITI policy priority areas and also the EITI Standard. The PNGEITI acknowledges the first drafts of the reports and appreciated the need for continual improvement of the reports to make informed decisions for the benefit of implementing the EITI Standard. The PNGEITI had provided inputs to the World Bank to consider prior to progressing to the piloting phase of the projects. 10.8.8 Proposed PNG Extractives Industry Transparency Commission (PNGEITC) Bill EITI implementation in PNG has gained momentum with increased participation by relevant regulatory departments and state-owned entities, provincial authorities, industry companies and civil societies. The sustainability and effectiveness of implementing EITI is dependent on having it legally established. The reason being that the EITI is currently implemented through the NEC Decision that holds no legal obligation for reporting entities to ensure compliance, especially providing financial data and information for the industry required for EITI reporting purpose.
The PNGEITI reports that have been published so far continue to have data and information gaps resulting in significant discrepancies in the data and information presented to the public

2022 National Budget, Volume 1
162
from reporting entities. Additionally, this scenario also presents constraints in implementing a number of EITI requirements due to the absence of a legal framework to sustain EITI governance and reporting framework domestically. Examples of reporting gaps that require legislative intervention include; disclosure of contracts for contracts transparency, disclosure of beneficial ownership details and the process involved in the issuance and transfer of mining, oil and gas licences and the absence of a licence registry or a data base at both the MRA and the Department of Petroleum amongst others for mining and petroleum activities respectively. These gaps have been identified and recommended for actioning in the 2018 Validation Report and the PNGEITI reports that have been published.
Limited visibility in revenue reporting over the years have hindered informed decision making for effective governance and better management of the extractive sector. The introduction of the EITI concept and the subsequent intervention of the PNGEITI National Policy now sets the framework for improved governance, not only in the mineral sector, but also in the non-mineral sector utilising the EITI model for improved transparency and accountability. The stakeholders have been making efforts in moving towards sustaining EITI implementation with a mandatory disclosure regime. A proposed PNGEIT Commission Bill is currently undergoing regional consultations to ensure that the project impact provincial stakeholders’ interests are captured well in the Bill before it goes to Parliament for enactment. The consultations have been completed and the Bill is anticipated to be finalised for submission to the NEC and subsequently to Parliament in 2022. 10.9 REFORMING THE RENEWABLE RESOURCE SECTOR
10.9. 1 AGRICULTURE SECTOR Papua New Guinea is an agriculture-based country with 85.0 per cent of its 7.5 million people depending on the sector for their livelihoods. This is the sector that provides food security, creates employment, brings family income and contributes to the national coffers (approx. 16.0 per cent of GDP). The sector plays a key role in the socio- economic development of the country and is the second largest foreign exchange revenue earner after mining and petroleum. The Department of Agriculture & Livestock (DAL) is a leading government agency responsible for the management of the agriculture sector in PNG. Its mandate is to promote improvement and expansion of food crops and livestock programmes and projects in a bid to assist the people of PNG meet their local requirements in nutrition and household food security. The Government’s focus is investing more into promoting sustainable economic growth in agriculture, fisheries, and forestry sectors through creation of income generating opportunities, encouraging effective land-owners participation, and promoting climate change resilience. 10.9.1.1 Commodities and Livestock The agriculture commodities of significant economic value, in terms of gross income in Papua New Guinea are coffee, cocoa and palm oil. The agencies are Oil Palm Industry Corporation (OPIC), Coffee Industry Corporation (CIC), PNG Cocoa Board (PNGCB), Kokonas Indastri Koporesen (KIK), Rubber Board, Spice Board, and Livestock Development Corporation (LDC) that were established or engaged under the ministerial determination of DAL to facilitate development of commodity crops respectively. These agencies and commodity boards under DAL are mandated to provide extension services, facilitate, manage and or regulate each

2022 National Budget, Volume 1
163
commercial crop and livestock in PNG. The other agencies under the agriculture sector are Fresh Produce Development Agency (FPDA), National Agriculture Quarantine & Inspection Authority (NAQIA), and National Agricultural Research Institute (NARI). There are plans in-place to improve performance of DAL to effectively coordinate operations of these agencies and commodity boards, at the national, provincial and district level. Effective sector coordination is important to drive policy initiatives and sector programs to see tangible results within the sector. Over the last few years, the Government, through the Commodity Boards (CB), has continued to support local farmers, SMEs and MSMEs in commercial projects. With the aim to encourage local participation in economic development, the Government has made significant investments through price support and special intervention programs under various commodities. The programs aim to facilitate value for money for local farmers and SME to be productive and result oriented. 10.9.1.2 Oil Palm The Oil Palm Industry Corporation (OPIC) is responsible for providing extension services to the smallholders, out-growers and settlers within the precincts of nuclear estates of oil palm growing provinces. OPIC’s key role is to provide efficient delivery programs and develop market infrastructure for its smallholders and out-growers. It generates on average about K1.2 billion in export revenues per year which is equivalent to approximately 47.0 per cent of PNG’s total agriculture exports. The Government will continue to support OPIC through the Small-Holder Agriculture Development Projects (SADP), and Research and Development Program (R&DP). The objective of SADP is to rehabilitate the most in need portions of oil palm small holder roads and implement sustainable maintenance systems for the entire road network in oil palm growing provinces. The target was to rehabilitate 200km of roads from 2018-2022. This program will continue and close in 2022. The R&DP promotes the growth and development of oil palm industry through appropriate research and development techniques. Through this program OPIC will rehabilitate run-down blocks and undertake research around Plant Pathology, Agronomy, Entomology and Socioeconomic through PNG Oil Palm Research Association (engaged) as Research arm of Oil Palm Industry. 10.9.1.2.a Review of PNG OPIC Act 1992 The PNG’s OPIC Act 1992 which established PNG OPIC is outdated and is due for review and amendment. The current Act does not conform to the current market dynamics of oil palm could be amended to improve OPIC’s operations and small holder farmers. Therefore, the Act will be reviewed with particular focus on the following items;
Fresh Fruit Bunches (FFB) levies. The rate of the FFB levies subject to OPIC Act 1992 have become outdated, not reflecting inflation. Hence, current rate is due for an update, and
Governance of Oil Palm Industry. The Act does not grant OPIC regulatory functions but recognise it as an extension service provider. OPIC has expressed its need to be

2022 National Budget, Volume 1
164
granted regulatory functions in order for proper coordination and management of the industry.
10.9.1.3 Coffee Coffee is the second most important agriculture cash crop after palm oil to PNG and it is cultivated by over half a million households around the country. Almost three million Papua New Guineans rely on coffee for their livelihoods. The Government will continue to support CIC22 to address on-going issues such as decline in production and coffee quality, problematic land tenure system in PNG, undefined demarcation of boundary, lack of proper survey and issue of official State Leases and climate change intensifying the incidence of pests and diseases such as coffee berry borer are major obstacles to on-going or new investments in the industry. The Government will continue to fund the following programs in 2022; Coffee Access Road, Coffee Berry Borer Containment, and Coffee Rehabilitation and Expansion. The Coffee Access Road program aimed at building roads and bridges in remote coffee growing districts through memorandum of Understanding/Agreement (MOU/MOA) initiated by CIC and District Development Authorities to establish counter funding arrangement for construction and rehabilitation of five (5) coffee economic roads. An estimate of 50,000 inaccessible coffee farmers will benefit from this infrastructure with an expected increase of 5-10.0 per cent of export volume of green beans by year 2025. Controlling Spread of Coffee Berry Borer where CIC will increase its awareness and research capacity oriented towards increasing and improving skills and knowledge of farmers; adopting innovative technology and farming practices; and creating better value for PNG coffee through the specialty markets and more. CIC focusing on Coffee Rehabilitation and Expansion program to rehabilitate existing plantations and consider establishing new smallholder plantations. This program coincides with the recent Government Land Reform initiative (amended Incorporated Land Group and Customary Land Registration Acts). This program aims to increase coffee production volumes by 2030 as indicated in the NCDR 2020-2030 and is piloted in Eastern Highlands Province to rehabilitate existing run-down plantations and develop new plantations on green fields. This is to ensure that landowners participate and own these plantations and assist to facilitate private investments in coffee plantations. The new National Coffee Replanting Program will be implemented in partnership with the rehabilitation programme. In 2022, CIC will continue to invest in new priority projects such as the Coffee SME Growers Groups, Roll–Out of Coffee Curriculum Program and Accessing Secured Land for Coffee Development. 10.9.1.4 Cocoa The PNG Cocoa Board (PNGCB) is the Government’s arm focused on facilitating a sustainable cocoa industry to advance the livelihood of the rural population, with the aim to bring about innovative farming practices that creates income generation through cocoa production. About 80 per cent of cocoa production is produced by smallholders on customary land.
22 The Coffee Industry Corporation, which is empowered under the Coffee Industry Corporation Statutory Powers and Functions Act 1991, has the
responsibility to provide both leadership and services to the PNG coffee industry as stipulated in its Constitution

2022 National Budget, Volume 1
165
The PNGCB is focusing on three (3) key strategic programs and these are: Nursery Program; Freight Subsidy Program; and Cocoa Quality and Market Promotion Program. Under the Nursery program, the Cocoa Board is facilitating the propagation of the recently released ten (10) Cocoa Pod Borer tolerant cocoa clone planting materials to rehabilitate village cocoa farms in provinces and introducing Cocoa Pod Borer tolerant seedlings due to declining production volume. The Cocoa Board has established agreements with provinces to initiate this program, which will continue into 2022 and beyond. 10.9.1.5 Coconut The Kokonas Indastri Koporesen (KIK) is the regulating institution of the coconuts industry in PNG. While expanding its traditional copra emphasis, KIK has ventured into down-stream processing through development of Micro Small and Medium Enterprises (MSME) of High Value Coconut products and creating market access. KIK is also developing bio-security measures against pest and disease and coconut replanting program. The corporation (KIK) have been progressing four (4) main programs over the recent years. These programs are Coconut Research Program, Market Development and Trade Program, Coconut Disease Containment & International Coconut Genebank Relocation, and Coconut Nurseries Establishment and Seed Distribution Program. The Coconut Research Program contains four (4) activities namely: Coconut cultivating and improvement; Soil improvement and farming system; Management of Bogia Coconut Syndrome (BCS) and Coconut Rhinoceros Beetle (CRB) and; Developing a biosecurity plan for the coconut industry. These activities have been affected by the COVID-19 pandemic but will pick up in 2022. The Market Development and Trade Program contains seven (7) activities. To improve quality of: copra; coconut products to HACCP standards; lab and downstream facilities and product packages, labelling & branding. As well as establishing new MSMEs’ partners; promoting and awareness of products and; facilitating farmer and MSMEs training. There has been some progress made in 2020 but slowed in 2021. The program will continue in 2022. The Coconut Disease Containment & International Coconut Genebank Relocation involves seven (7) activities. These include: Awareness of BCS; Genebank sanitation; undertaking BCS Tolerance & Screening Study; Relocation of BCS Tapo checkpoint to Naru in Ramu Highway; Pre-Entry Quarantine Nursery; Genebank Relocation and; Developing Risk Management Strategy for BCS. These activities are also affected by the COVID-19 pandemic and delayed funding including elapsing of donor support for the Development of the Risk Management Strategy for BCS resulting in slow implementation of these activities in 2021. The Coconut Nurseries Establishment and Seed Distribution Program contains six (6) activities that includes: Appraised and Rehabilitation of coconut plantation and smallholder blocks; Increasing number of Nurseries; Seedling Distribution and Planting; Mobilising Farmers; Training Farmers; and Awareness. These activities indicate progressive results against target outcome despite delays due to COVID-19 pandemic. Despite the delays the programs have indicated progressive results and KIK will continue to pursue these programs in 2022.

2022 National Budget, Volume 1
166
10.9.1.5.a Review of KIK Act 2002 The review of KIK Act 2002 is currently in progress. The aim of the review is to address loopholes in the governance and operations of the KIK and to encourage effective participation of landowners and farmers in the industry. This legislative review will be completed in 2022. 10.9.1.6 Fresh Produce The Fresh Produce Development Authority (FPDA) is a semi-autonomous government agency established under the PNG Companies Act to develop a commercially viable and sustainable horticulture industry for PNG. FPDA is responsible for facilitating the development of fresh produce industry in PNG to build capacity, enhance food security and promote healthy living to enable small holders to venture from subsistence farming to commercial operations. Projects that were supported through partnership arrangements have shown progressive results against target outcome in line with the Medium-Term Development Plan III. The deliverables support the pillars of increasing revenue and wealth creation and providing quality infrastructure and utilities. These projects include: The National Seed Potato Multiplication project; the Market Supply Value Chain; the Citrus project and; the Bulb Onion project. The Market for Village farmers Project is supported through counter-part funding from the National Government since 2018 and will end in 2024. It targets fresh food produce sectors (94.0 per cent of village farmers) to transition from semi-subsistence agriculture to market oriented farming as a business. The Government initiated Freight Subsidy Scheme in 2020 has resulted in more produce being freighted from Lae to Port Moresby however, with mixed results. In 2021, FPDA plans to ensure the National Government’s Freight Subsidy is effectively coordinated to ensure its sustainable going forward through continuous tracking of the impact of COVID-19 pandemic on food production and supply system. Government through FPDA will continue the partnership arrangements with GoPNG (Provincial and District levels); institutions; donor partners and other stakeholders to deliver on the various projects and endeavor on generating revenues from these existing projects in 2022. 10.9.1.6 Rubber The Rubber Board of PNG established under Rubber Industry Act 1975 is responsible for rubber industry development and is currently operating under the DAL. The Rubber Board manages different type of rubber licenses such as special license and, planting and replanting license. Special license specify certain area of which rubber should be planted and the period of license. This also covers planting and in possession of rubber by persons (natural persons/company/corporation) that the Board recognised under the Act. Currently, there are two Technically Specific Rubber factories in the country. These factories are located in Kiunga, Western Province and in Doa, Central Province. The two (2) factories export about 300-400 thousand tons of rubber every month.

2022 National Budget, Volume 1
167
The Government, through the DAL, will continue to support the PNG Rubber Board efforts to increase the factories’ volumes of production from 600-800 thousand tons every month by 2030. 10.9.1.7 Livestock The Livestock Development Corporation (LDC) was established in 1983 mandated to take over the responsibility and operation of various ranches, abattoirs and other activities operated by DAL. Livestock within the mandate of LDC includes cattle, poultry, pig, sheep and goats, rabbits, apiculture (honey bee) and aquaculture. Meat consumption in PNG has increased steadily over the last two decades, and is predicted to increase at a conservative rate of 5.0 per cent per annum. Increased demand for meat is currently met by meat imports costing around K140.0 million per year. The current target, as established under the PNG Development Strategic Plan (PNGDSP) 2010-2030, is to increase domestic production to four million metric tonnes by 2030. However, current production is about 400,000 tonnes which is only 10.0 per cent of the meat target set by the PNGDSP. There is great potential for livestock farmers and farming groups to raise their productivity and output to match future demand for meat. The Government will continue to support LDC plans on reviving the cattle industry in the short to medium term as poultry and piggery already have established private sector investments. 10.9.2 Forestry Sector The Government, through the PNG Forest Authority (PNGFA) is embarking on several initiatives in 2022 under the Capital Expenditure Program as well as generating income from its internal sources to supplement the National Governments grant. The Expansion and Development of existing Reforestation Projects consists of nine (9) reforestation projects earmarked by PNGFA as plantation developments projects for commercial and industrial utilisation. The projects were identified on both the State and customary land which PNGFA will work with landowners in ILG Groups through their respective Incorporated Landowners ”Tree Growers Association” with the purpose to acquire more land for reforestation. The Upgrading of PNGFA Information and Communication Systems project is designed to facilitate three (3) outcomes: (1) to capture better and reliable forest resource data to manage the nation’s forest resources; (2) to achieve socio-economic growth; and; (3) to mitigate emissions of greenhouse gases. A National Forestry Inventory (NFI) field assessment was conducted in seven (7) provinces however, donor support ended in 2019 and the project work stopped. The continuation of this project is important as it will provide accurate and reliable information for assessing PNG’s actions towards mitigations of climate change concerns and management of forest including socio-economic activities. 10.9.2.1 Review of the Forestry Act 1991 (as amended) In 2020, the PNGFA undertook the review of the Forestry Act 1991. The purpose of the review is to ensure that the Act harmonises with the Government’s forest policies, programs, and international best practices of forest management and development. PNGFA aims to complete the new revised Act in 2022. This revised Act will ensure effective and well-structured PNGFA’s governance and operations, promote land-owner participation and strengthen forest revenues and charge collection processes.

2022 National Budget, Volume 1
168
10.9.2.2 Timber Rights Purchase (TRP) The Government through the Department of Treasury and the National Forest Authority has initiated processes to establish policy guidelines and processes that will assist in addressing outstanding claims under the Timber Rights Purchases matters. The purpose of this Guideline is to ensure an established process is used in addressing the long outstanding TRP issues. This Guideline is necessary to determine appropriate processes and procedures to settle these accruing investment claims. The Guideline will be completed in 2022. 10.9.3 Fisheries Sector PNG has an extensive and valuable fisheries sector ranging from inland river fisheries, aquaculture, coastal beche-de-mer and reef fisheries to the prawn trawl and large-scale deep- water tuna fisheries. The range of participants covers artisanal community to medium sized domestic prawn and tuna longline operators to large international purse seine fleets in the deep-water tuna fishery. Under the Fisheries Management Act 1998, the National Fisheries Authority (NFA) is responsible for the management and development of the fisheries sector. The NFA in 2020 has officially launched a ten (10) year national fisheries strategic plan 2020-2030 which provides the road map and vision for a broad-based fisheries sector and industry that is inclusive, environmentally sustainable, globally competitive and promotes food security. As a maritime nation with the maritime zone covering over 2.4 million square kilometers, the ocean agenda is of immense importance to PNG, not only for the living and non-living resources but for the value added they bring to our national assets and more importantly for the country’s own identity and own way of life as a people of this nation. The Government therefore, is also prioritising the strengthening of management, governance and security of PNG’s maritime zones by adapting the 10-year National Ocean Policy 2020-2030 in July 2020. Through conservation and protection measures, the Government has adopted and launched the country’s maritime protected areas policy and the national action plan for stingrays, skates and sharks in June 2021. This policy will strengthen the country’s efforts to better protect its marine resources because we are an epi-center for global marine resources and biodiversity. Implementing this policy will assist PNG to reach the biodiversity at the target level to have 17.0 per cent of its terrestrial and inland water areas and 10.0 per cent of coastal and marine areas protected. Focus is also on domestic downstream processing that will enable Papua New Guineans as resource owners to be meaningfully involved in the economic opportunities from sea resources. The Government will continue to support programs under the fisheries sector in 2022. 10.9.4 Tourism Promotion Authority The Tourism sector has been hit hard due to the COVID-19 pandemic crisis since 2020. This has resulted in substantial losses of revenue for the Government as well as job losses and reduced earnings for those businesses that rely on tourism for their income.

2022 National Budget, Volume 1
169
The PNG Tourism Promotion Authority (PNGFA) has been working closely with participants in the travel and leisure industry under the public private partnership arrangement as places for COVID -19 quarantine program to support the tourism industry to continue operating under this alternate arrangement in 2022. 10.10 STATE PARTICIPATION AND INVESTMENTS IN AGRICULTURE SECTOR
It is under the Marape Government’s focus to transform the agriculture sector into a reliable commercial and sustainable food system that addresses food security and climate resilience as well as conservation and management of our vast biodiversity. The Government has prioritised investments in the agriculture sector as an engine of economic growth and prosperity for the country. The strategic interventions undertaken are a combination of credit schemes, freight and price subsidy for our rural farmers which has helped broaden the scope of agricultural production sites in the country. These interventions will not only help broaden the tax base and generate additional revenue the country needs for development but also more importantly improve rural communities and their livelihoods enabling them to be proactive nation builders. To support transforming the agriculture sector, the Government has set targets to increase cash crop production and livestock production by 30.0 per cent in 2025 with efforts to also increase downstream processing by 30.0 per cent and develop taxation incentives to local farmers. Additionally, this will include a formulation of an agriculture and livestock diversification plan in 2025 and ensure local landowners and provincial governments participate in the equity sharing and downstream business and associated spin offs. 10.10.1 Price Support Program The Price Support Program (PSP) is a critical initiative undertaken by the Government to cushion the effects of COVID-19 on the agriculture sector and to provide economic stimulus. This means growers or farmers get a better price on their produce to increase in both production and exports. The PSP started in 2020 with K50.0 million from the National Budget appropriation followed by K24.0 million in 2021 parked under DAL for administration of funds. The DAL under a tripartite Memorandum of Understanding (MOU) arrangement between the DAL, farmers and commodity boards have released the PSP funds to farmers under the terms and conditions stipulated in the MoU. The implementation of PSP resulted in some positive impacts by increasing farmers’ participation and interest dramatically. There was a significant increase in production, increase in cash flow in the villages and communities, small businesses and employment increased and new businesses established to cater for transportation and processing. However, concerns were raised whether such support programmes be sustained in the long run. Key challenges faced as a result of PSP implementation were lack of storage facilities to store surplus production from increased production and transportation issues (issues with mode of transport via sea, land and air) to transport surplus production from farm gate to markets causing decay. The commodity boards and agencies that were supported through this program advocated for proper management and sustainability of this support in the long run. There was no policy, guideline and or mechanism to direct the use of PSP funds was a key challenge for PSP

2022 National Budget, Volume 1
170
implementation. Hence, the Government will consider a guideline for the administration of the PSP. 10.10.2 Environment and Climate Change The Climate Change Development Authority (CCDA) is the lead agency responsible for developing policies and plans relating to climate change. The Government through CCDA has launched the Green Climate Fund Country Program and No Objection Procedure Guidelines in 2020 with support from the US Government. This allows PNG to access climate change financing through readiness support to manage and build resilience to climate change threats in PNG. The Government through CCDA has completed the due diligence process to enable CCDA to start generating revenue. These new fees are Carbon levies to be collected on all fuel types; Synthetic fertilisers and; Green fees. These proposed fees and levies will support the Government and sector agencies to implement the Sustainable Development Goal 13 Road Map measures. A significant amount of revenue is expected to be generated for the Government annually once approved. The launching of the Papua New Guinea Sustainable Development Goal 13 Road Map will enable respective sectors including all stakeholders to take onus in driving the SDG actions respectively to promote a climate resilient economic wise in climate governance, energy, forestry, agriculture fisheries, infrastructure, biodiversity conservation, tourism, health and minerals. The Building Resilience to Climate Change in PNG Project is aimed at increasing resilience to the impacts of climate vulnerability and climate change with an outcome to improve capacities of communities in vulnerable atolls and islands. The cross-cutting project has three outputs implemented by CCDA, National Fisheries, National Agricultural Research Institute and PNG Ports Corporation. In 2022, the program aims to implement three (3) outputs: (1) Carry out Climate change and vulnerability assessments and adaptation plans developed for target communities (CCVAP); (2) Implement Sustainable fishery Eco-systems and food security investments piloted in nine identified vulnerable islands and atoll communities and; (3) Enabling framework for climate-resilient infrastructure and early warning and communication network including additional financing for climate proof Provincial wharf in Alotau. The project is supported by the National Government and donor partners and administered by Asian Development Bank. 10.10.3 Mobilising Land for Renewable Resource Projects The Government focus to increase investments in the renewable resource sector. The development of agriculture and forestry projects encompass huge hectares of land that are customarily owned. This requires proper approaches to identify and mobilise genuine landowners and to recognise their rights over customary landownership before committing State to participate in customary land lease arrangements. Under the ongoing land reform programs, the Government through the Department of Lands and Physical Planning will utilise the Incorporated Land Group (ILG) and the Voluntary Customary Land Registration (VCLR) processes to mobilise customary land to allow potential developments to take place. Under the ILG/VCLR process the customary landowners will have land titles in perpetuity (last forever) enabling them to make available their land for potential

2022 National Budget, Volume 1
171
development purposes. The program “Accessing Secured Land for Coffee Development” is piloted in EHP with establishment of MOUs singed between landowners and CIC representing the Government. 10.10.4 Facilitating Investments in Agriculture The agriculture system in PNG ranges from small-scale subsistence, intensive farming and commercial/agri-business. It covers the activities of both the private and public sector in cropping (food, fruits, vegetables, and tree crop), livestock farming (meat, dairy and animal husbandry), management of land, water resources and post-harvest areas. Investments in this sector can also strengthen incomes and consumption in rural areas, thereby improving food security through enhancing not only food availability but also access to food and food utilisation. As such, the Government through the Department of Treasury and the Department of Agriculture and Livestock will establish a strategic framework to facilitate long-term reforms and investments in the agriculture sector. The strategic framework will consider a holistic approach that can drive the growth in the agriculture sector over the medium to long term by driving investments, infrastricture development, and creating access to markets and finance. This aims to generate more economic activity and expand the PNG’s economy base. This program is at the concept stage awaiting further approval to progress.

2022 National Budget, Volume 1
172
APPENDIX 1: GRANTS AND TRANSFERS TO PROVINCES Table 1.1: National Governments Grants to Provincial and Local Level
Governments (Kina Thousand) Table 1.2: Grants, Transfers and other resources of the Provinces (Kina
Thousand)

2022 National Budget, Volume 1
173
Table 1.1: National Governments Grants to Provincial and Local Level Governments (Kina Thousand)
Source: National Economic and Fiscal Commission (NEFC) and Department of Treasury
PS Salaries Teachers Salaries PS leave fares Teachers leave faresVillage Court
Allowances
Land Mediation
Allowances
Western 15,505,000.00 49,804,000.00 2,169,000.00 2,974,000.00 1,516,000.00 196,000.00 72,164,000.00 4,837,441 3,584,846 5,590,821 1,535,981 132,434 76,998 736,134 339,159 16,833,815 760,159 2,852,782 3,612,941 20,446,756 92,610,756
Gulf 14,066,000.00 20,552,000.00 309,000.00 701,000.00 1,837,000.00 122,000.00 37,587,000.00 5,345,868 4,438,992 6,333,977 2,268,788 480,955 68,579 1,621,980 2,235,371 22,794,508 146,592 1,354,163 1,500,755 24,295,263 61,882,263
Central 23,178,000.00 67,953,000.00 691,000.00 3,001,000.00 2,547,000.00 191,000.00 97,561,000.00 7,227,735 7,445,950 12,254,670 3,096,742 603,860 96,094 2,893,966 2,272,387 35,891,405 - 2,041,648 2,041,648 37,933,053 135,494,053
NCD* 1,070,000.00 36,000.00 1,106,000.00 - - 1,106,000
Milne Bay 9,596,000.00 72,308,000.00 330,000.00 1,410,000.00 2,976,000.00 196,000.00 86,816,000.00 6,670,130 7,049,146 6,852,518 2,637,826 390,988 70,739 3,306,434 2,040,188 29,017,968 295,350 2,382,632 2,677,982 31,695,950 118,511,950
Oro 11,959,000.00 31,262,000.00 516,000.00 1,379,000.00 1,629,000.00 110,000.00 46,855,000.00 4,673,343 4,125,166 4,198,898 2,094,658 338,925 70,374 2,008,426 1,196,219 18,706,009 733,681 1,701,939 2,435,619 21,141,629 67,996,629
Southern Highlands 27,090,000.00 98,763,000.00 382,000.00 1,056,000.00 3,337,000.00 253,000.00 130,881,000.00 5,442,800 7,915,397 6,598,455 1,961,111 579,122 99,227 2,565,053 1,638,148 26,799,313 698,683 2,484,405 3,183,088 29,982,401 160,863,401
Hela 11,050,000.00 39,289,000.00 154,000.00 435,000.00 1,688,000.00 171,000.00 52,787,000.00 6,452,100 4,381,452 4,528,275 1,839,640 384,030 68,701 1,765,193 2,353,716 21,773,107 978,415 1,510,768 2,489,183 24,262,290 77,049,290
Enga 11,667,000.00 86,179,000.00 206,000.00 1,287,000.00 5,830,000.00 208,000.00 105,377,000.00 5,374,796 8,799,260 10,908,577 4,058,489 997,774 198,356 1,937,634 2,400,341 34,675,228 243,564 2,663,002 2,906,566 37,581,794 142,958,794
Western Highlands 15,295,000.00 108,934,000.00 392,000.00 1,724,000.00 2,572,000.00 129,000.00 129,046,000.00 2,792,586 1,896,920 2,640,982 910,970 336,303 41,715 499,743 758,236 9,877,455 817,775 2,012,429 2,830,203 12,707,659 141,753,659
Jiwaka 11,868,000.00 60,501,000.00 129,000.00 681,000.00 1,701,000.00 88,000.00 74,968,000.00 5,398,289 7,805,265 11,849,521 1,306,996 401,902 83,595 2,213,692 2,269,736 31,328,996 - 1,356,772 1,356,772 32,685,768 107,653,768
Simbu 20,215,000.00 80,525,000.00 206,000.00 1,158,000.00 3,384,000.00 245,000.00 105,733,000.00 6,782,385 10,755,610 11,469,650 1,964,742 766,563 111,694 3,168,998 3,952,119 38,971,761 387,266 1,510,923 1,898,189 40,869,950 146,602,950
Eastern Highlands 10,487,000.00 123,179,000.00 723,000.00 2,701,000.00 3,795,000.00 269,000.00 141,154,000.00 7,315,783 11,037,839 17,742,673 2,708,530 646,106 98,733 3,679,215 2,963,565 46,192,443 761,330 2,754,760 3,516,090 49,708,533 190,862,533
Morobe 34,644,000.00 170,004,000.00 1,239,000.00 7,728,000.00 3,086,000.00 404,000.00 217,105,000.00 - - - - - - - - - 2,543,521 4,725,657 7,269,177 7,269,177 224,374,177
Madang 26,959,000.00 109,685,000.00 723,000.00 2,617,000.00 3,087,000.00 220,000.00 143,291,000.00 9,319,596 8,809,219 12,372,745 3,615,179 535,708 27,529 3,687,031 3,466,348 41,833,355 871,106 3,815,007 4,686,113 46,519,467 189,810,467
East Sepik 19,305,000.00 96,630,000.00 1,032,000.00 3,101,000.00 3,711,000.00 302,000.00 124,081,000.00 9,715,568 11,929,829 19,504,198 3,411,905 676,809 71,680 2,908,931 3,504,285 51,723,205 670,411 4,214,072 4,884,483 56,607,687 180,688,687
Sandaun 12,393,000.00 51,645,000.00 723,000.00 1,312,000.00 1,690,000.00 196,000.00 67,959,000.00 9,813,141 9,386,921 8,710,904 3,770,471 521,678 76,679 2,431,005 3,881,216 38,592,015 503,144 3,777,040 4,280,185 42,872,200 110,831,200
Manus 8,741,000.00 27,045,000.00 516,000.00 785,000.00 1,727,000.00 147,000.00 38,961,000.00 2,267,004 3,508,980 5,753,104 1,810,937 506,941 84,190 1,820,024 2,331,131 18,082,310 221,245 505,901 727,146 18,809,456 57,770,456
New Ireland 16,081,000.00 43,455,000.00 2,427,000.00 1,010,000.00 1,494,000.00 122,000.00 64,589,000.00 - - - - - - - - - 416,609 1,147,472 1,564,081 1,564,081 66,153,081
East New Britain 22,740,000.00 90,340,000.00 309,000.00 1,665,000.00 1,567,000.00 208,000.00 116,829,000.00 4,178,687 3,920,313 3,915,630 3,350,373 350,023 71,572 950,545 619,829 17,356,973 915,419 2,662,282 3,577,701 20,934,674 137,763,674
West New Britain 17,174,000.00 62,438,000.00 1,032,000.00 3,657,000.00 1,665,000.00 147,000.00 86,113,000.00 5,972,522 9,111,128 9,432,111 3,543,002 618,130 188,473 2,673,009 2,267,723 33,806,098 570,997 1,682,824 2,253,822 36,059,919 122,172,919
Bougainville* 49,594,000.00 72,633,000.00 998,000.00 8,752,000.00 2,196,000.00 416,000.00 134,589,000.00
TOTAL 389,607,000.00 1,563,124,000.00 15,206,000.00 49,134,000.00 54,105,000.00 4,376,000.00 2,075,552,000.00 109,579,773 125,902,232 160,657,709 45,886,339 9,268,253 1,604,929 40,867,014 40,489,716 534,255,965 12,535,266 47,156,478 59,691,745 593,947,710 2,534,910,710
Administration GrantEducation Function Grant
Transport
Infrastructure
Maintenance Function
Grant
Primary Production
Function Grant
Village Courts Function
Grant
Land Mediation
Grant
Other Service
Delivery Function
Grant
Province
Personnel Emoluments Goods and Services
Total Recurrent Grants (a) + (b)
Salaries Leave fares Allowances
Sub-total PE (a)Health Function
Grant
Total Provincial
Government GrantsUrban LLG Grants Rural LLG Grants Total LLG Grants Sub - total G&S (b)
Note:
NCD and Bougainville are not part of the Intergovernmental Financing Arrangement therefore do not receive any function grants
NCD receives Goods and Services Grant through a single Town and Services Grant indicated under urban LLG Grants category
ABG receive Goods and Services Grants through a single category of Recurrent Goods and Services Grants
Village Court and Land Mediation Allowances are now paid through the Alesco payroll system and are budgeted under the Village Court & Land Mediation Secretariat

2022 National Budget, Volume 1
174
Table 1.2: Grants, Transfers and other resources of the Provinces (Kina Thousand)
Source: National Economic and Fiscal Commission (NEFC)
Total Grants and Transfers
Recurrent Budget GST (1) Bookmakers Tax (2)
Mining & Petroleum
Royalties/Dividends
(3)
Own Source
Revenues (4)
Western 20,446,756 16,460,000 0 37,888,000 2,079,645 76,874,400
Gulf 24,295,263 4,241,000 0 0 297,150 28,833,413
Central 37,933,053 4,978,000 0 0 10,073,114 52,984,167
NCD* 0 291,787,000 2,287,000 0 0 294,074,000
Milne Bay 31,695,950 9,297,000 0 0 1,694,571 42,687,521
Oro 21,141,629 4,668,000 0 0 1,520,298 27,329,926
Southern Highlands 29,982,401 11,381,000 0 12,320,000 16,915 53,700,316
Hela 24,262,290 6,384,000 0 0 0 30,646,290
Enga 37,581,794 4,331,000 0 9,359,779 12,085,700 63,358,274
Western Highlands 12,707,659 42,980,000 13,000 0 2,210,934 57,911,593
Jiwaka 32,685,768 1,042,000 0 0 0 33,727,768
Simbu 40,869,950 4,455,000 0 0 1,602,104 46,927,054
Eastern Highlands 49,708,533 19,244,000 0 1,554 2,896,685 71,850,772
Morobe 7,269,177 184,384,000 408,000 3,881,650 12,262,158 208,204,986
Madang 46,519,467 21,041,000 842,000 0 2,601,920 71,004,388
East Sepik 56,607,687 15,496,000 0 0 3,542,387 75,646,075
Sandaun 42,872,200 9,282,000 0 0 2,945,752 55,099,952
Manus 18,809,456 2,082,000 0 0 551,417 21,442,873
New Ireland 1,564,081 14,092,000 0 47,633,922 919,278 64,209,282
East New Britain 20,934,674 35,093,000 0 0 5,289,905 61,317,579
West New Britain 36,059,919 14,813,000 10,000 0 3,686,871 54,569,790
Bougainville* 0 0 0 0 0
TOTAL 593,947,710 717,531,000 3,560,000 111,084,906 66,276,803 1,492,400,419
Source: National Economic and Fiscal Commision
Notes
1) GST is based on 60% of the 2020 net inland GST collections, to be distributed to each province in 2022
2) Bookmakers is 40% of 2020 net collections
3) NEFC estimate based on 2020 actual collections which includes dividends from equity shares of mining and petroleum resource projects
4) NEFC estimate based on 2020 Actuals
5) NEFC does not provide Own Source Revenue (4) estimates for NCD and Bougainville as these provinces are not part of Intergovernmental Financing Arrangement
Province
Non-Grant tax transfers
Total

2022 National Budget, Volume 1
175
APPENDIX 2: TABLES ON ECONOMIC AND FISCAL DATA
Table 1: Gross Domestic Product by Economic Activity at Current and
Constant Prices Table 2: Contributions to Growth in Real Gross Domestic Product Table 3: Prices of Main Export Commodities Table 4: Volume of Main Export Commodities Table 5: Value of Main Export Commodities Table 6: Summary of Balance of Payments Table 7: Employment Classified by Industry Table 8: Monetary Aggregates Table 9: Major Assumptions Underlying the Budget Table 10: Statement of Operations for the General Government Table 11: Statement of Sources and Uses of Cash for the General Government Table 12: General Government Revenue by Economic Classification Table 13A: General Government Expense by Economic Classification Table 13B: General Government Expense by Agency Type and Economic Classification Table 14: Transactions in Assets and Liabilities for the General Government Table 15: Stocks of General Government Debt

2022 National Budget, Volume 1
176
Table 1: Gross Domestic Product by Economic Activity at Current and Constant Prices (Kina Million)
*Sum of industries less bank imputed charge, plus import duties, less subsidies Source: Actual data for 2008-2019: National Statistical Office. Estimates and projections: Department of Treasury
2019 2020 2021 2022 2023 2024 2025 2026 2027
Actual Est Est Proj Proj Proj Proj Proj Proj
Agriculture, Forestry and Fishing
nominal 14234.5 15882.5 18055.2 19363.8 20628.4 22065.1 23674.4 25535.1 27638.0
deflator 136.9 152.6 167.0 174.0 179.5 186.7 194.4 202.9 212.0
real 10394.4 10408.8 10811.8 11126.6 11490.7 11819.5 12180.3 12582.5 13034.7
rate of real growth 2.3 0.1 3.9 2.9 3.3 2.9 3.1 3.3 3.6
Oil and Gas Extraction
nominal 14719.8 13968.3 15195.3 14941.8 14295.9 13842.8 13739.5 13385.2 13385.2
deflator 112.7 107.8 117.3 116.4 114.2 110.4 109.6 106.7 106.7
real 13056.7 12960.6 12952.4 12840.3 12519.6 12539.4 12539.4 12539.4 12539.4
rate of real growth 15.1 -0.7 -0.1 -0.9 -2.5 0.2 0.0 0.0 0.0
Mining and Quarrying
nominal 9038.7 8483.7 8771.5 12203.9 13360.1 13893.2 14334.7 13777.0 14347.0
deflator 115.4 137.3 162.3 166.3 169.7 174.4 179.4 172.3 179.3
real 7832.4 6177.8 5404.9 7337.3 7872.2 7965.3 7991.7 7995.5 7999.5
rate of real growth 5.3 -21.1 -12.5 35.8 7.3 1.2 0.3 0.0 0.0
Manufacturing
nominal 1418.2 1483.7 1587.5 1705.5 1868.8 2042.2 2238.2 2463.4 2721.5
deflator 141.4 147.5 154.7 160.6 169.2 177.8 186.6 196.0 205.8
rate of deflator growth 4.2 4.3 4.9 3.8 5.4 5.1 5.0 5.0 5.0
real 1003.1 1006.1 1026.2 1062.1 1104.6 1148.8 1199.3 1256.9 1322.2
rate of real growth -0.6 0.3 2.0 3.5 4.0 4.0 4.4 4.8 5.2
Electricity Gas & Airconditioning
nominal 685.8 768.2 854.2 941.6 1055.6 1175.8 1308.3 1456.4 1621.3
deflator 117.9 123.0 129.0 133.9 141.1 148.3 155.7 163.5 171.7
rate of deflator growth 3.4 4.3 4.9 3.8 5.4 5.1 5.0 5.0 5.0
real 581.5 624.5 662.0 703.0 748.0 792.9 840.5 890.9 944.3
rate of real growth 4.0 7.4 6.0 6.2 6.4 6.0 6.0 6.0 6.0
Water Supply & Waste Management
nominal 158.2 169.6 183.3 195.9 213.7 235.3 260.3 289.8 322.6
deflator 144.8 151.0 158.4 164.4 173.3 182.1 191.1 200.7 210.8
rate of deflator growth 0.0 4.3 4.9 3.8 5.4 5.1 5.0 5.0 5.0
real 109.3 112.3 115.7 119.2 123.3 129.2 136.2 144.4 153.1
rate of real growth 4.1 2.8 3.0 3.0 3.5 4.8 5.4 6.0 6.0
Construction
nominal 4759.5 4974.1 5322.2 5745.4 6325.9 6913.0 7561.7 8322.5 9177.3
deflator 140.5 146.6 153.7 159.6 168.2 176.7 185.5 194.8 204.6
rate of deflator growth 3.4 4.3 4.9 3.8 5.4 5.1 5.0 5.0 5.0
real 3387.0 3393.7 3461.6 3600.1 3762.1 3912.6 4076.9 4272.6 4486.2
rate of real growth -8.6 0.2 2.0 4.0 4.5 4.0 4.2 4.8 5.0
Wholesale and retail trade
nominal 7750.1 8002.5 8680.1 9460.4 10426.2 11503.4 12739.8 14182.2 15787.8
deflator 138.0 143.9 151.0 156.7 165.1 173.5 182.1 191.3 200.9
rate of deflator growth 3.6 4.3 4.9 3.8 5.4 5.1 5.0 5.0 5.0
real 5616.3 5560.1 5749.2 6036.6 6314.3 6630.0 6994.7 7414.4 7859.2
rate of real growth 1.5 -1.0 3.4 5.0 4.6 5.0 5.5 6.0 6.0
Transport and Storage
nominal 2013.4 1743.0 1865.0 2052.0 2367.4 2686.6 3031.8 3422.8 3864.2
deflator 138.1 144.0 151.1 156.8 165.2 173.6 182.2 191.4 201.0
rate of deflator growth 9.6 4.3 4.9 3.8 5.4 5.1 5.0 5.0 5.0
real 1458.2 1210.3 1234.5 1308.6 1432.9 1547.6 1663.6 1788.4 1922.5
rate of real growth 3.6 -17.0 2.0 6.0 9.5 8.0 7.5 7.5 7.5
Accomodation and Food Services
nominal 1416.2 1357.4 1449.6 1596.4 1833.4 2080.6 2337.0 2626.1 2951.0
deflator 128.2 133.7 140.3 145.6 153.4 161.2 169.2 177.7 186.7 rate of deflator growth -0.3 4.3 4.9 3.8 5.4 5.1 5.0 5.0 5.0
real 1104.4 1015.0 1033.3 1096.3 1195.0 1290.5 1380.9 1477.5 1581.0
rate of real growth -1.3 -8.1 1.8 6.1 9.0 8.0 7.0 7.0 7.0
Information and Communication
nominal 1334.6 1451.8 1644.8 1843.9 2098.2 2372.3 2679.5 3025.1 3415.3
deflator 95.2 99.3 104.1 108.1 113.9 119.7 125.6 131.9 138.6
rate of deflator growth -1.4 4.3 4.9 3.8 5.4 5.1 5.0 5.0 5.0
real 1402.1 1462.4 1579.4 1705.8 1842.2 1982.2 2132.9 2292.9 2464.8
rate of real growth 15.9 4.3 8.0 8.0 8.0 7.6 7.6 7.5 7.5
Financial and Insurance Activities
nominal 2055.4 2043.0 2194.5 2341.7 2558.6 2790.6 3046.6 3327.6 3634.4
deflator 136.1 142.0 148.9 154.6 162.9 171.1 179.7 188.7 198.2
rate of deflator growth 3.8 4.3 4.9 3.8 5.4 5.1 5.0 5.0 5.0real 1510.0 1439.0 1473.6 1514.8 1570.9 1630.6 1695.8 1763.6 1834.2
rate of real growth -4.6 -4.7 2.4 2.8 3.7 3.8 4.0 4.0 4.0
Real Estate Activities
nominal 5054.9 5309.2 5714.1 6127.0 6681.5 7287.6 7956.1 8731.5 9582.5
deflator 137.4 143.3 150.3 156.0 164.4 172.7 181.3 190.4 200.0 rate of deflator growth 3.8 4.3 4.9 3.8 5.4 5.1 5.0 5.0 5.0
real 3679.6 3705.3 3801.7 3927.1 4064.6 4219.0 4387.8 4585.2 4791.6
rate of real growth 2.7 0.7 2.6 3.3 3.5 3.8 4.0 4.5 4.5
Professional and Scientific
nominal 793.1 814.8 871.8 932.1 1011.5 1094.8 1188.3 1295.4 1421.6
deflator 128.9 134.5 141.0 146.4 154.3 162.1 170.2 178.7 187.7 rate of deflator growth 9.8 4.3 4.9 3.8 5.4 5.1 5.0 5.0 5.0
real 615.2 606.0 618.1 636.6 655.7 675.4 698.4 724.9 757.5
rate of real growth 11.6 -1.5 2.0 3.0 3.0 3.0 3.4 3.8 4.5
Administrative and Support Services
nominal 6430.8 6693.9 7092.2 7508.9 8109.3 8776.7 9489.8 10404.7 11429.6
deflator 137.7 143.6 150.6 156.4 164.7 173.1 181.7 190.8 200.4
rate of deflator growth 4.2 4.3 4.9 3.8 5.4 5.1 5.0 5.0 5.0
real 4670.8 4661.5 4708.1 4802.3 4922.3 5070.0 5222.1 5451.8 5702.6
rate of real growth 4.1 -0.2 1.0 2.0 2.5 3.0 3.0 4.4 4.6
Public Administration and Defence
nominal 3928.9 4127.0 4504.2 4955.9 5430.5 5877.5 6385.8 6974.6 7617.8
deflator 126.9 132.4 138.9 144.2 151.9 159.6 167.5 176.0 184.8
rate of deflator growth 2.8 4.3 4.9 3.8 5.4 5.1 5.0 5.0 5.0
real 3095.1 3179.5 3243.1 3437.7 3575.2 3682.5 3811.4 3963.8 4122.4
rate of real growth 0.5 2.7 2.0 6.0 4.0 3.0 3.5 4.0 4.0
Education
nominal 2187.4 2349.9 2563.6 2762.2 3041.2 3349.1 3691.5 4070.6 4488.7
deflator 125.8 131.2 137.7 142.9 150.6 158.2 166.1 174.4 183.2
rate of deflator growth 2.8 4.3 4.9 3.8 5.4 5.1 5.0 5.0 5.0
real 1738.3 1790.4 1862.0 1932.8 2019.7 2116.7 2222.5 2333.7 2450.3
rate of real growth 0.7 3.0 4.0 3.8 4.5 4.8 5.0 5.0 5.0
Health and Social Work Activities
nominal 1573.5 1779.3 2034.5 2238.5 2476.5 2732.3 3017.4 3340.0 3704.1
deflator 128.6 134.2 140.7 146.1 153.9 161.7 169.8 178.3 187.2
rate of deflator growth 3.1 4.3 4.9 3.8 5.4 5.1 5.0 5.0 5.0
real 1223.3 1326.3 1445.7 1532.5 1609.1 1689.5 1777.4 1873.4 1978.3
rate of real growth 0.7 8.4 9.0 6.0 5.0 5.0 5.2 5.4 5.6
Other Service Activities
nominal 540.0 574.5 617.7 660.4 730.6 798.4 877.5 967.6 1067.0
deflator 133.4 139.2 146.0 151.5 159.7 167.8 176.1 185.0 194.2
rate of deflator growth 3.8 4.3 4.9 3.8 5.4 5.1 5.0 5.0 5.0
real 404.7 412.8 423.1 435.8 457.6 475.9 498.2 523.2 549.3
rate of real growth 3.4 2.0 2.5 3.0 5.0 4.0 4.7 5.0 5.0
Total GDP
nominal 83846.0 85348.4 93314.1 101695.8 109555.3 116743.8 125451.6 134080.1 145407.9
rate of nominal growth 5.6 1.8 9.3 9.0 7.7 6.6 7.5 6.9 8.4
deflator 127.6 134.6 145.0 150.0 155.7 161.4 167.9 173.5 181.5
real 65714.3 63406.9 64343.9 67796.2 70348.5 72344.7 74701.5 77280.7 80110.5
rate of real growth 4.5 -3.5 1.5 5.4 3.8 2.8 3.3 3.5 3.7
Total non-mining GDP
nominal 60087.6 62896.4 69347.4 74550.1 81899.3 89007.8 97377.4 106918.0 117675.7
rate of nominal growth 4.9 4.7 10.3 7.5 9.9 8.7 9.4 9.8 10.1
deflator 134.0 142.1 150.8 156.6 163.9 171.7 179.8 188.4 197.5
real 44825.3 44268.5 45986.6 47618.6 49956.7 51840.1 54170.4 56745.8 59571.6
rate of real growth 1.6 -1.2 3.9 3.5 4.9 3.8 4.5 4.8 5.0

2022 National Budget, Volume 1
177
Table 2: Contributions to Growth in Real Gross Domestic Product (Percentage points)
Source: Department of Treasury
2015 2016 2017 2018 2019 2020 2021 2022 2023 2024 2025 2026 2027
Actual Actual Actual Actual Actual Est Proj Proj Proj Proj Proj Proj Proj
Agriculture, Forestry and Fishing -0.5 0.4 0.4 0.7 0.4 0.0 0.6 0.5 0.5 0.5 0.5 0.5 0.6
Oil and Gas Extraction 12.5 1.4 -0.5 -3.3 2.7 -0.1 0.0 -0.2 -0.5 0.0 0.0 0.0 0.0
Mining and Quarrying 0.2 1.6 1.6 0.3 0.6 -2.5 -1.2 3.0 0.8 0.1 0.0 0.0 0.0
Manufacturing -0.3 0.1 0.1 -0.1 0.0 0.0 0.0 0.1 0.1 0.1 0.1 0.1 0.1
Electricity Gas & Airconditioning 0.0 0.0 0.0 0.0 0.0 0.1 0.1 0.1 0.1 0.1 0.1 0.1 0.1
Water Supply & Waste Management 0.0 0.0 0.0 0.0 0.0 0.0 0.0 0.0 0.0 0.0 0.0 0.0 0.0
Construction -1.0 0.1 -0.7 -0.1 -0.5 0.0 0.1 0.2 0.2 0.2 0.2 0.3 0.3
Wholesale and retail trade -0.6 0.2 0.1 0.2 0.1 -0.1 0.3 0.4 0.4 0.4 0.5 0.6 0.6
Transport and Storage 0.1 0.1 0.0 0.1 0.1 -0.4 0.0 0.1 0.2 0.2 0.2 0.2 0.2
Accomodation and Food Services 0.0 0.0 0.1 0.2 0.0 -0.1 0.0 0.1 0.1 0.1 0.1 0.1 0.1
Information and Communication 0.1 0.1 0.0 0.0 0.3 0.1 0.2 0.2 0.2 0.2 0.2 0.2 0.2
Financial and Insurance Activities -0.6 -0.1 0.0 0.0 -0.1 -0.1 0.1 0.1 0.1 0.1 0.1 0.1 0.1
Real Estate Activities 0.2 0.3 0.2 0.1 0.2 0.0 0.2 0.2 0.2 0.2 0.2 0.3 0.3
Professional and Scientific -0.3 0.0 -0.1 -0.1 0.1 0.0 0.0 0.0 0.0 0.0 0.0 0.0 0.0
Administrative and Support Services -0.2 0.0 0.0 0.8 0.3 0.0 0.1 0.1 0.2 0.2 0.2 0.3 0.3
Public Administration and Defence 0.2 0.1 0.1 0.4 0.0 0.1 0.1 0.3 0.2 0.2 0.2 0.2 0.2
Education 0.1 0.1 0.1 0.1 0.0 0.1 0.1 0.1 0.1 0.1 0.1 0.1 0.2
Health and Social Work Activities 0.0 0.3 0.1 0.1 0.0 0.2 0.2 0.1 0.1 0.1 0.1 0.1 0.1
Other Service Activities -0.1 0.0 0.0 0.0 0.0 0.0 0.0 0.0 0.0 0.0 0.0 0.0 0.0
TOTAL GDP 9.5 4.1 2.2 -0.3 4.5 -3.5 1.5 5.4 3.8 2.8 3.3 3.5 3.7
Total Non-mining GDP -4.1 1.5 1.5 4.0 1.6 -1.2 3.9 3.5 4.9 3.8 4.5 4.8 5.0

2022 National Budget, Volume 1
178
Table 3: Prices of Main Export Commodities
Source: Actuals from BPNG. Projections from IMF, Consensus forecasts and Department of Treasury.
2015 2016 2017 2018 2019 2020 2021 2022 2023 2024 2025 2026 2027
Actual Actual Actual Actual Actual Actual Est Proj Proj Proj Proj Proj Proj
AGRICULTURE
Copra 1339 1848 2374 1821 1803 1930 2557 2636 2663 2690 2717 2744 2744
Cocoa 8260 9358 6329 7552 7934 8210 8790 9501 9438 9534 9630 9727 9631
Coffee 9220 9358 10714 10128 10228 12552 15138 17100 17580 17861 18041 18223 17268
Palm Oil 1720 1877 2155 1867 1717 2215 3649 3364 2937 2901 2930 2960 3115
Rubber 3534 3333 4655 3997 4029 3714 4239 4021 3915 3876 3915 3954 3954
Tea 3939 4222 4727 4070 4750 3999 3837 3640 3544 3508 3544 3579 3579
Copra Oil 2690 3358 4519 3026 2314 2643 5298 5463 5518 5574 5630 5687 5687
Logs (K/m³) 269 294 302 304 327 310 292 305 308 311 314 318 318
MINERALS
Gold (US$/oz) 1160 1248 1258 1270 1392 1770 1795 1788 1802 1844 1886 1912 1912
Copper (US$/ton) 5502 4865 6166 6517 6006 6170 9117 9059 9024 8963 8870 8841 8841
Oil (Kutubu Crude: US$/barrel) 49.0 44 51 65 57 39 65 64 61 58 57 56 56
LNG (US$ per thousand cubic feet) 7.9 7.1 8.1 10.2 10.6 8.3 10.3 9.8 9.5 9.1 8.9 8.6 8.6
Condensate (US$/barrel) 49 44 51 65 57 39 65 64 61 58 57 56 56
Nickel (US$/tonne) 11831 9595 10415 13109 10960 10639 16202 14080 14208 14337 14468 14600 14600
Cobalt (US$/tonne) 29255 25639 55988 72820 22836 21483 40620 40159 44175 48017 55001 48890 48890

2022 National Budget, Volume 1
179
Table 4: Volume of Main Export Commodities
Source: Actuals from BPNG. Projections from Department of Treasury.
2015 2016 2017 2018 2019 2020 2021 2022 2023 2024 2025 2026 2027
Actual Actual Actual Actual Actual Actual Est Proj Proj Proj Proj Proj Proj
AGRICULTURE
Copra 33.6 43.5 50.6 63.6 36.6 36.7 44.3 54.5 56.0 60.4 62.0 67.3 70.7
Cocoa 30.9 40.1 31.9 33.3 26.4 33.0 41.8 43.9 46.1 49.8 48.2 53.1 58.4
Coffee 42.8 68.0 47.8 52.1 47.2 40.0 46.2 46.7 52.9 54.9 54.3 60.0 67.4
Palm Oil 486.9 540.7 621.8 614.3 571.3 557.9 646.9 599.8 598.2 591.4 603.7 605.7 782.3
Rubber 2.2 2.4 2.9 4.9 3.4 3.1 2.8 2.8 3.0 3.1 3.3 3.5 3.6
Tea 1.3 0.9 1.1 0.5 0.4 0.3 0.4 0.4 0.4 0.4 0.4 0.4 0.4
Copra Oil 14.6 17.9 16.2 13.7 15.6 10.4 8.4 10.0 10.1 10.8 11.0 11.8 12.4
Logs 3868.0 3655.0 3260.5 4040.0 3684.0 2891.1 2892.3 3469.5 3469.5 3469.5 3469.5 3469.5 3469.5
Marine products 99.4 174.5 165.5 202.2 202.3 203.4 209.5 215.8 222.3 228.9 235.8 242.9 250.2
MINERAL
Gold (tonnes) 53.5 59.4 63.0 63.2 74.2 53.6 47.9 60.4 64.7 65.7 67.0 59.5 8.8
Silver (tonnes) 19.08 36.14 33.68 53.57 41.65 24.1 34.45 40.2 37.6 37.6 37.6 37.6
Copper (tonnes) 46.4 71.0 100.4 87.4 111.0 82.3 61.1 99.3 149.4 149.4 149.4 149.4 149.4
Oil (million barrels) 7.0 9.5 7.3 4.1 3.6 4.9 5.1 5.1 5.1 4.9 2.3 2.3 2.3
LNG (Tbtu) 377.8 389.1 447.0 382.0 433.0 430.6 430.9 430.6 428.0 430.0 430.0 430.0 430
Condensate (MB) 10.6 11.3 10.9 8.9 11.0 10.6 10.4 10.0 9.0 9.0 9.0 9.0 9
Nickle (tonnes) 21,600.0 22,400.0 35,800.0 25,500.0 40,300.0 28,714.0 35,000.0 33,000.0 33000.0 33000.0 33000.0 33000.0 33000
Cobalt (tonnes) 2100.0 2300.0 3400.0 2900.0 3600.0 2503.8 3248.3 3050.0 3050.0 3050.0 3050.0 3050.0 3050

2022 National Budget, Volume 1
180
Table 5: Value of Main Export Commodities Kina Million
Source: Actuals from BPNG. Projections from Dept. of Treasury. (a) Includes Oil Palm by-products, canned tuna and vanilla.
2015 2016 2017 2018 2019 2020 2021 2022 2023 2024 2025 2026 2027
Actual Actual Actual Actual Actual Actual Est Proj Proj Proj Proj Proj Proj
AGRICULTURE, FORESTRY, FISHERIES
Copra 45.0 80.4 120.1 115.8 66.0 70.8 87.8 122.9 124.2 125.4 126.7 128.0 128.0
Copra Oil 39.2 60.1 73.2 41.3 36.1 27.5 44.3 54.5 56.0 60.4 62.0 67.3 70.7
Cocoa 255.7 359.9 202.0 246.5 215.5 270.9 367.8 417.4 435.4 475.0 464.5 516.1 562.1
Coffee 393.5 646.9 450.1 487.9 415.1 502.1 699.9 798.0 930.7 980.8 979.2 1093.8 1164.1
Palm Oil 837.6 1014.7 1339.7 1146.8 980.8 1322.0 2360.2 2017.5 1756.8 1715.8 1769.2 1793.0 2436.6
Rubber 7.9 8.0 13.5 19.6 13.7 10.4 12.0 11.4 11.7 12.1 12.9 13.7 14.3
Tea 4.9 3.8 5.2 2.0 1.9 1.2 1.5 1.5 1.4 1.4 1.5 1.5 1.5
Other Agriculture (a) 243.2 303.7 609.8 251.0 237.2 316.9 537.7 512.0 468.9 485.7 514.5 545.0 601.3
Forest Products 1040.1 1083.7 999.8 1002.0 1238.9 896.0 843.4 1058.6 1069.3 1080.1 1091.0 1102.0 1102.0
Marine Products 497.1 1046.6 1316.6 1120.7 1162.0 1225.6 1325.1 1440.6 1563.4 1692.1 1829.5 1979.0 2140.7
Total Agricultural, Forestry, Fishing Exports 3364.2 4607.8 5130.0 4433.5 4367.2 4643.5 6279.7 6434.5 6417.8 6628.9 6850.9 7239.4 8221.2
MINERAL
Gold 5376.5 6976.4 7612.2 8207.2 10520.1 10551.0 9955.5 12905.7 14080.1 14774.9 15573.9 14160.3 2228.9
Copper 746.5 1114.9 1962.2 1889.7 2242.0 1706.0 1950.6 3248.1 4915.4 4931.8 4929.9 4963.2 4963.2
Silver 61.2 32.8 63.1 62.5 93.3 74.8 45.9 67.8 79.8 75.5 76.2 77.0 77.0
Oil 1003.4 1253.8 1255.9 910.2 741.4 1016.8 759.7 1290.3 1280.4 1190.9 540.0 534.6 522.9
LNG 9841.1 8188.9 10467.5 13835.1 15600.2 12315.0 15940.7 15665.0 15205.3 14759.2 14648.9 14373.4 14373.4
Condensate 1502.6 1592.3 1935.1 574.6 627.4 416.8 676.5 639.0 546.5 523.2 514.1 504.4 504.4
Nickel 695.1 668.2 1179.0 1087.0 1953.8 1056.9 2043.9 1726.7 1760.1 1794.0 1828.6 1863.9 1863.9
Cobalt 164.6 195.2 614.1 575.5 392.5 186.1 475.6 455.2 505.8 555.3 642.5 576.9 576.9
Refined Petroleum Products 541.3 862.5 1196.5 1394.5 1293.7 933.1 1633.4 1687.5 16.5 16.3 16.5 16.7 17.0
Total Mineral Exports 19932.3 20885.0 26285.6 28536.3 33464.5 28256.5 33481.7 37685.4 38389.7 38621.1 38770.7 37070.4 25127.6
TOTAL EXPORT VALUE 23296.5 25492.8 31415.6 32969.8 37831.7 32900.0 39761.4 44119.9 44807.5 45250.1 45621.6 44309.8 33348.8

2022 National Budget, Volume 1
181
Table 6: Summary of Balance of Payments Kina Million
Source: Actuals from BPNG. Projections from Dept. of Treasury. (a) Capital and Financial Account includes changes in reserves.
2015 2016 2017 2018 2019 2020 2021 2022 2023 2024 2025 2026 2027
Actual Actual Actual Actual Actual Actual Est Proj Proj Proj Proj Proj Proj
CURRENT ACCOUNT BALANCE 12146.1 16129.2 17085.0 17135.2 17620.4 17374.7 20590.9 23016.3 23326.2 23399.0 23412.9 22405.9 14160.9
Trade Balance 12946.6 16052.3 17513.4 18118.4 20055.2 17153.1 20408.2 22853.2 23283.5 23471.4 23619.7 22776.2 14553.6
Goods Balance 16233.1 19006.2 21658.1 22134.0 24168.6 21538.1 25827.9 28820.5 29305.1 29549.8 29741.7 28709.3 18581.2
Credit (Exports) 23297 25493 31416 33702 37832 32900 39761 44120 44808 45250 45622 44310 33349
Debit (Imports) -7063 -6487 -9757 -11568 -13663 -11362 -13934 -15299 -15502 -15700 -15880 -15600 -14768
Services Balance -3286.5 -2953.9 -4144.7 -4015.6 -4113.4 -4385.1 -5419.6 -5967.3 -6021.6 -6078.4 -6122.0 -5933.2 -4027.6
Services Credit 404 403 950 1426 1510 453 500 537 590 641 702 770 776
Services Debit -3691 -3357 -5095 -5442 -5624 -4838 -5919 -6505 -6612 -6720 -6824 -6704 -4803
Income Balance (RHS) -1095.3 -720.2 -1429.8 -2032.7 -3536.8 -935.2 -1031.1 -1108.5 -1217.8 -1323.5 -1447.9 -1601.0 -1612.9
Income Credit 27 16 74 103 230 117 129 139 153 166 182 188 189
Income Debit -1122 -736 -1504 -2136 -3767 -1053 -1161 -1248 -1371 -1490 -1630 -1789 -1802
Transfers Balance (RHS) 294.8 797.1 1001.4 1049.5 1102.0 1156.8 1213.8 1271.6 1260.5 1251.0 1241.1 1230.7 1220.2
Transfers Credit 1047 1216 1454 1523 1596 1673 1753 1837 1837 1837 1837 1837 1837
Transfers Debit -752 -419 -452 -474 -494 -516 -539 -565 -576 -586 -596 -606 -616
CAPITAL AND FINANCIAL ACCOUNT(a)
-12831 -16203 -16697 -17342 -17638 -16216 -20250 -22679 -23046 -23174 -23125 -22111 -5410
NET ERRORS AND OMISSIONS 684.9 73.5 -388.2 207.2 17.9 -1159.0 -341.3 -337.1 -280.1 -225.1 -288.0 -294.5 -8751.3
Current account balance as percentage 20.2 24.8 23.6 21.6 21.0 20.4 22.1 22.6 21.3 20.0 18.7 16.7 9.7
of Gross Domestic Product (GDP)

2022 National Budget, Volume 1
182
Table 7: Employment Classified by Industry Index March 2002=100
Source: BPNG. * June Quarter Preliminaries
2015 2016 2017 2018 2019 2020 2021
Annual Annual Annual Annual Annual Annual Jun Qtr*
Retail 159.6 148.6 141.7 132.7 136.3 135.5 133.6
Wholesale 207.5 204.0 193.0 198.4 194.0 163.5 159.9
Manufacturing 180.2 178.4 169.4 167.7 180.4 185.9 199.7
Building and Construction 262.5 242.3 184.7 164.4 147.5 123.0 94.0
Transportation 172.7 172.4 163.3 150.2 132.3 127.3 123.7
Agriculture, Forestry, Fisheries 168.1 165.2 165.9 157.7 158.7 160.9 160.3
Financial and Business 123.7 119.6 121.7 126.2 130.3 112.7 111.3
TOTAL NON-MINERAL 169.7 166.1 156.5 151.5 151.9 147.0 163.5
MINERAL 241.2 262.2 281.8 304.4 359.3 308.8 151.9

2022 National Budget, Volume 1
183
Table 8: Monetary Aggregates Kina Million
Source: BPNG *June Quarter Preliminaries
2015 2016 2017 2018 2019 2020 2021
Actual Actual Actual Actual Actual Actual Jun Qtr*
Domestic Credit 13054.7 13920.3 13794.3 14569.1 15323.8 15543.1 15163.4
% Change 11.3 6.6 -0.9 5.6 5.2 1.4 -2.4
Net Credit to Central Government 5345.3 9008.7 9155.4 6810.6 7150.4 7451.1 10381.5
% Change 28.4 68.5 1.6 -25.6 5.0 4.2 39.3
Credit to Private Sector 10611.9 11379.1 10972.9 11757.0 12231.9 12754.4 12869.1
% Change 3.4 7.2 -3.6 7.1 4.0 8.5 5.2
Money Supply 20218.6 22417.1 22275.0 21377.6 22312.0 23879.7 24598.1
% Change 8.0 10.9 -0.6 -4.0 4.4 11.7 10.2
Money Velocity (M3*) (average) 3.0 2.9 3.3 3.7 3.8 3.6 3.8

2022 National Budget, Volume 1
184
Table 9: Major Assumptions Underlying the Budget
Source: Department of Treasury.
2015 2016 2017 2018 2019 2020 2021 2022 2023 2024 2025 2026 2027
Actual Actual Actual Actual Actual Actual Est Proj Proj Proj Proj Proj Proj
Economic Growth
Total Real GDP (%) 9.5 4.1 2.2 -0.3 4.5 -3.5 1.5 5.4 3.8 2.8 3.3 3.5 3.7
Non-mining Real GDP (%) -4.1 1.5 1.5 4.0 1.6 -1.2 3.9 3.5 4.9 3.8 4.5 4.8 5.0
Inflation
Average on Average (%) 6.0 6.7 5.4 4.7 3.6 4.9 5.0 5.6 5.4 5.1 5.0 5.0 5.0
Dec on Dec (%) 6.4 6.6 4.7 4.9 2.7 5.1 5.8 5.1 5.4 5.2 4.9 4.8 4.8
Exchange rate
Real Exchange Rate Index (2007 = 100) 150.3 139.6 141.7 140.2 138.7 140.6 135.9 134.5 136.6 138.5 140.5 142.7 146.4
Interest rate
Kina Rate Facility (KFR) 6.25 6.25 6.25 6.25 5.50 3.00 3.00 3.00 3.00 3.00 3.00 3.00 3.00
Inscribed Stock (3 year yield) 9.7 9.7 9.7 9.0 10.5 9.0 9.8 9.8 9.8 9.8 9.8 9.8 9.8
Mineral Prices
Gold (US$/oz) 1160 1248 1258 1270 1392 1770 1795 1788 1802 1844 1886 1912 1912
Copper (US$/ton) 5502 4865 6166 6517 6006 6170 9117 9059 9024 8963 8870 8841 8841
Oil (Kutubu Crude: US$/barrel) 49 44 51.0 64.5 57.0 39.5 65.0 63.9 60.7 58.1 57.1 56.0 56
LNG (US$ per thousand cubic feet) 7.9 7.1 8.1 10.2 10.6 8.3 10.3 9.8 9.5 9.1 8.9 8.6 8.6
Condensate (US$/barrel) 49 44 51.0 64.5 57.0 39.5 65.0 63.9 60.7 58.1 57.1 56.0 56
Nickel (US$/tonne) 11831 9595 10415 13109 10960 10639 16202 14080 14208 14337 14468 14600 14600
Cobalt (US$/tonne) 29255 25639 55988 72820 22836 21483 40620 40159 44175 48017 55001 48890 48890

2022 National Budget, Volume 1
185
Table 10: Statement of Operations for General Government
13,680.5 12,093.3 13,674.5 16,190.2 17,685.7 19,555.5 21,847.2 24,606.0 27,768.0
10,918.1 9,802.1 10,868.3 12,522.8 14,369.2 16,166.8 18,361.3 20,668.8 23,328.5
Taxes on Income,profits, and capital gains 6,070.4 5,668.6 6,010.8 6,579.1 7,506.4 8,413.4 9,385.8 10,594.4 12,051.8
Taxes on payroll and workforce 1.9 0.4 0.5 0.0 0.0 0.0 0.0 0.0 0.0
Taxes on goods and services 3,936.6 3,372.7 4,127.1 5,095.2 5,816.8 6,561.9 7,604.9 8,669.4 9,835.4
Taxes on international trade and transactions 909.3 760.4 730.0 848.4 1,046.0 1,191.4 1,370.6 1,404.9 1,441.4
1,775.6 1,425.0 1,643.0 1,824.9 1,724.9 1,774.9 1,824.9 1,975.0 2,175.0
986.8 866.2 1,163.2 1,842.5 1,591.5 1,613.9 1,661.0 1,962.3 2,264.5
Dividends 501.2 718.5 860.0 1,270.0 950.0 950.0 950.0 1,250.0 1,550.0
KPHL 381.2 568.5 600.0 400.0 300.0 500.0 600.0 900.0 1,200.0
OkTedi 450.0 200.0 0.0 0.0 0.0 0.0
NFA 200.0 100.0 100.0 0.0 0.0 0.0
BPNG 120.0 150.0 260.0 200.0 200.0 200.0 200.0 175.0 175.0
KCHL 20.0 150.0 150.0 150.0 125.0 125.0
MVIL 0.0 0.0 0.0 0.0 25.0 25.0
PMMR Revenue 405.0 85.0 199.7 25.0 25.0
Fees and Charges 80.5 62.7 102.8 182.5 163.5 171.9 174.4 175.2 176.0
SWF Inflows 0.0 0.0 0.0 0.0 0.0 0.0 0.0 0.0 0.0
Interest & Fees from Lending 0.0 0.0 0.7 0.7 0.7 0.7 0.7 0.7 0.7
1,141.9 751.9 1,120.6 1,588.4 1,361.0 1,432.2 1,466.9 1,873.3 2,805.0
Mining and Petroleum Taxes 760.7 183.4 520.6 738.4 761.0 832.2 866.9 973.3 1,605.0
Mining, Petroleum and Gas Dividends 381.2 568.5 600.0 850.0 600.0 600.0 600.0 900.0 1,200.0
0.0 0.0 0.0 0.0 0.0 0.0 0.0 0.0 0.0
16.2% 14.8% 14.7% 15.9% 16.1% 16.8% 17.4% 18.4% 19.1%
17,852.5 19,397.8 20,287.3 22,174.8 22,470.8 23,354.2 24,555.0 26,048.5 27,719.8
21.1% 23.8% 21.7% 21.8% 20.5% 20.0% 19.6% 19.4% 19.1%
14,811.3 15,887.1 16,375.1 16,930.3 17,160.8 17,544.5 18,330.5 19,451.7 20,576.3
5,423.8 5,831.5 5,973.1 6,007.7 6,285.7 6,381.7 6,815.0 7,335.2 7,900.0
5,800.7 5,388.4 6,022.3 6,096.8 5,848.2 5,863.9 6,007.4 6,215.9 6,616.0
2,129.1 2,160.0 2,084.9 2,313.5 2,420.0 2,524.0 2,575.8 2,554.9 2,479.4
1,371.6 2,190.0 2,183.0 2,405.3 2,494.3 2,660.2 2,814.0 3,222.5 3,457.7
0.0 217.7 57.3 42.5 51.1 51.4 51.6 53.7 53.7
86.1 99.4 54.4 64.4 61.5 63.4 66.7 69.4 69.5
3,041.2 3,510.7 3,912.2 5,244.5 5,310.0 5,809.7 6,224.5 6,596.8 7,143.5
3,041.2 3,510.7 3,912.2 5,244.5 5,310.0 5,809.7 6,224.5 6,596.8 7,143.5
-1,130.8 -3,793.7 -2,700.6 -740.1 524.9 2,011.0 3,516.7 5,154.4 7,191.7
-4,172.0 -7,304.4 -6,612.8 -5,984.7 -4,785.1 -3,798.7 -2,707.8 -1,442.4 48.2
-4.9% -8.9% -7.1% -5.9% -4.4% -3.3% -2.2% -1.1% 0.0%
-2,043.0 -5,144.4 -4,527.9 -3,671.1 -2,365.1 -1,274.6 -132.0 1,112.5 2,527.5
-5,314.0 -8,056.3 -7,733.3 -7,573.0 -6,146.1 -5,230.9 -4,174.7 -3,315.7 -2,756.9
-3,184.9 -5,896.3 -5,648.4 -5,259.5 -3,726.1 -2,706.8 -1,598.9 -760.8 -277.5
4,172.0 7,304.4 6,612.8 5,984.7 4,785.1 3,798.7 2,707.8 1,442.4 -48.2
-783.9 -802.9 0.0 0.0 0.0 0.0 0.0 0.0 0.0
-783.9 -802.9 0.0 0.0 0.0 0.0 0.0 0.0 0.0
3,388.1 6,501.5 6,612.8 5,984.7 4,785.1 3,798.7 2,707.8 1,442.4 -48.2
1,054.2 2,882.0 2,000.1 2,240.0 2,348.9 1,340.5 0.0 -457.2 -398.4
1,513.7 1,710.5 500.0 260.1 819.0 790.2 -604.9 -1,651.2 -903.4
-355.7 1,266.2 1,600.6 1,750.0 1,500.0 645.4 700.0 1,289.0 600.0
-103.8 -94.7 -100.5 229.9 29.9 -95.0 -95.0 -95.0 -95.0
2,333.9 3,619.5 4,612.8 3,744.7 2,436.1 2,458.2 2,707.7 1,899.6 350.2
0.0 0.0 0.0 0.0 0.0 0.0 0.0 0.0 0.0
2,333.9 3,619.5 4,612.8 3,744.7 2,436.1 2,458.2 2,707.7 1,899.6 350.2
84,554.1 81,627.0 93,314.4 101,695.8 109,559.9 116,749.1 125,457.4 134,086.7 145,415.1
2021 Suppl.
Budget2026 2027
Fixed Assets
Net Lending (+) / Net Borrowing (–)
Gross Operating Balance3
Total Expenditure and lending
External
Loans
Transactions in financial assets and liabilities
Primary Balance4
Non-resource net lending (+)/borrowing (-)
Expense as percentage of GDP
Use of goods and services
ProjectionsBudget Estimates
2025
Actuals
20242022
Budget2023
Net Incurrence of Liabilities
Domestic
External
Gross Domestic Product5
Loans
2019
Net Acquition of Non-Financial Assets*
Grants
TRANSACTIONS AFFECTING NET WORTH:
Revenue
Taxes
Resource Revenue
Kina Million
Grants
Other Revenue
Revenue as percentage of GDP
Expense2
Compensation of employees
Transfer from the Stabilization Fund (SWF)
2020
Interest
Other expense
Non-resource primary balance
Net lending/borrowing as percentage of GDP
Debt securities: Treasury bills
Debt securities: Treasury bonds
Social benefits
Debt securities: Sovereign bonds
Net Acquisition of Financial Assets
Domestic
Source: Department of Treasury
5. Total nominal GDP by economic activity, Actual: National Statistics Office and Projections: Treasury Department.
4. Represent net lending/net borrowing excluding interest expense or net interest expense.
2. Include items that may require reclassification due to interfaces from the legacy systems, (The Provincial Government Accounting System, ALESCO payroll and the Department of Public Works and
Implementation, Oracle system).
3. Represents, revenue minus expense, excluding consumption of fixed capital (CFC). CFC are not yet calculated and reported for the government accounts in PNG.
1. General government represents national and provincial governments, the Autonomous Bouganville government and commercial and statutory
*Net Acquisition of Non-Financial Assets, excludes operational costs like maintenance and repair of fixed assets which are included in the use of goods and services.

2022 National Budget, Volume 1
186
Table 11: Statement of Sources and Uses of Cash
11,904.9 10,668.3 12,249.2 14,615.3 15,960.8 17,780.6 20,022.3 22,731.2 25,693.1
10,918.1 9,802.1 10,868.3 12,522.8 14,369.2 16,166.8 18,361.3 20,668.8 23,328.5
0.0 0.0 217.7 250.0 0.0 0.0 0.0 100.1 100.1
986.8 866.2 1,163.2 1,842.5 1,591.5 1,613.9 1,661.0 1,962.3 2,264.5
14.1% 13.1% 13.1% 14.4% 14.6% 15.2% 16.0% 17.0% 17.7%
13,203.9 14,299.9 14,755.3 15,983.2 16,154.1 16,489.3 17,257.5 17,331.9 18,237.7
5,281.5 5,669.3 5,778.5 5,807.1 6,075.9 6,168.7 6,587.5 7,090.4 7,636.3
5,800.7 5,388.4 6,022.3 6,096.8 5,848.2 5,863.9 6,007.4 6,215.9 6,616.0
2,129.1 2,160.0 2,084.9 2,313.5 2,420.0 2,524.0 2,575.8 2,554.9 2,479.4
-404.0 765.0 757.7 830.4 769.4 885.3 989.1 1,347.6 1,382.8
396.5 317.2 111.8 935.4 1,040.7 1,047.5 1,097.7 123.2 123.3
15.6% 17.5% 15.8% 15.7% 14.7% 14.1% 13.8% 12.9% 12.5%
-1,299.0 -3,631.5 -2,506.0 -1,368.0 -193.4 1,291.3 2,764.7 5,399.2 7,455.4
3,041.2 0.0 0.0 5,244.5 5,310.0 5,809.7 6,224.5 0.0 0.0
16,245.1 14,299.9 14,755.3 21,227.8 21,464.1 22,299.0 23,482.1 17,331.9 18,237.7
-4,340.3 -3,631.5 -2,506.0 -6,612.5 -5,503.3 -4,518.3 -3,459.8 5,399.2 7,455.4
-5.1% -4.4% -2.7% -6.5% -5.0% -3.9% -2.8% 4.0% 5.1%
3,388.1 6,501.5 6,612.8 5,984.7 4,785.1 3,798.7 2,707.8 1,442.4 -48.2
- - - -
783.90- 802.90- - - - - - - -
- - - -
3,388.1 6,501.5 6,612.8 5,984.7 4,785.1 3,798.7 2,707.8 1,442.4 -48.2
1,054.2 2,882.0 2,000.1 2,240.0 2,348.9 1,340.5 0.0 -457.2 -398.4
2,333.9 3,619.5 4,612.8 3,744.7 2,436.1 2,458.2 2,707.7 1,899.6 350.2
3,388.1 6,501.5 6,612.8 5,984.7 4,785.1 3,798.7 2,707.8 1,442.4 -48.2
4.0% 8.0% 7.1% 5.9% 4.4% 3.3% 2.2% 1.1% 0.0%
-952.2 2,870.0 4,106.8 -627.8 -718.3 -719.6 -752.0 6,841.6 7,407.2
Gross Domestic Product3 84,554.1 81,627.0 93,314.4 101,695.8 109,559.9 116,749.1 125,457.4 134,086.7 145,415.1
2025
Actuals
2024202320202021 Suppl.
Budget2026 2027
ProjectionsBudget Estimates
2022
Budget
Grants
Other payments
Kina Million
CASH FLOWS FROM OPERATING ACTIVITIES
Revenue Cash Flows
Taxes
Grants
Other Revenue
Revenue as percentage of GDP
Expense cash flows2
Compensation of employees
Uses of goods and services
Interest
Net incurrence of liabilities
Domestic
Net change in the stock of cash
Surplus/Deficit as percentage of GDP
Net cash inflow from financing activities
Net cash inflow as percentage of GDP
CASH FLOWS FROM TRANSACTIONS IN FINANCIAL ASSETS AND
LIABILITIES (FINANCING):
Expenditure cash flows
Transactions in financial assets and liabilities
External
Net acquisition of financial assets other than cash
Domestic
2019
External
Cash surplus (+) / Cash deficit (–)
Expense as percentage of GDP
Net cash inflow from operating activities
CASH FLOWS FROM TRANSACTIONS IN NONFINANCIAL ASSETS:
Net cash outflow from investment in nonfinancial assets
3. Total nominal GDP by economic activity, Actual: National Statistics Office
Source: Department of Treasury
1. General government represents National and Provincial Governments, the Autonomous Bouganville government and commercial and statutory authorities. District and local level governments are reflected
as grants from provincial governments. The statement is produced to reflect transactions on a modified cash basis of accounting but excludes in-kind related transactions.
2. Include items that may require reclassification due to interfaces from the legacy systems, (The Provincial Government Accounting System, ALESCO payroll and the Department of Public Works and
Implementation, Oracle system).

2022 National Budget, Volume 1
187
Table 12: General Government Revenue 2014 GFS Economic Classification
Source: Department of Treasury. 1. Under the GFS 2014 methodology, non-payable infrastructure tax credits, revenue on asset sales and GST transfers to WPA and Trust Accounts will be excluded 2. GST represents the total of collections by Province, PNG Ports and less Refunds.
Kina Million2019 2020
2021 Suppl.
Budget
2022
Budget2023 2024 2025 2026 2027
REVENUE1
13,680.5 12,093.3 13,674.5 16,190.2 17,685.7 19,555.5 21,847.2 24,606.0 27,768.0
TAXES 10,918.1 9,802.1 10,868.3 12,522.8 14,369.2 16,166.8 18,361.3 20,668.8 23,328.5
Taxes on Income, Profits and Capital Gains 6,070.4 5,668.6 6,010.8 6,579.1 7,506.4 8,413.4 9,385.8 10,594.4 12,051.8
Payable by individuals 3,211.6 3,517.3 3,360.0 3,608.3 4,265.6 4,873.3 5,344.1 5,944.1 6,344.1
Personal Income Tax 3,211.6 3,517.3 3,360.0 3,608.3 4,265.6 4,873.3 5,344.1 5,944.1 6,344.1
Salaries/Wages (Group Tax) 0.0 0.0 0.0 0.0 0.0 0.0 0.0 0.0 0.0
Individual Income Tax (Assessed) 0.0 0.0 0.0 0.0 0.0 0.0 0.0 0.0 0.0
Payable by corporations and other enterprises 2,500.6 1,787.9 2,281.9 2,569.5 2,811.2 3,078.0 3,561.9 4,152.7 5,190.3
Company Tax 1,696.9 1,554.2 1,698.6 1,763.2 1,974.7 2,164.6 2,602.9 3,084.2 3,486.7
Mining and Petroleum Taxes 760.7 183.4 520.6 738.4 761.0 832.2 866.9 973.3 1,605.0
Royalties Tax 25.8 30.1 37.7 40.4 45.3 48.9 50.2 51.5 52.9
Management Tax 17.2 20.1 25.1 27.5 30.2 32.2 41.9 43.8 45.7
Other taxes on income, profits and capital gains 358.2 363.4 368.8 401.4 429.6 462.1 479.7 497.6 517.3
Dividend Withholding Tax Mining 0.0 215.9 0.0 0.0 0.0 0.0 0.0 0.0 0.0
Dividend Withholding Tax Non Mining 215.0 134.9 218.4 234.3 257.4 279.8 287.4 295.2 303.3
Interest Withholding Tax 128.0 12.6 144.0 160.0 164.9 174.9 184.2 193.5 202.8
Tax Related Court Fines 14.6 0.0 6.3 7.0 7.2 7.4 7.6 7.8 9.6
Sundry IRC Taxes & Income 0.6 0.0 0.2 0.0 0.0 0.0 0.5 1.0 1.6
Taxes on Payroll and Workforce 1.9 0.4 0.5 0.0 0.0 0.0 0.0 0.0 0.0
Training Levy 1.9 0.4 0.5 0.0 0.0 0.0 0.0 0.0 0.0
Taxes on Goods and Services 3,936.6 3,372.7 4,127.1 5,095.2 5,816.8 6,561.9 7,604.9 8,669.4 9,835.4
General taxes on goods and services 2,299.2 2,122.5 2,560.3 3,275.2 3,604.0 3,980.6 4,624.5 5,173.2 5,934.8
Value Added Tax 2,252.5 2,079.2 2,517.1 3,223.4 3,542.4 3,911.7 4,554.7 5,102.6 5,863.3
GST2
2,252.5 2,079.2 2,517.1 3,223.4 3,542.4 3,911.7 4,554.7 5,102.6 5,863.3
GST Collection at Provinces 1,368.2 1,325.0 1,706.2 2,155.5 2,244.7 2,317.7 2,674.6 3,066.4 3,505.6
GST Collection at Ports 1,106.4 982.1 1,128.8 1,397.5 1,684.8 1,983.7 2,297.1 2,553.9 2,957.8
GST Refunds 276.5 228.0 317.9 329.6 387.2 389.7 417.1 517.7 600.1
GST from IRC Trust 54.4 0.0 0.0 0.0 0.0 0.0 0.0 0.0 0.0
Taxes on financial and capital transactions 46.6 43.3 43.3 51.8 61.6 69.0 69.8 70.6 71.4
Bank Account Debit Fees 0.0 0.0 0.0 0.0 0.0 0.0 0.0 0.0 0.0
Stamp Duties 46.6 43.3 43.3 51.8 61.6 69.0 69.8 70.6 71.4
Excise 1,360.7 1,074.6 1,279.0 1,507.6 1,893.9 2,242.3 2,619.9 3,129.3 3,510.6
Excise Duty 1,061.0 817.0 1,009.0 1,192.9 1,549.7 1,866.9 2,211.7 2,700.7 3,037.3
Import Excise 299.7 257.6 270.0 314.7 344.1 375.4 408.2 428.6 473.4
Profits of fiscal monopolies 0.0 0.0 0.0 0.0 0.0 0.0 0.0 0.0 0.0
Taxes on specific services 273.0 172.0 279.9 292.5 310.9 330.6 351.5 356.8 379.8
Bookmakers' Turnover Tax 17.2 8.9 21.2 23.0 25.1 27.5 30.4 32.4 36.0
Gaming Machine Turnover Tax 227.2 157.7 255.1 265.7 281.6 298.5 316.4 319.5 338.7
Departure Tax 28.6 5.4 3.5 3.8 4.2 4.6 4.6 4.9 5.1
Taxes on use of goods and on permission to use goods or perform activities 2.5 0.4 4.7 16.5 4.7 4.7 5.2 6.2 6.2
Motor vehicles taxes 2.0 0.0 3.5 15.0 3.5 3.5 4.5 4.5 4.5
Motor Vehicle Registration 2.0 0.0 3.5 15.0 3.5 3.5 3.5 3.5 3.5
Commercial Vehicle Licenses 0.0 0.0 0.0 0.0 0.0 0.0 1.0 1.0 1.0
Other taxes on use of goods and on permission to use goods or perform activities 0.5 0.4 1.2 1.5 1.2 1.2 0.7 1.7 1.7
Bookmakers' Licenses 0.0 0.0 0.0 0.0 0.0 0.0 0.0 1.0 1.0
Coastal Trading Licenses 0.2 0.3 0.5 0.5 0.5 0.5 0.0 0.0 0.0
Registration of Vessels 0.0 0.0 0.0 0.0 0.0 0.0 0.0 0.0 0.0
Inflammable Liquid 0.2 0.0 0.4 0.3 0.4 0.4 0.4 0.4 0.4
Trade Licenses 0.0 0.0 0.1 0.5 0.1 0.1 0.1 0.1 0.1
Mobile Phone Licenses 0.0 0.0 0.0 0.0 0.0 0.0 0.0 0.0 0.0
Import and export trade licences 0.0 0.0 0.0 0.0 0.0 0.0 0.0 0.0 0.0
Insurers' and Brokers' Licences 0.0 0.0 0.1 0.1 0.1 0.1 0.1 0.1 0.1
Banking & Financial Institutions License 0.0 0.0 0.0 0.0 0.0 0.0 0.0 0.0 0.0
Liquor Licensing Fee 0.0 0.0 0.0 0.0 0.0 0.0 0.0 0.0 0.0
Motor Vehicle Trade Licenses 0.0 0.0 0.1 0.1 0.1 0.1 0.1 0.1 0.1
Other taxes on goods and services 1.2 3.2 3.2 3.4 3.4 3.7 3.8 3.9 4.0
Sundry Taxes (Customs) 1.2 3.2 3.2 3.4 3.4 3.7 3.8 3.9 4.0
Taxes on International Trade and Transactions 909.3 760.4 730.0 848.4 1,046.0 1,191.4 1,370.6 1,404.9 1,441.4
Customs and other import duties 511.2 359.5 370.0 419.9 577.2 679.8 811.9 838.1 865.1
Import Duty 409.4 359.5 370.0 419.9 577.2 679.8 811.9 838.1 865.1
Other Import Taxes 101.8 0.0 0.0 0.0 0.0 0.0 0.0 0.0 0.0
Mining Levy 0.0 0.0 0.0 0.0 0.0 0.0 0.0 0.0 0.0
Import Duties & Fees 0.0 0.0 0.0 0.0 0.0 0.0 0.0 0.0 0.0
Customs Duty & Related Taxes 0.0 0.0 0.0 0.0 0.0 0.0 0.0 0.0 0.0
General Import Levy 0.0 0.0 0.0 0.0 0.0 0.0 0.0 0.0 0.0
Value Added Tax Including Mining Levy 0.0 0.0 0.0 0.0 0.0 0.0 0.0 0.0 0.0
Sundry Tax Receipts (Import Duties) 101.8 0.0 0.0 0.0 0.0 0.0 0.0 0.0 0.0
Taxes on exports 398.1 400.9 360.0 428.5 468.8 511.6 558.8 566.8 576.3
Export Tax 398.1 400.9 360.0 428.5 468.8 511.6 558.8 566.8 576.3
GRANTS 1,775.6 1,425.0 1,643.0 1,824.9 1,724.9 1,774.9 1,824.9 1,975.0 2,175.0
From Foreign Governments 1,408.5 908.1 1,400.9 1,498.4 1,414.6 1,395.3 1,444.3 1,594.4 1,794.4
Current 1,126.8 726.5 1,247.6 1,345.2 1,261.3 1,242.1 1,291.0 1,441.1 1,641.1
Cash 0.0 0.0 217.7 250.0 0.0 0.0 0.0 100.1 100.1
In-Kind 1,126.8 726.5 1,029.9 1,095.2 1,261.3 1,242.1 1,291.0 1,341.0 1,541.0
Capital 281.7 181.6 153.2 153.2 153.2 153.2 153.2 153.2 153.2
Cash 0.0 0.0 0.0 0.0 0.0 0.0 0.0 0.0 0.0
In-Kind 281.7 181.6 153.2 153.2 153.2 153.2 153.2 153.2 153.2
From International Organizations 367.1 516.9 242.1 326.5 310.4 379.6 380.6 380.6 380.6
Current 293.7 413.5 208.9 293.3 277.2 346.4 347.4 347.4 347.4
Cash 0.0 0.0 0.0 0.0 0.0 0.0 0.0 0.0 0.0
In-Kind 293.7 413.5 208.9 293.3 277.2 346.4 347.4 347.4 347.4
Capital 73.4 103.4 33.2 33.2 33.2 33.2 33.2 33.2 33.2
Cash 0.0 0.0 0.0 0.0 0.0 0.0 0.0 0.0 0.0
In-Kind 73.4 103.4 33.2 33.2 33.2 33.2 33.2 33.2 33.2
OTHER REVENUE 986.8 866.2 1,163.2 1,842.5 1,591.5 1,613.9 1,661.0 1,962.3 2,264.5
Property Income 529.5 741.1 912.8 1,305.8 1,062.4 1,070.5 1,073.0 1,373.7 1,674.3
Interest 0.0 0.0 0.7 0.7 0.7 0.7 0.7 0.7 0.7
Interest from residents other than general government 0.0 0.0 0.7 0.7 0.7 0.7 0.7 0.7 0.7
Dividends 501.2 718.5 860.0 1,270.0 950.0 950.0 950.0 1,250.0 1,550.0
Mining Petroleum and Gas Dividends 381.2 568.5 600.0 850.0 600.0 600.0 600.0 900.0 1,200.0
Dividends from Statutory Authorites 120.0 150.0 260.0 300.0 200.0 200.0 200.0 200.0 200.0
Shares in Private Enterprise 0.0 0.0 0.0 0.0 0.0 0.0 0.0 0.0 0.0
Dividends from State Owned Enterprises 0.0 0.0 0.0 120.0 150.0 150.0 150.0 150.0 150.0
Other Dividends 0.0 0.0 0.0 0.0 0.0 0.0 0.0 0.0 0.0
Withdrawals from income of quasi-corporations 0.0 0.0 0.0 0.0 0.0 0.0 0.0 0.0 0.0
Property income from investment income disbursements 0.0 0.0 0.0 0.0 0.0 0.0 0.0 0.0 0.0
Rent 28.2 22.6 52.1 35.1 111.7 119.8 122.3 123.0 123.6
Land Lease Rental 23.0 17.6 48.5 30.0 108.1 115.9 118.0 118.4 118.6
License Fees and Royalty Payments 0.0 0.0 0.0 0.0 0.0 0.0 0.0 0.0 0.0
Petroleum Prospecting Licenses 5.2 4.9 3.5 5.0 3.5 3.9 4.2 4.6 5.1
Mineral Prospecting Leases 0.0 0.0 0.0 0.0 0.0 0.0 0.0 0.0 0.0
Small-Scale Mining Fees 0.0 0.0 0.0 0.0 0.0 0.0 0.0 0.0 0.0
Reinvested earnings on foreign direct investment 0.0 0.0 0.0 0.0 0.0 0.0 0.0 0.0 0.0
Sales of goods and services 37.3 9.4 35.0 132.5 36.1 36.3 36.4 36.5 36.6
Sales by market establishments 0.0 0.0 0.0 0.0 0.0 0.0 0.0 0.0 0.0
Administrative fees 14.2 4.5 4.6 99.9 4.7 4.9 5.0 5.1 5.2
Incidental sales by nonmarket establishments 23.0 4.8 30.4 32.6 31.4 31.4 31.4 31.4 31.4
Imputed sales of goods and services 0.0 0.0 0.0 0.0 0.0 0.0 0.0 0.0 0.0
Fines, penalties, and forfeits 1.8 2.8 1.8 1.1 1.8 1.8 1.8 1.8 1.8
Sheriff's Fees and Poundage 0.0 0.0 0.0 0.0 0.0 0.0 0.0 0.0 0.0
Judicial Fines 0.0 0.0 1.8 0.1 1.8 1.8 1.8 1.8 1.8
Fines - Criminal 0.0 0.0 0.0 0.0 0.0 0.0 0.0 0.0 0.0
District Courts Fines 0.8 0.9 0.0 1.0 0.0 0.0 0.0 0.0 0.0
Forfeitures & Court Bails 1.0 1.9 0.0 0.0 0.0 0.0 0.0 0.0 0.0
Transfers not elsewhere classified 418.2 113.0 213.6 403.2 491.3 505.2 549.8 550.3 551.7
Current transfers not elsewhere classified 418.2 113.0 213.6 403.2 491.3 505.2 549.8 550.3 551.7
Subsidies 0.0 0.0 0.0 0.0 0.0 0.0 0.0 0.0 0.0
Other current transfers 418.2 113.0 213.6 403.2 491.3 505.2 549.8 550.3 551.7
Payroll Commission 13.2 28.0 13.9 13.9 13.9 13.9 13.9 13.9 13.9
State Services and Statutory Authority 405.0 85.0 199.7 388.7 477.3 491.3 535.9 536.3 537.8
Sundry/(Other) Income 0.1 0.0 0.0 0.6 0.0 0.0 0.0 0.0 0.0
Unacquited Travel 0.0 0.0 0.0 0.0 0.0 0.0 0.0 0.0 0.0
Other 0.0 0.0 0.0 0.0 0.0 0.0 0.0 0.0 0.0
SWF 0.0 0.0 0.0 0.0 0.0 0.0 0.0 0.0 0.0
Capital transfers not elsewhere classified 0.0 0.0 0.0 0.0 0.0 0.0 0.0 0.0 0.0
Premiums, fees and claims related to nonlife insurance and standardised guarantee schemes0.0 0.0 0.0 0.0 0.0 0.0 0.0 0.0 0.0
Budget Estimates ProjectionsActuals

2022 National Budget, Volume 1
188
Table 13A: General Government Expense by Economic Classification
Kina Million 2019 20202021 Suppl.
Budget
2022
Budget2023 2024 2025 2026 2027
Compensation of Employees 5,423.8 5,831.5 5,973.1 6,007.7 6,285.7 6,381.7 6,815.0 7,335.2 7,900.0
Wages and salaries 4,827.5 5,221.0 5,094.2 5,167.4 5,406.5 5,489.1 5,861.8 6,309.3 6,795.0
Wages and salaries in cash 4,685.2 5,058.8 4,899.7 4,966.8 5,196.7 5,276.1 5,634.3 6,064.4 6,531.3
Wages and salaries in kind 142.2 162.2 194.5 200.5 209.8 213.0 227.5 244.9 263.7
Employers' social contributions 596.3 610.4 878.8 840.3 879.2 892.6 953.2 1,026.0 1,105.0
Actual social contributions 596.3 610.4 878.8 840.3 879.2 892.6 953.2 1,026.0 1,105.0
Use of goods and services* 5,800.7 5,388.4 6,022.3 6,096.8 5,848.2 5,863.9 6,007.4 6,215.9 6,616.0
Use of goods and services 5,800.7 5,388.4 6,022.3 6,096.8 5,848.2 5,863.9 6,007.4 6,215.9 6,616.0
Use of goods and services 5,800.7 5,388.4 6,022.3 6,096.8 5,848.2 5,863.9 6,007.4 6,215.9 6,616.0
Interest** 2,129.1 2,160.0 2,084.9 2,313.5 2,420.0 2,524.0 2,575.8 2,554.9 2,479.4
To nonresidents 449.0 468.1 286.6 476.9 498.8 520.3 531.0 526.7 511.1
Interest to Non residents 449.0 468.1 286.6 476.9 498.8 520.3 531.0 526.7 511.1
To residents other than general government 1,680.1 1,691.9 1,798.3 1,836.6 1,921.1 2,003.8 2,044.9 2,028.3 1,968.3
Interest to residents other than general governments 1,680.1 1,691.9 1,798.3 1,836.6 1,921.1 2,003.8 2,044.9 2,028.3 1,968.3
Grants*** 1,371.6 2,190.0 2,183.0 2,405.3 2,494.3 2,660.2 2,814.0 3,222.5 3,457.7
Grants to other general government units 1,371.6 2,190.0 2,183.0 2,405.3 2,494.3 2,660.2 2,814.0 3,222.5 3,457.7
Grants to other general governments current 1,370.1 1,732.1 1,730.0 1,866.3 1,935.4 2,064.0 2,183.4 2,500.4 2,682.9
Grants to other general governments capital 1.5 457.9 453.0 539.0 558.9 596.1 630.6 722.1 774.8
Social Benefits 0.0 217.7 57.3 42.5 51.1 51.4 51.6 53.7 53.7
Social assistance benefits 0.0 217.7 57.3 42.5 51.1 51.4 51.6 53.7 53.7
Social assistance benefits in cash 0.0 217.7 57.3 42.5 51.1 51.4 51.6 53.7 53.7
Other expenses 86.1 99.4 54.4 64.4 61.5 63.4 66.7 69.4 69.5
Transfers not elsewhere classified 86.1 99.4 54.4 64.4 61.5 63.4 66.7 69.4 69.5
Other expense - Current transfers not elsewhere classified 86.1 99.4 54.4 64.4 61.5 63.4 66.7 69.4 69.5
Net Aquisition Nonfinancial assets**** 3,041.2 3,510.7 3,912.2 5,244.5 5,310.0 5,809.7 6,224.5 6,596.8 7,143.5
Nonproduced assets 0.0 0.0 0.0 7.8 7.9 8.9 9.6 10.1 11.0
NFA:Intangible nonproduced assets 0.0 0.0 0.0 7.8 7.9 8.9 9.6 10.1 11.0
NFA:Land 0.0 0.0 0.0 0.0 0.0 0.0 0.0 0.0 0.0
Aquisition of Fixed assets 3,041.2 3,510.7 3,912.2 5,236.7 5,302.1 5,800.8 6,214.9 6,586.7 7,132.5
NFA:Buildings and structures 0.0 1,050.5 1,943.4 913.5 957.7 1,008.6 1,060.5 1,113.8 1,171.5
NFA: Dwellings 0.0 0.0 4.3 25.6 26.0 29.1 31.6 33.3 36.2
NFA:Fixed assets 2,402.7 1,711.8 1,194.2 3,468.2 3,505.8 3,894.7 4,200.5 4,443.1 4,829.2
NFA:Information, computer, & telecommunications equipment 10.3 60.6 62.1 61.0 63.4 67.9 71.9 75.6 80.2
NFA:Machinery & equipment other than transport equipment 19.8 19.2 0.2 29.0 29.4 33.0 35.7 37.7 41.0
NFA:Other structures 11.8 0.2 13.3 14.3 14.5 16.3 17.6 18.6 20.2
NFA:Transport equipment 5.7 6.7 31.5 5.9 6.0 6.7 7.3 7.7 8.4
Other expense - Current transfers not elsewhere classified 590.8 661.8 663.3 719.0 699.3 744.5 789.9 856.9 945.8
Total expenditure 17,852.5 19,397.8 20,287.3 22,174.8 22,470.8 23,354.2 24,555.0 26,048.5 27,719.8
as % of GDP 21.1% 23.8% 21.7% 21.8% 20.5% 20.0% 19.6% 19.4% 19.1%
ProjectionsActuals Budget Estimates

2022 National Budget, Volume 1
189
Table 13B: General Government Expense by Agency Type
Kina Million 2019 20202021 Suppl.
Budget2022 Budget 2023 2024 2025 2026 2027
National Departments 8,120.4 7,855.1 7,843.5 10,340.2 10,371.3 10,744.0 11,313.8 12,005.0 12,879.3
Compensation of Employees 2,632.8 2,671.5 2,606.0 3,046.7 3,187.7 3,236.4 3,456.1 3,720.0 4,006.4
Wages and salaries 2,087.4 2,131.7 1,784.8 2,260.1 2,364.7 2,400.9 2,563.9 2,759.6 2,972.0
Wages and salaries in cash 2,009.2 2,044.9 1,690.8 2,153.7 2,253.4 2,287.8 2,443.1 2,629.6 2,832.1
Wages and salaries in kind 78.3 86.8 93.9 106.4 111.4 113.1 120.7 130.0 140.0
Employers' social contributions 545.4 539.8 821.3 786.6 823.0 835.5 892.3 960.4 1,034.3
Actual social contributions 545.4 539.8 821.3 786.6 823.0 835.5 892.3 960.4 1,034.3
Use of goods and services 4,107.7 3,489.4 3,807.7 4,046.7 3,869.3 3,851.5 3,928.6 4,041.4 4,283.7
Use of goods and services 4,107.7 3,489.4 3,807.7 4,046.7 3,869.3 3,851.5 3,928.6 4,041.4 4,283.7
Use of goods and services 4,107.7 3,489.4 3,807.7 4,046.7 3,869.3 3,851.5 3,928.6 4,041.4 4,283.7
Grants 727.5 607.2 721.1 942.9 977.8 1,042.8 1,103.1 1,263.2 1,355.5
Grants to other general government units 727.5 607.2 721.1 942.9 977.8 1,042.8 1,103.1 1,263.2 1,355.5
Grants to other general governments current 727.5 607.2 691.1 942.9 977.8 1,042.8 1,103.1 1,263.2 1,355.5
Grants to other general governments capital 0.0 0.0 30.0 0.0 0.0 0.0 0.0 0.0 0.0
Other expenses 84.8 97.7 50.9 59.2 57.0 58.7 61.8 64.3 64.4
Transfers not elsewhere classified 84.8 97.7 50.9 59.2 57.0 58.7 61.8 64.3 64.4
Other expense - Current transfers not elsewhere classified 84.8 97.7 50.9 59.2 57.0 58.7 61.8 64.3 64.4
Net Aquisition Nonfinancial assets 567.6 819.5 632.5 2,220.2 2,248.2 2,523.1 2,732.6 2,883.3 3,136.4
Nonproduced assets 0.0 0.0 0.0 7.8 7.9 8.9 9.6 10.1 11.0
NFA:Intangible nonproduced assets 0.0 0.0 0.0 7.8 7.9 8.9 9.6 10.1 11.0
NFA:Land 0.0 0.0 0.0 0.0 0.0 0.0 0.0 0.0 0.0
Aquisition of Fixed assets 567.6 819.5 632.5 2,212.4 2,240.3 2,514.3 2,723.0 2,873.1 3,125.4
NFA:Buildings and structures 0.0 0.0 590.7 13.0 13.2 14.8 16.0 16.9 18.4
NFA:Dwellings 0.0 0.0 4.0 1.7 1.7 1.9 2.0 2.2 2.4
NFA:Fixed assets 533.9 800.5 2.1 2,150.1 2,177.2 2,443.4 2,646.2 2,792.2 3,037.4
NFA:Information, computer, & telecommunications equipment 10.2 7.7 7.5 17.3 17.5 19.7 21.3 22.5 24.4
NFA:Machinery & equipment other than transport equipment 7.5 6.4 0.2 14.5 14.7 16.5 17.9 18.8 20.5
NFA:Other structures 11.8 0.2 12.8 12.3 12.4 13.9 15.1 15.9 17.3
NFA:Transport equipment 4.2 4.8 15.2 3.6 3.6 4.0 4.4 4.6 5.0
Social Benefits 0.0 169.8 25.1 23.9 31.3 31.5 31.6 32.9 32.9
Social assistance benefits 0.0 169.8 25.1 23.9 31.3 31.5 31.6 32.9 32.9
Social assistance benefits in cash 0.0 169.8 25.1 23.9 31.3 31.5 31.6 32.9 32.9
Out of scope for GFS coding purposes 0.0 0.0 0.2 0.5 0.0 0.0 0.0 0.0 0.0
Out of scope for GFS coding purposes 0.0 0.0 0.2 0.5 0.0 0.0 0.0 0.0 0.0
Provincial Governments 3,123.9 4,579.8 4,983.7 4,436.3 4,546.4 4,711.8 4,985.0 5,434.7 5,836.5
Compensation of Employees 1,960.3 2,135.1 2,006.4 1,885.1 1,972.3 2,002.5 2,138.4 2,301.7 2,478.9
Wages and salaries 1,960.2 2,135.1 2,006.4 1,885.1 1,972.3 2,002.5 2,138.4 2,301.7 2,478.9
Wages and salaries in cash 1,916.3 2,089.6 1,956.6 1,830.5 1,915.2 1,944.5 2,076.5 2,235.0 2,407.1
Wages and salaries in kind 43.9 45.5 49.8 54.6 57.1 57.99 61.93 66.65 71.78
Employers' social contributions 0.1 0.0 0.0 0.0 0.0 0.0 0.0 0.0 0.0
Actual social contributions 0.1 0.0 0.0 0.0 0.0 0.0 0.0 0.0 0.0
Use of goods and services 520.7 840.6 1,061.7 798.9 764.9 761.4 776.6 798.9 846.8
Use of goods and services 520.7 840.6 1,061.7 798.9 764.9 761.4 776.6 798.9 846.8
Use of goods and services 520.7 840.6 1,061.7 798.9 764.9 761.4 776.6 798.9 846.8
Grants 636.4 1,546.7 1,414.0 1,424.0 1,476.7 1,574.9 1,666.0 1,907.8 2,047.1
Grants to other general government units 636.4 1,546.7 1,414.0 1,424.0 1,476.7 1,574.9 1,666.0 1,907.8 2,047.1
Grants to other general governments current* 634.9 1,110.8 991.0 917.0 950.9 1,014.2 1,072.8 1,228.5 1,318.2
Grants to other general governments capital 1.5 435.9 423.0 507.0 525.8 560.7 593.1 679.2 728.8
Net Aquisition Nonfinancial assets 6.5 57.4 501.7 328.3 332.4 373.1 404.1 426.3 463.8
Aquisition of Fixed assets 6.5 57.4 501.7 328.3 332.4 373.1 404.1 426.3 463.8
NFA:Fixed assets 6.5 57.4 501.7 317.3 321.3 360.6 390.5 412.1 448.2
NFA:Buildings and structures 0.0 0.0 0.0 11.0 11.1 12.5 13.5 14.3 15.5
Autonomous Bougainville Government 159.4 240.4 314.4 426.8 429.3 447.1 472.3 501.1 538.6
Compensation of Employees 123.9 142.4 127.1 132.0 138.1 140.2 149.7 161.1 173.5
Wages and salaries 123.9 142.4 127.1 132.0 138.1 140.2 149.7 161.1 173.5
Wages and salaries in cash 120.5 133.4 118.1 122.2 127.9 129.8 138.7 149.2 160.7
Wages and salaries in kind 3.4 9.0 9.0 9.8 10.2 10.4 11.1 11.9 12.8
Employers' social contributions 0.0 0.0 0.0 0.0 0.0 0.0 0.0 0.0 0.0
Actual social contributions 0.0 0.0 0.0 0.0 0.0 0.0 0.0 0.0 0.0
Use of goods and services 33.5 69.9 163.8 148.1 141.8 141.2 144.0 148.2 157.0
Use of goods and services 33.5 69.9 163.8 148.1 141.8 141.2 144.0 148.2 157.0
Use of goods and services 33.5 69.9 163.8 148.1 141.8 141.2 144.0 148.2 157.0
Grants 0.0 28.1 10.0 32.0 33.2 35.4 37.4 42.9 46.0
Grants to other general government units 0.0 28.1 10.0 32.0 33.2 35.4 37.4 42.9 46.0
Grants to other general governments current 0.0 6.1 10.0 0.0 0.0 0.0 0.0 0.0 0.0
Grants to other general governments capital 0.0 22.0 0.0 32.0 33.2 35.4 37.4 42.9 46.0
Net Aquisition Nonfinancial assets 2.0 0.0 13.5 114.7 116.1 130.3 141.2 149.0 162.0
Fixed Assets 2.0 0.0 13.5 114.7 116.1 130.3 141.2 149.0 162.0
Commercial & Statutory Authorities 1,214.3 1,564.7 1,981.6 1,753.8 1,783.3 1,836.9 1,944.8 2,063.3 2,216.9
Compensation of Employees 706.7 882.4 1,233.6 943.9 987.6 1,002.7 1,070.7 1,152.5 1,241.2
Wages and salaries 656.0 811.8 1,176.0 890.2 931.4 945.6 1,009.8 1,086.9 1,170.5
Wages and salaries in cash 639.3 790.9 1,134.2 860.4 900.2 914.0 976.0 1,050.5 1,131.4
Wages and salaries in kind 16.6 20.9 41.8 29.8 31.1 31.6 33.8 36.3 39.1
Employers' social contributions 50.8 70.6 57.6 53.7 56.2 57.1 60.9 65.6 70.7
Actual social contributions 50.8 70.6 57.6 53.7 56.2 57.1 60.9 65.6 70.7
Use of goods and services 300.7 398.2 365.7 458.2 438.7 436.7 445.4 458.2 485.7
Use of goods and services 300.7 398.2 365.7 458.2 438.7 436.7 445.4 458.2 485.7
Use of goods and services 300.7 398.2 365.7 458.2 438.7 436.7 445.4 458.2 485.7
Grants 7.8 8.0 37.9 6.4 6.6 7.1 7.5 8.6 9.2
Grants to other general government units 7.8 8.0 37.9 6.4 6.6 7.1 7.5 8.6 9.2
Grants to other general governments current 7.8 8.0 37.9 6.4 6.6 7.1 7.5 8.6 9.2
Other expenses 1.3 1.8 2.9 4.8 4.5 4.7 4.9 5.1 5.1
Transfers not elsewhere classified 1.3 1.8 2.9 4.8 4.5 4.7 4.9 5.1 5.1
Other expense - Current transfers not elsewhere classified 1.3 1.8 2.9 4.8 4.5 4.7 4.9 5.1 5.1
Net Aquisition Nonfinancial assets 197.8 226.3 308.8 322.0 326.0 365.9 396.2 418.1 454.8
Aquisition of Fixed assets 197.8 226.3 308.8 322.0 326.0 365.9 396.2 418.1 454.8
NFA:Buildings and structures 0.0 0.0 267.7 16.4 16.6 18.6 20.2 21.3 23.1
NFA:Dwellings 0.0 0.0 0.2 23.5 23.8 26.7 28.9 30.5 33.2
NFA:Buildings other than dwellings 0.0 0.0 0.0 0.5 0.5 0.6 0.6 0.7 0.7
NFA:Fixed assets 183.8 211.3 23.9 262.7 266.0 298.5 323.3 341.1 371.1
NFA:Machinery & equipment other than transport equipment 12.4 12.9 0.1 14.5 14.7 16.5 17.9 18.8 20.5
NFA:Other structures 0.0 0.0 0.4 2.1 2.1 2.3 2.5 2.7 2.9
NFA:Transport equipment 1.5 1.8 16.4 2.4 2.4 2.7 2.9 3.1 3.3
NFA: Information, computer, and telecommunications (ICT) equipment 0.1 0.3 0.2 0.0 0.0 0.0 0.0 0.0 0.0
Social Benefits 0.0 48.0 32.2 18.6 19.8 19.9 20.0 20.8 20.8
Social assistance benefits 0.0 48.0 32.2 18.6 19.8 19.9 20.0 20.8 20.8
Social assistance benefits in cash 0.0 48.0 32.2 18.6 19.8 19.9 20.0 20.8 20.8
Out of scope for GFS coding purposes 0.0 0.0 0.5 0.0 0.0 0.0 0.0 0.0 0.0
0.5 0.0 0.0 0.0 0.0 0.0 0.0
Debt Service (Interest Payment) 2,147.2 2,165.1 2,100.8 2,324.4 2,431.3 2,535.9 2,587.9 2,566.9 2,491.0
Use of goods and services 18.1 5.1 15.9 10.9 11.4 11.8 12.1 12.0 11.6
Use of goods and services 18.1 5.1 15.9 10.9 11.4 11.8 12.1 12.0 11.6
Use of goods and services 18.1 5.1 15.9 10.9 11.4 11.8 12.1 12.0 11.6
Interest 2,129.1 2,160.0 2,084.9 2,313.5 2,420.0 2,524.0 2,575.8 2,554.9 2,479.4
To nonresidents 449.0 468.1 286.6 476.9 498.8 520.3 531.0 526.7 511.1
Interest to Non residents 449.0 468.1 286.6 476.9 498.8 520.3 531.0 526.7 511.1
To residents other than general government 1,680.1 1,691.9 1,798.3 1,836.6 1,921.1 2,003.8 2,044.9 2,028.3 1,968.3
Interest to residents other than general governments 1,680.1 1,691.9 1,798.3 1,836.6 1,921.1 2,003.8 2,044.9 2,028.3 1,968.3
Expenditure supported by donor grants 1,775.7 1,424.9 1,424.9 1,574.9 1,524.9 1,624.9 1,724.9 1,874.9 2,074.9
Use of goods and services 696.9 482.5 482.5 533.2 516.3 550.2 584.0 634.8 702.5
Use of goods and services 696.9 482.5 482.5 533.2 516.3 550.2 584.0 634.8 702.5
Use of goods and services 696.9 482.5 482.5 533.2 516.3 550.2 584.0 634.8 702.5
Net Aquisition Nonfinancial assets 1,078.8 942.4 942.4 1,041.7 1,008.6 1,074.7 1,140.9 1,240.1 1,372.3
Aquisition of Fixed assets (Buildings and Structures) 1,078.8 942.4 942.4 1,041.7 1,008.6 1,074.7 1,140.9 1,240.1 1,372.3
NFA:Fixed assets 621.6 325.9 325.9 360.2 348.8 371.7 394.5 428.8 474.6
Other expense - Current transfers not elsewhere classified 457.2 616.5 616.5 681.4 659.8 703.1 746.3 811.2 897.8
Expenditure financed by concessional loans 1,311.7 1,567.8 1,638.4 1,318.4 1,384.3 1,453.5 1,526.2 1,602.5 1,682.6
Use of goods and services 123.2 102.8 125.2 100.7 105.8 111.0 116.6 122.4 128.5
Use of goods and services 123.2 102.8 125.2 100.7 105.8 111.0 116.6 122.4 128.5
Use of goods and services 123.2 102.8 125.2 100.7 105.8 111.0 116.6 122.4 128.5
Net Aquisition Nonfinancial assets 1,188.6 1,465.0 1,513.2 1,217.7 1,278.6 1,342.5 1,409.6 1,480.1 1,554.1
Aquisition of Fixed assets (Buildings and Structures) 1,188.6 1,465.0 1,513.2 1,217.7 1,278.6 1,342.5 1,409.6 1,480.1 1,554.1
NFA:Buildings and structures 0.0 1,050.5 1,085.1 873.1 916.8 962.6 1,010.8 1,061.3 1,114.4
NFA:Fixed assets 1,055.0 316.7 327.1 263.2 276.4 290.2 304.7 319.9 335.9
NFA:Information, computer, & telecommunications equipment 0.0 52.6 54.3 43.7 45.9 48.2 50.6 53.1 55.8
NFA:Machinery & equipment other than transport equipment 0.0 0.0 0.0 0.0 0.0 0.0 0.0 0.0 0.0
Other expense - Current transfers not elsewhere classified 133.6 45.3 46.7 37.6 39.5 41.5 43.5 45.7 48.0
Total expenditure 17,852.5 19,397.8 20,287.3 22,174.8 22,470.8 23,354.2 24,555.0 26,048.5 27,719.8
as % of GDP 21.1% 23.8% 21.7% 21.8% 20.5% 20.0% 19.6% 19.4% 19.1%
* Net Acquisition of Non-Financial Assets, excludes operational costs like maintenance and repair of fixed assets which are included in the use of goods and services.
ProjectionsActuals Budget Estimates

2022 National Budget, Volume 1
190
Table 14: Transactions in Assets and Liabilities for General Government
2019 2020
2021
Suppl.
Budget
2022
Budget2023 2024 2025 2026 2027
-783.9 -802.9 0.0 0.0 0.0 0.0 0.0 0.0 0.0
-783.9 -802.9 0.0 0.0 0.0 0.0 0.0 0.0 0.0
-783.9 -802.9 0.0 0.0 0.0 0.0 0.0 0.0 0.0
0.0 0.0 0.0 0.0 0.0 0.0 0.0 0.0 0.0
0.0 0.0 0.0 0.0 0.0 0.0 0.0 0.0 0.0
0.0 0.0 0.0 0.0 0.0 0.0 0.0 0.0 0.0
0.0 0.0 0.0 0.0 0.0 0.0 0.0 0.0 0.0
0.0 0.0 0.0 0.0 0.0 0.0 0.0 0.0 0.0
0.0 0.0 0.0 0.0 0.0 0.0 0.0 0.0 0.0
3,388.1 6,501.5 6,612.9 5,984.7 4,785.1 3,798.7 2,707.8 1,442.4 -48.2
Net Incurrence of Liabilities as a % of GDP 4.0% 8.0% 7.1% 5.9% 4.4% 3.3% 2.2% 1.1% 0.0%
1,054.2 2,882.0 2,000.2 2,240.0 2,348.9 1,340.5 0.0 -457.2 -398.4
1,158.0 2,976.7 2,100.7 2,010.1 2,319.0 1,435.5 95.0 -362.2 -303.4
12,327.2 15,715.2 13,666.2 15,371.2 16,114.0 15,999.3 16,103.5 14,352.4 13,041.7
-11,169.2 -12,738.5 -11,565.5 -13,361.1 -13,795.0 -14,563.7 -16,008.5 -14,714.6 -13,345.1
1,513.7 1,710.5 500.0 260.1 819.0 790.2 -604.9 -1,651.2 -903.4
11,691.5 13,147.7 11,019.5 12,661.9 13,480.9 14,271.1 13,666.1 12,014.9 11,111.5
-10,177.7 -11,437.2 -10,519.4 -12,401.8 -12,661.9 -13,480.9 -14,271.1 -13,666.1 -12,014.9
-355.7 1,266.2 1,600.6 1,750.0 1,500.0 645.4 700.0 1,289.0 600.0
635.7 2,567.5 2,646.7 2,709.3 2,633.1 1,728.2 2,437.4 2,337.5 1,930.2
-991.4 -1,301.3 -1,046.1 -959.3 -1,133.1 -1,082.8 -1,737.5 -1,048.5 -1,330.2
-103.8 -94.7 -100.5 229.9 29.9 -95.0 -95.0 -95.0 -95.0
0.0 0.0 0.0 300.0 100.0 0.0 0.0 0.0 0.0
-103.8 -94.7 -100.5 -70.1 -70.1 -95.0 -95.0 -95.0 -95.0
0.0 0.0 0.0 0.0 0.0 0.0 0.0 0.0 0.0
0.0 0.0 0.0 0.0 0.0 0.0 0.0 0.0 0.0
103.4 0.0 0.0 0.0 0.0 0.0 0.0 0.0 0.0
2,333.9 3,619.5 4,612.8 3,744.7 2,436.1 2,458.2 2,707.7 1,899.6 350.2
0.0 0.0 0.0 0.0 0.0 0.0 0.0 0.0 0.0
0.0 0.0 0.0 0.0 0.0 0.0 0.0 0.0 0.0
0.0 0.0 0.0 0.0 0.0 0.0 0.0 0.0 0.0
0.0 0.0 0.0 0.0 0.0 0.0 0.0 0.0 0.0
0.0 0.0 0.0 0.0 0.0 0.0 0.0 0.0 0.0
0.0 0.0 0.0 0.0 0.0 0.0 0.0 0.0 0.0
0.0 0.0 0.0 0.0 0.0 0.0 0.0 0.0 0.0
0.0 0.0 0.0 0.0 0.0 0.0 0.0 0.0 0.0
0.0 0.0 0.0 0.0 0.0 0.0 0.0 0.0 0.0
0.0 0.0 0.0 0.0 0.0 0.0 0.0 0.0 0.0
0.0 0.0 0.0 0.0 0.0 0.0 0.0 0.0 0.0
0.0 0.0 0.0 0.0 0.0 0.0 0.0 0.0 0.0
0.0 0.0 0.0 0.0 0.0 0.0 0.0 0.0 0.0
0.0 0.0 0.0 0.0 0.0 0.0 0.0 0.0 0.0
2,333.9 3,619.5 4,612.8 3,744.7 2,436.1 2,458.2 2,707.7 1,899.6 350.2
2,726.4 5,982.0 6,146.6 4,629.4 3,356.1 3,612.0 4,029.6 3,300.7 1,748.6
-392.6 -2,362.6 -1,533.8 -884.8 -920.0 -1,153.8 -1,321.9 -1,401.1 -1,398.4
968.0 1,154.9 1,103.6 708.1 861.8 930.7 1,059.6 811.0 290.1
1,311.7 1,567.8 1,638.4 1,318.4 1,601.6 1,723.1 1,915.5 1,673.5 1,152.0
-343.7 -412.9 -534.8 -610.3 -739.8 -792.4 -855.9 -862.5 -861.9
36.8 -876.3 -938.8 -19.7 -41.9 -41.9 -41.9 -41.9 -39.9
54.8 18.1 44.4 22.2 0.0 0.0 0.0 0.0 0.0
-17.9 -894.4 -983.2 -41.9 -41.9 -41.9 -41.9 -41.9 -39.9
1,329.1 3,340.8 4,448.0 3,056.2 1,616.2 1,569.4 1,690.0 1,130.6 100.0
1,359.9 4,396.1 4,463.8 3,288.8 1,754.5 1,888.9 2,114.1 1,627.2 596.6
-30.9 -1,055.3 -15.9 -232.6 -138.3 -319.5 -424.1 -496.6 -496.6
New borrowing
Amortisation
Concessional financing
New borrowing
Amortisation
Amortisation
Extraordinary financing
Commercial financing
New borrowing
Amortisation
Currency and deposits
Debt securities
New instruments
Amortisation
Concessional financing
New instruments
Amortisation
Loans
New borrowing
Amortisation
Commercial financing
New instruments
Amortisation
Extraordinary financing
New instruments
Insurance, pension, and standardized guarantee schemes
Financial derivatives and employee stock options
Other accounts payable
External
Monetary gold and special drawing rights (SDR's)
Net Incurrence of Liabilities
Domestic
Amortisation
Debt securities
New instruments
Amortisation
Treasury Bills
New instruments
Amortisation
Treasury Bonds
New instruments
Amortisation
Loans
New borrowing
External
Loans
Budget Estimates ProjectionsActuals
1. General government represents national and provincial governments, the Autonomous Bouganville government and commercial and statutory authorities.
Kina Million
Net Acquisition of Financial Assets
Domestic
Currency and deposits
Other accounts receivable
Debt securities
Monetary gold and special drawing rights (SDR's)
Currency and deposits

2022 National Budget, Volume 1
191
Table 15: Stocks of General Government Debt
2019 2020
2021
Suppl.
Budget
2022
Budget2023 2024 2025 2026 2027
19,333.4 22,215.4 24,215.5 26,455.5 28,804.5 30,145.0 30,145.0 29,687.8 29,289.4
18,157.8 21,134.5 23,235.1 25,245.2 27,564.3 28,999.8 29,094.8 28,732.6 28,429.2
10,191.2 11,901.8 12,401.8 12,661.9 13,480.9 14,271.0 13,666.1 12,014.9 11,111.5
7,966.6 9,232.8 10,833.4 12,583.4 14,083.4 14,728.8 15,428.7 16,717.7 17,317.7
1,175.6 1,080.9 980.4 1,210.3 1,240.2 1,145.2 1,050.2 955.2 860.2
Guarantees 1,175.6 1,080.9 980.4 1,210.3 1,240.2 1,145.2 1,050.2 955.2 860.2
14,333.4 17,952.9 22,565.7 26,309.7 28,745.8 31,204.0 33,911.7 35,811.3 36,161.5
1,700.7 1,700.7 1,700.7 1,700.0 1,700.0 1,700.0 1,700.0 1,700.0 1,700.0
0.0 0.0 0.0 0.0 0.0 0.0 0.0 0.0 0.0
0.0 0.0 0.0 0.0 0.0 0.0 0.0 0.0 0.0
1,700.7 1,700.7 1,700.7 1,700.0 1,700.0 1,700.0 1,700.0 1,700.0 1,700.0
12,632.7 16,252.2 20,864.9 24,609.6 27,045.7 29,503.9 32,211.7 34,111.3 34,461.5
8,676.7 9,831.6 10,935.2 11,643.3 12,505.2 13,435.9 14,495.5 15,306.5 15,596.5
1,970.4 1,094.1 155.3 135.7 93.8 51.9 10.1 (31.8) (71.7)
1,985.6 5,326.4 9,774.4 12,830.6 14,446.8 16,016.1 17,706.1 18,836.7 18,936.6
33,666.9 40,168.4 46,781.2 52,765.2 57,550.2 61,349.0 64,056.7 65,499.1 65,450.9
39.8% 49.2% 50.1% 51.9% 52.5% 52.5% 51.1% 48.8% 45.0%
84,554.1 81,627.0 93,314.4 101,695.8 109,559.9 116,749.1 125,457.4 134,086.7 145,415.1
2. Total nominal GDP by economic activity, Actual: National Statistics Office and Projections: Treasury Department.
1. General government represents national and provincial governments, the Autonomous Bouganville government and commercial and statutory authorities.
Gross Domestic Product2
Loans
Concessional financing
Commercial financing
Extraordinary financing
Total Central Government Debt
Total debt as percentage of GDP
Domestic
Debt securities
Extraordinary financing
Treasury Bonds
Loans
External
Debt securities
Concessional financing
Commercial financing
Treasury Bills
Budget Estimates ProjectionsActuals
Kina Million

2022 National Budget, Volume 1
192