Kim Janey, Mayor Volume I - Overview of the Budget - Boston ...
1038
City of Boston Kim Janey, Mayor Operating Budget Fiscal Year 2022 Capital Plan Fiscal Years 2022-2026 Volume I - Overview of the Budget
-
Upload
khangminh22 -
Category
Documents
-
view
1 -
download
0
Transcript of Kim Janey, Mayor Volume I - Overview of the Budget - Boston ...

City of Boston
Kim Janey, Mayor
Operating Budget Fiscal Year 2022 Capital Plan Fiscal Years 2022-2026
Volume I - Overview of the Budget

Kim Janey, Mayor
Emme Handy, Chief Financial Officer
Office of Budget Management Justin Sterritt, Director
James Williamson, Deputy Director, Operating Budget
John Hanlon, Deputy Director, Capital Planning
Operating Budget and Capital Planning Staff
Johanna Bernstein Marc Chen Lydia Chim
Gabriella Germanos Ellen Hatch Era Kaplan
Omar Khoshafa Joseph Morrissey
Maryanne Peckham Marianne Regan
John Steies Todd Swisher
Mohammed Uddin David Urkevich Natasha White
Mor Zoran
Central Office Staff
Conor Kenney Deborah DeLeo Liliana Guzman Joanne Olivares
Special Acknowledgement
Meghan Aldridge
Gail Hackett Sonya Harris
Mary Churchill Nick Martin
Chris Osgood

D istinguishedB udget P resentation
A w ard
G O V E R N M E N T FIN A N C E O FFIC E R S A S S O C IA TIO N
July 1, 2020
For the Fiscal Year Beginning
PRESENTED TO
City of Boston
Executive Director
Massachusetts

Table of Contents
Volume I Overview of the Budget Letter of Transmittal: Kim Janey, Mayor Executive Summary 1 Operating Budget 9 Revenue Estimates and Analysis 43 Education 59 Capital Planning 69 Boston’s People and Economy 89 Financial Management 99 Statutes and Ordinances 111 Budget Organization and Glossary of Terms
127
City Council Orders 139
Volumes II & III - Cabinet & Department Detail

Budget Document Structure
The Operating Budget for FY22 and Five Year Capital Plan for FY22-26 are presented in three volumes. Volume I is an overview of the City’s financial position and policy direction.
Volumes II and III, which are organized by cabinet, present the budget detail for each department’s operating budget and capital projects. Please refer to the chapter on Budget Organization and Glossary in Volume I for an illustration of the City’s organizational chart.
The City’s budget is built at the program level for each department, which is the basis for budget planning. However, line item budget detail is only provided in this budget document at the department level. Program line item detail is available upon request.
In addition to program budgets, Volumes II and III provide a mission statement, key objectives, as well as past and promised performance levels for each departmental program. For those departments with capital projects, a project profile is provided for every capital project. The project profile includes authorization information as well as planned spending levels.
Definitions of the terms used throughout the budget document are presented in the glossary, which can be found in Volume I in the chapter titled Budget Organization and Glossary.


E x e c u t i v e S u m m a r y 1
Executive Summary
INTRODUCTION
This year's $3.75 billion Fiscal Year 2022 (FY22) Operating Budget and $3.2 billion FY22-FY26 Capital Plan provides the resources for the City's continued robust public health response to COVID-19 and sets the stage for our shared equitable recovery. COVID-19 has brought on unprecedented economic and social change to our City, and this budget proposal meets that moment responsibly and makes targeted investments to ensure that as we emerge from the public health crisis we are not going back to normal, but going back to better.
While prior to COVID-19, Boston had a growing economy and was attracting more residents and businesses every year, too many were being left behind and unable to take part in that shared prosperity. COVID-19 has deepened that divide and revealed the stark inequalities that have existed in our City for too long. That’s why equity lives at the heart of this budget proposal and informs everything from how the City is allocating new resources, to ensuring that those resources are spent with local organizations, especially businesses of color. This budget is one important part of the shared goal of making Boston a more equitable city for all.
The COVID-19 pandemic has brought on tremendous economic disruption to all sectors of Boston’s local economy, big and small, including the City budget. But thanks to years of shared fiscal responsibility, Boston entered this pandemic as one of the best prepared local governments in the country. Boston has had 7 years in a row of triple A bond ratings and took decisive
action over the past year to ensure a balanced budget despite large losses in local revenue. Fiscal responsibility remains the foundation of this year’s Operating Budget and Capital Plan proposals, and in turn will help accelerate the City’s overall recovery from the pandemic
Thanks to continued strength in local revenue and a significant infusion of federal funding from the American Rescue Plan, the Recommended FY22 Operating Budget proposes $3.75 Billion in spending, a year-over-year increase of $142 million or 3.9% over FY21. Even with weakness in certain sectors of the economy, property tax revenue has proven resilient over the past year, though the Budget is cautious on projecting the effect that COVID-19 will have on new development in the City. Other local revenue sources like excise taxes and department revenue will rebound slightly as the economy reopens more fully, but will remain well below pre-pandemic levels.
The most significant new dynamic to this year's budget is the recently passed American Rescue Plan that will provide hundreds of millions in federal funding to the City, the Boston Public Schools and other local organizations over the next five fiscal years. While the City awaits formal notice from the federal government, the City is expected to receive an estimated $215 million in funding for use over the next year and the City’s thoughtful approach to the utilizing this funding is two-fold:
Between FY21 and FY22 dedicate $100 million to offset local revenue declines during the pandemic to ensure flexibility, stability and

2 E x e c u t i v e S u m m a r y
fiscal resiliency, as well as, make near term investments to expand and create vital city programs to Reopen, Recover and Renew our City post COVID-19.
For the second portion of $115 million, the administration will establish an Equitable Recovery Resources Coordinating Committee, made up of stakeholders from across City government to ensure equitable, transparent and accountable distribution of these funds for economic and social recovery.
This fiscally responsible budget will also fully fund long-term liabilities, like pensions and debt service, enabling investment in our City’s largest Capital Plan in history. The plan touches all neighborhoods and supports capital projects, including schools and libraries, and programs, such as Vision Zero transportation efforts and street tree plantings. The proposed FY22 budget also fulfills the second year of the City’s three-year $100 million commitment to the Boston Public Schools. $36 million in new investments will go into schools and classrooms to facilitate a safe return to school buildings and support students and school communities through post-COVID-19 recovery. Total public education spending, including support for our charter school students, will increase by $66 million, representing 47% of all new city funding.
The City is also proposing a robust $3.2 billion FY22-26 Capital Plan to invest heavily in revitalizing the shared neighborhood spaces residents cherish. Unlike previous economic slowdowns when the City reduced the capital plan, this year’s plan increases the overall size and will serve as a catalyst for the local economy and get Bostonians back to work. This will allow the City to improve not only its vital City assets but to do so in a way that stimulates the local economy.
This year’s Capital Plan continues to pay particular attention to equity and focus on investments in the City’s inventory of roads, bridges, schools and parks in the neediest parts of the City. The Capital Plan invests in projects in every neighborhood consistent with the strategic master plans that have been developed with the community, under the Imagine Boston 2030 umbrella. This plan ensures the municipal, civic and open space assets, which residents cherish in their neighborhoods, remain active and vibrant parts of the community.
The FY22-FY26 Capital Plan includes funding for new schools and upgrading existing school facilities through the BuildBPS plan; transformative transportation projects like new bridges, roads, bus and bike lanes; major park upgrades in neighborhoods throughout the city; new civic places like City Hall Plaza and new community centers; and dedicating over 10% of new City funding toward climate resilient projects.
Boston, like every major city in the country has seen tremendous economic upheaval brought on by COVID-19. Businesses large and small have had to adjust to delivering services and products during the pandemic and will need to prepare for a post pandemic world. But Boston’s local economy continues to demonstrate resilience and its future is bright. The near-term public health measures have forced business to look different in Boston, but Boston’s innovation and creativity will allow it to come back stronger than before.
Boston is still a thriving city- adding new people and development at an extraordinary rate. Boston is a beacon for new residents, with the population up 12% since 2010; the City makes up 17% of the jobs in Massachusetts, up 21% since 2010. The City has 21 in-patient hospitals and was ranked first or second among most NIH funding of any city for the past 25 years. Boston is home to corporate headquarters old and new and the City continues to

E x e c u t i v e S u m m a r y 3
compete to be the home base of some of the nation’s most storied and most innovative corporations.
The City continues to monitor local revenue streams, but is projecting cautious optimism for next fiscal year. While the most economically elastic sources like Excises taxes from lodging and restaurants may remain at pandemic levels, other sources like Property Taxes and State Aid show signs of strength and new Federal funding will be available for the next several fiscal years.
The FY22 Operating Budget and FY22-26 Capital Plan reflect a commitment to growing opportunity, increasing equity, and moving Boston forward despite the new reality of a post COVID-19 world. This fiscal plan will help serve a roadmap for Boston to come back better than before.
REVENUE
Even within the context of the coronavirus, Boston’s expanding economy and ongoing development is generating growing revenue to support investments in city neighborhoods. Property tax revenue remains the primary driver of year-over-year revenue growth, thanks to the allowable 2.5% increase and cautious new growth estimates. Local receipts, such as fines, fees and excise tax, are expected to somewhat improve in the coming fiscal year, though will remain below pre-pandemic levels. The City projects new State Aid based on the FY22 Governor’s budget.
Figure 1 - Categories of Recurring Revenue FY02, FY10 and FY22
The FY22 Operating Budget relies on $3.75 billion in revenue, a $141.8 million increase over the FY21 budget (3.9%). $82.2 million is projected to come from property tax growth, state revenue is budgeted to increase by $8.2 million and local receipts (including Excises and Departmental revenue) are projected to increase by $1.4 million. Non-Recurring revenue is increasing by $50.0 million, as it includes funds from the American Rescue to offset local revenue declines.
Property Tax
While property tax remains the primary revenue source for all City services and departments, in Massachusetts, Proposition 2 ½ constrains the amount of property tax revenue the City can raise each year from its existing tax base to a 2.5% annual increase. So while total property value has grown 115% in the past 10 years, property tax revenue has grown by 66%. However, Proposition 2 ½ also allows the addition of new growth (e.g. new construction) to the City’s property tax levy. Due to the City’s commitment to new housing construction and the strength of Boston’s development climate, property tax growth continues to be a point of strength for the City.
52% 63%
73%
30% 18%
13%
14% 13% 8%
5% 4% 4% 2% 2%
FY02 FY10 FY22 Budget
Non Recurring
Excise
Departmental
State Aid
Net PropertyTax

4 E x e c u t i v e S u m m a r y
In FY22, we expect new growth to decrease compared to the last five years, due to the slowdown in the local and national economies. During the past five years, the City saw notable construction projects in Boston enter the City property tax base for commercial, mixed-use and residential properties, most notably in the Seaport District, Dorchester, and the Back Bay. According to the Boston Planning and Development Agency, the estimated revenue from building permit fees during FY20 indicated the potential for $8.2 billion in construction activity compared to an estimate of $7.4 billion for FY19.
Figure 2 - Property Tax Levy Increase by Type, FY13 - FY22
Despite the need to maintain and grow property tax revenue, the City is committed to keeping residential property tax bills down to retain more low and middle class homeowners in the City. Policies we have pursued are demonstrating success, as residential taxes are 32.8% below the statewide average. Thanks to advocacy to increase the residential exemption limit to 35% of the average assessed value of all class one residential properties, the City Council, with the approval of Mayor Walsh, once again was able to allow the maximum exemption permitted by law. The FY21
residential exemption amount increased by $273 over the FY20 exemption and has saved residents over $33 million annually since it was increased to 35%.
State Aid
In 2002, State Aid comprised 30% percent of the City’s annual budget and helped the City maintain a sustainable balance between local revenue and other resources. In the following decades the State pulled back from its investment and FY22 State Aid is projected to be 13% of the City’s budget. This divestment by the State has largely been driven by stagnant increases in K-12 Education (Chapter 70) and increases in State assessments.
The Student Opportunity Act, passes in 2019, represents a fundamental change in trajectory of State funding for Boston’s schools and students. The act will make an unprecedented $1.5 billion investment in Massachusetts public schools and will roll out in different phases over the next seven years as the Legislature funds it during their annual budget process. When fully implemented, the bill will ensure that Boston benefits in two main ways: a dramatic increase to Boston’s Chapter 70 funding and a commitment to fully fund the City’s charter school tuition reimbursement.
Net state aid, which is gross state aid revenue less state assessments, has been trending down steeply since FY02. With a decrease in net state aid in the FY22 budget, Boston is $235.5 million, or 64.5%, below its FY08 level of net state aid. The FY21 projected net state aid totals $153.9 million, and the FY22 budget assumes an additional reduction to $129.5 million. This loss of resources has put extraordinary pressure on the property tax and other local revenue sources, as well as on levels of expenditures.
$40 $42 $44 $47 $49 $52 $55 $59 $63 $67 $28
$53 $44
$48
$75 $77 $77
$99 $103
$45
$0
$20
$40
$60
$80
$100
$120
$140
$160
$180
FY13 FY15 FY17 FY18 FY22 Budget
Mill
ions
2.5% Increment New Growth

E x e c u t i v e S u m m a r y 5
Figure 3 - State Aid, State Assessments and Net State Aid (in millions), FY08-FY22
Local Receipts
Local receipts or revenue the City is able to generate locally, include items like excise taxes, fees, fines, and permits. This vital revenue source generally follows the City’s overall economic health and because of the coronavirus pandemic and economic fallout is projected to remain below pre-pandemic levels, increasing by only $1.4 million or 1.5% in FY22. The effects of the coronavirus pandemic are likely to continue to affect the collection of these sources. This category also represents the City’s limited opportunity to pursue new and expanded revenue streams and target that revenue towards important new projects.
As the City enters the unknown territory of an economic recession due to a global pandemic, extra precaution was used in projecting these receipts’ budgets. Excise taxes, such as Room Occupancy, Meals and Aircraft Fuel tax, are closely linked to the economy, and are likely to only somewhat increase in FY22. In addition, recent decreases of the Federal Reserve Federal Funds target range are likely to severely impact the City’s interest on investments revenue.
With limited revenue tools, and a developing economic environment, the City is continuing to strive to maximize local revenue. In FY22, the entire Administration & Finance Cabinet will continue to work with departments citywide to review collections, understand revenue drivers, and maximize revenue recovery efforts.
Non-Recurring Revenue
The FY22 budget includes $50 million from the $215 million payment estimate the City is expected to receive as part of the American Rescue Plan Act of 2021 (ARPA). The act is a $1.9 trillion economic stimulus bill passed by the U.S. Congress and signed into law by President Joe Biden on March 11, 2021.
This funding source will help the City continue provide essential services to its residents and make targeted investments to help reopen, recover and renew the City from the pandemic, despite facing revenue reductions due to the COVID-19 pandemic and the economic recession.
EXPENDITURES
Overall FY22 expenditures are increasing by $142 million or 3.9% over FY21, for a total of $3.75 billion. The FY22 spending growth falls within the City’s projected revenue growth and coupled with revenue replacement provided by the American Rescue Plan protects core services and allows for strategic recovery-based investments. The combined appropriations for City Departments, the Public Health Commission (PHC) and the School Department (BPS), and non-departmental appropriations as shown in the FY22 Budget Summary have increased by 2.4% from FY21.
$-
$100
$200
$300
$400
$500
$600
FY08 FY12 FY17 FY22Budget
Mill
ions
State Aid State Assessments
Net State Aid

6 E x e c u t i v e S u m m a r y
Figure 4 - Budgetary Growth by Category
Education
With a record $1.3 billion appropriation, the Boston Public Schools (BPS) budget is increasing by $34.2 million over the FY21 appropriation. Boston’s total investment in education, including BPS and the City’s charter school tuition assessment, is growing by $66 million, or 4.5%, over FY21.
FY22 marks the second year of a historic education funding commitment of $100 million over three years over and above standard cost increases. In FY22, the BPS level services budget is decreasing slightly, driven by central office efficiencies, while $36 million in funding for new investments will be added to provide for the health and safety of school communities returning to classrooms, address COVID-19 impacts to learning and wellness, and improve student outcomes while advancing equity goals. Federal COVID-19 relief funding will also be marshalled to make investments in these areas.
City Services
City Services such as Police, Fire, Public Works, Housing, and other central funds are projected to increase by a total of $19.3 million (1.4%). The City has created two new cabinets, Equity & Inclusion including
approximately $3 million in new investments in FY22 and the Office of Police Accountability & Transparency with an initial budget of $1 million. The FY22 budget includes over $4 million in various departments for job training to assist those in hard hit industries and to promote green jobs and other emerging industries. Other investments address immediate needs and expand services for post COVID-19 programming including in Arts & Culture, Parks, Youth Engagement and Employment, and Age Strong. The appropriation for the Housing Cabinet is growing by $6.2 million or 21.3% with the significant investments in housing and homelessness efforts to prevent displacement and expand housing opportunities for families of every income in neighborhoods across the city. The majority of union contracts have expired, so departmental wage growth is limited, while outstanding contracts are reserved for centrally. Funding for unsettled City, PHC and BPS union contracts are centralized in a $10 million collective bargaining reserve.
The Public Health Commission (PHC) budget is growing by $4.2 million (4.0%) in FY22. This increase includes key investments in infectious disease sustainable infrastructure, an after action report on COVID-19, and Emergency Medical Services equipment. Unlike other city departments, the PHC budget contains health insurance and pension.
Fixed Costs
City continues to honor its long-term financial commitments. This budget will continue to support the City’s fixed costs for next year, including pensions, debt service and non-charter school state assessments, and it maintains the City’s level of reserves to buffer against changes in the larger economic landscape. Fixed cost growth consumes 30% of the City’s revenue growth but this funding commitment is critical to maintaining
$0
$20
$40
$60
$80
$100
$120
$140M
illio
ns
CollectiveBargainingReserves
Debt Service
City Services& PHC
Pensions
Education

E x e c u t i v e S u m m a r y 7
Boston’s AAA bond rating and securing the long term fiscal health of the City.
Boston’s current pension schedule is based on an actuarial valuation as of January 1, 2020. Boston’s pension liability is 75.6% funded and will be fully funded by 2027.
Figure 5 - Pension Funding Schedule
FY22-26 CAPITAL PLAN
The $3.2 billion FY22-26 Capital Plan will make critical investments in the City’s infrastructure in every Boston neighborhood, guided by Imagine Boston 2030 and the schools, streets, arts, climate and resilience plans under its umbrella. Taken together, these initiatives will support Boston's dynamic economy and improve quality of life for residents by encouraging affordability, increasing access to opportunity, promoting a healthy environment, and guiding investment in the public realm.
The Capital Plan moves Imagine Boston 2030 from idea to action. Planned borrowings are expected to increase 18.8% over last year’s plan, one-time funding sources are leveraged, and the City continues to collaborate with the Massachusetts School Building Authority on the design and construction of new schools and the repair of existing building systems.
An estimated 90% of the investment in the FY22-26 Capital Plan is aligned with the City’s planning efforts:
The Capital Plan supports a commitment to invest $1 billion over ten years to bring Boston's school buildings into the 21st century, with the construction of new schools, MSBA Accelerated Repair Program partnerships, completion of projects in the pipeline, school kitchen renovations that support the delivery of fresh, nutritious food, and reserves for future projects identified by BuildBPS community engagement.
Boston, in collaboration with State and Federal sources, will invest $1.2 billion implementing the core initiatives outlined in Go Boston 2030: streets that are safer for all users of our roads and sidewalks, particularly pedestrians and cyclists; travel that is more reliable and predictable; and quality transportation choices that improve access to interconnect our neighborhoods for all modes of travel.
Boston will prepare for climate change by investing at least 10% of all new capital funding to open space, infrastructure, and facilities projects that are climate resilient or contribute to making the City more environmentally friendly.
Setting the stage for planning and early action items for the comprehensive, long-term recovery campus on Long Island to tackle the opioid crisis and when fully permitted move forward with the construction of a new bridge to Long Island.
The Percent for Art Program, demonstrates the City’s leadership and commitment to sustainable funding for the arts by setting aside one percent of the City’s annual capital borrowing for the commissioning of public art.
$0
$100
$200
$300
$400
$500
$600
FY21 FY22 FY23 FY24 FY25 FY26 FY27
Mill
ions

8 E x e c u t i v e S u m m a r y
O p e r a t i n g B u d g e t 9
Operating Budget
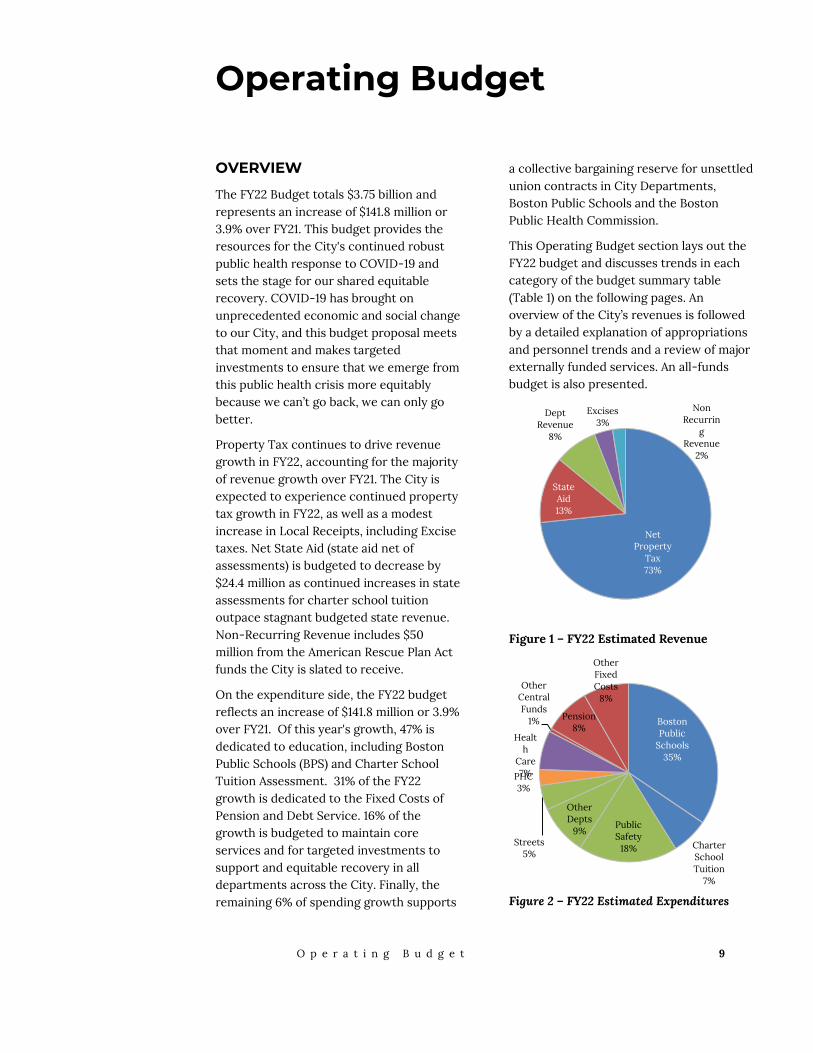
OVERVIEW
The FY22 Budget totals $3.75 billion and represents an increase of $141.8 million or 3.9% over FY21. This budget provides the resources for the City's continued robust public health response to COVID-19 and sets the stage for our shared equitable recovery. COVID-19 has brought on unprecedented economic and social change to our City, and this budget proposal meets that moment and makes targeted investments to ensure that we emerge from this public health crisis more equitably because we can’t go back, we can only go better.
Property Tax continues to drive revenue growth in FY22, accounting for the majority of revenue growth over FY21. The City is expected to experience continued property tax growth in FY22, as well as a modest increase in Local Receipts, including Excise taxes. Net State Aid (state aid net of assessments) is budgeted to decrease by $24.4 million as continued increases in state assessments for charter school tuition outpace stagnant budgeted state revenue. Non-Recurring Revenue includes $50 million from the American Rescue Plan Act funds the City is slated to receive.
On the expenditure side, the FY22 budget reflects an increase of $141.8 million or 3.9% over FY21. Of this year's growth, 47% is dedicated to education, including Boston Public Schools (BPS) and Charter School Tuition Assessment. 31% of the FY22 growth is dedicated to the Fixed Costs of Pension and Debt Service. 16% of the growth is budgeted to maintain core services and for targeted investments to support and equitable recovery in all departments across the City. Finally, the remaining 6% of spending growth supports
a collective bargaining reserve for unsettled union contracts in City Departments, Boston Public Schools and the Boston Public Health Commission.
This Operating Budget section lays out the FY22 budget and discusses trends in each category of the budget summary table (Table 1) on the following pages. An overview of the City’s revenues is followed by a detailed explanation of appropriations and personnel trends and a review of major externally funded services. An all-funds budget is also presented.
Figure 1 – FY22 Estimated Revenue
Figure 2 – FY22 Estimated Expenditures
Net Property
Tax 73%
State Aid 13%
Dept Revenue
8%
Excises 3%
Non Recurrin
g Revenue
2%
Boston Public
Schools 35%
Charter School Tuition
7%
Public Safety
18%
Other Depts
9% Streets
5%
PHC 3%
Health
Care 7%
Other Central Funds
1% Pension 8%
Other Fixed Costs
8%

1 0 O p e r a t i n g B u d g e t
BUDGET SUMMARY
FY19 Actual FY20 Actual
FY21 Projection FY22 Budget
REVENUES (1) Property Tax 2,354.14 2,514.16 2,674.86 2,786.73
Property Tax Overlay (33.26) -47.32 -3.74 -33.40
Excises 236.51 226.03 122.54 131.14
Fines 74.11 67.38 60.95 59.34
Interest On Investments 30.41 29.47 4.00 4.00
Payments in Lieu of Taxes 54.05 44.88 49.28 49.65
Urban Redev Chapter 121A 54.41 41.52 35.70 28.70
Department Revenue 72.40 66.63 59.19 59.22
Licenses & Permits 82.60 88.36 61.96 62.97
Penalties & Interest 11.42 10.11 9.00 9.00
Available Funds 0.00 0.00 30.95 30.95
State Aid 434.36 458.85 467.74 475.97
Total Recurring Revenue 3,371.15 3,500.05 3,572.43 3,664.26
Budgetary Fund Balance 0.00 0.00 40.00 40.00
Surplus Property Fund 0.00 0.00 0.00 0.00
American Rescue Plan 0.00 0.00 0.00 50.00
Total Revenues 3,371.15 3,500.05 3,612.43 3,754.26
EXPENDITURES City Appropriations (2) 1,364.99 1,412.28 1,405.90 1,425.22
Boston Public Health Commission (2) 87.97 93.41 106.47 110.70
Boston School Department (2) 1,126.68 1,178.56 1,260.49 1,294.72
Reserve for Collective Bargaining 2.51 2.20 1.14 10.00
Other Post Employment Benefits 40.00 40.00 40.00 40.00
Total Appropriations 2,622.14 2,726.45 2,814.00 2,880.64
Pensions 263.08 280.60 292.09 318.69
Debt Service 177.28 177.98 188.67 205.62
Charter School Tuition 185.03 199.70 214.88 246.88
MBTA 88.21 90.67 93.35 94.12
Other State Assessments 5.51 5.53 5.60 5.42
Suffolk County Sheriff Dept 3.87 3.85 3.85 2.90
Reserve 3.41 0.00 0.00 0.00
Total Fixed Costs 726.39 758.33 798.43 873.62
Total Expenditures 3,348.53 3,484.77 3,612.43 3,754.26
Surplus (Deficit) 22.61 15.28 0.00 0.00
(1) All revenues displayed are part of the City’s general fund that support expenditures displayed in the bottom half of the table. (2) See General Fund Appropriations by Cabinet & Department table for breakdown by cabinet and functional unit.
Numbers may not add.
Table 1

O p e r a t i n g B u d g e t 1 1
The City’s projected revenues provide the basis for planning FY22 appropriations to maintain a balanced budget. Selected FY22 budgeted City revenues compare with FY21 projected revenues as follows: the net property tax levy increases $82.2 million or 3.1%; excises increase $8.6 million or 7.0%; interest on investments and miscellaneous department revenue remain flat at $4.0 million and $59.2 million, respectively; state aid increased by $8.2 million, or 1.8%.
On the expenditure side of the budget, total appropriations increase by $66.6 million or 2.4% and fixed costs increase by $75 million or 9.4%. Selected FY22 budgeted appropriations compare with FY21 projections as follows: City appropriations increase $19.3 million or 1.4%; the Boston Public Health Commission (PHC) increases by $4.2 million or 4%; and the School Department (BPS) increases $34.2 million or 2.7%. In addition, a collective bargaining reserve has been set aside at $10 million; when the outstanding collective bargaining agreements are negotiated, these reserves will be used to cover those increased costs in City departments, PHC and BPS. Most union contracts have expired and as a result departmental personnel increases are limited in the FY22 budget. City Appropriations also consist of 11 central appropriations, including a large appropriation for Health Insurance totaling $212.2 million, which has a modest decrease of -1.8% over FY21.
FY22 budgeted fixed costs are growing by $75.2 million over FY21. Charter School Tuition assessment is a key driver with an increase of $32 million or 14.9%. Pensions will increase by $26.6 million or 9.1%. Debt Service is also growing with a $16.9 million or 9% increase. The MBTA state assessment is increasing by $772 thousand.
REVENUE
The City’s revenue budget can be divided into five categories: Property Tax, State Aid, Departmental, Excise and Non Recurring
revenue. Over the past two decades, the City’s revenue structure has shifted significantly towards a growing reliance on property tax, while State Aid has decreased as a share of the budget. In addition, the COVID-19 pandemic and the resulting economic recession have put a strain on Departmental and Excise revenue. A more detailed discussion of City revenues is provided in the Revenue Estimates and Analysis chapter of this volume.
Property Tax Levy
The property tax levy has always been the City’s largest and most dependable source of revenue. In FY21 the net property tax levy (levy less a reserve for abatements) totals $2.67 billion, providing 73.9% of the City’s revenue. In FY22, the net property tax levy is estimated to total $2.75 billion and account for 73.3% of budgeted revenues.
In Massachusetts, Proposition 2 ½ constrains the amount of property tax revenue the City can raise each year from its existing tax base. In each year since FY85, the City has increased its levy by the 2.5% allowable under the limits set forth in Proposition 2 ½.
During these same years, the levy has also been positively impacted by taxable new value or “new growth” that is excluded from the levy limit. Due in part to efforts to attract business development to Boston and grow its housing stock, Boston experienced unprecedented new growth property tax revenue in FY17 through FY21. New growth is budgeted at $45.0 million in FY22 due to the significant slowdown in the local and national economy, as well as the impact of the two-month non-essential construction pause enacted in the spring 2020 due the pandemic.
State Aid
The primary sources of aid from the State to municipalities are education aid and unrestricted general government aid. The

1 2 O p e r a t i n g B u d g e t
Commonwealth also distributes aid for libraries and provides some other reimbursements to municipalities.
State aid has been reduced substantially over the course of the last two recessions. Since FY02, net state aid (defined as state aid revenues less state assessments) to the City has been reduced by $298.8 million or 69.8%. In FY22, net state aid is budgeted to decline by $24.4 million or 15.8% compared to FY21, based on the FY22 Governor’s Budget.
In November 2019, the state passed the Student Opportunity Act, which represents a fundamental change in trajectory of State funding for Boston’s schools and students. This bill, when fully implemented, will ensure that Boston benefits from the changes to the Foundation Budget through additional Chapter 70 aid and a full reimbursement for charter school tuition.
Figure 3 - State Aid, State Assessments and Net State Aid, FY08-FY22
Local Receipts
11.6% of the City’s budgeted revenue in FY22 is comprised of excise taxes, fines, payments-in-lieu-of-taxes, Chapter 121A payments, investment income, departmental revenue, licenses and permits, penalties and interest, and available funds. To forecast these receipts, the City uses analytical trending of
historical collections, as well as analyzing economic data and assumptions.
The FY21 revenue projection includes $433.6 million in Local Receipt revenue, and the FY22 budget increases to $435.0 million. This modest $1.4 million increase assumes a slow reopening and return to normal in the Boston area.
American Rescue Plan Act
The FY22 budget includes $50 million from the $435 million payment Boston is estimated to receive as part of the American Rescue Plan Act of 2021 (ARPA). The act is a $1.9 trillion economic stimulus bill passed by the U.S. Congress and signed into law by President Joe Biden on March 11, 2021. These funds will help the City to continue provide essential services to its residents, despite facing revenue reductions due to the COVID-19 pandemic and the economic recession.
Budgetary Fund Balance
Fund Balance can be appropriated for use during the fiscal year. Budgetary fund balance, more commonly referred to as “free cash”, is described as the portion of available reserves, generated to a considerable degree by annual operating surpluses, which the City can responsibly appropriate for spending. The FY22 Budget uses $40 million in budgetary fund balance to fund the appropriation for other post-employment benefits (OPEB).
See the Financial Management section of Volume I for more detail on this revenue source.
EXPENDITURES
Expenditures are broken down into two primary groups: (1) appropriations directly related to departmental services and (2) fixed and mandated costs. FY22 appropriations are subdivided into three subgroups as follows:
$-
$100
$200
$300
$400
$500
$600
FY08 FY12 FY17 FY22 Budget
Mill
ions
State Aid State Assessments
Net State Aid

O p e r a t i n g B u d g e t 1 3
City Appropriations, which includes all operating department appropriations, centrally budgeted costs such as health insurance and Medicare, a risk retention reserve and a set-aside for tax title and annual audit expenses;
Boston Public Health Commission (PHC), the City appropriation for the quasi-independent authority and successor to the Department of Health and Hospitals;
and School Department, the City appropriation for the Boston Public Schools (BPS).
Appropriations are also presented by expenditure category across the three subgroups (Figure 6).
Figure 4 - FY22 Appropriations by Category
Personnel Services include salaries, overtime, unemployment compensation and workers’ compensation, and collective bargaining reserves for estimated wage increases for union employees whose agreements are not settled.
The Health Benefits category includes the cost of health, dental and life insurance for City, BPS and PHC employees and retirees, employer Medicare payroll taxes, and the
appropriation for Other Post-Employment Benefits (OPEB).
The Contractual Services category includes expenditures for communications, repairs and service to buildings, equipment and vehicles, transportation, trash collection and disposal, as well as outside legal, advertising, and printing expenses.
Included in the “Other” category are supplies and materials such as gasoline, uniform allowances, office supplies, workers’ compensation medical expenses, medical indemnification in the Fire and Police Departments, legal liabilities, and aid to veterans. Also included in the “Other” category are appropriations for equipment, vehicles, a risk retention reserve, the Housing Trust Fund, tax title, and funding for the City’s outside audit.
Health Benefits
Health benefit costs comprise a significant portion of the City budget and are a critical benefit for City employees and retirees.
In 2020, the City of Boston conducted an RFP for its non-Medicare health insurance plans. Effective July 1, 2021, the City will transition from two HMO plans to one standard HMO plan and one value HMO plan, with the standard HMO plan under a new provider. As a result of the RFP process, $12 million in savings will be realized in FY22, due to lower administrative fees and anticipated medical claims and prescription drug savings.
The City continues to benefit from health care cost reforms achieved in FY21-25 Public Employee Committee (PEC) agreement, which continues to provide over 30,000 active and retired employees with quality healthcare coverage while saving the City $59.7 million over five years. Based on savings included in this agreement, the City will realize up to $10.8 million in new avoided health care costs in FY22.
Personnel
Services 62.0%
Contracted
Services 14.7%
Other 5.7%
PHC 3.3%
Health Benefits
14.3%

1 4 O p e r a t i n g B u d g e t
The FY22 budget includes $412 million for all health benefits-related costs for the City’s employees and retirees, comprising 11.0% of total City expenditures – compared to 7.8% in 2001. $42.25 million of these costs are for future OPEB liabilities, which are discussed in more detail in the following section. The remaining $370 million of these costs are for current health, dental and life premiums, and employer Medicare payroll taxes.
As shown in Figure 5, these costs grew from $132 million in FY01 to $370 million in FY22, an increase of $238 million or 180%. Over the same period, all other City costs increased 118%. Figure 5 shows three distinct periods of annual cost increases. Steep increases averaged 9% per year from FY01 – FY11. Between FY12 – FY15, costs decreased on an average of 1% per year due to multiple factors, including state health reform legislation, cooperative efforts by the City and its unions to reduce both the City’s share of costs and total costs, and lower nationwide health care cost trends. For FY16 through FY22, health care costs increased at an average of 3% per year, contained by PEC agreement savings.
Figure 5 - Health Care Costs ($ Mil) Health, Dental, Life Premiums and Medicare Tax
Medicare
Municipal health care reform legislation, passed by the State legislature in 2011, provided municipalities more freedom in health plan design. It also mandated that all Medicare-eligible municipal retirees enroll in Medicare Part B and a City sponsored Medicare supplement plan. As a direct result of the legislation, approximately 5,500 additional City retirees and their spouses enrolled in Medicare supplement plans. Benefits for these plans are comparable to non-Medicare plans but costs are lower due to Medicare reimbursements. As a result of this reform, 74% of retirees and spouses are now enrolled in Medicare plans, compared to just 37% prior to the legislation. City savings from this mandate, beginning in FY13, have totaled approximately $20 million annually – a major contributor to the total cost decrease in FY13.
City retirees and their beneficiaries are eligible for Medicare through payment of Medicare payroll taxes during their working career. Medicare taxes are paid for all City employees who were hired after March 1986. The City’s share of 50% Medicare taxes, totaling $23.7 million in the FY22 budget, has increased an average of 7% annually since FY01. This growth is due to increases in total payroll and also the increasing percentage of total employees hired after March 1986 who have retired.
Number of Health Plan Subscribers
Jan 2021
Hlth Plan Active Retiree Total
Indemnity 888
757
1,645
HMO
14,694
2,350
17,044
Medicare - 11,617 11,617
Total
15,582
14,724 30,306
Table 2
$120
$170
$220
$270
$320
$370
$420
FY01 FY06 FY11 FY16 FY21Budget
Mill
ions

O p e r a t i n g B u d g e t 1 5
Health Care Costs ($ Mil) Health, Life, Dental, Medicare Tax
Fiscal Year
Total Cost
$ Change % Change
FY12 $318.9 $10.9 3.5%
FY13 $293.3 -$25.5 -8.0%
FY14 $304.4 $11.1 3.8%
FY15 $296.5 -$7.9 -2.6%
FY16 $313.2 $16.7 5.6%
FY17 $329.2 $16.0 5.1%
FY18 $351.4 $22.2 6.7%
FY19 $357.3 $5.9 1.7%
FY20 $358.9 $1.6 0.5%
FY21* $369.2 $10.3 2.9%
FY22* $369.7 $0.5 0.1%
*Budget estimates
Table 3
City - Union Partnership
In FY12, assisted by 2011 Municipal Health Care Reform, the City adopted MGL Chapter 32B S.19 and began working closely with its thirty-six unions, as represented through the Public Employee Committee (PEC), in making health care changes. Through the terms of the City and PEC’s three agreements, City employees and retirees are now paying a higher share of total health care costs through increased premium share, as well as higher out-of-pocket costs for co-pays and deductibles.
The City and the PEC’s FY21-25 agreement is projected to reduce costs by approximately $59.7 million over five years. With changes occurring over the course of five years, the City and the PEC have agreed to a number of cost-saving plan changes. In FY22, these changes include a new value network plan consisting of lower-cost, high-quality providers; small deductibles for PPO and standard HMO plans; and new co-payments for hospitalization and advanced imaging. The agreement also increases current co-payment charges and the share of the premiums paid by employees and retirees.
The City and PEC have also pursued changes to the management of health care claims costs, which have reduced total costs - for both the City and the members:
Self-insurance
Funding of health care costs has progressively moved to self-insurance since FY13. In FY22, roughly 98% of enrollees are enrolled are in self-insured plans, for an estimated annual City savings of $13.7 million, vs. insured premiums.
More cost effective prescription drug management
The City and the PEC continue to explore more cost effective management of the City’s prescription benefits, which total roughly $80 million per year for all plans, net of rebates. The City and PEC have worked to replace the City’s existing Medicare prescription drug coverage with lower cost prescription drug plans (PDPs). In FY21, a PDP was included in the Harvard Pilgrim Medicare Enhance plan, with City savings estimated at $3.9 million annually.
Cost effective provider networks
The City and PEC are making a significant step to encourage cost savings for both members and the City by introducing a value HMO plan, effective July 1, 2021. The AllWays Health Partners value network is focused on high quality, high performance, lower-cost providers, and enrollees will pay lower premiums and out-of-pocket costs. Savings realized from moving from the existing AllWays HMO plan to the AllWays value HMO plan are projected at $2.5 million.
Expanded wellness and disease management programs
The City, through the PEC agreement, annually contributes $150,000 toward wellness programs, managed through a subcommittee of the PEC. Recent wellness initiatives have included employee wellness fairs and the establishment of a citywide
1 6 O p e r a t i n g B u d g e t
digital platform through which City employees, retirees, and their dependents can access information about fitness and nutrition programs, and participate in wellness challenges. Also, new disease management initiatives are being explored and implemented through each respective carrier to assist members in managing chronic diseases such as diabetes.
Other Post-Employment Benefits (OPEB)
Similar to pensions, employees earn post-employment health care and life insurance benefits (OPEB) over their years of active service, with those benefits being received during retirement. The City, including the Boston Public Health Commission (BPHC), had an unfunded liability for these benefits of $2.13 billion, as of the most recent independent actuarial valuation on June 30, 2019. The size of this liability is largely influenced by changes to retiree health benefits, the City’s annual additional contribution to fund the liability, and the discount rate assumed.
While the City is required by law to make an annual contribution toward reducing its unfunded pension liability, there is no such requirement for retiree health and life insurance benefits. In FY08, the City followed new Governmental Accounting Standards Board (GASB) requirements to identify and disclose this estimated liability, and also began voluntary annual allocations to fund the liability. Annual allocations are retained in an irrevocable Trust Fund, authorized through the City’s acceptance of M.G.L. Chapter 32B section 20. As of June 30, 2020, the Fund had a balance of $683.0 million.
As in previous years, this budget dedicates $40 million toward reducing the City’s long term other post-employment benefits (OPEB) liability. These fiscally responsible actions are critical to the Administration’s prudent financial management policies,
which have contributed to Boston’s triple A bond rating.
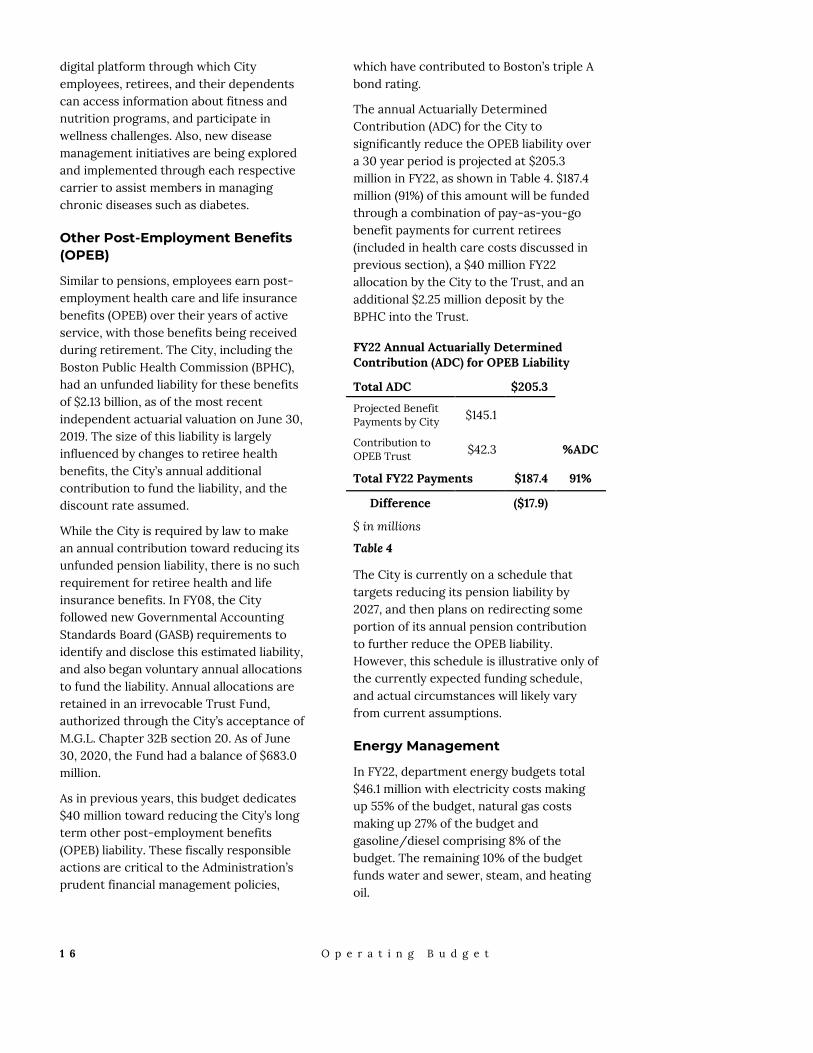
The annual Actuarially Determined Contribution (ADC) for the City to significantly reduce the OPEB liability over a 30 year period is projected at $205.3 million in FY22, as shown in Table 4. $187.4 million (91%) of this amount will be funded through a combination of pay-as-you-go benefit payments for current retirees (included in health care costs discussed in previous section), a $40 million FY22 allocation by the City to the Trust, and an additional $2.25 million deposit by the BPHC into the Trust.
FY22 Annual Actuarially Determined Contribution (ADC) for OPEB Liability
Total ADC $205.3 Projected Benefit
Payments by City $145.1
Contribution to OPEB Trust $42.3
%ADC
Total FY22 Payments $187.4 91%
Difference
($17.9) $ in millions
Table 4
The City is currently on a schedule that targets reducing its pension liability by 2027, and then plans on redirecting some portion of its annual pension contribution to further reduce the OPEB liability. However, this schedule is illustrative only of the currently expected funding schedule, and actual circumstances will likely vary from current assumptions.
Energy Management
In FY22, department energy budgets total $46.1 million with electricity costs making up 55% of the budget, natural gas costs making up 27% of the budget and gasoline/diesel comprising 8% of the budget. The remaining 10% of the budget funds water and sewer, steam, and heating oil.

O p e r a t i n g B u d g e t 1 7
The Chief of Environment, Energy and Open Space and Chief Financial Officer are charged with making decisions regarding the City’s procurement, use, and conservation of energy. In addition, the Chief of Environment, Energy and Open Space monitors the City’s progress in meeting the greenhouse gas reduction goals required by the City’s Climate Action Plan. The Municipal Energy Unit housed within the Environment, Energy and Open Space Cabinet works with City departments and the Office of Budget Management to develop design standards and implement measures that enhance the energy efficiency of the City’s new construction and capital improvement projects.
Over the past nine years, the City has achieved operational savings through the conversion of street lights to newer fixtures using Light Emitting Diode (“LED”) technology. The street light retrofits that the City has completed to date have permanently reduced the City's electricity consumption by 37.4 million kilowatt hours (kWh) per year. As a result, about $6 million of electricity expenses were avoided in the FY22 operating budget.
In FY22, the City will continue implementing improvements that result in utility cost savings for City facilities, under the “Renew Boston Trust” initiative. This is not a trust in the traditional sense, but a program to bundle municipal utility cost savings projects. Efforts began with selection of an Energy Service Company (“ESCO”) and their subsequent Investment Grade Audit (“IGA”) of the City’s facilities portfolio to identify projects with significant utility savings potential. The City selected projects based on the IGA analysis and has begun to implement the program's first phase guided by an Energy Management Service Agreement ("EMSA") that provides long-term financial guarantees on the net savings for such projects. The City will finance this program with general obligation bonds with debt
service costs expected to be offset by the long-term energy savings guaranteed by the ESCO.
To improve the tracking and control of energy use, the City has re-procured services to support an Enterprise Energy Management System (“EEMS”). The current EEMS enables the City to monitor and report on the energy consumed by its 300+ buildings and other fixed assets, and its vehicle fleet, and is used by the City to meet its public reporting obligation under the Building Energy Reporting and Disclosure Ordinance. The EEMS has also facilitated the identification of energy efficiency projects and billing errors that have saved the City $1.3 million in utility expenses.
The City’s electricity requirements have been met by third-party commodity supply contractors since March 2005. To date, the amounts the City has paid to its third-party electricity suppliers have been less than the amounts it would have paid if it had continued to accept default electric service from its local distribution company, Eversource. Avoided costs since FY15 total approximately $28 million.
Appropriations
The combined appropriations for City Departments, the Public Health Commission (PHC) and the School Department (BPS), and non-departmental appropriations as shown in the FY22 Budget Summary have increased by 2.4% from FY21 .
Boston Public Schools with a $1.29 billion appropriation is increasing by $34.2 million over the FY21. Boston’s total investment in education, including BPS and the City’s Charter School Assessment, is growing by $66 million (4.3%) over FY21.
City Services such as Police, Fire, Public Works, Housing, and other central funds are projected to increase by a total of $19.3 million (1.4%). The City has created two new

1 8 O p e r a t i n g B u d g e t
cabinets, Equity & Inclusion including approximately $3 million in new investments in FY22 and the Office of Police Accountability & Transparency with an initial budget of $1 million. The FY22 budget includes over $4 million in various departments for job training to assist those in hard hit industries and to promote green jobs and other growing fields. Other investments address immediate needs and expand services for post COVID-19 programming including in Arts & Culture, Parks, Youth Engagement and Employment, and Age Strong. The appropriation for the Housing Cabinet is growing by $6.2 million or 21.3% with the significant investments in housing and homelessness efforts to prevent displacement and expand housing opportunities for families of every income in neighborhoods across the city. The majority of union contracts have expired, so departmental wage growth is limited, while outstanding contracts are reserved for centrally. Funding for unsettled City, PHC and BPS union contracts are centralized in a $10 million collective bargaining reserve.
The Public Health Commission (PHC) budget is growing by $4.2 million (4.0%) in FY22. This increase includes key investments in infectious disease sustainable infrastructure, an after action report on COVID-19, and Emergency Medical Services equipment. Unlike other city departments, the PHC budget contains health insurance and pension.
The FY22 budget also continues and expands upon a number of savings initiatives.
Boston will realize $22.8 million in avoided health care costs in FY22, $10.8 million related to FY22 changes per the PEC agreement and $12.0 million from new HMO plans as a result of the non-Medicare RFP.
Across city departments, the City identified $2.5 million in various non-personnel account savings.
Favorable utilities and gasoline rates saved city departments an additional $2.5 million compared to FY21 budgets.
Renew Boston Trust energy conservation savings will amount to $910,000 in FY22. And reduced recycling rates will save $300,000.
Continuing the practice of proactive review, the City eliminated long-term vacant positions from the budget in FY22 for $390,000 in savings.
Continued tightening within City departments enables the City to afford targeted investments after reserving for costs associated with collective bargaining, funding its pension obligations, and paying its debt service.
O p e r a t i n g B u d g e t 1 9
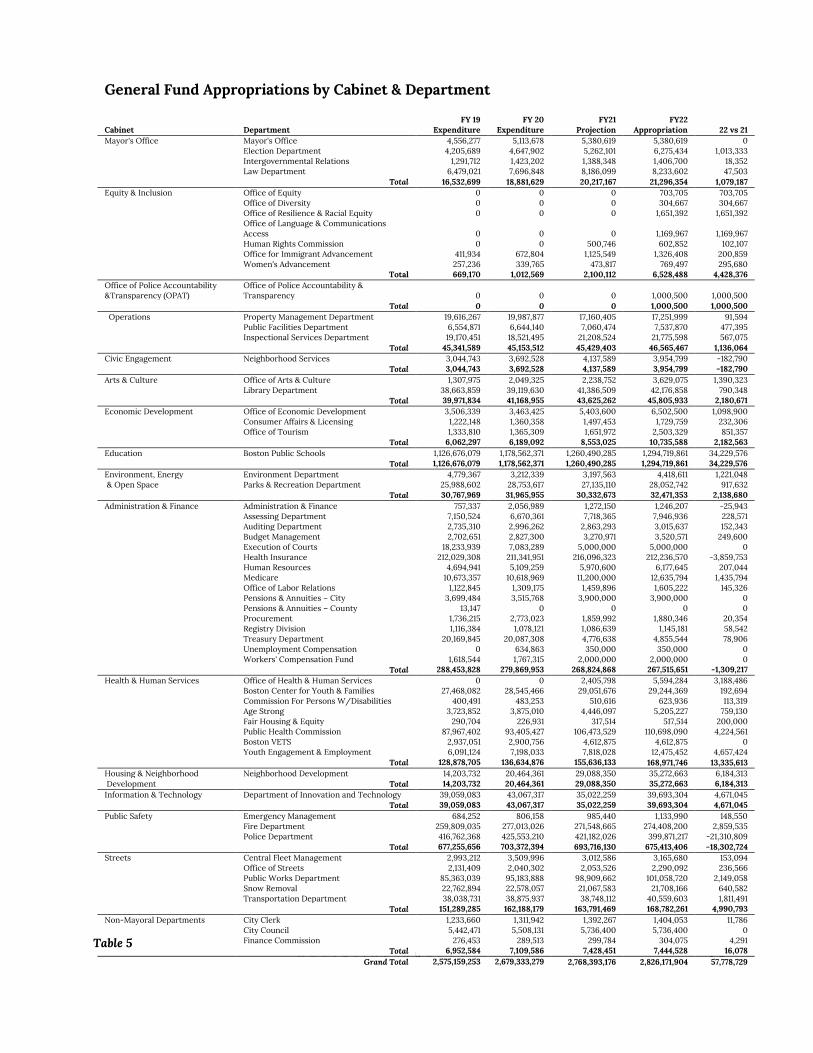
General Fund Appropriations by Cabinet & Department
Cabinet Department FY 19
Expenditure FY 20
Expenditure FY21
Projection FY22
Appropriation 22 vs 21 Mayor's Office Mayor's Office 4,556,277 5,113,678 5,380,619 5,380,619 0
Election Department 4,205,689 4,647,902 5,262,101 6,275,434 1,013,333 Intergovernmental Relations 1,291,712 1,423,202 1,388,348 1,406,700 18,352
Law Department 6,479,021 7,696,848 8,186,099 8,233,602 47,503
Total 16,532,699 18,881,629 20,217,167 21,296,354 1,079,187 Equity & Inclusion Office of Equity 0 0 0 703,705 703,705 Office of Diversity 0 0 0 304,667 304,667 Office of Resilience & Racial Equity 0 0 0 1,651,392 1,651,392
Office of Language & Communications Access 0 0 0 1,169,967 1,169,967
Human Rights Commission 0 0 500,746 602,852 102,107 Office for Immigrant Advancement 411,934 672,804 1,125,549 1,326,408 200,859 Women's Advancement 257,236 339,765 473,817 769,497 295,680 Total 669,170 1,012,569 2,100,112 6,528,488 4,428,376 Office of Police Accountability &Transparency (OPAT)
Office of Police Accountability & Transparency 0 0 0 1,000,500 1,000,500
Total 0 0 0 1,000,500 1,000,500 Operations Property Management Department 19,616,267 19,987,877 17,160,405 17,251,999 91,594 Public Facilities Department 6,554,871 6,644,140 7,060,474 7,537,870 477,395 Inspectional Services Department 19,170,451 18,521,495 21,208,524 21,775,598 567,075 Total 45,341,589 45,153,512 45,429,403 46,565,467 1,136,064 Civic Engagement Neighborhood Services 3,044,743 3,692,528 4,137,589 3,954,799 -182,790 Total 3,044,743 3,692,528 4,137,589 3,954,799 -182,790 Arts & Culture Office of Arts & Culture 1,307,975 2,049,325 2,238,752 3,629,075 1,390,323 Library Department 38,663,859 39,119,630 41,386,509 42,176,858 790,348 Total 39,971,834 41,168,955 43,625,262 45,805,933 2,180,671 Economic Development Office of Economic Development 3,506,339 3,463,425 5,403,600 6,502,500 1,098,900 Consumer Affairs & Licensing 1,222,148 1,360,358 1,497,453 1,729,759 232,306 Office of Tourism 1,333,810 1,365,309 1,651,972 2,503,329 851,357 Total 6,062,297 6,189,092 8,553,025 10,735,588 2,182,563 Education Boston Public Schools 1,126,676,079 1,178,562,371 1,260,490,285 1,294,719,861 34,229,576 Total 1,126,676,079 1,178,562,371 1,260,490,285 1,294,719,861 34,229,576 Environment, Energy Environment Department 4,779,367 3,212,339 3,197,563 4,418,611 1,221,048 & Open Space Parks & Recreation Department 25,988,602 28,753,617 27,135,110 28,052,742 917,632
Total 30,767,969 31,965,955 30,332,673 32,471,353 2,138,680 Administration & Finance Administration & Finance 757,337 2,056,989 1,272,150 1,246,207 -25,943 Assessing Department 7,150,524 6,670,361 7,718,365 7,946,936 228,571 Auditing Department 2,735,310 2,996,262 2,863,293 3,015,637 152,343 Budget Management 2,702,651 2,827,300 3,270,971 3,520,571 249,600 Execution of Courts 18,233,939 7,083,289 5,000,000 5,000,000 0
Health Insurance 212,029,308 211,341,951 216,096,323 212,236,570 -3,859,753
Human Resources 4,694,941 5,109,259 5,970,600 6,177,645 207,044 Medicare 10,673,357 10,618,969 11,200,000 12,635,794 1,435,794 Office of Labor Relations 1,122,845 1,309,175 1,459,896 1,605,222 145,326 Pensions & Annuities – City 3,699,484 3,515,768 3,900,000 3,900,000 0 Pensions & Annuities – County 13,147 0 0 0 0 Procurement 1,736,215 2,773,023 1,859,992 1,880,346 20,354 Registry Division 1,116,384 1,078,121 1,086,639 1,145,181 58,542 Treasury Department 20,169,845 20,087,308 4,776,638 4,855,544 78,906 Unemployment Compensation 0 634,863 350,000 350,000 0 Workers' Compensation Fund 1,618,544 1,767,315 2,000,000 2,000,000 0 Total 288,453,828 279,869,953 268,824,868 267,515,651 -1,309,217 Health & Human Services Office of Health & Human Services 0 0 2,405,798 5,594,284 3,188,486
Boston Center for Youth & Families 27,468,082 28,545,466 29,051,676 29,244,369 192,694
Commission For Persons W/Disabilities 400,491 483,253 510,616 623,936 113,319
Age Strong 3,723,852 3,875,010 4,446,097 5,205,227 759,130
Fair Housing & Equity 290,704 226,931 317,514 517,514 200,000 Public Health Commission 87,967,402 93,405,427 106,473,529 110,698,090 4,224,561 Boston VETS 2,937,051 2,900,756 4,612,875 4,612,875 0 Youth Engagement & Employment 6,091,124 7,198,033 7,818,028 12,475,452 4,657,424 Total 128,878,705 136,634,876 155,636,133 168,971,746 13,335,613 Housing & Neighborhood Neighborhood Development 14,203,732 20,464,361 29,088,350 35,272,663 6,184,313 Development Total 14,203,732 20,464,361 29,088,350 35,272,663 6,184,313 Information & Technology Department of Innovation and Technology 39,059,083 43,067,317 35,022,259 39,693,304 4,671,045 Total 39,059,083 43,067,317 35,022,259 39,693,304 4,671,045 Public Safety Emergency Management 684,252 806,158 985,440 1,133,990 148,550 Fire Department 259,809,035 277,013,026 271,548,665 274,408,200 2,859,535 Police Department 416,762,368 425,553,210 421,182,026 399,871,217 -21,310,809 Total 677,255,656 703,372,394 693,716,130 675,413,406 -18,302,724 Streets Central Fleet Management 2,993,212 3,509,996 3,012,586 3,165,680 153,094 Office of Streets 2,131,409 2,040,302 2,053,526 2,290,092 236,566 Public Works Department 85,363,039 95,183,888 98,909,662 101,058,720 2,149,058 Snow Removal 22,762,894 22,578,057 21,067,583 21,708,166 640,582 Transportation Department 38,038,731 38,875,937 38,748,112 40,559,603 1,811,491 Total 151,289,285 162,188,179 163,791,469 168,782,261 4,990,793 Non-Mayoral Departments City Clerk 1,233,660 1,311,942 1,392,267 1,404,053 11,786 City Council 5,442,471 5,508,131 5,736,400 5,736,400 0 Finance Commission 276,453 289,513 299,784 304,075 4,291 Total 6,952,584 7,109,586 7,428,451 7,444,528 16,078 Grand Total 2,575,159,253 2,679,333,279 2,768,393,176 2,826,171,904 57,778,729
Table 5

2 0 O p e r a t i n g B u d g e t
Figure 6 - FY22 Appropriations by Cabinet
The departmental appropriations are shown in the General Fund Appropriation by Cabinet table.
Departmental appropriations can also be viewed by cabinet, to better reflect the overall policy priorities and trends by service area.
In FY22 some programs have transferred between departments. Details of these changes are described below in each of the following cabinet sections.
Mayor's Office
The FY22 budget for the Mayor’s Office Cabinet is 5.3% over the FY21. The cabinet contains the Mayor’s Office, the Election Department, Intergovernmental Relations, and the Law Department. The Election Department’s budget will increase by 19.3% in FY22 due to the municipal election in November and additional expenses for implementation of no-excuse mail in voting and early voting. The FY22 budgets for the other departments in the cabinet will remain fairly stable.
For additional budget detail on the Mayor’s Office Cabinet see Volume II.
Equity & Inclusion
The new Equity & Inclusion Cabinet’s budget totals $6.5 million. The Cabinet includes the new Office of Equity, several new departments that were formerly
programs within the Mayor’s Office, as well as existing departments transferring from other cabinets.
The Office of Equity was created to provide administrative and policy direction to the departments making up the cabinet. Headed by the Chief of Equity, the department includes the Economic Mobility Lab and My Brother’s Keeper, programs previously in the Mayor’s Office. My Brother’s Keeper will also receive a new investment of $100,000 in program support. The Office of Equity plans to add staff in FY22, including a finance position for the cabinet.
The Office of Diversity and the Mayor’s Office of Resilience and Racial Equity (MORRE) are moving out of the Mayor’s Office in FY22. MORRE’s FY22 budget will include $1.3 million for the citywide rollout of racial equity and leadership training. An additional investment of $40,000 will enhance community engagement efforts.
Language and Communication Access is also a newly independent department in FY22, consisting of three positions previously in the Office of Neighborhood Services and two new positions that will build research and administrative capacity. The FY22 budget invests $300,000 in expanding language and communication access services, including interpretation, translation of the City’s vital documents, and translation of outreach materials at citywide events.
The Human Rights Commission’s FY22 budget is growing by 20.4%. The increase reflects $100,000 in funding for anti-discrimination supports. The department was previously in the Mayor’s Office Cabinet.
The FY22 budget of the Mayor’s Office for Immigrant Advancement (MOIA) is increasing by 17.8%. FY22 investments

O p e r a t i n g B u d g e t 2 1
include a dedicated position to coordinate the Immigrants Lead Boston program and its subsequent alumni classes, a pilot internship program for immigrant professionals trained in COVID-19 recovery sectors, and continuation of the Summer Fellowship program first piloted in summer 2020.
Women’s Advancement’s budget will increase by 62.4% in FY22. The Childcare Entrepreneur Fund will grow by $250,000, enabling the program to serve over 100 small, Boston-based childcare providers in the coming year. In tandem with the scaled-up programming, a new coordinator position will be added to boost program management capacity.
For additional budget detail on the Equity & Inclusion Cabinet see Volume II.
Office of Police Accountability & Transparency (OPAT)
The Office of Police Accountability & Transparency (OPAT) Cabinet has been created as part of the FY22 budget based on the recommendations of the Boston Police Reform Task Force. OPAT will consist of three programs including: the OPAT Commission, the Civilian Review Board, and the Internal Affairs Oversight Panel. The FY22 budget of $1 million includes funding to hire staff as well as for equipment and supplies.
The Office will support lasting, generational change by rooting out impropriety and ensuring the type of enhanced oversight that leads to greater community trust. The purpose of OPAT is to provide a single point of entry for individuals with concerns or complaints related to the Boston Police Department and its officers and sworn personnel.
For additional budget detail on the OPAT Cabinet see Volume II.
Operations
In FY22 the budget for the Operations Cabinet is increasing by 2.5%, with the addition of two positions in Public Facilities, as well as, investments in preparation for the post pandemic recovery in Property Management and Inspectional Services.
The Public Facilities’ FY22 budget will increase by 6.8% due to accelerated hiring and the addition of two project manager positions to help support efforts on the City’s capital plan.
The Property Management Department’s budget will increase by 0.5% primarily due to an adjustment made to security billing with other departments, which offsets the cost of the FY22 investment. A $500,000 investment will allow the department to implement measures to safely reopen city workspaces post-COVID-19. In FY22 Property Management has also taken on the care and maintenance of 1010 Massachusetts Avenue.
The Inspectional Services Department’s (ISD) budget will increase by 2.7% mainly due to contractual increases and an investment of $100,000 for post COVID-19 process improvements. Additionally, the department will undergo various operational reforms as recommended from an operational audit. These reforms will help to improve internal processes for permit review, investigations, and licensing. Once implemented, residents and businesses will benefit from more efficient review and processing of city permits and licenses. The COVID-19 pandemic has had a great effect on construction, restaurants, short-term rentals, and other industries. As the city prepares for the post pandemic recovery the $100,000 investment will help improve processes for these hard hit

2 2 O p e r a t i n g B u d g e t
industries to meet ISD regulatory and compliance standards.
For additional budget detail on the Operations Cabinet see Volume II.
Civic Engagement
The FY22 budget for the Civic Engagement Cabinet will decrease by 4.4%, due to the transfer of the Language and Communications Access, formerly a program of the Office of Neighborhood Services, to the new Equity & Inclusion Cabinet. The Civic Engagement Cabinet contains the Office of Neighborhood Services, which is home to the City’s neighborhood liaisons, Boston 311, and City Hall To Go. In response to COVID-19, the department increased the number of call-takers in Boston 311 to assist constituents with requests related to non-emergency services and information.
For additional budget detail on the Civic Engagement Cabinet see Volume II.
Arts & Culture
In FY22, funding for the Arts and Culture Cabinet will increase by $2.2 million, or 5.0%. The increase is largely driven by investments made in the Office of Arts and Culture to promote equity in the arts and support artists and arts organizations through post-COVID-19 recovery. The FY22 budget also maintains strong support for the Boston Public Library, with investments to facilitate an equitable expansion of services when branches reopen.
The FY22 Office of Arts and Culture budget will increase by 62.1%. This budget includes $1 million for an innovative program to train artists and connect them with City departments or local nonprofits to collaborate on COVID-19 recovery efforts. The City is also supporting local arts organizations through a $200,000 investment in programming at the historic Strand Theatre in Upham’s Corner. These funds will provide opportunities for BIPOC
artists, education and job training in creative sectors, and high-quality events and programming at the Strand.
Recognizing the need to invest in communities often underserved by philanthropic art funding, the City is investing $100,000 to establish a dedicated funding source for public art conservation and maintenance. This infusion of funds will enable the department to prioritize artworks that reflect the stories of marginalized communities. In addition, to support the ongoing expansion of the City’s Percent for Art capital program across Boston’s neighborhoods, the budget includes increased capacity for public art project management.
The Boston Public Library (BPL) budget will see a 1.9% increase in FY22. BPL’s budget includes the addition of a librarian to the Roslindale branch to meet robust community demand at that location following reopening after renovation. To support BPL’s Racial Equity Commitment and Action Plan, the budget also includes a new Equity and Outreach Coordinator and $30,000 to support related programming. In addition, BPL will add a Digital Content Creator and Public Relations Associate to increase marketing and communications capacity, resulting in proactive, targeted outreach and increased awareness of services. The City is also supporting BPL’s expansion of services through and beyond reopening from the COVID-19 pandemic, with $250,000 dedicated to virtual and in-person programming for all BPL patrons.
Additionally, BPL will implement a permanent elimination of fines for overdue materials beginning in FY22 to ensure that all of BPL’s services are accessible to Boston’s communities.
In addition to the FY22 general fund budget, BPL has support from external funding sources. These crucial resources, including the Commonwealth of

O p e r a t i n g B u d g e t 2 3
Massachusetts and Affiliates of the Public Library, support a variety of initiatives.
For additional budget detail on the Arts & Culture Cabinet see Volume II.
Economic Development
The Economic Development Cabinet includes the Office of Economic Development, Consumer Affairs & Licensing, and the Office of Tourism. Overall, the Cabinet will see a 25.5% increase in FY22.
The Office of Economic Development’s (OED) FY22 budget will increase by 20.3% from its FY21 appropriation. The increase is attributable to a $1 million investment in job training for hard hit industries as part of post COVID-19 recovery. The department also continues to build staffing and programming to support Minority- and Women-owned Business Enterprises (MWBE) and the Boston Residents Job Policy (BRJP) compliance through the FY21 Boston Police Department overtime reallocation. This is part of the City’s efforts to increase the supplier diversity of city contracts. Additionally, the department continues to manage the Boston Cannabis Equity Fund, which supports the development of equity applicants for the emerging cannabis industry.
The Office of Tourism will increase by 51.5% from its FY21 appropriation. The department is investing in a $1 million campaign to boost hospitality and local tourism as the city recovers and reopens.
The Consumer Affairs and Licensing Board will increase by 15.5% in FY22. The department will benefit from a $100,000 investment to support licensing capacity through reopening following the COVID-19 pandemic.
For additional budget detail on the Economic Development Cabinet see Volume II.
Education
At $1.29 billion, the FY22 operating budget is the largest in the history of the Boston Public Schools, increasing by 2.7% over the FY21 appropriation. In 2020, the City committed to increasing funding for school services by $100 million over three years, over and above standard cost increases. FY22 marks the second year of this historic commitment. In FY22 alone, $36 million in funding for new investments will be included in the BPS budget.
Funding directed to schools will increase to $831 million. Combined with another $322 million in school services budgeted centrally - such as transportation, special education, and facilities - total spending in schools will reach nearly $1.15 billion, representing 89% of the BPS budget.
Of the $36 million in new FY22 investments, 100% will be spent directly in school budgets or school services budgeted centrally. As a whole, the FY22 investments are aligned with Superintendent Cassellius’s strategic vision for the district and the goal of providing an equitable, quality education for all students.
Investments in BPS are guided by three principles: Return, Recover, and Reimagine. Operating investments focus on a safe return to schools to restart the work paused by COVID-19 and the equitable academic and emotional recovery of students from the pandemic. To ensure a safe return to schools, an investment of $1.4 million adds 20 additional daytime custodians to the BPS team, investing in building condition and cleanliness.
To assist students and their families in a strong recovery from COVID-19, a total of $16.9 million in investments expands on the FY21 investments in student success and outreach to connect families to resources. This includes an investment of $10 million to hire 95 new social workers to provide a coordinated, multi-tiered system of supports to meet the needs of students and

2 4 O p e r a t i n g B u d g e t
their families, needs made more acute by the COVID-19 crisis. An additional $6.8 million will fund the hiring of 80.5 new family liaisons who reflect the languages and cultures of communities and who will help families navigate BPS functions like registration, as well as facilitate access to community resources for housing, food, and counseling. These investments will guarantee a social worker and family liaison in every school.
Additionally, to mitigate the impact of declining enrollment due to COVID-19, an $18.5 million investment provides resources to schools beyond the Weighted Student Funding formula and on top of existing soft landings and Foundation for Quality supports. These supports go directly to schools and ensure that schools are able to maintain level services and support their students, regardless of enrollment declines.
In addition to the operating investments, BPS is allocating federal ESSER II funds to support Return, Recover, and Reimagine efforts. For more information, see the Education section in Volume I.
For additional budget detail on the Education Cabinet, see Volume II.
Environment, Energy & Open Space
The Environment, Energy and Open Space Cabinet, which includes the Environment Department and the Parks and Recreation Department, will increase by 7.1% in FY22. The cabinet is making targeted investments to ensure access to high-quality open spaces for all Bostonians, implement the City’s Climate Action Plan, and support an equitable city-wide recovery from COVID-19.
In FY22, the Environment Department’s budget will include a $1 million initiative to work with organizations in the city to develop job training programs in the renewable energy and green infrastructure industries and support the city’s recovery from COVID-19. The Environment
Department will also add a new program manager to work with Boston residents and small businesses in accessing state, utility, and other existing resources in energy efficiency and renewable energy. The department will also add a preservation planner to address the increasing complexity of the Landmark Commission’s work in creating and implementing historic districts.
The Parks and Recreation Department budget will increase by 3.4%, funding investments that will improve Boston’s open spaces and increase community resilience. As part of a safe reopening, $250,000 will support the Citywide Recreation program and expand summer recreation opportunities for Boston youth. In FY22, a new Environmental Justice Program Manager will be added to support the Design & Construction division’s ongoing work with the Environment Department and the new Equity Cabinet to coordinate the City’s equity priorities as they relate to its open spaces. The Animal Care & Control Revolving Fund is being replaced with a $220,000 appropriation in the operating budget starting in FY22.
For additional budget detail on the Environment, Energy & Open Space Cabinet see Volume II.
Administration & Finance
The Administration & Finance (A&F) Cabinet contains the majority of the central departments responsible for the City’s administrative functions. Boston has been recognized for its strong financial policies and practices and sound management of both its human and financial capital. The cabinet has a $1.3 million or -0.5% decrease in FY22, driven by central health insurance efficiencies.
The A&F cabinet has budgeted resources in FY22 to continue to implement the executive order on equitable procurement, which works to ensure the full participation of all enterprises in City spending, focusing

O p e r a t i n g B u d g e t 2 5
on small and local minority-, woman-, and veteran-owned businesses.
In FY22, the A&F cabinet will continue a citywide review of collections to better optimize the City’s non-tax revenues. The City will also continue to work to maximize federal health insurance reimbursements and revenue recovery efforts.
For additional budget detail on the Administration & Finance Cabinet see Volume III.
Health & Human Services
The FY22 appropriation for the Health & Human Services Cabinet will increase by $13.3 million or 8.6%. The majority of that increase is for new FY22 investments, including COVID-19 recovery efforts in the City. The cabinet works to promote the health and well-being of the City's residents, particularly its most vulnerable.
The Office of Health and Human Services (HHS), which includes the Office of Food Access, will be adding the Office of Public Safety in FY22. The department’s budget will increase by 132.5%. The department’s budget includes $1.25 million for the Youth Development Fund, a grant program which is a key part of a targeted violence prevention strategy with the goal of zero homicides in the City of Boston. Additionally, HHS will see an investment of $1.75 million for alternative policing planning. This investment will provide an opportunity for stakeholders to come together to develop a strategic plan and the creation of a model for alternative policing in Boston.
The Office of Food Access will see a $350,000 investment in efforts to address food insecurity with Community Food Access grants, the expansion of the Boston Double Up Program, and a safety net awareness campaign to increase utilization of food assistance programs. The Office of Public Safety will expand its Operation Exit program to assist young people returning
from incarceration with job training in aeronautics.
Boston Centers for Youth and Families’ (BCYF) FY22 budget will increase by 0.7% overall from FY21. The FY22 budget includes a $500,000 investment in expanded summer programming to ensure youth remain active throughout the summer. In FY22 the City is also kicking off #BCYFree, an initiative to make regular membership free for residents to ensure all centers are open to all residents.
The department’s budget also continues to provide grants to local nonprofits supporting after-school youth activities, sports, and academic study programs. Additionally BCYF runs both winter and summer Camp Joy programs with structured enriching activities for children and young adults with special needs. Camp Joy will return for summer 2021 in a hybrid model of virtual and in-person programming following public health guidelines.
The Age Strong Commission’s budget will increase by 17.1% in FY22. Investments in Age Strong for FY22 include new events for senior Bostonians to safely reconnect, a comprehensive hoarding assistance program, and a feasibility study to modernize the Commission’s taxi coupon program.
The Office of Fair Housing & Equity (FHE) budget has increased by 63% due to a $200,000 investment in housing investigation and caseload management. This investment is an important tool as the City moves into the pandemic recovery phase and eventual end of its eviction moratorium.
The Boston Public Health Commission (BPHC) serves as the City’s health department and provides emergency medical services (EMS); infectious disease surveillance; substance abuse prevention and treatment programs; community health programming; shelter, food, and advocacy

2 6 O p e r a t i n g B u d g e t
for homeless individuals; and home and school based health services for children and families. In FY22, BPHC’s appropriation will increase by 4%. Unlike most City departments, BPHC’s appropriation includes health insurance, pension and other post-employment benefits (OPEB).
BPHC is strengthening its infectious disease response by adding operations and clinical staff to the Communicable Disease Control division and multilingual staff in Education and Community Outreach. The Commission is also enhancing employee support and safety efforts. Additionally, $250,000 will be invested to study and produce an after action report on the City’s response to COVID-19.
EMS’s FY22 budget includes a targeted investment to ensure that in addition to annual ambulance replacements, essential equipment, such as AEDs and radios, will continue their scheduled replacement plans so EMTs and those doing life-saving work in the field have access to the tools and equipment they need. The Office of Recovery Services will invest in efforts to address improperly discarded syringes and provide sanitation services.
The FY22 budget for the Boston Office of Veterans Engagement, Transition, and Services (Boston VETS) will be level-funded despite a reduction in the need for services under state Chapter 115 due to fewer qualifying Boston veterans. A $100,000 FY22 investment will ensure the City’s COVID-19 recovery efforts remain veteran-inclusive at each step. Boston VETS continues efforts to broaden its reach amongst all veterans throughout the City.
The budget for Youth Engagement and Employment (YEE) will increase by 59.6% in FY22. Funding will continue to support a successful partnership with community-based organizations, and with a FY22 investment of $3.9 million combined with anticipated state funds, will provide an estimated 5,000 summer jobs. The
department will also work year round to support youth through the Mayor’s Youth Council and provide for 1,000 school-year jobs. Additionally, YEE will increase staff capacity and enhance relationships with community-based organizations and improve professional development for Youth Jobs participants.
The FY22 budget for the Commission for Persons with Disabilities will increase by 22.2%. A $100,000 FY22 investment will ensure the City’s COVID-19 recovery efforts remain disability-inclusive.
For additional budget detail on the Health & Human Services Cabinet see Volume III.
Housing and Neighborhood Development
The FY22 budget for the Housing and Neighborhood Development Cabinet will increase by 21.3%. This budget includes $6 million in new investments and reflects two primary goals: post-COVID-19 support for homelessness and businesses, as well as the expansion of programming and investments to reach the City’s Housing Boston 2030 goals.
As part of COVID-19 recovery, it will be all the more critical for the City to support individuals in finding and staying in permanent housing. The operating budget includes an array of programs to support renters. In FY22, the City will expand the City-funded rental voucher program with $2.5 million in additional funding, doubling total funding for the program. This program will subsidize the rents of those with the most need through providing hundreds of vouchers over five years.
To support small businesses that have borne the brunt of the economic downturn and uncertainty, the City is funding a new $1 million investment in commercial development assistance. This investment will subsidize ground floor commercial space and provide a significant opportunity to make this space accessible to local

O p e r a t i n g B u d g e t 2 7
businesses and community uses. Funding will be prioritized for projects in neighborhoods that have experienced historic disinvestment and/or are in lower-income census tracts. This investment, combined with the continuation of the existing Minority- and Women-owned Business Enterprises (MWBE) developer fund, not only creates a bridge to post-COVID-19 recovery, but also emphasizes the push for reinvestment and equity in the City’s small business community.
DND conducts various programs to move the needle on chronic, family, and youth homelessness. As part of the FY22 budget, a new investment of $2.5 million is dedicated to post-COVID-19 homelessness support. This money will create and expand existing DND programs. With this additional investment it will result in 235 households moving into permanent housing and 175 households maintaining their rental assistance for an additional year on average, preventing vulnerable individuals from returning to homelessness.
Furthermore, the FY22 budget projects that DND will have $138 million in external funds available from federal and state grants, as well as revenue from certain developer fees.
For additional budget detail on the Housing & Neighborhood Development Cabinet see Volume III.
Information & Technology
The Department of Innovation and Technology (DoIT) will see a 13.3% increase over its FY21 appropriation. The COVID-19 pandemic has underscored how critical access to the internet is for enabling households to engage with the economic, social, and civic life of their communities. Since the beginning of the crisis, the City has provided digital tools to thousands of students and their families, as well as older adults, new immigrants, and other vulnerable groups. In FY22, a $1 million investment in digital equity will support
these efforts and will include expansion of Boston’s outdoor wireless network, Wicked Free Wi-Fi.
The FY22 budget further builds out the City’s cyber security hardware and software solutions, supporting multi-layered protection to IT infrastructure and safeguarding sensitive data. The department will also make a $2 million investment in the City’s key enterprise systems including enhancements in HR services. As technology needs and corresponding costs grow, DoIT continues to look for efficiencies and in FY22 will reduce contractor spending.
For additional budget detail on the Information & Technology Cabinet, see Volume III.
Public Safety
Overall, the Public Safety Cabinet, which includes the Police Department, the Fire Department, and the Office of Emergency Management, will decrease by 2.6% from FY21. The FY22 budget does support an increase to the police force of 30 police officers, an increase of 20 police cadets, and the development of the fire cadet program.
The Police Department will decrease by 5.1%, due to a $21 million reduction from FY21 overtime spending. The department will continue its efforts to reduce overtime hours and in FY22, the sworn police force will increase by 30 officers. In order to increase the overall police force and keep pace with regular attrition, there will be two recruit classes in FY22. This budget continues to include funding for BEST clinicians who will be available to help police officers better serve their community.
Building on the continued success of recruiting a diverse police cadet class in FY19 through FY21, the FY22 budget increases the number of cadets from 40 to 60. This addition to the cadets will continue

2 8 O p e r a t i n g B u d g e t
to provide a stable pipeline of diverse young people for future police officer classes. An investment has also been made to medical services to aid the department in getting injured officers back to work efficiently.
The Fire Department budget will increase by 1.1% in FY22, which is primarily due to restoring overtime to pre-pandemic levels. The FY22 operating budget includes investments in facilities improvements, health and wellness training, and the development of the fire cadet program to start in spring of 2022. Also, in the budget is the annual program to replace apparatuses and the ongoing industrial cleaning of firehouses to promote the health and wellness of firefighters.
The Office of Emergency Management budget represents an increase of 15.1%. This increase is due to an upgrade to the communication system allowing the city to communicate in multiple languages.
For additional budget detail on the Public Safety Cabinet see Volume III.
Streets
The FY22 Streets Cabinet budget, which includes the Department of Public Works and the Boston Transportation Department, increased by 3% over the FY21 appropriation. This budget reflects both cost-saving measures and innovative new investments that expand high-quality basic city services to keep our streets clean, safe, and accessible for all users.
The Public Works Department (PWD) FY22 budget will increase by 2.2% over FY21, partially driven by projected increases in the street sweeping contracts. As part of an effort to rethink the future of waste disposal, PWD will create a Zero Waste Drop Off Center and invest in efforts to provide garbage disposals to residents as well as Zero Waste and Green Jobs training. The FY22 budget also provides additional maintenance funding for critical lighting
and building repairs. To accelerate the ADA Ramp program, PWD will hire an additional engineering crew to increase the amount of ramps brought into compliance per year, an investment that supports the capital budget goal of having all pedestrian ramps ADA compliant by 2030.
The Boston Transportation Department’s (BTD) FY22 budget will increase by 4.7% over FY21, with savings from inactivation of long term vacancies and anticipated reductions in certain contracted services offset by innovative investments. As part of the City’s overall renewal goal, this budget includes funding for additional bike lanes to support new and existing riders as well as funding to expand the Open Streets program to encourage safe outdoor activity. To better engage and support the community, BTD will invest in a Transportation Community Leadership Academy, where local community leaders will learn how a transportation project can improve community health through green infrastructure, bike lanes, and complete streets models. BTD will also support transportation planning and operations jobs training. Finally, BTD will expand a pilot to subsidize BlueBike memberships and MBTA passes to employees who work at several Main Street districts in order to expand access to public transportation options.
For additional budget detail on the Streets Cabinet see Volume III.
Reserve for Collective Bargaining
The FY22 collective bargaining reserve, a $10 million reserve for City departments, Boston Public Schools, and the Public Health Commission, contains funding for unsettled union contracts. Most union contracts have expired and the City has reserved a limited amount for successor agreements. Salary increases in these agreements will have a direct impact on dollars available in FY22 and in the upcoming years.

O p e r a t i n g B u d g e t 2 9
FIXED COSTS
Fixed costs make up a growing portion of the City’s Budget. The City has very little control over the fixed costs growth, largely driven by the Charter School Tuition Assessment, which is directly deducted from Boston’s state aid, and the City’s Pension schedule, which requires a 9.1% increase in FY22 to ensure funding consistent with the current pension schedule.
Pensions
Boston’s Pension budget is based on the current pension schedule approved by Boston’s Retirement Board. The City’s Pension schedule requires a $26.6 million or 9.1% increase in FY22.
The City of Boston participates in a contributory defined benefit retirement system that is administered by the Boston Retirement System (BRS). BRS is one of 106 public pension systems governed by Massachusetts General Law Chapter 32. Boston’s current pension schedule is based on an actuarial asset valuation as of January 1, 2020. The current pension schedule assumes a long term rate of return of 7.05%. The City’s pension liability is currently 75.6% funded and is on track to reduce the unfunded liability to zero by 2027, thirteen years prior to the legally required funding date of 2040.
Debt Service
The Debt Service budget supports borrowing to finance the City’s capital plan. In FY22 Debt Service is budgeted at $205.6 million, which is a $16.9 million or 9.0% increase over the previous year.
The City benefits from its strong financial policies and practices and has triple A bond ratings from Moody’s and Standard and Poor’s. Strong bond ratings are an assessment of the City’s long-term financial stability and lower the cost of borrowing. As the City borrows more over ten years to
support investments in its schools, debt service is projected to increase as well.
For further detail see the Capital Planning and Financial Management chapters of this volume.
State Assessments
Accompanying the local aid distributions on the State’s Cherry Sheet are charges to the City from the Commonwealth. These include items such as charter school tuition and MBTA service. The City expects to be assessed $346.4 million by the Commonwealth in FY22.
For further detail see the Revenue Estimates & Analysis chapter of this volume.
Suffolk County
The Suffolk County budget is a fixed cost mandated by state legislation, budgeted at $2.9 million in FY22. State legislation converted all existing and future Suffolk County Sheriff employees to state employees effective January 1, 2010. The State charges the City for Suffolk County through an assessment based on the residual unfunded pension liability for former Sherriff employees who retired prior to January 1, 2010. Once the unfunded pension liability is fully extinguished, the budget for Suffolk County will no longer be necessary.
Reserve
The Reserve budget is a fixed cost stipulated by state law and requires the City of Boston to maintain a reserve of 2.5% of the prior year appropriations, not including the School department, on its balance sheet. The reserve’s balance as of June 30, 2020 is $38.6 million; with this balance Boston has met its reserve requirements. The reserve can be used to provide for extraordinary and unforeseen expenditures and the Mayor may make drafts or transfers against this fund with City Council approval after June first of each fiscal year. Since the establishment of this reserve, the City has

3 0 O p e r a t i n g B u d g e t
yet to make any drafts or transfers from the reserve.

O p e r a t i n g B u d g e t 3 1
1/1/19 1/1/20 1/1/21 1/1/22 ProjectedFTE FTE FTE Projected Inc/(Dec)
Office of the Mayor Mayor's Office 44.6 51.0 51.0 51.0 - Election Department 29.0 28.0 28.0 28.0 - Intergovernmental Relations 9.0 10.0 9.0 10.0 1.0 Law Department 52.0 57.0 57.0 57.0 -
Total 134.6 146.0 145.0 146.0 1.0 Equity & Inclusion Office of Equity - - - 6.0 6.0
Office of Diversity - - - 3.0 3.0 Office of Resiliency & Racial Equity - - - 3.0 3.0 Language & Communications Access - - - 5.0 5.0
Human Rights Commission - - 2.0 6.0 4.0
Office of Immigrant Advancement 4.0 5.0 8.0 9.0 1.0 Women's Advancement 4.0 4.0 4.0 5.0 1.0
Total 8.0 9.0 14.0 37.0 23.0 Office of Police Accountability & OPAT - - - 6.0 6.0 Transparency (OPAT) Total - - - 6.0 6.0 Operations Inspectional Services 218.0 208.0 211.0 211.0 -
Property Management 132.0 126.5 121.5 124.0 2.5 Public Facilities Department 60.0 60.0 63.0 67.0 4.0
Total 410.0 394.5 395.5 402.0 6.5 Civic Engagement Neighborhood Services 45.0 48.0 56.0 53.0 (3.0)
Total 45.0 48.0 56.0 53.0 (3.0) Arts & Culture Office of Arts & Culture 10.0 15.0 13.0 14.0 1.0
Library Department 384.0 381.9 381.6 383.6 2.0 Total 394.0 396.9 394.6 397.6 3.0
Economic Development Office of Economic Development 26.0 25.0 24.4 24.4 - Consumer Affairs & Licensing 15.0 15.0 18.2 19.0 0.8 Office of Tourism 10.0 11.0 10.0 10.0 -
Total 51.0 51.0 52.6 53.4 0.8
Education School Department 9,248.6 9,302.9 9,527.8 9,716.0 188.2
Total 9,248.6 9,302.9 9,527.8 9,716.0 188.2
Environment, Energy & Open Space Environment 26.0 27.0 29.0 31.0 2.0
Parks and Recreation 213.0 227.0 230.0 231.0 1.0 Total 239.0 254.0 259.0 262.0 3.0
Administration & Finance Administration & Finance 5.0 6.0 5.0 6.0 1.0
Assessing Department 77.0 70.0 78.0 80.0 2.0 Auditing Department 33.0 32.0 29.0 29.0 - Budget Management 21.7 22.7 23.7 23.7 -
Human Resources 45.8 46.0 46.0 49.0 3.0 Labor Relations 8.0 9.0 9.0 9.0 - Purchasing Division 21.0 21.0 19.0 19.0 - Registry Division 19.0 18.0 18.0 18.0 - Treasury Department 46.0 49.0 49.0 49.0 -
Total 276.5 273.7 276.7 282.7 6.0
Health & Human Services Office of Health and Human Services - - 11.0 13.0 2.0 Boston Center for Youth & Families 369.0 359.5 351.7 351.7 - Commission for Persons with Disabilities 6.0 7.0 7.0 7.0 -
Age Strong Commission 48.5 48.4 47.8 48.8 1.0 Fair Housing & Equity 7.0 7.0 7.0 7.0 -
Public Health Commission 832.4 846.9 871.7 882.7 11.0 Boston VETS 12.0 14.0 12.0 12.0 - Youth Engagement & Employment 7.0 9.0 9.0 11.0 2.0
Total 1,281.9 1,291.8 1,317.2 1,333.2 16.0
Housing & Neighborhood
Development Neighborhood Development 37.0 39.7 42.4 42.4 - Total 37.0 39.7 42.4 42.4 -
Information & Technology Dept of Innovation & Technology 131.6 127.0 123.0 123.0 - Total 131.6 127.0 123.0 123.0 -
Public Safety Emergency Management 1.5 3.8 4.1 4.1 -
Fire Department 1,611.5 1,618.5 1,616.5 1,656.5 40.0
Police Department 2,862.6 2,895.7 2,839.7 2,889.7 50.0 Total 4,475.6 4,518.0 4,460.3 4,550.3 90.0
Streets Office of Streets 22.0 24.0 20.0 20.0 - Central Fleet Management 44.0 42.0 43.0 43.0 - Public Works Department 313.0 316.0 297.0 299.0 2.0 Transportation 363.5 365.5 359.0 359.0 -
Total 742.5 747.5 719.0 721.0 2.0 Non-Mayoral City Clerk 13.0 14.0 15.0 15.0 -
City Council 80.2 75.6 83.2 83.2 - Finance Commission 4.0 4.0 3.0 3.0 -
Total 97.2 93.6 101.2 101.2 - Grand Total 17,572.5 17,693.6 17,884.3 18,226.8 342.5
Personnel Summary
Table 6
3 2 O p e r a t i n g B u d g e t
Personnel Changes
The Personnel Summary table shows a four-year comparison of city-funded and filled full-time equivalent (FTE) positions. This includes both permanent and emergency employees. The projected FTE numbers used for FY22 are estimates based on the personnel funding levels contained in the FY22 budgets.
FY20-FY21 FTE Changes
The total net increase in FTEs from January 1, 2020 to January 1, 2021 was 190.7. The majority of the growth was in priority area of Education. The City’s Position Review Committee continued to review all proposed job postings for vacant positions. In FY21, the City instituted a more stringently controlled hiring process that slowed hiring significantly for impacted departments. While the controlled hiring was eased mid-year as the overall fiscal picture became clearer, the city continues to scrutinize all requests to post open positions. Additionally 16 long-term vacant positions were eliminated in the FY21 budget.
The School Department increased by 224.9 FTEs. Although General Education teachers decreased by 68.3, this is offset by an increase in Special Education teachers, which are up 95.3; overall, teachers are up 41.9 positions over Jan 1, 2020. Classroom Aides also increased by 45.4 positions. Despite schools being closed for most students for much of the year, BPS has focused on health and safety of students and staff reporting in person by increasing the amount of full time custodians by 24. Program Support positions grew with the addition of social workers at targeted schools. Long term leave positions were up 60, partially a result of the COVID-19 pandemic.
Public Safety FTEs decreased by 57.7 from Jan 1, 2020 to Jan 1, 2021. The Police Department declined by 56 FTEs; driven by a decrease of 30 cadet positions. Due to the
timing of cadet qualifications to join the sworn force, their numbers were higher than usual in Jan 2020. Police sworn officers’ retirements were higher than anticipated by 23 positions and the remaining change was due to civilian attrition. The Fire Department had a minimal decline of 2 FTEs due to normal attrition.
The Streets Cabinet decreased by 28.5 FTEs. Due to the controlled hiring policy in FY21, Public Works is down 19 positions since Jan 1, 2020. BTD also decreased 6.5 FTEs, as hiring slowed. Finally, the Office of Streets is down 4, driven by a departmental desire to reorganize after several high level vacancies.
The Equity and Inclusion Cabinet was newly created in FY21. The Jan 2021 FTEs included only three of the departments in the cabinet. The other four departments were programs in different departments in Jan 2021 as addressed in the next section on FY22 projected FTEs. The Human Rights Commission was re-inactivated in FY21 with services to promote education and enforcement of human rights; it had 2 FTEs. The Office of Immigrant Advancement increased by 3 over Jan 2020 due to programmatic expansion. Women’s Advancement remained flat.
While the Operations Cabinet as a whole only increased by 1 FTE despite larger departmental shifts. Property Management had a decrease of 5 FTEs, driven by critical, but hard to fill security officer positions. Public Facilities and Inspectional Services both increased by 3 as a result of aggressive efforts to fill vacancies.
The Civic Engagement Cabinet increased by 8 FTEs with the hiring of 311 Call Takers in response to the COVID-19 pandemic. The Arts & Culture Cabinet decreased by 2.3 FTEs. While the Library was essentially flat, the Office of Arts and Culture had 2 vacancies.

O p e r a t i n g B u d g e t 3 3
The Economic Development Cabinet grew by 1.6 FTEs, driven by 3 Cannabis Board members in Consumer Affairs and Licensing. That increase is offset by minor decreases in Tourism and the Office of Economic Development. The Environment, Energy and Open Space Cabinet increased by 5 from January 2020 to January 2021. The Parks Department increased by 3, the Environment Department by 2.
The Health & Human Services Cabinet shows a net increase of 24.5 FTEs. This is driven by the Public Health Commission’s increase of 24.8. The Recovery Services Bureau increased by 10 positions, reflecting the city’s commitment to those services. BPHC also increased by 7 public safety positions to improve security in the Northampton Square area. The Boston Centers for Youth and Families decrease of 7.8 FTEs is due to a transfer of 11 positions to the new Office of Health Human Services Department. Other departments in the cabinet remained the same or had minor changes.
Other cabinets had minor changes that are reflective of regular attrition and hiring patterns.
FY22 Projected FTE Changes
The City projects a net increase in FTE levels of 342.5 from January 1, 2021 to January 1, 2022. The vast majority of the growth is targeted in the priority areas of education, public safety, and equity.
The City will continue to review the need for hiring into all vacant positions in FY22. Only critical positions will be approved to post and hire. Departments eliminated 14 long-term vacant positions in the current budget process.
The School Department represents the greatest portion of the projected growth with an expected increase of 188.2 filled FTEs from January 2021 to January 2022. The district’s hiring plan will result in a social worker and family liaison in every
school, helping provide social-emotional support and assistance to families. Teaching positions will increase following the continued trend of additional special education and bilingual teachers. The district will also add 20 new daytime custodians.
The Public Safety Cabinet is expected to show an additional 90 FTEs in January 2022. Historically, the number of Public Safety employees on the payroll as of January 1 of any year has fluctuated with the timing of retirements and new classes. The Fire Department’s projected increase of 40 is due to the timing of the fall class. The goal of the department is to have enough firefighters in the suppression force to cover the minimum manning level of 262 and to reduce overtime. The Police Department is planning to increase the sworn force by 30 officers with a large fall class and a second spring class to retain the higher sworn level following expected attrition. This growth in the police sworn level is part of a concerted effort to reduce overtime. The department is also increasing cadet recruits by 50%, which will result in 20 additional FTEs.
The new Equity & Inclusion Cabinet is projected to have 37 FTEs, showing a projected increase of 23. The Office of Equity is building up with 6 positions, including the Chief of Equity and a finance position for the entire cabinet. The Office of Diversity and the Office of Resilience & Racial Equity are both moving out of the Mayor’s Office with existing staff. Language and Communications Access is transferring out of Neighborhood Services with 3 existing positions and is adding a new Research Analyst and administrative support. The Human Rights Commission is expected to add four additional staff to support the work of the commission. Immigrant Advancement and Women’s Advancement will each hire coordinators for successful new programs: Immigrants

3 4 O p e r a t i n g B u d g e t
Lead Boston and the Childcare Entrepreneur Fund.
The new Office of Police Accountability & Transparency will have a staff of 6 including an executive director. The Operations Cabinet is anticipated to increase by 6.5 FTEs as the departments fill vacancies and Public Facilities plans to hire 2 new project managers to support the expansion of the capital plan. The Civic Engagement Cabinet will decrease with the transfer of the Language Access program from the Office of Neighborhood Services to its own department in the Equity & Inclusion cabinet.
The Arts and Culture Cabinet will grow by 3 FTEs. The Office of Arts and Culture will hire a new Senior Public Art Project Manager to help manage new public art projects that enhance the public realm, including Percent for Art. The Library is adding a librarian for the revitalized Roslindale branch and an Equity & Outreach Coordinator as dedicated staff for its Racial Equity Commitment & Action Plan.
The Environment, Energy and Open Space Cabinet will grow by 3 FTEs. The Environment Department plans to hire a program manager to assist residents and small businesses in accessing renewable energy resources. Parks and Recreation will add a design and construction position to help coordinate environmental justice strategy. The Administration & Finance Cabinet projects an increase of 6 FTEs including a new Director of Strategic Procurement in the Office of Administration and Finance. Assessing is adding new positions to develop new talent and expand career pathways in the valuation division. Human Resources continues its HR transformation work with the goal of making Boston the gold standard of municipal human resources organizations.
The Health and Human Services Cabinet will increase by 16 FTEs primarily due to post COVID-19 efforts at the Public Health Commission (PHC). PHC’s Infectious Disease Bureau will add 8 FTEs to build additional capacity in education and community outreach with multilingual staff as well as communicable disease control operations and clinical staff. The Commission is also enhancing capacity around occupational health and safety and employee support with new staff. Youth Engagement & Employment will hire a Deputy Director and a Data Evaluation Manager.
Neighborhood Development in the Housing Cabinet and the Department of Innovation and Technology in the Information & Technology Cabinet anticipate stable staffing levels in FY22.
The Streets Cabinet is projected to increase by 2 FTEs. The Public Works Department is adding 2 engineers as part of its pedestrian ramp acceleration efforts.

O p e r a t i n g B u d g e t 3 5
External Funds
The City’s $3.75 billion operating budget is supplemented by approximately $429 million in external funds. These funds consist mainly of federal, state, and private funding earmarked for specific purposes. Education, housing, economic development, public health and public safety are some of the largest areas for which these funds are targeted.
Thirty-two departments and agencies expect to receive federal, state or other forms of external funding in FY22. Over 94% of the City’s external funds are found in eight of those thirty-two departments. These eight departments are Boston Public Schools, Neighborhood Development, Public Health Commission, Treasury Department, Emergency Management, Age Strong Commission, Police Department and the Library Department. Descriptions and amounts of grants by department can be found in Volumes II and III.
Federal grants have historically provided funding for the key City priorities of education, community development, and services for seniors. Boston Public Schools, the Department of Neighborhood Development (DND), and the Elderly
Commission have been the traditional recipients of recurring entitlement grants provided by the federal government.
In response to the catastrophic impact of the COVID-19 pandemic, the federal government has passed three unprecedented relief packages. These packages include:
CARES, CARES-Coronavirus Relief Fund (CRF) & FEMA
The Coronavirus Aid, Relief, and Economic Security Act, also known as the CARES Act, is a $2.2 trillion economic stimulus bill signed into law on March 27, 2020. CARES provided additional funding to Boston using existing federal funding formula grants to city departments including the Department of Neighborhood Development and the Age Strong Commission plus to Boston Public Schools through the Elementary and Secondary School Emergency Relief (ESSER) program. Finally, the most significant CARES program provided directly to Boston is the Coronavirus Relief Fund (CRF), specifically targeted for local government. Boston was awarded $120.8 million from CARES-CRF. The three caveats for CARE-CRF funds are:
External Funds FY20 Expenditure FY21 Estimated FY22 Estimated
Boston Public Schools 124,130,929 204,912,166 145,525,676
Neighborhood Development 68,972,279 118,593,445 138,087,574
Public Health Commission 43,764,815 45,847,893 47,009,403
Treasury Department 24,705,360 26,300,000 29,489,763
Emergency Management 10,840,210 16,686,045 11,328,932
Age Strong 5,965,259 7,738,724 10,466,853
Police Department 8,376,346 9,082,732 9,737,018
Library Department 10,341,952 9,847,532 9,457,743
Other 47,831,268 142,624,516 27,898,537
Total 344,928,418 581,633,052 429,001,499
Table 7

3 6 O p e r a t i n g B u d g e t
Necessary expenditures incurred due to the public health emergency of COVID-19
Budgets costs not accounted for in most recent adopted budget, AND
Costs incurred March 1 thru December 31, 2021
In addition to CARES CRF funding created as an immediate response to the COVID-19 emergency, the City anticipates reimbursement from the Federal Emergency Management Agency (FEMA) provide through the Commonwealth of Massachusetts for approximately $16 million in COVID-19 emergency response spending.
Both CARES-CRF and FEMA budgets are reflected in the Office of Budget Management.
Coronavirus Relief Bill
The second stimulus bill, the Consolidated Appropriations Act of 2021, provided an additional $900 billion in stimulus relief, extended the availability of CARES-CRF funding by one year and was signed into law on December 27, 2020. This second stimulus package provided second round of Elementary and Secondary School Emergency Relief (ESSER) funding to Boston Public Schools and a brand new Emergency Rent Relief program awarded to the Department of Neighborhood Development.
American Rescue Plan Act (ARPA) of 2021
The American Rescue Plan Act (ARPA) Act of 2021 is a $1.9 trillion stimulus bill providing hundreds of millions in federal funding to the City, the Boston Public Schools, through an unprecedented third round of Elementary and Secondary School Emergency Relief (ESSER), and other local organizations over the next five fiscal years. APRA’s program for aiding local governments will be provided in two tranches, the first 60 days after the
enactment of the law and the second tranche a year later.
Eligible use of ARPA funding is broader than CARES- CRF funding. Specifically, eligible uses include:
Revenue replacement for the provision of government services to the extent the reduction in revenue due the COVID-19 public health emergency relative to revenues collected in the most recent fiscal year prior to the emergency,
Assistance to small businesses, households, and hard-hit industries, and economic recovery,
Investments in water, sewer and broadband infrastructure.
While the City awaits formal award notice from the federal government, the City is expected to receive at least an estimated $215 million in funding for use over the next year and the City’s thoughtful approach to the utilizing this funding is two fold
1. Between FY21 and FY22 dedicate $100 million to offset local revenue declines during the pandemic to ensure flexibility, stability and fiscal resiliency, as well as, make near term investments to expand and create vital city programs to Reopen, Recover and Renew our City post COVID-19.
2. For the second portion of $115 million, the administration will establish an Equitable Recovery Resources Coordinating Committee, made up of stakeholders from across City government to ensure equitable, transparent and accountable distribution of these funds for economic and social recovery.
Community Preservation Act
By adopting the Community Preservation Act (CPA) in November 2016, the City has created a Community Preservation Fund. This fund is not part of the City’s general

O p e r a t i n g B u d g e t 3 7
fund and is displayed as a special revenue external fund in this budget document. This fund is capitalized primarily by a one percent property tax-based surcharge on residential and business property tax bills that began in July 2017. The City uses this revenue to fund initiatives consistent with CPA guidelines: affordable housing, historic preservation, open space and public recreation.
Boston has collected a $19.7 million in FY19 and $22.1 million in FY20, which was matched with $3.6 million and $4.8 million from the state through the CPA Trust Fund, respectively. The city expects to collect $26.3 million in revenue in FY21 and $29.5 million in FY22.
Since 2018, the first year of allocations, Boston's 9-member Community Preservation Committee, comprised of Boston residents, recommended 198 projects totaling $92.8 million in all three CPA categories.
FY22 All Funds Budget
The all funds table consolidates the projected FY22 expenditures from the General Fund, Special Revenue Funds (primarily external grants) and the Capital Fund by department. More detail on the expenditures made from each of these funds is shown in Volumes II and III of the City of Boston’s FY22 budget document.

3 8 O p e r a t i n g B u d g e t
All Funds Budgets - FY22
General Fund External Funds Capital Total All Funds
Cabinet Department Budget Budget Budget Budget Mayor's Office Mayor's Office 5,380,619 210,549 50,000 5,641,168
Election Department 6,275,434 6,275,434 Intergovernmental Relations 1,406,700 1,406,700 Law Department 8,233,602 250,000 8,483,602
Total 21,296,354 460,549 50,000 21,806,904 Equity & Inclusion Office of Equity 703,705 141,201 844,905
Office of Diversity 304,667 304,667 Office of Resiliency & Racial Equity 1,651,392 1,651,392 Office of Language & Communications Access
1,169,967 1,169,967
Human Right Commission 602,852 602,852 Office for Immigrant Advancement 1,326,408 330,276 1,656,685 Women's Advancement 769,497 58,000 827,497
Total 6,528,488 529,477 - 7,057,965 Office of Police Accountability Office of Police Accountability & Transparency % Transparency 1,000,500 - - 1,000,500
Total 1,000,500 1,000,500 Operation Property Management Department 17,251,999 46,059,733 63,311,732
Public Facilities Department 7,537,870 7,537,870 Inspectional Services Department 21,775,598 155,480 21,931,078
Total 46,565,467 155,480 46,059,733 92,780,680 Civic Engagement Neighborhood Services 3,954,799 30,000 3,984,799
Total 3,954,799 30,000 - 3,984,799 Arts & Culture Office of Arts & Culture 3,629,075 534,795 920,100 5,083,970
Library Department 42,176,858 9,457,743 20,977,918 72,612,519 Total 45,805,933 9,992,538 21,898,018 77,696,489
Economic Development Office of Economic Development 6,502,500 4,832,009 11,334,509 Boston Planning and Development Agency
1,059,494 1,059,494
Consumer Affairs & Licensing 1729758.74 64,557 1,794,316 Office of Tourism 2,503,329 50,000 2,553,329
Total 10,735,588 4,946,566 1,059,494 16,741,648 Education Boston Public Schools 1,294,719,861 145,525,676 162,466,111 1,602,711,648
Total 1,294,719,861 145,525,676 162,466,111 1,602,711,648 Environment, Energy & Open Space Environment Department 4,418,611 1,519,719 19,925,000 25,863,330
Parks & Recreation Department 28,052,742 5,585,712 39,537,351 73,175,805 Total 32,471,353 7,105,431 59,462,351 99,039,135
Administration & Finance Administration & Finance 1,246,207 265,091 1,511,298 Assessing Department 7,946,936 7,946,936 Auditing Department 3,015,637 246,131 3,261,767 Budget Management 3,520,571 3,520,571 Execution of Courts 5,000,000 5,000,000 Health Insurance 212,236,570 212,236,570 Human Resources 6,177,645 6,177,645 Medicare 12,635,794 12,635,794 Office of Labor Relations 1,605,222 1,605,222 Pensions & Annuities - City 3,900,000 3,900,000 Procurement 1,880,346 1,880,346 Registry Division 1,145,181 1,145,181 Treasury Department 4,855,544 29,489,763 34,345,307 Unemployment Compensation 350,000 350,000 Workers' Compensation Fund 2,000,000 2,000,000
Total 267,515,651 30,000,984 - 297,516,636 Health & Human Services Office of Health and Human Services 5,594,284 220,000 5,814,284
Boston Center for Youth & Families 29,244,369 1,005,888 23,050,000 53,300,258 Commission For Persons W/Disabilities 623,936 50,000 673,936 Age Strong 5,205,227 10,466,853 15,672,080 Fair Housing & Equity 517,514 799,762 1,317,276 Public Health Commission 110,698,090 47,009,403 31,445,984 189,153,477 Boston VETS 4,612,875 4,612,875 Youth Engagement & Employment 12,475,452 1,040,444 13,515,896
Total 168,971,746 60,592,351 54,495,984 284,060,081 Housing & Neighborhood Neighborhood Development 35,272,663 138,087,574 28,299,880 201,660,117 Development Total 35,272,663 138,087,574 28,299,880 201,660,117 Information & Technology Dept of Innovation & Technology 39,693,304 6,852,539 26,403,347 72,949,190
Total 39,693,304 6,852,539 26,403,347 72,949,190 Public Safety Emergency Management 1,133,990 11,328,932 50,000 12,512,921
Fire Department 274,408,200 2,846,758 29,095,913 306,350,871 Police Department 399,871,217 9,737,018 18,224,979 429,078,214
Total 675,413,406 23,912,708 47,370,892 746,697,006 Streets Central Fleet Management 3,165,680 3,165,680
Office of Streets 2,290,092 2,290,092 Public Works Department 101,058,720 10,000 61,722,454 162,791,174 Snow Removal 21,708,166 21,708,166 Transportation Department 40,559,603 799,625 42,162,924 83,522,152
Total 168,782,261 809,625 103,885,378 273,477,264 Non-Mayoral Departments City Clerk 1,404,053 1,404,053
City Council 5,736,400 5,736,400 Finance Commission 304,075 304,075 Total 7,444,528 - - 7,444,528
Grand Total 2,826,171,904 429,001,499 551,451,188 3,806,624,591
Table 8

O p e r a t i n g B u d g e t 3 9
Performance Management
Boston’s performance management efforts, driven in partnership between the Citywide Analytics Team and the Office of Budget Management, strive to ensure that the City delivers the most effective and efficient services possible.
CityScore
Launched in 2016, CityScore is a nationally recognized tool designed to inform the Mayor, City managers, and the public about the performance of City government by aggregating key performance metrics.
CityScore’s 22 metrics are monitored daily to get an understanding of the quality of life in Boston and the performance of City government. Since its inception, CityScore has prompted key process improvements, increased data-driven decision-making at all levels of city government, and informed the budget process.
The Mayor’s FY22 budget priorities highlight the goals of recovery, reopening, and renewal to a better Boston. Equity has lived at the heart of every budget decision, with the vision of creating a city that promotes equity, builds community, and helps fulfill Boston’s great promise. The performance measures listed below reflect the City’s top priorities and the partnerships necessary to achieve these ambitious goals.

4 0 O p e r a t i n g B u d g e t
Priority FY22 Performance Goals
Performance Measure Responsible Department FY21 Projected FY22 Target
Education
New K1 seats available Schools 117 179
Participants in the Early Literacy Program Boston Public Library 45,000 45,000
Housing
# of homeless Veterans placed in permanent housing Neighborhood Development 166 200
# of low income housing units permitted (deed restricted and IDP) Neighborhood Development 533 542 # of middle income housing units permitted (deed restricted and market) Neighborhood Development 1,542 1,485
# of potential evictions averted Neighborhood Development 850 850
Mobility
Average annual PCI rating of Boston’s roads Public Works 65.1 66.1
% of street light outages addressed on time Public Works 55% 80%
# of Accessible Pedestrian Signals Installed Transportation 24 24
Average personnel hours on a hokey route (hand cleaning streets/sidewalks) Public Works 2,500 3,500
Prosperity & Equity
# of jobs created through Small Business Programs Economic Development 150 150
# of employees in companies newly signing Boston’s 100% Talent Compact Women’s Advancement 500 1,250
Arts, Culture, and Creativity
% of first time Boston Cultural Council organizational grant awardees Arts & Culture 20% 20%
Library card daily usage Boston Public Library 3,500,000 3,400,000
Average number of eBook holds Boston Public Library 100,000 95,000
Health & Safety
EMS median response time for Priority 1 calls Public Health Commission 6.0 Min 6.0 Min
# of individuals placed in recovery services Public Health Commission 2,800 2.800
Firefighters attending resiliency, health, and safety symposiums Fire Department 300 350
Table 9
O p e r a t i n g B u d g e t 4 1
BUDGET DOCUMENT STRUCTURE
The Operating Budget for FY22 and Five Year Capital Plan for FY22-26 are presented in three volumes. Volume I is an overview of the City’s financial position and policy direction.
Volumes II and III, which are organized by cabinet, present the budget detail for each department’s operating budget and capital projects. Please refer to the chapter on Budget Organization and Glossary in Volume I for an illustration of the City’s organizational chart.
The City’s budget is built at the program level for each department, which is the basis for budget planning. However, line item budget detail is only provided in this budget document at the department level. Program line item detail is available upon request.
In addition to program budgets, Volumes II and III provide a mission statement, key objectives, as well as past and promised performance levels for each departmental program. For those departments with capital projects, a project profile is provided for every capital project. The project profile includes authorization information as well as planned spending levels.
Definitions of the terms used throughout the budget document are presented in the glossary, which can be found in Volume I in the chapter titled Budget Organization and Glossary.
Technical Note
The City of Boston’s combined FY22 Budget and FY22-FY26 Capital Plan was published using Microsoft Word. Graphics were generated using Microsoft Excel. Oracle - Hyperion Planning and Microsoft Access were used for data management and analysis.

4 2 O p e r a t i n g B u d g e t
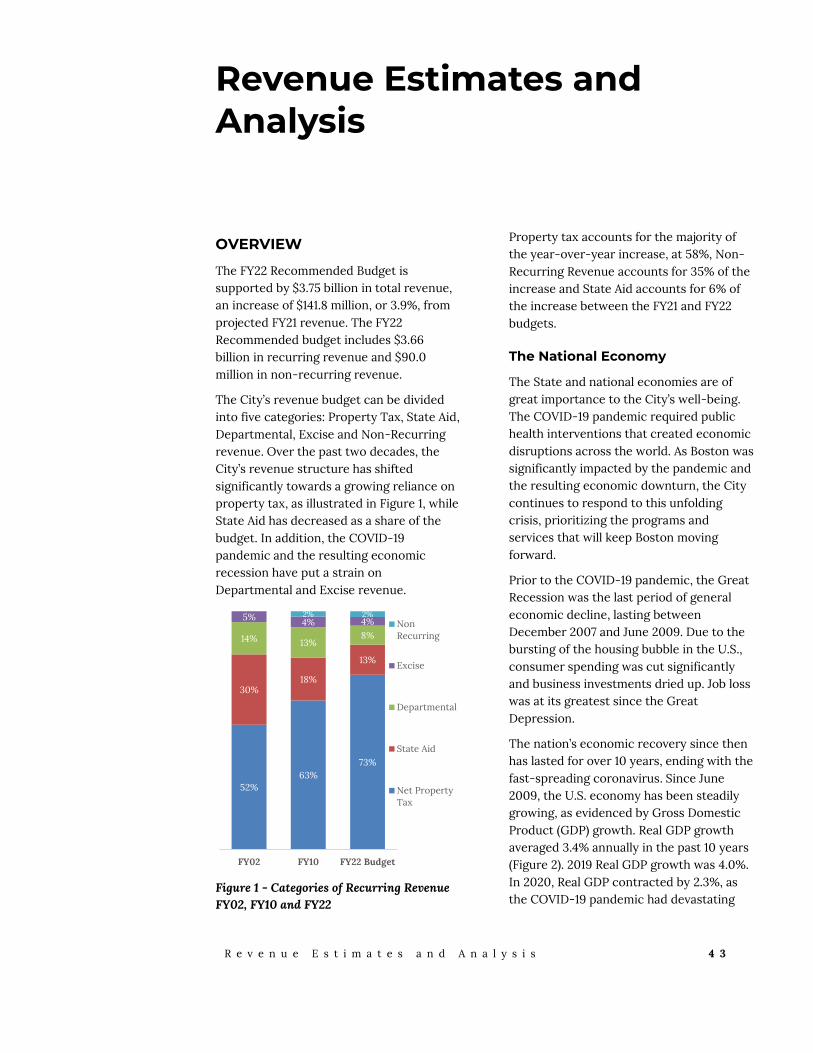
R e v e n u e E s t i m a t e s a n d A n a l y s i s 4 3
Revenue Estimates and Analysis
OVERVIEW
The FY22 Recommended Budget is supported by $3.75 billion in total revenue, an increase of $141.8 million, or 3.9%, from projected FY21 revenue. The FY22 Recommended budget includes $3.66 billion in recurring revenue and $90.0 million in non-recurring revenue.
The City’s revenue budget can be divided into five categories: Property Tax, State Aid, Departmental, Excise and Non-Recurring revenue. Over the past two decades, the City’s revenue structure has shifted significantly towards a growing reliance on property tax, as illustrated in Figure 1, while State Aid has decreased as a share of the budget. In addition, the COVID-19 pandemic and the resulting economic recession have put a strain on Departmental and Excise revenue.
Figure 1 - Categories of Recurring Revenue FY02, FY10 and FY22
Property tax accounts for the majority of the year-over-year increase, at 58%, Non-Recurring Revenue accounts for 35% of the increase and State Aid accounts for 6% of the increase between the FY21 and FY22 budgets.
The National Economy
The State and national economies are of great importance to the City’s well-being. The COVID-19 pandemic required public health interventions that created economic disruptions across the world. As Boston was significantly impacted by the pandemic and the resulting economic downturn, the City continues to respond to this unfolding crisis, prioritizing the programs and services that will keep Boston moving forward.
Prior to the COVID-19 pandemic, the Great Recession was the last period of general economic decline, lasting between December 2007 and June 2009. Due to the bursting of the housing bubble in the U.S., consumer spending was cut significantly and business investments dried up. Job loss was at its greatest since the Great Depression.
The nation’s economic recovery since then has lasted for over 10 years, ending with the fast-spreading coronavirus. Since June 2009, the U.S. economy has been steadily growing, as evidenced by Gross Domestic Product (GDP) growth. Real GDP growth averaged 3.4% annually in the past 10 years (Figure 2). 2019 Real GDP growth was 4.0%. In 2020, Real GDP contracted by 2.3%, as the COVID-19 pandemic had devastating
52% 63%
73%
30% 18%
13%
14% 13% 8%
5% 4% 4% 2% 2%
FY02 FY10 FY22 Budget
NonRecurring
Excise
Departmental
State Aid
Net PropertyTax
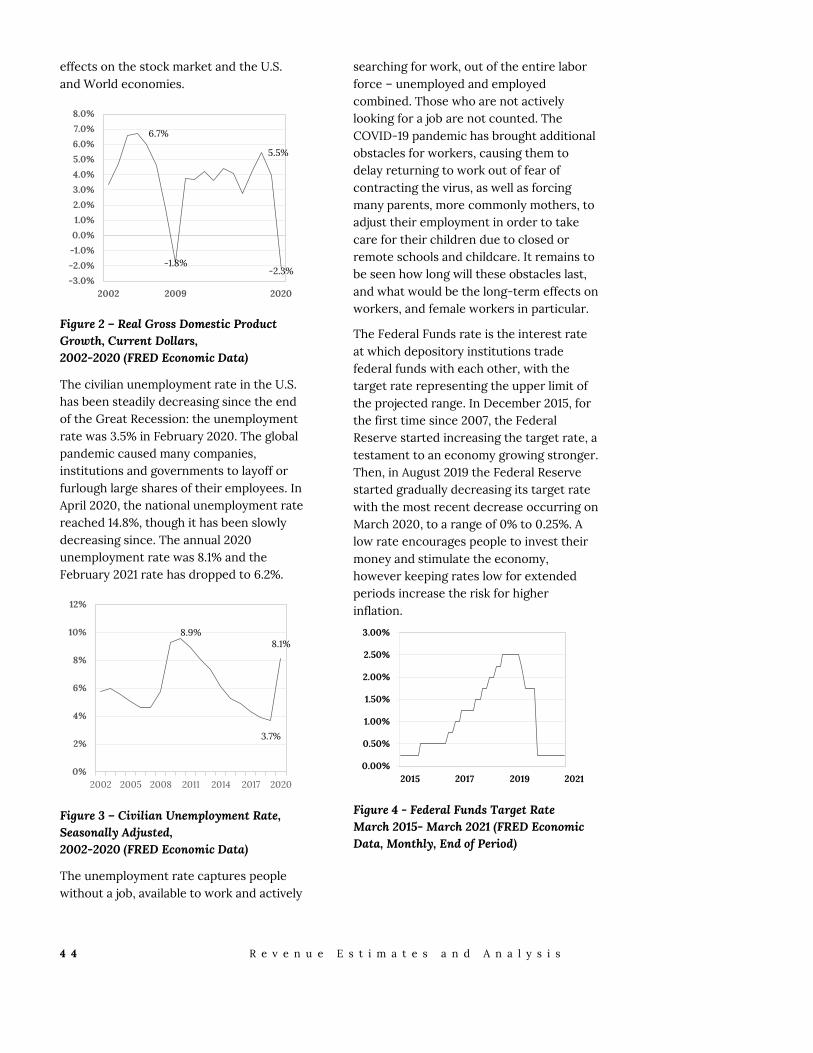
4 4 R e v e n u e E s t i m a t e s a n d A n a l y s i s
effects on the stock market and the U.S. and World economies.
Figure 2 – Real Gross Domestic Product Growth, Current Dollars, 2002-2020 (FRED Economic Data)
The civilian unemployment rate in the U.S. has been steadily decreasing since the end of the Great Recession: the unemployment rate was 3.5% in February 2020. The global pandemic caused many companies, institutions and governments to layoff or furlough large shares of their employees. In April 2020, the national unemployment rate reached 14.8%, though it has been slowly decreasing since. The annual 2020 unemployment rate was 8.1% and the February 2021 rate has dropped to 6.2%.
Figure 3 – Civilian Unemployment Rate, Seasonally Adjusted, 2002-2020 (FRED Economic Data)
The unemployment rate captures people without a job, available to work and actively
searching for work, out of the entire labor force – unemployed and employed combined. Those who are not actively looking for a job are not counted. The COVID-19 pandemic has brought additional obstacles for workers, causing them to delay returning to work out of fear of contracting the virus, as well as forcing many parents, more commonly mothers, to adjust their employment in order to take care for their children due to closed or remote schools and childcare. It remains to be seen how long will these obstacles last, and what would be the long-term effects on workers, and female workers in particular.
The Federal Funds rate is the interest rate at which depository institutions trade federal funds with each other, with the target rate representing the upper limit of the projected range. In December 2015, for the first time since 2007, the Federal Reserve started increasing the target rate, a testament to an economy growing stronger. Then, in August 2019 the Federal Reserve started gradually decreasing its target rate with the most recent decrease occurring on March 2020, to a range of 0% to 0.25%. A low rate encourages people to invest their money and stimulate the economy, however keeping rates low for extended periods increase the risk for higher inflation.
Figure 4 - Federal Funds Target Rate March 2015- March 2021 (FRED Economic Data, Monthly, End of Period)
6.7%
-1.8%
5.5%
-2.3% -3.0%
-2.0%
-1.0%
0.0%
1.0%
2.0%
3.0%
4.0%
5.0%
6.0%
7.0%
8.0%
2002 2009 2020
8.9%
3.7%
8.1%
0%
2%
4%
6%
8%
10%
12%
2002 2005 2008 2011 2014 2017 2020
0.00%
0.50%
1.00%
1.50%
2.00%
2.50%
3.00%

R e v e n u e E s t i m a t e s a n d A n a l y s i s 4 5
The State and City Economies
Massachusetts’ real GDP decreased by 2.1% in 2020. While Massachusetts decrease is slightly better than the nation as a whole (-2.3%, see above), the state’s contraction was ranked 28 in the U.S. During the Great Recession, the lowest GDP growth was 0.8% in 2009.
Figure 5 - Real Massachusetts Gross Product Growth, Current dollars 2002-2020
Prior to COVID-19, the unemployment rate had been decreasing for both Massachusetts and Boston, with both dropping below 3% in 2019. However, the prolonged shutdown in Massachusetts due to the spread of the virus caused the state unemployment rate to reach 16.4% in April 2020, or 558 thousand unemployed residents, the highest rate in the country. In May, the rate began dropping, reaching 7.1% in February 2021, or 267 thousand unemployed residents. Boston’s unemployment rate reached 19.3% in June, falling to 7.6% in December.
See the Boston’s People & Economy section of Volume I for more details on Boston’s population and labor force trends.
The Commonwealth Budget
State aid to the City represents its second largest single source of general fund revenue, although in the past two decades it has been declining as a share of revenue. Often, changes to law or policy recommendations that affect City
expenditures and revenue generating capacity occur within or alongside budget language. As a result, the State budget is of great interest to the City.
Recent State Budget History
Since the economic downturn in June 2009, the State has faced several years of ups and downs in managing their structural balance. While State revenue growth, especially income tax, has rebounded considerably, large variances in quarterly and yearly revenue collections have made budget decisions difficult at the State level.
As a result, the State has made use of its stabilization or “rainy day” fund, in addition to reductions in expenditures and increases in revenue, to deal with its structural imbalance. At the close of FY08, the stabilization fund balance was $2.1 billion. The State had drawn down the balance considerably by the close of FY10 to a low of approximately $670 million before revenues began to increase again in FY11-FY12. Between FY14 and FY17, the fund stabilized at approximately $1.3 billion, and has increased since to $3.5 billion.
The original benchmark for the state’s FY21 revenue collection was $28.4 billion. On January 15, 2021, as part of the FY22 Consensus Revenue process, the figure was adjusted to $29.1 billion. FY21 year-to-date collections totaled approximately $19.5 billion, $801M or 4.3% above the benchmark.
The FY22 State Budget
The City’s FY22 state aid budget is based on the Governor's proposed budget for FY22, as the legislature will release the final version of the state budget following release of the City's budget.
For more details, see State Aid and Assessments under the Revenue Estimates section below.
0.8%
-2.1% -3.0%-2.0%-1.0%0.0%1.0%2.0%3.0%4.0%5.0%6.0%7.0%

4 6 R e v e n u e E s t i m a t e s a n d A n a l y s i s
REVENUE ESTIMATES
The Property Tax
The property tax levy has always been the City’s largest and most dependable source of revenue. In FY21, the net property tax levy (levy less a reserve for abatements) totals $2.67 billion, providing 74.3% of the City’s revenue. In FY22, the net property tax levy is estimated to total $2.75 billion and account for 73.3% of budgeted revenues.
Thanks to a surging economy prior to the COVID-19 pandemic, property values in Boston had continued to rise steadily in FY21. In FY20, property values increased by $11.7 billion or 7.1%, and in FY21, property values increased by $14.5 billion or 8.2%, currently totaling $190.7 billion. The City is mindful of effects of COVID-19 on property values in the City, and continues to monitor its impacts.
Proposition 2 ½ has been the overwhelming factor affecting the City’s property tax levy since being passed in 1980 by the State Legislature. Proposition 2 ½ limits the property tax levy in a city or town to no more than 2.5% of the total fair cash value of all taxable real and personal property (referred to as the levy ceiling). It also limits the increase in the total property tax levy to no more than 2.5% over the prior year’s total levy (referred as the levy limit), with certain provisions for new construction. This means that while the property values have grown 115% in the past 10 years, property tax revenue has grown by 66% due to Proposition 2 ½.
In each year since FY85, the City has increased its levy by the allowable 2.5%. These increases have grown as the levy has grown, beginning in FY85 at $8.4 million and reaching $66.9 million in FY22.
Finally, Proposition 2 ½ provides for local overrides of the levy limit and a local option to exclude certain debt from the limit by referendum. The City of Boston has never sought a vote to either override the levy
limitations or exclude any debt from the limit.
Despite these constraints, the City is committed to keeping residential property tax bills down to retain more low and middle-income homeowners in the city. Policies the City has pursued are demonstrating success, as the average single-family tax bill in Boston is 32.8% below the FY21 statewide average. In 2016, the City advocated for a change in State law that increased the residential exemption limit, a reduction in real estate taxes for homeowners who occupy their property as their principal residence, from 30% to 35% of the average assessed value of all Class One residential properties. The City Council, with the approval of the Mayor, once again chose the maximum exemption allowed by law – 35% for the FY21 Tax Rate. The FY21 residential exemption amount increased by $273 over last year’s amount.
During these same years, the levy has also been positively impacted by taxable new value, or “new growth”. New growth can arise from both real and personal property and is outside of the Proposition 2 ½ cap. Thanks to efforts to attract business development and grow its housing stock, Boston experienced unprecedented new growth in property tax revenue over the past four fiscal years. In FY22, the City expects new growth to decrease to $45M, due to the significant slowdown in the local and national economy, as well as the impact of the two-month non-essential construction pause enacted in the spring 2020 due the pandemic.
During the past five years, the City saw notable construction projects in Boston enter the City property tax base for commercial, mixed-use and residential properties, most notably in the Seaport District, Dorchester, and the Back Bay. According to the BPDA, the estimated revenue from building permit fees during FY20 indicated the potential for $8.2 billion
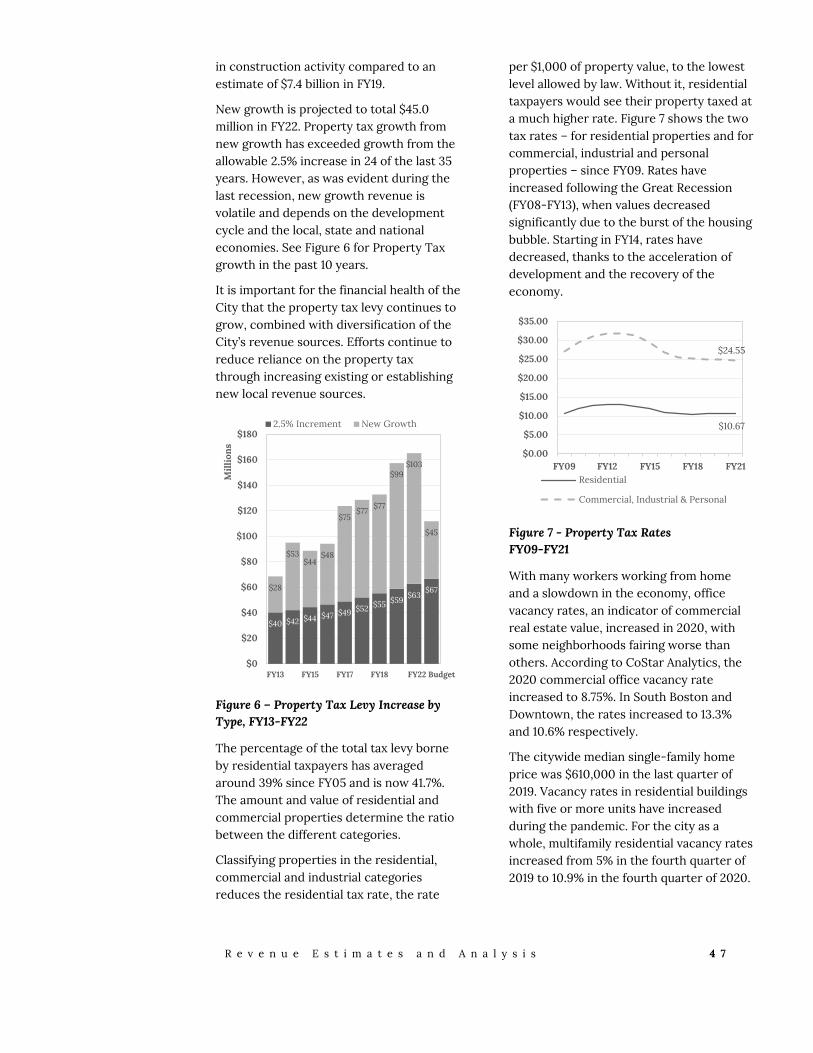
R e v e n u e E s t i m a t e s a n d A n a l y s i s 4 7
in construction activity compared to an estimate of $7.4 billion in FY19.
New growth is projected to total $45.0 million in FY22. Property tax growth from new growth has exceeded growth from the allowable 2.5% increase in 24 of the last 35 years. However, as was evident during the last recession, new growth revenue is volatile and depends on the development cycle and the local, state and national economies. See Figure 6 for Property Tax growth in the past 10 years.
It is important for the financial health of the City that the property tax levy continues to grow, combined with diversification of the City’s revenue sources. Efforts continue to reduce reliance on the property tax through increasing existing or establishing new local revenue sources.
Figure 6 – Property Tax Levy Increase by Type, FY13-FY22
The percentage of the total tax levy borne by residential taxpayers has averaged around 39% since FY05 and is now 41.7%. The amount and value of residential and commercial properties determine the ratio between the different categories.
Classifying properties in the residential, commercial and industrial categories reduces the residential tax rate, the rate
per $1,000 of property value, to the lowest level allowed by law. Without it, residential taxpayers would see their property taxed at a much higher rate. Figure 7 shows the two tax rates – for residential properties and for commercial, industrial and personal properties – since FY09. Rates have increased following the Great Recession (FY08-FY13), when values decreased significantly due to the burst of the housing bubble. Starting in FY14, rates have decreased, thanks to the acceleration of development and the recovery of the economy.
Figure 7 - Property Tax Rates FY09-FY21
With many workers working from home and a slowdown in the economy, office vacancy rates, an indicator of commercial real estate value, increased in 2020, with some neighborhoods fairing worse than others. According to CoStar Analytics, the 2020 commercial office vacancy rate increased to 8.75%. In South Boston and Downtown, the rates increased to 13.3% and 10.6% respectively.
The citywide median single-family home price was $610,000 in the last quarter of 2019. Vacancy rates in residential buildings with five or more units have increased during the pandemic. For the city as a whole, multifamily residential vacancy rates increased from 5% in the fourth quarter of 2019 to 10.9% in the fourth quarter of 2020.
$40 $42 $44 $47 $49 $52 $55 $59 $63 $67 $28
$53 $44
$48
$75 $77
$77
$99 $103
$45
$0
$20
$40
$60
$80
$100
$120
$140
$160
$180
FY13 FY15 FY17 FY18 FY22 Budget
Mill
ions
2.5% Increment New Growth $10.67
$24.55
$0.00
$5.00
$10.00
$15.00
$20.00
$25.00
$30.00
$35.00
FY09 FY12 FY15 FY18 FY21Residential
Commercial, Industrial & Personal

4 8 R e v e n u e E s t i m a t e s a n d A n a l y s i s
Any significant decline in property values can present a problem for cities as dependent on the property tax as Boston. As property values decreased in the early 1990’s, and the City continued each year to maximize the allowable levy increase under Proposition 2 ½, the levy rapidly approached the levy ceiling of 2.5% of total assessed value. Reaching the 2.5% ceiling would further limit the City’s capacity to increase the annual levy and raise the needed revenue to support the City’s budget.
However, due to years of strong new growth increases, the City has significant space between its FY21 net effective tax rate of 1.4% and the tax levy ceiling of 2.5% of total assessed values. If the real estate market were to depreciate, having a tax levy significantly lower than the levy ceiling would insulate revenues from an immediate shock. Nevertheless, if values were depressed long enough, future growth of the property tax would be impaired. The darker area in Figure 8 shows the difference, or gap, between the tax levy and ceiling.
Figure 8 – Property Tax Levy and Levy Ceiling, FY01-FY21
State Aid and Assessments
State aid refers primarily to distributions from the State to municipalities for Chapter 70 education aid, unrestricted general government aid, and charter school tuition
reimbursement, along with other relatively small State programs such as library aid. State aid, as it is used here, excludes any grants to or offsets for direct expenditures by City departments.
State aid in FY22 is based on the Governor's proposed budget for FY22, as the legislature will release the final version of the state budget following release of the City's budget.
The City received General Fund gross State aid totaling $434.4 million in FY19 and $458.8 million in FY20. The City is projected to receive $467.7 million in State aid in FY21 and has budgeted $476.0 for FY22.
Municipal Charges, also known as State assessments, are charged by the State to municipalities for items such as charter school tuition and MBTA service. State aid distributions are reduced by the amount of assessments charged to a municipality. The City paid $278.7 million in FY19 and $295.9 million in FY20. The City has budgeted to pay $313.8 million in assessments in FY21 and is budgeting $346.4 million in FY22.
In 1993, the State began an effort to increase and equalize funding for local education. The Chapter 70 education aid formula, derived from that effort, establishes a foundation budget, or a minimum level of education spending in each school district, which the State and the district then fund with the district’s local contribution and the State Chapter 70 education aid. The City received Chapter 70 education aid from the State totaling $220.0 million in FY19 and $221.9 million in FY20. The City expects to receive $221.9 million from the State in FY21 and budgeted $223.7 for FY22.
Boston is assessed by the Commonwealth to fund charter schools on a per-pupil basis. This assessment has rapidly increased since enactment of the 2010 Achievement Gap legislation that expanded the number of charter school seats. Boston’s charter school tuition assessment
$0
$1,000
$2,000
$3,000
$4,000
$5,000
$6,000
FY01 FY06 FY11 FY16 FY21
Mill
ions
2.5% Ceiling Final Tax Levy

R e v e n u e E s t i m a t e s a n d A n a l y s i s 4 9
is budgeted to increase by $32.0 million, or 14.9%, over the FY21 budget, as 11,244 Boston students are projected to attend a state charter school in FY22.
Boston has seen its charter school costs rise dramatically in the past 10 years – 190% or $140.8 million between FY12 and the FY21 budgets. As seen in Figure 9, the net cost of charter schools to the City – charter school tuition less charter school reimbursement – has been increasing over time as well. The City is projecting a $185.6 million net impact in FY21 and $205.9 million in FY22.
Figure 9 – Net Charter School Costs FY13-FY22
The Student Opportunity Act (SOA), passed in 2019, represents a fundamental change in the trajectory of State funding for Boston’s schools and students, providing funding that better reflects the needs of students. The SOA will make an unprecedented $1.5 billion investment in Massachusetts public schools.
When fully implemented, the act will ensure that Boston benefits in two main ways. First, Boston's Foundation budget will increase substantially with the full implementation of SOA’s goal foundation rates (health benefits, English language learners, out-of-district special education,
low income and guidance and psychological services). In addition, the SOA provides that all low income students are fully counted in every district.
Second, since the Foundation changes will also increase the charter tuition assessment, the SOA recognizes that impact and includes a commitment to fully fund the charter reimbursement in three years: 75% in the first year, 90% in the second year and 100% in the third year. The Governor’s FY22 budget fully funds Year 1 of the SOA’s commitment for Charter Tuition Reimbursement. The charter tuition reimbursement is budgeted in FY22 at $41.0 million, increasing by $11.8 million or 40.2% over the FY21 budget.
The second largest source of State revenue is the unrestricted general government aid (UGGA). From the FY10 budget going forward, the Governor and the Legislature combined general government aid from Additional Assistance and Lottery into one account: UGGA. Revenue derived from the State’s lottery now accounts for nearly all funds dispersed through UGGA. For Boston, UGGA revenue totaled $186.9 million in FY19 and $198.1 million in FY20. The City projects to receive $213.2 million in FY21, including a late FY20 payment, and $208.2 million in FY22, a 3.5% increase over the original FY21 budget.
Net state aid, which is gross state aid revenue less state assessments, has been trending down steeply since FY02. The rapid annual increase in the charter school tuition assessment has contributed to this trend. With a decrease in net state aid in the FY22 budget, Boston is $235.5 million, or 64.5%, below its FY08 level of net state aid. Net state aid amounted to $155.6 million in FY19 and increased to $163.0 million in FY20. The FY21 projected net state aid totals $153.9 million, and the FY22 budget assumes an additional reduction to $129.5 million. This loss of resources has put extraordinary pressure on the property
$-
$50
$100
$150
$200
$250
FY13 FY16 FY19 FY22Budget
Mill
ions

5 0 R e v e n u e E s t i m a t e s a n d A n a l y s i s
tax and other local revenue sources, as well as on levels of expenditures.
Figure 10 – State Aid, State Assessments and Net State Aid (in millions), FY08-FY22
Local Receipts
The City also collects recurring revenues other than property tax and State aid. The City collected $615.9 million in FY19 and $574.4 million in FY20 from these sources. The City projected $433.6 million in FY21, reducing the budget significantly as the COVID-19 pandemic impacted collection. The City budgeted to collect $435.0 million in FY22, taking into account the effects of the economic recession.
Revenue from excise taxes, payments-in-lieu-of-taxes, licenses and permits, fees and fines, investment income and available funds are part of this local receipts group. To forecast these receipts, the City uses analytical trending of historical collections, based on the specific revenue source and the availability of data, as well as analyzing economic data. As the City enters the unknown territory of an economic recession due to a global pandemic, extra precaution was used in budgeting these receipts.
Figure 11 – Recurring Local Receipts by Type FY18-FY22
Excise Taxes
There are eight excise taxes. Listed below are the main ones.
The local room occupancy excise was increased in FY20 from 6% to 6.5%, and is levied on both hotels and short-term rental units. In addition to the local tax, the State collects a 5.7% excise tax and a 2.75% fee, transferred to the State’s convention center fund, for a total tax from all sources of 14.95%. Local room occupancy excise revenue totaled $100.6 million in FY19 and $99.3 million in FY20.
The FY21 budget was reduced to $37.0 million in local room occupancy collections, a significant decline compared to previous years, due to the economic recession and the impact COVID-19 had on travel and tourism. The FY22 budget assumes a slow return to normal business, with $41.0 million in room occupancy excise.
The Commonwealth imposes an excise in lieu of property tax on motor vehicles, the proceeds of which are collected by the municipality in which the vehicle is principally kept. The excise is a uniform
$-
$100
$200
$300
$400
$500
$600
FY08 FY12 FY17 FY22 Budget
Mill
ions
State Aid State Assessments
Net State Aid
$582 $616
$574
$434 $435
$0
$100
$200
$300
$400
$500
$600
$700
FY18 FY19 FY20 FY21Budget
FY22Budget
Mill
ions
Excises PILOTs & 121A
Fines Department Revenue
Licenses & Permits Interest
Other

R e v e n u e E s t i m a t e s a n d A n a l y s i s 5 1
rate of $25 per $1,000 of vehicle valuation. Valuations are determined by a statutorily-defined depreciation schedule based on the manufacturer’s list price and the year of manufacture.
Motor vehicle excise revenue totaled $66.0 million in FY19 and $62.8 million in FY20. For motor vehicle excise revenue, the City budgeted $50.0 million in both FY21 and FY22. Since the tax lags the sale of the vehicle, this revenue estimate is generated based on projections of current year tax collections on motor vehicle sales in the state, as well as trend analysis.
Beginning in 2009, the State granted municipalities a new local option tax on restaurant meals. The City collected $33.0 million in FY19 and $28.9 million in FY20. The decrease in collection is attributed to the state’s stay-at-home advisory, which limited restaurants to take out only in the last few months of FY20. The City budgeted $18.8 million in FY21 and increased to $21 million in FY22, expecting the recession and pandemic to continue affecting this industry.
The excise on the sale of jet fuel is 5% of the average sales price of the previous quarter, but no less than five cents per gallon. Increases in flights arriving and departing Logan International Airport led to increased jet fuel excise revenue in recent years, mitigated by constant changes in prices. Jet fuel excise revenue totaled $34.5 million in FY19 and $32.5 million in FY20. The City budgeted $13.0 million in FY21 and $14.5 million in FY22. In calendar year 2020, total number of flights decreased by 52% and total passengers traveling through Logan airport decreased 70%.
The vehicle rental surcharge is a revenue-sharing arrangement with the State. Under this arrangement, all vehicle rental contracts originating in the City are subject to a $10 surcharge. The City receives $1 of this surcharge. The City received $1.6 million in FY19 and FY20. In FY21, the
budget was reduced to $700 thousand, due to the decrease in car rentals in the City with the decrease of visitors to the City. $1.1 million was budgeted for FY22.
Fines
In FY20, the City issued 1.0 million parking tickets, 205 thousand or 16% less than in FY19. The FY20 collection rate remained high at 92%. Major factors contributing to the City’s successful collection rate include non-renewal of violator’s registration and license by the Registry of Motor Vehicles until penalties are paid, increased ability to recover fine payments from rental agencies, and systematic collection of fines for company cars and leased vehicles. The City also contracts with a third-party vendor to collect delinquent fines from out of state vehicles and other hard-to-reach offenders.
The City collected parking fines revenue of $70.1 million in FY19. In FY20, issuance and collection was affected by COVID-19, starting in March 2020, as many businesses were closed throughout the City and traffic into the City was reduced. Total FY20 parking fines revenue collection decreased to $62.7 million. The FY21 budget includes $57.6 million in parking fines revenue, and the FY22 budget includes $55.9 million.
Interest on Investments
The City’s level of investment income is a function of prevailing short-term interest rates and daily cash balances. Investment income totaled $30.4 million in FY19 and $29.5 million in FY20.
The City budgeted interest income at $4 million in both FY21 and FY22. In August 2019, the Federal Reserve started to decrease the Federal Funds target range, the first time the rate was decreased since December 2008. Since then, additional decreases occurred and the range is currently 0%-0.25%. With such minimal rates, interest income is expected to remain flat at around $4 million.

5 2 R e v e n u e E s t i m a t e s a n d A n a l y s i s
Payments in Lieu of Taxes
Payments in Lieu of Taxes (PILOTs) are payments made by property tax-exempt institutions located in the City, including hospitals, universities, and cultural institutions. These are voluntary contributions for municipal services such as police and fire protection, street cleaning, and snow removal.
Growth in PILOT revenue comes from new agreements, escalations that adjust the payments for inflation, and re-negotiation or expansion of current agreements. The Massachusetts Port Authority (MassPort) currently provides 41% of the PILOT revenue the City receives annually.
In April 2010, the City released a report suggesting more standardization of PILOT agreements. Specifically, each agreement should represent, in cash or in-kind, 25% of the amount of tax that would be due if properties were not tax exempt. This type of change generates more revenue than what was previously collected, while providing some equity across paying institutions. New agreements under this framework were adopted in FY12, and that year includes the first installment of a five-year phase-in period to the new amounts. FY17 was the first year after that phase-in period.
Payments in lieu of taxes $54.0 million in FY19 and $44.9 million in FY20. Due to the COVID-19 impact on universities, hospitals and cultural institutions, revenue collection was decreased from this source in FY20. The FY21 budget includes $49.3 million PILOTs revenue and the FY22 budget includes $49.6 million.
Urban Redevelopment Chapter 121A
Massachusetts General Law (MGL), Chapter 121A allows local governments to suspend the imposition of property taxes at their normal rates in order to encourage redevelopment. Chapter 121A revenues are
based on two separate sections of the law as described below.
The Urban Redevelopment Corporation excise (Chapter 121A, section 10) is collected in-lieu-of-corporate income tax for which the Commonwealth acts as the collector and distributes the proceeds to municipalities. In most cases, the formula for the 121A section 10 payment in-lieu-of-tax is $10 per $1,000 of the current cash value of property plus 5% of gross income. In FY19 and FY20, the City received Chapter 121A section 10 distributions of $19.7 million and $13.9 million, respectively. Chapter 121A section 10 revenues are projected at $14 million in FY21 and $11 million in FY22, as timing of these payments is inconsistent.
In addition to the Section 10 payments collected by the State, most 121A corporations have individual agreements with the City that result in additional payments made directly to the City. These section 6A agreements are complex, with actual amounts owed dependent on a formula that varies widely. The City collected section 6A payments of $24.6 million in FY19 and $18.8 million in FY20. The City expects section 6A collections to surpass the budgeted $12.0 million in FY21 and budgeted FY22 collections at $11.0 million. As Chapter 121A agreements expire and the properties transition back to regular property taxes, these payments will decrease, while contributing to the new growth portion of the property tax levy.
Miscellaneous Department Revenue
With such limited revenue tools, the City is continuing in the FY22 budget to better maximize the local revenue options. In FY22, the Administration and Finance cabinet will continue a citywide review of collections, as well as address past due bills to recover additional revenue.
The largest revenue source in this category is Street Occupancy permits. The City received $11.0 million in FY19 and $10.1 million in FY20, due to delays in

R e v e n u e E s t i m a t e s a n d A n a l y s i s 5 3
construction in the spring of 2020. Street Occupancy Permits are budgeted at $10.0 million budget in both FY21 and FY22.
Licenses and Permits
This category is dominated by building permits revenue, from which the City received $61.8 million and $69.6 million in FY19 and FY20 respectively. Building permits revenue is budgeted at $45 million in FY21 and FY22, considering the effects of COVID-19 on construction starts and the economic recession.
The second largest Licenses and Permits revenue is the cable television license fee, from which the City received $6.5 million in FY19 and $6.3 million in FY20. The City is expected to surpass the budgeted $4.5 million in FY21, and budgeted to collect $5.2 million in FY22. New FCC rules and the timing of their implementation impact this account, as well as the trends in cable subscribers.
Alcoholic beverage licensing is the only other revenue source in this category that regularly exceeds $4 million in annual revenue. Alcoholic beverage licenses are budgeted at $4.5 million in FY21 and FY22.
Penalties and Interest
Taxpayers are assessed both a penalty and interest for late payments of property tax bills, motor vehicle excise bills, and other payments. The City collected $11.4 million in such penalties and interest in FY19 and $10.1 million in FY20. Actual penalty and interest collections for FY21 will likely slightly exceed the $9 million budgeted. The City has budgeted this source at $9 million in FY22 as well.
Available Funds
Most of the City’s General Fund budget is supported by the revenues that are estimated to come in during the course of the fiscal year, including property tax, excises, state aid, and the various other categories of revenues described above.
Available funds are linked to a separate category of expenditure appropriation - those supported by immediately available fund transfers.
The only two significant available funds that the City budgets each year are parking meter revenues to support the Transportation Department, and cemetery trust monies that are used to support the City’s maintenance of its public cemeteries. Both special funds have fees collected during the course of the year. By transferring out less than what is collected over the years, the City has built up a balance in both funds. Trust fund balances, such as the Cemetery Trust, also benefit from the opportunity to invest in securities offering a higher return than short-term fixed-income investments.
The City did not transfer any funds to the General Fund in FY19 or FY20. The City has budgeted to transfer $30 million from the Parking Meter Fund and $950,000 from the Cemetery Trust Fund to the General Fund in both FY21 and FY22.
See the Financial Management section of Volume I for details.
Non-Recurring Revenue
Surplus Property
The surplus property disposition fund contains proceeds from the sale of various City land or buildings. The use of these funds is usually restricted to one-time expenditures. No funds are included in the FY22 budget from this revenue source.
Budgetary Fund Balance
Budgetary Fund Balance can be appropriated for use during the fiscal year after certification by the Department of Revenue (DOR). Budgetary Fund Balance is more commonly referred to as “Free Cash” when used this way. This item is most simply described as the portion of available reserves, generated to a considerable degree by annual operating surpluses that

5 4 R e v e n u e E s t i m a t e s a n d A n a l y s i s
the City can responsibly appropriate for spending.
The FY19 and FY20 budgets did not use any fund balance, but instead used recurring revenue to support the appropriation for Other Post-Employment Benefits (OPEB), the liability associated with retiree health insurance costs. The FY21 and FY22 budgets assume the use of $40.0 million to support OPEB.
See the Financial Management section of Volume I for more details on this revenue source.
American Rescue Plan Act
The FY22 budget includes $50 million from the $435 million payment Boston is estimated to receive as part of the American Rescue Plan Act of 2021 (ARPA). The act is a $1.9 trillion economic stimulus bill passed by the U.S. Congress and signed into law by President Joe Biden on March 11, 2021.
The ARPA limits the usage of the Coronavirus States and Local Fiscal
Recovery Funds (Subtitle M) to three main categories, used by December 31, 2024:
Revenue replacement for theprovision of government servicesto the extent the reduction inrevenue due the COVID-19 publichealth emergency relative torevenues collected in the mostrecent fiscal year prior to theemergency
Assistance to small businesses,households, and hard-hitindustries, and economic recovery
Investments in water, sewer andbroadband infrastructure
The $50 million budgeted in FY22 will help the City continue provide essential services to its residents and make targeted investments to help reopen, recover and renew the City from the pandemic despite facing revenue reductions due to the COVID-19 pandemic and the economic recession.

R e v e n u e E s t i m a t e s a n d A n a l y s i s 5 5
Revenue Detail
FY19 Actual FY20 Actual FY21
Projection FY22 Budget
Property Tax 2,354,143,061 2,514,155,221 2,674,859,663 2,786,731,155
40116 Property Tax Overlay -33,260,646 -47,323,895 -3,735,387 -33,400,000
Subtotal 2,320,882,415 2,466,831,326 2,671,124,276 2,753,331,155
EXCISES
Motor Vehicle Excise 66,025,609 62,791,517 50,000,000 50,000,000
40129 Room Occupancy Excise 100,578,619 99,258,171 37,000,000 41,000,000
40130 Aircraft Fuel Excise 34,475,671 32,470,675 13,000,000 14,500,000
40140 Condominium Conversion Excise 742,500 619,000 500,000 500,000
40162 Short Term Rental 0 260,295 0 500,000
40601 Meals Excise Tax 33,013,330 28,926,658 18,800,000 21,000,000
40602 Marijuana Excise 0 0 1,250,000 1,250,000
40603 Host Community Agreements
62,466 119,870 1,250,000 1,250,000
41113 Vehicle Rental Surcharge 1,562,199 1,573,276 700,000 1,100,000
Boat Excise 50,152 6,689 40,000 40,000
Subtotal 236,510,546 226,026,152 122,540,000 131,140,000
FINES
Total Parking Fines 70,136,461 62,681,485 57,592,560 55,900,000
45104 Code Enforcement - Trash 1,225,810 1,310,455 1,100,000 1,100,000
Other Fines 2,751,403 3,385,284 2,260,000 2,340,000
Subtotal 74,113,675 67,377,224 60,952,560 59,340,000
Interest On Investments
47151 Interest On Investments 30,407,612 29,472,290 4,000,000 4,000,000
Subtotal 30,407,612 29,472,290 4,000,000 4,000,000
PILOTs
40167 PILOTs 34,432,514 25,173,824 29,000,000 29,000,000
40168 Other PILOTs 171,193 185,797 200,000 170,000
40169 Massport/DOT 19,443,369 19,520,739 20,078,133 20,479,699
Subtotal 54,047,076 44,880,360 49,278,133 49,649,699
URBAN REDEVLOPMENT CHAPTER 121A
121B Section 16 9,608,332 8,107,815 7,000,000 6,000,000
121A Section 6A 24,638,918 18,756,867 14,000,000 11,000,000
121C 450,000 727,794 700,000 700,000
41013 Chapter 121A Section 10 19,709,174 13,923,319 14,000,000 11,000,000
Subtotal 54,406,423 41,515,795 35,700,000 28,700,000

R e v e n u e E s t i m a t e s a n d A n a l y s i s
FY19 Actual FY20 Actual FY21
Projection FY22 Budget
MISC DEPARTMENT REVENUE
43105 Registry Division Fees 1,785,968 1,611,300 1,400,000 1,600,000
43109 Liens 583,425 695,050 600,000 600,000
43120 City Clerk Fees 652,907 637,908 650,000 650,000
43137 Municipal Medicaid Reimbursement
7,533,319 6,812,508 6,000,000 5,400,000
43138 Medicare Part D 5,336,079 2,285,931 2,700,000 2,500,000
43202 Police Services 696,919 1,111,110 800,000 700,000
43211 Fire Services 7,571,563 5,253,464 5,000,000 6,000,000
43301 Parking Facilities 2,643,593 1,973,799 1,400,000 750,000
43311 PWD - Street Occupancy. 10,955,380 10,104,389 10,000,000 10,000,000
43425 St. Furniture Prgm Fixed Fees
1,500,000 0 1,500,000 1,500,000
43426 St. Furniture Prgm Ad. Fees 971,116 1,069,191 560,000 500,000
44002 Tuition & Transportation 1,909,273 1,352,738 1,900,000 1,900,000
47119 Affirmative Recovery Unit 262,621 247,391 200,000 200,000
47130 Fringe Retirement 5,141,123 5,652,141 5,000,000 5,500,000
47131 Pensions & Annuities 5,075,815 5,374,001 5,300,000 5,500,000
47132 Indirect Costs Reimbursement 484,041 646,390 400,000 400,000
48000 Detail Admin Fee 4,040,562 3,647,193 2,300,000 2,800,000
Other Misc Department Revenue 15,260,389 18,151,845 13,482,927 12,716,259
72,404,095 66,626,348 59,192,927 59,216,259
61,819,068 69,572,085 45,000,000 45,000,000
288,915 215,100 290,000 290,000
3,309,952 2,978,604 2,500,000 2,800,000
1,850,369 1,765,597 1,530,000 1,530,000
15,139 16,424 10,000 0
4,602,126 4,449,548 4,500,000 4,500,000
0 0 0 10,000
1,883,126 1,820,938 1,800,000 1,600,000
37,288 23,297 30,000 30,000
166,914 142,169 160,000 160,000
6,469,226 6,255,985 4,460,000 5,200,000
Subtotal
LICENSES & PERMITS
40211 Building Permits
40213 Weights & Measures
40215 BTD - Street & Sidewlk Permits
40221 Health Inspections
40220 Boat Mooring Permits
40222 Alcoholic Beverage Licenses
40223 Marijuana License
40224 Entertainment Licenses
40227 Police - Firearm Permits
40229 Other Business Lic. &
Permits
40235 Cable Television
46001 Dog License
5 6
0 0 0 220,000

R e v e n u e E s t i m a t e s a n d A n a l y s i s 5 7
FY19 Actual FY20 Actual FY21
Projection FY22 Budget
Other Licenses & Permits 2,154,344 1,124,081 1,680,000 1,630,000
Subtotal 82,596,465 88,363,827 61,960,000 62,970,000
PENALTIES & INTEREST
40133 Pen & Int - Property Tax 2,581,079 2,647,983 2,300,000 2,300,000
40134 Pen & Int - MV Excise 2,860,626 3,191,937 2,200,000 2,200,000
40136 Pen & Int - Tax Title 5,977,523 4,266,493 4,500,000 4,500,000
Other Penalties & Interest 169 185 0 0
Subtotal 11,419,397 10,106,597 9,000,000 9,000,000
AVAILABLE FUNDS
42502 Approp. Cemetery Trust Fund 0 0 950,000 950,000
42503 Approp. Parking Meters 0 0 30,000,000 30,000,000
Subtotal 0 0 30,950,000 30,950,000
STATE AID
41015 State Owned Land 318,922 408,662 419,294 427,918
41104 Exemptions - Elderly 1,014,001 1,061,490 1,055,968 888,238
41114 Veterans Benefits 1,661,668 1,889,327 1,604,742 1,296,639
41118 Unrestricted General Government Aid
186,904,657 198,082,317 213,181,161 208,222,502
41119 Local Share Of Racing Taxes 331,187 319,061 294,586 369,263
41301 School Construction 5,107,351 2,461,330 0 0
41305 Charter Tuition Asses. Reimb.
19,017,852 32,711,889 29,264,974 41,024,634
41306 Chapter 70 Education Aid 220,001,735 221,915,045 221,915,045 223,736,165
Subtotal 434,357,373 458,849,121 467,735,770 475,965,359
RECURRING REVENUE TOTAL 3,371,145,077 3,500,049,040 3,572,433,666 3,664,262,472
NON-RECURRIMG REVENUE
42501 Approp. Surplus Property Fund
0 0 0 0
42504 Approp. Fund Balance 0 0 40,000,000 40,000,000
42507 American Rescue Plan 0 0 0 50,000,000
GRAND TOTAL 3,371,145,077 3,500,049,040 3,612,433,666 3,754,262,472
Table 1

5 8 R e v e n u e E s t i m a t e s a n d A n a l y s i s

E d u c a t i o n 5 9
Education
OVERVIEW
The FY22 Boston Public Schools (BPS) budget reflects a collective determination to address disruption caused by the pandemic and come back stronger than ever as a district. A record $1.3 billion in city operating budget funding will support over 52,000 students at BPS, and another $247 million will support approximately 11,244 Boston students in charter schools.
The increase of $36 million over the FY21 adopted BPS budget is the second installment of a historic three-year, $100 million commitment in school funding the City made beginning in 2020. This $100 million is on top of standard cost increases, such as inflation and employee costs. The City’s growing investment comes at a time when other cities have implemented cuts to education spending amid difficult economic conditions. Boston’s FY22 education budget, including the BPS operating budget and the City’s charter school tuition assessment, continues to represent over 40% of the City’s budget as a whole.
Following school closures in March 2020, BPS pivoted to remote learning and sought new ways to deliver critical services like meals and counseling to students and their families. BPS received assistance in these efforts from the Boston Public Health Commission and numerous other City departments and agencies, as well as the Boston Resiliency Fund. Significant costs for protective equipment, cleaning, and digital tools were partially offset by $32.3 million in Elementary and Secondary School Emergency Relief (ESSER I) funds that the district received from the federal government in FY20. The district is also expected to receive an additional $123 million in Elementary and Secondary
School Emergency Relief (ESSER II) funds, a federal grant that can be used through FY23 and will augment the City’s funding in important ways in the years to come.
Table 1
FY22 investments in BPS are grouped in three categories: Return, Recover, and Reimagine (Table 1). To meet facilities challenges and achieve a safe return to school buildings, the district is adding 20 custodians. In addition to $1.4 million in operating funds, $10.4 million in ESSER II funds will be put towards a successful reopening, including health and safety costs.
The Recover category responds to the learning loss and trauma that has disproportionately impacted students of color, English language learners, students with disabilities, and low-income students. An investment of $18.5 million in direct funding for schools will maintain key support positions despite enrollment declines. BPS will also add 95 social workers and 80.5 family liaisons. By leveraging $13.9 million more in ESSER II funds, BPS will tackle other Recover priorities, such as targeted interventions for students with the greatest needs and remedial education to address COVID-19 learning loss.
Reimagine expresses the Superintendent’s intention to transform BPS schools into
FY22 BPS Investments
Operating Budget
ESSER II
Return $1.4M $10.4M
Recover $35.4M $13.9M
Reimagine - $20.1M
Total $36.8M $44.3M

6 0 E d u c a t i o n
what students need them to be, drawing from ImagineBPS, the five-year strategic plan released in FY20. The $20 million in ESSER II funds allotted for this category in FY22 will be articulated as specific investments after a planning process.
BPS OPERATING BUDGET
At a $1.3 billion appropriation, the FY22 operating budget is the largest in BPS’s history (Table 2), despite a projected decline in student enrollment. The FY22 allocation makes investments to begin a multi-year effort to not only recover from COVID-19, but also transform the school district. The FY22 budget assists schools with declining enrollments to mitigate the negative impacts COVID-19 has had on school communities.
Funding directly in schools will increase by $22.1 million from the FY21 adopted budget to $831.1 million.
In addition to school budgets, schools receive significant support from services that are budgeted centrally. This includes items such as transportation, particular special education services, and facilities maintenance. This portion of the budget will increase 1.7% from the FY21 adopted budget to $322.1 million. With these support funds added to funds budgeted at the school level, $1.153 billion is expected to be spent on school services, nearly 90% of the BPS budget.
BPS is also responsible for funding services for students in Boston attending school outside of BPS, including adult education students, students placed out-of-district for special education and vocational education, and pre-kindergarten students at community-based organizations. In addition, BPS provides transportation for out-of-district special education students, and these costs comprise 24.5% of the FY22 BPS transportation budget. Total funds budgeted for non-BPS students will increase 7.5% from the FY21 adopted
budget to $71.7 million, comprising over 5.5% of the overall FY22 BPS budget.
In FY22, the Central Administration budget will increase 5.4% to $69.8 million. The Superintendent’s strategic vision affirms the importance of organizational effectiveness and accountability, as well as the need for strong coordination and support from district leadership.
Table 2
FY22 is the second year of the City’s three-year, $100 million education funding commitment. Alongside additional federal funding, the $36 million in FY22 BPS operating investments will support children and their families not only through a return to school, but also in the years beyond. The FY22 BPS investments are guided by three principles: Return, Recover, and Reimagine. These investments focus on improving student outcomes, advancing equitable recovery, and promoting the school community’s health and wellness amidst the COVID-19 pandemic. 100% of investments are directly in school budgets or school services budgeted centrally.
To prepare schools for a safe return, the FY22 operating budget devotes $1.4 million to the addition of 20 daytime custodians to ensure cleanliness in school facilities.
The FY22 BPS budget also includes $16.9 million to expand the FY21 investments in social workers and family liaisons. This additional funding will guarantee a social worker and family liaison in every school.
BPS Operating Budget Summary
FY21 Adopted
FY22 Recom. $ Change
Direct School Expenses $809M $831M $22M School Services Budgeted Centrally $317M $322M $5M Central Administration $66M $70M $4M Non-BPS Student Services $67M $72M $5M
Total BPS Budget $1.259B $1.295B $36M

E d u c a t i o n 6 1
Of the $16.9 million, $10 million will fund 95 new social workers to provide a coordinated, multi-tiered system of supports to meet the social-emotional needs of students and their families.
Also included in the $16.9 million is $6.8 million in new funding for 80.5 additional family liaisons who reflect the cultures and speak the languages represented at schools in the communities they serve. In addition to helping families navigate registration and other school functions, liaisons will refer families to community resources for housing, food, and counseling. In FY21, 98% of family liaisons hired were people of color, and these individuals helped parents and caregivers navigate challenges presented by the pandemic. In the coming year, the new family liaisons will continue this urgent and necessary work.
Because COVID-19 has caused enrollment declines across the country, the FY22 operating budget includes additional supports to mitigate negative impacts COVID-19 has had on school communities. An $18.5 million investment in school supports on top of existing soft landings and the Foundation for Quality is intended to ensure that schools are able to maintain level services and support their students, regardless of enrollment declines.
Early Childhood Education
Each year, the City continually expands the number of quality pre-kindergarten seats, as part of the Universal Pre-K (UPK) initiative. In April 2019, the City announced the creation of a first-of-its-kind $15 million investment in the Quality Pre-K Fund to support the creation of a citywide mixed-delivery system with school-based programs and community-based organizations.
Because of this extraordinary investment, as well as ongoing operating support in BPS’s Department of Early Childhood, in the 2021-2022 school year, up to 1,140 more
four-year- olds will be enrolled in a quality pre-kindergarten program than when the UPK initiative began in FY14, 75% of the way toward the City’s goal of 1,500. The Quality Pre-K Fund will enable the City to close the existing gap in quality seats, guaranteeing every four-year-old in Boston a high-quality pre-kindergarten experience.
BPS early education programs have been recognized as among the most effective in the nation at closing achievement gaps. They are content-rich in science, literacy, arts and math. Data shows that BPS pre-kindergarten attendees outperform their peers in third and fifth grade MCAS, in both ELA and Math. Two-thirds of BPS early childhood classrooms have earned accreditation from the National Association for the Education of Young Children (NAEYC), affirming that these programs offer high-quality, state-of-the-art education to help get children off to successful starts.
Special Education
The FY22 BPS budget makes robust investments in special education that will result in over 137 new school-budgeted special education teachers and paraprofessionals. The special education budget totals roughly $305 million in FY22, an increase of $11.9 million, or 4.1%, from the FY21 adopted budget. The special education budget accounts for nearly 24% of the total BPS budget and supports the over 11,000 students with disabilities, or 21% of the BPS student population.
The significant increase in special education teachers in the FY22 budget tracks with the continued inclusion rollout across the district and into new grade levels. Another driver of the growth in staffing and spending is autism need. The FY22 budget includes a $5.2 million, or 14%, increase in funding to support students with autism. With the new funding, budgeted personnel specializing in serving this population will increase by almost 12%

6 2 E d u c a t i o n
to 616. In FY22, BPS plans to dedicate $5 million in ESSER II funds for interventions for students with disabilities that address the impact of COVID-19 on their learning and well-being.
In addition to mainstream or substantially separate placements in the district, BPS is responsible for the educational services of approximately 450 special education students in out-of-district placements. Over time, BPS has seen an increase in the number of high-need students and DCF-involved students placed in group homes who require private placement. BPS is fully or partly responsible for paying for services for most of these students, at a total projected cost of $42.5 million in FY22. Some of the costs for these services will be reimbursed by Circuit Breaker. Tuition rates are established by the Commonwealth of Massachusetts Rate Setting Commission.
BPS is also responsible for providing education services to students with IEPs in private placements. To better support these students, the FY22 budget continues to fund a proportionate share team responsible for conducting IEP meetings and evaluations.
English Learners
The Bilingual/Sheltered English Immersion budget totals $103.5 million in FY22, an increase of $2.3 million, or 2.3%, from the FY21 adopted budget. Nearly a third (31%) of BPS students has an English Language Learner (ELL) designation; as a group, they hail from 132 different countries and speak 70 languages.
In addition to baseline ELL funding, the FY22 budget includes $1.56 million in supplemental support for students with limited or interrupted formal education (SLIFE). Anticipating that ELL students will require targeted support to address COVID-19-related learning loss, BPS will also devote $2.25 million in ESSER II funds to interventions in FY22.
BPS Enrollment
Student enrollment is the foundation of the BPS budget. The preliminary stage of the budget process involves enrollment projections for each program, grade, and school, which are based on historic trends and current data. The projected enrollment at each school for the upcoming school year determines the allocation of resources at the school level through the weighted student funding formula. The FY22 budget development process continued the work done in prior years to use data more rigorously and collaborate between school leaders and BPS Finance to develop accurate enrollment projections.
BPS projected enrollment for FY22 is approximately 52,280. The change in FY22 represents the largest single-year decline in enrollment in the last 15 years, driven in part by uncertainty due to the COVID-19 pandemic. Despite declining enrollment and decreasing salary and operational costs, BPS’s budget will increase by almost $1,700 per pupil, from approximately $21,800 per pupil to $23,500. At the school level, BPS has seen some shifts in enrollment. BPS gives parents a voice in where their child attends schools, which causes shifts from year to year. The BPS School Committee has also supported school communities that have requested to expand grades in recent years, which has led to shifts in enrollment.
Weighted Student Funding
Weighted Student Funding (WSF) ensures resource equity for all students no matter the school they attend. The weighted student funding model creates a baseline per-student funding amount and then adjusts the amount depending on individual student need. For example, students whose family income is at or below the poverty level will receive additional funding in the formula. Other needs-based weights include students with disabilities, English Language Learners, and vocational

E d u c a t i o n 6 3
education students. A school’s budget is calculated by adding the individual funding amounts for every student projected to attend that school in the fall. Additionally, each school also receives a foundation budget to support essential staff.
For FY22, the eleventh year using the WSF formula, BPS continues to refine this needs-based method of funding. Student-based allocation models are the standard for transparent and equitable school budgeting. Such models allow dollars to follow students, and those dollars are weighted based on student need. BPS’s highest-need students receive more resources through the weighted student funding structure.
When enrollment declines at a school, the BPS central office works closely with the school to appropriately adjust staffing. Particular care is made through this process to make classrooms full so that they are affordable to schools. There are safeguards in place to assist schools with declines in enrollment, such as sustainability allocations and soft landings, as well as other reserves that are used throughout the budgeting process.
In FY22, WSF funding is decreasing by $24.3 million, to $535.1 million. WSF is only one component of schools’ funding; total school funding will rise by $22.1 million in FY22.
BPS school budgets also include substantial supports on top of WSF. The Foundation for Quality, which replaces sustainability funds, expands the definition of baseline services for schools, ensuring that all schools have a baseline amount of funding above compliance. Schools in transition will receive additional targeted funding, including supports for K-6 transitions, new inclusion programs, strands undergoing redesign, and capacity maintenance for existing programs.
The Opportunity Index
FY22 is the fourth year that BPS will be using the Opportunity Index (OI) as part of WSF. The OI is an innovative tool that quantifies differences in experiences, opportunities, and need between students, allowing BPS to allocate resources more equitably. The OI is a composite index that incorporates a range of data representing factors that are outside of the schools’ control, yet are predictive of students’ academic outcomes. By rolling multiple measures into a single, more accessible metric ranging from 0.01 to 0.99, BPS is better equipped to direct resources and supports to the schools and students who need them most.
Since FY19, BPS has used OI for the allocation of two central sources of funding: School Support Funds, which support schools’ academic priorities, and the Partnership Fund, which enables schools to partner with community nonprofit organizations. Funding is allocated based on student enrollment and level of need. In FY22, $5 million in discretionary School Support Funds will be awarded to schools with an OI score greater than or equal to 0.35. Additionally, $5 million from the Partnership Fund will be awarded to schools with an OI score greater than or equal to 0.56.
EXTERNAL FUNDS
External funds are provided directly to BPS through formula grants (entitlements), competitive grants, reimbursement accounts, and other grants, primarily from state and federal sources. These external funds are critical to the success of the district, but have decreased to 9.8% of total funding in FY22 from 17% in FY12 (Figure 1). Decreased external funding was identified as a challenge to BPS’s long-term financial stability in the district’s 2016 Long-Term Financial Plan. In recent years, the BPS budget has relied on the increased City
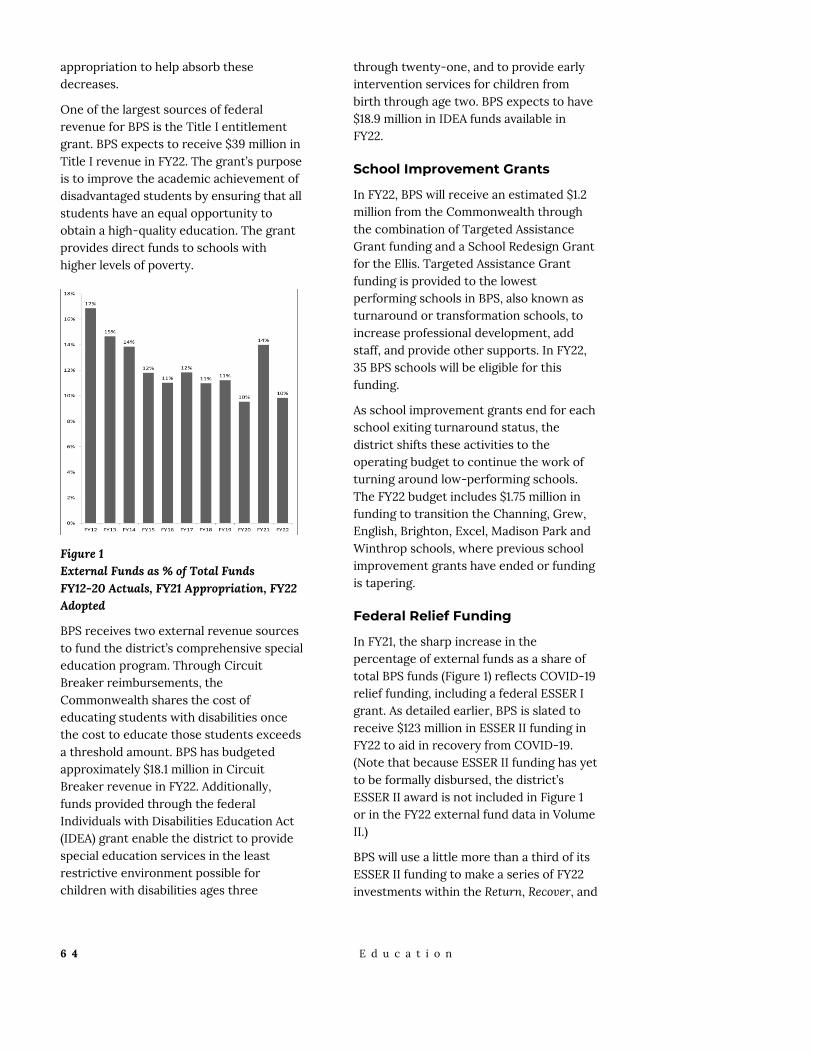
6 4 E d u c a t i o n
appropriation to help absorb these decreases.
One of the largest sources of federal revenue for BPS is the Title I entitlement grant. BPS expects to receive $39 million in Title I revenue in FY22. The grant’s purpose is to improve the academic achievement of disadvantaged students by ensuring that all students have an equal opportunity to obtain a high-quality education. The grant provides direct funds to schools with higher levels of poverty.
Figure 1 External Funds as % of Total Funds FY12-20 Actuals, FY21 Appropriation, FY22 Adopted
BPS receives two external revenue sources to fund the district’s comprehensive special education program. Through Circuit Breaker reimbursements, the Commonwealth shares the cost of educating students with disabilities once the cost to educate those students exceeds a threshold amount. BPS has budgeted approximately $18.1 million in Circuit Breaker revenue in FY22. Additionally, funds provided through the federal Individuals with Disabilities Education Act (IDEA) grant enable the district to provide special education services in the least restrictive environment possible for children with disabilities ages three
through twenty-one, and to provide early intervention services for children from birth through age two. BPS expects to have $18.9 million in IDEA funds available in FY22.
School Improvement Grants
In FY22, BPS will receive an estimated $1.2 million from the Commonwealth through the combination of Targeted Assistance Grant funding and a School Redesign Grant for the Ellis. Targeted Assistance Grant funding is provided to the lowest performing schools in BPS, also known as turnaround or transformation schools, to increase professional development, add staff, and provide other supports. In FY22, 35 BPS schools will be eligible for this funding.
As school improvement grants end for each school exiting turnaround status, the district shifts these activities to the operating budget to continue the work of turning around low-performing schools. The FY22 budget includes $1.75 million in funding to transition the Channing, Grew, English, Brighton, Excel, Madison Park and Winthrop schools, where previous school improvement grants have ended or funding is tapering.
Federal Relief Funding
In FY21, the sharp increase in the percentage of external funds as a share of total BPS funds (Figure 1) reflects COVID-19 relief funding, including a federal ESSER I grant. As detailed earlier, BPS is slated to receive $123 million in ESSER II funding in FY22 to aid in recovery from COVID-19. (Note that because ESSER II funding has yet to be formally disbursed, the district’s ESSER II award is not included in Figure 1 or in the FY22 external fund data in Volume II.)
BPS will use a little more than a third of its ESSER II funding to make a series of FY22 investments within the Return, Recover, and

E d u c a t i o n 6 5
Reimagine framework. In the Return category, nearly $10.4 million will fund a range of activities, including improved school maintenance contracts, a bus monitor on every bus, increased nursing support, and continued COVID-19 costs. In the Recover category, $13.9 million will support interventions for students with disabilities and English language learners, as well as tutoring, vacation and summer programming, and expansion of existing literacy and Hub Schools initiatives. Reimagine investments have not yet been defined, but $20 million in ESSER II funds will be allocated to advance the district’s strategic plan and drive equitable outcomes for all students.
Thanks to the signing into law of the American Rescue Plan Act in March, an additional $130 billion in funding for K-12 schools will be distributed nationwide. BPS will share information regarding its award as those details become available.
PERFORMANCE
BPS is committed to using data to improve school performance and provide the best education to students. In FY21, the district created a new performance management system based on the six anchor goals articulated in the Superintendent’s strategic vision: eliminate opportunity and achievement gaps, accelerate learning, amplify all voices, expand opportunity, cultivate trust, and activate partnerships. Each goal is paired with a series of aligned metrics to measure progress.
BPS has been evaluating its progress towards academic goals using measurable outcomes for several years. The district has seen positive gains in several performance metrics, including increases in graduation rates and decreases in dropout rates.
Graduation Rates
The overall four-year graduation rate for the BPS class of 2020 was 75.4%, a 3%
increase over the 2019 rate and the highest ever recorded by BPS. The graduation rate has increased by 17% over the past decade, from 64.4% in 2011.
In 2020, sixteen Boston high schools achieved graduation rates of 80% or above: the John D. O’Bryant School of Mathematics and Science, Edward M. Kennedy Academy for Health Careers, Boston Latin School, Boston Latin Academy, Fenway High School, New Mission High School, TechBoston Academy, Boston Arts Academy, Boston Community Leadership Academy, Mary Lyon Pilot High School, Another Course to College, East Boston High School, English High School, Snowden International School at Copley, Boston Green Academy, and Margarita Muniz Academy.
Dropout Rate
The overall dropout rate for grades 9-12 in 2020 was 3.9%, a 7% decrease from the 2019 dropout rate of 4.2%. BPS has cut the dropout rate by 39% over the past ten years, with a decrease of 548 students dropping out annually over that period.
According to state guidelines, students in grades 6-12 are counted as dropouts if they leave school during the year for any reason other than transfer, graduation, death, or expulsion with an option to return.
Accountability Results
The Massachusetts Department of Elementary and Secondary Education (DESE) implemented a new accountability system in the fall of 2018, which determines schools’ need for assistance or intervention based on a set of accountability indicators including student growth, graduation rate, and chronic absenteeism.
Due to the cancellation of state assessments related to COVID-19, DESE did not issue accountability determinations in 2020. In 2019, DESE singled out the Hale and Winship as schools of recognition.

6 6 E d u c a t i o n
Fourteen schools were classified as meeting or exceeding targets, and thirty-five were classified as making substantial progress toward targets. 67% of schools improved relative to 2018 performance. BPS met English language arts, math, and science targets for all students in grades 3-8, and many schools showed strong progress against targets.
In March 2020, as the result of a district review by DESE, BPS and DESE entered into a partnership to improve the district’s lowest performing schools, continue to address systemic barriers to equity across the school system, and support its most vulnerable students to achieve their highest educational potential.
As part of that partnership, BPS has committed to four priority initiatives: make improvements in BPS schools included among the lowest performing 10% of schools in the state; address instructional rigor, equitable access to advanced coursework, and chronic absenteeism at the high school level; improve educational services for students with disabilities; and improve on-time arrival of school buses. BPS has also committed to a long-term initiative to develop a plan for improving services to English learners and improve interpretation and translation services for limited English proficient parents and guardians.
The City will continue to work with state and community partners to make more improvements in our schools across the board.
BUILDBPS
In FY18, the City launched BuildBPS, a $1 billion investment to modernize Boston's public school infrastructure. Through a dedication of City capital funds and a strong working relationship with the Massachusetts School Building Authority (MSBA), the plan more than doubles the
capital spending on BPS facilities from FY18 to FY27.
This ten-year investment is the largest school building plan in forty years. The plan will result in new school buildings and major transformations, reconfigurations to align schools with K-6/7-12 and K-8/9-12 pathways, and increased investments district-wide for all school buildings and communities. The planning process is focused on creating high-quality, twenty-first-century learning environments for students, which contributes to closing opportunity gaps for more students.
Since FY18, BPS has completed construction on the new building for the Dearborn STEM Academy and the Eliot School at 585 Commercial Street. Boston Arts Academy is currently in construction. The Josiah Quincy Upper School is slated to begin construction in FY22, and the Carter School is currently in the process for MSBA funding. In FY22, the City will begin studying programming and siting for future elementary schools, including a new elementary school in East Boston. In addition, BPS will pursue building improvements to facilitate grade reconfigurations at various schools, including the McCormack and Irving Schools, in line with the goals of BuildBPS.
The City will continue FY21 districtwide investments in window replacements, bathroom upgrades, fire systems, radiator covers, entryway improvements, and plumbing and fixture upgrades to expand drinking water availability. The City is also investing in new school maintenance initiatives to increase building accessibility, upgrade auditoriums, and improve building interiors and exterior grounds, as well as the fourth phase of the multi-year kitchen upgrade initiative. Additionally, the City will continue annual programs for school yards, security improvements, and technology infrastructure, as well as leveraging the MSBA Accelerated Repair Program to fund roof, window, and boiler repairs.

E d u c a t i o n 6 7
The FY22-26 capital plan sustains ongoing BuildBPS initiatives and supports planning for large-scale projects coming out of the BuildBPS engagement process. The City is projected to spend $218 million on BuildBPS capital projects from FY18 through FY21. The FY22-26 capital plan projects $463 million in City spending over the next five years, and the City has committed an additional $49 million for the remainder of the ten-year plan. When combined with projected MSBA matching funds, Boston is committing $1 billion to BPS capital projects over ten years.
CHARTER SCHOOL TUITION
Commonwealth charter schools, which are granted charters by the Massachusetts Board of Elementary and Secondary Education, are publicly-funded schools administered independently from local school districts and district bargaining rules and regulations. Commonwealth charter schools are primarily financed by each student’s sending district through per-pupil-based tuition.
Commonwealth charter schools are projected to educate approximately 11,244 Boston students in FY22. Boston is assessed by the Commonwealth to fund charter schools on a per-pupil basis, and the City’s charter school tuition assessment is projected to increase by $32 million over FY21 to a total of $247 million due to increasing enrollment and higher per-pupil tuition rates.
As of FY21, Boston’s charter school assessment has more than tripled since the enactment of the 2010 Achievement Gap legislation. This has put increasing pressure on the City to fund education, as overall state support decreased for charter school tuition costs. However, thanks to the Student Opportunity Act (SOA) passed in 2019, Boston and other municipalities across the Commonwealth will see an increase in state education aid. The SOA will make an unprecedented $1.5 billion
investment in Massachusetts public schools, and provides an implementation timeline for fully funding charter school reimbursement costs. Due to COVID-19, the first year of SOA funding has been delayed to FY22.
See the Revenue Estimates and Analysis section of Volume I for more details on state education aid, charter school tuition reimbursement, and the SOA.

6 8 E d u c a t i o n

C a p i t a l P l a n n i n g 6 9
Capital Planning
INTRODUCTION
The $3.2 billion FY22-26 Capital Plan will make critical investments in the City’s infrastructure in every Boston neighborhood, guided by Imagine Boston 2030 and the schools, streets, arts, climate and resilience plans under its umbrella. Taken together, these initiatives will support Boston's dynamic economy and improve quality of life for residents by encouraging affordability, increasing access to opportunity, promoting a healthy environment, and guiding investment in the public realm.
The Capital Plan moves Imagine Boston 2030 from idea to action. Planned borrowings are expected to increase 18.8% over last year’s plan, one-time funding sources are leveraged, and the City continues to collaborate with the Massachusetts School Building Authority on the design and construction of new schools and the repair of existing building systems.
An estimated 90% of the investment in the FY22-26 Capital Plan is aligned with the City’s planning efforts:
The Capital Plan supports a commitment to invest $1 billion over ten years to bring Boston's school buildings into the 21st century, with the construction of new schools, MSBA Accelerated Repair Program partnerships, completion of projects in the pipeline, school kitchen renovations that support the delivery of fresh, nutritious food, and reserves for future projects identified by BuildBPS community engagement.
Boston, in collaboration with State and Federal sources, will invest $1.2 billion implementing the core initiatives
outlined in Go Boston 2030: streets that are safer for all users of our roads and sidewalks, particularly pedestrians and cyclists; travel that is more reliable and predictable; and quality transportation choices that improve access to interconnect our neighborhoods for all modes of travel.
Boston will prepare for climate change by investing at least 10% of all new capital funding to open space, infrastructure, and facilities projects that are climate resilient or contribute to making the City more environmentally friendly.
Setting the stage for planning and early action items for the comprehensive, long-term recovery campus on Long Island to tackle the opioid crisis and when fully permitted move forward with the construction of a new bridge to Long Island.
The Percent for Art Program, demonstrates the City’s leadership and commitment to sustainable funding for the arts by setting aside one percent of the City’s annual capital borrowing for the commissioning of public art.
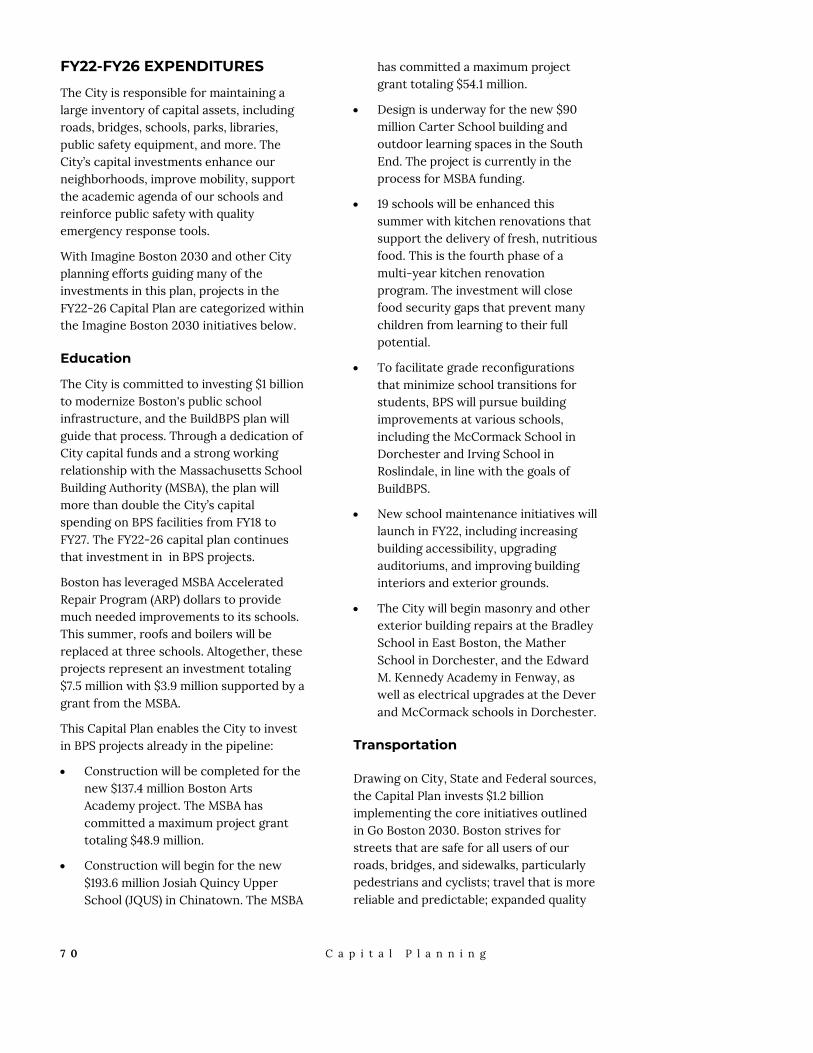
7 0 C a p i t a l P l a n n i n g
FY22-FY26 EXPENDITURES
The City is responsible for maintaining a large inventory of capital assets, including roads, bridges, schools, parks, libraries, public safety equipment, and more. The City’s capital investments enhance our neighborhoods, improve mobility, support the academic agenda of our schools and reinforce public safety with quality emergency response tools.
With Imagine Boston 2030 and other City planning efforts guiding many of the investments in this plan, projects in the FY22-26 Capital Plan are categorized within the Imagine Boston 2030 initiatives below.
Education
The City is committed to investing $1 billion to modernize Boston's public school infrastructure, and the BuildBPS plan will guide that process. Through a dedication of City capital funds and a strong working relationship with the Massachusetts School Building Authority (MSBA), the plan will more than double the City’s capital spending on BPS facilities from FY18 to FY27. The FY22-26 capital plan continues that investment in in BPS projects.
Boston has leveraged MSBA Accelerated Repair Program (ARP) dollars to provide much needed improvements to its schools. This summer, roofs and boilers will be replaced at three schools. Altogether, these projects represent an investment totaling $7.5 million with $3.9 million supported by a grant from the MSBA.
This Capital Plan enables the City to invest in BPS projects already in the pipeline:
Construction will be completed for the new $137.4 million Boston Arts Academy project. The MSBA has committed a maximum project grant totaling $48.9 million.
Construction will begin for the new $193.6 million Josiah Quincy Upper School (JQUS) in Chinatown. The MSBA
has committed a maximum project grant totaling $54.1 million.
Design is underway for the new $90 million Carter School building and outdoor learning spaces in the South End. The project is currently in the process for MSBA funding.
19 schools will be enhanced this summer with kitchen renovations that support the delivery of fresh, nutritious food. This is the fourth phase of a multi-year kitchen renovation program. The investment will close food security gaps that prevent many children from learning to their full potential.
To facilitate grade reconfigurations that minimize school transitions for students, BPS will pursue building improvements at various schools, including the McCormack School in Dorchester and Irving School in Roslindale, in line with the goals of BuildBPS.
New school maintenance initiatives will launch in FY22, including increasing building accessibility, upgrading auditoriums, and improving building interiors and exterior grounds.
The City will begin masonry and other exterior building repairs at the Bradley School in East Boston, the Mather School in Dorchester, and the Edward M. Kennedy Academy in Fenway, as well as electrical upgrades at the Dever and McCormack schools in Dorchester.
Transportation
Drawing on City, State and Federal sources, the Capital Plan invests $1.2 billion implementing the core initiatives outlined in Go Boston 2030. Boston strives for streets that are safe for all users of our roads, bridges, and sidewalks, particularly pedestrians and cyclists; travel that is more reliable and predictable; expanded quality

C a p i t a l P l a n n i n g 7 1
transportation choices that improve access by interconnecting our neighborhoods for all modes of travel; and upgraded capital assets that make travel more reliable and predictable. Driven by these core goals of safety, access, and reliability, the Capital Plan focuses on several key investments.
The Capital Plan makes critical investments to improve safety and accessibility for Boston’s most vulnerable street users with a focus on pedestrian ramps and safety interventions on residential streets and in small business districts. In FY22, the City will increase funding for the Pedestrian Ramp program by $25 million, as part of a commitment to make all pedestrian ramps ADA-compliant by 2030. The capital plan also invests $2 million to pilot a new Safety Intervention Program for Neighborhood Streets, which will help the City evaluate and quickly respond to all resident 311 safety requests. This complements the existing Vision Zero program, which focuses on proactively redesigning and reconstructing our most dangerous intersections and corridors. In FY22, Vision Zero program will invest $10.8 million, making targeted safety improvements at corridors and intersections with known safety challenges. The Neighborhood Slow Streets (NSS) program, which implements traffic-calming measures on residential streets, funds construction projects at 10 locations beginning this spring and into FY22 including zones in Highland Park, Chinatown, Mt. Hope, West of Washington, and Grove Hall. In total, 13 Neighborhood Slow Streets will be completed by the end of 2022, three additional areas will be designed in FY22, and additional zones will be selected. As Boston works to expand access and make neighborhoods interconnected for all modes of travel, this Capital Plan invests in the reconstruction of Ruggles Street, Nubian Square, Cummins Highway, Boylston Street, and the transformation of the Northern Avenue Bridge. All of these streets will be designed
and reconstructed with the Complete Streets approach to include new sidewalks, lighting, storm water infrastructure, and upgraded facilities for pedestrians and cyclists.
In FY22, bicycle and pedestrian safety improvements are planned for construction on Tremont Street in the South End, Massachusetts Avenue, south of Melnea Cass Boulevard, and permanent protected lanes on Cambridge Street in Allston. $500,000 will be invested in the replacement of Bikeshare docking stations based on age and condition.
This Capital Plan also takes the lead on prioritizing reliable bus transit for all commuters. In coordination with the MBTA, this Plan will transform several corridors Citywide to facilitate rapid bus transit, including the construction of dedicated bus lanes on Columbus Avenue and Warren Street among others. To complement the forthcoming Blue Hill Avenue Action Plan, $5.5 million is dedicated to resurfacing and installing new markings and pedestrian ramps along the entire 4.5 mile Blue Hill Avenue corridor. The City continues to develop plans and designs to widen sidewalks, realign the median, install new crosswalks, and make traffic signal improvements in Egleston Square and redesign Mattapan Square to enable pedestrians to cross Blue Hill Avenue directly from the Mattapan MBTA station and River Street/Cummins Highway.
The Capital Plan invests in design and provides matching funds to unlock Federal and State investment to transform key corridors in the City. The designs focus primarily on stress-free walking, protected bicycling, and public transportation. It also puts an additional emphasis on improving the street infrastructure in parallel with new housing investment in some of our neighborhoods. Key corridors include
7 2 C a p i t a l P l a n n i n g
Melnea Cass Boulevard, Commonwealth Avenue, Boylston Street, Columbia Road, the Sullivan Square / Rutherford Avenue / North Washington Street corridor, and street designs for the Boston Planning and Development Agency’s PLAN initiatives in Jamaica Plain/Roxbury and on Dorchester Avenue. The Capital Plan focuses on adding protected bicycle lanes on every “Great Streets” project, and on off-street Green Links pathways such as the Fenway-Roxbury Connector and the planned new gateway at Arboretum Road, that will create new entrances to the Arnold Arboretum and extend the Blackwell Path south to Roslindale Square. These connective investments are complemented by a $2.3 million FY22 investment in the Strategic Bicycle Network, which will fund the design and construction of 5 miles of new protected bike lanes over the next two years, part of the City’s four-year target of 15 new miles of high-quality protected bike infrastructure.
Through the FY22-26 Capital Plan, the City will also increase asset reliability through investments in bridges, roads, sidewalks, off-street paths, street lighting, traffic signals and building facilities that are essential to the high-quality delivery of services. In FY22, the City plans to invest $30.0 million in its annual road resurfacing, reconstruction, and sidewalk ramp programs. This Capital Plan invests in upgrades to the North Washington Street Bridge, Dalton Street Bridge and others so that the City’s bridges achieve a state of good repair by 2030. By investing in asset management programs for our bridges, street lights, ramps, and pavement markings, among other assets, Boston will continue targeting a state of good repair that ensures the safe and reliable movement of people across the City.
Technology
The City is dedicated to delivering exceptional City services by leveraging investments in technology. In FY22, the City will continue its focus on supporting and developing innovative initiatives and projects across departments while also enhancing its cyber security tools and the resilience of its systems. In line with its multi-layered approach to managing risk, the City will make investments to ensure continuity of operations and recovery of data in the event of a disaster. The City will also devote new funding to its five focus areas including: Core Infrastructure, Enterprise Applications, Digital Engagement and Service Delivery, Data Analytics, and Broadband and Digital Equity.
In FY22, the City will continue investing in the Boston Fiber Network (BoNet) to improve Boston’s fiber backbone and switching infrastructure. This $14 million network build-out will connect the remaining Boston Public Schools with City fiber, as well as public safety locations, public housing developments, and other sites. Altogether, the project aims to connect ~ 170 City buildings, providing broadband service to the City’s public schools, public works and public housing, and strengthening public safety communications.
In FY22, the Department of Innovation and Technology will partner with other City departments, including Inspectional Services, Neighborhood Development, Transportation, and the Public Health Commission, to support and develop innovative technology initiatives and projects.
Open Space
Imagine Boston 2030 calls for the City to strengthen Boston’s existing park system and invest in new open spaces. Through the
C a p i t a l P l a n n i n g 7 3
use of Winthrop Square proceeds, City capital dollars, and leveraging external funds, the City continues to take action in implementing Imagine Boston 2030’s Open Space goals including investing in Franklin Park as a keystone park for the city, completing the Emerald Necklace, and restoring Boston Common to its full vibrancy.
The Franklin Park Master Plan and Moakley Park Master Plan together serve as anchor projects to launch the City’s effort to complete the Emerald Necklace. The community engagement processes for the Franklin Park Master Plan is nearing its final stages, with a completed plan expected in summer of 2021. The Master Plan will reimagine Franklin Park as a signature park for all Boston residents according to the design concept’s “Four Big Ideas”: Amplify Magnet Destinations, Clarify Movement, Connect and Activate the Edges, and Unify the Park. In parallel to the community engagement process, the Parks and Recreation Department has completed key improvements to the park including repaving the pathway network and enhancing the tree canopy care program. The City has committed to a $23 million investment funded by the sale of the Winthrop Square garage to implement the Franklin Park Master Plan. The full Moakley Park design is nearing completion as well, with construction expected to begin in 2023.
The Boston Common Master Plan community engagement process is nearing completion as well, with a completed Master Plan expected in summer of 2021. The City has committed $23 million from the Winthrop garage sale to augment the current historic levels of investment in Boston Common to fully renovate America’s First Park. This investment will ensure future generations will enjoy the park in its full vibrancy.
The FY22-26 Capital Plan continues investments in the City’s parks to ensure
Boston’s open spaces are among the Nation’s most accessible and equitable, including $39.5 million of new capital funding for parks throughout the city. The City will invest $15 million to reimagine Copley Square Park, one of Boston’s most recognizable and popular places. The project will enhance the park’s ability to accommodate large events, mitigate the heat island effect, and provide a welcoming space for Boston’s residents and visitors alike to gather and relax. The City will also invest $6 million for the complete renovation of Malcolm X Park, $1.8 million to rehabilitate the pathways in Dorchester Park and improve accessibility, $2 million to reconstruct sports fields in the fourth and final phase of the Harambee Park renovation, and many other projects.
In the FY22 Capital Plan, the Parks and Recreation Department takes important steps to increase Boston’s climate readiness, as guided by Climate Ready Boston. This includes $2.2 million to continue engineering and design studies to support the transformation of Moakley Park into a more vital recreation space and at the same time designing it to protect the City from the effects of sea level rise. The FY22 plan also includes $2.5 million for the engineering design of improvements to Christopher Columbus Park. The renovation will elevate the site, improving its function as climate resilience infrastructure while improving recreation areas.
One hundred percent of Bostonians live within a ten-minute walk of a park, but those spaces are only truly equitable if they serve the diverse needs of all our residents. The City recognizes the need for inclusive design and has created robust budgets for park renovation projects including Malcolm X Park in Roxbury, Cutillo Park in the North End, Millennium Park in West Roxbury, Coppens Square in Dorchester, McLean Playground in East Boston, and Ringer Playground in Allston/Brighton. In

7 4 C a p i t a l P l a n n i n g
addition, the FY22-26 plan proposes new investments in athletic field lighting and playground improvements in more than a half dozen locations. The Capital Plan also supports investments in the renovation and renewal of playing courts (basketball, tennis, and street hockey) and playground safety surfacing in various parks.
Energy and Environment
As part of Boston’s implementation of Imagine Boston 2030, the FY22-26 Capital Plan includes investments to support a healthy environment, reduce energy consumption and greenhouse gas emissions, and prepare for climate change. Leveraging outside funding, the Capital Plan allows for development of more detailed climate plans for Boston neighborhoods, especially those most at risk for coastal flooding, as recommended in Climate Ready Boston. These long-term plans, early actions, are essential for protecting the safety and vitality of existing residents, businesses, and institutions, and for ensuring the implementation of continued growth and development. In FY22, the City will increase its capital commitment to the Climate Ready Boston Harbor Study by $1 million. These funds will supply matching funds to the U.S. Army Corps of Engineers, which will conduct the study to reduce Boston’s vulnerability to coastal flooding and sea-level rise.
The City has committed 10% of new capital funding to climate resilience projects. In FY22, the Climate Resilience Reserve is increasing by $2 million. These funds will support adding climate resilience features to existing project. For example, a play lot renovation project could become more resilient through the addition of a storm water retention system. If the project budget cannot accommodate the additional scope, the Resilience Reserve can be used to fund the improvements without sacrificing the project’s original goals.
To preserve the city’s natural areas and continue to combat the urban heat island effect, the department is investing $750,000 to rehabilitate the Mattahunt Woods, a valuable urban wild of secluded forested wetlands located in Mattapan.
The City has committed $10 million for the development of a new linear park along Fort Point Channel. This new park will protect the surrounding properties from expected sea level rise through the year 2070. The City has applied for a FEMA mitigation grant.
Renew Boston Trust has systematically identified energy projects in the City’s 300+ buildings to both lower energy bills and reduce emissions. The City finances the program through general obligation bonds, paid for in part from reduced energy consumption at City departments.
By utilizing contracts with Energy Service Companies (ESCOs) that guarantee the energy savings generated by the projects, the City will sufficiently offset anticipated debt service costs. A $10.7 million Phase 1 construction project began in February, 2019 and has been completed. Leveraging the experience gained from this pilot project, the City began construction on Phase 2, which is currently underway. The design process of Phase 3 has begun and will include projects in Boston Public Schools.
Health
To encourage a healthy environment, including safe streets and communities, Boston is renovating several neighborhood community centers to serve residents’ needs. Major renovation work will continue at the BCYF Curley Community Center, in South Boston. The heavily used building, which spans nearly a quarter mile on the South Boston beach front, will be completely refurbished. In East Boston, an $8.9 million renovation to the BCYF Paris Street Pool will be completed in FY22 with

C a p i t a l P l a n n i n g 7 5
new family changing rooms, refreshed existing locker rooms, creation of a new front entrance, and upgrades of all building and pool systems. The pool is expected to reopen in summer 2021. Design will also begin for a new North End Community Center, and funding for improvements to the pool at BCYF Marshall Community Center are also included.
Additionally, a $12.7 million investment will be made at BCYF Mattahunt for interior renovations to the lobby, gymnasium, community room and computer lab, $1 million at BCYF Roslindale to begin designing interior and exterior renovations and other facility upgrades to enable using the facility as a sheltering site year-round, and continuation of the annual $1 million Youth Budget.
The Capital Plan includes $23.5 million to implement upgrades to the Emergency Medical Services (EMS) radio system. Construction will begin to renovate a facility in West Roxbury as a new EMS training academy along with a new ambulance bay.
Construction will conclude in FY22 on a permanent Engagement Center, a new facility that will enhance recovery support services. Renovation work will be completed at the Woods Mullen Shelter. The scope of work includes the installation of a new elevator, relocating the entryway, and renovating bathrooms.
The City intends to replace the former Long Island Bridge with a new structure. Restoration of the bridge will allow the City to locate recovery services on Long Island. The Capital Plan includes $22 million for initial design work and for the preservation of buildings on Long Island that will be used as part of the future recovery campus.
Housing
In 2014, the City released Housing a Changing City: Boston 2030, the City’s comprehensive plan to accommodate Boston's rapid growth and stabilize the housing market by 2030. Through the strategies outlined in the plan, more than 36,000 new housing units have already been completed or are currently in construction, and almost 31,000 are under review. The City combines General Fund dollars with federal grants, state grants, and developer fees to leverage a wide variety of sources to invest in the creation and preservation of affordable housing citywide.
Recognizing that infrastructure investments are a key to housing development, the Capital Plan includes $5 million for an infrastructure fund to support the creation of affordable housing. The Capital Plan also commits $49 million to support necessary public infrastructure improvements in partnership with the Boston Housing Authority (BHA) including a $19 million investment in Phase 3 of the Orient Heights public housing redevelopment in East Boston. An additional $10 million will be used to upgrade elderly/disabled public housing units in several BHA communities, including Patricia White in Brighton, St. Botolph in the South End, and the Doris Bunte Apartments in Egleston Square.
$1 million will be invested in the reconstruction of roads and sidewalks in the Whittier Street housing development in conjunction with a $30 million Housing and Urban Development grant to revitalize the development and surrounding neighborhood.
Arts and Culture
The Mayor’s Office of Arts and Culture released the City’s first cultural plan, Boston Creates, in 2016, which calls for increased support to Boston’s arts and culture

7 6 C a p i t a l P l a n n i n g
ecosystem. The Percent for Art Program is a key policy outcome of this planning process. The City projects to borrow $280 million in FY22 to support the Capital Plan, and will invest one percent, or $2.8 million, in public art projects in FY22.
The FY22-26 Capital Plan continues support for revitalizing library branches throughout Boston’s neighborhoods. In FY22, programming studies for replacing branch libraries in Codman Square and South Boston will be underway.
Construction will be completed in FY22 on a major renovation of the Roslindale Branch and of a new Adams Street Branch library that will have a larger facility, new meeting rooms, an enhanced teen space, and redesigned outdoor spaces.
The design and construction of a major renovation and building addition to the Faneuil Branch Library is also underway. The renovation will focus on accessibility and new programming space.
In FY22, design activity will begin on a new building to replace the current Fields Corner Branch Library.
In FY22, after an 18-months long $15.7 million renovation, the Rare Books Departments will reopen. The renovated and modernized facility will enable the Boston Public Library to preserve its valuable and historic special collections that includes nearly 250,000 rare books and 1 million manuscripts. The renovation includes major environmental and mechanical improvements to regulate temperature and humidity control of the department’s collection storage areas, staff spaces, conservation lab, and public reading room. Ultimately, the project will increase accessibility to the collection and ensure its preservation for future generations.
Economy
As a $3.2 billion investment in the City’s assets, the Capital Plan supports economic
growth in Boston by creating construction jobs and investing in infrastructure that unlocks economic activity. The Capital Plan also supports targeted investments to strengthen Boston’s core and small businesses, as called for in Imagine Boston 2030. For example, Phase 2 roadway improvements in Nubian Square, with geometric changes, new traffic signal equipment and timing, bike lanes, and streetscape improvements, will improve access and safety. This project also begins implementation of the Go Boston 2030 goal to make public realm improvements in every Main Streets district in Boston by 2030.
Public Safety
As part of the Imagine Boston 2030 initiative to reduce cancer risks for firefighters, the Capital Plan includes health and safety improvements to firehouse projects. The new stations for Engine 42 and Engine 17 will be among the first firehouses in the nation to reflect these enhancements. The new Engine 42 firehouse in Egleston Square will be completed this fall and construction will begin on a new firehouse for Engine 17 in Dorchester. The City is also renovating neighborhood existing fire and police stations. In East Boston, construction will be completed on a new police station, a $29.9 million facility that will replace the existing A-7 station.
In FY22, design work will begin on HVAC updates to the police training academy; construction work will get underway to replace the roof and elevators at Police Headquarters. The Police Department is in the final stages of upgrading their radio system. The roof at Fire Department headquarters and at Fire Alarm will also be replaced.
The Fire Department will purchase 3 pumper trucks and 2 ladder trucks and 1

C a p i t a l P l a n n i n g 7 7
rescue truck in line with their annual replacement program. The FY22 Capital Plan includes $46 million to upgrade the Fire Department’s radio system. This project will leverage work done by the Police Department upgrading their radio system.
Government Effectiveness
The City Hall Master Plan was launched to allow Boston to rethink the way the public interacts with government in City Hall and to enliven the plaza. The current renovation project will deliver updated civic spaces and programming capabilities year-round. New infrastructure will make the plaza more environmentally sustainable. Specific improvements include connecting Congress and Cambridge Streets with an accessible sloped promenade, shady seating and gathering areas, play space, and public art space. The North entrance of City Hall will also be re-opened improving public access to the building. Phase 1 is expected to be completed in mid-2022. In addition, an overhaul of City Hall’s HVAC system and elevators is currently underway.

7 8 C a p i t a l P l a n n i n g
Project Budget Fiscal Year
C o mmunity Spaces
Roslindale Branch Library Renovation 11,660,000$
Adams Street Branch Library 18,300,000$
BCYF Paris Street Pool 8,900,000$
BCYF Curley Community Center 30,000,000$
Faneuil Branch Library 14,000,000$
City Hall and City Hall P laza 124,323,273$
South Boston Branch Library 100,000$
Fields Corner Branch Library 12,100,000$
Scho o ls
Boston Arts Academy 137,370,916$
M andela Athletic Complex Locker Rooms 8,030,325$
Carter School 89,564,411$
Josiah Qunicy Upper School 193,591,467$
P ublic Safety
Engine 42 23,560,000$
East Boston Police Station 29,900,000$
Engine 17 24,700,000$
P arks
Smith Playground Phase II 5,480,000$
M cConnell P layground 8,780,000$
Harambee Park Phase 4 2,090,000$
M attahunt Woods Preservation 750,000$
Copley Square Park 15,500,000$
Ceylon Park 4,100,000$
Boston Common M aster P lan 23,000,000$
Franklin Park M aster P lan 23,000,000$
M oakley Park 7,200,000$
Fort Point Channel Park 20,000,000$
Streets
New England Avenue 1,500,000$
Emerald Necklace 11,000,000$
Blue Hill Avenue Corridor Transportation Action Plan 300,000$
Egleston Square 500,000$
Cummins Highway 4,000,000$
Northern Avenue Bridge 100,000,000$
Long Island Bridge Replacement 108,758,144$
North Washington Street Bridge 218,957,519$
*Indicates new pro ject in FY22 Study
Design
Construction
2026
FY21-26 PROJECT HIGHLIGHTS AND SEQUENCING
2021 2022 2023 2024 2025

C a p i t a l P l a n n i n g 7 9
FY22 Expenditure Allocation
The City estimates FY22 capital expenditures from all sources will total $551.4 million (see Figure 2).
Figure 2 – Capital Expenditures FY19-FY26
All projects in the Capital Plan are categorized as Upkeep, Upgrade, New/Major Renovation, Planning or Matching Funds. The City tracks the overall distribution of these categories to maintain a balance between the upkeep of existing assets and the expansion or introduction of new ones.
Figure 3 – Capital Expenditure Allocation FY20-FY22
Upkeep represents projects that maintain the City’s assets, a fundamental priority of the Capital Plan. In FY22, 17% of projected spending supports Upkeep projects. These include roof and masonry repairs, the replacement of play equipment in parks, HVAC and boiler replacement, and critical repair funds for departments to address relatively small but vital repair projects not covered by routine maintenance. A substantial portion of the Upkeep category supports on-going bridge, street, sidewalk, and street lighting repairs that ensure the City’s roads and sidewalks are safe and in good condition.
Upgrade represents projects that improve existing assets by adding new capacity or innovations. This year’s upgrade allocations account for 43% of projected spending, and includes projects such as equipment upgrades for public safety radio systems.
New/Major Renovations represents 36% of FY22 allocations. New facilities and rehabilitation projects for schools, libraries, parks and community centers enable the City’s facilities to adapt to fit the needs of today’s programs, improve the ‘green’ performance of facilities, and extend the useful life of older assets. Highlights in this category include a new fire house at Engine 42 in Roxbury and a major renovation of the BCYF Curley Community Center in South Boston.
About 4% of the FY22 budget is assigned to matching fund requirements and planning projects. Comprehensive planning projects, which analyze a group of buildings or program needs, provide the groundwork for targeted investments in the categories of Upgrade and New/Major Renovations. Projects in this category include funds for a master plan of Boston Common and a transportation studies including the East Boston Transportation Action Plan. The Matching fund category includes projects in which the City covers the costs of design and engineering services. These expenditures are able to leverage State and
$0M
$100M
$200M
$300M
$400M
$500M
$600M
$700M
'19 '20 '21 '22 '23 '24 '25 '26
Actual Budget Projected
27%
11%17%
33%
38%
43%
35%48%
36%
0%
10%
20%
30%
40%
50%
60%
70%
80%
90%
100%
'20 '21 '22
Actual Estimated
Upkeep Upgrade New/Major Planning/Matching

8 0 C a p i t a l P l a n n i n g
Federal construction funds on projects such as the new North Washington Street Bridge.
FINANCING THE FY22-FY26 CAPITAL PLAN
The Capital Plan is financed with general obligation bonds issued by the City, other City funds, State grants, Federal grants, and private grants.
General Obligation (G.O.) Bonds
General obligation bonds represent 67.2% of all project funding. This year’s plan assumes $1.58 billion in new general obligation borrowings over the next five years, an 18.8% increase over last year’s plan. This borrowing level remains sustainable within the City’s debt affordability policy.
State and Federal Funds
State and Federal financing represent 23.6% of all project funding. Programs, such as the School Building Assistance program, Chapter 90 and the Transportation Improvement Program, provide key resources for Boston’s Capital Plan. Funds for capital financing are currently estimated at $370.6 million from State programs and $394.4 million from Federal programs.
School Building Assistance Program
The School Building Assistance (SBA) program, administered by the Massachusetts School Building Authority (MSBA), is an important revenue source for school renovation and construction. Annually, the MSBA accepts new project requests from cities, towns, and school districts, and if a project is ultimately approved, the MSBA pays 40% to 80% of eligible project costs.
The MSBA operates two major programs – the Core Program and the Accelerated
Repair Program (ARP). Major renovation and new construction projects are funded through the Core Program. The ARP funds roof, boiler, and window replacement projects in school buildings that are otherwise sound.
The City currently has three projects in various phases of the Core Program -- the Boston Arts Academy, the Josiah Quincy Upper Pilot School, and the Carter School.
The MSBA has approved a maximum project grant totaling $48.9 million for the Boston Arts Academy project, which covers 35.6% of the current $137.4 million project budget. Construction on the new school building will be completed in spring 2022 and will open for students in September 2022.
The Josiah Quincy Upper School project is in final design; construction is expected to begin in FY22. The MSBA has approved a maximum project grant totaling $54.1 million which covers 27.9% of the $193.6 million project budget.
The Carter School project is currently in design. During the first half of FY22, the City expects to submit a schematic design to the MSBA and enter into a Project Funding Agreement with the MSBA by the end of FY22. The current estimated cost of the project is $89.6 million.
The City has projects underway at five schools through the Accelerated Repair Program. Construction will begin in summer 2021 at three locations. The other two school projects will see construction begin during summer 2022.
Transportation Infrastructure Enhancement Fund
An Act was approved in August of 2016 that establishes oversight and regulation by the Department of Public Utilities over transportation network companies. As part of its oversight the Transportation Infrastructure Enhancement Fund was
C a p i t a l P l a n n i n g 8 1
established. Annually each transportation network company is required to submit a per-ride assessment of $0.20 based on number of rides in previous year and half of the assessment will be proportionately distributed to cities and towns based on the number of rides that originated within the city or towns with the funding used to address the impact of the transportation network services on municipal roads, bridges and other transportation infrastructure. The fee will be discontinued as of January 1, 2027.
The FY22-26 Capital Plan includes $15.2 million in revenue from this source.
Chapter 90 Funds
Administered by the Massachusetts Highway Department, Chapter 90 funds are allocated by formula through State bond authorizations and through the State budget to all cities and towns in the Commonwealth. The City uses Chapter 90 funds to support its roadway resurfacing and reconstruction programs as well as its sidewalk reconstruction programs. The City anticipates an allocation of approximately $14.7 million in FY22.
Transportation Improvement Program (TIP)
The Transportation Improvement Program is a statewide road and bridge construction advertisement program developed under the management of the Massachusetts Department of Transportation (MassDOT). It includes both local and State owned roads and bridges. The TIP’s funding sources include State-issued general obligation bonds and Federal funds made available through the Federal Highway Administration and other Department of Transportation agencies.
Other Funds
Other Funds is a revenue category that includes both City and non-City sources.
City sources of Other Funds include transfers from the Surplus Property Fund and the Parking Meter Fund.
Figure 4 – Other Funds Summary FY22-FY26
In FY22, the City proposes transferring $8.6 million from the Parking Meter Fund to the Capital Grants Fund and appropriating it for projects including Vision Zero: Neighborhood Slow Streets, Dedicated Bus Lanes, and Parking Meter and School Zone Signal upgrades. Using the Parking Meter Fund revenue in this way allows the City to make increased investments in infrastructure. Through this appropriation, the City will address important transportation capital needs.
Non-City sources of Other Funds include grants from the Boston Planning and Development Agency for roadway construction or other capital projects, as is the case with Harrison Avenue. Other Funds also include incentive rebates provided by utilities to carry out energy efficiency projects. Altogether, these City and non-City sources of capital funds are estimated at $298.3 million.
CAPITAL PLANNING PROCESS
Capital needs and resource availability are assessed annually through a capital planning process that results in a five-year Capital Plan. The first year of the spending plan constitutes the City’s capital budget. Expenditures against this budget are closely monitored throughout the year. To
Other Funds Summary
(in millions)
$ Amount
Parking Meter Fund 183.80
Surplus Property Fund 70.00
Utility Company Grants 15.34
Boston Water & Sewer 4.00
BPDA 3.04
Fund for Parks 2.50
Other Non-City 19.64
Total $298.32

8 2 C a p i t a l P l a n n i n g
emphasize the balance between needs and resource availability, the budget document (in Volumes 2 and 3) includes both capital authorizations and expenditure projections for each project.
The annual capital planning process begins with a capital improvement project request period during which all departments have an opportunity to identify their facility, equipment, infrastructure, and planning needs in a systematic manner, and to submit their proposals for funding consideration. The development of department project requests may involve both internal assessments of current needs and a review of external constituent requests.
A project request includes a cost estimate, a description of the proposed scope of work, and additional descriptive information to help OBM evaluate it.
Proposed projects must account for short-term and long-term effects on the City’s operating budget. Accordingly, project requests that OBM determines may impact the City’s operating budget are subject to additional review to determine the anticipated effect on personnel, utilities, maintenance, and supply costs, as well as expected changes in service demand or delivery of departmental programs. As a practical matter, it is assumed that certain types of projects such as energy conservation and energy efficiency projects (e.g. heating system upgrades or roof and window replacements) provide operating budget savings. OBM works with departments to measure these savings.
OBM reviews project proposals to determine the extent to which private purposes or benefits may exist; this review allows the City of Boston to maintain its tax-exempt financing status.
Proposals with strong alignment to City-wide planning efforts, such as Imagine Boston 2030 and climate resilience are prioritized for near-term investment.
Expertise from the Department of Innovation and Technology is leveraged to evaluate the feasibility, cost, and implementation plan for IT investment proposals City-wide. Investments with strong return-on-investment, alignment to master plans, and support of legal ordinances are prioritized using an automated scoring system that results in metric-based recommendations.
New capital requests that are recommended for funding are placed into a multi-year spending plan along with previously authorized projects. The Mayor submits the Capital Plan to the City Council each year. The City Council, in turn, holds public hearings to consider project authorizations. This year’s Capital Plan identifies 356 new and continuing projects and proposes $285.2 million in new bond authorization and an $8.6 million appropriation supported by the Parking Meter Fund.
Descriptions of all 356 projects can be found in Volumes 2 and 3 of the Budget. Project descriptions include authorizations and funding sources, projected expenditures, scope of work summary, and an indication of whether or not the project generates a near-term operating budget impact.
Operating Budget Impacts
Determining the impact that proposed capital investments will have on the City’s operating budget (personnel, contracted services, equipment and utilities) is essential to the capital budgeting process. Many capital projects, such as those that replace aged or outdated equipment with modern, more efficient versions, save the City money in future operating costs; others, such as those that allow the City to expand programming or establish a stronger presence in different neighborhoods, may entail future operating costs. Understanding the balance between future savings and future costs resulting

C a p i t a l P l a n n i n g 8 3
from these capital projects is vital to maintaining the City’s long-term financial health.
In Volumes 2 and 3 of this document, each capital project summary indicates whether or not there is an operating impact associated with the project.
While most capital projects can be assumed to have a marginal impact on energy savings or personnel demands, only those projects that will likely result in an increase or decrease in a budget appropriation are included here.
Savings
The Capital Plan supports investments that will decrease operating expenses by reducing costs associated with emergency repairs, maintenance of old systems, and energy inefficiency. A substantial portion of the Capital Plan is focused on these types of basic facility improvements.
Through an Executive Order relative to climate action, the City has committed to designing new buildings and selected major renovations to the standards required to attain U.S. Green Building Council LEED (Leadership in Energy and Environmental Design) certification.
By far the largest operational savings comes from the conversion of street lights to newer fixtures using Light Emitting Diode (LED) technology. To date, the City has performed over 51,000 streetlight LED retrofits. As a result, the FY22 Budget reflects energy avoidance of 37.4 MWh, a roughly $6 million non-personnel expense reduction directly attributable to this work.
Renew Boston Trust has systematically identified energy projects in the City’s 300+ buildings to both lower energy bills and reduce emissions. The City finances the program through general obligation bonds, paid for in part from reduced energy consumption at City departments.
A $10.7 million Phase 1 construction project completed in FY20 and will result in non-personnel operating expense savings of more than $600,000 annually. Implementation of the $24 million Phase 2 investment will increase estimated operating expense savings by $900,000 annually. A robust measurement and verification program was also established to ensure non-personnel expense savings truly offset fixed debt service costs related to the capital project. Implementation of a $24 million Phase 3 is also in development. The City will implement the program through contracts with Energy Service Companies (ESCOs) that will provide financial guarantees that the energy savings generated by the projects will be sufficient to cover anticipated debt service costs.
Costs
Increases in operating expenses expected as a result of capital projects are primarily driven by two areas: an expansion of the City’s IT infrastructure and the addition of buildings to the City’s portfolio.
The ongoing $128 million investment in radio system upgrade projects will require the procurement of compatible handheld units and related technology to achieve optimal functionality. The majority of these costs impact the City’s lease/purchase program, primarily for public safety departments and the Boston Public Health Department. The FY22 lease/purchase plan strategically includes 285 fully-compatible portable radios totaling approximately $1.2 million specifically for public safety departments.
Many of the projects identified in the Department of Innovation and Technology (DoIT)’s capital budget replace legacy systems, and in some cases they include an expansion of infrastructure, as well. Annual licensing fees to support the ongoing maintenance and upgrades of new software is typically required, and additional
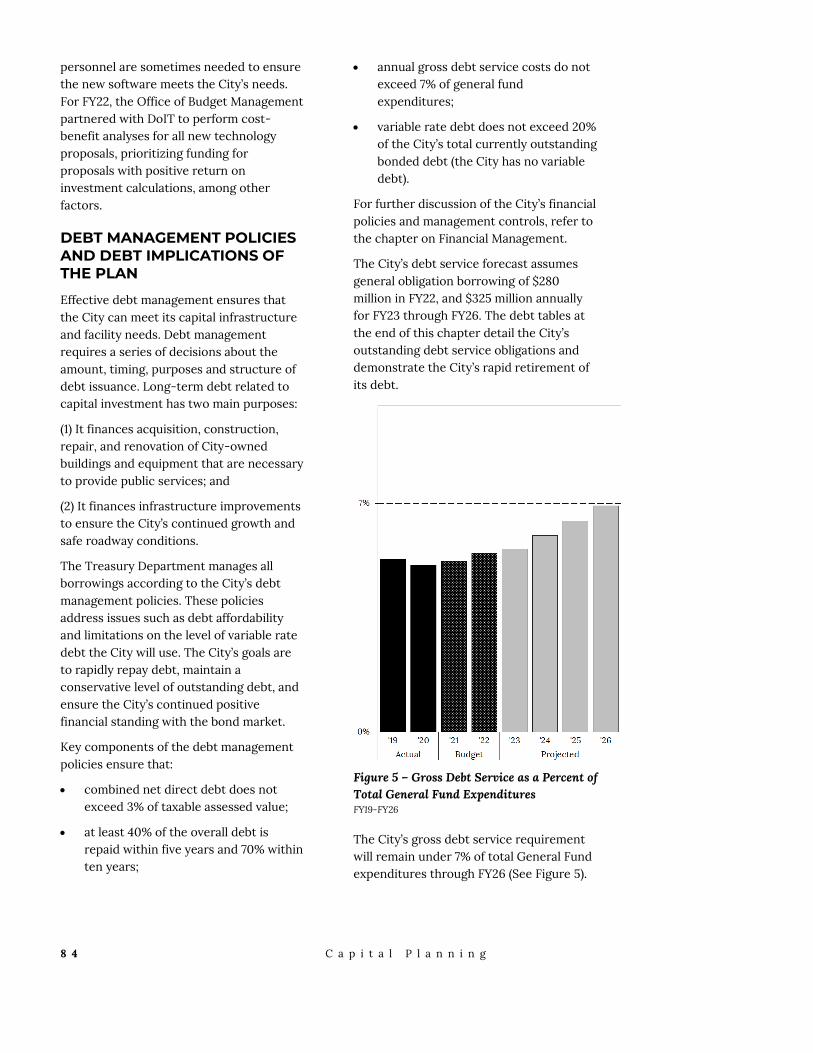
8 4 C a p i t a l P l a n n i n g
personnel are sometimes needed to ensure the new software meets the City’s needs. For FY22, the Office of Budget Management partnered with DoIT to perform cost-benefit analyses for all new technology proposals, prioritizing funding for proposals with positive return on investment calculations, among other factors.
DEBT MANAGEMENT POLICIES AND DEBT IMPLICATIONS OF THE PLAN
Effective debt management ensures that the City can meet its capital infrastructure and facility needs. Debt management requires a series of decisions about the amount, timing, purposes and structure of debt issuance. Long-term debt related to capital investment has two main purposes:
(1) It finances acquisition, construction, repair, and renovation of City-owned buildings and equipment that are necessary to provide public services; and
(2) It finances infrastructure improvements to ensure the City’s continued growth and safe roadway conditions.
The Treasury Department manages all borrowings according to the City’s debt management policies. These policies address issues such as debt affordability and limitations on the level of variable rate debt the City will use. The City’s goals are to rapidly repay debt, maintain a conservative level of outstanding debt, and ensure the City’s continued positive financial standing with the bond market.
Key components of the debt management policies ensure that:
combined net direct debt does not exceed 3% of taxable assessed value;
at least 40% of the overall debt is repaid within five years and 70% within ten years;
annual gross debt service costs do not exceed 7% of general fund expenditures;
variable rate debt does not exceed 20% of the City’s total currently outstanding bonded debt (the City has no variable debt).
For further discussion of the City’s financial policies and management controls, refer to the chapter on Financial Management.
The City’s debt service forecast assumes general obligation borrowing of $280 million in FY22, and $325 million annually for FY23 through FY26. The debt tables at the end of this chapter detail the City’s outstanding debt service obligations and demonstrate the City’s rapid retirement of its debt.
Figure 5 – Gross Debt Service as a Percent of Total General Fund Expenditures FY19-FY26
The City’s gross debt service requirement will remain under 7% of total General Fund expenditures through FY26 (See Figure 5).

C a p i t a l P l a n n i n g 8 5
The ratio of debt service to the City’s primary revenue source, the property tax levy, is projected to increase through FY25 (See Figure 6). Even with the increase, the ratio is not expected to exceed the City’s policy ceiling.
The City’s current overall debt burden (net direct debt to assessed property value of $179.79 billion) is approximately 0.69% as of December 1, 2020. The City’s net direct debt per capita currently stands at approximately $1,742 as of December 1, 2020.
Boston has been conservative about assuming long-term debt and aggressive about retiring debt expeditiously. Over 40% of the City’s outstanding debt will be retired within the next five years.
Figure 6 – Gross Debt Service as a Percent of the Net Property Tax Levy FY19-FY26
In December, 2020, Moody’s Investors Service and Standard & Poor’s reaffirmed Boston’s credit rating at Aaa, and AAA, respectively. A bond rating is a statement of credit quality and is analyzed when
determining the interest rate that should be paid for a municipality’s bonds. A higher bond rating translates into lower interest rates and real dollar savings for the City.

8 6 C a p i t a l P l a n n i n g
Exis
ting
Auth
oriz
atio
n
FY22
Auth
oriz
atio
n
FY23
-26
Auth
oriz
atio
n
Stat
eFe
dera
lO
ther
Trus
tTo
tal
Bost
on C
ente
rs fo
r You
th a
nd F
amili
es56
,431
,300
15
,200
,000
-
-
-
-
-
71
,631
,300
Bost
on P
lann
ing
and
Dev
elop
men
t Age
ncy
3,97
5,00
0
-
-
300,
000
-
-
-
4,27
5,00
0
Bost
on P
ublic
Lib
rary
70,3
10,76
7
5,80
0,00
0
38,9
83,73
3
-
-
262,
500
-
115,
357,0
00
Bost
on P
ublic
Sch
ools
366,
037,2
68
49
,934
,808
13
5,03
9,99
8
17
1,854
,035
-
13,0
60,0
00
-
73
5,92
6,10
9
Dep
artm
ent o
f Inn
ovat
ion
and
Tech
nolo
gy86
,198,
254
17
,727,6
44
2,84
4,25
8
-
-
-
-
10
6,77
0,15
6
Emer
genc
y M
anag
emen
t1,5
00,0
00
-
-
-
-
-
-
1,5
00,0
00
Envi
ronm
ent D
epar
tmen
t50
,298
,000
3,00
0,00
0
175,
000
1,088
,080
2,
500,
000
8,
000,
000
-
65
,061
,080
Fire
Dep
artm
ent
70,6
60,0
00
54
,400
,000
3,78
1,083
-
-
206,
614
-
129,
047,6
97
Nei
ghbo
rhoo
d D
evel
opm
ent
45,6
00,0
00
24
,000
,000
-
-
-
-
-
69,6
00,0
00
Offi
ce o
f Art
s & C
ultu
re7,6
05,0
00
4,00
0,00
0
4,80
0,00
0
-
-
-
-
16
,405
,000
Offi
ce o
f New
Urb
an M
echa
nics
200,
000
-
-
-
-
-
-
20
0,00
0
Park
s and
Rec
reat
ion
Dep
artm
ent
139,
305,
203
39,8
25,0
00
13
,848
,957
18
,390
,173
75
,694
,180
53
,034
,455
-
340,
097,9
68
Polic
e D
epar
tmen
t93
,870
,000
970,
000
6,20
0,00
0
-
-
-
-
10
1,040
,000
Prop
erty
Man
agem
ent D
epar
tmen
t19
4,79
0,50
0
15
,000
,000
-
-
-
4,
023,
273
-
21
3,81
3,77
3
Publ
ic H
ealth
Com
mis
sion
63,6
46,0
00
20
,766,
000
-
-
-
-
-
84,4
12,0
00
Publ
ic W
orks
Dep
artm
ent
335,
689,
000
20,6
10,0
00
36
,095
,000
144,
521,6
48
30
9,77
9,41
8
16
0,47
7,138
-
1,007
,172,
204
Tran
spor
tatio
n D
epar
tmen
t52
,887
,312
14
,000
,000
11,74
6,72
0
34,4
52,3
87
6,41
8,39
4
59,2
52,2
62
-
17
8,75
7,075
Tota
l1,6
39,0
03,6
04
285,
233,
452
253,
514,
749
370,
606,
323
394,
391,9
92
29
8,31
6,24
2
-
3,
241,0
66,3
62
Capi
tal P
roje
ct F
inan
cing
Fisc
al Y
ears
202
2 - 2
026

C a p i t a l P l a n n i n g 8 7
City of Boston
Outstanding Principal by Purpose as of December 1, 2020
Percent ofTotal
Outstanding @ OutstandingDecember 1, 2020 Debt
Purpose for Which Issued:General Purpose 837,527,479 69.2%
MCWT 12,448,409 1.0%Economic Development 8,132,026 0.7%
State Urban Development 4,366,958 0.4%Schools 3,609,620 0.3%
Public Buildings 183,269,565 15.2%Public Works 155,774,611 12.9%Cemeteries 4,419,302 0.4%
TOTAL: $ 1,209,547,970 100.0%

8 8 C a p i t a l P l a n n i n g
De
bt
Se
rvic
e R
eq
uir
em
en
ts S
um
ma
ry F
Y19
- F
Y2
6
Act
ua
lA
ctu
al
Pro
ject
ed
Pro
ject
ed
Pro
ject
ed
Pro
ject
ed
Pro
ject
ed
Pro
ject
ed
FY
19F
Y2
0F
Y2
1F
Y2
2F
Y2
3F
Y2
4F
Y2
5F
Y2
6
Gro
ss D
eb
t S
erv
ice
Re
qu
ire
me
nts
- B
on
de
d D
eb
t:
To
tal
Pri
nci
pa
l:12
5,8
31,
183
125
,914
,89
012
4,5
13,9
1613
8,8
78,2
37
150
,63
8,0
51
164
,39
2,8
182
04
,378
,09
42
08
,13
8,7
00
To
tal
Inte
rest
:5
6,5
71,7
30
57,
05
2,7
44
67,
702
,03
16
9,0
83
,56
270
,75
4,2
81
80
,16
7,4
158
8,7
13,7
41
96
,34
3,0
32
(1)
T
ota
l:18
2,4
02
,913
182
,96
7,6
34
192
,215
,94
72
07,
96
1,79
92
21,
39
2,3
32
24
4,5
60
,23
32
93
,09
1,8
34
30
4,4
81,
732
Le
ss:
Re
ve
nu
e D
ee
me
d A
va
ila
ble
fro
m R
ela
ted
So
urc
es:
(2)
Pre
miu
m,
Su
bsi
die
s, O
the
r3
,45
5,8
02
3,3
57,
85
53
,00
1,5
29
2,8
53
,14
12
,36
9,1
44
1,8
64
,63
31,
34
2,5
7179
9,9
67
Re
ne
w B
ost
on
Tru
st -
En
erg
y S
av
ing
s0
06
27,
42
59
09
,073
2,2
50
,00
02
,95
0,0
00
2,8
75,0
00
2,8
00
,00
0
Acc
rue
d I
nte
rest
00
00
00
00
(3
) I
rrig
ati
on
Pro
ject
9,1
49
00
00
00
0
(4)
10
10 M
ass
ach
use
tts
Av
en
ue
Pro
ject
1,9
54
,914
1,9
24
,36
32
,40
9,2
88
2,6
44
,95
12
,08
9,2
69
00
0
(5)
Pe
nsi
on
Ma
na
ge
me
nt
Sy
ste
m1,
90
2,6
68
1,9
03
,312
1,9
04
,18
78
93
,75
26
40
,475
45
,39
44
5,3
760
Sin
kin
g F
un
d f
or
No
ve
mb
er
20
09
QS
CB
00
00
00
20
,00
0,0
00
0
Plu
s: I
nte
rest
on
Te
mp
ora
ry L
oa
n N
ote
s a
nd
Ad
dit
ion
al
Ite
ms:
Re
ve
nu
e A
nti
cip
ati
on
00
2,4
43
,00
03
,00
0,0
00
3,0
00
,00
03
,00
0,0
00
3,0
00
,00
03
,00
0,0
00
Co
st o
f Is
sua
nce
109
,85
610
9,3
185
00
,00
05
00
,00
05
00
,00
05
00
,00
05
00
,00
05
00
,00
0
Le
ase
Pa
ym
en
t fo
r B
oll
ing
Mu
nic
ipa
l B
uil
din
g6
38
,00
06
38
,00
00
00
00
0
(6)
Sin
kin
g F
un
d f
or
No
v.,
20
09
QS
CB
1,4
54
,54
51,
45
4,5
45
1,4
54
,54
51,
45
4,5
45
1,4
54
,54
51,
45
4,5
45
36
3,6
37
0
To
tal
De
bt
Se
rvic
e/
Bu
dg
et
Su
mm
ary
:17
7,2
82
,78
017
7,9
83
,96
718
8,6
71,0
63
20
5,6
15,4
27
218
,99
7,9
90
24
4,6
54
,75
12
72,6
92
,52
33
04
,38
1,76
5
Le
ss A
dd
itio
na
l A
dju
stm
en
ts:
Sch
oo
l C
on
stru
ctio
n A
ssis
tan
ce5
,10
7,3
51
2,4
61,
33
00
00
00
0
To
tal
Ne
t D
eb
t S
erv
ice
Re
qu
ire
me
nts
:17
2,1
75,4
29
175
,52
2,6
37
188
,671
,06
32
05
,615
,42
72
18,9
97,
99
02
44
,65
4,7
51
272
,69
2,5
23
30
4,3
81,
765
NO
TE
S:
(1)
FY
19 -
th
e C
ity
iss
ue
d:
$14
5.1
0 m
illi
on
in
Ge
ne
ral
Ob
lig
ati
on
Bo
nd
s w
ith
a 2
0-y
ea
r m
atu
rity
an
d a
tru
e i
nte
rest
co
st o
f 2
.74
9%
; sa
le c
lose
d M
arc
h 2
019
.
$8
2,5
90
,00
0 i
n G
en
era
l O
bli
ga
tio
n R
efu
nd
ing
Bo
nd
s w
ith
a 1
3-y
ea
r m
atu
rity
an
d a
tru
e i
nte
rest
co
st o
f 2
.09
%;
sale
clo
sed
Oct
ob
er,
20
19
FY
20
- T
he
Cit
y d
id n
ot
issu
e a
ny
bo
nd
s.
FY
21
- th
e C
ity
iss
ue
d:
$12
1,6
60
,00
0 i
n G
en
era
l O
bli
ga
tio
n B
on
ds
wit
h a
20
-ye
ar
ma
turi
ty a
nd
a t
rue
in
tere
st c
ost
of
1.2
9%
; sa
le c
lose
d D
ece
mb
er
30
, 2
02
0
$2
3,8
85
,00
0 i
n G
en
era
l O
bli
ga
tio
n B
on
ds
(Gre
en
Bo
nd
s) w
ith
a 2
0-y
ea
r m
atu
rity
an
d a
tru
e i
nte
rest
co
st o
f 1.
82
%;
sale
clo
sed
De
cem
be
r 3
0,
20
20
$3
5,0
00
,00
0 i
n G
en
era
l O
bli
ga
tio
n B
on
ds
(Fe
de
rall
y T
ax
ab
le,
So
cia
l B
on
ds)
wit
h a
15
-ye
ar
ma
turi
ty a
nd
a t
rue
in
tere
st c
ost
of
1.75
%;
sale
clo
sed
De
cem
be
r 3
0,
20
20
$2
9,5
65
,00
0 i
n G
en
era
l O
bli
ga
tio
n R
efu
nd
ing
Bo
nd
s w
ith
a 6
-ye
ar
ma
turi
ty a
nd
a t
rue
in
tere
st c
ost
of
1.2
2%
; sa
le c
lose
d D
ece
mb
er
30
, 2
02
0
$6
1,8
40
,00
0 i
n G
en
era
l O
bli
ga
tio
n R
efu
nd
ing
Bo
nd
s (F
ed
era
ll y
Ta
xa
ble
) w
ith
a 1
3-y
ea
r m
atu
rity
an
d a
tru
e i
nte
rest
co
st o
f 1.
22
%;
sale
clo
sed
De
cem
be
r 3
0,
20
20
Ass
um
pti
on
s:
FY
22
- A
ssu
me
s G
en
era
l O
bli
ga
tio
n d
eb
t is
sua
nce
of
$2
60
mil
lio
n a
nd
$2
0 m
illi
on
fo
r th
e R
en
ew
Bo
sto
n T
rust
pro
ject
ea
ch w
ith
a 2
0 y
ea
r m
atu
rity
an
d a
n i
nte
rest
ra
te o
f 5
.0%
.
FY
23
- A
ssu
me
s G
en
era
l O
bli
ga
tio
n d
eb
t is
sua
nce
of
$3
15 m
illi
on
an
d $
10 m
illi
on
fo
r th
e R
en
ew
Bo
sto
n T
rust
pro
ject
ea
ch w
ith
a 2
0 y
ea
r m
atu
rity
an
d a
n i
nte
rest
ra
te o
f 5
.0%
.
FY
24
- A
ssu
me
s G
en
era
l O
bli
ga
tio
n d
eb
t is
sua
nce
of
$3
25
mil
lio
n w
ith
a 2
0 y
ea
r m
atu
rity
an
d a
n i
nte
rest
ra
te o
f 5
.0%
.
FY
25
- A
ssu
me
s G
en
era
l O
bli
ga
tio
n d
eb
t is
sua
nce
of
$3
25
mil
lio
n w
ith
a 2
0 y
ea
r m
atu
rity
an
d a
n i
nte
rest
ra
te o
f 5
.0%
.
FY
26
- A
ssu
me
s G
en
era
l O
bli
ga
tio
n d
eb
t is
sua
nce
of
$3
25
mil
lio
n w
ith
a 2
0 y
ea
r m
atu
rity
an
d a
n i
nte
rest
ra
te o
f 5
.0%
.
(2)
Un
de
r th
e A
me
rica
n R
eco
ve
ry a
nd
Re
inv
est
me
nt
Act
of
20
09
(A
RR
A),
in
20
10 a
nd
20
11,
the
Cit
y i
ssu
ed
Ta
x B
en
efi
ted
Bo
nd
s w
hic
h a
re e
nti
tle
d t
o r
ece
ive
su
bsi
dy
pa
ym
en
ts f
rom
th
e F
ed
era
l G
ov
ern
me
nt.
Th
e I
RS
ha
s re
lea
sed
su
bsi
dy
re
du
ctio
n n
oti
fica
tio
ns
sin
ce M
arc
h o
f 2
013
, re
du
cin
g t
he
ex
pe
cte
d a
nn
ua
l su
bsi
dy
.
An
est
ima
ted
Su
bsi
dy
re
du
ctio
n t
o A
RR
A-r
ela
ted
iss
ua
nce
s o
f 7.
3%
pe
r y
ea
r fr
om
FY
20
22
th
rou
gh
FY
20
26
ha
s b
ee
n a
pp
lie
d i
n r
esp
on
se t
o I
RS
wit
hh
old
ing
no
tifi
cati
on
s.
(3)
De
bt
Se
rvic
e C
ost
s w
ill
be
off
set
by
th
e "
Fu
nd
fo
r P
ark
s a
nd
Re
cre
ati
on
".
(4)
De
bt
Se
rvic
e C
ost
s w
ill
be
off
set
by
ch
arg
ing
Cit
y d
ep
art
me
nts
fo
r th
e s
pa
ce t
he
y o
ccu
py
.
(5)
De
bt
Se
rvic
e C
ost
s w
ill
be
off
set
by
se
mi-
an
nu
al
pa
ym
en
ts f
rom
th
e R
eti
rem
en
t B
oa
rd.
(6)
Qu
art
erl
y p
ay
me
nts
of
pri
nci
pa
l in
th
e a
mo
un
t o
f $
36
3,6
36
.36
are
cu
rre
ntl
y b
ein
g m
ad
e t
o t
he
pa
yin
g a
ge
nt
wit
h r
esp
ect
to
th
e C
ity
's o
uts
tan
din
g $
20
mil
lio
n G
.O.
Qu
ali
fie
d S
cho
ol
Co
nst
ruct
ion
Bo
nd
s, 2
00
9-S
eri
es
A,
wh
ich
we
re i
ssu
ed
as
tax
cre
dit
bo
nd
s th
at
do
no
t e
arn
in
tere
st.
Th
ese
fu
nd
s a
re k
ep
t in
esc
row
un
til
the
Bo
nd
s m
atu
re o
n S
ep
tem
be
r 15
, 2
02
4.

B o s t o n ’ s P e o p l e a n d E c o n o m y 8 9
Boston’s People and Economy
INTRODUCTION
Boston was first incorporated as a town in 1630 and then as a city in 1822, making it one of the oldest cities in the United States. The City has evolved into a center for innovation and entrepreneurship as well as for social and political change. Boston has become the economic engine and cultural hub of New England.
As the seat of Suffolk County, the capital city of Massachusetts, and the region’s hub, Boston is home to approximately 693 thousand residents, many world-renowned institutions of higher education, some of the world’s finest inpatient hospitals, numerous successful corporations, and many professional sports teams and cultural organizations. Tens of millions of people visit Boston each year to take in its historic sites, diverse neighborhoods, cultural or sporting events, and functions in one of Boston’s convention centers.
The outbreak of COVID-19, a respiratory illness caused by a new strain of coronavirus, which began in early 2020, required restrictive public health interventions that created severe economic disruptions in Boston and across the world and continues to adversely affect global, national, state and local economic activity. The City is vigorously pursuing economic opportunities and investments, to ensure Boston will continue to be a global leader in the twenty-first century.
Boston, Massachusetts Quick Facts Government
Founded
State (capital)
County (seat)
Government Type
Mayoral Term (years)
Councilor Term (years)
District Councilors
At-Large Councilors
U.S. House Reps. (MA)
Electoral Votes (MA)
Sept. 17, 1630
Massachusetts
Suffolk
Strong Mayor-Council
4
2
9
4
9
11
People
Population (2018) 692,600
% of State 10.0%
% Growth (from 2010) 12.1%
% Non-white/Hispanic 55.5%
% White/non-Hispanic 44.5%
Median age (years) 32.6 Geography
Neighborhoods 23
Land area (Sq. miles) 48.4
Water area (Sq. miles) 41.2
Density (Pop./Sq. mile) 14,155
Public road mileage 917.1
Ft. above sea-level 141.0 Boston Firsts
Public park (Bos. Common) 1634
Public school (Boston Latin) 1635
Public library 1653
Telephone 1875
Subway 1897
World Series 1903
Mutual Fund 1924
Community Health Center 1965
Table 1
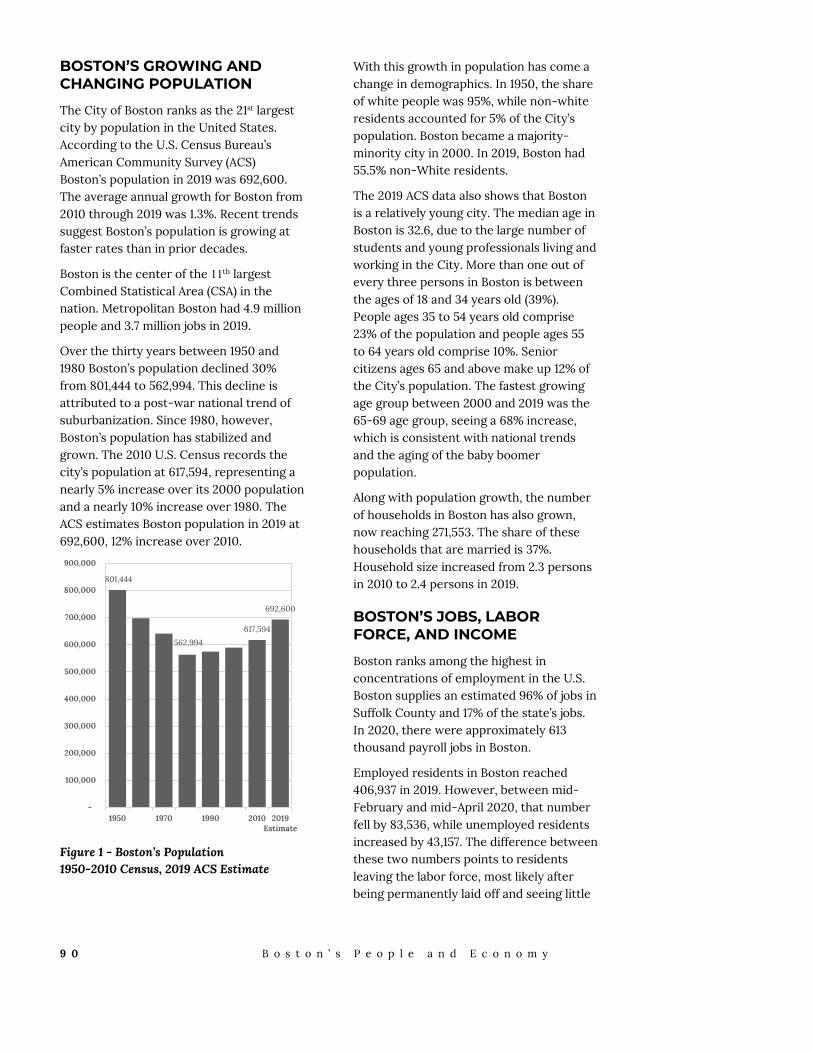
9 0 B o s t o n ’ s P e o p l e a n d E c o n o m y
BOSTON’S GROWING AND CHANGING POPULATION
The City of Boston ranks as the 21st largest city by population in the United States. According to the U.S. Census Bureau’s American Community Survey (ACS) Boston’s population in 2019 was 692,600. The average annual growth for Boston from 2010 through 2019 was 1.3%. Recent trends suggest Boston’s population is growing at faster rates than in prior decades.
Boston is the center of the 11th largest Combined Statistical Area (CSA) in the nation. Metropolitan Boston had 4.9 million people and 3.7 million jobs in 2019.
Over the thirty years between 1950 and 1980 Boston’s population declined 30% from 801,444 to 562,994. This decline is attributed to a post-war national trend of suburbanization. Since 1980, however, Boston’s population has stabilized and grown. The 2010 U.S. Census records the city’s population at 617,594, representing a nearly 5% increase over its 2000 population and a nearly 10% increase over 1980. The ACS estimates Boston population in 2019 at 692,600, 12% increase over 2010.
Figure 1 - Boston’s Population 1950-2010 Census, 2019 ACS Estimate
With this growth in population has come a change in demographics. In 1950, the share of white people was 95%, while non-white residents accounted for 5% of the City’s population. Boston became a majority-minority city in 2000. In 2019, Boston had 55.5% non-White residents.
The 2019 ACS data also shows that Boston is a relatively young city. The median age in Boston is 32.6, due to the large number of students and young professionals living and working in the City. More than one out of every three persons in Boston is between the ages of 18 and 34 years old (39%). People ages 35 to 54 years old comprise 23% of the population and people ages 55 to 64 years old comprise 10%. Senior citizens ages 65 and above make up 12% of the City’s population. The fastest growing age group between 2000 and 2019 was the 65-69 age group, seeing a 68% increase, which is consistent with national trends and the aging of the baby boomer population.
Along with population growth, the number of households in Boston has also grown, now reaching 271,553. The share of these households that are married is 37%. Household size increased from 2.3 persons in 2010 to 2.4 persons in 2019.
BOSTON’S JOBS, LABOR FORCE, AND INCOME
Boston ranks among the highest in concentrations of employment in the U.S. Boston supplies an estimated 96% of jobs in Suffolk County and 17% of the state’s jobs. In 2020, there were approximately 613 thousand payroll jobs in Boston.
Employed residents in Boston reached 406,937 in 2019. However, between mid-February and mid-April 2020, that number fell by 83,536, while unemployed residents increased by 43,157. The difference between these two numbers points to residents leaving the labor force, most likely after being permanently laid off and seeing little
801,444
562,994
617,594
692,600
-
100,000
200,000
300,000
400,000
500,000
600,000
700,000
800,000
900,000
1950 1970 1990 2010 2019Estimate

B o s t o n ’ s P e o p l e a n d E c o n o m y 9 1
hope of finding a new job in uncertain economic times.
Prior to the COVID-19 pandemic, the unemployment rate had been decreasing for both Massachusetts and Boston, with both dropping below 3% in 2019. However, the prolonged shutdown in Massachusetts due to the spread of the virus in the state caused the state unemployment rate to reach 16.4% in April 2020, or 558 thousand unemployed residents, the highest rate in the country. In May, the rate began dropping, reaching 7.1% in February 2021, or 267 thousand unemployed residents. Boston’s unemployment rate reached 19.3% in June, falling to 7.6% in December.
Figure 2 shows the National, Massachusetts and Boston Metro Area Unemployment rates since 2000. During and following recessions, unemployment rates increase dramatically. Nationally, the highest annual rate occurred in 2010, averaging 9.6%, following the Great Recession. In Massachusetts and Boston, the current recession has caused for the highest annual average, with 9.0% and 9.3%, respectively.
Figure 2 National, Massachusetts and Boston Metro Unemployment Rates, 2000-2020, Federal Reserve Economic Data
Higher education, health care, and financial services play a major role in Boston’s economy. Since the Great Recession, Boston’s job growth was positive across most industries but was mostly concentrated in health care and social assistance, professional and technical
services, and education. The health care and social assistance industry employs the largest number of people in Boston, 22.1% of total jobs. Educational services is an area of specialization for Boston (5.4% of total jobs), with an employment share three times the national average.
Boston hosts 35 universities, colleges, and community colleges, with a combined enrollment of approximately 150,000 students annually. Included among the city’s colleges and universities are some of the finest educational institutions in the country, including Boston College, Boston University, Northeastern University and Harvard University.
These institutions of higher education have a major effect on the Boston’s economy. Because many of these students remain in Boston after graduation, the city’s educational institutions are a major source of highly-skilled professionals for Boston’s workforce.
As the COVID-19 pandemic continues to surge throughout the country, and with many institutions continuing remote learning in the spring 2021 semester, enrollment figures are continuing to decline. Nationally, undergraduate enrollment was down 4.5%, while graduate enrollment increased by 4.3% compared to spring 2020. Overall, college enrollment stood at 2.9% lower than last spring’s level.
In 2019, the Boston Planning and Development Agency (BPDA) approved 672,000 new square feet of institutional development across the city and in 2020 over 1.1 million square feet were approved. These new projects primarily came from major educational and medical institutions.
Many of the nation’s finest research and teaching hospitals are located in Boston, including Massachusetts General Hospital, Brigham and Women’s Hospital, Beth Israel Deaconess Hospital, Boston Medical Center, Tufts Medical Center, and Boston Children’s Hospital, as well as 25
0%
2%
4%
6%
8%
10%
US MA Boston

9 2 B o s t o n ’ s P e o p l e a n d E c o n o m y
community-based health centers. In total, there are 21 inpatient hospitals in the city with a combined 6,095 beds as of 2019. Furthermore, Boston is home to the medical and dental schools of Harvard University, Tufts University, and Boston University.
The Boston metropolitan area remains the nation’s foremost region for the life sciences industry. Boston’s life science industry benefits from skilled labor force availability, leading universities in basic academic science fields, innovative research and development districts, proximity to major research hospitals, and strategic presence of venture capital resources. The realty group Jones Lang LaSalle ranks the Greater Boston area as the largest concentration of life science researchers (pharmaceuticals, biotechnology, and medical devices) in the U.S., home to 19 of the 20 largest biotechnology and pharmaceutical companies by market cap.
Many of the country’s leading financial services firms are located in Boston, including Fidelity Investments, John Hancock/Manulife Financial, State Street Corporation, and Wellington Management.
Table 2 provides a summary of the number of payroll jobs by industry for the year 2020.
Boston’s Total Payroll Job Estimates by Industry - 2020
Industry 2020 Percent
Total Jobs 612,533 100%
Table 2 Source: Massachusetts Executive Office of Labor and Workforce Development (EOLWD), ES-202 and CES, BPDA Research Division Analysis.
The BPDA estimates that the total number of payroll jobs located in Boston fell from 670,886 in 2019 to 612,535 in 2020, or a loss of approximately 58,000 payroll jobs (8.7%). This decrease is much greater than the 15,000 average annual jobs lost in Boston between 2001 and 2004 or the 17,500 jobs lost in 2009.
Job losses were not felt evenly across industries. Industries that rely on physical proximity suffered significant job losses. Figure 3 illustrates the percentage of jobs lost in industries where more than 10% of jobs were lost. Accommodation and Food Services suffered the highest number of jobs lost as well as the highest percentage, dropping from 62,687 jobs in 2019 to 37,816 in 2020 – almost 25,000 jobs lost, or 40%. Arts, Entertainment and Recreation lost 3,343 jobs, or 29%.

B o s t o n ’ s P e o p l e a n d E c o n o m y 9 3
Figure 3 Percentage Job Loss by Industry, 2020, BPDA Research Division Analysis
When examining the types of jobs held by Boston residents, it is clear the city’s resident labor force has undergone a significant transformation. Of the 266,505 Boston residents working in 1970, 45% held blue-collar jobs and 55% held white-collar jobs. In 2019, of the 406,937 Boston residents working, those holding blue-collar jobs fell to 29% and those employed in white-collar occupations rose to 71%. The changing needs of a service-based economy have resulted in a better-educated and more highly skilled workforce. In 2019, 89% of the adults in Boston had finished high school, compared to 53% in 1970. In 2019, 52% of adults in Boston had completed college education, compared to only 10% in 1970 and 36% in 2000.
Along with Boston’s well-educated workforce comes comparatively high household incomes and wages. In 2010, median household income in the City was $49,893, up 27% from 2000. Since 1990, median household income in Suffolk County was consistently more than 30% greater than the median household income in the United States, 59% greater in 2010. Per capita Personal Income in Suffolk County was $82,632 in 2018, 9% increase since 2010. The average annual wage and salary disbursement per job in Suffolk County was $102,336 in 2018. Beginning in
1990, wages in Suffolk County began to grow faster than the state and the nation. In 2018, the average annual wage per job in Suffolk County was 38% higher than the average Massachusetts wage and 76% higher than the national average wage.
Figure 4 –Average Annual Wages in the U.S., Massachusetts and Suffolk County 1980-2010 Census, 2018 ACS Estimate
ECONOMIC ACTIVITY IN THE CITY OF BOSTON
Transportation
A key to any city’s economic health is its ability to transport residents, workers, visitors, and goods efficiently and safely to their intended destinations, whether in the city or throughout the region.
Local Transportation
According to the 2010 census, 36% of households in Boston did not have a vehicle, which makes public and alternative transportation particularly important to city residents.
Boston’s public transportation system reaches into every neighborhood of the city whether by trolley, subway, bus, or commuter train. The MBTA provides commuter rail, subway, local and express
-40%
-29%
-26%
-20%
-12%
-12%
-11%
-11%
Accomodation and FoodServices
Arts, Entertainment, andRecreation
Other Services, excludingPublic Admin.
Transportation andWarehousing
Construction
Natural Resources andMining
Educational Services
Wholesale Trade
$-
$20,000
$40,000
$60,000
$80,000
$100,000
$120,000
1980 1990 2000 2010 2018
US MA Suffolk County

9 4 B o s t o n ’ s P e o p l e a n d E c o n o m y
bus services, and water ferry service to 175 cities and towns in eastern Massachusetts, offering public transit to a population of almost 4.8 million people in an area of 3,244 square miles. Prior to the COVID-19 pandemic, the MBTA served about 1.2 million passengers every weekday. As of November 2020, that number dropped to approximately 368,000 passengers. Figure 5 illustrates the average weekday trips by month in 2019 and 2020.
Figure 5 MBTA Average Weekday Trip by Month, 2019-2020
The Boston economy will struggle return to normal until residents and visitors feel fully comfortable taking mass transit again.
National and International Travel
Boston’s Logan International Airport is the most active airport in New England. In 2019, Logan served over 42.5 million international and domestic passengers, a 3.9% increase from 2018. In January and February 2020, the number of passengers departing and arriving in Logan airport increased by 7% compared to 2019, however starting in March, the numbers began declining rapidly due to the COVID-19 pandemic and the travel restrictions which followed. Total number of passengers in 2020 dropped to 12.6 million in 2020, a 70% decrease from 2019. Total number of flights, domestic and
international, decreased 52% between 2019 and 2020.
Figure 6 Air Passenger Travel at Logan Airport by Month, 2019-2020, Massport Airport Statistics
Tourism and Culture
Boston entertains many types of visitors each year: those seeking historical sites, museums, sporting events, restaurants, theatre or business conventions. According to the Greater Boston Convention and Visitors Bureau, an estimated 22.7 million people visited Boston in 2019. Of those, an estimated 2.9 million were international visitors to Greater Boston. Given the impact of COVID-19 on travel and tourism, we can expect a significant decline in the number of tourists visiting Boston in 2020 and 20201.
Prior to the pandemic, Boston was an attractive destination for conventions, meetings, and gate shows. The Boston Convention and Exhibition Center (BCEC), located on a 60-acre site in South Boston, contains 516,000 square feet of contiguous exhibition space designed to accommodate larger conventions. This facility, along with new hotel projects in the City, has given a significant boost to the local economy. In 2019, the Boston Convention and Exhibition
1,370,000
1,200,00
0
155,000
368,000
0
200,000
400,000
600,000
800,000
1,000,000
1,200,000
1,400,000
1,600,000
2019 2020
0
500,000
1,000,000
1,500,000
2,000,000
2,500,000
2019 2020

B o s t o n ’ s P e o p l e a n d E c o n o m y 9 5
Center, along with the John B. Hynes Memorial Convention Center, hosted 336 events, with an aggregate of 832,243 attendees, generating 800,000 hotel room nights and $870 million in economic impact. The COVID-19 pandemic forced the cancellation of conventions and events, and the BCEC was converted to the Boston Hope field hospital in April and May.
The Boston area is home to five major professional sports teams: The Boston Red Sox baseball team plays at historic Fenway Park, and the Boston Bruins hockey team and the Boston Celtics basketball team play at the TD Garden. The New England Patriots football and Revolution soccer teams play at Gillette Stadium in nearby Foxborough, MA.
The New England Aquarium, Museum of Fine Arts, Isabella Stewart Gardener Museum, Institute of Contemporary Art, and many other attractions bring in thousands of tourists each year. The city also provides venues for concerts, ice shows, circuses and other entertainment performances as well as street festivals and parades in its neighborhoods and parks.
Hotels
Tourism is a large Boston industry, which supported approximately 63,000 Accommodation and Food Services jobs in 2019, 9.3% of Boston’s total payroll jobs. The hotel industry provided 11,609 direct jobs in 2018, 1.8% of Boston’s total payroll jobs. These significant shares exposed the City to high rates of unemployment, due to the direct hit the industry has suffered and will continue to suffer due to COVID-19. In 2020, Accommodation and Food Services jobs decreased by 39.7%, losing 24,871 jobs in total.
As of January 2020, Boston had 93 hotels, with an average daily room rate of $269 per night. According to the Pinnacle Perspective Monthly Report, the average occupancy rate of hotels in Boston was 79.8% from 2009 through 2019. The rate
dipped in 2009 with the Great Recession but soon recovered, reaching an average of 83.7% in November 2019.
Due to COVID-19 and the state’s stay-at-home advisory, the occupancy rate dropped from 72.7% in February 2020 to 5.3% in April. Overall, the lodging market in Boston and Cambridge’s occupancy rate dropped to less than 26% in 2020, driving revenue per available room down more than 80% percent, according to the Pinnacle Advisory Group. The projected 2021 rate will increase to 42%, still half of the 2019 rate.
Figure 7 Boston Average Daily Rate and Room Occupancy, 2010-2020, Pinnacle Advisory Group and BPDA Research Division
The number of hotel rooms available in the City has grown over the last 10 years, increasing from about 18,000 rooms to almost 23,000 rooms. Much of this was in response to demand resulting from the construction of the Boston Convention and Exhibition Center (BCEC). The BCEC and the smaller Hynes Convention Center produce considerable demand for hotel nights.
At the end of 2019, nearly one million square feet of hotel space was under construction and 800,000 square feet was
0%
10%
20%
30%
40%
50%
60%
70%
80%
90%
$-
$50
$100
$150
$200
$250
$300
2010 2012 2014 2016 2018 2020
Average Daily Rate
Occupancy Rate

9 6 B o s t o n ’ s P e o p l e a n d E c o n o m y
completed in Boston, notably in the Back Bay, Downtown, Roxbury, and South Boston neighborhoods.
Consumer Spending
Overall consumer spending by Boston residents, which includes both online and in-person transactions, fell by 19% during the month of March and 41% in April as the COVID-19 shutdown began (See Figure 8). Boston residents who maintained their jobs during the pandemic still had income to spend, but may have shifted their spending patterns in light of the public health risks (for example limiting restaurant dining). However, for residents who lost their jobs or a significant portion of their income, lack of financial resources became a driving factor behind consumer spending decisions.
Between December 2020 and February 2021 total spending averaged -2% compared to January 2020. As of March 14, 2021, total spending by all consumers decreased by 1.1% compared to January 2020.
Boston spending on groceries has been elevated throughout the pandemic, as people eat at home more often, similar to national trends. On March 16, grocery spending peaked at 86.9% above January levels. In the months of March, September and December 2020 Grocery spending averaged 41% above January 2020 levels, reaching 48% in February 2021.
Spending in the Accommodation & Food category fell by 75% in April, increasing gradually over the spring as the stay-at-home advisory and other COVID related regulations were relaxed, averaging 33% less than January 2020 levels during the summer months. In February 2021, Accommodation & Food spending decreased by 36.3% compared to January 2020. Spending on Transportation decreased 83% in April 2020. It then increased slightly in the following months,
plateauing around 64% starting in July 2020.
Figure 8 Percent Change in Consumer Spending, January 2020-February 2021, Opportunity Insights Economic Tracker
Reduced consumer demand due to the pandemic continues to affect Boston businesses. Small business revenue in Boston fell by 67% from January to April 2020. Since September 2020, small business revenue averaged 54% below January 2020 levels. Revenue for small businesses in the Leisure and Hospitality sectors fell by 86% in April and is still down 71% in February 2021. Revenue for small businesses in the Education & Health Services sectors fell by 79% in May and was still down 65% percent in February 2021.
REAL ESTATE
The COVID-19 pandemic has altered the pace of development in Boston as construction activity was paused in the spring and the development review activities had to be restructured and moved online out of public health considerations. Moreover, the current economic recession’s length and impact are still not fully known and it is unclear how it will affect the Boston’s Real Estate market.
-41%
-3%
40% 48%
-75%
-30%
-83%
-62%
-100%
-80%
-60%
-40%
-20%
0%
20%
40%
60%
January2020
April2020
July2020
October2020
January2021
All Spending Grocery
Accommodation & Food Transportation

B o s t o n ’ s P e o p l e a n d E c o n o m y 9 7
Housing
The housing market is a source of growth for many industries and is a barometer of economic health overall. Since the end of the Great Recession, the housing market has come back unevenly across the country, with the COVID-19 pandemic creating a new set of challenges.
Despite initial setbacks during the spring and summer, the BPDA approved 15.9 million square feet of new development: 9.9 million residential square feet and 6.0 million non-residential square feet. A major contributor to the 2020 approval total is the Suffolk Downs Redevelopment which approved 7,150 new residential units in East Boston.
The 9.9 million residential square feet translate to over 10,123 new residential units, of which 2,826 are income-restricted. In comparison to earlier years, 2020 had a larger percentage of income-restricted units, at 27.9%.
Figure 9 Total Square Feet Approved by Residential and Non-Residential, 2014-2020, in millions, BPDA Research Division
The two-month construction halt in March-April 2020 affected the permitting of new projects in 2020. The year started strong with 2.5 million square feet of housing receiving permits in January and 1.4 million square feet in February. In March,
the number of permits declined to a little over 0.5 million square feet.
Vacancy rates in residential buildings with five or more units have increased during the pandemic. For the city as a whole, multifamily residential vacancy rates increased from 5.0% in the fourth quarter of 2019 to 10.9% in the fourth quarter of 2020.
Office Market
Prior to the COVID-19 pandemic, Boston experienced job growth in industries such as professional and scientific services, finance and insurance, which require commercial office space. This employment growth drove an increase in demand for office space in Boston. During the pandemic, many office workers began working from home and it is still unclear when and to what extent these workers will return to work in office.
As of 2020, there are approximately 112 million square feet of office space in Boston. Downtown, which includes the Financial District, remains Boston’s largest commercial office market with 48 million square feet of office space, followed by Back Bay with 17 million square feet and the South Boston Waterfront with 14 million square feet.
As existing leases expire and as new office developments come on line, reduced demand has led to increasing vacancy rates in the commercial office market, reaching 13% in the South Boston Waterfront and 10% in Downtown. The City’s total office real estate vacancy rate reached 8.8% in 2020.
Life Science and Technology Industry
Life science and biomedical research companies’ demand has shown to be resilient during the pandemic, unlike traditional office tenants. The Greater Boston lab and life science market has
5.7 4.8
8.9
5.0 4.5 4.7
9.9 3.9 4.3
6.5
5.2
7.4
5.3
6.0
9.6 9.1
15.5
10.2
11.9
10.0
15.9
0
2
4
6
8
10
12
14
16
18
2014 2015 2016 2017 2018 2019 2020Non-residential SF ApprovedResidential SF Approved

9 8 B o s t o n ’ s P e o p l e a n d E c o n o m y
continued to rank first across the nation in JLL annual report since 2012. As the lab space market in Cambridge becomes increasingly tight, Boston’s life science market absorbs the spillover, as well as independently attract new companies.
According to CBRE, several construction projects in the City, previously planned as office, are now likely becoming speculative lab developments. Samuels & Associates announced they will develop the remaining 250,000 sq. ft. of Car Gurus’ new headquarters building at 101 Massachusetts Ave into lab space. Current demand for lab space in Boston remains strong with 16 companies in the market for more than a combined 710,000 square feet of space downtown.

F i n a n c i a l M a n a g e m e n t o f t h e C i t y 9 9
Financial Management of the City
OVERVIEW
Strong financial management is the underpinning of City operations. Clear financial policies and practices provide a framework within which the City is able to safeguard the present, meet its obligations, and position itself for the future.
As the City’s Chief Executive Officer, the Mayor directs the City’s financial operations and has general supervision of and control over the City’s boards, commissions, officers, and departments.
The City operates under a cabinet form of government. This structure helps to facilitate the execution of mayoral priorities and the day-to-day executive and administrative business of the City.
The following departments are included in the Administration & Finance Cabinet and have major roles in the fiscal management of the City:
The Treasury Department collects all revenues due to the City and pays all amounts due for payrolls and outside vendors. The Treasury Department prudently manages the investment of City funds and prioritizes the safety of such investments.
The Auditing Department prepares the City’s annual financial statements, implements fiscal controls over departmental spending, provides technical assistance to departments, and reviews and processes all financial transactions for accuracy, completeness, and compliance.
The Assessing Department is responsible for the valuation and
assessment of all real and personal property in the City for the purpose of taxation.
The Office of Budget Management coordinates the analysis and presentation of the Mayor’s operating budget and capital plan, assembles, analyzes, and presents data with respect to revenue and debt management, and facilitates the establishment and use of data to analyze performance.
The Procurement Department procures all supplies, materials, and equipment, selects vendors through public bidding and processes purchase orders and contracts.
The Cabinet also includes the Office of Human Resources and the Office of Labor Relations. With employee compensation and health benefits comprising over three quarters of the City’s total appropriation, the management of these policy areas within a broader context promotes coordination and accountability across City government.
STRATEGIC FINANCIAL MANAGEMENT
Maintaining a healthy financial base that fully supports City services according to mayoral priorities requires both careful planning and proactive management. This work is reflected in restructuring City services in order to streamline operations, gaining improved operational efficiencies from financial management systems, securing sound recurring revenues, and making responsible spending adjustments in light of any revenue growth limitations in

1 0 0 F i n a n c i a l M a n a g e m e n t o f t h e C i t y
order to achieve a balanced budget. Strong financial management provides a framework within which the City is able to safeguard the present and position itself for the future.
Balanced Responsible Budgets
In accordance with state law, the City develops a balanced budget every year. The Massachusetts Department of Revenue (DOR) approves property tax rates during the tax certification process governed under General Laws Chapter 59, Section 23. This approval ensures that all cities and towns have balanced budgets and that tax levies are within the limits set by Proposition 2 ½ (see Revenue Estimates and Analysis section of Volume I for detail on Prop. 2 ½). Appropriations, fixed costs, and any prior year deficits along with the approved property tax levy, estimated local revenues, and available prior year surpluses must be in balance in order to obtain DOR authorization to issue property tax bills.
Healthy Credit Profile
In December 2020, Standard & Poor’s and Moody’s affirmed their AAA and Aaa bond ratings, respectively, the highest possible to achieve. These ratings reflect Boston’s sound fiscal management of a stable financial position and the City’s substantial and economically diverse tax base.
This superior credit quality allows the City to borrow new money and refinance existing debt at extremely attractive interest rates. In December 2020, the City sold a par amount of $180.5 million general obligation bonds that resulted in proceeds of $210.5 million. The City also issued $91.4 million in refunding bonds that resulted in $10.6 million in net present value savings in debt service.
Maximizing Return on Investment
The City has articulated a vision to make finance a high performing organization in supporting and serving the departments and citizens of Boston. By making daily operations more efficient, using leading
business practices, spending more time on value-added activities, improving customer service while maintaining appropriate controls, and engaging the next generation of finance leaders, this City has been at the forefront of municipal finance.
Stable Revenue Base
Over 88% of recurring general fund revenue comes from the property tax and state aid. The continued net decline in state aid, the City’s second largest single source of revenue, highlights the risk of relying on any one source of revenue. The City protects and grows its revenue base through the expansion of current revenue sources and the pursuit of diversified revenue sources that fit well with its economic strengths.
The City’s tax base has experienced significant growth. Based on assessed values as of January 1, 2020 Fiscal 2021 assessments totaled $190.7 billion, a 115% increase over the past 10 years.
Multi-Year Budget Plan
The City develops a financial forecast as part of the yearly budget process. Preparing a multi-year planning horizon provides time for the Administration to make adjustments and/or policy decisions that may be necessary.
FINANCIAL POLICIES, PROCEDURES & CONTROLS
Pursuant to state law mandates and policy initiatives, the City has well-established policies and internal controls to govern its financial operations effectively. These policies and controls are designed to maximize revenue collections, safeguard assets, monitor both operating and capital spending, evaluate infrastructure needs, and enhance the City’s internal control of its business procedures. The major components of the City’s system of financial management controls and relevant financial policies are discussed below.

F i n a n c i a l M a n a g e m e n t o f t h e C i t y 1 0 1
Expenditure Controls
The City operates under several statutory financial control systems which are summarized in the Statutes and Ordinances section in Volume I. Along with conservative revenue estimates and strong budgetary flexibility, the City is able to maintain a solid financial position. The City monitors spending and all transactions go through a budget-check process prior to procurement. Maintaining tight central expenditure controls allows for critical review of all non-personnel spending as well as the ability to adjust to fiscal changes or trends. Additionally, the Office of Budget Management prepares a monthly variance report, updating all departments expected year-end position using actual information, and maintains continuous dialogue with departments throughout the year.
Position Review Committee (PRC)
The PRC is comprised of the Chief Financial Officer, the Human Resources Director, and the City’s Budget Director. In place for over a decade, the committee serves to strictly control and monitor all hiring. In a budget where people and the benefits they carry account for over three quarters of total appropriations, this committee has been instrumental in maximizing City resources.
Debt Management
The City continually evaluates the potential impact of debt issuance on cash flow, credit, and statutory debt capacity. The Treasury Department manages all City borrowings, focusing on the timing of them in order to take advantage of favorable market conditions. The City’s cash flow is anchored by the quarterly billing of the property tax and the monthly receipt of state aid distributions. Treasury manages this cash flow wisely, obviating the need to borrow for operating purposes.
The Treasury Department also ensures adherence to the City’s conservative debt policies, including the rapid repayment of debt where at least 40% of overall debt is repaid within 5 years and 70% in 10 years,
as well as a 7% ceiling on debt service as a percentage of general fund expenditures. The City imposes a 20% ceiling on variable debt and has no variable debt outstanding at this time. Lease-purchase financing of equipment with a three-to-seven year useful life is used to replace front-line equipment and upgrade technology.
Capital Planning
A capital planning process aligned with the annual operating budget cycle allows for the regular reassessment of capital needs, the refinement of projections, and the update of the City’s rolling five-year capital plan. The City prioritizes capital requests and takes into account the financial requirements and timing of these requests in order to recommend the responsible allocation of resources.
The City primarily funds its capital plan through the issuance of general obligation bonds. The size of the City’s bond issue is consistent with the City’s financial management policies regarding debt levels, debt service, and rate of debt retirement.
Fund Balance Policy
The City maintains adequate levels of fund balance to mitigate current and future risks – a generally accepted accounting principles (GAAP) Unassigned Fund Balance in the General Fund that is 15% or higher than the current fiscal year’s GAAP General Fund Operating Expenditures, and a Budgetary Unassigned Fund Balance at 10% or higher than Budgetary Operating Expenses.
Budgetary fund balance can be appropriated for use during the fiscal year and is more commonly referred to as “free cash” when used this way. This item is most simply described as the portion of available reserves, generated to a considerable degree by annual operating surpluses, which the City can responsibly appropriate for spending. The appropriation of Budgetary Fund Balance or Free Cash certified by the MA Department of Revenue (DOR) is only considered to offset certain

1 0 2 F i n a n c i a l M a n a g e m e n t o f t h e C i t y
fixed costs (pensions, OPEB) or to fund extraordinary and non-recurring events as determined by the City Auditor.
Prior year certifications and the amount used or appropriated from each certification are in Table 1.
Budgetary Fund Balance
Date Certified
Annual Amount Certified
Amount Appropriated*
Mar. 2010 139.0 45.0
Mar. 2011 117.8 30.0
Mar. 2012 142.8 -
Mar. 2013 217.3 40.0
Mar. 2014 185.3 40.0
Mar. 2015 239.4 40.0
Mar. 2016 280.0 48.0**
Mar. 2017 337.8 40.0
Mar. 2018 346.5 40.0
May 2019 375.0 40.0
Apr. 2020 414.2 40.0 *Not all amounts appropriated were used **Includes $8M capital appropriation Notes: ($ millions)
Table 1
In April 2020, the Director of Accounts certified that the amount of funds available for appropriation (“free cash”), as of July 1, 2020, was $414.2 million. The FY22 budget assumes the use of $40 million in Budgetary Fund Balance from this certification. If the Budgetary Fund Balance is not required to fund expenses it reverts back to the pool of funds eligible to be certified as free cash. Budgetary Fund Balance was not required to be used in FY19 and FY20.
Investment Policy
Investment policies are defined in Chapter 643 of the Acts of 1983 (“The City of Boston Bond and Minibond Procedure Act”), Chapter 107 of the Acts of 1991, and Chapter 44 of the Massachusetts General Laws. The City’s policy for the investment of operating funds prioritizes security, liquidity, and yield. Certain limitations placed on the City’s investment activities or operational protocols are self-imposed so as to make sound, timely, and safe investment decisions. As a matter of practice, the City
tends to limit its investments to repurchase agreements, money markets and certificates of deposit, all of which are collateralized by U.S. Government obligations and are held with a third party.
Contracting Procedures
The Uniform Procurement Act (the UPA), Massachusetts General Laws Chapter 30B, creates uniform procedures for the contracting of services and supplies by all municipalities in the Commonwealth. The City has implemented internal processes to conform its contracting procedures to the requirements of the UPA and utilizes an online eProcurement system to further support these compliance efforts.
Tax Collections
Tax collection remedies as prescribed by statute are utilized when taxes become delinquent. The City’s ability to secure its right to foreclose by recording its tax title lien at the Registry of Deeds is the most effective tool available for payment enforcement.
The property tax collection rate was 98.8% of the FY20 gross tax levy as of June 30, 2020.
A Taxpayer Referral and Assistance Center provides “one-stop” service on tax-related matters and the City offers an on-line payment option for taxpayer convenience. Parcel-specific information as well as payment history is also available on-line.
Pension Management
The City’s employees are not participants in the federal social security system. Instead, they participate in a contributory defined benefit retirement system that is administered by the Boston Retirement System (BRS), of which the City is the largest member. The BRS provides pension benefits to retired City employees under a state contributory retirement statute and is administered by a Retirement Board comprised of five members: the City Auditor, who serves ex-officio; two individuals elected by members of the

F i n a n c i a l M a n a g e m e n t o f t h e C i t y 1 0 3
system; an individual chosen by the Mayor; and an individual chosen by the other four members or appointed by the Mayor, if a selection is not agreed upon within 30 days of a vacancy.
The BRS performs a full valuation every two years to determine the total system liability and assets and the annual funding requirement for future years.
The City’s pension liability is currently 75.60% funded and is on track to reduce the unfunded liability to zero by 2027, thirteen years prior to the legally required funding date of 2040. The BRS hires an investment manager who oversees the various fund managers of all (non-teacher) pension assets.
Other Post-Employment Benefits
Similar to pensions, employees earn post-employment health care and life insurance benefits (OPEB) over their years of active service, with those benefits being received during retirement. The City, including the Boston Public Health Commission (BPHC), has an unfunded liability for these benefits of $2.13 billion, as of the most recent independent actuarial valuation on June 30, 2019. The size of this liability is largely influenced by changes to retiree health benefits, the City’s annual additional contribution to fund the liability, and the discount rate assumed.
While the City is required by law to make an annual contribution toward reducing its unfunded pension liability, there is no such requirement for retiree health and life insurance benefits. In FY08, the City followed new Governmental Accounting Standards Board (GASB) requirements to identify and disclose this estimated liability, and also began voluntary annual allocations to fund the liability. Annual allocations are retained in an irrevocable Trust Fund, authorized through the City’s acceptance of M.G.L. Chapter 32B section 20. As of June 30, 2020, the Fund had a balance of $683.0 million.
The annual Actuarially Determined Contribution (ADC) for the City to significantly reduce the OPEB liability is projected at $205.3 million in FY22, as shown in Table 2. $187.4 million (91%) of this amount will be funded through a combination of pay-as-you-go benefit payments for current retirees, a $40 million FY22 allocation by the City to the Trust, and an additional $2.25 million deposit by the BPHC into the Trust.
FY22 Annual Actuarially Determined Contribution (ADC) for OPEB Liability Total ADC $205.3
Projected Benefit Payments by City $145.1
Contribution to OPEB Trust $42.3
%ADC
Total FY22 Payments $187.4 91%
Difference
($17.9) $ in millions
Table 2
As noted above, the City is currently on a schedule that targets reducing its pension liability by 2027, and then plans on redirecting some portion of its annual pension contribution to further reduce the OPEB liability. However, this schedule is illustrative only of the currently expected funding schedule, and actual circumstances will likely vary from current assumptions.
Risk Finance
The City’s risk-related costs related to legal liability claims, property losses, workplace injuries, and employee health care are managed by central departments, such as Law and Human Resources, in addition to individual operating departments. The Office of Budget Management’s Risk Finance unit works to maximize the effectiveness of these departmental efforts by reviewing cost trends, assisting in improvements, and implementing the City’s risk financing strategy.
The City’s risk financing strategy budgets for predictable levels of risk-related costs through the general fund, except for self-insured health care costs which are

1 0 4 F i n a n c i a l M a n a g e m e n t o f t h e C i t y
financed through trust funds established under MGL Ch 32b S. 3A. A catastrophic risk reserve is maintained for unexpected large losses, which allows the City to strategically purchase high deductible commercial insurance for specific exposures and minimum premium.
In addition to specific targeted insurance policies, the City purchases catastrophic property insurance for $100 million all risk coverage, after a $10 million deductible. The City partners with FM Global as its property insurer, to take advantage of FM Global’s engineering and loss control expertise in improving the resilience of the City’s buildings against all types of risk.
Reserve
As required by law since 1986, the City has maintained a reserve fund equal to 2 1/2% of the preceding year’s appropriations for all City departments except the School Department. The fund may be applied to extraordinary and unforeseen expenditures after June 1 in any fiscal year with the approval of the Mayor and the City Council. To date, this budgetary reserve has not been utilized. As of June 30, 2020, the reserve fund had a balance of $37.7 million.
Annual Audit/Management Letters
The City consistently receives unqualified opinions on the audit of its Basic Financial Statements and the Certificate of Achievement for Excellence in Financial Reporting from the Government Finance Officers Association for its Comprehensive Annual Financial Report. The City’s independent auditors also deliver a yearly management letter containing comments and recommendations on internal financial controls.
Financial Accounting Systems
The Boston Administrative Information System (BAIS), an integrated financial and human resources management system, supports financial management and improves operational efficiency. These systems support the rigorous monitoring
and reporting requirements enforced by the City.
FINANCIAL MANAGEMENT PROGRAMS
Performance Management and Program Evaluation
The City’s performance management and evaluation program aims to create a sustainable and reliable system to captures the core functions of City departments and citywide strategic goals, assist in the decision-making process, identify areas of improvement, and effectively communicate performance results to a broad range of stakeholders.
Using performance management as its foundation, the program encourages organizational changes and operational improvements that increase the effectiveness and productivity of City departments. The program does this by providing reliable, objective, and independent information and reports to City managers about department performance and operations.
Operational Reviews
The City systematically engages in independent operational reviews and other planning efforts aimed at making government more efficient in order to address areas needing renewed attention.
Energy Management
An Energy Management Unit develops design standards and implements measures that enhance the energy efficiency of the City’s new construction and capital improvement projects.
The conversion of street lights to newer fixtures using Light Emitting Diode (“LED”) technology has achieved significant operational savings.
In FY19, the City began implementing improvements to achieve utility cost savings at City facilities, under an initiative entitled “Renew Boston

F i n a n c i a l M a n a g e m e n t o f t h e C i t y 1 0 5
Trust.” The first phase was completed in FY20, the second phase is underway, and a third phase remains in development. The City plans to finance the program with general obligation bonds with debt service expected to be offset by the long-term energy savings guaranteed by the ESCO.
AUDITING & BUDGETING PRACTICES
The City prepares its comprehensive financial reports in accordance with generally accepted accounting principles (GAAP). However, accounting practices established by the Commonwealth’s Department of Revenue, the so-called “budgetary basis” which is a modified accrual method of accounting, is used in the annual general fund budget and property tax certification process. Budgetary basis departs from GAAP in the following ways:
(a) Real and personal property taxes are recorded as revenue when levied (budgetary), as opposed to when susceptible to accrual (GAAP).
(b) Encumbrances and continuing appropriations are recorded as the equivalent of expenditures (budgetary), as opposed to a reservation of fund balance (GAAP).
(c) Certain activities and transactions are presented as components of the general fund (budgetary), rather than as separate funds (GAAP).
(d) Prior years’ deficits and utilized available funds from prior years’ surpluses are recorded as expenditure and revenue items (budgetary), but have no effect on GAAP expenditures and revenues.
In addition, there are certain differences in classifications between revenues, expenditures and transfers. The reconciliation in Table 3 summarizes the differences between budgetary and GAAP basis accounting principles for the year ended June 30, 2020.
Table 4 shows a Statement of Revenues & Expenses and Changes in Fund Balance for FY19 & FY20 (actual) – FY21 (budgeted).
Financial statements for the fiscal year ended June 30, 2021 are expected to be available in late fall.

1 0 6 F i n a n c i a l M a n a g e m e n t o f t h e C i t y
Excess
Other (Deficiency) of
Financing Revenue and
Sources, Other Financing
Revenue Expenditures Net Sources
As reported on a budgetary basis 3,500,049 3,484,772 - 15,277
Adjustments:
Revenues to modified accrual basis 71,639 - - 71,639
Expenditures, encumbrances and
accruals, net - 2,047 - (2,047)
On-behalf contribution for
teachers pension 157,041 157,041 - -
Reclassifications:
Other transfers - (16,345) (16,345) -
As reported on a GAAP basis 3,728,729 3,627,515 (16,345) 84,869
Adjustments Between Budgetary Basis and
GAAP Basis of Accounting for FY20
(in thousands)
Table 3

F i n a n c i a l M a n a g e m e n t o f t h e C i t y 1 0 7
(in thousands)
2021 2020 2019
Revenues:
Real and personal property taxes 2,671,124 2,498,435 2,344,686
Excises 134,540 241,768 256,229
Payments in lieu of taxes 67,978 72,349 87,018
Fines 60,953 67,367 73,792
Investment income 4,000 29,472 30,408
Licenses and permits 61,960 88,272 82,658
Departmental and other 68,193 103,476 97,442
Intergovernmental 455,736 627,590 577,458
Total revenues 3,524,484 3,728,729 3,549,691
Expenditures:
Current:
General government 110,026 117,152 112,998
Human services 41,017 34,458 34,208
Public safety 744,491 763,381 726,406
Public works 125,043 111,346 106,504
Property and development 58,713 32,618 41,483
Parks and recreation 30,333 28,616 26,890
Library 41,387 38,270 38,597
Schools 1,260,490 1,176,493 1,118,332
Public health programs 106,474 94,337 87,487
Judgements and claims 5,000 11,670 1,202
Retirement costs 295,989 447,159 400,973
Other employee benefits 270,631 259,420 264,832
State and district assessments 317,670 299,740 283,360
Total Current Expenditures 3,407,263 3,414,660 3,243,272
Capital outlays 0 29,270 17,683
Debt Service 188,171 183,585 182,725
Total Expenditures 3,595,434 3,627,515 3,443,680
Excess/(deficiency) of revenues over
expenditures(70,950) 101,214 106,011
Other financing sources (uses):
Transfers in 70,950 0 0
Transfers out (1,455) (16,345) (1,455)
Total other financing sources 69,495 (16,345) (1,455)
Net change in fund balance (1,455) 84,869 104,556
Fund balance - beginning 1,271,479 1,186,610 1,082,054
Fund balance - ending 1,270,024 1,271,479 1,186,610
Statement of Revenues, Expenditures, and Changes in Fund Balances
Years ended June 30 2019 and 2020 (Actual), and 2021 (Budgeted)
Table 4
ADJUSTMENTS BETWEEN BUDGET GAAP BASIS
General Fund

1 0 8 F i n a n c i a l M a n a g e m e n t o f t h e C i t y
FUND STRUCTURE AND USE
The accounts of the City are organized on a fund basis. Each fund is considered to be a separate accounting entity and complies with finance-related legal requirements. All of the funds of the City can be divided into three categories: Governmental Funds, Proprietary Funds, and Fiduciary Funds.
The City has four governmental funds - the General Fund, Special Revenue Fund, Capital Projects Fund and all non-major governmental funds in an “Other” category. The General Fund is the only fund for which a budget is legally adopted and is used to account for all revenues, expenditures, and other financial resources except those required to be accounted for in other funds.
The Special Revenue Fund accounts for proceeds that are legally restricted for specific purposes. This fund accounts for federal and state grants and also money that has been set aside by state statute and can be used to support the City’s general fund operations.
The Capital Projects Fund accounts for financial resources, primarily from the issuance of bonds, used for the acquisition or construction of major capital facilities.
The Proprietary Funds are used to show activities that operate more like those of commercial enterprises. The City’s only proprietary is its Internal Service Fund, which accounts for the City’s self-insurance for health benefits.
Fiduciary Funds are used to account for resources held for the benefit of parties outside City government and are not available to support the City’s own programs. The City’s fiduciary funds are the Pension Trust Fund, the Other Post-Employment Benefits (OPEB) Liability Trust Fund, as well as Private Purpose Trust Funds.
The City’s operating and capital budgets are also supported by available governmental funds transferred and appropriated from other available funds. The City may appropriate yearly parking meter revenues
(Special Revenue Fund) to support the Transportation Department and to support transportation capital projects and cemetery trust monies (Other Governmental Funds) to support the City’s maintenance of its public cemeteries.
These tables provide a history as well as projected changes in fund balances for the available funds used to support the City’s operating budget.
The table at the end of this chapter shows the appropriations that make up the City’s FY21 budget.

F i n a n c i a l M a n a g e m e n t o f t h e C i t y 1 0 9
Parking Meter Fund
FY14 91.165 - 15.547 106.712
FY15 106.712 (5.343) 1.028 102.397
FY16 102.397 (6.500) 14.397 110.294
FY17 110.294 (15.000) 26.491 121.785
FY18 121.785 (46.385) 24.790 100.190
FY19 100.190 (53.803) 25.348 71.735
FY20 71.735 (36.400) 24.518 59.854
*FY21 59.854 (57.200) 21.000 23.654
*FY22 23.654 (38.600) 25.000 10.054
Notes: ($millions), *projected
Funds Out in FY16-FY22 include capital expenditures
Ending
Year
Balance
Fiscal
Year
Beginning
Year
Balance
Funds Out Funds In
Cemetery Trust Fund
FY14 8.401 - 1.088 9.489
FY15 9.489 - 1.077 10.566
FY16 10.566 (0.143) 0.576 10.999
FY17 10.999 (0.631) 2.449 12.816
FY18 12.816 (0.164) 1.534 14.186
FY19 14.186 (0.182) 1.325 15.330
FY20 15.330 (0.682) 1.539 16.186
*FY21 16.186 (0.950) 1.000 16.236
*FY22 16.236 (0.950) 1.000 16.286
Fiscal
Year
Beginning
Year
Balance
Funds Out Funds In
Ending
Year
Balance
Notes: ($millions), *projected
Surplus Property Disposition Fund
FY14 9.307 0.000 0.550 9.857
FY15 9.857 (5.250) 10.678 15.285
FY16 15.285 0.000 1.742 17.027
FY17 17.027 0.000 4.008 21.034
FY18 21.034 0.000 8.708 29.742
FY19 29.742 (92.000) 96.533 34.275
FY20 34.275 0.000 1.145 35.420
*FY21 35.420 0.000 1.145 36.565
*FY22 36.565 0.000 1.145 37.710
Fiscal
Year
Beginning
Year
Balance
Funds Out Funds In
Ending
Year
Balance
Notes: ($millions), *projected

1 1 0 F i n a n c i a l M a n a g e m e n t o f t h e C i t y
CITY OF BOSTON BUDGET SUMMARY - APPROPRIATED FUNDS (Dollars in Millions)
Direct
General Fund
Parking Meter Fund
Transfer
Cemetery Trust Fund
Transfer
Budgetary Fund Balance/ARPA
Total FY22 General
Fund Budget
REVENUES Property Tax 2,786.73 2,786.73 Property Tax Overlay (33.40) (33.40) Excises 131.14 131.14 Fines 59.34 59.34 Interest On Investments 4.00 4.00 Payments in Lieu of Taxes 49.65 49.65 Urban Redev Chapter 121A 28.70 28.70 Department Revenue 59.22 59.22 Licenses & Permits 62.97 62.97 Penalties & Interest 9.00 9.00 Available Funds - 30.00 0.95 30.95 State Aid 475.97 475.97 Total Recurring Revenue 3,633.31 30.00 0.95 3,664.26 Budgetary Fund Balance 40.00 40.00 American Rescue Plan Act (ARPA) 50.00 50.00 Total Revenues 30.00 0.95 90.00 3,754.26 EXPENDITURES City Appropriations 1,394.27 30.00 0.95 - 1,425.22 Public Health Commission 110.70 110.70 School Department 1,294.72 1,294.72 Reserve for Collective Bargaining 10.00 10.00 Other Post Employment Benefits - 40.00 40.00 Total Appropriations 2,809.69 30.00 0.95 40.00 2,880.64 Pensions 318.69 318.69 Debt Service 205.62 205.62 Charter School Tuition 246.88 246.88 MBTA 94.12 94.12 Other State Assessments 5.42 5.42 Suffolk County Sheriff Dept 2.90 2.90 Reserve - - Total Fixed Costs 873.62 873.62 Total Expenditures 3,683.31 30.00 0.95 40.00 3,754.26 Numbers may not add due to rounding

Statutes and Ordinances Governing Bost on ’s Operat ing and Capita l Budgets 1 1 1
Statutes and Ordinances Governing Boston’s Operating and Capital Budgets
OVERVIEW
This section summarizes key Massachusetts laws and City ordinances affecting Boston’s operating budget development and its subsequent expenditure. It also covers significant laws and ordinances governing general obligation loan authorization. Although the material is not all-inclusive, it covers the more important laws guiding the budget process.
In addition to the statutes and ordinances, other budget-related directives are set out in various mayoral Executive Orders and in the policies and administrative guidelines issued by the Office of Budget Management.
Two pieces of legislation important to understanding the City of Boston’s operating budget are Chapter 190 of the Acts of 1982, commonly referred to as the Tregor legislation, and Chapter 701 of the Acts of 1986, known as the Tregor Amendments.
Annual Appropriation Process
Section 15 of Chapter 190 of the Acts of 1982, as amended by Section 2 of Chapter 701 of the Acts of 1986, states that “all appropriations, excepting those for school purposes, to be met from taxes, revenue or any source other than loans, shall originate
with the mayor. The mayor, not later than the second Wednesday in April of each year, shall submit to the city council the annual budget of the current expenses of the city and county for the forthcoming fiscal year.
“The city council may reduce or reject any item but, except upon the recommendation of the mayor, shall not increase any item in, nor the total of, a budget nor add any item thereto, nor shall it originate a budget.
“Not later than the second Wednesday in June, the city council shall take definite action on the annual budget by adopting, reducing or rejecting it, and in the event of their failure to do so, the items and the appropriation orders in the budget as recommended by the mayor shall be in effect as if formally adopted by the city council.
“The city council shall take definite action on any supplementary appropriation order and any order for a transfer of appropriations by adopting, reducing or rejecting it within sixty days after it is filed with the city clerk…”

1 1 2 Statutes and Ordinances Governing Boston’s Operat ing and Capita l Bud gets
School Department Budget Process
Section 6 of Chapter 70 of the Massachusetts General Laws states that “in addition to the amounts appropriated for long-term debt service, school meals, adult education, student transportation, and tuition revenue, each municipality shall annually appropriate for the support of public schools in the municipality an amount not less than the (municipality’s) net school spending requirement (the sum of its Chapter 70 education aid and its required local contribution)....The commissioner (of the Department of Elementary and Secondary Education) shall estimate and report such amounts to each municipality and regional school district as early as possible, but no later than March first for the following fiscal year and shall revise such estimates within thirty days following the enactment of the general appropriations act (the state’s next fiscal year’s budget)…”.
Section 2 of Chapter 224 of the Acts of 1936, as amended by Chapter 613 of the Acts of 1987, further states that “(a) ….In acting on appropriations for educational costs, the city council shall vote on the total amount of the appropriations requested by the mayor, but neither the mayor nor the city council shall allocate appropriations among accounts or place any restriction on such appropriations. The appropriation of said city shall establish the total appropriation for the support of the public schools, but may not limit the authority of the school committee to determine expenditures within the total appropriation; provided, however, that if the city auditor determines that school department expenditures in any fiscal year are projected to be in excess of total budgeted expenditures for that fiscal year, as supported by appropriation and other available funding, then the school committee shall not reallocate or transfer funds from any item in the budget for that
fiscal year to fund any such projected additional expenditures.
“(b) After the fourth Wednesday of March of any fiscal year, the school committee shall not initiate or authorize any new or additional programs or categories of expenditures requiring additional unbudgeted expenditures unless such programs or categories have been incorporated or fully funded in the budget for the subsequent fiscal year. If such programs or categories have not been incorporated and fully funded in the budget for the subsequent fiscal year, they shall not be initiated or authorized until the school committee shall have amended its budget submission for the subsequent fiscal year to reduce or eliminate other costs,
Key Budget Dates/Requirements
Action Required City Charter
(FY22Budget)
Departments proposed budgets to
Office of Budget Management
No Requirement (1/11/2021)
School Superintendent's proposed
budget to School Committee on or
before 1st Wednesday in February
Ch. 613 Acts of 1987
(2/3/2021)
Meetings with Departments to
discuss funding, policy, and
performance
No Requirement (January –
March)
School Committee action taken on
budget on or before 4th
Wednesday in March
Ch. 613 Acts of 1987
(3/24/2021)
Mayor's budget submitted to City
Council on or before 2nd
Wednesday in April
Ch. 190 Acts of 1982, as
amended by Ch. 701 Acts of
1986 (4/14/2021)
Public Hearings held prior to
budget adoption
No Requirement (April-June)
City Council action on budget on
or before 2nd Wednesday in June
Ch. 190 Acts of 1982, as
amended by Ch. 701 Acts of
1986 (6/8/2021)
Mayor's approval of FY22 budget
adopted by City Council on or
before July 1, 2021
No Requirement (6/30/2021)

Statutes and Ordinances Governing Bost on ’s Operat ing and Capita l Budgets 1 1 3
programs or categories in amounts equal to the projected annualized costs of the new or additional programs or categories of expenditures.
“(c) The superintendent of schools shall prepare and submit to the school committee, the city auditor and the city office of budget and program evaluation (d/b/a Office of Budget Management), a monthly budget update report which shall detail and itemize year-to-date and projected school department expenditures and budget transfers…”
School Department Financial Affairs
Section 1B of Chapter 231 of the Acts of 1906, as amended by Chapter 613 of the Acts of 1987, notes that “(a) the school committee may delegate, in whole or in part, to the superintendent of schools the authority to approve for the school department the acceptance and expenditure of grants or gifts of funds from the federal government, charitable foundations, private corporations, individuals, or from the commonwealth, its counties, municipalities or an agency thereof, the provisions of Section 53A of Chapter 44 of the General Laws notwithstanding.
“(b) The superintendent of schools shall provide to the school committee, the city auditor and the office of budget and program evaluation (d/b/a Office of Budget Management) of the City of Boston a report, detailing the source, purpose and balance on hand of all funds received or expended pursuant to subsection (a), quarterly.”
Section 2 of Chapter 231 of the Acts of 1906, as amended by Chapter 613 of the Acts of 1987, states that “subject to appropriations therefore, the superintendent of schools shall have the exclusive authority to make on behalf of the school committee contracts, or amendments to contracts, for
the purchase or rental of equipment, materials, goods or supplies, leases of property, alterations and repairs of school property, and for professional or other services, with the exception of collective bargaining agreements and contracts for the transportation of students. All school department contracts or amendments to contracts shall otherwise conform to the requirements of the city charter of the city of Boston.
“(b) With respect to all contracts, agreements or amendments thereto made or entered into by the school department, the superintendent shall be responsible for establishing procedures for auditing and monitoring the compliance of the parties with the terms and obligations of such contracts, agreements or amendments thereto."
Reserve Fund
Section 7 of Chapter 701 of the Acts of 1986, requires the creation of an operating budget Reserve Fund to deal with “extraordinary and unforeseen expenditures.” This section requires that “prior to the date when the tax rate for a fiscal year is fixed, [the City must] include in the appropriations for such a fiscal year as a segregated reserve fund a sum not less than 2 1/2 percent of the preceding year’s appropriations for city and county departments, excepting the school department.
“The mayor, with the approval of the city council, may make direct drafts or transfers against such fund before the close of the fiscal year, provided that no such drafts or transfers be made before June first in any fiscal year.
“Each transfer recommended by the mayor to the city council shall be accompanied by written documentation detailing the amount of such transfers and an explanation of the reason for the transfer...”
1 1 4 Statutes and Ordinances Governing Boston’s Operat ing and Capita l Budgets
Prior to fiscal year 2018 the school department was required to establish a segregated reserve fund of not less than two and one-half percent of the current fiscal year’s school department appropriation, but Chapter 166 of the Acts of 2016 eliminated the requirement going forward.
Budget Allotment Process and Reallocations
Section 18 of Chapter 190 of the Acts of 1982, as amended by Sections 8 and 9 of Chapter 701 of the Acts of 1986, requires that “on or before August first of each year, or within ten days of the annual appropriation order for such fiscal year, whichever shall occur later, the city or county officials in charge of departments or agencies, including. the school department, shall submit to the city auditor, with a copy to the city clerk...an allotment schedule of the appropriations of all personnel categories included in said budget, indicating the amounts to be expended by the department or agency for such purposes during each of the fiscal quarters of said fiscal year.”
The school department’s allotment may not be greater than 20 percent for the first quarter and 30 percent in each of the remaining three quarters. Allotments for city and county agencies may not exceed 30 percent for first or second quarters or be less than 21 percent for the third and fourth quarters.
In addition, “whenever the city auditor determines that any department or agency, including the school department, will exhaust or has exhausted its quarterly allotment and any amounts unexpended in previous quarters, he shall give notice in writing to such effect to the department head, the mayor and the city clerk, who shall transmit the same to city council.
“The mayor, within seven days after receiving such notice, shall determine
whether to waive or enforce such allotment. If the allotment is waived or not enforced the department or agency head shall reduce the subsequent quarter’s allotments appropriately and the director of administrative services, within seven days, shall state in writing to the city council and the city clerk what reductions in each subsequent quarter’s allotment will be taken or what reallocations or transfers will be made to support the spending level in each subsequent quarter’s allotment. If the allotment for such quarter is enforced and not waived, thereafter the department shall terminate all personnel expenses for the remainder of such quarter.
No personal expenses earned or accrued, within any department, shall be charged to or paid from such department’s or agency’s allotment of a subsequent quarter without approval by the mayor, except for subsequently determined retroactive compensation adjustments.
“Approval of a payroll for payment of wages, or salaries or other personnel expenses which would result in an expenditure in excess of the allotment shall be a violation by the department or agency head.
“To insure that the overall city and county spending program remains in balance, the mayor may reallocate no more than three million dollars of non-personnel appropriations other than school appropriations during a fiscal year to other departmental purposes provided that in no department from which appropriations have been reallocated in accordance with this section shall any transfers be made from personal services to non-personal services, except with the approval of a two-thirds vote of city council, if such transfer would require the layoff of departmental personnel, who have been permanently appointed to a position in the department.

Statutes and Ordinances Governing Bost on ’s Operat ing and Capita l Budgets 1 1 5
“No reallocation may be made under this section after April fifteenth in any fiscal year.
“A list of each reallocation made by the mayor shall be transmitted to the city council and the city clerk by the city auditor by April thirtieth in any fiscal year. In each case, the report shall state the accounts from which the transferred funds were taken and the accounts to which the funds were reallocated, and the reasons therefore.”
Transfer of Appropriations
Section 23 of Chapter 190 of the Acts of 1982, as amended by Section 3 of Chapter 701 of the Acts of 1986, states that “after an appropriation of money has been made...no transfer of any part of the money thus appropriated, between such department or office and another department or office, shall be made, except in accordance with and after the written recommendation of the mayor to the city council, approved by a vote of two-thirds of all the members of the city council, provided that the city auditor, with the approval in each instance of the mayor, may make transfers, other than for personal services, from any item to any other item within the appropriations for a department, division of a department or county office.
“After the close of the fiscal year, the city auditor may, with the approval of the mayor in each instance, apply any income, taxes and funds not disposed of and make transfers from any appropriation to any other appropriation for the purpose only of closing the accounts of such fiscal year, provided further that the city auditor within seventy days after the close of the fiscal year, shall transmit to city council and the city clerk a report listing what income, taxes, or funds were applied and what transfers were made and the reasons therefore.”
Penalty for Overspending Budget
Section 17 of Chapter 190 of the Acts of 1982 (Tregor) states that “no official of the city or county except in the case of extreme emergency involving the health and safety of the people or their property, shall expend intentionally in any fiscal year any sum in excess of the appropriations duly made in accordance with law, nor involve the city in any contract for the future payment of money in excess of such appropriations...
“Any official who violates the provisions of this section shall be personally liable to the city for any amounts expended intentionally in excess of an appropriation to the extent the city does not recover such amounts from the person to whom paid...”
Appropriation Restrictions
Section 10 of Chapter 701 of the Acts of 1986, requires that “the mayor and city council shall appropriate for the hospitalization and insurance account an amount not less than the average of the past three years actual expenditures from those accounts. The city auditor shall certify, in writing to the board of assessors that adequate funds are provided in the operating budget for existing collective bargaining contracts...”
Restrictions on the Use of Proceeds from the Disposition Of Surplus Property - Section 24 of Chapter 190 of the Acts of 1982, as amended by Section 4 of Chapter 701 of the Acts of 1986, requires that “proceeds from the disposition of any surplus property shall be deposited in a separate fund which shall be known as the Surplus Property Disposition Fund, and shall be used only as follows: (1) the amount equivalent to the debt incurred, and interest paid or payable thereon, as a result of the acquisition or improvement from time to time of the property shall be used only for purposes for which the city is authorized to incur debt for a period of ten
1 1 6 Statutes and Ordinances Governing Boston’s Operat ing and Capita l Budgets
years or more and (2) all proceeds in excess of such amount shall be credited to the capital fund of the city unless the city council by a majority vote determines with the approval of the mayor to credit such proceeds to the general fund of the city.”
Duties of Supervisor of Budgets
City of Boston Code Ordinance 5, section 5 states that “the supervisor of budgets shall, under the direction of the mayor and in consultation with the director of administrative services, prepare in segregated form the annual and all supplementary budgets and shall report to the mayor on all subsequent revisions of the items in any budget.
“The supervisor of budgets shall also prepare all transfer orders.
“The supervisor of budgets shall further prepare the form of estimate sheets to be used by each officer, board and department, and each division of a department for which the city appropriates money, and the form of monthly report of such officer, board and department, and each division thereof, showing expenditures to date of all appropriations by item.
“The supervisor of budgets shall, in addition, have the powers and perform the duties conferred or imposed on the budget commissioner by any statute other than Section 56 of Chapter 35 of the General Laws.”
Convention Center Legislation
Chapter 152 of the Acts of 1997, the Convention Center Legislation, authorized the development and construction of a convention center in Boston.
Under this legislation and through the joint efforts of the Boston Redevelopment Authority (BRA) d/b/a Boston Planning and Development Agency) and Massachusetts Convention Center Authority (MCCA), the
new Boston Convention and Exhibition Center (BCEC) has been developed and constructed on a 60-acre site in South Boston. The facility, which opened in June 2004, includes 516,000 square feet of contiguous exhibition space, has made Boston a major competitor for larger international and national convention and exhibition business.
The City’s share of the BCEC development expense was $181 million for site acquisition and preparation. (The Commonwealth paid for all of construction, and for a small portion of site acquisition and preparation.) The city’s BCEC expense was financed by means of dedicated revenue sources. On April 1, 2011, the city’s BCEC related long-term debt was restructured. The remaining principal for the prior bonds was paid down by a combination of available cash in the convention center fund and new general obligation debt ($38.295 million) at a lower interest rate. The impact on annual debt service was significant: an annual savings of approximately $5 million per year through FY27. In October 2019, the City refunded $17.46 million of the remaining principal and achieved net present value debt service savings of $799,600.
Contracting Procedures
Chapter 196 of the Acts of 2011, as amended, brought the City’s bid requirements in line with Chapter 30B of the General Laws. It requires that documents are in writing and have approval of the mayor. Following passage of Chapter 218 of the Acts of 2016, An Act Modernizing Finance and Government, current procurement thresholds for goods and services were increased. The City has elected to implement the increase to its current Chapter 30B threshold requirement for competitive sealed bidding and competitive sealed proposals from $35 thousand to $50 thousand in FY17.
Statutes and Ordinances Governing Bost on ’s Operat ing and Capita l Budgets 1 1 7
Pension Funding COLAs
The annual Cost of Living Adjustment (COLA) pension increase for retirees is set each year at the Consumer Price Index (CPI) or an amount up to, but not greater than 3% on the first $14,000 also known as the COLA base of a retiree’s annual payment
To aid municipalities dealing with property tax reduction due to Proposition 2 ½ in the early 1980s, the state began assuming the cost for local pension COLAs starting in 1981. However, during the FY97 state budget process, the state decided it would not fund local pension COLAs in future years. Local systems, including the Boston Retirement System, have had to pay for retiree COLAs since FY99. The state, however, still remains obligated to pay for outstanding pension costs related to local pension COLAs granted between FY81 and FY97 for former employees that retired prior to July 1, 1998. The number of these retirees with older COLA increases along with the state’s funding obligation will diminish over time.
.
Boston Public Health Act of 1995
The Boston Public Health Act of 1995 (Chapter 147) established a new, comprehensive health care system to meet the challenges of a rapidly changing health care environment. Chapter 147 abolished the Department of Health & Hospitals and established the Boston Public Health Commission (BPHC) in its place. With City Council approval, the legislation allowed the City to merge or consolidate the operations and assets of the hospitals with the Boston University Medical Center Hospital.
The law requires the City to set the budget equal to the amount, if any, by which the projected expenditures exceed revenues, the net cost of public health services. If there is a net cost of public health services,
the budget is subject to mayoral review and approval. The mayor may approve or reject and return the budget to the BPHC. If the budget is accepted, the mayor shall include the net cost of public services in the City’s annual budget and may submit supplementary appropriations as needed. The BPHC must adopt its budget no later than the second Wednesday in June.
An Act Transferring the Sheriffs of 2009
Although Suffolk County remains as a legal entity in state law the passage of Chapter 61 of the Acts of 2009, “An Act Transferring Sheriffs to the Commonwealth”, as amended by Chapter 102 of the Acts of 2009, “An Act Relative to Sheriffs”, and again amended by section 39 of Chapter 166 of the Acts of 2009, “An Act Establishing Fiscal Stability Measures for Fiscal Year 2010”, completes the transfer of the offices and functions of Suffolk County to the Commonwealth.
Chapter 61 transfers the offices, responsibilities and duties of Barnstable, Bristol, Dukes, Nantucket, Norfolk, Plymouth and Suffolk County sheriffs to the Commonwealth. These were the remaining sheriffs not yet transferred previously to the Commonwealth. The Act includes provisions for transfer of county employees, properties, disposition of current lawsuits and reallocation of the Deeds Excise Tax. It provides that retired employees shall remain members of the county retirement system and in the case of Suffolk County the Boston Retirement System and the City of Boston shall be assessed by the State for the remainder of the amortization of the unfunded portion of this liability. In accordance with the BRS January 1, 2020 valuation, that annual amount shall be $2.898M for the years through FY 2027. Active employees have been transferred to the state retirement system along with their annuity saving

1 1 8 Statutes and Ordinances Governing Boston’s Operat ing and Capita l Budgets
funds. Their pension liability is now a liability of the state retirement system.
An Act Related to the Funding of Boston Teacher’s Pensions
Chapter 112 of the Acts of 2010 provides for a change to the funding mechanism for Boston Teacher’s Pensions. Sections 7 through 18, 48 and 50 adjust sections of Chapter 32 with regard to the City of Boston’s role in the funding and reimbursement by the Commonwealth of Teacher’s Pension liability. Those sections of Chapter 112 remove the City as a “middleman” and establish a relationship directly between the Commonwealth and the Boston Retirement System (BRS) Board for the financing of Boston teacher pensions. Consequently, the City will no longer show a revenue reimbursement for this item, and its annual pension funding cost will be significantly downsized. Meanwhile, Boston teacher’s pension assets are to be managed by the state. However, the administration of Boston teachers’ contributions and pension payments, as well as their membership, will remain with the BRS.
Local Option Meals Tax of 2009
In August 2009, effective October 1, 2009, the City adopted a local option offered under sections 60 and 156 of Chapter 27 of the Acts of 2009 to accept the provisions of Massachusetts General Laws Chapter 64L section 2(a) which allows municipalities to increase the excise tax on meals sold locally by .75% in addition to the state excise tax of 6.25% on the same purchase. The revenue generated by the .75% local tax and collected by the state Department of Revenue is returned to the municipality of sale origin.
An Act Relative to Municipal Health Insurance
Governor Patrick signed Chapter 69, An Act Relative to Municipal Health Insurance, on
July 12, 2011. The Act allows cities and towns to either make health insurance plan design changes or transfer into the State’s Group Insurance Commission (GIC). The Act lays out between a municipality and public employee committee strict notice, negotiations, and plan saving requirements. Chapter 69 allows cities and towns to include changes to copayments, deductibles, tiered provider network copayments, and other cost-sharing features up to the dollar amounts of those same or similar features in the most enrolled GIC plan for their proposed plan design changes. It also allows cities and towns to transfer to the GIC if savings for the first year is 5% or more than those achievable under planned design. The Act is clear it is not a vehicle for contribution ratio changes. The Act also requires that all eligible retirees be enrolled in a Medicare health plan.
Municipal Modernization Act
Chapter 218 of the Acts of 2016, An Act Modernizing Finance and Government, was approved on August 9, 2016, building upon previous acts that increased flexibility for municipalities. The Act eliminates and updates obsolete laws, promotes local independence where possible, and provides municipalities’ greater flexibility to do their day-to-day jobs.
Since the enactment of the Municipal Modernization Act, Boston has moved forward on several reforms. The City established a default speed limit of 25 miles per hour, enacted an ordinance that will authorize its revolving funds, increased the residential property tax exemption to 35%, the maximum rate established under the Act (in concert with the provisions of Chapter 326 of the Acts of 2016), and increased the current goods and services procurement thresholds under Chapter 30B. In 2017, the City implemented a single overlay reserve. In addition, the Act streamlined and consolidated the clauses in

Statutes and Ordinances Governing Bost on ’s Op erat ing and Capita l Budgets 1 1 9
Chapter 44 Section 7 and Section 8 that detail the purposes for which municipalities may borrow.
Departmental Revolving Funds
In accordance with amendments made to the statute governing revolving funds in the 2016 Municipal Modernization Act the City in 2017 authorized and established departmental revolving funds for use by City departments, boards, committees, agencies or officers in connection with the operation of programs or activities that generate fees, charges or other receipts to support all or some of the expenses of these programs or activities. No appropriation is required to expend money from a fund but City Council approval is required to establish an amount that can be spent from the funds before July 1st of year one and requires that interest credited to revolving fund be deposited in the general fund. Funds established include: Public Art Revolving Fund, Strand Theatre Total Revolving Fund, City Hall Child Care Revolving Fund, Boston Public School (BPS) Transportation Revolving Fund, BPS Facilities Revolving Fund, BPS Technology Revolving Fund, Solar Renewable Energy Certificates Revolving Fund, Animal Control Revolving Fund, Third Party Property Damages Revolving Fund, City Hall Plaza Rent Revolving Fund, Police Academy Revolving Fund, Canine Revolving Fund, Fitness Center Operations Revolving Fund and the Environment Conservation Commission Revolving Fund.
An Act to Ensure Safe Access to Medical and Adult-use of Marijuana
On July 28, 2017 the State enacted An Act to Ensure Safe Access to Medical and Adult-use of Marijuana in the Commonwealth. The Act was a complete and comprehensive rewrite of both the 2016 initiative petition that legalized recreational marijuana and
the 2012 initiative petition that legalized medical marijuana.
The legislation includes an increase in the total tax on recreational marijuana purchases to a maximum of 20% (including 6.25% in sales tax, 10.75% in marijuana excise tax and 3% in local sales tax), up from a maximum of 12% (combined sales tax and marijuana tax), that was approved in the recreational marijuana ballot law. The legislation also merges oversight of the recreational and medical marijuana industries into a five-person Cannabis Control Commission and details the rights of adults 21 and older to grow, buy, possess, and use limited quantities of marijuana. It establishes that in order to ban or severely limit recreational marijuana establishments in a city or town that voted ‘yes’ on the ballot initiative a voter referendum is required but in cities and towns that voted ‘no’ local elected officials can make that decision. In addition the Act also details that a host community agreement can include a community impact fee for the host community that shall be reasonably related to the costs imposed upon a community by operation of a marijuana establishment or treatment center and shall not amount to more than 3% of the gross sales of the marijuana establishment or treatment center and will be effective no longer than five years.
Establishing Equitable Regulation of the Cannabis Industry in the City of Boston
In order to ensure that communities disproportionately impacted by the prohibition on cannabis are able to benefit from this new emerging industry the City of Boston enacted an ordinance in November 2019 to ensure equity in the City of Boston’s cannabis industry. It provides that there will be an equal or greater number of equity licensees to non-equity licensees. Equity designation will only be given to license applicants with 51% of its ownership
1 2 0 Statutes and Ordinances Governing Boston’s Operat ing and Capita l Budgets
meeting at least three criteria including among others place of residence in a disproportionately impacted community, a marijuana arrest or conviction between 1971 and 2016, an annual household income at or below 100% of the area median income. The ordinance, also, establishes a Boston Cannabis Equity Program to provide services to equity applicants and establishes the Boston Cannabis Board which oversees designation of applicants as equity license applicants.
An Act Regulating Transportation Network Companies
An Act was approved in August of 2016 that establishes oversight and regulates transportation network companies. As part of its oversight it establishes a Transportation Infrastructure Enhancement Fund. Annually each transportation network company is required to submit a per-ride assessment of $.20 based on number of rides in previous year. Half of the assessment will be proportionately distributed to cities and towns based on the number of rides that originated within the city or town with the funding used to address the impact of the transportation network services on municipal roads, bridges and other transportation infrastructure. The fee will be discontinued as of January 1, 2027.
Establishing the Regulation of Shared Mobility Businesses
In March 2019 an ordinance establishing the City of Boston Transportation Department’s authority to license and regulate shared mobility businesses was enacted. Vehicle sharing businesses make available to pre-approved members a network of vehicles in exchange for hourly, daily or weekly rate. The ordinance provides oversight of businesses, who offer ten or more small vehicles, such as electric scooters, for rent or delivery service on a
self-service basis. It establishes a five hundred dollar fee for license or renewal for the operation of a small vehicle sharing business and gives the Boston Transportation Department authority to regulate including revoking or suspending the license for such business. The ordinance, also, establishes a Small Vehicle Sharing Business Advisory Committee. It, further, provides the Boston Transportation Department the authority to permit and issue regulations for vehicle sharing businesses.
Community Preservation Act
Boston voters approved the adoption of the Community Preservation Act (CPA) on November 8, 2016. Almost one year later the Boston City Council on August 2, 2017 voted to create a Community Preservation Act Committee to make recommendations on preservation needs and use of the funds generated by the CPA’s 1% surcharge on residential and business property taxes.
The Committee produces a Community Preservation Plan and makes recommendations to the Mayor for transmittal to City Council for the acquisition, creation, preservation, rehabilitation, restoration and support of open space, historic resources, affordable housing, recreation land, and community housing with CPA funding supplementing not supplanting existing operating funds.
To further support the Community Preservation Act, the State enacted in Chapter 41 of the Acts of 2019 an increase in the surcharge for registering deeds and municipal liens that would be directed to the State’s Community Preservation Trust Fund.
An Act Regulating and Insuring Short Term Rentals
On December 28, 2018 the State enacted the Act Regulating and Insuring Short Term Rentals. The Act regulates and taxes short
S tatutes and Ordinances Governing Bost on ’s Operat ing and Capita l Budgets 1 2 1
term rental (rentals for thirty-one or less days). It expands the State hotel and motel excise to include short term rentals including those rented through rental platforms. The Act subjects the rentals to the state hotel/motel excise of 5.7%, local excise by local option of up to 6.5%, a 2.75% excise for the Cape and Islands Water Protection Fund, a 2.75% Convention Center Fee (for transfers in Boston, Worcester, Cambridge, Springfield, West Springfield and Chicopee) and up to a 3% community impact fee on professionally managed units and units in two- or three-family houses with 35% of this fee dedicated to affordable housing or local infrastructure needs. The Act provides for a statewide registry, insurance requirements for the rental units and inspections by cities and towns. Rental booking made after January 1, 2019 are subject to the tax and the law becomes effective July 1, 2019.
An Act Relative to Educational Opportunity for Students
An Act Relative to Educational Opportunity for Students, known as the Student Opportunity Act, was enacted on November 26, 2019. The Act updates the Education Reform Act of 1993 bringing much needed reform to the education funding formula, increasing state support for education reforms by an estimated $1.5 billion over seven years and establishes a way forward to close the student achievement gap. The Act provides for a historic update of the Chapter 70 formula based on the 2015 recommendations of the Foundation Budget Review Commission with updates to the formulaic calculation of in-district special education enrollment and increases in foundation budget rates for: out-of-district special education, benefits, guidance, low income and English language learners, establishes a Twenty-first Century Trust Fund to provide support to districts in the closing the achievement gap, requires evidence-based three year district
improvement plans to address disparities in achievements among subgroups, establishes a data advisory commission charged with collecting, analyzing and reporting data on student preparedness, establishes a goal of fully funding charter school reimbursement by FY2023, expands circuit breaker reimbursable claims and establishes a schedule for full reimbursement (75%) for the expanded claims by FY2024, increases funding for school building assistance to $800 million and provides for policy studies on local contribution, rural schools, counting low income students, recovery high school per pupil costs and the school building assistance program expenses and reimbursement rates. (Deadlines for full funding of charter school reimbursement and expanded circuit breaker claims reimbursement have been extended by one year due to the one year delay in implementation of the Student Opportunity Act).
Covid-19 Pandemic
Twenty-three Acts were passed by the Massachusetts Legislature and signed into law by Governor Baker since March 10th when he declared a state of emergency to support the commonwealth’s response to the coronavirus. The twenty-three bills passed provide support to cities and towns as well as residents to better address the impact of Covid-19 and the effect of the state of emergency including:
Interim state budget funding to ensures that state is able to keep operating and that cities and towns will continue to receive state aid
Expanded voting options that will ensure wide voter participation in the 2020 primary and general elections; further expanded through June 30, 2021 for local elections.
Extended due dates for real estate and personal property taxes (June
1 2 2 Statutes and Ordinances Governing Boston’s Operat ing and Capita l Budgets
1st) and for 2019 income tax (July 15th).
Moratorium on evictions and foreclosures with periodic extensions by the Governor allowed; extensions ceased October 2020 immediately followed with the announcement of the Governor’s Comprehensive Eviction Diversion Initiative.
Provisions to strengthen the local and regional public health systems
Insulation from lawsuit for public health workers and facilities
Municipal and school budgeting supports including one-twelfth budgeting, budget deadlines extensions, use of free cash, amortization of 2020 deficits, expending from revolving funds, relaxation of competency requirement for graduation.
Expanded rights for licensed establishments to sell wine, beer and mixed drinks with purchase of food for outside consumption.
Extended health insurance coverage for COVID-19 testing and treatment.
Establishment of a federal coronavirus relief fund website to provide cities, towns and school districts with easily accessible information on available federal relief funding.
In addition, Governor Baker has signed sixty-five executive orders (with 43 currently in effect) providing regulation for the state, municipalities, businesses and residents during the Covid-19 pandemic. In addition the Massachusetts Department of Public Health has issued orders and guidance for congregate care, labs, hospitals, health care delivery, health care workforce, pharmacies and groceries. Many of these laws and executive orders
will expire once the state of emergency is lifted.
Classification of City Debt
Pursuant to the Bond Procedure Act of 1983, all indebtedness of the City, other than certain special obligation bonds, constitutes general obligation indebtedness of the City for which its full faith and credit are pledged and for the payment of which all taxable property in the City is subject to ad valorem taxation without limit as to rate or amount. Pursuant to the 1982 Funding Loan Act and the Bond Procedure Act of 1983, general obligation bonds of the City may also be secured by a pledge of specific City revenues pursuant to covenants or other arrangements established under a trust or other security agreement.
Special obligation bonds of the City may be issued and be payable from and secured solely by a pledge of specific revenues derived from a revenue-producing facility of the City. Indebtedness of the City may also be classified by the nature of the City’s obligation for the payment of debt service, depending on whether such debt is a direct obligation of the City or is an obligation of another governmental entity for the payment that the City is indirectly obligated.
Direct Debt
Direct debt of the City consists principally of the City’s outstanding general obligation bonds for which the City’s full faith and credit are pledged and for the payment of which all taxable property in the City is subject to ad valorem taxation without limit as to rate or amount.
The City’s direct indebtedness does not include special obligation debt which may be secured solely by a pledge of specific revenues derived from a revenue-producing facility of the City or for which the payment of which the City’s obligation is subject to annual appropriation. As of the

Statutes and Ordinances Governing Bost on ’s Operat ing and Capita l Budgets 1 2 3
current date, the City has no Special Obligation debt.
Secured Indebtedness
In addition to authorizing the City to secure its indebtedness with letters of credit, the Funding Loan Act of 1982, and the Bond Procedure Act of 1983, empower the City to secure any of its indebtedness issued under any general or special law by a pledge of all or any part of any revenues that the City received from or on account of the exercise of its powers. Examples include taxes (such as real property taxes), fees payable to or for the account of the City, and receipts, distributions, and reimbursements held or to be received by the City from the Commonwealth that are not restricted by law for specific purposes. Currently, the City does not have any outstanding bonds secured by such a pledge. The City, however, reserves the right in the future to issue bonds, notes or other obligations secured by various revenues of the City or by letters of credit.
Bond Procedure Act of 1983
In 1983, the City Council passed and the Mayor signed a home rule petition to the state legislature that enacted Chapter 643 of the Acts of 1983 of the Commonwealth. This act, formally entitled the City of Boston Bond and Minibond Procedure Act of 1983, is referred to as the Bond Procedure Act of 1983. In 1984, the legislation modified various procedural restrictions related to the City’s issuance of indebtedness. Such modifications provide, among other things, more flexible schedules for repaying debt principal, the issuance of variable rate bonds, term bonds and bonds redeemable at the option of the bondholder, and authorization for the sale of bonds at a discount. The legislation also provides the City with the authority to issue bonds in an amount up to $5 million in
any one fiscal year and notes in an amount outstanding at one time of up to five percent of the prior year’s property tax levy. Each bond and note is issued in a denomination less than $5,000 (known as minibonds and mininotes). In addition, the legislation authorizes the issuance of refunding bonds and grant anticipation notes, as well as restating the investment powers of the City and the extent to which city bonds are legal investments for certain entities.
The Bond Procedure Act of 1983 also reaffirms provisions of state law, indirectly affected by Proposition 2 ½. This law requires that the City’s annual tax levy must include the debt and interest charges that are not otherwise provided for as well as all general obligation indebtedness of the City regardless of the date of issue.
In addition to modifications to the procedures related to the City’s general obligation indebtedness, the legislation authorizes the City to finance revenue-producing facilities with special obligation bonds payable from and secured solely by a pledge of facility revenues. Under this act, the City may also issue general obligation bonds secured by the pledge of specific city revenues and finance projects that otherwise could be financed by bonds, lease, lease-purchase or sale-leaseback agreements. The Bond Procedure Act of 1983 was amended in August 1991 to provide, among other things, for increased flexibility in establishing debt principal amortization schedules.
Authorization of Direct Debt; Debt Limits
All direct debt of the City requires the authorization of the city council and approval of the mayor. If the mayor should veto a loan order passed by the city council, the charter of the City provides that the loan order is void and may not be passed over the mayor’s veto. Authorization of bonds under a loan order of the city council

1 2 4 Statutes and Ordinances Governing Boston’s Operat ing and Cap i ta l Budgets
includes, unless otherwise provided in the loan order, the authorization to issue temporary notes in anticipation of such bonds. Under the Bond Procedure Act of 1983, temporary notes in anticipation of bonds, including any renewals thereof, must mature within two years of their issue dates.
The laws of the Commonwealth provide for a statutory debt limit for the City consisting of a debt limit and a double debt limit. The debt limit is 5.0 percent of the assessed valuation of taxable property in the City as last equalized by the state Department of Revenue and the double debt limit is 10.0 percent. The most recent Equalized Valuation (“EQV”) of taxable property in the City approved on January 20, 2021 for use until January 30, 2023 or until a new EQV is established by the state legislature, stands at $203.89 billion. Based on the current EQV, the City’s debt limit is $10.19 billion and its double debt limit equals $20.34 billion. The City may authorize debt up to its debt limit without state approval. The City may authorize debt over the debt limit up to the double debt limit with the approval of a state board composed of the State Treasurer and Receiver General, the State Auditor, the Attorney General and the Director of Accounts, or their designees. As of December 1, 2020, the City’ had outstanding debt of $1.15billion subject to the debt limit, and authorized but unissued debt subject to the debt limit of $1.32billion. Based on the City’s EQV at that time, the City had capacity to authorize an additional $6.1 billion of debt. There are many categories of general obligation debt exempt from the general debt limit (although authorization of such debt is subject to various specific debt limits, specific dollar limitations or state approval). Among others, these exempt categories include temporary loans in anticipation of current and in anticipation of reimbursements or other governmental aid, emergency loans, loans exempted by special laws, certain school bonds, and
bonds for housing and urban and industrial development. The latter bonds are subject to special debt limits ranging from 5.0% to 10.0% of equalized valuation depending on purpose. On December 1, 2020 the City has $67 million in outstanding debt exempt from the general debt limit and $112.1 million in authorized but unissued debt exempt from the general debt limit.
Related Authorities and Agencies
In addition to direct and indirect indebtedness of the City, the City and certain agencies and commissions related to the City are authorized by law to issue obligations that are solely a debt of the agency or commission issuing the obligations or are payable solely from revenues derived from projects financed by such debt. Except as described below, such obligations are not a debt of the City.
The Boston Public Health Commission is an independent corporate and political subdivision of the Commonwealth created in June 1996 as the successor to the City’s Department of Health and Hospitals (DHH). Effective July 1, 1996, all powers and functions of DHH and THH (Trustees of Health & Hospitals) were transferred to the commission. In addition, the commission assumed all assets and liabilities of the City allocated to DHH. At its inception, the Commission also assumed responsibility for paying the City an amount equal to current debt service on all outstanding general obligation bonds of the City issued for public health and hospital purposes. All obligations have been paid. The commission has also assumed responsibility for paying the debt service on the City’s Special Obligation Refunding Bonds dated August 1, 2002 for Boston City Hospital (BCH), which were issued to refund bonds that first financed the project in 1993. On May 4, 2012, the City issued General Obligation Refunding Bonds to current-refund all of the outstanding BCH Special Obligation Bonds.

Statutes and Ordinances Governing Bost on ’s Operat ing and Capita l Budgets 1 2 5
The Boston Water and Sewer Commission (BWSC) is an independent political and corporate subdivision of the Commonwealth created 1977. At its inception, BWSC assumed responsibility for the operation of the City’s water and sewer systems and for paying to the City an amount equal to current debt service on all outstanding bonds the City issued for water and sewer purposes. All debt service for such bonds has been paid. The City is not obligated on bonds issued by the Commission.
The Economic Development and Industrial Corporation of Boston (EDIC) is a political and corporate entity of the Commonwealth led by a five member board who are also appointed as board members of the Boston Redevelopment Authority d/b/a as the Boston Planning and Development Agency (BPDA). EDIC has a variety of powers to assist industrial development projects in the City. EDIC is not authorized to issue debentures in excess of $5 million secured solely by the credit and properties of EDIC and revenue bonds secured by revenues from the lease or sale of its projects. The City is also authorized to appropriate or borrow monies for EDIC development projects within certain urban renewal debt limitations.
The BPDA is a public political and corporate body that combines the City’s redevelopment and planning board authority with certain powers of the state Department of Community Affairs. The BPDA board consists of four members appointed by the Mayor, subject to confirmation by the City Council, and one member appointed by the Governor. The BPDA is an urban planning and economic development agency and is part of the Mayor’s Economic Development cabinet. Although the BPDA is authorized to issue revenue bonds and notes that are not City debts, the BPDA traditionally finances its projects through a combination of federal and state grants, proceeds of general
obligation bonds issued by the City, and revenues from the lease or sale of land.
Major Debt Statutes and Borrowing Authority
Chapter 188 of the Acts of 2010, the Municipal Relief Act, passed by the State on July 27, 2010, made several positive changes to the purposes for which cities, towns and districts may borrow as well as to the terms, debt service schedules, and special approvals related to such borrowings. The addition of several new purposes for which the City may borrow as well as extensions to certain useful life determinations gives the City added borrowing flexibility.
Chapter 44, Sections 7 and 8 of the Massachusetts General Laws permits cities and towns in the Commonwealth to incur debt within and outside the statutory limits of indebtedness described previously for various municipal purposes and identifies the maximum maturity period for each purpose. The purposes include, but are not limited to, the acquisition of interests in land or the acquisition of assets, or for the construction, reconstruction, rehabilitation, improvement, or extraordinary repair of public buildings, facilities, assets, works or infrastructure, construction and/or reconstruction of water and sewer mains, improvements to parks and playgrounds, reconstruction and resurfacing of roads, and equipment acquisitions.
On July 31, 2003, the Municipal Relief Act, Chapter 46 of the Acts of 2003 passed. It amended section 7 of Chapter 44 of the General Laws so that the City would no longer be required to go to the state Emergency Finance Board for approval of debt incurred for remodeling, reconstruction, or extraordinary repairs to public buildings.
The Capital Improvements Act of 1966, as amended, permits the City of Boston to issue debt outside the debt limit for various

1 2 6 Statutes and Ord inances Governing Boston’s Operat ing and Capita l Budgets
municipal purposes, including new construction and renovation of existing facilities. The legislation provides a specific limit on the total amount of debt that may be issued under the statute.
Chapter 208 of the Acts of 2004 established the Massachusetts School Building Authority. The program is designed to assist cities and towns in building new schools or in renovating existing ones; however, the state’s reimbursement methodology has been modified. Projects for which cities and towns are currently receiving reimbursement approved under the former school building assistance program managed by the Department of Elementary and Secondary Education will continue to receive annual payments. The City of Boston received its final payment under the former school building assistance program in 2020. Chapter 208 also provides for a pay-as-you go system paying cities and towns for school projects in installment grants during construction to save on interest costs.

B u d g e t O r g a n i z a t i o n a n d G l o s s a r y o f T e r m s 1 2 7
Budget Organization and Glossary of Terms
INTRODUCTION
This chapter is a guide to the organization of Boston city government and the FY22 Operating Budget.
The City of Boston, incorporated as a town in 1630 and as a City in 1822, now exists under Chapter 486 of the Acts of 1909, and Chapter 452 of the Acts of 1948 of the Commonwealth which, as amended, constitute the City’s Charter. The chief executive officer of the City is the Mayor. Mayor Kim Janey assumed the role of Mayor in March 2021 upon the resignation of former Mayor Martin J. Walsh. Former Mayor Walsh was elected to serve his second four-year term, beginning in January 2018. On March 22, 2021, Mayor Walsh was confirmed as United States Secretary of Labor by the United States Senate and tendered his resignation as Mayor on the same day. Upon his resignation, City Council President Kim Janey, assumed the role of Mayor and she is expected to serve in this capacity until the certification of a regularly elected Mayor in November 2021. In her capacity as Mayor, under the City Charter, Mayor Janey possesses the powers of mayor in matters not admitting of delay and may not make permanent appointments.
The Mayor has general supervision of and control over the City’s boards, commissions, officers, and departments. The portion of the budget covering appropriations for all departments and operations of the City, except the School Department, is prepared under the direction of the Mayor.
The legislative body of the City is the Boston City Council, which consists of thirteen members serving two-year terms. Four councilors are elected at-large and nine are elected from geographic districts. The City Council may enact ordinances and adopt orders that the Mayor may either approve or veto. Ordinances and orders, except orders for the borrowing or appropriation of money, may be enacted by the City Council over the Mayor’s veto by a two-thirds vote. The City Council may reject or reduce a budget submitted to it by the Mayor, but may not increase it.
ORGANIZATION OF CITY GOVERNMENT: THE MAYOR’S CABINET
The City of Boston operates under a cabinet form of government to recognize the major functional responsibilities of city government, to facilitate improvements in the conduct of the executive and administrative business of the City, and to eliminate duplication and waste.
The structure of the Mayor’s cabinet is illustrated in the citywide organizational chart displayed on the next page. A description of the members of the Mayor’s cabinet and the City departments for which each has authority follows.
Mayor’s Chief of Staff
The Mayor’s Chief of Staff is a member of the Mayor’s cabinet and has an advisory role over all operations of City government. The Chief of Staff is also charged with supervising and directing the operations of the Mayor’s office, including scheduling, security, press, and constituent services.

1 2 8 B u d g e t O r g a n i z a t i o n a n d G l o s s a r y o f T e r m s
Mayor’s Chief of Policy
The Mayor’s Chief of Policy is a member of the Mayor’s cabinet and has an advisory role over all policy development across all departments of the City.
Operations
The Chief of Operations is responsible for Property Management, the Public Facilities Department, and the Inspectional Services Department.
Corporation Counsel
The Law Department provides professional legal services, including formal and informal opinions and advice to the Mayor, the City Council, the Boston School Committee, and other officials in matters relating to their official duties, and also represents all of the foregoing entities and individuals in litigation.
Communications
The Chief Communication Officer oversees all press related activities and advises the Mayor on the City’s overall communications strategy.
Equity & Inclusion
The Chief of Equity oversees the Equity & Inclusion cabinet and leads efforts to embed equity in all city planning, operations and work. The cabinet includes the Office of Equity, Office of Diversity, Mayor’s Office of Resilience and Racial Equity, Language & Communications Access, the Human Rights Commission, Immigrant Advancement, and Women’s Advancement.
Office of Police Accountability & Transparency (OPAT)
The Office of Police Accountability & Transparency (OPAT) provides a single point of public access to police
accountability and community oversight. OPAT includes the Civilian Review Board, the Internal Affairs Oversight Panel, and the OPAT Commission, which has subpoena power to investigate misconduct.
Administration & Finance
The Chief Financial Officer, who also serves as the Collector-Treasurer, oversees the City’s human and financial resources, including Treasury, Assessing, Auditing, Budget, and Procurement, as well as Labor Relations and Human Resources.
Education
The Chief of Education is appointed by the Mayor and is responsible for implementing a long-term, collaborative strategy across all educational platforms in the City. The Superintendent of the Boston Public Schools is appointed by the Boston School Committee and oversees all day-to-day operations.
Civic Engagement
This cabinet is comprised of the Mayor’s Office of Neighborhood Services, including the neighborhood liaisons, Boston 311, and City Hall To Go.
Information & Technology
The Department of Innovation and Technology (DoIT) is responsible for supporting and expanding the use of enterprise-wide technology to improve the business of government and delivery of service.
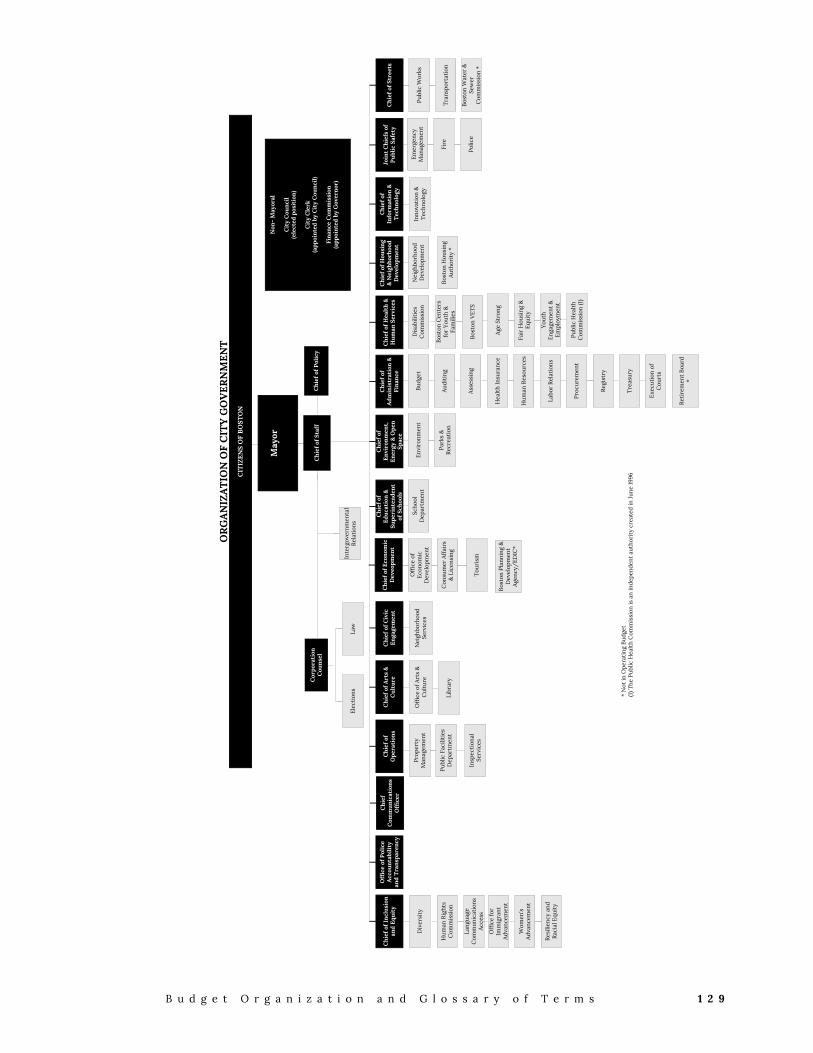
B u d g e t O r g a n i z a t i o n a n d G l o s s a r y o f T e r m s 1 2 9
CIT
IZEN
S O
F B
OST
ON
May
or
* N
ot in
Ope
rati
ng B
udge
t(1
) The
Pub
lic H
ealt
h C
omm
issi
on is
an
inde
pend
ent
auth
orit
y cr
eate
d in
June
1996
OR
GA
NIZ
AT
ION
OF
CIT
Y G
OV
ERN
MEN
T
Off
ice
of
Econ
omic
D
evel
opm
ent
Con
sum
er A
ffai
rs
& L
icen
sing
Budg
et
Park
s &
Re
crea
tion
Nei
ghbo
rhoo
d D
evel
opm
ent
Envi
ronm
ent
Inno
vati
on &
Te
chno
logy
Non
- M
ayor
al
Cit
y C
ounc
il(e
lect
ed p
osit
ion)
Cit
y C
lerk
(app
oint
ed b
y C
ity
Cou
ncil)
Fina
nce
Com
mis
sion
(app
oint
ed b
y G
over
nor)
Off
ice
of A
rts
&
Cul
ture
Scho
ol
Dep
artm
ent
Tour
ism
Hea
lth
Insu
ranc
e
Hum
an R
esou
rces
Audi
ting
Asse
ssin
g
Labo
r Re
lati
ons
Emer
genc
y M
anag
emen
t
Fire
Polic
e
Chi
ef o
f Pol
icy
Chi
ef o
f Sta
ff
Dis
abili
ties
C
omm
issi
on
Bost
on V
ETS
Age
Stro
ng
Bost
on C
ente
rs
for
Yout
h &
Fa
mili
es
Fair
Hou
sing
&
Equi
ty
Proc
urem
ent
Yout
h En
gage
men
t &
Em
ploy
men
t
Bost
on H
ousi
ng
Auth
orit
y *
Publ
ic W
orks
Tran
spor
tati
on
Bost
on W
ater
&
Sew
er
Com
mis
sion
*
Libr
ary
Reti
rem
ent
Boar
d *
Regi
stry
Trea
sury
Exec
utio
n of
C
ourt
s
Nei
ghbo
rhoo
d Se
rvic
es
Chi
ef
Com
mun
icat
ions
O
ffic
er
Chi
ef o
f O
pera
tion
sC
hief
of A
rts
&
Cul
ture
Chi
ef o
f Civ
ic
Enga
gem
ent
Chi
ef o
f Eco
nom
ic
Dev
eopm
ent
Chi
ef o
f Ed
ucat
ion
&
Supe
rint
ende
nt
of S
choo
ls
Chi
ef o
f En
viro
nmen
t,
Ener
gy &
Ope
n Sp
ace
Chi
ef o
f A
dmin
istr
atio
n &
Fi
nanc
e
Chi
ef o
f Hea
lth
&
Hum
an S
ervi
ces
Chi
ef o
f Hou
sing
&
Nei
ghbo
rhoo
d D
evel
opm
ent
Chi
ef o
f In
form
atio
n &
T
echn
olog
y
Join
t C
hief
s of
Pu
blic
Saf
ety
Chi
ef o
f Str
eets
Publ
ic F
acili
ties
D
epar
tmen
t
Insp
ecti
onal
Se
rvic
es
Publ
ic H
ealt
h C
omm
issi
on (1
)
Bost
on P
lann
ing
&
Dev
elop
men
t Ag
ency
/ED
IC*
Inte
rgov
ernm
enta
l Re
lati
ons
Prop
erty
M
anag
emen
t
Cor
pora
tion
C
ouns
el
Law
Elec
tion
s
Off
ice
of P
olic
e A
ccou
ntab
ility
an
d T
rans
pare
ncy
Chi
ef o
f Inc
lusi
on
and
Equi
ty
Div
ersi
ty
Lang
uage
C
omm
unic
atio
ns
Acce
ss
Off
ice
for
Imm
igra
nt
Adva
ncem
ent
Hum
an R
ight
s C
omm
issi
on
Wom
en's
Ad
vanc
emen
t
Resi
lienc
y an
d Ra
cial
Equ
ity

1 3 0 B u d g e t O r g a n i z a t i o n a n d G l o s s a r y o f T e r m s
Public Safety
The Police and Fire Departments provide and promote public safety and protection services, firefighting, and fire prevention services. The Office of Emergency Management is responsible for facilitating communication and cooperation across cities and towns and managing state and federal funds designated for homeland security initiatives.
Health & Human Services
Health & Human Services is responsible for providing human services and other support services for Boston’s residents through its departments and programs: the Boston Public Health Commission, including Emergency Medical Services, Boston Centers for Youth & Families, Youth Engagement & Employment, the Elderly Commission, Boston VETS, Fair Housing & Equity, and the Commission for Persons with Disabilities.
Economic Development
The Economic Development Cabinet is comprised of the Office of Economic Development, Consumer Affairs & Licensing, and the Office of Tourism. The Office of Economic Development includes the Small and Local Business Enterprises and the Boston Resident Jobs Policy programs. The Chief of Economic Development also oversees the Boston Planning and Development Agency and the Economic Development and Industrial Corporation, both of which are bodies politic and corporate and are responsible for economic development in the City.
Arts & Culture
This cabinet is responsible for supporting and promoting the arts community in Boston and works with the Boston Public Library, the Arts Commission, and the Boston Cultural Council to bring the arts to the forefront of City life.
Environment, Energy & Open Space
This cabinet is comprised of the Environment Department, the Parks & Recreation Department, and the Boston Landmarks Commission. The Chief is responsible for environmental and energy policies for the City.
Housing & Neighborhood Development
The Department of Neighborhood Development (DND), through its Office of Housing Stability and array of diverse programs, invests public resources strategically to strengthen and stabilize the City’s neighborhoods.
Chief of Streets
This cabinet includes the Public Works Department, the Transportation Department, Central Fleet Management, and Snow Removal.
An All-Funds Budget
The City of Boston presents a fully integrated budget - including capital, operating, and external funds - to show the total funding available to departments to fulfill their missions.
The operating budget funds personnel and non-personnel expenses to departments so that they may provide important city services. The capital budget funds new construction or renovations to existing city-owned facilities (e.g., police and fire stations, school buildings), infrastructure improvements (e.g., roads, sidewalks, lights), and major equipment purchases such as fire-fighting apparatus. The external funds budget describes the projects and programs that will be undertaken in the next fiscal year with funding received from the state, federal, or other non-general fund sources.
B u d g e t O r g a n i z a t i o n a n d G l o s s a r y o f T e r m s 1 3 1
ORGANIZATION OF THE BUDGET
The City of Boston’s program budget provides information related to City services and their associated costs. The operating and capital budgets present the recommended resource allocations in terms of personnel, facilities, goods, and services. The budget document also describes the services provided by each City department and the performance targets that have been set for FY22.
The Operating and Capital Budget Document: Organization of the Volumes
Volume I contains information on the FY22 budget and the context in which it is prepared. Sections include:
Mayoral Transmittal Letters
Executive Summary
Operating Budget
Revenue Estimates and Analysis
Education
Capital Planning
Boston’s People and Economy
Financial Management
Statutes and Ordinances
Budget Organization and Glossary
City Council Orders
In Volumes II and III, cabinet and departmental budgets are presented by cabinet. The cabinet presentation includes cabinet mission and initiatives, followed by a table displaying total operating, external, and capital budgets. The budget presents FY19 actual results through the FY22 budgets.
Departmental Operating Budgets
Activities and services of the City are grouped into programs for budgeting and management purposes. The operating budget for each department is presented by program.
A “program” is defined as an organized group of activities directed toward attaining one or more related objectives, and the resources to execute them.
A program can consist of direct services to the public and neighborhoods of the City (e.g. police patrol or tree maintenance), or traditional city staff functions (e.g. administrative services or engineering and design).
Some City activities may not be defined as separate programs, even though they may be self-contained operations. For example, a fire station is not a separate program, although for accounting purposes it is a cost center within the Fire Department’s Fire Suppression program.
Program budgets serve as the basic building blocks of the budget. There are three additional organizational levels above the program level in the budget. The three levels are:
The Division Level for units within some departments.
The Department Level, which includes departments, commissions, and other offices.
The Cabinet Level, which includes functionally-related departments.
Description of Organization and Definition of Categories
This section outlines the information reported within each department and program in the budget.
Department or Division Level
Department Mission: The mission statement is a fundamental statement of purpose.
Performance Goals: These goals represent stated aims for which the department or division is held accountable.
Description of Services: The description of services provides a general overview of the department and its responsibilities, and lists examples of major services provided.

1 3 2 B u d g e t O r g a n i z a t i o n a n d G l o s s a r y o f T e r m s
Authorizing Statutes: This section lists statutes and ordinances that create departments as well as endow them with legal powers.
Operating Budget: The operating budget presentation includes a table displaying total operating and external budgets by program beginning with FY19 actual expenses through the FY22 budget.
Program Level
Program Description: This section presents a general overview of the program, including its responsibilities and major services provided.
Program Goals: Each program identifies the department goals related to the efforts of the program to further the department’s mission.
Performance Measures: Performance measures demonstrate a program’s progress in implementing the department’s goals. Performance measures may gauge workload, effectiveness, efficiency, or productivity. Some performance measures also show the changing context in which programs are working.
Financial Data
The financial data tables identify the major groups and expenditure account codes (for example, Personnel Services/Overtime, Supplies and Materials/Office Supplies), historical expenditures in each, and the proposed appropriations in each group and account in for a four year period.
Two financial data sheets are provided for the operating budget: Department History and Department Personnel.
Department History
Expenditure account codes are listed within six expenditure groups. Dollar amounts are shown for:
FY19 actual expenditures,
FY20 actual expenditures,
FY21 appropriations,
FY22 appropriations, and
The difference between the FY21 appropriation and the FY22 appropriation.
Department Personnel Data
Personnel data shows funding for permanent positions, including existing and proposed positions. All permanent positions are listed by union and salary grade within the department or division. The total salary request is listed for these positions.
For each position shown, the following information is provided:
Title: The civil service/personnel system job title for the position.
Union Code and Grade: The union code (including exempt and CDH for department head) and code for the salary grade of the position.
Position and Salary Requirement: These columns show the number of permanent positions for which funding is available and the total funding provided for that title for the upcoming fiscal year.
Total Funding: The total funding for permanent employees, shown at the bottom right of the personnel sheet, reflects the amount of funding required to support personnel prior to adjustments. This figure may be adjusted by differential payments, other payments, chargebacks, and salary savings.
Differential Payments: Employees who are serving temporary job titles, or who are entitled to additional payments based on the shifts they work (e.g., night shifts), receive differential payments. This figure is added to the permanent employee line.
Other: The permanent employee line contains other payments such as sick leave and vacation buybacks.
Chargebacks: Some personnel costs are charged to another fund or appropriation. These costs or reimbursements are included in the permanent employee line.
Salary Savings: This figure reflects savings due to vacancies. The amount is estimated based on experience in prior fiscal years

B u d g e t O r g a n i z a t i o n a n d G l o s s a r y o f T e r m s 1 3 3
and subtracted from the total salary requirements.
External Funds
The financial data identify the major groups and expenditure account codes for external funds expenditures. Historical expenditures and the proposed appropriations in these accounts in are shown over a four year period. The personnel data show permanent positions, including existing and proposed positions, funded with external funds. All permanent positions are listed by union and grade within the department or division. The total salary request is listed for these positions by job title. The External Funds Projects page lists a description of each project’s mission.
Capital Budget
The capital budget section provides an overview of projects and major initiatives for departments charged with managing facilities and major equipment assets. Dollar amounts are shown for:
FY19 actual capital expenditures,
FY20 actual capital expenditures,
FY21 estimated capital expenditures,
FY22 projected capital expenditures
Following this overview are capital project profiles, including descriptions of each project mission, the department managing the project, the status and location of each project, and if there are operating budget impacts. A table summarizes the total capital funds authorized for projected expenditures in FY22 and for future years, as well as whether the source is City authorization or other funding such as federal and state infrastructure grants or trust funds. A listing of actual and planned capital expenditures in comparison to authorized dollars is also provided.
GLOSSARY OF TERMS
Account: A classification of appropriation by type of expenditure.
Account Number: The number by which the City Auditor categorizes an appropriation. For budget purposes, this is also known as appropriation code.
Accrual Basis: The basis of accounting under which transactions are recognized when they occur, regardless of the timing of related cash flows.
Allotment: The amount that can be expended quarterly for personnel as submitted to the City Auditor at the beginning of each fiscal year.
Appropriation: The legal authorization to expend funds during a specific period, usually one fiscal year. In the City of Boston, the City Council is the appropriating authority.
ARPA: The American Rescue Plan Act; a $1.9 trillion economic stimulus bill enacted by the federal government in 2021.
Audit: A systematic review of an organization’s financial records.
Authorization: The legal consent to expend funds.
Balanced Budget: A budget in which revenues equal expenditures. A requirement for all Massachusetts cities and towns.
BIPOC: Black, Indigenous, and People of Color.
Bond: An interest-bearing promise to pay, with a specific maturity.
Bonds Authorized and Unissued: The portion of approved bond authorizations or loan orders that has not yet been borrowed for or issued as bonds.
Boston Retirement System (BRS): Agency that manages the City’s defined-benefit pension benefit through the management of retirement assets of employees and payment of pensions to retired employees. The Retirement board, an independent board under Chapter 306 of the Acts of 1996, is funded through investment earnings.
1 3 4 B u d g e t O r g a n i z a t i o n a n d G l o s s a r y o f T e r m s
Budget: A formal estimate of expenditures and revenues for a defined period, usually for one year.
Budget Amendment: A change from originally budgeted quotas requested by departments to the Human Resources Department and the Office of Budget Management who authorize these changes.
Budget, Level-Service: A budget that describes the funding required for maintaining current levels of service or activity.
Budget/Credit Transfer: The transfer of appropriations from one expenditure account code to another within a department.
Capital Budget: A plan for capital expenditures for projects to be included during the first year of the capital program.
Capital Expenditure: Expenditure for acquiring fixed assets such as land, buildings, equipment, technology and vehicles or for making improvements to fixed assets such as a building addition or renovation.
Capital Plan: A multi-year plan of proposed outlays for acquiring long-term assets and the means for financing those acquisitions, usually by long-term debt.
Capital Improvement: An expenditure that adds to the useful life of the City’s fixed assets.
Capital Improvement Program: A multi-year plan for capital expenditures to be incurred each year over a fixed period of years to meet capital needs.
CARES: The Coronavirus Aid, Relief, and Economic Security Act (CARES); an economic stimulus bill enacted by the federal government in March 2020.
Cash basis: A basis of accounting under which transactions are recognized only when cash changes hands.
Chapter 90 Funds: A state-funded program for payments to cities and towns for 100% of the costs of construction,
reconstruction, and improvements to public ways.
Chargeback: A method of billing departments for costs incurred by them for which they are not billed directly (e.g., telephone, postage, and printing). This method can also be used for departmental expenditures that are paid for with external or capital funds.
Cherry Sheet: Originally printed on a cherry-colored form, this document reflects all Commonwealth charges, distributions and reimbursements to a city or town as certified by the state Director of the Bureau of Accounts.
Collective Bargaining: The process of negotiations between the City administration and bargaining units (unions) regarding the salary and benefits of city employees.
Commission: An appointed policy-setting body.
Community Development Block Grant (CDBG): A federal entitlement program that provides community development funds based on a formula.
Credit Balance: Account or departmental deficit. See departmental deficit.
Credit Rating: A formal evaluation of credit history and capability of repaying obligations. The bond ratings assigned by Moody’s Investors Service and Standard & Poor’s.
CRF: The Coronavirus Relief Fund (CRF) is CARES Act funding specifically for states, tribal governments and units of local government from the United States Treasury.
CRM: The Constituent Relationship Management (CRM) system tracks citizen requests received through the Mayor’s Hotline, online self-service forms, the Citizens Connect mobile application, and direct department contacts.
Debt: Money owed to another party, such as a lender.

B u d g e t O r g a n i z a t i o n a n d G l o s s a r y o f T e r m s 1 3 5
Debt Limit: The maximum amount of debt that a governmental unit may incur under constitutional, statutory, or charter requirements. The limitation is usually a percentage of assessed valuation and may be fixed upon either gross or net debt.
Debt Outstanding: The general obligation bonds that have been sold to cover the costs of the City’s capital outlay expenditures from bond funds.
Debt Service: The annual amount of money necessary to pay the interest and principal on outstanding debt.
Department: A major service-providing entity of city government.
Departmental Deficit: A condition that exists when departmental expenditures exceed departmental appropriations.
Departmental Income: Income generated by a specific city department, usually as a result of user revenues applied for services rendered. Parking meter charges, building permit fees, and traffic fines are examples of departmental income.
Depreciation: The decrease in value of an asset over time.
Division: A budgeted sub-unit of a department.
DNR: Did not report.
Encumbrance: Funds set aside from an appropriation to pay a known future liability.
Excise: A tax applying to a specific industry or good. The jet fuel tax and the hotel/motel occupancy tax are examples of excises.
Expenditure Account Code: An expenditure classification according to the type of item purchased or service obtained, for example, emergency employees, communications, food supplies, and automotive equipment.
Expenditure: An actual payment for goods or services received.
Expense/Debit Transfer: The transfer of actual expenditures from one expenditure
account code to another within or between departments.
External Fund: Money that is not generated from city general fund sources, but is received by an agency, such as grants or trusts.
FEMA: Federal Emergency Management Agency (FEMA).
Fiscal Year: The twelve-month financial period used by the City beginning July 1 and ending June 30 of the following calendar year. The City’s fiscal year is numbered according to the year in which it ends.
Fixed Debt: Long-term obligations other than bonds, such as judgments, mortgages, and long-term notes or certificates of indebtedness.
Free Cash: The amount of budgetary fund balance available for appropriation and certified by the MA Department of Revenue. Only considered to offset certain fixed costs or to fund extraordinary and non-recurring events.
Full Faith and Credit: A pledge of the general taxing powers for the payment of governmental obligations. Bonds carrying such pledges are usually referred to as general obligation or full faith and credit bonds.
Full-time Equivalent Position (FTE): A concept used to group together part-time positions into full-time units.
Fund: An independent fiscal and accounting entity with a self-balancing set of accounts recording cash and/or other resources with all related liabilities, obligations, reserves, and equities that are segregated for specific activities or objectives. Among the fund types used by the City are General, Special Revenue, Capital Projects, Trust, and Enterprise.
GAAP: Generally Accepted Accounting Principles. The basic principles of accounting and reporting applicable to state and local governments, including the use of the modified accrual or accrual basis of accounting, as appropriate, for measuring financial position and operating

1 3 6 B u d g e t O r g a n i z a t i o n a n d G l o s s a r y o f T e r m s
results. These principles must be observed to provide a basis of comparison for governmental units.
General Fund: The fund into which the general (non-earmarked) revenues of the municipality are deposited and from which money is appropriated to pay the general expenses of the municipality.
General Obligation (G.O.) Bonds: Bonds for whose payment, the full faith and credit of the issuer has been pledged. More commonly, but not necessarily, general obligation bonds are payable from property taxes and other general revenues.
Goal: A statement, in general terms, of a desired condition, state of affairs or situation. By establishing goals, departments can define their missions and the methods for achieving those goals.
Governmental Fund: A fund used in government accounting to support standard functions of a government.
Grant Year: The grant accounting period designated by the requirements of a specific grant.
Headcount: The actual number of full-time or full-time equivalent employees in a department at any given time.
Interest: Compensation paid or to be paid for the use of money, including interest payable at periodic intervals or discount at the time a loan is made.
Interest Rate: The interest payable, expressed as a percentage of the principal available for use during a specified period of time.
K1 seats: Kindergarten 1, the early childhood program for four-year olds.
Line item: See Expenditure Account Code.
Massachusetts Water Pollution Abatement Trust (MWPAT): A statewide revolving fund that commenced operations in 1990 to address necessary environmental actions outlined in the Federal Clean Water Act.
Mayoral Reallocation: A transfer of appropriations of up to $3 million that may
be authorized by the Mayor until April 15 in a given fiscal year to relieve departmental deficits or address unanticipated financial problems.
Mission A general overview of the purposes and major activities of a department or program.
Modified Accrual Basis: The accrual basis of accounting adapted to the governmental fund type, wherein only current assets and current liabilities are generally reported on fund balance sheets and the fund operating statements present financial flow information (revenues and expenditures). Revenues are recognized when they become both measurable and available to finance expenditures of the current period. Expenditures are recognized when the related fund liability is incurred except for a few specific exceptions. All governmental funds and expendable trust funds are accounted for using the modified accrual basis of accounting.
Official Statement: The municipal equivalent of a bond prospectus.
Operating Budget: A legally adopted plan for anticipated expenditures for personnel, contractual services, supplies, current charges, and equipment in one fiscal year.
Payments-In-Lieu-of-Taxes: Income to replace the loss of tax revenue resulting from property exempted from taxation.
Performance Measure: An indicator of progress toward a strategy. Measures can be defined for identifying output, work or service quality, efficiency, effectiveness, and productivity.
Principal: The face amount of a bond, exclusive of accrued interest.
Program: An organized group of activities and the resources to execute them.
Program Evaluation: The process of comparing actual service levels achieved with promised levels of service with the purpose of improving the way a program operates.
B u d g e t O r g a n i z a t i o n a n d G l o s s a r y o f T e r m s 1 3 7
Proposition 2 1/2: A statewide ballot initiative limiting the property tax levy in cities and towns in the Commonwealth to 2 1/2 percent of the full and fair cash valuation of the taxable real and personal property in that city or town. The statute also places an annual growth cap of 2 1/2 percent on the increase in the property tax levy, with exceptions for new growth.
Proprietary Fund: A fund used in government accounting to show activities that operate more like those of commercial enterprises.
Quota: The planned number of positions that can be filled by a department, subject to the availability of funds. The quota can refer either to specific titles or to the number of personnel in the entire department. The quota of positions may change by means of a budget amendment. The actual number of personnel working in a department at any given time may differ from the quota.
Reimbursement Grant: A federal or state grant that is paid to the City once a project is completed and inspected for conformance to the grant contract. The City must provide the full funding for the project until the reimbursement is received.
Reserve Fund: An appropriation for contingencies.
Revenue: Income received by the City.
Salary Savings: For budget purposes, savings that accrue due to employee turnover or unfilled budgeted positions in a department.
SLA: A Service Level Agreement (SLA) represents a department’s stated expectation of the amount of time it will take to close out specific types of constituent service requests in CRM. The SLA can then be used as a standard of department performance.
Special Appropriation An authorization to expend funds for a specific project not encompassed by normal operating categories.
Special Revenue Fund: Used to account for the proceeds of specific revenue sources (other than special assessments, expendable trusts, or sources for major capital projects) legally restricted to expenditures for specific purposes. A special revenue fund is accounted for in the same manner as a General Fund.
STAT: Statutory accounting and reporting adopted by a legislative body of a governmental entity. The method of recording and reporting actual expenditures and revenues within a plan of financial operations that establishes a basis for the control and evaluation of activities financed through the General Fund.
State Distributions All City revenue flowing from the state. Major categories include educational distributions and reimbursements, direct education expenditures, general government reimbursements, and other distributions.
Supplementary/Supplemental Appropriation: An appropriation that is submitted to the City Council after the operating budget has been approved. Such appropriations must specify a revenue source.
Tax Exempt Bonds: Bonds exempt from federal income, state income, or state or local personal property taxes.
TBR: To be reported.
Third Party Payment: Medical payments, usually from an insurance carrier to a health care provider on behalf of an injured or infirm party.
Trust Funds: Funds held by the City in a fiduciary role, to be expended for the purposes specified by the donor.
Unliquidated Reserve: A fund established at year-end, used to pay for goods and services received this year, but not billed until next year.

1 3 8 B u d g e t O r g a n i z a t i o n a n d G l o s s a r y o f T e r m s

City Council Orders 139
City Council Budget Orders Filed by the Mayor Operating Budget Orders:
Appropriation and Tax Order for the Fiscal Year 2022 Appropriation Order for the Boston Public Schools for Fiscal Year 2022 Appropriation Order for Other Post-Employment Benefits
Lease Purchase Agreement Order Capital Plan Orders:
One Order Appropriating from the Capital Grant Fund of the City via a transfer from the Parking Meter Fund to the Capital Grant Fund
One Order Appropriating from the Capital Grant Fund of the City via a transfer from special revenue received from the Commonwealth Transportation Infrastructure Enhancement Trust Fund
One Loan Order authorized under the provisions of Section 7 and/or Section 8 of Chapter 44 of the General Laws, as amended, Chapter 121B, or any other enabling authority – Boston Center for Youth and Families, Department of Innovation and Technology, Environment, Fire, Neighborhood Development, Office of Arts & Culture, Parks and Recreation, Police, Property Management, Public Works, and Transportation Departments, Boston Public Library, Boston Housing Authority, and Public Health Commission
One Loan Order authorized under the provisions of Section 7 of Chapter 44 of the General Laws, as amended – Boston Public Schools


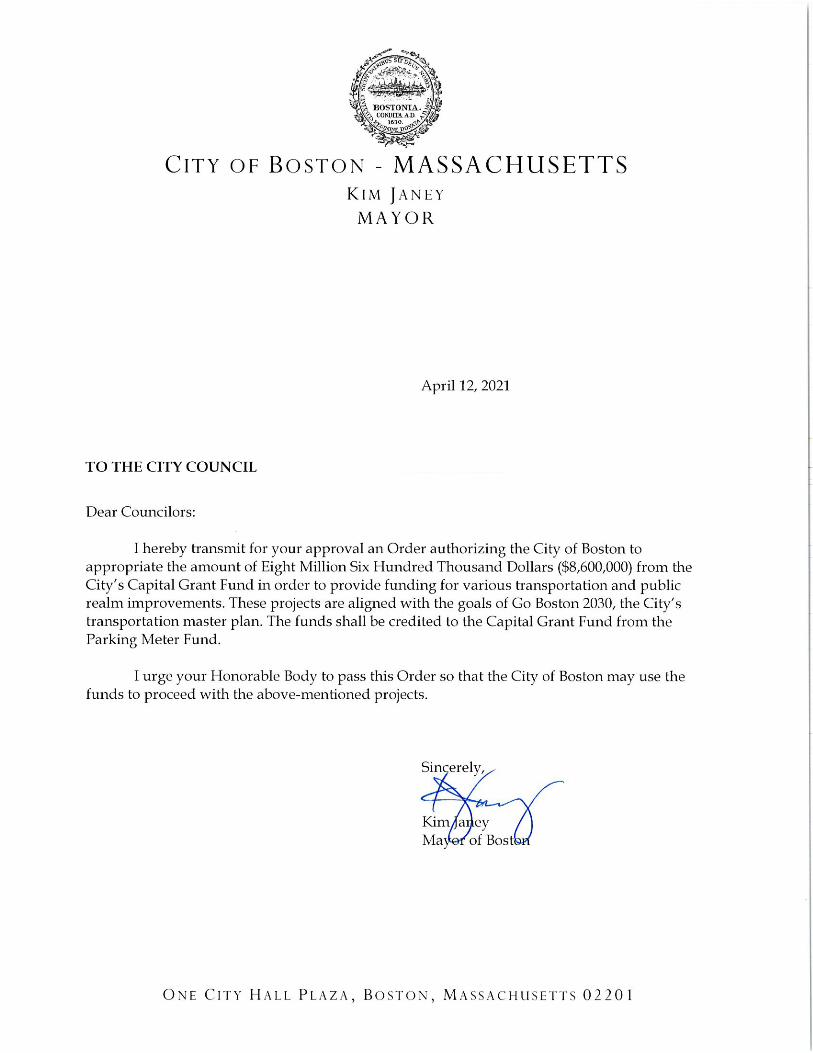


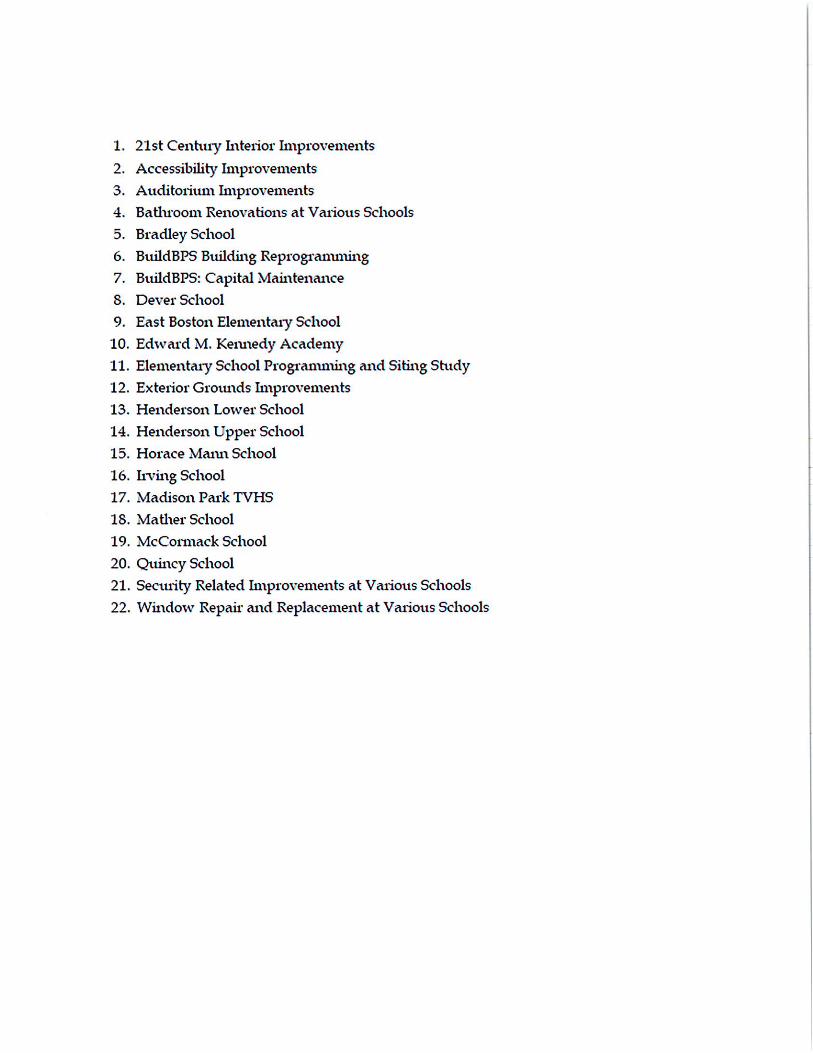

Volume II
Mayor's Office .......................................................................... 7
Mayor's Office .................................................................. 9
Mayor's Administration .................................... 15
Mayor's Executive .............................................. 16
Mayor's Policy & Planning ................................ 17
New Urban Mechanics ..................................... 18
Mayor's Communications ................................ 19
Election Department .................................................... 25
Election Division ............................................... 30
Election Administration .............................. 35
Voter Registration ........................................ 36
Election Activities ........................................ 37
Listing Board ...................................................... 38
Annual Listing ............................................... 42
Intergovernmental Relations ..................................... 45
IGR ........................................................................ 49
Grants Administration ..................................... 50
Law Department ............................................................ 51
Law Operations ................................................. 56
Litigation ............................................................. 57
Government Services ....................................... 58
Equity & Inclusion ................................................................ 63
Human Rights Commission ........................................ 65
Human Rights .................................................... 69
Office for Immigrant Advancement ........................... 71
Immigrant Advancement ................................ 76
Office of Diversity ......................................................... 79
Diversity .............................................................. 83
Office of Equity ............................................................. 85
Equity .................................................................... 91
Office of Language & Communications Access .............................................................................. 93
LCA ....................................................................... 97
Office of Resiliency & Racial Equity .......................... 99
MORRE .............................................................. 103
Women's Advancement ............................................. 105
Women's Advancement .................................. 110

Office of Police Accountability & Transparency .......... 115
Office of Police Accountability & Transparency ................................................................. 117
OPAT Commission ........................................... 122
Civilian Review Board ..................................... 123
Internal Affairs Oversight Panel ................... 124
Operations ............................................................................ 128
Inspectional Services Dept ........................................ 129
ISD Commissioner's Office ............................ 134
ISD Administration & Finance ....................... 135
Buildings & Structures ....................................136
Field Services .................................................... 137
Property Management ................................................139
PM Administration ........................................... 143
Building Operations ........................................ 144
Alterations & Repair ........................................ 145
Enforcement ..................................................... 146
Security Systems .............................................. 147
Building Systems .............................................. 148
Public Facilities Department ..................................... 153
PFD Capital Construction .............................. 157
Civic Engagement ............................................................... 161
Neighborhood Services ..............................................163
ONS Administration ........................................168
Neighborhood Serv ........................................ 169
Public Service & Community Outreach ............................................................ 170
Boston 311 ........................................................... 171
Arts & Culture ...................................................................... 175
Office of Arts & Culture .............................................. 177
Arts & Culture ................................................... 183
Library Department .................................................... 191
Library Administration ...................................198
Community Library Services ........................ 199
Research Services .......................................... 200
Economic Development .................................................... 215
Boston Planning and Development Agency ............................................................................ 217
Consumer Affairs & Licensing.................................. 223
Consumer Licensing ...................................... 229
Consumer Affairs ............................................ 230
Licensing Board ................................................ 231

Office of Economic Development ........................... 233
Economic Development ................................ 239
Equity & Inclusion ........................................... 240
Small & Local Business ................................... 241
Office of Tourism ........................................................ 245
MOATSE Administration ............................... 250
Film & Special Events ...................................... 251
Tourism ............................................................. 252
Education ............................................................................. 257
Boston Public Schools................................................ 259
General School Purposes .............................. 267
Environment, Energy & Open Space ............................. 299
Environment Department ......................................... 301
Environment .................................................... 308
Parks & Recreation Department...............................319
Parks & Recreation Administration ............ 326
Parks Operations ............................................ 327
Citywide Recreation ....................................... 329
Animal Care & Control ................................... 330
Parks Design & Construction ........................ 331
Cemetery .......................................................... 332

4 Mayor's OfficeCabinet
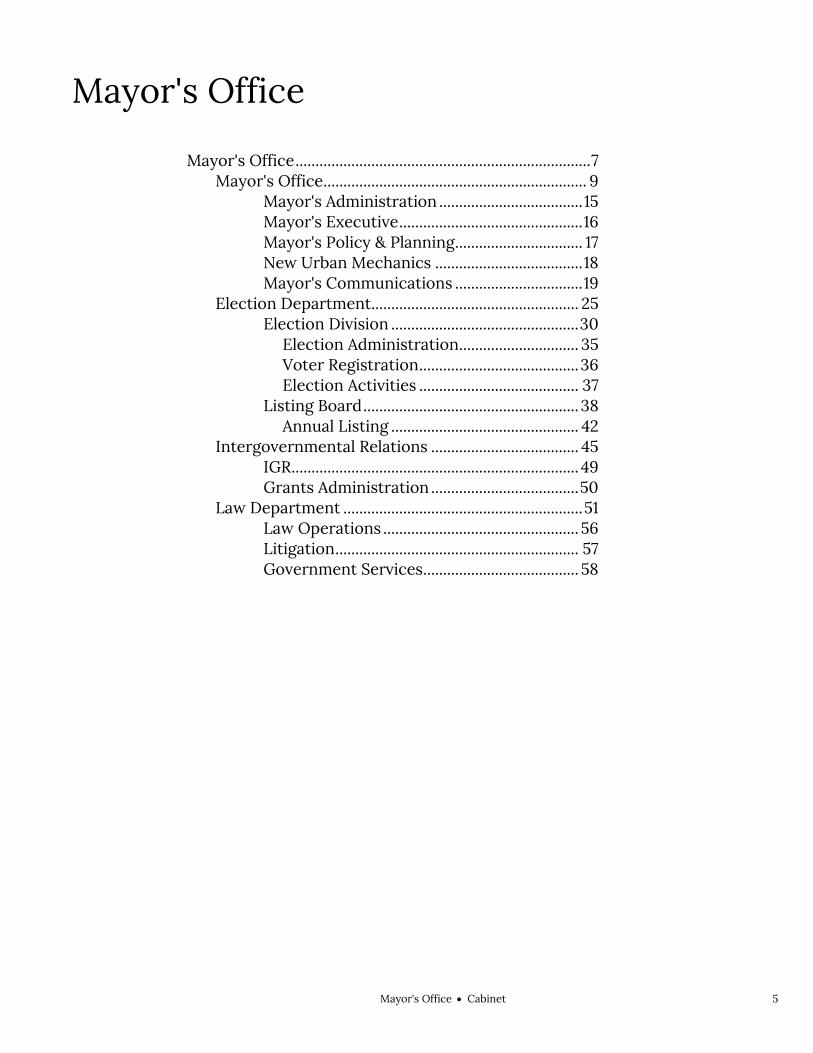
Mayor's OfficeCabinet 5
Mayor's Office Mayor's Office Cabinet
Mayor's Office .......................................................................... 7
Mayor's Office .................................................................. 9
Mayor's Administration .................................... 15
Mayor's Executive .............................................. 16
Mayor's Policy & Planning ................................ 17
New Urban Mechanics ..................................... 18
Mayor's Communications ................................ 19
Election Department .................................................... 25
Election Division ............................................... 30
Election Administration .............................. 35
Voter Registration ........................................ 36
Election Activities ........................................ 37
Listing Board ...................................................... 38
Annual Listing ............................................... 42
Intergovernmental Relations ..................................... 45
IGR ........................................................................ 49
Grants Administration ..................................... 50
Law Department ............................................................ 51
Law Operations ................................................. 56
Litigation ............................................................. 57
Government Services ....................................... 58

6 Mayor's OfficeCabinet

Mayor's OfficeCabinet 7
Mayor's Office Mayor's Office
Kim Janey, Mayor
Cabinet Mission The agencies reporting to the Mayor's Office represent the Mayor and the City in legal matters, intergovernmental relations, public relations, and elections. The Mayor's vision for the future of the City is reflected in the policies and directions carried forward by the staff of these offices.
Operating Budget
Total Actual '19 Total Actual '20 Total Approp '21 Total Budget '22
Mayor's Office 4,556,276 5,113,679 5,380,619 5,380,619
Election Department 4,205,690 4,647,901 5,262,102 6,275,434
Intergovernmental Relations 1,291,712 1,423,202 1,388,348 1,406,700
Law Department 6,479,022 7,696,847 8,186,098 8,233,601
Total 16,532,700 18,881,629 20,217,167 21,296,354
Capital Budget Expenditures Actual '19 Actual '20 Estimated '21 Projected '22
Mayor's Office 0 0 34,750 50,000 Total 0 0 34,750 50,000
External Funds Expenditures
Total Actual '19 Total Actual '20 Total Approp '21 Total Budget '22
Election Department 0 0 691,110 0 Law Department 411,765 127,372 500,000 250,000 Mayor's Office 645,488 267,101 374,989 210,549
Total 1,057,253 394,473 1,566,099 460,549


Mayor's OfficeMayor's Office 9
Mayor's Office Operating Budget Mayor's Office Mayor's Office Chris Osgood, Chief of Staff, Appropriation 111000
Department Mission The mission of the Office of the Mayor is to provide executive leadership, as well as to set priorities and goals for the City and its neighborhoods.
Operating Budget Program Name Total Actual '19 Total Actual '20 Total Approp '21 Total Budget '22
Administration 1,550,154 2,089,364 1,976,547 2,239,336
Executive 424,842 441,266 441,367 455,771
Policy & Planning 1,534,036 1,648,752 1,673,293 1,382,602
New Urban Mechanics 428,323 384,854 524,654 528,618
Communications 618,921 549,443 764,758 774,292
Total 4,556,276 5,113,679 5,380,619 5,380,619
External Funds Budget Fund Name Total Actual '19 Total Actual '20 Total Approp '21 Total Budget '22
BETA Blocks Pilot 105,958 5,381 0 0
Boston Safest Driver 42,484 29,196 32,391 0
Community Gardens 28,278 61,645 33,444 0
Early Childhood Innovation 4,727 8,820 66,453 0
Eos Foundation 1,905 0 0 0
Harvard Business School Service 87,311 86,218 100,000 100,275
Innovation Delivery Team 308,635 9,751 42,696 0
Lego Foundation Prime Award 0 8,960 0 0
Play Around the Snowy City 0 0 0 10,000
Policy Research Grant 41,064 32,130 50,005 50,137
Public Service Fellowship 25,127 25,000 50,000 50,137
Total 645,489 267,101 529,095 210,549
Operating Budget Actual '19 Actual '20 Approp '21 Budget '22
Personnel Services 4,254,539 4,701,791 4,747,785 4,744,459 Non Personnel 301,737 411,888 632,834 636,160 Total 4,556,276 5,113,679 5,380,619 5,380,619

10 Mayor's OfficeMayor's Office
Mayor's Office Operating Budget
Authorizing Statutes Chief Executive Officer, CBC St. 2 § 1;
CBC St. 5 § 100. Election and Duration of Term, CBC St. 2
§ 3. Administrative Powers and Duties, CBC
St. 2 § 7; CBC St. 5 §§ 101-102; CBC Ord. 2 generally.
Legislative Powers and Duties, CBC St. 2 §§ 12, 15-16, 750.
Fiscal Powers and Duties, CBC St. 6 §§ 251, 253; Tregor, 1982 Mass. Acts ch. 190, §15; 1986 Mass. Acts ch. 701, §2.
Description of Services The Office of the Mayor coordinates the activities of the Mayor, mayoral commissions, special assistants to the Mayor, and all City departments. Coordination of activities includes the Mayor’s scheduling, advance office, speech writing, policy development, communications, and twenty-four hour services. The Office of the Mayor is also charged with communicating mayoral directives and decisions to Cabinet officers and department heads, and coordinating implementation of those decisions.
Mayor
Administration
Reception & Correspondence
Scheduling
Mayoral Briefings
Executive
Mayoral Initiatives
Administration & Finance
Policy & Planning
Department Goals Process
Policy Coordination & Development
New Urban Mechanics
Civic Innovation
Civic Engagement
Press Inquiries
Press Conferences
Briefing of Mayor & Department Heads
Monitoring of New Accounts
Communications Program
Photography

Mayor's OfficeMayor's Office 11
Department History Personnel Services FY19 Expenditure FY20 Expenditure FY21 Appropriation FY22 Recommended Inc/Dec 21 vs 22
51000 Permanent Employees 4,212,515 4,674,176 4,747,785 4,744,459 -3,326 51100 Emergency Employees 0 0 0 0 0 51200 Overtime 0 0 0 0 0 51600 Unemployment Compensation 42,024 27,615 0 0 0 51700 Workers' Compensation 0 0 0 0 0 Total Personnel Services 4,254,539 4,701,791 4,747,785 4,744,459 -3,326
Contractual Services FY19 Expenditure FY20 Expenditure FY21 Appropriation FY22 Recommended Inc/Dec 21 vs 22
52100 Communications 49,674 57,766 54,440 57,766 3,326 52200 Utilities 0 0 0 0 0 52400 Snow Removal 0 0 0 0 0 52500 Garbage/Waste Removal 0 0 0 0 0 52600 Repairs Buildings & Structures 0 0 0 0 0 52700 Repairs & Service of Equipment 6,932 10,037 12,883 12,883 0 52800 Transportation of Persons 16,598 15,251 0 0 0 52900 Contracted Services 146,196 235,237 446,544 446,544 0 Total Contractual Services 219,400 318,291 513,867 517,193 3,326
Supplies & Materials FY19 Expenditure FY20 Expenditure FY21 Appropriation FY22 Recommended Inc/Dec 21 vs 22
53000 Auto Energy Supplies 0 0 0 0 0 53200 Food Supplies 14,125 30,044 20,500 20,500 0 53400 Custodial Supplies 0 0 0 0 0 53500 Med, Dental, & Hosp Supply 0 0 0 0 0 53600 Office Supplies and Materials 26,895 21,733 26,601 26,601 0 53700 Clothing Allowance 0 0 0 0 0 53800 Educational Supplies & Mat 0 0 0 0 0 53900 Misc Supplies & Materials 12,215 6,134 3,798 3,798 0 Total Supplies & Materials 53,235 57,911 50,899 50,899 0
Current Chgs & Oblig FY19 Expenditure FY20 Expenditure FY21 Appropriation FY22 Recommended Inc/Dec 21 vs 22
54300 Workers' Comp Medical 0 0 0 0 0 54400 Legal Liabilities 0 0 0 0 0 54500 Aid To Veterans 0 0 0 0 0 54600 Current Charges H&I 0 0 0 0 0 54700 Indemnification 0 0 0 0 0 54800 Reserve Account 0 0 0 0 0 54900 Other Current Charges 10,141 13,885 43,068 43,068 0 Total Current Chgs & Oblig 10,141 13,885 43,068 43,068 0
Equipment FY19 Expenditure FY20 Expenditure FY21 Appropriation FY22 Recommended Inc/Dec 21 vs 22
55000 Automotive Equipment 0 0 0 0 0 55400 Lease/Purchase 0 0 0 0 0 55600 Office Furniture & Equipment 4,091 0 0 0 0 55900 Misc Equipment 14,870 21,801 25,000 25,000 0 Total Equipment 18,961 21,801 25,000 25,000 0
Other FY19 Expenditure FY20 Expenditure FY21 Appropriation FY22 Recommended Inc/Dec 21 vs 22
56200 Special Appropriation 0 0 0 0 0 57200 Structures & Improvements 0 0 0 0 0 58000 Land & Non-Structure 0 0 0 0 0 Total Other 0 0 0 0 0
Grand Total 4,556,276 5,113,679 5,380,619 5,380,619 0

12 Mayor's OfficeMayor's Office
Department Personnel
Title Union Code Grade Position FY22 Salary Title
Union Code Grade Position FY22 Salary
Admin Asst MYO 04 3.00 151,923 Spec Asst IV MYO 14 2.00 241,095 Admin Asst III MYO 08 1.00 77,304 Special Asst II MYO 11 6.00 570,390 Administrative Asst MYO 05 2.00 112,486 Staff Assist I MYO 04 1.00 41,365 Administrative Asst MYO 06 3.00 211,474 Staff Assistant MYO 04 1.00 58,624 Chief Communication Officer CDH NG 1.00 160,440 Staff Assistant I MYO 05 1.00 63,788 Chief of Operations CDH NG 1.00 156,429 Staff Assistant II MYO 06 5.00 290,817 Chief of Staff CDH NG 1.00 182,500 Staff Asst - Photographer MYO 07 2.00 155,221 Chief Policy & Planning CDH NG 1.00 166,456 Staff Asst II MYO 07 1.00 69,677 Mayor EXM NG 1.00 199,547 Staff Asst III MYO 07 3.00 225,746 Project Mngr III MYO 10 1.00 98,203 Staff Asst IV MYO 09 4.00 290,234 Spec Asst MYN NG 9.00 956,191 Staff Asst-Photographer MYO 08 1.00 84,970 Spec Asst I MYO 10 1.00 88,154 Student Intern EXO NG 1.00 11,732
Temporary Mayoral Staff TMS NG 2.00 150,432
Total 55 4,815,198 Adjustments Differential Payments 0 Other 61,261 Chargebacks 0 Salary Savings -132,000 FY22 Total Request 4,744,459

Mayor's OfficeMayor's Office 13
External Funds History Personnel Services FY19 Expenditure FY20 Expenditure FY21 Appropriation FY22 Recommended Inc/Dec 21 vs 22
51000 Permanent Employees 267,101 143,243 219,707 200,549 -_19,156 51100 Emergency Employees 0 0 0 0 0 51200 Overtime 0 0 0 0 0 51300 Part Time Employees 0 0 0 0 0 51400 Health Insurance 15,611 114 0 0 0 51500 Pension & Annuity 10,214 1 0 0 0 51600 Unemployment Compensation 0 0 0 0 0 51700 Workers' Compensation 0 0 0 0 0 51800 Indirect Costs 7,241 2,881 9,610 0 -9,610 51900 Medicare 2,539 15 888 0 -888 Total Personnel Services 302,707 146,252 230,203 200,549 -29,653
Contractual Services FY19 Expenditure FY20 Expenditure FY21 Appropriation FY22 Recommended Inc/Dec 21 vs 22
52100 Communications 0 0 0 0 0 52200 Utilities 0 0 0 0 0 52400 Snow Removal 0 0 0 0 0 52500 Garbage/Waste Removal 0 0 0 0 0 52600 Repairs Buildings & Structures 0 0 0 0 0 52700 Repairs & Service of Equipment 0 0 0 0 0 52800 Transportation of Persons 1,279 850 566 0 -566 52900 Contracted Services 335,663 109,983 140,298 10,000 -130,298 Total Contractual Services 336,942 110,834 140,864 10,000 -130,864
Supplies & Materials FY19 Expenditure FY20 Expenditure FY21 Appropriation FY22 Recommended Inc/Dec 21 vs 22
53000 Auto Energy Supplies 0 0 0 0 0 53200 Food Supplies 1,058 0 828 0 -828 53400 Custodial Supplies 0 0 0 0 0 53500 Med, Dental, & Hosp Supply 0 0 0 0 0 53600 Office Supplies and Materials 1,766 4,576 918 0 -918 53700 Clothing Allowance 0 0 0 0 0 53800 Educational Supplies & Mat 0 0 0 0 0 53900 Misc Supplies & Materials 400 0 0 0 0 Total Supplies & Materials 3,224 4,576 1,746 0 -1,746
Current Chgs & Oblig FY19 Expenditure FY20 Expenditure FY21 Appropriation FY22 Recommended Inc/Dec 21 vs 22
54300 Workers' Comp Medical 0 0 0 0 0 54400 Legal Liabilities 0 0 0 0 0 54600 Current Charges H&I 0 0 0 0 0 54700 Indemnification 0 0 0 0 0 54800 Reserve Account 0 0 0 0 0 54900 Other Current Charges 0 0 0 0 0 Total Current Chgs & Oblig 0 0 0 0 0
Equipment FY19 Expenditure FY20 Expenditure FY21 Appropriation FY22 Recommended Inc/Dec 21 vs 22
55000 Automotive Equipment 0 0 0 0 0 55400 Lease/Purchase 0 0 0 0 0 55600 Office Furniture & Equipment 0 0 0 0 0 55900 Misc Equipment 2,616 5,438 2,176 0 -2,176 Total Equipment 2,616 5,438 2,176 0 -2,176
Other FY19 Expenditure FY20 Expenditure FY21 Appropriation FY22 Recommended Inc/Dec 21 vs 22
56200 Special Appropriation 0 0 0 0 0 57200 Structures & Improvements 0 0 0 0 0 58000 Land & Non-Structure 0 0 0 0 0 Total Other 0 0 0 0 0
Grand Total 645,488 267,101 374,989 210,549 -164,440

14 Mayor's OfficeMayor's Office
External Funds Personnel
Title Union Code Grade Position FY22 Salary Title
Union Code Grade Position FY22 Salary
Temporary Mayoral Staff TMS NG 4.00 200,549 Total
200,549
Adjustments Differential Payments 0 Other 0 Chargebacks 0 Salary Savings 0 FY22 Total Request 200,549

Mayor's OfficeMayor's Office 15
Program 1. Administration Chris Osgood, Chief of Staff, Organization 111100
Program Description The Administration Program provides administrative services and support to allow the Mayor’s Office to operate efficiently and cost effectively. This includes scheduling, correspondence and reception of visitors and callers.
Operating Budget Actual '19 Actual '20 Approp '21 Budget '22
Personnel Services 1,400,773 1,887,992 1,832,817 2,040,554 Non Personnel 149,381 201,372 143,730 198,782 Total 1,550,154 2,089,364 1,976,547 2,239,336
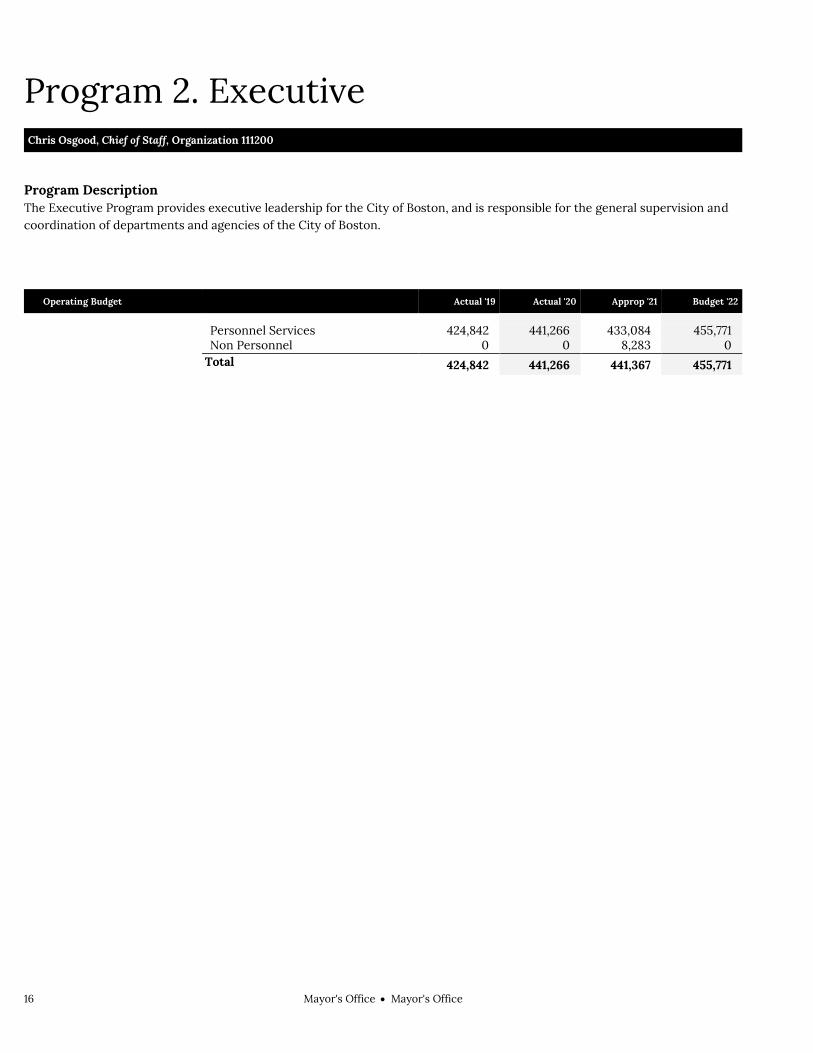
16 Mayor's OfficeMayor's Office
Program 2. Executive Chris Osgood, Chief of Staff, Organization 111200
Program Description The Executive Program provides executive leadership for the City of Boston, and is responsible for the general supervision and coordination of departments and agencies of the City of Boston.
Operating Budget Actual '19 Actual '20 Approp '21 Budget '22
Personnel Services 424,842 441,266 433,084 455,771 Non Personnel 0 0 8,283 0 Total 424,842 441,266 441,367 455,771

Mayor's OfficeMayor's Office 17
Program 3. Policy & Planning Mary Churchill, Director, Organization 111300
Program Description The Policy and Planning Program supports the Mayor in setting priorities in conjunction with Cabinet officers and line departments. In addition, the Policy and Planning Program is responsible for the overall implementation of the Mayor’s initiatives.
Operating Budget Actual '19 Actual '20 Approp '21 Budget '22
Personnel Services 1,493,172 1,515,285 1,257,293 993,523 Non Personnel 40,864 133,467 416,000 389,079 Total 1,534,036 1,648,752 1,673,293 1,382,602
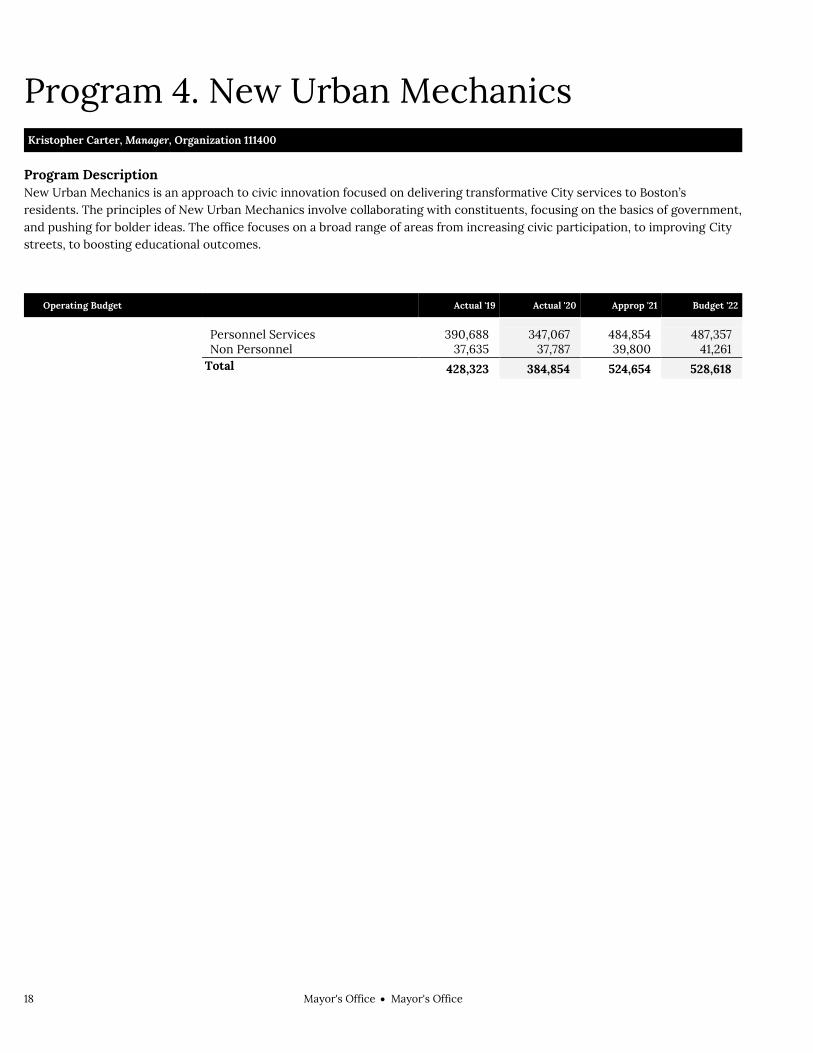
18 Mayor's OfficeMayor's Office
Program 4. New Urban Mechanics Kristopher Carter, Manager, Organization 111400
Program Description New Urban Mechanics is an approach to civic innovation focused on delivering transformative City services to Boston’s residents. The principles of New Urban Mechanics involve collaborating with constituents, focusing on the basics of government, and pushing for bolder ideas. The office focuses on a broad range of areas from increasing civic participation, to improving City streets, to boosting educational outcomes.
Operating Budget Actual '19 Actual '20 Approp '21 Budget '22
Personnel Services 390,688 347,067 484,854 487,357 Non Personnel 37,635 37,787 39,800 41,261 Total 428,323 384,854 524,654 528,618

Mayor's OfficeMayor's Office 19
Program 5. Communications Nicholas Martin, Manager, Organization 111500
Program Description The Communications Program uses print and electronic media to inform the public of the City’s handling of the local issues that affect them. The program conducts press conferences, arranges media interviews with the Mayor and City officials, issues press releases on events and initiatives, responds to media and public inquiries, and provides photographs of City events and programs for use by outside media outlets and City departments.
Operating Budget Actual '19 Actual '20 Approp '21 Budget '22
Personnel Services 545,064 510,181 739,737 767,254 Non Personnel 73,857 39,262 25,021 7,038 Total 618,921 549,443 764,758 774,292

20 Mayor's OfficeMayor's Office
External Funds Projects Beta Blocks Grant
Boston’s Safest Driver 2.0
Chief Resilience Officer Grant
Community Gardens
Early Childhood Innovation
Project Mission The "Beta Blocks" grant from the John S. and James L. Knight Foundation seeks to explore ways of making it easier for individuals and organizations to conduct experiments in city streets that provide clear civic value to Boston residents. These can range from sensor technologies to street furniture to temporary events or installations. With this grant, the Mayor's Office of New Urban Mechanics will hold a public process to discuss privacy and security concerns and how the City can support more meaningful relationships between communities throughout Boston and the many technologists, startups, and research labs that also call Boston home. The grant to the City of Boston totals $200,000 over two years.
Project Mission Boston’s Safest Driver 2.0 is a Road to Zero Safety Innovation grant, which aims to end roadway fatalities. The grant was awarded from the National Safety Council to implement safe driver practices in Boston through a city-wide safe driving competition set to launch in the winter of 2019. Boston’s Safest Driver is a key component of the City’s Vison Zero initiative aimed at eliminating traffic fatalities and serious injuries from Boston’s roadways by 2030.
Project Mission A two year grant administered by the Rockefeller Philanthropy Advisors, Inc, on behalf of the 100 Resilient Cities Initiative. The purpose of this grant is to fund a Chief Resilience Officer for the City of Boston and assist the City in building its capacity to maintain and recover critical functions despite shocks and stresses so that the cities people, communities and systems can bounce back more quickly and emerge stronger from these shocks and stresses.
Project Mission Community Gardens is a grant from TD Garden. This 3 year grant is for the activation of community gardens and green spaces throughout the City of Boston. The effort will combine physical installations with skill and community building events during the summer months of 2018, 2019, and 2020.
Project Mission Early Childhood Innovation is a grant from Gary Community Investments. The grant is focused on maximizing every child’s potential during the first three years of life. Specifically, funds will support solutions to address infant and childcare shortages in the City of Boston.
HBS Service Leadership Fellows Program
Project Mission The mission of the Harvard Business School Service Leadership Fellows Program is to both enrich the learning experience of the fellow and to provide valuable intellectual resources that will assist the City with strategic public policy analysis. The Harvard Business School has provided annual financial and personnel resources to support this program.

Mayor's OfficeMayor's Office 21
Innovation Delivery Team
Project Mission The Innovation Delivery Team grant provided by the Bloomberg Philanthropies seeks to provide cities with a method to address any barriers, implement solutions and deliver change more effectively to citizens. Innovation teams or i-teams seek to reduce the risks associated with innovation, and provide mayors and city leaders with assurance in their ability to develop and implement effective solutions to their highest-priority problems. The grant to the City of Boston totals $1,350,000 over three years.
Lego Foundation Prime Award
Project Mission MONUM will design a guidebook and retrospective, intended for aspiring public entrepreneurs in public space. The book will focus on the process of creating projects that inspire play and delight in public space. Grant amount: $10,000. Expended in FY20.
Play Around the Snowy City
Project Mission Play Around the Snowy City is a grant from the Center on the Developing Child at Harvard University. This grant is focused on funding early childhood learning and development projects. It will be used to create temporary design installations and events in the winter of 2019.
Policy Research Grant
Project Mission The Policy Research Grant is provided by UMASS Boston to support 50% of fellowship in the Mayor's Office focused on public policy research.
Public Service Fellowship
Project Mission The Public Service Fellowship Grant is provided by Harvard University to support 50% of a fellowship in the Mayor's Office to create paths for meaningful public service in Boston.

22 Mayor's OfficeMayor's Office
Mayor's Office Capital Budget Mayor's Office Mayor's Office
Overview The Mayor’s Office of New Urban Mechanics is charged with supporting innovation across all cabinets and departments and which focus on creating experiences for residents that are engaging, smart, and transparent.
FY22 Major Initiatives The Innovation Fund will work to address transportation and environmental challenges;
make government more accessible and streets more dynamic; and support projects that improve the online experience.
Capital Budget Expenditures Total Actual '19 Total Actual '20 Estimated '21 Total Projected '22
Total Department 0 0 34,750 50,000

Mayor's OfficeMayor's Office 23
Mayor's Office Project Profiles INNOVATION FUND
Project Mission Work across departments to deploy innovative improvements on streets, online, and in schools using technology
and cutting edge design.
Managing Department, Office of New Urban Mechanics Status, Implementation Underway Location, Various neighborhoods Operating Impact, No
Authorizations
Source Existing FY22 Future Non Capital
Fund Total City Capital 200,000 0 0 0 200,000 Grants/Other 0 0 0 0 0 Total 200,000 0 0 0 200,000
Expenditures (Actual and Planned)
Source Thru
6/30/20 FY21 FY22 FY23-26 Total City Capital 30,250 34,750 50,000 119,750 200,000 Grants/Other 0 0 0 0 0 Total 30,250 34.750 50,000 119,750 200,000


Mayor's OfficeElection Department 25
Election Department Operating Budget Mayor's Office Election Department Eneida Tavares, Commissioner, Appropriation 121000
Department Mission The mission of the Election Department is to ensure that all municipal, state and federal elections conducted within the City of Boston are properly managed in accordance with City, state and federal laws. The Department also seeks to ensure that all eligible citizens are registered to vote and that a comprehensive juror list is provided to the State Jury Commissioner.
Selected Performance Goals Annual Listing
Conduct an annual census of all residents age 17 and over. Annually submit a list to the State Jury Commissioner of residents who are eligible to be jurors.
Voter Registration
Encourage and facilitate the registration of eligible voters, with an emphasis on increasing electronic voter registrations.
Operating BudgetDIV Division Name Total Actual '19 Total Actual '20 Total Approp '21 Total Budget '22
Election Division 3,725,061 4,115,767 4,634,215 5,636,618
Listing Board 480,629 532,134 627,887 638,816
Total 4,205,690 4,647,901 5,262,102 6,275,434
External Funds Budget Fund Name Total Actual '19 Total Actual '20 Total Approp '21 Total Budget '22
Center for Tech and Civic Life 0 0 691,110 0
Total 0 0 691,110 0
Operating Budget Actual '19 Actual '20 Approp '21 Budget '22
Personnel Services 3,096,467 3,193,301 3,617,007 3,578,513 Non Personnel 1,109,223 1,454,600 1,645,095 2,696,921 Total 4,205,690 4,647,901 5,262,102 6,275,434

26 Mayor's OfficeElection Department
Election Department Operating Budget
Authorizing Statutes Enabling Legislation, 1895 Mass. Acts ch.
449. Primaries and Elections, M.G.L.A. cc. 50-
57; 1913 Mass. Acts ch. 835, as amended. Listing Board, 1938 Mass. Acts ch. 287. Election Employees/Civil Service, 1920
Mass. Acts ch. 305. "Juries Obligation to Serve, and Lists,"
M.G.L.A. c. 234A, §§ 4-6, CBC St. 2 §§ 200-245.
Description of Services The Election Department provides for voter registration, maintenance of election equipment, arrangement for and operation of polling places, certification of nomination papers and referendum petitions, tabulations and certification of election results, operation of a public service counter in Boston City Hall, and mailings to residents on voter registration and Election Day activities. The Department also conducts a census of Boston residents ages 17 years and older.

Mayor's OfficeElection Department 27
Department History Personnel Services FY19 Expenditure FY20 Expenditure FY21 Appropriation FY22 Recommended Inc/Dec 21 vs 22
51000 Permanent Employees 1,838,841 1,801,731 2,074,765 2,040,572 -34,193 51100 Emergency Employees 847,316 959,391 1,089,742 1,085,441 -4,301 51200 Overtime 403,318 427,807 445,000 445,000 0 51600 Unemployment Compensation 6,992 4,372 7,500 7,500 0 51700 Workers' Compensation 0 0 0 0 0 Total Personnel Services 3,096,467 3,193,301 3,617,007 3,578,513 -38,494
Contractual Services FY19 Expenditure FY20 Expenditure FY21 Appropriation FY22 Recommended Inc/Dec 21 vs 22
52100 Communications 87,137 90,818 105,000 90,000 -15,000 52200 Utilities 0 0 0 0 0 52400 Snow Removal 0 0 0 0 0 52500 Garbage/Waste Removal 0 0 0 0 0 52600 Repairs Buildings & Structures 0 0 0 0 0 52700 Repairs & Service of Equipment 23,054 10,492 21,750 17,750 -4,000 52800 Transportation of Persons 5,798 5,235 5,900 6,300 400 52900 Contracted Services 267,398 418,114 392,500 820,950 428,450 Total Contractual Services 383,387 524,659 525,150 935,000 409,850
Supplies & Materials FY19 Expenditure FY20 Expenditure FY21 Appropriation FY22 Recommended Inc/Dec 21 vs 22
53000 Auto Energy Supplies 5,724 5,149 12,000 8,818 -3,182 53200 Food Supplies 4,751 15,174 8,000 8,000 0 53400 Custodial Supplies 0 0 0 0 0 53500 Med, Dental, & Hosp Supply 0 0 0 0 0 53600 Office Supplies and Materials 438,239 462,765 565,000 1,144,350 579,350 53700 Clothing Allowance 4,346 4,250 4,500 4,500 0 53800 Educational Supplies & Mat 0 0 0 0 0 53900 Misc Supplies & Materials 14,968 185 15,000 78,500 63,500 Total Supplies & Materials 468,028 487,523 604,500 1,244,168 639,668
Current Chgs & Oblig FY19 Expenditure FY20 Expenditure FY21 Appropriation FY22 Recommended Inc/Dec 21 vs 22
54300 Workers' Comp Medical 0 0 0 0 0 54400 Legal Liabilities 0 0 0 0 0 54500 Aid To Veterans 0 0 0 0 0 54600 Current Charges H&I 0 0 0 0 0 54700 Indemnification 0 0 0 0 0 54800 Reserve Account 0 0 0 0 0 54900 Other Current Charges 83,135 105,623 153,700 158,700 5,000 Total Current Chgs & Oblig 83,135 105,623 153,700 158,700 5,000
Equipment FY19 Expenditure FY20 Expenditure FY21 Appropriation FY22 Recommended Inc/Dec 21 vs 22
55000 Automotive Equipment 0 0 0 0 0 55400 Lease/Purchase 174,673 336,795 361,745 359,053 -2,692 55600 Office Furniture & Equipment 0 0 0 0 0 55900 Misc Equipment 0 0 0 0 0 Total Equipment 174,673 336,795 361,745 359,053 -2,692
Other FY19 Expenditure FY20 Expenditure FY21 Appropriation FY22 Recommended Inc/Dec 21 vs 22
56200 Special Appropriation 0 0 0 0 0 57200 Structures & Improvements 0 0 0 0 0 58000 Land & Non-Structure 0 0 0 0 0 Total Other 0 0 0 0 0
Grand Total 4,205,690 4,647,901 5,262,102 6,275,434 1,013,332

28 Mayor's OfficeElection Department
Department Personnel
Title Union Code Grade Position FY22 Salary Title
Union Code Grade Position FY22 Salary
Adm Sec SU4 14 1.00 60,993 Data Proc Equip Tech (Ele) SU4 17 1.00 62,992 Admin Assistant SE1 07 1.00 66,486 Election Operations Asst SU4 11 2.00 87,393 Admin Asst SE1 05 2.00 137,289 Head Asst Registrar Of Voters SE1 10 1.00 126,024 Admin Asst (Election) SE1 06 2.00 162,062 Member-Board of Election EXM NG 3.00 142,223 Asst Reg Voters SU4 11 10.00 459,134 Prin Admin Assistant SE1 08 1.00 108,468 Chairperson CDH NG 1.00 120,330 Prin Asst Registrar Of Voters SU4 15 2.00 133,041 Civic Engagement Coord SE1 05 1.00 64,877 Senior Admin Asst SE1 07 1.00 87,288 Community Outreach Asst SU4 11 1.00 53,904 Sr Asst Registrar Of Voters SU4 13 2.00 113,233
Sr Data Proc Sys Analyst SE1 08 1.00 73,198
Total 33 2,058,935 Adjustments Differential Payments 0 Other 12,087 Chargebacks 0 Salary Savings -30,449 FY22 Total Request 2,040,573
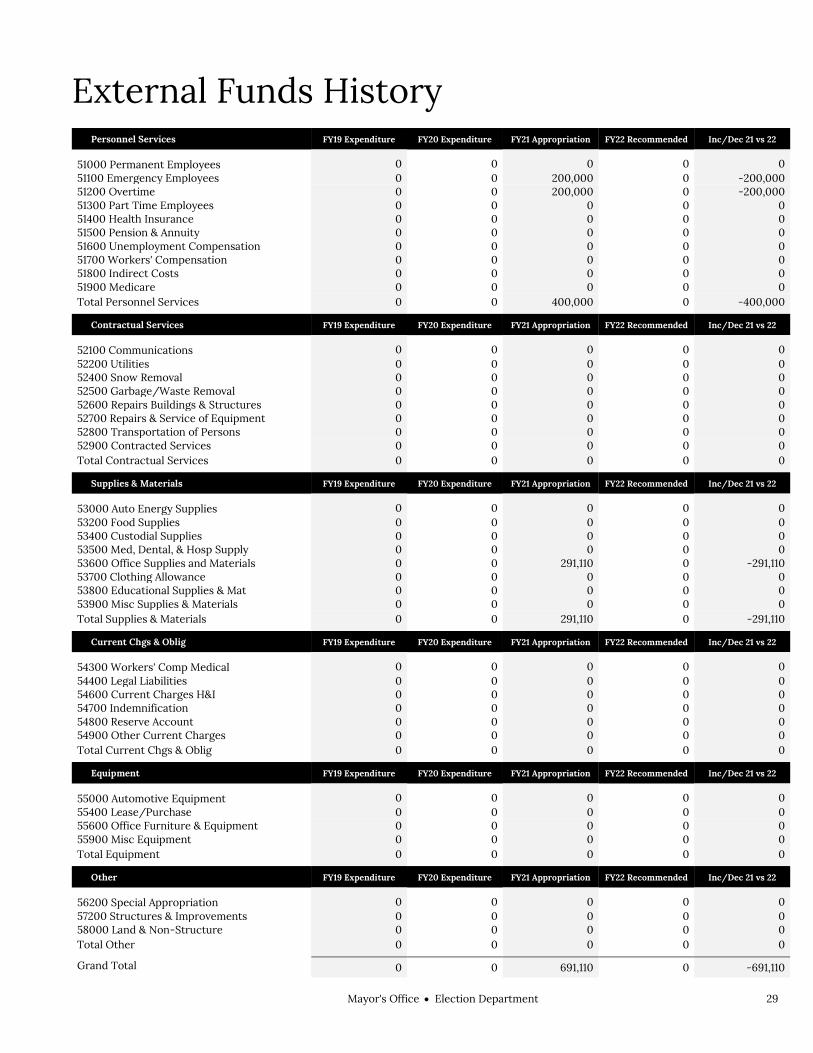
Mayor's OfficeElection Department 29
External Funds History Personnel Services FY19 Expenditure FY20 Expenditure FY21 Appropriation FY22 Recommended Inc/Dec 21 vs 22
51000 Permanent Employees 0 0 0 0 0 51100 Emergency Employees 0 0 200,000 0 -200,000 51200 Overtime 0 0 200,000 0 -200,000 51300 Part Time Employees 0 0 0 0 0 51400 Health Insurance 0 0 0 0 0 51500 Pension & Annuity 0 0 0 0 0 51600 Unemployment Compensation 0 0 0 0 0 51700 Workers' Compensation 0 0 0 0 0 51800 Indirect Costs 0 0 0 0 0 51900 Medicare 0 0 0 0 0 Total Personnel Services 0 0 400,000 0 -400,000
Contractual Services FY19 Expenditure FY20 Expenditure FY21 Appropriation FY22 Recommended Inc/Dec 21 vs 22
52100 Communications 0 0 0 0 0 52200 Utilities 0 0 0 0 0 52400 Snow Removal 0 0 0 0 0 52500 Garbage/Waste Removal 0 0 0 0 0 52600 Repairs Buildings & Structures 0 0 0 0 0 52700 Repairs & Service of Equipment 0 0 0 0 0 52800 Transportation of Persons 0 0 0 0 0 52900 Contracted Services 0 0 0 0 0 Total Contractual Services 0 0 0 0 0
Supplies & Materials FY19 Expenditure FY20 Expenditure FY21 Appropriation FY22 Recommended Inc/Dec 21 vs 22
53000 Auto Energy Supplies 0 0 0 0 0 53200 Food Supplies 0 0 0 0 0 53400 Custodial Supplies 0 0 0 0 0 53500 Med, Dental, & Hosp Supply 0 0 0 0 0 53600 Office Supplies and Materials 0 0 291,110 0 -291,110 53700 Clothing Allowance 0 0 0 0 0 53800 Educational Supplies & Mat 0 0 0 0 0 53900 Misc Supplies & Materials 0 0 0 0 0 Total Supplies & Materials 0 0 291,110 0 -291,110
Current Chgs & Oblig FY19 Expenditure FY20 Expenditure FY21 Appropriation FY22 Recommended Inc/Dec 21 vs 22
54300 Workers' Comp Medical 0 0 0 0 0 54400 Legal Liabilities 0 0 0 0 0 54600 Current Charges H&I 0 0 0 0 0 54700 Indemnification 0 0 0 0 0 54800 Reserve Account 0 0 0 0 0 54900 Other Current Charges 0 0 0 0 0 Total Current Chgs & Oblig 0 0 0 0 0
Equipment FY19 Expenditure FY20 Expenditure FY21 Appropriation FY22 Recommended Inc/Dec 21 vs 22
55000 Automotive Equipment 0 0 0 0 0 55400 Lease/Purchase 0 0 0 0 0 55600 Office Furniture & Equipment 0 0 0 0 0 55900 Misc Equipment 0 0 0 0 0 Total Equipment 0 0 0 0 0
Other FY19 Expenditure FY20 Expenditure FY21 Appropriation FY22 Recommended Inc/Dec 21 vs 22
56200 Special Appropriation 0 0 0 0 0 57200 Structures & Improvements 0 0 0 0 0 58000 Land & Non-Structure 0 0 0 0 0 Total Other 0 0 0 0 0
Grand Total 0 0 691,110 0 -691,110

30 Mayor's OfficeElection Division
Election Division Operating Budget Division Mayor's Office Election Division Eneida Tavares, Commissioner, Appropriation 121
Division Mission The Election Division prepares for and conducts municipal, state, and federal elections in accordance with all applicable laws.
Selected Performance Goals Voter Registration
Encourage and facilitate the registration of eligible voters, with an emphasis on increasing electronic voter registrations.
Operating Budget Actual '19 Actual '20 Approp '21 Budget '22
Personnel Services 2,812,551 2,894,885 3,240,520 3,217,597 Non Personnel 912,510 1,220,882 1,393,695 2,419,021 Total 3,725,061 4,115,767 4,634,215 5,636,618

Mayor's OfficeElection Division 31
Election Division Operating Budget
Description of Services
The Election Division conducts all municipal, state, and federal elections within the City of Boston. The Division handles registration of voters, maintains all election equipment, organizes and conducts elections, and tabulates and certifies election results.

32 Mayor's OfficeElection Division
Division History Personnel Services FY19 Expenditure FY20 Expenditure FY21 Appropriation FY22 Recommended Inc/Dec 21 vs 22
51000 Permanent Employees 1,714,315 1,638,838 1,907,537 1,868,710 -38,827 51100 Emergency Employees 737,487 893,345 940,483 956,387 15,904 51200 Overtime 353,757 358,330 385,000 385,000 0 51600 Unemployment Compensation 6,992 4,372 7,500 7,500 0 51700 Workers' Compensation 0 0 0 0 0 Total Personnel Services 2,812,551 2,894,885 3,240,520 3,217,597 -22,923
Contractual Services FY19 Expenditure FY20 Expenditure FY21 Appropriation FY22 Recommended Inc/Dec 21 vs 22
52100 Communications 87,137 90,818 105,000 90,000 -15,000 52200 Utilities 0 0 0 0 0 52400 Snow Removal 0 0 0 0 0 52500 Garbage/Waste Removal 0 0 0 0 0 52600 Repairs Buildings & Structures 0 0 0 0 0 52700 Repairs & Service of Equipment 23,054 10,492 21,750 17,750 -4,000 52800 Transportation of Persons 5,494 4,739 5,500 5,700 200 52900 Contracted Services 249,454 391,667 360,500 785,000 424,500 Total Contractual Services 365,139 497,716 492,750 898,450 405,700
Supplies & Materials FY19 Expenditure FY20 Expenditure FY21 Appropriation FY22 Recommended Inc/Dec 21 vs 22
53000 Auto Energy Supplies 5,724 5,149 12,000 8,818 -3,182 53200 Food Supplies 4,751 15,174 8,000 8,000 0 53400 Custodial Supplies 0 0 0 0 0 53500 Med, Dental, & Hosp Supply 0 0 0 0 0 53600 Office Supplies and Materials 260,370 256,490 346,500 907,000 560,500 53700 Clothing Allowance 3,750 3,750 4,000 4,000 0 53800 Educational Supplies & Mat 0 0 0 0 0 53900 Misc Supplies & Materials 14,968 185 15,000 75,000 60,000 Total Supplies & Materials 289,563 280,748 385,500 1,002,818 617,318
Current Chgs & Oblig FY19 Expenditure FY20 Expenditure FY21 Appropriation FY22 Recommended Inc/Dec 21 vs 22
54300 Workers' Comp Medical 0 0 0 0 0 54400 Legal Liabilities 0 0 0 0 0 54500 Aid To Veterans 0 0 0 0 0 54600 Current Charges H&I 0 0 0 0 0 54700 Indemnification 0 0 0 0 0 54800 Reserve Account 0 0 0 0 0 54900 Other Current Charges 83,135 105,623 153,700 158,700 5,000 Total Current Chgs & Oblig 83,135 105,623 153,700 158,700 5,000
Equipment FY19 Expenditure FY20 Expenditure FY21 Appropriation FY22 Recommended Inc/Dec 21 vs 22
55000 Automotive Equipment 0 0 0 0 0 55400 Lease/Purchase 174,673 336,795 361,745 359,053 -2,692 55600 Office Furniture & Equipment 0 0 0 0 0 55900 Misc Equipment 0 0 0 0 0 Total Equipment 174,673 336,795 361,745 359,053 -2,692
Other FY19 Expenditure FY20 Expenditure FY21 Appropriation FY22 Recommended Inc/Dec 21 vs 22
56200 Special Appropriation 0 0 0 0 0 57200 Structures & Improvements 0 0 0 0 0 58000 Land & Non-Structure 0 0 0 0 0 Total Other 0 0 0 0 0
Grand Total 3,725,061 4,115,767 4,634,215 5,636,618 1,002,403

Mayor's OfficeElection Division 33
Division Personnel
Title Union Code Grade Position FY22 Salary Title
Union Code Grade Position FY22 Salary
Adm Sec SU4 14 1.00 60,993 Data Proc Equip Tech (Ele) SU4 17 1.00 62,992 Admin Assistant SE1 07 1.00 66,486 Head Asst Registrar Of Voters SE1 10 1.00 126,024 Admin Asst SE1 05 1.00 54,409 Member-Board of Election EXM NG 3.00 142,223 Admin Asst (Election) SE1 06 2.00 162,062 Prin Admin Assistant SE1 08 1.00 108,468 Asst Reg Voters SU4 11 10.00 459,134 Prin Asst Registrar Of Voters SU4 15 2.00 133,041 Chairperson CDH NG 1.00 120,330 Senior Admin Asst SE1 07 1.00 87,288 Civic Engagement Coord SE1 05 1.00 64,877 Sr Asst Registrar Of Voters SU4 13 2.00 113,233 Community Outreach Asst SU4 11 1.00 53,904 Sr Data Proc Sys Analyst SE1 08 1.00 73,198 Total 30 1,888,662 Adjustments Differential Payments 0 Other 10,498 Chargebacks 0 Salary Savings -30,449 FY22 Total Request 1,868,711

34 Mayor's OfficeElection Division
External Funds History Personnel Services FY19 Expenditure FY20 Expenditure FY21 Appropriation FY22 Recommended Inc/Dec 21 vs 22
51000 Permanent Employees 0 0 0 0 0 51100 Emergency Employees 0 0 200,000 0 -200,000 51200 Overtime 0 0 200,000 0 -200,000 51300 Part Time Employees 0 0 0 0 0 51400 Health Insurance 0 0 0 0 0 51500 Pension & Annuity 0 0 0 0 0 51600 Unemployment Compensation 0 0 0 0 0 51700 Workers' Compensation 0 0 0 0 0 51800 Indirect Costs 0 0 0 0 0 51900 Medicare 0 0 0 0 0 Total Personnel Services 0 0 400,000 0 -400,000
Contractual Services FY19 Expenditure FY20 Expenditure FY21 Appropriation FY22 Recommended Inc/Dec 21 vs 22
52100 Communications 0 0 0 0 0 52200 Utilities 0 0 0 0 0 52400 Snow Removal 0 0 0 0 0 52500 Garbage/Waste Removal 0 0 0 0 0 52600 Repairs Buildings & Structures 0 0 0 0 0 52700 Repairs & Service of Equipment 0 0 0 0 0 52800 Transportation of Persons 0 0 0 0 0 52900 Contracted Services 0 0 0 0 0 Total Contractual Services 0 0 0 0 0
Supplies & Materials FY19 Expenditure FY20 Expenditure FY21 Appropriation FY22 Recommended Inc/Dec 21 vs 22
53000 Auto Energy Supplies 0 0 0 0 0 53200 Food Supplies 0 0 0 0 0 53400 Custodial Supplies 0 0 0 0 0 53500 Med, Dental, & Hosp Supply 0 0 0 0 0 53600 Office Supplies and Materials 0 0 291,110 0 -291,110 53700 Clothing Allowance 0 0 0 0 0 53800 Educational Supplies & Mat 0 0 0 0 0 53900 Misc Supplies & Materials 0 0 0 0 0 Total Supplies & Materials 0 0 291,110 0 -291,110
Current Chgs & Oblig FY19 Expenditure FY20 Expenditure FY21 Appropriation FY22 Recommended Inc/Dec 21 vs 22
54300 Workers' Comp Medical 0 0 0 0 0 54400 Legal Liabilities 0 0 0 0 0 54600 Current Charges H&I 0 0 0 0 0 54700 Indemnification 0 0 0 0 0 54800 Reserve Account 0 0 0 0 0 54900 Other Current Charges 0 0 0 0 0 Total Current Chgs & Oblig 0 0 0 0 0
Equipment FY19 Expenditure FY20 Expenditure FY21 Appropriation FY22 Recommended Inc/Dec 21 vs 22
55000 Automotive Equipment 0 0 0 0 0 55400 Lease/Purchase 0 0 0 0 0 55600 Office Furniture & Equipment 0 0 0 0 0 55900 Misc Equipment 0 0 0 0 0 Total Equipment 0 0 0 0 0
Other FY19 Expenditure FY20 Expenditure FY21 Appropriation FY22 Recommended Inc/Dec 21 vs 22
56200 Special Appropriation 0 0 0 0 0 57200 Structures & Improvements 0 0 0 0 0 58000 Land & Non-Structure 0 0 0 0 0 Total Other 0 0 0 0 0
Grand Total 0 0 691,110 0 -691,110

Mayor's OfficeElection Division 35
Program 1. Administration Eneida Tavares, Manager, Organization 121100
Program Description The Administration Program provides overall administrative and management support to the Election Department, including managing staff and Election Day employee attendance, hiring and compensation, handling complaints, and monitoring the performance of each of the Department's programs.
Operating Budget Actual '19 Actual '20 Approp '21 Budget '22
Personnel Services 655,553 592,067 680,557 691,855 Non Personnel 363,393 509,074 557,895 532,021 Total 1,018,946 1,101,141 1,238,452 1,223,876
Performance
Goal: Administer Elections in a manner that allows all eligible voters to exercise their right to vote without unreasonable impediments, and in accordance with the applicable laws and regulations
Performance Measures Actual '19 Actual '20 Projected '21 Target '22
Average number minutes a voter waits in line 30 5 15 30

36 Mayor's OfficeElection Division
Program 2. Voter Registration Eneida Tavares, Manager, Organization 121300
Program Description The Voter Registration Program works to promote voting among eligible City of Boston residents in accordance with state laws. The Voter Registration Program registers voters, maintains accurate and up-to-date lists of registered voters, keeps a master voting list of eligible Boston voters, and provides information to voters about registration and the voting process.
Operating Budget Actual '19 Actual '20 Approp '21 Budget '22
Personnel Services 364,052 386,259 394,463 355,408 Non Personnel 28,369 27,291 25,900 26,100 Total 392,421 413,550 420,363 381,508
Performance
Goal: Encourage and facilitate the registration of eligible voters, with an emphasis on increasing electronic voter registrations
Performance Measures Actual '19 Actual '20 Projected '21 Target '22
Electronic voter registrations 91,302 127,121 130,000 145,000
Youth Pre-registration 1,649 1,404 2,000 2,000
Youth registrations (H.S. & BCYF) 891 500 1,000 1,200
% of Mailed Ballot Requests (absentee &Early Voting) Processed in 48 hours
100% 100% 100% 100%

Mayor's OfficeElection Division 37
Program 3. Election Activities Eneida Tavares, Manager, Organization 121400
Program Description The Election Activities Program manages all activities related to the conduct of elections in the City of Boston, certifies nomination papers, provides all material for polling locations, trains election day officials, conducts the absentee ballot process, tabulates and certifies election results, registers voters, and responds to inquiries regarding voter status. The Election Activities Program is also responsible for equipping election sites with the proper equipment.
Operating Budget Actual '19 Actual '20 Approp '21 Budget '22
Personnel Services 1,792,946 1,916,559 2,165,500 2,170,334 Non Personnel 520,748 684,517 809,900 1,860,900 Total 2,313,694 2,601,076 2,975,400 4,031,234

38 Mayor's OfficeListing Board
Listing Board Operating Budget Division Mayor's Office Listing Board Eneida Tavares, Commissioner, Appropriation 128
Division Mission The Listing Board's mission is to produce, on an annual basis, a listing of all residents of the City of Boston who are age 17 years or older. This list must be provided to the Jury Commissioner each year.
Operating Budget Actual '19 Actual '20 Approp '21 Budget '22
Personnel Services 283,916 298,416 376,487 360,916 Non Personnel 196,713 233,718 251,400 277,900 Total 480,629 532,134 627,887 638,816

Mayor's OfficeListing Board 39
Listing Board Operating Budget
Description of Services
The Listing Board is responsible for an annual listing of Boston residents age 17 or older. The Listing Board prepares an Annual Listing of Residents and a Jury List and verifies voters eligible to vote in elections.

40 Mayor's OfficeListing Board
Division History Personnel Services FY19 Expenditure FY20 Expenditure FY21 Appropriation FY22 Recommended Inc/Dec 21 vs 22
51000 Permanent Employees 124,526 162,893 167,228 171,862 4,634 51100 Emergency Employees 109,829 66,046 149,259 129,054 -20,205 51200 Overtime 49,561 69,477 60,000 60,000 0 51600 Unemployment Compensation 0 0 0 0 0 51700 Workers' Compensation 0 0 0 0 0 Total Personnel Services 283,916 298,416 376,487 360,916 -15,571
Contractual Services FY19 Expenditure FY20 Expenditure FY21 Appropriation FY22 Recommended Inc/Dec 21 vs 22
52100 Communications 0 0 0 0 0 52200 Utilities 0 0 0 0 0 52400 Snow Removal 0 0 0 0 0 52500 Garbage/Waste Removal 0 0 0 0 0 52600 Repairs Buildings & Structures 0 0 0 0 0 52700 Repairs & Service of Equipment 0 0 0 0 0 52800 Transportation of Persons 304 496 400 600 200 52900 Contracted Services 17,944 26,447 32,000 35,950 3,950 Total Contractual Services 18,248 26,943 32,400 36,550 4,150
Supplies & Materials FY19 Expenditure FY20 Expenditure FY21 Appropriation FY22 Recommended Inc/Dec 21 vs 22
53000 Auto Energy Supplies 0 0 0 0 0 53200 Food Supplies 0 0 0 0 0 53400 Custodial Supplies 0 0 0 0 0 53500 Med, Dental, & Hosp Supply 0 0 0 0 0 53600 Office Supplies and Materials 177,869 206,275 218,500 237,350 18,850 53700 Clothing Allowance 596 500 500 500 0 53800 Educational Supplies & Mat 0 0 0 0 0 53900 Misc Supplies & Materials 0 0 0 3,500 3,500 Total Supplies & Materials 178,465 206,775 219,000 241,350 22,350
Current Chgs & Oblig FY19 Expenditure FY20 Expenditure FY21 Appropriation FY22 Recommended Inc/Dec 21 vs 22
54300 Workers' Comp Medical 0 0 0 0 0 54400 Legal Liabilities 0 0 0 0 0 54500 Aid To Veterans 0 0 0 0 0 54600 Current Charges H&I 0 0 0 0 0 54700 Indemnification 0 0 0 0 0 54800 Reserve Account 0 0 0 0 0 54900 Other Current Charges 0 0 0 0 0 Total Current Chgs & Oblig 0 0 0 0 0
Equipment FY19 Expenditure FY20 Expenditure FY21 Appropriation FY22 Recommended Inc/Dec 21 vs 22
55000 Automotive Equipment 0 0 0 0 0 55400 Lease/Purchase 0 0 0 0 0 55600 Office Furniture & Equipment 0 0 0 0 0 55900 Misc Equipment 0 0 0 0 0 Total Equipment 0 0 0 0 0
Other FY19 Expenditure FY20 Expenditure FY21 Appropriation FY22 Recommended Inc/Dec 21 vs 22
56200 Special Appropriation 0 0 0 0 0 57200 Structures & Improvements 0 0 0 0 0 58000 Land & Non-Structure 0 0 0 0 0 Total Other 0 0 0 0 0
Grand Total 480,629 532,134 627,887 638,816 10,929

Mayor's OfficeListing Board 41
Division Personnel
Title Union Code Grade Position FY22 Salary Title
Union Code Grade Position FY22 Salary
Admin Asst SE1 05 1.00 82,880 Election Operations Asst SU4 11 2.00 87,393 Total 3 170,273 Adjustments Differential Payments 0 Other 1,589 Chargebacks 0 Salary Savings 0 FY22 Total Request 171,862

42 Mayor's OfficeListing Board
Program 1. Annual Listing Sabino Piemonte, Manager, Organization 128100
Program Description The Annual Listing is mandated by the Commonwealth to provide annually, a list of all residents 17 years of age and older to the Jury Commission. This list is compiled through an annual citywide census including residents of multiple dwelling units, nursing homes, shelters and college residences.
Operating Budget Actual '19 Actual '20 Approp '21 Budget '22
Personnel Services 283,916 298,416 376,487 360,916 Non Personnel 196,713 233,718 251,400 277,900 Total 480,629 532,134 627,887 638,816
Performance
Goal: Conduct an annual census of all residents age 17 and over. Annually submit a list to the State Jury Commissioner of residents who are eligible to be jurors
Performance Measures Actual '19 Actual '20 Projected '21 Target '22
# response census using online form 23,623 24,965 22,500 25,000
% response to census mailing 52.5% 52% 50% 52%

Mayor's OfficeListing Board 43
External Funds Projects Center for Tech and Civic Life
Project Mission The Center for Tech and Civic Life (“CTCL”) is a team of civic technologists, trainers, researchers, election administration and data experts working to foster a more informed and engaged democracy, and helping to modernize U.S. elections. PURPOSE: The grant funds provided were used exclusively for the public purpose of planning and operationalizing safe and secure election administration in the City of Boston in the year 2020.


Mayor's OfficeIntergovernmental Relations 45
Intergovernmental Relations Operating Budget Mayor's Office Intergovernmental Relations Kaitlin Passafaro, Director, Appropriation 150000
Department Mission The mission of the Intergovernmental Relations Department is to coordinate the City's relations with the federal, state and other local governments, seeking to foster constructive links between the City and these entities and improved communication among city departments. The department keeps the Mayor informed on intergovernmental issues and assists her in representing the City's interests in these matters.
Operating Budget Program Name Total Actual '19 Total Actual '20 Total Approp '21 Total Budget '22
Intergovernmental Relations 1,185,293 1,314,432 1,279,550 1,297,902
Grants Administration 106,419 108,770 108,798 108,798
Total 1,291,712 1,423,202 1,388,348 1,406,700
Operating Budget Actual '19 Actual '20 Approp '21 Budget '22
Personnel Services 907,812 935,129 1,001,315 1,020,154 Non Personnel 383,900 488,073 387,033 386,546 Total 1,291,712 1,423,202 1,388,348 1,406,700

46 Mayor's OfficeIntergovernmental Relations
Intergovernmental Relations Operating Budget
Description of Services The department tracks legislation and policy initiatives that concern the City directly, or urban and regional affairs more generally. It arranges for testimony by the Mayor, or on behalf of the Mayor, at legislative hearings of special concern. It maintains relationships with and coordinates the City’s participation in national, state, and municipal organizations and further coordinates with all city departments on policy and budget issues. Intergovernmental Relations also coordinates the City's applications for federal and state grants, seeking out public grant opportunities and providing technical support to departments preparing grant applications.
Director
Grants Development Federal Relations
Tracks Federal Legislation/Grants
Coordinates Federal External Funding
Applications
Liaison to National Organizations
State Relations
Initiates & Tracks State Legislation
Monitors State Budget & Funding Programs
Liaison to State Organizations
City Council Liaison
Initiates & Tracks City Council Legislation
Liaison to Boston City Council & City Agencies
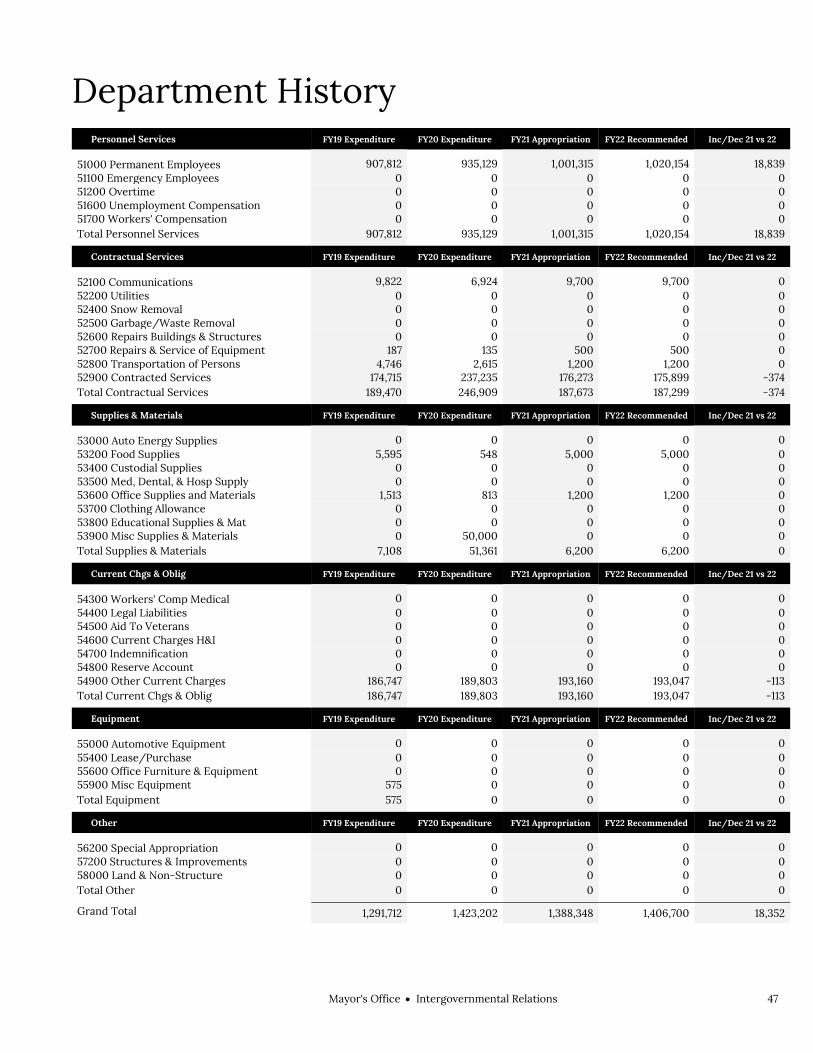
Mayor's OfficeIntergovernmental Relations 47
Department History Personnel Services FY19 Expenditure FY20 Expenditure FY21 Appropriation FY22 Recommended Inc/Dec 21 vs 22
51000 Permanent Employees 907,812 935,129 1,001,315 1,020,154 18,839 51100 Emergency Employees 0 0 0 0 0 51200 Overtime 0 0 0 0 0 51600 Unemployment Compensation 0 0 0 0 0 51700 Workers' Compensation 0 0 0 0 0 Total Personnel Services 907,812 935,129 1,001,315 1,020,154 18,839
Contractual Services FY19 Expenditure FY20 Expenditure FY21 Appropriation FY22 Recommended Inc/Dec 21 vs 22
52100 Communications 9,822 6,924 9,700 9,700 0 52200 Utilities 0 0 0 0 0 52400 Snow Removal 0 0 0 0 0 52500 Garbage/Waste Removal 0 0 0 0 0 52600 Repairs Buildings & Structures 0 0 0 0 0 52700 Repairs & Service of Equipment 187 135 500 500 0 52800 Transportation of Persons 4,746 2,615 1,200 1,200 0 52900 Contracted Services 174,715 237,235 176,273 175,899 -374 Total Contractual Services 189,470 246,909 187,673 187,299 -374
Supplies & Materials FY19 Expenditure FY20 Expenditure FY21 Appropriation FY22 Recommended Inc/Dec 21 vs 22
53000 Auto Energy Supplies 0 0 0 0 0 53200 Food Supplies 5,595 548 5,000 5,000 0 53400 Custodial Supplies 0 0 0 0 0 53500 Med, Dental, & Hosp Supply 0 0 0 0 0 53600 Office Supplies and Materials 1,513 813 1,200 1,200 0 53700 Clothing Allowance 0 0 0 0 0 53800 Educational Supplies & Mat 0 0 0 0 0 53900 Misc Supplies & Materials 0 50,000 0 0 0 Total Supplies & Materials 7,108 51,361 6,200 6,200 0
Current Chgs & Oblig FY19 Expenditure FY20 Expenditure FY21 Appropriation FY22 Recommended Inc/Dec 21 vs 22
54300 Workers' Comp Medical 0 0 0 0 0 54400 Legal Liabilities 0 0 0 0 0 54500 Aid To Veterans 0 0 0 0 0 54600 Current Charges H&I 0 0 0 0 0 54700 Indemnification 0 0 0 0 0 54800 Reserve Account 0 0 0 0 0 54900 Other Current Charges 186,747 189,803 193,160 193,047 -113 Total Current Chgs & Oblig 186,747 189,803 193,160 193,047 -113
Equipment FY19 Expenditure FY20 Expenditure FY21 Appropriation FY22 Recommended Inc/Dec 21 vs 22
55000 Automotive Equipment 0 0 0 0 0 55400 Lease/Purchase 0 0 0 0 0 55600 Office Furniture & Equipment 0 0 0 0 0 55900 Misc Equipment 575 0 0 0 0 Total Equipment 575 0 0 0 0
Other FY19 Expenditure FY20 Expenditure FY21 Appropriation FY22 Recommended Inc/Dec 21 vs 22
56200 Special Appropriation 0 0 0 0 0 57200 Structures & Improvements 0 0 0 0 0 58000 Land & Non-Structure 0 0 0 0 0 Total Other 0 0 0 0 0
Grand Total 1,291,712 1,423,202 1,388,348 1,406,700 18,352

48 Mayor's OfficeIntergovernmental Relations
Department Personnel
Title Union Code Grade Position FY22 Salary Title
Union Code Grade Position FY22 Salary
Admin Asst (IGR) SE1 04 1.00 75,441 Exec Sec (IGR) SE1 04 1.00 75,441
Assistant City Council Liaison EXM 05 1.00 54,409 Policy Analyst & Project Manager
EXM 08 1.00 73,198
Chief of Staff (Inter Govern) EXM 12 1.00 116,744 Prin Admin Assistant SE1 08 1.00 108,468 City Council Liaison EXM 08 1.00 86,952 Special Advisor EXM NG 1.00 123,964 Director CDH NG 1.00 125,343 State Government Liaison EXM 06 2.00 169,194 Total 11 1,009,154 Adjustments Differential Payments 0 Other 11,000 Chargebacks 0 Salary Savings 0 FY22 Total Request 1,020,154

Mayor's OfficeIntergovernmental Relations 49
Program 1. Intergovernmental Relations Kaitlin P assafaro, Manager, Organization 150100
Program Description The department tracks legislation and policy initiatives that concern the City directly or urban and regional affairs more generally. It arranges for testimony by the Mayor, or on behalf of the Mayor, at legislative hearings of special concern. It maintains liaison with and coordinates the City’s participation in national, state and municipal organizations and further coordinates with all the departments of the city on policy and budget issues.
Operating Budget Actual '19 Actual '20 Approp '21 Budget '22
Personnel Services 802,025 826,923 892,847 911,686 Non Personnel 383,268 487,509 386,703 386,216 Total 1,185,293 1,314,432 1,279,550 1,297,902

50 Mayor's OfficeIntergovernmental Relations
Program 2. Grants Administration Inez Foster, Manager, Organization 150200
Program Description The IGR office provides City departments with professional assistance in resource development. As a champion for the City, the Office will prioritize and maximize coordinated and collaborative grant application resources to address the Mayor’s strategic goals.
Operating Budget Actual '19 Actual '20 Approp '21 Budget '22
Personnel Services 105,787 108,206 108,468 108,468 Non Personnel 632 564 330 330 Total 106,419 108,770 108,798 108,798

Mayor's OfficeLaw Department 51
Law Department Operating Budget Mayor's Office Law Department Henry C. Luthin, Corporation Counsel, Appropriation 151000
Department Mission The mission of the Law Department is to provide a high level of professional legal services to its clients, the Mayor, City Council and City departments, supporting all official capacities within City government, in a timely and cost effective manner. Law Department personnel are committed to upholding the highest ethical standards and to assuming a professional and caring attitude toward their clients, and among themselves.
Selected Performance Goals Litigation
To defend the City against legal claims. To maximize the recovery of funds to the City, including delinquent taxes. Government services
To maximize the recovery of funds to the City, including delinquent taxes. To provide consultation services that include rendering legal opinions, drafting and
approving legal instruments such as contracts, agreements, licensing and indemnity agreements, zoning issues, public record requests and subpoena responses.
Operating Budget Program Name Total Actual '19 Total Actual '20 Total Approp '21 Total Budget '22
Operations 1,190,105 1,747,325 1,239,579 1,419,850
Litigation 2,287,469 2,835,871 2,821,605 2,862,074
Government Services 3,001,448 3,113,651 4,124,914 3,951,677
Total 6,479,022 7,696,847 8,186,098 8,233,601
External Funds Budget Fund Name Total Actual '19 Total Actual '20 Total Approp '21 Total Budget '22
Third Party Property Damages 411,765 127,372 500,000 250,000
Total 411,765 127,372 500,000 250,000
Operating Budget Actual '19 Actual '20 Approp '21 Budget '22
Personnel Services 4,714,934 5,062,116 5,765,155 5,938,110 Non Personnel 1,764,088 2,634,731 2,420,943 2,295,491 Total 6,479,022 7,696,847 8,186,098 8,233,601
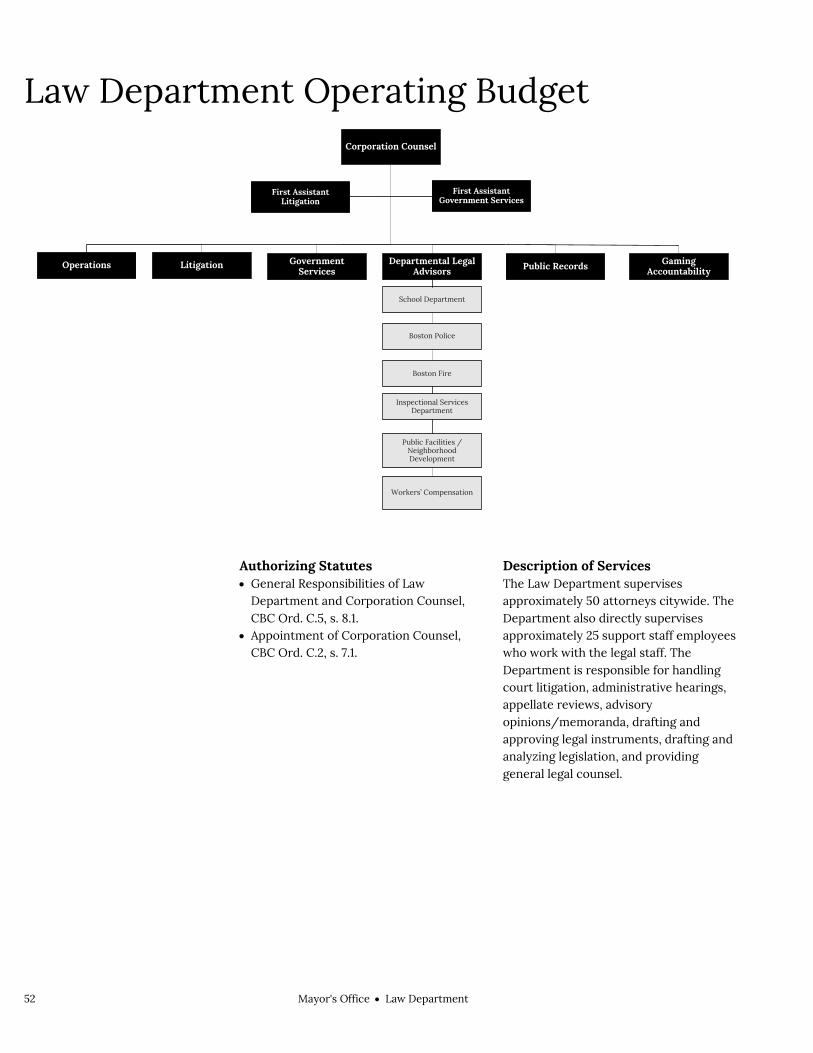
52 Mayor's OfficeLaw Department
Law Department Operating Budget
Authorizing Statutes General Responsibilities of Law
Department and Corporation Counsel, CBC Ord. C.5, s. 8.1.
Appointment of Corporation Counsel, CBC Ord. C.2, s. 7.1.
Description of Services The Law Department supervises approximately 50 attorneys citywide. The Department also directly supervises approximately 25 support staff employees who work with the legal staff. The Department is responsible for handling court litigation, administrative hearings, appellate reviews, advisory opinions/memoranda, drafting and approving legal instruments, drafting and analyzing legislation, and providing general legal counsel.
Corporation Counsel
First Assistant Government Services
Operations Litigation Government Services
School Department
Boston Fire
Inspectional Services Department
Departmental Legal Advisors
First Assistant Litigation
Gaming Accountability
Public Facilities /Neighborhood Development
Public Records
Boston Police
Workers’ Compensation

Mayor's OfficeLaw Department 53
Department History Personnel Services FY19 Expenditure FY20 Expenditure FY21 Appropriation FY22 Recommended Inc/Dec 21 vs 22
51000 Permanent Employees 4,714,934 5,062,116 5,765,155 5,938,110 172,955 51100 Emergency Employees 0 0 0 0 0 51200 Overtime 0 0 0 0 0 51600 Unemployment Compensation 0 0 0 0 0 51700 Workers' Compensation 0 0 0 0 0 Total Personnel Services 4,714,934 5,062,116 5,765,155 5,938,110 172,955
Contractual Services FY19 Expenditure FY20 Expenditure FY21 Appropriation FY22 Recommended Inc/Dec 21 vs 22
52100 Communications 43,953 11,453 12,925 12,925 0 52200 Utilities 0 0 0 0 0 52400 Snow Removal 0 0 0 0 0 52500 Garbage/Waste Removal 0 0 0 0 0 52600 Repairs Buildings & Structures 0 0 0 0 0 52700 Repairs & Service of Equipment 7,592 6,288 9,050 9,050 0 52800 Transportation of Persons 15,394 11,578 15,600 15,600 0 52900 Contracted Services 1,607,481 2,358,487 2,207,630 2,082,630 -125,000 Total Contractual Services 1,674,420 2,387,806 2,245,205 2,120,205 -125,000
Supplies & Materials FY19 Expenditure FY20 Expenditure FY21 Appropriation FY22 Recommended Inc/Dec 21 vs 22
53000 Auto Energy Supplies 0 0 0 0 0 53200 Food Supplies 0 0 0 0 0 53400 Custodial Supplies 25 87 475 475 0 53500 Med, Dental, & Hosp Supply 0 0 0 0 0 53600 Office Supplies and Materials 14,421 13,876 34,178 15,000 -19,178 53700 Clothing Allowance 1,750 1,500 1,500 1,500 0 53800 Educational Supplies & Mat 0 0 0 0 0 53900 Misc Supplies & Materials 0 0 0 0 0 Total Supplies & Materials 16,196 15,463 36,153 16,975 -19,178
Current Chgs & Oblig FY19 Expenditure FY20 Expenditure FY21 Appropriation FY22 Recommended Inc/Dec 21 vs 22
54300 Workers' Comp Medical 0 0 0 0 0 54400 Legal Liabilities 0 0 0 0 0 54500 Aid To Veterans 0 0 0 0 0 54600 Current Charges H&I 0 0 0 0 0 54700 Indemnification 0 0 0 0 0 54800 Reserve Account 0 0 0 0 0 54900 Other Current Charges 73,472 158,312 139,585 158,311 18,726 Total Current Chgs & Oblig 73,472 158,312 139,585 158,311 18,726
Equipment FY19 Expenditure FY20 Expenditure FY21 Appropriation FY22 Recommended Inc/Dec 21 vs 22
55000 Automotive Equipment 0 0 0 0 0 55400 Lease/Purchase 0 0 0 0 0 55600 Office Furniture & Equipment 0 0 0 0 0 55900 Misc Equipment 0 73,150 0 0 0 Total Equipment 0 73,150 0 0 0
Other FY19 Expenditure FY20 Expenditure FY21 Appropriation FY22 Recommended Inc/Dec 21 vs 22
56200 Special Appropriation 0 0 0 0 0 57200 Structures & Improvements 0 0 0 0 0 58000 Land & Non-Structure 0 0 0 0 0 Total Other 0 0 0 0 0
Grand Total 6,479,022 7,696,847 8,186,098 8,233,601 47,503

54 Mayor's OfficeLaw Department
Department Personnel
Title Union Code Grade Position FY22 Salary Title
Union Code Grade Position FY22 Salary
Adm Asst SU4 15 1.00 70,871 Director of Public Records EXM NG 1.00 103,114 Admin Asst (Law) SU4 16 1.00 76,637 Exec Asst (Law) SU4 16 1.00 76,637 Articled Clerk EXM 06 4.00 316,564 First Asst Corporation Counsel EXM NG 2.00 310,576 Asst Corp Counsel I EXM 05 16.00 1,079,767 General Counsel EXM 11 8.00 1,009,733 Asst Corp Counsel II EXM 07 15.00 1,278,653 Head Clerk & Secretary SU4 13 1.00 58,286 Asst Corp Counsel III EXM 08 6.00 533,506 Office Manager II EXM 08 1.00 105,822 Asst Corp Counsel IV EXM 09 2.00 211,168 Paralegal MYO 02 4.00 185,066 Asst Corp Counsel V EXM 10 2.00 245,901 Prin Legal Asst (Law) SE1 05 1.00 82,880
Claims & Affirm Recovery Analyst
SU4 17 2.00 165,752 Principal Clerk SU4 10 1.00 37,169
Corporation Counsel CDH NG 1.00 171,470 Public Facillities Comms Secr EXM 08 1.00 105,427 Total 71 6,224,999 Adjustments Differential Payments 0 Other 44,695 Chargebacks 0 Salary Savings -331,582 FY22 Total Request 5,938,112

Mayor's OfficeLaw Department 55
External Funds History Personnel Services FY19 Expenditure FY20 Expenditure FY21 Appropriation FY22 Recommended Inc/Dec 21 vs 22
51000 Permanent Employees 0 0 0 0 0 51100 Emergency Employees 0 0 0 0 0 51200 Overtime 0 0 0 0 0 51300 Part Time Employees 0 0 0 0 0 51400 Health Insurance 0 0 0 0 0 51500 Pension & Annuity 0 0 0 0 0 51600 Unemployment Compensation 0 0 0 0 0 51700 Workers' Compensation 0 0 0 0 0 51800 Indirect Costs 0 0 0 0 0 51900 Medicare 0 0 0 0 0 Total Personnel Services 0 0 0 0 0
Contractual Services FY19 Expenditure FY20 Expenditure FY21 Appropriation FY22 Recommended Inc/Dec 21 vs 22
52100 Communications 0 0 0 0 0 52200 Utilities 0 0 0 0 0 52400 Snow Removal 0 0 0 0 0 52500 Garbage/Waste Removal 0 0 0 0 0 52600 Repairs Buildings & Structures 229,115 9,380 0 0 0 52700 Repairs & Service of Equipment 109,752 7,050 0 0 0 52800 Transportation of Persons 0 0 0 0 0 52900 Contracted Services 0 0 500,000 250,000 -250,000 Total Contractual Services 338,867 16,430 500,000 250,000 -250,000
Supplies & Materials FY19 Expenditure FY20 Expenditure FY21 Appropriation FY22 Recommended Inc/Dec 21 vs 22
53000 Auto Energy Supplies 0 0 0 0 0 53200 Food Supplies 0 0 0 0 0 53400 Custodial Supplies 0 0 0 0 0 53500 Med, Dental, & Hosp Supply 0 0 0 0 0 53600 Office Supplies and Materials 0 0 0 0 0 53700 Clothing Allowance 0 0 0 0 0 53800 Educational Supplies & Mat 0 0 0 0 0 53900 Misc Supplies & Materials 0 23,102 0 0 0 Total Supplies & Materials 0 23,102 0 0 0
Current Chgs & Oblig FY19 Expenditure FY20 Expenditure FY21 Appropriation FY22 Recommended Inc/Dec 21 vs 22
54300 Workers' Comp Medical 0 0 0 0 0 54400 Legal Liabilities 0 0 0 0 0 54600 Current Charges H&I 0 0 0 0 0 54700 Indemnification 0 0 0 0 0 54800 Reserve Account 0 0 0 0 0 54900 Other Current Charges 0 0 0 0 0 Total Current Chgs & Oblig 0 0 0 0 0
Equipment FY19 Expenditure FY20 Expenditure FY21 Appropriation FY22 Recommended Inc/Dec 21 vs 22
55000 Automotive Equipment 72,898 87,840 0 0 0 55400 Lease/Purchase 0 0 0 0 0 55600 Office Furniture & Equipment 0 0 0 0 0 55900 Misc Equipment 0 0 0 0 0 Total Equipment 72,898 87,840 0 0 0
Other FY19 Expenditure FY20 Expenditure FY21 Appropriation FY22 Recommended Inc/Dec 21 vs 22
56200 Special Appropriation 0 0 0 0 0 57200 Structures & Improvements 0 0 0 0 0 58000 Land & Non-Structure 0 0 0 0 0 Total Other 0 0 0 0 0
Grand Total 411,765 127,372 500,000 250,000 -250,000

56 Mayor's OfficeLaw Department
Program 1. Operations Henry C. Luthin, Corporation Counsel, Organization 151100
Program Description The Operations Program provides the Department with the administrative structure and services necessary for the Department to carry out its day-to-day activities under court mandated litigation deadlines. The Operational duties include general managerial functions of recruiting, training, supervising administrative and support staff members and procuring supplies and services necessary to protect the City’s legal interests. The Operations Program also provides the database administration and technical support to ensure attorney staff members have the legal research resources in carrying out their duties. Furthermore, the administrative staff within the Operations Program provides centralized administrative support for the attorneys, including but not limited to legal documents preparation, courier services coordination, depositions assistance, and duplication of hundreds of documents daily, and servicing and filing of legal papers.
Operating Budget Actual '19 Actual '20 Approp '21 Budget '22
Personnel Services 862,712 1,111,480 831,452 1,009,015 Non Personnel 327,393 635,845 408,127 410,835 Total 1,190,105 1,747,325 1,239,579 1,419,850

Mayor's OfficeLaw Department 57
Program 2. Litigation Susan Weise, Manager, Organization 151200
Program Description The Litigation Program is responsible for the pretrial, trial, disposition and appeals of lawsuits in federal and state courts. It supervises and manages litigation matters including personal injury cases, road defect cases, employment claims, civil rights claims, and contract disputes. Litigation support includes legal advice and representation of City employees in cases arising from the performance of their official duties. The Program also oversees the litigation of affirmative and non-litigation claims by the City against other parties. In addition, the Litigation Program manages contracts with special outside counsel and provides day to day liaison with the police department legal advisor and school department legal advisor for all litigation matters.
Operating Budget Actual '19 Actual '20 Approp '21 Budget '22
Personnel Services 941,883 902,263 1,194,689 1,231,040 Non Personnel 1,345,586 1,933,608 1,626,916 1,631,034 Total 2,287,469 2,835,871 2,821,605 2,862,074
Performance
Goal: To defend the City against legal claims
Performance Measures Actual '19 Actual '20 Projected '21 Target '22
Claims Disposed 886 725 725 750
New cases handled-Actual 1,337 1,200 1,200 1,200
Goal: To maximize the recovery of funds to the City, including delinquent taxes
Performance Measures Actual '19 Actual '20 Projected '21 Target '22
Affirmative recovery judgments and settlements-Actual 441,551 250,500 250,500 400,000
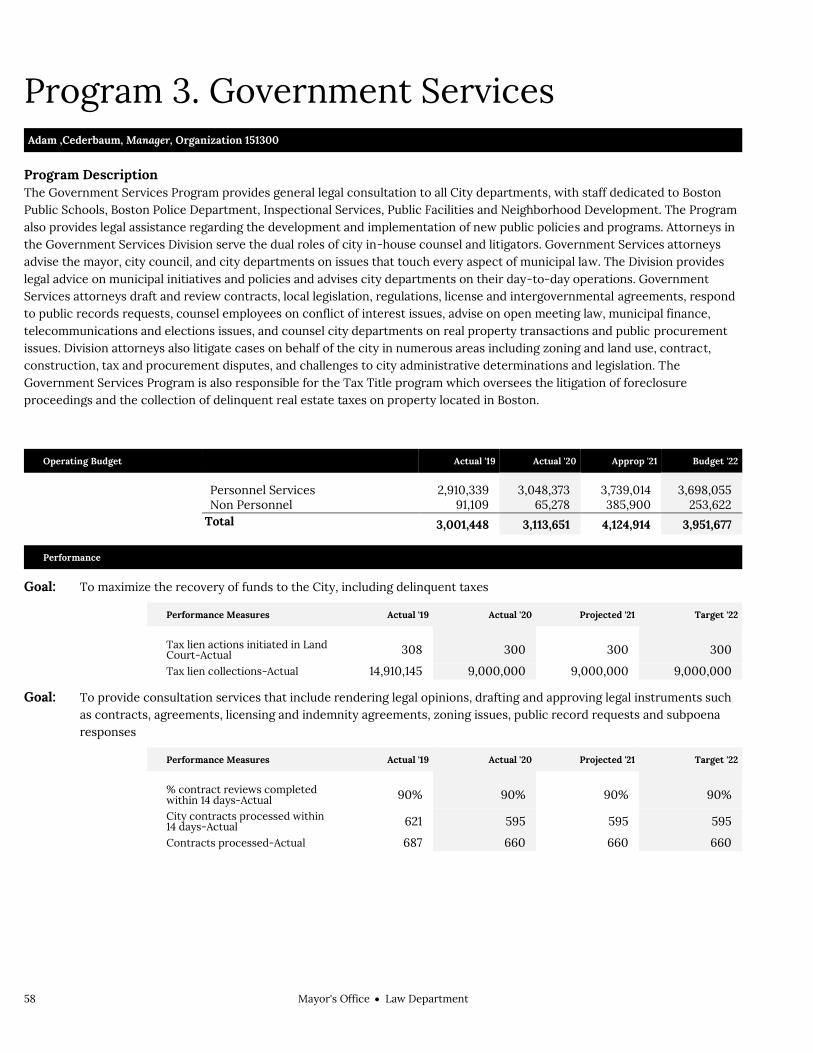
58 Mayor's OfficeLaw Department
Program 3. Government Services Adam ,Cederbaum, Manager, Organization 151300
Program Description The Government Services Program provides general legal consultation to all City departments, with staff dedicated to Boston Public Schools, Boston Police Department, Inspectional Services, Public Facilities and Neighborhood Development. The Program also provides legal assistance regarding the development and implementation of new public policies and programs. Attorneys in the Government Services Division serve the dual roles of city in-house counsel and litigators. Government Services attorneys advise the mayor, city council, and city departments on issues that touch every aspect of municipal law. The Division provides legal advice on municipal initiatives and policies and advises city departments on their day-to-day operations. Government Services attorneys draft and review contracts, local legislation, regulations, license and intergovernmental agreements, respond to public records requests, counsel employees on conflict of interest issues, advise on open meeting law, municipal finance, telecommunications and elections issues, and counsel city departments on real property transactions and public procurement issues. Division attorneys also litigate cases on behalf of the city in numerous areas including zoning and land use, contract, construction, tax and procurement disputes, and challenges to city administrative determinations and legislation. The Government Services Program is also responsible for the Tax Title program which oversees the litigation of foreclosure proceedings and the collection of delinquent real estate taxes on property located in Boston.
Operating Budget Actual '19 Actual '20 Approp '21 Budget '22
Personnel Services 2,910,339 3,048,373 3,739,014 3,698,055 Non Personnel 91,109 65,278 385,900 253,622 Total 3,001,448 3,113,651 4,124,914 3,951,677
Performance
Goal: To maximize the recovery of funds to the City, including delinquent taxes
Performance Measures Actual '19 Actual '20 Projected '21 Target '22
Tax lien actions initiated in Land Court-Actual 308 300 300 300
Tax lien collections-Actual 14,910,145 9,000,000 9,000,000 9,000,000
Goal: To provide consultation services that include rendering legal opinions, drafting and approving legal instruments such as contracts, agreements, licensing and indemnity agreements, zoning issues, public record requests and subpoena responses
Performance Measures Actual '19 Actual '20 Projected '21 Target '22
% contract reviews completed within 14 days-Actual 90% 90% 90% 90%
City contracts processed within 14 days-Actual 621 595 595 595
Contracts processed-Actual 687 660 660 660

Mayor's OfficeLaw Department 59
External Funds Projects Third Party Property Damages
Project Mission A revolving fund authorized by (Chapter 44, Section 53E ½) for purchasing goods and services to pay for repairs to city property from receipts from recoveries for damages to city property caused by third parties.

60 Mayor's OfficeLaw Department

Equity & InclusionCabinet 61
Equity & Inclusion Equity & Inclusion Cabinet
Equity & Inclusion ................................................................ 63
Human Rights Commission ........................................ 65
Human Rights .................................................... 69
Office for Immigrant Advancement ........................... 71
Immigrant Advancement ................................ 76
Office of Diversity ......................................................... 79
Diversity .............................................................. 83
Office of Equity ............................................................. 85
Equity .................................................................... 91
Office of Language & Communications Access ..... 93
LCA ....................................................................... 97
Office of Resiliency & Racial Equity .......................... 99
MORRE .............................................................. 103
Women's Advancement ............................................. 105
Women's Advancement .................................. 110

62 Equity & InclusionCabinet

Equity & InclusionCabinet 63
Equity & Inclusion Equity & Inclusion
Vacant, Chief of Equity
Cabinet Mission The Equity & Inclusion cabinet seeks to embed equity and racial justice into all City planning, operations, and programming. The cabinet actively works to dismantle racism, sexism, xenophobia, and other forms of discrimination by putting an intentional focus on supporting communities of color and marginalized groups across all departments and by building equitable and innovative governmental structures to sustain this work.
Operating Budget
Total Actual '19 Total Actual '20 Total Approp '21 Total Budget '22
Human Rights Commission 0 0 500,746 602,852
Office for Immigrant Advancement 411,935 672,805 1,125,549 1,326,408
Office of Diversity 0 0 0 304,667
Office of Equity 0 0 0 703,705
Office of Language & Communications Access 0 0 0 1,169,967
Office of Resiliency & Racial Equity 0 0 0 1,651,392
Women's Advancement 257,235 339,764 473,817 769,497
Total 669,170 1,012,569 2,100,112 6,528,488
External Funds Expenditures
Total Actual '19 Total Actual '20 Total Approp '21 Total Budget '22
Office for Immigrant Advancement 254,130 5,656 241,000 330,276 Office of Equity 103,853 253,355 150,106 141,201 Women's Advancement 0 30,000 192,000 58,000
Total 357,983 289,011 583,106 529,477


Equity & InclusionCabinet 65
Human Rights Commission Operating Budget Equity & Inclusion Human Rights Commission Evandro Carvalho, Executive Director, Appropriation 401000
Department Mission The mission of the Boston Human Rights Commission is to create a more accessible and harmonious atmosphere within the City. The Commission works to assure access to public services and accommodations, to enforce the Boston Human Rights Ordinance (which prohibits discrimination and harassment), and to education Boston residents about their civil rights.
Operating Budget Program Name Total Actual '19 Total Actual '20 Total Approp '21 Total Budget '22
Human Rights 0 0 500,746 602,852
Total 0 0 500,746 602,852
Operating Budget Actual '19 Actual '20 Approp '21 Budget '22
Personnel Services 0 0 453,346 455,452 Non Personnel 0 0 47,400 147,400 Total 0 0 500,746 602,852

66 Equity & InclusionCabinet
Human Rights Commission Operating Budget
Authorizing Statutes Ord 1984, c16 s408. Ord 1984 c 16 s209. Ord 1984 c16 s 411.
Description of Services The Human Rights Commission is responsible for investigating and enforcing all anti-discrimination laws and harassment claims that come before the Commission and to provide public education and outreach to support its mission.
Executive Director
Administration Outreach/Public Education Enforcement
Commission

Equity & InclusionCabinet 67
Department History Personnel Services FY19 Expenditure FY20 Expenditure FY21 Appropriation FY22 Recommended Inc/Dec 21 vs 22
51000 Permanent Employees 0 0 453,346 455,452 2,107 51100 Emergency Employees 0 0 0 0 0 51200 Overtime 0 0 0 0 0 51600 Unemployment Compensation 0 0 0 0 0 51700 Workers' Compensation 0 0 0 0 0 Total Personnel Services 0 0 453,346 455,452 2,107
Contractual Services FY19 Expenditure FY20 Expenditure FY21 Appropriation FY22 Recommended Inc/Dec 21 vs 22
52100 Communications 0 0 2,000 2,000 0 52200 Utilities 0 0 0 0 0 52400 Snow Removal 0 0 0 0 0 52500 Garbage/Waste Removal 0 0 0 0 0 52600 Repairs Buildings & Structures 0 0 0 0 0 52700 Repairs & Service of Equipment 0 0 0 0 0 52800 Transportation of Persons 0 0 900 900 0 52900 Contracted Services 0 0 32,500 132,500 100,000 Total Contractual Services 0 0 35,400 135,400 100,000
Supplies & Materials FY19 Expenditure FY20 Expenditure FY21 Appropriation FY22 Recommended Inc/Dec 21 vs 22
53000 Auto Energy Supplies 0 0 0 0 0 53200 Food Supplies 0 0 0 0 0 53400 Custodial Supplies 0 0 0 0 0 53500 Med, Dental, & Hosp Supply 0 0 0 0 0 53600 Office Supplies and Materials 0 0 1,000 1,000 0 53700 Clothing Allowance 0 0 0 0 0 53800 Educational Supplies & Mat 0 0 0 0 0 53900 Misc Supplies & Materials 0 0 0 0 0 Total Supplies & Materials 0 0 1,000 1,000 0
Current Chgs & Oblig FY19 Expenditure FY20 Expenditure FY21 Appropriation FY22 Recommended Inc/Dec 21 vs 22
54300 Workers' Comp Medical 0 0 0 0 0 54400 Legal Liabilities 0 0 0 0 0 54500 Aid To Veterans 0 0 0 0 0 54600 Current Charges H&I 0 0 0 0 0 54700 Indemnification 0 0 0 0 0 54800 Reserve Account 0 0 0 0 0 54900 Other Current Charges 0 0 11,000 11,000 0 Total Current Chgs & Oblig 0 0 11,000 11,000 0
Equipment FY19 Expenditure FY20 Expenditure FY21 Appropriation FY22 Recommended Inc/Dec 21 vs 22
55000 Automotive Equipment 0 0 0 0 0 55400 Lease/Purchase 0 0 0 0 0 55600 Office Furniture & Equipment 0 0 0 0 0 55900 Misc Equipment 0 0 0 0 0 Total Equipment 0 0 0 0 0
Other FY19 Expenditure FY20 Expenditure FY21 Appropriation FY22 Recommended Inc/Dec 21 vs 22
56200 Special Appropriation 0 0 0 0 0 57200 Structures & Improvements 0 0 0 0 0 58000 Land & Non-Structure 0 0 0 0 0 Total Other 0 0 0 0 0
Grand Total 0 0 500,746 602,852 102,107

68 Equity & InclusionCabinet
Department Personnel
Title Union Code Grade Position FY22 Salary Title
Union Code Grade Position FY22 Salary
Exec Dir CDH NG 1.00 123,338 Exec Asst MYO 06 1.00 59,100 Total 2 182,438 Adjustments Differential Payments 0 Other 273,014 Chargebacks 0 Salary Savings 0 FY22 Total Request 455,452
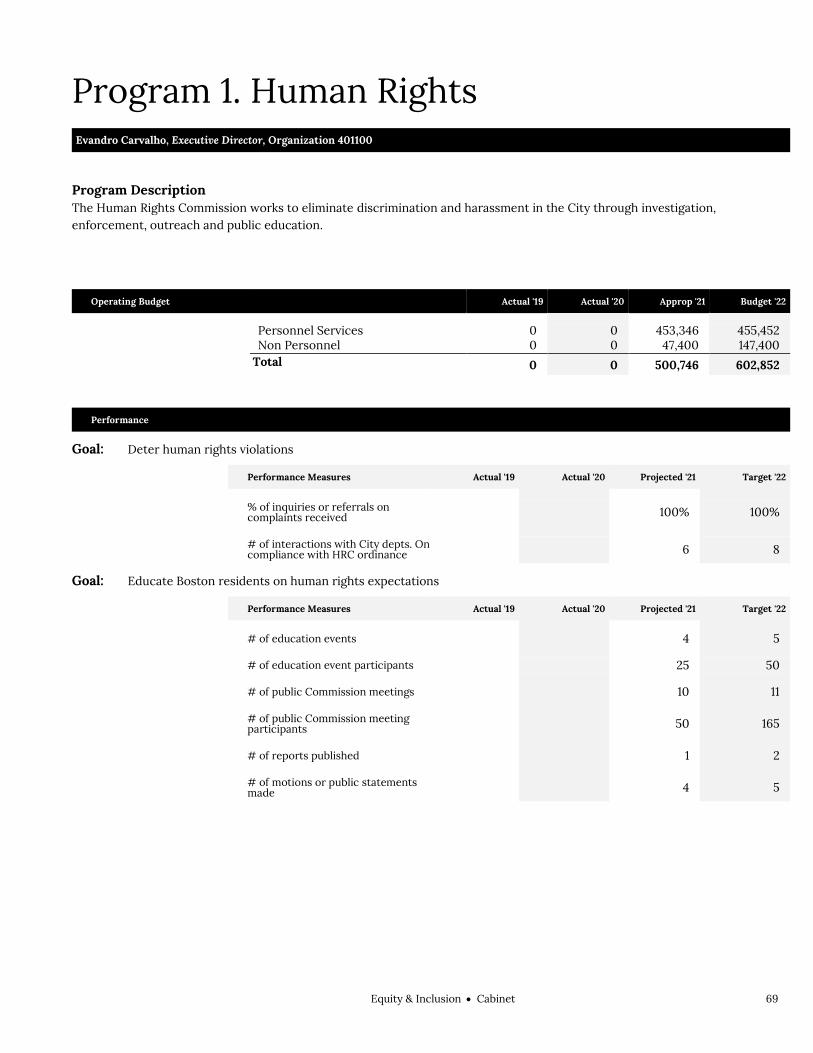
Equity & InclusionCabinet 69
Program 1. Human Rights Evandro Carvalho, Executive Director, Organization 401100
Program Description The Human Rights Commission works to eliminate discrimination and harassment in the City through investigation, enforcement, outreach and public education.
Operating Budget Actual '19 Actual '20 Approp '21 Budget '22
Personnel Services 0 0 453,346 455,452 Non Personnel 0 0 47,400 147,400 Total 0 0 500,746 602,852
Performance
Goal: Deter human rights violations
Performance Measures Actual '19 Actual '20 Projected '21 Target '22
% of inquiries or referrals on complaints received 100% 100%
# of interactions with City depts. On compliance with HRC ordinance 6 8
Goal: Educate Boston residents on human rights expectations
Performance Measures Actual '19 Actual '20 Projected '21 Target '22
# of education events 4 5
# of education event participants 25 50
# of public Commission meetings 10 11
# of public Commission meeting participants 50 165
# of reports published 1 2
# of motions or public statements made 4 5


Equity & InclusionOffice for Immigrant Advancement 71
Office for Immigrant Advancement Operating Budget Equity & Inclusion Office for Immigrant Advancement Yusufi Sabir Vali, Director, Appropriation 113000
Department Mission The mission of the Office for Immigrant Advancement is to strengthen the ability of immigrants, and the diverse cultural and linguistic communities of which they are a part, to fully participate in the economic, civic, social, and cultural life of the City of Boston, and to promote the commemoration and public understanding of the contributions of immigrants.
Selected Performance Goals Immigrant Advancement
Assist immigrant constituents in accessing programs, services & critical information. Connect Immigrant-serving organizations to resources to better serve their constituents. Publicize critical resources and immigrant contributions to immigrant communities. Support city, state, and federal agencies to more equitably serve our immigrant residents.
Operating Budget Program Name Total Actual '19 Total Actual '20 Total Approp '21 Total Budget '22
Immigrant Advancement 411,935 672,805 1,125,549 1,326,408
Total 411,935 672,805 1,125,549 1,326,408
External Funds Budget Fund Name Total Actual '19 Total Actual '20 Total Approp '21 Total Budget '22
Immigrant Integration & Empowerment 5,193 0 0 0
New Americans Library Corners 28,147 0 0 0
Office of Immigrant Advancement Fund 220,792 5,656 241,000 330,276
Total 254,131 5,656 241,000 330,276
Operating Budget Actual '19 Actual '20 Approp '21 Budget '22
Personnel Services 333,821 471,398 737,339 838,138 Non Personnel 78,114 201,407 388,210 488,270 Total 411,935 672,805 1,125,549 1,326,408

72 Equity & InclusionOffice for Immigrant Advancement
Office for Immigrant Advancement Operating Budget
Description of Services The Office for Immigrant Advancement provides public education to inform immigrants about City services, information and referral to community services as well as information in conducting outreach to immigrant groups. The Office conducts on-going outreach, including surveys to identify concerns and problems that immigrants face in Boston. The Office works with City departments to better reach and serve diverse cultural and linguistic communities and create a welcoming multicultural environment. The Office collaborates with other agencies to promote multiculturalism and understanding of immigrant history.
Resource Development
Administration and Finance
Constituent Services
Education/Community Outreach
Director
Research
Mayor's Immigrant Advisory Committee

Equity & InclusionOffice for Immigrant Advancement 73
Department History Personnel Services FY19 Expenditure FY20 Expenditure FY21 Appropriation FY22 Recommended Inc/Dec 21 vs 22
51000 Permanent Employees 333,821 471,398 737,339 838,138 100,799 51100 Emergency Employees 0 0 0 0 0 51200 Overtime 0 0 0 0 0 51600 Unemployment Compensation 0 0 0 0 0 51700 Workers' Compensation 0 0 0 0 0 Total Personnel Services 333,821 471,398 737,339 838,138 100,799
Contractual Services FY19 Expenditure FY20 Expenditure FY21 Appropriation FY22 Recommended Inc/Dec 21 vs 22
52100 Communications 1,101 3,092 2,500 9,700 7,200 52200 Utilities 0 0 0 0 0 52400 Snow Removal 0 0 0 0 0 52500 Garbage/Waste Removal 0 0 0 0 0 52600 Repairs Buildings & Structures 0 0 0 0 0 52700 Repairs & Service of Equipment 1,599 1,540 1,000 1,000 0 52800 Transportation of Persons 7,192 8,102 0 6,525 6,525 52900 Contracted Services 18,952 165,531 372,110 456,745 84,635 Total Contractual Services 28,844 178,265 375,610 473,970 98,360
Supplies & Materials FY19 Expenditure FY20 Expenditure FY21 Appropriation FY22 Recommended Inc/Dec 21 vs 22
53000 Auto Energy Supplies 0 0 0 0 0 53200 Food Supplies 6,627 3,888 9,000 9,000 0 53400 Custodial Supplies 0 0 0 0 0 53500 Med, Dental, & Hosp Supply 0 0 0 0 0 53600 Office Supplies and Materials 2,183 1,417 2,200 2,500 300 53700 Clothing Allowance 0 0 0 0 0 53800 Educational Supplies & Mat 0 0 0 0 0 53900 Misc Supplies & Materials 0 0 0 0 0 Total Supplies & Materials 8,810 5,305 11,200 11,500 300
Current Chgs & Oblig FY19 Expenditure FY20 Expenditure FY21 Appropriation FY22 Recommended Inc/Dec 21 vs 22
54300 Workers' Comp Medical 0 0 0 0 0 54400 Legal Liabilities 0 0 0 0 0 54500 Aid To Veterans 0 0 0 0 0 54600 Current Charges H&I 0 0 0 0 0 54700 Indemnification 0 0 0 0 0 54800 Reserve Account 0 0 0 0 0 54900 Other Current Charges 27,371 5,099 1,400 2,800 1,400 Total Current Chgs & Oblig 27,371 5,099 1,400 2,800 1,400
Equipment FY19 Expenditure FY20 Expenditure FY21 Appropriation FY22 Recommended Inc/Dec 21 vs 22
55000 Automotive Equipment 0 0 0 0 0 55400 Lease/Purchase 0 0 0 0 0 55600 Office Furniture & Equipment 0 1,098 0 0 0 55900 Misc Equipment 13,089 11,640 0 0 0 Total Equipment 13,089 12,738 0 0 0
Other FY19 Expenditure FY20 Expenditure FY21 Appropriation FY22 Recommended Inc/Dec 21 vs 22
56200 Special Appropriation 0 0 0 0 0 57200 Structures & Improvements 0 0 0 0 0 58000 Land & Non-Structure 0 0 0 0 0 Total Other 0 0 0 0 0
Grand Total 411,935 672,805 1,125,549 1,326,408 200,859

74 Equity & InclusionOffice for Immigrant Advancement
External Funds History Personnel Services FY19 Expenditure FY20 Expenditure FY21 Appropriation FY22 Recommended Inc/Dec 21 vs 22
51000 Permanent Employees 22,874 0 0 0 0 51100 Emergency Employees 0 0 0 0 0 51200 Overtime 0 0 0 0 0 51300 Part Time Employees 0 0 0 0 0 51400 Health Insurance -4,344 0 0 0 0 51500 Pension & Annuity 0 0 0 0 0 51600 Unemployment Compensation 0 0 0 0 0 51700 Workers' Compensation 0 0 0 0 0 51800 Indirect Costs 0 0 0 0 0 51900 Medicare -192 0 0 0 0 Total Personnel Services 18,338 0 0 0 0
Contractual Services FY19 Expenditure FY20 Expenditure FY21 Appropriation FY22 Recommended Inc/Dec 21 vs 22
52100 Communications 0 0 0 0 0 52200 Utilities 0 0 0 0 0 52400 Snow Removal 0 0 0 0 0 52500 Garbage/Waste Removal 0 0 0 0 0 52600 Repairs Buildings & Structures 0 0 0 0 0 52700 Repairs & Service of Equipment 0 0 0 0 0 52800 Transportation of Persons 0 1,144 500 0 -500 52900 Contracted Services 145,692 4,421 155,000 330,276 175,276 Total Contractual Services 145,692 5,565 155,500 330,276 174,776
Supplies & Materials FY19 Expenditure FY20 Expenditure FY21 Appropriation FY22 Recommended Inc/Dec 21 vs 22
53000 Auto Energy Supplies 0 0 0 0 0 53200 Food Supplies 0 91 500 0 -500 53400 Custodial Supplies 0 0 0 0 0 53500 Med, Dental, & Hosp Supply 0 0 0 0 0 53600 Office Supplies and Materials 0 0 0 0 0 53700 Clothing Allowance 0 0 0 0 0 53800 Educational Supplies & Mat 0 0 0 0 0 53900 Misc Supplies & Materials 0 0 0 0 0 Total Supplies & Materials 0 91 500 0 -500
Current Chgs & Oblig FY19 Expenditure FY20 Expenditure FY21 Appropriation FY22 Recommended Inc/Dec 21 vs 22
54300 Workers' Comp Medical 0 0 0 0 0 54400 Legal Liabilities 0 0 0 0 0 54600 Current Charges H&I 0 0 0 0 0 54700 Indemnification 0 0 0 0 0 54800 Reserve Account 0 0 0 0 0 54900 Other Current Charges 90,100 0 85,000 0 -85,000 Total Current Chgs & Oblig 90,100 0 85,000 0 -85,000
Equipment FY19 Expenditure FY20 Expenditure FY21 Appropriation FY22 Recommended Inc/Dec 21 vs 22
55000 Automotive Equipment 0 0 0 0 0 55400 Lease/Purchase 0 0 0 0 0 55600 Office Furniture & Equipment 0 0 0 0 0 55900 Misc Equipment 0 0 0 0 0 Total Equipment 0 0 0 0 0
Other FY19 Expenditure FY20 Expenditure FY21 Appropriation FY22 Recommended Inc/Dec 21 vs 22
56200 Special Appropriation 0 0 0 0 0 57200 Structures & Improvements 0 0 0 0 0 58000 Land & Non-Structure 0 0 0 0 0 Total Other 0 0 0 0 0
Grand Total 254,130 5,656 241,000 330,276 89,276

Equity & InclusionOffice for Immigrant Advancement 75
Department Personnel
Title Union Code Grade Position FY21 Salary Title
Union Code Grade Position FY21 Salary
Assistant Dir MYO 08 1.00 84,970 Outreach & Engagement Manager
MYO 07 1.00 61,482
Communications Manager MYO 08 1.00 67,133 Policy Analyst MYO 08 1.00 79,716
Constituent Advocacy Coordinator MYO 06 1.00 57,227 Prj Manager MYO 08 1.00 76,174
Director CDH NG 1.00 105,867 Staff Asst III MYO 07 1.00 77,610 Coordinator (NSD) MYO 07 1.00 55,829 Program Coordinator MYO 07 1.00 55,829 Total 10 772,409 Adjustments Differential Payments 0 Other 65,729 Chargebacks 0 Salary Savings 0 FY21 Total Request 838,138
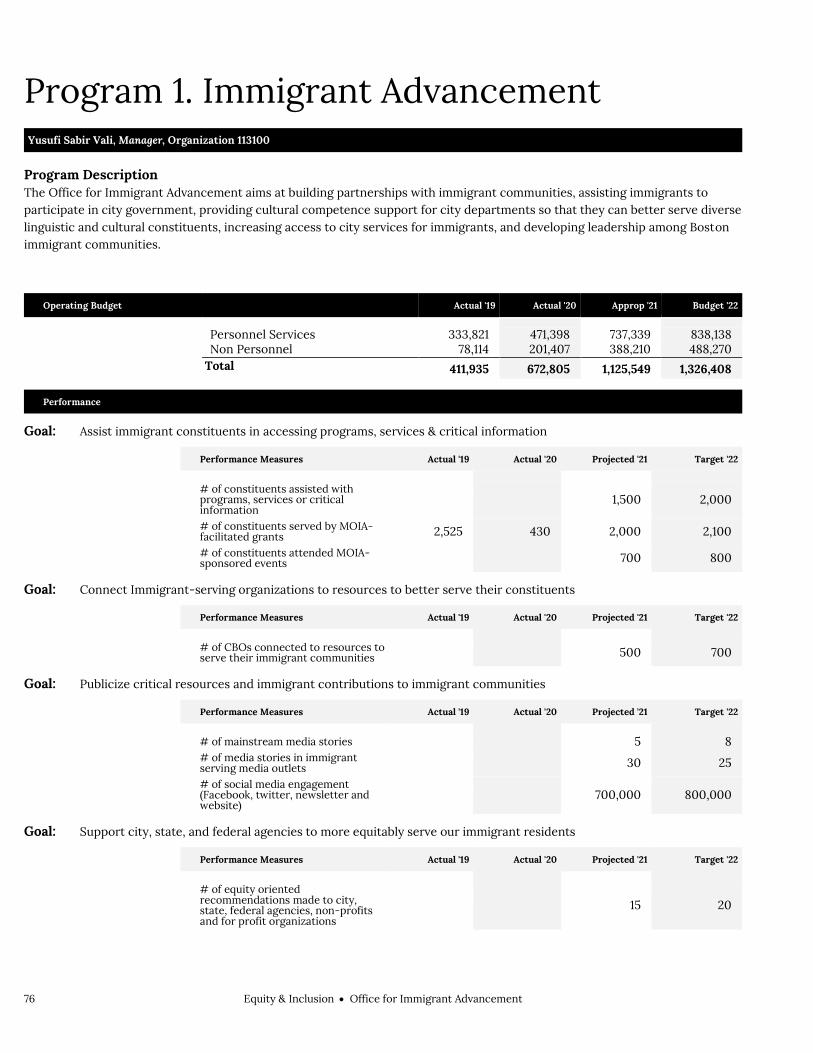
76 Equity & InclusionOffice for Immigrant Advancement
Program 1. Immigrant Advancement Yusufi Sabir Vali, Manager, Organization 113100
Program Description The Office for Immigrant Advancement aims at building partnerships with immigrant communities, assisting immigrants to participate in city government, providing cultural competence support for city departments so that they can better serve diverse linguistic and cultural constituents, increasing access to city services for immigrants, and developing leadership among Boston immigrant communities.
Operating Budget Actual '19 Actual '20 Approp '21 Budget '22
Personnel Services 333,821 471,398 737,339 838,138 Non Personnel 78,114 201,407 388,210 488,270 Total 411,935 672,805 1,125,549 1,326,408
Performance
Goal: Assist immigrant constituents in accessing programs, services & critical information
Performance Measures Actual '19 Actual '20 Projected '21 Target '22
# of constituents assisted with programs, services or critical information
1,500 2,000
# of constituents served by MOIA-facilitated grants 2,525 430 2,000 2,100
# of constituents attended MOIA-sponsored events
700 800
Goal: Connect Immigrant-serving organizations to resources to better serve their constituents
Performance Measures Actual '19 Actual '20 Projected '21 Target '22
# of CBOs connected to resources to serve their immigrant communities
500 700
Goal: Publicize critical resources and immigrant contributions to immigrant communities
Performance Measures Actual '19 Actual '20 Projected '21 Target '22
# of mainstream media stories
5 8
# of media stories in immigrant serving media outlets
30 25
# of social media engagement (Facebook, twitter, newsletter and website)
700,000 800,000
Goal: Support city, state, and federal agencies to more equitably serve our immigrant residents
Performance Measures Actual '19 Actual '20 Projected '21 Target '22
# of equity oriented recommendations made to city, state, federal agencies, non-profits and for profit organizations
15 20

Equity & InclusionOffice for Immigrant Advancement 77
External Funds Projects
Immigrant Integration & Empowerment
Project Mission The Immigrant Integration and Empower Initiative seeks to develop a detailed action plan for all City Departments and launch a citywide media and public relations campaign in mainstream, ethnic, and local media outlets to change the rhetoric about immigrants and maximize engagement and participation, and partner with nonprofits to facilitate four annual “Community Leadership Institutes” for immigrant communities that offer leadership training on taking a more active role on decision-making bodies and navigating city government services and resources. Funding is provided by the BARR Foundation that totals $262,500 over a time frame of 30 months.
New Americans Library Corners
Project Mission New Americans Library Corners Initiative, to provide citizenship information, financial empowerment, and legal assistance information, and other crucial programs that enable New Bostonians to play an active role in the economic, civic, social and cultural life of the city of Boston.
Office of Immigrant Advancement Fund
Project Mission Purpose of funding the Immigrant Integration and Empowerment Initiative, Immigrant Information Corners, Immigration Advice Clinics, Citizenship Day, Mini-grants to Immigrant-led non-profit organizations, the English for New Bostonians Initiative, a city-private-community partnership providing access to English classes, and other crucial programs that enable New Bostonians to play an active role in the economic, civic, social and cultural life of the city of Boston and, to promote the commemoration and public understanding of the contributions of immigrants to become full participants in Boston.

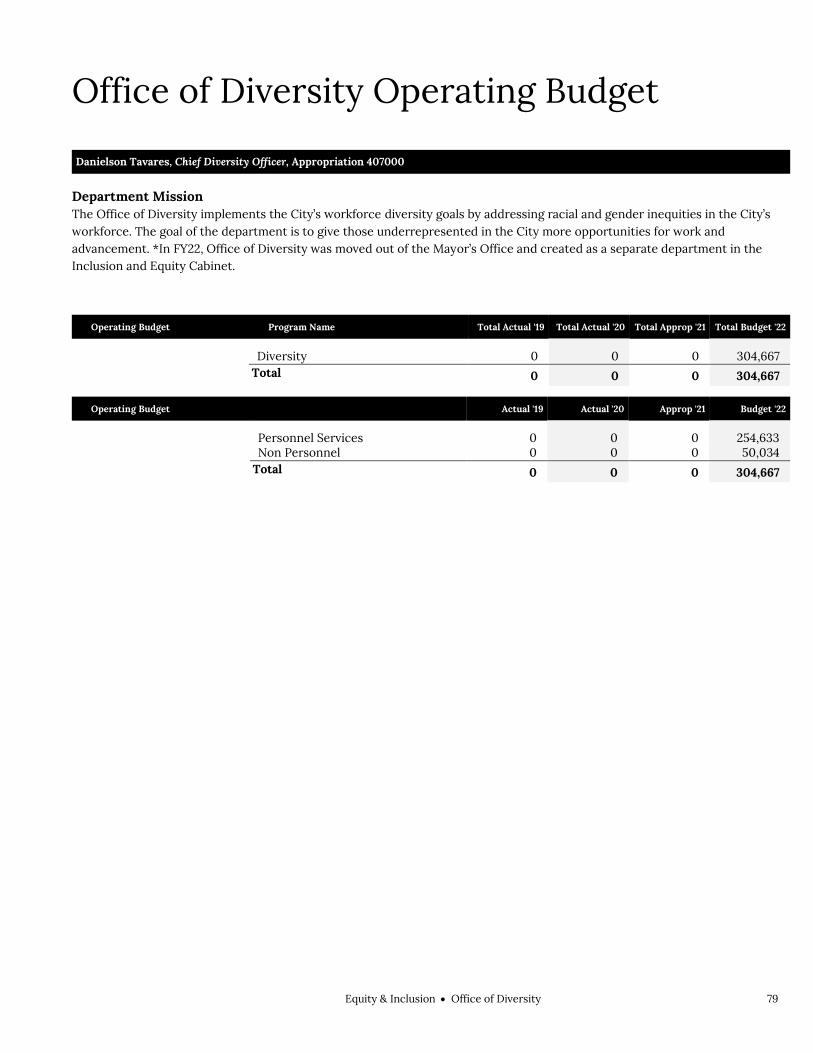
Equity & InclusionOffice of Diversity 79
Office of Diversity Operating Budget Equity & Inclusion Office of Diversity Danielson Tavares, Chief Diversity Officer, Appropriation 407000
Department Mission The Office of Diversity implements the City’s workforce diversity goals by addressing racial and gender inequities in the City’s workforce. The goal of the department is to give those underrepresented in the City more opportunities for work and advancement. *In FY22, Office of Diversity was moved out of the Mayor’s Office and created as a separate department in the Inclusion and Equity Cabinet.
Operating Budget Program Name Total Actual '19 Total Actual '20 Total Approp '21 Total Budget '22
Diversity 0 0 0 304,667
Total 0 0 0 304,667
Operating Budget Actual '19 Actual '20 Approp '21 Budget '22
Personnel Services 0 0 0 254,633 Non Personnel 0 0 0 50,034 Total 0 0 0 304,667

80 Equity & InclusionOffice of Diversity
Office of Diversity Operating Budget
Description of Services The Office of Diversity leads the City’s diversity agenda, including the ongoing development and delivery of the City’s diversity goals and objectives in areas of hiring, leadership and career development, diversity training, strategic planning, recruitment and retention. The department performs outreach to community, academic, and business organizations in order to increase diversity of employee candidate pools, and assist in the development of hiring processes to ensure maximum opportunities for employment and career advancement for candidates from underrepresented demographic groups. To that end, the Office will be responsible for collecting, analyzing and reporting the City’s employee diversity data, working closely with the City’s Human Resources Department.
Director
Administration
Personnel and Finance
Analysis
Employee Support Research Group
Employee Demographics Research
Community Engagement and Outreach
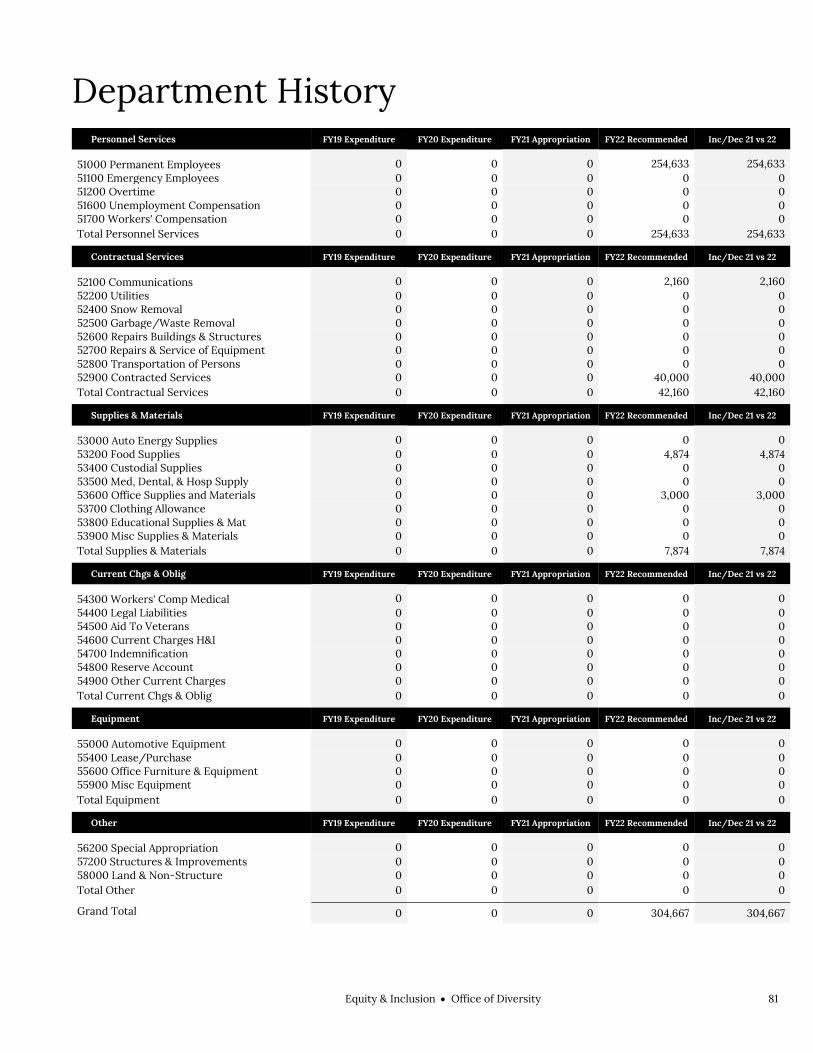
Equity & InclusionOffice of Diversity 81
Department History Personnel Services FY19 Expenditure FY20 Expenditure FY21 Appropriation FY22 Recommended Inc/Dec 21 vs 22
51000 Permanent Employees 0 0 0 254,633 254,633 51100 Emergency Employees 0 0 0 0 0 51200 Overtime 0 0 0 0 0 51600 Unemployment Compensation 0 0 0 0 0 51700 Workers' Compensation 0 0 0 0 0 Total Personnel Services 0 0 0 254,633 254,633
Contractual Services FY19 Expenditure FY20 Expenditure FY21 Appropriation FY22 Recommended Inc/Dec 21 vs 22
52100 Communications 0 0 0 2,160 2,160 52200 Utilities 0 0 0 0 0 52400 Snow Removal 0 0 0 0 0 52500 Garbage/Waste Removal 0 0 0 0 0 52600 Repairs Buildings & Structures 0 0 0 0 0 52700 Repairs & Service of Equipment 0 0 0 0 0 52800 Transportation of Persons 0 0 0 0 0 52900 Contracted Services 0 0 0 40,000 40,000 Total Contractual Services 0 0 0 42,160 42,160
Supplies & Materials FY19 Expenditure FY20 Expenditure FY21 Appropriation FY22 Recommended Inc/Dec 21 vs 22
53000 Auto Energy Supplies 0 0 0 0 0 53200 Food Supplies 0 0 0 4,874 4,874 53400 Custodial Supplies 0 0 0 0 0 53500 Med, Dental, & Hosp Supply 0 0 0 0 0 53600 Office Supplies and Materials 0 0 0 3,000 3,000 53700 Clothing Allowance 0 0 0 0 0 53800 Educational Supplies & Mat 0 0 0 0 0 53900 Misc Supplies & Materials 0 0 0 0 0 Total Supplies & Materials 0 0 0 7,874 7,874
Current Chgs & Oblig FY19 Expenditure FY20 Expenditure FY21 Appropriation FY22 Recommended Inc/Dec 21 vs 22
54300 Workers' Comp Medical 0 0 0 0 0 54400 Legal Liabilities 0 0 0 0 0 54500 Aid To Veterans 0 0 0 0 0 54600 Current Charges H&I 0 0 0 0 0 54700 Indemnification 0 0 0 0 0 54800 Reserve Account 0 0 0 0 0 54900 Other Current Charges 0 0 0 0 0 Total Current Chgs & Oblig 0 0 0 0 0
Equipment FY19 Expenditure FY20 Expenditure FY21 Appropriation FY22 Recommended Inc/Dec 21 vs 22
55000 Automotive Equipment 0 0 0 0 0 55400 Lease/Purchase 0 0 0 0 0 55600 Office Furniture & Equipment 0 0 0 0 0 55900 Misc Equipment 0 0 0 0 0 Total Equipment 0 0 0 0 0
Other FY19 Expenditure FY20 Expenditure FY21 Appropriation FY22 Recommended Inc/Dec 21 vs 22
56200 Special Appropriation 0 0 0 0 0 57200 Structures & Improvements 0 0 0 0 0 58000 Land & Non-Structure 0 0 0 0 0 Total Other 0 0 0 0 0
Grand Total 0 0 0 304,667 304,667

82 Equity & InclusionOffice of Diversity
Department Personnel
Title Union Code Grade Position FY22 Salary Title
Union Code Grade Position FY22 Salary
Chief Diversity Officer CDH NG 1.00 114,313 Diversity Outreach Officer MYO 07 1.00 75,763
Staff Asst MYO 05 1.00 64,557
Total 3 254,633 Adjustments Differential Payments 0 Other 0 Chargebacks 0 Salary Savings 0 FY22 Total Request 254,633

Equity & InclusionOffice of Diversity 83
Program 1. Diversity Danielson Tavares, Chief Diversity Officer, Organization 407100
Program Description The Office of Diversity promotes transparency through the publication of an Employee Demographic Dashboard and regular reports on employment, inclusion through Employee Resource Groups, and community engagement through neighborhood career fairs and partnerships with organizations in the private sector.
Operating Budget Actual '19 Actual '20 Approp '21 Budget '22
Personnel Services 0 0 0 254,633 Non Personnel 0 0 0 50,034 Total 0 0 0 304,667


Equity & InclusionOffice of Equity 85
Office of Equity Operating Budget Equity & Inclusion Office of Equity Vacant, Chief of Equity, Appropriation 402000
Department Mission The Office of Equity actively works to align the City’s plans and policies through a unified equity lens, dismantle systemic policy and process barriers to advancement, and execute institutional change, both internally and externally through local and national partnerships.
Operating Budget Program Name Total Actual '19 Total Actual '20 Total Approp '21 Total Budget '22
Equity 0 0 0 703,705
Total 0 0 0 703,705
External Funds Budget Actual '19 Actual '20 Approp '21 Budget '22
Economic Mobility Lab 103,853 253,355 150,106 141,201 Total 103,853 253,355 150,106 141,201
Operating Budget Actual '19 Actual '20 Approp '21 Budget '22
Personnel Services 0 0 0 596,745 Non Personnel 0 0 0 106,960 Total 0 0 0 703,705
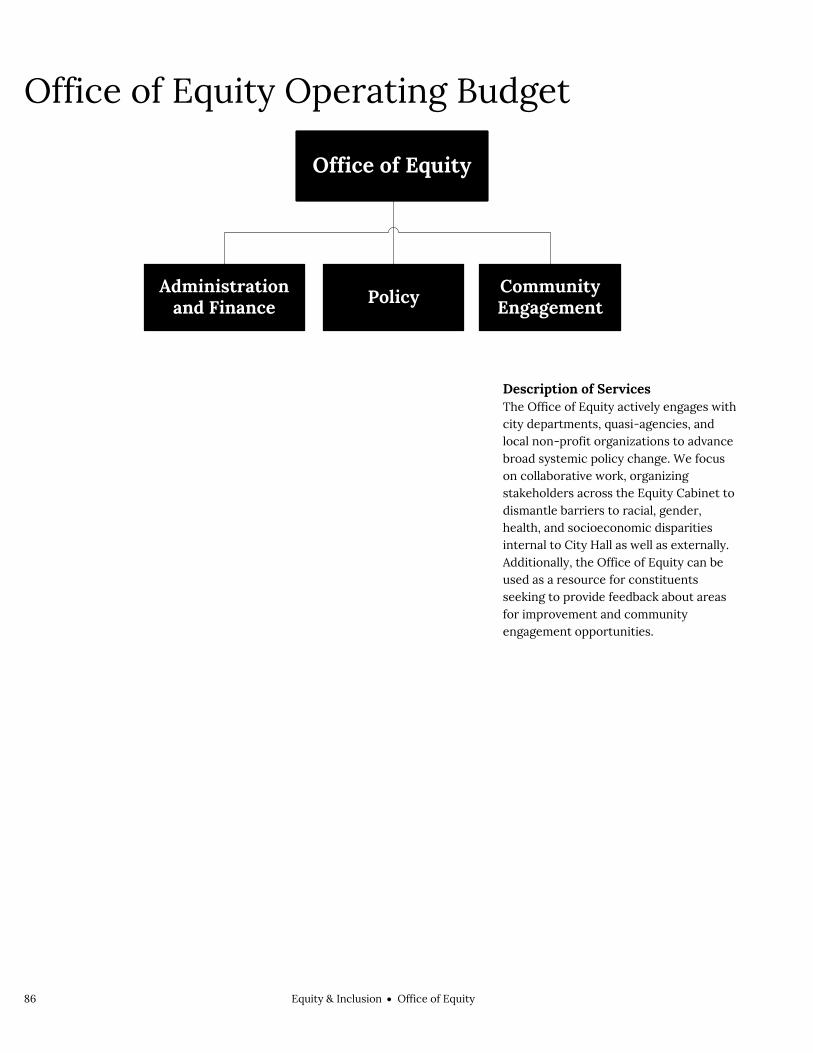
86 Equity & InclusionOffice of Equity
Office of Equity Operating Budget
Description of Services The Office of Equity actively engages with city departments, quasi-agencies, and local non-profit organizations to advance broad systemic policy change. We focus on collaborative work, organizing stakeholders across the Equity Cabinet to dismantle barriers to racial, gender, health, and socioeconomic disparities internal to City Hall as well as externally. Additionally, the Office of Equity can be used as a resource for constituents seeking to provide feedback about areas for improvement and community engagement opportunities.
Administration and Finance
Office of Equity
Policy Community Engagement

Equity & InclusionOffice of Equity 87
Department History Personnel Services FY19 Expenditure FY20 Expenditure FY21 Appropriation FY22 Recommended Inc/Dec 21 vs 22
51000 Permanent Employees 0 0 0 596,745 596,745 51100 Emergency Employees 0 0 0 0 0 51200 Overtime 0 0 0 0 0 51600 Unemployment Compensation 0 0 0 0 0 51700 Workers' Compensation 0 0 0 0 0 Total Personnel Services 0 0 0 596,745 596,745
Contractual Services FY19 Expenditure FY20 Expenditure FY21 Appropriation FY22 Recommended Inc/Dec 21 vs 22
52100 Communications 0 0 0 3,060 3,060 52200 Utilities 0 0 0 0 0 52400 Snow Removal 0 0 0 0 0 52500 Garbage/Waste Removal 0 0 0 0 0 52600 Repairs Buildings & Structures 0 0 0 0 0 52700 Repairs & Service of Equipment 0 0 0 0 0 52800 Transportation of Persons 0 0 0 900 900 52900 Contracted Services 0 0 0 100,500 100,500 Total Contractual Services 0 0 0 104,460 104,460
Supplies & Materials FY19 Expenditure FY20 Expenditure FY21 Appropriation FY22 Recommended Inc/Dec 21 vs 22
53000 Auto Energy Supplies 0 0 0 0 0 53200 Food Supplies 0 0 0 0 0 53400 Custodial Supplies 0 0 0 0 0 53500 Med, Dental, & Hosp Supply 0 0 0 0 0 53600 Office Supplies and Materials 0 0 0 1,000 1,000 53700 Clothing Allowance 0 0 0 0 0 53800 Educational Supplies & Mat 0 0 0 0 0 53900 Misc Supplies & Materials 0 0 0 0 0 Total Supplies & Materials 0 0 0 1,000 1,000
Current Chgs & Oblig FY19 Expenditure FY20 Expenditure FY21 Appropriation FY22 Recommended Inc/Dec 21 vs 22
54300 Workers' Comp Medical 0 0 0 0 0 54400 Legal Liabilities 0 0 0 0 0 54500 Aid To Veterans 0 0 0 0 0 54600 Current Charges H&I 0 0 0 0 0 54700 Indemnification 0 0 0 0 0 54800 Reserve Account 0 0 0 0 0 54900 Other Current Charges 0 0 0 1,500 1,500 Total Current Chgs & Oblig 0 0 0 1,500 1,500
Equipment FY19 Expenditure FY20 Expenditure FY21 Appropriation FY22 Recommended Inc/Dec 21 vs 22
55000 Automotive Equipment 0 0 0 0 0 55400 Lease/Purchase 0 0 0 0 0 55600 Office Furniture & Equipment 0 0 0 0 0 55900 Misc Equipment 0 0 0 0 0 Total Equipment 0 0 0 0 0
Other FY19 Expenditure FY20 Expenditure FY21 Appropriation FY22 Recommended Inc/Dec 21 vs 22
56200 Special Appropriation 0 0 0 0 0 57200 Structures & Improvements 0 0 0 0 0 58000 Land & Non-Structure 0 0 0 0 0 Total Other 0 0 0 0 0
Grand Total 0 0 0 703,705 703,705

88 Equity & InclusionOffice of Equity
Department Personnel
Title Union Code Grade Position FY22 Salary Title
Union Code Grade Position FY22 Salary
Chief of Equity CDH NG 1.00 160,440 Admin Asst_III MYO 08 1.00 61,482 Spec Asst IV MYO 14 1.00 120,547 Staff Asst III MYO 07 1.00 74,223 Asst Director MYO 13 1.00 106,465 Administrative Asst MYO 05 1.00 49,063 Total 6 572,220 Adjustments Differential Payments 0 Other 24,525 Chargebacks 0 Salary Savings 0

Equity & InclusionOffice of Equity 89
External Funds History Personnel Services FY19 Expenditure FY20 Expenditure FY21 Appropriation FY22 Recommended Inc/Dec 21 vs 22
51000 Permanent Employees 103,361 190,105 150,106 73,201 -76,905 51100 Emergency Employees 0 0 0 0 0 51200 Overtime 0 0 0 0 0 51300 Part Time Employees 0 0 0 0 0 51400 Health Insurance 171 13,088 0 0 0 51500 Pension & Annuity 0 8,309 0 0 0 51600 Unemployment Compensation 0 0 0 0 0 51700 Workers' Compensation 0 0 0 0 0 51800 Indirect Costs 0 0 0 0 0 51900 Medicare 321 1,853 0 0 0 Total Personnel Services 103,853 213,355 150,106 73,201 -76,905
Contractual Services FY19 Expenditure FY20 Expenditure FY21 Appropriation FY22 Recommended Inc/Dec 21 vs 22
52100 Communications 0 0 0 0 0 52200 Utilities 0 0 0 0 0 52400 Snow Removal 0 0 0 0 0 52500 Garbage/Waste Removal 0 0 0 0 0 52600 Repairs Buildings & Structures 0 0 0 0 0 52700 Repairs & Service of Equipment 0 0 0 0 0 52800 Transportation of Persons 0 0 0 0 0 52900 Contracted Services 0 40,000 0 68,000 68,000 Total Contractual Services 0 40,000 0 68,000 68,000
Supplies & Materials FY19 Expenditure FY20 Expenditure FY21 Appropriation FY22 Recommended Inc/Dec 21 vs 22
53000 Auto Energy Supplies 0 0 0 0 0 53200 Food Supplies 0 0 0 0 0 53400 Custodial Supplies 0 0 0 0 0 53500 Med, Dental, & Hosp Supply 0 0 0 0 0 53600 Office Supplies and Materials 0 0 0 0 0 53700 Clothing Allowance 0 0 0 0 0 53800 Educational Supplies & Mat 0 0 0 0 0 53900 Misc Supplies & Materials 0 0 0 0 0 Total Supplies & Materials 0 0 0 0 0
Current Chgs & Oblig FY19 Expenditure FY20 Expenditure FY21 Appropriation FY22 Recommended Inc/Dec 21 vs 22
54300 Workers' Comp Medical 0 0 0 0 0 54400 Legal Liabilities 0 0 0 0 0 54600 Current Charges H&I 0 0 0 0 0 54700 Indemnification 0 0 0 0 0 54800 Reserve Account 0 0 0 0 0 54900 Other Current Charges 0 0 0 0 0 Total Current Chgs & Oblig 0 0 0 0 0
Equipment FY19 Expenditure FY20 Expenditure FY21 Appropriation FY22 Recommended Inc/Dec 21 vs 22
55000 Automotive Equipment 0 0 0 0 0 55400 Lease/Purchase 0 0 0 0 0 55600 Office Furniture & Equipment 0 0 0 0 0 55900 Misc Equipment 0 0 0 0 0 Total Equipment 0 0 0 0 0
Other FY19 Expenditure FY20 Expenditure FY21 Appropriation FY22 Recommended Inc/Dec 21 vs 22
56200 Special Appropriation 0 0 0 0 0 57200 Structures & Improvements 0 0 0 0 0 58000 Land & Non-Structure 0 0 0 0 0 Total Other 0 0 0 0 0
Grand Total 103,853 253,355 150,106 141,201 -8,905

90 Equity & InclusionOffice of Equity
External Funds Personnel
Title Union Code Grade Position FY22 Salary Title
Union Code Grade Position FY22 Salary
Temporary Mayoral Staff TMS NG 1.00 73,201 Spec Asst I MYO 10 1.00 73,915 Total 2 147,116 Adjustments Differential Payments 0 Other 0 Chargebacks 0 Salary Savings -73,915 FY22 Total Request 73,201

Equity & InclusionOffice of Equity 91
Program 1. Equity Vacant, Chief of Equity, Organization 402100
Program Description The Equity program seeks to dismantle systemic barriers to achieve racial, gender, health and socio-economic equality, develop a city workforce that is representative at all levels of the demographics of the city, support immigrant, refugee and other vulnerable communities to promote public safety, quality of life, and human rights, support communities of color and marginalized groups across all departments, and building equitable governmental structures, support coordinated efforts to drive forward equity throughout the City of Boston, such as through supporting the Boston Racial Equity Fund, and working across City departments to address Health Equity, Digital Equity, and Police Reform.
Operating Budget Actual '19 Actual '20 Approp '21 Budget '22
Personnel Services 0 0 0 596,745 Non Personnel 0 0 0 106,960 Total 0 0 0 703,705

92 Equity & InclusionOffice of Equity
External Funds Projects Economic Mobility Lab
Project Mission The City of Boston, in partnership with 100 Resilient Cities and the Rockefeller Foundation, has launched an Economic Mobility Lab. The Lab works across City departments and agencies to advance economic mobility for Bostonians by analyzing existing programs and policies, highlighting and expanding what works, and creating innovative, scalable solutions to promote economic security for everyone. The structure of the Economic Mobility Lab is modeled on successful innovation labs in the Mayor’s Office of New Urban Mechanics (MONUM), the City’s civic innovation team.

Equity & InclusionOffice of Language & Communications Access 93
Office of Language & Communications Access Operating Budget Equity & Inclusion Office of Language & Communications Access Jeniffer Vivar Wong, Interim Director, Appropriation 409000
Department Mission To ensure all City of Boston programs, services and activities are meaningfully accessible to all. *In FY22, LCA was moved out of Office of Neighborhood Services and created as a separate department in the Inclusion and Equity Cabinet.
Operating Budget Program Name Total Actual '19 Total Actual '20 Total Approp '21 Total Budget '22
Language & Communications Access 0 0 0 1,169,967
Total 0 0 0 1,169,967
Operating Budget Actual '19 Actual '20 Approp '21 Budget '22
Personnel Services 0 0 0 269,382 Non Personnel 0 0 0 900,585 Total 0 0 0 1,169,967

94 Equity & InclusionOffice of Language & Communications Access
Office of Language & Communications Access Operating Budget
Authorizing Statutes Communications Ordinance of 2016.
Description of Services The Mayor’s Office of Language and Communications Access is a mostly internal facing department which focuses on serving as a guiding office to other departments when it comes to implementing language & communications access. The department supports other City departments by creating resources and training sessions, and working one-on-one with their LCA liaisons to ensure language & communications access is incorporated in all their programming, documents and events. Externally, LCA communicates with individuals and community based organizations to inform them about their rights when it comes to language & communications access within the City and the accommodations available to them.
Director
Administration
Personnel and Finance
Analysis
Community Outreach
ResearchTraining and Coordination
of Accommodations

Equity & InclusionOffice of Language & Communications Access 95
Department History Personnel Services FY19 Expenditure FY20 Expenditure FY21 Appropriation FY22 Recommended Inc/Dec 21 vs 22
51000 Permanent Employees 0 0 0 269,382 269,382 51100 Emergency Employees 0 0 0 0 0 51200 Overtime 0 0 0 0 0 51600 Unemployment Compensation 0 0 0 0 0 51700 Workers' Compensation 0 0 0 0 0 Total Personnel Services 0 0 0 269,382 269,382
Contractual Services FY19 Expenditure FY20 Expenditure FY21 Appropriation FY22 Recommended Inc/Dec 21 vs 22
52100 Communications 0 0 0 0 0 52200 Utilities 0 0 0 0 0 52400 Snow Removal 0 0 0 0 0 52500 Garbage/Waste Removal 0 0 0 0 0 52600 Repairs Buildings & Structures 0 0 0 0 0 52700 Repairs & Service of Equipment 0 0 0 0 0 52800 Transportation of Persons 0 0 0 0 0 52900 Contracted Services 0 0 0 897,585 897,585 Total Contractual Services 0 0 0 897,585 897,585
Supplies & Materials FY19 Expenditure FY20 Expenditure FY21 Appropriation FY22 Recommended Inc/Dec 21 vs 22
53000 Auto Energy Supplies 0 0 0 0 0 53200 Food Supplies 0 0 0 0 0 53400 Custodial Supplies 0 0 0 0 0 53500 Med, Dental, & Hosp Supply 0 0 0 0 0 53600 Office Supplies and Materials 0 0 0 3,000 3,000 53700 Clothing Allowance 0 0 0 0 0 53800 Educational Supplies & Mat 0 0 0 0 0 53900 Misc Supplies & Materials 0 0 0 0 0 Total Supplies & Materials 0 0 0 3,000 3,000
Current Chgs & Oblig FY19 Expenditure FY20 Expenditure FY21 Appropriation FY22 Recommended Inc/Dec 21 vs 22
54300 Workers' Comp Medical 0 0 0 0 0 54400 Legal Liabilities 0 0 0 0 0 54500 Aid To Veterans 0 0 0 0 0 54600 Current Charges H&I 0 0 0 0 0 54700 Indemnification 0 0 0 0 0 54800 Reserve Account 0 0 0 0 0 54900 Other Current Charges 0 0 0 0 0 Total Current Chgs & Oblig 0 0 0 0 0
Equipment FY19 Expenditure FY20 Expenditure FY21 Appropriation FY22 Recommended Inc/Dec 21 vs 22
55000 Automotive Equipment 0 0 0 0 0 55400 Lease/Purchase 0 0 0 0 0 55600 Office Furniture & Equipment 0 0 0 0 0 55900 Misc Equipment 0 0 0 0 0 Total Equipment 0 0 0 0 0
Other FY19 Expenditure FY20 Expenditure FY21 Appropriation FY22 Recommended Inc/Dec 21 vs 22
56200 Special Appropriation 0 0 0 0 0 57200 Structures & Improvements 0 0 0 0 0 58000 Land & Non-Structure 0 0 0 0 0 Total Other 0 0 0 0 0
Grand Total 0 0 0 1,169,967 1,169,967
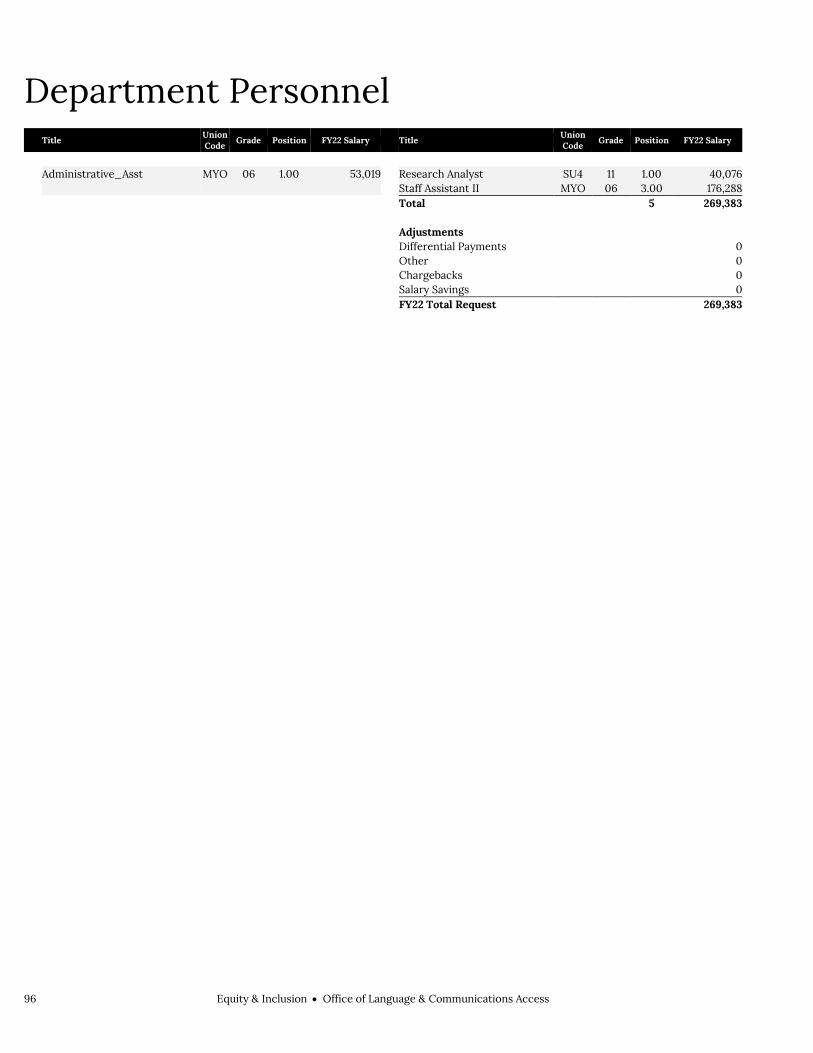
96 Equity & InclusionOffice of Language & Communications Access
Department Personnel
Title Union Code Grade Position FY22 Salary Title
Union Code Grade Position FY22 Salary
Administrative_Asst MYO 06 1.00 53,019 Research Analyst SU4 11 1.00 40,076
Staff Assistant II MYO 06 3.00 176,288
Total 5 269,383 Adjustments Differential Payments 0 Other 0 Chargebacks 0 Salary Savings 0 FY22 Total Request 269,383

Equity & InclusionOffice of Language & Communications Access 97
Program 1. Language & Communications Access Jennifer Vivar Wong, Interim Director, Organization 409100
Program Description The Office of Language and Communications Access coordinates access to City resources through the procurement of interpretation and translation services. Program staff also facilitates the training of front-facing City staff and coordination of assistive technologies and services.
Operating Budget Actual '19 Actual '20 Approp '21 Budget '22
Personnel Services 0 0 0 269,382 Non Personnel 0 0 0 900,585 Total 0 0 0 1,169,967
Performance
Goal: To make the City of Boston accessible for everyone
Performance Measures Actual '19 Actual '20 Projected '21 Target '22
% of rapid response texts that go out within 24 hours 100% 100%
% of departments trained on protocols for language access 50% 100%
# of interpreters provided 300 500
# of documents translated 200
# of proactive community outreaches 10 10


Equity & InclusionOffice of Resiliency & Racial Equity 99
Office of Resiliency & Racial Equity Operating Budget Equity & Inclusion Office of Resiliency & Racial Equity Lori Nelson, Chief Resilience Officer, Appropriation 408000
Department Mission Our mission is to ensure that historically marginalized communities and voices have equitable access and opportunities from childhood to retirement. *In FY22, MORRE was moved out of the Mayor’s Office and created as a separate department in the Inclusion and Equity Cabinet.
Operating Budget Program Name Total Actual '19 Total Actual '20 Total Approp '21 Total Budget '22
MORRE 0 0 0 1,651,392
Total 0 0 0 1,651,392
Operating Budget Actual '19 Actual '20 Approp '21 Budget '22
Personnel Services 0 0 0 275,287 Non Personnel 0 0 0 1,376,105 Total 0 0 0 1,651,392
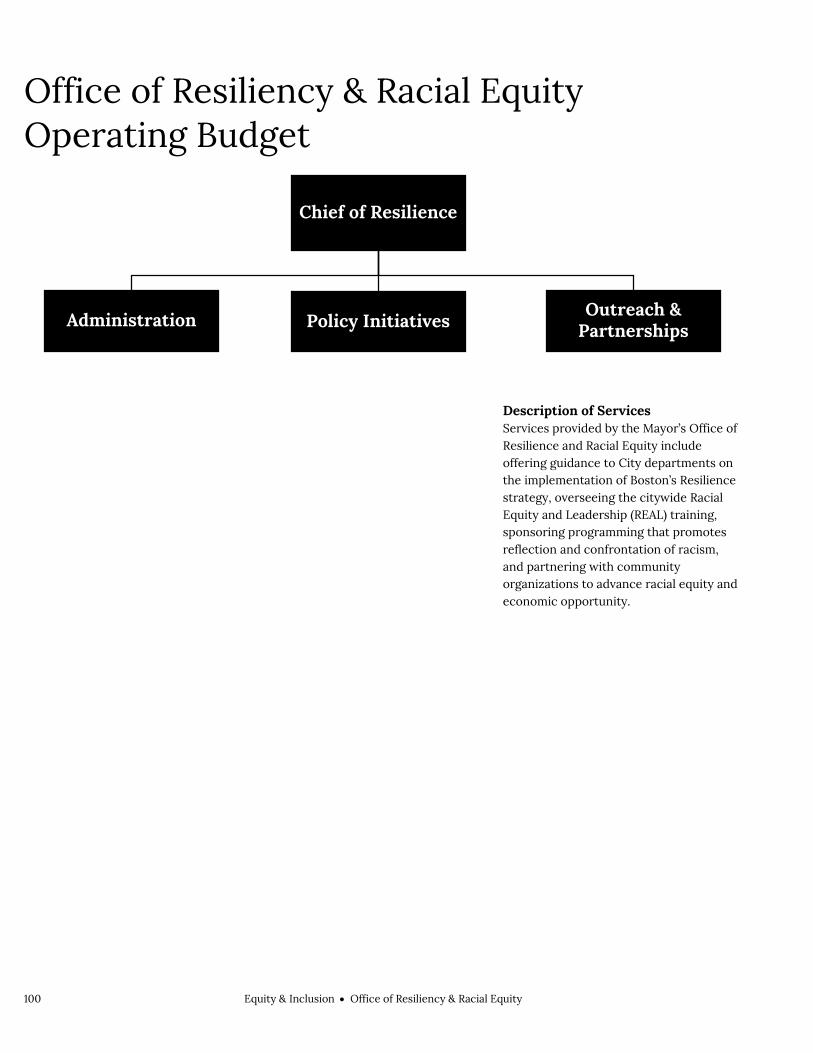
100 Equity & InclusionOffice of Resiliency & Racial Equity
Office of Resiliency & Racial Equity Operating Budget
Description of Services Services provided by the Mayor’s Office of Resilience and Racial Equity include offering guidance to City departments on the implementation of Boston’s Resilience strategy, overseeing the citywide Racial Equity and Leadership (REAL) training, sponsoring programming that promotes reflection and confrontation of racism, and partnering with community organizations to advance racial equity and economic opportunity.
Chief of Resilience
Administration Policy InitiativesOutreach &
Partnerships

Equity & InclusionOffice of Resiliency & Racial Equity 101
Department History Personnel Services FY19 Expenditure FY20 Expenditure FY21 Appropriation FY22 Recommended Inc/Dec 21 vs 22
51000 Permanent Employees 0 0 0 275,287 275,287 51100 Emergency Employees 0 0 0 0 0 51200 Overtime 0 0 0 0 0 51600 Unemployment Compensation 0 0 0 0 0 51700 Workers' Compensation 0 0 0 0 0 Total Personnel Services 0 0 0 275,287 275,287
Contractual Services FY19 Expenditure FY20 Expenditure FY21 Appropriation FY22 Recommended Inc/Dec 21 vs 22
52100 Communications 0 0 0 2,160 2,160 52200 Utilities 0 0 0 0 0 52400 Snow Removal 0 0 0 0 0 52500 Garbage/Waste Removal 0 0 0 0 0 52600 Repairs Buildings & Structures 0 0 0 0 0 52700 Repairs & Service of Equipment 0 0 0 0 0 52800 Transportation of Persons 0 0 0 600 600 52900 Contracted Services 0 0 0 1,372,940 1,372,940 Total Contractual Services 0 0 0 1,375,700 1,375,700
Supplies & Materials FY19 Expenditure FY20 Expenditure FY21 Appropriation FY22 Recommended Inc/Dec 21 vs 22
53000 Auto Energy Supplies 0 0 0 0 0 53200 Food Supplies 0 0 0 0 0 53400 Custodial Supplies 0 0 0 0 0 53500 Med, Dental, & Hosp Supply 0 0 0 0 0 53600 Office Supplies and Materials 0 0 0 250 250 53700 Clothing Allowance 0 0 0 0 0 53800 Educational Supplies & Mat 0 0 0 0 0 53900 Misc Supplies & Materials 0 0 0 0 0 Total Supplies & Materials 0 0 0 250 250
Current Chgs & Oblig FY19 Expenditure FY20 Expenditure FY21 Appropriation FY22 Recommended Inc/Dec 21 vs 22
54300 Workers' Comp Medical 0 0 0 0 0 54400 Legal Liabilities 0 0 0 0 0 54500 Aid To Veterans 0 0 0 0 0 54600 Current Charges H&I 0 0 0 0 0 54700 Indemnification 0 0 0 0 0 54800 Reserve Account 0 0 0 0 0 54900 Other Current Charges 0 0 0 155 155 Total Current Chgs & Oblig 0 0 0 155 155
Equipment FY19 Expenditure FY20 Expenditure FY21 Appropriation FY22 Recommended Inc/Dec 21 vs 22
55000 Automotive Equipment 0 0 0 0 0 55400 Lease/Purchase 0 0 0 0 0 55600 Office Furniture & Equipment 0 0 0 0 0 55900 Misc Equipment 0 0 0 0 0 Total Equipment 0 0 0 0 0
Other FY19 Expenditure FY20 Expenditure FY21 Appropriation FY22 Recommended Inc/Dec 21 vs 22
56200 Special Appropriation 0 0 0 0 0 57200 Structures & Improvements 0 0 0 0 0 58000 Land & Non-Structure 0 0 0 0 0 Total Other 0 0 0 0 0
Grand Total 0 0 0 1,651,392 1,651,392

102 Equity & InclusionOffice of Resiliency & Racial Equity
Department Personnel
Title Union Code Grade Position FY22 Salary Title
Union Code Grade Position FY22 Salary
Spec Asst MYN NG 1.00 125,034 Spec Asst I MYO 10 1.00 80,620 Special Asst IV MYO 09 1.00 67,133 Total 3 272,787 Adjustments Differential Payments 0 Other 2,500 Chargebacks 0 Salary Savings 0

Equity & InclusionOffice of Resiliency & Racial Equity 103
Program 1. MORRE Lori Nelson, Chief Resilience Officer, Organization 408100
Program Description Our department works to dismantle systemic racism within the city of Boston by executing Boston's Resilience strategy. Our work is focused on social and economic justice resilience in a City affected by historic and persistent divisions of race and class.
Operating Budget Actual '19 Actual '20 Approp '21 Budget '22
Personnel Services 0 0 0 275,287 Non Personnel 0 0 0 1,376,105 Total 0 0 0 1,651,392
Performance
Goal: To successfully train the citywide employee universe in REAL (Race, Equity and Leadership) training
Performance Measures Actual '19 Actual '20 Projected '21 Target '22
% of employees trained 33% 100%
% of departments with mission statements reflecting commitment to equity
50% 60%
# of department trainers (TT) 20
Goal: To successfully implement public speaker series that continue to promote racial equity as a citywide mandate
Performance Measures Actual '19 Actual '20 Projected '21 Target '22
# of employees who have engaged in a speaker series 780 960
Satisfaction rate of speaker series attendees 85%

104 Equity & InclusionOffice of Resiliency & Racial Equity

Equity & InclusionWomen's Advancement 105
Women's Advancement Operating Budget Equity & Inclusion Women's Advancement Alexandra Valdez, Executive Director, Appropriation 417000
Department Mission The mission of the Mayor's Office of Women’s Advancement is to advocate for equal opportunity for women in all arenas of our city. The Office provides educational opportunities for women that emphasize economic equality, child care, programs for young girls and the health and safety of all women.
Selected Performance Goals Women's Advancement
Decrease the wage gap for women in Boston. Increase the number of family childcare businesses open in Boston.
Operating Budget Program Name Total Actual '19 Total Actual '20 Total Approp '21 Total Budget '22
Women's Advancement 257,235 339,764 473,817 769,497
Total 257,235 339,764 473,817 769,497
External Funds Budget Fund Name Total Actual '19 Total Actual '20 Total Approp '21 Total Budget '22
Childcare Entrepreneur Fund 0 30,000 192,000 58,000
Total 0 30,000 192,000 58,000
Operating Budget Actual '19 Actual '20 Approp '21 Budget '22
Personnel Services 255,380 276,763 313,673 359,184 Non Personnel 1,855 63,001 160,144 410,313 Total 257,235 339,764 473,817 769,497

106 Equity & InclusionWomen's Advancement
Women's Advancement Operating Budget
Description of Services Services provided by the Mayor's Office of Women's Advancement include outreach to individuals and groups, organizing working groups and task forces, and advocacy through support of legislative initiatives. The Office collaborates with state and city agencies and non-profit organizations on women's issues.
Executive Director
Data & Research Economic Equity Health & Safety Special Projects
Women’s Commission

Equity & InclusionWomen's Advancement 107
Department History Personnel Services FY19 Expenditure FY20 Expenditure FY21 Appropriation FY22 Recommended Inc/Dec 21 vs 22
51000 Permanent Employees 255,380 276,763 313,673 359,184 45,511 51100 Emergency Employees 0 0 0 0 0 51200 Overtime 0 0 0 0 0 51600 Unemployment Compensation 0 0 0 0 0 51700 Workers' Compensation 0 0 0 0 0 Total Personnel Services 255,380 276,763 313,673 359,184 45,511
Contractual Services FY19 Expenditure FY20 Expenditure FY21 Appropriation FY22 Recommended Inc/Dec 21 vs 22
52100 Communications 280 703 700 948 248 52200 Utilities 0 0 0 0 0 52400 Snow Removal 0 0 0 0 0 52500 Garbage/Waste Removal 0 0 0 0 0 52600 Repairs Buildings & Structures 0 0 0 0 0 52700 Repairs & Service of Equipment 144 77 350 350 0 52800 Transportation of Persons 0 4 0 0 0 52900 Contracted Services 877 61,495 158,075 408,075 250,000 Total Contractual Services 1,301 62,279 159,125 409,373 250,248
Supplies & Materials FY19 Expenditure FY20 Expenditure FY21 Appropriation FY22 Recommended Inc/Dec 21 vs 22
53000 Auto Energy Supplies 0 0 0 0 0 53200 Food Supplies 0 0 0 0 0 53400 Custodial Supplies 0 0 0 0 0 53500 Med, Dental, & Hosp Supply 0 0 0 0 0 53600 Office Supplies and Materials 414 7 800 800 0 53700 Clothing Allowance 0 0 0 0 0 53800 Educational Supplies & Mat 0 0 0 0 0 53900 Misc Supplies & Materials 0 0 0 0 0 Total Supplies & Materials 414 7 800 800 0
Current Chgs & Oblig FY19 Expenditure FY20 Expenditure FY21 Appropriation FY22 Recommended Inc/Dec 21 vs 22
54300 Workers' Comp Medical 0 0 0 0 0 54400 Legal Liabilities 0 0 0 0 0 54500 Aid To Veterans 0 0 0 0 0 54600 Current Charges H&I 0 0 0 0 0 54700 Indemnification 0 0 0 0 0 54800 Reserve Account 0 0 0 0 0 54900 Other Current Charges 140 140 219 140 -79 Total Current Chgs & Oblig 140 140 219 140 -79
Equipment FY19 Expenditure FY20 Expenditure FY21 Appropriation FY22 Recommended Inc/Dec 21 vs 22
55000 Automotive Equipment 0 0 0 0 0 55400 Lease/Purchase 0 0 0 0 0 55600 Office Furniture & Equipment 0 0 0 0 0 55900 Misc Equipment 0 575 0 0 0 Total Equipment 0 575 0 0 0
Other FY19 Expenditure FY20 Expenditure FY21 Appropriation FY22 Recommended Inc/Dec 21 vs 22
56200 Special Appropriation 0 0 0 0 0 57200 Structures & Improvements 0 0 0 0 0 58000 Land & Non-Structure 0 0 0 0 0 Total Other 0 0 0 0 0
Grand Total 257,235 339,764 473,817 769,497 295,680

108 Equity & InclusionWomen's Advancement
Department Personnel
Title Union Code Grade Position FY22 Salary Title
Union Code Grade Position FY22 Salary
Director CDH NG 1.00 97,266 Staff Asst III MYO 07 1.00 71,090
Staff Assistant II MYO 06 3.00 182,982
Total 5 351,338 Adjustments Differential Payments 0 Other 7,846 Chargebacks 0 Salary Savings 0 FY22 Total Request 359,184

Equity & InclusionWomen's Advancement 109
External Funds History Personnel Services FY19 Expenditure FY20 Expenditure FY21 Appropriation FY22 Recommended Inc/Dec 21 vs 22
51000 Permanent Employees 0 0 0 0 0 51100 Emergency Employees 0 0 0 0 0 51200 Overtime 0 0 0 0 0 51300 Part Time Employees 0 0 0 0 0 51400 Health Insurance 0 0 0 0 0 51500 Pension & Annuity 0 0 0 0 0 51600 Unemployment Compensation 0 0 0 0 0 51700 Workers' Compensation 0 0 0 0 0 51800 Indirect Costs 0 0 0 0 0 51900 Medicare 0 0 0 0 0 Total Personnel Services 0 0 0 0 0
Contractual Services FY19 Expenditure FY20 Expenditure FY21 Appropriation FY22 Recommended Inc/Dec 21 vs 22
52100 Communications 0 0 0 0 0 52200 Utilities 0 0 0 0 0 52400 Snow Removal 0 0 0 0 0 52500 Garbage/Waste Removal 0 0 0 0 0 52600 Repairs Buildings & Structures 0 0 0 0 0 52700 Repairs & Service of Equipment 0 0 0 0 0 52800 Transportation of Persons 0 0 0 0 0 52900 Contracted Services 0 30,000 192,000 58,000 -134,000 Total Contractual Services 0 30,000 192,000 58,000 -134,000
Supplies & Materials FY19 Expenditure FY20 Expenditure FY21 Appropriation FY22 Recommended Inc/Dec 21 vs 22
53000 Auto Energy Supplies 0 0 0 0 0 53200 Food Supplies 0 0 0 0 0 53400 Custodial Supplies 0 0 0 0 0 53500 Med, Dental, & Hosp Supply 0 0 0 0 0 53600 Office Supplies and Materials 0 0 0 0 0 53700 Clothing Allowance 0 0 0 0 0 53800 Educational Supplies & Mat 0 0 0 0 0 53900 Misc Supplies & Materials 0 0 0 0 0 Total Supplies & Materials 0 0 0 0 0
Current Chgs & Oblig FY19 Expenditure FY20 Expenditure FY21 Appropriation FY22 Recommended Inc/Dec 21 vs 22
54300 Workers' Comp Medical 0 0 0 0 0 54400 Legal Liabilities 0 0 0 0 0 54600 Current Charges H&I 0 0 0 0 0 54700 Indemnification 0 0 0 0 0 54800 Reserve Account 0 0 0 0 0 54900 Other Current Charges 0 0 0 0 0 Total Current Chgs & Oblig 0 0 0 0 0
Equipment FY19 Expenditure FY20 Expenditure FY21 Appropriation FY22 Recommended Inc/Dec 21 vs 22
55000 Automotive Equipment 0 0 0 0 0 55400 Lease/Purchase 0 0 0 0 0 55600 Office Furniture & Equipment 0 0 0 0 0 55900 Misc Equipment 0 0 0 0 0 Total Equipment 0 0 0 0 0
Other FY19 Expenditure FY20 Expenditure FY21 Appropriation FY22 Recommended Inc/Dec 21 vs 22
56200 Special Appropriation 0 0 0 0 0 57200 Structures & Improvements 0 0 0 0 0 58000 Land & Non-Structure 0 0 0 0 0 Total Other 0 0 0 0 0
Grand Total 0 30,000 192,000 58,000 -134,000

110 Equity & InclusionWomen's Advancement
Program 1. Women's Advancement Alexandra Valdez, Manager, Organization 417100
Program Description The Women’s Advancement program provides information and referrals, advocacy, and policy changes for women in the City of Boston. The program emphasizes economic and gender equality for women and girls. This program collaborates with every city department, Suffolk County, state and federal government, nonprofit organizations and private partners to advance women’s issues.
Operating Budget Actual '19 Actual '20 Approp '21 Budget '22
Personnel Services 255,380 276,763 313,673 359,184 Non Personnel 1,855 63,001 160,144 410,313 Total 257,235 339,764 473,817 769,497
Performance
Goal: Decrease the wage gap for women in Boston
Performance Measures Actual '19 Actual '20 Projected '21 Target '22
# of businesses recruited for Boston's 100% Talent Compact 39 49 10 25
# of employees in companies that are new signers to the compact 31,791 3,514 500 1,250
# of participants in salary negotiation workshops 2,189 1,506 300 1,200
# of salary negotiation workshops 114 51 1 50
Goal: Increase the number of family childcare businesses open in Boston
Performance Measures Actual '19 Actual '20 Projected '21 Target '22
# of business skills workshops
6 24 30
# of businesses receiving financial support
22 82 110

Equity & InclusionWomen's Advancement 111
External Funds Projects Childcare Entrepreneur Fund Grants
Project Mission These grants reflect funding received in support of the Boston Childcare Entrepreneur Fund (CEF), which provides financial assistance and business training to current and aspiring owners of family childcare businesses in Boston. Funding received to date includes grants from the Office of Workforce Development and the Osbourne Foundation, and supplements an annual appropriation from the City operating budget.

112 Equity & InclusionWomen's Advancement

Office of Police Accountability & TransparencyCabinet 113
Office of Police Accountability & Transparency Office of Police Accountability & Transparency Cabinet
Office of Police Accountability & Transparency .......... 115
Office of Police Accountability & Transparency .... 117
OPAT Commission ........................................... 122
Civilian Review Board ..................................... 123
Internal Affairs Oversight Panel ................... 124

114 Office of Police Accountability & TransparencyCabinet

Office of Police Accountability & TransparencyCabinet 115
Office of Police Accountability & Transparency Office of Police Accountability & Transparency
Vacant, Executive Director
Cabinet Mission The Office of Police Accountability and Transparency Cabinet will support lasting, generational change by rooting out impropriety and ensuring the type of enhanced oversight that leads to greater community trust.
Operating Budget Total Actual '19 Total Actual '20 Total Approp '21 Total Budget '22
Office of Police Accountability & Transparency 0 0 0 1,005,500
Total 0 0 0 1,005,500

116 Office of Police Accountability & TransparencyCabinet

Office of Police Accountability & TransparencyOffice of Police Accountability & Transparency 117
Office of Police Accountability & Transparency Operating Budget Office of Police Accountability & Transparency Office of Police Accountability & Transparency Vacant, Executive Director, Appropriation 410000
Department Mission The Office of Police Accountability and Transparency will support lasting, generational change by rooting out impropriety and ensuring the type of enhanced oversight that leads to greater community trust.
Operating Budget Program Name Total Actual '19 Total Actual '20 Total Approp '21 Total Budget '22
OPAT Commission 0 0 0 820,500 Civilian Review Board 0 0 0 55,000 Internal Affairs Oversight Panel 0 0 0 130,000
Total 0 0 0 1,005,500
Operating Budget Actual '19 Actual '20 Approp '21 Budget '22
Personnel Services 0 0 0 977,500 Non Personnel 0 0 0 28,000
Total 0 0 0 1,005,500
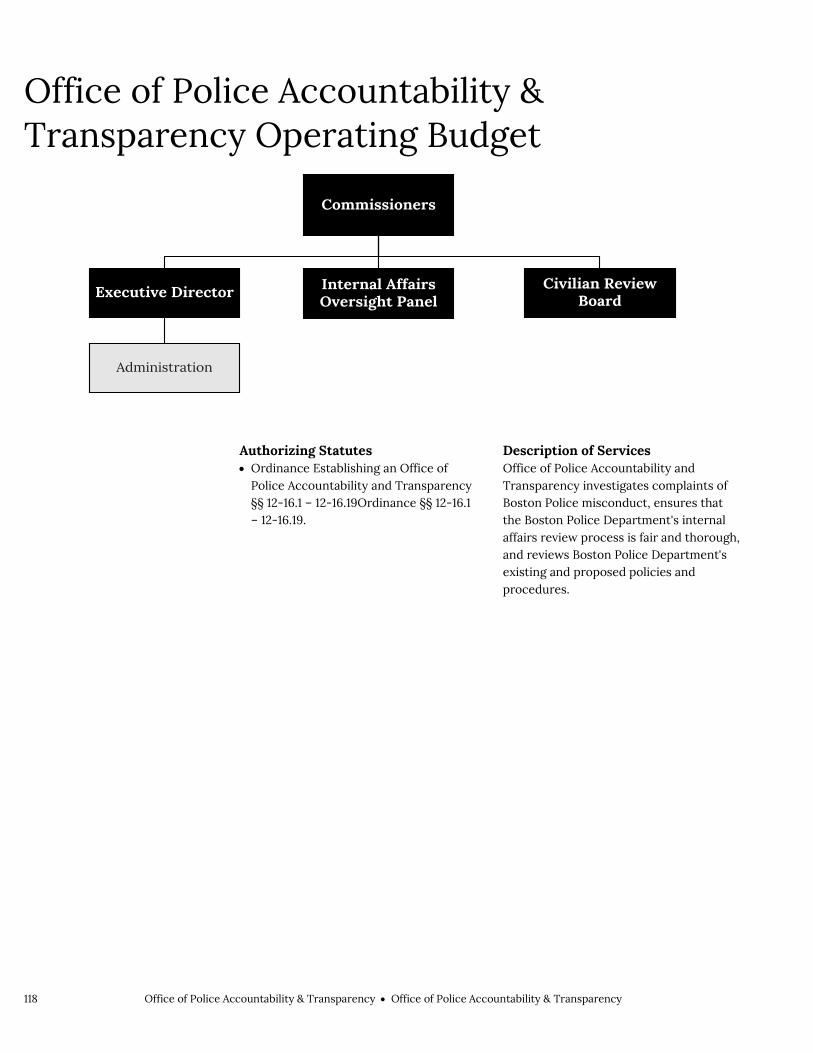
118 Office of Police Accountability & TransparencyOffice of Police Accountability & Transparency
Office of Police Accountability & Transparency Operating Budget
Authorizing Statutes Ordinance Establishing an Office of
Police Accountability and Transparency§§ 12-16.1 – 12-16.19Ordinance §§ 12-16.1– 12-16.19.
Description of Services Office of Police Accountability and Transparency investigates complaints of Boston Police misconduct, ensures that the Boston Police Department's internal affairs review process is fair and thorough, and reviews Boston Police Department's existing and proposed policies and procedures.
Commissioners
Executive Director
Administration
Internal Affairs Oversight Panel
Civilian Review Board

Office of Police Accountability & TransparencyOffice of Police Accountability & Transparency 120
Department History Personnel Services FY19
Expenditure FY20
Expenditure FY21 Appropriation FY22 Recommended Inc/Dec 21 vs
22
51000 Permanent Employees 0 0 0 977,500 977,500 51100 Emergency Employees 0 0 0 0 0 51200 Overtime 0 0 0 0 0 51600 Unemployment Compensation 0 0 0 0 0 51700 Workers' Compensation 0 0 0 0 0 Total Personnel Services 0 0 0 0 0
Contractual Services FY19 Expenditure
FY20 Expenditure
FY21 Appropriation FY22 Recommended Inc/Dec 21 vs 22
52100 Communications 0 0 0 0 0 52200 Utilities 0 0 0 0 0 52400 Snow Removal 0 0 0 0 0 52500 Garbage/Waste Removal 0 0 0 0 0 52600 Repairs Buildings & Structures 0 0 0 0 0 52700 Repairs & Service of Equipment 0 0 0 0 0 52800 Transportation of Persons 0 0 0 0 0 52900 Contracted Services 0 0 0 13,000 13,000 Total Contractual Services 0 0 0 0 0
Supplies & Materials FY19 Expenditure
FY20 Expenditure
FY21 Appropriation FY22 Recommended Inc/Dec 21 vs 22
53000 Auto Energy Supplies 0 0 0 0 0 53200 Food Supplies 0 0 0 0 0 53400 Custodial Supplies 0 0 0 0 0 53500 Med, Dental, & Hosp Supply 0 0 0 0 0 53600 Office Supplies and Materials 0 0 0 9,000 9,000 53700 Clothing Allowance 0 0 0 0 0 53800 Educational Supplies & Mat 0 0 0 0 0 53900 Misc Supplies & Materials 0 0 0 0 0 Total Supplies & Materials 0 0 0 0 0
Current Chgs & Oblig FY19 Expenditure
FY20 Expenditure FY21 Appropriation FY22 Recommended
Inc/Dec 21 vs 22
54300 Workers' Comp Medical 0 0 0 0 0 54400 Legal Liabilities 0 0 0 0 0 54500 Aid To Veterans 0 0 0 0 0 54600 Current Charges H&I 0 0 0 0 0 54700 Indemnification 0 0 0 0 0 54800 Reserve Account 0 0 0 0 0 54900 Other Current Charges 0 0 0 0 0 Total Current Chgs & Oblig 0 0 0 0 0
Equipment FY19 Expenditure
FY20 Expenditure
FY21 Appropriation FY22 Recommended Inc/Dec 21 vs
22
55000 Automotive Equipment 0 0 0 0 0 55400 Lease/Purchase 0 0 0 0 0 55600 Office Furniture & Equipment 0 0 0 0 0 55900 Misc Equipment 0 0 0 6,000 6,000 Total Equipment 0 0 0 0 0
Other FY19 Expenditure
FY20 Expenditure FY21 Appropriation FY22 Recommended
Inc/Dec 21 vs 22
56200 Special Appropriation 0 0 0 0 0 57200 Structures & Improvements 0 0 0 0 0 58000 Land & Non-Structure 0 0 0 0 0 Total Other 0 0 0 0 0 Grand Total 0 0 0 1,005,500 1,005,500

Office of Police Accountability & TransparencyOffice of Police Accountability & Transparency 121
Department Personnel
Title Union Code Grade Position FY22 Salary Title
Union Code Grade Position FY22 Salary
Total
Adjustments Differential Payments Other 977,500 Chargebacks Salary Savings FY22 Total Request 977,500

122 Office of Police Accountability & TransparencyOffice of Police Accountability & Transparency
Program 1. OPAT Commission Vacant, Executive Director, Organization 410100
Program Description The Office of Police Accountability and Transparency will provide intake services, research, and administrative support to the Civilian Review Board and the Internal Affairs Oversight Panel.
Operating Budget Actual '19 Actual '20 Approp '21 Budget '22
Personnel Services 0 0 0 802,500 Non Personnel 0 0 0 18,000
Total 0 0 0 820,500

Office of Police Accountability & TransparencyOffice of Police Accountability & Transparency 123
Program 2. Civilian Review Board Vacant, Chair CRB, Organization 410200
Program Description Civilian Review Board reviews and investigates complaints on Police misconduct.
Operating Budget Actual '19 Actual '20 Approp '21 Budget '22
Personnel Services 0 0 0 50,000 Non Personnel 0 0 0 5,000 Total 0 0 0 55,000

124 Office of Police Accountability & TransparencyOffice of Police Accountability & Transparency
Program 3. Internal Affairs Oversight Panel Vacant, Chair IAOP, Organization 410300
Program Description Internal Affairs Oversight Panel ensures the Boston Police Department's internal affairs review process is fair and thorough.
Operating Budget Actual '19 Actual '20 Approp '21 Budget '22
Personnel Services 0 0 0 125,000 Non Personnel 0 0 0 5,000 Total 0 0 0 130,000

Office of Police Accountability & TransparencyOffice of Police Accountability & Transparency 125
126 OperationsCabinet
Operations Operations Cabinet
Operations ............................................................................ 128
Inspectional Services Dept ........................................ 129
ISD Commissioner's Office ............................ 134
ISD Administration & Finance ....................... 135
Buildings & Structures ....................................136
Field Services .................................................... 137
Property Management ................................................139
PM Administration ........................................... 143
Building Operations ........................................ 144
Alterations & Repair ........................................ 145
Enforcement ..................................................... 146
Security Systems .............................................. 147
Building Systems .............................................. 148
Public Facilities Department ..................................... 153
PFD Capital Construction .............................. 157

OperationsCabinet 127
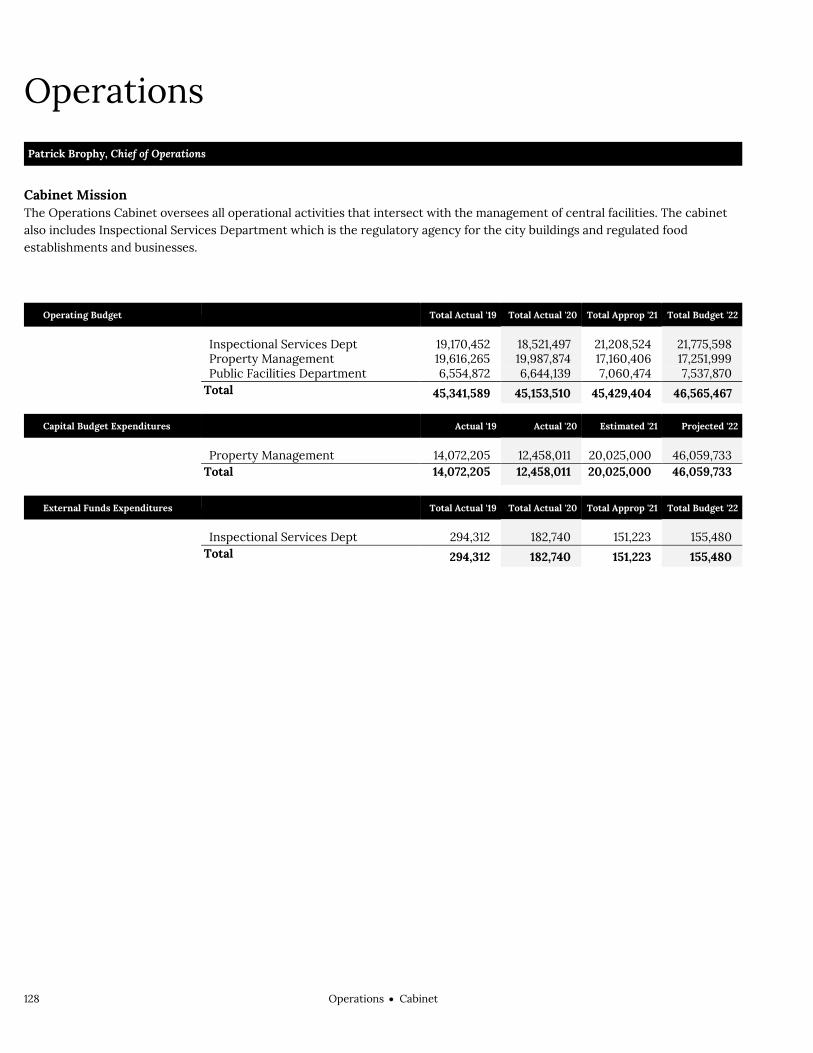
128 OperationsCabinet
Operations Operations
Patrick Brophy, Chief of Operations
Cabinet Mission The Operations Cabinet oversees all operational activities that intersect with the management of central facilities. The cabinet also includes Inspectional Services Department which is the regulatory agency for the city buildings and regulated food establishments and businesses.
Operating Budget
Total Actual '19 Total Actual '20 Total Approp '21 Total Budget '22
Inspectional Services Dept 19,170,452 18,521,497 21,208,524 21,775,598
Property Management 19,616,265 19,987,874 17,160,406 17,251,999
Public Facilities Department 6,554,872 6,644,139 7,060,474 7,537,870
Total 45,341,589 45,153,510 45,429,404 46,565,467
Capital Budget Expenditures Actual '19 Actual '20 Estimated '21 Projected '22
Property Management 14,072,205 12,458,011 20,025,000 46,059,733 Total 14,072,205 12,458,011 20,025,000 46,059,733
External Funds Expenditures
Total Actual '19 Total Actual '20 Total Approp '21 Total Budget '22
Inspectional Services Dept 294,312 182,740 151,223 155,480
Total 294,312 182,740 151,223 155,480
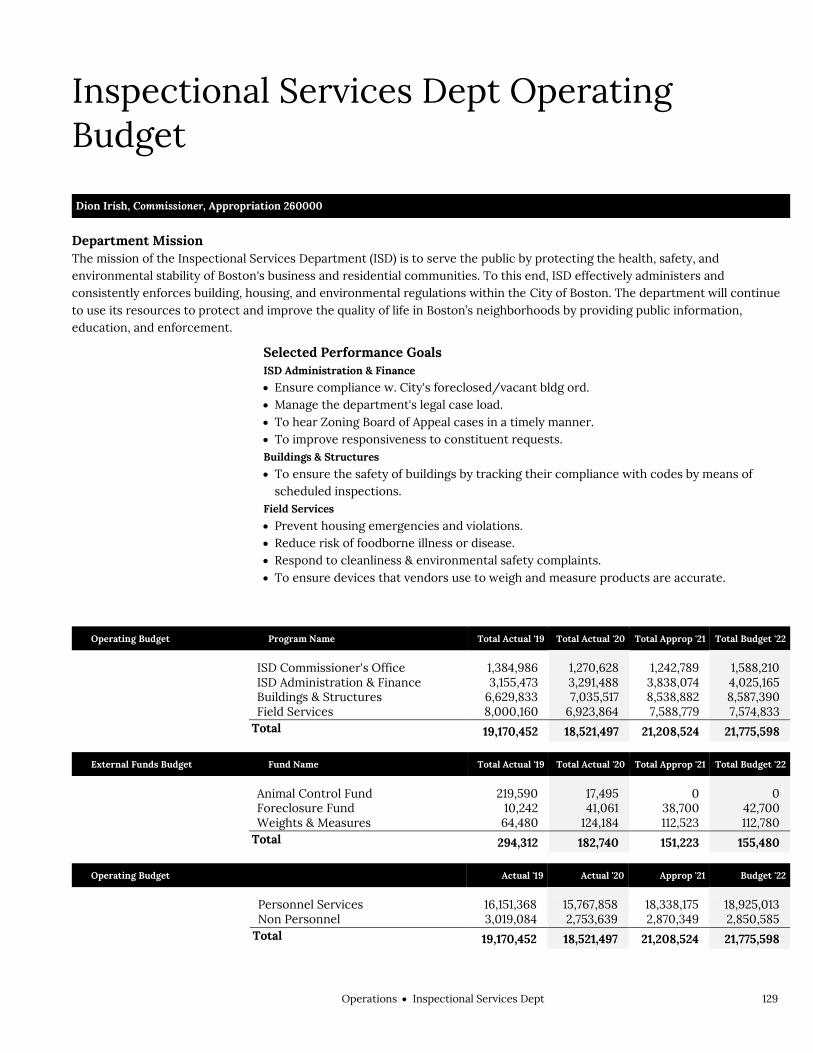
OperationsInspectional Services Dept 129
Inspectional Services Dept Operating Budget Operations Inspectional Services Dept Dion Irish, Commissioner, Appropriation 260000
Department Mission The mission of the Inspectional Services Department (ISD) is to serve the public by protecting the health, safety, and environmental stability of Boston's business and residential communities. To this end, ISD effectively administers and consistently enforces building, housing, and environmental regulations within the City of Boston. The department will continue to use its resources to protect and improve the quality of life in Boston’s neighborhoods by providing public information, education, and enforcement.
Selected Performance Goals ISD Administration & Finance
Ensure compliance w. City's foreclosed/vacant bldg ord. Manage the department's legal case load. To hear Zoning Board of Appeal cases in a timely manner. To improve responsiveness to constituent requests. Buildings & Structures
To ensure the safety of buildings by tracking their compliance with codes by means of scheduled inspections.
Field Services
Prevent housing emergencies and violations. Reduce risk of foodborne illness or disease. Respond to cleanliness & environmental safety complaints. To ensure devices that vendors use to weigh and measure products are accurate.
Operating Budget Program Name Total Actual '19 Total Actual '20 Total Approp '21 Total Budget '22
ISD Commissioner's Office 1,384,986 1,270,628 1,242,789 1,588,210
ISD Administration & Finance 3,155,473 3,291,488 3,838,074 4,025,165
Buildings & Structures 6,629,833 7,035,517 8,538,882 8,587,390
Field Services 8,000,160 6,923,864 7,588,779 7,574,833
Total 19,170,452 18,521,497 21,208,524 21,775,598
External Funds Budget Fund Name Total Actual '19 Total Actual '20 Total Approp '21 Total Budget '22
Animal Control Fund 219,590 17,495 0 0
Foreclosure Fund 10,242 41,061 38,700 42,700
Weights & Measures 64,480 124,184 112,523 112,780
Total 294,312 182,740 151,223 155,480
Operating Budget Actual '19 Actual '20 Approp '21 Budget '22
Personnel Services 16,151,368 15,767,858 18,338,175 18,925,013 Non Personnel 3,019,084 2,753,639 2,870,349 2,850,585 Total 19,170,452 18,521,497 21,208,524 21,775,598

130 OperationsInspectional Services Dept
Administration & Finance
Commissioner
Field Services
Environment
Health
Weights & Measures
Buildings
Buildings & Structures
Administration & Finance
Budget
Human Resources
Constituent Services
Board of Appeals
Housing
Plans & Zoning
Community Outreach
Response Team
Inspectional Services Dept Operating Budget
Authorizing Statutes Establishment, CBC Ord. §§ 9-9.1, 9-9.5-
9-9.7. Building & Structural Regulation;
Swimming Pool; Elderly/Handicapped, State Building Code, 780 CMR; CBC St. 9 § 207; CBC Ord. § 9-9.10; CBC Ord. §§ 9-9.11.1-9-9.11.6.
Housing Inspection, CBC Ord. 9, s. 1-2; State Sanitary Code, 5 CMR 400-419; Ord. 1984, c. 26, 39.
Health Inspection, State Sanitary Code, 5 CMR 590-595.
Weights & Measures; Transient Vendors & Hawkers; Inspection & Sale of Food, Drugs, Various Articles, 1817 Mass. Acts ch. 50, §§ 1-6; CBC St.9 § 10; CBC Ord. § 9-2.1; M.G.L.A. cc. 6, 94, 101; M.G.L.A. c. 98, § 56.
Rodent Control, State Sanitary Code, 105 CMR 550.
Board of Appeals, CBC St. 9 §§ 150-152; CBC Ord. §§ 9-4.1-9-4.2, 9-9.5.
Board of Examiners, CBC St.9 §§ 150-152; CBC Ord. §§ 9-8.1-9-8.2, 9-9.5.
Description of Services The Inspectional Services Department provides a broad range of regulatory services that includes the inspection of buildings for compliance with building and public safety regulations, general housing inspections, and retail food establishment inspections for compliance with public health regulations. The Department provides services to victims of serious incidents such as fire, building collapse, power failure, etc., by providing coordination and assistance with building board-ups, hazard waste removal, short term make-safe repair activities and counseling. The Department works in cooperation with other public safety, human service, and law enforcement agencies to investigate and prosecute fraudulent contractors, environmental violators and others engaged in illegal activities that could have a negative impact on the quality of life. The Inspectional Services Department continues to develop and implement public information programs about the services and activities available through this agency.
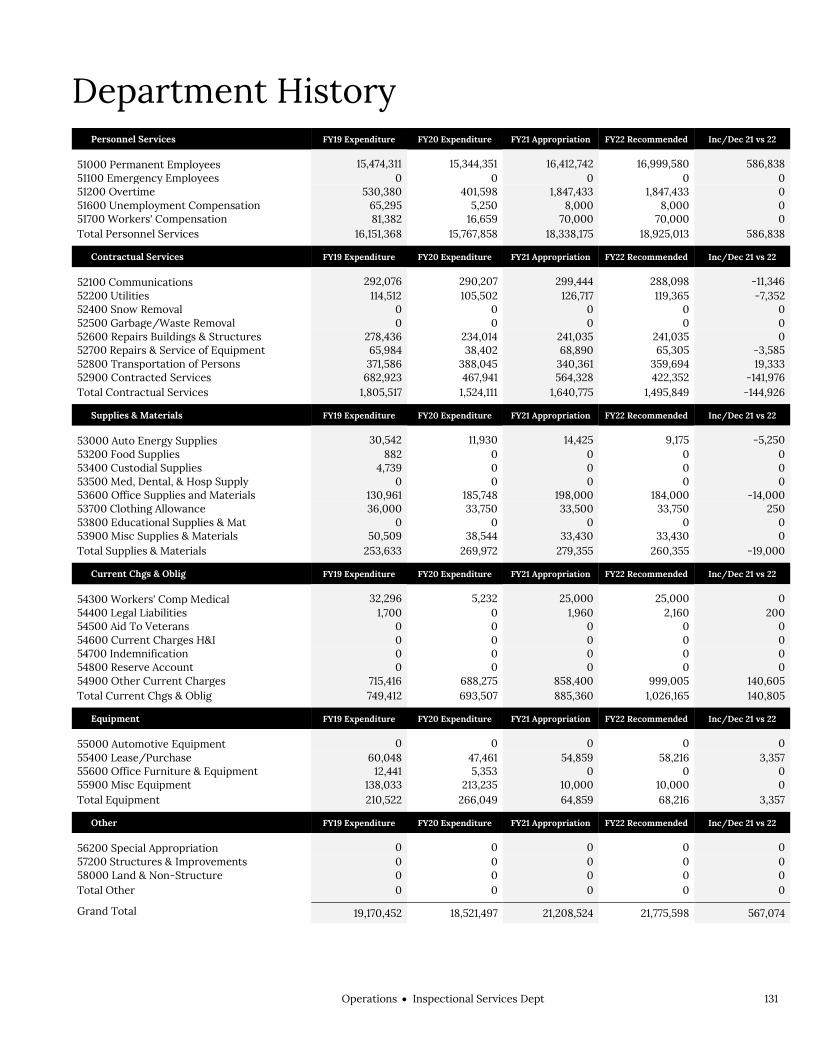
OperationsInspectional Services Dept 131
Department History Personnel Services FY19 Expenditure FY20 Expenditure FY21 Appropriation FY22 Recommended Inc/Dec 21 vs 22
51000 Permanent Employees 15,474,311 15,344,351 16,412,742 16,999,580 586,838 51100 Emergency Employees 0 0 0 0 0 51200 Overtime 530,380 401,598 1,847,433 1,847,433 0 51600 Unemployment Compensation 65,295 5,250 8,000 8,000 0 51700 Workers' Compensation 81,382 16,659 70,000 70,000 0 Total Personnel Services 16,151,368 15,767,858 18,338,175 18,925,013 586,838
Contractual Services FY19 Expenditure FY20 Expenditure FY21 Appropriation FY22 Recommended Inc/Dec 21 vs 22
52100 Communications 292,076 290,207 299,444 288,098 -11,346 52200 Utilities 114,512 105,502 126,717 119,365 -7,352 52400 Snow Removal 0 0 0 0 0 52500 Garbage/Waste Removal 0 0 0 0 0 52600 Repairs Buildings & Structures 278,436 234,014 241,035 241,035 0 52700 Repairs & Service of Equipment 65,984 38,402 68,890 65,305 -3,585 52800 Transportation of Persons 371,586 388,045 340,361 359,694 19,333 52900 Contracted Services 682,923 467,941 564,328 422,352 -141,976 Total Contractual Services 1,805,517 1,524,111 1,640,775 1,495,849 -144,926
Supplies & Materials FY19 Expenditure FY20 Expenditure FY21 Appropriation FY22 Recommended Inc/Dec 21 vs 22
53000 Auto Energy Supplies 30,542 11,930 14,425 9,175 -5,250 53200 Food Supplies 882 0 0 0 0 53400 Custodial Supplies 4,739 0 0 0 0 53500 Med, Dental, & Hosp Supply 0 0 0 0 0 53600 Office Supplies and Materials 130,961 185,748 198,000 184,000 -14,000 53700 Clothing Allowance 36,000 33,750 33,500 33,750 250 53800 Educational Supplies & Mat 0 0 0 0 0 53900 Misc Supplies & Materials 50,509 38,544 33,430 33,430 0 Total Supplies & Materials 253,633 269,972 279,355 260,355 -19,000
Current Chgs & Oblig FY19 Expenditure FY20 Expenditure FY21 Appropriation FY22 Recommended Inc/Dec 21 vs 22
54300 Workers' Comp Medical 32,296 5,232 25,000 25,000 0 54400 Legal Liabilities 1,700 0 1,960 2,160 200 54500 Aid To Veterans 0 0 0 0 0 54600 Current Charges H&I 0 0 0 0 0 54700 Indemnification 0 0 0 0 0 54800 Reserve Account 0 0 0 0 0 54900 Other Current Charges 715,416 688,275 858,400 999,005 140,605 Total Current Chgs & Oblig 749,412 693,507 885,360 1,026,165 140,805
Equipment FY19 Expenditure FY20 Expenditure FY21 Appropriation FY22 Recommended Inc/Dec 21 vs 22
55000 Automotive Equipment 0 0 0 0 0 55400 Lease/Purchase 60,048 47,461 54,859 58,216 3,357 55600 Office Furniture & Equipment 12,441 5,353 0 0 0 55900 Misc Equipment 138,033 213,235 10,000 10,000 0 Total Equipment 210,522 266,049 64,859 68,216 3,357
Other FY19 Expenditure FY20 Expenditure FY21 Appropriation FY22 Recommended Inc/Dec 21 vs 22
56200 Special Appropriation 0 0 0 0 0 57200 Structures & Improvements 0 0 0 0 0 58000 Land & Non-Structure 0 0 0 0 0 Total Other 0 0 0 0 0
Grand Total 19,170,452 18,521,497 21,208,524 21,775,598 567,074

132 OperationsInspectional Services Dept
Department Personnel
Title Union Code Grade Position FY22 Salary Title
Union Code Grade Position FY22 Salary
Admin Asst SE1 05 2.00 165,760 Dir of Operations (ISD) EXM 10 1.00 122,950 Admin Asst(Law-GeneralSvcs) SE1 06 1.00 90,319 Dir-Publicity SE1 08 1.00 108,468
Admin Secretary AFF 14 2.00 106,687 Environmental Health Inspector I
AFB 16A 1.00 56,162
Admin Secretary (ISD) SE1 03 5.00 316,421 Environmental Health Inspector I AFF 16A 13.00 947,922
Assoc Inspec Engineer (ISD) SE1 09 10.00 1,007,771 Head Clerk AFF 12 25.00 1,140,455 Assoc Inspection Eng Fire-Serv SE1 10 1.00 126,024 Health Inspector AFF 16A 21.00 1,521,793 Asst Bldg Commissioner EXM 12 1.00 136,209 Housing Inspector OPE 16A 28.00 1,898,083
Asst Comm Bldg & Structure Div
EXM 10 1.00 122,950 Legal Asst AFF 15 1.00 67,633
Asst Comm/Weights & Measures
EXM 10 1.00 113,515 Legal Asst (ISD) AFF 16 2.00 125,527
Asst Commissioner Constituent Serv EXM 10 1.00 122,950 Management Analyst (ISD) SE1 05 3.00 222,565
Asst Commissioner Environmental Serv
EXM 10 1.00 122,950 Member-Bd of Review EXO NG 1.00 23,986
Asst Commissioner of Health EXM 10 1.00 109,448 Plumbing And Gasfitting Insp. AFF 18A 7.00 630,612 Asst Commissioner of Housing EXM 10 1.00 103,525 Prin Admin Assistant SE1 08 3.00 315,618
Asst Commissioner of Plans & Zoning
EXM 10 1.00 105,871 Prin Clerk & Typist AFF 09 13.00 520,414
Asst Dir Housing Inspection SE1 07 4.00 391,195 Prin Health Inspector SE1 07 3.00 268,246 Board Member Appeals EXO NG 7.00 167,900 Prin Housing Inspector OPE 18A 2.00 163,779 Board Members (Examiners) EXO NG 3.00 44,895 Spec Asst MYN NG 1.00 114,151 Building Inspector AFF 18A 23.00 1,829,901 Sr Adm Analyst SE1 06 1.00 90,319 Chief Bldg Admin Clerk AFF 14 2.00 120,249 Sr Adm Asst (WC) SE1 06 1.00 90,319 Chief Bldg Inspector AFF 20A 3.00 311,725 Sr Cashier AFF 10 1.00 35,384
Chief Deputy Sealer Wts & Msrs AFF 18A 1.00 93,342 Sr Data Proc Sys Analyst SE1 08 1.00 108,468
Chief Electrical Inspector FEW 18 1.00 99,884 Sr Legal Asst (ISD) AFF 16 3.00 215,004 Chief of Staff EXM 11 1.00 109,453 Sr Management Analyst EXM 08 1.00 105,822 Code Enforce Inspector(Isd) AFF 16A 2.00 154,764 Sr Personnel Analyst SE1 07 1.00 99,243 Commissioner (ISD) CDH NG 1.00 135,371 Sub Board Member EXO NG 5.00 119,929 Community Liaison (ISD) AFF 15 2.00 117,996 Sup of Plumbing & Gas Insp. SE1 08 1.00 108,468
Data Proc Equip Tech (Mis/Dpu
SU4 15 1.00 50,797 Supv of Building Inspection SE1 08 1.00 108,468
Dep Sealer(Wts & Msrs) AFF 16A 5.00 388,473 Supv Permitting&Building Admin
SE1 08 1.00 91,313
Dir Bldg & Structure Div SE1 10 1.00 126,024 Supv-Electrical Inspection SE1 08 1.00 108,468 Dir Human Resources EXM 08 1.00 89,971 Wire Inspector FEW 17 8.00 708,778 Total 239 17,220,687 Adjustments Differential Payments 0 Other 329,946 Chargebacks -151,053 Salary Savings -400,000 FY22 Total Request 16,999,580

OperationsInspectional Services Dept 133
External Funds History Personnel Services FY19 Expenditure FY20 Expenditure FY21 Appropriation FY22 Recommended Inc/Dec 21 vs 22
51000 Permanent Employees 0 72,310 0 0 0 51100 Emergency Employees 0 0 0 0 0 51200 Overtime 20,835 0 0 0 0 51300 Part Time Employees 0 0 0 0 0 51400 Health Insurance 0 0 0 0 0 51500 Pension & Annuity 0 0 0 0 0 51600 Unemployment Compensation 0 0 0 0 0 51700 Workers' Compensation 0 0 0 0 0 51800 Indirect Costs 0 0 0 0 0 51900 Medicare 0 0 0 0 0 Total Personnel Services 20,835 72,310 0 0 0
Contractual Services FY19 Expenditure FY20 Expenditure FY21 Appropriation FY22 Recommended Inc/Dec 21 vs 22
52100 Communications 0 0 0 0 0 52200 Utilities 0 0 0 0 0 52400 Snow Removal 0 0 0 0 0 52500 Garbage/Waste Removal 0 0 0 0 0 52600 Repairs Buildings & Structures 0 0 0 0 0 52700 Repairs & Service of Equipment 0 0 0 0 0 52800 Transportation of Persons 6,663 9,750 16,000 16,000 0 52900 Contracted Services 146,087 25,761 67,148 67,150 2 Total Contractual Services 152,750 35,511 83,148 83,150 2
Supplies & Materials FY19 Expenditure FY20 Expenditure FY21 Appropriation FY22 Recommended Inc/Dec 21 vs 22
53000 Auto Energy Supplies 0 0 0 0 0 53200 Food Supplies 0 0 0 0 0 53400 Custodial Supplies 1,646 0 0 0 0 53500 Med, Dental, & Hosp Supply 52,914 0 0 0 0 53600 Office Supplies and Materials 26,044 31 5,000 5,000 0 53700 Clothing Allowance 0 0 0 0 0 53800 Educational Supplies & Mat 0 0 0 0 0 53900 Misc Supplies & Materials 17,403 17,830 21,800 22,000 200 Total Supplies & Materials 98,007 17,861 26,800 27,000 200
Current Chgs & Oblig FY19 Expenditure FY20 Expenditure FY21 Appropriation FY22 Recommended Inc/Dec 21 vs 22
54300 Workers' Comp Medical 0 0 0 0 0 54400 Legal Liabilities 0 0 0 0 0 54600 Current Charges H&I 0 0 0 0 0 54700 Indemnification 0 0 0 0 0 54800 Reserve Account 0 0 0 0 0 54900 Other Current Charges 11,514 30,828 41,275 45,330 4,055 Total Current Chgs & Oblig 11,514 30,828 41,275 45,330 4,055
Equipment FY19 Expenditure FY20 Expenditure FY21 Appropriation FY22 Recommended Inc/Dec 21 vs 22
55000 Automotive Equipment 0 0 0 0 0 55400 Lease/Purchase 0 0 0 0 0 55600 Office Furniture & Equipment 894 0 0 0 0 55900 Misc Equipment 10,312 26,230 0 0 0 Total Equipment 11,206 26,230 0 0 0
Other FY19 Expenditure FY20 Expenditure FY21 Appropriation FY22 Recommended Inc/Dec 21 vs 22
56200 Special Appropriation 0 0 0 0 0 57200 Structures & Improvements 0 0 0 0 0 58000 Land & Non-Structure 0 0 0 0 0 Total Other 0 0 0 0 0
Grand Total 294,312 182,740 151,223 155,480 4,257
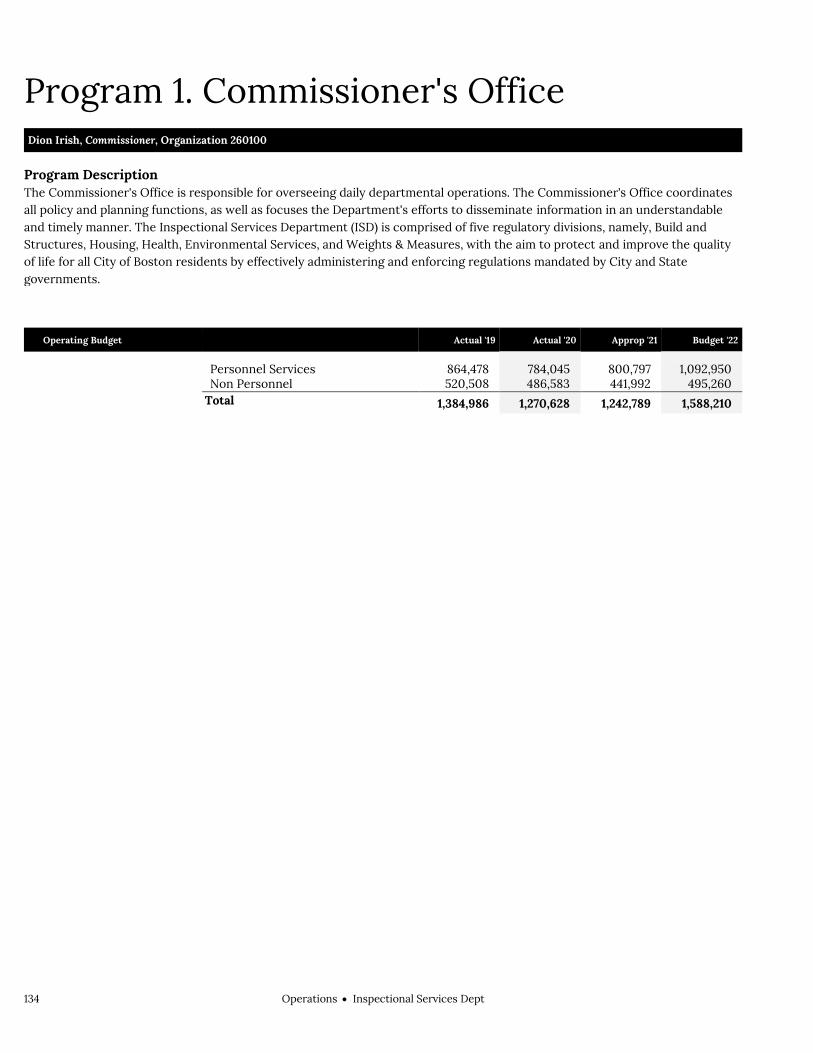
134 OperationsInspectional Services Dept
Program 1. Commissioner's Office Dion Irish, Commissioner, Organization 260100
Program Description The Commissioner's Office is responsible for overseeing daily departmental operations. The Commissioner's Office coordinates all policy and planning functions, as well as focuses the Department's efforts to disseminate information in an understandable and timely manner. The Inspectional Services Department (ISD) is comprised of five regulatory divisions, namely, Build and Structures, Housing, Health, Environmental Services, and Weights & Measures, with the aim to protect and improve the quality of life for all City of Boston residents by effectively administering and enforcing regulations mandated by City and State governments.
Operating Budget Actual '19 Actual '20 Approp '21 Budget '22
Personnel Services 864,478 784,045 800,797 1,092,950 Non Personnel 520,508 486,583 441,992 495,260 Total 1,384,986 1,270,628 1,242,789 1,588,210

OperationsInspectional Services Dept 135
Program 2. Administration & Finance Dion Irish, Manager, Organization 260200
Program Description The Administration and Finance program provides direction and supervision for Human Resources, Budget Management, Information Technology, and Legal Services. Human Resources directs the administration of all employee services, payroll, and labor relations. Budget provides fiscal oversight for the responsible management of the departmental non-personnel operating budget, in addition to asset/fleet management. Information Technology is responsible for maintaining the department’s local area network, web page materials and Microsoft exchange server. Legal works with departmental field inspection divisions in enforcing State Building, Housing and Sanitary Codes, in addition to addressing distressed properties and processing property liens. Constituent Services holds Zoning Board of Appeal hearings and responds to non-emergency complaints from the public.
Operating Budget Actual '19 Actual '20 Approp '21 Budget '22
Personnel Services 1,797,764 1,816,116 2,301,558 2,373,955 Non Personnel 1,357,709 1,475,372 1,536,516 1,651,210 Total 3,155,473 3,291,488 3,838,074 4,025,165
Performance
Goal: Ensure compliance w. City's foreclosed/vacant bldg ord
Performance Measures Actual '19 Actual '20 Projected '21 Target '22
# of foreclosures reported 595 470 230 500
Goal: Manage the department's legal case load
Performance Measures Actual '19 Actual '20 Projected '21 Target '22
# legal cases processed 1,015 928 400 750
Goal: To hear Zoning Board of Appeal cases in a timely manner
Performance Measures Actual '19 Actual '20 Projected '21 Target '22
ZBA appeals filed 826 968 800 1,000
ZBA decisions filed 852 852 800 1,000
Goal: To improve responsiveness to constituent requests
Performance Measures Actual '19 Actual '20 Projected '21 Target '22
# of community meetings
15 176 0 200
% calls answered 85% 90% 80% 90%
Call volume 79,212 126,144 130,000 100,000
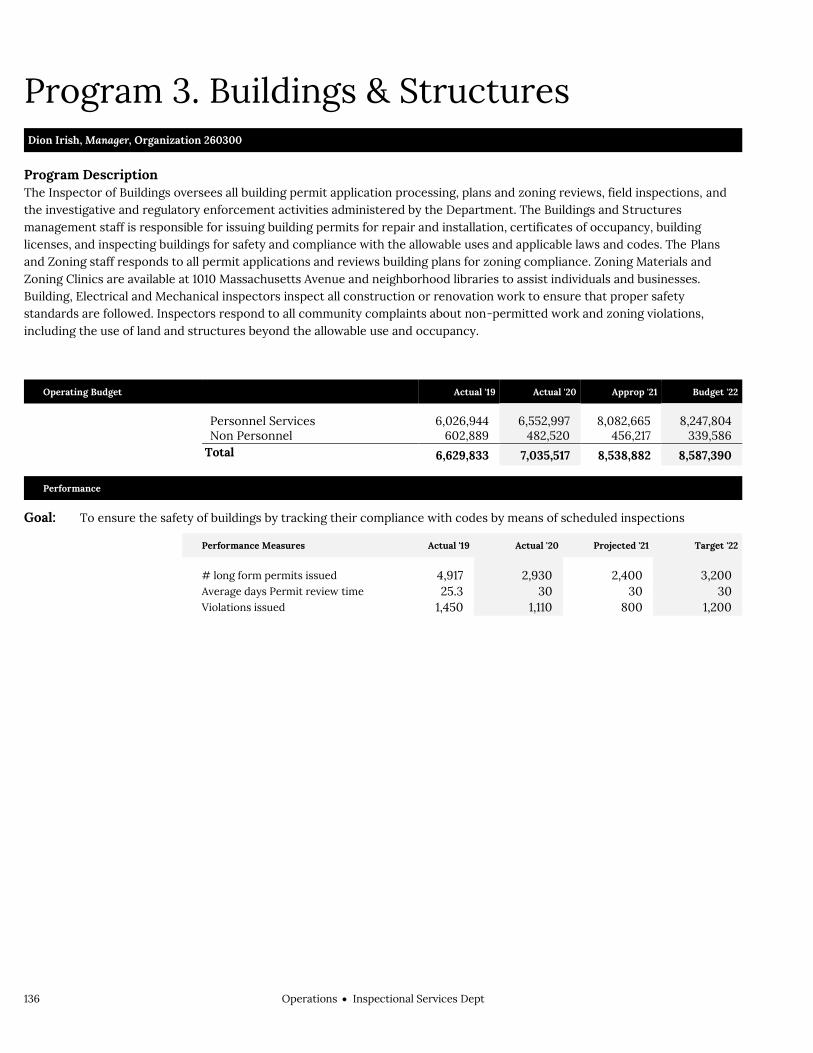
136 OperationsInspectional Services Dept
Program 3. Buildings & Structures Dion Irish, Manager, Organization 260300
Program Description The Inspector of Buildings oversees all building permit application processing, plans and zoning reviews, field inspections, and the investigative and regulatory enforcement activities administered by the Department. The Buildings and Structures management staff is responsible for issuing building permits for repair and installation, certificates of occupancy, building licenses, and inspecting buildings for safety and compliance with the allowable uses and applicable laws and codes. The Plans and Zoning staff responds to all permit applications and reviews building plans for zoning compliance. Zoning Materials and Zoning Clinics are available at 1010 Massachusetts Avenue and neighborhood libraries to assist individuals and businesses. Building, Electrical and Mechanical inspectors inspect all construction or renovation work to ensure that proper safety standards are followed. Inspectors respond to all community complaints about non-permitted work and zoning violations, including the use of land and structures beyond the allowable use and occupancy.
Operating Budget Actual '19 Actual '20 Approp '21 Budget '22
Personnel Services 6,026,944 6,552,997 8,082,665 8,247,804 Non Personnel 602,889 482,520 456,217 339,586 Total 6,629,833 7,035,517 8,538,882 8,587,390
Performance
Goal: To ensure the safety of buildings by tracking their compliance with codes by means of scheduled inspections
Performance Measures Actual '19 Actual '20 Projected '21 Target '22
# long form permits issued 4,917 2,930 2,400 3,200
Average days Permit review time 25.3 30 30 30
Violations issued 1,450 1,110 800 1,200

OperationsInspectional Services Dept 137
Program 4. Field Services Dion Irish, Manager, Organization 260400
Program Description The Field Services program consists of four divisions: Health, Housing, Environmental Services and Weights & Measures. The Health Division's role is to protect the public health by permitting and inspecting food establishments, restaurants, caterers, health clubs, massage practitioners, and recreational camps. The Housing Division's role is to ensure the availability of clean, safe living conditions as required by the State Sanitary Code. The Environmental Services Division is responsible for the abatement and prevention of rodent infestation, the implementation of the City's site cleanliness ordinance, the boarding and securing of abandoned properties, and the coordination of the vacant lot maintenance program. The Weights and Measures Division is charged with protecting consumers by ensuring accuracy in retail establishment pricing and proper readings on gas pumps, taxi meters, scales and fuel truck meters.
Operating Budget Actual '19 Actual '20 Approp '21 Budget '22
Personnel Services 7,462,182 6,614,700 7,153,155 7,210,304 Non Personnel 537,978 309,164 435,624 364,529 Total 8,000,160 6,923,864 7,588,779 7,574,833
Performance
Goal: Prevent housing emergencies and violations
Performance Measures Actual '19 Actual '20 Projected '21 Target '22
# of new units registered in rental register 10,246 6,135 10,000 10,000
# of rental housing inspections attempted 5,000 11,802 6,000 8,000
Goal: Reduce risk of foodborne illness or disease
Performance Measures Actual '19 Actual '20 Projected '21 Target '22
# restaurants inspections 8,699 10,066 13,000 13,000
Goal: Respond to cleanliness & environmental safety complaints
Performance Measures Actual '19 Actual '20 Projected '21 Target '22
# Locations baited 168 325 300 300
# of Environmental complaints 3,938 4,421 5,000 5,000
# of sewers or sites baited 550 473 700 700
Average hours response time to Environmental complaints 24 24 24 24
Goal: To ensure devices that vendors use to weigh and measure products are accurate
Performance Measures Actual '19 Actual '20 Projected '21 Target '22
# of Weights and Measure Inspections 320 275 300 350

138 OperationsInspectional Services Dept
External Funds Projects Animal Control Fund
Project Mission The Animal Control Fund authorized by (Chapter 44, Section 53E ½) generates monies derived from dog licenses and animal violations. The revolving fund is used to defer and supplement the costs of the animal control program such as veterinary care, animal food, spay and neuter services, and public service television programming. This fund will transition to the Parks and Recreation Department in FY20.
Foreclosure Fund
Project Mission The Foreclosure Fund was created in 2008 in compliance with the M.G.L. c.59, s57D, M.G.L. c,,156D, s5.02 and the 950CMR 113,20 requirement to register vacant or foreclosed properties. The fund allows Inspectional Services to charge an annual $100 fee for the registration of each foreclosed property. Monies collected are to be used to offset costs to track and secure foreclosed properties.
Weights and Measures Enforcement Fund
Project Mission The fund was created in 1998 in order to be in compliance with MGL c. 98 s. 29A, which was amended in 1998 to allow local weights and measures departments to issue civil citations (fines). The amended law specifically required that the revenue collected from said fines be retained and expended only for the purposes of enforcing “item pricing” and weights and measures laws.

OperationsProperty Management 139
Property Management Operating Budget Operations Property Management Indira Alvarez Commissioner, Appropriation 180000
Department Mission The mission of the Property Management Department is to manage, maintain, repair and provide security for the City's municipal buildings including City Hall and Faneuil Hall; to preserve the useful life of City facilities and reduce operating costs through effective preventive maintenance measures.
Selected Performance Goals Building Operations
To improve and maintain the operational condition of managed city-owned facilities. Alterations & Repair
To improve and maintain the operational condition of managed city-owned facilities. Building Systems
Maintain heating ventilation and air condition (HVAC) system in proper working order.
Operating Budget Program Name Total Actual '19 Total Actual '20 Total Approp '21 Total Budget '22
PM Administration 2,047,698 1,913,069 3,144,551 1,548,725
Building Operations 7,907,055 8,086,438 8,272,888 8,153,689
Alterations & Repair 4,036,425 3,515,111 1,487,693 1,594,187
Enforcement 2,825,484 3,068,232 1,221,103 2,942,770
Security Systems 727,402 756,413 686,237 708,933
Building Systems 2,072,201 2,648,611 2,347,934 2,303,695
Total 19,616,265 19,987,874 17,160,406 17,251,999
Operating Budget Actual '19 Actual '20 Approp '21 Budget '22
Personnel Services 8,150,585 8,770,355 7,676,251 7,646,732 Non Personnel 11,465,680 11,217,519 9,484,155 9,605,267 Total 19,616,265 19,987,874 17,160,406 17,251,999

140 OperationsProperty Management
Property Management Operating Budget
Authorizing Statutes Property Management Board: Powers &
Duties, CBC Ord. §§ 11-7.1-11-7.2; 1943 Mass. Acts ch. 1943, as amended; 1946 Mass. Acts ch. 474, as amended.
Powers and Duties of Commissioner of Real Property, CBC Ord. § 11-7.3; 1943 Mass. Acts ch. 1943, as amended; 1946 Mass. Acts ch. 474, as amended.
Powers and Duties of Assistant Commissioner of Real Property, CBC Ord. §§ 11-7.4-11-7.10.
Description of Services The Property Management Department is responsible for the management, maintenance, security, and repair of the City's municipal buildings including City Hall, Faneuil Hall, and the Old State House. Property Management is responsible for facility layout and space planning analysis for City departments, building security, and events management.
Operations
Commissioner
Building Operations
Custodial Services
Security
Municipal Protective Services
Security Systems
Administration & Finance
Budget
Revenue
Asset Management Events
Graffiti BustersHuman
Resources
Alterations & Repairs Building Systems

OperationsProperty Management 141
Department History Personnel Services FY19 Expenditure FY20 Expenditure FY21 Appropriation FY22 Recommended Inc/Dec 21 vs 22
51000 Permanent Employees 5,999,803 6,403,317 6,176,251 6,146,732 -29,519 51100 Emergency Employees 0 0 0 0 0 51200 Overtime 1,837,931 2,081,776 1,300,000 1,300,000 0 51600 Unemployment Compensation 3,707 9,695 25,000 25,000 0 51700 Workers' Compensation 309,144 275,567 175,000 175,000 0 Total Personnel Services 8,150,585 8,770,355 7,676,251 7,646,732 -29,519
Contractual Services FY19 Expenditure FY20 Expenditure FY21 Appropriation FY22 Recommended Inc/Dec 21 vs 22
52100 Communications 131,482 132,996 142,676 142,676 0 52200 Utilities 3,347,038 3,080,137 3,646,702 3,139,251 -507,451 52400 Snow Removal 29,865 9,571 25,000 25,000 0 52500 Garbage/Waste Removal 36,363 16,146 56,382 59,632 3,250 52600 Repairs Buildings & Structures 4,035,007 3,560,494 3,322,031 3,389,997 67,966 52700 Repairs & Service of Equipment 259,132 150,388 379,181 379,181 0 52800 Transportation of Persons 7,810 8,624 1,600 8,300 6,700 52900 Contracted Services 3,017,707 3,291,236 1,288,796 1,341,960 53,164 Total Contractual Services 10,864,404 10,249,592 8,862,368 8,485,997 -376,371
Supplies & Materials FY19 Expenditure FY20 Expenditure FY21 Appropriation FY22 Recommended Inc/Dec 21 vs 22
53000 Auto Energy Supplies 39,089 28,373 40,858 29,711 -11,147 53200 Food Supplies 0 0 0 0 0 53400 Custodial Supplies 64,811 60,826 50,000 63,000 13,000 53500 Med, Dental, & Hosp Supply 0 0 0 0 0 53600 Office Supplies and Materials 9,552 9,953 10,400 10,400 0 53700 Clothing Allowance 32,975 49,154 55,450 55,450 0 53800 Educational Supplies & Mat 0 0 0 0 0 53900 Misc Supplies & Materials 209,055 386,115 256,365 761,490 505,125 Total Supplies & Materials 355,482 534,421 413,073 920,051 506,978
Current Chgs & Oblig FY19 Expenditure FY20 Expenditure FY21 Appropriation FY22 Recommended Inc/Dec 21 vs 22
54300 Workers' Comp Medical 28,767 43,265 30,000 30,000 0 54400 Legal Liabilities 17,557 3,900 3,670 4,040 370 54500 Aid To Veterans 0 0 0 0 0 54600 Current Charges H&I 0 0 0 0 0 54700 Indemnification 0 0 0 0 0 54800 Reserve Account 0 0 0 0 0 54900 Other Current Charges 96,285 16,834 88,400 91,425 3,025 Total Current Chgs & Oblig 142,609 63,999 122,070 125,465 3,395
Equipment FY19 Expenditure FY20 Expenditure FY21 Appropriation FY22 Recommended Inc/Dec 21 vs 22
55000 Automotive Equipment 0 0 0 0 0 55400 Lease/Purchase 75,129 66,214 63,644 50,754 -12,890 55600 Office Furniture & Equipment 0 100,407 0 0 0 55900 Misc Equipment 28,056 202,886 23,000 23,000 0 Total Equipment 103,185 369,507 86,644 73,754 -12,890
Other FY19 Expenditure FY20 Expenditure FY21 Appropriation FY22 Recommended Inc/Dec 21 vs 22
56200 Special Appropriation 0 0 0 0 0 57200 Structures & Improvements 0 0 0 0 0 58000 Land & Non-Structure 0 0 0 0 0 Total Other 0 0 0 0 0
Grand Total 19,616,265 19,987,874 17,160,406 17,251,999 91,593
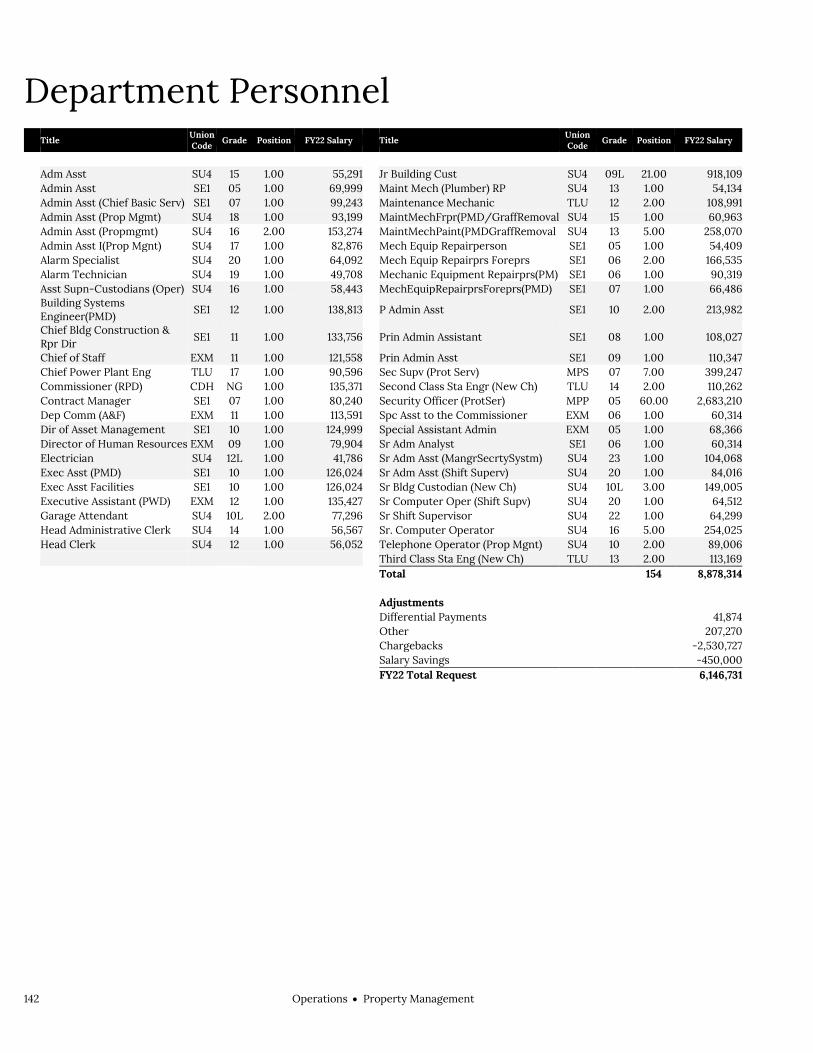
142 OperationsProperty Management
Department Personnel
Title Union Code Grade Position FY22 Salary Title
Union Code Grade Position FY22 Salary
Adm Asst SU4 15 1.00 55,291 Jr Building Cust SU4 09L 21.00 918,109 Admin Asst SE1 05 1.00 69,999 Maint Mech (Plumber) RP SU4 13 1.00 54,134 Admin Asst (Chief Basic Serv) SE1 07 1.00 99,243 Maintenance Mechanic TLU 12 2.00 108,991 Admin Asst (Prop Mgmt) SU4 18 1.00 93,199 MaintMechFrpr(PMD/GraffRemoval SU4 15 1.00 60,963 Admin Asst (Propmgmt) SU4 16 2.00 153,274 MaintMechPaint(PMDGraffRemoval SU4 13 5.00 258,070 Admin Asst I(Prop Mgnt) SU4 17 1.00 82,876 Mech Equip Repairperson SE1 05 1.00 54,409 Alarm Specialist SU4 20 1.00 64,092 Mech Equip Repairprs Foreprs SE1 06 2.00 166,535 Alarm Technician SU4 19 1.00 49,708 Mechanic Equipment Repairprs(PM) SE1 06 1.00 90,319 Asst Supn-Custodians (Oper) SU4 16 1.00 58,443 MechEquipRepairprsForeprs(PMD) SE1 07 1.00 66,486
Building Systems Engineer(PMD)
SE1 12 1.00 138,813 P Admin Asst SE1 10 2.00 213,982
Chief Bldg Construction & Rpr Dir SE1 11 1.00 133,756 Prin Admin Assistant SE1 08 1.00 108,027
Chief of Staff EXM 11 1.00 121,558 Prin Admin Asst SE1 09 1.00 110,347 Chief Power Plant Eng TLU 17 1.00 90,596 Sec Supv (Prot Serv) MPS 07 7.00 399,247 Commissioner (RPD) CDH NG 1.00 135,371 Second Class Sta Engr (New Ch) TLU 14 2.00 110,262 Contract Manager SE1 07 1.00 80,240 Security Officer (ProtSer) MPP 05 60.00 2,683,210 Dep Comm (A&F) EXM 11 1.00 113,591 Spc Asst to the Commissioner EXM 06 1.00 60,314 Dir of Asset Management SE1 10 1.00 124,999 Special Assistant Admin EXM 05 1.00 68,366 Director of Human Resources EXM 09 1.00 79,904 Sr Adm Analyst SE1 06 1.00 60,314 Electrician SU4 12L 1.00 41,786 Sr Adm Asst (MangrSecrtySystm) SU4 23 1.00 104,068 Exec Asst (PMD) SE1 10 1.00 126,024 Sr Adm Asst (Shift Superv) SU4 20 1.00 84,016 Exec Asst Facilities SE1 10 1.00 126,024 Sr Bldg Custodian (New Ch) SU4 10L 3.00 149,005 Executive Assistant (PWD) EXM 12 1.00 135,427 Sr Computer Oper (Shift Supv) SU4 20 1.00 64,512 Garage Attendant SU4 10L 2.00 77,296 Sr Shift Supervisor SU4 22 1.00 64,299 Head Administrative Clerk SU4 14 1.00 56,567 Sr. Computer Operator SU4 16 5.00 254,025 Head Clerk SU4 12 1.00 56,052 Telephone Operator (Prop Mgnt) SU4 10 2.00 89,006
Third Class Sta Eng (New Ch) TLU 13 2.00 113,169
Total 154 8,878,314 Adjustments Differential Payments 41,874 Other 207,270 Chargebacks -2,530,727 Salary Savings -450,000 FY22 Total Request 6,146,731

OperationsProperty Management 143
Program 1. Administration Samuel Lovison , Manager, Organization 180100
Program Description The Administration Program provides centralized administrative, fiscal, and human resource support services for the Public Property Cabinet. The program processes contracts, manages finances, implements human resource management policies and personnel paperwork, and monitors all budgetary actions through internal auditing of expenditures and revenue collections. In addition, it assists in efforts to enhance the effectiveness and efficiency of the Department's programs and activities.
Operating Budget Actual '19 Actual '20 Approp '21 Budget '22
Personnel Services 1,754,758 1,732,549 2,952,208 1,310,527 Non Personnel 292,940 180,520 192,343 238,198 Total 2,047,698 1,913,069 3,144,551 1,548,725

144 OperationsProperty Management
Program 2. Building Operations Leon Graves, Manager, Organization 180200
Program Description The Building Operations Program provides for asset management and maintenance for Boston City Hall, municipal buildings, and historic structures. The Program is also responsible for graffiti removal from public and private property in the City of Boston. The program also provides maintenance and operational support for special events and celebrations held in municipal buildings managed by the Department.
Operating Budget Actual '19 Actual '20 Approp '21 Budget '22
Personnel Services 1,572,728 1,898,590 1,608,535 1,563,525 Non Personnel 6,334,327 6,187,848 6,664,353 6,590,164 Total 7,907,055 8,086,438 8,272,888 8,153,689
Performance
Goal: To improve and maintain the operational condition of managed city-owned facilities
Performance Measures Actual '19 Actual '20 Projected '21 Target '22
% of locksmith requests closed within 48 hours 91% 95% 95% 95%
% of plumbing requests closed within 48 hours 90% 91% 80% 90%

OperationsProperty Management 145
Program 3. Alterations & Repair Carlene Laurent, Manager, Organization 180300
Program Description The Alterations and Repair Program performs and oversees non-capital alterations and repairs to City-owned facilities to meet the needs of building occupants, responds to emergency repair and hazardous waste removal needs, and ensures that all systems are functioning and that the facilities are environmentally safe. The program also preserves the useful life of City facilities and reduces operating costs by developing and implementing preventive maintenance programs.
Operating Budget Actual '19 Actual '20 Approp '21 Budget '22
Personnel Services 725,511 742,907 698,774 635,640 Non Personnel 3,310,914 2,772,204 788,919 958,547 Total 4,036,425 3,515,111 1,487,693 1,594,187
Performance
Goal: To improve and maintain the operational condition of managed city-owned facilities
Performance Measures Actual '19 Actual '20 Projected '21 Target '22
% of maintenance repairs and requests for City Hall handled internally vs. by vendor
96% 95% 95% 95%

146 OperationsProperty Management
Program 4. Enforcement Vacant, Manager, Organization 180400
Program Description The Municipal Protective Services Division (MPSD) protects City property from vandalism, arson, and theft in City buildings.
Operating Budget Actual '19 Actual '20 Approp '21 Budget '22
Personnel Services 2,622,679 2,891,963 1,008,528 2,716,413 Non Personnel 202,805 176,269 212,575 226,357 Total 2,825,484 3,068,232 1,221,103 2,942,770

OperationsProperty Management 147
Program 5. Security Systems John Gillis, Manager, Organization 180500
Program Description The Security Systems Program monitors public buildings for safety and security violations, coordinates an effective response by the Municipal Protective Services Division (MPSD) as well as other public safety agencies of the City of Boston, installs, maintains, and monitors fire and intrusion alarms in public buildings, and installs and monitors temporary alarm systems to protect various projects.
Operating Budget Actual '19 Actual '20 Approp '21 Budget '22
Personnel Services 683,578 710,978 635,973 665,317 Non Personnel 43,824 45,435 50,264 43,616 Total 727,402 756,413 686,237 708,933

148 OperationsProperty Management
Program 7. Building Systems John Sinagra, Manager, Organization 180700
Program Description The Building Systems program is responsible for all mechanical systems in Boston City Hall and at 52 other City-owned buildings. Responsibilities include preventive maintenance and incidental repairs to heating, ventilation, and air conditioning (HVAC).
Operating Budget Actual '19 Actual '20 Approp '21 Budget '22
Personnel Services 791,331 793,368 772,233 755,310 Non Personnel 1,280,870 1,855,243 1,575,701 1,548,385 Total 2,072,201 2,648,611 2,347,934 2,303,695
Performance
Goal: Maintain heating ventilation and air condition (HVAC) system in proper working order
Performance Measures Actual '19 Actual '20 Projected '21 Target '22
# of preventive maintenance/corrective maintenance 63 33 60 75
% of HVAC breakdowns corrected within 8 hours 81% 80% 75% 80%
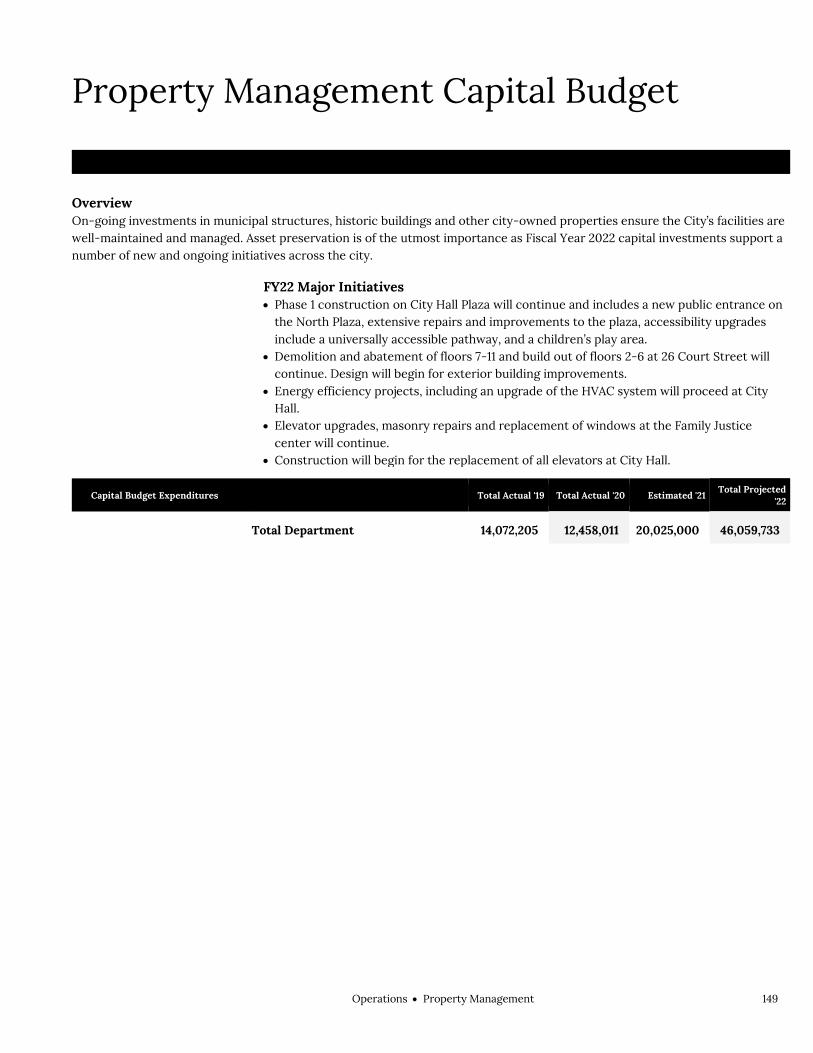
OperationsProperty Management 149
Property Management Capital Budget Operations Property Management
Overview On-going investments in municipal structures, historic buildings and other city-owned properties ensure the City’s facilities are well-maintained and managed. Asset preservation is of the utmost importance as Fiscal Year 2022 capital investments support a number of new and ongoing initiatives across the city.
FY22 Major Initiatives Phase 1 construction on City Hall Plaza will continue and includes a new public entrance on
the North Plaza, extensive repairs and improvements to the plaza, accessibility upgrades include a universally accessible pathway, and a children’s play area.
Demolition and abatement of floors 7-11 and build out of floors 2-6 at 26 Court Street will continue. Design will begin for exterior building improvements.
Energy efficiency projects, including an upgrade of the HVAC system will proceed at City Hall.
Elevator upgrades, masonry repairs and replacement of windows at the Family Justice center will continue.
Construction will begin for the replacement of all elevators at City Hall.
Capital Budget Expenditures Total Actual '19 Total Actual '20 Estimated '21 Total Projected
'22
Total Department 14,072,205 12,458,011 20,025,000 46,059,733

150 OperationsProperty Management
Property Management Project Profiles 201 RIVERMOOR
Project Mission Install new backup generator and high density shelving for City archives. Upgrade HVAC to optimize building
conditions for long term storage. Relocate the Archeology Department.
Managing Department, Public Facilities Department Status, To Be Scheduled Location, West Roxbury Operating Impact, No
Authorizations
Source Existing FY22 Future Non Capital
Fund Total City Capital 2,160,000 0 0 0 2,160,000 Grants/Other 0 0 0 0 0 Total 2,160,000 0 0 0 2,160,000
Expenditures (Actual and Planned)
Source Thru
6/30/20 FY21 FY22 FY23-26 Total City Capital 0 0 50,000 2,110,000 2,160,000 Grants/Other 0 0 0 0 0 Total 0 0 50,000 2,110,000 2,160,000
26 COURT STREET Project Mission Renovate building to improve envelope (roof, new windows, masonry repair) and upgrade interior. Managing Department, Public Facilities Department Status, In Design Location, Financial District/Downtown Operating Impact, No
Authorizations
Source Existing FY22 Future Non Capital
Fund Total City Capital 20,000,000 0 0 0 20,000,000 Grants/Other 0 0 0 0 0 Total 20,000,000 0 0 0 20,000,000
Expenditures (Actual and Planned)
Source Thru
6/30/20 FY21 FY22 FY23-26 Total City Capital 0 0 2,500,000 17,500,000 20,000,000 Grants/Other 0 0 0 0 0 Total 0 0 2,500,000 17,500,000 20,000,000

OperationsProperty Management 151
Property Management Project Profiles CITY HALL AND CITY HALL PLAZA
Project Mission Implement early action items from the City Hall Master plan including masonry and roof repairs, HVAC
improvements, and construction of Phase 1 which includes a new public entrance on the north plaza, accessibility upgrades, and extensive plaza renovations.
Managing Department, Public Facilities Department Status, In Construction Location, Government Center/Faneuil Hall Operating Impact, No
Authorizations
Source Existing FY22 Future Non Capital
Fund Total City Capital 120,300,000 0 0 0 120,300,000 Grants/Other 4,023,273 0 0 0 4,023,273 Total 124,323,273 0 0 0 124,323,273
Expenditures (Actual and Planned)
Source Thru
6/30/20 FY21 FY22 FY23-26 Total City Capital 20,680,243 35,000,000 38,000,000 26,619,757 120,300,000 Grants/Other 15,046 8,227 2,000,000 2,000,000 4,023,273 Total 20,695,289 35,008,227 40,000,000 28,619,757 124,323,273
FAMILY JUSTICE CENTER BUILDING ENVELOPE REPAIRS Project Mission Window replacements and building envelope improvements. Managing Department, Public Facilities Department Status, In Design Location, Allston/Brighton Operating Impact, No
Authorizations
Source Existing FY22 Future Non Capital
Fund Total City Capital 2,200,000 0 0 0 2,200,000 Grants/Other 0 0 0 0 0 Total 2,200,000 0 0 0 2,200,000
Expenditures (Actual and Planned)
Source Thru
6/30/20 FY21 FY22 FY23-26 Total City Capital 0 100,000 500,000 1,600,000 2,200,000 Grants/Other 0 0 0 0 0 Total 0 100,000 500,000 1,600,000 2,200,000

152 OperationsProperty Management
Property Management Project Profiles FAMILY JUSTICE CENTER ELEVATOR UPGRADE
Project Mission Upgrade elevator. Managing Department, Public Facilities Department Status, In Construction Location, Allston/Brighton Operating Impact, No
Authorizations
Source Existing FY22 Future Non Capital
Fund Total City Capital 650,500 0 0 0 650,500 Grants/Other 0 0 0 0 0 Total 650,500 0 0 0 650,500
Expenditures (Actual and Planned)
Source Thru
6/30/20 FY21 FY22 FY23-26 Total City Capital 40,767 100,000 509,733 0 650,500 Grants/Other 0 0 0 0 0 Total 40,767 100,000 509,733 0 650,500
MUNICIPAL FACILITY REPAIRS Project Mission Building renovations at various municipal buildings including City Hall, 26 Court Street, and 1010 Massachusetts
Avenue.
Managing Department, Public Facilities Department Status, In Construction Location, Various neighborhoods Operating Impact, No
Authorizations
Source Existing FY22 Future Non Capital
Fund Total City Capital 49,480,000 15,000,000 0 0 64,480,000 Grants/Other 0 0 0 0 0 Total 49,480,000 15,000,000 0 0 64,480,000
Expenditures (Actual and Planned)
Source Thru
6/30/20 FY21 FY22 FY23-26 Total City Capital 73,359 2,000,000 2,500,000 59,906,641 64,480,000 Grants/Other 0 0 0 0 0 Total 73,359 2,000,000 2,500,000 59,906,641 64,480,000
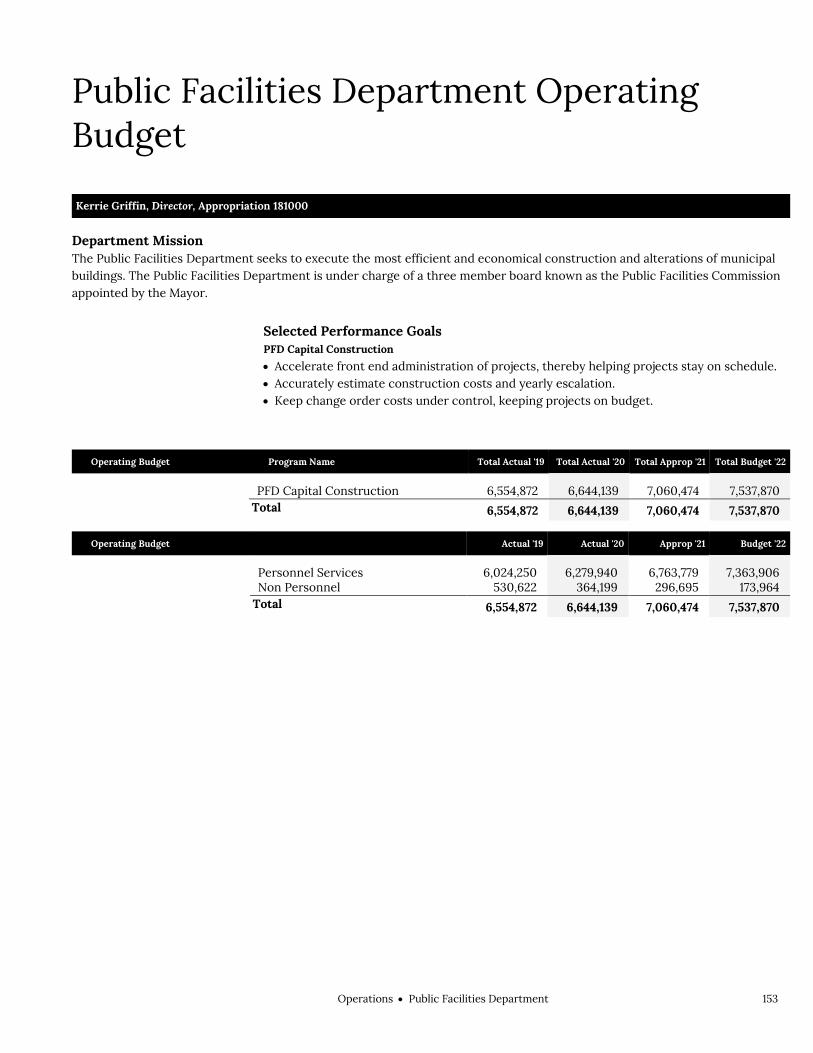
OperationsPublic Facilities Department 153
Public Facilities Department Operating Budget Operations Public Facilities Department Kerrie Griffin, Director, Appropriation 181000
Department Mission The Public Facilities Department seeks to execute the most efficient and economical construction and alterations of municipal buildings. The Public Facilities Department is under charge of a three member board known as the Public Facilities Commission appointed by the Mayor.
Selected Performance Goals PFD Capital Construction
Accelerate front end administration of projects, thereby helping projects stay on schedule. Accurately estimate construction costs and yearly escalation. Keep change order costs under control, keeping projects on budget.
Operating Budget Program Name Total Actual '19 Total Actual '20 Total Approp '21 Total Budget '22
PFD Capital Construction 6,554,872 6,644,139 7,060,474 7,537,870
Total 6,554,872 6,644,139 7,060,474 7,537,870
Operating Budget Actual '19 Actual '20 Approp '21 Budget '22
Personnel Services 6,024,250 6,279,940 6,763,779 7,363,906 Non Personnel 530,622 364,199 296,695 173,964 Total 6,554,872 6,644,139 7,060,474 7,537,870

154 OperationsPublic Facilities Department
Public Facilities Department Operating Budget
Authorizing Statutes Enabling Legislation, 1966. Mass Acts Ch
642.
Description of Services The Public Facilities Department is responsible for the coordination of capital improvement projects for approximately 370 buildings within its jurisdiction.
Public Facilities Director
LegalPlanning &
Administration Design & Review Construction Operations
Public Facilities Commission

OperationsPublic Facilities Department 155
Department History Personnel Services FY19 Expenditure FY20 Expenditure FY21 Appropriation FY22 Recommended Inc/Dec 21 vs 22
51000 Permanent Employees 5,962,797 6,188,772 6,663,779 7,283,906 620,127 51100 Emergency Employees 0 0 0 0 0 51200 Overtime 52,464 69,422 100,000 80,000 -20,000 51600 Unemployment Compensation 8,989 0 0 0 0 51700 Workers' Compensation 0 21,746 0 0 0 Total Personnel Services 6,024,250 6,279,940 6,763,779 7,363,906 600,127
Contractual Services FY19 Expenditure FY20 Expenditure FY21 Appropriation FY22 Recommended Inc/Dec 21 vs 22
52100 Communications 37,577 47,530 48,225 48,225 0 52200 Utilities 0 0 0 0 0 52400 Snow Removal 0 0 0 0 0 52500 Garbage/Waste Removal 457 388 1,000 0 -1,000 52600 Repairs Buildings & Structures 5,515 6,205 11,000 0 -11,000 52700 Repairs & Service of Equipment 12,126 13,556 15,495 15,495 0 52800 Transportation of Persons 5,130 5,664 7,100 7,100 0 52900 Contracted Services 391,615 252,961 152,200 43,700 -108,500 Total Contractual Services 452,420 326,304 235,020 114,520 -120,500
Supplies & Materials FY19 Expenditure FY20 Expenditure FY21 Appropriation FY22 Recommended Inc/Dec 21 vs 22
53000 Auto Energy Supplies 1,544 900 1,625 1,194 -431 53200 Food Supplies 0 0 0 0 0 53400 Custodial Supplies 0 0 0 0 0 53500 Med, Dental, & Hosp Supply 0 0 0 0 0 53600 Office Supplies and Materials 18,078 16,477 32,300 18,000 -14,300 53700 Clothing Allowance 1,750 1,750 1,750 1,750 0 53800 Educational Supplies & Mat 0 0 0 0 0 53900 Misc Supplies & Materials 4,965 4,679 5,500 5,500 0 Total Supplies & Materials 26,337 23,806 41,175 26,444 -14,731
Current Chgs & Oblig FY19 Expenditure FY20 Expenditure FY21 Appropriation FY22 Recommended Inc/Dec 21 vs 22
54300 Workers' Comp Medical 0 0 0 0 0 54400 Legal Liabilities 0 0 0 0 0 54500 Aid To Veterans 0 0 0 0 0 54600 Current Charges H&I 0 0 0 0 0 54700 Indemnification 0 0 0 0 0 54800 Reserve Account 0 0 0 0 0 54900 Other Current Charges 29,925 14,089 14,700 27,200 12,500 Total Current Chgs & Oblig 29,925 14,089 14,700 27,200 12,500
Equipment FY19 Expenditure FY20 Expenditure FY21 Appropriation FY22 Recommended Inc/Dec 21 vs 22
55000 Automotive Equipment 0 0 0 0 0 55400 Lease/Purchase 0 0 0 0 0 55600 Office Furniture & Equipment 0 0 0 0 0 55900 Misc Equipment 21,940 0 5,800 5,800 0 Total Equipment 21,940 0 5,800 5,800 0
Other FY19 Expenditure FY20 Expenditure FY21 Appropriation FY22 Recommended Inc/Dec 21 vs 22
56200 Special Appropriation 0 0 0 0 0 57200 Structures & Improvements 0 0 0 0 0 58000 Land & Non-Structure 0 0 0 0 0 Total Other 0 0 0 0 0
Grand Total 6,554,872 6,644,139 7,060,474 7,537,870 477,396

156 OperationsPublic Facilities Department
Department Personnel
Title Union Code Grade Position FY22 Salary Title
Union Code Grade Position FY22 Salary
Adm Asst SU4 15 4.00 276,237 Data Proc Sys Analyst I SE1 07 1.00 66,486 Admin Assistant EXM 05 1.00 75,326 Dirctr CDH NG 1.00 140,385 Admin Asst (Propmgmt) SU4 16 1.00 76,637 Ex Asst EXM 25 1.00 99,079
Admin Officer (PMDConstr&Rpr)
SE1 04 1.00 70,434 Procurement/AP Manager SE1 08 1.00 73,198
Architectural Designer (PCM) SE1 08 1.00 108,468 Program Director EXM 09 1.00 99,390
Asst Dirtr EXM 11 7.00 914,901 Program Assistant(PMDConst&Rp) SE1 04 1.00 75,441
Chief of Staff (Inter Govern) EXM 12 1.00 117,080 Project Manager (PMD) SE1 08 11.00 1,095,561
Clerk of Works II SE1 07 20.00 1,898,589 Project Manager II (PMDConst&Rpr)
SE1 09 8.00 877,371
Contract Manager (PropMngt) SU4 18 1.00 93,199 Sr Adm Analyst SE1 06 1.00 90,319
Contracts Administrator SU4 17 1.00 82,739 Sr Project Manager (PMDConst&Rp)
SE1 10 6.00 756,143
Sr Review Architect (PMDConRp) SE1 10 2.00 234,716
Total 72 7,321,699 Adjustments Differential Payments 0 Other 72,000 Chargebacks 0 Salary Savings -109,794 FY22 Total Request 7,283,905

OperationsPublic Facilities Department 157
Program 1. PFD Capital Construction Kerrie Griffin, Manager, Organization 181100
Program Description The Capital Construction program is responsible for the renovation, repair and new construction of City-owned facilities. The program provides professional planning, design and construction management services for capital funded projects at 370 City facilities.
Operating Budget Actual '19 Actual '20 Approp '21 Budget '22
Personnel Services 6,024,250 6,279,940 6,763,779 7,363,906 Non Personnel 530,622 364,199 296,695 173,964 Total 6,554,872 6,644,139 7,060,474 7,537,870
Performance
Goal: Accelerate front end administration of projects, thereby helping projects stay on schedule
Performance Measures Actual '19 Actual '20 Projected '21 Target '22
Average time for designer selection 5 8 6 5
Goal: Accurately estimate construction costs and yearly escalation
Performance Measures Actual '19 Actual '20 Projected '21 Target '22
% of bids awarded within 15% of estimate 80% 84% 75% 80%
Goal: Keep change order costs under control, keeping projects on budget
Performance Measures Actual '19 Actual '20 Projected '21 Target '22
% of closed-out projects where change orders total less than 10% of the original contract price, including elective change orders
62% 70% 60% 65%

158 OperationsPublic Facilities Department

Civic EngagementCabinet 159
Civic Engagement Civic Engagement Cabinet
Civic Engagement ............................................................... 161
Neighborhood Services ..............................................163
ONS Administration ........................................168
Neighborhood Serv ........................................ 169
Public Service & Community Outreach ...... 170
Boston 311 ........................................................... 171

160 Civic EngagementCabinet

Civic EngagementCabinet 161
Civic Engagement Civic Engagement
Aisha E. Miller, Chief of Civic Engagement
Cabinet Mission The Civic Engagement Cabinet seeks to improve the delivery of City Services as well as create opportunities for all Boston Residents to participate in local government.
Operating Budget
Total Actual '19 Total Actual '20 Total Approp '21 Total Budget '22
Neighborhood Services 3,044,743 3,692,527 4,137,590 3,954,800
Total 3,044,743 3,692,527 4,137,590 3,954,800
External Funds Expenditures
Total Actual '19 Total Actual '20 Total Approp '21 Total Budget '22
Neighborhood Services 9,620 4,335 70,000 30,000
Total 9,620 4,335 70,000 30,000

162 Civic EngagementCabinet

Civic EngagementNeighborhood Services 163
Neighborhood Services Operating Budget Civic Engagement Neighborhood Services Edward McGuire, Director, Appropriation 412000
Department Mission The Mayor's Office of Neighborhood Services (ONS) encourages, facilitates and maximizes citizen input and participation in all aspects of government through service requests, neighborhood meetings, mailings, and emergency responses. Also included in ONS is the Mobile City Hall to Go truck that visits Boston’s neighborhoods offering a select menu of services directly to constituents. The Boston 311 Program provides a wide-ranging information and referral function as well as coordinates emergency response after business hours. The program also responds to citizens’ requests for service through direct interaction with City departments.
Selected Performance Goals Neighborhood Services
Increase public access to city services. Boston 311
Maintain a high level of constituent service.
Operating Budget Program Name Total Actual '19 Total Actual '20 Total Approp '21 Total Budget '22
ONS Administration 473,314 684,969 727,273 838,168
Neighborhood Serv 1,385,637 1,298,843 1,472,061 1,366,871
Public Service & Community Outreach 35,457 77,322 107,077 106,977
Boston 311 1,150,336 1,631,393 1,831,179 1,642,784
Total 3,044,743 3,692,528 4,137,589 3,954,799
External Funds Budget Fund Name Total Actual '19 Total Actual '20 Total Approp '21 Total Budget '22
Love Your Block 9,620 0 0 0
Make Boston Shine Trust 0 4,335 70,000 30,000
Total 9,620 4,335 70,000 30,000
Operating Budget Actual '19 Actual '20 Approp '21 Budget '22
Personnel Services 2,843,284 3,160,023 3,464,835 3,868,239 Non Personnel 201,459 532,505 672,755 86,561 Total 3,044,743 3,692,528 4,137,589 3,954,799

164 Civic EngagementNeighborhood Services
Neighborhood Services Operating Budget
Description of Services The Office of Neighborhood Services invites community involvement in municipal government across the wide spectrum of its programs. Neighborhood Services provides a forum for both groups and individuals to express concerns, request services, and extend opinions, while serving to disseminate information and facilitate delivery of City services. The City Hall to Go truck offers a select menu of city services to all Boston’s neighborhoods. The Boston 311 Program provides a wide-ranging information and referral function as well as coordinates emergency response after business hours. The program also responds to citizens’ requests for service through direct interaction with City departments.
Administration
Notifications of Pending Regulatory Decisions and
Constituent Correspondence
Training, Development and Coordination of Staff
Activities
Personnel and Finance
Coordination of Service Responses to Neighborhood
Requests
Neighborhood Services
Director
Involvement of Civic Groups and Residents, and
Neighborhood Councils, in Neighborhood Development
Coordination of Linguistic Minority Outreach
Coordination of LGBTQ Community Outreach
City Hall to Go
24 Hour Phone Line for Citizen Requests
Monitoring of Department Responses to Service
Requests
Direct Responses to Fire& Other Emergencies
Boston 311
Coordinate with city departments on services provided, adding more
services, and upcoming events and initiatives.
Coordinate with the press office on a communications
plan for neighborhood outreach and promotion.
Assist leaders from other cities in creating similar programs.
Coordinate monthly truck schedule for visits at
neighborhood events in all sections of Boston.
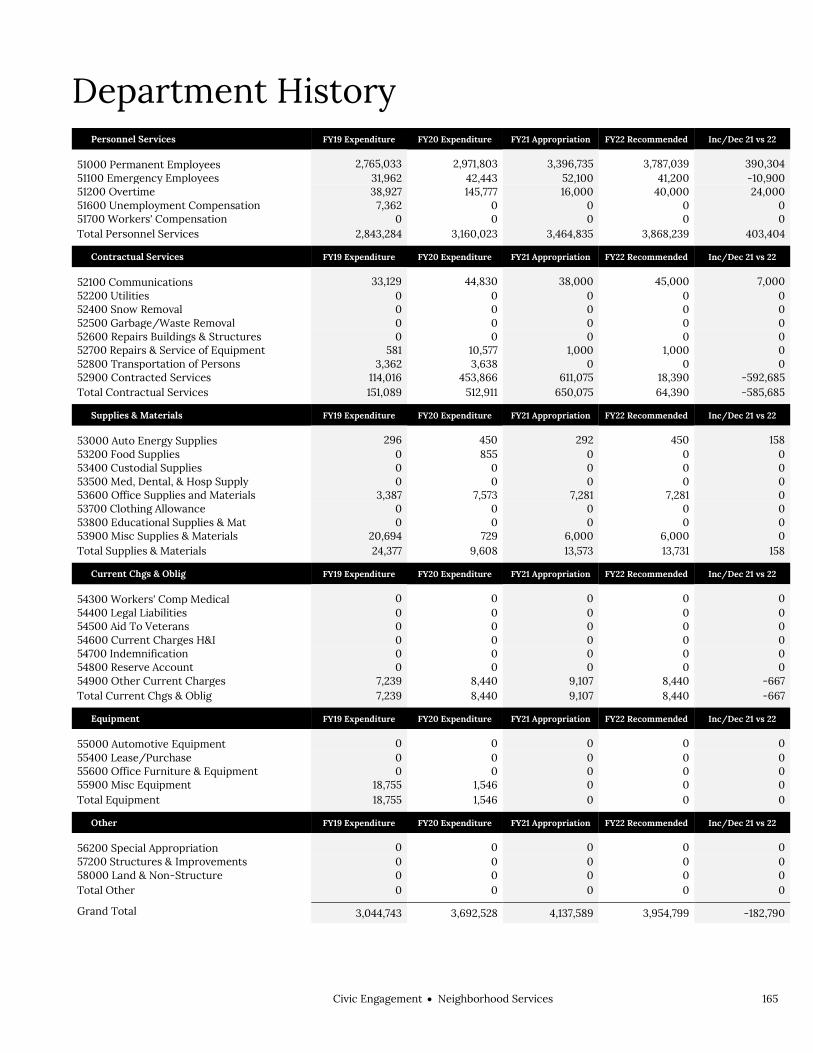
Civic EngagementNeighborhood Services 165
Department History Personnel Services FY19 Expenditure FY20 Expenditure FY21 Appropriation FY22 Recommended Inc/Dec 21 vs 22
51000 Permanent Employees 2,765,033 2,971,803 3,396,735 3,787,039 390,304 51100 Emergency Employees 31,962 42,443 52,100 41,200 -10,900 51200 Overtime 38,927 145,777 16,000 40,000 24,000 51600 Unemployment Compensation 7,362 0 0 0 0 51700 Workers' Compensation 0 0 0 0 0 Total Personnel Services 2,843,284 3,160,023 3,464,835 3,868,239 403,404
Contractual Services FY19 Expenditure FY20 Expenditure FY21 Appropriation FY22 Recommended Inc/Dec 21 vs 22
52100 Communications 33,129 44,830 38,000 45,000 7,000 52200 Utilities 0 0 0 0 0 52400 Snow Removal 0 0 0 0 0 52500 Garbage/Waste Removal 0 0 0 0 0 52600 Repairs Buildings & Structures 0 0 0 0 0 52700 Repairs & Service of Equipment 581 10,577 1,000 1,000 0 52800 Transportation of Persons 3,362 3,638 0 0 0 52900 Contracted Services 114,016 453,866 611,075 18,390 -592,685 Total Contractual Services 151,089 512,911 650,075 64,390 -585,685
Supplies & Materials FY19 Expenditure FY20 Expenditure FY21 Appropriation FY22 Recommended Inc/Dec 21 vs 22
53000 Auto Energy Supplies 296 450 292 450 158 53200 Food Supplies 0 855 0 0 0 53400 Custodial Supplies 0 0 0 0 0 53500 Med, Dental, & Hosp Supply 0 0 0 0 0 53600 Office Supplies and Materials 3,387 7,573 7,281 7,281 0 53700 Clothing Allowance 0 0 0 0 0 53800 Educational Supplies & Mat 0 0 0 0 0 53900 Misc Supplies & Materials 20,694 729 6,000 6,000 0 Total Supplies & Materials 24,377 9,608 13,573 13,731 158
Current Chgs & Oblig FY19 Expenditure FY20 Expenditure FY21 Appropriation FY22 Recommended Inc/Dec 21 vs 22
54300 Workers' Comp Medical 0 0 0 0 0 54400 Legal Liabilities 0 0 0 0 0 54500 Aid To Veterans 0 0 0 0 0 54600 Current Charges H&I 0 0 0 0 0 54700 Indemnification 0 0 0 0 0 54800 Reserve Account 0 0 0 0 0 54900 Other Current Charges 7,239 8,440 9,107 8,440 -667 Total Current Chgs & Oblig 7,239 8,440 9,107 8,440 -667
Equipment FY19 Expenditure FY20 Expenditure FY21 Appropriation FY22 Recommended Inc/Dec 21 vs 22
55000 Automotive Equipment 0 0 0 0 0 55400 Lease/Purchase 0 0 0 0 0 55600 Office Furniture & Equipment 0 0 0 0 0 55900 Misc Equipment 18,755 1,546 0 0 0 Total Equipment 18,755 1,546 0 0 0
Other FY19 Expenditure FY20 Expenditure FY21 Appropriation FY22 Recommended Inc/Dec 21 vs 22
56200 Special Appropriation 0 0 0 0 0 57200 Structures & Improvements 0 0 0 0 0 58000 Land & Non-Structure 0 0 0 0 0 Total Other 0 0 0 0 0
Grand Total 3,044,743 3,692,528 4,137,589 3,954,799 -182,790

166 Civic EngagementNeighborhood Services
Department Personnel
Title Union Code Grade Position FY22 Salary Title
Union Code Grade Position FY22 Salary
Admin Asst MYG 16 1.00 49,010 Spec Asst MYN NG 1.00 126,045 Asst Director MYO 13 1.00 104,599 Special Asst II MYO 11 1.00 96,537 Chief of Civic Engagement CDH NG 1.00 150,412 St Asst I MYO 04 2.00 92,013 Coordinator (NSD) MYO 07 19.00 1,198,588 Staff Aide MYN NG 3.00 114,387 Dep Director MYO 14 1.00 100,135 Staff Assist I MYO 04 18.00 880,740 Director of Policy MYO 12 1.00 109,176 Staff Assistant MYO 04 4.00 198,324 Exec Dir CDH NG 1.00 113,310 Staff Assistant I MYO 05 1.00 53,386 Executive_Asst MYO 08 1.00 84,970 Staff Assistant II MYO 06 2.00 133,104
Staff Asst IV MYO 09 2.00 182,751
Total 60 3,787,488 Adjustments Differential Payments 0 Other 283,800 Chargebacks -180,805 Salary Savings -103,444 FY22 Total Request 3,787,039

Civic EngagementNeighborhood Services 167
External Funds History Personnel Services FY19 Expenditure FY20 Expenditure FY21 Appropriation FY22 Recommended Inc/Dec 21 vs 22
51000 Permanent Employees 0 0 0 0 0 51100 Emergency Employees 0 0 0 0 0 51200 Overtime 0 0 0 0 0 51300 Part Time Employees 0 0 0 0 0 51400 Health Insurance 0 0 0 0 0 51500 Pension & Annuity 0 0 0 0 0 51600 Unemployment Compensation 0 0 0 0 0 51700 Workers' Compensation 0 0 0 0 0 51800 Indirect Costs 0 0 0 0 0 51900 Medicare 0 0 0 0 0 Total Personnel Services 0 0 0 0 0
Contractual Services FY19 Expenditure FY20 Expenditure FY21 Appropriation FY22 Recommended Inc/Dec 21 vs 22
52100 Communications 0 0 0 0 0 52200 Utilities 0 0 0 0 0 52400 Snow Removal 0 0 0 0 0 52500 Garbage/Waste Removal 0 0 0 0 0 52600 Repairs Buildings & Structures 0 0 0 0 0 52700 Repairs & Service of Equipment 0 0 0 0 0 52800 Transportation of Persons 0 0 0 0 0 52900 Contracted Services 6,775 4,335 70,000 30,000 -40,000 Total Contractual Services 6,775 4,335 70,000 30,000 -40,000
Supplies & Materials FY19 Expenditure FY20 Expenditure FY21 Appropriation FY22 Recommended Inc/Dec 21 vs 22
53000 Auto Energy Supplies 0 0 0 0 0 53200 Food Supplies 1,219 0 0 0 0 53400 Custodial Supplies 0 0 0 0 0 53500 Med, Dental, & Hosp Supply 0 0 0 0 0 53600 Office Supplies and Materials 0 0 0 0 0 53700 Clothing Allowance 0 0 0 0 0 53800 Educational Supplies & Mat 0 0 0 0 0 53900 Misc Supplies & Materials 1,626 0 0 0 0 Total Supplies & Materials 2,845 0 0 0 0
Current Chgs & Oblig FY19 Expenditure FY20 Expenditure FY21 Appropriation FY22 Recommended Inc/Dec 21 vs 22
54300 Workers' Comp Medical 0 0 0 0 0 54400 Legal Liabilities 0 0 0 0 0 54600 Current Charges H&I 0 0 0 0 0 54700 Indemnification 0 0 0 0 0 54800 Reserve Account 0 0 0 0 0 54900 Other Current Charges 0 0 0 0 0 Total Current Chgs & Oblig 0 0 0 0 0
Equipment FY19 Expenditure FY20 Expenditure FY21 Appropriation FY22 Recommended Inc/Dec 21 vs 22
55000 Automotive Equipment 0 0 0 0 0 55400 Lease/Purchase 0 0 0 0 0 55600 Office Furniture & Equipment 0 0 0 0 0 55900 Misc Equipment 0 0 0 0 0 Total Equipment 0 0 0 0 0
Other FY19 Expenditure FY20 Expenditure FY21 Appropriation FY22 Recommended Inc/Dec 21 vs 22
56200 Special Appropriation 0 0 0 0 0 57200 Structures & Improvements 0 0 0 0 0 58000 Land & Non-Structure 0 0 0 0 0 Total Other 0 0 0 0 0
Grand Total 9,620 4,335 70,000 30,000 -40,000

168 Civic EngagementNeighborhood Services
Program 1. Administration Edward McGuire, Manager, Organization 412100
Program Description The Administration Program notifies local groups, community leaders, media and elected officials of pending regulatory decisions, available City services, programs and meetings on a timely basis. Program staff also facilitate the training, development and coordination of departmental activities.
Operating Budget Actual '19 Actual '20 Approp '21 Budget '22
Personnel Services 412,124 516,408 665,543 777,674 Non Personnel 61,190 168,561 61,730 60,495 Total 473,314 684,969 727,273 838,168

Civic EngagementNeighborhood Services 169
Program 2. Neighborhood Services Edward McGuire, Manager, Organization 412200
Program Description The Neighborhood Services Program improves interdepartmental coordination of the delivery of basic City services and promotes the involvement of neighborhood residents and civic groups in neighborhood events, activities and neighborhood development including the permitting and licensing processes. Program staff coordinates and attends neighborhood meetings, facilitates the delivery of basic services, and represents the neighborhood related to development issues and testifying at zoning and licensing hearings.
Operating Budget Actual '19 Actual '20 Approp '21 Budget '22
Personnel Services 1,336,980 1,296,455 1,463,411 1,352,871 Non Personnel 48,657 2,389 8,650 14,000 Total 1,385,637 1,298,843 1,472,061 1,366,871
Performance
Goal: Increase public access to city services
Performance Measures Actual '19 Actual '20 Projected '21 Target '22
% Increase in ENS newsletter subscribers 6% 9% 10% 10%
New ENS Newsletter Subscribers 1,425 2,000 2,200 2,200
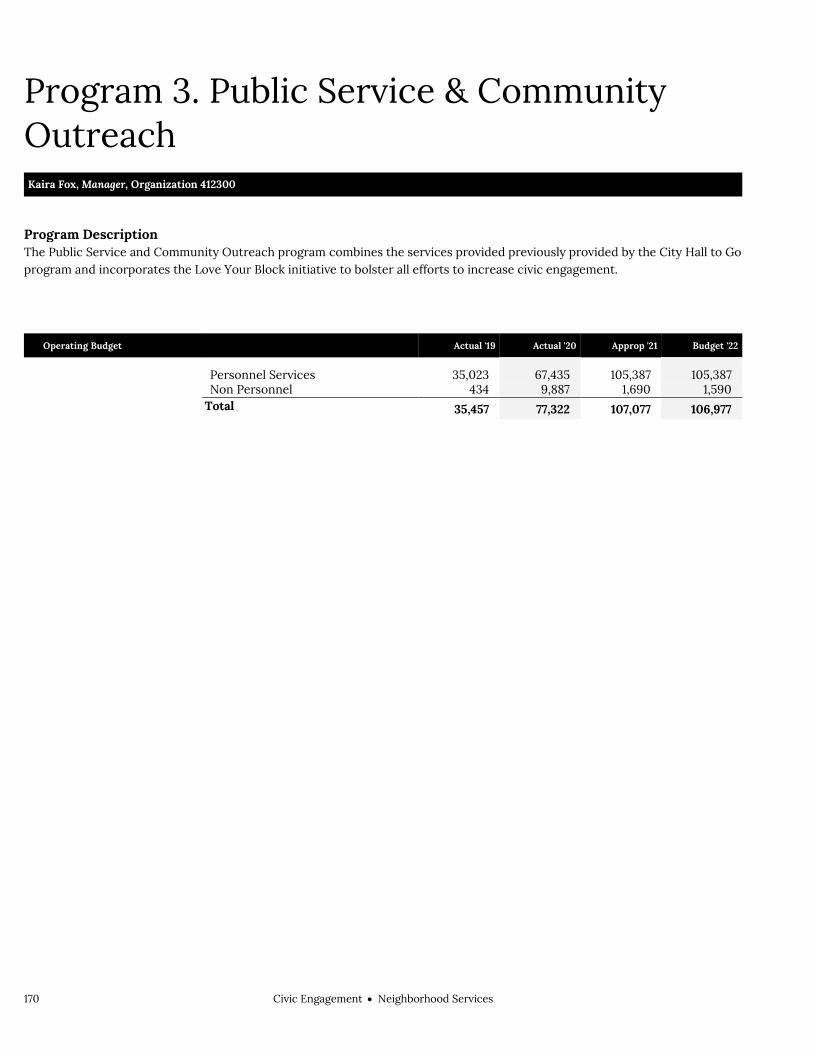
170 Civic EngagementNeighborhood Services
Program 3. Public Service & Community Outreach Kaira Fox, Manager, Organization 412300
Program Description The Public Service and Community Outreach program combines the services provided previously provided by the City Hall to Go program and incorporates the Love Your Block initiative to bolster all efforts to increase civic engagement.
Operating Budget Actual '19 Actual '20 Approp '21 Budget '22
Personnel Services 35,023 67,435 105,387 105,387 Non Personnel 434 9,887 1,690 1,590 Total 35,457 77,322 107,077 106,977

Civic EngagementNeighborhood Services 171
Program 4. Boston 311 Rocco Corigliano, Manager, Organization 412400
Program Description The Boston311 Program provides a wide-ranging information and referral function as well as coordinates emergency response after business hours. The program also responds to citizens’ requests for service through direct interaction with City departments.
Operating Budget Actual '19 Actual '20 Approp '21 Budget '22
Personnel Services 1,059,157 1,279,725 1,230,494 1,632,308 Non Personnel 91,178 351,668 600,685 10,476 Total 1,150,336 1,631,393 1,831,179 1,642,784
Performance
Goal: Maintain a high level of constituent service
Performance Measures Actual '19 Actual '20 Projected '21 Target '22
% of calls answered within 30 seconds 95.5% 86% 85% 85%
Average call handle time (minutes) 1.9 1.59 2 2

172 Civic EngagementNeighborhood Services
External Funds Projects Love Your Block/Boston Shines
Project Mission Love Your Block originated in 2015 as a mini-grant program for neighborhood beautification projects. It was originally funded with $30,000 from Cities of Service, to be used over 3 years ending in 2018. In 2018, Love Your Block was combined with Boston Shines, a spring clean-up initiative funded by external donations. Starting in 2019, Love Your Block is funded with external donations to the Make Boston Shine Trust.

Arts & CultureCabinet 173
Arts & Culture Arts & Culture Cabinet
Arts & Culture ...................................................................... 175
Office of Arts & Culture .............................................. 177
Arts & Culture ................................................... 183
Library Department .................................................... 191
Library Administration ...................................198
Community Library Services ........................ 199
Research Services .......................................... 200

174 Arts & CultureCabinet

Arts & CultureCabinet 175
Arts & Culture Arts & Culture
Kara Elliott-Ortega, Chief of Arts and Culture
Cabinet Mission The mission of the Arts & Culture Cabinet is to foster the growth and well-being of the cultural community and promote participation in the arts. Recognizing the importance of creativity across all policy areas, the cabinet seeks to promote access to arts and culture to all the City’s residents, and to make Boston a municipal arts leader. The Cabinet includes the Boston Public Library as a city department, and provides oversight and support of the Library’s vision and operation.
Operating Budget
Total Actual '19 Total Actual '20 Total Approp '21 Total Budget '22
Office of Arts & Culture 1,307,974 2,049,325 2,238,752 3,629,075
Library Department 38,663,860 39,119,631 41,386,507 42,176,857
Total 39,971,834 41,168,956 43,625,259 45,805,932
Capital Budget Expenditures Actual '19 Actual '20 Estimated '21 Projected '22
Library Department 9,978,882 19,074,299 29,045,000 20,977,918 Office of Arts & Culture 60,000 287,500 530,000 920,100
Total 10,038,882 19,361,799 29,575,000 21,898,018
External Funds Expenditures
Total Actual '19 Total Actual '20 Total Approp '21 Total Budget '22
Library Department 9,974,903 10,341,952 9,847,532 9,457,743 Office of Arts & Culture 1,078,722 686,050 937,758 534,795
Total 11,053,624 11,028,002 10,785,290 9,992,538


Arts & CultureOffice of Arts & Culture 177
Office of Arts & Culture Operating Budget Arts & Culture Office of Arts & Culture Kara Elliott-Ortega, Director, Appropriation 414000
Department Mission The mission of the Office of Arts & Culture is to foster the growth of the cultural community and promote participation in the arts.
Selected Performance Goals Arts & Culture
Equitable resources and access for all. Integrate arts and culture into all aspects of civic life. Keep artists in Boston.
Operating Budget Program Name Total Actual '19 Total Actual '20 Total Approp '21 Total Budget '22
Arts & Culture 1,307,974 2,049,325 2,238,752 3,629,075
Total 1,307,974 2,049,325 2,238,752 3,629,075
External Funds Budget Fund Name Total Actual '19 Total Actual '20 Total Approp '21 Total Budget '22
Adopt-A-Statue 0 0 10,000 30,895
Americans For The Arts 0 0 7,000 0
Artist Resource Desk 81,212 153 0 0
ArtLab 0 0 0 30,000
Boston Artists in Residence Program 126,724 33,855 75,206 0
Boston Cultural Council 286,361 228,469 236,400 245,900
Boston Marathon Memorial 30,881 68,869 0 0
Communications Staff Grant 75,899 153 0 0
Creative Placemaking Study 0 0 50,000 0
Emerging Artists Program 5,324 5,000 0 0
Grants to Individual Artists 242,567 120,494 0 50,000
National Arts Program 1,000 989 0 0
National Endowment for the Arts 100,000 0 0 0
NEA Artworks 0 0 20,000 0
NEA CARES Act 0 0 250,000 0
Public Art Fund 55,652 142,329 150,000 120,000
Quest Eternal Sculpture 0 0 3,000 3,000
Strand Theatre 66,004 73,988 80,000 30,000
Surdna Foundation 7,098 11,750 31,152 0
Total 1,078,722 686,049 937,758 534,795
Operating Budget Actual '19 Actual '20 Approp '21 Budget '22
Personnel Services 782,758 1,102,255 1,161,637 1,369,492 Non Personnel 525,216 947,070 1,077,115 2,259,583 Total 1,307,974 2,049,325 2,238,752 3,629,075

178 Arts & CultureOffice of Arts & Culture
Office of Arts & Culture Operating Budget
Authorizing Statutes Enabling Legislation, CBC Ord. §§ 15-3.1-
15-3.2. Boston Arts Lottery Council, CBC Ord.
§§ 5-9.1-5-9.10. Art Commission Enabling Legislation,
1890 Mass. Acts ch. 122, §§ 1-4. Establishing Arts & Humanities Division,
CBC Ord. §§ 15-9.1-15-9.5.
Description of Services The Office of Arts and Culture enhances the quality of life, the economy, and the design of the city through the arts. The role of the arts in all aspects of life in Boston is reinforced via equitable access to arts and culture in every community, its public institutions, and public places. Key areas of work include support to the cultural sector through grants and programs such as the Artist Resource Desk, Open Studios, and the Poet Laureate; as well as the production and permitting of art in public places via exhibitions, temporary installations, the stewardship of the City’s collection of permanent sculpture, memorials and monuments, and the management of the Strand Theatre. The mission is articulated in a cultural plan for Boston and is carried out via the implementation of this plan which will foster further investment in the arts community, deepen intergovernmental collaborations, and address cultural facility development and
Office of Arts & Culture
Arts in Public Places
Art on Public Property
Support to Arts Community
Programs
Grant Making
Cultural Planning
Cultural Districts
Inter-Departmental Collaborations
Cultural Facilities
Boston Art Commission
Boston Cultural Council
Exhibitions

Arts & CultureOffice of Arts & Culture 179
the support of cultural districts.

180 Arts & CultureOffice of Arts & Culture
Department History Personnel Services FY19 Expenditure FY20 Expenditure FY21 Appropriation FY22 Recommended Inc/Dec 21 vs 22
51000 Permanent Employees 782,758 1,102,255 1,161,637 1,369,492 207,855 51100 Emergency Employees 0 0 0 0 0 51200 Overtime 0 0 0 0 0 51600 Unemployment Compensation 0 0 0 0 0 51700 Workers' Compensation 0 0 0 0 0 Total Personnel Services 782,758 1,102,255 1,161,637 1,369,492 207,855
Contractual Services FY19 Expenditure FY20 Expenditure FY21 Appropriation FY22 Recommended Inc/Dec 21 vs 22
52100 Communications 1,108 2,000 2,000 2,472 472 52200 Utilities 172,763 152,644 241,650 189,960 -51,690 52400 Snow Removal 0 0 0 0 0 52500 Garbage/Waste Removal 0 0 0 0 0 52600 Repairs Buildings & Structures 0 0 0 0 0 52700 Repairs & Service of Equipment 0 0 0 0 0 52800 Transportation of Persons 9,000 876 0 0 0 52900 Contracted Services 312,804 765,042 780,855 2,017,000 1,236,145 Total Contractual Services 495,675 920,562 1,024,505 2,209,432 1,184,927
Supplies & Materials FY19 Expenditure FY20 Expenditure FY21 Appropriation FY22 Recommended Inc/Dec 21 vs 22
53000 Auto Energy Supplies 0 0 0 0 0 53200 Food Supplies 3,751 4,690 0 0 0 53400 Custodial Supplies 0 0 0 0 0 53500 Med, Dental, & Hosp Supply 0 0 0 0 0 53600 Office Supplies and Materials 5,170 2,645 5,320 4,000 -1,320 53700 Clothing Allowance 0 0 0 0 0 53800 Educational Supplies & Mat 0 0 0 0 0 53900 Misc Supplies & Materials 4,339 18 5,088 1,000 -4,088 Total Supplies & Materials 13,260 7,353 10,408 5,000 -5,408
Current Chgs & Oblig FY19 Expenditure FY20 Expenditure FY21 Appropriation FY22 Recommended Inc/Dec 21 vs 22
54300 Workers' Comp Medical 0 0 0 0 0 54400 Legal Liabilities 0 0 0 0 0 54500 Aid To Veterans 0 0 0 0 0 54600 Current Charges H&I 0 0 0 0 0 54700 Indemnification 0 0 0 0 0 54800 Reserve Account 0 0 0 0 0 54900 Other Current Charges 13,910 10,201 42,202 45,151 2,949 Total Current Chgs & Oblig 13,910 10,201 42,202 45,151 2,949
Equipment FY19 Expenditure FY20 Expenditure FY21 Appropriation FY22 Recommended Inc/Dec 21 vs 22
55000 Automotive Equipment 0 0 0 0 0 55400 Lease/Purchase 0 0 0 0 0 55600 Office Furniture & Equipment 0 4,392 0 0 0 55900 Misc Equipment 2,371 4,562 0 0 0 Total Equipment 2,371 8,954 0 0 0
Other FY19 Expenditure FY20 Expenditure FY21 Appropriation FY22 Recommended Inc/Dec 21 vs 22
56200 Special Appropriation 0 0 0 0 0 57200 Structures & Improvements 0 0 0 0 0 58000 Land & Non-Structure 0 0 0 0 0 Total Other 0 0 0 0 0
Grand Total 1,307,974 2,049,325 2,238,752 3,629,075 1,390,323
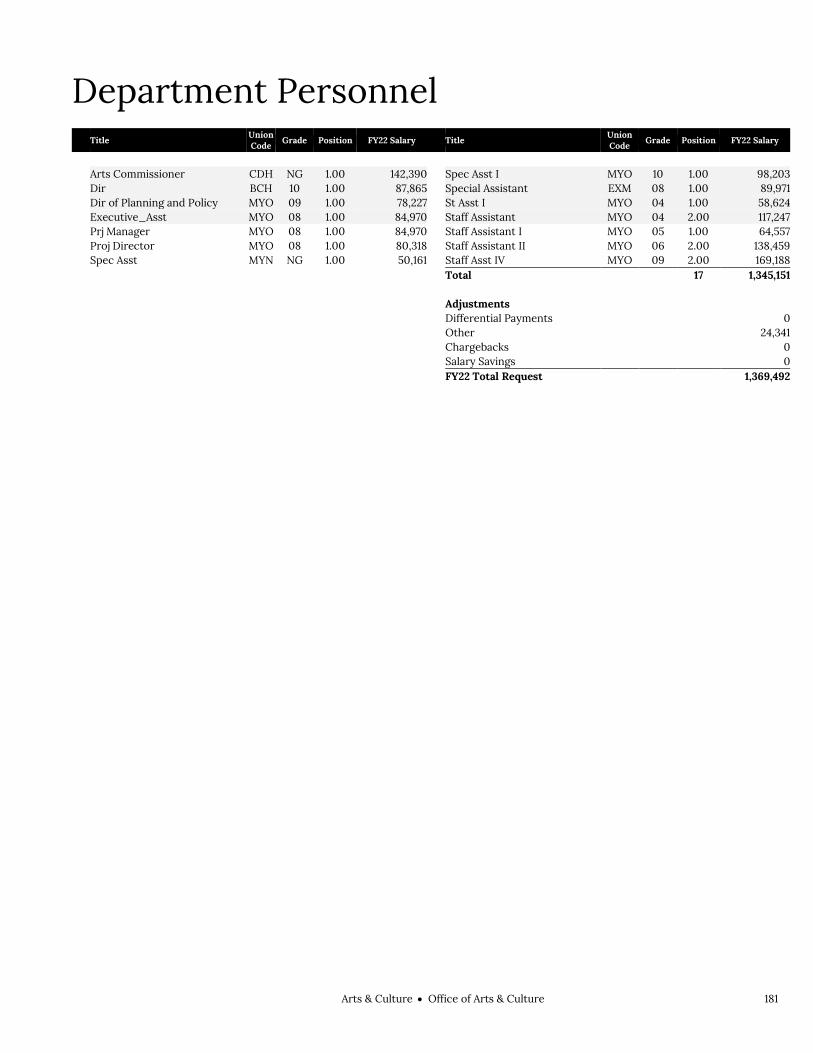
Arts & CultureOffice of Arts & Culture 181
Department Personnel
Title Union Code Grade Position FY22 Salary Title
Union Code Grade Position FY22 Salary
Arts Commissioner CDH NG 1.00 142,390 Spec Asst I MYO 10 1.00 98,203 Dir BCH 10 1.00 87,865 Special Assistant EXM 08 1.00 89,971 Dir of Planning and Policy MYO 09 1.00 78,227 St Asst I MYO 04 1.00 58,624 Executive_Asst MYO 08 1.00 84,970 Staff Assistant MYO 04 2.00 117,247 Prj Manager MYO 08 1.00 84,970 Staff Assistant I MYO 05 1.00 64,557 Proj Director MYO 08 1.00 80,318 Staff Assistant II MYO 06 2.00 138,459 Spec Asst MYN NG 1.00 50,161 Staff Asst IV MYO 09 2.00 169,188 Total 17 1,345,151 Adjustments Differential Payments 0 Other 24,341 Chargebacks 0 Salary Savings 0 FY22 Total Request 1,369,492

182 Arts & CultureOffice of Arts & Culture
External Funds History Personnel Services FY19 Expenditure FY20 Expenditure FY21 Appropriation FY22 Recommended Inc/Dec 21 vs 22
51000 Permanent Employees 136,663 23,626 75,206 0 -75,206 51100 Emergency Employees 0 0 0 0 0 51200 Overtime 0 0 0 0 0 51300 Part Time Employees 0 0 0 0 0 51400 Health Insurance 6,802 3,442 0 0 0 51500 Pension & Annuity 11,915 2,296 0 0 0 51600 Unemployment Compensation 0 0 0 0 0 51700 Workers' Compensation 0 0 0 0 0 51800 Indirect Costs 0 0 0 0 0 51900 Medicare 2,068 297 0 0 0 Total Personnel Services 157,448 29,661 75,206 0 -75,206
Contractual Services FY19 Expenditure FY20 Expenditure FY21 Appropriation FY22 Recommended Inc/Dec 21 vs 22
52100 Communications 0 0 0 0 0 52200 Utilities 0 0 0 0 0 52400 Snow Removal 851 0 0 0 0 52500 Garbage/Waste Removal 0 0 0 0 0 52600 Repairs Buildings & Structures 5,665 7,685 0 2,000 2,000 52700 Repairs & Service of Equipment 0 0 0 0 0 52800 Transportation of Persons 5,098 2,448 0 0 0 52900 Contracted Services 904,692 627,961 862,552 526,055 -336,497 Total Contractual Services 916,306 638,094 862,552 528,055 -334,497
Supplies & Materials FY19 Expenditure FY20 Expenditure FY21 Appropriation FY22 Recommended Inc/Dec 21 vs 22
53000 Auto Energy Supplies 0 0 0 0 0 53200 Food Supplies 2,530 2,515 0 0 0 53400 Custodial Supplies 0 0 0 0 0 53500 Med, Dental, & Hosp Supply 0 0 0 0 0 53600 Office Supplies and Materials 0 831 0 0 0 53700 Clothing Allowance 0 0 0 0 0 53800 Educational Supplies & Mat 0 0 0 0 0 53900 Misc Supplies & Materials 1,093 4,006 0 1,500 1,500 Total Supplies & Materials 3,623 7,352 0 1,500 1,500
Current Chgs & Oblig FY19 Expenditure FY20 Expenditure FY21 Appropriation FY22 Recommended Inc/Dec 21 vs 22
54300 Workers' Comp Medical 0 0 0 0 0 54400 Legal Liabilities 0 0 0 0 0 54600 Current Charges H&I 0 0 0 0 0 54700 Indemnification 0 0 0 0 0 54800 Reserve Account 0 0 0 0 0 54900 Other Current Charges 0 464 0 240 240 Total Current Chgs & Oblig 0 464 0 240 240
Equipment FY19 Expenditure FY20 Expenditure FY21 Appropriation FY22 Recommended Inc/Dec 21 vs 22
55000 Automotive Equipment 0 0 0 0 0 55400 Lease/Purchase 0 0 0 0 0 55600 Office Furniture & Equipment 0 1,948 0 0 0 55900 Misc Equipment 1,345 8,530 0 5,000 5,000 Total Equipment 1,345 10,478 0 5,000 5,000
Other FY19 Expenditure FY20 Expenditure FY21 Appropriation FY22 Recommended Inc/Dec 21 vs 22
56200 Special Appropriation 0 0 0 0 0 57200 Structures & Improvements 0 0 0 0 0 58000 Land & Non-Structure 0 0 0 0 0 Total Other 0 0 0 0 0
Grand Total 1,078,722 686,049 937,758 534,795 -402,963

Arts & CultureOffice of Arts & Culture 183
Program 1. Arts & Culture Kara Elliott-Ortega, Manager, Organization 414100
Program Description The Arts & Culture program oversees the City’s efforts to support artists, the arts and outreach to new audiences in Boston and beyond.
Operating Budget Actual '19 Actual '20 Approp '21 Budget '22
Personnel Services 782,758 1,102,255 1,161,637 1,369,492 Non Personnel 525,216 947,070 1,077,115 2,259,583 Total 1,307,974 2,049,325 2,238,752 3,629,075
Performance
Goal: Equitable resources and access for all
Performance Measures Actual '19 Actual '20 Projected '21 Target '22
% of first time Boston Cultural Council organizational grant awardees
29% 39% 20% 20%
% of zip codes receiving organizational grant funding 92% 57% 50% 50%
% of zip codes with approved public art applications 26% 41% 10% 20%
Goal: Integrate arts and culture into all aspects of civic life
Performance Measures Actual '19 Actual '20 Projected '21 Target '22
Number of Percent for Art Projects contracted per fiscal year 2 3 10 15
Goal: Keep artists in Boston
Performance Measures Actual '19 Actual '20 Projected '21 Target '22
Number of artists receiving Boston Artist Certification 214 234 220 220
Number of Artists supported by the Artist Resource Manager 1,200 1,557 1,500 1,500
Number of artists who have applied for an opportunity through MOAC 1,431 2,551 2,000 2,000

184 Arts & CultureOffice of Arts & Culture
External Funds Projects Adopt-a-Statue
Project Mission The Adopt-a-Statue grant funds the care and maintenance of the Samuel Adams and Edgar Allen Poe statues and the Hungarian Revolution and Angell memorials. The award is funded by the Boston Foundation, to be expended through FY26.
Americans for the Arts
Project Mission The Americans for the Arts grant funds a study of the economic impact of arts and cultural institutions in Boston. The award is funded by the Barr Foundation and will be expended by FY23.
Artist Resource Desk
Project Mission The Artist Resource Desk supports artists through the process of permitting, zoning, and other regulatory requirements for arts and culture uses. The award was funded as part of a public benefit obligation of the Russia Wharf Redevelopment Project. As of FY20, the Artist Resource Desk is now funded on the operating budget.
ArtLab
Project Mission The ArtLab grant funds Allston-Brighton artists and projects through the Opportunity Fund, a program that supports professional development for Boston-based artists, events and festivals in the City, and cultural field trips organized by public schools. The award is funded by Harvard University as part of a public benefit obligation of the ArtLab Project, to be expended over five years through FY23.
Boston Artists in Residence
Project Mission The Boston Artists in Residence program seeks to integrate artists into City departments and agencies. The award was funded as part of a public benefit obligation of the Russia Wharf Redevelopment Project. As of FY20, the Artists in Residence program is now funded on the operating budget.
Boston Cultural Council
Project Mission The Boston Cultural Council allocates funds from the Massachusetts Cultural Council annually to Boston to be re-granted to non-profit arts organizations in the City.
Boston Marathon Memorial
Project Mission The Boston Marathon Memorial grant supported the planning of a memorial in Copley Square that speaks to the resilience of Boston, honors survivors and victims of domestic terrorism and violence, and celebrates Boston's peacekeepers and healers. This one-time grant was awarded by the Copley Square Charitable Trust.
Communications Staff Grant
Project Mission Funded by the Boston Foundation through FY19, full-time, in-house communications staff enhances the
Arts & CultureOffice of Arts & Culture 185
Mayor's Office of Arts and Culture capacity to reach every community and all of Boston's artists. As of FY20, communications staff is now funded on the operating budget.
Creative Placemaking Study
Project Mission The Creative Placemaking Study will explore public art and creative interventions in the public realm to build a sense of community and connection in the Allston/Brighton neighborhood. The award is funded by the Harvard-Allston Public Realm Flexible Fund and will be expended by FY22.
Emerging Artists Program
Project Mission Supported by the Boston Foundation, the Fay Chandler Emerging Artist was a five-year grant ending in FY20 that awarded three local artists who produce fresh, original, and contemporary work.
Grants to Individual Artists
Project Mission The Grants to Individual Artists programs give support to artists for activities that enable them to share their work, teach others, and continue their professional development. Funding is used for materials, stipends for teaching artists, or anything that helps an artist develop their artistic practice. The award is funded as part of a public benefit obligation of the Russia Wharf Redevelopment Project and supplements funding on the operating budget for individual artist grants.
National Arts Program
Project Mission Funded by the National Arts Program Foundation, this annual grant supports the City of Boston's National Arts Program Awards, an annual exhibition that invites City employees and immediate family members to display their art in City Hall.
National Endowment for the Arts
Project Mission Awarded through the National Endowment for the Arts’ Our Town program, this year-long grant supported arts programming and cultural district planning in Hyde Square's Latin Quarter Cultural District.
National Endowment for the Arts (NEA) Artworks
Project Mission Awarded through the National Endowment for the Arts, the Project Partnership Grant accomplishes the City of Boston's goal of creating a responsive capacity-building program for community arts events, cultural festivals, and projects. These grants allow the Office of Arts and Culture to provide project support for events and projects that serve Boston's underrepresented artists and communities. This award is to be expended by FY22.
National Endowment for the Arts (NEA) CARES Act
Project Mission This award funded grants for community arts organizations in Boston affected by COVID-19. These funds targeted organizations that are not eligible for most relief grants in Greater Boston, prioritizing those that serve communities of color, people with disabilities, non-English-speaking and immigrant communities, low-income communities, youth, and older adults.
Public Art Revolving Fund
Project Mission

186 Arts & CultureOffice of Arts & Culture
The purpose of this fund is to purchase goods and services to support public art throughout the City of Boston. Funding is received from easements granted by the Public Improvement Commission, per G.L.c44, §53E ½.
Quest Eternal Sculpture
Project Mission Funded by a one- time donation by Boston Properties, this grant supports maintenance of the Quest Eternal sculpture and will be expended by FY25.
Strand Theatre Revolving Fund
Project Mission The purpose of this fund is to pay for expenses related to the operations of the Strand Theatre. Funding is received through receipts from theater rental fees, per G.L.c44, §53E ½.
Surdna Foundation Grants
Project Mission Funds from the Surdna Foundation have provided project support for MOAC’s implementation of Surdna’s refined strategy, Radical Imagination for Racial Justice (RIRJ). In addition, Surdna’s RIRJ Grant supports a three-year collaboration with the Center for Art and Community Partnerships and MassArt to invest in artists, artists collectives, and small arts organizations of color proposing projects to imagine and practice more racially just systems and structures.

Arts & CultureOffice of Arts & Culture 187
Office of Arts & Culture Capital Budget Arts & Culture Office of Arts & Culture
Overview The Mayor’s Office of Arts and Culture is responsible for the integration of arts and culture into all aspects of civic life. Their office enhances the quality of life, the economy, and the design of the City through the arts. The Percent for the Arts project will utilize one percent of the City’s annual capital borrowing, to provide permanent public artwork by collaborating between professional artists and the community.
FY22 Major Initiatives Installation of exterior artwork at the Jamaica Plain Branch Library will be completed. Fabrication of exterior artwork at the Mattapan Branch Library will begin. Leveraging CPA funding, the City will fund public art and a plaza honoring Frederick
Douglass in Douglass Square. Ongoing public art projects at the Roxbury Branch Library, Boston Arts Academy, East
Boston Police Station, Vine Street BCYF, and Dewitt Playground will continue. New public art will be installed in conjunction with the Public Works Department in Hyde
Square. A new round of project locations will be identified.
Capital Budget Expenditures Total Actual '19 Total Actual '20 Estimated '21 Total Projected '22
Total Department 60,000 287,500 530,000 920,100

188 Arts & CultureOffice of Arts & Culture
Office of Arts & Culture Project Profiles BOOK MARK'D
Project Mission Fabricate and install a bronze sculpture of books for the entrance of the Mattapan Branch Library. Managing Department, Office of Arts and Culture Status, New Project Location, Mattapan Operating Impact, No
Authorizations
Source Existing FY22 Future Non Capital
Fund Total City Capital 0 250,000 0 0 250,000 Grants/Other 0 0 0 0 0 Total 0 250,000 0 0 250,000
Expenditures (Actual and Planned)
Source Thru
6/30/20 FY21 FY22 FY23-26 Total City Capital 0 0 50,000 200,000 250,000 Grants/Other 0 0 0 0 0 Total 0 0 50,000 200,000 250,000
EDWARD O. GOURDIN AND AFRICAN AMERICAN VETERANS MEMORIAL Project Mission Complete fabrication and install a bronze memorial portrait of Justice Gourdin and ten bas-relief portraits of
African American veterans of wars from the American Revolution to the Iraq War.
Managing Department, Office of Arts and Culture Status, New Project Location, Roxbury Operating Impact, No
Authorizations
Source Existing FY22 Future Non Capital
Fund Total City Capital 0 150,000 0 0 150,000 Grants/Other 0 0 0 0 0 Total 0 150,000 0 0 150,000
Expenditures (Actual and Planned)
Source Thru
6/30/20 FY21 FY22 FY23-26 Total City Capital 0 0 50,000 100,000 150,000 Grants/Other 0 0 0 0 0 Total 0 0 50,000 100,000 150,000
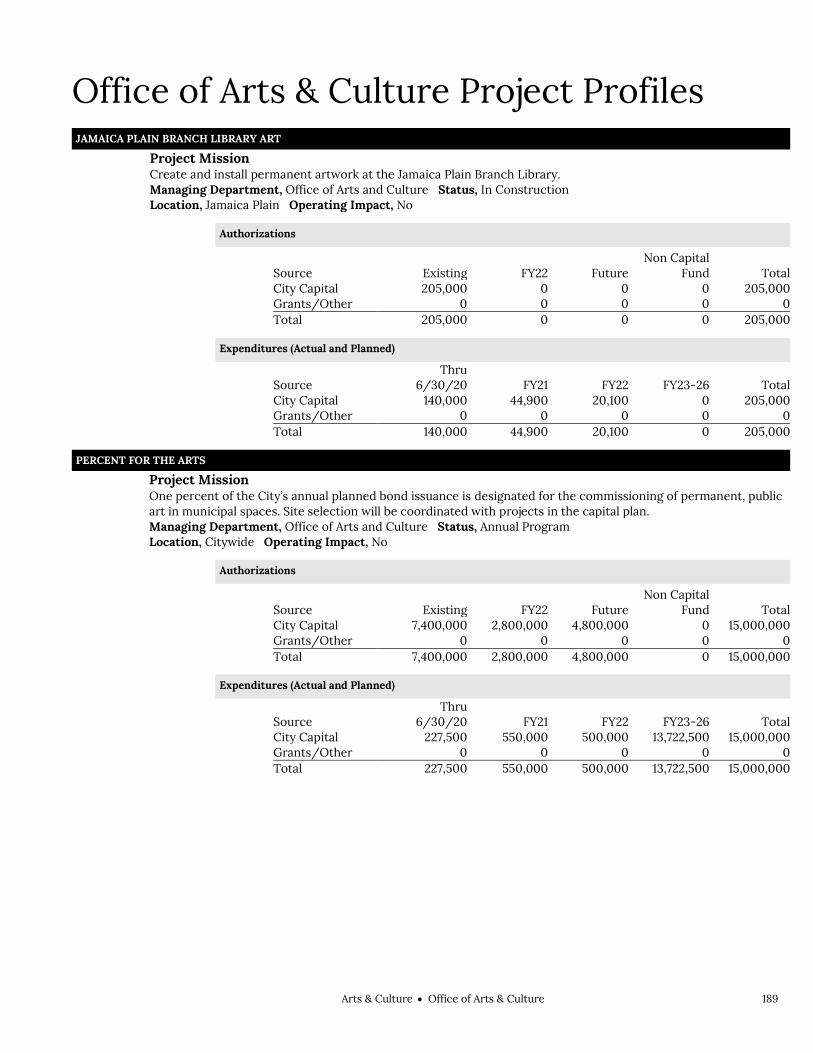
Arts & CultureOffice of Arts & Culture 189
Office of Arts & Culture Project Profiles JAMAICA PLAIN BRANCH LIBRARY ART
Project Mission Create and install permanent artwork at the Jamaica Plain Branch Library. Managing Department, Office of Arts and Culture Status, In Construction Location, Jamaica Plain Operating Impact, No
Authorizations
Source Existing FY22 Future Non Capital
Fund Total City Capital 205,000 0 0 0 205,000 Grants/Other 0 0 0 0 0 Total 205,000 0 0 0 205,000
Expenditures (Actual and Planned)
Source Thru
6/30/20 FY21 FY22 FY23-26 Total City Capital 140,000 44,900 20,100 0 205,000 Grants/Other 0 0 0 0 0 Total 140,000 44,900 20,100 0 205,000
PERCENT FOR THE ARTS Project Mission One percent of the City’s annual planned bond issuance is designated for the commissioning of permanent, public
art in municipal spaces. Site selection will be coordinated with projects in the capital plan.
Managing Department, Office of Arts and Culture Status, Annual Program Location, Citywide Operating Impact, No
Authorizations
Source Existing FY22 Future Non Capital
Fund Total City Capital 7,400,000 2,800,000 4,800,000 0 15,000,000 Grants/Other 0 0 0 0 0 Total 7,400,000 2,800,000 4,800,000 0 15,000,000
Expenditures (Actual and Planned)
Source Thru
6/30/20 FY21 FY22 FY23-26 Total City Capital 227,500 550,000 500,000 13,722,500 15,000,000 Grants/Other 0 0 0 0 0 Total 227,500 550,000 500,000 13,722,500 15,000,000

190 Arts & CultureOffice of Arts & Culture
Office of Arts & Culture Project Profiles STRAND THEATER
Project Mission Study to assess capital needs at the Strand Theater. Managing Department, Public Facilities Department Status, New Project Location, Dorchester Operating Impact, No
Authorizations
Source Existing FY22 Future Non Capital
Fund Total City Capital 0 250,000 0 0 250,000 Grants/Other 0 0 0 0 0 Total 0 250,000 0 0 250,000
Expenditures (Actual and Planned)
Source Thru
6/30/20 FY21 FY22 FY23-26 Total City Capital 0 0 250,000 0 250,000 Grants/Other 0 0 0 0 0 Total 0 0 250,000 0 250,000
THE LEGACY OF FREDERICK DOUGLASS Project Mission Fabricate and install a bronze figure grouping and construct a plaza honoring Frederick Douglass in Douglass
Square.
Managing Department, Office of Arts and Culture Status, New Project Location, Roxbury Operating Impact, No
Authorizations
Source Existing FY22 Future Non Capital
Fund Total City Capital 0 550,000 0 0 550,000 Grants/Other 0 0 0 0 0 Total 0 550,000 0 0 550,000
Expenditures (Actual and Planned)
Source Thru
6/30/20 FY21 FY22 FY23-26 Total City Capital 0 0 50,000 500,000 550,000 Grants/Other 0 0 0 0 0 Total 0 0 50,000 500,000 550,000
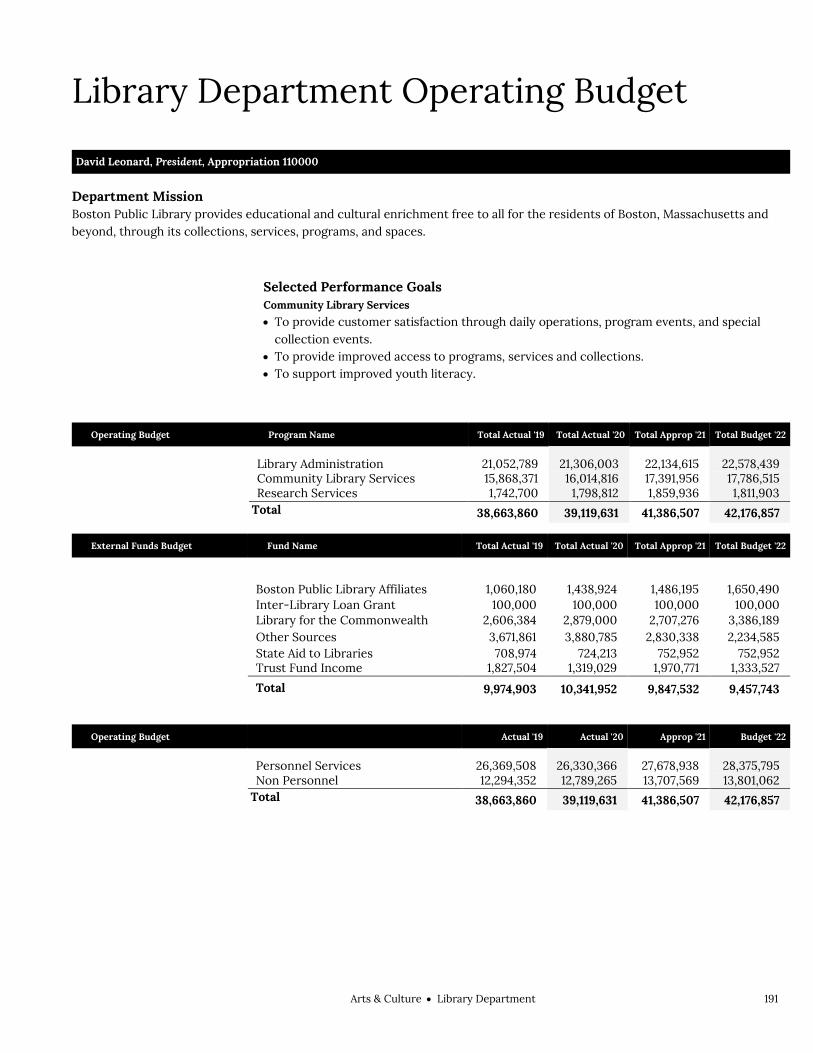
Arts & CultureLibrary Department 191
Library Department Operating Budget Arts & Culture Library Department David Leonard, President, Appropriation 110000
Department Mission Boston Public Library provides educational and cultural enrichment free to all for the residents of Boston, Massachusetts and beyond, through its collections, services, programs, and spaces.
Selected Performance Goals Community Library Services
To provide customer satisfaction through daily operations, program events, and special collection events.
To provide improved access to programs, services and collections. To support improved youth literacy.
Operating Budget Program Name Total Actual '19 Total Actual '20 Total Approp '21 Total Budget '22
Library Administration 21,052,789 21,306,003 22,134,615 22,578,439
Community Library Services 15,868,371 16,014,816 17,391,956 17,786,515
Research Services 1,742,700 1,798,812 1,859,936 1,811,903
Total 38,663,860 39,119,631 41,386,507 42,176,857
External Funds Budget Fund Name Total Actual '19 Total Actual '20 Total Approp '21 Total Budget '22
Boston Public Library Affiliates 1,060,180 1,438,924 1,486,195 1,650,490
Inter-Library Loan Grant 100,000 100,000 100,000 100,000
Library for the Commonwealth 2,606,384 2,879,000 2,707,276 3,386,189
Other Sources 3,671,861 3,880,785 2,830,338 2,234,585
State Aid to Libraries 708,974 724,213 752,952 752,952
Trust Fund Income 1,827,504 1,319,029 1,970,771 1,333,527
Total 9,974,903 10,341,952 9,847,532 9,457,743
Operating Budget Actual '19 Actual '20 Approp '21 Budget '22
Personnel Services 26,369,508 26,330,366 27,678,938 28,375,795 Non Personnel 12,294,352 12,789,265 13,707,569 13,801,062 Total 38,663,860 39,119,631 41,386,507 42,176,857

192 Arts & CultureLibrary Department
Library Department Operating Budget
Authorizing Statutes Power of City to Establish and Maintain
a Library, 1848 Mass. Acts ch. 52, §1. Library Department: Trustees of the
Public Library, Appointment, Compensation, etc., 1878 Mass. Acts ch. 114, §3; 1994 Mass. Acts ch. 157, §3.
Organization of Board; Powers and Duties, 1878 Mass. Acts ch. 114, §4-5.
Librarian and Other Officers, 1878 Mass. Acts ch. 114, §1-2, 6; 1943 Mass. Acts ch. 218; 1953 Mass. Acts ch. 167.
Reports to Mayor and City Council, 1887 Mass. Acts ch. 60.
Incorporation of the Trustees, Duties, 1878 Mass. Acts ch. 114 §1.
Authority of Corporation to Take and Hold Property; Limitation, 1878 Mass. Acts ch. 114 §2.
Description of Services The Boston Public Library system consists of the Central Library at Copley Square, including the Kirstein Business Library, branch libraries located throughout Boston’s neighborhoods and one remote storage facility. Library staff assists users in locating and using resources, and provides public programming, exhibits, and outreach. Internet, wireless, and online technology resources connect people to informational resources aimed at enriching individuals, organizations, and the entire community.
Trustees
Library Services
Central Library Services
Neighborhood Branch Services
Adult Services
Communications Operations
Online & Web Services
Youth Services
Facility & Custodial Services
Collections Finance & Administration
President
Information Technology
Major Projects Office
Reader Services
Special Collections
Technical & Digital Services
Budget & Procurement Department
Accounting Department
Special Events
Human Resources

Arts & CultureLibrary Department 193
Department History Personnel Services FY19 Expenditure FY20 Expenditure FY21 Appropriation FY22 Recommended Inc/Dec 21 vs 22
51000 Permanent Employees 25,549,158 25,736,524 27,254,938 27,980,795 725,857 51100 Emergency Employees 0 0 0 0 0 51200 Overtime 668,148 539,476 325,000 325,000 0 51600 Unemployment Compensation 84,026 0 20,000 20,000 0 51700 Workers' Compensation 68,176 54,366 79,000 50,000 -29,000 Total Personnel Services 26,369,508 26,330,366 27,678,938 28,375,795 696,857
Contractual Services FY19 Expenditure FY20 Expenditure FY21 Appropriation FY22 Recommended Inc/Dec 21 vs 22
52100 Communications 165,871 135,680 99,118 133,556 34,438 52200 Utilities 3,810,386 2,671,521 3,946,488 3,469,119 -477,369 52400 Snow Removal 0 0 0 0 0 52500 Garbage/Waste Removal 0 0 0 0 0 52600 Repairs Buildings & Structures 2,273,731 2,671,244 2,537,150 2,537,150 0 52700 Repairs & Service of Equipment 89,222 37,989 174,100 174,100 0 52800 Transportation of Persons 61,707 59,559 62,000 62,000 0 52900 Contracted Services 1,963,332 2,411,138 2,580,588 3,018,649 438,061 Total Contractual Services 8,364,249 7,987,131 9,399,444 9,394,574 -4,870
Supplies & Materials FY19 Expenditure FY20 Expenditure FY21 Appropriation FY22 Recommended Inc/Dec 21 vs 22
53000 Auto Energy Supplies 0 0 0 0 0 53200 Food Supplies 0 0 0 0 0 53400 Custodial Supplies 909 6,312 7,500 7,500 0 53500 Med, Dental, & Hosp Supply 0 0 0 0 0 53600 Office Supplies and Materials 17,340 14,500 17,340 17,340 0 53700 Clothing Allowance 0 0 0 0 0 53800 Educational Supplies & Mat 0 0 0 0 0 53900 Misc Supplies & Materials 3,300,168 4,038,621 3,300,168 3,300,168 0 Total Supplies & Materials 3,318,417 4,059,433 3,325,008 3,325,008 0
Current Chgs & Oblig FY19 Expenditure FY20 Expenditure FY21 Appropriation FY22 Recommended Inc/Dec 21 vs 22
54300 Workers' Comp Medical 50,295 7,910 10,000 10,000 0 54400 Legal Liabilities 0 0 0 0 0 54500 Aid To Veterans 0 0 0 0 0 54600 Current Charges H&I 0 0 0 0 0 54700 Indemnification 0 0 0 0 0 54800 Reserve Account 0 0 0 0 0 54900 Other Current Charges 262,071 369,043 497,249 601,404 104,155 Total Current Chgs & Oblig 312,366 376,953 507,249 611,404 104,155
Equipment FY19 Expenditure FY20 Expenditure FY21 Appropriation FY22 Recommended Inc/Dec 21 vs 22
55000 Automotive Equipment 0 0 0 0 0 55400 Lease/Purchase 245,743 325,728 405,868 388,076 -17,792 55600 Office Furniture & Equipment 0 0 0 0 0 55900 Misc Equipment 19,578 13,898 35,000 47,000 12,000 Total Equipment 265,321 339,626 440,868 435,076 -5,792
Other FY19 Expenditure FY20 Expenditure FY21 Appropriation FY22 Recommended Inc/Dec 21 vs 22
56200 Special Appropriation 0 0 0 0 0 57200 Structures & Improvements 0 0 0 0 0 58000 Land & Non-Structure 33,999 26,122 35,000 35,000 0 Total Other 33,999 26,122 35,000 35,000 0
Grand Total 38,663,860 39,119,631 41,386,507 42,176,857 790,350
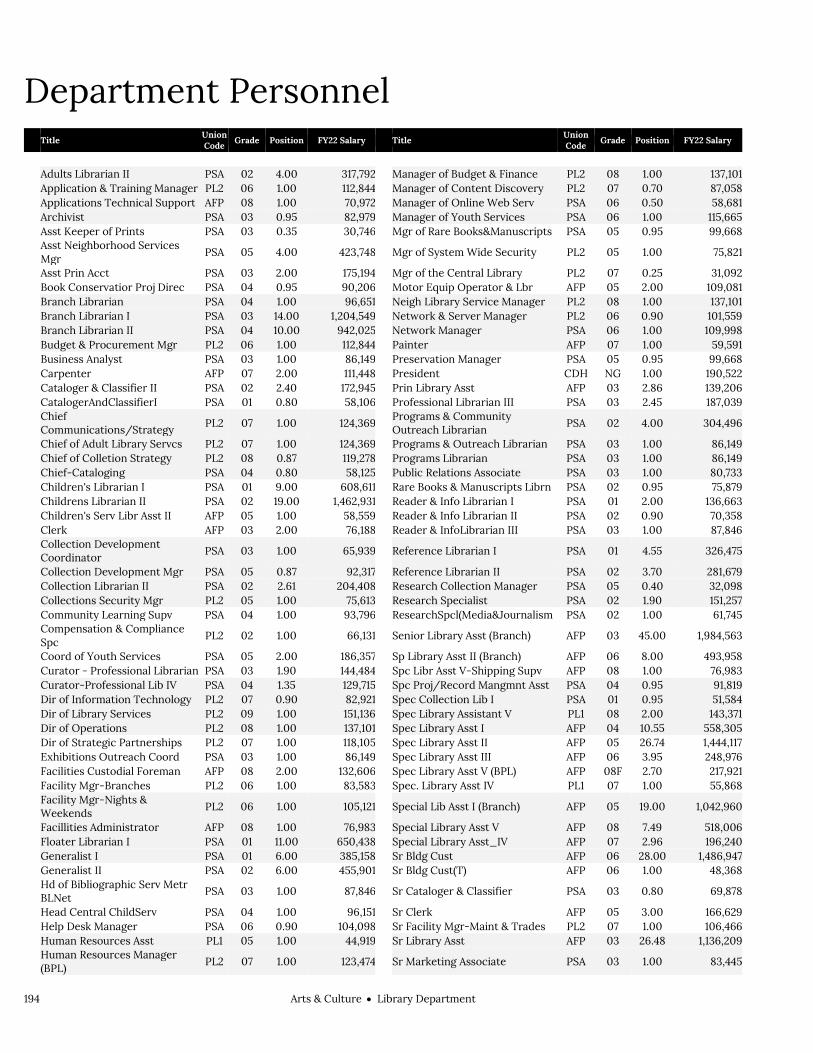
194 Arts & CultureLibrary Department
Department Personnel
Title Union Code Grade Position FY22 Salary Title
Union Code Grade Position FY22 Salary
Adults Librarian II PSA 02 4.00 317,792 Manager of Budget & Finance PL2 08 1.00 137,101 Application & Training Manager PL2 06 1.00 112,844 Manager of Content Discovery PL2 07 0.70 87,058 Applications Technical Support AFP 08 1.00 70,972 Manager of Online Web Serv PSA 06 0.50 58,681 Archivist PSA 03 0.95 82,979 Manager of Youth Services PSA 06 1.00 115,665 Asst Keeper of Prints PSA 03 0.35 30,746 Mgr of Rare Books&Manuscripts PSA 05 0.95 99,668
Asst Neighborhood Services Mgr
PSA 05 4.00 423,748 Mgr of System Wide Security PL2 05 1.00 75,821
Asst Prin Acct PSA 03 2.00 175,194 Mgr of the Central Library PL2 07 0.25 31,092 Book Conservatior Proj Direc PSA 04 0.95 90,206 Motor Equip Operator & Lbr AFP 05 2.00 109,081 Branch Librarian PSA 04 1.00 96,651 Neigh Library Service Manager PL2 08 1.00 137,101 Branch Librarian I PSA 03 14.00 1,204,549 Network & Server Manager PL2 06 0.90 101,559 Branch Librarian II PSA 04 10.00 942,025 Network Manager PSA 06 1.00 109,998 Budget & Procurement Mgr PL2 06 1.00 112,844 Painter AFP 07 1.00 59,591 Business Analyst PSA 03 1.00 86,149 Preservation Manager PSA 05 0.95 99,668 Carpenter AFP 07 2.00 111,448 President CDH NG 1.00 190,522 Cataloger & Classifier II PSA 02 2.40 172,945 Prin Library Asst AFP 03 2.86 139,206 CatalogerAndClassifierI PSA 01 0.80 58,106 Professional Librarian III PSA 03 2.45 187,039
Chief Communications/Strategy PL2 07 1.00 124,369
Programs & Community Outreach Librarian PSA 02 4.00 304,496
Chief of Adult Library Servcs PL2 07 1.00 124,369 Programs & Outreach Librarian PSA 03 1.00 86,149 Chief of Colletion Strategy PL2 08 0.87 119,278 Programs Librarian PSA 03 1.00 86,149 Chief-Cataloging PSA 04 0.80 58,125 Public Relations Associate PSA 03 1.00 80,733 Children's Librarian I PSA 01 9.00 608,611 Rare Books & Manuscripts Librn PSA 02 0.95 75,879 Childrens Librarian II PSA 02 19.00 1,462,931 Reader & Info Librarian I PSA 01 2.00 136,663 Children's Serv Libr Asst II AFP 05 1.00 58,559 Reader & Info Librarian II PSA 02 0.90 70,358 Clerk AFP 03 2.00 76,188 Reader & InfoLibrarian III PSA 03 1.00 87,846
Collection Development Coordinator
PSA 03 1.00 65,939 Reference Librarian I PSA 01 4.55 326,475
Collection Development Mgr PSA 05 0.87 92,317 Reference Librarian II PSA 02 3.70 281,679 Collection Librarian II PSA 02 2.61 204,408 Research Collection Manager PSA 05 0.40 32,098 Collections Security Mgr PL2 05 1.00 75,613 Research Specialist PSA 02 1.90 151,257 Community Learning Supv PSA 04 1.00 93,796 ResearchSpcl(Media&Journalism PSA 02 1.00 61,745
Compensation & Compliance Spc
PL2 02 1.00 66,131 Senior Library Asst (Branch) AFP 03 45.00 1,984,563
Coord of Youth Services PSA 05 2.00 186,357 Sp Library Asst II (Branch) AFP 06 8.00 493,958 Curator - Professional Librarian PSA 03 1.90 144,484 Spc Libr Asst V-Shipping Supv AFP 08 1.00 76,983 Curator-Professional Lib IV PSA 04 1.35 129,715 Spc Proj/Record Mangmnt Asst PSA 04 0.95 91,819 Dir of Information Technology PL2 07 0.90 82,921 Spec Collection Lib I PSA 01 0.95 51,584 Dir of Library Services PL2 09 1.00 151,136 Spec Library Assistant V PL1 08 2.00 143,371 Dir of Operations PL2 08 1.00 137,101 Spec Library Asst I AFP 04 10.55 558,305 Dir of Strategic Partnerships PL2 07 1.00 118,105 Spec Library Asst II AFP 05 26.74 1,444,117 Exhibitions Outreach Coord PSA 03 1.00 86,149 Spec Library Asst III AFP 06 3.95 248,976 Facilities Custodial Foreman AFP 08 2.00 132,606 Spec Library Asst V (BPL) AFP 08F 2.70 217,921 Facility Mgr-Branches PL2 06 1.00 83,583 Spec. Library Asst IV PL1 07 1.00 55,868
Facility Mgr-Nights & Weekends PL2 06 1.00 105,121 Special Lib Asst I (Branch) AFP 05 19.00 1,042,960
Facillities Administrator AFP 08 1.00 76,983 Special Library Asst V AFP 08 7.49 518,006 Floater Librarian I PSA 01 11.00 650,438 Special Library Asst_IV AFP 07 2.96 196,240 Generalist I PSA 01 6.00 385,158 Sr Bldg Cust AFP 06 28.00 1,486,947 Generalist II PSA 02 6.00 455,901 Sr Bldg Cust(T) AFP 06 1.00 48,368
Hd of Bibliographic Serv Metr BLNet
PSA 03 1.00 87,846 Sr Cataloger & Classifier PSA 03 0.80 69,878
Head Central ChildServ PSA 04 1.00 96,151 Sr Clerk AFP 05 3.00 166,629 Help Desk Manager PSA 06 0.90 104,098 Sr Facility Mgr-Maint & Trades PL2 07 1.00 106,466 Human Resources Asst PL1 05 1.00 44,919 Sr Library Asst AFP 03 26.48 1,136,209
Human Resources Manager (BPL)
PL2 07 1.00 123,474 Sr Marketing Associate PSA 03 1.00 83,445

Arts & CultureLibrary Department 195
Title
Union Code
Grade Position FY22 Salary Title Union Code
Grade Position FY22 Salary
ILL and Research Svcs Librarian PSA 01 0.90 48,869 Staff Officer-Special Projects PL2 05 2.00 204,710 Instruction Librarian II PSA 02 1.00 68,600 Supv of Accounting Services PL2 07 1.00 124,369 Inter Library Loan Librarian PSA 02 0.35 20,941 Supv of Circulation & Shelving AFP 09 0.98 109,516 Interlibrary Loan Coordinator PSA 03 0.40 26,376 Systems Officer PL2 08 1.00 137,101 Interlibrary Loan Officer PSA 04 0.54 52,192 Technical Specialist AFP 09T 4.80 443,123 Jr Bld Cust-Traveling AFP 06 2.00 114,259 Technical Support Associate AFP 05 5.00 287,383 Jr Bldg Cust AFP 04 15.00 609,608 Technology Access Manager PSA 05 1.00 91,300 Jr Building Custodian AFP 04 1.00 49,870 Teen Librarian II PSA 02 1.00 68,052 Keeper of Special Collections PL2 07 0.95 118,150 Training Coordinator AFP 09 1.00 111,751 Laborer AFP 04 3.00 118,373 Web Services Librarian PSA 03 0.50 39,611 Lead Archivist PSA 04 0.95 89,840 Web Services Specialist AFP 08F 0.50 38,003 Legal Advisor PL2 06 1.00 110,811 Wkg Foreprs,Oper/Labor BPL AFP 08 1.00 65,521 Librarian I PSA 01 1.00 69,349 Wkg Frperson Painter AFP 08 1.00 65,521 Librarian Manager I PSA 05 0.60 63,490 Wkg Frprs Carpenter AFP 08 1.00 65,521 Library Aide EXO NG 54.00 463,692 Workforce Develop Librarian PSA 02 0.45 35,943 Literacy Coordinator PSA 03 1.00 86,149 Young Adults Librarian I PSA 01 5.00 315,420 Literacy Specialist II (BPL) PSA 02 1.00 75,446 Young Adults Librarian II PSA 02 3.00 203,054
Major Projects Coord PSA 03 2.00 166,883 Youth & Community Outreach Lib PSA 02 1.00 66,680
Major Projects Program Manager
PL2 05 1.00 102,355 Youth Prog Support Adminstrtor AFP 05 1.00 58,559
Total 487 29,431,460 Adjustments Differential Payments 0 Other 370,704 Chargebacks 0 Salary Savings -1,821,363 FY22 Total Request 27,980,801
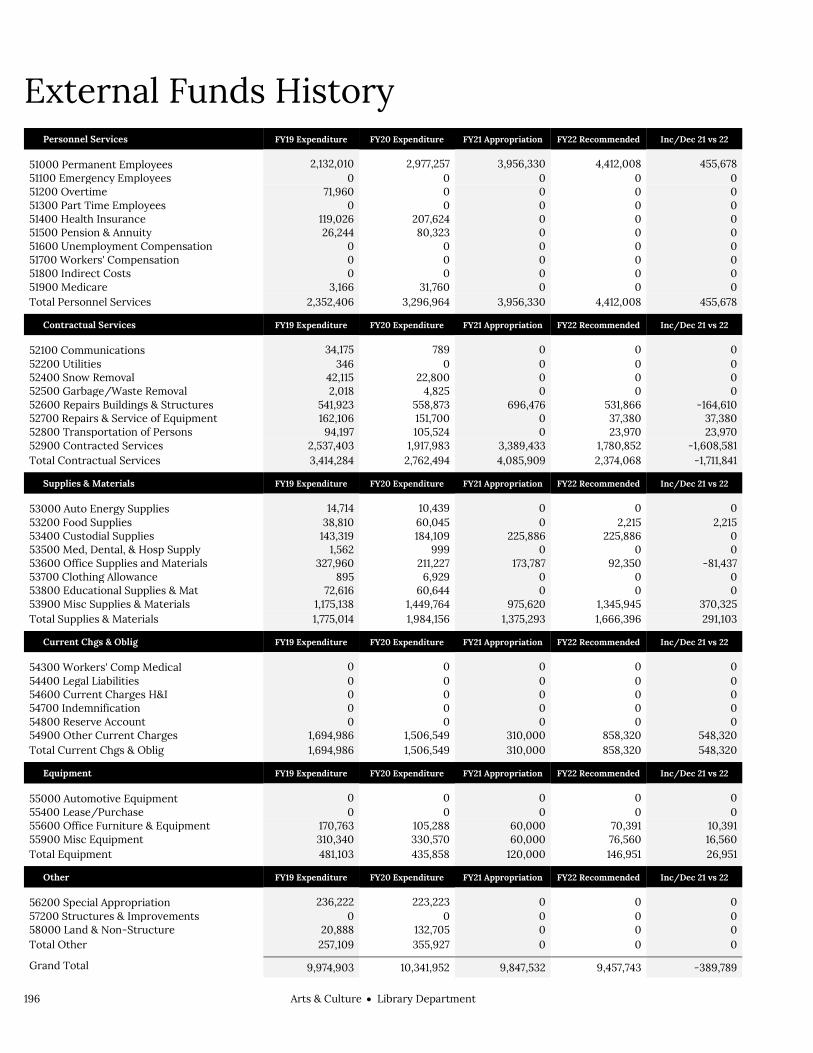
196 Arts & CultureLibrary Department
External Funds History Personnel Services FY19 Expenditure FY20 Expenditure FY21 Appropriation FY22 Recommended Inc/Dec 21 vs 22
51000 Permanent Employees 2,132,010 2,977,257 3,956,330 4,412,008 455,678 51100 Emergency Employees 0 0 0 0 0 51200 Overtime 71,960 0 0 0 0 51300 Part Time Employees 0 0 0 0 0 51400 Health Insurance 119,026 207,624 0 0 0 51500 Pension & Annuity 26,244 80,323 0 0 0 51600 Unemployment Compensation 0 0 0 0 0 51700 Workers' Compensation 0 0 0 0 0 51800 Indirect Costs 0 0 0 0 0 51900 Medicare 3,166 31,760 0 0 0 Total Personnel Services 2,352,406 3,296,964 3,956,330 4,412,008 455,678
Contractual Services FY19 Expenditure FY20 Expenditure FY21 Appropriation FY22 Recommended Inc/Dec 21 vs 22
52100 Communications 34,175 789 0 0 0 52200 Utilities 346 0 0 0 0 52400 Snow Removal 42,115 22,800 0 0 0 52500 Garbage/Waste Removal 2,018 4,825 0 0 0 52600 Repairs Buildings & Structures 541,923 558,873 696,476 531,866 -164,610 52700 Repairs & Service of Equipment 162,106 151,700 0 37,380 37,380 52800 Transportation of Persons 94,197 105,524 0 23,970 23,970 52900 Contracted Services 2,537,403 1,917,983 3,389,433 1,780,852 -1,608,581 Total Contractual Services 3,414,284 2,762,494 4,085,909 2,374,068 -1,711,841
Supplies & Materials FY19 Expenditure FY20 Expenditure FY21 Appropriation FY22 Recommended Inc/Dec 21 vs 22
53000 Auto Energy Supplies 14,714 10,439 0 0 0 53200 Food Supplies 38,810 60,045 0 2,215 2,215 53400 Custodial Supplies 143,319 184,109 225,886 225,886 0 53500 Med, Dental, & Hosp Supply 1,562 999 0 0 0 53600 Office Supplies and Materials 327,960 211,227 173,787 92,350 -81,437 53700 Clothing Allowance 895 6,929 0 0 0 53800 Educational Supplies & Mat 72,616 60,644 0 0 0 53900 Misc Supplies & Materials 1,175,138 1,449,764 975,620 1,345,945 370,325 Total Supplies & Materials 1,775,014 1,984,156 1,375,293 1,666,396 291,103
Current Chgs & Oblig FY19 Expenditure FY20 Expenditure FY21 Appropriation FY22 Recommended Inc/Dec 21 vs 22
54300 Workers' Comp Medical 0 0 0 0 0 54400 Legal Liabilities 0 0 0 0 0 54600 Current Charges H&I 0 0 0 0 0 54700 Indemnification 0 0 0 0 0 54800 Reserve Account 0 0 0 0 0 54900 Other Current Charges 1,694,986 1,506,549 310,000 858,320 548,320 Total Current Chgs & Oblig 1,694,986 1,506,549 310,000 858,320 548,320
Equipment FY19 Expenditure FY20 Expenditure FY21 Appropriation FY22 Recommended Inc/Dec 21 vs 22
55000 Automotive Equipment 0 0 0 0 0 55400 Lease/Purchase 0 0 0 0 0 55600 Office Furniture & Equipment 170,763 105,288 60,000 70,391 10,391 55900 Misc Equipment 310,340 330,570 60,000 76,560 16,560 Total Equipment 481,103 435,858 120,000 146,951 26,951
Other FY19 Expenditure FY20 Expenditure FY21 Appropriation FY22 Recommended Inc/Dec 21 vs 22
56200 Special Appropriation 236,222 223,223 0 0 0 57200 Structures & Improvements 0 0 0 0 0 58000 Land & Non-Structure 20,888 132,705 0 0 0 Total Other 257,109 355,927 0 0 0
Grand Total 9,974,903 10,341,952 9,847,532 9,457,743 -389,789

Arts & CultureLibrary Department 197
External Funds Personnel
Title Union Code Grade Position FY22 Salary Title
Union Code Grade Position FY22 Salary
Adult Technology Coord PSA 03 1.00 86,149 Manager of Online Web Serv PSA 06 0.50 58,681 Archivist PSA 03 0.05 4,367 Manager of the Arts PSA 05 1.00 104,914
Assistant Events Coordinator PL1 07 1.00 72,574 Mgr of Rare Books&Manuscripts
PSA 05 0.05 5,246
Asst Keeper of Prints PSA 03 0.65 57,100 Mgr of the Central Library PL2 07 0.75 93,277 Book Conservatior Proj Direc PSA 04 0.05 4,748 Network & Server Manager PL2 06 0.10 11,284 Cash Management Auditor PSA 02 1.00 68,052 Preservation Manager PSA 05 0.05 5,246 Cataloger & Classifier II PSA 02 0.60 43,236 Prin Library Asst AFP 03 0.14 6,695 CatalogerAndClassifierI PSA 01 0.20 14,526 Professional Librarian III PSA 03 2.55 209,263
Chief of Colletion Strategy PL2 08 0.13 17,823 Rare Books & Manuscripts Librn PSA 02 0.05 3,994
Chief-Cataloging PSA 04 0.20 14,531 Reader & Info Librarian II PSA 02 0.10 7,818 Collection Development Mgr PSA 05 0.13 13,794 Reference Librarian I PSA 01 0.45 32,358 Collection Librarian II PSA 02 0.39 30,544 Reference Librarian II PSA 02 0.30 23,144 CommHistory&DigitizationSpcls PSA 02 1.00 76,427 Research Collection Manager PSA 05 0.60 48,147 Communications Assistant AFP 05 1.00 48,719 Research Specialist PSA 02 0.10 7,987 Conservation Officer PSA 03 1.00 82,843 Spc Collections Pub Servs Lib PSA 03 1.00 65,939
Corp Events Coord PL1 08 1.00 77,437 Spc Proj/Record Mangmnt Asst
PSA 04 0.05 4,833
Curator - Professional Librarian PSA 03 4.10 306,365 Spec Collection Lib I PSA 01 0.05 2,715 Curator-Professional Lib IV PSA 04 0.65 61,890 Spec Library Asst I AFP 04 2.45 129,517 Dep Dir of Special Events PL2 05 1.00 99,778 Spec Library Asst II AFP 05 10.26 535,423 Digital Imaging Production Ast PSA 02 1.00 68,052 Spec Library Asst III AFP 06 0.05 2,961 Digital ImagingProductionCoord PSA 04 1.00 94,954 Spec Library Asst V (BPL) AFP 08F 0.30 23,903 Digital Projects Librarian II PSA 02 1.00 59,831 Special Library Asst V AFP 08 0.51 38,085 Digital Repository Dev Ops Eng PSA 05 1.00 80,245 Special Library Asst_IV AFP 07 0.04 2,812 Digital Repository Developer PSA 05 1.00 91,669 Sr Cataloger & Classifier PSA 03 1.20 103,619 Digitization Asst Proj Archivist PSA 02 1.00 78,175 Sr Library Asst AFP 03 0.52 22,117
Dir of Information Technology PL2 07 0.10 9,213 Statewide Metadata Coordinator
PSA 03 1.00 82,240
Director of Special Events PL2 06 1.00 112,844 Supv of Circulation & Shelving AFP 09 0.02 2,235 Help Desk Manager PSA 06 0.10 11,566 Technical Specialist AFP 09T 0.20 17,947 ILL and Research Svcs Librarian PSA 01 0.10 5,430 Teen Librarian II PSA 02 1.00 59,831 Inter Library Loan Librarian PSA 02 0.65 38,890 Teen Technology Coord PSA 03 1.00 85,624 Interlibrary Loan Coordinator PSA 03 0.60 39,563 Web Services Librarian PSA 03 0.50 39,611 Interlibrary Loan Officer PSA 04 0.46 44,460 Web Services Specialist AFP 08F 0.50 38,003 Keeper of Special Collections PL2 07 0.05 6,218 Welcome Services Supervisor AFP 08 1.00 76,983 Lead Archivist PSA 04 0.05 4,728 Workforce Develop Librarian PSA 02 0.55 43,930 Librarian Manager I PSA 05 0.40 41,966 Young Adults Librarian II PSA 02 1.00 76,268 Librarian Manager II PSA 06 1.00 115,665 Youth Programs Librarian PSA 01 1.00 67,218
Manager of Content Discovery PL2 07 0.30 37,311 Yth Educational Outreach Coord PSA 02 1.00 63,113
Yth Programs Librarian III PSA 03 1.00 87,347 Total 59 4,412,011 Adjustments Differential Payments 0 Other 0 Chargebacks 0 Salary Savings 0 FY22 Total Request 4,412,011

198 Arts & CultureLibrary Department
Program 1. Administration David Leonard, President, Organization 110100
Program Description The Administration Program proposes goals and objectives to the Board of Trustees, manages the library to continuously improve service to the public, and provides centralized functional support for the library. The program functions through the centralized offices of the President, Human Resources, Finance, Facilities, Systems, Technical Services, and Communications and Community Affairs.
Operating Budget Actual '19 Actual '20 Approp '21 Budget '22
Personnel Services 9,131,284 8,674,830 8,527,046 9,178,377 Non Personnel 11,921,505 12,631,173 13,607,569 13,400,062 Total 21,052,789 21,306,003 22,134,615 22,578,439

Arts & CultureLibrary Department 199
Program 2. Community Library Services David Leonard, President, Organization 110200
Program Description The Community Library Services Program supports the strategic goal of the library being a center for, and facilitator of, lifelong learning. Its objective is to assist people of various ages, backgrounds, and stages of learning through the development of a variety of materials and programs, including those designed to teach information literacy.
Operating Budget Actual '19 Actual '20 Approp '21 Budget '22
Personnel Services 15,499,896 15,860,860 17,291,956 17,385,515 Non Personnel 368,475 153,956 100,000 401,000 Total 15,868,371 16,014,816 17,391,956 17,786,515
Performance
Goal: To provide customer satisfaction through daily operations, program events, and special collection events
Performance Measures Actual '19 Actual '20 Projected '21 Target '22
% of Satisfied customer surveys 91% 95% 93% 90%
% of Satisfied program exit surveys 82% 82% 85% 88%
Average Daily Library Users 8,669 9,452 10,000 9,500
Average number of EBook holds 73,742 82,300 100,000 95,000
Library Card Daily Usage 3,120,980 3,450,149 3,500,000 3,400,000
Goal: To provide improved access to programs, services and collections
Performance Measures Actual '19 Actual '20 Projected '21 Target '22
Library Reach 9,815,213 8,497,940 5,500,000 7,500,000
Goal: To support improved youth literacy
Performance Measures Actual '19 Actual '20 Projected '21 Target '22
Participants in Early Literacy Program 43,503 48,505 45,000 45,000

200 Arts & CultureLibrary Department
Program 3. Research Services David Leonard, President, Organization 110300
Program Description The Research Services Program provides and preserves access to information and collections in all fields of knowledge for users at the local, state, and national levels through the assistance of professionally skilled staff. The program also provides Internet use and wireless access to the Internet.
Operating Budget Actual '19 Actual '20 Approp '21 Budget '22
Personnel Services 1,738,328 1,794,676 1,859,936 1,811,903 Non Personnel 4,372 4,136 0 0 Total 1,742,700 1,798,812 1,859,936 1,811,903

Arts & CultureLibrary Department 201
External Funds Projects Boston Public Library Affiliates
Project Mission Represents funding received through the Library’s fundraising partners, including the Fund for the Boston Public Library, the Associates of the Boston Public Library, the Boston Public Library’s City-wide Friends group, and Boston Public Library branch Friends’ groups.
InterLibrary Loan Grant
Project Mission Interlibrary loan (ILL) is a service through which a user of one library can borrow materials or receive electronic copies of documents (usually journal or magazine articles) that are owned by another library. Massachusetts Library System contracts with the Boston Public Library to supply copies of documents electronically to all Massachusetts Library System members. These documents come either from the Boston Public Library’s own collection or BPL’s ILL staff will locate and request documents from libraries around the world. BPL is uniquely suited to provide documents to the state because of BPL’s large and diverse collection that is second in size only to the Library of Congress.
Library for the Commonwealth
Project Mission The Library for the Commonwealth (LFC) provides reference and research services for all residents of the Commonwealth of Massachusetts at the Boston Public Library through developing, maintaining, and preserving comprehensive collections to supplement library resources available throughout Massachusetts. The Massachusetts Board of Library Commissioners provides this appropriation for the BPL to support personnel, purchase materials, digitize content, and develop a digital repository. The appropriation is calculated on a statewide per capita basis and distributed annually.
Other sources
Project Mission Represents revenue from private events, royalties, commissions, pay for print, etc.
State Aid To Libraries
Project Mission The Library Incentive Grant/Municipal Equalization Grant is annually granted by the Commonwealth of Massachusetts Board of Library Commissioners to the Trustees of the Boston Public Library. The Library is required to meet certain minimum standards of free public service established by the Board to receive the grant. Four important measures are used to determine eligibility: the Municipal Appropriation Requirement (MAR), the percent of the total budget spent on library materials, the hours of operation, and the ability to lend books to other libraries in the Commonwealth.
Trust funds and other donations
Project Mission Represents gifts received from individuals, corporations, and other private donors. Donations made via trusts are held in accordance with the intention of the donor, and the principle is invested in securities that generate an annual income. This income is used to purchase library materials, support specific library positions, and enhance library programming.

202 Arts & CultureLibrary Department
Library Department Capital Budget Arts & Culture Library Department
Overview The City is committed to investing in reinvigorating its branch libraries, an important cultural attraction in neighborhoods across the city. Fiscal year 2022 capital investments will further enhance the Boston Public Library by continuing to preserve existing buildings and build new library spaces to provide better services for all.
FY22 Major Initiatives The construction of a new Adams Street Branch Library and a major renovation of the
Roslindale Branch Library will be complete this fiscal year. Construction of a major renovation and addition to the Faneuil Branch Library is underway
this fiscal year. Design for a major renovation at the Fields Corner Branch Library will begin. A renovation project at the Central Library in Copley Square, to enhance preservation of
historic special collections of rare books and manuscripts, will be complete this year. The City will develop a building program for a new Upham’s Corner Branch Library. A study at the Codman Square Branch will be completed. A study at the South Boston Branch will begin.
Capital Budget Expenditures Total Actual '19 Total Actual '20 Estimated '21 Total Projected
'22
Total Department 9,978,882 19,074,299 29,045,000 20,977,918
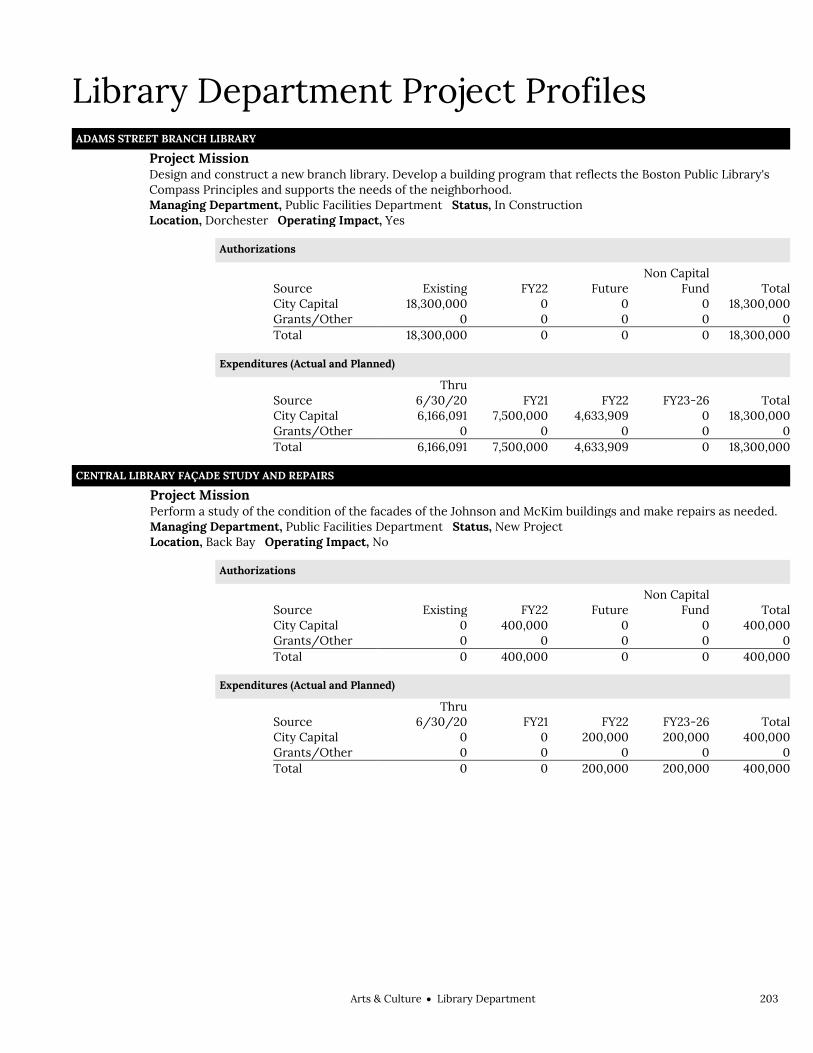
Arts & CultureLibrary Department 203
Library Department Project Profiles ADAMS STREET BRANCH LIBRARY
Project Mission Design and construct a new branch library. Develop a building program that reflects the Boston Public Library's
Compass Principles and supports the needs of the neighborhood.
Managing Department, Public Facilities Department Status, In Construction Location, Dorchester Operating Impact, Yes
Authorizations
Source Existing FY22 Future Non Capital
Fund Total City Capital 18,300,000 0 0 0 18,300,000 Grants/Other 0 0 0 0 0 Total 18,300,000 0 0 0 18,300,000
Expenditures (Actual and Planned)
Source Thru
6/30/20 FY21 FY22 FY23-26 Total City Capital 6,166,091 7,500,000 4,633,909 0 18,300,000 Grants/Other 0 0 0 0 0 Total 6,166,091 7,500,000 4,633,909 0 18,300,000
CENTRAL LIBRARY FAÇADE STUDY AND REPAIRS Project Mission Perform a study of the condition of the facades of the Johnson and McKim buildings and make repairs as needed. Managing Department, Public Facilities Department Status, New Project Location, Back Bay Operating Impact, No
Authorizations
Source Existing FY22 Future Non Capital
Fund Total City Capital 0 400,000 0 0 400,000 Grants/Other 0 0 0 0 0 Total 0 400,000 0 0 400,000
Expenditures (Actual and Planned)
Source Thru
6/30/20 FY21 FY22 FY23-26 Total City Capital 0 0 200,000 200,000 400,000 Grants/Other 0 0 0 0 0 Total 0 0 200,000 200,000 400,000

204 Arts & CultureLibrary Department
Library Department Project Profiles CENTRAL LIBRARY: JOHNSON BUILDING
Project Mission Renovate existing staff restroom into a women's staff restroom and locker room. Managing Department, Public Facilities Department Status, In Construction Location, Back Bay Operating Impact, No
Authorizations
Source Existing FY22 Future Non Capital
Fund Total City Capital 708,000 0 0 0 708,000 Grants/Other 0 0 0 0 0 Total 708,000 0 0 0 708,000
Expenditures (Actual and Planned)
Source Thru
6/30/20 FY21 FY22 FY23-26 Total City Capital 11,113 250,000 400,000 46,887 708,000 Grants/Other 0 0 0 0 0 Total 11,113 250,000 400,000 46,887 708,000
CENTRAL LIBRARY: MCKIM FIRE PANEL Project Mission Upgrade the McKim Building fire panel. Managing Department, Boston Public Library Status, In Design Location, Back Bay Operating Impact, No
Authorizations
Source Existing FY22 Future Non Capital
Fund Total City Capital 1,000,000 0 0 0 1,000,000 Grants/Other 0 0 0 0 0 Total 1,000,000 0 0 0 1,000,000
Expenditures (Actual and Planned)
Source Thru
6/30/20 FY21 FY22 FY23-26 Total City Capital 0 50,000 500,000 450,000 1,000,000 Grants/Other 0 0 0 0 0 Total 0 50,000 500,000 450,000 1,000,000

Arts & CultureLibrary Department 205
Library Department Project Profiles CENTRAL LIBRARY: MCKIM FOUNTAIN
Project Mission Repair the water basin and tile, upgrade lighting, piping and restore the sculpture. Managing Department, Public Facilities Department Status, In Construction Location, Back Bay Operating Impact, No
Authorizations
Source Existing FY22 Future Non Capital
Fund Total City Capital 1,196,500 0 0 0 1,196,500 Grants/Other 0 0 0 262,500 262,500 Total 1,196,500 0 0 262,500 1,459,000
Expenditures (Actual and Planned)
Source Thru
6/30/20 FY21 FY22 FY23-26 Total City Capital 0 1,059,275 137,225 0 1,196,500 Grants/Other 0 0 0 0 0 Total 0 1,059,275 137,225 0 1,196,500
CENTRAL LIBRARY: MCKIM STUDY Project Mission This project will focus on a re-imagining of the Master Plan for the non-renovated floors of the McKim Building
and develop a new program for and repairs to the Dartmouth Street Plaza.
Managing Department, Public Facilities Department Status, Study Underway Location, Back Bay Operating Impact, No
Authorizations
Source Existing FY22 Future Non Capital
Fund Total City Capital 800,000 0 0 0 800,000 Grants/Other 0 0 0 0 0 Total 800,000 0 0 0 800,000
Expenditures (Actual and Planned)
Source Thru
6/30/20 FY21 FY22 FY23-26 Total City Capital 0 267,600 532,400 0 800,000 Grants/Other 0 0 0 0 0 Total 0 267,600 532,400 0 800,000
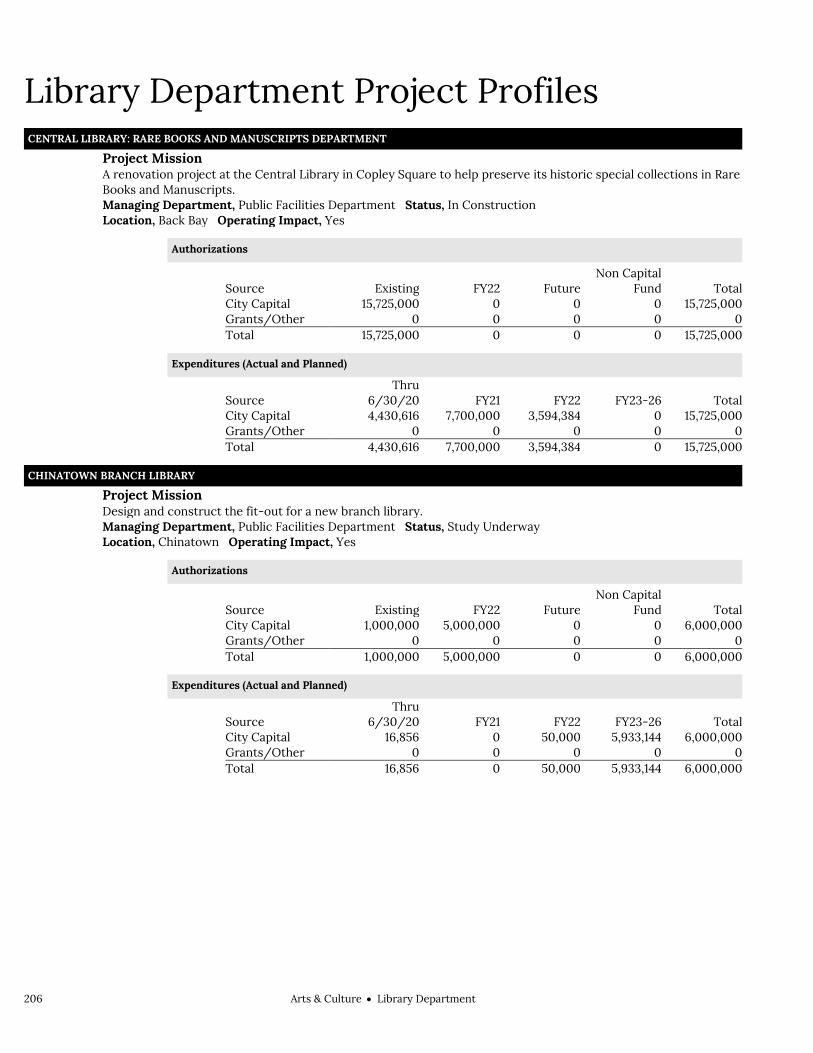
206 Arts & CultureLibrary Department
Library Department Project Profiles CENTRAL LIBRARY: RARE BOOKS AND MANUSCRIPTS DEPARTMENT
Project Mission A renovation project at the Central Library in Copley Square to help preserve its historic special collections in Rare
Books and Manuscripts.
Managing Department, Public Facilities Department Status, In Construction Location, Back Bay Operating Impact, Yes
Authorizations
Source Existing FY22 Future Non Capital
Fund Total City Capital 15,725,000 0 0 0 15,725,000 Grants/Other 0 0 0 0 0 Total 15,725,000 0 0 0 15,725,000
Expenditures (Actual and Planned)
Source Thru
6/30/20 FY21 FY22 FY23-26 Total City Capital 4,430,616 7,700,000 3,594,384 0 15,725,000 Grants/Other 0 0 0 0 0 Total 4,430,616 7,700,000 3,594,384 0 15,725,000
CHINATOWN BRANCH LIBRARY Project Mission Design and construct the fit-out for a new branch library. Managing Department, Public Facilities Department Status, Study Underway Location, Chinatown Operating Impact, Yes
Authorizations
Source Existing FY22 Future Non Capital
Fund Total City Capital 1,000,000 5,000,000 0 0 6,000,000 Grants/Other 0 0 0 0 0 Total 1,000,000 5,000,000 0 0 6,000,000
Expenditures (Actual and Planned)
Source Thru
6/30/20 FY21 FY22 FY23-26 Total City Capital 16,856 0 50,000 5,933,144 6,000,000 Grants/Other 0 0 0 0 0 Total 16,856 0 50,000 5,933,144 6,000,000

Arts & CultureLibrary Department 207
Library Department Project Profiles CODMAN SQUARE BRANCH LIBRARY STUDY
Project Mission Conduct a facility assessment and develop a building program that reflects the BPL's Compass Principles and
supports the needs of the neighborhood. Design and construct a new branch library.
Managing Department, Public Facilities Department Status, Study Underway Location, Dorchester Operating Impact, No
Authorizations
Source Existing FY22 Future Non Capital
Fund Total City Capital 100,000 0 0 0 100,000 Grants/Other 0 0 0 0 0 Total 100,000 0 0 0 100,000
Expenditures (Actual and Planned)
Source Thru
6/30/20 FY21 FY22 FY23-26 Total City Capital 0 20,000 80,000 0 100,000 Grants/Other 0 0 0 0 0 Total 0 20,000 80,000 0 100,000
EGLESTON SQUARE BRANCH LIBRARY Project Mission Conduct a facility assessment and develop a building program that reflects the BPL's Compass Principles and
supports the needs of the neighborhood. Design and construct a new branch library.
Managing Department, Public Facilities Department Status, Study Underway Location, Roxbury Operating Impact, No
Authorizations
Source Existing FY22 Future Non Capital
Fund Total City Capital 206,267 0 11,893,733 0 12,100,000 Grants/Other 0 0 0 0 0 Total 206,267 0 11,893,733 0 12,100,000
Expenditures (Actual and Planned)
Source Thru
6/30/20 FY21 FY22 FY23-26 Total City Capital 2,145 91,240 750,000 11,256,615 12,100,000 Grants/Other 0 0 0 0 0 Total 2,145 91,240 750,000 11,256,615 12,100,000

208 Arts & CultureLibrary Department
Library Department Project Profiles FANEUIL BRANCH LIBRARY
Project Mission Library branch improvements consistent with the BPL's Compass Principles and based on the completed
programming study which calls for improved accessibility, interior renovations and refurbishment, as well as, a building addition.
Managing Department, Public Facilities Department Status, In Construction Location, Allston/Brighton Operating Impact, Yes
Authorizations
Source Existing FY22 Future Non Capital
Fund Total City Capital 14,000,000 0 0 0 14,000,000 Grants/Other 0 0 0 0 0 Total 14,000,000 0 0 0 14,000,000
Expenditures (Actual and Planned)
Source Thru
6/30/20 FY21 FY22 FY23-26 Total City Capital 366,453 2,000,000 6,000,000 5,633,547 14,000,000 Grants/Other 0 0 0 0 0 Total 366,453 2,000,000 6,000,000 5,633,547 14,000,000
FIELDS CORNER BRANCH LIBRARY Project Mission Conduct a facility assessment and develop a building program that reflects the BPL's Compass Principles and
supports the needs of the neighborhood. Design and construct a new branch library.
Managing Department, Public Facilities Department Status, Study Underway Location, Dorchester Operating Impact, No
Authorizations
Source Existing FY22 Future Non Capital
Fund Total City Capital 2,100,000 0 10,000,000 0 12,100,000 Grants/Other 0 0 0 0 0 Total 2,100,000 0 10,000,000 0 12,100,000
Expenditures (Actual and Planned)
Source Thru
6/30/20 FY21 FY22 FY23-26 Total City Capital 78,583 0 50,000 11,971,417 12,100,000 Grants/Other 0 0 0 0 0 Total 78,583 0 50,000 11,971,417 12,100,000

Arts & CultureLibrary Department 209
Library Department Project Profiles NORTH END BRANCH LIBRARY
Project Mission Assess the existing interior and exterior physical conditions and systems according to how ably the branch can
accomplish the Compass principles; develop and implement an improvement plan.
Managing Department, Public Facilities Department Status, To Be Scheduled Location, North End Operating Impact, No
Authorizations
Source Existing FY22 Future Non Capital
Fund Total City Capital 865,000 0 610,000 0 1,475,000 Grants/Other 0 0 0 0 0 Total 865,000 0 610,000 0 1,475,000
Expenditures (Actual and Planned)
Source Thru
6/30/20 FY21 FY22 FY23-26 Total City Capital 4,183 0 50,000 1,420,817 1,475,000 Grants/Other 0 0 0 0 0 Total 4,183 0 50,000 1,420,817 1,475,000
RESEARCH COLLECTIONS PRESERVATION AND STORAGE PLAN Project Mission A planning study for the storage, preservation and security of the BPL's research collections. Managing Department, Boston Public Library Status, To Be Scheduled Location, Citywide Operating Impact, No
Authorizations
Source Existing FY22 Future Non Capital
Fund Total City Capital 200,000 0 0 0 200,000 Grants/Other 0 0 0 0 0 Total 200,000 0 0 0 200,000
Expenditures (Actual and Planned)
Source Thru
6/30/20 FY21 FY22 FY23-26 Total City Capital 0 0 100,000 100,000 200,000 Grants/Other 0 0 0 0 0 Total 0 0 100,000 100,000 200,000

210 Arts & CultureLibrary Department
Library Department Project Profiles ROSLINDALE BRANCH LIBRARY RENOVATION
Project Mission A comprehensive building renovation will enrich library services and visitor experience through improved spatial
definition, a fully accessible facility, improve signage and increase energy efficiency.
Managing Department, Public Facilities Department Status, In Construction Location, Roslindale Operating Impact, Yes
Authorizations
Source Existing FY22 Future Non Capital
Fund Total City Capital 11,660,000 0 0 0 11,660,000 Grants/Other 0 0 0 0 0 Total 11,660,000 0 0 0 11,660,000
Expenditures (Actual and Planned)
Source Thru
6/30/20 FY21 FY22 FY23-26 Total City Capital 2,052,629 5,000,000 3,000,000 1,607,371 11,660,000 Grants/Other 0 0 0 0 0 Total 2,052,629 5,000,000 3,000,000 1,607,371 11,660,000
SOUTH BOSTON BRANCH LIBRARY STUDY Project Mission Conduct a facility assessment and develop a building program that reflects the BPL's Compass Principles and
supports the needs of the neighborhood. Design and construct a new branch library.
Managing Department, Public Facilities Department Status, New Project Location, South Boston Operating Impact, No
Authorizations
Source Existing FY22 Future Non Capital
Fund Total City Capital 0 250,000 0 0 250,000 Grants/Other 0 0 0 0 0 Total 0 250,000 0 0 250,000
Expenditures (Actual and Planned)
Source Thru
6/30/20 FY21 FY22 FY23-26 Total City Capital 0 0 100,000 150,000 250,000 Grants/Other 0 0 0 0 0 Total 0 0 100,000 150,000 250,000

Arts & CultureLibrary Department 211
Library Department Project Profiles SOUTH END BRANCH LIBRARY STUDY
Project Mission This project will conduct a facility assessment, review neighborhood goals, develop an updated building program
that reflects the BPL's strategic vision supporting the future needs of the neighborhood, and support additional interior improvements.
Managing Department, Public Facilities Department Status, To Be Scheduled Location, South End Operating Impact, No
Authorizations
Source Existing FY22 Future Non Capital
Fund Total City Capital 100,000 150,000 750,000 0 1,000,000 Grants/Other 0 0 0 0 0 Total 100,000 150,000 750,000 0 1,000,000
Expenditures (Actual and Planned)
Source Thru
6/30/20 FY21 FY22 FY23-26 Total City Capital 0 0 250,000 750,000 1,000,000 Grants/Other 0 0 0 0 0 Total 0 0 250,000 750,000 1,000,000
UPHAM'S CORNER LIBRARY Project Mission Site acquisition, design, construction, and furnishings for the development of a new branch library. Managing Department, Public Facilities Department Status, Study Underway Location, Dorchester Operating Impact, Yes
Authorizations
Source Existing FY22 Future Non Capital
Fund Total City Capital 2,250,000 0 15,730,000 0 17,980,000 Grants/Other 0 0 0 0 0 Total 2,250,000 0 15,730,000 0 17,980,000
Expenditures (Actual and Planned)
Source Thru
6/30/20 FY21 FY22 FY23-26 Total City Capital 0 50,000 500,000 17,430,000 17,980,000 Grants/Other 0 0 0 0 0 Total 0 50,000 500,000 17,430,000 17,980,000
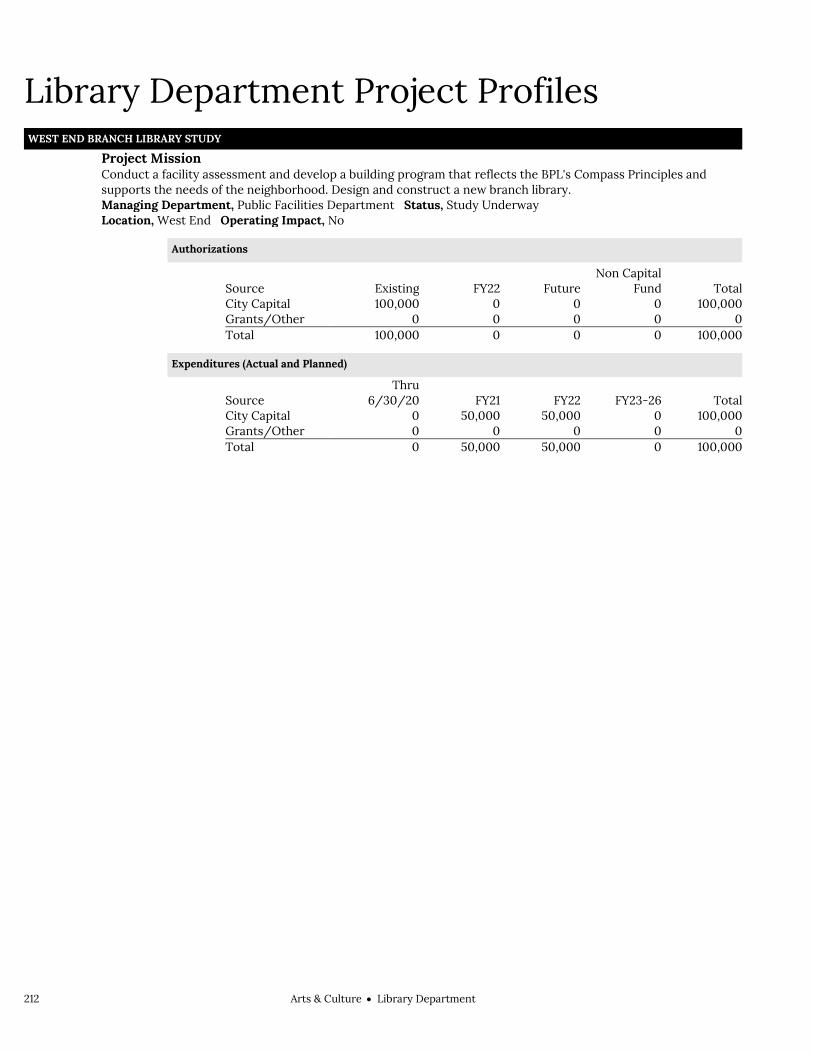
212 Arts & CultureLibrary Department
Library Department Project Profiles WEST END BRANCH LIBRARY STUDY
Project Mission Conduct a facility assessment and develop a building program that reflects the BPL's Compass Principles and
supports the needs of the neighborhood. Design and construct a new branch library.
Managing Department, Public Facilities Department Status, Study Underway Location, West End Operating Impact, No
Authorizations
Source Existing FY22 Future Non Capital
Fund Total City Capital 100,000 0 0 0 100,000 Grants/Other 0 0 0 0 0 Total 100,000 0 0 0 100,000
Expenditures (Actual and Planned)
Source Thru
6/30/20 FY21 FY22 FY23-26 Total City Capital 0 50,000 50,000 0 100,000 Grants/Other 0 0 0 0 0 Total 0 50,000 50,000 0 100,000

Economic DevelopmentCabinet 213
Economic Development Economic Development Cabinet
Economic Development .................................................... 215
Boston Planning and Development Agency ........... 217
Consumer Affairs & Licensing.................................. 223
Consumer Licensing ...................................... 229
Consumer Affairs ............................................ 230
Licensing Board ................................................ 231
Office of Economic Development ........................... 233
Economic Development ................................ 239
Equity & Inclusion ........................................... 240
Small & Local Business ................................... 241
Office of Tourism ........................................................ 245
Administration ................................................. 250
Film & Special Events ...................................... 251
Tourism ............................................................. 252

214 Economic DevelopmentCabinet

Economic DevelopmentCabinet 215
Economic Development Economic Development
Midori Morikawa, Interim Chief of Economic Development
Cabinet Mission The mission of the Economic Development Cabinet is to lead a broad effort to streamline and support areas of focus that contribute to Boston’s economy including tourism, jobs and employment, business development, and real estate development. The cabinet will concern itself with increasing transparency and promoting accessibility for all Bostonians, especially women- and minority-owned businesses and local businesses, to share in and benefit from the economic boom in Boston.
Operating Budget
Total Actual '19 Total Actual '20 Total Approp '21 Total Budget '22
Consumer Affairs & Licensing 1,222,148 1,360,359 1,497,453 1,729,759
Office of Economic Development 3,506,339 3,463,425 5,403,599 6,502,499
Office of Tourism 1,333,809 1,365,309 1,651,973 2,503,330
Total 6,062,296 6,189,093 8,553,025 10,735,588
Capital Budget Expenditures Actual '19 Actual '20 Estimated '21 Projected '22
Boston Planning and Development Agency
345,557 871,082 1,665,130 1,059,494
Total 345,557 871,082 1,665,130 1,059,494
External Funds Expenditures
Total Actual '19 Total Actual '20 Total Approp '21 Total Budget '22
Consumer Affairs & Licensing 65,004 64,433 64,557 64,557 Office of Economic Development 3,778,014 3,893,841 4,896,234 4,832,009 Office of Tourism 45,011 124,677 150,000 50,000
Total 3,888,028 4,082,951 5,110,791 4,946,566


Economic DevelopmentBoston Planning and Development Agency 217
Boston Planning and Development Agency Operating Budget Economic Development Boston Planning and Development Agency Brian Golden, Director, Appropriation 171000
Department Mission In partnership with communities, the BPDA plans Boston’s future while respecting its past. We prepare our residents for new opportunities through training, human services and job creation. The BPDA guides physical, social, and economic change in Boston’s neighborhoods and its downtown to shape a more prosperous, comfortable, and beautiful city for all.*The Boston Planning and Development Agency's operating budget is not funded by the City’s general fund but is included in the City’s capital plan.

218 Economic DevelopmentBoston Planning and Development Agency
Boston Planning and Development Agency Capital Budget Economic Development Boston Planning and Development Agency
Overview The Boston Planning & Development Agency, functioning as Boston’s central planning organization, will continue providing in-house planning expertise and will also help leverage the external resources necessary to shape Boston’s future. The Capital Plan will support opportunities in commercial districts such as Dorchester Avenue and Northern Avenue.
FY22 Major Initiatives Complete a technical analysis and develop coastal protective design options that address
two near-term flood pathways identified through the 2017 Climate Ready East Boston report.
Complete analysis of the transportation capacity and develop conceptual design and cost for future infrastructure improvements on Dorchester Avenue in South Boston.
Complete design for infrastructure improvements at Long Wharf.
Capital Budget Expenditures Total Actual '19 Total Actual '20 Estimated '21 Total Projected
'22
Total Department 345,557 871,028 1,665,130 1,059,494
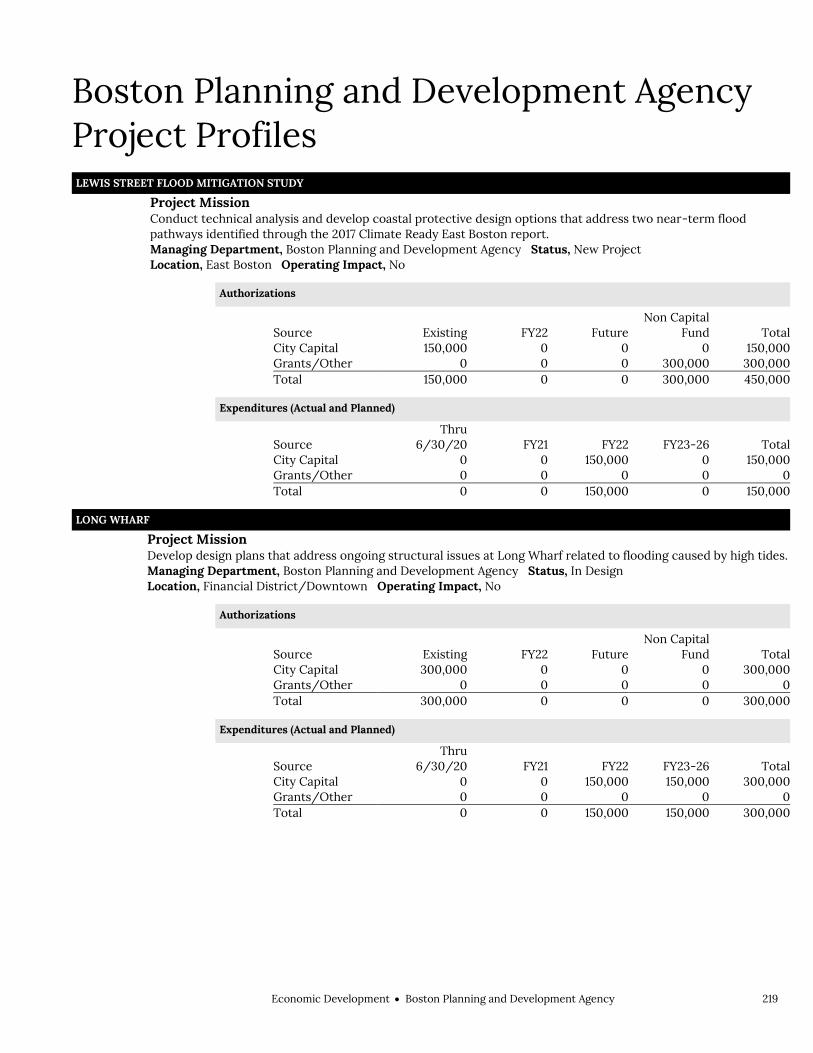
Economic DevelopmentBoston Planning and Development Agency 219
Boston Planning and Development Agency Project Profiles LEWIS STREET FLOOD MITIGATION STUDY
Project Mission Conduct technical analysis and develop coastal protective design options that address two near-term flood
pathways identified through the 2017 Climate Ready East Boston report.
Managing Department, Boston Planning and Development Agency Status, New Project Location, East Boston Operating Impact, No
Authorizations
Source Existing FY22 Future Non Capital
Fund Total City Capital 150,000 0 0 0 150,000 Grants/Other 0 0 0 300,000 300,000 Total 150,000 0 0 300,000 450,000
Expenditures (Actual and Planned)
Source Thru
6/30/20 FY21 FY22 FY23-26 Total City Capital 0 0 150,000 0 150,000 Grants/Other 0 0 0 0 0 Total 0 0 150,000 0 150,000
LONG WHARF Project Mission Develop design plans that address ongoing structural issues at Long Wharf related to flooding caused by high tides. Managing Department, Boston Planning and Development Agency Status, In Design Location, Financial District/Downtown Operating Impact, No
Authorizations
Source Existing FY22 Future Non Capital
Fund Total City Capital 300,000 0 0 0 300,000 Grants/Other 0 0 0 0 0 Total 300,000 0 0 0 300,000
Expenditures (Actual and Planned)
Source Thru
6/30/20 FY21 FY22 FY23-26 Total City Capital 0 0 150,000 150,000 300,000 Grants/Other 0 0 0 0 0 Total 0 0 150,000 150,000 300,000

220 Economic DevelopmentBoston Planning and Development Agency
Boston Planning and Development Agency Project Profiles LONG WHARF HARBORWALK SIGNAGE
Project Mission Design interpretive and way finding signage that directs the public to the Harborwalk and nearby public amenities. Managing Department, Boston Planning and Development Agency Status, To Be Scheduled Location, Financial District/Downtown Operating Impact, No
Authorizations
Source Existing FY22 Future Non Capital
Fund Total City Capital 150,000 0 0 0 150,000 Grants/Other 0 0 0 0 0 Total 150,000 0 0 0 150,000
Expenditures (Actual and Planned)
Source Thru
6/30/20 FY21 FY22 FY23-26 Total City Capital 0 0 75,000 75,000 150,000 Grants/Other 0 0 0 0 0 Total 0 0 75,000 75,000 150,000
RFMP DRY DOCK AVENUE Project Mission Improve Dry Dock Avenue streetscape to the meet current standards for accessibility, promote multi-modal
transit connectivity, and enhance climate resilience.
Managing Department, Boston Planning and Development Agency Status, To Be Scheduled Location, South Boston Operating Impact, No
Authorizations
Source Existing FY22 Future Non Capital
Fund Total City Capital 400,000 0 0 0 400,000 Grants/Other 0 0 0 0 0 Total 400,000 0 0 0 400,000
Expenditures (Actual and Planned)
Source Thru
6/30/20 FY21 FY22 FY23-26 Total City Capital 0 0 200,000 200,000 400,000 Grants/Other 0 0 0 0 0 Total 0 0 200,000 200,000 400,000

Economic DevelopmentBoston Planning and Development Agency 221
Boston Planning and Development Agency Project Profiles RFMP DRY-DOCK 4
Project Mission Develop a design for the permanent closure of the Dry-dock 4 caisson. Managing Department, Boston Planning and Development Agency Status, In Design Location, South Boston Operating Impact, No
Authorizations
Source Existing FY22 Future Non Capital
Fund Total City Capital 250,000 0 0 0 250,000 Grants/Other 0 0 0 0 0 Total 250,000 0 0 0 250,000
Expenditures (Actual and Planned)
Source Thru
6/30/20 FY21 FY22 FY23-26 Total City Capital 192,915 6,558 50,527 0 250,000 Grants/Other 0 0 0 0 0 Total 192,915 6,558 50,527 0 250,000
RFMP PIER 6 Project Mission Develop design plans for the replacement of the Pier 6 steel bulkhead. Managing Department, Boston Planning and Development Agency Status, In Design Location, South Boston Operating Impact, No
Authorizations
Source Existing FY22 Future Non Capital
Fund Total City Capital 400,000 0 0 0 400,000 Grants/Other 0 0 0 0 0 Total 400,000 0 0 0 400,000
Expenditures (Actual and Planned)
Source Thru
6/30/20 FY21 FY22 FY23-26 Total City Capital 155,807 38,950 100,000 105,243 400,000 Grants/Other 0 0 0 0 0 Total 155,807 38,950 100,000 105,243 400,000

222 Economic DevelopmentBoston Planning and Development Agency
Boston Planning and Development Agency Project Profiles RFMP RESILIENCY IMPROVEMENTS
Project Mission Climate resilience improvements at the Raymond Flynn Marine Park. Managing Department, Boston Planning and Development Agency Status, In Design Location, South Boston Operating Impact, No
Authorizations
Source Existing FY22 Future Non Capital
Fund Total City Capital 2,075,000 0 0 0 2,075,000 Grants/Other 0 0 0 0 0 Total 2,075,000 0 0 0 2,075,000
Expenditures (Actual and Planned)
Source Thru
6/30/20 FY21 FY22 FY23-26 Total City Capital 92,303 44,255 250,000 1,688,442 2,075,000 Grants/Other 0 0 0 0 0 Total 92,303 44,255 250,000 1,688,442 2,075,000
STRATEGIC PLANNING AREA TRANSPORTATION STUDY Project Mission Analyze transportation capacity and develop conceptual design and cost for future infrastructure improvements
for Washington Street in Jamaica Plain/Roxbury, Glovers Corner in Dorchester, and Nubian Square in Roxbury.
Managing Department, Boston Planning and Development Agency Status, Study Underway Location, Various neighborhoods Operating Impact, No
Authorizations
Source Existing FY22 Future Non Capital
Fund Total City Capital 250,000 0 0 0 250,000 Grants/Other 0 0 0 0 0 Total 250,000 0 0 0 250,000
Expenditures (Actual and Planned)
Source Thru
6/30/20 FY21 FY22 FY23-26 Total City Capital 166,033 0 83,967 0 250,000 Grants/Other 0 0 0 0 0 Total 166,033 0 83,967 0 250,000

Economic DevelopmentConsumer Affairs & Licensing 223
Consumer Affairs & Licensing Operating Budget Economic Development Consumer Affairs & Licensing Kathleen Joyce, Director, Appropriation 114000
Department Mission The Consumer Affairs & Licensing Department contributes to the overall mission of improving the quality of life in the City of Boston by maintaining safety and order in the restaurant community through the licensing of entertainment activities and monitoring compliance with relevant laws. The office also educates and mediates on behalf of Boston area consumers in order to facilitate successful resolution of consumer related complaints. The Licensing Board grants and regulates various types of alcohol, food licenses and other licenses for restaurants, nightclubs, private clubs, liquor stores. The Licensing Board consists of 3 Commissioners appointed by the Mayor. Boston Police officers support the office and report violations of the alcoholic and other laws of the Commonwealth. The Licensing Board holds hearings on these violations and issues penalties.
Selected Performance Goals Consumer Affairs
Close cases in a short amount of time for better service to consumers. More resolved cases from consumer complaints filed with our department. To track cases closed per month.
Operating Budget Program Name Total Actual '19 Total Actual '20 Total Approp '21 Total Budget '22
Consumer Licensing 498,850 597,537 373,007 543,213
Consumer Affairs 105,605 100,762 194,311 111,071
Licensing Board 617,693 662,060 930,135 1,075,475
Total 1,222,148 1,360,359 1,497,453 1,729,759
External Funds Budget Fund Name Total Actual '19 Total Actual '20 Total Approp '21 Total Budget '22
Local Consumer Aid Fund 65,004 64,433 64,557 64,557
Total 65,004 64,433 64,557 64,557
Operating Budget Actual '19 Actual '20 Approp '21 Budget '22
Personnel Services 1,174,402 1,296,933 1,452,308 1,585,464 Non Personnel 47,746 63,426 45,145 144,295 Total 1,222,148 1,360,359 1,497,453 1,729,759

224 Economic DevelopmentConsumer Affairs & Licensing
Consumer Affairs & Licensing Operating Budget
Authorizing Statutes Enabling Legislation, CBC Ord. §§ 15-5.1-
15-5.2. Dancing Halls, M.G.L.A. c. 136, § 4. Commonly Used Provisions, M.G.L.A.
c.140, §§ 177A, 181, 183A, 185H. Theatrical Exhibitions and Public
Amusements, CBC Ord. §§ 17-13.1-17-13.5.
Consumer Protection, M.G.L.A. c.93A, § 9.
2014 Mass. Acts ch. 287 ss. 71-75B, 84-85, 119,128,130-132 (Gives Mayor appointing authority) 2014 Mass. Acts ch. 287 ss. 71-75B, 84-85, 119,128,130-132 (Gives Mayor appointing authority).
2014 Mass. Acts ch. 312 ss. 1-2. 2015 Mass. Acts ch. 119 ss. 18-19,32-33. M.G.L.A. c. 138 ss. 12,14,15,17,23,34,64 67. M.G.L.A. c. 140 ss. 1-7,9-12,22-32,177, 185I.
Description of Services The Consumer Affairs and Licensing Department is responsible for licensing and regulating all forms of entertainment, alcohol and food within Boston. The Office processes new applications and renewals, inspects premises, and holds hearings on licensing requests and violations. The Office also educates and mediates on behalf of Boston area consumers.
Director/Chairman
Public Outreach
Consumer Affairs
Administration
Mediation
Investigation
Administration
Office Management
Systems Management
Fiscal Management
Licensing
Regulatory
Permitting
Fiscal Management
Investigation
Public Outreach

Economic DevelopmentConsumer Affairs & Licensing 225
Department History Personnel Services FY19 Expenditure FY20 Expenditure FY21 Appropriation FY22 Recommended Inc/Dec 21 vs 22
51000 Permanent Employees 1,137,086 1,221,678 1,433,767 1,585,464 151,697 51100 Emergency Employees 5,194 2,065 18,541 0 -18,541 51200 Overtime 0 0 0 0 0 51600 Unemployment Compensation 0 0 0 0 0 51700 Workers' Compensation 32,122 73,190 0 0 0 Total Personnel Services 1,174,402 1,296,933 1,452,308 1,585,464 133,156
Contractual Services FY19 Expenditure FY20 Expenditure FY21 Appropriation FY22 Recommended Inc/Dec 21 vs 22
52100 Communications 3,138 6,720 3,150 6,720 3,570 52200 Utilities 0 0 0 0 0 52400 Snow Removal 0 0 0 0 0 52500 Garbage/Waste Removal 0 0 0 0 0 52600 Repairs Buildings & Structures 0 0 0 0 0 52700 Repairs & Service of Equipment 200 200 1,000 950 -50 52800 Transportation of Persons 692 586 800 700 -100 52900 Contracted Services 5,514 4,859 6,580 106,500 99,920 Total Contractual Services 9,544 12,365 11,530 114,870 103,340
Supplies & Materials FY19 Expenditure FY20 Expenditure FY21 Appropriation FY22 Recommended Inc/Dec 21 vs 22
53000 Auto Energy Supplies 0 0 0 0 0 53200 Food Supplies 0 0 0 0 0 53400 Custodial Supplies 0 0 0 0 0 53500 Med, Dental, & Hosp Supply 0 0 0 0 0 53600 Office Supplies and Materials 19,556 18,201 19,050 16,150 -2,900 53700 Clothing Allowance 1,000 1,000 1,250 1,250 0 53800 Educational Supplies & Mat 0 0 0 0 0 53900 Misc Supplies & Materials 0 0 0 0 0 Total Supplies & Materials 20,556 19,201 20,300 17,400 -2,900
Current Chgs & Oblig FY19 Expenditure FY20 Expenditure FY21 Appropriation FY22 Recommended Inc/Dec 21 vs 22
54300 Workers' Comp Medical 3,115 17,028 0 0 0 54400 Legal Liabilities 0 0 0 0 0 54500 Aid To Veterans 0 0 0 0 0 54600 Current Charges H&I 0 0 0 0 0 54700 Indemnification 0 0 0 0 0 54800 Reserve Account 0 0 0 0 0 54900 Other Current Charges 11,785 12,700 13,315 12,025 -1,290 Total Current Chgs & Oblig 14,900 29,728 13,315 12,025 -1,290
Equipment FY19 Expenditure FY20 Expenditure FY21 Appropriation FY22 Recommended Inc/Dec 21 vs 22
55000 Automotive Equipment 0 0 0 0 0 55400 Lease/Purchase 0 0 0 0 0 55600 Office Furniture & Equipment 2,746 1,102 0 0 0 55900 Misc Equipment 0 1,030 0 0 0 Total Equipment 2,746 2,132 0 0 0
Other FY19 Expenditure FY20 Expenditure FY21 Appropriation FY22 Recommended Inc/Dec 21 vs 22
56200 Special Appropriation 0 0 0 0 0 57200 Structures & Improvements 0 0 0 0 0 58000 Land & Non-Structure 0 0 0 0 0 Total Other 0 0 0 0 0
Grand Total 1,222,148 1,360,359 1,497,453 1,729,759 232,306

226 Economic DevelopmentConsumer Affairs & Licensing
Department Personnel
Title Union Code Grade Position FY22 Salary Title
Union Code Grade Position FY22 Salary
Adm Asst SU4 15 1.00 51,809 Exec Dir of Consumer Affairs & Licensing
CDH NG 1.00 143,393
Admin Asst (Law) SU4 16 1.00 66,144 Head Administrative Clerk SU4 14 3.00 178,887 Board Secretary EXM NG 1.00 102,280 Lic Invest II MYG 19 1.00 66,825 Chief of Staff MYN NG 1.00 88,677 Prj Manager MYO 08 1.00 84,970 Commissioner (Cannabis Bd) EXM NG 4.00 125,143 Receptionist/Secretary MYG 14 1.00 43,581 Commissioner (LBD) CDH NG 2.00 170,467 Secretary II MYG 15 1.00 49,202 Consumer Investigator MYG 17 1.00 58,971 Sr Personnel Officer (PWD) SE1 06 1.00 90,319 Director MYO 10 1.00 96,123 Staff Asst III MYO 07 1.00 70,331 Exec Asst MYO 06 1.00 70,298 Staff Asst IV MYO 09 1.00 83,201 Total 24 1,640,621 Adjustments Differential Payments 0 Other 14,843 Chargebacks 0 Salary Savings -70,000 FY22 Total Request 1,585,464

Economic DevelopmentConsumer Affairs & Licensing 227
External Funds History Personnel Services FY19 Expenditure FY20 Expenditure FY21 Appropriation FY22 Recommended Inc/Dec 21 vs 22
51000 Permanent Employees 58,521 64,085 64,557 64,557 0 51100 Emergency Employees 0 0 0 0 0 51200 Overtime 0 0 0 0 0 51300 Part Time Employees 0 0 0 0 0 51400 Health Insurance 625 318 0 0 0 51500 Pension & Annuity 0 0 0 0 0 51600 Unemployment Compensation 0 0 0 0 0 51700 Workers' Compensation 0 0 0 0 0 51800 Indirect Costs 5,800 0 0 0 0 51900 Medicare 58 30 0 0 0 Total Personnel Services 65,004 64,433 64,557 64,557 0
Contractual Services FY19 Expenditure FY20 Expenditure FY21 Appropriation FY22 Recommended Inc/Dec 21 vs 22
52100 Communications 0 0 0 0 0 52200 Utilities 0 0 0 0 0 52400 Snow Removal 0 0 0 0 0 52500 Garbage/Waste Removal 0 0 0 0 0 52600 Repairs Buildings & Structures 0 0 0 0 0 52700 Repairs & Service of Equipment 0 0 0 0 0 52800 Transportation of Persons 0 0 0 0 0 52900 Contracted Services 0 0 0 0 0 Total Contractual Services 0 0 0 0 0
Supplies & Materials FY19 Expenditure FY20 Expenditure FY21 Appropriation FY22 Recommended Inc/Dec 21 vs 22
53000 Auto Energy Supplies 0 0 0 0 0 53200 Food Supplies 0 0 0 0 0 53400 Custodial Supplies 0 0 0 0 0 53500 Med, Dental, & Hosp Supply 0 0 0 0 0 53600 Office Supplies and Materials 0 0 0 0 0 53700 Clothing Allowance 0 0 0 0 0 53800 Educational Supplies & Mat 0 0 0 0 0 53900 Misc Supplies & Materials 0 0 0 0 0 Total Supplies & Materials 0 0 0 0 0
Current Chgs & Oblig FY19 Expenditure FY20 Expenditure FY21 Appropriation FY22 Recommended Inc/Dec 21 vs 22
54300 Workers' Comp Medical 0 0 0 0 0 54400 Legal Liabilities 0 0 0 0 0 54600 Current Charges H&I 0 0 0 0 0 54700 Indemnification 0 0 0 0 0 54800 Reserve Account 0 0 0 0 0 54900 Other Current Charges 0 0 0 0 0 Total Current Chgs & Oblig 0 0 0 0 0
Equipment FY19 Expenditure FY20 Expenditure FY21 Appropriation FY22 Recommended Inc/Dec 21 vs 22
55000 Automotive Equipment 0 0 0 0 0 55400 Lease/Purchase 0 0 0 0 0 55600 Office Furniture & Equipment 0 0 0 0 0 55900 Misc Equipment 0 0 0 0 0 Total Equipment 0 0 0 0 0
Other FY19 Expenditure FY20 Expenditure FY21 Appropriation FY22 Recommended Inc/Dec 21 vs 22
56200 Special Appropriation 0 0 0 0 0 57200 Structures & Improvements 0 0 0 0 0 58000 Land & Non-Structure 0 0 0 0 0 Total Other 0 0 0 0 0
Grand Total 65,004 64,433 64,557 64,557 0

228 Economic DevelopmentConsumer Affairs & Licensing
External Funds Personnel
Title Union Code Grade Position FY22 Salary Title
Union Code Grade Position FY22 Salary
Staff Asst MYO 05 1.00 64,557
Total 1 64,557 Adjustments Differential Payments 0 Other 0 Chargebacks 0 Salary Savings 0 FY22 Total Request 64,557

Economic DevelopmentConsumer Affairs & Licensing 229
Program 1. Consumer Licensing Kathleen Joyce, Director, Organization 114100
Program Description The Licensing Program maintains safety and order throughout the City neighborhoods by licensing entertainment activities and maintaining compliance with relevant laws. The Licensing Division processes new applications and renewals, inspects premises and holds hearings on licensing requests and violations. The Licensing Division works closely with the Boston Police Department and neighborhood organizations.
Operating Budget Actual '19 Actual '20 Approp '21 Budget '22
Personnel Services 491,394 572,251 364,167 534,583 Non Personnel 7,456 25,286 8,840 8,630 Total 498,850 597,537 373,007 543,213
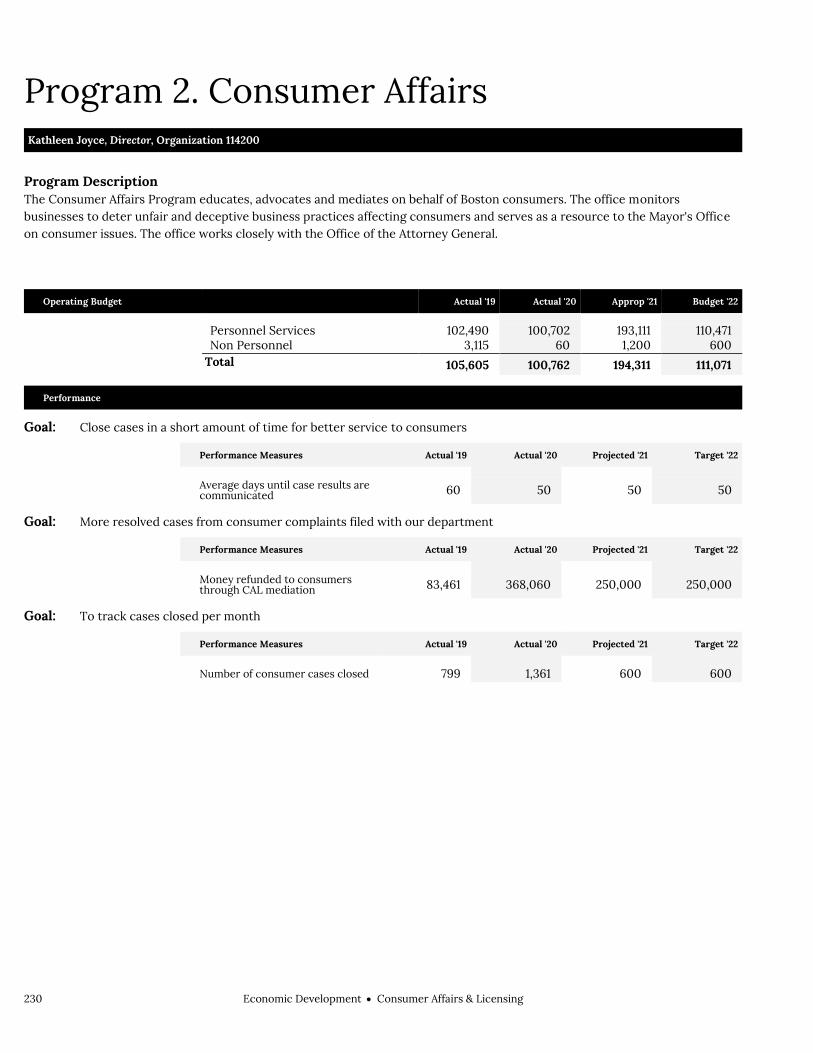
230 Economic DevelopmentConsumer Affairs & Licensing
Program 2. Consumer Affairs Kathleen Joyce, Director, Organization 114200
Program Description The Consumer Affairs Program educates, advocates and mediates on behalf of Boston consumers. The office monitors businesses to deter unfair and deceptive business practices affecting consumers and serves as a resource to the Mayor's Office on consumer issues. The office works closely with the Office of the Attorney General.
Operating Budget Actual '19 Actual '20 Approp '21 Budget '22
Personnel Services 102,490 100,702 193,111 110,471 Non Personnel 3,115 60 1,200 600 Total 105,605 100,762 194,311 111,071
Performance
Goal: Close cases in a short amount of time for better service to consumers
Performance Measures Actual '19 Actual '20 Projected '21 Target '22
Average days until case results are communicated 60 50 50 50
Goal: More resolved cases from consumer complaints filed with our department
Performance Measures Actual '19 Actual '20 Projected '21 Target '22
Money refunded to consumers through CAL mediation 83,461 368,060 250,000 250,000
Goal: To track cases closed per month
Performance Measures Actual '19 Actual '20 Projected '21 Target '22
Number of consumer cases closed 799 1,361 600 600

Economic DevelopmentConsumer Affairs & Licensing 231
Program 3. Licensing Board Kathleen Joyce, Director, Organization 114300
Program Description The Licensing Program regulates all licenses for retail sales of alcoholic and non-alcoholic beverages, restaurant food, and lodgings. The Licensing Board conducts business hearings, disciplinary hearings, and public meetings. This program performs outreach to the community to inform citizens of the work of the Licensing Board.
Operating Budget Actual '19 Actual '20 Approp '21 Budget '22
Personnel Services 580,518 623,980 895,030 940,410 Non Personnel 37,175 38,080 35,105 135,065 Total 617,693 662,060 930,135 1,075,475
Performance
Goal: To process applications and issue entertainment licenses or other licenses
Performance Measures Actual '19 Actual '20 Projected '21 Target '22
% non-live entertainment licenses granted in 14 days from application 100% 100% 100% 100%
% of live entertainment licenses granted in statutory time 100% 100% 100% 100%

232 Economic DevelopmentConsumer Affairs & Licensing
External Funds Projects Local Consumer Aid Fund Grant
Project Mission This grant from the Massachusetts Attorney General’s Office is issued annually to the Mayor’s Office of Consumer Affairs and Licensing for mediation and resolution of consumer complaints for residents of the City of Boston.

Economic DevelopmentOffice of Economic Development 233
Office of Economic Development Operating Budget Economic Development Office of Economic Development Midori Morikawa, Interim Director, Appropriation 182000
Department Mission The mission of the Office of Economic Development is to increase accessibility for all Bostonians to share in and benefit from the economic boom in Boston. This includes increasing construction employment opportunities for Boston’s residents, minorities and women as well as advocating on behalf of minority and women-owned business enterprises (MWBEs) and small and Boston-based business enterprises (SLBEs) to help them compete for City contracts.
Selected Performance Goals Equity & Inclusion
Develop Pathways to Overcome Income and Wealth Disparity. Small & Local Business
Create an ecosystem that is Open for Business by Attracting, Retaining and helping Companies to Grow.
Develop Pathways to Overcome Income and Wealth Disparity.
Operating Budget Program Name Total Actual '19 Total Actual '20 Total Approp '21 Total Budget '22
Economic Development 1,773,590 1,640,880 1,031,032 1,420,321
Equity & Inclusion 705,653 873,288 3,615,901 2,925,230
Small & Local Business 1,027,096 949,257 756,666 2,156,948
Total 3,506,339 3,463,425 5,403,599 6,502,499
External Funds Fund Name Actual '19 Actual '20 Approp '21 Budget '22
Boston Cannabis Equity Fund 0 0 123,869 876,131 CDBG 3,369,718 3,362,387 3,657,163 3,175,9231
Choice Neighborhood Implementation Grant 0 0 50,000 50,000
Neighborhood Development Fund 318,296 473,341 287,500 317,500 Commonwealth Community Compact 30,000 0 0 0 Down Dudley Event Series 0 5,000 0 0 EDIC 0 3,113 777,702 412,454 Regionalization and Efficiency 60,000 0 0 0 Small Business Relief 0 50,000 0 0
Total 3,778,014 3,893,841 4,896,233 4,832,009
Operating Budget Actual '19 Actual '20 Approp '21 Budget '22
Personnel Services 2,566,251 2,699,783 3,518,159 3,510,610 Non Personnel 940,088 763,642 1,885,440 2,991,889 Total 3,506,339 3,463,425 5,403,599 6,502,499

234 Economic DevelopmentOffice of Economic Development
Office of Economic Development
Economic Development
Business Marketing
Equity and Inclusion
Compliance Monitoring
Jobs Bank
Small & Local Business
Outreach
Monitoring
Reporting
Boston Employment Commission
Office of Economic Development Operating Budget
Description of Services The Office of Economic Development helps support new business development, ensures pathways to careers and seeks to streamline business permitting and licensing. The Office monitors compliance with Equity & Inclusion to increase the level of Boston residents working on construction projects. The Jobs Bank assists Boston residents, minorities and women who are seeking construction employment and contractors who are seeking to employ Boston residents, minorities and women on monitored projects. The Small and Local Business Enterprise program assists City departments to contract with minority and women-owned businesses and small and Boston-based businesses. The Office provides outreach to minority, women, small and local businesses and assistance to City departments. It also monitors the performance of City departments and produces quarterly and annual performance reports. The Office promotes MWBE and SLBE participation on all City of Boston construction projects.

Economic DevelopmentOffice of Economic Development 235
Department History Personnel Services FY19 Expenditure FY20 Expenditure FY21 Appropriation FY22 Recommended Inc/Dec 21 vs 22
51000 Permanent Employees 2,566,251 2,696,152 3,465,628 3,458,079 -7,549 51100 Emergency Employees 0 2,925 16,516 16,516 0 51200 Overtime 0 0 0 0 0 51600 Unemployment Compensation 0 706 0 0 0 51700 Workers' Compensation 0 0 36,015 36,015 0 Total Personnel Services 2,566,251 2,699,783 3,518,159 3,510,610 -7,549
Contractual Services FY19 Expenditure FY20 Expenditure FY21 Appropriation FY22 Recommended Inc/Dec 21 vs 22
52100 Communications 10,323 10,949 15,714 12,750 -2,964 52200 Utilities 0 0 0 0 0 52400 Snow Removal 0 0 0 0 0 52500 Garbage/Waste Removal 0 0 0 0 0 52600 Repairs Buildings & Structures 21,677 18,530 23,061 0 -23,061 52700 Repairs & Service of Equipment 4,628 373 9,400 10,400 1,000 52800 Transportation of Persons 26,877 28,415 5,790 9,612 3,822 52900 Contracted Services 760,839 596,698 1,770,880 2,871,674 1,100,794 Total Contractual Services 824,344 654,965 1,824,845 2,904,436 1,079,591
Supplies & Materials FY19 Expenditure FY20 Expenditure FY21 Appropriation FY22 Recommended Inc/Dec 21 vs 22
53000 Auto Energy Supplies 0 0 0 0 0 53200 Food Supplies 14,878 8,693 13,685 13,685 0 53400 Custodial Supplies 0 0 0 0 0 53500 Med, Dental, & Hosp Supply 0 0 0 0 0 53600 Office Supplies and Materials 11,798 21,652 10,000 10,000 0 53700 Clothing Allowance 2,800 2,575 3,125 3,625 500 53800 Educational Supplies & Mat 0 0 0 0 0 53900 Misc Supplies & Materials 0 1,200 1,430 1,430 0 Total Supplies & Materials 29,476 34,120 28,240 28,740 500
Current Chgs & Oblig FY19 Expenditure FY20 Expenditure FY21 Appropriation FY22 Recommended Inc/Dec 21 vs 22
54300 Workers' Comp Medical 4,431 4,684 0 0 0 54400 Legal Liabilities 0 0 0 0 0 54500 Aid To Veterans 0 0 0 0 0 54600 Current Charges H&I 0 0 0 0 0 54700 Indemnification 0 0 0 0 0 54800 Reserve Account 0 0 0 0 0 54900 Other Current Charges 36,070 40,632 28,155 54,513 26,358 Total Current Chgs & Oblig 40,501 45,316 28,155 54,513 26,358
Equipment FY19 Expenditure FY20 Expenditure FY21 Appropriation FY22 Recommended Inc/Dec 21 vs 22
55000 Automotive Equipment 0 0 0 0 0 55400 Lease/Purchase 0 0 0 0 0 55600 Office Furniture & Equipment 12,426 17,955 0 0 0 55900 Misc Equipment 33,341 11,286 4,200 4,200 0 Total Equipment 45,767 29,241 4,200 4,200 0
Other FY19 Expenditure FY20 Expenditure FY21 Appropriation FY22 Recommended Inc/Dec 21 vs 22
56200 Special Appropriation 0 0 0 0 0 57200 Structures & Improvements 0 0 0 0 0 58000 Land & Non-Structure 0 0 0 0 0 Total Other 0 0 0 0 0
Grand Total 3,506,339 3,463,425 5,403,599 6,502,499 1,098,900

236 Economic DevelopmentOffice of Economic Development
Department Personnel
Title Union Code Grade Position FY22 Salary Title
Union Code Grade Position FY22 Salary
Adm Asst SU4 15 1.00 61,761 Prin Admin Assistant SE1 08 1.00 108,468 Admin Asst (M/Wbe) SU4 16 2.00 151,283 Prin AdminAsst EXM 08 1.00 105,822 Admin Manager MYO 09 1.00 89,562 Prin Research Analyst SE1 06 1.00 90,319 Administ.Assist EXM 19 0.10 6,189 Principal Clerk SU4 10 1.00 51,838 Dep Dir EXM NG 1.00 96,835 Prog Asst SU2 19 0.30 21,416 Design Services Manager SU2 24 0.10 7,230 Sr Adm Analyst SE1 06 1.00 87,060 Dir of Outreach & Engagement MYN NG 1.00 105,141 Sr Adm Asst (WC) SE1 06 1.00 90,319 Director of Operations MYO 12 1.00 73,915 Sr Business Manager SU2 23 0.20 15,479 Economic Development Chief CDH NG 1.00 161,442 Sr Neigh Business Mgr SU2 24 0.10 10,545 International Partnerships Mgr EXM NG 1.00 91,984 Sr Program Manager SU2 23 0.10 9,755 Mobile Enterprises Mgr MYO 09 1.00 67,133 Sr Research Analyst (BRJP) SU4 18 7.00 596,954
Neighborhood Business Manager
SU2 22 0.60 47,288 Sr. Research Analyst SE1 03 2.00 120,627
Operations Manager EXM 25 0.10 9,813 Staff - Asst MYN NG 1.00 95,515 Operations Mgr EXM NG 1.00 80,921 Staff Assist I MYO 04 1.00 58,624 Operations Specialist MYN NG 0.10 11,476 Staff Asst IV MYO 09 1.00 87,022 Prin Accountant SU4 16 1.00 75,815 Staff Asst IV MYO 12 2.00 205,357 Total 34 2,892,908 Adjustments Differential Payments 0 Other 575,175 Chargebacks 0 Salary Savings -10,000 FY22 Total Request 3,458,083

Economic DevelopmentOffice of Economic Development 237
External Funds History Personnel Services FY19 Expenditure FY20 Expenditure FY21 Appropriation FY22 Recommended Inc/Dec 21 vs 22
51000 Permanent Employees 1,080,208 1,104,881 1,637,756 1,907,372 269,617 51100 Emergency Employees 0 0 0 0 0 51200 Overtime 0 0 0 0 0 51300 Part Time Employees 0 0 0 0 0 51400 Health Insurance 145,839 144,652 8,833 35,328 26,495 51500 Pension & Annuity 103,421 86,236 5,300 21,196 15,896 51600 Unemployment Compensation 0 0 0 0 0 51700 Workers' Compensation 0 0 0 0 0 51800 Indirect Costs 0 0 0 0 0 51900 Medicare 12,549 12,990 854 3,415 2,561 Total Personnel Services 1,342,017 1,348,759 1,652,743 1,967,311 314,569
Contractual Services FY19 Expenditure FY20 Expenditure FY21 Appropriation FY22 Recommended Inc/Dec 21 vs 22
52100 Communications 0 0 0 0 0 52200 Utilities 0 0 0 0 0 52400 Snow Removal 0 0 0 0 0 52500 Garbage/Waste Removal 0 0 0 0 0 52600 Repairs Buildings & Structures 0 0 0 0 0 52700 Repairs & Service of Equipment 0 0 0 0 0 52800 Transportation of Persons 2,829 2,478 2,520 0 -2,520 52900 Contracted Services 2,426,589 2,534,404 3,235,971 2,859,034 -376,937 Total Contractual Services 2,429,418 2,536,882 3,238,491 2,859,034 -379,457
Supplies & Materials FY19 Expenditure FY20 Expenditure FY21 Appropriation FY22 Recommended Inc/Dec 21 vs 22
53000 Auto Energy Supplies 0 0 0 0 0 53200 Food Supplies 0 5,000 0 0 0 53400 Custodial Supplies 0 0 0 0 0 53500 Med, Dental, & Hosp Supply 0 0 0 0 0 53600 Office Supplies and Materials 0 0 0 0 0 53700 Clothing Allowance 2,700 2,925 0 0 0 53800 Educational Supplies & Mat 0 0 0 0 0 53900 Misc Supplies & Materials 0 0 0 0 0 Total Supplies & Materials 2,700 7,925 0 0 0
Current Chgs & Oblig FY19 Expenditure FY20 Expenditure FY21 Appropriation FY22 Recommended Inc/Dec 21 vs 22
54300 Workers' Comp Medical 0 0 0 0 0 54400 Legal Liabilities 0 0 0 0 0 54600 Current Charges H&I 0 0 0 0 0 54700 Indemnification 0 0 0 0 0 54800 Reserve Account 0 0 0 0 0 54900 Other Current Charges 275 275 5,000 5,664 664 Total Current Chgs & Oblig 275 275 5,000 5,664 664
Equipment FY19 Expenditure FY20 Expenditure FY21 Appropriation FY22 Recommended Inc/Dec 21 vs 22
55000 Automotive Equipment 0 0 0 0 0 55400 Lease/Purchase 0 0 0 0 0 55600 Office Furniture & Equipment 2,095 0 0 0 0 55900 Misc Equipment 1,510 0 0 0 0 Total Equipment 3,605 0 0 0 0
Other FY19 Expenditure FY20 Expenditure FY21 Appropriation FY22 Recommended Inc/Dec 21 vs 22
56200 Special Appropriation 0 0 0 0 0 57200 Structures & Improvements 0 0 0 0 0 58000 Land & Non-Structure 0 0 0 0 0 Total Other 0 0 0 0 0
Grand Total 3,778,014 3,893,841 4,896,234 4,832,009 -64,224

238 Economic DevelopmentOffice of Economic Development
External Funds Personnel
Title Union Code Grade Position FY22 Salary Title
Union Code Grade Position FY22 Salary
Admin Asst EXM 19 0.90 55,698 Neighborhood Business Manager
SU2 22 5.40 429,115
Admin Manager MYO 09 1.00 67,133 Operations Manager EXM 25 0.90 88,314 Design Services Manager SU2 24 0.90 65,073 Operations Specialist MYN NG 0.90 103,283
Dir-Economic Development Policy MYO 13 1.00 94,258 Prog Asst SU2 19 2.70 192,741
Director EXM NG 1.00 125,143 Sr Business Manager SU2 23 1.80 142,467 Director of Business Strategy MYO 13 1.00 113,686 Sr Neigh Business Mgr SU2 24 0.90 94,904
Economic Develop Policy Analyst
EXM NG 1.00 70,942 Sr Program Manager SU2 23 0.90 87,795
International Bus Strategy Mgr EXM NG 1.00 81,405 Staff Asstistant I MYN NG 1.00 52,163 Total 24 1,864,119 Adjustments Differential Payments 0 Other 43,253 Chargebacks 0 Salary Savings 0 FY22 Total Request 1,907,372

Economic DevelopmentOffice of Economic Development 239
Program 1. Economic Development Midori Morikawa, Manager, Organization 182100
Program Description The Economic Development Program will focus on fostering economic development in all of Boston’s neighborhoods through marketing Boston on a national and international scale; ensuring access to employment, pathways to careers, and strong job growth; streamlining licensing and permitting processes; and supporting small businesses.
Operating Budget Actual '19 Actual '20 Approp '21 Budget '22
Personnel Services 1,319,201 1,449,227 938,093 1,329,037 Non Personnel 454,389 191,653 92,939 91,284 Total 1,773,590 1,640,880 1,031,032 1,420,321
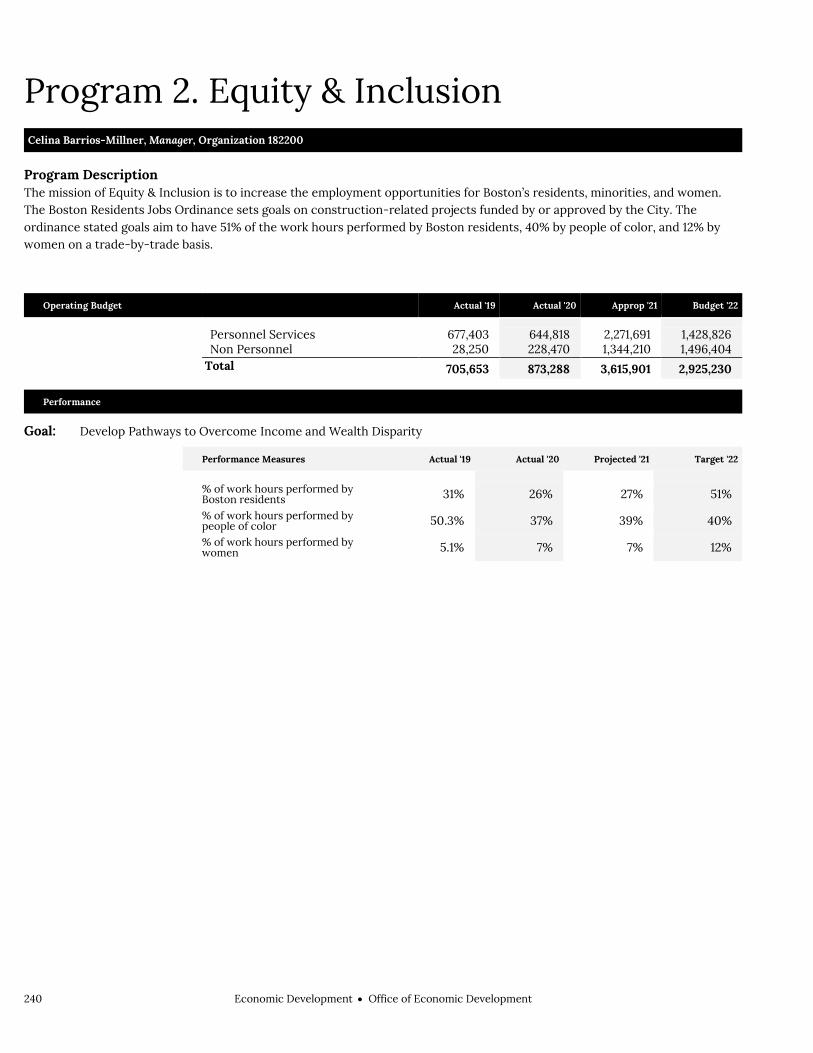
240 Economic DevelopmentOffice of Economic Development
Program 2. Equity & Inclusion Celina Barrios-Millner, Manager, Organization 182200
Program Description The mission of Equity & Inclusion is to increase the employment opportunities for Boston’s residents, minorities, and women. The Boston Residents Jobs Ordinance sets goals on construction-related projects funded by or approved by the City. The ordinance stated goals aim to have 51% of the work hours performed by Boston residents, 40% by people of color, and 12% by women on a trade-by-trade basis.
Operating Budget Actual '19 Actual '20 Approp '21 Budget '22
Personnel Services 677,403 644,818 2,271,691 1,428,826 Non Personnel 28,250 228,470 1,344,210 1,496,404 Total 705,653 873,288 3,615,901 2,925,230
Performance
Goal: Develop Pathways to Overcome Income and Wealth Disparity
Performance Measures Actual '19 Actual '20 Projected '21 Target '22
% of work hours performed by Boston residents 31% 26% 27% 51%
% of work hours performed by people of color 50.3% 37% 39% 40%
% of work hours performed by women 5.1% 7% 7% 12%

Economic DevelopmentOffice of Economic Development 241
Program 3. Small & Local Business Natalia Urtubey, Manager, Organization 182300
Program Description The Small and Local Business Program encourages, assists, and provides opportunities for minority and women-owned businesses and small and Boston-based businesses to participate in the City’s contracting arena as well as in the broader Boston area economy. The program assists City departments to increase both the number of City contracts and the dollars awarded to those businesses on goods and services contracts and construction contracts.
Operating Budget Actual '19 Actual '20 Approp '21 Budget '22
Personnel Services 569,647 605,738 308,375 752,747 Non Personnel 457,449 343,519 448,291 1,404,201 Total 1,027,096 949,257 756,666 2,156,948
Performance
Goal: Create an ecosystem that is Open for Business by Attracting, Retaining and helping Companies to Grow
Performance Measures Actual '19 Actual '20 Projected '21 Target '22
# of businesses assisted 5,112 3,577 3,500 3,500
# of new businesses open as a result of Small Business Assistance 116 24 25 25
# of projects completed 85 146 100 120
% Main Streets storefronts occupied 95% 94.5% 95% 92%
Funds leveraged - private dollars invested 1,441,187 643,857 100,000 150,000
Goal: Develop Pathways to Overcome Income and Wealth Disparity
Performance Measures Actual '19 Actual '20 Projected '21 Target '22
# of jobs created through Small Business Programs 540 166 150 150
# of M/WBE firms certified 32 15 18 35
# of MBE firms certified 16 22 29 25
# of MWBE companies with City of Boston Contracts 191 187 TBR TBR
# of VBE firms recognized 1 1 2 2
# of WBE firms certified 15 16 28 25
City of Boston money spent with MWBE contracts
51,611,091 TBR TBR

242 Economic DevelopmentOffice of Economic Development
External Funds Projects Boston Cannabis Equity Fund
Project Mission The Boston Cannabis Equity Fund was established by the Ordinance Establishing Equitable Regulation of the Cannabis Industry in the City of Boston” This fund will make resources and technical assistance available for equity applicants and licensees to establish and operate a cannabis business in the City of Boston.
The Community Development Block Grant (CDBG) is an annual entitlement grant from the U.S. Department of Housing of neighborhood
CDBG
Project Mission The Community Development Block Grant (CDBG) is an annual entitlement grant from the U.S. Department of Housing and Urban Development to the City of Boston designed to fund a variety of neighborhood development activities. At least 70 percent of CDBG funds must be used to benefit low- and moderate-income households. CDBG funds are used to produce and preserve affordable housing, revitalize neighborhood commercial districts, assist the renovation of non-profit facilities, improve vacant lots, promote and monitor fair housing activities, and assist non-profit organizations in the operation of emergency shelters, health care, child care, youth and adult literacy programs. CDBG funds cannot be used for general government services or to replace funding cuts from existing public service activities. The CDBG awards for FY17, FY18, and FY19 were $15,958,081, $15,761,309, and $17,229,498 respectively. The FY20 award was $17,146,361, and the FY21 award is $17,437,636.
Choice Neighborhoods Implementation Grant
Project Mission The Choice Neighborhood Implementation Grant is a competitive grant from the U.S. Department of Housing and Urban Development. The $30 million grant was awarded to the Boston Housing Authority (BHA) for the redevelopment of the Whittier Street public housing development. With DND as the lead, several City of Boston departments are responsible for administering the $4 million neighborhood improvements portion of the grant, which includes road improvements, open space projects, art projects, first-time homebuyer assistance, business assistance, and educational assistance. The grant started on 8/15/17 and ends on 9/30/23.
Commonwealth Community Compact
Project Mission The Community Compact is a voluntary, mutual agreement entered into between the Baker-Polito Administration and individual cities and towns of the Commonwealth. In a Community Compact, a community will agree to implement at least one best practice that they select from across a variety of areas. The community’s chosen best practice(s) will be reviewed between the Commonwealth and the municipality to ensure that the best practice(s) chosen are unique to the municipality and reflect needed areas of improvement. Once approved, the written agreement will be generated and signed by both the municipality and the Commonwealth. The Compact also articulates the commitments the Commonwealth will make on behalf of all communities.
EDIC
Project Mission Funded by the Economic Development and Industrial Corporation (EDIC), this program will support the operational needs of the Office of Economic Development. This multi-year project will award the department $500,000 each year over the next three years.

Economic DevelopmentOffice of Economic Development 243
Regionalization and Efficiency Study
Project Mission The purpose of the Efficiency and Regionalization competitive grant program is to provide financial
support for governmental entities interested in implementing regionalization and other efficiency
initiatives that allow for long-term sustainability. Grant awards provided by Massachusetts Department of
Revenue - Division of Local Services provided one-time funds to assist in the planning and
implementation of regionalization and other efficiency initiatives that support long-term municipal
sustainability
Small Business Relief
Project Mission Funding provided by the Massachusetts Attorney General’s Office was included as part of the larger
‘Small Business Relief Fund’ that provided emergency grants to City businesses and business owners
who have been critically impacted by the COVID-19 pandemic. The Neighborhood Development the repayment of Urban Development Action Grant (UDAG The Neighborhood
Neighborhood Development Fund
Project Mission The Neighborhood Development Fund receives revenue from the repayment of Urban Development Action Grant (UDAG) loans to the City. Funds can be used for eligible HUD Title I activities which are somewhat less restrictive than CDBG regulations.

244 Economic DevelopmentOffice of Economic Development

Economic DevelopmentOffice of Tourism 245
Office of Tourism Operating Budget Economic Development Office of Tourism Kate Davis, Director, Appropriation 416000
Department Mission The mission of the Office of Tourism is to advance tourism in Boston and promote participation in public celebrations.
Operating Budget Program Name Total Actual '19 Total Actual '20 Total Approp '21 Total Budget '22
Administration 501,048 501,366 505,606 1,520,749
Film & Special Events 740,761 785,528 1,033,385 864,511
Tourism 92,000 78,415 112,982 118,070
Total 1,333,809 1,365,309 1,651,973 2,503,330
External Funds Budget Fund Name Total Actual '19 Total Actual '20 Total Approp '21 Total Budget '22
City Hall Plaza Fund 45,010 124,677 150,000 50,000
Total 45,010 124,677 150,000 50,000
Operating Budget Actual '19 Actual '20 Approp '21 Budget '22
Personnel Services 765,217 804,484 842,233 866,901 Non Personnel 568,592 560,825 809,740 1,636,429 Total 1,333,809 1,365,309 1,651,973 2,503,330

246 Economic DevelopmentOffice of Tourism
Office of Tourism Operating Budget
Authorizing Statutes Enabling Legislation, CBC Ord. §§ 15-3.1-
15-3.2.
Description of Services The Office of Tourism serves Boston’s residents, visitors, and the tourism industry in the following ways: producing year-round events including festivals, concerts, exhibitions, and public celebrations both downtown and in Boston’s neighborhoods; supporting film and television production through Boston Film Bureau with permitting, location assistance, and coordination with local and state agencies; providing technical assistance to neighborhood based groups with event production; promoting Boston as a desirable destination for visitors, conventions, and family-oriented sporting events such as amateur collegiate, and Olympic tournaments.
Office of Tourism
Tourism & Promotion
Publications
Distinguished Guests/International Delegations
Sponsorships
Grants Administration
Budget
Operations
Film & Special Events
Film Office
Public Celebrations
Production/Technical Assistance
Administration

Economic DevelopmentOffice of Tourism 247
Department History Personnel Services FY19 Expenditure FY20 Expenditure FY21 Appropriation FY22 Recommended Inc/Dec 21 vs 22
51000 Permanent Employees 722,886 776,579 745,233 769,901 24,668 51100 Emergency Employees 42,331 27,905 97,000 97,000 0 51200 Overtime 0 0 0 0 0 51600 Unemployment Compensation 0 0 0 0 0 51700 Workers' Compensation 0 0 0 0 0 Total Personnel Services 765,217 804,484 842,233 866,901 24,668
Contractual Services FY19 Expenditure FY20 Expenditure FY21 Appropriation FY22 Recommended Inc/Dec 21 vs 22
52100 Communications 17,490 12,237 18,400 18,400 0 52200 Utilities 0 0 0 0 0 52400 Snow Removal 0 0 0 0 0 52500 Garbage/Waste Removal 0 0 0 0 0 52600 Repairs Buildings & Structures 0 0 0 0 0 52700 Repairs & Service of Equipment 2,663 2,718 3,440 3,440 0 52800 Transportation of Persons 3,800 5,507 0 0 0 52900 Contracted Services 216,483 244,081 470,520 1,270,540 800,020 Total Contractual Services 240,436 264,543 492,360 1,292,380 800,020
Supplies & Materials FY19 Expenditure FY20 Expenditure FY21 Appropriation FY22 Recommended Inc/Dec 21 vs 22
53000 Auto Energy Supplies 1,160 706 1,180 849 -331 53200 Food Supplies 9,870 10,649 12,500 14,500 2,000 53400 Custodial Supplies 0 0 0 0 0 53500 Med, Dental, & Hosp Supply 0 0 0 0 0 53600 Office Supplies and Materials 2,099 4,541 2,400 2,400 0 53700 Clothing Allowance 0 0 0 0 0 53800 Educational Supplies & Mat 0 0 0 0 0 53900 Misc Supplies & Materials 0 0 0 0 0 Total Supplies & Materials 13,129 15,896 16,080 17,749 1,669
Current Chgs & Oblig FY19 Expenditure FY20 Expenditure FY21 Appropriation FY22 Recommended Inc/Dec 21 vs 22
54300 Workers' Comp Medical 0 0 0 0 0 54400 Legal Liabilities 0 0 0 0 0 54500 Aid To Veterans 0 0 0 0 0 54600 Current Charges H&I 0 0 0 0 0 54700 Indemnification 0 0 0 0 0 54800 Reserve Account 0 0 0 0 0 54900 Other Current Charges 56,167 56,406 60,550 60,550 0 Total Current Chgs & Oblig 56,167 56,406 60,550 60,550 0
Equipment FY19 Expenditure FY20 Expenditure FY21 Appropriation FY22 Recommended Inc/Dec 21 vs 22
55000 Automotive Equipment 0 0 0 0 0 55400 Lease/Purchase 0 0 0 0 0 55600 Office Furniture & Equipment 0 0 0 0 0 55900 Misc Equipment 1,676 17,688 2,000 2,000 0 Total Equipment 1,676 17,688 2,000 2,000 0
Other FY19 Expenditure FY20 Expenditure FY21 Appropriation FY22 Recommended Inc/Dec 21 vs 22
56200 Special Appropriation 257,184 206,292 238,750 263,750 25,000 57200 Structures & Improvements 0 0 0 0 0 58000 Land & Non-Structure 0 0 0 0 0 Total Other 257,184 206,292 238,750 263,750 25,000
Grand Total 1,333,809 1,365,309 1,651,973 2,503,330 851,357

248 Economic DevelopmentOffice of Tourism
Department Personnel
Title Union Code Grade Position FY22 Salary Title
Union Code Grade Position FY22 Salary
AdminAsst MYO 03 1.00 53,164 Production/Stage Manager MYO 05 1.00 64,557 Dir of Administration & Finance MYO 09 1.00 91,375 Staff - Asst MYN NG 1.00 90,247 Director BCH 10 1.00 100,275 Staff Assist I MYO 04 1.00 58,624 Directr CDH NG 1.00 100,275 Staff Asst III MYO 07 1.00 61,006
Manager-Marketing&Vistors Srvc
MYO 09 1.00 72,220 Technical Manager MYO 05 1.00 64,557
Total 10 756,300 Adjustments Differential Payments 0 Other 13,600 Chargebacks 0 Salary Savings 0 FY22 Total Request 769,900
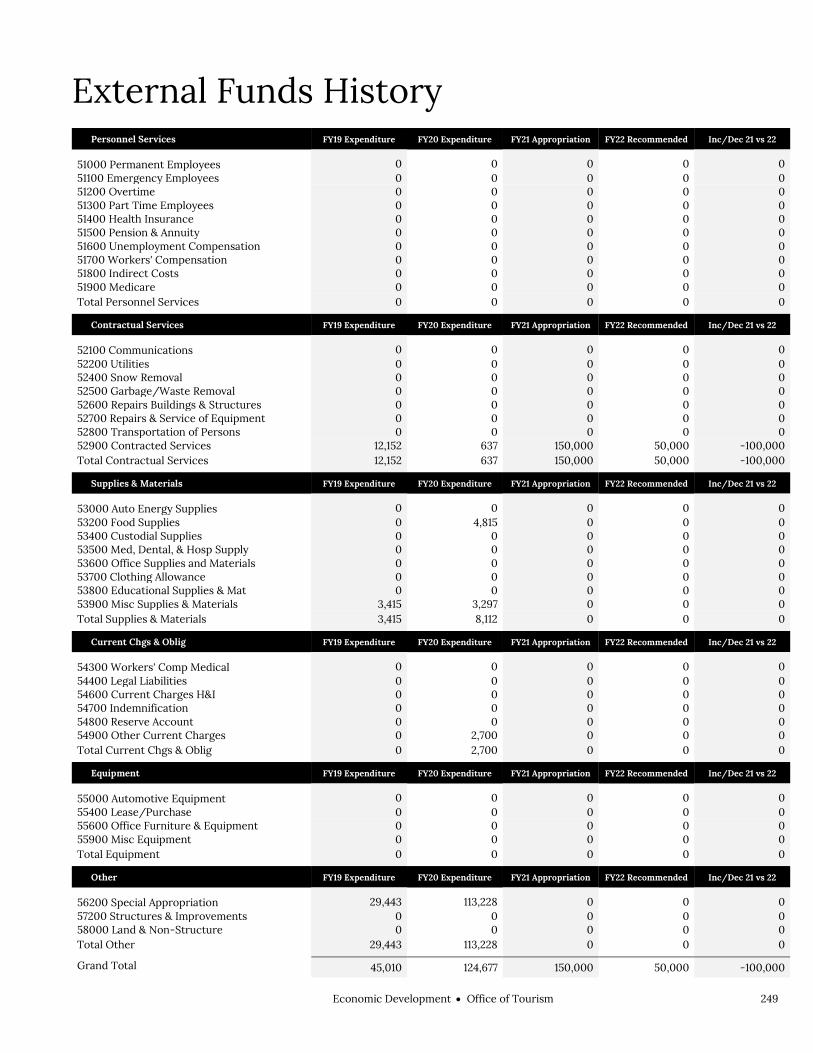
Economic DevelopmentOffice of Tourism 249
External Funds History Personnel Services FY19 Expenditure FY20 Expenditure FY21 Appropriation FY22 Recommended Inc/Dec 21 vs 22
51000 Permanent Employees 0 0 0 0 0 51100 Emergency Employees 0 0 0 0 0 51200 Overtime 0 0 0 0 0 51300 Part Time Employees 0 0 0 0 0 51400 Health Insurance 0 0 0 0 0 51500 Pension & Annuity 0 0 0 0 0 51600 Unemployment Compensation 0 0 0 0 0 51700 Workers' Compensation 0 0 0 0 0 51800 Indirect Costs 0 0 0 0 0 51900 Medicare 0 0 0 0 0 Total Personnel Services 0 0 0 0 0
Contractual Services FY19 Expenditure FY20 Expenditure FY21 Appropriation FY22 Recommended Inc/Dec 21 vs 22
52100 Communications 0 0 0 0 0 52200 Utilities 0 0 0 0 0 52400 Snow Removal 0 0 0 0 0 52500 Garbage/Waste Removal 0 0 0 0 0 52600 Repairs Buildings & Structures 0 0 0 0 0 52700 Repairs & Service of Equipment 0 0 0 0 0 52800 Transportation of Persons 0 0 0 0 0 52900 Contracted Services 12,152 637 150,000 50,000 -100,000 Total Contractual Services 12,152 637 150,000 50,000 -100,000
Supplies & Materials FY19 Expenditure FY20 Expenditure FY21 Appropriation FY22 Recommended Inc/Dec 21 vs 22
53000 Auto Energy Supplies 0 0 0 0 0 53200 Food Supplies 0 4,815 0 0 0 53400 Custodial Supplies 0 0 0 0 0 53500 Med, Dental, & Hosp Supply 0 0 0 0 0 53600 Office Supplies and Materials 0 0 0 0 0 53700 Clothing Allowance 0 0 0 0 0 53800 Educational Supplies & Mat 0 0 0 0 0 53900 Misc Supplies & Materials 3,415 3,297 0 0 0 Total Supplies & Materials 3,415 8,112 0 0 0
Current Chgs & Oblig FY19 Expenditure FY20 Expenditure FY21 Appropriation FY22 Recommended Inc/Dec 21 vs 22
54300 Workers' Comp Medical 0 0 0 0 0 54400 Legal Liabilities 0 0 0 0 0 54600 Current Charges H&I 0 0 0 0 0 54700 Indemnification 0 0 0 0 0 54800 Reserve Account 0 0 0 0 0 54900 Other Current Charges 0 2,700 0 0 0 Total Current Chgs & Oblig 0 2,700 0 0 0
Equipment FY19 Expenditure FY20 Expenditure FY21 Appropriation FY22 Recommended Inc/Dec 21 vs 22
55000 Automotive Equipment 0 0 0 0 0 55400 Lease/Purchase 0 0 0 0 0 55600 Office Furniture & Equipment 0 0 0 0 0 55900 Misc Equipment 0 0 0 0 0 Total Equipment 0 0 0 0 0
Other FY19 Expenditure FY20 Expenditure FY21 Appropriation FY22 Recommended Inc/Dec 21 vs 22
56200 Special Appropriation 29,443 113,228 0 0 0 57200 Structures & Improvements 0 0 0 0 0 58000 Land & Non-Structure 0 0 0 0 0 Total Other 29,443 113,228 0 0 0
Grand Total 45,010 124,677 150,000 50,000 -100,000

250 Economic DevelopmentOffice of Tourism
Program 1. Administration Sean O'Connor, Manager, Organization 416100
Program Description The Administration Program provides administrative, financial, and personnel support for the department. The Program builds partnerships to support and strengthen the City’s cultural life.
Operating Budget Actual '19 Actual '20 Approp '21 Budget '22
Personnel Services 454,128 468,075 460,796 473,919 Non Personnel 46,920 33,291 44,810 1,046,830 Total 501,048 501,366 505,606 1,520,749

Economic DevelopmentOffice of Tourism 251
Program 2. Film & Special Events Kate Davis, Manager, Organization 416300
Program Description The Film and Special Events program oversees the annual production of special events and public celebrations that celebrate and promote the City’s cultural and ethnic diversity along with Boston’s rich history and promotes Boston as a location for film and video productions by supporting the film and television industry’s work in the City.
Operating Budget Actual '19 Actual '20 Approp '21 Budget '22
Personnel Services 278,337 301,489 314,305 320,762 Non Personnel 462,424 484,039 719,080 543,749 Total 740,761 785,528 1,033,385 864,511

252 Economic DevelopmentOffice of Tourism
Program 3. Tourism Amy B. Yandle, Manager, Organization 416400
Program Description The Tourism program oversees the department's promotional efforts, its sponsorships and its international relations.
Operating Budget Actual '19 Actual '20 Approp '21 Budget '22
Personnel Services 32,752 34,920 67,132 72,220 Non Personnel 59,248 43,495 45,850 45,850 Total 92,000 78,415 112,982 118,070

Economic DevelopmentOffice of Tourism 253
External Funds Projects City Hall Plaza Fund
Project Mission The purpose of this fund is to purchase goods and services to support events and programming on and around City Hall Plaza to advance tourism and promote participation in public celebrations, civic, and cultural events from lease revenue received from the rental of City Hall Plaza.

254 Economic DevelopmentOffice of Tourism

EducationCabinet 255
Education Education Cabinet
Education ............................................................................. 257
Boston Public Schools................................................ 259
General School Purposes .............................. 267

256 EducationCabinet
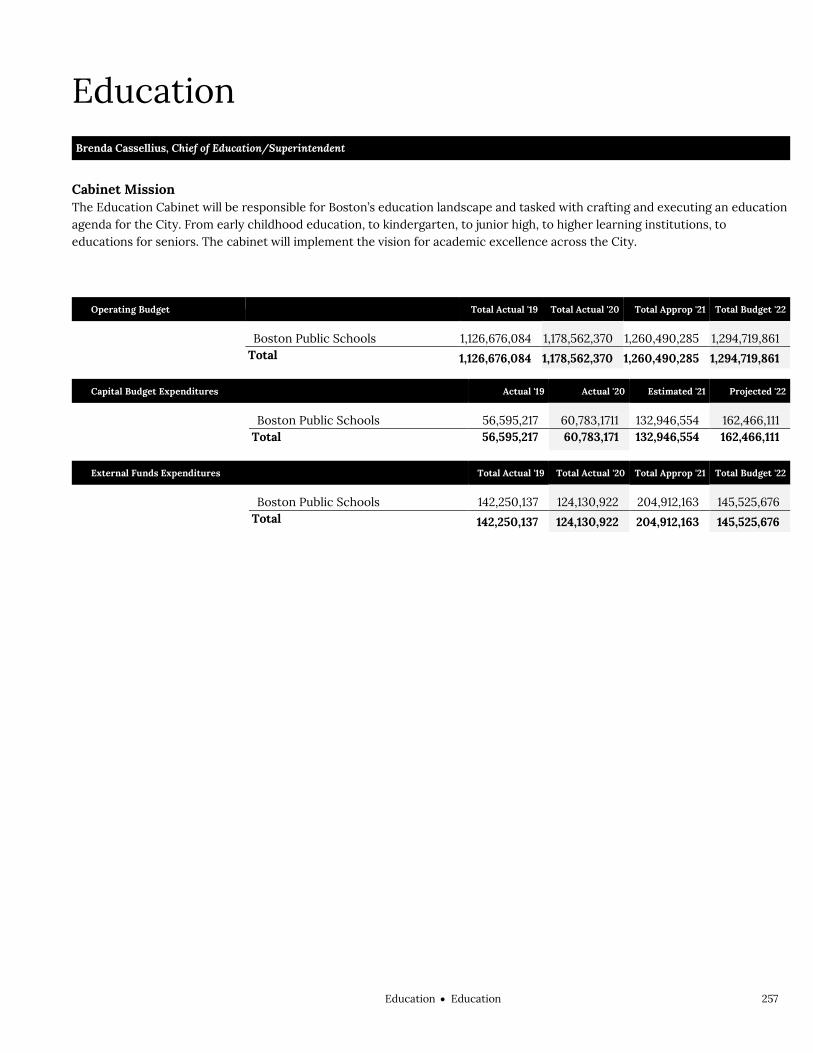
EducationEducation 257
Education Education
Brenda Cassellius, Chief of Education/Superintendent
Cabinet Mission The Education Cabinet will be responsible for Boston’s education landscape and tasked with crafting and executing an education agenda for the City. From early childhood education, to kindergarten, to junior high, to higher learning institutions, to educations for seniors. The cabinet will implement the vision for academic excellence across the City.
Operating Budget
Total Actual '19 Total Actual '20 Total Approp '21 Total Budget '22
Boston Public Schools 1,126,676,084 1,178,562,370 1,260,490,285 1,294,719,861
Total 1,126,676,084 1,178,562,370 1,260,490,285 1,294,719,861
Capital Budget Expenditures Actual '19 Actual '20 Estimated '21 Projected '22
Boston Public Schools 56,595,217 60,783,1711 132,946,554 162,466,111 Total 56,595,217 60,783,171 132,946,554 162,466,111
External Funds Expenditures
Total Actual '19 Total Actual '20 Total Approp '21 Total Budget '22
Boston Public Schools 142,250,137 124,130,922 204,912,163 145,525,676
Total 142,250,137 124,130,922 204,912,163 145,525,676

258 EducationEducation

EducationBoston Public Schools 259
Boston Public Schools Operating Budget Education Boston Public Schools Brenda Cassellius, Superintendent, Appropriation 101000
Department Mission We welcome the children of this city into the Boston Public Schools, where effective teaching and learning prepare all of our students to achieve at high levels, and where the entire community works together to focus on children.
Selected Performance Goals General School Purposes
BPS will provide rigorous, effective, and engaging curriculum, instruction, and enrichment. To graduate all students from high school prepared for college and career success.
Operating Budget Program Name Total Actual '19 Total Actual '20 Total Approp '21 Total Budget '22
General School Purposes 1,126,676,084 1,178,562,370 1,260,490,285 1,294,719,861
Total 1,126,676,084 1,178,562,370 1,260,490,285 1,294,719,861
External Funds Budget Program Name Total Actual '19 Total Actual '20 Total Approp '21 Total Budget '22
21st Century Community Learn 1,142,822 750,511 915,653 731,032
Adult Education Fund 590,128 607,380 636,549 998,631
Alternative English Learner Ed - Summer 0 0 70,428 1,823
ARABIC Summer Academy 88,295 0 0 0
Arts Opportunity Fund 3,000 0 0 0
Assessment Audit 0 15,000 0 0
Athletics Revolving Fund 26,288 12,590 0 0
Better: Bite by Bite 130,365 0 0 0
BHCC Dual Enrollment 0 31,829 0 0
BOKS Grant 0 0 77,000 0
Boston Adult High School 5,617 8,387 0 0
Boston Athletic Assoc Donation 0 0 225,000 5,979
Boston Children's CCH Grant 0 0 178 0
Boston Resiliency Fund 0 2,000,000 620,000 0
Capital Skills 0 436,434 180,000 0
Career and Technical Education 0 60,000 60,000 11,912
CARES/ESSER 0 1,953,041 30,212,358 4,244,623
Children's Pilot Funds 204,405 215,874 505,472 212,486
Commonwealth Preschool Partnership Initiative 0 0 515,000 506,644
Community Impact Fund 10,000 6,500 0 0
Community Partnership Program 156,027 109,814 0 0
Comprehensive Behavorial Health Model Initiative 450,491 291,481 354,705 385,903
Comprehensive School Health 0 284,490 400,000 401,103
Country Music Assoc. Foundation 19,679 0 0 0
CPPI Grant 388,914 622,800 0 0
Crown Castle Donation 0 0 50,000 1,329
CTE Planning School Year - State 0 2,000 0 0
Digital Literacy Now 0 17,964 0 0
Early College - CHS 136,280 59,713 20,000 0
Early College Designation WROX 0 3,100 0 0
Early Literacy Intervention 53,571 128,781 0 0

260 EducationBoston Public Schools
E.B. Early Childhood Playground 0 567,500 0 0
Ed-Fi CTA Grant 314,918 75,881 108,978 16,050
EDIC -309 3,113 777,702 412,454
Educator Effectiveness 151,061 88,167 0 0
EdVestor Human Capital 43,435 214,842 403,549 0
Emergency Impact & Assist Home 28,174 18,525 0 0
Emergency Food Relief Services 0 0 50,000 0
English for New Bostonians 24,000 24,000 24,000 24,000
English Language Learners 2,950 0 0 0
Eos Foundation's Nourishing Kids Initiative 0 0 58,750 0
EPA Reduction in Lead Exposure 0 0 6,215,000 165,161
Expanded Learning Time 1,305,954 1,187,958 1,369,972 570,710
Facilities Fund 2,190,862 1,822,188 2,600,000 2,200,000
Family Literacy 0 0 197,000 157,314
FC735 Early Lit. Pilot Program 0 6,868 0 0
Fidelity Grant - Philbrick 0 1,450 0 0
Financial Ed. Innovation BCLA 0 2,500 0 0
Financial Ed. Innovation BLA 2,500 0 0 0
Financial Ed. Innovation GE 2,500 0 0 0
Financial Ed. Innovation N Miss 5,000 0 0 0
Fresh Fruit & Vegetable Program 1,185,002 661,421 1,577,772 1,240,245
Gateway City 0 38,807 108,693 2,888
GED Test Score 5,287 7,164 6,665 0
Higginson School Playground 500,000 0 0 0
High Quality Instruction Summer Planning 30,000 0 0 0
High Quality Summer Learning 38,223 43,620 0 0
High School Voter Registration 0 0 20,000 0
HQPBL Grant 0 864,877 25,000 0
Humane Society of Mass CPR 1,600 0 0 0
i3 Scale Up Grant 9,724 19,847 0 5,000
IDEA 17,532,551 14,987,072 20,036,549 18,922,674
Improving Student Access to Behavioral & Mental Health Services 0 102,489 0 0
Indirect 1,270,751 1,194,649 1,392,950 1,461,418
Influence 100 Fellow 0 2,000 0 0
Innovation Pathways 6,017 74,831 70,000 0
Innovation Schools Enhancement 30,000 0 0 0
Instrument Rental Account 6,849 63,582 0 0
Integrated English Literacy & Civics Education - Culinary Pathway 40,000 40,000 40,000 68,768
Kaleidoscope Cohort School Fund 0 0 21,000 0
Lee School Playground 0 827,030 0 0
MassGrad Excel High 0 0 30,000 30,000
MassGrad Implementation 338,891 186,183 210,000 0
Mass Life Sciences 421,665 0 0 0
MassWin 0 0 15,000 0
MCIEA Performance Assessment Support 21,858 0 0 0
McKinney Homeless 104,016 115,000 115,000 180,854
Multi-State Mentor Initiative 0 0 39,250 0
National Institute of Justice Comprehensive School Safety 54,120 0 129,039 0
No Kid Hungry Breakfast After the Bell 0 11,235 0 0
OpenSciEd Field Test 9,488 11,500 56,467 1,265
Otis Community Playground 440,200 0 0 0
Partnerships in Social Emotion 708,460 662,525 803,672 1,540,302
Perkins Vocational Education 1,680,973 1,544,231 1,632,474 1,348,112
Playball! Foundation-Athletics 123,732 66,428 0 0
Preschool Expansion Grant 3,927,816 0 0 0
Quality Pre-K Grant 0 1,296,649 4,772,350 4,560,254

EducationBoston Public Schools 261
Reimbursable 5,321,215 6,122,051 7,491,867 0
Remote Learning Tech Essentials 0 0 672,342 400,000
ROTC 676,673 748,577 808,911 811,624
Safe Schools 10,000 0 0 0
School Improvement 1,114,162 304,277 950,000 524,570
School Lunch - Food Services 31,335,271 24,854,676 35,007,425 32,890,423
School Redesign Grant -Ellis 0 282,582 379,603 329,420
Secondary Virtual Course Access 0 0 834,392 0
Small Donations Grant 0 19,653 97,786 25,500
Special Ed. Early Childhood Discretionary Program Improvement 7,000 4,592 31,940 0
Special Education 15,000 0 3,750 0
Special Education 188 Early Childhood 468,682 442,320 493,022 585,870
Special Education Circuit Breaker 21,435,713 10,926,886 17,737,525 18,138,392
SRG 925,735 867,105 0 0
STARS Grant 173,799 165,997 0 0
STEM - Focused Teacher Externship 0 4,550 0 0
Strategic Support 400,000 270,594 490,315 5,315
Strategic Support Grant Blackstone Chittick King 120,000 0 0 0
Summer Food Program 1,040,004 949,600 1,145,407 1,145,714
Sup. Search Process Engagement 24,761 0 0 0
Supporting Chemistry Teachers 185,575 123,383 216,709 196,973
Teacher Diversification Pilot 24,183 337,107 178,647 0
Teachers Feedback- Mathematica 0 3,500 0 0
Technology Fund 1,003,160 65,300 2,000,000 2,000,000
Title I 33,945,979 33,961,257 48,407,776 39,037,173
Title II - Teacher Quality 3,449,131 3,689,203 3,254,353 3,276,373
Title III - Bilingual Lang Acq 1,534,876 1,922,938 3,413,158 2,564,028
Title III - Language Instruction 57,222 30,735 0 0
Title IV 2,220,416 2,759,545 2,863,990 2,688,070
Transportation Fund 102,008 286,040 120,000 100,000
Turnaround Assistance Grant TAG 0 150,106 14,485 0
USFA Support-Emergency Meals 0 0 202,428 0
USV 226,291 0 0 0
Valedictorian Lunch 5,000 0 0 0
Verizon Innovative Learning 75,000 0 0 0
Volkswagen Settlement 0 0 416,964 0
WGBH Grant 2,000 0 0 0
Yellow School Bus 13,000 0 15,000 0
Total 142,250,128 124,130,929 204,912,166 145,525,676
Operating Budget Actual '19 Actual '20 Approp '21 Budget '22
Personnel Services 905,517,406 947,770,892 1,005,576,413 1,034,825,227 Non Personnel 221,158,678 230,791,478 254,913,872 259,894,634 Total 1,126,676,084 1,178,562,370 1,260,490,285 1,294,719,861

262 EducationBoston Public Schools
Boston Public Schools Operating Budget
Authorizing Statutes Rev. St. 1647, ch. 23, § 10 Rev. St. General Laws and Liberties of the
Massachusetts Colony (1672). Massachusetts Constitution, Mass.
Const. part II ch. 5, § 2. Boston City Charter, 1821 Mass. Acts ch.
110, §19. 1987 Mass. Acts ch. 613. 1991 Mass. Acts ch. 108. Education Reform Act, 1993 Mass. Acts
ch. 71, as amended.

EducationBoston Public Schools 263
Department History Personnel Services FY19 Expenditure FY20 Expenditure FY21 Appropriation FY22 Recommended Inc/Dec 21 vs 22
51000 Permanent Employees 718,913,720 749,198,744 793,476,267 816,486,983 23,010,716 51100 Emergency Employees 13,269,102 15,869,368 13,221,761 13,548,543 326,782 51200 Overtime 5,879,717 9,016,185 16,934,045 17,729,922 795,877 51300 Part Time Employees 18,315,767 22,651,628 17,905,064 18,713,096 808,032 51400 Health Insurance 121,115,425 125,352,646 135,857,385 140,593,675 4,736,290 51500 Pension & Annuity 12,503,536 11,052,636 11,819,420 11,676,555 -142,865 51600 Unemployment Compensation 2,174,401 1,422,921 2,283,121 2,142,710 -140,411 51700 Workers' Compensation 3,720,104 3,877,744 3,933,706 4,049,971 116,265 51900 Medicare 9,625,634 9,329,020 10,145,644 9,883,772 -261,872 Total Personnel Services 905,517,406 947,770,892 1,005,576,413 1,034,825,227 29,248,814
Contractual Services FY19 Expenditure FY20 Expenditure FY21 Appropriation FY22 Recommended Inc/Dec 21 vs 22
52100 Communications 1,972,877 964,341 1,732,324 1,755,993 23,669 52200 Utilities 21,861,429 18,787,143 22,529,782 21,287,805 -1,241,977 52300 Contracted Ed. Services 23,034,083 38,314,037 27,846,565 28,378,958 532,393 52400 Snow Removal 0 0 0 0 0 52500 Garbage/Waste Removal 0 0 0 0 0 52600 Repairs Buildings & Structures 17,544,993 17,847,821 18,332,807 20,103,257 1,770,450 52700 Repairs & Service of Equipment 51,715 64,816 77,000 77,000 0 52800 Transportation of Persons 103,738,458 101,798,347 106,800,976 111,828,897 5,027,921 52900 Contracted Services 23,840,024 29,470,972 33,925,465 38,403,599 4,478,134 Total Contractual Services 192,043,579 207,247,477 211,244,919 221,835,509 10,590,590
Supplies & Materials FY19 Expenditure FY20 Expenditure FY21 Appropriation FY22 Recommended Inc/Dec 21 vs 22
53000 Auto Energy Supplies 87,489 62,604 87,148 87,148 0 53200 Food Supplies 1,538,902 1,553,228 432,813 363,301 -69,512 53400 Custodial Supplies 0 0 0 0 0 53500 Med, Dental, & Hosp Supply 70,344 86,456 77,520 77,520 0 53600 Office Supplies and Materials 323,884 211,370 315,587 329,245 13,658 53800 Educational Supplies & Mat 6,924,502 4,138,280 9,218,565 8,515,511 -703,054 53900 Misc Supplies & Materials 978,508 840,831 1,344,643 1,406,191 61,548 Total Supplies & Materials 9,923,629 6,892,769 11,476,276 10,778,916 -697,360
Current Chgs & Oblig FY19 Expenditure FY20 Expenditure FY21 Appropriation FY22 Recommended Inc/Dec 21 vs 22
54300 Workers' Comp Medical 1,193,873 1,042,523 874,903 874,902 -1 54400 Legal Liabilities 0 0 0 0 0 54600 Current Charges H&I 0 0 0 0 0 54800 Reserve Account 0 0 10,710,144 5,854,971 -4,855,173 54900 Other Current Charges 6,234,719 6,305,592 7,463,644 6,865,308 -598,336 Total Current Chgs & Oblig 7,428,592 7,348,115 19,048,691 13,595,181 -5,453,510
Equipment FY19 Expenditure FY20 Expenditure FY21 Appropriation FY22 Recommended Inc/Dec 21 vs 22
55000 Automotive Equipment 27,424 112,704 0 0 0 55400 Lease/Purchase 7,326,674 7,300,147 10,892,167 11,472,994 580,827 55600 Office Furniture & Equipment 161,337 290,754 446,034 439,192 -6,842 55900 Misc Equipment 2,672,126 784,860 994,043 961,100 -32,943 Total Equipment 10,187,561 8,488,465 12,332,244 12,873,286 541,042
Other FY19 Expenditure FY20 Expenditure FY21 Appropriation FY22 Recommended Inc/Dec 21 vs 22
56200 Special Appropriation 1,575,317 814,652 811,742 811,472 0 57200 Structures & Improvements 0 0 0 0 0 58000 Land & Non-Structure 0 0 0 0 0 Total Other 0 0 0 0 0
Grand Total 1,126,676,079 1,178,562,371 1,260,490,285 1,294,719,861 34,229,576

264 EducationBoston Public Schools
General Fund Employees by Category Acct Code Expense Title
FY19 Actuals
1/1/2019
FY20 Actuals
1/1/2020
FY21 Actuals
1/1/2021
FY22 Projected
1/1/202251002 General Education Teacher 1,614.5 1,524.4 1,456.1 1,374.551005 Kindergarten Teacher 171.5 175.5 163.6 163.951006 Vocational Ed. Tchr. 50.5 49.5 55.0 56.151007 Bilingual Kindergarten Teacher 60.0 59.0 61.0 60.151008 Sped Resource Teacher 217.4 214.8 198.4 209.051009 Special Education Teacher 1,059.1 1,053.0 1,148.3 1,205.151010 Bilingual Tchr 720.0 760.6 772.1 801.751011 Specialist Teacher 434.2 431.1 455.1 462.551012 Sped Itinerant Teacher 244.6 246.9 247.1 256.7
Total Teachers 4,571.8 4,514.8 4,556.7 4,589.6
51013 Central Administrator 86.0 80.7 72.6 74.251014 Elementary Sch Administrator 105.5 97.4 95.7 93.851015 Middle School Administrator 41.0 45.9 44.8 43.051016 High School Administrator 89.8 89.8 87.8 89.951017 Special School Administrator 13.0 10.0 12.1 12.151019 Professional Support 204.2 208.3 219.5 220.551046 Managerial Support 126.9 134.9 136.5 135.6
Total Administrators 666.4 667.0 669.0 669.1
51020 Itinerant Pupil Support 79.1 75.4 80.3 80.151021 Program Support 244.6 249.0 302.3 369.151023 Librarian 19.5 19.5 18.3 17.451024 Guidance 104.4 100.1 93.3 92.651025 Athletic Instructor 5.0 2.0 4.0 4.051026 Nurse 124.1 143.5 149.3 148.851045 Instructional Coach 27.3 34.4 71.2 77.2
Total Support 604.0 623.9 718.7 789.2
51039 Instructional Aide 208.7 185.5 203.1 198.051041 Sped Resource Aide 4.9 5.4 2.0 0.051042 Special Education Aide 1,134.9 1,144.5 1,160.9 1,190.151043 Bilingual Ed. Aide 126.0 119.2 130.2 119.051047 ABA Specialist 95.7 115.0 119.0 146.151048 Sign Language Interpreter 5.5 5.0 5.0 4.651049 Support Specialist 1.0 8.0 7.0 6.5
Total Aides 1,576.7 1,582.6 1,627.2 1,664.3
51027 Secretarial/Clerical 179.5 171.5 159.0 158.551028 Etl-Secretarial/Clerical 66.6 69.0 71.0 71.051029 Guidance-Secretarial/Clerical 3.0 2.0 3.0 3.0
Total Secretarial 249.1 242.5 233.0 232.5
51030 Custodian 394.0 383.0 407.0 426.651032 Ft Food Service Worker 0.0 0.0 0.0 0.051033 Technical Support 146.6 153.8 183.7 238.451034 Technical/Supervisory 40.0 42.0 40.0 40.051035 School Police Officer 71.0 65.0 62.0 62.051036 Community Field Coordinator 161.3 148.3 137.3 124.451038 Health Paraprofessional 6.0 6.0 6.0 6.051044 Security Aide 28.0 25.5 29.2 23.251304 Food Service Worker 0.0 0.0 0.0 0.051307 Transportation Attendant 307.8 316.9 310.9 310.751308 Part-Time Custodian 58.5 56.0 40.0 40.0
Total Cust/Safe/Tech 1,213.2 1,196.5 1,216.1 1,271.3
51040 Library Aide 24.4 23.2 23.3 24.051303 Part-Time Clerical 0.0 0.5 2.5 1.551305 Non-Academic Part-Time 4.0 13.0 1.0 0.751306 Lunch Monitor 167.0 165.0 152.5 145.8
Total Part-Time 195.4 201.7 179.3 172.0
Total Active Positions 9,076.6 9,029.0 9,200.0 9,388.0
51003 Long-Term Leave 102.0 209.0 269.0 269.051701 Workers Compensation 69.0 65.0 59.0 59.0
Total Other 171.0 274.0 328.0 328.0
Total FTEs 9,248.6 9,302.9 9,527.8 9,716.0

EducationBoston Public Schools 265
External Funds History Personnel Services FY19 Expenditure FY20 Expenditure FY21 Appropriation FY22 Recommended Inc/Dec 21 vs 22
51000 Permanent Employees 34,307,950 36,576,835 40,595,122 36,044,260 -4,550,862 51100 Emergency Employees 3,697,827 663,534 3,847,747 3,076,605 -771,142 51200 Overtime 14,525,428 13,006,205 15,046,345 8,450,161 -6,596,184 51300 Part Time Employees 6,025,398 3,193,053 9,317,786 6,650,722 -2,667,064 51400 Health Insurance 6,125,619 6,494,001 9,729,510 10,254,453 524,943 51500 Pension & Annuity 3,829,090 4,405,046 5,782,691 6,249,366 466,675 51600 Unemployment Compensation 0 0 80,309 4,238 -76,071 51700 Workers' Compensation 500 0 80,418 4,238 -76,180 51800 Indirect Costs 1,861,013 1,561,205 2,987,730 2,056,867 -930,863 51900 Medicare 585,768 599,240 1,082,603 1,096,748 14,145 Total Personnel Services 70,958,593 66,499,119 88,550,261 73,887,658 -14,662,603
Contractual Services FY19 Expenditure FY20 Expenditure FY21 Appropriation FY22 Recommended Inc/Dec 21 vs 22
52100 Communications 7,350 872,677 434,711 443,961 9,250 52200 Utilities 0 0 0 0 0 52300 Contracted Ed. Services 22,008,818 11,416,958 18,237,525 18,138,392 -99,133 52400 Snow Removal 6,788 0 0 0 0 52500 Garbage/Waste Removal 0 0 0 0 0 52600 Repairs Buildings & Structures 2,459,709 1,936,833 10,946,345 2,762,000 -8,184,345 52700 Repairs & Service of Equipment 0 842 0 0 0 52800 Transportation of Persons 575,687 951,434 731,376 387,547 -343,829 52900 Contracted Services 20,190,830 20,416,458 32,035,249 23,004,757 -9,030,492 Total Contractual Services 45,249,182 35,595,202 62,385,206 44,736,657 -17,648,549
Supplies & Materials FY19 Expenditure FY20 Expenditure FY21 Appropriation FY22 Recommended Inc/Dec 21 vs 22
53000 Auto Energy Supplies 0 0 0 0 0 53200 Food Supplies 17,532,943 13,323,348 16,965,751 16,493,188 -472,563 53400 Custodial Supplies 0 0 0 0 0 53500 Med, Dental, & Hosp Supply 0 0 0 0 0 53600 Office Supplies and Materials 1,883 510 2,000 2,000 0 53800 Educational Supplies & Mat 4,180,196 3,506,191 8,152,265 5,758,149 -2,394,116 53900 Misc Supplies & Materials 1,710,632 1,853,178 6,180,535 2,101,943 -4,078,592 Total Supplies & Materials 23,425,654 18,683,227 31,300,551 24,355,280 -6,945,271
Current Chgs & Oblig FY19 Expenditure FY20 Expenditure FY21 Appropriation FY22 Recommended Inc/Dec 21 vs 22
54300 Workers' Comp Medical 0 0 0 0 0 54400 Legal Liabilities 0 0 0 0 0 54600 Current Charges H&I 0 0 0 0 0 54800 Reserve Account 0 0 10,704,493 1,082,419 -9,622,074 54900 Other Current Charges 94,877 46,540 86,471 135,583 49,112 Total Current Chgs & Oblig 94,877 46,540 10,790,964 1,218,002 -9,572,962
Equipment FY19 Expenditure FY20 Expenditure FY21 Appropriation FY22 Recommended Inc/Dec 21 vs 22
55000 Automotive Equipment 61,108 23,990 405,884 0 -405,884 55400 Lease/Purchase 0 0 28,418 28,418 0 55600 Office Furniture & Equipment 203,522 33,702 10,000 0 -10,000 55900 Misc Equipment 2,257,201 3,249,142 11,440,879 1,299,661 -10,141,218 Total Equipment 2,521,831 3,306,834 11,885,181 1,328,079 -10,557,102
Other FY19 Expenditure FY20 Expenditure FY21 Appropriation FY22 Recommended Inc/Dec 21 vs 22
56200 Special Appropriation 0 0 0 0 0 57200 Structures & Improvements 0 0 0 0 0 58000 Land & Non-Structure 0 0 0 0 0 Total Other 0 0 0 0 0
Grand Total 142,250,137 124,130,922 204,912,163 145,525,676 -59,386,487
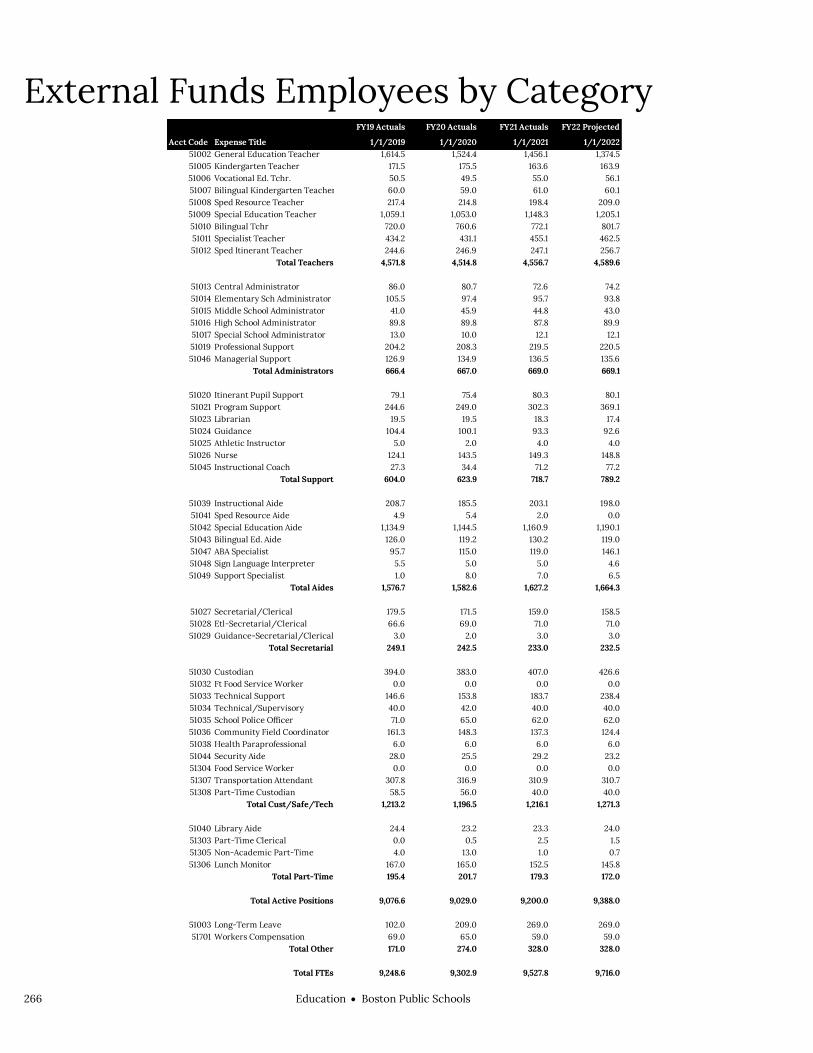
266 EducationBoston Public Schools
External Funds Employees by Category Acct Code Expense Title
FY19 Actuals
1/1/2019
FY20 Actuals
1/1/2020
FY21 Actuals
1/1/2021
FY22 Projected
1/1/202251002 General Education Teacher 1,614.5 1,524.4 1,456.1 1,374.551005 Kindergarten Teacher 171.5 175.5 163.6 163.951006 Vocational Ed. Tchr. 50.5 49.5 55.0 56.151007 Bilingual Kindergarten Teacher 60.0 59.0 61.0 60.151008 Sped Resource Teacher 217.4 214.8 198.4 209.051009 Special Education Teacher 1,059.1 1,053.0 1,148.3 1,205.151010 Bilingual Tchr 720.0 760.6 772.1 801.751011 Specialist Teacher 434.2 431.1 455.1 462.551012 Sped Itinerant Teacher 244.6 246.9 247.1 256.7
Total Teachers 4,571.8 4,514.8 4,556.7 4,589.6
51013 Central Administrator 86.0 80.7 72.6 74.251014 Elementary Sch Administrator 105.5 97.4 95.7 93.851015 Middle School Administrator 41.0 45.9 44.8 43.051016 High School Administrator 89.8 89.8 87.8 89.951017 Special School Administrator 13.0 10.0 12.1 12.151019 Professional Support 204.2 208.3 219.5 220.551046 Managerial Support 126.9 134.9 136.5 135.6
Total Administrators 666.4 667.0 669.0 669.1
51020 Itinerant Pupil Support 79.1 75.4 80.3 80.151021 Program Support 244.6 249.0 302.3 369.151023 Librarian 19.5 19.5 18.3 17.451024 Guidance 104.4 100.1 93.3 92.651025 Athletic Instructor 5.0 2.0 4.0 4.051026 Nurse 124.1 143.5 149.3 148.851045 Instructional Coach 27.3 34.4 71.2 77.2
Total Support 604.0 623.9 718.7 789.2
51039 Instructional Aide 208.7 185.5 203.1 198.051041 Sped Resource Aide 4.9 5.4 2.0 0.051042 Special Education Aide 1,134.9 1,144.5 1,160.9 1,190.151043 Bilingual Ed. Aide 126.0 119.2 130.2 119.051047 ABA Specialist 95.7 115.0 119.0 146.151048 Sign Language Interpreter 5.5 5.0 5.0 4.651049 Support Specialist 1.0 8.0 7.0 6.5
Total Aides 1,576.7 1,582.6 1,627.2 1,664.3
51027 Secretarial/Clerical 179.5 171.5 159.0 158.551028 Etl-Secretarial/Clerical 66.6 69.0 71.0 71.051029 Guidance-Secretarial/Clerical 3.0 2.0 3.0 3.0
Total Secretarial 249.1 242.5 233.0 232.5
51030 Custodian 394.0 383.0 407.0 426.651032 Ft Food Service Worker 0.0 0.0 0.0 0.051033 Technical Support 146.6 153.8 183.7 238.451034 Technical/Supervisory 40.0 42.0 40.0 40.051035 School Police Officer 71.0 65.0 62.0 62.051036 Community Field Coordinator 161.3 148.3 137.3 124.451038 Health Paraprofessional 6.0 6.0 6.0 6.051044 Security Aide 28.0 25.5 29.2 23.251304 Food Service Worker 0.0 0.0 0.0 0.051307 Transportation Attendant 307.8 316.9 310.9 310.751308 Part-Time Custodian 58.5 56.0 40.0 40.0
Total Cust/Safe/Tech 1,213.2 1,196.5 1,216.1 1,271.3
51040 Library Aide 24.4 23.2 23.3 24.051303 Part-Time Clerical 0.0 0.5 2.5 1.551305 Non-Academic Part-Time 4.0 13.0 1.0 0.751306 Lunch Monitor 167.0 165.0 152.5 145.8
Total Part-Time 195.4 201.7 179.3 172.0
Total Active Positions 9,076.6 9,029.0 9,200.0 9,388.0
51003 Long-Term Leave 102.0 209.0 269.0 269.051701 Workers Compensation 69.0 65.0 59.0 59.0
Total Other 171.0 274.0 328.0 328.0
Total FTEs 9,248.6 9,302.9 9,527.8 9,716.0

EducationBoston Public Schools 267
Program 1. General School Purposes Brenda Cassellius, Superintendent, Organization 101000
Program Description BPS strives to promote ongoing improvement in teaching and learning at each and every Boston Public School and in each and every classroom within these schools.
Operating Budget Actual '19 Actual '20 Approp '21 Budget '22
Personnel Services 905,517,396 947,770,897 1,005,576,413 1,034,825,227 Non Personnel 221,158,683 230,791,474 254,913,872 259,894,634 Total 1,126,676,079 1,178,562,371 1,260,490,285 1,294,719,861
Performance
Goal: BPS will provide rigorous, effective, and engaging curriculum, instruction, and enrichment
Performance Measures Actual '19 Actual '20 Projected '21 Target '22
4 year unadjusted graduation rate 73.2 75.4
Goal: To graduate all students from high school prepared for college and career success
Performance Measures Actual '19 Actual '20 Projected '21 Target '22
Annual dropout rate % - High School 4.2 3.9

268 EducationBoston Public Schools
External Funds Projects Formula Grants
Project Mission Formula grants are funds received through federal or state programs that provide assistance for educational services for low income, minority, and special needs students. Levels of funding are established through a predetermined formula that considers the amount of legislative appropriation and the number of students eligible for the program. Federal formula grants include the Title I, Title II, and IDEA grants. MCAS support/Academic support is a state formula grant.
Competitive Grants
Project Mission Competitive grants are funds received through open competition with other school districts and non-profit organizations. The grant providers establish the levels of funding. The use of these funds is determined through local planning, which typically aims to advance local priorities while meeting the funding requirements.
Reimbursements
Project Mission Reimbursement funds are resources received by the local school districts as compensation for costs incurred by certain programs. Reimbursement programs include the Department of Agriculture’s School Lunch Program and Summer Food Program.
Revolving Funds and Other Grants
Project Mission Additional resources are received through revolving funds and other grants. These include funds raised through the Boston Education Development Foundation, and the Homeless Student Initiative.

EducationBoston Public Schools 269
Boston Public Schools Capital Budget Education Boston Public Schools
Overview Boston Public Schools is entering Year 5 of BuildBPS, the District’s 10-year educational and facilities master plan. BuildBPS will transform the way the District and the City plan, build, and renovate school facilities. Boston is on track for its planned $1 billion investment in schools over 10 years, with $730 million coming from City borrowing.
FY22 Major Initiatives Construction will be completed for the new $137 million Boston Arts Academy building,
funded in partnership with the Massachusetts School Building Authority (MSBA). Construction will begin for the new $193 million Josiah Quincy Upper School in Chinatown,
funded in partnership with the MSBA. Design will continue for the new $89 million Carter School building and outdoor learning
spaces, which will be funded in partnership with the MSBA. BPS will pursue building improvements to facilitate grade reconfigurations at various
schools, including the McCormack and Irving Schools, in line with the goals of BuildBPS. 19 school kitchens will be upgraded over the summer in Phase 4 of an innovative fresh food
program that launched in early fall 2018. The City will invest in new school maintenance initiatives to increase building accessibility,
upgrade auditoriums, and improve building interiors and exterior grounds. The City will begin envelope repairs at the Bradley School, Mather School, and EMK
Academy and electrical upgrades at the Dever School and McCormack School.
Capital Budget Expenditures Total Actual '19 Total Actual '20 Estimated '21 Total Projected
'22
Total Department 56,595,217 60,783,171 132,946,554 162,466,111

270 EducationBoston Public Schools
Boston Public Schools Project Profiles 21ST CENTURY INTERIOR IMPROVEMENTS
Project Mission Improve interior spaces at various schools to promote a 21st century learning experience, including lighting,
security, classroom technology, and wayfinding.
Managing Department, Boston Public Schools Status, New Project Location, Citywide Operating Impact, No
Authorizations
Source Existing FY22 Future Non Capital
Fund Total City Capital 0 1,000,000 0 0 1,000,000 Grants/Other 0 0 0 0 0 Total 0 1,000,000 0 0 1,000,000
Expenditures (Actual and Planned)
Source Thru
6/30/20 FY21 FY22 FY23-26 Total City Capital 0 0 1,000,000 0 1,000,000 Grants/Other 0 0 0 0 0 Total 0 0 1,000,000 0 1,000,000
ACCESSIBILITY IMPROVEMENTS Project Mission Upgrade facilities at various schools to increase building accessibility, including improvements to ramps, doors,
and elevators.
Managing Department, Public Facilities Department Status, New Project Location, Citywide Operating Impact, No
Authorizations
Source Existing FY22 Future Non Capital
Fund Total City Capital 0 1,000,000 0 0 1,000,000 Grants/Other 0 0 0 0 0 Total 0 1,000,000 0 0 1,000,000
Expenditures (Actual and Planned)
Source Thru
6/30/20 FY21 FY22 FY23-26 Total City Capital 0 0 500,000 500,000 1,000,000 Grants/Other 0 0 0 0 0 Total 0 0 500,000 500,000 1,000,000

EducationBoston Public Schools 271
Boston Public Schools Project Profiles ACCREDITATION IMPROVEMENTS AT VARIOUS SCHOOLS
Project Mission Accreditation projects to be completed in FY22 through FY26. Managing Department, Boston Public Schools Status, Annual Program Location, Various neighborhoods Operating Impact, No
Authorizations
Source Existing FY22 Future Non Capital
Fund Total City Capital 3,000,000 0 921,750 0 3,921,750 Grants/Other 0 0 0 0 0 Total 3,000,000 0 921,750 0 3,921,750
Expenditures (Actual and Planned)
Source Thru
6/30/20 FY21 FY22 FY23-26 Total City Capital 409,750 762,000 500,000 2,250,000 3,921,750 Grants/Other 0 0 0 0 0 Total 409,750 762,000 500,000 2,250,000 3,921,750
ADAMS SCHOOL ROOF AND MASONRY Project Mission Replace roof and repair parapet masonry. Managing Department, Public Facilities Department Status, In Design Location, East Boston Operating Impact, No
Authorizations
Source Existing FY22 Future Non Capital
Fund Total City Capital 1,090,051 0 0 0 1,090,051 Grants/Other 0 0 0 0 0 Total 1,090,051 0 0 0 1,090,051
Expenditures (Actual and Planned)
Source Thru
6/30/20 FY21 FY22 FY23-26 Total City Capital 26,350 400,000 663,701 0 1,090,051 Grants/Other 0 0 0 0 0 Total 26,350 400,000 663,701 0 1,090,051

272 EducationBoston Public Schools
Boston Public Schools Project Profiles ARP 2019: ROOFS AND BOILERS AT 3 SCHOOLS
Project Mission Replace boiler at the Lyon School and roofs at the McKinley K-12 and Curley K-8 Schools, in conjunction with the
MSBA Accelerated Repair Program.
Managing Department, Public Facilities Department Status, In Construction Location, Various neighborhoods Operating Impact, No
Authorizations
Source Existing FY22 Future Non Capital
Fund Total City Capital 3,527,867 0 0 0 3,527,867 Grants/Other 3,922,740 0 0 0 3,922,740 Total 7,450,607 0 0 0 7,450,607
Expenditures (Actual and Planned)
Source Thru
6/30/20 FY21 FY22 FY23-26 Total City Capital 0 497,176 3,030,691 0 3,527,867 Grants/Other 0 552,824 3,369,916 0 3,922,740 Total 0 1,050,000 6,400,607 0 7,450,607
ARP 2020: BOILERS AND WINDOWS AT 2 SCHOOLS Project Mission Replace boilers at the P.J. Kennedy School and windows at the Adams School, in conjunction with the
Massachusetts School Building Authority's Accelerated Repair Program.
Managing Department, Public Facilities Department Status, New Project Location, Various neighborhoods Operating Impact, No
Authorizations
Source Existing FY22 Future Non Capital
Fund Total City Capital 115,500 0 0 0 115,500 Grants/Other 184,500 0 0 0 184,500 Total 300,000 0 0 0 300,000
Expenditures (Actual and Planned)
Source Thru
6/30/20 FY21 FY22 FY23-26 Total City Capital 0 40,000 75,500 0 115,500 Grants/Other 0 60,000 124,500 0 184,500 Total 0 100,000 200,000 0 300,000

EducationBoston Public Schools 273
Boston Public Schools Project Profiles AUDITORIUM IMPROVEMENTS
Project Mission Repair and upgrade auditorium facilities at various schools, including lighting, seating, and sound equipment. Managing Department, Boston Public Schools Status, New Project Location, Citywide Operating Impact, No
Authorizations
Source Existing FY22 Future Non Capital
Fund Total City Capital 0 250,000 0 0 250,000 Grants/Other 0 0 0 0 0 Total 0 250,000 0 0 250,000
Expenditures (Actual and Planned)
Source Thru
6/30/20 FY21 FY22 FY23-26 Total City Capital 0 0 250,000 0 250,000 Grants/Other 0 0 0 0 0 Total 0 0 250,000 0 250,000
BATHROOM RENOVATIONS AT VARIOUS SCHOOLS Project Mission Upgrade bathrooms at various schools, including fixtures, flooring, partitions, lighting, and paint. Managing Department, Boston Public Schools Status, In Construction Location, Various neighborhoods Operating Impact, No
Authorizations
Source Existing FY22 Future Non Capital
Fund Total City Capital 4,000,000 2,000,000 4,000,000 0 10,000,000 Grants/Other 0 0 0 0 0 Total 4,000,000 2,000,000 4,000,000 0 10,000,000
Expenditures (Actual and Planned)
Source Thru
6/30/20 FY21 FY22 FY23-26 Total City Capital 0 1,500,000 3,000,000 5,500,000 10,000,000 Grants/Other 0 0 0 0 0 Total 0 1,500,000 3,000,000 5,500,000 10,000,000

274 EducationBoston Public Schools
Boston Public Schools Project Profiles BLACKSTONE SCHOOL INTERIOR RENOVATIONS
Project Mission Refurbish building interior to include classroom enclosures, security measures, fire sprinklers, and related HVAC
and fire alarm work in alignment with enclosure activities.
Managing Department, Public Facilities Department Status, To Be Scheduled Location, South End Operating Impact, No
Authorizations
Source Existing FY22 Future Non Capital
Fund Total City Capital 600,000 0 4,400,000 0 5,000,000 Grants/Other 0 0 0 0 0 Total 600,000 0 4,400,000 0 5,000,000
Expenditures (Actual and Planned)
Source Thru
6/30/20 FY21 FY22 FY23-26 Total City Capital 0 0 250,000 4,750,000 5,000,000 Grants/Other 0 0 0 0 0 Total 0 0 250,000 4,750,000 5,000,000
BOSTON ARTS ACADEMY Project Mission Design and construct a new facility that supports the requirements of the Boston Arts Academy. The MSBA will
partner with the City in the development and funding of this new school.
Managing Department, Public Facilities Department Status, In Construction Location, Fenway/Kenmore Operating Impact, No
Authorizations
Source Existing FY22 Future Non Capital
Fund Total City Capital 88,480,296 0 0 0 88,480,296 Grants/Other 48,890,620 0 0 0 48,890,620 Total 137,370,916 0 0 0 137,370,916
Expenditures (Actual and Planned)
Source Thru
6/30/20 FY21 FY22 FY23-26 Total City Capital 25,088,322 27,614,846 30,330,498 5,446,630 88,480,296 Grants/Other 13,134,576 18,409,898 16,331,807 1,014,339 48,890,620 Total 38,222,898 46,024,744 46,662,305 6,460,969 137,370,916

EducationBoston Public Schools 275
Boston Public Schools Project Profiles BRADLEY SCHOOL ENVELOPE
Project Mission Repair masonry, windows, and doors. Managing Department, Public Facilities Department Status, New Project Location, East Boston Operating Impact, No
Authorizations
Source Existing FY22 Future Non Capital
Fund Total City Capital 0 1,663,839 0 0 1,663,839 Grants/Other 0 0 0 0 0 Total 0 1,663,839 0 0 1,663,839
Expenditures (Actual and Planned)
Source Thru
6/30/20 FY21 FY22 FY23-26 Total City Capital 0 0 110,000 1,553,839 1,663,839 Grants/Other 0 0 0 0 0 Total 0 0 110,000 1,553,839 1,663,839
BRIGHTON HIGH SCHOOL LOCKER ROOMS Project Mission Renovate locker rooms. Managing Department, Public Facilities Department Status, In Design Location, Allston/Brighton Operating Impact, No
Authorizations
Source Existing FY22 Future Non Capital
Fund Total City Capital 2,800,000 0 0 0 2,800,000 Grants/Other 0 0 0 0 0 Total 2,800,000 0 0 0 2,800,000
Expenditures (Actual and Planned)
Source Thru
6/30/20 FY21 FY22 FY23-26 Total City Capital 39,777 587,927 2,172,296 0 2,800,000 Grants/Other 0 0 0 0 0 Total 39,777 587,927 2,172,296 0 2,800,000
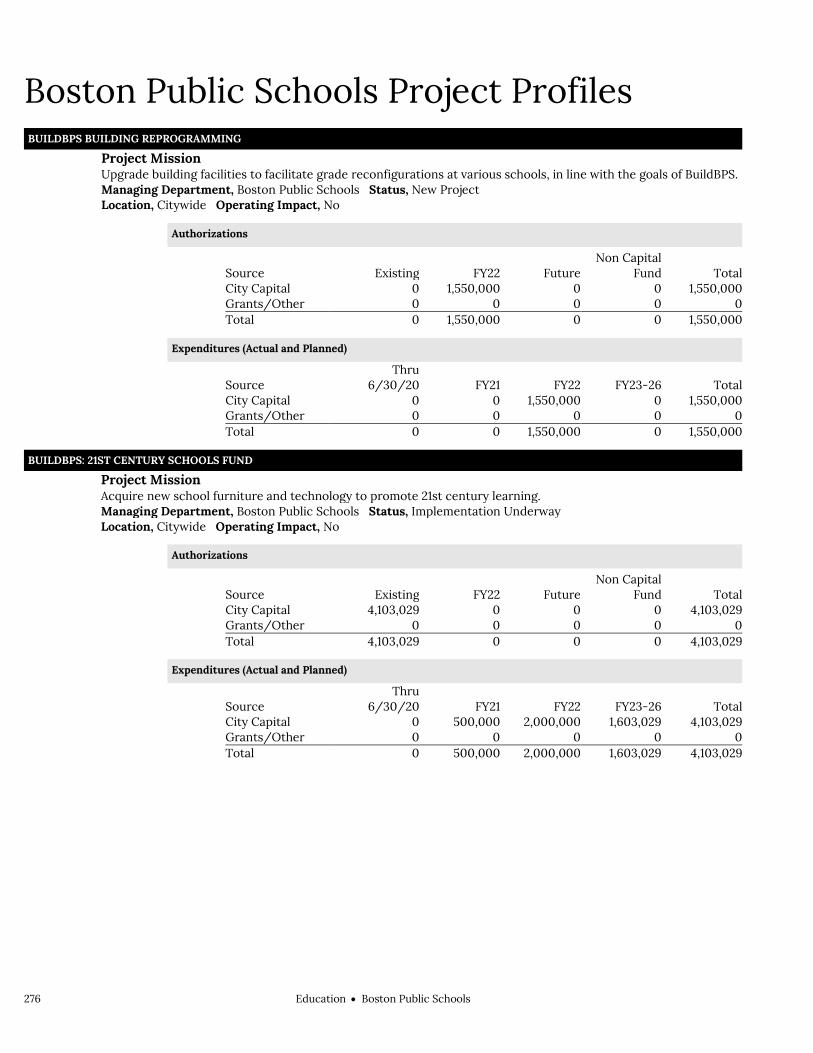
276 EducationBoston Public Schools
Boston Public Schools Project Profiles BUILDBPS BUILDING REPROGRAMMING
Project Mission Upgrade building facilities to facilitate grade reconfigurations at various schools, in line with the goals of BuildBPS. Managing Department, Boston Public Schools Status, New Project Location, Citywide Operating Impact, No
Authorizations
Source Existing FY22 Future Non Capital
Fund Total City Capital 0 1,550,000 0 0 1,550,000 Grants/Other 0 0 0 0 0 Total 0 1,550,000 0 0 1,550,000
Expenditures (Actual and Planned)
Source Thru
6/30/20 FY21 FY22 FY23-26 Total City Capital 0 0 1,550,000 0 1,550,000 Grants/Other 0 0 0 0 0 Total 0 0 1,550,000 0 1,550,000
BUILDBPS: 21ST CENTURY SCHOOLS FUND Project Mission Acquire new school furniture and technology to promote 21st century learning. Managing Department, Boston Public Schools Status, Implementation Underway Location, Citywide Operating Impact, No
Authorizations
Source Existing FY22 Future Non Capital
Fund Total City Capital 4,103,029 0 0 0 4,103,029 Grants/Other 0 0 0 0 0 Total 4,103,029 0 0 0 4,103,029
Expenditures (Actual and Planned)
Source Thru
6/30/20 FY21 FY22 FY23-26 Total City Capital 0 500,000 2,000,000 1,603,029 4,103,029 Grants/Other 0 0 0 0 0 Total 0 500,000 2,000,000 1,603,029 4,103,029

EducationBoston Public Schools 277
Boston Public Schools Project Profiles BUILDBPS: CAPITAL MAINTENANCE
Project Mission Core maintenance work in various schools, including electrical, HVAC, masonry, and window repairs. Managing Department, Boston Public Schools Status, Annual Program Location, Citywide Operating Impact, No
Authorizations
Source Existing FY22 Future Non Capital
Fund Total City Capital 11,200,000 5,800,000 0 0 17,000,000 Grants/Other 0 0 0 0 0 Total 11,200,000 5,800,000 0 0 17,000,000
Expenditures (Actual and Planned)
Source Thru
6/30/20 FY21 FY22 FY23-26 Total City Capital 0 0 15,152,873 1,847,127 17,000,000 Grants/Other 0 0 0 0 0 Total 0 0 15,152,873 1,847,127 17,000,000
BUILDBPS: MSBA ARP RESERVE Project Mission Reserve for future MSBA Accelerated Repair Program projects. Managing Department, Public Facilities Department Status, Annual Program Location, Various neighborhoods Operating Impact, No
Authorizations
Source Existing FY22 Future Non Capital
Fund Total City Capital 0 0 29,694,412 0 29,694,412 Grants/Other 0 0 34,328,309 0 34,328,309 Total 0 0 64,022,721 0 64,022,721
Expenditures (Actual and Planned)
Source Thru
6/30/20 FY21 FY22 FY23-26 Total City Capital 0 0 500,000 29,194,412 29,694,412 Grants/Other 0 0 5,000,000 29,328,309 34,328,309 Total 0 0 5,500,000 58,522,721 64,022,721

278 EducationBoston Public Schools
Boston Public Schools Project Profiles BUILDBPS: RESERVE FOR FUTURE PROJECTS
Project Mission Reserve for future BuildBPS projects. Managing Department, Public Facilities Department Status, Annual Program Location, Citywide Operating Impact, No
Authorizations
Source Existing FY22 Future Non Capital
Fund Total City Capital 24,500,000 0 25,500,000 0 50,000,000 Grants/Other 0 0 0 0 0 Total 24,500,000 0 25,500,000 0 50,000,000
Expenditures (Actual and Planned)
Source Thru
6/30/20 FY21 FY22 FY23-26 Total City Capital 0 0 500,000 49,500,000 50,000,000 Grants/Other 0 0 0 0 0 Total 0 0 500,000 49,500,000 50,000,000
BUS MONITOR TECHNOLOGY Project Mission Purchase and install bus monitor technology to enhance transportation planning and operations. Managing Department, Boston Public Schools Status, To Be Scheduled Location, N/A Operating Impact, No
Authorizations
Source Existing FY22 Future Non Capital
Fund Total City Capital 100,000 0 0 0 100,000 Grants/Other 0 0 0 0 0 Total 100,000 0 0 0 100,000
Expenditures (Actual and Planned)
Source Thru
6/30/20 FY21 FY22 FY23-26 Total City Capital 0 0 100,000 0 100,000 Grants/Other 0 0 0 0 0 Total 0 0 100,000 0 100,000
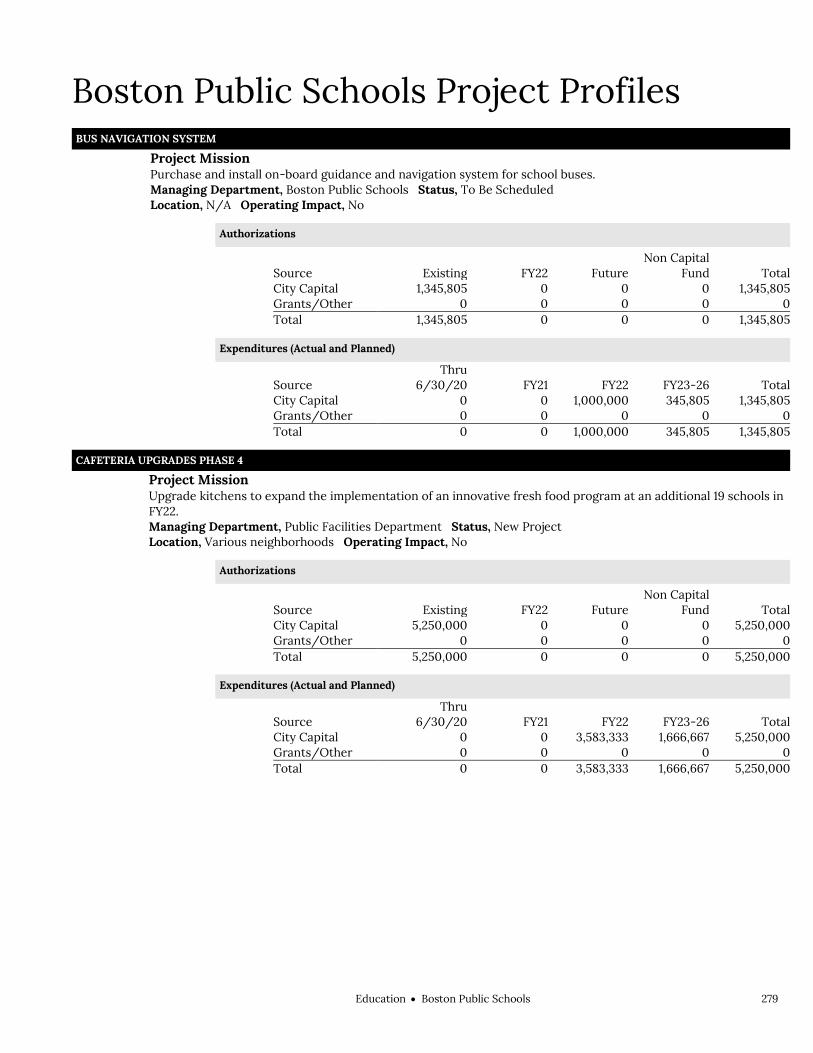
EducationBoston Public Schools 279
Boston Public Schools Project Profiles BUS NAVIGATION SYSTEM
Project Mission Purchase and install on-board guidance and navigation system for school buses. Managing Department, Boston Public Schools Status, To Be Scheduled Location, N/A Operating Impact, No
Authorizations
Source Existing FY22 Future Non Capital
Fund Total City Capital 1,345,805 0 0 0 1,345,805 Grants/Other 0 0 0 0 0 Total 1,345,805 0 0 0 1,345,805
Expenditures (Actual and Planned)
Source Thru
6/30/20 FY21 FY22 FY23-26 Total City Capital 0 0 1,000,000 345,805 1,345,805 Grants/Other 0 0 0 0 0 Total 0 0 1,000,000 345,805 1,345,805
CAFETERIA UPGRADES PHASE 4 Project Mission Upgrade kitchens to expand the implementation of an innovative fresh food program at an additional 19 schools in
FY22.
Managing Department, Public Facilities Department Status, New Project Location, Various neighborhoods Operating Impact, No
Authorizations
Source Existing FY22 Future Non Capital
Fund Total City Capital 5,250,000 0 0 0 5,250,000 Grants/Other 0 0 0 0 0 Total 5,250,000 0 0 0 5,250,000
Expenditures (Actual and Planned)
Source Thru
6/30/20 FY21 FY22 FY23-26 Total City Capital 0 0 3,583,333 1,666,667 5,250,000 Grants/Other 0 0 0 0 0 Total 0 0 3,583,333 1,666,667 5,250,000
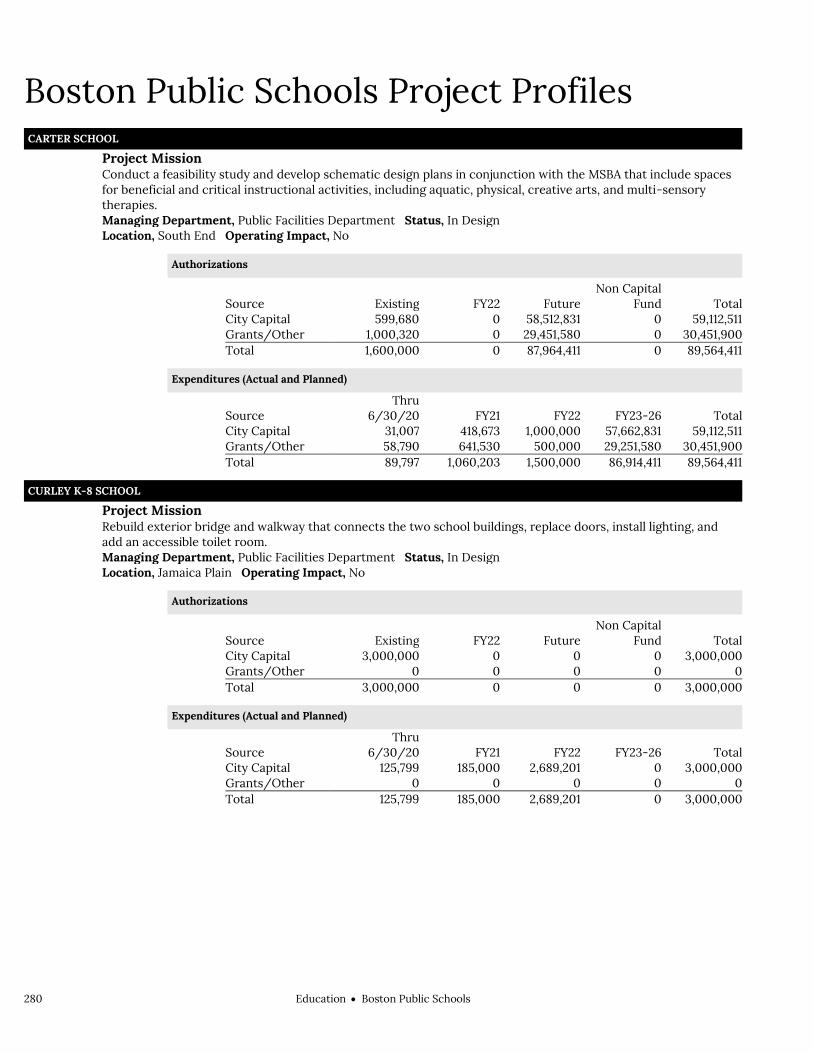
280 EducationBoston Public Schools
Boston Public Schools Project Profiles CARTER SCHOOL
Project Mission Conduct a feasibility study and develop schematic design plans in conjunction with the MSBA that include spaces
for beneficial and critical instructional activities, including aquatic, physical, creative arts, and multi-sensory therapies.
Managing Department, Public Facilities Department Status, In Design Location, South End Operating Impact, No
Authorizations
Source Existing FY22 Future Non Capital
Fund Total City Capital 599,680 0 58,512,831 0 59,112,511 Grants/Other 1,000,320 0 29,451,580 0 30,451,900 Total 1,600,000 0 87,964,411 0 89,564,411
Expenditures (Actual and Planned)
Source Thru
6/30/20 FY21 FY22 FY23-26 Total City Capital 31,007 418,673 1,000,000 57,662,831 59,112,511 Grants/Other 58,790 641,530 500,000 29,251,580 30,451,900 Total 89,797 1,060,203 1,500,000 86,914,411 89,564,411
CURLEY K-8 SCHOOL Project Mission Rebuild exterior bridge and walkway that connects the two school buildings, replace doors, install lighting, and
add an accessible toilet room.
Managing Department, Public Facilities Department Status, In Design Location, Jamaica Plain Operating Impact, No
Authorizations
Source Existing FY22 Future Non Capital
Fund Total City Capital 3,000,000 0 0 0 3,000,000 Grants/Other 0 0 0 0 0 Total 3,000,000 0 0 0 3,000,000
Expenditures (Actual and Planned)
Source Thru
6/30/20 FY21 FY22 FY23-26 Total City Capital 125,799 185,000 2,689,201 0 3,000,000 Grants/Other 0 0 0 0 0 Total 125,799 185,000 2,689,201 0 3,000,000

EducationBoston Public Schools 281
Boston Public Schools Project Profiles DEVER SCHOOL AND MCCORMACK SCHOOL OPEN SPACE STUDY
Project Mission Study to determine outdoor improvements at the Dever School and McCormack School. Managing Department, Boston Public Schools Status, To Be Scheduled Location, Dorchester Operating Impact, No
Authorizations
Source Existing FY22 Future Non Capital
Fund Total City Capital 200,000 0 0 0 200,000 Grants/Other 0 0 0 0 0 Total 200,000 0 0 0 200,000
Expenditures (Actual and Planned)
Source Thru
6/30/20 FY21 FY22 FY23-26 Total City Capital 0 50,000 150,000 0 200,000 Grants/Other 0 0 0 0 0 Total 0 50,000 150,000 0 200,000
DRINKING WATER UPGRADES AT VARIOUS SCHOOLS Project Mission Upgrade plumbing and fixtures to expand the availability of drinking water at various schools. Managing Department, Boston Public Schools Status, To Be Scheduled Location, Various neighborhoods Operating Impact, No
Authorizations
Source Existing FY22 Future Non Capital
Fund Total City Capital 10,360,000 0 0 0 10,360,000 Grants/Other 0 0 0 0 0 Total 10,360,000 0 0 0 10,360,000
Expenditures (Actual and Planned)
Source Thru
6/30/20 FY21 FY22 FY23-26 Total City Capital 0 0 250,000 10,110,000 10,360,000 Grants/Other 0 0 0 0 0 Total 0 0 250,000 10,110,000 10,360,000
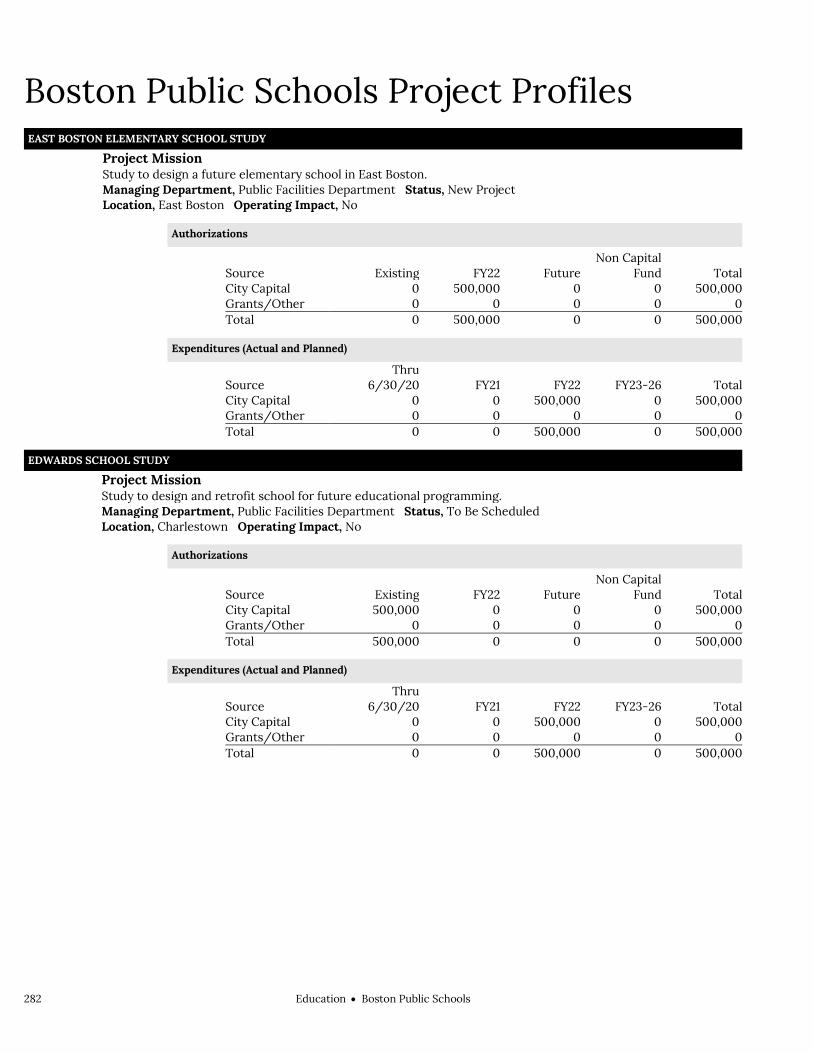
282 EducationBoston Public Schools
Boston Public Schools Project Profiles EAST BOSTON ELEMENTARY SCHOOL STUDY
Project Mission Study to design a future elementary school in East Boston. Managing Department, Public Facilities Department Status, New Project Location, East Boston Operating Impact, No
Authorizations
Source Existing FY22 Future Non Capital
Fund Total City Capital 0 500,000 0 0 500,000 Grants/Other 0 0 0 0 0 Total 0 500,000 0 0 500,000
Expenditures (Actual and Planned)
Source Thru
6/30/20 FY21 FY22 FY23-26 Total City Capital 0 0 500,000 0 500,000 Grants/Other 0 0 0 0 0 Total 0 0 500,000 0 500,000
EDWARDS SCHOOL STUDY Project Mission Study to design and retrofit school for future educational programming. Managing Department, Public Facilities Department Status, To Be Scheduled Location, Charlestown Operating Impact, No
Authorizations
Source Existing FY22 Future Non Capital
Fund Total City Capital 500,000 0 0 0 500,000 Grants/Other 0 0 0 0 0 Total 500,000 0 0 0 500,000
Expenditures (Actual and Planned)
Source Thru
6/30/20 FY21 FY22 FY23-26 Total City Capital 0 0 500,000 0 500,000 Grants/Other 0 0 0 0 0 Total 0 0 500,000 0 500,000

EducationBoston Public Schools 283
Boston Public Schools Project Profiles ELECTRICAL UPGRADES AT 2 SCHOOLS
Project Mission Upgrade electrical equipment at the Dever and McCormack schools to align with transformer replacements in
Columbia Point.
Managing Department, Public Facilities Department Status, New Project Location, Dorchester Operating Impact, No
Authorizations
Source Existing FY22 Future Non Capital
Fund Total City Capital 0 5,530,518 0 0 5,530,518 Grants/Other 0 0 60,000 0 60,000 Total 0 5,530,518 60,000 0 5,590,518
Expenditures (Actual and Planned)
Source Thru
6/30/20 FY21 FY22 FY23-26 Total City Capital 0 0 500,000 5,030,518 5,530,518 Grants/Other 0 0 60,000 0 60,000 Total 0 0 560,000 5,030,518 5,590,518
ELEMENTARY SCHOOL PROGRAMMING AND SITING STUDY Project Mission Study to identify programming and sites for future elementary schools. Managing Department, Public Facilities Department Status, New Project Location, Various neighborhoods Operating Impact, No
Authorizations
Source Existing FY22 Future Non Capital
Fund Total City Capital 0 2,000,000 0 0 2,000,000 Grants/Other 0 0 0 0 0 Total 0 2,000,000 0 0 2,000,000
Expenditures (Actual and Planned)
Source Thru
6/30/20 FY21 FY22 FY23-26 Total City Capital 0 0 1,000,000 1,000,000 2,000,000 Grants/Other 0 0 0 0 0 Total 0 0 1,000,000 1,000,000 2,000,000

284 EducationBoston Public Schools
Boston Public Schools Project Profiles ENTRYWAY IMPROVEMENTS AT VARIOUS SCHOOLS
Project Mission Improve entryways to create a more welcoming, calm, and safe environment, including upgrades to security,
doors, lighting, and wayfinding at various schools.
Managing Department, Boston Public Schools Status, To Be Scheduled Location, Various neighborhoods Operating Impact, No
Authorizations
Source Existing FY22 Future Non Capital
Fund Total City Capital 2,000,000 0 0 0 2,000,000 Grants/Other 0 0 0 0 0 Total 2,000,000 0 0 0 2,000,000
Expenditures (Actual and Planned)
Source Thru
6/30/20 FY21 FY22 FY23-26 Total City Capital 0 250,000 500,000 1,250,000 2,000,000 Grants/Other 0 0 0 0 0 Total 0 250,000 500,000 1,250,000 2,000,000
EVERETT SCHOOL ROOF Project Mission Replace roof. Managing Department, Public Facilities Department Status, In Design Location, Dorchester Operating Impact, No
Authorizations
Source Existing FY22 Future Non Capital
Fund Total City Capital 1,741,924 0 0 0 1,741,924 Grants/Other 0 0 0 0 0 Total 1,741,924 0 0 0 1,741,924
Expenditures (Actual and Planned)
Source Thru
6/30/20 FY21 FY22 FY23-26 Total City Capital 0 1,102,594 639,330 0 1,741,924 Grants/Other 0 0 0 0 0 Total 0 1,102,594 639,330 0 1,741,924

EducationBoston Public Schools 285
Boston Public Schools Project Profiles EXTERIOR GROUNDS IMPROVEMENTS
Project Mission Improve landscaping, walkways, paving, and outdoor lighting and signage at various schools. Managing Department, Boston Public Schools Status, New Project Location, Citywide Operating Impact, No
Authorizations
Source Existing FY22 Future Non Capital
Fund Total City Capital 0 2,250,000 0 0 2,250,000 Grants/Other 0 0 0 0 0 Total 0 2,250,000 0 0 2,250,000
Expenditures (Actual and Planned)
Source Thru
6/30/20 FY21 FY22 FY23-26 Total City Capital 0 0 750,000 1,500,000 2,250,000 Grants/Other 0 0 0 0 0 Total 0 0 750,000 1,500,000 2,250,000
FIRE SYSTEMS AT VARIOUS SCHOOLS Project Mission Upgrade or replace fire alarms and/or fire protection systems at various schools. Managing Department, Public Facilities Department Status, To Be Scheduled Location, Various neighborhoods Operating Impact, No
Authorizations
Source Existing FY22 Future Non Capital
Fund Total City Capital 1,000,000 0 1,500,000 0 2,500,000 Grants/Other 0 0 0 0 0 Total 1,000,000 0 1,500,000 0 2,500,000
Expenditures (Actual and Planned)
Source Thru
6/30/20 FY21 FY22 FY23-26 Total City Capital 0 0 500,000 2,000,000 2,500,000 Grants/Other 0 0 0 0 0 Total 0 0 500,000 2,000,000 2,500,000

286 EducationBoston Public Schools
Boston Public Schools Project Profiles FOOD AND NUTRITIONAL SERVICES TECHNOLOGY
Project Mission Purchase and install point of sale system for food services at all schools. Managing Department, Boston Public Schools Status, To Be Scheduled Location, Citywide Operating Impact, No
Authorizations
Source Existing FY22 Future Non Capital
Fund Total City Capital 740,000 0 0 0 740,000 Grants/Other 0 0 0 0 0 Total 740,000 0 0 0 740,000
Expenditures (Actual and Planned)
Source Thru
6/30/20 FY21 FY22 FY23-26 Total City Capital 0 500,000 240,000 0 740,000 Grants/Other 0 0 0 0 0 Total 0 500,000 240,000 0 740,000
GRADE K-6 SCHOOL CONVERSIONS PHASE 1 Project Mission Interior renovations to facilitate K-6 conversions at various schools, including adding/removing walls, installing
lockers, and relocating offices.
Managing Department, Boston Public Schools Status, In Construction Location, Various neighborhoods Operating Impact, No
Authorizations
Source Existing FY22 Future Non Capital
Fund Total City Capital 500,000 0 0 0 500,000 Grants/Other 0 0 0 0 0 Total 500,000 0 0 0 500,000
Expenditures (Actual and Planned)
Source Thru
6/30/20 FY21 FY22 FY23-26 Total City Capital 0 350,000 150,000 0 500,000 Grants/Other 0 0 0 0 0 Total 0 350,000 150,000 0 500,000

EducationBoston Public Schools 287
Boston Public Schools Project Profiles HENDERSON INCLUSION LOWER SCHOOL WINDOWS
Project Mission Replace windows, add fire sprinklers, and make accessibility improvements. Managing Department, Public Facilities Department Status, In Design Location, Dorchester Operating Impact, No
Authorizations
Source Existing FY22 Future Non Capital
Fund Total City Capital 8,600,000 2,128,239 0 0 10,728,239 Grants/Other 0 0 0 0 0 Total 8,600,000 2,128,239 0 0 10,728,239
Expenditures (Actual and Planned)
Source Thru
6/30/20 FY21 FY22 FY23-26 Total City Capital 138,451 977,594 3,712,239 5,899,955 10,728,239 Grants/Other 0 0 0 0 0 Total 138,451 977,594 3,712,239 5,899,955 10,728,239
HENDERSON UPPER SCHOOL YARD Project Mission Design and construct a new school yard at the Henderson Upper School. Managing Department, Public Facilities Department Status, New Project Location, Dorchester Operating Impact, No
Authorizations
Source Existing FY22 Future Non Capital
Fund Total City Capital 0 1,000,000 0 0 1,000,000 Grants/Other 0 0 0 0 0 Total 0 1,000,000 0 0 1,000,000
Expenditures (Actual and Planned)
Source Thru
6/30/20 FY21 FY22 FY23-26 Total City Capital 0 0 500,000 500,000 1,000,000 Grants/Other 0 0 0 0 0 Total 0 0 500,000 500,000 1,000,000

288 EducationBoston Public Schools
Boston Public Schools Project Profiles HORACE MANN SCHOOL RELOCATION
Project Mission Infrastructure improvements associated with relocation to accommodate specialized programmatic needs for
students with hearing impairments.
Managing Department, Public Facilities Department Status, To Be Scheduled Location, Allston/Brighton Operating Impact, No
Authorizations
Source Existing FY22 Future Non Capital
Fund Total City Capital 100,000 900,000 0 0 1,000,000 Grants/Other 0 0 0 0 0 Total 100,000 900,000 0 0 1,000,000
Expenditures (Actual and Planned)
Source Thru
6/30/20 FY21 FY22 FY23-26 Total City Capital 0 0 1,000,000 0 1,000,000 Grants/Other 0 0 0 0 0 Total 0 0 1,000,000 0 1,000,000
IRVING SCHOOL RECONFIGURATION Project Mission Upgrade building facilities at the Irving School to facilitate grade reconfiguration. Managing Department, Public Facilities Department Status, New Project Location, Roslindale Operating Impact, No
Authorizations
Source Existing FY22 Future Non Capital
Fund Total City Capital 0 5,200,000 0 0 5,200,000 Grants/Other 0 0 0 0 0 Total 0 5,200,000 0 0 5,200,000
Expenditures (Actual and Planned)
Source Thru
6/30/20 FY21 FY22 FY23-26 Total City Capital 0 0 2,200,000 3,000,000 5,200,000 Grants/Other 0 0 0 0 0 Total 0 0 2,200,000 3,000,000 5,200,000

EducationBoston Public Schools 289
Boston Public Schools Project Profiles JOSIAH QUINCY UPPER SCHOOL
Project Mission Design and construct a new facility for the Josiah Quincy Upper School. The MSBA will partner with the City in the
development and funding of this new school.
Managing Department, Public Facilities Department Status, In Design Location, Chinatown Operating Impact, No
Authorizations
Source Existing FY22 Future Non Capital
Fund Total City Capital 126,515,501 0 0 0 126,515,501 Grants/Other 67,075,966 0 0 0 67,075,966 Total 193,591,467 0 0 0 193,591,467
Expenditures (Actual and Planned)
Source Thru
6/30/20 FY21 FY22 FY23-26 Total City Capital 773,463 3,000,000 14,000,000 108,742,038 126,515,501 Grants/Other 6,276,429 4,000,000 12,000,000 44,799,537 67,075,966 Total 7,049,892 7,000,000 26,000,000 153,541,575 193,591,467
KENNEDY ACADEMY ENVELOPE Project Mission Repair roof, masonry, windows, and doors. Managing Department, Public Facilities Department Status, New Project Location, Mission Hill Operating Impact, No
Authorizations
Source Existing FY22 Future Non Capital
Fund Total City Capital 0 1,892,212 0 0 1,892,212 Grants/Other 0 0 0 0 0 Total 0 1,892,212 0 0 1,892,212
Expenditures (Actual and Planned)
Source Thru
6/30/20 FY21 FY22 FY23-26 Total City Capital 0 0 100,000 1,792,212 1,892,212 Grants/Other 0 0 0 0 0 Total 0 0 100,000 1,792,212 1,892,212
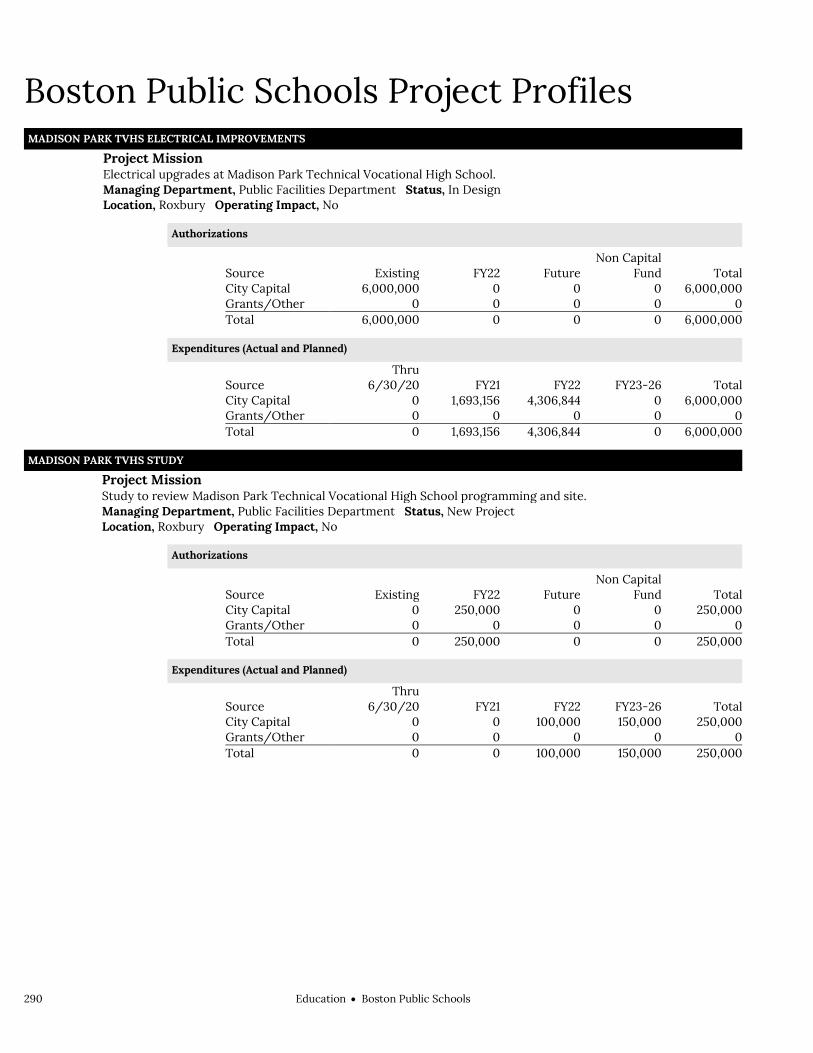
290 EducationBoston Public Schools
Boston Public Schools Project Profiles MADISON PARK TVHS ELECTRICAL IMPROVEMENTS
Project Mission Electrical upgrades at Madison Park Technical Vocational High School. Managing Department, Public Facilities Department Status, In Design Location, Roxbury Operating Impact, No
Authorizations
Source Existing FY22 Future Non Capital
Fund Total City Capital 6,000,000 0 0 0 6,000,000 Grants/Other 0 0 0 0 0 Total 6,000,000 0 0 0 6,000,000
Expenditures (Actual and Planned)
Source Thru
6/30/20 FY21 FY22 FY23-26 Total City Capital 0 1,693,156 4,306,844 0 6,000,000 Grants/Other 0 0 0 0 0 Total 0 1,693,156 4,306,844 0 6,000,000
MADISON PARK TVHS STUDY Project Mission Study to review Madison Park Technical Vocational High School programming and site. Managing Department, Public Facilities Department Status, New Project Location, Roxbury Operating Impact, No
Authorizations
Source Existing FY22 Future Non Capital
Fund Total City Capital 0 250,000 0 0 250,000 Grants/Other 0 0 0 0 0 Total 0 250,000 0 0 250,000
Expenditures (Actual and Planned)
Source Thru
6/30/20 FY21 FY22 FY23-26 Total City Capital 0 0 100,000 150,000 250,000 Grants/Other 0 0 0 0 0 Total 0 0 100,000 150,000 250,000

EducationBoston Public Schools 291
Boston Public Schools Project Profiles MANDELA ATHLETIC COMPLEX LOCKER ROOMS
Project Mission Renovate women's locker rooms for Madison Park Technical Vocational High School and the O'Bryant School of
Mathematics and Science.
Managing Department, Public Facilities Department Status, In Design Location, Roxbury Operating Impact, No
Authorizations
Source Existing FY22 Future Non Capital
Fund Total City Capital 8,030,325 0 0 0 8,030,325 Grants/Other 0 0 0 0 0 Total 8,030,325 0 0 0 8,030,325
Expenditures (Actual and Planned)
Source Thru
6/30/20 FY21 FY22 FY23-26 Total City Capital 60,074 400,000 4,500,000 3,070,251 8,030,325 Grants/Other 0 0 0 0 0 Total 60,074 400,000 4,500,000 3,070,251 8,030,325
MATHER SCHOOL ENVELOPE Project Mission Repair roof, masonry, windows, and doors. Managing Department, Public Facilities Department Status, New Project Location, Dorchester Operating Impact, No
Authorizations
Source Existing FY22 Future Non Capital
Fund Total City Capital 0 3,000,000 0 0 3,000,000 Grants/Other 0 0 0 0 0 Total 0 3,000,000 0 0 3,000,000
Expenditures (Actual and Planned)
Source Thru
6/30/20 FY21 FY22 FY23-26 Total City Capital 0 0 225,000 2,775,000 3,000,000 Grants/Other 0 0 0 0 0 Total 0 0 225,000 2,775,000 3,000,000

292 EducationBoston Public Schools
Boston Public Schools Project Profiles MATTAHUNT SCHOOL
Project Mission Safety upgrades at the Mattahunt Elementary School. Managing Department, Public Facilities Department Status, To Be Scheduled Location, Mattapan Operating Impact, No
Authorizations
Source Existing FY22 Future Non Capital
Fund Total City Capital 500,000 0 0 0 500,000 Grants/Other 0 0 0 0 0 Total 500,000 0 0 0 500,000
Expenditures (Actual and Planned)
Source Thru
6/30/20 FY21 FY22 FY23-26 Total City Capital 0 0 500,000 0 500,000 Grants/Other 0 0 0 0 0 Total 0 0 500,000 0 500,000
MCCORMACK SCHOOL 7-12 CONVERSION PHASES 1-2 Project Mission Refurbish building interior to facilitate grade 7-12 conversion. Managing Department, Boston Public Schools Status, New Project Location, Dorchester Operating Impact, No
Authorizations
Source Existing FY22 Future Non Capital
Fund Total City Capital 200,000 2,800,000 0 0 3,000,000 Grants/Other 0 0 0 0 0 Total 200,000 2,800,000 0 0 3,000,000
Expenditures (Actual and Planned)
Source Thru
6/30/20 FY21 FY22 FY23-26 Total City Capital 0 200,000 2,800,000 0 3,000,000 Grants/Other 0 0 0 0 0 Total 0 200,000 2,800,000 0 3,000,000

EducationBoston Public Schools 293
Boston Public Schools Project Profiles QUINCY SCHOOL EXTERIOR UPGRADES
Project Mission Repair masonry and replace roof, windows, and exterior doors. Managing Department, Public Facilities Department Status, In Design Location, Chinatown Operating Impact, No
Authorizations
Source Existing FY22 Future Non Capital
Fund Total City Capital 9,400,000 5,960,000 0 0 15,360,000 Grants/Other 0 0 0 0 0 Total 9,400,000 5,960,000 0 0 15,360,000
Expenditures (Actual and Planned)
Source Thru
6/30/20 FY21 FY22 FY23-26 Total City Capital 0 400,000 8,000,000 6,960,000 15,360,000 Grants/Other 0 0 0 0 0 Total 0 400,000 8,000,000 6,960,000 15,360,000
RADIATOR COVERS AT VARIOUS SCHOOLS Project Mission Replace radiator covers at various schools. Managing Department, Boston Public Schools Status, To Be Scheduled Location, Various neighborhoods Operating Impact, No
Authorizations
Source Existing FY22 Future Non Capital
Fund Total City Capital 1,000,000 0 0 0 1,000,000 Grants/Other 0 0 0 0 0 Total 1,000,000 0 0 0 1,000,000
Expenditures (Actual and Planned)
Source Thru
6/30/20 FY21 FY22 FY23-26 Total City Capital 0 250,000 500,000 250,000 1,000,000 Grants/Other 0 0 0 0 0 Total 0 250,000 500,000 250,000 1,000,000

294 EducationBoston Public Schools
Boston Public Schools Project Profiles SCHOOL YARD IMPROVEMENTS
Project Mission Design and construct school yards to be completed in FY22 through FY26, including the Haley School yard. Managing Department, Public Facilities Department Status, Annual Program Location, Various neighborhoods Operating Impact, No
Authorizations
Source Existing FY22 Future Non Capital
Fund Total City Capital 4,774,650 0 2,400,000 0 7,174,650 Grants/Other 0 0 0 0 0 Total 4,774,650 0 2,400,000 0 7,174,650
Expenditures (Actual and Planned)
Source Thru
6/30/20 FY21 FY22 FY23-26 Total City Capital 412,937 750,000 236,859 5,774,854 7,174,650 Grants/Other 0 0 0 0 0 Total 412,937 750,000 236,859 5,774,854 7,174,650
SECURITY RELATED IMPROVEMENTS AT VARIOUS SCHOOLS II Project Mission Security-related improvements at various schools, including installing or upgrading PA and alarm systems. Managing Department, Boston Public Schools Status, Annual Program Location, Citywide Operating Impact, No
Authorizations
Source Existing FY22 Future Non Capital
Fund Total City Capital 1,050,000 1,760,000 0 0 2,810,000 Grants/Other 0 0 0 0 0 Total 1,050,000 1,760,000 0 0 2,810,000
Expenditures (Actual and Planned)
Source Thru
6/30/20 FY21 FY22 FY23-26 Total City Capital 0 0 1,310,000 1,500,000 2,810,000 Grants/Other 0 0 0 0 0 Total 0 0 1,310,000 1,500,000 2,810,000

EducationBoston Public Schools 295
Boston Public Schools Project Profiles SNOWDEN INTERNATIONAL SCHOOL ROOF
Project Mission Replace roof. Managing Department, Public Facilities Department Status, In Design Location, Back Bay Operating Impact, No
Authorizations
Source Existing FY22 Future Non Capital
Fund Total City Capital 1,301,635 0 0 0 1,301,635 Grants/Other 0 0 0 0 0 Total 1,301,635 0 0 0 1,301,635
Expenditures (Actual and Planned)
Source Thru
6/30/20 FY21 FY22 FY23-26 Total City Capital 54,529 500,000 747,106 0 1,301,635 Grants/Other 0 0 0 0 0 Total 54,529 500,000 747,106 0 1,301,635
TECHNOLOGY INFRASTRUCTURE II Project Mission Upgrades to technology infrastructure in support of 21st century learning. Managing Department, Boston Public Schools Status, Annual Program Location, Citywide Operating Impact, No
Authorizations
Source Existing FY22 Future Non Capital
Fund Total City Capital 21,000,000 0 6,000,000 0 27,000,000 Grants/Other 0 0 0 0 0 Total 21,000,000 0 6,000,000 0 27,000,000
Expenditures (Actual and Planned)
Source Thru
6/30/20 FY21 FY22 FY23-26 Total City Capital 11,308,411 3,000,000 3,000,000 9,691,589 27,000,000 Grants/Other 0 0 0 0 0 Total 11,308,411 3,000,000 3,000,000 9,691,589 27,000,000
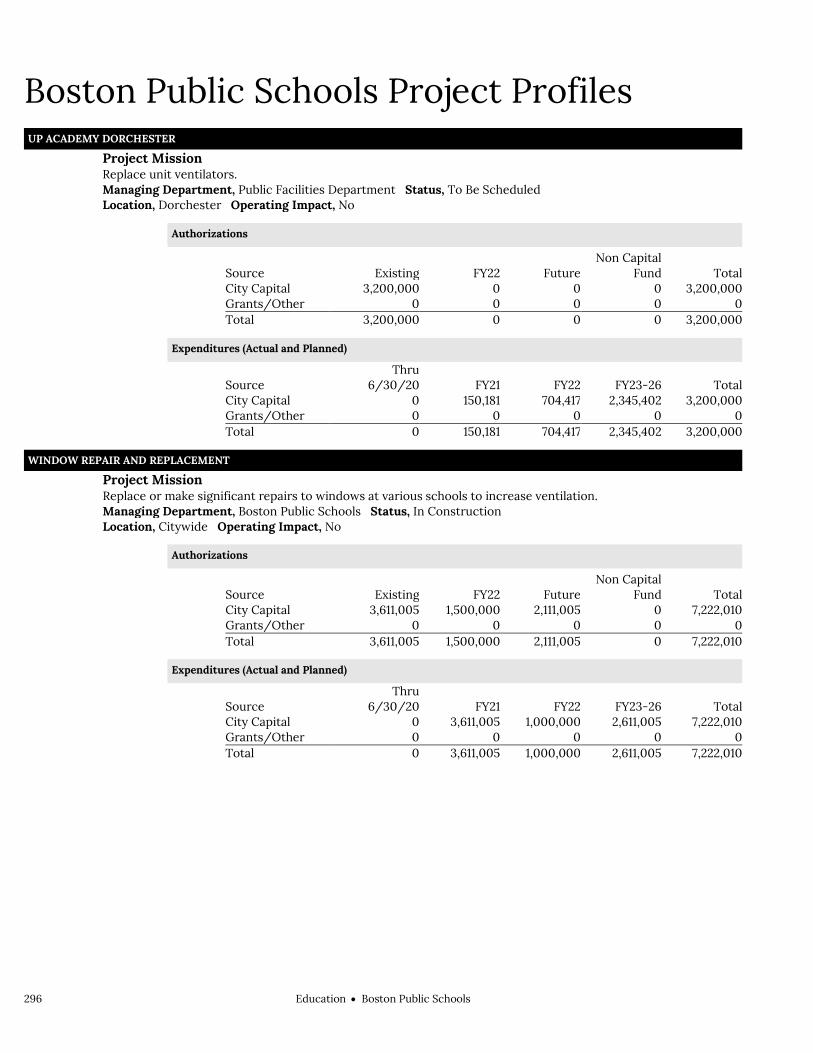
296 EducationBoston Public Schools
Boston Public Schools Project Profiles UP ACADEMY DORCHESTER
Project Mission Replace unit ventilators. Managing Department, Public Facilities Department Status, To Be Scheduled Location, Dorchester Operating Impact, No
Authorizations
Source Existing FY22 Future Non Capital
Fund Total City Capital 3,200,000 0 0 0 3,200,000 Grants/Other 0 0 0 0 0 Total 3,200,000 0 0 0 3,200,000
Expenditures (Actual and Planned)
Source Thru
6/30/20 FY21 FY22 FY23-26 Total City Capital 0 150,181 704,417 2,345,402 3,200,000 Grants/Other 0 0 0 0 0 Total 0 150,181 704,417 2,345,402 3,200,000
WINDOW REPAIR AND REPLACEMENT Project Mission Replace or make significant repairs to windows at various schools to increase ventilation. Managing Department, Boston Public Schools Status, In Construction Location, Citywide Operating Impact, No
Authorizations
Source Existing FY22 Future Non Capital
Fund Total City Capital 3,611,005 1,500,000 2,111,005 0 7,222,010 Grants/Other 0 0 0 0 0 Total 3,611,005 1,500,000 2,111,005 0 7,222,010
Expenditures (Actual and Planned)
Source Thru
6/30/20 FY21 FY22 FY23-26 Total City Capital 0 3,611,005 1,000,000 2,611,005 7,222,010 Grants/Other 0 0 0 0 0 Total 0 3,611,005 1,000,000 2,611,005 7,222,010
Environment, Energy & Open SpaceCabinet 297
Environment, Energy & Open Space Environment, Energy & Open Space Cabinet
Environment, Energy & Open Space ............................. 299
Environment Department ......................................... 301
Environment .................................................... 308
Parks & Recreation Department...............................319
Parks & Recreation Administration ............ 326
Parks Operations ............................................ 327
Citywide Recreation ....................................... 329
Animal Care & Control ................................... 330
Parks Design & Construction ........................ 331
Cemetery .......................................................... 332

298 Environment, Energy & Open SpaceCabinet

Environment, Energy & Open SpaceCabinet 299
Environment, Energy & Open Space Environment, Energy & Open Space
Christopher Cook, Chief of Environment and Energy
Cabinet Mission The mission of the Environment, Energy and Open Space Cabinet is to coordinate several City departments and programs to enhance sustainability, preserve historic and open space resources, protect the health and safety of the built environment, prepare for climate change, and provide public spaces to gather and recreate in Boston. The Environment, Energy and Open Space Cabinet includes initiatives that reduce energy use in municipal buildings and in the community with Renew Boston, enforce the right to a healthy home, engage the community on sustainability with Greenovate Boston, promote waste reduction, and expand the network of street trees.
Operating Budget
Total Actual '19 Total Actual '20 Total Approp '21 Total Budget '22
Environment Department 4,779,367 3,212,339 3,197,563 4,418,612
Parks & Recreation Department 25,988,602 28,753,617 27,135,110 28,052,742
Total 30,767,969 31,965,955 30,332,673 32,229,576
Capital Budget Expenditures Actual '19 Actual '20 Estimated '21 Projected '22
Environment Department 1,193,665 7,685,272 8,975,678 19,925,000 Parks & Recreation Department 27,521,798 30,451,531 36,475,848 39,537,351
Total 28,715,463 38,136,803 45,451,526 59,462,351
External Funds Expenditures
Total Actual '19 Total Actual '20 Total Approp '21 Total Budget '22
Environment Department 968,790 900,741 2,384,786 1,519,718 Parks & Recreation Department 13,084,131 7,212,467 6,140,728 5,585,712
Total 14,052,921 8,113,208 8,525,515 7,105,431


Environment, Energy & Open SpaceEnvironment Department 301
Environment Department Operating Budget Environment, Energy & Open Space Environment Department Carl Spector, Commissioner, Appropriation 303000
Department Mission The mission of the Environment Department is to enhance the quality of life in Boston by protecting air, water, climate and land resources, and by preserving and improving the integrity of Boston's architectural and historic resources.
Selected Performance Goals Environment
Engage Community. Increase sustainability. Protect historic resources. Reduce GHG Emissions. To protect environmental quality and resources.
Operating Budget Program Name Total Actual '19 Total Actual '20 Total Approp '21 Total Budget '22
Environment 4,779,367 3,212,339 3,197,563 4,418,611
Total 4,779,367 3,212,339 3,197,563 4,418,611
External Funds Budget Fund Name Total Actual '19 Total Actual '20 Total Approp '21 Total Budget '22
Archeology Fund 9,353 6,881 1,900 0
BARR/Climate Ready Boston 0 0 259,093 312,595
BARR/Smart Utilities Policy 6,800 30,250 25,000 0
Boston Pollution Abatement Fund 185,508 324,261 509,252 236,680
Climate Action Plan Grant/ BARR Foundation 977 829 15,497 0
Climate Preparedness Grant 233,466 100,249 367,055 0
Coastal Community Resilience 34,438 0 0 0
DEP Sustainable Materials 0 0 60,000 60,000
DOER Energy Manager Grant 35,000 0 0 0
Greenovate Fellowships 0 0 10,846 0
Highland Park Study Report/MHC 0 25,000 15,000 0
Humanities Collections & Reference Resources 350 186,303 210,968 280,373
Moon Island Project 0 0 0 200,000
Multi-City Microgrids 57 0 0 0
Municipal Waterway 148,109 100,738 148,000 0
MVP Children's Museum 0 0 313,675 0
MVP Heat Resilience Study 0 0 0 280,070
National Register Nomination 34,210 18,800 0 0
Renew Boston 13,915 7,430 198,500 0
Solar Renewable Energy Certificates 264,635 100,000 250,000 150,000
Total 968,790 900,741 2,384,786 1,519,718

302 Environment, Energy & Open SpaceEnvironment Department
Operating Budget Actual '19 Actual '20 Approp '21 Budget '22
Personnel Services 1,843,431 2,139,826 2,488,647 2,811,695 Non Personnel 2,935,936 1,072,513 708,916 1,606,916 Total 4,779,367 3,212,339 3,197,563 4,418,611

Environment, Energy & Open SpaceEnvironment Department 303
Environment Department Operating Budget
Authorizing Statutes Archaeology, M.G.L.A. c.9, §§ 26-27c;
1982 Mass. Acts ch. 152. Environmental, CBC Ord. § 5-2.1; CBC
Ord. § 7-1.1; M.G.L.A. c. 131, § 40. Administration, 1982 Mass. Acts ch. 624,
§§ 1-10. Preservation, 36 CFR 60; M.G.L.A. c. 40C;
CBC Ord. § 7-3.1; 1955 Mass. Acts ch. 616, as amended; 1966 Mass. Acts ch. 625, as amended; 1975 Mass. Acts ch. 772.
Generally, CBC St. 5 §§ 3-5, 9, 100, 102, 104, 113; CBC St. 2 § 752; CBC St. 11 §174; CBC St. 14 § 170; CBC Ord. § 5-2.1; M.G.L.A. c. 41, §§ 82-84.
Description of Services The Environment Department reviews permit applications and development proposals, coordinates City policy on environmental issues and sustainability, conducts surveys of built and natural resources, provides public information and referrals on environmental and historic preservation issues, and develops City programs such as the preservation guidebook for homeowners. The department also provides support for the operations of the Groundwater Trust and the Boston Waterways Board.
Director
Administration
Personnel
Budget/Grants Administration
Public Information
Environment
Harbor Planning
Energy & Sustainability
Environment Impact Reports
Boston Conservation Commission
Air Pollution Control Commission
Preservation
Commissions
Historic Properties
Architectural Review
Archaeology

304 Environment, Energy & Open SpaceEnvironment Department
Department History Personnel Services FY19 Expenditure FY20 Expenditure FY21 Appropriation FY22 Recommended Inc/Dec 21 vs 22
51000 Permanent Employees 1,843,431 2,139,826 2,488,647 2,811,695 323,048 51100 Emergency Employees 0 0 0 0 0 51200 Overtime 0 0 0 0 0 51600 Unemployment Compensation 0 0 0 0 0 51700 Workers' Compensation 0 0 0 0 0 Total Personnel Services 1,843,431 2,139,826 2,488,647 2,811,695 323,048
Contractual Services FY19 Expenditure FY20 Expenditure FY21 Appropriation FY22 Recommended Inc/Dec 21 vs 22
52100 Communications 8,946 8,711 7,700 7,700 0 52200 Utilities 0 0 0 0 0 52400 Snow Removal 0 0 0 0 0 52500 Garbage/Waste Removal 0 0 0 0 0 52600 Repairs Buildings & Structures 0 0 0 0 0 52700 Repairs & Service of Equipment 2,160 2,189 1,000 1,000 0 52800 Transportation of Persons 5,285 5,157 0 0 0 52900 Contracted Services 2,863,969 1,006,093 664,816 1,564,816 900,000 Total Contractual Services 2,880,360 1,022,150 673,516 1,573,516 900,000
Supplies & Materials FY19 Expenditure FY20 Expenditure FY21 Appropriation FY22 Recommended Inc/Dec 21 vs 22
53000 Auto Energy Supplies 0 0 0 0 0 53200 Food Supplies 4,001 6,343 2,000 0 -2,000 53400 Custodial Supplies 0 0 0 0 0 53500 Med, Dental, & Hosp Supply 0 0 0 0 0 53600 Office Supplies and Materials 33,678 28,834 27,000 27,000 0 53700 Clothing Allowance 0 0 0 0 0 53800 Educational Supplies & Mat 0 0 0 0 0 53900 Misc Supplies & Materials 7,653 3,334 2,000 2,000 0 Total Supplies & Materials 45,332 38,511 31,000 29,000 -2,000
Current Chgs & Oblig FY19 Expenditure FY20 Expenditure FY21 Appropriation FY22 Recommended Inc/Dec 21 vs 22
54300 Workers' Comp Medical 0 0 0 0 0 54400 Legal Liabilities 0 0 0 0 0 54500 Aid To Veterans 0 0 0 0 0 54600 Current Charges H&I 0 0 0 0 0 54700 Indemnification 0 0 0 0 0 54800 Reserve Account 0 0 0 0 0 54900 Other Current Charges 1,377 1,679 4,400 4,400 0 Total Current Chgs & Oblig 1,377 1,679 4,400 4,400 0
Equipment FY19 Expenditure FY20 Expenditure FY21 Appropriation FY22 Recommended Inc/Dec 21 vs 22
55000 Automotive Equipment 0 0 0 0 0 55400 Lease/Purchase 0 0 0 0 0 55600 Office Furniture & Equipment 0 0 0 0 0 55900 Misc Equipment 8,867 10,173 0 0 0 Total Equipment 8,867 10,173 0 0 0
Other FY19 Expenditure FY20 Expenditure FY21 Appropriation FY22 Recommended Inc/Dec 21 vs 22
56200 Special Appropriation 0 0 0 0 0 57200 Structures & Improvements 0 0 0 0 0 58000 Land & Non-Structure 0 0 0 0 0 Total Other 0 0 0 0 0
Grand Total 4,779,367 3,212,339 3,197,563 4,418,611 1,221,048

Environment, Energy & Open SpaceEnvironment Department 305
Department Personnel
Title Union Code Grade Position FY22 Salary Title
Union Code Grade Position FY22 Salary
Admin Asst MYO 04 1.00 46,611 Dir CCE MYO 09 1.00 80,620 Admin Asst_III MYO 08 2.00 122,965 Dir of Design Review MYO 09 1.00 91,375 Admin Manager MYO 09 1.00 71,937 Dir of Recycling Programs EXM 08 1.00 105,822 Administrative_Asst MYO 06 1.00 50,631 Environmental Asst MYO 06 3.00 195,479
Archaeologist MYO 06 1.00 70,491 Exec Dir, Bos Con Comm Fld Mng
MYO 09 1.00 68,546
Archaeology Laboratory Mgr MYO 06 1.00 70,491 Finance Manager, Energy MYO 13 1.00 110,529 Architect MYO 09 1.00 76,739 Greenovate Program Manager MYO 06 1.00 50,631 Asst Survey Director MYO 06 1.00 70,491 Preservation Assistant MYO 06 1.00 56,994 Chief of Environment & Energy CDH NG 1.00 145,398 Preservation Planner MYO 06 2.00 125,226 Chief of Staff/Executive Asst MYO 11 1.00 94,465 Senior Preservation Planner MYO 08 1.00 71,937
Climate&BlddPr Mgr(Envrnmntl) MYO 08 1.00 71,937 Spec Asst IV MYO 14 3.00 332,987
Commissioner CDH NG 1.00 115,316 Special Asst II MYO 11 3.00 257,794 Conservation Assistant MYO 05 1.00 45,660 Staff Assistant II MYO 06 1.00 62,425
Zero Waste Coordinator EXM 08 1.00 71,937
Total 35 2,735,438 Adjustments Differential Payments 0 Other 137,000 Chargebacks 0 Salary Savings -60,742 FY22 Total Request 2,811,695

306 Environment, Energy & Open SpaceEnvironment Department
External Funds History Personnel Services FY19 Expenditure FY20 Expenditure FY21 Appropriation FY22 Recommended Inc/Dec 21 vs 22
51000 Permanent Employees 290,213 339,484 618,833 602,180 -16,653 51100 Emergency Employees 0 0 0 0 0 51200 Overtime 0 0 0 0 0 51300 Part Time Employees 0 0 0 0 0 51400 Health Insurance 15,460 20,267 69,120 24,691 -44,429 51500 Pension & Annuity 9,281 14,210 33,600 18,947 -14,653 51600 Unemployment Compensation 0 0 0 0 0 51700 Workers' Compensation 0 0 0 0 0 51800 Indirect Costs 98,672 17,633 0 42,104 42,104 51900 Medicare 1,385 1,981 6,425 3,228 -3,197 Total Personnel Services 415,011 393,575 727,978 691,150 -36,828
Contractual Services FY19 Expenditure FY20 Expenditure FY21 Appropriation FY22 Recommended Inc/Dec 21 vs 22
52100 Communications 0 0 0 0 0 52200 Utilities 0 0 0 0 0 52400 Snow Removal 0 0 0 0 0 52500 Garbage/Waste Removal 0 0 0 0 0 52600 Repairs Buildings & Structures 220,903 100,000 0 0 0 52700 Repairs & Service of Equipment 7,549 0 0 0 0 52800 Transportation of Persons 0 -25 0 0 0 52900 Contracted Services 241,690 406,841 1,622,628 790,577 -832,051 Total Contractual Services 470,142 506,816 1,622,628 790,577 -832,051
Supplies & Materials FY19 Expenditure FY20 Expenditure FY21 Appropriation FY22 Recommended Inc/Dec 21 vs 22
53000 Auto Energy Supplies 0 0 0 0 0 53200 Food Supplies 2,526 0 14,280 12,280 -2,000 53400 Custodial Supplies 0 0 0 0 0 53500 Med, Dental, & Hosp Supply 0 0 0 0 0 53600 Office Supplies and Materials 0 0 15,000 25,711 10,711 53700 Clothing Allowance 0 0 0 0 0 53800 Educational Supplies & Mat 0 0 0 0 0 53900 Misc Supplies & Materials 80,761 0 2,000 0 -2,000 Total Supplies & Materials 83,287 0 31,280 37,991 6,711
Current Chgs & Oblig FY19 Expenditure FY20 Expenditure FY21 Appropriation FY22 Recommended Inc/Dec 21 vs 22
54300 Workers' Comp Medical 0 0 0 0 0 54400 Legal Liabilities 0 0 0 0 0 54600 Current Charges H&I 0 0 0 0 0 54700 Indemnification 0 0 0 0 0 54800 Reserve Account 0 0 0 0 0 54900 Other Current Charges 350 350 0 0 0 Total Current Chgs & Oblig 350 350 0 0 0
Equipment FY19 Expenditure FY20 Expenditure FY21 Appropriation FY22 Recommended Inc/Dec 21 vs 22
55000 Automotive Equipment 0 0 0 0 0 55400 Lease/Purchase 0 0 0 0 0 55600 Office Furniture & Equipment 0 0 0 0 0 55900 Misc Equipment 0 0 2,900 0 -2,900 Total Equipment 0 0 2,900 0 -2,900
Other FY19 Expenditure FY20 Expenditure FY21 Appropriation FY22 Recommended Inc/Dec 21 vs 22
56200 Special Appropriation 0 0 0 0 0 57200 Structures & Improvements 0 0 0 0 0 58000 Land & Non-Structure 0 0 0 0 0 Total Other 0 0 0 0 0
Grand Total 968,790 900,741 2,384,786 1,519,718 -865,068

Environment, Energy & Open SpaceEnvironment Department 307
External Funds Personnel
Title Union Code Grade Position FY22 Salary Title Union Code Grade Position FY22 Salary
Archaeologist I MYO 08 2.00 127,580 Spec_Asst MYN NG 2.00 127,594 Carbon Neutrality Prog Mgr MYO 08 1.00 76,174 Spec Asst IV MYO 14 1.00 109,874 Environmental Asst MYO 06 1.00 50,631 Staff Assistant I MYO 05 2.00 110,326 Total 9 602,180 Adjustments Differential Payments 0 Other 0 Chargebacks 0 Salary Savings 0 FY22 Total Request 602,180

308 Environment, Energy & Open SpaceEnvironment Department
Program 1. Environment Carl Spector, Manager, Organization 303100
Program Description The Environment Program works to enhance the quality of Boston’s air, water, and land, and the integrity of its architecture and historic resources. The program researches and writes study reports, prepares National Register nominations, and performs design review of properties subject to landmark, local, district, and National Register review. The Program is focused on implementing the Mayor’s commitment to sustainable development, climate protection, and the environment by reviewing environmental impact assessments, issuing permits and providing information and referral services on environmental issues. Through participation in various local, state, and federal review processes, the program seeks to increase the accessibility and quality of Boston’s water and riverfronts. The program provides improved access to energy efficiency services for both residents and businesses.
Operating Budget Actual '19 Actual '20 Approp '21 Budget '22
Personnel Services 1,843,431 2,139,826 2,488,647 2,811,695 Non Personnel 2,935,936 1,072,513 708,916 1,606,916 Total 4,779,367 3,212,339 3,197,563 4,418,611
Performance
Goal: Engage Community
Performance Measures Actual '19 Actual '20 Projected '21 Target '22
# of social media followers (multiple platforms) 36,731 41,152 46,000 47,000
Goal: Increase sustainability
Performance Measures Actual '19 Actual '20 Projected '21 Target '22
Average LEED rating level of new buildings (building permit stage) 3 3 3 3
Goal: Protect historic resources
Performance Measures Actual '19 Actual '20 Projected '21 Target '22
# of preservation violations 78 67 40 40
# of protected buildings and sites 103 103 112 114
% of approved hearing items 91.2% 87.4% 97% 97%
Goal: Reduce GHG Emissions
Performance Measures Actual '19 Actual '20 Projected '21 Target '22
Annual community GHG emissions (compared to 2005) -21 -19 -25 -27
Annual municipal GHG emissions (compared to 2005) -41 -37 -45 -48
Municipal PV +CHP capacity 6 6.1 7 8
Goal: To protect environmental quality and resources

Environment, Energy & Open SpaceEnvironment Department 309
Performance Measures Actual '19 Actual '20 Projected '21 Target '22
# of noise complaints 683 493 400 400
Average PM2.5 (particulate matter) level (micrograms/m3) 5.3 5.2 5.2 5.2
Ozone level (ppm) 0.07 0.06 0.06 0.06
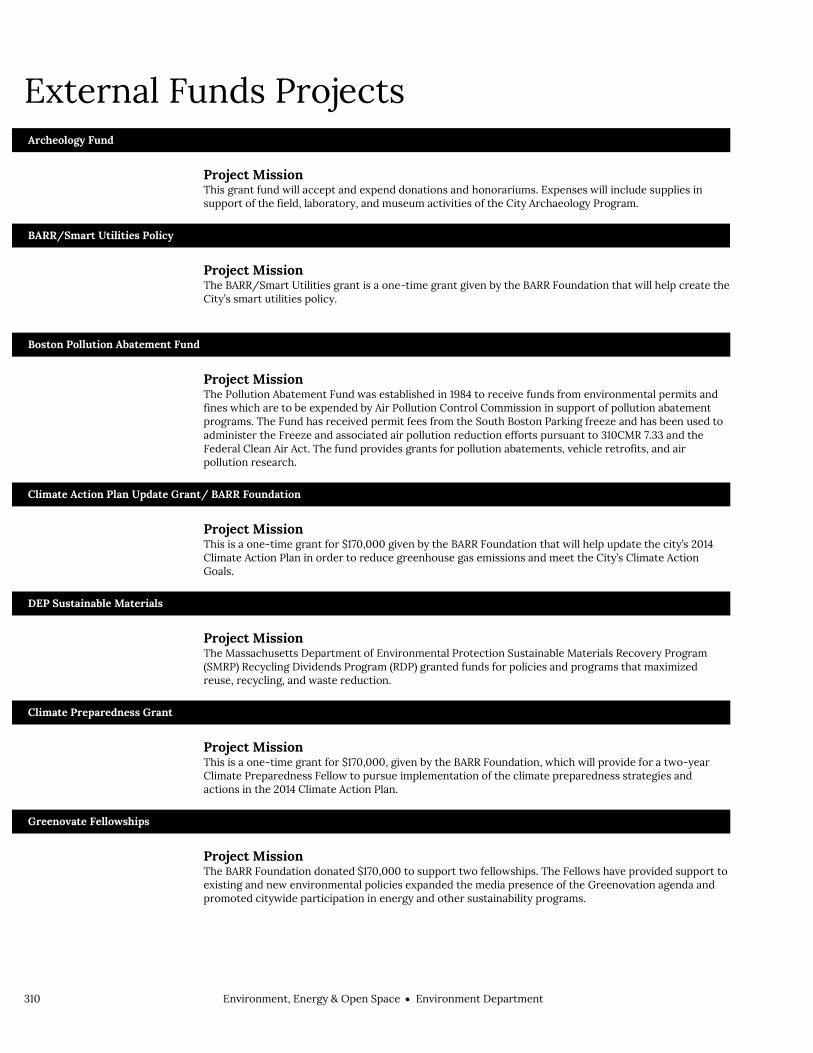
310 Environment, Energy & Open SpaceEnvironment Department
External Funds Projects Archeology Fund
Project Mission This grant fund will accept and expend donations and honorariums. Expenses will include supplies in support of the field, laboratory, and museum activities of the City Archaeology Program.
BARR/Smart Utilities Policy
Project Mission The BARR/Smart Utilities grant is a one-time grant given by the BARR Foundation that will help create the City’s smart utilities policy.
Boston Pollution Abatement Fund
Project Mission The Pollution Abatement Fund was established in 1984 to receive funds from environmental permits and fines which are to be expended by Air Pollution Control Commission in support of pollution abatement programs. The Fund has received permit fees from the South Boston Parking freeze and has been used to administer the Freeze and associated air pollution reduction efforts pursuant to 310CMR 7.33 and the Federal Clean Air Act. The fund provides grants for pollution abatements, vehicle retrofits, and air pollution research.
Climate Action Plan Update Grant/ BARR Foundation
Project Mission This is a one-time grant for $170,000 given by the BARR Foundation that will help update the city’s 2014 Climate Action Plan in order to reduce greenhouse gas emissions and meet the City’s Climate Action Goals.
DEP Sustainable Materials
Project Mission The Massachusetts Department of Environmental Protection Sustainable Materials Recovery Program (SMRP) Recycling Dividends Program (RDP) granted funds for policies and programs that maximized reuse, recycling, and waste reduction.
Climate Preparedness Grant
Project Mission This is a one-time grant for $170,000, given by the BARR Foundation, which will provide for a two-year Climate Preparedness Fellow to pursue implementation of the climate preparedness strategies and actions in the 2014 Climate Action Plan.
Greenovate Fellowships
Project Mission The BARR Foundation donated $170,000 to support two fellowships. The Fellows have provided support to existing and new environmental policies expanded the media presence of the Greenovation agenda and promoted citywide participation in energy and other sustainability programs.

Environment, Energy & Open SpaceEnvironment Department 311
Humanities Collections & Reference Resources
Project Mission The National Endowment for the Humanities awarded a grant to digitize archaeological collections from five sites throughout the city.
Moon Island Project
Project Mission Massachusetts Clean Energy Technology Center, an independent public instrumentality of the Commonwealth of Massachusetts, provided funding to defray the City’s costs in implementing solar and energy storage options at the Moon Island safety training facility for the Boston Fire Department.
Multi-City Microgrids
Project Mission This funding enables USDN core members, associate members, and partners to explore together the potential benefits and various complexities of developing multi-user micro-grids with or without district energy in cities.
Municipal Waterways Account
Project Mission Pursuant to Massachusetts General Law Chapter 40 Section 5G, this municipal waterways improvement and maintenance fund receives revenue under subsection (i) of section 2 of chapter 60B and under section 10A of chapter 91 and sums received from the commonwealth or the federal government, and may expend funding for: (1) maintenance, dredging, cleaning and improvement of harbors, inland waters and great ponds of the commonwealth, (2) the public access thereto, (3) the breakwaters, retaining walls, piers, wharves and moorings thereof, and (4) law enforcement and fire prevention.
MVP Heat Resilience Study
Project Mission The Massachusetts Executive Office of Energy and Environmental Affairs, through the Municipal Vulnerability Preparedness Program, will provide funding for a city-wide heat resilience planning study.
Renew Boston
Project Mission This ongoing fund will accept and expend utility funds and other donations in support of Renew Boston Programming. Funds will be spent on community-based outreach services to promote residential and small business energy efficiency and solar projects.
National Register Nomination
Project Mission National Register Nomination is an annual grant from the Massachusetts Historical Commission. This survey and planning grant allows the Boston Landmarks Commission to support the third and final phase of a comprehensive survey of cultural resources in the North End neighborhood of the City of Boston.
Solar Renewable Energy Certificates
Project Mission A revolving fund authorized (by Chapter 44, Section 53E ½) to facilitate the purchase of offsets of greenhouse gas emissions which is associated with a portion of the electricity consumed by the City annually as well as to operate, maintain, monitor, and expand the City and Boston Public Schools existing solar and combined heat and power facilities. This revolving fund is funded by the sale of solar renewable energy certificates and alternative energy credits produced by the City and Boston Public School’s solar photovoltaic arrays and the combined heat and power units.

312 Environment, Energy & Open SpaceEnvironment Department
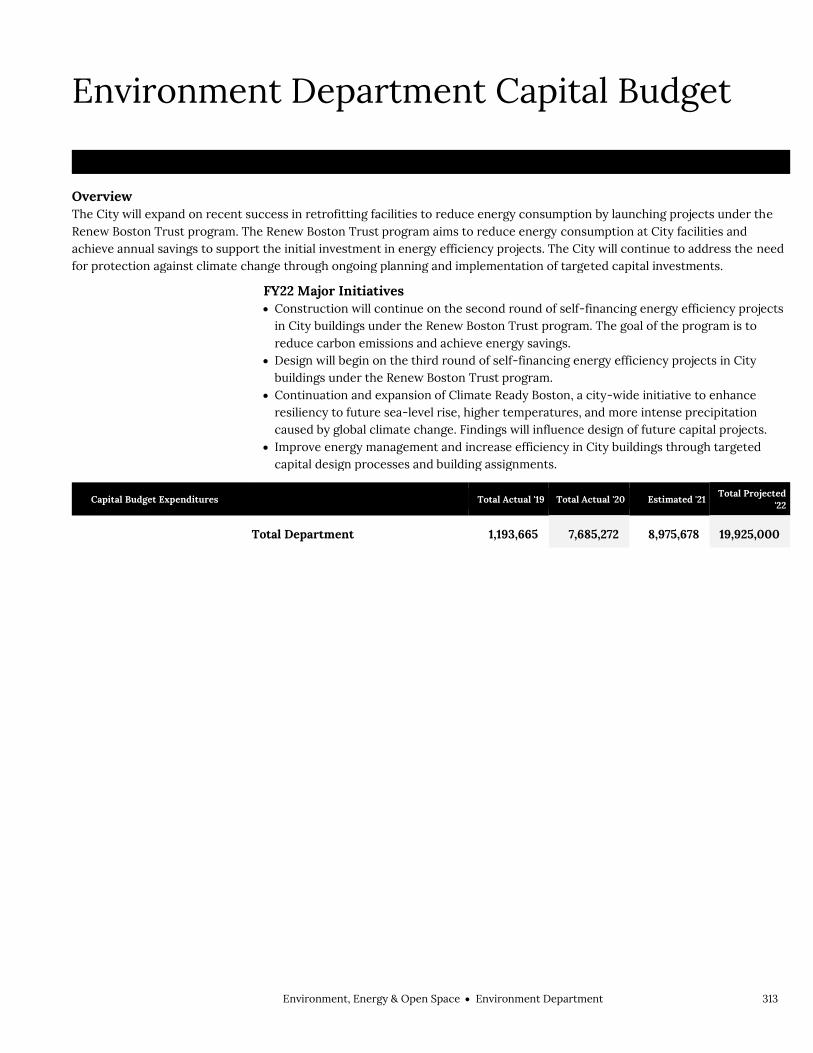
Environment, Energy & Open SpaceEnvironment Department 313
Environment Department Capital Budget Environment, Energy & Open Space Environment Department
Overview The City will expand on recent success in retrofitting facilities to reduce energy consumption by launching projects under the Renew Boston Trust program. The Renew Boston Trust program aims to reduce energy consumption at City facilities and achieve annual savings to support the initial investment in energy efficiency projects. The City will continue to address the need for protection against climate change through ongoing planning and implementation of targeted capital investments.
FY22 Major Initiatives Construction will continue on the second round of self-financing energy efficiency projects
in City buildings under the Renew Boston Trust program. The goal of the program is to reduce carbon emissions and achieve energy savings.
Design will begin on the third round of self-financing energy efficiency projects in City buildings under the Renew Boston Trust program.
Continuation and expansion of Climate Ready Boston, a city-wide initiative to enhance resiliency to future sea-level rise, higher temperatures, and more intense precipitation caused by global climate change. Findings will influence design of future capital projects.
Improve energy management and increase efficiency in City buildings through targeted capital design processes and building assignments.
Capital Budget Expenditures Total Actual '19 Total Actual '20 Estimated '21 Total Projected
'22
Total Department 1,193,665 7,685,272 8,975,678 19,925,000

314 Environment, Energy & Open SpaceEnvironment Department
Environment Department Project Profiles CLIMATE READY BOSTON HARBOR STUDY
Project Mission Support the development of a study that will examine the feasibility of measures along and within the Boston
Harbor to reduce vulnerability of coastal flooding due to sea level rise caused by climate change.
Managing Department, Environment Department Status, To Be Scheduled Location, Various neighborhoods Operating Impact, No
Authorizations
Source Existing FY22 Future Non Capital
Fund Total City Capital 1,000,000 1,000,000 0 0 2,000,000 Grants/Other 0 0 0 3,000,000 3,000,000 Total 1,000,000 1,000,000 0 3,000,000 5,000,000
Expenditures (Actual and Planned)
Source Thru
6/30/20 FY21 FY22 FY23-26 Total City Capital 0 0 2,000,000 0 2,000,000 Grants/Other 0 0 0 0 0 Total 0 0 2,000,000 0 2,000,000
CLIMATE READY BOSTON PHASE 2 Project Mission Climate resilience planning for City neighborhoods and municipal facilities affected by climate change. Managing Department, Environment Department Status, Study Underway Location, Citywide Operating Impact, No
Authorizations
Source Existing FY22 Future Non Capital
Fund Total City Capital 731,280 0 0 0 731,280 Grants/Other 0 0 0 0 0 Total 731,280 0 0 0 731,280
Expenditures (Actual and Planned)
Source Thru
6/30/20 FY21 FY22 FY23-26 Total City Capital 331,280 250,000 150,000 0 731,280 Grants/Other 0 0 0 0 0 Total 331,280 250,000 150,000 0 731,280

Environment, Energy & Open SpaceEnvironment Department 315
Environment Department Project Profiles CLIMATE READY BOSTON PHASE 3
Project Mission Climate resilience planning for City neighborhoods and municipal facilities affected by climate change. Managing Department, Environment Department Status, Implementation Underway Location, Citywide Operating Impact, No
Authorizations
Source Existing FY22 Future Non Capital
Fund Total City Capital 991,720 0 0 0 991,720 Grants/Other 0 0 0 0 0 Total 991,720 0 0 0 991,720
Expenditures (Actual and Planned)
Source Thru
6/30/20 FY21 FY22 FY23-26 Total City Capital 0 0 250,000 741,720 991,720 Grants/Other 0 0 0 0 0 Total 0 0 250,000 741,720 991,720
CLIMATE RESILIENCE RESERVE Project Mission Reserve for climate resilient capital investments. Managing Department, Environment Department Status, Implementation Underway Location, Citywide Operating Impact, No
Authorizations
Source Existing FY22 Future Non Capital
Fund Total City Capital 3,000,000 2,000,000 0 0 5,000,000 Grants/Other 0 0 0 0 0 Total 3,000,000 2,000,000 0 0 5,000,000
Expenditures (Actual and Planned)
Source Thru
6/30/20 FY21 FY22 FY23-26 Total City Capital 0 624,871 0 4,375,129 5,000,000 Grants/Other 0 0 0 0 0 Total 0 624,871 0 4,375,129 5,000,000

316 Environment, Energy & Open SpaceEnvironment Department
Environment Department Project Profiles ENERGY EFFICIENCY DESIGN SERVICES
Project Mission Design services to enhance the energy efficiency of municipal capital assets. Managing Department, Environment Department Status, To Be Scheduled Location, Citywide Operating Impact, Yes
Authorizations
Source Existing FY22 Future Non Capital
Fund Total City Capital 325,000 0 175,000 0 500,000 Grants/Other 0 0 0 0 0 Total 325,000 0 175,000 0 500,000
Expenditures (Actual and Planned)
Source Thru
6/30/20 FY21 FY22 FY23-26 Total City Capital 101,990 0 150,000 248,010 500,000 Grants/Other 0 0 0 0 0 Total 101,990 0 150,000 248,010 500,000
EXTERIOR LIGHTING ENERGY PERFORMANCE Project Mission Identify energy retrofit project opportunities for City owned light fixtures. Managing Department, Environment Department Status, To Be Scheduled Location, Citywide Operating Impact, Yes
Authorizations
Source Existing FY22 Future Non Capital
Fund Total City Capital 4,000,000 0 0 0 4,000,000 Grants/Other 0 0 0 0 0 Total 4,000,000 0 0 0 4,000,000
Expenditures (Actual and Planned)
Source Thru
6/30/20 FY21 FY22 FY23-26 Total City Capital 0 0 250,000 3,750,000 4,000,000 Grants/Other 0 0 0 0 0 Total 0 0 250,000 3,750,000 4,000,000

Environment, Energy & Open SpaceEnvironment Department 317
Environment Department Project Profiles MOON ISLAND ENERGY STORAGE
Project Mission Design and installation of a photovoltaic array and battery storage unit on Moon Island to support regional fire
prevention training curriculum.
Managing Department, Environment Department Status, In Design Location, Harbor Islands Operating Impact, Yes
Authorizations
Source Existing FY22 Future Non Capital
Fund Total City Capital 250,000 0 0 0 250,000 Grants/Other 0 0 0 588,080 588,080 Total 250,000 0 0 588,080 838,080
Expenditures (Actual and Planned)
Source Thru
6/30/20 FY21 FY22 FY23-26 Total City Capital 0 125,000 125,000 0 250,000 Grants/Other 0 0 0 0 0 Total 0 125,000 125,000 0 250,000
RENEW BOSTON TRUST PHASE 2 Project Mission Identify energy retrofit project opportunities in City owned buildings that are self-financed by future energy
savings. The City will implement the program through contracts with Energy Service Companies (ESCOs) that will guarantee the energy savings.
Managing Department, Public Facilities Department Status, In Design Location, Citywide Operating Impact, Yes
Authorizations
Source Existing FY22 Future Non Capital
Fund Total City Capital 20,000,000 0 0 0 20,000,000 Grants/Other 0 0 4,000,000 0 4,000,000 Total 20,000,000 0 4,000,000 0 24,000,000
Expenditures (Actual and Planned)
Source Thru
6/30/20 FY21 FY22 FY23-26 Total City Capital 0 4,232,564 14,000,000 1,767,436 20,000,000 Grants/Other 0 0 3,000,000 1,000,000 4,000,000 Total 0 4,232,564 17,000,000 2,767,436 24,000,000

318 Environment, Energy & Open SpaceEnvironment Department
Environment Department Project Profiles RENEW BOSTON TRUST PHASE 3
Project Mission Identify energy retrofit project opportunities in City owned buildings that are self-financed by future energy
savings. The City will implement the program through contracts with Energy Service Companies (ESCOs) that will guarantee the energy savings.
Managing Department, Public Facilities Department Status, To Be Scheduled Location, Citywide Operating Impact, Yes
Authorizations
Source Existing FY22 Future Non Capital
Fund Total City Capital 20,000,000 0 0 0 20,000,000 Grants/Other 0 0 4,000,000 0 4,000,000 Total 20,000,000 0 4,000,000 0 24,000,000
Expenditures (Actual and Planned)
Source Thru
6/30/20 FY21 FY22 FY23-26 Total City Capital 0 0 0 20,000,000 20,000,000 Grants/Other 0 0 0 4,000,000 4,000,000 Total 0 0 0 24,000,000 24,000,000

Environment, Energy & Open SpaceParks & Recreation Department 319
Parks & Recreation Department Operating Budget Environment, Energy & Open Space Parks & Recreation Department Ryan Woods, Commissioner, Appropriation 300000
Department Mission The mission of the Parks and Recreation Department is to maintain clean, green, safe, accessible and well-programmed park land for the City's residents.
Selected Performance Goals Parks & Recreation Administration
Commitment to contributing to the livability of our city and providing access to our open spaces.
Parks Operations
Being a successful steward to the environment. Developing a consistent measure for the Department's goal of providing a consistent high
level of quality across all open spaces. Parks goal of welcoming people of all abilities into our city's open spaces. To maintain clean, green, safe, attractive parks and playgrounds. To manage a street tree maintenance program.
Parks Design & Construction
Efficiently managing public resources.
Operating Budget Program Name Total Actual '19 Total Actual '20 Total Approp '21 Total Budget '22
Parks & Recreation Administration 3,293,549 3,320,956 3,729,797 3,689,087
Parks Operations 14,777,778 16,398,891 16,073,984 16,644,384
Citywide Recreation 1,006,833 998,322 1,129,125 1,346,022
Animal Care & Control 0 1,224,626 1,290,071 1,565,288
Parks Design & Construction 4,357,799 4,461,528 2,363,701 2,245,640
Cemetery 2,552,643 2,349,290 2,548,432 2,562,321
Total 25,988,602 28,753,613 27,135,110 28,052,742
External Funds Budget Fund Name Total Actual '19 Total Actual '20 Total Approp '21 Total Budget '22
Fund for Parks and Recreation 11,903,337 5,677,347 4,371,522 4,035,001
George W. Parkman Trust Fund 1,084,783 1,304,697 1,300,000 1,300,000
Park Floodlighting Fees 55,408 192,391 220,000 220,000
Parks Animal Control 0 0 220,000 0
The Ryder Cup Trust Fund 40,603 38,032 29,206 30,711
Total 13,084,131 7,212,467 6,140,728 5,585,712
Operating Budget Actual '19 Actual '20 Approp '21 Budget '22
Personnel Services 14,900,257 16,806,302 16,866,519 16,859,180 Non Personnel 11,088,345 11,947,315 10,268,591 11,193,562 Total 25,988,602 28,753,617 27,135,110 28,052,742

320 Environment, Energy & Open SpaceParks & Recreation Department
Parks & Recreation Department Operating Budget
Authorizing Statutes Care of Public Parks and Playgrounds,
CBC St. 7 §§ 100-106. Parks and Recreation Board: Powers and
Duties, CBC Ord. §§ 7-4.1-7-4.13. Administration, Ch. 624m, s. 1-10, Acts of
1982. Generally, 1953 Mass. Acts ch. 473 § 1;
CBC Ord. §§ 11-10.1-11-10.2(q).
Description of Services The Department is responsible for 217 City parks, playgrounds and athletic fields, 2 golf courses, 65 squares, 17 fountains, 75 game courts, 16 historic and 3 active cemeteries, urban wilds, 4 High School Athletic Fields, and approximately 125,000 trees, all covering 2,346 acres, 1,000 of which comprise the historic Emerald Necklace. In addition, the Parks Department is responsible for more than 35,000 street trees. The department annually beautifies these park and open space areas with ornamental plantings of trees, shrubs, and flowers. The department schedules events and programs for the participation and enjoyment of the public.
CommissionerParks
Commission
Field OperationsAdministration & Support Services
Finance
Golf & Business Operations
HR/Payroll
Contracts
Permitting
External Affairs
Citywide Recreation
Maintenance
Design & Construction
Park Rangers
Cemetery
Animal Control

Environment, Energy & Open SpaceParks & Recreation Department 321
Department History Personnel Services FY19 Expenditure FY20 Expenditure FY21 Appropriation FY22 Recommended Inc/Dec 21 vs 22
51000 Permanent Employees 12,405,550 14,503,813 14,736,678 14,755,479 18,801 51100 Emergency Employees 377,051 336,402 763,241 737,100 -26,141 51200 Overtime 1,831,386 1,740,512 1,156,600 1,156,600 0 51600 Unemployment Compensation 165,153 59,777 75,000 75,000 0 51700 Workers' Compensation 121,118 165,796 135,000 135,000 0 Total Personnel Services 14,900,258 16,806,300 16,866,519 16,859,179 -7,340
Contractual Services FY19 Expenditure FY20 Expenditure FY21 Appropriation FY22 Recommended Inc/Dec 21 vs 22
52100 Communications 266,298 228,099 288,197 288,197 0 52200 Utilities 2,329,476 2,410,769 1,674,310 1,640,167 -34,143 52400 Snow Removal 40,768 54,475 66,500 66,500 0 52500 Garbage/Waste Removal 275,394 225,171 375,860 385,628 9,768 52600 Repairs Buildings & Structures 305,105 276,796 374,181 393,021 18,840 52700 Repairs & Service of Equipment 759,642 671,308 593,290 593,290 0 52800 Transportation of Persons 15,851 14,184 15,685 15,685 0 52900 Contracted Services 3,135,758 3,731,054 1,803,862 2,448,067 644,205 Total Contractual Services 7,128,292 7,611,856 5,191,885 5,830,555 638,670
Supplies & Materials FY19 Expenditure FY20 Expenditure FY21 Appropriation FY22 Recommended Inc/Dec 21 vs 22
53000 Auto Energy Supplies 313,363 248,895 324,726 269,586 -55,140 53200 Food Supplies 0 0 3,000 3,000 0 53400 Custodial Supplies 64,791 125,863 77,619 78,619 1,000 53500 Med, Dental, & Hosp Supply 658 564 1,000 1,000 0 53600 Office Supplies and Materials 19,493 20,025 21,000 22,000 1,000 53700 Clothing Allowance 36,750 39,750 37,500 44,250 6,750 53800 Educational Supplies & Mat 0 0 0 0 0 53900 Misc Supplies & Materials 571,405 608,058 590,380 594,180 3,800 Total Supplies & Materials 1,006,460 1,043,155 1,055,225 1,012,635 -42,590
Current Chgs & Oblig FY19 Expenditure FY20 Expenditure FY21 Appropriation FY22 Recommended Inc/Dec 21 vs 22
54300 Workers' Comp Medical 53,857 74,480 67,000 67,000 0 54400 Legal Liabilities 34,299 42,000 42,000 42,700 700 54500 Aid To Veterans 0 0 0 0 0 54600 Current Charges H&I 0 0 0 0 0 54700 Indemnification 0 0 0 0 0 54800 Reserve Account 0 0 0 0 0 54900 Other Current Charges 417,908 422,070 598,932 715,236 116,304 Total Current Chgs & Oblig 506,064 538,550 707,932 824,936 117,004
Equipment FY19 Expenditure FY20 Expenditure FY21 Appropriation FY22 Recommended Inc/Dec 21 vs 22
55000 Automotive Equipment 0 0 0 0 0 55400 Lease/Purchase 607,952 828,480 1,185,382 1,312,669 127,287 55600 Office Furniture & Equipment 0 0 0 0 0 55900 Misc Equipment 52,033 177,712 42,000 51,500 9,500 Total Equipment 659,985 1,006,192 1,227,382 1,364,169 136,787
Other FY19 Expenditure FY20 Expenditure FY21 Appropriation FY22 Recommended Inc/Dec 21 vs 22
56200 Special Appropriation 61,645 69,679 78,000 90,000 12,000 57200 Structures & Improvements 0 0 0 0 0 58000 Land & Non-Structure 1,725,898 1,677,881 2,008,167 2,071,268 63,101 Total Other 1,787,543 1,747,560 2,086,167 2,161,268 75,101
Grand Total 25,988,602 28,753,613 27,135,110 28,052,742 917,632

322 Environment, Energy & Open SpaceParks & Recreation Department
Department Personnel
Title Union Code Grade Position FY22 Salary Title
Union Code Grade Position FY22 Salary
Admin Asst MYO 04 1.00 45,660 Head Storekeeper AFG 14 1.00 49,879 Admin Asst (Parks/Finance) AFE 18 2.00 154,848 HeadStorekeeperII(PksMaintDiv) AFE 15 1.00 48,426 Admin Secretary AFE 14 5.00 282,364 Hvy Mtr Equip Oper & Lbr (P&R) AFE 10L 8.00 355,797 Administrative_Assistant AFE 15 3.00 202,898 HvyMtrEquipReprprs(HMER/Parks) AFE 13 3.00 153,888 Administrative_Assistant AFG 15 1.00 67,633 Laborer (Park) AFE 06L 23.00 886,036 Animal Room Attendant AFL 09 4.00 160,328 Landscape Designer SE1 10 1.00 126,024 Asst Electrical Engineer AFJ 18A 1.00 92,560 Maint Mech (Carpenter) AFE 12L 2.00 97,834 Board Secretary EXM 10 1.00 122,950 Maint Mech (Painter) AFE 12L 2.00 108,727 Cemetery Foreperson AFG 13 3.00 168,180 Maint Mech (Plumber) AFE 12L 1.00 54,233 Chief Engineer (P&R) SE1 11 1.00 133,756 Maint Mech (Welder) AFE 12L 1.00 41,395 Commissioner (P&R) CDH NG 1.00 135,371 Maint Mech Foreman (Welder) AFE 15A 1.00 63,739
Community Relations Spec (P&R)
SE1 05 2.00 165,760 Maint Mech Frprs (Carpenter) AFG 15A 1.00 63,891
Contract Manager SE1 07 1.00 74,763 Maint Mech Frprs (Painter) AFG 15A 1.00 71,119 Contract Compliance Manager SE1 06 1.00 84,949 Maint Mech Frprs (Plumber) AFG 15A 1.00 71,119 Dir - Operations EXM 11 1.00 130,493 Maint Mech Helper AFE 08L 1.00 45,688 Dir Human Resources (Parks) EXM 10 1.00 122,950 MaintMechaFrprs(Machi/Parks) AFG 16A 1.00 77,903 Dir of Animal Control (ISD) EXM 10 1.00 103,860 MotorEquipOper&Lbr (P&R) AFE 07L 13.00 501,194 Dir of Maintenance (Parks) EXM 10 1.00 87,958 Park Keeper AFE 08L 12.00 508,937 Dir Recreation Programming EXM 08 1.00 105,822 Park Maint Foreprs AFE 13 2.00 112,467 Dir, Administration & Finance EXM 11 1.00 130,493 Park Maint Foreprs AFG 13 18.00 953,224 Dog Offcr(Sr Animal Cntl Ofcr) AFL 17A 1.00 70,534 Park Maint Foreprs AFL 13 1.00 53,792
Dog Offcr(Supv/Anim Cntl Ofcr) AFL 17A 1.00 83,068 Park Ranger I BPR 01 11.00 442,383
Dog Officer (Animal Control) AFL 14A 7.00 426,981 Park Ranger II BPR 02 3.00 169,125 Exec Asst (CC) SE1 06 4.00 315,043 Park Ranger III BPR 03 2.00 144,295 Exec Asst (Parks&Rec) SE1 05 3.00 215,258 Prin Admin Analyst (Aud) SE1 07 1.00 99,243 Exec Sec (CommOffice) EXM 04 1.00 73,601 Prin Admin Assistant SE1 08 4.00 390,759 Exec Sec (P&R) SE1 08 5.00 473,364 Prin Admin Asst (P&R) SE1 06 8.00 722,549 Exec Sec (P&R) Cemeteries SE1 08 1.00 108,468 Prin Clerk & Typist AFE 09 1.00 34,024 Finance Dir EXM 09 1.00 79,904 Prin Research Analyst SE1 06 1.00 74,092 Fleet Manager SE1 07 1.00 100,807 Res_Analyst AFE 14 1.00 59,087 Gardener AFE 11L 13.00 606,869 Research Analyst (P&R) AFE 16 1.00 52,377 Gardener Foreperson AFG 14 5.00 267,393 Senior Admin Asst SE1 07 1.00 99,243 Gen Maint Mech Frprs AFG 16A 1.00 76,860 Spec Asst EXM 07 1.00 96,823 Gen Park Maint Frprs AFB 16A 1.00 76,077 Spec Hvy Meo AFE 11L 4.00 186,309 Gen Park Maint Frprs AFG 16A 6.00 455,043 Sr Adm Analyst SE1 06 1.00 60,314 Gen Sup Pk Maint (Cemetery) SE1 10 1.00 126,024 Sr Research Analyst (P&R) AFG 18A 1.00 84,976 Gen Supn (Pks/Turf Maint) SE1 10 1.00 120,332 Sr Research Analyst (P&R) AFJ 18A 2.00 157,729 Gen Tree Maint Frprs AFG 18 2.00 152,985 Sr. Personnel Officer II AFE 16 2.00 138,787 Graphic Arts Technician AFE 14 1.00 55,199 Staff Assist I MYO 04 1.00 58,624 Grave Digger AFE 09L 16.00 697,751 Staff Assistant II MYO 06 1.00 70,491 Greenhouse Gardener AFE 12L 1.00 54,233 Staff Asst II MYO 05 1.00 64,557 Head Administrative Clerk SU4 14 1.00 63,025 Supn Of Park Maint (Trades) SE1 07 1.00 99,243 Head Clerk AFE 12 2.00 100,325 Supn of Tree Maintenance SE1 07 1.00 96,823 Head Clerk SU4 12 1.00 28,449 Supn-Horticulture SE1 07 1.00 99,243 Head Clerk & Sec AFE 13 1.00 54,993 Supn-Park Maint SE1 07 6.00 590,872 Head Clerk & Secretary SU4 13 1.00 52,315 Tree Maint Frprs## AFG 14 1.00 61,950 Head Storekeeper AFE 14 1.00 60,907 Veterinarian (Animal Care Facility) EXM 08 1.00 94,848 Total 267 16,263,482 Adjustments Differential Payments 0 Other 126,100 Chargebacks -1,000,000 Salary Savings -634,102

Environment, Energy & Open SpaceParks & Recreation Department 323
Title
Union Code
Grade Position FY22 Salary Title Union Code
Grade Position FY22 Salary
FY22 Total Request 14,755,480

324 Environment, Energy & Open SpaceParks & Recreation Department
External Funds History Personnel Services FY19 Expenditure FY20 Expenditure FY21 Appropriation FY22 Recommended Inc/Dec 21 vs 22
51000 Permanent Employees 1,847,729 2,039,000 2,048,446 2,132,584 84,138 51100 Emergency Employees 705,997 706,196 726,943 230,296 -496,647 51200 Overtime 100,434 2,068 0 0 0 51300 Part Time Employees 0 0 0 0 0 51400 Health Insurance 154,410 161,385 0 0 0 51500 Pension & Annuity 0 0 0 0 0 51600 Unemployment Compensation 0 0 0 0 0 51700 Workers' Compensation 0 0 0 0 0 51800 Indirect Costs 0 0 0 0 0 51900 Medicare 17,428 20,787 0 0 0 Total Personnel Services 2,825,998 2,929,436 2,775,389 2,362,880 -412,509
Contractual Services FY19 Expenditure FY20 Expenditure FY21 Appropriation FY22 Recommended Inc/Dec 21 vs 22
52100 Communications 4,718 0 4,718 4,718 0 52200 Utilities 259,769 251,695 409,770 422,758 12,988 52400 Snow Removal 0 0 0 0 0 52500 Garbage/Waste Removal 15,294 21,696 15,294 20,294 5,000 52600 Repairs Buildings & Structures 53,025 25,268 96,525 96,525 0 52700 Repairs & Service of Equipment 89,448 68,165 89,448 89,448 0 52800 Transportation of Persons 5,820 5,784 5,820 5,820 0 52900 Contracted Services 8,641,667 2,960,204 1,431,038 1,220,543 -210,495 Total Contractual Services 9,069,741 3,332,812 2,052,613 1,860,106 -192,507
Supplies & Materials FY19 Expenditure FY20 Expenditure FY21 Appropriation FY22 Recommended Inc/Dec 21 vs 22
53000 Auto Energy Supplies 8,899 7,395 8,899 8,899 0 53200 Food Supplies 0 500 0 0 0 53400 Custodial Supplies 11,370 6,904 11,370 11,370 0 53500 Med, Dental, & Hosp Supply 0 0 0 0 0 53600 Office Supplies and Materials 2,394 2,568 2,394 2,394 0 53700 Clothing Allowance 0 0 0 0 0 53800 Educational Supplies & Mat 0 0 0 0 0 53900 Misc Supplies & Materials 755,441 478,704 758,771 758,771 0 Total Supplies & Materials 778,104 496,071 781,434 781,434 0
Current Chgs & Oblig FY19 Expenditure FY20 Expenditure FY21 Appropriation FY22 Recommended Inc/Dec 21 vs 22
54300 Workers' Comp Medical 0 0 0 0 0 54400 Legal Liabilities 0 0 0 0 0 54600 Current Charges H&I 0 0 0 0 0 54700 Indemnification 0 0 0 0 0 54800 Reserve Account 0 0 0 0 0 54900 Other Current Charges 93,880 266,566 66,079 75,079 9,000 Total Current Chgs & Oblig 93,880 266,566 66,079 75,079 9,000
Equipment FY19 Expenditure FY20 Expenditure FY21 Appropriation FY22 Recommended Inc/Dec 21 vs 22
55000 Automotive Equipment 0 0 0 0 0 55400 Lease/Purchase 0 0 0 0 0 55600 Office Furniture & Equipment 39,918 4,744 39,918 39,918 0 55900 Misc Equipment 148,383 120,977 164,383 164,383 0 Total Equipment 188,301 125,721 204,301 204,301 0
Other FY19 Expenditure FY20 Expenditure FY21 Appropriation FY22 Recommended Inc/Dec 21 vs 22
56200 Special Appropriation 9,149 8,020 109,149 100,149 -9,000 57200 Structures & Improvements 0 0 0 0 0 58000 Land & Non-Structure 118,958 53,841 151,763 201,763 50,000 Total Other 128,107 61,861 260,912 301,912 41,000
Grand Total 13,084,131 7,212,467 6,140,728 5,585,712 -555,016

Environment, Energy & Open SpaceParks & Recreation Department 325
External Funds Personnel
Title Union Code Grade Position FY22 Salary Title
Union Code Grade Position FY22 Salary
Business Operations Mgr EXM 08 2.00 202,102 Head Golf Professional EXM 09 1.00 113,659 Exc Asst EXM 10 1.00 122,950 Mechanic MYN NG 1.00 77,527 Golf Course Asst Supn MYO 04 2.00 99,989 Park Ranger I BPR 01 2.00 71,804 Golf Course Operations Mgr MYO 04 3.00 175,871 Staff Assistant MYO 04 1.00 41,365 Golf Course Superintendent EXM 09 2.00 227,317 Total 15 1,132,584 Adjustments Differential Payments 0 Other 0 Chargebacks 1,000,000 Salary Savings 0 FY22 Total Request 2,132,584

326 Environment, Energy & Open SpaceParks & Recreation Department
Program 1. Parks & Recreation Administration Ryan Woods, Commissioner, Organization 300100
Program Description The Administration Program provides administrative, financial, and personnel support for all departmental units. This program is also responsible for monitoring MOAs, contractual arrangements, licensing of major park facilities, coordination of community-based organizations, solicitation of corporate sponsorship, and communication with the public.
Operating Budget Actual '19 Actual '20 Approp '21 Budget '22
Personnel Services 2,320,538 2,382,518 2,603,259 2,519,304 Non Personnel 973,011 938,438 1,126,538 1,169,783 Total 3,293,549 3,320,956 3,729,797 3,689,087
Performance
Goal: Contribute to the livability of our city and providing access to our open spaces.
Performance Measures Actual '19 Actual '20 Projected '21 Target '22
Attendance at Parks Department organized events 71,250 67,320 0 30,000
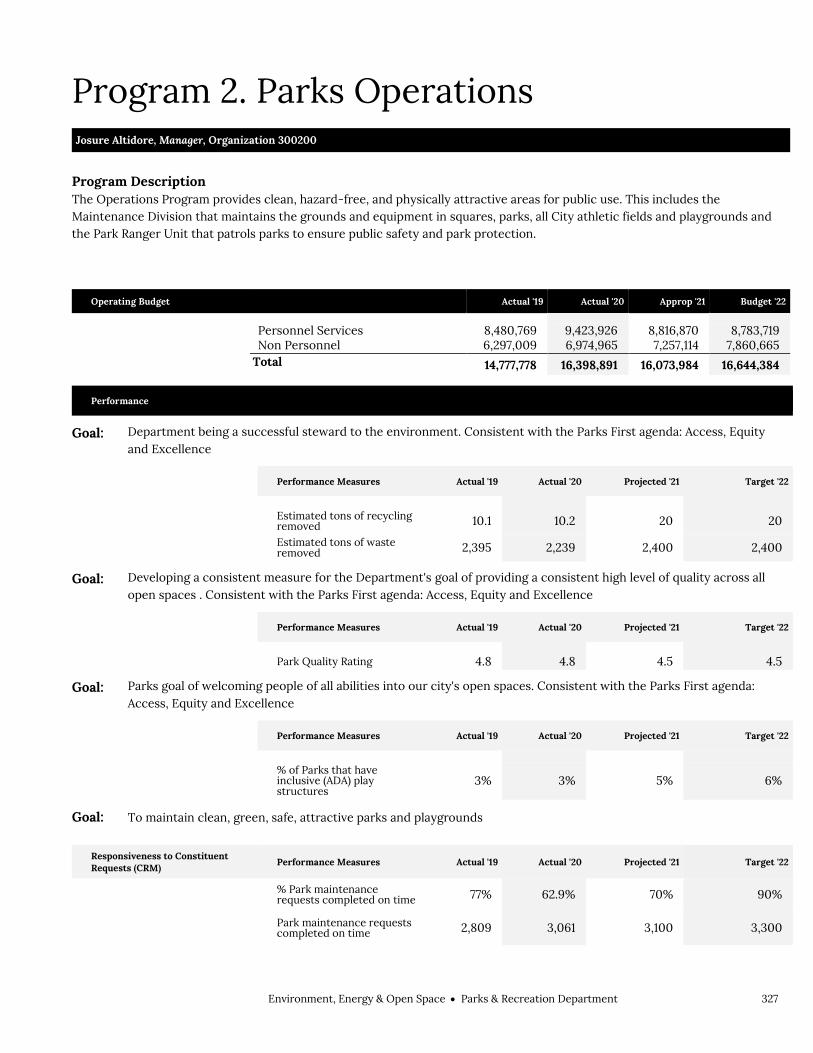
Environment, Energy & Open SpaceParks & Recreation Department 327
Program 2. Parks Operations Josure Altidore, Manager, Organization 300200
Program Description The Operations Program provides clean, hazard-free, and physically attractive areas for public use. This includes the Maintenance Division that maintains the grounds and equipment in squares, parks, all City athletic fields and playgrounds and the Park Ranger Unit that patrols parks to ensure public safety and park protection.
Operating Budget Actual '19 Actual '20 Approp '21 Budget '22
Personnel Services 8,480,769 9,423,926 8,816,870 8,783,719 Non Personnel 6,297,009 6,974,965 7,257,114 7,860,665
Total 14,777,778 16,398,891 16,073,984 16,644,384
Performance
Goal: Department being a successful steward to the environment. Consistent with the Parks First agenda: Access, Equity and Excellence
Performance Measures Actual '19 Actual '20 Projected '21 Target '22
Estimated tons of recycling removed 10.1 10.2 20 20
Estimated tons of waste removed 2,395 2,239 2,400 2,400
Goal: Developing a consistent measure for the Department's goal of providing a consistent high level of quality across all open spaces . Consistent with the Parks First agenda: Access, Equity and Excellence
Performance Measures Actual '19 Actual '20 Projected '21 Target '22
Park Quality Rating 4.8 4.8 4.5 4.5
Goal: Parks goal of welcoming people of all abilities into our city's open spaces. Consistent with the Parks First agenda: Access, Equity and Excellence
Performance Measures Actual '19 Actual '20 Projected '21 Target '22
% of Parks that have inclusive (ADA) play structures
3% 3% 5% 6%
Goal: To maintain clean, green, safe, attractive parks and playgrounds
Responsiveness to Constituent Requests (CRM) Performance Measures Actual '19 Actual '20 Projected '21 Target '22
% Park maintenance requests completed on time 77% 62.9% 70% 90%
Park maintenance requests completed on time 2,809 3,061 3,100 3,300

328 Environment, Energy & Open SpaceParks & Recreation Department
Goal: To manage a street tree maintenance program
Responsiveness to Constituent Requests (CRM)
Performance Measures Actual '19 Actual '20 Projected '21 Target '22
% Tree maintenance work orders closed within 365 calendar days
98.5% 99.3% 95% 95%
Average time to complete a tree emergency request (Days)
1.2 1.2 1.2 1
Tree maintenance requests completed on time 4,593 4,324 4,000 4,000

Environment, Energy & Open SpaceParks & Recreation Department 329
Program 3. Citywide Recreation Michael Devlin, Manager, Organization 300300
Program Description The Citywide Recreation Program offers youth athletic programs, clinics, and camps in neighborhood parks citywide, as well as local community centers in partnership with Boston Centers for Youth & Families. The program offers a variety of healthy activities and events including golf lessons, the All Girls Sports Festival, Sox Talks with Boston Red Sox players and coaches, Boston Neighborhood Basketball League games, Mayor’s Cup baseball, cross country, golf, hockey, soccer, and softball tournaments, and much more.
Operating Budget Actual '19 Actual '20 Approp '21 Budget '22
Personnel Services 815,993 814,272 910,776 869,432 Non Personnel 190,840 184,050 218,349 476,590 Total 1,006,833 998,322 1,129,125 1,346,022

330 Environment, Energy & Open SpaceParks & Recreation Department
Program 4. Animal Care & Control Alexis Trzcinski, Manager, Organization 300500
Program Description The Animal Care and Control Program provides safe and humane care and control of animals for the protection of both residents and the animals. The program manages the licensing and registration of all dogs and responds to resident complaints and issues violations and captures stray or unsafe animals. The program maintains a city animal shelter for stray animals and manages adoptions.* Animal Care and Control was included in the Inspectional Services Department budget prior to FY20.
Operating Budget Actual '19 Actual '20 Approp '21 Budget '22
Personnel Services 0 1,087,160 1,210,702 1,256,732 Non Personnel 0 137,466 79,369 308,556 Total 0 1,224,626 1,290,071 1,565,288

Environment, Energy & Open SpaceParks & Recreation Department 331
Program 5. Parks Design & Construction Cathy Baker-Eclipse, Manager, Organization 300400
Program Description The Design & Construction Program works to develop and revitalize the full potential of Boston's physical park system by designing, contracting, and monitoring capital improvement projects. The planning process analyzes active and passive park opportunities, restores park lands, and promotes open space that is safe and accessible as well as functional and aesthetically pleasing. Improvements must be sensitive to community needs, budget limitations, appropriate environmental and horticultural values, and maintenance requirements.
Operating Budget Actual '19 Actual '20 Approp '21 Budget '22
Personnel Services 1,315,640 1,320,237 1,421,203 1,491,717 Non Personnel 3,042,159 3,141,291 942,498 753,923
Total 4,357,799 4,461,528 2,363,701 2,245,640
Performance
Goal: Efficiently managing public resources. Consistent with the Parks First agenda: Access, Equity and Excellence
Performance Measures Actual '19 Actual '20 Projected '21 Target '22
% of capital allotment expended 83.5% 71% 80% 90%

332 Environment, Energy & Open SpaceParks & Recreation Department
Program 6. Cemetery Thomas A. Sullivan, Manager, Organization 400100
Program Description The Cemetery Program provides grounds maintenance for the City's three active cemeteries and sixteen historic cemeteries ensuring that they are physically attractive and well-manicured. Special efforts are undertaken in preparation for Memorial Day, Veterans' Day, and other holidays. This program is also responsible for completing all burials requested during the year. Preparation involves identifying and preparing grave sites, escorting the funeral service, and securing the burial plot upon completion of service.
Operating Budget Actual '19 Actual '20 Approp '21 Budget '22
Personnel Services 1,967,318 1,778,187 1,903,709 1,938,275 Non Personnel 585,325 571,103 644,723 624,046 Total 2,552,643 2,349,290 2,548,432 2,562,321
Environment, Energy & Open SpaceParks & Recreation Department 333
External Funds Projects Animal Control Revolving Fund
Project Mission The Animal Care and Control Program provides safe and humane care and control of animals for the protection of both residents and the animals. The revolving fund receives revenues from the licensing and registration of all dogs. The fund helps the Animal Care & Control Division maintain a city animal shelter for stray animals and manage adoptions. In FY22, the related expenses and revenues are moving to the General Fund and this revolving fund will be closed.
Fund for Parks and Recreation
Project Mission The Fund for Parks and Recreation in Boston was established in 1983 for the purpose of furthering the maintenance and preservation of parks now or in the future belonging to the City of Boston and to provide recreational programs to the residents of Boston.
George W. Parkman Trust Fund
Project Mission The Parkman Fund annually provides additional funding to maintain and improve parks, such as the Boston Common, Public Garden, Franklin Park, the Fens, etc. This includes tree work, repairs to roads, turf, and funding for maintenance employees working in designated parks.
Park Floodlighting Fees
Project Mission Floodlighting fees are charged to non-resident groups and resident non-youth group organizations (typically sports leagues) conducting permitted night-time activities which require the use of the floodlights located at City parks.
Ryder Cup/Youth Endowment Fund
Project Mission The Ryder Cup/Youth Endowment Fund was formed from the proceeds of tickets to the 1999 Ryder Cup matches. The tickets were donated by the Country Club of Brookline to the City of Boston. The income from the Fund is used to support youth golf programming and other youth recreation activities.

334 Environment, Energy & Open SpaceParks & Recreation Department
Parks & Recreation Department Capital Budget Environment, Energy & Open Space Parks & Recreation Department
Overview Boston’s parks and open spaces provide environmental, recreational, social and economic benefits to the City’s residents and visitors. The City will make a robust investment in urban signature parks projects. Many of these investments tackle environmental justice issues and have the ability to stabilize neighborhoods. Ongoing capital investment in parks, playgrounds, and other recreational areas utilized by the City’s visitors, youth and families, help to protect and enrich a park system that is among the nation’s best.
FY22 Major Initiatives Construction will be completed at Mary Hannon Park in Upham’s Corner, Medal of Honor
Park in South Boston, and Harambee Park in Roxbury will complete Phase 3 and enter a final phase of construction.
Construction will begin on the renovation of McConnell Playground, Malcolm X Park, Roslindale Wetlands, and Mission Hill Playground.
Design will begin for major renovations and upgrades to both Copley Square Park in Back Bay and Moakley Park in South Boston to address programmatic and environmental resilience needs.
Design will be completed and construction will begin for upgrades at various parks throughout the City including Crawford Street Playground in Roxbury, Cutillo Park in the North End, Daisy Field in Jamaica Plain, Mission Hill Playground, Jeep Jones Playground in Roxbury, Millennium Park in West Roxbury, Hynes Playground in West Roxbury, Ryan Play Area in Dorchester, Doherty Gibson Playground in Dorchester, and Edwards Playground in Charlestown.
Planning will begin for projects including Mattahunt Woods in Mattapan, Dorchester Park Pathways, McLean Playground in East Boston, and Paula Titus Park in Roxbury.
Capital Budget Expenditures Total Actual '19 Total Actual '20 Estimated '21 Total Projected '22
Total Department 27,521,798 30,451,531 36,475,848 39,537,351

Environment, Energy & Open SpaceParks & Recreation Department 335
Parks & Recreation Department Project Profiles ANIMAL SHELTER
Project Mission Develop a building program and assess siting options. Managing Department, Public Facilities Department Status, Study Underway Location, Roxbury Operating Impact, No
Authorizations
Source Existing FY22 Future Non Capital
Fund Total City Capital 100,000 0 0 0 100,000 Grants/Other 0 0 0 0 0 Total 100,000 0 0 0 100,000
Expenditures (Actual and Planned)
Source Thru
6/30/20 FY21 FY22 FY23-26 Total City Capital 0 30,000 70,000 0 100,000 Grants/Other 0 0 0 0 0 Total 0 30,000 70,000 0 100,000
ARTIFICIAL TURF REPLACEMENT Project Mission Annual program to replace artificial turf fields. High priority projects include Charlestown High School and multi-
purpose fields at East Boston Memorial Park.
Managing Department, Parks and Recreation Department Status, Implementation Underway Location, Citywide Operating Impact, Yes
Authorizations
Source Existing FY22 Future Non Capital
Fund Total City Capital 4,000,000 0 0 0 4,000,000 Grants/Other 250,000 0 0 0 250,000 Total 4,250,000 0 0 0 4,250,000
Expenditures (Actual and Planned)
Source Thru
6/30/20 FY21 FY22 FY23-26 Total City Capital 80,696 1,875,931 1,500,000 543,373 4,000,000 Grants/Other 0 0 0 250,000 250,000 Total 80,696 1,875,931 1,500,000 793,373 4,250,000

336 Environment, Energy & Open SpaceParks & Recreation Department
Parks & Recreation Department Project Profiles BACK BAY FENS PATHWAYS
Project Mission Rehabilitate pathways at the Back Bay Fens to improve accessibility and site conditions. Managing Department, Parks and Recreation Department Status, To Be Scheduled Location, Fenway/Kenmore Operating Impact, No
Authorizations
Source Existing FY22 Future Non Capital
Fund Total City Capital 7,500,000 0 0 0 7,500,000 Grants/Other 0 0 0 0 0 Total 7,500,000 0 0 0 7,500,000
Expenditures (Actual and Planned)
Source Thru
6/30/20 FY21 FY22 FY23-26 Total City Capital 0 0 250,000 7,250,000 7,500,000 Grants/Other 0 0 0 0 0 Total 0 0 250,000 7,250,000 7,500,000
BAY VILLAGE NEIGHBORHOOD PARK Project Mission Comprehensive park renovation and addition of new plantings, park furniture, and interpretive feature describing
neighborhood history.
Managing Department, Parks and Recreation Department Status, New Project Location, South End Operating Impact, No
Authorizations
Source Existing FY22 Future Non Capital
Fund Total City Capital 0 550,000 0 0 550,000 Grants/Other 0 0 0 25,000 25,000 Total 0 550,000 0 25,000 575,000
Expenditures (Actual and Planned)
Source Thru
6/30/20 FY21 FY22 FY23-26 Total City Capital 0 0 75,000 475,000 550,000 Grants/Other 0 0 0 0 0 Total 0 0 75,000 475,000 550,000

Environment, Energy & Open SpaceParks & Recreation Department 337
Parks & Recreation Department Project Profiles BILLINGS FIELD
Project Mission Design a comprehensive park renovation including fields, courts, and other park infrastructure. Managing Department, Parks and Recreation Department Status, To Be Scheduled Location, West Roxbury Operating Impact, No
Authorizations
Source Existing FY22 Future Non Capital
Fund Total City Capital 500,000 0 0 0 500,000 Grants/Other 0 0 0 0 0 Total 500,000 0 0 0 500,000
Expenditures (Actual and Planned)
Source Thru
6/30/20 FY21 FY22 FY23-26 Total City Capital 0 0 250,000 250,000 500,000 Grants/Other 0 0 0 0 0 Total 0 0 250,000 250,000 500,000
BOSTON COMMON MASTER PLAN Project Mission Develop a master plan to bring the nation's oldest public park to the level of excellence commensurate with its
historical importance and use by the City’s residents and visitors.
Managing Department, Parks and Recreation Department Status, Study Underway Location, Beacon Hill Operating Impact, No
Authorizations
Source Existing FY22 Future Non Capital
Fund Total City Capital 0 0 0 0 0 Grants/Other 23,000,000 0 0 0 23,000,000 Total 23,000,000 0 0 0 23,000,000
Expenditures (Actual and Planned)
Source Thru
6/30/20 FY21 FY22 FY23-26 Total City Capital 0 0 0 0 0 Grants/Other 361,253 500,000 1,000,000 21,138,747 23,000,000 Total 361,253 500,000 1,000,000 21,138,747 23,000,000

338 Environment, Energy & Open SpaceParks & Recreation Department
Parks & Recreation Department Project Profiles BOSTON COMMON TADPOLE PLAY LOT
Project Mission Revitalize the Boston Common playground including new play equipment, safety surfacing and site furnishings. Managing Department, Parks and Recreation Department Status, To Be Scheduled Location, Beacon Hill Operating Impact, No
Authorizations
Source Existing FY22 Future Non Capital
Fund Total City Capital 150,000 0 0 0 150,000 Grants/Other 0 0 0 0 0 Total 150,000 0 0 0 150,000
Expenditures (Actual and Planned)
Source Thru
6/30/20 FY21 FY22 FY23-26 Total City Capital 0 0 50,000 100,000 150,000 Grants/Other 0 0 0 0 0 Total 0 0 50,000 100,000 150,000
BOSTON COMMON UTILITY STUDY Project Mission Study to determine utility needs (electric and drainage) of the Boston Common in advance of needed utility
upgrades and future pathway paving.
Managing Department, Parks and Recreation Department Status, Study Underway Location, Beacon Hill Operating Impact, No
Authorizations
Source Existing FY22 Future Non Capital
Fund Total City Capital 100,000 0 0 0 100,000 Grants/Other 0 0 0 0 0 Total 100,000 0 0 0 100,000
Expenditures (Actual and Planned)
Source Thru
6/30/20 FY21 FY22 FY23-26 Total City Capital 29,100 32,378 38,522 0 100,000 Grants/Other 0 0 0 0 0 Total 29,100 32,378 38,522 0 100,000

Environment, Energy & Open SpaceParks & Recreation Department 339
Parks & Recreation Department Project Profiles BUSSEY BROOK MEADOW TRAIL AT ARNOLD ARBORETUM
Project Mission Repair and extension of walking paths, wetland habitat restoration and improvements to Bussey Brook flood
retention capacity.
Managing Department, Parks and Recreation Department Status, To Be Scheduled Location, Jamaica Plain Operating Impact, Yes
Authorizations
Source Existing FY22 Future Non Capital
Fund Total City Capital 600,000 0 0 0 600,000 Grants/Other 0 0 0 0 0 Total 600,000 0 0 0 600,000
Expenditures (Actual and Planned)
Source Thru
6/30/20 FY21 FY22 FY23-26 Total City Capital 0 25,000 575,000 0 600,000 Grants/Other 0 0 0 0 0 Total 0 25,000 575,000 0 600,000
BYNOE PARK Project Mission Upgrades to play equipment. Managing Department, Parks and Recreation Department Status, In Design Location, Roxbury Operating Impact, Yes
Authorizations
Source Existing FY22 Future Non Capital
Fund Total City Capital 1,120,000 0 0 0 1,120,000 Grants/Other 0 0 0 0 0 Total 1,120,000 0 0 0 1,120,000
Expenditures (Actual and Planned)
Source Thru
6/30/20 FY21 FY22 FY23-26 Total City Capital 0 36,500 250,000 833,500 1,120,000 Grants/Other 0 0 0 0 0 Total 0 36,500 250,000 833,500 1,120,000

340 Environment, Energy & Open SpaceParks & Recreation Department
Parks & Recreation Department Project Profiles CEYLON PARK
Project Mission Design of park improvements including upgrades to artificial turf, sports lighting, basketball court, playgrounds,
splash pad, spectator seating, and accessibility.
Managing Department, Parks and Recreation Department Status, To Be Scheduled Location, Roxbury Operating Impact, No
Authorizations
Source Existing FY22 Future Non Capital
Fund Total City Capital 500,000 0 3,600,000 0 4,100,000 Grants/Other 0 0 0 0 0 Total 500,000 0 3,600,000 0 4,100,000
Expenditures (Actual and Planned)
Source Thru
6/30/20 FY21 FY22 FY23-26 Total City Capital 0 0 100,000 4,000,000 4,100,000 Grants/Other 0 0 0 0 0 Total 0 0 100,000 4,000,000 4,100,000
CHRISTOPHER COLUMBUS PARK Project Mission Playground renovation including play structure, safety surfacing, fencing, lighting, site furnishings, pathway
repairs, drainage, signage, and green infrastructure to mitigate future sea level rise.
Managing Department, Parks and Recreation Department Status, To Be Scheduled Location, North End Operating Impact, Yes
Authorizations
Source Existing FY22 Future Non Capital
Fund Total City Capital 1,000,000 2,500,000 0 0 3,500,000 Grants/Other 0 0 0 0 0 Total 1,000,000 2,500,000 0 0 3,500,000
Expenditures (Actual and Planned)
Source Thru
6/30/20 FY21 FY22 FY23-26 Total City Capital 0 0 100,000 3,400,000 3,500,000 Grants/Other 0 0 0 0 0 Total 0 0 100,000 3,400,000 3,500,000

Environment, Energy & Open SpaceParks & Recreation Department 341
Parks & Recreation Department Project Profiles CLARENDON STREET PLAYGROUND
Project Mission Upgrade play equipment. Managing Department, Parks and Recreation Department Status, In Design Location, Back Bay Operating Impact, Yes
Authorizations
Source Existing FY22 Future Non Capital
Fund Total City Capital 1,730,000 0 0 0 1,730,000 Grants/Other 0 0 0 0 0 Total 1,730,000 0 0 0 1,730,000
Expenditures (Actual and Planned)
Source Thru
6/30/20 FY21 FY22 FY23-26 Total City Capital 0 40,000 500,000 1,190,000 1,730,000 Grants/Other 0 0 0 0 0 Total 0 40,000 500,000 1,190,000 1,730,000
CODMAN SQUARE Project Mission Implementation of redesign of Codman Square Park. Managing Department, Parks and Recreation Department Status, To Be Scheduled Location, Dorchester Operating Impact, No
Authorizations
Source Existing FY22 Future Non Capital
Fund Total City Capital 640,000 0 0 0 640,000 Grants/Other 0 0 0 1,170,000 1,170,000 Total 640,000 0 0 1,170,000 1,810,000
Expenditures (Actual and Planned)
Source Thru
6/30/20 FY21 FY22 FY23-26 Total City Capital 0 3,000 250,000 387,000 640,000 Grants/Other 0 0 0 0 0 Total 0 3,000 250,000 387,000 640,000
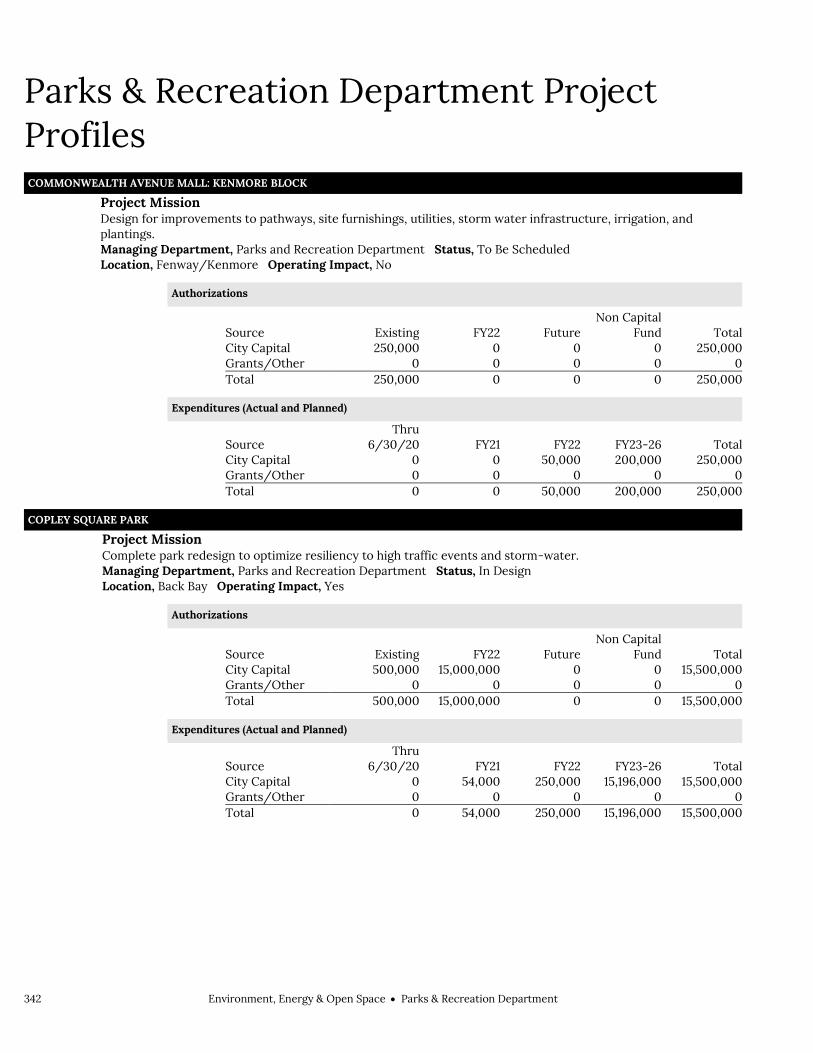
342 Environment, Energy & Open SpaceParks & Recreation Department
Parks & Recreation Department Project Profiles COMMONWEALTH AVENUE MALL: KENMORE BLOCK
Project Mission Design for improvements to pathways, site furnishings, utilities, storm water infrastructure, irrigation, and
plantings.
Managing Department, Parks and Recreation Department Status, To Be Scheduled Location, Fenway/Kenmore Operating Impact, No
Authorizations
Source Existing FY22 Future Non Capital
Fund Total City Capital 250,000 0 0 0 250,000 Grants/Other 0 0 0 0 0 Total 250,000 0 0 0 250,000
Expenditures (Actual and Planned)
Source Thru
6/30/20 FY21 FY22 FY23-26 Total City Capital 0 0 50,000 200,000 250,000 Grants/Other 0 0 0 0 0 Total 0 0 50,000 200,000 250,000
COPLEY SQUARE PARK Project Mission Complete park redesign to optimize resiliency to high traffic events and storm-water. Managing Department, Parks and Recreation Department Status, In Design Location, Back Bay Operating Impact, Yes
Authorizations
Source Existing FY22 Future Non Capital
Fund Total City Capital 500,000 15,000,000 0 0 15,500,000 Grants/Other 0 0 0 0 0 Total 500,000 15,000,000 0 0 15,500,000
Expenditures (Actual and Planned)
Source Thru
6/30/20 FY21 FY22 FY23-26 Total City Capital 0 54,000 250,000 15,196,000 15,500,000 Grants/Other 0 0 0 0 0 Total 0 54,000 250,000 15,196,000 15,500,000

Environment, Energy & Open SpaceParks & Recreation Department 343
Parks & Recreation Department Project Profiles COPPENS SQUARE
Project Mission Design and construction of park improvements including replacement of the Mayor Theodore Lyman fountain that
was removed in 1951.
Managing Department, Parks and Recreation Department Status, In Design Location, Dorchester Operating Impact, No
Authorizations
Source Existing FY22 Future Non Capital
Fund Total City Capital 250,000 1,125,000 0 0 1,375,000 Grants/Other 0 0 0 0 0 Total 250,000 1,125,000 0 0 1,375,000
Expenditures (Actual and Planned)
Source Thru
6/30/20 FY21 FY22 FY23-26 Total City Capital 0 0 250,000 1,125,000 1,375,000 Grants/Other 0 0 0 0 0 Total 0 0 250,000 1,125,000 1,375,000
COURT RENOVATIONS Project Mission Annual program to rehabilitate tennis, basketball, and street hockey courts citywide. Managing Department, Parks and Recreation Department Status, Annual Program Location, Citywide Operating Impact, No
Authorizations
Source Existing FY22 Future Non Capital
Fund Total City Capital 8,526,081 0 241,363 0 8,767,444 Grants/Other 0 0 0 0 0 Total 8,526,081 0 241,363 0 8,767,444
Expenditures (Actual and Planned)
Source Thru
6/30/20 FY21 FY22 FY23-26 Total City Capital 5,369,901 700,000 700,000 1,997,543 8,767,444 Grants/Other 0 0 0 0 0 Total 5,369,901 700,000 700,000 1,997,543 8,767,444
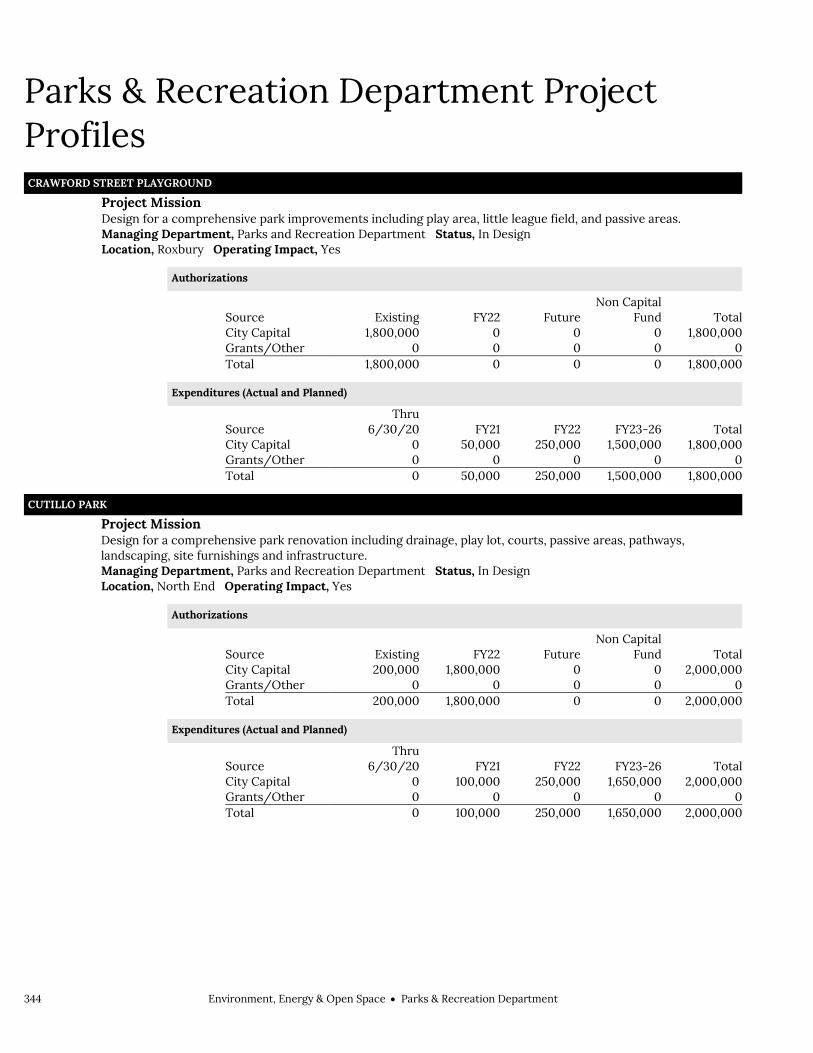
344 Environment, Energy & Open SpaceParks & Recreation Department
Parks & Recreation Department Project Profiles CRAWFORD STREET PLAYGROUND
Project Mission Design for a comprehensive park improvements including play area, little league field, and passive areas. Managing Department, Parks and Recreation Department Status, In Design Location, Roxbury Operating Impact, Yes
Authorizations
Source Existing FY22 Future Non Capital
Fund Total City Capital 1,800,000 0 0 0 1,800,000 Grants/Other 0 0 0 0 0 Total 1,800,000 0 0 0 1,800,000
Expenditures (Actual and Planned)
Source Thru
6/30/20 FY21 FY22 FY23-26 Total City Capital 0 50,000 250,000 1,500,000 1,800,000 Grants/Other 0 0 0 0 0 Total 0 50,000 250,000 1,500,000 1,800,000
CUTILLO PARK Project Mission Design for a comprehensive park renovation including drainage, play lot, courts, passive areas, pathways,
landscaping, site furnishings and infrastructure.
Managing Department, Parks and Recreation Department Status, In Design Location, North End Operating Impact, Yes
Authorizations
Source Existing FY22 Future Non Capital
Fund Total City Capital 200,000 1,800,000 0 0 2,000,000 Grants/Other 0 0 0 0 0 Total 200,000 1,800,000 0 0 2,000,000
Expenditures (Actual and Planned)
Source Thru
6/30/20 FY21 FY22 FY23-26 Total City Capital 0 100,000 250,000 1,650,000 2,000,000 Grants/Other 0 0 0 0 0 Total 0 100,000 250,000 1,650,000 2,000,000

Environment, Energy & Open SpaceParks & Recreation Department 345
Parks & Recreation Department Project Profiles DAISY FIELD AT OLMSTED PARK
Project Mission Park renovation including two softball fields, pathways, and LED sports lighting. Managing Department, Parks and Recreation Department Status, In Design Location, Jamaica Plain Operating Impact, Yes
Authorizations
Source Existing FY22 Future Non Capital
Fund Total City Capital 1,140,000 0 0 0 1,140,000 Grants/Other 0 0 0 0 0 Total 1,140,000 0 0 0 1,140,000
Expenditures (Actual and Planned)
Source Thru
6/30/20 FY21 FY22 FY23-26 Total City Capital 0 100,000 900,000 140,000 1,140,000 Grants/Other 0 0 0 0 0 Total 0 100,000 900,000 140,000 1,140,000
DOHERTY-GIBSON PLAYGROUND Project Mission Refurbish play lot and adjacent passive areas. Managing Department, Parks and Recreation Department Status, In Design Location, Dorchester Operating Impact, No
Authorizations
Source Existing FY22 Future Non Capital
Fund Total City Capital 1,120,000 0 0 0 1,120,000 Grants/Other 0 0 0 0 0 Total 1,120,000 0 0 0 1,120,000
Expenditures (Actual and Planned)
Source Thru
6/30/20 FY21 FY22 FY23-26 Total City Capital 16,676 250,000 500,000 353,324 1,120,000 Grants/Other 0 0 0 0 0 Total 16,676 250,000 500,000 353,324 1,120,000

346 Environment, Energy & Open SpaceParks & Recreation Department
Parks & Recreation Department Project Profiles DORCHESTER PARK PATHWAYS
Project Mission Mill and repave existing paved walkways in Dorchester Park. Managing Department, Parks and Recreation Department Status, New Project Location, Dorchester Operating Impact, No
Authorizations
Source Existing FY22 Future Non Capital
Fund Total City Capital 0 1,820,000 0 0 1,820,000 Grants/Other 0 0 0 0 0 Total 0 1,820,000 0 0 1,820,000
Expenditures (Actual and Planned)
Source Thru
6/30/20 FY21 FY22 FY23-26 Total City Capital 0 0 100,000 1,720,000 1,820,000 Grants/Other 0 0 0 0 0 Total 0 0 100,000 1,720,000 1,820,000
DUDLEY TOWN COMMON Project Mission Improvements to Dudley Town Common to support the use of this neighborhood "Common" for gathering and
civic uses.
Managing Department, Parks and Recreation Department Status, To Be Scheduled Location, Roxbury Operating Impact, No
Authorizations
Source Existing FY22 Future Non Capital
Fund Total City Capital 972,000 0 298,000 0 1,270,000 Grants/Other 0 0 0 0 0 Total 972,000 0 298,000 0 1,270,000
Expenditures (Actual and Planned)
Source Thru
6/30/20 FY21 FY22 FY23-26 Total City Capital 0 0 50,000 1,220,000 1,270,000 Grants/Other 0 0 0 0 0 Total 0 0 50,000 1,220,000 1,270,000

Environment, Energy & Open SpaceParks & Recreation Department 347
Parks & Recreation Department Project Profiles EAST BOSTON GREENWAY
Project Mission Design of comprehensive park improvements including sea level rise mitigation, storm water management
upgrades, improvements to pathways, furnishings, plantings and murals.
Managing Department, Parks and Recreation Department Status, To Be Scheduled Location, East Boston Operating Impact, No
Authorizations
Source Existing FY22 Future Non Capital
Fund Total City Capital 400,000 0 0 0 400,000 Grants/Other 0 0 0 0 0 Total 400,000 0 0 0 400,000
Expenditures (Actual and Planned)
Source Thru
6/30/20 FY21 FY22 FY23-26 Total City Capital 0 0 50,000 350,000 400,000 Grants/Other 0 0 0 0 0 Total 0 0 50,000 350,000 400,000
EDWARDS PLAYGROUND Project Mission Renovations to the playground including safety surfacing; passive park improvements including site furnishings,
upgraded utilities and pathways.
Managing Department, Parks and Recreation Department Status, In Design Location, Charlestown Operating Impact, No
Authorizations
Source Existing FY22 Future Non Capital
Fund Total City Capital 1,400,000 0 0 0 1,400,000 Grants/Other 0 0 0 0 0 Total 1,400,000 0 0 0 1,400,000
Expenditures (Actual and Planned)
Source Thru
6/30/20 FY21 FY22 FY23-26 Total City Capital 89,128 1,000,000 310,872 0 1,400,000 Grants/Other 0 0 0 0 0 Total 89,128 1,000,000 310,872 0 1,400,000

348 Environment, Energy & Open SpaceParks & Recreation Department
Parks & Recreation Department Project Profiles FIELD HOUSE PROGRAMMING STUDY
Project Mission Study and design of facility and programming improvements at Billings Field Fieldhouse and Lee Playground
Fieldhouse.
Managing Department, Public Facilities Department Status, New Project Location, Various neighborhoods Operating Impact, No
Authorizations
Source Existing FY22 Future Non Capital
Fund Total City Capital 0 125,000 0 0 125,000 Grants/Other 0 0 0 0 0 Total 0 125,000 0 0 125,000
Expenditures (Actual and Planned)
Source Thru
6/30/20 FY21 FY22 FY23-26 Total City Capital 0 0 50,000 75,000 125,000 Grants/Other 0 0 0 0 0 Total 0 0 50,000 75,000 125,000
FIELD LIGHTS AT VARIOUS PARKS Project Mission Upgrade park field lights at various locations including Hemenway Park, Billings Field, and Fallon Field. Managing Department, Parks and Recreation Department Status, In Construction Location, Various neighborhoods Operating Impact, No
Authorizations
Source Existing FY22 Future Non Capital
Fund Total City Capital 2,700,000 0 0 0 2,700,000 Grants/Other 0 0 0 0 0 Total 2,700,000 0 0 0 2,700,000
Expenditures (Actual and Planned)
Source Thru
6/30/20 FY21 FY22 FY23-26 Total City Capital 65,816 68,000 50,000 2,516,184 2,700,000 Grants/Other 0 0 0 0 0 Total 65,816 68,000 50,000 2,516,184 2,700,000

Environment, Energy & Open SpaceParks & Recreation Department 349
Parks & Recreation Department Project Profiles FLAHERTY (WILLIAM F.) PLAYGROUND
Project Mission Upgrade play lot. Managing Department, Parks and Recreation Department Status, To Be Scheduled Location, Jamaica Plain Operating Impact, Yes
Authorizations
Source Existing FY22 Future Non Capital
Fund Total City Capital 1,930,000 0 0 0 1,930,000 Grants/Other 0 0 0 0 0 Total 1,930,000 0 0 0 1,930,000
Expenditures (Actual and Planned)
Source Thru
6/30/20 FY21 FY22 FY23-26 Total City Capital 0 25,000 500,000 1,405,000 1,930,000 Grants/Other 0 0 0 0 0 Total 0 25,000 500,000 1,405,000 1,930,000
FORT POINT CHANNEL PARK Project Mission Design and implementation of a signature, climate resilient waterfront park along the Fort Point Channel. Federal
funding is anticipated.
Managing Department, Parks and Recreation Department Status, To Be Scheduled Location, South Boston Operating Impact, No
Authorizations
Source Existing FY22 Future Non Capital
Fund Total City Capital 10,000,000 0 0 0 10,000,000 Grants/Other 0 0 10,000,000 0 10,000,000 Total 10,000,000 0 10,000,000 0 20,000,000
Expenditures (Actual and Planned)
Source Thru
6/30/20 FY21 FY22 FY23-26 Total City Capital 0 0 0 10,000,000 10,000,000 Grants/Other 0 0 0 10,000,000 10,000,000 Total 0 0 0 20,000,000 20,000,000

350 Environment, Energy & Open SpaceParks & Recreation Department
Parks & Recreation Department Project Profiles FRANKLIN PARK MASTER PLAN
Project Mission Consistent with the goals of Imagine Boston 2030, develop a master plan that will enhance historic Franklin Park
as a keystone park in the geographical heart of the City.
Managing Department, Parks and Recreation Department Status, Study Underway Location, Various neighborhoods Operating Impact, No
Authorizations
Source Existing FY22 Future Non Capital
Fund Total City Capital 0 0 0 0 0 Grants/Other 23,000,000 0 0 0 23,000,000 Total 23,000,000 0 0 0 23,000,000
Expenditures (Actual and Planned)
Source Thru
6/30/20 FY21 FY22 FY23-26 Total City Capital 0 0 0 0 0 Grants/Other 459,496 500,000 1,500,000 20,540,504 23,000,000 Total 459,496 500,000 1,500,000 20,540,504 23,000,000
FRANKLIN PARK YARD MASTER PLAN UPDATE Project Mission Update the existing master plan to build out the Franklin Park Yard as a full administration and maintenance
facility for the Parks and Recreation Department.
Managing Department, Public Facilities Department Status, Study Underway Location, Roxbury Operating Impact, No
Authorizations
Source Existing FY22 Future Non Capital
Fund Total City Capital 112,000 0 0 0 112,000 Grants/Other 0 0 0 0 0 Total 112,000 0 0 0 112,000
Expenditures (Actual and Planned)
Source Thru
6/30/20 FY21 FY22 FY23-26 Total City Capital 94,698 0 17,302 0 112,000 Grants/Other 0 0 0 0 0 Total 94,698 0 17,302 0 112,000

Environment, Energy & Open SpaceParks & Recreation Department 351
Parks & Recreation Department Project Profiles FROG POND
Project Mission Study to evaluate the mechanical systems of the Frog Pond. Managing Department, Public Facilities Department Status, Study Underway Location, Beacon Hill Operating Impact, No
Authorizations
Source Existing FY22 Future Non Capital
Fund Total City Capital 150,000 0 0 0 150,000 Grants/Other 0 0 0 0 0 Total 150,000 0 0 0 150,000
Expenditures (Actual and Planned)
Source Thru
6/30/20 FY21 FY22 FY23-26 Total City Capital 24,200 0 125,800 0 150,000 Grants/Other 0 0 0 0 0 Total 24,200 0 125,800 0 150,000
GARVEY PLAYGROUND Project Mission Park renovation including play lot, field improvements, lighting, pathways, and court upgrades. Managing Department, Parks and Recreation Department Status, In Construction Location, Dorchester Operating Impact, No
Authorizations
Source Existing FY22 Future Non Capital
Fund Total City Capital 5,160,000 290,000 0 0 5,450,000 Grants/Other 0 0 0 0 0 Total 5,160,000 290,000 0 0 5,450,000
Expenditures (Actual and Planned)
Source Thru
6/30/20 FY21 FY22 FY23-26 Total City Capital 1,434,766 3,565,234 450,000 0 5,450,000 Grants/Other 0 0 0 0 0 Total 1,434,766 3,565,234 450,000 0 5,450,000

352 Environment, Energy & Open SpaceParks & Recreation Department
Parks & Recreation Department Project Profiles GENERAL PARKS IMPROVEMENTS
Project Mission Replace fencing, pavement, court lighting, and other infrastructure improvements needed. Managing Department, Parks and Recreation Department Status, Annual Program Location, Citywide Operating Impact, No
Authorizations
Source Existing FY22 Future Non Capital
Fund Total City Capital 1,500,000 0 0 0 1,500,000 Grants/Other 0 0 0 0 0 Total 1,500,000 0 0 0 1,500,000
Expenditures (Actual and Planned)
Source Thru
6/30/20 FY21 FY22 FY23-26 Total City Capital 6,659 743,341 750,000 0 1,500,000 Grants/Other 0 0 0 0 0 Total 6,659 743,341 750,000 0 1,500,000
GEORGE WRIGHT CLUBHOUSE PHASE 2 Project Mission Building renovations include installation of a new boiler, electrical system and fire protection. Update bathroom
for accessibility.
Managing Department, Public Facilities Department Status, In Design Location, Hyde Park Operating Impact, No
Authorizations
Source Existing FY22 Future Non Capital
Fund Total City Capital 1,400,000 0 0 0 1,400,000 Grants/Other 0 0 0 0 0 Total 1,400,000 0 0 0 1,400,000
Expenditures (Actual and Planned)
Source Thru
6/30/20 FY21 FY22 FY23-26 Total City Capital 250,463 250,000 450,000 449,537 1,400,000 Grants/Other 0 0 0 0 0 Total 250,463 250,000 450,000 449,537 1,400,000
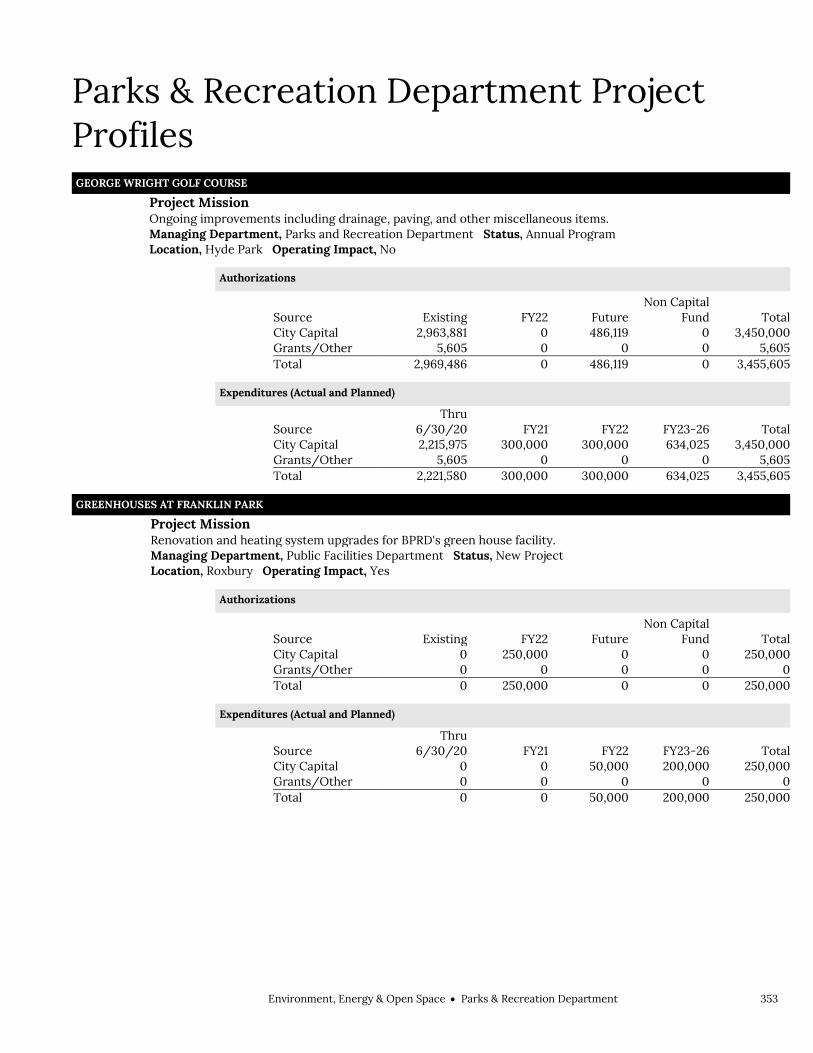
Environment, Energy & Open SpaceParks & Recreation Department 353
Parks & Recreation Department Project Profiles GEORGE WRIGHT GOLF COURSE
Project Mission Ongoing improvements including drainage, paving, and other miscellaneous items. Managing Department, Parks and Recreation Department Status, Annual Program Location, Hyde Park Operating Impact, No
Authorizations
Source Existing FY22 Future Non Capital
Fund Total City Capital 2,963,881 0 486,119 0 3,450,000 Grants/Other 5,605 0 0 0 5,605 Total 2,969,486 0 486,119 0 3,455,605
Expenditures (Actual and Planned)
Source Thru
6/30/20 FY21 FY22 FY23-26 Total City Capital 2,215,975 300,000 300,000 634,025 3,450,000 Grants/Other 5,605 0 0 0 5,605 Total 2,221,580 300,000 300,000 634,025 3,455,605
GREENHOUSES AT FRANKLIN PARK Project Mission Renovation and heating system upgrades for BPRD's green house facility. Managing Department, Public Facilities Department Status, New Project Location, Roxbury Operating Impact, Yes
Authorizations
Source Existing FY22 Future Non Capital
Fund Total City Capital 0 250,000 0 0 250,000 Grants/Other 0 0 0 0 0 Total 0 250,000 0 0 250,000
Expenditures (Actual and Planned)
Source Thru
6/30/20 FY21 FY22 FY23-26 Total City Capital 0 0 50,000 200,000 250,000 Grants/Other 0 0 0 0 0 Total 0 0 50,000 200,000 250,000

354 Environment, Energy & Open SpaceParks & Recreation Department
Parks & Recreation Department Project Profiles HARAMBEE PARK PHASE 3
Project Mission Reorientation of football field and sports lighting improvements. Continuation of pedestrian pathway network
throughout the park, and public safety improvements. Feasibility study of parking and bus accommodation.
Managing Department, Parks and Recreation Department Status, In Construction Location, Dorchester Operating Impact, Yes
Authorizations
Source Existing FY22 Future Non Capital
Fund Total City Capital 3,035,000 0 0 0 3,035,000 Grants/Other 400,000 0 0 0 400,000 Total 3,435,000 0 0 0 3,435,000
Expenditures (Actual and Planned)
Source Thru
6/30/20 FY21 FY22 FY23-26 Total City Capital 133,000 914,250 1,987,750 0 3,035,000 Grants/Other 0 0 400,000 0 400,000 Total 133,000 914,250 2,387,750 0 3,435,000
HARAMBEE PARK PHASE 4 Project Mission Reconstruction of both cricket fields and the little league field. Managing Department, Parks and Recreation Department Status, New Project Location, Dorchester Operating Impact, No
Authorizations
Source Existing FY22 Future Non Capital
Fund Total City Capital 0 2,090,000 0 0 2,090,000 Grants/Other 0 0 0 0 0 Total 0 2,090,000 0 0 2,090,000
Expenditures (Actual and Planned)
Source Thru
6/30/20 FY21 FY22 FY23-26 Total City Capital 0 0 500,000 1,590,000 2,090,000 Grants/Other 0 0 0 0 0 Total 0 0 500,000 1,590,000 2,090,000

Environment, Energy & Open SpaceParks & Recreation Department 355
Parks & Recreation Department Project Profiles HISTORIC CEMETERIES
Project Mission Ongoing program of repairs in designated historic cemeteries located throughout the City. Managing Department, Parks and Recreation Department Status, Annual Program Location, Citywide Operating Impact, No
Authorizations
Source Existing FY22 Future Non Capital
Fund Total City Capital 1,964,196 1,000,000 25,804 0 2,990,000 Grants/Other 228,000 0 0 166,117 394,117 Total 2,192,196 1,000,000 25,804 166,117 3,384,117
Expenditures (Actual and Planned)
Source Thru
6/30/20 FY21 FY22 FY23-26 Total City Capital 1,390,378 300,000 400,000 899,622 2,990,000 Grants/Other 228,000 0 0 0 228,000 Total 1,618,378 300,000 400,000 899,622 3,218,000
HYNES PLAYGROUND Project Mission Improvements to baseball and softball fields including; drainage, backstops, players benches, and infield repairs. Managing Department, Parks and Recreation Department Status, In Design Location, West Roxbury Operating Impact, Yes
Authorizations
Source Existing FY22 Future Non Capital
Fund Total City Capital 1,600,000 0 0 0 1,600,000 Grants/Other 0 0 0 0 0 Total 1,600,000 0 0 0 1,600,000
Expenditures (Actual and Planned)
Source Thru
6/30/20 FY21 FY22 FY23-26 Total City Capital 0 50,000 500,000 1,050,000 1,600,000 Grants/Other 0 0 0 0 0 Total 0 50,000 500,000 1,050,000 1,600,000

356 Environment, Energy & Open SpaceParks & Recreation Department
Parks & Recreation Department Project Profiles JAMAICA POND BOATHOUSE STUDY
Project Mission Programming study for Jamaica Pond Boathouse. Managing Department, Public Facilities Department Status, New Project Location, Jamaica Plain Operating Impact, No
Authorizations
Source Existing FY22 Future Non Capital
Fund Total City Capital 0 250,000 0 0 250,000 Grants/Other 0 0 0 0 0 Total 0 250,000 0 0 250,000
Expenditures (Actual and Planned)
Source Thru
6/30/20 FY21 FY22 FY23-26 Total City Capital 0 0 50,000 200,000 250,000 Grants/Other 0 0 0 0 0 Total 0 0 50,000 200,000 250,000
JEEP JONES PARK Project Mission Study and design for park renovations. Managing Department, Parks and Recreation Department Status, In Design Location, Roxbury Operating Impact, No
Authorizations
Source Existing FY22 Future Non Capital
Fund Total City Capital 750,000 500,000 0 0 1,250,000 Grants/Other 0 0 0 0 0 Total 750,000 500,000 0 0 1,250,000
Expenditures (Actual and Planned)
Source Thru
6/30/20 FY21 FY22 FY23-26 Total City Capital 0 25,000 725,000 500,000 1,250,000 Grants/Other 0 0 0 0 0 Total 0 25,000 725,000 500,000 1,250,000

Environment, Energy & Open SpaceParks & Recreation Department 357
Parks & Recreation Department Project Profiles JUSTICE GOURDIN VETERANS MEMORIAL PARK
Project Mission Major park renovation including pathways, walls, plazas, ADA improvements, and landscaping. Managing Department, Parks and Recreation Department Status, In Design Location, Roxbury Operating Impact, No
Authorizations
Source Existing FY22 Future Non Capital
Fund Total City Capital 930,000 390,000 0 0 1,320,000 Grants/Other 0 0 0 0 0 Total 930,000 390,000 0 0 1,320,000
Expenditures (Actual and Planned)
Source Thru
6/30/20 FY21 FY22 FY23-26 Total City Capital 53,050 50,000 800,000 416,950 1,320,000 Grants/Other 0 0 0 0 0 Total 53,050 50,000 800,000 416,950 1,320,000
L STREET OPEN SPACE AREA Project Mission This new open space on L Street will create an inter-generational gathering space. The park space will provide
senior residents a place to relax and socialize while encouraging young children to engage and play.
Managing Department, Parks and Recreation Department Status, In Design Location, South Boston Operating Impact, No
Authorizations
Source Existing FY22 Future Non Capital
Fund Total City Capital 600,000 0 0 0 600,000 Grants/Other 0 0 0 0 0 Total 600,000 0 0 0 600,000
Expenditures (Actual and Planned)
Source Thru
6/30/20 FY21 FY22 FY23-26 Total City Capital 0 0 250,000 350,000 600,000 Grants/Other 0 0 0 0 0 Total 0 0 250,000 350,000 600,000

358 Environment, Energy & Open SpaceParks & Recreation Department
Parks & Recreation Department Project Profiles MALCOLM X PARK
Project Mission Design and construction of a comprehensive park renovation excluding fields, which were recently renovated. Managing Department, Parks and Recreation Department Status, In Design Location, Roxbury Operating Impact, Yes
Authorizations
Source Existing FY22 Future Non Capital
Fund Total City Capital 700,000 5,950,000 0 0 6,650,000 Grants/Other 0 0 750,000 2,000,000 2,750,000 Total 700,000 5,950,000 750,000 2,000,000 9,400,000
Expenditures (Actual and Planned)
Source Thru
6/30/20 FY21 FY22 FY23-26 Total City Capital 0 92,686 500,000 6,057,314 6,650,000 Grants/Other 0 0 0 750,000 750,000 Total 0 92,686 500,000 6,807,314 7,400,000
MARY HANNON PLAYGROUND PHASE II Project Mission Renovate ball field and passive areas. Managing Department, Parks and Recreation Department Status, In Construction Location, Roxbury Operating Impact, No
Authorizations
Source Existing FY22 Future Non Capital
Fund Total City Capital 1,060,000 0 0 0 1,060,000 Grants/Other 0 0 0 0 0 Total 1,060,000 0 0 0 1,060,000
Expenditures (Actual and Planned)
Source Thru
6/30/20 FY21 FY22 FY23-26 Total City Capital 42,944 500,000 517,056 0 1,060,000 Grants/Other 0 0 0 0 0 Total 42,944 500,000 517,056 0 1,060,000

Environment, Energy & Open SpaceParks & Recreation Department 359
Parks & Recreation Department Project Profiles MATTAHUNT WOODS PRESERVATION
Project Mission Clean up debris, manage invasive species, and build trails to restore wetland habitat and create usable open space. Managing Department, Parks and Recreation Department Status, New Project Location, Mattapan Operating Impact, No
Authorizations
Source Existing FY22 Future Non Capital
Fund Total City Capital 0 750,000 0 0 750,000 Grants/Other 0 0 0 0 0 Total 0 750,000 0 0 750,000
Expenditures (Actual and Planned)
Source Thru
6/30/20 FY21 FY22 FY23-26 Total City Capital 0 0 375,000 375,000 750,000 Grants/Other 0 0 0 0 0 Total 0 0 375,000 375,000 750,000
MCCONNELL PLAYGROUND Project Mission Comprehensive park renovation to include play lot, three fields, passive park, parking lot and address access
issues.
Managing Department, Parks and Recreation Department Status, In Design Location, Dorchester Operating Impact, No
Authorizations
Source Existing FY22 Future Non Capital
Fund Total City Capital 7,780,000 0 0 0 7,780,000 Grants/Other 1,000,000 0 0 0 1,000,000 Total 8,780,000 0 0 0 8,780,000
Expenditures (Actual and Planned)
Source Thru
6/30/20 FY21 FY22 FY23-26 Total City Capital 146,252 2,000,000 5,633,748 0 7,780,000 Grants/Other 0 0 1,000,000 0 1,000,000 Total 146,252 2,000,000 6,633,748 0 8,780,000
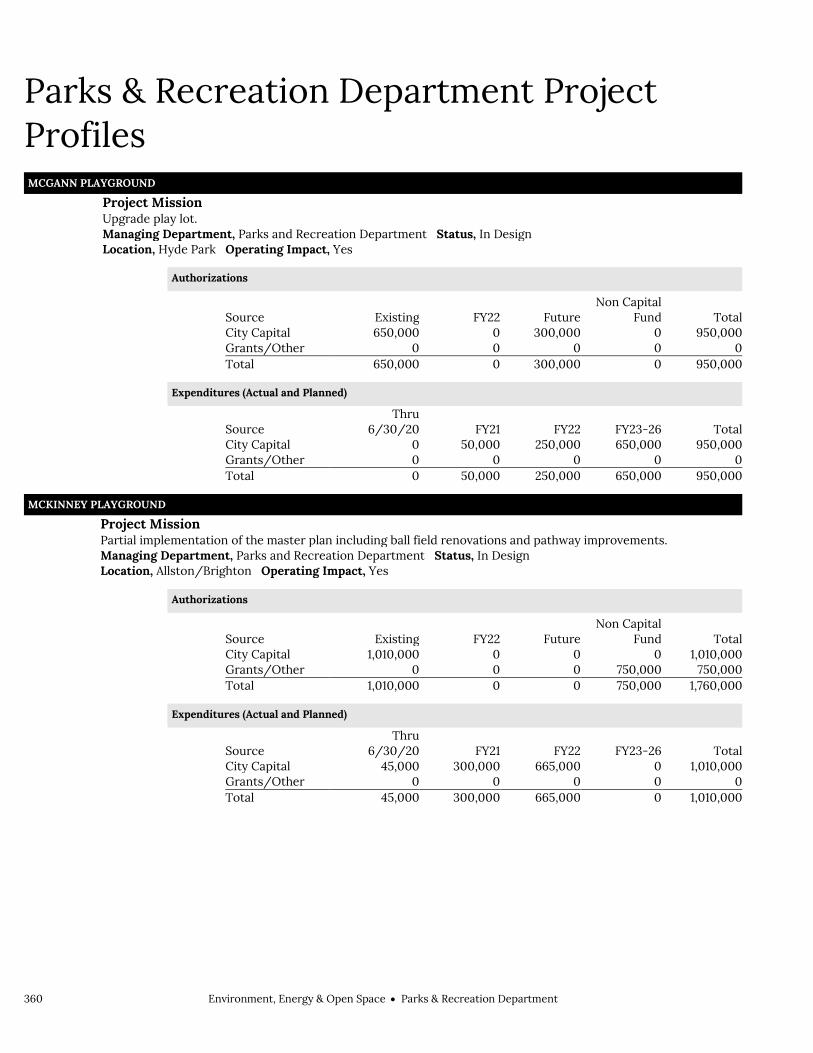
360 Environment, Energy & Open SpaceParks & Recreation Department
Parks & Recreation Department Project Profiles MCGANN PLAYGROUND
Project Mission Upgrade play lot. Managing Department, Parks and Recreation Department Status, In Design Location, Hyde Park Operating Impact, Yes
Authorizations
Source Existing FY22 Future Non Capital
Fund Total City Capital 650,000 0 300,000 0 950,000 Grants/Other 0 0 0 0 0 Total 650,000 0 300,000 0 950,000
Expenditures (Actual and Planned)
Source Thru
6/30/20 FY21 FY22 FY23-26 Total City Capital 0 50,000 250,000 650,000 950,000 Grants/Other 0 0 0 0 0 Total 0 50,000 250,000 650,000 950,000
MCKINNEY PLAYGROUND Project Mission Partial implementation of the master plan including ball field renovations and pathway improvements. Managing Department, Parks and Recreation Department Status, In Design Location, Allston/Brighton Operating Impact, Yes
Authorizations
Source Existing FY22 Future Non Capital
Fund Total City Capital 1,010,000 0 0 0 1,010,000 Grants/Other 0 0 0 750,000 750,000 Total 1,010,000 0 0 750,000 1,760,000
Expenditures (Actual and Planned)
Source Thru
6/30/20 FY21 FY22 FY23-26 Total City Capital 45,000 300,000 665,000 0 1,010,000 Grants/Other 0 0 0 0 0 Total 45,000 300,000 665,000 0 1,010,000
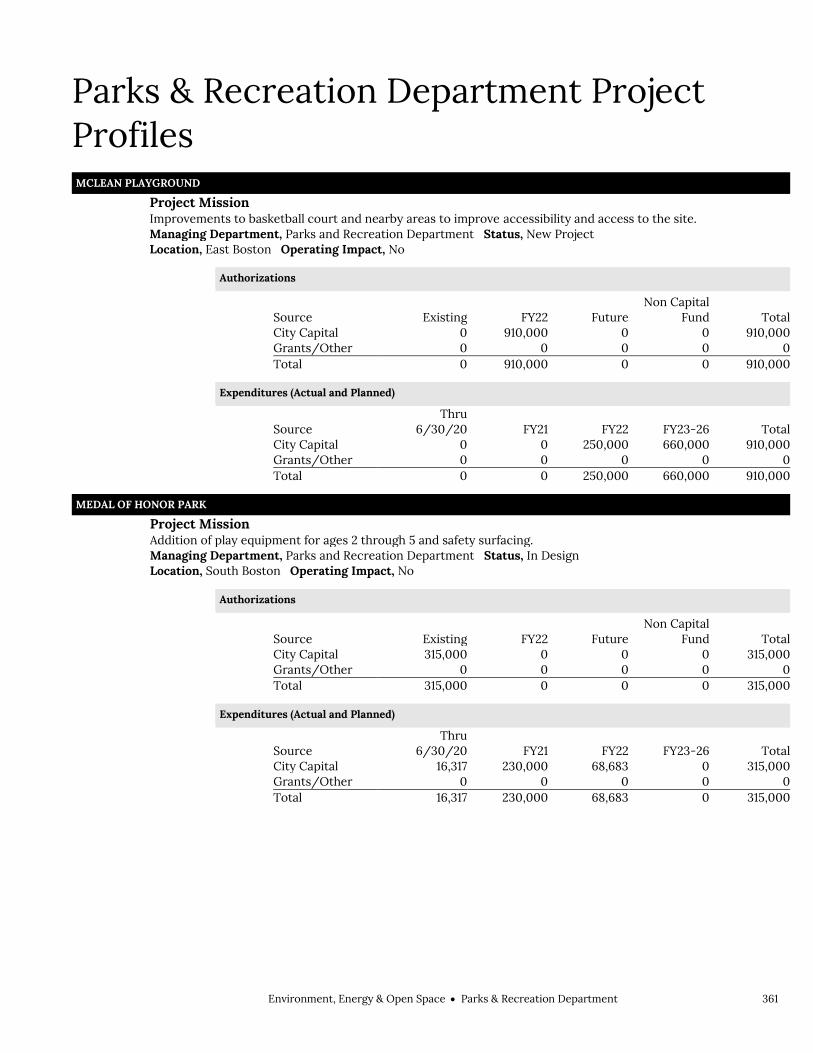
Environment, Energy & Open SpaceParks & Recreation Department 361
Parks & Recreation Department Project Profiles MCLEAN PLAYGROUND
Project Mission Improvements to basketball court and nearby areas to improve accessibility and access to the site. Managing Department, Parks and Recreation Department Status, New Project Location, East Boston Operating Impact, No
Authorizations
Source Existing FY22 Future Non Capital
Fund Total City Capital 0 910,000 0 0 910,000 Grants/Other 0 0 0 0 0 Total 0 910,000 0 0 910,000
Expenditures (Actual and Planned)
Source Thru
6/30/20 FY21 FY22 FY23-26 Total City Capital 0 0 250,000 660,000 910,000 Grants/Other 0 0 0 0 0 Total 0 0 250,000 660,000 910,000
MEDAL OF HONOR PARK Project Mission Addition of play equipment for ages 2 through 5 and safety surfacing. Managing Department, Parks and Recreation Department Status, In Design Location, South Boston Operating Impact, No
Authorizations
Source Existing FY22 Future Non Capital
Fund Total City Capital 315,000 0 0 0 315,000 Grants/Other 0 0 0 0 0 Total 315,000 0 0 0 315,000
Expenditures (Actual and Planned)
Source Thru
6/30/20 FY21 FY22 FY23-26 Total City Capital 16,317 230,000 68,683 0 315,000 Grants/Other 0 0 0 0 0 Total 16,317 230,000 68,683 0 315,000

362 Environment, Energy & Open SpaceParks & Recreation Department
Parks & Recreation Department Project Profiles MILLENNIUM PARK
Project Mission Design and construction of play lot improvements, pathway repaving, and installation of modular bathroom
facilities.
Managing Department, Parks and Recreation Department Status, In Design Location, West Roxbury Operating Impact, Yes
Authorizations
Source Existing FY22 Future Non Capital
Fund Total City Capital 3,250,000 825,000 0 0 4,075,000 Grants/Other 0 0 0 0 0 Total 3,250,000 825,000 0 0 4,075,000
Expenditures (Actual and Planned)
Source Thru
6/30/20 FY21 FY22 FY23-26 Total City Capital 0 25,000 500,000 3,550,000 4,075,000 Grants/Other 0 0 0 0 0 Total 0 25,000 500,000 3,550,000 4,075,000
MISSION HILL PLAYGROUND Project Mission Upgrade play lot. Managing Department, Parks and Recreation Department Status, In Design Location, Mission Hill Operating Impact, Yes
Authorizations
Source Existing FY22 Future Non Capital
Fund Total City Capital 2,680,000 0 0 0 2,680,000 Grants/Other 400,000 0 0 0 400,000 Total 3,080,000 0 0 0 3,080,000
Expenditures (Actual and Planned)
Source Thru
6/30/20 FY21 FY22 FY23-26 Total City Capital 0 39,440 250,000 2,390,560 2,680,000 Grants/Other 0 0 0 400,000 400,000 Total 0 39,440 250,000 2,790,560 3,080,000
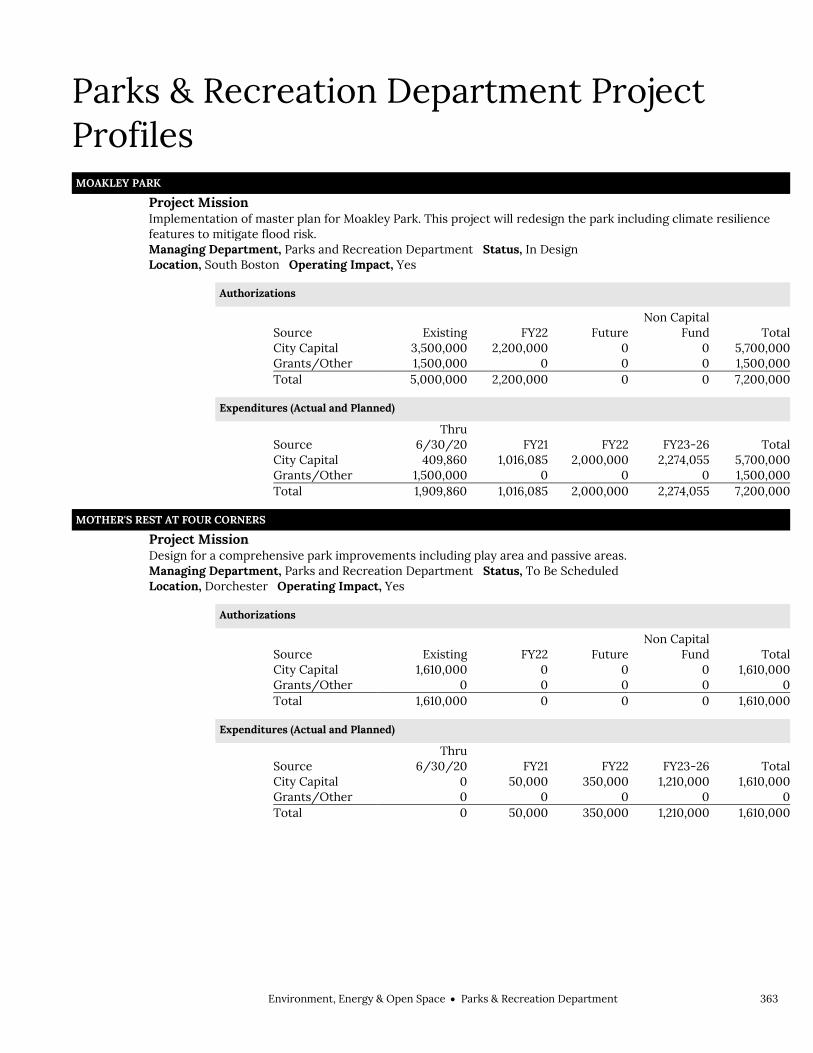
Environment, Energy & Open SpaceParks & Recreation Department 363
Parks & Recreation Department Project Profiles MOAKLEY PARK
Project Mission Implementation of master plan for Moakley Park. This project will redesign the park including climate resilience
features to mitigate flood risk.
Managing Department, Parks and Recreation Department Status, In Design Location, South Boston Operating Impact, Yes
Authorizations
Source Existing FY22 Future Non Capital
Fund Total City Capital 3,500,000 2,200,000 0 0 5,700,000 Grants/Other 1,500,000 0 0 0 1,500,000 Total 5,000,000 2,200,000 0 0 7,200,000
Expenditures (Actual and Planned)
Source Thru
6/30/20 FY21 FY22 FY23-26 Total City Capital 409,860 1,016,085 2,000,000 2,274,055 5,700,000 Grants/Other 1,500,000 0 0 0 1,500,000 Total 1,909,860 1,016,085 2,000,000 2,274,055 7,200,000
MOTHER'S REST AT FOUR CORNERS Project Mission Design for a comprehensive park improvements including play area and passive areas. Managing Department, Parks and Recreation Department Status, To Be Scheduled Location, Dorchester Operating Impact, Yes
Authorizations
Source Existing FY22 Future Non Capital
Fund Total City Capital 1,610,000 0 0 0 1,610,000 Grants/Other 0 0 0 0 0 Total 1,610,000 0 0 0 1,610,000
Expenditures (Actual and Planned)
Source Thru
6/30/20 FY21 FY22 FY23-26 Total City Capital 0 50,000 350,000 1,210,000 1,610,000 Grants/Other 0 0 0 0 0 Total 0 50,000 350,000 1,210,000 1,610,000

364 Environment, Energy & Open SpaceParks & Recreation Department
Parks & Recreation Department Project Profiles MUDDY RIVER
Project Mission Dredge main channel and restore habitat along the Muddy River. Project will be implemented through the Army
Corps of Engineers. Additional project funding is provided by the Army Corps of Engineers, the Commonwealth, and the Town of Brookline.
Managing Department, Parks and Recreation Department Status, In Design Location, Fenway/Kenmore Operating Impact, No
Authorizations
Source Existing FY22 Future Non Capital
Fund Total City Capital 10,352,500 0 0 0 10,352,500 Grants/Other 1,277,086 0 0 77,676,056 78,953,142 Total 11,629,586 0 0 77,676,056 89,305,642
Expenditures (Actual and Planned)
Source Thru
6/30/20 FY21 FY22 FY23-26 Total City Capital 7,476,771 500,000 500,000 1,875,729 10,352,500 Grants/Other 952,773 0 125,000 199,313 1,277,086 Total 8,429,544 500,000 625,000 2,075,042 11,629,586
ODOM SERENITY GARDEN Project Mission Design park improvements in conjunction with DND for a park named in memory of Steven P. Odom. Managing Department, Parks and Recreation Department Status, In Design Location, Dorchester Operating Impact, No
Authorizations
Source Existing FY22 Future Non Capital
Fund Total City Capital 50,000 0 0 0 50,000 Grants/Other 0 0 0 500,000 500,000 Total 50,000 0 0 500,000 550,000
Expenditures (Actual and Planned)
Source Thru
6/30/20 FY21 FY22 FY23-26 Total City Capital 4,000 21,000 25,000 0 50,000 Grants/Other 0 0 0 0 0 Total 4,000 21,000 25,000 0 50,000

Environment, Energy & Open SpaceParks & Recreation Department 365
Parks & Recreation Department Project Profiles PARCEL PRIORITY PLAN
Project Mission Analyze and identify lands of recreational, habitat, connectivity, or ecological value in the City of Boston that
should be protected as open space.
Managing Department, Parks and Recreation Department Status, Study Underway Location, Citywide Operating Impact, No
Authorizations
Source Existing FY22 Future Non Capital
Fund Total City Capital 90,000 0 0 0 90,000 Grants/Other 0 0 0 0 0 Total 90,000 0 0 0 90,000
Expenditures (Actual and Planned)
Source Thru
6/30/20 FY21 FY22 FY23-26 Total City Capital 0 26,000 64,000 0 90,000 Grants/Other 0 0 0 0 0 Total 0 26,000 64,000 0 90,000
PARK PLANNING STUDIES Project Mission Planning and related landscape design services including: capital phasing plans, development of standard details
and specifications and miscellaneous planning services.
Managing Department, Parks and Recreation Department Status, Annual Program Location, Citywide Operating Impact, No
Authorizations
Source Existing FY22 Future Non Capital
Fund Total City Capital 332,383 0 0 0 332,383 Grants/Other 0 0 0 0 0 Total 332,383 0 0 0 332,383
Expenditures (Actual and Planned)
Source Thru
6/30/20 FY21 FY22 FY23-26 Total City Capital 39,051 50,000 100,000 143,332 332,383 Grants/Other 0 0 0 0 0 Total 39,051 50,000 100,000 143,332 332,383

366 Environment, Energy & Open SpaceParks & Recreation Department
Parks & Recreation Department Project Profiles PAULA TITUS PARK
Project Mission Design and construction of a new park. Managing Department, Parks and Recreation Department Status, New Project Location, Roxbury Operating Impact, No
Authorizations
Source Existing FY22 Future Non Capital
Fund Total City Capital 0 1,000,000 0 0 1,000,000 Grants/Other 0 0 0 35,000 35,000 Total 0 1,000,000 0 35,000 1,035,000
Expenditures (Actual and Planned)
Source Thru
6/30/20 FY21 FY22 FY23-26 Total City Capital 0 0 25,000 975,000 1,000,000 Grants/Other 0 0 0 0 0 Total 0 0 25,000 975,000 1,000,000
PENNIMAN ROAD PLAY AREA Project Mission Design for a comprehensive park renovation including drainage, play lot, courts, passive areas, pathways,
landscaping, site furnishings and infrastructure.
Managing Department, Parks and Recreation Department Status, To Be Scheduled Location, Allston/Brighton Operating Impact, Yes
Authorizations
Source Existing FY22 Future Non Capital
Fund Total City Capital 300,000 0 0 0 300,000 Grants/Other 0 0 0 0 0 Total 300,000 0 0 0 300,000
Expenditures (Actual and Planned)
Source Thru
6/30/20 FY21 FY22 FY23-26 Total City Capital 0 0 50,000 250,000 300,000 Grants/Other 0 0 0 0 0 Total 0 0 50,000 250,000 300,000

Environment, Energy & Open SpaceParks & Recreation Department 367
Parks & Recreation Department Project Profiles PETERS PARK BALLFIELD
Project Mission Address drainage issues on Little League Field. Managing Department, Parks and Recreation Department Status, To Be Scheduled Location, South End Operating Impact, No
Authorizations
Source Existing FY22 Future Non Capital
Fund Total City Capital 500,000 0 0 0 500,000 Grants/Other 0 0 0 0 0 Total 500,000 0 0 0 500,000
Expenditures (Actual and Planned)
Source Thru
6/30/20 FY21 FY22 FY23-26 Total City Capital 0 0 250,000 250,000 500,000 Grants/Other 0 0 0 0 0 Total 0 0 250,000 250,000 500,000
PUBLIC GARDEN LAGOON Project Mission Repair and backfill missing, destroyed, and leaking granite coping surrounding the lagoon. Managing Department, Parks and Recreation Department Status, In Design Location, Beacon Hill Operating Impact, No
Authorizations
Source Existing FY22 Future Non Capital
Fund Total City Capital 1,882,000 0 0 0 1,882,000 Grants/Other 0 0 0 0 0 Total 1,882,000 0 0 0 1,882,000
Expenditures (Actual and Planned)
Source Thru
6/30/20 FY21 FY22 FY23-26 Total City Capital 604,865 100,000 1,000,000 177,135 1,882,000 Grants/Other 0 0 0 0 0 Total 604,865 100,000 1,000,000 177,135 1,882,000

368 Environment, Energy & Open SpaceParks & Recreation Department
Parks & Recreation Department Project Profiles PUBLIC GARDEN TOOL SHED
Project Mission Design of facility upgrades at the Public Garden Tool Shed. Managing Department, Parks and Recreation Department Status, New Project Location, Beacon Hill Operating Impact, No
Authorizations
Source Existing FY22 Future Non Capital
Fund Total City Capital 150,000 150,000 0 0 300,000 Grants/Other 0 0 0 0 0 Total 150,000 150,000 0 0 300,000
Expenditures (Actual and Planned)
Source Thru
6/30/20 FY21 FY22 FY23-26 Total City Capital 0 0 100,000 200,000 300,000 Grants/Other 0 0 0 0 0 Total 0 0 100,000 200,000 300,000
RAMSAY PARK BALLFIELD Project Mission Ball field renovations including irrigation, site utilities, seating, backstop, fencing, and site furnishings. Managing Department, Parks and Recreation Department Status, To Be Scheduled Location, South End Operating Impact, No
Authorizations
Source Existing FY22 Future Non Capital
Fund Total City Capital 920,000 0 0 0 920,000 Grants/Other 0 0 0 0 0 Total 920,000 0 0 0 920,000
Expenditures (Actual and Planned)
Source Thru
6/30/20 FY21 FY22 FY23-26 Total City Capital 0 0 50,000 870,000 920,000 Grants/Other 0 0 0 0 0 Total 0 0 50,000 870,000 920,000

Environment, Energy & Open SpaceParks & Recreation Department 369
Parks & Recreation Department Project Profiles RINGER PARK MASTER PLAN
Project Mission Develop comprehensive park master plan that will guide future capital investments. Managing Department, Parks and Recreation Department Status, Study Underway Location, Allston/Brighton Operating Impact, No
Authorizations
Source Existing FY22 Future Non Capital
Fund Total City Capital 50,000 0 0 0 50,000 Grants/Other 0 0 0 25,000 25,000 Total 50,000 0 0 25,000 75,000
Expenditures (Actual and Planned)
Source Thru
6/30/20 FY21 FY22 FY23-26 Total City Capital 0 30,000 20,000 0 50,000 Grants/Other 0 0 0 0 0 Total 0 30,000 20,000 0 50,000
RINGER PLAYGROUND Project Mission Design of recommendations from the master plan. Managing Department, Parks and Recreation Department Status, New Project Location, Allston/Brighton Operating Impact, No
Authorizations
Source Existing FY22 Future Non Capital
Fund Total City Capital 0 250,000 0 0 250,000 Grants/Other 0 0 0 0 0 Total 0 250,000 0 0 250,000
Expenditures (Actual and Planned)
Source Thru
6/30/20 FY21 FY22 FY23-26 Total City Capital 0 0 250,000 0 250,000 Grants/Other 0 0 0 0 0 Total 0 0 250,000 0 250,000

370 Environment, Energy & Open SpaceParks & Recreation Department
Parks & Recreation Department Project Profiles ROBERT G. SHAW / 54TH REGIMENT MEMORIAL
Project Mission Restoration and conservation work of the Robert G. Shaw/54th Regiment Memorial on Boston Common. The
National Parks Service will lead the project.
Managing Department, Parks and Recreation Department Status, In Construction Location, Beacon Hill Operating Impact, No
Authorizations
Source Existing FY22 Future Non Capital
Fund Total City Capital 1,420,244 0 0 0 1,420,244 Grants/Other 0 0 0 2,667,944 2,667,944 Total 1,420,244 0 0 2,667,944 4,088,188
Expenditures (Actual and Planned)
Source Thru
6/30/20 FY21 FY22 FY23-26 Total City Capital 1,244,094 50,000 126,150 0 1,420,244 Grants/Other 0 0 0 0 0 Total 1,244,094 50,000 126,150 0 1,420,244
ROSLINDALE WETLANDS TRAIL Project Mission Repair and extension of perimeter walking trail and boardwalk, wetland restoration, and improvements to flood
retention capacity.
Managing Department, Parks and Recreation Department Status, In Design Location, Roslindale Operating Impact, Yes
Authorizations
Source Existing FY22 Future Non Capital
Fund Total City Capital 590,000 0 0 0 590,000 Grants/Other 0 0 0 0 0 Total 590,000 0 0 0 590,000
Expenditures (Actual and Planned)
Source Thru
6/30/20 FY21 FY22 FY23-26 Total City Capital 14,122 25,200 250,000 300,678 590,000 Grants/Other 0 0 0 0 0 Total 14,122 25,200 250,000 300,678 590,000

Environment, Energy & Open SpaceParks & Recreation Department 371
Parks & Recreation Department Project Profiles RYAN PLAY AREA
Project Mission Design for a comprehensive park improvements including play area and passive areas. Managing Department, Parks and Recreation Department Status, In Design Location, Dorchester Operating Impact, Yes
Authorizations
Source Existing FY22 Future Non Capital
Fund Total City Capital 1,470,000 0 0 0 1,470,000 Grants/Other 0 0 0 0 0 Total 1,470,000 0 0 0 1,470,000
Expenditures (Actual and Planned)
Source Thru
6/30/20 FY21 FY22 FY23-26 Total City Capital 0 100,000 400,000 970,000 1,470,000 Grants/Other 0 0 0 0 0 Total 0 100,000 400,000 970,000 1,470,000
RYAN PLAYGROUND Project Mission Design for a comprehensive park improvements to ball fields, playground, basketball court, parking area, harbor
walk, lighting, and green infrastructure to mitigate future sea level rise caused by climate change.
Managing Department, Parks and Recreation Department Status, In Design Location, Charlestown Operating Impact, Yes
Authorizations
Source Existing FY22 Future Non Capital
Fund Total City Capital 800,000 0 200,000 0 1,000,000 Grants/Other 0 0 0 0 0 Total 800,000 0 200,000 0 1,000,000
Expenditures (Actual and Planned)
Source Thru
6/30/20 FY21 FY22 FY23-26 Total City Capital 0 25,000 400,000 575,000 1,000,000 Grants/Other 0 0 0 0 0 Total 0 25,000 400,000 575,000 1,000,000

372 Environment, Energy & Open SpaceParks & Recreation Department
Parks & Recreation Department Project Profiles SAFETY SURFACING REPLACEMENT
Project Mission Upgrade and replace safety surfacing at various City parks. Managing Department, Parks and Recreation Department Status, Implementation Underway Location, Citywide Operating Impact, No
Authorizations
Source Existing FY22 Future Non Capital
Fund Total City Capital 2,000,000 0 0 0 2,000,000 Grants/Other 0 0 0 0 0 Total 2,000,000 0 0 0 2,000,000
Expenditures (Actual and Planned)
Source Thru
6/30/20 FY21 FY22 FY23-26 Total City Capital 0 500,000 500,000 1,000,000 2,000,000 Grants/Other 0 0 0 0 0 Total 0 500,000 500,000 1,000,000 2,000,000
SMITH PLAYGROUND PHASE 2 Project Mission Additional park improvements including the ball field area based on the master plan. Managing Department, Parks and Recreation Department Status, In Design Location, Allston/Brighton Operating Impact, No
Authorizations
Source Existing FY22 Future Non Capital
Fund Total City Capital 5,480,000 0 0 0 5,480,000 Grants/Other 0 0 0 0 0 Total 5,480,000 0 0 0 5,480,000
Expenditures (Actual and Planned)
Source Thru
6/30/20 FY21 FY22 FY23-26 Total City Capital 63,945 169,672 500,000 4,746,383 5,480,000 Grants/Other 0 0 0 0 0 Total 63,945 169,672 500,000 4,746,383 5,480,000
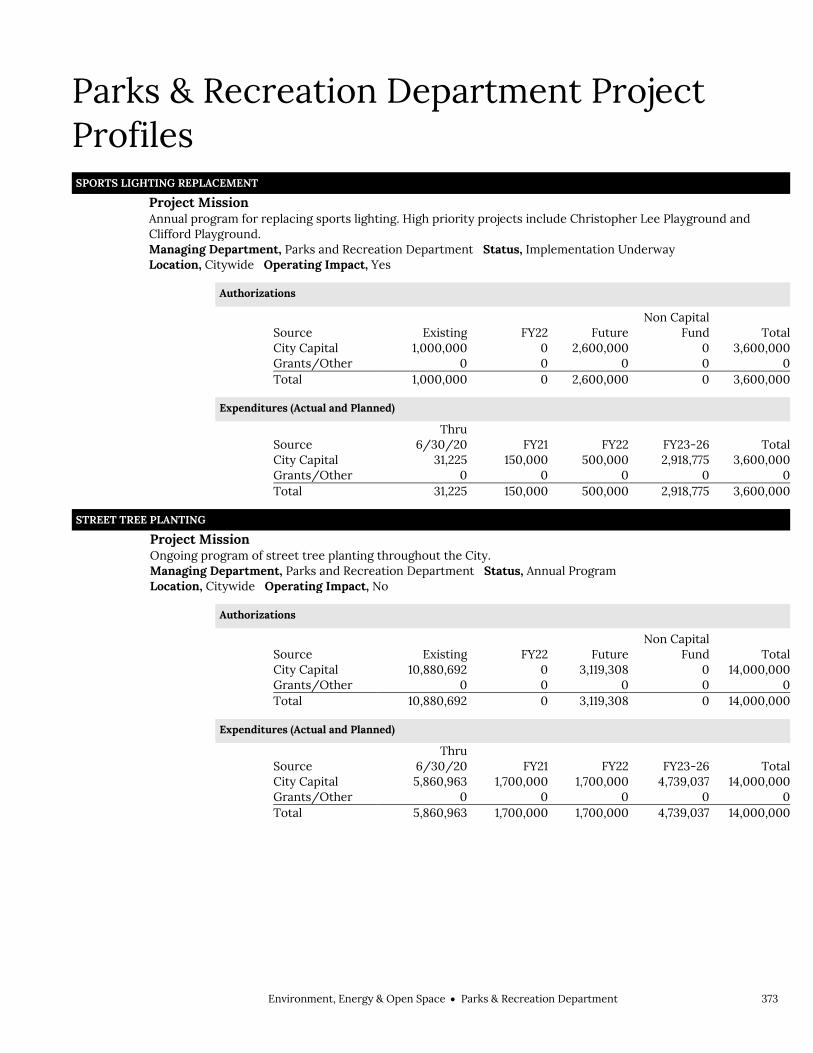
Environment, Energy & Open SpaceParks & Recreation Department 373
Parks & Recreation Department Project Profiles SPORTS LIGHTING REPLACEMENT
Project Mission Annual program for replacing sports lighting. High priority projects include Christopher Lee Playground and
Clifford Playground.
Managing Department, Parks and Recreation Department Status, Implementation Underway Location, Citywide Operating Impact, Yes
Authorizations
Source Existing FY22 Future Non Capital
Fund Total City Capital 1,000,000 0 2,600,000 0 3,600,000 Grants/Other 0 0 0 0 0 Total 1,000,000 0 2,600,000 0 3,600,000
Expenditures (Actual and Planned)
Source Thru
6/30/20 FY21 FY22 FY23-26 Total City Capital 31,225 150,000 500,000 2,918,775 3,600,000 Grants/Other 0 0 0 0 0 Total 31,225 150,000 500,000 2,918,775 3,600,000
STREET TREE PLANTING Project Mission Ongoing program of street tree planting throughout the City. Managing Department, Parks and Recreation Department Status, Annual Program Location, Citywide Operating Impact, No
Authorizations
Source Existing FY22 Future Non Capital
Fund Total City Capital 10,880,692 0 3,119,308 0 14,000,000 Grants/Other 0 0 0 0 0 Total 10,880,692 0 3,119,308 0 14,000,000
Expenditures (Actual and Planned)
Source Thru
6/30/20 FY21 FY22 FY23-26 Total City Capital 5,860,963 1,700,000 1,700,000 4,739,037 14,000,000 Grants/Other 0 0 0 0 0 Total 5,860,963 1,700,000 1,700,000 4,739,037 14,000,000

374 Environment, Energy & Open SpaceParks & Recreation Department
Parks & Recreation Department Project Profiles TITUS SPARROW PARK
Project Mission Improve the playground; renovate the tennis and basketball courts. Managing Department, Parks and Recreation Department Status, To Be Scheduled Location, South End Operating Impact, No
Authorizations
Source Existing FY22 Future Non Capital
Fund Total City Capital 100,000 0 1,880,000 0 1,980,000 Grants/Other 0 0 0 0 0 Total 100,000 0 1,880,000 0 1,980,000
Expenditures (Actual and Planned)
Source Thru
6/30/20 FY21 FY22 FY23-26 Total City Capital 0 0 50,000 1,930,000 1,980,000 Grants/Other 0 0 0 0 0 Total 0 0 50,000 1,930,000 1,980,000
URBAN FORESTRY PLAN Project Mission Develop an inventory and planning document to optimize the management of City-owned trees. Managing Department, Parks and Recreation Department Status, To Be Scheduled Location, N/A Operating Impact, No
Authorizations
Source Existing FY22 Future Non Capital
Fund Total City Capital 500,000 0 0 0 500,000 Grants/Other 0 0 0 0 0 Total 500,000 0 0 0 500,000
Expenditures (Actual and Planned)
Source Thru
6/30/20 FY21 FY22 FY23-26 Total City Capital 0 0 50,000 450,000 500,000 Grants/Other 0 0 0 0 0 Total 0 0 50,000 450,000 500,000

Environment, Energy & Open SpaceParks & Recreation Department 375
Parks & Recreation Department Project Profiles URBAN WILDS RENOVATIONS
Project Mission Renovate walls, walkways, and signage within urban wilds owned by the Environment Department and the Parks
and Recreation Department.
Managing Department, Parks and Recreation Department Status, Annual Program Location, Citywide Operating Impact, No
Authorizations
Source Existing FY22 Future Non Capital
Fund Total City Capital 2,660,900 0 516,689 0 3,177,589 Grants/Other 293,000 0 0 0 293,000 Total 2,953,900 0 516,689 0 3,470,589
Expenditures (Actual and Planned)
Source Thru
6/30/20 FY21 FY22 FY23-26 Total City Capital 1,519,971 200,000 250,000 1,207,618 3,177,589 Grants/Other 293,000 0 0 0 293,000 Total 1,812,971 200,000 250,000 1,207,618 3,470,589
WALKER PLAYGROUND Project Mission Upgrades to play lot. Managing Department, Parks and Recreation Department Status, In Construction Location, Mattapan Operating Impact, No
Authorizations
Source Existing FY22 Future Non Capital
Fund Total City Capital 870,000 0 0 0 870,000 Grants/Other 0 0 0 0 0 Total 870,000 0 0 0 870,000
Expenditures (Actual and Planned)
Source Thru
6/30/20 FY21 FY22 FY23-26 Total City Capital 52,532 350,000 467,468 0 870,000 Grants/Other 0 0 0 0 0 Total 52,532 350,000 467,468 0 870,000

376 Environment, Energy & Open SpaceParks & Recreation Department
Parks & Recreation Department Project Profiles WALNUT PARK PLAY AREA
Project Mission Upgrade play lot. Managing Department, Parks and Recreation Department Status, In Design Location, Roxbury Operating Impact, No
Authorizations
Source Existing FY22 Future Non Capital
Fund Total City Capital 1,340,000 0 0 0 1,340,000 Grants/Other 0 0 0 0 0 Total 1,340,000 0 0 0 1,340,000
Expenditures (Actual and Planned)
Source Thru
6/30/20 FY21 FY22 FY23-26 Total City Capital 0 25,000 500,000 815,000 1,340,000 Grants/Other 0 0 0 0 0 Total 0 25,000 500,000 815,000 1,340,000
WILLIAM DEVINE GOLF COURSE Project Mission Improve drainage, paving, and other miscellaneous items. Managing Department, Parks and Recreation Department Status, Annual Program Location, Roxbury Operating Impact, No
Authorizations
Source Existing FY22 Future Non Capital
Fund Total City Capital 3,318,326 0 581,674 0 3,900,000 Grants/Other 0 0 0 0 0 Total 3,318,326 0 581,674 0 3,900,000
Expenditures (Actual and Planned)
Source Thru
6/30/20 FY21 FY22 FY23-26 Total City Capital 2,126,540 557,141 350,000 866,319 3,900,000 Grants/Other 0 0 0 0 0 Total 2,126,540 557,141 350,000 866,319 3,900,000
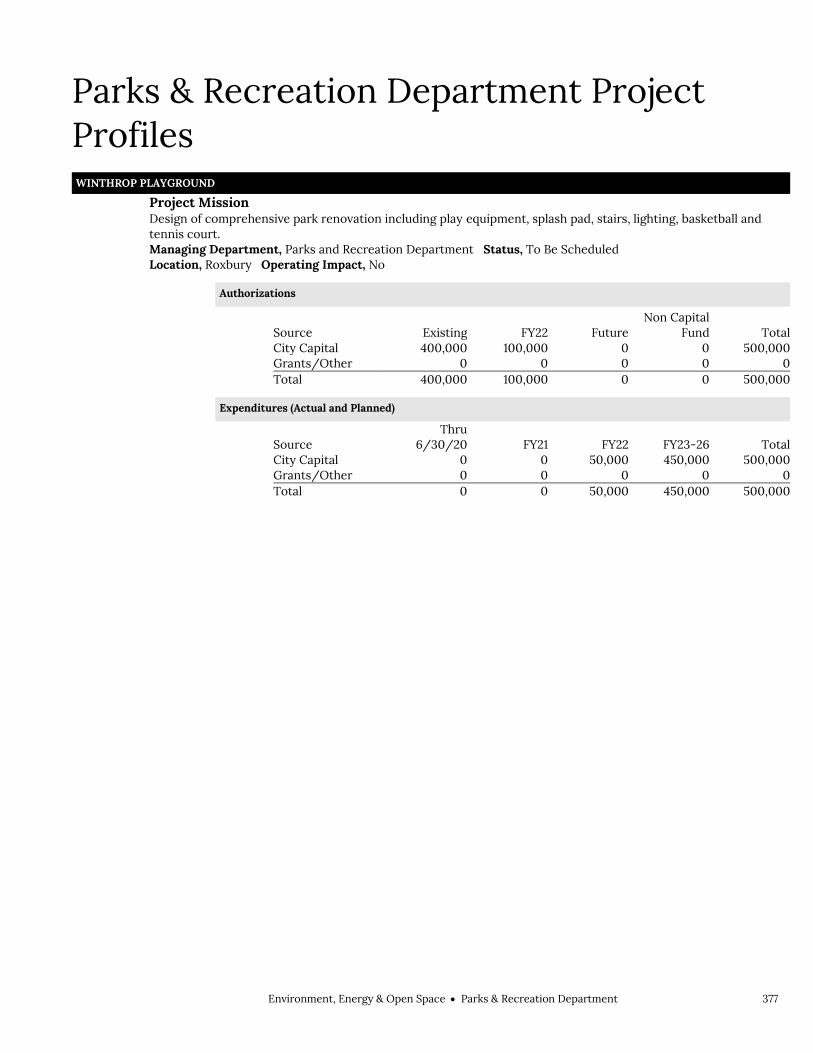
Environment, Energy & Open SpaceParks & Recreation Department 377
Parks & Recreation Department Project Profiles WINTHROP PLAYGROUND
Project Mission Design of comprehensive park renovation including play equipment, splash pad, stairs, lighting, basketball and
tennis court.
Managing Department, Parks and Recreation Department Status, To Be Scheduled Location, Roxbury Operating Impact, No
Authorizations
Source Existing FY22 Future Non Capital
Fund Total City Capital 400,000 100,000 0 0 500,000 Grants/Other 0 0 0 0 0 Total 400,000 100,000 0 0 500,000
Expenditures (Actual and Planned)
Source Thru
6/30/20 FY21 FY22 FY23-26 Total City Capital 0 0 50,000 450,000 500,000 Grants/Other 0 0 0 0 0 Total 0 0 50,000 450,000 500,000


Index Boston Planning and Development Agency
Capital Projects Lewis Street Flood Mitigation Study ........................ 219 Long Wharf ....................................................................... 219 Long Wharf Harborwalk Signage .............................. 220 RFMP Dry Dock Avenue ............................................... 220 RFMP Dry-dock 4 ........................................................... 221 RFMP Pier 6 ...................................................................... 221 RFMP Resiliency Improvements ................................ 222 Strategic Planning Area Transportation Study...... 222
Boston Public Schools Capital Projects
21st Century Interior Improvements ........................270 Accessibility Improvements ........................................270 Accreditation Improvements at Various Schools .. 271 Adams School Roof and Masonry ............................... 271 ARP 2019
Roofs and Boilers at 3 Schools .............................. 272 ARP 2020
Boilers and Windows at 2 Schools ....................... 272 Auditorium Improvements .......................................... 273 Bathroom Renovations at Various Schools ............. 273 Blackstone School Interior Renovations ................. 274 Boston Arts Academy .................................................... 274 Bradley School Envelope .............................................. 275 Brighton High School Locker Rooms ....................... 275 BuildBPS
21st Century Schools Fund ..................................... 276 Capital Maintenance ................................................ 277 MSBA ARP Reserve ................................................... 277 Reserve for Future Projects ................................... 278
BuildBPS Building Reprogramming ........................... 276 Bus Monitor Technology .............................................. 278 Bus Navigation System.................................................. 279 Cafeteria Upgrades Phase 4 ........................................ 279 Carter School .................................................................. 280 Curley K-8 School ......................................................... 280 Dever School and McCormack School Open Space
Study ............................................................................. 281 Drinking Water Upgrades at Various Schools ....... 281 East Boston Elementary School Study .................... 282 Edwards School Study ................................................. 282 Electrical Upgrades at 2 Schools .............................. 283 Elementary School Programming and Siting Study
....................................................................................... 283 Entryway Improvements at Various Schools ........ 284 Everett School Roof ...................................................... 284 Exterior Grounds Improvements ............................. 285 Fire Systems at Various Schools ............................... 285 Food and Nutritional Services Technology ........... 286 Grade K-6 School Conversions Phase 1 .................. 286 Henderson Inclusion Lower School Windows....... 287 Henderson Upper School Yard .................................. 287 Horace Mann School Relocation............................... 288 Irving School Reconfiguration ................................... 288 Josiah Quincy Upper School ...................................... 289 Kennedy Academy Envelope ...................................... 289 Madison Park TVHS Electrical Improvements ..... 290
Madison Park TVHS Study .......................................... 290 Mandela Athletic Complex Locker Rooms .............. 291 Mather School Envelope .............................................. 291 Mattahunt School ........................................................... 292 McCormack School 7-12 Conversion Phases 1-2 .. 292 Quincy School Exterior Upgrades ............................. 293 Radiator Covers at Various Schools .......................... 293 School Yard Improvements ......................................... 294 Security Related Improvements at Various Schools
II ..................................................................................... 294 Snowden International School Roof ......................... 295 Technology Infrastructure II ...................................... 295 UP Academy Dorchester ............................................. 296 Window Repair and Replacement ............................ 296
Programs Program 1. General School Purposes ....................... 267
Consumer Affairs & Licensing Programs
Program 1. Consumer Licensing ................................ 229 Program 2. Consumer Affairs .................................... 230 Program 3. Licensing Board ........................................ 231
Election Department Programs
Program 1. Annual Listing .............................................. 42 Program 1. Election Administration ............................ 35 Program 2. Voter Registration ...................................... 36 Program 3. Election Activities ...................................... 37
Environment Department Capital Projects
Climate Ready Boston Harbor Study ........................ 314 Climate Ready Boston Phase 2 ................................... 314 Climate Ready Boston Phase 3 ................................... 315 Climate Resilience Reserve ......................................... 315 Energy Efficiency Design Services ............................ 316 Exterior Lighting Energy Performance ................... 316 Moon Island Energy Storage ........................................ 317 Renew Boston Trust Phase 2 ....................................... 317 Renew Boston Trust Phase 3 ...................................... 318
Programs Program 1. Environment .............................................. 308
Human Rights Commission Programs
Program 1. Human Rights .............................................. 69 Inspectional Services Dept
Programs Program 1. ISD Commissioner's Office .................... 134 Program 2. ISD Administration & Finance .............. 135 Program 3. Buildings & Structures ............................ 136 Program 4. Field Services .............................................. 137
Intergovernmental Relations Programs
Program 1. IGR ................................................................... 49 Program 2. Grants Administration .............................. 50
Law Department Programs
Program 1. Law Operations ........................................... 56 Program 2. Litigation ....................................................... 57 Program 3. Government Services ............................... 58

Library Department Capital Projects
Adams Street Branch Library ..................................... 203 Central Library
Johnson Building ...................................................... 204 McKim Fire Panel ..................................................... 204 McKim Fountain ....................................................... 205 McKim Study ............................................................. 205 Rare Books and Manuscripts Department ....... 206
Central Library Façade Study and Repairs ............ 203 Chinatown Branch Library ......................................... 206 Codman Square Branch Library Study .....................207 Egleston Square Branch Library ................................207 Faneuil Branch Library ................................................. 208 Fields Corner Branch Library..................................... 208 North End Branch Library .......................................... 209 Research Collections Preservation and Storage Plan
....................................................................................... 209 Roslindale Branch Library Renovation ..................... 210 South Boston Branch Library Study ......................... 210 South End Branch Library Study ................................ 211 Upham's Corner Library ................................................ 211 West End Branch Library Study ................................. 212
Programs Program 1. Library Administration ............................ 198 Program 2. Community Library Services ................ 199 Program 3. Research Services ................................... 200
Mayor's Office Capital Projects
Innovation Fund ................................................................ 23 Programs
Program 1. Mayor's Administration ............................. 15 Program 2. Mayor's Executive ...................................... 16 Program 3. Mayor's Policy & Planning ........................ 17 Program 4. New Urban Mechanics .............................. 18 Program 5. Mayor's Communications ........................ 19
Neighborhood Services Programs
Program 1. ONS Administration ................................. 168 Program 2. Neighborhood Serv .................................. 169 Program 3. Public Service & Community Outreach
........................................................................................ 170 Program 4. Boston 311 .................................................... 171
Office for Immigrant Advancement Programs
Program 1. Immigrant Advancement .......................... 76 Office of Arts & Culture
Capital Projects Book Mark'd ..................................................................... 188 Edward O. Gourdin and African American Veterans
Memorial ..................................................................... 188 Jamaica Plain Branch Library Art ............................... 189 Percent for the Arts ....................................................... 189 Strand Theater ................................................................ 190 The Legacy of Frederick Douglass ............................ 190
Programs Program 1. Arts & Culture ............................................ 183
Office of Diversity Programs
Program 1. Diversity ......................................................... 83 Office of Economic Development
Programs
Program 1. Economic Development.......................... 239 Program 2. Equity & Inclusion ................................... 240 Program 3. Small & Local Business ............................241
Office of Equity Programs
Program 1. Equity .............................................................. 91 Office of Language & Communications Access
Programs Program 1. LCA .................................................................. 97
Office of Police Accountability & Transparency Programs
Program 1. OPAT Commission .....................................122 Program 2. Civilian Review Board ............................. 123 Program 3. Internal Affairs Oversight Panel ...........124
Office of Resiliency & Racial Equity Programs
Program 1. MORRE ......................................................... 103 Office of Tourism
Programs Program 1. MOATSE Administration ....................... 250 Program 3. Film & Special Events ...............................251 Program 4. Tourism ....................................................... 252
Parks & Recreation Department Capital Projects
Animal Shelter ................................................................. 335 Artificial Turf Replacement ......................................... 335 Back Bay Fens Pathways.............................................. 336 Bay Village Neighborhood Park ................................. 336 Billings Field ..................................................................... 337 Boston Common Master Plan ..................................... 337 Boston Common Tadpole Play Lot............................338 Boston Common Utility Study....................................338 Bussey Brook Meadow Trail at Arnold Arboretum
....................................................................................... 339 Bynoe Park....................................................................... 339 Ceylon Park ..................................................................... 340 Christopher Columbus Park ...................................... 340 Clarendon Street Playground ..................................... 341 Codman Square............................................................... 341 Commonwealth Avenue Mall
Kenmore Block .......................................................... 342 Copley Square Park........................................................ 342 Coppens Square .............................................................. 343 Court Renovations ......................................................... 343 Crawford Street Playground ....................................... 344 Cutillo Park ....................................................................... 344 Daisy Field at Olmsted Park ........................................ 345 Doherty-Gibson Playground ....................................... 345 Dorchester Park Pathways ..........................................346 Dudley Town Common .................................................346 East Boston Greenway .................................................. 347 Edwards Playground ..................................................... 347 Field House Programming Study ............................... 348 Field Lights at Various Parks ....................................... 348 Flaherty (William F.) Playground ................................349 Fort Point Channel Park ...............................................349 Franklin Park Master Plan ........................................... 350 Franklin Park Yard Master Plan Update ................. 350 Frog Pond ......................................................................... 351 Garvey Playground ........................................................ 351 General Parks Improvements ..................................... 352 George Wright Clubhouse Phase 2 ........................... 352
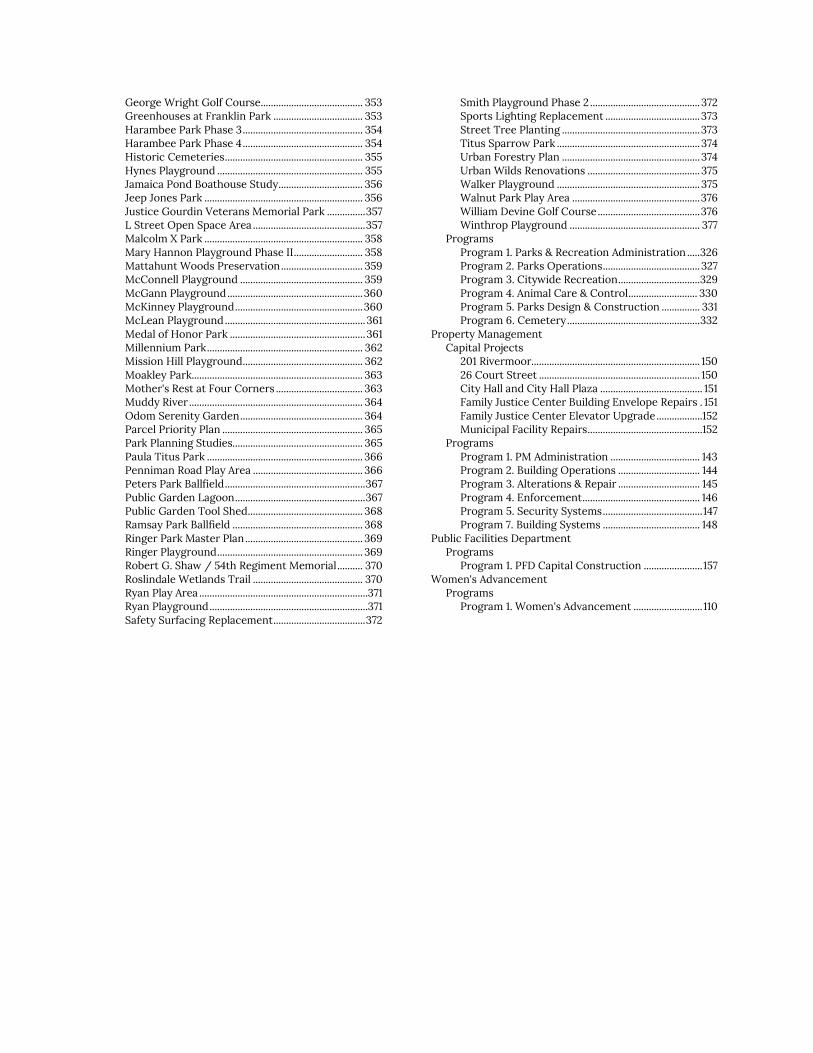
George Wright Golf Course........................................ 353 Greenhouses at Franklin Park ................................... 353 Harambee Park Phase 3 ............................................... 354 Harambee Park Phase 4 ............................................... 354 Historic Cemeteries ...................................................... 355 Hynes Playground ......................................................... 355 Jamaica Pond Boathouse Study ................................. 356 Jeep Jones Park .............................................................. 356 Justice Gourdin Veterans Memorial Park ............... 357 L Street Open Space Area ............................................ 357 Malcolm X Park .............................................................. 358 Mary Hannon Playground Phase II ........................... 358 Mattahunt Woods Preservation ................................ 359 McConnell Playground ................................................ 359 McGann Playground ..................................................... 360 McKinney Playground .................................................. 360 McLean Playground ....................................................... 361 Medal of Honor Park ..................................................... 361 Millennium Park ............................................................. 362 Mission Hill Playground ............................................... 362 Moakley Park................................................................... 363 Mother's Rest at Four Corners .................................. 363 Muddy River .................................................................... 364 Odom Serenity Garden ................................................ 364 Parcel Priority Plan ....................................................... 365 Park Planning Studies................................................... 365 Paula Titus Park ............................................................. 366 Penniman Road Play Area ........................................... 366 Peters Park Ballfield ....................................................... 367 Public Garden Lagoon ................................................... 367 Public Garden Tool Shed ............................................. 368 Ramsay Park Ballfield ................................................... 368 Ringer Park Master Plan .............................................. 369 Ringer Playground ......................................................... 369 Robert G. Shaw / 54th Regiment Memorial .......... 370 Roslindale Wetlands Trail ........................................... 370 Ryan Play Area ..................................................................371 Ryan Playground ..............................................................371 Safety Surfacing Replacement .................................... 372
Smith Playground Phase 2 ........................................... 372 Sports Lighting Replacement ..................................... 373 Street Tree Planting ...................................................... 373 Titus Sparrow Park ........................................................ 374 Urban Forestry Plan ...................................................... 374 Urban Wilds Renovations ............................................ 375 Walker Playground ........................................................ 375 Walnut Park Play Area .................................................. 376 William Devine Golf Course ........................................ 376 Winthrop Playground ................................................... 377
Programs Program 1. Parks & Recreation Administration ..... 326 Program 2. Parks Operations ...................................... 327 Program 3. Citywide Recreation ................................ 329 Program 4. Animal Care & Control ........................... 330 Program 5. Parks Design & Construction ............... 331 Program 6. Cemetery .................................................... 332
Property Management Capital Projects
201 Rivermoor.................................................................. 150 26 Court Street ............................................................... 150 City Hall and City Hall Plaza ........................................ 151 Family Justice Center Building Envelope Repairs . 151 Family Justice Center Elevator Upgrade ..................152 Municipal Facility Repairs .............................................152
Programs Program 1. PM Administration ................................... 143 Program 2. Building Operations ................................ 144 Program 3. Alterations & Repair ................................ 145 Program 4. Enforcement .............................................. 146 Program 5. Security Systems ....................................... 147 Program 7. Building Systems ...................................... 148
Public Facilities Department Programs
Program 1. PFD Capital Construction ....................... 157 Women's Advancement
Programs Program 1. Women's Advancement ........................... 110

Volume III
Administration & Finance...................................................... 7
Administration & Finance ............................................. 9
A & F ...................................................................... 15
Assessing Department .................................................. 17
Assessing Operations ........................................ 21
Valuation ............................................................. 22
Executive ............................................................ 23
Auditing Department ................................................... 25
Auditing Administration .................................. 30
Accounting .......................................................... 31
Central Payroll ................................................... 32
Grants Monitoring ............................................ 33
Accounts Payable .............................................. 34
Budget Management .................................................... 37
Budget Administration .................................... 42
Budget & Management .................................... 43
Revenue Monitoring ......................................... 44
Capital Budgeting ............................................. 45
Risk Management.............................................. 46
Execution of Courts ..................................................... 49
Health Insurance ............................................................ 51
Human Resources ......................................................... 53
Personnel ............................................................ 57
Affirmative Action ............................................. 58
Health Benefits & Insurance........................... 59
Employee Assistance ........................................ 60
Workers Comp ................................................... 61
Labor Relations .............................................................. 63
Labor Relations .................................................. 67
Medicare Payments ...................................................... 69
Pensions & Annuities - City ......................................... 71
Pensions & Annuities - County .................................. 73
Procurement .................................................................. 75
Administration ................................................... 79
Procurement ...................................................... 80
Central Services ................................................. 81
Registry Division ........................................................... 83

Administration ................................................... 87
Vital Statistics .................................................... 88
Depositions ........................................................ 89
Treasury Department ................................................... 91
Treasury Division .............................................. 97
Treasury Administration .......................... 103
General Service/Payroll ........................... 104
Treasury Accounting ................................. 105
Accounts Receivable .................................. 106
Trust ............................................................... 107
Collecting Division .......................................... 108
General Management ................................. 112
Special Collections...................................... 113
Payment Services ........................................ 114
Accounting/Quality Control .................... 115
Unemployment Compensation .................................. 117
Workers' Compensation Fund .................................. 119
Health & Human Services ................................................. 123
Office of Health & Human Services ......................... 125
Health & Human Services ............................. 130
Office of Health & Human Services ............. 131
Office of Health & Human Services ............. 132
Age Strong ..................................................................... 135
Age Strong Administration ............................ 141
Age Strong Operations ................................... 142
Age Strong Transportation ............................ 143
Programs & Partnerships ............................... 144
Boston Centers for Youth & Families ...................... 149
Administrative & Policy .................................. 155
Sports & Fitness ............................................... 156
Youth & Family Services ................................. 157
Child Care & Out-of-School .......................... 158
Boston VETS .................................................................. 173
Veterans' Services ............................................ 177
Commission for Persons With Disabilities ............. 179
Disabilities ......................................................... 184
Fair Housing & Equity ................................................. 187
Fair Housing Commission ..............................193
Public Health Commission......................................... 195
Public Health Services ................................... 202
Youth Engagement & Employment ........................ 227
Youth Engagement & Employment ............ 232

Housing & Neighborhood Development ....................... 237
Neighborhood Development .................................... 239
Neighborhood Development Administration ................................................. 246
Real Estate Management & Sales ................ 247
Housing Development & Services ............... 248
Information & Technology ................................................ 261
Department of Innovation & Technology ............. 263
DoIT Operations ............................................. 270
Enterprise Applications .................................. 271
Digital Engagement & Services .................... 272
Core Infrastructure ........................................ 273
Data & Analytics .............................................. 274
Broadband & Digital Equity .......................... 275
Public Safety ........................................................................ 287
Emergency Management .......................................... 289
Homeland Security ......................................... 295
Fire Department .......................................................... 299
BFD Administration ........................................ 308
Boston Fire Suppression .............................. 309
Fire Alarm ......................................................... 310
BFD Training ..................................................... 311
Maintenance ..................................................... 312
BFD Fire Prevention ........................................ 313
Firefighter Safety, Health and Wellness ............................................................. 314
Police Department ...................................................... 325
Police Commissioner's Office ...................... 333
Bureau of Community Engagement ........... 334
BAT-Operations .............................................. 335
BAT-Admin & Technology ............................ 336
Bureau of Professional Development .................................................... 337
Bureau of Field Services ................................ 338
Bureau of Professional Standards ............... 339
Bureau of Investigative Services ................. 340
Bureau of Intelligence & Analysis ................. 341
Streets ...................................................................................361
Central Fleet Management ....................................... 363
Fleet Services ................................................... 367
Office of Streets .......................................................... 369
Admin & Finance ............................................. 373

Public Works Department ........................................ 375
PWD Commissioner's Office ........................ 380
Building/Facility Maintenance ..................... 381
Engineering ...................................................... 382
Construction Management .......................... 383
Highway Field Operations ............................ 384
Bridge Operations/Maintenance................ 385
Street Lights ..................................................... 386
Waste Reduction ............................................. 387
Snow & Winter Management .................................... 413
Transportation Department ...................................... 417
Traffic Division ................................................ 422
Traffic Commissioner's Office ................ 427
Traffic Management & Engineering ................................................. 428
Policy & Planning ....................................... 429
Traffic Enforcement .................................. 430
Traffic Operations....................................... 431
Parking Clerk ................................................... 433
Parking Clerk ............................................... 437
Non-Mayoral Departments ............................................. 463
City Clerk ...................................................................... 465
Legislative Support ......................................... 470
Document Filing ............................................... 471
Archives ............................................................. 472
City Council .................................................................. 473
City Council Administration ......................... 478
Finance Commission ...................................... 479
City Councilors ................................................ 479
Legislative/Financial Support ..................... 480
Finance Commission ................................................... 481
Finance Commission ...................................... 485

Administration & FinanceCabinet 5
Administration & Finance Administration & Finance Cabinet
Administration & Finance...................................................... 7
Administration & Finance ............................................. 9
A & F ...................................................................... 15
Assessing Department .................................................. 17
Assessing Operations ........................................ 21
Valuation ............................................................. 22
Executive ............................................................ 23
Auditing Department ................................................... 25
Administration ................................................... 30
Accounting .......................................................... 31
Central Payroll ................................................... 32
Grants Monitoring ............................................ 33
Accounts Payable .............................................. 34
Budget Management .................................................... 37
Budget Administration .................................... 42
Budget & Management .................................... 43
Revenue Monitoring ......................................... 44
Capital Budgeting ............................................. 45
Risk Management.............................................. 46
Execution of Courts ..................................................... 49
Health Insurance ............................................................ 51
Human Resources ......................................................... 53
Personnel ............................................................ 57
Affirmative Action ............................................. 58
Health Benefits & Insurance........................... 59
Employee Assistance ........................................ 60
Workers Comp ................................................... 61
Labor Relations .............................................................. 63
Labor Relations .................................................. 67
Medicare Payments ...................................................... 69
Pensions & Annuities - City ......................................... 71
Pensions & Annuities - County .................................. 73
Procurement .................................................................. 75
Administration ................................................... 79
Procurement ...................................................... 80
Central Services ................................................. 81
Registry Division ........................................................... 83
Administration ................................................... 87
Vital Statistics .................................................... 88
Depositions ........................................................ 89

6 Administration & FinanceCabinet
Treasury Department ................................................... 91
Treasury Division .............................................. 97
Treasury Administration .......................... 103
General Service/Payroll ........................... 104
Treasury Accounting ................................. 105
Accounts Receivable .................................. 106
Trust ............................................................... 107
Collecting Division .......................................... 108
General Management ................................. 112
Special Collections...................................... 113
Payment Services ........................................ 114
Accounting/Quality Control .................... 115
Unemployment Compensation .................................. 117
Workers' Compensation Fund .................................. 119

Administration & FinanceCabinet 7
Administration & Finance Administration & Finance
Emme Handy, Chief Financial Officer & Collector-Treasurer
Cabinet Mission The Administration and Finance Cabinet ensures that city services are delivered with high quality, with high ethical standards, are financially prudent, are responsive to the needs of the citizens of Boston, and consistent with the laws and ordinances governing municipal government.
Operating Budget
Total Actual '19 Total Actual '20 Total Approp '21 Total Budget '22
Administration & Finance 757,336 2,056,989 1,272,150 1,246,207
Assessing Department 7,150,524 6,670,362 7,718,365 7,946,936
Auditing Department 2,735,312 2,996,261 2,863,291 3,015,636
Budget Management 2,702,650 2,827,300 3,270,970 3,520,571
Execution of Courts 18,233,939 7,083,289 5,000,000 5,000,000
Health Insurance 212,029,308 211,341,951 216,096,323 212,236,570
Human Resources 4,694,941 5,109,259 5,970,601 6,177,644
Labor Relations 1,122,845 1,309,176 1,459,896 1,605,222
Medicare Payments 10,673,357 10,618,969 11,200,000 12,635,794
Pensions & Annuities - City 3,699,484 3,515,768 3,900,000 3,900,000
Pensions & Annuities - County 13,147 0 0 0
Procurement 1,736,213 2,773,022 1,859,992 1,880,345
Registry Division 1,116,385 1,078,121 1,086,639 1,145,181
Treasury Department 20,169,845 20,087,307 4,776,638 4,855,544
Unemployment Compensation 0 634,863 350,000 350,000
Workers' Compensation Fund 1,618,544 1,767,314 2,000,000 2,000,000
Total 288,453,830 279,869,951 268,824,865 267,515,650
External Funds Expenditures
Total Actual '19 Total Actual '20 Total Approp '21 Total Budget '22
Administration & Finance 0 0 205,208 265,091 Auditing Department 15,000 59,242 218,394 246,131 Budget Management 0 23,600,385 113,252,974 0 Treasury Department 35,263,149 24,705,360 26,300,000 29,489,763S
Total 35,278,149 48,364,987 139,976,576 30,000,985


Administration & FinanceAdministration & Finance 9
Administration & Finance Operating Budget Administration & Finance Administration & Finance Emme Handy, Chief Financial Officer & Collector Treasurer, Appropriation 144000
Department Mission The Administration and Finance program supports the long-term growth and stability of the City through sound fiscal stewardship and results driven management of the City’s human and financial resources.
Operating Budget Program Name Total Actual '19 Total Actual '20 Total Approp '21 Total Budget '22
A & F 757,336 2,056,989 1,272,150 1,246,207
Total 757,336 2,056,989 1,272,150 1,246,207
External Funds Budget Fund Name Total Actual '19 Total Actual '20 Total Approp '21 Total Budget '22
Strategic Partnerships 0 0 205,208 265,091
Total 0 0 205,208 265,091
Operating Budget Actual '19 Actual '20 Approp '21 Budget '22
Personnel Services 660,178 734,473 899,942 873,999 Non Personnel 97,158 1,322,516 372,208 372,208 Total 757,336 2,056,989 1,272,150 1,246,207
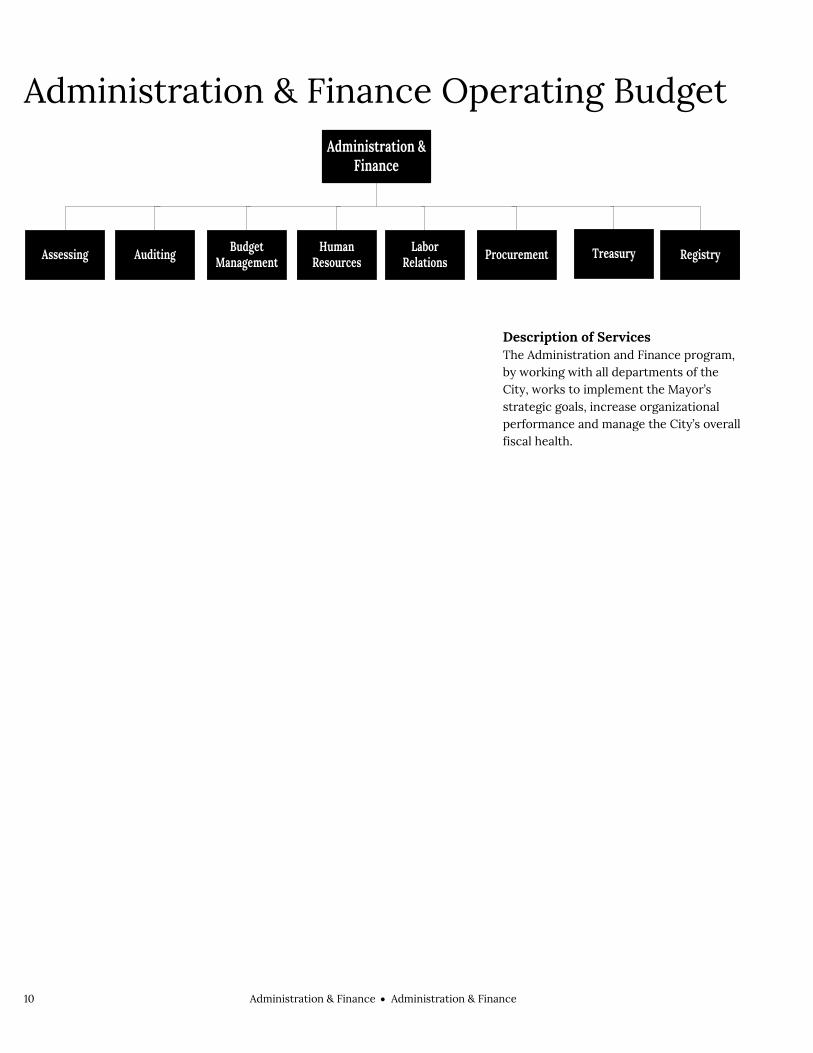
10 Administration & FinanceAdministration & Finance
Administration & Finance Operating Budget
Description of Services The Administration and Finance program, by working with all departments of the City, works to implement the Mayor’s strategic goals, increase organizational performance and manage the City’s overall fiscal health.
Budget Management
Administration & Finance
RegistryTreasuryAssessing Auditing Human Resources ProcurementLabor
Relations
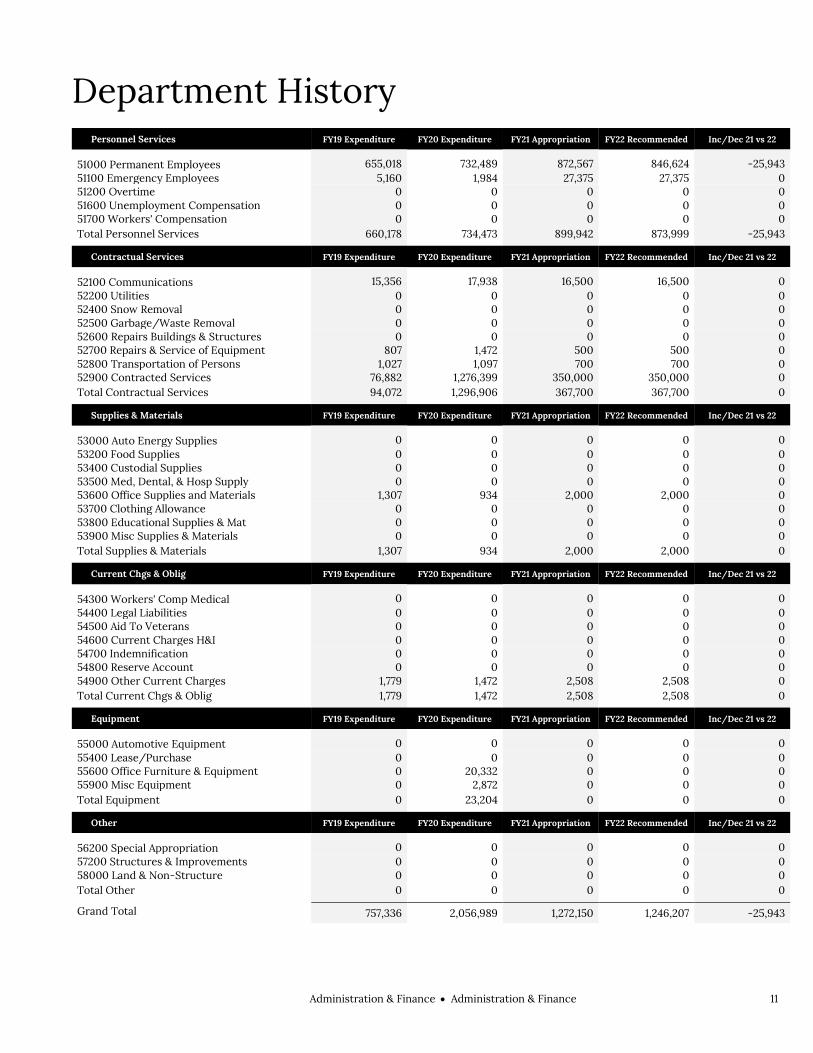
Administration & FinanceAdministration & Finance 11
Department History Personnel Services FY19 Expenditure FY20 Expenditure FY21 Appropriation FY22 Recommended Inc/Dec 21 vs 22
51000 Permanent Employees 655,018 732,489 872,567 846,624 -25,943 51100 Emergency Employees 5,160 1,984 27,375 27,375 0 51200 Overtime 0 0 0 0 0 51600 Unemployment Compensation 0 0 0 0 0 51700 Workers' Compensation 0 0 0 0 0 Total Personnel Services 660,178 734,473 899,942 873,999 -25,943
Contractual Services FY19 Expenditure FY20 Expenditure FY21 Appropriation FY22 Recommended Inc/Dec 21 vs 22
52100 Communications 15,356 17,938 16,500 16,500 0 52200 Utilities 0 0 0 0 0 52400 Snow Removal 0 0 0 0 0 52500 Garbage/Waste Removal 0 0 0 0 0 52600 Repairs Buildings & Structures 0 0 0 0 0 52700 Repairs & Service of Equipment 807 1,472 500 500 0 52800 Transportation of Persons 1,027 1,097 700 700 0 52900 Contracted Services 76,882 1,276,399 350,000 350,000 0 Total Contractual Services 94,072 1,296,906 367,700 367,700 0
Supplies & Materials FY19 Expenditure FY20 Expenditure FY21 Appropriation FY22 Recommended Inc/Dec 21 vs 22
53000 Auto Energy Supplies 0 0 0 0 0 53200 Food Supplies 0 0 0 0 0 53400 Custodial Supplies 0 0 0 0 0 53500 Med, Dental, & Hosp Supply 0 0 0 0 0 53600 Office Supplies and Materials 1,307 934 2,000 2,000 0 53700 Clothing Allowance 0 0 0 0 0 53800 Educational Supplies & Mat 0 0 0 0 0 53900 Misc Supplies & Materials 0 0 0 0 0 Total Supplies & Materials 1,307 934 2,000 2,000 0
Current Chgs & Oblig FY19 Expenditure FY20 Expenditure FY21 Appropriation FY22 Recommended Inc/Dec 21 vs 22
54300 Workers' Comp Medical 0 0 0 0 0 54400 Legal Liabilities 0 0 0 0 0 54500 Aid To Veterans 0 0 0 0 0 54600 Current Charges H&I 0 0 0 0 0 54700 Indemnification 0 0 0 0 0 54800 Reserve Account 0 0 0 0 0 54900 Other Current Charges 1,779 1,472 2,508 2,508 0 Total Current Chgs & Oblig 1,779 1,472 2,508 2,508 0
Equipment FY19 Expenditure FY20 Expenditure FY21 Appropriation FY22 Recommended Inc/Dec 21 vs 22
55000 Automotive Equipment 0 0 0 0 0 55400 Lease/Purchase 0 0 0 0 0 55600 Office Furniture & Equipment 0 20,332 0 0 0 55900 Misc Equipment 0 2,872 0 0 0 Total Equipment 0 23,204 0 0 0
Other FY19 Expenditure FY20 Expenditure FY21 Appropriation FY22 Recommended Inc/Dec 21 vs 22
56200 Special Appropriation 0 0 0 0 0 57200 Structures & Improvements 0 0 0 0 0 58000 Land & Non-Structure 0 0 0 0 0 Total Other 0 0 0 0 0
Grand Total 757,336 2,056,989 1,272,150 1,246,207 -25,943

12 Administration & FinanceAdministration & Finance
Department Personnel
Title Union Code Grade Position FY22 Salary Title
Union Code Grade Position FY22 Salary
Admin Assistant EXM 05 1.00 80,858 Director Administrative Services
CDH NG 1.00 182,500
Administrative Assistant EXM 04 1.00 49,311 Exec Asst MYO 06 1.00 50,631
Ch of Staff EXM NG 1.00 109,542 Project Manager, Alternative Financing EXM 10 1.00 122,950
Data Proc Systems Anl EXM 06 1.00 88,116 Special Advisor EXM 10 1.00 122,950 Total 8 806,858 Adjustments Differential Payments 0 Other 127,100 Chargebacks 0 Salary Savings -87,335 FY22 Total Request 846,623

Administration & FinanceAdministration & Finance 13
External Funds History Personnel Services FY19 Expenditure FY20 Expenditure FY21 Appropriation FY22 Recommended Inc/Dec 21 vs 22
51000 Permanent Employees 0 0 205,208 211,091 5,883 51100 Emergency Employees 0 0 0 0 0 51200 Overtime 0 0 0 0 0 51300 Part Time Employees 0 0 0 0 0 51400 Health Insurance 0 0 0 32,000 32,000 51500 Pension & Annuity 0 0 0 19,000 19,000 51600 Unemployment Compensation 0 0 0 0 0 51700 Workers' Compensation 0 0 0 0 0 51800 Indirect Costs 0 0 0 0 0 51900 Medicare 0 0 0 3,000 3,000 Total Personnel Services 0 0 205,208 265,091 59,883
Contractual Services FY19 Expenditure FY20 Expenditure FY21 Appropriation FY22 Recommended Inc/Dec 21 vs 22
52100 Communications 0 0 0 0 0 52200 Utilities 0 0 0 0 0 52400 Snow Removal 0 0 0 0 0 52500 Garbage/Waste Removal 0 0 0 0 0 52600 Repairs Buildings & Structures 0 0 0 0 0 52700 Repairs & Service of Equipment 0 0 0 0 0 52800 Transportation of Persons 0 0 0 0 0 52900 Contracted Services 0 0 0 0 0 Total Contractual Services 0 0 0 0 0
Supplies & Materials FY19 Expenditure FY20 Expenditure FY21 Appropriation FY22 Recommended Inc/Dec 21 vs 22
53000 Auto Energy Supplies 0 0 0 0 0 53200 Food Supplies 0 0 0 0 0 53400 Custodial Supplies 0 0 0 0 0 53500 Med, Dental, & Hosp Supply 0 0 0 0 0 53600 Office Supplies and Materials 0 0 0 0 0 53700 Clothing Allowance 0 0 0 0 0 53800 Educational Supplies & Mat 0 0 0 0 0 53900 Misc Supplies & Materials 0 0 0 0 0 Total Supplies & Materials 0 0 0 0 0
Current Chgs & Oblig FY19 Expenditure FY20 Expenditure FY21 Appropriation FY22 Recommended Inc/Dec 21 vs 22
54300 Workers' Comp Medical 0 0 0 0 0 54400 Legal Liabilities 0 0 0 0 0 54600 Current Charges H&I 0 0 0 0 0 54700 Indemnification 0 0 0 0 0 54800 Reserve Account 0 0 0 0 0 54900 Other Current Charges 0 0 0 0 0 Total Current Chgs & Oblig 0 0 0 0 0
Equipment FY19 Expenditure FY20 Expenditure FY21 Appropriation FY22 Recommended Inc/Dec 21 vs 22
55000 Automotive Equipment 0 0 0 0 0 55400 Lease/Purchase 0 0 0 0 0 55600 Office Furniture & Equipment 0 0 0 0 0 55900 Misc Equipment 0 0 0 0 0 Total Equipment 0 0 0 0 0
Other FY19 Expenditure FY20 Expenditure FY21 Appropriation FY22 Recommended Inc/Dec 21 vs 22
56200 Special Appropriation 0 0 0 0 0 57200 Structures & Improvements 0 0 0 0 0 58000 Land & Non-Structure 0 0 0 0 0 Total Other 0 0 0 0 0
Grand Total 0 0 205,208 265,091 59,883

14 Administration & FinanceAdministration & Finance
External Funds Personnel
Title Union Code Grade Position FY22 Salary Title
Union Code Grade Position FY22 Salary
Spec Asst I MYO 10 1.00 91,696 Spec Asst MYN NG 1.00 119,395 Total 2 211,091 Adjustments Differential Payments 0 Other 0 Chargebacks 0 Salary Savings 0 FY22 Total Request 211,091

Administration & FinanceAdministration & Finance 15
Program 1. Administration & Finance Emme Handy, Chief Financial Office & Collector Treasurer, Organization 144100
Program Description The Administration and Finance program assists in supporting the City’s long-term growth and stability by working with all departments to strengthen and improve the City’s financial and administrative resources.
Operating Budget Actual '19 Actual '20 Approp '21 Budget '22
Personnel Services 660,178 734,473 899,942 873,999 Non Personnel 97,158 1,322,516 372,208 372,208 Total 757,336 2,056,989 1,272,150 1,246,207

16 Administration & FinanceAdministration & Finance
External Funds Projects Strategic Partnerships
Project Mission The Strategic Partnerships is supported by earned indirect grant resources to support a unit whose mission is to catalyze and facilitate partnerships between the City and philanthropy, nonprofits, and other partners. This office provides leadership and strategy in cultivating and coordinating the pursuit of philanthropic funding, and other innovative partnership strategies that align with the City’s priorities.
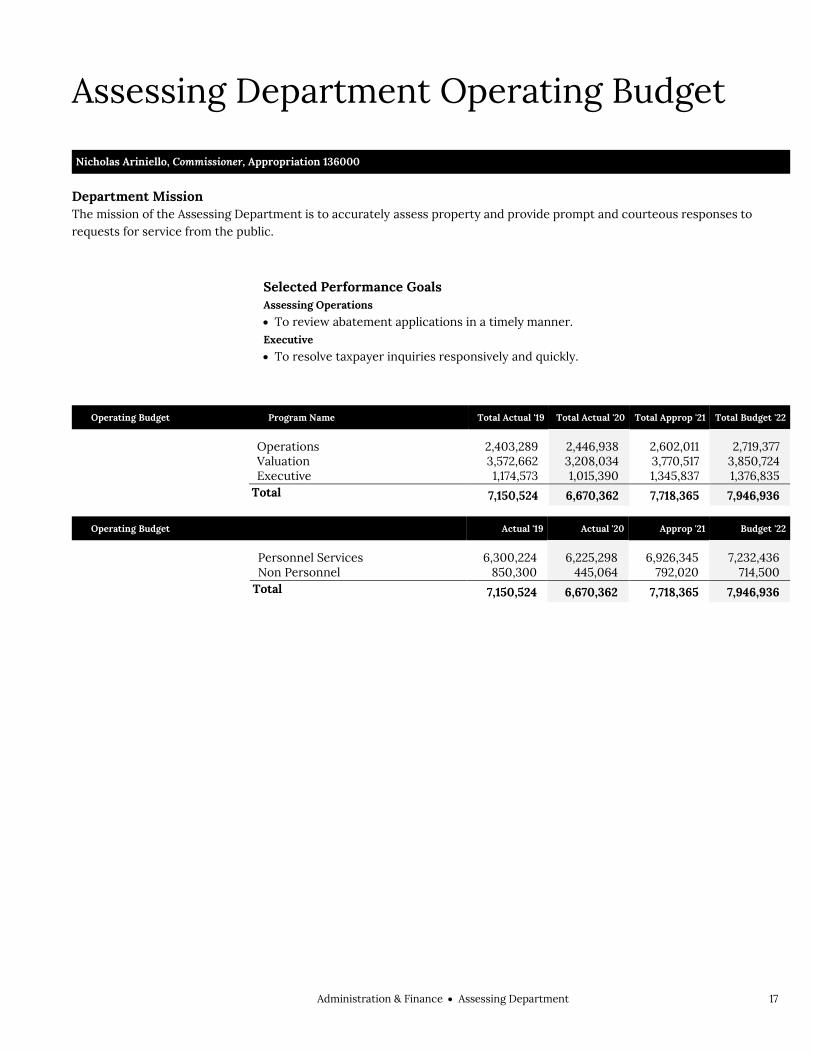
Administration & FinanceAssessing Department 17
Assessing Department Operating Budget Administration & Finance Assessing Department Nicholas Ariniello, Commissioner, Appropriation 136000
Department Mission The mission of the Assessing Department is to accurately assess property and provide prompt and courteous responses to requests for service from the public.
Selected Performance Goals Assessing Operations
To review abatement applications in a timely manner. Executive
To resolve taxpayer inquiries responsively and quickly.
Operating Budget Program Name Total Actual '19 Total Actual '20 Total Approp '21 Total Budget '22
Operations 2,403,289 2,446,938 2,602,011 2,719,377
Valuation 3,572,662 3,208,034 3,770,517 3,850,724
Executive 1,174,573 1,015,390 1,345,837 1,376,835
Total 7,150,524 6,670,362 7,718,365 7,946,936
Operating Budget Actual '19 Actual '20 Approp '21 Budget '22
Personnel Services 6,300,224 6,225,298 6,926,345 7,232,436 Non Personnel 850,300 445,064 792,020 714,500 Total 7,150,524 6,670,362 7,718,365 7,946,936

18 Administration & FinanceAssessing Department
Assessing Department Operating Budget
Authorizing Statutes Organizations, CBC St. 6 §§ 100-107;
CBC Ord. §§ 6-2.1-6-2.5. Taxation, M.G.L.A. cc. 59, 60A-B, 61A-B,
121A. Abatement of Back Taxes, M.G.L.A. c. 58,
§ 8. Classification, M.G.L.A. c.59, § 2A;
M.G.L.A. c. 40, § 56. Annual Assessment, M.G.L.A. c. 59 § 21C. Proposition 2 1/2, M.G.L.A. c. 59 § 21C. Cherry Sheets - State Aid, M.G.L.A. c. 58,
§§ 18B, 18C, 18F, 20A, 25, 25A; M.G.L.A. c. 29, §§ 2O, 71.
Description of Services The Assessing Department is responsible for the valuation and assessment of all real and personal property in the City of Boston for the purpose of taxation. Assessment records are reviewed annually to reflect new construction, fire damage, and changes in ownership. The department conducts a revaluation program every three years. The department conducts research on assessment practices and provides the necessary accounting control and other related clerical support to properly assess real and personal property. The department maintains official maps, records of assessment and ownership, abatements and related property description data.
CommissionerBoard of Review
Valuation
Residential
Data Collection Team
Condominium
Commercial
Litigation
Tax Policy
Information Systems
Operations
Tax Data Administration
Land Records
Technical Services
Fiscal & Human Resources
Executive Unit
Taxpayer Referral &
Assistance Center
Support Services
Personal Property
Research and Standards
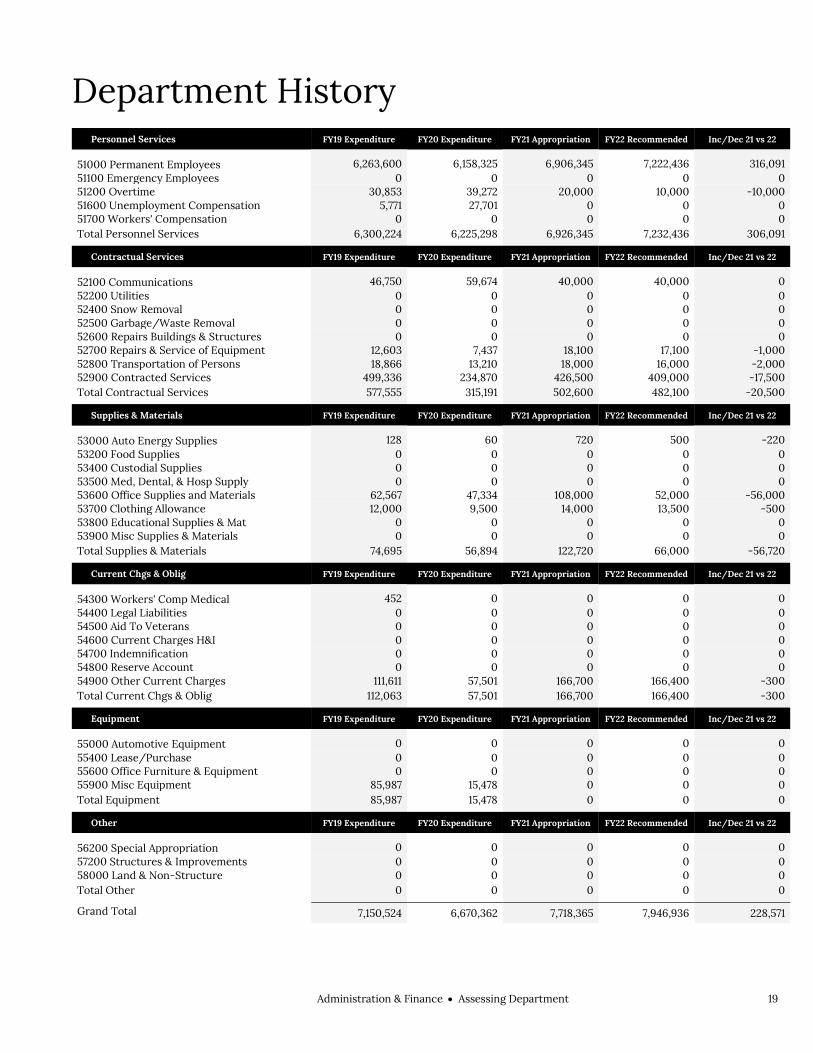
Administration & FinanceAssessing Department 19
Department History Personnel Services FY19 Expenditure FY20 Expenditure FY21 Appropriation FY22 Recommended Inc/Dec 21 vs 22
51000 Permanent Employees 6,263,600 6,158,325 6,906,345 7,222,436 316,091 51100 Emergency Employees 0 0 0 0 0 51200 Overtime 30,853 39,272 20,000 10,000 -10,000 51600 Unemployment Compensation 5,771 27,701 0 0 0 51700 Workers' Compensation 0 0 0 0 0 Total Personnel Services 6,300,224 6,225,298 6,926,345 7,232,436 306,091
Contractual Services FY19 Expenditure FY20 Expenditure FY21 Appropriation FY22 Recommended Inc/Dec 21 vs 22
52100 Communications 46,750 59,674 40,000 40,000 0 52200 Utilities 0 0 0 0 0 52400 Snow Removal 0 0 0 0 0 52500 Garbage/Waste Removal 0 0 0 0 0 52600 Repairs Buildings & Structures 0 0 0 0 0 52700 Repairs & Service of Equipment 12,603 7,437 18,100 17,100 -1,000 52800 Transportation of Persons 18,866 13,210 18,000 16,000 -2,000 52900 Contracted Services 499,336 234,870 426,500 409,000 -17,500 Total Contractual Services 577,555 315,191 502,600 482,100 -20,500
Supplies & Materials FY19 Expenditure FY20 Expenditure FY21 Appropriation FY22 Recommended Inc/Dec 21 vs 22
53000 Auto Energy Supplies 128 60 720 500 -220 53200 Food Supplies 0 0 0 0 0 53400 Custodial Supplies 0 0 0 0 0 53500 Med, Dental, & Hosp Supply 0 0 0 0 0 53600 Office Supplies and Materials 62,567 47,334 108,000 52,000 -56,000 53700 Clothing Allowance 12,000 9,500 14,000 13,500 -500 53800 Educational Supplies & Mat 0 0 0 0 0 53900 Misc Supplies & Materials 0 0 0 0 0 Total Supplies & Materials 74,695 56,894 122,720 66,000 -56,720
Current Chgs & Oblig FY19 Expenditure FY20 Expenditure FY21 Appropriation FY22 Recommended Inc/Dec 21 vs 22
54300 Workers' Comp Medical 452 0 0 0 0 54400 Legal Liabilities 0 0 0 0 0 54500 Aid To Veterans 0 0 0 0 0 54600 Current Charges H&I 0 0 0 0 0 54700 Indemnification 0 0 0 0 0 54800 Reserve Account 0 0 0 0 0 54900 Other Current Charges 111,611 57,501 166,700 166,400 -300 Total Current Chgs & Oblig 112,063 57,501 166,700 166,400 -300
Equipment FY19 Expenditure FY20 Expenditure FY21 Appropriation FY22 Recommended Inc/Dec 21 vs 22
55000 Automotive Equipment 0 0 0 0 0 55400 Lease/Purchase 0 0 0 0 0 55600 Office Furniture & Equipment 0 0 0 0 0 55900 Misc Equipment 85,987 15,478 0 0 0 Total Equipment 85,987 15,478 0 0 0
Other FY19 Expenditure FY20 Expenditure FY21 Appropriation FY22 Recommended Inc/Dec 21 vs 22
56200 Special Appropriation 0 0 0 0 0 57200 Structures & Improvements 0 0 0 0 0 58000 Land & Non-Structure 0 0 0 0 0 Total Other 0 0 0 0 0
Grand Total 7,150,524 6,670,362 7,718,365 7,946,936 228,571
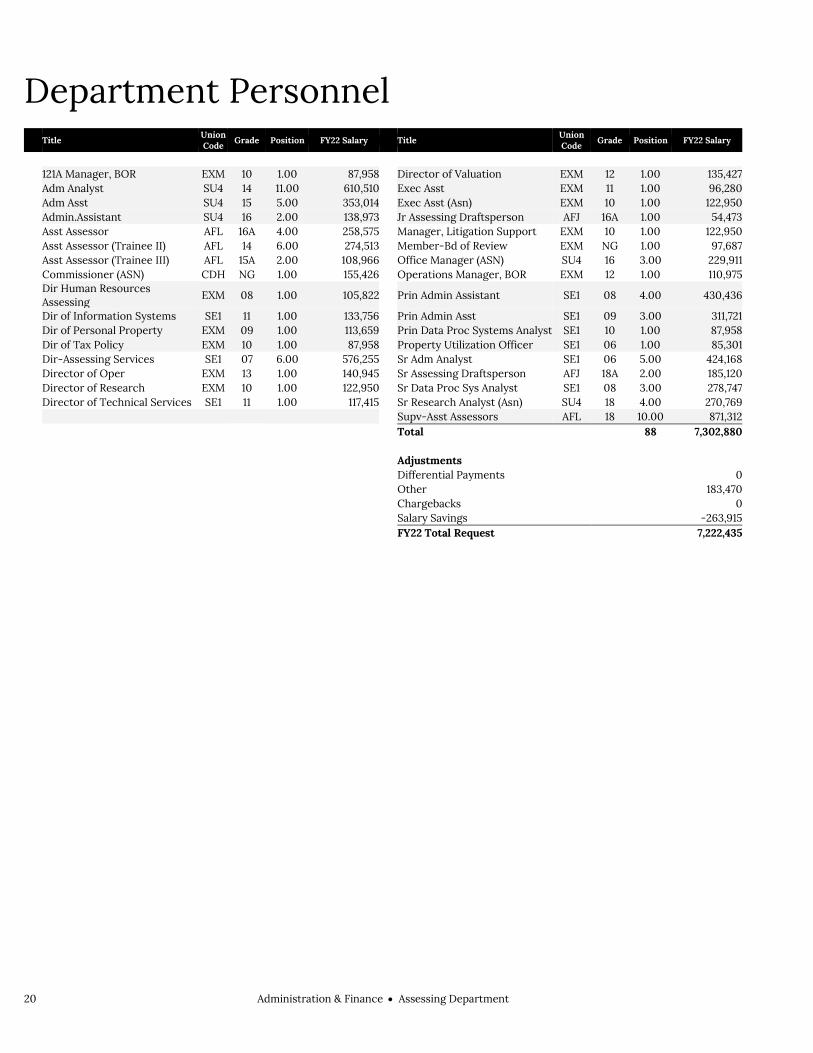
20 Administration & FinanceAssessing Department
Department Personnel
Title Union Code Grade Position FY22 Salary Title
Union Code Grade Position FY22 Salary
121A Manager, BOR EXM 10 1.00 87,958 Director of Valuation EXM 12 1.00 135,427 Adm Analyst SU4 14 11.00 610,510 Exec Asst EXM 11 1.00 96,280 Adm Asst SU4 15 5.00 353,014 Exec Asst (Asn) EXM 10 1.00 122,950 Admin.Assistant SU4 16 2.00 138,973 Jr Assessing Draftsperson AFJ 16A 1.00 54,473 Asst Assessor AFL 16A 4.00 258,575 Manager, Litigation Support EXM 10 1.00 122,950 Asst Assessor (Trainee II) AFL 14 6.00 274,513 Member-Bd of Review EXM NG 1.00 97,687 Asst Assessor (Trainee III) AFL 15A 2.00 108,966 Office Manager (ASN) SU4 16 3.00 229,911 Commissioner (ASN) CDH NG 1.00 155,426 Operations Manager, BOR EXM 12 1.00 110,975
Dir Human Resources Assessing
EXM 08 1.00 105,822 Prin Admin Assistant SE1 08 4.00 430,436
Dir of Information Systems SE1 11 1.00 133,756 Prin Admin Asst SE1 09 3.00 311,721 Dir of Personal Property EXM 09 1.00 113,659 Prin Data Proc Systems Analyst SE1 10 1.00 87,958 Dir of Tax Policy EXM 10 1.00 87,958 Property Utilization Officer SE1 06 1.00 85,301 Dir-Assessing Services SE1 07 6.00 576,255 Sr Adm Analyst SE1 06 5.00 424,168 Director of Oper EXM 13 1.00 140,945 Sr Assessing Draftsperson AFJ 18A 2.00 185,120 Director of Research EXM 10 1.00 122,950 Sr Data Proc Sys Analyst SE1 08 3.00 278,747 Director of Technical Services SE1 11 1.00 117,415 Sr Research Analyst (Asn) SU4 18 4.00 270,769
Supv-Asst Assessors AFL 18 10.00 871,312
Total 88 7,302,880 Adjustments Differential Payments 0 Other 183,470 Chargebacks 0 Salary Savings -263,915 FY22 Total Request 7,222,435

Administration & FinanceAssessing Department 21
Program 1. Operations Emmanuel Dikibo, Manager, Organization 136100
Program Description The Operations program provides administration, fiscal, human resources, and other related administrative services to all operating units within the department. It also provides management and technical support for fleet administration, facilities and office management, and office technology, including ownership and physical description changes to real property that are maintained by the Tax Data Administration and Land Records units. The Taxpayer Referral and Assistance Center (TRAC) provides a single point of contact to taxpayers seeking information, assistance or referrals regarding excise, personal property and real estate. TRAC handles inquiries by phone, mail and email.
Operating Budget Actual '19 Actual '20 Approp '21 Budget '22
Personnel Services 2,144,763 2,290,599 2,369,391 2,551,277 Non Personnel 258,526 156,339 232,620 168,100 Total 2,403,289 2,446,938 2,602,011 2,719,377
Performance
Goal: To review abatement applications in a timely manner
Performance Measures Actual '19 Actual '20 Projected '21 Target '22
% of residential exemption applications processed within 15 days
100% 100% 100% 100%
Residential exemption applications reviewed within 15 days 9,315 11,035 8,900 8,900

22 Administration & FinanceAssessing Department
Program 2. Valuation John Taglilatela, Manager, Organization 136200
Program Description The Valuation program establishes and records the full and fair cash value of all real and personal property in the City of Boston as of January 1st of each year. Program staff also conducts research to develop sales models and valuation standards to produce market-based assessments.
Operating Budget Actual '19 Actual '20 Approp '21 Budget '22
Personnel Services 3,114,275 2,961,779 3,411,817 3,505,024 Non Personnel 458,387 246,255 358,700 345,700 Total 3,572,662 3,208,034 3,770,517 3,850,724

Administration & FinanceAssessing Department 23
Program 3. Executive Nicholas Ariniello, Commissioner, Organization 136300
Program Description The Executive program provides support services to the Commissioner, including tax policy and information coordination and dissemination. In addition, both the Board of Review and Litigation units handle rulings on all abatement applications and representation at the state's Appellate Tax Board regarding these applications.
Operating Budget Actual '19 Actual '20 Approp '21 Budget '22
Personnel Services 1,041,186 972,920 1,145,137 1,176,135 Non Personnel 133,387 42,470 200,700 200,700 Total 1,174,573 1,015,390 1,345,837 1,376,835
Performance
Goal: To resolve taxpayer inquiries responsively and quickly
Performance Measures Actual '19 Actual '20 Projected '21 Target '22
# of calls to the Taxpayer Referral & Assistance Center (TRAC) 33,203 18,454 32,000 32,000
% of calls to TRAC answered within 3 minutes 100% 100% 100% 100%
% of public requests to Commissioner's office addressed within 2 days
100% 100% 100% 100%
Public request received 948 3,165 3,200 3,200


Administration & FinanceAuditing Department 25
Auditing Department Operating Budget Administration & Finance Auditing Department Maureen Ann Joyce, City Auditor, Appropriation 131000
Department Mission The mission of the Auditing Department is to present a complete and accurate statement of the City's financial condition.
Selected Performance Goals Accounting
Ensure Stability of Financial Reporting. Grants Monitoring
Ensure Stability of Financial Reporting. Accounts Payable
% contracts routed within 3 days of receipt. % procurement documents approved within 3 days. % vendor invoices processed within 5 days. Improvement through the use of technology & resources to manage the City's Accounts
Payable.
Operating Budget Program Name Total Actual '19 Total Actual '20 Total Approp '21 Total Budget '22
Administration 441,154 689,775 583,921 702,741
Accounting 741,514 688,913 797,333 800,931
Central Payroll 632,572 617,072 659,719 600,535
Grants Monitoring 265,563 325,109 166,864 149,440
Accounts Payable 654,509 675,392 655,454 761,989
Total 2,735,312 2,996,261 2,863,291 3,015,636
External Funds Budget Fund Name Total Actual '19 Total Actual '20 Total Approp '21 Total Budget '22
Earned Indirect 15,000 59,242 218,394 246,131
Total 15,000 59,242 218,394 246,131
Operating Budget Actual '19 Actual '20 Approp '21 Budget '22
Personnel Services 2,629,117 2,834,746 2,738,216 2,817,834 Non Personnel 106,195 161,515 125,075 197,802 Total 2,735,312 2,996,261 2,863,291 3,015,636

26 Administration & FinanceAuditing Department
Auditing Department Operating Budget
Authorizing Statutes Annual Audit, 31 U.S.C. § 7502; M.G.L.A.
c. 41, §§ 50, 53; M.G.L.A. c. 44, §§ 40, 53D; M.G.L.A. c. 60 § 97; Tregor, 1982 Mass. Acts ch. 190, § 14; CBC Ord. § 6-1.5.
Annual Appropriation, M.G.L.A. c. 41, §§ 57-58; 1982 Mass. Acts 190, § 18; 1986 Mass. Acts ch. 701, § 3, 7-10; CBC St. 6 § 252; CBC Ord. § 6-1.10.
Execution of Contracts, M.G.L.A. c 41, § 17; CBC St. 4 §§ 7-8; CBC Ord. § 5-5.28.
Payment of Bills, M.G.L.A. c.41, §§ 51, 56; CBC Ord. § 5-5.27; CBC Ord. §§ 6-1.4-6-1.6; CBC Ord. § 11-6.37.
Payment of Payrolls, M.G.L.A. c. 41, § 56; Tregor, 1982 Mass. Acts ch. 190 § 18; 1986 Mass. Acts ch. 701 § 9; CBC Ord. § 5-5.29; CBC Ord. § 6-1.3.
Debt Service, Tregor, 1982 Mass. Acts ch. 190 §§ 4,8; M.G.L.A. c.41, § 57, CBC St. 6 §§ 254-255; CBC Ord. § 6-1.2.
Financial Accounting and Reporting, 31 U.S.C. § 7502; M.G.L.A. c.41, §§ 54, 57-58, 61; M.G.L.A. c.44, § 43; CBC St.6 §§ 2-3; CBC Ord. § 5-5.34 ;CBC Ord. §§ 6-1.7-6.-1.8.
Description of Services The Department prepares the City's annual financial statements, reviews and processes all financial transactions for accuracy, completeness, and compliance, implements fiscal controls over departmental spending, and provides technical assistance to departments and agencies.
City Auditor
Deputy City Auditor
System Support
Accounting
Administrative Support
Central Payroll Accounts PayableGrants Monitoring
General Accounting
Financial Reporting
Contracts
Commitment Control/
Vendor Payment

Administration & FinanceAuditing Department 27
Department History Personnel Services FY19 Expenditure FY20 Expenditure FY21 Appropriation FY22 Recommended Inc/Dec 21 vs 22
51000 Permanent Employees 2,564,853 2,762,967 2,728,216 2,807,834 79,618 51100 Emergency Employees 0 0 0 0 0 51200 Overtime 64,264 65,623 10,000 10,000 0 51600 Unemployment Compensation 0 6,156 0 0 0 51700 Workers' Compensation 0 0 0 0 0 Total Personnel Services 2,629,117 2,834,746 2,738,216 2,817,834 79,618
Contractual Services FY19 Expenditure FY20 Expenditure FY21 Appropriation FY22 Recommended Inc/Dec 21 vs 22
52100 Communications 4,419 8,280 7,252 9,048 1,796 52200 Utilities 0 0 0 0 0 52400 Snow Removal 0 0 0 0 0 52500 Garbage/Waste Removal 0 0 0 0 0 52600 Repairs Buildings & Structures 0 0 0 0 0 52700 Repairs & Service of Equipment 5,657 2,507 6,420 6,570 150 52800 Transportation of Persons 13,651 10,462 7,707 7,684 -23 52900 Contracted Services 12,320 105,473 48,971 122,680 73,709 Total Contractual Services 36,047 126,722 70,350 145,982 75,632
Supplies & Materials FY19 Expenditure FY20 Expenditure FY21 Appropriation FY22 Recommended Inc/Dec 21 vs 22
53000 Auto Energy Supplies 0 0 0 0 0 53200 Food Supplies 0 467 0 0 0 53400 Custodial Supplies 0 0 0 0 0 53500 Med, Dental, & Hosp Supply 0 0 0 0 0 53600 Office Supplies and Materials 8,368 5,043 9,002 9,028 26 53700 Clothing Allowance 2,250 2,250 2,500 2,500 0 53800 Educational Supplies & Mat 0 0 0 0 0 53900 Misc Supplies & Materials 0 0 0 0 0 Total Supplies & Materials 10,618 7,760 11,502 11,528 26
Current Chgs & Oblig FY19 Expenditure FY20 Expenditure FY21 Appropriation FY22 Recommended Inc/Dec 21 vs 22
54300 Workers' Comp Medical 946 99 0 0 0 54400 Legal Liabilities 0 0 0 0 0 54500 Aid To Veterans 0 0 0 0 0 54600 Current Charges H&I 0 0 0 0 0 54700 Indemnification 0 0 0 0 0 54800 Reserve Account 0 0 0 0 0 54900 Other Current Charges 58,584 26,934 40,274 40,292 18 Total Current Chgs & Oblig 59,530 27,033 40,274 40,292 18
Equipment FY19 Expenditure FY20 Expenditure FY21 Appropriation FY22 Recommended Inc/Dec 21 vs 22
55000 Automotive Equipment 0 0 0 0 0 55400 Lease/Purchase 0 0 0 0 0 55600 Office Furniture & Equipment 0 0 0 0 0 55900 Misc Equipment 0 0 2,949 0 -2,949 Total Equipment 0 0 2,949 0 -2,949
Other FY19 Expenditure FY20 Expenditure FY21 Appropriation FY22 Recommended Inc/Dec 21 vs 22
56200 Special Appropriation 0 0 0 0 0 57200 Structures & Improvements 0 0 0 0 0 58000 Land & Non-Structure 0 0 0 0 0 Total Other 0 0 0 0 0
Grand Total 2,735,312 2,996,261 2,863,291 3,015,636 152,345
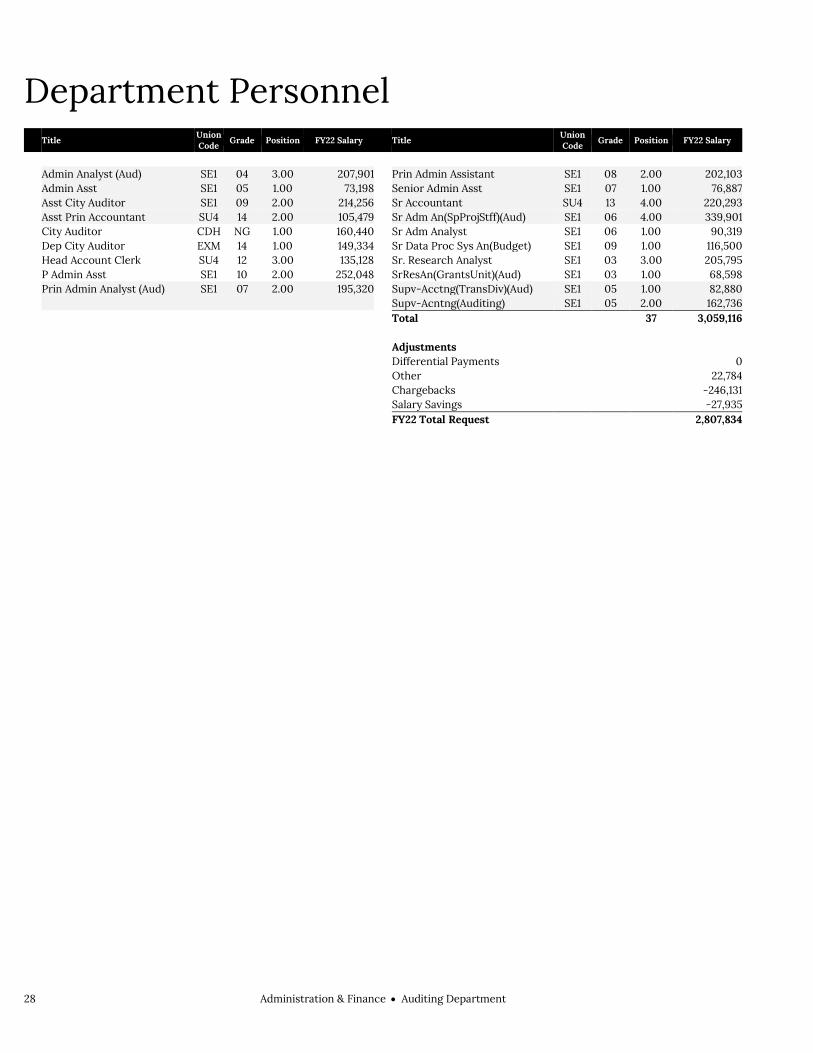
28 Administration & FinanceAuditing Department
Department Personnel
Title Union Code Grade Position FY22 Salary Title
Union Code Grade Position FY22 Salary
Admin Analyst (Aud) SE1 04 3.00 207,901 Prin Admin Assistant SE1 08 2.00 202,103 Admin Asst SE1 05 1.00 73,198 Senior Admin Asst SE1 07 1.00 76,887 Asst City Auditor SE1 09 2.00 214,256 Sr Accountant SU4 13 4.00 220,293 Asst Prin Accountant SU4 14 2.00 105,479 Sr Adm An(SpProjStff)(Aud) SE1 06 4.00 339,901 City Auditor CDH NG 1.00 160,440 Sr Adm Analyst SE1 06 1.00 90,319 Dep City Auditor EXM 14 1.00 149,334 Sr Data Proc Sys An(Budget) SE1 09 1.00 116,500 Head Account Clerk SU4 12 3.00 135,128 Sr. Research Analyst SE1 03 3.00 205,795 P Admin Asst SE1 10 2.00 252,048 SrResAn(GrantsUnit)(Aud) SE1 03 1.00 68,598 Prin Admin Analyst (Aud) SE1 07 2.00 195,320 Supv-Acctng(TransDiv)(Aud) SE1 05 1.00 82,880
Supv-Acntng(Auditing) SE1 05 2.00 162,736
Total 37 3,059,116 Adjustments Differential Payments 0 Other 22,784 Chargebacks -246,131 Salary Savings -27,935 FY22 Total Request 2,807,834

Administration & FinanceAuditing Department 29
External Funds History Personnel Services FY19 Expenditure FY20 Expenditure FY21 Appropriation FY22 Recommended Inc/Dec 21 vs 22
51000 Permanent Employees 0 0 218,394 246,131 27,737 51100 Emergency Employees 0 0 0 0 0 51200 Overtime 0 0 0 0 0 51300 Part Time Employees 0 0 0 0 0 51400 Health Insurance 0 0 0 0 0 51500 Pension & Annuity 0 0 0 0 0 51600 Unemployment Compensation 0 0 0 0 0 51700 Workers' Compensation 0 0 0 0 0 51800 Indirect Costs 0 0 0 0 0 51900 Medicare 0 0 0 0 0 Total Personnel Services 0 0 218,394 246,131 27,737
Contractual Services FY19 Expenditure FY20 Expenditure FY21 Appropriation FY22 Recommended Inc/Dec 21 vs 22
52100 Communications 0 0 0 0 0 52200 Utilities 0 0 0 0 0 52400 Snow Removal 0 0 0 0 0 52500 Garbage/Waste Removal 0 0 0 0 0 52600 Repairs Buildings & Structures 0 0 0 0 0 52700 Repairs & Service of Equipment 0 0 0 0 0 52800 Transportation of Persons 0 8,522 0 0 0 52900 Contracted Services 0 34,970 0 0 0 Total Contractual Services 0 43,492 0 0 0
Supplies & Materials FY19 Expenditure FY20 Expenditure FY21 Appropriation FY22 Recommended Inc/Dec 21 vs 22
53000 Auto Energy Supplies 0 0 0 0 0 53200 Food Supplies 0 0 0 0 0 53400 Custodial Supplies 0 0 0 0 0 53500 Med, Dental, & Hosp Supply 0 0 0 0 0 53600 Office Supplies and Materials 0 0 0 0 0 53700 Clothing Allowance 0 0 0 0 0 53800 Educational Supplies & Mat 0 0 0 0 0 53900 Misc Supplies & Materials 0 0 0 0 0 Total Supplies & Materials 0 0 0 0 0
Current Chgs & Oblig FY19 Expenditure FY20 Expenditure FY21 Appropriation FY22 Recommended Inc/Dec 21 vs 22
54300 Workers' Comp Medical 0 0 0 0 0 54400 Legal Liabilities 0 0 0 0 0 54600 Current Charges H&I 0 0 0 0 0 54700 Indemnification 0 0 0 0 0 54800 Reserve Account 0 0 0 0 0 54900 Other Current Charges 15,000 15,750 0 0 0 Total Current Chgs & Oblig 15,000 15,750 0 0 0
Equipment FY19 Expenditure FY20 Expenditure FY21 Appropriation FY22 Recommended Inc/Dec 21 vs 22
55000 Automotive Equipment 0 0 0 0 0 55400 Lease/Purchase 0 0 0 0 0 55600 Office Furniture & Equipment 0 0 0 0 0 55900 Misc Equipment 0 0 0 0 0 Total Equipment 0 0 0 0 0
Other FY19 Expenditure FY20 Expenditure FY21 Appropriation FY22 Recommended Inc/Dec 21 vs 22
56200 Special Appropriation 0 0 0 0 0 57200 Structures & Improvements 0 0 0 0 0 58000 Land & Non-Structure 0 0 0 0 0 Total Other 0 0 0 0 0
Grand Total 15,000 59,242 218,394 246,131 27,737
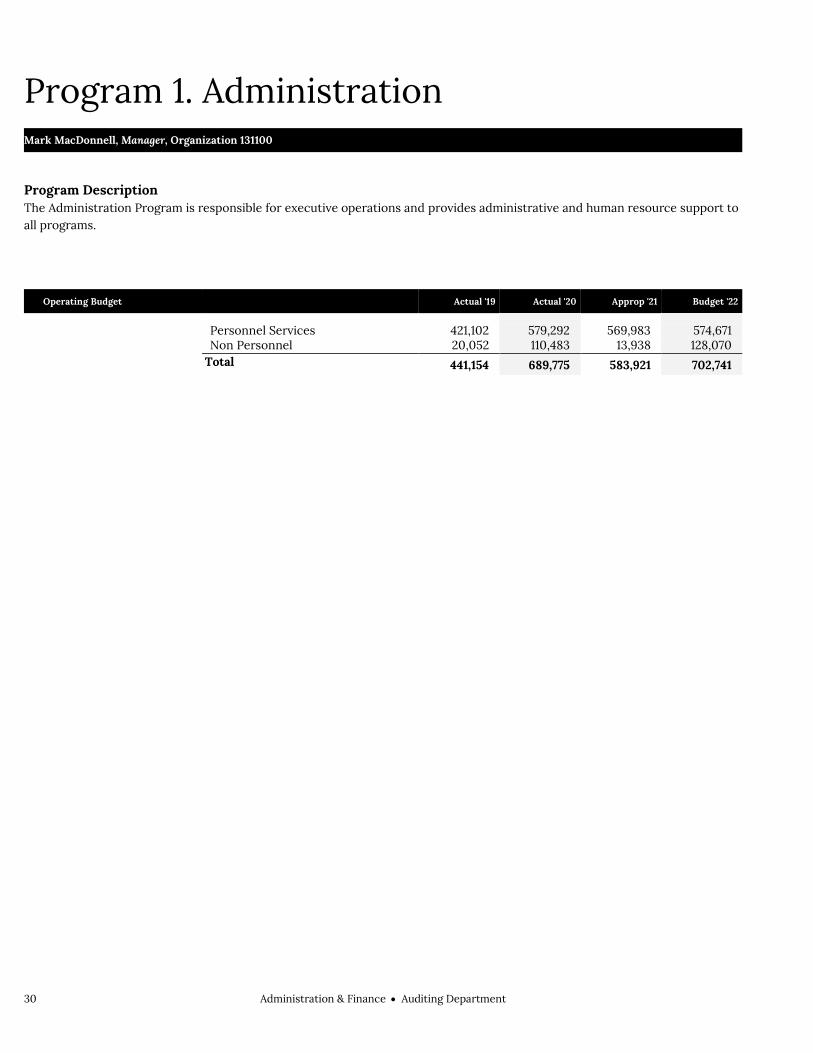
30 Administration & FinanceAuditing Department
Program 1. Administration Mark MacDonnell, Manager, Organization 131100
Program Description The Administration Program is responsible for executive operations and provides administrative and human resource support to all programs.
Operating Budget Actual '19 Actual '20 Approp '21 Budget '22
Personnel Services 421,102 579,292 569,983 574,671 Non Personnel 20,052 110,483 13,938 128,070 Total 441,154 689,775 583,921 702,741

Administration & FinanceAuditing Department 31
Program 2. Accounting Licia C. Lima-Pires, Manager, Organization 131200
Program Description The primary responsibility of the Accounting Program is to provide accurate and complete financial data and technical assistance to all City departments. The Program also oversees the coordination of the City's Annual Financial Audit and the publication of the Comprehensive Annual Financial Report.
Operating Budget Actual '19 Actual '20 Approp '21 Budget '22
Personnel Services 682,002 656,862 753,871 754,317 Non Personnel 59,512 32,051 43,462 46,614 Total 741,514 688,913 797,333 800,931
Performance
Goal: Ensure Stability of Financial Reporting
Performance Measures Actual '19 Actual '20 Projected '21 Target '22
% of Financial Audit Work Completed 100% 100% 100% 100%
% of New GASB Standards Implemented 100% 100% 100% 100%
Financial Audit Completion 1 1 1 1

32 Administration & FinanceAuditing Department
Program 3. Central Payroll Michael O'Keefe, Manager, Organization 131300
Program Description The primary responsibility of the Central Payroll Program is the timely and accurate processing of wages for all employees for both pay frequencies in compliance with all local, state, and federal laws, and in conformity with the City’s collective bargaining agreements.
Operating Budget Actual '19 Actual '20 Approp '21 Budget '22
Personnel Services 626,720 613,102 615,701 594,824 Non Personnel 5,852 3,970 44,018 5,711 Total 632,572 617,072 659,719 600,535

Administration & FinanceAuditing Department 33
Program 4. Grants Monitoring Scott Finn, Manager, Organization 131400
Program Description The primary responsibility of the Grants Monitoring Program is to establish and monitor Special Revenue for all City departments and to provide technical assistance in the process. The program also oversees and coordinates the City's Annual Single Audit for Federal Financial Assistance Programs and also produces the City's Cost Allocation Plan.
Operating Budget Actual '19 Actual '20 Approp '21 Budget '22
Personnel Services 261,870 321,741 162,459 144,943 Non Personnel 3,693 3,368 4,405 4,497 Total 265,563 325,109 166,864 149,440
Performance
Goal: Ensure Stability of Financial Reporting
Performance Measures Actual '19 Actual '20 Projected '21 Target '22
% of Single Audit Completion 100% 100% 100% 100%
% of Single Audit Work Completed 100% 100% 100% 100%

34 Administration & FinanceAuditing Department
Program 5. Accounts Payable Marie Murray, Manager, Organization 131500
Program Description The Accounts Payable Program is responsible for approving procurement documents and processing payment documents completely, accurately, and on-time while maintaining expenditure controls to limit deficit spending citywide.
Operating Budget Actual '19 Actual '20 Approp '21 Budget '22
Personnel Services 637,423 663,749 636,202 749,079 Non Personnel 17,086 11,643 19,252 12,910 Total 654,509 675,392 655,454 761,989
Performance
Goal: % contracts routed within 3 days of receipt
Performance Measures Actual '19 Actual '20 Projected '21 Target '22
% contracts routed within 3 days of receipt 70.8% 77% 85% 85%
Goal: % procurement documents approved within 3 days
Performance Measures Actual '19 Actual '20 Projected '21 Target '22
% procurement documents approved within 3 days 93% 90.8% 95% 95%
Goal: % vendor invoices processed within 5 days
Performance Measures Actual '19 Actual '20 Projected '21 Target '22
% vendor invoices processed within 5 days 99% 100% 100% 100%
Goal: Improvement through the use of technology & resources to manage the City's Accounts Payable
Performance Measures Actual '19 Actual '20 Projected '21 Target '22
% of Standard Contracts Completed On-Line 41% 50% 100% 100%
Administration & FinanceAuditing Department 35
External Funds Projects Earned Indirect
Project Mission Earned Indirect is funding provided through various grants to cover the City’s cost of supporting the operations of these grants. This funding is used to support two administrative positions in the Grant Monitoring Program of the Auditing Department.


Administration & FinanceBudget Management 37
Budget Management Operating Budget Administration & Finance Budget Management Justin Sterritt, Director, Appropriation 141000
Department Mission The Office of Budget Management (OBM) promotes the high quality delivery of services to Boston’s residents in a cost effective way. OBM evaluates City programs and then uses analysis to build, present, and manage the Mayor's operating budget. OBM also creates the capital plan. The capital plan is a strategic document that shows how the City's investment in its infrastructure, such as bridges and roads, contributes to Boston's future. The City also uses the plan to make smart spending decisions and protect its assets.
Selected Performance Goals Budget & Management
Improve use of limited city resources. Revenue Monitoring
Ensure long-term financial stability. Maximize current and future revenues. Capital Budgeting
Improve use of limited city resources.
Operating Budget Program Name Total Actual '19 Total Actual '20 Total Approp '21 Total Budget '22
Administration 1,298,242 1,380,074 987,170 1,241,891
Budget & Management 721,157 807,592 955,420 949,191
Revenue Monitoring 152,799 84,407 721,860 671,131
Capital Budgeting 352,578 370,042 411,015 393,753
Risk Management 177,874 185,185 195,505 264,605
Total 2,702,650 2,827,300 3,270,970 3,520,571
External Funds Budget Fund Name Total Actual '19 Total Actual '20 Total Approp '21 Total Budget '22
CARES-Coronavirus Relief Fund 0 14,203,649 106,649,710 0
FEMA-Coronavirus Response 0 9,396,736 6,603,264 0
Total 0 23,600,385 113,252,974 0
Operating Budget Actual '19 Actual '20 Approp '21 Budget '22
Personnel Services 2,149,392 2,251,768 2,460,680 2,585,681 Non Personnel 553,258 575,532 810,290 934,890 Total 2,702,650 2,827,300 3,270,970 3,520,571
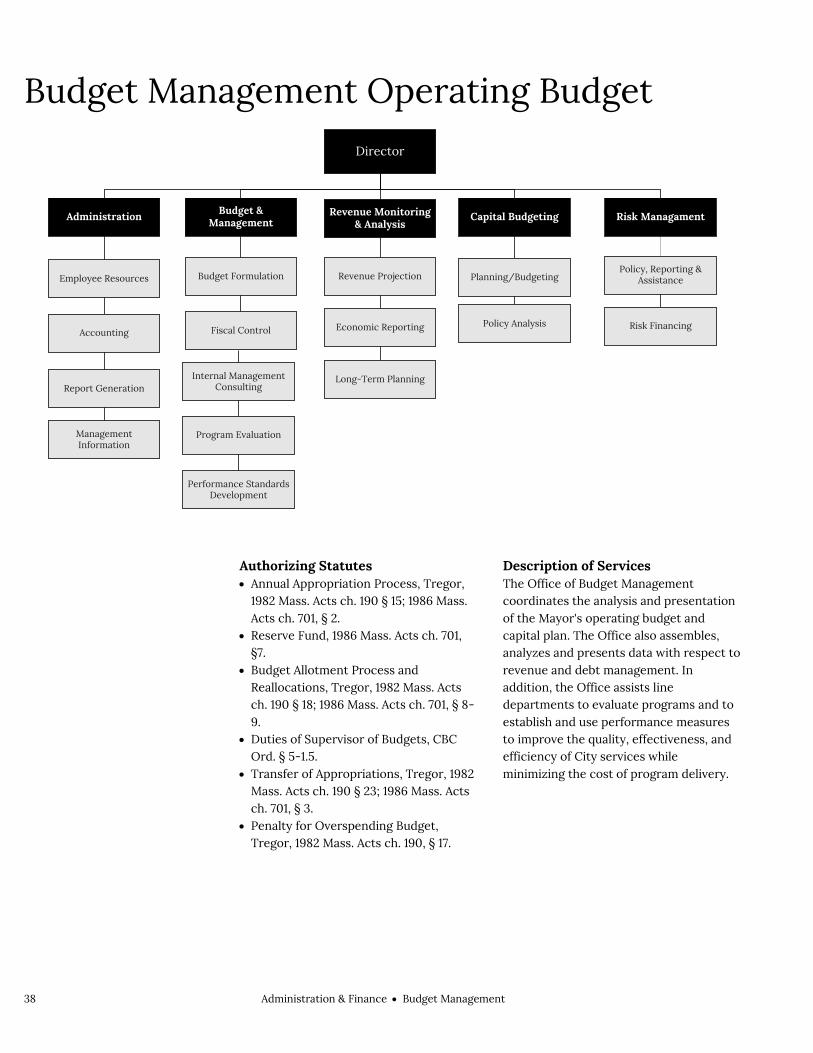
38 Administration & FinanceBudget Management
Budget Management Operating Budget
Authorizing Statutes Annual Appropriation Process, Tregor,
1982 Mass. Acts ch. 190 § 15; 1986 Mass. Acts ch. 701, § 2.
Reserve Fund, 1986 Mass. Acts ch. 701, §7.
Budget Allotment Process and Reallocations, Tregor, 1982 Mass. Acts ch. 190 § 18; 1986 Mass. Acts ch. 701, § 8-9.
Duties of Supervisor of Budgets, CBC Ord. § 5-1.5.
Transfer of Appropriations, Tregor, 1982 Mass. Acts ch. 190 § 23; 1986 Mass. Acts ch. 701, § 3.
Penalty for Overspending Budget, Tregor, 1982 Mass. Acts ch. 190, § 17.
Description of Services The Office of Budget Management coordinates the analysis and presentation of the Mayor's operating budget and capital plan. The Office also assembles, analyzes and presents data with respect to revenue and debt management. In addition, the Office assists line departments to evaluate programs and to establish and use performance measures to improve the quality, effectiveness, and efficiency of City services while minimizing the cost of program delivery.
Director
Administration
Employee Resources
Accounting
Report Generation
Management Information
Budget & Management
Budget Formulation
Fiscal Control
Revenue Monitoring & Analysis
Revenue Projection
Economic Reporting
Long-Term Planning
Capital Budgeting
Planning/Budgeting
Policy Analysis
Internal Management Consulting
Program Evaluation
Performance Standards Development
Policy, Reporting & Assistance
Risk Financing
Risk Managament

Administration & FinanceBudget Management 39
Department History Personnel Services FY19 Expenditure FY20 Expenditure FY21 Appropriation FY22 Recommended Inc/Dec 21 vs 22
51000 Permanent Employees 2,130,420 2,221,018 2,422,680 2,547,681 125,001 51100 Emergency Employees 0 0 0 0 0 51200 Overtime 18,972 30,750 38,000 38,000 0 51600 Unemployment Compensation 0 0 0 0 0 51700 Workers' Compensation 0 0 0 0 0 Total Personnel Services 2,149,392 2,251,768 2,460,680 2,585,681 125,001
Contractual Services FY19 Expenditure FY20 Expenditure FY21 Appropriation FY22 Recommended Inc/Dec 21 vs 22
52100 Communications 2,902 5,719 4,700 6,700 2,000 52200 Utilities 0 0 0 0 0 52400 Snow Removal 0 0 0 0 0 52500 Garbage/Waste Removal 0 0 0 0 0 52600 Repairs Buildings & Structures 0 0 0 0 0 52700 Repairs & Service of Equipment 2,060 1,139 3,500 3,500 0 52800 Transportation of Persons 9,048 5,417 6,000 6,000 0 52900 Contracted Services 405,724 421,656 652,320 777,320 125,000 Total Contractual Services 419,734 433,931 666,520 793,520 127,000
Supplies & Materials FY19 Expenditure FY20 Expenditure FY21 Appropriation FY22 Recommended Inc/Dec 21 vs 22
53000 Auto Energy Supplies 0 0 0 0 0 53200 Food Supplies 0 0 0 0 0 53400 Custodial Supplies 0 74 0 0 0 53500 Med, Dental, & Hosp Supply 0 0 0 0 0 53600 Office Supplies and Materials 3,052 2,667 4,100 4,100 0 53700 Clothing Allowance 250 500 500 500 0 53800 Educational Supplies & Mat 0 0 0 0 0 53900 Misc Supplies & Materials 898 135 1,500 1,500 0 Total Supplies & Materials 4,200 3,376 6,100 6,100 0
Current Chgs & Oblig FY19 Expenditure FY20 Expenditure FY21 Appropriation FY22 Recommended Inc/Dec 21 vs 22
54300 Workers' Comp Medical 0 0 0 0 0 54400 Legal Liabilities 0 0 0 0 0 54500 Aid To Veterans 0 0 0 0 0 54600 Current Charges H&I 0 0 0 0 0 54700 Indemnification 0 0 0 0 0 54800 Reserve Account 0 0 0 0 0 54900 Other Current Charges 124,505 113,055 135,270 135,270 0 Total Current Chgs & Oblig 124,505 113,055 135,270 135,270 0
Equipment FY19 Expenditure FY20 Expenditure FY21 Appropriation FY22 Recommended Inc/Dec 21 vs 22
55000 Automotive Equipment 0 0 0 0 0 55400 Lease/Purchase 0 0 0 0 0 55600 Office Furniture & Equipment 3,399 10,042 0 0 0 55900 Misc Equipment 1,420 15,128 2,400 0 -2,400 Total Equipment 4,819 25,170 2,400 0 -2,400
Other FY19 Expenditure FY20 Expenditure FY21 Appropriation FY22 Recommended Inc/Dec 21 vs 22
56200 Special Appropriation 0 0 0 0 0 57200 Structures & Improvements 0 0 0 0 0 58000 Land & Non-Structure 0 0 0 0 0 Total Other 0 0 0 0 0
Grand Total 2,702,650 2,827,300 3,270,970 3,520,571 249,601

40 Administration & FinanceBudget Management
Department Personnel
Title Union Code Grade Position FY22 Salary Title
Union Code Grade Position FY22 Salary
Adm Sec SU4 14 1.00 63,025 Office Operations Mgr (Budget) SE1 08 1.00 88,965 Adminis Assistant SU4 16 1.00 61,309 Risk Finance Mgr EXM 10 1.00 122,950 Assistant Director (OBM) EXM 10 3.00 349,031 Sr Adm An(SpProjStff)(Aud) SE1 06 1.00 90,319 Dep Dir (Capital) EXM 12 1.00 135,427 Sr Advisor (OBM) EXM 12 1.00 135,427 Deputy Director (Budget) EXM 14 1.00 149,334 Sr Data Proc Sys An(Budget) SE1 09 1.00 79,904 Exec Asst (Obpe) EXM 10 1.00 122,950 Sr Finance Manager EXM 09 1.00 79,904 Management Analyst (Obpe) SE1 06 9.00 665,306 Sr Management Analyst EXM 08 2.00 189,085
Supervisor of Budgets CDH NG 1.00 150,412
Total 26 2,483,348 Adjustments Differential Payments 0 Other 151,500 Chargebacks 61,307 Salary Savings -148,476 FY22 Total Request 2,547,679

Administration & FinanceBudget Management 41
External Funds History Personnel Services FY19 Expenditure FY20 Expenditure FY21 Appropriation FY22 Recommended Inc/Dec 21 vs 22
51000 Permanent Employees 0 0 0 0 0 51100 Emergency Employees 0 0 2,500,000 0 -2,500,000 51200 Overtime 0 4,145,720 21,707,942 0 -21,707,942 51300 Part Time Employees 0 0 0 0 0 51400 Health Insurance 0 0 0 0 0 51500 Pension & Annuity 0 0 0 0 0 51600 Unemployment Compensation 0 0 0 0 0 51700 Workers' Compensation 0 0 0 0 0 51800 Indirect Costs 0 0 0 0 0 51900 Medicare 0 0 0 0 0 Total Personnel Services 0 4,145,720 24,207,942 0 -24,207,942
Contractual Services FY19 Expenditure FY20 Expenditure FY21 Appropriation FY22 Recommended Inc/Dec 21 vs 22
52100 Communications 0 0 0 0 0 52200 Utilities 0 0 0 0 0 52400 Snow Removal 0 0 0 0 0 52500 Garbage/Waste Removal 0 0 0 0 0 52600 Repairs Buildings & Structures 0 0 0 0 0 52700 Repairs & Service of Equipment 0 0 0 0 0 52800 Transportation of Persons 0 282,435 147,313 0 -147,313 52900 Contracted Services 0 13,506,807 72,641,427 0 -72,641,427 Total Contractual Services 0 13,789,242 72,788,740 0 -72,788,740
Supplies & Materials FY19 Expenditure FY20 Expenditure FY21 Appropriation FY22 Recommended Inc/Dec 21 vs 22
53000 Auto Energy Supplies 0 0 0 0 0 53200 Food Supplies 0 0 3,000,000 0 -3,000,000 53400 Custodial Supplies 0 0 0 0 0 53500 Med, Dental, & Hosp Supply 0 0 0 0 0 53600 Office Supplies and Materials 0 0 0 0 0 53700 Clothing Allowance 0 0 0 0 0 53800 Educational Supplies & Mat 0 0 0 0 0 53900 Misc Supplies & Materials 0 2,396,198 1,256,292 0 -1,256,292 Total Supplies & Materials 0 2,396,198 4,256,292 0 -4,256,292
Current Chgs & Oblig FY19 Expenditure FY20 Expenditure FY21 Appropriation FY22 Recommended Inc/Dec 21 vs 22
54300 Workers' Comp Medical 0 0 0 0 0 54400 Legal Liabilities 0 0 0 0 0 54600 Current Charges H&I 0 0 0 0 0 54700 Indemnification 0 0 0 0 0 54800 Reserve Account 0 0 0 0 0 54900 Other Current Charges 0 0 0 0 0 Total Current Chgs & Oblig 0 0 0 0 0
Equipment FY19 Expenditure FY20 Expenditure FY21 Appropriation FY22 Recommended Inc/Dec 21 vs 22
55000 Automotive Equipment 0 0 0 0 0 55400 Lease/Purchase 0 0 0 0 0 55600 Office Furniture & Equipment 0 0 0 0 0 55900 Misc Equipment 0 3,269,225 12,000,000 0 -12,000,000 Total Equipment 0 3,269,225 12,000,000 0 -12,000,000
Other FY19 Expenditure FY20 Expenditure FY21 Appropriation FY22 Recommended Inc/Dec 21 vs 22
56200 Special Appropriation 0 0 0 0 0 57200 Structures & Improvements 0 0 0 0 0 58000 Land & Non-Structure 0 0 0 0 0 Total Other 0 0 0 0 0
Grand Total 0 23,600,385 113,252,974 0 -113,252,974

42 Administration & FinanceBudget Management
Program 1. Administration Justin Sterritt, Manager, Organization 141100
Program Description The Administration Program provides both overall direction and management to the Department, and support services such as internal budget preparation, personnel administration, IT support and training, and internal report production.
Operating Budget Actual '19 Actual '20 Approp '21 Budget '22
Personnel Services 806,809 865,956 880,385 1,010,706 Non Personnel 491,433 514,118 106,785 231,185 Total 1,298,242 1,380,074 987,170 1,241,891

Administration & FinanceBudget Management 43
Program 2. Budget & Management James M. Williamson, Manager, Organization 141200
Program Description The Budget & Management Program is responsible for the development and implementation of the City's operating budget. Program staff analyze program and fiscal management issues throughout City government.
Operating Budget Actual '19 Actual '20 Approp '21 Budget '22
Personnel Services 718,791 805,637 941,120 946,891 Non Personnel 2,366 1,955 14,300 2,300 Total 721,157 807,592 955,420 949,191
Performance
Goal: Improve use of limited city resources
Performance Measures Actual '19 Actual '20 Projected '21 Target '22
% achieved of savings identified in budget process 81% 62% 100% 100%
% of new investments implemented 87% 84% 97% 100%
New healthcare savings achieved through the Public Employee Committee (PEC)
1.5M 0.6M 8.6M 22.8M

44 Administration & FinanceBudget Management
Program 3. Revenue Monitoring Mor Zoran, Manager, Organization 141300
Program Description The Revenue Monitoring and Fiscal Analysis Program works to improve Boston's ability to deliver services by maximizing its revenue. The program also provides economic and fiscal analyses as an aid in fiscal decision-making by the Mayor, the Chief Financial Officer, and the Budget Director.
Operating Budget Actual '19 Actual '20 Approp '21 Budget '22
Personnel Services 152,799 84,407 106,560 110,831 Non Personnel 0 0 615,300 560,300 Total 152,799 84,407 721,860 671,131
Performance
Goal: Ensure long-term financial stability
Performance Measures Actual '19 Actual '20 Projected '21 Target '22
% by which actual revenues exceed actual expenditures 0.7% 0.4% 0.5% 0.5%
Goal: Maximize current and future revenues
Performance Measures Actual '19 Actual '20 Projected '21 Target '22
% achieved of new revenue identified in the budget process 283% 127% 62% 100%

Administration & FinanceBudget Management 45
Program 4. Capital Budgeting John Hanlon, Manager, Organization 141500
Program Description The Capital Budgeting Program manages the capital plan of the City. It prepares a multi-year capital plan, oversees capital construction projects, equipment acquisitions, and contracts, and manages all capital fund appropriations and related revenue including bonds and grants.
Operating Budget Actual '19 Actual '20 Approp '21 Budget '22
Personnel Services 351,671 369,092 409,665 392,403 Non Personnel 907 950 1,350 1,350 Total 352,578 370,042 411,015 393,753
Performance
Goal: Improve use of limited city resources
Performance Measures Actual '19 Actual '20 Projected '21 Target '22
% of capital plan associated with City planning efforts (Imagine Boston, Build BPS, Go Boston 2030, City Hall)
90.5% 90.5% 90.9% 90.9%

46 Administration & FinanceBudget Management
Program 5. Risk Management Stephanie Miller, Manager, Organization 141600
Program Description The Risk Management Program develops and implements the City’s integrated risk financing program, which includes self-insurance and commercial policies. The program also assists other City departments in their efforts to minimize costs related to property losses and legal injury and medical claims.
Operating Budget Actual '19 Actual '20 Approp '21 Budget '22
Personnel Services 119,322 126,676 122,950 124,850 Non Personnel 58,552 58,509 72,555 139,755 Total 177,874 185,185 195,505 264,605

Administration & FinanceBudget Management 47
External Funds Projects CARES-Coronavirus Relief Fund
Project Mission The Coronavirus Aid, Relief, and Economic Security Act, also known as the CARES Act, is a $2.2 trillion economic stimulus bill passed by the 116th U.S. Congress and signed into law by the President on March 27, 2020 in response to the economic fallout of the COVID-19 pandemic in the United States. The CARES Act is a broad-based economic stimulus bill, but the City of Boston is a direct recipient from a $150 billion program called the Coronavirus Relief Fund (CRF) specifically for states, tribal governments and units of local government paid in advance by the United States Treasury. Boston with a population in excess of 500,000 was eligible for a direct payment totaling $120.8 million. These funds were approved in the Boston City Council on May 6, 2020 and have been used to respond to COVID-19 crisis by providing resources to support rental relief, small business support, public health interventions and based on a recent extension will be used by December 31, 2021.
FEMA-Coronavirus Response
Project Mission The Federal Emergency Management Agency (FEMA) will provide reimbursement through the Commonwealth of Massachusetts for costs related to the emergency response funding for the COVID-19 emergency. The Boston City Council approved the first round of reimbursement on June 24, 2020 additional reimbursement authorization has been submitted to City Council.


Administration & FinanceExecution of Courts 49
Execution of Courts Operating Budget Administration & Finance Execution of Courts Appropriation 333000
Department Mission The Execution of Courts appropriation provides for funding for settlements, awards, and court orders. These result from claims against the City of Boston and its agencies and employees for damages to persons or property. The appropriation also funds interest on tax abatements.
Operating Budget Program Name Total Actual '19 Total Actual '20 Total Approp '21 Total Budget '22
Execution of Courts 18,233,939 7,083,289 5,000,000 5,000,000
Total 18,233,939 7,083,289 5,000,000 5,000,000

50 Administration & FinanceExecution of Courts
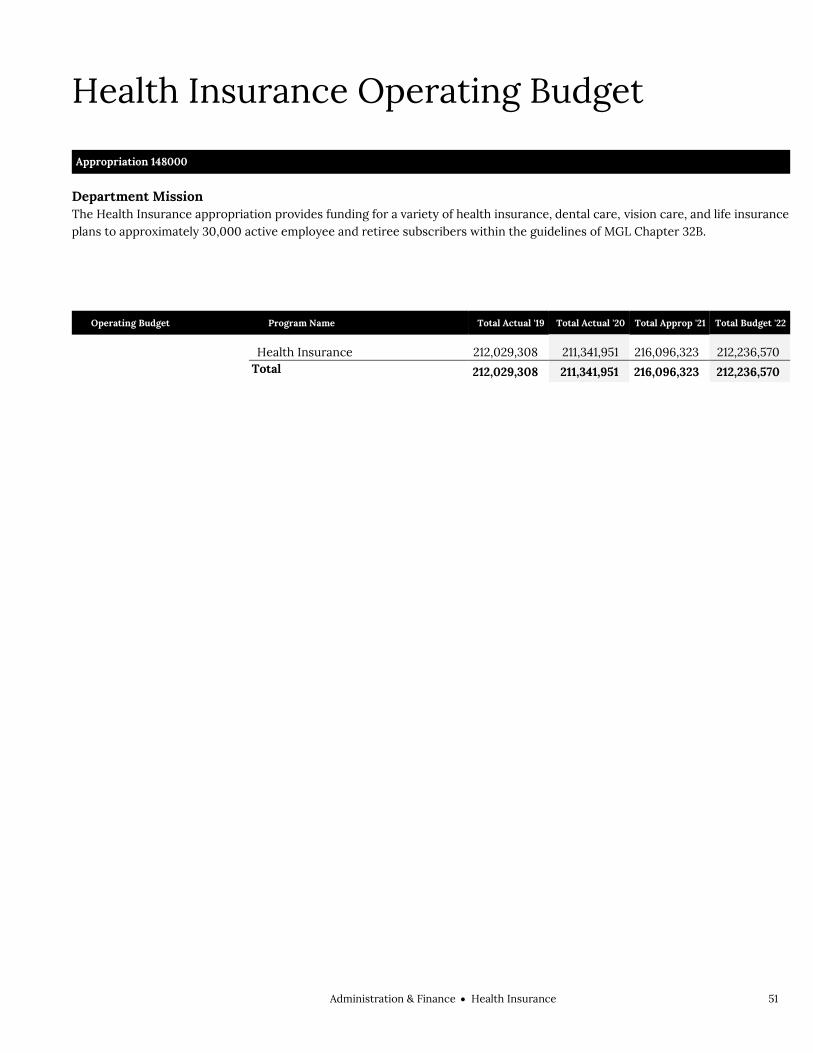
Administration & FinanceHealth Insurance 51
Health Insurance Operating Budget Administration & Finance Health Insurance Appropriation 148000
Department Mission The Health Insurance appropriation provides funding for a variety of health insurance, dental care, vision care, and life insurance plans to approximately 30,000 active employee and retiree subscribers within the guidelines of MGL Chapter 32B.
Operating Budget Program Name Total Actual '19 Total Actual '20 Total Approp '21 Total Budget '22
Health Insurance 212,029,308 211,341,951 216,096,323 212,236,570
Total 212,029,308 211,341,951 216,096,323 212,236,570

52 Administration & FinanceHealth Insurance

Administration & FinanceHuman Resources 53
Human Resources Operating Budget Administration & Finance Human Resources Vivian Leonard, Director, Appropriation 142000
Department Mission The mission of the Office of Human Resources is to help departments attract, motivate, retain, manage, and develop qualified and productive employees. The Office also provides unemployment benefits where necessary, as well as health and life insurance and workers' compensation benefits.
Selected Performance Goals Personnel
Improved Recruitment Process to Better Meet Needs of COB Departments. Affirmative Action
Increase Diversity in COB Workforce.
Operating Budget Program Name Total Actual '19 Total Actual '20 Total Approp '21 Total Budget '22
Personnel 2,751,269 2,832,764 3,483,604 4,097,383
Affirmative Action 50,971 206,189 527,500 63,625
Health Benefits & Insurance 842,744 915,301 944,739 923,632
Employee Assistance 281,134 232,114 138,225 307,785
Workers’ Compensation 768,823 922,891 876,533 785,219
Total 4,694,941 5,109,259 5,970,601 6,177,644
Operating Budget Actual '19 Actual '20 Approp '21 Budget '22
Personnel Services 3,578,473 3,740,830 4,132,853 4,575,456 Non Personnel 1,116,468 1,368,429 1,837,748 1,602,188 Total 4,694,941 5,109,259 5,970,601 6,177,644

54 Administration & FinanceHuman Resources
Human Resources Operating Budget
Authorizing Statutes Civil Service, M.G.L.A. c. 31. Collective Bargaining, M.G.L.A. C. 150E. Compensation of Employees; CBC Ord. §
5-5.18; M.G.L.A. c. 41, § 41. Employees Subject to Civil Service Laws,
CBC St. 5 § 110. Duties of Supervisor of Personnel, CBC
Ord. § 5-1.6. Generally, M.G.L.A. c. 152. County Employees Salary Classification,
M.G.L.A. c. 35, § 56. Third Parties; Subrogation, M.G.L.A. c.
152, § 15. Group Insurance Plan to Municipalities,
M.G.L.A. c. 32B, §§ 1-19. Operation As Self-Insurer, M.G.L.A. c.
152, § 25. Second Injury Reimbursement, M.G.L.A.
c. 152, § 37. Special Fund; Trust Fund; Assessment
Base and Rates; Payments; Reports; Audits, M.G.L.A. c. 152, § 65.
Description of Services Human Resources supplies departments with systems with which to manage hiring, compensation, and promotion. It pursues good labor relations, monitors unemployment benefits, and conducts affirmative action and recruitment programs as well as a full range of training programs. Additionally, the Department operates elements of the City's risk management program including employee assistance and managing attendance. As a direct service to both active and retired employees, the Department provides comprehensive and economical health insurance and life insurance, as well as access to all records.
Recruitment
Director Executive Secretary
Affirmative Action
Quarterly Hiring
Grievance Procedure
Employment Audits
Personnel Management
Training
Personnel Systems
Class. and Comp.
Unemployment
Employee Assistance
Counseling Services
Department/Employee Training
CDL Program
Community Outreach
Health Benefits
Administration
Orientation and Education
Benefit Services
Workers' Compensation
Litigation
Compensation Service
Claims Maintenance
Medical Case Management &
Bill Review
Utilization ReviewCivil Service
Collective Bargaining

Administration & FinanceHuman Resources 55
Department History Personnel Services FY19 Expenditure FY20 Expenditure FY21 Appropriation FY22 Recommended Inc/Dec 21 vs 22
51000 Permanent Employees 3,383,969 3,608,904 3,922,522 4,365,125 442,603 51100 Emergency Employees 168,574 119,863 205,331 205,331 0 51200 Overtime 4,774 5,388 5,000 5,000 0 51600 Unemployment Compensation 21,156 6,675 0 0 0 51700 Workers' Compensation 0 0 0 0 0 Total Personnel Services 3,578,473 3,740,830 4,132,853 4,575,456 442,603
Contractual Services FY19 Expenditure FY20 Expenditure FY21 Appropriation FY22 Recommended Inc/Dec 21 vs 22
52100 Communications 15,639 16,477 15,718 19,018 3,300 52200 Utilities 0 0 0 0 0 52400 Snow Removal 0 0 0 0 0 52500 Garbage/Waste Removal 0 0 0 0 0 52600 Repairs Buildings & Structures 0 0 0 0 0 52700 Repairs & Service of Equipment 4,051 6,087 5,350 6,400 1,050 52800 Transportation of Persons 8,380 10,881 9,000 9,000 0 52900 Contracted Services 150,097 291,597 642,100 449,375 -192,725 Total Contractual Services 178,167 325,042 672,168 483,793 -188,375
Supplies & Materials FY19 Expenditure FY20 Expenditure FY21 Appropriation FY22 Recommended Inc/Dec 21 vs 22
53000 Auto Energy Supplies 20 0 500 500 0 53200 Food Supplies 1,008 2,690 0 0 0 53400 Custodial Supplies 0 0 0 0 0 53500 Med, Dental, & Hosp Supply 0 0 0 0 0 53600 Office Supplies and Materials 46,493 35,965 55,180 53,430 -1,750 53700 Clothing Allowance 3,750 4,000 4,000 4,000 0 53800 Educational Supplies & Mat 0 0 0 0 0 53900 Misc Supplies & Materials 0 0 0 0 0 Total Supplies & Materials 51,271 42,655 59,680 57,930 -1,750
Current Chgs & Oblig FY19 Expenditure FY20 Expenditure FY21 Appropriation FY22 Recommended Inc/Dec 21 vs 22
54300 Workers' Comp Medical 0 66 0 0 0 54400 Legal Liabilities 0 0 0 0 0 54500 Aid To Veterans 0 0 0 0 0 54600 Current Charges H&I 0 0 0 0 0 54700 Indemnification 0 0 0 0 0 54800 Reserve Account 0 0 0 0 0 54900 Other Current Charges 878,899 907,061 1,105,900 1,060,465 -45,435 Total Current Chgs & Oblig 878,899 907,127 1,105,900 1,060,465 -45,435
Equipment FY19 Expenditure FY20 Expenditure FY21 Appropriation FY22 Recommended Inc/Dec 21 vs 22
55000 Automotive Equipment 0 0 0 0 0 55400 Lease/Purchase 0 0 0 0 0 55600 Office Furniture & Equipment 8,131 6,062 0 0 0 55900 Misc Equipment 0 87,543 0 0 0 Total Equipment 8,131 93,605 0 0 0
Other FY19 Expenditure FY20 Expenditure FY21 Appropriation FY22 Recommended Inc/Dec 21 vs 22
56200 Special Appropriation 0 0 0 0 0 57200 Structures & Improvements 0 0 0 0 0 58000 Land & Non-Structure 0 0 0 0 0 Total Other 0 0 0 0 0
Grand Total 4,694,941 5,109,259 5,970,601 6,177,644 207,043

56 Administration & FinanceHuman Resources
Department Personnel
Title Union Code Grade Position FY22 Salary Title
Union Code Grade Position FY22 Salary
Adm Asst SU4 15 1.00 70,871 Intern & Fellowship Program Coord
SE1 06 1.00 90,319
Ass Dir of Investns & Training EXM 08 1.00 73,198 Manager, Leave Administration EXM 10 1.00 115,848 Assistant Compliance Manager SE1 06 1.00 69,440 Nurse Case Manager SE1 07 1.00 99,243 Assoc Dir (EAP) EXM 09 1.00 113,659 Personnel Analyst SE1 05 1.00 54,409 Asst Dirtr EXM 11 1.00 96,280 Personnel Asst (Ads/Psd) SU4 17 1.00 82,876
Benefits HRIS Manager EXM 08 1.00 73,198 Policy Analyst & Project Manager EXM 08 1.00 98,282
Dir (Class & Comp) EXM 11 1.00 123,055 Prin Admin Assistant SE1 08 3.00 290,134 Dir of Employee Asst (EAP) EXM 12 1.00 125,198 Prin Admin Asst_(ASD) SE1 07 1.00 66,486 Dir of Health Benefits EXM 12 1.00 127,255 Principal Clerk SU4 10 1.00 51,282 Dir of Investg & Training(OHR) EXM 10 1.00 87,958 Retiree Benefits Mgr EXM 08 1.00 105,822 Dir of Talent Aquisition Mgmt EXM 10 1.00 87,958 Retiree Benefits Rep SU4 16 1.00 72,725 Director Operations EXM 12 1.00 133,560 Senior Admin Asst SE1 07 2.00 195,320 DP Sys Anl SE1 06 1.00 90,319 Special Advisor EXM NG 1.00 178,990 Employee Assistance Clinician EXM 08 4.00 342,775 Sr Adm Asst (OHR) SE1 08 2.00 216,936 Head Account Clerk SU4 12 4.00 214,095 Sr Adm Asst (WC) SE1 06 1.00 90,319 Head Clerk SU4 12 1.00 56,052 Sr Admin Asst EXM 06 1.00 86,356 HR Transformation Director EXM NG 1.00 170,467 Sr Data Proc Sys Analyst SE1 08 1.00 75,881 HRIS Associate Manager EXM 08 1.00 105,822 Sr Personnel Analyst SE1 07 1.00 84,941 Human Resources Generalist EXM 07 1.00 96,823 Supervisor of Personnel CDH NG 1.00 135,371
Human Resources HRIS Manager
EXM 10 1.00 122,950 Supvising Claims Agent (Asd) EXM 09 1.00 79,904
Human Resources Representative
SU4 15 4.00 255,386 Worker's Compensation Case Mgr
SU4 18 3.00 263,565
Total 57 5,171,328 Adjustments Differential Payments 0 Other 33,000 Chargebacks -559,200 Salary Savings -280,000 FY22 Total Request 4,365,128

Administration & FinanceHuman Resources 57
Program 1. Personnel Vivian Leonard, Manager, Organization 142100
Program Description The Personnel Program provides personnel services to all City departments. Through Personnel, departments are provided with management systems with which to hire, classify, compensate and promote employees, pursue good labor relations and management practices, provide unemployment benefits and, in each process, have access to relevant records. The program also carries out a variety of training and assistance programs to encourage and enhance human resource management in the City of Boston.
Operating Budget Actual '19 Actual '20 Approp '21 Budget '22
Personnel Services 1,782,959 1,903,366 2,389,127 2,770,261 Non Personnel 968,310 929,398 1,094,477 1,327,122 Total 2,751,269 2,832,764 3,483,604 4,097,383
Performance
Goal: Improved Recruitment Process to Better Meet Needs of COB Departments
Performance Measures Actual '19 Actual '20 Projected '21 Target '22
Days from Job Requisition Posting to Candidate Hire 55 68 85 60

58 Administration & FinanceHuman Resources
Program 2. Affirmative Action Vivian Leonard, Manager, Organization 142200
Program Description The Affirmative Action Program is responsible for implementing the City's Affirmative Action Plan. It reviews the city's hiring practices and employment policies, audits affirmative action statistics, implements anti-harassment policies, ensures city compliance with federal and state EEO requirements and provides affirmative action assistance to all city departments.
Operating Budget Actual '19 Actual '20 Approp '21 Budget '22
Personnel Services 1,860 0 0 0 Non Personnel 49,111 206,189 527,500 63,625 Total 50,971 206,189 527,500 63,625
Performance
Goal: Increase Diversity in COB Workforce
Performance Measures Actual '19 Actual '20 Projected '21 Target '22
% City Workforce - people of color 39% 39% 40% 41%
% City Workforce - women 31% 29% 31% 32%
% of total promotions - people of color 43% 43% 45% 45%
% of total promotions - women 36% 34% 31% 33%

Administration & FinanceHuman Resources 59
Program 3. Health Benefits & Insurance Marianna Gil, Manager, Organization 142300
Program Description The Health Benefits and Insurance Program is responsible for providing life insurance, dental and vision care, and a variety of health insurance plans to active and retired employees of the City of Boston as efficiently and economically as possible within the guidelines of MGL Chapter 32B.
Operating Budget Actual '19 Actual '20 Approp '21 Budget '22
Personnel Services 793,573 856,081 882,284 861,177 Non Personnel 49,171 59,220 62,455 62,455 Total 842,744 915,301 944,739 923,632

60 Administration & FinanceHuman Resources
Program 4. Employee Assistance Wendolyn M. Costello-Cook, Manager, Organization 142400
Program Description The Employee Assistance Program (EAP) is designed to attract and assist employees who experience personal problems. The program will assist employees in the identification and resolution of productivity problems associated with employees impaired by personal concerns including but not limited to: health, marital, financial, substance abuse, emotional stress and other personal concerns which may adversely affect job performance.
Operating Budget Actual '19 Actual '20 Approp '21 Budget '22
Personnel Services 280,591 231,557 135,673 306,433 Non Personnel 543 557 2,552 1,352 Total 281,134 232,114 138,225 307,785

Administration & FinanceHuman Resources 61
Program 5. Workers’ Compensation Kerry Gillian Nero, Manager, Organization 142500
Program Description The Workers' Compensation Program implements all procedures for the processing of workers' compensation claims and approved medical and related bills. It also distributes workers' compensation information and statistics to City departments and works with the Law Department to develop legal strategies to resolve workers' compensation cases in an appropriate manner.
Operating Budget Actual '19 Actual '20 Approp '21 Budget '22
Personnel Services 719,490 749,826 725,769 637,585 Non Personnel 49,333 173,065 150,764 147,634 Total 768,823 922,891 876,533 785,219


Administration & FinanceLabor Relations 63
Labor Relations Operating Budget Administration & Finance Labor Relations Kate Kleimola, Acting Director, Appropriation 147000
Department Mission The mission of the Office of Labor Relations is to create and promote a productive work environment that fosters an efficient and effective relationship between labor and management.
Selected Performance Goals Labor Relations
To negotiate labor contracts and meet other bargaining obligations with the City's labor unions.
Operating Budget Program Name Total Actual '19 Total Actual '20 Total Approp '21 Total Budget '22
Labor Relations 1,122,845 1,309,176 1,459,896 1,605,222
Total 1,122,845 1,309,176 1,459,896 1,605,222
Operating Budget Actual '19 Actual '20 Approp '21 Budget '22
Personnel Services 768,311 804,291 864,127 1,009,358 Non Personnel 354,534 504,885 595,769 595,864 Total 1,122,845 1,309,176 1,459,896 1,605,222

64 Administration & FinanceLabor Relations
Labor Relations Operating Budget
Authorizing Statutes Duties of Supervisor of Labor Relations,
CBC Ord. 5, s. 4.
Description of Services The Office of Labor Relations represents the Mayor and City departments in all labor relations matters before state and federal courts, state agencies, and in various other forums. The Office is responsible for negotiating and administering collective bargaining agreements with approximately 19 unions covering 7,200 employees. Additionally, the Office advises City managers and supervisors on labor matters regarding policy issues.
Supervisor
Legal
Negotiations
Grievance & Arbitration Hearings
Legal Counsel & Advice to City Departments
Administration
Accounting
Personnel
Analysis
ManagementTraining
Research
Statistical DataAdministrative Management
Adjudication of Contractual Grievances

Administration & FinanceLabor Relations 65
Department History Personnel Services FY19 Expenditure FY20 Expenditure FY21 Appropriation FY22 Recommended Inc/Dec 21 vs 22
51000 Permanent Employees 768,311 795,971 864,127 1,009,358 145,231 51100 Emergency Employees 0 0 0 0 0 51200 Overtime 0 0 0 0 0 51600 Unemployment Compensation 0 8,320 0 0 0 51700 Workers' Compensation 0 0 0 0 0 Total Personnel Services 768,311 804,291 864,127 1,009,358 145,231
Contractual Services FY19 Expenditure FY20 Expenditure FY21 Appropriation FY22 Recommended Inc/Dec 21 vs 22
52100 Communications 791 2,480 1,750 2,875 1,125 52200 Utilities 0 0 0 0 0 52400 Snow Removal 0 0 0 0 0 52500 Garbage/Waste Removal 0 0 0 0 0 52600 Repairs Buildings & Structures 0 0 0 0 0 52700 Repairs & Service of Equipment 0 0 1,000 770 -230 52800 Transportation of Persons 1,925 1,788 1,800 2,100 300 52900 Contracted Services 318,656 470,518 552,200 551,095 -1,105 Total Contractual Services 321,372 474,786 556,750 556,840 90
Supplies & Materials FY19 Expenditure FY20 Expenditure FY21 Appropriation FY22 Recommended Inc/Dec 21 vs 22
53000 Auto Energy Supplies 0 0 0 0 0 53200 Food Supplies 0 0 0 0 0 53400 Custodial Supplies 0 0 0 0 0 53500 Med, Dental, & Hosp Supply 0 0 0 0 0 53600 Office Supplies and Materials 1,727 1,267 3,000 2,800 -200 53700 Clothing Allowance 0 0 0 0 0 53800 Educational Supplies & Mat 0 0 0 0 0 53900 Misc Supplies & Materials 0 0 0 0 0 Total Supplies & Materials 1,727 1,267 3,000 2,800 -200
Current Chgs & Oblig FY19 Expenditure FY20 Expenditure FY21 Appropriation FY22 Recommended Inc/Dec 21 vs 22
54300 Workers' Comp Medical 0 0 0 0 0 54400 Legal Liabilities 0 0 0 0 0 54500 Aid To Veterans 0 0 0 0 0 54600 Current Charges H&I 0 0 0 0 0 54700 Indemnification 0 0 0 0 0 54800 Reserve Account 0 0 0 0 0 54900 Other Current Charges 31,435 28,832 36,019 36,224 205 Total Current Chgs & Oblig 31,435 28,832 36,019 36,224 205
Equipment FY19 Expenditure FY20 Expenditure FY21 Appropriation FY22 Recommended Inc/Dec 21 vs 22
55000 Automotive Equipment 0 0 0 0 0 55400 Lease/Purchase 0 0 0 0 0 55600 Office Furniture & Equipment 0 0 0 0 0 55900 Misc Equipment 0 0 0 0 0 Total Equipment 0 0 0 0 0
Other FY19 Expenditure FY20 Expenditure FY21 Appropriation FY22 Recommended Inc/Dec 21 vs 22
56200 Special Appropriation 0 0 0 0 0 57200 Structures & Improvements 0 0 0 0 0 58000 Land & Non-Structure 0 0 0 0 0 Total Other 0 0 0 0 0
Grand Total 1,122,845 1,309,176 1,459,896 1,605,222 145,326

66 Administration & FinanceLabor Relations
Department Personnel
Title Union Code Grade Position FY22 Salary Title
Union Code Grade Position FY22 Salary
Asst Corp Counsel III EXM 08 6.00 519,980 Labor Relations Analyst EXM 04 1.00 52,933 Asst Supv/Labor Relations EXM 12 1.00 121,106 Legal Secretary (OLR) MYG 17 1.00 58,534 Exec Director CDH NG 1.00 160,440 Office Manager EXM 06 1.00 88,116 Total 11 1,001,109 Adjustments Differential Payments 0 Other 8,250 Chargebacks 0 Salary Savings 0 FY22 Total Request 1,009,359
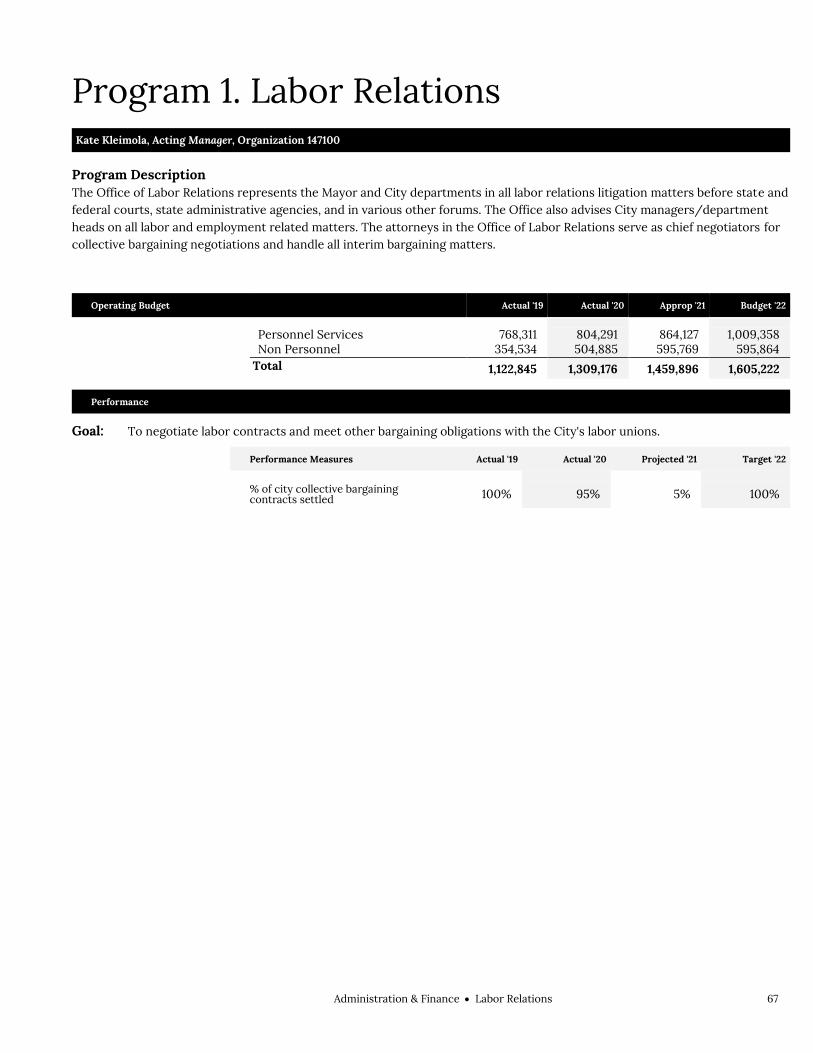
Administration & FinanceLabor Relations 67
Program 1. Labor Relations Kate Kleimola, Acting Manager, Organization 147100
Program Description The Office of Labor Relations represents the Mayor and City departments in all labor relations litigation matters before state and federal courts, state administrative agencies, and in various other forums. The Office also advises City managers/department heads on all labor and employment related matters. The attorneys in the Office of Labor Relations serve as chief negotiators for collective bargaining negotiations and handle all interim bargaining matters.
Operating Budget Actual '19 Actual '20 Approp '21 Budget '22
Personnel Services 768,311 804,291 864,127 1,009,358 Non Personnel 354,534 504,885 595,769 595,864 Total 1,122,845 1,309,176 1,459,896 1,605,222
Performance
Goal: To negotiate labor contracts and meet other bargaining obligations with the City's labor unions.
Performance Measures Actual '19 Actual '20 Projected '21 Target '22
% of city collective bargaining contracts settled 100% 95% 5% 100%


Administration & FinanceMedicare Payments 69
Medicare Payments Operating Budget Administration & Finance Medicare Payments Appropriation 139000
Department Mission The Medicare Payments appropriation supports federal regulations that extend mandatory Medicare coverage to municipal employees. Federal law requires the City of Boston and County of Suffolk to pay the Social Security Trust Fund a Medicare insurance premium amounting to 1.45% of an employee's salary up to $125,000 for each employee hired after March 31, 1986. The Medicare Payments appropriation reflects the amount of this contribution. The City's payment is matched by an equal contribution from the employee.
Operating Budget Program Name Total Actual '19 Total Actual '20 Total Approp '21 Total Budget '22
Medicare Payments 10,673,357 10,618,969 11,200,000 12,635,794
Total 10,673,357 10,618,969 11,200,000 12,635,794


Administration & FinancePensions & Annuities - City 71
Pensions & Annuities - City Operating Budget Administration & Finance Pensions & Annuities - City Appropriation 374000
Department Mission The Pensions and Annuities appropriation funds City payments for retirees who are not members of the contributory retirement system. These include approximately 28 individuals who qualify under the Veteran's Retirement Law as being World War II veterans, having 30 years of service, and being employed prior to 1939, and approximately 25 Police and Fire members who received special legislation retirements due to extreme workplace injuries.
Operating Budget Program Name Total Actual '19 Total Actual '20 Total Approp '21 Total Budget '22
Pensions & Annuities - City 3,699,484 3,515,768 3,900,000 3,900,000
Total 3,699,484 3,515,768 3,900,000 3,900,000
Operating Budget Actual '19 Actual '20 Approp '21 Budget '22
Personnel Services 3,699,484 3,515,768 3,900,000 3,900,000 Total 3,699,484 3,515,768 3,900,000 3,900,000

72 Administration & FinancePensions & Annuities - City

Administration & FinancePensions & Annuities - County 73
Pensions & Annuities - County Operating Budget Administration & Finance Pensions & Annuities - County Appropriation 749000
Department Mission The Pensions and Annuities appropriation funds the County's payments to retired County officials and employees who were not members of the contributory retirement systems. Individuals paid under this system are veterans of World War II, have 30 years of service, and were employed prior to 1939.
Operating Budget Program Name Total Actual '19 Total Actual '20 Total Approp '21 Total Budget '22
Pensions & Annuities - County 13,147 0 0 0
Total 13,147 0 0 0
Operating Budget Actual '19 Actual '20 Approp '21 Budget '22
Personnel Services 13,147 0 0 0 Total 13,147 0 0 0

74 Administration & FinancePensions & Annuities - County

Administration & FinanceProcurement 75
Procurement Operating Budget Administration & Finance Procurement Kevin Coyne, Purchasing Agent, Appropriation 143000
Department Mission The Procurement Department mission is to purchase the best quality products using fair and Equitable Procurement Processes, inclusive of small and local businesses, including minority-owned businesses (MBEs), woman-owned businesses (WBEs), and veteran-owned small businesses. These products are to be purchased at the lowest possible price and delivered promptly to City departments. The department is also responsible for surplus property, processing mail, providing copier service and publishing the City Record.
Operating Budget Program Name Total Actual '19 Total Actual '20 Total Approp '21 Total Budget '22
Administration 627,043 1,681,843 862,647 874,988
Procurement 940,361 747,960 643,963 652,718
Central Services 168,809 343,219 353,382 352,639
Total 1,736,213 2,773,022 1,859,992 1,880,345
Operating Budget Actual '19 Actual '20 Approp '21 Budget '22
Personnel Services 1,679,446 1,777,022 1,767,742 1,780,928 Non Personnel 56,767 996,000 92,250 99,417 Total 1,736,213 2,773,022 1,859,992 1,880,345

76 Administration & FinanceProcurement
Procurement Operating Budget
Authorizing Statutes Enabling Legislation, M.G.L.A. c.41, § 103. Duties of the Purchasing Agent, CBC
Ord. § 5-1.8. Content and Sale, CBC St. 2 § 650. Uniform Procurement Act, M.G.L.A. c.
30B.
Description of Services The Procurement Department procures all supplies, materials, and equipment for City departments. The department selects vendors through public bidding and processes purchase orders and contracts. The Central Services Unit ensures the efficient and economical disposal of all surplus City property excluding land and buildings, and processes and posts all outgoing, inter-office, and incoming mail. This unit also produces the City Record and operates the Copy Center.

Administration & FinanceProcurement 77
Department History Personnel Services FY19 Expenditure FY20 Expenditure FY21 Appropriation FY22 Recommended Inc/Dec 21 vs 22
51000 Permanent Employees 1,676,131 1,730,820 1,767,742 1,780,928 13,186 51100 Emergency Employees 0 0 0 0 0 51200 Overtime 687 -368 0 0 0 51600 Unemployment Compensation 0 0 0 0 0 51700 Workers' Compensation 2,628 46,570 0 0 0 Total Personnel Services 1,679,446 1,777,022 1,767,742 1,780,928 13,186
Contractual Services FY19 Expenditure FY20 Expenditure FY21 Appropriation FY22 Recommended Inc/Dec 21 vs 22
52100 Communications 3,942 7,961 4,000 8,376 4,376 52200 Utilities 0 0 0 0 0 52400 Snow Removal 0 0 0 0 0 52500 Garbage/Waste Removal 0 0 0 0 0 52600 Repairs Buildings & Structures 5,040 0 0 0 0 52700 Repairs & Service of Equipment 26,443 55,282 30,000 30,000 0 52800 Transportation of Persons 4,821 4,038 4,875 4,875 0 52900 Contracted Services 7,439 7,162 5,544 5,544 0 Total Contractual Services 47,685 74,443 44,419 48,795 4,376
Supplies & Materials FY19 Expenditure FY20 Expenditure FY21 Appropriation FY22 Recommended Inc/Dec 21 vs 22
53000 Auto Energy Supplies 0 0 0 0 0 53200 Food Supplies 0 0 0 0 0 53400 Custodial Supplies 0 0 0 0 0 53500 Med, Dental, & Hosp Supply 0 0 0 0 0 53600 Office Supplies and Materials 11,430 12,139 8,525 12,225 3,700 53700 Clothing Allowance 2,750 3,000 3,000 3,000 0 53800 Educational Supplies & Mat 0 0 0 0 0 53900 Misc Supplies & Materials 0 0 0 0 0 Total Supplies & Materials 14,180 15,139 11,525 15,225 3,700
Current Chgs & Oblig FY19 Expenditure FY20 Expenditure FY21 Appropriation FY22 Recommended Inc/Dec 21 vs 22
54300 Workers' Comp Medical 1,745 12,955 0 0 0 54400 Legal Liabilities 0 0 0 0 0 54500 Aid To Veterans 0 0 0 0 0 54600 Current Charges H&I 0 0 0 0 0 54700 Indemnification 0 0 0 0 0 54800 Reserve Account 0 0 0 0 0 54900 Other Current Charges 4,009 2,689 5,500 5,065 -435 Total Current Chgs & Oblig 5,754 15,644 5,500 5,065 -435
Equipment FY19 Expenditure FY20 Expenditure FY21 Appropriation FY22 Recommended Inc/Dec 21 vs 22
55000 Automotive Equipment 0 0 0 0 0 55400 Lease/Purchase 42,623 0 24,806 24,332 -474 55600 Office Furniture & Equipment 8,183 760 0 0 0 55900 Misc Equipment 3,258 16,747 0 0 0 Total Equipment 54,064 17,507 24,806 24,332 -474
Other FY19 Expenditure FY20 Expenditure FY21 Appropriation FY22 Recommended Inc/Dec 21 vs 22
56200 Special Appropriation -64,916 873,267 6,000 6,000 0 57200 Structures & Improvements 0 0 0 0 0 58000 Land & Non-Structure 0 0 0 0 0 Total Other -64,916 873,267 6,000 6,000 0
Grand Total 1,736,213 2,773,022 1,859,992 1,880,345 20,353
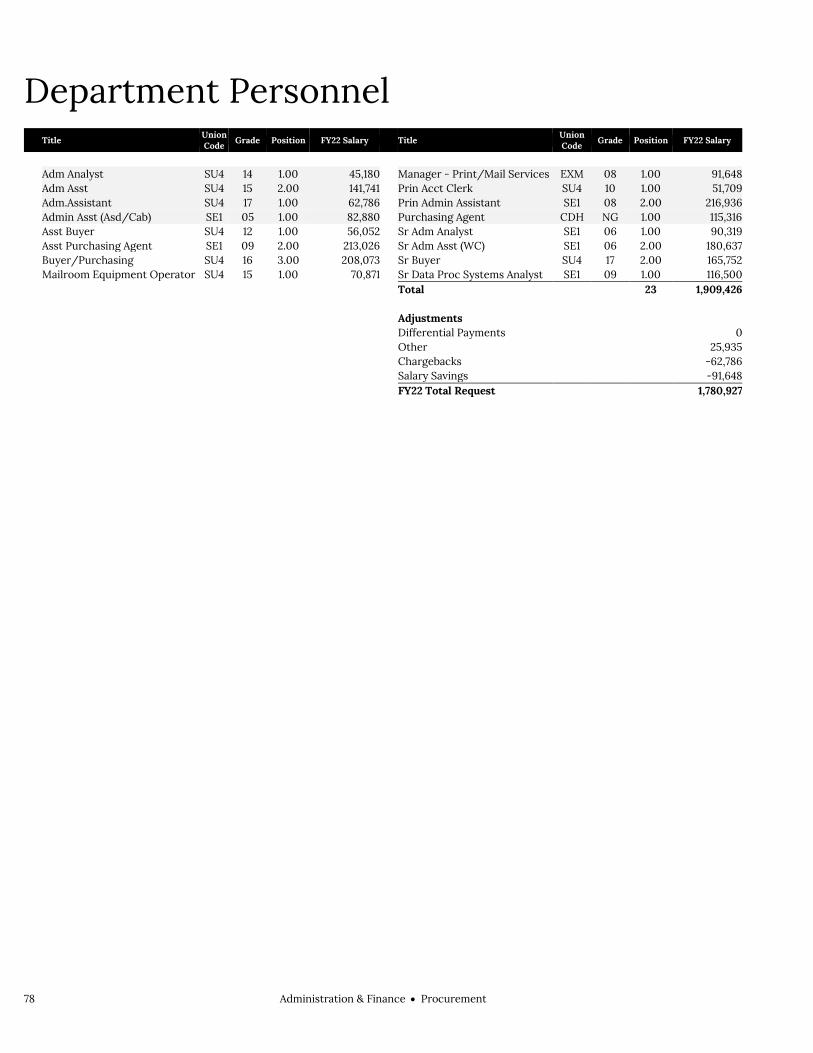
78 Administration & FinanceProcurement
Department Personnel
Title Union Code Grade Position FY22 Salary Title
Union Code Grade Position FY22 Salary
Adm Analyst SU4 14 1.00 45,180 Manager - Print/Mail Services EXM 08 1.00 91,648 Adm Asst SU4 15 2.00 141,741 Prin Acct Clerk SU4 10 1.00 51,709 Adm.Assistant SU4 17 1.00 62,786 Prin Admin Assistant SE1 08 2.00 216,936 Admin Asst (Asd/Cab) SE1 05 1.00 82,880 Purchasing Agent CDH NG 1.00 115,316 Asst Buyer SU4 12 1.00 56,052 Sr Adm Analyst SE1 06 1.00 90,319 Asst Purchasing Agent SE1 09 2.00 213,026 Sr Adm Asst (WC) SE1 06 2.00 180,637 Buyer/Purchasing SU4 16 3.00 208,073 Sr Buyer SU4 17 2.00 165,752 Mailroom Equipment Operator SU4 15 1.00 70,871 Sr Data Proc Systems Analyst SE1 09 1.00 116,500 Total 23 1,909,426 Adjustments Differential Payments 0 Other 25,935 Chargebacks -62,786 Salary Savings -91,648 FY22 Total Request 1,780,927

Administration & FinanceProcurement 79
Program 1. Administration Kevin Coyne, Manager, Organization 143100
Program Description The Administration Program provides administrative, fiscal and human resource support to the Department.
Operating Budget Actual '19 Actual '20 Approp '21 Budget '22
Personnel Services 592,597 860,926 818,814 822,888 Non Personnel 34,447 820,917 43,833 52,100 Total 627,045 1,681,843 862,647 874,988

80 Administration & FinanceProcurement
Program 2. Procurement Gerard Bonaceto, Kevin Coyne, Managers, Organization 143200
Program Description The Procurement Program procures goods and materials for use by all City departments. This program selects vendors through the public bid process, and initiates purchase orders and contracts consistent with appropriateness of cost, quality, delivery requirements, and vendor service. All procurements are fully inclusive of small and local businesses, including minority-owned businesses (MBEs), woman-owned businesses (WBEs), and veteran-owned small businesses are conducted to ensure taxpayers money is spent appropriately. Our Procurement Program follows a Green Purchasing process and purchases products that has a lesser or reduced negative effect or increased positive effect on human health and the environment, when compared with competing products that serve the same purpose.
Operating Budget Actual '19 Actual '20 Approp. '21 Budget '22
Personnel Services 923,144 537,746 631,067 640,322 Non Personnel 17,217 210,214 12,896 12,396 Total 940,361 747,961 643,963 652,718
Performance
Goal: The Procurement Office in the City of Boston uses a 100% electronic format. Creating a contract should be a seamless and relatively quick process. This is achieved by continuously monitoring and reviewing this process.
Performance Measures Actual '19 Actual '20 Projected '21 Target '22
Average time to create contract (days)
17.63 21.5 15 15
Goal: To display the percentage of savings the departments are able to achieve from request to the time of order
Performance Measures Actual '19 Actual '20 Projected '21 Target '22
Requisition to Purchase Order savings in percent
2.% 3% 3% 3%
Goal: To measure the amount of time that it takes to produce a purchase order (should be less than seven days). There are certain cases where there is need to be publically bid, and it will be longer
Performance Measures Actual '19 Actual '20 Projected '21 Target '22
Average Requisition to Purchase Order timeline (days)
7.33 6.38 5.00 5.00
Goal: To simplify conducting business with the City of Boston. To provide an exceptional experience and a superior level of customer service for all vendors. To supply support to vendors at all stages of procurement
Performance Measures Actual '19 Actual '20 Projected '21 Target '22
Supplier Portal Vendor support requests
44,268 14,303 7,500 7,500

Administration & FinanceProcurement 81
Program 3. Central Services Kevin Coyne, Manager, Organization 143300
Program Description The Central Services Program provides central mailroom services, manages the central photocopy center, manages the disposal of departmental surplus goods and publishes the City Record.
Operating Budget Actual '19 Actual '20 Approp '21 Budget '22
Personnel Services 163,705 378,350 317,861 317,718 Non Personnel 5,104 -35,131 35,521 34,921 Total 168,809 343,219 353,382 352,639


Administration & FinanceRegistry Division 83
Registry Division Operating Budget Administration & Finance Registry Division Patricia A. McMahon, Registrar, Appropriation 163000
Department Mission The mission of the Registry Division is to promptly and accurately register, amend, maintain, and issue certified copies of birth, marriage and death records while following Massachusetts General Laws regulating these documents.
Selected Performance Goals Administration
Expand crosstraining. Vital Statistics
Online death requests. Register new records and issue certified copies. To automate the certificate request process.
Operating Budget Program Name Total Actual '19 Total Actual '20 Total Approp '21 Total Budget '22
Administration 343,168 355,844 396,128 389,514
Vital Statistics 643,256 602,744 569,913 609,754
Depositions 129,961 119,533 120,598 145,913
Total 1,116,385 1,078,121 1,086,639 1,145,181
Operating Budget Actual '19 Actual '20 Approp '21 Budget '22
Personnel Services 956,814 980,148 985,714 1,064,241 Non Personnel 159,571 97,973 100,925 80,940 Total 1,116,385 1,078,121 1,086,639 1,145,181

84 Administration & FinanceRegistry Division
Registry Division Operating Budget
Authorizing Statutes Civil Service, M.G.L.A. c. 31. Births, Marriages, Deaths, and
Depositions, M.G.L.A. cc. 46, 207, 209c, 210; M.G.L.A. c.190, § 7; M.G.L.A. c. 272, § 96.
Fees & Charges, CBC Ord. § 18-1.2.
Description of Services The Registry Division maintains custody of all birth, marriage, and death records dating back to 1630. Each year the Division adds approximately 33,000 new entries and issues more than 100,000 copies of certified records.
City Registrar
Administration
Employee Resources
State Requirements
Technology and Digitalization
Vital Statistics
Register Births, Marriages and Deaths
Issue Certified Copied of Registry Records
Depositions
Amending Records
Paternity Cases
Posting of Despositions
File Marriage Intentions and Issue
Licenses

Administration & FinanceRegistry Division 85
Department History Personnel Services FY19 Expenditure FY20 Expenditure FY21 Appropriation FY22 Recommended Inc/Dec 21 vs 22
51000 Permanent Employees 956,814 980,148 985,714 1,064,241 78,527 51100 Emergency Employees 0 0 0 0 0 51200 Overtime 0 0 0 0 0 51600 Unemployment Compensation 0 0 0 0 0 51700 Workers' Compensation 0 0 0 0 0 Total Personnel Services 956,814 980,148 985,714 1,064,241 78,527
Contractual Services FY19 Expenditure FY20 Expenditure FY21 Appropriation FY22 Recommended Inc/Dec 21 vs 22
52100 Communications 930 2,066 3,000 2,700 -300 52200 Utilities 0 0 0 0 0 52400 Snow Removal 0 0 0 0 0 52500 Garbage/Waste Removal 0 0 0 0 0 52600 Repairs Buildings & Structures 0 0 0 0 0 52700 Repairs & Service of Equipment 539 0 2,500 2,000 -500 52800 Transportation of Persons 2,775 2,089 2,700 2,520 -180 52900 Contracted Services 120,799 34,902 64,645 35,040 -29,605 Total Contractual Services 125,043 39,057 72,845 42,260 -30,585
Supplies & Materials FY19 Expenditure FY20 Expenditure FY21 Appropriation FY22 Recommended Inc/Dec 21 vs 22
53000 Auto Energy Supplies 0 0 0 0 0 53200 Food Supplies 0 0 0 0 0 53400 Custodial Supplies 0 0 0 0 0 53500 Med, Dental, & Hosp Supply 0 0 0 0 0 53600 Office Supplies and Materials 23,482 33,556 23,240 33,900 10,660 53700 Clothing Allowance 3,750 3,750 3,750 3,750 0 53800 Educational Supplies & Mat 0 0 0 0 0 53900 Misc Supplies & Materials 0 0 0 0 0 Total Supplies & Materials 27,232 37,306 26,990 37,650 10,660
Current Chgs & Oblig FY19 Expenditure FY20 Expenditure FY21 Appropriation FY22 Recommended Inc/Dec 21 vs 22
54300 Workers' Comp Medical 0 0 0 0 0 54400 Legal Liabilities 0 0 0 0 0 54500 Aid To Veterans 0 0 0 0 0 54600 Current Charges H&I 0 0 0 0 0 54700 Indemnification 0 0 0 0 0 54800 Reserve Account 0 0 0 0 0 54900 Other Current Charges 934 975 1,090 1,030 -60 Total Current Chgs & Oblig 934 975 1,090 1,030 -60
Equipment FY19 Expenditure FY20 Expenditure FY21 Appropriation FY22 Recommended Inc/Dec 21 vs 22
55000 Automotive Equipment 0 0 0 0 0 55400 Lease/Purchase 0 0 0 0 0 55600 Office Furniture & Equipment 0 0 0 0 0 55900 Misc Equipment 6,362 20,635 0 0 0 Total Equipment 6,362 20,635 0 0 0
Other FY19 Expenditure FY20 Expenditure FY21 Appropriation FY22 Recommended Inc/Dec 21 vs 22
56200 Special Appropriation 0 0 0 0 0 57200 Structures & Improvements 0 0 0 0 0 58000 Land & Non-Structure 0 0 0 0 0 Total Other 0 0 0 0 0
Grand Total 1,116,385 1,078,121 1,086,639 1,145,181 58,542

86 Administration & FinanceRegistry Division
Department Personnel
Title Union Code Grade Position FY22 Salary Title
Union Code Grade Position FY22 Salary
Adm Sec SU4 14 1.00 63,025 Deposition Clerk SU4 14 2.00 110,160 Asst City Registrar SE1 05 2.00 138,291 First Asst City Registrar SE1 07 1.00 97,428 City Registrar CDH NG 1.00 109,299 Prin Clerk (Vitals/Registry) SU4 10 12.00 536,037 Total 19 1,054,240 Adjustments Differential Payments 0 Other 10,000 Chargebacks 0 Salary Savings 0 FY22 Total Request 1,064,240

Administration & FinanceRegistry Division 87
Program 1. Administration Jessica Fumarola, Manager, Organization 163100
Program Description The Administration Program provides effective management of the day-to-day operations of the Division and monitors that the Registry's practices are in compliance with MGL and State Office of Vital Records regulations.
Operating Budget Actual '19 Actual '20 Approp '21 Budget '22
Personnel Services 325,345 331,367 350,828 357,774 Non Personnel 17,823 24,477 45,300 31,740 Total 343,168 355,844 396,128 389,514
Performance
Goal: Expand crosstraining
Performance Measures Actual '19 Actual '20 Projected '21 Target '22
75% of staff competent in 2 areas 74% 74% 70% 75%

88 Administration & FinanceRegistry Division
Program 2. Vital Statistics Jasmine ,Rodriguez , Manager, Organization 163200
Program Description The Vital Statistics Program registers new records and issues certified copies of birth, marriage, and death records. This program also files marriage intentions and issues marriage licenses. The program also responds to requests for information from federal, state, and local authorities.
Operating Budget Actual '19 Actual '20 Approp '21 Budget '22
Personnel Services 502,511 530,096 515,138 561,404 Non Personnel 140,745 72,648 54,775 48,350 Total 643,256 602,744 569,913 609,754
Performance
Goal: Online Death requests
Performance Measures Actual '19 Actual '20 Projected '21 Target '22
Death Certificate requests by mail 6,978 4,166 4,300 4,000
Death Certificates requests at counter 14,686 9,104 150 3,000
Deaths registered 7,700 7,088 8,100 7,850
Goal: Register new records and issue certified copies
Performance Measures Actual '19 Actual '20 Projected '21 Target '22
Birth Certificate requests by mail 13,519 3,120 3,500 3,500
Birth Records registered from Hospitals 20,429 20,545 19,500 20,000
Marriage Certificate requests at counter 11,547 5,820 70 150
Marriage Certificate requests by mail 3,883 1,253 250 250
Marriage Intentions Filed Electronically 5,160 4,329 1,900 4,000
Birth Certificate Request at counter 28106 200 20000
Goal: To Automate the certificate request process
Performance Measures Actual '19 Actual '20 Projected '21 Target '22
Birth Certificates Request online 7,543 26,244 46,000 36,000
Death Certificates Request online 13,443 23,351 34,000 28,000
Marriage Certificate Request online 3826 6000 5000
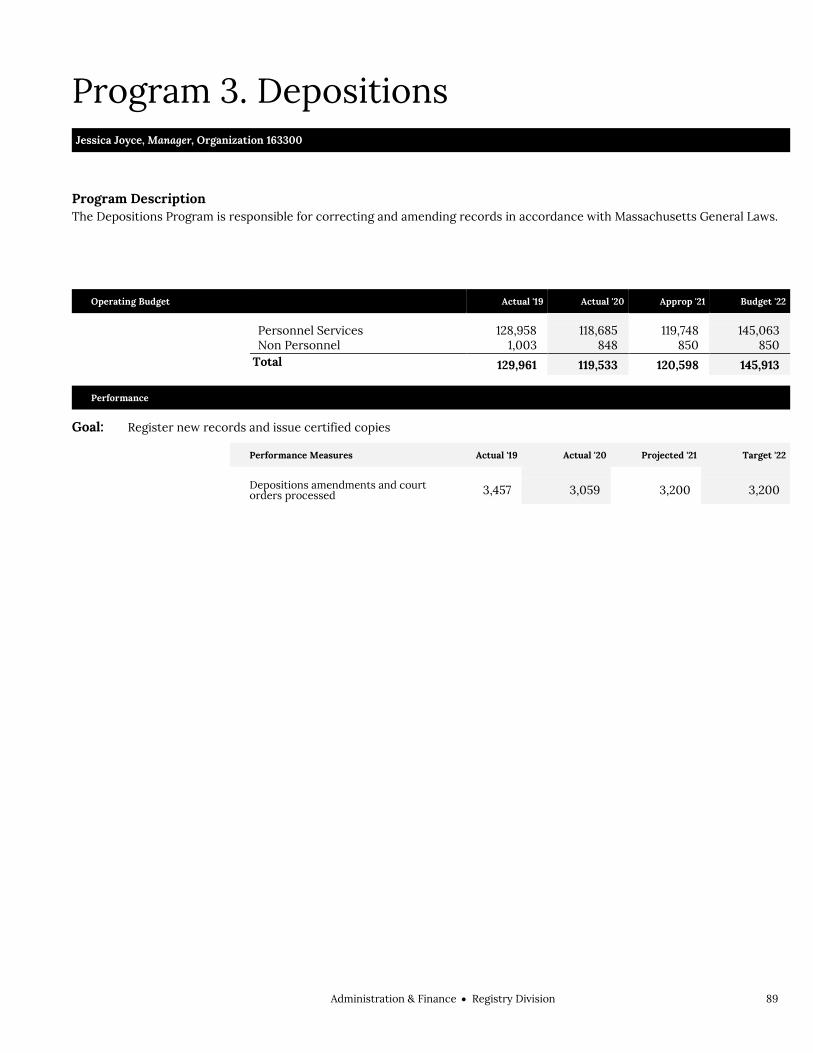
Administration & FinanceRegistry Division 89
Program 3. Depositions Jessica Joyce, Manager, Organization 163300
Program Description The Depositions Program is responsible for correcting and amending records in accordance with Massachusetts General Laws.
Operating Budget Actual '19 Actual '20 Approp '21 Budget '22
Personnel Services 128,958 118,685 119,748 145,063 Non Personnel 1,003 848 850 850 Total 129,961 119,533 120,598 145,913
Performance
Goal: Register new records and issue certified copies
Performance Measures Actual '19 Actual '20 Projected '21 Target '22
Depositions amendments and court orders processed 3,457 3,059 3,200 3,200


Administration & FinanceTreasury Department 91
Treasury Department Operating Budget Administration & Finance Treasury Department Emme Handy, Chief Financial Officer & Collector-Treasurer, Appropriation 137000
Department Mission The mission of the Treasury Department is to collect and transfer all funds due to the City. The Department also deposits and invests City funds, manages the City's borrowings, and makes all disbursements.
Operating Budget Division Name Total Actual '19 Total Actual '20 Total Approp '21 Total Budget '22
Collecting Division 3,227,798 3,071,539 2,791,876 2,914,768
Treasury Division 16,942,047 17,015,768 1,984,762 1,940,776
Total 20,169,845 20,087,307 4,776,638 4,855,544
External Funds Budget Fund Name Total Actual '19 Total Actual '20 Total Approp '21 Total Budget '22
Community Preservation Act 35,263,149 24,705,360 26,300,000 29,489,763
Total 35,263,149 24,705,360 26,300,000 29,489,763
Operating Budget Actual '19 Actual '20 Approp '21 Budget '22
Personnel Services 3,197,442 3,249,561 3,311,940 3,305,644 Non Personnel 16,972,403 16,837,746 1,464,698 1,549,900 Total 20,169,845 20,087,307 4,776,638 4,855,544

92 Administration & FinanceTreasury Department
Treasury Department Operating Budget Authorizing Statutes Bonding Requirements, M.G.L.A. c. 41, §
35. Deposit on Funds, M.G.L.A. c. 40, § 35;
M.G.L.A. c. 41, § 46; M.G.L.A. c. 44, §§ 53-55; M.G.L.A. c. 94C, § 47.
Custody and Safekeeping of Municipal Funds, M.G.L.A. c. 40, § 5B; M.G.L.A. c. 41, §§ 36, 44, 46; M.G.L.A. c. 44, §§ 53-55.
Payment of Bills, Payrolls, Withholding, M.G.L.A. c. 41, §§ 35, 41-43, 52, 56, 65-67; M.G.L.A. c.71, § 37B; M.G.L.A. c.149, §§ 148, 178B; M.G.L.A. c. 62B, § 2; M.G.L.A. c. 62, § 10; M.G.L.A. c. 32, § 22; M.G.L.A. c. 32B, § 7; M.G.L.A. c.154, § 8; M.G.L.A. c.175, §§ 138A, 193R; M.G.L.A. c. 180, § 17; 26 U.S.C. §§ 3401-3403, 3405-3406.
Reporting of Indebtedness, M.G.L.A. c. 41, § 59; M.G.L.A. c.44, §§ 22-28.
Appropriated Expenditures, M.G.L.A. c. 44, §§ 31, 53, 62-63.
Tax Title Responsibilities, M.G.L.A. c. 60, §§ 61-63, 76-77, 79-80.
Tax Rate Determination/Classification, M.G.L.A. c. 59, §§ 23, 38, 43, 53-55.
Tax Abatements, M.G.L.A. c.58, § 8; M.G.L.A. c.59, §§ 5, 59, 63, 69.
Collection of Local Taxes, M.G.L.A. c. 60, §§ 61-63, 76-77, 79-80.
General Authorizing Statutes, 1943 Mass. Acts ch. 434, § 7.
Motor Vehicle Excise Tax, M.G.L.A. c. 60A.
Gifts and Grants, M.G.L.A. c. 44, § 53A. Municipal Indebtedness, M.G.L.A. c. 44,
§§ 11,20. Sale/Disposal of Realty/Public Land,
M.G.L.A. c. 44, §§ 63-63A. Excise on Boats, Ships & Vessels in Lieu
of Local Property Taxes, M.G.L.A. c. 60B.
Description of Services The Treasury Department receives, deposits, and invests funds and pays all warrants, drafts, and orders. The Department issues, redeems, and pays interest on all bonds and notes and maintains custody of all trusts and bequests left to the City. Additionally, the Department issues payroll and required federal and state tax forms. The Department issues and collects all current and delinquent tax billings and departmental revenue. The Department also prepares petitions for land court proceedings and municipal liens and processes abatements and refunds. Additionally, the Department prepares tax certifications and tax takings, and researches tax problems.

Administration & FinanceTreasury Department 93
Department History Personnel Services FY19 Expenditure FY20 Expenditure FY21 Appropriation FY22 Recommended Inc/Dec 21 vs 22
51000 Permanent Employees 3,151,809 3,219,536 3,268,740 3,262,444 -6,296 51100 Emergency Employees 0 0 0 0 0 51200 Overtime 45,633 30,025 43,200 43,200 0 51600 Unemployment Compensation 0 0 0 0 0 51700 Workers' Compensation 0 0 0 0 0 Total Personnel Services 3,197,442 3,249,561 3,311,940 3,305,644 -6,296
Contractual Services FY19 Expenditure FY20 Expenditure FY21 Appropriation FY22 Recommended Inc/Dec 21 vs 22
52100 Communications 15,909 19,170 17,400 17,400 0 52200 Utilities 0 0 0 0 0 52400 Snow Removal 0 0 0 0 0 52500 Garbage/Waste Removal 0 0 0 0 0 52600 Repairs Buildings & Structures 0 0 0 0 0 52700 Repairs & Service of Equipment 20,500 19,901 27,250 27,250 0 52800 Transportation of Persons 12,136 11,224 5,350 7,750 2,400 52900 Contracted Services 263,640 560,900 550,000 622,250 72,250 Total Contractual Services 312,185 611,195 600,000 674,650 74,650
Supplies & Materials FY19 Expenditure FY20 Expenditure FY21 Appropriation FY22 Recommended Inc/Dec 21 vs 22
53000 Auto Energy Supplies 0 0 0 0 0 53200 Food Supplies 0 0 0 0 0 53400 Custodial Supplies 0 0 0 0 0 53500 Med, Dental, & Hosp Supply 0 0 0 0 0 53600 Office Supplies and Materials 755,255 831,611 802,698 814,000 11,302 53700 Clothing Allowance 5,750 5,250 6,500 5,750 -750 53800 Educational Supplies & Mat 0 0 0 0 0 53900 Misc Supplies & Materials 0 0 0 0 0 Total Supplies & Materials 761,005 836,861 809,198 819,750 10,552
Current Chgs & Oblig FY19 Expenditure FY20 Expenditure FY21 Appropriation FY22 Recommended Inc/Dec 21 vs 22
54300 Workers' Comp Medical 0 0 0 0 0 54400 Legal Liabilities 0 0 0 0 0 54500 Aid To Veterans 0 0 0 0 0 54600 Current Charges H&I 0 0 0 0 0 54700 Indemnification 0 0 0 0 0 54800 Reserve Account 0 0 0 0 0 54900 Other Current Charges 29,050 28,438 35,500 35,500 0 Total Current Chgs & Oblig 29,050 28,438 35,500 35,500 0
Equipment FY19 Expenditure FY20 Expenditure FY21 Appropriation FY22 Recommended Inc/Dec 21 vs 22
55000 Automotive Equipment 0 0 0 0 0 55400 Lease/Purchase 0 0 0 0 0 55600 Office Furniture & Equipment 0 0 0 0 0 55900 Misc Equipment 0 248 20,000 20,000 0 Total Equipment 0 248 20,000 20,000 0
Other FY19 Expenditure FY20 Expenditure FY21 Appropriation FY22 Recommended Inc/Dec 21 vs 22
56200 Special Appropriation 15,870,163 15,361,004 0 0 0 57200 Structures & Improvements 0 0 0 0 0 58000 Land & Non-Structure 0 0 0 0 0 Total Other 15,870,163 15,361,004 0 0 0
Grand Total 20,169,845 20,087,307 4,776,638 4,855,544 78,906

94 Administration & FinanceTreasury Department
Department Personnel
Title Union Code Grade Position FY22 Salary Title
Union Code Grade Position FY22 Salary
Adm Analyst SU4 14 1.00 45,180 Mgmt Analyst SE1 06 1.00 82,231 Admin Asst (Law) SU4 16 1.00 65,717 Prin Accountant SU4 16 6.00 416,399 Chief of Staff EXM 10 1.00 122,950 Prin Admin Asst (Treas/Treas) SE1 06 1.00 90,319 Collector-Treasurer CDH NG 1.00 182,500 Prin Admin Asst (Trs/Col) SE1 06 3.00 250,780 Data Proc Sys Analyst I SE1 07 1.00 72,035 Second Asst Coll-Trs (Trs/Col) SE1 10 1.00 126,024 Dep Collector SU4 13 6.00 291,672 Second Asst Coll-Trs (Trs/Trs) SE1 14 1.00 153,068 Director CDH NG 1.00 135,371 Sr Adm Asst SE1 05 4.00 298,353 Exec Asst (Treas/Trea) SE1 11 1.00 133,756 Sr Legal Asst SU4 14 1.00 63,025 Exec Asst (Treasury) SE1 06 1.00 86,708 Sr Programmer SU4 15 1.00 70,871 First Asst Coll-Trs SE1 11 1.00 133,756 Supervisor Accounting SE1 08 8.00 797,203 Head Administrative Clerk SU4 14 2.00 115,002 Tax Title Supv SU4 15 2.00 141,741 Head Clerk SU4 12 3.00 140,205 Tell. SU4 13 4.00 210,205
Trust Manager SE1 09 1.00 116,500
Total 54 4,341,571 Adjustments Differential Payments 0 Other 37,400 Chargebacks -1,071,667 Salary Savings -44,860 FY22 Total Request 3,262,444

Administration & FinanceTreasury Department 95
External Funds History Personnel Services FY19 Expenditure FY20 Expenditure FY21 Appropriation FY22 Recommended Inc/Dec 21 vs 22
51000 Permanent Employees 287,573 266,107 361,745 400,000 38,255 51100 Emergency Employees 0 0 0 0 0 51200 Overtime 0 0 0 0 0 51300 Part Time Employees 0 0 0 0 0 51400 Health Insurance 18,021 18,358 63,216 79,100 15,884 51500 Pension & Annuity 0 0 0 36,000 36,000 51600 Unemployment Compensation 0 0 0 0 0 51700 Workers' Compensation 0 0 5,000 5,000 0 51800 Indirect Costs 0 0 0 0 0 51900 Medicare 3,625 3,102 5,231 5,800 569 Total Personnel Services 309,219 287,567 435,192 525,900 90,708
Contractual Services FY19 Expenditure FY20 Expenditure FY21 Appropriation FY22 Recommended Inc/Dec 21 vs 22
52100 Communications 0 0 0 0 0 52200 Utilities 0 0 0 0 0 52400 Snow Removal 0 0 0 0 0 52500 Garbage/Waste Removal 0 0 0 0 0 52600 Repairs Buildings & Structures 0 0 0 0 0 52700 Repairs & Service of Equipment 0 54 0 0 0 52800 Transportation of Persons 698 588 2,000 2,000 0 52900 Contracted Services 34,932,133 24,381,182 320,700 455,000 134,300 Total Contractual Services 34,932,831 24,381,824 322,700 457,000 134,300
Supplies & Materials FY19 Expenditure FY20 Expenditure FY21 Appropriation FY22 Recommended Inc/Dec 21 vs 22
53000 Auto Energy Supplies 0 0 0 0 0 53200 Food Supplies 0 0 0 0 0 53400 Custodial Supplies 0 0 0 0 0 53500 Med, Dental, & Hosp Supply 0 0 0 0 0 53600 Office Supplies and Materials 706 3,285 1,000 1,000 0 53700 Clothing Allowance 0 0 0 0 0 53800 Educational Supplies & Mat 0 0 0 0 0 53900 Misc Supplies & Materials 0 0 0 0 0 Total Supplies & Materials 706 3,285 1,000 1,000 0
Current Chgs & Oblig FY19 Expenditure FY20 Expenditure FY21 Appropriation FY22 Recommended Inc/Dec 21 vs 22
54300 Workers' Comp Medical 0 0 0 0 0 54400 Legal Liabilities 0 0 0 0 0 54600 Current Charges H&I 0 0 0 0 0 54700 Indemnification 0 0 0 0 0 54800 Reserve Account 0 0 25,517,608 28,477,363 2,959,755 54900 Other Current Charges 20,394 27,637 21,000 21,000 0 Total Current Chgs & Oblig 20,394 27,637 25,538,608 28,498,363 2,959,755
Equipment FY19 Expenditure FY20 Expenditure FY21 Appropriation FY22 Recommended Inc/Dec 21 vs 22
55000 Automotive Equipment 0 0 0 0 0 55400 Lease/Purchase 0 0 0 0 0 55600 Office Furniture & Equipment 0 0 0 5,000 5,000 55900 Misc Equipment 0 5,047 2,500 2,500 0 Total Equipment 0 5,047 2,500 7,500 5,000
Other FY19 Expenditure FY20 Expenditure FY21 Appropriation FY22 Recommended Inc/Dec 21 vs 22
56200 Special Appropriation 0 0 0 0 0 57200 Structures & Improvements 0 0 0 0 0 58000 Land & Non-Structure 0 0 0 0 0 Total Other 0 0 0 0 0
Grand Total 35,263,150 24,705,360 26,300,000 29,489,763 3,189,763
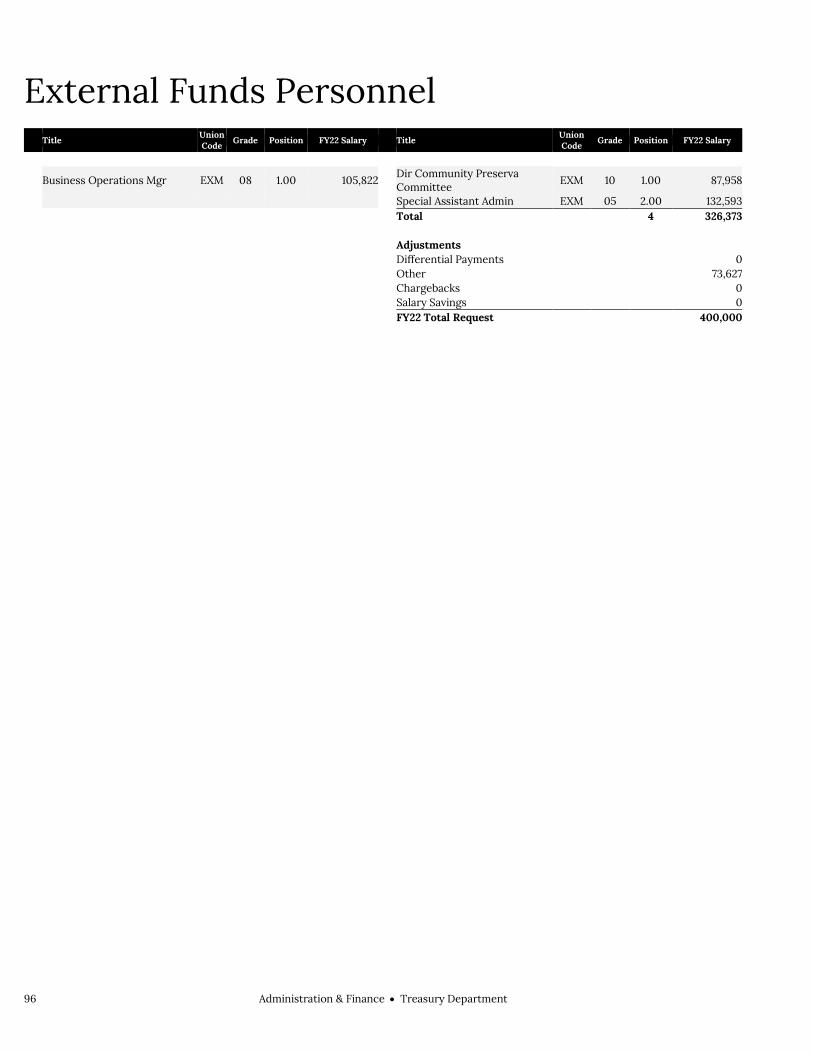
96 Administration & FinanceTreasury Department
External Funds Personnel
Title Union Code Grade Position FY22 Salary Title
Union Code Grade Position FY22 Salary
Business Operations Mgr EXM 08 1.00 105,822 Dir Community Preserva Committee
EXM 10 1.00 87,958
Special Assistant Admin EXM 05 2.00 132,593 Total 4 326,373 Adjustments Differential Payments 0 Other 73,627 Chargebacks 0 Salary Savings 0 FY22 Total Request 400,000

Administration & FinanceTreasury Division 97
Treasury Division Operating Budget Administration & Finance Treasury Division W. Drew Smith, First Assistant Collector-Treasurer, Appropriation 138
Division Mission The Treasury Division receives and has care and custody of all monies, property, and securities acquired by virtue of any statute, ordinance, gift, devise, bequest, or deposit. In addition, the Division pays all warrants, drafts, bonds, and approved executions against the City.
Operating Budget Actual '19 Actual '20 Approp '21 Budget '22
Personnel Services 1,476,532 1,510,041 1,517,462 1,468,076 Non Personnel 15,465,515 15,505,727 467,300 472,700 Total 16,942,047 17,015,768 1,984,762 1,940,776

98 Administration & FinanceTreasury Division
Treasury Division Operating Budget
Description of Services
The Treasury Division invests all City funds, including amounts held by the Collector-Treasurer as custodian of all City trust funds, is responsible for managing the City's tax-exempt debt transactions, processes the salaries of all City employees, makes payments on all warrants, drafts and orders, and processes disbursements to all City vendors and contractors. The Treasury Division is also responsible for making debt service payments on outstanding City bonds, notes and other tax-exempt financing.

Administration & FinanceTreasury Division 99
Division History Personnel Services FY19 Expenditure FY20 Expenditure FY21 Appropriation FY22 Recommended Inc/Dec 21 vs 22
51000 Permanent Employees 1,457,739 1,505,792 1,497,462 1,448,076 -49,386 51100 Emergency Employees 0 0 0 0 0 51200 Overtime 18,793 4,249 20,000 20,000 0 51600 Unemployment Compensation 0 0 0 0 0 51700 Workers' Compensation 0 0 0 0 0 Total Personnel Services 1,476,532 1,510,041 1,517,462 1,468,076 -49,386
Contractual Services FY19 Expenditure FY20 Expenditure FY21 Appropriation FY22 Recommended Inc/Dec 21 vs 22
52100 Communications 13,347 15,492 12,400 12,400 0 52200 Utilities 0 0 0 0 0 52400 Snow Removal 0 0 0 0 0 52500 Garbage/Waste Removal 0 0 0 0 0 52600 Repairs Buildings & Structures 0 0 0 0 0 52700 Repairs & Service of Equipment 19,738 17,514 25,750 25,750 0 52800 Transportation of Persons 6,313 5,703 900 3,300 2,400 52900 Contracted Services 112,489 175,997 131,500 130,250 -1,250 Total Contractual Services 151,887 214,706 170,550 171,700 1,150
Supplies & Materials FY19 Expenditure FY20 Expenditure FY21 Appropriation FY22 Recommended Inc/Dec 21 vs 22
53000 Auto Energy Supplies 0 0 0 0 0 53200 Food Supplies 0 0 0 0 0 53400 Custodial Supplies 0 0 0 0 0 53500 Med, Dental, & Hosp Supply 0 0 0 0 0 53600 Office Supplies and Materials 295,863 275,572 276,000 281,000 5,000 53700 Clothing Allowance 1,500 1,000 1,750 1,000 -750 53800 Educational Supplies & Mat 0 0 0 0 0 53900 Misc Supplies & Materials 0 0 0 0 0 Total Supplies & Materials 297,363 276,572 277,750 282,000 4,250
Current Chgs & Oblig FY19 Expenditure FY20 Expenditure FY21 Appropriation FY22 Recommended Inc/Dec 21 vs 22
54300 Workers' Comp Medical 0 0 0 0 0 54400 Legal Liabilities 0 0 0 0 0 54500 Aid To Veterans 0 0 0 0 0 54600 Current Charges H&I 0 0 0 0 0 54700 Indemnification 0 0 0 0 0 54800 Reserve Account 0 0 0 0 0 54900 Other Current Charges 16,265 14,449 19,000 19,000 0 Total Current Chgs & Oblig 16,265 14,449 19,000 19,000 0
Equipment FY19 Expenditure FY20 Expenditure FY21 Appropriation FY22 Recommended Inc/Dec 21 vs 22
55000 Automotive Equipment 0 0 0 0 0 55400 Lease/Purchase 0 0 0 0 0 55600 Office Furniture & Equipment 0 0 0 0 0 55900 Misc Equipment 0 0 0 0 0 Total Equipment 0 0 0 0 0
Other FY19 Expenditure FY20 Expenditure FY21 Appropriation FY22 Recommended Inc/Dec 21 vs 22
56200 Special Appropriation 15,000,000 15,000,000 0 0 0 57200 Structures & Improvements 0 0 0 0 0 58000 Land & Non-Structure 0 0 0 0 0 Total Other 15,000,000 15,000,000 0 0 0
Grand Total 16,942,047 17,015,768 1,984,762 1,940,776 -43,986

100 Administration & FinanceTreasury Division
Division Personnel
Title Union Code Grade Position FY22 Salary Title
Union Code Grade Position FY22 Salary
Adm Analyst SU4 14 1.00 45,180 Mgmt Analyst SE1 06 1.00 82,231 Admin Asst (Law) SU4 16 1.00 65,717 Prin Accountant SU4 16 6.00 416,399 Chief of Staff EXM 10 1.00 122,950 Prin Admin Asst (Treas/Treas) SE1 06 1.00 90,319 Collector-Treasurer CDH NG 1.00 182,500 Second Asst Coll-Trs (Trs/Trs) SE1 14 1.00 153,068 Director CDH NG 1.00 135,371 Sr Adm Asst SE1 05 3.00 220,169 Exec Asst (Treas/Trea) SE1 11 1.00 133,756 Supervisor Accounting SE1 08 7.00 688,735 Exec Asst (Treasury) SE1 06 1.00 86,708 Trust Manager SE1 09 1.00 116,500 Total 27 2,539,603 Adjustments Differential Payments 0 Other 25,000 Chargebacks -1,071,667 Salary Savings -44,860 FY22 Total Request 1,448,076

Administration & FinanceTreasury Division 101
External Funds History Personnel Services FY19 Expenditure FY20 Expenditure FY21 Appropriation FY22 Recommended Inc/Dec 21 vs 22
51000 Permanent Employees 287,573 266,107 361,745 400,000 38,255 51100 Emergency Employees 0 0 0 0 0 51200 Overtime 0 0 0 0 0 51300 Part Time Employees 0 0 0 0 0 51400 Health Insurance 18,021 18,358 63,216 79,100 15,884 51500 Pension & Annuity 0 0 0 36,000 36,000 51600 Unemployment Compensation 0 0 0 0 0 51700 Workers' Compensation 0 0 5,000 5,000 0 51800 Indirect Costs 0 0 0 0 0 51900 Medicare 3,625 3,102 5,231 5,800 569 Total Personnel Services 309,219 287,567 435,192 525,900 90,708
Contractual Services FY19 Expenditure FY20 Expenditure FY21 Appropriation FY22 Recommended Inc/Dec 21 vs 22
52100 Communications 0 0 0 0 0 52200 Utilities 0 0 0 0 0 52400 Snow Removal 0 0 0 0 0 52500 Garbage/Waste Removal 0 0 0 0 0 52600 Repairs Buildings & Structures 0 0 0 0 0 52700 Repairs & Service of Equipment 0 54 0 0 0 52800 Transportation of Persons 698 588 2,000 2,000 0 52900 Contracted Services 34,932,133 24,381,182 320,700 455,000 134,300 Total Contractual Services 34,932,831 24,381,824 322,700 457,000 134,300
Supplies & Materials FY19 Expenditure FY20 Expenditure FY21 Appropriation FY22 Recommended Inc/Dec 21 vs 22
53000 Auto Energy Supplies 0 0 0 0 0 53200 Food Supplies 0 0 0 0 0 53400 Custodial Supplies 0 0 0 0 0 53500 Med, Dental, & Hosp Supply 0 0 0 0 0 53600 Office Supplies and Materials 706 3,285 1,000 1,000 0 53700 Clothing Allowance 0 0 0 0 0 53800 Educational Supplies & Mat 0 0 0 0 0 53900 Misc Supplies & Materials 0 0 0 0 0 Total Supplies & Materials 706 3,285 1,000 1,000 0
Current Chgs & Oblig FY19 Expenditure FY20 Expenditure FY21 Appropriation FY22 Recommended Inc/Dec 21 vs 22
54300 Workers' Comp Medical 0 0 0 0 0 54400 Legal Liabilities 0 0 0 0 0 54600 Current Charges H&I 0 0 0 0 0 54700 Indemnification 0 0 0 0 0 54800 Reserve Account 0 0 25,517,608 28,477,363 2,959,755 54900 Other Current Charges 20,394 27,637 21,000 21,000 0 Total Current Chgs & Oblig 20,394 27,637 25,538,608 28,498,363 2,959,755
Equipment FY19 Expenditure FY20 Expenditure FY21 Appropriation FY22 Recommended Inc/Dec 21 vs 22
55000 Automotive Equipment 0 0 0 0 0 55400 Lease/Purchase 0 0 0 0 0 55600 Office Furniture & Equipment 0 0 0 5,000 5,000 55900 Misc Equipment 0 5,047 2,500 2,500 0 Total Equipment 0 5,047 2,500 7,500 5,000
Other FY19 Expenditure FY20 Expenditure FY21 Appropriation FY22 Recommended Inc/Dec 21 vs 22
56200 Special Appropriation 0 0 0 0 0 57200 Structures & Improvements 0 0 0 0 0 58000 Land & Non-Structure 0 0 0 0 0 Total Other 0 0 0 0 0
Grand Total 35,263,150 24,705,360 26,300,000 29,489,763 3,189,763

102 Administration & FinanceTreasury Division
External Funds Personnel
Title Union Code Grade Position FY22 Salary Title
Union Code Grade Position FY22 Salary
Business Operations Mgr EXM 08 1.00 105,822 Dir Community Preserva Committee
EXM 10 1.00 87,958
Special Assistant Admin EXM 05 2.00 132,593 Total 4 326,373 Adjustments Differential Payments 0 Other 73,627 Chargebacks 0 Salary Savings 0 FY22 Total Request 400,000

Administration & FinanceTreasury Division 103
Program 1. Administration W. Drew Smith, Manager, Organization 138100
Program Description The Administration Program hires, trains, and manages all Treasury Division personnel and ensures overall effective and efficient fund management.
Operating Budget Actual '19 Actual '20 Approp '21 Budget '22
Personnel Services 490,510 507,926 515,740 438,974 Non Personnel 158,254 226,784 179,150 178,500 Total 648,764 734,710 694,890 617,474

104 Administration & FinanceTreasury Division
Program 2. General Service/Payroll Chinele Velazquez, Manager, Organization 138200
Program Description The program is responsible for the processing and distribution of all payroll, payroll deductions, garnishment payments, accounts payable, issuance of refund payments for real estate tax overpayments and tax title payments. In addition, the program is responsible for the distribution of retirement benefit payments. The program maintains schedules for principal and interest on City borrowings.
Operating Budget Actual '19 Actual '20 Approp '21 Budget '22
Personnel Services 417,464 421,850 387,491 423,549 Non Personnel 233,467 256,297 265,550 270,650 Total 650,931 678,147 653,041 694,199

Administration & FinanceTreasury Division 105
Program 3. Accounting Marirose Graham, Manager, Organization 138400
Program Description The Accounting Program records and reconciles on a daily basis the cash and investment balances of the City. It reports daily on all financial transactions. Additionally, the program prepares and files federal and state forms and ensures payment of withholding taxes to state and federal agencies. The program is also responsible for ensuring the timely reconciliation of bank statements and city records.
Operating Budget Actual '19 Actual '20 Approp '21 Budget '22
Personnel Services 176,015 175,415 185,391 185,390 Non Personnel 5,414 5,120 4,700 5,650 Total 181,429 180,535 190,091 191,040

106 Administration & FinanceTreasury Division
Program 4. Accounts Receivable Maureen Garceau, Manager, Organization 138500
Program Description The Accounts Receivable Program is responsible for establishing policies and procedures, monitoring compliance, and providing a central resource to revenue generating departments that utilize the accounts receivable and billing systems.
Operating Budget Actual '19 Actual '20 Approp '21 Budget '22
Personnel Services 392,543 404,767 428,840 420,163 Non Personnel 68,130 17,526 17,900 17,900 Total 460,673 422,293 446,740 438,063

Administration & FinanceTreasury Division 107
Program 5. Trust Richard DePiano, Manager, Organization 138600
Program Description The Trust Program is charged with the responsibility of providing technical assistance to the City's various boards of trustees in the oversight of the investment programs for the more than 250 testamentary trust funds that have been entrusted to the City while ensuring that all beneficiary distributions are made in accordance with each benefactor's instructions.
Operating Budget Actual '19 Actual '20 Approp '21 Budget '22
Personnel Services 0 83 0 0 Non Personnel 15,000,250 15,000,000 0 0 Total 15,000,250 15,000,083 0 0
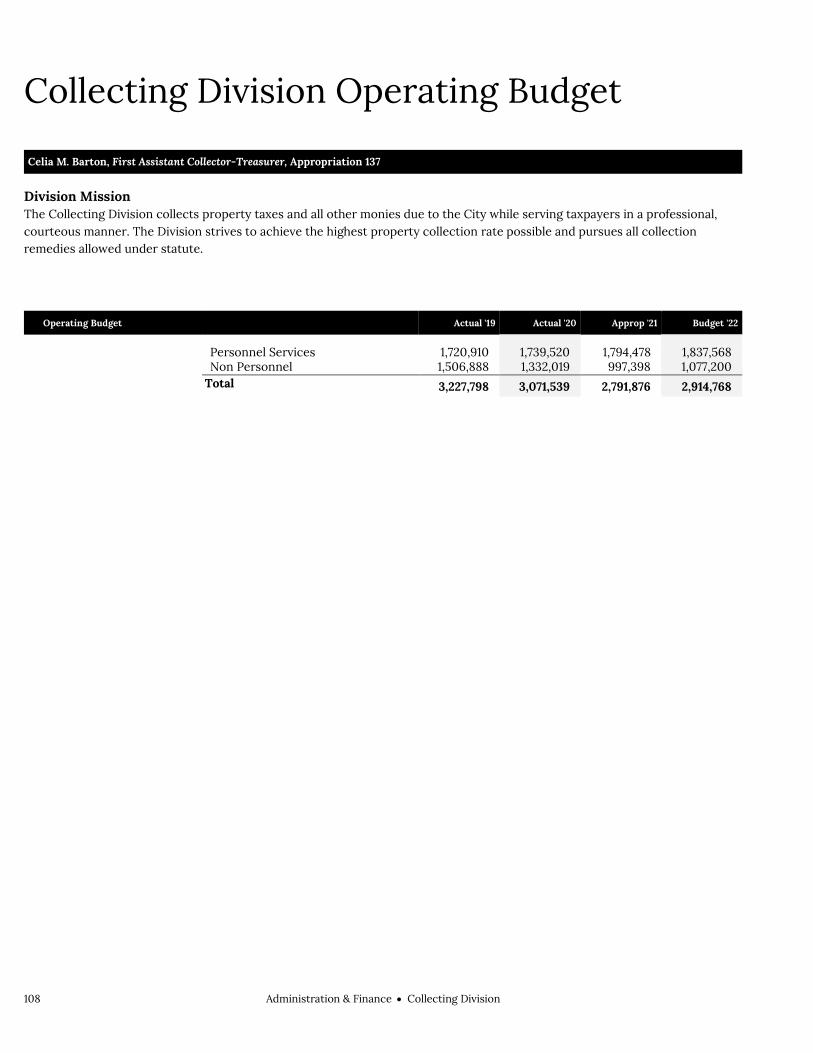
108 Administration & FinanceCollecting Division
Collecting Division Operating Budget Administration & Finance Collecting Division Celia M. Barton, First Assistant Collector-Treasurer, Appropriation 137
Division Mission The Collecting Division collects property taxes and all other monies due to the City while serving taxpayers in a professional, courteous manner. The Division strives to achieve the highest property collection rate possible and pursues all collection remedies allowed under statute.
Operating Budget Actual '19 Actual '20 Approp '21 Budget '22
Personnel Services 1,720,910 1,739,520 1,794,478 1,837,568 Non Personnel 1,506,888 1,332,019 997,398 1,077,200 Total 3,227,798 3,071,539 2,791,876 2,914,768

Administration & FinanceCollecting Division 109
Collecting Division Operating Budget
Description of Services
The Collecting Division mails all tax bills and collects both current and delinquent taxes. The Division also prepares and files tax takings and tax certification liens, issues municipal lien certificates, and prepares petitions for foreclosures with the Law Department. Additionally, the Division prepares property redemption certificates, collects fees and fines and all other City revenue through teller windows.

110 Administration & FinanceCollecting Division
Division History Personnel Services FY19 Expenditure FY20 Expenditure FY21 Appropriation FY22 Recommended Inc/Dec 21 vs 22
51000 Permanent Employees 1,694,070 1,713,744 1,771,278 1,814,368 43,090 51100 Emergency Employees 0 0 0 0 0 51200 Overtime 26,840 25,776 23,200 23,200 0 51600 Unemployment Compensation 0 0 0 0 0 51700 Workers' Compensation 0 0 0 0 0 Total Personnel Services 1,720,910 1,739,520 1,794,478 1,837,568 43,090
Contractual Services FY19 Expenditure FY20 Expenditure FY21 Appropriation FY22 Recommended Inc/Dec 21 vs 22
52100 Communications 2,562 3,678 5,000 5,000 0 52200 Utilities 0 0 0 0 0 52400 Snow Removal 0 0 0 0 0 52500 Garbage/Waste Removal 0 0 0 0 0 52600 Repairs Buildings & Structures 0 0 0 0 0 52700 Repairs & Service of Equipment 762 2,387 1,500 1,500 0 52800 Transportation of Persons 5,823 5,521 4,450 4,450 0 52900 Contracted Services 151,151 384,903 418,500 492,000 73,500 Total Contractual Services 160,298 396,489 429,450 502,950 73,500
Supplies & Materials FY19 Expenditure FY20 Expenditure FY21 Appropriation FY22 Recommended Inc/Dec 21 vs 22
53000 Auto Energy Supplies 0 0 0 0 0 53200 Food Supplies 0 0 0 0 0 53400 Custodial Supplies 0 0 0 0 0 53500 Med, Dental, & Hosp Supply 0 0 0 0 0 53600 Office Supplies and Materials 459,392 556,039 526,698 533,000 6,302 53700 Clothing Allowance 4,250 4,250 4,750 4,750 0 53800 Educational Supplies & Mat 0 0 0 0 0 53900 Misc Supplies & Materials 0 0 0 0 0 Total Supplies & Materials 463,642 560,289 531,448 537,750 6,302
Current Chgs & Oblig FY19 Expenditure FY20 Expenditure FY21 Appropriation FY22 Recommended Inc/Dec 21 vs 22
54300 Workers' Comp Medical 0 0 0 0 0 54400 Legal Liabilities 0 0 0 0 0 54500 Aid To Veterans 0 0 0 0 0 54600 Current Charges H&I 0 0 0 0 0 54700 Indemnification 0 0 0 0 0 54800 Reserve Account 0 0 0 0 0 54900 Other Current Charges 12,785 13,989 16,500 16,500 0 Total Current Chgs & Oblig 12,785 13,989 16,500 16,500 0
Equipment FY19 Expenditure FY20 Expenditure FY21 Appropriation FY22 Recommended Inc/Dec 21 vs 22
55000 Automotive Equipment 0 0 0 0 0 55400 Lease/Purchase 0 0 0 0 0 55600 Office Furniture & Equipment 0 0 0 0 0 55900 Misc Equipment 0 248 20,000 20,000 0 Total Equipment 0 248 20,000 20,000 0
Other FY19 Expenditure FY20 Expenditure FY21 Appropriation FY22 Recommended Inc/Dec 21 vs 22
56200 Special Appropriation 870,163 361,004 0 0 0 57200 Structures & Improvements 0 0 0 0 0 58000 Land & Non-Structure 0 0 0 0 0 Total Other 870,163 361,004 0 0 0
Grand Total 3,227,798 3,071,539 2,791,876 2,914,768 122,892

Administration & FinanceCollecting Division 111
Division Personnel
Title Union Code Grade Position FY22 Salary Title
Union Code Grade Position FY22 Salary
Data Proc Sys Analyst I SE1 07 1.00 72,035 Second Asst Coll-Trs (Trs/Col) SE1 10 1.00 126,024 Dep Collector SU4 13 6.00 291,672 Sr Adm Asst SE1 05 1.00 78,184 First Asst Coll-Trs SE1 11 1.00 133,756 Sr Legal Asst SU4 14 1.00 63,025 Head Administrative Clerk SU4 14 2.00 115,002 Sr Programmer SU4 15 1.00 70,871 Head Clerk SU4 12 3.00 140,205 Supervisor Accounting SE1 08 1.00 108,468 Prin Admin Asst (Trs/Col) SE1 06 3.00 250,780 Tax Title Supv SU4 15 2.00 141,741
Tell. SU4 13 4.00 210,205
Total 27 1,801,968 Adjustments Differential Payments 0 Other 12,400 Chargebacks 0 Salary Savings 0 FY22 Total Request 1,814,368

112 Administration & FinanceCollecting Division
Program 1. General Management Celia M. Barton, Manager, Organization 137100
Program Description The General Management Program is responsible for hiring, training, and supervising Collection Division staff and systems.
Operating Budget Actual '19 Actual '20 Approp '21 Budget '22
Personnel Services 476,947 481,265 476,522 477,314 Non Personnel 136,663 60,614 255,750 531,250 Total 613,610 541,879 732,272 1,008,564
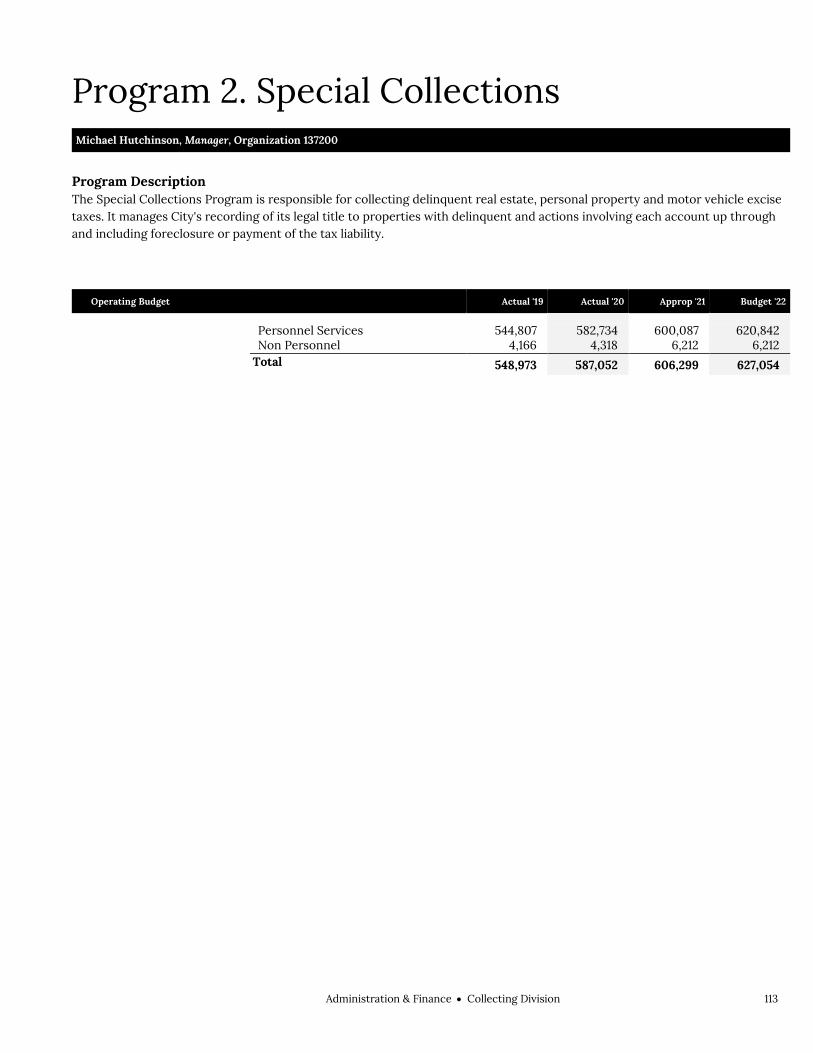
Administration & FinanceCollecting Division 113
Program 2. Special Collections Michael Hutchinson, Manager, Organization 137200
Program Description The Special Collections Program is responsible for collecting delinquent real estate, personal property and motor vehicle excise taxes. It manages City's recording of its legal title to properties with delinquent and actions involving each account up through and including foreclosure or payment of the tax liability.
Operating Budget Actual '19 Actual '20 Approp '21 Budget '22
Personnel Services 544,807 582,734 600,087 620,842 Non Personnel 4,166 4,318 6,212 6,212 Total 548,973 587,052 606,299 627,054

114 Administration & FinanceCollecting Division
Program 3. Payment Services Nancy Cincotti, Manager, Organization 137300
Program Description The Payment Services Program processes all funds received by the City from taxpayers and City departments. It mails all current tax notices, resolves questions from taxpayers and financial institutions, provides duplicate tax bills, and processes all refunds and abatements.
Operating Budget Actual '19 Actual '20 Approp '21 Budget '22
Personnel Services 283,941 302,800 328,246 324,546 Non Personnel 1,364,282 1,265,207 733,723 538,025 Total 1,648,223 1,568,007 1,061,969 862,571

Administration & FinanceCollecting Division 115
Program 4. Accounting/Quality Control Robinson Butterworth, Manager, Organization 137400
Program Description The Accounting/Special Assessments Program is responsible for maintaining the books of the Collecting Division, as well as managing the database used for controlling Collecting Division activities.
Operating Budget Actual '19 Actual '20 Approp '21 Budget '22
Personnel Services 415,215 372,721 389,623 414,866 Non Personnel 1,777 1,880 1,713 1,713 Total 416,992 374,601 391,336 416,579
116 Administration & FinanceCollecting Division
External Funds Projects Community Preservation Act
Project Mission The Massachusetts legislature passed the Community Preservation Act in 2000. The law gave individual cities and towns authority to mount a ballot campaign to add a surcharge on real estate taxes to fund affordable housing, parks and open space improvements, and historic restoration. Boston voters approved the ballot initiative in November 2016 to adopt the Community Preservation Act. By adopting the CPA, the City created a Community Preservation Fund and finances this fund in part by a 1% property tax-based surcharge on residential and business property tax bills. Beginning in FY18, funding will be available every year for affordable housing, parks and open space improvements, and historic restoration. Additionally, a statewide Community Preservation Trust Fund gives cities and towns that passed the act a “match.” Real estate transfer fees from across the state provide money for the Trust Fund.
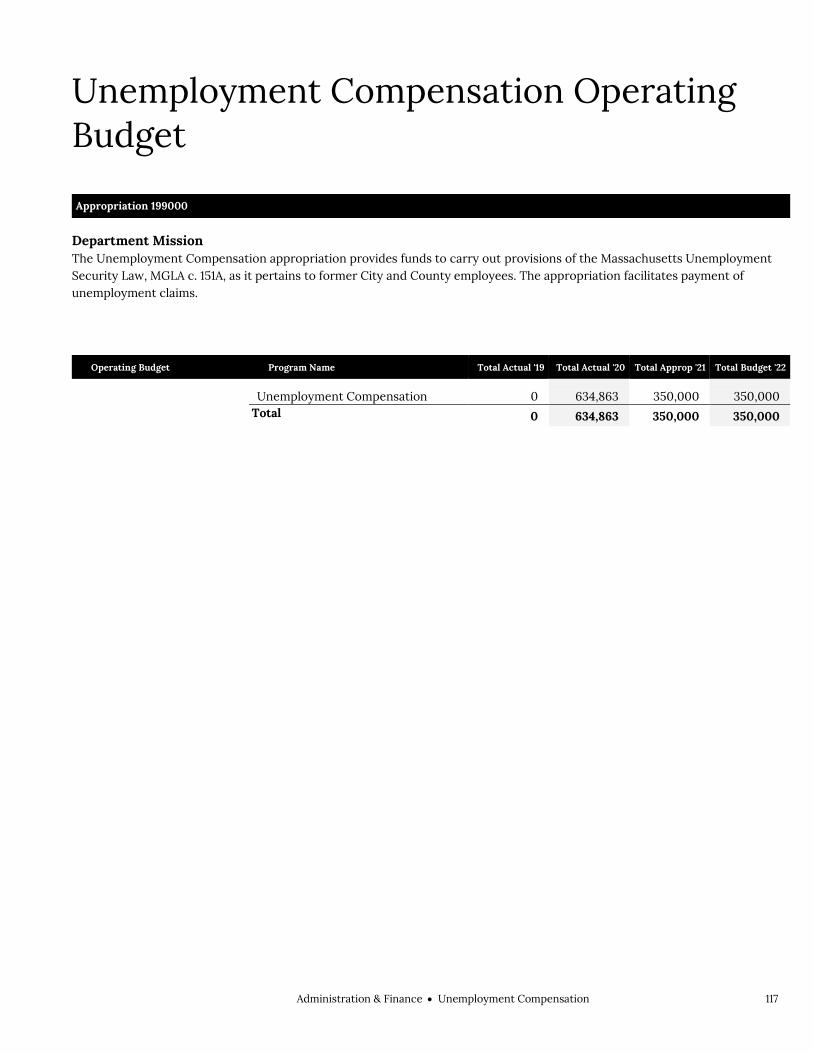
Administration & FinanceUnemployment Compensation 117
Unemployment Compensation Operating Budget Administration & Finance Unemployment Compensation Appropriation 199000
Department Mission The Unemployment Compensation appropriation provides funds to carry out provisions of the Massachusetts Unemployment Security Law, MGLA c. 151A, as it pertains to former City and County employees. The appropriation facilitates payment of unemployment claims.
Operating Budget Program Name Total Actual '19 Total Actual '20 Total Approp '21 Total Budget '22
Unemployment Compensation 0 634,863 350,000 350,000
Total 0 634,863 350,000 350,000

118 Administration & FinanceUnemployment Compensation

Administration & FinanceWorkers' Compensation Fund 119
Workers' Compensation Fund Operating Budget Administration & Finance Workers' Compensation Fund Appropriation 341000
Department Mission The Workers' Compensation Fund provides for proper payments of compensation benefits, medical treatment and, if necessary, rehabilitation for employees permanently injured in work related accidents prior to July, 1995, or for employees from former City departments, e.g. Department of Health and Hospitals.
Operating Budget Program Name Total Actual '19 Total Actual '20 Total Approp '21 Total Budget '22
Workers' Compensation Fund 1,618,544 1,767,314 2,000,000 2,000,000
Total 1,618,544 1,767,314 2,000,000 2,000,000

120 Administration & FinanceWorkers' Compensation Fund

Health & Human ServicesCabinet 121
Health & Human Services Health & Human Services Cabinet
Health & Human Services ................................................. 123
Office of Health & Human Services ......................... 125
Health & Human Services ............................. 130
Office of Health & Human Services ............. 131
Office of Health & Human Services ............. 132
Age Strong ..................................................................... 135
Age Strong Administration ............................ 141
Age Strong Operations ................................... 142
Age Strong Transportation ............................ 143
Programs & Partnerships ............................... 144
Boston Centers for Youth & Families ...................... 149
Administrative & Policy .................................. 155
Sports & Fitness ............................................... 156
Youth & Family Services ................................. 157
Child Care & Out-of-School .......................... 158
Boston VETS .................................................................. 173
Veterans' Services ............................................ 177
Commission for Persons With Disabilities ............. 179
Disabilities ......................................................... 184
Fair Housing & Equity ................................................. 187
Fair Housing Commission ..............................193
Public Health Commission......................................... 195
Public Health Services ................................... 202
Youth Engagement & Employment ........................ 227
Youth Engagement & Employment ............ 232

122 Health & Human ServicesCabinet

Health & Human ServicesCabinet 123
Health & Human Services Health & Human Services
Marty Martinez, Chief of Human Services
Cabinet Mission The Health and Human Services Cabinet is committed to promoting the health and well-being of the City's residents particularly the most vulnerable. The provision of social, recreational, health and support services to city residents, particularly the homeless, persons with disabilities, women, the elderly, youth, immigrants and veterans, will be coordinated and made available in a customer-friendly and culturally sensitive manner. The Cabinet enforces all antidiscrimination laws and protections under the jurisdiction of the City, and advocates for the advancement of policies and legislation to address the needs of individuals and groups, supports disease and injury prevention, delivers emergency health services and health education and promotion services within the City.
Operating Budget Total Actual '19 Total Actual '20 Total Approp '21 Total Budget '22
Office of Health & Human Services 0 0 2,405,798 5,594,284 Age Strong 3,723,852 3,875,008 4,446,097 5,205,226 Boston Centers for Youth & Families 27,468,083 28,545,467 29,051,675 29,244,370 Boston VETS 2,937,050 2,900,757 4,612,875 4,612,875 Commission for Persons With Disabilities 400,491 483,253 510,616 623,936
Emergency Shelter Commission 0 0 0 0 Fair Housing & Equity 290,704 226,930 317,514 517,514 Public Health Commission 87,967,402 93,405,426 106,473,529 111,698,090 Youth Engagement & Employment 6,091,124 7,198,033 7,818,028 12,475,451
Total 128,878,706 136,634,874 155,636,132 168,971,746
Capital Budget Expenditures Actual '19 Actual '20 Estimated '21 Projected '22
Boston Centers for Youth & Families 3,597,802 1,045,289 15,700,000 23,050,000 Public Health Commission 2,630,896 1,337,961 18,642,381 31,445,984
Total 6,228,698 2,383,250 34,342,381 54,495,984
External Funds Expenditures Total Actual '19 Total Actual '20 Total Approp '21 Total Budget '22
Age Strong 7,181,393 5,965,259 9,145,649 9,591,850 Boston Centers for Youth & Families 1,595,336 878,325 1,168,014 1,005,888 Fair Housing & Equity 711,800 837,604 737,846 799,761 Office of Health & Human Services 114,080 24,538 274,050 220,000 Youth Engagement & Employment 856,047 933,750 1,040,443 1,040,444
Total 10,458,656 8,639,476 12,366,002 12,657,943


Health & Human ServicesOffice of Health & Human Services 125
Office of Health & Human Services Operating Budget Health & Human Services Office of Health & Human Services Marty Martinez, Chief of Health & Human Services, Appropriation 388000
Department Mission The Office of Health & Human Services oversees all programs and operations of the Health & Human Services Cabinet. The Office also provides centralized policy development and coordination.
Operating Budget Program Name Total Actual '19 Total Actual '20 Total Approp '21 Total Budget '22
Office of Health & Human Services 0 0 1,631,076 3,916,665 Mayor's Office of Food Access 0 0 774,722 1,104,885 Mayor's Office of Public Safety 0 0 0 572,734
Total 0 0 2,405,798 5,594,284
Operating Budget Actual '19 Actual '20 Approp '21 Budget '22
Personnel Services 0 0 945,648 1,405,216 Non Personnel 0 0 1,460,150 4,189,068
Total 0 0 2,405,798 5,594,284
External Funds Budget Fund Name Total Actual '19 Total Actual '20 Total Approp '21 Total Budget '22
Can Share 33,334 1,133 10,000 100,000 Children’s Hospital- Boston EATS 80,746 23,405 80,000 27,000 Double Up Food Bucks 0 0 160,000 25,000 Strategic Planning Grant 0 0 24,050 0 SOS Food Insecurity Specialist 0 0 0 18,000 ABCD-CSBG Cares 0 0 0 50,000
Total 114,080 24,538 274,050 220,000

126 Health & Human ServicesOffice of Health & Human Services
Office of Health & Human Services Operating Budget
Description of Services The Office of Health & Human Services oversees the operations of the individual departments within the cabinet. The Office also provides policy development and support for those departments and the Food Access and Public Safety programs.
Commission for Persons With
DisabilitiesAge Strong Fair Housing Youth Engagement
& EmploymentBCYFPublic Health Commission Boston VETS
Office of Health & Human Services
Office of Immigrant
Advancement
Health & Human Services

Health & Human ServicesOffice of Health & Human Services 127
Department History Personnel Services FY19 Expenditure FY20 Expenditure FY21 Appropriation FY22 Recommended Inc/Dec 21 vs 22
51000 Permanent Employees 0 0 945,648 1,405,216 459,568 51100 Emergency Employees 0 0 0 0 0 51200 Overtime 0 0 0 0 0 51600 Unemployment Compensation 0 0 0 0 0 51700 Workers' Compensation 0 0 0 0 0 Total Personnel Services 0 0 945,648 1,405,216 459,568
Contractual Services FY19 Expenditure FY20 Expenditure FY21 Appropriation FY22 Recommended Inc/Dec 21 vs 22
52100 Communications 0 0 1,000 1,000 0 52200 Utilities 0 0 0 0 0 52400 Snow Removal 0 0 0 0 0 52500 Garbage/Waste Removal 0 0 0 0 0 52600 Repairs Buildings & Structures 0 0 0 0 0 52700 Repairs & Service of Equipment 0 0 0 0 0 52800 Transportation of Persons 0 0 0 0 0 52900 Contracted Services 0 0 1,447,000 4,175,918 2,278,918 Total Contractual Services 0 0 1,448,000 4,176,918 2,278,918
Supplies & Materials FY19 Expenditure FY20 Expenditure FY21 Appropriation FY22 Recommended Inc/Dec 21 vs 22
53000 Auto Energy Supplies 0 0 0 0 0 53200 Food Supplies 0 0 500 500 0 53400 Custodial Supplies 0 0 0 0 0 53500 Med, Dental, & Hosp Supply 0 0 0 0 0 53600 Office Supplies and Materials 0 0 11,500 11,500 0 53700 Clothing Allowance 0 0 0 0 0 53800 Educational Supplies & Mat 0 0 0 0 0 53900 Misc Supplies & Materials 0 0 0 0 0 Total Supplies & Materials 0 0 12,000 12,000 0
Current Chgs & Oblig FY19 Expenditure FY20 Expenditure FY21 Appropriation FY22 Recommended Inc/Dec 21 vs 22
54300 Workers' Comp Medical 0 0 0 0 0 54400 Legal Liabilities 0 0 0 0 0 54500 Aid To Veterans 0 0 0 0 0 54600 Current Charges H&I 0 0 0 0 0 54700 Indemnification 0 0 0 0 0 54800 Reserve Account 0 0 0 0 0 54900 Other Current Charges 0 0 150 150 0 Total Current Chgs & Oblig 0 0 150 150 0
Equipment FY19 Expenditure FY20 Expenditure FY21 Appropriation FY22 Recommended Inc/Dec 21 vs 22
55000 Automotive Equipment 0 0 0 0 0 55400 Lease/Purchase 0 0 0 0 0 55600 Office Furniture & Equipment 0 0 0 0 0 55900 Misc Equipment 0 0 0 0 0 Total Equipment 0 0 0 0 0
Other FY19 Expenditure FY20 Expenditure FY21 Appropriation FY22 Recommended Inc/Dec 21 vs 22
56200 Special Appropriation 0 0 0 0 0 57200 Structures & Improvements 0 0 0 0 0 58000 Land & Non-Structure 0 0 0 0 0 Total Other 0 0 0 0 0
Grand Total 0 0 2,405,798 5,594,284 3,188,486

128 Health & Human ServicesOffice of Health & Human Services
Department Personnel
Title Union Code Grade Position FY22 Salary Title
Union Code Grade Position FY22 Salary
Admin Asst III MYO 08 1.00 84,970 Program Director EXM NG 1.00 80,331 Administrative_Asst MYO 06 1.00 55,829 Spec Asst MYN NG 1.00 123,574
Chief of Human Services CDH NG 1.00 160,439 Spec Asst to Chief of Human Services
MYN NG 3.00 226,621
Dir of Food Initiative EXM NG 1.00 93,907 Special Asst II MYO 11 2.00 198,438 Exec Director MYO 09 1.00 77,304 Staff - Asst MYN NG 1.00 50,133 Program Coordinator MYO 07 1.00 61,671 Staff Assistant II MYO 06 2.00 131,608
Staff Asst MYO 05 1.00 58,391
Total 17 1,403,216 Adjustments Differential Payments 0 Other 2,000 Chargebacks 0 Salary Savings 0 FY22 Total Request 1,405,216
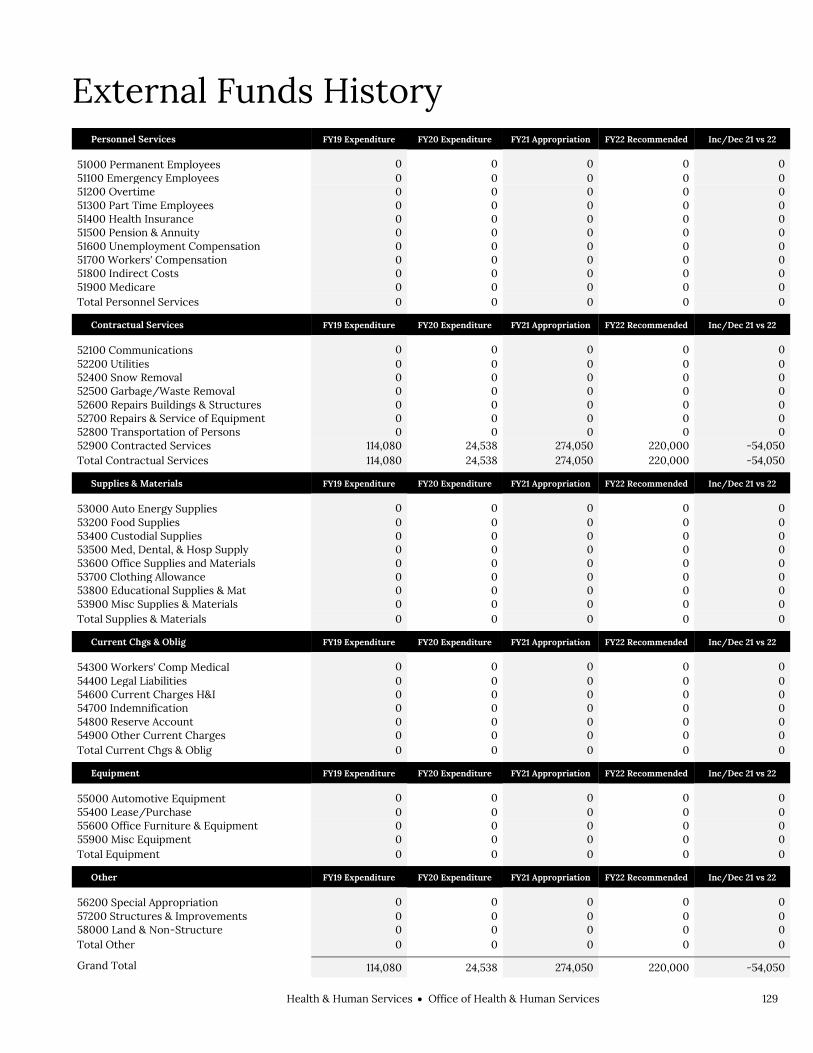
Health & Human ServicesOffice of Health & Human Services 129
External Funds History Personnel Services FY19 Expenditure FY20 Expenditure FY21 Appropriation FY22 Recommended Inc/Dec 21 vs 22
51000 Permanent Employees 0 0 0 0 0 51100 Emergency Employees 0 0 0 0 0 51200 Overtime 0 0 0 0 0 51300 Part Time Employees 0 0 0 0 0 51400 Health Insurance 0 0 0 0 0 51500 Pension & Annuity 0 0 0 0 0 51600 Unemployment Compensation 0 0 0 0 0 51700 Workers' Compensation 0 0 0 0 0 51800 Indirect Costs 0 0 0 0 0 51900 Medicare 0 0 0 0 0 Total Personnel Services 0 0 0 0 0
Contractual Services FY19 Expenditure FY20 Expenditure FY21 Appropriation FY22 Recommended Inc/Dec 21 vs 22
52100 Communications 0 0 0 0 0 52200 Utilities 0 0 0 0 0 52400 Snow Removal 0 0 0 0 0 52500 Garbage/Waste Removal 0 0 0 0 0 52600 Repairs Buildings & Structures 0 0 0 0 0 52700 Repairs & Service of Equipment 0 0 0 0 0 52800 Transportation of Persons 0 0 0 0 0 52900 Contracted Services 114,080 24,538 274,050 220,000 -54,050 Total Contractual Services 114,080 24,538 274,050 220,000 -54,050
Supplies & Materials FY19 Expenditure FY20 Expenditure FY21 Appropriation FY22 Recommended Inc/Dec 21 vs 22
53000 Auto Energy Supplies 0 0 0 0 0 53200 Food Supplies 0 0 0 0 0 53400 Custodial Supplies 0 0 0 0 0 53500 Med, Dental, & Hosp Supply 0 0 0 0 0 53600 Office Supplies and Materials 0 0 0 0 0 53700 Clothing Allowance 0 0 0 0 0 53800 Educational Supplies & Mat 0 0 0 0 0 53900 Misc Supplies & Materials 0 0 0 0 0 Total Supplies & Materials 0 0 0 0 0
Current Chgs & Oblig FY19 Expenditure FY20 Expenditure FY21 Appropriation FY22 Recommended Inc/Dec 21 vs 22
54300 Workers' Comp Medical 0 0 0 0 0 54400 Legal Liabilities 0 0 0 0 0 54600 Current Charges H&I 0 0 0 0 0 54700 Indemnification 0 0 0 0 0 54800 Reserve Account 0 0 0 0 0 54900 Other Current Charges 0 0 0 0 0 Total Current Chgs & Oblig 0 0 0 0 0
Equipment FY19 Expenditure FY20 Expenditure FY21 Appropriation FY22 Recommended Inc/Dec 21 vs 22
55000 Automotive Equipment 0 0 0 0 0 55400 Lease/Purchase 0 0 0 0 0 55600 Office Furniture & Equipment 0 0 0 0 0 55900 Misc Equipment 0 0 0 0 0 Total Equipment 0 0 0 0 0
Other FY19 Expenditure FY20 Expenditure FY21 Appropriation FY22 Recommended Inc/Dec 21 vs 22
56200 Special Appropriation 0 0 0 0 0 57200 Structures & Improvements 0 0 0 0 0 58000 Land & Non-Structure 0 0 0 0 0 Total Other 0 0 0 0 0
Grand Total 114,080 24,538 274,050 220,000 -54,050

130 Health & Human ServicesOffice of Health & Human Services
Program 1. Health & Human Services Marty Martinez, Chief, Organization 388100
Program Description The Office of Health & Human Services oversees all programs and operations of the Health & Human Services Cabinet. The Office also provides centralized policy development and coordination.
Operating Budget Actual '19 Actual '20 Approp '21 Budget '22
Personnel Services 0 0 586,076 624,665 Non Personnel 0 0 1,045,000 3,292,000
Total 0 0 1,631,076 3,916,665

Health & Human ServicesOffice of Health & Human Services 131
Program 2. Mayor’s Office of Food Access Catalina Lopez-Ospina, Director, 388200
Program Description The Office of Food Access works to make healthy food more available and affordable in Boston.
Operating Budget Actual '19 Actual '20 Approp '21 Budget '22
Personnel Services 0 0 359,572 339,735 Non Personnel 0 0 415,150 765,150 Total 0 0 774,722 1,104,885

132 Health & Human ServicesOffice of Health & Human Services
Program 3. Mayor’s Office of Public Safety Rufus Faulk, Director, 388300
Program Description The Mayor’s Office of Public Safety studies, develops, and puts in place violence intervention and prevention programs and policies.
Operating Budget Actual '19 Actual '20 Approp '21 Budget '22
Personnel Services 0 0 0 440,816 Non Personnel 0 0 0 131,918 Total 0 0 0 572,735

Health & Human ServicesOffice of Health & Human Services 133
External Funds Projects Can Share
Project Mission Can Share fund raising supports the Office of Food Access’ Double Bucks and Healthy Incentives Program (HIP). These programs enable SNAP beneficiaries to increase their buying power at Boston farmer’s markets and at brick and mortar stores that provide access to fresh food.
Children’s Hospital- Boston EATS
Project Mission Boston Eats seeks to improve food access in Boston communities by increasing the number of open sites for summer and after-school meals. These open sites offer free meals to children age 18 and under in a stigma-free way, without prior registration, identification, or any eligibility requirements to receive a meal. These meal sites ensure that children have access to free, healthy food when school breakfast and lunch are not available. This work happens through partnerships with community partners who can expand the support they offer to their community through the resources provided through this program, including technical assistance from coordinating partners and mini-grants to fund meal site activities
Double Up Food Bucks
Project Mission Double Up Boston Food Bucks Pilot Program will increase the buying power of SNAP recipients to buy fresh food and vegetables, by expanding SNAP-matching programs to locally-owned, brick-and-mortar food retailers. OFA is participating in a multi-state USDA Food Insecurity Nutrition Incentive (FINI) application led by Fair Food Network (FFN). Fair Food Network, is a non-profit in Minnesota that pioneers solutions that support farmers strengthen local economies, and increase access to healthy food, specifically in underserved communities. Can Share fund raising supports the Office of Food Access’ Double Bucks and Healthy Incentives Program (HIP). These programs enable SNAP beneficiaries to increase their buying power at Boston farmer’s markets and at brick and mortar stores that provide access to fresh food.
Strategic Planning Grant
Project Mission Share Our Strength and the Mayor’s Office of Food Access desire to work together toward a collective goal of expanding access to Breakfast After the Bell in Boston Public Schools. The purpose of this grant is to support critical work to end childhood hunger by adding staff capacity to the Mayor’s Office of Food Access to provide additional support and technical assistance for Boston Public Schools’ Breakfast After the Bell program.
SOS Food Insecurity Specialist
Project Mission Share Our Strength and the Mayor’s Office of Food Access desire to work together toward a collective goal of expanding food security to students in Boston Public Schools. The purpose of this grant is to support critical work to end childhood hunger through increased participation in federal child nutrition programs and create awareness of how students and families can access these programs. This grant is expected to conclude in FY22.
ABCD-CSBG Cares
Project Mission This grant from Action for Boston Community Development through the Community Service Block Grant program is a federal funding source designed to help low-income people become more self-sufficient. CSBG CARES is a special allocation intended to address the urgent need in low-income communities created by the COVID-19 pandemic. This grant is expected to conclude in FY22.


Health & Human ServicesAge Strong 135
Age Strong Operating Budget Health & Human Services Age Strong Emily Shea, Commissioner, Appropriation 387000
Department Mission The mission of the Age Strong Commission is to enhance the quality of life for Boston's senior citizens through developing, planning, coordinating, implementing, and monitoring the delivery of programs and services to the elderly in an efficient and effective manner. These activities are provided in collaboration with various federal, state, and City agencies, along with neighborhood service providers and senior citizen groups.
Selected Performance Goals Age Strong Operations
Keep older adults engaged, informed and connected to resources, services, and programs. Age Strong Transportation
Provide accessible, reliable, discounted and free transportation options to Boston's older adults.
Programs & Partnerships
Promote meaningful volunteer engagement opportunities to Boston's older adults. Set course for successful aging programs, policies and practices in Boston.
Operating Budget Program Name Total Actual '19 Total Actual '20 Total Approp '21 Total Budget '22
Administration 1,061,716 1,182,379 1,002,773 1,148,178
Operations 1,015,786 1,033,852 1,268,483 1,991,768
Transportation 1,378,199 1,428,703 1,514,701 1,495,352
Programs & Partnerships 268,151 230,074 660,140 569,928
Total 3,723,852 3,875,008 4,446,097 5,205,226
External Funds Budget Fund Name Total Actual '19 Total Actual '20 Total Approp '21 Total Budget '22
Area Agency On Aging (AAA) 3,593,708 3,334,413 2,112,903 5,770,781 AAA CARES 0 0 1,531,586 875,000
Family First Coronavirus Response Act (FFCRA) 0 0 567,216 0
Elderly Universal Fund 46,266 146,414 100,000 76,500
EOEA Formula Grant 1,019,747 1,131,653 1,064,286 1,112,854
MassDOT Mobility Management Grant 35,000 0 0 0
MCOA Respite 23,746 76,958 68,195 18,771
Mobility Assistance Program 0 0 35,000 0
Nutrition Services Incentive Program 387,318 259,407 352,818 700,000
Prevention Wellness Trust Fund 0 5,797 0 0
Retired Senior Volunteers Program 120,889 135,858 137,753 142,780
Senior Companion Program 272,829 205,530 280,840 282,038
State Elder Lunch Program 1,681,892 669,230 1,488,128 1,488,128
Total 7,181,395 5,965,260 7,738,724 10,466,852
Operating Budget Actual '19 Actual '20 Approp '21 Budget '22
Personnel Services 2,902,048 3,007,706 3,327,606 3,448,066 Non Personnel 821,804 867,302 1,118,491 1,757,160 Total 3,723,852 3,875,008 4,446,097 5,205,226

136 Health & Human ServicesAge Strong
Age Strong Operating Budget
Authorizing Statutes Enabling Legislation, CBC Ord. § 12-3.1. Powers and Duties, CBC Ord. § 12-3.2.
Description of Services Those services which are developed, planned, coordinated, and delivered by the Age Strong Commission include assistance in applying for government benefits and community-based services, discount programs, health screening programs, housing programs, transportation, advocacy, employment and volunteer programs, counseling services and information and referrals. The Commission also coordinates and monitors neighborhood-based nutrition, legal, health, transportation and other elderly services, and senior centers.
Commissioner
Administration & Finance Operations Programs &
Partnerships
Operating & External Funds Budgets
Performance
Transportation
Senior Shuttle
Seniority Magazine
Outreach & Engagement
Housing
Volunteers
Area Agency on Aging
Age Friendly Program
Taxi Coupons

Health & Human ServicesAge Strong 137
Department History Personnel Services FY19 Expenditure FY20 Expenditure FY21 Appropriation FY22 Recommended Inc/Dec 21 vs 22
51000 Permanent Employees 2,831,897 2,935,684 3,287,948 3,421,566 133,618 51100 Emergency Employees 0 0 0 0 0 51200 Overtime 27,282 18,793 11,500 11,500 0 51600 Unemployment Compensation 0 0 5,000 5,000 0 51700 Workers' Compensation 42,869 53,229 23,158 10,000 -13,158 Total Personnel Services 2,902,048 3,007,706 3,327,606 3,448,066 120,460
Contractual Services FY19 Expenditure FY20 Expenditure FY21 Appropriation FY22 Recommended Inc/Dec 21 vs 22
52100 Communications 45,918 42,074 26,000 42,560 16,560 52200 Utilities 0 0 0 0 0 52400 Snow Removal 0 0 0 0 0 52500 Garbage/Waste Removal 0 0 0 0 0 52600 Repairs Buildings & Structures 0 0 0 0 0 52700 Repairs & Service of Equipment 62,624 72,831 72,000 72,000 0 52800 Transportation of Persons 46,020 38,794 42,300 42,300 0 52900 Contracted Services 367,861 481,293 716,800 1,236,870 520,070 Total Contractual Services 522,423 634,992 857,100 1,393,730 536,630
Supplies & Materials FY19 Expenditure FY20 Expenditure FY21 Appropriation FY22 Recommended Inc/Dec 21 vs 22
53000 Auto Energy Supplies 64,023 47,687 60,000 53,640 -6,360 53200 Food Supplies 98,237 103,128 112,126 215,145 103,019 53400 Custodial Supplies 0 0 0 0 0 53500 Med, Dental, & Hosp Supply 0 0 0 0 0 53600 Office Supplies and Materials 12,271 11,941 10,200 12,900 2,700 53700 Clothing Allowance 8,571 9,036 12,250 10,390 -1,860 53800 Educational Supplies & Mat 0 0 0 0 0 53900 Misc Supplies & Materials 12,890 9,211 13,975 13,975 0 Total Supplies & Materials 195,992 181,003 208,551 306,050 97,499
Current Chgs & Oblig FY19 Expenditure FY20 Expenditure FY21 Appropriation FY22 Recommended Inc/Dec 21 vs 22
54300 Workers' Comp Medical 1,977 13,928 5,000 5,000 0 54400 Legal Liabilities 0 0 6,640 6,680 40 54500 Aid To Veterans 0 0 0 0 0 54600 Current Charges H&I 0 0 0 0 0 54700 Indemnification 0 0 0 0 0 54800 Reserve Account 0 0 0 0 0 54900 Other Current Charges 73,059 37,379 41,200 45,700 4,500 Total Current Chgs & Oblig 75,036 51,307 52,840 57,380 4,540
Equipment FY19 Expenditure FY20 Expenditure FY21 Appropriation FY22 Recommended Inc/Dec 21 vs 22
55000 Automotive Equipment 0 0 0 0 0 55400 Lease/Purchase 28,353 0 0 0 0 55600 Office Furniture & Equipment 0 0 0 0 0 55900 Misc Equipment 0 0 0 0 0 Total Equipment 28,353 0 0 0 0
Other FY19 Expenditure FY20 Expenditure FY21 Appropriation FY22 Recommended Inc/Dec 21 vs 22
56200 Special Appropriation 0 0 0 0 0 57200 Structures & Improvements 0 0 0 0 0 58000 Land & Non-Structure 0 0 0 0 0 Total Other 0 0 0 0 0
Grand Total 3,723,852 3,875,008 4,446,097 5,205,226 759,129

138 Health & Human ServicesAge Strong
Department Personnel
Title Union Code Grade Position FY22 Salary Title
Union Code Grade Position FY22 Salary
Adm Dir for Age-Friendly Boston
EXM 05 1.00 80,858 Dispatcher AFT 10 1.00 41,670
Adm Dir for Transportation EXM 05 1.00 80,858 Driver AFT 10 21.00 975,934
Adm Dir of Volunteer Programs EXM 05 0.30 23,555 Executive Director MYO 08 1.00 84,970
Admin Dir of Outreach & Engagement
EXM 05 1.00 80,858 Fleet Main Manager SU6 12 1.00 64,998
Admin Director of Communications
EXM 05 1.00 80,858 Housing Spec SU6 11 2.00 104,814
Administrative Assistant SU6 07 1.20 49,856 Off_Manager SU6 15 1.00 73,088
Advocacy & Benefits Coordinator SU6 14 0.63 23,008 Office Clerk SU6 04 1.00 47,546
Advocacy Representative SU6 10 8.04 426,469 Outreach & Engagement Spc (Elderly)
SU6 15 1.00 73,088
Asst Dir MYO 05 1.00 55,845 Prin Personnel Officer (Elderly) SE1 06 1.00 74,987 Commissioner Elderly Affairs CDH NG 1.00 109,299 Project Mngr EXM 05 1.00 74,414
Dep Commis of Prgs & Partnership
MYN NG 0.50 43,416 Receptnist SU6 06 1.00 43,107
Dep Commissioner of Finance MYN NG 0.80 69,466 Scheduler AFT 10 3.00 148,252
Dep Commissioner of Operations MYN NG 1.00 86,832 Scheduling Manager SU6 15 1.00 73,088
Director of Development SU6 15 1.00 53,429 SrBudgetAnalyst(Eld/Fiscal) SE1 06 1.00 87,879
Staff Assistant I MYO 05 2.00 107,911
Total 58 3,340,353 Adjustments Differential Payments 0 Other 173,900 Chargebacks 0 Salary Savings -92,689 FY22 Total Request 3,421,564

Health & Human ServicesAge Strong 139
External Funds History Personnel Services FY19 Expenditure FY20 Expenditure FY21 Appropriation FY22 Recommended Inc/Dec 21 vs 22
51000 Permanent Employees 1,092,967 1,051,045 1,086,438 1,848,908 524,956 51100 Emergency Employees 180,175 142,948 240,431 178,328 -62,103 51200 Overtime 312 0 0 0 0 51300 Part Time Employees 0 0 0 0 0 51400 Health Insurance 293,309 287,671 162,918 281,776 73,499 51500 Pension & Annuity 103,826 106,495 97,751 158,499 33,534 51600 Unemployment Compensation 0 0 0 9,249 9,249 51700 Workers' Compensation 0 0 0 0 0 51800 Indirect Costs 0 11,204 8,639 27,746 4,774 51900 Medicare 14,240 14,508 15,748 25,535 5,403 Total Personnel Services 1,684,829 1,613,871 1,611,924 2,530,041 589,312
Contractual Services FY19 Expenditure FY20 Expenditure FY21 Appropriation FY22 Recommended Inc/Dec 21 vs 22
52100 Communications 21,000 21,000 22,880 50,128 24,128 52200 Utilities 0 0 0 0 0 52400 Snow Removal 0 0 0 0 0 52500 Garbage/Waste Removal 0 0 0 0 0 52600 Repairs Buildings & Structures 0 0 0 0 0 52700 Repairs & Service of Equipment 150 0 0 0 0 52800 Transportation of Persons 47,564 5,722 6,576 9,478 2,278 52900 Contracted Services 5,209,326 4,080,197 5,988,307 7,792,899 -142,727 Total Contractual Services 5,278,040 4,106,919 6,017,763 7,852,505 -116,321
Supplies & Materials FY19 Expenditure FY20 Expenditure FY21 Appropriation FY22 Recommended Inc/Dec 21 vs 22
53000 Auto Energy Supplies 0 0 0 0 0 53200 Food Supplies 17,038 27,805 52,661 0 -54,096 53400 Custodial Supplies 0 0 0 0 0 53500 Med, Dental, & Hosp Supply 0 0 0 0 0 53600 Office Supplies and Materials 8,587 519 5,275 11,409 6,134 53700 Clothing Allowance 4,928 4,714 0 0 0 53800 Educational Supplies & Mat 0 0 0 0 0 53900 Misc Supplies & Materials 41,803 20,912 376 9,200 8,200 Total Supplies & Materials 72,356 53,950 58,312 20,609 -39,762
Current Chgs & Oblig FY19 Expenditure FY20 Expenditure FY21 Appropriation FY22 Recommended Inc/Dec 21 vs 22
54300 Workers' Comp Medical 0 0 0 0 0 54400 Legal Liabilities 0 0 0 0 0 54600 Current Charges H&I 0 0 0 0 0 54700 Indemnification 0 0 0 0 0 54800 Reserve Account 0 0 0 0 0 54900 Other Current Charges 44,229 85,086 50,725 63,697 12,972 Total Current Chgs & Oblig 44,229 85,086 50,725 63,697 12,972
Equipment FY19 Expenditure FY20 Expenditure FY21 Appropriation FY22 Recommended Inc/Dec 21 vs 22
55000 Automotive Equipment 0 105,130 0 0 0 55400 Lease/Purchase 0 0 0 0 0 55600 Office Furniture & Equipment 9,049 303 0 0 0 55900 Misc Equipment 92,890 0 0 0 0 Total Equipment 101,939 105,433 0 0 0
Other FY19 Expenditure FY20 Expenditure FY21 Appropriation FY22 Recommended Inc/Dec 21 vs 22
56200 Special Appropriation 0 0 0 0 0 57200 Structures & Improvements 0 0 0 0 0 58000 Land & Non-Structure 0 0 0 0 0 Total Other 0 0 0 0 0
Grand Total 7,181,393 5,965,259 7,738,724 10,466,852 446,201

140 Health & Human ServicesAge Strong
External Funds Personnel
Title Union Code Grade Position FY22 Salary Title
Union Code Grade Position FY22 Salary
Adm Dir of Constituen Services
EXM 05 1.00 80,858 Grants and Payroll Coordinator SU6 13 1.00 67,588
Adm Dir of Volunteer Programs EXM 05 0.70 54,963 Housing Coordinator (Elderly) SU6 14 1.00 61,672
Administrative Assistant SU6 07 0.80 33,597 Housing Director SU6 15 1.00 53,429
Advocacy & Benefits Coordinator
SU6 14 0.38 8,281 Housing Spec SU6 11 2.00 98,863
Advocacy Director SU6 15 1.00 53,429 Information & Referral Coord SU6 14 1.00 61,672 Advocacy Representative SU6 10 2.96 168,466 NutritionAdvocacy&PlanningDir SU6 15 1.00 53,429 Coord Area Agency On Aging SU6 15 1.00 64,546 Outreach & Engagement Spec SU6 10 2.00 109,205
Dep Commis of Prgs & Partnership
MYN NG 0.50 43,416 Program_Monitor SU6 10 1.00 59,023
Dep Commissioner of Finance MYN NG 0.20 17,366 Staff Assistant I MYO 05 1.00 51,265 Editor/Sr Citizen Newspaper SU6 13 1.00 67,588 Taxi Coupon Coordinator SU6 13 1.00 67,588 Finance Assistant SU6 10 1.00 55,203 Volunteer Prog Coord SU6 13 3.00 168,589 Total 26 1,500,037 Adjustments Differential Payments 0 Other 348,871 Chargebacks 0 Salary Savings 0 FY22 Total Request 1,848,908

Health & Human ServicesAge Strong 141
Program 1. Administration Francis Thomas, Manager, Organization 387100
Program Description The Administration Program provides fiscal supervision of all Commission programs, and procures resources to ensure that all programs perform their mission on time and on budget. The program provides data management, purchasing, staff training, program evaluation and analysis. The Administration Program maintains a close relationship with senior citizen groups, and service providers through administrating and monitoring providers supported by Area Agency on Aging grants. Administration staff is responsible for initiating systems that increase productivity and community outreach. Administration is also responsible for financially preparing the Commission to serve the growing needs of our multicultural and linguistically diverse clients and staff and the eventual boom in the elder population.
Operating Budget Actual '19 Actual '20 Approp '21 Budget '22
Personnel Services 893,153 968,388 949,483 1,067,888 Non Personnel 168,563 213,991 53,290 80,290 Total 1,061,716 1,182,379 1,002,773 1,148,178

142 Health & Human ServicesAge Strong
Program 2. Operations Karine Querido, Manager, Organization 387200
Program Description The Operations Program provides seniors, caregivers, and the general public with essential information that helps to improve the quality and safety of seniors’ lives. The monthly newspaper and web site offer articles and information of special interest to seniors. The Commission produces television shows for Boston Neighborhood Network and the Boston cable channel. The Operations program creates and manages internal and external relationships aimed at developing and maintaining staff, city, neighborhood, public, media and business relationships. This program promotes employment and volunteer opportunities for seniors and helps to develop, coordinate and support intergenerational and multicultural activities. It also coordinates special fundraising, recreation, health and fitness events to reduce isolation and encourage community involvement of seniors.
Operating Budget Actual '19 Actual '20 Approp '21 Budget '22
Personnel Services 505,213 518,568 740,282 755,168 Non Personnel 510,573 515,284 528,201 1,236,600 Total 1,015,786 1,033,852 1,268,483 1,991,768
Performance
Goal: Keep older adults engaged, informed and connected to resources, services, and programs
Performance Measures Actual '19 Actual '20 Projected '21 Target '22
Number of Applications Completed (Housing and Benefits) 601 2,026 3,500 4,000
Number of Events and Programs 225 173 100 225
Number of Information and Service Referrals Provided 11,245 4,070 10,000 13,000
Number of Older Adults Attending Presentations 1,950 1,415 250 2,500
Number of Older Adults Participating in Events and Programs
13,391 12,650 2,000 11,550

Health & Human ServicesAge Strong 143
Program 3. Transportation Michael Killoran, Manager, Organization 387300
Program Description Through the Age Strong Shuttle, the Transportation Program provides curb-to-curb transportation to Boston’s elderly. The shuttle operates scheduled trips within Boston with medical appointments receiving highest priority, followed by grocery shopping. Social and recreational activities are provided based on availability. The Transportation Program also oversees the Taxi Discount Coupon Program and develops and maintains collaborations with other senior transportation providers, elder service organizations and city agencies to provide access to other transportation services and to help educate our seniors on pedestrian safety and safe driver issues.
Operating Budget Actual '19 Actual '20 Approp '21 Budget '22
Personnel Services 1,240,540 1,291,342 1,367,601 1,356,412 Non Personnel 137,659 137,361 147,100 138,940 Total 1,378,199 1,428,703 1,514,701 1,495,352
Performance
Goal: Provide accessible, reliable, discounted and free transportation options to Boston's older adults
Performance Measures Actual '19 Actual '20 Projected '21 Target '22
% of Taxi Coupon Booklets Sold 100% 100% 30% 100%
Rides Provided to Older Adults 32,051 10,469 10,000 30,000

144 Health & Human ServicesAge Strong
Program 4. Programs & Partnerships Melissa Carlson, Manager, Organization 387400
Program Description The Programs & Partnerships unit is where the Age Strong Commission’s community service advocates provide face-to-face assistance to seniors to identify government benefits and programs that promote healthy and independent living. The advocates also provide information and referral services to Boston’s older adults and their caregivers. The Advocacy and Planning unit develops and implements strategies related to emerging issues and concerns of seniors. This includes regularly assessing the needs of Boston’s older adults and creating Boston’s Area Plan for people over 60.
Operating Budget Actual '19 Actual '20 Approp '21 Budget '22
Personnel Services 263,142 229,408 270,240 268,598 Non Personnel 5,009 666 389,900 301,330 Total 268,151 230,074 660,140 569,928
Performance
Goal: Promote meaningful volunteer engagement opportunities to Boston's older adults
Performance Measures Actual '19 Actual '20 Projected '21 Target '22
Avg Number of Older Adult Volunteers 393 441 450 450
Hours completed by Older Adult Volunteers 111,653 65,347 60,000 95,000
Goal: Set course for successful aging programs, policies and practices in Boston
Performance Measures Actual '19 Actual '20 Projected '21 Target '22
Age-Friendly Boston Action Items Completed 15 20 5 7
Number of Older Adults Served by Grantees 19,853 18,704 19,000 20,000
Health & Human ServicesAge Strong 145
External Funds Projects Area Agency on Aging
Project Mission As Boston's Area Agency on Aging (AAA), the Age Strong Commission, also known as the Elderly Commission, is a sub-grantee of federal Title III funding through the Massachusetts Executive Office of Elder Affairs. The federal funding source of this annual grant is the Administration on Aging, an agency of the Department of Health and Human Services. The AAA plans and coordinates public, private and voluntary programs to provide the best possible service for Boston’s older citizens. The AAA also provides direct funding for elderly-related services throughout Boston. The AAA Unit of the Elderly Commission monitors the agencies providing services and provides technical assistance as needed. The grant awarded in FY18 totaled $3,873,198 started on 10/01/17 and ended on 09/30/18. The FY19 award is $3,734,042.
AAA CARES
Project Mission The Coronavirus Aid, Relief, and Economic Security Act (CARES) is federal legislation providing among other things support to state and local governments in light of the COVID-19 pandemic. Grant funding will be utilized to support congregate meal sites and home delivered meals and is expected to end in FY22. FY22 amount includes carryover amount of $1.8M from FY21.
Family First Coronavirus Response Act (FFCRA)
Project Mission The Families First Coronavirus Response Act is federal legislation providing paid sick leave, free coronavirus testing, expanded food assistance, unemployment benefits, and requires employers to provide additional protections for health care workers. Grant funding will be utilized to support congregate meal sites and home delivered meals and is expected to end in FY21.
Elderly Universal Fund
Project Mission The Universal Fund is the repository for funds donated to the Age Strong Commission, also known as the Elderly Commission, to support events and services provided by the Commission for the seniors of Boston. The projected amount to be collected in FY19 is $100,000.
EOEA Formula Award
Project Mission As Boston’s Council on Aging, the Age Strong Commission, also known as the Elderly Commission, receives the formula grant from the Massachusetts Executive Office of Elder Affairs. The annual grant provides for direct services including the community service advocates. The grant also provides resources to the housing unit which provides information, referral and direct assistance to Boston’s elder tenants and homeowners. The grant starts on July 1st and ends on June 30th. Both FY18 and FY19 awards are $1,056,840, or $12 per senior.

146 Health & Human ServicesAge Strong
Mobility Management Program
Project Mission The Mobility Management Program of $220,017 for multi-year is received as state funding through the Massachusetts Department of Transportation to help provide meaningful transportation options across the Commonwealth. The Commission will use funds to acquire and implement a suite of technologies, including both software and hardware to help the Age Strong Shuttle, also known as Elderly Commission’s Senior Shuttle, to achieve responsive dispatching, an efficient deployment of resources, automated scheduling and dispatching, and on-board navigation assistance. The grant awarded in FY18 totaled $170,017 and the FY19 additional award is $50,000.
MCOA Respite
Project Mission The Massachusetts Councils on Aging through the U.S. Department of Health and Human Service’s Administration for Community Living provides this Caregiver Respite and Support Services grant. This grant funding will enable the department to create a broad community-based support network for those with Alzheimer’s and their caregivers – a new Memory Café, a volunteer Respite Companion program, support for the Alzheimer’s Associations’ Family Service Volunteers, and a social outing listing so that people with dementia can stay engaged and connected. The FY22 amount is $18,771.
Nutrition Services Incentive Program
Project Mission The Nutrition Services Incentive Program (NSIP), formerly called the USDA Elder Lunch Program, is received as federal funding through the Massachusetts Executive Office of Elder Affairs. The federal funding source of this annual grant is the Agency on Aging within the U.S. Department of Health and Human Services. The NSIP program is a pass through grant, providing direct funding to nutritional service providers. The grant awarded in FY18 totaled $349,003 started on 10/01/17 and will end on 09/30/18. The FY18 award is estimated at $341,985.
Prevention and Wellness Trust
Project Mission This annual grant is provided by the Boston Public Health Commission, a body politic and corporate and political subdivision of the Commonwealth of Massachusetts, to the Commission and sub-grantees for the continued operation of prevention and wellness programs to the elderly of Boston. The FY17 award was $391,624 and the remaining portion for FY18 is $11,200.
Retired Senior Volunteers Program
Project Mission The federal funding for the Retired Senior Volunteer Program (RSVP) comes from the Corporation for National and Community Service. The purpose of RSVP is to develop a recognized role in the community and a meaningful life in retirement for older adults through significant volunteer services. RSVP recruits and places approximately 500 senior volunteers in opportunities allowing them to use their skills, acquire new skills and explore new interests. Volunteers are partially reimbursed for meals and transportation and receive insurance coverage. Volunteers must be at least 55 years old to participate. The FY18 and FY19 awards are $130,253, and each grant begins on April 1st.

Health & Human ServicesAge Strong 147
Senior Companion Program
Project Mission The Age Strong Commission, also known as the Elderly Commission, receives federal funding for the Senior Companion Program annually from the Corporation for National and Community Service. The Senior Companion Program offers part-time stipendiary community service opportunities for low-income persons who are 55 years and older. Volunteers provide assistance to adults with exceptional needs, development and disabilities, or other special needs throughout Boston’s neighborhoods. These volunteers work 20 hours weekly and receive accident insurance in addition to a meal and travel allowance. The FY18 and FY19 awards are $250,250, and the grant now begins on April 1st.
State Elder Lunch Program
Project Mission This annual grant is provided by the Massachusetts Executive Office of Elder Affairs for the purpose of providing direct funding to nutritional service providers. This grant is a pass through grant, starting each year on July 1st. The FY18 and FY19 awards were $1,363,864.


Health & Human ServicesBoston Centers for Youth & Families 149
Boston Centers for Youth & Families Operating Budget Health & Human Services Boston Centers for Youth & Families William Morales, Director, Appropriation 385000
Department Mission The mission of Boston Centers for Youth & Families (BCYF) is to enhance the quality of life for Boston residents by partnering with community center councils, agencies and businesses to support children, youth, individuals and families. BCYF accomplishes its mission through a wide range of comprehensive programs and services according to neighborhood needs.
Selected Performance Goals Administrative & Policy
To support health and wellness through community center sports, fitness, and recreation programming.
Sports & Fitness
To support health and wellness through community center sports, fitness, and recreation programming.
Operating Budget Program Name Total Actual '19 Total Actual '20 Total Approp '21 Total Budget '22
Administrative & Policy 16,984,522 17,512,897 16,499,331 16,112,015
Sports & Fitness 4,170,943 4,167,860 4,770,849 5,369,530
Youth & Family Services 3,905,486 4,317,602 5,175,425 5,153,552
Child Care & Out-of-School 2,407,132 2,547,108 2,606,070 2,609,273
Total 27,468,083 28,545,467 29,051,675 29,244,370
External Funds Budget Fund Name Total Actual '19 Total Actual '20 Total Approp '21 Total Budget '22
Charles E Shannon Grant 97,836 76,046 100,000 100,000
Child & Adult Care Food 3,353 1,518 0 0
Childhood Obesity Prevention 106,392 35,386 0 0
Children's Hospital - Boston EATS 0 0 80,000 0
City Hall Child Care 638,587 458,406 750,000 850,000
Double Up Food Bucks 81,401 133,141 160,000 0
Mass Marketing Partnership 58,494 22,537 0 0
Strategic Planning Grant 13,846 31,731 0 0
Street Safe Boston 478,129 92 0 0
Tiny Tots Program 74,756 50,826 78,014 55,888
Youth Homelessness Demonstration Program 0 35,359 0 0
Youth at Risk 0 33,284 0 0
Total 1,595,336 878,326 1,168,014 1,005,888
Operating Budget Actual '19 Actual '20 Approp '21 Budget '22
Personnel Services 22,536,414 23,032,244 23,165,144 23,284,138 Non Personnel 4,931,669 5,513,223 5,886,531 5,960,232 Total 27,468,083 28,545,467 29,051,675 29,244,370
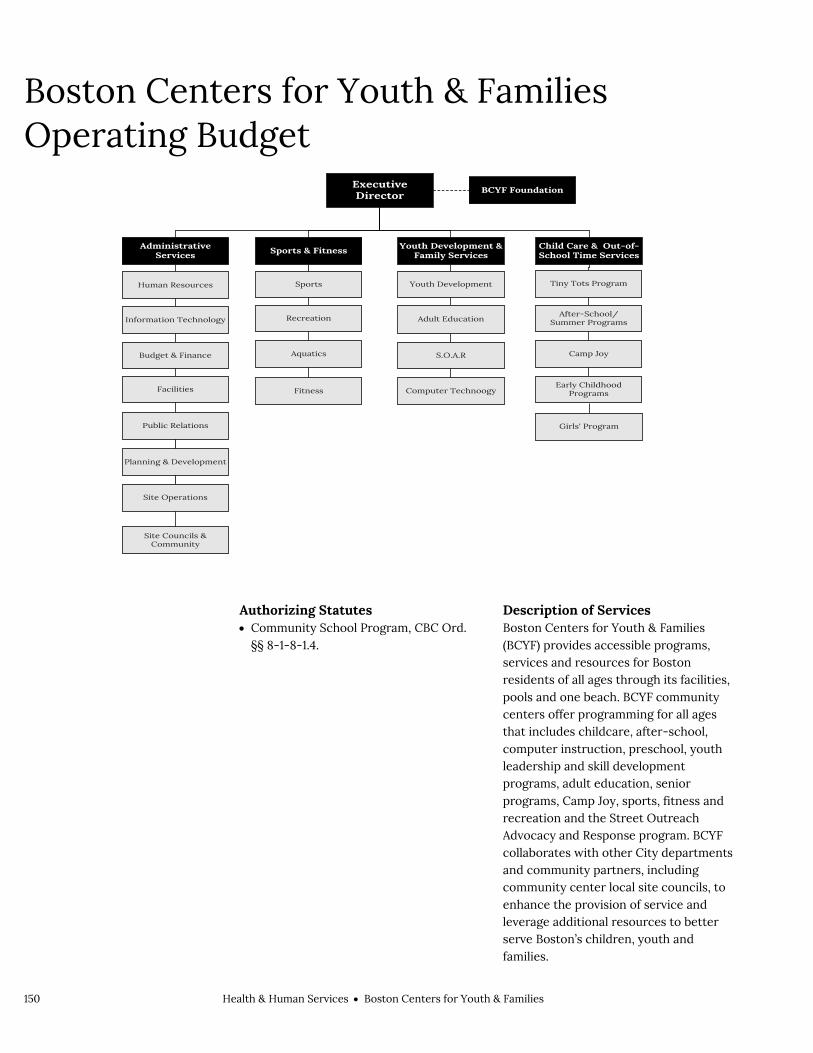
150 Health & Human ServicesBoston Centers for Youth & Families
Boston Centers for Youth & Families Operating Budget
Authorizing Statutes Community School Program, CBC Ord.
§§ 8-1-8-1.4.
Description of Services Boston Centers for Youth & Families (BCYF) provides accessible programs, services and resources for Boston residents of all ages through its facilities, pools and one beach. BCYF community centers offer programming for all ages that includes childcare, after-school, computer instruction, preschool, youth leadership and skill development programs, adult education, senior programs, Camp Joy, sports, fitness and recreation and the Street Outreach Advocacy and Response program. BCYF collaborates with other City departments and community partners, including community center local site councils, to enhance the provision of service and leverage additional resources to better serve Boston’s children, youth and families.
Executive Director
BCYF Foundation
Sports & Fitness
Sports
Youth Development & Family Services
Youth Development
Child Care & Out-of-School Time Services
Tiny Tots Program
After-School/Summer ProgramsAdult Education
S.O.A.R
Recreation
Aquatics
Fitness
Camp Joy
Administrative Services
Human Resources
Information Technology
Budget & Finance
Facilities
Public Relations
Planning & Development
Computer TechnoogyEarly Childhood
Programs
Girls' Program
Site Operations
Site Councils & Community

Health & Human ServicesBoston Centers for Youth & Families 151
Department History Personnel Services FY19 Expenditure FY20 Expenditure FY21 Appropriation FY22 Recommended Inc/Dec 21 vs 22
51000 Permanent Employees 21,656,289 22,152,963 22,348,954 22,440,382 91,428 51100 Emergency Employees 514,857 446,083 642,636 670,202 27,566 51200 Overtime 318,892 343,619 103,554 103,554 0 51600 Unemployment Compensation 26,763 65,053 25,000 25,000 0 51700 Workers' Compensation 19,613 24,526 45,000 45,000 0 Total Personnel Services 22,536,414 23,032,244 23,165,144 23,284,138 118,994
Contractual Services FY19 Expenditure FY20 Expenditure FY21 Appropriation FY22 Recommended Inc/Dec 21 vs 22
52100 Communications 186,325 206,619 358,696 358,696 0 52200 Utilities 1,694,721 1,564,070 1,814,981 1,442,732 -372,249 52400 Snow Removal 63,621 17,467 43,400 43,400 0 52500 Garbage/Waste Removal 100,470 108,419 110,500 113,500 3,000 52600 Repairs Buildings & Structures 16,560 19,396 160,000 160,000 0 52700 Repairs & Service of Equipment 65,254 59,235 41,000 93,500 52,500 52800 Transportation of Persons 265,312 282,799 256,000 261,000 5,000 52900 Contracted Services 1,985,194 2,423,222 2,043,380 2,457,300 413,920 Total Contractual Services 4,377,457 4,681,227 4,827,957 4,930,128 102,171
Supplies & Materials FY19 Expenditure FY20 Expenditure FY21 Appropriation FY22 Recommended Inc/Dec 21 vs 22
53000 Auto Energy Supplies 13,363 13,205 50,648 50,648 0 53200 Food Supplies 1,624 3,750 0 0 0 53400 Custodial Supplies 33,314 64,096 32,000 32,000 0 53500 Med, Dental, & Hosp Supply 0 0 1,600 1,600 0 53600 Office Supplies and Materials 19,644 55,558 61,500 61,500 0 53700 Clothing Allowance 0 0 0 0 0 53800 Educational Supplies & Mat 0 0 0 0 0 53900 Misc Supplies & Materials 266,584 318,459 290,000 261,000 -29,000 Total Supplies & Materials 334,529 455,068 435,748 406,748 -29,000
Current Chgs & Oblig FY19 Expenditure FY20 Expenditure FY21 Appropriation FY22 Recommended Inc/Dec 21 vs 22
54300 Workers' Comp Medical 7,536 8,689 0 0 0 54400 Legal Liabilities 4,600 4,830 5,310 5,840 530 54500 Aid To Veterans 0 0 0 0 0 54600 Current Charges H&I 0 0 0 0 0 54700 Indemnification 0 0 0 0 0 54800 Reserve Account 0 0 0 0 0 54900 Other Current Charges 101,050 149,498 300,289 328,972 28,683 Total Current Chgs & Oblig 113,186 163,017 305,599 334,812 29,213
Equipment FY19 Expenditure FY20 Expenditure FY21 Appropriation FY22 Recommended Inc/Dec 21 vs 22
55000 Automotive Equipment 0 0 0 0 0 55400 Lease/Purchase 90,820 96,021 84,647 75,963 -8,684 55600 Office Furniture & Equipment 9,838 63,760 50,000 30,000 -20,000 55900 Misc Equipment 5,839 54,130 182,580 182,581 1 Total Equipment 106,497 213,911 317,227 288,544 -28,683
Other FY19 Expenditure FY20 Expenditure FY21 Appropriation FY22 Recommended Inc/Dec 21 vs 22
56200 Special Appropriation 0 0 0 0 0 57200 Structures & Improvements 0 0 0 0 0 58000 Land & Non-Structure 0 0 0 0 0 Total Other 0 0 0 0 0
Grand Total 27,468,083 28,545,467 29,051,675 29,244,370 192,695
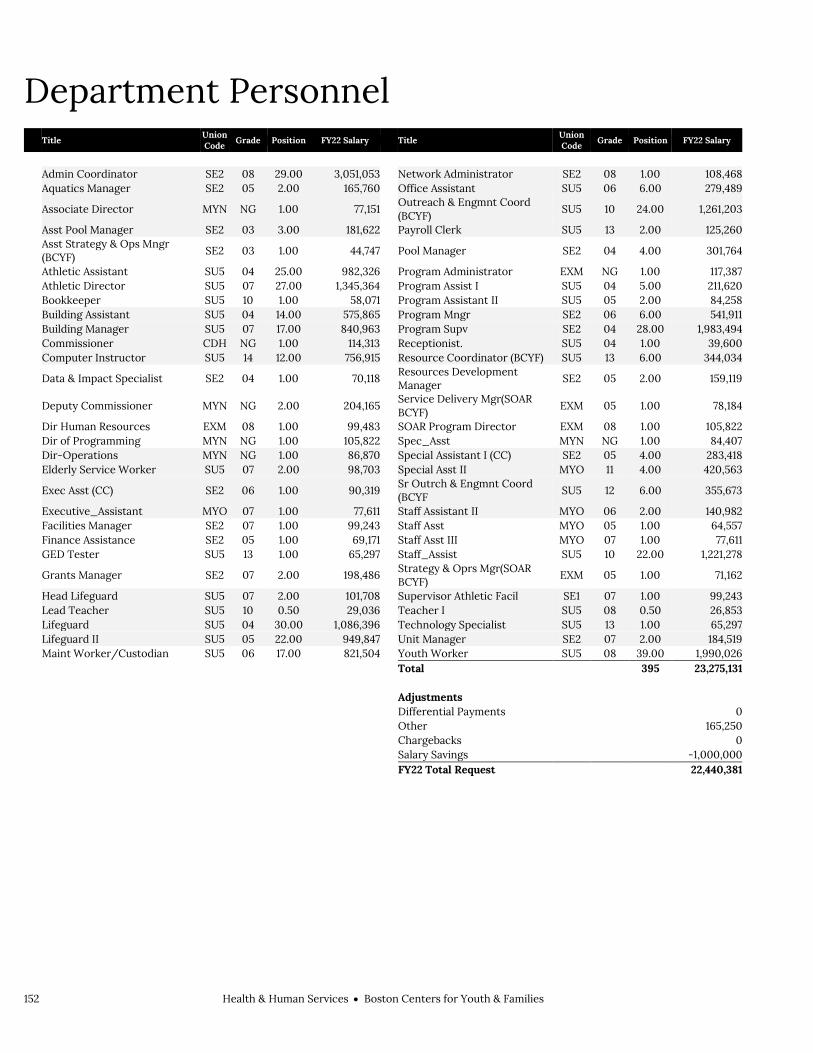
152 Health & Human ServicesBoston Centers for Youth & Families
Department Personnel
Title Union Code Grade Position FY22 Salary Title
Union Code Grade Position FY22 Salary
Admin Coordinator SE2 08 29.00 3,051,053 Network Administrator SE2 08 1.00 108,468 Aquatics Manager SE2 05 2.00 165,760 Office Assistant SU5 06 6.00 279,489
Associate Director MYN NG 1.00 77,151 Outreach & Engmnt Coord (BCYF)
SU5 10 24.00 1,261,203
Asst Pool Manager SE2 03 3.00 181,622 Payroll Clerk SU5 13 2.00 125,260
Asst Strategy & Ops Mngr (BCYF) SE2 03 1.00 44,747 Pool Manager SE2 04 4.00 301,764
Athletic Assistant SU5 04 25.00 982,326 Program Administrator EXM NG 1.00 117,387 Athletic Director SU5 07 27.00 1,345,364 Program Assist I SU5 04 5.00 211,620 Bookkeeper SU5 10 1.00 58,071 Program Assistant II SU5 05 2.00 84,258 Building Assistant SU5 04 14.00 575,865 Program Mngr SE2 06 6.00 541,911 Building Manager SU5 07 17.00 840,963 Program Supv SE2 04 28.00 1,983,494 Commissioner CDH NG 1.00 114,313 Receptionist. SU5 04 1.00 39,600 Computer Instructor SU5 14 12.00 756,915 Resource Coordinator (BCYF) SU5 13 6.00 344,034
Data & Impact Specialist SE2 04 1.00 70,118 Resources Development Manager
SE2 05 2.00 159,119
Deputy Commissioner MYN NG 2.00 204,165 Service Delivery Mgr(SOAR BCYF)
EXM 05 1.00 78,184
Dir Human Resources EXM 08 1.00 99,483 SOAR Program Director EXM 08 1.00 105,822 Dir of Programming MYN NG 1.00 105,822 Spec_Asst MYN NG 1.00 84,407 Dir-Operations MYN NG 1.00 86,870 Special Assistant I (CC) SE2 05 4.00 283,418 Elderly Service Worker SU5 07 2.00 98,703 Special Asst II MYO 11 4.00 420,563
Exec Asst (CC) SE2 06 1.00 90,319 Sr Outrch & Engmnt Coord (BCYF SU5 12 6.00 355,673
Executive_Assistant MYO 07 1.00 77,611 Staff Assistant II MYO 06 2.00 140,982 Facilities Manager SE2 07 1.00 99,243 Staff Asst MYO 05 1.00 64,557 Finance Assistance SE2 05 1.00 69,171 Staff Asst III MYO 07 1.00 77,611 GED Tester SU5 13 1.00 65,297 Staff_Assist SU5 10 22.00 1,221,278
Grants Manager SE2 07 2.00 198,486 Strategy & Oprs Mgr(SOAR BCYF)
EXM 05 1.00 71,162
Head Lifeguard SU5 07 2.00 101,708 Supervisor Athletic Facil SE1 07 1.00 99,243 Lead Teacher SU5 10 0.50 29,036 Teacher I SU5 08 0.50 26,853 Lifeguard SU5 04 30.00 1,086,396 Technology Specialist SU5 13 1.00 65,297 Lifeguard II SU5 05 22.00 949,847 Unit Manager SE2 07 2.00 184,519 Maint Worker/Custodian SU5 06 17.00 821,504 Youth Worker SU5 08 39.00 1,990,026 Total 395 23,275,131 Adjustments Differential Payments 0 Other 165,250 Chargebacks 0 Salary Savings -1,000,000 FY22 Total Request 22,440,381

Health & Human ServicesBoston Centers for Youth & Families 153
External Funds History Personnel Services FY19 Expenditure FY20 Expenditure FY21 Appropriation FY22 Recommended Inc/Dec 21 vs 22
51000 Permanent Employees 759,765 377,666 708,122 689,484 -18,638 51100 Emergency Employees 51,682 9,726 0 0 0 51200 Overtime 2,054 152 0 0 0 51300 Part Time Employees 0 0 0 0 0 51400 Health Insurance 218,369 117,472 0 0 0 51500 Pension & Annuity 77,931 28,729 0 0 0 51600 Unemployment Compensation 0 0 0 0 0 51700 Workers' Compensation 0 0 0 0 0 51800 Indirect Costs 0 0 0 0 0 51900 Medicare 11,942 4,552 0 0 0 Total Personnel Services 1,121,743 538,297 708,122 689,484 -18,638
Contractual Services FY19 Expenditure FY20 Expenditure FY21 Appropriation FY22 Recommended Inc/Dec 21 vs 22
52100 Communications 3,751 0 0 0 0 52200 Utilities 0 0 0 0 0 52400 Snow Removal 0 0 0 0 0 52500 Garbage/Waste Removal 0 0 0 0 0 52600 Repairs Buildings & Structures 0 0 0 0 0 52700 Repairs & Service of Equipment 0 0 0 0 0 52800 Transportation of Persons 962 1,458 0 0 0 52900 Contracted Services 341,176 292,043 459,892 316,404 -143,488 Total Contractual Services 345,889 293,501 459,892 316,404 -143,488
Supplies & Materials FY19 Expenditure FY20 Expenditure FY21 Appropriation FY22 Recommended Inc/Dec 21 vs 22
53000 Auto Energy Supplies 0 0 0 0 0 53200 Food Supplies 7,669 2,594 0 0 0 53400 Custodial Supplies 0 0 0 0 0 53500 Med, Dental, & Hosp Supply 166 0 0 0 0 53600 Office Supplies and Materials 1,346 3,644 0 0 0 53700 Clothing Allowance 0 0 0 0 0 53800 Educational Supplies & Mat 0 0 0 0 0 53900 Misc Supplies & Materials 40,478 16,547 0 0 0 Total Supplies & Materials 49,659 22,785 0 0 0
Current Chgs & Oblig FY19 Expenditure FY20 Expenditure FY21 Appropriation FY22 Recommended Inc/Dec 21 vs 22
54300 Workers' Comp Medical 0 0 0 0 0 54400 Legal Liabilities 0 0 0 0 0 54600 Current Charges H&I 0 0 0 0 0 54700 Indemnification 0 0 0 0 0 54800 Reserve Account 0 0 0 0 0 54900 Other Current Charges 49,813 1,417 0 0 0 Total Current Chgs & Oblig 49,813 1,417 0 0 0
Equipment FY19 Expenditure FY20 Expenditure FY21 Appropriation FY22 Recommended Inc/Dec 21 vs 22
55000 Automotive Equipment 0 0 0 0 0 55400 Lease/Purchase 0 0 0 0 0 55600 Office Furniture & Equipment 0 0 0 0 0 55900 Misc Equipment 28,232 22,325 0 0 0 Total Equipment 28,232 22,325 0 0 0
Other FY19 Expenditure FY20 Expenditure FY21 Appropriation FY22 Recommended Inc/Dec 21 vs 22
56200 Special Appropriation 0 0 0 0 0 57200 Structures & Improvements 0 0 0 0 0 58000 Land & Non-Structure 0 0 0 0 0 Total Other 0 0 0 0 0
Grand Total 1,595,336 878,325 1,168,014 1,005,888 -162,126

154 Health & Human ServicesBoston Centers for Youth & Families
External Funds Personnel
Title Union Code Grade Position FY22 Salary Title
Union Code Grade Position FY22 Salary
Asst Teacher SU5 04 1.00 45,935 Lead Teacher SU5 10 2.50 145,178 Dir. SU5 13 1.00 65,297
Teacher I SU5 08 8.50 433,074 Total 13 689,485 Adjustments Differential Payments 0 Other 0 Chargebacks 0 Salary Savings 0 FY22 Total Request 689,485

Health & Human ServicesBoston Centers for Youth & Families 155
Program 1. Administrative & Policy William Morales, Manager, Organization 385100
Program Description The Administrative Services Division is responsible for the overall operation of BCYF and includes budget and finance, human resources, facilities management, public relations, planning and development and information technology. The division is responsible for ensuring the fiscal integrity and effectiveness of BCYF, training BCYF staff and leveraging additional resources. The division also includes Chief of Health and Human Services and The Office of Food Access. The division works with community centers to build their capacity to serve as neighborhood hubs for services, resources and programming and supports community outreach and partnership development, including the development of local community center site councils.
Operating Budget Actual '19 Actual '20 Approp '21 Budget '22
Personnel Services 13,205,443 13,596,951 12,187,480 12,167,801 Non Personnel 3,779,079 3,915,946 4,311,851 3,944,214 Total 16,984,522 17,512,897 16,499,331 16,112,015
Performance
Goal: To support health and wellness through community center sports, fitness, and recreation programming
Performance Measures Actual '19 Actual '20 Projected '21 Target '22
# of Community Center visits 920,018 388,939 32,779 900,000
# of program participants 93,932 46,481 9,637 92,000
# of programs offered 4,608 2,646 431 4,600
# of teen visits 204,596 68,578 3,217 140,000
% of evening visits
20%
% of weekend visits
10%

156 Health & Human ServicesBoston Centers for Youth & Families
Program 2. Sports & Fitness Hector Alvarez, Manager, Organization 385200
Program Description The Sports and Fitness Division is responsible for developing and coordinating citywide sports and fitness programming for children and youth including various clinics, leagues, and classes aimed at developing athletic skills and sense of sportsmanship. The division works to address the obesity epidemic and support the health and wellness of Boston residents through partnerships and programming. The division also provides training for community center athletic staff and volunteers.
Operating Budget Actual '19 Actual '20 Approp '21 Budget '22
Personnel Services 4,170,411 4,167,296 4,770,849 4,869,530 Non Personnel 532 564 0 500,000 Total 4,170,943 4,167,860 4,770,849 5,369,530
Performance
Goal: To support health and wellness through community center sports, fitness, and recreation programming
Performance Measures Actual '19 Actual '20 Projected '21 Target '22
# of aquatic program participants 29,969 16,781 6,981 30,000
# of girls program participants 2,515 1,532 81 2,500

Health & Human ServicesBoston Centers for Youth & Families 157
Program 3. Youth & Family Services Talia Wright-Rivera, Director, Organization 385300
Program Description The Youth Development and Family Services Division is responsible for providing resources and access to educational and skill development programming for youth and adults. The division oversees adult education and youth leadership. The division also includes the SOAR (Street Outreach, Advocacy and Response) Boston program.
Operating Budget Actual '19 Actual '20 Approp '21 Budget '22
Personnel Services 3,904,879 3,996,412 4,765,347 4,832,134 Non Personnel 607 321,190 410,078 321,418 Total 3,905,486 4,317,602 5,175,425 5,153,552

158 Health & Human ServicesBoston Centers for Youth & Families
Program 4. Child Care & Out-of-School William Ryan, Manager, Organization 385400
Program Description The Child Care and Out-Of-School Division oversees all Tiny Tot, out-of-school time, summer, preschool, girls and family programming at community centers, ensuring that it is high-quality, outcome driven and responsive to neighborhood needs. The division is responsible for supporting early childhood programming at community centers. The division also oversees Camp Joy, a therapeutic recreation program for children and adults with special needs.
Operating Budget Actual '19 Actual '20 Approp '21 Budget '22
Personnel Services 1,255,681 1,271,585 1,441,468 1,414,673 Non Personnel 1,151,451 1,275,523 1,164,602 1,194,600 Total 2,407,132 2,547,108 2,606,070 2,609,273

Health & Human ServicesBoston Centers for Youth & Families 159
External Funds Projects
Double Up Food Bucks
Project Mission Can Share fund raising supports the Office of Food Access’ Double Bucks and Healthy Incentives Program (HIP). These programs enable SNAP beneficiaries to increase their buying power at Boston farmer’s markets and at brick and mortar stores that provide access to fresh food.
Charles E. Shannon Grant
Project Mission Funded by the Executive Office of Public Safety and Security in partnership with proven successful faith and community based organizations and city agencies for focused Prevention, Intervention and Suppression support services to youth at risk or involved in gang related activity in hopes of reducing gun and gang related violence in hot spot areas of city.
Child & Adult Care Food Program
Project Mission BCYF child care programs participate in the USDA Child and Adult Care Food Program. Meals are provided by Boston Public Schools and are available without a separate charge to participating children. Annual funding is provided by the Commonwealth of Massachusetts, Department of Early Education and Care.
City Hall Child Care Program
Project Mission The City Hall Child Care Program provides quality infant, toddler and preschool care for children and their families. The funding for this program comes from parental fees and state vouchers.
Youth Homelessness Demonstration Program
Project Mission The Youth Homeless Demonstration Grant from the U.S. Department of Housing and Urban Development supports planning for the design and implementation of a youth homelessness reduction plan. Activities include recruitment and coordination of stakeholders, Youth Action Board stipends, and a Youth and Young Adult homelessness awareness campaign. This $200,000 grant is expected to conclude in FY22.
Mayor's Food Security Action Plan
Project Mission This three-year grant in the amount of $195,000 from United Way of Massachusetts Bay and Merrimack Valley, is for the purpose of supporting the Mayor’s Food Security Action Plan through the hire of a Food Security Action Plan Fellow.
Mass Marketing Partnership
Project Mission The Mass Marketing Partnership Grant will provide funding in the amount of $100,000 to be expended by June 30, 2019 from Massachusetts Office of Travel & Tourism to provide equipment for the fitness center and pre-school classroom at the Roslindale Community Center.

160 Health & Human ServicesBoston Centers for Youth & Families
Children’s Hospital- Boston EATS
Project Mission Boston Eats seeks to improve food access in Boston communities by increasing the number of open sites for summer and after-school meals. These open sites offer free meals to children age 18 and under in a stigma-free way, without prior registration, identification, or any eligibility requirements to receive a meal. These meal sites ensure that children have access to free, healthy food when school breakfast and lunch are not available. This work happens through partnerships with community partners who can expand the support they offer to their community through the resources provided through this program, including technical assistance from coordinating partners and mini-grants to fund meal site activities.
Street Safe Grant
Project Mission The Street Safe Grant will provide funding in the amount of $3,100,000 from the Boston Foundation to enhance anti-violence measures. Violence Interrupters work with "Proven-Risk/At-Risk" youth in a variety of capacities, including providing case management, conflict and resolution, trauma services and outreach and support to family members of youth served. This funding is expected to increase access to targeted youth reaching 550-600 individuals annually, as well as facilitate on-going training for outreach workers in critical areas.
Tiny Tots Program
Project Mission The Tiny Tots Program is funding provided by community center site councils to support the personnel and fringe costs for existing city employees that staff the Tiny Tots programs at each center. The current agreement has site councils covering 50% of costs.

Health & Human ServicesBoston Centers for Youth & Families 161
Boston Centers for Youth & Families Capital Budget Health & Human Services Boston Centers for Youth & Families
Overview The City’s Capital Plan for BCYF targets an increase to programming capacity at the City’s community centers and supports high-quality facilities. Community centers provide families, children and teens with enriching programs such as after school care, athletics, job and computer training.
FY22 Major Initiatives Construction will be completed at BCYF Paris Street Pool to enhance interior conditions and
accessibility, and transform the facility’s connection with nearby outdoor spaces. Major renovations will continue at BCYF Curley Community Center including climate
resilience and accessibility improvements will be completed. Design will begin for a new North End Community Center. Youth budgeting will continue for the ninth year. Youth Engagement & Employment will
focus on project implementation and preparation for another round of participatory voting. Begin design for facility renovations at BCYF Hyde Park and Roslindale. Begin planning for major upgrades to technology infrastructure and security systems,
providing new servers, security cameras, and Wi-Fi equipment. Begin planning for renovation work to the BCYF Marshall Pool.
Capital Budget Expenditures Total Actual '19 Total Actual '20 Estimated '21 Total Projected '22
Total Department 3,597,802 1,803,024 15,700,000 23,050,000

162 Health & Human ServicesBoston Centers for Youth & Families
Boston Centers for Youth & Families Project Profiles BCYF COMMUNITY CENTER PROGRAM STUDIES
Project Mission Develop building programs and assess siting options for new community centers in Dorchester, Charlestown, and
Allston/Brighton.
Managing Department, Public Facilities Department Status, Study Underway Location, Various neighborhoods Operating Impact, No
Authorizations
Source Existing FY22 Future Non Capital
Fund Total City Capital 300,000 0 0 0 300,000 Grants/Other 0 0 0 0 0 Total 300,000 0 0 0 300,000
Expenditures (Actual and Planned)
Source Thru
6/30/20 FY21 FY22 FY23-26 Total City Capital 0 75,000 150,000 75,000 300,000 Grants/Other 0 0 0 0 0 Total 0 75,000 150,000 75,000 300,000
BCYF CURLEY COMMUNITY CENTER Project Mission Major renovation of existing building that supports re-programming the interior space and provides resilient
protection from future sea level rise.
Managing Department, Public Facilities Department Status, In Construction Location, South Boston Operating Impact, No
Authorizations
Source Existing FY22 Future Non Capital
Fund Total City Capital 30,000,000 0 0 0 30,000,000 Grants/Other 0 0 0 0 0 Total 30,000,000 0 0 0 30,000,000
Expenditures (Actual and Planned)
Source Thru
6/30/20 FY21 FY22 FY23-26 Total City Capital 1,103,344 5,000,000 14,000,000 9,896,656 30,000,000 Grants/Other 0 0 0 0 0 Total 1,103,344 5,000,000 14,000,000 9,896,656 30,000,000

Health & Human ServicesBoston Centers for Youth & Families 163
Boston Centers for Youth & Families Project Profiles BCYF HYDE PARK COMMUNITY CENTER
Project Mission Interior and exterior building renovation including improvements to athletic facilities, redesign the front entrance,
window and door replacements, and other facility upgrades to enable using the facility as a sheltering site year-round.
Managing Department, Public Facilities Department Status, New Project Location, Hyde Park Operating Impact, No
Authorizations
Source Existing FY22 Future Non Capital
Fund Total City Capital 0 1,000,000 0 0 1,000,000 Grants/Other 0 0 0 0 0 Total 0 1,000,000 0 0 1,000,000
Expenditures (Actual and Planned)
Source Thru
6/30/20 FY21 FY22 FY23-26 Total City Capital 0 0 100,000 900,000 1,000,000 Grants/Other 0 0 0 0 0 Total 0 0 100,000 900,000 1,000,000
BCYF MARSHALL COMMUNITY CENTER POOL Project Mission Repair pool systems at BCYF Marshall. Upgrade pool liner and filtration system. Managing Department, Public Facilities Department Status, In Design Location, Dorchester Operating Impact, No
Authorizations
Source Existing FY22 Future Non Capital
Fund Total City Capital 2,500,000 0 0 0 2,500,000 Grants/Other 0 0 0 0 0 Total 2,500,000 0 0 0 2,500,000
Expenditures (Actual and Planned)
Source Thru
6/30/20 FY21 FY22 FY23-26 Total City Capital 0 250,000 1,000,000 1,250,000 2,500,000 Grants/Other 0 0 0 0 0 Total 0 250,000 1,000,000 1,250,000 2,500,000

164 Health & Human ServicesBoston Centers for Youth & Families
Boston Centers for Youth & Families Project Profiles BCYF MATTAHUNT COMMUNITY CENTER
Project Mission Interior renovation that includes refurbishing the lobby, gymnasium, community room, and computer lab. Managing Department, Public Facilities Department Status, In Design Location, Mattapan Operating Impact, No
Authorizations
Source Existing FY22 Future Non Capital
Fund Total City Capital 2,500,000 10,200,000 0 0 12,700,000 Grants/Other 0 0 0 0 0 Total 2,500,000 10,200,000 0 0 12,700,000
Expenditures (Actual and Planned)
Source Thru
6/30/20 FY21 FY22 FY23-26 Total City Capital 146,662 49,190 1,000,000 11,504,148 12,700,000 Grants/Other 0 0 0 0 0 Total 146,662 49,190 1,000,000 11,504,148 12,700,000
BCYF MATTAHUNT COMMUNITY CENTER EXTERIOR LIGHTING Project Mission Improve exterior lighting at the Mattahunt Community Center. Managing Department, Public Facilities Department Status, To Be Scheduled Location, Mattapan Operating Impact, No
Authorizations
Source Existing FY22 Future Non Capital
Fund Total City Capital 500,000 0 0 0 500,000 Grants/Other 0 0 0 0 0 Total 500,000 0 0 0 500,000
Expenditures (Actual and Planned)
Source Thru
6/30/20 FY21 FY22 FY23-26 Total City Capital 0 0 50,000 450,000 500,000 Grants/Other 0 0 0 0 0 Total 0 0 50,000 450,000 500,000

Health & Human ServicesBoston Centers for Youth & Families 165
Boston Centers for Youth & Families Project Profiles BCYF PARIS STREET POOL
Project Mission Complete building renovation including upgrades to the mechanical systems, bathrooms and locker rooms, pool
deck, lighting, and entryway.
Managing Department, Public Facilities Department Status, In Construction Location, East Boston Operating Impact, No
Authorizations
Source Existing FY22 Future Non Capital
Fund Total City Capital 8,900,000 0 0 0 8,900,000 Grants/Other 0 0 0 0 0 Total 8,900,000 0 0 0 8,900,000
Expenditures (Actual and Planned)
Source Thru
6/30/20 FY21 FY22 FY23-26 Total City Capital 441,636 4,500,000 3,500,000 458,364 8,900,000 Grants/Other 0 0 0 0 0 Total 441,636 4,500,000 3,500,000 458,364 8,900,000
BCYF QUINCY COMMUNITY CENTER Project Mission Replace auditorium seating. Managing Department, Boston Public Schools Status, To Be Scheduled Location, Chinatown Operating Impact, No
Authorizations
Source Existing FY22 Future Non Capital
Fund Total City Capital 250,000 0 0 0 250,000 Grants/Other 0 0 0 0 0 Total 250,000 0 0 0 250,000
Expenditures (Actual and Planned)
Source Thru
6/30/20 FY21 FY22 FY23-26 Total City Capital 0 50,000 200,000 0 250,000 Grants/Other 0 0 0 0 0 Total 0 50,000 200,000 0 250,000
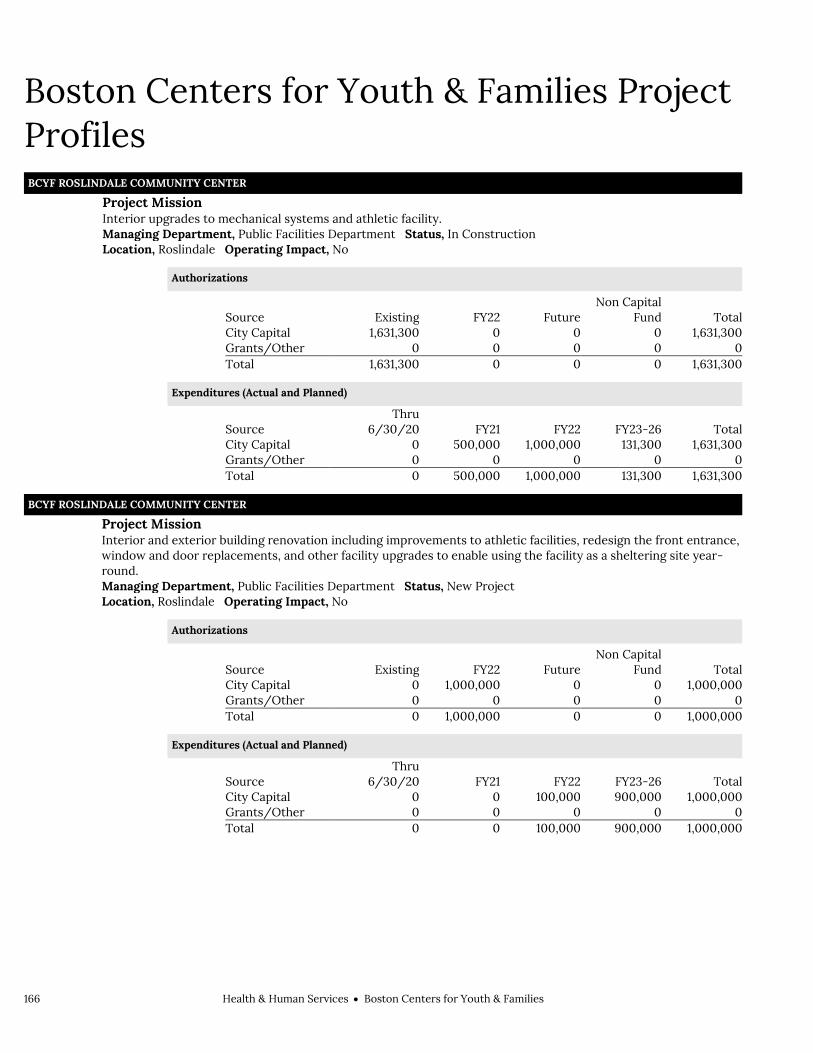
166 Health & Human ServicesBoston Centers for Youth & Families
Boston Centers for Youth & Families Project Profiles BCYF ROSLINDALE COMMUNITY CENTER
Project Mission Interior upgrades to mechanical systems and athletic facility. Managing Department, Public Facilities Department Status, In Construction Location, Roslindale Operating Impact, No
Authorizations
Source Existing FY22 Future Non Capital
Fund Total City Capital 1,631,300 0 0 0 1,631,300 Grants/Other 0 0 0 0 0 Total 1,631,300 0 0 0 1,631,300
Expenditures (Actual and Planned)
Source Thru
6/30/20 FY21 FY22 FY23-26 Total City Capital 0 500,000 1,000,000 131,300 1,631,300 Grants/Other 0 0 0 0 0 Total 0 500,000 1,000,000 131,300 1,631,300
BCYF ROSLINDALE COMMUNITY CENTER Project Mission Interior and exterior building renovation including improvements to athletic facilities, redesign the front entrance,
window and door replacements, and other facility upgrades to enable using the facility as a sheltering site year-round.
Managing Department, Public Facilities Department Status, New Project Location, Roslindale Operating Impact, No
Authorizations
Source Existing FY22 Future Non Capital
Fund Total City Capital 0 1,000,000 0 0 1,000,000 Grants/Other 0 0 0 0 0 Total 0 1,000,000 0 0 1,000,000
Expenditures (Actual and Planned)
Source Thru
6/30/20 FY21 FY22 FY23-26 Total City Capital 0 0 100,000 900,000 1,000,000 Grants/Other 0 0 0 0 0 Total 0 0 100,000 900,000 1,000,000

Health & Human ServicesBoston Centers for Youth & Families 167
Boston Centers for Youth & Families Project Profiles BCYF SECURITY & TECHNOLOGY UPGRADES
Project Mission Improvements to technology infrastructure and security systems including cameras at all stand alone sites. Managing Department, Boston Centers for Youth and Families Status, To Be Scheduled Location, Citywide Operating Impact, No
Authorizations
Source Existing FY22 Future Non Capital
Fund Total City Capital 750,000 0 0 0 750,000 Grants/Other 0 0 0 0 0 Total 750,000 0 0 0 750,000
Expenditures (Actual and Planned)
Source Thru
6/30/20 FY21 FY22 FY23-26 Total City Capital 0 0 300,000 450,000 750,000 Grants/Other 0 0 0 0 0 Total 0 0 300,000 450,000 750,000
BCYF TOBIN COMMUNITY CENTER RETAINING WALL Project Mission Repair or replace the retaining wall adjacent to the BCYF Tobin Community Center. Managing Department, Public Facilities Department Status, To Be Scheduled Location, Mission Hill Operating Impact, No
Authorizations
Source Existing FY22 Future Non Capital
Fund Total City Capital 100,000 0 0 0 100,000 Grants/Other 0 0 0 0 0 Total 100,000 0 0 0 100,000
Expenditures (Actual and Planned)
Source Thru
6/30/20 FY21 FY22 FY23-26 Total City Capital 0 0 100,000 0 100,000 Grants/Other 0 0 0 0 0 Total 0 0 100,000 0 100,000
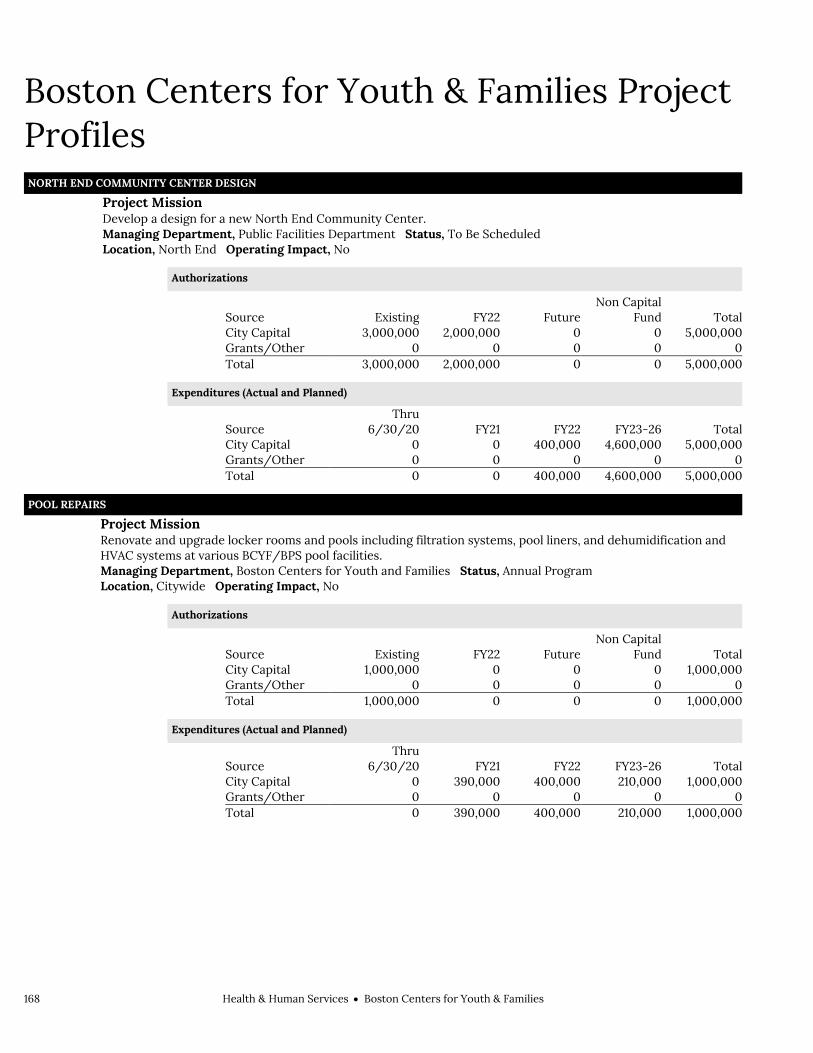
168 Health & Human ServicesBoston Centers for Youth & Families
Boston Centers for Youth & Families Project Profiles NORTH END COMMUNITY CENTER DESIGN
Project Mission Develop a design for a new North End Community Center. Managing Department, Public Facilities Department Status, To Be Scheduled Location, North End Operating Impact, No
Authorizations
Source Existing FY22 Future Non Capital
Fund Total City Capital 3,000,000 2,000,000 0 0 5,000,000 Grants/Other 0 0 0 0 0 Total 3,000,000 2,000,000 0 0 5,000,000
Expenditures (Actual and Planned)
Source Thru
6/30/20 FY21 FY22 FY23-26 Total City Capital 0 0 400,000 4,600,000 5,000,000 Grants/Other 0 0 0 0 0 Total 0 0 400,000 4,600,000 5,000,000
POOL REPAIRS Project Mission Renovate and upgrade locker rooms and pools including filtration systems, pool liners, and dehumidification and
HVAC systems at various BCYF/BPS pool facilities.
Managing Department, Boston Centers for Youth and Families Status, Annual Program Location, Citywide Operating Impact, No
Authorizations
Source Existing FY22 Future Non Capital
Fund Total City Capital 1,000,000 0 0 0 1,000,000 Grants/Other 0 0 0 0 0 Total 1,000,000 0 0 0 1,000,000
Expenditures (Actual and Planned)
Source Thru
6/30/20 FY21 FY22 FY23-26 Total City Capital 0 390,000 400,000 210,000 1,000,000 Grants/Other 0 0 0 0 0 Total 0 390,000 400,000 210,000 1,000,000
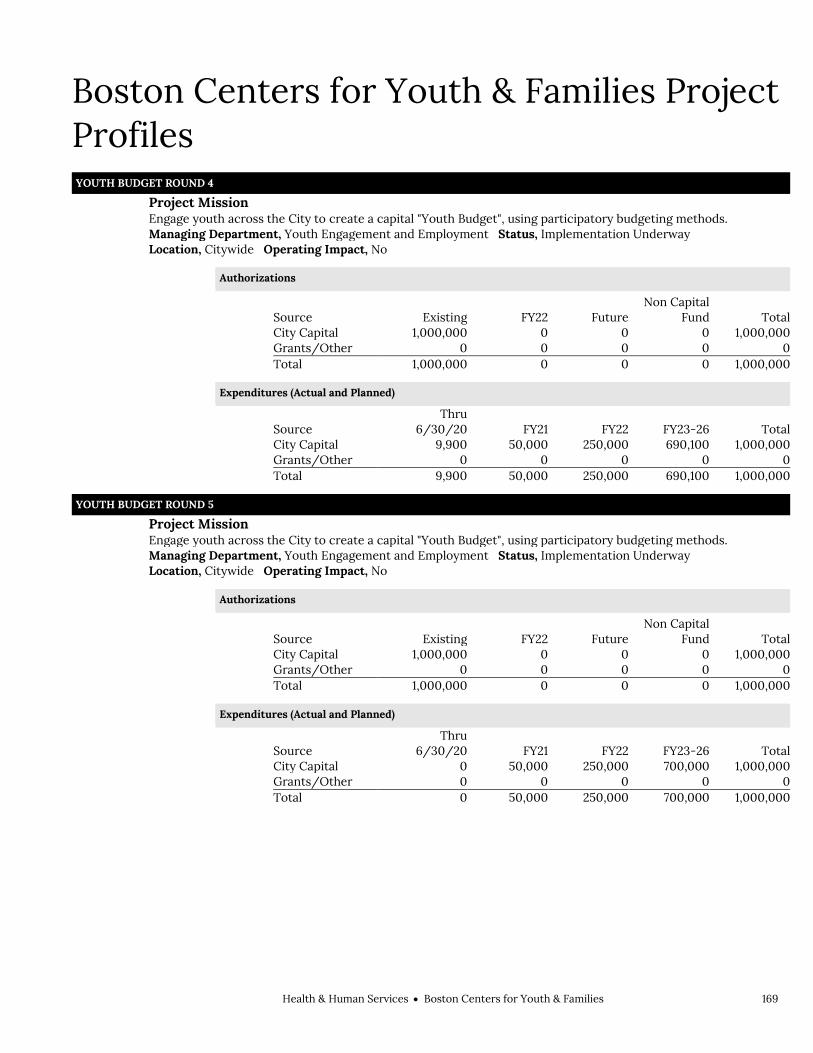
Health & Human ServicesBoston Centers for Youth & Families 169
Boston Centers for Youth & Families Project Profiles YOUTH BUDGET ROUND 4
Project Mission Engage youth across the City to create a capital "Youth Budget", using participatory budgeting methods. Managing Department, Youth Engagement and Employment Status, Implementation Underway Location, Citywide Operating Impact, No
Authorizations
Source Existing FY22 Future Non Capital
Fund Total City Capital 1,000,000 0 0 0 1,000,000 Grants/Other 0 0 0 0 0 Total 1,000,000 0 0 0 1,000,000
Expenditures (Actual and Planned)
Source Thru
6/30/20 FY21 FY22 FY23-26 Total City Capital 9,900 50,000 250,000 690,100 1,000,000 Grants/Other 0 0 0 0 0 Total 9,900 50,000 250,000 690,100 1,000,000
YOUTH BUDGET ROUND 5 Project Mission Engage youth across the City to create a capital "Youth Budget", using participatory budgeting methods. Managing Department, Youth Engagement and Employment Status, Implementation Underway Location, Citywide Operating Impact, No
Authorizations
Source Existing FY22 Future Non Capital
Fund Total City Capital 1,000,000 0 0 0 1,000,000 Grants/Other 0 0 0 0 0 Total 1,000,000 0 0 0 1,000,000
Expenditures (Actual and Planned)
Source Thru
6/30/20 FY21 FY22 FY23-26 Total City Capital 0 50,000 250,000 700,000 1,000,000 Grants/Other 0 0 0 0 0 Total 0 50,000 250,000 700,000 1,000,000

170 Health & Human ServicesBoston Centers for Youth & Families
Boston Centers for Youth & Families Project Profiles YOUTH BUDGET ROUND 6
Project Mission Engage youth across the City to create a capital "Youth Budget", using participatory budgeting methods. Managing Department, Youth Engagement and Employment Status, Implementation Underway Location, Citywide Operating Impact, No
Authorizations
Source Existing FY22 Future Non Capital
Fund Total City Capital 1,000,000 0 0 0 1,000,000 Grants/Other 0 0 0 0 0 Total 1,000,000 0 0 0 1,000,000
Expenditures (Actual and Planned)
Source Thru
6/30/20 FY21 FY22 FY23-26 Total City Capital 0 332,431 250,000 417,569 1,000,000 Grants/Other 0 0 0 0 0 Total 0 332,431 250,000 417,569 1,000,000
YOUTH BUDGET ROUND 7 Project Mission Engage youth across the City to create a capital "Youth Budget", using participatory budgeting methods. Managing Department, Youth Engagement and Employment Status, Implementation Underway Location, Citywide Operating Impact, No
Authorizations
Source Existing FY22 Future Non Capital
Fund Total City Capital 1,000,000 0 0 0 1,000,000 Grants/Other 0 0 0 0 0 Total 1,000,000 0 0 0 1,000,000
Expenditures (Actual and Planned)
Source Thru
6/30/20 FY21 FY22 FY23-26 Total City Capital 0 0 0 1,000,000 1,000,000 Grants/Other 0 0 0 0 0 Total 0 0 0 1,000,000 1,000,000
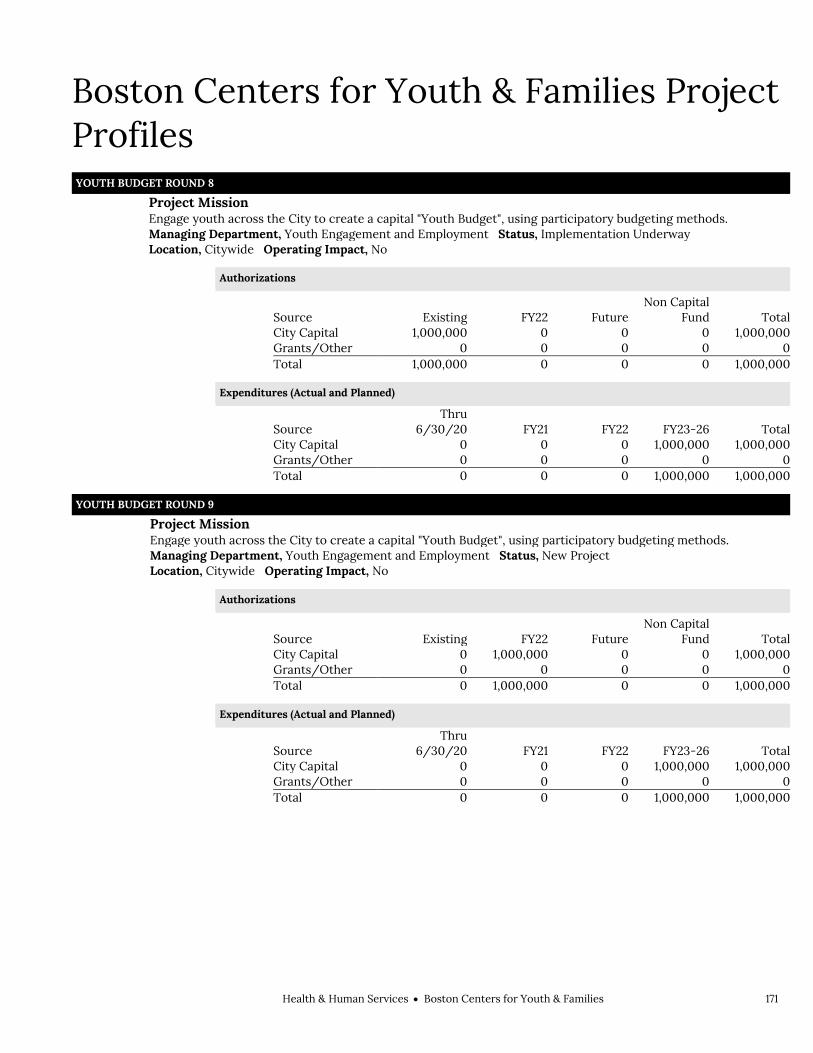
Health & Human ServicesBoston Centers for Youth & Families 171
Boston Centers for Youth & Families Project Profiles YOUTH BUDGET ROUND 8
Project Mission Engage youth across the City to create a capital "Youth Budget", using participatory budgeting methods. Managing Department, Youth Engagement and Employment Status, Implementation Underway Location, Citywide Operating Impact, No
Authorizations
Source Existing FY22 Future Non Capital
Fund Total City Capital 1,000,000 0 0 0 1,000,000 Grants/Other 0 0 0 0 0 Total 1,000,000 0 0 0 1,000,000
Expenditures (Actual and Planned)
Source Thru
6/30/20 FY21 FY22 FY23-26 Total City Capital 0 0 0 1,000,000 1,000,000 Grants/Other 0 0 0 0 0 Total 0 0 0 1,000,000 1,000,000
YOUTH BUDGET ROUND 9 Project Mission Engage youth across the City to create a capital "Youth Budget", using participatory budgeting methods. Managing Department, Youth Engagement and Employment Status, New Project Location, Citywide Operating Impact, No
Authorizations
Source Existing FY22 Future Non Capital
Fund Total City Capital 0 1,000,000 0 0 1,000,000 Grants/Other 0 0 0 0 0 Total 0 1,000,000 0 0 1,000,000
Expenditures (Actual and Planned)
Source Thru
6/30/20 FY21 FY22 FY23-26 Total City Capital 0 0 0 1,000,000 1,000,000 Grants/Other 0 0 0 0 0 Total 0 0 0 1,000,000 1,000,000


Health & Human ServicesBoston VETS 173
Boston VETS Operating Budget Health & Human Services Boston VETS Robert Santiago, Commissioner, Appropriation 741000
Department Mission The mission of the Boston Office of Veterans Engagement, Transition, and Services (Boston VETS) is to provide benefits to veterans and their dependents residing in Boston and eligible under M.G.L. c. 115 and 108 CMR; pay the funeral and burial expenses for indigent veterans under prescribed regulations; assist all veterans with obtaining federal, state, or local benefits to which they may be entitled; oversee the decoration of veterans graves and hero squares on Memorial Day; and carry out commemorative activities related to Boston veterans.
Selected Performance Goals Veterans' Services
Advocate-To support events, panels, legislation and summits aimed at meeting the needs of local veterans.
Engage-To reach out to all 22,000 veterans that call Boston their home through meaningful community engagement.
Recognize- to recognize the services of veterans who have died in service to their country and to assist with burial costs as needed.
Serve-To serve our (600+) homeless and low income veterans through a financial assistance program aimed to increase the housing stability of veterans and their families based on household need.
Operating Budget Program Name Total Actual '19 Total Actual '20 Total Approp '21 Total Budget '22
Veterans' Services 2,937,050 2,900,757 4,612,875 4,612,875
Total 2,937,050 2,900,757 4,612,875 4,612,875
Operating Budget Actual '19 Actual '20 Approp '21 Budget '22
Personnel Services 860,706 931,839 1,049,873 1,014,522 Non Personnel 2,076,344 1,968,918 3,563,002 3,598,353 Total 2,937,050 2,900,757 4,612,875 4,612,875

174 Health & Human ServicesBoston VETS
Boston VETS Operating Budget
Authorizing Statutes Enabling Legislation, CBC Ord. §§ 12-2.1-
12-2.3. Veterans' Benefits, M.G.L.A. c. 115, as
amended. Appropriation for Grave Decoration,
M.G.L.A. c. 115, § 9.
Description of Services The Boston Office of Veterans Engagement, Transition, and Services (Boston VETS) assists Boston veterans in need of financial, medical, or other support services. The Department also coordinates with federal, state, and local agencies to help refer veterans suffering from Agent Orange exposure, Post-Traumatic Stress Disorder, or other issues to appropriate service providers. The Department provides financial assistance and pays medical expenses for eligible veterans and their dependents. In addition, the Department assists veterans with obtaining burial plots in cemeteries owned by the City of Boston and assists indigent veterans with funeral and burial expenses. The Department also oversees the decoration of veterans’ graves and hero squares on Memorial Day.
Commissioner
Administration
Records Database
Veterans' Grave Registration
Deceased Veteran's Records
Memorial Day Grave Decoration
Veterans' Benefits
Community Relations
Finance
Veterans’ Services
DeputyCommissioner

Health & Human ServicesBoston VETS 175
Department History Personnel Services FY19 Expenditure FY20 Expenditure FY21 Appropriation FY22 Recommended Inc/Dec 21 vs 22
51000 Permanent Employees 859,306 931,839 1,049,873 1,014,522 -35,351 51100 Emergency Employees 0 0 0 0 0 51200 Overtime 0 0 0 0 0 51600 Unemployment Compensation 1,400 0 0 0 0 51700 Workers' Compensation 0 0 0 0 0 Total Personnel Services 860,706 931,839 1,049,873 1,014,522 -35,351
Contractual Services FY19 Expenditure FY20 Expenditure FY21 Appropriation FY22 Recommended Inc/Dec 21 vs 22
52100 Communications 9,749 10,057 10,500 10,500 0 52200 Utilities 0 0 0 0 0 52400 Snow Removal 0 0 0 0 0 52500 Garbage/Waste Removal 0 0 0 0 0 52600 Repairs Buildings & Structures 0 0 0 0 0 52700 Repairs & Service of Equipment 0 0 1,820 1,820 0 52800 Transportation of Persons 2,538 2,403 0 1,500 1,500 52900 Contracted Services 62,644 86,361 84,382 181,382 97,000 Total Contractual Services 74,931 98,821 96,702 195,202 98,500
Supplies & Materials FY19 Expenditure FY20 Expenditure FY21 Appropriation FY22 Recommended Inc/Dec 21 vs 22
53000 Auto Energy Supplies 0 0 0 0 0 53200 Food Supplies 11,114 5,703 8,000 8,000 0 53400 Custodial Supplies 0 0 0 0 0 53500 Med, Dental, & Hosp Supply 0 0 0 0 0 53600 Office Supplies and Materials 8,459 12,349 10,500 10,500 0 53700 Clothing Allowance 1,750 2,250 2,250 2,250 0 53800 Educational Supplies & Mat 0 0 0 0 0 53900 Misc Supplies & Materials 36,604 38,968 50,800 50,800 0 Total Supplies & Materials 57,927 59,270 71,550 71,550 0
Current Chgs & Oblig FY19 Expenditure FY20 Expenditure FY21 Appropriation FY22 Recommended Inc/Dec 21 vs 22
54300 Workers' Comp Medical 0 0 0 0 0 54400 Legal Liabilities 0 0 0 0 0 54500 Aid To Veterans 1,936,165 1,807,077 3,389,100 2,725,951 -663,149 54600 Current Charges H&I 0 0 0 0 0 54700 Indemnification 0 0 0 0 0 54800 Reserve Account 0 0 0 0 0 54900 Other Current Charges 3,264 3,310 5,650 605,650 600,000 Total Current Chgs & Oblig 1,939,429 1,810,387 3,394,750 3,331,601 -63,149
Equipment FY19 Expenditure FY20 Expenditure FY21 Appropriation FY22 Recommended Inc/Dec 21 vs 22
55000 Automotive Equipment 0 0 0 0 0 55400 Lease/Purchase 0 0 0 0 0 55600 Office Furniture & Equipment 4,057 0 0 0 0 55900 Misc Equipment 0 440 0 0 0 Total Equipment 4,057 440 0 0 0
Other FY19 Expenditure FY20 Expenditure FY21 Appropriation FY22 Recommended Inc/Dec 21 vs 22
56200 Special Appropriation 0 0 0 0 0 57200 Structures & Improvements 0 0 0 0 0 58000 Land & Non-Structure 0 0 0 0 0 Total Other 0 0 0 0 0
Grand Total 2,937,050 2,900,757 4,612,875 4,612,875 0

176 Health & Human ServicesBoston VETS
Department Personnel
Title Union Code Grade Position FY22 Salary Title
Union Code Grade Position FY22 Salary
Adm Assistant SE1 04 1.00 75,441 Community Relations Specialist SU4 17 2.00 129,762
Adm Sec SU4 14 1.00 54,575 Dep Comm Veterans Benefits & Services
EXM 08 1.00 94,848
Burial Agent SU4 17 1.00 71,526 HdAdmClerk/VeteransBenefitsSpc SU4 15 5.00 307,660 Commissioner (Vet) CDH NG 1.00 100,275 Principal Adm Asst. SE1 06 1.00 88,116
Sr Adm Analyst SE1 06 1.00 90,319
Total 14 1,012,522 Adjustments Differential Payments 0 Other 2,000 Chargebacks 0 Salary Savings 0 FY22 Total Request 1,014,522

Health & Human ServicesBoston VETS 177
Program 1. Veterans' Services Robert Santiago, Manager, Organization 741100
Program Description The Veterans’ Services Program explores all legal avenues to provide veterans and their dependents with assistance in obtaining benefits to which they are entitled. The Department provides emergency cash assistance to homeless or about –to-be-displaced eligible veterans and their dependents. The Department also provides financial assistance and reimbursement of medical expenses to indigent veterans. The Department offers employment, housing, and other referral services. In addition, Department employees participate in the Massachusetts Veterans’ Service Officer Association to improve services to veterans.
Operating Budget Actual '19 Actual '20 Approp '21 Budget '22
Personnel Services 860,706 931,839 1,049,873 1,014,522 Non Personnel 2,076,344 1,968,918 3,563,002 3,598,353 Total 2,937,050 2,900,757 4,612,875 4,612,875
Performance
Goal: Advocate-To support events, panels, legislation and summits aimed at meeting the needs of local veterans
Performance Measures Actual '19 Actual '20 Projected '21 Target '22
# Outreach - All Other 22 23 25 25
Goal: Engage-To reach out to all 22,000 veterans that call Boston their home through meaningful community engagement
Performance Measures Actual '19 Actual '20 Projected '21 Target '22
# of Volunteers Participating - Operation Thank A Vet 244 287 850 1,000
% of Veterans reached- Operation Thank A Vet (OTAV) 50% 9.4% 50% 50%
Goal: Recognize- to recognize the services of veterans who have died in service to their country and to assist with burial costs as needed
Performance Measures Actual '19 Actual '20 Projected '21 Target '22
% of Graves decorated 100% 100% 100% 100%
% of Hero Squares decorated 100% 100% 100% 100%
Goal: Serve-To serve our (600+) homeless and low income veterans through a financial assistance program aimed to increase the housing stability of veterans and their families based on household need
Performance Measures Actual '19 Actual '20 Projected '21 Target '22
# of Homeless Veterans receiving CH115 186 187 84 86
% Reimbursement for Aid to Vet Rate 75% 75% 75% 75%
New Chpt 115 Aid Recipient- Shelter/Residence 147 118 105 105


Health & Human ServicesCommission for Persons With Disabilities 179
Commission for Persons With Disabilities Operating Budget Health & Human Services Commission for Persons With Disabilities Kristen McCosh, Commissioner, Appropriation 404000
Department Mission The mission of the Commission is to increase opportunities for people with disabilities by facilitating full and equal participation in all aspects of life within the City of Boston. This includes reducing architectural, procedural, attitudinal, and communication barriers as well as promoting equity in housing, education, employment, transportation, and civic activities.
Selected Performance Goals Disabilities
Assure adherence to all architectural access guidelines in Boston's built environment. Connect the public to the Commission, particularly underserved residents with disabilities. Ensure COB compliance with Title II of the ADA, Advise City of Boston agencies on policies
and practices that increase access and opportunities for people with disabilities. Promote interactive participation between disabled residents and City government. Provide effective & prompt services, including warm hand-offs and follow-up, to
constituents.
Operating Budget Program Name Total Actual '19 Total Actual '20 Total Approp '21 Total Budget '22
Disabilities 400,491 483,253 510,616 623,936
Total 400,491 483,253 510,616 623,936
External Funds Budget Fund Name Total Actual '19 Total Actual '20 Total Approp '21 Total Budget '22
Disabilities Public Awareness 0 0 0 50,000
Total 0 0 0 50,000
Operating Budget Actual '19 Actual '20 Approp '21 Budget '22
Personnel Services 382,462 465,517 490,496 504,316
Non Personnel 18,029 17,736 20,120 119,620
Total 400,491 483,253 510,616 623,936

180 Health & Human ServicesCommission for Persons With Disabilities
Commission for Persons With Disabilities Operating Budget
Authorizing Statutes Enabling Legislation, CBC Ord. §§ 12-4.1-
12-4.9. Powers and Duties, CBC Ord. §§ 12-4.1-
12-4.9. Responsibilities of City Agencies, CBC
Ord. §§ 12-4.1-12-4.9. Access to Public Buildings by Physically
Handicapped, CBC Ord. §§ 21-4.1-21-4.10.
Issuance of Temporary Parking Permits, CBC Ord. § 6-7.3.
Description of Services The Disabilities Commission is responsible for investigating and enforcing anti-discrimination laws, providing information and referral services, advocating the support of disabilities issues, conducting education and outreach to constituents, and coordinating the City’s compliance with the Americans with Disabilities Act (ADA).
Commissioner
Persons With Disabilities
ADA &Section 504 Compliance
Access Monitoring
Information & Referral
Advocacy and Outreach
Resident Handicapped Parking Program
Training & Technical Assistance

Health & Human ServicesCommission for Persons With Disabilities 181
Department History Personnel Services FY19 Expenditure FY20 Expenditure FY21 Appropriation FY22 Recommended Inc/Dec 21 vs 22
51000 Permanent Employees 382,462 465,517 490,496 504,316 13,820 51100 Emergency Employees 0 0 0 0 0 51200 Overtime 0 0 0 0 0 51600 Unemployment Compensation 0 0 0 0 0 51700 Workers' Compensation 0 0 0 0 0 Total Personnel Services 382,462 465,517 490,496 504,316 13,820
Contractual Services FY19 Expenditure FY20 Expenditure FY21 Appropriation FY22 Recommended Inc/Dec 21 vs 22
52100 Communications 374 938 1,020 1,020 0 52200 Utilities 0 0 0 0 0 52400 Snow Removal 0 0 0 0 0 52500 Garbage/Waste Removal 0 0 0 0 0 52600 Repairs Buildings & Structures 0 0 0 0 0 52700 Repairs & Service of Equipment 0 0 500 300 -200 52800 Transportation of Persons 511 13 0 200 200 52900 Contracted Services 11,230 12,161 11,100 111,100 100,000 Total Contractual Services 12,115 13,112 12,620 112,620 100,000
Supplies & Materials FY19 Expenditure FY20 Expenditure FY21 Appropriation FY22 Recommended Inc/Dec 21 vs 22
53000 Auto Energy Supplies 0 0 0 0 0 53200 Food Supplies 1,152 768 2,000 1,500 -500 53400 Custodial Supplies 0 0 0 0 0 53500 Med, Dental, & Hosp Supply 0 0 0 0 0 53600 Office Supplies and Materials 1,933 1,400 2,000 2,000 0 53700 Clothing Allowance 0 0 0 0 0 53800 Educational Supplies & Mat 0 0 0 0 0 53900 Misc Supplies & Materials 2,829 2,456 3,500 3,500 0 Total Supplies & Materials 5,914 4,624 7,500 7,000 -500
Current Chgs & Oblig FY19 Expenditure FY20 Expenditure FY21 Appropriation FY22 Recommended Inc/Dec 21 vs 22
54300 Workers' Comp Medical 0 0 0 0 0 54400 Legal Liabilities 0 0 0 0 0 54500 Aid To Veterans 0 0 0 0 0 54600 Current Charges H&I 0 0 0 0 0 54700 Indemnification 0 0 0 0 0 54800 Reserve Account 0 0 0 0 0 54900 Other Current Charges 0 0 0 0 0 Total Current Chgs & Oblig 0 0 0 0 0
Equipment FY19 Expenditure FY20 Expenditure FY21 Appropriation FY22 Recommended Inc/Dec 21 vs 22
55000 Automotive Equipment 0 0 0 0 0 55400 Lease/Purchase 0 0 0 0 0 55600 Office Furniture & Equipment 0 0 0 0 0 55900 Misc Equipment 0 0 0 0 0 Total Equipment 0 0 0 0 0
Other FY19 Expenditure FY20 Expenditure FY21 Appropriation FY22 Recommended Inc/Dec 21 vs 22
56200 Special Appropriation 0 0 0 0 0 57200 Structures & Improvements 0 0 0 0 0 58000 Land & Non-Structure 0 0 0 0 0 Total Other 0 0 0 0 0
Grand Total 400,491 483,253 510,616 623,936 113,320
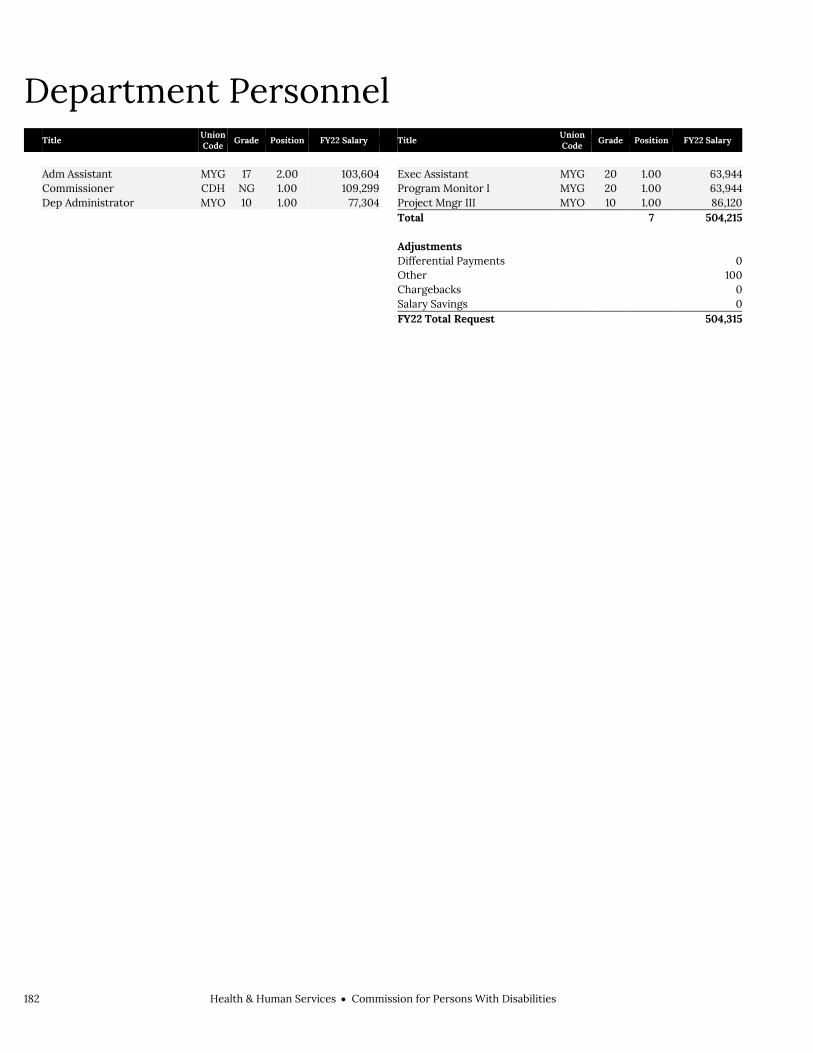
182 Health & Human ServicesCommission for Persons With Disabilities
Department Personnel
Title Union Code Grade Position FY22 Salary Title
Union Code Grade Position FY22 Salary
Adm Assistant MYG 17 2.00 103,604 Exec Assistant MYG 20 1.00 63,944 Commissioner CDH NG 1.00 109,299 Program Monitor I MYG 20 1.00 63,944 Dep Administrator MYO 10 1.00 77,304 Project Mngr III MYO 10 1.00 86,120 Total 7 504,215 Adjustments Differential Payments 0 Other 100 Chargebacks 0 Salary Savings 0 FY22 Total Request 504,315

Health & Human ServicesCommission for Persons With Disabilities 183
External Funds History Personnel Services FY19 Expenditure FY20 Expenditure FY21 Appropriation FY22 Recommended Inc/Dec 21 vs 22
51000 Permanent Employees 0 0 0 0 0 51100 Emergency Employees 0 0 0 0 0 51200 Overtime 0 0 0 0 0 51300 Part Time Employees 0 0 0 0 0 51400 Health Insurance 0 0 0 0 0 51500 Pension & Annuity 0 0 0 0 0 51600 Unemployment Compensation 0 0 0 0 0 51700 Workers' Compensation 0 0 0 0 0 51800 Indirect Costs 0 0 0 0 0 51900 Medicare 0 0 0 0 0 Total Personnel Services 0 0 0 0 0
Contractual Services FY19 Expenditure FY20 Expenditure FY21 Appropriation FY22 Recommended Inc/Dec 21 vs 22
52100 Communications 0 0 0 0 0 52200 Utilities 0 0 0 0 0 52400 Snow Removal 0 0 0 0 0 52500 Garbage/Waste Removal 0 0 0 0 0 52600 Repairs Buildings & Structures 0 0 0 0 0 52700 Repairs & Service of Equipment 0 0 0 0 0 52800 Transportation of Persons 0 0 0 0 0 52900 Contracted Services 0 0 0 50,000 50,000 Total Contractual Services 0 0 0 50,000 50,000
Supplies & Materials FY19 Expenditure FY20 Expenditure FY21 Appropriation FY22 Recommended Inc/Dec 21 vs 22
53000 Auto Energy Supplies 0 0 0 0 0 53200 Food Supplies 0 0 0 0 0 53400 Custodial Supplies 0 0 0 0 0 53500 Med, Dental, & Hosp Supply 0 0 0 0 0 53600 Office Supplies and Materials 0 0 0 0 0 53700 Clothing Allowance 0 0 0 0 0 53800 Educational Supplies & Mat 0 0 0 0 0 53900 Misc Supplies & Materials 0 0 0 0 0 Total Supplies & Materials 0 0 0 0 0
Current Chgs & Oblig FY19 Expenditure FY20 Expenditure FY21 Appropriation FY22 Recommended Inc/Dec 21 vs 22
54300 Workers' Comp Medical 0 0 0 0 0 54400 Legal Liabilities 0 0 0 0 0 54600 Current Charges H&I 0 0 0 0 0 54700 Indemnification 0 0 0 0 0 54800 Reserve Account 0 0 0 0 0 54900 Other Current Charges 0 0 0 0 0 Total Current Chgs & Oblig 0 0 0 0 0
Equipment FY19 Expenditure FY20 Expenditure FY21 Appropriation FY22 Recommended Inc/Dec 21 vs 22
55000 Automotive Equipment 0 0 0 0 0 55400 Lease/Purchase 0 0 0 0 0 55600 Office Furniture & Equipment 0 0 0 0 0 55900 Misc Equipment 0 0 0 0 0 Total Equipment 0 0 0 0 0
Other FY19 Expenditure FY20 Expenditure FY21 Appropriation FY22 Recommended Inc/Dec 21 vs 22
56200 Special Appropriation 0 0 0 0 0 57200 Structures & Improvements 0 0 0 0 0 58000 Land & Non-Structure 0 0 0 0 0 Total Other 0 0 0 0 0
Grand Total 0 0 0 50,000 50,000

184 Health & Human ServicesCommission for Persons With Disabilities
Program 1. Disabilities Kristen McCosh, Manager, Organization 404100
Program Description The Commission facilitates full and equal participation in all aspects of life by persons with disabilities in the City of Boston. The Commission strives to reduce architectural, procedural, attitudinal, and communication barriers which affect persons with disabilities. The Commission coordinates and monitors the City’s compliance with civil rights laws for persons with disabilities.
Operating Budget Actual '19 Actual '20 Approp '21 Budget '22
Personnel Services 382,462 465,517 490,496 504,316 Non Personnel 18,029 17,736 20,120 119,620 Total 400,491 483,253 510,616 623,936
Performance
Goal: Assure adherence to all architectural access guidelines in Boston's built environment
Performance Measures Actual '19 Actual '20 Projected '21 Target '22
# Developer meetings to review compliance 43 392 400 500
% Answered technical assistance requests 100% 93% 95% 100%
Goal: Connect the public to the Commission, particularly underserved residents with disabilities
Performance Measures Actual '19 Actual '20 Projected '21 Target '22
# APS resident applications processed 242 298 150 200
# Neighborhood outreach interactions 48 395 800 900
Goal: Ensure COB compliance with Title II of the ADA, Advise City of Boston agencies on policies and practices that increase access and opportunities for people with disabilities
Performance Measures Actual '19 Actual '20 Projected '21 Target '22
# Interactions with City Dept on ADA compliance 32 331 350 400
Goal: Promote interactive participation between disabled residents and City government
Performance Measures Actual '19 Actual '20 Projected '21 Target '22
# City resident interactions 60 1,737 1,750 2,000
Goal: Provide effective & prompt services, including warm hand-offs and follow-up, to constituents
Performance Measures Actual '19 Actual '20 Projected '21 Target '22
Average days to review HP applications 40 24 25 21

Health & Human ServicesCommission for Persons With Disabilities 185
External Funds Projects Disabilities Public Awareness
Project Mission
Provided by the Boston Foundation to support operations in the pursuit of increasing opportunities for people with
disabilities by facilitating full and equal participation in all aspects of life within the City of Boston, particularly in light of COVID-19. To increase employment equity, in collaboration with the disability community, a public awareness campaign will highlight the important and impressive contributions people with disabilities have made to the workforce in Boston.
Project expected to be completed in FY22.

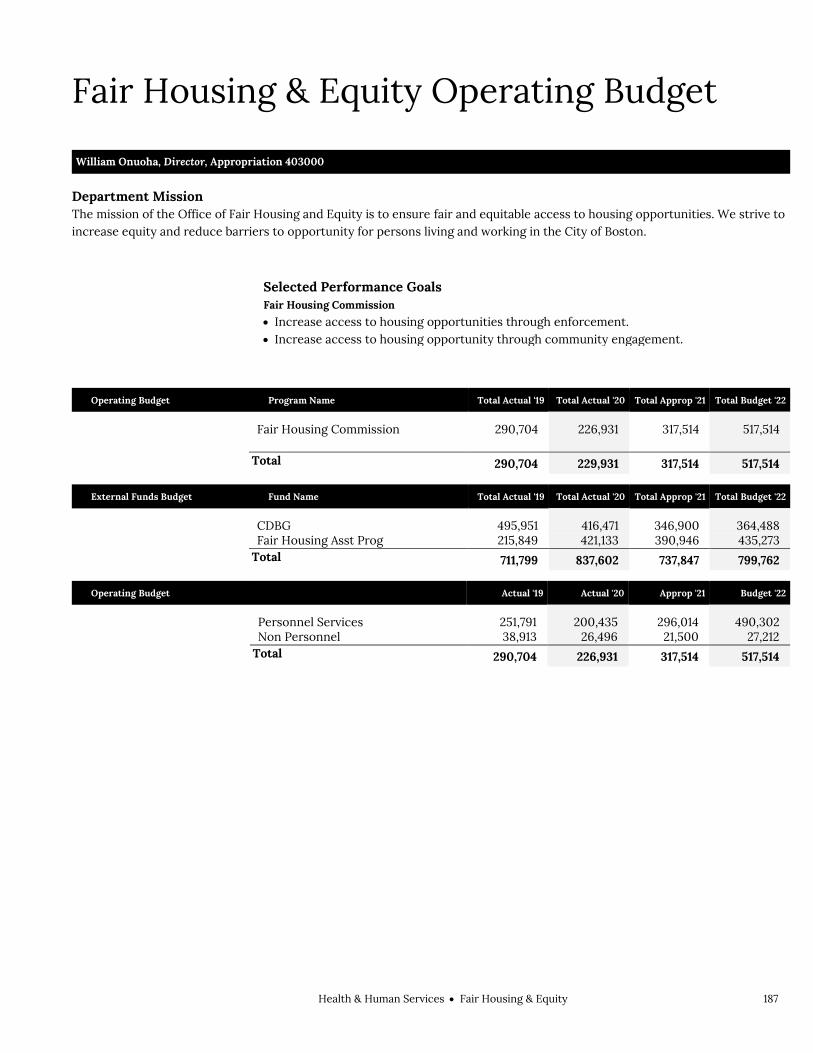
Health & Human ServicesFair Housing & Equity 187
Fair Housing & Equity Operating Budget Health & Human Services Fair Housing & Equity William Onuoha, Director, Appropriation 403000
Department Mission The mission of the Office of Fair Housing and Equity is to ensure fair and equitable access to housing opportunities. We strive to increase equity and reduce barriers to opportunity for persons living and working in the City of Boston.
Selected Performance Goals Fair Housing Commission
Increase access to housing opportunities through enforcement. Increase access to housing opportunity through community engagement.
Operating Budget Program Name Total Actual '19 Total Actual '20 Total Approp '21 Total Budget '22
Fair Housing Commission 290,704 226,931 317,514 517,514
Total 290,704 229,931 317,514 517,514
External Funds Budget Fund Name Total Actual '19 Total Actual '20 Total Approp '21 Total Budget '22
CDBG 495,951 416,471 346,900 364,488
Fair Housing Asst Prog 215,849 421,133 390,946 435,273
Total 711,799 837,602 737,847 799,762
Operating Budget Actual '19 Actual '20 Approp '21 Budget '22
Personnel Services 251,791 200,435 296,014 490,302 Non Personnel 38,913 26,496 21,500 27,212 Total 290,704 226,931 317,514 517,514
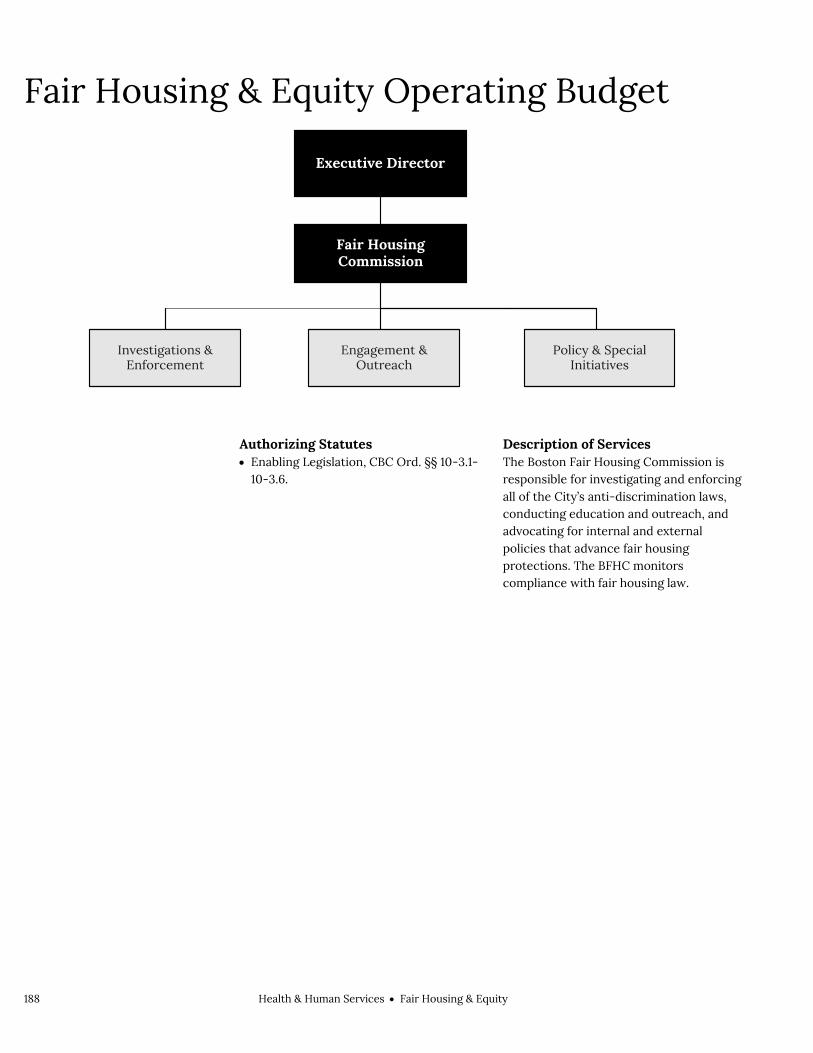
188 Health & Human ServicesFair Housing & Equity
Fair Housing & Equity Operating Budget
Authorizing Statutes Enabling Legislation, CBC Ord. §§ 10-3.1-
10-3.6.
Description of Services The Boston Fair Housing Commission is responsible for investigating and enforcing all of the City’s anti-discrimination laws, conducting education and outreach, and advocating for internal and external policies that advance fair housing protections. The BFHC monitors compliance with fair housing law.
Executive Director
Fair Housing Commission
Investigations & Enforcement
Engagement & Outreach
Policy & Special Initiatives

Health & Human ServicesFair Housing & Equity 189
Department History Personnel Services FY19 Expenditure FY20 Expenditure FY21 Appropriation FY22 Recommended Inc/Dec 21 vs 22
51000 Permanent Employees 251,791 199,895 296,014 490,302 194,288 51100 Emergency Employees 0 0 0 0 0 51200 Overtime 0 0 0 0 0 51600 Unemployment Compensation 0 0 0 0 0 51700 Workers' Compensation 0 540 0 0 0 Total Personnel Services 251,791 200,435 296,014 490,302 194,288
Contractual Services FY19 Expenditure FY20 Expenditure FY21 Appropriation FY22 Recommended Inc/Dec 21 vs 22
52100 Communications 2,287 5,566 3,900 5,566 1,666 52200 Utilities 0 0 0 0 0 52400 Snow Removal 0 0 0 0 0 52500 Garbage/Waste Removal 0 0 0 0 0 52600 Repairs Buildings & Structures 0 0 0 0 0 52700 Repairs & Service of Equipment 610 724 500 724 224 52800 Transportation of Persons 0 1,594 0 0 0 52900 Contracted Services 5,799 2,633 6,950 6,950 0 Total Contractual Services 8,696 10,517 11,350 13,240 1,890
Supplies & Materials FY19 Expenditure FY20 Expenditure FY21 Appropriation FY22 Recommended Inc/Dec 21 vs 22
53000 Auto Energy Supplies 0 0 0 0 0 53200 Food Supplies 0 0 0 0 0 53400 Custodial Supplies 0 0 0 0 0 53500 Med, Dental, & Hosp Supply 0 0 0 0 0 53600 Office Supplies and Materials 4,476 7,426 8,000 7,572 -428 53700 Clothing Allowance 0 0 0 0 0 53800 Educational Supplies & Mat 0 0 0 0 0 53900 Misc Supplies & Materials 0 4,252 0 4,250 4,250 Total Supplies & Materials 4,476 11,678 8,000 11,822 3,822
Current Chgs & Oblig FY19 Expenditure FY20 Expenditure FY21 Appropriation FY22 Recommended Inc/Dec 21 vs 22
54300 Workers' Comp Medical 0 3,495 0 0 0 54400 Legal Liabilities 0 0 0 0 0 54500 Aid To Veterans 0 0 0 0 0 54600 Current Charges H&I 0 0 0 0 0 54700 Indemnification 0 0 0 0 0 54800 Reserve Account 0 0 0 0 0 54900 Other Current Charges 1,749 806 2,150 2,150 0 Total Current Chgs & Oblig 1,749 4,301 2,150 2,150 0
Equipment FY19 Expenditure FY20 Expenditure FY21 Appropriation FY22 Recommended Inc/Dec 21 vs 22
55000 Automotive Equipment 0 0 0 0 0 55400 Lease/Purchase 0 0 0 0 0 55600 Office Furniture & Equipment 0 0 0 0 0 55900 Misc Equipment 23,992 0 0 0 0 Total Equipment 23,992 0 0 0 0
Other FY19 Expenditure FY20 Expenditure FY21 Appropriation FY22 Recommended Inc/Dec 21 vs 22
56200 Special Appropriation 0 0 0 0 0 57200 Structures & Improvements 0 0 0 0 0 58000 Land & Non-Structure 0 0 0 0 0 Total Other 0 0 0 0 0
Grand Total 290,704 226,931 317,514 517,514 200,000

190 Health & Human ServicesFair Housing & Equity
Department Personnel
Title Union Code Grade Position FY22 Salary Title
Union Code Grade Position FY22 Salary
Dep Dir EXM NG 1.00 96,264 Member-Fair Housing Comm EXO NG 5.00 52,143 Exec Director CDH NG 1.00 114,313 Staff Asst III MYO 07 1.00 61,483 Total 8 324,203 Adjustments Differential Payments 0 Other 218,243 Chargebacks -52,143 Salary Savings 0 FY22 Total Request 490,303
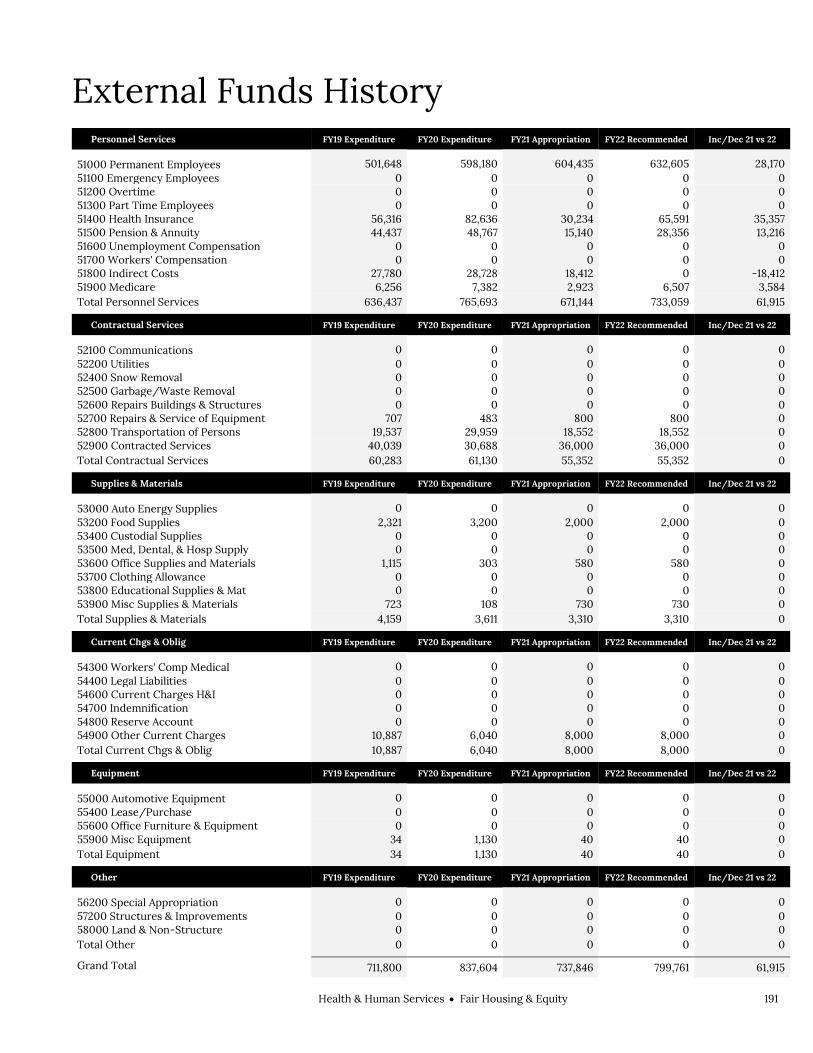
Health & Human ServicesFair Housing & Equity 191
External Funds History Personnel Services FY19 Expenditure FY20 Expenditure FY21 Appropriation FY22 Recommended Inc/Dec 21 vs 22
51000 Permanent Employees 501,648 598,180 604,435 632,605 28,170 51100 Emergency Employees 0 0 0 0 0 51200 Overtime 0 0 0 0 0 51300 Part Time Employees 0 0 0 0 0 51400 Health Insurance 56,316 82,636 30,234 65,591 35,357 51500 Pension & Annuity 44,437 48,767 15,140 28,356 13,216 51600 Unemployment Compensation 0 0 0 0 0 51700 Workers' Compensation 0 0 0 0 0 51800 Indirect Costs 27,780 28,728 18,412 0 -18,412 51900 Medicare 6,256 7,382 2,923 6,507 3,584 Total Personnel Services 636,437 765,693 671,144 733,059 61,915
Contractual Services FY19 Expenditure FY20 Expenditure FY21 Appropriation FY22 Recommended Inc/Dec 21 vs 22
52100 Communications 0 0 0 0 0 52200 Utilities 0 0 0 0 0 52400 Snow Removal 0 0 0 0 0 52500 Garbage/Waste Removal 0 0 0 0 0 52600 Repairs Buildings & Structures 0 0 0 0 0 52700 Repairs & Service of Equipment 707 483 800 800 0 52800 Transportation of Persons 19,537 29,959 18,552 18,552 0 52900 Contracted Services 40,039 30,688 36,000 36,000 0 Total Contractual Services 60,283 61,130 55,352 55,352 0
Supplies & Materials FY19 Expenditure FY20 Expenditure FY21 Appropriation FY22 Recommended Inc/Dec 21 vs 22
53000 Auto Energy Supplies 0 0 0 0 0 53200 Food Supplies 2,321 3,200 2,000 2,000 0 53400 Custodial Supplies 0 0 0 0 0 53500 Med, Dental, & Hosp Supply 0 0 0 0 0 53600 Office Supplies and Materials 1,115 303 580 580 0 53700 Clothing Allowance 0 0 0 0 0 53800 Educational Supplies & Mat 0 0 0 0 0 53900 Misc Supplies & Materials 723 108 730 730 0 Total Supplies & Materials 4,159 3,611 3,310 3,310 0
Current Chgs & Oblig FY19 Expenditure FY20 Expenditure FY21 Appropriation FY22 Recommended Inc/Dec 21 vs 22
54300 Workers' Comp Medical 0 0 0 0 0 54400 Legal Liabilities 0 0 0 0 0 54600 Current Charges H&I 0 0 0 0 0 54700 Indemnification 0 0 0 0 0 54800 Reserve Account 0 0 0 0 0 54900 Other Current Charges 10,887 6,040 8,000 8,000 0 Total Current Chgs & Oblig 10,887 6,040 8,000 8,000 0
Equipment FY19 Expenditure FY20 Expenditure FY21 Appropriation FY22 Recommended Inc/Dec 21 vs 22
55000 Automotive Equipment 0 0 0 0 0 55400 Lease/Purchase 0 0 0 0 0 55600 Office Furniture & Equipment 0 0 0 0 0 55900 Misc Equipment 34 1,130 40 40 0 Total Equipment 34 1,130 40 40 0
Other FY19 Expenditure FY20 Expenditure FY21 Appropriation FY22 Recommended Inc/Dec 21 vs 22
56200 Special Appropriation 0 0 0 0 0 57200 Structures & Improvements 0 0 0 0 0 58000 Land & Non-Structure 0 0 0 0 0 Total Other 0 0 0 0 0
Grand Total 711,800 837,604 737,846 799,761 61,915

192 Health & Human ServicesFair Housing & Equity
External Funds Personnel
Title Union Code Grade Position FY22 Salary Title
Union Code Grade Position FY22 Salary
Adm Assistant MYG 17 1.00 58,971 Prj Manager MYO 08 1.00 78,208 Dir - Investigations MYO 09 1.00 89,199 Sr. Investigator MYO 07 4.00 256,476 Exec Assistant MYG 20 1.00 72,139 Staff Asst III MYO 07 1.00 77,611 Total 9 632,604 Adjustments Differential Payments 0 Other 0 Chargebacks 0 Salary Savings 0 FY22 Total Request 632,604

Health & Human ServicesFair Housing & Equity 193
Program 1. Fair Housing Commission William Onuoha, Manager, Organization 403100
Program Description The Fair Housing Commission works to eliminate discrimination and increase access to housing in Boston through investigation and enforcement, affirmative marketing, and interagency coordination.
Operating Budget Actual '19 Actual '20 Approp '21 Budget '22
Personnel Services 251,791 200,435 296,014 490,302 Non Personnel 38,913 26,496 21,500 27,212 Total 290,704 226,931 317,514 517,514
Performance
Goal: Increase access to housing opportunities through enforcement
Performance Measures Actual '19 Actual '20 Projected '21 Target '22
# of dual filed investigations completed 33 76 65 70
# Discrimination inquiries/intakes 1,208 1,148 1,200 1,200
% of discrimination complaints moved to investigations in 30 days 100% 100% 100% 100%
Average age of open cases (days) 198 190 150 150
Goal: Increase access to housing opportunity through community engagement
Performance Measures Actual '19 Actual '20 Projected '21 Target '22
# community members engaged and reached at events, meetings, and workshops
3,360 4,362 3,400 2,000
% of current year cases investigated within 200 days 47% 32% 50% 60%

194 Health & Human ServicesFair Housing & Equity
External Funds Projects Community Development Block Grant
Project Mission The Community Development Block Grant (CDBG) is an annual entitlement grant from the U.S. Department of Housing and Urban Development to the City of Boston designed to fund a variety of neighborhood development activities. At least 70 percent of CDBG funds must be used to benefit low- and moderate-income households. CDBG funds are used to produce and preserve affordable housing, revitalize neighborhood commercial districts, assist the renovation of non-profit facilities, improve vacant lots, promote and monitor fair housing activities, and assist non-profit organizations in the operation of emergency shelters, health care, child care, youth and adult literacy programs. CDBG funds cannot be used for general government services or to replace funding cuts from existing public service activities. The CDBG awards for FY17, FY18, and FY19 were $15,958,081, $15,761,309, and $17,229,498 respectively. The FY20 award was $17,146,361, and the FY21 award is $17,437,636.
Fair Housing Assistance Program (FHAP)
Project Mission The Boston Fair Housing Commission is contracted by the U.S Department of Housing & Urban Development to investigate and enforce complaints of housing discrimination under federal and state law within the City of Boston. The FHAP funding provides the BFHC support for a variety of fair housing administrative and enforcement activities, including complaint investigation, conciliation, administrative and/or judicial enforcement, training, and education and outreach.

Health & Human ServicesPublic Health Commission 195
Public Health Commission Operating Budget Health & Human Services Public Health Commission Rita Nieves, Interim Executive Director, Appropriation 620000
Department Mission The mission of the Boston Public Health Commission is to protect, preserve and promote the health and well-being of Boston residents, particularly those who are most vulnerable.
Selected Performance Goals Public Health Services
Advance Healthy Equity. Improve median response times. Respond to critical public health issues. Strengthen partnerships with healthcare.
Operating Budget Program Name Total Actual '19 Total Actual '20 Total Approp '21 Total Budget '22
Public Health Services 73,232,691 68,215,619 91,091,090 93,505,153
PHC Administration 11,283,890 18,901,699 10,497,587 12,342,457
Public Health Property 3,450,821 6,288,109 4,884,852 4,850,480
Total 87,967,402 93,405,426 106,473,529 110,698,090

196 Health & Human ServicesPublic Health Commission
Public Health Commission Operating Budget
Authorizing Statutes Enabling Act, 1995 Mass. Acts ch. 147.

Health & Human ServicesPublic Health Commission 197
Department History FY19
Expenditures
FY20
Expenditures FY21 Budget FY22 Budget
Recovery Services Bureau 502,702 514,997 532,432 533,527
Residential Services 1,233,379 1,041,633 999,299 997,576
Resources and Referral Center 2,869,024 3,291,896 4,260,554 4,133,902
Risk Reduction and Overdose Prevention 826,336 896,482 1,360,411 1,801,478
Specialized Outpatient Counseling Services 1,094,369 979,551 1,227,626 1,193,725
Total Recovery Services Bureau 6,525,810 6,724,559 8,380,322 8,660,208
CAHD Health Services 3,361,346 3,296,791 3,785,625 3,841,516
Child, Adolescent and Family Health 598,068 781,475 886,665 900,188
Family Justice Center 346,041 335,868 397,215 402,402
Healthy Baby/Healthy Child 3,416,194 3,225,253 3,939,632 4,087,245
VIP/Trauma Prevention 2,966,646 3,077,832 4,658,653 4,731,092
Youth Development Network 589,260 517,558 597,505 604,141
Total Child, Adolescent & Family Health Bureau 11,277,555 11,234,777 14,265,296 14,566,584
Asthma Prevention and Healthy Homes 725,471 652,107 777,574 805,356
Biological Safety 134,222 153,147 129,764 131,281
Community Initiatives Bureau 699,942 712,116 866,605 799,484
Environmental Hazards 1,660,185 1,722,902 1,879,051 1,965,073
Health Promotion 771,363 759,813 864,664 873,027
Injury Prevention 247,599 214,207 246,178 251,184
Mayor's Health Line 315,588 301,950 433,718 437,192
Public Health Wellness Center 415,037 387,948 428,142 419,917
Tobacco Control 105,123 120,861 105,581 110,079
Total Community Initiatives Bureau 5,074,530 5,025,051 5,731,277 5,792,593
Emergency Medical Services 59,430,511 58,553,134 69,748,144 67,976,388
Homeless Services Bureau 6,976,490 6,310,855 7,516,020 7,478,272
Communicable Diseases Control 2,025,117 1,965,922 2,207,817 2,858,493
Education and Outreach 1,411,750 1,821,358 2,119,028 2,197,889
State of Emergency for Communities of Color 100,000 100,000 100,000 100,000
Infectious Disease Bureau 536,047 492,227 678,946 987,490
Total Infectious Diseases Bureau 4,072,914 4,379,507 5,105,791 6,143,871
Accreditation and Quality Improvement 215,392 163,861 237,013 281,111
Communications 372,252 385,249 560,244 579,422
Community Health Centers 3,634,531 3,779,508 3,786,772 3,786,772
Consortium for Professional Development 827,918 812,043 908,640 916,993
Information Technology Services 4,196,497 3,664,488 4,138,319 4,194,731
Intergovernmental Relations 278,569 183,784 243,806 249,321
Program Operations 2,458,547 2,207,327 2,576,558 2,694,243
Public Health Preparedness 201,134 229,069 192,920 445,067
Racial Equity and Health Improvement 891,738 493,336 2,347,665 1,820,459
Research and Evaluation 1,406,200 1,266,021 3,132,837 3,611,001
Total Public Health Service Centers 14,482,778 13,184,686 18,124,774 18,579,122

198 Health & Human ServicesPublic Health Commission
Total Public Health Services Expenditures 107,840,588 105,412,569 128,871,622 129,197,039
Program Revenue EMS 34,231,606 37,034,699 37,780,532 35,691,886
Program Revenue Non EMS 376,291 162,251 - -
Public Health Program Revenue 34,607,897 37,196,950 37,780,532 35,691,886
TOTAL PUBLIC HEALTH SERVICES 73,232,691 68,215,619 91,091,090 93,505,153
FY19
Expenditures
FY20
Expenditures FY21 Budget FY22 Budget
Administration 741,679 499,922 573,217 810,920
Budget and Grants Office 1,375,218 1,251,400 1,431,786 1,489,494
Executive Director 1,331,011 1,552,258 1,296,348 1,548,089
Finance 3,666,180 2,756,543 3,300,663 3,220,411
Human Resources 1,326,170 1,385,647 1,645,168 1,742,929
Labor and Employment 419,946 379,306 465,146 462,643
Office of the General Counsel 757,241 454,423 915,442 924,773
Security Administration 3,758,076 3,745,680 4,199,800 4,153,082
Public Health Nursing Administration 5,747 7,875 12,500 12,500
Programs Professional Development - 449 14,000 14,000
Health Insurance - Retirees 2,158,965 2,251,128 - -
Administration Expenditures 15,540,233 14,284,631 13,854,070 14,378,840
Administration Revenue 4,857,883 6,502,685 4,286,383 4,286,383
TOTAL ADMINISTRATION 10,682,350 7,781,946 9,567,687 10,092,457
FY19
Expenditures
FY20
Expenditures FY21 Budget FY22 Budget
Albany Street Campus 828,318 824,679 896,401 889,850
Long Island Campus 1,083,834 1,097,641 1,329,587 1,322,040
Mattapan Campus 853,039 1,130,309 1,274,387 1,255,940
Northampton Square 1,303,058 1,694,068 1,854,755 1,858,179
Property Administration 844,029 671,328 933,647 943,607
Southampton Campus 1,152,885 920,516 1,151,075 1,135,865
Total Property Expenditures 6,065,163 6,338,541 7,439,852 7,405,480
Property Revenue 2,664,342 2,050,432 2,555,000 2,555,000
Trinity Utilities Provision (50,000) (2,000,000) - -
TOTAL PROPERTY 3,450,821 6,288,109 4,884,852 4,850,480
FY19
Expenditures
FY20
Expenditures FY21 Budget FY22 Budget
Other Post Employment Benefits (OPEB) 2,250,000 2,250,000 2,250,000 2,250,000
Total Other Expenditures 2,250,000 2,250,000 2,250,000 2,250,000
Change in Fund Balance (1,648,460) 8,869,753 (1,320,100) -
COB Appropriation Grand Total 87,967,402 93,405,427 106,473,529 110,698,090

Health & Human ServicesPublic Health Commission 199
Personnel FTEs PUBLIC HEALTH PROGRAMS
FY21
Internal
FY21
External FY21 Total
FY22
Internal
FY22
External FY22 Total
Recovery Services Bureau 3.37 - 3.37 3.37 - 3.37
Community Prevention Services - 4.14 4.14 - 3.35 3.35
Residential Services
11.75 45.40
57.15
11.75 42.94 54.69
Resources and Referral Center 35.08 0.28 35.36 35.08 0.28 35.36
Risk Reduction and Overdose Prevention 17.05
13.81 30.86 17.30 19.35 36.65
Specialized Outpatient Counseling Services 12.42 2.70
15.12
12.17 2.95
15.12
Total Addictions Prevention, Treatment, &
Recovery Support Services Bureau 79.67 66.33 146.00 79.67 68.87 148.54
Boston Healthy Start - 3.50 3.50 - 4.37 4.37
CAHD Health Services 33.74 7.39
41.13 33.79 7.42
41.21
Child, Adolescent and Family Health 6.00 - 6.00 6.00 - 6.00
Early Childhood Mental Health - 5.00 5.00 - 2.00 2.00
Family Justice Center 4.00 - 4.00 4.00 - 4.00
Healthy Baby/Healthy Child
34.71 1.19 35.90 34.91 1.19 36.10
VIP/Trauma Prevention 15.40 8.60 24.00
15.15 7.85 23.00
Youth Development Network 6.50 - 6.50 6.50 - 6.50
Total Child, Adolescent, & Family Health Bureau 100.35 25.68 126.03 100.35 22.84
123.19
Asthma Prevention and Healthy Homes 6.87 0.03 6.90 6.87 0.04 6.90
Biological Safety 0.83 0.24 1.07 0.83 0.22 1.05
Community Initiatives Bureau 5.40 - 5.40 5.40 - 5.40
Environmental Hazards
15.10 7.23 22.33
15.10 7.15 22.25
Health Promotion 8.00 - 8.00 8.00 - 8.00
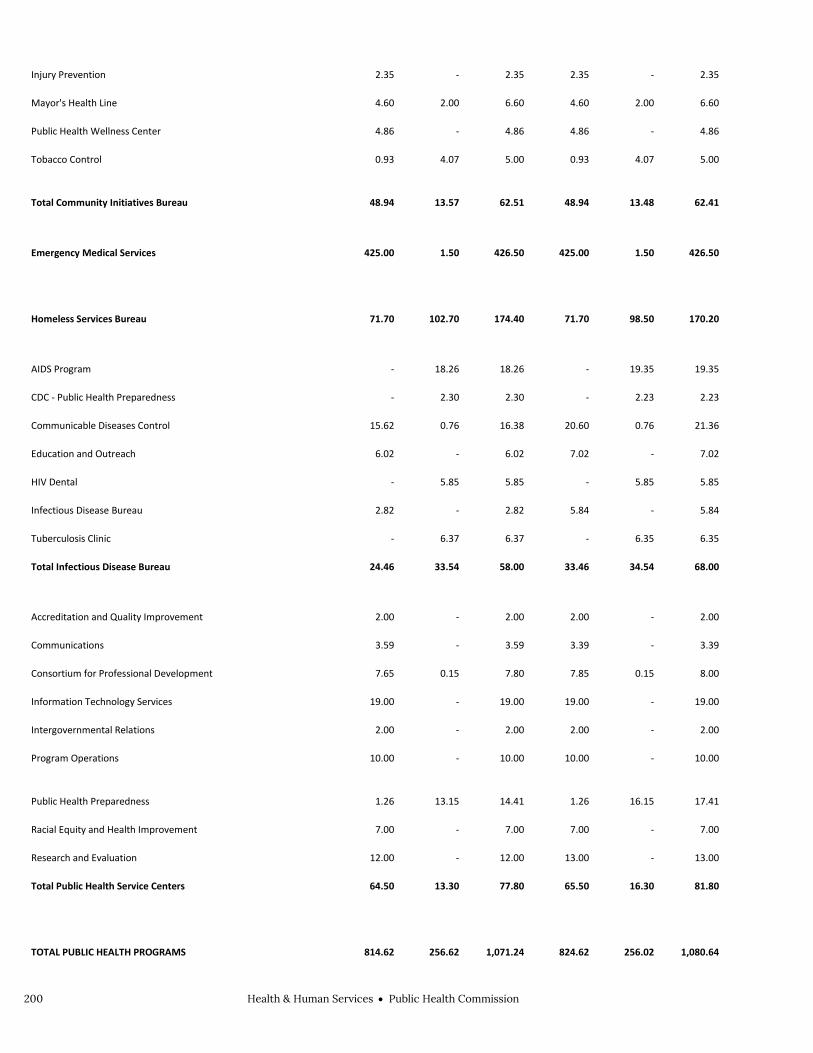
200 Health & Human ServicesPublic Health Commission
Injury Prevention 2.35 - 2.35 2.35 - 2.35
Mayor's Health Line 4.60 2.00 6.60 4.60 2.00 6.60
Public Health Wellness Center 4.86 - 4.86 4.86 - 4.86
Tobacco Control 0.93 4.07 5.00 0.93 4.07 5.00
Total Community Initiatives Bureau 48.94
13.57 62.51 48.94 13.48 62.41
Emergency Medical Services 425.00 1.50 426.50 425.00 1.50 426.50
Homeless Services Bureau
71.70 102.70 174.40
71.70 98.50 170.20
AIDS Program - 18.26 18.26 - 19.35 19.35
CDC - Public Health Preparedness - 2.30 2.30 - 2.23 2.23
Communicable Diseases Control 15.62 0.76 16.38 20.60 0.76 21.36
Education and Outreach 6.02 - 6.02 7.02 - 7.02
HIV Dental - 5.85 5.85 - 5.85 5.85
Infectious Disease Bureau 2.82 - 2.82 5.84 - 5.84
Tuberculosis Clinic - 6.37 6.37 - 6.35 6.35
Total Infectious Disease Bureau 24.46 33.54 58.00 33.46 34.54 68.00
Accreditation and Quality Improvement 2.00 - 2.00 2.00 - 2.00
Communications 3.59 - 3.59 3.39 - 3.39
Consortium for Professional Development 7.65 0.15 7.80 7.85 0.15 8.00
Information Technology Services 19.00 - 19.00 19.00 - 19.00
Intergovernmental Relations 2.00 - 2.00 2.00 - 2.00
Program Operations 10.00 - 10.00 10.00 - 10.00
Public Health Preparedness 1.26
13.15
14.41 1.26
16.15
17.41
Racial Equity and Health Improvement 7.00 - 7.00 7.00 - 7.00
Research and Evaluation 12.00 - 12.00 13.00 - 13.00
Total Public Health Service Centers 64.50 13.30 77.80 65.50 16.30 81.80
TOTAL PUBLIC HEALTH PROGRAMS 814.62 256.62
1,071.24 824.62 256.02 1,080.64

Health & Human ServicesPublic Health Commission 201
ADMINISTRATION
FY21
Internal
FY21
External FY21 Total
FY22
Internal
FY22
External FY22 Total
Administration 4.00 - 4.00 6.00 - 6.00
Budget and Grants Office 10.25 - 10.25 10.25 - 10.25
Executive Director 6.00 - 6.00 7.00 - 7.00
Finance 25.00 - 25.00 24.00 - 24.00
Human Resources 9.00 - 9.00 10.00 - 10.00
Labor and Employment 3.00 - 3.00 3.00 - 3.00
Office of the General Counsel 6.00 - 6.00 6.00 - 6.00
Security Administration 47.00 - 47.00 47.00 - 47.00
Administration
110.25 -
110.25
113.25 -
113.25
PROPERTY
FY21
Internal
FY21
External FY21 Total
FY22
Internal
FY22
External FY22 Total
Albany Street Campus 3.60 - 3.60 3.60 - 3.60
Long Island Campus 1.20 - 1.20 1.20 - 1.20
Mattapan Campus 2.90 - 2.90 2.90 - 2.90
Northampton Square 6.95 - 6.95 6.95 - 6.95
Southampton Campus 2.35 - 2.35 2.35 - 2.35
Property Administration 6.00 - 6.00 6.00 - 6.00
TOTAL PROPERTY 23.00 - 23.00 23.00 - 23.00
TOTAL FTE's 947.87 256.62 1,204.49 960.87 256.02
1,216.89
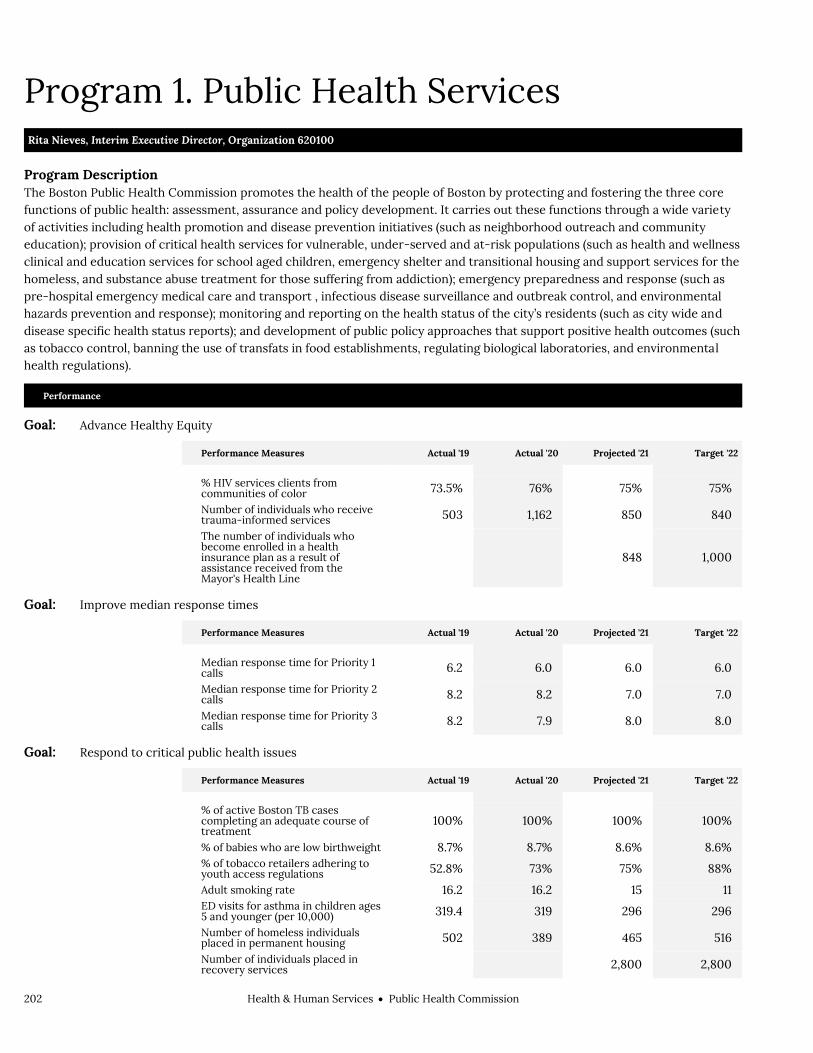
202 Health & Human ServicesPublic Health Commission
Program 1. Public Health Services Rita Nieves, Interim Executive Director, Organization 620100
Program Description The Boston Public Health Commission promotes the health of the people of Boston by protecting and fostering the three core functions of public health: assessment, assurance and policy development. It carries out these functions through a wide variety of activities including health promotion and disease prevention initiatives (such as neighborhood outreach and community education); provision of critical health services for vulnerable, under-served and at-risk populations (such as health and wellness clinical and education services for school aged children, emergency shelter and transitional housing and support services for the homeless, and substance abuse treatment for those suffering from addiction); emergency preparedness and response (such as pre-hospital emergency medical care and transport , infectious disease surveillance and outbreak control, and environmental hazards prevention and response); monitoring and reporting on the health status of the city’s residents (such as city wide and disease specific health status reports); and development of public policy approaches that support positive health outcomes (such as tobacco control, banning the use of transfats in food establishments, regulating biological laboratories, and environmental health regulations).
Performance
Goal: Advance Healthy Equity
Performance Measures Actual '19 Actual '20 Projected '21 Target '22
% HIV services clients from communities of color 73.5% 76% 75% 75%
Number of individuals who receive trauma-informed services 503 1,162 850 840
The number of individuals who become enrolled in a health insurance plan as a result of assistance received from the Mayor's Health Line
848 1,000
Goal: Improve median response times
Performance Measures Actual '19 Actual '20 Projected '21 Target '22
Median response time for Priority 1 calls 6.2 6.0 6.0 6.0
Median response time for Priority 2 calls 8.2 8.2 7.0 7.0
Median response time for Priority 3 calls 8.2 7.9 8.0 8.0
Goal: Respond to critical public health issues
Performance Measures Actual '19 Actual '20 Projected '21 Target '22
% of active Boston TB cases completing an adequate course of treatment
100% 100% 100% 100%
% of babies who are low birthweight 8.7% 8.7% 8.6% 8.6%
% of tobacco retailers adhering to youth access regulations 52.8% 73% 75% 88%
Adult smoking rate 16.2 16.2 15 11
ED visits for asthma in children ages 5 and younger (per 10,000) 319.4 319 296 296
Number of homeless individuals placed in permanent housing 502 389 465 516
Number of individuals placed in recovery services
2,800 2,800
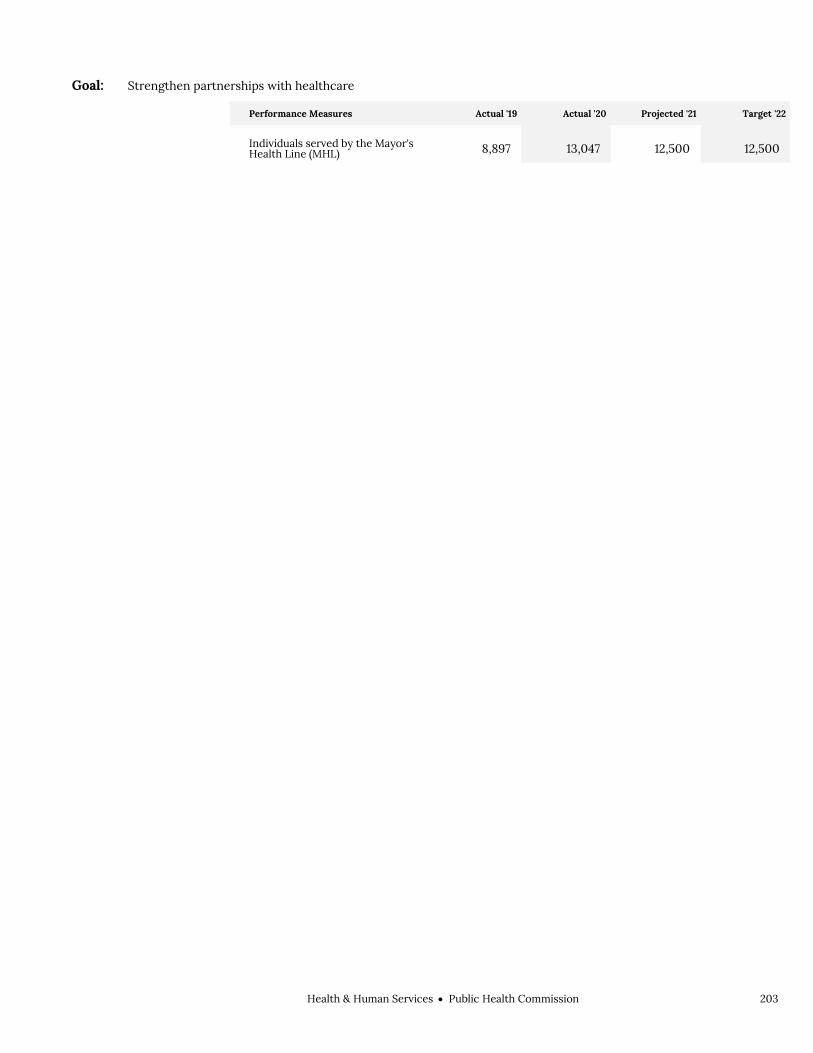
Health & Human ServicesPublic Health Commission 203
Goal: Strengthen partnerships with healthcare
Performance Measures Actual '19 Actual '20 Projected '21 Target '22
Individuals served by the Mayor's Health Line (MHL) 8,897 13,047 12,500 12,500

204 Health & Human ServicesPublic Health Commission
External Funds Projects Bureau of Recovery Services
Ambulatory Services
Project Mission Funding obtained from the Massachusetts Department of Public Health for outpatient substance misuse counseling and treatment services provided to residents of Boston.
Behavioral Health Services
Project Mission Funding obtained from third party billing for a comprehensive mental health clinic serving men and women residents of Boston and for outpatient behavioral health and addiction psychiatry services provided to men and women residents of Boston.
Boston Empowered Communities
Project Mission Funding obtained from the Department of Health and Human Services Office of Minority Health to expand street outreach and harm reduction services in communities of color in Boston.
Boston Healthcare for the Homeless Program RIZE
Project Mission Funding obtained from the RIZE Foundation to continue the work of the CareZone van and augment harm reduction services by adding fentanyl drug checking to the menu of Access Harm reduction Overdose Prevention Education (AHOPE) services provided to active users.
DON PAATHS Navigator
Project Mission Funding from the Steward Health Care to fund a PAATHS Public Health Advocate to provide substance abuse treatment navigation services in the Carney Hospital Emergency Department and the St. Elizabeth’s Emergency Department.
Entre Familia Food Stamps
Project Mission Funding from the Supplemental Nutrition Assistance Program (SNAP) for meals provided to Entre Familia residents.
Entre Familia Pregnant and Post-Partum Women (PPW) Wellness Program
Project Mission Funding from Substance Abuse and Mental Health Services Administration (SAMHSA) to integrate primary care, health education, pre-natal and post-natal care and pediatric services into the family residential substance use disorder treatment model at Entre Familia.
Entre Familia - Residential Treatment Program
Project Mission Funding from the Massachusetts Department of Public Health (MDPH) and Transitional Aid to Needy Families (TANF) to provide residential substance abuse treatment for women and children. This funding also provides for day care for children whose parents are enrolled in Entre Familia.
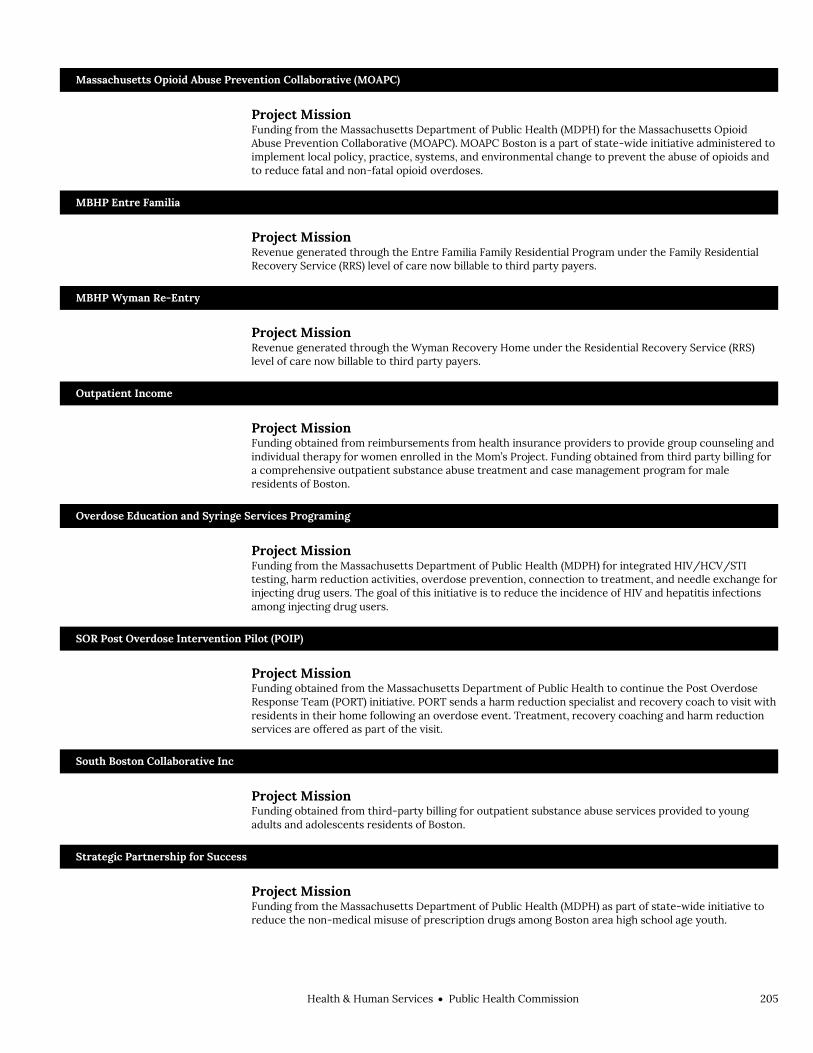
Health & Human ServicesPublic Health Commission 205
Massachusetts Opioid Abuse Prevention Collaborative (MOAPC)
Project Mission Funding from the Massachusetts Department of Public Health (MDPH) for the Massachusetts Opioid Abuse Prevention Collaborative (MOAPC). MOAPC Boston is a part of state-wide initiative administered to implement local policy, practice, systems, and environmental change to prevent the abuse of opioids and to reduce fatal and non-fatal opioid overdoses.
MBHP Entre Familia
Project Mission Revenue generated through the Entre Familia Family Residential Program under the Family Residential Recovery Service (RRS) level of care now billable to third party payers.
MBHP Wyman Re-Entry
Project Mission Revenue generated through the Wyman Recovery Home under the Residential Recovery Service (RRS) level of care now billable to third party payers.
Outpatient Income
Project Mission Funding obtained from reimbursements from health insurance providers to provide group counseling and individual therapy for women enrolled in the Mom’s Project. Funding obtained from third party billing for a comprehensive outpatient substance abuse treatment and case management program for male residents of Boston.
Overdose Education and Syringe Services Programing
Project Mission Funding from the Massachusetts Department of Public Health (MDPH) for integrated HIV/HCV/STI testing, harm reduction activities, overdose prevention, connection to treatment, and needle exchange for injecting drug users. The goal of this initiative is to reduce the incidence of HIV and hepatitis infections among injecting drug users.
SOR Post Overdose Intervention Pilot (POIP)
Project Mission Funding obtained from the Massachusetts Department of Public Health to continue the Post Overdose Response Team (PORT) initiative. PORT sends a harm reduction specialist and recovery coach to visit with residents in their home following an overdose event. Treatment, recovery coaching and harm reduction services are offered as part of the visit.
South Boston Collaborative Inc
Project Mission Funding obtained from third-party billing for outpatient substance abuse services provided to young adults and adolescents residents of Boston.
Strategic Partnership for Success
Project Mission Funding from the Massachusetts Department of Public Health (MDPH) as part of state-wide initiative to reduce the non-medical misuse of prescription drugs among Boston area high school age youth.

206 Health & Human ServicesPublic Health Commission
Substance Abuse Prevention Collaboration
Project Mission Funding from the Massachusetts Department of Public Health (MDPH) focusing on substance use disorder prevention and underage drinking prevention efforts targeting youth across Boston.
Transitions
Project Mission Funding from the Massachusetts Department of Public Health (MDPH) Bureau of Substance Abuse Services for a 40-bed Transitional Support Services Program to provide intensive substance abuse counseling and short-term residence for men and women being discharged from detoxification programs and awaiting placement in residential recovery.
Women and Families Division
Project Mission Funding from donations to the women’s program and DPH reimbursements.
Wyman Food Stamps
Project Mission Funding from the Supplemental Nutrition Assistance Program (SNAP) for meals that we provide to Wyman clients.
Wyman Recovery Home
Project Mission Funding from the Massachusetts Department of Public Health (MDPH) Bureau of Substance Abuse Services for 25 beds to provide 4-6 months of substance use disorder recovery home services for clients with a history in the correctional system.
Child, Adolescent, Family Health
After School Out of School Time
Project Mission After-school and out-of-school time programs provide quality academic and social supports to students both during the school year and the summer months. High-quality after-school programs supplement learning initiated during the traditional school day and help kids develop into productive citizens and healthy members of their communities.
Boston F.I.R.S.T. Systems of Care
Project Mission Funding from the Substance Abuse and Mental Health Services Administration (SAMHSA) to develop a system of care with the Department of Child and Family Services (DCF) and Children’s Services of Roxbury (CSR) focusing on early childhood mental health of infants and toddlers (birth to 48 months) who are involved with the state child welfare system. This grant is funded for 4 years (October 2019-September 2023) pending annual renewal from SAMHSA. It is the Family Independence, Resilience, Support, and Treatment System of Care (FIRST SOC). Three direct service grant staff will be employed by CSR and work closely with grant staff from BPHC to design and deliver services and systems change projects in partnership with DCF.
Boston Healthy Start Initiatives (BHSI)
Project Mission Boston Healthy Start Initiative aims to reduce disparities in infant mortality and adverse perinatal outcomes by (1) improving access to quality health care and services for women, infants and children (2)
Health & Human ServicesPublic Health Commission 207
strengthening the health workforce (3) building healthy communities and (4) promoting and improving health equity by connecting with appropriate organizations and strengthening family resilience. BHSI funds 5 sites which include community-based health centers and a hospital. The families served are residents of the Boston neighborhoods of Dorchester, Mattapan, and Roxbury. Each BHSI site provides intensive case management services to Black and Latina pregnant women, prenatally and postpartum for up to 18 months post-delivery. It also supports the Father Friendly Initiative (FFI), an initiative to strengthen families by providing men with support related to life planning and informed fatherhood. This project is funded by Health Resources and Services Administration (HRSA).
CH Defending Childhood
Project Mission The Children’s DCI funds will support the Office of Capacity building and Resilience Training within the Division of Violence Prevention. The funding will support the salary of a Training Manager. This office delivers at least two 3-day Trauma, Domestic violence and Resilience Training institutes for Home Visiting and Community – Embedded Providers reaching 60 participants. Deliver at least two 3-day Trauma and Resilience Training Institute for Early Childcare Educators reaching 40 participants. Provide at least 50 hours of tailored training, coaching and technical assistance to at least five organizations (total 250-300 hours).
Community Based Crime Reduction (CBCR)
Project Mission The CBCR grant will be used to fund a two-prong violence prevention strategy in the Bowdoin Geneva neighborhood. We will partner with Dorchester Bay Economic Development Corp and College Bound to increase services for the Re-Entry population in the neighborhood. Additionally, we will partner with Boston Police Department (BPD)/C-11 and various neighborhood service providers and resident associations to implement Crime Prevention Through Environmental Design (CPTED). Through CPTED, neighborhood groups will partner with BPD/C-11 to identify areas of the neighborhood for enhancement projects aimed at reducing crime and increasing social cohesion.
Determination of Need
Project Mission Funding from Boston Children’s Hospital Determination of Need (DON) provides funds to two community health centers to employ a mental health clinician and a family partner. Together the mental health clinician and family partner support children or adolescents who have been exposed to violence and their families with case management, home visiting, advocacy and clinical care. In addition, the team collaborates with community partners to offer training and consultation to staff and parents and to offer preventative and therapeutic groups.
Family Planning Services
Project Mission Funding from the Action for Boston Community Development (ABCD) to employ a full-time health educator to provide services at 8 school-based health centers.
Healthy Relationship Grant
Project Mission Develop and implement a sexual assault and dating violence prevention program focused on middle and high school youth of color and LGBTQ youth of color in Boston Public Schools with the aim of building healthy relationships and youth dating and sexual violence peer leadership programs.
Mental Health Systems of Care
Project Mission Funding from the Substance Abuse and Mental Health Services Administration (SAMHSA) to expand a focus on early childhood mental health systems of care and replicate the previously-developed model for integrating early childhood mental health in primary care, building a comprehensive system of support for young children and their families diagnosed or at imminent risk for a Serious Emotional Disturbance.

208 Health & Human ServicesPublic Health Commission
Expansion sites are Community Service Agencies providing Children’s Behavioral Health Initiative services in Boston, Worcester, and Springfield. Funding supports a large focus on Family Engagement, including parent councils and an annual Family Engagement Summit.
Model State Supported AHEC
Project Mission Funding from the statewide Area Health Education Center (AHEC) through UMass/Medical Center to develop and implement strategies to foster and provide community based training and education to individuals seeking careers in health professions within underserved areas for the purpose of developing and maintaining a diverse care workforce that is prepared to deliver high quality care, with an emphasis on primary care, in underserved areas or for health disparity populations, in collaboration with health care workforce development programs and in health care safety net sites.
Opioid Affected Youth
Project Mission The grant will fund sites to develop a data driven coordinated response to identify and address challenges resulting from opioid abuse that are impacting youth and community safety.
Safe and Successful Youth Initiative
Project Mission Funding from state Health & Human Services budget that supports the city’s PACT initiative as a pass-through from the Boston Police Department. PACT actively engages with individuals who are at high risk of being victims or perpetrators of violence. Individuals are identified by BPD as in need of services and BPHC contracts with 15 community-based organizations to provide a wide variety of support to these individuals, including education/training, job placement and housing.
SBHC Capital Program
Project Mission Funds awarded by Department of Health and Human Services (HRSA) to purchase updated furniture and medical equipment for the School Based Health centers to allow the health centers to see more patients and enhance the care of the patients.
School Based Health
Project Mission Funding from the Massachusetts Department of Public Health (MDPH) to support medical services to students served by school-based health centers located in 8 Boston Public High Schools.
School Health Programs-Income
Project Mission Funding received from third-party payers for services provided to students in school-based health centers. Funding supports medical services to students served by school-based health centers located in 8 Boston Public High Schools.
Trauma Recovery and Support
Project Mission Funding from Boston Children’s Hospital the Neighborhood Trauma Team Network which provides trauma response and recovery services to Boston residents impacted by community gun violence. These funds will support a BPHC a Program Manager – Performance Analytics. whose key responsibilities is the development of data management protocols and oversight of data management systems.
Health & Human ServicesPublic Health Commission 209
Welcome Family
Project Mission Funding through Department of Public Health. The Welcome Family is a program that offers a universal, one-time home visit to mothers with newborns. The one-time home visit is conducted by a maternal child health nurse up to eight weeks postpartum and last approximately 90 minutes. Mothers are the primary target population, but any caregiver is eligible, including fathers, grandparents, adoptive and foster parents.
Community Initiatives Bureau
Asbestos Removal Permits
Project Mission Funding obtained from permit fees paid for the regulation of asbestos abatement work in the city of Boston.
Bio-Safety Income
Project Mission Funding obtained from annual issuance of permits to entities seeking to conduct biological research with high risk agents (BSL-3 and BSL-4).
Boston Safe Shops Nail Salon
Project Mission Funding obtained from issuing permits for operation of nail salons.
Boston Tobacco Control - DPH
Project Mission Funding from the Massachusetts Department of Public Health (MDPH) to educate and enforce compliance of the local laws, ordinances and regulations.
Boston Tobacco Control - Fines
Project Mission Funding obtained from City tobacco ordinance fines, including the sale of tobacco to minors.
Boston Tobacco Control - Ordinance Permits
Project Mission Funding obtained from permits for tobacco retailers.
BPHC Permits
Project Mission Funding obtained from issuing permits for operation of body art facilities; licenses for body art practitioners; permits for private water well construction and/or operation; and permits for operation of junkyards, recycling businesses, waste container storage lots and issuing burial permits per state regulations with information obtained from original death certificates submitted by funeral directors for permanent registration with City of Boston Death Registry.
Childhood Injury Prevention
Project Mission Income from sale of window guards and bicycle helmets to the public at a below-cost rate.

210 Health & Human ServicesPublic Health Commission
Childhood Lead Poisoning Prevention
Project Mission Funding from the Massachusetts Department of Public Health (MDPH) and the federal Centers for Disease Control and Prevention to respond to elevated blood lead levels in children under six years of age. Staff members provide education, environmental and medical follow-up to ensure proper treatment, improved health status and the abatement of lead paint hazards.
Connecting Consumers with Care
Project Mission Funding from Blue Cross Blue Shield Foundation to help consumers enroll in and maintain access to coverage, collaborate with advocacy organizations to address system-level barriers, and educate and equip consumers to utilize the health care system more effectively and appropriately.
Death Registry/ Burial Permits
Project Mission Funding obtained from issuing burial permits per state regulations with information obtained from original death certificates submitted by funeral directors for permanent registration with City of Boston Death Registry.
DPH (Statutory) Permits
Project Mission Funding obtained from issuing permits for operation of tanning salons and indoor ice rinks.
Lead Training Income
Project Mission Funding obtained from fees collected from the Moderate Risk De-leading and/or Renovate, Repair and Paint (RRP) trainings. Classes in Moderate Risk De-leading taught by program staff are conducted throughout the year and provided to home owners or their agents to teach them techniques they can use themselves to reduce lead hazards in their property. Renovate, Repair, and Paint classes teach contractors lead-safe renovation practices and qualify them for state-mandated certification.
Mass Navigator Program
Project Mission Funding from the MA Health Connector to develop and implement culturally and linguistically relevant programming that helps consumers apply, enroll and maintain health coverage. Target the city’s remaining uninsured and help to reduce churn.
Medical Marijuana
Project Mission Funding obtained from issuing permits to operate registered medical marijuana dispensaries and dispensary agent licenses.
MHL Children’s Hospital Fund
Project Mission Funding from Children’s Hospital to implement a plan that strengthens Boston’s public health systems and improves health outcomes for vulnerable populations, specifically to support online resource directory.
Residency Training Agreement
Project Mission

Health & Human ServicesPublic Health Commission 211
Funding from Boston University School of Medicine to support the supervision of dental residents.
Emergency Medical Services
911 PSAP Support and Initiatives
Project Mission Funding from the Commonwealth of Massachusetts, overseen by the Executive Office of Public Safety and Security. The purpose of the State 911 Department PSAP and Regional Emergency Communication Center Support and Incentive Grants is to assist public-safety answering points (PSAPs) and regional emergency centers in providing enhanced 911 service. The funding is used to cover both personnel and dispatch-related expenses. Funding is managed locally through the Boston Police Department for all public safety agencies in the city (Police, Fire, and EMS).
Boston EMS Details
Project Mission Funding obtained from billing for coverage of special events/details (i.e. sports events, performances, exhibitions, concerts, festivals, marches, parades, processions, road races, contests, and film events).
Bragdon Street Lease
Project Mission Funding from the Mayor’s Office of Emergency Management, to cover the rent expenses for 85 Bragdon Street, Jamaica Plain, Massachusetts. Said facility houses Boston’s Emergency Operation Center, the EMS Special Operations Division, and preparedness equipment for both the department and City.
Central Medical Emergency Direction (CMED) Grant
Project Mission Funding from the Region IV EMS council to cover expenses associated with providing Central Medical Emergency Direction (CMED) for the 62 cities and towns in the Metro Boston region. The system allows personnel in ambulances to contact CMED via radio and request entry notification to the destination hospital.
EMS Community Programs
Project Mission Funding is obtained through fees associated with the Boston EMS EMT Course, provision of car seats and community CPR certification trainings. Revenue is used to cover the costs associated with these services, including personnel time, materials and car seats.
State 911 Training Grant
Project Mission Funding from the Commonwealth of Massachusetts grant, overseen by the Executive Office of Public Safety. This grant covers fees and personnel expenses associated with approved 911 training courses for certified telecommunicators. Funding is managed locally through the Boston Police Department, for all public safety agencies in the City (Police, Fire & EMS).
Homeless Services Bureau
Boston Healthcare for the Homeless Case Management
Project Mission A new MassHealth initiative that provides qualified MassHealth enrollees with a service benefit called Behavioral Health Community Partners (BH-CP). BPHC/HSB under the leadership of Boston Health Care for the Homeless Program has partnered with eight community-based providers to form the Social Determinants of Health BH-CP Consortium to serve eligible MassHealth enrollees.

212 Health & Human ServicesPublic Health Commission
CPS - CSPECH
Project Mission Funding from the Massachusetts Behavioral Health Partnership (MBHP) to provide an array of services delivered by a community-based, mobile, multidisciplinary teams of paraprofessionals. Community Support Program (CSP) and Community Support Program for people experiencing Chronic Homelessness (CSPECH) provides reimbursement for case management and care coordination services delivered to MBHP members.
DHCD - Permanent Supportive Housing (SIF)
Project Mission Funding from the State Department of Housing Community Development (DHCD) through line item 7004-0102 in the state budget that funds emergency assistance for homeless individuals to provide 20 units of permanent housing with supportive services for homeless men and women.
DHCD Rapid Rehousing
Project Mission Program funded by the Commonwealth to provide case management, rapid rehousing and housing search navigation to homeless individuals. The goal is to house the individual in market rates units in less than 90 days.
DHCD – Southampton Shelter
Project Mission Funding from the State Department of Housing and Community Development (DHCD) through line item 7004-0102 in the state budget that funds emergency assistance for homeless individuals to provide 467 emergency shelter and transitional housing beds for homeless men and women.
DHCD - Woods Mullen Shelter
Project Mission Funding from the State Department of Housing Community Development (DHCD) through line item 7004-0102 in the state budget that funds emergency assistance for homeless individuals to provide 200 emergency shelter beds for homeless men and women at Woods Mullen Shelter.
DMH Adult Community Support
Project Mission Funding from the Massachusetts Department of Mental Health (MDMH) for social work services at Southampton and Woods Mullen emergency shelters.
DPH Supportive Case Management
Project Mission The primary goal of SCM is to assist adults, families and young adults in their recovery, stabilization of their housing and achieving self-sufficiency. This goal is achieved through provision of services within a permanent or transitional housing setting that reinforces recovery through establishing community-based supports to maintain ongoing goals in the recovery process. The environment created by SCM reduces risk of relapse through encouraging and supporting residents to coalesce as a community to support each other in their recovery from substances and in the development of independent living skills.
Emergency Solutions Grant
Project Mission Funding from the US Department of Housing and Urban Development/Emergency Solutions Grant (ESG) administered through DHCD to provide 50 overflow beds in our emergency shelters.
Health & Human ServicesPublic Health Commission 213
Friends Fund
Project Mission Funding obtained from donations and grants received by The Friends of Boston’s Homeless to support homeless services programs.
General Fund HSB
Project Mission Funding obtain from donations and fees received to support homeless services.
Housing Works Partnerships
Project Mission Funding from the US Department of Housing and Urban Development (HUD) to provide permanent supportive housing to homeless clients who have been in BPHC shelters for more than one year. Pine Street Inn subcontracts to BPHC to house and provide stabilization services to 15 chronic homeless adults.
Long Term Stayers Housing
Project Mission Funding from the US Department of Housing and Urban Development (HUD) to provide permanent supportive housing to homeless clients who have been in BPHC shelters for more than one year. Pine Street Inn subcontracts to BPHC to house and provide stabilization services to 10 chronically homeless adults.
MetroBoston Consolidated Sponsor Based CoC
Project Mission Dedicated to connecting the residents of Greater Boston with safe, decent homes they can afford. Metro Housing empowers families and individuals to move along the continuum from homelessness to housing stability.
MHSA – Home and Healthy for Good
Project Mission Funding from the state budget line item 4406-3010 to the Massachusetts Housing and Shelter Alliance (MHSA). MHSA sub contracts with BPHC to fund the HUES to Home Program. The goal of the program is to house the highest utilizers of the city’s emergency departments.
Peer Housing Navigator
Project Mission Funding to hire four peer navigators to help individuals experiencing homelessness to move out of emergency shelter and into permanent housing. Peer Navigators will target services to individuals experiencing chronic homelessness, long term stayers, and women with complex challenges.
Rapid Rehousing for the Homeless
Project Mission Funding from the US Department of Housing and Urban Development (HUD) to provide permanent supportive housing to homeless clients who have been in BPHC shelters for more than one year. Pine Street Inn subcontracts to BPHC to house and provide stabilization services to 15 chronic homeless adults.
Shelter Plus Care - MBHP
Project Mission Shelter Plus Care rental assistance subsidies through MBHP under the Community Services Block grant.

214 Health & Human ServicesPublic Health Commission
Youth Rapid Rehousing
Project Mission The goal is to house homeless youth in market rate units in less than 90 days.
Infectious Disease Bureau
CDC Suffolk County Jail
Project Mission Funding from Suffolk County Sheriff’s Department to provide HIV program services (nursing case management) at the Suffolk County Jail and House of Correction.
Ending HIV Epidemic
Project Mission This is a ten-year initiative beginning in FY 2020 to achieve the important goal of reducing new HIV infections to less than 3,000 per year by 2030. Reducing new infections to this level would essentially mean that HIV transmissions would be rare and meet the definition of ending the epidemic.
HIV Dental Program
Project Mission Funding from the Massachusetts Department of Public Health to assist clients with access to dental care and reimburse dental expenses for HIV positive clients who do not have dental insurance covering western counties of Massachusetts as well as the Cape and the Islands.
HIV Emergency Relief Subcontracts
Project Mission Funding from the Health Resources and Services Administration (HRSA) Ryan White HIV/AIDS Treatment Extension Act (RWTEA) Part A to provide a range of HIV Core and Support services for people living with HIV through subcontracts with Community Health Centers and Community Based Organizations. The service area also known as the Boston Eligible Metropolitan Area (Boston EMA) is made up of seven counties in Massachusetts and three counties in Southern New Hampshire.
I-3 Immunization
Project Mission Funding from the Massachusetts Department of Public Health (MDPH) to assist in distribution of vaccines to healthcare providers and facilities in Boston and to follow-up on selected vaccine-preventable diseases.
Public Health Preparedness (EPI)
Project Mission Funding from the US Centers for Disease Control and Prevention (CDC), passed through the Massachusetts Department of Public Health (MDPH), to develop epidemiological and surveillance plans related to mass dispensing of oral medication; to enhance and maintain a surveillance system used to detect significant patterns in emergency room visits; and to perform surveillance including follow-up investigations for bioterrorism and other communicable disease events.
RW Part A Administration
Project Mission Funding from the HRSA RWTEA “Part A” to administer and manage Part A grant and sub recipients.
Health & Human ServicesPublic Health Commission 215
RW Part A Dental Program
Project Mission Funding from the Ryan White Treatment Extension Act, Part A to assist clients with access to dental care and reimburse dental expenses for HIV positive clients who do not have dental insurance. This funding also provides support for HIV/AIDS education to clients and providers. The service area is the Boston EMA, seven counties in Massachusetts and three counties in Southern New Hampshire.
RW Part A Quality Management
Project Mission Funding from the HRSA RWTEA “Part A” to ensure that services funded under Ryan White meet federal guidelines and improve access and quality care for individuals receiving HIV services in the EMA.
RW Part A Support Services
Project Mission Funding from the HRSA RWTEA “Part A” to provide support and professional planning services to the Boston EMA HIV Services Planning Council.
RW Part A Training
Project Mission This program is funded to provide training & capacity building assistance services to providers funded for Medical Case Management located in the Boston EMA. Services can be provided in a range of modalities, including but not limited to, classroom training, webinars, individualized agency technical assistance, the development and dissemination of resource materials, and through smaller regional provider meetings.
TB Clinic-3rd Party Reimbursement
Project Mission Funding obtain from third-party payers (excluding MDPH) for TB clinic services.
Public Health Service Centers
Barr Foundation
Project Mission Funding from the Barr Foundation to build capacity for community resilience and preparedness through a Community Resilience Network to generate community driven solutions in response to extreme climate and other climate emergencies.
CHEC Income
Project Mission Funding obtained from fees for training programs offered through the Community Health Education Center.
HMCC ASPR
Project Mission Funding from the Assistant Secretary for Preparedness and Response passed through the Massachusetts Department of Public Health (MDPH) to support Healthcare System Preparedness, including the management and administration of the City of Boston’s Health and Medical Coordinating Coalition and the Boston Hospital Preparedness Program.
216 Health & Human ServicesPublic Health Commission
HMCC MRC Reserve
Project Mission Funding from the Massachusetts Department of Public Health (MDPH) to support the administration and management of the Boston Medical Reserve Corps volunteer program.
HMCC Public Health Emergency Preparedness
Project Mission Funding from CDC, passed through the Massachusetts Department of Public Health (MDPH), to support public health preparedness and response initiatives in the City of Boston, including community resilience, public health emergency management, public health and healthcare emergency response and recovery, and education and training. This funding builds our capacity to provide equitable access for Boston residents to health and human services during and following an emergency.
HMCC Public Information
Project Mission Funding from US Centers for Disease Control and Prevention (CDC), passed through the Massachusetts Department of Public Health (MDPH), to develop culturally competent risk communication plans and materials to inform and educate residents about emergency preparedness, before, during and after a public health emergency. Public information also includes communicating the need to dispense medication to the entire population within 48 hours.
Mass Health CHW Training
Project Mission The MassHealth CHW Training project trains a cohort of 25 CHWs from ACOs/CPs in the CHW core competency training program in 2020. In addition, it builds future capacity to expand and enhance training for CHWs from ACOs/CPs.
OPHP Income
Project Mission Funding obtained from fees for training programs offered through the DelValle Institute for Emergency Preparedness.
Racial Ineq. in Opioid Treat
Project Mission BPHC, in collaboration with the Institute for Community Health, Boston University School of Public Health, and Boston Medical Center, received RIZE Massachusetts grant funding to conduct a qualitative study to build understanding of the factors impacting racial/ethnic inequities in substance use disorder treatment access post opioid overdose in Boston. The research team will conduct interviews with residents of different racial and ethnic backgrounds who recently had an opioid overdose to better understand their subsequent treatment seeking experience and with members of the prevention and treatment providing community to gain additional understanding for why these racial inequities exist. Together, these interviews will inform lived-experience policy recommendations for improving substance misuse treatment access for all.
Statewide Training
Project Mission Funding from the Massachusetts Department of Public Health (MDPH) to serve as the Massachusetts Emergency Preparedness Education and Training Center. The Education and Training Center assesses, develops, delivers, coordinates, and evaluates competency-based emergency preparedness education and training utilizing an all-hazards approach while focusing on the CDC/ASPR Public Health and Healthcare Preparedness Capabilities.

Health & Human ServicesPublic Health Commission 217
UASI – Emergency Tracking
Project Mission Funding from the Urban Area Security Initiative (UASI) through the Mayor's Office of Emergency Management that provides resources for planning, organization, and equipment, training, and exercise needs of the Metro Boston Emergency Tracking System, also known as the Patient Tracking System. This is a secure web-based, HIPAA compliant application, which facilitates incident management, family reunification and overall patient accountability during several types of emergency incidents, including mass casualty incidents, hospital evacuations, mass prophylaxis dispensing clinics and emergency shelter operations.
UASI Mutual Aid
Project Mission Funding from the Urban Area Security Initiative (UASI) through the Mayor's Office of Emergency Management to continue supporting the Massachusetts Mutual Aid Program which supports and facilitates the evacuation of long term care facilities, and provides situational awareness and mutual aid for community health centers during emergencies.
UASI Social Services Resilience
Project Mission Funding from the Urban Area Security Initiative (UASI) through the Mayor's Office of Emergency Management to support community, human services, and social services organizations to develop Continuity of Operations plans.
UASI Training for ESF-8
Project Mission Funding from the Urban Area Security Initiative (UASI) through the Mayor's Office of Emergency Management to provide public health and healthcare system training for the Metro Boston Homeland Security Region.

218 Health & Human ServicesPublic Health Commission
Public Health Commission Capital Budget Health & Human Services Public Health Commission
Overview Capital investment in the facilities used by the Public Health Commission improves service delivery and enhances the administration of public health services provided by the City.
FY22 Major Initiatives Complete construction for a new, permanent Engagement Center. Begin a programming and siting study for EMS facilities. Increase preparedness of the Commission’s computer system infrastructure by establishing
a disaster recovery site. Begin renovation of space at 201 Rivermoor Street in West Roxbury for use as an EMS
Training Academy that will provide a dedicated space for department continuing education, Advanced Life Support, paramedic, recruit, and community EMT courses.
Construction of a new ambulance bay at 201 Rivermoor Street in conjunction with the Training Academy project.
Planning is underway for bringing recovery services to Long Island. The project will include an assessment of programming needs and existing facility conditions along with estimated costs for repairs.
Renovation project at the Woods Mullen Shelter, including installation of new elevator and an improved entrance will be completed.
Implementation of upgrades to EMS radio system network.
Capital Budget Expenditures Total Actual '19 Total Actual '20 Estimated '21 Total Projected '22
Total Department 2,630,896 3,751,681 18,642,381 31,445,984

Health & Human ServicesPublic Health Commission 219
Public Health Commission Project Profiles EMS NEIGHBORHOOD STATION STUDY
Project Mission Programming and site evaluation to support EMS facilities that better serve each community with Emergency
Medical Services.
Managing Department, Public Facilities Department Status, New Project Location, Various neighborhoods Operating Impact, No
Authorizations
Source Existing FY22 Future Non Capital
Fund Total City Capital 0 100,000 0 0 100,000 Grants/Other 0 0 0 0 0 Total 0 100,000 0 0 100,000
Expenditures (Actual and Planned)
Source Thru
6/30/20 FY21 FY22 FY23-26 Total City Capital 0 0 100,000 0 100,000 Grants/Other 0 0 0 0 0 Total 0 0 100,000 0 100,000
EMS RADIO SYSTEM UPGRADES Project Mission Design and implement upgrades to the EMS radio system. Managing Department, Boston Public Health Commission Status, Implementation Underway Location, Citywide Operating Impact, No
Authorizations
Source Existing FY22 Future Non Capital
Fund Total City Capital 11,585,000 11,970,000 0 0 23,555,000 Grants/Other 0 0 0 0 0 Total 11,585,000 11,970,000 0 0 23,555,000
Expenditures (Actual and Planned)
Source Thru
6/30/20 FY21 FY22 FY23-26 Total City Capital 0 5,000,000 8,000,000 10,555,000 23,555,000 Grants/Other 0 0 0 0 0 Total 0 5,000,000 8,000,000 10,555,000 23,555,000

220 Health & Human ServicesPublic Health Commission
Public Health Commission Project Profiles EMS SEAPORT STATION
Project Mission Design and construction of a new EMS station. Managing Department, Public Facilities Department Status, To Be Scheduled Location, South Boston Operating Impact, No
Authorizations
Source Existing FY22 Future Non Capital
Fund Total City Capital 375,000 0 0 0 375,000 Grants/Other 0 0 0 0 0 Total 375,000 0 0 0 375,000
Expenditures (Actual and Planned)
Source Thru
6/30/20 FY21 FY22 FY23-26 Total City Capital 0 0 50,000 325,000 375,000 Grants/Other 0 0 0 0 0 Total 0 0 50,000 325,000 375,000
EMS TRAINING ACADEMY Project Mission Renovate space at 201 Rivermoor Street to accommodate Emergency Medical Services (EMS) training
requirements.
Managing Department, Public Facilities Department Status, In Design Location, West Roxbury Operating Impact, No
Authorizations
Source Existing FY22 Future Non Capital
Fund Total City Capital 12,620,000 1,630,000 0 0 14,250,000 Grants/Other 0 0 0 0 0 Total 12,620,000 1,630,000 0 0 14,250,000
Expenditures (Actual and Planned)
Source Thru
6/30/20 FY21 FY22 FY23-26 Total City Capital 229,101 1,500,000 6,000,000 6,520,899 14,250,000 Grants/Other 0 0 0 0 0 Total 229,101 1,500,000 6,000,000 6,520,899 14,250,000

Health & Human ServicesPublic Health Commission 221
Public Health Commission Project Profiles ENGAGEMENT CENTER
Project Mission Design and build a permanent Engagement Center to enhance recovery support services. Managing Department, Public Facilities Department Status, In Construction Location, Dorchester Operating Impact, No
Authorizations
Source Existing FY22 Future Non Capital
Fund Total City Capital 9,120,000 0 0 0 9,120,000 Grants/Other 0 0 0 0 0 Total 9,120,000 0 0 0 9,120,000
Expenditures (Actual and Planned)
Source Thru
6/30/20 FY21 FY22 FY23-26 Total City Capital 418,113 3,000,000 5,701,887 0 9,120,000 Grants/Other 0 0 0 0 0 Total 418,113 3,000,000 5,701,887 0 9,120,000
IT DISASTER RECOVERY/BUSINESS CONTINUITY Project Mission Establish a disaster recovery site to increase disaster preparedness of BPHC’s primary computer system
infrastructure.
Managing Department, DoIT Status, New Project Location, N/A Operating Impact, Yes
Authorizations
Source Existing FY22 Future Non Capital
Fund Total City Capital 0 565,000 0 0 565,000 Grants/Other 0 0 0 0 0 Total 0 565,000 0 0 565,000
Expenditures (Actual and Planned)
Source Thru
6/30/20 FY21 FY22 FY23-26 Total City Capital 0 0 565,000 0 565,000 Grants/Other 0 0 0 0 0 Total 0 0 565,000 0 565,000

222 Health & Human ServicesPublic Health Commission
Public Health Commission Project Profiles LONG ISLAND FACILITY PRESERVATION
Project Mission Repair and upkeep of buildings on Long Island that may be utilized in the development of the recovery campus. Managing Department, Public Facilities Department Status, To Be Scheduled Location, Harbor Islands Operating Impact, No
Authorizations
Source Existing FY22 Future Non Capital
Fund Total City Capital 18,000,000 2,000,000 0 0 20,000,000 Grants/Other 0 0 0 0 0 Total 18,000,000 2,000,000 0 0 20,000,000
Expenditures (Actual and Planned)
Source Thru
6/30/20 FY21 FY22 FY23-26 Total City Capital 0 0 5,000,000 15,000,000 20,000,000 Grants/Other 0 0 0 0 0 Total 0 0 5,000,000 15,000,000 20,000,000
LONG ISLAND RECOVERY CAMPUS Project Mission Renovate existing buildings on Long Island to support the creation of a recovery campus. Managing Department, Public Facilities Department Status, To Be Scheduled Location, Harbor Islands Operating Impact, No
Authorizations
Source Existing FY22 Future Non Capital
Fund Total City Capital 2,000,000 0 0 0 2,000,000 Grants/Other 0 0 0 0 0 Total 2,000,000 0 0 0 2,000,000
Expenditures (Actual and Planned)
Source Thru
6/30/20 FY21 FY22 FY23-26 Total City Capital 0 3,178 1,000,000 996,822 2,000,000 Grants/Other 0 0 0 0 0 Total 0 3,178 1,000,000 996,822 2,000,000

Health & Human ServicesPublic Health Commission 223
Public Health Commission Project Profiles LONG ISLAND STUDY
Project Mission The first phase of this study will assess the current condition of the existing PHC facilities. The second phase will
be the development of a master plan for the creation of a recovery campus on the island providing a range of services.
Managing Department, Public Facilities Department Status, Study Underway Location, Harbor Islands Operating Impact, No
Authorizations
Source Existing FY22 Future Non Capital
Fund Total City Capital 2,000,000 0 0 0 2,000,000 Grants/Other 0 0 0 0 0 Total 2,000,000 0 0 0 2,000,000
Expenditures (Actual and Planned)
Source Thru
6/30/20 FY21 FY22 FY23-26 Total City Capital 1,195,336 300,000 504,664 0 2,000,000 Grants/Other 0 0 0 0 0 Total 1,195,336 300,000 504,664 0 2,000,000
MIRANDA-CREAMER / SEFC REPAIRS Project Mission Roof replacement at the Miranda-Creamer and South End Fitness Center buildings. Window and masonry repairs
to the interconnecting walkway. Electrical and HVAC upgrades.
Managing Department, Public Facilities Department Status, In Design Location, South End Operating Impact, No
Authorizations
Source Existing FY22 Future Non Capital
Fund Total City Capital 800,000 4,300,000 0 0 5,100,000 Grants/Other 0 0 0 0 0 Total 800,000 4,300,000 0 0 5,100,000
Expenditures (Actual and Planned)
Source Thru
6/30/20 FY21 FY22 FY23-26 Total City Capital 0 250,000 1,000,000 3,850,000 5,100,000 Grants/Other 0 0 0 0 0 Total 0 250,000 1,000,000 3,850,000 5,100,000

224 Health & Human ServicesPublic Health Commission
Public Health Commission Project Profiles NORTHAMPTON SQUARE ELECTRICAL IMPROVEMENTS
Project Mission Implement electrical upgrades at Northampton Square including separation of the Miranda Creamer Low Rise
electrical service from the High Rise.
Managing Department, Public Facilities Department Status, New Project Location, Roxbury Operating Impact, Yes
Authorizations
Source Existing FY22 Future Non Capital
Fund Total City Capital 0 201,000 0 0 201,000 Grants/Other 0 0 0 0 0 Total 0 201,000 0 0 201,000
Expenditures (Actual and Planned)
Source Thru
6/30/20 FY21 FY22 FY23-26 Total City Capital 0 0 201,000 0 201,000 Grants/Other 0 0 0 0 0 Total 0 0 201,000 0 201,000
SOUTHAMPTON STREET SHELTER GENERATOR Project Mission Install generator at 112 Southampton Street to support the shelter and Engagement Center. Managing Department, Public Facilities Department Status, In Construction Location, Dorchester Operating Impact, No
Authorizations
Source Existing FY22 Future Non Capital
Fund Total City Capital 1,646,000 0 0 0 1,646,000 Grants/Other 0 0 0 0 0 Total 1,646,000 0 0 0 1,646,000
Expenditures (Actual and Planned)
Source Thru
6/30/20 FY21 FY22 FY23-26 Total City Capital 643,258 179,309 823,433 0 1,646,000 Grants/Other 0 0 0 0 0 Total 643,258 179,309 823,433 0 1,646,000
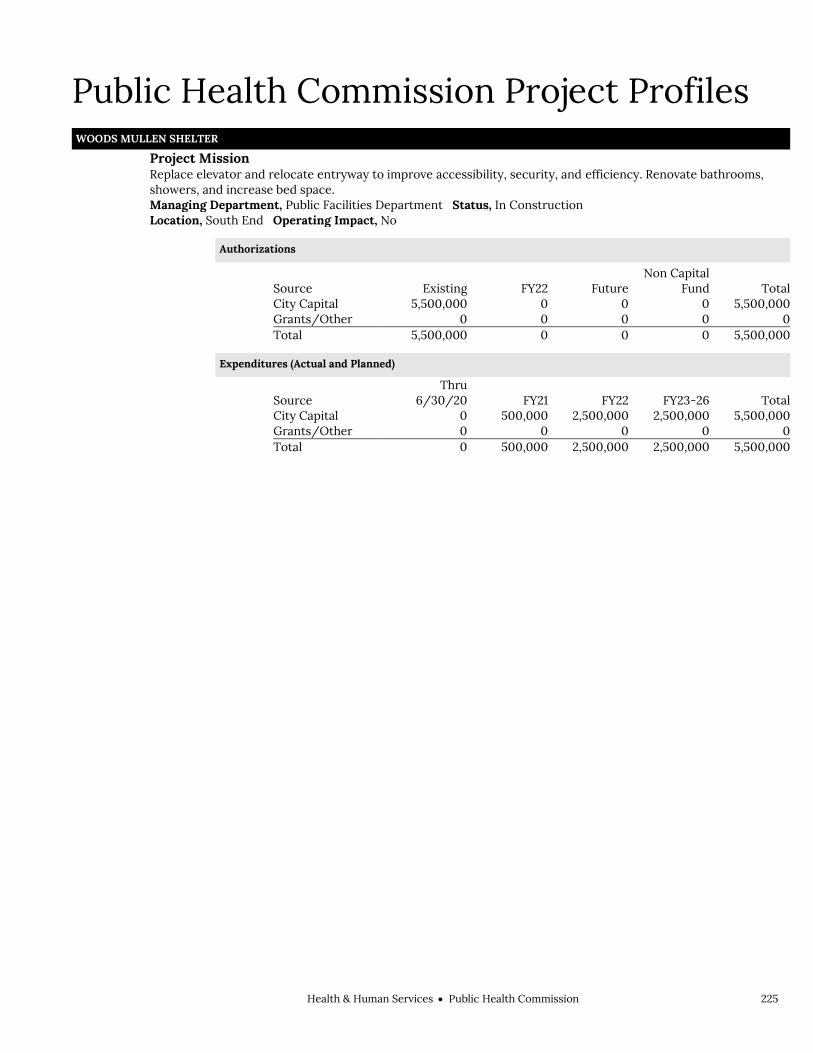
Health & Human ServicesPublic Health Commission 225
Public Health Commission Project Profiles WOODS MULLEN SHELTER
Project Mission Replace elevator and relocate entryway to improve accessibility, security, and efficiency. Renovate bathrooms,
showers, and increase bed space.
Managing Department, Public Facilities Department Status, In Construction Location, South End Operating Impact, No
Authorizations
Source Existing FY22 Future Non Capital
Fund Total City Capital 5,500,000 0 0 0 5,500,000 Grants/Other 0 0 0 0 0 Total 5,500,000 0 0 0 5,500,000
Expenditures (Actual and Planned)
Source Thru
6/30/20 FY21 FY22 FY23-26 Total City Capital 0 500,000 2,500,000 2,500,000 5,500,000 Grants/Other 0 0 0 0 0 Total 0 500,000 2,500,000 2,500,000 5,500,000

226 Health & Human ServicesPublic Health Commission

Health & Human ServicesYouth Engagement & Employment 227
Youth Engagement & Employment Operating Budget Health & Human Services Youth Engagement & Employment Rashad Cope, Director, Appropriation 448000
Department Mission The Youth Engagement & Employment appropriation is used to support activities and services for Boston's youth. The department provides youths and families with resources including employment, out of school time activities, peers who listen, and youth development opportunities.
Selected Performance Goals Youth Engagement & Employment
To hire the maximum number of young residents.
Operating Budget Program Name Total Actual '19 Total Actual '20 Total Approp '21 Total Budget '22
Youth Engagement & Employment 6,091,124 7,198,033 7,818,028 12,475,451
Total 6,091,124 7,198,033 7,818,028 12,475,451
External Funds Budget Fund Name Total Actual '19 Total Actual '20 Total Approp '21 Total Budget '22
Summer Jobs Fund 17,267 13,000 0 0
Youth at Risk 838,781 920,749 840,443 840,443
Youth Jobs Grant 0 0 200,000 200,000 Total 856,048 933,749 1,040,443 1,040,443
Operating Budget Actual '19 Actual '20 Approp '21 Budget '22
Personnel Services 5,184,758 6,439,695 7,031,817 10,901,144 Non Personnel 906,366 758,338 786,211 1,574,307 Total 6,091,124 7,198,033 7,818,028 12,475,451

228 Health & Human ServicesYouth Engagement & Employment
Youth Engagement & Employment Operating Budget
Description of Services Youth Engagement and Employment supports employment opportunities and serves as a resource for Boston youth. It provides funding for summer jobs for youth at community based organizations (CBOs) and teams aimed at citywide beautification initiatives. During the school year, Youth Engagement and Employment maintains a fully accessible - via web or phone - and comprehensive database of resources available to Boston’s youth and their parents. The Youthline provides timely information and referrals to education, health, sport, cultural, civic participation and after-school resources available to youth in the City of Boston.
Youth Employment Mayor’s Youth Council
Director
Partnership
Youthline Outreach
Youth & Career Development

Health & Human ServicesYouth Engagement & Employment 229
Department History Personnel Services FY19 Expenditure FY20 Expenditure FY21 Appropriation FY22 Recommended Inc/Dec 21 vs 22
51000 Permanent Employees 454,878 510,773 570,047 723,585 153,538 51100 Emergency Employees 4,707,918 5,929,968 6,461,770 10,177,559 3,715,789 51200 Overtime 16,836 -1,046 0 0 0 51600 Unemployment Compensation 5,126 0 0 0 0 51700 Workers' Compensation 0 0 0 0 0 Total Personnel Services 5,184,758 6,439,695 7,031,817 10,901,144 3,869,327
Contractual Services FY19 Expenditure FY20 Expenditure FY21 Appropriation FY22 Recommended Inc/Dec 21 vs 22
52100 Communications 6,000 0 6,580 6,580 0 52200 Utilities 0 0 0 0 0 52400 Snow Removal 0 0 0 0 0 52500 Garbage/Waste Removal 0 0 0 0 0 52600 Repairs Buildings & Structures 0 0 0 0 0 52700 Repairs & Service of Equipment 0 0 1,000 1,000 0 52800 Transportation of Persons 0 -25 0 0 0 52900 Contracted Services 246,327 61,862 133,231 133,231 0 Total Contractual Services 252,327 61,837 140,811 140,811 0
Supplies & Materials FY19 Expenditure FY20 Expenditure FY21 Appropriation FY22 Recommended Inc/Dec 21 vs 22
53000 Auto Energy Supplies 0 0 0 0 0 53200 Food Supplies 1,049 3,284 0 0 0 53400 Custodial Supplies 474 119 500 500 0 53500 Med, Dental, & Hosp Supply 0 0 0 0 0 53600 Office Supplies and Materials 5,071 2,842 5,500 5,500 0 53700 Clothing Allowance 0 0 0 0 0 53800 Educational Supplies & Mat 0 0 0 0 0 53900 Misc Supplies & Materials 49,595 35,670 62,500 62,500 0 Total Supplies & Materials 56,189 41,915 68,500 68,500 0
Current Chgs & Oblig FY19 Expenditure FY20 Expenditure FY21 Appropriation FY22 Recommended Inc/Dec 21 vs 22
54300 Workers' Comp Medical 0 0 0 0 0 54400 Legal Liabilities 0 0 0 0 0 54500 Aid To Veterans 0 0 0 0 0 54600 Current Charges H&I 0 0 0 0 0 54700 Indemnification 0 0 0 0 0 54800 Reserve Account 0 0 0 0 0 54900 Other Current Charges 3,783 58,725 9,900 797,996 788,096 Total Current Chgs & Oblig 3,783 58,725 9,900 797,996 788,096
Equipment FY19 Expenditure FY20 Expenditure FY21 Appropriation FY22 Recommended Inc/Dec 21 vs 22
55000 Automotive Equipment 0 0 0 0 0 55400 Lease/Purchase 0 0 0 0 0 55600 Office Furniture & Equipment 14,265 0 0 0 0 55900 Misc Equipment 17,212 33,361 4,500 4,500 0 Total Equipment 31,477 33,361 4,500 4,500 0
Other FY19 Expenditure FY20 Expenditure FY21 Appropriation FY22 Recommended Inc/Dec 21 vs 22
56200 Special Appropriation 562,590 562,500 562,500 562,500 0 57200 Structures & Improvements 0 0 0 0 0 58000 Land & Non-Structure 0 0 0 0 0 Total Other 562,590 562,500 562,500 562,500 0
Grand Total 6,091,124 7,198,033 7,818,028 12,475,451 4,657,423

230 Health & Human ServicesYouth Engagement & Employment
Department Personnel
Title Union Code Grade Position FY22 Salary Title
Union Code Grade Position FY22 Salary
Dir (Adsl) MYN NG 1.00 90,247 Youth Employment Coord MYO 05 2.00 103,120 Office Manager. MYO 04 1.00 58,624 Youth Fund Manager MYO 08 2.00 143,079 Partnerships Manager MYO 06 1.00 70,491 Youth Outreach Coord MYO 05 1.00 57,459
Yth & Career Development Coord
MYO 05 1.00 61,739
Total 9 584,759 Adjustments Differential Payments 0 Other 138,827 Chargebacks 0 Salary Savings 0 FY22 Total Request 723,586

Health & Human ServicesYouth Engagement & Employment 231
External Funds History Personnel Services FY19 Expenditure FY20 Expenditure FY21 Appropriation FY22 Recommended Inc/Dec 21 vs 22
51000 Permanent Employees 0 0 0 0 0 51100 Emergency Employees 823,000 892,465 1,040,443 1,040,443 0 51200 Overtime 0 0 0 0 0 51300 Part Time Employees 0 0 0 0 0 51400 Health Insurance 0 0 0 0 0 51500 Pension & Annuity 0 0 0 0 0 51600 Unemployment Compensation 0 0 0 0 0 51700 Workers' Compensation 0 0 0 0 0 51800 Indirect Costs 0 0 0 0 0 51900 Medicare 0 0 0 0 0 Total Personnel Services 823,000 892,465 1,040,443 1,040,443 0
Contractual Services FY19 Expenditure FY20 Expenditure FY21 Appropriation FY22 Recommended Inc/Dec 21 vs 22
52100 Communications 0 0 0 0 0 52200 Utilities 0 0 0 0 0 52500 Garbage/Waste Removal 0 0 0 0 0 52600 Repairs Buildings & Structures 0 0 0 0 0 52700 Repairs & Service of Equipment 0 0 0 0 0 52800 Transportation of Persons 0 5,240 0 0 0 52900 Contracted Services 20,615 14,945 0 0 0 Total Contractual Services 20,615 20,185 0 0 0
Supplies & Materials FY19 Expenditure FY20 Expenditure FY21 Appropriation FY22 Recommended Inc/Dec 21 vs 22
53000 Auto Energy Supplies 0 0 0 0 0 53200 Food Supplies 5,658 3,539 0 0 0 53400 Custodial Supplies 0 0 0 0 0 53600 Office Supplies and Materials 0 0 0 0 0 53700 Clothing Allowance 0 0 0 0 0 53800 Educational Supplies & Mat 0 0 0 0 0 53900 Misc Supplies & Materials 6,774 8,950 0 0 0 Total Supplies & Materials 12,432 12,489 0 0 0
Current Chgs & Oblig FY19 Expenditure FY20 Expenditure FY21 Appropriation FY22 Recommended Inc/Dec 21 vs 22
54300 Workers' Comp Medical 0 0 0 0 0 54400 Legal Liabilities 0 0 0 0 0 54600 Current Charges H&I 0 0 0 0 0 54900 Other Current Charges 0 2,304 0 0 0 Total Current Chgs & Oblig 0 2,304 0 0 0
Equipment FY19 Expenditure FY20 Expenditure FY21 Appropriation FY22 Recommended Inc/Dec 21 vs 22
55000 Automotive Equipment 0 0 0 0 0 55400 Lease/Purchase 0 0 0 0 0 55600 Office Furniture & Equipment 0 0 0 0 0 55900 Misc Equipment 0 6,307 0 0 0 Total Equipment 0 6,307 0 0 0
Other FY19 Expenditure FY20 Expenditure FY21 Appropriation FY22 Recommended Inc/Dec 21 vs 22
56200 Special Appropriation 0 0 0 0 0 57200 Structures & Improvements 0 0 0 0 0 58000 Land & Non-Structure 0 0 0 0 0 Total Other 0 0 0 0 0
Grand Total 856,047 933,750 1,040,443 1,040,443 0
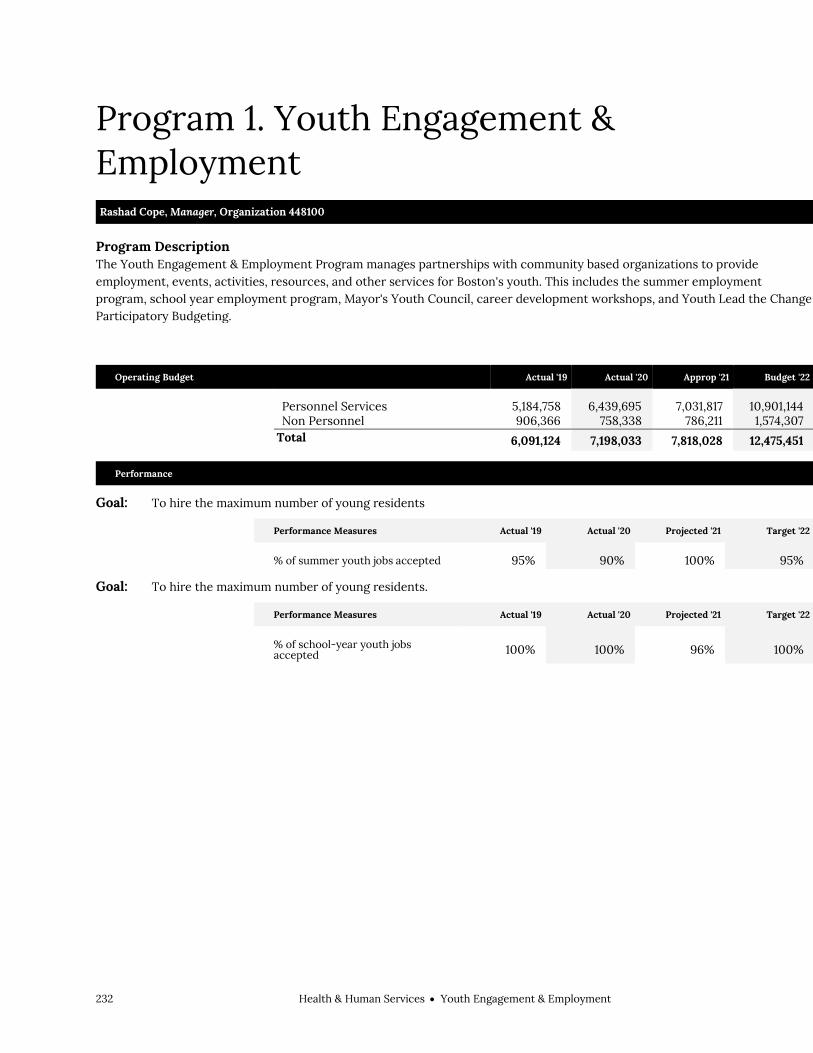
232 Health & Human ServicesYouth Engagement & Employment
Program 1. Youth Engagement & Employment Rashad Cope, Manager, Organization 448100
Program Description The Youth Engagement & Employment Program manages partnerships with community based organizations to provide employment, events, activities, resources, and other services for Boston's youth. This includes the summer employment program, school year employment program, Mayor's Youth Council, career development workshops, and Youth Lead the Change Participatory Budgeting.
Operating Budget Actual '19 Actual '20 Approp '21 Budget '22
Personnel Services 5,184,758 6,439,695 7,031,817 10,901,144 Non Personnel 906,366 758,338 786,211 1,574,307 Total 6,091,124 7,198,033 7,818,028 12,475,451
Performance
Goal: To hire the maximum number of young residents
Performance Measures Actual '19 Actual '20 Projected '21 Target '22
% of summer youth jobs accepted 95% 90% 100% 95%
Goal: To hire the maximum number of young residents.
Performance Measures Actual '19 Actual '20 Projected '21 Target '22
% of school-year youth jobs accepted 100% 100% 96% 100%

Health & Human ServicesYouth Engagement & Employment 233
External Funds Projects Youth Jobs Grant
Project Mission As a result of events precipitated by two private companies: Bechtel International Corp. and Turner Broadcasting Systems, the city of Boston received financial settlements totaling over two million. These funds were dedicated by the Mayor to supplement the year-round youth job program.
Youth at Risk
Project Mission The Youth at Risk program is a summer jobs program for at-risk youth funded through the Commonwealth of Massachusetts. Funds are targeted to cities in Massachusetts that have the greatest incidence of juvenile detention and adjudication, where low-income youth are especially in need of access to summer job opportunities.
Youth Employment & Enrichment Fund
Project Mission The Youth Employment & Enrichment Fund was established 2014 to ensure that Boston youth have access to high quality opportunities for employment, enrichment and personal development during the summer and school months. The fund was made possible by financial contributions from local corporations and foundations committed to supporting youth employment in the City of Boston. The fund is used to hire youth and to pay for non-personnel costs associated with youth employees such as enrichment training, materials and supplies.

234 Health & Human ServicesYouth Engagement & Employment

Housing & Neighborhood DevelopmentCabinet 235
Housing & Neighborhood Development Housing & Neighborhood Development Cabinet
Housing & Neighborhood Development ....................... 237
Neighborhood Development .................................... 239
Administration ................................................. 246
Real Estate Management & Sales ................ 247
Housing Development & Services ............... 248

236 Housing & Neighborhood DevelopmentCabinet

Housing & Neighborhood DevelopmentCabinet 237
Housing & Neighborhood Development Housing & Neighborhood Development
Sheila Dillon, Chief of Housing & Neighborhood Development
Cabinet Mission The Cabinet is committed to making Boston the most livable city in the nation by working with its many communities to build strong neighborhoods through the strategic investment of public resources.
Operating Budget
Total Actual '19 Total Actual '20 Total Approp '21 Total Budget '22
Neighborhood Development 14,203,729 20,464,363 29,088,350 35,272,662
Total 14,203,729 20,464,363 29,088,350 35,272,662
Capital Budget Expenditures Actual '19 Actual '20 Estimated '21 Projected '22
Neighborhood Development 162,224 1,800,120 11,500,000 28,299,880 Total 162,224 1,800,120 11,500,000 28,299,880
External Funds Expenditures
Total Actual '19 Total Actual '20 Total Approp '21 Total Budget '22
Neighborhood Development 78,471,568 68,972,283 118,593,445 138,087,575
Total 78,471,568 68,972,283 118,593,445 138,087,575

238 Housing & Neighborhood DevelopmentCabinet

Housing & Neighborhood DevelopmentNeighborhood Development 239
Neighborhood Development Operating Budget Housing & Neighborhood Development Neighborhood Development Sheila Dillon, Chief of Housing & Neighborhood Development, Appropriation 188000
Department Mission The Cabinet is committed to making Boston the most livable city in the nation by working with its many communities to build strong neighborhoods through the strategic investment of public resources. In 2014, the City announced his Boston 2030 plan which outlines a new comprehensive approach to accommodating Boston's complex housing needs over the next 15 years. Funding committed for the new plan has been renamed the “Housing 2030 Fund” which is included in the Neighborhood Development Operating Budget in “Program 3. Housing Development and Services.”.
Selected Performance Goals Real Estate Management & Sales
Dispose of tax-foreclosed and surplus property.Housing Development & Services
Assist existing homeowners in retaining their homes. Assist tenants and landlords to preserve their tenancies. Ensure growth and affordability in Boston's Housing Market. Foster Homeownership in Boston Neighborhoods. Help Homeowners Improve their Homes and Communities. Provide assistance towards ending homelessness in Boston.
Operating Budget Program Name Total Actual '19 Total Actual '20 Total Approp '21 Total Budget '22
Neighborhood Development Administration 1,729,831 1,690,779 1,880,835 1,851,811
Real Estate Management & Sales 1,962,524 2,040,771 2,056,247 3,201,706 Housing Development & Services 10,511,377 16,732,810 25,151,268 30,219,146
Total 14,203,732 20,464,361 29,088,350 35,272,663
External Funds Budget
Fund Name Total Actual '19 Total Actual '20 Total Approp '21 Total Budget '22
Brownfields Economic Development Initiative 11,864 12,794 25,000 25,000
CDBG 15,614,172 14,540,565 20,701,283 20,004,013 CDBG - COVID-19 Response 0 1,000,000 10,000,000 20,039,341
Choice Neighborhood Implementation Grant 49,500 522,915 125,450 463,500
Continuum of Care 24,833,357 24,209,624 32,097,760 40,042,069 Emergency Rental Assistance 0 0 10,000,000 10,000,000
Emergency Solutions Grant 1,790,091 982,159 1,506,611 1,503,828
Emergency Solutions Grant - COVID-19 Response
0 0 6,506,611 13,590,618
EPA/Brownfields 75,590 84,611 0 0 HOME 9,029,140 3,174,726 6,880,736 7,455,880 HOPWA 3,350,033 1,573,915 3,089,166 3,092,506 HOPWA - COVID-19 0 0 3,538,728 0

240 Housing & Neighborhood DevelopmentNeighborhood Development
Response
Inclusionary Development Fund 19,413,957 17,622,974 20,150,540 20,180,000
Lead Paint Abatement 1,143,291 1,021,223 1,354,128 1,474,643
Neighborhood Development Fund 237,239 393,621 67,025 63,525
Regional Foreclosure Education Grant (COM) 2,923,327 2,644,998 191,357 152,651
Section 108 (Emp Zone) 0 821,427 0 0
Youth Homelessness Demonstration Program 0 366,729 2,359,050 0
Total 78,471,560 68,972,279 118,593,445 138,087,574
Operating Budget Actual '19 Actual '20 Approp '21 Budget '22
Personnel Services 3,595,118 3,815,103 4,159,825 4,233,052 Non Personnel 10,608,614 16,649,258 24,928,525 31,039,611 Total 14,203,732 20,464,362 29,088,350 35,272,663

Housing & Neighborhood DevelopmentNeighborhood Development 241
Neighborhood Development Operating Budget
Authorizing Statutes Enabling Legislation, 1961 Mass. Acts ch.
642, §§ 1-3. Sale of Certain Surplus Property, 1982
Mass. Acts ch. 190, § 24; 1986 Mass. Acts ch. 701, § 4.
Design Services, M.G.L.A. c. 7, § 38A 1/2. Public Works Construction, M.G.L.A. c.
30, § 39M. Building Construction, M.G.L.A. c. 149, §§
44A-44J. Municipal Participation in
Condominiums, M.G.L.A. c. 183A, § 20. Boston Urban Homestead Program, CBC
Ord. §§ 8-2.1-8-2.8. Code Enforcement, M.G.L.A. c.40, § 21d;
M.G.L.A. c. 270, § 16. Transfers of Property to Boston
Redevelopment Authority, CBC St. 11 §§ 251, 255.
Committee on Foreclosed Real Estate; Powers, CBC Ord. §§ 11-7.1-11-7.2; CBC
St. 11 §§ 251, 255.
1994 Mass. Acts ch. 282; CBC Ord. § 10-2.1.
Description of Services The Department provides services and assistance through a wide variety of programs that are designed to improve the current housing stock of existing homeowners, promote homeownership, develop and preserve affordable housing, and dispose of City-owned tax foreclosed and surplus property in a responsible manner.
Public Facilities Commission
Chief of Housing and Director
Administration & Finance
Policy Development &
Research
Real Estate Management
& Sales
Boston Home Center
Supportive Housing
Housing Development & Services
Neighborhood Housing
Development
Office of Housing Stability
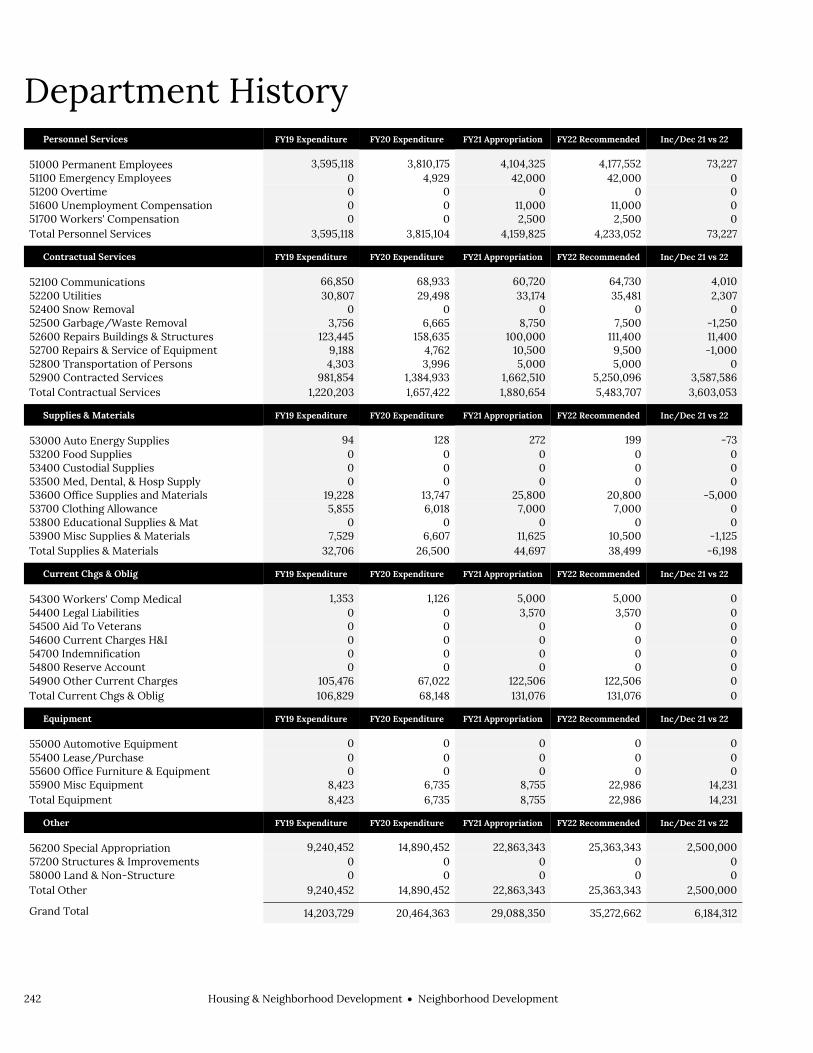
242 Housing & Neighborhood DevelopmentNeighborhood Development
Department History Personnel Services FY19 Expenditure FY20 Expenditure FY21 Appropriation FY22 Recommended Inc/Dec 21 vs 22
51000 Permanent Employees 3,595,118 3,810,175 4,104,325 4,177,552 73,227 51100 Emergency Employees 0 4,929 42,000 42,000 0 51200 Overtime 0 0 0 0 0 51600 Unemployment Compensation 0 0 11,000 11,000 0 51700 Workers' Compensation 0 0 2,500 2,500 0 Total Personnel Services 3,595,118 3,815,104 4,159,825 4,233,052 73,227
Contractual Services FY19 Expenditure FY20 Expenditure FY21 Appropriation FY22 Recommended Inc/Dec 21 vs 22
52100 Communications 66,850 68,933 60,720 64,730 4,010 52200 Utilities 30,807 29,498 33,174 35,481 2,307 52400 Snow Removal 0 0 0 0 0 52500 Garbage/Waste Removal 3,756 6,665 8,750 7,500 -1,250 52600 Repairs Buildings & Structures 123,445 158,635 100,000 111,400 11,400 52700 Repairs & Service of Equipment 9,188 4,762 10,500 9,500 -1,000 52800 Transportation of Persons 4,303 3,996 5,000 5,000 0 52900 Contracted Services 981,854 1,384,933 1,662,510 5,250,096 3,587,586 Total Contractual Services 1,220,203 1,657,422 1,880,654 5,483,707 3,603,053
Supplies & Materials FY19 Expenditure FY20 Expenditure FY21 Appropriation FY22 Recommended Inc/Dec 21 vs 22
53000 Auto Energy Supplies 94 128 272 199 -73 53200 Food Supplies 0 0 0 0 0 53400 Custodial Supplies 0 0 0 0 0 53500 Med, Dental, & Hosp Supply 0 0 0 0 0 53600 Office Supplies and Materials 19,228 13,747 25,800 20,800 -5,000 53700 Clothing Allowance 5,855 6,018 7,000 7,000 0 53800 Educational Supplies & Mat 0 0 0 0 0 53900 Misc Supplies & Materials 7,529 6,607 11,625 10,500 -1,125 Total Supplies & Materials 32,706 26,500 44,697 38,499 -6,198
Current Chgs & Oblig FY19 Expenditure FY20 Expenditure FY21 Appropriation FY22 Recommended Inc/Dec 21 vs 22
54300 Workers' Comp Medical 1,353 1,126 5,000 5,000 0 54400 Legal Liabilities 0 0 3,570 3,570 0 54500 Aid To Veterans 0 0 0 0 0 54600 Current Charges H&I 0 0 0 0 0 54700 Indemnification 0 0 0 0 0 54800 Reserve Account 0 0 0 0 0 54900 Other Current Charges 105,476 67,022 122,506 122,506 0 Total Current Chgs & Oblig 106,829 68,148 131,076 131,076 0
Equipment FY19 Expenditure FY20 Expenditure FY21 Appropriation FY22 Recommended Inc/Dec 21 vs 22
55000 Automotive Equipment 0 0 0 0 0 55400 Lease/Purchase 0 0 0 0 0 55600 Office Furniture & Equipment 0 0 0 0 0 55900 Misc Equipment 8,423 6,735 8,755 22,986 14,231 Total Equipment 8,423 6,735 8,755 22,986 14,231
Other FY19 Expenditure FY20 Expenditure FY21 Appropriation FY22 Recommended Inc/Dec 21 vs 22
56200 Special Appropriation 9,240,452 14,890,452 22,863,343 25,363,343 2,500,000 57200 Structures & Improvements 0 0 0 0 0 58000 Land & Non-Structure 0 0 0 0 0 Total Other 9,240,452 14,890,452 22,863,343 25,363,343 2,500,000
Grand Total 14,203,729 20,464,363 29,088,350 35,272,662 6,184,312

Housing & Neighborhood DevelopmentNeighborhood Development 243
Department Personnel
Title Union Code Grade Position FY22 Salary Title
Union Code Grade Position FY22 Salary
Accountant SU2 21 0.25 20,875 Finance Manager SU2 22 0.25 22,562 Accounting Manager SU2 22 0.25 22,562 Financial_Analyst SU2 19 0.25 17,871 Administ.Assist EXM 19 0.07 4,332 HMIS Administrator SU2 23 0.05 4,878 Archt SU2 21 0.10 8,350 Housing Crisis Case Coord SU2 21 2.00 148,075 Asset Manager SU2 21 0.25 20,531 Housing Development Officer SU2 22 1.98 175,442 Assistant Director EXM 26 5.10 520,713 Legal_Sec EXM 19 0.25 15,472 Assistant-Director EXM 26 0.35 37,508 Loan Monitor SU2 19 0.50 26,707 Assoc Deputy Director EXM 28 0.65 68,046 Manager Of Research & Dev SU2 23 0.25 24,388 Asst Dir for Compliance Loans EXM 26 0.25 26,791 Operations Manager EXM 25 2.45 237,906 Budget Manager SU2 22 0.25 21,546 Policy Advisor EXM 28 0.25 31,342
Business Analyst/Product Owner
SU2 22 0.25 20,262 Procurement Officer SU2 20 0.25 19,314
Communication Spec EXM 22 0.25 15,678 Prog Asst SU2 19 3.50 211,018 Compliance Monitor SU2 20 0.20 15,451 Program Manager SU2 21 4.30 342,704 Computer Specialist SU2 20 0.25 19,314 Project Manager SU2 22 1.00 90,249
Construction & Design Serv Manager SU2 24 0.10 10,545 Project Mngr SU2 21 2.40 196,001
Construction Manager SU2 23 0.40 39,020 Property Mgmt SU2 22 2.00 180,498 Construction Specialist II SU2 21 0.90 74,763 Reasearch & Development Anl SU2 21 0.25 20,875 Construction Supervisor SU1 21 0.80 63,769 Records Manager SU2 21 0.25 20,875 Construction Supervisor SU2 21 0.40 31,311 Senior Account Specialist SU2 21 0.25 20,875 Controller EXM 27 0.25 26,620 Spec Asst (DND) EXM 25 0.25 24,770 Deputy Director EXM 27 0.40 46,364 Special Assistant EXM 22 0.25 19,576 Deputy Director EXM 29 2.75 366,273 Sr Budget Manager SU2 24 0.25 26,362 Dir of Asset & Prog Strategy EXM 29 0.40 54,239 Sr Communications Spec EXM 24 0.25 16,090 Dirctr CDH NG 1.00 166,456 Sr Compliance Officer SU2 22 0.20 17,983 Director of Legal Unit EXM 28 0.25 31,342 Sr Developer SU2 24 0.25 26,362 Director of Marketing EXM 28 0.25 31,342 Sr Housing Develop Officer SU2 24 0.50 51,169 Director of Operations EXM 29 1.00 123,761 Sr Program Manager SU2 23 0.75 72,158 Dir-Public/Media Relations EXM 28 1.00 125,368 Sr Project Manager SU2 23 1.00 97,550
Sr Project Manager (DND) SU2 24 1.00 105,449
Total 46 4,277,653 Adjustments Differential Payments 0 Other 24,900 Chargebacks 0 Salary Savings -125,000 FY22 Total Request 4,177,553

244 Housing & Neighborhood DevelopmentNeighborhood Development
External Funds History Personnel Services FY19 Expenditure FY20 Expenditure FY21 Appropriation FY22 Recommended Inc/Dec 21 vs 22
51000 Permanent Employees 7,575,434 7,771,758 7,856,642 7,928,578 71,937 51100 Emergency Employees 0 0 0 0 0 51200 Overtime 0 0 0 0 0 51300 Part Time Employees 0 0 0 0 0 51400 Health Insurance 1,004,161 1,084,360 1,123,381 1,098,261 -25,121 51500 Pension & Annuity 735,142 583,491 674,029 658,957 -15,072 51600 Unemployment Compensation 0 0 0 0 0 51700 Workers' Compensation 0 0 0 0 0 51800 Indirect Costs 0 0 0 0 0 51900 Medicare 91,253 92,496 108,593 106,165 -2,428 Total Personnel Services 9,405,991 9,532,105 9,762,645 9,791,961 29,316
Contractual Services FY19 Expenditure FY20 Expenditure FY21 Appropriation FY22 Recommended Inc/Dec 21 vs 22
52100 Communications 44,246 61,949 53,204 67,117 13,913 52200 Utilities 58,247 40,128 59,000 59,000 0 52400 Snow Removal 0 0 0 0 0 52500 Garbage/Waste Removal 1,310 0 5,264 5,750 486 52600 Repairs Buildings & Structures 17,721 36,369 141,153 153,653 12,500 52700 Repairs & Service of Equipment 6,370 3,297 23,675 24,000 325 52800 Transportation of Persons 54,919 30,422 64,130 57,895 -6,235 52900 Contracted Services 68,706,639 59,076,740 108,132,727 127,400,894 19,268,167 Total Contractual Services 68,889,451 59,248,904 108,479,153 127,768,309 19,289,156
Supplies & Materials FY19 Expenditure FY20 Expenditure FY21 Appropriation FY22 Recommended Inc/Dec 21 vs 22
53000 Auto Energy Supplies 51 0 0 5,000 5,000 53200 Food Supplies 0 0 0 0 0 53400 Custodial Supplies 745 0 1,250 1,250 0 53500 Med, Dental, & Hosp Supply 0 0 0 0 0 53600 Office Supplies and Materials 54,653 35,890 78,300 75,800 -2,500 53700 Clothing Allowance 14,645 14,482 13,903 14,381 478 53800 Educational Supplies & Mat 0 0 0 0 0 53900 Misc Supplies & Materials 9,024 8,981 19,400 19,400 0 Total Supplies & Materials 79,118 59,353 112,853 115,831 2,978
Current Chgs & Oblig FY19 Expenditure FY20 Expenditure FY21 Appropriation FY22 Recommended Inc/Dec 21 vs 22
54300 Workers' Comp Medical 0 0 5,000 5,000 0 54400 Legal Liabilities 0 0 0 0 0 54600 Current Charges H&I 0 0 0 0 0 54700 Indemnification 0 0 0 0 0 54800 Reserve Account 0 0 0 0 0 54900 Other Current Charges 69,871 95,381 137,530 325,209 187,679 Total Current Chgs & Oblig 69,871 95,381 142,530 330,209 187,679
Equipment FY19 Expenditure FY20 Expenditure FY21 Appropriation FY22 Recommended Inc/Dec 21 vs 22
55000 Automotive Equipment 0 0 0 0 0 55400 Lease/Purchase 0 0 0 0 0 55600 Office Furniture & Equipment 1,848 4,092 25,000 25,000 0 55900 Misc Equipment 25,281 32,443 71,264 56,264 -15,000 Total Equipment 27,129 36,535 96,264 81,264 -15,000
Other FY19 Expenditure FY20 Expenditure FY21 Appropriation FY22 Recommended Inc/Dec 21 vs 22
56200 Special Appropriation 0 0 0 0 0 57200 Structures & Improvements 0 0 0 0 0 58000 Land & Non-Structure 0 0 0 0 0 Total Other 0 0 0 0 0
Grand Total 78,471,568 68,972,279 118,593,445 138,087,574 19,494,129

Housing & Neighborhood DevelopmentNeighborhood Development 245
External Funds Personnel
Title Union Code Grade Position FY22 Salary Title
Union Code Grade Position FY22 Salary
Accountant SU2 21 0.75 62,624 Finance Manager SU2 22 0.75 67,687 Accounting Manager SU2 22 0.75 67,687 Financial_Analyst SU2 19 0.75 53,613 Admin Asst EXM 19 0.93 57,554 HMIS Administrator SU2 23 0.95 92,673 Advisor to the Chief of DND EXM NG 1.00 70,192 Housing Crisis Case Coord SU2 21 2.00 141,700 Architect SU2 21 0.90 75,148 Housing Development Officer SU2 22 12.02 950,965 Asset Manager SU2 21 0.75 61,594 Legal_Sec EXM 19 0.75 46,415 Assistant Director EXM 26 5.90 623,949 Loan Monitor SU2 19 1.50 80,121 Assistant-Director EXM 26 1.65 176,822 Manager Of Research & Dev SU2 23 0.75 73,163 Assoc Deputy Director EXM 28 2.35 250,164 Operations Manager EXM 25 3.55 324,970 Asst Dir for Compliance Loans EXM 26 0.75 80,374 Policy Advisor EXM 28 0.75 94,026 Budget Manager SU2 22 0.75 64,639 Procurement Officer SU2 20 0.75 57,941
Business Analyst/Product Owner
SU2 22 0.75 60,786 Prog Asst SU2 19 3.50 237,037
Communication Spec EXM 22 0.75 47,034 Program Manager SU2 21 6.70 508,097 Compliance Monitor SU2 20 1.80 139,059 Project Mngr SU2 21 3.60 300,594 Computer Specialist SU2 20 0.75 57,941 Reasearch & Development Anl SU2 21 0.75 62,624
Construction & Design Serv Manager SU2 24 0.90 94,904 Records Manager SU2 21 0.75 62,624
Construction Manager SU2 23 1.60 156,081 Senior Account Specialist SU2 21 0.75 62,624 Construction Specialist II SU2 21 2.10 174,356 Spec Asst (DND) EXM 25 0.75 74,309 Construction Supervisor SU1 21 3.20 255,077 Special Assistant EXM 22 0.75 58,729 Construction Supervisor SU2 21 1.60 125,245 Sr Budget Manager SU2 24 0.75 79,087 Controller EXM 27 0.75 79,859 Sr Communications Spec EXM 24 0.75 48,271 Deputy Director EXM 27 0.40 46,364 Sr Compliance Officer SU2 22 1.80 161,845 Deputy Director EXM 29 4.25 556,426 Sr Developer SU2 24 0.75 79,087 Dir of Asset & Prog Strategy EXM 29 0.60 81,359 Sr Housing Develop Officer SU2 24 4.50 465,709 Director of Legal Unit EXM 28 0.75 94,026 Sr Program Manager SU2 23 3.25 293,828 Director of Marketing EXM 28 0.75 94,026 Sr Project Manager SU2 23 1.00 97,550 Total 92 8,228,579 Adjustments Differential Payments 0 Other 0 Chargebacks 0 Salary Savings -300,000 FY22 Total Request 7,928,579

246 Housing & Neighborhood DevelopmentNeighborhood Development
Program 1. Administration Rick Wilson, Deputy Director, Organization 188100
Program Description The Administration Program enforces Department policies and procedures and provides support services to all Neighborhood Development programs to ensure the effective completion of departmental goals in compliance with City, State and Federal laws and regulations.
Operating Budget Actual '19 Actual '20 Approp '21 Budget '22
Personnel Services 1,353,829 1,382,499 1,493,753 1,499,892 Non Personnel 376,002 308,281 387,082 351,918 Total 1,729,831 1,690,779 1,880,835 1,851,810
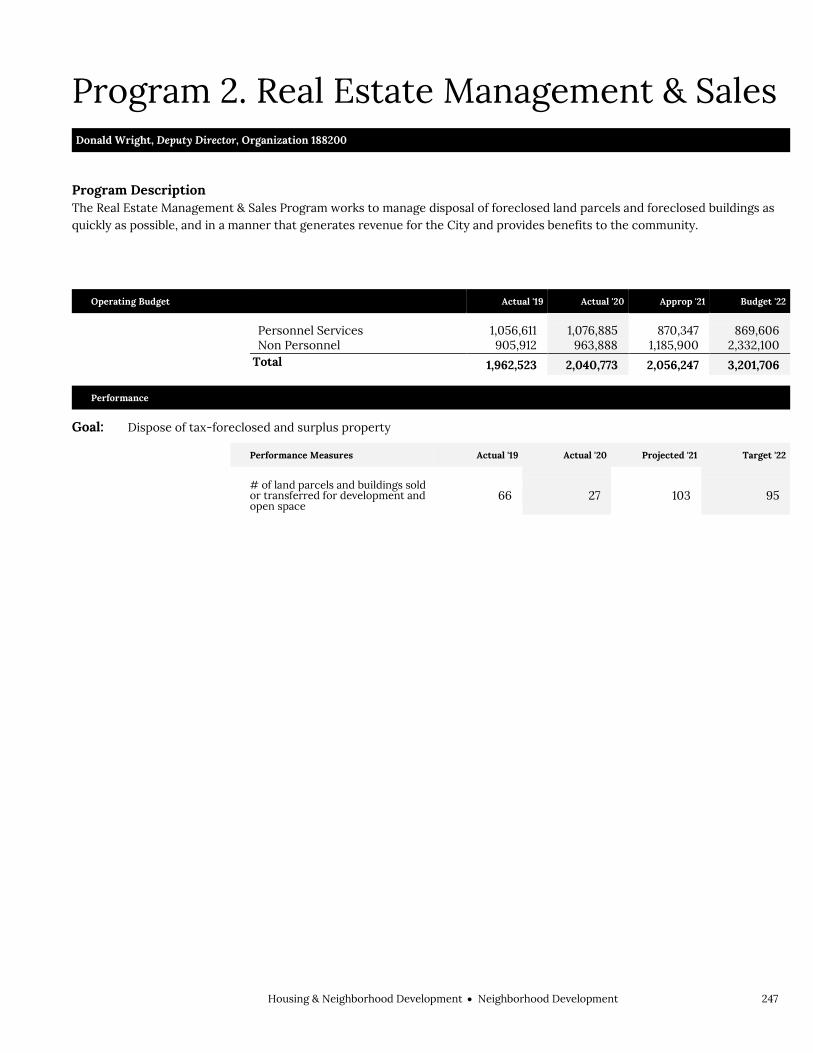
Housing & Neighborhood DevelopmentNeighborhood Development 247
Program 2. Real Estate Management & Sales Donald Wright, Deputy Director, Organization 188200
Program Description The Real Estate Management & Sales Program works to manage disposal of foreclosed land parcels and foreclosed buildings as quickly as possible, and in a manner that generates revenue for the City and provides benefits to the community.
Operating Budget Actual '19 Actual '20 Approp '21 Budget '22
Personnel Services 1,056,611 1,076,885 870,347 869,606 Non Personnel 905,912 963,888 1,185,900 2,332,100 Total 1,962,523 2,040,773 2,056,247 3,201,706
Performance
Goal: Dispose of tax-foreclosed and surplus property
Performance Measures Actual '19 Actual '20 Projected '21 Target '22
# of land parcels and buildings sold or transferred for development and open space
66 27 103 95

248 Housing & Neighborhood DevelopmentNeighborhood Development
Program 3. Housing Development & Services M. Flynn, L. Bernstein, J. Boatright, D. Williams, Deputy Directors, Organization 188300
Program Description DND's Housing Development and Services programs support a wide range of housing creation and support activities that strive to make Boston the most livable city in the nation. This is accomplished through the work of the Boston Home Center (BHC), Neighborhood Housing Development (NHD), and the Supportive Housing (SH) divisions. BHC is designed to help Boston residents obtain, retain, and improve their homes. NHD works with non-profit and for-profit partners to develop and preserve affordable housing. SH provides funding for housing and supportive services for Boston’s homeless and those at risk of homelessness. In 2014, the City announced the Boston 2030 plan which outlines a new comprehensive approach to accommodating Boston's complex housing needs over the next 15 years. Funding committed for the new plan has been renamed the “Housing 2030 Fund” which is included in this program.
Operating Budget Actual '19 Actual '20 Approp '21 Budget '22
Personnel Services 1,184,678 1,355,720 1,795,725 1,863,553 Non Personnel 9,326,698 15,377,091 23,355,543 28,355,593 Total 10,511,376 16,732,811 25,151,268 30,219,146
Performance
Goal: Assist existing homeowners in retaining their homes
Performance Measures Actual '19 Actual '20 Projected '21 Target '22
# of homeowners assisted with foreclosure prevention counseling 226 187 150 230
Goal: Assist tenants and landlords to preserve their tenancies
Performance Measures Actual '19 Actual '20 Projected '21 Target '22
# of housing-insecure households placed in permanent housing 456 243 150 325
# of potential evictions averted 680 663 850 850
Goal: Ensure growth and affordability in Boston's Housing Market
Performance Measures Actual '19 Actual '20 Projected '21 Target '22
# of low income housing units permitted (Deed restricted and IDP) 254 207 533 542
# of middle income housing units permitted (Deed restricted and market)
882 1,460 1,542 1,485
Total # of net new housing units permitted 2,387 3,599 3,304 3,303
Goal: Foster Homeownership in Boston Neighborhoods
Performance Measures Actual '19 Actual '20 Projected '21 Target '22
# of homebuyers assisted with down 81 55 95 191

Housing & Neighborhood DevelopmentNeighborhood Development 249
payment assistance
Goal: Help Homeowners Improve their Homes and Communities
Performance Measures Actual '19 Actual '20 Projected '21 Target '22
# of homeowners assisted through the home repair and rehab program 1,084 830 653 653
Goal: Provide assistance towards ending homelessness in Boston
Performance Measures Actual '19 Actual '20 Projected '21 Target '22
# of homeless individuals placed in permanent housing 1,202 1,414 840 1,000
# of homeless veterans placed in permanent housing 265 219 166 200

250 Housing & Neighborhood DevelopmentNeighborhood Development
External Funds Projects Brownfields Economic Development Initiative
Project Mission The purpose of the Brownfields Economic Development Initiative (BEDI) is to spur the return of Brownfields to productive economic use through financial assistance to public entities and enhance the security or improve the viability of a project financed with Section 108 guaranteed loan authority. BEDI grants must be used in conjunction with a new Section 108 guaranteed loan commitment. The most recent BEDI grant was used to promote the remediation and redevelopment of the former Modern Electroplating Brownfields site, with a portion of the funding being used to pay environmental monitoring at the Dudley Police Station.
Choice Neighborhoods Implementation Grant
Project Mission The Choice Neighborhood Implementation Grant is a competitive grant from the U.S. Department of Housing and Urban Development. The $30 million grant was awarded to the Boston Housing Authority (BHA) for the redevelopment of the Whittier Street public housing development. With DND as the lead, several City of Boston departments are responsible for administering the $4 million neighborhood improvements portion of the grant, which includes road improvements, open space projects, art projects, first-time homebuyer assistance, business assistance, and educational assistance. The grant started on 8/15/17 and ends on 9/30/23.
Community Development Block Grant
Project Mission The Community Development Block Grant (CDBG) is an annual entitlement grant from the U.S. Department of Housing and Urban Development (HUD) to the City of Boston designed to fund a variety of neighborhood development activities. At least 70 percent of CDBG funds must be used to benefit low- and moderate-income households. CDBG funds are used to produce and preserve affordable housing, revitalize neighborhood commercial districts, assist the renovation of non-profit facilities, improve vacant lots, promote and monitor fair housing activities, and assist non-profit organizations in the operation of emergency shelters, and workforce development programs. CDBG funds cannot be used for general government services or to replace funding cuts from existing public service activities. The CDBG awards for FY18, FY19 and FY20 were $15,761,309, $17,229,498 and $17,146,361 respectively. The FY21 award was $17,434,907 and the FY22 award is $17,421,783.
Community Development Block Grant - CV
Project Mission In FY20, DND received a one-time award of CDBG funds as part of the Coronavirus Aid, Relief, and Economic Security (CARES) Act. The award was for $20,039,341, and will be used for rent relief in order to prevent widespread displacement. The grant started on 3/1/2020 and ends on 2/28/2022.
Continuum of Care
Project Mission The Continuum of Care (CoC) program combines the previously standalone Supportive Housing and Shelter Plus Care programs into one annual competitive grant program from the US Department of Housing and Urban Development (HUD). The purpose of the program is to assist individuals and families experiencing homelessness and to provide the services needed to help such individuals move into transitional and permanent housing, with the goal of long term stability. Specifically, the program helps develop housing and related supportive services for people moving from homelessness to independent living. The program provides rental assistance that, when combined with social services, provides supportive housing for homeless people with disabilities and their families. The CoC awards for FY18, FY19 and FY20 were $24,583,209, $26,368,398 and $29,021,101 respectively. The FY21 award was $31,661,917 and the FY22 award is $38,685,686.

Housing & Neighborhood DevelopmentNeighborhood Development 251
Emergency Solutions Grant
Project Mission The Emergency Solutions Grant (ESG) is an annual entitlement grant to the City of Boston from the U.S. Department of Housing and Urban Development. It is used to assist individuals and families to quickly regain stability in permanent housing after experiencing a crisis or homelessness. The ESG awards for FY18, FY19, FY20 were $2,014,377, $1,418,872 and $1,461,960 respectively. The FY21 award is $1,506,611 and the FY22 awards is $1,487,124.
Emergency Solutions Grant – CV
Project Mission
In FY20, DND received a one-time award of ESG funds as part of the Coronavirus Aid, Relief, and Economic Security
(CARES) Act. The award was for $28,543,879 and will be used to support homeless shelters and services. The grant
started on 3/1/2020 and ends on 9/30/2022.
Emergency Rental Assistance
Project Mission This grant was awarded to the City of Boston through the 2020 Coronavirus Relief Fund. The start date is retroactive to 3/13/20 and the grant ends on 12/31/21. As required, the funding will be used to provide rent relief to households adversely affected by the COVID-19 pandemic. The award was for $20,670,810.
EPA/Brownfields
Project Mission The U.S. Environmental Protection Agency makes Brownfield Assessment and Clean-up grants available on a competitive basis. These grants are used to evaluate and/or clean-up contamination at EPA-eligible Brownfield sites. Brownfields are defined as real property, expansion, redevelopment, or re-use of which may be complicated by the presence or the potential presence of a hazardous substance, pollutant, or contaminant. Assessment grant funds were used to assess environmental conditions on parcels abutting or near the Fairmount-Indigo Commuter Rail line. The EPA is expected to issue an RFP for a new grant in the third quarter of FY21.
Home Investment Partnership (HOME)
Project Mission The HOME Partnership Program is an annual entitlement grant from the U.S. Department of Housing and Urban Development (HUD) to the City of Boston to support the development of affordable housing. Eligible activities include new construction or rehabilitation of housing, tenant-based rental assistance for up to two years, and assistance to first-time homebuyers. All HOME funds must be used to benefit low and moderate income households. Fifteen percent of HOME funds are set aside for Community Housing Development Organizations. HOME grants are four years in duration. The HOME awards in FY19, and FY20 were $5,863,642, and $5,336,980, respectively. The FY21 award was $5,871,574, and the FY22 award is $5,959,142.

252 Housing & Neighborhood DevelopmentNeighborhood Development
HOPWA
Project Mission The Housing Opportunities for People with AIDS (HOPWA) Program is a three-year grant awarded annually from the U.S. Department of Housing and Urban Development to the City of Boston. The program is designed to provide affordable, appropriate housing for people with AIDS (PWAs) in the metropolitan Boston area. Eligible activities include housing, counseling, housing development, rental assistance, technical assistance, homelessness prevention, operating costs including support services, and housing-related costs. DND will be directing these funds to three primary activities: metropolitan-area housing counseling to help PWAs find/retain affordable housing, technical assistance to developers of housing for PWAs, and emergency assistance payments to help PWAs retain their existing housing. The HOPWA awards in FY18, FY19, and FY20 were $2,285,329, $2,588,781 and $2,894,494 respectively. The FY21 award was $3,089,167, and the FY22 award is $3,248,220.
HOPWA - CV
Project Mission In FY20, DND received a one-time award of HOPWA funds as part of the Coronavirus Aid, Relief, and Economic Security (CARES) Act. The award was for $449,562 and will be used to support homelessness prevention and supportive services programs for Persons with HIV/AIds affected by the pandemic. The grant started on 3/1/2020 and ends on 2/28/2022.
Inclusionary Development Fund
Project Mission The Inclusionary Development (IDP) fund is managed jointly by the Boston Redevelopment Authority and the Department of Neighborhood Development. The fund is capitalized through fees paid by private developers in lieu of building onsite inclusionary affordable housing. IDP is used to fund the department’s affordable housing production pipeline.
Lead Paint Abatement
Project Mission The Lead Paint Abatement grant is a competitive 42-month grant from the U.S. Department of Housing and Urban Development’s Office of Healthy Homes and Lead Hazard Control to the City of Boston. The purpose of the grant is to reduce the exposure of young children to lead-based paint hazards in their homes through intensive services consisting of counseling, outreach and abatement in the high-risk target areas of Dorchester, Roxbury and Mattapan and to provide financing services citywide. Activities include abatement, inspections, risk assessments, and temporary relocations. The grant awarded in FY20 totals $4,342,674 and started on 12/1/19.
Neighborhood Development Fund
Project Mission The Neighborhood Development Fund receives revenue from the repayment of Urban Development Action Grant (UDAG) loans to the City. Funds can be used for eligible HUD Title I activities which are somewhat less restrictive than CDBG regulations.
Regional Foreclosure Education Grant (COM)
Project Mission The Regional Foreclosure Education grant from the Commonwealth of Massachusetts supported the expansion of foreclosure counseling providers under contract with the City of Boston. These providers served geographic areas of Boston with high rates of default and foreclosures targeting occupants of 1-4 unit properties.
Housing & Neighborhood DevelopmentNeighborhood Development 253
Section 108 Loan Guarantee Programs/Section 108 Unrestricted
Project Mission Section 108 funds are available to eligible cities from the U.S. Department of Housing and Urban Development (HUD) on an application basis. Section 108 funds are secured by the City through a pledge of its current and future CDBG grant awards. These funds are used for economic development projects. The Boston Invests in Growth Loan Fund is a $40 million HUD Section 108 funded loan pool designed to jumpstart well-financed construction projects, create jobs, and strengthen Boston’s economy. This program is designed for large commercial projects in Boston that have both permanent financing and equity in place. Boston Invests will finance the gap that remains between the financing and equity and the total project cost, known as mezzanine financing. In addition, up to 10% of the loan pool will be set aside for smaller neighborhood based projects of at least 5,000 square feet, the underwriting criteria for which will be the same as for the larger loans but the interest rate charged as well as the additional interest paid at the end will be lower. Additionally, $2.5 million HUD Section 108 funded loan pool will be used for energy efficiency and to promote job creation. The Section 108 Spread Unrestricted Fund is income earned as a result of the interest spread between Section 108 loan repayments owed to DND by its borrowers and Section 108 repayments DND owes to HUD.
Youth Homelessness Demonstration Program Grant
Project Mission To help end youth homelessness in Boston, the U.S. Department of Housing and Urban Development (HUD) has awarded $4.92 million through its Youth Homelessness Demonstration Program (YHDP). This project will support a wide range of housing programs including rapid rehousing, permanent supportive housing, transitional housing, and host homes. The start date of this two-year grant was 10/1/2019.
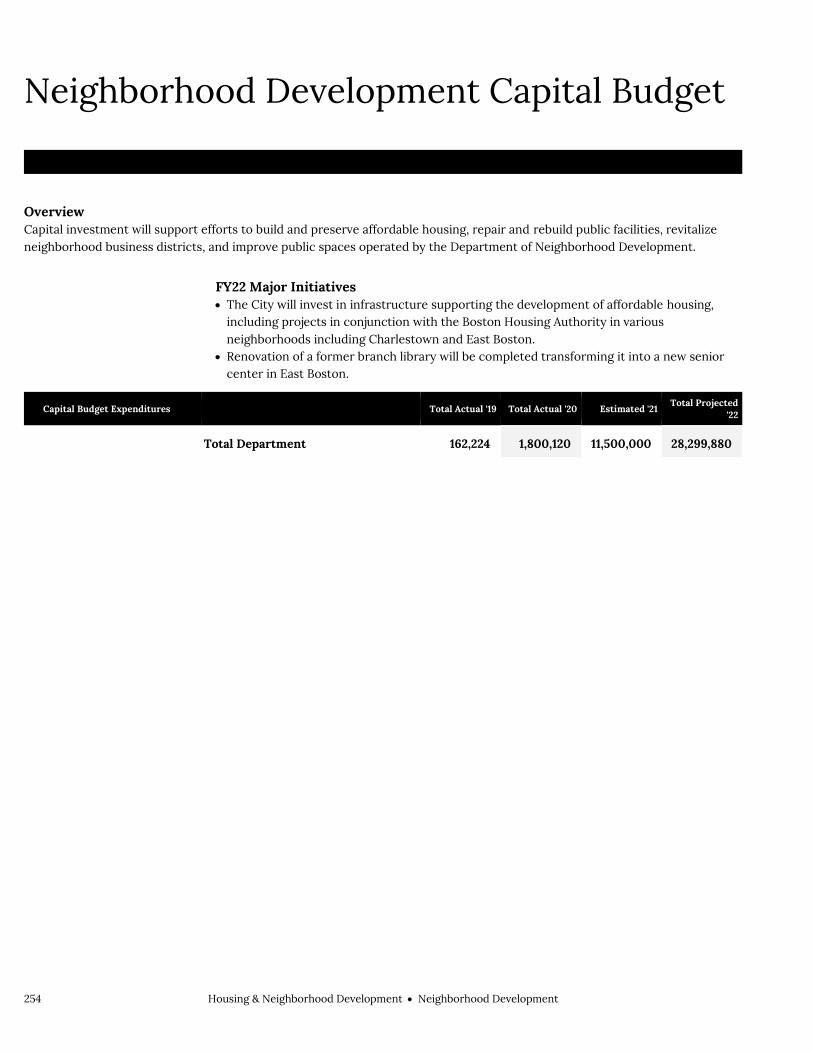
254 Housing & Neighborhood DevelopmentNeighborhood Development
Neighborhood Development Capital Budget Housing & Neighborhood Development Neighborhood Development
Overview Capital investment will support efforts to build and preserve affordable housing, repair and rebuild public facilities, revitalize neighborhood business districts, and improve public spaces operated by the Department of Neighborhood Development.
FY22 Major Initiatives The City will invest in infrastructure supporting the development of affordable housing,
including projects in conjunction with the Boston Housing Authority in various neighborhoods including Charlestown and East Boston.
Renovation of a former branch library will be completed transforming it into a new senior center in East Boston.
Capital Budget Expenditures Total Actual '19 Total Actual '20 Estimated '21 Total Projected
'22
Total Department 162,224 1,800,120 11,500,000 28,299,880
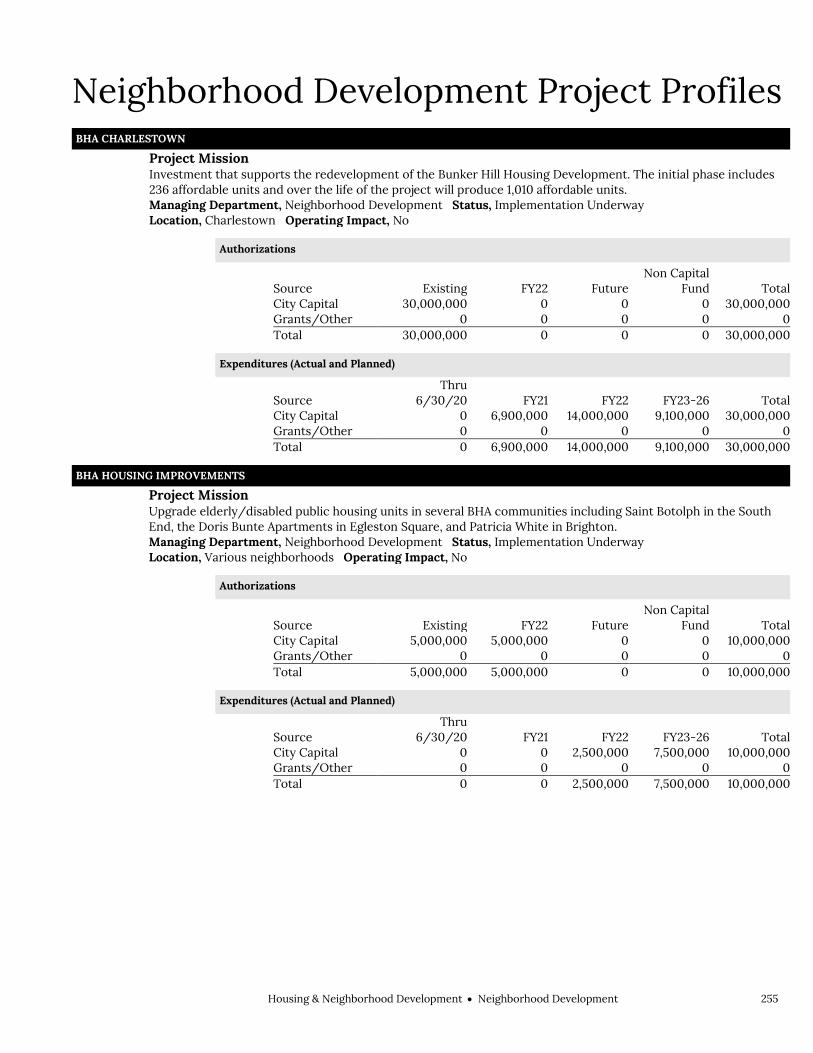
Housing & Neighborhood DevelopmentNeighborhood Development 255
Neighborhood Development Project Profiles BHA CHARLESTOWN
Project Mission Investment that supports the redevelopment of the Bunker Hill Housing Development. The initial phase includes
236 affordable units and over the life of the project will produce 1,010 affordable units.
Managing Department, Neighborhood Development Status, Implementation Underway Location, Charlestown Operating Impact, No
Authorizations
Source Existing FY22 Future Non Capital
Fund Total City Capital 30,000,000 0 0 0 30,000,000 Grants/Other 0 0 0 0 0 Total 30,000,000 0 0 0 30,000,000
Expenditures (Actual and Planned)
Source Thru
6/30/20 FY21 FY22 FY23-26 Total City Capital 0 6,900,000 14,000,000 9,100,000 30,000,000 Grants/Other 0 0 0 0 0 Total 0 6,900,000 14,000,000 9,100,000 30,000,000
BHA HOUSING IMPROVEMENTS Project Mission Upgrade elderly/disabled public housing units in several BHA communities including Saint Botolph in the South
End, the Doris Bunte Apartments in Egleston Square, and Patricia White in Brighton.
Managing Department, Neighborhood Development Status, Implementation Underway Location, Various neighborhoods Operating Impact, No
Authorizations
Source Existing FY22 Future Non Capital
Fund Total City Capital 5,000,000 5,000,000 0 0 10,000,000 Grants/Other 0 0 0 0 0 Total 5,000,000 5,000,000 0 0 10,000,000
Expenditures (Actual and Planned)
Source Thru
6/30/20 FY21 FY22 FY23-26 Total City Capital 0 0 2,500,000 7,500,000 10,000,000 Grants/Other 0 0 0 0 0 Total 0 0 2,500,000 7,500,000 10,000,000

256 Housing & Neighborhood DevelopmentNeighborhood Development
Neighborhood Development Project Profiles BHA ORIENT HEIGHTS
Project Mission City funding for Phase 3 consisting of 119 units of housing, gateway park, and community center. Managing Department, Neighborhood Development Status, New Project Location, East Boston Operating Impact, No
Authorizations
Source Existing FY22 Future Non Capital
Fund Total City Capital 0 19,000,000 0 0 19,000,000 Grants/Other 0 0 0 0 0 Total 0 19,000,000 0 0 19,000,000
Expenditures (Actual and Planned)
Source Thru
6/30/20 FY21 FY22 FY23-26 Total City Capital 0 0 9,500,000 9,500,000 19,000,000 Grants/Other 0 0 0 0 0 Total 0 0 9,500,000 9,500,000 19,000,000
HOUSING INFRASTRUCTURE FUND Project Mission Investment in infrastructure to support affordable housing development. Managing Department, Neighborhood Development Status, To Be Scheduled Location, Various neighborhoods Operating Impact, No
Authorizations
Source Existing FY22 Future Non Capital
Fund Total City Capital 5,000,000 0 0 0 5,000,000 Grants/Other 0 0 0 0 0 Total 5,000,000 0 0 0 5,000,000
Expenditures (Actual and Planned)
Source Thru
6/30/20 FY21 FY22 FY23-26 Total City Capital 0 100,000 500,000 4,400,000 5,000,000 Grants/Other 0 0 0 0 0 Total 0 100,000 500,000 4,400,000 5,000,000

Housing & Neighborhood DevelopmentNeighborhood Development 257
Neighborhood Development Project Profiles ORIENT HEIGHTS SENIOR CENTER
Project Mission Convert the former Orient Heights Branch Library into a new senior center. Managing Department, Public Facilities Department Status, In Construction Location, East Boston Operating Impact, No
Authorizations
Source Existing FY22 Future Non Capital
Fund Total City Capital 5,600,000 0 0 0 5,600,000 Grants/Other 0 0 0 0 0 Total 5,600,000 0 0 0 5,600,000
Expenditures (Actual and Planned)
Source Thru
6/30/20 FY21 FY22 FY23-26 Total City Capital 300,120 3,500,000 1,799,880 0 5,600,000 Grants/Other 0 0 0 0 0 Total 300,120 3,500,000 1,799,880 0 5,600,000

258 Housing & Neighborhood DevelopmentNeighborhood Development

Information & TechnologyCabinet 259
Information & Technology Information & Technology Cabinet
Information & Technology ................................................ 261
Department of Innovation & Technology ............. 263
DoIT Operations ............................................. 270
Enterprise Applications .................................. 271
Digital Engagement & Services .................... 272
Core Infrastructure ........................................ 273
Data & Analytics .............................................. 274
Broadband & Digital Equity .......................... 275

260 Information & TechnologyCabinet
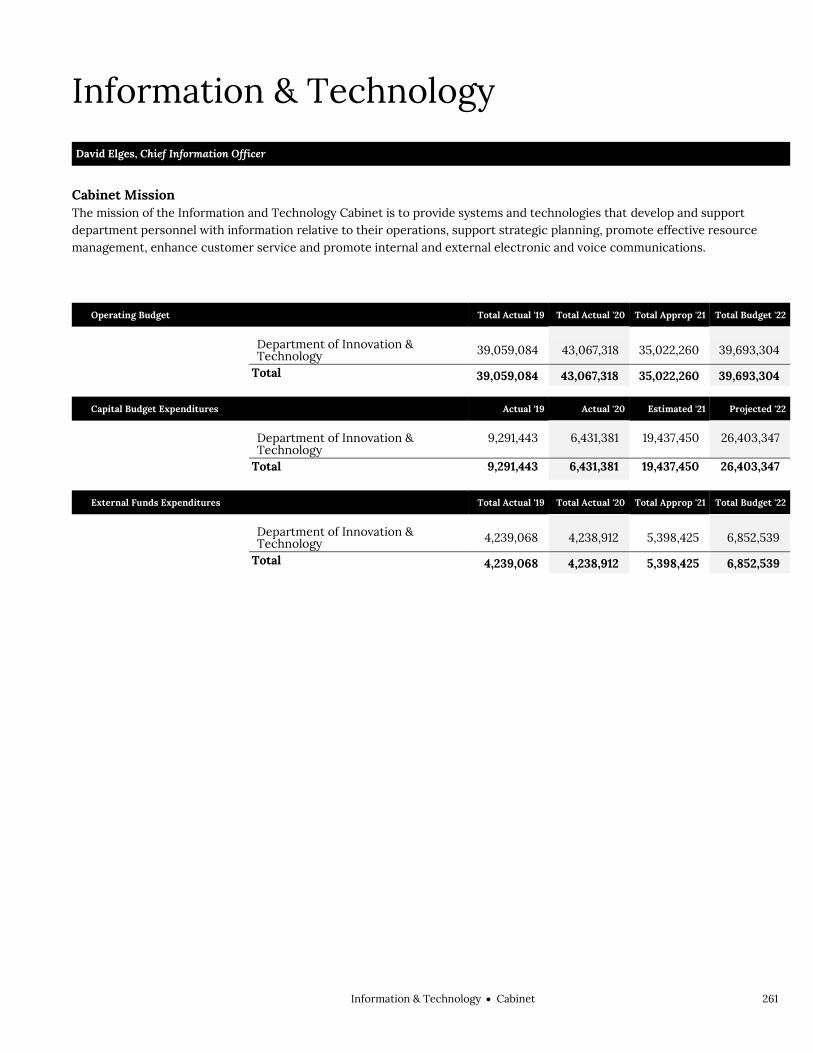
Information & TechnologyCabinet 261
Information & Technology Information & Technology
David Elges, Chief Information Officer
Cabinet Mission The mission of the Information and Technology Cabinet is to provide systems and technologies that develop and support department personnel with information relative to their operations, support strategic planning, promote effective resource management, enhance customer service and promote internal and external electronic and voice communications.
Operating Budget
Total Actual '19 Total Actual '20 Total Approp '21 Total Budget '22
Department of Innovation & Technology 39,059,084 43,067,318 35,022,260 39,693,304
Total 39,059,084 43,067,318 35,022,260 39,693,304
Capital Budget Expenditures Actual '19 Actual '20 Estimated '21 Projected '22
Department of Innovation & Technology
9,291,443 6,431,381 19,437,450 26,403,347
Total 9,291,443 6,431,381 19,437,450 26,403,347
External Funds Expenditures
Total Actual '19 Total Actual '20 Total Approp '21 Total Budget '22
Department of Innovation & Technology 4,239,068 4,238,912 5,398,425 6,852,539
Total 4,239,068 4,238,912 5,398,425 6,852,539

262 Information & TechnologyCabinet

Information & TechnologyDepartment of Innovation & Technology 263
Department of Innovation & Technology Operating Budget Information & Technology Department of Innovation & Technology David Elges, Chief Information Officer, Appropriation 149000
Department Mission The Department of Innovation and Technology is the City’s enterprise wide technology services organization providing solutions that enable our business partners across all City departments. DoIT’s primary day-to-day responsibility is to ensure that the networks, desktop computers, e-mail systems, and applications that support the business of City government are continuously available and operating effectively. DoIT embraces its responsibility to help manage costs through difficult financial times by continuously improving the cost structure of the City’s technology without compromising service. Our commitment to being environmentally responsible is often synergistic with these economic and service responsibilities.
Selected Performance Goals Enterprise Applications
Increase productivity through high-quality IT support. Digital Engagement & Services
Ensure the city's digital services are accessible to all residents. Promote engagement between city and residents. Core Infrastructure
Enhance cyber security. Increase productivity through high-quality IT support. Data & Analytics
Provide consistent access to data. Broadband & Digital Equity
Promote broadband adoption and decrease barriers to digital access.
Operating Budget Program Name Total Actual '19 Total Actual '20 Total Approp '21 Total Budget '22
DoIT Operations 5,499,262 4,892,533 4,251,053 5,730,844
Enterprise Applications 13,455,615 18,607,315 12,628,373 13,000,236
Digital Engagement & Services 1,772,336 1,480,100 1,244,852 1,745,352
Core Infrastructure 16,013,590 15,454,772 14,167,754 15,611,972
Data & Analytics 1,885,043 2,185,950 1,962,899 2,030,794
Broadband & Digital Equity 433,238 446,648 767,329 1,574,106
Total 39,059,084 43,067,318 35,022,260 39,693,304
External Funds Budget Fund Name Total Actual '19 Total Actual '20 Total Approp '21 Total Budget '22
21st Century Access Fund 4,179,586 4,179,586 4,200,000 4,400,000
BAIS Modernization 0 0 85,000 1,375,000
Digital Equity/Smart City 0 54,727 1,113,426 1,077,539
Human Capital Management (HCM) Upgrade 59,483 0 0 0
New Urban Mechanics 0 4,600 0 0
Total 4,239,069 4,238,913 5,398,426 6,852,539
Operating Budget Actual '19 Actual '20 Approp '21 Budget '22
Personnel Services 13,502,722 13,657,617 13,933,745 13,680,596 Non Personnel 25,556,362 29,409,701 21,088,515 26,012,708

264 Information & TechnologyDepartment of Innovation & Technology
Total 39,059,084 43,067,318 35,022,260 39,693,304

Information & TechnologyDepartment of Innovation & Technology 265
Department of Innovation & Technology Operating Budget
Description of Services The Department of Innovation and Technology (DoIT) improves the delivery of government services to the public through the effective management of the City’s existing and emerging technologies. DoIT introduces innovative technologies and processes designed to drive efficiency into government operations. DoIT also provides professional project management and business analysis services, in addition to maintaining the hardware and software platforms necessary to support the daily technical and communication operations of the City. Personnel skilled in programming, analysis, hardware and software support, training, communications, and general technology consulting work with user departments on enhancing and maintaining their information systems.
Chief Information Officer
Enterprise Operations
Digital Engagement &
Service
Core Infrastructure Data & AnalyticsOperations Broadband
& Digital Equity

266 Information & TechnologyDepartment of Innovation & Technology
Department History Personnel Services FY19 Expenditure FY20 Expenditure FY21 Appropriation FY22 Recommended Inc/Dec 21 vs 22
51000 Permanent Employees 13,154,123 13,321,482 13,665,604 13,412,458 -253,146 51100 Emergency Employees 28,487 6,001 50,141 50,138 -3 51200 Overtime 298,451 307,077 218,000 218,000 0 51600 Unemployment Compensation 12,048 23,057 0 0 0 51700 Workers' Compensation 9,613 0 0 0 0 Total Personnel Services 13,502,722 13,657,617 13,933,745 13,680,596 -253,149
Contractual Services FY19 Expenditure FY20 Expenditure FY21 Appropriation FY22 Recommended Inc/Dec 21 vs 22
52100 Communications 1,055,630 798,166 585,000 505,000 -80,000 52200 Utilities 0 0 0 0 0 52400 Snow Removal 0 0 0 0 0 52500 Garbage/Waste Removal 0 0 0 0 0 52600 Repairs Buildings & Structures 0 0 0 0 0 52700 Repairs & Service of Equipment 989,401 1,755,603 2,044,290 2,616,606 572,316 52800 Transportation of Persons 78,338 62,356 21,600 21,600 0 52900 Contracted Services 7,382,674 9,208,506 2,766,702 3,259,916 493,214 Total Contractual Services 9,506,043 11,824,631 5,417,592 6,403,122 985,530
Supplies & Materials FY19 Expenditure FY20 Expenditure FY21 Appropriation FY22 Recommended Inc/Dec 21 vs 22
53000 Auto Energy Supplies 0 0 0 0 0 53200 Food Supplies 0 0 0 0 0 53400 Custodial Supplies 0 0 0 0 0 53500 Med, Dental, & Hosp Supply 0 0 0 0 0 53600 Office Supplies and Materials 15,993 7,005 15,050 6,700 -8,350 53700 Clothing Allowance 1,750 2,250 1,750 2,000 250 53800 Educational Supplies & Mat 0 0 0 0 0 53900 Misc Supplies & Materials 23,357 42,041 25,000 33,000 8,000 Total Supplies & Materials 41,100 51,296 41,800 41,700 -100
Current Chgs & Oblig FY19 Expenditure FY20 Expenditure FY21 Appropriation FY22 Recommended Inc/Dec 21 vs 22
54300 Workers' Comp Medical 5,420 0 0 0 0 54400 Legal Liabilities 0 0 0 0 0 54500 Aid To Veterans 0 0 0 0 0 54600 Current Charges H&I 0 0 0 0 0 54700 Indemnification 0 0 0 0 0 54800 Reserve Account 0 0 0 0 0 54900 Other Current Charges 14,657,859 16,326,231 14,907,180 18,646,972 3,739,792 Total Current Chgs & Oblig 14,663,279 16,326,231 14,907,180 18,646,972 3,739,792
Equipment FY19 Expenditure FY20 Expenditure FY21 Appropriation FY22 Recommended Inc/Dec 21 vs 22
55000 Automotive Equipment 0 0 0 0 0 55400 Lease/Purchase 1,175,819 840,149 696,943 895,914 198,971 55600 Office Furniture & Equipment 0 0 0 0 0 55900 Misc Equipment 170,121 367,394 25,000 25,000 0 Total Equipment 1,345,940 1,207,543 721,943 920,914 198,971
Other FY19 Expenditure FY20 Expenditure FY21 Appropriation FY22 Recommended Inc/Dec 21 vs 22
56200 Special Appropriation 0 0 0 0 0 57200 Structures & Improvements 0 0 0 0 0 58000 Land & Non-Structure 0 0 0 0 0 Total Other 0 0 0 0 0
Grand Total 39,059,084 43,067,318 35,022,260 39,693,304 4,671,044

Information & TechnologyDepartment of Innovation & Technology 267
Department Personnel
Title Union Code Grade Position FY22 Salary Title
Union Code Grade Position FY22 Salary
Admin Asst (Election) SE1 06 1.00 62,529 DP Sys Anl SE1 06 19.00 1,478,096 Asst Manager-DataProcessing SE1 04 5.00 379,873 Exec Asst (Mgmt Info Svcs) EXM 14 1.00 149,334
Broadband Digital Equity Advocate
SE1 06 1.00 60,314 Exec.Assistant SE1 12 2.00 277,626
Chief Data Officer EXM 14 1.00 145,831 Executive Secretary SE1 06 1.00 90,319 Chief Digital Officer EXM 14 1.00 149,334 Head Clerk SU4 12 1.00 40,186
Chief Inform & Security Officer EXM NG 1.00 175,481 Management Analyst (Asd/Admin) SE1 06 1.00 66,218
Chief of Enterprise Application EXM 14 1.00 149,334 Mgmt_ Analyst SU4 15 1.00 70,871 Chief of Staff EXM 11 1.00 96,280 Prin Admin Assistant SE1 08 1.00 108,468 Chief Technology Officer EXM 14 1.00 149,334 Prin Data Proc Systems Analyst SE1 10 25.00 2,872,453
Data Proc Equip Tech (Mis/Dpu
SU4 15 6.00 382,348 Prin Dp Sys Anl-DP SE1 11 10.00 1,228,611
Data Proc Proj Mgr (Asn Svc) SE1 10 1.00 126,024 Prin Research Analyst SE1 06 1.00 90,319 Data Proc Sys Analyst I SE1 07 3.00 297,730 Principal Clerk SU4 10 1.00 49,843
Dep CTO (Chief Technology Offcr)
EXM 12 1.00 135,427 Sr Computer Operator SU4 13 1.00 58,286
Dir - Operations EXM 11 1.00 117,415 Sr Data Proc Sys Analyst SE1 08 48.00 4,598,133
Dir of Performance Management EXM 10 1.00 87,958 Sr Data Proc Sys Anl (Ads/Dpu) SE1 10 13.00 1,524,114
Director of MIS CDH NG 1.00 185,508 Sr Management Analyst EXM 08 1.00 73,198
Sr Programmer SU4 15 3.00 173,507
Total 157 15,650,302 Adjustments Differential Payments 0 Other 111,600 Chargebacks 0 Salary Savings -2,349,444 FY22 Total Request 13,412,458

268 Information & TechnologyDepartment of Innovation & Technology
External Funds History Personnel Services FY19 Expenditure FY20 Expenditure FY21 Appropriation FY22 Recommended Inc/Dec 21 vs 22
51000 Permanent Employees 0 48,571 90,415 88,643 -1,773 51100 Emergency Employees 0 0 0 0 0 51200 Overtime 0 0 50,000 150,000 100,000 51300 Part Time Employees 0 0 0 0 0 51400 Health Insurance 0 4,392 13,562 13,296 -265 51500 Pension & Annuity 0 1,071 8,137 7,978 -159 51600 Unemployment Compensation 0 0 0 0 0 51700 Workers' Compensation 0 0 0 0 0 51800 Indirect Costs 0 0 0 0 0 51900 Medicare 0 692 1,311 1,285 -26 Total Personnel Services 0 54,727 163,426 261,202 97,776
Contractual Services FY19 Expenditure FY20 Expenditure FY21 Appropriation FY22 Recommended Inc/Dec 21 vs 22
52100 Communications 0 0 5,000 10,000 5,000 52200 Utilities 0 0 0 0 0 52400 Snow Removal 0 0 0 0 0 52500 Garbage/Waste Removal 0 0 0 0 0 52600 Repairs Buildings & Structures 0 0 0 0 0 52700 Repairs & Service of Equipment 0 0 0 0 0 52800 Transportation of Persons 0 0 0 0 0 52900 Contracted Services 4,239,069 4,184,186 5,225,000 5,536,337 311,337 Total Contractual Services 4,239,069 4,184,186 5,230,000 5,546,337 316,337
Supplies & Materials FY19 Expenditure FY20 Expenditure FY21 Appropriation FY22 Recommended Inc/Dec 21 vs 22
53000 Auto Energy Supplies 0 0 0 0 0 53200 Food Supplies 0 0 0 0 0 53400 Custodial Supplies 0 0 0 0 0 53500 Med, Dental, & Hosp Supply 0 0 0 0 0 53600 Office Supplies and Materials 0 0 5,000 15,000 10,000 53700 Clothing Allowance 0 0 0 0 0 53800 Educational Supplies & Mat 0 0 0 0 0 53900 Misc Supplies & Materials 0 0 0 0 0 Total Supplies & Materials 0 0 5,000 15,000 10,000
Current Chgs & Oblig FY19 Expenditure FY20 Expenditure FY21 Appropriation FY22 Recommended Inc/Dec 21 vs 22
54300 Workers' Comp Medical 0 0 0 0 0 54400 Legal Liabilities 0 0 0 0 0 54600 Current Charges H&I 0 0 0 0 0 54700 Indemnification 0 0 0 0 0 54800 Reserve Account 0 0 0 0 0 54900 Other Current Charges 0 0 0 1,030,000 1,030,000 Total Current Chgs & Oblig 0 0 0 1,030,000 1,030,000
Equipment FY19 Expenditure FY20 Expenditure FY21 Appropriation FY22 Recommended Inc/Dec 21 vs 22
55000 Automotive Equipment 0 0 0 0 0 55400 Lease/Purchase 0 0 0 0 0 55600 Office Furniture & Equipment 0 0 0 0 0 55900 Misc Equipment 0 0 0 0 0 Total Equipment 0 0 0 0 0
Other FY19 Expenditure FY20 Expenditure FY21 Appropriation FY22 Recommended Inc/Dec 21 vs 22
56200 Special Appropriation 0 0 0 0 0 57200 Structures & Improvements 0 0 0 0 0 58000 Land & Non-Structure 0 0 0 0 0 Total Other 0 0 0 0 0
Grand Total 4,239,069 4,238,913 5,398,426 6,852,539 1,454,113

Information & TechnologyDepartment of Innovation & Technology 269
External Funds Personnel
Title Union Code Grade Position FY22 Salary Title
Union Code Grade Position FY22 Salary
Temporary Mayoral Staff TMS NG 1.00 88,643 Total 1 88,643 Adjustments Differential Payments 0 Other 0 Chargebacks 0 Salary Savings 0 FY22 Total Request 88,643

270 Information & TechnologyDepartment of Innovation & Technology
Program 1. DoIT Operations Sarah Figalora, Manager, Organization 149100
Program Description The Operations program provides project management, business consulting services, and administrative support to agencies so that they can effectively develop and maintain new IT applications and improve service delivery through effective integration of innovative technology solutions.
Operating Budget Actual '19 Actual '20 Approp '21 Budget '22
Personnel Services 1,780,221 1,704,483 1,974,616 1,894,013 Non Personnel 3,719,041 3,188,050 2,276,437 3,836,831 Total 5,499,262 4,892,533 4,251,053 5,730,844

Information & TechnologyDepartment of Innovation & Technology 271
Program 2. Enterprise Applications Michael Hamel, Manager, Organization 149200
Program Description This program provides an integrated technology culture to select and develop information technologies that enable and support critical citywide, crosscutting agency business processes. Enterprise programs include Geographic Information Systems (GIS), Enterprise Resource Planning (PeopleSoft), Constituent Relationship Management (CRM) Asset Management, Permitting, Tax and Youth and Human Services Systems.
Operating Budget Actual '19 Actual '20 Approp '21 Budget '22
Personnel Services 5,516,587 5,565,643 5,537,476 5,529,762 Non Personnel 7,939,028 13,041,672 7,090,897 7,470,474 Total 13,455,615 18,607,315 12,628,373 13,000,236
Performance
Goal: Increase productivity through high-quality IT support
Performance Measures Actual '19 Actual '20 Projected '21 Target '22
% of Application support requests closed on-time 77% 65% 61% 65%

272 Information & TechnologyDepartment of Innovation & Technology
Program 3. Digital Engagement & Services Jeanethe H. Falvey, Manager, Organization 149300
Program Description This program provides constituents access to government from home "online instead of in line" through innovative web based eGovernment technologies. It also oversees the City’s cable franchise(s) by enforcing contractual and regulatory obligations for the operators, produces government and education access television, and advocates for customers in disputes with cable operators.
Operating Budget Actual '19 Actual '20 Approp '21 Budget '22
Personnel Services 787,959 870,294 856,175 835,539 Non Personnel 984,377 609,806 388,677 909,813 Total 1,772,336 1,480,100 1,244,852 1,745,352
Performance
Goal: Ensure the city's digital services are accessible to all residents
Performance Measures Actual '19 Actual '20 Projected '21 Target '22
Boston.gov Accessibility score 60% 60% 61% 63%
Goal: Promote engagement between city and residents
Performance Measures Actual '19 Actual '20 Projected '21 Target '22
Boston.gov search engine optimization score 78% 82% 82% 83%
Newsletter open rates across all City newsletters 40% 41% 40% 42%
Number of unique visitors to boston.gov 6,120,119 7,503,454 8,552,748 8,600,000
Social media referrals to Boston.gov 282,539 471,257 412,108 425,000

Information & TechnologyDepartment of Innovation & Technology 273
Program 4. Core Infrastructure Daniel Rothman, Manager, Organization 149400
Program Description Core Infrastructure is responsible for the development and maintenance of City technology systems, data storage, and networks. Functional areas include server and mainframe technology, network and telecommunications, security, and electronic communication services.
Operating Budget Actual '19 Actual '20 Approp '21 Budget '22
Personnel Services 4,128,483 4,408,506 4,162,096 4,047,554 Non Personnel 11,885,107 11,046,266 10,005,658 11,564,418 Total 16,013,590 15,454,772 14,167,754 15,611,972
Performance
Goal: Enhance cyber security
Performance Measures Actual '19 Actual '20 Projected '21 Target '22
2-factor authentication enrollment % (Citywide)
86% 88%
Security Awareness training completion % (Citywide) 58% 63% 78% 80%
Goal: Increase productivity through high-quality IT support
Performance Measures Actual '19 Actual '20 Projected '21 Target '22
% of Technical support requests closed on-time 83% 76% 76% 80%

274 Information & TechnologyDepartment of Innovation & Technology
Program 5. Data & Analytics Stefanie Costa Leabo, Manager, Organization 149500
Program Description Use data and analytics to improve quality of life and the effectiveness of government operations. By providing technology and business support, we aim to create a modern, data-driven, responsive City government. We have worked on a variety of initiatives to improve performance and accountability (CityScore, BFD shift swap dashboard) and to deliver services more effectively (signal timing optimization, moving day trash collection).
Operating Budget Actual '19 Actual '20 Approp '21 Budget '22
Personnel Services 856,775 662,572 901,303 899,872 Non Personnel 1,028,268 1,523,378 1,061,596 1,130,922 Total 1,885,043 2,185,950 1,962,899 2,030,794
Performance
Goal: Provide consistent access to data
Performance Measures Actual '19 Actual '20 Projected '21 Target '22
Data Pipeline Reliability 87% 93% 91% 92%

Information & TechnologyDepartment of Innovation & Technology 275
Program 6. Broadband & Digital Equity Michael Lynch, Manager, Organization 149600
Program Description Work towards a future where every resident and business has access to affordable broadband internet, and the skills and equipment to make use of it. We support a variety of digital equity and public access initiatives, and work to provide both regulatory oversight for our cable TV providers and to lower the barriers to entry in Boston’s broadband market.
Operating Budget Actual '19 Actual '20 Approp '21 Budget '22
Personnel Services 432,697 446,119 502,079 473,856 Non Personnel 541 529 265,250 1,100,250 Total 433,238 446,648 767,329 1,574,106
Performance
Goal: Promote broadband adoption and decrease barriers to digital access
Performance Measures Actual '19 Actual '20 Projected '21 Target '22
Number of households provided digital equity tools
3,500 3,500

276 Information & TechnologyDepartment of Innovation & Technology
External Funds Projects 21st Century Access Fund
Project Mission The 21st Century Access Fund is used to support Public, Educational or Governmental (PEG) access services pursuant to Section 53F3/4 of Chapter 44 of the Massachusetts General Laws funded provided through cable television franchise agreements.
BAIS Modernization
Project Mission BAIS Modernization funding is drawn from existing special revenue (E-Rate) and non-recurring revenue (Indirect) funds and supports upgrades to the City's Enterprise Resource Planning financial and human capital systems. While the majority of the project is backed by a capital investment, this supplementary funding will pay for software, staffing, contracted services, telecommunications, and supplies costs incurred between the project's kickoff in FY21 and its planned completion in FY23.
Digital Equity/Smart City
Project Mission The Digital Equity/Smart City grant is provided by Verizon Wireless and will provide $1 million for the City to provide for digital equity grants and an additional $500 thousand for the City to hire a Smart City Fellow for up to four years. The fellow will be a technologist for the public realm who will lead the planning and execution of the $4.7 million Verizon Smart Communities program. The fellow will work closely with the Streets Cabinet and the Department of Innovation and Technology (DoIT) to identify Verizon Smart Communities technologies and services that have 1) demonstrated proven value for addressing community challenges and 2) can be used to improve safety for vulnerable users of the public right of way and quality of life in Boston.

Information & TechnologyDepartment of Innovation & Technology 277
Department of Innovation & Technology Capital Budget Information & Technology Department of Innovation & Technology
Overview Capital investment in technology enables the City to work more efficiently at a lower cost; to be more responsive to citizens; and to provide convenience for Boston’s residents, businesses and visitors. Ongoing and new initiatives will build upon this progress, ensuring the City remains competitive and coordinated in computer information and communication technology.
FY22 Major Initiatives Expansion of the City’s fiber optic network (BoNet) will continue in FY22. The fiber network
will connect additional Boston Public School buildings. An increased investment in Cyber Security and Resiliency will further build out the city’s
multi-layered defenses and ensure continuity of operations and data recovery in the event of a disaster.
In Enterprise Applications, DoIT will continue developing Constituent Relationship Management tools and expanding usage to more departments, as well as pursue solutions that improve IT operations and support citywide.
In Digital Service Delivery and Engagement, DoIT will continue modernization of multiple digital tools and public applications to improve the experience of users engaging with the city online.
The City will fund the third round of IT solutions identified in an innovative proposal and evaluation process. FY22’s projects will support various City departments, including Inspectional Services, Neighborhood Development, Transportation, and the Public Health Commission.
Capital Budget Expenditures Total Actual '19 Total Actual '20 Estimated '21 Total Projected
'22
Total Department 9,291,443 6,431,381 19,437,450 26,403,347

278 Information & TechnologyDepartment of Innovation & Technology
Department of Innovation & Technology Project Profiles CITYWIDE REVENUE MODERNIZATION
Project Mission Planning and design of a centralized collections system to maximize City revenue. Managing Department, DoIT Status, New Project Location, N/A Operating Impact, Yes
Authorizations
Source Existing FY22 Future Non Capital
Fund Total City Capital 0 650,000 0 0 650,000 Grants/Other 0 0 0 0 0 Total 0 650,000 0 0 650,000
Expenditures (Actual and Planned)
Source Thru
6/30/20 FY21 FY22 FY23-26 Total City Capital 0 0 325,000 325,000 650,000 Grants/Other 0 0 0 0 0 Total 0 0 325,000 325,000 650,000
CORE TECHNOLOGY INFRASTRUCTURE Project Mission Install hardware platforms to run applications supporting City business. Scope includes equipment refresh for
DWDM and BoNet equipment refresh, VoIP, firewall modernization, SQL environment recovery, and 700 MHz radio equipment and firmware.
Managing Department, DoIT Status, Annual Program Location, N/A Operating Impact, Yes
Authorizations
Source Existing FY22 Future Non Capital
Fund Total City Capital 8,669,773 4,000,000 0 0 12,669,773 Grants/Other 0 0 0 0 0 Total 8,669,773 4,000,000 0 0 12,669,773
Expenditures (Actual and Planned)
Source Thru
6/30/20 FY21 FY22 FY23-26 Total City Capital 3,287,605 3,252,000 6,000,000 130,168 12,669,773 Grants/Other 0 0 0 0 0 Total 3,287,605 3,252,000 6,000,000 130,168 12,669,773

Information & TechnologyDepartment of Innovation & Technology 279
Department of Innovation & Technology Project Profiles CYBER SECURITY AND RESILIENCY
Project Mission Implement solutions to manage and mitigate cyber security risks. Managing Department, DoIT Status, Annual Program Location, N/A Operating Impact, Yes
Authorizations
Source Existing FY22 Future Non Capital
Fund Total City Capital 6,454,238 2,213,811 0 0 8,668,049 Grants/Other 0 0 0 0 0 Total 6,454,238 2,213,811 0 0 8,668,049
Expenditures (Actual and Planned)
Source Thru
6/30/20 FY21 FY22 FY23-26 Total City Capital 2,576,194 2,450,000 3,638,000 3,855 8,668,049 Grants/Other 0 0 0 0 0 Total 2,576,194 2,450,000 3,638,000 3,855 8,668,049
DATA ANALYTICS Project Mission Invest in data analytic tools, technologies, and processes to empower data-driven management. Managing Department, DoIT Status, Annual Program Location, N/A Operating Impact, No
Authorizations
Source Existing FY22 Future Non Capital
Fund Total City Capital 4,765,516 0 1,865,649 0 6,631,165 Grants/Other 0 0 0 0 0 Total 4,765,516 0 1,865,649 0 6,631,165
Expenditures (Actual and Planned)
Source Thru
6/30/20 FY21 FY22 FY23-26 Total City Capital 2,232,747 1,000,000 765,000 2,633,418 6,631,165 Grants/Other 0 0 0 0 0 Total 2,232,747 1,000,000 765,000 2,633,418 6,631,165

280 Information & TechnologyDepartment of Innovation & Technology
Department of Innovation & Technology Project Profiles DIGITAL SERVICE DELIVERY AND ENGAGEMENT
Project Mission Implement digital technology solutions that better engage residents with government. Managing Department, DoIT Status, Annual Program Location, Citywide Operating Impact, No
Authorizations
Source Existing FY22 Future Non Capital
Fund Total City Capital 8,433,296 0 978,609 0 9,411,905 Grants/Other 0 0 0 0 0 Total 8,433,296 0 978,609 0 9,411,905
Expenditures (Actual and Planned)
Source Thru
6/30/20 FY21 FY22 FY23-26 Total City Capital 3,523,398 1,150,000 1,253,200 3,485,307 9,411,905 Grants/Other 0 0 0 0 0 Total 3,523,398 1,150,000 1,253,200 3,485,307 9,411,905
ENTERPRISE APPLICATIONS Project Mission Identify and procure enterprise business applications that enhance productivity and improve City business
operations.
Managing Department, DoIT Status, Annual Program Location, N/A Operating Impact, Yes
Authorizations
Source Existing FY22 Future Non Capital
Fund Total City Capital 27,000,000 0 0 0 27,000,000 Grants/Other 0 0 0 0 0 Total 27,000,000 0 0 0 27,000,000
Expenditures (Actual and Planned)
Source Thru
6/30/20 FY21 FY22 FY23-26 Total City Capital 10,946,797 3,470,000 800,000 11,783,203 27,000,000 Grants/Other 0 0 0 0 0 Total 10,946,797 3,470,000 800,000 11,783,203 27,000,000

Information & TechnologyDepartment of Innovation & Technology 281
Department of Innovation & Technology Project Profiles ERP SYSTEM UPGRADE
Project Mission Investment in key City-wide systems including an upgrade for BAIS Financials application and tools, and a tools
and PUM upgrade for BAIS HCM.
Managing Department, DoIT Status, Implementation Underway Location, N/A Operating Impact, Yes
Authorizations
Source Existing FY22 Future Non Capital
Fund Total City Capital 7,000,000 8,654,000 0 0 15,654,000 Grants/Other 0 0 0 0 0 Total 7,000,000 8,654,000 0 0 15,654,000
Expenditures (Actual and Planned)
Source Thru
6/30/20 FY21 FY22 FY23-26 Total City Capital 0 3,500,000 7,000,000 5,154,000 15,654,000 Grants/Other 0 0 0 0 0 Total 0 3,500,000 7,000,000 5,154,000 15,654,000
FIBER NETWORK EXPANSION Project Mission Invest in and expand BoNet infrastructure, including extending the fiber network's reach to additional BPS schools
and providing public Wi-Fi opportunities.
Managing Department, DoIT Status, Implementation Underway Location, Various neighborhoods Operating Impact, Yes
Authorizations
Source Existing FY22 Future Non Capital
Fund Total City Capital 12,310,690 1,709,833 0 0 14,020,523 Grants/Other 0 0 0 0 0 Total 12,310,690 1,709,833 0 0 14,020,523
Expenditures (Actual and Planned)
Source Thru
6/30/20 FY21 FY22 FY23-26 Total City Capital 8,410,885 2,000,000 2,000,000 1,609,638 14,020,523 Grants/Other 0 0 0 0 0 Total 8,410,885 2,000,000 2,000,000 1,609,638 14,020,523

282 Information & TechnologyDepartment of Innovation & Technology
Department of Innovation & Technology Project Profiles FY19 IT INVESTMENT PROPOSALS
Project Mission Identify and procure IT solutions for City departments. Managing Department, DoIT Status, Implementation Underway Location, N/A Operating Impact, Yes
Authorizations
Source Existing FY22 Future Non Capital
Fund Total City Capital 3,664,741 0 0 0 3,664,741 Grants/Other 0 0 0 0 0 Total 3,664,741 0 0 0 3,664,741
Expenditures (Actual and Planned)
Source Thru
6/30/20 FY21 FY22 FY23-26 Total City Capital 1,136,953 414,244 500,000 1,613,544 3,664,741 Grants/Other 0 0 0 0 0 Total 1,136,953 414,244 500,000 1,613,544 3,664,741
FY20 IT INVESTMENT PROPOSALS Project Mission Identify and procure IT solutions for City departments. Managing Department, DoIT Status, Implementation Underway Location, N/A Operating Impact, Yes
Authorizations
Source Existing FY22 Future Non Capital
Fund Total City Capital 1,000,000 0 0 0 1,000,000 Grants/Other 0 0 0 0 0 Total 1,000,000 0 0 0 1,000,000
Expenditures (Actual and Planned)
Source Thru
6/30/20 FY21 FY22 FY23-26 Total City Capital 65,250 612,603 322,147 0 1,000,000 Grants/Other 0 0 0 0 0 Total 65,250 612,603 322,147 0 1,000,000

Information & TechnologyDepartment of Innovation & Technology 283
Department of Innovation & Technology Project Profiles FY21 IT INVESTMENT PROPOSALS
Project Mission Identify and procure IT solutions for City departments. Managing Department, DoIT Status, Implementation Underway Location, N/A Operating Impact, Yes
Authorizations
Source Existing FY22 Future Non Capital
Fund Total City Capital 1,500,000 0 0 0 1,500,000 Grants/Other 0 0 0 0 0 Total 1,500,000 0 0 0 1,500,000
Expenditures (Actual and Planned)
Source Thru
6/30/20 FY21 FY22 FY23-26 Total City Capital 0 250,000 500,000 750,000 1,500,000 Grants/Other 0 0 0 0 0 Total 0 250,000 500,000 750,000 1,500,000
FY22 IT INVESTMENT PROPOSALS Project Mission Identify and procure IT solutions for City departments. Managing Department, DoIT Status, New Project Location, N/A Operating Impact, Yes
Authorizations
Source Existing FY22 Future Non Capital
Fund Total City Capital 0 500,000 0 0 500,000 Grants/Other 0 0 0 0 0 Total 0 500,000 0 0 500,000
Expenditures (Actual and Planned)
Source Thru
6/30/20 FY21 FY22 FY23-26 Total City Capital 0 0 300,000 200,000 500,000 Grants/Other 0 0 0 0 0 Total 0 0 300,000 200,000 500,000

284 Information & TechnologyDepartment of Innovation & Technology
Department of Innovation & Technology Project Profiles TRUNKED RADIO SYSTEM
Project Mission Design and implementation of upgrades to the Trunked radio system. Managing Department, DoIT Status, New Project Location, N/A Operating Impact, No
Authorizations
Source Existing FY22 Future Non Capital
Fund Total City Capital 5,400,000 0 0 0 5,400,000 Grants/Other 0 0 0 0 0 Total 5,400,000 0 0 0 5,400,000
Expenditures (Actual and Planned)
Source Thru
6/30/20 FY21 FY22 FY23-26 Total City Capital 0 700,000 3,000,000 1,700,000 5,400,000 Grants/Other 0 0 0 0 0 Total 0 700,000 3,000,000 1,700,000 5,400,000
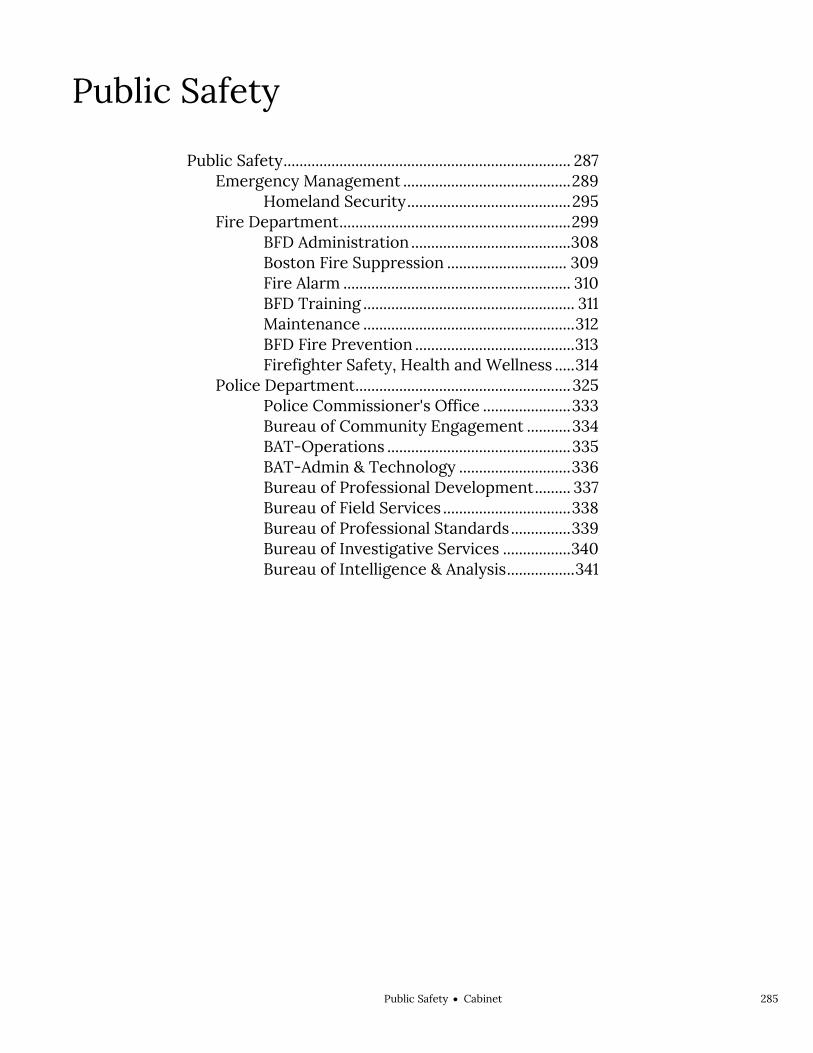
Public SafetyCabinet 285
Public Safety Public Safety Cabinet
Public Safety ........................................................................ 287
Emergency Management .......................................... 289
Homeland Security ......................................... 295
Fire Department .......................................................... 299
BFD Administration ........................................ 308
Boston Fire Suppression .............................. 309
Fire Alarm ......................................................... 310
BFD Training ..................................................... 311
Maintenance ..................................................... 312
BFD Fire Prevention ........................................ 313
Firefighter Safety, Health and Wellness ..... 314
Police Department ...................................................... 325
Police Commissioner's Office ...................... 333
Bureau of Community Engagement ........... 334
BAT-Operations .............................................. 335
BAT-Admin & Technology ............................ 336
Bureau of Professional Development ......... 337
Bureau of Field Services ................................ 338
Bureau of Professional Standards ............... 339
Bureau of Investigative Services ................. 340
Bureau of Intelligence & Analysis ................. 341

286 Public SafetyCabinet
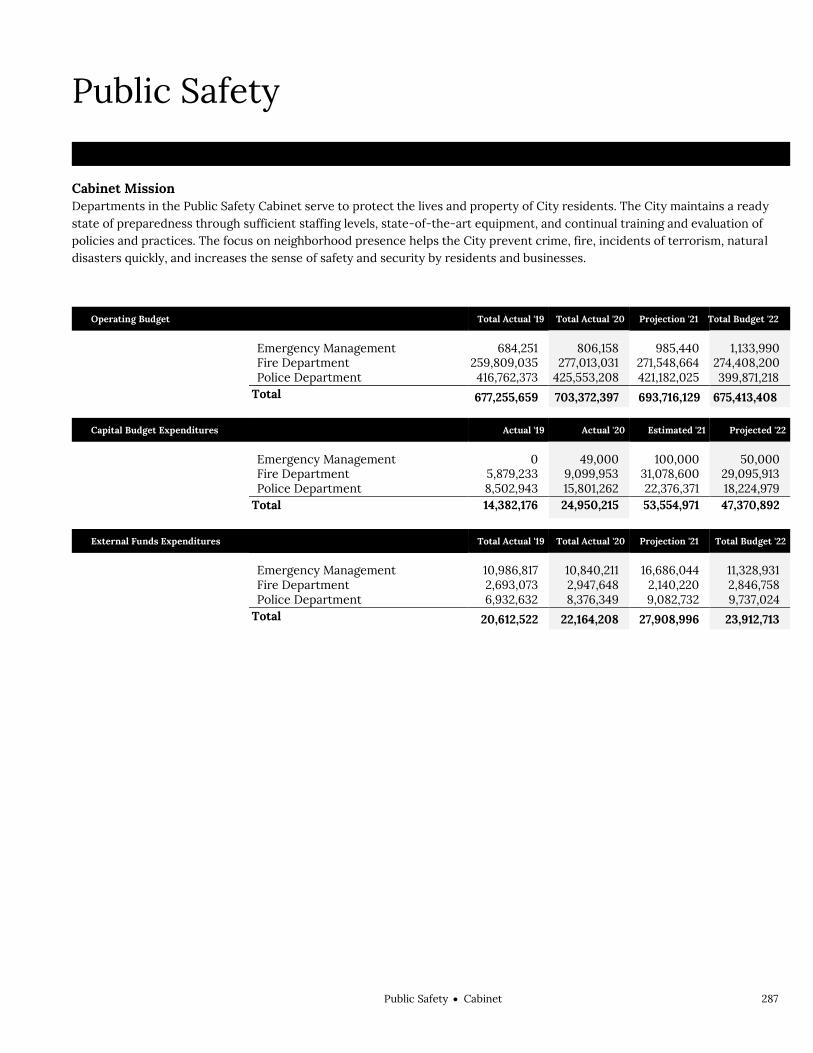
Public SafetyCabinet 287
Public Safety Public Safety
Cabinet Mission Departments in the Public Safety Cabinet serve to protect the lives and property of City residents. The City maintains a ready state of preparedness through sufficient staffing levels, state-of-the-art equipment, and continual training and evaluation of policies and practices. The focus on neighborhood presence helps the City prevent crime, fire, incidents of terrorism, natural disasters quickly, and increases the sense of safety and security by residents and businesses.
Operating Budget Total Actual '19 Total Actual '20 Projection '21 Total Budget '22
Emergency Management 684,251 806,158 985,440 1,133,990 Fire Department 259,809,035 277,013,031 271,548,664 274,408,200 Police Department 416,762,373 425,553,208 421,182,025 399,871,218
Total 677,255,659 703,372,397 693,716,129 675,413,408
Capital Budget Expenditures Actual '19 Actual '20 Estimated '21 Projected '22
Emergency Management 0 49,000 100,000 50,000 Fire Department 5,879,233 9,099,953 31,078,600 29,095,913 Police Department 8,502,943 15,801,262 22,376,371 18,224,979
Total 14,382,176 24,950,215 53,554,971 47,370,892
External Funds Expenditures Total Actual '19 Total Actual '20 Projection '21 Total Budget '22
Emergency Management 10,986,817 10,840,211 16,686,044 11,328,931 Fire Department 2,693,073 2,947,648 2,140,220 2,846,758 Police Department 6,932,632 8,376,349 9,082,732 9,737,024
Total 20,612,522 22,164,208 27,908,996 23,912,713

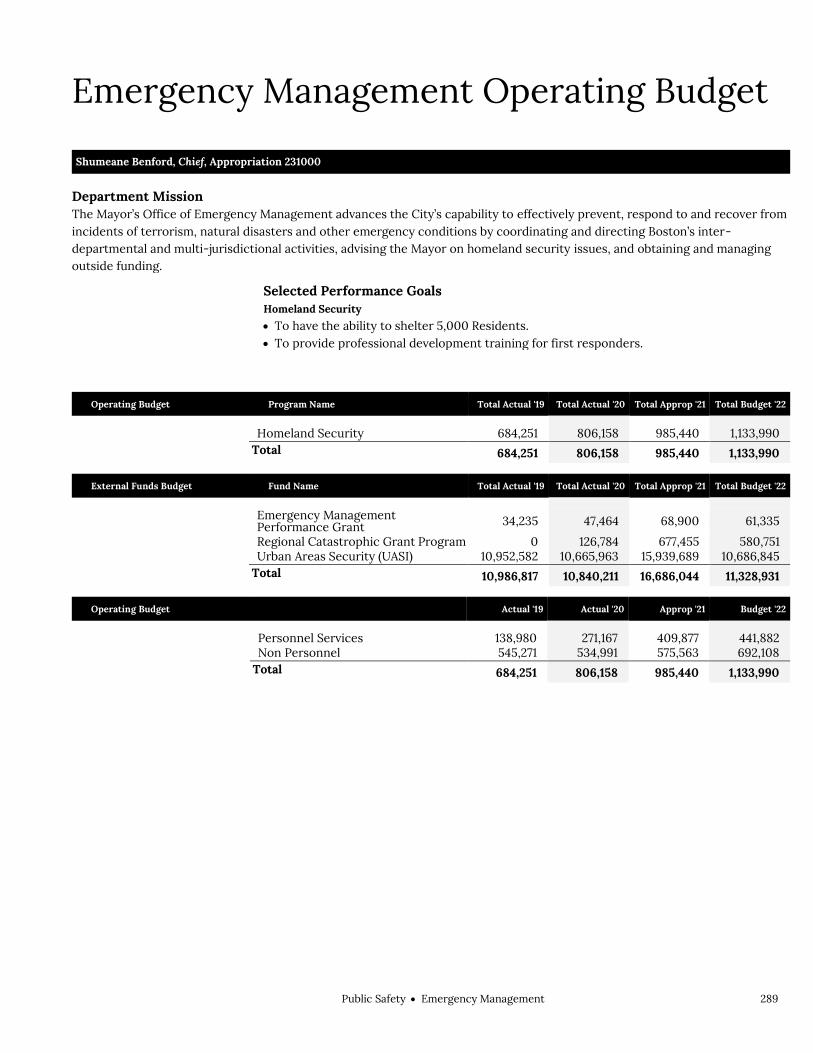
Public SafetyEmergency Management 289
Emergency Management Operating Budget Public Safety Emergency Management Shumeane Benford, Chief, Appropriation 231000
Department Mission The Mayor’s Office of Emergency Management advances the City’s capability to effectively prevent, respond to and recover from incidents of terrorism, natural disasters and other emergency conditions by coordinating and directing Boston’s inter-departmental and multi-jurisdictional activities, advising the Mayor on homeland security issues, and obtaining and managing outside funding.
Selected Performance Goals Homeland Security
To have the ability to shelter 5,000 Residents. To provide professional development training for first responders.
Operating Budget Program Name Total Actual '19 Total Actual '20 Total Approp '21 Total Budget '22
Homeland Security 684,251 806,158 985,440 1,133,990
Total 684,251 806,158 985,440 1,133,990
External Funds Budget Fund Name Total Actual '19 Total Actual '20 Total Approp '21 Total Budget '22
Emergency Management Performance Grant 34,235 47,464 68,900 61,335
Regional Catastrophic Grant Program 0 126,784 677,455 580,751
Urban Areas Security (UASI) 10,952,582 10,665,963 15,939,689 10,686,845
Total 10,986,817 10,840,211 16,686,044 11,328,931
Operating Budget Actual '19 Actual '20 Approp '21 Budget '22
Personnel Services 138,980 271,167 409,877 441,882 Non Personnel 545,271 534,991 575,563 692,108 Total 684,251 806,158 985,440 1,133,990

290 Public SafetyEmergency Management
Emergency Management Operating Budget
Description of Services The Mayor’s Office of Emergency Management coordinates the City's comprehensive Emergency Management Program, supports line departments in their individual homeland security responsibilities, promotes regular communication across all departments and disciplines, and brings departments together to jointly implement a unified citywide strategy for emergency preparedness. The Office also bears primary responsibility for the resource development and management of state and federal funds that support the City’s emergency preparedness strategy.
Chief
Deputy Chief Communication Director
Executive Assistant
Admin & Finance Administration Operations Grant Admin
Regional Catastrophic Preparedness Grant
Program
Training and Exercises
Planning and Preparedness
Geographic Information System
Emergency Operation Center
Logistics
Cybersecurity
Volunteer Coordinator

Public SafetyEmergency Management 291
Department History Personnel Services FY19 Expenditure FY20 Expenditure FY21 Appropriation FY22 Recommended Inc/Dec 21 vs 22
51000 Permanent Employees 123,407 271,167 409,877 421,882 12,005 51100 Emergency Employees 0 0 0 0 0 51200 Overtime 0 0 0 20,000 20,000 51600 Unemployment Compensation 15,573 0 0 0 0 51700 Workers' Compensation 0 0 0 0 0 Total Personnel Services 138,980 271,167 409,877 441,882 32,005
Contractual Services FY19 Expenditure FY20 Expenditure FY21 Appropriation FY22 Recommended Inc/Dec 21 vs 22
52100 Communications 59,409 65,927 63,500 63,500 0 52200 Utilities 0 0 0 0 0 52400 Snow Removal 0 0 0 0 0 52500 Garbage/Waste Removal 0 0 0 0 0 52600 Repairs Buildings & Structures 0 0 0 0 0 52700 Repairs & Service of Equipment 3,817 4,025 3,500 3,500 0 52800 Transportation of Persons 958 1,349 0 0 0 52900 Contracted Services 108,535 102,515 137,913 243,508 105,595 Total Contractual Services 172,719 173,816 204,913 310,508 105,595
Supplies & Materials FY19 Expenditure FY20 Expenditure FY21 Appropriation FY22 Recommended Inc/Dec 21 vs 22
53000 Auto Energy Supplies 329 0 1,000 1,000 0 53200 Food Supplies 2,610 2,394 2,000 2,000 0 53400 Custodial Supplies 0 0 0 0 0 53500 Med, Dental, & Hosp Supply 0 0 0 0 0 53600 Office Supplies and Materials 4,384 996 1,000 1,000 0 53700 Clothing Allowance 0 0 0 0 0 53800 Educational Supplies & Mat 0 0 0 0 0 53900 Misc Supplies & Materials 17,850 1,554 2,000 2,000 0 Total Supplies & Materials 25,173 4,944 6,000 6,000 0
Current Chgs & Oblig FY19 Expenditure FY20 Expenditure FY21 Appropriation FY22 Recommended Inc/Dec 21 vs 22
54300 Workers' Comp Medical 0 0 0 0 0 54400 Legal Liabilities 0 0 0 0 0 54500 Aid To Veterans 0 0 0 0 0 54600 Current Charges H&I 0 0 0 0 0 54700 Indemnification 0 0 0 0 0 54800 Reserve Account 0 0 0 0 0 54900 Other Current Charges 347,379 353,600 364,650 375,600 10,950 Total Current Chgs & Oblig 347,379 353,600 364,650 375,600 10,950
Equipment FY19 Expenditure FY20 Expenditure FY21 Appropriation FY22 Recommended Inc/Dec 21 vs 22
55000 Automotive Equipment 0 0 0 0 0 55400 Lease/Purchase 0 0 0 0 0 55600 Office Furniture & Equipment 0 0 0 0 0 55900 Misc Equipment 0 2,631 0 0 0 Total Equipment 0 2,631 0 0 0
Other FY19 Expenditure FY20 Expenditure FY21 Appropriation FY22 Recommended Inc/Dec 21 vs 22
56200 Special Appropriation 0 0 0 0 0 57200 Structures & Improvements 0 0 0 0 0 58000 Land & Non-Structure 0 0 0 0 0 Total Other 0 0 0 0 0
Grand Total 684,251 806,158 985,440 1,133,990 148,550

292 Public SafetyEmergency Management
Department Personnel
Title Union Code Grade Position FY22 Salary Title
Union Code Grade Position FY22 Salary
Admin Manager MYO 09 0.10 9,138 Proj Director MYO 11 1.20 117,728 Administrative_Asst MYO 06 0.10 6,101 Project_Director MYO 09 0.30 23,176 Asst Dir (Homeland Sec) MYO 12 0.10 10,918 Regional Coordinator MYO 08 1.30 83,048
Chief of Office of Emrgcy Mgmt CDH NG 0.31 43,519 Regional Emergency Mgmnt Planner
MYO 09 0.10 8,113
Emrg Mgt Training & Exercise Coord MYO 09 0.10 8,371 Regional Planner MYO 07 0.40 26,119
Executive_Assistant MYO 07 1.00 63,178 Staff Assistant MYO 04 0.10 5,862 Logistics Coordinator MYO 09 0.10 7,730 Staff Asst IV MYO 09 0.10 7,881 Total 5 420,882 Adjustments Differential Payments 0 Other 1,000 Chargebacks 0 Salary Savings 0 FY22 Total Request 421,882

Public SafetyEmergency Management 293
External Funds History Personnel Services FY19 Expenditure FY20 Expenditure FY21 Appropriation FY22 Recommended Inc/Dec 21 vs 22
51000 Permanent Employees 479,435 1,101,097 1,289,135 1,470,620 181,485 51100 Emergency Employees 0 0 0 0 0 51200 Overtime 17,578 38,564 0 0 0 51300 Part Time Employees 0 0 0 0 0 51400 Health Insurance 46,168 125,021 198,363 5,640 -192,723 51500 Pension & Annuity 42,056 85,824 119,018 0 -119,018 51600 Unemployment Compensation 0 0 0 0 0 51700 Workers' Compensation 0 0 0 0 0 51800 Indirect Costs 0 0 0 0 0 51900 Medicare 6,005 8,569 19,175 5,940 -13,235 Total Personnel Services 591,242 1,359,075 1,625,691 1,482,200 -143,491
Contractual Services FY19 Expenditure FY20 Expenditure FY21 Appropriation FY22 Recommended Inc/Dec 21 vs 22
52100 Communications 0 630 0 0 0 52200 Utilities 0 0 0 0 0 52400 Snow Removal 0 0 0 0 0 52500 Garbage/Waste Removal 0 0 0 0 0 52600 Repairs Buildings & Structures 0 0 0 0 0 52700 Repairs & Service of Equipment 60,715 58,330 135,792 82,000 -53,792 52800 Transportation of Persons 141,347 146,175 23,250 142,000 118,750 52900 Contracted Services 6,725,566 6,492,344 10,019,259 6,567,816 -3,451,443 Total Contractual Services 6,927,628 6,697,479 10,178,301 6,791,816 -3,386,485
Supplies & Materials FY19 Expenditure FY20 Expenditure FY21 Appropriation FY22 Recommended Inc/Dec 21 vs 22
53000 Auto Energy Supplies 0 0 0 0 0 53200 Food Supplies 1,569 1,964 0 0 0 53400 Custodial Supplies 0 0 0 0 0 53500 Med, Dental, & Hosp Supply 0 0 0 0 0 53600 Office Supplies and Materials 2,445 2,508 6,000 2,000 -4,000 53700 Clothing Allowance 0 0 0 0 0 53800 Educational Supplies & Mat 0 19 0 0 0 53900 Misc Supplies & Materials 0 0 0 0 0 Total Supplies & Materials 4,014 4,491 6,000 2,000 -4,000
Current Chgs & Oblig FY19 Expenditure FY20 Expenditure FY21 Appropriation FY22 Recommended Inc/Dec 21 vs 22
54300 Workers' Comp Medical 0 0 0 0 0 54400 Legal Liabilities 0 0 0 0 0 54600 Current Charges H&I 0 0 0 0 0 54700 Indemnification 0 0 0 0 0 54800 Reserve Account 0 0 0 0 0 54900 Other Current Charges 656,446 519,161 386,191 479,000 92,809 Total Current Chgs & Oblig 656,446 519,161 386,191 479,000 92,809
Equipment FY19 Expenditure FY20 Expenditure FY21 Appropriation FY22 Recommended Inc/Dec 21 vs 22
55000 Automotive Equipment 319,745 160,467 1,031,247 413,260 -617,987 55400 Lease/Purchase 0 0 0 0 0 55600 Office Furniture & Equipment 0 138 0 0 0 55900 Misc Equipment 2,487,742 2,099,400 3,458,614 2,160,655 -1,297,959 Total Equipment 2,807,487 2,260,005 4,489,861 2,573,915 -1,915,946
Other FY19 Expenditure FY20 Expenditure FY21 Appropriation FY22 Recommended Inc/Dec 21 vs 22
56200 Special Appropriation 0 0 0 0 0 57200 Structures & Improvements 0 0 0 0 0 58000 Land & Non-Structure 0 0 0 0 0 Total Other 0 0 0 0 0
Grand Total 10,986,817 10,840,211 16,686,044 11,328,931 -5,357,113
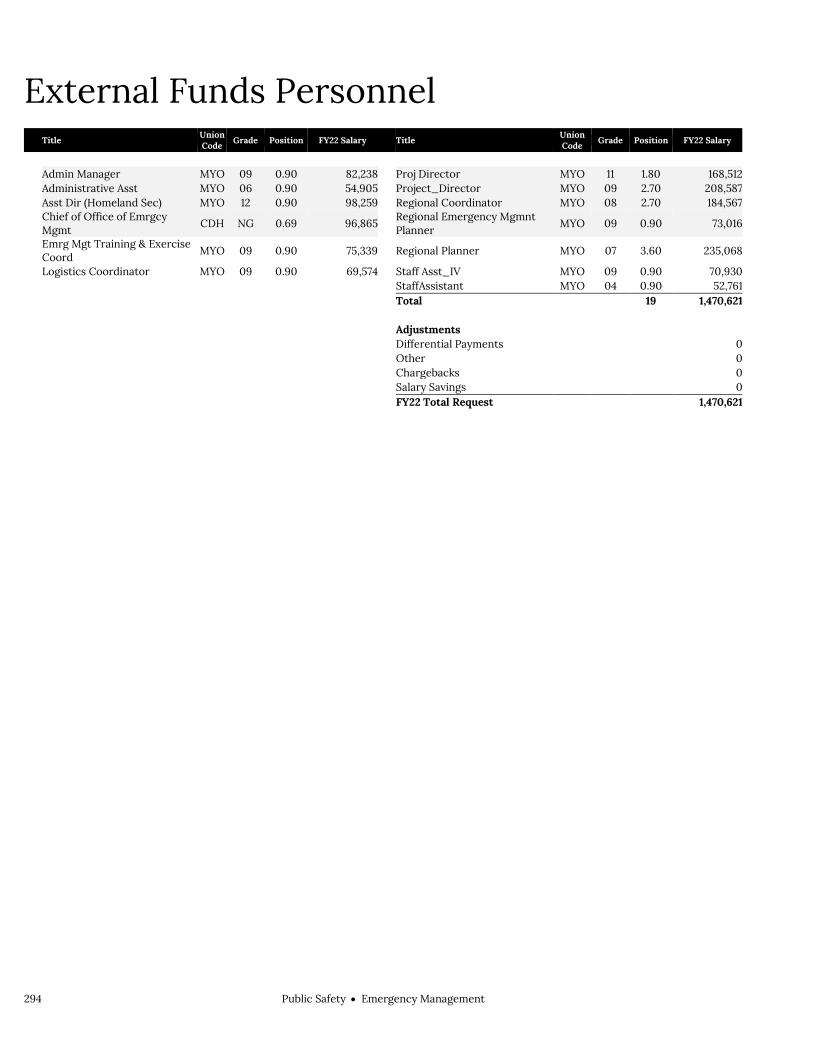
294 Public SafetyEmergency Management
External Funds Personnel
Title Union Code Grade Position FY22 Salary Title
Union Code Grade Position FY22 Salary
Admin Manager MYO 09 0.90 82,238 Proj Director MYO 11 1.80 168,512 Administrative Asst MYO 06 0.90 54,905 Project_Director MYO 09 2.70 208,587 Asst Dir (Homeland Sec) MYO 12 0.90 98,259 Regional Coordinator MYO 08 2.70 184,567
Chief of Office of Emrgcy Mgmt
CDH NG 0.69 96,865 Regional Emergency Mgmnt Planner
MYO 09 0.90 73,016
Emrg Mgt Training & Exercise Coord MYO 09 0.90 75,339 Regional Planner MYO 07 3.60 235,068
Logistics Coordinator MYO 09 0.90 69,574 Staff Asst_IV MYO 09 0.90 70,930
StaffAssistant MYO 04 0.90 52,761
Total 19 1,470,621 Adjustments Differential Payments 0 Other 0 Chargebacks 0 Salary Savings 0 FY22 Total Request 1,470,621

Public SafetyEmergency Management 295
Program 1. Homeland Security Shumeane Benford, Chief, Organization 231800
Program Description The Homeland Security Program advances the City’s capability to effectively prevent, respond to and recover from incidents of terrorism and other emergency incidents, by coordinating and directing Boston’s inter-departmental and multi-jurisdictional homeland security activities, advising the Mayor on issues, and obtaining and managing outside funding.
Operating Budget Actual '19 Actual '20 Approp '21 Budget '22
Personnel Services 138,980 271,167 409,877 441,882 Non Personnel 545,271 534,991 575,563 692,108 Total 684,251 806,158 985,440 1,133,990
Performance
Goal: To have the ability to shelter 5,000 Residents
Performance Measures Actual '19 Actual '20 Projected '21 Target '22
# of cots available for Mass Care Sheltering 4,840 5,384 5,926 6,000
Goal: To provide professional development training for first responders
Performance Measures Actual '19 Actual '20 Projected '21 Target '22
# of Threat and Hazard Based Trainings 20 35 11 20

296 Public SafetyEmergency Management
External Funds Projects Emergency Management Performance Grant
Project Mission The federal EMPG Program serves to assist local governments in preparing for all hazards, as authorized by the Robert T. Stafford Disaster Relief and Emergency Assistance Act (42 U.S.C. 5121 et seq.). Title VI of the Stafford Act authorizes FEMA to make grants for the purpose of providing a system of emergency preparedness for the protection of life and property in the United States from hazards and to vest responsibility for emergency preparedness jointly in the federal government and the states and their political subdivisions. The federal government, through the EMPG Program, provides necessary direction, coordination, and guidance, and provides necessary assistance, as authorized in this title so that a comprehensive emergency preparedness system exists for all hazards. Funding is received from the Federal Emergency Management Agency and the Commonwealth of Massachusetts’s Emergency Management Agency.
Regional Catastrophic Preparedness Grant Program
Project Mission The federal RCPGP grant serves to build local and state capacity to manage catastrophic incidents by improving and expanding regional collaboration for incident preparedness. The City of Boston partners include Massachusetts Emergency Management Agency (MEMA) and Metro-Boston Homeland Security Region (MBHSR) jurisdictions (brookline, Cambridge, Chelsea, Everett, Quincy, Revere, Somerville and Winthrop)
Urban Area Security Initiative
Project Mission The federal UASI grant serves to address the unique equipment, planning, exercise, training and operational needs of first responder agencies in the Boston Urban Area (Boston, Brookline, Cambridge, Everett, Revere, Quincy, Winthrop, Chelsea, Somerville) and to assist them in building an enhanced and sustainable capacity to prevent, protect against, respond to, and recover from threats or acts of terrorism, including chemical, biological, radiological, nuclear and explosive (CBRNE) incidents. UASI is an annual grant program and funding is received from the US Department of Homeland Security and the Commonwealth of Massachusetts Executive Office of Public Safety.

Public SafetyEmergency Management 297
Emergency Management Capital Budget Public Safety Emergency Management
Overview The capital plan for the Office of Emergency Management works to provide OEM a space that is flexible, sustainable, secure, strategically located, and fully interoperable.
FY22 Major Initiatives With a program developed, the City will identify and assess potential sites for a new
Emergency Operations Center.
Capital Budget Expenditures Total Actual '19 Total Actual '20 Estimated '21 Total Projected
'22
Total Department 0 49,000 100,000 50,000

298 Public SafetyEmergency Management
Emergency Management Project Profiles EMERGENCY OPERATIONS CENTER
Project Mission A programming and siting study for the development of an emergency operations center. Managing Department, Public Facilities Department Status, Study Underway Location, N/A Operating Impact, No
Authorizations
Source Existing FY22 Future Non Capital
Fund Total City Capital 1,500,000 0 0 0 1,500,000 Grants/Other 0 0 0 0 0 Total 1,500,000 0 0 0 1,500,000
Expenditures (Actual and Planned)
Source Thru
6/30/20 FY21 FY22 FY23-26 Total City Capital 49,000 0 50,000 1,401,000 1,500,000 Grants/Other 0 0 0 0 0 Total 49,000 0 50,000 1,401,000 1,500,000
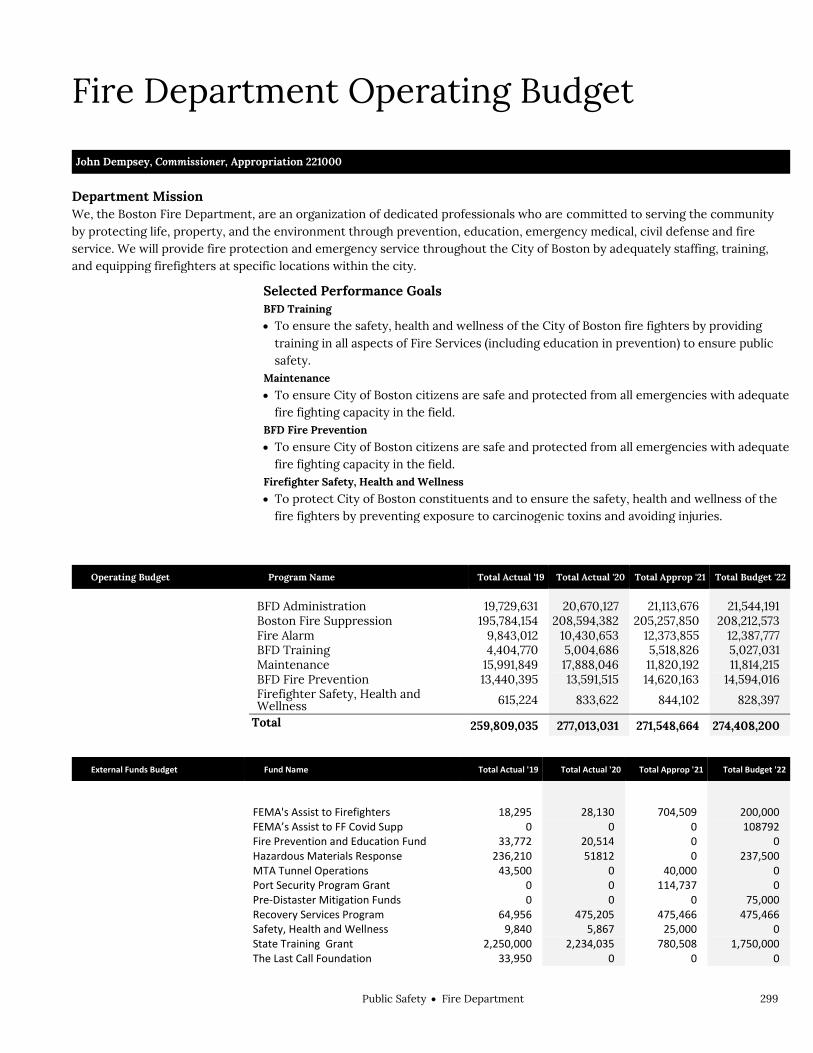
Public SafetyFire Department 299
Fire Department Operating Budget Public Safety Fire Department John Dempsey, Commissioner, Appropriation 221000
Department Mission We, the Boston Fire Department, are an organization of dedicated professionals who are committed to serving the community by protecting life, property, and the environment through prevention, education, emergency medical, civil defense and fire service. We will provide fire protection and emergency service throughout the City of Boston by adequately staffing, training, and equipping firefighters at specific locations within the city.
Selected Performance Goals BFD Training
To ensure the safety, health and wellness of the City of Boston fire fighters by providing training in all aspects of Fire Services (including education in prevention) to ensure public safety.
Maintenance
To ensure City of Boston citizens are safe and protected from all emergencies with adequate fire fighting capacity in the field.
BFD Fire Prevention
To ensure City of Boston citizens are safe and protected from all emergencies with adequate fire fighting capacity in the field.
Firefighter Safety, Health and Wellness
To protect City of Boston constituents and to ensure the safety, health and wellness of the fire fighters by preventing exposure to carcinogenic toxins and avoiding injuries.
Operating Budget Program Name Total Actual '19 Total Actual '20 Total Approp '21 Total Budget '22
BFD Administration 19,729,631 20,670,127 21,113,676 21,544,191
Boston Fire Suppression 195,784,154 208,594,382 205,257,850 208,212,573
Fire Alarm 9,843,012 10,430,653 12,373,855 12,387,777
BFD Training 4,404,770 5,004,686 5,518,826 5,027,031
Maintenance 15,991,849 17,888,046 11,820,192 11,814,215
BFD Fire Prevention 13,440,395 13,591,515 14,620,163 14,594,016
Firefighter Safety, Health and Wellness 615,224 833,622 844,102 828,397
Total 259,809,035 277,013,031 271,548,664 274,408,200
External Funds Budget Fund Name Total Actual '19 Total Actual '20 Total Approp '21 Total Budget '22
FEMA's Assist to Firefighters 18,295 28,130 704,509 200,000
FEMA’s Assist to FF Covid Supp 0 0 0 108792
Fire Prevention and Education Fund 33,772 20,514 0 0
Hazardous Materials Response 236,210 51812 0 237,500
MTA Tunnel Operations 43,500 0 40,000 0
Port Security Program Grant 0 0 114,737 0 Pre-Distaster Mitigation Funds 0 0 0 75,000
Recovery Services Program 64,956 475,205 475,466 475,466
Safety, Health and Wellness 9,840 5,867 25,000 0 State Training Grant 2,250,000 2,234,035 780,508 1,750,000
The Last Call Foundation 33,950 0 0 0

300 Public SafetyFire Department
Total 2,693,073 2,947,646 2,140,200 2,846,758
Operating Budget Actual '19 Actual '20 Approp '21 Budget '22
Personnel Services 227,825,846 244,546,358 246,738,338 249,378,035 Non Personnel 31,983,189 32,466,673 24,810,326 25,030,165 Total 259,809,035 277,013,031 271,548,664 274,408,200

Public SafetyFire Department 301
Fire Department Operating Budget
Authorizing Statutes Generally, See Boston Fire Prevention
Code; CBC St. 11 §§ 75-87; CBC St.2 § 753; M.G.L.A. c. 148.
Commissioner: Appointments, Powers and Duties, CBC St. 11 §§ 75-78; CBC Ord. §§ 11-4.1-11-4.4; 1960 Mass. Acts ch. 755 § 1; 1962 Mass. Acts ch. 338 § 1.
Mutual Aid Assistance, CBC Ord. § 11-4.3. Licenses and Permits, See Boston Fire
Prevention Code; CBC St. 14 §§ 50, 158-159; M.G.L.A. c. 148, § 28.
Fire Prevention Code, 1962 Mass. Acts ch. 314.
Description of Services The Fire Department provides fire and emergency protection to all Boston residents and to the hundreds of thousands of people who work, shop and visit the city. To provide this protection, the Fire Department deploys 33 engine companies (five of which are trained and staffed to respond to hazardous material, weapons of mass destruction and decontamination incidents), 19 ladder companies, one fire brigade, three tower ladder companies, two rescue companies, one marine unit (comprised of two vessels), a Safety Division, Six Special Operations Command Units which include a Hazardous Materials Operations Unit, a Mobile Decontamination Unit, a Decontamination Supply Unit, two Technical Rescue Support Units and a Collapse Unit. The Fire Department also operates a Special Unit that doubles as a lighting plant and backup Hazardous Materials Unit through a dispatching
Fire Commissioner
Deputy Commissioner
Labor Relations, HR & Legal
Personnel
Medical Office
Human Resources
Legal Affairs
Labor Relatiopns
Civil Service Liaison
Chief of OperationsSupport Services
Uniformed Personnel
Medical Office
Fire Prevention
Fleet & Facilities
Information Technology
MOEP/UASI
Detail Office
Deputy Commissioner
Administration & Finance
Budget & Finance
Payroll
Procurement
Accounts Payable
Grants Administration
Capital Projects
Chief of OperationsField Services
Division1Division2
Training
Office of Field Services
Special Operations Command
Fire Alarm
Emergency Medical Response
Chief of Safety, Health & Wellness

302 Public SafetyFire Department
system maintained at the Fire Alarm Communications Center. The City’s mutual aid agreement with surrounding areas continues to benefit the City and the involved communities. The Fire Prevention Program provides public education and inspections of residential and commercial properties, investigates suspected arson fires, and issues permits and licenses.

Public SafetyFire Department 303
Department History Personnel Services FY19 Expenditure FY20 Expenditure FY21 Appropriation FY22 Recommended Inc/Dec 21 vs 22
51000 Permanent Employees 204,201,217 217,087,185 224,136,640 223,773,493 -363,147 51100 Emergency Employees 0 0 0 0 0 51200 Overtime 23,569,944 27,339,883 22,391,698 25,394,542 3,002,844 51600 Unemployment Compensation 34,955 26,520 60,000 60,000 0 51700 Workers' Compensation 19,730 92,770 150,000 150,000 0 Total Personnel Services 227,825,846 244,546,358 246,738,338 249,378,035 2,639,697
Contractual Services FY19 Expenditure FY20 Expenditure FY21 Appropriation FY22 Recommended Inc/Dec 21 vs 22
52100 Communications 976,960 958,675 923,568 923,568 0 52200 Utilities 1,729,740 1,685,127 2,075,432 1,625,141 -450,291 52400 Snow Removal 16,029 10,280 40,000 40,000 0 52500 Garbage/Waste Removal 185,130 274,749 274,051 274,051 0 52600 Repairs Buildings & Structures 1,489,537 1,883,327 1,450,000 1,450,000 0 52700 Repairs & Service of Equipment 1,327,279 1,516,125 1,622,130 1,622,130 0 52800 Transportation of Persons 211,375 112,933 54,600 54,600 0 52900 Contracted Services 3,779,548 3,060,117 3,500,242 3,840,372 340,130 Total Contractual Services 9,715,598 9,501,333 9,940,023 9,829,862 -110,161
Supplies & Materials FY19 Expenditure FY20 Expenditure FY21 Appropriation FY22 Recommended Inc/Dec 21 vs 22
53000 Auto Energy Supplies 896,068 830,451 682,838 682,838 0 53200 Food Supplies 0 0 0 0 0 53400 Custodial Supplies 39,953 74,955 64,000 64,000 0 53500 Med, Dental, & Hosp Supply 148,255 167,264 148,751 148,751 0 53600 Office Supplies and Materials 156,030 76,431 138,800 138,800 0 53700 Clothing Allowance 872,550 873,725 867,060 867,060 0 53800 Educational Supplies & Mat 0 0 0 0 0 53900 Misc Supplies & Materials 3,693,464 3,875,029 3,948,585 3,948,585 0 Total Supplies & Materials 5,806,320 5,897,855 5,850,034 5,850,034 0
Current Chgs & Oblig FY19 Expenditure FY20 Expenditure FY21 Appropriation FY22 Recommended Inc/Dec 21 vs 22
54300 Workers' Comp Medical 11,530 22,646 41,500 41,500 0 54400 Legal Liabilities 107,124 147,000 140,000 147,000 7,000 54500 Aid To Veterans 0 0 0 0 0 54600 Current Charges H&I 0 0 0 0 0 54700 Indemnification 4,177,534 4,505,761 3,500,000 3,500,000 0 54800 Reserve Account 0 0 0 0 0 54900 Other Current Charges 690,488 528,848 687,116 803,116 116,000 Total Current Chgs & Oblig 4,986,676 5,204,255 4,368,616 4,491,616 123,000
Equipment FY19 Expenditure FY20 Expenditure FY21 Appropriation FY22 Recommended Inc/Dec 21 vs 22
55000 Automotive Equipment 1,824,231 2,061,406 0 0 0 55400 Lease/Purchase 4,901,814 4,263,338 3,412,616 3,619,616 207,000 55600 Office Furniture & Equipment 144,444 14,820 20,000 20,000 0 55900 Misc Equipment 4,581,936 5,506,217 1,199,037 1,199,037 0 Total Equipment 11,452,425 11,845,781 4,631,653 4,838,653 207,000
Other FY19 Expenditure FY20 Expenditure FY21 Appropriation FY22 Recommended Inc/Dec 21 vs 22
56200 Special Appropriation 0 0 0 0 0 57200 Structures & Improvements 0 0 0 0 0 58000 Land & Non-Structure 22,170 17,449 20,000 20,000 0 Total Other 22,170 17,449 20,000 20,000 0
Grand Total 259,809,035 277,013,031 271,548,664 274,408,200 2,859,536

304 Public SafetyFire Department
Department Personnel
Title Union Code Grade Position FY22 Salary Title
Union Code Grade Position FY22 Salary
Admin Analyst AFI 14 2.00 112,851 Fire Fighter-Advance Technician IFF 01AT 57.00 6,826,765 Admin Secretary AFI 14 1.00 60,125 Fire Fighter-Technician IFF 01T 149.00 17,392,145 Administrative_Assistant AFI 15 2.00 135,265 Fire Lieut Scuba Diver Tech IFF 02T 1.00 144,666 Administrative_Asst. AFI 17 2.00 149,848 Fire Lieutenant IFF 02 149.00 20,762,318 Assoc Inspec Engineer (BFD) SE1 09 3.00 349,501 Fire Lieutenant (ScubaDiver) IFF 02 3.00 424,839 Asst Prin Accntant. AFI 14 3.00 149,892 Fire Lieutenant Administration IFF 02 30.00 4,391,311 Asst Supn(Bfd/Fad) IFF 05 1.00 180,575 Fire Lieutenant-ADR IFF 02 5.00 678,970 Case Manager (BFD) SE1 08 1.00 108,468 Fire Lieutenant-AdvanceTech IFF 02AT 9.00 1,285,531 Chaplain (Fire Dept) AFI 12 2.00 95,811 Fire Lieutenenant Tech IFF 02T 24.00 3,421,210
Chaplain In Charge AFI 12 1.00 53,451 Fire Lt Admn-AdvanceTechnician
IFF 02AT 2.00 303,515
Chemist IFF 05 1.00 180,939 Fire Prev Supv(Fire Prot Eng) SE1 10 1.00 126,024 Chief Bureau of Admin Serv (Fire) EXM NG 1.00 130,249 FireF(Divemaster) IFF 01 1.00 118,059 Chief of Field Services EXF NG 1.00 239,771 FireFighter IFF 01 807.00 90,947,850 Chief of Support Services EXF NG 1.00 239,771 FireFighter(AsstDiveMast) IFF 01 1.00 117,060 Chief Technology Officer EXM 12 1.00 135,427 FireFighter(AutoArsonUnit) IFF 01 2.00 239,497 Chief Telephone Operator AFI 10 1.00 41,946 FireFighter(EMSCoordinator) IFF 01 1.00 126,676 Collection Agent BFD Fire Preve AFI 14 1.00 60,125 FireFighter(FrstMarEngDi) IFF 01 1.00 93,431 Commissioner (BFD) CDH NG 1.00 250,687 FireFighter(InctComndSp)DEP IFF 01 8.00 917,271 Data Proc Equip Tech AFI 15 2.00 123,251 FireFighter(InctComndSp)DFC IFF 01 17.00 2,018,918 Dep Comm-Labor & Legal EXM NG 1.00 130,249 FireFighter(LEPCTitle3Insp) IFF 01 1.00 120,119 Dep Fire Chief IFF 06 10.00 2,051,131 FireFighter(MasOfFBoat) IFF 02 6.00 823,460
Dep Fire Chief Admn-AdvTechnician IFF 06AT 1.00 219,636 FireFighter(ScubaDiver) IFF 01 4.00 482,455
Deputy Fire Chief Administration IFF 06 7.00 1,537,236 FirePreventionPermitTech AFI 18A 1.00 80,116 Dir Human Resources (Fire) EXM 12 1.00 133,094 Fleet Safety Coordinator SE1 10 1.00 119,022 Dir Transportation EXM 11 1.00 130,493 Frpr-Lineperson&CableSplicers IFF 03 2.00 309,128 Dist Fire Chief IFF 05 22.00 3,948,558 Frprs Electrical Equip Rprprs IFF 03 1.00 154,564 Dist Fire Chief-Adm Asst Dvmtr IFF 05 1.00 190,947 FUIArmorer IFF 01 1.00 122,868 Distric F Chief Liaison/Ret Bd IFF 05 1.00 194,493 FUIDigitalLabSupervisor IFF 01 1.00 122,919 District Fire Chief Admin. IFF 05 6.00 1,151,989 FUISupervisorPhotoUnit IFF 01 1.00 118,570
District Fire Chief Admn-AdvTech
IFF 05AT 2.00 388,648 Gen Main Mech Frprs (CFM) AFG 19A 3.00 283,676
District Fire Chief Tech IFF 05T 16.00 2,922,802 Gen Maint Mech AFI 11L 2.00 91,982 District Fire Chief-Adv Tech IFF 05AT 4.00 733,714 Gen Maint Mech Frprs AFG 16A 2.00 153,720 Diversity Officer EXM 08 1.00 92,700 GenFrprs-FireAlarmConstruct IFF 04 1.00 169,841 DP Sys Anl SE1 06 2.00 160,027 Head Clerk AFI 12 13.00 615,627
EAP Coordinator IFF 02 1.00 147,957 Hvy Mtr Equip Repairperson BFD
AFI 16 8.00 491,678
EAP Counselor IFF 01 3.00 369,851 Incident Command Tech to Fire Commissioner IFF 01 2.00 236,483
Electrical Equip Repairperson IFF 01 3.00 321,150 Inside Wireperson IFF 02 3.00 405,584 Exec Asst Facilities SE1 10 1.00 126,024 Lineperson IFF 01 5.00 527,823
Executive Assistant Commissioner
IFF 05 1.00 196,811 Maint Mech - HVAC Technician AFI 14 1.00 43,049
FF - Safety Specialist IFF 01 2.00 228,925 Maint Mech (Painter) AFI 12L 1.00 54,233 FF (Asst To Pub Inf Officer) IFF 01 1.00 122,378 Maint Mech Frprs (Plumber) AFI 15A 1.00 68,172 FF (FPD InspLev2Certification) IFF 01 2.00 249,667 Management Analyst SE1 05 2.00 163,404 FF (FPD Night Division Inspec) IFF 01 5.00 641,136 Mask Repair Specialist IFF 01 3.00 342,685 FF (FPDInspLevl1Certification) IFF 01 10.00 1,202,447 Mgmt Analyst SE1 06 1.00 78,563 FF (Juvenile F5 Program) IFF 01 1.00 118,570 Motor Equ RpprclassI(Bpdfleet) AFI 18 3.00 255,855
FF (Procurement Offcr) IFF 01 1.00 124,733 Motor Equip Rppr ClassII (Bpdfleet)
AFI 16 1.00 73,932
FF Master Fire Boat Scuba Diver IFF 02 1.00 142,140 Prin Admin Assistant SE1 08 6.00 601,362 FF Soc Best Team Adv Tech IFF 01AT 3.00 385,500 Prin Clerk AFI 09 1.00 41,129 FF(ConstituentLiaisonOff) IFF 01 1.00 130,374 Prin Data Proc Systems Analyst SE1 10 1.00 126,024 FF(FPDPlaceofAssemblyInsp) IFF 01 8.00 989,582 Prin Fire Alarm Operator IFF 03 4.00 617,058

Public SafetyFire Department 305
Title
Union Code
Grade Position FY22 Salary Title Union Code
Grade Position FY22 Salary
FF(FPDSpecialHazardsInsp) IFF 01 3.00 370,252 Prin.Accnt. AFI 16 1.00 73,150
FF(IncidentCommandSp)DFC-AdvTe IFF 01AT 2.00 247,028 Prin_Storekeeper AFI 14 1.00 43,049
FF(NFIRSProgramManager) IFF 01 2.00 218,365 Public Information Officer IFF 01 1.00 126,586 FFTechnicianFemaleLiaisonOffcr IFF 01 1.00 122,318 Radio Operator (BFD) IFF 02 1.00 135,744 FF-Training Inst Adv Tech IFF 01AT 1.00 130,476 Radio Repairperson (BFD) IFF 01 1.00 108,569 Fire Alarm Operator IFF 01 21.00 2,318,984 Radio Supvervisor (BFD) IFF 04 1.00 169,841 Fire Captain IFF 03 50.00 7,913,521 Sr Adm Asst SE1 05 9.00 738,063 Fire Captain (ScubaDiver) IFF 03 1.00 160,511 Sr Adm Asst (BFD) SE1 06 8.00 709,116
Fire Captain Admin Scuba DivAdvTech
IFF 03AT 1.00 174,241 Sr Data Proc Sys Analyst SE1 08 5.00 468,467
Fire Captain Administration IFF 03 14.00 2,334,562 Sr Fire Alarm Oper (Train Ofc) IFF 02 1.00 141,417
Fire Captain Admn-Advance Tech
IFF 03AT 2.00 347,934 Sr Fire Alarm Operator IFF 02 5.00 677,273
Fire Captain Tech IFF 03T 7.00 1,129,176 Sr Legal Asst (BFD) AFI 15 1.00 67,633 Fire Captain-Advance Technician IFF 03AT 3.00 487,785 Supn (BFD/FAD) IFF 06 1.00 201,898
Fire Fighter (SOC Eq & Log Mgr) Tech IFF 01T 1.00 123,361 Supv Management Svcs AFI 17 1.00 77,785
Fire Fighter ICS DFC Tech IFF 01T 16.00 1,922,397 Wkg Frpr Linepr & Cablesplicer IFF 02 5.00 675,924
Fire Fighter Paid Detail Officer IFF 01 6.00 735,007 Wkg Frprs Leather & Canvas Wkr
AFG 13 1.00 56,371
Fire Fighter(AstSupnMaint) IFF 05 1.00 188,450 Wkg Frprs Machinist IFF 02 1.00 135,594 Fire Fighter(Training Instruc) IFF 01 4.00 499,010 WkgFrprElec.EquipRepairprs IFF 02 1.00 135,594 Total 1,680 204,677,524 Adjustments Differential Payments 1,800,000 Other 21,114,851 Chargebacks 170,388 Salary Savings -3,989,271 FY22 Total Request 223,773,492
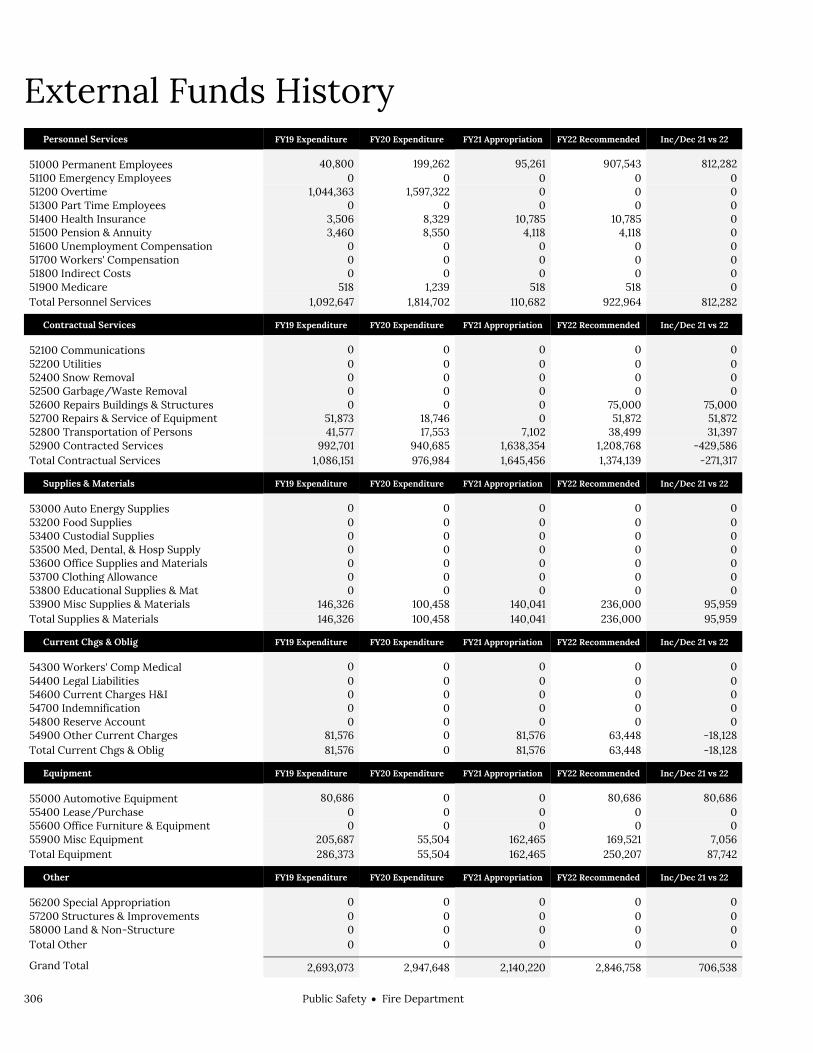
306 Public SafetyFire Department
External Funds History Personnel Services FY19 Expenditure FY20 Expenditure FY21 Appropriation FY22 Recommended Inc/Dec 21 vs 22
51000 Permanent Employees 40,800 199,262 95,261 907,543 812,282 51100 Emergency Employees 0 0 0 0 0 51200 Overtime 1,044,363 1,597,322 0 0 0 51300 Part Time Employees 0 0 0 0 0 51400 Health Insurance 3,506 8,329 10,785 10,785 0 51500 Pension & Annuity 3,460 8,550 4,118 4,118 0 51600 Unemployment Compensation 0 0 0 0 0 51700 Workers' Compensation 0 0 0 0 0 51800 Indirect Costs 0 0 0 0 0 51900 Medicare 518 1,239 518 518 0 Total Personnel Services 1,092,647 1,814,702 110,682 922,964 812,282
Contractual Services FY19 Expenditure FY20 Expenditure FY21 Appropriation FY22 Recommended Inc/Dec 21 vs 22
52100 Communications 0 0 0 0 0 52200 Utilities 0 0 0 0 0 52400 Snow Removal 0 0 0 0 0 52500 Garbage/Waste Removal 0 0 0 0 0 52600 Repairs Buildings & Structures 0 0 0 75,000 75,000 52700 Repairs & Service of Equipment 51,873 18,746 0 51,872 51,872 52800 Transportation of Persons 41,577 17,553 7,102 38,499 31,397 52900 Contracted Services 992,701 940,685 1,638,354 1,208,768 -429,586 Total Contractual Services 1,086,151 976,984 1,645,456 1,374,139 -271,317
Supplies & Materials FY19 Expenditure FY20 Expenditure FY21 Appropriation FY22 Recommended Inc/Dec 21 vs 22
53000 Auto Energy Supplies 0 0 0 0 0 53200 Food Supplies 0 0 0 0 0 53400 Custodial Supplies 0 0 0 0 0 53500 Med, Dental, & Hosp Supply 0 0 0 0 0 53600 Office Supplies and Materials 0 0 0 0 0 53700 Clothing Allowance 0 0 0 0 0 53800 Educational Supplies & Mat 0 0 0 0 0 53900 Misc Supplies & Materials 146,326 100,458 140,041 236,000 95,959 Total Supplies & Materials 146,326 100,458 140,041 236,000 95,959
Current Chgs & Oblig FY19 Expenditure FY20 Expenditure FY21 Appropriation FY22 Recommended Inc/Dec 21 vs 22
54300 Workers' Comp Medical 0 0 0 0 0 54400 Legal Liabilities 0 0 0 0 0 54600 Current Charges H&I 0 0 0 0 0 54700 Indemnification 0 0 0 0 0 54800 Reserve Account 0 0 0 0 0 54900 Other Current Charges 81,576 0 81,576 63,448 -18,128 Total Current Chgs & Oblig 81,576 0 81,576 63,448 -18,128
Equipment FY19 Expenditure FY20 Expenditure FY21 Appropriation FY22 Recommended Inc/Dec 21 vs 22
55000 Automotive Equipment 80,686 0 0 80,686 80,686 55400 Lease/Purchase 0 0 0 0 0 55600 Office Furniture & Equipment 0 0 0 0 0 55900 Misc Equipment 205,687 55,504 162,465 169,521 7,056 Total Equipment 286,373 55,504 162,465 250,207 87,742
Other FY19 Expenditure FY20 Expenditure FY21 Appropriation FY22 Recommended Inc/Dec 21 vs 22
56200 Special Appropriation 0 0 0 0 0 57200 Structures & Improvements 0 0 0 0 0 58000 Land & Non-Structure 0 0 0 0 0 Total Other 0 0 0 0 0
Grand Total 2,693,073 2,947,648 2,140,220 2,846,758 706,538
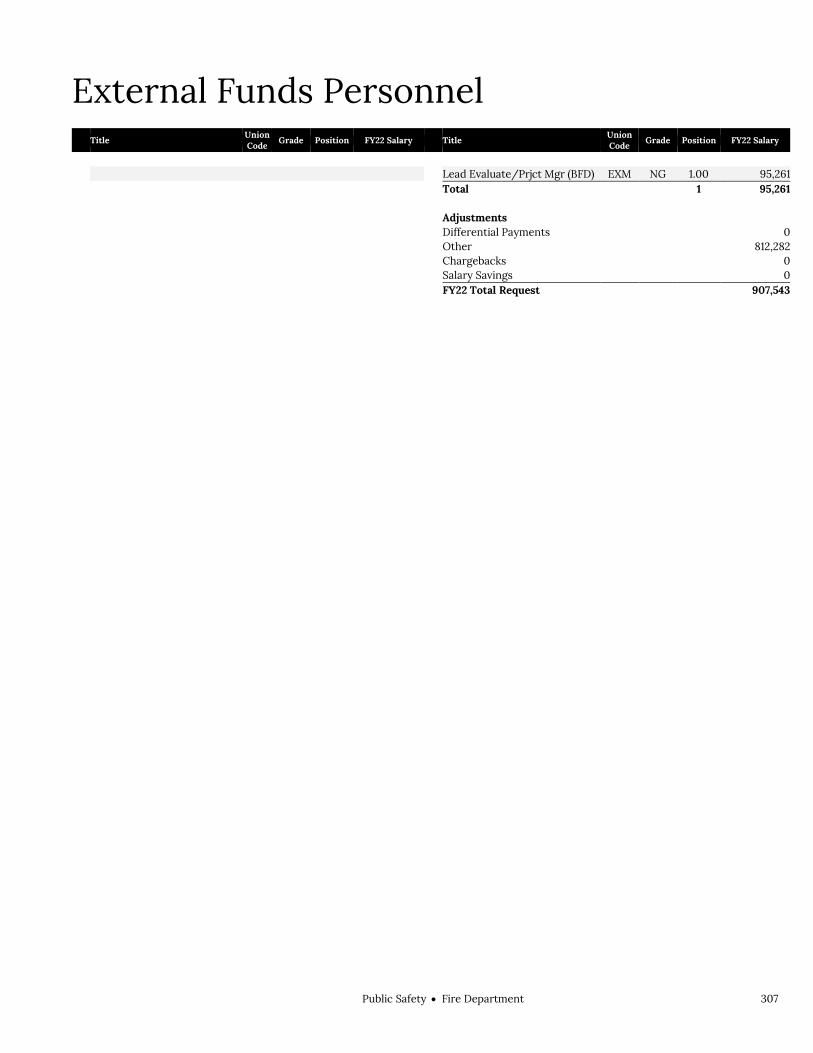
Public SafetyFire Department 307
External Funds Personnel
Title Union Code Grade Position FY22 Salary Title
Union Code Grade Position FY22 Salary
Lead Evaluate/Prjct Mgr (BFD) EXM NG 1.00 95,261
Total 1 95,261 Adjustments Differential Payments 0 Other 812,282 Chargebacks 0 Salary Savings 0 FY22 Total Request 907,543

308 Public SafetyFire Department
Program 1. Administration John Dempsey, Manager, Organization 221100
Program Description The Administration Program is responsible for the efficient daily management and administration of the Fire Department. Fire Administration coordinates all activities in other department programs. The command staff ensures that all orders and policies of the Fire Commissioner are coordinated and successfully implemented.
Operating Budget Actual '19 Actual '20 Approp '21 Budget '22
Personnel Services 12,425,176 13,043,654 13,871,174 14,509,887 Non Personnel 7,304,455 7,626,473 7,242,502 7,034,304 Total 19,729,631 20,670,127 21,113,676 21,544,191

Public SafetyFire Department 309
Program 2. Boston Fire Suppression Andre R Stallworth, Manager, Organization 221200
Program Description The Fire Suppression Program is responsible for extinguishing all fires and protecting life and property in emergencies for the citizens of Boston, and for surrounding communities on a mutual aid basis. The Fire Suppression Program force responds to hazardous material incidents as well as man-made and natural disasters.
Operating Budget Actual '19 Actual '20 Approp '21 Budget '22
Personnel Services 186,773,452 201,001,394 199,283,196 202,009,096 Non Personnel 9,010,702 7,592,988 5,974,654 6,203,477 Total 195,784,154 208,594,382 205,257,850 208,212,573

310 Public SafetyFire Department
Program 3. Fire Alarm Stephen Keeley, Manager, Organization 221300
Program Description The Fire Alarm Program is responsible for receiving alarms, dispatching apparatus, and control and movement of appropriate personnel and equipment. The program also monitors the status of all firefighting companies and is responsible for all communications, radios, electrical equipment, and appliances in the department.
Operating Budget Actual '19 Actual '20 Approp '21 Budget '22
Personnel Services 7,636,342 8,415,281 9,571,335 9,549,381 Non Personnel 2,206,670 2,015,372 2,802,520 2,838,396 Total 9,843,012 10,430,653 12,373,855 12,387,777

Public SafetyFire Department 311
Program 4. Training Steven E. Shaffer, Manager, Organization 221400
Program Description The Training Program is responsible for training new personnel and retraining existing personnel in firefighting and emergency medical and rescue techniques. This includes assisting eligible candidates in preparing for promotional examinations. The program also evaluates new tools and equipment.
Operating Budget Actual '19 Actual '20 Approp '21 Budget '22
Personnel Services 4,032,761 4,532,787 5,163,421 4,675,986 Non Personnel 372,009 471,899 355,405 351,045 Total 4,404,770 5,004,686 5,518,826 5,027,031
Performance
Goal: To ensure the safety, health and wellness of the City of Boston fire fighters by providing training in all aspects of Fire Services (including education in prevention) to ensure public safety
Performance Measures Actual '19 Actual '20 Projected '21 Target '22
Companies trained in Back to Basics. 228 228 228 228

312 Public SafetyFire Department
Program 5. Maintenance Joseph McMahon, Manager, Organization 221500
Program Description The Maintenance Program is responsible for repair and evaluation of all apparatus and other vehicles assigned to the Fire Department. The program also evaluates, repairs, and provides supplies for the department's facilities.
Operating Budget Actual '19 Actual '20 Approp '21 Budget '22
Personnel Services 3,297,998 3,559,223 3,933,666 3,761,590 Non Personnel 12,693,851 14,328,823 7,886,526 8,052,625 Total 15,991,849 17,888,046 11,820,192 11,814,215
Performance
Goal: To ensure City of Boston citizens are safe and protected from all emergencies with adequate fire fighting capacity in the field
Performance Measures Actual '19 Actual '20 Projected '21 Target '22
Apparatus purchased by fiscal year. 8 8 6 6

Public SafetyFire Department 313
Program 6. Fire Prevention Paul Glora, Manager, Organization 221600
Program Description The Fire Prevention Program is responsible for decreasing fire incidents through engineering, education, and enforcement. Fire Prevention conducts awareness programs especially designed for the target audience and through media campaigns.
Operating Budget Actual '19 Actual '20 Approp '21 Budget '22
Personnel Services 13,122,324 13,317,105 14,201,644 14,158,898 Non Personnel 318,071 274,410 418,519 435,118 Total 13,440,395 13,591,515 14,620,163 14,594,016
Performance
Goal: To ensure City of Boston citizens are safe and protected from all emergencies with adequate fire fighting capacity in the field
Performance Measures Actual '19 Actual '20 Projected '21 Target '22
% Calls Responded to under 4 Mins. 80% 60% 60% 65%
Elderly outreach and education visits. 1,575 876 0 400
Knock and Drop community programs held. 488 203 300 350
Number of incidents responded to 83,197 84,357 70,000 72,000
Response Time 4 4 4 4
School programs held to provide fire safety education. 383 234 0 100

314 Public SafetyFire Department
Program 7. Firefighter Safety, Health and Wellness James Lonergan, Manager, Organization 221800
Program Description The Firefighter Safety, Health and Wellness program works to protect and promote the well-being of Firefighters as they perform physically challenging responsibilities. The program includes creating awareness through fitness and medical evaluations, encouraging physical fitness and healthy eating and living, improving personal protective equipment, and providing safe driver training. Firefighters who are more physically fit, in addition to benefiting from general wellness benefits, encounter fewer workplace injuries from physically challenging repetitive situations.
Operating Budget Actual '19 Actual '20 Approp '21 Budget '22
Personnel Services 537,793 676,914 713,902 713,197 Non Personnel 77,431 156,708 130,200 115,200 Total 615,224 833,622 844,102 828,397
Performance
Goal: To protect City of Boston constituents and to ensure the safety, health and wellness of the fire fighters by preventing exposure to carcinogenic toxins and avoiding injuries.
Performance Measures Actual '19 Actual '20 Projected '21 Target '22
Firefighters attending resiliency, health and safety symposiums. 900 0 0 450

Public SafetyFire Department 315
External Funds Projects Assistance to Firefighters Grant Program
Project Mission Funding provided from the US Department of Homeland Security, Preparedness Directorate’s Office of Grants and Training, in cooperation with the United States Fire Administration under a competitive federal grant program. Prior years’ funding included the SAFER Grant (Staffing for Adequate Fire and Emergency Response) which provided funding to increase the number of trained, “front-line” firefighters and to construct a building at Moon Island to simulate wind driven fires as well as driver training education. FY20 funding will include the purchase of radio equipment and an accountability management system.
Assistance to Firefighters Grant Program -Supplemental
Project Mission The purpose of the Assistance to Firefighters Grant Program –Covid-19 Supplemental (AFG-S) is to provide funds for the purpose of PPE and related supplies, including reimbursements, to prevent, prepare for, and respond to coronavirus.
Fire Prevention and Education Fund
Project Mission This fund is supported by donations from private businesses, organizations, foundations, and individuals. It will be used to promote fire prevention and fire safety education.
Hazmat Materials Response
Project Mission A grant awarded through the Commonwealth of Massachusetts Executive Office of Public Safety for the Hazardous Materials Response Teams and for the Training Academy. This grant provides for additional training of BFD HazMat personnel and equipment.
Port Security Program Grant
Project Mission Funded through the U.S. Department of Homeland Security, the Port Security Program Grant will fund underwater hazardous device response training.
Pre-Disaster Mitigation
Project Mission This project will fund the first phase of the development of a cost-effective, resilient and environmentally viable protection strategy and mitigation plan for Moon Island and its causeway.
Recovery Services Program
Project Mission Funding from Substance Abuse and Mental Health Services Administration (SAMHSA) to reduce and prevent opioid overdoses. This will be attained by improving access to recovery services and support for affected families and collaborating with other first responders and community stakeholders.

316 Public SafetyFire Department
Safety, Health and Wellness
Project Mission This fund is supported by donations from private businesses, organizations, foundations, and individuals. It will be used to promote policies and procedures that will provide equipment, information, education, and training on firefighter health, wellness and safety.
State Training Grant
Project Mission Funded through the Commonwealth of Massachusetts Executive Office of Public Safety, for the purpose of providing equipment, training and administrative support for the BFD Training Academy on Moon Island.
The Last Call Foundation
Project Mission Funding provided by the foundation to the Boston Fire Department to develop technology to create lightweight fire-resistant hoses and to install commercial washing machines that remove toxins from a fire fighter's clothing in all fire houses.

Public SafetyFire Department 317
Fire Department Capital Budget Public Safety Fire Department
Overview The Fire Department continues to improve the fire protection and emergency services vital to neighborhood safety and security through capital investment in state-of-the-art technology and equipment. The five-year plan includes replacements or renovations of fire stations across the City.
FY22 Major Initiatives The department will purchase two new ladder trucks, three new engine trucks and a new
rescue truck as part of a multi-year fire apparatus replacement plan. Construction of a new fire station will be completed at Engine 42 in Egleston Square. Construction of a new fire station for Engine 17 in Dorchester will begin. Implementation of a phased radio system upgrade will continue. HVAC upgrades will continue at various fire stations, to improve energy efficiency and take
advantage of utility rebates. Design for infrastructure improvements to seawall adjacent to the Fire Department Training
Academy.
Capital Budget Expenditures Total Actual '19 Total Actual '20 Estimated '21 Total Projected '22
Total Department 5,879,233 9,099,953 31,078,600 29,095,913

318 Public SafetyFire Department
Fire Department Project Profiles BUILDING ENVELOPE REPAIRS AT VARIOUS STATIONS
Project Mission Building and envelope repairs at Engine 29, 32, 37, 53, and 56. Managing Department, Public Facilities Department Status, In Construction Location, Citywide Operating Impact, No
Authorizations
Source Existing FY22 Future Non Capital
Fund Total City Capital 5,610,000 0 0 0 5,610,000 Grants/Other 0 0 0 0 0 Total 5,610,000 0 0 0 5,610,000
Expenditures (Actual and Planned)
Source Thru
6/30/20 FY21 FY22 FY23-26 Total City Capital 94,400 100,000 2,000,000 3,415,600 5,610,000 Grants/Other 0 0 0 0 0 Total 94,400 100,000 2,000,000 3,415,600 5,610,000
ENGINE 17 Project Mission Design and construct a new fire station. Managing Department, Public Facilities Department Status, In Design Location, Dorchester Operating Impact, No
Authorizations
Source Existing FY22 Future Non Capital
Fund Total City Capital 5,000,000 19,700,000 0 0 24,700,000 Grants/Other 0 0 0 0 0 Total 5,000,000 19,700,000 0 0 24,700,000
Expenditures (Actual and Planned)
Source Thru
6/30/20 FY21 FY22 FY23-26 Total City Capital 34,147 1,500,000 3,000,000 20,165,853 24,700,000 Grants/Other 0 0 0 0 0 Total 34,147 1,500,000 3,000,000 20,165,853 24,700,000

Public SafetyFire Department 319
Fire Department Project Profiles ENGINE 3
Project Mission Design and construct a new fire station. Managing Department, Public Facilities Department Status, To Be Scheduled Location, South End Operating Impact, No
Authorizations
Source Existing FY22 Future Non Capital
Fund Total City Capital 3,000,000 0 0 0 3,000,000 Grants/Other 0 0 0 0 0 Total 3,000,000 0 0 0 3,000,000
Expenditures (Actual and Planned)
Source Thru
6/30/20 FY21 FY22 FY23-26 Total City Capital 0 0 100,000 2,900,000 3,000,000 Grants/Other 0 0 0 0 0 Total 0 0 100,000 2,900,000 3,000,000
ENGINE 33 Project Mission Building renovations including envelope repairs, door and window replacement, and interior improvements
including building systems.
Managing Department, Public Facilities Department Status, To Be Scheduled Location, Back Bay Operating Impact, No
Authorizations
Source Existing FY22 Future Non Capital
Fund Total City Capital 0 0 800,000 0 800,000 Grants/Other 0 0 0 0 0 Total 0 0 800,000 0 800,000
Expenditures (Actual and Planned)
Source Thru
6/30/20 FY21 FY22 FY23-26 Total City Capital 0 0 0 800,000 800,000 Grants/Other 0 0 0 0 0 Total 0 0 0 800,000 800,000
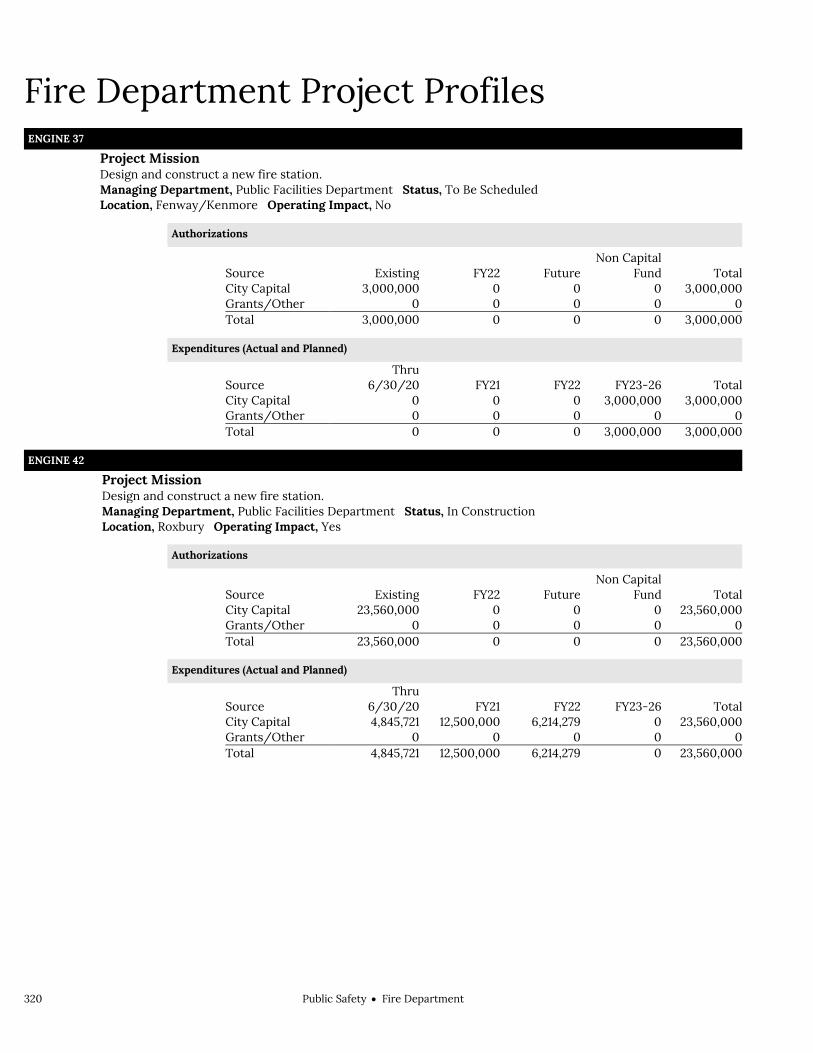
320 Public SafetyFire Department
Fire Department Project Profiles ENGINE 37
Project Mission Design and construct a new fire station. Managing Department, Public Facilities Department Status, To Be Scheduled Location, Fenway/Kenmore Operating Impact, No
Authorizations
Source Existing FY22 Future Non Capital
Fund Total City Capital 3,000,000 0 0 0 3,000,000 Grants/Other 0 0 0 0 0 Total 3,000,000 0 0 0 3,000,000
Expenditures (Actual and Planned)
Source Thru
6/30/20 FY21 FY22 FY23-26 Total City Capital 0 0 0 3,000,000 3,000,000 Grants/Other 0 0 0 0 0 Total 0 0 0 3,000,000 3,000,000
ENGINE 42 Project Mission Design and construct a new fire station. Managing Department, Public Facilities Department Status, In Construction Location, Roxbury Operating Impact, Yes
Authorizations
Source Existing FY22 Future Non Capital
Fund Total City Capital 23,560,000 0 0 0 23,560,000 Grants/Other 0 0 0 0 0 Total 23,560,000 0 0 0 23,560,000
Expenditures (Actual and Planned)
Source Thru
6/30/20 FY21 FY22 FY23-26 Total City Capital 4,845,721 12,500,000 6,214,279 0 23,560,000 Grants/Other 0 0 0 0 0 Total 4,845,721 12,500,000 6,214,279 0 23,560,000

Public SafetyFire Department 321
Fire Department Project Profiles FIRE ALARM ROOF AND ANTENNA
Project Mission Exterior repointing, roof replacement, skylight replacement, and repairs to rooftop masonry and antenna supports. Managing Department, Public Facilities Department Status, In Design Location, Fenway/Kenmore Operating Impact, No
Authorizations
Source Existing FY22 Future Non Capital
Fund Total City Capital 1,550,000 0 0 0 1,550,000 Grants/Other 0 0 0 0 0 Total 1,550,000 0 0 0 1,550,000
Expenditures (Actual and Planned)
Source Thru
6/30/20 FY21 FY22 FY23-26 Total City Capital 0 18,366 1,531,634 0 1,550,000 Grants/Other 0 0 0 0 0 Total 0 18,366 1,531,634 0 1,550,000
FIRE EQUIPMENT FY22 Project Mission Purchase new fire apparatus for FY22 as scheduled in the Apparatus Replacement Plan. Managing Department, Fire Department Status, Annual Program Location, Citywide Operating Impact, No
Authorizations
Source Existing FY22 Future Non Capital
Fund Total City Capital 4,400,000 0 0 0 4,400,000 Grants/Other 0 0 0 0 0 Total 4,400,000 0 0 0 4,400,000
Expenditures (Actual and Planned)
Source Thru
6/30/20 FY21 FY22 FY23-26 Total City Capital 0 0 4,400,000 0 4,400,000 Grants/Other 0 0 0 0 0 Total 0 0 4,400,000 0 4,400,000

322 Public SafetyFire Department
Fire Department Project Profiles FIRE EQUIPMENT FY23-FY26
Project Mission Purchase new fire apparatus for FY23-FY26 as scheduled in the Apparatus Replacement Plan. Managing Department, Fire Department Status, Annual Program Location, Citywide Operating Impact, No
Authorizations
Source Existing FY22 Future Non Capital
Fund Total City Capital 4,050,000 4,000,000 2,750,000 0 10,800,000 Grants/Other 0 0 0 0 0 Total 4,050,000 4,000,000 2,750,000 0 10,800,000
Expenditures (Actual and Planned)
Source Thru
6/30/20 FY21 FY22 FY23-26 Total City Capital 0 0 0 10,800,000 10,800,000 Grants/Other 0 0 0 0 0 Total 0 0 0 10,800,000 10,800,000
FIRE HEADQUARTERS Project Mission Building renovations at the Boston Fire Department Headquarters building, including installation of a new security
gate.
Managing Department, Public Facilities Department Status, In Design Location, Dorchester Operating Impact, No
Authorizations
Source Existing FY22 Future Non Capital
Fund Total City Capital 1,290,000 0 0 0 1,290,000 Grants/Other 0 0 0 0 0 Total 1,290,000 0 0 0 1,290,000
Expenditures (Actual and Planned)
Source Thru
6/30/20 FY21 FY22 FY23-26 Total City Capital 8,244 31,600 450,000 800,156 1,290,000 Grants/Other 0 0 0 0 0 Total 8,244 31,600 450,000 800,156 1,290,000

Public SafetyFire Department 323
Fire Department Project Profiles FIRE RADIO SYSTEM UPGRADES
Project Mission Design and implementation of upgrades to the Fire radio system. Managing Department, Fire Department Status, Implementation Underway Location, Citywide Operating Impact, No
Authorizations
Source Existing FY22 Future Non Capital
Fund Total City Capital 15,300,000 30,700,000 0 0 46,000,000 Grants/Other 0 0 0 0 0 Total 15,300,000 30,700,000 0 0 46,000,000
Expenditures (Actual and Planned)
Source Thru
6/30/20 FY21 FY22 FY23-26 Total City Capital 0 3,000,000 10,800,000 32,200,000 46,000,000 Grants/Other 0 0 0 0 0 Total 0 3,000,000 10,800,000 32,200,000 46,000,000
HVAC / BOILER REPLACEMENT AT VARIOUS STATIONS Project Mission Install boilers, heating and lighting systems at fire stations including Engines 41, Engine 53, and the Fire Alarm
Division.
Managing Department, Fire Department Status, Implementation Underway Location, Various neighborhoods Operating Impact, No
Authorizations
Source Existing FY22 Future Non Capital
Fund Total City Capital 3,100,000 0 231,083 0 3,331,083 Grants/Other 206,614 0 0 0 206,614 Total 3,306,614 0 231,083 0 3,537,697
Expenditures (Actual and Planned)
Source Thru
6/30/20 FY21 FY22 FY23-26 Total City Capital 2,090,247 250,000 500,000 490,836 3,331,083 Grants/Other 201,514 0 0 5,100 206,614 Total 2,291,761 250,000 500,000 495,936 3,537,697

324 Public SafetyFire Department
Fire Department Project Profiles MOON ISLAND SEAWALL
Project Mission Design for infrastructure improvements to seawall adjacent to the Fire Department Training Academy. Managing Department, Public Facilities Department Status, In Design Location, Harbor Islands Operating Impact, No
Authorizations
Source Existing FY22 Future Non Capital
Fund Total City Capital 800,000 0 0 0 800,000 Grants/Other 0 0 0 0 0 Total 800,000 0 0 0 800,000
Expenditures (Actual and Planned)
Source Thru
6/30/20 FY21 FY22 FY23-26 Total City Capital 0 0 100,000 700,000 800,000 Grants/Other 0 0 0 0 0 Total 0 0 100,000 700,000 800,000

Public SafetyPolice Department 325
Police Department Operating Budget Public Safety Police Department Dennis White, Commissioner, Appropriation 211000
Department Mission The mission of the Police Department is Neighborhood Policing. The Department dedicates itself to work in partnership with the community to fight crime, reduce fear, and improve the quality of life in Boston's neighborhoods.
Selected Performance Goals Police Commissioner's Office
Divert and assist individuals experiencing crises related to mental health/substance use. Engage with the community. Prevent and reduce crime and violence.BAT-Operations
Timely and efficient response to crime and calls for service.BAT-Admin & Technology
Effectively manage overtime.Bureau of Field Services
Engage with the community. Prevent and reduce crime and violence.Bureau of Professional Standards
Provide accountability and transparency.Bureau of Investigative Services
Prevent and reduce crime and violence.
Operating Budget Program Name Total Actual '19 Total Actual '20 Projection '21 Total Budget '22
Police Commissioner's Office 9,148,894 9,858,589 14,171,395 13,963,041 Bureau of Community Engagement 0 4,248,149 6,386,804 4,208,894 BAT-Operations 28,134,822 12,824,055 19,360,455 19,079,371 BAT-Admin & Technology 58,322,837 77,298,755 81,143,986 81,067,358 Bureau of Professional Development 14,970,510 20,293,727 6,104,723 5,843,281 Bureau of Field Services 214,602,984 202,164,885 211,446,972 193,165,065 Bureau of Professional Standards 9,190,977 6,325,894 4,587,730 4,714,308 Bureau of Investigative Services 78,720,941 87,232,670 74,369,133 73,878,856 Bureau of Intelligence & Analysis 3,670,408 5,306,484 3,610,828 3,619,269
Total 416,762,373 425,553,208 421,182,026 399,871,218
External Funds Budget Fund Name Total Actual '19 Total Actual '20 Projection '21 Total Budget '22
Academy Revolving Fund 55,563 10,000 20,000 0 BC Neighborhood Improvements 0 0 0 2,615 BU Pilot Grant 4,221 4,648 0 0 Byrne JAG Reallocation 79,180 65,346 65,000 0 Canine Revolving Fund 31,905 75,000 100,000 100,000 CEASE Boston 19,026 78,976 85,722 109,154 COAP Program 0 37,584 160,596 161,520 Community Based Crime Reduction 0 0 0 15,361 Connecting the Peaces 3,475 0 0 0 Coverdell N.F.S.I. 32,790 14,500 31,315 12,784
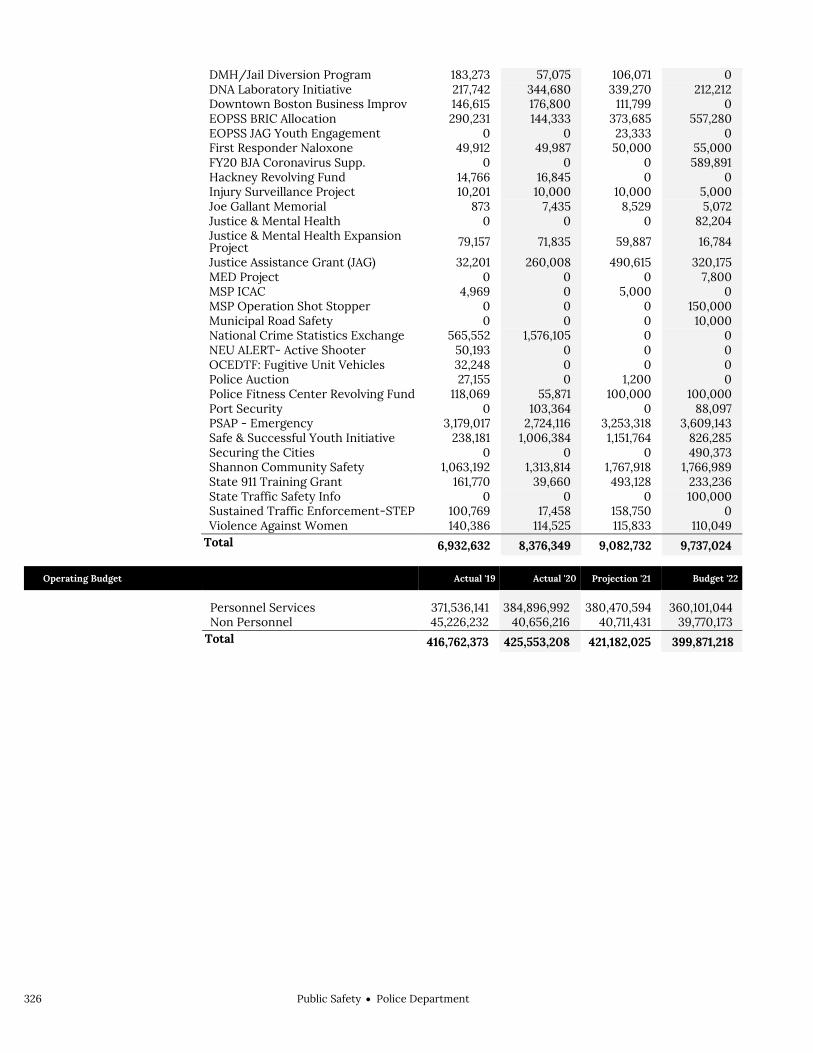
326 Public SafetyPolice Department
DMH/Jail Diversion Program 183,273 57,075 106,071 0 DNA Laboratory Initiative 217,742 344,680 339,270 212,212 Downtown Boston Business Improv 146,615 176,800 111,799 0 EOPSS BRIC Allocation 290,231 144,333 373,685 557,280 EOPSS JAG Youth Engagement 0 0 23,333 0 First Responder Naloxone 49,912 49,987 50,000 55,000 FY20 BJA Coronavirus Supp. 0 0 0 589,891 Hackney Revolving Fund 14,766 16,845 0 0 Injury Surveillance Project 10,201 10,000 10,000 5,000 Joe Gallant Memorial 873 7,435 8,529 5,072 Justice & Mental Health 0 0 0 82,204 Justice & Mental Health Expansion Project 79,157 71,835 59,887 16,784
Justice Assistance Grant (JAG) 32,201 260,008 490,615 320,175 MED Project 0 0 0 7,800 MSP ICAC 4,969 0 5,000 0 MSP Operation Shot Stopper 0 0 0 150,000 Municipal Road Safety 0 0 0 10,000 National Crime Statistics Exchange 565,552 1,576,105 0 0 NEU ALERT- Active Shooter 50,193 0 0 0 OCEDTF: Fugitive Unit Vehicles 32,248 0 0 0 Police Auction 27,155 0 1,200 0 Police Fitness Center Revolving Fund 118,069 55,871 100,000 100,000 Port Security 0 103,364 0 88,097 PSAP - Emergency 3,179,017 2,724,116 3,253,318 3,609,143 Safe & Successful Youth Initiative 238,181 1,006,384 1,151,764 826,285 Securing the Cities 0 0 0 490,373 Shannon Community Safety 1,063,192 1,313,814 1,767,918 1,766,989 State 911 Training Grant 161,770 39,660 493,128 233,236 State Traffic Safety Info 0 0 0 100,000 Sustained Traffic Enforcement-STEP 100,769 17,458 158,750 0 Violence Against Women 140,386 114,525 115,833 110,049
Total 6,932,632 8,376,349 9,082,732 9,737,024
Operating Budget Actual '19 Actual '20 Projection '21 Budget '22
Personnel Services 371,536,141 384,896,992 380,470,594 360,101,044 Non Personnel 45,226,232 40,656,216 40,711,431 39,770,173
Total 416,762,373 425,553,208 421,182,025 399,871,218

Public SafetyPolice Department 327
Police Department Operating Budget
Authorizing Statutes Police Commissioner, CBC St. 11 § 1; 1962
Mass. Acts ch. 322. Appointment, Removal and
Compensation of the Police and Complaints, CBC St. 11 § 4.
Powers and Duties of the Police, CBC St. 11 § 5; M.G.L.A. c. 41, § 98.
Detective Bureau, CBC St. 11 § 6. Generally, CBC St.11 §§ 1-25; CBC Ord. §§
11-1.1-11-1.6. Common Nuisance/Voiding of Lease ,
M.G.L.A. c. 139, § 19. Hackney Carriage, 1930 Mass. Acts ch.
392; 1931 Mass. Acts ch. 408 § 7; 1933 Mass. Acts ch. 306; 1934 Mass. Acts ch. 280.
Description of Services The Department provides many services to protect and serve residents of and visitors to the City of Boston. The Department provides: a well trained force of patrol officers to solve problems and reduce crime, victimization, and fear; a well trained force of detectives to investigate incidents of crime; a state-of-the-art Computer Aided Dispatch system; an administrative and management system to support the delivery of police services and an internal investigation function designed to ensure the integrity of all employees.
Special Operations Facilities Management
Finance
Central Supply
Human Resources
Licensing & Public Service
Commissioner
Firearms Training
AcademyMajor CasesBoston Regional
Intelligence Center
SignalsBureau of Field
Services
Waste Reducti
onBureau of
Administration & Technology
Bureau of Investigative
Services
Bureau of Professional Development
Office of the Legal Advisor
Bureau of Professional
Standards
Office of the Superintendent-in-
Chief
Special Events
Bureau of Intelligence &
Analysis
Zone Patrol 1
Zone Patrol 2
Zone Patrol 3
Field Support Information Technology
Fleet Management
Evidence Management
Operations
Anti-Corruption Division
Internal Affaits Division
Criminal Investigations
Forensics
Family Justice
Community Disorders
Investigative Planning

328 Public SafetyPolice Department
Department History Personnel Services FY19 Expenditure FY20 Expenditure FY21 Projection FY22 Recommended Inc/Dec 21 vs 22
51000 Permanent Employees 301,527,854 309,838,070 314,142,009 315,652,820 1,510,811 51100 Emergency Employees 0 0 0 0 0 51200 Overtime 69,759,822 74,694,593 65,803,585 43,923,226 -21,880,359 51600 Unemployment Compensation 82,639 98,036 300,000 300,000 0 51700 Workers' Compensation 165,826 266,293 225,000 225,000 0 Total Personnel Services 371,536,141 384,896,992 380,470,594 360,101,044 -20,369,550
Contractual Services FY19 Expenditure FY20 Expenditure FY21 Projection FY22 Recommended Inc/Dec 21 vs 22
52100 Communications 3,050,943 3,996,243 3,430,000 3,430,000 0 52200 Utilities 2,532,983 2,336,456 2,842,176 2,195,885 -646,291 52400 Snow Removal 0 0 0 0 0 52500 Garbage/Waste Removal 82,363 115,709 88,500 88,500 0 52600 Repairs Buildings & Structures 1,470,812 1,493,911 1,446,681 1,446,681 0 52700 Repairs & Service of Equipment 1,847,204 2,265,158 2,249,138 2,249,138 0 52800 Transportation of Persons 106,864 100,790 0 46,500 46,500 52900 Contracted Services 6,623,702 10,349,284 11,869,912 11,498,542 -371,379 Total Contractual Services 15,714,871 20,657,551 21,926,407 20,623,472 -1,302,935
Supplies & Materials FY19 Expenditure FY20 Expenditure FY21 Projection FY22 Recommended Inc/Dec 21 vs 22
53000 Auto Energy Supplies 1,900,554 1,780,912 2,414,950 1,784,666 -630,284 53200 Food Supplies 142,283 142,898 144,600 144,600 0 53400 Custodial Supplies 39,981 87,563 89,725 89,725 0 53500 Med, Dental, & Hosp Supply 0 0 0 0 0 53600 Office Supplies and Materials 252,224 301,453 276,566 276,566 0 53700 Clothing Allowance 2,035,981 2,053,284 1,973,211 1,973,211 0 53800 Educational Supplies & Mat 0 0 0 0 0 53900 Misc Supplies & Materials 3,149,015 4,071,088 3,392,353 3,392,353 0 Total Supplies & Materials 7,520,038 8,437,198 8,291,405 7,661,121 -630,284
Current Chgs & Oblig FY19 Expenditure FY20 Expenditure FY21 Projection FY22 Recommended Inc/Dec 21 vs 22
54300 Workers' Comp Medical 101,000 98,468 150,000 150,000 0 54400 Legal Liabilities 802,896 520,483 692,000 671,000 -21,00054500 Aid To Veterans 0 0 0 0 0 54600 Current Charges H&I 0 0 0 0 0 54700 Indemnification 3,470,545 3,241,682 2,500,000 2,500,000 0 54800 Reserve Account 0 0 0 0 0 54900 Other Current Charges 1,653,162 1,589,833 1,801,658 1,960,135 158,477 Total Current Chgs & Oblig 6,027,603 5,450,466 5,143,658 5,281,135 137,477
Equipment FY19 Expenditure FY20 Expenditure FY21 Projection FY22 Recommended Inc/Dec 21 vs 22
55000 Automotive Equipment 3,716,344 84,995 0 0 0 55400 Lease/Purchase 5,989,274 4,418,621 3,782,778 4,305,487 522,709 55600 Office Furniture & Equipment 66,425 26,630 30,000 30,000 0 55900 Misc Equipment 6,191,677 1,580,755 1,537,183 1,537,183 0 Total Equipment 15,963,720 6,111,001 5,349,961 5,872,670 522,709
Other FY19 Expenditure FY20 Expenditure FY21 Projection FY22 Recommended Inc/Dec 21 vs 22
56200 Special Appropriation 0 0 0 0 0 57200 Structures & Improvements 0 0 0 0 0 58000 Land & Non-Structure 0 0 0 0 0 Total Other 0 0 0 0 0
Grand Total 416,762,373 425,553,208 421,182,025 399,871,218 -21,310,807

Public SafetyPolice Department 329
Department Personnel
Title Union Code Grade Position FY22 Salary Title
Union Code Grade Position FY22 Salary
Adm.Sec. SU4 14 1.00 63,025 Police Captain/Hackney Investigator
PSO 04 1.00 159,362
Adm_Asst SU4 15 3.00 198,755 Police Captain-DDC/HRCD PSO 05 1.00 195,958 Admin Asst (BPD) SE1 04 1.00 75,441 Police Clerk And Typist SU4 10 53.00 2,477,682 Admin Asst/EvidencTechncn(BPD) SU4 14 2.00 95,977 Police Detective PDB 01 284.00 32,938,125 Admin_Asst SE1 05 1.00 74,110 Police Dispatcher SU4 17 40.00 3,143,484
Assoc Dir,BPD Office of Reas & Devel SE1 08 1.00 108,468 Police Lieut/Paid Detail Ser PSO 03 1.00 163,862
Asst Corp Counsel I EXM 05 1.00 71,744 Police Lieutenant PSO 03 45.00 7,278,222 Asst Dir BPD Neigh Crime Watch SE1 07 1.00 99,243 Police Lieutenant (Det) PDS 03 25.00 4,188,288 Asst Payroll Supervisor SE1 06 1.00 90,319 Police Lieutenant Det PDS 03 2.00 309,828
Asst Prin Accountant SU4 14 3.00 182,617 Police Lieutenant-Hdqs Dispatcher
PSO 03 3.00 466,768
Audio-Visual Tech & Photograph SU4 11 1.00 54,425 Police Lieutenat/Mobile Operations
PSO 03 2.00 319,751
Bldg Maint Supervisor AFG 18 1.00 89,781 Police Off BPP 01 1,286.00 125,661,175 BPD Homicide Intelligence Anl EXM 06 1.00 72,325 Police Off Harbor Boat BPP 03 11.00 1,203,826 Building Systems Engineer SE1 11 1.00 133,756 Police Officer Ballistician BPP 04 3.00 303,400 Business Operations Data Analyst SE1 06 1.00 60,314 Police Officer Bomb Squad BPP 07 5.00 536,060 Buyer SU4 15 2.00 134,888 Police Officer Breath BPP 05 1.00 116,358 Cadet BPC 01 40.00 1,172,451 Police Officer Canine2$6 BPP 02 17.00 1,785,157 Captain/Academy Instructor PSO 04 1.00 188,548 Police Officer Harbor Boat BPP 03 4.00 430,908 Captain/Supv of Court Cases PSO 04 1.00 188,548 Police Officer Hdq Dispatch BPP 07 14.00 1,508,423 Chaplain EXO NG 4.00 67,786 Police Officer/BombSquad BPP 07 10.00 1,105,583
ChCommEquipOper I (SCTT) SU4 14 14.00 851,911 Police Officer/Comm Serv Officer BPP 03 46.00 4,993,930
Collection Agent (BPD) SU4 15 2.00 127,803 Police Officer-Canine Officer2$6 BPP 02 8.00 884,688 Collection Agent I SU4 17 2.00 165,479 Police Sargeant/FET PSO 02 6.00 821,108 Commissioner (BPD) CDH NG 1.00 250,687 Police Sargeant/HackneyInvest PSO 02 1.00 142,619 Commun Equip Op III, R-13 (CT) SU4 13 62.00 3,223,360 Police Sargeant/MobileOper PSO 02 6.00 826,794 Communic. EquipOp II 9II(SS) SU4 12 36.00 1,935,032 Police Sargeant/PdDetServ PSO 02 2.00 268,871
Community Services Officer SE1 05 12.00 912,182 Police Sargeant/SupvCourtCases
PSO 02 6.00 853,514
Contract Manager SE1 07 1.00 99,243 Police Sergeant PSO 02 128.00 17,697,740 Criminalist I PDF 01 12.00 762,659 Police Sergeant (Det) PDS 02 66.00 9,611,284 Criminalist II PDF 02 3.00 247,097 Police Sergeant Det PDS 02 50.00 7,269,765 Criminalist III PDF 03 11.00 1,108,071 PoliceCaptain/DDC PSO 05 15.00 2,888,671 Criminalist IV PDF 04 10.00 1,144,298 PoliceLieutenant/Acad Instruct PSO 03 1.00 139,065 Data Proc Coordinator SE1 04 1.00 75,441 PoliceOff/JuvenileOffc BPP 04 13.00 1,391,955 Data Proc Equip Tech (BPD) SU4 17 3.00 241,725 PoliceOfficer/AutoInv BPP 04 1.00 97,885 Data Proc Svcs Director (BPD) SE1 12 1.00 138,813 PoliceOfficer/AutoInvest BPP 04 10.00 1,040,276 DataProgrmming&ApplicationTech SU4 17 1.00 82,876 PoliceOfficer/FgrPrtEvTch BPP 04 2.00 211,317 Dep Chief Staff EXM 07 1.00 69,999 PoliceOfficer/FgrPrtEvTech BPP 04 22.00 2,327,151 Dep Dir Chief Financial Officer EXM 13 1.00 140,945 PoliceOfficer/HospLiaison BPP 04 4.00 455,984 Dep Dir of Human Resources BPD EXM 09 1.00 90,307 PoliceOfficerAcadInst2$6 BPP 02 1.00 116,640 Dep Supn (BPD) EXP 02 11.00 2,273,108 PoliceOfficerAcadInstr2$6 BPP 02 22.00 2,339,689 Digital Video Technician SU4 14 1.00 51,977 PoliceOfficerHackneyInvest BPP 03 2.00 214,054 Dir Forensic Quality Control SE1 10 1.00 126,024 PoliceOfficerMobileOfficer2$6 BPP 02 39.00 4,056,009 Dir of Human Resources (BPD) EXM 12 1.00 135,427 PoliceOfficerMobileOper2$6 BPP 02 2.00 227,823 Dir of Latent Print Unit (BPD) EXM 12 1.00 135,427 PoliceSargeant/BombSquad PSO 02 2.00 292,904 Dir of Quality Assurance EXM 10 1.00 122,950 PoliceSargeant/CHFRADIODISP PSO 02 11.00 1,577,602 Dir/OfficeofResearch&DeveloBPD EXM 11 1.00 130,493 PoliceSargeant/CommServOffc PSO 02 11.00 1,502,935 Dir-Crimalistic Services EXM 12 1.00 131,227 PoliceSargeant/HdqDispatcher PSO 02 1.00 148,207 Director of Health & Wellness SE1 07 0.50 49,622 PoliceSergeant/AcadInstructor PSO 02 4.00 541,367 Director of Projects & Initiat SE1 10 1.00 126,024 Prin Accountant SU4 16 1.00 72,485 Director of Transportation SE1 11 1.00 133,756 Prin Dp Sys Anl-DP SE1 11 1.00 133,756 Dir-Public Info (BPD) EXM 11 1.00 130,493 Prin Personnnel Officer SE1 04 2.00 139,513

330 Public SafetyPolice Department
Title
Union Code
Grade Position FY22 Salary Title Union Code
Grade Position FY22 Salary
Dir-Signal Service (BPD) SE1 10 1.00 126,024 Prin Research Analyst SE1 06 7.00 563,989 Distance Learning Coordinator EXM 06 1.00 88,116 Prin/Storekeeper SU4 11 3.00 141,237 DiversityRecruitmntOff&ExmAdmn EXM 09 1.00 97,510 Prin_Admin_Assistant SE1 08 11.00 1,155,688 DP Sys Anl SE1 06 5.00 438,161 Prin_Admin_Asst SE1 09 2.00 210,632 Employee Development Asst(Ems) SU4 16 1.00 76,637 Public Relations Rep (BPD) SU4 10 1.00 51,838 Exec Asst (B.P.D.) EXM 12 1.00 103,525 Radio Supv (BPD) SE1 11 1.00 133,756 Exec Asst (BPD) EXM 11 1.00 130,493 Research Analyst SU4 11 4.00 197,747 Exec Sec (BPD) SU4 15 10.00 697,185 Research Assist (Bpd) SU4 14 1.00 63,025 Exec Sec (IGR) SE1 04 1.00 75,441 School Traffic Supv STS 01 207.00 3,002,027 Exec_Asst_(BPD) SE1 11 2.00 267,512 Senior_Admin_Asst SE1 07 1.00 99,243 ExecSec (BPD) SE1 03 2.00 137,197 Sergeant/HarborPatrol PSO 02 2.00 283,166 Executive Coordinator SU4 18 1.00 93,199 Signalperson-Elec SU4 19 3.00 273,796 Fleet Operations Manager SU4 19 1.00 100,789 Social Worker SU4 16 5.00 361,473 Fusion Center Coordinator SU4 18 1.00 93,199 Sr Accountant SU4 13 10.00 526,071 Head Accountant. SU4 17 1.00 82,876 Sr Adm Anl SE1 06 4.00 361,274 Head Administrative Clerk SU4 14 3.00 177,565 Sr Bldg Cust (BPD) AFI 10L 5.00 247,086 Head Clerk & Secretary SU4 13 28.00 1,542,447 Sr Budget Analyst (BPD) SU4 15 3.00 172,464 Head Clerk & Secretary. EXM 13 1.00 57,613 Sr Data Proc Sys Analyst SE1 08 3.00 325,403 Head Trainer SU4 18 1.00 93,199 Sr Data Proc Sys Anl (Ads/Dpu) SE1 10 2.00 252,048 Head_Clerk SU4 12 2.00 113,146 Sr Data Proc Sys Anl BPD SE1 09 1.00 116,500 IAPRO Systems Coordinator SU4 17 1.00 82,876 Sr Employee Development Asst SE1 08 1.00 73,198 IBIS Support Technician SE1 06 2.00 150,632 Sr Personnel Analyst SE1 07 1.00 88,324 Interpreter SU4 09 2.00 99,704 Sr Personnel Officer II SU4 16 2.00 134,811 Jr Building Custodian AFI 09L 37.00 1,626,271 Sr Programmer SU4 15 2.00 133,247 Lab Informatioin Mgmt Admn BPD EXM 08 1.00 105,822 Sr Radio Communications Tech SU4 18 10.00 848,294 Legal Assistant SU4 15 2.00 136,544 Sr_Adm_Asst SE1 05 2.00 149,366 Legal Secretary SU4 12 1.00 56,052 Staff Asst (Administration) EXM 09 1.00 113,659 Liaison Agent (BPD) SU4 11 9.00 438,829 Statistical Analyst (BPD) SU4 14 4.00 192,782 Liaison Agent II SU4 12 2.00 112,104 Store Control Supv(Bpd Fleet) AFG 21 1.00 81,395 Lieut-HackneyCarriage Inves PSO 03 1.00 139,065 Supn Auto Maint(Bpdfleet) AFG 21 1.00 112,613 Maint Mech - HVAC Technician AFI 14 1.00 59,185 Supn BPD EXP 01 10.00 2,325,123 Maint Mech (Painter-Bpd) AFI 14 1.00 60,125 Supn of Police Building SE1 10 1.00 126,024 Management Analyst (BPD) SE1 05 5.00 410,039 Supn-Custodians (Buildings) SU4 18 1.00 93,199 Motor Equ RpprclassI(Bpdfleet) AFI 18 22.00 1,929,507 Supn-In-Chief EXP 01 1.00 246,230 Motor Equip Rep Class III AFI 14 1.00 46,151 Supn-Police Buildings SE1 07 1.00 66,486
Motor Equip Rppr ClassII (Bpdfleet) AFI 16 4.00 295,727 Support Desk Specialist SU4 15 5.00 302,657
Office Mgr SU4 14 4.00 234,827 Supv Graph Arts Svc SE1 10 1.00 126,024 Offset_Compositor TGU NG 3.00 210,098 Supvmtrequprpprbpd AFG 19 1.00 97,306 P Admin Asst SE1 10 3.00 345,411 Supv-Payrolls SE1 09 1.00 116,500 Personnel Asst SU4 11 1.00 53,326 Tape Librarian I SU4 16 1.00 77,419 Personnel Off. SU4 12 1.00 50,473 Tape Librarian(Oper/Bpd) SU4 15 1.00 71,653 Police Captain PSO 04 4.00 758,033 Technology Support Specialist SU4 15 1.00 58,633 Police Captain(Det) PDS 04 4.00 783,848 Video Forensic Analyst SU4 18 1.00 93,199
Worker's Compensation Case Mgr
SU4 18 4.00 325,070
Total 3,066 293,382,956 Adjustments Differential Payments 0 Other 32,801,797 Chargebacks -1,944,186 Salary Savings -8,587,750 FY22 Total Request 315,652,817
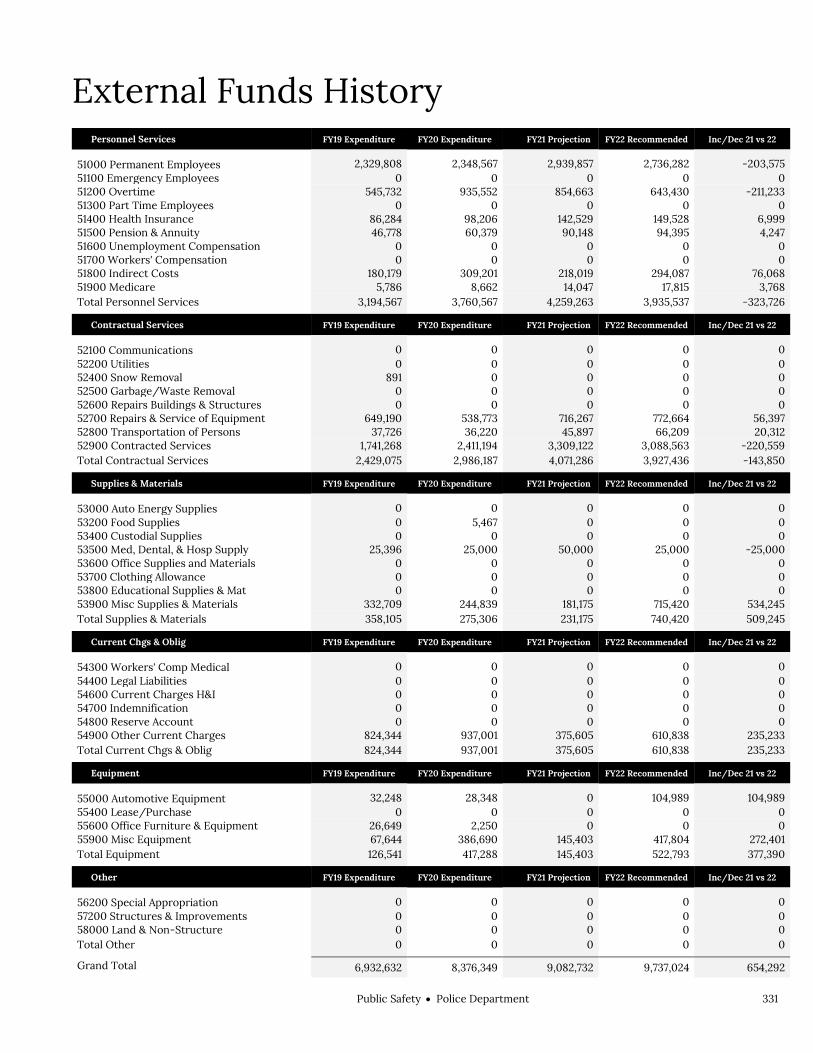
Public SafetyPolice Department 331
External Funds History Personnel Services FY19 Expenditure FY20 Expenditure FY21 Projection FY22 Recommended Inc/Dec 21 vs 22
51000 Permanent Employees 2,329,808 2,348,567 2,939,857 2,736,282 -203,575 51100 Emergency Employees 0 0 0 0 0 51200 Overtime 545,732 935,552 854,663 643,430 -211,23351300 Part Time Employees 0 0 0 0 0 51400 Health Insurance 86,284 98,206 142,529 149,528 6,999 51500 Pension & Annuity 46,778 60,379 90,148 94,395 4,247 51600 Unemployment Compensation 0 0 0 0 0 51700 Workers' Compensation 0 0 0 0 0 51800 Indirect Costs 180,179 309,201 218,019 294,087 76,068 51900 Medicare 5,786 8,662 14,047 17,815 3,768 Total Personnel Services 3,194,567 3,760,567 4,259,263 3,935,537 -323,726
Contractual Services FY19 Expenditure FY20 Expenditure FY21 Projection FY22 Recommended Inc/Dec 21 vs 22
52100 Communications 0 0 0 0 0 52200 Utilities 0 0 0 0 0 52400 Snow Removal 891 0 0 0 0 52500 Garbage/Waste Removal 0 0 0 0 0 52600 Repairs Buildings & Structures 0 0 0 0 0 52700 Repairs & Service of Equipment 649,190 538,773 716,267 772,664 56,397 52800 Transportation of Persons 37,726 36,220 45,897 66,209 20,312 52900 Contracted Services 1,741,268 2,411,194 3,309,122 3,088,563 -220,559Total Contractual Services 2,429,075 2,986,187 4,071,286 3,927,436 -143,850
Supplies & Materials FY19 Expenditure FY20 Expenditure FY21 Projection FY22 Recommended Inc/Dec 21 vs 22
53000 Auto Energy Supplies 0 0 0 0 0 53200 Food Supplies 0 5,467 0 0 0 53400 Custodial Supplies 0 0 0 0 0 53500 Med, Dental, & Hosp Supply 25,396 25,000 50,000 25,000 -25,00053600 Office Supplies and Materials 0 0 0 0 0 53700 Clothing Allowance 0 0 0 0 0 53800 Educational Supplies & Mat 0 0 0 0 0 53900 Misc Supplies & Materials 332,709 244,839 181,175 715,420 534,245 Total Supplies & Materials 358,105 275,306 231,175 740,420 509,245
Current Chgs & Oblig FY19 Expenditure FY20 Expenditure FY21 Projection FY22 Recommended Inc/Dec 21 vs 22
54300 Workers' Comp Medical 0 0 0 0 0 54400 Legal Liabilities 0 0 0 0 0 54600 Current Charges H&I 0 0 0 0 0 54700 Indemnification 0 0 0 0 0 54800 Reserve Account 0 0 0 0 0 54900 Other Current Charges 824,344 937,001 375,605 610,838 235,233 Total Current Chgs & Oblig 824,344 937,001 375,605 610,838 235,233
Equipment FY19 Expenditure FY20 Expenditure FY21 Projection FY22 Recommended Inc/Dec 21 vs 22
55000 Automotive Equipment 32,248 28,348 0 104,989 104,989 55400 Lease/Purchase 0 0 0 0 0 55600 Office Furniture & Equipment 26,649 2,250 0 0 0 55900 Misc Equipment 67,644 386,690 145,403 417,804 272,401 Total Equipment 126,541 417,288 145,403 522,793 377,390
Other FY19 Expenditure FY20 Expenditure FY21 Projection FY22 Recommended Inc/Dec 21 vs 22
56200 Special Appropriation 0 0 0 0 0 57200 Structures & Improvements 0 0 0 0 0 58000 Land & Non-Structure 0 0 0 0 0 Total Other 0 0 0 0 0
Grand Total 6,932,632 8,376,349 9,082,732 9,737,024 654,292
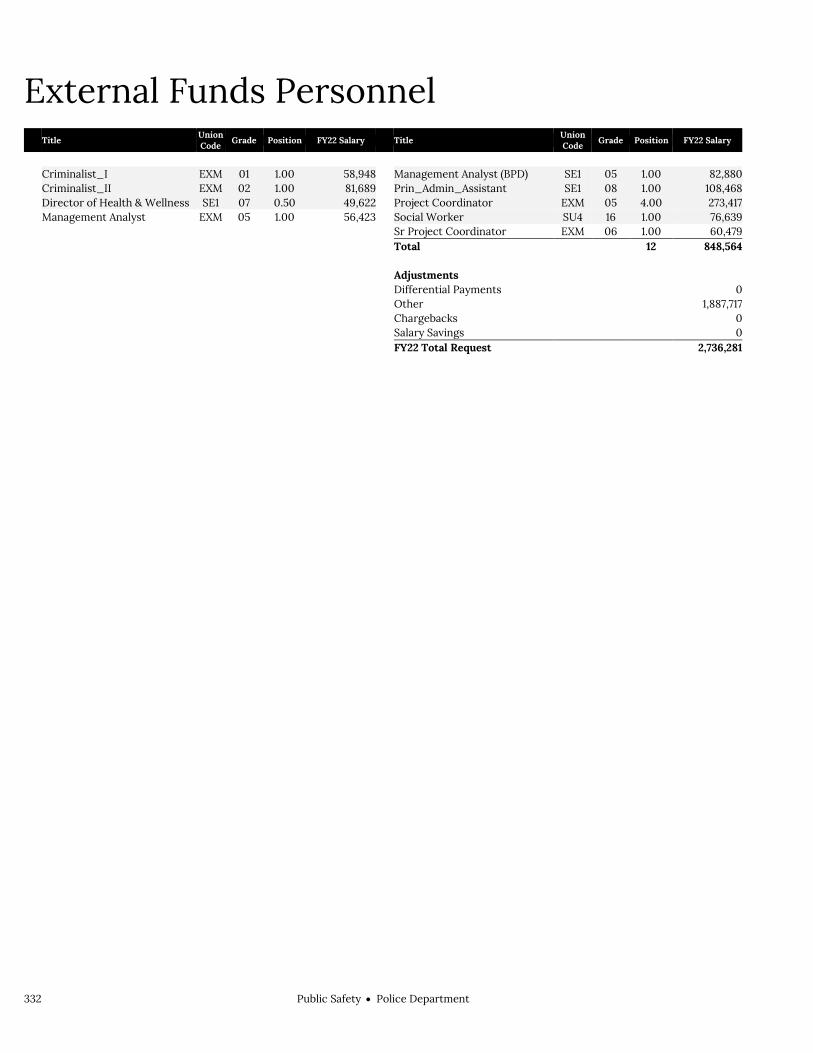
332 Public SafetyPolice Department
External Funds Personnel
Title Union Code Grade Position FY22 Salary Title
Union Code Grade Position FY22 Salary
Criminalist_I EXM 01 1.00 58,948 Management Analyst (BPD) SE1 05 1.00 82,880 Criminalist_II EXM 02 1.00 81,689 Prin_Admin_Assistant SE1 08 1.00 108,468 Director of Health & Wellness SE1 07 0.50 49,622 Project Coordinator EXM 05 4.00 273,417 Management Analyst EXM 05 1.00 56,423 Social Worker SU4 16 1.00 76,639 Sr Project Coordinator EXM 06 1.00 60,479 Total 12 848,564 Adjustments Differential Payments 0 Other 1,887,717 Chargebacks 0 Salary Savings 0 FY22 Total Request 2,736,281

Public SafetyPolice Department 333
Program 1. Police Commissioner's Office Dennis White, Manager, Organization 211100
Program Description The Office of the Police Commissioner sets the priorities and direction of the Police Department. Units located under the Commissioner are responsible for monitoring the performance of the department and its personnel, planning for its future, and providing information to the public and other law enforcement agencies. Included in this program are the Office of Administrative Hearings, Office of the Legal Advisor, Office of Labor Relations, and the Office of Strategic Planning and Research.
Operating Budget Actual '19 Actual '20 Projection '21 Budget '22
Personnel Services 8,629,309 9,129,492 13,384,571 13,165,517 Non Personnel 519,585 729,097 786,824 797,524
Total 9,148,894 9,858,589 14,171,395 13,963,041
Performance
Goal: Divert and assist individuals experiencing crises related to mental health/substance use
Performance Measures Actual '19 Actual '20 Projected '21 Target '22
Number of calls to which officers co-responded with BEST Clinicians 240 527 700
Number of Proactive Interventions by BEST Clinicians 279 502 700
Street Outreach Unit Interactions with Community 874 706 700
Goal: Engage with the community
Performance Measures Actual '19 Actual '20 Projected '21 Target '22
Number of individuals following BPD Twitter feed 532,672 533,276 531,000 550,000
Goal: Prevent and reduce crime and violence
Performance Measures Actual '19 Actual '20 Projected '21 Target '22
Number of Field Interrogation and Observations (FIOs)
8,337 TBR
Number of Firearm Arrests 387 392 451 Total arrests 9,264 4,758 5,273 Total Shooting Victims 245 242 284

334 Public SafetyPolice Department
Program 2. Bureau of Community Engagement Nora L. Baston, Manager, Organization 211X00
Program Description The Community Engagement Bureau oversees a citywide effort to further strengthen community policing, and will focus on ways to build relationships and trust between law enforcement and residents.
Operating Budget Actual '19 Actual '20 Projection '21 Budget '22
Personnel Services 0 4,224,644 4,277,304 4,104,869 Non Personnel 0 23,505 2,109,500 104,025
Total 0 4,248,149 6,386,804 4,208,894

Public SafetyPolice Department 335
Program 3. BAT-Operations James G. Hasson, Manager, Organization 211200
Program Description The Bureau of Administration and Technology Operations Program provides logistic support and maintenance in the areas of fleet management, communications and building maintenance.
Operating Budget Actual '19 Actual '20 Projection '21 Budget '22
Personnel Services 8,056,687 290,489 6,991,122 6,826,281 Non Personnel 20,078,135 12,533,566 12,369,333 12,253,090
Total 28,134,822 12,824,055 19,360,455 19,079,371
Performance
Goal: Timely and efficient response to crime and calls for service
Performance Measures Actual '19 Actual '20 Projected '21 Target '22
Median Response Time Priority One Calls: Receipt to arrival (mins) 9 8.5 9 9
Number of Priority one Calls for Service 91,553 92,101 93,120 93,000
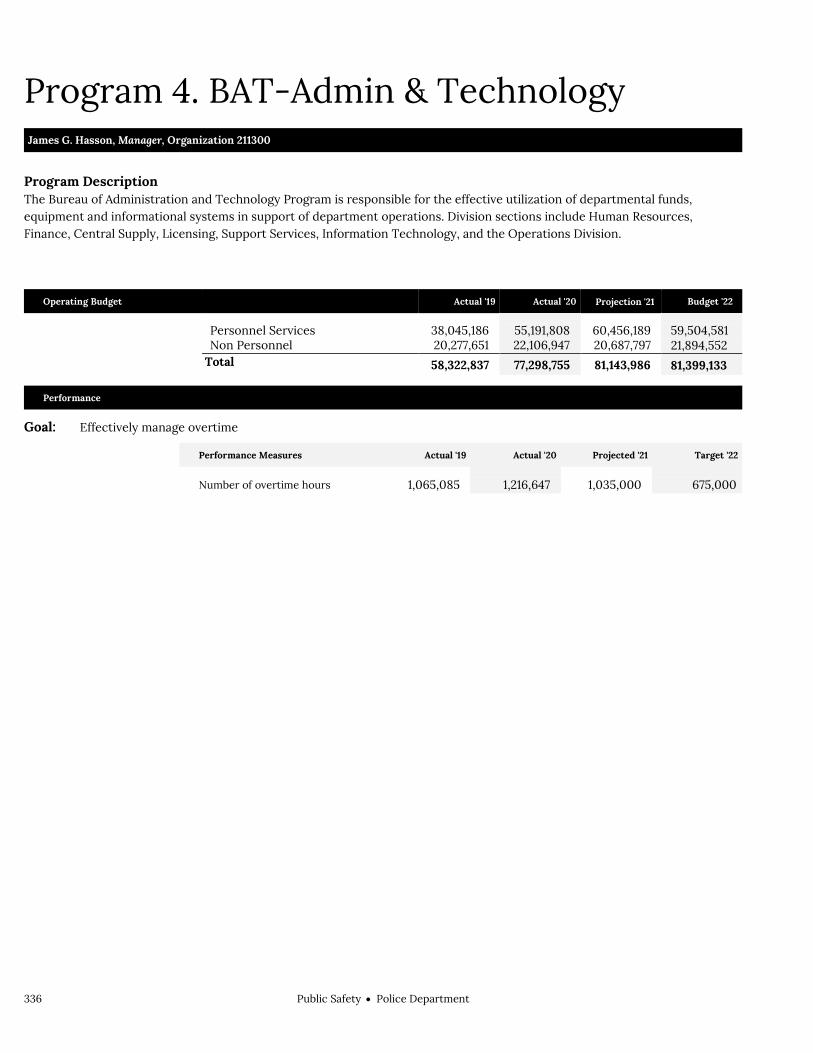
336 Public SafetyPolice Department
Program 4. BAT-Admin & Technology James G. Hasson, Manager, Organization 211300
Program Description The Bureau of Administration and Technology Program is responsible for the effective utilization of departmental funds, equipment and informational systems in support of department operations. Division sections include Human Resources, Finance, Central Supply, Licensing, Support Services, Information Technology, and the Operations Division.
Operating Budget Actual '19 Actual '20 Projection '21 Budget '22
Personnel Services 38,045,186 55,191,808 60,456,189 59,504,581 Non Personnel 20,277,651 22,106,947 20,687,797 21,894,552
2 Total 58,322,837 77,298,755 81,143,986 81,399,133
Performance
Goal: Effectively manage overtime
Performance Measures Actual '19 Actual '20 Projected '21 Target '22
Number of overtime hours 1,065,085 1,216,647 1,035,000 675,000
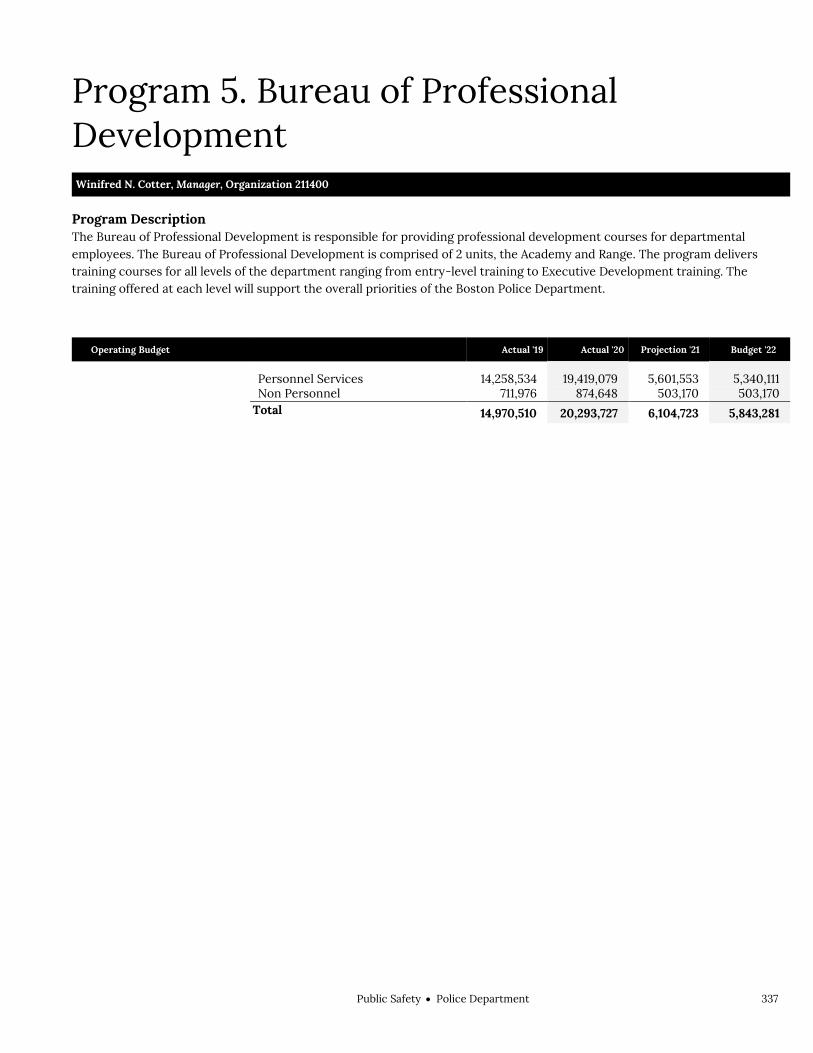
Public SafetyPolice Department 337
Program 5. Bureau of Professional Development Winifred N. Cotter, Manager, Organization 211400
Program Description The Bureau of Professional Development is responsible for providing professional development courses for departmental employees. The Bureau of Professional Development is comprised of 2 units, the Academy and Range. The program delivers training courses for all levels of the department ranging from entry-level training to Executive Development training. The training offered at each level will support the overall priorities of the Boston Police Department.
Operating Budget Actual '19 Actual '20 Projection '21 Budget '22
Personnel Services 14,258,534 19,419,079 5,601,553 5,340,111 Non Personnel 711,976 874,648 503,170 503,170
Total 14,970,510 20,293,727 6,104,723 5,843,281

338 Public SafetyPolice Department
Program 6. Bureau of Field Services Kevin McGoldrick, Manager, Organization 211500
Program Description The Bureau of Field Services has primary responsibility for the delivery of police services throughout the City of Boston. The program includes all personnel assigned to the eleven police districts, Special Operations Division, Field Support Division, Special Events Management, and Emergency Preparedness. Also assigned to this program are the Neighborhood Crime Watch Program, Officer Friendly Program, Senior Service Officer, and the Paid Details Assignment Unit.
Operating Budget Actual '19 Actual '20 Projection '21 Budget '22
Personnel Services 212,440,284 199,827,049 208,613,065 190,344,579 Non Personnel 2,162,700 2,337,836 2,833,907 2,820,486
Total 214,602,984 202,164,885 211,446,972 193,165,065
Performance
Goal: Engage with the community
Performance Measures Actual '19 Actual '20 Projected '21 Target '22
Code 19 Total Walk and Talk Patrols 133,190 177,955 166,199 180,000
Goal: Prevent and reduce crime and violence
Performance Measures Actual '19 Actual '20 Projected '21 Target '22
Number of Firearms Recovered 759 469 772 1,000 Total Property Crimes 13,619 13,476 13,400 Total Violent Crimes 4,035 4,107 3,920
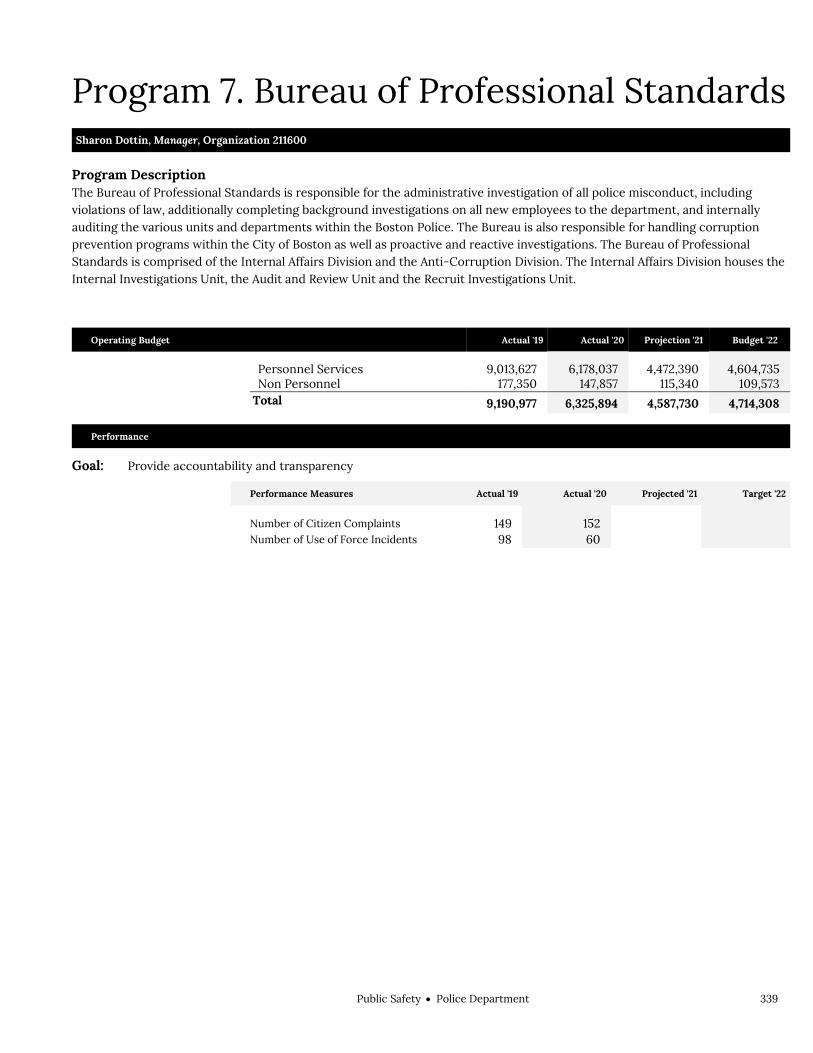
Public SafetyPolice Department 339
Program 7. Bureau of Professional Standards Sharon Dottin, Manager, Organization 211600
Program Description The Bureau of Professional Standards is responsible for the administrative investigation of all police misconduct, including violations of law, additionally completing background investigations on all new employees to the department, and internally auditing the various units and departments within the Boston Police. The Bureau is also responsible for handling corruption prevention programs within the City of Boston as well as proactive and reactive investigations. The Bureau of Professional Standards is comprised of the Internal Affairs Division and the Anti-Corruption Division. The Internal Affairs Division houses the Internal Investigations Unit, the Audit and Review Unit and the Recruit Investigations Unit.
Operating Budget Actual '19 Actual '20 Projection '21 Budget '22
Personnel Services 9,013,627 6,178,037 4,472,390 4,604,735 Non Personnel 177,350 147,857 115,340 109,573
Total 9,190,977 6,325,894 4,587,730 4,714,308
Performance
Goal: Provide accountability and transparency
Performance Measures Actual '19 Actual '20 Projected '21 Target '22
Number of Citizen Complaints 149 152 Number of Use of Force Incidents 98 60

340 Public SafetyPolice Department
Program 8. Bureau of Investigative Services Paul Donovan, Manager, Organization 211700
Program Description The Bureau of Investigative Services is responsible for providing investigative and forensic technical support to all victims, witnesses and crime prevention units of the department. The Bureau of Investigative Services will be comprised of the Major Case Division and the Criminal Investigative Division. The program coordinates all specialized units (e.g. homicide, sexual assault, drug control, domestic violence district detectives), and the general investigative units (e.g. auto theft, fugitive, fraud and missing person/exploited children and also includes the Community Disorders Unit).
Operating Budget Actual '19 Actual '20 Projection '21 Budget '22
Personnel Services 77,437,875 85,351,784 73,063,573 72,591,103 Non Personnel 1,283,066 1,880,886 1,305,560 1,287,753
Total 78,720,941 87,232,670 74,369,133 73,878,856
Performance
Goal: Prevent and reduce crime and violence
Performance Measures Actual '19 Actual '20 Projected '21 Target '22
Homicide Clearance Rate 64.9 35.1

Public SafetyPolice Department 341
Program 9. Bureau of Intelligence & Analysis Colm P. Lydon, Manager, Organization 211900
Program Description It is the mission of the Bureau of Intelligence and Analysis, through the Boston Regional Intelligence Center, to gather information from all sources in a manner consistent with the law and to analyze that information to provide tactical and/or strategic intelligence on the existence, identities, and capabilities of criminal suspects and enterprises generally and, in particular, to further crime prevention and enforcement objectives/priorities identified by the Boston Police Department as well as the communities comprising the Urban Area Security Initiative (UASI): Brookline, Somerville, Quincy, Revere, Chelsea, Winthrop, Cambridge, and Everett. The Bureau of Intelligence and Analysis is comprised of two Divisions, the Homeland Security Division and the Criminal Intelligence and Analysis Division; with an overarching coordination responsibility of being the Boston Regional Intelligence Center and the Department of Homeland Security designated urban fusion center for the Boston UASI region.
Operating Budget Actual '19 Actual '20 Projection '21 Budget '22
Personnel Services 3,654,639 5,284,610 3,610,828 3,619,269 Non Personnel 15,769 21,874 0 0
Total 3,670,408 5,306,484 3,610,828 3,619,269

342 Public SafetyPolice Department
External Funds Projects Academy Revolving Fund
Project Mission The purpose of the fund authorized by (Chapter 44, Section 53E ½) was for purchasing training equipment, certifying instructors, updating facilities, and providing funds for other training needs not otherwise budgeted for. This revolving fund is funded by receipts of tuition and other fees paid by outside law enforcement agencies for training at the Boston Police Academy.
Byrne JAG Reallocation
Project Mission Funded by the Executive Office of Public Safety and Security, through the Office of Justice Programs, these funds will be utilized to implement the objectives of the Sex Offender Registry Notification Act (SORNA) by implementing the Address Verification Pilot Program (AVPP) in Boston. This program intends to identify, investigate, and locate offenders known to be in violation of their registration obligations.
Canine Revolving Fund
Project Mission The purpose of the fund authorized by (Chapter 44, Section 53E ½) is for purchasing training equipment, certifying instructors, updating facilities to support its Canine Unit training programs for officers and police dogs for non-City of Boston law enforcement agencies, and providing funds for other training needs. This revolving fund is funded by receipts of tuition and other fees paid by outside law enforcement agencies for training with the Canine Unit at the Boston Police Department Special Operations Division.
Imago Dei Fund(Cease)
Project Mission Funding by the Imago Dei Fund. This funding is to coordinate efforts to prevent and address commercial sexual exploitation and human trafficking through increasing collaboration between City departments and initiatives, as well as with community based education, prevention and intervention efforts. The vision is to reduce the demand for Illegal Commercial Sexual Exploitation in the Boston area through public awareness, education, prevention, intervention, suppression and enforcement efforts in partnership with an ever-widening partnership movement.
COAP Grant
Project Mission
Funded by the U.S. Department of Justice, Office of Justice Programs, Bureau of Justice Assistance, in partnership with
the Office for Victims of Crime. The purpose of this grant is to plan and implement comprehensive programs in response
to the growing opioid epidemic. The program furthers the department’s mission by providing resources to support the
department’s efforts to reduce violent crime and drug abuse and enhance public safety, while supporting victims.
Community Based Violence Prevention Demonstration Program
Project Mission Funded by the Office of Juvenile Justice and Delinquency Prevention (OJJDP). The goal of this funding is to reduce youth homicides and shootings in Mattapan by increasing enforcement and accountability; providing violence interruption, conflict resolution, and opportunities to our 'shooters' and their families; and mobilizing the community through a saturated social norms and consequences campaign.

Public SafetyPolice Department 343
Department of Mental Health Jail Diversion Program
Project Mission Funded by the MA Department of Mental Health, this grant allows for a Boston Emergency Services Team (BEST) clinician to be housed in the BPD District B-2 station. This position gives B2 officers and the BPD Street Outreach Team direct clinician access for assistance with emotionally disturbed individuals, ideally decreasing the likelihood of these individuals being arrested.
DNA Laboratory Initiative
Project Mission The project is funded by the U.S. Department of Justice, National Institute of Justice. This grant is intended to focus resources on solving old homicide and sexual assault cases where there is no suspect identified - “cold cases”. Funds are being used for overtime for detectives to further investigate these cases, and for criminalists to process evidence (DNA testing, etc.). Funds are also used to purchase supplies necessary for DNA testing of evidence in these cases.
Downtown Boston Business Improvement
Project Mission These funds will be used for the purchase and installation of electronic equipment Downtown Boston Business Improvement District (BID). The purpose of the funding is to assist the Boston Police Department in enhancing public safety and improving quality of life in the downtown area. Funding was awarded in FY16.
EOPSS BRIC Allocation
Project Mission For the Boston Regional Intelligence Center, or BRIC, to upgrade, expand, and integrate technology and protocols related to antiterrorism, anticrime, antigang and emergency response. Funds were awarded on 6/24/16 and expire on 12/31/17.
EOPSS JAG Youth Engagement
Project Mission The Edward Byrne Memorial Justice Assistance Grant (JAG), funded through the Executive Office of Public Safety, will be utilized to continue to create positive relationships between youth and police and deliver youth/police engagement in hot-spot neighborhoods.
First Responder Naloxone Grant
Project Mission As part of the Commonwealth’s comprehensive strategy to address the opioid overdose epidemic in Massachusetts, the Department of Public Health awarded funds for the Boston Police Department to carry and administer naloxone, an opioid overdose antidote. The funds will be utilized to purchase naloxone and related costs.
Hackney Revolving Fund
Project Mission The purpose of the fund authorized by (Chapter 44, Section 53E ½) is for purchasing, leasing, or renting space, materials and equipment to be partially or wholly used for instructional purposes for new hackney carriage driver applicants and provide funds for other educational needs. The fund is funded from a one-time $75 new applicant fee that drivers pay for Hackney Carriage Driver Training Class.

344 Public SafetyPolice Department
JAG Equipment Grant
Project Mission The FY15 Law Enforcement Equipment Grant funded by the Edward Byrne Memorial Justice Assistance Grant (JAG) will be utilized for the purpose of purchasing printers to be installed in police cruisers as part of the Data-Driven Approaches to Crime and Traffic Safety (DDACTS) crime and traffic safety program pilot project.
Joe Gallant Memorial
Project Mission Funded by the Joe Gallant Memorial Foundation, which was created by his family to continue his legacy of serving the city he loved so much and, in particular, to support the men and women of the Boston Police Department. The funds are allocated to various Boston Police Departments to assist pay for training and/or equipment that might not be available otherwise due to budgetary constraints facing the Department at any time.
Justice and Mental Health Expansion Project
Project Mission Funded by the U.S. Department of Justice, Bureau of Justice Assistance, these funds allow the BPD to expand on its collaborative partnership with the Boston Emergency Services Team through increased services for persons in need of mental health assistance and training for police officers in the event of an encounter with such persons.
Justice Assistance Grant (JAG)
Project Mission The grant was awarded by the U.S. Department of Justice, Bureau of Justice Assistance. These funds provide for the continuation of several successful initiatives, including: Domestic Violence Advocacy at the District Level, the Youth Service Providers Network, Crime and Intelligence Analysis, Research and Analysis Capacity at the Youth Violence Strike Force, Strategic Planning and Policy Analysis, and Improving Crime Reporting Capabilities.
MSP ICAC - Project Mission U.S. Department of Justice, Office of Justice Programs, Office of Juvenile Justice and Delinquency Prevention awards funds to the Massachusetts State Police as part of the Internet of Crimes Against Children Task Force Program and is used to support State and local law enforcement agencies to maintain and expand State and regional task forces to address technology-facilitated child exploitation.MA State Police awards funds for Boston Police Officers to attend the Annual Internet Crimes Against Children Conference.
National Crime Statistics Exchange
Project Mission 2016 National Crime Statistics Exchange (NCS-X) Implementation Assistance Program: Phase III- Support for Large Local Agencies, awarded on 10/01/16 , will be provided to support the transition to incident-based reporting (IBR) among agencies with 750 or more sworn officers that currently do not report IBR data to their state UCR Program or to the FBI's NIBRS. BJS and the FBI are implementing the NCS-X program to further the Department's mission to work with the justice community to develop innovative strategies that support information sharing between and across sectors of the justice community. The grant expires on 9/30/18.

Public SafetyPolice Department 345
National Violent Death Reporting Grant (aka Injury Surveillance Project)
Project Mission Funded by the US Department of Justice, this grant will provide funds to support the transition to incident-based reporting (IBR) among agencies with 750 or more sworn officers. BJS and the FBI are implementing the NCS-X program to further the Department's mission to work with the justice community to develop innovative strategies that support information sharing between and across sectors of the justice community.
NEU ALERT- Active Shooter
Project Mission Funds were awarded from the U.S. Department of Homeland Security Science and Technology Directorate. This supported a cooperative agreement between the BPD and Northeastern University to hold the Combating Terrorism Technology Evaluation Program (CTTEP) Training at Fenway Park.
OCEDTF: Fugitive Unit Vehicles
Project Mission Funding by the Organized Crime Drug Enforcement Task Force Program. The funds are used to purchase vehicles and/or emergency equipment for the Boston Police Department’s Fugitive Unit for the purposes of supporting crime prevention and law enforcement working directly with the United States Marshall's Service
Paul Coverdell National Forensic Grant
Project Mission This grant was awarded by the U.S. Department of Justice, National Institute of Justice programs. Funds are utilized to hire a vendor who provides LIMS services and items based on a comprehensive assessment and best suited to the Boston Police Department.
Police Auction
Project Mission The Police Auction fund pays for the rental of a trailer used by the department during vehicle auctions and occasionally pays for paid details associated with the auction.
Police Fitness Center Revolving Fund
Project Mission The purpose of the fund authorized by (Chapter 44, Section 53E 1/2 is to pay salaries and benefits of employees and to purchase supplies and equipment necessary to operate the Police Department Fitness Center. The revolving fund is funded from monthly membership fees.
Port Security Grant
Project Mission Funded by the U.S. Department of Homeland Security, this grant supports the security of Boston’s waterfront through the acquisition of new engines for two Boston Police Department Harbor Patrol vessels (the Guardian and the Protector) and ensure proper maintenance of these new engines as well as the Harbor Patrol’s SAFE boat over the course of the grant period. FY17 expenses include a donation from the Boston Police Foundation as local matching funds.
Public Safety Answering Point (PSAP)-Emergency
Project Mission Funded by the Executive Office of Public Safety and Security-State 911 Department funds will provide upgrade support to the Boston Police Department 911 Center.
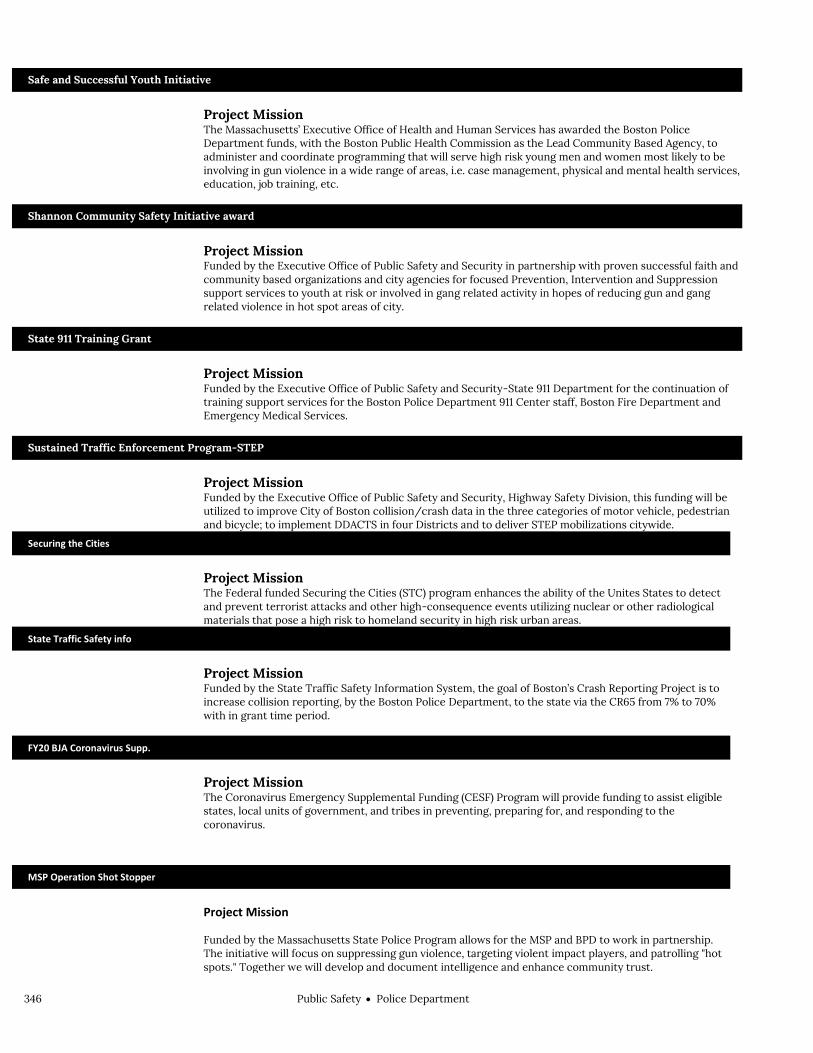
346 Public SafetyPolice Department
Safe and Successful Youth Initiative
Project Mission The Massachusetts’ Executive Office of Health and Human Services has awarded the Boston Police Department funds, with the Boston Public Health Commission as the Lead Community Based Agency, to administer and coordinate programming that will serve high risk young men and women most likely to be involving in gun violence in a wide range of areas, i.e. case management, physical and mental health services, education, job training, etc.
Shannon Community Safety Initiative award
Project Mission Funded by the Executive Office of Public Safety and Security in partnership with proven successful faith and community based organizations and city agencies for focused Prevention, Intervention and Suppression support services to youth at risk or involved in gang related activity in hopes of reducing gun and gang related violence in hot spot areas of city.
State 911 Training Grant
Project Mission Funded by the Executive Office of Public Safety and Security-State 911 Department for the continuation of training support services for the Boston Police Department 911 Center staff, Boston Fire Department and Emergency Medical Services.
Sustained Traffic Enforcement Program-STEP
Project Mission Funded by the Executive Office of Public Safety and Security, Highway Safety Division, this funding will be utilized to improve City of Boston collision/crash data in the three categories of motor vehicle, pedestrian and bicycle; to implement DDACTS in four Districts and to deliver STEP mobilizations citywide.
Securing the Cities
Project Mission The Federal funded Securing the Cities (STC) program enhances the ability of the Unites States to detect and prevent terrorist attacks and other high-consequence events utilizing nuclear or other radiological materials that pose a high risk to homeland security in high risk urban areas.
State Traffic Safety info
Project Mission Funded by the State Traffic Safety Information System, the goal of Boston’s Crash Reporting Project is to increase collision reporting, by the Boston Police Department, to the state via the CR65 from 7% to 70% with in grant time period.
FY20 BJA Coronavirus Supp.
Project Mission The Coronavirus Emergency Supplemental Funding (CESF) Program will provide funding to assist eligible states, local units of government, and tribes in preventing, preparing for, and responding to the coronavirus.
MSP Operation Shot Stopper
Project Mission
Funded by the Massachusetts State Police Program allows for the MSP and BPD to work in partnership. The initiative will focus on suppressing gun violence, targeting violent impact players, and patrolling "hot spots." Together we will develop and document intelligence and enhance community trust.
Public SafetyPolice Department 347
VAWA STOP Project
Project Mission Funded by the Office of Violence Against Women, pass thru the Executive Office of Public Safety and Security. Funds will support a Civilian Domestic Violence Advocate who will provide referrals to shelters and assistance with obtaining restraining orders, safety planning, service referral, and assistance in navigating the criminal justice process, and advocacy for victims of domestic violence.

348 Public SafetyPolice Department
Police Department Capital Budget Public Safety Police Department
Overview Capital investment in modern police facilities and information technology systems remain a priority in order to continually enhance the Police Department’s capacity to protect and serve the communities of Boston.
FY22 Major Initiatives Construction of a new station in East Boston will be completed. Two programming studies will begin to determine the space needs and requirements for
District stations in Mattapan and Hyde Park. Police Headquarters renovations to include: roof and elevator replacement as well as the
redesign and expansion of the Forensic Unit. Study to develop a program and space requirements for the Police Academy. Renovations to the Brighton Police Station with new windows and roof replacement.
Capital Budget Expenditures Total Actual '19 Total Actual '20 Estimated '21 Total Projected
'22
Total Department 8,502,943 15,801,262 22,376,371 18,224,979

Public SafetyPolice Department 349
Police Department Project Profiles COMMUNICATIONS INFRASTRUCTURE UPGRADES
Project Mission Design and implementation of upgrades to the police radio system. Managing Department, Police Department Status, Implementation Underway Location, Citywide Operating Impact, Yes
Authorizations
Source Existing FY22 Future Non Capital
Fund Total City Capital 52,815,000 0 0 0 52,815,000 Grants/Other 0 0 0 0 0 Total 52,815,000 0 0 0 52,815,000
Expenditures (Actual and Planned)
Source Thru
6/30/20 FY21 FY22 FY23-26 Total City Capital 40,295,923 5,000,000 7,519,077 0 52,815,000 Grants/Other 0 0 0 0 0 Total 40,295,923 5,000,000 7,519,077 0 52,815,000
DISTRICT B-3 STATION STUDY Project Mission Programming study to evaluate space requirements for the District B-3 station. Managing Department, Public Facilities Department Status, To Be Scheduled Location, Mattapan Operating Impact, No
Authorizations
Source Existing FY22 Future Non Capital
Fund Total City Capital 100,000 0 0 0 100,000 Grants/Other 0 0 0 0 0 Total 100,000 0 0 0 100,000
Expenditures (Actual and Planned)
Source Thru
6/30/20 FY21 FY22 FY23-26 Total City Capital 0 0 50,000 50,000 100,000 Grants/Other 0 0 0 0 0 Total 0 0 50,000 50,000 100,000

350 Public SafetyPolice Department
Police Department Project Profiles DISTRICT D-14 STATION
Project Mission Install new windows on the second floor. Managing Department, Public Facilities Department Status, In Construction Location, Allston/Brighton Operating Impact, No
Authorizations
Source Existing FY22 Future Non Capital
Fund Total City Capital 360,000 0 0 0 360,000 Grants/Other 0 0 0 0 0 Total 360,000 0 0 0 360,000
Expenditures (Actual and Planned)
Source Thru
6/30/20 FY21 FY22 FY23-26 Total City Capital 333,629 26,371 0 0 360,000 Grants/Other 0 0 0 0 0 Total 333,629 26,371 0 0 360,000
DISTRICT E-18 STATION STUDY Project Mission Programming study to evaluate space requirements for the District E-18 station. Managing Department, Public Facilities Department Status, In Design Location, Hyde Park Operating Impact, No
Authorizations
Source Existing FY22 Future Non Capital
Fund Total City Capital 100,000 0 0 0 100,000 Grants/Other 0 0 0 0 0 Total 100,000 0 0 0 100,000
Expenditures (Actual and Planned)
Source Thru
6/30/20 FY21 FY22 FY23-26 Total City Capital 0 0 50,000 50,000 100,000 Grants/Other 0 0 0 0 0 Total 0 0 50,000 50,000 100,000

Public SafetyPolice Department 351
Police Department Project Profiles EAST BOSTON POLICE STATION
Project Mission Design and construct a new police station. Managing Department, Public Facilities Department Status, In Construction Location, East Boston Operating Impact, No
Authorizations
Source Existing FY22 Future Non Capital
Fund Total City Capital 29,900,000 0 0 0 29,900,000 Grants/Other 0 0 0 0 0 Total 29,900,000 0 0 0 29,900,000
Expenditures (Actual and Planned)
Source Thru
6/30/20 FY21 FY22 FY23-26 Total City Capital 6,293,574 12,500,000 8,806,426 2,300,000 29,900,000 Grants/Other 0 0 0 0 0 Total 6,293,574 12,500,000 8,806,426 2,300,000 29,900,000
EMERGENCY 9-1-1 BACKUP STUDY Project Mission Develop program for a new backup facility for E-9-1-1 call takers and police dispatch. Managing Department, Public Facilities Department Status, To Be Scheduled Location, N/A Operating Impact, No
Authorizations
Source Existing FY22 Future Non Capital
Fund Total City Capital 50,000 0 0 0 50,000 Grants/Other 0 0 0 0 0 Total 50,000 0 0 0 50,000
Expenditures (Actual and Planned)
Source Thru
6/30/20 FY21 FY22 FY23-26 Total City Capital 0 0 25,000 25,000 50,000 Grants/Other 0 0 0 0 0 Total 0 0 25,000 25,000 50,000

352 Public SafetyPolice Department
Police Department Project Profiles EVIDENCE/ARCHIVES/CENTRAL SUPPLY STUDY
Project Mission Program and siting study for new facility to house evidence management, archives, and central supply functions. Managing Department, Public Facilities Department Status, To Be Scheduled Location, N/A Operating Impact, No
Authorizations
Source Existing FY22 Future Non Capital
Fund Total City Capital 75,000 0 0 0 75,000 Grants/Other 0 0 0 0 0 Total 75,000 0 0 0 75,000
Expenditures (Actual and Planned)
Source Thru
6/30/20 FY21 FY22 FY23-26 Total City Capital 0 0 0 75,000 75,000 Grants/Other 0 0 0 0 0 Total 0 0 0 75,000 75,000
FORENSICS UNIT FACILITY UPGRADES Project Mission Renovation of interior space at BPD headquarters to redesign and expand the Forensic Units. Managing Department, Public Facilities Department Status, To Be Scheduled Location, Roxbury Operating Impact, No
Authorizations
Source Existing FY22 Future Non Capital
Fund Total City Capital 50,000 0 0 0 50,000 Grants/Other 0 0 0 0 0 Total 50,000 0 0 0 50,000
Expenditures (Actual and Planned)
Source Thru
6/30/20 FY21 FY22 FY23-26 Total City Capital 0 0 50,000 0 50,000 Grants/Other 0 0 0 0 0 Total 0 0 50,000 0 50,000

Public SafetyPolice Department 353
Police Department Project Profiles HEADQUARTERS ROOF AND ELEVATOR REPLACEMENT
Project Mission Replace roof and elevators. Managing Department, Public Facilities Department Status, In Design Location, Roxbury Operating Impact, No
Authorizations
Source Existing FY22 Future Non Capital
Fund Total City Capital 1,000,000 0 6,200,000 0 7,200,000 Grants/Other 0 0 0 0 0 Total 1,000,000 0 6,200,000 0 7,200,000
Expenditures (Actual and Planned)
Source Thru
6/30/20 FY21 FY22 FY23-26 Total City Capital 0 0 250,000 6,950,000 7,200,000 Grants/Other 0 0 0 0 0 Total 0 0 250,000 6,950,000 7,200,000
POLICE ACADEMY HVAC REPAIRS Project Mission Replace HVAC and boiler system at the Police Academy. Managing Department, Public Facilities Department Status, New Project Location, N/A Operating Impact, No
Authorizations
Source Existing FY22 Future Non Capital
Fund Total City Capital 0 970,000 0 0 970,000 Grants/Other 0 0 0 0 0 Total 0 970,000 0 0 970,000
Expenditures (Actual and Planned)
Source Thru
6/30/20 FY21 FY22 FY23-26 Total City Capital 0 0 500,000 470,000 970,000 Grants/Other 0 0 0 0 0 Total 0 0 500,000 470,000 970,000

354 Public SafetyPolice Department
Police Department Project Profiles POLICE ACADEMY STUDY
Project Mission Programming and siting study to evaluate space requirements for the Police Academy. Managing Department, Public Facilities Department Status, To Be Scheduled Location, N/A Operating Impact, No
Authorizations
Source Existing FY22 Future Non Capital
Fund Total City Capital 100,000 0 0 0 100,000 Grants/Other 0 0 0 0 0 Total 100,000 0 0 0 100,000
Expenditures (Actual and Planned)
Source Thru
6/30/20 FY21 FY22 FY23-26 Total City Capital 0 0 0 100,000 100,000 Grants/Other 0 0 0 0 0 Total 0 0 0 100,000 100,000
POLICE FACILITY SIGNAGE Project Mission Design and installation of upgraded signage at BPD facilities. Managing Department, Public Facilities Department Status, In Design Location, Various neighborhoods Operating Impact, No
Authorizations
Source Existing FY22 Future Non Capital
Fund Total City Capital 1,000,000 0 0 0 1,000,000 Grants/Other 0 0 0 0 0 Total 1,000,000 0 0 0 1,000,000
Expenditures (Actual and Planned)
Source Thru
6/30/20 FY21 FY22 FY23-26 Total City Capital 0 25,000 40,000 935,000 1,000,000 Grants/Other 0 0 0 0 0 Total 0 25,000 40,000 935,000 1,000,000

Public SafetyPolice Department 355
Police Department Project Profiles POLICE HEADQUARTERS SECURITY
Project Mission Upgrade existing security program at Boston Police headquarters. Managing Department, Public Facilities Department Status, In Design Location, Roxbury Operating Impact, No
Authorizations
Source Existing FY22 Future Non Capital
Fund Total City Capital 1,970,000 0 0 0 1,970,000 Grants/Other 0 0 0 0 0 Total 1,970,000 0 0 0 1,970,000
Expenditures (Actual and Planned)
Source Thru
6/30/20 FY21 FY22 FY23-26 Total City Capital 277,732 100,000 750,000 842,268 1,970,000 Grants/Other 0 0 0 0 0 Total 277,732 100,000 750,000 842,268 1,970,000
RECORDS MANAGEMENT REPLACEMENT Project Mission Replace existing records management system. Managing Department, Police Department Status, Implementation Underway Location, N/A Operating Impact, Yes
Authorizations
Source Existing FY22 Future Non Capital
Fund Total City Capital 2,850,000 0 0 0 2,850,000 Grants/Other 0 0 0 0 0 Total 2,850,000 0 0 0 2,850,000
Expenditures (Actual and Planned)
Source Thru
6/30/20 FY21 FY22 FY23-26 Total City Capital 1,165,524 1,500,000 184,476 0 2,850,000 Grants/Other 0 0 0 0 0 Total 1,165,524 1,500,000 184,476 0 2,850,000

356 Public SafetyPolice Department
Police Department Project Profiles SPECIAL OPERATIONS UNIT FACILITY UPGRADES
Project Mission Study to evaluate relocation of the EOD Unit. Managing Department, Public Facilities Department Status, To Be Scheduled Location, N/A Operating Impact, No
Authorizations
Source Existing FY22 Future Non Capital
Fund Total City Capital 100,000 0 0 0 100,000 Grants/Other 0 0 0 0 0 Total 100,000 0 0 0 100,000
Expenditures (Actual and Planned)
Source Thru
6/30/20 FY21 FY22 FY23-26 Total City Capital 0 0 0 100,000 100,000 Grants/Other 0 0 0 0 0 Total 0 0 0 100,000 100,000
STATION FACILITY REPAIRS Project Mission Capital maintenance at various BPD facilities including exterior repairs. Managing Department, Police Department Status, To Be Scheduled Location, Various neighborhoods Operating Impact, No
Authorizations
Source Existing FY22 Future Non Capital
Fund Total City Capital 1,500,000 0 0 0 1,500,000 Grants/Other 0 0 0 0 0 Total 1,500,000 0 0 0 1,500,000
Expenditures (Actual and Planned)
Source Thru
6/30/20 FY21 FY22 FY23-26 Total City Capital 0 0 0 1,500,000 1,500,000 Grants/Other 0 0 0 0 0 Total 0 0 0 1,500,000 1,500,000
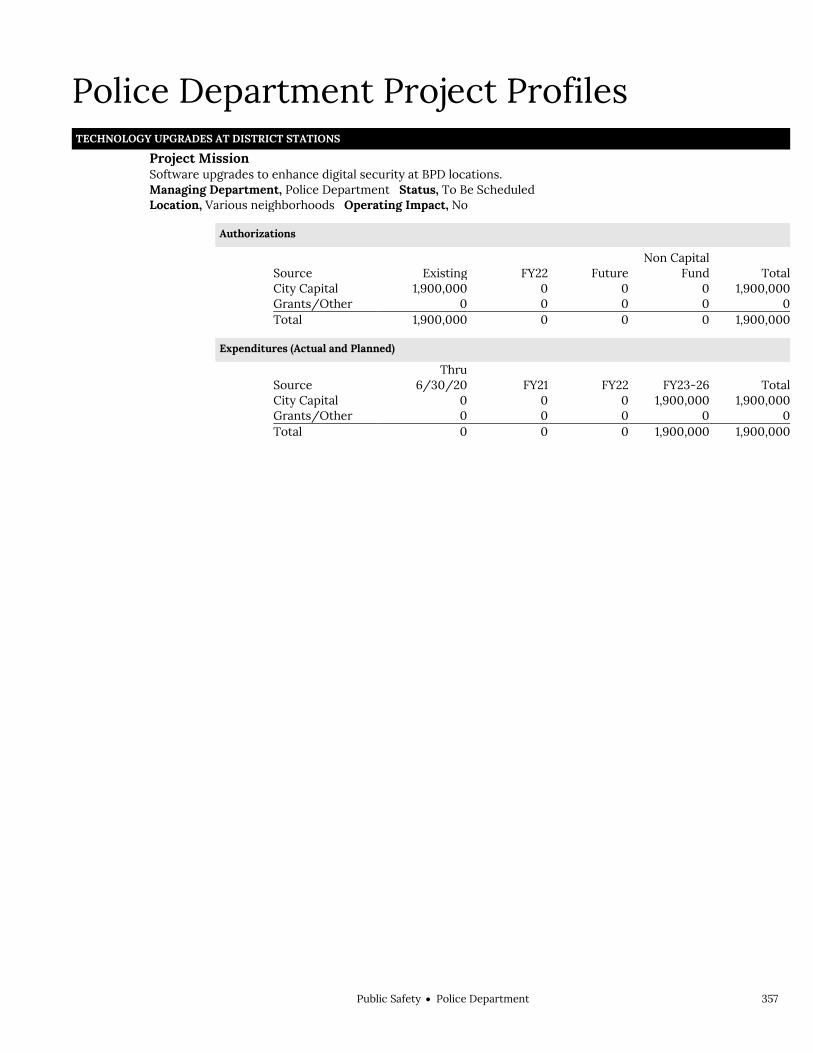
Public SafetyPolice Department 357
Police Department Project Profiles TECHNOLOGY UPGRADES AT DISTRICT STATIONS
Project Mission Software upgrades to enhance digital security at BPD locations. Managing Department, Police Department Status, To Be Scheduled Location, Various neighborhoods Operating Impact, No
Authorizations
Source Existing FY22 Future Non Capital
Fund Total City Capital 1,900,000 0 0 0 1,900,000 Grants/Other 0 0 0 0 0 Total 1,900,000 0 0 0 1,900,000
Expenditures (Actual and Planned)
Source Thru
6/30/20 FY21 FY22 FY23-26 Total City Capital 0 0 0 1,900,000 1,900,000 Grants/Other 0 0 0 0 0 Total 0 0 0 1,900,000 1,900,000

358 Public SafetyPolice Department

StreetsCabinet 359
Streets Streets Cabinet
Streets ...................................................................................361
Central Fleet Management ....................................... 363
Fleet Services ................................................... 367
Office of Streets .......................................................... 369
Admin & Finance ............................................. 373
Public Works Department ........................................ 375
PWD Commissioner's Office ........................ 380
Building/Facility Maintenance ..................... 381
Engineering ...................................................... 382
Construction Management .......................... 383
Highway Field Operations ............................ 384
Bridge Operations/Maintenance................ 385
Street Lights ..................................................... 386
Waste Reduction ............................................. 387
Snow & Winter Management .................................... 413
Transportation Department ...................................... 417
Traffic Division ................................................ 422
Traffic Commissioner's Office ................ 427
Traffic Management & Engineering ....... 428
Policy & Planning ....................................... 429
Traffic Enforcement .................................. 430
Traffic Operations....................................... 431
Parking Clerk ................................................... 433
Parking Clerk ............................................... 437

360 StreetsCabinet

StreetsCabinet 361
Streets Streets
Chris Osgood, Chief of Streets
Cabinet Mission The mission of the Streets Cabinet is to innovate, develop, implement, support and manage all programs, projects and policies that enhance clean, well-lit, attractive and efficient infrastructure that moves vehicular and pedestrian traffic safely.
Operating Budget
Total Actual '19 Total Actual '20 Total Approp '21 Total Budget '22
Central Fleet Management 2,993,210 3,509,994 3,012,586 3,165,680
Office of Streets 2,131,409 2,040,302 2,053,526 2,290,092
Public Works Department 85,363,038 95,183,893 98,909,660 101,058,718
Snow & Winter Management 22,762,894 22,578,056 21,067,583 21,708,166
Transportation Department 38,038,728 38,875,939 38,748,114 40,559,603
Total 151,289,279 162,188,184 163,791,469 168,782,259
Capital Budget Expenditures Actual '19 Actual '20 Estimated '21 Projected '22
Public Works Department 46,497,635 41,890,077 61,322,632 61,722,454 Transportation Department 11,448,556 14,404,502 37,462,197 42,162,924
Total 57,946,191 56,294,579 98,784,829 103,885,378
External Funds Expenditures
Total Actual '19 Total Actual '20 Total Approp '21 Total Budget '22
Public Works Department 47,081 37,156 144,825 10,000 Transportation Department 446,713 466,696 1,099,625 799,625
Total 493,794 503,852 1,244,450 809,625


StreetsCentral Fleet Management 363
Central Fleet Management Operating Budget Streets Central Fleet Management William Coughlin, Director, Appropriation 321000
Department Mission Under the direction of the Public Works Commissioner, Central Fleet Management provides pro-active, cost effective fleet services by responding to vehicle maintenance requests in a timely manner. Requests for service consist of routine repairs, preventive maintenance and emergency service for the City's centralized fleet.
Selected Performance Goals Fleet Services
Efficiently Deliver Services.
Operating Budget Program Name Total Actual '19 Total Actual '20 Total Approp '21 Total Budget '22
Fleet Services 2,993,210 3,509,996 3,012,586 3,165,680
Total 2,993,210 3,509,996 3,012,586 3,165,680
Operating Budget Actual '19 Actual '20 Approp '21 Budget '22
Personnel Services 2,380,645 2,295,163 2,179,550 2,250,354 Non Personnel 612,565 1,214,831 833,036 915,326 Total 2,993,210 3,509,994 3,012,586 3,165,680

364 StreetsCentral Fleet Management
Central Fleet Management Operating Budget
Authorizing Statutes Motor Vehicle Management Bureau, CBC
Ord. §§ 7-8.1-7-8.8.
Description of Services The Central Fleet Management Division is responsible for preventive maintenance, routine and emergency repair of vehicles. Central Fleet Management maintains vehicles for all City departments excluding the public safety agencies.

StreetsCentral Fleet Management 365
Department History Personnel Services FY19 Expenditure FY20 Expenditure FY21 Appropriation FY22 Recommended Inc/Dec 21 vs 22
51000 Permanent Employees 2,013,118 2,135,261 2,119,550 2,190,354 70,804 51100 Emergency Employees 0 0 0 0 0 51200 Overtime 367,527 159,902 60,000 60,000 0 51600 Unemployment Compensation 0 0 0 0 0 51700 Workers' Compensation 0 0 0 0 0 Total Personnel Services 2,380,645 2,295,163 2,179,550 2,250,354 70,804
Contractual Services FY19 Expenditure FY20 Expenditure FY21 Appropriation FY22 Recommended Inc/Dec 21 vs 22
52100 Communications 6,201 6,121 6,900 6,900 0 52200 Utilities 0 0 0 0 0 52400 Snow Removal 0 0 0 0 0 52500 Garbage/Waste Removal 55,760 4,995 5,000 5,000 0 52600 Repairs Buildings & Structures 0 0 0 0 0 52700 Repairs & Service of Equipment 127,488 323,477 153,000 153,000 0 52800 Transportation of Persons 6,486 10,302 7,500 7,500 0 52900 Contracted Services 56,925 31,577 175,381 330,396 155,015 Total Contractual Services 252,860 376,472 347,781 502,796 155,015
Supplies & Materials FY19 Expenditure FY20 Expenditure FY21 Appropriation FY22 Recommended Inc/Dec 21 vs 22
53000 Auto Energy Supplies 46,011 139,093 72,966 36,615 -36,351 53200 Food Supplies 0 0 0 0 0 53400 Custodial Supplies 0 0 0 0 0 53500 Med, Dental, & Hosp Supply 0 0 0 0 0 53600 Office Supplies and Materials 2,790 3,070 3,200 3,200 0 53700 Clothing Allowance 9,500 9,500 9,750 9,750 0 53800 Educational Supplies & Mat 0 0 0 0 0 53900 Misc Supplies & Materials 11,981 349,986 60,900 60,900 0 Total Supplies & Materials 70,282 501,649 146,816 110,465 -36,351
Current Chgs & Oblig FY19 Expenditure FY20 Expenditure FY21 Appropriation FY22 Recommended Inc/Dec 21 vs 22
54300 Workers' Comp Medical 0 0 0 0 0 54400 Legal Liabilities 0 0 0 0 0 54500 Aid To Veterans 0 0 0 0 0 54600 Current Charges H&I 0 0 0 0 0 54700 Indemnification 0 0 0 0 0 54800 Reserve Account 0 0 0 0 0 54900 Other Current Charges 6,564 8,583 6,350 6,350 0 Total Current Chgs & Oblig 6,564 8,583 6,350 6,350 0
Equipment FY19 Expenditure FY20 Expenditure FY21 Appropriation FY22 Recommended Inc/Dec 21 vs 22
55000 Automotive Equipment 0 0 0 0 0 55400 Lease/Purchase 257,974 276,278 307,089 270,715 -36,374 55600 Office Furniture & Equipment 0 0 0 0 0 55900 Misc Equipment 24,885 51,849 25,000 25,000 0 Total Equipment 282,859 328,127 332,089 295,715 -36,374
Other FY19 Expenditure FY20 Expenditure FY21 Appropriation FY22 Recommended Inc/Dec 21 vs 22
56200 Special Appropriation 0 0 0 0 0 57200 Structures & Improvements 0 0 0 0 0 58000 Land & Non-Structure 0 0 0 0 0 Total Other 0 0 0 0 0
Grand Total 2,993,210 3,509,994 3,012,586 3,165,680 153,094

366 StreetsCentral Fleet Management
Department Personnel
Title Union Code Grade Position FY22 Salary Title
Union Code Grade Position FY22 Salary
Dir of Fleet Management EXM 12 1.00 137,252 Logistics Specialist AFG 20A 1.00 102,641
Fleet Support Serv System Operator
AFT 10L 1.00 40,864 Master Gen Maint Mech Foreman
AFG 20 1.00 105,942
Gen Main Mech Frprs (CFM) AFG 19A 1.00 102,980 Motor Equiopment Repair Foreperson AFG 18A 2.00 179,891
Head Admin Clerk AFT 14 1.00 60,125 Motor Equip Rep Frpr (CFM) AFG 17A 1.00 83,067
Heavy Motor Equipment Repair Class I
AFT 18 5.00 411,402 Prin Admin Assistant SE1 08 1.00 110,814
HME Repairperson Class II AFT 16 12.00 826,793 Safety Inspector(C Fleet Mn) AFG 15 1.00 68,936 HME Repairperson Class III AFT 14 9.00 469,704 Service Writer AFG 15 2.00 135,265 Hvy Mtr Equip Repairperson AFT 15 5.00 327,300 Sr Radio Comm Tech (CFM) AFG 18A 1.00 72,358
Supn-Automotive Maint (CFM) SE1 10 2.00 232,566
Total 47 3,467,900 Adjustments Differential Payments 0 Other 22,800 Chargebacks -1,238,900 Salary Savings -61,449 FY22 Total Request 2,190,351

StreetsCentral Fleet Management 367
Program 1. Fleet Services William Coughlin, Director, Organization 321100
Program Description The Fleet Services Program is responsible for the preventive maintenance and routine or emergency repair of vehicles in all City departments excluding public safety agencies. Preventive maintenance includes oil change, brake repair, and fluid changes. Routine and emergency repair includes engine servicing, body work, transmission repair, and glass replacement. The Fleet Services Program also conducts emission testing and registration functions.
Operating Budget Actual '19 Actual '20 Approp '21 Budget '22
Personnel Services 2,380,645 2,295,163 2,179,550 2,250,354 Non Personnel 612,565 1,214,831 833,036 915,326 Total 2,993,210 3,509,994 3,012,586 3,165,680
Performance
Goal: Efficiently Deliver Services
Performance Measures Actual '19 Actual '20 Projected '21 Target '22
% of preventative maintenance (PM) actions completed in 24 hours 95% 94% 93% 95%
% of preventative maintenance (PM) services completed within 30 days of schedule
90% 94% 80% 95%


StreetsOffice of Streets 369
Office of Streets Operating Budget Streets Office of Streets Chris Osgood, Chief of Streets, Appropriation 310000
Department Mission The Office of Streets oversees all programs and operations that ensure well-lit, attractive and efficient infrastructure that moves vehicular and pedestrian traffic safely. The Office of the Chief also provides administrative and financial support for the entire cabinet.
Operating Budget Program Name Total Actual '19 Total Actual '20 Total Approp '21 Total Budget '22
Admin & Finance 2,131,409 2,040,302 2,053,526 2,290,092
Total 2,131,409 2,040,302 2,053,526 2,290,092
Operating Budget Actual '19 Actual '20 Approp '21 Budget '22
Personnel Services 2,118,484 1,988,514 1,999,078 2,251,988 Non Personnel 12,925 51,788 54,448 38,104 Total 2,131,409 2,040,302 2,053,526 2,290,092

370 StreetsOffice of Streets
Office of Streets Operating Budget
Description of Services The Office of Streets oversees the operations of the individual departments within the cabinet. The Office also provides administration and finance support for those departments.
Office of Streets
Transportation Signals
Facility & Building Maintenan
ce
Sanitation
Recycling
Engineering Public Works
Administration & Finance
Central Fleet Maintenance

StreetsOffice of Streets 371
Department History Personnel Services FY19 Expenditure FY20 Expenditure FY21 Appropriation FY22 Recommended Inc/Dec 21 vs 22
51000 Permanent Employees 2,037,593 1,937,342 1,979,078 2,231,988 252,910 51100 Emergency Employees 0 0 0 0 0 51200 Overtime 80,891 51,172 20,000 20,000 0 51600 Unemployment Compensation 0 0 0 0 0 51700 Workers' Compensation 0 0 0 0 0 Total Personnel Services 2,118,484 1,988,514 1,999,078 2,251,988 252,910
Contractual Services FY19 Expenditure FY20 Expenditure FY21 Appropriation FY22 Recommended Inc/Dec 21 vs 22
52100 Communications 0 0 0 0 0 52200 Utilities 0 0 0 0 0 52400 Snow Removal 0 0 0 0 0 52500 Garbage/Waste Removal 0 0 0 0 0 52600 Repairs Buildings & Structures 0 0 0 0 0 52700 Repairs & Service of Equipment 2,038 0 5,750 750 -5,000 52800 Transportation of Persons 4,348 37,235 3,300 3,300 0 52900 Contracted Services 228 0 30,000 20,000 -10,000 Total Contractual Services 6,614 37,235 39,050 24,050 -15,000
Supplies & Materials FY19 Expenditure FY20 Expenditure FY21 Appropriation FY22 Recommended Inc/Dec 21 vs 22
53000 Auto Energy Supplies 0 0 0 0 0 53200 Food Supplies 0 0 0 0 0 53400 Custodial Supplies 0 0 0 0 0 53500 Med, Dental, & Hosp Supply 0 0 0 0 0 53600 Office Supplies and Materials 3,081 0 5,150 5,150 0 53700 Clothing Allowance 1,250 1,750 1,250 1,250 0 53800 Educational Supplies & Mat 0 0 0 0 0 53900 Misc Supplies & Materials 0 0 0 0 0 Total Supplies & Materials 4,331 1,750 6,400 6,400 0
Current Chgs & Oblig FY19 Expenditure FY20 Expenditure FY21 Appropriation FY22 Recommended Inc/Dec 21 vs 22
54300 Workers' Comp Medical 0 0 0 0 0 54400 Legal Liabilities 0 0 0 0 0 54500 Aid To Veterans 0 0 0 0 0 54600 Current Charges H&I 0 0 0 0 0 54700 Indemnification 0 0 0 0 0 54800 Reserve Account 0 0 0 0 0 54900 Other Current Charges 0 9,950 6,610 6,610 0 Total Current Chgs & Oblig 0 9,950 6,610 6,610 0
Equipment FY19 Expenditure FY20 Expenditure FY21 Appropriation FY22 Recommended Inc/Dec 21 vs 22
55000 Automotive Equipment 0 0 0 0 0 55400 Lease/Purchase 1,980 2,853 2,388 1,044 -1,344 55600 Office Furniture & Equipment 0 0 0 0 0 55900 Misc Equipment 0 0 0 0 0 Total Equipment 1,980 2,853 2,388 1,044 -1,344
Other FY19 Expenditure FY20 Expenditure FY21 Appropriation FY22 Recommended Inc/Dec 21 vs 22
56200 Special Appropriation 0 0 0 0 0 57200 Structures & Improvements 0 0 0 0 0 58000 Land & Non-Structure 0 0 0 0 0 Total Other 0 0 0 0 0
Grand Total 2,131,409 2,040,302 2,053,526 2,290,092 236,566

372 StreetsOffice of Streets
Department Personnel
Title Union Code Grade Position FY22 Salary Title
Union Code Grade Position FY22 Salary
Admin Analyst (Btd/Pers) AFM 15 2.00 134,099 Mgr. of Comm & Inter Relations
EXM 07 1.00 66,486
Admin Asst (Election) SE1 06 1.00 90,319 Prin Admin Assistant SE1 08 4.00 409,138 Admin Asst (Pwd) AFG 16 1.00 71,888 Prin Admin Asst (BTD) SE1 09 1.00 116,500 Admin Secretary AFG 14 2.00 102,579 Sr Adm Asst (Admin Br) SE1 07 1.00 89,888
Chief Public Works & Transport CDH NG 1.00 150,412 Sr Adm Asst (PWD) SE1 09 2.00 180,567
Constituent Rel&Soc Med Spec EXM 09 1.00 109,934 Sr Data Proc Sys Analyst SE1 08 1.00 108,468 Director.. EXM 09 1.00 108,261 Sr Personnel Officer (PWD) SE1 06 1.00 60,314 Human Resources Dir EXM 11 1.00 130,493 Supervisor of Contracts AFG 17 1.00 79,085 Management Analyst (PWD) SE1 10 1.00 87,958 Utilities Permitting Agent AFT 17A 1.00 82,285 Total 24 2,178,674 Adjustments Differential Payments 0 Other 153,314 Chargebacks 0 Salary Savings -100,000 FY22 Total Request 2,231,988

StreetsOffice of Streets 373
Program 1. Admin & Finance Chris Osgood, Manager, Organization 310100
Program Description The Administration and Finance program provides financial, personnel, technological as well as public information services for the entire cabinet.
Operating Budget Actual '19 Actual '20 Approp '21 Budget '22
Personnel Services 2,118,484 1,988,514 1,999,078 2,251,988 Non Personnel 12,925 51,788 54,448 38,104 Total 2,131,409 2,040,302 2,053,526 2,290,092


StreetsPublic Works Department 375
Public Works Department Operating Budget Streets Public Works Department Chris Osgood, Interim Commissioner, Appropriation 311000
Department Mission The mission of the Public Works Department is to provide a quality environment for the City of Boston and ensure that the City's roadways, streets and bridge infrastructures are safe, clean and attractive. The Public Works Department also maintains street lights, traffic signals, provides snow removal and garbage collection and disposal as well as curbside recycling.
Selected Performance Goals Construction Management
Ensure that Boston’s streets, sidewalks, and bridges are safe, clean and attractive. Highway Field Operations
Ensure that Boston’s streets, sidewalks, and bridges are safe, clean and attractive. Street Lights
Improve neighborhood quality of life. Waste Reduction
Effectively control and manage Boston's public space. Efficiently deliver services.
Operating Budget Program Name Total Actual '19 Total Actual '20 Total Approp '21 Total Budget '22
PWD Commissioner's Office 2,317,666 2,110,374 2,207,308 2,253,002
Building/Facility Maintenance 2,607,642 2,715,188 2,904,474 2,781,345
Engineering 2,222,270 1,712,580 1,827,251 1,917,604
Construction Management 3,218,657 2,632,443 3,150,493 3,237,770
Highway Field Operations 19,951,867 19,085,206 20,143,801 20,170,991
Bridge Operations/Maintenance 2,298,329 1,970,384 1,807,349 1,812,202
Street Lights 10,025,188 9,263,373 9,791,173 10,507,071
Waste Reduction 42,721,419 55,694,345 57,077,811 58,378,733
Total 85,363,038 95,183,893 98,909,660 101,058,718
External Funds Budget Fund Name Total Actual '19 Total Actual '20 Total Approp '21 Total Budget '22
Bloomberg Mayor's Challenge 41,413 25,389 74,825 0
Home Composting 5,668 11,767 10,000 10,000
Sustainable Materials Recovery Program Municipal Grant 0 0 60,000 0
Total 47,081 37,156 144,825 10,000
Operating Budget Actual '19 Actual '20 Approp '21 Budget '22
Personnel Services 22,253,969 21,363,053 23,700,073 23,768,449 Non Personnel 63,109,069 73,820,840 75,209,587 77,290,269 Total 85,363,038 95,183,893 98,909,660 101,058,718
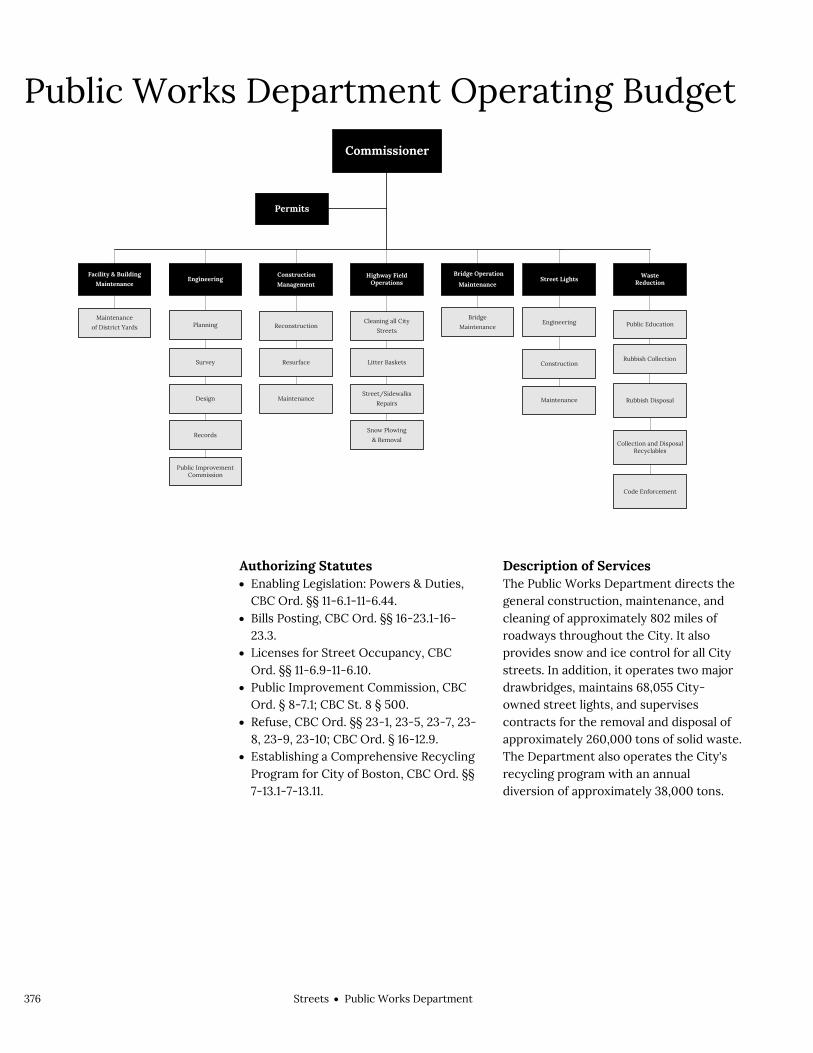
376 StreetsPublic Works Department
Public Works Department Operating Budget
Authorizing Statutes Enabling Legislation: Powers & Duties,
CBC Ord. §§ 11-6.1-11-6.44. Bills Posting, CBC Ord. §§ 16-23.1-16-
23.3. Licenses for Street Occupancy, CBC
Ord. §§ 11-6.9-11-6.10. Public Improvement Commission, CBC
Ord. § 8-7.1; CBC St. 8 § 500. Refuse, CBC Ord. §§ 23-1, 23-5, 23-7, 23-
8, 23-9, 23-10; CBC Ord. § 16-12.9. Establishing a Comprehensive Recycling
Program for City of Boston, CBC Ord. §§ 7-13.1-7-13.11.
Description of Services The Public Works Department directs the general construction, maintenance, and cleaning of approximately 802 miles of roadways throughout the City. It also provides snow and ice control for all City streets. In addition, it operates two major drawbridges, maintains 68,055 City-owned street lights, and supervises contracts for the removal and disposal of approximately 260,000 tons of solid waste. The Department also operates the City's recycling program with an annual diversion of approximately 38,000 tons.
Engineering
Construction
Maintenance
Maintenance
of District Yards Public Education
Rubbish Collection
Rubbish Disposal
Planning
Survey
Design
Records
Public Improvement Commission
Reconstruction
Resurface
Maintenance
Commissioner
Litter Baskets
Cleaning all City
Streets
Snow Plowing
& Removal
Street/Sidewalks
Repairs
Bridge
Maintenance
Bridge Operation
MaintenanceStreet Lights
Facility & Building
MaintenanceWaste
ReductionEngineeringConstruction
ManagementHighway Field
Operations
Permits
Collection and Disposal Recyclables
Code Enforcement

StreetsPublic Works Department 377
Department History Personnel Services FY19 Expenditure FY20 Expenditure FY21 Appropriation FY22 Recommended Inc/Dec 21 vs 22
51000 Permanent Employees 18,112,712 18,510,235 19,811,259 19,979,635 168,376 51100 Emergency Employees 266,909 193,882 649,990 649,990 0 51200 Overtime 2,900,488 1,796,358 2,328,824 2,228,824 -100,000 51600 Unemployment Compensation 59,006 36,149 110,000 110,000 0 51700 Workers' Compensation 914,854 826,429 800,000 800,000 0 Total Personnel Services 22,253,969 21,363,053 23,700,073 23,768,449 68,376
Contractual Services FY19 Expenditure FY20 Expenditure FY21 Appropriation FY22 Recommended Inc/Dec 21 vs 22
52100 Communications 294,355 290,276 294,555 294,555 0 52200 Utilities 6,419,088 6,178,990 6,487,806 6,668,557 180,751 52400 Snow Removal 0 0 0 0 0 52500 Garbage/Waste Removal 39,841,721 52,626,619 53,829,103 53,858,413 29,310 52600 Repairs Buildings & Structures 1,433,771 1,472,110 1,380,000 1,430,000 50,000 52700 Repairs & Service of Equipment 1,870,671 1,652,549 1,719,250 1,719,250 0 52800 Transportation of Persons 86,269 48,592 35,000 35,000 0 52900 Contracted Services 8,119,822 6,498,762 6,024,632 7,739,756 1,715,124 Total Contractual Services 58,065,697 68,767,898 69,770,346 71,745,531 1,975,185
Supplies & Materials FY19 Expenditure FY20 Expenditure FY21 Appropriation FY22 Recommended Inc/Dec 21 vs 22
53000 Auto Energy Supplies 687,682 535,346 729,150 539,255 -189,895 53200 Food Supplies 0 0 0 0 0 53400 Custodial Supplies 25,669 43,055 35,500 35,500 0 53500 Med, Dental, & Hosp Supply 0 0 0 0 0 53600 Office Supplies and Materials 108,199 110,231 143,200 140,900 -2,300 53700 Clothing Allowance 73,500 96,949 81,050 81,050 0 53800 Educational Supplies & Mat 0 0 0 0 0 53900 Misc Supplies & Materials 744,452 1,030,524 1,056,700 1,056,700 0 Total Supplies & Materials 1,639,502 1,816,105 2,045,600 1,853,405 -192,195
Current Chgs & Oblig FY19 Expenditure FY20 Expenditure FY21 Appropriation FY22 Recommended Inc/Dec 21 vs 22
54300 Workers' Comp Medical 279,817 151,096 200,000 200,000 0 54400 Legal Liabilities 197,310 187,915 314,000 314,000 0 54500 Aid To Veterans 0 0 0 0 0 54600 Current Charges H&I 0 0 0 0 0 54700 Indemnification 0 0 0 0 0 54800 Reserve Account 0 0 0 0 0 54900 Other Current Charges 157,439 123,889 106,150 106,650 500 Total Current Chgs & Oblig 634,566 462,900 620,150 620,650 500
Equipment FY19 Expenditure FY20 Expenditure FY21 Appropriation FY22 Recommended Inc/Dec 21 vs 22
55000 Automotive Equipment 47,811 371,299 0 0 0 55400 Lease/Purchase 2,289,996 2,119,635 2,371,191 2,468,383 97,192 55600 Office Furniture & Equipment 294 167 0 0 0 55900 Misc Equipment 64,060 1,319 2,300 2,300 0 Total Equipment 2,402,161 2,492,420 2,373,491 2,470,683 97,192
Other FY19 Expenditure FY20 Expenditure FY21 Appropriation FY22 Recommended Inc/Dec 21 vs 22
56200 Special Appropriation 0 0 0 0 0 57200 Structures & Improvements 367,143 281,517 400,000 600,000 200,000 58000 Land & Non-Structure 0 0 0 0 0 Total Other 367,143 281,517 400,000 600,000 200,000
Grand Total 85,363,038 95,183,893 98,909,660 101,058,718 2,149,058

378 StreetsPublic Works Department
Department Personnel
Title Union Code Grade Position FY22 Salary Title
Union Code Grade Position FY22 Salary
Admin Analyst AFT 14 1.00 61,428 Maint Mech (Light Svc Rpr) AFT 14 16.00 811,618 Admin Asst SE1 05 1.00 54,409 Maint Mech (Millwright) AFT 12L 1.00 54,233
Admin Asst (Gser Sec Hwy Pwd)
AFG 17 1.00 79,085 Maint Mech Frprs (Carpenter) AFG 15A 1.00 71,119
Admin Secretary AFG 14 1.00 59,678 Maint Mech I(Light SrvRep/Pwd) AFT 15 3.00 186,712
Admin Secretary AFT 14 4.00 236,662 Mgmt Analyst SE1 06 1.00 74,316 Admin_Secretary AFT 14 1.00 60,125 MotorEquipOper&Lbr(Print) AFT 07L 57.00 2,226,404 Administrative_Asst. AFJ 17 1.00 65,637 P Admin Asst SE1 10 1.00 124,231 Area Supv of Street Operations AFG 19A 3.00 230,913 Paver AFT 10L 10.00 463,338 Assoc Civil Engineer SE1 10 2.00 251,279 Permit Supervisor AFT 16 1.00 71,829 Assoc Electrical Engineer SE1 12 1.00 122,112 Prin Admin Assistant SE1 08 4.00 398,302 Asst Civil Engineer AFJ 18A 1.00 66,274 Prin Admin Asst (PWD) SE1 09 1.00 116,500 Asst Electrical Engineer AFJ 18A 4.00 364,382 Prin Civil Eng (Fss) AFJ 20A 1.00 109,063 Asst Supn of Street Operations SE1 10 2.00 251,819 Prin Civil Engineer AFJ 20A 3.00 266,109
Asst Supn-Collection & Disposal
SE1 10 1.00 126,024 Prin Electrical Engineer AFJ 20A 1.00 77,531
Building Main Person AFT 09L 6.00 254,091 Prin Storekeeper AFT 11 2.00 88,739 Building Maint Supv AFG 15 1.00 68,512 Public Works Hokey AFT 05 6.00 198,476
Chief Engineer(Pwd Highway Di)
SE1 12 1.00 121,106 Public Works Laborer AFT 06L 4.00 158,685
Chief Highway Const Inspector AFG 16A 1.00 67,599 Sanitation Insp AFG 13A 7.00 366,286
Code Enforce Offcr(Prmgmt&Car) AFL 14A 14.00 752,430 Spec Hvy Meo AFT 11L 19.00 888,594
Code Enforce Officer AFL 17A 3.00 246,537 Sr Adm Asst SE1 05 5.00 402,514 Commissioner (PWD) CDH NG 1.00 130,357 Sr Civil Engineer AFJ 19A 11.00 990,543 Division Engineer EXM 13 1.00 140,945 Sr Engineering Aid AFJ 14A 6.00 336,418 Drawtender## AFT 15A 3.00 213,358 Sr Highway Maint Crftsprs(Pwd AFT 12L 13.00 613,179 First Asst Drawtender## AFT 13A 10.00 537,602 Sr Research Analyst SE1 05 1.00 64,877 Head Clerk AFT 12 1.00 53,452 Street Lighting Compliance Spc SE1 07 2.00 142,162 Head Storekeeper AFG 14 2.00 114,094 Street Permit Examiner AFT 14A 3.00 162,137 Head_Act_Clerk AFT 12 2.00 106,903 Streetlighting Const Insp AFG 16 9.00 671,300 Highway Const Inspector (Pwd) AFG 13 2.00 79,608 Supn Highway Maintenance SE1 12 1.00 138,813 Highway Maint Frprs (PWD) AFG 14 23.00 1,351,249 Supn of Buildings and Bridges SE1 11 1.00 133,756 Highway Maint Inspector AFG 12 21.00 1,056,093 Supn-Sanitation SE1 12 1.00 129,826 Highway Maint Inspector AFT 12 1.00 43,495 Supv Struct Engineer SE1 10 3.00 378,072
Hvy Mtr Equip Oper & P W Lbr AFT 10L 45.00 1,904,827 Supv Utility Compliance & Coord
AFJ 20A 1.00 108,281
Jr Civil Eng AFJ 16A 8.00 494,903 Supv-Highway Maint AFG 17 15.00 1,036,906 Jr Civil Eng (Fss Eng Div Pwd) AFJ 16A 1.00 76,107 Supv-Sanitation AFG 17 2.00 159,736 Jr Eng Aid AFJ 12 1.00 38,272 Supv-Street Lighting AFG 17 3.00 240,386
Maint Mech (LightServRep/App)
AFT 13 3.00 119,412 Waste Reduction Prog Mgr SE1 08 1.00 73,198
Maint Mech (Carpenter) AFT 12L 4.00 210,690 Wkg Frprs Maint Mech(Painter) AFG 13 1.00 43,142 Total 397 22,788,800 Adjustments Differential Payments 0 Other 82,800 Chargebacks 0 Salary Savings -2,891,963 FY22 Total Request 19,979,637

StreetsPublic Works Department 379
External Funds History Personnel Services FY19 Expenditure FY20 Expenditure FY21 Appropriation FY22 Recommended Inc/Dec 21 vs 22
51000 Permanent Employees 18,942 0 74,825 0 -74,825 51100 Emergency Employees 0 0 0 0 0 51200 Overtime 0 0 0 0 0 51300 Part Time Employees 0 0 0 0 0 51400 Health Insurance 0 0 0 0 0 51500 Pension & Annuity 0 0 0 0 0 51600 Unemployment Compensation 0 0 0 0 0 51700 Workers' Compensation 0 0 0 0 0 51800 Indirect Costs 0 0 0 0 0 51900 Medicare 174 0 0 0 0 Total Personnel Services 19,116 0 74,825 0 -74,825
Contractual Services FY19 Expenditure FY20 Expenditure FY21 Appropriation FY22 Recommended Inc/Dec 21 vs 22
52100 Communications 0 0 0 0 0 52200 Utilities 0 0 0 0 0 52400 Snow Removal 0 0 0 0 0 52500 Garbage/Waste Removal 0 0 0 0 0 52600 Repairs Buildings & Structures 0 0 0 0 0 52700 Repairs & Service of Equipment 0 0 0 0 0 52800 Transportation of Persons 0 0 0 0 0 52900 Contracted Services 19,616 25,389 70,000 0 -70,000 Total Contractual Services 19,616 25,389 70,000 0 -70,000
Supplies & Materials FY19 Expenditure FY20 Expenditure FY21 Appropriation FY22 Recommended Inc/Dec 21 vs 22
53000 Auto Energy Supplies 0 0 0 0 0 53200 Food Supplies 0 0 0 0 0 53400 Custodial Supplies 0 0 0 0 0 53500 Med, Dental, & Hosp Supply 0 0 0 0 0 53600 Office Supplies and Materials 0 0 0 0 0 53700 Clothing Allowance 0 0 0 0 0 53800 Educational Supplies & Mat 0 0 0 0 0 53900 Misc Supplies & Materials 8,349 11,767 0 10,000 10,000 Total Supplies & Materials 8,349 11,767 0 10,000 10,000
Current Chgs & Oblig FY19 Expenditure FY20 Expenditure FY21 Appropriation FY22 Recommended Inc/Dec 21 vs 22
54300 Workers' Comp Medical 0 0 0 0 0 54400 Legal Liabilities 0 0 0 0 0 54600 Current Charges H&I 0 0 0 0 0 54700 Indemnification 0 0 0 0 0 54800 Reserve Account 0 0 0 0 0 54900 Other Current Charges 0 0 0 0 0 Total Current Chgs & Oblig 0 0 0 0 0
Equipment FY19 Expenditure FY20 Expenditure FY21 Appropriation FY22 Recommended Inc/Dec 21 vs 22
55000 Automotive Equipment 0 0 0 0 0 55400 Lease/Purchase 0 0 0 0 0 55600 Office Furniture & Equipment 0 0 0 0 0 55900 Misc Equipment 0 0 0 0 0 Total Equipment 0 0 0 0 0
Other FY19 Expenditure FY20 Expenditure FY21 Appropriation FY22 Recommended Inc/Dec 21 vs 22
56200 Special Appropriation 0 0 0 0 0 57200 Structures & Improvements 0 0 0 0 0 58000 Land & Non-Structure 0 0 0 0 0 Total Other 0 0 0 0 0
Grand Total 47,081 37,156 144,825 10,000 -134,825

380 StreetsPublic Works Department
Program 1. PWD Commissioner's Office Chris Osgood, Interim Commissioner, Organization 311100
Program Description The Commissioner's Office defines long-term policy and direction, and works to enhance service delivery throughout the Department. The office is also responsible for issuing permits for street openings and street occupancy.
Operating Budget Actual '19 Actual '20 Approp '21 Budget '22
Personnel Services 1,310,423 1,237,729 1,224,479 1,273,801 Non Personnel 1,007,243 872,645 982,829 979,201 Total 2,317,666 2,110,374 2,207,308 2,253,002

StreetsPublic Works Department 381
Program 2. Building/Facility Maintenance Fouad Hamzeh, Manager, Organization 311200
Program Description The Building/Facility Maintenance Program ensures that Department personnel work in clean, properly maintained buildings. The program is also charged with maintaining telephone communications at the Department's operations center.
Operating Budget Actual '19 Actual '20 Approp '21 Budget '22
Personnel Services 689,343 738,771 751,415 766,964 Non Personnel 1,918,299 1,976,417 2,153,059 2,014,381 Total 2,607,642 2,715,188 2,904,474 2,781,345

382 StreetsPublic Works Department
Program 3. Engineering Para Jayasinghe, P.E., Manager, Organization 311300
Program Description The Engineering Program plans, designs, schedules and prepares contracts for the reconstruction of sidewalks, roadways and bridges. Engineering firms are used to supplement staff and all work is coordinated with other City and state planning agencies. Through the Public Improvement Commission, the program reviews any proposed changes on, over, or under public ways by outside groups. The program also maintains the official records of all City-owned land and streets.
Operating Budget Actual '19 Actual '20 Approp '21 Budget '22
Personnel Services 1,544,574 1,563,991 1,655,800 1,743,784 Non Personnel 677,696 148,589 171,451 173,820 Total 2,222,270 1,712,580 1,827,251 1,917,604

StreetsPublic Works Department 383
Program 4. Construction Management Vacant, Manager, Organization 311400
Program Description The Construction Management Program is responsible for the construction and maintenance of the highway infrastructure of the City. Responsibilities include installing pedestrian ramps and managing major capital improvements in business districts. Engineering and inspection is provided for reconstruction and resurfacing projects and for the permanent restoration of damaged public ways. By inspecting public ways, analyzing and programming field data and estimating recovery cost, this program seeks to minimize the damages to roadways and sidewalks by utility companies and contractors.
Operating Budget Actual '19 Actual '20 Approp '21 Budget '22
Personnel Services 2,939,958 2,288,721 2,853,554 2,954,542 Non Personnel 278,699 343,722 296,939 283,228 Total 3,218,657 2,632,443 3,150,493 3,237,770
Performance
Goal: Ensure that Boston’s streets, sidewalks, and bridges are safe, clean and attractive
Performance Measures Actual '19 Actual '20 Projected '21 Target '22
Annual basis of the PCI for Boston's Streets 68 65.2 65.1 66.1
Average PCI of the Roads being resurfaced 30.4 25.9 25 22

384 StreetsPublic Works Department
Program 5. Highway Field Operations Michael Brohel, Manager, Organization 311500
Program Description The Highway Field Operations Program is responsible for cleaning all city streets from curb to curb, with special emphasis on high litter areas and neighborhoods with posted street cleaning times. The program maintains and empties litter receptacles in busier areas of the city, clears snow from the streets during winter, makes temporary repairs to streets and sidewalks and provides assistance to the Recycling Program. The program also provides graffiti services and cleans and maintains the Boston Freedom Trail.
Operating Budget Actual '19 Actual '20 Approp '21 Budget '22
Personnel Services 9,303,423 9,275,865 10,643,587 10,182,748 Non Personnel 10,648,444 9,809,341 9,500,214 9,988,243 Total 19,951,867 19,085,206 20,143,801 20,170,991
Performance
Goal: Ensure that Boston’s streets, sidewalks, and bridges are safe, clean and attractive
Performance Measures Actual '19 Actual '20 Projected '21 Target '22
Average personnel hours on a hokey route (hand cleaning streets/sidewalks)
3,145 2,198 2,500 3,500
Responsiveness to Constituent Requests (CRM)
Actual '19 Actual '20 Projected '21 Target '22
# of pothole repair requests received 11,578 7,118 2,800 3,000
% of pothole repair requests completed on time 78.2% 82% 85% 85%
Average days to complete a pothole repair request 1 1.6 2 1
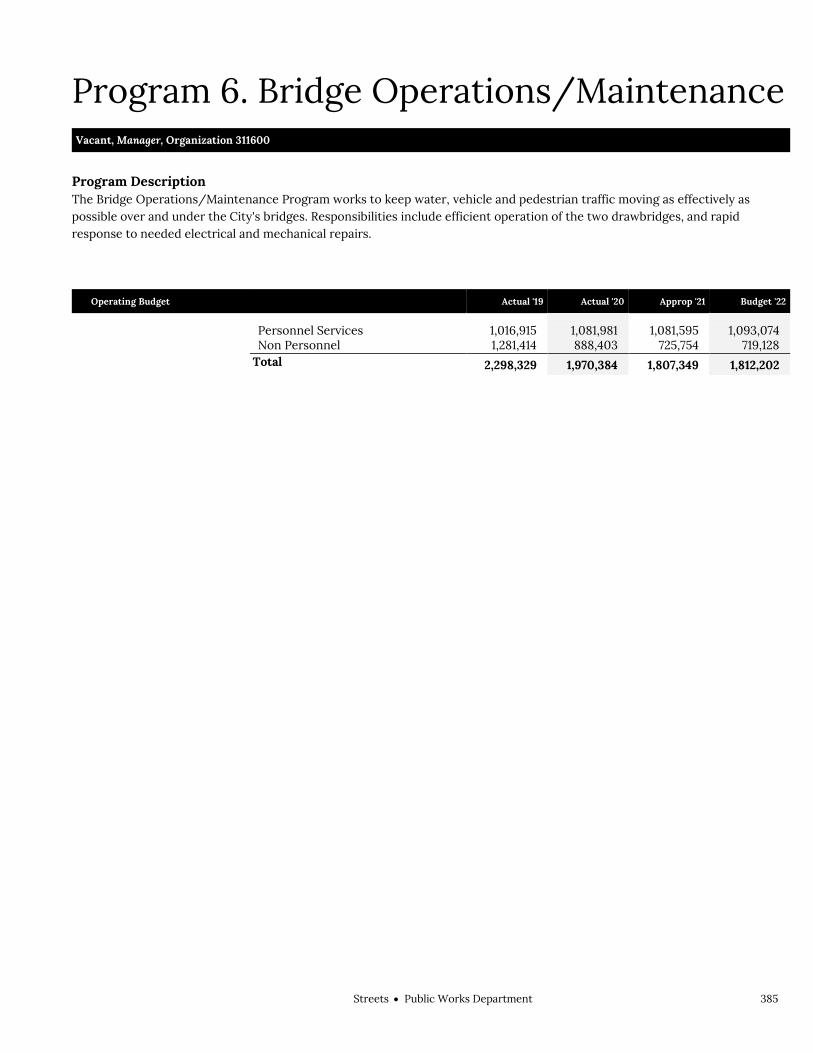
StreetsPublic Works Department 385
Program 6. Bridge Operations/Maintenance Vacant, Manager, Organization 311600
Program Description The Bridge Operations/Maintenance Program works to keep water, vehicle and pedestrian traffic moving as effectively as possible over and under the City's bridges. Responsibilities include efficient operation of the two drawbridges, and rapid response to needed electrical and mechanical repairs.
Operating Budget Actual '19 Actual '20 Approp '21 Budget '22
Personnel Services 1,016,915 1,081,981 1,081,595 1,093,074 Non Personnel 1,281,414 888,403 725,754 719,128 Total 2,298,329 1,970,384 1,807,349 1,812,202

386 StreetsPublic Works Department
Program 7. Street Lights John Yetman, Manager, Organization 311700
Program Description The Street Lights program is responsible for the maintenance of streetlights. The program provides modern, cost efficient and effective street lighting services to protect the safety of the general and traveling public on Boston's streets and in the City's parks and playgrounds.
Operating Budget Actual '19 Actual '20 Approp '21 Budget '22
Personnel Services 3,119,285 2,764,296 3,113,840 3,282,177 Non Personnel 6,905,903 6,499,077 6,677,333 7,224,894 Total 10,025,188 9,263,373 9,791,173 10,507,071
Performance
Goal: Improve neighborhood quality of life
Responsiveness to Constituent Requests (CRM) Actual '19 Actual '20 Projected '21 Target '22
# of street light outage constituent requests received 5,286 3,556 3,000 3,000
% of street light outages addressed on time 65% 64% 55% 80%
Average time to complete a street light outage request (days)
18 58 80 60

StreetsPublic Works Department 387
Program 8. Waste Reduction Brian Coughlin, Manager, Organization 311800
Program Description The Waste Reduction Division is responsible for implementing and managing recycling activities in the City in conjunction with the collection and disposal of solid waste generated by City of Boston households and enforcing all codes and ordinances to protect health, safety and enforcement. Responsibilities include program design, public education around recycling, monitoring contractor work and exploration of cost effective and environmentally sound disposal alternatives.
Operating Budget Actual '19 Actual '20 Approp '21 Budget '22
Personnel Services 2,330,048 2,411,699 2,375,803 2,471,359 Non Personnel 40,391,371 53,282,646 54,702,008 55,907,374 Total 42,721,419 55,694,345 57,077,811 58,378,733
Performance
Goal: Effectively control and manage Boston's public space
Performance Measures Actual '19 Actual '20 Projected '21 Target '22
% of Code Enforcement cases responded to on time 96.6% 90% 98% 99%
Recycling Diversion Rate (%) 21 21.1 22 23
Goal: Efficiently deliver services
Responsiveness to Constituent Requests (CRM)
Actual '19 Actual '20 Projected '21 Target '22
# of missed trash requests received 15,672 15,987 14,000 13,000
% of missed trash requests completed on time 92% 81% 97% 99%
Average time to complete a missed trash request (days) 1 0.7 0.2 1

388 StreetsPublic Works Department
External Funds Projects Bloomberg Mayor's Challenge
Project Mission .A grant provided by Bloomberg Philanthropies to build innovative ways to build equity into dispatching repairs and maintenance in its sidewalk and street maintenance programs.
Home Composting
Project Mission This revolving account was started with a grant from the State Department of Environmental Protection and uses yard waste materials from community gardens to create compost. The compost is sold and the proceeds were used to buy compost bins, which are also sold to residential gardeners, along with compost.
Sustainable Materials Recovery Program
Project Mission The Recycling Dividends Program funds from MassDEP provide payments to municipalities that implement specific Zero Waste policies. This grant will help the City of Boston fund a Zero Waste public education campaign.

StreetsPublic Works Department 389
Public Works Department Capital Budget Streets Public Works Department
Overview This Capital Plan invests deeply in the core goals of Go Boston 2030: transformational projects that expand access and interconnect Boston neighborhoods; streets that are safer for all users, particularly pedestrians and cyclists; and travel that is more reliable and predictable.
FY22 Major Initiatives Reconstruct Ruggles Street, from Tremont to Shawmut Street, with a pedestrian/bike
connection between Ruggles and Dudley Station. Begin community engagement and design on improvements for Melnea Cass Boulevard. Complete reconstruction of New England Avenue from Talbot Avenue to Norfolk Street with
new sidewalks, ramps, and speed humps. Redesign and reconstruct Cummins Highway, from Mattapan Square to Harvard Street, for
safety improvements and bike access. Design and begin construction on a new Northern Avenue bridge, which will prioritize
multi-modal transit and opportunities for public realm uses. Expand our ramp reconstruction program to make all City sidewalk ramps ADA-compliant
by 2030. Continue the Walkable Streets sidewalk expansion and rebuild high-use corridors in the
most vulnerable neighborhoods. Construction will continue on a new North Washington Street Bridge.
Capital Budget Expenditures Total Actual '19 Total Actual '20 Estimated '21 Total Projected
'22
Total Department 46,497,635 41,890,077 61,322,632 61,722,454

390 StreetsPublic Works Department
Public Works Department Project Profiles ADA/AAB PEDESTRIAN RAMPS
Project Mission Install or reconstruct pedestrian ramps to conform to current Americans With Disabilities Act (ADA) and
Architectural Access Board (AAB) regulations.
Managing Department, Public Works Department Status, Annual Program Location, Citywide Operating Impact, No
Authorizations
Source Existing FY22 Future Non Capital
Fund Total City Capital 4,800,000 0 25,300,000 0 30,100,000 Grants/Other 27,000,000 0 0 0 27,000,000 Total 31,800,000 0 25,300,000 0 57,100,000
Expenditures (Actual and Planned)
Source Thru
6/30/20 FY21 FY22 FY23-26 Total City Capital 0 0 1,600,000 28,500,000 30,100,000 Grants/Other 0 6,000,000 9,000,000 12,000,000 27,000,000 Total 0 6,000,000 10,600,000 40,500,000 57,100,000
AMORY STREET EXTENSION Project Mission Reconstruct road, sidewalks, and lighting from Amory Street to the end. Managing Department, Public Works Department Status, In Design Location, Roxbury Operating Impact, No
Authorizations
Source Existing FY22 Future Non Capital
Fund Total City Capital 1,000,000 0 0 0 1,000,000 Grants/Other 0 0 0 0 0 Total 1,000,000 0 0 0 1,000,000
Expenditures (Actual and Planned)
Source Thru
6/30/20 FY21 FY22 FY23-26 Total City Capital 0 0 250,000 750,000 1,000,000 Grants/Other 0 0 0 0 0 Total 0 0 250,000 750,000 1,000,000

StreetsPublic Works Department 391
Public Works Department Project Profiles BLUE HILL AVENUE
Project Mission Repave and restripe the entire Blue Hill Avenue corridor from Mattapan to Roxbury. Upgrade pedestrian ramps. Managing Department, Public Works Department Status, To Be Scheduled Location, Roxbury Operating Impact, No
Authorizations
Source Existing FY22 Future Non Capital
Fund Total City Capital 0 0 0 0 0 Grants/Other 0 0 5,500,000 0 5,500,000 Total 0 0 5,500,000 0 5,500,000
Expenditures (Actual and Planned)
Source Thru
6/30/20 FY21 FY22 FY23-26 Total City Capital 0 0 0 0 0 Grants/Other 0 0 500,000 5,000,000 5,500,000 Total 0 0 500,000 5,000,000 5,500,000
BOYLSTON STREET SIDEWALKS Project Mission Design and construct sidewalk and/or streetscape improvements on Boylston Street. Phased construction
includes the north side sidewalks from Fairfield Street to Hereford Street.
Managing Department, Public Works Department Status, In Construction Location, Back Bay Operating Impact, No
Authorizations
Source Existing FY22 Future Non Capital
Fund Total City Capital 0 0 0 0 0 Grants/Other 3,761,000 0 0 0 3,761,000 Total 3,761,000 0 0 0 3,761,000
Expenditures (Actual and Planned)
Source Thru
6/30/20 FY21 FY22 FY23-26 Total City Capital 0 0 0 0 0 Grants/Other 1,052,564 50,000 1,250,000 1,408,436 3,761,000 Total 1,052,564 50,000 1,250,000 1,408,436 3,761,000

392 StreetsPublic Works Department
Public Works Department Project Profiles BRIDGE REPAIRS
Project Mission Ongoing repairs at various City-owned bridges as needed to bring the portfolio of 40 bridges to a state of good
repair.
Managing Department, Public Works Department Status, Annual Program Location, Citywide Operating Impact, No
Authorizations
Source Existing FY22 Future Non Capital
Fund Total City Capital 75,000,000 0 0 0 75,000,000 Grants/Other 0 0 0 0 0 Total 75,000,000 0 0 0 75,000,000
Expenditures (Actual and Planned)
Source Thru
6/30/20 FY21 FY22 FY23-26 Total City Capital 8,046,150 4,000,000 4,000,000 58,953,850 75,000,000 Grants/Other 0 0 0 0 0 Total 8,046,150 4,000,000 4,000,000 58,953,850 75,000,000
CAMBRIDGE STREET BRIDGE Project Mission Rehabilitate bridge, performing repairs as needed. Managing Department, Public Works Department Status, To Be Scheduled Location, Charlestown Operating Impact, No
Authorizations
Source Existing FY22 Future Non Capital
Fund Total City Capital 0 0 0 0 0 Grants/Other 750,000 0 2,000,000 0 2,750,000 Total 750,000 0 2,000,000 0 2,750,000
Expenditures (Actual and Planned)
Source Thru
6/30/20 FY21 FY22 FY23-26 Total City Capital 0 0 0 0 0 Grants/Other 0 0 750,000 2,000,000 2,750,000 Total 0 0 750,000 2,000,000 2,750,000
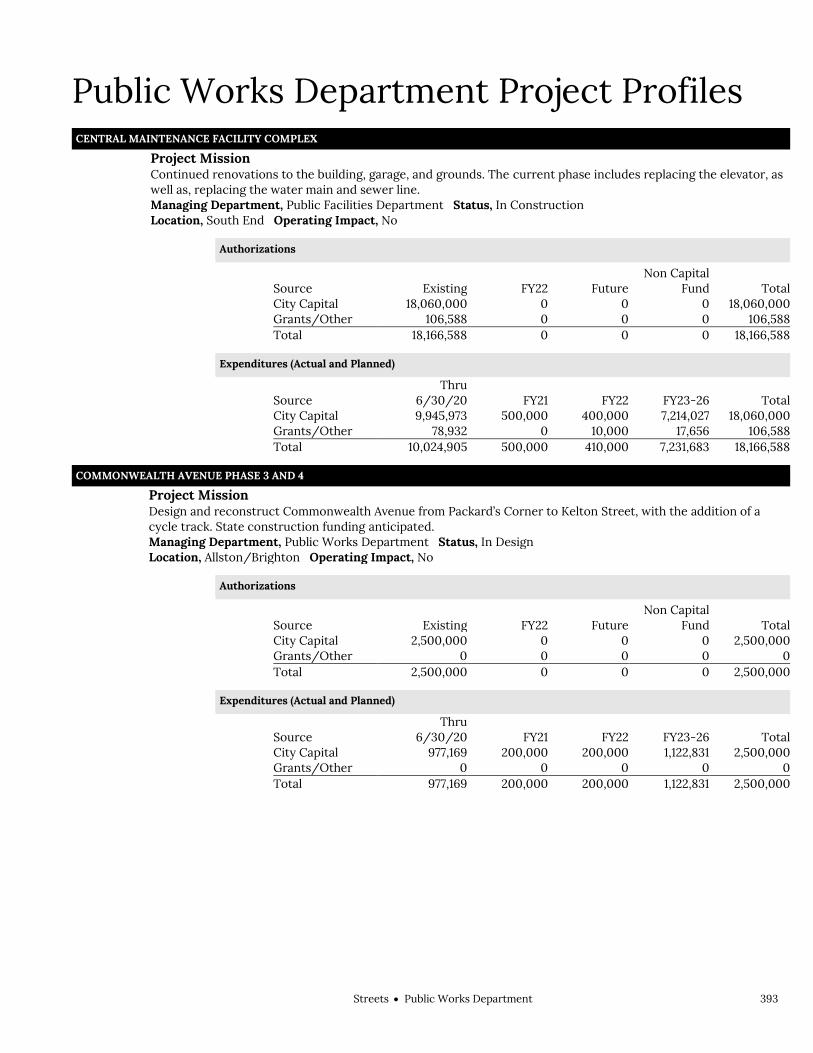
StreetsPublic Works Department 393
Public Works Department Project Profiles CENTRAL MAINTENANCE FACILITY COMPLEX
Project Mission Continued renovations to the building, garage, and grounds. The current phase includes replacing the elevator, as
well as, replacing the water main and sewer line.
Managing Department, Public Facilities Department Status, In Construction Location, South End Operating Impact, No
Authorizations
Source Existing FY22 Future Non Capital
Fund Total City Capital 18,060,000 0 0 0 18,060,000 Grants/Other 106,588 0 0 0 106,588 Total 18,166,588 0 0 0 18,166,588
Expenditures (Actual and Planned)
Source Thru
6/30/20 FY21 FY22 FY23-26 Total City Capital 9,945,973 500,000 400,000 7,214,027 18,060,000 Grants/Other 78,932 0 10,000 17,656 106,588 Total 10,024,905 500,000 410,000 7,231,683 18,166,588
COMMONWEALTH AVENUE PHASE 3 AND 4 Project Mission Design and reconstruct Commonwealth Avenue from Packard’s Corner to Kelton Street, with the addition of a
cycle track. State construction funding anticipated.
Managing Department, Public Works Department Status, In Design Location, Allston/Brighton Operating Impact, No
Authorizations
Source Existing FY22 Future Non Capital
Fund Total City Capital 2,500,000 0 0 0 2,500,000 Grants/Other 0 0 0 0 0 Total 2,500,000 0 0 0 2,500,000
Expenditures (Actual and Planned)
Source Thru
6/30/20 FY21 FY22 FY23-26 Total City Capital 977,169 200,000 200,000 1,122,831 2,500,000 Grants/Other 0 0 0 0 0 Total 977,169 200,000 200,000 1,122,831 2,500,000
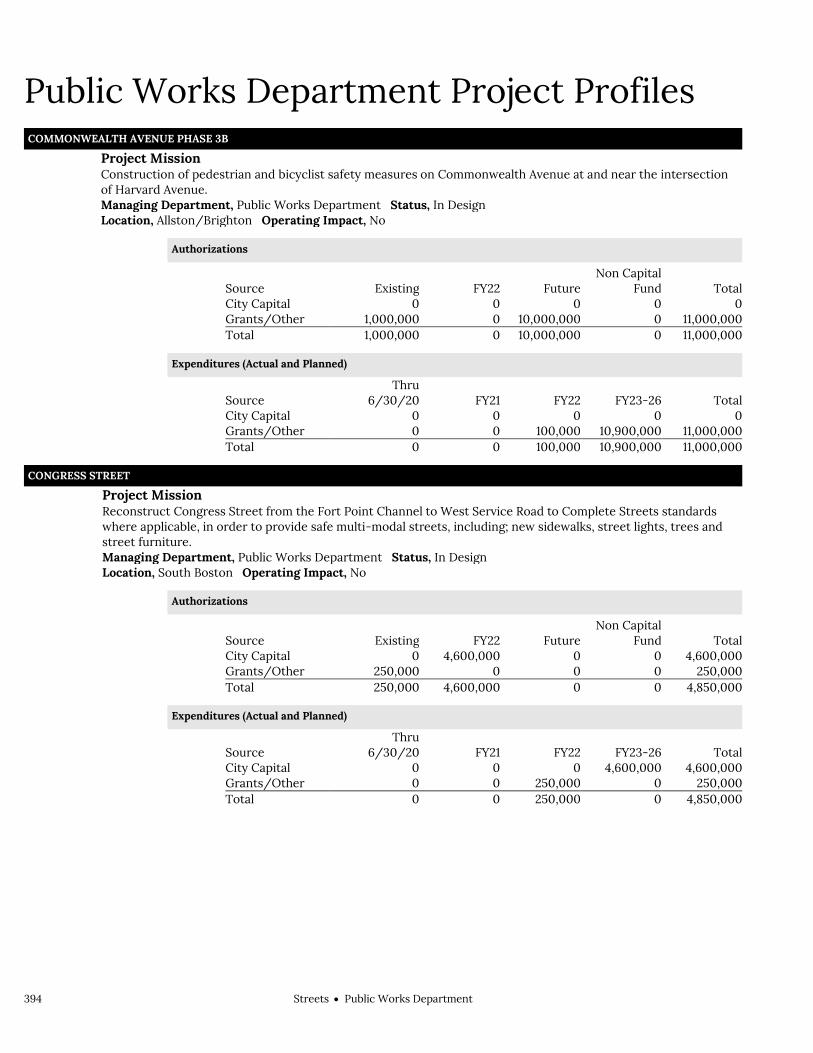
394 StreetsPublic Works Department
Public Works Department Project Profiles COMMONWEALTH AVENUE PHASE 3B
Project Mission Construction of pedestrian and bicyclist safety measures on Commonwealth Avenue at and near the intersection
of Harvard Avenue.
Managing Department, Public Works Department Status, In Design Location, Allston/Brighton Operating Impact, No
Authorizations
Source Existing FY22 Future Non Capital
Fund Total City Capital 0 0 0 0 0 Grants/Other 1,000,000 0 10,000,000 0 11,000,000 Total 1,000,000 0 10,000,000 0 11,000,000
Expenditures (Actual and Planned)
Source Thru
6/30/20 FY21 FY22 FY23-26 Total City Capital 0 0 0 0 0 Grants/Other 0 0 100,000 10,900,000 11,000,000 Total 0 0 100,000 10,900,000 11,000,000
CONGRESS STREET Project Mission Reconstruct Congress Street from the Fort Point Channel to West Service Road to Complete Streets standards
where applicable, in order to provide safe multi-modal streets, including; new sidewalks, street lights, trees and street furniture.
Managing Department, Public Works Department Status, In Design Location, South Boston Operating Impact, No
Authorizations
Source Existing FY22 Future Non Capital
Fund Total City Capital 0 4,600,000 0 0 4,600,000 Grants/Other 250,000 0 0 0 250,000 Total 250,000 4,600,000 0 0 4,850,000
Expenditures (Actual and Planned)
Source Thru
6/30/20 FY21 FY22 FY23-26 Total City Capital 0 0 0 4,600,000 4,600,000 Grants/Other 0 0 250,000 0 250,000 Total 0 0 250,000 0 4,850,000

StreetsPublic Works Department 395
Public Works Department Project Profiles CUMMINS HIGHWAY
Project Mission Reconstruct road, make traffic improvements, install new pedestrian ramps, enhance bike access, install new tree
plantings, and improve lighting from River Street in Mattapan Square to Harvard Street.
Managing Department, Public Works Department Status, In Design Location, Mattapan Operating Impact, No
Authorizations
Source Existing FY22 Future Non Capital
Fund Total City Capital 12,000,000 0 0 0 12,000,000 Grants/Other 0 0 0 0 0 Total 12,000,000 0 0 0 12,000,000
Expenditures (Actual and Planned)
Source Thru
6/30/20 FY21 FY22 FY23-26 Total City Capital 0 0 1,000,000 11,000,000 12,000,000 Grants/Other 0 0 0 0 0 Total 0 0 1,000,000 11,000,000 12,000,000
DALTON STREET BRIDGE Project Mission Design and construction to support the rehabilitation of the bridge. Managing Department, Public Works Department Status, In Construction Location, Back Bay Operating Impact, No
Authorizations
Source Existing FY22 Future Non Capital
Fund Total City Capital 0 0 0 0 0 Grants/Other 12,600,000 0 0 0 12,600,000 Total 12,600,000 0 0 0 12,600,000
Expenditures (Actual and Planned)
Source Thru
6/30/20 FY21 FY22 FY23-26 Total City Capital 0 0 0 0 0 Grants/Other 0 1,250,000 1,000,000 10,350,000 12,600,000 Total 0 1,250,000 1,000,000 10,350,000 12,600,000

396 StreetsPublic Works Department
Public Works Department Project Profiles DISTRICT YARD IMPROVEMENTS
Project Mission Annual program to identify, prioritize, and implement facility repairs at the City's district yards utilized by the
Public Works Department.
Managing Department, Public Works Department Status, To Be Scheduled Location, Various neighborhoods Operating Impact, No
Authorizations
Source Existing FY22 Future Non Capital
Fund Total City Capital 650,000 0 0 0 650,000 Grants/Other 0 0 0 0 0 Total 650,000 0 0 0 650,000
Expenditures (Actual and Planned)
Source Thru
6/30/20 FY21 FY22 FY23-26 Total City Capital 0 0 75,000 575,000 650,000 Grants/Other 0 0 0 0 0 Total 0 0 75,000 575,000 650,000
DOWNTOWN CROSSING Project Mission Design improvements to the Washington Street/Summer Street/Winter Street intersections, including
reconstruction of the roadway, implementation of a pedestrian zone or shared street, and security improvements.
Managing Department, Public Works Department Status, In Design Location, Financial District/Downtown Operating Impact, No
Authorizations
Source Existing FY22 Future Non Capital
Fund Total City Capital 700,000 0 0 0 700,000 Grants/Other 0 0 0 0 0 Total 700,000 0 0 0 700,000
Expenditures (Actual and Planned)
Source Thru
6/30/20 FY21 FY22 FY23-26 Total City Capital 0 0 250,000 450,000 700,000 Grants/Other 0 0 0 0 0 Total 0 0 250,000 450,000 700,000
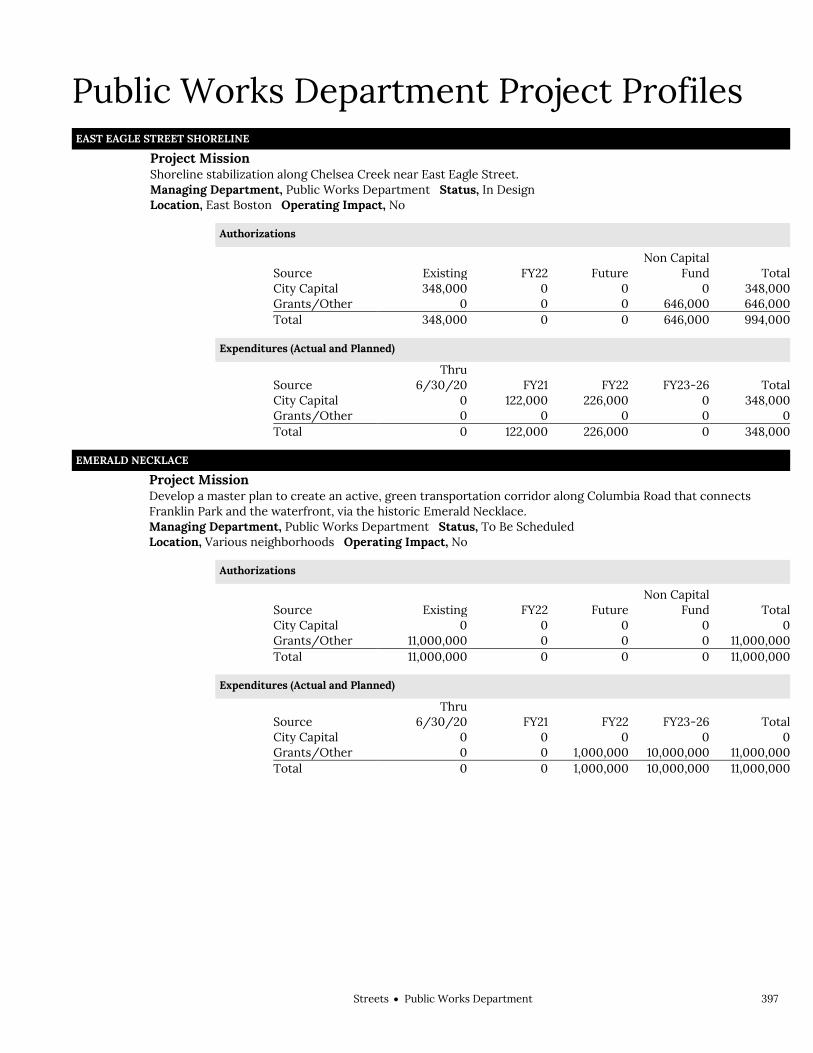
StreetsPublic Works Department 397
Public Works Department Project Profiles EAST EAGLE STREET SHORELINE
Project Mission Shoreline stabilization along Chelsea Creek near East Eagle Street. Managing Department, Public Works Department Status, In Design Location, East Boston Operating Impact, No
Authorizations
Source Existing FY22 Future Non Capital
Fund Total City Capital 348,000 0 0 0 348,000 Grants/Other 0 0 0 646,000 646,000 Total 348,000 0 0 646,000 994,000
Expenditures (Actual and Planned)
Source Thru
6/30/20 FY21 FY22 FY23-26 Total City Capital 0 122,000 226,000 0 348,000 Grants/Other 0 0 0 0 0 Total 0 122,000 226,000 0 348,000
EMERALD NECKLACE Project Mission Develop a master plan to create an active, green transportation corridor along Columbia Road that connects
Franklin Park and the waterfront, via the historic Emerald Necklace.
Managing Department, Public Works Department Status, To Be Scheduled Location, Various neighborhoods Operating Impact, No
Authorizations
Source Existing FY22 Future Non Capital
Fund Total City Capital 0 0 0 0 0 Grants/Other 11,000,000 0 0 0 11,000,000 Total 11,000,000 0 0 0 11,000,000
Expenditures (Actual and Planned)
Source Thru
6/30/20 FY21 FY22 FY23-26 Total City Capital 0 0 0 0 0 Grants/Other 0 0 1,000,000 10,000,000 11,000,000 Total 0 0 1,000,000 10,000,000 11,000,000

398 StreetsPublic Works Department
Public Works Department Project Profiles FOOTPATH AND STAIRWAYS
Project Mission Conduct assessment of footpaths and stairways throughout the City. Managing Department, Public Works Department Status, Annual Program Location, Various neighborhoods Operating Impact, No
Authorizations
Source Existing FY22 Future Non Capital
Fund Total City Capital 500,000 0 0 0 500,000 Grants/Other 0 0 0 0 0 Total 500,000 0 0 0 500,000
Expenditures (Actual and Planned)
Source Thru
6/30/20 FY21 FY22 FY23-26 Total City Capital 0 0 100,000 400,000 500,000 Grants/Other 0 0 0 0 0 Total 0 0 100,000 400,000 500,000
FRIEND STREET Project Mission Reconstruct street and sidewalk on Friend Street from New Chardon Street to Causeway Street. Managing Department, Public Works Department Status, In Construction Location, Financial District/Downtown Operating Impact, No
Authorizations
Source Existing FY22 Future Non Capital
Fund Total City Capital 1,750,000 0 0 0 1,750,000 Grants/Other 0 0 0 0 0 Total 1,750,000 0 0 0 1,750,000
Expenditures (Actual and Planned)
Source Thru
6/30/20 FY21 FY22 FY23-26 Total City Capital 62,784 1,200,000 487,216 0 1,750,000 Grants/Other 0 0 0 0 0 Total 62,784 1,200,000 487,216 0 1,750,000
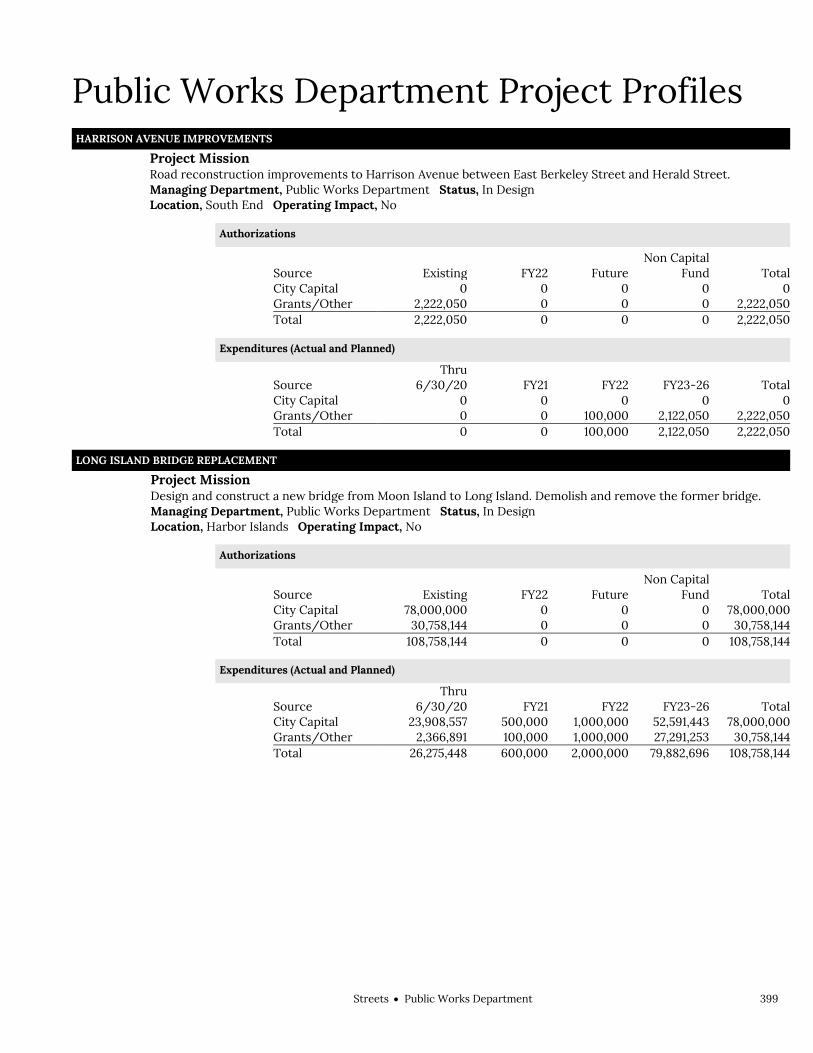
StreetsPublic Works Department 399
Public Works Department Project Profiles HARRISON AVENUE IMPROVEMENTS
Project Mission Road reconstruction improvements to Harrison Avenue between East Berkeley Street and Herald Street. Managing Department, Public Works Department Status, In Design Location, South End Operating Impact, No
Authorizations
Source Existing FY22 Future Non Capital
Fund Total City Capital 0 0 0 0 0 Grants/Other 2,222,050 0 0 0 2,222,050 Total 2,222,050 0 0 0 2,222,050
Expenditures (Actual and Planned)
Source Thru
6/30/20 FY21 FY22 FY23-26 Total City Capital 0 0 0 0 0 Grants/Other 0 0 100,000 2,122,050 2,222,050 Total 0 0 100,000 2,122,050 2,222,050
LONG ISLAND BRIDGE REPLACEMENT Project Mission Design and construct a new bridge from Moon Island to Long Island. Demolish and remove the former bridge. Managing Department, Public Works Department Status, In Design Location, Harbor Islands Operating Impact, No
Authorizations
Source Existing FY22 Future Non Capital
Fund Total City Capital 78,000,000 0 0 0 78,000,000 Grants/Other 30,758,144 0 0 0 30,758,144 Total 108,758,144 0 0 0 108,758,144
Expenditures (Actual and Planned)
Source Thru
6/30/20 FY21 FY22 FY23-26 Total City Capital 23,908,557 500,000 1,000,000 52,591,443 78,000,000 Grants/Other 2,366,891 100,000 1,000,000 27,291,253 30,758,144 Total 26,275,448 600,000 2,000,000 79,882,696 108,758,144

400 StreetsPublic Works Department
Public Works Department Project Profiles MASSACHUSETTTS AVENUE AND MELNEA CASS BOULEVARD INTERSECTION
Project Mission Re-design the intersection of Massachusetts Avenue and Melnea Cass Boulevard to improve pedestrian, bicycle
and vehicular safety.
Managing Department, Public Works Department Status, New Project Location, South End Operating Impact, No
Authorizations
Source Existing FY22 Future Non Capital
Fund Total City Capital 0 500,000 0 0 500,000 Grants/Other 0 0 0 0 0 Total 0 500,000 0 0 500,000
Expenditures (Actual and Planned)
Source Thru
6/30/20 FY21 FY22 FY23-26 Total City Capital 0 0 250,000 250,000 500,000 Grants/Other 0 0 0 0 0 Total 0 0 250,000 250,000 500,000
MCARDLE BRIDGE Project Mission Rehabilitate bridge structure. Managing Department, Public Works Department Status, To Be Scheduled Location, East Boston Operating Impact, No
Authorizations
Source Existing FY22 Future Non Capital
Fund Total City Capital 0 0 0 0 0 Grants/Other 1,000,000 0 2,000,000 0 3,000,000 Total 1,000,000 0 2,000,000 0 3,000,000
Expenditures (Actual and Planned)
Source Thru
6/30/20 FY21 FY22 FY23-26 Total City Capital 0 0 0 0 0 Grants/Other 0 0 500,000 2,500,000 3,000,000 Total 0 0 500,000 2,500,000 3,000,000

StreetsPublic Works Department 401
Public Works Department Project Profiles MELNEA CASS BOULEVARD
Project Mission Reconstruct Melnea Cass Blvd. in conjunction with the South Bay Harbor Trail project. State and federal
construction funding anticipated.
Managing Department, Public Works Department Status, New Project Location, Roxbury Operating Impact, No
Authorizations
Source Existing FY22 Future Non Capital
Fund Total City Capital 0 1,700,000 0 0 1,700,000 Grants/Other 0 0 0 25,000,000 25,000,000 Total 0 1,700,000 0 25,000,000 26,700,000
Expenditures (Actual and Planned)
Source Thru
6/30/20 FY21 FY22 FY23-26 Total City Capital 0 0 850,000 850,000 1,700,000 Grants/Other 0 0 0 0 0 Total 0 0 850,000 850,000 1,700,000
NEIGHBORHOOD COMMONS Project Mission Reconstruction of Centre Street to include increased sidewalk space, traffic and pedestrian safety improvements,
new lighting, landscaping, and the installation of public art. Project also supports work at Liberty Tree Plaza.
Managing Department, Public Works Department Status, In Construction Location, Various neighborhoods Operating Impact, No
Authorizations
Source Existing FY22 Future Non Capital
Fund Total City Capital 1,460,000 0 0 0 1,460,000 Grants/Other 0 0 0 0 0 Total 1,460,000 0 0 0 1,460,000
Expenditures (Actual and Planned)
Source Thru
6/30/20 FY21 FY22 FY23-26 Total City Capital 1,225,226 50,000 184,774 0 1,460,000 Grants/Other 0 0 0 0 0 Total 1,225,226 50,000 184,774 0 1,460,000
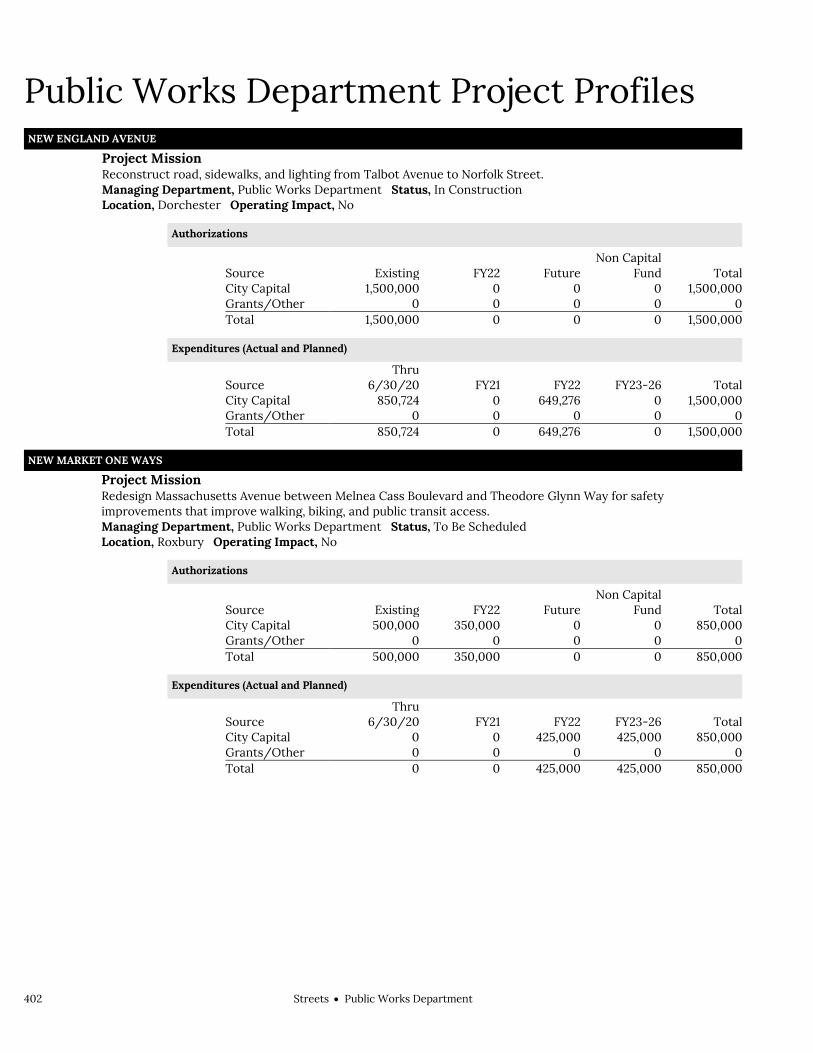
402 StreetsPublic Works Department
Public Works Department Project Profiles NEW ENGLAND AVENUE
Project Mission Reconstruct road, sidewalks, and lighting from Talbot Avenue to Norfolk Street. Managing Department, Public Works Department Status, In Construction Location, Dorchester Operating Impact, No
Authorizations
Source Existing FY22 Future Non Capital
Fund Total City Capital 1,500,000 0 0 0 1,500,000 Grants/Other 0 0 0 0 0 Total 1,500,000 0 0 0 1,500,000
Expenditures (Actual and Planned)
Source Thru
6/30/20 FY21 FY22 FY23-26 Total City Capital 850,724 0 649,276 0 1,500,000 Grants/Other 0 0 0 0 0 Total 850,724 0 649,276 0 1,500,000
NEW MARKET ONE WAYS Project Mission Redesign Massachusetts Avenue between Melnea Cass Boulevard and Theodore Glynn Way for safety
improvements that improve walking, biking, and public transit access.
Managing Department, Public Works Department Status, To Be Scheduled Location, Roxbury Operating Impact, No
Authorizations
Source Existing FY22 Future Non Capital
Fund Total City Capital 500,000 350,000 0 0 850,000 Grants/Other 0 0 0 0 0 Total 500,000 350,000 0 0 850,000
Expenditures (Actual and Planned)
Source Thru
6/30/20 FY21 FY22 FY23-26 Total City Capital 0 0 425,000 425,000 850,000 Grants/Other 0 0 0 0 0 Total 0 0 425,000 425,000 850,000

StreetsPublic Works Department 403
Public Works Department Project Profiles NORTH WASHINGTON STREET BRIDGE
Project Mission Design and construction of a new bridge that will replace the existing structure. State and federal construction
funds awarded.
Managing Department, Public Works Department Status, In Construction Location, Charlestown Operating Impact, No
Authorizations
Source Existing FY22 Future Non Capital
Fund Total City Capital 5,620,000 0 0 0 5,620,000 Grants/Other 35,270,000 0 0 178,067,519 213,337,519 Total 40,890,000 0 0 178,067,519 218,957,519
Expenditures (Actual and Planned)
Source Thru
6/30/20 FY21 FY22 FY23-26 Total City Capital 5,556,278 63,722 0 0 5,620,000 Grants/Other 9,145,996 4,000,000 2,700,000 19,424,004 35,270,000 Total 14,702,274 4,063,722 2,700,000 19,424,004 40,890,000
NORTHERN AVENUE BRIDGE Project Mission Re-build the bridge and preserve certain elements of the historic structure while creating a transformative multi-
modal bridge that prioritizes pedestrians and shared public space.
Managing Department, Public Works Department Status, In Design Location, South Boston Operating Impact, No
Authorizations
Source Existing FY22 Future Non Capital
Fund Total City Capital 85,000,000 0 0 0 85,000,000 Grants/Other 15,000,000 0 0 0 15,000,000 Total 100,000,000 0 0 0 100,000,000
Expenditures (Actual and Planned)
Source Thru
6/30/20 FY21 FY22 FY23-26 Total City Capital 0 0 0 85,000,000 85,000,000 Grants/Other 422,228 8,000,000 1,000,000 5,577,772 15,000,000 Total 422,228 8,000,000 1,000,000 90,577,772 100,000,000
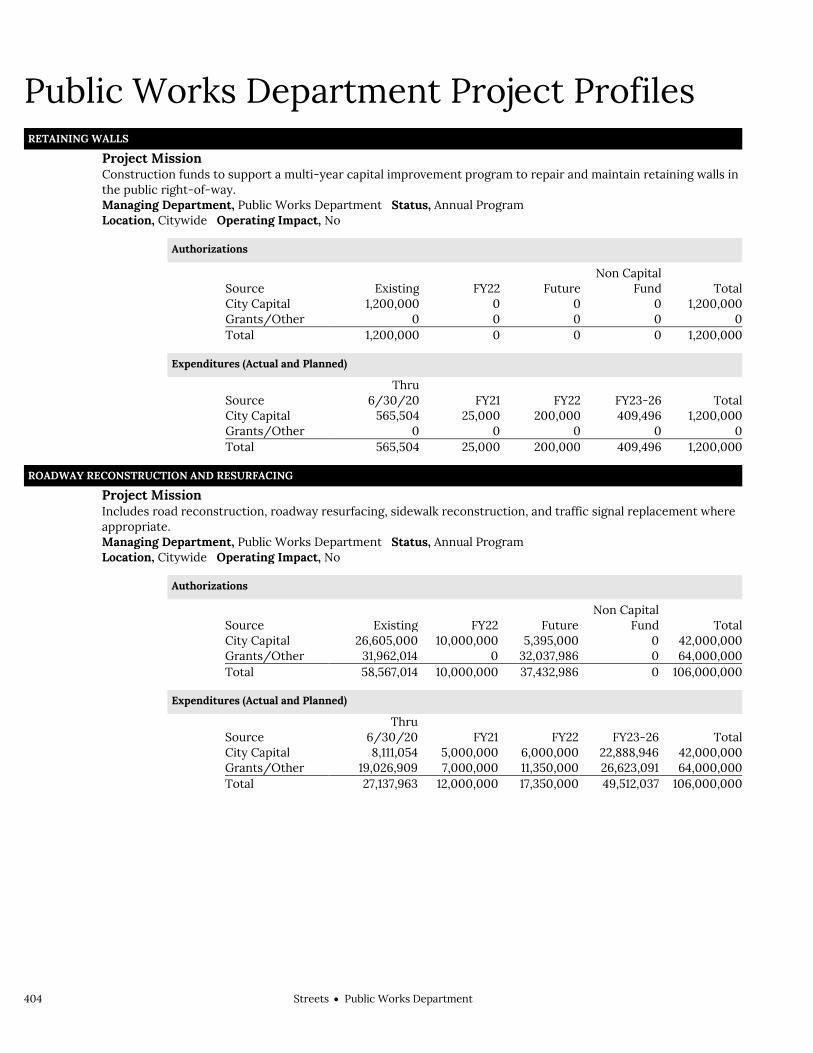
404 StreetsPublic Works Department
Public Works Department Project Profiles RETAINING WALLS
Project Mission Construction funds to support a multi-year capital improvement program to repair and maintain retaining walls in
the public right-of-way.
Managing Department, Public Works Department Status, Annual Program Location, Citywide Operating Impact, No
Authorizations
Source Existing FY22 Future Non Capital
Fund Total City Capital 1,200,000 0 0 0 1,200,000 Grants/Other 0 0 0 0 0 Total 1,200,000 0 0 0 1,200,000
Expenditures (Actual and Planned)
Source Thru
6/30/20 FY21 FY22 FY23-26 Total City Capital 565,504 25,000 200,000 409,496 1,200,000 Grants/Other 0 0 0 0 0 Total 565,504 25,000 200,000 409,496 1,200,000
ROADWAY RECONSTRUCTION AND RESURFACING Project Mission Includes road reconstruction, roadway resurfacing, sidewalk reconstruction, and traffic signal replacement where
appropriate.
Managing Department, Public Works Department Status, Annual Program Location, Citywide Operating Impact, No
Authorizations
Source Existing FY22 Future Non Capital
Fund Total City Capital 26,605,000 10,000,000 5,395,000 0 42,000,000 Grants/Other 31,962,014 0 32,037,986 0 64,000,000 Total 58,567,014 10,000,000 37,432,986 0 106,000,000
Expenditures (Actual and Planned)
Source Thru
6/30/20 FY21 FY22 FY23-26 Total City Capital 8,111,054 5,000,000 6,000,000 22,888,946 42,000,000 Grants/Other 19,026,909 7,000,000 11,350,000 26,623,091 64,000,000 Total 27,137,963 12,000,000 17,350,000 49,512,037 106,000,000

StreetsPublic Works Department 405
Public Works Department Project Profiles RUGGLES STREET
Project Mission Design and build a context sensitive Ruggles Street, between Washington Street and Ruggles MBTA Station,
adhering to Complete Street guidelines.
Managing Department, Public Works Department Status, In Design Location, Roxbury Operating Impact, No
Authorizations
Source Existing FY22 Future Non Capital
Fund Total City Capital 0 0 0 0 0 Grants/Other 5,000,000 0 1,500,000 0 6,500,000 Total 5,000,000 0 1,500,000 0 6,500,000
Expenditures (Actual and Planned)
Source Thru
6/30/20 FY21 FY22 FY23-26 Total City Capital 0 0 0 0 0 Grants/Other 0 0 200,000 6,300,000 6,500,000 Total 0 0 200,000 6,300,000 6,500,000
SIDEWALK RECONSTRUCTION Project Mission Various sidewalk and pedestrian ramp repairs and reconstruction. Managing Department, Public Works Department Status, Annual Program Location, Citywide Operating Impact, No
Authorizations
Source Existing FY22 Future Non Capital
Fund Total City Capital 2,000,000 0 1,000,000 0 3,000,000 Grants/Other 0 0 0 0 0 Total 2,000,000 0 1,000,000 0 3,000,000
Expenditures (Actual and Planned)
Source Thru
6/30/20 FY21 FY22 FY23-26 Total City Capital 0 0 2,000,000 1,000,000 3,000,000 Grants/Other 0 0 0 0 0 Total 0 0 2,000,000 1,000,000 3,000,000

406 StreetsPublic Works Department
Public Works Department Project Profiles SLEEPER STREET
Project Mission Re-design Sleeper Street to improve sidewalks and create bicycle facilities. Managing Department, Public Works Department Status, To Be Scheduled Location, South Boston Operating Impact, No
Authorizations
Source Existing FY22 Future Non Capital
Fund Total City Capital 100,000 0 0 0 100,000 Grants/Other 0 0 0 0 0 Total 100,000 0 0 0 100,000
Expenditures (Actual and Planned)
Source Thru
6/30/20 FY21 FY22 FY23-26 Total City Capital 0 0 100,000 0 100,000 Grants/Other 0 0 0 0 0 Total 0 0 100,000 0 100,000
STATE STREET Project Mission Reconstruct road, sidewalks, and lighting from Congress Street to Rose Kennedy Greenway. Managing Department, Public Works Department Status, In Design Location, Financial District/Downtown Operating Impact, No
Authorizations
Source Existing FY22 Future Non Capital
Fund Total City Capital 1,500,000 0 3,500,000 0 5,000,000 Grants/Other 0 0 0 0 0 Total 1,500,000 0 3,500,000 0 5,000,000
Expenditures (Actual and Planned)
Source Thru
6/30/20 FY21 FY22 FY23-26 Total City Capital 0 0 100,000 4,900,000 5,000,000 Grants/Other 0 0 0 0 0 Total 0 0 100,000 4,900,000 5,000,000

StreetsPublic Works Department 407
Public Works Department Project Profiles STORM WATER POLLUTION STUDY
Project Mission Engineering study to identify methods to eliminate storm water pollution. Managing Department, Public Works Department Status, To Be Scheduled Location, South End Operating Impact, No
Authorizations
Source Existing FY22 Future Non Capital
Fund Total City Capital 150,000 0 0 0 150,000 Grants/Other 0 0 0 0 0 Total 150,000 0 0 0 150,000
Expenditures (Actual and Planned)
Source Thru
6/30/20 FY21 FY22 FY23-26 Total City Capital 0 0 75,000 75,000 150,000 Grants/Other 0 0 0 0 0 Total 0 0 75,000 75,000 150,000
STREET LIGHT GAS LAMPS Project Mission Using utility subsidies, this program is designed to retrofit solar powered timers to activate gas lamp street lights. Managing Department, Public Works Department Status, Annual Program Location, Various neighborhoods Operating Impact, No
Authorizations
Source Existing FY22 Future Non Capital
Fund Total City Capital 950,000 0 900,000 0 1,850,000 Grants/Other 187,500 0 0 0 187,500 Total 1,137,500 0 900,000 0 2,037,500
Expenditures (Actual and Planned)
Source Thru
6/30/20 FY21 FY22 FY23-26 Total City Capital 79,400 100,000 250,000 1,420,600 1,850,000 Grants/Other 0 0 0 187,500 187,500 Total 79,400 100,000 250,000 1,608,100 2,037,500
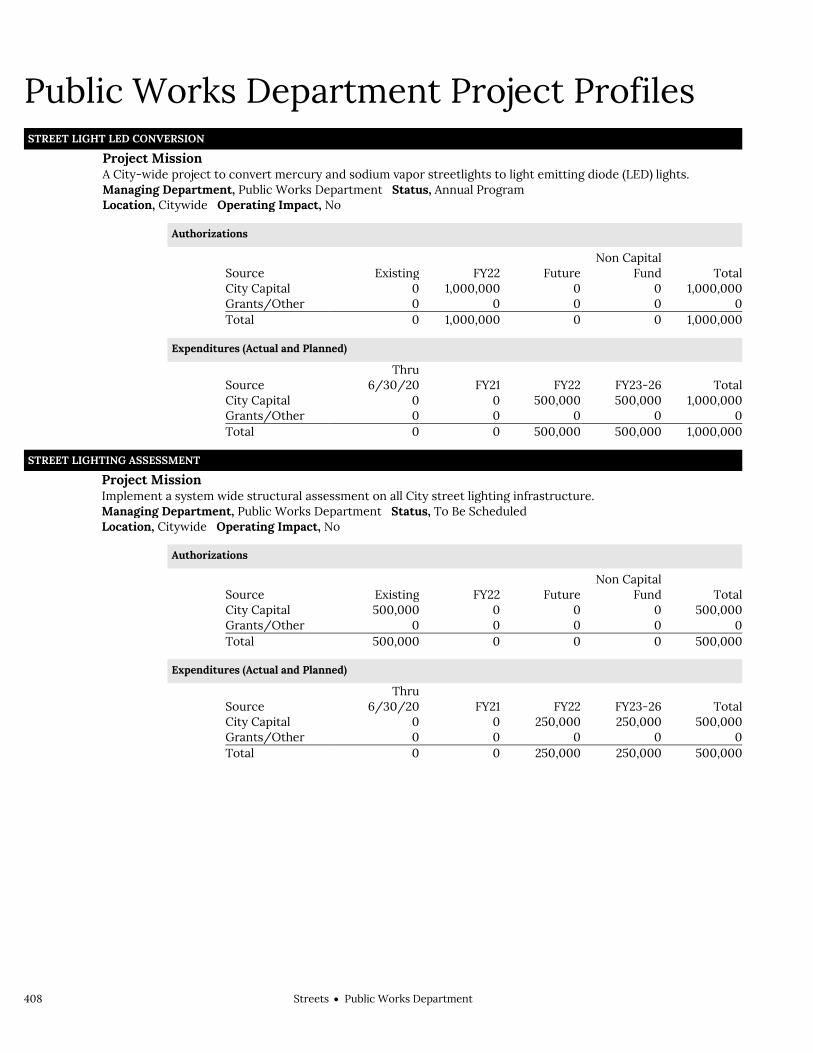
408 StreetsPublic Works Department
Public Works Department Project Profiles STREET LIGHT LED CONVERSION
Project Mission A City-wide project to convert mercury and sodium vapor streetlights to light emitting diode (LED) lights. Managing Department, Public Works Department Status, Annual Program Location, Citywide Operating Impact, No
Authorizations
Source Existing FY22 Future Non Capital
Fund Total City Capital 0 1,000,000 0 0 1,000,000 Grants/Other 0 0 0 0 0 Total 0 1,000,000 0 0 1,000,000
Expenditures (Actual and Planned)
Source Thru
6/30/20 FY21 FY22 FY23-26 Total City Capital 0 0 500,000 500,000 1,000,000 Grants/Other 0 0 0 0 0 Total 0 0 500,000 500,000 1,000,000
STREET LIGHTING ASSESSMENT Project Mission Implement a system wide structural assessment on all City street lighting infrastructure. Managing Department, Public Works Department Status, To Be Scheduled Location, Citywide Operating Impact, No
Authorizations
Source Existing FY22 Future Non Capital
Fund Total City Capital 500,000 0 0 0 500,000 Grants/Other 0 0 0 0 0 Total 500,000 0 0 0 500,000
Expenditures (Actual and Planned)
Source Thru
6/30/20 FY21 FY22 FY23-26 Total City Capital 0 0 250,000 250,000 500,000 Grants/Other 0 0 0 0 0 Total 0 0 250,000 250,000 500,000

StreetsPublic Works Department 409
Public Works Department Project Profiles STREET LIGHTING INSTALLATION
Project Mission Installation of street lights in various locations. Managing Department, Public Works Department Status, Annual Program Location, Citywide Operating Impact, No
Authorizations
Source Existing FY22 Future Non Capital
Fund Total City Capital 3,540,000 2,460,000 0 0 6,000,000 Grants/Other 0 0 0 0 0 Total 3,540,000 2,460,000 0 0 6,000,000
Expenditures (Actual and Planned)
Source Thru
6/30/20 FY21 FY22 FY23-26 Total City Capital 873,906 1,000,000 2,000,000 2,126,094 6,000,000 Grants/Other 0 0 0 0 0 Total 873,906 1,000,000 2,000,000 2,126,094 6,000,000
STREET LIGHTING STRAY VOLTAGE ASSESSMENT Project Mission Assess infrastructure conditions to eliminate stray voltage. Managing Department, Public Works Department Status, To Be Scheduled Location, Various neighborhoods Operating Impact, No
Authorizations
Source Existing FY22 Future Non Capital
Fund Total City Capital 650,000 0 0 0 650,000 Grants/Other 0 0 0 0 0 Total 650,000 0 0 0 650,000
Expenditures (Actual and Planned)
Source Thru
6/30/20 FY21 FY22 FY23-26 Total City Capital 0 0 50,000 600,000 650,000 Grants/Other 0 0 0 0 0 Total 0 0 50,000 600,000 650,000

410 StreetsPublic Works Department
Public Works Department Project Profiles SULLIVAN SQUARE / RUTHERFORD AVENUE
Project Mission Engineering and design services to provide for corridor-wide transportation improvements. State and federal
funding anticipated.
Managing Department, Transportation Department Status, In Design Location, Charlestown Operating Impact, No
Authorizations
Source Existing FY22 Future Non Capital
Fund Total City Capital 3,706,000 0 0 0 3,706,000 Grants/Other 3,809,403 0 0 162,000,000 165,809,403 Total 7,515,403 0 0 162,000,000 169,515,403
Expenditures (Actual and Planned)
Source Thru
6/30/20 FY21 FY22 FY23-26 Total City Capital 1,683,707 1,002,376 1,019,916 1 3,706,000 Grants/Other 3,109,403 0 700,000 0 3,809,403 Total 4,793,110 1,002,376 1,719,916 1 7,515,403
SUMMER STREET PHASE 2 Project Mission Continuation of Crossroads Initiative at Summer Street to improve roadway, sidewalks, street lighting, and
bicyclist safety. Phase 1 scope included area from Fort Point Channel to Boston Wharf Road. Phase 2 will extend from BCEC towards South Boston.
Managing Department, Public Works Department Status, In Design Location, South Boston Operating Impact, No
Authorizations
Source Existing FY22 Future Non Capital
Fund Total City Capital 0 0 0 0 0 Grants/Other 600,000 0 0 0 600,000 Total 600,000 0 0 0 600,000
Expenditures (Actual and Planned)
Source Thru
6/30/20 FY21 FY22 FY23-26 Total City Capital 0 0 0 0 0 Grants/Other 0 0 300,000 300,000 600,000 Total 0 0 300,000 300,000 600,000

StreetsPublic Works Department 411
Public Works Department Project Profiles WALKABLE STREETS
Project Mission Sidewalk improvement program designed to target key neighborhood streets and corridors by reconstructing
longer, contiguous sidewalk sections.
Managing Department, Public Works Department Status, Annual Program Location, Various neighborhoods Operating Impact, No
Authorizations
Source Existing FY22 Future Non Capital
Fund Total City Capital 5,400,000 0 0 0 5,400,000 Grants/Other 7,500,000 0 3,500,000 0 11,000,000 Total 12,900,000 0 3,500,000 0 16,400,000
Expenditures (Actual and Planned)
Source Thru
6/30/20 FY21 FY22 FY23-26 Total City Capital 4,650,255 749,745 0 0 5,400,000 Grants/Other 0 250,000 3,500,000 7,250,000 11,000,000 Total 4,650,255 999,745 3,500,000 7,250,000 16,400,000
WASHINGTON STREET / TRAVELER STREET Project Mission Roadway improvements to Washington Street from East Berkeley Street to Herald Street, and Traveler Street
between Washington Street and Harrison Avenue. Improvements include resurfacing, pavement markings, and new traffic signals.
Managing Department, Public Works Department Status, In Construction Location, South End Operating Impact, No
Authorizations
Source Existing FY22 Future Non Capital
Fund Total City Capital 0 0 0 0 0 Grants/Other 1,750,000 0 0 0 1,750,000 Total 1,750,000 0 0 0 1,750,000
Expenditures (Actual and Planned)
Source Thru
6/30/20 FY21 FY22 FY23-26 Total City Capital 0 0 0 0 0 Grants/Other 229,728 500,000 1,020,272 0 1,750,000 Total 229,728 500,000 1,020,272 0 1,750,000
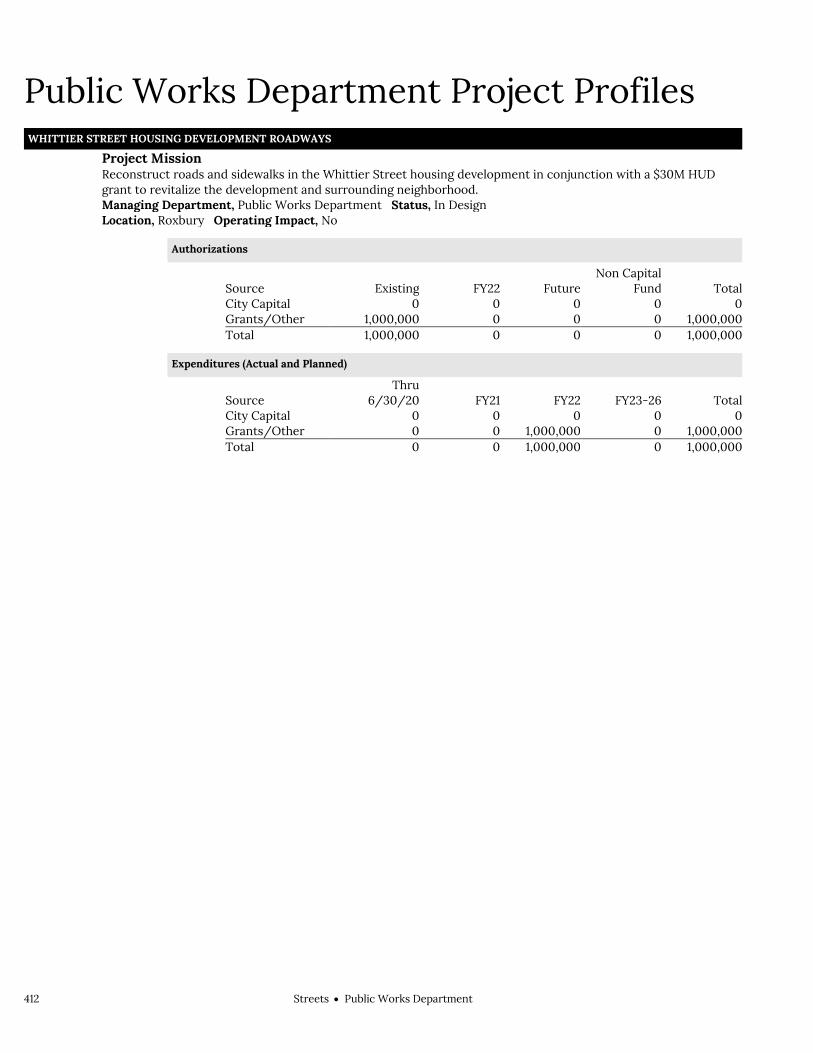
412 StreetsPublic Works Department
Public Works Department Project Profiles WHITTIER STREET HOUSING DEVELOPMENT ROADWAYS
Project Mission Reconstruct roads and sidewalks in the Whittier Street housing development in conjunction with a $30M HUD
grant to revitalize the development and surrounding neighborhood.
Managing Department, Public Works Department Status, In Design Location, Roxbury Operating Impact, No
Authorizations
Source Existing FY22 Future Non Capital
Fund Total City Capital 0 0 0 0 0 Grants/Other 1,000,000 0 0 0 1,000,000 Total 1,000,000 0 0 0 1,000,000
Expenditures (Actual and Planned)
Source Thru
6/30/20 FY21 FY22 FY23-26 Total City Capital 0 0 0 0 0 Grants/Other 0 0 1,000,000 0 1,000,000 Total 0 0 1,000,000 0 1,000,000

StreetsSnow & Winter Management 413
Snow & Winter Management Operating Budget Streets Snow & Winter Management Appropriation 331000
Department Mission The Snow & Winter Management appropriation supports the City of Boston's efforts to clear ice and snow from Boston streets and property. Snow removal is done by City personnel supplemented and assisted by private contractors.
Operating Budget Program Name Total Actual '19 Total Actual '20 Total Approp '21 Total Budget '22
Snow & Winter Mgmt 22,762,894 22,578,056 21,067,583 21,708,166
Total 22,762,894 22,578,056 21,067,583 21,708,166
Operating Budget Actual '19 Actual '20 Approp '21 Budget '22
Non Personnel 22,762,894 22,578,056 21,067,583 21,708,166 Total 22,762,894 22,578,056 21,067,583 21,708,166

414 StreetsSnow & Winter Management
Snow & Winter Management Operating Budget
Authorizing Statutes Vehicles Interfering with the Removal of
Snow, CBC Ord. § 11-6.43.
Description of Services The appropriation provides for the purchase of salt and sand, plowing and hauling of snow by contractors, purchase and repair of snow removal equipment, and financing for regular City personnel engaged in snow removal operations after normal working hours.

StreetsSnow & Winter Management 415
Department History Personnel Services FY19 Expenditure FY20 Expenditure FY21 Appropriation FY22 Recommended Inc/Dec 21 vs 22
51000 Permanent Employees 0 0 0 0 0 51100 Emergency Employees 0 0 0 0 0 51200 Overtime 0 0 0 0 0 51600 Unemployment Compensation 0 0 0 0 0 51700 Workers' Compensation 0 0 0 0 0 Total Personnel Services 0 0 0 0 0
Contractual Services FY19 Expenditure FY20 Expenditure FY21 Appropriation FY22 Recommended Inc/Dec 21 vs 22
52100 Communications 0 0 0 0 0 52200 Utilities 0 0 0 0 0 52400 Snow Removal 21,014,188 21,319,427 19,204,611 19,790,311 585,700 52500 Garbage/Waste Removal 0 0 0 0 0 52600 Repairs Buildings & Structures 0 0 0 0 0 52700 Repairs & Service of Equipment 1,454,084 948,213 1,533,090 1,533,090 0 52800 Transportation of Persons 0 0 0 0 0 52900 Contracted Services 9,304 10,207 13,000 13,000 0 Total Contractual Services 22,477,576 22,277,847 20,750,701 21,336,401 585,700
Supplies & Materials FY19 Expenditure FY20 Expenditure FY21 Appropriation FY22 Recommended Inc/Dec 21 vs 22
53000 Auto Energy Supplies 0 0 0 0 0 53200 Food Supplies 0 0 0 0 0 53400 Custodial Supplies 0 0 0 0 0 53500 Med, Dental, & Hosp Supply 0 0 0 0 0 53600 Office Supplies and Materials 45,000 43,783 50,000 50,000 0 53700 Clothing Allowance 0 0 0 0 0 53800 Educational Supplies & Mat 0 0 0 0 0 53900 Misc Supplies & Materials 0 0 7,500 7,500 0 Total Supplies & Materials 45,000 43,783 57,500 57,500 0
Current Chgs & Oblig FY19 Expenditure FY20 Expenditure FY21 Appropriation FY22 Recommended Inc/Dec 21 vs 22
54300 Workers' Comp Medical 0 0 0 0 0 54400 Legal Liabilities 0 0 0 0 0 54500 Aid To Veterans 0 0 0 0 0 54600 Current Charges H&I 0 0 0 0 0 54700 Indemnification 0 0 0 0 0 54800 Reserve Account 0 0 0 0 0 54900 Other Current Charges 0 204 0 0 0 Total Current Chgs & Oblig 0 204 0 0 0
Equipment FY19 Expenditure FY20 Expenditure FY21 Appropriation FY22 Recommended Inc/Dec 21 vs 22
55000 Automotive Equipment 0 0 0 0 0 55400 Lease/Purchase 240,318 256,222 259,382 314,265 54,883 55600 Office Furniture & Equipment 0 0 0 0 0 55900 Misc Equipment 0 0 0 0 0 Total Equipment 240,318 256,222 259,382 314,265 54,883
Other FY19 Expenditure FY20 Expenditure FY21 Appropriation FY22 Recommended Inc/Dec 21 vs 22
56200 Special Appropriation 0 0 0 0 0 57200 Structures & Improvements 0 0 0 0 0 58000 Land & Non-Structure 0 0 0 0 0 Total Other 0 0 0 0 0
Grand Total 22,762,894 22,578,056 21,067,583 21,708,166 640,583

416 StreetsSnow & Winter Management

StreetsTransportation Department 417
Transportation Department Operating Budget Streets Transportation Department Gregory T. Rooney, Commissioner, Appropriation 251000
Department Mission The mission of the Boston Transportation Department is to promote public safety, manage the City's transportation network, and enhance the quality of life for residents of our City neighborhoods. Accomplishment of our mission is ensured through the use of planning, coordinated engineering, education and enforcement. The Transportation Department strives to improve circulation in and around the City, enhance public transportation services, gain efficiencies in the management of parking resources, adjudicate and collect fines, collaborate with relevant agencies and encourage the use of alternate transportation modes.
Selected Performance Goals Parking Clerk
Provide people-focused service. Traffic Management & Engineering
Design, construct, and maintain streetscapes that prioritize moving people safely and provide people focuses of service..
Encourage multimodal, active transportation. Enhance Boston's walkability and neighborhood interconnectedness. Provide people-focused service. Policy & Planning
Design, construct, and maintain streetscapes that prioritize moving people safely. Traffic Enforcement
Design, construct, and maintain streetscapes that prioritize moving people safely. Traffic Operations
To efficiently maintain traffic signs and parking meters throughout the city.
Operating Budget Division Name Total Actual '19 Total Actual '20 Total Approp '21 Total Budget '22
Parking Clerk 8,570,179 7,939,984 8,588,128 8,090,936
Traffic Division 29,468,549 30,935,955 30,159,986 32,468,667
Total 38,038,728 38,875,939 38,748,114 40,559,603
External Funds Budget Fund Name Total Actual '19 Total Actual '20 Total Approp '21 Total Budget '22
Boston Bike Share 11,249 177,214 468,125 468,125
Go Boston 2030 Tracking and Communication 0 0 300,000 0
Parking Facilities Fund 433,278 289,482 331,500 331,500
Partnerships/Community Health 2,186 0 0 0
Total 446,713 466,696 1,099,625 799,625
Operating Budget Actual '19 Actual '20 Approp '21 Budget '22
Personnel Services 25,125,196 25,595,105 26,453,813 26,296,035 Non Personnel 12,913,532 13,280,834 12,294,301 14,263,568 Total 38,038,728 38,875,939 38,748,114 40,559,603

418 StreetsTransportation Department
Transportation Department Operating Budget
Authorizing Statutes Establishing Boston Traffic Commission:
Power and Duties, 1929 Mass. Acts ch. 263, §§ 1-2, as amended; 1957 Mass. Acts ch. 253, § 1, as amended.
Powers and Duties of Commissioner of Traffic and Parking, CBC St.7 § 201.
Off-Street Parking, Parades, Loading Zones, CBC St.7 §§ 206, 207, 214.
Violation of Parking Rules in the City of Boston, M.G.L.A. c. 90, § 20A 1/2.
Abandoned Motor Vehicles, M.G.L.A. c. 90 § 22C; 1988 Mass. Acts ch. 212.
Description of Services The Transportation Department regulates traffic and parking for approximately 800 miles of roadway and 3,700 public streets. In order to ensure an efficient yet safe flow of traffic and to balance competing demands for parking resources, the Department enforces 42 parking regulations, maintains and collects from the City's 7,100 parking meters, and annually replaces or repairs several thousand of the City's 300,000 street and traffic signs. The Department also continually responds to the changing transportation needs of the City and its neighborhoods by re-evaluating traffic patterns, increasing parking enforcement in response to neighborhood requests, incorporating the City's interests into state and federal roadway developments, and working to promote alternative modes of transportation for commuters.

StreetsTransportation Department 419
Department History Personnel Services FY19 Expenditure FY20 Expenditure FY21 Appropriation FY22 Recommended Inc/Dec 21 vs 22
51000 Permanent Employees 22,801,662 23,306,273 24,555,141 24,399,363 -155,778 51100 Emergency Employees 171,034 122,367 217,298 217,298 0 51200 Overtime 1,519,200 1,491,476 1,071,374 1,069,374 -2,000 51600 Unemployment Compensation 16,346 40,774 60,000 60,000 0 51700 Workers' Compensation 616,954 634,215 550,000 550,000 0 Total Personnel Services 25,125,196 25,595,105 26,453,813 26,296,035 -157,778
Contractual Services FY19 Expenditure FY20 Expenditure FY21 Appropriation FY22 Recommended Inc/Dec 21 vs 22
52100 Communications 255,757 185,467 229,150 229,150 0 52200 Utilities 476,031 604,962 521,311 487,937 -33,374 52400 Snow Removal 0 0 0 0 0 52500 Garbage/Waste Removal 447 0 1,500 1,500 0 52600 Repairs Buildings & Structures 48,548 26,098 30,100 30,100 0 52700 Repairs & Service of Equipment 908,745 1,044,909 773,810 815,060 41,250 52800 Transportation of Persons 41,488 41,090 42,775 42,775 0 52900 Contracted Services 7,809,767 8,121,295 7,252,582 9,349,482 2,096,900 Total Contractual Services 9,540,783 10,023,821 8,851,228 10,956,004 2,104,776
Supplies & Materials FY19 Expenditure FY20 Expenditure FY21 Appropriation FY22 Recommended Inc/Dec 21 vs 22
53000 Auto Energy Supplies 320,910 247,790 379,955 276,463 -103,492 53200 Food Supplies 0 0 0 0 0 53400 Custodial Supplies 3,237 3,497 3,500 3,500 0 53500 Med, Dental, & Hosp Supply 0 0 0 0 0 53600 Office Supplies and Materials 332,859 302,712 286,000 226,000 -60,000 53700 Clothing Allowance 79,576 81,750 81,658 81,658 0 53800 Educational Supplies & Mat 0 0 0 0 0 53900 Misc Supplies & Materials 1,299,613 1,168,703 1,046,970 1,046,970 0 Total Supplies & Materials 2,036,195 1,804,452 1,798,083 1,634,591 -163,492
Current Chgs & Oblig FY19 Expenditure FY20 Expenditure FY21 Appropriation FY22 Recommended Inc/Dec 21 vs 22
54300 Workers' Comp Medical 242,458 168,017 150,000 150,000 0 54400 Legal Liabilities 110,000 92,000 92,000 99,000 7,000 54500 Aid To Veterans 0 0 0 0 0 54600 Current Charges H&I 0 0 0 0 0 54700 Indemnification 0 0 0 0 0 54800 Reserve Account 0 0 0 0 0 54900 Other Current Charges 75,905 124,316 96,755 124,820 28,065 Total Current Chgs & Oblig 428,363 384,333 338,755 373,820 35,065
Equipment FY19 Expenditure FY20 Expenditure FY21 Appropriation FY22 Recommended Inc/Dec 21 vs 22
55000 Automotive Equipment 0 0 0 0 0 55400 Lease/Purchase 736,344 895,625 1,270,735 1,263,653 -7,082 55600 Office Furniture & Equipment 18,364 9,515 15,000 15,000 0 55900 Misc Equipment 153,483 163,088 20,500 20,500 0 Total Equipment 908,191 1,068,228 1,306,235 1,299,153 -7,082
Other FY19 Expenditure FY20 Expenditure FY21 Appropriation FY22 Recommended Inc/Dec 21 vs 22
56200 Special Appropriation 0 0 0 0 0 57200 Structures & Improvements 0 0 0 0 0 58000 Land & Non-Structure 0 0 0 0 0 Total Other 0 0 0 0 0
Grand Total 38,038,728 38,875,939 38,748,114 40,559,603 1,811,489

420 StreetsTransportation Department
Department Personnel
Title Union Code Grade Position FY22 Salary Title
Union Code Grade Position FY22 Salary
Admin Analyst SE1 03 1.00 44,747 Parking Meter Technology Specl
AFG 18A 1.00 87,715
Admin Analyst (Btd/Pers) AFM 15 2.00 135,265 Pr Strkeeper AFM 13 1.00 56,371 Admin Asst SE1 05 1.00 73,198 Prin Admin Assistant SE1 08 1.00 108,468 Admin Secretary AFT 14 1.00 43,049 Prin Admin Asst (BTD) SE1 09 2.00 233,001
Administrative_Assistant AFG 15 3.00 202,898 Prin Admin Asst Customer Svrtp SE1 10 1.00 126,024
Administrative_Assistant AFM 15 1.00 61,061 Prin Admin Asst(Planningt&P) SE1 10 1.00 126,024 Administrative_Asst. AFM 17 1.00 79,769 Prin Data Proc Systems Analyst SE1 10 1.00 126,024 Asst Dir of Parking Mgmt EXM 09 1.00 105,678 Prin Research Analyst(T&P) SE1 06 2.00 180,637 Asst Parking Clerk EXM 11 1.00 130,493 Prin Traffic Investigator AFG 14 1.00 43,049 Asst Supv-Parking Enforcement AFG 17A 10.00 781,976 Sr Adm Asst SE1 05 2.00 144,178 Asst Traffic Engineer AFJ 18A 3.00 211,057 Sr Claims Investigator AFG 13A 4.00 204,805 Asst Traffic Sign Supv ## AFG 17A 1.00 83,067 Sr Data Proc Sys Analyst SE1 08 3.00 298,241 Asst Traffic Signal Supv SE1 06 1.00 92,144 Sr Data Proc System Analyst SE1 09 1.00 116,500 Chief Claims Investigator AFG 15A 11.00 709,432 Sr Parking Meter Supervisor I AFG 16 21.00 1,472,908 Chief Claims Investigator I AFG 17A 2.00 164,571 Sr Parking Meter Supervisor II AFG 17A 6.00 470,340 Chief Traffic Invest AFG 18 1.00 88,999 Sr Radio Com Tech AFG 19 2.00 194,063 Claims Investigator(Opc) AFM 12 13.00 587,767 Sr Traffic Engineer AFJ 19A 8.00 769,653 Commissioner (T&P) CDH NG 1.00 135,371 Sr Traffic Investigator AFG 12 5.00 252,078 Data Proc Coordinator SE1 04 1.00 75,441 Sr Traffic Main Prs(Sign Fab) AFM 14A 1.00 63,311 Dep Comm(Field Operations) EXM 12 1.00 135,427 Sr Traffic Maint Person AFM 10L 14.00 622,350
Dep Comm-Cen-Art/3Rd Har Tun
EXM 14 1.00 119,092 Sr Traffic Signal Repairprs I AFM 14 4.00 216,105
Dispatcher. AFM 10 7.00 268,078 SrTraffic Signal Repairprs II AFM 15 3.00 205,697 DP Sys Anl SE1 06 1.00 86,356 Supn - Parking Enforcement SE1 09 1.00 116,500 Exec.Assistant SE1 12 1.00 103,525 Supvising Traffic Engineer SE1 10 3.00 378,072 Gen Maint Mech AFM 11L 2.00 97,099 Supv-Parking Enforcement SE1 08 2.00 216,935
Head Admin Clerk AFM 14 3.00 156,189 Supv-Parking Meter Operations
SE1 08 2.00 216,936
Head Cashier AFM 15 1.00 67,633 Teller AFM 13 4.00 197,964 Head Clerk AFM 12 2.00 91,723 Traffic Engineering Director EXM 12 1.00 135,427 Jr Traffic Engineer AFJ 16A 7.00 465,907 Traffic Signal Inspector AFG 16 2.00 130,964 Maint Mech (Painter) (T & P) AFM 13 1.00 56,371 Traffic Signal Repairprs## AFM 13 7.00 350,198 Operations Mgr BTD Oper Div EXM 10 1.00 87,958 Traffic Signal Supv SE1 08 1.00 110,032 Parking Meter Operat Person I AFM 12 2.00 108,467 Trans Prog Planner V SE1 12 1.00 138,813 Parking Meter Operations Frprs AFG 16A 1.00 76,972 Trans Program Planner III SE1 06 9.00 691,554 Parking Meter Opr Person I## AFG 12 1.00 38,272 Trans Program Planner IV SE1 08 6.00 649,264 Parking Meter Opr Person I## AFM 12 8.00 384,211 Trf Signl Supv SE1 08 1.00 108,468 Parking Meter Supervisor AFK 14A 168.00 9,174,980 Vehicle Impound Specialist AFM 11L 29.00 1,438,216
Wrkg Frpr Tra Signal Rppr Test AFG 18 2.00 139,831
Total 420 26,460,959 Adjustments Differential Payments 0 Other 434,450 Chargebacks 232,814 Salary Savings -2,728,859 FY22 Total Request 24,399,364
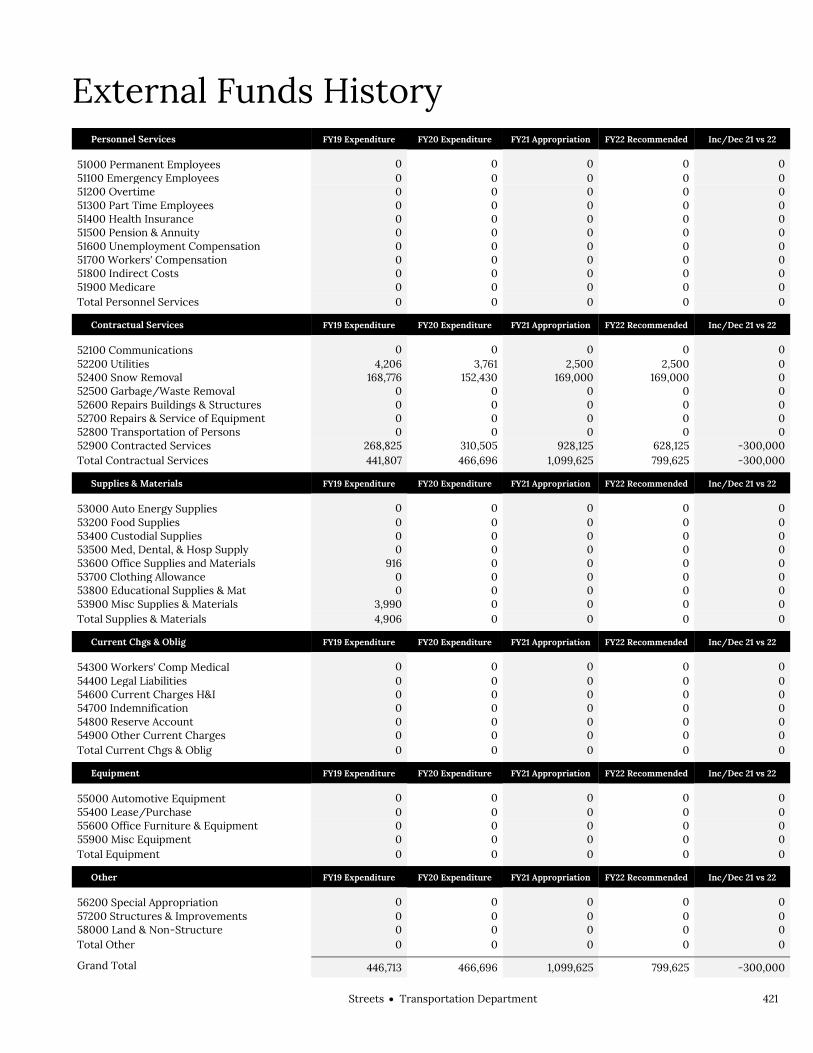
StreetsTransportation Department 421
External Funds History Personnel Services FY19 Expenditure FY20 Expenditure FY21 Appropriation FY22 Recommended Inc/Dec 21 vs 22
51000 Permanent Employees 0 0 0 0 0 51100 Emergency Employees 0 0 0 0 0 51200 Overtime 0 0 0 0 0 51300 Part Time Employees 0 0 0 0 0 51400 Health Insurance 0 0 0 0 0 51500 Pension & Annuity 0 0 0 0 0 51600 Unemployment Compensation 0 0 0 0 0 51700 Workers' Compensation 0 0 0 0 0 51800 Indirect Costs 0 0 0 0 0 51900 Medicare 0 0 0 0 0 Total Personnel Services 0 0 0 0 0
Contractual Services FY19 Expenditure FY20 Expenditure FY21 Appropriation FY22 Recommended Inc/Dec 21 vs 22
52100 Communications 0 0 0 0 0 52200 Utilities 4,206 3,761 2,500 2,500 0 52400 Snow Removal 168,776 152,430 169,000 169,000 0 52500 Garbage/Waste Removal 0 0 0 0 0 52600 Repairs Buildings & Structures 0 0 0 0 0 52700 Repairs & Service of Equipment 0 0 0 0 0 52800 Transportation of Persons 0 0 0 0 0 52900 Contracted Services 268,825 310,505 928,125 628,125 -300,000 Total Contractual Services 441,807 466,696 1,099,625 799,625 -300,000
Supplies & Materials FY19 Expenditure FY20 Expenditure FY21 Appropriation FY22 Recommended Inc/Dec 21 vs 22
53000 Auto Energy Supplies 0 0 0 0 0 53200 Food Supplies 0 0 0 0 0 53400 Custodial Supplies 0 0 0 0 0 53500 Med, Dental, & Hosp Supply 0 0 0 0 0 53600 Office Supplies and Materials 916 0 0 0 0 53700 Clothing Allowance 0 0 0 0 0 53800 Educational Supplies & Mat 0 0 0 0 0 53900 Misc Supplies & Materials 3,990 0 0 0 0 Total Supplies & Materials 4,906 0 0 0 0
Current Chgs & Oblig FY19 Expenditure FY20 Expenditure FY21 Appropriation FY22 Recommended Inc/Dec 21 vs 22
54300 Workers' Comp Medical 0 0 0 0 0 54400 Legal Liabilities 0 0 0 0 0 54600 Current Charges H&I 0 0 0 0 0 54700 Indemnification 0 0 0 0 0 54800 Reserve Account 0 0 0 0 0 54900 Other Current Charges 0 0 0 0 0 Total Current Chgs & Oblig 0 0 0 0 0
Equipment FY19 Expenditure FY20 Expenditure FY21 Appropriation FY22 Recommended Inc/Dec 21 vs 22
55000 Automotive Equipment 0 0 0 0 0 55400 Lease/Purchase 0 0 0 0 0 55600 Office Furniture & Equipment 0 0 0 0 0 55900 Misc Equipment 0 0 0 0 0 Total Equipment 0 0 0 0 0
Other FY19 Expenditure FY20 Expenditure FY21 Appropriation FY22 Recommended Inc/Dec 21 vs 22
56200 Special Appropriation 0 0 0 0 0 57200 Structures & Improvements 0 0 0 0 0 58000 Land & Non-Structure 0 0 0 0 0 Total Other 0 0 0 0 0
Grand Total 446,713 466,696 1,099,625 799,625 -300,000
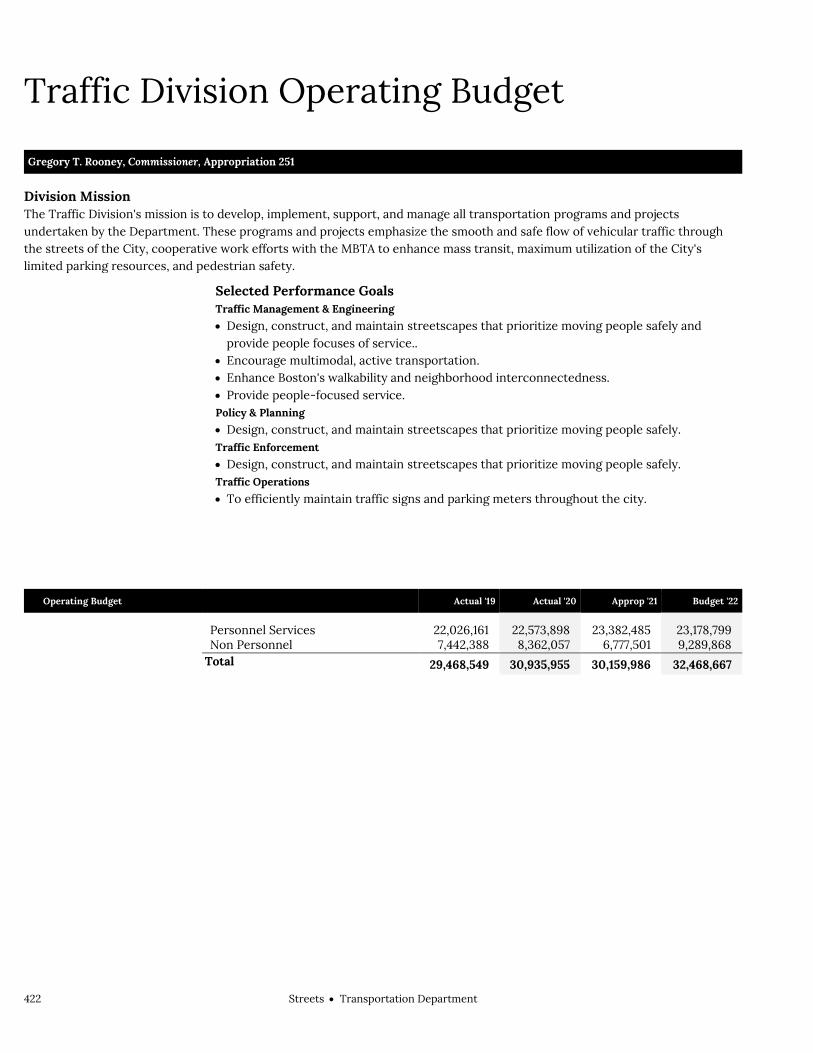
422 StreetsTransportation Department
Traffic Division Operating Budget Streets Traffic Division Gregory T. Rooney, Commissioner, Appropriation 251
Division Mission The Traffic Division's mission is to develop, implement, support, and manage all transportation programs and projects undertaken by the Department. These programs and projects emphasize the smooth and safe flow of vehicular traffic through the streets of the City, cooperative work efforts with the MBTA to enhance mass transit, maximum utilization of the City's limited parking resources, and pedestrian safety.
Selected Performance Goals Traffic Management & Engineering
Design, construct, and maintain streetscapes that prioritize moving people safely and provide people focuses of service..
Encourage multimodal, active transportation. Enhance Boston's walkability and neighborhood interconnectedness. Provide people-focused service. Policy & Planning
Design, construct, and maintain streetscapes that prioritize moving people safely. Traffic Enforcement
Design, construct, and maintain streetscapes that prioritize moving people safely. Traffic Operations
To efficiently maintain traffic signs and parking meters throughout the city.
Operating Budget Actual '19 Actual '20 Approp '21 Budget '22
Personnel Services 22,026,161 22,573,898 23,382,485 23,178,799 Non Personnel 7,442,388 8,362,057 6,777,501 9,289,868 Total 29,468,549 30,935,955 30,159,986 32,468,667

StreetsTransportation Department 423
Traffic Division Operating Budget
Description of Services
The Traffic Division establishes and maintains a wide variety of programs to enhance transportation throughout Boston. The Division delivers such services as increased loading zone access for the delivery of goods and services, increased short-term parking opportunities and resident restricted parking spaces, efficient flow of vehicular traffic during peak periods, removal and disposal of abandoned vehicles, computerization of traffic signals, and traffic planning and engineering for the design or redesign of streets and intersections. The Division also provides clean, safe, and convenient parking facilities downtown and in neighborhood business districts. Provision of this service includes inspections, cleaning and renovations of facilities and enforcing existing parking leases.
Commissioner
Maintenance
Lease ManagementProject Planning Policy & Planning
Neighborhood Planning
Demand Management &
Environment Impact
Public Transportation
Policy
Traffic Management
Licensing, Rules & Regulations
PlanningAdministratio
n & Field Operations
Operations
Meter Shop
Sign Shop
Enforcement
Traffic Control
Parking Control
Tow & Hold Unit
Parking Facilities
Environment Management
Neighborhood Business
Traffic Signals

424 StreetsTransportation Department
Division History Personnel Services FY19 Expenditure FY20 Expenditure FY21 Appropriation FY22 Recommended Inc/Dec 21 vs 22
51000 Permanent Employees 19,821,515 20,413,560 21,642,927 21,439,241 -203,686 51100 Emergency Employees 62,526 10,650 70,184 70,184 0 51200 Overtime 1,510,838 1,474,699 1,059,374 1,059,374 0 51600 Unemployment Compensation 14,328 40,774 60,000 60,000 0 51700 Workers' Compensation 616,954 634,215 550,000 550,000 0 Total Personnel Services 22,026,161 22,573,898 23,382,485 23,178,799 -203,686
Contractual Services FY19 Expenditure FY20 Expenditure FY21 Appropriation FY22 Recommended Inc/Dec 21 vs 22
52100 Communications 200,150 140,869 213,850 213,850 0 52200 Utilities 476,031 604,962 521,311 487,937 -33,374 52400 Snow Removal 0 0 0 0 0 52500 Garbage/Waste Removal 447 0 1,500 1,500 0 52600 Repairs Buildings & Structures 48,548 26,098 30,100 30,100 0 52700 Repairs & Service of Equipment 904,157 1,040,414 763,810 805,060 41,250 52800 Transportation of Persons 32,365 32,438 34,375 34,375 0 52900 Contracted Services 2,733,185 3,545,078 2,047,982 4,627,982 2,580,000 Total Contractual Services 4,394,883 5,389,859 3,612,928 6,200,804 2,587,876
Supplies & Materials FY19 Expenditure FY20 Expenditure FY21 Appropriation FY22 Recommended Inc/Dec 21 vs 22
53000 Auto Energy Supplies 320,910 247,790 379,955 276,463 -103,492 53200 Food Supplies 0 0 0 0 0 53400 Custodial Supplies 3,237 3,497 3,500 3,500 0 53500 Med, Dental, & Hosp Supply 0 0 0 0 0 53600 Office Supplies and Materials 27,659 32,119 28,000 28,000 0 53700 Clothing Allowance 72,076 74,750 74,658 74,658 0 53800 Educational Supplies & Mat 0 0 0 0 0 53900 Misc Supplies & Materials 1,292,771 1,165,476 1,041,970 1,041,970 0 Total Supplies & Materials 1,716,653 1,523,632 1,528,083 1,424,591 -103,492
Current Chgs & Oblig FY19 Expenditure FY20 Expenditure FY21 Appropriation FY22 Recommended Inc/Dec 21 vs 22
54300 Workers' Comp Medical 242,458 168,017 150,000 150,000 0 54400 Legal Liabilities 110,000 92,000 92,000 99,000 7,000 54500 Aid To Veterans 0 0 0 0 0 54600 Current Charges H&I 0 0 0 0 0 54700 Indemnification 0 0 0 0 0 54800 Reserve Account 0 0 0 0 0 54900 Other Current Charges 73,067 121,429 94,255 122,320 28,065 Total Current Chgs & Oblig 425,525 381,446 336,255 371,320 35,065
Equipment FY19 Expenditure FY20 Expenditure FY21 Appropriation FY22 Recommended Inc/Dec 21 vs 22
55000 Automotive Equipment 0 0 0 0 0 55400 Lease/Purchase 736,344 895,625 1,270,735 1,263,653 -7,082 55600 Office Furniture & Equipment 15,500 8,716 10,000 10,000 0 55900 Misc Equipment 153,483 162,779 19,500 19,500 0 Total Equipment 905,327 1,067,120 1,300,235 1,293,153 -7,082
Other FY19 Expenditure FY20 Expenditure FY21 Appropriation FY22 Recommended Inc/Dec 21 vs 22
56200 Special Appropriation 0 0 0 0 0 57200 Structures & Improvements 0 0 0 0 0 58000 Land & Non-Structure 0 0 0 0 0 Total Other 0 0 0 0 0
Grand Total 29,468,549 30,935,955 30,159,986 32,468,667 2,308,681

StreetsTransportation Department 425
Division Personnel
Title Union Code Grade Position FY22 Salary Title
Union Code Grade Position FY22 Salary
Admin Analyst (Btd/Pers) AFM 15 2.00 135,265 Parking Meter Technology Specl
AFG 18A 1.00 87,715
Admin Asst SE1 05 1.00 73,198 Pr Strkeeper AFM 13 1.00 56,371 Admin Secretary AFT 14 1.00 43,049 Prin Admin Assistant SE1 08 1.00 108,468 Administrative_Assistant AFG 15 3.00 202,898 Prin Research Analyst(T&P) SE1 06 2.00 180,637 Administrative_Assistant AFM 15 1.00 61,061 Prin Traffic Investigator AFG 14 1.00 43,049 Administrative_Asst. AFM 17 1.00 79,769 Sr Adm Asst SE1 05 2.00 144,178 Asst Dir of Parking Mgmt EXM 09 1.00 105,678 Sr Parking Meter Supervisor I AFG 16 21.00 1,472,908 Asst Supv-Parking Enforcement AFG 17A 10.00 781,976 Sr Parking Meter Supervisor II AFG 17A 6.00 470,340 Asst Traffic Engineer AFJ 18A 3.00 211,057 Sr Radio Com Tech AFG 19 2.00 194,063 Asst Traffic Sign Supv ## AFG 17A 1.00 83,067 Sr Traffic Engineer AFJ 19A 8.00 769,653 Asst Traffic Signal Supv SE1 06 1.00 92,144 Sr Traffic Investigator AFG 12 5.00 252,078 Chief Traffic Invest AFG 18 1.00 88,999 Sr Traffic Main Prs(Sign Fab) AFM 14A 1.00 63,311 Claims Investigator(Opc) AFM 12 6.00 284,352 Sr Traffic Maint Person AFM 10L 14.00 622,350 Commissioner (T&P) CDH NG 1.00 135,371 Sr Traffic Signal Repairprs I AFM 14 4.00 216,105 Dep Comm(Field Operations) EXM 12 1.00 135,427 SrTraffic Signal Repairprs II AFM 15 3.00 205,697
Dep Comm-Cen-Art/3Rd Har Tun EXM 14 1.00 119,092 Supn - Parking Enforcement SE1 09 1.00 116,500
Dispatcher. AFM 10 7.00 268,078 Supvising Traffic Engineer SE1 10 3.00 378,072 Exec.Assistant SE1 12 1.00 103,525 Supv-Parking Enforcement SE1 08 2.00 216,935
Gen Maint Mech AFM 11L 2.00 97,099 Supv-Parking Meter Operations
SE1 08 2.00 216,936
Head Admin Clerk AFM 14 3.00 156,189 Traffic Engineering Director EXM 12 1.00 135,427 Head Clerk AFM 12 2.00 91,723 Traffic Signal Inspector AFG 16 2.00 130,964 Jr Traffic Engineer AFJ 16A 7.00 465,907 Traffic Signal Repairprs## AFM 13 7.00 350,198 Maint Mech (Painter) (T & P) AFM 13 1.00 56,371 Traffic Signal Supv SE1 08 1.00 110,032 Operations Mgr BTD Oper Div EXM 10 1.00 87,958 Trans Prog Planner V SE1 12 1.00 138,813 Parking Meter Operat Person I AFM 12 2.00 108,467 Trans Program Planner III SE1 06 9.00 691,554 Parking Meter Operations Frprs AFG 16A 1.00 76,972 Trans Program Planner IV SE1 08 6.00 649,264 Parking Meter Opr Person I## AFG 12 1.00 38,272 Trf Signl Supv SE1 08 1.00 108,468 Parking Meter Opr Person I## AFM 12 8.00 384,211 Vehicle Impound Specialist AFM 11L 29.00 1,438,216
Parking Meter Supervisor AFK 14A 168.00 9,174,980 Wrkg Frpr Tra Signal Rppr Test
AFG 18 2.00 139,831
Total 378 23,450,288 Adjustments Differential Payments 0 Other 404,450 Chargebacks 232,814 Salary Savings -2,648,312 FY22 Total Request 21,439,240

426 StreetsTransportation Department
External Funds History Personnel Services FY19 Expenditure FY20 Expenditure FY21 Appropriation FY22 Recommended Inc/Dec 21 vs 22
51000 Permanent Employees 0 0 0 0 0 51100 Emergency Employees 0 0 0 0 0 51200 Overtime 0 0 0 0 0 51300 Part Time Employees 0 0 0 0 0 51400 Health Insurance 0 0 0 0 0 51500 Pension & Annuity 0 0 0 0 0 51600 Unemployment Compensation 0 0 0 0 0 51700 Workers' Compensation 0 0 0 0 0 51800 Indirect Costs 0 0 0 0 0 51900 Medicare 0 0 0 0 0 Total Personnel Services 0 0 0 0 0
Contractual Services FY19 Expenditure FY20 Expenditure FY21 Appropriation FY22 Recommended Inc/Dec 21 vs 22
52100 Communications 0 0 0 0 0 52200 Utilities 4,206 3,761 2,500 2,500 0 52400 Snow Removal 168,776 152,430 169,000 169,000 0 52500 Garbage/Waste Removal 0 0 0 0 0 52600 Repairs Buildings & Structures 0 0 0 0 0 52700 Repairs & Service of Equipment 0 0 0 0 0 52800 Transportation of Persons 0 0 0 0 0 52900 Contracted Services 268,825 310,505 928,125 628,125 -300,000 Total Contractual Services 441,807 466,696 1,099,625 799,625 -300,000
Supplies & Materials FY19 Expenditure FY20 Expenditure FY21 Appropriation FY22 Recommended Inc/Dec 21 vs 22
53000 Auto Energy Supplies 0 0 0 0 0 53200 Food Supplies 0 0 0 0 0 53400 Custodial Supplies 0 0 0 0 0 53500 Med, Dental, & Hosp Supply 0 0 0 0 0 53600 Office Supplies and Materials 916 0 0 0 0 53700 Clothing Allowance 0 0 0 0 0 53800 Educational Supplies & Mat 0 0 0 0 0 53900 Misc Supplies & Materials 3,990 0 0 0 0 Total Supplies & Materials 4,906 0 0 0 0
Current Chgs & Oblig FY19 Expenditure FY20 Expenditure FY21 Appropriation FY22 Recommended Inc/Dec 21 vs 22
54300 Workers' Comp Medical 0 0 0 0 0 54400 Legal Liabilities 0 0 0 0 0 54600 Current Charges H&I 0 0 0 0 0 54700 Indemnification 0 0 0 0 0 54800 Reserve Account 0 0 0 0 0 54900 Other Current Charges 0 0 0 0 0 Total Current Chgs & Oblig 0 0 0 0 0
Equipment FY19 Expenditure FY20 Expenditure FY21 Appropriation FY22 Recommended Inc/Dec 21 vs 22
55000 Automotive Equipment 0 0 0 0 0 55400 Lease/Purchase 0 0 0 0 0 55600 Office Furniture & Equipment 0 0 0 0 0 55900 Misc Equipment 0 0 0 0 0 Total Equipment 0 0 0 0 0
Other FY19 Expenditure FY20 Expenditure FY21 Appropriation FY22 Recommended Inc/Dec 21 vs 22
56200 Special Appropriation 0 0 0 0 0 57200 Structures & Improvements 0 0 0 0 0 58000 Land & Non-Structure 0 0 0 0 0 Total Other 0 0 0 0 0
Grand Total 446,713 466,696 1,099,625 799,625 -300,000
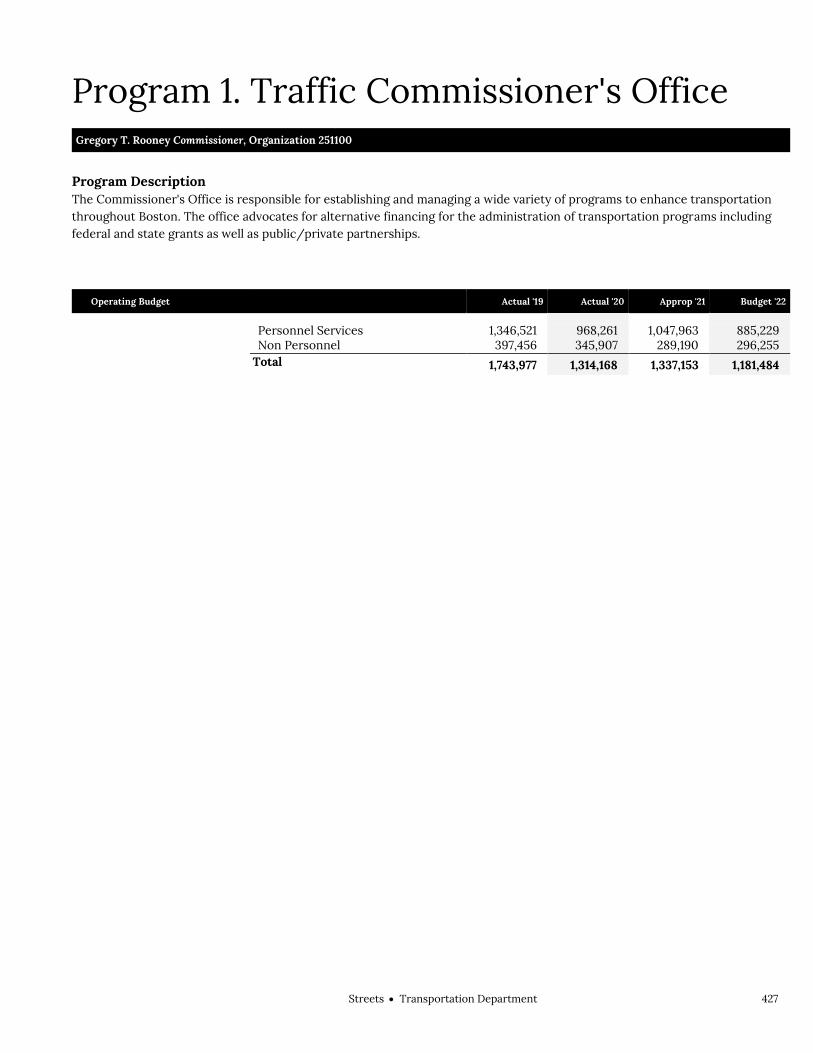
StreetsTransportation Department 427
Program 1. Traffic Commissioner's Office Gregory T. Rooney Commissioner, Organization 251100
Program Description The Commissioner's Office is responsible for establishing and managing a wide variety of programs to enhance transportation throughout Boston. The office advocates for alternative financing for the administration of transportation programs including federal and state grants as well as public/private partnerships.
Operating Budget Actual '19 Actual '20 Approp '21 Budget '22
Personnel Services 1,346,521 968,261 1,047,963 885,229 Non Personnel 397,456 345,907 289,190 296,255 Total 1,743,977 1,314,168 1,337,153 1,181,484

428 StreetsTransportation Department
Program 2. Traffic Management & Engineering Amy Cording, Acting Manager, Organization 251200
Program Description The Traffic Management and Engineering Program manages Boston’s transportation network to provide safe, efficient travel throughout the City. This is accomplished through maintenance of traffic signal timings using the City’s computerized traffic signal system; design and review of new/upgraded traffic signal installations; review of proposed roadway and transit projects, review and approval of private development plans; licensing of on-street construction; permitting of special events; review and modification of existing parking rules and regulations; and working with neighborhood groups to improve traffic and pedestrian safety on residential streets.
Operating Budget Actual '19 Actual '20 Approp '21 Budget '22
Personnel Services 2,101,060 2,310,215 2,182,209 2,212,773 Non Personnel 1,175,365 1,944,652 363,722 379,742 Total 3,276,425 4,254,867 2,545,931 2,592,515
Performance
Goal: Design, construct, and maintain streetscapes that prioritize moving people safely and provide people focuses of service..
Performance Measures Actual '19 Actual '20 Projected '21 Target '22
# Accessible Pedestrian Signals Installed 35 18 24 24
Goal: Encourage multimodal, active transportation
Performance Measures Actual '19 Actual '20 Projected '21 Target '22
Traffic Congestion Index (AM) 1.8 1.4 1.4 1.2
Traffic Congestion Index (PM) 1.8 1.6 1.4 1.3
Goal: Enhance Boston's walkability and neighborhood interconnectedness
Performance Measures Actual '19 Actual '20 Projected '21 Target '22
% of traffic signals on-line 80% 82% 75% 75%
Goal: Provide people-focused service
Performance Measures Actual '19 Actual '20 Projected '21 Target '22
% of development project impact reports, construction management plans and site plans reviewed on time
75% 65% 75% 75%
% of engineering service requests completed and responded to on time 75% 65% 80% 80%

StreetsTransportation Department 429
Program 3. Policy & Planning Vineet Gupta, Manager, Organization 251300
Program Description The Policy and Planning Division provides planning services leading to more effective engineering, construction and management of the city’s transportation networks and initiates new projects to support the department’s mission. Through extensive community process and coordination with city and state agencies, the division encourages the use of alternative modes, enhances pedestrian safety, addresses neighborhood traffic and parking concerns, reviews new development projects and proposes long-term strategies. The division also includes bicycle programs.
Operating Budget Actual '19 Actual '20 Approp '21 Budget '22
Personnel Services 1,034,896 1,384,093 1,571,370 1,624,724 Non Personnel 189,492 126,588 182,722 1,762,722 Total 1,224,388 1,510,681 1,754,092 3,387,446
Performance
Goal: Design, construct, and maintain streetscapes that prioritize moving people safely
Performance Measures Actual '19 Actual '20 Projected '21 Target '22
Annual total reported pedestrians injured in crashes 701 548 207 0
Average monthly collisions that cause fatality or injury 353 325 TBR 0

430 StreetsTransportation Department
Program 4. Traffic Enforcement Bradley Gerratt, Manager, Organization 251400
Program Description The Enforcement Program enhances public safety, improves traffic flow, and promotes parking opportunities and curbside access by encouraging compliance with the City's rules and regulations through issuance of citations and towing of illegally parked vehicles.
Operating Budget Actual '19 Actual '20 Approp '21 Budget '22
Personnel Services 13,473,805 13,971,693 14,117,069 14,323,633 Non Personnel 2,021,877 2,133,853 2,154,370 2,080,520 Total 15,495,682 16,105,546 16,271,439 16,404,153
Performance
Goal: Design, construct, and maintain streetscapes that prioritize moving people safely
Responsiveness to Constituent Requests (CRM)
Actual '19 Actual '20 Projected '21 Target '22
% of abandoned vehicle requests completed on time 52% 38% 25% 75%
Average time to complete an abandoned vehicle request (days) 17 27 30 16

StreetsTransportation Department 431
Program 5. Traffic Operations Bradley Gerratt, Manager, Organization 251500
Program Description The Operations Program promotes public safety through the maintenance of and regulatory signage and traffic signals on City roadways, and coordination of special events effecting traffic and parking in the City. Operations also supports economic development in the City by encouraging efficient use of short-term on-street parking through the maintenance of parking meters.
Operating Budget Actual '19 Actual '20 Approp '21 Budget '22
Personnel Services 4,069,879 3,939,636 4,463,874 4,132,440 Non Personnel 3,658,198 3,811,057 3,787,497 4,770,629 Total 7,728,077 7,750,693 8,251,371 8,903,069
Performance
Goal: Enhance Boston's walkability and neighborhood interconnectedness
Performance Measures Actual '19 Actual '20 Projected '21 Target '22
Total footage of crosswalks in good repair
515,000
Total footage of lane lines in good repair
150,000
Goal: To efficiently maintain traffic signs and parking meters throughout the city
Responsiveness to Constituent Requests (CRM)
Actual '19 Actual '20 Projected '21 Target '22
% of sign repair requests completed on time 75% 87% 90% 95%
Average time to complete a sign repair request (days) 6 9 10 8

432 StreetsTransportation Department

StreetsTransportation Department 433
Parking Clerk Operating Budget Streets Parking Clerk Stephen McGuire, Assistant Parking Clerk, Appropriation 253
Division Mission The Office of the Parking Clerk's primary mission is to respond effectively to public inquiries about parking tickets, resolve any disagreements through an adjudication process, and to deter illegal parking by successfully collecting parking violation fines. The Office is also responsible for adjudicating and collecting fines on abandoned vehicles and for administering resident parking permits.
Selected Performance Goals Parking Clerk
Provide people-focused service.
Operating Budget Actual '19 Actual '20 Approp '21 Budget '22
Personnel Services 3,099,035 3,021,207 3,071,328 3,117,236 Non Personnel 5,471,144 4,918,777 5,516,800 4,973,700 Total 8,570,179 7,939,984 8,588,128 8,090,936

434 StreetsTransportation Department
Parking Clerk Operating Budget
Description of Services
The Office of the Parking Clerk oversees and operates a number of major components of the City's Parking Violation System (PVS). The PVS is a high volume, complex operation involving numerous computer-based systems that support all elements relating to parking tickets from design, procurement, and processing of tickets, through providing responses to public inquiries, adjudication, collection, and final disposition. Parking permits for neighborhood residents are issued by the Office of the Parking Clerk.
Commissioner/Parking Clerk
Public Inquiry & Adjudication
Data Processing Special Processing &
Correspondence
Telephone & Walk-in Inquiries
Parking Ticket & Abandoned Vehicle Hearing &
Adjudication
Resident Parking Permit Issuance
Quality Control & Systems Monitoring
Systems & Planning
Collection & Enforcement
Lease & Fleet Collections
Internal Collections
Cashiering
Quality Control & Systems Monitoring
Systems & Planning
Assistant Parking Clerk

StreetsTransportation Department 435
Division History Personnel Services FY19 Expenditure FY20 Expenditure FY21 Appropriation FY22 Recommended Inc/Dec 21 vs 22
51000 Permanent Employees 2,980,147 2,892,713 2,912,214 2,960,122 47,908 51100 Emergency Employees 108,508 111,717 147,114 147,114 0 51200 Overtime 8,362 16,777 12,000 10,000 -2,000 51600 Unemployment Compensation 2,018 0 0 0 0 51700 Workers' Compensation 0 0 0 0 0 Total Personnel Services 3,099,035 3,021,207 3,071,328 3,117,236 45,908
Contractual Services FY19 Expenditure FY20 Expenditure FY21 Appropriation FY22 Recommended Inc/Dec 21 vs 22
52100 Communications 55,607 44,598 15,300 15,300 0 52200 Utilities 0 0 0 0 0 52400 Snow Removal 0 0 0 0 0 52500 Garbage/Waste Removal 0 0 0 0 0 52600 Repairs Buildings & Structures 0 0 0 0 0 52700 Repairs & Service of Equipment 4,588 4,495 10,000 10,000 0 52800 Transportation of Persons 9,123 8,652 8,400 8,400 0 52900 Contracted Services 5,076,582 4,576,217 5,204,600 4,721,500 -483,100 Total Contractual Services 5,145,900 4,633,962 5,238,300 4,755,200 -483,100
Supplies & Materials FY19 Expenditure FY20 Expenditure FY21 Appropriation FY22 Recommended Inc/Dec 21 vs 22
53000 Auto Energy Supplies 0 0 0 0 0 53200 Food Supplies 0 0 0 0 0 53400 Custodial Supplies 0 0 0 0 0 53500 Med, Dental, & Hosp Supply 0 0 0 0 0 53600 Office Supplies and Materials 305,200 270,593 258,000 198,000 -60,000 53700 Clothing Allowance 7,500 7,000 7,000 7,000 0 53800 Educational Supplies & Mat 0 0 0 0 0 53900 Misc Supplies & Materials 6,842 3,227 5,000 5,000 0 Total Supplies & Materials 319,542 280,820 270,000 210,000 -60,000
Current Chgs & Oblig FY19 Expenditure FY20 Expenditure FY21 Appropriation FY22 Recommended Inc/Dec 21 vs 22
54300 Workers' Comp Medical 0 0 0 0 0 54400 Legal Liabilities 0 0 0 0 0 54500 Aid To Veterans 0 0 0 0 0 54600 Current Charges H&I 0 0 0 0 0 54700 Indemnification 0 0 0 0 0 54800 Reserve Account 0 0 0 0 0 54900 Other Current Charges 2,838 2,887 2,500 2,500 0 Total Current Chgs & Oblig 2,838 2,887 2,500 2,500 0
Equipment FY19 Expenditure FY20 Expenditure FY21 Appropriation FY22 Recommended Inc/Dec 21 vs 22
55000 Automotive Equipment 0 0 0 0 0 55400 Lease/Purchase 0 0 0 0 0 55600 Office Furniture & Equipment 2,864 799 5,000 5,000 0 55900 Misc Equipment 0 309 1,000 1,000 0 Total Equipment 2,864 1,108 6,000 6,000 0
Other FY19 Expenditure FY20 Expenditure FY21 Appropriation FY22 Recommended Inc/Dec 21 vs 22
56200 Special Appropriation 0 0 0 0 0 57200 Structures & Improvements 0 0 0 0 0 58000 Land & Non-Structure 0 0 0 0 0 Total Other 0 0 0 0 0
Grand Total 8,570,179 7,939,984 8,588,128 8,090,936 -497,192

436 StreetsTransportation Department
Division Personnel
Title Union Code Grade Position FY22 Salary Title
Union Code Grade Position FY22 Salary
Admin Analyst SE1 03 1.00 44,747 Prin Admin Asst (BTD) SE1 09 2.00 233,001
Asst Parking Clerk EXM 11 1.00 130,493 Prin Admin Asst Customer Svrtp
SE1 10 1.00 126,024
Chief Claims Investigator AFG 15A 11.00 709,432 Prin Admin Asst(Planningt&P) SE1 10 1.00 126,024 Chief Claims Investigator I AFG 17A 2.00 164,571 Prin Data Proc Systems Analyst SE1 10 1.00 126,024 Claims Investigator(Opc) AFM 12 7.00 303,415 Sr Claims Investigator AFG 13A 4.00 204,805 Data Proc Coordinator SE1 04 1.00 75,441 Sr Data Proc Sys Analyst SE1 08 3.00 298,241 DP Sys Anl SE1 06 1.00 86,356 Sr Data Proc System Analyst SE1 09 1.00 116,500 Head Cashier AFM 15 1.00 67,633 Teller AFM 13 4.00 197,964 Total 42 3,010,671 Adjustments Differential Payments 0 Other 30,000 Chargebacks 0 Salary Savings -80,547 FY22 Total Request 2,960,124

StreetsTransportation Department 437
Program 1. Parking Clerk Stephen Maguire, Manager, Organization 253100
Program Description The Office of the Parking Clerk is responsible for the oversight and management of the City's comprehensive Parking Violation and Parking Management Information Services System, the administration of the issuance program for Resident Parking Permits, and adjudication related to the issuance of parking citations and the abandoned vehicle program.
Operating Budget Actual '19 Actual '20 Approp '21 Budget '22
Personnel Services 3,099,035 3,021,207 3,071,328 3,117,236 Non Personnel 5,471,144 4,918,777 5,516,800 4,973,700 Total 8,570,179 7,939,984 8,588,128 8,090,936
Performance
Goal: Provide people-focused service
Performance Measures Actual '19 Actual '20 Projected '21 Target '22
Parking Enforcement Effectiveness- Parking Fine Revenue 70,136,461 62,631,486 48,000,000 55,900,000

438 StreetsTransportation Department
External Funds Projects Boston Bike Share
Project Mission Various funding sources will support the Boston Bike Share program, including grants from the Federal Transit Authority, sponsorship donations, funds from the Boston Public Health Commission’s ARRA grant, the Barr Foundation and other state funding sources. The program began in FY12 and has 1,800 bicycles at publically accessible stations for member use.
Go Boston 2030 Tracking and Communication
Project Mission This grant from the Barr Foundation helps BTD develop and sustain the transparent communication, tracking, and evaluation of the Projects and Aspirational Targets identified in Go Boston 2030.
Parking Facilities Fund
Project Mission The City owns and operates several revenue producing parking lots. The resulting revenue from these lots goes into the fund to support their non-personnel operating expenses. This is an ongoing revolving account.

StreetsTransportation Department 439
Transportation Department Capital Budget Streets Transportation Department
Overview This Capital Plan invests deeply in the core goals of Go Boston 2030: transformational projects that expand access and interconnect Boston neighborhoods; streets that are safer for all users, particularly pedestrians and cyclists; and travel that is more reliable and predictable.
FY22 Major Initiatives Begin reconstruction of Tremont Street, from Herald Street to Melnea Cass, to prioritize
pedestrian safety and build protected bike facilities. Transform several corridors Citywide for bus transit, including the construction of
dedicated bus lanes on Columbus Avenue and Warren Street. Construct Neighborhood Slow Streets projects at in various neighborhoods. Expand the 311 Constituent Safety Program and Pedestrian Signal Retiming initiative in
order to address all resident safety requests and retime our most dangerous intersections. The addition of protected bicycle lanes on Massachusetts Avenue (South of Melnea Cass),
Columbus Avenue, and other corridors by increasing the annual investment in the Strategic Bicycle Network.
Vision Zero will continue to deliver targeted safety improvements in both our residential neighborhoods and along some of our most challenging corridors.
A citywide, multi-year campaign to bring all painted crosswalks, lane markings, and bike lanes into a state of good repair continues this year.
Design and installation of new traffic signals at 5 locations, including Roxbury, South Boston, Roslindale and West Roxbury.
Capital Budget Expenditures Total Actual '19 Total Actual '20 Estimated '21 Total Projected
'22
Total Department 11,448,556 14,404,502 37,462,197 42,162,924
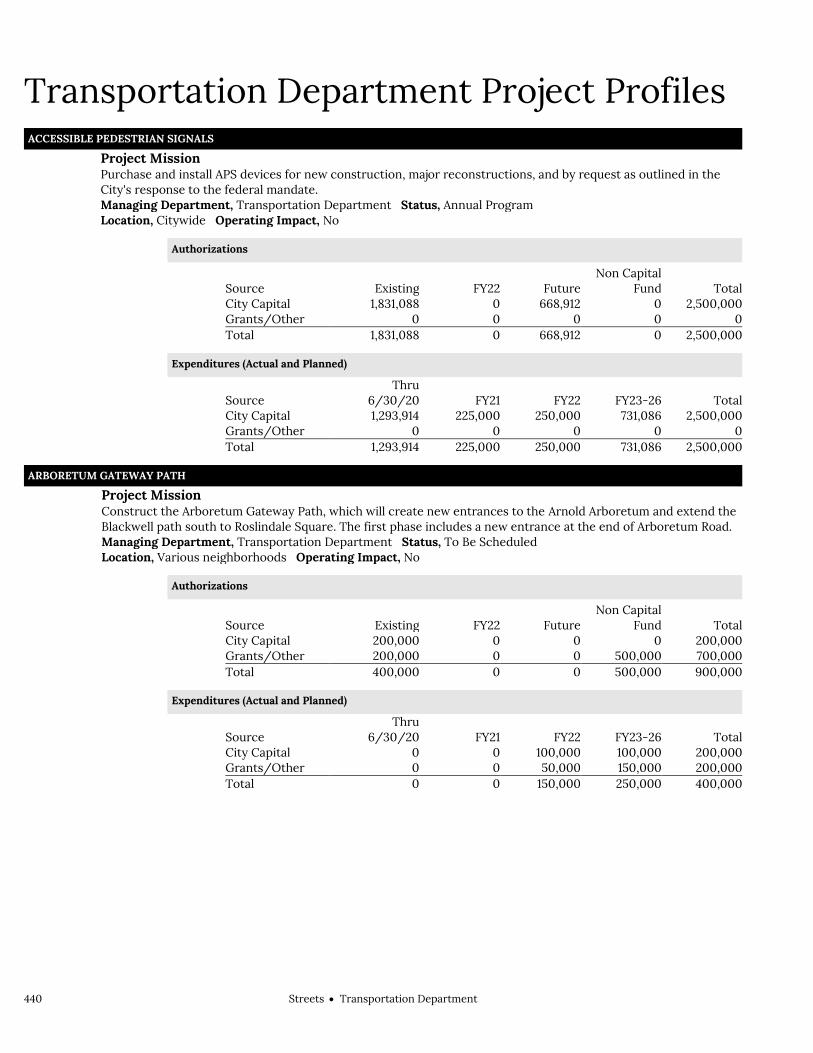
440 StreetsTransportation Department
Transportation Department Project Profiles ACCESSIBLE PEDESTRIAN SIGNALS
Project Mission Purchase and install APS devices for new construction, major reconstructions, and by request as outlined in the
City's response to the federal mandate.
Managing Department, Transportation Department Status, Annual Program Location, Citywide Operating Impact, No
Authorizations
Source Existing FY22 Future Non Capital
Fund Total City Capital 1,831,088 0 668,912 0 2,500,000 Grants/Other 0 0 0 0 0 Total 1,831,088 0 668,912 0 2,500,000
Expenditures (Actual and Planned)
Source Thru
6/30/20 FY21 FY22 FY23-26 Total City Capital 1,293,914 225,000 250,000 731,086 2,500,000 Grants/Other 0 0 0 0 0 Total 1,293,914 225,000 250,000 731,086 2,500,000
ARBORETUM GATEWAY PATH Project Mission Construct the Arboretum Gateway Path, which will create new entrances to the Arnold Arboretum and extend the
Blackwell path south to Roslindale Square. The first phase includes a new entrance at the end of Arboretum Road.
Managing Department, Transportation Department Status, To Be Scheduled Location, Various neighborhoods Operating Impact, No
Authorizations
Source Existing FY22 Future Non Capital
Fund Total City Capital 200,000 0 0 0 200,000 Grants/Other 200,000 0 0 500,000 700,000 Total 400,000 0 0 500,000 900,000
Expenditures (Actual and Planned)
Source Thru
6/30/20 FY21 FY22 FY23-26 Total City Capital 0 0 100,000 100,000 200,000 Grants/Other 0 0 50,000 150,000 200,000 Total 0 0 150,000 250,000 400,000
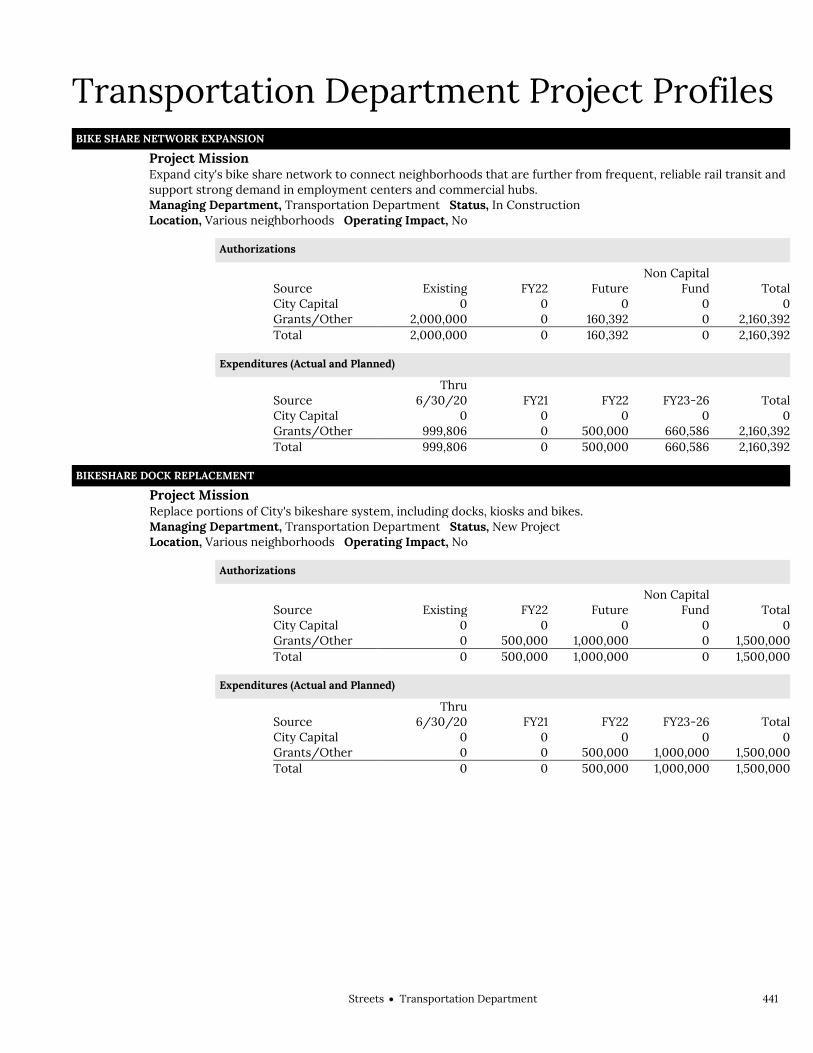
StreetsTransportation Department 441
Transportation Department Project Profiles BIKE SHARE NETWORK EXPANSION
Project Mission Expand city's bike share network to connect neighborhoods that are further from frequent, reliable rail transit and
support strong demand in employment centers and commercial hubs.
Managing Department, Transportation Department Status, In Construction Location, Various neighborhoods Operating Impact, No
Authorizations
Source Existing FY22 Future Non Capital
Fund Total City Capital 0 0 0 0 0 Grants/Other 2,000,000 0 160,392 0 2,160,392 Total 2,000,000 0 160,392 0 2,160,392
Expenditures (Actual and Planned)
Source Thru
6/30/20 FY21 FY22 FY23-26 Total City Capital 0 0 0 0 0 Grants/Other 999,806 0 500,000 660,586 2,160,392 Total 999,806 0 500,000 660,586 2,160,392
BIKESHARE DOCK REPLACEMENT Project Mission Replace portions of City's bikeshare system, including docks, kiosks and bikes. Managing Department, Transportation Department Status, New Project Location, Various neighborhoods Operating Impact, No
Authorizations
Source Existing FY22 Future Non Capital
Fund Total City Capital 0 0 0 0 0 Grants/Other 0 500,000 1,000,000 0 1,500,000 Total 0 500,000 1,000,000 0 1,500,000
Expenditures (Actual and Planned)
Source Thru
6/30/20 FY21 FY22 FY23-26 Total City Capital 0 0 0 0 0 Grants/Other 0 0 500,000 1,000,000 1,500,000 Total 0 0 500,000 1,000,000 1,500,000

442 StreetsTransportation Department
Transportation Department Project Profiles BLOSSOM STREET
Project Mission Upgrades to Blossom Street including upgraded lighting, geometric changes for pedestrian safety, roadway
resurfacing, and pavement markings including bicyclist accommodations.
Managing Department, Public Works Department Status, To Be Scheduled Location, West End Operating Impact, No
Authorizations
Source Existing FY22 Future Non Capital
Fund Total City Capital 0 0 0 0 0 Grants/Other 2,000,000 0 0 0 2,000,000 Total 2,000,000 0 0 0 2,000,000
Expenditures (Actual and Planned)
Source Thru
6/30/20 FY21 FY22 FY23-26 Total City Capital 0 0 0 0 0 Grants/Other 0 0 200,000 1,800,000 2,000,000 Total 0 0 200,000 1,800,000 2,000,000
BLUE HILL AVENUE TRANSPORTATION PLAN Project Mission Community process and conceptual design for improving mobility along the Blue Hill Avenue corridor. Managing Department, Transportation Department Status, To Be Scheduled Location, Various neighborhoods Operating Impact, No
Authorizations
Source Existing FY22 Future Non Capital
Fund Total City Capital 0 0 0 0 0 Grants/Other 300,000 0 0 0 300,000 Total 300,000 0 0 0 300,000
Expenditures (Actual and Planned)
Source Thru
6/30/20 FY21 FY22 FY23-26 Total City Capital 0 0 0 0 0 Grants/Other 1,000 25,000 274,000 0 300,000 Total 1,000 25,000 274,000 0 300,000

StreetsTransportation Department 443
Transportation Department Project Profiles BOWDOIN STREET/GENEVA AVENUE
Project Mission Design transportation improvements in the Bowdoin Street and Geneva Avenue area in Dorchester. Managing Department, Transportation Department Status, To Be Scheduled Location, Dorchester Operating Impact, No
Authorizations
Source Existing FY22 Future Non Capital
Fund Total City Capital 300,000 0 0 0 300,000 Grants/Other 0 0 0 0 0 Total 300,000 0 0 0 300,000
Expenditures (Actual and Planned)
Source Thru
6/30/20 FY21 FY22 FY23-26 Total City Capital 0 0 100,000 200,000 300,000 Grants/Other 0 0 0 0 0 Total 0 0 100,000 200,000 300,000
BOYLSTON STREET Project Mission Redesign and reconstruct Boylston Street from Ipswich Street south to Park Drive and the Muddy River Crossing.
Build protected bike lanes, a mid-block crossing, upgraded signals, replacement lighting and new sidewalks in certain locations.
Managing Department, Transportation Department Status, In Design Location, Back Bay Operating Impact, No
Authorizations
Source Existing FY22 Future Non Capital
Fund Total City Capital 0 0 0 0 0 Grants/Other 1,170,744 0 0 8,500,000 9,670,744 Total 1,170,744 0 0 8,500,000 9,670,744
Expenditures (Actual and Planned)
Source Thru
6/30/20 FY21 FY22 FY23-26 Total City Capital 0 0 0 0 0 Grants/Other 0 500,000 670,744 0 1,170,744 Total 0 500,000 670,744 0 1,170,744

444 StreetsTransportation Department
Transportation Department Project Profiles CENTRE STREET / SOUTH STREET
Project Mission Redesign portions of Centre Street and South Street in Jamaica Plain using a Complete Streets approach. Managing Department, Transportation Department Status, In Design Location, Jamaica Plain Operating Impact, No
Authorizations
Source Existing FY22 Future Non Capital
Fund Total City Capital 750,000 0 0 0 750,000 Grants/Other 0 0 0 0 0 Total 750,000 0 0 0 750,000
Expenditures (Actual and Planned)
Source Thru
6/30/20 FY21 FY22 FY23-26 Total City Capital 296,192 55,000 50,000 348,808 750,000 Grants/Other 0 0 0 0 0 Total 296,192 55,000 50,000 348,808 750,000
CENTRE STREET SAFETY IMPROVEMENTS Project Mission Design and implement pedestrian and bicycle safety improvements on Centre Street in West Roxbury. Managing Department, Transportation Department Status, In Design Location, West Roxbury Operating Impact, No
Authorizations
Source Existing FY22 Future Non Capital
Fund Total City Capital 400,000 0 0 0 400,000 Grants/Other 0 0 0 0 0 Total 400,000 0 0 0 400,000
Expenditures (Actual and Planned)
Source Thru
6/30/20 FY21 FY22 FY23-26 Total City Capital 0 75,000 325,000 0 400,000 Grants/Other 0 0 0 0 0 Total 0 75,000 325,000 0 400,000

StreetsTransportation Department 445
Transportation Department Project Profiles CROSSWALK AND LANE MARKING REVITALIZATION
Project Mission Provide additional crosswalk and lane markings. Managing Department, Transportation Department Status, Annual Program Location, Citywide Operating Impact, No
Authorizations
Source Existing FY22 Future Non Capital
Fund Total City Capital 0 0 0 0 0 Grants/Other 9,560,000 0 0 0 9,560,000 Total 9,560,000 0 0 0 9,560,000
Expenditures (Actual and Planned)
Source Thru
6/30/20 FY21 FY22 FY23-26 Total City Capital 0 0 0 0 0 Grants/Other 2,951,003 1,500,000 1,500,000 3,608,997 9,560,000 Total 2,951,003 1,500,000 1,500,000 3,608,997 9,560,000
DEDICATED BUS LANES Project Mission Transform several corridors Citywide for rapid bus transit, including the construction of dedicated bus lanes on
Summer Street, Columbus Avenue and Warren Street.
Managing Department, Transportation Department Status, Annual Program Location, Various neighborhoods Operating Impact, No
Authorizations
Source Existing FY22 Future Non Capital
Fund Total City Capital 0 7,000,000 0 0 7,000,000 Grants/Other 0 850,000 14,350,000 0 15,200,000 Total 0 7,850,000 14,350,000 0 22,200,000
Expenditures (Actual and Planned)
Source Thru
6/30/20 FY21 FY22 FY23-26 Total City Capital 0 0 3,000,000 4,000,000 7,000,000 Grants/Other 0 3,000,000 3,000,000 9,200,000 15,200,000 Total 0 3,000,000 6,000,000 13,200,000 22,200,000

446 StreetsTransportation Department
Transportation Department Project Profiles EAGLE SQUARE
Project Mission Design for traffic flow and safety improvements in Eagle Square. Managing Department, Transportation Department Status, To Be Scheduled Location, East Boston Operating Impact, No
Authorizations
Source Existing FY22 Future Non Capital
Fund Total City Capital 150,000 0 0 0 150,000 Grants/Other 0 0 0 0 0 Total 150,000 0 0 0 150,000
Expenditures (Actual and Planned)
Source Thru
6/30/20 FY21 FY22 FY23-26 Total City Capital 0 50,000 100,000 0 150,000 Grants/Other 0 0 0 0 0 Total 0 50,000 100,000 0 150,000
EGLESTON SQUARE Project Mission Redesign of Egleston Square featuring widened sidewalks, median realignment, new crosswalks, raised crosswalks
and neckdowns, traffic signal improvements, and rehabilitation of the sculpture garden.
Managing Department, Transportation Department Status, To Be Scheduled Location, Roxbury Operating Impact, No
Authorizations
Source Existing FY22 Future Non Capital
Fund Total City Capital 0 0 0 0 0 Grants/Other 500,000 500,000 0 0 1,000,000 Total 500,000 500,000 0 0 1,000,000
Expenditures (Actual and Planned)
Source Thru
6/30/20 FY21 FY22 FY23-26 Total City Capital 0 0 0 0 0 Grants/Other 0 100,000 300,000 600,000 1,000,000 Total 0 100,000 300,000 600,000 1,000,000

StreetsTransportation Department 447
Transportation Department Project Profiles ELECTRIC CHARGING STATIONS
Project Mission Installation of electric vehicle charging stations at various municipal lots. Managing Department, Transportation Department Status, In Construction Location, Citywide Operating Impact, No
Authorizations
Source Existing FY22 Future Non Capital
Fund Total City Capital 0 0 0 0 0 Grants/Other 300,000 0 0 0 300,000 Total 300,000 0 0 0 300,000
Expenditures (Actual and Planned)
Source Thru
6/30/20 FY21 FY22 FY23-26 Total City Capital 0 0 0 0 0 Grants/Other 0 25,000 275,000 0 300,000 Total 0 25,000 275,000 0 300,000
FATHER HART BRIDGE TRAFFIC IMPROVEMENTS Project Mission Install new traffic signals at the intersections of Milton St. at Neponset Valley Parkway, Milton St. at Hyde Park Ave.
and Neponset Valley Parkway and Hyde Park Ave. at Wolcott Square. Install wheelchair ramps, new crosswalks and bicycle accommodations.
Managing Department, Public Works Department Status, In Construction Location, Hyde Park Operating Impact, No
Authorizations
Source Existing FY22 Future Non Capital
Fund Total City Capital 3,100,000 0 0 0 3,100,000 Grants/Other 0 0 0 0 0 Total 3,100,000 0 0 0 3,100,000
Expenditures (Actual and Planned)
Source Thru
6/30/20 FY21 FY22 FY23-26 Total City Capital 2,193,974 600,000 306,026 0 3,100,000 Grants/Other 0 0 0 0 0 Total 2,193,974 600,000 306,026 0 3,100,000

448 StreetsTransportation Department
Transportation Department Project Profiles GREEN LINKS
Project Mission Annual program to create a connected network of pedestrian and bicycle paths that will allow more access to
green open spaces.
Managing Department, Transportation Department Status, Annual Program Location, Various neighborhoods Operating Impact, No
Authorizations
Source Existing FY22 Future Non Capital
Fund Total City Capital 700,000 0 500,000 0 1,200,000 Grants/Other 150,116 0 0 0 150,116 Total 850,116 0 500,000 0 1,350,116
Expenditures (Actual and Planned)
Source Thru
6/30/20 FY21 FY22 FY23-26 Total City Capital 193,282 100,000 269,000 637,718 1,200,000 Grants/Other 118,210 0 31,906 0 150,116 Total 311,492 100,000 300,906 637,718 1,350,116
JFK/UMASS STATION Project Mission Study improvements and create a transportation action plan for the MBTA's JFK/UMass Station area. Managing Department, Transportation Department Status, To Be Scheduled Location, Dorchester Operating Impact, No
Authorizations
Source Existing FY22 Future Non Capital
Fund Total City Capital 0 0 0 0 0 Grants/Other 250,000 0 0 0 250,000 Total 250,000 0 0 0 250,000
Expenditures (Actual and Planned)
Source Thru
6/30/20 FY21 FY22 FY23-26 Total City Capital 0 0 0 0 0 Grants/Other 0 0 50,000 200,000 250,000 Total 0 0 50,000 200,000 250,000

StreetsTransportation Department 449
Transportation Department Project Profiles MASSACHUSETTS AVENUE, NORTH OF MELNEA CASS BLVD.
Project Mission The project will improve pedestrian and cyclist safety on Massachusetts Avenue from Harrison Avenue to Melnea
Cass Boulevard by adjusting curbs and medians, upgrading ramps, and establishing continuous bike facilities in both directions of the roadway.
Managing Department, Transportation Department Status, In Design Location, South End Operating Impact, No
Authorizations
Source Existing FY22 Future Non Capital
Fund Total City Capital 0 0 0 0 0 Grants/Other 150,000 0 0 0 150,000 Total 150,000 0 0 0 150,000
Expenditures (Actual and Planned)
Source Thru
6/30/20 FY21 FY22 FY23-26 Total City Capital 0 0 0 0 0 Grants/Other 0 75,000 75,000 0 150,000 Total 0 75,000 75,000 0 150,000
MATTAPAN SQUARE Project Mission Redesign of Mattapan Square to create a direct crossing of Blue Hill Avenue between Mattapan Station and River
Street/Cummins Highway. This project will introduce a bus/bike lane from Mattapan Station to Babson Street on Blue Hill Avenue.
Managing Department, Transportation Department Status, In Design Location, Mattapan Operating Impact, No
Authorizations
Source Existing FY22 Future Non Capital
Fund Total City Capital 0 0 0 0 0 Grants/Other 500,000 0 0 0 500,000 Total 500,000 0 0 0 500,000
Expenditures (Actual and Planned)
Source Thru
6/30/20 FY21 FY22 FY23-26 Total City Capital 0 0 0 0 0 Grants/Other 0 0 100,000 400,000 500,000 Total 0 0 100,000 400,000 500,000

450 StreetsTransportation Department
Transportation Department Project Profiles MISSION HILL TRANSPORTATION PLANNING
Project Mission Planning for pedestrian improvements. Managing Department, Transportation Department Status, New Project Location, Mission Hill Operating Impact, No
Authorizations
Source Existing FY22 Future Non Capital
Fund Total City Capital 0 300,000 0 0 300,000 Grants/Other 0 0 0 0 0 Total 0 300,000 0 0 300,000
Expenditures (Actual and Planned)
Source Thru
6/30/20 FY21 FY22 FY23-26 Total City Capital 0 0 150,000 150,000 300,000 Grants/Other 0 0 0 0 0 Total 0 0 150,000 150,000 300,000
MUNICIPAL PARKING LOTS Project Mission Lighting, paving, re-striping, and other upgrades to municipal parking lots Citywide. Managing Department, Transportation Department Status, Annual Program Location, Citywide Operating Impact, No
Authorizations
Source Existing FY22 Future Non Capital
Fund Total City Capital 1,000,000 0 0 0 1,000,000 Grants/Other 0 0 0 0 0 Total 1,000,000 0 0 0 1,000,000
Expenditures (Actual and Planned)
Source Thru
6/30/20 FY21 FY22 FY23-26 Total City Capital 0 0 250,000 750,000 1,000,000 Grants/Other 0 0 0 0 0 Total 0 0 250,000 750,000 1,000,000

StreetsTransportation Department 451
Transportation Department Project Profiles NUBIAN SQUARE IMPROVEMENTS
Project Mission Roadway improvements from Shawmut Avenue to Harrison Avenue including six key Nubian Square intersections.
The scope of work includes geometric changes, new traffic signal equipment and timing, bike lanes, and streetscape improvements.
Managing Department, Transportation Department Status, In Construction Location, Roxbury Operating Impact, No
Authorizations
Source Existing FY22 Future Non Capital
Fund Total City Capital 922,183 0 0 0 922,183 Grants/Other 13,477,817 3,500,000 0 0 16,977,817 Total 14,400,000 3,500,000 0 0 17,900,000
Expenditures (Actual and Planned)
Source Thru
6/30/20 FY21 FY22 FY23-26 Total City Capital 792,105 25,000 105,078 0 922,183 Grants/Other 2,149,504 2,000,000 5,000,000 7,828,313 16,977,817 Total 2,941,609 2,025,000 5,105,078 7,828,313 17,900,000
OPERATIONS CENTER AT 12 CHANNEL STREET Project Mission Renovations to address interior office improvements, heating, ventilation, and sound. Managing Department, Public Facilities Department Status, In Construction Location, South Boston Operating Impact, No
Authorizations
Source Existing FY22 Future Non Capital
Fund Total City Capital 2,500,000 0 0 0 2,500,000 Grants/Other 0 0 0 0 0 Total 2,500,000 0 0 0 2,500,000
Expenditures (Actual and Planned)
Source Thru
6/30/20 FY21 FY22 FY23-26 Total City Capital 105,504 1,700,000 694,496 0 2,500,000 Grants/Other 0 0 0 0 0 Total 105,504 1,700,000 694,496 0 2,500,000

452 StreetsTransportation Department
Transportation Department Project Profiles PARKING METER AND SCHOOL ZONE SIGNAL UPGRADE
Project Mission Upgrade the technological infrastructure for all City meters and school zone signals. Managing Department, Transportation Department Status, New Project Location, Various neighborhoods Operating Impact, No
Authorizations
Source Existing FY22 Future Non Capital
Fund Total City Capital 0 0 0 0 0 Grants/Other 1,125,000 525,000 0 0 1,650,000 Total 1,125,000 525,000 0 0 1,650,000
Expenditures (Actual and Planned)
Source Thru
6/30/20 FY21 FY22 FY23-26 Total City Capital 0 0 0 0 0 Grants/Other 0 0 250,000 1,400,000 1,650,000 Total 0 0 250,000 1,400,000 1,650,000
RAPID BUS TRANSPORTATION SEAPORT Project Mission Develop an action plan and implementation program for rapid bus transit between North Station and the Seaport. Managing Department, Transportation Department Status, To Be Scheduled Location, South Boston Operating Impact, No
Authorizations
Source Existing FY22 Future Non Capital
Fund Total City Capital 0 0 0 0 0 Grants/Other 260,000 0 0 0 260,000 Total 260,000 0 0 0 260,000
Expenditures (Actual and Planned)
Source Thru
6/30/20 FY21 FY22 FY23-26 Total City Capital 0 0 0 0 0 Grants/Other 0 0 260,000 0 260,000 Total 0 0 260,000 0 260,000

StreetsTransportation Department 453
Transportation Department Project Profiles ROSLINDALE GATEWAY
Project Mission Design relative to the Arboretum Road Green Link project. Managing Department, Parks and Recreation Department Status, In Design Location, Roslindale Operating Impact, No
Authorizations
Source Existing FY22 Future Non Capital
Fund Total City Capital 0 0 0 0 0 Grants/Other 50,000 0 0 0 50,000 Total 50,000 0 0 0 50,000
Expenditures (Actual and Planned)
Source Thru
6/30/20 FY21 FY22 FY23-26 Total City Capital 0 0 0 0 0 Grants/Other 6,765 43,235 0 0 50,000 Total 6,765 43,235 0 0 50,000
SAFE AND RELIABLE STREETS Project Mission Support anti-congestion efforts Citywide through data collection, safety and public realm improvements. Includes
staff support to augment operational needs. Funded by state TNC revenue.
Managing Department, Transportation Department Status, Annual Program Location, Various neighborhoods Operating Impact, No
Authorizations
Source Existing FY22 Future Non Capital
Fund Total City Capital 0 0 0 0 0 Grants/Other 5,000,000 1,500,000 0 0 6,500,000 Total 5,000,000 1,500,000 0 0 6,500,000
Expenditures (Actual and Planned)
Source Thru
6/30/20 FY21 FY22 FY23-26 Total City Capital 0 0 0 0 0 Grants/Other 682,760 750,000 1,500,000 3,567,240 6,500,000 Total 682,760 750,000 1,500,000 3,567,240 6,500,000

454 StreetsTransportation Department
Transportation Department Project Profiles SOUTH BAY HARBOR TRAIL
Project Mission Design and construct an important link in the City's Greenway, connecting trails from the Fenway, the Southwest
Corridor, Charles River Park, Broadway Bridge, and the Central Artery parks.
Managing Department, Transportation Department Status, In Construction Location, South End Operating Impact, No
Authorizations
Source Existing FY22 Future Non Capital
Fund Total City Capital 463,000 0 0 0 463,000 Grants/Other 480,000 0 0 3,370,000 3,850,000 Total 943,000 0 0 3,370,000 4,313,000
Expenditures (Actual and Planned)
Source Thru
6/30/20 FY21 FY22 FY23-26 Total City Capital 376,091 25,000 61,909 0 463,000 Grants/Other 470,187 0 9,813 0 480,000 Total 846,278 25,000 71,722 0 943,000
SOUTHWEST CORRIDOR BIKE PATH EXTENSION Project Mission Advance planning and design for a Go Boston 2030 priority project that would extend the Southwest Corridor, via
on-street bike facilities, to connect with major destinations in Downtown and Beacon Hill.
Managing Department, Transportation Department Status, In Design Location, Various neighborhoods Operating Impact, No
Authorizations
Source Existing FY22 Future Non Capital
Fund Total City Capital 0 0 0 0 0 Grants/Other 250,000 0 0 0 250,000 Total 250,000 0 0 0 250,000
Expenditures (Actual and Planned)
Source Thru
6/30/20 FY21 FY22 FY23-26 Total City Capital 0 0 0 0 0 Grants/Other 0 0 250,000 0 250,000 Total 0 0 250,000 0 250,000
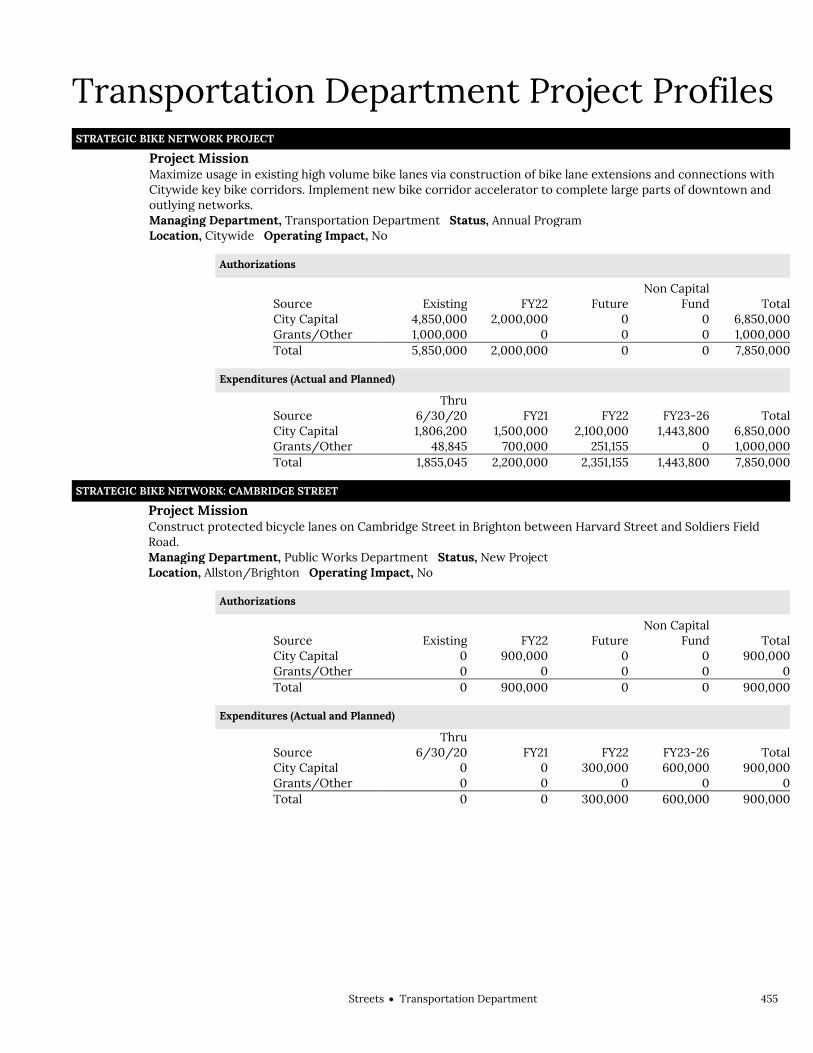
StreetsTransportation Department 455
Transportation Department Project Profiles STRATEGIC BIKE NETWORK PROJECT
Project Mission Maximize usage in existing high volume bike lanes via construction of bike lane extensions and connections with
Citywide key bike corridors. Implement new bike corridor accelerator to complete large parts of downtown and outlying networks.
Managing Department, Transportation Department Status, Annual Program Location, Citywide Operating Impact, No
Authorizations
Source Existing FY22 Future Non Capital
Fund Total City Capital 4,850,000 2,000,000 0 0 6,850,000 Grants/Other 1,000,000 0 0 0 1,000,000 Total 5,850,000 2,000,000 0 0 7,850,000
Expenditures (Actual and Planned)
Source Thru
6/30/20 FY21 FY22 FY23-26 Total City Capital 1,806,200 1,500,000 2,100,000 1,443,800 6,850,000 Grants/Other 48,845 700,000 251,155 0 1,000,000 Total 1,855,045 2,200,000 2,351,155 1,443,800 7,850,000
STRATEGIC BIKE NETWORK: CAMBRIDGE STREET Project Mission Construct protected bicycle lanes on Cambridge Street in Brighton between Harvard Street and Soldiers Field
Road.
Managing Department, Public Works Department Status, New Project Location, Allston/Brighton Operating Impact, No
Authorizations
Source Existing FY22 Future Non Capital
Fund Total City Capital 0 900,000 0 0 900,000 Grants/Other 0 0 0 0 0 Total 0 900,000 0 0 900,000
Expenditures (Actual and Planned)
Source Thru
6/30/20 FY21 FY22 FY23-26 Total City Capital 0 0 300,000 600,000 900,000 Grants/Other 0 0 0 0 0 Total 0 0 300,000 600,000 900,000

456 StreetsTransportation Department
Transportation Department Project Profiles STRATEGIC BIKE NETWORK: MASS. AVE. SOUTH OF MELNEA CASS BLVD.
Project Mission Reconfigure an existing pedestrian island Massachusetts Avenue between Melnea Cass and Theodore Glynn, and
create a bike lane from Columbia Road in Dorchester to Melnea Cass in Roxbury/South End.
Managing Department, Public Works Department Status, In Design Location, Dorchester Operating Impact, No
Authorizations
Source Existing FY22 Future Non Capital
Fund Total City Capital 500,000 1,900,000 0 0 2,400,000 Grants/Other 0 0 0 0 0 Total 500,000 1,900,000 0 0 2,400,000
Expenditures (Actual and Planned)
Source Thru
6/30/20 FY21 FY22 FY23-26 Total City Capital 0 50,000 250,000 2,100,000 2,400,000 Grants/Other 0 0 0 0 0 Total 0 50,000 250,000 2,100,000 2,400,000
TRAFFIC SIGNAL CONSTRUCTION AT 5 LOCATIONS Project Mission Design and construct safety improvements to various traffic signals throughout the City. Managing Department, Transportation Department Status, To Be Scheduled Location, Various neighborhoods Operating Impact, No
Authorizations
Source Existing FY22 Future Non Capital
Fund Total City Capital 1,500,000 900,000 0 0 2,400,000 Grants/Other 0 0 0 0 0 Total 1,500,000 900,000 0 0 2,400,000
Expenditures (Actual and Planned)
Source Thru
6/30/20 FY21 FY22 FY23-26 Total City Capital 0 0 50,000 2,350,000 2,400,000 Grants/Other 0 0 0 0 0 Total 0 0 50,000 2,350,000 2,400,000

StreetsTransportation Department 457
Transportation Department Project Profiles TRAFFIC SIGNALS
Project Mission Provide traffic signal design services, install or upgrade existing traffic signals and controls, install new control
boxes and battery backup equipment.
Managing Department, Transportation Department Status, Annual Program Location, Citywide Operating Impact, No
Authorizations
Source Existing FY22 Future Non Capital
Fund Total City Capital 12,500,000 0 8,500,000 0 21,000,000 Grants/Other 0 0 0 0 0 Total 12,500,000 0 8,500,000 0 21,000,000
Expenditures (Actual and Planned)
Source Thru
6/30/20 FY21 FY22 FY23-26 Total City Capital 4,802,711 1,500,000 3,000,000 11,697,289 21,000,000 Grants/Other 0 0 0 0 0 Total 4,802,711 1,500,000 3,000,000 11,697,289 21,000,000
TRANSPORTATION ACTION PLAN IMPLEMENTATION Project Mission Create conceptual designs for key projects identified from planning studies and action plans. Managing Department, Transportation Department Status, Annual Program Location, Various neighborhoods Operating Impact, No
Authorizations
Source Existing FY22 Future Non Capital
Fund Total City Capital 300,000 0 0 0 300,000 Grants/Other 0 0 0 0 0 Total 300,000 0 0 0 300,000
Expenditures (Actual and Planned)
Source Thru
6/30/20 FY21 FY22 FY23-26 Total City Capital 0 0 300,000 0 300,000 Grants/Other 0 0 0 0 0 Total 0 0 300,000 0 300,000
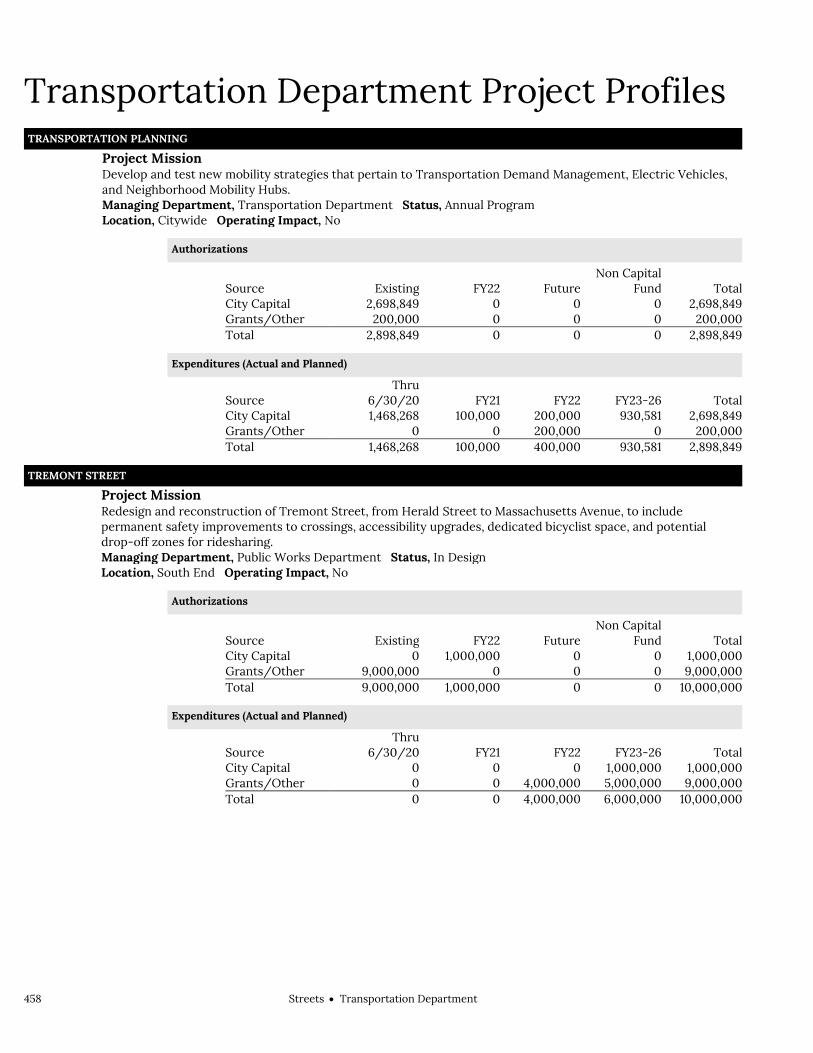
458 StreetsTransportation Department
Transportation Department Project Profiles TRANSPORTATION PLANNING
Project Mission Develop and test new mobility strategies that pertain to Transportation Demand Management, Electric Vehicles,
and Neighborhood Mobility Hubs.
Managing Department, Transportation Department Status, Annual Program Location, Citywide Operating Impact, No
Authorizations
Source Existing FY22 Future Non Capital
Fund Total City Capital 2,698,849 0 0 0 2,698,849 Grants/Other 200,000 0 0 0 200,000 Total 2,898,849 0 0 0 2,898,849
Expenditures (Actual and Planned)
Source Thru
6/30/20 FY21 FY22 FY23-26 Total City Capital 1,468,268 100,000 200,000 930,581 2,698,849 Grants/Other 0 0 200,000 0 200,000 Total 1,468,268 100,000 400,000 930,581 2,898,849
TREMONT STREET Project Mission Redesign and reconstruction of Tremont Street, from Herald Street to Massachusetts Avenue, to include
permanent safety improvements to crossings, accessibility upgrades, dedicated bicyclist space, and potential drop-off zones for ridesharing.
Managing Department, Public Works Department Status, In Design Location, South End Operating Impact, No
Authorizations
Source Existing FY22 Future Non Capital
Fund Total City Capital 0 1,000,000 0 0 1,000,000 Grants/Other 9,000,000 0 0 0 9,000,000 Total 9,000,000 1,000,000 0 0 10,000,000
Expenditures (Actual and Planned)
Source Thru
6/30/20 FY21 FY22 FY23-26 Total City Capital 0 0 0 1,000,000 1,000,000 Grants/Other 0 0 4,000,000 5,000,000 9,000,000 Total 0 0 4,000,000 6,000,000 10,000,000

StreetsTransportation Department 459
Transportation Department Project Profiles VISION ZERO
Project Mission Implement roadway design changes to reduce speeds, control movements, and improve the visibility of vulnerable
users.
Managing Department, Transportation Department Status, Annual Program Location, Various neighborhoods Operating Impact, No
Authorizations
Source Existing FY22 Future Non Capital
Fund Total City Capital 17,922,192 0 2,077,808 0 20,000,000 Grants/Other 2,000,000 2,000,000 0 0 4,000,000 Total 19,922,192 2,000,000 2,077,808 0 24,000,000
Expenditures (Actual and Planned)
Source Thru
6/30/20 FY21 FY22 FY23-26 Total City Capital 9,341,095 2,500,000 1,000,000 7,158,905 20,000,000 Grants/Other 0 0 3,000,000 1,000,000 4,000,000 Total 9,341,095 2,500,000 4,000,000 8,158,905 24,000,000
VISION ZERO: NEIGHBORHOOD SLOW STREETS Project Mission Design and construct Neighborhood Slow Street zones throughout the City. Managing Department, Transportation Department Status, Annual Program Location, Various neighborhoods Operating Impact, No
Authorizations
Source Existing FY22 Future Non Capital
Fund Total City Capital 0 0 0 0 0 Grants/Other 8,900,000 1,000,000 0 0 9,900,000 Total 8,900,000 1,000,000 0 0 9,900,000
Expenditures (Actual and Planned)
Source Thru
6/30/20 FY21 FY22 FY23-26 Total City Capital 0 0 0 0 0 Grants/Other 0 800,000 6,800,000 2,300,000 9,900,000 Total 0 800,000 6,800,000 2,300,000 9,900,000

460 StreetsTransportation Department
Transportation Department Project Profiles WARREN STREET AND BLUE HILL AVENUE
Project Mission Reconstruct Warren Street and Blue Hill Avenue from Nubian Square to Talbot Avenue to improve connections to
Grove Hall. State and federal construction funding anticipated.
Managing Department, Transportation Department Status, In Construction Location, Roxbury Operating Impact, No
Authorizations
Source Existing FY22 Future Non Capital
Fund Total City Capital 500,000 0 0 0 500,000 Grants/Other 666,074 0 0 2,377,900 3,043,974 Total 1,166,074 0 0 2,377,900 3,543,974
Expenditures (Actual and Planned)
Source Thru
6/30/20 FY21 FY22 FY23-26 Total City Capital 196,203 150,000 153,797 0 500,000 Grants/Other 631,827 34,247 0 0 666,074 Total 828,030 184,247 153,797 0 1,166,074

Non-Mayoral DepartmentsCabinet 461
Non-Mayoral Departments Non-Mayoral Departments Cabinet
Non-Mayoral Departments ............................................. 463
City Clerk ...................................................................... 465
Legislative Support ......................................... 470
Document Filing ............................................... 471
Archives ............................................................. 472
City Council .................................................................. 473
City Council Administration ......................... 478
Finance Commission ...................................... 479
City Councilors ................................................ 479
Legislative/Financial Support ..................... 480
Finance Commission ................................................... 481
Finance Commission ...................................... 485

462 Non-Mayoral DepartmentsCabinet

Non-Mayoral DepartmentsCabinet 463
Non-Mayoral Departments Non-Mayoral Departments
Cabinet Mission These departments are governed independently by appointed or elected officials, but are financed by the City: City Clerk (elected by the City Council); City Council (elected position); Finance Commission (appointed by Governor).
Operating Budget
Total Actual '19 Total Actual '20 Total Approp '21 Total Budget '22
City Clerk 1,233,659 1,311,943 1,392,267 1,404,053
City Council 5,442,471 5,508,131 5,736,400 5,736,400
Finance Commission 276,452 289,514 299,784 304,075
Total 6,952,582 7,109,588 7,428,451 7,444,528
External Funds Expenditures
Total Actual '19 Total Actual '20 Total Approp '21 Total Budget '22
City Clerk 0 4,245 0 0 City Council 27,862 50,000 0 0
Total 27,862 54,245 0 0


Non-Mayoral DepartmentsCity Clerk 465
City Clerk Operating Budget Non-Mayoral Departments City Clerk Maureen Feeney, City Clerk, Appropriation 161000
Department Mission The mission of the City Clerk's office is to accept, file, record, and maintain all municipal records. The City Clerk publishes the agenda for all City Council meetings, records all Council and related Mayoral actions, and edits and compiles the minutes of Council meetings. The Department also maintains the City Council document system database and publishes all ordinances and amended codes on a yearly basis. The City Clerk is also responsible for overseeing the work of the Archives Commission.
Selected Performance Goals Legislative Support
City Council meeting are created, updated, and published on the City of Boston website. To distribute copies of the Municipal Code and Annual Supplements. To Update the Ordinance section of the Municipal Code and distribute supplements. Document Filing
Scanning and indexing documents. Time used for processing documents. Document Filing
To receive and record statutory filings as required by law. Archives
To provide archives record center to City departments and the public; provide records disposition services to departments.
Operating Budget Program Name Total Actual '19 Total Actual '20 Total Approp '21 Total Budget '22
Legislative Support 300,989 508,174 410,287 420,486
Document Filing 489,146 342,528 498,840 494,917
Archives 443,524 461,241 483,140 488,650
Total 1,233,659 1,311,943 1,392,267 1,404,053
External Funds Budget Fund Name Total Actual '19 Total Actual '20 Total Approp '21 Total Budget '22
Preservation Assistance Grant 0 4,245 0 0
Total 0 4,245 0 0
Operating Budget Actual '19 Actual '20 Approp '21 Budget '22
Personnel Services 1,129,957 1,207,264 1,268,627 1,283,897 Non Personnel 103,702 104,679 123,640 120,156 Total 1,233,659 1,311,943 1,392,267 1,404,053
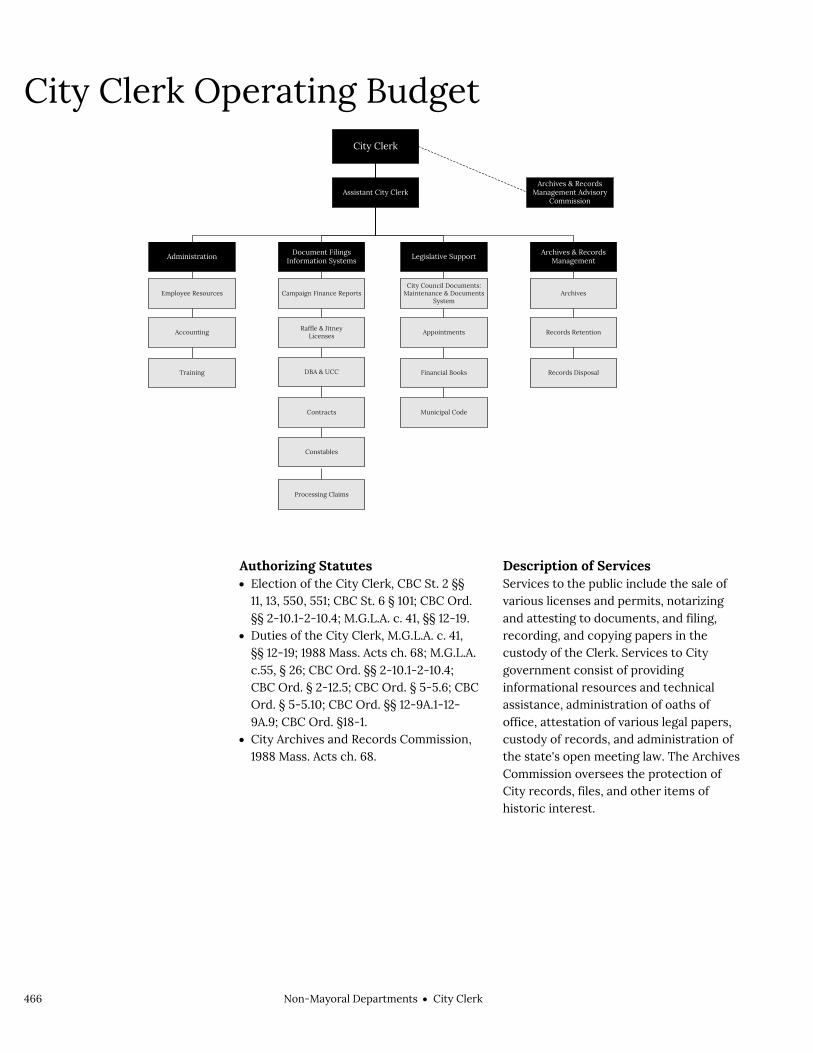
466 Non-Mayoral DepartmentsCity Clerk
City Clerk Operating Budget
Authorizing Statutes Election of the City Clerk, CBC St. 2 §§
11, 13, 550, 551; CBC St. 6 § 101; CBC Ord. §§ 2-10.1-2-10.4; M.G.L.A. c. 41, §§ 12-19.
Duties of the City Clerk, M.G.L.A. c. 41, §§ 12-19; 1988 Mass. Acts ch. 68; M.G.L.A. c.55, § 26; CBC Ord. §§ 2-10.1-2-10.4; CBC Ord. § 2-12.5; CBC Ord. § 5-5.6; CBC Ord. § 5-5.10; CBC Ord. §§ 12-9A.1-12-9A.9; CBC Ord. §18-1.
City Archives and Records Commission, 1988 Mass. Acts ch. 68.
Description of Services Services to the public include the sale of various licenses and permits, notarizing and attesting to documents, and filing, recording, and copying papers in the custody of the Clerk. Services to City government consist of providing informational resources and technical assistance, administration of oaths of office, attestation of various legal papers, custody of records, and administration of the state's open meeting law. The Archives Commission oversees the protection of City records, files, and other items of historic interest.
City Clerk
Administration
Employee Resources
Accounting
Training
Document Filings Information Systems
Campaign Finance Reports
Raffle & Jitney Licenses
DBA & UCC
Contracts
Constables
Legislative Support
City Council Documents: Maintenance & Documents
System
Appointments
Financial Books
Municipal Code
Archives & Records Management Advisory
Commission
Archives & Records Management
Archives
Records Retention
Records Disposal
Processing Claims
Assistant City Clerk

Non-Mayoral DepartmentsCity Clerk 467
Department History Personnel Services FY19 Expenditure FY20 Expenditure FY21 Appropriation FY22 Recommended Inc/Dec 21 vs 22
51000 Permanent Employees 1,106,168 1,185,905 1,248,283 1,263,553 15,270 51100 Emergency Employees 0 0 0 0 0 51200 Overtime 23,789 21,359 20,344 20,344 0 51600 Unemployment Compensation 0 0 0 0 0 51700 Workers' Compensation 0 0 0 0 0 Total Personnel Services 1,129,957 1,207,264 1,268,627 1,283,897 15,270
Contractual Services FY19 Expenditure FY20 Expenditure FY21 Appropriation FY22 Recommended Inc/Dec 21 vs 22
52100 Communications 4,013 5,654 6,500 6,500 0 52200 Utilities 0 0 0 0 0 52400 Snow Removal 0 0 0 0 0 52500 Garbage/Waste Removal 0 0 0 0 0 52600 Repairs Buildings & Structures 0 0 0 0 0 52700 Repairs & Service of Equipment 4,391 2,997 4,500 3,500 -1,000 52800 Transportation of Persons 5,779 5,999 7,299 7,299 0 52900 Contracted Services 64,258 56,559 77,231 77,231 0 Total Contractual Services 78,441 71,209 95,530 94,530 -1,000
Supplies & Materials FY19 Expenditure FY20 Expenditure FY21 Appropriation FY22 Recommended Inc/Dec 21 vs 22
53000 Auto Energy Supplies 0 0 0 0 0 53200 Food Supplies 0 0 0 0 0 53400 Custodial Supplies 0 0 0 0 0 53500 Med, Dental, & Hosp Supply 0 0 0 0 0 53600 Office Supplies and Materials 18,350 21,256 18,747 18,747 0 53700 Clothing Allowance 1,000 250 1,000 750 -250 53800 Educational Supplies & Mat 0 0 0 0 0 53900 Misc Supplies & Materials 0 0 0 0 0 Total Supplies & Materials 19,350 21,506 19,747 19,497 -250
Current Chgs & Oblig FY19 Expenditure FY20 Expenditure FY21 Appropriation FY22 Recommended Inc/Dec 21 vs 22
54300 Workers' Comp Medical 0 0 0 0 0 54400 Legal Liabilities 0 0 0 0 0 54500 Aid To Veterans 0 0 0 0 0 54600 Current Charges H&I 0 0 0 0 0 54700 Indemnification 0 0 0 0 0 54800 Reserve Account 0 0 0 0 0 54900 Other Current Charges 2,934 3,570 8,363 6,129 -2,234 Total Current Chgs & Oblig 2,934 3,570 8,363 6,129 -2,234
Equipment FY19 Expenditure FY20 Expenditure FY21 Appropriation FY22 Recommended Inc/Dec 21 vs 22
55000 Automotive Equipment 0 0 0 0 0 55400 Lease/Purchase 0 0 0 0 0 55600 Office Furniture & Equipment 412 4,812 0 0 0 55900 Misc Equipment 2,565 3,582 0 0 0 Total Equipment 2,977 8,394 0 0 0
Other FY19 Expenditure FY20 Expenditure FY21 Appropriation FY22 Recommended Inc/Dec 21 vs 22
56200 Special Appropriation 0 0 0 0 0 57200 Structures & Improvements 0 0 0 0 0 58000 Land & Non-Structure 0 0 0 0 0 Total Other 0 0 0 0 0
Grand Total 1,233,659 1,311,943 1,392,267 1,404,053 11,786
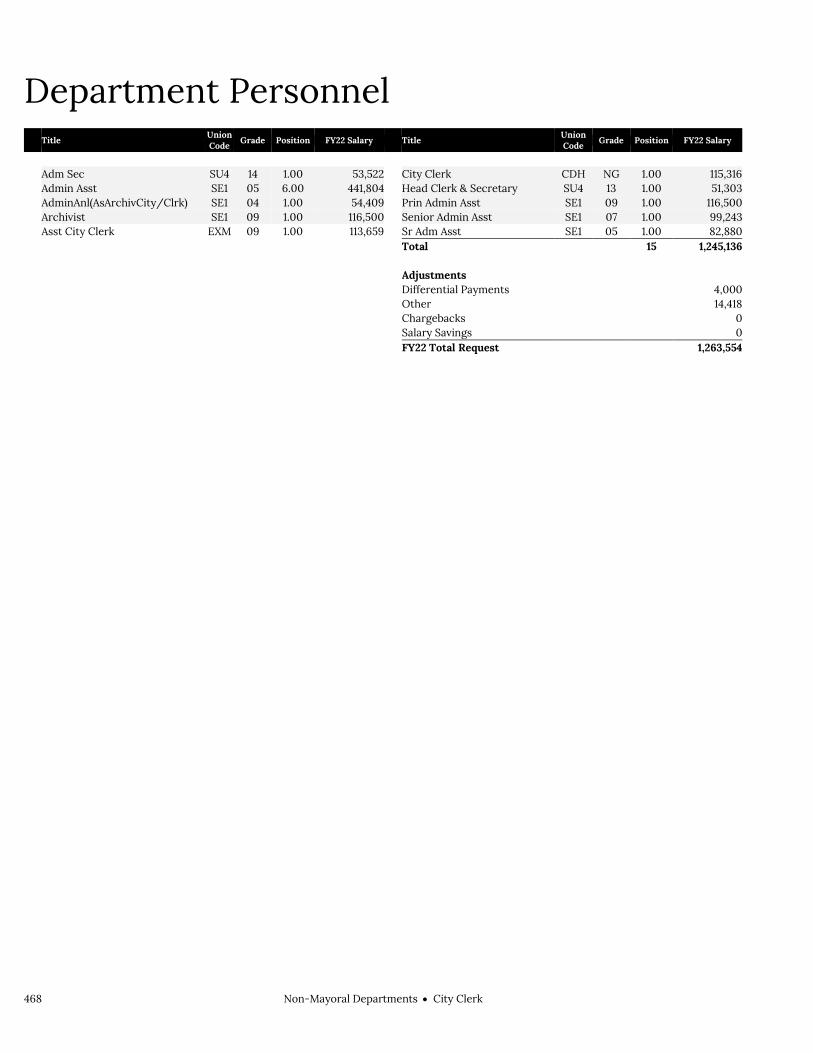
468 Non-Mayoral DepartmentsCity Clerk
Department Personnel
Title Union Code Grade Position FY22 Salary Title
Union Code Grade Position FY22 Salary
Adm Sec SU4 14 1.00 53,522 City Clerk CDH NG 1.00 115,316 Admin Asst SE1 05 6.00 441,804 Head Clerk & Secretary SU4 13 1.00 51,303 AdminAnl(AsArchivCity/Clrk) SE1 04 1.00 54,409 Prin Admin Asst SE1 09 1.00 116,500 Archivist SE1 09 1.00 116,500 Senior Admin Asst SE1 07 1.00 99,243 Asst City Clerk EXM 09 1.00 113,659 Sr Adm Asst SE1 05 1.00 82,880 Total 15 1,245,136 Adjustments Differential Payments 4,000 Other 14,418 Chargebacks 0 Salary Savings 0 FY22 Total Request 1,263,554

Non-Mayoral DepartmentsCity Clerk 469
External Funds History Personnel Services FY19 Expenditure FY20 Expenditure FY21 Appropriation FY22 Recommended Inc/Dec 21 vs 22
51000 Permanent Employees 0 0 0 0 0 51100 Emergency Employees 0 0 0 0 0 51200 Overtime 0 0 0 0 0 51300 Part Time Employees 0 0 0 0 0 51400 Health Insurance 0 0 0 0 0 51500 Pension & Annuity 0 0 0 0 0 51600 Unemployment Compensation 0 0 0 0 0 51700 Workers' Compensation 0 0 0 0 0 51800 Indirect Costs 0 0 0 0 0 51900 Medicare 0 0 0 0 0 Total Personnel Services 0 0 0 0 0
Contractual Services FY19 Expenditure FY20 Expenditure FY21 Appropriation FY22 Recommended Inc/Dec 21 vs 22
52100 Communications 0 0 0 0 0 52200 Utilities 0 0 0 0 0 52400 Snow Removal 0 0 0 0 0 52500 Garbage/Waste Removal 0 0 0 0 0 52600 Repairs Buildings & Structures 0 0 0 0 0 52700 Repairs & Service of Equipment 0 0 0 0 0 52800 Transportation of Persons 0 0 0 0 0 52900 Contracted Services 0 0 0 0 0 Total Contractual Services 0 0 0 0 0
Supplies & Materials FY19 Expenditure FY20 Expenditure FY21 Appropriation FY22 Recommended Inc/Dec 21 vs 22
53000 Auto Energy Supplies 0 0 0 0 0 53200 Food Supplies 0 0 0 0 0 53400 Custodial Supplies 0 0 0 0 0 53500 Med, Dental, & Hosp Supply 0 0 0 0 0 53600 Office Supplies and Materials 0 4,245 0 0 0 53700 Clothing Allowance 0 0 0 0 0 53800 Educational Supplies & Mat 0 0 0 0 0 53900 Misc Supplies & Materials 0 0 0 0 0 Total Supplies & Materials 0 4,245 0 0 0
Current Chgs & Oblig FY19 Expenditure FY20 Expenditure FY21 Appropriation FY22 Recommended Inc/Dec 21 vs 22
54300 Workers' Comp Medical 0 0 0 0 0 54400 Legal Liabilities 0 0 0 0 0 54600 Current Charges H&I 0 0 0 0 0 54700 Indemnification 0 0 0 0 0 54800 Reserve Account 0 0 0 0 0 54900 Other Current Charges 0 0 0 0 0 Total Current Chgs & Oblig 0 0 0 0 0
Equipment FY19 Expenditure FY20 Expenditure FY21 Appropriation FY22 Recommended Inc/Dec 21 vs 22
55000 Automotive Equipment 0 0 0 0 0 55400 Lease/Purchase 0 0 0 0 0 55600 Office Furniture & Equipment 0 0 0 0 0 55900 Misc Equipment 0 0 0 0 0 Total Equipment 0 0 0 0 0
Other FY19 Expenditure FY20 Expenditure FY21 Appropriation FY22 Recommended Inc/Dec 21 vs 22
56200 Special Appropriation 0 0 0 0 0 57200 Structures & Improvements 0 0 0 0 0 58000 Land & Non-Structure 0 0 0 0 0 Total Other 0 0 0 0 0
Grand Total 0 4,245 0 0 0

470 Non-Mayoral DepartmentsCity Clerk
Program 1. Legislative Support Maureen Feeney, Manager, Organization 161100
Program Description The Legislative Support Program carries out government functions required by state and local law and manages and maintains the City Council document system database. The program also administers oaths of office and maintains records relative to the appointment or election of City officers. The program maintains and updates the City of Boston Code, advises City officials on the Commonwealth's open meeting law, and maintains copies of City of Boston official reports.
Operating Budget Actual '19 Actual '20 Approp '21 Budget '22
Personnel Services 276,957 481,027 380,274 389,722 Non Personnel 24,032 27,147 30,013 30,764 Total 300,989 508,174 410,287 420,486
Performance
Goal: City Council meeting are created, updated, and published on the City of Boston website
Performance Measures Actual '19 Actual '20 Projected '21 Target '22
Records Digitized - Legislative Support 1,772 1,927 2,000 2,200
Goal: To distribute copies of the Municipal Code and Annual Supplements
Performance Measures Actual '19 Actual '20 Projected '21 Target '22
Codes and Supplements distributed 190 177 180 180
Goal: To receive, prepare, record and distribute financial and legislative documents
Performance Measures Actual '19 Actual '20 Projected '21 Target '22
Processing Hours - Legislative Support 2,200 1,856 1,100 1,500
Goal: To Update the Ordinance section of the Municipal Code and distribute supplements
Performance Measures Actual '19 Actual '20 Projected '21 Target '22
Annual Code Supplement and CD produced in April 1 1 1 1

Non-Mayoral DepartmentsCity Clerk 471
Program 2. Document Filing Maureen Feeney, Manager, Organization 161200
Program Description The City Clerk is the supervisor of records and the filing agency for the City. The Office of the City Clerk is required to record, file, and maintain indices of public documents.
Operating Budget Actual '19 Actual '20 Approp '21 Budget '22
Personnel Services 477,493 324,444 481,092 480,404 Non Personnel 11,653 18,084 17,748 14,513 Total 489,146 342,528 498,840 494,917
Performance
Goal: Scanning and indexing documents
Performance Measures Actual '19 Actual '20 Projected '21 Target '22
Records Digitized 6,000 5,737 12,000 13,000
Goal: Time used for processing documents
Performance Measures Actual '19 Actual '20 Projected '21 Target '22
Processing Hours - Document Filing 2,500 2,987 2,800 2,900
Goal: To receive and record statutory filings as required by law
Performance Measures Actual '19 Actual '20 Projected '21 Target '22
Business Certificate Received & Processed, Physican Certificate Received & Processed, & Claims
8,000 6,918 10,000 11,000
Other Statutory Document Filing & Public Hearing Notices 2,721 1,831 1,600 1,700
Statement of Financial Interest & University Accountability Report 80 71 70 70

472 Non-Mayoral DepartmentsCity Clerk
Program 3. Archives Maureen Feeney, Manager, Organization 161300
Program Description The Archives oversees the preservation of significant records and facilitates improved and cost-effective access to public records by Boston municipal government and its citizens. It also oversees the elimination of obsolete records.
Operating Budget Actual '19 Actual '20 Approp '21 Budget '22
Personnel Services 375,507 401,793 407,261 413,771 Non Personnel 68,017 59,448 75,879 74,879 Total 443,524 461,241 483,140 488,650
Performance
Goal: To provide archives record center to City departments and the public; provide records disposition services to departments
Performance Measures Actual '19 Actual '20 Projected '21 Target '22
Administrative and Constituent Consultation 2,059 2,324 1,300 1,400
Destruction Approvals (Cu. Ft.) 1,003 340 5,000 5,000
Processing Hours - Archives 2,200 1,301 2,000 2,100
Records Digitized Images 2,059 2,505 1,200 1,300
Records Transfers to Archives & Offsite Storage MB 2,792 1,491,008 150,000 150,000

Non-Mayoral DepartmentsCity Council 473
City Council Operating Budget Non-Mayoral Departments City Council Matthew O’Malley, Acting Council President, Appropriation 112000
Department Mission As the Legislative body of the City, the City Council serves as a link between the citizens of Boston and their municipal government. Through the filing of legislation, the enactment of orders, ordinances and resolutions, the Council actively represents the diverse interests of Bostonians while ensuring the efficient and cost effective delivery of services. The Council fulfills its obligation as the appropriating authority by analyzing appropriations and loan orders.
Selected Performance Goals City Councilors
To ensure the sustainable and efficient delivery of city services for Boston residents. To review, create and/or strengthen policies and laws that address the current and future
needs of Boston residents, businesses and organizations.
Operating Budget Program Name Total Actual '19 Total Actual '20 Total Approp '21 Total Budget '22
City Council Administration 383,899 326,790 481,145 481,145
City Councilors 4,495,360 4,613,843 4,677,795 4,721,415
Legislative/Financial Support 563,212 567,498 577,460 533,840
Total 5,442,471 5,508,131 5,736,400 5,736,400
External Funds Budget Fund Name Total Actual '19 Total Actual '20 Total Approp '21 Total Budget '22
Racial Equality Training 27,862 50,000 0 0
Total 27,862 50,000 0 0
Operating Budget Actual '19 Actual '20 Approp '21 Budget '22
Personnel Services 5,254,376 5,309,830 5,420,000 5,420,000 Non Personnel 188,095 198,301 316,400 316,400 Total 5,442,471 5,508,131 5,736,400 5,736,400

474 Non-Mayoral DepartmentsCity Council
City Council Operating Budget
Authorizing Statutes Structure of City Council, 1948 Mass.
Acts ch. 452, as amended. District Representation, 1982 Mass. Acts
ch. 605; 1991 Mass. Acts ch. 108; 1986 Mass. Acts ch. 343.
Description of Services Members draft and file legislation on a wide range of public affairs in Boston designed to improve the quality of life for its citizens. Each year the Council conducts an extensive series of public hearings to review the Mayor's appropriation request for the subsequent fiscal year. After a thorough analysis and determination that the request is fiscally sound, the Council approves an appropriation. Constituent needs are served as directed by each individual councilor.
President
Administration
Accounts Maintenance
Supplies Inventory Maintenance
Reception Services
Support Services
Legislative/Financial
Research & Analysis
Legislative Drafting
Meetings & Hearings Coordination
Reference Library
City Councillors' Services
Constituent Services
Legislation
Appropriating Authority
City Services Oversight
City Council
Staff Director

Non-Mayoral DepartmentsCity Council 475
Department History Personnel Services FY19 Expenditure FY20 Expenditure FY21 Appropriation FY22 Recommended Inc/Dec 21 vs 22
51000 Permanent Employees 5,201,111 5,293,088 5,300,000 5,300,000 0 51100 Emergency Employees 0 0 0 0 0 51200 Overtime 0 0 0 0 0 51600 Unemployment Compensation 35,260 16,742 90,000 90,000 0 51700 Workers' Compensation 18,005 0 30,000 30,000 0 Total Personnel Services 5,254,376 5,309,830 5,420,000 5,420,000 0
Contractual Services FY19 Expenditure FY20 Expenditure FY21 Appropriation FY22 Recommended Inc/Dec 21 vs 22
52100 Communications 12,742 13,355 20,000 20,000 0 52200 Utilities 0 0 0 0 0 52400 Snow Removal 0 0 0 0 0 52500 Garbage/Waste Removal 0 0 0 0 0 52600 Repairs Buildings & Structures 0 0 0 0 0 52700 Repairs & Service of Equipment 8,971 2,694 7,600 7,600 0 52800 Transportation of Persons 0 -525 0 0 0 52900 Contracted Services 115,130 119,994 181,000 181,000 0 Total Contractual Services 136,844 135,289 207,100 179,500 0
Supplies & Materials FY19 Expenditure FY20 Expenditure FY21 Appropriation FY22 Recommended Inc/Dec 21 vs 22
53000 Auto Energy Supplies 0 0 0 0 0 53200 Food Supplies 8,220 8,594 8,000 8,000 0 53400 Custodial Supplies 0 0 0 0 0 53500 Med, Dental, & Hosp Supply 0 0 0 0 0 53600 Office Supplies and Materials 10,375 9,301 31,500 31,500 0 53700 Clothing Allowance 0 0 0 0 0 53800 Educational Supplies & Mat 0 0 0 0 0 53900 Misc Supplies & Materials 0 0 0 0 0 Total Supplies & Materials 18,595 17,895 39,500 39,500 0
Current Chgs & Oblig FY19 Expenditure FY20 Expenditure FY21 Appropriation FY22 Recommended Inc/Dec 21 vs 22
54300 Workers' Comp Medical 0 0 10,000 10,000 0 54400 Legal Liabilities 0 0 0 0 0 54500 Aid To Veterans 0 0 0 0 0 54600 Current Charges H&I 0 0 0 0 0 54700 Indemnification 0 0 0 0 0 54800 Reserve Account 0 0 0 0 0 54900 Other Current Charges 17,190 15,493 29,300 29,300 0 Total Current Chgs & Oblig 17,190 15,493 39,300 39,300 0
Equipment FY19 Expenditure FY20 Expenditure FY21 Appropriation FY22 Recommended Inc/Dec 21 vs 22
55000 Automotive Equipment 0 0 0 0 0 55400 Lease/Purchase 0 0 0 0 0 55600 Office Furniture & Equipment 952 3,745 8,000 8,000 0 55900 Misc Equipment 14,515 25,879 22,500 22,500 0 Total Equipment 15,467 29,624 30,500 30,500 0
Other FY19 Expenditure FY20 Expenditure FY21 Appropriation FY22 Recommended Inc/Dec 21 vs 22
56200 Special Appropriation 0 0 0 0 0 57200 Structures & Improvements 0 0 0 0 0 58000 Land & Non-Structure 0 0 0 0 0 Total Other 0 0 0 0 0
Grand Total 5,442,471 5,508,131 5,736,400 5,736,400 0
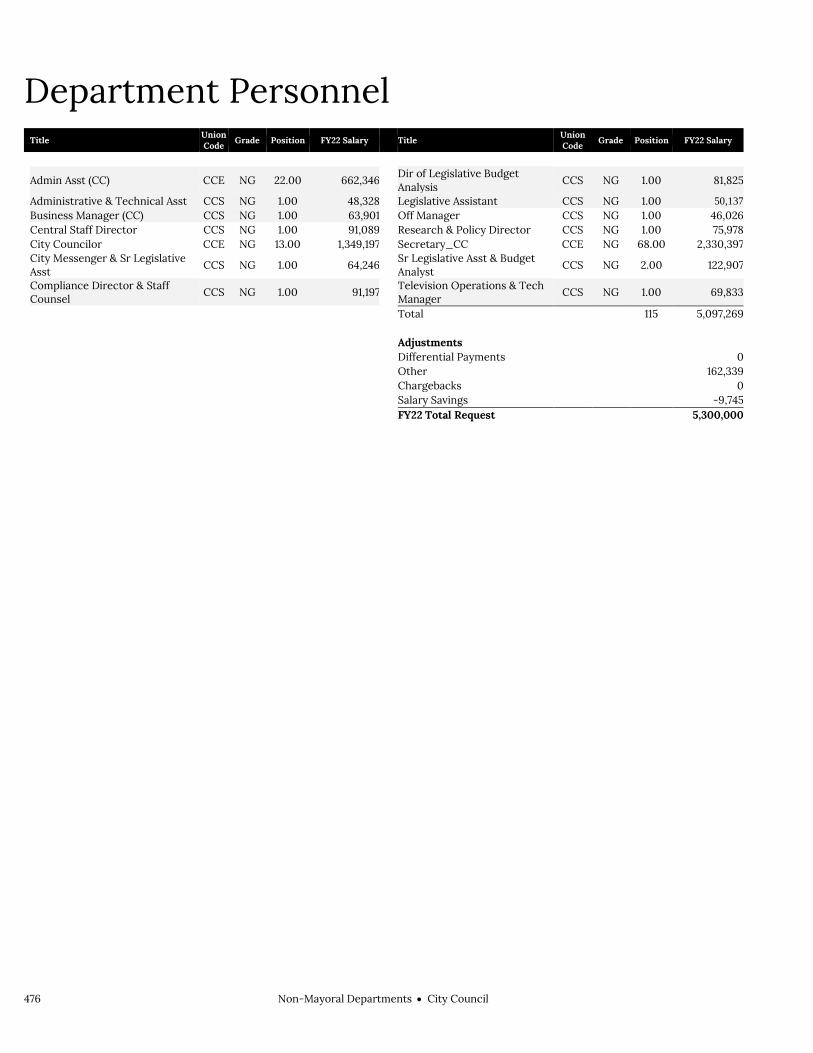
476 Non-Mayoral DepartmentsCity Council
Department Personnel
Title Union Code Grade Position FY22 Salary Title
Union Code Grade Position FY22 Salary
Admin Asst (CC) CCE NG 22.00 662,346 Dir of Legislative Budget Analysis
CCS NG 1.00 81,825
Administrative & Technical Asst CCS NG 1.00 48,328 Legislative Assistant CCS NG 1.00 50,137 Business Manager (CC) CCS NG 1.00 63,901 Off Manager CCS NG 1.00 46,026 Central Staff Director CCS NG 1.00 91,089 Research & Policy Director CCS NG 1.00 75,978
City Councilor CCE NG 13.00 1,349,197 Secretary_CC CCE NG 68.00 2,330,397
City Messenger & Sr Legislative Asst CCS NG 1.00 64,246
Sr Legislative Asst & Budget Analyst CCS NG 2.00 122,907
Compliance Director & Staff Counsel
CCS NG 1.00 91,197 Television Operations & Tech Manager
CCS NG 1.00 69,833
Total 115 5,097,269 Adjustments Differential Payments 0 Other 162,339 Chargebacks 0 Salary Savings -9,745 FY22 Total Request 5,300,000

Non-Mayoral DepartmentsCity Council 477
External Funds History Personnel Services FY19 Expenditure FY20 Expenditure FY21 Appropriation FY22 Recommended Inc/Dec 21 vs 22
51000 Permanent Employees 0 0 0 0 0 51100 Emergency Employees 0 0 0 0 0 51200 Overtime 0 0 0 0 0 51300 Part Time Employees 0 0 0 0 0 51400 Health Insurance 0 0 0 0 0 51500 Pension & Annuity 0 0 0 0 0 51600 Unemployment Compensation 0 0 0 0 0 51700 Workers' Compensation 0 0 0 0 0 51800 Indirect Costs 0 0 0 0 0 51900 Medicare 0 0 0 0 0 Total Personnel Services 0 0 0 0 0
Contractual Services FY19 Expenditure FY20 Expenditure FY21 Appropriation FY22 Recommended Inc/Dec 21 vs 22
52100 Communications 0 0 0 0 0 52200 Utilities 0 0 0 0 0 52400 Snow Removal 0 0 0 0 0 52500 Garbage/Waste Removal 0 0 0 0 0 52600 Repairs Buildings & Structures 0 0 0 0 0 52700 Repairs & Service of Equipment 0 0 0 0 0 52800 Transportation of Persons 0 0 0 0 0 52900 Contracted Services 26,637 50,000 0 0 0 Total Contractual Services 26,637 50,000 0 0 0
Supplies & Materials FY19 Expenditure FY20 Expenditure FY21 Appropriation FY22 Recommended Inc/Dec 21 vs 22
53000 Auto Energy Supplies 0 0 0 0 0 53200 Food Supplies 1,225 0 0 0 0 53400 Custodial Supplies 0 0 0 0 0 53500 Med, Dental, & Hosp Supply 0 0 0 0 0 53600 Office Supplies and Materials 0 0 0 0 0 53700 Clothing Allowance 0 0 0 0 0 53800 Educational Supplies & Mat 0 0 0 0 0 53900 Misc Supplies & Materials 0 0 0 0 0 Total Supplies & Materials 1,225 0 0 0 0
Current Chgs & Oblig FY19 Expenditure FY20 Expenditure FY21 Appropriation FY22 Recommended Inc/Dec 21 vs 22
54300 Workers' Comp Medical 0 0 0 0 0 54400 Legal Liabilities 0 0 0 0 0 54600 Current Charges H&I 0 0 0 0 0 54700 Indemnification 0 0 0 0 0 54800 Reserve Account 0 0 0 0 0 54900 Other Current Charges 0 0 0 0 0 Total Current Chgs & Oblig 0 0 0 0 0
Equipment FY19 Expenditure FY20 Expenditure FY21 Appropriation FY22 Recommended Inc/Dec 21 vs 22
55000 Automotive Equipment 0 0 0 0 0 55400 Lease/Purchase 0 0 0 0 0 55600 Office Furniture & Equipment 0 0 0 0 0 55900 Misc Equipment 0 0 0 0 0 Total Equipment 0 0 0 0 0
Other FY19 Expenditure FY20 Expenditure FY21 Appropriation FY22 Recommended Inc/Dec 21 vs 22
56200 Special Appropriation 0 0 0 0 0 57200 Structures & Improvements 0 0 0 0 0 58000 Land & Non-Structure 0 0 0 0 0 Total Other 0 0 0 0 0
Grand Total 27,862 50,000 0 0 0

478 Non-Mayoral DepartmentsCity Council
Program 1. Administration Yuleidy Valdez, Manager, Organization 112100
Program Description The Administration Program is responsible for providing staff resources and administrative direction to City Council programs. It also oversees budgeting, purchasing, information systems, and personnel matters for the City Council.
Operating Budget Actual '19 Actual '20 Approp '21 Budget '22
Personnel Services 281,149 280,657 371,045 371,045 Non Personnel 102,750 46,133 110,100 110,100 Total 383,899 326,790 481,145 481,145

Non-Mayoral DepartmentsCity Council 479
Program2. City Councilors Mathew O’Malley, Manager, Organization 112200
Program Description The City Councilors program provides a liaison between Bostonians and their municipal government, and advocates on behalf of constituent needs at the city department, state, and federal levels. The program also translates appropriate citizen concerns into Council legislation.
Operating Budget Actual '19 Actual '20 Approp '21 Budget '22
Personnel Services 4,436,632 4,477,620 4,505,695 4,549,315 Non Personnel 58,728 136,223 172,100 172,100 Total 4,495,360 4,613,843 4,677,795 4,721,415
Performance
Goal: To ensure the sustainable and efficient delivery of city services for Boston residents
Performance Measures Actual '19 Actual '20 Projected '21 Target '22
Administrative Matters 419 399 420 360
Appropriations & Loan Orders 61 43 64 34
Grants 103 111 110 69
Goal: To maximize opportunities for citizen input into the Council's legislative process
Performance Measures Actual '19 Actual '20 Projected '21 Target '22
Legislative matters receiving public hearing 185 204 190 182
Orders for Hearings 112 113 120 162
Public hearings held 133 146 120 145
Goal: To review, create and/or strengthen policies and laws that address the current and future needs of Boston residents, businesses and organizations
Performance Measures Actual '19 Actual '20 Projected '21 Target '22
Council working sessions and meetings 16 20 15 28
Home Rule Petitions 9 8 10 8
Hours of Council meetings, hearings and working sessions 308 338 300 300
Legislative Resolutions 45 67 45 62
Ordinances 8 8 13 13
Regular Council sessions 35 35 35 34

480 Non-Mayoral DepartmentsCity Council
Program 3. Legislative/Financial Support Yuleidy Valdez, Manager, Organization 112300
Program Description The mission of the Legislative/Financial Support Program is to provide research and draft legislation to be filed by City Councilors and provide analysis of legislation introduced by the Mayor. The program also provides a comprehensive analysis of the operating and capital budgets. The program maintains the Council's municipal reference library, furnishing City departments and the general public with information on municipal government.
Operating Budget Actual '19 Actual '20 Approp '21 Budget '22
Personnel Services 536,595 551,553 543,260 499,640 Non Personnel 26,617 15,945 34,200 34,200 Total 563,212 567,498 577,460 533,840
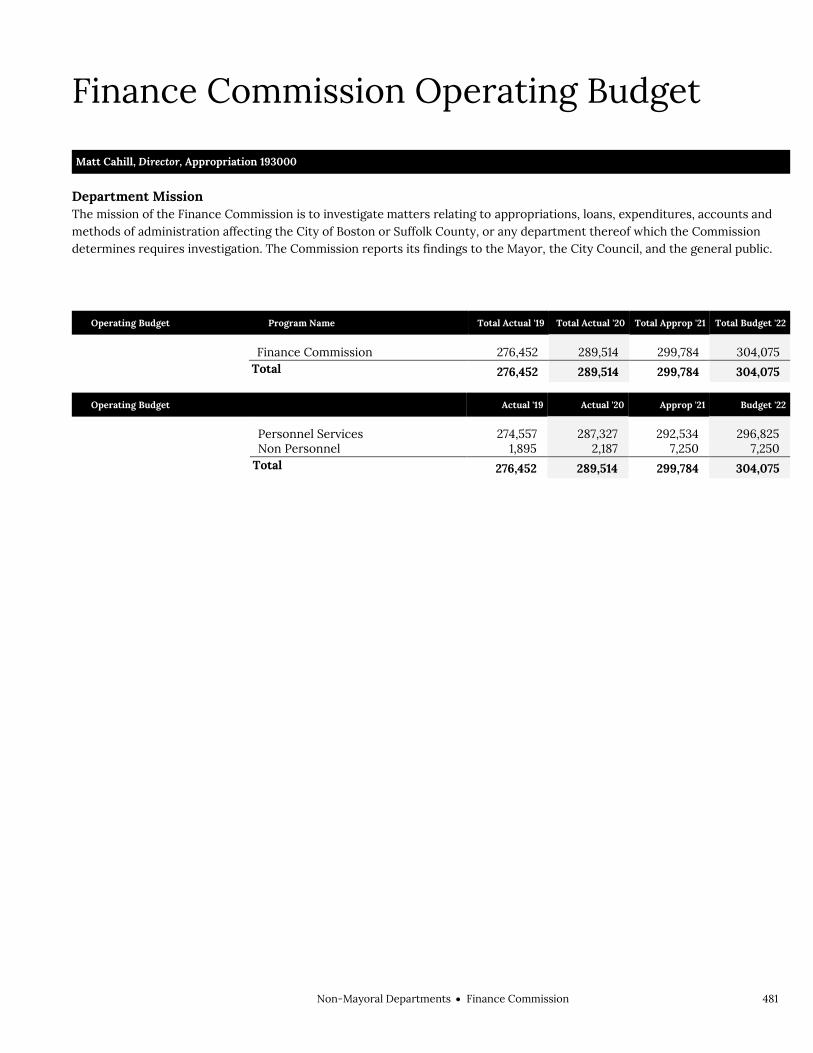
Non-Mayoral DepartmentsFinance Commission 481
Finance Commission Operating Budget Non-Mayoral Departments Finance Commission Matt Cahill, Director, Appropriation 193000
Department Mission The mission of the Finance Commission is to investigate matters relating to appropriations, loans, expenditures, accounts and methods of administration affecting the City of Boston or Suffolk County, or any department thereof which the Commission determines requires investigation. The Commission reports its findings to the Mayor, the City Council, and the general public.
Operating Budget Program Name Total Actual '19 Total Actual '20 Total Approp '21 Total Budget '22
Finance Commission 276,452 289,514 299,784 304,075
Total 276,452 289,514 299,784 304,075
Operating Budget Actual '19 Actual '20 Approp '21 Budget '22
Personnel Services 274,557 287,327 292,534 296,825 Non Personnel 1,895 2,187 7,250 7,250 Total 276,452 289,514 299,784 304,075

482 Non-Mayoral DepartmentsFinance Commission
Finance Commission Operating Budget
Authorizing Statutes Finance Commission, 1908 Mass. Acts
ch. 562; 1909 Mass. Acts ch. 486, § 17. Duties, 1909 Mass. Acts ch. 486, § 18-19;
1948 Mass. Acts ch. 261. Referrals to Finance Commission by the
Mayor, Auditor, or Collector-Treasurer, 1909 Mass. Acts ch. 486, § 18-19; 1948 Mass. Acts ch. 452, §§ 49-50.
Expenses, 1965 Mass. Acts ch. 894. Powers, Penalties, Perjury, Depositions,
Protection Against Self-Incrimination, 1909 Mass. Acts ch. 486, §§ 20-21, as amended.
Off-Street Parking Facilities, Eminent Domain, 1946 Mass. Acts ch. 474, § 1a, as amended.
Description of Services The Finance Commission conducts investigations into all matters it deems appropriate. The Commission hires independent staff who conduct many of the investigations, with the Commission publishing and presenting all final reports. The Finance Commission also reviews, and if necessary investigates, all contracts referred to it and reports its findings and recommendations to the Mayor.
Finance Commission
Executive Director
Research & Analysis
Contract ReviewInvestigations

Non-Mayoral DepartmentsFinance Commission 483
Department History Personnel Services FY19 Expenditure FY20 Expenditure FY21 Appropriation FY22 Recommended Inc/Dec 21 vs 22
51000 Permanent Employees 274,557 287,327 292,534 292,534 4,291 51100 Emergency Employees 0 0 0 0 0 51200 Overtime 0 0 0 0 0 51600 Unemployment Compensation 0 0 0 0 0 51700 Workers' Compensation 0 0 0 0 0 Total Personnel Services 274,557 287,327 292,534 292,534 4,291
Contractual Services FY19 Expenditure FY20 Expenditure FY21 Appropriation FY22 Recommended Inc/Dec 21 vs 22
52100 Communications 1,327 1,582 2,000 2,000 0 52400 Snow Removal 0 0 0 0 0 52500 Garbage/Waste Removal 0 0 0 0 0 52600 Repairs Buildings & Structures 0 0 0 0 0 52700 Repairs & Service of Equipment 0 0 250 250 0 52800 Transportation of Persons 302 279 600 600 0 52900 Contracted Services 0 228 1,500 1,500 0 Total Contractual Services 1,629 2,088 4,350 4,350 0
Supplies & Materials FY19 Expenditure FY20 Expenditure FY21 Appropriation FY22 Recommended Inc/Dec 21 vs 22
53000 Auto Energy Supplies 0 0 0 0 0 53200 Food Supplies 0 0 0 0 0 53400 Custodial Supplies 0 0 0 0 0 53500 Med, Dental, & Hosp Supply 0 0 0 0 0 53600 Office Supplies and Materials 150 63 525 525 0 53700 Clothing Allowance 0 0 0 0 0 53800 Educational Supplies & Mat 0 0 0 0 0 53900 Misc Supplies & Materials 0 0 0 0 0 Total Supplies & Materials 150 63 525 525 0
Current Chgs & Oblig FY19 Expenditure FY20 Expenditure FY21 Appropriation FY22 Recommended Inc/Dec 21 vs 22
54300 Workers' Comp Medical 0 0 0 0 0 54400 Legal Liabilities 0 0 0 0 0 54500 Aid To Veterans 0 0 0 0 0 54600 Current Charges H&I 0 0 0 0 0 54700 Indemnification 0 0 0 0 0 54800 Reserve Account 0 0 0 0 0 54900 Other Current Charges 116 35 250 250 0 Total Current Chgs & Oblig 116 35 250 250 0
Equipment FY19 Expenditure FY20 Expenditure FY21 Appropriation FY22 Recommended Inc/Dec 21 vs 22
55000 Automotive Equipment 0 0 0 0 0 55400 Lease/Purchase 0 0 0 0 0 55600 Office Furniture & Equipment 0 0 0 0 0 55900 Misc Equipment 0 0 2,125 2,125 0 Total Equipment 0 0 2,125 2,125 0
Other FY19 Expenditure FY20 Expenditure FY21 Appropriation FY22 Recommended Inc/Dec 21 vs 22
56200 Special Appropriation 0 0 0 0 0 57200 Structures & Improvements 0 0 0 0 0 58000 Land & Non-Structure 0 0 0 0 0 Total Other 0 0 0 0 0
Grand Total 276,452 289,513 299,784 304,075 4,291

484 Non-Mayoral DepartmentsFinance Commission
Department Personnel
Title Union Code Grade Position FY22 Salary Title
Union Code Grade Position FY22 Salary
Admin Asst (FC) EXM 03 1.00 62,819 Confidential Secretary EXM 12 1.00 135,427 Chairperson (Fin Com) EXO NG 1.00 5,014 Financial Analyst EXM 06 1.00 88,116 Total 4 291,375 Adjustments Differential Payments 0 Other 5,450 Chargebacks 0 Salary Savings 0 FY21 Total Request 296,825

Non-Mayoral DepartmentsFinance Commission 485
Program 1. Finance Commission Matt Cahill, Manager, Organization 193100
Program Description The Finance Commission investigates matters relating to appropriations, loans, expenditures, accounts, and methods of administration affecting the City of Boston or Suffolk County, or any department thereof which the Commission determines requires investigation. The Commission reports its findings to the Mayor, the City Council, and the general public.
Operating Budget Actual '19 Actual '20 Approp '21 Budget '22
Personnel Services 274,557 287,327 292,534 296,825 Non Personnel 1,895 2,187 7,250 7,250
Total 276,453 289,513 299,784 304,075

l

Index Administration & Finance
Programs Program 1. A & F ................................................................ 15
Age Strong Programs
Program 1. Age Strong Administration ...................... 141 Program 2. Age Strong Operations ........................... 142 Program 3. Age Strong Transportation .................... 143 Program 4. Programs & Partnerships ....................... 144
Assessing Department Programs
Program 1. Assessing Operations ..................................21 Program 2. Valuation ....................................................... 22 Program 3. Executive ...................................................... 23
Auditing Department Programs
Program 1. Auditing Administration ........................... 30 Program 2. Accounting ................................................... 31 Program 3. Central Payroll ............................................ 32 Program 4. Grants Monitoring ..................................... 33 Program 5. Accounts Payable ....................................... 34
Boston Centers for Youth & Families Capital Projects
BCYF Community Center Program Studies............ 162 BCYF Curley Community Center ............................... 162 BCYF Hyde Park Community Center ........................ 163 BCYF Marshall Community Center Pool ................. 163 BCYF Mattahunt Community Center ....................... 164 BCYF Mattahunt Community Center Exterior
Lighting ........................................................................ 164 BCYF Paris Street Pool .................................................. 165 BCYF Quincy Community Center .............................. 165 BCYF Roslindale Community Center ........................ 166 BCYF Security & Technology Upgrades................... 167 BCYF Tobin Community Center Retaining Wall ... 167 North End Community Center Design ..................... 168 Pool Repairs...................................................................... 168 Youth Budget Round 4 .................................................. 169 Youth Budget Round 5 .................................................. 169 Youth Budget Round 6 .................................................. 170 Youth Budget Round 7 .................................................. 170 Youth Budget Round 8 ................................................... 171 Youth Budget Round 9 ................................................... 171
Programs Program 1. Administrative & Policy ........................... 155 Program 2. Sports & Fitness ........................................ 156 Program 3. Youth & Family Services .......................... 157 Program 4. Child Care & Out-of-School ................. 158
Boston VETS Programs
Program 1. Veterans' Services ...................................... 177 Budget Management
Programs Program 1. Budget Administration .............................. 42 Program 2. Budget & Management ............................. 43 Program 3. Revenue Monitoring .................................. 44 Program 5. Capital Budgeting ....................................... 45 Program 6. Risk Management ....................................... 46
Central Fleet Management Programs
Program 1. Fleet Services ............................................. 367 City Clerk
Programs Program 1. Legislative Support ................................... 470 Program 2. Document Filing ........................................ 471 Program 3. Archives ...................................................... 472
City Council Programs
Program 1. City Council Administration .................. 478 Program 2. Finance Commission ............................... 479 Program 3. City Councilors ......................................... 479 Program 4. Legislative / Financial Support .......... 480
Commission for Persons With Disabilities Programs
Program 1. Disabilities ................................................... 184 Department of Innovation & Technology
Capital Projects Citywide Revenue Modernization ............................. 278 Core Technology Infrastructure................................ 278 Cyber Security and Resiliency .................................... 279 Data Analytics .................................................................. 279 Digital Service Delivery and Engagement .............. 280 Enterprise Applications ............................................... 280 ERP System Upgrade ..................................................... 281 Fiber Network Expansion ............................................ 281 FY19 IT Investment Proposals .................................... 282 FY20 IT Investment Proposals ................................... 282 FY21 IT Investment Proposals..................................... 283 FY22 IT Investment Proposals .................................... 283 Trunked Radio System .................................................. 284
Programs Program 1. DoIT Operations ....................................... 270 Program 2. Enterprise Applications ........................... 271 Program 3. Digital Engagement & Services ............ 272 Program 4. Core Infrastructure ................................. 273 Program 5. Data & Analytics ....................................... 274 Program 6. Broadband & Digital Equity ................... 275
Emergency Management Capital Projects
Emergency Operations Center ..................................298 Programs
Program 1. Homeland Security ................................... 295 Fair Housing & Equity
Programs Program 1. Fair Housing Commission ...................... 193
Finance Commission Programs
Program 1. Finance Commission ................................ 485 Fire Department
Capital Projects Building Envelope Repairs at Various Stations ..... 318 Engine 17 ........................................................................... 318 Engine 3............................................................................. 319 Engine 33 .......................................................................... 319 Engine 37 .......................................................................... 320 Engine 42 ......................................................................... 320
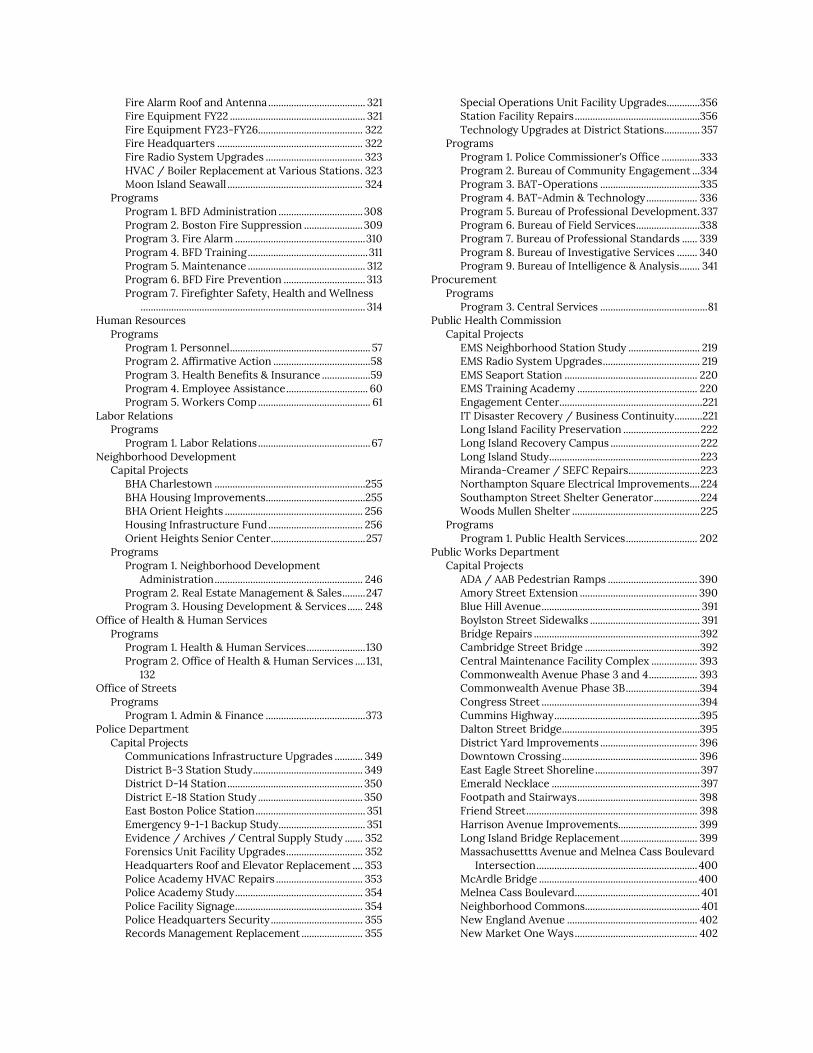
Fire Alarm Roof and Antenna ...................................... 321 Fire Equipment FY22 ..................................................... 321 Fire Equipment FY23-FY26......................................... 322 Fire Headquarters ......................................................... 322 Fire Radio System Upgrades ...................................... 323 HVAC / Boiler Replacement at Various Stations . 323 Moon Island Seawall ..................................................... 324
Programs Program 1. BFD Administration ................................. 308 Program 2. Boston Fire Suppression ....................... 309 Program 3. Fire Alarm ................................................... 310 Program 4. BFD Training ............................................... 311 Program 5. Maintenance .............................................. 312 Program 6. BFD Fire Prevention ................................ 313 Program 7. Firefighter Safety, Health and Wellness
........................................................................................ 314 Human Resources
Programs Program 1. Personnel ....................................................... 57 Program 2. Affirmative Action ...................................... 58 Program 3. Health Benefits & Insurance ................... 59 Program 4. Employee Assistance ................................ 60 Program 5. Workers Comp ............................................ 61
Labor Relations Programs
Program 1. Labor Relations ............................................ 67 Neighborhood Development
Capital Projects BHA Charlestown ...........................................................255 BHA Housing Improvements .......................................255 BHA Orient Heights ...................................................... 256 Housing Infrastructure Fund ..................................... 256 Orient Heights Senior Center ..................................... 257
Programs Program 1. Neighborhood Development
Administration .......................................................... 246 Program 2. Real Estate Management & Sales ......... 247 Program 3. Housing Development & Services ...... 248
Office of Health & Human Services Programs
Program 1. Health & Human Services ....................... 130 Program 2. Office of Health & Human Services .... 131,
132 Office of Streets
Programs Program 1. Admin & Finance ....................................... 373
Police Department Capital Projects
Communications Infrastructure Upgrades ........... 349 District B-3 Station Study ........................................... 349 District D-14 Station ..................................................... 350 District E-18 Station Study ......................................... 350 East Boston Police Station ........................................... 351 Emergency 9-1-1 Backup Study .................................. 351 Evidence / Archives / Central Supply Study ....... 352 Forensics Unit Facility Upgrades .............................. 352 Headquarters Roof and Elevator Replacement .... 353 Police Academy HVAC Repairs .................................. 353 Police Academy Study .................................................. 354 Police Facility Signage .................................................. 354 Police Headquarters Security .................................... 355 Records Management Replacement ........................ 355
Special Operations Unit Facility Upgrades.............356 Station Facility Repairs .................................................356 Technology Upgrades at District Stations.............. 357
Programs Program 1. Police Commissioner's Office ............... 333 Program 2. Bureau of Community Engagement ... 334 Program 3. BAT-Operations ....................................... 335 Program 4. BAT-Admin & Technology .................... 336 Program 5. Bureau of Professional Development. 337 Program 6. Bureau of Field Services .........................338 Program 7. Bureau of Professional Standards ...... 339 Program 8. Bureau of Investigative Services ........ 340 Program 9. Bureau of Intelligence & Analysis ........ 341
Procurement Programs
Program 3. Central Services .......................................... 81 Public Health Commission
Capital Projects EMS Neighborhood Station Study ............................ 219 EMS Radio System Upgrades ...................................... 219 EMS Seaport Station .................................................... 220 EMS Training Academy ............................................... 220 Engagement Center ........................................................221 IT Disaster Recovery / Business Continuity...........221 Long Island Facility Preservation .............................. 222 Long Island Recovery Campus ................................... 222 Long Island Study ........................................................... 223 Miranda-Creamer / SEFC Repairs............................ 223 Northampton Square Electrical Improvements .... 224 Southampton Street Shelter Generator .................. 224 Woods Mullen Shelter .................................................. 225
Programs Program 1. Public Health Services ............................ 202
Public Works Department Capital Projects
ADA / AAB Pedestrian Ramps ................................... 390 Amory Street Extension .............................................. 390 Blue Hill Avenue .............................................................. 391 Boylston Street Sidewalks ........................................... 391 Bridge Repairs ................................................................. 392 Cambridge Street Bridge ............................................. 392 Central Maintenance Facility Complex .................. 393 Commonwealth Avenue Phase 3 and 4 ................... 393 Commonwealth Avenue Phase 3B .............................394 Congress Street ..............................................................394 Cummins Highway .........................................................395 Dalton Street Bridge ......................................................395 District Yard Improvements ...................................... 396 Downtown Crossing ..................................................... 396 East Eagle Street Shoreline ......................................... 397 Emerald Necklace .......................................................... 397 Footpath and Stairways ............................................... 398 Friend Street ................................................................... 398 Harrison Avenue Improvements............................... 399 Long Island Bridge Replacement .............................. 399 Massachusettts Avenue and Melnea Cass Boulevard
Intersection ............................................................... 400 McArdle Bridge .............................................................. 400 Melnea Cass Boulevard ................................................. 401 Neighborhood Commons ............................................. 401 New England Avenue ................................................... 402 New Market One Ways ................................................ 402

North Washington Street Bridge .............................. 403 Northern Avenue Bridge ............................................. 403 Retaining Walls ............................................................... 404 Roadway Reconstruction and Resurfacing ............ 404 Ruggles Street................................................................. 405 Sidewalk Reconstruction ............................................ 405 Sleeper Street ................................................................. 406 State Street ...................................................................... 406 Storm Water Pollution Study ......................................407 Street Light Gas Lamps ................................................407 Street Light LED Conversion ..................................... 408 Street Lighting Assessment ........................................ 408 Street Lighting Installation ......................................... 409 Street Lighting Stray Voltage Assessment ............. 409 Sullivan Square / Rutherford Avenue ...................... 410 Summer Street Phase 2 ................................................ 410 Walkable Streets .............................................................. 411 Washington Street / Traveler Street ........................ 411 Whittier Street Housing Development Roadways 412
Programs Program 1. PWD Commissioner's Office................. 380 Program 2. Building / Facility Maintenance .......... 381 Program 3. Engineering ............................................... 382 Program 4. Construction Management .................. 383 Program 5. Highway Field Operations .................... 384 Program 6. Bridge Operations / Maintenance .... 385 Program 7. Street Lights .............................................. 386 Program 8. Waste Reduction ...................................... 387
Purchasing Division Programs
Program 1. Purchasing Administration ...................... 79 Program 2. Procurement ............................................... 80
Registry Division Programs
Program 1. Administration ............................................. 87 Program 2. Vital Statistics .............................................. 88 Program 3. Depositions ..................................................89
Transportation Department Capital Projects
Accessible Pedestrian Signals .................................... 440 Arboretum Gateway Path ............................................ 440 Bike Share Network Expansion .................................. 441 Bikeshare Dock Replacement ..................................... 441 Blossom Street ................................................................442 Blue Hill Avenue Transportation Plan ......................442 Bowdoin Street / Geneva Avenue Study ............... 443 Boylston Street ............................................................... 443 Centre Street / South Street ......................................444 Centre Street Safety Improvements .........................444 Crosswalk and Lane Marking Revitalization .......... 445 Dedicated Bus Lanes .................................................... 445 Eagle Square .................................................................... 446
Egleston Square .............................................................. 446 Electric Charging Stations ........................................... 447 Father Hart Bridge Traffic Improvements .............. 447 Green Links ...................................................................... 448 JFK / UMASS Station .................................................... 448 Massachusetts Avenue, North of Melnea Cass Blvd.
........................................................................................ 449 Mattapan Square ............................................................ 449 Mission Hill Transportation Planning ..................... 450 Municipal Parking Lots ................................................ 450 Nubian Square Improvements ................................... 451 Operations Center at 12 Channel Street ................. 451 Parking Meter and School Zone Signal Upgrade .. 452 Rapid Bus Transportation Seaport ............................ 452 Roslindale Gateway........................................................ 453 Safe and Reliable Streets .............................................. 453 South Bay Harbor Trail ................................................. 454 Southwest Corridor Bike Path Extension ............... 454 Strategic Bike Network
Cambridge Street ..................................................... 455 Mass. Ave. South of Melnea Cass Blvd. .............. 456
Strategic Bike Network Project .................................. 455 Traffic Signal Construction at 5 locations .............. 456 Traffic Signals .................................................................. 457 Transportation Action Plan Implementation ......... 457 Transportation Planning .............................................. 458 Tremont Street ............................................................... 458 Vision Zero ....................................................................... 459
Neighborhood Slow Streets .................................. 459 Warren Street and Blue Hill Avenue ........................ 460
Programs Program 1. Parking Clerk .............................................. 437 Program 1. Traffic Commissioner's Office .............. 427 Program 2. Traffic Management & Engineering ... 428 Program 3. Policy & Planning ..................................... 429 Program 4. Traffic Enforcement ............................... 430 Program 5. Traffic Operations ................................... 431
Treasury Department Programs
Program 1. General Management ............................... 112 Program 1. Treasury Administration......................... 103 Program 2. General Service / Payroll ...................... 104 Program 2. Special Collections ................................... 113 Program 3. Payment Services ...................................... 114 Program 3. Treasury Accounting............................... 105 Program 4. Accounting / Quality Control ............... 115 Program 4. Accounts Receivable ............................... 106 Program 5. Trust ..............................................................107
Youth Engagement & Employment Programs
Program 1. Youth Engagement & Employment ..... 232