SOIBULLETIN 0Department of the Treasury - Internal ...
143
Statistics of Income SOIBULLETIN 0 Department of the Treasury Internal Revenue Service Volume 9, Number 3 Winter 1989-1990 Contents of This Issue Page 111 [5] SOI Bulletin Board Partnership Returns, 1987 Partnerships, Passive Losses, and Tax Reform, 1981-1987 Foreign Recipients of U.S. Income, 1987 Corporate Foreign Tax Credits, 1984 Projections of Tax Return Filings, 1990-1997 Selected Historical Data Publication 1136 (Rev. 4-90)
-
Upload
khangminh22 -
Category
Documents
-
view
0 -
download
0
Transcript of SOIBULLETIN 0Department of the Treasury - Internal ...

Statistics of Income
SOIBULLETIN0 Department of the Treasury
Internal Revenue Service
Volume 9, Number 3 Winter 1989-1990
Contents of This IssuePage
111
[5]
SOI Bulletin Board
Partnership Returns, 1987
Partnerships, Passive Losses, and Tax Reform, 1981-1987
Foreign Recipients of U.S. Income, 1987
Corporate Foreign Tax Credits, 1984
Projections of Tax Return Filings, 1990-1997
Selected Historical Data
Publication 1136 (Rev. 4-90)

Statistics of Income
Department of the TreasuryInternal Revenue Service
Fred T. GoldbergCommissioner
Charles H. BrennanDeputy Commissioner(Operations)
Charles J. PeoplesAssistant Commissioner(Returns Processing)
Fritz ScheurenDirector, Statistics of Income Division
01 ULLETIN
Publication 1136 (Rev. 4-90)
The SOI Bulletin provides the earliest published annual financial statisticsfrom various types of tax and information returns filed with the InternalRevenue Service. It also includes information from periodic or special ana-lytical studies of particular interest to tax administrators. In addition, historicaldata are provided for selected types of taxpayers, as well as the grossinternal revenue collections and other tax related items.
Information on the availability of additional unpublished data concerning thetopics in this issue may be obtained by writing to the Statistics of IncomeDivision, R:S Internal Revenue Service, Washington, DC 20224.
In addition, special Statistics of Income tabulations based on income taxreturns can be produced upon request on a reimbursable basis. Requestsfor this service should be addressed to the Director, Statistics of IncomeDivision, at the address shown above.
Robert A. Wilson and Bettye Jamerson of the Statistics of Income Divisionwere the technical editors and were assisted by Wendy Alvey and Beth Kilss,who wrote the SOI Bulletin Board column, and Clementine, Brittain whoprovided editorial support and prepared the copy. Any views expressed inthe articles are those of the authors and do not necessarily represent theviews of the Treasury Department.
Suggested Citation
Internal Revenue ServiceStatistics of Income BulletinWinter 1989-1990Washington, D.C. 1990
For sale by the Superintendent of Documents,U.S. Government Printing Office,Washington, D.C. 20402

STATISTICS OF INCOME DIVISIONPUBLICATIONS AND TAPES
Statistical Information Service Desk(202) 233-1755
FAX (202) 233-1620
The following Statistics of Income reports and tapes can be purchased from the Statistics of IncomeDivision (unless otherwise indicated). Prepayment is required, with checks made payable to the IRSAccounting Section. For copies from the Statistics of Income Division, please write:
Director, Statistics of Income Division (R:S)Internal Revenue ServiceP. 0. Box 2608Washington, DC 20013
BUSINESS SOURCE BOOKS:
0 Corporation Source Book, 1986, Publication 1053 -- Price $175.00
This 480-page document presents detailed income statement, balance sheet, tax and investmentcredit items by major and minor industries and size of total assets. The report, which underliesthe Statistics ofIncome--CoToration Income Tax Retums publication, is part of an annual seriesand can be purchased for $175 (issues prior to 1982 are for sale at $150 per year). A magnetictape containing the tabular statistics for 1986 can be purchased for $1,500.
0 Partnership Source BooA; 1957-1983, Publication 1289 -- Price $30.00
This 291-page document shows key partnership data for 1957 through 1983, at the minor, majorand division industry levels. It includes a historical definition of terms section and a summary oflegislative changes affecting the comparability of partnership data during that period. Tablesshow:
• Number of partnerships o Depreciation o Payroll• Number of partners o Taxes paid deduction o Payments to partners• Business receipts o Interest paid o Net income
( A magnetic tape containing the tabular statistics for partnerships can be purchased for $300from the National Technical Information Service, U.S. Department of Commerce, Springfield,VA 22161.) More recent partnership data are published annually in the Statistics ofIncomeBulleti&
Sole Proprietorship Source Book, 1957-1984, Publication 1323 -- Price $95.00
This Source Book is a companion to that for partnerships, described above. It is a 244-page docu-ment showing key proprietorship data for 1957 through 1984. Each page contains statistics for aparticular industry. Tables show:
• Number of businesses o Depreciation o Payroll• Busineis receipts o Taxes paid deduction o Net income• Interest paid

STATISTTCS -OFINCOME DIVISION
. PUBLICATIONS AND TAPES '
A magnetic tape containing the tabular statistics can be.purchased. for, $24_5, , As with partner-
ships, more recent (nonfarm) sole proprietorship data are published-annually in the Statistics ofIncome Bulletin.,.
COMPENDIUMS:
fIntemational Income. and Taxes, 1979-1983, Publication i,267 -,'Price $45.60o Studies q
This rep.ort presents informa*tion from, 13 Stati~tics ofIncome studies in- the. international area
(many of them previously published in the SOIBulletiri), including:,
o Foreign activity ofU;S,,corporki6ns 6 Data. presented by--geographical area or industrial.o Activity of foreigricoiporationin the
United States activity, as well as other• Foreign, interests in U. S. corporations classifiers• Statistics related to individualsi trusts and estates
0 Partnership Retums, 1978-1982, Publication 369 -- Price $22.00
This report presents,. previously unpublished Statistics ofIncome data for. 1980, 1981 and 1982, as-well as dataVreviously issued7in-the SOI Bulletin and in otherpublicatiom7~atures include-
• Number of partnerships• Limited partnerships,• Receipts• Cost of sales and operations
o Deductionsp Net income,o. Capital gains
o Data presented by--'industry..,size of total assetsState
.,number of partners
REIMBURSABLE SERVICES. (prices dependent on. therequest):
Public Use MagpeticT, Microdata..Files
This includes ~indl ivi ua income takretuMs for 1978 1986. (Individual income'taireturns for1966-1977 ardava,ilAble, 66m;thle benter for Electronic Records (NNX) 6t'th6 National Archivesand Records Administration, Washingtqn,.,DC 20408.) Files containing more iiinited'aata foreach State are also.available. for 1,985-., All of, these.', files have been . edited to. piotdathe confiden-tiality of
,individual,taxp ' Private, f6undkibns- for 1982 1983 and 085,6nd, nono 'fit. V 1, . 4 , .-P - " ro.
tiiiisTbrJ9,83 Arid 19,85 are a 96 available' rom the'Siatis"charitable organiza ioI
tics:bf Income:Division. The~ individual, private-foundation arid charitable oii'anization-,til~e's"~.~'ar'e t e,cinly.microdata files'that can, be released to the public
0 Migration Data
Compilations showifig.rifigri'atidn' patterns, from where~to 'where; by:State a
.ridic6un ty, based on
year-to-year changes in the tax return address. - Data are available fot'sele'ded time periods(according to the years in which returns were filed) between 1978 and
'1988 ~ and, include counts of
the number of individual income tax returns and personal,ej~cemp'iions."IdAiiddition,'county incometotals are available for Income Years 1982 And 1984 through 4081.

STATISTICS OF INCOME DPVISIONPUBLICATIONS AND TAPES
9 Other Unpublished Tabulations
Unpublished tabulations also from Statistics ofIncome (S01), including detailed tables underlyingthose published in the SOIBulletin. Special tabulations may also be produced, depending on theavailability of SOI computer programming resources.
OTHER PUBLICATIONS:
The following Statistics ofIncome publications are available from the Superintendent of Docu-ments, U.S. Government Printing Office. For copies write:
Superintendent of DocumentsU.S. Government Printing OfficeWashington, DC 20402
Statistics ofIncome (SOI) Bulletin (Quarterly), Publication No. 1136Stock Number 748-005-00000-5 -- Subscription price $20.00; Single copy price $7.50
Provides the earliest published financial statistics from individual and corporation income tax returns.The Bulletin also includes annual data on sole proprietorships and partnerships, as well as from peri-odic or special studies of particular interest to tax analysts and administrators and to economists. His-torical tables include data from SOI as well as on tax collections and refunds by type of tax.
Statistics ofIncome-4986, Corporation Income Tax Returns, Publication No. 16Stock Number 048-004-02290-7 -- Price $10.00
This report presents more comprehensive and complete data on corporation income tax returns withaccounting periods ended July 1986 through June 1987, than those published earlier in the SOI Bulletin.
Presents information on-- o Data classified by--• Receipts o Tax credits industry• Deductions o Assets accounting period• Net income o Liabilities size of total assets• Taxable income size of business receipts• Income tax
Statistics ofIncome-4986, Individual Income Tax Returns, Publication No. 1304Stock number 048-004-02285-1 -- Price $11-00
This report presents more comprehensive and complete data on individual income tax returns for 1986than those published earlier in the SOIBulletin.
o Presents information on-- o Data presented by--Sources of income size of adjusted gross incomeExemptions marital statusItemized deductionsTax computations ,

CONTENT Page
SOI Bulletin Board 1
Partnership Returns, 1987 ............................................ 5By Joseph H. Middough
For 1987, partnerships reported an overall net loss of $5.4 billion, down by nearly 70percent from the $17.4 billion overall net loss reported for 1986. Net losses reported byreal estate operators and lessors of buildings contributed significantly to the size of theoverall loss. The number of active partnerships declined for the second consecutiveyear, to 1,648,032 for 1987. These are among the first tax return statistics reflectingsome of the effects of the Tax Reform Act of 1986 on partnerships.
Partnerships, Passive Losses, and Tax Reform, 1981-1987 ................. 31By Susan Nelson and Tom Petska
Partnerships responded during 1987 to the 1986 Tax Reform provisions to curb partner-ship tax shelter activity, but not nearly as much as the $12.0 billion improvement in netincome implies. While net losses did decline, those of real estate limited partnershipscontinued to grow, but by only $1.0 billion or 4 percent. Oil and gas partnerships sharedin the increased profit picture even though they were exempted from the 1986 "passiveloss" restrictions. The early effects of Tax Reform were more evident among individualpartners than among partnerships. Partners' net income increased for 1987 by at least$21 billion. About $10 billion resulted from disallowed passive losses under the 1986Act. Results were particularly notable among high-income individuals with low effectivetax rates; for these taxpayers use of partnership losses to offset other income declinedsubstantially for 1987.
Foreign Recipients of U.S. Income, and Tax Withheld, 1987 - .* .............. 41By Marilyn J. FlahertyU.S. source income paid to foreign persons rose 4 percent in 1987 to $22.7 billion. Japanwas, for the first time ever, the largest recipient with $4.5 billion. Tax withheld on U.S.source income rose by more than 13 percent, to $1.3 billion. The disproportionateincrease in tax relative to income was due to the rise in dividend income which was rarelyexempt from tax withholding. Tax withheld on dividends made up the major portion ofall tax withheld (68 percent).
Corporate Foreign Tax Credit, by Industry, 1984 .......................... 57By Vergie Mose
Foreign tax credits enabled U.S. companies to reduce their U. S. income tax for 1984 by$21.4 billion. Between 1982 and 1984, the foreign tax credit claimed by U.S. corpora-tions rose by $2.5 billion, an increase of 13 percent. The credit declined from $24.9billion for 1980, to $18.9 billion for 1982, then rose to $21.4 billion for 1984 and thenafterward to $24.3 billion for 1985. The swaying pattern of the foreign tax credit reflectsthe changing levels of both foreign and domestic profits and income taxes of U.S.companies between 1980 and 1985.

Page
Projections of Returns to be Filed In Fiscal Years 1990-1997 ................... 91By Marion W. Mak
A total of,202.8 million primary tax returns and supplemental documents are projectedto be filed with the Internal Revenue Service in Fiscal Year 1990, an increase of 1.7percent over the number filed in FY 1989. Although projected year-to-year increaseswill range between 2 to 5 million returns,' the yearly, rates of,gro.Wth"in -total filings areexpected to decline from 2.6 percent in 198.9 to 1.7 percent in 1997..Selected Statistical Series ........... ......................... 99~
~Appendlx-_Gi'eneral Description,of SOI Sample,Procedures,and Data"Llmitai-:~--tiont.- . .129.................................................. .
Cumulative Index of Previously Published'SOI Bulletin Articles..... Back Cover

SOME OBSERVATIONS ANDINSIGHTS
For the first time in nearly 20years, the Statistics of IncomeDivision has a new home. Our of-fices.are now located at 500 NorthCapitol Street, NW, very nearUnion Station and the U.S. Capitol,but further away from the Main IRSBuilding and the Department of theTreasury.
We moved out of our previouslocation -- 1201 E Street, NW, issoon to be torn down -- in the mid-dle ofJanuary. After many monthsof concerted and careful planning,and weeks of packing and unpack-ing, we are finally getting settled inand are starting to feel at home.The effects of all the changes as-sociated with moving are graduallyunfolding (and, when necessary,being resolved). Some of the moreimmediate benefits include betterconference and training rooms;larger, more adequate space to ac-commodate the ongoing computermodernization efforts; and an of-fice environment that will betterenable us to serve our numerouscustomers.
As for the drawbacks, there havebeen some minor inconveniences
-_e.g., distance from the Main IRSbuilding; disrupted carpools; and anew telephone system -- but we'relearning to adjust. Other, moreserious, drawbacks (althoughthey're temporary ones) have beenthe disruption to our work flow andwork schedules. The delay inpublishing this issue of theBulletin,for example, is due in large part tothe move.
'Me moving process rekindledold memories of previous movesfrom other Division residences formany of our "long timers." In fact,for some of our staff, this newresidence becomes their fifthchange of address since working inthe Division. You may be inter-ested to know that, over the years,the Statistics of Income Division(originally created in 1917 as theStatistical Section of the IncomeTax Unit, Clearing Division of theBureau of Internal Revenue) hasoccupied quite a variety of sitesaround the District of Columbia.Chronologically, these include:
e Annex Building (1918-1931).--One of our earliest (if not ourfirst) locations, according to the1924 Treasury Departmentphone book, was the AnnexBuilding located at Pennsylva-nia,Avenueand Madison Place,near the Treasury Building. Wemay have actually been there asearly as 1918, since the phonenumbers for 1918 and 1924werethe same, although no addresswas given in the earlier phonebook. It wasn't until the mainInternal Revenue Building wasbuilt, however, that we changedaddresses.
0 Main IRS Building (1931-1963).--Little did the Statistical Sectionknow when it relocated to theMain IRS Building at 1111 Con-stitution Avenue, NW, in 1931,that it would be at home therefor the next 32 years. Duringthis era the many changes takingplace in the national and inter-national arenas were paralleledby changes in leadership, pro-
gram content, technology andstaff right within our own or-ganization. Atonepoint,in thelate 1940's, the number ofemployees in the Divisionreached its all-time highest level(close to 500 people), consistingalmost entirely of clerical-levelwomen who manually processedall of the returns for the Statis-tics of Income programs. Thiswas in the days prior to the ad-vent of computers, when SOIprocessing was conducted en-tirely in-house. It was also at atime when statistical sampling,as we know it today, was justbeginning and the samples ofreturns to be processed weremuch larger than they are now.Eventually, SOI purchased aone-third interest in a UNIVACcomputer at the Census Bureau(in 1956) and "SOI modern-ization"was underway!
0 Pension Building (1963-1968). --Following the more than threedecades at the Main IRS Build-ing, our offices were relocated tothe old Pension Building (nowknown as the National BuildingMusuem) at F Street between4th and 5th Streets, NW. Thissite, built after the Civil War,may be remembered, by some,more for the large pigeon pop-ulation that was often observedflying or nesting in its cavernousatrium than for the home itprovided for the Division. Thestory goes that, because ofall thefeathered tenants in the build-ing, some of the women of theDivision took towearing shawlsor carrying umbrellas to protectthemselves. These years also
I

coincided with. the estab-lishm6nt of !the Detroit DataCenter and the relocation of ourcomputer operations (and.mu,cho
qf 66 k ffianuIa*l, .'operation
.1s,
-as
well) to that site. -
0,Main IRSBuilding (1968_1~71).--W.e.thought perhaps it was a caseof"dejavuil but rather it was justthat - another,mQve,1 in 1968,~rqught us back. among the lapy-rinthian.halls,of the IRSBuild-ing for, yet. another 3 years,?residence.,
o 1201 E Street, NW (1971-199q).--The year was, 1971,, and,:the.,Statistics-Division~-once again,found itselfpacking and unpack-ing'a mere.twd blocks frontitsfo.riner' h6ifte. -~Foi th& next 19years (until, the present), we car-riedon thebusiriess'of6rb
.ducina
statistics from,tax return infor-matiop, while at the same timewe~ contiri
'.ued 'to . undergo more.
changes. Just. tomendotia few,we revised our organizationalstructuie and changed our name(both "again"), introduce
'd many
technological inn6vati.0nsto
help us, do . our. jobs, better andtimelier -- e.g.,
0 increasing:'otir computercapabilities and acquiringour own (again);
moving. most ~of bur data-processing operations fromDetroit to the IRS servicecenters located. throughoutthe'country;
o changing sample sizes, pro-gram content, and numberof publications in response
to budgetary constraintsand user needs; and
0. introducing direct. on-lineediting of returns for SOI.
We also began publishing. the, SOIBulletinl
'-A part of our. hist ry~ then,. has0 ,been:-tied m our physical location,.We are now looking -forward, toutilizing the new.. opportunity wehave at 500 North Capitol Street,NW, to continue to improve as anorganization and ~to provide. thekind and quality of,,services ourusers expect. We
'welcome you to
come by and see ~ u& in'our. new ."digs.".
Fritz ScheurenDirector -Statistics of Income
Division
THIS ISSUE AT A GLANCE
The Winter 1989-1990 issue ofthe Bulletin. 'contains informationfrom domestic as well,as foreignbusiness income tax returns, andpresents projections of tax returnfili, riefpgs thiougli.1997. A babstract of each, artick, is providedbelow:
Partnership Returns, 1987.--Provides, data on parknership incorhe deduct*ions a.nd' fofitsp Iderived from a sample.
.1o
.f partner-
'ship tax returns, Form 1,065,processed by,JRS during 1988- for1987, the Study presents the firststatistics on the effects -of the TaxReform Act of 1986.
Partnerships, Passive Losses, andTax Reforin, 1981-1987-Provides
data.on theuse of partnershivs as ameans for individuals to shelter in-come from taxation.and the firstindications of the effectso'f,the TaxReform,.Act of 1986"on curbingpartnership tax shelter, activity.
Fore~gn, Rec~pients of, L~.S- In-come,,,and,t "Withheld, 1987.--Pr'o'yldes~'~'datA,by.c6u try,.on U.S.souicd income paid to foreign per-sons in' 1987 and, theA f.S. tax' thatwas Withheld on it, all based onF6fm's'1642S fitedwith the IRS in
Corporate Foreign T~x Credits,1984.--Provides data. on foreign in-come
.and tax, by.U.S. industry and
by, country, reported.by U.S. cor-por
,ations- in, compu. tifig their
foT,eign tax,credits, with comparisons toother recent years.
Piojecqbns of Tax Return'Filings,-1990~1997.--Piovides,"pr'oj'ectiong,ofthe major'typ.es ofreturns to be filedin Fiscal
,Years 10%-499T. ProJeC7
tion~*&cfadjusirnenis made4or.r
,ecent l6gi~!~iiofi,-inclydi.ng the Tax
Reform Act of 1986.And theTech-
nical arid Nfiskellafi6ous Revenuek . I ...- . - ~Act of 1988.
BEHIND THE SCENES
Asydwinight expe'etiAM reloca-tionofthe~Divisibndidh'tjust,~hap-pen.",.'~ Looking back over the.mdny.'months
'-weeks, days'land -hour
%s
devoted to "the move," it, is. ap'propriate to recognize' those'responsible for the careful planningand c6hiplex iniplem6niationwhich 'iesulted'in a'~Iery smoothtransitioh'to'bur n6whbind. Itwastruly a team effort,to get nearly 200people relocated, while at the same

time trying to keep projects as closeto or on schedule as possible. Un-fortunately, space does not permitmentioning everyone involved --they are just too numerous to listhere. Nevertheless, all of the SOIindividuals involved deserve specialthanks for the long hours put in(often on weekends) and for theimportant roles they played inmaking the movepossible. I would,however, like to devote the re-mainder of this section to highlight-ingone individualwho provided theleadership necessary to bring it allabout so effectively.
Special acknowledgment goes toJIM KADY, the key person in themyriad details of the entire moveoperation. He tirelessly oversawevery aspect of the process -- fromcoordinating with IRS logisticalsupport officials to the NTEU (Na-tional Treasury Employees Union)representatives and chairing theIRS Management NegotiatingTeam, from the vendors to themovers, from the old buildingmanagers to the new buildingmanagers, and from one SOIDivision manager to another (allconcerned about space and storageallotments). Jim was truly "graceunder pressure" personified, as heso ably participated in theseeming-ly endless round of discussions andmeetings required. We are all in-debted to him for a job well done.
YOUR CALL
As you might have guessed, notonly do we have a new physical loca-tion, but also we have new phone
numbers that you, as our cus-tomers, will need to know.
Of particular importance is ourStatistical Information Service(SIS) desk, which we have broughtto your attention on previous oc-casions. This special staff -- estab-lished in February 1989 to answeryour questions on tax return statis-tical information (and particularlythose from projects and publica-tions of our Statistics of Incomeprogram) -- is now back in opera-tion and ready to receive your calls.Its new number is (202) 233-1755.The staff there, led by DAVIDJORDAN, with the assistance ofSANDY BYBERG, JOHNKOZIELEC and DARLENEREYNOLDS, can be reached onMonday - Friday, 8:00 am - 4:30 pm.
To assist you further in your in-quiries, we havealso provided here,on the pages that follow, an up-dated list of Statistics of IncomeProjects and Contacts, containingthe name of the primary analyst as-signed and his or her new phonenumber. (This list should be usedonly if you have a specific questionof a technical nature about a par-ticular project.) In order to serveyou better, however, the SIS staffshould be considered your firstpoint of contact for all inquiries.Please be assured that, if you mustleave a message, they'll call youback as soon as possible. Or, ifyouprefer, they also respond to in-quiries received by mail, so feel freeto write to us. The address is thesame as before:
Statistics of IncomeDivision R:S:P
Internal Revenue Service1111 Constitution Avenue, NW
Washington, DC 20224.
We would also like to invite youto come and visit our staff in ournew facility. 'Mere is space avail-ableifyou wish to come in and lookat our publications. However, foryour convenience, please be sure tocall ahead and make an appoint-ment so that someone is availableto help you and clearance to thebuilding can be arranged.
Finally, I invite you to call medirectly with your comments, sug-gestions or concerns. You canreach me on (202) 233-1741. Welook forward to hearing from you.
UPCOMING FEATURES
The following are a few of thearticles to look for in upcoming is-sues of the SOIBulletin:
Individual Income TaxReturns, Preliminary Data,1988;
~ 0 Estate Tax Returns, 1987;
0 Estate Tax ReturnsRevisited, 1916-1945;
9 Personal Wealth, 1986;
Marginal and Average TaxRates, Individual IncomeTax Returns, 1987; and
0 Controlled Foreign Cor-porations, 1984.
3
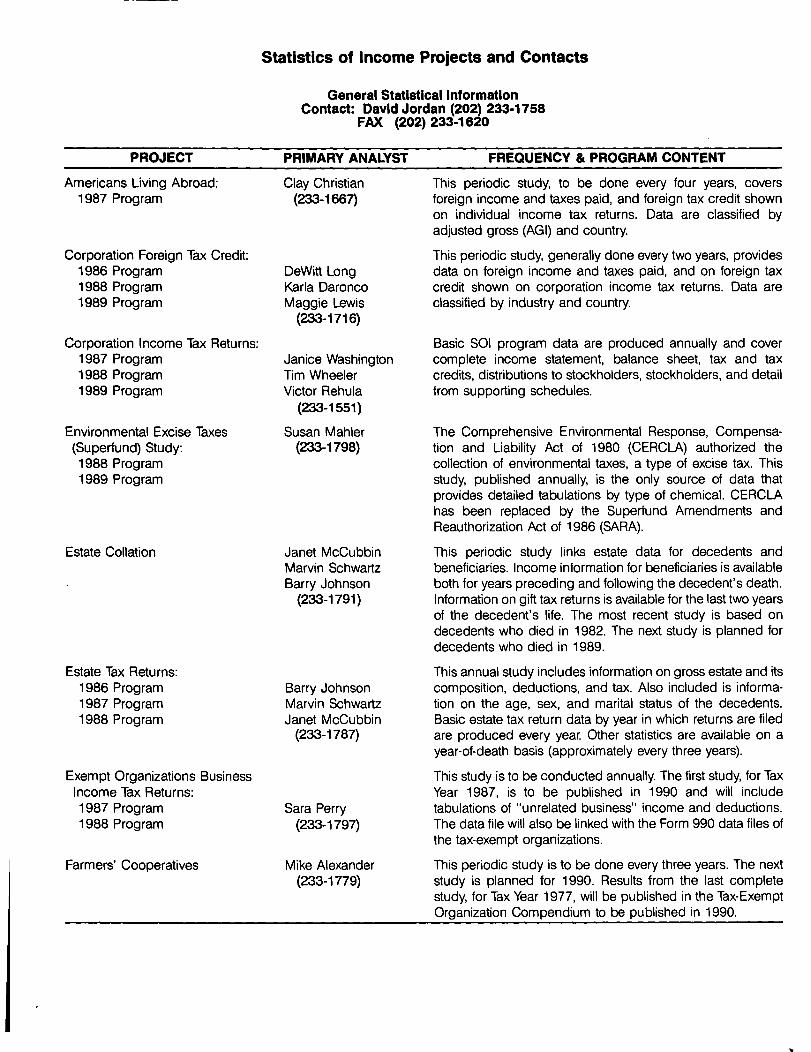
Statistics of Income Projects and Contacts
General Statistical InformationContact: David Jordan (202) 233-1758
FAX (202) 233-1620
PROJECT PRIMARY ANALYST FREQUENCY & PROGRAM CONTENT
Americans Living Abroad:1987 Program
Corporation Foreign Tax Credit:1986 Program1988 Program1989 Program
Corporation Income Tax Returns:1987 Program1988 Program1989 Program
Environmental Excise Taxes(Superfund) Study:1988 Program1989 Program
Estate Collation
Estate Tax Returns:1986 Program1987 Program1988 Program
Exempt Organizations BusinessIncome Tax Returns:1987 Program1988 Program
Farmers' Cooperatives
Clay Christian(233-166-7)
DeWitt LongKarla DaroncoMaggie Lewis
(233-1716)
Janice WashingtonTim WheelerVictor Rehula
(233-1551)
Susan Mahler(233-1798)
Janet McCubbinMarvin SchwartzBarry Johnson
(233-1791)
Barry JohnsonMarvin SchwartzJanet McCubbin
(233-1787)
Sara Perry(233-1797)
Mike Alexander(233-1779)
This periodic study, to be done every four years, coversforeign income and taxes paid, and foreign tax credit shownon individual income tax returns. Data are classified byadjusted gross (AGI) and country.
This periodic study, generally done every two years, providesdata on foreign income and taxes paid, and on foreign taxcredit shown on corporation income tax returns. Data areclassified by industry and country.
Basic SOI program data are produced annually and covercomplete income statement, balance sheet, tax and taxcredits, distributions to stockholders, stockholders, and detailfrom supporting schedules.
The Comprehensive Environmental Response, Compensa-tion and Liability Act of 1980 (CERCLA) authorized thecollection of environmental taxes, a type of excise tax. Thisstudy, published annually, is the only source of data thatprovides detailed tabulations by type of chemical. CERCLAhas been replaced by the Supertund Amendments andReauthorization Act of 1986 (SARA).
This periodic study links estate data for decedents andbeneficiaries. Income information for beneficiaries is availableboth for years preceding and following the decedent's death.Information on gift tax returns is available for the last two yearsof the decedent's life. The most recent study is based ondecedents who died in 1982. The next study is planned fordecedents who died in 1989.
This annual study includes information on gross estate and itscomposition, deductions, and tax. Also included is informa-tion on the age, sex, and marital status of the decedents.Basic estate tax return data by year in which returns are filedare produced every year. Other statistics are available on ayear-of-death basis (approximately every three years).
This study is to be conducted annually. The first study, for TaxYear 1987, is to be published in 1990 and will includetabulations of "unrelated business" income and deductions.The data file will also be linked with the Form 990 data files ofthe tax-exempt organizations.
This periodic study is to be done every three years. The nextstudy is planned for 1990. Results from the last completestudy, for Tax Year 1977, will be published in the Tax-ExemptOrganization Compendium to be published in 1990.
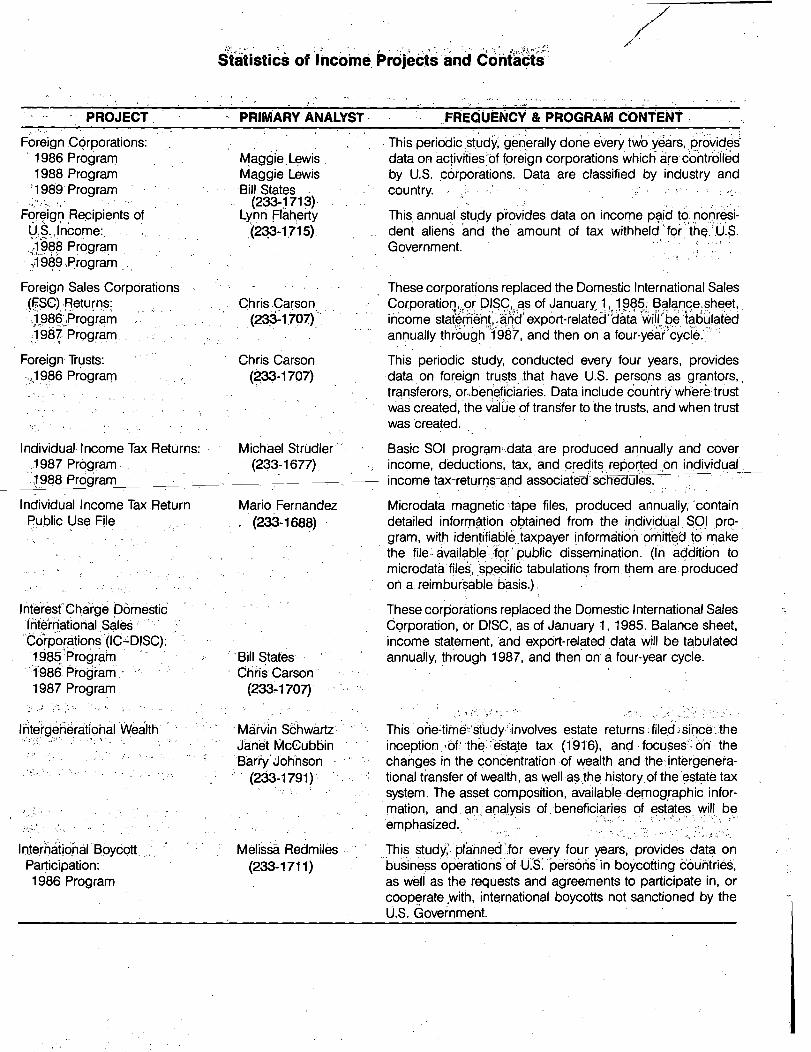
Shitistics of IncoMe. PrdjeOt and C6hthibts *
I PROJECT, - PRIMARY ANALYST - FREQUENCY & PROGRAM CONTENT
Foreign Corporations:1986 Program .1988 Program
'1999*Program
Foreign Recipients ofY,§.,,Inc.ome:.
1,.1988 Programi'9̀89̀ Program
Foreign Sales Corporations(~,$C)J.~qturns:.11_981~,Progr4rn.1.987 Program" 11 7
Foreign Trusts:.,19.86 Program
Individual Income Tax Returns:.1987, Program
Program
Individual Income Tax ReturnPublic. Use File
lnte'reist'Chargb DomesticInternational Salestoir'pora-tions'(1
,C~'DISC):
I 686'Pro'ra-m'1986 Peooram,,1987 Program
MaggieLewis,Maggie Lewis
..Bill!States .(233-1,713)
Lynn.Flaherty
Qhris,Carson-1 i 0~).(2:3P- 7. ~ ,
Chris Carson(~33-1707)
Michael Strudler. (233-1677)
Mario Fernandez(2W-1688)
'Bill StatesChris Carson
(233-1707)
Marvin SchwartzJanet McCubbin
'Johnson(233-ml 791)
ttInt 'n'I B a Redmile'sernatio
"a oyco Melissc
Participation: (233-1711)1986 Program
This periodic.study" generally done every two* years, provicles~data on activities of foreign corporations which are controlledby U.S. corporations. Data are classified by industry andcountry.
This annual slugly.piovicles data on income p~iicl to~ ribq'iesi-dent al
Iiens
.and the
.amount of tax withheld f6r.'thq.
! U.S.Government.
These corporations replaced the Domestic International SalesCorporation,.or DISC, as of January 1, 1985; Balance,sheet,.income staterh&t,'*id~ export-related 'data'w' i I* be ulatedannually thro"6g'h"I 9'8-'7, and then on a four-ydar cyc e.~,
This periodic study, conducted every four years, provides.data on foreign trusts that have U.S. perso,ns.as grantors,transferors, or,berieficiaries. Data include country wh"e're,trustwas created, the valibe'of transfer to the trusts, and when trustwas created.
Basic SOI program,-.data are produced annually and coverinco
.me, deductions', tax, and credits, reported on individual
-income-tax-returns-and-associateFd-sc-he~dules.-,
Microdata - magnetic tape files, produced annually, 'containdetailed information obtained from the individual $01 pro-gram, with identifiable-taxpayer informatibn,orniffe.d.tlo makethe file -6vail6ble'-for public dissemination. (In addition to
bulations from them are,p'roducedmicroclata''fileg, specific taon a. reimbursable basis.).
These corOorations replaced the Domestic International SalesCorporation, or DISC, as of January 1, 1985. Balance sheet,income statement,, and export- related clata will be tabulatedannually, through 1987, and then on a four-year cycle.
This o-h'e_time~Vudyr'%ih,voIves estate returns; file.d-~since'. theinception. i6f:'-the~:estate tax (191'6), and,focuses'dn thechanges in the concentration -of wealth and the: intergen&a-tional transfer of wealth, as well as.the history,of the'estc e taxatsystem. The asset composition, available,clernogTc~phic infor-mation, and,, an' analysis of . beneficiaries of estates, will beemphasized.
This stucly,':pl~anned'.for every four years, provides data on-bu
.1si ,ness
Iopera
Itions
-o
,f U.S.'persons'in boycotting countri6s,
as weli as the requests and agreements to participate in, orcoop~rate 'with, international boycotts not sanctioned by theU.S. Government.

Statistics of Income Projects and Contacts
PROJECT PRIMARY ANALYST FREQUENCY & PROGRAM CONTENT
Non-exempt charitable trusts:1989 Program
Nonprofit CharitableOrganizations:1986 Program1987 Program1988 Program
Nonresident Alien Estates:1986 Program
Occupation Studies
Peggy RileyAlicia Meckstroth
(233-1790)
Cecelia HilgertSusan Mahler
(233-1798)
DeWitt Long(233-1719),
Bobby Clark(233-1683)
This periodic study is planned for every three years. The nextstudy is planned for Tax Year 1989 and will include primarilybalance sheet and income statement information.
This annual study includes information on net worth and variousdata from the balance sheet and income statement for organi-zations classified as tax-exempt under subsection 501(c)(3) ofthe Internal Revenue Code. The groups covered are religious,educational, scientific, and literary (excluding private founda-tions). However, for Tax Year 1988, the study will be expanded toalso include section 501 (c)(4)-(9) organizations.
This periodic study, planned for every four years, providesdata on estates of nonresident aliens who had more than$60,000 of assets in the United States. The estates are subjectto U.S. estate taxation on the U.S. property.
This periodic study, based on availability of outside funding, isdesigned to classify individual income tax returns by occupa-tion and to develop a dictionary of occupation titles that canbe used to enhance the economic data of many otherindividual income tax return studies.
Partnership Returns of Income:1988 Program1989 Program
Personal Wealth Study:1986 Program
Private Foundations:1986 Program1987 Program1988 Program
Gail Moglen(233-1767)
Marvin SchwartzJanet McCubbinBarry Johnson
(233-1791)
Peggy RileyAlicia Meckstroth
(233-1790)
Basic SOI program data, produced annually, cover incomestatement, balance sheet, and detail from supporting schedules.
This periodic study provides data estimates of personalwealth of top wealthholders that are generated from estate taxreturn data using the "estate multiplier" technique, in con-junction with both filing-year and year-of-death estate databases. The most recent data (1982) are based on returns filedfrom 1982 to 1984. The next study is planned for returns filedfrom 1986 to 1988 and will be available in 1990. A compen-dium of previously published SOI articles on wealth andwealth-related studies will be published in 1991. Other re-search papers and previously unpublished articles and tableswill also be included.
This annual study includes information on net worth andvarious data from the balance sheet and income statement. Acompendium of previously published SOI articles on tax-exempt organizations will be published in 1990. Other re-search papers and previously unpublished articles and tableswill also be included.
Private Foundation Grant Sara Perry This one-time study was mandated by Congress in the TaxAdministrative Expenses Ed Chung Reform Act of 1984 to assess the impact of current rules
(233-1788) governing the treatment of grant administrative expenses.

Statistics of IncomeProjectP and- Contacts
, PROJECT
Sales of'Capital Assets:
1985 Program1985-89 Panel Study
PRIMARY ANALYST
Laura Prizzi(233-1682)
FREOUENCY & PROGRAM'..'CONTENT
.This periodic study, to be done every jour. -years,. providesdetailed data on the sales of capital assets. rep
.oded on
Schedule D, plus.sales of residences, an.d sailes.of personal
or business depreciable property.
Sales of U.S.,Real Propertyintere'sts'by Foreign Persons:1988 Program
Secretary's Percentage Study
Small-Area Data:1984 Program1985 Program
-Sole-proprietorships:1988 Program1989 Program
Sole ProprietorshipHistorical Source Book
State Data:1985 Program1987 Program
Statistical Subscription Services:Corporation Source BookPartnership Source Book
Migration Flow Data
Tax-,Exempt PrivateActivity Bonds:1987 Program1988 Program
Chris Carson(233-1707)
Bertie Brame(233-1770)
Bob O'KeefeBobby Clark. (233-1683)
Michael-Stmudler(233-1677)
Dodie Riley(233-1689)
Mario Fernandez(2313-1688)
Sandy Bybe-rg
(233-1759)
Susan Mahler(233-1798)
The panel study provides the same data on capital. assettransactions for a subsample of the returns in the Sales ofCapitalAssets basic study; however, data for these tax.payersare obtained over a five-year.period.
This annual study prOvides.data on transfers of U S. realproperty interests, when these interests are -acquired fromforeign persons.--Data'will. include- amount -realized-on'-trans-,fers, the amount of U.S. tax withheld, and country of foreignpersons.
This annual study includes data for computation of thepercentage used in determining income tax-liability of foreignlife insurance companies with operations in the United States.
Special tabulations are produced. All data are from the IRSIndividual Master File system.
Basic SOI program data;''produced annually, cover the busi-ness receipts, ceipts, deductions, - and net income reportedon Schedule C (for nonfarm proorietors): Similar data from .Schedule F (for farmers) are available on an occasional basis.
A tape file of basic Sol program data is produced annuallyand-covers the same data provided in'the Sole~ ProprietorshipSol program, including business receipts, depreciation de-clubtion, taxes paid deduction, interest. paid deduction, pay-
-roll, and net income since 10.5.7, by year and by industry Aprinted copy is published every five years..;
Special tabulations of selected individual income, deduction,and tax data by State are produced on a reimbursable basis.(Data file for 1987 is now,in preparation.)
Annual.detailed indystry data and other information is com-piled. Corporation data, by* industry, are more detailed thanthose included in regular Sol, reports.
Migration flow data.(based on changes in ind ividual incometax return addresses) and income data, by county or State areavailable annually on a reimbursable basis.
This.annual study provides information on industrial develop-ment bonds, student loan bonds, and qualified mortgagebonds, by i1ndustry, type of property financed, size of faceamount, of bond, and State. Beginning in 1987, informationon public purpose bonds will be included.

Statistics of Income Projects and Contacts
PROJECT PRIMARY ANALYST FREQUENCY & PROGRAM CONTENT
Taxpayer Usage Study: Pete Sailer Basic S01 program data are produced annually and provide1989 Program (233-1681) frequencies of specific line entries made by taxpayers, the
use of various return schedules and associated forms, as wellas general characteristics of the individual taxpayer popula-tion. Weekly reports are produced during the primary filingseason (January through April).
U.S. Possessions Lynn Flaherty This periodic study, planned for every two years, providesCorporations: (233-1715) data on income statement, balance sheet, tax and "posses-1987 Program sions tax credit" data for "qualifying" U.S. possessions cor-
porations. (Most of these corporations are located in PuertoRico.)

Partnership Returns, 1987
By Joseph H. Middough*
For 1987, partnerships reported an overall net lossof $5.4 billion, a reduction by nearly 70 percent fromthe $17.4 billion overall net loss reported for 1986 [1 ].Net losses reported by real estate operators andlessors of buildings ($33.1 billion) contributed sig-nificantly to the overall net loss. The number ofactive partners hips--1 648,032--decli ned for thesecond year, with the decline occurring largely in thereal estate and services industries [2].
THE TAX REFORM ACT OF 1986 ANDPARTNERSHIPS
Tax shelters provide investors with a means ofrealizing an economic profit, while minimizing thetaxable income they must report on their tax returns[3]. Partnerships have been an effective vehicle foraccomplishing these goals, because partners' in-vestment resources can be pooled for a particularactivity, and business income (or losses) can bepassed through to the partners. Partnership incomeis not taxed directly.
Since a partnership is not a taxable entity, the TaxReform Act of 1986 targeted tax laws which apply tothe distributive shares of income, deductions and taxcredits generated by the partnership and passedthrough to its partners which can be individuals,corporations, other partnerships or virtually anyother legal entity [4]. Before the Act, for example,individual partners could generally use deductions(and thereby losses) from partnerships to offset in-come from other sources and tax credits to reducetheir total income tax. In order to curtail this, the Actlimited the use of "passive" losses by those "limited"partners who are individuals [5]. In general, theselosses could only be deducted from passive income[6].
Passive income or loss is generally derived fromany business activity in which the taxpayer does not
materially participate, i.e., does not participateregularly, continuously or substantially in its day-to-day operations. A phase-in period from 1987through 1991 was included in the Act in order toprovide some relief for taxpayers with passive invest-ments entered into prior to its enactment. Becauseof this phase-in provision, a certain percentage, e.g.,65 for Income Year 1987, of these passive activitylosses was allowed to offset nonpassive income.Although rental activity was a passive activity,partners were allowed to fully deduct passive lossesfrom nonpassive income up to $25,000. In order toqualify, partners had to participate in the rental realestate activity in a significant and bonafide sense,i.e., by making management decisions or by arrang-ing for others to provide services such as repairs,and also by not allowing their ownership interest inthe activity to fall below 10 percent at any time duringtheir taxable year. However, for rental real estateactivities, this special $25,000 offset was reduced by50 percent of the amount by which an individual's"adjusted gross income" (or AGI) exceeded$100,000. Consequently, there was generally norelief from the passive loss limitations for partnerswith adjusted gross income more than $150,000.For tax credits earned by the partnership for low-in-come housing and rehabilitation activities andpassed through to partners, the phase-out of the$25,000 offset was required once the taxpayer'sadjusted gross income exceeded $200,000.
The "at-risk" rules continued to limit deductiblebusiness losses of limited partners to the amount ofcash, property, and loans invested or made for whichthere is personal liability. The Act, however, ex-tended these rules to include the holding of realestate which had previously been exempted fromthem [7]. With the exception of mineral property, allpartnerships acquiring real estate after 1986 wereaffected by the extended rules regardless of whenthe partnership placed the property in service.
*Corporation Special Projects Section. Prepared under the direction ofAlan Zempel, Chief 5

6 Partn*rship'ftiturns-l 987
Partnerships were also. afl`466d -by. the new. rules_f al "gains.applicable to partners-on taxation"o
*. capit
Prior to the Act, individuals were:-entitled. to.deduct60 percent of their net capital gairi(i.d., net long-term-capital gain. less any Pet short-term capital loss) incomputing AGI. Thus; -,thei ~maxirnum effePtivelaxrate for 1986 on ab'. individUal's. net -capital:gain was20 percent. The preferentiaV,'treatment: of capitalgains was repealed by.,.th,e,.iAct...,~tThe.'r'e'peal, -wasgeneral,ly effective for all, taxabl-el.-yeass beginningafter 1986. Lo
.ng-:term
.ca
.Oital ",gains,. h,owev6r, r
Ieal-
ized by noncorporate, taxpayers. durihg 1,087 was
capital. Since nearly 99,percent of Oll, partnershipsfili.ng.for 1987. Used -a 'c'ale'n,d.'a'-r-.'~'*y'-.e:ar": accountingperiod, the effect of this:provisibri on' partnershipstatistidsJor. 1987 it probably very. slighl.I
-INDUSTAY.'AcTIVITY IFOR' 1987
Partnerships in. services,*-real estate and miningdo'minated,*partnership ~adtivityjor 1987 a's they didtfor.198
16 'u e'A)' 'T:,(see' Fig* r. hey.accou,nte'.d. for 66
pIercent of partnership' net inciorne,"arid 65,pOtdient, of
partnership net loss.sUbjectto, 6~ maximum rate,'df 281 pert rit"u e
-The Act rnodified the - depreciation,, of assetscovered under the Accel.erated,,C6st..Rbcovery Sys-
y, period. fortern (ACRS), by:len6thening.the(,recovermany pf.the pers6nal'and rea[
,pro
4perty categories.
W.hile the Act, Ie*ngthehedthe depreciation period, it
also provided that, assets 06nera.11y could.-.bepercent sit. er:than a 150-depreciated under'a 200-
percent, declining bIalance method. Rda[estate,- for
which the more limited ~deductions .~ under thestraight-line method were required, was the ej(cep-tion to this change. Also,,the maximurn:0 amountallowed under the. election to expense,, certain
'assets '(Inter I al'Rev nuedepr~epiable business, n eCode 'se'ction''f~9) 7wa.s riitedd,fro'm $0,000 'Jo$10,000., *
The Act included prbvis'ions'fo.r d0terminingwhichinventory .'costs should.be' dapitalizeid'if"all-bf the'property. were not sold:
.dbring,thicuirbrit-year. The
new provision QnArOat.rnent of ~invbnt6ry, costs ap-plied to "real oritangiblia'persori"611'proper.ty" producedby the partndrshipj6i. sale 40,'bustoriie"is.,46d, td: alirrifteid'exte'nit,16' '166lible 'and Intangible,
.property"
acquired,.fo'r'resaid..'~.:ExponseIis
. tha,t
.had to' e.-cap
.i-
talized we're directbbsts~&'the 'prdpert 'and mostA " ~~6d6ced orin.direct,costs thatrelaite.d.*tql~propery
acquired. for resale., Under previous law, -treatmenty wereof indirect costs varied,;,~ altho~66h; man
deducted for the year. in which-th4Y.. Wer6.-incurred,regardless Of when the property' wais* actually sold.(The costs, reported
'for, 1987 as aresult of this law
change are, shown in~ Table I. in this.,article, As "'addi-tional -inventory. posts" under, '!cost of, sales and
Par,tnersh.ips, generally were required to ,adopt,retain or, change their Acq9untinj pdriodito,,co,irididewith1hose of partners. who owned a rhajority;(rhOrethan 50 percent) i
IMerest in pcjrtnetshlp..profits~a'hd
As Figure. B.shows, the overwhelming number of.limited partnerships are in the finance, insurance. and,real estate industrial divisi.on--l 89,914 outOf 262,210limited -partnerships, [9]. The limited partnerships inthis, divisio
In accounted for less'thanI 2 per
Icent of all
partnerships, but reported 92 percent of all,partner-ship losses.
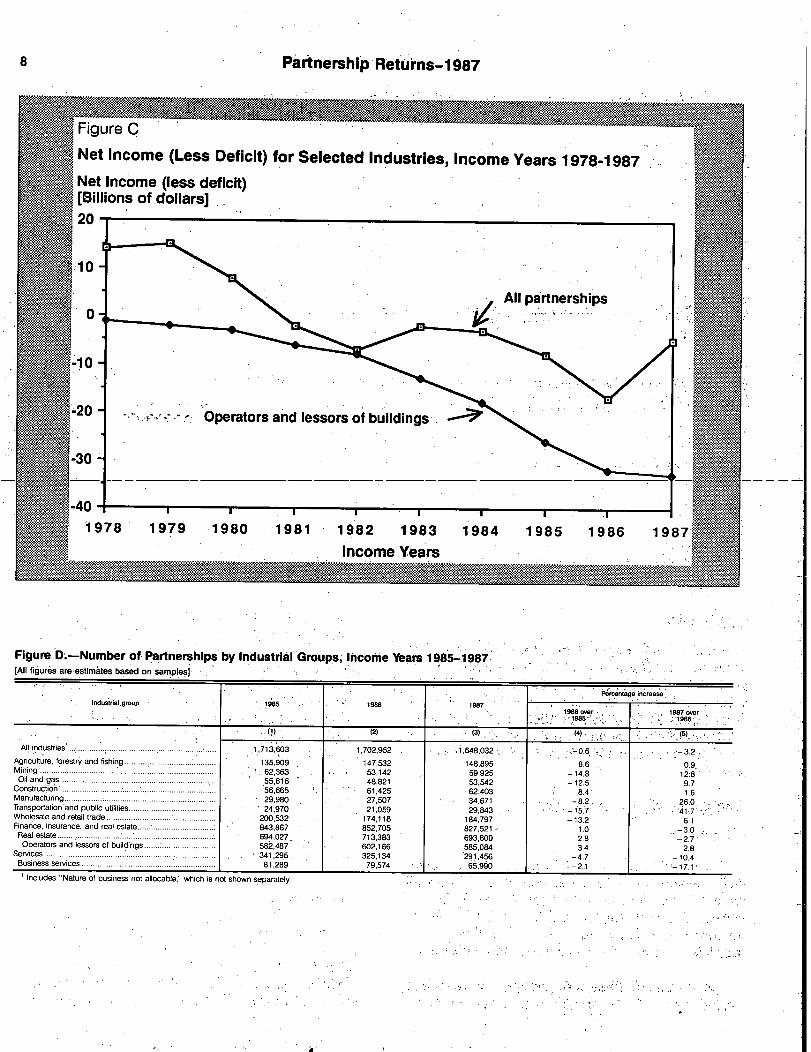
The vast majority of partnerships within thefinance, insurance and real estate.division,werei real- -estate operators. and . lessors. of buildings, account-irig for nearly ~ 20 percent ofpartneTship overall netincome and 54 percent of partnership overall net loss(seeTable,l). Figure C-compares, net income (lessdeficit).fdr this lndu6try_6~oUp to the'n6tihco
,me.-(less
deficit), for., - all pa,;rtnerships ove'r.`the2'- period 1978L1987. The dom
.inance by the 'real estate industry is
undoubtedly connected to the popularity of tax shel-ters within this industry. [10]. For 1987, the decreasein the number of partnerships identifying,themseilves.on their.Aak returns at', real ~6state - operators andI 1 .1. 1
" '
i _I, 7
' '. '
I
lessors of buildings an alsothe'reauctio'*nin~t'h'e*"netlosses'-the Id suggest that thisy wo.U.-industry's'p6pularity for tax.sheltering.actiAies, maybe'dedlinirig'.
Figures D and b6th.focUson partndrship activityfrom' 1985.to 198.7,,the,yeeirs.sUrrounding?the~'1'986Tax Reform Act. Although, six of the eidhtjn'dUstria.1divisions . -reported an increase,_,in , the number ofpartnerships'filing
?returhs,'Pigure 1) shows that the
decline in the number of real estate and. servicepartnerships was,enough to pausean overall declineof 3.2 percent for 198,7 -ovbr.1'986, compared to, adecline of' 0.6 percent i;n the' number, of partners
.h
Ihis
from:1 985 to 1986. FigureE presents partnershipiriet inc6me'~Idss'~deficit) lot! the's6-3 years. 061,6iiUCIL
s'jion. apd,,W"'hole "a e 'and' retail trade was th6--oi,ly' 2i1ndustri.als,divisi6ris whose, reporting -behavior
o' rvices, for examremaine c n6isterit. ple,'6h6w6d

Partnership Returns-1987 7
Figure A
Net Income and'Deficit by Industrial Classification, Income Year 1987
Services
Real estate
Finance and Insurance
Mining
Agriculture, forestry,and fishing
Transportation, coin-munication, lectric,
$-11.0$29.1
457.9
0 incomeED, Deficit
-$4.9$13.3
.$7.1.$5.7
-$2.5$4.5
41.5$4.2
.$0.6$3.3
$2.5
.$5.8$2.0
gas, and sanitary I I 1 -1services - 6 0
1 -40 -20 0, 20
Net income or deficit (billions of dollars)
$22.8
t
P
1:
4 0
Figure B.-Number of Returns and Net Income (Less Deficit), by Type of, Partnership and Industrial Division, Income Year1987[All figures are estimates based onsamples-money amounts are in millions of dollars]
Industrial division
All industries 1 ................................................................................
Agriculture, forestry, and fishing ......................... ..............................Mining ...................... ........................................................................'Construction .....................................................................................Manufacturing ...................................................................................Transportation and public utilities-I ...................................................Wholesale and retail trade ......................................................Finance, insurance, and real estate ................................... ...........Services........................... . ............ . ................................................
' Includes "Nature of business not allocable:' which is not shown separatelyNCFrE: Detail may not add to totals because of rounding.
Number ofreturns
(1)
262.210
7,96819,1143,3373,1974.7669709
189:91424,111
I Limited partnerships
an overall gain in net income of 12.2 percent for 1986.However, for 1987, net income decreased by only2.5 percent. On the other hand, real estate partner-ships reported a 23.0 percent increase in net loss for1986, while for 1987 net losses decreased by 4.0. ipercent. Figure F shows that for 1987 generalpartnerships reported a 25 percent increase in over-all net inbome while limited partnerships reported a
Not income(law deficit)
(2)
$-28,169
-2752,273
184219
-1,540214
-25,91 4-3,218
Number ofreturns
(3)
1,385.824
140,92740,81159,06631,47425,077
175088637:607267,345
General partnerships
Not income(less deficit)
(4)
$22,750
2,290-3,633
2,587587
-2,2412,483-863
21,310
20 percent reduction in overall net losses [11 ]. Al-though it is not possible to fully assess the impact ofthe 1986 Act.on partnerships based on the 1987statistics, the trend established for Income Years1981 through 1986 -- overalf'net income remainingfairly stable for general partnerships, while limitedpartnerships were reporting larger and larger overallnet losses -- came to an end for 1987.
Piftnershi'P Refulms-4987
Figure D.-Number of- Partnerships by Industrial- Groups, Income Years 1985-1987[All fidures are estimates based on samples]
I d i i l 4 !
P"nt~ge Increasen us r a ,group 85 1986 1987
1986 5nr 1987 over198~-
(2) (3)
All industries' ................... ................................... 1,713,603 1,702,952 -1,648.032 0. 6 -3.2.Agriculture, forestr~ and fishing .......... ............. ..........
.135,909 147,532 148,895 8.6 0.9
Mining :..: .............................................. .................... 4 62,363 53,142 59,925 -14.8,
1 ~.8Oil and gas ...................................................................... 48,821 53,542 -12.5 9.7
Construction ........... ... ......................................................... .56,665 61,425 62,403 l§.4 1.6Manufacturing ... .. ....... ;.................................................. 29,980 27,507 34,671 i -8.2, 260Transportation and public utilities. ...................................... 24.970 21,059 29,643 -15.7 41~7Wholesale and retail trade .........................
** ..............200,532 174,118 184,797 -13.2 6 1
Finance, insurance, and real estate- ,
.
........... ... . ....843,867 852,705 827,521 - 1.0
:-3.0
, ,Real estate .................................................
........... ........694,027 713,383 693,800 2.8 -2J
Operators and lessors of buildings ..................... 582.487 602,166 585,084 3.4 -2.8Services ............................................................................. 341.219.5 325,134 291,456 -4.7 -10.4Businessservices .................................... .........................
. 81,289 79,574 65,990 2.1 17.1
Includes "Nature of business not allocable:' which is not shown separately
Partnership Returns-1 987
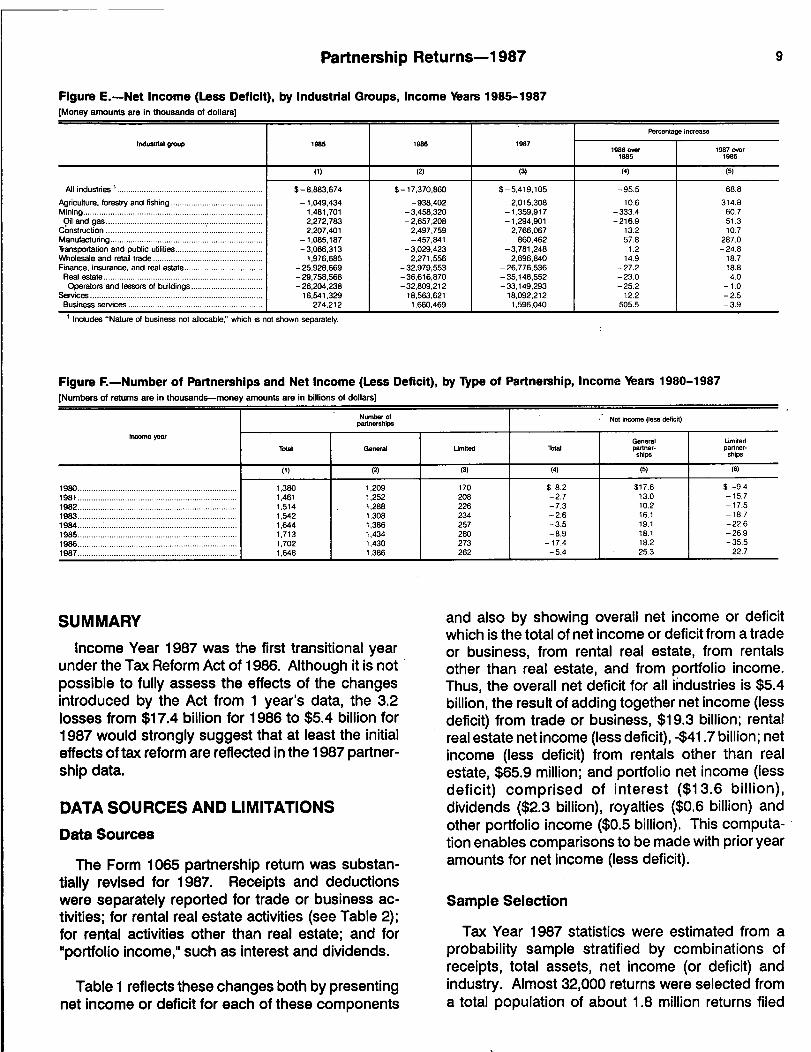
Figure E.-Net Income (Less Deficit), by Industrial Groups, Income Years 1985-1987[Money amounts are in thousands of dollarsl
(3)
Percentage increase
Industrial group 1986 1986 19871986 over 1987 mer
1 9a5 1986
(1) (2) (3) (4) (5)
All industries 1 ................................................................. $-8.883,674 $ -17.370.860 5,419,105 -95.5 68.8
Agriculture, forestry and fishing ......................................... -1,049,434 -938,402 2,015,308 10.6 314.8Mining................................................................................ 1,481,701 -3,458,320 -1,359,917 -333.4 60.7Oil and gas ............................................. ......................... 2,272,783 -2,657,208 -1,294,901 -216.9 51.3.
GbilstruclJon ...................................................................... 2,207,401 2,497,759 2,766,067 13.2 10.7Manufacturing .................................................................... -1,085,187 -457,841 860,462 57.8 287.0Transportation and public utilities ................. ..................... -3.066,313 -3.029,423 -3,781,248 1.2 -24.8Wholesale and retail trade ................................................. 1.976,685 2,271,556 2,696,840 14.9 18.7Finance, insurance, and real estate................................... -25.928,669 -32.979,553 26,776,536 -27.2 18.8Real estate ....................................................................... - 29.758,568 - 36,616,870 -35,148.552 -23.0 4.0Operators and lessors of buildings ................................ -26.204,238 -32.809,212 33,149,293 -25.2 -1.0
Services ..........: ................................ * * * ............. *-*
16.541,329 18,563,621 18.092,212 12.2 -2.5Business services ............................................................ 1 274.212 1 1,660,469 1,596,040 1 505.5 1 -3.9
' Includes "Nature of business not allocable:' which is not shown separately.
Figure F.-Number of Partnerships and Net Income (Less Deficit), by Type of Partnership, Income Years 1980-1987
[Numbers of returns are in thousands-money amounts are in billions of dollars]
Number ofpartnerships
Income year
1980 .......................................................................1981 .......................................................................1982 .......................................................................1983 .......................................................................1984 .............................................. ........................1985 .......................................................................1986 ...................................... ................................1987 ........................................... ...........................
Total General Limited TOW
(1)
1,3801.4611,5141,5421,6441,7131,7021,648
(2)
1,2091,2521,2881,3081,3861,4341,4301,386
SUMMARY
Income Year 1987 was the first transitional yearunder the Tax Reform Act of 1986. Although it is notpossible to fully assess the effects of the changesintroduced by the Act from 1 year's data, the 3.2losses from $17.4 billion for 1986 to $5.4 billion for1987 would strongly suggest that at least the initialeffects of tax reform are reflected in the 1987 partner-ship data.
DATA SOURCES AND LIMITATIONS
Data Sources
The Form 1065 partnership return was substan-tially revised for 1987. Receipts and deductionswere separately reported for trade or business ac-tivities; for rental real estate activities (see Table 2);for rental activities other than real estate; and for"portfolio income," such as interest and dividends.
Table 1 reflects these changes both by presentingnet income or deficit for each of these components
170208226234257280273262
(4)
$ 8.2-2.7-7.3-2.6-3.5-8.9
-17.4-5.4
Net income (law deficit)
Generalpartner-
ships
Limitedpartner-
ships
(5)
$17.613.010.216.119.118.118.225.3
(6)
$ -9A-15.7-17.5-18.7-22.6-26.9-35.5
22.7
and also by showing overall net income or deficitwhich is the total of net income or deficit from a tradeor business, from rental real estate, from rentalsother than real estate, and from portfolio income.Thus, the overall net deficit for all industries is $5.4billion, the result of adding together net income (lessdeficit) from trade or business, $19.3 billion; rentalreal estate net income (less deficit), -$41.7 billion; netincome (less deficit) from rentals other than realestate, $65.9 million; and portfolio net income (lessdeficit) comprised of interest ($13.6 billion),dividends ($2.3 billion), royalties ($0.6 billion) andother portfolio income ($0.5 billion). This computa-tion enables comparisons to be made with prior yearamounts for net income (less deficit).
Sample Selection
Tax Year 1987 statistics were estimated from aprobability sample stratified by combinations ofreceipts, total assets, net income (or deficit) andindustry. Almost 32,000 returns were selected froma total population of about 1.8 million returns filed

10 Partnership Returns-1987
during Calendar Year 1988. All partnerships engag-ing in business in, or having income from sourceswithin, the United States were required to file a Form1065, U.S.- PartnershO Return of Income, to reportthe income or loss, deductions, credits and othertax-related items generated by the ~artnership.Sampling rates ranged from 0.1 percent to iOO per-cent.
Data Limitations
Because the data presented in this 'article arebased on a sample of returns, the are sub
.ect toy J_
sampling error. To.ensure proper use of the es-timates, the magnitude of the Sampling error shouldbe known.
Figure G presents approximate coefficients ofvariation (CV's) for frequency estimates. The ap-proximate CV's shown. here are intended only as ageneral indication of.data reliability and are notapplicable to money amounts. For numibers' of
---partnerships other than those shown, the cor-responding CV's can be estimated by interpolation.
Figure G.-Coefficient of Variation for FrequencyEitimates, Income Year 1987
Estimatednumber of returns
1740000 ...........
s ................ ........ * *** * .... ...... , - ,1:210:000 ............. .............................................. ... . .......J435,000 .....................................................................110,000 ....................................................................................27,000 .............................................. ............ :....................8,900 ................................................................................4,400 1 .................... I...........
Apprmim tecoefficientof variation
0.0250.030.050.100.200.350.50
The reliability ot estimates based on saritples and the use of CV's for evaluating the precision ofsample estimates are discussed in the general Appendix to this publication.
NOTES AND REF.ERENCES
[11 Zempel, Alan, "Partnership Returns, 1986,"Statistics of Income Bulletin,- Summer 1988,Volume 8, Number 1.
[2] The statistics include data- only for activepartnerships, which are defined as those thatreported any items of income or deductionderived from a trade or business, or from rentalincome or portfolio income.
[3] Tax ~shelters create a mismatching of incomeand deductions,to create tax losses and, priorto tax reform, converted ordinary income (which
was fully taxed) into tax4avored,capita.1 gainsincome. For example,.oil and,gas.partnershipsinitially produced deductions (and resulting los-ses) mainly through the. expensing.pf. dry holeand intangible drilling costs; only later (if at all )did the oil or gas production result in income.In addition, once wells became productive, theywere often sold by the partnership, and theresulting profit received favorable long-termcapital gains treatment.
[4] Most of the new provisions were effectiveJanuary. 1,, 198
-7;- -a: few were retroactive to
January 1, 1986,. and -some were. phased inthrough 1990. -
[5] A "limited" partner, in, contrast- to a "general"partner, is one whose. indebtedness in the firmis limited to.the. amount the person has in-vested. See the discussion, of the "at risk" rules,below.
[6]-However-in-the-case of-oil-and-gas-partner--- -ships, th~ partners were exempt. from theselimitations if their obligations were not limitedwith regard to oil or gas property. Anotherdiscussion of tax reform and partnership pas-sive losses is available in Nelson, Susan andPetska, Tom, -"Partnerships, Passive Lossesand Tax Reform," presented at t.he Annual Meet-ings of the American Statistical Association,August 6-10, 1989,and also included in thisissue of the Statistics of Income Bulletin. Also,refer, for, as revised, example, to Shapleigh,Colbert C., and Raley, Terry M., 'The Effect ofthe Passive Loss Rule and Other RelatedProvisions of the Tax' ReformAct'! Journal ofPartnership Taxation, Spring 1987; Volume 4,Number 1.
[7] Exemption of real estate from the "at risk" ruleshad made this industry particularly attractivesince the partner could be entitled to deductlosses far, in excess of actual investment in theactivity. In fact, losses deducted for the firstyear of operation could have been 10 (or more)times the size of investment required to becomea partner. Even so, a high ratio of losses de-ducted to investment could have subjected theactivity to scrutiny by the Internal Revenue Ser-vice to determine whether it was "economicallyviable." If it was not, the losses were disallowed.

Partnership Returns-1987 11
48] For more information on the 1986 Act and itseffect on partnerships and partners, see, forexample, McKee, William S.; Nelson, William F.;Whitmire, Robert L. and Kuller, Mark A., Effectsof 1986 Tax Law Changes on Partnerships andPartners, Warren, Gorham and Lamont, Inc.,1987.
[91 Partnerships fall into either one of two types:"general," those composed entirely of generalpartners, i.e., partners each of which is per-sonally liable for the obligations of the partner-ship; and "limited," those composed of at leastone general partner and one or more limitedpartners, defined as partners whose liability forthe partnership's debts is limited to the amounteach invested.
[10] Two of the most common means by which a taxshelter partnership formerly generated deduc-
tions (and thereby losses) were through bor-rowing, which created a deduction for interestpaid, and through acquiring property, for whicha deduction for accelerated depreciation couldbe taken. Because real estate is usually ac-quired by means of a mortgage and buildingsare entitled to accelerated depreciation deduc-tions, this industry was well-suited to generatingthese deductions. There was a further tax ad-vantage when property was held for 6 monthsor more, because any gain on the sale of thatproperty was a long-term capital gain which waseffectively taxed at lower rates. These ad-vantages were either limited or eliminated bythe Tax Reform Act of 1986.
[11 ] More detailed analyses of partnership incomeand losses by type of partnership are availablein Dworin, Lowell, "An Analysis of PartnershipActivity, 1981-83," Statistics of Income Bulletin,Spring 1986, Volume 5, Number 4.

12 Partner6hip'Returns-l 987
Table l.-Total Assets, Trade or Business Income','Portfo'llo Income and NIet Rental lric~me (Loss) for Se
.lected Industries
JAJI figures are estimates based on samples-money amounts are in thousands of dollars]
Agriculture. forestry, and fis"
ItemAll
Farms
industriesTotal
TOW Field Fruit and saw cameBeef Cards,
exoWDairyt
Crop tree nut feedlots feedloft and goatserms
(2)' (3) (4) (5) (6) (7)
Partnerships with andwithout not Income.
Number. of partnerships ......................... 1,648,032 148,895 117,206 50,971 2,269 9,382 2,5S6 15,464 i'lill 16,518
lifulmos! of partners ................................ 16,963,2" M,M 421,884 174,119 5,082 93,510 6,076 47,337 7,1563 39,363-
Total "to ........................................... 1,381,296,736 26,402,003 19,652,269 7,331,736 368,470 3,706,020 693,106 3,165,475. 282,621 1,550,200
Receipts and deductions from trade
or, business:
Total recelpIts ........... ........................... 442,802,234 10,11F99,879 7271,668 2,619,312 298,628 443,726 618,119 943,100 350,340 741,855
Business receipt .......................................... 411,457,126 6,756,189 ~.482,553 846,574 144,335. 2412,438 539,416 386.849 132,927 225,842
Ordinary income from other partnershipsand fiduciaries ......................... ................. 3,909,729 135,400 135.240 ~7.025 1,580 .2,482 296 107,206 - 16,505
Farm net profit ................................ ............ 6,Wl,876 _,3,262,066 3,156.545 1,586,949 151,402 148,213 71,543 292,227 212,329 437,679
Net gain, noncapital assets ..................... 2.669.190 329,226. 275.927 87,287 62 8,264 4,321 .103.909 3 56.715
Other receipts ...............; .............................. 11EI.264.316 316,998 221,403 91,477 1,449 42:329 2,544 52,910 5,082 5,115
Total deductions
..................................
423,498,684 _111,14S,755 5,443,081 1,303,159 204,403 .843,801 620,708 733,967 154,131 382,559
Cost of sales and;operations....................... 237,1156,8~9 4,175.59,1 2,355,684 462,539.
124,842, 176,061 471,546 334,666 13,621' 151,880
Inventory, beginning of year ...................... 28,361,810 ., 554,073 458,802 236,608 14,805 57.664 47,196 50,081 1,759 7,580
Purchases.
............................................... 167,977,884 2,949,406 1,863,904 355,897 59,338 69.851- 447,678 291,465 112,974 136.919
Cost of labor ...................................... 9,975,053 195,481 77,976 27,668 6.548. 16,197 3,176 1,307 - 5,695
Additional inventory costs : .................. j,265,482 33,673 23,992 5,168 . - , 18,62~ 16 183 - -
Other costs .............................................. 61.270,873 1,133,066 482,612 120,080 62,419' 116,887 30.960 23,891 932 8,666
Less: Inventory,.end of year ...................... 31,659,M 690.137 551,602 282,882 18,268 103,163 V.480 32.261 2,044 6,980
Salaries and wages ..................................... 40,676,362 507,067 187,913 69,636 2,830 14,672 :5,862 6,378 72 17,957
Less: Jobs credit .............. :........................ 2,785,107 15,155 15,108 - - 6 - - - -
Guaranteed payments to partners ............... -7,212,21.4 418,998 356,134 147,602 537 29,341 .3,081 59,779 3,973 52,378
Rent paid ..............................
..................... .8~983,537 76,299 47,527 16,999 180 2.779 1,357 3,602 3 i,476
-Interest paid- ................ _ .................. 19,9~,W_ -288,6U- 57,165 39,511 _982 56,911 _11,540 22,458 73 4,330
Taxes paid ................................................... 6,867,461 100,508 39,227 17.091 530 4,166 1,047 1,830 144 3,742
Bad debts ....... ........................................... 1220,161 22,203 16,751 11,460 245 129 - 775 1.529- 2 87
Repairs ........................................................ 2.513,M 104,302 39,937 210 3,182 1,935 1,534 1,102 4,102
Depreciation ................................................ 19,307,397 377,142 161,997 31,418 2,147 17,465 6,047 8,652 3,295 1,948
Depletion .......................... I ........................ 28.7,787 13.003 2,847 - 281
Pension, profit sharing, innuity and bondpurchase plans ..................................... 744,077 3.861 2,074 58 113 363 30 231 1,120
Employee benefit plans 1,267,221 6,476, 4,742 1,471 42 399 316 270 1,001
Ordinary loss from other partnershipsand fiduciaries..~ .......................................... 5.511,410 101,969 21,850 16,479 4,080 15 628 - 57
Farm net loss ................................. ............ 1,675,642 1,552,798 1.366,957 236,017 64,551 450,478 89,924 230,497, 23,286 120,255
Net loss, noncapital assets.I ........... ............. 1,022,652 34,057 29,086. 1,802. 7 10,780 102 14,659 40 323
Other deductions ........................................ 71,883,520 1,377,982 668,298 237,225 7,188. 73,001 27,132 47,255 21,621
Not Income or deficit from trade...................................or business .... 19,303,350 1,654,124 1,828,586 1,316,153 94,425 _400,0715 -2,589 209,134 196,208 359,2967
Net income .................................................. 62.028,990 4,125,099 3,564,333 1,649,733 161,505 159,514 464,883 219,867 481.173
Deficit .......................................................... 42.725,640 2,470,976 1,735,746 333,581 67,081 559,589 87,108 255,750 23,658 121,877
Portfolio Income distributed directlyWpartners:Total income (less deficit).:............................. 29,662,546 581,724 434,091 .135,279 2,889 69,433 7727 79,441 4.218 86,267
Interest income: ...................... :.................... 13,568,398 308.236 218,044 78,561 1,796 27,487 3:516 46,428 4.210 21,000
Dividend income ......................................... 2,310,346 13,406 11,467. 3,184 Ill 2,775 2, 1.076 7 1,7190
Royalty income .................. ................... 588,096 17,230 17,228 13,107, 769 - 3.058 64
Net'short-term capital gain Oess loss) .......... 414,372 51,162 38,077 3,105 - 1 16,076 1.690 3,639 13,271
Net long-term capital gain (less loss) 1 12.260,025 183,226 142,315 35,022 214 19.998 2,519 25,060 48,789
Other portfolio kicome (less loss) ............... .491,309 8,464 6,960 2,3010 - 3,096 - 179 1,353
Real estate rental not Income.or deficit ... -41,746,473 246 -6,463 128,432 1,711, -6,496 -130,941 3,697 11250 8,2149
Net income .......................... ......................... 13,145,084, 192,795 178,896 147,265, 1,715 6,989 2,614 4,780 1.250 2,097.
Deficit ............................................................ 54,891,657 192,549 185.359 18,832 3 13,485 133,655 8,477 - 10,"6
Net Income or deficit from other rental . .I
I .I -
activity ................................................ 65,869 '13,602 14,213. 10,940 -223 209 416 694 104 .1,725
Net income .................................................... 1,341,105 16,378 16,163 12,666 - 209 416 694 104
Deficit ............................ ........................... 1,275.235 2,777 1,949 1,726 223 - - - -
Total net Income or deficit ...................... ~5,4119,105 2,015,307 2,090,036 1,552,677 98'590 373,004 -129,595 256,872 201,780
Net income .................................................... 87.654,011 4,487,634 3,891,650 1,878,395 162,256 182,283 86,812 494,724 225,438 496,310
Deficit ................................ ........................... 1 93.073,116 2,472,327 1 1,801,614 325,718 63,666 555,287 1 216,407 237,853 23,658 119,431
Footnote at end of table.

Partnership Returns-1987
Table I.-Total Assets, TWe or Business Income, Portfolio Income and Net Rental Income (Loss) for SelectedIndustries-Continued[All figures are estimates based on samples-money amounts are in thousands of dollars)
13
Agriculture, forestry. and fishing
tram AllI d i
Farmsn ustr es
TotalTotal Field
Vere""Fruit and Beef cattle Beef cattle
.11M.crop an Ms. tree nut feedlots and goats
(2) (3) (4) (5) (6) (7) (a) (9) (10)
Partnerships with not Income
Number of partnerships ......................... 864,840 96,575 79,963 39,340 1,739 3,1583 1,402 9,144 1,383 13,061
Number of partners................................ 9,239,094 302,586 2",109 143,519 3,999 28,819 3.060 24,385 3,548 30,626
Total assets ........................................... 595,323,180 12,009,261 10,096,502 4,755,188 151,332 1,318,308 384,827 1,383,230 75,047 814,744
Receipts and deductions from tradeor business: 1 .......................................
Total receipts....................................... 347,580,586 9,116,112 6,220,93S 2,300,139 245,727 339,488 556,825 738,001 346,615 688,348Business receipt .......................................... 320,754,624 5.285,700 2,603,590 572,141 92,287 158.782 487,710 230,880 132,649 196,207Ordinary income from other partnershipsand fiduciaries ............................................ 3,693,914 128,119 127,983 3,611 1,344 2,455 296 103,634 - 16,505Farm net profit ............................................. -6,408,026 3,207,542 3,102,104 1.576,981 151,402 145,008 68,305 273,324 208,882 425,261Net gain, noncapital assets ......................... 2,164,108 281,041 234,141 85,272 46 5,494 44 90,525 3 47,539Other receipts.............................................. 14,559,914 213,711 153,119 62,134 648 27,749 470 39,638 5,082 2,835
Total deductions .................................. 286,722,750 5,035,647 2,698,297 6S4,119 84,222 184,870 475,343 287,966 126,748 207,984Cost of sales and operations....................... 185,261,594 3,181,544 1,733,070 278.958 76,990 436.739 197,003 113,621 136,132
Inventory, beginning of year ...................... 17,111,987 284,606 242,549 120,254 12,420 28,250 44,584 14,941 1,707 4,159Purchases ............................................... 140,349,553 2,369,994 1,446,522 244,163 54.750 48,348 405,292 188,256 112,974 122,177Cost of labor ........................................... 7,129,441 139.753 52,465 17,029 3,866 4,745 3,171 1,307 - 5,695Additional inventory costs........................ 685,708 12,349 6,933 5,168 - 1,581 - 183 - -Other costs .............................................. 38,607,291 783.143 328,110 77,999 21.103 51,779 30,814 22,500 932 8,666
Less: Inventory, end of year ...................... 18,610,085 408.300 343,509 185,655 15.148 39,255 47,122 30,184 1.992 4,565Salaries and wages ..................................... 29,019,226 338,474 116,064 38,002 1,264 9,008 2,522 1,627 72 17,957Less: Jobs credit ....................................... 578,720 15,155 15,108 - - 6 - - - -
Guaranteed payments to partners ............... 4,898,818 263,339 208,833 117.763 537 10,418 1.418 14,150 103 18,491Rent paid ............... .................................... 6,311,478 51,703 28,212 5,296 162 692 450 1,766 3 1,382Interest paid ...................................... 7,891,282 99,706 47,235 12,505 88 7,454 7.810 11,831 73 1,669Taxes paid ................................................... 4,276,574 52,159 23,441 10,594 379 1,762 377 731 144 3,641Bad debts ................................................... 392,512 16,467 13,927 11,117 135 71 6 46 2 87Repairs ........................................................ 1,510,479 67,561 20,653 9,323 8 1,865 1,116 785 1,102 3.835Depreciation ................................................ 6,517,246 134,220 50,929 21,453 171 3,242 4,528 5,108 3,295 1,688Depletion ..................................................... 235,323 4,732 2,847 - - - - - - 281Pension, profit sharing, annuity and bondpurchase plans........................................... 633,209 2.736 2,060 58 113 361 30 231 - 1,120Employee benefits plans ............................. 921,907 4.501 3,740 834 42 376 82 190 - 1,001Ordinary loss from other partnershipsand fiduciaries... ......................................... 254,002 2,067 1,782 358 - 746 15 309 - -Farm net loss .............................................. 94,842 53,515 52,015 7,541 - 5,121 2,463 27,237 364 2,175Net loss, noncapital assets .......................... 52,642 13,715 12,606 418 7 10,780 102 936 40 323Other deductions ........................................ 39,030,333 764,361 395,990 139,900 4,326 37,532 17,687 26.017 7,928 18,202
Net Income or deficit from tradeor business ........................................ 60,857,836 4,080,466 3,522,638 1,646,019 161,505 154,618 81,482 450,035 219,867 480,364Net income .................................................. 61,623,007 4,121,540 3,560,865 1,649,733 161,505 157,992 83,945 463,510 219,867 481,173Deficit .......................................................... 765,171 41,074 38,226 3,714 - 3,374 2,463 13,475 - 809
Portfolio Income distributed directlyto partners:Total income (less deficit) ............................... 20,962,979 352,075 298,731 115,007 724 25,109 2,423 61,249 4,218 57,867Interest income ............................................ 10,512,983 205,472 173,282 69,802 702 18,650 2,437 38,929 4,210 15,756Dividend income ......................................... 2,148,169 11,010 9,762 2,640 - 2,236 2 628 7 1,785Royalty income ............................................ 539,527 14,584 14,584 13,107 - - 1,413 - 64Net short-term capital gain (less loss).......... -224,155 25,567 18,468 1,645 - 1 3,331 - -104 - 13,271Net long-term capital gain (less loss) .......... 7,619,162 91,522 78,985 25,534 24 893 -16 20.383 - 25,652Other portfolio income (less loss) ................ 367,293 3.921 3,650 2,279 - - - - - 1,340
Real estate rental net Income or deficit ... 12,027,714 160,185 155,915 135,304 49 6,570 2,475 3,719 1,250 -4,724Net income.................................................... 12,930,089 169,653 165,259 136.842 52 6,611 2.614 4,057 1,250 2,045Deficit ............................................................ 902,375 9,468 9,344 1.538 3 41 139 338 - 6,769
get Income or deficit Mm other rentalactivity ................................................ 1,200,490 11,998 11,619 9,245 - 209 416 - 104 1,725Net income.................................................... 1,249,189 12,738 12,526 9,951 209 416 - 104 1,725Deficit ............................................................ 48,698 741 706 706 - - - - - -
ratal not Income or deficit ...................... 1 87,654,011 1 4,487,6341 3,891,650 1 1,878,395 1 162,256 1 182,283 1 86,812 494,724 1 225,438 496,310
Footnote at end of table.

14 Partneithip"ketuFfis'-1 987
Table I.-Total Assets, Trade or.Business inco'nie, Portf
.ollo l6comeand Net Rental income (Loss) for Sallicted
Industries-Continued[All figures. are estimates based on samples-money amountserLe. in.t.housands.of dollars)
AWkLdture, forestry, and fishing-corijinued. Mining
Farrns-oontimied
ItemGeneired
AgrimiltureJservices, Total I0=
Other TotalGeneral
livestockOther
mining contractore
farmspecialty
(11) (12) A13) (14) (15) (16) (17) (18) (19)
P:,tnemh'ps with and.,thoutnet Income
Number of partnerships ............................... 618 10,242 7,085 31,S89 59,925 53,542 6,383 62,403, 214,546
Number of partners ........................................ 25,791 21,S66 170;394 2,742,346- 2,660,632 81,714 153,160 69,902
Total assets................................................. 481,080 1,604,660 448,901 6,749,735 71,492,079 62,805,479 8,686,600, 17,076,642t. 14,893,747
Receipts and deductions from tradeor business: ....... .......... : ...............
Total receipts ............................................ W8,433 576,431 371,523 3,528,211 17,306,189 13,045,578 4,260,611 26,92S,343 18,543;456Business receipt ......................... a ........... .,278,413 418,653 267,107 3,273,635 15,332,029 11,246,879 4,085~151~ 26,295,278 16,010,508
Ordinary income from other partnershipsand fiduciaries..:~ ........................... ........... 9, 160 761,635 751,524 10,111 144.474
Farm net profit ............ ~~: ..................... ............... 27.942 124,640 103,622, 105,521 314 287 - 28 ~'7.703 7.395Net gain, noncapital assets ................................ 125 1~,175 67
.53,300 376,112 321.339 54,773 49.744 9,328
Other receipts ............................. : ........... 11~8115 17,955 728 95,595 ~,836.099 725,550 110,548 425,112 371.752
Total deductions ........................................ 31 3,639 582,530 304,184 3,702,674 19,423,635 15,060,712 4,362,923 24,293,104 17,174,261Cost of sales and operations ............... W ............. 161,1.72 266,573 62,784 1,819,907 5.212,323 2,510,284 2,702,039 l%645,701 14.691,236Inventory, beginning of year..: .......................... -4,455 6,956 31.698 95,271 272,733 83,134 189,599 2,1973,394 2,794.674,Purchases :.................................................. P6,293 265,761 37,727 1,085,501 1,379,'487 816,449 563,038 6,454,081 4,085,476Cost of labor ....................... : ........................... 10,566 335 6,485 117,505 330,297 , 57,4115 272,882 1,871,124 914,322
.............Additional inventory costs.
- - 9,681 27.789.
5,355 22,434 44,265 30,303Other costs.............................. :...................... 95,263 3,745 19,770 6W,484 ~,500,753 1,628,190 1,872,563 11:745,772 T10,174,7a5
Less: Inventory, end of year ............................. 5,405 10,223 3Z896 138:535 298,736 80,259 218,478 3,442,936 3,308,323Salaries and ~vages : ................. ................... 11,532 23.993 34.982 319,154 362.03T 2.76,944 - 851,093 763,445 259,495Less: Jobs credit .....W.: ................. .................... - - 15,102 1 . 47 3.000 3,000 466 '! 441
-Guaranteed-payments to parMers.-..==. i4,481- 32~141- --22,&10- -62,864- 300,547 259.157 41,390 352.454 165,149Rent paid ........................................................... 1,886 1 4.967 4,278 28,772,
1154.332, 119,965 34,367 121,922 57,913
Interest paid .................. ................................... -5,978 6.502 EI,880 131,489 855,606. 7113,6130 142,006 229,076 164,658
. 1axes paid ..................... :.............................. %. 1,867 4,885 3,925 61,282 ~29,138 620,561 108,577 169.560 62,149
Bad debts ............................................. ............ 369 28 2,126 5.452 19,288 17,597 . 1,691 17,094 4,727
Repairs ............ :~ ............................. 4.:........... : ~3,215 1,992 8,813 64,365.174,703 122,160, 52,544, a4,144 24.169
Depreciation ....................................................... 13,303 47,168 30,555 215.145 4,164,824 3,843,927 320,80 301,716 112,113
Depletion .......... i: .......................... ..................... 2,566 10.156 210,536 6,508 204,028 571 393
Pensiori, profit sharing, annuity and bondpurchase plans .................... . ........................... 147 13 - 1,787 15,13M 10,om 5,784- 9,767 3.877Employee benefits.plans .................................... 241 504 498 1,734 29,394 17,086 12,308 "1 3,942 5,781Ordinary loss from other partnershipsand fiduciaries.. .......................... ................ .... 591 - 80,119 24
'3,641 234,942 8,699 16,757 16,660
Farm net loss .......... .......... : ............................... 29,495 93,853 28,602 185,840 6,791 3,625 3,166 76 76Net loss, noncapital assets ........................ - 1,373 - .4,971 .16,136 8,132 8,005 1,155 869
Other deduction ................................................ 49,953 87,947 108,457 709,684 6,931,454, 6,299,125, 632,328 2,566.190 1,605,435
Nei Income or deficit front tradeor lguslnese~.....................;; ........ : ............. 7 5;206 -6,098 67,339 -174,463 7 2,117,44111 2,015,133: -102,312 2,632,239 1,269,195
Net income........................... ........................... 36,128 146,175 160,835 560,767 5,075,840 4,512,584 563.256 3,179,281 1;801,324
Deficit ................................................................. 41,334 152,274 93,496 735,229 7,193,285 6,527,717.~ 665,568, 547,0412 .4321.129,
Portfolio Income distributed directlyto partners:Total income (less deficit) ........... ......................... ~:363 34,276 12 199 1 47,633 783,040 727,006 56,034 200,311 184493Interest income ............................... ................... .2,151 27,186 5:708 90,192 424.235 398,460: 25,775 169,529 154,797Dividend incom
.e: ............................................... 76 938 1,506 1,939. 89,549 '84.742 4,80 1,222 620
Royalty inooinne .......................... ..................... 230 1 238,309 237,193 1.116 414 379Net short-term capi
Ital gain (less loss) .............. 62, 245 -9 13,085 -,18,083 -18,072 -11 5,949 10,366
Net long-tem cIapital gain (less loss) ................. 73 5,676 4,963 40,911 34,603 10.255: 24,347 22,645 17,909
.......... ...........Other portfolio i6c6me (less loss),, 31 1, 505 14,427 14.427- 553_ 523
Real estate reirtal,net income or deficit ......... 231 4,532 6,865 -.'6,709 -10,405 -11,820 1,415 -46,518 -47,676
Net income ................................................ 756 4,567 6,865 13,899 6,694 5,141, 1,554 36,118 24,366Deficit ............. .................
....... .........526 35 .7,190 17,100 16.961 - 139 82,636 72,036
Not Income or deficlt from other rentalactivity ................................ ....................... 348. -611 1,415 -2,769 4,184, 8,628 7,222
.Net income :.......... I ............................. 348 216 12,208. 7,023 5,185 14,090Deficit ............. ............................................... 827 1'6,793 :9,792 1,001 :5,461 5,4 16,
Total net Income or deficit ............................ -2,749 27,136 61,450 -74,729 1,359,11il 5 1,294,000 -65,015 2,766,066 -1,485,066Net income.......... ................................................ 36,291 166182
'162.959 595,984 5,698,012 5.108,534 589,478 3,349,845 1.954,W8
Deficit ................................................................... 1 39,039 046139 81.509 670,713 7.057 928' 6,403,434 654,493 583,779 469,742
Footnote at end of table

Partneirship Returns-1987
Table I.-Total Assets, TVade or Business Income, Portfolio Income and Net Rental Income (Loss) for SelectedIndustries-Continued(All figures are estimates based on samples-money amounts are in thousands of dollars)
15
AWIculture, forestry, and fishing--continued M" Construction
Farnts--continued
hern at
Poultry
Generallivestock
Otherlor=and Total
0."=9-Othermining
Total Generalcontractors
and o9pIrZLKH~gIM fanns
specialty
(11) (12) (13) (14) (15) (16) (17) (18) (19)
Partnerships with not Income
u
ber of partnerships ...............................
m
533 5,361 4,418 16,612 24,427 21,591 2,836 48,138 18,296
u ber of partners ..................................... 1,274 13,959 10,919 38,477 1,916,189 1,874,065 42,104 119,266 54,483
Total assets ................................................. 326,852 726,968 180,015 1,912,759 40,858,287 37,764,086 3,094,200 11,328,980 9,817,064
Receipts and deductions from tradeor business: I
Tout receipts ............................................ 220,916 469,787 315,089 2,895,177 13,855,702 10,647 111113 3,208,020 22,BU,172 15,876,365Business receipt................................................. 191,699 330.403 210,829 2.682,110 12, 214,771 9,149.409 3.065,361 22,303,540 15,379,653Ordinary income from other partnerships .and fiduciaries .................................................. 138 - - 136 733,036 722.978 10,058 146,115 143,084Farm net profit.................................................... 27,942 121,377 103,622 105,439 266 254 13 7,685 7,377Net gain, noncapital assets ................................ 49 5,104 64 46,900 346.953 300.195 46,758 44,263 8,877Other receipts ..................................................... 1,088 12,902 574 60,592 5150,676 474,846 85,830 386.569 337,374
Total deductions ........................................ 184,788 330,322 161,934 2,337,360 8,830,094 6,179,753 2,650,332 19,722,703 14,088,586Cost of sades and operations ............................. 127,935 218,102 52,141 1,448,474 3.161.718 1.299,647 1,862,071 15,918,023 12.035,772Inventory, beginning of year ............ ................ 4.244 6,569 5,421 42,057 125,668 62,466 63,202 1,990.330 1,921,162Purchases ...................................................... 23,569 217,664 29,330 923,471 771,261 306,087 465,174 5,277,370 3,284,364Cost of labor .................................................. 10,101 172 6,379 87,288 180,241 22,489 157,753 1,509,089 797,045Additional inventory costs ............................... - - - 5,416 23,683 5.081 18.602 39,542 26.629Other costs ..................................................... 95,144 1,542 17,630 455,033 2,176,369 959.024 1,217,345 9,841,915 8,679,283
Less: Inventory, end of year ............................. 5.122 7,846 6,619 64,792 115,504 55.500 60.005 2,740,223 2,672,711Salaries and wages .......................... ................. 6,161 19,030 20,420 222,410 176,446 119,852 56.594 633,352 221,902Less: Jobs credit.: ............................................ - 15,102 47 - - - 466 441
Guaranteed payments to partners ...................... 2,669 21,879 21,406 54,505 228,216 224,473 3,743 259,207 141,290Rent paid ........................................................... 373 14,737 3,349 23,491 86.501 78,341 8,160 80,620 32,579Interest paid ....................................................... 1,296 1.772 2,737 52,471 346,095 307,853 38,242 135,198 93,078Taxes paid .......................................................... 729 3,253 1,831 28,718 404.740 345,528 59.212 138,675 53,209Bad debts .......................................................... 369 27 2,068 6.419 5,W5 834 10,227 4,397Repairs ............................................................... 1,486 847 287 46.908 120.859 87.486 33.373 67,230 17,707Depreciation ....................................................... 3,111 1,842 6,491 83,292 1,011,658 889,214 122.444 227,070 84,207Depletion ............................................................ - - 2,566 1,885 168,472 6.352 162,120 544 393Pension, profit sharing, annuity and bondpurchase plans ................................................. 145 3 - 676 9,335 6,696 2,639 9,520 3,637Employee benefits plans .................................... 231 487 498 761 15,958 9.034 6,924 13,281 5,480Ordinary loss from other partnershipsand fiduciaries ...................* .....................I........... - 355 - 285 12,766 10,618 2,147 3,481 3,384Farm net loss ..................................................... 4,841 2,274 1,500 2,914 2,914' - 76 76Net loss, noncapital assets................................. - - - 1,109 5.555 5,253 303 180 150Other deductions .......... .................................... 40,283 43,149 60,969 368,371 3,072.434 2.780,908 291,526 2,226,486 1,391,767
Not Income or deficit from tradeor business .............................................. 36,128 139,"5 153,155 557,827 5,025,618 4,467,930 557,688 3,165,469 1,787,779Net income ......................................................... 36,128 146,175 160,835 560,675 5.074,236 4,510,981 563,256 3,178,413 1,800,456Deficit ................................................................. - 6,710 7,680 2,848 48,618 43,051 5,567 12,944 12,677
Portfolio Income distributed directlyto partners:Total income (less deficit) ..................................... 471 23,930 7,733 53.344 669,380 621,655 47,725 175,163 160,843Interest income ................................................... 233 21,111 1,454 32,189 344,683 324.201 20,482 155,558 142,013Dividend income ................................................ 75 931 1,458 1,248 72,131 67.344 4,787 1,210 610Royalty income .......... ........................................ - - - - 236,343 235,301 1.042 401 367Net short-term capital gain (less loss) ................ 91 245 -9 7,099 -18,180 -18,165 -15 6.186 10,616Net long-term capital gain (less loss) ................. 73 1,644 4,799 12,537 21,218 -212. 21,430 11.380 6,840Other portfolio income (less loss) ....................... - - 31 271 13,1S5 13,185 - 428 398
Real estate fented not Income or deficit ......... -145 4,555 6,861 4,270 -2,180 -2,822 642 17,162 15,410Net income........................................................... 371 4,555 6,861 4,394 5,129 4.486 642 34,904 23,187Deficit ................................................................... 515 - - 124 7,309 7,308 1 17,742 7,777
Not Income or deficit from other rentalactivity ...................................................... - 120 178 8,232 4,838 9,618 8,233Net income........................................................... 120 213 8,298 - 3.414 4.884 13925 12540Deficit ................................................................... - - - 34
~66 20 46 4:307 4:307
Total not Income or deficit ............................ 1 36,291 1 166,182 1 162,959 595,984 5,698,012 5,108,534 589,478 1 3,349,845 1 1,954,808
Footnote at end of table.

16
Table I.-Total Assets, Tmde or Business Income, Portfolio Income and Net Rental 1ncome (Loss) for SelectedIndustriesm-Continued(Ail figures are estimates based on samples-money amounts are*in thousands of dollars]
TOW
(20)
37,85603,245.
2,175,542
8,370,5108,273,411
3,031. 308
40,41653,343
7,108,5084,945.219
178,7212,368,606
956,80213,962
1,561,741134,613:503,950
25
64,010-64,348-
107,411
59,975169.603
177,
5.8908,160
97-
286959;734
1,262,0021,376,916.
114.914'
15,71714,732
60234
-4,4184,736
301,152
11,75210,600
1,4061,466-
1,279,9591,393,996
114,037
Plumbing.heating and
airconditioning
(21)
6,464Miff
352,757
11,500,9281,498,030'
137394
2,3671,333,259
985,86317.413
679,154142,607
-159,352i 2,662
101,303,
27,36112,449
- -10,500-19,1872,5918,768
19.838
6~1,626
-26
143,747
167,669178,466
10,797
3,4363,324
--4
8030,
335712377
171,357182,52911,171
Pawing,pawhanging and
decorating
(22)
6,21113,86262,273
723,121722,855-
1265
504,875193,105
1,342110,37029,400
-52,1491
. 15583,859
38,3146,675
-1,699--7,125
.4,2184,124
11,212-
-318
-154,227
218,246224,625
6,379
3,8771,959-
-1,918-
-9,912-
9,912
210,293,216,672
6,379
Masonry.stonework,tile =no
plastering
(23)
...
...
...
...
...
...
...
Contractorsr
Xie.flecl
(24)
20,950
47,3571,639,875
5,309,11W5,217,637
2.626172
39,99449,42~
4,578,4473,353.726.
154,2421,379,159
670,4769,886
1,257,998118,033234,102
2094,53333,415
_48711-70:7864,951
33,893135,411
26
4.013
2-
256559,813
731,406827.67596,270
7,9198,964
60234
--4,421:2.739
-
10,72511,036
31 11~
1,4061,406.-
753,138848,182
95.045
Contractorsit=
(25)
...
...
...
...
...
...
...
...
Tot"
(26)
177,79330,965,381
33,224,64632.355,935
49,0293,597
320,928495,151
'32,576,1 SS23,793,3603,587,522
13.913,0232.343,232
546,6997,222,8813,819,9961,973,930
607155,532317,357789,475276,22660,599
153.755826.22654.405
74,233160,203
28,9869,248
18,5923,884,634
648,4852,381,5161,733,031
296,092120,17615,39216,960
354143,089
121-9,504
6,09015,593
14,83124,6819,850
806,4612,504,4911,698,029
Lumber andwood
Products,"cala
furniture
(27)
9,9242,836,224
3;?01,2573.145,658~
12,862-
20,836-21,900
.3,093,7202.197,421:
241,781.,1,040,433
361,00230,248
786,917,1262,960.104,868
4832,28122,144
'134.873-26,308
6,107. 45,448
144,804229
2,4026,057
433,053
.4,703363,027
107,537206,77199,234
58,60016,661
51,-
2404.1,649
-
2,3162,606
290
-7,025303
7,329119,539216.282
96,743
Manufacturing
Pnd
industries
(28)
6,81731,481
-2,165,824
2,988,0782,878.564
7,618665176
101,0562,832,678-1,250,139-
96,915396,871220,845.28,045
596,08688,622
302,4171 14
11,51369,68655.88335,57515,1648,962
50,726.302
4,79018,288
7,5645,3361,504
994,844
155,400385.431230.030
76,88213,587
124. 7,8021 -6955,273,
1,1761,449
273
2,2232,984
760180,340404,408224,068
Machinery,W-P!electrical
(29)
608.1,734
.11,1148,11711
1,062,05511,015,374
-8591,472
44:~501,001,083
680,981274,9133511,328
12,657143,0513",09782,079
6,22014,92745,704
9,2146,2373,992
49,792
4,40910,701
60,972119.86258,890
13,7375,094
232,720
773
2222
68,830126,24157,411
Partnemhlps with andwithout net Income
~umber of partnerships ......................
Number of partners.. ...........Total assets ................... ....Receipts and deductions from trade,q!business:Total receipts ...................... ; .............-Business receipt ................................Ordinary income from other partnerships- and fiduciaries ......................................Farm net profit ........................................Net gain, noncapital assets ....................Other receipts, ................ : ..................
Total deductlons.~ ...........................Cost of sales and operations .................Inventory, beginning of year .................Purchases..: ........................................Cost of labor: ............ : .........................Additional inventory costs ...................Other costs : :% .................. ............
Less: Inventory; end of year ..... ............Salaries and wages ................................Less: Jobs credit ..................................
Guaranteed payments to partners .Rent paid ...............................:................Inierest-paid.
........- =
1axes paid ................................ *
_Bad debts
........ .. ' * *......... ... .. ...........
Repairs ............ ...... . ................Depreciation
' ' - * ....................
Depletion ................... ** ............. * ..........Pension, profit sharing, annuity and bond
purchase plans.t .....................................Employee benefits plans.........................Ordinary loss from other partnerships'and fiduciaries ............................... -
, Farm net loss ........................ ................. iNettoss, noricapital assets .....................Other deductions ....................................
Net Income or deficit from tradeor. business ......................... ; ..........Net income ..............I .......................Deficit .................................... : ................
Portfolio Income distributed directlyto partners:Total'income (less deficit) ....................
Interest income ......................................Dividend income .................... : ...............Royally income ................. ....................Net short-term capital gain (less loss)Net long-term capital gain (less loss)Other portfolio income (less loss)
Real estate rental net Income or deficit..Net income ...............................................Deficit .......................................................
Net Income or deficit from other rentalactivity .....: ......................................Net income ; .................... :....................Deficit .......................................................
Total net Income or deficit ...................Net income ...............................................Deficit .............................. ........................
Footnote at end of table.
-Partne.1'ship Returns-1987
OthermWW
23,141.134,653
24,815,162
25,973,25025,316.339
28,548, 2;073
298,445327,B44
25,648,67419,664.8182,973,843
11.964.391
475,7495.696,8273; 1 K3171,4814,567
545105;518210,600553,015205,129
95,352580,90453,874
62,632125,157
21;379~ 85912,369
2.439,q53
324,5761,669.4521,344.876
146,87384,83415,1946,438-727
41,04093
-13,0172,013
15,030
-19,63421 ~3951,761
437,75211,7~7,5601,319,808
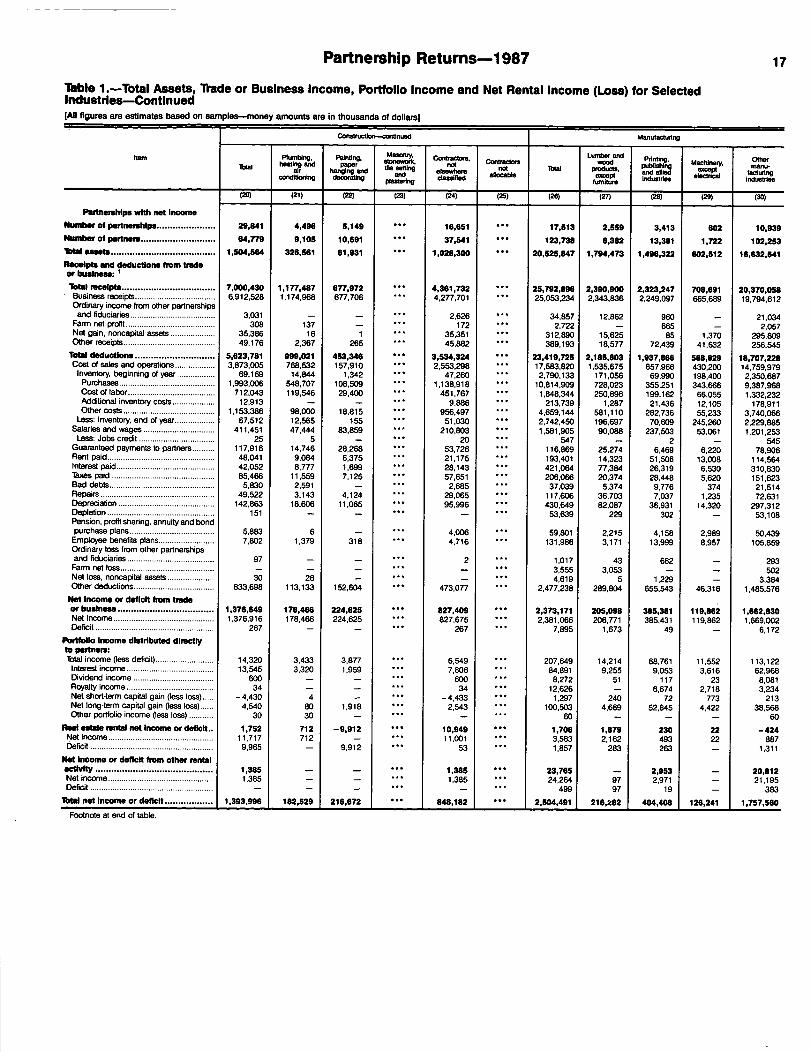
Partnership Returns-1987
Table l.-Total Assets, Trade or Business Income, Portfolio Income and Net Rental Income (Loss) for SelectedIndustries-ContinuedJAII figures are estimates based on samples money amounts are in thousands of dollars]
17
Conwuctior~~uw Manufacturing
ROM Pitentling, Pa"no, Contractors.C
Lmber and
r
OtherTotal hea7 and paper
=and file :::Nnot
elsewhereordractora
not Totalwood
VWUcts,F-.B
Machinery. rrmu~rg
01~Classified allocable
bwustries
(20) (21) (22) (23) (24) (25) (26) (27) (2s) (29) (30)
Partnerships with not Income
Numbeir at partnerships ...................... 29,841 4,496 5,149...
16,651 ...17,513 2,559 3,413 602 10,939
Number of partners ............................ 64,779 9,105 10,691...
37,541 ...123,738 6,382 13,381 1,722 102,253
ToW assets ....................................... i,sw,w 326,561 61,931 1.020,300 ... 20,525,847 1,794,473 1,496,322 602,512 16,632,541
flOcOlpts and deductions from tradeor business: ITom receipts ................................... 7,000,430 1,177,487 677,972 ...
4,381,732...
25,792,896 2,390,900 2,323,247 708,691 20,370,058Business receipts.................................... 6.912,528 1,174.968 677,706 ... 4,277,701 25,053,234 2.343,836 2,249,097 665,689 19.794,612Ordinary income from other partnershipsand fiduciaries ...................................... 3,031 - - ... 2,626 ... 34,857 12,862 960 - 21,034
Farm net profit ........................................ 308 137 - ... 172 ... 2,722 - 665 - 2.057Net gain, noncapital assets .................... 35.386 16 1 ... 35,351 ... 312,890 15,625 85 1,370 295.809Other receipts ......................................... 49.176 2,367 265 ... 45,882 ... 389.193 18,577 72,439 41,632 256,545
Total deductions .............................. 5,623,781 999,021 453,346 ... 3,534,324 ... 23,419,725 2,18111,803 1,937,866 568,829 18,707,220Cost of sales and operations .................. 3,873,005 768,532 157,910 ... 2,553,298 ... 17,583,820 1,535,675 857,966 430,200 14,759.979
Inventory, beginning of year ................. 69,169 14,844 1.342 ... 47.260 ... 2,790,133 171,056 69,990 198,400 2,350,687Purchases ........................................... 1.993,006 548.707 108,509 ... 1.138.918 ... 10,814,909 728,023 355,251 343,666 9,387,968cost of labor ....................................... 712,043 119.546 29,400 ... 451,767 ... 1,848,344 250,896 199,162 66,055 1,332,232Additional inventory costs ................... 12,913 - - ... 9.886 ... 213,739 1,287 21.436 12,105 178,911Other costs ......................................... 1,153,386 98,000 18,815 ... 956,497 ... 4.659.144 581,110 282.736 65,233 3.740,066
Less: Inventory, end of year.................. 67.512 12,565 155 ... 51,1330 ... 2,742,450 196.697 70,609 245,260 2,229,885Salaries and wages ................................ 411,451 47,444 83,859 ... 210,803 ... 1.581,905 90,088 237,503 53,061 1,201,253Less: Jobs credit .................................. 25 5 - ... 20 547
-2
-545
Guaranteed payments to partners .......... 117,916 14.746 28.268 ... 53.726 116,869 25,274 6,469 6,220 78.906Rent paid ................................................ 48,D41 9,084 6.375 ... 21,175 ... 193,401 14,323 51,506 13.008 114,564Interest paid ............................................ 42,052 8,777 1,699 ... 28.143 ... 421,064 77,384 26,319 6,530 310,830Taxes paid .............................................. 85,466 11,559 7.125 57.651 ... 206,066 20,374 28."8 5,620 151,623Bad debts ............................................... 5,1330 2,591 - ... 2,685 ... 37.039 5.374 9,776 374 21,514Repairs ................................................... 49,522 3,143 4,124 ... 29,065 ... 117,606 36,703 7,037 1,235 72,631Depreciation ........................................... 142,863 18,606 11,065 ... 95,996 ... 430,649 82,087 36,931 14,320 297,312Depletion ................................................ 151 - - ... 53,639 229 302 - 53,108Pension, profit sharing. annuity and bondpurchase plans ...................................... 5,883 6 - ... 4.006 ... 59,801 2,215 4,158 2.989 50.439Employee benefits plans......................... 7,802 1,379 318 ... 4,716 ... 131,986 3.171 13,999 8,957 105,859Ordinary loss from other partnershipsand fiduciaries ....................................... 97 - - 2 ::: 1017 43 682 - 293Farm net loss.......................................... - - 3:555 3,053 - 502Not loss, noncapital assets ..................... 30 26 ... 4,619 5 1,229 - 3,384Other deductions.................................... a33,698 113,133 152,604 ... 473,077 ... 2,477,238 289,804 655,543 46,316 1,485,576
IM Income or deficit from trade-or business .................................... 1,376,649 178,466 224,625 827,409 ... 2,373,171 205,098 385,381 119,862 1,662,830
Net income ............................................. 1,376.916 178,466 224,625 ... 827,675 ... 2,381,066 206.771 385,431 119.862 1,669,002Deficit ..................................................... 267 - - ... 267 ... 7,895 1.673 49 - 6,172
Portfolio Income distributed directlyto partners:Total income Qess deficit) .......................... 14.320 3,433 3,877 ... 6,549 ... 207,649 14,214 68,761 11,552 113,122Interest income ....................................... 13.545 3,320 1,959 ... 7,806 ... 84,891 9,255 9,053 3,616 62.968Dividend income .................................... 600 - - ... 600 ... 8,272 51 117 23 8,081Royalty income ....................................... 34 - - ... 34 ... 12,626 - 6,674 2,718 3,234Net short-term capital gain Vess loss) -4,430 4 - ... -4,433 ... 1,297 240 72 773 213Net long-term capital gain Qess loss) 4.540 so 1,918 ... 2,543 ... 100,503 4,669 52,645 4,422 38,568Other portfolio income oess loss) ........... 30 30 - - ... 60 - - - 60
PAW ' - rental not Income or d~.. 1,752 712 -9,912 10,949 ::: 1,706 1,879 230 22 -424Net income ............................................... 11,717 712 - ... 11,001 3,563 2.162 493 22 1387Deficit ....................................................... 9,965 - 9,912 ... 53 ... 1,857 283 263 - 1,311
Not Income or deficit from other rental@C&AW ............................................ 1,385 - ... 1,385 ... 23,765 - 2,953 20,812Net income ......................... ..................... 1,385 - ... 1.385 ... 24,264 97 2,971 21,195Deficit ....................................................... - - - - ... 499 97 19 383
Total not Income or deficit .................. 1 1,393,996 1 182,529 1 216,672 8*11,1182 ... 1 2,504,491 1 216,k82 1 404,408 1 126,241 1 1,757,560Footnote at end of table.

18 Partnership Returns-1987
Table l.-Total Assets, lVade or Business I ncome, Portfolio Income and Net Rental Income (Loss) for SelectedIndustries-Continued(All figures are estimates based on samples-money amounts are in thousands of dollars]
lhm~, communication, electric, gas & sanitary services
Transportation
ftern
Partnerships with andwithout not Income
Number of partnerships ..........................
Number of partners ................................
Tatel assets ...........................................
Receipts and deductions from tradeor business:Total receipts ..... ; .................................Business receipt...........................................Ordinary income from other partnershipsand fiduciaries .......................................Farm net profit .............................................Net gain, noncapital assets ..........................Other receipts ......................................
"Ibited deductions...................................Cost of sales and operations .......................Inventory, beginning of year ......................Purchases .............................. ..................Cost of labor ............................................Additional inventory costs ........................Other costs ..............................................
Less:-Invenfor)& end of-year.__Salaries and wages......................................Less: Jobs credit ............ ...........................
Guaranteed payments to partners ...............Rent paid .....................................................*Interest paid .................................................Taxes paid ....................................................Bad'debts ....................................................Repe'I
rs .............. *1 - -*..........................
Depreciation. ................................................Depletion ............. .........................................Pension,'profit sharing, annuity and bondpurchase plans ..........Employed I)dn6fits plans ..............................Ordinary loss from other partnershipsand fiduciaries ............................................Farm net loss ...............................................Net loss, noncapital assets ..........................Other deductions ............ : ............................
Not Income or deficit from tradeor business ........................................Net income
*- ...... * * * .........................Deficit ...........................................................
Portfolio Income distributed directlyto partners:Total income Oess deficit) ................................Interest income ............................................Dividend income....................................Royalty income .......... :.................................Net short-term capital gain Qess loss) ..........Net long-term capital gain Qess loss) ...........Other portfolio income oess loss) .................
Real estate rental not Income or deficit ...................................................Net income
Deficit .............................................................
Hot Income or deficit from other nimliallac
.Why .....
...................................Net income..........
.........................................................Deficit ...........
TaW-not Income or deficit ......................
Net income :.....................................Deficit .............................................................
Footnote at end of table.
(31)
29,"3428,859
42,01S,1190
20,341,51319,794,652
30,5188,314
137,976370,053
24,228,3287.238,289
11 227,8364,613,307
161,72634,352
2,450.900249,830
1,299.410928
168,370407,266
1,602,197356,409465.657312,515
3,981,692891
26,44471,103
255.1006
573,5467,470,360
-3,686,8151,885.1885,772.004
1,002,301162,404
1,24653
14,347822.998
1.254-23,133
27,17750,309
1-36,258
78,631114.888
-3,781,2492,028.0835,809,332
(32)
.19,611481'"o
10,321,304
8,182,6098,004,341
. 4,075-
63,499110,695
8,015,6514.812,474
39.3993.365,956
101,0017,094
1,370,52071,496
290.054-13
.101.53283,198
343,596
5,713146.464692.565
369
7,16915,035
9,0806
6031,418,993
166,958682,767515,809
17.80924,5131,092
3-,571
-7,196-31
-16,83320.44337,276
-48,28964,708
112,996127,414780.222652.809
Truddrigand
warehouaft
(33)
14,92436,586
1,63.6,684
1,962,8841.924,238
'559
10,42927,637
1,811,049469,099
3,219139,51333,2073.483
294,3444,668
_116111113
96,51535,97372.19943,478
1 83979,624
211,084369
1,4785,786
1306
408674.863
151,814212,03860,224
3,1663,140
67-89
12.8292,663
4,3017,0962,795
169,380232.12462,743
Othertrans.
ponation
(34)
4,76045,094
8,684,620
6,21.9,7466,080,102
3,516
53,07083,058
6,204,6024.343,376
36,1813,226,443
67,7941 3,6111.076.175
66,828170,843-
-5,01747,224
271,39745,335
4,87466,840
481,481-
6,6929,248
8,950-
195744.130
11111,1144470,729455,585
14,64321.3i2
1.0433
-571-7,263
58-26,999
7,61434.613
-52,58957.612
110,201-41,967548,098590,065
Communi.
electricqa3 and
(35)
10,159347,179
31,693,886
12,158,90411,790.311
26,4438314
74:477259,358
16,212,6772,425.815
188,4361,247,351
60,72427,258
1,080,380178.335
__1_'M_.356_915
66.839324,068
1,258,601267,597459,944166,051
3,289,127522
19,275,56,068
246,020-
572,9436,051,367
4,053,T731,202.4215,256.195
984,492137,891
154so
14,918830,194
1,285-6,300
6,734'13,034
12,031.13.923
1,8923,90111,6631,247,8615,156,524
TOW
(36)
164,797475,961
26,105,12.5
71,565,94770.559,503
1314.79236,687 -
122,117712,848
69,276,64751,029,083
6.085.07147,952.922
1,010.537117,512
2,646,2856,983,243
_~_7,509,762_2,560,581
998,8521,896.568
866,323- 970;726
129,519372,876
1.031,5422,216
47,568108,126
25,6838,821
25,7126.813.750
2,289,4003,787,4461,498,046
446,28.8145,488232,183
7395.201
72.841238
8,04883,03274,984
20,7"34.33413.590
2,696,8404,214,7131,517,873
wholesaleUwe
Total
(37)
Wholesale and MARIJ traft
(38)
164,872
424,03717,421,727
'19,92S51,923
8,683,398
23,175,96822,905,SW
".4,30530,88461,624
173,56722,499,93419,649,139
1,574,56718,752,801
228,68259.689
839,8851,806.485
_6411088-955
244,840130,649246,220110,97351,35658,679
123,226515
23,511525,950
6125,2611,005
1,187,792
676,034928,988252,954
97;49269,35922,532
664-1.950
6,940-54
29,02833,783
4,755
2,9153,342
428,800,479
1,044.264243,785
48,38%lilf7l)47,653,914
1 130,4885,804
60,493539,~81
46,T?8,61231,379.9"
4,510.50329.200,121
781,85557,8221
2,006,4005,176,758
-61868.675-2,559,627
754,0131,765,919
620,103859,754.
78,163314.198908'ji~
1,701'
23,98382.176
26.6713,560
24,7075.625,958
1,613,3672,858.45~1,245.092
348.79676.129
209,6511 75
-3,251
291-20,980
49,24970,230
17,82930,99213,16.3
1,898,362.3.170.4491,274.088
Retail trade
hardware,gardenBL=dealers
(39)
4,45512,825
838,899
2,416,8012,396,939
13828
29019,407
2,291,88151.687,536
, 355,2381,633,846
22,1683,324
48,191375,230
--188,562-
38.46339,16024,68037,797
9,98411,39931;226
1.7824,995
91,343
14,160200,790
124,916172,15947,243
8,2477.594
333-- 1
321
14,04214.171
129.
3030
146,915193,56846,653
Gerwalmerchandige
stores
(40)
2,1395,459
334,671
775,051767,729
757,248
768,163530,670
87.745488.120
4,5013,378
36,93890,012
-75,4a5-
-29,26018,6885,581
13,909433
1,20118,704
444417
-70230
63.071,'
16,889.35,30
'6
18,417
C3776,241
44-
-48140
593693,100

Partnership Returns-1987
Table I.-Total Assets, Trade or Business Income, Portfolio Income and Net Rental Income (Loss) for SelectedIndustries-Continued[All figures are estimates based on sampies-money amounts are in thousands of dollars]
19
Transportation, communication, electric, gas & sanitary services wholesale and retail trade
TkansportationWholesal
trade Retail trade
ItemTotal
Communi.cation,electric Total
Total'11ZIng Other
trans-gas and
Total Totalhardware,
gardenGeneral
merchandise.arehousing portation suppog and storesm ,
Isdealers
(31) (32) (33) (34) (35) (36) j (37) (38) (39) (40)
Partnerships with net Income
Number of partnerships .......................... 13,091 9,799 8,007 1,793 3,292 100,271 12,431 87,840 3,618 963
Number of partners ................................ 80,520 54,018 20,170 33,848 26,502 268,481 33,381 235,100 10,799 3,006
Total assets ........................................... 13,180,891 5,237,043 945,562 4,291,481 7,943,848 17,905,605 6,875,501 11,030,104 690,235 262,580
Receipts and deductions from tradeor business: 1
Total receipts ....................................... 8,833,331 4,185,350 1,399,763 2,785,587 4,647,981 52,587,339 17,840,411 34,746,927 2,089,149 533,510
Business receipt........................................... 8,500,476 4,034,900 1,363,746 2,671,154 4,465,576 51,844,006 17,599,360 34,244,646 2,072,774 527.828
Ordinary income from other partnershipsand fiduciaries ........................... ............... 28,744 2,734 - 2,734 26,010 131,390 4,305 127,086 73 -
Farm net profit ............................................. 2 - - - 2 36,058 30.883 5,175 28 -
Net gain, noncapital assets .......................... 127,800 62,759 10,211 52,548 65,041 99,315 60,912 38,403 156 75
Other receipts .............................................. 176,308 84,956 25,806 59,150 91,352 476,570 144,952 331,618 16,119 5.607
Total deductions ................................... 6,957,849 3,503,687 1,188,145 2,315,543 3,454,162 48,812,265 16,913,922 31,898,343 1,917,000 498,293
Cost of sales and operations ....................... 3,100,426 1,846,997 278,008 1,568,990 1,253.428 37,025,646 14,757,835 22,267,812 1,440,413 390,209Inventory, beginning of year ...................... 163,575 6,819 2,187 4,632 156,756 4,162,954 1,070,143 3,092,812 273,895 58,491
Purchases ................................................ 1,884,523 1,153,132 124,653 1,028,479 731,391 34,763,392 14,143,808 20,619,584 1,420,843 350,812Cost of labor ............................................ 73,995 49,890 17,394 32,495 24,105 740,722 196,296 544,426 13,861 4,501
Additional inventory costs ........................ 640 338 - 338 302 86,559 36,923 49,637 3,074 3,378
Other costs .............................................. 1.149,255 672,770 135,508 537.262 476,485 2,038,334 661,445 1,376,888 35,086 34,922
Less: Inventory, end of year ....................... 171,562 35,951 1,735 34,216 135,611 4,766,315 1,350,780 3,415,535 306,345 61,695Salaries and wages ...................................... 332,713 164,411 93,665 70,747 168,302 3,794,531 504,306 3,290,225 159.313 40,525Less: Jobs credit ........................................ 899 - - - 899 365,628 43 365,586 - -
Guaranteed payments to partners ............... 133,472 96,996 92,963 4,034 36,476 607,911 201,125 406,787 21,840 2.000
Rent paid ..................................................... 89.202 44,413 32,536 11,878 44,789 1,183,275 93,034 1,090,241 31.981 11,147
Interest paid ................................................. 301,774 138,766 37,723 101,043 163,007 443,013 155,783 287,230 20,077 3,577
Taxes paid .................................................... 133,325 61,821 32,355 29,466 71,504 676,011 89,435 586,576 .30.379 4,652
Bad debts .................................................... 22,139 3,152 640 2,511 18,988 77,151 41,234 35,917 4.544 88
Repairs ......................................................... 133,416 102,917 73,195 29,722 30,499 254,479 49,757 204,722 8.387 960
Depreciation ................................................. 1,002,657 302,681 111,421 191,260 699,977 581,608 92,255 489,353 23,348 8.438
Depletion ................................ ........... 667 369 369 - 298 1,666 - 1,666 - -
Pension, profit sharing, annuity and bondpurchase plans ................. ......................... 3,447 2,021 931 1,089 1,426 37,647 20,223 17,424 1,775 433
Employee benefits plans .............................. 15,439 8,230 4,922 3,308 7,209 81,198 19,195 62,003 4,530 260
Ordinary loss from other partnershipsand fiduciaries ............................................ 4,696 1,264 - 1.264 3,432 8,524 473 8,051 9 -
Farm net loss ..................................... - - - - - 5,963 5,246 717 - 70
Net loss, noncapital assets .......................... 917 590 408 181 327 3,388 707 2,681 117 230
Other deductions ......................................... 1,684.459 729.060 429,010 300,050 955,399 4,395,881 883,357 3,512,524 170,289 35,704
Not Income or deficit from tradeor business ........................................ 1,875,481 601,662 211,618 470,044 1,193,819 3,775,073 926,489 2,848,584 172,149 35,217
Net income .................................................. 1,885,178 682,757 212,027 470,729 1,202,421 3.781.920 928.359 2,853,561 172,159 35,306
Deficit ........................................................... 9,696 1,094 409 685 8,602 6,846 1,870 4,976 -10 88
Portfolio Income distributed directlyto partners:Total income (less deficit) ............................... 166,369 16,359 2,653 13,706 150,009 396,252 85,292 310,960 7,767 6,268
Interest income .......................................... _ 63,778 15,669 2,617 13,052 48,109 124,067 63,744 60,324 7,113 6,132
Dividend income .......................................... 1.039 995 48 947 44 232,031 22,519 209,512 333 44
Royalty income ............................................ - - - - - 682 664 17 - -
Net short-term capital gain (less loss) .......... 13,307 -122 - -122 13,429 -2,794 -2,013 -781 - 1 -48
Net long-term capital gain (less loss) ........... 88,308 -119 77 -197 88,427 42,062 432 41,630 321 140
Other portfolio income (less loss) ................. -63 -63 -89 26 - 205 -54 258 - -
Real estate rental net Income or deficit .... 22,638 16,203 10,971 7,232 4,435 50,707 28,029 22,677 13,943 582
Net income .................................................... 26,212 19,868 12,384 7,484 6,344 72,564 31,390 41,174 13,943 662
Deficit ............................................................. 3,574 1,665 1,413 252 1,909 21,857 3,360 18,497 - 100
Net Income or deficit from other rentalactivity ................................................. 65,210 63,756 6,969 56,797 1,454 31,948 2,872 29,077 30 so
Net income .................................................... 65,223 63,756 6,959 56,797 1,467 32.879 3,299 29,580 30 66
Deficit ............................................................. 13 - - - 13 930 428 503 - -
Total net Income or deficit ......................1
2,028,083 1 780,222 1 232,124 1 548,098 1 1,247,861 14,214,713
11,044,264 1 3,170,449 1 193,568 1 42,041
Footnote at end of table.

20 Partnership Returns-7-1987
Table I.-Total Assets, Trade-or Business Income, Portfolio Income and Net Rental Income (Loss) for SelectedIndustries-Continued[All figures are estimates based on samples-money amounts are in thousands of dollars)
Wholesale and retail trattw-oontinuiiid
item
Partnerships with and, without not Income
Num~er of partnerehips ..........................
Number of, partners ................. ...............
Total issete ...........................................
Receipts and deductions from tradeor.business
Wall receipts .......................................Business receipt .................... : ......................;Orclinary incbme from other partnershipsand fiduciaries ............................................+arm net profit :............................................'Net gain, noricapital assets ...................Other.receipts ................................
Tatal deductions...................................Cost 6f sales and operations .......................Inventory, beginning of year ........... L..........
Purchases .................................................Cost of labor.:..: ................ W.......... .............AcIditional
Iinventory costs ........................r c
:,Othe osts ................................. ............~!'Less: Inventory, end of year ............
Salaries and wages .............. ........................
ib~; jobs credit ....................... ................~Guaranteed payments to partners~Re6t paid ...........................................
,interest paid ............ ....................................
'Taxes paid :.: ..........................................
.............. :~ ..................... : ..............Repairs.........................................................
Depreciation .................................................
Depletion ! ................................... : ............
Pension, profit sharing, annuity and bondpurchase plans ...........................................Employee benefits plans ........................
OFdi6ary loss from other partnershipsand fiduciaries ............................................
-Farm 'net loss ....................... ........................
:Net loss,'noncapital assets ..........................
Mer deductions .........................................
Net4i6ome or deficit from tradeor business ..... ;..................................N6t,income ..................................... .............Deficit~..: .......................................................
Portfolio Income distributed directlyto partners:Total income (less deficit) ................
..................Interest income ......................... .
Dividend income ..........................................
Royalty income.: ..........................................
-Net short-term capital gain Oess toss) ..........
Net long-terni capital gain (less loss) ...........Other portfolio income (less loss) ..................
Real estate rental net Income or deficit ....
Net incorne..:............................... r..................
Deficit ............. ...............................................
Net Income or deficit from other rentalactivity .................................................Net income ....................................................DeficiL ...........................................................
Total net Income or deficit ..~ ...................Net income ....................................................Deficit... ..........................................................
(41)
22,210
49,529
1,665,099
8,S79,5828,510,808
94-
5,82262,858
111,~64,4326.309,745.463,5835,789,316
66,251.20,562426,421456,390665,994
19,520119,863-187,99373,121
116,6678,677
50,006130,995
1
2,95116,206
15,119197
721,410
195,150370.720175,570
8,0075,184.
27716
-122.542
-
-3742,7783,151
18,70218,702
218,956393,736174,*
Food stores
Grocerystores
(42)
14,456
30,940
1,040,505
6,045,8265,989,398,
14-
3,36653,048
5,902,8'544,762.688
381,4634,478,688
22,2412,976 7
258.965381.645372.73719,520
-50,161---80,95145,55967,179
8,22931,46176,199 -
1
2,11813,185
1511988
411,666
142,972222,487
79.515
5,7253,248
18216-8
2,287-
32,7532,750
18,699,18,699
165,119244,40579.286
Otherfood
stores;
(43)
7,754
18,589
624,594
2,533,7S62,521,410
2,4569,810
2,481,5771,547,057
82,1201,310,629
44,01117,586
167,45674,745
293,257
-69,703-107,04227,56249,488
44818,54454,796
-
8333,014
-109309,724
52,179.148,233
96,055
2,2831,937
95-
-4255-
-37725
402
44
53~837149,33295,495
(44) -
17,278
47,262
2,829,767,
11,004,114410,776,209
.60,53715,382,
23.138138,877
10,829,2358,949,3131,157,5918,867,107
.74.7575,702p
228,851'.1,384,6952,646,8162,160,277
46,847- 160,657
135.031114,186
15419,42:017
116,317180
2,72312,616.
961.3822,342
643.570
174,909368,414193,505,
16,342,10,081
1792
1245,952
5
9,65613,484,3,828
2,32636291:303
197,157386,650189,492
Retall trado-oominued
mowvehicledealers
Autorrictive
GasolineservicestailDrull
(45)
6,521
14,518
1,147,783
4,956,2814,823,125
42,
1
185,1342,294
83;610
4,863,1144,148,412
73~5,6934,089,575
2,73666,658
777,1512,368,1382,160,269
13,116 -S 51,214
71,38539,4155,823
18,12732.455
23
1,3849,073
91-4
264,724
93,167.151,851
58.684
8,4143,519
1029
4.875-
2,3543,9471,593
92421961:272
99,975157.82857,853
(46)
4,653
9,490
689,869
4,173,7784,125.129
4,130248
12.37331,897
4,065,7243,492,875
102,0193,389,558
22,8652,680
96,411120,657164,148
8--35,375-
52,30624,00951,4432,826
15,89845,103
157
5431,954
21.3822.332
175,379
106,054127,175
19.121
4,3193,119
46
--151,164
5
2,0603,9241,865
2-2
113,285131,50118,216
Otherautomotive
dealers
.6,704
'i3,254
992,115
p:1,874,0861,827,955
14,289
8,47123,370
1,900,3981,308,027
319,8781,387,975
20,992286
65,782486.886114.530
98,35657,13639,63823,3286,7707,992
38,759-
7961,590
2-
6203,466
-26,31289,388
115.701
3,6093,443
123-
129-86-
5,2435,613
371
1,4001,431
31
-16,10397,321
113,423
Apparel andaccessory
stores
(48)
13,204
28,261
$30,152
1,788,1321,780,607
54-47
7,423
1,791,2091,130,323
439,3781,167,592
8.720
57,504545,245148,198
30,268145,35428,17727,194,
1,0919,326
29,048-
7694.390
1,813-57
235,204
-3,07797,340
100,418
3,6134,588
52--1,
-1,027-
2,4792,518
40
-2,14415
2,159
1,898102,112100,214
Fumftureand home
tumIsWrWgores
(49)
9,673
23,205
1.177,3413
2,4S9,2332,381,21F5
337-
7,562-70.059
2,291,800.1,557,760
1 339,6631,490,329
85,2353,755
65.0,3942k261158,772
5.35127,68167,38543,29441,299
7,5558,352
33.003-
3,9601,344
3,656-2
343,089
167,433207,29339,860
9,3326:947
759-
1,607.32
78821,1141,997
174,287212,35138,063
EatftPI&C-
(50)
30,584
109,965
3,946,597
9,594,9519,502,223
21,1677
5,89665,657
9,171,458~3,945,163
~ 150,5903,M.580
409.0182,203
318,555150,782
2,011,582366,634159,187624,804
.149,303306,25910,493
124,607306,757
1,450
1,34125,857
5,83167
1.9321.863.458
423,493793,038369,545
253.42114,741
206,3637
-5832,140
228
-37,310.4,95242,261
485.938453
608,0071.002.411
394,405
Footnote at end of table.

Partnership Returns-1987
Table l.-Total Assets, Trade or Business Income, Portfolio Income and Net Rental Income (Loss) for SelectedIndustries-Continued[All figures are estimates based on samples-money amounts are in thousands of dollars]
Wholesale and retail tradle-~oontlnued
Retail vadG--conbnuGd
21
ItemFood stores Automotme
FumitursApparel aridand home Etng
Total GroceryOtherfood Total
Motor~qhidq
GasolineWrVICS
Otherautomotme
acces"stores fumishings
stores
as
stores storesjdes are
stations dealers
(41) (42) (43) (45) (46) (47) (48) (49) (50)
Partnerships with net Income
Number of partnerships .......................... 12,308 9,377 2,931 9,928 4,083 2,453 3,392 7,173 5,817 17,345
Number of partners ................................ 27,611 19,944 7,667 30,867 9,388 5,991 15,498 15,930 14,469 63,860
Totai assets ........................................... 998,263 654,146 344,117 1,855,715 774,919 514,271 566,526 395,039 841,638 1,843,586
Receipts and deductions from tradeor business: '
Total receipts ....................................... 6,277,132 4,407,170 1,869,963 7,623,091 3,497,754 2,890,612 1,234,726 1,039,534 1,888,937 6,685,060Business receipt ........................................... 6,220,095 4,359,850 1.860,245 7,456,399 3.391.928 2,864,710 1.199,762 1,035,162 1.851.163 6,616,063Ordinary income from other partnershipsand fiduciaries ............................................ 94 14 80 60,521 42,102 4,130 14,289 54 337 18,103Farm net profit ............................................. - - - 6,140 5,128 12 - - - -Net gain, noncapital assets .......................... 3,825 3,360 465 5,227 1,734 3,469 24 29 7,418 5,617Other receipts .......... ................................... 53,118 43,946 9,172 95,804 56,862 18,291 20,651 4,289 30,019 45.277
Total deductions ................................... 5,907,790 4,186,061 1,721,729 7,257,504 3,347,043 2,763,568 1,146,893 942,194 1,682,190 5,894,771Cost of sales and operations ................ 4,586,168 3,442.377 1,143,790 6,129.903 2,900,573 2,399,315 830,016 612,486 1,191.124 2,602.096
Inventory, beginning of year ...................... 284,344 233.481 50,863 701.575 466,911 W809 165,855 227,258 233.850 100.767Purchases ............ ............................. 4,275,415 3,225.354 1,050,061 5,985.802 2,883,133 ?,311,406 791,264 6G3,939 1,141,579 2.130,157Cost of labor ............................................ 58,142 19,657 38,486 59,680 21,019 19,488 19,172 8,720 59.028 253,016Additional inventory costs ........................ 19,904 2,318 17,586 2,432 2,146 - 286 2,020 3,572 476Other costs .............................................. 271,885 230,061 41,824 122,824 808 85,628 36,388 45.757 58,623 218,052
Less: Inventory, end of year ....................... 323,522 268,494 55,028 742,410 473,445 86,017 182,949 275,210 305,527 100,372Salaries and wages ...................................... 462,957 242,718 220,240 300,663 134,641 110,521 55,500 78,430 122.778 1,431,085Less: Jobs credit ........................................ 59 59 - 103 100 3 - 4 5,351 353,228
Guaranteed payments to partners ............... 52,779 24.471 28,307 84.990 9,538 10,399 65,053 12,463 12.049 107,172Rent paid ............................. ....................... 115,307 55.402 59.905 114,035 41,053 38,612 34,370 54,546 45,293 390,233Interest paid ................................................. 29,218 22,840 6.379 66,505 31,719 15,886 18,899 10,575 21,882 57,839Taxes paid ........................... ........................ 79,707 43,885 35,822 70,369 25,268 3.3,158 11,942 15,336 32,155 207,685Bad debts ............................. ...................... 7,373 7,206 167 5,188 2,072 1,980 1,135 545 5,803 2,398Repairs ......................................................... 30,831 18,905 11,926 22,046 9,245 9,187 3,615 5,567 6,821 82,040Depreciation................................................. 71,399 42,983 26,415 59,188 14,521 31,078 13,589 12,634 22,345 161,562Depletion ...................................................... - - - 157 - 157 - - - 1,439Pension, profit sharing, annuity and bondpurchase plans ............................... ........... 2,503 1,782 722 2,253 1,093 511 649 766 911 820Employee benefits plans .............................. 13,397 10,571 2,826 8,079 5,419 1,363 1,297 2,176 819 19,200Ordinary loss from other partnershipsand fiduciaries .................................. 15 15 - 94 91 2 - 168 3,656 338Farm net loss ................... ........................... - - - - - - - - 67Net loss, noncapital assets .......................... 2 1 - 1,356 - 1,350 6 57 2 321Other deductions ......................................... 456.194 272,964 183,230 392,782 171,910 110,051 110,821 136,451 221,904 1,183,704
Net Income or deficit from tradeor business ........................................ 369,342 221,109 148,233 365,587 150,711 127,044 87,832 97,340 206,747 790,289Net income .................................................. 369,550 221,317 148,233 367.385 150.822 127,175 89.388 97,340 207,025 791,918Deficit .......................................... ................ 208 208 - 1.798 ill 131 1.556 - 278 1,629
Portfolio Income distributed directlyto partners:Total income (less deficit) ............................... 5,585 4.300 1,285 13,971 7,932 3,042 2,997 2,828 6,751 226.097Interest income ...................... ..................... 3,726 2.693 1,033 8,564 3,049 2,645 2,870 3,804 4,436 10,217Dividend income .......................................... 204 148 56 140 9 46 85 52 759 206,336Royalty income ............................................ - - - 2 2 - - - - 7Net short-term capital gain (less loss).. 6 -8 13 129 - - 129 - 1 -13 -14I"et long-term capital gain (less loss) ........... 1,649 1,467 182 5,131 4,872 345 -86 -1,027 1,537 9,357Other portfolio income (less loss) - - - 5 - 5 - - 32 195
Real estate rental net Income or deficit .... 1,797 1,787 9 9,835 2,944 1,758 5,133 901 377 -5,117Net income ............................... .................... 1,924 1,899 25 11,756 3,069 3.477 5,210 914 873 4,446Deficit ........................................ .................... 127 112 15 f,921 125 1.719 77 13 496 9,563
Net Income or deficit from other rentalactivity ................................................. 18,668 18,668 - 2,517 1,114 2 1,400 is - 485Net income .................................................... 18,668 18,668 - 2,566 1,133 2 1,431 15 938Deficit ............................................................. - - - 49 19 - 31 - - 453
Totai net Income or deficit ...................... 1 393,736 1 244,405 1 149,332 1 386,650 1 157,828 1 131,501 1 97,3211
102,1121
212,3511
1,002,411
Footnote at end of table.

22.
train
Partnerships with andwithout not Income
Number. of partnerships ...........................
Number of' partners .......................... : .......
TotaII assets ............................................
Receipts and deductions trom tradeor business-'Total recel ......................................Business receipt* ................................Ordinary income from other partnershipsAnd fiduciaries ............................. ; ...............Farm net profit..L ................
. ` ..............:Net gain, noricapital assets ..........................Other recdpts.:;.-.? ..........
I..:.................
-Tatal de~uctions ......................................Cost of sales and operations ...................!nventory. beginning of year ..............Puichases .............................. ..................Cost of labor..:.~..~........... .................
1:~Adcfitional invento costs ..............., ryOther costs: ..... : ........................................
Less: lnventory~ end of year ............ :............Salarie~ and wages ................. 0 ....................'Law: Jobs credit: .......... : .............................Guaranteed
.................................................paidInterest paid.:..,.,: ........... :.......................Tdxi3i paid ..................................................Bad debts ............... .................. : .. ...............Flppairs.;
.............. ............. ***...................
Depreciation ............................................Depletion.i ....................................................Pefisjon,, profit sharing, annuity and bondpurchase plans ............................................Employee benefits plans ...............................Ordinary loss,from other partnershipsand fiduciaries ..............................................Farm net loss ................................................Net loss~ non&apftW assets ...........I................
~Oth6r.deductions ..........................................Na Inco-me- or difflck friont tradeor
............r 1business: . . ......................S......
Net i6come ..............................................Deficit..%.; .................................................
Poirtfolio Income distributed directlyto partners:Total income (less defich)............ .......Interest inconne ......................................Dividend income.:..~.........................................Royalty income.2
'Net'short-term gain Oess loss) ...........................Net long-term capital gain oess loss) ............Other portfohoincorne Oess loss).,, ...............
Real.-eatiate rental not Income or defictit ...........................................Net income
Deficit.: ........................................................... .
Not.
IIncome or difictt-frorn other rental
Activity............. ......................... ...........Net income ' .................
. ............ ........... tDeficit..................... M.M ................
het In-0-,*m̀-i or deficit .........................Net income ......................................................Deficit...............................................................
Footnote at end of table.
Mirtnership. Returns;-.l 987
Table I.-Total Assets, Tiade or Business Income, Portfolio Income and Net Rental Income . (Loss):.fqr - SelectedIndustrIes-ContInued[A!I figures are estimates based on samples-money amounts are in thousands of dollars]
Wholesale and retail
Retall trade--oontinued
lktnWMPlaces -
(51)
7,65S19,007
478,672
1,175,3491,153,252
7,613
14,4851,083,252
438,04525.493
362,68827,214
I -53,42930.779
166,059-
17,20058490,
15,23141,416
25315,58256,952
67654
4.155237,054
1 92,097131,472.39,374
.473405-
-69-
1,6761,576
2,24S2,245
96,323-134,47038,147
Liquorstores
(52)
2,2864,795
235,255
878,527871,399
-555
6,573801,37S684,129_81~633
.667.1235.202
14631,616,
101,59055,4085;6386,577
'19,51710,81915,904
2524,321.
14,617-
-327
1240,131
32,11M35,5013,349
15,680.723
11
14,946-
-1,9131,004
.2,916
Otherretall
Stores
(53)
55,387.123,728
5,085,271
9,718,2089,513,473
40,548387
17,107146,694
9,328,8036,147.2601,409,5885,518,419
78,79016,380
739,8571,615,773
751,7982,202
178,667-7--411-777-
134,866145,122
~~~24,00647,387
170,69971
9,94615,375
13,652SW
1,6201.278,181
..389,405647,216257,811
27,30319,625
1,633 .51
3,2439,210
278,847.6,960.
15,807
3,8825,366
"..9.247398,012667,806269,794
Wholesaleand retall
-Uwenotallocable
(54)
---
-
--
-
--
---
--
(55)
827,52110,327,352
1,040,671,508
39,886-,658123,238,540
2,1368970533,143:
1135,49410,532,674
139,479,959105,195,35213,839,00784,124,713
319,057.,350,377
21,835,60915,240,9803,830,654
16,2691.021,613
~607 107-9,016,162
.879.200215.817226,145
1,379,2234,473
.112,82394,209
3,643,73095,257
302,32812,672,135
406,69913,971,24713,564,548
24,567.40611,193,797.1.911,0,53
251,771390,440
10.379,178441,168
-40,973,03012,428.53053,401,560
-7,994282,155290,149
3606054662:837:081
(56)
128,0042,604,956
234,678,715
96,870,89885,510,000
1395.807,3:080,975
127.0886,757,028
94il62,58781,170.546
1,032,70675,902.493
10.317:62,558
4,967,447.804,975
2,011,22310,161
583,361---7229 209-
4,378,721.200.962
214,210499
81,46434,894
1,633,05738,0901,252
3,462,863
2,706,3106,540,9503.832,640
13590,4514,312,9021,723,670
152,513_188,2967,054.399
.158,671~1,100,921
1,510,324
-5,56223,55829,120
7,949,58312,497,6414,548,058
Finance, insurance, and real estate
banks
's"
(57)
3,594102,415
13,713,694
1,537,615740,2
.45
15,4343,905
102777,928
1,3.94,433170,231
147,713-
- 616,6754,246
.1 60,2b6
50.053--24,968-
584.249
~19,016V~.3,21953,581
56
5619,856
5,970-
305,082
143,AiI2259,082115,900
181,004
1,191120
3.04316,688
996.-1,667
1,6723,339
308,873420,326111,453
brokers and
(58)
4,14376,776
47,5oo,7-n
88,643,42982,645,263
121,6532,843,265
x 14,866! 3,018,38387,754,6"8o,o42,492
731,15375,288,033
8,78256,087
4,361,128402,692
1.6.57,0539,846-
342,949-162,961-
3,292,31213028:r63557,048
101,121410
74,67117,740
42,1618,179
2111,806,235
888,7831,862,478
973.695
1,334,163185,551118,41732,986.
394125.600:498
2,586-4,784
3135,097
206206-
1,223,7452,028,395
Holding andinvestmentcomparim
(59)
1 io,26-7,2,425,764
173,464,2,N
6689,854-~,124_492
1,258.720233.806:112.120
2.960,7165,013,509
957,823~.291,470466,747
1.5356 46i5
589:644396,038193,874
2V190,359
-41,280502,15962,74617,4327,615
59.50734
6,232,7~M~
1,584,926.29,911
9931,351,545
1 676,345~,419.3902,743,045
12,075,2843,962,300,1,604,062.119407- 202:786.6,,07,212
155,089-1,094,4
407,4181,501,888
-5,76923,35129.120
i"416,96510,048,9203,631.955
Instirancentn%. a~~
b service
."(60)
4.1iii'3'4,336
4,376,7~54
4,394,5463,399,122
31,,4.94
71993,855
4,061,705
8.21 1146,170
5,5121 V1
546:121664
379,736
.61,106~---~711664 -
29,20233,054
4,7i13
..22,0124
5,918~,89~
'4.789
6372,734
1.495
-,-332,841700,813367,972
122,68283,138
2,393
'~,65~3.1,169
85,3,826,26,512.22~686
..150,150
_4ii liiJil.7W,156343,723
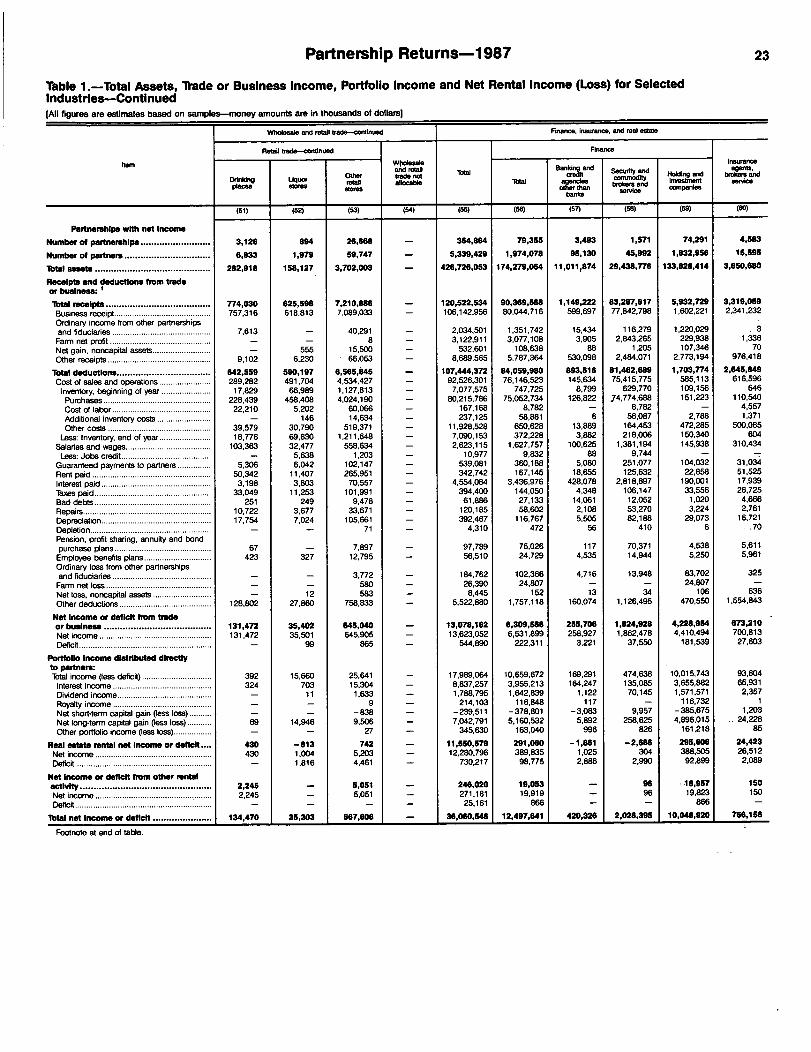
Item
Partnerships with not I me
Number of partnerships ..........................
Number of partners ................................
Total assets ...........................................
Receipts and deductions from trade
or business: '
Tatall receipts .......................................
Business receipt ...........................................
Ordinary ircome from other partnerships
and fiduciaries ............................................
Farm net profit .............................................
Net gain, noricapital assets..........................
Other receipts ..............................................
Total deductions...................................
Cost of sales and operations .......................
Inventory, beginning of year ......................
Purchases ................................................
Cost of labor ............................................
Additional inventory costs ........................
Other costs ..............................................
Less: Inventory, end of year .......................
Salaries and wages ......................................
Less: Jobs credit ........................................
Guaranteed payments to partners ...............
Rent paid .....................................................
Interest paid .................................................
Taxes paid ....................................................
Bad debts ....................................................
Repairs.........................................................
Depreciation .................................................
Depletion ......................................................
Pension. profit sharing, annuity and bond
purchase plans ...........................................
Employee benefits plans ..............................
Ordinary loss from other partnerships
and fiduciaries ............................................
Farm net loss ...............................................
Net loss, noncapital assets ..........................
Other deductions .........................................
Not Income or deficit from trade
or business ........................................
Net income ..................................................
Deficit ...........................................................
Portfolio Income distributed directly
to partners:Total income Qess deficit) ...............................
Interest income ............................................
Dividend income ..........................................
Royalty income ............................................
Net short-term capital gain oess; loss) ..........
Net long-term capital gain Qess loss) ...........
Other portfolio income oess loss) .................
Real estate rental not Income or deficit ....
Net income ....................................................
Deficit .............................................................
Not Income or deficit from other rental
actift .................................................
Net income ....................................................
Deficit .............................................................
Total not Income or deficit ......................
Footnote at end of table.
Partnership Returns-1987
Table l.-Total Assets, Trade or Business Income, Porttollo Income and Net Rental Income (Loss) for SelectedIndustries-Continued[All figures are estimates based on samples money amounts are in thousands of dollars]
Whokmale mid retail trade-continued
Retail trade-conflnued
(51)
3,126
6,833
282,918
774,030757,316
7,613--
9,102
642,559289.28217,829
228,43922,210
-
39,57918,776
103,363-
5,30650,3423,198
33.049251
10.72217.754
-
67423
-
128,802
131,472131.472
-
392324-
-
69-
430430-
2,2452,245
-
134,470
Liquor8tDM
(52)
894
1,979
158,127
625,598618,813
-
5556,230
590,197491,70466,989
458,4085.202
14630.79069.83032.477
5,6386,042
11,4073,803
11,253249
3,6777,024
-
-
327
-
1227,860
35.40235,501
99
15,660703
11-
14,946
-8131,0041,816
-
35,303
OtherretallStores
(53)
26,668
59,747
3,702,003
7,210,9867,089,033
40,2918
15.50066.053
6,565,8454,534,4271,127,8134,024,190
60,06614,634
519,3711,211,648
558,6341,203
102,147265.951
70,557101,991
9,47833,671
105,66171
7,89712,795
3,772580583
758.833
645,040645.905
865
25.64115,3041,633
9-8389,506
27
7425,2034.461
6,0SI5.051
-
667,806
wt~arx! raw)Veda notallocable
(54)
-
-
-
-
-
-
--
----
-
-----
---
---
-
TOW
(55)
364,864
5,339,429
426,726,053
120,522,534106,142,956
2,034,5013.122,911
532,6018.689,565
107,444,37292,526,301
7,077,575
80,215,786167,168237,125
11,928,5287,090.1532,623,115
10,977539,081342,742
4,554,084394,40061,886
120,185392,467
4,310
97,78956,510
184.76226.390
8,4455,522,880
13,078,18213.623,052
544,890
17,989,0648.837,2571,788,795
214,103-239.5117,042.791
345.630
11,550,57912,280,796
730,217
246,020
271,18125,161
36,060,546
Finance,
Total
(56)
79,355
1,974,078
174,279,064
90,369,56880,044,716
1,351.7423.077.108
108,6385,787,364
84.059,98076.146,523
747,72575,052,734
8,78258,881
650,628372,228
1,627,7579,832
360,188167.145
3,436,976144,05027,13358,602
116,767472
75,02624,729
102,36624,807
1521,757,118
6,309,5886,531,899
222,311
10,659,6723,M,2131.642,839
116,848-378,801
5,160,532163,040
291,060389,83598,775
19,05319.919
866
12,497,641
Finance, Insurance, and real adate
Ban=~"
=183bank$
(57)
3,493
95,130
11,011,874
1,149,222599,697
15,4343.905
88530.098
893,516145,634
8,799126,822
-
613.8893,882
100,62588
5,08018,655
428,0784.348
14,0612,1085.505
56
1174,535
4,716
-13160,074
255,706258,927
3,221
169,291164.247
1.122117
-3,0835,892
996
-1,8611,0252,886
-
=url andity
brokare aridservice
(58)
1,571
45,992
29,438,776
93,287,61777,842,798
116,2792,843,265
1,2052,484,071
81,462,68975,415.775
629.77074,774,6a8
8,7a256,087
164,453218,006
1,381,1949,744
251,077
125,6322,818,897
106,14712,05253,27082,188
410
70,37114,944
13,948-
341.126.495
1,824,9281,862,478
37,550
474,638135,08570,145
-9,957258.625
a26
-2,686304
2,990
9696-
2,028.395 1
FWdbV &rWl1wesurbentcornpanies
(59)
74,291
1,832,9SO
133,828,414
5,932,7291,602.221
1.220,029229,938107,346
2.773,194
1,703,774W5, 113109,156151,223
-
2,788472,285150,340145.938
-
104.03222.858
190,00133.5561,0203.224
29,0736
4.5385,250
83,70224,807
106
470,550
4,228,9544,410.494
181,539
10,015,7433.655,8821,571.571
116,732-385,6754.896,015
161,218
295,606388,50592,899
.18,0719,823
866
10,048,920
Insurance
W=Wservice
(80)
4,583
15,595
3,650,680
3,319,0592,341,232
31,336
70976,418
2,645,849616.596
646110,540
4,5571.371
500,085604
310.434
-31.03451,52517,93926,7254,6662,761
16,721.70
5,6115,961
325-
6361.554.843
673,210700,81327,6D3
23
93,80465,931
2,3571
1.20324.228
85
24,42326,512
2.089
ISOISO-
766,156

24 Pi4linershlo'Re'tuens-A 967
Table l.-Total Asieti'Tkideor Busines's Income, Portfolio Income and Net Rental Incoine,(Losi) for SelectedIndustries-Continw;;iIM figures are -estimates basedon samplais-money amounts are in thousands of dolla!sl
Finance. Insurance, and rest esbxte-~oondnue~d Semloes
Real estate and othm lotiging placesROM
OPKMM UnsorsRest estate Other TOW Motals. Other
TOM andof buildings
,other thanbuild =
managersrow
estateTaw motor hotels
and touristcourts
(61) (64 (W) (64) (55) (am (an (68) (am
Partnerships wtth andwithout not Income
Number of partnerships ......................... 693,SW .585,084 36,2T7 11,748 60,692 291',456 24,672 110,M8 13,M
Number of partners .................................... 7,688,061 6;792,107 246,040 76,069 573,846: 2,041,763 486,094 88,189 397,905
Total assets ............................. .............. 801,616,039 667,657,738 15,350,262 10, 159,794 108,448,245 125,133.974 55,159,299 -114,W8,748 .40,27.0,551
Receipts and deductions from budsor business:
T061 re'celpts ................................ ....... 38,621,215 1 0,T75,4183 537,215 2,225,7615 25',082,772 11211,811118,209-~ 21,726,148 -5,526,620 -16,199,628Businew receipt ....................
*:....................... 34,329,418 8,334.197 396,470 1,919.093 23,679,658 116,379,038 21,116,159 5;353,886 15.762,274
Ordinary income from'other partnershipsand.fiducian
.
es ............................................... 741,087 467.217. 10.760 .60,985 202,125 510,387 34,764 13,466 21,298Farm'net profii ............................................... 60,584
127,482 10.732 27 22,342 39.927 4,809 135 - 4;674
Net gain, norrapital assets .......................... 708,335 548,576 10.981 11,460 137,319 497;208 67,652 34,323 '33,328Other receipts , * 1. . -
..;'.4 q...................... 2,781,791 1,397.990 108.272 234,201 1.041,328 4.461,,649 502,765 124,711. 378,054
Total deductions .................................... 41,255,667 -13,427,364 619,280 2,246,404 24,962.620- 104,2i6,409 26,743,262 6,291',215 20,452,047Cbst 6f sales and operations ........................ 23,324.857 4,"7.955 198,513. 612.362 18.066,028 20,476,781 7,050,914 747,919 6,302.995inventory, beginning of year .................... L. 12.798,090 1,831.826 0.8843 182,904 10,752,477 776,610 199,781 39,107 160,674Purchases..: ........................................... b..
.8,076,050 1,380.069 95,528 119,092 6.481,361 6,298,907 1,582,751 322,717 1~260,034
Cost of labor ............................. 303,227 123.965 558 3,046 175,658 3,664,654 1,132,597 150,668Additional inventory cost3 .........................
,286,448 165 15.474 226,163 1'10;760 38,530 9.980 28,5W
Other costs ............................................... 16,322,041 3,014.076 .91,779 .455.530 12.760,656 I0,5M,606 4,322,400 4,061,273'Less: Inventory, end of year ........................ 14,435.400 1,936,899 20,400 163.685 12.3114,4W : 875,183 222,573 35,682 186,891Salaries and wages ...................................... 1,439,694, 608.847 30.208 344,938 455,701 24,376,186 2,759,616 894,993 1,864,623Less: Jobs credit......................................... 6,108 2.501 1 3,606 18fl.100 12,218 %895 2,323
Guaranteed payments to partners ................ 377,146 173.558 6.026 33,841 163,721 3,786,768 119,732 54.612 65'.120-Rent paid ........................................................ ~96,234- 128.006- 13,945- -85,664- - -~8.618- --5,387,3i4- --367,486- - --106.420- - -261.066-
Int6r6st paid .................................................. 4,608.239 2,066.700 64.400 142.371 2.334,768 6,256,539 4,145,962 1,117,205 3,028.757Ta~es, paid ......................... ........................... 645,184 291.797 44,923 284.395 3:379,177 1,034,344 303.564 '730,780Bad debts ...................................... .............. 146,521 52,513 22.272 6,825 64,910 289,715 33,133 8,466 24,668Repairs ............ .................................... 152.880 92,752 5.001 10,044 45,083 1,083,730 427,240 140,679 -286:561.Depreciation ................... ............................. 1,142.990 840.163 48.588 55,326 198,912 7,21 4,054 3,187,943 884,559 2,303.385Depletion ...................................................... 3,903 ~2.835 644 - 424 1,692 .102 102Pension, profit slha~ing, annuity and bond
' ~66ase plansU ............................................P 25,440 15.394 1.610 1,666 6,770 451,668 11.966 1.539 10,427Employee benefits plans ............................... 50,420 30,005 1,835 8,217 10,363 782,551 167;1 12 28,326' 138;786Ordinary loss frcin other partnershipsand fiduciaries ......................................... 2,205,884 1,532,570 28.548 27,864 616,912 991.149 793,030 60.951Farm net loss ................................................ '57,167 43,176 9,347 4,644 2,645 339 339Net loss, noricapital assets ........................... 300,439 157,373 96,207 2,13~9 44,010 .51,126 10.219 439, 9;780Other deductions .......................................... 61474,777 2,946,219 77,417 860,177 2.6 0,964- 29,956.356 6.646,340. 1,951,100 4,695,241
Net income or deficit from tradeor'6usine'
as....................................... -2,634,452 -2,651,9011 -82,065 -20,639 1120,115i 117,59i"799 "5,017,114 -764,695 -4,252,419
Net income ................................................ 6,729,484 2,473.849 136.093 292,943 3,826,600 27,460,656 681,913 278,271 403,642Deficit ............................................................. 9,363.936 5,125,749 218.158 313,582 3,706,447 9,868,857 5.699.026 1,042.966 4,656,061.
Portfolio-Income distributed directly
~to parinera:To
'tal income (less deficit) ................ ............... 10.854,273 8,832,954 241,976 '202,689 1,576.655 1;753.602 747,328 138,597 -:608,731
.Interest income.: ........................................... 6,797,757 5,576,983 1195,193 134;704 890.878 1,023126 338,889 115,301 223,588Dividend income ........................................... 184,990 .164,742 4,096 14.820 35:687 4,090 612 3,478R6yWty income .......... ~: ................................. 99,257 87,452 6.069 333 5,404 62,558 19 19Net short-term ca~rtal gain (less loss) ........... 196,187 92,828 54.742 149,976 -225 m-93' '~-132Nk long-term capital gain (less loss) ............ 3,293,670 2.672.808 89,133 56,799 474,930 633,093 385,310 20,262 _365,648Other portfolio ir~c=a (less loss.) 282,412 238,141 -2,227 .1,396 40,647 23;195 19,245 2,515: -.16,730
Realestate rental net Income or deficit ..... -39,875,935 -36,562,225 -T7,288 -20%848 3'035,574 -695,054 -235,958 -12045 -223,913Net income .................................. * ................... 11,992,615 11,106,555 556,269 185,559
1,144,233 356,250 112,945 13,356 99.588
Deficit.............................................................. 51,868,550 . 47,668,780 633,556 386,407 3,179.807 1.051,305 348,903 -25,462 323,501
Nit Income or deficit from other rentalacilvity.................................................. -i,581 -2,486 -:3,423 5,522 -2,194 50""1 4,T74 2,532 2,242Net income ..................................................... 258,448 222,707 22,521 S.522 7,698 878,628 9,848 3,801Deficit I., - ....... ........... 261,029 :225 ~25,944 -.9,892 827,727 1,269 3.805
Total net Income or deficit ....................... -3648,552 -33,149,293 '809 -78,201 -1965,867 18,092,211 -4,886,055 -656,7ib 4',230,2757Net income ..................................................... 22.796,748 16,972,569 856,732 500.287 4,467,161 29,117,537 878,739 360,554 518.185Deficit .............................................................. 1 57,945,301 1 50,121,862 1 811,923 578,488 1 6,433,028 11,025,325 5,764,794 1,016,334 4,748,460
Footnote at end of table.

Partnership Returns-1987
Table I.-Total Assets, lVade or Business income, Portfolio Income and Net Rental Income (Loss) for SelectedIndustries-Continued[All figures are estimates based on samples-money amounts are in thousands of dollars]
Rem
Partnerships with not Income
Number of partnerships ...........................
Number of partners .................................
"Iblal assets ............................................
Receipts and deductions from tradeor business: ITotal receipts ........................................Business receipt ...........................................Ordinary income from other partnershipsand fiduciaries .............................................Farm net profit ..............................................Net gain, noncapital assets ..........................Other receipts ...............................................
Total deductions ...................................Cost of sales and operations ........................Inventory, beginning of year .......................Purchases .................................................Cost of labor .............................................Additional inventory costs .........................Other costs ...............................................
Less: Inventory, end of year ........................Salaries and wages ......................................Lew: Jobs credit .........................................
Guaranteed payments to partners ................Rent paid ......................................................Interest paid ..................................................Taxes paid .....................................................Bad debts .....................................................Repairs .........................................................Depreciation .................................................Depletion ......................................................Pension, profit sharing, annuity and bondpurchase plans ............................................Employee benefits plans ...............................Ordinary loss from other partnershipsand fiduciaries .............................................Farm net loss ................................................Net loss, noncapital assets ...........................Other deductions ..........................................
Not Income or deficit from tradeor business .........................................Net income ...................................................Deficit ............................................................
Portfolio Income distributed directlyto partners:Total income (less deficit) ................................Interest income ................................... .........Dividend income ...........................................Royalty income .............................................Net short-term capital gain (less loss) ...........Net long-term capital gain oess loss) ............Other portfolio income (less loss)..................
Real estate rental net Income or deficit.....Net income .....................................................Deficit..................................... ........................
Not Income or deficit from other rentalactivity ..................................................Net income .....................................................Deficit..............................................................
Total not Income or deficit .......................
Total
(61)
280,9273,349,766
248,796,309
26,833,90823,757.008
682,75644,467
423,8921,925,784
20,738,54415,763,1836,329,2035,052,512
153.828176,873
10,777,8156,717,320
684,9241.145
147,859124,072
1,099,169223,62430,08758,822
258,9793,768
17,15225,820
82,0711,5837,657
2,210,919
6,095,3646,390,341
294,977
7,235,5884,816,113
143,59997,254
138,0871,858,031
182.50511,235,09711,864,450
629,353
226,817251,112
24,29522,796,748
Finance, Insurance, and real estaft--continued
of buildirgs
ReW estate
1.0180116other thenbukUngs
Real estate=n1Wmanagers
(62)
237,0382,9411,06
202,782,1502
6,062,7764.328,905
428,14424,112
290,019
4,122,2692,350.295
624,401796,83137,02914.217
1,559,665672,119217,394
7352.97727,815
386,79583,54716,07734.980
166,9902,833
13,16915,937
55,454747
6,995690,339
1,940,5072.163,948
223,441
5,911,4473,956,713
132,46886,13146,028
1,556.744133,363
10,S26,03311,048,541
522,508
197,353219,13021,777
16,972,569
(63)
17,389124,137
7,SS9,036
396,010291,905
10,51810,73210,30272,553
278.760156.095
16,01577,107
558165
76,99714,74621,318
-3,695
13,47824,63815,327
-1,005
19,115644
1.5911.131
20,723
117,250133,57916,329
191,555167,150
3,3586,036
-56,41469,890
1,534539,9SS552,701
12,745
21,44822.382
934856,732
(64)
3,35640,884
4,515,768
1,468,9631,256,425
57,580-
9,706145,252
1,201,247368,17723.57356,198
248972
325.84938,662
226,8551
18,50649,59944.11223,0753,5584,626
22,919-
1,4905,960
6.255620207
425,290
267,716290,424
22,708
112,47899,411
1,044333506
10,728456
125,899134,189
8,290
S,4295,429
-
500,287
Otherreal
estate
(65)
23,11"243,178
33,909,003
18,906,15917,879,774
186,5159,623
113,866716,381
15,136,26812,888,6175,665,2154,122,376
115,993161.520
8,815,3055,991,793
219,3581,071
72.68133,179
643,624101,67510.45218,21149,955
291
9032,793
20,361217455
1,074,566
3,769,8913,802,389
32,499
1,020,109592,838
6,7284,754
147.967220,66947,15243,209
129,02085.811
2,S884,1711,584
4,467,161
Total
M
194,0131,071,246
52,026,766
93,448,88688,991.687
453,58630,634
418,8603.554,118
66,117,20912,496,223
499,4443,998,2822,443,095
72,0716.017,504
531,59919,519,501
185,0482,740.6594,275.8061.570,4392,267,995
160,932628,685
2,734.1791.294
412,327602,234
36,5162,430
15,82318,837,213
27,331,67627,414,887
83,210
973,768676,598
23,59560,789-9.487
219.6762,597
218,582328,933110.351
803,700820,681
16,98129,117,537
Total
(67)
services
Hotels and other WVng
MOID0113,rriotor hotelsand tourist
courts
8,079
81,70410,947,069
7,265,5"6,988,876
29,0493,058
43,827200,736
6,627,5752.804,488
74,298365,307259.371
5.2772,180,149
77,341733,176
10,18931.172
102,240533,529306,608
7,913111,272433,638
102
5,76053.825
6,471339323
1,506,909
637,971666,56628.595
174,924147,639
2,724
--18724,639
10888,23897,6769,438
2,0593.3281,269
878,739
(613)
3ASS25,763
4,293,796
1,878,7491,767,722
10,371132
28.01772,508
1,621,333193.400
19,942103,72134,912
1,89945,86812.942
278,9789,758
14,24730,416
221,46292,7071,860
42,466185,526
-
1,1025,922
1,463339
36561,166
257,417275,288
17,871
68,28294,797
288-
-85-26,719
17,5828,547
965
4691,7381,269
360,S54
25
places
other
(69)
5,02155,941
6,663,273
5,386,7975,221,154
18,6782,927
15,811128,228
6,006,2422,611,088
54,356261.586224,459
3.3782,134,281
64,399454.197
43116.92571.824
312,066213,902
6,05368,807
248,111102
4,65847.903
5,008
286945,743
380,SS4391,278
10,723
106,64252,8422,436
--10151,358
10780,6S589,1298,474
1,5901,590
-
sle'les
Footnote at end of table.

26 Partnerthip ReWirns-m--IR87.
Table 1.-Total Assets, Trade or Business Income, Portfolio Income and Net Rental Income (Loss) for SelectedIndustries-Continued[All figures are estimates based on samples-money amounts are in thousands of dollars].
S.M..,;-contiriusd
Personal services Auttirnott"Irepair and other services
ItemLaurmides, Business
Automobile repair senricatiAutomobile
Wicell-11110CUST0tW
dry cleaningI:V
BarberOther services
Totalp.%g- rer=
a%=nt Ps ShopsTotal
Generalautomotive
Otherautomobile
her
servicesrepair shops repair
V11) (72) (73) -(74) (76) 1 (76) (77) VS) (79) (80) A81)
Partnerships with andwittiout not Income,.
lumber of.partnerships ..................P . 29,287 7,748 3,594 3,358 14,588 65,990 27,992 17,481 8,500 10,510 9,953
"Umber of partners .................. 72,694 19,868 7,703 10,996 U12117 589 292 6002 36,698 '18,422 118,21F6 30,004 20,700
Total essete ................................... 1,528,944 282,814 40,207 109,910 1,096,613 24,306,502. 2,29.4,935 653,306 520,370 132,936 1,641,629 ;1,266,573'
Receipts and deductions from tradeor business:
Total receipts: ............................... 3,241,184 888,315 200,768 409,686 1,743,015 10,445,768 4,071,561 2,545,964 1,323,261 1,222,703 1,525,597 ~7711,5115
Business receipt ................................. 3,040,141 802,168 188,936 402.810 1.646,226 9,102,051: 3,949,131 2,484,1192 1,264,677 1,219,515 1,464,939 758,644
Ordinary incom6from otherpartnerships and fiduciaries .............. 33,073 33,073 , 91,134 1,417 - - ~1,417Farm net profit .............. .................... 18,387 18,387. ~ 2,468 7,976 7.25 725 - 7,251Net gain, noncapital assets ................ 20,774 4,939 6,574 - 9,262 222,110 . '33.786 2,603 27 2,576 - 31,183 1,921Other receipts .................................... 128,W8 81~,207 5,2.58 6,275 36,067 1,028,005 79.251 58,445 57,832 612 20,806 10,950
Total deductions ............................ 3,019,262 795,418 192,501 363,811 1,667,532 9,004,012 3,662,782 2,i76,64 1,186,216-
1,090,61118 1,385,869- 702,174Cost of sales and operations ............. 888,182 154,985 153,670 _
137,731 641,795 2,681,935 2,159,246 1,428,014 724,377 703,636 731,232. 432,706
Inventory, beginning of year ............. 36,561 2,384 2,159 1 3,351 28,667 ' 103,806 159,617 _96,341 25.705 70,636 63,276.70,538
Purchases ...................................... 340,789 36,728 9,222 7,587 287,253 .1,178,409 1,595,183 1,02~,297'
-475,343 549,954 569,887 265,488Cost of labor ................................... 123,169 27,035 42,546 29,145 24,444 357.145 284.322 1.054~2 97,704 123.350 63,268 41,671Additional inventory costs .............. 9 9 11,597 8.485 8,039 8,039 - - 446 -
Other costs .............................. 427,179 91,247 1,666 1,600 333,265 1,166,088 298.900 180 395' 145,932 34,463 118.504 128,917
Less: Inventory, end of year ............. 39,526 1,924 3,351 31,843 135,109 187,261 "103:112 28,346 * 74,766 84,149 63,909
Salaries and wages ............................ 481.069 143,008 32,868 108,962 196,231~ 1,103,581 283,846, 164,349 59,954 104,394 119,497 62,105
Less: Jobs credit .............................. ~32.414 - - - 32,414 18 35 - - - 35 1 -
--Guaranteed payments to-partners= ~70,484- --14-.174 -6,203- -7~12.568- ~37.539- -214,068 -70,619- -63;246- -37,948 ~25,298- 7;373- 7,476-
Rent paid ........................................... 254,087 106,941 26,921 42,262 77,963. 400,162 159.793 104.3.75 39,784 64.592 55,418 24,844
Interest paid ............................. ......... 87,736 25,783 5,051 336 56,567 450,155 113.774 35,569 28,104 7,466 78.205 18,347
Ta~es paid .......................................... 89,623 30,666 4,356 23,866 30,736 146,258 86.382 56,888. 26,723 30,166 29,494 12,882
Bad debts .......................................... 53,268 106 21 - .53,141 29,076 .2.472 1,305 720 585 1,167 2,218
Repairs .......................... ; ................ 47,178 24,537 3,645 1,125 17,871 105,426 21.732 9,737 5,438 4,299 11,994 3,766
Depreciation ....................................... 179,675 88,490 11,360 17,438 62,387 773,265 203.008 61,265, 43,350 17,915 141,744 27,846
Depletion ..................................... - - - - 32 - - - - -
Pension, profit sharing, annuity and
bond purchase plans ........................ 2,546 - - 2,546 28,673 585 554 231 323 31' 39Employee benefits plans .................... 5,667 505 35 - 5.127 34,207 5,831 4,668 1,067 3,600 1,163 323Ordinary loss from other partnershipsand fiduciaries ................ ................. 4,527 369 - - 4,158 49,495 1,493 - - 1,493Farm net loss ..................................... 17 - - 17 132 - - - -
-Nei loss, noncapitat assets ................ 304 - - - 304 18,097 6,459 104 53 51 6,355Other. deductions ............................... 887,312 205,854 48,372 119,524 513,563 2,969,468 547.578 346,841. 218,467 128,374 200,738 109,622
Net Income or deficit from tradeor business ... 221,921 92,897 8,267 45,274 75,483 1,441,756 408,779 269,051 137,046 132,005 139,728 69,340Net income ............. ..................... 392,329 138,493 13,594 51.686 188,555 2,491,615 545,142 323,492 160,063 163,429 221,650
Deficit ................................................. 170,407 45,597 5,327 6,412 113,072 1,049.860 136,364 54,441 23,018 31,424 81,922 37,985
Portfolio Income distributed directlyto partners:
: Total income (less deficit) ..................... 10,970 625' 397 9,949 528.373 23.475 10,912 3,905 7,006 12.563 ..449
Interest income ...................... 8,477 95 139 8,243 346.500 17,390 7,6~6 661 6,995 9.735 457
Dividend income ................................ 1,175 83 - 1,091 8.478- 186 11 - 11 174 ~~565
Royalty income ~ .......................... 14,128 "29 - -
Net short-term capital gain Oess loss) -645 - - -645 -10,714 729 - - -29 -572Net long-term ca
,tpital gain oess loss) 1,964 446 258 1,260 170,111 5.897 3,245 3,245 - ..2,652
Other portfolio income (less loss) - - - - -130 2 - - 2
Real estate rental net Income ordeficit
.........................................
-17,359 - -17,359 -220,812 -4,355 -1,149 -1,257 109 -3,206Net income
* ................................* -*
792 - - 792 176,516 4,720 3,533 3,424 109 1,187
Deficit ............. :..................................... 18:150 - - 18,150 397,328, 9,075 4,682 4,682 - 4,393
Net income or deficit from otherrental actlvtty~ ............................... 5,300 5,300 6,121 39 39
Net income .................... . .................... 5,300 5,300 799,816 12,013 12,01 b
Deficit..~ ................................................ - - 793,695 11,974 11,974
Total not Income or deficit .............. 219,514 93,675 13,706 45,274 87,4SB 1,596,040 422,070 275,569 :136,449 139,120 146,501 70,362
Net income.~ ........................................ 401,765 138,574 19,033 51,686 192,473 3,609.117 577,963 334,641 164,105 170,536 243,312 107,783
Deficit ................................................... 1 182.2§1 1 45.499 1 5,326 1 6,412 1 125,014 2,013,077 155,8W 59,072 1 27,656 31;416 96,812 37,,420
Footnote at end of table.

Partnership Returns-1987
Table l.-Total Assets, Trade or Business Income, Portfolio Income and Net Rental Income (Loss) for SelectedIndustries-Continued[All figures are estimates based on samples-money amounts are in thousands of dollars]
Services--writinued
27
Personal servioes Automotive repair and other services
ItemLaundries Business
Automobile repair servicesAutomobile
Misoell-aneous
iTotal
,dry cleartingand g nt
Beautyshops
Barbershops
Otherpersonale i s
servioesTOW General Other
par~mrand repa r
serviDesms s rv oe Total automotive
repair shopsautomobile
repairSO-083
(70) (71) (72) (73) (74) (75) 1 (76) (77) (78) (79) (80)1
(81)
Pairtnerships with net Income
Number of partnerships .................. 19,007 4,318 1,345 2,311 11,033 41,620 19,662 12,532 7,242 5,290 7,130 6,276
Number of partners ........................ 45,762 10,748 2,690 6,716 25,608 372,221 45,672 25,445 14,670 10,776 20,227 12,669
Total assets ................................... 690,534 71,860 39,191 7,576 571,907 12,950,879 1,209,732 491,090 383,927 107,163 718,641 1,133,793
Receipts and deductions from tradeor business: I
Total receipts ............................... 1,794,992 456,086 171,686 170,188 996,832 8,479,369 3,293,676 2,176,369 1,055,541 1,120,828 1,117,307 637,190
Business receipt................................. 1,657,497 370,614 160,3`12 163,913 962,659 7,412,913 3,190.183 2,114,997 997,265 1,117,732 1,075,1136 624,548
Ordinary income from otherpartnerships and fiduciaries .............. 309 - - 309 84,468 1,417 - - - 1,417 -
Farm net profit ................................... 18,387 - - - 18,387 2.318 725 725 725 - - -
Net gain, noricapital assets ................ 20,419 4.844 6,316 - 9,258 201,985 30,653 2,603 27 2,576 28,050 1,921
Other receipts .................................... 98,380 80,628 5,258 6,275 6,219 777,686 70,699 58,044 57,524 520 12.655 10,712
Total deductions .......................... 1,403,940 317,592 158,292 116,502 809,554 6,046,264 2,749,708 11,852,877 895,478 957,399 896,832 529,855
Cost of sales and operations ............. 411,569 28,410 46,126 30,145 306,888 1,860,815 1,723,648 1,183,417 551,994 631.423 540,231 350,398
Inventory, beginning of year ............ 22,455 1,402 1,901 - 19.152 67,387 135,025 82,417 11 7,296 K121 52,608 68.592
Purchases ...................................... 238,303 8,929 7.294 - 222,080 976,264 1,222,900 821,738 325,591 496,147 401,163 236,628
Cost of labor ....................... .......... 90,015 10,196 38,852 29,145 11,823 266,494 262.887 199,883 79,422 120,462 63,004 31,065
Additional inventory costs .............. 9 - - - 9 11,331 8,401 8,039 8,039 - 362 -
Other costs .................................... 84,793 9,507 - . 1.000 74,286 632,645 235,199 159,886 137,891 21,995 75,313 70,202
Less: Inventory, end of year ............. 24.007 1,623 1,921 - 20,463 93,305 140,765 88,546 16,245 72,302 52,218 56,088
Salaries and wages ............................ 205,317 64,479 29,704 2,015 119,120 896,354 208,507 138,35B 41,335 97,023 70,148 45,414
Less: Jobs credit .............................. 32,414 - - - 32,414 7 35 - - - 35 -
Guaranteed payments to partners 31,626 4.906 6,203 - 20,517 177.170 21,936 19,833 9,585 10,247 2,103 3,545
Rent paid ........................................... 132,101 48,532 23,628 25,810 34,131 242,601 130,835 84,245 30,757 53,488 46,590 14,142
Interest paid ....................................... 38,901 5,857 3,466 336 29,242 168,693 67,070 31,000 24,454 6,546 36,071 7,977
Taxes paid .......................................... 33,165 13,235 3,342 3.345 13,243 113,357 67,040 50,069 21,105 28,964 16,971 10,794
Bad debts .................... ..................... 2,653 - 21 - 2,632 11,344 2,237 1,302 718 565 934 2,202
Repairs ............................................... 28,688 15,133 3,247 1.125 9,183 80,780 11,431 5,929 2,358 3,572 5,502 3,047
Depreciation ....................................... 67,374 28,437 8,517 3,388 27,031 413,062 123,778 52,205 37,508 14,697 71,573 17,277
Depletion............................................ - - - - - 32 - - - - - -
Pension, profit sharing, annuity andbond purchase plans ........................ 477 - - - 477 26,655 585 554 231 323 31 35
Employee benefits plans .................... 3,554 5 35 - 3,514 23,153 5,445 4,327 726 3,600 1,119 323
Ordinary loss from other partnershipsand fiduciaries .................................. - - - - - 5,764 1,491 - - - 1,491 -
Farm net loss ..................................... 17 - - 17 132 - - - - -
Net loss, noricapitalassets ................ 304 - - - 304 9,615 66 53 2 51 14 -
Other deductions ............................... 480,610 118,599 34,002 52,339 275,669 2,016,744 385,676 281,585 174,704 106,881 104,091 74,700
Net Income or deficit from tradeor business ................................ 391,052 138,493 13,594 51,686 187,279 2,433,105 643,967 323,492 160,063 163,429 220,475 107,326
Net income ........................................ 392,329 138,493 13,594 51,686 188,555 2,473,810 545,142 323.492 160.063 163,429 221,650 107,326
Deficit ................................................. 1,277 - - - 1,277 40,705 1,175 - - - 1,175 -
Port Ho Income distributed directlyto partners:Total income (less deficit) ..................... 6,365 552 139 - 5,674 430,223 23,165 10,904 3,905 6,998 12.261 457
Interest income .................................. 4,510 - 139 - 4,371 265,533 17,096 7,656 661 6,995 9,440 457-
Dividend income ................................ 580 80 - - 499 6,499 170 4 - 4 166 -
Royalty income .................................. - - - - - 13,375 29 - - 29 -
Net short-term capital gain Oess loss) -187 - - - -187 2,791 -29 - - - -29 -
Net long-term capital gain Oess loss) 1,462 471 - - 991 142,163 5,897 3,245 3,245 - 2,662 -
Other portfolio income oess loss) - - - - - -137 2 - - - 2 -
Real estate rental net Income ordeficit .......................................... 323 - - 323 157,375 4,677 3,490 3,381 109 1,167 -
Net income .......................................... 792 - - 792 172,808 4,720 3,533 3,424 109 1,187 -
Deficit................................................... 468 - - 468 15,434 43 43 43 - - -
Not Income or deficit from otherrental activity................................ 5,300 - 5,300 - 733,369 12,013 - - - 12,013 -
Net income .......................................... 5,300 - 5,300 - 749,043 12,013 - 12,013 -
Deficit................................................... - - - - 15,674 - - - - - -
Total not Income or deficit ..............1
401,765 1 138,574 1 19,033 1 51,686 1 192,473 1 3,609,117 1 577,953 1 334,641 164,105 170,536 1 243,312 107,783
Footnote at end of table.

28 Partnership Retukns~--l,987
Table I.-Total Assets - Trade or Business Income, Portfolio Income'ahd Net Rental Income '(Loas) for~Seilectiiid.:lndustrles-Contlnu;~[All figures are estimates based on samples--money amounts are in thousands of dollars)
Servlce~ued
Arriummem Medical and healthand
1Nan" of
Item recreationservim
1n=other Othm
bustroess notallocabbe.
TOWoffices
ofothw
nwxflcW andhealth
tooturalservices TOW
Cirbilledpublic
aco-ftv.auditing and
services
pick- physidarks Bervioes eowuntants b=ng
(83) (84) (85) (86) (87) (88) (89)_1 (90) M
Partnerships with andwithout not Income
Mumbler of partnerships ...................... 26,213 40,930 1 11,11i73 29,357 25,248 11,910 i0,1138 4,714 19,125 fil,~20
Number of partneirs........................ 269,621 227,889 39,937 187,952 127,891 211,1167 40,202 30,460 9,742 112,511 23,758
Total 88 ....................................... 13,122,449 11,369,871 1,538,711 9,831,160 7,669,075 995,664 3,168,040 2,110,350 982,690 4,252,62i. - 11,43~11,835
Receipts and deductions from trade ,or busiriess~
11~tal receipts ................................... 10,128,656 20,113,341 8,273,823 11,939,517 30,408,132 4,811,997 10,842,614 10,331,366 511,249 S,327,294 U3,856Business receipt ............................ ........ 8,988,287 18.850,948 7,223,939 11,627,009 29,892.445 4,754,208 10,736,351 10,278,413 457,938 5,190.672 745,962Ordinary income from other partnershipsand fiduciaries ................................ 102.036 34,428 5~278 29,150 104,435 9,540, 62.890 12,980 49,910 36,671 .3,566Farm net profit ......................................... - 498 321 1177 1 1,089 183 4,467 A.467 - 51- 210Net gain, noncapital assets ............ 130,397 9.708 1,137 8.571 3.833: ~206. 1,299 ~1,299 - 5.522, 385Other receipts ............................. ........... : 907.936 1,217,759 1.043.148 1,74.611 406,329 47,861 37,608 -34,208 .4013 94,376 113.732
Tblal deductions .............................. 10,089,183 15,600,774 5,042,729 10,558,044 18,778,847 4,089,414 8,419,235 8,014,309 404,926 4,187,464 T?8,992Cost of sales and operations .................. 2,724,659 1,464,23T 236,236 1,228,001 -214.267 1,332,521 64.880 52,242 12.638 1,463,235 390.379
Inventory, beginning of year ................. . 1~1.590 36,169 1.978 34,191 - 20,004 579 29 549 27,965 45,564Purchases ..................... .~....... ............. 725.048 368,160 15,537 11,079 92,781 1,930 1,679 250 147~288 292,038:"Cost of
labor t ................................ 148,596 234,397 43,530 190.867, 24.463 .219,510 -38.072 34,358 3,714 1,060,711 78.946Additional inventory costs ............... 46,387 .522 2 521 869 4,357 5 55Other costs ......................................... 1;825,272 '859,559 177,377 682,182 177.857 1,007,390 ~4,954 16,176 8,778 265,089 ~31,973
Less: Inventory, end of yew................. 142,234 34,571 2,188 32.384 - ' 11,521 . 655 - 654 37,824 58;197Salaries and wages ................................ 1."0,255 4,091.916 1.482,774 2,609.142 .8,355,859 980,660 3,931,452 3,812,318 1119.13~ 885,825 53,87~
-Less:-Jobs'credit ..................... .-7,297 -12,095- ~929- -11,166- --56,815- -63,011- -2,372- -2,372- -_ 1-1825 . -
Guaranteed payrnIants to partners .......... ?36,884 934,062 567,690 366,372 1.018,196 291,462 607.363 589.788 17,575 210.420 _1 5.080
Rent paid ................................................ .238,305 920.268.379,653 540,615 2,021,634 175,852 629,604 608,878 20,726 195,339 15,312
Interest.paid ............................................ 469,598 498,994 50,990 "8,005 207,569 37,433 143,204 85,338 57,865 86,767 46,813Taxes paid .............................................. 215,455 445,312 117;768 .327,543' '808.030 118,828 345,597 -335,865 9,732 76,465. .6,516Bad debts : ....................................... 19,131 74.211 15,746 58,465 29,174 5.493 22,489 22,478 10 19,049Repairs .......
....**** .............. *....................124,681 128.542 41,693 86,849 140,774 18,536 51,901 44,936 6.966 13,954 1,675
Depreciation ........................................... 1,113,412 639,791 108,318 531,473 649,204 77,546 256,182 241,472 14,710 106,1821 30,977Depletion
*** ...........:. 398 942 8 '206- 206 - 4
Pension, profit sharing; annuity and bondpurchase plans ...................................... 19,279 77,048 48,858 28,190 202,093 18,758 79,077 78.696 - 380 111604 ~1,831Employee benefits plans ......................... 40,374 181,090 104,329 76,761 209,767 34.197 84,068 81,884 2,184 19:917 1.215Ordinary loss from other partnershipsand fiduciaries ....................................... 90,305 15,066 41 15,025. 7,224 1,647. -3,054 3,054 - 25.307 4,395Farm net loss ........................................... 215 - 1~9411 -Net loss, noncapital assets ..................... 12,330 19 7 12 2,282 77 187 187. 1,152Other deductions,; ............................. 3,351.198 6.142,313 1,889,554 4,252,759 4.966,706 1,059,406 2,202,343 21059,339 143,005 1,074,070- 210,658
Income or deficit from trade -or business ...... ............................. 39,473 4,512,567 3,231,094 1,281,473 11,629,285 722,583 -2,423,i7l) 2,317,057 106,322 1,139,830 84,864Net income ............................................. 1.386.621 5,547,373 3,298,234 ,2,249,140 11,751,225 763,553 2,481,420, 2,342,297 139,123 1,312,140 162,715Dqficit ............................... :..................... 1,347J48 1.034~ 806 67,140 967,667 121,940 40,970 58,040 25,240 jZ801 172:310 ~..7711,851
Portfolio Income distributed directlyto partners:Total income (less deficit) .......................... 107,089 114,382 11,553 102,829 103.590 9,951 30,725 28,757 1,968 ~77,270 31.782Interest income ........................... 61,156 82,300 11,277 71,023 75,600 9,191 28.329, 26,361 1.968. 54,836, 21,408Dividend income .............. ..................... 6.401 8,381 181 8,200 4,284 777 126, 126 - 1,225 -10,607Royalty income .............................. 47,417 - - 950 12 12 ~ 3' '' 63Net short-term capital gain,(Iess loss) -13,419 908 - 908 66 12 -144 _1" 706~ -540Net long-term capital gain (less loss) 4,953 22,600 94 22,506 2.1,691EI -31 2,392 2,392 ;18 199, 1,646Otfi& portfolio income (less loss) ........... 582 192 191 992 to: 10 2:301 1,89'1
Real aside rental not Income or deficit.. -8,366 -118,055 -24,974 -93,080 84,458 -9n -22 1,526' 1,504 -4,691 2,876Net income ............................................... 35.903 .9,426 2,019 7,406 9,479. 116 2,980 1,475. 1.504.. 13,375 , 8,397Deficit .................. 7 .................... ............... ",268 127,481 .26,994
1.100,487 ,93.937 1,095 __3,002 3,002
,8,066
, .5,5~21
Not Income or defictit from other rentalactivity ...... ..... 5,251 12,722 -150 12;872 18,530 0,642 3 3 -10,481Net income ..................... : ..................... 5,392 19,061 .764 18,296 18.539 8,642 3 3 15~
................... M ............ I........... 141 6.339 914 ~.424 -10,495
Total'net Income or deficit ................... 151,913 4,498,107 3,217,427 1,280,680 1111,645J82 740,:1116 2,451;838 2,342,043'
109,795 1,183,025 121,709Net income ............................................... 1,491,008 5,606.493 3,309,591 2.296,902 11.789,079 781,135 2,508.400 2,365.815 1 42,585 1,366,064Deficit ............. ......................................... . 1,339,095 1 1,108,386 92,164 1,016,222 143,897 40,921 56,562 23,M 32,790 _183,039 71,4141
Footnote at end of table.

Partnership Returns-1987
Table I.-Total Assets, Trade or Business Income, Portfolio Income and Net Rental Income (Loss) for SelectedIndustries-Continued(All figures are estimates based on samples-money amounts are In thousands of dollars]
29
Amusement Medical and health services Acctg, auditing At bookkeeping servicesNature of
hemand
recreationOther
Engineeringandarchl- Other Other
business notalloCable
senrioes.
TOW
officesOf
rnatfical and tecturalservices TOW
Certified"Ic
accounting.auditing and
services
plaunes Wisicianshealth
servicesaccountants bo:rkeervio
(84 (83) (84) (85) (88) (87) (88) (as) (90) (91) (94
Partnerships with not Income
bar of partnerships...................... 13,436 29,068 8,641 20,417 24,165 9,074 9,293 5,318 3,975 14,352 5,948
mber of partners ............................u 107,650 126,651 31,527 95,124 123,708 22,323 37,810 29,598 8,213 95,076 17,660
Total assets ....................................... 5,876,177 S.281,646 940,340 4,341,306 7,010,719 745,492 2,971,449 2,062,506 908,943 3,209,296 761,490
Receipts and deductions from trade
or business: '
Total receipts ................................... 6,496,054 16,157,993 7,641,3T7 8,616,616 29,675,086 4,186,647 10,621,453 10,166,585 454,868 4,840,889 535,614
Business receipt ..................................... 5,602,484 14,981.997 6,527,815 8.454,181 29,167,136 4,131,442 10,517,989 10,116,151 401.838 4,716,624 418,255
Ordinary income from other partnerships
and fiduciaries ....................................... 94,894 32,591 4,998 27,593 104,435 9,540 62,890 12,980 49,910 33,994 3,566
Farm net profit ........................................ - 454 321 133 1,089 183 4,369 4.369 - 51 205
Net gain, noricapital assets .................... 101,811 8,759 1,137 7,622 3,726 206 1.275 1,275 - 4,278 385
Other receipts ......................................... 696.865 1,134,193 1.007,106 127,087 398.699 45,278 34.930 31,810 3,120 85,942 113,203
Total deductions .............................. 5,120,620 10,621,486 4,243,451 6,378,035 17,924,562 3,423,110 8,140,033 7,824,288 315,745 3,530,055 382,895
Cost of sales and operations .................. 1.578.568 1,134,525 221,189 913,337 147.676 1,077.329 56,962 52,242 4,719 1,350,245 267,893
Inventory. beginning of year ................. 57.290 27,930 1,757 26,174 - 18,214 579 29 549 27,673 17,701
Purchases ........................................... 408,002 304,314 14.168 290,146 7,510 92,781 1,930 1,679 250 144,343 254,036
Cost of labor ....................................... 73,073 1 a2,591 43,530 139,061 7,949 195.111 38.072 34.358 3,714 1,036,465 27,034
Additional inventory costs .............. 41,300 522 2 521 869 4,357 - - - 5 -
Other costs ......................................... 1.064,039 647,111 163,480 483,631 131,348 775,825 17,036 16,176 859 179,158 13,099
Less: Inventory, end of year .................. 65,136 27,942 1,748 26.195 - 8,960 655 - 654 37,400 43,978
Salaries and wages ................................ 819,989 2.925.000 1,353,048 1,571,952 8,108,866 913,a68 3,839,724 3,745,171 94,553 823,286 19.189
Less: Jobs credit .................................. 7,077 11.303 929 10,374 56,815 63,011 2,372 2,372 - 1,825 -
Guaranteed payments to partners .......... 160,177 582,910 264,386 318,523 825,826 225,407 551.850 550,962 888 129,042 10.063Rent paid ................................................ 132,161 656.662 338,692 317,971 1,948.198 162.430 615,"l 597,878 17,563 138,996 8,228Interest paid............................................ 167,103 180.255 33.776 146,480 193,185 24,183 127,001 72,668 54,333 62,542 19,909Taxes paid .............................................. 124,458 311,427 107,360 204,067 784,386 108,073 337,846 329,830 8,016 70.839 3,203Bad debts ............................................... 8,187r 52,612 12,682 39,930 27,881 4,521 22,478 22,478 - 18,904 252Repairs ................................................... 87,931 96,478 35.322 61,156 133,506 16,779 49,357 44,288 5,069 9,416 460Depreciation ........................................... 360,154 341.717 81,597 260.120 623,343 57,365 245,477 235,499 9,978 50,994 2,738Depletion ................................................ - - - - 942 8 206 206 - 4 -
Pension, profit sharing, annuity and bondpurchase plans ...................................... 11,158 58,564 43,608 14,956 200,340 18,661 78,613 78.233 380 11,478 607Employee benefits plans ......................... 26,229 148,313 103,460 44,853 207,666 33,177 82,299 80,175 2,125 18,249 800Ordinary loss from other partnershipsand fiduciaries ....................................... 4,198 1,722 41 1,681 3,436 1,642 2,964 2.964 - 8,829 174
Farm net loss .......................................... - - - - 1,941 - - - - - -
Net loss, noncapital assets ..................... 1.879 7 5 2 2,282 77 117 117 - 1,152 -
Other deductions .................................... 1,645,505 4,142,595 1,649,214 2,493,381 4,771,902 842,600 2,132.070 2,013,949 118,121 837,902 49,381
Not Income or deficit from tradeor business .................................... 1,375,434 5,536,507 3,297,92S 2,238,582 11,750,524 763,537 2,481,420 2,342,297 139,123 1,310,834 152,719
Net income ......................................... 1,381,493 5,540.577 3.297,967 2.242,610 11,750,532 763,553 2.481,420 2,342.297 139.123 1,312,140 162,715
Deficit ..................................................... 6,059 4,070 41 4,029 8 16 - - - 1.307 9,997
Portfolio Income distributed directlyto partners*Total income (less deficit) .......................... 78,710 81,065 9.889 71,175 74,330 9,874 29,810 27,853 1,958 64,845 33,258Interest income ....................................... 37,536 60,728 9,614 51.113 56,255 9,115 27,842 25,884 1,958 49,888 20,679Dividend income .................................... 5,864 1,415 181 1,234 4.216 777 126 126 - 1,225 10,087Royalty income ....................................... 46,419 - - - 950 - 12 12 - 3 -
Net short-term capital gain (less loss) -13,323 2,244 - 2,244 75 12 -144 -144 - -741 -540
Net long-term capital gain (less loss) 1,667 16,486 94 16.392 1 1;842 -31 1,965 1,965 - 13,587 1,702
Other portfolio income (less loss) ........... 547 192 - 191 992 - 10 10 - 883 1,330
Realestate.en I not Incomeordefich.. 20,041 -10,965 1,111 -12,077 -42,398 -936 -1,013 -2,517 1,504 3,231 8,336
Net income ............................................... 32,490 6,217 1,915 4,302 8,802 116 1,989 484 1,504 3,323 8,335
Deficit ....................................................... 12,449 17,182 804 16,378 51,191 1,052 3.002 3,002 - 92 -
Net Income or deficit from other rentalactivity ............................................ 5,167 16,618 760 17,858 18,530 6,642 3 3Net income ............................................... 5,1
91 18,622 764 17,858 18,539 8,642 3 3
Deficit ................................................... 24 4 4 - 9 - - -
Total net Income or deficit .................. 1,491,WS 1 5,606,493 1 3,309,591 1 2,296,902 1 11,789,079 1 781,135 1 2,508,400 1 2,365,615 1 142,595 1 11,311111,064 1 193,150
' Due to significant changes to Form 1065, Total receipts as reported for prior years may be derived by adding amounts shown for Total income, Net real estate rental income (deficit) net income (aeficit) fromother than rental activity, and the following items listed under Portfolio income: interest, dividend, and royalty.
* * * The estimate for this cell is not shown separately to avoid disclosure of information about specific taxpayers. The data are included in the appropriate totals.
NOTE: Detail may not add to total because of rounding.
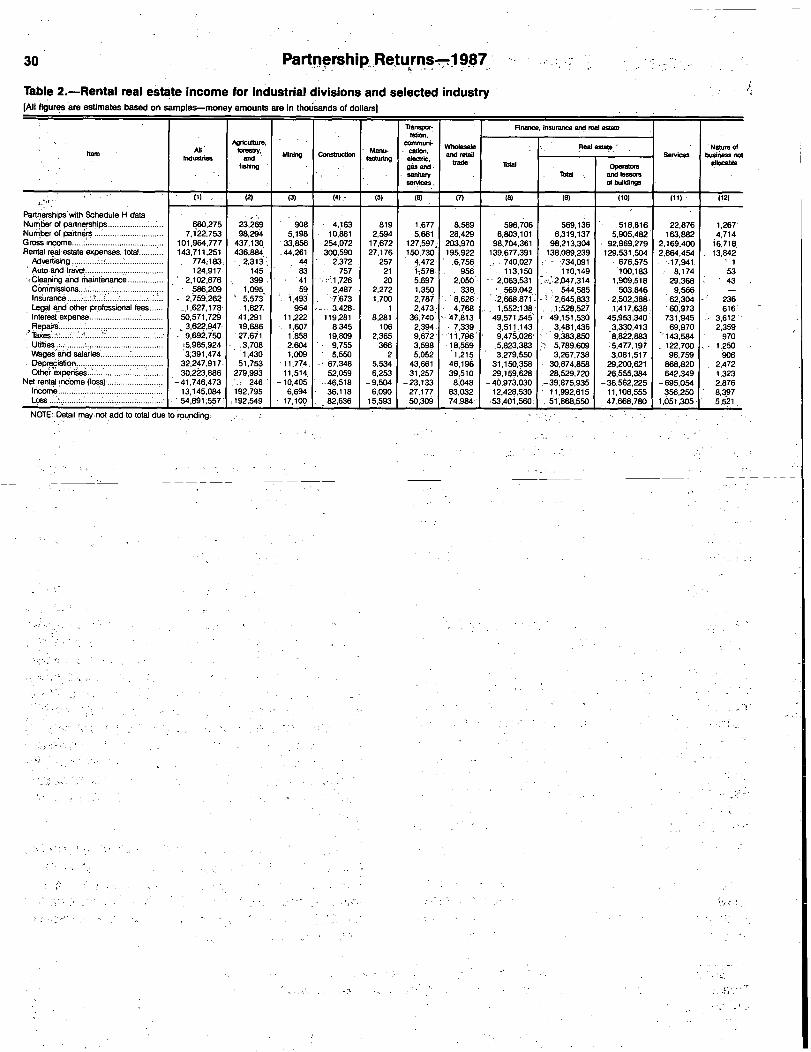
30 Part.nership,.Retu,rn.s-"1 9-87-*-
Table 2.-Rental real estate Income for Industrial divisions and selected Industry[All ~figuras
.are estimates based on samples money amounts are in thoisands of dollars]
tationFffiance, insurance and real estate
ROM AliAgriculture,
f-estry.Mining Construction Menu`
.
calicn.con""ur'j.
Wholesaleand retail
Real esW,e.ervices
Natuns ofbusiness notIndustries and
fishingbicturing electric.
gas arldtrade TOW
operat-allocable
san" TOW arid80-1003. of buildings
(2) (3) (4),- (5) (6) (7) (a) (9) (10) (11) (12)
Partnerships* with Schedule H dataNumber of partnerships ......................... 660,275 23,269 908 4,163 819 1,677 8,589 596,706 569.136 .518.816 22,876 1.267Number of partn6m : ........................... 7,f22,753 98,294 5,198 1 O.il8l 2.594 5.661 28,429 6.803,101 6,319,137 5,905,482 163.8a2 4,714Gross income.......................................... 101,964,777 437,130 '33,856 254,072 17.672 127,597. 203,970 98,704.361 98,213,304 92,969,279 2,169,400 1
.6,718
Rental re al estate expenses, total........... 143,711,251 436,8a4 .44,261 300,590 27,176 150,730 195,922 139,677,391 138.089,239 129,531,504 2,864,454 8413 2Advertising ........... ................. 774;1831 2.313:~ 44 2.372 257 4,472 6,756 740,027 - 1734,091 676,575 17,941,
1
Auto and travel ................... : ................ 124,917 145 83 757 21 1-,578 956 113,150 110,149.100,183 8,174 53
Clea'ring and maintenance M ............ 2,102.876 399 *41 ':!-1-1,726 20 5,697 2.050' 2,063,531 7.3142,04 1,909,518 29,368 43
Co~mmissjons ......................... 586,209 1,095'
59 2.487 2,272 1,350 338 569.042.
544,585 503,646 9.566 -
insurance: ........................................... 2.759,262 5,573 1,4913 7.673 1,700 2,787 ..'8.626 z1EiWA71 '2,645,a33 2,502,3a8. 62,304 236Legal and other professional fees 1,627,178 -1,627, 954 3,428. 1 2.473: - .4.768 -1;552;138 1;528,527 1,417,638 60.973 616Interest expense ................................. 50.571,72§ 41,291 11,222 119,281 8,281 36,740 --47,813 49,571,54~* 49,1~1,530 45.953,340
'731,945 3,612
Repairs ................................................ 3.622,947 19,686 1,607 8,345 106 2,394, . 7 3~9 3,511,143 3,481.436 3,330,413 69,970 2,359taxes'..-.: : .................................... 9,692,i5O 27.671 1,858 19,809 2,365 9,672
.`11 796 9.47~,026 9,3a3,aSO 8,822,13M 1 43,584 970
Utilities ................. ...........................
'
-5,985,924 2,604 9,755 366 3,598 ~ 18,559 5.823.383 5,789,609 122,700 1,250ahd salaries ............................Wagei 3;391,474 1.430 1,009 5,550 2 5,OU 'l.M 3,279,550 3,267.738 3,08, 517 96,759 906
Depreciation .................... ~.: ............. :..
' '
32,247,917 51.753 :11,774, 67,348 5,534 43,661 46,196 31,150.358 30,874,858 29,200.621 868,820 2.472.0 eth r nses'.. ..~ ............................. 30,223,886 279,993 11,514 52,059 6,253 31,257 39.510 29.159.i528 28.529,720 526.55 .384 642,349 1,323Net
rental income (loss) .................. 41,746,473 246 10.4M -46,518 -9,504 -23,133 8,048 -40,973,030 .-39,875,935 -36,562,225 -695,054 2,876lricom,6 A
.................... 13.145,084 192.795 6,694 36.118 6,090 27,177 83.032 12,428.530 11,992,615 11.106,555 356,250 8,397Loaa....
..' ......................... ................... 1 54,891,557:1 192,549 1 17,109 1 82,636 1 15,593 1 50,309 1 74,984: 1 -53,401,560~ I ~,, 51,868,550 1 ~ 47,668,780 1 1,051,305 5,~21,
NOTE:.Detail may not add to total due to to riding:

Partnerships, Passive Losses, and TaxReform
By Susan Nelson and Tom Petska*
The Tax Reform Act of 1986 (TRA) containedprovisions that could greatly reduce the tax shelterbenefits of partnerships [1 ]. This article discussesthe use of partnerships as a means for individuals toshelter income from taxation and seeks evidence onthe effects of TRA for 1987, the first year affected bythe new law.
The first section of this article provides a briefbackground on the treatment of partnership incomein the pre- and post-Reform periods and on theelements that contribute to a tax shelter. The secondsection examines time series data on the income anddeficits of partnerships, focusing on how 1987 com-pares with earlier years. Partnership income andlosses as reported on tax returns of individualpartners are analyzed in the third section, againfocusing on the differences between 1987 and earlieryears. The final section summarizes results andconclusions.
TAX SHELTERS AND THE TAXATION OFPARTNERSHIP INCOME
A partnership is not a taxable entity. Each partner-ship files an information return (Form 1065) with theInternal Revenue Service (IRS), which shows thepartnership's taxable income or loss for the year andthe allocation of that income or loss to the separatepartners. Partners can be individuals, corporations,other partnerships or virtually any other legal entity.As partners calculate their annual tax liabilities, theyinclude their distributive shares of income anddeductions from the partnership along with incomefrom other sources.
Tax shelters are generally defined as investments"in which a significant portion of the investor's returnis derived from the realization of tax saving withrespect to other income, as well as the receipt of
tax-favored (or, potentially, tax-exempt) income fromthe investment itself' [2]. Tax shelters commonlyinvolve one or more of the following advantages:
Deferral of tax liability through the use of taxprovisions or tax preferences that acceleratedeductions. Deferral, in effect, produces aninterest4ree loan from the Government to thetaxpayer. Examples of such provisions areaccelerated depreciation and expensing of in-tangible drilling costs.
9 Conversion of ordinary income into capitalgains or other forms of income subject to lowerrates of tax.
0 Leveraged purchasing which magnifies theother tax advantages.
Because of its nature as a "flow-through entity"and its flexibility in allocating income amongpartners, the partnership form provides an attractivestructure for tax shelters. Individuals with substantialamounts of positive income from other sources,such as wages and salaries or self-employmentearnings, could invest in partnerships and offsetsome (or even all) of that income with their distribu-tive share of any tax losses from the partnership. Ifthey invested in a "limited" partnership (as opposedto a "general" partnership), they could receive thelimited liability benefit comparable to corporations aswell as the flow-through benefit of partnerships[3,4,5,6].
One of the main goals of the 1986 Tax Reform Actwas to reduce the ability of individual taxpayers tooffset income with losses from tax shelters, therebylowering their tax liabilities [7]. The Tax Reform Actof 1986 took several steps to reduce the attractive-ness of tax shelters, including:
*Susan Nelson is an economist in the Office of Tax Analysis, U.S. Department ofTreasury. Tom Petska is Chief, Coordination and Publications Staff, Statistics of IncomeDivision, Internal Revenue Service. 31

.32 Partnerships, Passive1osses, and Tax Reform
0 eliminating the preferential . tax rate, on netJong-term -capital gains;
,o, reducing the acceleration of. depreciationdeductions
. lowering, overall marginal tax rates; and
0 imposing limitations on "passive losses."
While the passive:loss limitationsapply to,lossesthat individuals, receive - from .*most forms of flow-through businesses, they particularly concernpartnerships. (The -passive loss limitations do notapply to corporations or other taxable entities.), Theymean that "passive" partners, those who do not!'materially participate" in the business of,the.firm,which include most limited partners, can no longeruse any temporary losses,generated by the businessto
'offset "active" income from sources such'as wages
and., salaries, or., from '.'Portfolio'incomb" -
'such as
Interest And, dividends. [8]. (Exceptio ris were-provided -for certain-pairtners for losses-from-oil-and-gas operations and from certain real estate ac-ti,vities.)
The basic mechanics of the~pre- and - Reformposttaxation, of partnership income at the, individual levelcan be illustrated as follows, using cate ' ids intro-gc~rauced by I KA. Let
A!=., "Active Incomen-which. includes -wages,salaries, and other types of. earned, income;
YJ . "Portfolio - Income" which., includes inter.est,
dividends,, most - capital,lgains, and othertypes of taxable . investment income.,
"Passive Income" which -includes taxableincome or loss generated by a business suchas a limi.tedipcIrtnership or-.S,Corppration inWhich the,individual does notmateriailly par-ticipate, [9]; - an'.d
The- sum of, active,,(YA.)i portfolio (Y.,J).,. andpassive, (YKJ, income. which corresponds toadjusted.:gross -income prior to adjus
't
'rne.nts
in both the pre- and post-Tax Reform periods.
Thus,, YT YA +YJ: + YK
The differences. in YT before and after Tax-Reformare-mainly in Yi.and YK.
o - Before Tax Reform,, portfolio ~income (~J) in-clUded only 40"p6rcent of most'lopg-term cap!.-tal gains, whereas after TRA,
,1 60 percent were
included.
0 . Before Tak.Reform, passive income (YK),cquldbe. positive or, negative in the YT equation.After Tax Reform, it could not be neJaLtive. While this does not appear to be a 6ig-nificant change, the'large passive losses .(YK)thatwere previously used to.offset active (YA)or portfolio (yi) income.coUld' now. only -beused to offset passive (YK) gains.
-Although some~-telief Was provided throughphase-in rules,, it'washypoth6siidd that, tax shelterparthersh
.ips we
Ire 'dealt a very serious if notfatail,
blow by these provisions, [101. Specifidally,' it wouldbe expected that net losses would decline''and netincome would rise, and that loss partnerships, par-11"c6larly lim'ited'ori6s; w6uld-bbbom`6 less attractive..One test of this.'6ypofhesis* Would -compare actualdata'from .1
.987 with ditimiates of expected-gains,a'n'd- -
losses based on a*m"o"del-of pre~-TRA behavior. I'n the
absence of6 reliable' model, an alternative approach,Ad reflected in this'ailicle, would be t6'exa*min'eAca;xretur
In data for 0a
.rtne
.rships and. pariners'for years
b.df&e and after the 6nictme'nt of,TRA for evidence
'of -the -anticipated "response.
EXAMINATION OF PARTNERSHIP DATA
Some of the significant trends in partners'hip data
for 1981-1987 arepresdrited in-Figures Athr6ugh C.In each figure, tKe'data are presented by type of-partnership (general o
'r limited) an
.d- ove'r'aI Iprofit
gain or loss in "ordinary" income, with capital. gainsexcluded) as well as in total.
Figure A'shows the number of partnerships forthese four categories.' The total number of partner-ships gre-w'quite steadily' in the 1981-85 period,dropped slightly for 19,86, then dropped,sub.stantiallyfor,1 987. Jhe.data.f6r. each of the.foUr,classes showwhere the changes occurred. ''All foUr typesregistered consistent increases through 1985, withlimited., partnerships . (both -tho.se..with a - gain, ~andthose ., wit.h,,a, loss), rising at a...more.. rapid - rate,,..t,h,,a,ngeneral. partnerships. . - .
After 1.985, howeVeri profits (or- the. Iack,.ther990provided., the;i,,common . factor .-for,. increasibg,,:,,qrdecreasing numbers.,The 1985786, decline.occu.rredamong gain partnerships, both ~gpneral. and 1i'mited;

Partnerships, Passive Losses, and Tax Reform 33
Figure A.-Number of Partnerships by lype of Partnershipand Gain or Loss Status, Income Years 1981-1987[Number of partnerships are in thousands]
IncorneYew Ali .partnerships
1,461514
15421:1,644
1,714
1703
1 ~648
General
With gain
(1)
677
707707750774766769
Sources: See note following Figure C.
General
United
With loss
(4)
133139152157173181166
and the larger drop between 1986 and 1987 oc-curred only among loss partnerships, again for bothgeneral and limited. The decline in the number ofloss partnerships for 1987 is consistent with theexpected response to TRA.
The overall number of partners, as shown in Fig-ure B, exhibited steady and uninterrupted growththroughout the entire period,-even for years in whichthe number of partnerships dropped. The numberof partners in limited partnerships grew much morerapidly and constantly than those in general partner-ships, which can be attributed to the growth of taxshelters. The number of partners of gain generalpartnerships show a large decline for 1985, while thenumber of partners in loss general partnershipsdeclined for 1987, as predicted.
Figure B.-Number of Partners by Type of Partnership andGain or Loss Status, Income Years 1981-1987(Number of partners are in thousands)
lnc*molea. 'MIpartnerships
9,0959765
10:589
12427
13:24515
,301
16,963
With gain
(1)
2,8832,8662,9393,5272,990
30613:185
Sources: See note following Figure C.
(2)
2,0362,1672,2162,2152,340
2,4262,255
With gain
(3)
1,6282,0272,4883,0823,6804,709
6,0554
Unnited
With Ioss
(4)
2,5482,6842,947
3,6034,2345,1055,469
The overall profits (excluding capital gains) ofpartnerships are shown in Figure C. In total, partner-ships had net losses in ordinary income throughoutthe entire period, peaking initially for 1982, a reces-sion year, and again at $17 billion for 1986, the lastpre-Reform year. Not income for gain partnerships(both general and limited) grew every year between1981 and 1987. Losses for both general and limited
Type 0 partnership
With loss
(2)
576581160636660663617
With gain
(3)
758782
1011079296
Type of partnership
With km
loss partnerships also increased persistentlythrough 1986, but then declined for 1987, droppingby $4.6 billion. (The only exception came for 1983when losses for loss general partnerships shrank abit from the previous year, probably reflecting somerecovery from the 1982 recession.) The pattern ofchanges in net income for 1987 is consistent with the
cted response to TRA.expe
Figure C.-Partnership Gain or Loss in Ordinary Incomeby Type of Partnership and Gain or Loss Status, incomeYears 1981-1987[Money amounts are in billions ot dollars]
Type of partnership
Income'tea,
Total plinlaw
-2.7-7.3-2.6-3.5-8.9
-17.4-5.4
With gain
42.
8
44.448.655.760.563.566.2
General
With law
-29.8-34.2-32.5-36.6-42.4-45.3-43.4
With gain
7.89.2
11.714.016.616.821.5
urnited
With loss
-23.5-26.7-30.4-36.6-43.5-52.3-49.6
SOURCES: Statistics of Income (SOI) Bulletin selected issues; Statistics of Income-1978-82,
Partnership Returns; and unpublished data from Office of Tax Analysis and SOI Partnership data
files.
Looking at these figures together, it can be notedthat despite the increasing losses of loss partner-ships (both general and limited), the number of losspartnerships and the number of partners in themboth increase through 1986. Such behavior iscounter to conventional economic motives whichwould have predicted resources (firms and inves-tors) expanding in profitable activities and decliningwhere losses were incurred. The observed patternsare instead consistent with tax sheltering motives.For 1987, the pattern changes and the dual motivesof partnership ownership (i.e., profit- and loss-seek-ing) are evident. Gain partnerships show increasedprofits while loss partnerships show the first reactionto TRA.
To understand better the changes for 1987 andtheir relation to Tax Reform, the data on net incomeare classified by industry in Figure D for 1985-87, theperiod "surrounding" TRA. Column 4 decomposesthe $12.0 billion improvement in net income (lessdeficit) between 1986 and 1987 by industrial division.That column shows a number of significant points:
$6.2 billion (or 52 percent) of the 1986-87improvement came in the finance, insuranceand real estate industrial division. This is notsurprising in view of the large and growinglosses in that industrial division before TRA.

34 Partnerships,. Passive Losses, and Tax Reform
Figure D.-Partnership Net Income Less Deficit by Industrial Division and Selected Industry Groups,'Income Years1985-1987[Money amounts are in billions of dollars)
AJI partnerships General partnerships Urnited partnerships
Industrial division.group
1985 1986 1987 C,=- igas 1986 1S87 C1986-87 1985 1 !86 1987
C1
(1) (2) (3) (4) (5) (6) (7) '(9) (10) (11) (12)
All industries 1 ..................................... -8.9 -17.4 -5.4 12.0 18.0 18.1 22.7 -25.8 -35.5 -28.2 7.3
Agriculture, forestry, and fishing ............. -1.0. -0.9 2.0 3.0 -0.2 -0.1 2.3 2.4 -0.9 -0.8. -0.3 0.6
Mining .................................................... 1.5 -3.5 -1.4 2.1 0.2 -3.0 -3.6 -0.7 2.4 -0.5 2.3 2.8Oil and gas .................................. ; ...... 3.3 - -2.7 -13 1.4 0.8 -2.3 -3.6 -1.2 2.5 -0.3 2.3 2.6
Construction ........................................... 2.2 2.5 2.8 0.3 2.2 2.4 2.6 0.2 0.1 0.2 0.1
Manufacturing ........................................ - 1.1 -0.5 0.8 1.3, -0.8 -0.2 0.6 0.8 -0.2 -0.3 0.2 0.5
Transportation. communication,electric, gas, and sanitary services -3.1 -3.0 -3.8 -0.8 -1.9 -1.6 -2.2 -0.6 - 1.1 -1.4 -1.5 -0.1
Communication .................................. -1.7 -2.5 -3.2 -0.7 -0.9 -1.5 -1.9 -0.4 -0.8 -1.0 -1.3 -0.3
Wholesale and retail trade ..................... 2.0 2.3 2.7 0.4 1.8 2.2 2.5 0.3 0.2 0.1 0.2 0.1
Finance, insurance and real estate -25.9 '-33.0 -26.8 15.2 -3.0 -3.5 -0.6 2.9. ~23.0 -26.1 3.3Real estate operators and lessors
of buildings ..................................... -26.2 -32.8 -33.1 m- 0.3 -4.7 -6.1 -5.4 0.7 -21.5 -26.7., 27.8 1.1Subdividers and developers ............... -2.7 -3.0 -2.0 1.0 -1.3 -0.5 -0.6 -0.1 -1.4 -2.5 -1.5 1.1Holding and'investment'companies, except investment
clubs and common trust funds 0.6 1.1 4.0 2.9 0.8 1.1 1.7 0.5 -0.1 -0.1 2.3 2.4
Services ........... ..............................1
16.51
18.6 18.1 -0.51
19.71
21.71
21.31
0.4 3.21
-3.2 3.2 (3),
! lincludei "Nature of business not allocalble:~ not reported separately.2 Positive net income (less deficit) less than $0.05 billion.3 Negative net income (less'deficit) less than $0.05 billion.SOURCES: Statistics of Income (SOI) Bulletin, selected issues; Statistics of Income-1978-82, Partnership Returns; and unpublished data from Office of Tax Analysis and SOI partnership data files.
-What-is-noteworthy-,though, is that-r-eal estateoperators And, lessors.ofbuildings (the sourceof most of the finance division's losses) con-tributed nothing to the 1986-87 decrease inlosses. Indeed, net losses in.real estate grewslightly, by $0.3 billion. It is, also noteworthythat, within real estate, the net-losses of limitedpartnerships continued to grow (from,.$26.7billion to $27.8.billi6n). while they shrank (f~om$6.1 billion to.$5.4. billion) for general partner-ships. This occurred even though somepartners in general partnerships, but. not inlimited partnerships, would ~ualify for the,spe-cial $25,000 exemption from the passive losslimitations. for losses from "active real estateactivities.
Does the,expenence in the, real estate industrymean. that TRA had little effect on realestatetax shelters? To the contrary, the factestate losses in limited partnerships grew byonly' $1.0 billion, or 4 percent, is a tharpreversal of the trend of the rest of the decadewhen losses grew by 30 percent -pe
,r year.
This. reduction in losses, is.m.ore remarkablebecause it came in the face of strongdownturns that the real estate industry ex-perienced in certain geographic areas, par-ticularly in. the Sun.Belt States (in part due toover-building caused by the pre-TRA taxbenefits).
o The largest part of the,iMprovement in netincome (lets deficit) in the finance,d.ivisioncame from holding and investment companies,(other than . investment 'clubs and c
'o
'mmon
trust, funds),'where net'income hearly'quad-rupled -between 19156 and 1987' (from $1.1billion, to $4.0,billi6n)-. This $2.9 billion increaseac
Icc
Iunteld for24percent of partnerships'total
improvement, between 11986 and 1981. Howmuch of this is a. response to TRA.is Uncertain.On the one hand,, some of the increase, mightbe due to for "passive in-.come" to offset* their 'Passive 'losses. I On 'theother hand, most of the income reported,forthis industryjs ."portfolio income," in the formof interest and Aividends,,-not,~ useful forcushioning the effect ofthe. passive loss limita-tions.
G About $3 billion, or. 25 percent, of .,the totalpartnership improvement from 1986 to 1987came. in agriculture, forest
'ry, and fishing.
Some of this can be attributed toTRA, -butmaiply.it appears to result,frorn a generallygood, year in farming [11., 1 2]. -
o Oil and gas extraction in the mining-divisioncontributed substantially to the improvementfrom 1986 to 1987. While the energy sector asa whole was recovering during this period fromthe sharp decline in o.il prices in.late 1985, the

Partnerships, Passive Losses, and Tax Reform
partnership figures suggest a strong responseto TRA. Oil and gas extraction was one of thefew industries granted major exceptions to thepassive loss limitations. Basically, losses frommost general partnerships in oil and gas couldcontinue to shelter ordinary income from othersources, while losses from limited partner-ships in oil and gas could not. The numbersin Figure D show a turnabout among oil andgas limited partnerships from a loss of $0.3billionfor 1986to again of $2.3billion for 1987.At the same time losses among generalpartnerships in oil and gas grew from $2.3billion to $3.6 billion. Both of these changesare consistent with the incentives provided byTRA.
This discussion suggests that partnershipsresponded to the tax shelter provisions of TRA in1987, but not nearly as much as the $12.0 billionimprovement in net income would imply. Since thepassive loss limitations apply only to losses flowingthrough to individuals, many corporations can stillbenefit from tax shelter partnerships. It is likely,therefore, that some of the market for tax sheltersmay have shifted to corporations. Nevertheless, asthe phase-in of the passive loss limitations proceedand partnerships are able to restructure even theirilliquid investments, it can be expected that partner-ship losses, the number of partnerships, and thenumber of investor/partners will continue to declinein those industries in which pre-TRA provisions werea large part of their attractiveness.
ANALYSIS OF INDIVIDUAL INCOME TAXRETURN DATA
This section examines partnership data reportedon individual income tax returns to see if TRA ap-pears to have reduced (1) the amount of partnershiplosses claimed by individuals, and (2) the use ofpartnership losses by high-income taxpayers tolower their income tax liabilities.
Figure E presents time series data on total and netordinary income and losses from partnerships asreported on individuals' income tax returns [13]. Theincreases in losses that persisted through 1986 werereversed abruptly for 1987, decreasing by $17 billion.Combined with a growth of $4 billion in total income,partners' net income increased by $21 billion. Thepassive loss limitations are undoubtedly responsiblefor much of the reversal in losses. Directly, the limita-tions disallowed approximately $10 billion in partner-
Figure E.-Partnership Ordinary Income and LossesReported on Individual Income Tax Returns, 1980-1987
[Money amounts are in billions of dollars]
35
Iricorre,you
NotIm.
Totalincom
Totalloss
(1) (2) (3)
1980 ........................... 9.6 29.8 20.2
1
981 ....................... -0 1 31.1 31.2
1982 ............................ -0 7 33.0 33.8
1
983 ........................ ... -2.3 36.2 38.5
1984 ............................ -8.2 38.6 46.8
1
985 ................ I........... -8.5 45.5 54.0
1986 ............................ -13.0 48.2 61.2
1987 ............................ 8.2 52.0 43.82
' Includes "expense deduction."2 Deductible loss after passive loss limitations.SOURCES: Internal Revenue Service, Statistics of Income-Individual Income Tax Returns, for
1980-1986; unpublished data from Office of Tax Analysis, Individual Income Tax Model, 1987.
ship passive losses [1 4]. Indirectly, taxpayers wouldhave responded to the limitations to some extent bydiverting investment into other activities, furtherreducing reported partnership losses. Otherprovisions of TRA, such as the reduction in ac-celerated depreciation, would have reduced the taxlosses associated with new investments. However,improvements in general economic conditions couldhave contributed to the change in partnership netincome as well. Separating the indirect response toTRA from the effect of other factors would require abehavioral model that is beyond the scope of thisarticle.
A complication in interpreting these figures is thatthe 1987 partnership figures do not include "portfolioincome" (interest, dividends, and royalties) earnedby partnerships, while figures for earlier years do[151. This would tend to understate the gains andoverstate the losses for 1987 relative to previousyears. Based on the reporting of interest anddividends at the partnership level, income may beunderstated as much as 20 percent, while lossesmay be overstated only about 5 percent.
Figure F shows the relative magnitude of thedifferent categories of partnership losses for 1987.This chart represents all partnership losses reflectedon individual income tax returns for 1987 [16]. Theslices of the pie show the type of loss -- active orpassive -- and, if it was passive, whether it wasdisallowed, and, if allowed, why.
0 Of all partnership losses for 1987, 23.4 per-cent were "active" losses and were thereforenot affected by the passive loss limitations.
For the passive losses:
9 25.6 percent of total losses were passive but
4

36 Partnerships, Pas'sive'Losses, and Tax Reform
.Figure F-Treatment of Partnership Losses o.n Individual Income Tax Returns, Income IYear 1,987
offset by passive income;
27.4 percent of total losses were.passive butwere~al lowed. because of the grad.yal phase-inof the limitations; '
benefited: from the special'treatment of. certainrental losses; and
5.1 ~percent~ of total -losses were passive but
o 1,8.6 percent, o.Ir about $10 billion, were pas-
sive and disallowed.
If the partnership-losses reported by all individualtaxpayers were lower for 1987, does that mean that.high-income individuals used them less,to reducetheir*tax liability? How has the useTof. partnershiplosses to reduce tax~ liability-for. high-income tax-payers changed. with Tax Reform? Figure.-.G helpsaddress these questions with data from 1983through1 987. : , . .1 . 11 . .1
In Figure G, a measure of income is used that
Passive losses~allowed byrental exception
ignores taxpayers' losses in determining whetheror
n6t'they have': high-,inco'mes.I
The measur,e t
Iot
,al
positive income, or TPI, l6okS"bhly at positive sour-ces of income, Viewing'people as high income if they;have largeamophtsoi gross incomb'withio.ne ittingof. losses~ [17,18].'' Figure G reports'thefra.6tionofTPIoffset by partnership losses,for returns with at Je-ait$250,000o
.f TPI. Thes~'high TPI returns are":61as-
sified according to their income'tax burdens~relative,to TPI.
Figure G shows that', for high-income. returns,partnership losses did indeed offset a, smaller frac-
Figure G.-.mPartnership Losses as a Percentage of Total,Positive Income (TPI) for Tixpay6rs with TPI Over$250,000, ~y.Percentage !of Taxes to,TPI, 1983-1967
Pe=T Me cl11983 1984. 1685 1986 1987
(2) (3~ (4) (5)
All high TPI, returns ......................... 10.9 10.9 it. 9. 1 8.5Less than 5percent ..................... :2 36.2 42.1 45.9 47.7 35~95 percent under, 10 percent ........... 21.4 22.9 24.1 23.6 .21.310 percent unaer 20 percent 6.) 7.8 7.6 5.3 'fl.020 percent or more.: ....... 3.6 3.6 3:7 3.0
Source: Unpublished data from Office of Tax Analysis: Individual Income Tax Models.

Partnerships, Passive Losses, and Tax Reform 37
tion of TPI after Tax Reform than before it [19]. Thisconclusion is particularly true for returns with thesmallest fraction (less than 5 percent) of their TPIreportable as tax.
For returns with low tax burdens, partnership los-ses had been offsetting an increasing fraction of TPIbefore TRA, from 36 percent for 1983 to nearly 48percent for 1986. For 1987, however, the trend wassharply reversed and deductible partnership lossesoffset no more of TPI than they did for 1983. As theperiod for phasing-in the passive loss provisionsexpires, this effect can be expected to grow.
SUMMARY AND CONCLUSIONS
The goal of this article was to see, based on thefirst returns filed under the 1986 Tax Reform Act (i.e.,for Income Year 1987) whether the Act was achievingits intended effect on tax shelter partnerships. Thisarticle presents evidence suggesting that this hasbegun to happen, although there are instanceswhere the anticipated effects were not as prominentas had been hypothesized. Nevertheless, TRA hashad a definite impact on tax shelter partnerships.
tion with increases in the number and profits of gainpartnerships are further signs of the effect of TRA.
Finding a larger response of TRA at the individuallevel than at the partnership level is consistent withexpectations. The passive loss limitations affect thetax liabilities of individuals, giving them incentives tomove out of tax shelters. Since corporate partnerscan still benefit from the tax advantages of tax shelterpartnerships, many partnerships have less incentiveto eliminate tax losses than do individual partners.
As tax return data for 1988 and later years becomeavailable, more evidence of responses to TRA areexpected. The passage of time will provide in-creased liquidity to partnerships to restructure theirportfolios and to individuals to sell or terminate in-vestments that no longer provide immediate tax ad-vantages. Additionally, the phase-in of the passiveloss provisions will end. Partnership losses, thenumber of firms, and the number of investor/partnersare likely to continue to decline in those industries inwhich pre-TRA tax provisions were a large part oftheir attractiveness.
At this point, the early effects of TRA are moreevident among individual partners than among thepartnerships themselves. Net income from partner-ships reported on individual income tax returns in-creased by at least $21 billion for 1987, and perhapsby more than $30 billion, if interest and dividendsreceived by individual partners, which are nowreported separately on the individual income taxreturn, Form 1040, are taken into account. Ap-proximately $10 billion of this came from lossesdirectly disallowed by passive loss limitations. Anundetermined amount of the remaining improvementrepresents an indirect response to TRA. Amonghigh-income taxpayers, the role of partnership los-ses in sheltering income from taxation shrank, par-ticularly among those with low tax burdens.
On the partnership side, net income improved by$12.0 billion for 1987. While some of this remainseither unexplained or is attributable to factors otherthan TRA, the improvements in the mining and realestate industries, in particular, are consistent with aresponse toTRA. (In real estate, part of the responseis simply slowing growth in losses among limitedpartnerships, rather that an absolute decrease inlosses.) The declines for 1987 in the number of losspartnerships and the size of their losses in combina-
NOTES AND REFERENCES
Ill U.S. Congress, Joint Committee on Taxation,General Explanation of the Tax Reform Act of1986 (H.R. 3838, 99th Congress; Public Law99-514), May 4,1987.
[2] U.S. Congress, Joint Committee on Taxation,Tax Reform Proposals: Tax Shelters and Min i-mum Tax (JCS-34-85), August 7,1985.
[3] Nelson, Susan, "Taxes Paid by High-incomeTaxpayers and the Growth of Partnerships,1983," Statistics of Income Bulletin, Fall 1985,Volume 5, Number 2.
[4] Nelson, Susan, "Noncorporate Business Taxa-tion: Before and After the Tax Reform Act of1986," OTA Paper 59, U.S. Department ofTreasury, Office of Tax Analysis, May 1988.
[51 Shapleigh, Colbert C., and Raley, Terry M.,"The Effect of the Passive Loss Rule and OtherRelated Provisions of the Tax Reform Act,"Journal of Partnership Taxation, Spring 1987.
[61 A "general" partnership was comprised entire-ly of "general" partners, i.e., partners each of

38 Partnerships `Pasiivei'Loises';_a'nd -Taii'Refdrm
[7]
which could be personally liablafor the'obliga-tions of the partnership. A "limited" lpartner-ship is one in which the liability of one (ormore) partners was generally I imited to theamount the person had invested (the amount"at risk").
See footnote 2.
.of net losses from partnerships adjusted'f6r
~gIuaranteed . 0aym
.ents iio.partheri~*d for
6therseoirately-tirdaMed items.
Pairtn~rship'totalvbas6d on'Schbd-6
ile
IE, Form
.-I . .. .- I .. i I
" -h I _~,F_Iej_ I I1040, -'differ from those, 66" t e orm 1065
partnershi~p'.retu-m` income- staterfidnt for..." %_~: .. .. - .~ ~ ~ ~ - ~, 0'. ~'. ~ 7'.. - . I -reasons such as*the followin9,
(a) the amounts shown,,on Form 1'040 are
after the "at risk" and (for 1987) the "pas-sive loss" limitations imposed on partners(the "at risk" limitation restricts the allow-able losses limited partners can deduct tothe amounts they invested);
[8] ' See footnote 5.
191 An S Corporation was generally a small cor-poration, with no more than 35 shareholders(primarily individuals), electing to be taxed atthe shareholder level.
[10] For 1987, 65 percent of passive losses frompre-TRA investments were allowed; for 1988,40 percent; for 1 989, 20 percent; for 1990, 10percent; and none for 1991.
[11 ] An example of an'industry affected by TRA is
----beef-cattle-except feedlots~--which-hadbenefited from treating most income as capitalgains and deducting most expenses from or-dinary income. This industry switched from anet loss of $0.3 billion for 1986 to a net gain of$0.7 billion for 1987.
[12] According to the'Department of Agriculture,net income of farm operators from farmingrose from $37.5 billion for 1986 to $46.3 billionfor 1987. See.Economic Indicators ofthe FarmSector: National Financial Summary, annual,U.S. Department of Agriculture, Economic*Re-search Service.
(131 Net (ordinary) income or loss on individuals'returns (Figure E) frequently differs from thecomparable figures for partnerships (FiguresC and D) because not all partners are, in-dividuals and because of the income reportingrequirements on individual income tax returns,as described below.
'Total income" as reported in. Schedule E,Supplemental Income Schedule, Individual In-come Tax Return, Form. 1040, is the sum ofpositive net income from gain partnerships,including
,separately treated items reported on
Schedule K-1, Partner's Share. of Income,Credits, Deductions, Etc., such as guaranteedpayments to partners. 'Total loss" is the sum
(b) guaranteed payments- to partners andcertain other separately-treated items (ex-cept. capital g.ai.ns) are handled differentlyin computing net income, by the partner-ship and by the Partners on Form 1040 (for
-instance,-in-the-case-of guaranteed-payments, they are deducted by thepartnership in computing partnership netincome on -Form 1065, but areincluded asincome by partners in computing partner-ship net income on Form 1040); and
(c) partners other than individuals share inpartnersh.ip income (or loss).
[1 4] Estimate made by Susan Nelson.
[15] In general, starting with 1987 partnership"Portfolio income" was reported on the in-dividdal income tax- return schedules accord-ing to the type-of portfolio income and thuswas not reported as income from partnerships..Previously, total partnership portfolio incomewas combined under income from partner-ships.
[16] Because Of how passive losses are reportedon the individual income tax return, some ofthese figures had -to be estimated for manyreturns. For partnership income, only activelosses and total.allowed passive losses, aredirectly reported.. Disallowed passive lossesand the allocation of allowed passive lossesaccording to the-reason for their being allowedwere estimated by Susan Nelson from returnswith more than one type of passive loss.

Partnerships, Passive Losses, and Tax Reform 39
[17] Total Positive Income (TPI) measures "gross"income reported on individual income taxreturns before losses. Specifically, it sums allpositive amounts of income on the Form 1040return and accompanying schedules, beforelosses or exclusions (such as the 60 percentexclusion of long-term capital gains allowedbefore 1987) or deductions which reduce ad-justed gross income (such for contributions toindividual retirement arrangements, or Keoghretirement plans).
[18] See footnote 3 for a similar use of the TPIconcept.
[191 For all high-income returns, Figure G showspartnership losses covering notably less TPIfor both 1986 and 1987 than before. The dropfor 1986 is due less to a reduction in partner-ship losses than it is to a jump in TPI astaxpayers realized their capital gains beforethe Tax Reform Act ended the partial exclusionof long-term capital gains from adjusted grossincome.

Foreign Recipients of U.S. Income,and Tax Withheld, 1987
By Marilyn J. Flaherty*
Total U.S. source income paid to foreign persons(including individuals, corporations and other or-ganizations) approached $23 billion in 1987, a 4percent increase over the amount paid in 1986 [1 ].Tax withheld on this income rose by more than 13percent, to $1.3 billion.
Japan was, for the first time ever, the recipient ofthe most U.S. source income, receiving $4.5 billionin 1987. This represents an increase of 56 percentover the previous year. Income paid to the United1,Gngdom, the former leader, increased 15 percent,from $3.7 billion in 1986 to $4.3 billion in 1987.
BACKGROUND
A U.S. individual or organization paying income toa foreign individual (who, for tax purposes, was nota resident or citizen of the United States) or to acorporation or other organization that was not incor-porated or organized in the United States reports thisincome and the U.S. tax withheld on Form 1042S,Foreign Persons' U.S. Source Income Subject toWithholding. Although the basic tax rate is 30 per-cent, certain types of income are taxed at lower rates[2]. Since 1984, portfolio interest payments havebeen exempt. Additionally, tax treaties, which theU.S. has entered into with most of its principal tradingpartners, allow income paid to residents of thesecountries to be taxed at lower rates.
In most instances the tax withheld on foreignpersons represents the final tax liability; the foreignrecipients thus do not have to file a U.S. income taxreturn because their tax liability is satisfied by with-holding at source. The responsibility for withholdingthis tax belongs to the payer or a representative ofthe payer (usually a financial institution).
Income "effectively connected" with a foreignrecipient's U.S. trade or business is exempt fromwithholding tax. This income is taxed by the UnitedStates separately. The foreign recipient is requiredto file a U.S. tax return (Form 1120F for foreigncorporations; Form 1040NR for foreign individuals),and the income is taxed in a manner similar to thatfor income received by a U.S. citizen or corporation.Such income is generally not included in the statis-tics for U.S. source income presented here. U.S.source income discussed in this article also excludesbank deposit interest. (See "Explanation of SelectedTerms.")
U.S. source income is taxed at a flat rate (generally30 percent) rather than being subject to graduatedtax rates as is the income of U.S. individuals andorganizations (and "effectively connected" income offoreign persons). Most foreign persons receivingincome from U.S. sources are not required to file U.S.income tax returns (which would require that theyconsolidate all of their U.S. income), because it isdifficult for the United States to tax a foreign personon a net basis on income that is not effectivelyconnected to a U.S. trade or business. Since it isdifficult, if not impossible, for the Internal RevenueService to verify expenses of a foreign person, theInternal Revenue Service taxes the foreign person'sgross income. Also, the tax is not based on theforeign person's worldwide income so graduatedrates may not be appropriate. Therefore, the flat ratewithholding is employed in situations involvingforeign individuals or organizations who receivedmany classes of income from one or more U.S.source.
The Social Security Amendments of 1983 re-quired U.S. tax withholding on certain benefits paidto foreign persons beginning in 1984. At the same
*Foreign Returns Analysis Section. Prepared under the direction ofChris Carson, Chief
41

42 Foreign Recipients of-U
IS. Income, 1987
time, the Railroad Retirement Act of 1937was alsorevised to require withholding on certain paymentsto foreigners. As a result, $71 million in taxes wasWithheld in 1987 on $793 million. of social securityand railroad retirement benefit payments.
The Deficit Reduction Act of 1984 removed thewithholding tax on most interest payments made toforeigners. This exemption was effective for allqualified debt issues made after July 18,1984. TheAct was intended to reduce.U.S. borrowing throughtax-haven countries, and toencourage U.S. corpora-tion-s to borrow foreign funds through directEurobond placements [3]. The interest paid on thesenew issues was exempted from withholding taxregardless of the redipient'scountry. The amounts,however,,,-are
.still -reported on Form 10428 and are
included in these statistics.
DATA HIGHLIG14TS AND TRENDS
The most significant change's occurring in 1987Were the marked increase in the income paid to.Japan, and the large decrease in income paid to theNetherlands Antilles'. These two topics rare ad-dressed in the "Country of Recipient" and "TaxHaven Countries" sections of this article.
While. the, total income paid to'foreign recipientsincreased by only 4.percent betWeen.1 986 and 1987,total tax withheld increased 13 percent. This occur-rence is explained b the fact that there was a largeyincrease in dividend income. Income from dividends(which is rarely exempt from Withholding tax) Jn-creased from- $6.5_ billion, in 1986 to $8.0. billion in1987.~'Thd,$1.5 billion increase in dividend incomewas. partly offset,by a slight drop in interest income,,rents and royalties income and personal servicesincome. Consequently, total income increased byonly $900 million from the 1986 level.
The,average payment increased $761 from - 1986to'$21,033. Likewise, the' average tax withheld onthese payments iricreased'aporoximately'$200 to$1,209. These changes are accounted for,by in-creases in both total income (4 percent) and taxwithheld (13 percent), but an -almost- imperceptibleincrease in the number of Forms 1042S being filed
.(0.51 percent).
The average effective tax rate (tax,withheld as apercentage of total income) for all'.countrids roseslightly from.5.29 in 1986 to 5.75 percent in''1987.
The effective rate is significantly lower than the. 30percent basic rate. The disparity -between the,tworates reflects the significant impact of income whichis exempt from withholding (such as most interestpayments), as well as income subject to reduced orzero withholding rates due to tax-treaties.
TYPES OF INCOME
As Figure A shows, interest paid remained thelargest single portion of.totAl'incoine paid, althoughthe amount did drop from its 1986 level. Whileinterest accounted for- 50 percent. of
.the tot
-al
-income
paid, tax withheld on this income accounted for only18 percent of the total amount of tax withheld. Thedisproportionately small amount of withholding oninterest payments stems from two main sources; the1984.Deficit Reduction Act,and treaty exemptions.At the same time, dividends paid, as a percent of totalincome paid to foreigners in 1987., increased 5 per-cent. Thus, dividend payments made up 35 percentofall income paidto nonresident aliens. The taxwithheld on dividends constituted 68 percent of thetotal. tax withheld. In contrast to interest, dividendsare ediely exempt from Withholding tax. The increasein dividend payments may- be explained in large partby the shifting,of foreign holdingsawa from-U.S.y - - -Treasury securities and into other U.S.. securities.Foreign 'holdings Of U.S. corporation stock in-creased notably ~during the first. three,quarters of1987, with purchases for that period exceeding thecombined purchases of the two''prior', year
.
's [4]. After
the stock market crash of October 19,1987, foreign-ers.were somewhat_leary of the. U.S. market, andthere were largo ~ sal6s'[5]. For.*thezyear, however,foreign persons made net.siock purchases of $15billion-, and this may, in part, account for the 23percent rise in dividend payments,,,from $6.5 billionin 1986 to $8 billion in 1987 [6].
This is only the third year for which statistics on.social security and railroad retirement benefit I~ay-ments are available. These payments constitutedonly' 3 percent of total income pai.d,,in 1987 to non-resident aliens. The total amount of
'these payments
increased from $769 million in 1986 to $793 millionin 1987,'A'rise of 3 percent. The percentage of thetotal going to each country, however, remained vir-tually'unchanged from 1986 (see Figure B). As in thetwo previous years, danada.and Mexico togetherreceived more th6n'40 percent of all social securityand railroad retirement benefit payments. Becausethese two countries border the United States many

Foreign Recipients of U.S. Income, 1987
Figure APercentage of Total Income Paid, by IncomeType, 1986 and 1987
Interest
Dividends
Rents and Royalties
tedrernent P%rments
Other Income
B 5%
5%
4%
4%
7%
6%
43
of their residents have worked in the United States,and are therefore entitled to these benefits.
Figure BPercentage of Social Security and RailroadRetirement Payments to Recipients inSelected Countries, 1987
Mexico19.1% Canada
22-8%
26.8%
United Kingdom 4.4% '4W VZ'ZZ,0r-1' OtherWest
Geff?r9yc4e23.7%
0 10 20 30 40 SD so
Percentage
Income Paid: 1986-$21.8 billion; 1987-$22.7billion.
Percentage of Total Tax Withheld by IncomeType, 1986 and 1987
Interest
Dividends
Rents and Royalties
Retirement Paymental
. Other Income
a IE 20 W 40 W
Percentage
so
Tax Withheld: 1198641.2 billion; 1987-$1.3billion.
Includes social security and railroad retirementpayments.
79
Countries
Total Paid: $793 million
TYPE OF RECIPIENT
Corporations received 62 percent of all U.S.source income paid to foreign persons in 1987: butaccounted for only 53 percent of the total tax with-held. One reason for this difference was that cor-porations received 59 percent of their income frominterest (which was subject to low or zero withhold-ing tax), and only 30 percent of their income fromdividends. Also, direct investment dividends(dividends paid on the investment of a parent com-pany in a subsidiary or other affiliate) were subjectto a lower tax rate under some tax treaties than Wereportfolio dividends.
The next two largest classes of income recipientswere nominees and fid,uciaries, ($2.8 billion, 12~ per-cent of total) and individuals ($2.2 billion, 9 percent.of total). Nominees and fiduciaries accounted for 14percent of total tax withheld on U.S. source income,while individuals accounted for 17 percent of thattotal.
For reasons previously mentioned, the effectivewithholding tax rate for corporations was significant-ly lower than the effective rate for most other typesof recipients. The effective U.S. withholding tax rate

44 Foreign Reciolents of.U.S. Income, -1987
for corporations was 4.9 percent, compared with aneffective tax rate of 7.2 percent- for all.other types, ofrecipients.
Government, international, and foreign tax-ex-empt organizations received 4.3 percent of total U.S.source. indbme'paid to forei 'n persohi,-but,.the tax1 ~ . .. 1; , 9withheld on this income constituted o'riIy..O.,4,p¢oftfi'~tbt~alt,*~cixW,it'hh'e'ldinl987. Generaillytax-ighotwithheld o6:payriients` to such orgahiiatiohs1f, theIntdrb_6I.~ReVonde,8ervice has determinedthat "theyare not forplg6 private foundation~ [7].
The averagep'ayment received by individuals wasby far the smallest of any recipient type, at $2,517, a2 percent dr6p,from 1986. For c6rpor6tions-,.theaverage payment was.$1 ~7,320, an increase of -7.2percent from'the previous year. Government, international and. foreign tax-exempt organizationsreceived the,lar'g,pst averag
.e
Ipayment,at $2,714,458.
FigyrIe,)b-,:,'s`h'6Ws'1'.'.t.he distrib,Ution of 'in
,c.ome
-receWd'and- tax withheld-by-various'types of-income-
for~~*eye(al categories of foreign, recipients.~ Th'irty-
ncome,seven ~peiedent,o,f the total i paid to indivi ualswas !rf ~the- form of'social security , payrri6nts'* andrailroad retirement benefits, thereby explaining thevery large "other." income paid to individuals asshown in Figure C. Similarly, tax Withheld on thesesociWsec6rity'and.railroad, retirement benefits con-stituted 32 of the 53 percent of the tax withheld on"other" income.
COUNTR -OF.RECIPIENT i
Figure.'D
.-:shows
.~ the percentade: of total - incomePC
and.i6e"i'to' fa~lta'x~'Withh'eld for16,6`6inp,,,countn6s` ,
1 :1 r ~US;l .1 1:1 'b '__-with, the~ leirge'-st .. source income.~ ecausd'Bel-gian n6mindes,once again receivedlarge interestpayments
,1
1million) the final re
idipients of this
income may not have been Belgian residents. Forthis'reason the''data On Belgium
may be somewhat'overstated.
As mentioned previously, payments to Japan in1987 increased 56. perc.ent and payments toJapanese residents accounted for 20 percent of thetotal income paid to foreign persons. Japan's moveto the position ofthe largest income recipient comesas no surprise. Japan's U.S, source income hasincreased steadily in,the years prior to 1987. FigureE plots Japan's U.S. source income in bbthcurrentand, constant dollars for the period 1982 through
1987 [8]. During the mid to late 1980's, Japaneseresidents purchased over $50 billion in U.S.Treasurybonds. In 1986, U.S. real. estate pu' rchaise theJapanese were estimated at $4 billion [9]. Mostnotably, Japan accounted for more than 70 percentof the. foreign purchases in the U.S. stock marketduring ih&'first, three quarters of,.1081.. The strongvalue of the ' 'e and the relaxation of certain restric-. . . Y q ... ~ 1. - .. - .1 .. ..ti6ns'. imposed by the
.Japanese government on
foreign Portfolios made the United States bull marketan extre'ni'd'l~,attrictive~place'for Japane
.se Anvest-
md6i:,J16f.:ihis,:strong stock jnveli~6eht.w'as re-P.-Alvidend.flebted - in-.a' 1*34 percent increase.. in
payments made to Japan; from $380million ln~ 1986to $888 million in 1987.
The Netherlands Ahtilles,lost the biggest percent-age~ of total U.S. source income. from 1986 to, 1987.Antilles' U.S. source income dropped 39 ~ percentfrom-VIO billion. in 1986 to $1,7,billio'n in*,l 987., This.decrease -mIay,have stemmed fr6rii,st,."number of
-Principal reason,was I iheex.causes: The probably,,.,_-Pectedrbs se -to-the-removal "Ott, ithhbldingPon.. he w
tax on mo,st.types,.of interest for issues~madd after
July~1984~ As,likeviously mentioned, the.,interitofthisch6n66' wa"s "partly to. decrease
.inte
.rest
.p'
,aid to. the
Netherlands Antillesb.y facilitating borrowing directlyfrom persons in other countries* that are not'con-sidered teix.havens (See"Tax Heiven'Countries.")
It is, howdver,'Iik6ly that another factor may haveplayed-a role in'the drop'in U.S. source.income paidto the Netherlands Antilles. OmJune.29, 1987,.theU.S. Treas6rv Department anef6undiDdIhe, termina-
Itiori.-of. a,_40-year,old tax treaty'with'the_,.NeiherI6ndsAnti 11 ff " -We January 1!,' 1 988.'.,A hew tre
iaty hadOs, q e" T . - ,~. I . . _. -..~
'b6e'n_U'd' ime* in which then er-,negotiation for'. ..'_, preventUhite.d.,.Siat
.e
.s sought to introduce tuies'16
..the" of:'Ihe. 'United States-Netheriands"' Antillestreaty by-r6sidents of a third count 'for- channellingy rYinvestment into'the United States.The announce-m.ent of the- termination by',the Treasury Departmentset off a'flurry'of activity in the'Eurobo'n''d market..13onds issued in the 1970's and ~eariy 1980's had'been issued at interest rates significantly hig46r thanther prevailing rate of June 1.987. Additionallyj themajority of the bonds
.issued through the. Nether-
lands Antilles included a caveat that allowed the, issuing corporations to call the bonds and refinancethe debt at current rates if there was ever a changein the treaty status of the Antilles. A number of U.Scorporations intended
'to take advantage of this by
paying off some very expensive debt early,-'while

Foreign Recipients of U.S. Income, 1987
Figure CPercentage of Income Paid and Tax Withheld by Income and Recipient Type, 1987
Corporations
Ix8X
Income ($14.2 Billion)
Income ($63-Million)
Tax ($692 Million)
Partnerships
ex
Tax (S9 Million)
Government, International,and Tax-Exempt Organizations'
Income ($981 Million)
ix
1 Other than private foundations.
Tax ($5 Million)
Individuals
Income ($2.2 Billion) Tax ($221 Million)
Nominees and Fiduciaries
Income ($2.8 Billion) Tax ($189 Milli6n)
Private Foundations
5X
4%
Income ($3 Million)
Interest
Tax (S472 Thousand)
<::~ Rents and Royalties
Dividends -.40 Other Income
45
5X
3X
2X

46' Foreign Recipients of U.S.'Incbme,1987'
Figure DPercentage of Total Income Paid, byCountry of Recipient,. 1986 and 1987
Percentag'e-of.T6tal'Tax.Withhe'ld byCountry-o"f Recipient, 1986 and 1987
Udid Kmqdom
jW*
Nahdods Wk
49
13%
Percentage
26%
Income Paid: 1986421.8 billion;'billion.1987-$22.7 1
POOPPOP/l/f/
'Percentage
Jax Withheld: 1986-$1.2 billion;1987-$1.3, billion.

Foreign Recipients of U.S. Income, 1987
suffering no penalty [11 ]. Eurobonds, which hadbeen trading at a premium, dropped dramatically inprice upon the Treasury's announcement of thetermination of the treaty. Not only was,there con-cern in foreign markets, but U.S. financial institutionswere in an uproar as well.
Although Eurobonds must initially be sold inforeign markets, after 90 days they may be resold inthe
,United States. In recent years, U.S. banks and
other financial institutions had acquired large hold-ings of Eurobonds [12]. In order to calm markets,the Treasury announced, on July 10, 1987, that thetermination would not apply to the interest pro-visions, thus preserving the interest exemption forthe Netherlands Antilles. The termination of theother provisions, however, eliminated the attractive-ness of the Antilles as a conduit for most investmentsinto the United States. The movement of many ofthese investments from the Antilles would bereflected in a decline in U.S. income payments to theAntilles.
47
TAX WITHHELD AND EFFECTIVE TAXRATES BY COUNTRY
The overall effective tax rate increased slightly in1987 to 5.75 percent (from 5.29 percent in 1986).The overall effective tax rate was much lower thanthe basic U.S. withholding rate of 30 percent for anumber of reasons:
e Tax treaties allow for lower tax rates on certaintypes of payments made to residents of certaincountries.
U.S. income paid to foreign government or-ganizations is generally not taxed.
9 Most U.S. income paid to foreign private foun-dations is taxed at only a 4 percent rate. Thestatutory rate for social security and railroadretirement benefit payments is 15 percent.
9 The Tax Reform Act of 1984 removed thewithholding tax on most types of interest.

48 Foreign Recipients of U.S. Income, 1987
These factors result in considerable variationamong countries (as well as among types ofrecipients and income paid) in the effective U.S.withholding-tax rate (tax withheld as'a percentage oftotal income paid).
Figure F ranks the 15 countries with the lowesteffective U.S. withholding-tax rates for, 1987. Taxwithheld by foreign governments and foreign with-holding
Iagents is not included in this figure (except
for Canada), because s.uch tax cannot be properly
attributed.to income for a particular year. (See "DataSources
,and Umitations."), 'This tax is, however,
shown in table 1. at the end of this article. Onlycountries receiving at least 500 payments and $1million or more of U.S. source income were con-sidered for,this ranking.
Figure F.~Ranklng of 15 Countries With Lowest Effective,U.S.,Tax Rates,.1987[Money amounts in thousands of dollars]
country
All countries . ...... ..............United Arab Emirat s .........................~Singapore ........... ......................Belgium.: ......................................... ..Pal~istan ...................... ! .......................Saudi Arabia ........ . ................ ......Netherlands Antilles .~ ................Kuwait ............. ..................................Finland ............. ................. ................Cyprus :
... . . . ............... ..Italy ............................................ : ........
China ...............................Taiwan .................
.. - *Malta ....................
.* ...................Denmark.~ .......
.......... ....... . . ........."Cayman Island,. ................. I ........ . .....(?tl~er,cquntries ' ~ ...............................
-Total-
. income
(1)
$22,748,677
313,95415~.882999399
15:700.146,185
1,736,794182,76936.5607,524
32,43541.264
30606137:604
18.667,339
-Tax
-Iwithheld
(2)
$1,307,308
4661,689
11,660~ 194
2,08226,726.3,161
654137
7,007942
1,390
1 153'5:210
1,244,783
Effective US.tax rate
5.75%
0.151.091.171.24
142
1.541.731.791.822,87
3.371453.773:796.67
Includes all other countries not listed, regardless of number oi payments or amount of incomepaid. ~. - I i . ! I . I
As in previous years, the UnitedArab Emirateshad. the lowest effective. tax rate, 0. 15 percent, com-.pared, with the average for all Countries., of. 5.75percent.. Although the'Unite
,d Arab
,Emirates is not a
treaty country, most U.S. source income paid to the'ites was paidl o government, or-United Arab Emir t
gan.izat
.ions, which are g6nerally'exempt fr6m,
-with-
holding tak. The five newcomers to the'list ofcountries'with the lowest effective'tax ratei
Iwere
d' MPakistan, ' Kuwait, Cyprus, China, 'an enm6rk.Three ofthese, China,,b6nrark and Cyprus were the
of t atyag~ebments 'hichsubjectbeneficiaries' ax'ire wthem to. low withholding tax rates. -Ci-hadk NewZealand, Puerto Rico, Baheaih'.and the'Netherl'ands,were.displaded from. last;ybaIr's list. While Canadaand Ndvi Zealind'werd both tax treaty countries', the
provisions of their treaties did not reduce their with-holding tax rates by nearly as much as did the taxtreaties of the newcomem,' China, Denmark andCyprus. The low effective tax rates for Kuwait andPakistan can be explained by the fact.that. over 94percent of t
'he income -paid to these. two countries
was exempt from withholding tax.
TAX TREATY COUNTRIES'~
As a means-of avoiding double.taxation of incomeearned in one country by residents of another, theUnited States- has negotiated tax treaties with manycountries that reduce the withholding rates in bothcountries [13]. Presumably any losses in withhold-ing tax revenue resulting from tax treaties. are at leastpartly offset, by a. reduction in the foreign tax creditsclaimed by U.S. individuals and corporations againstU.S. income tax. Reciprocal tax treaties generallyprovide for a reduced- withholding rate for U.S.recipients of foreign-. income , and for foreignrecipients of U.S. income.. As a result, U.S,. in-dividuals and cor orations receiving, income from.taxtreaty countries ave less foreign tax withheld, andthis,usually reduces their-foreign tax credit claimedand increases the amount of income tax paid to theUnited States.
I Figure G compares the effective tax rates on pay-,ments to recipients in treaty countries (5.4 percent)with those in nontreaty countries (8.0 percent). Be-cause nearly 90 *percent of all U.S. source income'was paid to residents of treaty countries, there is littledifference between the -average effective tax rate forall countries and that for treaty,,countries., (For a listof many of the tax-treaty and nontreaty. countries:andcomparative data,on,inc6me paid and tax withheld,see Table 1.),
Figure G.-Total Incorne,:Tax Withheld, and Effective U.S.Tax Rates for Treaty and Nontreaty-Couritries,'1987[Money amounts in thousands of dollars]
Treaty Total T" tffectivestatus income withheld U.S. tax rate
(2) (3)
All countries .................................... $22,748,677' $1,307,308 5.7&0/b_
Treaty countries ..................... ....... .... 19,899,575 1,078,295 5.42
N6ntr6aty countries....~ ............. : :2,849,102 229,013 8.04
Reiiderits in tax treaty coLi6triie's typically enjoyedlowee U.S. withholding ta)(rates than did recipientsin- other cod6iries. ~ However, when U.S. soduir'de in-come is paid to a;fo'r'eign nominee or fiduciary'in a

Foreign Recipients of U.S. Income, 1987 49
treaty country on behalf of a person in a country notentitled to the treaty benefit, additional withholdingmay sometimes be collected by the government ofthe nominee or fiduciary. The purpose of this addi-tional withholding is to prevent citizens of nontreatycountries from taking advantage of the lower taxrates of treaty countries. The additional tax is with-held by the government or withholding agent untilthe ultimate recipient provides proof of residency inthat country. If residency is not proven, the tax isremitted to the United States (as shown in Table 1,column 7). These amounts are not included in thetax withheld data cited in Figure G and elsewhere inthis article.
ing taxes at a low rate. Tax-haven countries have thefollowing characteristics:
Low or zero withholding tax on most or certainclasses of payments from the tax-havencountry to foreign individuals and organiza-tions;
Low or zero effective income tax rates forforeign individuals and organizations operat-ing within the tax-haven country; and
Secrecy laws to prevent foreign governmentsfrom obtaining financial information abouttheir own citizens and organizations.
During 1987, the'U.S. terminated its treaty withSouth Africa and announced the cancellation of itstreaty with the Netherlands Antilles.
In the fall of 1986, the U.S. Congress passedsanctions against South Africa to protest the policyof apartheid practiced by the South African govern-ment. Among these sanctions was a termination ofthe United States-South Africa tax treaty effectiveJuly 1, 1987. Because the change in the treaty statusof South Africa came in the middle of the year, thetrue effects of the termination are not completelyreflected in the 1987 data. Additionally, because thetreaty did not lower the withholding rates significant-ly, the effect on U.S. source income paid to SouthAfrican residents, even when bourne out completely,may not be notable.
Prior to the termination of the Netherlands Antillestreaty, residents enjoyed a zero withholding rate oninterest and royalties and reduced rates ondividends. With the partial termination of the treatyin January 1988, the withholding rate on dividendsand royalties jumped to 30 percent. However, thetax rate on interest paid by U.S. obligors remainedat zero because of the decision not to terminate theinterest provisions of the United States-NetherlandsAntilles treaty.
TAX HAVEN COUNTRIES
Countries having tax and secrecy laws favorableto foreign individuals and organizations are generallyconsidered to be tax havens. They attempt to at-tract foreign investors by offering taxation lower thanthat imposed by the investor's own country or byother foreign countries. The tax-haven country typi-cally benefits by collecting certain fees or by impos-
A number of tax-haven countries have low taxrates in an effort to attract capital investment into thecountry, as well as financial investment.
In addition to tax haven countries, almost anytreaty country can be an attractive conduit for third-country residents to invest in the United States withlittle or no withholding tax. All treaties may be subjectto abuse by these third-country parties, and so newtreaties with all countries now generally deny treatybenefits to residents of the treaty country if thosebenefits flow through to third-country residents.There is generally an exception to this rule, in dif-ferent form depending on the treaty, if the residentof the treaty country is engaged in an active businessin the treaty country and is not established or main-tained merely to take advantage of the treaty. Thisis to prevent persons not entitled to treaty benefitsfrom funneling U.S. source income through the treatycountries in order to minimize tax liability. The mostnotable of these tax treaty/tax haven countries hasbeen the Netherlands Antilles.
For a number of years, the Netherlands Antillesserved as the major conduit for placements ofEurobond issues and for other foreign borrowing byU.S. corporations. U.S. companies set up financialaffiliates in the Antilles to borrow large amounts offoreign monies which they relend to the U.S. parentor other affiliates. The interest payments from theparent company to the Netherlands Antilles affiliateare exempt from U.S. tax withholding under theremaining portion of the United States-NetherlandsAnti I les, treaty. Additionally, the U.S. corporation canclaim the
.interest paid -as a deduction on their federal
income tax. The financial affiliates receive the inter-est as income but because the interest payments to

50 Foreign Recipients of U.S. Income, 1987
the third-country lenders are deductible on Nether-lands Antilles tax returns, the financial affiliates havelittle net income for Netherlands Antilles tax pur-poses. In addition there is no, withholding tax im-posed by the Government of the Netherlands Antillesbn the interest payments'to the foreign lenders.
Although the Deficit Reduction Act. of 1984 at-ter
'npt
'ed, to reduce such borrowing through tax
haven countries by exempting most interest pay-merits from the withholding tax, as of July 1987 thereremained more than $30 billion worth of outstandingEurobond issues -made through. the NetherlandsAntilles before July 1.8,1984, the effective date of thisportion of the Act [1 4]. The interest paid on this debtis still subject to reporting' on Forms 1042S andtherefore is.-included in these statistics. New issues,however, tend to be placed directly in the Eurobondmarket.
SUMMARY
U., S. source income pai0o foreign perso~ns rose4' percent in 1987 to $22.7 billion. The largestrecipient of this income was Japan with'$4.5 billion.Japan's U.S. source income increased by 56 p6rcentin 1987, following a trend of double digit increases.The removal of withholding tax on. interest due to theDeficit Reduction Act of 1 984, combined With thepartial te
'rmination of the Netherlands Antilles treaty
caused U.S-
source income paid to the Antilles todrop. 39 percent to $1.7'billion in: 1987. Interestremained the most common type of income, paid toallbountries, accounting for 50 percent of the totalpaid in 1987..
Corporations, which received 62 percent of thetotal income paid, remained the largest class ofrecipient's of U.S. source income, while foreigngovernments received the largest average payment($2,714,458).
Tax withheld on income paid to foreign persons-rose 13 percent, to $1.3 billion. - Tax withheld-.ondividends made up the major portion of all tax,with-held (68 percent).
DATA SOURCES AND LIMITATIONS
Payers of most U.S. source income -to foreignpersons must withhold tax in accordance with theInternal Revenue..Code., Form'1042S, ForeignPersons' U.S. Source Income Subject to Withhold-
ing, is filed by the payer to -report this income Andthe'U.S. tax withheld. Often a financial institutionacts as the payer's withholding agent.
The statistics in this article were tabulated bycalendar year, based on all Forms 1042S filed withthe IRS in 1987. The amounts shown represent theincome that was paid and the U.S. tax that waswithheld in 1987, except for U.S. tax withheld byforeign governments and withholding agents (whichreflects.the amount of tax remitted to the UnitedStates Under treaty agreements during 1987)
''.'This
additional tax cannot- be pr6perly-attrib.i.ited tospecific income types and years. For.this reason,tax withheld amounts throughout the article andpercentages shown in Table 2 and Figures A, C, D,~F and G do not include tax withheld by foreigngovernments and foreign withholding agents (ex-cept for Canada, which remits its tax paymentsduring the same calendar year in which the U.S.income is paid).
--Income, that-is "effectively connected" with- aforeign person's U.S. trade or business
.is not sub,ect
to withholding tax, and is therefore generally notincluded in' these statistics.
.This category of intome
was subject to the same graduated tax rates,andmethods of payment as the -income of U.S.'in-dividuals and corporations. The U.S. source incomediscussed in this article also excludes bank depositinterest.
Because all Forms 1042S are included in thestatistics, the data are not subject to sampling error.However, the data are subject to nonsampling error,such as computer data entry errors and minor tax-payer reporting errors. A limited,corhpUterize'd pro-gram was used to test the'data for certain basicnumerical relationships, including the'calculatioh ofthe
..correct tax withheld. 'In,additi
Ion, Forms,1042S
with income greater. than $1 - million were.. manuallyverified.
EXPLANATION OF SELECTED TERMS
Eurobond.--Eurobond placements are U.S. cdr-porate bonds placed in foreign markets that, aredenominated and sold in dollars and that also yield-dollar interest.
Foreign Person.--For purposes of.this artidle,*.'foreign~pers6ns include (a) individuals whoseresidence (for tax., purposes) is not within the United

Foreign Recipients of U.S. Income, 1987 51
States and who are not U.S. citizens; and (b) cor-porations and other organizations, including partner-ships, private foundations, estates, trusts, andcharitable organizations, created or organized out-sidethe United States. Persons residing in PuertoRico and other U.S. possessions are also con-sidered foreign persons for purposes of the incomeand withholding tax discussed in this article.
Foreign Tax Credit.--U.S. persons are subject toU.S. tax on their worldwide income. The portion ofthis income derived from foreign sources is alsogenerally subject to tax by the country in which it wasearned. In order to avoid double taxation on thisforeign source income, U.S. tax law allows for adollar-for-dollar credit against U.S. income tax forincome taxes paid on the foreign source income toforeign governments. This credit is subject to anumber of limitations [15].
Income Effectively Connected With a U.S. Trade orBusiness. --Income that is "effectively connected"with the conduct of a trade or business in the UnitedStates is exempt from withholding tax. This incomeis subject to substantially the same tax rates thatapply to U.S. citizens, residents, and corporations.When a foreign corporation, for instance, has abusiness operation in the United States, it has to filea U.S. income tax return on Form 1120F and payappropriate taxes on the income of this operation.When this income isthen remitted by this U.S. branchof a foreign corporation to the foreign parent cor-poration, it is generally not subject to further U.S.taxation [16]. These amounts may be erroneouslyreported on Forms 1042S, but the extent of theirinclusion in these statistics is unknown.
Nominee and Fiduciafy.--An entity chosen or ap-pointed to accept income for, or act on behalf of, theeventual recipient of the income. Typically, a finan-cial institution acts as a nominee or fiduciary.
Foreign governments may also act as withholdingagents by withholding additional taxes on personswho are not entitled to the treaty rates.
NOTES AND REFERENCES
[11 U.S. source income includes, but is not limitedto, interest, dividends, rents, royalties, capitalgains, and compensation for personal servicespaid to foreign persons from sources within theUnited States. Many of these types of incomeare subject to a withholding tax at the source.The U.S. source income discussed in this articleexcludes bank deposit interest and income "ef-fectively connected" with a U.S. trade or busi-ness. (See the "Explanation of Selected Terms"section of this article.) For a further discussionof U.S. source income, see U.S. Department ofthe Treasury, Internal Revenue Service, With-holding of Tax on Nonresident Aliens andForeign Corporations, Publication 515, Novem-ber 1988.
[2] For an explanation of the varying withholdingrates, see IRS Publication 515.
[3]
Resident (of a jurisdiction other than the UnitedStates).--A resident (other than a U.S. citizen) is aforeign "person" as described above.
Withholding Agent.--Any person (individual, cor-poration, partnership, estate, or trust) required towithhold tax. Usually the withholding agent is thepayer of the income or a "person" (usually a financialinstitution) acting on behalf of the payer. A foreignnominee or fiduciary required to withhold additionaltax under a tax treaty is also a withholding agent.
Prior to the passage of the 1984 Act, U.S.multinationals, seeking to borrow largeamounts of money at interest rates below theprevailing U.S. rates, set up finance subsidiariesin the Netherlands Antilles and other tax havencountries. These subsidiaries borrowed largeamounts of money in the Eurobond market andloaned that money to the parent. Smaller com-panies which needed to borrow less money,were substantially shut out of the Eurobondmarket, as the cost of setting up and maintain-ing a Netherlands Antilles finance subsidiarywas prohibitive. As a result of the 1984 Act,small U.S. companies, as well as the Treasury,are now able to enter the foreign market directly.See "Explanation of Selected Terms."
[4] Scholl, Russell B., "The Investment Position ofthe United States in 1987," Survey of CurrentBusiness, U.S. Department of Commerce, June1987, pp. 79-80.
Ibid., p. 80.
Ibid.
Foreign tax-exempt organizations are thosecorporations that would be tax-exempt under

5.2 For6ign'Reciplionts of - U.S. Incomo'." 1981'
U.S. law despite the fact that they are incor-Olofitibd ifi:616r6ign country. The tAk exemptionapplies only to income "effectively connected"to'*the; organization's tax-exempt purpose orfunction. Tax-exempt organizations may betaxed 6 n- "unrelated business income." See IRS-Publication 515.
[8] Computed using the implicit GNP price deflator,- Economic Report of the President, February
1989, pp. 312-313.
191 -Glasgall, William, et al.0 "An InVeitor the U.S.'Can't Afford.To Lose," Business Week, May 4,1987, p.
[10] Scholl, op, cit., p. 80.
[111 Brady, Rose and Englis.h, Victoria, "A Eurobond:13ombshell,".'Rusiness Week, July 13, 1987, p.100.
[1 2] iIgas, David,
.et
o'X~
-1T
--emip-es~t- Hits'.-the
:.Treasury" Business Week, -July-20, 1*987, p. 124.
[131 For a list of specific tax treaty countries and theirappropriate withholding rates, see IRS Publica-
-tion 515.
[1 41. Figures compiled by Salomon Brothers, Inc.,and reported in the Wal/StreetJournal, June 30,1.987.
[15], For further information on corporations...claim-ing foreign jax- credits, see-~ Mosej Vergiei1C* inorporate Foreign Tax_ Credit by Industry"-'this Issue of Ah.e Statistics of Income Bulletin.
[16] For further iriformatioh on foreignc6rpoe'a'tionswith "effectivqly, connected" income,,~seeHobbs, James R., "Foreign Investment an.dAc-tivity in'the'United States Through Corpora-tions, 1964 ~and 1985" Statistic
-s:, of In
.come
~Bulletln, Spring 1989, Volume 8, Number 4.

Foreign Recipients of U.S. Income, and Tax Withheld, 1987
Table I.-Forms 1042S: Number of Returns, Total Income Paid, Tax Withheld, by Selected Iteaty and Nontreaty Countries(Money amounts are in thousands of dollars]
53
Imorne paid Tax withheld
Country orNurnbor
ofBy foreign
geographic area FormTotal
Exempt from SubjectM
TotalBy dmvgkwithholding
go'ernmentand
1042S withholding withholdlingagente withholdfing
agents
(1) (2) (3) (4) (5) (a) M
Total .......................................................... 1,081,571 22,748,677 12.329.619 10,419,057 1,431,074 1,307,308 123,763
Treaty countries, total .................................... 783,272 19.899,575 10,447,512 9.452,065 1.202,058 1,078,295 123.763Australia ..................................................... 20.095 187,166 83,533 103,632 16,738 16,738 -
Austria ........................................................ 4,831 30,993 18,862 12,131 2,002 2,002 -
Belgium ...................................................... 11,394 999,399 917,977 81,422 15,181 11.660 3.521Canada ...................................................... 315,930 1,742,873 1.113,341 629,532 92,479 92,479 -
Denmark .................................................... 3,251 30.606 22,856 7.750 1,156 1,153 3Egypt.......................................................... 1,214 2,371 1,565 806 135 135 -
Finland ....................................................... 1,254 36,560 29,753 6,808 654 654 -
France ........................................................ 22,473 693,479 263.742 429,737 41,766 41,158 608
Greece ....................................................... 15,553 40,907 6,555 34,353 5,634 5,634 -
Ireland ........................................................ 8,374 26,931 10,643 16.288 2,644 2,517 127Italy............................................................. 34,770 244,088 188,711 55,377 7.007 7,007 -
Jamaica ...................................................... 2,288 6,794 1,195 5,599 806 806Japan ......................................................... 23,476 4,464,485 1,919,955 2,544,530 288,778 288,778 -
Luxembourg ............................................... 4.467 114.023 62.200 51,823 15,495 12,699 2,796
Netherlands................................................ 11,218 1,930,405 840.486 1,089,919 81,129 81,129 -
Netherlands Antilles ................................... 3,743 1,736,794 1.473,300 263,494 26,727 26,726 1
New Zealand .............................................. 2.655 9,294 3,328 5,966 891 891 -
Norway ................................ ...................... 6,610 42,328 26,175 16,153 2,528 2.528 -
Philippines .................................................. 29,601 77,377 4,002 73,375 11,722 11,722 -
Poland ........................................................ 2,881 13.642 3,310 10,332 1,517 1,517 -
Sweden ...................................................... 8,129 140,908 52,929 87,979 7.449 7,449 -
Switzerland ................................................. 36,685 1,657,933 596,664 1,061,269 243,022 129,349 113,673
Trinidad and Tobago .................................. 1,032 3,112 948 2.165 353 353 -
United Kingdom ......................................... 127,378 4,267,678 1,999,063 2,268,615 244,235 241,201 3.034
Wast Germany ............................................ 70.733 1,316,499 743,237 573,262 88.396 88,396 -
Other treaty countries ................................. 13,237 82,930 63,182 19.748 3,610 3,610 -
Nontreaty countries, total .................... 298,299 2,849,102 1,882,107 966,989 229,013 229,013 -
Argentina.................................................... 8,661 22,G61 8,6B2 13,379 2,851 2,a5l -
Bahamas .................................................... 3,693 132,564 75,249 57.316 16.425 16,425 -
Barbados ................................................... 656 7,539 3,748 3,792 828 828 -
Bermuda .................................................... 2,388 138,799 69,627 69,172 20,497 20,497 -
Brazil .......................................................... 5,457 19,8" 9,286 10,558 2,334 2,334 -
British Virgin Islands ................................... 956 36.378 11,628 24,750 7,027 7,027 -
Cayman Islands ......................................... 2,091 137,604 119,151 18,453 5,210 5,210 -
Hong Kong ................................................. 16,725 171,123 101.073 70.050 19,626 19,626 -
Israel .......................................................... 6,850 23.988 11,683 12,305 2,623 2,623 -
Jersey ......................................................... 492 25,559 8.774 16,785 4,681 4,681 -
Kuwait ........................................................ 1,418 182,769 172.168 10,601 3,161 3,161 -
Liberia ........................................................ 926 25,292 15,675 9,617 2,794 2,794 -
Liechtenstein .............................................. 1,736 27,294 12,072 15,222 4,539 4,539 -
Mexico........................................................ 90,070 278,221 70,580 207,642 37,381 37,381 -
Panama ...................................................... 8,180 219,722 128,458 91,264 26,789 26,789 -
Portugal ...................................................... 7,021 22,143 2,647 19,495 3,055 3,055 -
Puerto Rico ................................................ 6,431 11,333 5,553 5,780 1,137 1,137 -
Saudi Arabia .............................................. 4.492 146,185 139,066 7,119 2,082 2,082 -
Singapore ................................................... 6,800 154,882 149,081 5,800 1,689 1,689 -
South Africa ............................................... 2,777 7,285 2,764 4,520 1,203 1,203 -
Spain .......................................................... 9,732 48,554 22.735 25,819 5,607 5,607 -
Taiwan ........................................................ 5,002 41.264 35,129 6,135 1,390 1,390 -
United Arab Emirates ................................. 682 313.954 312,379 1,576 466 466 -
Venezuela ................................................... 8,142 33,426 13,990 19,437 5,238 5,238 -
Other nontreaty countries...........................1 96.921 1
621,3191
380,909 1 240,410 1 50,380 1 50,380 1-
Note: Detail may not add to totals due to rounding.

54 Foreign -Recipients of U.S. -income, and Tax Withhold,1987
Table 2. - Forms 1042S: Number of Returns, Tax Withheld, and Total Income. Paid by'Income Type, by Selected,Recipient7ype and Country of Recipient[Money amounts are in thousands of dollars]
orNmber of
.
TaxIncome paid
areaand recipient typeForms 1042S withheld
Total Interest DMdends Rents Social security ahd Personalroyalties railroad retirement service
(1) -(2) (3) (4) (5) (6) (7) (8)
AJI countries, total............................... 1.081,571 1,307,308 22,748,677 11,383,656 8,031,076 1,186,225 792,748 405,617Individuals ....................................... 856.634 220.996 2.156,416 310,634 513,107 73,244 792,748 189,419Corporations ................. ; ................. 80,150 691.723 14,212.190 8,384,626 4,321,986 1,027,605 - 191,959.
Argentina ............................................... 8,661 2,851 22.061 9,848 4,015 181 3.509 1.739-Individuals ............................................ 7,854 2,310 1 5,906 5,122 3,430 116 3.509 1,157Corporations ........................................ 114 120
12,604 2.416 143 30 -
Australia ................................................. 20,095 16,738 187,166 85,186 60,675 16,551 3,847 16.109Individuals ............................................ 16,981 5,849 29.403 1,051 5,851 1,559 3.847 13,199Corporations ~....................................... 1,258 3.158 101,432 79,989 7,294 1 i'155 - 2,493
Austria .................................................... 4,831 2.002 30,993 14,067 7,498 6a3 2,988 1,584Individuals ............................................ 3,363 1,059 .9,743 605 1.937 177 2,988 1, 305Corporations ........................................ 323 676 17,518 12,227 4,419 373 -
. ,22
Bahamas................................................ 3,693 16,425 132,564 65,814 52,427 1,488 643 375Individuals ........................................... 1,738 1,393 13,673 4,579 7,753 5 643 367Corp~rations ............................. .......... 1,260 7.462 64,438 32,171 22,819 576 - -
Bahrain ..................................................
i425 737 12,047 7,891 3,824 52 15
Indiv duals ............................................
~324 168 594 10 258 (1) 15
rations ....................Cor .................... 52 506 7,793 5,414 2,167 - -Barbados ................................
7656 828 7,539 3,196 3,008 18 995 3
Individuals.............................. .............. 521 323 1,831 61 610 18 995 3Corporations ....................................... 72 480 3,861 1,489 2,238 1
Belgium .................................................. 1,1.394 .11,660 999,399 931,627 39,806 15,244 1,815 4 142Individuals............................................. 9,006 1,973 17,697
13,946 4,132 374 1,815
,7053
Corporations ........................................ 1,142 4,938 64,968 36,649 12,003 14,780 -,
417Bermuda ................................................ 2,388 20,497 138,799 61,844 66,539 8,245 473 973IndNiduals ............................................ 1,278 912 5,107 1,654 2,463 61 473 273Gorporations ........................................ ~550 11,432 89,538 43,632 38.477 6,381 - 685
Bolivia- .................................................. 664 217 3,527 2,553 486 (1) 144 15Individuals ............................................ 574 196 2,063 -1,343 408 - 144 13Corporations : ................................ 19 1 168 159 1 - 1
Brazil ......................................................
-
5,457 2,334 19,844 8.605--- 3,030 - - - _313 2,964 -2,143-individuals ............................................ 4,858 1,802 14,053 4,068 2,378 221 2,964 1,677Corporation
'
s ........................................ 117 194 1,305 1.114 115 49 -British Virgin Islands .............................. 956 7,027 36,378 6,481 10,158 17.843 11Individuals ............................................ 462 327 1,496 342
.1,070 42 -
Corporations ........................................ 329 .6,550 32,542 4,366 8,564 17.753 - ill",anada .................................................. 315,930 92,479 1,742,873 756,627 571,636 70.749 180,594 47,669Individuals ............................................ 257,841 21,225 357,008 22,820 63,637 13,731 180,594 21,832Corporations ........................................ 18,082 53,610 996,746 562,659 300,777 47,540 23,533'ayman islands ..................................... 2,091 5.2110 137,604 107,502 18,555 623 357 425Individuals............................................ 487 412
.3,743 2,326 977 60 357
Corporations ........................................ 1,323 3,724 89,434 13.712 1,582 563 - 422hile ....................................................... 3,166 983. 9,190 4,890 1,736 121 1,161 300Individuals ............................................ 2,715 729 5,943 2,181 1,350 61 1,161 277Corporations ........................................ 108 109 1,590 1,361 178 50 -'hina ..................................................... 5.389 942 32,435 4,790 1,789 9 56 18.347Individuals .............: .............................. 5,206 419 2 6,304 850. 347 ~7 56 17 849Corporations ........................................ 24 82 ,1,915 1,284 3 1 -
,
465olomba ............................................... 5,740 1,497 13,769 6,582 2,937 165 2,571 172Individuals ............................................ 5,083 1,309 10,358 4,192 2,402 95 2,571 167Corporations ........................................ 127 1 70 1,562 1,344 202 12 - -
4'osta Rica ............................................. 2,606 856 10,275 2,707 1,136 72 2,543 145Individuals ....................... 7 .................... Z052 754 6,427 1,339 804 72 2,543 65Corporations ........................................
.119 73 1,186 848 236 - - 78~
zec~hoslovakja ...................................... 1,155 1,041 5,431 104 47 213 3,392 1',294Individuals ............................................ 1,092 817 4,679 102 46 17 3,392 745Corl:l~iations :......................... 1 7 23 79 2 - 2 -ennnark ........... : .................................... 3,251 1,153 30,606 16,622 2,594 5.386 3,387 840Individuitis ............................................ 2,879 880 6,333 353 780 131 3873 620Corporations ........................................ 152 143 13,304 6,654 979 4,950
.- 14
iominican Republic ............................... 3.224 1,'162 8,589 558 329 26 6,720 231,Individuals ............................................ 3,055 1,137 7,696 248 294 18 6,720 189
rp6rations:**** ..................-,*--", . 38 6 150 129 13 2 - . 1
cuad6r ................................................. 2,257 856 7,225.1.
790 793 437 2,998 -427,Individuals.i .......................................... 2,085 765 5,958 1,291 596 303 2,998 :~386Corporations ........................................ 47 '53 540 248 137 ill - : 2gypt -~ :............................................ :. 1.214 135 2,371 683 589 15 27 208ndivid6als............................................ 1,117 118 2.100 493 514 14 27 204
rpoiations ........................................ 31 8 89 46 40 - - 21 Salvador ............................................. 1,145 333 3,924
.924 486 54 934 11
ridividuals ........................ : ...................Corpora ions
934
20
299 2,813 881 377 54 934 11t ........................................
nland
...................................................1,254
21654
7136,560
222,602
694,455
-
925
-
1,965 3,377 .ridividuals ............................................ 1,133 412 4,497 997 213 100 1,965 631Corporations ........................................ 49 219 12.857 5,058 4,190 752 - :2,702ance ..................................................... 22,343 41,115 .693,479 214,397 279,786 128.921 9,593 31,982ridividuals ............................................
lE o ti15.320 7,825 83,016 .6,164 34,196 8,691 9,593 13,466
,or i ra ons ........................................ 2,624 19,534 461,690 185,905 138,400 107,997 - 17,322reece ................................................... 15,553 5,634 40,907 2,658 3,584 127 29,038 1,311ndividuals .................................. 14,860 5,189 38,136 1,378 2,310 113 29,038 1,223,'orporations ........................................ 150 274 2,011 1,093 842 4 - 20uateimaja ...................... * * *** * 3,116 600 9,224 1,602 963 173 1,129 892ridi%iduals ......................................... 1,901 516 3,899 1,221 686 164 1,129 234,~Orporations ........................................ 71 49 485 311 170 3 -uernsey ...................................... : 475 3,176 15.617 4,861 10,147 113ndividuals ............................................ . 136 156 542 143 274 109
'
E
E
E
F

Foreign Recipients of U.S. Income, and Tax Withheld, 1987
Table 2.-Forms 1042S: Number of Returns, Tax Withheld, and Total Income Paid by Income Type, by Selected Recipientlype and Country of Recipient-Continued[Money amounts are in thousands of dollars)
55
01
Income paid
areaand recipient
Number ofForms 1042S
TaxvAthheld
otal nterest ividendsRents androyalties
Social security andrailroad retirement
Personalservice
(2) (3) (4) (5) (6) (7) (8)
Corporations ........................................ 66 1,187 8,727 4,174 4,070 3 - -
H nduras ...............................................
o
1,323 453 5454 554 478 69 987 383
lndividuals ............................................ 1.088 426 4:452 455 396 12 987 381
Corporations ........................................ 19 14 91 13 36 40 - 2
Hong Kong ............................................ 16,725 19,626 171.123 102,815 54,093 3,547 4,703 1,421
Individuals .................................... 13,165 7,273 42,593 15,043 19,958 774 4,703 602
Corporations ........................................ 1,388 8,886 88,434 60,097 22,839 2,766 - 795
India ....................................................... 3,071 1,372 11,898 2,494 1,721 394 588 491
Individuals ............................................ 2,718 1,170 8,504 280 816 389 588 424
Corporations ........................................ 35 41 2,634 1,906 102 1 - 1
Indonesia ............................................... 1,393 592 11,347 8,391 1,146 20 32 515
Individuals ............................................ 1,223 306 2,866 371 747 20 32 490
Corporations ........................................ 33 184 7,903 7,833 46 - - -
Iran ......................................................... 1.241 512 2,977 823 1,571 18 205
Individuals .................................. 1,154 277 2,050 666 806 18 203
Corporations ........................................ 14 221 751 13 738 - - -
Ireland ................... ................................ 8,374 2,517 26,931 8,055 7,758 517 7,865 1,193
Individuals ............................................ 7,899 1,577 12,853 601 1,893 331 7,865 761
Corporations ........................................ 125 104 8,305 7,377 636 60 - 222
Israel ...................................................... 6,850 2,623 23,988 10,178 3,649 681 3,472 2.063
Individuals ............................................ 5,849 2,142 13,729 2,065 2,327 577 3,472 1,622
Corporations ........................................ 196 234 7,074 6,032 738 24 - 107
Italy ........................................................ 34,770 7,007 244,088 87,120 33,558 20.863 85.889 6,829
Individuals ............................................ 33,283 2,427 108,813 2,737 5,346 1,721 85,889 4,555
Corporations ........................................ 382 2,087 108,623 73,923 14,330 18,222 - 1,116
Jamaica ................................................. 2,288 806 6,794 307 563 72 4.606 128
Individuals ............................................ 2.092 755 5,909 134 300 71 4,606 124
Corporations ........................................ 27 43 302 65 237 - - -
Japan ..................................................... 23,476 288,778 4,464,485 2,834,056 888,368 353,987 10,175 83,109
Individuals ............................................ 15,198 2,700 51,066 4,249 5,399 3,947 10,175 10,500
Corporations ........................................ 2,957 238,076 3,508,727 2,446,217 568,850 341,979 - 71,447
Jersey .................................................... 492 4,681 25,559 9,979 15.517 39 6 12
Individuals............................................ 100 107 466 195 258 - 6 7
Corporations ........................................ 153 1,914 7,532 982 6.510 34 - 3
Kuwait .................................................... 1,418 3,161 182,769 131,344 50.610 67 39
Individuals............................................ 1,092 465 3,419 849 2,409 57 39
Corporations ........................................ 101 1,552 30,294 24,869 5.339 - - -
Lebanon ................................................. 1,560 709 4,546 1,585 1,251 82 351 58
Individuals............................................ 1,415 650 4,108 1,378 1,059 82 351 56
Corporations ........................................ 39 34 114 6 108 - - -
Liberia .................................................... 926 2,794 25,292 11,953 9,720 146 46 26
Individuals............................................ 382 224 1,104 114 693 - 46 26
Corporations ........................................ 464 1,460 19,838 11,124 5,476 146 - -
Liechtenstein .......................................... 1,736 4,539 27,294 12,398 14,049 617 5 3
Individuals ............................................ 316 946 4,360 1.871 2,378 59 5 -
Corporations ........................................ 1,074 2,097 12,532 5,084 6,865 550 - 1
Luxembourg .......................................... 4,467 12,699 114,023 58,777 52,124 48 171 919
Individuals ............................................ 874 173 4,147 2,745 885 (1) 171 194
Corporations ........................................ 1,666 3,830 58.640 38,990 17,592 47 - 724
Malaysia ................................................. 1,713 306 4,455 3,269 640 42 24 102
Individuals ............................................ 1,563 245 1,097 33 541 40
1
24 99
Corporations ....................... ................ 40 50 224 159 34 ( )- -
Mexico ................................................... 90.070 37,381 278,221 77,029 25,144 6,705 151,205 3,366
Individuals ............................................ 87.243 32,294 236,053 46.853 20,351 6,067 151,205 2,209
Corporations ........................................ 627 3,922 22,475 14,725 2,445 300-
471
Monaco.................................................. 637 1,916 12,271 5,493 4,898 114 127 1.090
Individuals ............................................ 411 996 3,999 1,987 1,101 98 127 567
Corporations ........................................ 115 467 3.716 719 2,577 5 - 57
Netherlands ........................................... 11,218 81,129 1,930,405 726,960 1,126,466 46,933 5,004 6,722
Individuals ............................................ 8,431 3,948 44,541 9,874 18,953 586 5,004 5,284
Corporations ................................. 1,145 51,272 1,589,654 663,366 868,834 44,644 - 1,163
Netherlands Antilles ............................... 3,690 26,726 1,736,794 1,346,940 290,231 85,580 370 351
Individuals ............................................ 1,344 1,041 15,386 7,988 6,358 37 370 33
Corporations ........................................ 1,785 16,462 1,498,594 1,287,824 117,173 85,015 - 318
New Zealand .~....................................... 2,655 891 9,294 1,431 4,881 561 303 1,384
Individuals ............................................ 2,216 297 2,412 304 698 135 303 283
Corporations ........................................ 131 414 5,533 908 3,193 411 - 1.019
Norway ................................................... 6,610 2,528 42,328 11,891 5,501 824 10,830 821
Individuals ............................................ 6,065 1,939 14,600 379 954 753 10.830 786
Corporations ........................................ 234 446 13.721 10,096 3,604 7 - 12
Panama .................................................. 8,810 26,789 219,722 132,697 73,878 7,775 960 176
Individuals ............................................ 2,401 1,676 10,982 4,038 4,685 93 960 108
Corporations ........................................ 4,556 19,982 165,119 94,742 59,897 7,621 - 16
Peru ....................................................... 2,450 550 4,768 1,852 1,028 73 808 108
Individuals ............................................ 2,171 442 3,675 1.339 782 49 808 B4
Corporations ........................................ 40 57 246 125 104 18 - -
Philippines ............................................. 29,601 11.722 77,377 2,972 3.023 96 66,434 553
Individuals ............................................ 29,022 11.557 76,080 2,334 2,431 94 66,434 541
Corporations ........................................ 104 99 756 380 363 2 - 6
Portugal ................................................. 7,021 3,055 22,143 2,424 716 25 18,201 117
Individuals ............................................ 6,820 3.003 19.829 284 584 19 18,201 107
Corporations ........................................ 76 5 1,476 1,450 14 - 10
Puerto Rico ............................................ 6.431 1,137 11,333 6,881 685 3,320 305
Individuals ............................................ 5,778 708 4.340 187 441 3,320 255
Corporations ........................................ 403 403 6,749 6,575 142 - 30
Saudi Arabia .......................................... 4,492 2,082 146,185 85,065 56,962 78 8 3.123
Individuals ............................................ 3,756 11,326 1 7,000 1 874 1 5.218 78 8
1
1
41

56 Foreign Recipients of U.S. Income, and Tax Withheld, 1987
Table 2.-Forms 1042S: Number of Returns, Tax Withheld, and Total Income Paid by Income ly0e, biselected RecipientType and Country of Recipient-Continued(Money amounts are in thousands of dollars]
and rec4)ient type
Corporations ........................................Singapore ..............................................
Individuals ............................................Corporations ........................................
South Africa.................****"*** * *"****'Individuals
............. * * ..... ::...............
Corporations ........................................South Korea .......... :..................A .............
Individuals .......... .......................Corporations .......................... ..............
Spain................ * - **'*'* *
;Individuals ............................................Corporafions ........................................
;.Sweden ..............................................
Individuals ............................................Corporations ........................................
Switzerland .............................................Individuals ............................................Corporations ........................................
Taiwan ....................................................
Individuals.; ................. ..............Corporations ........................................
Thailandaj ............................................Individuals ............................................dor~oiations .........................
Tinidad and Tobago ..............................InclMduals: .......................... : ................Corporations ........................................
United Arab Emirates..............................Individuals.! ..........................................,Cor~porations :...............-
United Kingdom ...................'individuals ............................................Corporations ............................ ............Uruguay
......................... *** *"**'**Individuals ............................................Corporations ........................................*nezubla ............ : .................................Individuals ................................ ...........
i~~Corporations..: ....................................
"'West Germany ................ A .............Individuals ......................... s .............Corporations ........................................
Yugoslavia ......................... .....................--Individuals .............................................
C6rp6ratioins .............................I...........
Other Countries.............. .......................Individuals .......................................Corporations ........................................
Nurriber ofForrns 1042S
(1)
1006.8005.975
2642.7772.479
471.5111,422
47,9,7328,922
3068.1297,478
25636,68512,29915,9115,0024,735
611,071
97822
1,032.966.2268257435
127.37138076411:1562,1151,162
3188,1426,833
33670,73359,9072,6083,9803,857
2261,16348,3592,436
TaxlAthheld
(2)
1791.689
618781
1.20391910305179451
5.6073.876
97117.4494,9811 X8
129,3486,960
63,8001,3901,030
279.348312
17353,346
4466204224
24~13,71894,790
1,236491567
5,238.2,043
295.88,39630,49947,619
2,4832j175
2332,00212,28110,754
TOW
(3)
33,589154,882
3,0839,2957,2856.064
3579,9385.3724,139
48,55424,78018,127
140,90834,87695,783
1,657,933~ 64,399
.1,652,56941,264
8.9854,6924,9802.390
~ 3923,112
.2,7~26336
313,9541,5221,285
4,267,679170,311
2,696,90711,1053,8165,484
33,42614,572
~ 4,0641,316,499
282,848917,167
15,12213,983
81487,776125,236219,263
Irderest
(4)
7,62994,201
6853.572
527311102800119472
20,9663.137
15,83927,262
83622,563
708,70220.9M
571.00533.3593,1473,8W2,713
207378583221323
156,94677
1621,509,557
19.2201,312.828
7,0271,6764,351
22,6926,6533,172
553,30559,162
467,882260169
218,01214,124
200,404
DvIdends
(5)
I~ paid
Rerft androyattles
25,89055,9821.5911.9701,2261,0W1 1083.959
3333,5805.822,%
.3,662170
77,7039.799
64,617,742.a32'28,582
346.650A 0632:365
597460*387
13152130
13155.815
627749
2,348,04945,800
1,175,1842,83111491,1306,8114,479
712.591,610145,895370,116
50629477
150,008'18,14471,260
(6)
112102
5741401142
77
2,561-274
-1,4567,442,
_1 15,8162,978
109280
242'
463456
(1),179179
44
177.01315,870
'126,998223.209
i
271132
72,922~ 8,016.60,956
102~86_(1)
9,4321,3637,122
social and
(7)
145145
500500
100100
11.656
10,79610,796
4,015,4,015
144144
539539
1,8851,885
77
34,71934,719
115115
906906
31,82431,824
11,35611,356
43,70843,7013
Personalservice
(8)
691.901
1541.6941.660
..1.429
3.1612,996.
3,1201,819
63110,90210,066
.38220,983..3,15910532,3832,217
162,9999
113
79.85533,66740.885
112
448363
21.74316,270
2~7161
48.6486,7011,471
' Less than $500Note: detail may not add to totals due to rounding.
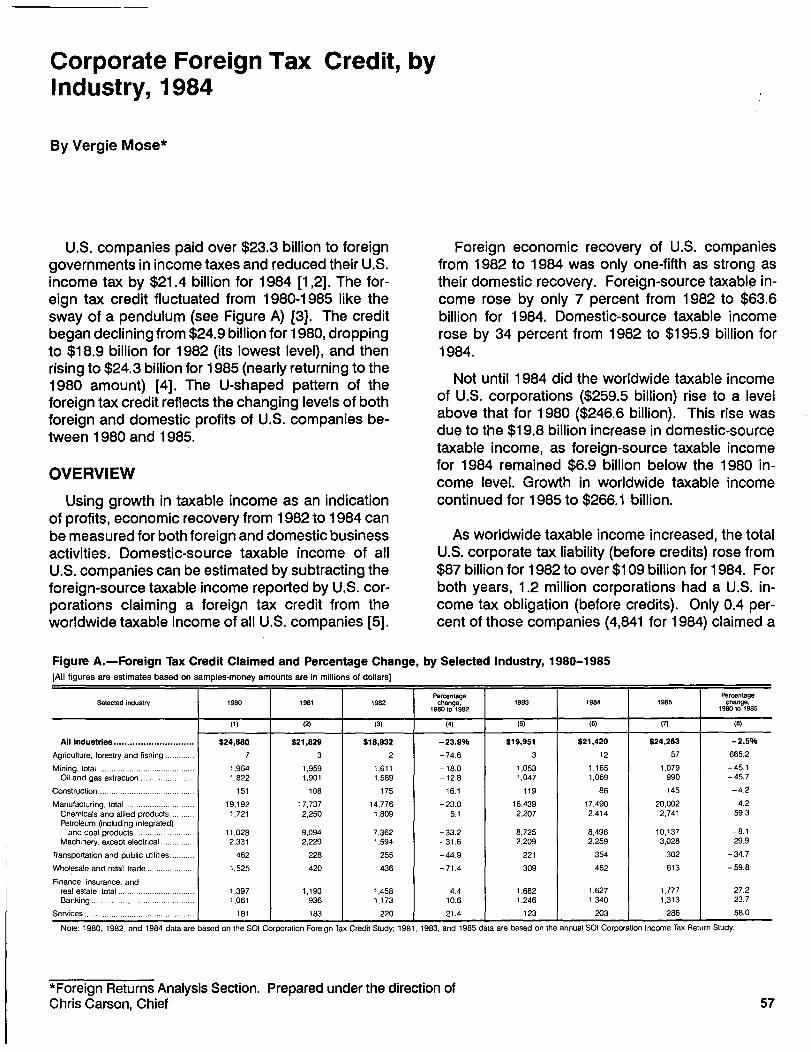
Corporate Foreign Tax Credit, byIndustry, 1984
By Vergie Mose*
U.S. companies paid over $23.3 billion to foreigngovernments in income taxes and reduced their U.S.income tax by $21.4 billion for 1984 [1,2]. The for-eign tax credit fluctuated from 1980-1985 like thesway of a pendulum (see Figure A) [3]. The creditbegan declining from $24.9 billion for 1980, droppingto $18.9 billion for 1982 (its lowest level), and thenrising to $24.3 billion for 1985 (nearly returning to the1980 amount) [4]. The U-shaped pattern of theforeign tax credit reflects the changing levels of bothforeign and domestic profits of U.S. companies be-tween 1980 and 1985.
OVERVIEW
Using growth in taxable income as an indicationof profits, economic recovery from 1982 to 1 984 canbe measured for both foreign and domestic businessactivities. Domestic-source taxable income of allU.S. companies can be estimated by subtracting theforeign-source taxable income reported by U.S. cor-porations claiming a foreign tax credit from theworldwide taxable income of all U.S. companies [5].
Foreign economic recovery of U.S. companiesfrom 1982 to 1984 was only one-fifth as strong astheir domestic recovery. Foreign-source taxable in-come rose by only 7 percent from 1982 to $63.6billion for 1984. Domestic-source taxable incomerose by 34 percent from 1982 to $195.9 billion for1984.
Not until 1984 did the worldwide taxable incomeof U.S. corporations ($259.5 billion) rise to a levelabove that for 1980 ($246.6 billion). This rise wasdue to the $19.8 billion increase in domestic-sourcetaxable income, as foreign-source taxable incomefor 1984 remained $6.9 billion below the 1980 in-come level. Growth in worldwide taxable incomecontinued for 1985 to $266.1 billion.
As worldwide taxable income increased, the totalU.S. corporate tax liability (before credits) rose from$87 billion for 1982 to over $109 billion for 1984. Forboth years, 1.2 million corporations had a U.S. in-come tax obligation (before credits). Only 0.4 per-cent of those companies (4,841 for 1984) claimed a
Figure A.-Foreign Tax Credit Claimed and Percentage Change, by Selected Industry, 1980-1985[All figures are estimates based on samples-money amounts are in millions of dollars]
Selected industry 1980 1981 1982Percenloge1 ~".nil.,'.1
.21983 1984 1985
Percentage"hanglo,
1980t.
85
(1) (2) (3) (4) (5) (6) (7) (8)
All Industries .............................. $24,880 $21,829 $18,932 -23.9% $19,951 $21,420 $24,263 -2.5%
Agriculture, forestry and fishing ............. 7 3 2 -74.6 3 12 57 665.2
Mining total ........................................... 1,964 1,959 1,611 -18.01
053 1651
1.079 -45.1
01 a~d gas extraction ...... ................. 1,822 1,901 1,589 -12.8 1:047 :069 990 -45.7
Construction ........................................... 151 108 175 16.1 119 86 145 -4.2
Manufacturing, total ... ............................ 19,192 17,737 14,776 -23.0 16,439 17,490 20,002 4.2
Chemicals and allied products ........... 1,721 2,250 1,809 5.1 2,207 2,414 2,741 59.3
Petroleum (including integrated)and coal products ........................... 11,028 9,094 7,362 -33.2 8,725 8,496 10,137 -8.1
Machinery, except electrical ............... 2,331 2,229 1,594 -31.6 2,209 2,259 3,028 29.9
Transportation and public utilities ........... 462 228 255 -44.9 221 354 302 -34.7
Wholesale and retail trade ..................... 1,525 420 436 -71.4 309 482 613 -59.8
Finance, insurance, andreal estate, total .................................. 1,397 1,190 1,458 4.4 1.682 1,627 1,777 27.2Banking .......... I I ............................ 1,061 936 1,173 10~6 1,246 1,340 1,313 23.7
Services ...................... . . . 181 1 183 1 220 1 21.4 123 203 286 58.0
Note: 1980, 1982, a based on the SOI Corporation Foreign Tax Credit Study; 1981, 1983, and 1985 data are based on the annual SOI Corporation Income Tax Ret rn Study,
*Foreign Returns Analysis Section. Prepared under the direction ofChris Carson, Chief 57

58 Corporate Foreign Tax Credit, 1984
U.S. tax credit for taxes paid to foreign countries.The foreign -tax credit reduced the total 1984, U.S..corporate income tax by 20 percent to $87 -billion,the smallest percentage reduction during the 1980-1985 period. The largest percentage reduction ofthe total U.S. corporate income tax during this periodoccurred for 1980, a 24-percent reduction.
Throughout the first half of the 1980's (and earlieryears as well) corporations primarily engaged inmanufacturing activities claimed over 75 percent ofthe total foreign tax credit, reaching a high of'82percent -from- 1.983, through, 1985. The predomi-nance of manufacturing reflected- the activities ofintegrated petroleum companies. The business ac-tivities of these companies included the extract ing,refining, and marketing of oil products.
Of the 4,841 U.S. corporation income tax returnswith a foreign tax credit for 1984, only 25returnsshowed integrated petroleum activities as theirprimary business. However, these :95 companiesclaimed $8.5-billion offoreign tax-credit-or 40-percent-Of the total credit. The 'foreign tax credit of thesecompanies reduced the total U.S. income tax of allintegrated petroleum companies by two-thirds, from$12.8 billion to $4.3 billion.
FOREIGN TAX CREDIT: A GLOBAL VIEWOF TAXATION
U.S. corporations are subject to U.S. tax on theirworldwide income. income earned- by these com-panies in a foreign country is generally taxed by theforeign c,6untry pi well as by the United States andCould result in double taxation. To alleviate this,-U.S.tax law has allowed corporations a credit since 1918to reduce U.S. income -tax for the income taxes paidt6,f6r'e.ig'n countries'.
Changes.in the foreign tax credit provisions of U.S.tax.law often parallel the development of'U.S..busi-n6ss''adtivities in the interdependent global economy[P]. When modern U.S. income taxation began in1913, some U.S.. corporations had operations incountries where income tax rates
,exceeded the* U.S.
tax,raW. Because the foreign taxes exceeded whatthe.U
'S. taxes would -have been, c6rporati6ns'were
able to use the exces's foreign taxes,to reduce theirU.S., tax on both foreign-source and domestic-source income by claiming a foreign tax credit.' 'Thissituatioh Was. possible because there had"beenlimitation on the. credit: foreign - income taxes 'paid
could reduce the U.S. income tax,on a dollar-for-dollar basis.
Responding to this issue,the Revenue Act of 1921placed a limitation on the foreign tax credit, whichremains in effect today'. 'The limitation restricted thecredit for foreign income taxes to. the lesser of (1) theU.S. tax on foreign-source taxable income, or (2) theactual foreign income -taxes paid. Thus, the creditcannot exceed that percentage of U.S. income taxrepresented by the ratio of foreign-so.urce taxableincome to worldwide taxable income. - If a corpora-tion has an,over6ll foreign loss,'then-the limitation iszero (no credit). In the case of a worldwide loss, thecorpor
.ation has~ no U.S. income' tax against Which to
claim a credit.
I As international business activities became morevaried, so, too' did 'thei methods - of restricting- theforeign tax cre~it Themethods acted as a means ofadjusting'for global variation in income tax rates aswell as variation i,n international business, practices.
---For example, interes"rom-certain-foreign- investwments was taxed at either very low rates or not at -allin some countries. Other types..-of f foreign income,however, were often taxed at rates higher than theU'S. rate. By combining the "passive" foreign interestincome '(and~ lower foreign taxes paid) ~with
Iother
types of foreign ''income. -(on which the tax.* washigher),,more~of the foreign'taxes that exceeded theU.S. tax rate~could be'credited against the.~U.S.income tax bedAuse'the limitation was increased: bythe interest,,. income. 'The different types of incomecould be 'generated in countries with 'different,,,taxrates,-or-withih one country which:had various taxrates for different types, of-income.
The U.S. Congress responded by- establishingseparate limitations on the foreign tax credit basedo
In, several different categories'of foreign. income.
The separate categories of income limit6d'Aheforeign taxes to the specific income category towhich they were related. For 1984~, the~ separatelimitations on the foreign, tax credit were computedfor (1) "passive for.eign interest income,"'as defined,in sectioh,904(dy of'the Internal Rev6nue*Q6de;`(2)dividends from a Domestic
IInter
Inat ional'.Sal6stor-
poration (DISC) or former DISC; and (3) all otherincome from foreign sources [7].
The former separate limitation for '16reign oil-46-'lated income" w
.as discontinued for-tax years after
i982. However, the separate' limitation-on foreign

Corporate Foreign Tax Credit, 1984 59
taxes paid on foreign oil and gas extraction incomewas still required. Under this limitation, foreign taxespaid on foreign oil and gas extraction income inexcess of the U.S. tax on such income were excludedfrom the "current-year foreign taxes" (see the "Defini-tions" section ofthis article) for computing the foreigntax credit.
Carryover provisions for foreign taxes applied tothe separate limitations of the foreign tax credit. Anyforeign taxes paid, accrued, or deemed paid, inexcess of a current-year separate limitation could becarried back 2 years, then forward 5 years [8]. Thetotal taxes under each separate limitation ("totalforeign taxes available for credit before reduction," inthe statistics) included current-year foreign taxesplus taxes that were carried forward from prior years.
The total foreign tax credit for 1984 was the sumof the amounts computed using the three separatelimitations (previously noted). In some instances,the total credit was reduced for participation in, or forcooperation with, international boycotts [9].
To claim a foreign tax credit, a U.S. corporationmust have foreign-source taxable income, payforeign income tax on the foreign income, and havea U.S. income tax liability. Only certain taxes arecreditable. These include income taxes imposed byU.S. possessions or the national government of aforeign country, as well as its cities, states, and othersubdivisions. Corporations can deduct all foreignincome taxes in lieu of claiming a foreign tax credit.However, most corporations obtain a greater taxbenefit by electing to credit these taxes against U.S.income tax [10]. Taxes such as excise, franchise,sales, and certain other taxes, do not qualify ascreditable foreign taxes, but can be deducted incalculating worldwide taxable income, even whenthe foreign tax credit was elected for foreign incometaxes.
CHANGES IN THE LAW
The data for Income Year 1984 reflect certainchanges in the foreign tax credit provisions of U.S.tax law. The Tax Equity and Fiscal Responsibility Actof 1982 (TEFRA) was effective for tax years begin-ning after December 31, 1982, while the Tax ReformAct of 1984 affected foreign tax credit transactionsmade after July 17,1984. The changes under thesetax acts affected: (1) foreign oil-related and oil andgas extraction income and taxes (by TEFRA), and (2)
passive foreign income and taxes from interest anddividends, including certain passive income fromforeign sources reclassified as domestic-source in-come (by the 1984 Act).
Foreign Oil-Related Income Prior to the TaxEquity and Fiscal Responsibility Act of 1982(TEFRA)
Prior to TEFRA, the "foreign oil-related income"category included income from both the extractionof foreign oil and gas and from other oil-relatedactivities. Other oil-related activities includedprocessing, transporting, and distributing extractedminerals from foreign oil and gas wells. For tax yearsbeginning after December 31, 1982, "foreign oil-re-lated income" was included in a general limitationcategory, rather than having a separate limitation ofits own.
The credit for foreign taxes on oil and gas extrac-tion income was limited to the U.S. tax on foreignoil-related income. For this purpose, the extractiontaxable income arising in one foreign country wasnot offset by any "net operating losses" arising inother foreign countries.
There were carryover provisions for the excesstaxes paid on foreign oil and gas extraction income.The excess taxes could be carried back 2 years thencarried forward 5 years. The carryover of the excesstaxes was limited to 2 percent of the foreign oil andgas extraction taxable income for the current year.
Changes to the Foreign Tax Credit Under theTax Equity and Fiscal Responsibility Act of1982(TEFRA)
The Tax Equity and Fiscal Responsibility Act of1982 (TEFRA) eliminated the separate limitation onthe foreign tax credit for "foreign oil-related income,"effective with taxable years beginning after Decem-ber 31, 1982. After 1982, to compute the separatelimitation on the foreign tax credit for "all other foreignincome," the current-year foreign taxes were firstreduced by the amount of foreign taxes paid on oiland gas extraction income that exceeded the U.S.tax on such income. However, the oil and gas ex-traction taxable income first had to be reduced bynet operating losses arising in other foreigncountries before computing the U.S. tax. In addition,TEFRA eliminated the 2-percent limitation on thecarryover of oil and gas extraction taxes.

60;: Corporate Foreign Tax.Credit, 1984
The 1982 Act also introduced provisions to limitthe foreign taxes Paid on oi,l-related income otherthan oil- and gas extraction, income in.cert~in cases.rilere was.concern 'that some foreign countriesmight avoi
'd -the limitation by shifting their higher tax
rates from extraction income to income from nonex-~traction oil-related -activities.
'-As a result,.. foreign
taxes paid on,oil-related income (redefined as non-extraction income) were reduced to the amo
'unt of
tax that the foreign country would impose on incomethat:-was neither foreign oil and gas extraction in-come nor foreign oil-related income, with any excesstreated as a deductible business expense.
PassivwForeign Interest- and Dividend IncomeUnder the Tax Reform Act of 1984
-The, Tax, Reform'~ Act of '1 984 introduced newpro.visionstelating-to foreign 'interest and dividendirlibolmie, ' -,The 'new' provisions general ly Applied toint.e-re'.4an'd c"ertain'diVidends paid or accrued
.sifter
July 11 1984. 'Certain foreign dividend income wasc6iiibified* with.p4isiv6,foreig'n . interest inqbme'W'
-compute -a-separate lirnitation-on-1he' foreign tax-credit. Prior to the Act, this category of passivef6i6ibn income was limited to interest income.
i,ln'additioinii c4rtaininterest.and dividend income,f6rmerlV treated'as foreign incom6lithat was receivedor, in some instances', deemed received,'bya U.S.sfiaie'holder'was, rec-laissified -a's U.S.-sourced in-
- When 1 6 Oercerit.,ormore of the ecome. arnings andfits of -6 U.s.-6wrie'd'fore-ign corporation Was from
a~ U.S."source, a portion of thei interest And dividendincome re'66ived-by the U.S shareholder was recla,,3-:
I0iI
s d' U.S. ` s*ource-',' i n' cclme. Conseqbe'ritly,' thee;
as,
. . - t,to
.rl
Idwidd'incoMe'raltiobf for'eign'-w'urce- income wo
was reduced and, thus, reduced the limitation'of theforeign tax credit as well. The same rules applied to
and ~dividends'deemed 'recbived'frorri 'ub-int rest ss1diarle's of U.S.,-owned -foreign patent corporations.
FOREIGN INCOMEY, TAXEIS, AND CREDIT6.Y`I,i`4bQ8TRY
-Manufacturing companies increased theirJoreigntax' credit from $1.4i8 billion for, 1982 to $17.5 billion'forl 984. (By: 1985, these,companies had increasedtheir foreign taxicredit to $20 billion .)- By comparison,the f6rbigri tax credit for all othler industries combineddecreased by,$227:million from 19824o,1984..
,:~The foreign tax credit claimed by banks steadily-increased~betWeen 1 082'and 1984, froth nearly $1.2
billion to over $1.3.,billion, a 14:percent increase.-Banks had also. increased the,credit they'claimed,. by,10 percent,~ between 1980 and 1982. The foreign taxcredit for most other industries,declined during this,earlier time. period;.
Dominance of the Petroleum Industry
Companies in, the petroleum industry demonstratethe influence that a;small subgroup can~ ha-ve on''anentire population. During the 1980-1985 period, only1 percent of'all U.S. corporations were classified inthe PetroleumIndustry (oil and gas.extraction opera-tions as well as integrated petroleum activities, whichwere a combination of extracting, refining.. andmarketing). However, this small group accountedfor over 10 percent of the worldwide taxable income-and income-tax (before credits) of all U.S. corpora-,tions.
~ The significance."of -petroleum companies:to-the,population of U.S.- corporations that"'claimed !aforeign tax credit is ~shown 'in_Figu're~ B.- N
.ote.-that-for
1984, only 1 47 petroleum companies (3 perce,nt o
.f
the total for all )'claimed 45 percent of the'total
.foreign tax credit. They -also accounted for 34
percent of the total fore'igh-'source taxable income,and' paid $11--.3.bil lion in foreign -taxes (49 percent ofthetotal). U.S' -companies paid '$1.9 billion% mcleel'inforeign'taxes for 1984 than they could use as a credit,
. nagainst-thdir U.S."i come tax-' 'Of-that'exd'ds6l`petroleum compan ies'zicdounted - for $1.7.billioh.--
Figure B.-Returns with a Foreign Tax Credit: PetroleumIndustry Compared to All Industries, 1984[All figures are
.estimates based on sapriples-money ai~nounts are in th6usandi of dollars]
Selected itemsAil
industriesPetroleuindustryT
PI I,e'n;enua a ofin !
dtries
(1)~~ (2) (3)
Number of returns .......................... 4,841 147 3.0%
Total assets ......................... $4,339,759,746 $532,758,080 12.3Total non-branch foreign grow'..income ..................... ...................... 85,453,725 27.308,413 32.0
Total non-branch foreign deductions.., 38,766,636 12,298,672 31.7Foreign branch income and specially
allocable income (section 863(b)) 16,900,886 6,686,277;Total foreign-source taxable income 63,587,976 21.696,018 34.1qurrent-year foreign taxes ........... 23,327,908 11,306,452 48.5Income subject to U.S. tax ~.: 133.135.963 29,551.997 22.2U.S. income tax before credits ........... 59.593,157 13,454,329 22.6dForeign px credit .................. ; ............. 21,419.643 9,565,171 44.7
' Includes integrated petroleum companies (extracting, refining, and ni,arketing) and oil and gasextraction companies.
The 147 petroleum companies also, exemplify the,effect that foreign activities 'can have on U.S. income:tax,data. . For, example,:the, 1.984,U.S. income-Jaxbefore credits for.all 3311-590 petroleum companies;(including those.with no foreign tax credit) was. $14.8

Corporate Foreign Tax Credit, 1984
billion, nearly 14 percent of the U.S. total. As shownin Figure C, by reducing the U.S. corporate incometax before credits by the foreign tax credit, thepetroleum industry accounted for less than 6 percentof the total remaining corporate income tax (beforereduction by other credits).
Figure C.-All Corporation Returns: Petroleum IndustryCompared To All Industries, U.S. Income Tax and ForeignTax Credit, 1984[All figures are estimates based on samples-money amounts are in billions of dollars]
Tax and creditAll PetmleuT
PomentageOf all
industries industry ndustries
(1) (2) (3)
U.S. income tax before credits .......................... $109.1 $14.8 13.6%
Foreign tax credit ............................................... 21.4 9.6 44.9
U.S. income tax after foreign tax credit ............. 87.7 5.2 5.9
' Includes integrated petroleum companies (extracting, refining, and marketing) as well as oil andgas extraction companies.
Underlying the effect on U.S. tax liabilities from theforeign tax credit is the relationship of foreign-sourcetaxable income to worldwide taxable income. FigureD shows that foreign-source taxable income madeup two-thirds of the $32.6 billion of worldwide taxableincome of all U.S. petroleum companies for 1984.After reducing worldwide taxable income by theforeign-source taxable income, petroleum com-p~nies accounted for less than 6 percent of theremaining, domestic-source, taxable income. Bycomparison, based on their worldwide activities, the$32.6 billion reported by these companies ac-counted for nearly 13 percent of the total incomesubject to U.S. tax.
Figure D.-All Corporation Returns: Petroleum IndustryCompared To All Industries, Worldwide Taxable Income,1984[All figures are estimates based on samples-money amounts are in billions of dollars)
Incorne AD . ~etroleuryPeroenrgea W
industn es industryindustries
(2) (3)
Worldwide taxable income ................................. $259.5 $32.6 12.6%
Foreign-source taxable income.......................... 63.6 21.7 34.1
Domestic-source taxable income ....................... 195.9 10.9 5.6. III cludes integrated petroleum companies (extracting, refining, and marketing) as well as oil and
gas extraction companies.Note: Worldwide taxable income is "income subject to U.S. tax" for all U.S. corporations with and
without a foreign tax credit. Foreign-source taxable income is income earned outside the UnitedStates by corporations which claimed a foreign tax credit.
Worldwide Taxable Income
As seen in the petroleum industry, the taxableincome earned abroad can have a significant impacton U.S. tax liabilities. As shown in Figure E, 25
61
Figure E.-All Corporation Returns: Foreign-SourceTaxable Income as a Percentage of Worldwide TaxableIncome, 1980, 1982, and 1984(Ali figures are estimates based on samples-money amounts are in billions of dollars]
Incorre 1 9801 1982 1984
(1) (2) (3)
All U.S. corporations:
Worldwide taxable income ........................................ $246.6 $205.2 $259.5Foreign_source taxable income ................................. 70.5 59.5 63.6
D.mestic-source taxable income .............................. 176.1 145.7 195.9
Foreign-source taxable income as a percentageof worldwide taxable income ................................. 29% 29% 25%
U.S. corporations claiming a foreign tax credit:
Worldwide taxable income ........................................ $138.6 $107.2 $133.1
Foreign-source taxable income ................................. 70.5 59.5 63.6
Domestic-source taxable income .............................. 68.1 47.7 69.5
Foreign-source taxable income as a percentageof worldwide taxable income .......... ............. 1 51% 1 56% 1 48%
Note: Worldwide taxable income is "income sublect to U.S. tax" for all U.S. corporations with andwithout a foreign tax credit. Foreign-source taxable income is income earned outside the UnitedStates by corporations which claimed a foreign tax credit.
percent of the worldwide taxable income of U.S.corporations for 1984 was from foreign sources. Aswould be expected, for corporations that claimed aforeign tax credit, the proportion of foreign-sourcetaxable income to worldwide taxable income (48percent) was much greater than for all corporations.For 1984, the ratio was nearly double.
Worldwide taxable income for all industries roseby 26 percent from 1982 to $259.5 billion for 1984.The unequal growth in foreign-source (7 percentincrease) and domestic-source (34 percent in-crease) taxable income between 1982 and 1984resulted in a smaller proportion of foreign-sourcetaxable income to worldwide taxable income (29percent decreased to 25 percent). That growth con-trasted with the nearly equal decline in both foreignand domestic income between 1980 and 1982, whenthe proportion of foreign-source taxable income toworldwide taxable income was unchanged at 29percent for both years.
Foreign-source taxable income decreased be-tween 1982 and 1984 for five of the eight industrialdivisions, including: mining; finance, insurance, andreal estate; construction; wholesale and retail trade;and services. Mining companies earned more thanhalf (55 percent) of their worldwide taxable incomefrom foreign sources for both 1982 and 1984. Thepercentage decline in foreign-source taxable incomebetween 1982 and 1984 was nearly equal to thedecline in domestic-source taxable income for thesecompanies. From 1980 to 1982, on the other hand,the percentage decline in domestic-source taxableincome was nearly double that for foreign-sourcetaxable income. This decline in both domestic-source and foreign-source taxable income that oc-

62 Corporate- Fdreigr~ Tax Credit, 1 984
curred in the mining industry between 1980 and 1984was attributable to companies in the oil and gas.extraction industry, as shown infigure F. -
Figure F.-Selected Mining Industries: Worldwide,Foreign-s6tirce, and Domestic-Source Taxable Income,1980; 1082, and .1 984(All figures are,estimates based on samples-money amounts are in millions of dollars)
S="Ind-"law 19W 198i
(1) (2) (3)
Mining, total:
Worldwide taxable incorne~ ............................ $9,074 $7 320 $5,167Foreignosource taxable income.......................... 4.656 4:041 2,818Domestic-sotirce taxable income ......... ............. 4,418 3,278 2,349
Oil and gas extraction:
Worldwide taxable income ...................... 7,479 6,705 4,310Foreian-source taxable income. 4
*284 3.989 2,565
Domestic-source, taxable income ............. 3,196 2,716 1,745
Notes:,Wbridwide taxable income is "income subject to U.S. tax" for U.S. corporations with andwithout a foreidn~tax credit. F6reign-wurce taxable income is income earned outside the UnitedStates by corporations which, claimed a foreign tax credit.
Detail may not add to totals because of'rounding.
Manufacturers accounted for more than half of thetotal 154.3 billion increase in'worldwide taxable in-
-come-from-1982 to 1984~----The-wo*rldwide-taxable-income of manufacturingi comp
-anies; increased -by,
31 -percent, from '$102.2 billion to.,$133.9 billion.While this increase reflected. profitsfrom both foreignand domestic activities,,domestic-source taxable in-come -grew 2.5 times faster than foreign-source rtax-able',inconfe (41'percent compared to 16-percent).
For 1984,- manufacturing,companies generated 34percent i,of .their worldwide. taxable income fromforeign sources,. down from. 19820, when 39 percentof their, worldwide. taxclble,incomb. was.,from foreign
'this ~6oritrasts'witha'36: per.cent.figuro'forsources
1990;
TheJncreases between 1982 and 1984 in bothf6reign~soprce andglorinestic-source taxable. income.for manufacturers, however., d1priot reveal the'under~lying ~~variation In economic activity of the differentsegments of this industrial division, as shown inFigure G. The foreign-source taxable income of allmanufacturing companies increased by $6.2 billion,between 1982 and 1984. Of that amount, 42 percentwas attributed to integrated petroleu.m companies.However, this was accompaniedby a continueddecline in.ihe'dombstic-sciur,ce.-t-axable inc6me.forthese:Lsame petroleum companies, which droppedfrom $21.8 billion for 1980 to $12.1 and $9.1. billionfor 1982 and 1984, respectively. This decline wasaccompanied .,.by a decline in the domestic capitalspending of these companies, which. for.1 984 was in
sharp contrast to increases in domestic capitalspending reported, by other manufacturers of non-durable goods [1.1 ]. -
Figure G.-Selected Manufacturing Industries: Worldwide,F~brelgn-Source, and Domestic-Source Taxable Income,1.980, 1982, and 1984[All figur6s are estimates based on samples-money amounts are in millions of dollars]
Selected Industryand lncoo
1980 1982 198~
(1) (2) (3)
Manufacturing, total:
Worldwide taxable income ............. $134,844 $102,158 $133,410Foreign-source taxable income ................. 47,993 39,359 45,583Domestic-source taxable income.: ................ 86,851 62,798 . 88,328
Petroleum (including integrated)and coal products:
Worldwide taxable income ............................. 46,192 28,588 28,279Foreign-source taxable inco
'me ...................... 24,363 16,514 19,131
Domestic-source taxable income .......... 21,829 12.074 9,147
All other manufacturing(nonpetroleum products), total:
Worldwide taxable income ............................. 88,652 73,570 105,632Foreign-source taxable income:, :.......... 23,630 22,845 .26,45
*1
Domestic-source taxable income ................ 65,021 50.725 79,181
Chemicals and allied products:
Worldwide taxable income ............ 13,241 12,522 16,393taxable incomeForeign-sour~ce 4,575 4,740 6,294.
Dorr~estic-'source taxable income ......... 8,666 7,781 10,098
'Machinery, except electrical.-
_ffiorldwide-taxable income. ............... - _14,330- 10,881- -13,330-Foreign-source taxable income 5,819 5,194 6,867Domestic-source taxable income 8,511 5,687 6,464
Motor vehicles and equipment:
Woddwide taxable income ................... 2,215 2,857 9,957'.Foreign-source taxable income ............ 1,244 2,212 2,503
'Domestic-source taxable income 972 645 7,454
Electrical and electronic equipment:
Worldwide taxable income ................... 8,717 8,046Forign-source taxable inco
.me ............ 2,3 77 3,182 2,SW
Domestic-source taxable income 6,340 4,864 8,969
Food and kindred products:
Worldwide taxable income ............ 10,267 9,162 9,501Foreign-source taxable income..~ 1,703 2,014 1,784Domestic-souTce taxable income.: 8,565 7,148
Notes: Worldwide taxable income is "income subject to U.S. tax" for U.S. corporations with andwithout a foreign tax credit. Foreign-source taxable income is income earned outside the UnitedStates bV corporations which claimed a foreign tax credit.
Detail may not add-to,totals because of, rounding.
The economic recovery between 1.982 and 1984in domestic-'source taxable income for all other U.S.manufacturers was led by manufacturers of motorvehicles and equipment and electrical and'. electronic,equipment These two industries alone accountedfor .43 percent of the, $25.5 billion overall increasefrom 1982 to 1984 in domestic-source taxable mr,come of all manufacturing companies.
one-half -of the, foreign-source taxable. in-come of manufacturers of nonpetroleum productswas attributed to -manufacturers of chemicals andallied products and of non-electrical machinery. Thefive groups shown. in Figure G accounted for three-fourths of the total fo.reign-source taxable income, ofnonpetroleum manufacturers ($26
*5-billion). These
five groups comprised. only,one7half of.the $79.2billion of domestic-source taxable'income, for. 1984.

Corporate Foreign Tax Credit, 1984 63
For finance, -insurance, and real estate com-panies, taxable income from foreign activities wasstable for 1960,1982 and 1984, as compared to theirearnings from domestic activities. The foreign-source taxable income of these companies was lessthan half (46 percent) of their worldwide taxableincome for 1984, compared to 61 percent for 1982.This percentage shift reflects the sharp rise for 1984in their domestic-source taxable income.
source taxable income to worldwide taxable incomeshould approximate the ratio of current-year foreigntaxes to U.S. income tax after credits (excluding theforeign tax credit). Figure I suggests that for allcorporations foreign tax liabilities were slightly higherthan the U.S. tax, since the foreign tax ratio (27.2percent) is higher than the foreign income ratio (24.5percent) [11 41. However, there were variations byindustry.
For 1984, banks accounted for 85 percent of the$11.5 billion of foreign-source taxable income of theentire finance, insurance, and real estate industrialdivision, as shown in Figure H. Foreign-source tax-able income of banks alone was $9.8 billion. How-ever, this amount was nearly $1 billion less than thatfor 1982. A slowdown in foreign lending in 1984contrasted with strong growth in domestic banklending [121. Throughout the 1980-1984 period,banks as a group reported domestic-source deficitson their U.S. income tax returns. However, thedeficits they reported for 1984 dropped below $500million. For 1982, the deficits totaled $4.4 billion [13].
Figure H.-Selected Finance, Insurance, and Real EstateCompanies: Worldwide, Foreign-Source, andDomestic-Source Taxable Income, 1980,1982, and 1984[All figures are estimates based on samples-money amounts are in millions of dollars]
Selected industryand income
1982 198`1
(1) (2) (3)
Finance, insurance, and real estate, total:
Worldwide taxable income .......................... $24,320 $19,973 $25,208Foreign-source taxable income ................... 11,400 12,138 11,504D.mestic-source taxable income 12,920 7,835 13,704
Banking:
Worldwide taxable income ............... .......... 7,087 6,351 9,338Foreign-source taxable
income......... .... 1 118 10766 9.831
Domestic-source taxable income _...:
2800 1 -4:415 - 493
Notes: Worldwide taxable income is "income subject to U.S. tax" for U.S. corporations with andwithout a foreign tax credit. Foreign-source taxable income is income earned outside the UnitedStates by corporations which claimed a foreign tax credit.
Detail may not add to totals because of rounding.
Foreign Taxes
. U.S. companies claiming a foreign tax credit paid$23.3 billion in current-year foreign taxes for 1984.The relatively modest $533 million increase from1982 to 1984 in current-year foreign taxes may becompared with the $7.2 billion decrease from 1980to 1982. Inasmuch as manufacturing companiesaccounted for most of the increase in foreign-sourcetaxable income between 1982 and 1984, they alsoaccounted for most of the increase in current-yearforeign taxes.
If effective foreign tax rates were the same as theU.S. rate, it would follow that the ratio of foreign-
For the finance, insurance, and real estate in-dustrial division, foreign-source taxable income wasnearly half of the worldwide taxable income (45.6percent), while foreign taxes were only one-fifth asgreat as the U.S. income tax after credits (excludingthe foreign tax credit). Low foreign withholding taxrates on banking income (primarily interest) wereresponsible for this low effective foreign tax rate.
On the other hand, while over one-half of thetaxable income generated by the mining industrialdivision was from foreign sources, foreign taxes were70 percent of the U.S. income tax after credits (ex-.cluding the foreign tax credit). The relatively largeamount of foreign taxes reported by mining com-panies was due to the high tax rates associated withoil and gas extraction income.
Manufacturing also had a large amount of foreign,taxes, comprising over 39 percent of the U.S. incometax on worldwide taxable income, even though only34 percent of that income was from foreign sources.
CORPORATE STRUCTURES AND FOREIGNBUSINESS ACTIVITY
U.S. corporations with foreign business activitiescan operate abroad using a variety of businessstructures or methods. In some cases, foreigncountries require the use of certain organizationalstructures. The types of structures or methods in-clude:
unincorporated foreign branches -- income isreported as branch taxable income;
9 controlled foreign corporations [115] -- incomeis reported as dividends and "dividend gross-up" (see the "Definitions" section of this ar-ticle); and
direct transactions with a foreign corporation(whether controlled or not) or with unrelated

64 Corporate Foreign Tax Credit-, 1984
Figure 1.
Foreign-Source Taxable. . Income and Current-Year ForeignTaxes-; as. - Percentages of Worldwide Taxable Income-and.U.S.Income Tax-4ftert Credits,. (Except the Foreign. Tax Credit), by.Industrial Division, 1984
All Corporations,
3.8%
Taxable Income, Tax
Transportationand 4.1%
Public Utilities
Wholesale and , 3.4%Retail TradeAgricult u re,
Forestry, 3.2%anu ris"Ing
Corporations Claiming a Foreign Tax Credit
45.6%
Agricult u re,Forestry,
a 'd Fln ishing
Wholesale andRetail7rade
Transportationand
,,,,Public Utilities
45.1%
50.3%
70.0%
92.4%
90.3%
Note::these percentages are estimates.as a small
-amount of foreign income and tax data are not
IIncluded in
' these statistics (see the !'Data Sources and Limitations"' section of this 6rticle).~

Corporate Foreign Tax Credit, 1984
entities -- income is reported as gross income,including interest, rents, royalties, and ser-vices income.
. The components of foreign branch income (grossincome and deductions) are not generally includedin the statistics because corporations are not re-quired to report them. However, the taxable incomeand taxes of foreign branches of U.S. corporationsare included in the statistics and are separatelydiscussed later in the "Foreign Branch Taxable In-come" section of this article. The following sectioncontains a discussion of the gross income (less loss)and taxes of controlled foreign corporations andfrom U.S. direct transactions abroad.
Foreign Gross Income and Taxes: ControlledForeign Corporations and U.S. Direct Transac-tions Abroad
The increase in profits of foreign corporations for1982 and 1984 was reflected in the $4.8 billion (17percent) increase in dividends (including thedividend gross-up) for 1984. A comparison of thecomponents of foreign gross income (less loss) for1984 and 1982 revealed that dividends and interestreversed positions as the leading sources of incomefrom controlled foreign corporations and U.S. directtransactions abroad. As shown in Figure J for 1984,dividends were the most common type of foreigngross income; for 1982, interest had captured thatposition. The decline in interest income was primari-ly due to banks. While foreign-source interest of U.S.banks rose to $16.6 billion for 1982, by 1984, thatinterest had fallen by 22 percent to $12.9 billion. U.S.corporations other than banks experienced a 1 9-per-cent decline in foreign interest income for 1984 aswell, from $5.9 billion to $4.8 billion.
Corporations engaged primarily in manufacturingand trade seemed more likely than corporations inother industries to operate through foreign sub-sidiaries, rather than through direct transactions.This tendency is best shown in Figure K by the highpercentage of dividends (including the dividendgross-up) these industries received from foreignsubsidiaries (53 percent and 48 percent of grossincome, respectively). This is probably due to theforeign presence required of these companies tooperate in certain foreign countries. Unlike corpora-tions in these two industrial divisions, finance, in-surance, and real estate companies seldomoperated abroad through subsidiaries. These cor-
Figure JCorporations Claiming a Foreign TaxCredit: Foreign Gross Income (LessLoss), Excluding Branch Income, byIncoming Type, 1984
'Excludes branch income and specially allocableincome. See the "Definitions' section, at the endof this article.
2 Includes non-branch business receipts fromsales, as well as net capital gains and partner-ship net income.
65
porations thus received only 7 percent of theirforeign-source gross income as dividends (includingthe dividend gross-up). Income received throughforeign subsidiaries was even less significant to cor-porations primarily engaged in agriculture, forestry,and fishing. Dividends and dividend gross-up ac-counted for only 2 percent of their foreign-sourcegross income.
For 1984, U.S. corporations paid or accrued $6.2billion in foreign taxes on $85.5 billion of "grossincome," excluding branch and specially allocableincome (see Figure J). These represented 2 percentand 18 percent decreases in income and taxes,respectively, compared to 1982.
Taxes withheld at the source on dividends andrents, royalties, and license fees amounted to $2.5billion for 1984, and accounted for 40 percent of the

66 Corporate Foreign Tax Credit, 1984
Figure K.
Corporations Claiming a Foreign Tax Credit: Foreign GrossIncome (Less Loss), and Foreign Taxes, by Income Type~andIndustrial -Division, 1984'Agriculture, Forestry, and Fishing Mining
Percentage
I
. .I .
.. I
-o 25 50Income-$6,bO5 Million
12 9~2 8 .8
Tax-$758 Million
Construc-tioh~
Percentage
0 25Income-$379 Million
22 8 4 5 -7
-Tax~$70-Million-'
50
89
Transportation and Public Utilities
75
55
100
Percentage
01 25 50 75 100Income= $ 2,403 Million
18- 5 3' 5 40
Tax-$195 Million
Mi.12 3 6 10
Finance, Insurance, and Real Estate
Percentage
0 50Income-$18,018 Million
5 2 79
7100
14 10
Taix-$874 Million
::X-Fill I
6 87
Dividends
29
V75
.................
DividendGross-up
70
Interest
4 '10
Manufacturing
Percentage
.0 25 50Income-$52,581 Million
2033
Tax-$4,132 Million
30 25
75
Wholesale and Retail Trade'
Percentage*
0 25 5PIncome-$2,298 Million
8 4
44
Services
Percentage
75
~211
1 7 71 T0 50Income-$1,929 Million -:: . . . ....................
14 5
Tax-$71 Million
28 18
F75
34
100
10.0
17 2 35 21 26
Rents, Royalties,and License Fees Services
T_75
62
84
16
16
20
22
13
Other
-!/Excludes branch and specially allocable income. See the "Definitions" section of this article.
NOTE: Detail may not add to totals duelo rounding.

Corporate Foreign Tax Credit, 1984 67
total foreign taxes paid or accrued on gross income,excluding branch operations and specially allocableincome. Manufacturers alone reported nearly all (91percent) of the tax withheld.
Foreign tax withheld at the source on interestincome accounted for 16 percent of the total foreigntaxes paid or accrued on gross income other thanfrom foreign branches and specially allocable in-come. By comparison, 21 percent of the total grossincome was interest. The difference between thesepercentages reflects the low withholding rates as-sociated with interest income, due especially to thefact that U.S. tax treaties with certain foreigncountries required a zero withholding tax rate on thisincome. Almost three-fourths of the foreign tax with-held on interest income (from other than foreignbranches) was reported by U.S. banks.
Taxes paid or accrued on "other" income ac-counted for nearly 40 percent of the total foreigntaxes associated with the non-branch foreign grossincome shown in Figure J. In contrast, this "other"income was only 22 percent of total gross income.Most of this income category was non-branch busi-ness receipts, generally from sales. However, in-come from foreign partnerships and net capital gainswere also included in "other"' income. More than 82percent of the $2.5 billion in taxes paid or accruedon "other" foreign gross income, and over 62 percentof the $18.9 billion of that income were attributableto corporations in the petroleum industry.
The distribution of foreign non-branch gross in-come by type varied considerably by industrialdivision, as shown in Figure K. The distribution ofincome and taxes of manufacturers was similar to thedistribution of income and taxes for all industries,these corporations comprised over half of both totaigross income and total taxes. While wholesale andretail trade followed the overall pattern for income,44 percent of the taxes represented amounts with-held on dividends while only 13 percent was paid on"other" income. The other industry groups deviatedsubstantially from the overall distribution by type ofincome. Finance, insurance, and real estate com-panies, for example, received large amounts of inter-est income. For companies primarily engaged inagriculture, forestry, and fishing, services incomewas predominant.
Foreign Branch Taxable Income
As an alternative to incorporating in foreigncountries, many U.S. companies establish unincor-
porated foreign branches to conduct businessabroad. Income from these branches representednearly one-fourth of total foreign-source taxable in-come for 1 984, as shown in Figure L. Foreign branchtaxable income remained stable for 1984 at $14.5billion, compared to 1982. In contrast, taxable in-come from foreign branches declined by $7.3 billionbetween 1980 and 1982, due mainly to the integratedpetroleum industry.
Figure L.-Returns with a Foreign Tax Credit: ForeignBranch Taxable Income as a Percentage of TotalForeign-Source Taxable Income, by Selected Industry,1984(All figures are estimates based on samples-money amounts are in millions of dollars]
Selected industryTotal
=J:~Zocat me
= Pranchincome Percentage
(1) (2) (3)
All industries, total ...................................... $63,588 $14,541 22.9%
Agriculture, forestry, and fishing ................... 50 1 1.3Mining .............................. ................................. 2,818 328 11.7Construction ................................................... _ 295 5 1.7Manufactuiing, total ........................................... 45,582 7,779 17.1
Petroleum (including integrated)and coal products ....................................... 19,131 6,392 33.4
Transportation and public utilities ....................... 1.308 165 12.6Wholesale and retail trade ................................. 1,320 17 1.3Finance, insurance, and real estate, total .......... 11,504 6,202 53.9
Banking .............................................. ........... 9,831 5,991 60.9Services __ ........ - . ........... .................. 711 1 46 6.4
Note: Detail may not add to totals because of rounding.
Nearly all of the total foreign branch taxable in-come for 1984 and 1982 was attributable to themanufacturing and finance, insurance, and real es-tate industrial divisions. While for 1984, over half (53percent) of this income was attributable to manufac-turing, for 1982, this industrial division accounted forless than half (45 percent) of the total. This changereflected the increased profits of the integratedpetroleum industry, whose foreign branch taxableincome rose by 28 percent from 1982 to 1984. Forboth years, this industry largely (82 percent) ac-counted for the total foreign branch taxable incomeof U.S. manufacturers.
For 1984, one-third of the total foreign-sourcetaxable income of integrated petroleum companieswas earned through foreign branches. The com-ponents of foreign branch taxable income (grossincome and deductions) are not generally includedin the aggregate statistics. However, the gross in-come and deduction statistics for foreign oil and gasextraction activities, presented separately in Tables1 and 4, include amounts earned through foreignbranches as well as through controlled foreign cor-porations and direct transactions abroad. Unfor-tunately, the exact amount of gross income anddeductions related to the extraction activities of
"V
68, Corporate Foreign Tax Credit, 1984
foreign branches can not be determined from theaggregate statistics.
As a contrast to manufacturers, the foreign branchtaxable income of finance, insurance, and real estatecompanies decreased by 16 percent1between 1982and 1984. Financial corporations accounted for lessthan half of total foreign branch. taxable income (43percent).for 1984, while they comprised 51 percentfor 1982. However, Pompanies.in the finance, in-surance, and real estate industrial division as a wholerelied more o.n branch operations than did manufac-turing companies. . Fifty-four and 61 percent of..thetotal foreign-source taxable . inporne
-of these
.com-
panies was earned through foreign branches for.1.984
'and, 1982,- respectively. - By compari
.son, for the
manufacturing division, branch income'was. only 17
percent of total foreign7Source taxable income forboth years.
Figur6L shows that U.S. banks, in particular,.hada strong preference to conduct. business in foreigncountries, through branch ol erations. Historicallv,_
-U-3-.15ankstiavemad-e- - foreign loans through1heirforeign branches rather than by establishing foreignbanking subsidiaries. During the early part of 1984,U.S. banks also used. their foreign branches as partof an effort to establish -l.arge credit lines for possiblemergers (16].
SUMMARY
Between , 1982 and 1984,'the foreign. tax. credit
claimed by U.S. corporations rose by $2.5 bi,llion, anincrease:of 13 percent. Likewise, the increases inworldwide. taxable income, . foreign-source taxableIncomej and U.S. income tax before credits overthese 2 years contrasted sharply with the economicdownturn between 1980 and 1982. The increases inforeign income and, taxes for 1984 primarily reflecteda strong foreign recovery, made by manufacturingcompan.ies in the petroleum industry., While thepetroleum industry experienced, a strong foreignrecovery for A 984, many other industries . ex-perienced a stronger domestic recovery, withdecreases in foreign7Source taxable income andtaxes. - , : I
. Dividends (including the dividend gross-up) fromforeign-subsidiaries. emerged as-the largest com~ponent of total,foreign non-branch gro
'ss in
'come. in
1984, ~accounting for 39 percent~ of the total $85.5billion. - Between 1982 and 1984, dividends, (includ-
ing the dividend gross-up) increased,by $4.8 billion.to $32.9 billion, while interest income decreased byan.equal amount, to $177 billion..
Foreign branch operations were especially impor-tant to the bankin.9 ind.ustry. Over 60 percent,of.theforeign-source taxable income of banks Was earned .through foreign branches. As a contrast to. banki,,corporations in the trade and manufacturing in-r,dustries more often established foreign subsidiarycorporations. This was reflected in the large amountof foreign dividends and the. dividend. gros, s-upreported by those U.S. corporations.
DATA SOURCES AND LIMITATIONS
Sample Selection and Sampling-Varia'bility
The statistics for lncor~e Year 1984- (which M6.cluded * accounting periods ending between July
.1 984'and June 1985) Were estimated from a stratifiedprobability. sample of about 94,000 icorporationin-come'tax returns selected after revenue processing,
-buttbefore-audit examinatiom-"escription-d--thesample selection procedures for corporate returnsispresented in the Appendix of this publication.
Returns claiming. a foreign tax credit were selected.for the 1984 statistics presented in this article from..the general corporate, sample. Slight differePces-exist between the 1984 foreign tax credit datapresented here and the data previously published inStatistics of Income-71984, Corporation, income TaxReturns, as . well, as data shown in. Table 1 3r of , theSelected Historical Data.section of this publication.,The difference's exist.
.because
.the statistics
presented in this article-
include, 1,984.data foe 25'
returns with foreign tax credit that.were prescribed ,'for inclusion in the 100 percent sample class, butwere received too late to be included-in,the regularcorporate statistics.. However, estimates were,.usedin the corporate statistics for the most significant (10)returns.
.Accounting periods which ended January through.,June 1985, included returns filed for the first time by.Foreign.. Sales Corporations (FSQ's) , and, InterestCharge Domestic Internati
"onal Sales Corporations
(IC-DISC's). . Effective January 1§85, the FSC,.a,ndIC-DISC replaced the former Domestic International.Sales Corporation (DISC). When a U.S. parent cor-poration receives a dividend from a FSC or an 11C-DISC, the parent corporation can.sometimes claim.a.,foreign tax credit for a. portion of the foreign taxes

Corporate Foreign Tax Credit, 1984 69
paid by those corporations. However, no returns inthe corporate sample for Income Year 1984 includeda foreign tax credit for distributions from either a FSCor an IC-DISC.
Unlike an IC-DISC, a FSC may pay U.S. incometax. Therefore, a FSC can sometimes claim a foreigntax credit for the foreign taxes paid on its foreigntrade income. A separate study of income taxreturns (Forms 11 20-FSC) was conducted for thesenewly created corporations with accounting periodsending January through June 1985. None of theForeign Sales Corporations included in that studyclaimed a foreign tax credit.
Sampling error is a limitation only to the extent thatreturns are selected at a rate of less than 100 per-cent. However, for this article, returns selected at the100 percent rate accounted for the largest part of theestimated amounts. For instance, for 1984, corpora-tions with $250 million or more in total assets (whichwere selected at the 100 percent rate) accounted foralmost all of total assets (97.9 percent), foreign taxcredit claimed (96.5 percent), and foreign-sourcetaxable income (96.1 percent) reported by all cor-porations claiming a foreign tax credit. Because ofthe predominance of these large corporations, sam-pling error is not considered a major limitation of thestatistics.
reported for purposes of this credit is finally deter-mined. In addition, some corporations provided onlypreliminary foreign income and tax data with theirU.S. tax returns because not all the information ontheir foreign operations was available at the time theU.S. income tax return had to be filed.
There is a certain amount of undercoverage in theforeign income and tax data. Some corporationswith foreign income and taxes reported an overalldeficit on their U.S. income tax return and thus hadno U.S. tax liability against which a foreign tax creditcould be claimed. Other corporations may havechosen to deduct their foreign taxes from grossincome rather than credit them against their U.S.income tax liability. It is believed that the amounts offoreign income and tax were insignificant for thosereturns. In both circumstances, the tax returns wouldhave been excluded from this study. In other instan-ces, corporations did not provide a Form 1118 insupport of the foreign tax credit claimed with their taxreturn as originally filed. Since the foreign tax creditclaimed by these corporations represented ap-proximately 0.06 percent of the total foreign tax creditclaimed by all corporations, it is believed that therelated foreign income and tax data are insubstantial.Certain data about these corporations are, however,included in columns 1-16 of Table 1.
General Limitations
The foreign tax credit is claimed under section 901of the Internal Revenue Code. Corporations claim-ing a foreign tax credit generally provide supportingforeign income and tax data on Form 1118, Com-putation of Foreign Tax Credit-Corporations, at-tached to their U.S. income tax returns (Forms 11 20).
Form 1118 is the source of the foreign income andtax data for this article. Detailed statistics from thisform are generally obtained for only even numberedincome years. The foreign income, taxes, and creditin this article were thus obtained from Forms 1118for 1980,1982, and 1984. The foreign tax credit wasobtained for other years (i.e., 1981, 1983, and 1985)through the annual corporation income tax returnstatistics. Because of the different cycles of datacollection, only the foreign tax credit can be com-pared or contrasted annually.
The statistics do not reflect any adjustments thatmay be made during audit examination, when theacceptability of the foreign income and taxes
The U.S. tax law allows parent corporations to fileconsolidated income tax returns presenting the com-bined financial data of an entire group of affiliatedcorporations. Therefore, the actual number of cor-porations claiming a foreign tax credit is understated,inasmuch as the statistics in this article are for cor-poration income tax returns with a foreign tax credit.For purposes of this article, however, the term "cor-porations" is used interchangeably with "returns."
Each return included in the statistics was assignedan industry code during statistical processing. Thiscode was used as a classifier of the returns. Theindustry code represented the principal businessactivity of the corporation filing the return. However,a given return may have been for a companyengaged in several business activities or may havebeen a consolidated return filed for an affiliatedgroup of corporations which conducted differentbusiness activities. To the extent that some returns(consolidated and nonconsolidated) were for cor-porations engaged in many types of business ac-tivities, the data in this article are not entirely relatedto the industrial activity under which they are shown.

70 Corporate Foreign Tax Credit, 19.84
DEFINITIONS
Current-y~ar Foreign Taxes. --Generally, current-year foreign taxes available for credit included (a)foreign taxes directly paid or accrued by a U.S.corporation'on profits of.-foreign branch Operations;taxes withheld on dividends, interest, rents, royaltiesand license fees; and foreign taxes paid or accruedon other income including income from partnershipsand from the performance of'services; and (b)foreign taxes indirectly,.or "deemed," paid by a U.S..corporation. The deemed paid taxes were the. taxespaid or accrued by a related foreign corporation onthe profits from which dividends wefe -paid ',(.or con-structive distributions made) to the U.S. corporation.
Dividend Gross-up.--Ah amount of income equalto tax deemed paid thatis associated with dividendsreceived or with includable income
.constructively
received from Controlled, Foreign Corporations.
Foreign-sourceTaxable Income. '-Foreibn-sburcegross income, including certain income'"con6truc-tively"althougghnot Actually-received (i.e., foreigndividend gross-up and includable income ofControl-led Foreign'Corporatidns)' less, or "'net". of, the al-locable deductions determined under the InternalRevenue Code and by provisions of any tax treatybetween the United States and a particular foreigncountry. This taxable income was the amount onwhich the U.S. income tax on foreign earnings wasdetermined. It could differ from the taxable incomefrom overseas business operations and investmentscorriputed under foreign tax law,. which was used asthe basis for foreign 'ta'x4fion. In general, foreign'-source. taxable income included foreign, branchprofits, dividends received from foreign corpora-tions, rental'income, royalties, license-fe'es, interest,gains from the sale ofreal oroperty,and compensa-tion for. labor or. services performed.-
Specially Allocable (Section 863(b)) Income.-- In-come partially earned within the United States andpartially earned within a foreigrv country or U.S.possession. In general, the income was generatedeither by production within the United States andsales abroad, or vice versa; or by transportation,telegraph, or cable services.
NOTES AND REFERENCES
[1] For an explanation of the difference betweenthe $21.4 billion total foreign tax credit figureshown here and the, $21.1 billion figure shown
,in Statistics of Income -1984,-, Corporation In-come Tax Returns, see the "Data Sources andUmitations" section of this article.
[2]. Unless otherwise.stated, the tdrm foreign taxespaid is used- in this article to mean curre*nt'ryearforeign taxes,,which is described in the"'Definktions" section- of this, article. Taxes~ paid toforeign governments on some income that wasnot repatriated to the United - States are notincluded in the statisticsin this report.
[3] The focus of this- article is. Tak Year 1984 be-cause statistics
'on the foreign income and
taxes, which generate the foreign tax credit, are~not available for 1,985. See -the "Generali Litnita-,tioris" section of this Article for-, a moredetailedexplanation. Whilethe-focus is also on industrydata, ~ information by selected countries isprovided in Table 4, at the end of this article.
[4] - Star,ting -from a record high of $36.8, billion for
-1 979,-the-foreign-tax~c.rediUplunged farri-980-
This plunge. resulted primarily from thenationaliz*ation of certain U.S.:oil extraction in-terests in the Middle East.
[5] Taxable , income,. in, contrast to. I net : income,which is somewhat higher, is usedJormeasur-ing the recovery because it is the U.S.* tax-baseused in the. computation of: the. foreign, taxcredit.- The . foreign-source and. domestic-source taxable income are estimates becausea small . amount of foreign-source,taxable in-come- is.not included in these statistlcs.,~ See the
.. "Data Source's and.11mitations" section of thisarticle.
[6]. Major U.S. corporations today include multinA-tional operations distributed 'throughout 'theEuropean Economic Community, Japan,Canada,~and numerous developing, countriesaround the world. Many foreign ~countries areproducing various component parts of the finalproducts sold by U.S. companies today. Not,only does the manufacturing of goods resultfrom multinational. -coordination, so does thenecessary financing which is provided throughinternationally coordinated operations of U.S.companies. For a discussion of a prototype ofa large computer-age multinational firm see forexample: Blumenthal, Michael, "Two Perspec-tives on International Macroeconomic Policy

Corporate Foreign Tax Credit, 1984
Coordination," International EconomicCooperation, Martin Feldstein, editor, Universityof Chicago Press, 1988, pp. 43-49.
[7] Under the Deficit Reduction Act of 1984, theDISC was replaced with the Foreign Sales Cor-poration (FSC), which created two newcategories of foreign income (effective January1985): (1) foreign trade income of a FSC and (2)distribution's from a FSC or former FSC. Seethe "Data Sources and Limitations" section ofthis article for more details concerning the ex-clusion of these categories of foreign incomefrom the 1984 statistics.
[8] The foreign tax credit shown in the statistics donot include any foreign taxes carried back be-cause this would require filing an amended taxreturn. Amended tax returns were not includedin this study.
191 See Mose, Vergie, "Report on InternationalBoycotts, 1976-1982: A Focus on the MiddleEast," Statistics of Income Bulletin, Summer1985, Volume 5, Number 1.
[10] For comparison of the tax effect using foreigntaxes paid as a credit versus a deduction, seeBarlow, Mary, "Foreign Tax Credit by Industry,1982," Statistics of Income Bulletin, Spring1986, Volume 5, Number 4.
[11 ] Seskin, Eugene P. and Landefeld, J. Steven,"Plant and Equipment Expenditures, the FourQuarters of 1984," Survey of Current Business,Bureau of Economic Analysis, Department ofCommerce, June 1984.
[1 2] Dilullo, Anthony J., "U.S. International Transac-tions, Third Quarter 1984," Survey of Current
71
Business, Bureau of Economic Analysis,Department of Commerce, December 1984.
[13] In general, a deficit occurred when the sum ofordihary and necessary business expensesplus statutory special deductions exceededgross income. Ordinary business deductions,in the case of banks, include interest paid todepositors, as well as deductions for bad debts.
[14] U.S. tax laws mandate the sequence in whichtax credits must be taken in reducing U.S. in-come tax. The first credit to reduce U.S. incometax is the foreign tax credit. The remaining. U.S.tax determines the limits of the other succeed-ing tax credits. For the calculations shown inFigure 1, the reported amounts of the othercredits were used to reduce U.S. income tax.These credits were not recalculated to simulatehigher limitations due to the U.S. income taxbefore credits not being reduced by the foreigntax credit (for Figure 1).
[15] A Controlled Foreign Corporation (CFC) isgenerally described as a corporation createdunder the laws of a government outside of theUnited States and with more than 50 percent ofthe voting stock or more than 50 percent of allclasses of stock owned by U.S. "persons" onany day during the taxable year of the CFC. For1984 industrially classified Controlled ForeignCorporation data, see Lewis, Margaret P., "Con-trolled Foreign Corporations, 1984: An IndustryFocus," Statistics of Income Bulletin, Fall 1989,Volume 9, Number 2.
[16] Krueger, Russel C., "U.S. International Transac-tions, First Quarter 1984," Survey of CurrentBusiness, Bureau of Economic Analysis,Department of Commerce, June 1984.

72. Corporate foreigrt Tax Credit,--1984
All Corporation Returns with Foreign Tax CreditTable l.--!-Total Assets, Income,..Taxes-and,Credits and Foreign-Income, Taxes and Credit, by.Majqvindustry..[All figures are estimates based on samples money amounts are in thousands of dollars]
maw Inck"Number of
return9 ToW asew TOWreoet t
Dividendsreoelved fr= CONklends
r9celved from
trAludablefroome ofC4ntrolled
IncoffmMSWUng from Not irwxxm Ir4orne
"-p s DISC's = kweign hu= (IM deficit)
Ur..C.
(2) (3) (4) (5) (6) (7) (8)
All Indusbies ...I...... ........................................ 4,841 4,339,759,748 '2,365,182,002 ~,114,654,W' 4,859,970 3,862,959 12,095,447 '139,112,230 1
-33,13S,963
Agriculturs,.forestry, and fishing ........... ............. 55 2,491,866 5,487,388 20,322 - "12,103 1,173 3,231 256,010 248,798Mining ........ 143 93,528,192 52,245,406 -672,975 34,656 114,007 636,358 3,980,095 3,724,630
............Metal mining .................................. ................i *13 -2,274,014 -1,790,179 *8,022 *321 *8.122-. 142,752 102,939Coal mining
....................................... 3 3.177,&% 2,272,903 84 - 164,918 160,354
Gil and gas extraction ............... ................................. 122 86,575.076 46,577,588 660,434 34.656 113,603 627,676 3,475,236 3.285,111Nonmetallic minerals, except fuels ................... -6 1.604,735 .'W 177,189 *176;126
Cbaff6ctlon ..................................................... 99 16,55S,188 9'15S1157 62,464 5,403 16,3S8 29,234 346,209 2158,187General building contracts and operative builders -1,587,418 *5,768.749 *33,907 *219 *100 -14,385 .235.763 -178,539Heavy construction contractors
*...........*12 *11~~721,944 *3,074,613 -26,593, -5.184 -16,128 1 4.263 ~8~~7W '5~,2§1
Special trade contractors .. .................................. -7 1,964 130 ',%6 *26,6a8 "'25.358.Manufacturing. .......................................... 1,709 11,4183,1187,1187 1,501,703,306 12,290,707 4,691,051 . 3,038,417- 10,596,834 102,432,248, - 99,909,028Food and kindred products ...............: ........................ 85 69,736,405 113.579826 658,078 123,283 230,361 541,796 5,528,038 5 426 331lbba6co manufactures .......................................... 1 6 46,692,190 37,467:091 35,386 129,091 52,331- 40,553 4,113,136
,-4,098,582
Textile mill products .......................................... b 38- '7,923,961 10,842.731 25,189 6,788 15,937 19,897 579,697 :576,310Apparel and other textile products ............................. so 6,599,344 9,464,355 13,600, 3,630 5,373 7.511 645,899 642.630Lumber and wood products ....................................... 18 29,781,501 26,578,063 10,587 66.795 45,283 13.027 1,130,35~" 1,094,721Furniture and fixtures
............................... *'****.............18 2,516,576 3,918,508 1,297 2,
.693 861 476,350 470.136
Paper and allied products......................... *** - -*
W 40.447,280 45.899,090 223.366 145,389 39.711 170,882 2,973,208 2,898.580Printing and publishing
..............................................96 28.796,978 33,189,867 81,381 24,687 14,835 75,610 3,734,954 3,695,930
Chemicals and allied products ................................... 242 193.890.741 202.468,506 2.024.633, 1,024,274 785,728 1,734,613 13.220,399 _13,007,067Petroleum Cinducling integrated) and coal products 25 446.183,004 394.568,998 _4,465,174 i32,999 577,479 4,085,187 27,042,329 ~6,266,886Rubber and miscellaneous plastics products ............. 81, 17,7177,124 24,720.012 132,844 47~445 .17,082 74,616 1,2#,858 1, 1 U.545Leather and leather products ..................................... 3,1F30,968 5,752,109' 9,554 218 194 5,864 261,725
.250,423
Stone, clay, and glass products ~ ................................. 44 22.308,060 25,073,101 227,964 63,432 24,553 199,970 1,834,840 .1,799,569Primary metal industries ............................................. 50 50,160,428 35,749,069 120,797 58,965, 99,399 53,563 1.M.599 1,A7,286Fabricated metal products .......................
_ _156 40,175,607, 38,977,957 513,771 122,022 44,146 345,850 2 974 685
.- -2 826 889
Machiner~ ~capt electrical ....................................... .233, 125.589,174 114.174,860 1~719,725 661,977 402,150 1,685.874, . 7
11,643,1~O, ,
11.422,326Electrical and,elecironic equipment ........................... 211 123,809,196 131,603,739 541,786 649750 213237 292,819 7,944,502 J,741.692Motor vehicles and equipment .................................... 50 154,376,591 -152,672.562, 929,652 585:729 .239:831 729,231 9,466,308 9.317,794Transportalion equipment, except motor vehicles 26 29,461.625 42.545,198 179.954 355294 43536 142,558 2,308,162 2,104,419Instruments and related products ............................... 104 30,915,004 38,653,913 323,284 458:031 179:023 336,482 31
11.2,91
15 2 777 929
Miscellaneous manufacturing products and. , ,
manufacturing not allocable .................. ................. 80 12,315,430 13,803,753 52,684 28,559 8,228 40,068 1,166,761 1.070,982Transportation and public utilities ........................ 239 209,169,334 126,032,746 166,757 12,900 255,851 .12919OS- 8,575;905 -.7,855,802
Transportation.................................... : .........................
187 43,498,155 36,420,876 54,934 1,564 21.603 15,580 1,890,434 1 515 918VVater-transportation ................. ........... 6 6,590,871 13.444 5,832 su 91.339
, ,86,148'
Other transportation ................................................ 181 .36,907,285 34,053,483 41.491 1,564 15,771 15,045 1,799,095 1,429771Communication .................. ................................ 14 57.633,211 30,055,208,
.68,587. 6.352 109,259 69,792 2,813183 2 629:701
Electric. gas, and sanitary services ............................ 38 108,037.968 59,556.663 43,236 4.984 124,989 44,534 3,872:288 3:710,183Wholesale and retail trade .......... ...................... 735 229,204,886 250,642,292 529,509 62,502 202,612 340,312 8,933,854 7,826,424
iftlesale tradei ...................................................
W.. 636 89,494,330 82,371,216 363,518 51,085 66,657 199,065' 3,428,366' 3:,353,91 1,Groceries and related products ............................... *17 *1,79i.938 7,351,401 *6,545 *869-. *5,114 -4,497- ~*76 424* ' '69 7521Machinery, equipment, and supplies ...................... 85 3,773,873 6,843,706 6,835,. 4,933. 9,372 7.864
,255,742
.~ 250.607,
M.iscellaneous wholesale trade ....................... ; 534 83,926,518 68,176,109' 350,138 45.283,'
52.171 186,704 3,096,200 3,04,'1~2Drugs, chemicals, and allied products .......... 115 3,1 ~6,127 8,010,364 16,901 5.3~1. 1.561 9,729. 219,244, 204,4~8Petroleum and petroleum products ..................... ~1 1, 4,076.406 *9,737,311 *213.540 '723 '32,620 '115,973 '~443,308 ~'446 431Other miscellaneous wholesale trade ............... 408 76,665,984 50.428,435 119,697
39,168. 117,990 -_611,002, .2,433,648 2,3M:243
Retail trade' : ' ' * " ' ' " ' ' *" ' ' '
100 139,710,559 168,271,076 165,991 11,417 135,955 141,247 5,505,488 .4,472,512Building mate riaJs , gard en supplies, a nd mobile:home dealers .
.................1 29,643, *234,492. 3 1
General merchandise stores ................................... 10 107,102,221: 103,426.966.
89;742 2,271 102,024. 69,966 2,825,007 2,331,568Food stores ............................................................. 7 10,142,298 36.301,555 58.699 5,809 14,797 56,490 662,84~ 332,581Apparel and accessory stores . ................................ *21, -3,754,401 *6,889,028 *350 - 1,d50 *170 *390,684 *354,022Eating and drinking places :.................... ............... 15 10,898,348 4,964 2,771 16,228 6,617 '86~,628 845,884Miscellaneous retail stores ...................................... 23 .7.301,640 10520,686 12,204 566 8,003 754,437 600802
Finance, Insurance, and real estate ..................... 1,362 2;270,614,319 379,310,593 723,118 6,525 181,195 267,461 12149,312 10,9 6,504Banking ...........................
.... * ..................153 1.6i'8,619',515 193,158,524 384,976- 197 97,436 129.298 5,884,257 5,894,079
Credit agencies other than banks .......... : ........... 97 85,042,081 18, 175,292 i 48,517 265 34,833 27,558 ~,~~'404;868 265,814-Sec~urity, commodity brokers, and services ................ 102 .72,750,775 6,536,543 16,002 2.168 3.234, 405,534 307,544Insurance carriers ....................................................... 224 477,136,039 148,030,217 89,933 368 39,061 35,707 4,346,505 3.673,496-Insurance agents, brokers and services : ................ ~, 16 2,532,915, 1,861,625 9,810 -1. 1'0D9 6,444 74,886 71,585Real estate ... :........................ ...................................... 346 2,601,383 2,762,232 6.136 293 - 3,638 186,310 '1 WHolding and other investment companies except
bank holding companies ................... 424 11,931,610 8,786,156 167,750 7.401 6,687 61,581. 846.951 596,.838
3ervices ..~ ......................................................... 499 35,008,771 40,605,114 189,095 32,829 73,34S 92,111 2,458,596 2,366,690Hotels and other lodging places ................................ .8 *3,908,429 -3.105,*600 - - '138.933 -1,33,690Personal services ................ ........................... 8 -1,621,069 2.389,922 20,868 19,304 198,477 187.959':Business services ....................................................... 253 11,673,898 19.594,126 71,760, 12,050 26,319 44,593 1,143,010 1,111,328Auto repair; miscellaneous repair services ................. -6 .*3,998,025 -3,761.950 *3,854
'
-'126,270 126,123
Amusement and recreational services ................... q 127 5,888.762 4,659,433 82,03~ 11,536 36,785 17,573 258.464 251,649.Other services ............................................................ 97 7,618,587 1 7,094,083 9.719 ~9,243 10,241 7,660 593,443
.555,942
notes at endof table.

Corporate Foreign Tax Credit, 1984
All Corporation Returns with Foreign Tax CreditTable I.-Total Assets, Income, Taxes and Credits and Foreign Income, Taxes and Credit, by Major Industry-Continued
(All figures are estimates based on samples-money amounts are In thousands of dollars]
73
us. incorne tax before Fweh)n Incorne and taxescredits reported on Form 1118
Major IndustryFo=n lax U.S.
salonsGerwhralbusiness Other credits
U.S. incometax after
Grow Incorne Pow low) excluding branchR=ond claimed tax credit credit
credit, operations and specially allocable incomeTOW
taxTotal Diviciends
I
Dividendgmss-up
(10) (11) (12) (13) (14) (15) (16) (17) (18) (19)
All Industries ..................................................... 59,593,157 S8,05,320 21,419,643 12,333 9,108,438 1,391,978 27,660,764 85,453,725 20,834,778 12,094,872
Agriculture, forestry, and fishing ......................... 105,152 104,459 11,985 - 9,833 1,368 81,966 1,040,798 21,495 3,232
Mining .............................................................. 1,746,686 1,689,279 1,164,747 - 54,747 2,402 524,790 6,805,006 789,198 636,358Metal mining ............................................................... *43,631 41,381 *35,238 - *3,626 649,467 *8.024 *8,122Coal mining ................................................................ 69,572 67,414 58,836 - 3,033 - 7,703 1,795 84 -
Oil and gas extraction ................................................ 1,552,764 1,500,450 1,069,449 - 35,259 2,375 445,681 6,147,416 776,572 627,676Nonmetallic minerals, except fuels ............................. *80,719 *80,034 * 1,224 - '11,715 - *67,781 *6,328 *4,518 1' 5W
Construction ..................................................... 117,412 114,963 86,027 5,843 63 25,479 378,705 83,634 29,234
General building contracts and operafive builders *80,785 -80,067 -68,464 *2,336 '63 *9,922 251,244 -34,007 14,385Heavy construction contractors .................................. -25,297 -23,745 '16,509 - *5,611 1 14,705 *47.532 1 4,263Special trade contractors ............................................ * 11,330 *11,151 * 1,053 - *9,947 * 12,757 -2,095 *586
Manufacturing ................................................... 4S,053,227 44,305,507 17,490,318 11,328 5,892,030 1,306,926 20,352,625 52,581,078 17,558,110 10,596,281
Food and kindred products ........................................ 2,449,202 2,420,632 765,270 - 315,801 117,742 1,250,389 2,138,062 901,327 541,796libbacco manufactures ............................................... 1,760.529 1,756,615 71,029 - 158,242 5,817 1,525,440 1,201,650 140,972 40,553Texble mill products .................................................... 262,427 258,920 25,251 - 56,041 1,480 179,655 89,456 41,128 19,897Apparel and other textile products ............................. 294,571 293,846 13,290 - 18,465 422 262,395 102,157 19,256 7,511Lumber and wood products ....................................... 388,019 361,202 23,801 - 158,384 2,038 203,796 85,520 52,103 13,027
Furniture and fixtures .................................................. 216,016 215,421 1,314 - 13.436 744 200,521 4,826 1,297 861Paper and allied products .......................................... 1,271,951 1,248,825 246,131 - 282,063 37,045 706,712 799,651 337,317 170,499
Printing and publishing .............................................. 1,575,722 1,565,739 93,508 - 164,756 3.433 1,314,026 517,987 106,760 75,609Chemicals and allied products ................................... 5,902,304 5,789,792 2,414,330 8,584 815,873 228,467 2,435,050 7,168,996 3,111,455 1,734,610
Petroleum (including integrated) and coal products 11,901,565 11,771,474 8,495,722 - 815,034 57.762 2,533,046 21,160,997 5,812,189 4,085,187Rubber and miscellaneous plasti6s products ............. 516,257 506,474 136,140 - 88,905 16,664 274,549 473,258 158,028 74,616Leather and leather products ..................................... 114,954 114,381 7,825 - 11.440 550 95,140 31,436 9,750 5,862Stone, clay, and glass products .................................. 806,914 788,496 223,991 - 77,366 14,554 491,003 678,289 276,656 199,970Primary metal industries ............................................. 574,550 560,163 123,104 - 106.958 10,955 333,532 509,110 225,774 53,563Pabricated metal products .......................................... 1.277,222 1,269,596 411,544 2.294 100,303 16,465 746,616 1,252,550 568,905 345,686Machinery, except electrical ....................................... 5,324,905 5,181,970 2,259,393 362 558,516 267,933 2,238,701 8,087,489 2,215,111 1,685,872Electrical and electronic equipment ........................... 3,356,823 3,228,132 539,626 - 722,928 210,341 1,883,928 3,104,544 1,078,819 292,821Motor vehicles and equipment ................................... 4,325,740 4,269,999 970,271 - 1,028.286 139,602 2,187,581 2,512,433 1,260,206 729,231Transportation equipment, except motor vehicles 965,707 957,431 213,206 - 181,764 72,646 498,090 1,107,857 465,698 142,558Instruments and related products ............................... 1,277,148 1,261,761 404,742 88 183,531 89,275 599,512 1,412,733 713,514 336,482Miscellaneous manufacturing products and
manufacturing not allocable .................................... 490,701 484,637 50,830 - 33,939 12,991 392,941 142,078 61,847 40,068
'firansportation and public utilities ........................ 3,490,450 3,429,021 353,604 - 1,559,987 22,341 1,554,519 2,403,213 419,787 129,905
Transportation ............................................................. 669,287 661,141 55.631 - 421,023 1,229 191.404 810,249 76,413 15,580Water transportation ................................................ 39,492 39,305 19,752 - 6,950 18 12,773 239,531 19,275 534
Other transportation ................................................ 629,795 621,836 35,879 - 414,073 1,212 178,631 570.719 57.137 15,045Communication .......................................................... 1.158,683 1,125.696 103,617 - ~20,635 9,771 524,661 703.053 172,868 69.792
Electric, gas, and sanitary services ............................ 1,662,480 1,642.184 194,357 - 618,329 11,341 838,454 889,911 170,506 44,534
Wholesale and retall trade .................................. 3,508,538 3,464,482 482,406 1,005 578,686 22,451 2,423,989 2,298,290 762,224 340,314
Wholesale trade .......................................................... 1,514,946 1,502.434 300.618 - 91.744 10.042 1,112,541 1,487,484 459,262 199,064Groceries and related products .............................. -31,665 *31,273 *5,764 - *461 -17,674 * 24,546 1 1,491 *4,497Machinery, equipment, and supplies ...................... 114,194 110,924 12,595 - 13,950 373 87,276 145,940 17,669 7,864Miscellaneous wholesale trade ............................... 1,369,087 1,360,237 282,259 - 70,029 9,207 1.007,591 1,316,998 430,102 186,704
Drugs, chemicals, and allied products ................ 88.679 87,133 13,688 - 8.874 117 66,001 111,737 18,463 9,729Petroleum and petroleum products ..................... *200,591 199,591 169.183 - *219 *25,807 *480,985 '276,335 115,973Other miscellaneous wholesale trade .................. 1,079.816 1,073,513 99,389 - 55,773 8,872 915,783 724,276 135,304 61,002
Retail trade ................................................................. 1,993.592 1,962,049 181,788 1,005 486,942 12,409 1,311,448 810,806 302,962 141,250Building materials, garden supplies, and mobile
-home dealers ....................................................... *3,044 ~2,995 1.008 *37 *1,799 1,340 *31 -
General merchandise stores ................................... 1,028,357 1,012,157 83,070 - 262,476 9,948 672.863 474,037 193,577 69,966Food stores ............................................................. 153.135 1150,160 60,368 1,005 55,556 2,086 34,119 170,400 73,317 56,490
Apparel and accessory stores ................................ -162,846 162,263 *2,117 - '10,687 - -150,042 *8,703 *1,700 '170
Ealing and drinking places ..................................... 375,868 364,550 17,786 - 80,308 104 277,671 125,904 20,577 6,618Miscellaneous retail stores ...................................... 270.343 269,923 18,248 - 76,907 234 174,954 30,421 13,760 8,006
Finance, Insurance, and real estate ..................... 4,481,673 4,371,760 1,627,IS6 - 783,794 19,784 2,050,939 18,017,937 934,510 267,441
Banking ...................................................................... 2.509,947 2,443,233 1,339.753 - 520,334 6.196 643,663 14,524,591 471,425 129,298
Credit agencies other than banks .............................. 111.645 101,864 53,297 - 26,322 - 32,026 1,467,016 152,612 27,558
Security, commodity brokers, and services ................ 124,823 122,687 10,177 - 22.375 1.587 90.685 155,547 18,171 3,234
Insurance carriers ....................................................... 1,410.597 1.388,389 130,846 - 191,140 9,430 1,079,181 1,441,301 127,427 35,707
Insurance agents, brokers and services ..................... 30.725 29,630 8,091 - 3,005 142 19,486 54,047 10.684 6,444
Real estate .................................................................. 51,185 48,607 6,458 - 5,042 287 39,398 78,777 6,138 3,635Holding and other investment companies exceptbank holding companies ........................................ 242,751 237,350 78,534 - 15,576 2.141 146.500 296,658 148.054 61,564
sonrices ............................................................ 1,090,019 11,00,849 203,401 - 223,519 16,642 646,457 1,928,697 265,821 92,106
Hotels and other lodging places ................................ *57,402 *55,242 * 5,528 - 19,666 - *32,207 * 14,673Personal services ........................................................ 84,948 84,549 21,741 - 16,124 59 47,024 126.576 20,868 19.304
Business services ....................~- : **...................
525,135 499,966 93,191 - 89,536 14,546 327,862 905,331 98,103 44,593Auto repair; miscellaneous repair services ................. -54,930 '53,760 -5,204 - *35,324 *78 14,325 * 16,106 *3,854Amusement and recreational services ....................... 111,916 111,484 56,762 - 22,988 251 31,915 523,456 125,499 17,573Other services ............................................................ 1 255,687 1 250,849 1 20,973 1 - 39,881 1 1,708 1 193.125 1 342,556 1 16,636 1 7,656
Footnotes at end of table.
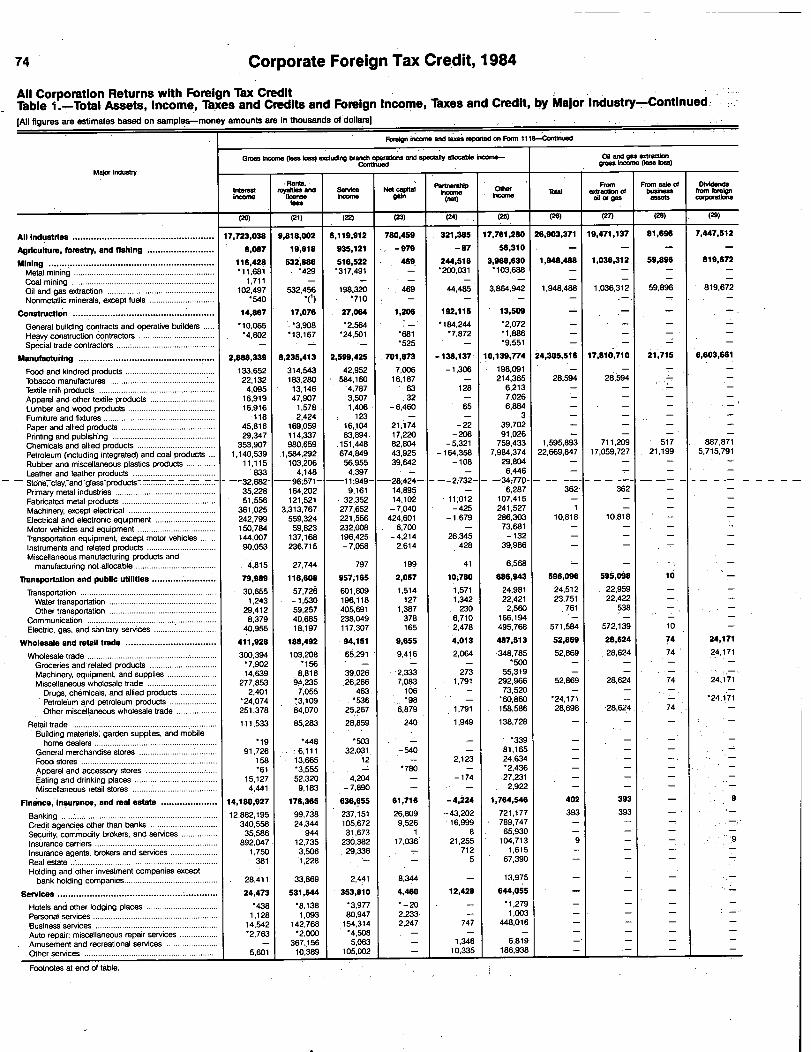
74 Corporate. Foreign Tax Credit, 1984
All Corporation Returns with Foreign Tax CreditTable l.-Total Assets, Income, Taxes and Credits and Foreign Income, Taxes and Credit, by Major Industry-ContInued:
[All figures are estimates based on samples money amounts are in thousands of dollars]
Inoorm aWtaxes reported on Form 11118-k"itinued
Groashioon poss low) exclualbV branch operations and spedally alloca Inoorne- 00 and gas
or IndM strContinued gmss Incorne (is- loss)
aj u y
Rents,-=and servioll Not awlitai
Partnershipbow
otherTOW
Fromextraction of
From sale ofbusiness
Dividends=Ign
fewhim, gain (nat)
hnooi oU or gas asseds,=
(20) (21) (22) (23) (24) (25) (26) (27) (28) (20)
All Industries ..................................................... 17,723,038 9,818,W2
*
6,119,912 780,459 321,395 17,761,280 26,903,371 19,471,137 81,696 7,447,512
Agriculture, forestry, and fishing ......................... 6,087 10,618 935,121 -979 -87 56,310 - - - -
Mining .............................................................. 116,428 53206 516,522 469 244,516, 3,968,630 1,948,488 1,026,312 59,896 819,672.
Metal.mining ............................................................... '11.681 *317,491 '260.031 103.688 - - - -
Coal mining ................................................................ 1.711 - - - - - - -
Oil and gas extraction ................................................ 102,497 532,456 198,320 469 44.4a5 3,864.942 1,948,488 1,036,312 59,896 819,672
Nonmetallic minerals, except fuels .............................T) '710 - -
Construction ..................................................... 14,867 17,076 27,054 .1,206 192,115.
13,509
General building contracts and operative builders *10.065 3.908 -2,,W 1 84,244
Heavy construction contractors .................................. -4,802 13,167 '24.501 681 -1,886
Special trade contractors ..................................... - 525
Manufacturing ................................................... 2,888,339 8,235,413 2,599,425 701,873 -138,137 10,139,774 24,305,516 17,810,710 21,715 6,603,661
Food and kindred products .................................... 133652 314.543 42,952 7.006 -1,306 198,091 - -
Tobacco manufactures ............................................... 22:132 183.280 584.160 16,187 - 214,365 28,594 28,594
Textile mill products .................................................... 4.095 13.146 '4,787 63 128 6,213 - -
Apparel and other textile products ............................. 16,919 47.907 3.507 .32 - 7,026 -
Lumber and wood products ....................................... 16,916 1,578 1.4D6 -6.460 65 6.884 -
Furniture and fixtures .................................................. 118 2,424 123 - - 3 -
Paper and allied products .......................................... 45.816 169,059 16,104 21,174 -22 39.702 -
Printing and publishing .............................................. 29.347 114.337 83,694 17,220 -206 91,026 - -
Chemicals and allied products ................................... 353,907 980,659 .151,448 82,804 -5,321 759,433 1,595.893 711.209 517 887,871
Petroleum (including integrated) and coal products ... 1,140,539 ~1,584,292 674.849 43,925 -164,358 7,984,374 22,669.847 17,059,727 21,199 5,715,791
Rubber and miscellaneous plastics products ............. 11,115 103,206 56,955 39,642 -108 29,804 - - - -
Leather and leather products ..................................... 833 4,148 4,397 - 6,446
Stone, clay, and-glass-products :: .... .....:~:.: ...... :- - -=32.682- -96,571- -11,949- -28,424- --2,732- - -34i770- -
Primary metal industries ............................................. 35,228 164,202 9,161 14,895 - 6,287 362- 362
Fabricated metal products .......................................... 51,556 121,521 32,352 14,102 11.012 107,415 - -
Machinery, except electrical ............ .......................... 361,025 3,313,767 277,652 -7,040 -425 241,527 1 -
Electrical and electronic equipment...........................
242,799 559,324 221,556 424,601 -1,679 286,303 10.818 10,818
Motor vehicles and equipment ................................... 150,784 59,823 232,008 6,700 - 73.681 - -
Transportation equipment, except motor vehicles 144,007 137,168 196,425 -4,214 26,345 -132
Instruments and related products ............................... 90,053 236,715 -7,058 2,614 428 39,986
Miscellaneous manufacturing products andmanufacturing not allocable .................................... 4,815 27,744 797 199 41 6,568 -
Transportition and public utilities ........................ 79,989 116,608 957,16S 2,07 10,760 686,943 596,096 595,098 Id
Transportation ............................................................. 30,655 57,7216 601,809 1.514 1,571 24,981 24,512 22,959 -
Water transportation ................................................ 1,243 -1,530 196,118 127 1,342 22,421 23,751 22,422 -
Other transportation ................................................ 29,412 59.257 405,691 1,387 230 2,560 538 -
Communication .......................................................... 8,379 40,685 238,049 378 6,710 166,194 -
Electric, gas, and sanitary services .............................
40,955 18,197 117,307 165 2,478 495,768 571,584 572,139 10
Wholesale and retail trade .................................. 411,928 188,492 94,11SI 9,655 4,013 487,513 52,869 28,624 74 24,171
Wholesale trade .......................................................... 300,394 103,208 66,291 9,416 2,064 348,785 52,869 28,624 74 K 171
Groceries and related products ........... - ............... 7,902 .*156
Machinery, equipment, and supplies ...................... 14,639 .8,818 39,026 2,333 273 55,319 - -
Miscellaneous wholesale trade ............................... 277.853 94,235 ~6.266 7,083 .1,791 292,966 52,869 28.624 74 24,171
Drugs, chemicals, and allied products ................ 2.401 7,055 463. 106 - 73,520 - -
Petroleum and petroleum products ..................... -24,074 -,3,109
Other miscellaneous wholesale trade .................. 251,378 84,070 .25,267 6.879 1,791 158,586 28.698 .28,624 74
Retail trade ................................................................. 111,533 85.283 28,859 240 1,949 138,728 -
Building materials; garden supplies, and mobilehome dealers ....................................................... '503 -
General merchandise stores ................................... 91.726 6,111 32,031 -540 - 81,165
Food stores ............................................................. 158 13,665 - 12 - 2,123 24,634
Apparel and accessory stores .......................... : *61 *3,555 --:. *780 - -2,436
Eating and drinking places ..................................... 15,127 52,320 4,204 - -174 27,231
Miscellaneous retail stores ...................................... 4,441 9,183 -7,890 - 2.922
Finance, Insurance, and real estate ..................... 14,160,927 176,365 636,665 61,716 -4,224 1,764,546 402 393 9
.............................................................Banking 12,882,195 99,738 237,151 26,809 -43,202 721.177 393 393 -
Credit agencies other than banks .............................. 340,558 24,344 105,672 9,526 16,999 789,747 - -
Security, commodity brokers, and services ................ 35,586 944 31,673 1 8 65,930 - -:
Insurance carriers ........................... ........................... 892,047 12.735 230,382 21,255 104,713 9 79
Insurance agents, brokers and services ..................... 1,750 3.506 29,336 712 1,615 -
.........................................Real estate ..: ...................... 381 1,228 5 67,390
Holding and other investment companies except
bank holding companies.......................................... 28,411 33,869 2,441 8,344 - 13,975
Services ............................................... L ............ 24,473 531,5" 353,810 4,460 12,428 644,055
Hotels and other lodging places ................................ *438 *8,138 -20 1,279
Personal services ........................................................ 1,128 1.093 80,947 2,233 1,003
Business services ..............................",* . ....... * ***
14.542 142,768 .154,314 2,247 747 448,016:
Auto repair; miscellaneous repair services ................. *2,763 *2,000 *4,508 - -
Amusement and recreatonal services ....................... - 367,156 5,063 1,346 6,819
Other services ............................................................ 5,601 1 10,389 1 105,002 10,335 186,938 1
Footnotes at end of table.

Corporate Foreign Tax Credit, 1984
All Corporation Returns with Foreign Tax CreditTable i.-Total Assets, Income, Taxes and Credits and Foreign Income, Taxes and Credit, by Major Industry-Continued(All figures are estimates based on samples money amounts are In thousands of dollars]
Foreign Incorne and taxeg reported on Form 1118--Continued
75
Oil ancl on extraction91 i=r= kee),_ Decluctione other than incen branch operations aW specially aflocawe incorne
Major Industry Decluctions alloceW to specift types of Incorne Dockictions, no allocable
I l d bllo Specific types of Income
nc u a eing:orne ofControlled partneraw
Incornep Total
Rental, royalty andlicensing expenses Research
Total service Other Total amDepreciation. experme deductions developmentdepletion andarnontuation
Other expenses
(30) (31) (32) (33) (34) (35) (36) (37) (38) (39)
All Industries ...................................................... 2,773 -99,748 38,788,636 25,481,874 320,279 954,455 2,286,314 21,920,826 13,294,762 42,721Agriculture, forestry, and fishing ......................... - - "11,200 964,047 - - - 964,047 27,153 5,785Mining ..............................................................
Metal mining- 32,609 4,315,160
*4,099,417'
64,145-
58'"6 332,149 3,646,457 215,743 10................................................................Coal mining ................................................................
--
--
535.623-
535.623-
4,067-
--
'184,690 *346,866 - -
Oil and gas extraction ..................................................Nonmetallic minerals t f l
- 32,609 3.778,339-
3,563,251 60.077 58,666-
147.460 3,297,048- 215,088--10, excep ue s ............................. - - 1.198 '543 - - .543 * 655 -
Construction ..................................................... 91,596 36,670 913 12,631 23,226 54,926 -General building contracts and operative builders *46,325 -2,075 - 544 249'44 -Heavy construction contractors ..................................Special trade contractors
*44.232*
'34.523 *913 .10.999 *22,611,
9.708 -............................................ 1,040 - - *968 -
Manufacturing ................................................... 17 -130,587 17,012,611 13,461,379 181,381 654,307 827,8" 11,797,847 3,551,232 27,"5Food and kindred products ........................................Tobacco manufactures
- - 50i.889 322,184 - 58,739 8,747 254,698 185,705 3,272...............................................Textile mill products ....................................................
--
--
877.04817 228
238,3335679
1.3811 309
1,263 5,3714 430
230,318 638,716 -
Apparel and other textile products ............................. - -,
34,706,
19.334,
11-
4,683.
1,5253.828
13 1147,661
15 373--Lumber and wood products ....................................... - - 10,721 3,444 - 281 131
,3 032
,7 276 -Furniture and fixtures .................................................. - - 155 60 - - -
,60
.95 -Paper and allied products ..........................................
Printing and publishing--
- 183,6592 2
128,899 - 860 3,530 124,509 54,760 -..............................................Chemicals and allied products ................................... -
--3.703
0 ,8061,837,709
184,4711,145,641
374457
31,53310,193
58.26152,636
94,3021 082 355
18,336692 069
-4 392Petroleum (including integrated) and coal products 17 -126,886 8.520,333 7,982.210 122,121 388,247 221 008
, ,7 250 834
,538 124
,-Rubber and miscellaneous plastics products ............. - - 73,652 20,786 71 2,448
,1,557
. ,16 710
,52 866 2 071Leather and leather products ..................................... - - 6,006 4,300 - - -
.4 300
,1 706
,-Stone, clay, and glass products ..................................
Primary metal industries- - 120.782 57.619 648 14,925 12,669
,29,377
,63,163 2,724.............................................
Fabricated metal products ..........................................
--
--
192,097210,008
138,950117,748
30,141883
62,7521,012
22521,896
45,83393 958
53,14792 260
-634Machinery, except electrical .......................................
Electrical and electronic equipment-
11 2,129,513 1,777,646 9,118 11,284 132,323
.1,624.921
,351,867 14,738...........................
Motor vehicles and equipment ...................................( )-
--
1,000,003606.410
765.834323,324
29360
47,0486,554
72,110207,791
646,3a3108 919
234,169283 086
163-
Transportation equipment, except motor vehicles - - 251,002 171,536 12,745 9,866 22,171.
126 754,
79 466 -Instruments and related products ...............................Miscellaneous manufacturing products and
- - 210,648 45,099 756 446 1,231,
42,665,
165,549 -
manufacturing not aflocable .................................... - - 20.235 4,395 1.012 2.173 233 977 15,840 (1)transportation and public utilities ........................ 2,756 -1,769 1,358,408 998,134 11,622 51,130 455,429 469,953 370,274 -Transportation .............................................................Water transportation
- 1,553 645,722 432,059 6,654 48,874 360,737 15,794 213,663 -................................................
Other transportation ................................................--
1,330223
188,331457,391
7,663424,395
1,6155,039
3,71445.160
22360 715
2,31248213
180,66732 995
--
Communication ...................... : ...................................Electric, gas, and sanitary services
-2 756
--3 322
295,349417 337
233,215322
529 1,961,
24,439,
206,286,
62,134 -............................ , , , ,860 4,439 295 70,253 247,874 94,477 -
Vholesale and retail trade .................................. - - 1,006,075 534,922 1,179 37,532 79,853 416,357 471,154 -Wholesale trade ..........................................................
Groceries and related products- - 730,727
*360,259 946 35,587 61,601 262,125 370,468 -
..............................Machinery, equipment, and supplies ..................
--
--
429101,794 79,595
-676
-68
-37 508 41 342 22 199 -Miscellaneous wholesale trade ...............................
Drugs chemicals and allied products- - 628,504 280,627 270 35.518
,24,092
,220,746
,347,877 -
, , ................Petroleum and petroleum products .....................
--
--
78,775'95,016
76,408*60,336
--
2,566-
40*446
73,802*59 890
2,36734 680
--
Other miscellaneous wholesale trade .................. - - 454.713 143,883 270 32,952 23.607,
87.054,
310,830 -Retail trade .................................................................
Building materials, garden supplies, and mobile- - 275,348 174,662 233 1,946 18,253 154,231 100,686 -
home dealers .......................................................General merchandise stores
- - *811 - 224 - -.............. ....................
Food stores- - 203.274 149,566 - - 15.561 134,006 53,708 -
.............................................................Apparel and accessory stores ................................
--
--
21,196 15,394*770
176-
761M
- 14,457'
5,801 -
Eating and drinking places ..................................... - - 38.483 6,032 - 254-
1 69387
4 085 32 451Miscellaneous retail stores ...................................... - - 10.784 2,089 56 23,647
,1.363
,8,695 -
Inance, insurance, and real estate ..................... - - 12,722,974 4,435,816 57,892 88,478 356,012 3,933,433 8,287,158 8,637Banking ......................................................................Credit agencies other than banks ..............................
--
--
10,688,2101.194.130
2,838,7981,001,858
54,6923,020
59,15127,327
130.62913 730
2.594,326781957
7,849,412192 272
8,598-Security, commodity brokers, and services ................ - - 29,258 28,761 - 96
,23 929
.7364
.497 -
Insurance carriers .......................................................Insurance agents, brokers and services ........
--
--
626,39425 622
447,00916 282
179 1,905,
187.610,
257,316 179,385 -.............
Real estate .................................................................. - -,
65.935.
65,551- - 8
10616,27365 444
9,340384
--Holding and other investment companies except
.
bank holding companies ........................................ - - 93,426 37.558 - - - 37,558 55,867 39ervices ............................................................ - - 1,268,612 961,489 4,060 63,428 222,495 671,506 307,123 293Hotels and other lodging places ................................ - - -6,298 *3,433 - - *124 -3 309 *2 866 -Personal services ........................................................Business services
- - 77,958 77.607 - 390 69,867,
7,350,351 -
................................................Auto repair; miscellaneous repair services .................
--
- 649,073 592,551733* 7
1,220-
55,422 95,144 440,765*
56,523*
293
Amusement and recreational services ....................... - 291.751,
88,963 2,066-
6,973-
2777,733
647791,088
787202--Other services ............................................................ 234,711 , 191,203 774 1 644 1 57,083 ,
,132,702
,43,508 1 -
S

-76 ~Corporatd Foreign' Tak Credit,- 1984
All Corporation Returns with Foreign Tax CreditTable I.-Total Assetsti~ Income; Taxes-and Credits and Foreign Income, Taxes and Credit, b~ Major Industry-Continued,
[All figures are estimates based on samples money amounts are in thousands of dollars]
Foreign income and taxosreported on Form I I l&-Continued
Deductions other than himbr=nckn3 and
aflocableDeductom ftom oil and gas extraction
IncomeTaxable income (lew loss)
lncoff*--Continued
Major IndustryDeductions not allocable
to specific typ" Of Before to= recaptureInODM-Continued
Allocable tospecific
t4otallocable to COw
than
Recapture Of
P=TOW from branch
InterestGeneral and
administrative Total Incomeoperationsam losses
expensesexpenses Income - 2.-Oo;(B)
Income
(40) (41) (42)- (43) (45) (48) (47) (48) (49)
All Industries .................. ................................... 4,637,836 1,396,214 9,41131111,672 9,306,920 179,752, 63,587,976 14,541,126 2,359,760 46,687,089 181,246
Agriculture, forestry, and fishing ......................... 10,594 9,361 49,734 635 -499 49,598 -7
Mining ............'******'*'*"**'*"*""**""**'
p
*................53,888 75,0150 498,906 394,428 94,478 2,818,291 328,445 - 2,489,84411 S,541.
Metal mining .
-` *
I
-*-- --* .............. * .................
'115,187 -1.344 - *113,843 -7
Coal mining ................................................................ 129,058 127.263 - 1,795 -
Oil and gas extraction ...................................... z 53.888 75.050 488,906 394,428 94,478 2,564,710 195,632 - 2,369,078-
5,541
Nonmetallic minerals, except fuels ............................. - - - - - *9,336 -4,206 .5.130,
Construction ..................................................... 4,241 2,218 295,251 4,898 3,243. 28 109 1,899
General building contracts and operative builders- -
1,325 *204 920.6m
-construction contractors ... :..............................Heavy 4,241 .*2.218 2,494 *3,243 70:473 1,293.
Special trade contractors ............................................. - 12,797 1,080 -
................................Manutacturin'g ...................I 520,889 632,801 8,699,441 8,638,360 61,081 45,582,499 7,778,640 2,235,392 35,568,467 136,607
Food and Idndred products ........................................ 9,088 5.065 1.783,568 126.000 27,395 'l 630,173 1,105
Tobacco manufactures :........................................... 161,827 18,565 18,565 335,478 -47.412 58,289 324,601?
5,980
Textile mill products .................................................... 1.,
- -72,512 318 -34.
72.228 2.876
Apparel and other textile products ............................. .67,598 - 147 ~67.451
......................................Lumber and wood products . .90,622 10.032 5,791 74.799 14,480
.Furniture and fixtures .................................................. 2 14 5.734 125 937
-Paper and allied products ............. : .................. 13,583 _654926- 7-- -3,485- -35,449- 615.992 --7
Printing and publishing ............................................... 966 6,508 313:316 -8,454 6,589 315.180
Chemicals and allied products ................................. 48.096 .75,167 187,373 158,170 29,203 , 6,294,392 644,654 318,451 5331,287 .6,368
Petroleum (including integrated) and coal products 2015,820 147,526 8,483,014 8.451,181 31.832 ~19.131,308 6,392.491 98,154 12:640,664 72,494
Rubber and miscellaneous plastics products ............. 3,904 1,640 403,733 186 3,940 399,6D6' ,
603
il6ather and leather products ..................................... 14 5 25,430 - - 25,430.1 . .82
Stone, clay, And glass products .................................. 4,175 10,863 570,379 4.308 8,5CA 557,507
Primary metal industries ............................................. 280 653 48 3 45 .391,563. 18.102 56,448 .317,01.3 18.399
products ..................................Fabricated metal 6.705 26.366 - - - 1,173,511 99,004 31,965"
1,042.541 4,803,
Machinery, except electrical ................................... 55.438 73,087 (1)- 6,866,751 309,237 599,537, 5,957.976 1,321
Electrical and electronic equipment .*** ........... *...........
16.218 15,287 10,440 10,440 2,502.578 206,839 191,197 2,104,541 5,310
Motor ~ehicles and equipment ...................... E ............ 152,920 81,385 - - 2,502,767 -23,801 620,545 1,906,023 1,170
Transportation equipment, except motor vehicles 1,498 2,004 874,097 4,661 12,581 856.855 1,278
Instruments and related products ............................... 95 6,957 1,378365 38,844 137,436 1.202,086 61
products AndMiscellaneous manufacturing'
,
'manufacturing
,
not allocable ................. ............ 765 1 ,409 143,873 20 22,009 121,843, 277
Transportation and,public utilities ........................ 27,299 277,615 253,423 24,193 1,307,628 164,503 98,320 1,044,806 24,923
Transportation ....................................................
.12,883 27,299 2,480 2,480 383,02 132.422 86.143 164,528 11.044,
Water transportation ................ ....................... 26.484 2,305 2,305 189,225 119.162 18,863, 51,200
Other transportation b ......................................... 12.883 '816 175 175 193,868 13,260 67.280 113.328'
11,044~_
...............................Communication : ..................... - : . - - '428,434 8,724 12,005 407,7041, _
:Electric, gas, and sanitary services ...........................
-48.559 275,135 250,942 24,193 496,102 23,356 172 472,5T4 13,87.9
Wholesale and retail trade .................................. 110,220 8,056 20,710 20,710 11,3119,926 16,801 10,910, 11,292,2114 5,002
Wholesale trade ................. : ...................... 96,957 383 20.710 20,710 j~9,582 11,583 11,243' ,756,757-
5,002
Groceries and related products .............................. - - - - *24,117 - - '24,117
Machinery, equipment, and supplies ........... E.......... 44.192 47*
44146
Miscellaneous wholesale trade ............................... 96,957 383 20,710 20.710 711.273 11,536 ,24311 688:494 5,D02
Drugs, chemicals, and allied products ................ 14 383 - - 33,512 -445 995 32,962
Petroleurn and petroleum products .......... : .......... -1,431 *1,431 *385,934 * -35 - '385.969
Other miscellaneous wholesale trade .................. 96,943 19,278 19,278 291,827 12.016 10.248 269,563 5,002
Retail trade ............................. :................... ............ 13,263 7,673 77 640,343 5,218 -332 535.458
Building materials, garden supplies, and mobile
home dealers ........................................... ~529 - 529
General merchandise stores ......................... 12,601 79 268,446 -2,324 8 270762
Food stores .............................................................. - - - 149:205
Apparel and accessory stores ................................ *8,635 1,068 -336 *7.903
Ealing and drinking places .......................... o, . I-I
. - 71,451 -15,966 ~4 87.421
ittorei; ......................................Miscellaneous retail 662 7,594 42,077 22, 0 - 19.637
Finance, Insurance, and real estate ..................... 3,872,741 630iM 11',503,915 6,201,663 1,290 5,294,962 -31198
Banking ........................................................... 3,843,595 624,935 9.~30,790 3,060 3,836,381 25
.......................Credit agencies other than banks - 366,657 93,771 272 886:Security, commodity brokers, and services ................ 17 - 147,042 20,753 - 126:289
Insurance carriers ....................................................... 24,874 1,841 913,297 95.221 3.169 :814,907 2,269
Insurance agents, brokers and services ..................... 4,254 3,778 28,425 - - 28,425
Real estate ............................ : ...................; ................. - 14 16,824 3.981 12,842
Holding anclother investment companies exceptbank holding companies ........................................ 1 230 200,881 -3,412 1,061 ~9134
Services ............................................................. 3,821 631 710,732 45,542 5,104 .660,088 4,0175
Hotels and other lodging places .....................
-2.866 - -,-22,627 '14,252 *8.375
Personal services ................................. 44 - 49,303 684 48,618 541
Business services .............................. ........................ 256 .631 280,118 22,927 933 256.258 3.467:
Auto ippair; miscellaneous repair servic -7 14,865 .-7.580 -7,285,-
Arr;6sement 6hdiocneitiohid services ................ 233,088 -628 2,011 .231.705...
Other services .................... : .............. ...................... 655 110,732 726 2,160 107.845 67
Footnotes at end of table.

Corporate Foreign Tax Credit, 1984
All Corporation Returns with Foreign Tax CreditTable I.-Total Assets, Income, Taxes and Credits and Foreign Income, 713xes and Credit, by Major Industry-Continued[All figures are estimates based on samples-money amounts are in thousands of dollars)
Foreign Income and taxes reported on Form 111 $-Continued
77
TaxableIncome
Foreo taxes evallable for creditnued!
Major Industrypaid or accrued
After loss Total after Reduction forcertain TOW before Tax withhold at source on Other taxtes paid or accrued on
recapture reductionbrair taxes
reductionTOW
Divitlends InterestRents,
a'_=BranchIncome
serviceIncomeI..e.
(50) (51) (52) (53)1
(54) (55) (56) (57) (58) (59)
All Industries ................................................ 63,406,730 27,008,241 1,596,589 28,604,831 11,233,040 1,398,26S 958,051 1,098,086 5,047,204 261'"1
Agriculture, forestry, and fishing ......................... 49,734 35,078 - 35,078 8,948 892 23 894 297 6,347
Mining ... o ............... o .........o................................=
2,812,750 3,071,799 121,503 3,193,303 889'"s 30,323 7,557 5,726 131,343 74,559M mining ............................................................... * 115,187 '136,046 *7,813 '143,859 103.510 -1,174 '66 - *542 *58.511Coal mining ................................................................ 129,058 58.836 7,034 65,870 65,870 - 257 - 65,613 -Oil and gas extraction ................................................ 2,559,169 2,875,693 106,657 2,982,350 719.536 29,112 7,205 5,726 64,976 15,756Nonmetallic minerals, except fuels ............................. *9,336 -1.224 - -1,224 *570 *37
.229 - *211
Construction ..................................................... 293,352 114,712 - 114,712 73,811 3,363 340 932 3,477 3,437
General building contracts and operative builders ..... '205,639 *82,147 - *82,147 *63,868*W - *345 *216
Heavy construction contractors .................................. 74,916 *31,212 - *31,212 -9.186 *2.389 *587 1.904 *3,221Special trade contractors ............................................ 12.797 * 1,352 - * 1,352
.91 - - .15"
Manufacturing .................................. o ...........o .... 45,4415,892 20,695,675 1,420,048 22,115,723 8,451,344 1,245,ISB 168,138 1,034,263 4,319,414 131,"g
Food and kindred products ........................................ 1,782,463 847,546 47 847,593 228.842 93.685 9,438 22,519 91,884 3.384Tobacco manufactures ............................................... 329,499 71,053 6,791 77,844 37,291 4.525 1.438 10,069 4,841 4,963Textile mill products .................................................... 69,636 30.694 - 30,694 6,084 4,338 142 1,136 10 230Apparel and other textile products ............................. 67,598 13,858 - 13,858 6.032 1,243 437 3,685 - 355Lumber and wood products ....................................... 76,141 27,843 6 27,850 8,039 5,222 2,310 173 200 -Furniture and fixtures .................................................. 5,734 1.318 - 1.318 430 103 7 258 44 18Paper and allied products .......................................... 654,926 278,520 - 278,520 59,814 26,049 2,035 13,110 17,842 643Printing and publishing .............................................. 313.316 130,913 - 130,913 39,127 8,043 2,556 5,291 5,574 1,979Chemicals and allied products ................................... 6.288.023 2,646,882 74,364 2.721,246 740,694 206,304 21,700 70,617 412,989 6,688Petroleum (including integrated) and coal products 19,058,814 10,957,777 1,324,287 12,282,064 5,874,053 320,965 79,592 623,402 3.371,912 43,608Rubber and miscellaneous plastics products ............. 403,129 146,146 3 146.149 44,492 18,437 669 13,684 845 5,470Leather and leather products ..................................... 25,347 8,126 - 8,126 2,237 580 44 429 - 409Stone, clay, and glass products .................................. 570,379 264,994 2 264.996 47,255 29,436 2.169 8,495 4,824 899Primary metal industries ............................................. 373,163 144,694 3,308 148,002 51,180 7,583 284 10,277 28,521 3.370Fabricated metal products .......................................... 1,168,708 460,619 - 460,619 93,901 51,445 2,843 9,672 25,397 552Machinery, except electrical ....................................... 6,865,430 2,310,263 ill 2,310,374 575,086 192,482 17,692 160,003 159,688 16,135Electrical and electronic equipment ........................... 2,497,268 601,889 11,128 613.017 253.553 47,170 5,266 44,885 129,902 14,517Motor vehicles and equipment ................................... 2.501,596 1,038,696 1 1,038,697 226,333 157,076 12,506 6,468 29,913 15.996Transportation equipment, except motor vehicles 872,819 225,672 - 225,672 65,749 23,619 4.396 10,626 14.191 12,320Instruments and related products ............................... 1,378,304 427,996 - 427,996 81.914 42,572 2,349 15,550 20,533 206Miscellaneous manufacturing products and
manufacturing not allocable .................................... 143,596 60,175 - 60,175 9,239 4,281 266 3,916 305 167
Thinsportation and public utilities .................... o ... 1,282,705 389,489 54,297 443,788 229,682 22,487 5,641 11,198 34,325 19,763
Transportation ............................................................. 372,049 67,362 90 67,451 43,518 6,173 3,503 2,727 7,778 9,982Water transportation ................................................ 189,225 23,077 - 23,077 21,978 1 140 1,404 3,403 7.873Other transportation ................................................ 182,824 44,284 90 44,374 21,540 6,172 3,363 1,322 4,375 2,109
Communication ...................... : ................................... 428,434 106,312 - 106.312 35,480 12,479 582 7,551 5.110 3,198Electric, gas, and sanitary services ............................ 482,223 215,816 54.207 270,024 150,684 3,835 1.51% 920 21,436 6,574
Nholesale and retail trade .................................. 1,314,923 579,020 660 579,680 95,659 33,314 16,188 12,493 19,243 4,668
Wholesale trade .......................................................... 774,580 333,674 660 334,335 49,226 21,685 8,696 4.440 4,721 2,527Groceries and related products .............................. *24.117 *6.005 - *6.005 1,406 1.1 12 *278 *16 - -Machinery, equipment, and supplies ...................... 44,193 18,387 - 18,387 3,810 292 276 630 - 1,130Miscellaneous wholesale trade ............................... 706,271 309,281 660 309,942 44,010 20.281 8,142 3,795 4,721 1,397
Drugs, chemicals, and allied products ................ 33.512 21,728 - 21.728 3.330 1.062 449 720 171 23Petroleum and petroleum products ..................... *385,934 169,897
W'170,557 10,242 -8,490 *48 *55 - .5
Other miscellaneous wholesale trade .................. 286,825 117,657 - 117,657 30,437 10,730 7.645 3,020 4,550 1,368
Retail trade ................................................................. 540.343 245,346 - 245,346 46,433 11,628 7,491 8.052 14,521 2,141Building materials, garden supplies, and mobilehome dealers ....................................................... *529 *199 - 199 '93 -4 - - -
General merchandise stores ................................... 268,446 118,412 - 118,412 17.260 4,009 5,150 475 5,765 918Food stores ............................................................. 149.205 64,855 - 64,855 8,055 5,746 139 1,424 - 432Apparel and accessory stores ................................ *8,635 *2,139 - *2,139 1,969 *18 *81 -Eating and. drinking places ..................................... 71,451 18.297 - 18,297 10.084 530 1,993 4.318 2,173 791Miscellaneous retail stores ...................................... 42,077 41,443 - 41,443 8,970 921 192 1.346 6,502 -
-Inance, Insurance, and real aside ..................... 11,500,717 1,854,471 4 1,854,475 1,393,021 50,906 759,773 7,640 519,458 6,122
Banking ...................................................................... 9,830,765 1,402.426 4 1,402,430 1,208,009 28,434 712,202 2.468 441,266 316Credit agencies other than banks .............................. 366,657 113,275 - 113,275 57,225 2,011 14,925 741 29,988 1,009Security, commodity brokers, and services ................ 147,042 10,517 - 10,517 5,937 1,796 661 135 1,669 1,592Insurance carriers ....................................................... 911,028 190,558 - 190,558 104,038 8,513 30,345 923 46,535 3.176Insurance agents. brokers and services ..................... 28,425 8,446 - 8,446 2,002 1,470 66 114 - 3Real estate .................................................................. 16,824 8,518 - 8,518 3,294 582 45 461 -Holding and other investment companies exceptbank holding companies ........................................ 199.977 120,730 - 120,730 12,516 8,099 1.530 2,799 - 26
ilervices ................ o ....................... o................... 706,657 287,997 76 268,073 91,091 11,823 1,191 24,940 19,647 14,646
Hotels and other lodging places ................................ '22.627 -5.679 - *5,679 *5,534 - *46 -1,968 *2.445 *556Personal services ........................................................ 48,761 29,539 - 29,539 3.086 1,281 23 52 93 432Business services ....................................................... 276,651 135,342 76 135,418 45,484 5,095 383 7,870 16,231 11,664Auto repair; miscellaneous repair services ................. * 14.865 *5.204 - * 5,204 *2,224 *827 '399 * 107 *405 *485Amusement and recreational services ....................... 233,088 58,783 - 58,783 20,099 4,195 - 14,465 - 225Other services ............................................................ 110.664 33,451 - V,451 14.664 425 340 477 473 1,284
Footnotes at end of table.

78 Corporate Foreign' Taxi Credit, 1984
All Corporation Returns with Foreign Tax CreditTable I.-Total Assets, Income, Taxes and Credits and Foreign Income, Taxes and Credit, by Major Industry-Continued'
[All figures are estimates based on samples~-money amounts are in thousands of dollars]
Foreign bvxxm and taxes reported on Form I I 18--Contfnued
Foreign Wine available for credit--QxrUnued Foreign tax credit wirriputedIncome wW tam of
ratated foreign corporations and DISC's
major industrypaid or aocrued--Condnued
Dividends
Othertiiu==or accrued on DeernedBefors
reduction for Reduction forInternational
Afterreduction for
Gains profitsThX89
r..paid or
cC
Liedpaw
Carryow International
I
international .and Iricorne
P=.WW=to dome ti
=ops c
cor orations,Partnermpinoorne
otherftorne
p
(60) (61) (63) (64) (65) (am (07) (68) (09)
All Industries .............................. ...................... 123,064 2,346,140 12,094,SU 5,276,923 21,415,963 1,843 21,414,121 68,372,124 26,200,709 .16,459,170
Agriculture, forestry. and fishing ......................... 496 3,231 22,898 11,985 - 11,985 17,523 . 6,194 5,892
Mining .............................
42,393 597,584 636,358 1,667,460 .11,1164,747 - 1,164,747 1,736,530 1,131,217 425,089Metal mining .. .................................... t ........................ *41,836 -1.381 *8,122 32.227 '35,238 - *35,238 *.28.696 -15.713 -7,068
Coal mining ................................................................ - - - 58,836' - 58,836 -
01 and gas extraction ................................................ 557 596,203 627,06 1,635,138 1,069.449 - 1,069,449 .1,698,953 1,111,476 417,551
Nonmetallic minerals, except fuels ............................. - - 1,224 .8.880 * 4,028 *471
construction ....................................... I ............. 62,0" 174 29,234 11,667 86,027 - 86,027 165,8015 36,985 61,188
General building contracts and operative builders 174 1 4,385 -3.894 *68,464 - '68,464 *38,547 12.900 *25,648Heavy construction contractors .................................. 744 - 14,263 -7,763 -16.509 - 16,509 '111,134 '19,035 *34,706
Special trade contractors ............................................ - .91,053 - 1,053 16,124 5,051
.13M
Manufacturing ................................................... 8,172 1,5",288 10,696,281 3,068,098 17;496,392 1,842 17,494,550 60,519,460 23,285;394 14;059,9N
Food and kindred products ........................................ 636 7,296 541,796 76,956 765,200 420 764,780 2,327,985 787,05~ 781,044
Tobacco manufactures ............................................... - 11,455 40.553 - 71,029 - 71.029 316,341 M.534 98,338
Textile mill products .................................................... 144 85 19,897 4,712 25,251 - 25,251 163,078 57,449. 28,920
Apparel and other textile products ............................. - 312 7,511 314 13,269 - 13,269 68,451 21,044 .18.192
Lumber and wood products ....................................... 24 ill 13,027 6,784 23,801 - 23,801 149,306 34,631 41.824
Furniture and fixtures .... .............................................. - - 861 26 1,314 - 1,314 6,787 3.00611,185
Paper and allied products .......................................... - 135 170,499 48,207 245,679 245,679 1.004,343 360,072 202,553
Printing and publishing .............................................. 47 15,636 75,609 16,177 93.508 - 93,508 721,391 279,303 90.134
-Chemicals and allied products .................................. 2,489 19.907 1.734,61 0 245.941 2,414,530 202 2,414,328 8,051,011 2,802,260 2,700,893
Petroleum (including integrated) and coal products - 1,434,575_
4,085,187 2,322,824- -8,-495,722 --~ -8,495.722 -19,917,118- ~7,491-1872- --.4.575,521-
Rubber and miscellaneous plastics products ............. - 5,388 74,616 27,040 136.352 204 136,148 516,325 ' 178,510 121,601
Leather and leather products ..................................... - 776 5,862 27 7,655 - 7,655 18,481 ~ 5,595 7,711
Stone, clay, and glass products .................................. - 1.432 199,970 17,772 224,006 15 223,991 958,742 332,146 231,781
Primary metal industries ............................................. - 1,145 53,563 43,259 123,104 - 123.104 809,380 251,532'
147,845
Fabricated metal products ........................................... 3,184 808 345,686 21,031 416,983 - 416,983 1,585,737 585,530 515,584
Machinery, except electrical ....................................... 1.369 27,717 1.685,872 49,417 2,259,524 131 2,259.393 10.042,424 4.535,903 1,995,511
Electrical and electronic equipment ........................... 6 11,806 292,821 66,643 539,654 16 539,638- 2,043,309 713,915 506,044Motor vehicles and equipment ................................... - 4,374 729.231 83,133 970,229 - 970,~29 8,677,048, 3,546,122 1,226,671
Transportation equipment, except motor vehicles ....... 225 372 142,558 17,365 213.206 - 213,206 1 760,431 252,235 243.626
Instruments and related products ............................... 40 664 336,482 9,601 405.543 851 404,692 2.188,793 918,426 468,896
Miscellaneous manufacturing products andmanufacturing not allocable .................................... 9 294 40,068 10,869 50,833 3 50,830 192.978 70,252 56,117
Transportation'and public. utilities ........................ 2,275 . 134,002 129,905 84,199 354,7ifil - 354,738 945,333 248,071 3.52,668
Transportation ............ ......................... q ................... - 874 12,480 15,580 8,354 55,631 - 56,631 149,480 26,172 56,159
Water transportation ................................................ 750 8,407 534 565 19,752 - 19,752 55.054 1,647 17,163
Other transportation ................................................ 124 4.073 15,045 7,789 35,879 - 35,879 94,426 24,524 38.996
Communication .......................................................... 775 5,785 69,792 1,040 104,752 - 104,762 501,895 144,370'162.347
Electric, gas, and sanitary services ............................ 626 115,737 44,534 74,806 194,356 - 194,356 293,958 77,5N 134,162
Wholesale and retail trade 1,087 8,667 340,314. 143,708 482,407 1 482,406 2,147,959 653,041 696,028
Wholesale trade . ~ ........................................................ 1,035 A120 199,064 8~,045 300,619 1 300,619 1,148,407 307,764 407,406
.Grocaries and related products .............................. -
'
.1 103 *5,764 - *5,764 11,897 5,065 *6,061
Machinery, equipment, and supplies ................. - 1,480 7,864 6,714 12,595 - 12,595 39,855 14,947 15,292
Miscellaneous wholesale trade ............................... 1.035 4,639 186,703 79,228 282,260 1 282,260 1,096,151W 287,752 386,053
Drugs, chemicals, and allied products : - 906 9,729 8,669 13,689 1 13,688 43,868 17,525 14,507
Petroleum and petroleum products ......... ........... - *1,645 115,973 *44,342 169,183 - 169,183. '360,250 115,973 *242 477
Other miscellaneous wholesale trade : 1,035 2,089 61.002 26,217 99,389 - 99,389 692,537 154,254 129:069
Retail trade ................................................................. 52 2,547 141,250 57,662 181,788 - 181,78.8 999,552 345,277. 288,622
'Building materials, garden supplies, and mobilehome dealers ....................................................... - 106 199
General merchandise stores ................................... - 944 69,966 31,185 83,070 - 83,070 732,221 226,842 184,065
Food stores ............................................................. - 315 56,490 310 60,368 - 60.368 129,872 56,518
Apparel and accessory stores ................................ - *1,033 170*
- *2,117 - *2,117 1,636 187 1,424
Eating and drinking places ..................................... 52 228 6,61 8 1,595 17,786 - 17,786 85,257 37,165 17,820
Miscellaneous retail stores ...................................... - ~9 8,006 24,467 18,248 - 18,246 50,567 24,566 12,115
Finance, Insurance, and real estate ..................... 4,145 44,978 267,437 194,017 1,616,276 - 1,616,276 2,294,368 662,603 676,365
Banking ...................................................... ............... 438 22,885 129,298 65,123 1,328,811 - 1,328,811 1,~63.116 446,682 406,200
Credit agencies other than banks .............................. 1,445 7,106 27,657 28,493 53,297 - 53,297 80,117 30,946 44,118
Security, commodity brokers, and services ................ . 2 . 81. 3,234 1,346 10,177 - 10,177 74,976 10,137 13,417
Insurance carriers ....................................................... 1,947 12,599 35,707 50,813 130,915 - 130,915 170,865 55,523 72,126
Insurance agents, brokers and services ..................... 312 37 6,444 - 8,091 - 8,091 158,711 28,823 8,269
Real estate .................................................................. - 2,208 3,635' 1,589 6,458 - 6,458 14,454 6,186 .--5.338
Holding and other investment companies exceptbank holding companies ........................................ 62 61,561 46,653 78,527 - 78,527 332,129 84,306 126,897
Services ............................................................ 2,893 15,951 92,106 84,8,76 203,391 - 203,391 545,145 177,204 1 .81,949
Hotels and other lodging places ................................ - - .145 *5,528 - -5,528
Personal services ........................................................ - 1,205 19,304 7,150 21,741 - 21,741 118,765 53,046 20,868
Business services ..............................* *.............
672 3,569 44.593 45,340 93,181 - 93,181 213,414 78,946, 63,092:
Auto repair; miscellaneous repair services ................. - - *5,204-
*5,204 *6,835 *2,981
Amusement and recreational services ....................... 137 1,077 17.573 21.111 56,762 - 56.762 179,160 32.464 79,574
Other services ............................................................ 2,084 9,580 1 7,656 1 11,131 20,973 - 1 20,973 26,972 9,868 14,561
Footnotes at end of table.

Corporate Foreign Tax Credit, 1984
All Corporation Returns with Foreign Tax CreditTable i.-Total Assets, Income, Taxes and Credits and Foreign Income, Taxes and Credit, by Major Industry-Continued
[All figures are estimates based on samples-money amounts are in thousands of dollars)
Foreign income and taxes reported on Form 11 18-Continued
Income and taxes of related foreign corporations and DISC's-Continued
79
Dividends Income and taxes of first, secon%an5 thi foreignMajor industry Taxes
paid10related
Dividendspaid
to
corporations from which constructive istributions wers received
deemed foreign second-tierpaidrelatz
=onsCIS
foreigncorporations
T:es paiit
Dividendsns rucVv 1
on
Tures,earnedd T"esam
d dforeign by by ~thlrd-tler Gains, profitsd
~ in.
It. f' a.y
dn ined paid by
la
paid bycorporations second-tierf ' nre g
an income
pro is.it
domes!icre ated
domesticforeigncorporations
corporations InCOMe corporations foreigncorporations corporations
(70) (71) (72) (73) (74) (75) (76) (T7)
All Industries ..................................................... 4,389,878 5,617,042 255,698 7,241,862 1,879,031 3,070,724 391,245 1,320,467
Agriculture, forestry, and fishing ......................... - - - - - - - -
Mining .............................................................. 1,255 20,943 10,000 160,001 31,899 87,655 1,007 17,998metal mining .................................. ..........................Coal mining ................................................................ - - - - - - - -Oil and gas extraction .......................... ..................... 1,255 20,943 10,000 160,001 31,899 87,655 1,007 17,998Nonmetallic minerals, except fuels ......................... - - - - - - - -
nstruction ..................................................... 21,314 30,171 38,378 4,868 13,119 1,968
General building contracts and operative builders * 1,486 - - - -Heavy construction contractors .................................. 19,829 4,868 13,119 1,968Special trade contractors ............................................ - - - -
Manufacturing ................................................... 4,168,161 5,235,712 205,642 6,228,742 1,720,656 2,431,048 355,763 1,175,440
Food and kindred products ........................................ 185,337 360,448 85,670 442,677 122,316 203,209 44,000 121,380Tobacco manufactures ............................... ............... 52,409 94,875 - 141,478 24,473 51,026 24,346 22,683Textile mill products .................................................... 11 11 - 22,492 10,971 5,597 - 7,942Apparel and other textile products ............................. - - - 9,362 530 4,601 - 208Lumber and wood products ....................................... 1,530 2,430 - 140.932 31,467 39,304 1,530 11,141Furniture and fixtures .................................................. - - - - - - - -Paper and allied products ........................... 36,237 46.309 5,208 47,076 13,547 21,521 4,291 13,088Printing and publishing ..................... ........................ 3.5ffi 3,762 3,088 23,784 9,735 13,473 - 9,535Chemicals and allied products ................................... 267,521 516.731 21,729 1,515,286 359,572 702,544 138,103 296,672Petroleum (including integrated) and coal products 3,107,907 3,434,118 6,414 1.233,980 372,417 434,502 79,230 187,875Rubber and miscellaneous plastics products ............. 7,869 13,770 - 13,711 3,840 7,325 - 2,840Leather and leather products ..................................... 3,075 3,750 - 1,822 183 194 - 19Stone, clay, and glass products ............ ..................... 48,242 78,671 9,505 18,391 5,091 8,739 1,466 5,324Primary metal industries ................................... 8,772 15,565 743 67,487 4,029 42,914 295 2,649Fabricated metal products .......................................... 46,354 98,320 53,785 67,325 28,043 33,729 768 22,974Machinery~ except electrical ....................................... 161,625 240.876 369 964,896 348,782 354,805 29,355 258,029Electrical and electronic equipment .............. ............ 64,276 101,028 12,506 319,515 70,584 103,039 3,895 43,267Motor vehicles and equipment ................................... 88,634 102,945 299 519,761 56,672 205,236 1,221 52,736Transportation equipment, except motor vehicles 32,963 55,010 5,766 102,720 35,067 29,994 7,415 18,633Instruments and related products ............................... 51,449 66.651 512 566,416 219,746 165,137 19,845 94,860Miscellaneous manufacturing products and
manufacturing not allocable .................................... 370 441 47 9,632 3,591 4,158 4 3,586
Tkansportation and public utilities ........................ 62,072 61 838 355,569 35,450 219,291 28,099 46,697
Transportation ............................................................. 3,847 6,972 634 55,478 3,803 18,945 264 2,689Water transportation ............................... ................ - - - 37,001 1,579 3,757 - 471Other transportation ................................................ 3,847 6,972 634 18,478 2,224 15,187 264 2,219
Communication ..............: .......................... 54,701 55,842 138 131,483 8,652 94,391 27,743 21,087Electric, gas, and sanitary services ............................ 3.525 5,930 66 168,607 22,995 105,955 92 22,921
Wholesale and retail trade .................................. 73,390 97,058 19,317 263,416 40,502 185,156 5,998 36,423
Wholesale trade .......................................................... 11,080 21,613 1,005 103,202 18,248 55,076 2,308 12,979Groceries and related products .............................. - - - - - - - -Machfnery~ equipment, and supplies ...................... - - - 19,204 6,501 9,190 - 4,719Miscellaneous wholesale trade ................. ............. 11,080 21,613 1,005 83,997 11,747 45,885 2,308 8,260
Drugs, chemicals, and allied products ................ - - - 65 21 44 - 21Petroleum and petroleum products ..................... - - - 34.646 - '3,808Other miscellaneous wholesale trade .................. 11,080 21,613 1,005 49,287 7,917 15,004 2.308 4,431
Retail trade ...................................................... .......... 62,310 75,446 18.312 160,215 22,254 130,080 3,690 23,443Building materials, garden supplies, and mobilehome dealers ....................................................... - - - - - - -
General merchandise stores ................................... 62,186 75,345 18,312 126,167 17,552 101,136 3,690 19.182Food stores .... ............................................ ........... - - - 15,345 727 14,618 - 727Apparel and accessory stores ................................ - - -Eating and drinking places ..................................... 120 96 - 16,930 3,873 12,868 3,450Miscellaneous retail stores ...................................... 4 5 - 599 78 308 - 60
Finance, Insurance, and real estate ..................... 56,341 151,848 18,641 172,379 40,266 1 1 7,232 378 37,287
Banking ...................................................................... 2.225 7.323 - 91,235 18,722 65,541 - 17,492Credit agencies other than banks .............................. 5 17 - 29,797 10,354 19,296 - 10,180Security, commodity brokers, and senvices ................ 1,521 1,521 1,111 2,656 609 2,016 - 609Insurance carriers ................ ...................................... 925 2,943 264 32,920 7,727 24,989 - 7,640Insurance agents, brokers and services ..................... 26,548 97.139 7,725 1,473 167 668 136 225Real estate .............................. ................................... - - - - - - - -Holding and other investment companies exceptbank holding companies ........................................ 25,118 42,906 9.541 14,298 2,687 4,723 241 1,140
3ervices ............................................................ 7,345 12,564 1,250 23,378 5,390 17,223 - 4,654
Hotels and other lodging places ................................ - - - - - - -Personal services ........................................................ 2,316 7,603 1,180 - - - -Business services ....................................................... 4,971 4,628 70 4,664 2,312 1,586 1,577Auto repair; miscellaneous repair services ................. - - - - - - -Amusement and recreational services ....................... - - 6,902 768 6,134 768Other services ............................................................ 58 333 11.812 2,309 9,503 2,309
This estimate should be used with caution because of the small number of sample returns on which it was based.Less than $500 per return.
NOTE: Detail may not add to totals because of rounding.

80 Corporate'Foreign: Tax Credit, 1984
Corporation Returns with Form I I 18 Filed In Support of Foreign Tax Credit Claimed.Table 2.-Total Assets, Income, Taxes and Credits and Foreign Income, Taxes and Credit, by Size. of Total Assets
[All figures are estimates based on samples-money amounts are in thousands of dollars]
Number Dividends Dividendsncludable
!noome of
Foreigndividend income Income
Size of total assets of Totalassets
Totalreceipts
recaNedfrom foreign
reoeivedfrom
Controlledresulting from
n tNot IncomePew deficit)
return corporations DISCs ForeignC ti
=Ld =
orpora ons (gm-p)
(2) (3) (4) (5) (6) (7) (8) (9)
Total ...................................... 4,809 4,338,015,298 2,361,756,510 14,654,209 4,856,696 3,882,572 12,094,902 138,927,479 132,9S3,823
Zero assets .......................................................... 86 - 14,504,099 54,619 20,542 45,028 54.264 1,685,990 1,619,117
$1 under $~i,006,00o ............................. : ............ 1,374 636,679 807,211 4,603 972 - 1,798 82,969 73,306$1,000,000 under $10,000,000 .......................... 1,217 4,670.240 6,721,629 26,766 10.888 4,791 18,811 617,601 542,458
$10,000,000 under $50,000,000 ........................ 822 19,961,217 30,792,088 .107,970 66,553 41,057 86,745 2,415,915 2,275,859
$50,000,000 under $100,000,000 ...................... 258 18,856,761 26.223,154 71,702 103,087 23,894 52.752 2,095,180 1,959,945$100,000,000 under $250,000,000 ..................... 291 46,194,161 66,994,730, 250,032 155,726 52,405 193,375 4,828,962 4.651.353
$250,000,000 under $500,000,000 .................... 171 62.550,929 81,150.234 327,504 214,963 62,733 228,649 5.319,840 5,137,551.
$500,000,000 under $1,000,000,000 ................. 162 114,79B,752 144,664,941 557.238 284,509 118,855 376,069 8,433,688 8,148,669
$1,000,000,ODO or more ..................................... 429 4,070,356,550 1.989,898,425 13,253.775 3,999,4561
3,533,8091
11,082,439 113,447,3351
108.545.565
U.S. income tax Foreign inoorns and taxesbefore credits reported on Form 1118
FD~J~ tax U.S. General OtherU.S.
income taxGross income (low low)
excluding branch operationsSize of total assets
jt
claimedpossemons
tax creditbusiness
creditcredits after and "aby allocable
Total credits WOOM
Total Dividends Dividendgross-up
(10) (11) (12) .(13) (14) (15) (16) (17) (18) (19)
Total ...................................... 59,508,965 58,451,956 21,407,265 12,333 9,104,476 1,391,254 27,593,637 85,453,725 20,834,778 12,094,872
Zero assets
..... ...................... ** .................. * -
799,949 713,972 147,458 - 46,958 5,235 600,297 772,187 99,647 54,264$1 under $1,000,000 .......................................... : 18,499 18,352 4,315 512 3 13,669 127,209 4,665 1,794$1,000,000 under $10,000,000 .......................... 221,743 219,955 34,687 1,087 14,111 5,153 166,705 331,394 33,907 18,789
$10,000,000 under $50,000,000 ........................ 1,019,044 1,011,593 133,139 10,241 77,516 18,750 779,399 856,704 150,948 86,744
$50,000,000 under $100,000,000 ...................... 872,651.'866,371 119,954 - 74,875 18,206 659,616 633,320 100,702 52.749
$1 000.000 under $250,000,000 .................... 2,111,344 2.090.145 303,685 1.005 185,951 41,328 1,579,376 2.076,675 319,608 193,375$250,000,000 under $500,66006~ ................-... 2,295,193 --2.277 588 - 357,297- -258 696- - - 41,925-- - 1,637,274- - 1.395,864 -418,425 - -- - 228,649
$500,000,000 under $1,000,000,000 ................. 3,719,366 3,681:392 682,865 482:563 85,256 2,468,682 2,960,395 682.330 376,066
$1,000,000,000 or more ...............................1
48,451.175 1 47,572,583 19.623,866 7.963,294 11.175,397
1 19,688,618 176,299,977 19,024,548
111,082,442
Foreign income and tans reported on Form 1118-Continued
Gross income Pess loss)excluding branch operations
and sped locabledi 1=
Taxable income (less loss)nuencorn 1 TOW
d d tiSize Of total assets
Total grossIncome Pass
e uc onsexcluding.
Totaldeductions Before loss recapture
loss) from branch from oil andextraction of operations and gas extraction
interest Other oil or gas income S Other thanfrom branch
Recaptureof prior yew
Income income incomeTotal income operations
and speciallyforeign lowes
income (Section863(B)) allocable
income
(20) (21) (22) (23) (24) (25) (26) (27) (28)1
(29)
Total ...................................... 17,723,038 34,801,037 26,903,371 38,766,636 9,486,672 63,587,976 14,541,126 2,359,760 46,687,089 181,246
Zero assets .................................................... 345.475 V2.801 30,024 202,110 626,313 41,359 14,878 570,077 2,992
$1 under $1,000,000 .................. ....................... 116 120,634 - 92,452 - 34,756. - - 34,756 -
$1,,000.000 under $10,000,000 .......................... 11,057 267,641 5,971 197,895 1,271 136,011 1,703 809 133,499 494
$10,000,000 under $50,000,000 ........................ 38,204 580,808 109,074 431,150 48,655 462,548 29,098 7,895 425,554 4,207
$50,000,000 under $100,000,000 ...................... 22,225 457,645 67,831- 281,124 30.246 388,975 16,600 20,179 352,196 1,069
$100,000,000 under $250,000,000 .................... 75.003 1,488,690 585 1,295.041 48 .842.871 29,303 31,933 .781,634 1,114
$250,000,000 under $500,000,000 .................... 130,1585 618,206 261,614 516,727 95,195 1.011,366 60,554 71,675 879,137 1,748
$500,000,000 under $1.000,000,000 ................. 271,155 1,630.844 199,657 1,175,237 68.549 2,098,203 210,149 102,896 1,785,158 4,861$1,000,000,000 or more ..................................... 16,829,218 29,363.770 1 26,228,616 1 34,574,899
19,~42.708 1 57,986.933 14,152,360 1 2,109,495 1 41,725,078 1 164,762
Foreign income and taxes reported on Form M&LContinued
Taxable[noon* Foreign taxes available for credit
Size of total assetsPaid or accrued on
After loss Totalaftef
Reduction fordn foreigncerti
T&jdbefore
-
Rents.recapture
reduction tam reduction
7T
Dividends interestroyaftles
and licenseBranchincome Other Income
fees
(30) (31) (32) (33) (34) 1 (35) (36) (37) (38) (39)
Tbtal ...................................... 63,406 730 27,008,241 1,596,569 28,604,831 11,233,040 1,398,265 958,BSI 1,090,086 5,047,204 2,730,634
Zero assets .......................................................... 623,321 171,590 76 171.666 63.098 3,339 34, 1 B3 2,030 481 23,065
$1 under $1,000,000 .......................................... 34,756 17,189 - 17,189 4,902 421 8 1,802 - 2,671
$1,000,000 under $10,000,000 .......................... 135,517 47,760 - 47,760 18,718 1,274 779 3,508 864 12,295
$10,000.000 under $50,000,000 .................. : 458,341 198,208 1,268 199,476 60,868 9,447 2.370 11,961 14,723 22,367
$50,000.000 under $100,000,000 ...................... 387,907 141,279 1.643 142.922 64,368 8,614 1,440 6,640 6,435 41,239
$100,000,000 under $250,ODO,000 .................... 841,757 409,472 74 409,546 168,147 23,439 3,405 13,854 14,304 113,145
$250,000,000 under $500,000,000 .................... 1,009,618 449,593 27,600 477,193 171,040 29,932 4,107 11,587 28,553 96,861
$500,000,000 under $1,000,000,000 ................. 2,093,342 843.466 19,350 862,816 364,141 51,654 7,799 22,979 64,625 217,084
$1,000.000,000 or more ........................... . ........ 1 57,822,171 124,729,685 1 1,546.578 1 26,276,263 1 10,317,755 1 1.270,144 1 904,760 1 1,023,726 1 4,917,220 1 2,201,906

Corporate Foreign Tax Credit, 1984
Corporation Returns with Form 1118 Filed In Support of Foreign Tax Credit Claimed
81
Table 2.-Total Assets, Income, Taxes and Credits and Foreign Income, Taxes and Credit, by Size of Total Assets-Continued[All figures are estimates based on samples-money amounts are in thousands of dollars]
Size of tatai assets
Total ............................................................................................................................................
Zero assets ....................................................................................................................................................................................$1 under $1,000,000 .....................................................................................................................................................................$1,
000,000 under $10,000,000 .....................................................................................................................................................$10,000,000 under $50,000,000 ...................................................................................................................................................$50.000,000 under $100,000,000 .................................................................................................................................................$100,000,000 under $250,000,000 ...............................................................................................................................................$250,000,000 under $500,000,000 ............................................................................................................... I ...............................$500,000,000 under $1,000.000,000 ............................................................................................................................................$1,000,000,000 or more ................................................................................................................................................................
NCYFE: Detail may not add to totals because of rounding.
Foreign Income and taxasreported on Form 1118-Contl
Foreign taxes available forcredit-
Continued
Total dearnedpaid
(40)
12,094,868
54.2641,791
18,78986,74452.749
193,375228,649376,066
11,082,442
CaW.-avat ~r
credit
(41)
5,276,923
.54,30410,49610,25351,86325,80548,02477,504
122,6094,876,065
Foreign tax credit corn
Beforereduction forinternational
O=S
(42)
21,415,963
147,4584,315
34.687133.140119,954303,721357,298682,865
19,632,527
Reduction forInternational
boycottoperations
(43)
1,843
15
1,827
tied
Wad
Attarreduction forinternational
boycottoperations
(44)
21,414,121
147,4584,315
34,687133,140119,954303,706357,297682,865
19.630,700

82 Corporate Foreign Tax Credit, 1984
Corporation Returns with Form 1118 Filed In Support of Foreign Tax Credit ClaimedTable 3.-Total Assets, Income,.Taxes and Credits and Foreign Income, Taxes and Credit, by lype of Foreign Income forwhich Separate Credit-was Computed
11 figures are estimates based on samples-money amounts are in thousands of dollars]
Dividends DividendsIncludableIncome Of
FOMdividendto. Income
Type of foreign Incorne for which NurnberOf
TOWassets
TOWreceipts
recohed received
from
Controlledresuldrig fromt Not tricomis(I. deficit) Unto
separate credit was computedreturns Discs
=r =ed
(grose~P)
(2) (3) (4) (6) (7) (8) (9)
Total .................................... 4,809 4,338,015,288 2,361,758,510 114,04,209 4,856,696 3,882,572.
12,094,902 1 38,927,47ill~ 132,963,82i
Certain interest income ..................................... 231 1,225,375,752 910,399.612 8.974,111 2,347.69i .068,0072 7,953,355 59,861,447 58,338.292
Dividends received from DISC's ....................... 110 658,665.932 566,927.900 3,916,765 1,773,097., 1,080,187 3,066,884 35,188,311 33,583,914
All other foreign source income ........................ 4,716 4,284,486,953 2.350,693,127 14,653,855 4,847,182 3,881,052. 12,094,778 138,532,784 132,504,054
Foreign oil and gas extraction income 59 1 676,218,995 1 542,653,476 1 5,973,180 1 725,000 1,137.796 5.474,277 1 36,485,620 1 35,162,101
Foreign income and taxeisU.S. Income tax before credits rs".on Form 1118
Type of foreign income for which -Foreign
tax- U.S.OS99-
Generalbusiness Other
U.S. incometax after
Gross Income (less loss)excluding branch operations
separate credit was computed credit Ptax credit credit credits
credits and specially allocableI
Total
ulw atM=mative
claimed ncome
Total 6mdendsDFAdendgross-up
(10) (11) (12) (13) (14) -(15) (17) (18) (19)
Totat ........................ ........ 59,508,965 58,451,950 21,407,265 12,333 9,104,476 1,391,254 27,593,637 85,453,7" 20,834,778 12,094,872
Certain income ..................................... 26,577,776 26,052,985 13,344.800 - 3,172,217 771,420 9,289,340. 1,298,348 - 109.976 - 25,299.
Dividends received from DISC's ....................... 15,059,635 14,684,024 6,489,213 - 2.310,511 335,467 5,924,444 1.716,894 1,709,109 7,785
All other foreign sourceIincome .............. L. 59,305,455 58.25OM5 21.403,346 12,333 9,060,049 1,390,618 27,439,108 82,438,483 19,015,694 12,061,787
Foreig~ oil and gas extraction income 15,780,409 1 ~.462,7114 10.878,032 - 1,526,076 137,197 , 3,239.104 28,214,058 7,776,393 5,457,315
Foreign income and taxes reported on jFcan 11 ig-Continued
Gross income oess Ioss)excluding branch Taxable Income oess loss)
IlLdin
Type of foreign income for whichseparate credit was computed
T"gross
Vas"ft n
deductionsexcluding
branch
Totaldeductionsfrom oil and
Before loss recapture0,Z
operations and gas extraction
Interest Other oil or gas income ailyspedOther thanfrom branch
Recaptureof prior yew
income income incomeTotal
Foreignbranch
allocableincome
r n= foreign losses
income (Section
aally
allocgibleW3(B)) Income
(20) (21) (22) (23) (24) (25) (26) (27) (28) (29)
'Tbtal .................................... 17,723,038 34,801,037 26,903,371 38,766,636 9,486,672 63,587,976 14,541,126 2,359,760 46,687,089 181,246
Certain interest income ..................................... 1,163.073 297,667 - 1,060,682 1,000,682 51
Dividends received from DISC's ....................... - 374,355 1,342,539 .1,342,539 608
All other foreign source income ........................ 16,559,965 34,801,037 26,903,371 38,094,614 9,486,672 61,244,756 14,541,126 2.359,760 44,343,869 180,587
Foreign oil and gas extraction Income 1.149,981 13,830.,369 26.903,371 10,804,602 9,486,672 17,416.699 7,255,966 1 1 ~6,042 1 17,499,456 73,967
Foreign income and taxes reported on Form 111 B-Continued
Taxable income(less loss)--~ Foreign taim a~Wlable for credit
n income for whiche of foreiTContinued
goseparaft credit was computed
Paid or accrued onj
After lossrecapture
Totalafter
Reduction forcertain foreign
Totalbefore Rents, royalties. Branch
reduction taxes reduction Total Dividends Interest and license Income Other irxximeis.
(30) (31) (32) (33) (34) (35)_ (36) (37) (38) (39)
Total .................................... 63,406,730 27,008,241 1,596,589 28,604,831 11,233,040 1,398,265 956,851 1,098,086 5,047,204 2,730,634
Certain interest incom ..................................... i,o6o,630 83.664 83,664 57.399 289 57,110 -
Dividends received from DISC'S ...................... 1,341,931 8,182 8,182 133 133 -
All other foreign source income ........................ 61,064,169 26,916,395 1.596,589 28,512,985 11,175,508 1,397;843 901,742 1,098,086 5,047,204 2,730,634
Foreign oil and.gas extraction income 24,757,496_ 14,562,225 1,536,755 16,140,413 5,431,805 402,168 60,160 650,593 3.831,239 2,062,81410-
Foreign income and taxes reported on Form 1118--Continued
Foreign taxes; ariailable for credit Foreign tax credit computed--Continued
Type of foreign income for which separate credit was computed
Total deemedZT. forC
Beforereduction forinternational
Reduction forInternational
Afterreduction forinternational
paidcredit boycott
operations
boycottoperations boycott
operations
(40) (41) (42) (43) (44)
Total ........................................................................................................................................... 12,094,868 5,276,923 21,415,963 1,843 21,414,121
Certain interest income ........................................................................................................................................................... 25,299 966 76,977 - -
Dividends received from DISC's................................................................................................................................................... 7,785 264 8,057 -
All other foreign source income ......................................................... ........................... I .............................................................. 12,061,783 5,275,693 21,330,929 -
Foreign oil and gas extraction income ...................................................................................................................................... 3,611,604 5§0525 10,829,795 1 - I
NOTE: The data in columns 1-16 pertain to the total activity of the domestic parent corporation. Since many corporations compute a foreign tax credit for more than one type of foreign income, the data in
these columns are not additive. The data in columns 43 and 44 are reported as corporate totals only, not by type of income. The data in columns 17-21, 23, 26-31 , 33. 35-39, and 42 of the foreign oil and
gas extraction income line represent the amounts of total all other foreign source income and tax for those corporations reporting foreign oil and gas*extraction income and taxes. The data in columns 22, 24~
25, 32, 34,,40, and 41 of the foreign oil and gas extraction income line are the actual foreign oil and gas extraction income and tax amounts. Form 11 18,detail may not add to totals because of roun.ding.

Corporate Foreign Tax Credit, 1984 83
RETURNS WITH FORM 1118 FILED IN SUPPORT OF FOREIGN TAX CREDIT CLAIMED AND WITH $250
MILLION OR MORE IN TOTAL ASSETSTable 4.-Total Assets, Income, Tax and Credits and Foreign Income, Taxes and Credit, by Selected Country to WhichForeign Taxes Were Paid and DISC Dividends[Money, amounts are in thousands of dollars]
Income and taxes from all sources
Taxable
Country and DISC dMdendsNumber
ofTotal
assets Not Income Income Regular arW Foreign taxincome
(Im lose) Foreign tax" Fmalf;n taxes Reduction Wreturns
(1,deficit)
subject aft.mative
Credit from foreignpaw o,
doomed certainto U.S. tax tax claimed a0,nCOS
b faccrued paid foreign taxes
e oreIoas recalmne
(1) (2) (3) (4) (5) (6) (7) (8) (9) (10)
AR geographic areas, total ............ 762 4,247,696,231 127,200,863 121,831,785 S3,S31,563 20,664,028 61,096,502 10,852,937 11,887,156 1,593,628
Canada .......................... 567 3,T76,7119,834 117,217,818 112,060,793 49,138,002 20,151,443 68,979,708 10,375,933 1111,485,15,16 1,S41,785
Latin America, total ................ 499 3,731,943,323 109,697,647 106,100,115 46,576,797 19,959,96a 68,772,340 10,328,958 11,339,649 1,525,184
. . ........................Mexico 402 3,398,513.149 99,434,350 96,188,232 42,262,840 18,509,263 54,919.739 9,636,400 10,518,857 1,423,577.Central America, total . ............ 236 2,836,838,886 B4,986,203 82,496,378. 36,051,415 16,998,230 49,758,189 8,749,389 9,555.059 1,215,483
Honduras . - -..... 79 1,742,895,671 52,427,448 50,507,494 22,187,159 11,324,104 32,653,417 6,749,529 6,784,802 968,405
Panama (including Canal Zone) .... 179 2,491.717,367 75,011,844 72,809,013 31,730,013 14,463,777 43,215,829 7,100,567 8,557,094 1,138,757
Caribbean countries, total ..... 241 2,885.924,708 83,531,865 80,911,332 35,384,112 17,030,425 49.803,227 8,795,697 9,694,346 1,273,544Cayman Islands (British) ........ 121 1,970,083,994 53,878,225 51,679,637 22,749,802 12,632,548 37,090.185 7,172,664 6,769.282 1,143,877
Dominican Republic .............. 103 1.86,11,092,886 57,969,673 55,854,967 24,479,169 12,247,366 35,367,359 5,463,078 7,689,869 469,248
Trinidad and Tobago ............. 103 1,714,713.544 56,039,201 54.697,061 23,973.714 12,890,060 35.573,533 6,492,323 7,513,557 628,365
South America, total ............ ... 410 3.468,821,384 103,807.366 100,475,848 44.064,847 19.511,947 57,141,209 10.234,667 11,039,248 1,525,658Argentina ...................... 246 2,916,946.565 87,008,919 84,799,8a5 37,372,076 18,205,855 52,758,276 9.647,906 10,228,176 1,472,883
Brwl .......................... 304 3,216,615,521 92,067,196 89,683.659 39,306.274 18,075,615 52,971,550 9,175,915 10,449,278 1,306,087
Chile .......................... 172 2,575,245,666 77,077,175 75,2115,279 32,904,257 15,758,968 46.058,739 8,361,903 8,780,041 1.182,090
Color"bia, ............ ......... 191 2,604.388,582 80.813,647 78,124,266 34,479,960 16.938,578 48,196,776 8,656,664 9.778,418 1,284,551Ecuador ....................... 140 2,280.462,029 71,771,676 69,832,418 30,697,861 15,778,852 44,447,563 8,279,146 8,948,347 1,237,930P
ru .................. 178 2,649,277,567 76,877,239 74,338,336 32,679,286 16,545,851 47,901,294 8,706,185 9,348,602 1,331,438V:nezuela ... ..... -- ..... 264 2,967,273,498 90,674,541 87,626,433 38,612,536 17,996,526 52,458,346 9,583.323 10,251,964 1,504,506
Other Weatem Hemisphere, total ..... 314 3,270,009,156 97,515,132 94,215,824 41,326,717 18.937.985 55,152,462 9,881l,709 10,609,929 1,509,946
The Bah as . .................... 120 2.282,146.861 61,828,382 59,693,902 26,200,174 13,573,638 40,489,161 7,446,345 7,396,292 1,122,564
Netherlands Antilles ................ 203 2,735,167,690 76,345,281 73,811,526 32,242,128 15,006,210 44,169,400 7,231,997 9,216,116 1,214,240
Europe, total ..................... 527 3,716,251.971 112,924,034 108.759,105 47,764,829 20,271,969 59,640,100 10,428,345 11,557,448 1,534,120
Common Market countries, total ...... 503 3,664,117,625 111,768,441 107,703,344 47,289,769 20,197,691 59.367,596 10,344,394 11,538,947 1,509,216
Belgium ........................ 246 2,889.159,670 87,929,068 85,597,427 37,450.316 16,931,280 49,706,878 8,584,847 9,742,078 1,200,153France (including Andorra) ......... 316 3,062,295,580 93,349,344 90,503,383 39,618.429 16.748,022 50,123,205 7,745,877 10,373,565 1,190,644Greece ........................ 118 1,926,416,950 61,112,709 59,327,241 26,022,599 13,541,437 38,777,201 7,311,213 7,475,934 1,019,514
land .........................le
120 1,992,647,391 60,260,322 59,276,329 25,880,745 14,739,831 41,367,184 8,022,806 8,204,093 1.263,396taty (including San Marino) ......... 300 3,062,806,944 93,290,939 90,418,609 39,583,717 18,005,418 52,822,821 9,406,623 10,190,377 1,396,633
Luxembourg .................... 53 1,474,281,489 31,369,574 30,235.051 13,350,058 8,605,113 24,077,222 4,458,714 5,105,693 513,456
Netherlands ................... 264 2,881,586,627 86,387,566 84,007,963 36,770,274 17,475,774 50,323,1334 8,935,226 10,079,439 1,299.445
United Kingdom ................. 427 3,483,222,176 107,981,590 104,238,786 45,768,027 19,974,413 58,319,678 10,222,407 11,421,155 1,499,768West Germany .................. 331 3,098,867,049 96,869,485 93,518,133 40.9",052 17,986,OD3 52,483,208 8,987,676 10,396,579 1,252,787
Other West European countries, total ... 386 3,436,599,656 102,512,787 99,318,002 43.571,480 119,714,031 57,753,912 10,234,225 11,196,594 1,507,848
........ - ........ - ...Austria . 133 949 486 314'
62,842,804 60,948,791 26,750,774 13,915,876 39,998,323 6,661,274 8,519,722 1,041,657.Finland ............. ..........
,36 2284 132521: : : 64,623,485 63,479,697 27.651,148 12,693,977 37,658,868 6,170,401 7,524,849 959,849
Norway ........................ 148 1,924,688,335 68,124,486 66.457,104 29,088,652 14,946,547 42,024,472 8,298,064 8,265,350 1,406,977Spain .......................... 265 3,132,676,340 88,994,155 86,696,739 37,919,713 17,627,791 52,093,357 8,914,580 10,161,421 1,276,578Sweden ........................ 199 2,523,043,739 73,927,710 71,919,825 31,325,783 14,855,358 43,739,613 7,066.657 9,086,166 1,139,748
Switzerland ..................... 246 2,843,416,538 86,541,863 84,366,394 36,938,323 17,586.342 50,932.083 8,710,008 10,332,651 1.174,299Tu,key ......... ............... 87 1,707.816,849 56,757,236 55,574,002 24,640,193 13,098,450 36,624,638 6,981,292 7,177,644 942,134
East European countries, total ........ 112 1,756,323,950 63.358.929 61,739,007 27,266.SB8 13,923,581 39,092,618 7,959,025 7,462,710 1,317,483
Africa, total ...................... 309 3,060,723,690 97,123,522 94,272,439 41,375,756 19,160,024 54,464,006 9,965,597 10,874,224 11,500,298
North Africa, total .................. 135 2,374,027,341 72,633,548 70,426,185 31,099,907 16,174.634 45,251,006 9,191,261 8,554,482 1,488,173
Egypt .............. .......... 104 2,071 411,339 62,701,460 60,669,146 26,786,392 14,470,645 40,846,844 8,021,769 7,720,064 1,196,829
Libya .......................... 24 687:474,836 29,090,003 28,538,376 12,837,753 8,514,517 21,553.440 3,650,078 5.392,732 272,279
East Africa, total .................. 63 1,470,129,251 49,666,092 48,323.292 21,626,151 13,287,530 35,733,565 7,260,153 7,358,948 1,150,217
West and Central AtHcan countries total 126 2,248,929,336 70,514,427 68,817,955 30,425,008 15,450,095 42,915,362 8,296,895 8,651.298 1,289,776Gabon ............... ......... 30 1,067,606,306 39944606 38947,956 17,267,849 11,2a5,860 29,829,817 6,601,526 6,101,673 1.090,782
Nigeria ........................ 631
417650136 43:866:701 42:536,744 19,008,460 11,789,444 31,307,639 6,685,777 6,503.498 1,105,156
Zaire ~ ......................... 27 1:031:843:676 36.522
,519 35,653,611 16,029,368 10,229,628 27,366,090 5,439,136 5,727,628 495,219
Southern Africa, total . . . . ..... ..... 249 2,630,707,454 84,890,323 82,633,925 36,240,238 16,599,155 47.240,318 8,070,528 10.029,644 1,337,467
South Atdca (inclucles Namilpia) . . . . . 240 2,479,502,345 83,886,519 81,784,155 35,868,170 16,394,355 46,507,063 7,930,909 9,983,565 1,337467
Zimbabwe ...................... 42 764,560,646 33,020,814 32,585,894 14,662,999 7,920,474 22,145,025 3,495,558 4,998,527 212:858
Asia, total ........................ 509 3,664,194,9" 113,142,995 109,041,699 47,925,368 20,235,682 69,415,845 10,612,438 11,472,007 1,575,167
!Iliddle East, total .................. 242 2 8 63 63852 1
646 7849'3
81,643,281 36,025,770 17,350,166 49,618.879 9,145,429 9.W3,524 1,332,693
ra. ........................... 39 87: ,14:4511:0 1 7:79246~5 45,503,735 20,358.273 11,480,777 30,862,483 6,484,955 6,321,353 1,141,036~srael ........................ - 139 1,954.909,418 56,738,411 54,692,470 24,215,536 11,381,248 33,728,816 5,174.807 7.153,140 580,657
Kuwaj ......................... 61 1,238,736,000 42,911,686 42,074,235 18,860,786 9,796,983 27,291,457 5132563 5824598 991,429
Qatar ................ ......... 25 1,079,735,465 37,952,B52 37,016,774 16,351,055 9,483,763 25,931,109 4:437:954 5:976:487 461,474
Saudi AraUa .................... 125 1.751,325,056 57,795,342 55,930,446 24,637,675 13,135,465 37,009,486 61655765 7914,646 1,152,239
United Arab Emirates ............. 65 1,696,822,101 51,342,561 50,023,533 22.283,368 13,087,578 35,692,829 6,769~478 7~456,237 747,095
Southern and Southeastern Asia, total 339 3,198,629,767 99,989,142 96,081,170 42,382,141 19,437,674 56,430,267 10,208,281 10,921,626 1,534,594
India'
...............' 1
55 2155645922 75,547,921 73,819,023 32,666,653 16,436,142 45,751,556 8,888,936 9,062,163 1,406,863
Inclonaa .......... ..... 143 2:312:997:632 68,514,812 66,548,310 29,270,487 15,583,402 43,936.509 8,667,284 8,390,675 1,345,709
Malaysia ....................... 127 1,983,339,360 62,591,571 60.719.629 26,644,780 14,171,332 39,618,335 7,795,607 7,629,046 1,228,209
Philippines ..................... 196 2,710,061,454 81.146,783 78,203,142 34,468,502 16,874,133 48,885,081 8714615 9,578.943 1,278,700
Singapore ...................... 197 2,766,606.511 83,063,586 79.994,368 35,215,178 17,073,608 49,701,165 8:875:855 9,713,583 1,324,763
Thailand .......... ............ 145 2,203.344,343 65,694.034 63,766,080 27,926,767 14,512,405 41,460,639 7.896,960 7,863,810 1,134,047
Eastern Asia, total .................. 466 3,540.157,034 110,382,687 106,395.081 46,762,212 19,854,011 57,981,753 10164285 11 402,825 1,531,224
China- - - - - ..
.. ......... 100 1,563,696,747 44,766.204 43,794,318 19,173,601 9,827,177 28,541,204 7:067:616 4:269,232 1,414,542
Hong Kong ..................... 204 2.534,190,299 73,152,734 70,604,603 30.991,720 15.271,435 45.174,665 8061,863 8,485,552 1,109,117Japan (Okinaa. Ryukyu) .......... 441 3,473,983,318 107,844,361 104,036,427 45,696,417 19,296,619 56,496,807 9:482,949 11,323,362 1.334,199South Korea, Republic of .......... 163 2,472,816,344 69,218,750 67,368,645 29,398,738 14,466,86,11 42,662,902 7,438,352 8,542,383 1,260,603Taiwan ........................ 175 2,533,274.675 76,587,641 74,506,402 32,727,280 16,226,965 46,639.162 8,849,596 8.856,633 1,385,709
Oceania, total ..................... 395 3,435,116,006 103,722,3TY 100,391,574 ".057,288 19,237,440 56,492,332 9,562,431 11,150,730 1,325,405
Australia ........ ........ ....... 376 3,381,807,288 101,972,891 98,901,468 43,388,861 19,061,082 55,923,441 9,620,334 11,012,113 1,325,405
New Zealand ...... .............. 187 2,112,655,509 77,563.334 75,245,566 33,252,386 16,260,698 45,048,395 8,073,879 9,510,403 1.216,378
Puerto Rico and U.S. Possessions,total ........................... 2548 2,640,081,898 82,970,712 80.093,874 34,994,221 16,124,712 45,968,228 7,952,293 9,670,478 1,259,362
Puerto Rico ...................... 243 2,595,237,589 82,093,888 79.236,562 34,640,971 15,917,426 45,167,208 7,776,678 9,639,603 1,259.361
U.S. possessions, total ......... .... 81 1,767,204,032 53,951,550 52,129,931 22,926,559 11,748,924 31,581,864 5,206.718 7,496,614 524,710
Country not stated ................. 379 3,231,642,829 95,070,522 92,236,263 40,408,743 18,298,546 52,425,372 9,094,287 10,653,888 1,344,150
DISC dividends ................... So 656,274,032 34,879,033 33,279,718 114,546,02 6,461,408 17,414.691 4,243,905 3,0",293 647,970
OPEC countries, total Pincluded1 1 1above)
.........................336 3,120,262,338 98,464,906 94,767,733 41,778,634 19,284,732 55,942,154 10,382,664 10,795,236 I,ST7,6311
Footnotes at and of table,
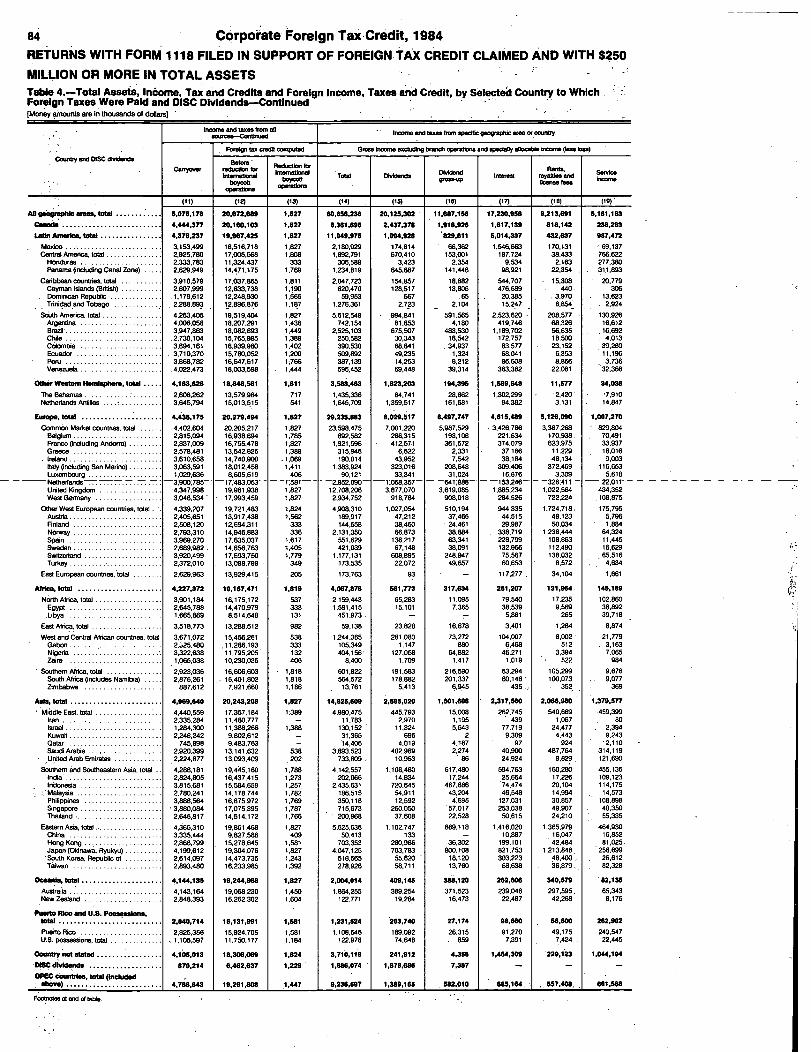
,Vco
cIm
I's03LL.C
,0=
cCC,
vvC30
1 go960
-E-u-Is
or.S-c
GN
!o1:
m~2
wwl
~zci,:
c6d
cqdcli
'i----------
SR.,
Awi
OR
NR
t2-6g
ci~4c6
66
ggc;
gpzg
6c6-icl
.NN.
-N-v
c,~R
REE
I
-7cli
WF
MI
--
-z
c6gd
6g
d16
dg
gI
g6c:;g
-7p~
gN
T1
x.6
6Q
-:,i 5.6
g-7
-,FN
RvP
%o
ut
eqcoz
LQciq
cl
Pq9~t
EE
2.
a-
-Nq
-.7g
gQm
cdL6
u;L6
cN1'i
c%ic;g
~igg
ciq
92
P&
vc1t
m;;
w~
m2-2
I~
t2~t2
m-V
2--w
mI;z
w-
..
-.G10
9ZA
A"h
MM
ig-
-8~
~:":cici
IR
--
19R.
,g
X16V
-7816
11R;V
8-:
vR
gLd
Lq
gg
~:d
?~
2-
pa
g~z
Ldcli
cliv
HII
Bnu
RM
UM
f!H
uw
m9
H~
N112
p~N2
Vw8-
,.",
,,,
gIg
-----
--
-----
--
~
;1z-w-
w.,v,all
2v~W,
t2.4
..
.
ME
gglig
g,8
65
13,0
8.
~;;
L61It N
"SR
Ld16
A2
al1.cliclicli,
c6dd
Ldd
da
---
--
--
--
-----
---
c6Ld
---
.-
-c1f.7
16L
C-1C%j(31
Ck
c,!q
Z;H
M:
IqN
ME
RU
92N
.wo
As
2G2
N,
Ldg
sLdR
~~R2
1~2
.I
N21Z
,R
P,RS
Am
NN
Nm
-~N
4'i6
a6
"d~S
ecN
i's,icic!cic6c
izc6
,iR
'iciR
cqc6c4
cdc%;
Ncq
cocliP
~z6
cmN
N-i,6
1qiic
q,iq
cli
..
..
..
..
..
..
..
..
..
..
.
..
..
..
..
..
..
..
..
...
..
..
..
..:
..
..
1.
..
zs
..
..
..
.
5.
..
..
..4B
E.
..
..
..
:,p:~
Rfl
RE
2,
w
Em
21z
3251
<-1
IM
2w
w:31z
o1
3:z
wU
-1,
H-
-:91
9.0
,

Corporate Foreign Tax Credit, 1984 85RETURNS WITH FORM 1118 FILED IN SUPPORT OF FOREIGN TAX CREDIT CLAIMED AND WITH $250MILLION OR MORE IN TOTAL ASSETSTable 4.-Total Assets, Income, Tax and Credits and Foreign Income, Taxes and Credit, by Selected Country to WhichForeign Taxes Were Paid and DISC Dividends-Continued[Money amounts are in thousands of dollarsl
Income and taxes from &pacific geographic ares or oixintry--Confinued
GrossI"come excludingbranch operations and specially
allDcable Income (Ises Im) Oil and gas extraction grow; incone (leas kiss)
Country and DISC ithridends --Continued
Indud"bleNot capital Partnership OtherTotal
Frornextraction of
Frovi see ofbusiness
OMdends fromNreign
Income ofControlled
Parin-shipgain Incoons in`00n`0 oil or gas assets corporations Foreign
Income
Corporations(20) (21) (22) (23) (24) (25) (26) (27) (28)
AN gielographic aress, total ............ 743,255 300,SO2 16,174,209 26,689,886 19,334,888 51,691 7,408,641 2,M -108,007Canaft ......................... 81,075 196,32S 1,054,419 1,807,926 1,317,187 45,893 Q12,096 2,756 -7Latin America, total ............... -4,S84 20,393 2,674,984 2,IS5,221 2,130,038 1,012 24,171 -Mexico ......................... -7,568 11,699 149,691 (1) (1) - - -Central America, total .............. 1,822 298 74,480 23,867 -289 -14 24,171
Honduras ..................... -13 11 11,737 - 1 - I - -Panama [including Canal Zone) .... 1,909 37 12.569 24,086 -115 - 24,171
Caribbean countries. total .......... 2,725 460 1,290,005 1,114,871 1,112.685 2,186 -Cayman Islands (Brifish) .......... -25 14 722 - -D
irornin
mRepublic ............. 21 68 21,155 -2 -2 -
Trinidad and Tobago ............ 2,669 232 1.243,608 1,114,897 1,112.686 2.211South America
'total ............... -1,564 7,936 1,156.647 1,016,483 1,017,643 -1,160
Argentina .* ............. ....
-8,334 549 159,222 96,932 97.652 -720Brazil .....
.... ... ....3032 -1,040 101045 -11,806 -11,694 -113
Chile ............. . .....
4:669 1931
:563 is is -Colombia .
- . . ............-81885 631 148997 212,451 212,594 -143
Ecuador.... * ............ - '
-290 108 373:725 358,022 358,213 -191Peru .....
...-218 -146 265828 31 595 319595 -
Venezuela ...... 986 7,700 61:196 23829: 2376 7 -
Other Waste Hervilaphere, tobd ..... 752 320 -70,471 -87,680 -87,982 - 402
The Bahamas .... ................ - 41 9.063 2,396 2,396 -Netherlands Antilles ................ 637 82 11.431 - - - -
Europe, total ..................... 111,246 -3S,701 3,884,225 12,380,329 6,507,174 5,412 5,882,849 17 -15,122Common Market countries. total ..... 99,187 -19.043 2,905,725 8,699.504 2,831.288 5,480 5.865,247 - -2,512Belgium ....................... -177,825 523 127,400 (1) (1) - -Frarice (inclucling Andorra) ......... 6.058 -6,528 115.932 24,938 25 -6 24.919Greece ........................ -18,470 130 258,922 (1) (1) - -
:reland ......................... -2 26 45,174 -698 -698 -tsfy (including San Marino) . . ....... 13,055 1,449 39,228 -2.108 -2,002 -106Luxembourg . ~ ..................
-805 -77 1034
- --
-Netherlands ............... .... 375,137 -4,138 369:177 1,290,404 418.541 6.689 869,489 -3,317United Kingdom .................
5.594 -566 1,864,873 7.053,990 2,335,748 -97 4,717,535 804
West Germany .................. -47.189 -6,482 45,996 253,636 332 - 253,304 -Other West European countries, total ... 11,756 -16,750 531,208 3,688,891 3,683,951 -68 17,600 17 -12,610
Austria ......................... 164 -21 6,662 17.610 10 - 17,600 - -Finland ........................w~ -38 -3,356 3,128 - - - - - -Ngr y ........................
-367 -5,452 391,924 3,557,201 3,563,426 -2 17 -6,239Spain .......................... -19,007 -3,516 25,487 92,944 99,380 -66 - .-6,37iSweden ........................ 23,665 -3,038 33,087 - - -Switzerland ..................... 4.613 6 35.556 - -Turkey
' * ..... * * .... * ...........
2,635 -1,391 26.705 21.138 21,138
East European countries. total ........ 435 91 20,102 -6.760 -6,760 - -
Africa, total ...................... 8,717 18,388 2,633,004 3,509,171 3,308,491 3,264 172,708 - 24,709North Africa total .................. 7.870 -3,246 1,878,1306 2.301,964 2.298.843 542 5.830 - -3,250Egypt .. ~ ...................... 38 15 1,473.895 1.437,290 1.431,460 - 5,83D -Ubya .......................... 37 (1) 406.072 844,418 844,403 15
East Africa, total ................... -1,327 29 6,372 561 497 63 - -
West and Central African countries, total 181 21,174 734,871 1,206,646 1,009,151 2,659 166,878 27,959Gabon ... ..................... - 27,963 65,216 92,183 61.744 2,480 - 27,959Nigeria ........................ 269 47 155,169 519,110 351,963 269 166.878 -Zaire .......................... - 1 -13 2.762 95,480 95,480 - -
Southern Akira, total ............... 1.993 431 12.954 - -South Africa lincludes Namibia) ..... 1,993 343 12,719Zimbabwe ...................... - 89 158 - - -
Ads, toW ........................ 122,397 71,332 4,681.136 4,S811,216 3,796,541 -4,300 885,843 1 le,weMiddle East, total .................. 2,687 197,045 3,057.130 1,379,248 1.371,097 -35 8,186
:- ... ........... .. .. I . .......873 13 5.146 558 558 - -
SMel .. .. .. .. 368 493 7.734 - -Kuwait ......................... - 70 7,601 - -Older
.. .... ... .......... -2,992 16 6,065 8,186 - 8.186
Saud kalbe .. .. 3,697 196,626 2,445,153 376,281 376.281 -United Arab Emirates ............. 266 -47 566,109 994.526 994,561 -35 - -
Southern and Southeastern Asia, total . . 12,038 -127.929 1,324.310 3,142,865 2,388,881 -4,266 875,117 -116.868ncha ..........................
:3,545 66 14,364 -8.937 -8,937 - - -
ndonesia ...................... -1,694 -126.638 1,166,678 2,439,095 1,684,948 -4,102 875,117 -116,868Malaysia
................. * .....1,966 2,646 7,672 697,705 697,705 - - -
Philippines.............. ......
-443 640 65.M 22,563 22,563 -Singapore
................... -5.994 - 4,8D3 54,120 8.807 8.884 -77
Thailand ....................... 2,743 96 7.834 -28,258 -28,252 -7 -
Eastern Asia, total .................. 107.792 2.216 296.833 39,546 37,WS - 2,540China ......................... 3,442 -1.142 4,194 -274 -274 -Hong Kong ..................... 4,051 -174 59,578 - - -Japan (Okinawa, Ryukyu) .......... 77,224 3,252 170,468 41,830 39,290 2,540South Korea, Republic of .......... 13.298 157 53.135 -2,010 -2.010 -Taiwan ........................ 9,361 122 9,126 - -
ocian", tow ..................... 403,279 -835 118,981 2.374,927 2,375,097 -170Australia ......................... 403.393 -1,091 99,192 2,375,318 2,375,488 -170New Zoaland ..................... -102 258 13,927 -363 -363 -
loweato Rico ond U.S. Polualuallons,2. ........................... 1,454 -1,609 522,593 - -
Puerto Rico ...................... 1,461 -2,744 613,429U.S. possessions, total .............. -7 1,055 9.164 - - - -
Courall, not atiatlej ................. 18,918 31,N9 675,337 -11,323 - 111,6117 480 572 -718DISC iffirklenda ................... - - - - - -
OPEC couriti limm (bwhxwEA-) .......................... 1,442 . 102,5W , 5,257.M , 5,631,509 , 4,675,045 , -1,557 , 1.050,180 -92,160
Footnotas at and of Ube.

c5r
CW
OX
"d
2:taa,M
Tr
NZ
L),
Eczru7
3.
so -g
Tl
ggal
~3>
7a
'k-l
gE
m.3
.1.1
0-0
.0.
..
'0
0
00
..
..
..
..
..
..
..
..
..
P.
0
..
..
..
..
..
..
..
..
..
..
..
..
..
..
..
..
..
..
-'
'TIg
n1
gb
'8.
T.-
8-:2
181
'8P'
.g
8~-g
--
88
oN
o0
0o
oN
08-
891.
i8
ON
811
41W
22i~
~3i
:IY
5~
, --
88.
~2,
N-
-8,
N8
5A
HN
:~-
-.
..
..
..
.:-
-,
sI Nj
-8
1991,9
9..
;39
aEs
8N
8-
sN
S-S
!M
l~.
u
'2SO
'm'
1
0H
EE
N,
eT
'"N
j1,
2:8,
TMVISH.
§T,82
--
--
--
--
--
Mgt
H-2=
EBV
~so
4,
..
....
82!
WZ3
TE
5291
E.
E:t
D3S
9i
a9
E
8i~
EE
2.!.
c.-
p.
.8
'T9
2,18
,.
~T-HA2H
2IS
1S
1
N l
Z~. 22
HH
9ME
.F.M.H9
f.2
El
0.
0'-t
'.g
.,
Z-8w
o-
tt
9IV
§2
a3E
1V
W2
isw
HE
T.T
.m
-88.
Al
5ce
2?
Et
SE
ziP,
2a
Z;jG
22
2.
8N
2AI
~.:
~W
2
Ei
Ui
T0
-
58.
Z;.'2
ENT
~wsg
EH
94IN
t1.2
.1T
S-1
ITJ.
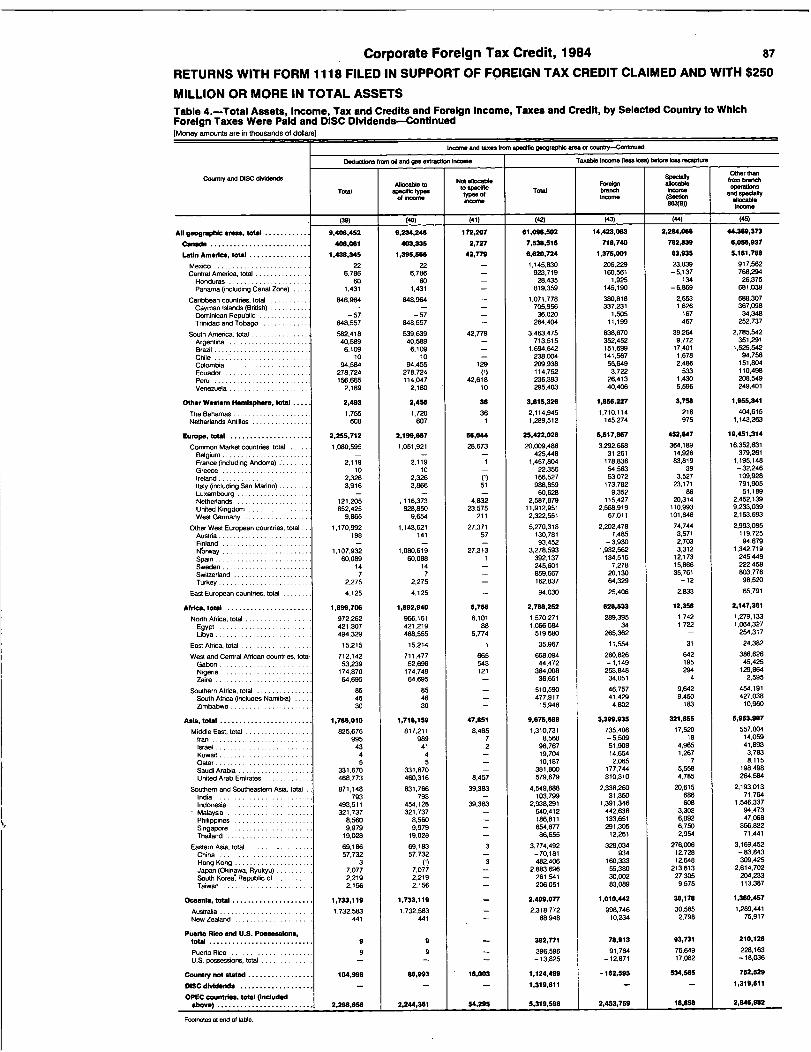
Corporate Foreign Tax Credit, 1984 87
RETURNS WITH FORM 1118 FILED IN SUPPORT OF FOREIGN TAX CREDIT CLAIMED AND WITH $250
MILLION OR MORE IN TOTAL ASSETSTable 4.-Tatal Assets, Income, Tax and Credits and Foreign income, Taxes and Credit, by Selected Country to WhichForeign Taxes Were Paid and DISC Dividends-Continued[Money amounts are in thousands of dollars]
Inx,orne and taxes from specific geograPhic area, or country-COntiftubd
Dedueti~ from oil and gas extraction incorne Taxable Inoorne Pess IM) before kne recelYrum
Country and DISC dMdmft Not allocable Specialtyoil_ than
tnxrt branchAADCable to
to apectricForeign allocable
operatbmTotal SP-Cft types
of incomatypes Of Total branch
Inco'naIncorre(Section arid specialty
Inoorre883m))
allocableInoorne
(39) (40) (41) (42) (43) (44) (45)
All geographic areas, total ........... 9,406,452 9,234,245 172,207 61,095,502 14,423,063 2,284,066 44,389,373
Canada ......................... 406,061 403,335 2,727 7,538,516 718,740 762,839 6,058,937
LaUn America, total ............... 1,438,345 1,395,566 42,779 6,620,724 1,375,001 63,935 5,181,788
Mexico ....................... 22 22 - 1,145,830 205.229 23.039 917,562Central America. total ....... 6,786 6,786 923,719 160,561 -5,137 768,294
Honduras ..................... 60 60 28,435 1,925 134 26.375
Panama (including Canal Zone) .... 1,431 1,431 819,359 145.190 -6.869 681,038
Caribbean countries. total .......... 848,964 848,964 1,071,778 380.818 2.653 688,307Cayman Islands (British) .......... - - 705,956 337,231 1,626 367,098
Dominican Republic ............. -57 -57 36.020 1,505 167 34,348
Trinidad and Tobago ............ 848,557 848,557 - 264,404 11,199 467 252,737
South America, total ............... 582,418 539,639 42,779 3,463,475 638,670 39,264 2,785,542Argentina ..................... 40,589 40,589 - 713,516 352,452 9,772 351,291Bra23l
. .. .....6,109 6,109 1,694,642 151,699 17,401 1,525,W
Chile' '' '
10 10 - 238,OD4 141,567 1,678 94,758
Colombia ..................... 94,584 94.455 129 209,938 55~649 2,486 151,804
Ecuador ...................... 278,724 278,724 (1) 114,752 3,722 533 110,498Peru156,665 114,047 42,618 236,393 26,413 1,430 208,549
Venezuela ..................... 2,189 2,180 10 295,403 40.406 5.596 249,401
Other Western Hemisphere, total .... 2,493 2,456 36 3,815,326 1,866,227 3,758 1,955,341
The Bahamas .................... 1,755 1,720 36 2,114.945 1,710.114 216 404,615Netherlands Antilles . . ~ ~ ~ . . ........ 608 607 1 1,289,512 145,274 975 1,143,263
Eumpe, total .................... 2,255,712 2,199,667 56,"4 25,422,028 5,517,867 452,847 19,451,314
Common Market countries, total ..... 1,080,595 1,051,921 28,673 20,009,4BB 3,292,668 364,189 16,352,631aegium ....................... - - - 425,"8 31,261 14,926 379,261France (including Andorra) ........ 2,119 2,119 1 1,457,8D4 178,836 83,819 1,195,148
Greece .......................1
010 - 22,356 54,563 39 -32,246
Ireland ........................ 2.326 2,326 (1) 166,527 53,072 3,527 109,928
,taly (including San Marino) ........ 3,916 3,866 51 988859 173782 23,171 791905
Luxembourg ... ............... - - 60:628 9:352 86 51 :189Netherlands ................... 121,205 116,373 4,832 2,587,879 115,427 20,314 2,452,139United Kingdom ......... -.- - 852,425 828,850 23,575 11,912,951 2,568,919 110,993 9,233,039
West Germany ................. 9,866 9,654 211 2,322,551 67,011 101,846 2,153,693
Other West European countries, total . . 1,170,992 1,143,621 27,371 5,270,318 2,202,478 74,7" 2.993,095Austria ........................ 198 141 57 130,781 7,485 3,571 119,725
Finland ....................... - - - 93,452 -3,930 2,703 94,679worway . . ... ... 1.107,932 1,080,619 27,313 3,278,593 1,932,562 3,312 1,342,719
Spain ......................... 60,089 60,088 1 392,137 134,516 12,173 245,"8
Sweden ....................... 14 14 - 245,601 7,278 15,866 222,458Switzerland .................... 7 7 859,667 20,130 35,761 803,776
Turkey ...................... I . 2.275 2,275 162,837 64.329 -12 98.520
East European countnes, total ....... 4,125 4,125 - 94,030 25,406 2,833 66,791
Africa, total ..................... 11699,706 1,692,940 6,766 2,788,252 628,533 12,358 2,147,361
North Africa, total ... ........... 972,262 966,161 6.101 1,570,271 289,395 1,742 1,279,133
Egypt 421 307 421.219 88 1,066,084 34 1,722 1,064,327
Ubya - .. ........... 494:329 488.555 5,774 519,680 265,362 - 254,317
East Africa, total .................. 15,215 15,214 1 35,967 11.5u 31 24,382
West and Central African countries, total 712,142 711,477 665 668.094 280,826 642 386,626
Gabon ...................... 53239 52696 543 44472 -1 149 195 45425Niger
- * ...... . .. 174:870 174:749 121 384:006 253:848 294
129:864
Zaire .......................... 64,695 64,695 - 36,651 34.051 4 2,595
Southern Africa, total . . . . . . ......... 85 85 510,590 46,757 9,642 454.191
South Africa (includes Namibia) 46 46 477,917 41,429 9,450 427,0387,m-
bebwe ................... 30 30 - 15,946 4,802 183 10,960
Asia, total ........................ 1,766,010 1,716,159 47,851 9,675,698 3,399,935 321,855 6,963,907
Middle East, total .............. ... 825,676 817,211 8,465 1,310,731 735,406 17,520 557,804,an ........................... 995 989 7 8,568 -5.509 18 14,059~srael . .................... - 43 41 2 98.767 51,908 4,965 41,893
Kurwaj ......................... 4 4 - 19.704 14,654 1,267 3,783
Qatar .......................... 5 5 10,187 2,065 7 8,115
Saudi Arabia .................... 331,670 331,670 - 381,800 177,744 5,558 198,498
United Arab Emirates ............. 468,773 460,316 8,457 579,679 310,310 4,785 264,584
Southern and Southeastern Asia. total . . 871,148 831,766 39,383 4,549,888 2,336.260 20,615 2,193,0131ndia .......................... 793 793 - 103,799 31,350 686 71,7641ndonesia ...................... 493,511 454,128 39.383 2,938,291 1.391,346 608 1,546,337
Malaysia .......... ........... 321,737 321,737 - 540,412 442,636 3,302 94,473
Philippines ..................... 8,%0 8.560 186,811 133,651 6,092 47,068
Singapor . ..................... 9,979 91979 654,877 291,305 6,750 356.822
Thailand ....................... 19,028 19,028 - 86,655 12,261 2,954 71,"l
Eastern Asia, total .................. 69,186 69,183 3 3,774,492 329,034 276,006 3,169,452
China ................ ........ 57.732 57,732 - -70,181 93412,728 -83,843
Hong Kong ..................... 3 (1) 3 482.406 160.333 12,648 309,425
Japan (Oluna a, Ryukyu) . . ........ 7.077 7077 - 2,883,696 55,380 213,613 2,614,702
South Korea. wepublic of .......... 2.219 2:219 261,541 30,002 27,305 204,233
Taiwan ........................ 2,156 2,156 206,061 83,089 9,575 113,387
Oceania, total ..................... 1,733,119 1,733,119 2,409,077 1,010,442 38,176 1,360,457
A st alia .........................u r
1,732,583 1,732,583 2,318,772 998,746 30,5115 1,289441ewN Zealand ..................... 441 441 88,948 10,234 2,798 75:917
Puerto RICO and U.S. Possessions,total ........................... 9 9 382,771 78,913 93,731 210,126
Puerto Rico ...................... 9 9 396,596 91.7B4 76,649 228,163U.S. possessions, total . ............. - - - -13,825 -12.871 17,082 -18,036
Country not stated ................. 104,998 08,993 16,003 1,124,499 -162,595 534,565 752,529
DISC dividends ................... - - - 1,319,611 - - 1,319,611
OPEC countries, total (includedabove) ... ...- 2,298,656 2,2".361 54,295 5,319,698 2,453,769 16,858 2,646,982
Footnotes at end of table.

0-H
71H
AI
45-
5.91"
&a19
mi
gV
a
.5
al
I
S2
..
..
..
..
..
..
..
..
..
..
..
..
..
..
..
.
77
..
..
..
..
..
..
..
77
77
771
77
7.
..
..
..
..
..
.9Z;
we
Ov
~sA.
-0
8v
8is
ws-
S'-SO
Ap
aB!R
...
..II I
8j,8
S.
~tI
Es-
Il-
oH.H81.
..
8
mg
19F
~3R
AS
To
P.
:4z;
w
v8,
~.8~.g
5X9
Ein
at9
.8
89
wg
.18
2a
Isi
As
1wo8.
SIB
.Tt
-W
.D3-
b,
wH
iNs
21Z-3
HH
""M
So
s-.
,
Sett
'Va
HF
9I
t1.
28.
11o
.-
918"M
8§1
§11
'T
HI
6
PDP
.P
:~S
.
M16
I1
91
3.1
PD.
Is
~s
o0
'o stpAM
-on0,
CLg
m0,
C',C
Ls
0om
i
rF
rLC
LM
.o
0m
0C
LOC
L0
=CL
0 m0
02,
0to
0 90
CDm M
0
z.MQ
CL

Corporate Foreign Tax Credit, 1984 89
RETURNS WITH FORM 1118 FILED IN SUPPORT OF FOREIGN TAX CREDIT CLAIMED AND WITH $250
MILLION OR MORE IN TOTAL ASSETSTable 4.-Total Assets, income, Tax and Credits and Foreign Income, Taxes and Credit, by Selected Country to WhichForeign Taxes Were Paid and DISC Dividends-Continued(Money amounts are in thousands of dollars]
Income and taxes from specific, geographic area or cQUn"Y--CXXt1nu9d
Income and taxes of related foreign omporatbm and DISC's
Country and DISC divridendsGahm,
proft andIncome
Texas paid ong-. profile
Divideruft,paid or
constructivelydistributedto domesticcmporau-
Texas
Pawrelatedforeign
Dividends paidto related
famocorporations
and DISC's bysecorKI-tier
foraigncorporatlors
Dividends paidto seowxkw
Imeo
by"thInRiffforeign
(56) (57) (58) (59) (60) (61)
AN geographic areas, total ........... 68.382,784 25.434,723 1S,"4,901 4,252,561 5,532,581 254,969
Carol" ......................... 12,820,620 5,244,577 2,340,564 722,370 822,138 56,111
Latin Americo, total ............... 0,852,150 2,003,199 11,7117,8911 114,775 193,974 12,240
Mexico .. ...................... 1.090.657 335,483 145,404 7,501 21,561 3,924Central America, total ............ 1,294,821 140,272 596,790 43,854 75,680 47
Honduras` ' , ' ' ' '
10,104 3.009 3,324 - - -Panama (inclu~Ing Can slions) 1,228,670 123,408 S72.587 43.662 74,738 47
Caribbean countries, total ......... 201,795 31,657 105,686 4,503 7.217 -Cayman Islands (Bftsh) .......... 151,245 20,257 80,564 4,503 7,217Dominican Republic ............. 2150 370 214 - -Trinidad and Tobago ............ 13:072 5,540 2.561 - - -
South America. total ............... 4,264,877 1,495,788 870,013 58,917 89,516 8,269Argentina ..................... 143,570 20,818 21,541 - - -Brazil ......................... 3.131,273 1.146,056 658,239 46,820 58,816 636Chile ......................... 132,146 43,131 30,283 251 5.627 -Colombia ..................... 398,376 130,155 68,615 1,241 7,774 732Ecuador ...................... 23,708 4,379 5,470 29 505 -Peru ......................... 161,322 56,245 14,226 21 36 -Venezuela ..................... 252.683 89,773 66.530 10,539 16,738 6,901
Oliver Wedem Homiliplaore, total .... 1,802,238 221,003 1,363,308 12,869 38,407 10,000
The Bahamas .................... 161,138 38,327 75,800 12,846 36,336 10,000Netherlands Antilles ............... 1,520,574 '177,762 1,200.844 - - -
Europe, total .................... 30,170,435 11,613,973 7,373,424 3,239,861 4,149,682 144,6110
Common Market countries, total ...... 27,191,038 10,814,679 6,382,184 3,070,316 3,794,727 126,259Belgium.
' ' ' ' .......... 1212,583 480,186 282.248 1,247 2,194 17
Frarxxl QncIucfing Andorra) 1:774,436 756,282 408,148 110,326 134,665 2,568Greece
............ ... . - '17,438 7,147 3,248 1 5 -
Ireland......... .... ..........
93,685 11,138 41.726 21 4,155Italy (inclucling San Manno) ......... 1,243,605 465,697 320.153 11,345 19,761Luxembourg .................... 67.913 33,137 31,592 746 1,301 -
Netherlands .................... 7,141.766 2,993,378 989,141 72,873 245,570 54,005United Kingdom ................ 8,791.464 2,762,830 3,365,388 2,758,076 3,222,503 54.836West Germany ................. 6,687,481 3,245,245 909.464 115,407 164,119 14,B33
Other West European countries, total . . 2,978.223 799,270 990.090 169,545 354,955 18,390Austria ........................ 160,084 65.781 46.741 11,107 22,286 -Finland ....................... 107.183 42,816 38,446 552 1,183 1.183Norway . ...................... 205,986 69.022 66,786 534 771 -Spain ......................... 605.458 179,340 135.867 5.105 9,935 711Sweden ....................... 212,264 77.330 59.793 11,699 44,474 7,304Switzerland .................... 1.435,096 231,413 589,811 140.221 276,070 9.192Turkey ......................... 168,992 113,483 22,010 - - -
East European countries, toted ........ - - - - -
Aides, total ...................... 1,426,881 567,568 363,633 32,OS5 45,781 3,91111
North Africa'total .................. 84,566 33,166 18,042 346 349 -
Egypt.........................
62,912 22,970 14,901 - -Libya .......................... - - - - -
East Affical, total ................... 73,796 26,493 23,751 5.566 4,857
West and Central African countries, total 528,326 176,611 137,330 68 110Gabon ......................... 4,552 1,991 1,147 - -Nigeria ........................ 346,872 98,231 127,058Zaire .......................... 20,013 9,287 1,682 - - -
Southern Africa. total ............... 740,192 331,298 164,410 26,075 40.465 3,965South AJr1aa (includes Namibia) ..... 690,160 304,608 173,873 25,932 40,304 3,960Zimbabwe ...................... 16,463 9,118 3,613 74 124 5
Asia, total ........................ 10,623,634 4,880,234 11,8011,958 39,784 43,489 3,100
Middle East. total .................. 191,279 75,707 35,847 5 17 -:,an ........................... 13.377 4,100 2,970 - -srael .......................... 75,230 27,961 10,477 5 17Kuwait ......................... 823 10 127 - -Qatar .......................... 68,932 35,352 4,019Saud Arabia .. ................. 11,582 5,344 2,742United Arab Emirates ............. 4,380 86 4,294 - -
Southern and Southeastern Asia. total 5,061,933 2,451,388 717,355 4,304 3.994India
... * ...... *'*'' *' ... ....214705 97.496 13,349 2,195 569
In"m *, ** .. 3,990:597 2.072,599 445,578 - -Malaysia
,
' * ...... ....203278 82987 53,826 1,520 1.955
Philippines ........- * ........ * '
52:098 20:203 9,561 356 1.090Singapore
.......... . * .. ......381,852 92.022 152,662 228 369
Thailand ..
* .............. .... *
193,720 72,247 37,227 6 10
Eastern Asia. total ....... .......... 5,270,422 2,353,140 1,050,755 35,455 39,458 3,100China ......................... - - - - - -
Hong Kong ..................... 708,123 95,899 242,265 3,499 5.689 3,088Japan (Okinawa, Ryukyu) ....... 4,190.904 2,174,609 694.055 31,860 33,611 11South Korea, Republic of .......... 141,008 38,434 65,216 95 157 -Taiwan ........................ 213,789 40,898 55,793 - - -
Oceania, total ..................... 2.101,973 ew,768 399,847 187,011 211,607 24,904
Australia ......................... 2,013,912 797,556 380,435 184,293 207.241 24,904New Zealand ..................... 87.209 38,931 18,944 2,718 4,366 -
Puerto Filed, and U.S. Possessions,total ........................... 110,734 39,432 37,933 466 8,197
Puerto Rico ...................... 104,456 38,364 34,163 466 8,197U.S. possessions, total .............. 6.278 1,068 3,770 - -
Coun" not stated ................. 61,175 22,640 9,568 - -
DISC dIvIdends ................... 512,944 5,340 435,056 3,390 21,327 -
OPEC countries, total (Includedabove) ................. 4,717,506 2.31 I,SW 659,935 10,508 17.243 6,901
Footnotes at end of table.

90 Corporate Foreign Tax Credit, 1984RETURNS WITH FORM 1118 FILED IN SUPPORT OF FOREIGNTAX CREDIT CLAIMED AND WITH $250MILLION OR MORE IN TOTAL ASSETSTable 4.-Total Assets, Income, tax and Credits and Foreign Income, Taxes and Credit, by Selected Country* to WhichForeign Taxes Were Paid and DISC Dividends-Continued[Money amounts are in thousands of dollars]
Income and uums from specific gsolaapft anN Or
and DISC dividends
Income and taxes of related Wallin corponalons and DISC's-Confinued
Income and taxes of find, noond. and third4lerI~ corporationsfrom whicli constructive distributions wers received
Gains.proft and
Inoome
T-es paid ongains. P-11tsand income
Divdendsconstructively
distributedto domestic
comorallom,
Tuft deernedpaid by,"ad
foreign
Tun deemedpaid by
domesticc-porations'
(82) (63) (64) (65) (66)
All geographic areas, total .............................. 6,953,36S 1,783,141 2,937,158 382,826 11,2441757
cans"", ............................................ ............... 410,726 147,6111111 151,769 41,388 120,963Latin America, total ................................................... 1,181,453 181,208 466,715 43,414 127,452MeAco .. .......... I I .................. ... '' ........ I.............. 1 105,166 33,637 19,928 - 13,032Central America, total ............. ..................................... 662.454 41,139 319.745 36.607 72,482Honduras .......................................................... - - - -Panama lincluding Canal Zone) ......................................... 1
1660,051 40,925 317,918 36.585 72,265
Caribbean countries. total .................... ........................ 152,876 13,802 87,853 4,503 8.246Cayman Wands (Brifish) . . ..... _ . ._ .. .. .... ~ r 129,785 13,095 68,427 4.503 7.737Dominican Republic ................................................ - - -TnmdadwdTobago .. .............. : ................................ 139 61 (1) V)
South America, total ................. .... ... ... ...
260,967 92,631 39,189 2,303 33,692A,gen na .......................:11 .... ............................... 14,382 2.461 1,695 - 534Brazil
.... * . . ...... ............... 229.634 82,900 36,342 2,190 32,815
Chile' .. ..... * ... .... ... --* ' ' ''
883 140 153 28Colorribia .......................................................... 6,472 .2,553 400 - 96Ecuador ......................................................Pe ...... .................................. .....................Venez~mla ........................................................ 8,902 4,159 583 113 196
Other Western Hemisphere, total ...................................... 1,505,714 193,472 1,121,623 12,884 176,604
The Bahamas ....................... - ............................... 130,163 24.140 68,013 12,846 22,239Netherlands Antilles ........... ........................... __ ........ 1,334.277 167,708 1,030,407 153,062
Europe, total ....................................................... 2,930,009 9S3,302 964,327 201,907 672,795
Common Market countries, total ........................................ 2,016,341 786,345 432,329 72,383 426,535Belgiurp .......................................... ................ 227,727 86,034 50,253 262 43.353France (Including Andorra) . . . .......................................... 274,865 152,790 39.753 34.507 53,990Greece .......................................................... 517 474 (1) -
-:rdand 21;344- - -583- - - - 2,899 - - - - - - 166taly (including San Marino) ............................................. 57,112 20,361 943 234 963Luxembourg ................................... ......... - 8,893 3.389 4,289 746 3,424Netherlands ................... '' ................... ..... I ......... 319,066 112,158 161,207 27,255 107.479United Kingdom ..................................................... 790197 239,014 118,435 7,166 131,271West Germany ...................................................... 3
13:324 169,669 54,233 2,213 85,761
,Other West European countries, total ...................... 912,494 176,933 520,848 129,525 246,237Austria ............................................................. 18,143 2,562 13,661 9,140 10,537Finland ........................................................... - - - - -Norway ............................................................ 77,798 31,405 34,714 26.303Spain ........................................................... _ 35,023 15,073 5,064 238 3,524Sweden ............................................................ 874 554 127 - 13
Switzerland......................................................... 748,060 124,944 465,577 119.825 204.179
Turkey ....... ..................... ...... I ........................ - - - --
East European countries. total ............................................ - - - -
Atrice, total ......................................................... 19,194 7,714 2,T73 483 1,940
North Africa, total .......... - ....................... __ ..............Egypt ................ I ..................... ....... I ...............Ulbya .........................................................
East Africa, total .......................................................
West and Central African countries, total .................................... 15,298 6,224 2,754 1.829,Gabon ................ .......... I ..................... ........... - - -Nigen .......... __ ...... .... .................. ............ 11 ... 14,814 6,092 2,563 1,790Zaire ................................................ ............. - - - -
Southern Africa, total ......... __ ...................................... 3,897 1,489 19 483 111South Africa (includes Namibm) ............................... ......... 3.897 1,489 19 483Zimbabwe ......... i ............................... ................ - - - -
Asia, total ............................................................ 567,669 189,330 IS3,425 5,414 68,292
Middle East, total ...................................................... 10,253 650 9,302 - 421
: .... . .......... .. . .. .... . .. .. .. . .arael .. ... ...... .. ....... .. ... .... ... .. .. . ... .Kuwait .................................... .... - ..................Oster ............................ .................................,Saudi Arabia . . ........................ '' .... '' .................United Arab Emirates ..... ...........................................
Southern'and Southeastern Asia, total ........ ...................... 111,562 31,682 22,383 1,077 5,928India 9,002 8.005 4 747 38Indonesia ................................................... 4 2 2 2Male qysia ...........................................................
5,112
12,2 6
12 1 - 254
Philippines ......................................................... 6,508 3,101 426 330 310Singapore ....................................................... .. 84,886 14,901 21.603 - 5,018Thailand ............................................... .... _ 3.512 1,664 75 - 140
Eastern Asj~, total ...................................................... "5,843 156,998 121,746 4,337 61.944China . ............................. ........................Hong Kong ......................................................... 123,179 15,913 52,970, 312 6,982Japan (Okinawa, Ryukyu) ................... .......................... 322,384 141,014 68,605 4,026 54,911South Korea, Republic of .............................................. - - - -Taiwan ............................................................
jr7 165 '51
Oceania, total ....................................................... 304.1ilill' 92,362 $4,177 TT'130 7S,037
Australia ............................................................. 302,266 90,746 83,874 77,130 74,640New Zealand ....................... ................................. 2,393 1,555 303 - 396
Puerto RICO and U.S. Posseaslonts, total .................................. 32,956 7,714 1,912 206 1,323
Puerto Rico ....................................................... - 32,956 7.71 4 .1,912 2D6 I,MU.S. possessions, total ................................................ -
~- -
Country not stated ................................................... 787 349 437 3.49
DISC dividends ................................... - - - 7 -
OPEC countries, total (included above) ........................... 23,r20 10,264 3,146 113 1,988
I Less than $500.Note: The number of parent corporations which received income trom or paid taxes to a specific country we identified in column 1. The data in columni 2-13 are not finuted to amounts attributable to a specific country, i.e.,
"income and Im" from all scurces." When a corporation recekvd income from or paid taxes to more it= one country, that corporation is included in toolumn 1) and the corporaton's same aggregate date we included incolumns 2_1 3 for
mmthan we country. The data by geographic was for columns 1-13 are not additit" to the all geographic was, total. Ho-amr, the data in columns 14-66 we amounts for the SpecifiC country. The data
by geographic was for columns 14-M we additive to the all geographic areas, total. Data far specific geographic areas am not additive as data are present for only selected countries.

Projections of Returns to be Filed inFiscal Years 1990-1997
By Marion W. Mak*
Fiscal year projections of the major types ofreturns provide a foundation for Internal RevenueService (IRS) workload estimates, resource require-ments, and budget submissions to the Treasury,Office of Management and Budget, and Congress.The most recent IRS projections indicate that a totalof 202.8 million returns will be filed in Fiscal Year (FY)1990, or an increase of 1.7 percent over the numberof returns filed in FY 1989 [1 ]. Although projectedyear-to-year increases will range between 2 to 5million returns, the yearly rates of growth in totalfilings are expected to decline from 2.6 percent in1989 to 1.7 percent in 1997. Much of the year-to-yeargrowth in total returns reflects the growth in in-dividual returns, which make up more than half of thetotalreturns.
Projections of returns are developed by: (1) usingeconometric models that relate the number ofreturns filed to selected independent economic anddemographic variables and (2) extrapolating ob-served time trends into the projection period. Theforecasting models are initially formulated on acalendar year basis. Fiscal year projections arederived from calendar year statistics by variousmethods including the seasonal adjustment method(see the section on Data Sources and Limitations).
The projections also include adjustments for theeffects of recent legislative, regulatory and ad-ministrative changes. They generally do not an-ticipate legislative or administrative changes whichare under consideration.
TOTAL PROJECTED RETURNS
The total number of returns, as shown in Table 1,Projection of the Number of Returns to be Filed withthe Internal Revenue Service, Fiscal Years 1989-1997, is comprised of primary and supplementalreturns. With few exceptions, items in both of thesecategories are a part of the IRS Master File system.
Primary returns are those that account for themajority of total filings and historically havegenerated the majority ofthe IRS document process-ing workload. These returns are expected to con-tinue to account for the bulk of total filingsthroughout the forecast period.
Of the 194.3 million tax forms filed in 1988,183.8million were designated as primary returns. Majorreturns in the primary returns category include: U.S.Individual Income Tax Return; Individual Declarationof Estimated Tax; U.S. Corporation Income TaxReturn; and Employer's Quarterly Federal TaxReturn.
The number of information documents processedby the Service, such as interest and dividend state-ments and Forms W-2, Wage and Tax Statement, arenot included in the returns counted or projected inthis article because they are mostly filed on magnetictape [2]. These returns are large in number so that,if included, they would increase the total number ofreturns substantially. In 1988, about 992 million infor-mation returns were processed by the Service. In1989, the number is expected to exceed 1 billion.
Figure A presents the average annual percentagechanges for the major return types during the 1990-1997 projection period. Total returns increased byan average of 1.6 percent per year during this timeframe. Projections for 1990 and the associated ratesof change from 1989 to 1990 are presented in FigureB.
Individual Income Tax Returns
Important adjustments for recent legislation weremade to the Form 1040, Form 1040A and Form1040EZ returns projections. These return types willcontinue to be impacted in 1990 and subsequentyears due to the Tax Reform Act of 1986 and theTechnical and Miscellaneous Revenue Act of 1988.
*Statistican, Projections and Forecasting Group, Research Division. 91
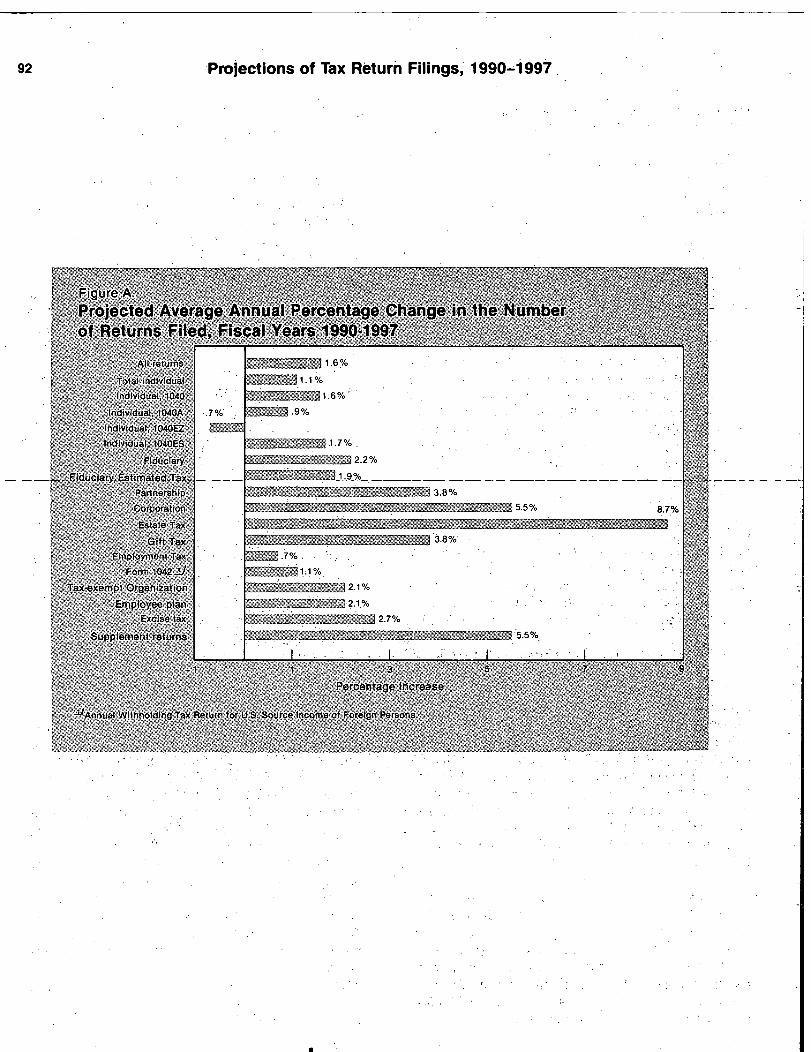
92 Prolections of Tax ROurh Filings,' 1900-1997',
Figure A.
Projected Average Annual Percentage Change in the Numberof Returns Filed, Fiscal Years 1990-1997
All return,
Tot.,il individual
Indivi(lual, 1040
ndiyidual, 1040A
Individwil, 1040EZ
Individual, 1040ES
Fiducia,y
Fiduciary Estimated Tax
Partn~rship
Corporation
E~,tate Tax,
Gift Tax
Empk~ymEr)t Ta,
Form 10421-1
Tax-eAempt Ofganization
Employee plan
tyrisp ta,
Supplement returns
.7
Percentage Increase
--~JAnnu~l V~ithholding T~3~ Rp;urn for U S Smirce Income ot Foreig Persons.

Projections of Tax Return Filings, 1990-1997 93
Figure B.-Projections for Fiscal Year 1990
Type of return1990
Projection(thousands)
Percentageincrease
trorn 1989
Total retums .....................................
Primary returns, total .........................................~ndividual income tax .....................................
ndividual declaration of estimated tax ..........
Fiduciary income tax .....................................Fiduciary estimated tax ............ .....................Partnership ....................................................Corporation income tax .................................Estate and gift tax ..........................................Employment tax .............................................Form 10421 ................................... ..............Tax
exemptorgani7ation ................................
Employee plan*............................. * ....... *Excise tax
.................................... *.................Supplemental returns .........................................
202,783
190.685111.48737.2202,556
7502,0144,425
16628,680
19524
1,910934
12,098
1 Annual Withholding Tax Return for U.S. Source Income of Foreign Persons.
1.7
1.41.41.81.9
-1.23.55.04.4
.41.94.42.5
-2.16.8
The Tax Reform Act of 1986 is expected to resultin a continued shift to simpler forms being filed in1990. This shift is the result of such tax reformprovisions as the repeal of the deduction for marriedcouples when both work; the elimination of incomeaveraging; limits on the use of (individual retirementarrangement (IRA) contributions to reduce "adjustedgross income"; and changes in the area of itemizeddeductions. The actual movement to simpler returnsis also a function of taxpayers becoming morefamiliar with the effects of the law changes andrealizing they can now use the shorter Forms 1040Aor 1040EZ. An estimated 680,000 individual returnfilers are expected to shift to the simpler returnsduring the 1990 filing season. Though substantial,this shift is less than that which occurred in the prior2 years under tax reform.
Growth in individual returns is dependent, in largepart, on the growth of total employment. Currentforecasts show the rate of employment growth slow-ing down throughout the 1989 to 1997 forecastperiod [3]. Total employment is projected to reach119.4 million in Calendar Year 1989, a 1.9 percentincrease over actual employment of 117.1 million in1988. The rate of growth will gradually taper downto 1.3 percent by Calendar Year 1996. This slow-down in the rate of employment growth is mirroredin individual income tax return filings, so that adecline in the rate of growth of these filings is an-ticipated.
In addition, the growth in individual returns isexpected to be further reduced in FY 1990 due to theeffects of the 1988 Technical and MiscellaneousRevenue Act. Under this Act, parents may now electto claim on their returns the unearned income ofcertain children. This law is effective for Tax Year1989 returns and is expected to result in 570,000fewer dependent filers in Fiscal Year 1990.
Figure C compares the number of Forms 1040,1040A, 1040EZ, and total individual returns expectedto be filed in 1990 and 1997, respectively.
Individual Declarations of Estimated Tax
Projections of Individual Declarations of EstimatedTax (Form 1040-ES "vouchers"--up to four per yearcan be filed) are developed from a regression ofvouchers on the number of their taxpayer counter-parts. The growth in Form 1040ES returns, there-fore, is determined by the growth in individualreturns. Current forecasts are calling for growth inForm 1040ES returns that ranges from 1.8 percent in1990 to 1.6 percent in 1997.
Fiduciary Income Tax Returns
A provision in the Tax Reform Act of 1986 man-dated that taxable trust filers of fiduciary income taxreturns (Forms 1041), who previously could havefiled on a noncalendar year basis, had to begin filingtheir returns on a calendar year basis. This resultedin a large one-time increase of 8.0 percent in FiscalYear 1988 as noncalendar year filers adjusted theiraccounting periods to coincide with the calendaryear by filing additional returns to cover transitionalpart year accounting periods. In 1989, as taxpayersreturn to their normal filing pattern, the number ofreturns to be filed is projected to show a substantialdecrease of nearly 10 percent. After 1989, the yearlygrowth in returns is expected to be around 2.0percent.
Fiduciary Estimated Tax Returns
The Tax Reform Act of 1986 required that both newand existing estates and trusts make estimated taxpayments for the first time for calendar years begin-ning after 1986. Form 1041-ES, Estimated IncomeTax for Fiduciaries, was developed for taxpayers witha tax liability of $500 or more to compute and payestimated taxes. Beginning with the quarterly es-timated tax payments due September 18, 1988, theService required financial institutions servicing 200or more taxable trusts to remit payments through theFederal Tax Deposit (FTD) System by magnetic tape.Financial institutions servicing at least 50 taxabletrusts can elect to file under the FTD Magnetic TapeProgram. As a result of this procedure, the numberof Form 1041 -ES returns is expected to show a largedecrease of 28.0 percent in FY 1989, and a smallerdecrease of 1.2 percent in 1990. By 1997, a growthof 1.8 percent is expected.

94 Projections of Tax Return Filings, .1990-1997
Partnership Tax Returns
A provision Jn the Tax Reform Act of 11986 requiringthat "passive losses" be offset only against "passivegains" resulted in fewer persons investing'M theseventures [4]. As a result, there was a small declinein pailhership returns, in 1988. In 1989, the year-to-year growth was expected to reach 7.2 percent.asinvestors adjusted their investment strat6gie
Is to
coinc, ide with tax reform. Year-to-year increases from1990 to 1997 will range from 3.5 percent to 5.0percent.
.Corporation Tax Returns
The Revenue Act of 1987 required that filers of"personal service" land S Corporation returns thatwished to maintain the Use of noncalendar yearaccounting periods estimate the amount of tax ap-plicable to the deferral period--the period betweenthe noncalendar year and the calendar year--andprepay this entire amount when filing the requiredexcise'.tax return (see Excise Tax Returns, bel6w) [5].If the corporations decided to. switch to a calendaryear filing status'in order to avoid this prepayment,they had to file twice during the year--the first to close
w !
out the remainder of,the noncalendar year.and.the
second to end the calendar. year. It is estimated thatapproximately - ~0,000 noncalendar or fiscal 'yearfilers. wi.l[switchJo
.filing a calendar year return.. As a
result, the number of-corporation returns for 1989 isexpected'to indease by,.5.7,percent. By 1990, the.rate of 'increase wil[. level. off" at 5.0 percent as anormal filing pattern is resumed.
Edtate'iind i3ift Tax Returns'-.The, Tax Reform Act, of 1976 and the Economic
Recovery Act of 19811. both stipulated-that the,filingthreshold. for the U.S.
,Estate Taix Return (Form 706)
be gradually increased~.oin 'an 'annual basis,.from
$60,000 for decedents'who died in 1976 to $600,000for decedents who died in 1987 and beyond. Estatetax returns are projected to grow by. only 3.6 percentin, Filing Year 1989,,as -compared to 7.8 percent in1 §96. - The smaller growth in. 1989 ispainly due tothe impactolf the raised filing threshold which shobldcause
.many'small estateslo stop filing. By 19§7, the
growth is-ex.pIected t6'reach 8.7 percent. U.S. G ift Tax
Returns-'(Forms 709) are. projected to show a 2.2percent growth in'l 989; And'a 2.5 percent growth in1997.

Projections of Tax Return Filings, 1990-1997
Employment Tax Returns
Employment tax returns consist of Employer'sAnnual Federal Unemployment Tax ReturnEmployer's Annual/Quarterly Federal Tax Return:and Employer's Annual Railroad Retirement TaxReturn. Projections for the forecast period 1990-1997 reflect year-to-year increases that average 0.7percent per year.
Form 1042
Form 1042 is an annual withholding tax return filedfor foreign "persons" with income from U.S. sources.Projections of Form 1042 returns are expected toincrease by an average of 1.1 percent between 1990and 1997.
Tax-Exempt Organization ReturnsA host of tax-exempt entities, including those for
public charities, farmers' cooperative associations,private foundations, and "other" exempt organiza-tions, embody the exempt organization category ofreturns. The magnitude of this return category isdictated by changes in Form 990, Return of Or-ganization Exempt From Income Tax (filed by the"other" organizations and by most public charities),which accounts for 78 percent of exempt organiza-tion filings. Current estimates of the year-to-yearincrease in tax exempt organizations are expectedto range from 4.4 percent in 1990 to 1.5 percent in1997.
Employee Plan Returns
The total for employee plan returns consists of thefollowing: Form 5500, Annual Return/Report ofEmployee Benefit Plan; Form 5500C (same as theForm 5500 except that it is filed for plans with fewerthan 100 participants); Form 5500EZ, Annual Returnof One-Participant (Owners and Their Spouses)Benefit Plan; and Form 5500R, Registration State-ment of Employee Benefit Plan (filed for plans,withfewer than 100 participants). The projections areexpected to show an increase of 2.5 percent in 1990and 2.2 percent in 1997.
Excise Tax Returns
Total excise returns are the sum of the followingreturns: Form 11 C, Special Tax Return and Applica-tion for Registry-Wagering; Form 720, QuarterlyFederal Excise Tax Return; Form 730, Tax on Wager-ing; and Form 2290, Heavy Vehicle Use Tax Return.Two provisions of the Tax Reform Act of 1986
95
(modified by the Revenue Act of 1987) will continueto reduce the number of Form 720 returns filed topay the excise taxes on gasoline and diesel fuel. Thefirst provision requires that wholesalers pay the ex-cise tax on diesel fuel rather than retailers. Thesecond provision requires that the excise tax ongasoline be paid by the refiner, or first importer, ratherthan the wholesaler.
On the other hand, the implementation of aprovision of the Revenue Act of 1987 partially offsetsthe decline in Form 720 returns filed. This provisionspecifies that all partnerships and S Corporationselecting to maintain a noncalendar year reportingperiod must file Form 720 to make certain requiredpayments. The net impact of these law changes onthe filing of total excise tax returns is expected to bea 0.2 percent drop in returns in 1989 and a 2.1percent drop in 1990. The balance of the forecastinterval is expected to show a positive growth of 3.1percent in 1991 and 2.7 percent in 1997.
Supplemental Documents
Supplemental documents are mainly composedof amended returns and requests for filing exten-sions from both individuals and corporations. Cur-rent forecasts of supplemental documents call forincreases ranging from 6.8 percent in 1990 to 5.0percent in 1997.
DATA SOURCES AND LIMITATIONS
The number of returns filed (as used in this article)represents returns processed at IRS service centersduring a fiscal year [6]. The 1989 data for individual,estate, gift, employment, and excise tax returns wereestimated by using actual returns processed throughJune 1989. The 1989 data for the rest of the formsare based on projections.
To illustrate the general forecasting process,projections for the combined total of Forms 1040,1040A, and 1040EZ returns were developed basedon a multiple regression relating total 1040 returnsto total employment; an interaction variable involvingboth total employment and employed marriedwomen with husbands present (used as a proxy forpotential joint filers); pension beneficiaries and an-nuitants; and qualitative "dummy" variables to ac-count for the effects of law changes [7]. The histori-cal base period for this regression was 1952-1989with 1989 estimated on the basis of returns filedthrough June 1989. Return projections were primark

'96 Projections of Tax Return Filings, 1990--4997
ly formulated on, a calendar year basis and, sub-sequently converted to fiscal year projections by oneof four methods. The method used most frequentlyemploys the. Census Bureau's Xl 1 -Q Seasonal Ad-justment Program [8]. The method used secondmost frequently is to compute a ratio based on thequarterly filing experience of 'one or more historicalyears. The third method (used in instances wherefiling trends are not
*well defined) is bas
'ed on as-
sumed relationships between the number of returnsand various filing patterns. The, fourth'method is avariation of the X-1 1 Q approach in which theseasonal factors afe subsequently trended.'
NOTES-AND REFERENCES
Ill All statistics are for the years in 'which the taxreturns were processed by the Internal, RevenueService, stated on a fiscal year (i.e,, Octoberthrough September) basis, unless otherwise
-noted. Actual-counts for all-of Fiscal-Year 1989-were incomplete at t
'he time this article was
written (see the Data Sources and Limitationssection). For complete counts, see U. S.Department of the Treasury, Internal RevenueService, 1989 Annual Report, Commissionerand Chief Counsel, Internal Revenue Service,1990.
[2] Certain types of income tax returns'are also
either now being filed or will begin.to be filed onmagnetic tape during the projection 'period.However, it is expected that in most cases thesereturns will comprise a small proportion of thetotals shown.
[3] The. largest,component of total. employment--isrepresented by civilian employment, which wasobtained from Data Res
'ources, Inc. (DRI), in
June 1989. DRI believes, that employmentgrowth will decline due to a general slowdownin economic activity through the mid-1 990's'.
[4] Passi.ve gains or los''se's resulted from trade or
[5]
business activities in which the partners did notmaterially participate' in the business'' on aregular, continuous, or substantial basis (i.e.,they were "limited" partners). In general,as aresult -of the Tax Reform -Act -of 1986,..suchpassive losses could - not. be deducted from'other, non-passive, types of income
in general, a "personal servicei" corporation is a.company whose principal' activity is personalservice substantially performed by employee-owners who are shareholders at any.timeduring the year. An S Corporation is a companywith no more than 35 shareholders (Who are.ind ividuals), 'electing to be taxed at.the'shared-holder-level-.
[6] U.S. Department of the Treasury, . Internal
[7]
Revenue Service, 1989 Annual Report, 6p. cit.
-Projections of total, employment, employedmarried women with husbands present, and
~pension beneficiaries and Annuitant's were
181
made by the Projections and ForecastingGroup, Research Division, Internal RevenueService.
U.S. Department of Commerce, Bureau of theCensus, 'The Xl 1 -Q Variant of the CensusMethod 11 Seasonal Adjustment Program,"Technical Paper No. 15 (1'967 revision). .

Projections of Tax Return Filings, 1990-1997
Table I.-Projection of the Number of Returns to be Filed with the Internal Revenue Service, Fiscal Years 1989-1997
[Number of returns are in thousands]
97
ActualProjected
Type of return 19881989 1990 1991 1992 1993 1994 1995 1996 1997
(1) (2) (3) (4) (5) (6) (7) (a) (9) (10)
T*M returns I .................... 194,305 199,328 202,783 205,195 206,744 212,407 215,712 219,278 223,076 226,942
Prl Tatal ........................ 183,781 187,997 190,685 192,393 195,159 198,024 200,550 203,312 206,281 209,217
Individual income tax, total 106,994 109,942 2 111,487 111,997 113,405 114.866 116,033 117,373 1118,1134 120,222
Form 1040 series, total 106,764 109,693 2 111,223 111,721 113.115 114.561 115,713 117,038 118,484 119,856
Form 1040 ........................ 70,770 71,5332 72.793 73,582 75,049 76.527 77,427 78,615 79,896 81,119
Form 1040A...................... 17,657 18,7002 19.125 19,203 19,357 19.398 19,768 20,011 20,283 20,353
Form 1040EZ .................... 18,337 19,4602 19.305 18,936 18,709 18,636 18,518 18,412 18.304 18,384
Other 3 .................................. 230 2492 264 276 290 305 320 335 350 366
Individual estimated tax ........... 35,489 36,577 37.220 37,865 38,511 39,157 39,802 40,"8 41,093 41,739
Fiduciary income tax 4 ............. 2,783 2,507 2.556 2,615 2,679 2,745 2,803 2,861 2,921 2,979
Fiduciary estimated tax ............ 1,055 759 750 765 782 800 817 832 841 856
Partnership .............................. 1,814 1,946 2,014 2,033 2,109 2,?19 2,294 2,379, 2,492 2,615
Corporation income tax 5 3,986 4.213 4,425 4,612 4,852 5,133 5,415 5,721 6,064 6,440
Estate Tax ................................ 52 54 58 63 69 75 82 89 96 105
Gift Tax ............................. _ 103 1052
108 113 118 123 128 132 136 140
Employment Tax 6 .................... 28,218 28,5552
28,680 28,855 29.079 29.274 29,467 29,690 29,935 30,165
Form 1042 7 ............................ 17 182 19 19 19 19 19 20 20 20
Tax-exempt organization 8 ........ 490 502 524 540 554 566 577 587 596 605
Employee plans 9..................... 1,819 1,864 1.910 1,953 1,994 2,036 2.075 2,115 2,158 2,206
Excise 10 ................ .................
9569542
934 962 988 1.010 1,036 1,065 1,096 1,125
Supplematel documents ...... 10,524 11,331 12,098 12,802 13,584 14,383 15,162 15,967 16,795 17,625
Form 104OX ............................. 1,559 1.649 1,769 1,875 1,993 2.117 2,238 2,363 2,494 2,625
Form 4868 ............................... 5,563 6.049 6,486 6.872 7,324 7,790 8,244 8,720 9.215 9,713
Form 2688 ............................... 1.484 1.680 1,787 1,873 1,967 2,059 2,143 2.227 2,311 2,392
Form 112OX ............................. 51 43 36 32 30 28 27 26 25 24
Form 7004 ............................... 1,836 1,881 1,990 2,118 2,238 2,357 2,477 2,596 2,715 2,835
Form 1041 A ............................. 31 30 31 31 32 33 34 34 35 36
' Included in the total are the following "Non-master FiW returns: Form CT-2, 941M, 990BL and 1120-IC-DISC for FY 1988; projections of these formsfor future years have been discontinued and are
therefore not shown below.2 Projection is based on returns processed through June 1989.3 Includes Forms 104ONR, 1040 PR, 1040SS, and 1040C; Form 104OX is included under Supplemental Documents, below.4 Includes Forms 1041 and 1041S; Form 1041A is included under Supplemental Documents, below.5 Includes Forms 1120, 1120A, 1120F, 1120H, 1120L, 1120M, 1120POL, 1120S, 112ODF, 1120SFC, 1120PC, 1120EIT, and 1120 FIC; Form 112OX is included under Supplemental Documents, below.6 Includes Forms 940, 940EZ, 940PR, 941, 941 E, 941 PR, 941 SS, 942, 942PR, 943, 943PR, and CT- 1.7 Annual Withholding Tax Return for U.S. Source income of Foreign Pesons.8 Includes Forms 990, 990C, 990PF, 990T, 4720, and 5227.9 Includes Forms 5500, 5500C, 5500EZ and 5500R.'o Includes Forms 11 C, 720. 730 and 2290; excludes Forms 11 and 5000.24 which are filed with the Bureau of Alcohol, Tobacco and Firearms, U.S. Department of the Treasury, instead of with the Internal
Revenue Service.NOTE: Detail may not add to totals because of rounding.

Selected Historical Data
Table Page
1 -individual Income Tax Returns: Selected Income and Tax Items, for Selected Tax Years, 1970-1987 ..... 100
2-Individual Income and Tax Data, by State, Tax Year 1987 .................................................................. 101
3-Number of Individual Returns, Income, Tax and Average Tax, by Size of Adjusted Gross Income,Tax Years 1984-1987 ..................................................................................................................... 104
4-Reconcillation of Adjusted Gross Income (AGI) and Personal Income Used in the National Income andProduct Accounts (NIPA), Selected Tax Years, 1970-1987 ................................................................. 106
5-Personal Income and Total Adjusted Gross Income, Based on Individual Income Tax Returns,
Tax Years 1947-19i8 ..................................................................................................................... 106
6-Total Adjusted Gross Income and Adjusted Gross Income Reported on Individual Income Tax Returns,Tax Years 1947-1987 ..................................................................................................................... 107
7-Standard and Itemized Deductions, Taxable and Nontaxable Individual Income Tax Returns,Tax Years 1944-1987 ..................................................................................................................... 108
8-Personal Income, Taxable Income and Individual Income Tax, Tax Years 1947-1987 ............................ 109
9-Number of Individual Income Tax Returns, by Type of Tax Settlement, Tax Years 1944-1987 ................ 110
10-Nonfarm Sole Proprietorship Returns: Selected Income and Deduction Items, for Selected Tax Years,1970-1987 .................................................................................................................................... ill
11 -Partnership Returns: Selected Income Statement and Balance Sheet Items, for Selected Tax Years,
1970-1987 .................................................................................................................................... ill
12-Number of Business Income Tax Returns, by Size of Receipts and Assets, for Selected Income Years,
1970-1987 ............................................................................................................. *,*,**,,**,*,,*** ...... 112
13-Corporation Income Tax Returns: Balance Sheet, Income Statement, and Tax Items, for SelectedIncome Years, 1970-1986 .............................................................................................................. 113
14-Corporation Income Tax Returns: Selected Balance Sheet, Income Statement, and Tax Items,
by Industrial Division, for Selected Income Years, 1970-1986 ........................................................... 115
15-Corporation Profits Before Taxes and Income Subject to Tax, Income Years, 1960-1988 ...................... 117
16-Gross Internal Revenue Collections: Amount Collected, by Quarter and Fiscal Year, 1984-1989 ........... 118
17-Internal Revenue Refunds: Amount Refunded, by Quarter and Fiscal Year, 1984-1989 ....................... 119
18-Classes of Excise Taxes, by Selected Fiscal Year, 1970-1989 ............................................................ 120
19-Selected Returns and Forms Filed During Selected Calendar Years, 1970-1989 .................................. 121
20-Taxpayers Receiving Assistance, Paid and Unpaid, by Tax Year of Return, 1985-1988 ......................... 121
Notes to Selected Statistical Series Tables ............................................................................................ 122
NOTICE
The data on the following pages are the latest and most accurateavailable at time of publication. However, they are subject tocontinuous revision as more information becomes available. Datalabeled as preliminary should be used with caution.

Selected Historical Data
Table I.-Individual Income Tax Returns: Selected Income and Tax Items for Selected Tax Years, 1970-1987IAII figures are estimates based on samples money amounts are in thousands of dollars]
100
ftern 1970 1975 low 1985 1986 1987
(1) M (3) (4) (5) (6)
All returns ...................................................................... 74,279,831 82,229,332 93,902,469 101,660,287 103,045,170 106,996,270Form 1040 returns ............................................................................ 74,279,831 64.527,726 57,122,592 67,006,425 68,909,828 71,032,103Form
1040A returns .......................................................................... N/A 27.701,606 36,779,877 18,124,702 17,584,689 17,446,685
Form 1040EZ returns .......................................................... N/A N/A N/A 16,529,160 16,550,653 18,517,482Adjusted gross Income (AGI) ............................................... 631,692,540 947,784,873 1,613,731,497 2,305,951,483 2,481,681,046 2,773,824,198Salaries and wages:Number of returns ......................................................................... 66,965,659 73,520,046 83,802,109 87,198,001 88,217.638 90,984.304Amount .......................................................................................... 531,883,892 795,399,462 1,349,842,802 1,928,200,978 2,031,025,984 2,163,905,509
Taxable interest received:Number of returns ......................................................................... 32,630,355 40.378,240 49,019,575 64,526.434 65,236,518 67,933,810Amount .......................................................................................... 22,021,267 43,433,554 102.009,444 182,109,194 167,640,438 168,966,067
Dividends in AGPNumber of returns ......................................................................... 7,729,939 8,853,491 10,738,982 15,527,579 16,753,537 22,324,321Amount ..................................................................... .................... 15,806,924 21,892,126 38.761.253 55,046,351 61,623,348 66,791.158
Business or profession net income less loss:Number of returns ............................................ ............................ 6.159.985 7.242,542 8,881,119 11,900,341 12,360,345 13,002,055Amount ...................................................................... ................... 30.554.201 39.421,478 55,129,154 78,772,577 90,423,763 105,460,627
Net capital gain less loss in AGI: 2
Number of returns ......................................................................... 7.962,663 7,574,823 9,970,921 11,125,595 15,560,453 15,450,141Amount .......................................................................................... 9,006,683 14,071,893 30,029,074 67.694,001 132.841,678 137,398,726
Pensions and annuities in AGI:Number of returns ......................................................................... 3,249.558 5.088,937 7,373,704 13.133,295 14,771,235 16,497,586Amount ........................................................... .............................. 7.878.808 20,886.871 43,339,736 95,096,003 107.696,794 124,754.B33
Unemployment compensation in AGI:Number of returns ......................................................................... N/A N/A 1,798,210 4,771,546 5,106,015 7,370,742Amount ......................................... ................................................ NIA N/A 2,028,456 6,355,539 6,975,196 12,286,674
Social security benefits in AGI:Number of returns ......................................................................... N/A N/A N/A 2,956,073 3,174,904 3.637,211Amount .............. ..................................................................... N/A N/A NIA 9,594,182 10,648,112 12.524,112
Rents and royalties net income less low.Number of returns ......................................................................... 6.557.498 7,143,812 8,208,132 9,970,604 9.394,506 9.492,112Amount ............ ............ ................................................................ 3,232,817 5,202,078 4,105,381 -12.963,727 -15,292,084 -9,254,758
Partnership and S Corporation net income less loss:Number of returns ........................................................ n.a. n.a. n.a. 5,487,671 5,817,455 5,574,532Amount ................. ............ ................ ....... .............. .......... 12,637,912 12,811,091 10,099.346 -2,526,591 -5,859,500 24,314,070
Farm net income less loss:Number of returns ........................... .................. ..................... 3,026,530 2,755,041 2,W8,430 2,620,861 2,524,331 2,420,186Amount ..................................... ..................................... .............. 2,788,713 3.563,325 -1,792,466 -12,006,483 -7,284,231 -1,323,464
lbtal -statutory adjustments:Number of returns ............................. ................................ 6.370,552 9.024,255 13,148,919 37,763,418 38,034,061 11,620,127Amount ............................................ .................................... 7,665,251 15.101,999 28,614,061 95,082,299 99,008,229 30,116,329Individual Retirement Arrangements:Number of returns ................................................................ N/A 1.211,794 2,564,421 16,205,846 15,535.531 7,318.727Amount.............................. ...................... ................................. N/A 1.436,443 3,430,894 38,211,574 37,758,393 14,065,722
Self-employed retirement plans:Number of returns ............................................... ...................... 591,655 595.892 568,936 675,822 773,296 759,083Amount.................................... .................................................. 847.692 1.603,788 2,007,666 5,181,993 6,194,617 6.183,441
Married couples who both work:Number of returns ......................... ............................................ N/A N/A N/A 24,835,278 25,647.221 N/AAmount....................................................................................... N/A N/A N/A 24,614,993 26,672.241 N/A
Exemptlonw.Number of exemptions .......................... ....................................... 204,126,402 212,202,596 227,925,098 244,180,202 245,752,978 217,495.163Number, age 65 or over ............................. .................................. 8,904.331 9,937,208 11,847,168 16,748.810 17,395,776 N/A
Total deductions:Number of returns... ...................................................................... 73.862,448 81,585,541 88,491,251 96,848.626 98,180,981 106,005,861Amount ........................................................................ ................. 120,549.755 233,181,778 346,000,155 554,733,5233 611,293,1623 607,223,5134Itemized deductions:Number of returns .......................................... ..................... 35,430,047 26,074,061 28,950,282 39,848,184 40,667.008 35,627,790Total amounts ............................... ............................ .......... 88,178,487 122,260,601 218,028.139 405,023,525 447,057,972 392,020,128Medical and dental expense ...................................................... 10.585,749 11,422,312 14,972,082 22,926,214 25.112,007 17,151,819Taxes paid ............................ ..................................................._ 32,014,673 44.141,289 69,404,275 128,084,618 143,446,005 119.388,068Interest paid .................... .......................... ............................... 23,929,477 38.8a5,282 91,187,006 180,094,578 196,566,331 179,942,422Contributions .......................... .................................... .......... 12,892,732 15.393,331 25,809,608 47,962,848 53,815,979 49,623,907
Taxable Income:Number of returns ...................... .................................................. 59.593.598 65,852,602 88,104,696 96,124,046 97,358,296 90,079,102Amount .................... ..................................................................... 401,154,285 595.492,866 1,279,985,360 1,820,740.833 1,947,024.584 1,850,697,119
Income tax before credits:Number of returns .......................... ...................................... 59,596,755 65,854,734 76,135.819 85,994.216 86,600,724 89,717,924Amount ..................................................... .................................... 84,156,6956 132,452,044 256,294,315 332,165,333 367,591,995 373,857,125
Total tax credital? ............................................................... 369,610 8,069,846 7,215,839 10,248,0" 7,020,731 6,329,438Child care credit ............................................................................ N/A N/A 956.439 3,127,702 3,397,090 3,438.314Credit for the elderly and disabled. .................... .......................... 167,656 128,968 134,993 108,642 85,764 66.633Residential energy credit .............................................................. N/A N/A 562.141 811,675 N/A N/AForeign tax credit ........................................................................ - 169,623 381,985 1.341,675 782,561 773,939 1,099.484Investment credit ...................................................................... 30.554 1,593,150 3.288,415 M MGeneral business credit ...................................................... .......... N/A N/A N/A 4,791,132 1,115,8368 1.018,624
Income tax after credits ...................................................... 83,787,323 124,382,197 249,078,475 321,917,289 360,571,264 367,527,687Total Income tax: 9
Number of returns ...................................................................... 59,317,371 61.490,737 73,906,244 82,846.420 83,967,413 86,723,796Amount .......................................................................................... 1 83,909,311 1 124,526,297 1 250,341,440 1 325,710,254 1 367,287,213 1 369,202,757
See notes following Table 20.
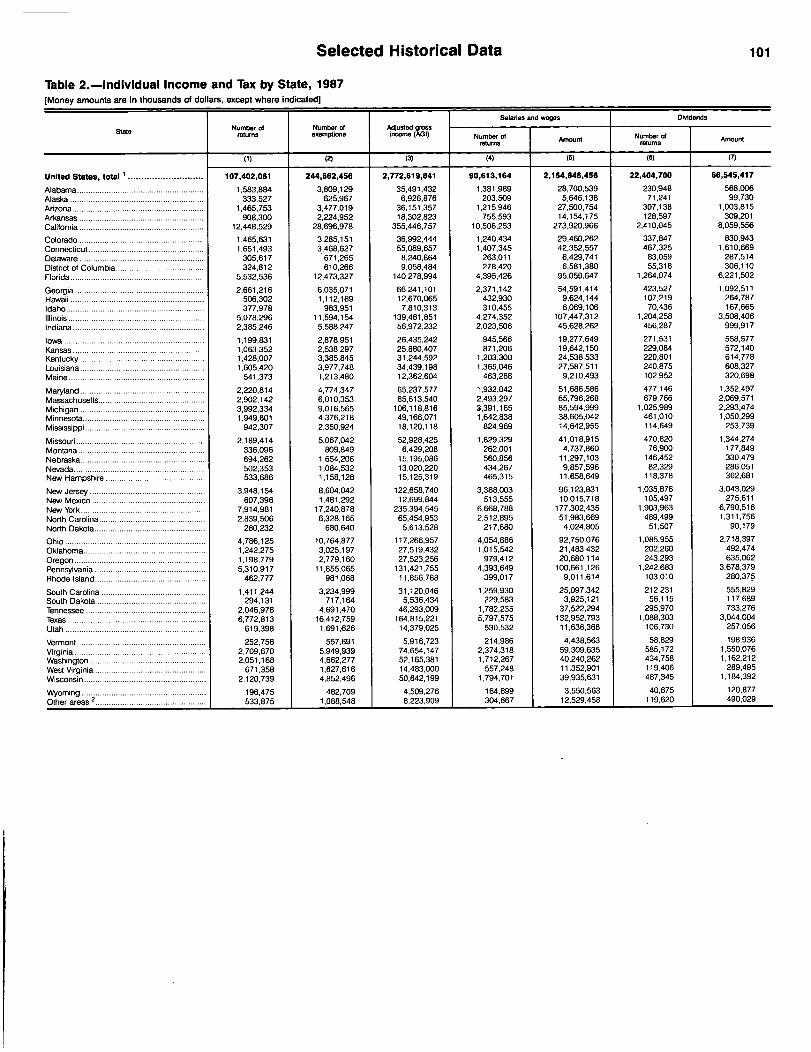
Selected Historical Data
Table 2.-Individual Income and Tax by State, 1987[Money amounts are in thousands of dollars, except where indicated]
101
Salaries and ages Dividends
stateNumber of Number of Adjusted
%,areturns exemptions income, ( ,) Number of Amount Number Of Amountreturns returns
(1) (2) (3) (4) (5) (6)
United States, total 1 ............................ 107,402,061 244,662,456 2,772,619,841 90,613,164 2,154,846,456 22,404,700 66,545,417
A abama ........................................................ 1,583,884 3,809,129 35,491,432 1,381,989 28,700,539 230.948 568,006~
A aska ........................................................... 333,527 625,967 6,926,876 203,509 5,646,138 71.241 99,730
Arizona .......................................................... 1,465,753 3,477,019 36,151,357 1,215,946 27,500,754 307.138 1,003,815
Arkansas ....................................................... 908,300 2.224,952 18,302,823 755,593 14,154,175 128.597 309,201
California ....................................................... 12,448,529 28.696,978 355,446,757 10,508,253 273,920,966 2,410,045 8,059,556
Colorado ............... ....................................... 1,465,631 3,285,151 36,992,444 1,240,434 29,460,262 337,847 830,943
Connecticut ................................................... 1,651,493 3,468,627 55,089,657 1,407,345 42.352,557 467,325 1,610,669
Delaware ....................................................... 305,617 671,265 8,240,864 263,011 6,429,741 83,059 287,514
District of Columbia ................... ....... . ....... 324,812 610,266 9,058,484 278,420 6,581,380 55,318 306,110
Florida ........................................................... 5,532,536 12,473,327 140,278,994 4,395,426 95,059,647 1,264,074 6,221,502
Georgia .................................. ...................... 2,661,216 6,035,071 66,241,101 2,371,142 54,591,414 423,527 1,092,511
Hawaii ........................................................... 506,302 1,112,189 12,670,065 432.930 9,624,144 107,219 264,787
Idaho ............................................................. 377,978 983,951 7,810,313 310.455 6,069,106 70,436 167,665
Illinois ............................................................ 5,078,296 11,594,154 139,481,851 4,274,352 107,447.312 1,204,258 3,508.406
Indiana ................. ........................................ 2,385,246 5,588,247 56.972,232 2,023,506 45,628,262 456,287 999,917
Iowa ... .......................................... ......... .. 1,199,831 2,878,951 26,435,242 945,566 19,277,649 271,531 558,577
Kansas .......................................................... 1,063,352 2,538,297 25,880,407 871,206 19,642,150 229,084 572,140
Kentucky ....................................................... 1,428,007 3,385.845 31,244.592 1,203,300 24,538,533 220,801 614,778
Louisiana ....................................................... 1,605,420 3,977,748 34,439,198 1,365,046 27,587,511 240,875 608,327
Maine ............................................................ 541,373 1,213,480 12,362,604 463,288 9,210,493 102,952 320,698
Maryland ................................. ..................... 2,220,814 4,774,347 65,237,577 1,932,042 51,686.586 477,146 1,352,497
Massachusetts ...................................... ........ 2,902,142 6,010,353 85,613,540 2,493,297 65,796,268 679,766 2,069,571
Michigan .................................................... 3,992,334 9,016,565 106,118,816 3,391,165 85,594,999 1,025,989 2,293,474
Minnesota.................. ..... . ........ - * *
1,949801 4376218 49,166,071 1.642,838 38,605,042 461,010 1,050,299:
Mississippi ..................................................... 942:307 2:350:924 16.120,118 824,969 14,642,955 114.649 253,739
Missouri ......................................................... 2,189,414 5,067,042 52,928,425 1,829,329 41,018,915 470,820 1,344,274
Montana ........................................................ 336,096 809,849 6,429,208 262,001 4,737,860 76,900 177,849
Nebraska.............................................. ....... 694.262 1,654,206 15,195,086 560,856 11,297,103 146,452 330,479
Nevada .......................... ............................... 502,353 1,084,532 13,020,220 434,267 9,857,596 82,329 286,051
New Hampshire ............................................ 533,686 1,158,128 15,125,319 465,315 11,658,649 118,378 362,681
New Jersey ................................................... 3,948,154 8,604,042 122,658,740 3,388,003 96,123,831 1,035,878 3,043,029
New Mexico .................................................. 607,396 1,481,292 12,699,844 513,555 10,015,718 105,497 275,611
New York ....................................................... 7,914,981 17,240,878 235,394,545 6,668,788 177,302,435 1,903,963 6,790,516
North Carolina ............................................... 2,839,506 6,328,165 65,454,953 2,512,895 51,983,669 489,499 1,311,756
North Dakota ................................................. 280,232 680,640 5,613,528 21 7,6aO 4,024,805 51,507 90,179
Ohio ................................................. - .......... 4,786,125 10,764,877 117,266,957 4,054,886 92,750,076 1,085,955 2,718,397
Oklahoma .................................................. 1,242,275 3,025,197 27,519,432 1,015,542 21,483,432 202,260 492,474
Oregon ............................. ............................ 1,198,779 2,779,160 27,523,256 979,412 20,680,114 243,293 635,062
Pennsylvania ................................................. 5,310,917 11,855,065 131,421,755 4,393,649 100.661,126 1,242,683 3,678,379
Rhode Island ................................................. 462,777 981,068 11,856,788 399.017 9,011,614 103,010 280,375
South Carolina .................................. ........... 1,411,244 3,234,999 31,120,046 1,259,930 25,097,342 212,231 555,829
South Dakota ................................................ 294.131 717,164 5,536.434 229,583 3,925,121 56,115 117,689
Tennessee ............................................. 2,046,978 4,691,470 46,293,009 1,782.235 37,522,294 295,970 733,276
Texas ....................... ..................................... 6,772,813 16,412,759 164,815,221 5,797,575 132,952.793 1.088,303 3,044,004
Utah .............................................................. 619,398 1,691,~626 14,379,025 530,532 11,636,368 106,730 257,056
Vermont ......................................................... 252,758 557,691 5,916,723 214,986 4,438,563 58,829 198,936
Virginia .......................................................... 2,709,670 5,949,939 74,654,147 2,374,318 59,309,635 585,172 1,550,076
Washington ................................................... 2,051,168 4,662.277 52.165,381 1,712,267 40,240,262 434.758 1,162,212
West Virginia .................................................. 671,358 1,627.616 14,483,000 557,248 11,352,901 119,406 289,495
Wisconsin ....................................... .............. 2,120,739 4,852,496 50,642,199 1,794,701 39,935,631 487,345 1,184,392
Wyoming ....................................................... 196.475 482,709 4,509,276 164,899 3,550,563 40,675 120,877
Other areas 2 .................... ......... .... .......... 533,875 11088,548 18,223,909 1 304,667 1 12,529,458 1 119,620 490,029

102 Selected Histo'rical Data
Table 2. (Continued)-Individual Income and Tax by State, 1987[Money amounts are in thousands of dollars, except where indicatedl
interest unemployr,701"'pensation thernized deductions
StateAwage
Number ofAmount
Number ofAmount Number of Total
amount
returns returns returns Deductions (wholedollars)
(8) (9) (10) It 1) (12) (13) (14)
United States, total I ........................... 67,754,641 167,478,801 7,308,358 12,228,525 36,976,374 404,019,811 10,926
Alabama ........................................................ 806,370 1,642,035 146,995 153,609 496.152 4,292,455 8,651Masks ........................................................... 169,934 252,110 35,457 82,760 84,496 978,652 11,582Arizona .......................................................... 889,331 2,765,677 77,828 113,465 578,764 6,535,021 11,291Arkansas ..................... ................................. 472,910 1,211,094 81.828 117495 239,674 2.129,279 8.884California ....................................................... 7.710,496 22,253,436 905.713 1.485:930 4.852,036 69,267,097 14,276
Colorado ....................................................... 981,431 2,234,855 93.045 176,172 612,745 6.861,712 11,198Connecticut ................................................... 1.237,452 3,002,819 B5,948 128,887 573,075 7,292,581 12,725Delaware ................................ ~: ................. 192,153 388,530 14,817 20,734 113,660 1,157.724 10,186District of Columbia ....................................... 165,675 461,445 11,346 26.001 113,979 1,511,949 13,265Florida ........................................................... 3,294,153 12.629,542 166,473 267.112 1,661,888 17,860,274 10,747
Georgia ................................................ 1,343,427 2,948,729 164,416 185,370 908,481 9,826,566 10,816Hawaii ........................................................... 373,796 695,344 23,826 39,199 175,582 2,049,374 11,672Idaho ............................................................. 235,355 559,997 43,864 71,068 135,496 1,325,508 9,783Illinois ............................................................ 3.440,865 8,690,849 316,642 663.578 1.660.057 16,893,990 10,177Indiana .......................................................... 1,500,612 3,127,463 151,529 174,891 720,103 6,094,294 8,463
Iowa .............................................................. 879,867 2,224.754 74.349 119,958 401,407 3,360.352 8,371Kansas ............................................... ........... .710,828 1,890,283 68,624 123,009 381,216 3,505,374 9,195Kentucky ....................................................... 781,799 1,737,236 124,612 151,260 441,403 3,749,994 8,496Louisiana ........................ ................. E ............ 849,949 2,039,543 171,979 332,397 429,722 4,066,856 9,464Maine ....................... :.................................... 358.126 680,117 38,548 50,440 158.350 1,515,092 9,568
Maryland ... ................................................... 1,460,139 3,096,303 k,529 165,492 951,693 11,415,475 11,995Massachusetts ............................................... 2.163,886 4,703,360 165,495 333,391 1,043,160 12.126,648 11,625Michigan ....................................................... 2,689,336 5,286,316 422,401 810,038 1,584,777 14,650,529 9,245Minnesota...................................................... 1,410,664 3,001,305 130,848 276,858 842,942 8,582,372 10,181Mississippi ..................................................... 411,221 942,453 82,902, 98,741 234,823 2,079,166 8,854
Missouri ......................................................... 1.380,530 3,504,831 166,845 223,979 677,851 6,011,633 8,869Montana .........A ............................ ................. 229,260 580,664 28,635 44,811 1 i6,991 946,284 8,089Nebraska ................... .................. ........ -484-1498 --1-1183,118- -36,947---45,366- ---208.368- -1-1911-1001- - - -91-171--Nevada .......................................................... 271,265 852,972 .36,204 57,942 160,612 1,756,325 10,935New Hampshire ............................................ 383,894 790,316 19,828 23.726 177,605 1,936,713 10,905
New Jersey ................................................... 2,745,125 6,469,449 220,925 444,334 1,440,551 17,653,364 12,255New Mexico .................................................. 334,405 802,968 67,634 179,114 1,674,406 9,348New York ....................................................... 5,539,864 15,009,241 469,310 861,980 3,223,852 41,574,221 12,896North Carolina ............................................... 1,528,355 2,910.733 180,273 177,228 960,791 9,110,282 9,482North Dakota ................................................. 200.054 485,589 20,206 36,660 72,577 624.403 8,603
Ohio .............................................................. 3,095,393 6,239,989 333,314 597,153 1,557,372 14,237,232 9,142Oklahoma...................................................... 708,777 1,899.639 80,664 131,486 424,385 3,999,248 9,424Oregon .......................................................... 782,619 1,873,079 114,301 194,203 476,404 4,821,905 10,121Pennsylvania ................................................. 3,670,097 7,474,324 466,444 868,234 1,U6,298 14,898,308 9,161Rhodelsland ............................................... 315,388 674,992 40,311 60,637 .148,185 1,524,278 10.286
South Carolina .............................................. 704.868 1,335,360 80,088 80,681 477,540 4,411,663 9,238South Dakota ................................................ 196,993 495,243 1,233 14,752 63,175 489,933 7,755Tennessee ..................................................... 1,069,121 2,334,225 157,775 168,281 496,836 4,468,912 8,995Texas ............................................................. 3,619,964 11.205,228 441,467 888,968 1,901,260 20,877,852 10,981Utah : ............... ................................. 403,894 703,711 43,223 82,248 276,441 2,842,650 10,283
Vermont ......................................................... 172.426 335.283 15,841 21.563 79,914 .750,091 9.386Virginia .......................................................... 1,639,056 3,510,911 123,708 130,606 1,018,812 11.560,064 11,347Washington ................................................... 1,371,010 3,322,650 180.279 332,075 684,997 6,652,293 9.711West Virginia.................................................. 403,921 788.994 70,171 132,858 149,330 1,244,340 8.333Wisconsin ...................................................... 1,578,185 3,004,061 206,973 318,547 784,824 7,165,344 9,130
Wyom,ng .. ............ .... .. .. . .................. 130,058 310,437 19,130 38,746 61,055 511,104 8,371Other areas 2 . ................ .............. .... . .
265,8461
915,199 6,945 15,9701
135,553 1,237,629 9,130

Selected Historical Data
Table 2. (Continued)-individual Income and Tax by State, 1987[Money amounts are in thousands of dollars, except where indicated]
103
Tax liability Earned income credit
StateTotal tax Averag
t Number of
Numberreturns
of Amount
ax(.hotdollars)
returnsAmount
(15) (16) (17) (18) (19)
United States, total . ............................................. 91,119,609 386,357,209 4,240 8,789,469 3,932,549
Alabama ................................................. .......................... 1,281 651
4426484 3455 229278 109238
Alaska ..................................................................... .......... 305: 104 1:043:533 3:420 12:355 4:675
Arizona .............................................................................. 1,222,666 4,615,277 3,775 134,021 59,376
Arkansas ............................................................................ 726,249 2,185,528 3,009 129.919 59,953
California ............................................................................ 10,512.603 50,216,312 4,777 1,047,495 477,197
Colorado
..... ...... * ............. ... ....... * ...........
1,259,984 4,885,027 3,877 102,664 44,657
Connecticut .................................................... ............. 1,495,588 9,183,726 6,141 54.082 22,231
Delaware ............................................................................ 266,355 1,124,878 4,223 21,798 9,683
District of Columbia ........................................................... 276,709 1,381,825 4,994 32,180 14,057
Florida .................................. ............................................. 4,633,080 20,736.508 4,476 495,345 227,071
Georgia ................................................................... .......... 2,229,724 8,759,810 3,929 306,941 141,351
Hawaii ................................................................................ 439,394 1,640,755 3,734 29,665 11,876
Idaho ................. ........................................................... 313,332 904,315 2,886 39,054 16,939
Illinois ................................................................................. 4,355.429 20,912,962 4,802 349,982 153,256
Indiana ............................................................................... 2,004,654 7,532,781 3,758 182,086 80,745
Iowa ............................................................................... 1,021,053 3,359,015 3,290 74,834 31,756
Kansas ............................................................................... 908,592 3,535,965 3,892 72,647 30,934
Kentucky ......................................... .................................. 1,168,913 3,924,439 3,357 162,902 74,566
Louisiana ............................. .............................................. 1,259,820 4,456,136 3,537 259,750 122,072
Maine ................................................................................. 466,153 1,555,973 3,338 39,682 16,876
Maryland ............................................................................ 1,960,048 9,070,694 4,628 137,383 59,534
Massachusetts ................................................................... 2,617,242 12,911,003 4,933 107,189 44,639
Michigan ............................................................................ 3,421,729 14,632,718 4,276 222,843 95,840
Minnesota ........................................................ ................. 1,718,690 6,368,518 3,705 95,772 40,024
Mississippi ......................................................................... 712,645 2,094,264 2,939 197,072 96,353
Missouri .................. ................................................... 1,856,091 7,217,637 3,889 184,733 81,845
Montana............................................................................. 270,459 778,279 2.878 33,061 14,495
Nebraska ...................................................................... 591,741 1,955,460 3,305 49,590 21,263
Nevada .............................................................................. 430,511 1,908,668 4,433 36,578 15,606
New Hampshire ................................................................. 478,414 2,211,103 4,622 22,463 9,344
New Jersey ........................................................................ 3,528,569 18,919,420 5,362 212,216 89,144
New Mexico ......................................... ............................. 477,467 1,523,963 3,192 84.795 37,922
New York ........................................................................... 6,908,152 34,943,260 5,058 556,373 246,399
North Carolina ................................................................... 2,374,741 8,182,060 3,445 307,190 139,237
North Dakota ..................................................................... 237,805 706,667 2,972 22,087 9,242
Ohio ................................................................................... 4,091,529 15,568,112 3,805 311,329 135.671
Oklahoma ................................................................. 1,016,186 3,515,864 3,460 138,088 62,755
........................................................................Oregon 1,002,296 3,369,459 3,362 91,307 40,015:
Pennsylvania ...................................................................... 4,547,167 18,199,689 4,002 330,058 142,489
Rhode Island ..................................................................... 407,961 1,624,975 3,983 24,436 10,451
South Carolina ................................................................... 1,157,729 3,677,911 3,177 176,074 81,784
South Dakota ..................................................................... 242,398 709,049 2,925 27,469 11,771
Tennessee ............................... ................................. 1,684,986 6,202,822 3,681 242,203 111,225
Texas .................................................................................. 5,516.129 23,936,483 4,339 818,317 373,886
Utah .......................... ........................................................ 517,880 1,583,725 3,058 48,707 20,753
Vermont ............................................................................. 220,774 762,160 3,452 15,925 6,637
Virginia ............................................................................... 2,363,623 10,170,891 4.303 188,517 83,382
Washington ........................................................................ 1,765,588 7,214,494 4,086 126,579 54,063
West Virginia ................................................... .................. 549,736 1,746,777 3,177 72,723 32,137
Wisconsin ............................................................ ............. 1,829,563 6,362,271 3,477 114,195 48,549
Wyoming ............................................................................ 164,777 605,029 3,672 15,897 6.894
Other areas 2 ................... ... ............ .......... .... ....1
310,416 11,302,535
14,196
11,620 694
,See notes following Tables 20.

104 Selected Historical Data
Table 3.-Number of Individual Returns, Income, Tax, and Average Tax, By Size of Income, Tax Years 1984-1987[All figures are estimates based on samples-money amounts are in thousands of dollars except as indicated]
Size of adjustedgross income
Total ........................................................
Less than $1,000 ... ...............................................
$1.000 under $3.000 .............................................
$3,000 under $5,000 .............................................
$5,000 under $7,000 .............................................
$7,000 under $9,000 .............................................
$9,OGO under $11,000 ...........................................
$11,000 under $13,000 .........................................
$13,000 under $15,000 .........................................
$15,000 under $17,000 .........................................
$17,OGO under $19,000 .........................................
$19,000 under $22,000 .........................................$22,000 under $25,000 .........................................
$25,000 under $30,000 .........................................
S30,G00 under $35,000 .........................................
$35,000 under $40,000 .........................................
$40,000 under $50,000 .........................................
$50,000 under $75,000 .........................................$75,000 under $100,000 .......................................
$100,000 under $150,000 .....................................
$150,000 under $200,000 .....................................
$200,000 under $300,000 .....................................
$300,000 under $500,000 .....................................
$500,000 under $1,000,000 ..................................
$1,000,000 or more ....... ........................................
Si.e of adjustedgross income
Total ........................................................
Less than$1,000 1,2 ........... .. ...................... ...
$1,000 under $3,000 ..........................................
$3,000 under $5,000 .............................................$5,000 under $7,000 .............................................
$7,GOO under $9,000 .............................................
$9,000 under $11,000 ..................................
$11,000 under $13,000 ..........................................
$13,000 under $15,000 .........................................
$15,000 under $17,000 .........................................
$17,000 under $19,000 ..................... I ...............
$19,000 under $22,000 ........................ ................
$22,000 under $25,000 .........................................
$25,000 under $30.000 .........................................
$30,000 under $35,000 .........................................
$35,000 under $40,000 .............................. :..........
$40,000 under $50,000 .......................................
$50,000 under $75,000 .........................................
$75,000 under $100,000 .......................................
$100,000 under $150,000 .......... : .............. I...........$150,000 under $200,000 .....................................
$200,000 under $300,000 ............................... :$300,000 under $500,000 : ...............................
$500,000 under $1,000,000 ..................................
$1,000,000 or more ...............................................
1984
(1)
99,438,708
3,329,148
6,883,7607.030,5376,584,4346,792,9316,051,873
5,877,9795,202,5474.893.8334.561,5415,645,7595,198,716
7,635,4046,020,6365,054,4705,963,0414.657,7021,049.444
581,498179,695132,30667,40529,21514,834
Total income tax 3
1984
(7)
301,923,057
419,79044,652
430,1671,233.034
2,483,2823,617,920
5,013,5065,831,9036,785,3247,775,189
11,677,76813,237,769
23,793,00423,926,88124,678,34838,675,24147,355,17418,759,377
17,117,8748,644,645
10.013,5248,761,557
7,526,58514,120,545
1985
(8)
1985
(2)
101,660,287
3.292,0076,771,4876,685,4816,570,9686,664,2796,235,044
5,582,9215,386,7724.895,3934.542,5986,089,0645,051,210
7,457,9476,451,0405,184,6206,701,5445,628,6391,263,409
706,248203,109152,52385.56541,10717,312
Adjustedgross income (AGI)
1984
(3)
2,139,904,356
-31,984,44313,732,88028,151,19939,617.70654,388.54560.390.249
70,439,37972,660,37278,195,61482,012,673
115,466,828122,123,861
209,274,643195,263.778188,944.011264,922,227
275,046,84989,289,787
69,273,54630,767,97231,729,78725,780,15819.729.29634.687,437
Percentage ofreturns showing no
total income tax
1984
(9)
325,710,254
185,92241,698
347,8781,193,0432,259,7633,480,779
4,548,8435,789,4956,534,3617,482,062
12,203,16512,275,305
22,916,849
25,080,33224,713,42441,501,66556,064,78121,794,656
19,895,9789,760,959
11,362,14610,670,8329,878,188
15,728,128
Number ofurns for-
17.9
99.293.840.8'33.721.38.2
5.23.62.01.81.51.0
.2
.2
.2
1985
(10)
18.5
99.794.448.233.926.311.8
5.93.92.92.32.01.6
1.0..8.8.4.2.3
.4
.1
.2
.2
.2
1985
(4)
2,305,951,483
-36.740,95613,581,24526,769,868
39,356,89653,477,88862.125,340
66,863,38175,352,29078,225,26981.675.266
124,506.145118,539,622
204,399,150209,135,063193,807,899297,914,321333,710,362107,424,625
84,315,94734,884,49236,457,24432,529,03227,541,42740,099,667
Taxable
1984
(5)
1,701,365,731
63,799
6,504,12917,251,76126,095,66338,888.49345,303,739
54.708,66457,397,78862,489,60266,307,24893,889,175r99,375,158
168,006,165155,819,230149,423,027210,324,094214,921,14169,194,901
53 604,014
23:865.52324,405.33919,789,38315,798,72327,938,970
Returns showing total income tax
Average tax(whole dollars)
19M
3,698
16,7833104103282465651
8991,1631,4151,7362,1002,573
3.1524,0044,9076,504
10,21117,944
29,50248,20575,844
130,272258,255954,091
1985
(12)
3,931
16,9643
ill100275460633
8651,1191,375.1,6862,0442,469
3,1033,9194,8036,2159,984
17,297
28,29648,12874,658
124,947240,714910,931
1984
(13)
14.4
-
5.42.54.75.86.5
7.58.38.99.7
10.311.0
11Z12.313.114.617.321.1
24.828.2,31.634.138.240.8
income
1985
(6)
1,820,740,833
6.8565,947,953
- 16,049.01325,680,02537,544,43146,036,142
51,016.09258,884,57561,708,17765,462,334
100,462,53695,256,056
164,077.078
320,091,716233.646,097259.467,072
82,293.087
90,834,865
52,919,88921,269,59532,087.247
Tax as percentageof AGI
1985
(14)
14.4
-
5.4'2.44.6
5:76.3
7.28.08.69.4
10.010.5
11.312.112.814.016.820.3
23.728.031.232.235.939.3
See notes follovAng Table 20.
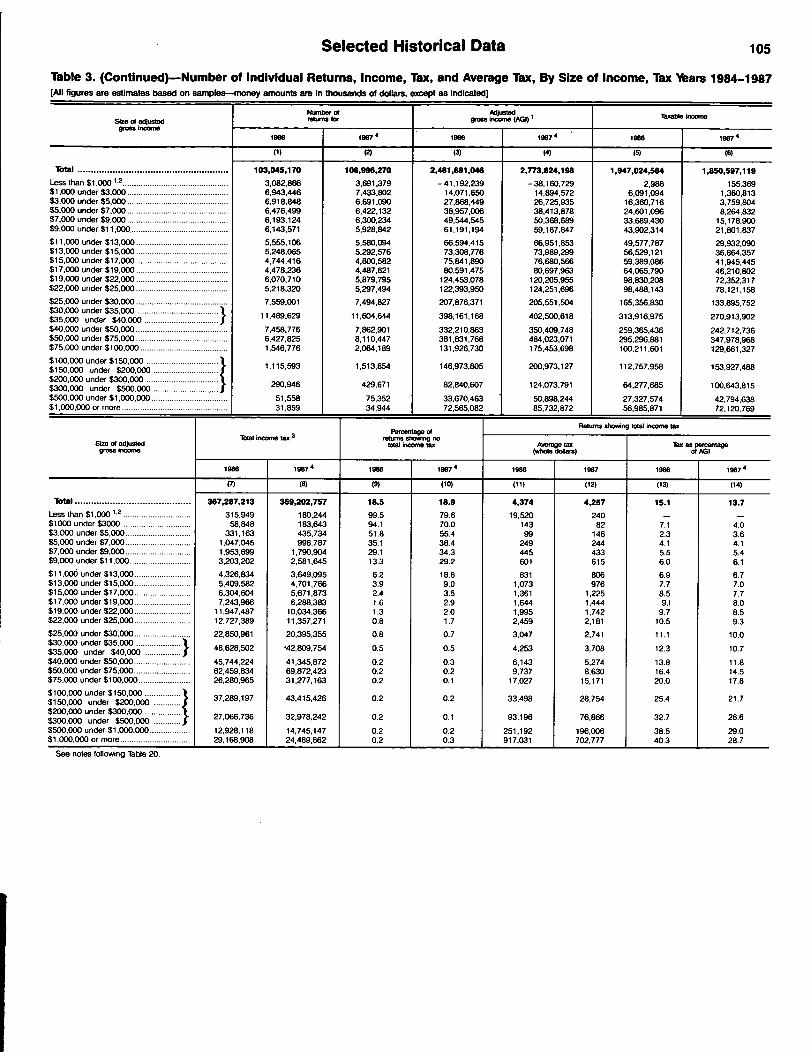
0Cl)
MM
§N
§N
10
t':2
CIJ04
WU
)W
01
2W
Cl)U
,4~
-8
1cq
W~
;C
li?
eC
liP
%%
--
-.
-%
.-
00CM
LnCIJ
1.1
Nc
~N
"
"q
r-:I
PW
-7~
-7-~
Pr-~
9V~
19
r-~G~
U~cq
VCO)
-0LO
WW
W00
1W
cm'N
Nm
Ca
qCi
kW
0.0
0C
:~Y
Cl)v
NN
vC,C,
clicm
..
....I.
.Q
IW
LOco0
c.
lN
Cl)lll~
Oim
C)C)v
..
.C`
N.
I.
..
..
QP%
Cli
Cli(3i
MI
u)~2
NI
CY-
t-O
CM
W4R
t2lc
o~
vc\lz
p;!
0;z
WI
cum,"A
wA
-0~ .T-
N2-
N.0
8~,
--
C4C4
6Ld
adLd
coW
WC
\i
NI
1.0r
coN
CYNR
CqLo
OO~1
I2V
01~4
wa)
CO1
G0
P-
--
--
---
--
--
-%
-(q.
cq-
?-
-1
N~
mgm
§~G
G§
&22
CIA-A
".0
08
N0
C,N
0)1V
!cl!
-~(31
--
--
--
--
--
C~C
!cq
r%co
a)co
wR
-4Ln
2cS
p-e
go.0
Rcl,
.0-k
U)-
n1
Nco
ccm
gm
2g
mA
:98
C,o
c)0,
vC-3
:10)
0,
C6C
\iI
..
.v
W0)
C')c))
U)
VN
vo
mc)
Npm
88
.18
--
0% ,N
,zz -
C',0
010
U)
cvA
Na!
Lqlo:
QC~
(31W
-o
7CNY
RIV
INN,
I1
00cq
Wcq
93Im
~qR
cm,911
10N
W9
-tI
C4cq
9V~I
qN
r~00,9
WA
Rc
NN
I?M
cnc\jc\j-0
0000
00
00
pLi
0)
NCM
CNJW
NLO
NN
q"
cg
C%j
§;z
.N
9
1
NW
mpm
Wc)
cc,
W!Iq
cqI
N1
14:WI
WOR
V~C4
NN
Nclq
C~%
q.
q.
--
C\j~q~
'CO)§
NR~!g
C%"R
L.In
va
S?G
-nR
WI
CM--
00
000.
a0
00
C6rl:
(d(6
Ww
iV
iLd
V~-li
LdLd
PZN7
06C%i
~7
-N
NN
28
;z.9
sr,
22
2Qv
q8
r-Cli
NN
pl~R
CliCli
NC
ifl~
aq~~
1-:1~t
C\!-~
Iu)
co0)
Z;;:
@g
NN
ND
00u)
0)Z6,
WC\j
II
II
qI
IID
cC
eC
t'
RR
qLn
RN
Cl)W
N
..
..
..
qi
qN
~%
tcli
cliV7
--
-W
(2C4
a,I
C\lV
;g
NN
WC',
WW
-W
-o-
)-
LW
VV
toU
)N
10-
100
00)CM
CYN
ClJV
LON
~2C-4
COJ00
C',V
C\:
[~
:gg
-1
81
A"
vcm0%C4
00N
N0
RiW
00cq
(qc
oI
..
..
.!
kPZ
cd~
Wcm
.06
Nto
ccli
vv
Wcm
Icli
9H
M
..
..
..
..
..
..
..
..
..
..
..
..
..
.
C;§C6
Lda;
C4
N'
LN'a
69C6C\fLd
c;16g
L6C1,
Cl
4~
69
qZ5
w~5
EP
AZ
;6
o'
'40)'0)'0
-D2
cc
zC.
C.S
'a'O
'D'D
cc
ac
cc
cc
citdrz0;C\iL6
LddLn
1-6
Z-
04CV
9Zq
99
00
6969
2,
69b9
692221

106 Selected Historical Data
Table C-Reconcilation of Adjusted Gross Income (AGI) and Personal Income Used In the National Income and ProductAccounts (NIPA), Selected Nbars, 1970-1987(All figures we estimales-money amounts we in billions of dollans)
Incorne and a*avnerd 1970 1975 19W 1985 law p1967
(1) (2) (3) (4) (5) (6)
1. Personal Income am NIpA) ................... ; ....................... 831.8 1,313.4 2,2S8.5 3,325.3 r3,526.2 3,TT7.62. Portion at persona Incoma not Included in AGI .............. 181.2 350.5 608.5 1,021.4 rl,100.6 1,090.0
Transfer payments (except taxable military pay and taxableGovernment pensions) ......................................................... 79.3 176.9 290.3 r416.8 r440.8 454 3
Other labor income (except fees) ............................................ 31.9 65.0 136.5 084.3 r195.7.
208.9Imputed income ...................................................................... 25.5 33.4 45.1 55.3 r7l.l. 91.9Investment income received by nonprofit institutions or
retained by fiduciaries.......................................................... 7.7 11.2 21.7 34.8 r33.0 33.1Investment income retained ~y life insurance carriers and
noninsured pension funds ................................................. 12.5 23.5 59.9 112.8 rl 19.0 129.1Differences in accounting treatment (NIPA vs. IRS) ................ 8.5 16.0 14.1 87.3 r97.7 91.2Other excluded or tax exempt income .................................... 15.8 24.4 41.0 130.2 r143.3 81.5
3. Portion of AGI riot Included In personal Income .............. 47.7 8S.1 157.8 299.4 r397..8 452.2Personal contributions for social insurance.......... ...................... 27.9 50.4 88.6 149.3 r161.9 172.9
Net capital gain trorn sales of property ........................... : 8.9 14.2 29.7 69.8 r133.6 134 2Taxable private pensions ......................................................... 6.3 13.1 28.3 72.9 r94.1
.110.0
S Corporation income (taxed through shareholders)............... 1.7 2.1 .7 6.2 r7.5 23.6Other taxable income .............................................................. 2.9 5.4 10.5 1.2 r.6 11.4
4. TWO net adjustment for conceptual dtfileolne 2 minus line 3)................................................... 133.5 MA 450.7 722.0 r7O2.8 637.8
5. Estimated total AGI (per NIPA) pina I minus line 4) ......... 698.3 1,048.0 1,807.9 2,603.4 r2,823.4 3,139.86. Adjusted grow Income (AGI) (Sol) ................................. 631.7 947.8 1,613.7 2,306.0 2,481.7 2,788.07. Estimated difference In AGI (NIVA vs. S0Q
Olne 5 min" line 6) 2 ................................................66.6
1 100.2 1 194.1 1 297.41 r341.7 351.8
notes tollovAng Table 20.
Table S.-Personal Income and Total Adjusted Gross income Based on Individual Income Tax Returns per National Incomeand Product Accoun trillIPA), lax Years 1947-1988[All-figures are estimates-money amounts are in billions of dollars]- --
Tax yew
19471948 ........................1949 ................................................................................................
1950 .....................................................................1951 ..................................................1952 ....................................................................... . .......................1953 ........................... ....................................................................1954
1955 ...........................................................................................1956 ..............................................................................19571958 .......................................................................1959
1960 ............................................................................................1961196219631964
1965 ..................
1966 :.- ..........
.............
1967 ~ ..................... * ...............1968 .................*..................1969
1970 ..................................................................19711972 .......... ............................19731974
19751976 .....................1977-19781979
19801981198219831984
1985 ................................................................................................1986
................1987* * *'***...............P1988 ................................................................................................
See notes follovAng Table 20.
(Par NMI'
(1)
190.2209.2206.4
228.1256.5273.8290.5
- 293.0
314.2337.2356.3367.1390.7
409.4426.0453.2476.3510.2
552.0600.8644.5707.2772.9
831.8894.0981.6
1,101.71.210.1
1,313.41,451.41,607.51.812.42.034.0
2,258.52,520.92.670.82,838.63,108.7
3,325.3r3.526.23.777.64,064.5
Total
=p-(per NIPA)
(2)
170.6184.6181.7
201.4228.8.241.8257.1256.4
277.1297.9310.7316.0338.7
352.5365.8387.8408.7442.0
479.4520.0555.4610.0663.4
698.3745.6824.7926.0
1,004.0
1,048.01,166.71,297.01,466.91,647.3
1,807.91,990.02,059.42,176.32,407.3
2.603.4r2,823.43,139.82
n.a.
A~rwt
(3)
19.624.624.7
26.727.732.033.436.6
37.139.345.651.152.0
56.960.265.467.668.2
72.680.889.197.2
109.5
133.5148.4156.9175.7206.1
265.4284.7310.5345.5386.7
450.6530.9611.4662.3701.4
713.7r702.8637.82
n.a.
Diff t=]
Percentage of
WS"14i.
(4)
10.311.812.0
11.710.811.711.512.5
11.811.712.813.913.3
13.914.114.414.213.4
13.213.413.813.714.2
16.016.616.015.917.0
20.219.619.319.119.0
20.021.122.923.322.6
21.5r19.91
6.92
n.a.

Selected Historical Data 107
Table 6.-Total Adjusted Gross Income Estimated from National Income and Product Accounts (NIPA) and Adjusted GrossIncome Reported on Individual Income Tax Returns per Sol, Tax Years 1947-1987[All figures are estimates-money amounts are in billions of dollars]
Tw yew
1947 ............................................................................................1948 ........................ .................................................................. -.-1949 ........................................................................................
1950 ............ .......................................... ........................................1951 ................................................................................................1952 ................................................................................................1953 .................... .....................................................................1954 ............ ...................................................................................
1955 ................... ............... ......................................................1956 ................... ............... ............................................................1957 ............... ............ .......................................... ................1958 ............................. ........................................................... ......1959 ............................................ ...............................................
1960 ................................................. ....................................
1961 ............ .................. .................... ...........................................1962 ................................................ ...........................................1963 .......................................................................... ........... -1964 ......................................................... ........................... ..........
1965 ............................................... - ....................... .......................
1966 ........................................... -- ............ ................................
1967 ...................................... .........................................................
1968 ............................................... ................................................1969 ....... . .......................................................................................
1970 ..........................................................................................1971 ................................................................................ .........1972 .................................................................................. .............
1973 .................................................................................. ...........1974 ........... ............................ .............................................. --
1975 ................................................................................................1976 ............................................................................... ................1977 ................................ ........................ ...........................1978 ...................................................... ...... ...............................1979 ......................... ....................... ..............................................
1980 .................................................... .................................1981 ....................... ............................................. .............1982 .............................................. .................................................1983 ................................................................................ ...............1984 .................................................................... .....................
1985 ................................................................................................1986 ................................................................................................1987 ................................................................................................
Total
(1)
170.6
184.6
181.7
201.4228.8241.8257.1256.4
277.1279.9310.7316.0338.7
352.5365.8387.8408.7442.0
479.4520.0555.4610.0663.4
698.3745.6824.7926.0
1.004.0
1.048.01,166.71,297.01.466.91.647.3
1.807.91,990.02,059.42,176.32,407.3
r2,603.4r2,823.43,139.8
Adjusted WOSS hoorne (AGO
Reported on tax
r'l-,,-
(2)
149.7
163.6
160.6
179.1202.4215.3228.7229.2
248.5267.8280.4281.2305.1
315.5329.9348.7368.8396.7
429.2468.5504.8554.4603.5
631.7673.6746.0827.1905.5
947.81,053.91,158.51,302.41,465.4
1,613.71,772.61,852.11,942.62,139.9
2,306.02,481.72,773.82
Arnount
(3)
20.921.021 .1
22.326.426.528.427.2
28.630.130.334.833.6
37.035.939.139.
9
45.3
50.251.5W655.659.9
66.672.078.798.998.5
100.2112.8138.5164.5181.9
194.2217.4207.3233.7267.4
r297.4r341.7366.02
Diftronoe
pementaspOf total
(4)
12.3
11-4
11.6
11.111.511.011.010.6
10.310.19.8
11.09.9
10.59.8
10.19.8
10.2
10.59.99.19.19.0
9.59.79.5
10.79.8
9.69.7
10.711.211.0
10.710.910.110.711.1
rl 1.4rl 2.
111.7 2
See notes follovAng Table 20.

108 Selected Historical Data
Table 7.-Standard, Itemized, and Total Deductions Reported on Individual Income Tax Returns, Tax Yeam 1944-1987[All figures are estimates based on samples-4umber of returns are in millions; money amounts are in billions of dollars)
SWWard deduction tWmuWd deducborts TOW deductionsTOW
TM numberyear Of
returnsNumber
of 2returnsAmount
Number01 2returns
Amoum 3 Amurd 4P0100,4090Z.J.uslld
(AGQ
(1) (2) (3) (4) (5) (6) (7)
19. .............................................................. 47.1 38.7 8.0 8.4 4.8 12.8 11.01945 .............................................................. 49.9 41.5 8.1 8.5 5.5 13.6 11.31946 .............................................................. 52.8 44.1 8.9 8.8 6.3 15.2 11.31947 .............................................................. 55.1 44.7 9.8 10.4 7.8 17.6 11.81948 .............................................................. 52.1 43.2 11.5 8.8 7.9 19.4 11.91949 .............................................................. 51.8 42.1 11.1 9.7 8.8 19.9 12.4
1
950 .............................................................. 53.1 42.7 12.0 10.3 9.9 21.9 12.21951 .............................................................. 55.4 43.9 13.3 11.6 11.9 25.2 12.51952 .............................................................. 56.5 43.7 13.7 12.8 13.6 27.3 12.71953 .............................................................. 57.8 43.4 14.2 14.4 15.6 29.8 13.01954 .............................................................. 56.7 41.0 13.3 15.7 17.4 30.7 13.41955 .............................................................. 58.3 41.4 13.6 16.9 20.0 33.6 13.51956 .............................................................. 59.2 40.7 13.8 18.5 22.6 36.4 13.61957 .............................................................. 59.8 39.7 13.8 20.2 25.7 39.5 14.11958 .............................................................. 59.1 38.3 13.2 20.8 27.5 40.7 14.51959 .............................................................. 60.3 37.8 13.4 22.5 32.0 45.4 14.9
1960 .............................................................. 61.0 36.9 13.1 24.1 35.3 48.4 15.31961 .............................................................. 61.5 36.2 12.9 25.3 38.4 51.3 15.61962 .............................................................. 62.7 36.3 13.1 26.5 41.7 54.8 15.71963 .............................................................. 63:9 35.8 13.1 28.2 46.1 59.2 16.11964 .............................................................. 66.4 38.5 20.2 26.9 46.8 67.0 16.91965 .............................................................. 67.6 39.7 20.6 27.9 50.7 71.4 16.61966 .............................................................. 70.2 41.6 21.8 28.6 54.6 76.4 16.31967 .............................................................. 71.7 41.9 22.1 29.8 59.6 81.7 16.21968 .............................................................. 73.7 41.7 22.1 32.0 69.2 91.3 16.41969 .............................................................. 75.8 40.9 21.6 34.9 80.2 10i.8 16.81970 .............................................................. 74.3 38.8 32.4 35.4 88.2 120.5 19.0971 .............................................................. 74.6 43.9 48.1 30.7 91.9 139.9 20.7972 .............................................................. 77.6 50.6 69.8 - ?7.0 96.7 166.4 22.2973...-
**'*"*** ............. ............ * ............80.7 52.6 73.6
-- --28.0 107.0 180.6
- - -21.8
974 .............................................................. 83.3 53.8 76.1 29.6 119.4 195.5 21.6
975 .............................................................. 82.2 56.1 100.9 26.1 122.3 233.2 23.5976 .............................................................. 84.7 58.7 113.8 26.0 133.9 247.6 23.5977 .............................................................. 86.6 63.7 137.7 22.9 138.5 276.2 23.8978 .............................................................. 89.8 64.0 139.8 25.8 164.4 304.3 23.4979 ........................ i ..................................... 92.7 66.2 148.8 26.5 184.2 333.0 22.7980 .............................................................. 93.9 65.0 146.0 29.0 218.0 346.0 22.6981 ............................... :.............................. 95.4 63.8 144.7 31.6 256.4 401.2 22.6982 ........................ ..................................... 95.3 61.9 140.2 33.4 284.5 425.2 22.9983 .............................................................. 96.3 61.1 138.5 35.2 309.6 448.7 23.1984 .............................................................. 99.4 61.2 139.5 38.2 358.9 499.6 23.3985 .............................................................. 101.7 61.8 145.0 39.8 405.0 5~4.7 23.9986 .............................................................. 103.0 62.4 151.0 40.7 447.1 611.3 24.6987 ...................................... ....................... 107.0 71.4 215.2 35.6 392.0 607.2 21.9
notes following Table 20.
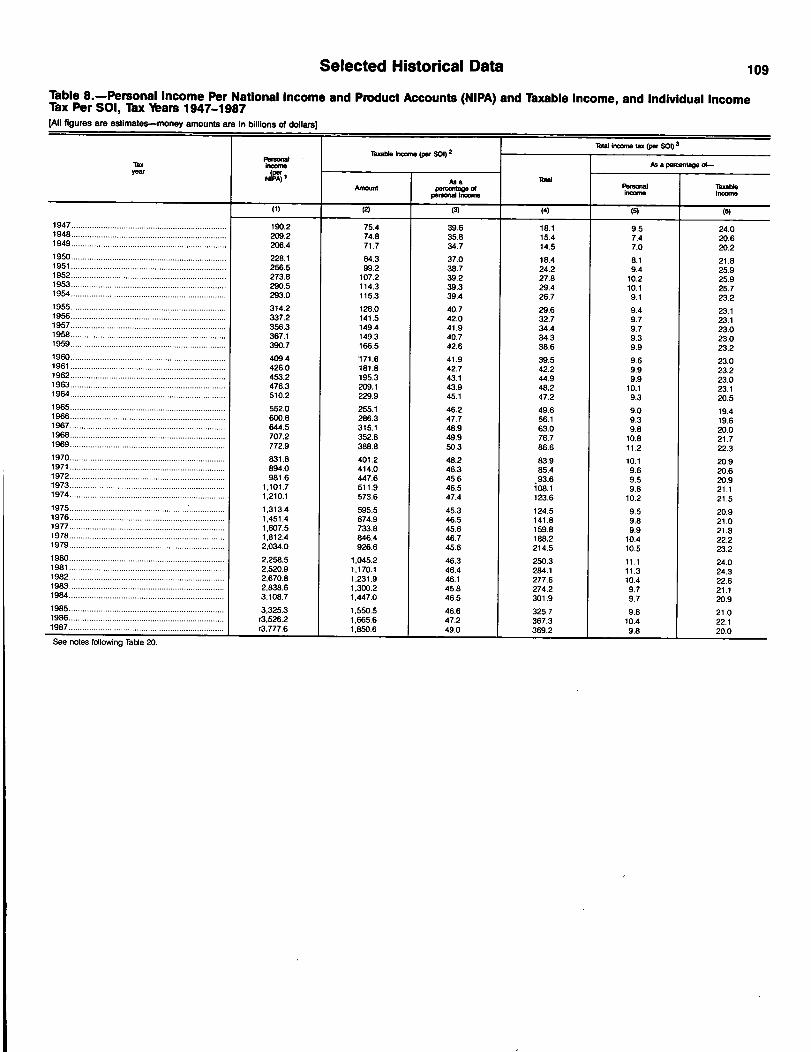
Selected Historical Data 109
Table B.-Personal Income Per National Income and Product Accounts (NIPA) and Taxable Income, and Individual IncomeTax Per Sol, Tax Ybars; 1947-1987[All figures are estimates-money amounts are in billions of dollars)
Taxable hoorM er Soo 2Total InCOM tax (pe, Soo 3
Peraonal(p
Taxear
Inoome As a percentap of--y
fr IN A) As a TOWAmotuft
A=% 01
Personalftworrift
Taxablehwoffw
M (3) (4) (5) (6)
1
947 ..................................................................... 190.2 75.4 39.61
8.1 9.5 24.01948 ..................................................................... 209.2 74.8 35.8 15.4 7.4 20.61949 ..................................................................... 206.4 71.7 34.7 14.5 7.0 20.2
1950 ..................................................................... 228.1 84.3 37.0 18.4 8.1 21.8
1951 ..................................................................... 256.5 99.2 38.7 24.2 9.4 25.9
1952 ..................................................................... 273.8 107.2 39.2 27.8 10.2 25.91953 ..................................................................... 290.5 114.3 39.3 29.4 10.1 25.71954 ..................................................................... 293.0 115.3 39.4 26.7 9.1 23.2
1
955 ..................................................................... 314.2 128.0 40.7 29.6 9.4 23.11956 ..................................................................... 337.2 141.5 42.0 32.7 9.7 23.11957 ..................................................................... 356.3 149.4 41.9 34.4 9.7 23.01958 ..................................................................... 367.1 149.3 40.7 34.3 9.3 23.01959 ..................................................................... 390.7 166.5 42.6 38.6 9.9 23.21960 ..................................................................... 409.4 *171.6 41.9 39.5 9.6 23.01961 ..................................................................... 426.0 181.8 42.7 42.2 9.9 23.21962 ..................................................................... 453.2 195.3 43.1 44.9 9.9 23.01963 ..................................................................... 476.3 209.1 43.9 48.2 10.1 23.11964 ..................................................................... 510.2 229.9 45.1 47.2 9.3 20.51965 ..................................................................... 552.0 255.1 46.2 49.6 9.0 19.41966 ..................................................................... 600.8 286.3 47.7 56.1 9.3 19.61967 ..................................................................... 644.5 315.1 48.9 63.0 9.8 20.01968 ..................................................................... 707.2 352.8 49.9 76.7 10.8 21.71969 ..................................................................... 772.9 388.8 50.3 86.6 11.2 22.31970 ..................................................................... 831.8 401.2 48.2 83.9 10.1 20.91971 ..................................................................... 894.0 414.0 46.3 85.4 9.6 20.61972 ................................................................ 981.6 447.6 45.6 93.6 9.5 20.91973 ..................................................................... 1,101.7 511.9 46.5 108.1 9.8 21.11974 ..................................................................... 1,210.1 573.6 47.4 123.6 10.2 21.51975 ..................................................... *................ 1,313.4 595.5 45.3 124.5 9.5 20.91976 ..................................................................... 1,451.4 674.9 46.5 141.8 9.8 21.01977 ..................................................................... 1,607.5 733.8 45.6 159.8 9.9 21.81978 ..................................................................... 1,812.4 846.4 46.7 1158.2 10.4 22.21979 ..................................................................... 2,034.0 926.6 45.6 214.5 10.5 23.21980 ..................................................................... 2,258.5 1,045.2 46.3 250.3 11.1 24.01981 ..................................................................... 2,520.9 1,170.1 46.4 284.1 11.3 24.31982 ..................................................................... 2,670.8 1,231.9 46.1 277.6 10.4 22.61983 ..................................................................... 2.838.6 1,300.2 45.8 274.2 9.7 21.11984 ..................................................................... 3.108.7 1.447.0 46.5 301.9 9.7 20.91985 ..................................................................... 3,325.3 1.550.5 46.6 325.7 9.8 21.01986 ..................................................................... r3,526.2 1,665.6 47.2 367.3 10.4 22.11987 ..................................................................... r3,777.6 1,850.6 49.0 369.2 9.8
120.0
notes following Table 20.

110 Selected Historical Data
Table 9.-Number of Individual Income Tax Retums, by TVpe of Tax Settlement, Tax Yeam 1944-1987
(All figures are estimates based on samples number of returns are in millions)
TMyou
1944 ............................ ..................................................................-1945 ................. ................... ............................................................1946 ..................................................................................................1947 ..................................................................................................1948 .......................... .......................................................................1949 ..................................................................................................
1950~ ........................................ I ..............................................
1951 ....................................................... ..........................................1952 ................................ .................................................................1953 .......... ....................... ................... I............................054 ..................... ........... ................................................................
1955 ................................................................... ........... ..................
1956- .......................................... ...........................................1957-- ............. ................... I ...........................................................1958 ............. .......................... .........................................................1959 ............................ ........................................... ...........
1960 ........................................................................................... I
1961 ~ ....................................... -.- ........... .........................................1962 ............................................. ..........- .......................................1963 ............... --- .................. ..........................................................19(A ............. ....................................... ............................................
1965 ................................. ................................................................1966 ................... ..............................................................................
1967 ..................................................................................................1968- ............... I-- ................................... ..................................... .1969 ..................................................................................................
1970 ................................................ .................................................1971 ............1972 ............ :................ ..........................................................1973 ................................................. .........................................1974 .................... .............................................................................
1975 ...... .... ............... ..................................................1976 .................................................................................................1977 ....................................................................19M .................. .. ...............................................................1979 .......................................................................................
1980..................................................................................................1981-................................................. ......... ................... ...............1982.......................... .................................................... I ................1983 ...................................................................................... ...........1984 ............ ....................... I ........................................................
1985 ...................... ......................................................................... I.1986 ...............- ...................... ........ ................................... ..............
1987 ............. ........ ...........................................
See notes follovAng Table 20.
TOWnumber of
returnsTa. due82 fime
IdMV
PhRuffts wtd~
0".,P.Y,.m I
(1)
47.149.952
*8
55.152.151.8
53.155.456.557.856.7
5B.359.259.859.160.3
61.061.562.763.965.4
67.670.271.773.775.B
74.3
- ----74.6_77.680.7B3.3
82.2.84.786.689.892.7
93.995.495.396.399.4
101.7103.0107.0
(2)
22.614.5
13.6
15.38.1
13.8
14.318.619.3
19
'0
16.6
18.719.4
18 6
18 119.1
18.118.618.719.322.5
20.017.817.520.317.9
16.517.0
-M914.215.4
15.816.917.821.618.8
21.823.0X318.521.2
21.221.523.8
R
22.933.534
'4
33.038.430.2
32.031.032.132.735.2
35.436.137.637.438.4
39.440.040.941.439.3
44.349.451.250.654.9
55.355.3
-63.3-64.265.8
63.865.066.0.65.571.4
69.970.072.475.075.6
77.478.179.8
No overpaymentsof to. due a~firne
(4)
1.61.94.86.75.67.9
6.85.85.16.25.0
4.23.73.63.62.8
3.52.93.13.33.5
3.23.03.02.83.0
2.52A
-2.3---2.22.1
2.62.82.82.72A
2.32.42.62.92.7
3.03.53.4

Selected Historical Data
Table I O.-Nonfarm Sole Proprietorship Returns: Selected Income and Deduction Items for Selected Income Years,1970-1987[All figures are estimates based on samples-money amounts are in thousands of dollars)
III
Rom 1970 1975 1980 1985 INS 1987
(1) (2) (3) (4) (5) (a)
Number of returns, total ............................... 5,769,741 7,221,346 8,931,712 11,928,S73 12,393,700 13,091,132Number with net income .................................... n.8. n.a. na. 8,640.701 9,247,806 9,884,338
Inventory, end of year .................................. 11,060,77S 15,578,040 21,996,236 24,969,895 24,476,892 26,332,702
Business receipts, total ................................ I 98,SS2,172 273,954,741 411,205,713 S40,04S,430 559,394,259 610,822,732Income from sales and operations ..................... n.a. 272.342.560 407,169,299 528.675,271 r548,273.173 598,315,189
Total deductions .......................................... 168,044,746 224,318,288 356,268,495 461,272,852 468,960,496 505,362,105Cost of sales and operations .............................. 109,148,811 146,261,435 209,889,809 232.294,132 232,134.760 255,045,271
Purchases ....................................................... 88,585,913 117,722,352 168,301.517 n.a. n.a. 173,399,840Cost of labor ................................................... 7,704,285 8,791,083 10,922,221 14,504,201 17,317,871 19,631,015Materials and supplies ............. ...................... 6,216,057 9,090,638 12,909,222 n.a. n.a. 23.841,762
Commissions ...................................................... 1,274,016 2,225,830 3,333,345 n.a. 5,461,118 6,261,859Net salaries and wages ...................................... 15,107,047 20,227,859 26,560,821 38,265,691 38,691,599 42,329,477Car and truck expenses ..................................... na. n.a. 13.378.289 17,044.421 16,380,826 17,469,744Rent paid ............................................................ 4,636,528 6.676,314 9.636,290 15,258,690 15.653,599 16,358,248Repairs ............................................................... 2,444,607 3,044,175 5,031,573 n.a. n.a. 7,437,987Taxes paid ........................................................... 3,775,502 5,423,961 7.672.459 n.a. n.a. 8,449,142Utilities ................................................................ n.a. n.a. 4,790,337 n.a. 12,644,624 13,361,789Insurance ............................................................ 2,309,608 3,503,812 6,003,126 n.a. 10,783,481 11,718,559Interest paid ........................................................ 1.784,276 3,390,845 7,190,257 11,913,982 11,504,437 11,615,902Depreciation ....................................................... 5.451.525 7,958,143 13,952,703 26,291,389 26,418,043 25,557,350Pension and prolit sharing plans ........................ 72.741 125,296 141,463 311,323 638,262 547,886
Net Income Pass deficit) .............................. 30,537,426 39,636,453r 54,947,219 78,772,578 90,423,763 105,460,627Net income ......................................................... 33,735,732 45,624,890 68,010,051 98,775,563 110,496.952 123.782,540Deficit .................................................................. 3,198,306 5,988,437 13,062,832 20,002,986 20,073.189 18.321,913
See notes following Table 20.
Table ll.-Partnership Returns: Balance Sheet Items and Selected Income Statement for Selected Income Years, 1970-1987[All figures are estimates based on samples money amounts are in thousands of dollars)
Item 1970 1975 1980 1985 19W 0987
(1) (2) (3) (4) (5) (6)
Total number of active partnerships ....................... 936.133 1,073,094 1,379,654 1.713,603 1,702,952 1,648,032Number with net income .................................... 639,795 661,134 774,173 875.846 850,884 864,840Number with balance sheets ............................. 555,741 783.271 1,194,236 1.227,498 1,202,737 n.a.
Number of partners .................................... ........... 3.697,818 4,950,634 8,419,899 13.244.824 15,301,345 16,963,258
Total assets I ............................... ....................... 116,752,751 235,468,301 597,503,923 1,269,434,302 1,403,750.213 1,381.296,736
Depreciable assets (net) ..................................... n.a. 113,124,969 239,139,823 695.878,822 779,936,070 n.a.Inventories, end of year ...................................... n.a. 11,985,431 33.218,272 27,279,234 27,463,816 n.a.Land ................................................................... n.a. 36,731,958 70.241,248 152,179,314 179,141,689 n.a.
Total liabilities ......................................................... n.a. 193,875,629 488,734,023 rl,069,221,714 rl,175,727,564 n.a.Accounts payable ............... ............................... n.a. 12,302,055 33,899,048 r46,871,755 43,621,862 n.a.Short-term debt 2 ................................................ n.a. 22,709,476 48,001,839 102,760,363 92,456.724 n.a.Long-term debt 3 .................... .......... ................
n.a. 136,296,764 178,044,406 93,319,855 429,195,599 n.a.Nonrecourre loans ............................................. n.a. n.a. 118,910,380 327,558,208 365,044,180 n.a.
Partners' capital accounts I ............................. n.a. 41,592,672 108,769,900 r200,212,688 r228.022,649 n.a.
Total receiptS4........ . .............................................
93,348,080 148,417,529 291,998,115 367,117.316 397,302,544 578,243,838Business receipts ............................................... 90,208,834 142,505,781 271,108,832 302,733,374 327,428,647 411,457,126Interest received ................................................. 942.304 2,477.173 10,869,323 20,558.966 21,715,994 15,878,744
Total deduclionS4............ ... .......... ..... ... ..........
83,557,684 140,679,959 283,749,460 376,000,991 414,673,405 569,361,424Cost of sales and operations ............................. 46,040,874 64,672,843 113,885,668 146,315,315 164.167,707 237,156,859
Purchases .............................................. 31,820,581 42,608,734 70.439,607 91,925,923 100,010,383 167,977,884Cost of labor .................................................. 4,146,927 4,585,836 7,015,547 8.845.106 9,789,253 9,975,053
Salaries and wages ............................................ 8,129,233 12,489,039 22,336.337 33.884,204 36,304,654 44,303,276Taxes paid .......................................................... 3,159,258 5,770,918 9,553,145 7,745,756 7,866,233 17,031,106Interest paid ....................... ............................... 4,470,206 12,097,100 28,362,385 28,674,933 29,452,297 70,525,574Depreciation 5 ..................................................... 4,578,820 10,108,834 21.576.189 53,650,790 59,847,381 55,909,217
Net income (less deficit) ......................................... 9,790,396 7,737,570 8,248,655 -8,883,674 -17,370,860 -5,419,105Net income......................................................... 14,419,124 22,431,931 45,061,756 77,044,693 80,214,873 87,654,011Deficit ................................................................. 4,628,728 14,694,361 36,813.100 85,928,367 97,585,733 93,073,116
See notes tollowing Table 20.
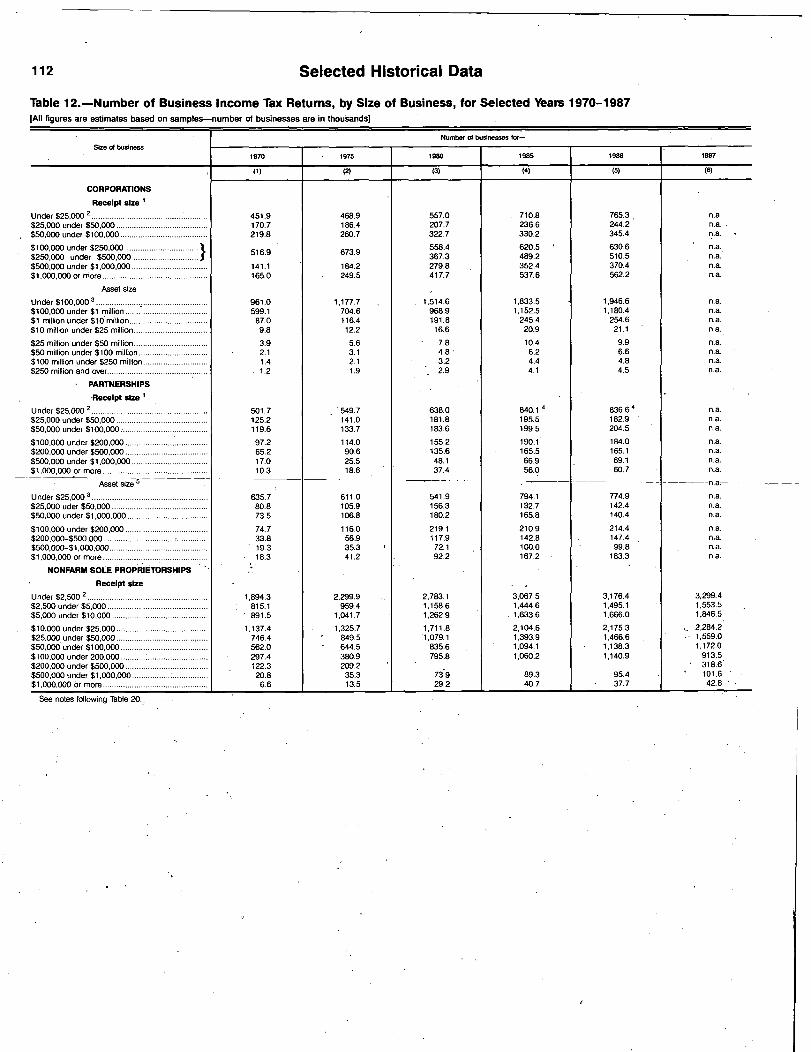
112 Selected Historical Data
Table 12.-Number of Business Income Tax Returns, by Size of Business, for Selected Years 1970-1987[All figures are estimates based on samples-number of businesses are in thousands)
Size cd business
CORPORATIONS
Receipt size I
Under $25,000 2 ....................................................
$25.000
under $50,000 .........................................$50,000 under $100.000 .......................................
$100,000 under $250,000 ................................$250,000 under $500,000 .............................$500,000 under $1,000,000 ..................................$1.0D0,000 or more ...............................................
Asset size
Under $100,0001 ...................................................$100,000 under $1 million .......................... ..........$1 million under $10 million ...................................$10 million under $25 million .................................
$25 million under $50 miilion .................................$50 million under $100 million ...............................$100 million under $250 million .............................$250 million and over...................................... :
- PARTNERSHIPS
Receipt size
Under $25,000 2 ....................................................$25,000 under $50,000 .........................................$50,000 under $100,1300 ~......................................
$100,000 under $200,000 .....................................$200,OGO under $500,000 .....................................
$500,000 under $1,000,000 ..................................
$1,000,000 or more ...............................................
Asset size 5
Under $25,000 1 ....................................................$25,000 uder $50,000 ...........................................$50,000 under $1,000,000 ............ .......................
$100,000 under $200,000 .....................................$200,0004500,000 ................................ ! ..............$500,00041,000.000 ............................................$1,000,000 or more ......................... : . ............ ....
NONFARM SOLE PROPRIETORSHIPS
Receipt size
Under $2,500 2 ... . ... .......... . ............... ..............
$2,500 under $5,000 .............................................$5,000 under $10,GOO ...........................................
$10,000 under $25,000 .........................................$25,000 under $50.000 .........................................$50,006 under $100,000 .......................................$100,000 under 200,000 ........... : ...........................$200,000 under $500,000 .....................................$500,000 under $1,000,000 ..................................$1,000,000 or more ...............................................
1970
(1)
451.9170.7219.8
516.9
141.1165.0
961.0599.1
67.09.8
3.92.11.41.2
501.7125.2119.6
97.265.217.010.3
635.780.873.5
74.733.819.318.3
1.894.3815.1891.5
1.137.4746.4562.0297.4122.320.86.6
1975
(2)
468.9186.4260.7
673.9
184.2249.5
1,177.7704.6116.412.2
5.63.12.11.9
549.7141.6133.7
114.090~625.518.6
611.0105.9106.8
116.056.935.341.2
2,299.9959.4
1,041.7
1,325.7849.5644.5380.9209.235.313.5
Number of busnesses for-
1980
(3)
557.0207.7322.7
558.4367.3279.8417.7
1985
(4)
710.8236.6330.2
620.5489.2352.4537.6
1,514.6968.9191.816.6
7.84.83.22.9
638.0181.8183.6
155.2135.6
48.137.4
541.9156.3180.2
219.1117.972.192.2
2,783.1
1158.6
1:262.9
1,711.81,079.1
835.6795.8
73.929.2
1,833.51,152.5
245.420.9
10.46.24.44.1
840.1 4
195.5199.5
190.1165.566.956.0
794.1132.7165.8
210.9142.8100.0167.2
3,067.51,444.61.633.6
2,104.61,393.91,094.11,060.2
89.340.7
1986
(5)
765.3.244.2345.4
630.6510.5370.4562.2
1,946.61,180.4
254.621.1
9.96.64.84.5
836.6 4
182.9204.5
184.0165.169.160.7
774.9142.4140.4
214.4147.4,99.8
183.3
3,176.41,495.11,666.0
2,175.31,466.61,138.31,140.9
95.437.7
1987
(6)
n.a.n.a.n.a.n.a.n.a.n.a.n.a.
n.a.n.a.n. a.n.a.n.a.n.a.n.a.n.a.
n. a.n.a.n.a.na.n.a.n.a.n.a.
-n.a~n.a.n.a.n.a.
n.a.n.a.n. a.n.a.
3,299.41,553.51,846.6
2,284.21,559.01,172.0
913.5318.6101.642.8
See notes following Table 20.,

Selected Historical Data
Table 13.-Corporation Income Tax Returns: Balance Sheet, Income Statement, and Tax Items for Selected Years,1970-1986[All figures are estimates based on samples - money amounts are in thousands of dollarsl
113
Item 1970 1975 19W 1984 1985 1986
(1) (2) (3) (4) (5) (6)
Number of returns, total ........................
..
1,665,477 2,023,647 2,710,5W 3,170,743 3,277,219 3,428,S15Number with net income .................................... 1,008,337 1,226,208 1,596,632 1.777,770 1,820,120 1,907,738Consolidated returns 1,2 ...................................... 19,871 38,307 57,890 80,256 79,598 81,956S
Corporation returnS2.3 ..................................... 257,475 358413 545389 701,339 724,749 826,214DISC returnS2,4 ................................................... N/A 6:431 8:665 12,480 1,383 1,443FSC returnS2.5 .................................................... N/A N/A N/A N/A 2,341 2,900
Total assets................................................. 2,634,708,564 4,286,556,273 7,617,238,403 11,106,701,948 12,773,093,888 14,163,209,894Cash ........................... ....................................... 176,924,573 290,426,439 528.914,747 595,773,262 683,204,264 762,946,878Notes and accounts receivable . ........................ 614,667,367 1,051,542,806 1,984.601,790 2,896,980,896 3,317,635,191 3,593,528,670Lew: Allowance for bad debts ........................ 20,030,327 31,032,998 50,057,307 54.341,671 61,580,335 74,228,426
Inventories .......................................................... 190,401,642 317.718.545 534,806,547 664,243,060 714,722,928 732,587.518Investments in Government obligations .............. 196,625,390 316.131,699 472.059,737 725.695,801 916,550,098 1,058,718,859Other current assets ........................................... 73,058,482 145.101,716 310.177,160 513,743,712 629,136,396 739,043,506Loans to stockholders ......................................... 4,774,082 9.355,636 29,873,250 58,430,009 56,761,232 63,653,862Mortgage and real estate loans .......................... 327,593,354 548054,483 894.323,489 1,126,962,114 1,258,672,577 1,377,441,452Other investments ............................................... 401,389,022 626.266,074 1,213.9a6.210 1,972,830,815 2,413,551,474 2,847,727,452Depreciable assets ............................................. 868,908,018 1,276.564,500 2,107.027,914 2,913,301,626 3,174,193,649 3,382,556,559
Less: Accumulated depreciation ..................... 334,646,086 483.798,526 767.841,763 1,116,171,771 1,232,072,530 1,342,114.626Depletable assets ............................................... 18.517.264 38.511,396 71.901,490 114,808,431 112,339,389 116,010.459Less: Accumulated depletion . ........................ 6.774.796 14,501,561 19,569.556 36,340,299 37,203,920 44,083,149
Land ................................................................... 46,626.157 66.819,206 92,931.935 128,269,064 141,448,357 149,522.450Intangible assets (amortizable) ............................ 12.818.168 12,823,183 45,480,694 117,467,829 145,290,625 212,265.625
Less: Accumulated amortization ...................... 5.984.184 4,491,990 18,393,037 36,190,604 42,505,240 46,696,699Other assets........................................................ 69,a38,438 121,065,665 187,015.1 G6 521,126,077 582,949,738 634,329,507
7btal liabilities ............................................. 2,634,706,564 4,286,556,273 7,617,238,403 11,106,701,948 12,773,093,886 14,163,209,894Accounts payable ............................................... 148,812,597 263,417,584 542,172.368 741,372,874 891,571,443 909,090,964Mortgages, notes, and bondspayable in less than 1 year . ........................... 170.884.261 272,123,551 504,802.288 866,546,604 1,001,337,795 1,083,947.776
Other current liabilities ........................................ 892,218.397 1.577,425,991 2,706,796.360 3,760,174,725 4,234,983,432 4,599,886,537Loans from stockholders .................................... 24,573,814 38,143,936 85,718,510 145,250,514 174,317,253 185.0,34.570Mortgages, notes, and bonds
payable in 1 year or more ............................... 362,700,303 586,703.526 986,663.932 1.494,350,573 1,699,272,481 1.958,477,161Other liabilities .................................................... 283,106,029 451,676,880 846,696,691 1,214,879,371 1,467,912,913 1.728,638.194Capital stock ....................................................... 201,213,719 251,715,862 417,153,783 839,344,197 920.182,882 1.190,628,800Paid-in or capital surplus .................................... 196,642,421 298,534,854 532,039,407 1,066,288,359 1.420,996,805 1,725.785,087Retained earnings, appropriated ........................ 16,657,051 29,955,676 41.461,644 51,100,507 54,074,364 64,975,012Retained earnings, unappropriated .................... 349,225,750 537,631,026 1,027.902,049 1,256,771,201 1,311,512,589 1,313,686,600Less: Cost of treasury stock ................................ 11,327,778 20,772,613 74.168,627 329,376,924 403,068,064 612.525,394
Totalrecelpts .............................................. 1,750,T76,503 3,198,627,860 6,361,284,012 7,860,711,2266 8,398,278,426 8,669,378,501Business receipts ................................................ 1,620,886,576 2,961,729,640 5,731.616,337 6,948,481,893 7,369,538,953 7,535.482,221Interest on State and localGovernment obligations .................................. 3.775,917 6,711,606 12.620,876 16,613,501 20,164,514 23.578,340
Other interest ...................................................... 67.794,508 136,587,304 354.243,674 566,537,9747 617,622,4257 638.524,9517Dividends received from
domestic corporations ..................................... 5,238,421 8,818,282 18,654,800 21,185,391 16,967,379 15,156,098Dividends received from
foreign corporations ........................................ 3,466,515 5,467,726 14,563,353 15,373,474 20,770,361 22,747,046Rents .................................................................. 13,938,502 21,765,130 41,371,141 75,834,113 89,700,937 93,972,214Royalties ............................................................. 2,586,387 5,167,141 12,450.250 14,535,929 15,237,421 16,411,642Net short-term capital gain reduced by
net long-term capital loss ................................ 190,439 301,601 2,013.510 3,233,9996 7,032,062 11.797,841Net long-term capital gain reduced by
net short-term capital loss ............................... 5,481,580 8,364.523 24,910,957 38,518,792 53,771,685 93,297,600Net gain, noncapital assets ................................ 5,315,562 7,757.287 20,117.615 26,506,096 33,537,842 44,149,339Other receipts ..................................................... 1 22,102,096 1 35,957,620 1 128,721.498 1 133,948,728 1 153,934,848 1 174,261,151
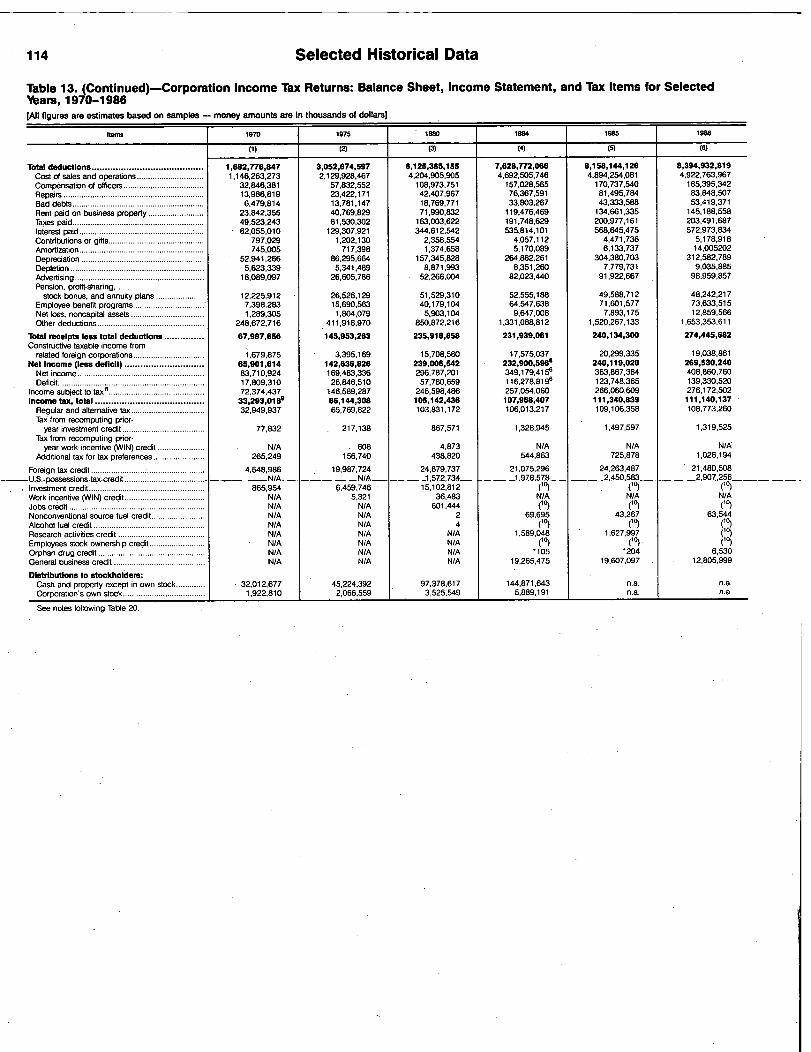
114 Selected Historical Data
Table 13. (Continued)-Corporation Income Tax Returns: Balance Sheet, Income Statement, and Tax Items for SelectedYears, 1970-1986[AJI figures are estimates based on samples - money amounts are In thousands of dollars]
th"M 1970 1975 1980 1984 1985 1986
(1) (2) (3) (4) (5) (6)
Total deductions .......................................... 1,682,778,847 3,052,674,597 6,125,365,155 7,626,T?2,066 8,158,1",126 8,394,932,819
Cost Of sales and operations .............................. 1.146,263.273 2,129,928,467 4,204.905,905 4,692.505,746 4,894,254,081 4.922,763,967
Compensation of officers .................................... 32,846.381 57,832,552 108,973,751 157,028,565 170,737,540 185.395,342
Repairs ............................................................... 13,986.819 23,422,171 42.407.967 76,367,591 81,495,784 83,848,507
Bad debts ........................................................... 6.479,814 13,781,147 18,769,771 33.803.267 43,333,588 53,419.371
Rent paid on business property ......................... 23,842.355 40,769,829 71,990.832 119.476,469 134,661,335 145,188,558
Taxes paid........................................................... 49,523,243 81.530,302 163,003.622 191,748,629 200,977.161 203,491,687
Interest paid ................................................... 62,055,010 129.307,921 344,612.542 535,814,101 568,645.475 572,973,834
Contributions or gifts........................................... 797,029 1,202.130 2,358.554 4,057.112 4,471,736 5,178,918
Amortization ........................................................ 745005 717.398 1,374,658 5,170.089 6,133.737 14,005202
Depreciation ....................................................... 52,941:266 86,295.664 157,345,828 264,882.261 304,3BO.703 312,582,789
Depletion ............................................................ 5,623.339 5,341,489 8.871,993 8.351,260 7,779,731 9,035,885
Advertising .......................................................... 18.089,097 26,605,786 52.266,004 82,023,440 91,922,667 98,959,857
Pension, profit-sharing, . .stock bonus, and annuity plans .................. 12,225,912 26,526,129 51,529.310 52,555,188 49.588,712 48,242.217
Employee benefit programs ................................. 7,398,283 15,690,563 40,179.1 D4 64,547,638 71,601,577 73,633.515
Net loss, noncapital assets ................................. 1,289,305 1,804,079 5.903.104 9,647,008 7,893,175 12,859,566
Other deductions ................................................ 248,672,716 411,918,970 850.872.216 1,331,088,812 1,520,267,133 1,653,353.611
Total receipts less total deductions ............... 67,997,656 145,953,263 235,918,858 231,939,061 240,134,300 274,445,682
Constructive taxable income fromrelated foreign corporations ................................ 1,679,875 3,395.169 15.708,560 17,575,037 20,299.335 19,038,861
Net Income (less deficit) .............................. 65,901,614 142,636,826 239,006,542 232,900,59666
240,119,020867363 384
269,530,240760408 860Net income .........................................................
Deficit..................................................................
83,710,92417,809.310
169,483,33626,846,510
296.787,20157.780,659
349,179.415116,278,8196
, ,123,748,365
,,139.330,520
Income subject to tax" ........................................... 72,374,437 146,589,287 246,598,486 257,054,060 266,060,609 276.172,502
Income tax, total ......................................... 33,293,0189 66,1",308 105,142,436 107,968,407 111,340,839 111,140,137
Regular and alternative tax ................................. 32,949,937 65,769,822 103,831,172 106,013,217 109,106,358 108,773,26
-
0
Tax from recomputing prior-year investment credit ..................................... 77,832 217,138 867,571 1,328,945 1,497,597 1,319,525
Tax from recomputing prior-year work incentive (WIN) credit ............... N/A 608 4,873 N/A NIA N/9
Additional tax for tax preferences ....................... 265.249 156.740 438,820 544.863 725,878 1,026,194
Foreign tax credit ................................................... 4.548,986 19,987,724 24,879,737 21,075,296 24,263.487 21,480.508
-U.S.- possessions tax credit ..................................... -N/A-- 1.572,734- ----1.978,578-- 2,450,583 2,907.256
Investment credit .................................................... 865,954 6,459,746 15,102,812 M (1) (1)
Work incentive (WIN) credit .................................... N/A 5,321 36,483 N/A N/A N/A
Jobs credit ............................................................. N/A N/A 601.444 (1) (1)Nonconventional source fuel credit ........................ N/A N/A 2 69,695 43,267 63,544
Alcohol fuel credit .................................................. N/A N/A 4 (1)Research activities credit ....................................... N/A NIA N/A 1,589,048 1,627,997
Employees stock ownership credit ......................... NIA N/A N/AOrphan drug credit ................................................ NIA N/A N/A 6,530
General business credit ......................................... N/A N/A N/A 19,265,476 19,607,097 12,805,999
Distributions to stockholders:Cash and property except in own stock............. 32,012,677 45,224,392 97.378,617 1 ".871,643 n.a. n.a.
Corporation's own stock ..................................... . 1,922,810 2,066,559 3,525,549 5.889,191 n.a. n.a.
See notes following Table 20.

Selected Historical Data
Table 14.-Co' ration Income Tax Returns: Selected Balance, Sheet, Income Statement, and Tax Items by IndustrialDivision, for S=ected Income Years, 1970-1986[All figures are estimates based on samples-money amounts are in thousands of dollars]
115
Industrial division and 11OMS 1970 1975 1980 19" 1985 1986
(1) (2) (3) (4) (5) (6)
AGRICULTURE, FORESTRY AND FISHINGNumber of returns, total ...................................... 37,283 56,280 80,883 98,361 103,156 106,634
Nu bar with net income .................................m
19,843 33,328 43,827 r5o 037 52,776 57,810
Total assets ......................................................... 11,909,403 21,177,941 40,738,97750,
699:926 52,651,197 53,478,288
Net worth ............................................................ 4,012,068 6,844,949 11,460,935 14,310,555 15,406,221 17,062,622
Total receipts ....................................................... 14.277,707 28,118.514 52,089,915 66,645,119 70,491,486 77.502,215
Business receipts ............................................ 13,591,763 26,624,149 48,850,056 62,093,338 65,419,402 71.787,552
Interest received ....................................... 69,742 171,732 476,654 723,118' 775.31331 720,405'
Total deductions .................................................. 14,209,713 27,369,286 51.418,280 66,436,289 70,559.478 76,330,943
Cost of sales and operations ........................... 10,555,539 19,738,447 35,798,332 42,991,472 45,085,526 50,971,455
Interest paid .................................................... 356,225 797,420 2,184,441 2,952,198 2,758,952 2,570,846
Net income Oess deficit) ..................................... 65,295 746,908 673,158 202,522 -74,270 1,148,686Net income...................................................... 493,400 1,493,168 2.464,381 2,874,899 2,930,905 3,676,645Deficit .............................................................. 428.105 746,260 1,791,222 2,672,377 3,005,175 2,527,960
Income tax before credits ...................................1131152 351,059 533,768 509,081 540,671 589,887
Total income tax after creditS3 ............................ 107:0232 294,584 422,356 373,115 344,626 475.606
Distributions to stockholdersexcept in own stock ........................................... 65.824 244,524 304,733 417.177 n.a. n.a.
MININGNumber of returns, total...................................... 14,465 14,242 25,576 40.564 41,426 40,354
Number with net income ........... ..................... 7,303 8,297 12,698 18.177 18,031 18,150
Total assets ................................................. ....... 23,972,812 64,505,341 126,947,880 209,036.474 240,815,996 206,122,125
Net worth ............................................................ 13,381,821 32,765,690 54,068,148 94,335,000 104,772,797 98,604,268
Total receipts ....................................................... 17,747,750 65,909,994 176,672,390 123,496,633 142,038,595 98,577.216Business receipts ............................................ 16,699,586 63,670,496 167.397,918 111,030,063 126,710,610 86,873,761Interest received ..................................... 176,728 522.757 1,301,266 3,089,562' 3,584,890' 3,154,332'
Total deductions.................................................. 15,927,348 42,348.765 169,051,624 124,627,966 145,389,514 102,093,971
Cost of sales and operations........................... 9,955,600 30,171.612 116,989,880 74.213,000 87,972,035 58,115,191
Interest paid .... ............................................... 388,032 1,166.182 3,440,080 7,077,300 7,789,995 6,395,032
Net income (less deficit) ..................................... 1,834,315 23,574,833 7,750,561 -353,185 -2,543,487 -3,122,565
Net income ...................................................... 2,399,507 24,347,893 10,133.685 6,991,815 6,166,623 5,352,717
Deficit .............................................................. 565.192 773,060 2,383,124 7,344,999 8,710,110 8,475.282
Income tax before credits ................................... 1,031,5502 11,361,037 3,947,569 2,381,154 1,810,559 1,453.090
Total income tax after creditS3 ............................ 342.9282 1,051,138 1,674,566 1,014,361 557,519 694,690
Distributions to stockholdersexcept in own stock........................................... 1,177,550 1,015,895 4,757,780 3,057.411 na. n.a.
CONSTRUCTIONNumber of returns, total ...................................... 138,905 191,219 272,432 306,906 318,276 341,816
Number with net income................................. 82,078 108.852 150,368 173,351 185,613 194,446
Total assets ......................................................... 42,719,792 76,691.947 132.939,026 195,272,738 215,297,771 218,680,512
Net worth ............................................................ 11,819.604 19,029.077 32,826,174 50,338,974 54,687,270 52,781,280
Total receipts ....................................................... 90,610,644 146,955.117 267,205,356 338,575,635 387,232,953 412,477,214
Business receipts ............................................ 88,945,385 143,412.715 260,387,692 326,752,784 374,590,273 399,436,063
Interest received .................... ......................... 219,698 614,583 2,073,650 3,540,4301 3,851,6281 3,981,459'
Total deductions .................................................. 89,070,022 144,717,309 262,116,275 335,696,154 382,823,113 406,663,574
Cost of sales and operations........................... 73,434,969 116,845,554 208.064,925 257,057,538 295,803.244 314.065,258Interest paid .................................................... 711,496 1,973.2" 4,278,502 5,990.178 6,407,652 6,869,790
Net income (less deficit) ..................................... 1,538,418 2,236,262 5.271,209 .2,906.704 4,370.924 5,781,722Net income...................................................... 2.548,013 4,514,864 8,911,143 9,147,150 11,053,145 12,443,085
Deficit .............................................................. 1,009,595 2,278.602 3,639,934 6,240,445 6,682,220 6,661.363
Income tax before credits ................................... 776.9792 1,320,196 2,521,507 1,767,756 2,312,846 2,525,994
Total income tax after creditS3 ............................ 756,6372 1,131,960 1,973,659 1.296,301 1,662,563 2,183,820Distributions to stockholdersexcept in own stock ........................................... 299,204 464,553 793,764 738,873 n.a. n.a.
MANUFACTURINGNumber of returns, total ...................................... 197,807 217,354 242,550 272,050 276,545 285,119
Number with net income ................................. 120,814 136,839 153,640 162,584 159,778 163,161
Total assets ......................................................... 612,912,516 944,581,970 1,709,471,700 2,417,631.605 2.644.393,424 2,931.610,462
Net worth ............................................................ 308,923,293 442,587,674 749,186,774 1,025,028,491 1.099.645,876 1,124.399,497
Total receipts ....................................................... 722,952,890 1,296,359,650 2,404,323,844 2,768,247.655 2.831.062,496 2,810.713,781
Business receipts ............................................ 700,090,661 1,258,338,650 2,301,056,550 2,608,971,901 2,656,345.750 2,614.526.752
Interest received .............................................. 4,748,499 8,691,092 28,315,784 42,749,996' 47,753,6261 50,749.530'
Total deductions .................................................. 692,455,462 1,230,689,496 2,290,593,808 2.661,153,853 2,733,105,346 2,723,698,904Cost of sales and operations ........................... 495,879,549 925,111.030 1.707,143,900 1,796.313,155 1,797,852,805 1.746,954,429
Interest paid .................................................... 12.570,242 22,055,903 54,177.356 85,039,616 90,452,072 102,372,701
Net income (less deficit) ..................................... 31.846,078 68.406,627 125,667.815 121,215,254 113,758,645 101,827,271
Net income ...................................................... 37,925,489 74,466,554 141,547.510 147,852,003 142,541,119 136,081,206
Deficit .............................................................. 6079,411 6,059.927 15,879,695 26,636,749 28,782,474 34,253,935
Income tax before credits ...................................16:744,9052 32,306,739 59,577,413 58,542,710 56,687,476 50,222,612
Total income tax after creditS3 ............................ 13,242.2262 21,024,964 32.726,986 30,429,379 25,382,459 25,761,951
Distributions to stockholdersexcept in own stock ........................................... 14,616.282 1 19,973,061 1 37.306,509 1 45,630,537 1 n.a. n.a.

116 Selected Historical Data
Table 14. (Continued)-Corpomtion Income Tax Returns: Selected Balance Sheet, Income Statement, and Tax Items byIndustrial Division, for Selected Income Years, 1970-1986[All figures are estimates based on samples money amounts are in thousands of dollars)
InduStral dM51on WW fterns 1970 1975 1980 19S4 1985 1986
(1) (2) (3) (4) (5) (6)
TRANSPORTATION AND PUBLIC UTILITIESNumber of returns
.total ................ : ..................... 67,398 80,701 111,324 128.184 138,337 138,428
Number vAth net income ................................. 38,204 45.360 62,232 65,405 69,938 68,517Total assets ......................................................... 287,740,207 443.236,797 758,364.400 1,084,873,718 1,246,426,899 1.310,227,440Net worth ............................................................ 121,205,022 176.444,407 290,655,693 423,937,357 490,481,127 502.486,821Total receipts ....................................................... 135,495,271 243.480,637 523,807.396 725,631,232 772,358,188 762.231,202
Business receipts ............................................ 131,463,171 234,689,427 507,372,820 693,105,168 733,943.970 717,929,024Interest received .............................................. 930,266 1,520,913 5,760,072 11,250,353' 12,310,594' 12,050,844'
Total deductions .................................................. 127,931,131 233,409.166 503.954,285 697.240,089 747,836,158 740,781,131Cost of sales and operations........................... 77,743,359 143.932,463 336,868,172 373,236.459 381,028,354 338,754,789Interest paid ......................................... .......... 7.364,200 13,761,062 27,638,591 40,178,514 44.880,858 47,070.426
Net income (less deficit) ..................................... 7,543,718 10,099,571 20,046,155 28,851,644 25.087,629 21,803,663Net income ...................................................... 9,471,595 12,088,189 24,917,293 37,897,899 37,880,144 41,098,014Deficit .............................................................. 1,927,877 1,9a8,618 4,871,138 9,041,255 12,792,516 19,294,351
Income tax before credits ................................... 4,342,3342 5.107.158 10,532,722 15,579.597 15,214,129 15616 499Total income tax after creditS3 ............................ 4,036,6502 2,836,470 5,322,655 8,532,848 8.432,924
, ,71,005,034
Distributions to stockholdersexcept in own stock........................................... 5,837,565 8,900,353 17~329.807 27,505,378 n.a. n.a.
WHOLESALE AND RETAIL TRADENumber of returns, total...................................... 518,062 614,632 799,628 896,524 917,301 939,159Number with net income ................................. 339,987 399,668 487.300 516,750 510,825 527,779
Total assets ......................................................... 192,181,800 323,496,726 646,901,005 899,032,645 1,009,965,739 1,073,523,697Net worth ............................................................ 77,002,132 122.649.734 222,289,687 289,338.722 286,260,274 300,103,440Total receipts ....................................................... 522,547,923 969.938,872 1.955,523,778 2,307.612.139 2.473,865,453 2,547,440,986
Business receipts .......... ; ................................. 511,316,BW 951,463,550 1,919.347,689 2,250,774,641 2,408,174,933 2.472,495,351Interest received .............................................. 1,291,906 3,857,318 10.503.989 18,406,334' 21.633,4801 23,264,441
Total deductions .................................................. 512,910,193 947,511,780 1,919.454.218 2,265,843,128 2.440.403,373 2,512,0811,940Cost of sales and operations ........................... 392,391,856 745,299,204 1,538,128,634 1,759,718,001 1.869.766,621 1,895,237,380Interest paid .................................................... 4,309,663 8,587.173 25,645,855. 33,204,502 38,217,998 39,961,980
Net income (less deficit) ..................................... 9,671,044 22,489,430 38,309,671 42,010,706 33,126,702 34,919,948Net income ....................... :.............................. 12,395.411 27,681,721 49,426,500 58,584,558 51,434,500 55,246,479Deficit .............................................................. 2,724.367 5,192,291 11; 116,829 .16,573,852 18,307,798 20,326,531
Income tax before credits ................................... 4,476,0472 8,103,316 13,515,653 15,062,817 16.392,896 17 097 449Total income tax after creditS3 ......... .................. 4,237,1812 7,348,619 10,564,358 12,414,978 13.396,555
, ,15,166.086
--Distributions to-stocktiolders.
except in own stock........................................... 2,068,501 5,029,897 10,343,087 13,057,047 n.a. n.a.FINANCE, INSURANCE, AND REAL ESTATENumber of returns, total ...................................... 406.235 411,846 493.426 518,432 537.384Number with net income ................................. 248,586 243,409 273,853 274,171 285,273 296,921
Total assets ......................................................... 1,401,153,520 2.321,965,956 4,022,206,073 5.938.984,929 7.029,452,681 7.985,641,912Net worth ..................... ; * ............ * **'***'* 196,480,448 269,770,527 530,541,317 901,658,317 1,161,968,009 1,502,198,831Total receipts ....................................................... 177,321,173 315,795,981 697.460,846 1,033,146,416 1,182,034,309 1,365,095,368
Business receipts ............... :............................ 92,0911.1587 157.126,715 256.892.475 431,157,290 501.993,840 618,646,549Interest received .............................................. 63,694,046 127,040,303 315,146,115 497.044.3271 541,268,193' 75,727,059'
Total deductions ................................. :................ 161,630,060 297.963.817 652,637,787 985,687,308 1,104,572.202 1,245,473,109Cost of sales and operations ........................... 48,434,362 84,614,209 129,644,330 213,655,427 237,577,BM 320,622,944Interest paid .................................... i .......... 34,548,5W 77,677,659 219.167,684 347,164,947 363,009,417 35.193,465
Net income (less deficit) ..................................... 12,214,079 11,663,330 33.122,792 32,677,646 60,670,526 99,808,908Net income...................................................... 15.081.939 18,825,003 46,040.390 66,225.666 90,546,934 131,284.234Deficit ............. t................................................ 2,867,860 7,161,673 12,917,599 33,548,620 29,876,408 31,475,326
Income tax before credits ................................... 4,404,4492 5,558.647 9,680,755 9,619,055 13,598,201 i8,091,476Total income tax after creditS3 ............................ 4,150,0092 4,673,705 7,699,628 6,730,460 10,193,877 14,665,774Distributions to stockholdersexcept in own stock ........................................... 7,387,211 8,729,977 24,692,146 51,315,346 n.a. n.a.
SERVICESNumber of returns, total ..................
............... 281,218 435,672 671,338 899,370 939.390 1,012,178Number with net income................................. 150,525 249.641 408,716 508,336 529,337 575,016
Total assets ................................... . .................... 61,875,140 90,534,067 178.163.737 307,895,160 330,982,941 381,609,099Net worth ........................................... : ................ 19,529.062 26,855,374 52,865.513 .84.773.772 89,852,365 100,190.0-54Total receipts ....................................................... 69,572,626 131,377.364 279,883,187 490,332,811 534,587,609 591,849.715
Business receipts ............................................ 66,459,515' 125,747.462 266,088,619 458,038,533 497,980,990 550,590.929Interest received .............................................. .435,070 875,506 3,269,412 6,277,591 6,561,3011 ~ 6,871,344'
Total deductions.................................................. 68,384.452 127,996,443 271,792.974 484,990.160 528,685,613 584.295,930Cost of ~ales and operations........................... 37,733.747 63,724,869 129,352,692 170.889,613 176.070,808 196,127,453Interest paid .: .................................................. 1,802.80~ 3,279,438 8,033,612 14.068,343 15,027,259 15,718.343
Nei income Oess deficit) ..................................... 1,198,703 3,396,744 8,193,903 5,464,130 5,883,782 7,448,023Net income.................................... ................. 3,384,869 6,0 55 292 - 13.246.601 1 19,373,912 21,124,460 1 8,116,081
... ......... * *'* ..........Income tax'before'credits .............................1
058,2r.4 2
--
1:625:093
-
3,497,265 4.458,267 4:742:347
_
4:94 :317Total income tax after creditS3 ............................ 1,003.1302 1.323,637 2,603,370 3,175,178 3,343,830 3,863,565Distributions to stockholdersexcept in own stock M................................... 558,452 855,402 11,1541.945 3,126,700 n.a. n.a.
See notes following Table 20.

Selected Historical Data
Table IS.-Corporation Profits Before Taxes Per National Income and Product Accounts (NIPA) and Per Sol, and IncomeSubject to Tax per Sol, Income Years, 1960-1988(All figures are estimates-money amounts are in billion of dollars]
Incomeyew
1960 .....................................................................................................................
1961 .....................................................................................................................
1962 .....................................................................................................................1963 .....................................................................................................................1964 .....................................................................................................................
1965 .....................................................................................................................1966 .....................................................................................................................1967 .....................................................................................................................1968 .....................................................................................................................
1969 .....................................................................................................................1970 .................................. .................................................................................1971 .....................................................................................................................1972 .....................................................................................................................1973 ................... .................................................................................................1974 .....................................................................................................................
1975 .....................................................................................................................1976 .....................................................................................................................1977 .....................................................................................................................1978 .....................................................................................................................1979 .....................................................................................................................
1980 .....................................................................................................................
1981 .....................................................................................................................
1982 .....................................................................................................................
1983 .....................................................................................................................1984 .....................................................................................................................
1985 .....................................................................................................................
1986 ...............................................................................................................1907 .....................................................................................................................
p-1988 .....................................................................................................................
See notes following Table 20.
Proftbefore(per NIP"A)
(1)
49.949.855.159.866.7
77.483.380.189.1
87.276.087.3
101.5122.2138.9
134.8170.3200.4233.5257.2
237.1226.5169.6207.6240.0224.3.221.6266.7306.8
Net Income
IMASOOft IT
(2)
43.545.949.654.361.6
73.980.578.286.0
80.265.979.796.8
120.4148.2
142.6185.4219.2246.9284.6
239.0213.6154.3188.3232.9240.1269.5
n.a.n.a.
IncomesublWto tax
(per Soo
(3)
47.247.951.754.360.4
70.877.174.881.4
81.272.483.295.1
115.5144.0
146.6183.5212.5239.6279.4
246.6241.5205.2218.7257.1266.1276.2
n.a.n.a.
117

118 Selected Historical Data
Table 16.-Gross Internal Revenue Collections: Amount Collected by Quarter and Fiscal Year, 1985-1989[Money amounts are in millions of dollars) I
Amount Collected by " of ratitrn
Ouarter and fiscal you TotallndWual Corporation Excise Sm nt Estate
noom taxes I Inome taxes 2 taxes 3=4
gift taxes
(2) (3) (4) (5) (6)
FISCAL YEAR 1985, TOTAL ................................................. 742,871 396,659 77,413 37,005 225,214 6,680October 1984-December 1984 .................................................... 155,919 79,775 17,546 9,732 47,286 1,580January 1985-March 1985 ........................................................... 176,324 89,325 17,350 8.650 59,352 1,647April 1985-June 1985 .................................................................. 233,946 136,141 24,843 9.013 62,313 1,636July 1985-September 1985 .......................................................... 176,682 91,418 17,674 9.610 56,263 1,717
FISCAL YEAR 1986, TOTAL ................................................. 782,252 416,965 80,442 33,672 243,978 7,195October 1985-December 1985 .................................................... 167,a36 86,608 .18,854 9,321 51,354 1,699January 1986-March 1986 ........................................................... 186,178 97,804 16,243 8,175 62,309 1,647April 1986-June 1986 .................................................................. 240,680 134,129 25,703 8,191 70,687 1,970duly 1986-September 1986. ......................................................... 187,558 98,424 19,642 7,985 59,628 1,879
FISCAL YEAR 1987, TOTAL ................................................. 886,290 465,452 102,859 33,311 277,000 7,668October 1986-December 1986 .................................................... 180,580 92,346 22,466 8,281 55,615 1,872January 1987-March 1987 ............................................ ....... 209,032 105.483 22,649 7.925 71,156 1,819April 1987-June 1987 ........................................... ...................... 285,477 164.008 29,748 8,493 81,139 2,089July 1987-September 1987 .................................... ..................... 211,201 103.615 27,996 8,612 69,090 1,888
FISCAL YEAR 1988, TOTAL ................................................. 935,107 473,667 109,683 25,934 318,039 7,784October 1987-December 1987 .................................................... 197,095 97,479 24,828 6.475 66,500 1.813January 1988-March 1988 ........................................................... 220,447 111,215 22,006 5.304 80,161 1.761April 1988-June 1988 .................................................................. 296,175 160,018 35,991 6.550 91.426 2,190July 1988-September 1988 .......................................................... 221,390 104,955 26,858 7,605 79.952 2,020
FISCAL YEAR 1989October 1988-December 1988 .............................. ..................... 213,518 104,522 29,551 6,657 70,632 2,156January 1989-March 1989 ........................................................... 235,883 114,475 20,760 6,097 92,587 1,964April 1989-June 1989 .......................................................... 331,478 180,947 40,825 6,900 100,077 2,729
See notes following Table 20.

Selected Historical Data
Table 17.-Internal Revenue Refunds: Amount Refunded By Quarter and Fiscal Year, 1985-1989
[Money amounts are in millions of dollars]
119
Amount refunded tyy type of mum
Ouarter and fiscal year TotalIndividual Corporation Excise E=rn Estate and
income taxes Income taxes 2 taxes 3 gift taxes
(2)--
(3) (4) (5) (6)
FISCAL YEAR 1985, TOTAL ................................................. 86,322 66,908 16,725 892 1,606 191
October 1984-DeCember 1984 .................................................... 6,729 2,246 4,177 122 138 46
January 1985-March 1985 ........................................................... 17,664 12,808 4,286 91 439 40
April 1985-June 1985 .......... ....................................................... 52,376 46,370 4,701 556 702 47
July 1985-Septernber 1985 ............... .................................. 9,551 5,484 3,561 123 326 57
FISCAL YEAR 1986, TOTAL ................................................. 94,424 73,078 18,297 962 1,800 287
October 1995-December 1985 .................................................... 7,948 3,003 4,268 128 488 61
January 1986-March 1986 ..................................... ..................... 25.895 19,950 4,997 320 577 51April 1986-June 1986 .................................................................. 50,200 44,375 5,058 232 435 100
July 1986-September 1986 .......................................................... 10,381 5,750 3,974 282 300 75
FISCAL YEAR 1987, TOTAL ................................................. 96,969 73,583 19,891 1,381 1,900 214
October 1986-December 1986 .................................................... 8,668 3,406 4,789 ill 312 50
January 1987-March 1987 ........................................................... 28,422 22,198 5.296 479 r393 56April 1987-June 1987 .......... ................................................ 50,063 42,858 5,948 332 r869 57July 1987-September 1987 ........................ ................................. 9,816 5,121 3,858 459 326 52
FISCAL YEAR 1988, TOTAL ................................................. 94,480 74,399 16,477 1,114 2,263 227
October 1987-December 1987 .................................................... 7,701 3,437 3,727 207 275 55
January 1988-March 1988 ........................................................... 27,798 21,744 5,248 198 553 55
April 1988-June 1988 ............. ............................................... 49,202 43,769 3,848 421 1,114 50
July 1988-September 1988 .......................................................... 9,776 5,449 3,654 288 321 67
FISCAL YEAR igagOctober 1988-December 1988 ............................. ................. 8,380 3,362 4,461 118 359 80
January 1989-March 1989 ........................................................... 32,041 26,759 4,462 182 570 67
April 1989-June 1989 .................................................................. . 43,538 38.895 3,849 350 381 63
See notes following Table 20.

120 Selected Historical Data
Table 18.-Classes of Excise Taxes by Selected Fiscal Years, 1970-1989(Money amounts are in thousands of dollars]
Taxes collected try fiscal yew
1970 1975 1980 1985 1987 1988
(1) (2) (3) (4) (5) (6)
ALCOHOL AND TOBACCO TAXES, TOTAL ............................ 6,840,594 7,665,948 8,151,184 9,881,293 10,364,367 10,352,709Distilled spirits ............................................................................... 3,501,538 3,865,162 3,945,377 3,520,697 3,799.226 3,813,516Wine .............................................................................................. 163,337 177,113 211,538 305,966 316,457 322,613Beer ..............
............ *................... ....................... **'* ...........1,081,507 1,308,583 1,547,853 1,571,436 1,675,669 1,693,7~7
Cigarettes
.......... * ..... * ............ * *2,036,101 2,261,116 2,402,857 4,448,916
Cigars ........................... ................................................................ 56,834 51,226 39,500 24.294 4,573,015 4,522.833MANUFACTURERS EXCISE TAXES, TOTAL...... 6,683,061 5,516;611 6,487,421 10,020,574 10,221,574 10,643,379
Gasoline and gasohol .................... ............................ 3,517,586 4,071,465 4,326,549 9,062'630
9,163,790 9,453,441Tires, tubes and tread rubber ........................
:-.. ........ **'** * **614.795 697,660 682,624 242.9232 4082296 1412319
Motor vehicles, bodies, parts 3 .......... ................. .........................1,753,327 662,556 1,088,696 N/A
,
N/A,N/A
Recreational products ................................................................... 53,427 84,946 136,521 166,666 186,608 169,663Black Lung taxes .......................................................................... N/A N/A 251,288 548,356 574,769 601,279
SPECIAL FUELS, AND RETAILERS TAXES, TOTAL4 ..............
257,820 404,187 560,144 3,802,608 3,762,284 4,528,300Diesel and special motor fuels ...................................................... 257.712 370,489 512,718 2,430.165 2,659.404 3,119,934Trucks and buses .......................................................................... N/A N/A N/A 1.289.750 1,020.553 1,155,808
MISCELLANEOUS EXCISE TAXES, TOTAL ............................. 2,084,730 3,306,077 6,359,198 11,044,833 7,255,284 8,7117,082Telephone and teletype 5 ..............................................................
. 1,469,562 2,023,744 1,117,834 2,307,607 2,522,062 2,555,082Air transportation ............................... ............................................ 250,802 850,567 1,748,837 2,589,818 2,913.249 3,145,422Highway use tax ........................................................................ 135,086 207.663 263,272 456,143 556,006 570,053Foreign insurance ......................................................................... 8,614 19,458 74,630 73,494 115,133 97.270Exempt organization net investment income ................................. N/A 63,828 65,280 136,153 218,102 379'229Crude oil windfall
profit 6 ..... ....... ............. ............................. ... N/A N/A 3,051,719 5,073,159 14,910,
372 847Environmental taxes 7 ..
................................................................. N/A N/A N/A 272,957 4017,167,
924,951
Selected class of taxFiscal yew quarter ending
March 19M June 1988 Sept. 1988 Dec. 19M March 19M June 1989
(7) (8) (9) (10) (12)
ALCOHOL AND TOBACCO TAXES, TOTAL .................... ..... 3,540,736 1,267,603 2,921,505 2,615,149 2,407,574 2,486,435Distilled spirits ............................... ........................................... 2.024,011 -506,616 1,312,960 1,039,009 872,127 804.609
- -Wine~~
.. .. . ... .............................................. -191-,493-- --227,073- --312,979- --204,300- ---165,077- - -202-.208
Beer ..............
...: ............ .. ................... 322,992 428,821 642,068 301,664 316,510 363,789
Cigarettes and cigars .................................................................... 11002;240 1,118.325 1,279,456 1,070,176 1,053,860 1,11,5,829
MANUFACTURERS EXCISE TAXES, TOTAL............................ 2,602,434 2,635,047 2,709,412 3,030,722 2,66,045 2,523,743Gasoline and gasohol ................................................................... 2.317,004 2,322,096 2,402,290 2,719,151 2,542.789 2 224 923Tires, tubes and tread rubber 2 ..... ........ . ................. . ................
83,000 76,461 78,861 86,524 76,402, ,
70,104Recreational products ................................................. ................. 45,957 r61,015 45,474 53,131 49,047 62,091Black Lung taxes ............ - ............................................................ 156,473 146.735 146,222 148,700 143,200 128,300
SPECIAL FUELS AND RETAILERS TAXES, TOTAL 4 ............... 1,021,290 963,679 1,562,215 1,698,279 1,657,015 1,067,603Diesel and special motor fuels ...................................................... 703,431 661,684 1.101,412 1,228,702 1.136,524 729,706Trucks and buses, chassis, bodies, etc ......................................... 297,710 281,747 298,417 307,675 313,687 283,667
MISCELLANEOUS EXCISE TAXES, TOTAL .............-
............. 2,094,963 2,051,243 2,781,670 1,977,738 2,352,971 2,195,379Telephone and teletype
5....................................................... 379.100 740,637 693,568 603,896 916,426 736,957
Air transportation ..................................................................... 719,181 830,224 812,162 865,813 833,030 840,613Highway use tax ............................................................................ 126,368 96,212 300,221 48,462 124,239 102,160Foreign insurance .............................. ........................................... 26.802 23,383 21,853 17.758 28,862 5,330Exempt organization net investment income................................. 32,558 19,011 158,425 26.584 28,128 63,630Crude oil windfall profit
6 .......... ......... .................................. .......501.123 17,108 22,674 -25,526 49,356 -2,204
Environmental taxes 7... ........... __ ................................................1
224,758 ~28,248 247,428 254,760 257,800,
247,070
ee notes following Table 20.

Selected Historical Data
Table 19.-Selected Returns and Forms Filed or to be Filed During Selected Calendar Years, 1970-1989
Type Of return or form
Individual Income .....................................................Form 1040...................................................................... ...Nonbusiness....................................... ...........................Business .........................................................................Schedule C ........................ ............. ................. ........Schedule F .................................................................
Form 1040A .......................................................................Form 1040EZ ................................................ .... ........... ...Other . .................................................... ....... ... _ .............
Corporation Income ..................................................Forms 1120, L, and M .............................................. ........Form 1120A ........................... ...........................................Form 1120S...................................... . . .............................Other 2 .. .... ....... ... .......... .. . ............... ............... .........
Partnership, Form 1065 ..............................................
Fiduciary, Forms 1041 and 1041S ................................
Estate Tax, Forms 706 and 706NA ..............................
Gift Tax, Form 709 .....................................................
Exempt Organization .................................................Form 990 ...................................................................... . ...Form 990-PF .................................................................. ..Form 990-T ................................................... ................. ..Forms 990C, 4720, and 5227 ............................................
See notes on following Table 20.
1970
(1)
77,281,38477,143,25168,129,3519,013.9006,351.3042,662,596
NIAN/A
138,133
1,758,6001,487,244
N/A248,936
1,414
991,904
1,149,4453
141,156
146,338
387,469377.0304
N/A5,0465,393
1975
(2)
84,026,78561,450,27951,377,15310,073,1267,438,9682,634,158
22,462,776N/A
113,730
2,132,7581,762,920
NIA367,219
2,619
1,132,839
1,558,570
225,827
273,184
403,809346,627
29,63719,6837,862
-6
Number Filed In Calendar Year-
1980
(3)
93,196,07655.360,03043.957,14111,402,8898,944.2982,458.591
37,692,282N/A
143,764
2,675,7042,115,542
N/A528,07032,092
1,401,567
1,876,392
147,303
214,789
442,607362,632
33.13723.45523,383
1985
(4)
99,704,24664,010,06849,873,30014,136,76811,767,3482,369,420
18,779,08416,739,767
175,327
3,437,2492,432,265
199,665736,94568,374
1,755,339
2,124,969
80,768
97,720
454,097365,506
32,00526,18130,405
1987
(5)
103,462,01168,545,02353,736,83714,808,18612,633,2612,174,925
17,870,31216,835,390
211,286
3,828,6132,550,692
300,760892,376
84.785
1,824,166
2,335,805
57,165
104,095
514,947400,33242,22733,15639,232
Table 20.-Taxpayers Receiving Assistance, Paid and Unpaid, by Tax Year of Return, 1984-1988
[Some estimates based on samples-all amounts are in thousands]
Type of assistance
Returns with paid preparer signature: 1All returns ............................................... ................. .... . ............. . ..... .......... ... .
1040EZ ....................................... ............ ...... ... .... ...... I. .. ...............................1040A ........................................................... . ..... .................................... ... .......1040, total .......................................... .. ............. ......................... .........................
1040 Business, total ........................................ ................. ........ ..... .... .. ........
Nonfarm .................................................................... ......................................
Farm ......................................... ............... . .............. .. ............ ........... ..... ..1040 Nonbusiness, total .............................. ..................................... ................
With itemized deductions .................................................................. ...........Without itemized deductions .............................................. ... ... ............ ........
Assistance provided by IRS: 2
Telephone inquiries .............................................................................................. ......Recorded telephone information .............................. . ............................... .............. .Office walk-ins, information ........................................ ..... . ..... ..... ...................... ....Written inquiries............................. ................ .. .................. .. .................. ..............Special programs:
Community classes and seminars (taxpayers assisted)............................................Volunteer Income Tax Assistance (VITA) (returns prepared) .....................................Tax Counseling for the Elderly (returns prepared)..................................... .... ........
1985
(1)
46,685740
4,38941,55610,6588,9241,734
30,89818,99611,902
37,8637,8508,114
241
374302333
1986
(2)
48,049655
4,13543,25911,0879,3851,702
32,17218,73212,627
34,65510,8927,090
169
903337331
Tu Year
1987
(3)
50,695842
3,94745,90611,3219,7471,574
34,58516,84217,743
38,52613,4057,408
166
1,103385375
1988
(6)
107,258,96271,055,22055,817,37015,237,85013,125,5072,112,343
17,645,14918,328,572
230,021
4,027,4282,472,376
285,7771,169,736
99,539
1,825,865
2,669,014
52,449
104,105
482,305361,18442,69035,63542,796
121
1989(Projected)
(7)
110,031,90071,562,20055,581,90015,980,30013,838.9002,141,400
18,729,90019,478,700
252,100
4,269,6002,605,300
296,7001,259,900
107,700
1,950,100
2,484,600
55,000
104,900
508,600385,600
42,80037,30042,900
P1988
(4)
51,435894
4,30446,23811,5609,9551,605
34,671314,88519,793
n.a.n.a.n.a.n.a.
n.a.n.a.n.a.
See notes on following page.

122 Notes to Selected Historical Data Tables
General notations
N/A - Not applicable
n.a. - Not available
p - Preliminary
r - Revised
* - See Appendix, General Description of Statistics ofIncome Sample Procedures and Data Limitations.
Table I
Ill Starting with 1987, represents total dividends; previously itrepresented total dividends after statutory. exclusion.
[21 Starting with 1987, represents total capital gains; previ-ously it represented total capital gains after statutoryexclusion.
[3] Starting with 1988, does not include IRA distributions;- -previously pensions-and-IRA-distributions-in AGI-were- -
represented together
[4] Includes total itemized deductions before subtraction of11 zero bracket amount," and charitable contributionsand zero bracket amount on non-itemized deductionreturns.
[5] Includes itemized deductions, "basic" standard deduc-tion and "additional" standard deduction (for age 65and over and for blindness). Also includes "zerobracket amount" reported on the small number ofprior-year returns filed in 1988 that were included in the1987 statistics.
[61 Includes deductions not shown separately below.
[7] Includes surcharge of $2,018,078,000.
[81 Includes credits not shown separately below.
[9] Investment credit was included in the more-inclusivegeneral business tax credit beginning with 1984. Withexceptions, investment credit was repealed effectivewith 1986.
[10] Includes income tax after credits and the additional taxfor tax preferences, i.e., "minimum tax" (applicable for1970-1982) and "alternative minimum tax" (appli-cable after 1979).
SOURCE: Statistics of Income-Individual Income Tax Re-turns, appropriate years. Data are subject to sampling error
Tax law and tax form changes affect the year-to-yearcomparability of the data. See the specific Statistics ofIncome reports for a description of sampling error and ofthe changes mentioned above.
Table 2
Ill Totals in Table 2 do. not agree with Tables 1 and 3because they were obtained from a different source.For purposes of Table 2:
a. Number of returns by State include, in addition toForms 1040, 1040A and 1040EZ filed by U.S.citizens and residents, Forms 1040NR filed by non-resident aliens, as well'as self-employment tax re-turns used in Puerto Rico and certain U.S. territoriesand possessions.
b. "Total tax" liability includes total income tax plus taxfrom recomputing prior-year investment credit, taxapplicable to Individual Retirement Arrangements(IRA's), self-employment tax,'social security tax ontip income, and certain ~pther income-related taxes.Total tax is before reduction by earned income credit
--(see -also footnote-2(c),-below).--c. Earned income credit, available to certain low-
income workers, could result in a refund (1) if therewas no "total tax" (as defined in footnote 2(b),above), in which case the full amount was refund-able, or (2) if the credit exceeded "total tax:' in whichcase the excess was refundable. Columns 18 and19 includes both the refundable and nonrefundableportions.
Total tax (column 16) minus earned income credit(column 19) is the amount most comparable to totaltax in Tables 1 and 3. The total tax which results fromthis subtraction differs from Tables 1 and 3 becauseit includes additionallaxes (see footnote 2(b), above)and because earned income credit used to offset taxalso includes both the refundable portion (see foot-note 2(c)), as well as amounts offset against theseadditional taxes.
fo,-,, plo-~~L-J ------~_ I -M , 1UL 11 U I r-uSuvJmC;e-and Fleet Post Office addresses by service men andwomen stationed overseas; returns filed by other U.S.citizens abroad; and returns filed by residents of PuertoRico with income from sources outside Puerto Rico or withincome earned as U.S. Government employees.
NOTE: This table presents aggregates of all returns filedand processed through the Individual Master File (IMF)system during Calendar Year 1988. Data have not beenedited for Statistics of Income purposes.
SOURCE: Internal Revenue Service, Tax Processing Sys-tems Division, IMF Returns Systems Branch.
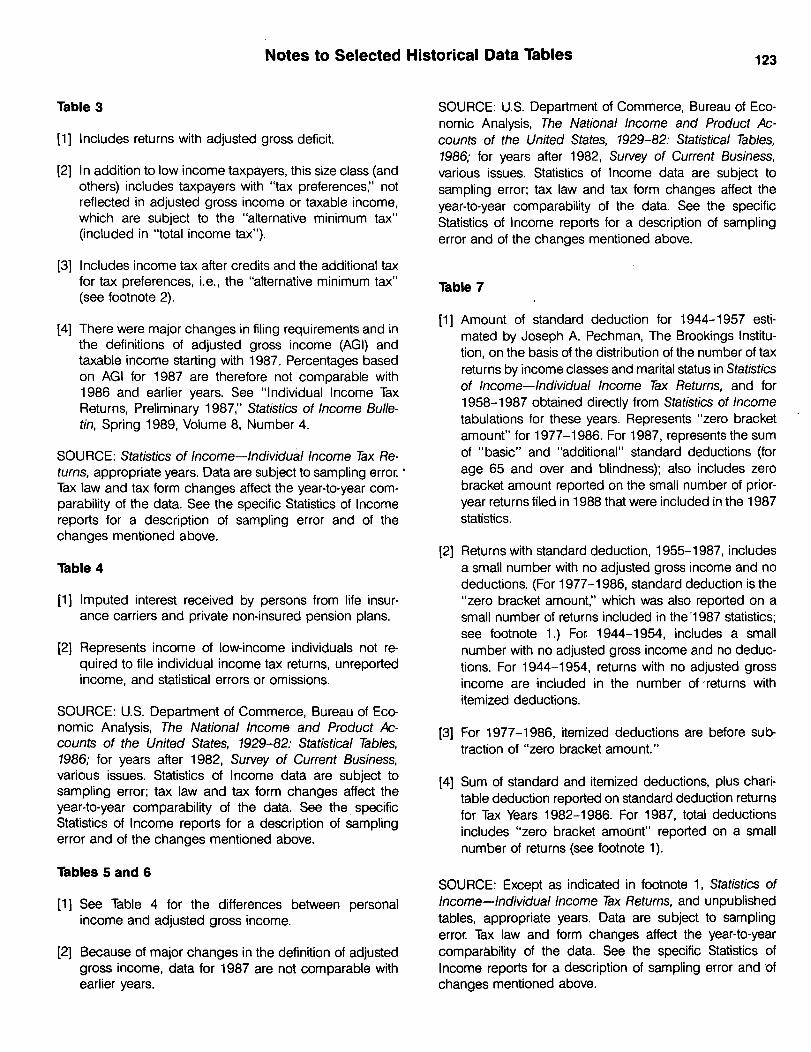
Notes to Selected Historical Data Tables
Table 3
Ill
[21
[31
Includes returns with adjusted gross deficit.
In addition to low income taxpayers, this size class (andothers) includes taxpayers with "tax preferences:' notreflected in adjusted gross income or taxable income,which are subject to the "alternative minimum tax"(included in "total income tax").
Includes income tax after credits and the additional taxfor tax preferences, i.e., the "alternative minimum tax"(see footnote 2).
[41 There were major changes in filing requirements and inthe definitions of adjusted gross income (AGI) andtaxable income starting with 1987. Percentages basedon AGI for 1987 are therefore not comparable with1986 and earlier years. See "Individual Income TaxReturns, Preliminary 1987," Statistics of Income Bulle-tin, Spring 1989, Volume 8, Number 4.
SOURCE: Statistics of Income-Individual Income Tax Re-turns, appropriate years. Data are subject to sampling error.Tax law and tax form changes affect the year-to-year com-parability of the data. See the specific Statistics of Incomereports for a description of sampling error and of thechanges mentioned above.
Table 4
[11 Imputed interest received by persons from life insur-ance carriers and private non-insured pension plans.
[2] Represents income of low-income individuals not re-quired to file individual income tax returns, unreportedincome, and statistical errors or omissions.
SOURCE: U.S. Department of Commerce, Bureau of Eco-nomic Analysis, The National Income and Product Ac-counts of the United States, 1929-82.- Statistical Tables,1986,- for years after 1982, Survey of Current Business,various issues. Statistics of Income data are subject tosampling error; tax law and tax form changes affect theyear-to-year comparability of the data. See the specificStatistics of Income reports for a description of samplingerror and of the changes mentioned above.
Tables 5 and 6
[1] See Table 4 for the differences between personalincome and adjusted gross income.
[2] Because of major changes in the definition of adjustedgross income, data for 1987 are not comparable withearlier years.
123
SOURCE: U.S. Department of Commerce, Bureau of Eco-nomic Analysis, The National Income and Product Ac-counts of the United States, 1929-82: Statistical Tables,1986,- for years after 1982, Survey of Current Business,various issues. Statistics of Income data are subject tosampling error; tax law and tax form changes affect theyear-to-year comparability of the data. See the specificStatistics of Income reports for a description of samplingerror and of the changes mentioned above.
Table 7
Ill Amount of standard deduction for 1944-1957 esti-mated by Joseph A. Pechman, The Brookings Institu-tion, on the basis of the distribution of the number of taxreturns by income classes and marital status in Statisticsof Income-Individual Income Tax Returns, and for1958-1987 obtained directly from Statistics of Incometabulations for these years. Represents "zero bracketamount" for 1977-1986. For 1987, represents the sumof "basic" and "additional" standard deductions (forage 65 and over and blindness); also includes zerobracket amount reported on the small number of prior-year returns filed in 1988 that were included in the 1987statistics.
[2] Returns with standard deduction, 1955-1987, includesa small number with no adjusted gross income and nodeductions. (For 1977-1986, standard deduction is the"zero bracket amount," which was also reported on asmall number of returns included in the -1987 statistics;see footnote 1.) For 1944-1954, includes a smallnumber with no adjusted gross income and no deduc-tions. For 1944-1954, returns with no adjusted grossincome are included in the number of -returns withitemized deductions.
[3] For 1977-1986, itemized deductions are before sub-traction of "zero bracket amount."
[41 Sum of standard and itemized deductions, plus chari-table deduction reported on standard deduction returnsfor Tax Years 1982-1986. For 1987, total deductionsincludes "zero bracket amount" reported on a smallnumber of returns (see footnote 1).
SOURCE: Except as indicated in footnote 1, Statistics ofIncome-Individual Income Tax Returns, and unpublishedtables, appropriate years. Data are subject to samplingerror Tax law and form changes affect the year-to-yearcomparability of the data. See the specific Statistics ofIncome reports for a description of sampling error and 'ofchanges mentioned above.

124
Table 8
Notes to Selected Historical Data Tables
[11 See Table 4 for the differences between personalincome and adjusted gross income.
[21 Taxable income excludes "zero bracket amount" for1977-1986. Because of major changes in law, taxableincome starting with 1987 is not comparable with earlieryears.
[3] For the definition of total income tax, see footnote 9,Table 1.
SOURCE: U.S. Department of Commerce; Bureau of Eco-nomic Analysis, The National Income and Product Ac-counts of the United States, 1929-82: Statistical Tables,1986; for years after 1982, Survey of Current Business,various issues; and Statistics of Income-Individual IncomeTax Returns, appropiate years. Statistics of Income data aresubject to sampling errors; tax law and tax form changesaffect the year-to-year comparability of the data. See thespecific Statistics of Income reports for a description ofsampling error and of the changes mentioned above.
Table 9 - __ - - -
[1] Excludes returns with refundable earned income creditonly, starting with 1975; and returns with refundablecrude oil windfall profit tax overpayment only, startingwith 1980.
SOURCE: Statistics of Income-Individual Income Tax Re-turns, and unpublished tables, appropriate years. Data aresubject to sampling'error Tax law and tax form changesaffect the year-to-year comparability of the data. See thespecific Statistic's of Income reports for a description ofsampling error and of the changes mentioned above.
Table 10
SOURCE: Statistics of Income-Sole Pr6prietorship Re-turns, appropriate years, and SOI Bulletin, Summer issues(for most years). Data are subject to sampling error. Tax lawand tax form changes affect the year-to-year comparability
a description of sampling error and of the changes men-tioned above.
Table 11
[11 Total assets, total, liabilities, and partners' capital ac-count are somewhat understated because not all part-nership returns included a complete balance sheet.
[2] Short-term debt is the abbreviated title given to m6rt-gages, notes, and bonds payable in less than 1 year
[51
addition, for Income Year 1975, long-term debt in-cluded nonrecourse loans.
[41 See footnote 4, Table 12, forchanges in the compara-bility of the statistics for receipts and deductions after1980. Also, statistics for interest received were com-bined with dividends from 1982 through 1986. For1987, interest represents only portfolio income distrib-uted to partners; amounts received through trade orbusiness are excluded.
After 1980, represents the more all-inclusive amountsreported in depreciation computation schedules ratherthan the amounts reported as the depreciation deduc-tion (augmented by depreciation identified in cost ofsales and operations schedules).
SOURCE: Statistics of Income-Partnership Returns, ap-propriate yea~rs, and SOI Bulletin, Summer issues (for mostyears). Data are subject to sampling error. Tax law and taxform changes affect the year-to-year comparability of-thedata. See the specific Statistics of Income reports for adescription of sampling error and of the changes men-tioned above.
Table 12
[11 Size classes are based on business receipts, i.e., grossamounts from sales and operations, for industries ex-cept those in finance, insurance and real estate. For the[after
*industries, total receipts, which is the sum of
business receipts and investment income, was used.For partnerships, see also footnote 4, below.
[2] Includes returns with no receipts as defined in footnote1 . .
.
[3] Includes corporations with zero assets and liabilities. Inaddition, for partnerships, includes partnerships withoutbalance sheet information (see also footnote 5, below).
[41 For 1981 through 1986, "total receipts" in Table 11includes, in part, only the net income or loss fromfarming and rentals; however, for 1987, gross real estate
cluded the gross receipts from farming and rentals and,if rental receipts were the principal source of totalreceipts, they were treated as "business receipts" forthe statistics. To help minimize the break in compar-ability caused by this change in statistical treatment offarm and rental income, an effort was made startingwith 1981 to include rental (though not farm) grossreceipts in the receipts used for the size distribution inTable 12. In Table 11, since only the net income or lossfrom farming and rentals was included from 1981through 1986, the deductions reported in computingthese net incomes are excluded from the deduction
[3] Long-term debt is the abbreviated title given to mort- statistics; starting with 1987, real estate rental deduc-gages, notes, and bonds payable in 1 year or more. In tions are included as they were before 1981.

Notes to Selected Historical Data Tables
[5) Prior to 1979, partnerships that had liquidated wereassumed to have zero assets and liabilities, even if theirbalance sheets showed otherwise, and were includedin the "under $25,000" asset size class. Beginning with1980, balance sheet data reported for liquidated part-nerships were tabulated as reported and were includedin the appropriate asset size classes.
SOURCE: Statistics of Income-Corporation Income TaxReturns, appropriate years, Statistics of Income-Partner-ship Returns, appropriate years, Statistics of Income-SoleProprietorship Returns, appropriate years, and SOI Bulletin,Summer issues (for most years). Tax law and tax formchanges affect the year-to-year comparability of the data.See the appropriate Statistics of Income reports for adescription of sampling error and of the changes men-tioned above.
Table 13
[1] Estimate should be used with caution because of thesmall number of sample returns on which it is based.
[2] Consolidated returns were filed on an elective basis foraffiliated groups of corporations (with exceptions), ingeneral, if 80 percent or more of the stock of theaffiliates was owned within the group and a commonparent corporation owned at least 80 percent of thestock of at least one of the affiliates.
[3] Included in "Number of returns, total" and "Numberwith net income."
[4] Generally, small corporations with no more than 35shareholders (10 prior to 1983), most of them individ-uals, electing to be taxed at the shareholder level.
[5] Domestic International Sales Corporations (DISC's)were designed to promote U.S. exports. They weretaxed through parent corporations, but only whenprofits were distributed or deemed distributed to them.This system of tax deferral was generally replaced after1984 with a new system of Foreign Sales Corporations(FSC's); see footnote 5. Tax benefits of DISC's remain-ing after 1984 were limited and an interest charge fortax deferred amounts was imposed on the parentcorporations.
[6] Foreign Sales Corporations (FSC's) generally re-placed DISC's as a means of promoting U.S. exports(see footnote 4). Under the FSC provisions, a portionof these subsidiaries' "foreign trade incomd' wasexempt from U.S. income tax.
[7] For 1984, net long-term for capital gain reduced bynet short-term capital loss from Forms 11 20S, are not
125
included in computed total receipts nor in net income.Therefore, the components of total receipts do notequal the computed total receipts for that year
[8] Includes dividends reported in combination with inter-est on Form 1120-S by S Corporations, i.e., certaincorporations that elect to be taxed through sharehold-ers (see footnote 3). Based on prior years, when Form1120-S required each to be reported separately,nearly all of the combined amount represents interest.
191 For most years, "income subject to tax" (the corporatetax base) exceeds "net income less deficit" chieflybecause of the deficits reported on returns without netincome. Moreover, it is the sum of the several taxbases applicable over time to different classes ofcorporations, not all of which were directly related tonet income. Income subject to tax thus includes the"taxable income" base used by most companies (anddefined as net income minus certain statutory specialdeductions); a variation of this base in combinationwith net long-term capital gains in certain situationswhen the lower capital gains tax applied; the specialtax bases applicable to S Corporations and insurancebusinesses; and the amounts taxable to certain invest-ment companies. Profits of Domestic InternationalSales Corporations were tax-deferred; most of those ofqualifying Foreign Sales Corporations were tax-exempt and those of S Corporations were taxed (withfew exceptions) through their individual shareholders,so that the net income of these corporations is ex-cluded from income subject to tax.
[10] Includes surcharge of $784,437,000.
[11] General business credit includes alcohol fuel, invest-ment, jobs, and employee stock ownership plan(ESOP) credits which were reported separately forprevious years. With exceptions, investment credit wasrepealed effective 1986. For 1986, research credit wasalso included in general business credit.
NOTE: Detail may not add to totals because of rounding.
SOURCE: Statistics of Income-Corporation Income TaxReturns, appropriate years. Data are subject to samplingerror. Tax law and tax form changes affect the year-to-yearcomparability of the data. See the appropriate Statistics ofIncome reports for a description of sampling error and ofthe changes mentioned above.
Table 14
[11 See footnote 7, Table 13.
[2] See footnote 9, Table 13.

126 Notes to Selected Historical Data Tables
[3] Also includes additional tax for tax preferences("minimum tax"), tax from recomputing prior-year in-vestment credit, and Personal Holding Company tax.
SOURCE: Statistics of Income-Corporation Income TaxReturns, appropriate years. Data are subject to samplingerror Tax law and tax form changes affect the year-to-yearcomparability of the data. See the appropriate Statistics ofIncome reports for a description of sampling error and ofthe changes mentioned above.
Table 15
J11 Profits shown are without inventory valuation andcapital-consumption adjustment.
SOURCE: U.S. Department of Commerce, Bureau of Eco-nomic Analysis, The National Income and Product Ac-counts of the United States, 1929-82: Statistical Tables,1986; for years after 1982, 'Survey of Current Business,various issues; and Statistics of Income-Corporation In-come Tax Returns, appropriate years. Statistics of Incomedata are subject to sampling error; tax law and tax form
--changes- affect the year-to-year comparability of the data.See the specific Statistics of Income reports for a descrip-tion of sampling error and of the changes mentionedabove.
Tables 16 and 17
Ill Individual income tax collected includes that portionwhich was designated for the presidential electioncampaign fund by taxpayers on their returns. Alsoincluded is the fidiciary income tax collected (fromestates and trusts). Fidiciary income tax collected was$6.5 billion in 1988, $8.4 billion in 1997, $4.5 billion in1986, and $4.1 billion in 1985. Presidential electioncampaign designations amounted to $34.4 million in1988, $33.2 million in 1987, $35.9 million in 1986, and$34.8 million in 1985..
[2] Corporation income tax collected includes varioustaxes applicable to tax-exempt organizations, including
~+6e=* - 1-M-:-"Zibt~ ___tov~o_ .L11 ~ - -!- taxes_collected from tax-ekempt organizations were $137.5million (1988), $119.9 billion (1987), $30J million(1986), and $54.9 million (1985).
[31 Excise taxes are imposed on selected products, serv-ices, and activities, such as on sales of alcohol andtobacco products and on the manufacture of gasoline.
[4] Employment taxes include payroll taxes levied on sala-ries and wages, such as social security, railroad retire-ment, and unemployment taxes; plus the self-employ-ment tax imposed on "self-employment income."
NOTE'S: Collections (or refunds) are those made during the
time periods indicated, regardless of the year or otherperiod during which the tax liability was incurred (or towhich the refund applied).
Collections represent the gross amounts before refundsand include amounts paid with the return; prior to filing thereturn (as applicable, income tax withheld by employersand estimated tax payments); and subsequent to filing thereturn (chiefly the result of initial return processing or ofexamination and enforcement activities). Collections alsoinclude interest.and penalties.
Refunds result chiefly from tax overpayments determined attime of filing a return. Also included are amounts subse-quently determined as due the taxpayer as a result of anamended return or a claim for refund (including thoseproduced by "net operating loss" and other carrybackadjustments from future taxable years); or as a result ofinitial return processing or of examination and other activ-ities. Individual income tax refunds are net of offsets underlaws which require IRS to act as collection agent fordelinquent payments owed various U.S. agencies underspecific programs. All refund data include interest paid byIRS_ -
Detail may not add to totals because of rounding.
SOURCE: Internal Revenue Service, Returns Processingand Accounting Division, Accounting Branch.
Table 18
Ill Also includes lubricating oil taxes. Effective January 7,1983, taxes on lubricating oil were repealed.
[2] Effective January 1, 1984, taxes on tubes and treadrubber were repealed, and dealers holding taxable tireswere assessed a one-time floor stock tax.
[31 Effective January 7, 1983, the excise taxes on parts andaccessories for trucks and buses, which are included inthis classification, were repealed. Beginning with thequarter ending December 1983, motor vehicles areexcluded.
[4] Special fuels, total, includes diesel and special motorfuels which were classified as miscellaneous excisetaxes in 1970. Beginning with the quarter endingDecember 1983, motor vehicles are included.
(5] Effective January 1, 1983, the excise tax increased from1 percent to 3 percent.
[6] Repealed effective August 23, 1988 (RL. 100-418).Amounts reported for more recent quarters result fromamended filings, delinquent taxes, examination activi-ties, and refunds.

Notes to Selected Historical Data Tables
[71 Expired September 30, 1985; reimposed in January1987.
NOTES: For 1970 and 1975, the fiscal year was defined as.July of the previous calendar year through June of the yearnoted. Starting with 1980, the fiscal year was defined asOctober of the previous calendar year through Septemberof the year noted.
Starting with Fiscal Year 1988, additional detail on manu-facturers' excise taxes, retailers' and special fuel taxes, andmiscellaneous excise taxes is available in the fourth quarterInternal Revenue Report of Excise Taxes; previously thisinformation was published in the Annual Report of theCommissioner and Chief Counsel, Internal Revenue Serv-ice. For additional detail for alcohol and tobacco taxes, seethe Statistical Release, "Alcohol and Tobacco Tax Collec-tions," Bureau of Alcohol, Tobacco and Firearms, U.S.Department of the Treasury, 1989.
SOURCE: U.S. Department of the Treasury, Internal Reve-nue Service, Returns Processing and Accounting Division,Revenue and Accounting Branch; and Financial Manage-ment Service.
Table 19
Ill Includes Forms 1040C, 1040NR, 1040PR, and1040SS; excludes amended returns (Form 1040X).
[2] Includes Forms 1120F, 1120 POL, and 1120H; ex-cludes Forms 1120-DISC/FSC and amended returns(Form 1120X).
[31 Includes Form 1041A.
[4] Includes Form 990A.
SOURCE: Internal Revenue Service, Research Division,Projections and Forecasting Group.
Table 20
127
Estimates of returns with paid preparer assistance for1985 and earlier years are based on the full-yearsample of returns used for Statistics of Income-Individual Income Tax Returns. Data for 1987 are basedon the sample used to produce preliminary Statistics ofIncome (SOI) data and are therefore subject to revision.Since data on paid preparers are not available from the1986 SOI file, estimates were obtained by convertingthe 1986 Taxpayer Usage Study (TPUS) sample to theequivalent of the SOI sample. This was done becausethe TPUS sample represents returns filed through April,while the SOI sample represents all individual incometax returns filed in a calendar year For additionalinformation about the TPUS sample, see "TaxpayerUsage of Forms 1040, 1040A, and 1040EZ," Statisticsof Income Bulletin, Fall 1989, Volume 9, Number 2.
[2] Data on IRS Taxpayer Service Programs are collectedon a fiscal-year basis. In general, assistance renderedin a given fiscal year may be related to returns due onApril 15th during that fiscal year and are for the tax yearending with the previous December. Therefore, data inTable 20, which are presented on a tax year basis, areactually for a fiscal year, so that data shown as for TaxYear 1987, for example, are actually for Fiscal Year1988. However, data shown as for Tax Year 1986 inprevious issues of the SOI Bulletin were actually for thefirst 7 months of Fiscal Year 1987; the revised datarepresent the entire Fiscal Year 1987.
NOTE: Data on IRS assistance represent taxpayer contacts.Some taxpayers make more than one contact. The numberof taxpayers assisted (in contrast to the number of contactsmade) is not known.
SOURCE: Data on paid preparers were obtained fromStatistics of Income and Taxpayer Usage Study samples.Data on IRS assistance were compiled by the TaxpayerService Division.
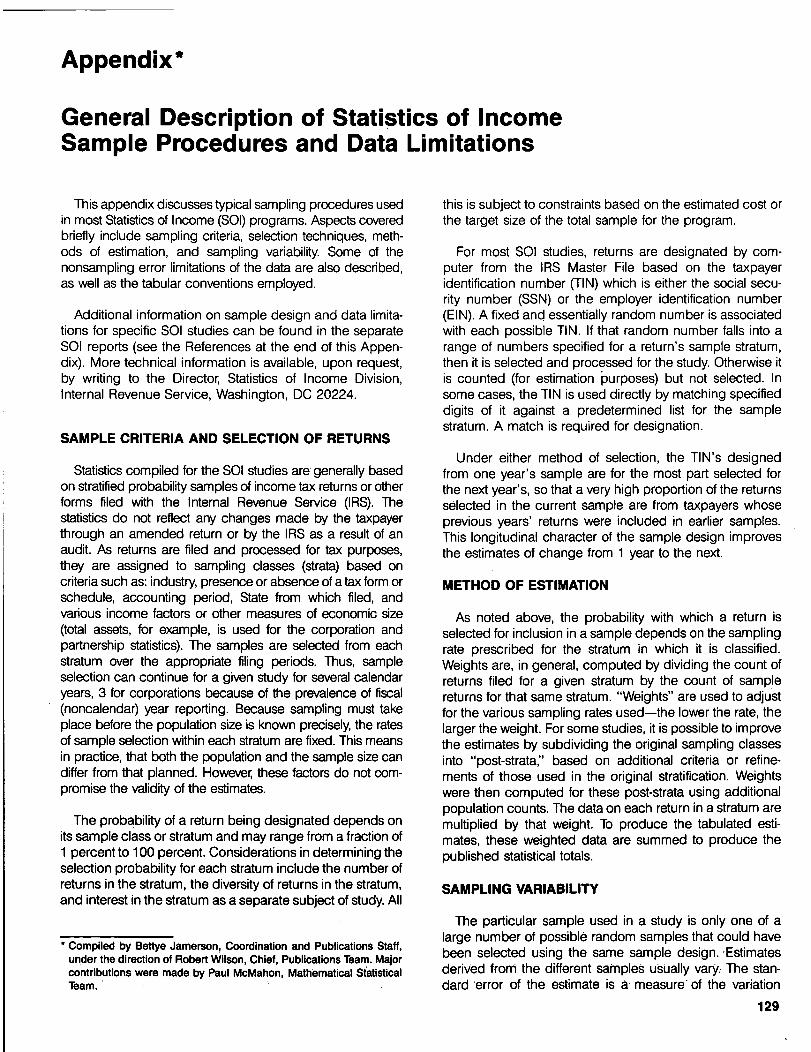
Appendix*
General Description of Statistics of IncomeSample Procedures and Data Limitations
This appendix discusses typical sampling procedures usedin most Statistics of Income (SOI) programs. Aspects coveredbriefly include sampling criteria, selection techniques, meth-ods of estimation, and sampling variability. Some of thenonsampling error limitations of the data are also described,as well as the tabular conventions employed.
Additional information on sample design and data limita-tions for specific SOI studies can be found in the separateSOI reports (see the References at the end of this Appen-dix). More technical information is available, upon request,by writing to the Director, Statistics of Income Division,Internal Revenue Service, Washington, DC 20224.
SAMPLE CRITERIA AND SELECTION OF RETURNS
this is subject to constraints based on the estimated cost orthe target size of the total sample for the program.
For most SOI studies, returns are designated by com-puter from the IRS Master File based on the taxpayeridentification number (TIN) which is either the social secu-rity number (SSN) or the employer identification number(EIN). A fixed and essentially random number is associatedwith each possible TIN. If that random number falls into arange of numbers specified for a return's sample stratum,then it is selected and processed for the study. Otherwise itis counted (for estimation purposes) but not selected. Insome cases, the TIN is used directly by matching specifieddigits of it against a predetermined list for the samplestratum. A match is required for designation.
Statistics compiled for the SOI studies are generally basedon stratified probability samples of income tax returns or otherforms filed with the Internal Revenue Service (IRS). Thestatistics do not reflect any changes made by the taxpayerthrough an amended return or by the IRS as a result of anaudit. As returns are filed and processed for tax purposes,they are assigned to sampling classes (strata) based oncriteria such as: industry, presence or absence of a tax form orschedule, accounting period, State from which filed, andvarious income factors or other measures of economic size(total assets, for example, is used for the corporation andpartnership statistics). The samples are selected from eachstratum over the appropriate filing periods. Thus, sampleselection can continue for a given study for several calendaryears, 3 for corporations because of the prevalence of fiscal(noncalendar) year reporting. Because sampling must takeplace before the population size is known precisely, the ratesof sample selection within each stratum are fixed. This meansin practice, that both the population and the sample size candiffer from that planned. However, these factors do not com-promise the validity of the estimates.
The probability of a return being designated depends onits sample class or stratum and may range from a fraction of1 percent to 100 percent. Considerations in determining theselection probability for each stratum include the number ofreturns in the stratum, the diversity of returns in the stratum,and interest in the stratum as a separate subject of study. All
Compiled by Bettye Jamerson, Coordination and Publications Staff,under the direction of Robert Wilson, Chief, Publications Team. Majorcontributions were made by Paul McMahon, Mathematical StatisticalTeam.
Under either method of selection, the TIN's designedfrom one year's sample are for the most part selected forthe next year's, so that a very high proportion of the returnsselected in the current sample are from taxpayers whoseprevious years' returns were included in earlier samples.This longitudinal character of the sample design improvesthe estimates of change from 1 year to the next.
METHOD OF ESTIMATION
As noted above, the probability with which a return isselected for inclusion in a sample depends on the samplingrate prescribed for the stratum in which it is classified.Weights are, in general, computed by dividing the count ofreturns filed for a given stratum by the count of samplereturns for that same stratum. "Weights" are used to adjustfor the various sampling rates used-the lower the rate, thelarger the weight. For some studies, it is possible to improvethe estimates by subdividing the original sampling classesinto "post-strata:' based on additional criteria or refine-ments of those used in the original stratification. Weightswere then computed for these post-strata using additionalpopulation counts. The data on each return in a stratum aremultiplied by that weight. To produce the tabulated esti-mates, these weighted data are summed to produce thepublished statistical totals.
SAMPLING VARIABILITY
The particular sample used in a study is only one of alarge number of possible random samples that could havebeen selected using the same sample design. Estimatesderived from the different samples usually vary, The stan-dard 'error of the estimate is a measure'of the variation
129

130 SOI.SAMPLING METHOPOLOGY
among the estimates from all possible samples and is usedto measure the precision with which an estimate from aparticular sample approximates the avetaide'result of-thepossible samples. The sample estimate and an estimate ofits standard error permit the construction of interval esti-mates with prescribed confidence that this interval includesthe actual population value.
..
In SOI reports the standard error is not directly pre-sented
"Instead, the ratio of the standard error. to the
estimate itself is presented in decimal form. This ratio iscalled the coefficient of variation (CV). The user of SOI datamay
-multiply an estimate- by its coefficient of variation to
recreate the standard error and, to construct confidenceintervals.
For example, if a sample estimate of 150,000 returns isknown to have a coefficient of variation of 0:02, then thefollowing arith.metic procedure Would be followed to -con-st.ruct a 68 percent confidence interval estimate:
150,000 (sample estimate)x 0..02 (coefficient of variation).= 1 3,000 (standard error of estima"_
150,000 (sample estimate)+ or - 3,000 (standard error)
= 147,000-153,000 (68 percent confidence interval)
Based on these data, the interval estimate is from 147 to'153 thousand returns. A conclusion-th
'at the average esti-
mate of the number of returns lies within an intervalcomputed in this way would, be, correct for approximatelytwo-thirds, of all possib.le similarly :selected samples. Toobtain this interval estimate with 95 percent confidence, thestandard error should be multiplied by 2 before.adding toand subtracting from the sample estimate (In this particularcase, the resulting interval would be from 144 to 156thousand returns.).
Genereilly in the SOI Bulletin only conservative upper limitCVIS are provided -fo-r f.requency.es.timates. These do,however, provide~ a rough guide to the order of magnitudeof ihp,ssminlinn Prror
.Fu.rthe.r,.details,conce.rning.sample~des.ign, sample,.selec-tion, estimation meth,0d,:.and.,_sampIin variabilitg . Y, forparticular SOI study,, maylbe:obtairied-an rrqqupst~ by Writing -the Director, Statistics of Income Division.
NONSAMPLING ERROR CONTROLS ANDLIMITATIONS.
_-Afthough-1he previous discussion focuses on. samplingmethods:and the limitations~ofthe data caused:by samplingerror, there ar&other sources of error that may. be~significant in:
evaluating the usefulness of SOI data. These include taxpayerreporting errors, -processing -errors, and- effects of an earlycut-off of sampling. More extensive information- on -nonsam-piing error is presented in SOI reports, when appropriate.
In transcribing and-tabulating the information -from thereturns or forms' selebted -for the sample, checks areimposed to improve.the quality of the resultant estimates.Tax return data may be disadgregated Or rec6mbinedduring statistical "editing" in order both to improve.dataconsistency from return to return and to achieve clefinitions~'of the data items that are more in keeping- with the needs ofmajor users. In some. cases not all of the data are availableft6lm -the iax,!teturn"as originally. filed., Sometimes, themissing data can --be obtained AhroUgWfield followup. - Moreoften -though,- they Are'obtaindd through imputation meth-ods. As examples, 'other information in the return or inaccompanying schedules may be sufficient to enable anestimate to be madelt Orior-year data for the same taxpayermay be used for the same purpose; or data from anotherreturn for the same year that has similar characteristics maybe substituted. Research to improve methods of imputingdata that - are missing from returns continues to be anongoing-process [1].
Quality. of the basic data abstracted from the returns issubjected to a num ber of, quality control steps. including1 00-percent key verification. The data.are then subjected tomany tests based on-the structure of the tax law and theimprobability of various data combinat
'ions.. Records failing
these tests are then* subjected to further review and anynecessary corrections are made. In addition, the Statisticsof -Income Division in the National Office conducts anindependent reprocessing of a small subsample ofstatistically-processe,d returns as a further check [2].
Finally, before publication, all statistics are reviewed foraccuracy and reasonableness in light of provisions of thetax laws, taxpayer reporting"variations and limitations, eco-nomic conditions, comparability with.other statistical series,and statistical Jechniques used in Aata processing andestimating.
TAPI 11 A12 r PJVF:MTInPJQ
'' Estimates offfe-qUendies-a6d. 'money amounts that arec6nsidered'uhr'eliablb due to-the small sample size onWhibh1h6y ,are based -are noted in SOI tables by ah'asterisk(*) to the left-of the data item(s~.- The_p~esence of an asteriskindicates that1he'sample rate is'less than, 100 percent of thep
,opulation and -that there are fewbr-than 10'sample obser-
vations available for estimation purposes.
A dash- in iblace of ei frequency or. amount indicate§ thatno-sampl& return had that characteristic. In additiono-adashin: place of a coefficient of variation for which there is an

SOI SAMPLING METHODOLOGY 131
estimate indicates that all returns contributing to the esti-mate were selected at the 100-percent rate.
Whenever a weighted frequency in a data cell is less than3, the estimate is either combined with other cells ordeleted in order to avoid disclosure of information aboutindividual taxpayers or businesses [3]. These combinationsand deletions are indicated by a double asterisk
NCYTES
Ill See, for example, Hinkins, Susan M., "Matrix Samplingand the Effects of Using Hot Deck Imputation:' in 1984Proceedings: American Statistical Association, Sectionon Survey Research Methods. Other research effortsare included in Statistical Uses of AdministrativeRecords: Recent Research and Present Prospects,Volume 1, Internal Revenue Service, March 1984.
[21 Quality control activities for all SOI studies will bepublished in a series of forthcoming reports. Thesereports will provide detailed information relating toquality in all phases of SOI processing.
[31 For geographic statistics, these same steps are takenwhen a weighted frequency is less than 10.
REFERENCES
For information about the samples used for specific SOIprograms see:
Statistics of Income-1985, Individual Income Tax Re-turns, 1984, (see especially pages 4-7).
Statistics of Income-1984, Corporation Income Tax Re-turns (see especially pages 7-12).
Statistics of Income-1978-82, Partnership Returns (seeespecially pages 237-244).
Statistics of Income-1979-83, Compendium of Studiesof International Income and Taxes, Foreign Income andTaxes Reported on U.S. Tax Returns (see informationabout the samples used at the end of each chapter).
SOI Bulletin (see each issue).

Form 6839 (Rev- 4-90). USER SURVEYDepartment of the TreasuryInternal Revenue Service I S01 BULLETIN Winter 1989-1990
Please take a few moments to answer the following questions concerning this Statistics of Income publication. Your
responses will enable us to direct our efforts to meeting the needs of our users. After indicating your responses,
please cut, tape, and mail. No postage or envelope is required. Thank you for your cooperation.
How did you obtain this publication?
• Purchased from the Government Printing Office 0 Subscription 0 Single copy
• From a public library• From a university or college library1:1 Other (Specify)
2. Have you ever used any other Statistics of Income publication?
• Yes (Specify)• No
3. What subject matter in the report interests you particularly?
• SOI Bulletin Board 0 Foreign Recipients of U.S. Income, 1987
• Partnership Returns, 1987 El Corporate Foreign Tax Credits, 1984
• Partnerships, Passive Losses, 0 Projections of Tax Return Filings, 1990-1997
and Tax Reform, 1981-1987 0 Selected Historical Data
4. Which table(s) in the Selected Historical Data section did you find helpful to your needs?
0 Individual income and taxes 0 Corporation income and taxes 0 Internal Revenue refunds
EJ Individual income and tax data 0 Comparisons between Commerce [I Classes of excise taxes
by State Department estimates and SOI data 0 Number of returns filed
• Sole proprietorship returns 0 Gross Internal Revenue collections 0 Taxpayers receiving
• Partnership returns assistance
5. If microdata files on computer tape were available in these subject matter areas, please check if you would
be interested in purchasing them. 0
If so, which areas?
If tabulations were available on diskette, please check if you would be interested in purchasing them. 0
If so, which area?
6. How would you describe the usability of the text?
• Too technical• Not detailed enough
• About right• Did not use text
7. What type of organization are you connected with?
• Federal Government 0 Consulting firm• State or local Government 0 Accounting firm• Trade association 0 University or college• Other nonprofit organization 0 Legal firm• Other (Specify)
8. What changes (additions, deletions, alterations) would you like to see in the contents or format of this publication?
9. Other comments (Use other side if needed.)
Form 6839 (Rev. 4-90)
9. Other comments
Internal Revenue ServiceWashington, DC 20224
OFFICIAL BUSINESSPENALTY FOR PRIVATEUSE, $300.
Fold Here
Fold Here
BUSINESS REPLY MAILFIRST CLASS PERMIT NO. 12686 WASHINGTON, DC
POSTAGE WILL BE PAID BY IRS
Internal Revenue ServiceStatistics of Income Division R:S:P1111 Constitution Avenue, NWWashington, DC 20224
NO POSTAGENECESSARY
IF MAILEDIN THE
UNITED STATES

Subscription Order Form DepartmentNo. 39-FF
Mail this form to: Superintendent of Documents, U.S. Government Printing Office, Department No. 39-FF, Washington, D.C. 20402
Enclosed is$- 0 check,0 money order, or charge to myDeposit Account No.
Credit Card Ordem OnlyTotal charges $
CreditCard No.
-M
Fill in the boxes below.
0- ;.-*; r%-#
Order No.
Please enter my subscription to the Statistics of Income Bulletinat $20.00 per year ($25.00 for other than U.S. mailing).
p V" 0
Month/Year
Company or personal name
Additional address/attention line
I I I I I I I I I I I I I I I I I I I I I I I I I I I I I
Street address
I i I I I I I I I I I I I I I I I I I I I I I I I I I I Icity State Zip Code
I I I I I I I I I I I I I I I I I I I I 1 1.1 1 1 1 1 1 1(or Country)
I I I I I I I I I I I I I I I I I I I I I I I I I I I I I
PLEASE PRINT OR TYPE
For Office Use OnlyQuantity Charges
..... Enclosed ..........
..... To be mailed .......
..... Subscriptions ......Postage ..................Fbreign handling ...........MMOB ..................OPNR ..................
.......UPNS
.......Discount
.......Refund
---------------------------------------------
Subscription Information
Title: Statistics of Income Bulletin
Subscription Price: $20.00 domestic, $25.00 foreign
Single Copy Price: $7.50 domestic, $9.38 foreign
Available From: Superintendent of DocumentsU.S. Government Printing OfficeDepartment 39-FFWashington, D.C. 20402(Subscription order form above)
Issued: Ouarterly
--------------------------------------------
Change of Address Form forStatistics of Income
01 ULL T1 NMail this form to: New Address, Superintendent of Documents, U.S. Government Printing Office, Washington, D.C. 20402
Company or personal nameI I I I I I I I I I I I I I I I I I I I I I I I I I I I IAdditional address/attention lineI I I I I I I I I I I I I I I I I I I I I I I I I I I I IStreet address
I I I I I I I I I I I I I I I I I I I I I I I I I I I I Icity State Zip Code
I I I I I I I I I I I I I I I I I I I I I I I I I I I I I(or Country)I I I I I I I I I I I I I I I I I I I I I I I I I I I I IPLEASE PRINT OR TYPE
Attach last subscriptionlabel here.

INDEX OF PREVIOUSLY PUBLISHEDSOI BULLETIN ARTICLES
(issue, Volume and Number)
Corporation Income tax returns:(See also Foreign incomV and taxes)Domestic International Sales,Corporations:
1980, Fag 1983 (3-2)
Employee benefit plans:1977, Spring 1982 (1-4)
Estate tax returns:1983, Fag 1984 (4-2)1916-31 Revisited, Spring 1987 (6-4)
Excise taxes:Environmental:
1981-1985, Spring 1987 (6-4)1987, Fall, 1989 (9-2)
Exempt organizations:Nonprofit charitable organizations:
1983, Spring 1987 (6-4)1985, Fall 1989 (9-2)
Other than private foundations:1975-1978, Fag 1981 (1-2)
Private foundations:1983, Winter 1986-1987 (6-3)1985, Summer 1989 (9-1)
Fiduciary Income tax returns:1982, Spring 1985 (4-4)
Foreign Income and taxes:Controlled Foreign Corporations:
1982, Winter 1986-1987 (6-3)1984, Fall 1989 (9-2)
Corporation foreign tax credit:1982, Fag 1986 (6-2)
Foreign corporate investment andactivity in the U.S.:
1983, Summer 1987 (7-1)1984-85, Spring 1989 (8-4)
Foreign trusts:1986, Spring 1988 (7-4)
Individual foreign income and1983, Summer 1987 (7-1)
International boycotts:
taxes:
1976-1982, Summer 1985 (5-1)Possessions corporations tax credit:
1980, .- /~ .101JI111y luou (a-W1983, Spring 1988 (7-4)
Foreign Recipients of U.S. Income:1985, Faft 1987 (7-2)1986, Winter 1988-89 (8-3)
Individual income tax returns:(See also Foreign income and taxes)'Age and tax filing:
1981, Fag 1985 (5-2)
Demographic characteristics oftaxpayers:
1983, Summer 1986 (6-1)High-income returns:
1983, Spring 1986 (5-4)1984, Spring 1987 (6-4)
High-income taxpayers and the growthof partnerships:
1983, Fall 1985 (5-2)Historical summary of income andtaxes (see also, SO[ StatisticalServices):'~ 1913-1982, Winter 1983-84 (3-3)Income by ZIP Code areas:
1969-1979, Spring 1983 (2-4)1979. & 1982, Summer 1985 (5-1)
Individual income tax shares andaverage tax rates:
1916-1950, Winter 1988-89.(8-3)1951-1986, Spring 1989 (8-4)
Interest income and deductions:1968-1984, Fall 1986 (6-2)
Legally-blind tax filers:1983, Fall 1987 (7-2)
-Life-cycle-of individual tax-returns:_Spring 1984 (3-4)
Marginal and average tax rates:1985, Winter 1987-88 (7-3)1986, Spring 1989 (8-4)
Personal Income and Adjusted GrossIncome:
1984-1986, Winter 1988-89 (8-3)Preliminary data:
1987, Spring 1989 (8-4)Salaries and wages by marital statusand age:
1983, Winter 1987-88 (7-3)Sales of capital assets:
1981 -*82, Winter 1985-86 (5-3)Taxation of social security and railroadretirement benefits:
1985-1990, FaH 1987 (7-2)Taxpayers by sex:
1969-1979, Spring 1985 (4-4)Taxpayer usage of Forms 1040:
1987, Summer 1988 (8-1):1984, Fag 1989 (9-?)
Partnership returns:Analysis of partnership activity:
1981-1983, Spring 1986 (5-4)Employment and payroll:
1979, Spring 1984 (3-4)High-income taxpayers and the growthof partnerships:
1983, Fall 1985 (5-2)Income statements by industry*
1985, Summer 1987 (7-1)1986, Summer 1988 (8-1)
Personal wealth:. 1982 revised, Spring 1988 (7-4)
Realized income and personal wealth:Spring 1983 (2-4)
Trends, 1976-1981:,Summer 1983 (3-1)
Private activity tax-exempt bonds:.1984, Winter 1985-86 (5-3)1985, Spring 1987 (6-4)1986, Summer 1988 (8-1)
Projections of returns to be filed:1988-1995, Fag 1987 (7-2)1989-1996, Winter 1988-89 (8-3)
Safe Harbor Leasing:1981-1982, Fall 1983 (3-2)
Sales of capital assets:(See individual income tax returns)
SOI Statistical Services:1985-86, Spring 1986 (5-4)
Studies of international income andtaxes:
Fag 1986 (6-2)Domestic special studies:
Fag 1987 (7-2)SOI: 75 years of service:
Winter 1987-88 (7-3)75th Anniversary:
1913-1988, Fall 1988 (8-2)Studies of individual income taxreturns:
Winter 1987-88 (7-3)Studies of business income taxreturns:
1985, Spring 1988 (7-4)
Sole proprietorship returns:Income statements by industry:
1986, Summer 1988 (8-1)1987, Summer 1989 (9a-l)
Nonfarm proprietorships and sex ofowner:
1980, Spring 1983 (2-4)
Tav man-
1973-1992, Summer 1988 (8-1)
Tax incentives for saving:Spring, 1984 (3-4)
Underground economy (see also, Taxgap):
Informal suppliers:Summer 1983 (3-1)
Tip income in eating places:1982, Winter 1983-84 (3-3)