A case of adiaspiromycosis causing *Address correspondence to: 20
Upload
taipeimedicalCategory
view
0download
0
ANALYTICAL SCIENCES SEPTEMBER 2013, VOL. 29 885
Introduction
Toxocara canis (T. canis), a zoonotic parasite, is an intestinal nematode in canines, and is now considered to be the most common human parasitic infection in many countries. However, the prevalence of this global infectious disease seems to be underestimated.1,2 Toxocarosis is a zoonosis caused by the transmission of the T. canis larvae to humans. Researchers have reported humans carrying Toxocara larvae in their brains.3 Its infectious third-stage larvae can invade the brains of paratenic hosts, causing brain injury, which can then result in cerebral toxocarosis (CT).4 However, CT is not prevalent in the literature.
The pathogenesis of CT, so far, remains unknown.Astrocytes, the major supportive structural elements of the
nervous system, have important neurotrophic and neuroprotective functions in the brain. However, improper functioning of these cells can contribute to the beginning of neurodegenerative diseases.5 Astrocytes can be identified by neuron intermediate filaments such as glial fibrillary acidic protein (GFAP).6 Reactive astrocytes (astrogliosis) with increased expression of GFAP are commonly found in cerebral infarctions and in many cases of brain damage.7 A substantial amount of evidence has indicated that the effects of Toxocara larvae in the human brain are too cryptic to be clinically detected because the parasite burden is too light. Thus, the neuropathogenesis and sequelae of the subtle brain injuries in CT remain unclear.8 Liao et al. used the murine model to detect these subtle effects and observed increases in several biomarkers associated with brain injury, such as GFAP. After said study, Liao et al. also
2013 © The Japan Society for Analytical Chemistry
† To whom correspondence should be addressed.E-mail: [email protected] (C.-S. C.); [email protected] (C.-K. F.)
Biophysical Analysis of Astrocytes Apoptosis Triggered by Larval E/S Antigen from Cerebral Toxocarosis-Causing Pathogen Toxocara canis
Wesley W. HSIAO,*1,*3,*4 Hsien-Shun LIAO,*1 Hsing-Hung LIN,*2,*3 Yueh-Lun LEE,*5 Chia-Kwung FAN,*6,*7† Chien-Wei LIAO,*6,*7 Po-Yen LIN,*1 En-Te HWU,*1 and Chia-Seng CHANG *1,*3†
*1 Institute of Physics, Academia Sinica, Nangang, Taipei 115, Taiwan R.O.C.*2 Genomics Research Center, Academia Sinica, Nangang, Taipei 115, Taiwan R.O.C.*3 Taiwan International Graduate Program–Chemical Biology and Molecular Biophysics, Institute of
Biological Chemistry, Academia Sinica, Nangang, Taipei 115, Taiwan R.O.C.*4 College of Life Sciences, National Tsing Hua University, Hsinchu 300, Taiwan R.O.C.*5 Department of Microbiology and Immunology, Taipei Medical University, Taipei 110, Taiwan R.O.C.*6 Department of Parasitology, Taipei Medical University, Taipei 110, Taiwan R.O.C.*7 Master Program in Global Health and Development, Taipei Medical University, Taipei 110, Taiwan R.O.C.
Toxocarosis is a zoonosis caused by the transmission of the Toxocara canis (T. canis) larvae to humans. Its infectious third-stage larvae can invade the brains of paratenic hosts. The resultant brain damage can result in cerebral toxocarosis (CT). Astrocytes have important neurotrophic and neuroprotective functions in the brain. Substantial studies have shown that astrocyte apoptosis may contribute to the pathogenesis of many acute and chronic neurodegenerative disorders. We propose an alternation detection method, a combination of the astigmatic detection microscopy (ADM) and atomic force microscopy (AFM) techniques, to investigate the apoptosis of astrocytes triggered with T. canis larval excretory/secretory (Tc E/S) antigen. The variation in the pathology of a cell’s morphological changes was investigated with ADM and AFM analyses and then confirmed by western blotting. The results showed that the round cells increased as the concentration of Tc E/S antigen and incubated time increased. In addition, the mean height of apoptotic cells was approximately twice that of untreated normal cells, which meant there was correlation between the Tc E/S antigen treatment and cell height. For each cleaved caspase-3 in the cells cocultured with Tc E/S antigen and incubated for 9 h, the corresponding intensities increased about 34-fold (34.4 ± 1.8) compared with those of the control cells. This method can provide researchers with a perspective for understanding the limited information on the mechanism of astroglial injury and death during a T. canis larval invasion in a brain infection.
Keywords Astigmatic detection microscopy (ADM), atomic force microscopy (AFM), Toxocara canis (T. canis), T. canis larval excretory/secretory (Tc E/S) antigen, toxocarosis, astrocytes, apoptosis
(Received May 21, 2013; Accepted July 19, 2013; Published September 10, 2013)

886 ANALYTICAL SCIENCES SEPTEMBER 2013, VOL. 29
investigated blood-brain barrier (BBB) impairment in experimental CT, as measured by cerebral Evans Blue (EB) concentration, pathological changes and GFAP expression.9 We found that BBB permeability (EB increased) and injury (GFAP enhanced) increased with infection duration but that these effects did not appear to be related to larval number. Later, Othman et al. also indicated that increased levels of inducible nitric oxide synthase (iNOS) and GFAP were found in the brains of infected mice.10 All of the above studies have indicated that astrocyte plays an important role in the pathogenesis of CT.
Myriad studies have shown that any deformation through cell morphology provides important information of a cell’s state and functions, and consequently about diseases. Apoptosis is a form of programmed cell death based on distinct morphological features. Electron microscopy was the basis for the first detection method to identify apoptosis.11 However, due to the limitations of finding a single apoptotic cell with electron microscopy, most of the current insight into the occurrence and quantitative significance of apoptosis have been obtained using light microscopic evaluation.12 Although conventional optical microscopy (OM) provides an easy and non-invasive way to detect astrocytes in real time, it cannot obtain three-dimensional images for transparent cells. Thus, correlating the relationship between morphology and astrocytes is difficult, in part due to the poor understanding of the functional significance of the many structured features. Astrocytes are capable of undergoing apoptosis without the presence of neurons.13 Substantial studies have shown that astrocyte apoptosis may contribute to the pathogenesis of many acute and chronic neurodegenerative disorders, such as cerebral ischemia, Alzheimer’s disease and Parkinson’s disease.14 Understanding the relationship between the changes in morphology and cellular function can benefit how researchers interpret the limited information on the mechanism of astroglial injury and death during a T. canis larval invasion of the brain; however, to our knowledge, so far there are no biophysically analytical studies on astrocytes undergoing apoptosis cocultured with the T. canis larval excretory/secretory (Tc E/S) antigen in CT.
Atomic force microscopy (AFM) has demonstrated its power in applications ranging from studies on pure materials to studies on biomedicine. AFM can provide not only morphological information but also the mechanical properties of biological samples at a picoNewton (pN) resolution in both air and fluids. These unique capabilities make AFM a promising technique with which to answer unsolved questions about biological samples under certain physiological conditions.15 Kim et al. used AFM to study apoptotic changes in morphology and biophysical properties caused by paclitaxel in Ishikawa and HeLa cells.16 Vergara et al. used AFM and proteomics methods to analyze and correlate the interferon-β (IFN-β) induced astrocytes in the viscoleastic properties and changes in protein expression.17 However, due to the softness of cell membranes, a higher resolution for the AFM image of cells requires optimal settings for the scanning parameters and conditions. In addition, the scanning rate of the AFM is relatively slow at a single-cell level compared to the scanning rate of the AFM at a single-molecule level, mainly because of the slow response of the feedback loop. Furthermore, the cell height being too high can cause artifacts in AFM images.18
Tsai et al. proposed a method to deconvolute local surface responses from topography in a general class of profilometric techniques.19 This gave us the idea to use optical profilometry for label-free observation of cells’ morphologies. The soft and dynamic nature of cell surfaces can obstruct imaging. Even when applied at low forces such as <50 pN, the AFM scanning
tip may deform a cell surface. One approach to solve these problems is to use a laser-based astigmatic detection methods to scan over the specimen surface. This method, known as astigmatic detection microscopy (ADM), does not require making physical contact with the specimen surface.20–22 Previously, Hwu et al. developed a hybrid scanning probe microscopy (SPM) module based on a DVD pickup head.23 The DVD pickup head offers the advantages of a small laser spot size, light weight, compactness, and low cost. When the DVD pickup head detects the deflection of the AFM cantilever, this hybrid SPM can execute the AFM module. The DVD pickup head can also scan the sample directly, with the hybrid SPM performing in an optical profilometry mode. Liao later optimized the sensitivity of ADM for liquid environments, and constructed an ADM for the imaging of biological samples in liquid.24
ADM and AFM are complementary techniques, capable of producing high-contrast cell surface images (though ADM) and measuring the height of cells (though AFM). This is the first report using a combination of ADM and AFM techniques to investigate apoptotic changes in the morphology of astrocytes. Our results show the capability and feasibility of this method in determining whether the astrocytes apoptosis triggered by Tc E/S antigen in vitro approach the possible pathogenesis of astrocytes apoptosis involved in human CT.
Experimental
Coculture of astrocytes with Tc E/S antigenWe obtained the rat cortical astrocyte cell line CTX TNA2
from ATCC and maintained it in DMEM supplemented with 10% (v/v) FBS, penicillin (100 U/mL) and streptomycin (100 U/mL). We grew the cell line at 37°C and 5% CO2 in a humidified air incubator with the culture periodically screened for mycoplasma infection. Before the experiment, the cell was seeding on a 6-well plate, and the cell number was 8 × 10⁴ per well. We incubated the cells on the 6-well plate with previously prepared Tc E/S antigen at different concentrations and different time points.25 The Tc E/S antigen concentrations were 25, 50, 75, 100, 125, and 150 μg/mL, and the time points were 3, 6, 9, 12, and 15 h. After the allotted time, we washed the cells with Dulbecco’s phosphate-buffered saline (PBS, Gibco BRL) and fixed them with 4% (w/v) paraformaldehyde in PBS for 15 min at room temperature. Finally, we washed the cells three times in PBS for further analysis.
Cleaved caspase-3 assessed by western blottingWe performed western blotting as described with some
modifications in our previous studies.8,9 Briefly, we homogenized the astrocyte, which was incubated with the Tc E/S antigen, and lysed it in a radioimmunoprecipitation assay buffer that contained a protease inhibitor cocktail (Sigma, St. Louis, MO) on ice for over 1 h, after which we harvested the proteins via centrifugation at 10000 × g at 4°C for 10 min. We then stored it at –80°C for further studies. Before loading them onto the gel, the protein extracts were boiled for 5 min. In each lane, we boiled 50 μg of proteins in the loading buffer and then electrophoresed them in a 6 – 18% (w/v) SDS/PAGE mini gel. We electrically transferred the proteins onto a Hybond-P polyvinylidene fluoride membrane for 2 h. We blocked the membranes in 10% (w/v) PBS/skimmed milk and then added mouse anti-caspase-3 monoclonal antibodies (Sigma, cat. No. c5737, St. Louis, MO) for 2 h at 37°C. After the membranes were washed several times with PBS–Tween-20, a peroxidase-

ANALYTICAL SCIENCES SEPTEMBER 2013, VOL. 29 887
conjugated secondary antibody was added and hybridized at 37°C for 30 min. We detected immunoreactions with a Western Lightning® kit (Perkin Elmer Life Sciences, Boston, MA). We used the secondary antibody, rabbit anti-mouse immunoglobulin G (IgG) (Sigma), at 1:10000 dilutions. We measured the optical density of the immunoreactive band with a Typhoon 9000D cabinet equipped with ImageQuant software (GE Life Sciences, Fairfield, CT).
ADM imagingFigure 1(a) illustrates the optical configuration of the
astigmatic detection method.20–24 A laser beam focuses onto the sample through a collimator and an objective lens. The reflective laser beam is detected by a photo detector integrated chip (PDIC). As shown in Fig. 1(b), the four-quadrant photosensors (A – D) on the PDIC generate voltage signals UA, UB, UC, and UD, respectively. When the laser is correctly focused on the sample, the laser spot on the PDIC is circular, as illustrated at point (II). However, any defocused displacement z will cause the laser spot to change into an elliptical shape, as displayed at points (I) and (III). The cantilever displacement is measured by the focus error signal UFES = (UA + UC) – (UB + UD), and the UFES versus the sample displacement curve (the S-curve) characterizes their linear relationship with an approximate range of ±3 μm. The UFES can thus be used to measure the sample surface in the linear region.
Figure 1(c) shows the schematic diagram of the ADM setup. In the experiments, we dropped the buffer on the sample first. Then, a Z-axis stepper motor brought the sample into the scanning range of the DVD pickup head, and the laser beam focused on the sample surface through a cover glass and the buffer. We equipped the apparatus with an optical microscopy to search for the target cell on the sample. An XYZ stage, which can position the laser spot around the target cell, carries the DVD pickup head. An XYZ scanner (P611.3S NanoCube, Physik Instrumente) scanned the sample in the XY-plane, and the focus error signal UFES was recorded simultaneously. The
Z-axis position of the sample was kept constant during the scanning. All the processes were executed by an embedded controller (sbRIO-9632, National Instrument), which was programmed by the home-made LabVIEW software, for the prototype of this ADM system.24
Height measurement using AFMWe used a commercial AFM (Innova, Veeco) to measure the
height of the cell. A commercial cantilever (NSG01, NT-MDT) in tapping mode imaged the cell. The cantilever’s dimensions were 125 μm in length, 30 μm in width, and 2 μm in thickness. Its typical resonant frequency in air was 150 kHz, and its spring constant was 5.1 N/m. In the experiments, the scanning rate was 0.4 lines/s. We adopted an image resolution of 256 × 256 pixels, and the scanning range was 30 × 30 – 70 × 70 μm2, which was dependent on the cell size.
Statistical assessmentAll data are expressed as mean ± SEM, obtained from at least
three separate experiments. We compared the differences between groups using the unpaired t-test, performed on the basis of equal or unequal variance as appropriate. We considered p < 0.05 to be statistically significant.
Results and Discussion
The contrast (C) of images is defined as the ratio of intensities,
C = ΔI/Ib
where ΔI is the difference in intensity between the cell and its background, and Ib is the intensity of the background.26 In general, the contrast of ADM images is measured as 0.224 ± 0.014, and the contrast of OM images is measured as 0.143 ± 0.032. As a result, the image shown in Fig. 2(a) without Tc E/S antigen demonstrates that the ADM provides a pseudo three-
Fig. 1 (a) Schematic diagram of astigmatic detection method. (b) Focus error signal UFES vs. sample displacement. (c) Schematic diagram of ADM setup.
888 ANALYTICAL SCIENCES SEPTEMBER 2013, VOL. 29
dimensional image. This is due to the image’s higher contrast than that of the image taken with the 1000× OM in phase contrast mode, as in Fig. 2(d) under the same conditions. In addition, the filament structures of astrocyes in Fig. 2(b) with 75 μg/mL Tc E/S antigen can be visualized more clearly in ADM when comparing to the image under the same conditions taken with the 1000× OM in phase contrast mode shown in Fig. 2(e). In Fig. 2(c), apoptotic debris can also be identified more easily in ADM with 125 μg/mL Tc E/S antigen incubated for 9 h when comparing the image to that in Fig. 2(f) with the 1000× OM in phase contrast mode, which might be confusing and disturbed by the presence of phase halos outside the focal plane.
For the OM system, light passes through a transparent cell; identifying the cell without staining is sometimes difficult. When light passes from a material of one refractive index to the material of another, as from glass to air or from air to glass, it bends. Light of different wavelengths bends at different angles; as objects are magnified, the images become increasingly less distinct. Therefore, researchers use oil immersion to increase the resolution of a microscopy for the 1000×. They achieve this by immersing both the objective lens and the specimen in a transparent oil of high refractive index, thereby increasing the numerical aperture of the objective lens. However, a wet mount
must be secured when using with oil. Oil cannot be used with dry lenses for lower resolution, such as the 400× lens. Oil distorts images seen with dry lenses, so placing oil on a slide requires the user to clean it off thoroughly before using the high dry lens again. In brief, the OM is rife with tedious procedures for switching between high and low resolution. In contrast, ADM is free from such inconveniences. In addition, similar to AFM, ADM has a great advantage over OM in that it can zoom in and out to scan the area of interest. Thus, ADM allows researchers to conveniently investigate fine surface structures of biological samples.
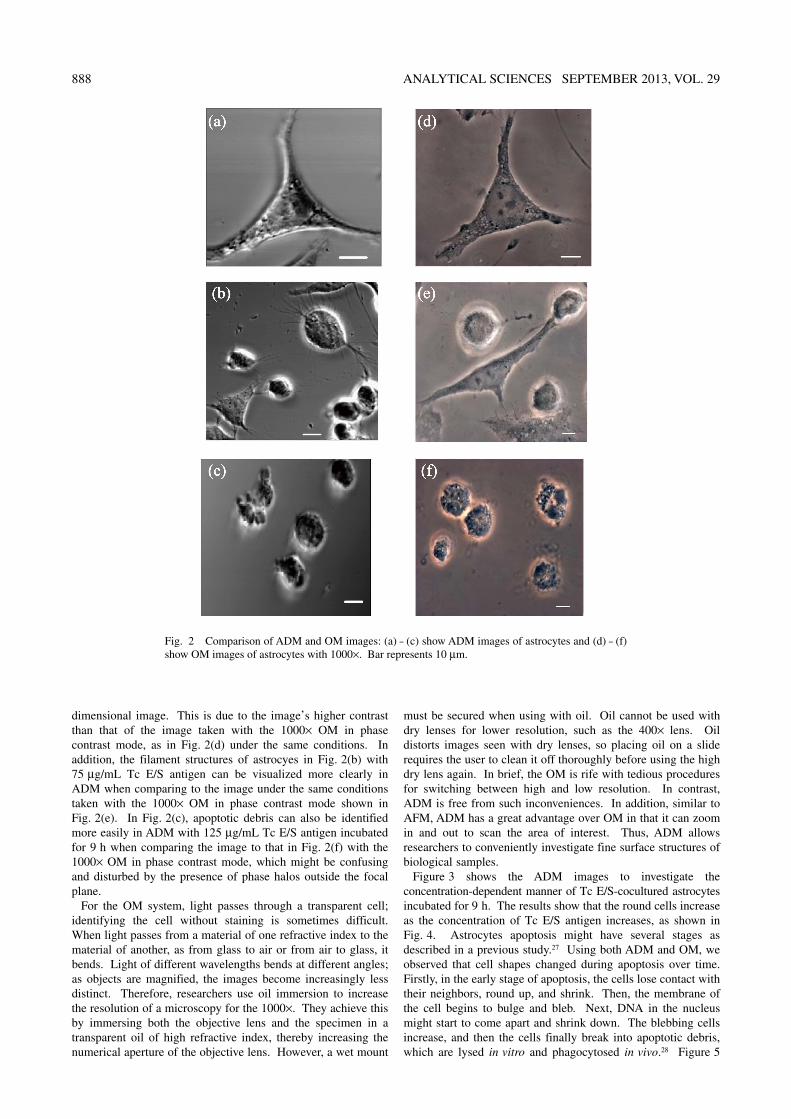
Figure 3 shows the ADM images to investigate the concentration-dependent manner of Tc E/S-cocultured astrocytes incubated for 9 h. The results show that the round cells increase as the concentration of Tc E/S antigen increases, as shown in Fig. 4. Astrocytes apoptosis might have several stages as described in a previous study.27 Using both ADM and OM, we observed that cell shapes changed during apoptosis over time. Firstly, in the early stage of apoptosis, the cells lose contact with their neighbors, round up, and shrink. Then, the membrane of the cell begins to bulge and bleb. Next, DNA in the nucleus might start to come apart and shrink down. The blebbing cells increase, and then the cells finally break into apoptotic debris, which are lysed in vitro and phagocytosed in vivo.28 Figure 5
Fig. 2 Comparison of ADM and OM images: (a) – (c) show ADM images of astrocytes and (d) – (f) show OM images of astrocytes with 1000×. Bar represents 10 μm.
ANALYTICAL SCIENCES SEPTEMBER 2013, VOL. 29 889
shows time-dependent results with 75 μg/mL Tc E/S antigen incubated for 0 – 15 h. Furthermore, we observed a similar
phenomenon of the round cells increasing as the incubated time increased, shown in Fig. 6. From what we have found, we tried to show a trend: the percentage of the apoptotic-like round cells increasing with increased concentration and time, which indicates that Tc E/S antigen might trigger the apoptosis of astrocyes. It is noteworthy that the apoptotic cell changes become significantly visible after 9 h.
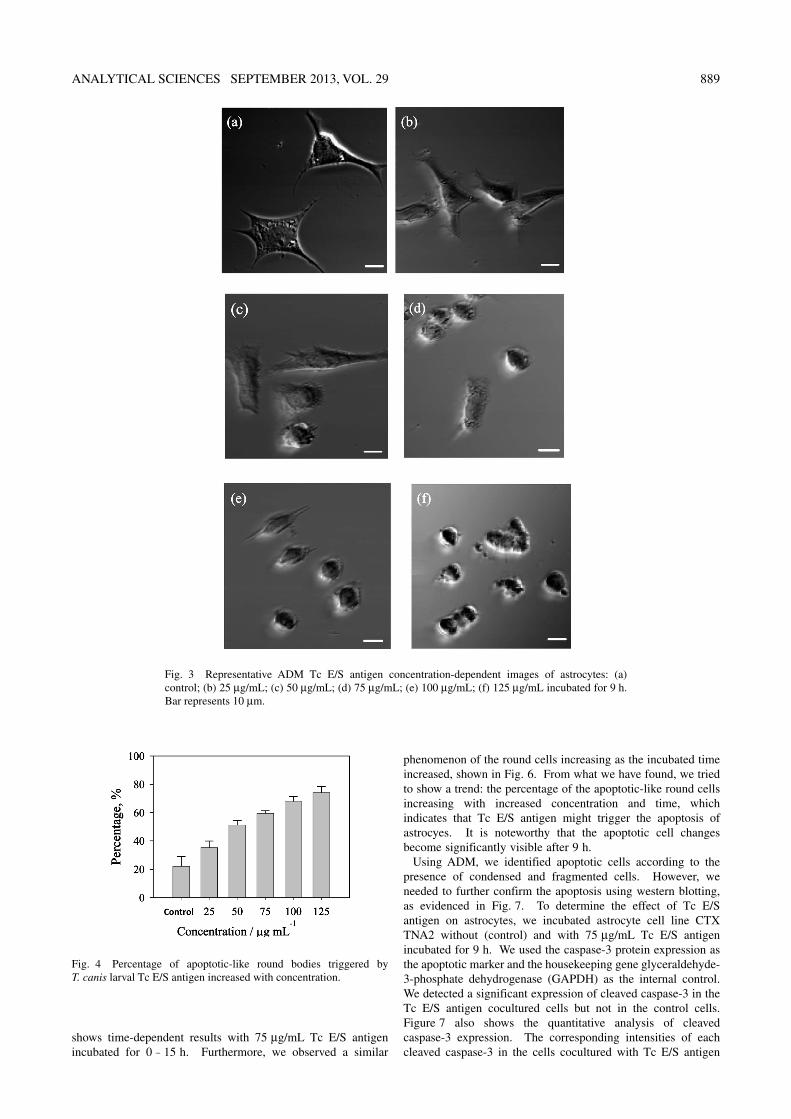
Using ADM, we identified apoptotic cells according to the presence of condensed and fragmented cells. However, we needed to further confirm the apoptosis using western blotting, as evidenced in Fig. 7. To determine the effect of Tc E/S antigen on astrocytes, we incubated astrocyte cell line CTX TNA2 without (control) and with 75 μg/mL Tc E/S antigen incubated for 9 h. We used the caspase-3 protein expression as the apoptotic marker and the housekeeping gene glyceraldehyde-3-phosphate dehydrogenase (GAPDH) as the internal control. We detected a significant expression of cleaved caspase-3 in the Tc E/S antigen cocultured cells but not in the control cells. Figure 7 also shows the quantitative analysis of cleaved caspase-3 expression. The corresponding intensities of each cleaved caspase-3 in the cells cocultured with Tc E/S antigen
Fig. 3 Representative ADM Tc E/S antigen concentration-dependent images of astrocytes: (a) control; (b) 25 μg/mL; (c) 50 μg/mL; (d) 75 μg/mL; (e) 100 μg/mL; (f) 125 μg/mL incubated for 9 h. Bar represents 10 μm.
Fig. 4 Percentage of apoptotic-like round bodies triggered by T. canis larval Tc E/S antigen increased with concentration.

890 ANALYTICAL SCIENCES SEPTEMBER 2013, VOL. 29
incubated for 9 h increased by about 34 times (34.4 ± 1.8) versus those of the control cells. Thus, we found caspase-mediated apoptosis in astrocytes triggered by Tc E/S antigen.
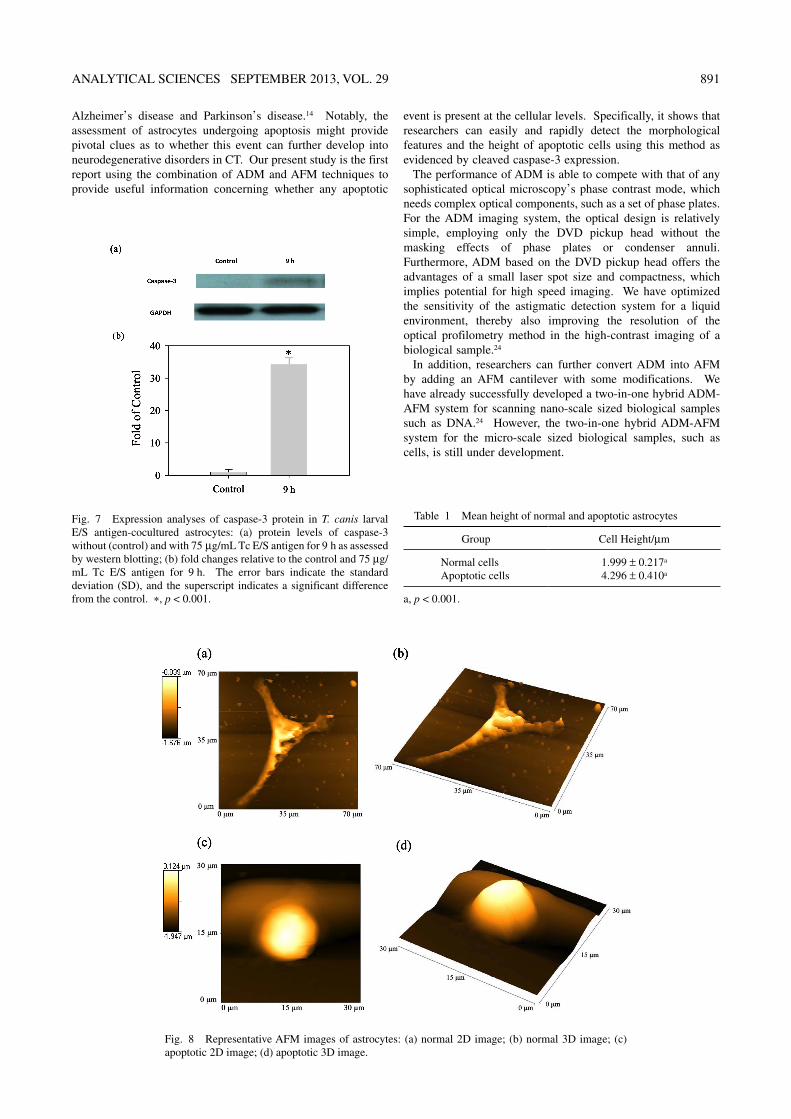
We defined cell height as the difference between the top and
bottom of the cell as per images from AFM shown in Fig. 8. Our results in Table 1 show that the mean height of apoptotic cells is approximately twice that of untreated normal cells, which means there is a correlation between the Tc E/S antigen treatment and cell height. We determined the average data from more than five cells per group.
Brain injury (BI) caused by any number of physical, chemical, or biological stimuli can have disabling or even fatal consequences.29 Astrocytes are supportive structural elements of the nervous system. They play active roles in normal brain physiology and in certain pathological conditions. Astrogliosis with increased expression of GFAP are commonly found in cerebral infarction and in many areas of brain damage.7 In our previous studies, we found astrogliosis, an indicator of BI, to have 78.9 – 142.0-fold increases in GFAP expression and that the T. canis larval invasion in a brain can cause BBB dysfunction as well as enhanced Alzheimer’s disease-associated biomarker expression, e.g., TGF-β1, S100B, and AβPP in the brains of T. canis-infected mice.8,9 The deformation of astrocyte cells might be due to stress, cell skeleton changes/movement and chemical toxins. Research has shown that astrocyte apoptosis can contribute to the pathogenesis of many acute and chronic neurodegenerative disorders, such as cerebral ischemia,
Fig. 5 Representative ADM time-dependent images of astrocytes: (a) control; (b) 3 h; (c) 6 h; (d) 9 h; (e) 12 h; (f) 15 h with 75 μg/mL of Tc E/S antigen. Bar represents 10 μm.
Fig. 6 Percentage of apoptotic-like round bodies triggered by T. canis larval Tc E/S antigen increased with time.
ANALYTICAL SCIENCES SEPTEMBER 2013, VOL. 29 891
Alzheimer’s disease and Parkinson’s disease.14 Notably, the assessment of astrocytes undergoing apoptosis might provide pivotal clues as to whether this event can further develop into neurodegenerative disorders in CT. Our present study is the first report using the combination of ADM and AFM techniques to provide useful information concerning whether any apoptotic
event is present at the cellular levels. Specifically, it shows that researchers can easily and rapidly detect the morphological features and the height of apoptotic cells using this method as evidenced by cleaved caspase-3 expression.
The performance of ADM is able to compete with that of any sophisticated optical microscopy’s phase contrast mode, which needs complex optical components, such as a set of phase plates. For the ADM imaging system, the optical design is relatively simple, employing only the DVD pickup head without the masking effects of phase plates or condenser annuli. Furthermore, ADM based on the DVD pickup head offers the advantages of a small laser spot size and compactness, which implies potential for high speed imaging. We have optimized the sensitivity of the astigmatic detection system for a liquid environment, thereby also improving the resolution of the optical profilometry method in the high-contrast imaging of a biological sample.24
In addition, researchers can further convert ADM into AFM by adding an AFM cantilever with some modifications. We have already successfully developed a two-in-one hybrid ADM-AFM system for scanning nano-scale sized biological samples such as DNA.24 However, the two-in-one hybrid ADM-AFM system for the micro-scale sized biological samples, such as cells, is still under development.
Fig. 7 Expression analyses of caspase-3 protein in T. canis larval E/S antigen-cocultured astrocytes: (a) protein levels of caspase-3 without (control) and with 75 μg/mL Tc E/S antigen for 9 h as assessed by western blotting; (b) fold changes relative to the control and 75 μg/mL Tc E/S antigen for 9 h. The error bars indicate the standard deviation (SD), and the superscript indicates a significant difference from the control. *, p < 0.001.
Table 1 Mean height of normal and apoptotic astrocytes
Group Cell Height/μm
Normal cellsApoptotic cells
1.999 ± 0.217a
4.296 ± 0.410a
a, p < 0.001.
Fig. 8 Representative AFM images of astrocytes: (a) normal 2D image; (b) normal 3D image; (c) apoptotic 2D image; (d) apoptotic 3D image.

892 ANALYTICAL SCIENCES SEPTEMBER 2013, VOL. 29
In conclusion, we have proposed an alternative detection method, a combination of ADM and AFM techniques, which can aid the investigation of the apoptosis of astrocytes. This method can provide shape, surface structure, and height information without tedious procedures. Future designs might also incorporate a blue-ray pickup head for better resolution, due to its higher intensity and shorter wavelength. This method should help to provide researchers with new insight in their studies of the variation in the pathological significance of cell morphological changes for T. canis research, or even for any central nervous system (CNS) invading helminth.
Acknowledgements
We gratefully acknowledge Dr. Alice Yu’s lab at Genomics Research Center, Academia Sinica for providing us the optical microscopy used in this study. We also thank Mr. Damon Verial for proofreading the manuscript. This work was supported by the research projects (NSC 98-2112-M-001-016-MY3) and (NSC 99-2628-B-038-001-MY3) granted by the National Science Council of Taiwan.
References
1. C. V. Holland and C. M. Hamilton, J. Exp. Biol., 2013, 216, 78.
2. P. J. Hotez and P. P. Wilkins, PLoS Negl. Trop. Dis., 2009, 3, 1.
3. I. R. Hill, D. A. Denham, and C. L. Scholtz, T. Roy. Soc. Trop. Med. H., 1985, 79, 351.
4. D. Despommier, Clin. Microbiol. Rev., 2003, 16, 265. 5. M. S. Forman, D. Lal, B. Zhang, D. V. Dabir, E. Swanson,
V. M. Y. Lee, and J. Q. Trojanowski, J. Neurosci., 2005, 25, 3539.
6. R. H. Miller and M. C. Raff, J. Neurosci., 1984, 4, 585. 7. C. M. Liberto, P. J. Albrecht, L. M. Herx, V. W. Yong, and
S. W. Levison, J. Neurochem., 2004, 89, 1092. 8. C. W. Liao, C. K. Fan, T. C. Kao, D. D. Ji, K. E. Su, Y. H.
Lin, and W. L. Cho, BMC Infect. Dis., 2008, 8, 84. 9. C. W. Liao, W. L. Cho, T. C. Kao, K. E. Su, Y. H. Lin, and
C. K. Fan, Parasite Immunol., 2008, 30, 525. 10. A. A. Othman, G. A. Abdel-Aleem, E. M. Saied, W. W.
Mayah, and A. M. Elatrash, Mol. Biochem. Parasitol., 2010, 172, 1.
11. A. Haunstetter and S. Izumo, Circ. Res., 1998, 82, 1111. 12. A. Saraste, Herz, 1999, 24, 189. 13. A. C. H. Yu, H. K. Wong, H. W. Yung, and L. T. Lau, Glia,
2001, 35, 121. 14. K. Takuma, A. Baba, and T. Matsuda, Prog. Neurobiol.,
2004, 72, 111. 15. W. W. Hsiao, H. S. Liao, H. H. Lin, R. F. Ding, K. Y.
Huang, and C. S. Chang, Anal. Sci., 2013, 29, 3. 16. K. S. Kim, C. H. Cho, E. K. Park, M. H. Jung, K. S. Yoon,
and H. K. Park, PLoS One, 2012, 7, 1. 17. D. Vergara, R. Martignago, S. Leporatti, S. Bonsegna, G.
Maruccio, F. De Nuccio, A. Santino, R. Cingolani, G. Nicolardi, M. Maffia, and R. Rinaldi, Nanotechnology, 2009, 20, 455106.
18. S. B. Velegol, S. Pardi, X. Li, D. Velegol, and B. E. Logan, Langmuir, 2003, 19, 851.
19. C. W. Tsai, C. H. Lee, and J. Wang, Opt. Lett., 1999, 24, 1732.
20. E. T. Hwu, S. K. Hung, C. W. Yang, I. S. Hwang, and K. Y. Huang, Appl. Phys. Lett., 2007, 91, 221908.
21. E. T. Hwu, S. K. Hung, C. W. Yang, K. Y. Huang, and I. S. Hwang, Nanotechnology, 2008, 19, 1.
22. E. T. Hwu, H. S. Liao, F. G. Bosco, C. H. Chen, S. S. Keller, A. Boisen, and K. Y. Huang, J. Sens., 2012, 2012, 1.
23. E. T. Hwu, H. Illers, L. Jusko, and H. U. Danzebrink, Meas. Sci. Technol., 2009, 20, 084005.
24. H. S. Liao and Ph.D. Dissertation, “Design and Development of Atomic Force Microscope Systems for Liquid Environment”, 2013, National Taiwan University, Taiwan.
25. C. K. Fan, H. S. Lan, C. C. Hung, W. C. Chung, C. W. Liao, W. Y. Du, and K. E. Su, Am. J. Trop. Med. Hyg., 2004, 71, 216.
26. D. B. Murphy, “Fundamentals of Light Microscopy and Electron Imaging”, 1st ed., 2001, Wiley-Liss, Canada, 22.
27. A. Lawen, BioEssays, 2003, 25, 888. 28. J. D. Sokolowski and J. W. Mandell, Am. J. Pathol., 2011,
178, 1416. 29. T. J. Bruns and W. A. Hauser, Epilepsia, 2003, 44, 2.
Copyright © 2022 FDOKUMEN