2012 Update Institutional Effectiveness - Santa Monica College
96
2012 Update Institutional Effectiveness Prepared by the Office of Institutional Research Fall 2012
-
Upload
khangminh22 -
Category
Documents
-
view
1 -
download
0
Transcript of 2012 Update Institutional Effectiveness - Santa Monica College

Ebook.com
2012 Update
Institutional Effectiveness
Prepared by the
Office of Institutional Research
Fall 2012
ii | 2012 UDPATE - INSTITUTIONAL EFFECTIVENESS Santa Monica College Office of Institutional Research
Table of Contents Dashboard: Institutional Priorities ............................................................................... iv
Dashboard: Innovative & Responsive Academic ............................................................. v
Dashboard: Supportive Learning ................................................................................ vii
Dashboard: Stable Fiscal ........................................................................................... viii
Dashboard: Sustainable Physical ................................................................................. ix
Dashboard: Supportive Collegial .................................................................................. x
Introduction .............................................................................................................. 1
Purpose of Institutional Effectiveness ......................................................................... 1
Definition of Key Terms ............................................................................................ 3
Institutional Effectiveness Cycle ................................................................................ 3
Development of the Key Indicators ............................................................................ 5
Revisions and Additions of Key Indicators ................................................................... 6
Development of Dashboards and Targets ................................................................... 7
Next Steps ............................................................................................................. 8
Organization of Report ............................................................................................. 9
Chapter 1: Innovative and Responsive Academic ......................................................... 10
Future Key Indicators ............................................................................................ 11
1.1 Persistence Rate .............................................................................................. 13
1.2 Course Success Rate ........................................................................................ 17
1.3 Degrees Awarded ............................................................................................ 18
1.4 Certificates Awarded ........................................................................................ 19
1.5 Transfers to Public Four-Year Institutions ............................................................ 20
1.6 Progress and Achievement Rate......................................................................... 22
1.7 Transfer Rate .................................................................................................. 24
1.8 Basic Skills Course Success Rate ....................................................................... 28
1.9 Basic Skills Course Improvement Rate ................................................................ 30
1.10 Basic Skills Transition to Degree Course Rate .................................................... 34
1.11 CTE Course Success Rate ................................................................................ 38
1.12 CTE Completion Rate ...................................................................................... 40
1.13 Distance Learning Course Success Rate Gap ...................................................... 45
1.14 Distance Learning Course Retention Rate Gap ................................................... 46

iii | 2012 UDPATE - INSTITUTIONAL EFFECTIVENESS Santa Monica College Office of Institutional Research
1.15 SMMUSD Graduates to SMC Rate ..................................................................... 47
1.16 Geographic Area HS Graduates to SMC Rate...................................................... 48
1.17 Equity Gap – Course Success Rate ................................................................... 50
1.18 Equity Gap – Progress and Achievement Rate .................................................... 52
1.19 Equity Gap – Transfer Rate ............................................................................. 55
1.20 Percentage of Students Enrolled in Sustainability Related or Focused Courses ....... 58
Chapter 2: Supportive Learning ................................................................................. 59
Future Key Indicators ............................................................................................ 59
2.1 First-time Freshmen Orientation Rate ................................................................. 61
2.2 First-time Freshmen Assessment Rate ................................................................ 62
2.3 Percentage of Students Receiving Financial Aid .................................................... 63
2.4 Counseling Contact Rate ................................................................................... 65
2.5 CCSSE – Active & Collaborative Learning ............................................................ 68
2.6 CCSSE – Student Effort .................................................................................... 68
2.7 CCSSE – Academic Challenge ............................................................................ 68
2.8 CCSSE – Student-Faculty Interaction ................................................................. 68
2.9 CCSSE – Support for Learners ........................................................................... 68
Chapter 3: Stable Fiscal ............................................................................................ 74
3.1 Operating Surplus-Deficit .................................................................................. 75
3.2 WSCH/FTEF .................................................................................................... 77
3.3 Fund Balance Ratio .......................................................................................... 78
3.4 Non-Resident Tuition Revenue ........................................................................... 79
Chapter 4: Sustainable Physical ................................................................................. 80
Future Key Indicators ............................................................................................ 80
4.1 Electricity Usage by Sq. Foot ............................................................................. 81
4.2 Gas Usage by Sq. Foot ..................................................................................... 82
4.3 Annual Employee per Capita Waste Disposal ....................................................... 83
4.4 Annual Student per Capita Waste Disposal .......................................................... 84
Chapter 5: Supportive Collegial .................................................................................. 85
Future Key Indicator .............................................................................................. 85
5.1 Institutional Objectives Completion Rate ............................................................. 86

iv | 2012 UDPATE - INSTITUTIONAL EFFECTIVENESS Santa Monica College Office of Institutional Research
Dashboard: Institutional Priorities
1.1: Enrolled in credit course in subsequent fall term anywhere in CCC / First-time freshmen completed 6 units 1.7: Transferred to any four-year institution within 6 years / First-time freshmen completed 12 units & attempted transfer-level English or math 1.9: Successfully completed higher level course within 3 years / Began English, math, or ESL sequence and successfully completed course 2 or more levels below transfer 1.10: Enrolled in degree-applicable English, ESL, or math course within 3 years / Began English, ESL, or math sequence in basic skills 1.12: Earned certificate or AA/AS or transferred within 6 years / First-time freshmen completed 12 units & attempted an advanced occupational course 1.18: Difference in average progress and achievement rates between group with highest rates (Asian/PI & White) and group with lowest rates (Black & Hispanic); progress and achievement rates calculated by dividing the number of first-time freshmen completed 12 units & attempted a transfer-level math or English or advanced occupational course (cohort) by the number of students in the cohort who transfer to a four-year institution, earn a certificate or AA/AS, or achieve transfer prepared (complete 60 transferable units with 2.0 GPA or higher) or transfer directed (complete transfer English or math) status within 6 years 1.19: Difference in average transfer rates between group with highest rates (Asian/PI & White) and group with lowest rates (Black & Hispanic)
Institutional Priorities
Key Indicator 2009 2010 2011 2012 Target Performance
Trend
(Prior to
Current
Year)
1.1 Persistence Rate
(see page #13) 73.9% 74.7% 73.2% 76.2%
75% by
2015-2016
1.7 Transfer Rate
(see page #24) 50.6% 58.3% 49.5% 51.9% Remain steady
1.9 Basic Skills Course
Improvement Rate
(see page #30) 66.9% 68.9% 68.1% 67.2%
69% by
2015-2016
1.10 Basic Skills Transition to
Degree Course Rate
(see page #34) 34.4% 35.9% 34.4% 36.5%
College-wide
discussion in
progress
NA
1.12 CTE Completion Rate
(see page #40) 43.7% 50.6% 46.5% 45.8%
47% by
2015-2016
1.18 Equity Gap – Progress &
Achievement Rate
(see page #52) 23.9% 23.1% 23.2% 25.2%
Decrease
year-over-year
1.19 Equity Gap – Transfer
Rate (see page #55) 26.1% 19.0% 24.6% 24.1%
Decrease
year-over-year
Priorities
v | 2012 UDPATE - INSTITUTIONAL EFFECTIVENESS Santa Monica College Office of Institutional Research
Dashboard: Innovative and Responsive Academic Goal
1.2: A, B, C, CR, P grades / A, B, C, CR, D, DR, F, I, NC, NP, P, W grades 1.3: # Associate Degrees awarded 1.4: # career certificates awarded (does not include departmental certificates) 1.5: # transferred to UC or CSU institution 1.6: Transferred to a four-year institution, earned a certificate or AA/AS, or achieve transfer prepared (completed 60 transferable units with 2.0 GPA or higher) or transfer directed (completed transfer English or math) status within 6 years / First-time freshmen completed 12 units & attempted transfer-level English or math or advanced occupational course
Progress & Achievement
Key Indicator 2009 2010 2011 2012
Trend
(Prior to
Current
Year)
1.2 Course Success Rate
(see page #17) 65.4% 67.0% 68.6% 69.0%
1.3 Degrees Awarded
(see page #18) 1,329 1,409 1,243 1,225
1.4 Certificates Awarded
(see page #19) 158 257 1,397 1,505
1.5 Transfers to Public 4-Years (UC/CSU Combined)
(see page #20) 2,111 1,930 1,833 2,063
1.6 Progress & Achievement Rate
(see page #22) 58.5% 66.5% 60.5% 59.2%
Basic Skills & Career Technical Education (CTE)
1.8 Basic Skills Course Success Rate
(see page #28) 53.6% 55.4% 57.1% 56.9%
1.11 CTE Course Success Rate
(see page #38) 68.1% 69.3% 70.8% 71.4%
Distance Learning 1.13 Distance Learning Course Success Rate Gap
(see page #45) 7.4% 5.2% 5.3% 4.1%
1.14 Distance Learning Course Retention Rate Gap
(see page #46) 9.1% 6.5% 6.5% 5.1%
Response to Community Needs 1.15 SMMUSD Graduates to SMC Rate
(see page #47) 32.2% 31.7% 30.1% 30.2%
1.16 Geographic Area HS Graduates to SMC Rate
(see page #48) 24.8% 26.7% 21.9% 20.0%
Student Equity & Curriculum 1.17 Equity Gap – Course Success Rate
(see page #50) 15.7% 15.2% 14.2% 15.5%
1.20 Percentage of Students Enrolled in Sustainability
Related or Focused Courses (see page #58) -- -- -- 61.2% NA
Academic

vi | 2012 UDPATE - INSTITUTIONAL EFFECTIVENESS Santa Monica College Office of Institutional Research
1.8: A, B, C, CR P grades in basic skills English, ESL, and math courses / A, B, C, CR, D, DR, F, I, NC, NP, P, W grades in basic skills English, ESL, and math courses 1.11: A, B, C, CR P grades in courses with SAM code A, B, C, or D / A, B, C, CR, D, DR, F, I, NC, NP, P, W grades in courses with SAM code A, B, C, or D 1.13: Difference between course success rates in distance learning and on-ground classes for same courses 1.14: Difference between course retention rates in distance learning and on-ground classes for same courses 1.15: Enrolled in credit course at SMC within 1 year of HS graduation / Graduated from public HS in SMMUSD 1.16: Enrolled in credit course at SMC within 1 year of HS graduation / Graduated from public/charter HS within 10 miles of SMC main campus zip code (90405) 1.17: Difference in average course success rates between group with highest rates (Asian/PI & White) and group with lowest rate (Black & Hispanic) 1.20: Enrolled in credit course identified as sustainability related or focused / Credit student

vii | 2012 UDPATE - INSTITUTIONAL EFFECTIVENESS Santa Monica College Office of Institutional Research
Dashboard: Supportive Learning Goal
2.1: Completed online orientation within 1 term of enrollment / First-time freshmen with transfer, degree, or certificate goal 2.2: Completed assessment (including SMC placement, challenge exam, prior completion of coursework, advanced placement exam, or other college’s placement) within 1 year of enrollment / First-time freshmen enrolled in credit course 2.3: Received BOG enrollment fee waivers, grants, loans, scholarships, and/or work-study / Enrolled in credit course 2.4: Visited counseling center or enrolled in COUNS 20 fall and/or spring term / Credit student with transfer, degree, or certificate goal 2.5: Average score of sample on 7 survey items related to Active & Collaborative Learning Benchmark 2.6: Average score of sample on 8 survey items related to Student Effort Benchmark 2.7: Average score of sample on 10 survey items related to Academic Challenge Benchmark 2.8: Average score of sample on 6 survey items related to Student-Faculty Interaction Benchmark 2.9: Average score of sample on 7 survey items related to Support for Learners Benchmark
Supportive Learning
Key Indicator 2009 2010 2011 2012
Trend
(Prior to
Current
Year)
2.1 First-time Freshmen Orientation Rate
(see page #61) 98.3% 98.8% 98.6% 98.7%
2.2 First-time Freshmen Assessment Rate
(see page #62) 98.6% 98.6% 98.4% 98.4%
2.3 Percentage of Students Receiving Financial Aid
(see page #63) 30.8% 35.8% 40.4% 46.1%
2.4 Counseling Contact Rate
(see page #65) 57.8% 59.6% 61.4% 61.3%
2.5 CCSSE – Active & Collaborative Learning (range 0 to 1)
(see page #68) NA NA NA 0.38 NA
2.6 CCSSE – Student Effort (range 0 to 1)
(see page #68) NA NA NA 0.48 NA
2.7 CCSSE – Academic Challenge (range 0 to 1)
(see page #68) NA NA NA 0.61 NA
2.8 CCSSE – Student-Faculty Interaction (range 0 to 1)
(see page #68) NA NA NA 0.40 NA
2.9 CCSSE – Support for Learners (range 0 to 1)
(see page #68) NA NA NA 0.42 NA
Support

viii | 2012 UDPATE - INSTITUTIONAL EFFECTIVENESS Santa Monica College Office of Institutional Research
Dashboard: Stable Fiscal Goal
3.1: Actual revenues and transfers – Actual expenditures with one-time items 3.2: Sum of class contact hours per week per student in each class section / Sum of weekly teaching load 3.3: Total expenditures and transfers / fund balance (excluding designated revenue) 3.4: Fees paid by international and out-of-state residents and Intensive English Program students
Stable Fiscal
Key Indicator 2009 2010 2011 2012
Trend
(Prior to
Current
Year)
3.1 Operating Surplus-(Deficit)
(see page #75) $610,782 $1,061,345 $2,618,738 ($8,840,474)
3.2 WSCH/FTEF
(see page #77) 586.38 641.07 659.30 635.00
3.3 Fund Balance Ratio
(see page #78) 12.98% 13.96% 15.44% 8.38%
3.4 Non-Resident Tuition Revenue
(see page #79) $17,961,185 $20,199,343 $21,387,129 $24,544,282
Fiscal

ix | 2012 UDPATE - INSTITUTIONAL EFFECTIVENESS Santa Monica College Office of Institutional Research
Dashboard: Sustainable Physical Goal
4.1 Annual electricity usage in kilowatt-hour (kWh) by the gross square footage from space inventory (not including space that does not meter electricity) 4.2 Annual natural gas usage in British Thermal Unit (BTU) by the gross square footage from space inventory (not including space that does not use or meter gas) 4.3 Total pounds of waste disposed / Number of SMC employees / Number of days in a year (365) 4.4 Total pounds of waste disposed / Number of SMC students / Number of days in a year (365)
Sustainable Physical
Key Indicator 2009 2010 2011 2012
Trend
(Prior to
Current
Year)
4.1 Electricity Usage (kWh) by Sq. Foot
(see page #81) 14.15 13.93 12.84 13.76
4.2 Gas Usage (BTU) by Sq. Foot
(see page #82) 27,359 25,947 25,859 21,855
4.3 Annual Employee per Capita Waste Disposal
(lbs/employees/365)
(see page #83) 1.9 1.3 0.9 0.9
4.4 Annual Student per Capita Waste Disposal
(lbs/students/365)
(see page #84) 0.2 0.1 0.1 0.0
Physical

x | 2012 UDPATE - INSTITUTIONAL EFFECTIVENESS Santa Monica College Office of Institutional Research
Dashboard: Supportive Collegial Goal
5.1 Institutional objectives in the SMC Master Plan for Education that is “Completed” or “Substantially Completed” / Institutional objectives in the SMC Master Plan for Education
Supportive Collegial
Key Indicator 2009 2010 2011 2012
Trend
(Prior to
Current
Year)
5.1 Institutional Objectives Completion Rate
(see page #86) 65.4% 78.6% 78.6% 81.8%
Collegial
1 | 2012 UDPATE - INSTITUTIONAL EFFECTIVENESS Santa Monica College Office of Institutional Research
Introduction
Institutional Effectiveness is the systematic and continuous process of measuring the extent to which a college achieves its mission, as expressed through the goals and strategic objectives developed in an educational master plan. The current (2012) report provides an update of the 2011-2016 institutional effectiveness process and an analysis of the college’s progress towards the target goals.
Purpose of Institutional Effectiveness
The ultimate purpose of the institutional effectiveness process is to advance educational quality and institutional improvement. The process involves an analysis of longitudinal data related to the fundamental areas of the college and identification and prioritization of the areas needing critical attention. Institutional effectiveness is not achieved by simply reporting the college’s performance on key institutional effectiveness indicators. The process relies on the dialogue and collaborative inquiry among campus constituents around the institutional effectiveness performance. The process drives evidence-based college planning and supports decision-making processes. The following assumptions provide the foundation for the institutional effectiveness process:
• The primary purpose of the institutional effectiveness process is for self-review for institutional improvement and not to satisfy accountability requirements or comply with external mandates (for example, accrediting agencies, the state-wide accountability system, or the Student Success Taskforce recommendations);
• The institutional effectiveness process is not designed to replace ongoing college planning and evaluative processes, such as program review or assessment of student learning outcomes;
• The institutional effectiveness data is not intended to fulfill all of the campus data needs. It is expected that additional data will need to be collected and reviewed at multiple levels of practice including the classroom and program levels. The institutional effectiveness process aims to monitor and review data using a college-wide perspective to inform institutional strategies;
• The indicators measuring institutional effectiveness are purely descriptive and do not provide a causal or scientific explanation for trends in performance. Instead, the goal of institutional effectiveness is to spark robust dialogue among campus groups and encourage the college to engage in further inquiry to examine some of the “why” and “how” questions; and,
• The institutional effectiveness involves an ongoing and dynamic process that responds to the changing needs and priorities of the college.

2 | 2012 UPDATE INSTITUTIONAL EFFECTIVENESS DATA Santa Monica College Office of Institutional Research
The institutional effectiveness process documents the college’s performance against its goals. SMC aims to achieve its vision and mission by addressing five supporting goals.
Vision Santa Monica College will be a leader of and innovator in learning and achievement. As a
community committed to open dialog and the free exchange of ideas, Santa Monica
College will foster its core values: knowledge, intellectual inquiry, research-based planning
and evaluation, academic integrity, ethical behavior, democratic processes,
communication and collegiality, global awareness, and sustainability.
Mission Santa Monica College provides a safe and inclusive learning environment that encourages
personal and intellectual exploration, and challenges and supports students in achieving
their educational goals. Students learn to contribute to the global community as they
develop an understanding of their relationship to diverse social, cultural, political,
economic, technological, and natural environments. The College recognizes the critical
importance of each individual's contribution to the achievement of this mission.
Santa Monica College provides open and affordable access to high quality associate
degree and certificate of achievement programs and participates in partnerships with
other colleges and universities to facilitate access to baccalaureate and higher degrees.
The College's programs and services assist students in the development of skills needed to
succeed in college, prepare students for careers and transfer, and nurture a lifetime
commitment to learning.
Supporting Goals: Innovative and Responsive Academic Environment: Continuously develop curricular
programs, learning strategies, and services to meet the evolving needs of students and the
community.
Supportive Learning Environment: Provide access to comprehensive student learning
resources such as library, tutoring, and technology and comprehensive and innovative
student support services such as admissions and records, counseling, assessment,
outreach, and financial aid.
Stable Fiscal Environment: Respond to dynamic fiscal conditions through ongoing
evaluation and reallocation of existing resources and the development of new resources.
Sustainable Physical Environment: Apply sustainable practices to maintain and enhance
the college’s facilities and infrastructure including grounds, buildings, and technology.
Supportive Collegial Environment: Improve and enhance decision-making and
communication processes in order to respect the diverse needs and goals of the entire
college community.
The five college goals correspond to the major areas of the college, including instructional programs and curriculum, academic and student support services, fiscal operations, physical infrastructure, and the human resources and collegiality. The institutional effectiveness process is organized by college goal.

3 | 2012 UPDATE INSTITUTIONAL EFFECTIVENESS DATA Santa Monica College Office of Institutional Research
Definitions of Key Terms
The terms “key indicator”, “dashboard”, “target”, “performance year”, and “primary sponsor” are used extensively in the discussion of institutional effectiveness at Santa Monica College and are defined below.
• Key indicator: a metric identified as being important in informing institutional effectiveness. A more detailed description of criteria for a key indicator is described in the “Development of Key Indicators” section.
• Dashboard: a visual tool monitoring the college’s performance on the key indicators which highlights trends and patterns. The six dashboards, when reviewed together, provide a balanced view of institutional effectiveness. One of the dashboards contains key indicators that have been identified as institutional priorities, and the other five dashboards highlight trend performance related to the college’s five goals. A more detailed description of the process of identifying the key indicators for the Institutional Priorities Dashboard is described in the “Development of Dashboards” section.
• Target: a measurable outcome expressed either as a quantifiable value (for example, a target of 75%) or a trend (for example, year-over-year decrease), when achieved, will meaningfully move the needle on institutional effectiveness.
• Performance year: the key indicator value of the most recently reported year of institutional effectiveness. For key indicators on the Institutional Priorities Dashboard, the value in the performance year is measured against the target.
• Primary sponsor: campus personnel or groups directly responsible for or impacted by the key indicators. For example, the primary sponsors of Key Indicator 1.5: Transfer Rate are the Dean of Counseling, the Counseling Department Chair, and the Transfer Center faculty leader.
The following section describes, in detail, the five-year cycle and process of institutional effectiveness at Santa Monica College.
Institutional Effectiveness Cycle
Institutional effectiveness was measured and reviewed systematically at Santa Monica College for the first time in its history in 2010-2011. During this pilot year, the Office of Institutional Research compiled an inventory of metrics related to the various areas of the college and relied on data that was readily available. The initial report was presented to various campus groups and informed the activities of the first official year of the 2011-2016 institutional effectiveness process in 2011-2012. The five steps of the five-year institutional effectiveness process are described in the following figure.

4 | 2012 UPDATE INSTITUTIONAL EFFECTIVENESS DATA Santa Monica College Office of Institutional Research
Institutional Effectiveness Process/Cycle
Year 1: Organize Data
• Develop institutional effectiveness key indicators Organize existing data
• Select key indicators for Institutional Priorities Dashboard and draft targets Based on recommendations from the District Planning Advisory Council (DPAC), the Academic Senate Joint Institutional Effectiveness Committee, and the primary sponsors of the key indicators
• Identify key indicators needing further inquiry Based on recommendations from the primary sponsors of key indicators on the Institutional Priorities Dashboard; fine tune indicators
Year 2: Dig into Data
• Conduct follow-up studies Conduct qualitative and quantitative research studies to deepen understanding of performance on Institutional Priorities Dashboard
Year 3: Develop Action Plan
• Update targets Based on the findings of the follow-up research studies and inquiry when necessary
• Identify areas for intervention and develop action plan Based on discussion with relevant campus bodies on college’s performance on the Institutional Priorities Dashboard and findings of follow-up studies
Year 4: Act
• Implement action plan Begin to implement action strategies addressing Institutional Priorities Dashboard performance
1 Organize Data
2 Dig into Data
3 Develop
Action Plan
4 Act
5 Assess Action
Plan

5 | 2012 UPDATE INSTITUTIONAL EFFECTIVENESS DATA Santa Monica College Office of Institutional Research
Year 5: Assess Action Plan
• Evaluate effectiveness of action plan/interventions Begin to collect data assessing the effectiveness of the intervention strategies
The institutional effectiveness cycle includes an annual update to the key indicators with the most recent available data and an annual report to the Board of Trustees on the progress of the institutional effectiveness process. Once the institutional effectiveness cycle ends, a new cycle will start as institutional effectiveness is an ongoing and continuous cycle.
Development of the Key Indicators
The set of key indicators included in the report was purposefully designed to measure the supporting goals. The key indicators relied only on data that are systematically and regularly collected as they need to be monitored and tracked on an annual basis.
Institutional effectiveness is not intended for report to external agencies such as federal, state, and accreditation. Instead, institutional effectiveness primarily functions as an internal tool for the college to engage in self-evaluation. However, when possible and appropriate, key indicators were aligned with and built on measures in federal and statewide accountability and research reports, including the American Association of Community Colleges’ report on educational attainment of community college students1 and the Accountability for Reporting California Community Colleges (ARCC)2.
Institutional effectiveness key indicators are:
• Stable, consistent, and fair: Focuses on measures that can be at least somewhat influenced by the colleges;
• Aggregated and institution-focused: Includes aggregated student and institutional data on major college milestones and outcomes and avoids data that are too narrow or focus on evaluating specific programs or departments;
• Purely descriptive: Does not provide a causal (scientific) explanation (the “whys?”) for trends in performance. They do not help us understand the relationship between inputs and outcomes, they simply describe the performance; and,
• Purposeful: Are meaningful to stakeholders. Indicators are not simply a “fact book” collection of data.
The set of key indicators reported do not depict a complete picture of the college but provides a starting point for building a functional framework for monitoring institutional effectiveness. The key indicators are useful in providing meaningful feedback for informing the institutional goals and objectives. Some of the key indicators are discussed in the context of the college’s history of practice and state and federal policies in order to provide some insight on the external factors impacting the college’s performance on the key indicators.
1 AACC Policy Brief 2011-04PBL - The Road Ahead: A Look at Trends in the Educational Attainment of Community College Students 2 California Community College Chancellor’s Office 2012 - Focus on Results: Accountability Reporting for California Community Colleges

6 | 2012 UPDATE INSTITUTIONAL EFFECTIVENESS DATA Santa Monica College Office of Institutional Research
The first annual report of the institutional effectiveness (2010-2011) reflected the work to build an inventory of potential key indicators. The current report describes the 2011-2012 activities of the first step in the five-year institutional effectiveness cycle, “Organize Data”, including the revision and additions of key indicators, the development of the institutional effectiveness dashboards, setting of appropriate targets for some key indicators, and identification of key indicators needing further inquiry. In addition, the current document reports on the 38 metrics identified as appropriate measures of institutional effectiveness for Santa Monica College.
Revisions and Additions of Key Indicators
A total of 9 of the 32 indicators reported in the 2011 update of the institutional effectiveness process were refined in the 2012 updated report. The data source, methodology, and/or focus of the following key indicators were revised: 1.1 (Persistence Rate), 1.5 (Transfers to Public 4-Years), 1.9 (Basic Skills Course Improvement Rate), 1.10 (Basic Skills Transition to Degree Course Rate), 1.13 (Distance Learning Course Success Rate Gap), 1.14 (Distance Learning Course Retention Gap), 1.15 (SMMUSD Graduates to SMC Rate), 1.16 (Geographic Area HS Graduates to SMC Rate), and 2.1 (First-time Freshmen Orientation Rate). The changes in the existing key indicators reflect the extensive dialogue that took place around the data with DPAC, the Institutional Effectiveness Committee, and primary sponsors of the indicators. The changes are discussed in more detail in the descriptions of the key indicator performances.
A total of 6 new key indicators were added to the 2012 update of the institutional effectiveness process, including 1.20 (Percentage of Students Enrolled in Sustainability Related or Focused Courses), 2.5 (CCSSE – Active & Collaborative Learning), 2.6 (CCSSE – Student Effort), 2.7 (CCSSE – Academic Challenge), 2.8 (CCSSE – Student-Faculty Interaction), and 2.9 (CCSSE – Support for Learners). Data for Key Indicators 2.5 to 2.9 were collected using the findings from the spring 2012 administration of the Community College Survey of Student Engagement (CCSSE), a national survey assessing the extent to which students engage in programs and activities related to five different benchmarks of effective educational practice. The CCSSE and the benchmarks are discussed in more detail on pages 68-73.
In addition to the revision and addition of indicators, the 2012 update of the institutional effectiveness disaggregates data by student gender, ethnicity/race, and age (when available) for the key indicators on the Institutional Effectiveness Dashboard. According to the Accrediting Commission for Community and Junior Colleges (ACCJC), effective fall 2012, colleges conducting self-evaluation as part of the accreditation process will be expected to sufficiently disaggregate student success data to pinpoint areas where resources and efforts need to be repurposed to improve outcomes for all students.
7 | 2012 UPDATE INSTITUTIONAL EFFECTIVENESS DATA Santa Monica College Office of Institutional Research
Development of Dashboards and Targets
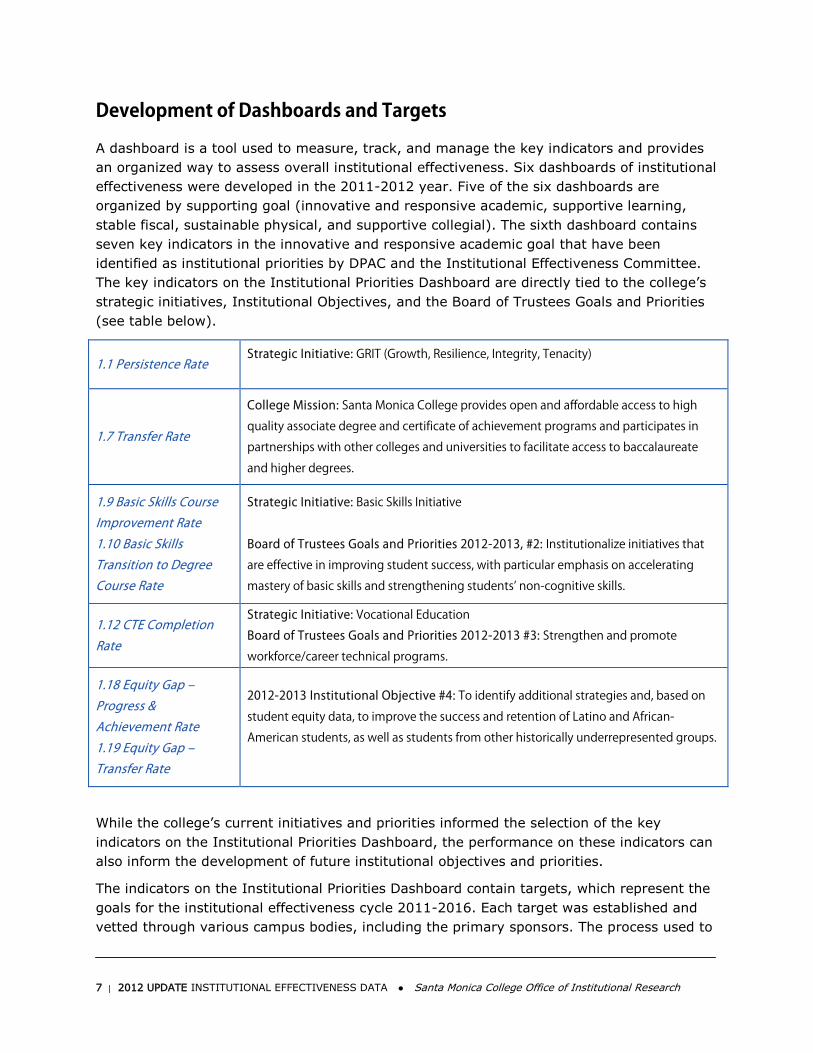
A dashboard is a tool used to measure, track, and manage the key indicators and provides an organized way to assess overall institutional effectiveness. Six dashboards of institutional effectiveness were developed in the 2011-2012 year. Five of the six dashboards are organized by supporting goal (innovative and responsive academic, supportive learning, stable fiscal, sustainable physical, and supportive collegial). The sixth dashboard contains seven key indicators in the innovative and responsive academic goal that have been identified as institutional priorities by DPAC and the Institutional Effectiveness Committee. The key indicators on the Institutional Priorities Dashboard are directly tied to the college’s strategic initiatives, Institutional Objectives, and the Board of Trustees Goals and Priorities (see table below).
1.1 Persistence Rate Strategic Initiative: GRIT (Growth, Resilience, Integrity, Tenacity)
1.7 Transfer Rate
College Mission: Santa Monica College provides open and affordable access to high
quality associate degree and certificate of achievement programs and participates in
partnerships with other colleges and universities to facilitate access to baccalaureate
and higher degrees.
1.9 Basic Skills Course Improvement Rate 1.10 Basic Skills Transition to Degree Course Rate
Strategic Initiative: Basic Skills Initiative
Board of Trustees Goals and Priorities 2012-2013, #2: Institutionalize initiatives that
are effective in improving student success, with particular emphasis on accelerating
mastery of basic skills and strengthening students’ non-cognitive skills.
1.12 CTE Completion Rate
Strategic Initiative: Vocational Education
Board of Trustees Goals and Priorities 2012-2013 #3: Strengthen and promote
workforce/career technical programs.
1.18 Equity Gap – Progress & Achievement Rate 1.19 Equity Gap – Transfer Rate
2012-2013 Institutional Objective #4: To identify additional strategies and, based on
student equity data, to improve the success and retention of Latino and African-
American students, as well as students from other historically underrepresented groups.
While the college’s current initiatives and priorities informed the selection of the key indicators on the Institutional Priorities Dashboard, the performance on these indicators can also inform the development of future institutional objectives and priorities.
The indicators on the Institutional Priorities Dashboard contain targets, which represent the goals for the institutional effectiveness cycle 2011-2016. Each target was established and vetted through various campus bodies, including the primary sponsors. The process used to

8 | 2012 UPDATE INSTITUTIONAL EFFECTIVENESS DATA Santa Monica College Office of Institutional Research
determine the targets is discussed in detail in the descriptions of the individual key indicator performances. Performance on the targets in the most recently reported year (performance year) was evaluated against the coinciding target.
• Indicators which fell below the target or target range3 were marked with a
light on the dashboard. • Indicators which met the target or were within the target range were marked with a
light on the dashboard. • Indicators which exceeded the target or target range were marked with a
light on the dashboard.
The targets will continue to be discussed and refined in each year of the institutional effectiveness process.
The Innovative and Responsive Academic, Supportive Learning, Stable Fiscal, Sustainable Physical, and Supportive Learning Dashboards document the trend in data, comparing the current year data with the prior year data, and use arrows to indicate the direction of the trend.
• Indicators which experienced a decrease of 1% or more in current year data when compared to prior year data were marked with a down arrow on the dashboard.
• Indicators which changed less than 1% in current year data when compared to prior year data were marked with a dash on the dashboard.
• Indicators which experienced an increase of 1% or more were marked with an up arrow on the dashboard.
Next Steps
The next step (“Dig into Data”) of the institutional effectiveness process is to conduct further analysis on key indicators. Based on extensive discussion with primary sponsors on the key indicators on the Institutional Priorities Dashboard, several research projects were proposed for the 2012-2013 academic year. The purpose of the follow-up studies will be to investigate the student experience and to identify factors that successfully predict the outcome. The “Dig into Data” step will rely on campus-wide dialogue and participation, therefore, while the Office of Institutional Research will provide general guidance and administrative support, the primary sponsors will be closely involved in collaboratively defining the research problem, developing the research tools, and analyzing the findings. The following four projects have been proposed:
• Transfer: A mixed methods study examining the college experience of students who, according to a transcript analyses, were ready to transfer to a four-year institution but did not transfer, and identifying the student behaviors and programs which predict successful transfer.
3 Target ranges: 1% above or below specified target figure or within 1% year-over-year change for targets monitoring trends in direction

9 | 2012 UPDATE INSTITUTIONAL EFFECTIVENESS DATA Santa Monica College Office of Institutional Research
• Equity: A qualitative study employing student interview methods to examine the educational experiences of students from different cultural and ethnic backgrounds.
• Basic Skills: A qualitative study employing student focus group methods to examine the educational experiences of students who are successful in basic skills courses yet do not progress through the sequence of courses.
• CTE: A quantitative study employing student survey methods to examine the career-related gains of former CTE students.
The 2013 report of institutional effectiveness will include a summary of findings from the follow-up studies, as well as provide an update to the key indicators, targets, and dashboard.
Organization of Report
The report is organized into five chapters which coincide with the supporting goals being measured. Each chapter starts with an introduction and provides a description of future key indicators (when available).
Each key indicator is reported separately. The data source and methodology are detailed. A four-year trend of data is reported in a table and/or figures and a narrative interpretation and analyses of the data are provided. For the key indicators on the Institutional Priorities Dashboard, the indicator report ends with a discussion of performance relative to the set target or target ranges.

10 | 2012 UPDATE INSTITUTIONAL EFFECTIVENESS DATA Santa Monica College Office of Institutional Research
Chapter 1: Innovative and Responsive Academic
Santa Monica College strives to create an innovative and responsive academic environment by continuously developing curricular programs, learning strategies, and services to meet the evolving needs of students and the community. This area of institutional effectiveness measures how well the college is doing in helping students to achieve academic success and to meet their educational goals. There are 20 key indicators in this chapter. The indicators are categorized into the following elements of the college goal:
Category Key Indicator
PROGRESS & ACHIEVEMENT Measures
completion, course success, and “momentum”
or progress points which document milestones
toward achievement.
1.1 Persistence Rate
1.2 Course Success Rate
1.3 Degrees Awarded
1.4 Certificates Awarded
1.5 Transfers to Public 4-Year Institutions (UC/CSU
Combined)
1.6 Progress & Achievement Rate
1.7 Transfer Rate
BASIC SKILLS
Measures the success of students enrolled in
pre-collegiate courses.
1.8 Basic Skills Course Success Rate
1.9 Basic Skills Course Improvement Rate
1.10 Basic Skills Transition to Degree Course Rate
CAREER TECHNICAL EDUCATION Measures the
success and progress of CTE students.
1.11 CTE Course Success Rate
1.12 CTE Completion Rate
DISTANCE LEARNING
Compares the success of students enrolled in
distance learning courses with the success of
students enrolled in non-distance learning
courses.
1.13 Distance Learning Course Success Rate Gap
1.14 Distance Learning Course Retention Rate Gap
RESPONSE TO COMMUNITY Measures the
extent to which the college serves the
community.
1.15 SMMUSD Graduates to SMC Rate
1.16 Geographic Area HS Graduates to SMC Rate
STUDENT EQUITY
Compares the success and progress of
students by subgroup.
1.17 Equity Gap - Course Success Rate
1.18 Equity Gap - Progress & Achievement Rate
1.19 Equity Gap - Transfer Rate
CURRICULUM
Measures the impact of college-wide initiatives
through the curriculum.
1.20 Percentage of Students Enrolled in Sustainability
Related or Sustainability Focused Courses

11 | 2012 UPDATE INSTITUTIONAL EFFECTIVENESS DATA Santa Monica College Office of Institutional Research
Key Indicator 1.20 (Percentage of Students Enrolled in Sustainability Focused or Sustainability Related Courses) is a new addition to the 2012 update of the 2011-2016 Institutional Effectiveness process and cycle. The indicator was identified as a future indicator in the 2011 update.
Future Key Indicators
Other measures were identified as potential key indicators for future editions of the report by campus groups contributing to the “Innovative and Responsive Academic Environment” goal and DPAC. They were not included in the current document primarily because the data had not yet been collected. The future key indicators include:
• Percentage of Students Enrolled in Globally Focused & Globally Related Courses: SMC is currently engaged in dialogue regarding potentially modeling the STARS (Sustainability, Tracking, Assessment, & Rating System) tracking system and creating a system to track the extent to which the curricula focuses or relates to the Global Citizenship strategic initiative of the college.
• Job Placement Rates: A new mandate from the U.S. Department requires colleges to disclose a variety of information for any financial aid eligible program that prepares students for gainful employment in a recognized occupation. Among the data that will be reported in future years is the job placement rate, or percentage of CTE certificate or degree earners who, within a specified time period after receiving the award, obtained gainful employment in the recognized occupation for which they were trained.
• Time to Award Completion: In addition to ensuring that students achieve their goals, it is imperative that the college help students achieve outcomes in a timely manner. Therefore, an indicator measuring the time to certificate and degree completion will provide information on the average number of years it takes students to earn a certificate or degree at the college.
The key indicators in the “Innovative and Responsive Academic” goal align with a majority of the student outcome metrics in the current state-wide accountability report, the Accountability Reporting for Community Colleges. Five of the key indicators, including 1.1 Persistence Rate, 1.6 Progress and Achievement Rate, 1.8 Basic Skills Course Success Rate, 1.9 Basic Skills Course Improvement Rate, and 1.11 CTE Course Success Rate, overlap with ARCC in some way. However, the methodology for calculating key indicators 1.8 Basic Skills Course Success Rate, 1.9 Basic Skills Course Improvement Rate, and 1.11 CTE Course Success Rate are somewhat modified for the current report to account for some nuances of the college that the Chancellor’s Office is not able to address.
Key Indicators 1.17 (Equity Gap – Course Success Rate), 1.18 (Equity Gap – Progress and Achievement Rate), and 1.19 (Equity Gap – Transfer Rate) are related to the recommendations made by the Student Success Taskforce, a group of community college practitioners established by the California Community Colleges Board of Governors, on closing the achievement gap. Based on research related to best practices and effective models within higher education, the taskforce produced a set of 22 recommendations

12 | 2012 UPDATE INSTITUTIONAL EFFECTIVENESS DATA Santa Monica College Office of Institutional Research
designed to increase transfer, degree, and certificate attainment and help close the achievement gap for historically underrepresented students. For more information on the Student Success Taskforce and their recommendations, visit: http://www.californiacommunitycolleges.cccco.edu/PolicyInAction/StudentSuccessTaskForce.aspx
Each of the key indicators in this goal are described and discussed.
13 | 2012 UPDATE INSTITUTIONAL EFFECTIVENESS DATA Santa Monica College Office of Institutional Research
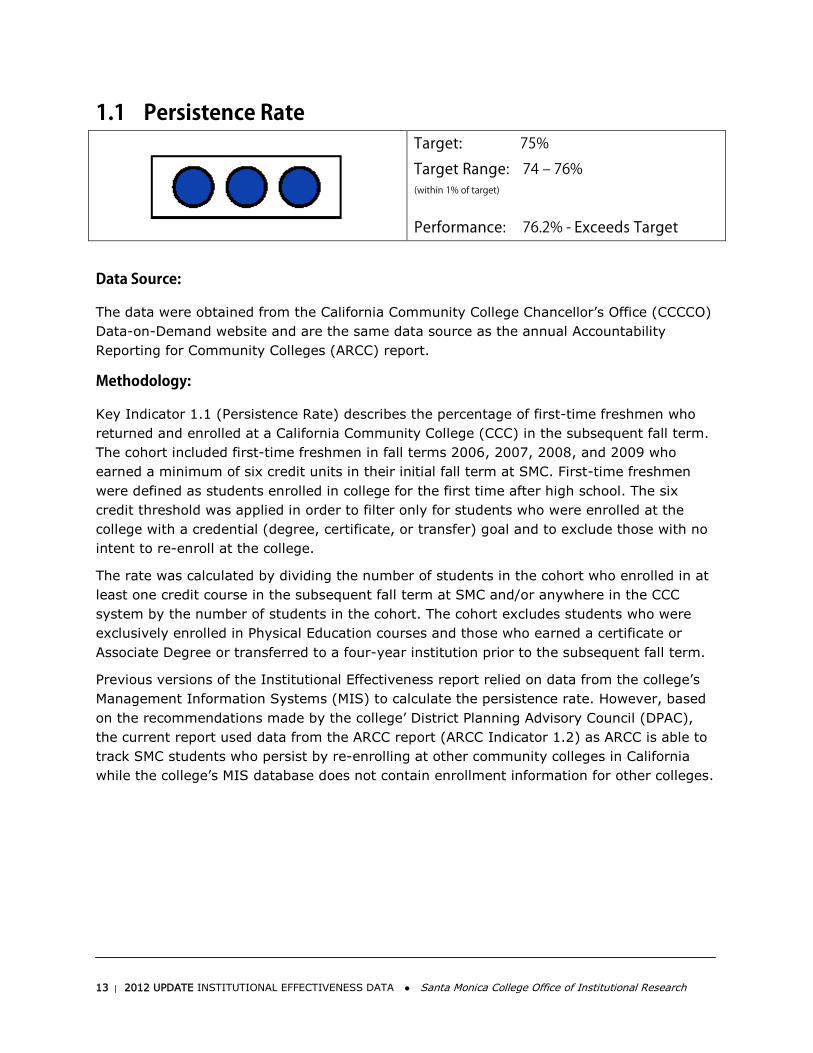
1.1 Persistence Rate
Target: 75%
Target Range: 74 – 76% (within 1% of target)
Performance: 76.2% - Exceeds Target
Data Source:
The data were obtained from the California Community College Chancellor’s Office (CCCCO) Data-on-Demand website and are the same data source as the annual Accountability Reporting for Community Colleges (ARCC) report.
Methodology:
Key Indicator 1.1 (Persistence Rate) describes the percentage of first-time freshmen who returned and enrolled at a California Community College (CCC) in the subsequent fall term. The cohort included first-time freshmen in fall terms 2006, 2007, 2008, and 2009 who earned a minimum of six credit units in their initial fall term at SMC. First-time freshmen were defined as students enrolled in college for the first time after high school. The six credit threshold was applied in order to filter only for students who were enrolled at the college with a credential (degree, certificate, or transfer) goal and to exclude those with no intent to re-enroll at the college.
The rate was calculated by dividing the number of students in the cohort who enrolled in at least one credit course in the subsequent fall term at SMC and/or anywhere in the CCC system by the number of students in the cohort. The cohort excludes students who were exclusively enrolled in Physical Education courses and those who earned a certificate or Associate Degree or transferred to a four-year institution prior to the subsequent fall term.
Previous versions of the Institutional Effectiveness report relied on data from the college’s Management Information Systems (MIS) to calculate the persistence rate. However, based on the recommendations made by the college’ District Planning Advisory Council (DPAC), the current report used data from the ARCC report (ARCC Indicator 1.2) as ARCC is able to track SMC students who persist by re-enrolling at other community colleges in California while the college’s MIS database does not contain enrollment information for other colleges.

14 | 2012 UPDATE INSTITUTIONAL EFFECTIVENESS DATA Santa Monica College Office of Institutional Research
Data and Analyses: Table 1.1: Persistence Rate
Fall 2006 to Fall 2007
Fall 2007 to Fall 2008
Fall 2008 to Fall 2009
Fall 2009 to Fall 2010
Cohort 3,530 3,864 3,963 4,469 Persisted 2,610 2,885 2,901 3,406 % Persisted 73.9% 74.7% 73.2% 76.2%
The data show that the numbers of first-time freshmen who earned six or more credits in their initial term (cohort size) have increased over the last four fall terms. The average persistence rate for the last four cohort years is 74.6% which indicate that nearly three in four first-time freshmen earning a minimum of six units in the first term persist and re-enroll in the CCC system in the subsequent fall term. Current performance (76.2%) reflects an increase of 2.3% over the fall 2006 cohort.
The following tables describe persistence rates by student demographic subgroup, including rates by gender, ethnicity/race, and age.
Disaggregated Data: Gender Table 1.1a: Persistence Rate by Gender – Fall 2009 Cohort
Female Male Total
Cohort 2,299 2,170 4,469
Persisted 1,756 1,650 3,406
% Persisted 76.4% 76.0% 76.2%
Data for the fall 2009 cohort reveal that female and male students persist at similar rates. More than three-quarters of fall first-time freshmen in both groups persist to the subsequent fall term. Moreover, both gender groups exceed the persistence rate target of 75%.
Ethnicity/Race Figure 1.1b: Persistence Rate by Ethnicity/Race – Fall 2009 Cohort
65.0%
70.0%
75.0%
80.0%
85.0%
Asian/PI (n = 925) Hispanic (n = 1,679) Total (N = 4,469) White (n = 1,036) Black (n = 427)
81.2%
76.4% 76.2%
73.1% 71.4%
15 | 2012 UPDATE INSTITUTIONAL EFFECTIVENESS DATA Santa Monica College Office of Institutional Research
Persistence data disaggregated by ethnicity and race groups reveal that Asian/Pacific Islander students persist at the highest rate (81.2%) followed by Hispanic (76.4%), White (73.1%), and Black (71.4%) student groups. Different ethnicity/race groups perform at different rates for this key indicator. The disparity of persistence rates among the four largest ethnicity/race student groups is nearly 10% (highest, Asian/PI: 81.2%; lowest, Black: 71.4%). Two of the four largest ethnicity and race groups (Asian/PI and Hispanic) have persistence rates meeting or exceeding the target of 75% and two groups (White and Black) have rates that are below the target. While differences in rates are observed by student ethnicity/race group, it is important to note that a large majority of students, regardless of ethnicity and race, persist to the subsequent fall term.
The “total” rate includes students who identified themselves as Native American/Alaskan Native and students who did not report their ethnicity/race group. These students were not reported separately because the group sizes were too small for analyses.
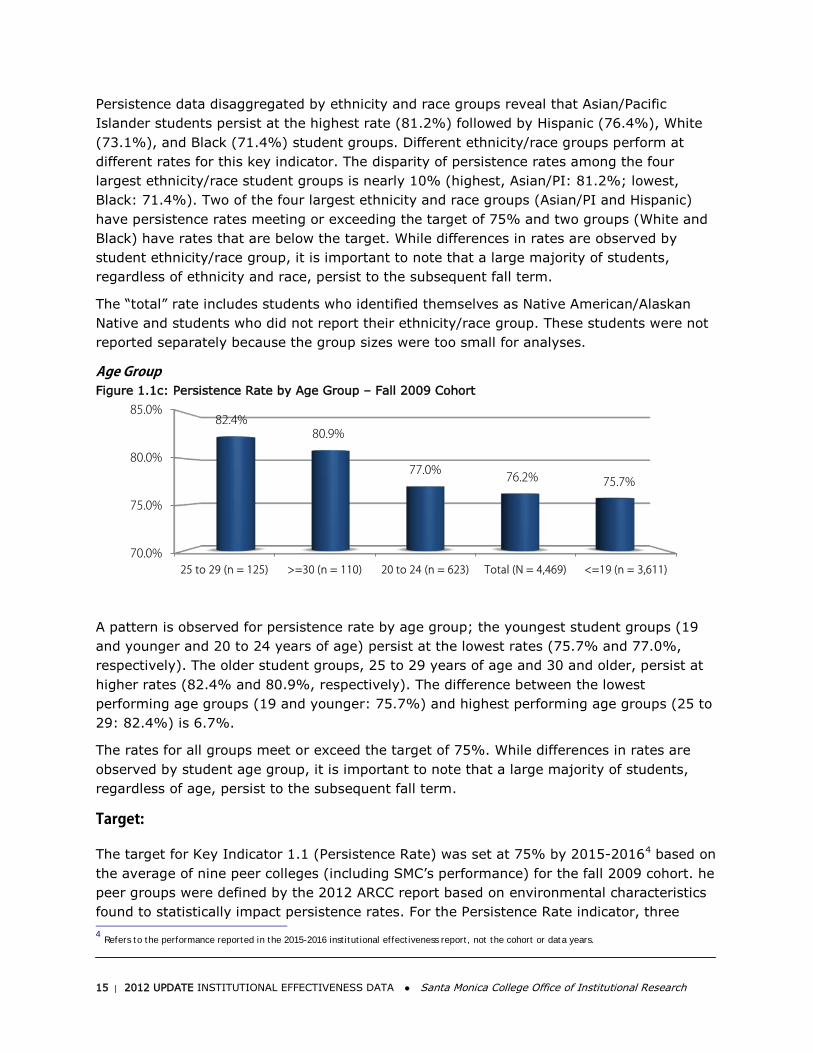
Age Group Figure 1.1c: Persistence Rate by Age Group – Fall 2009 Cohort
A pattern is observed for persistence rate by age group; the youngest student groups (19 and younger and 20 to 24 years of age) persist at the lowest rates (75.7% and 77.0%, respectively). The older student groups, 25 to 29 years of age and 30 and older, persist at higher rates (82.4% and 80.9%, respectively). The difference between the lowest performing age groups (19 and younger: 75.7%) and highest performing age groups (25 to 29: 82.4%) is 6.7%.
The rates for all groups meet or exceed the target of 75%. While differences in rates are observed by student age group, it is important to note that a large majority of students, regardless of age, persist to the subsequent fall term.
Target: The target for Key Indicator 1.1 (Persistence Rate) was set at 75% by 2015-20164 based on the average of nine peer colleges (including SMC’s performance) for the fall 2009 cohort. he peer groups were defined by the 2012 ARCC report based on environmental characteristics found to statistically impact persistence rates. For the Persistence Rate indicator, three 4 Refers to the performance reported in the 2015-2016 institutional effectiveness report, not the cohort or data years.
70.0%
75.0%
80.0%
85.0%
25 to 29 (n = 125) >=30 (n = 110) 20 to 24 (n = 623) Total (N = 4,469) <=19 (n = 3,611)
82.4% 80.9%
77.0% 76.2% 75.7%

16 | 2012 UPDATE INSTITUTIONAL EFFECTIVENESS DATA Santa Monica College Office of Institutional Research
environmental variables, including percent students age 25 or older (the percentage of students at a community college in the fall of 2006 that are 25 years or older), student count (the unduplicated number of students taking credit courses attending the college during fall of 2006), and ESAI Median HH (the economic service area index median household income which is the median household income of the population in the college’s service area from Census 2000) were found to significantly predict persistence rates.
The following peer colleges were found to be more alike with SMC on these variables than different: American River, Mt. San Antonio, Palomar, Pasadena City, Riverside, San Francisco City, Santa Ana, and Santa Rosa. Grouping like colleges allow practitioners to somewhat account for extraneous influences on the persistence rate that are out of the direct control of the college.
An advantage of using a peer group average as a target is that it provides a viable benchmark for measuring oneself against the context of similar institutions.
The data reveal that in the performance year (fall 2009 cohort), the college exceeded the target for Key Indicator 1.1 – Persistence Rate and was higher than the target by 1.2% and was within the range or 1% of the target (74% to 76%).

17 | 2012 UPDATE INSTITUTIONAL EFFECTIVENESS DATA Santa Monica College Office of Institutional Research
1.2 Course Success Rate
Data Source:
The data were obtained from the college’s Management Information Systems (MIS) database.
Methodology:
Key Indicator 1.2 (Course Success Rate) describes the percentage of C or better grades earned in all credit courses in academic years 2008-2009, 2009-2010, 2010-2011, and 2011-2012. Only fall and spring terms were included in the annual performance data. The course success rates were calculated by dividing the total number of A, B, C, CR (credit), and P (pass) grades earned by the total number of course enrollments (A, B, C, CR, D, F, I, NC, NP, DR - drop, and W - withdrawal grades earned). Grades of IP (in progress) and RD (report delayed) were excluded from the analyses.
Data and Analyses: Table 1.2: Course Success Rate
2008-2009 2009-2010 2010-2011 2011-2012 Enrollments 172,384 177,050 174,780 171,026 Success 112,778 118,655 119,982 117,968 % Success 65.4% 67.0% 68.6% 69.0%
The college-wide course success rates have steadily increased over the last four years from 65.4% in 2008-2009 to 69.0% in the performance year (2011-2012).
Table 1.2a: Course Success Rate – Transferable Courses Only 2008-2009 2009-2010 2010-2011 2011-2012
Enrollments 142,769 146,389 144,297 142,937 Success 95,597 100,278 101,407 101,197 % Success 67.0% 68.5% 70.3% 70.8%
Course success rates are disaggregated for Basic Skills (Key Indicator 1.8) and Career Technical Education (Key Indicator 1.11) courses in the institutional effectiveness process. Therefore, it is useful to also report course success rates for transferable courses only. Approximately 84% of all enrollments are in transferable courses. Table 1.2a describes the course success rates for transferable courses only (CSU and/or UC transferable). The course success rates for transferable courses have steadily increased from 67.0% in 2008-2009 to 70.8% in the performance year (2011-2012), similar to the overall course success rate trends. There is very little difference in course success rates when comparing the transferable course success rate (70.8% in 2011-2012) to the overall course success rate (69.0% in 2011-2012).

18 | 2012 UPDATE INSTITUTIONAL EFFECTIVENESS DATA Santa Monica College Office of Institutional Research
1.3 Degrees Awarded
Data Source:
The data were obtained from the college’s Management Information Systems (MIS) database.
Methodology:
Key Indicator 1.3 (Degrees Awarded) describes the total number of Associate Degrees awarded in an academic year (earned between July 1 of a year and June 30 of the following year). The data includes performance in years 2008-2009, 2009-2010, 2010-2011, and 2011-2012. The award counts are duplicated by students (i.e., students were counted once for each degree they earned in the observed year) and do not take into account when students began their academic career.
Data and Analyses: Table 1.3: Degrees Awarded
2008-2009 2009-2010 2010-2011 2011-2012 Degrees 1,329 1,409 1,243 1,225
On average, SMC awarded 1,302 degrees in the last four academic years. In the performance year (2011-2012), the college awarded 1,225 Associate Degrees, a decrease of 18 degrees when compared to the prior year (2010-2011). The decrease in degrees awarded is not substantial (decrease of approximately 1.4% degrees) and follows the pattern of variability from year to year.
19 | 2012 UPDATE INSTITUTIONAL EFFECTIVENESS DATA Santa Monica College Office of Institutional Research
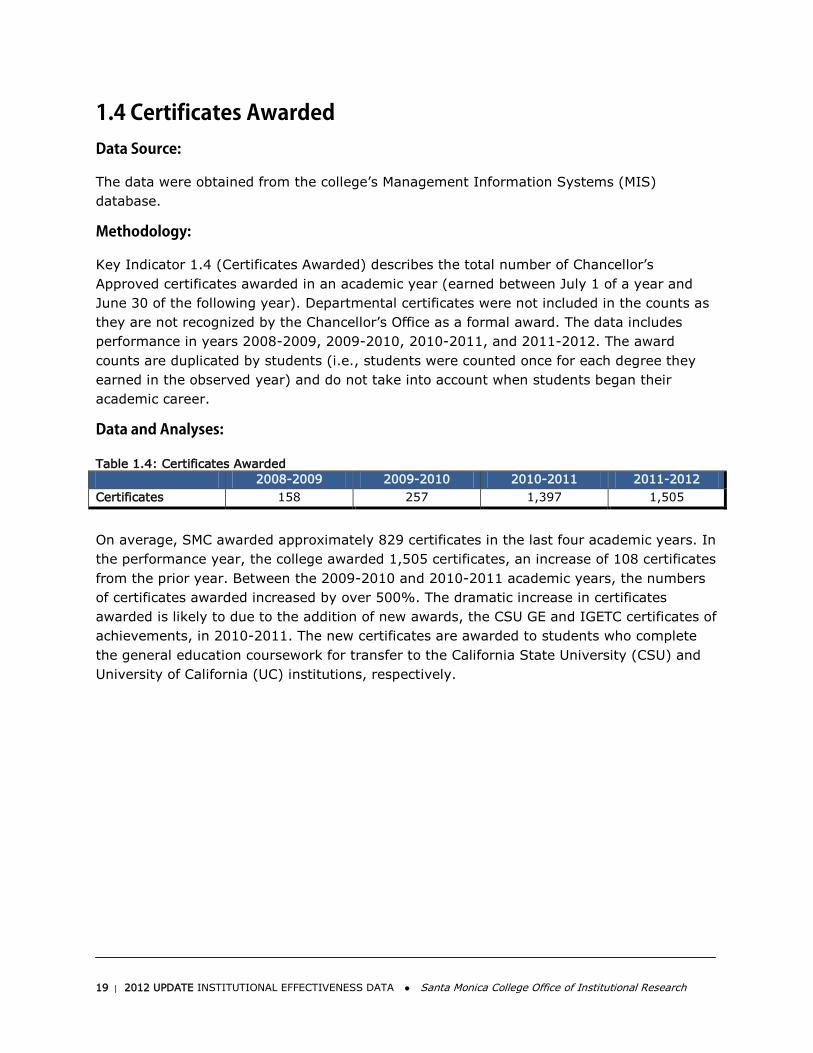
1.4 Certificates Awarded
Data Source:
The data were obtained from the college’s Management Information Systems (MIS) database.
Methodology:
Key Indicator 1.4 (Certificates Awarded) describes the total number of Chancellor’s Approved certificates awarded in an academic year (earned between July 1 of a year and June 30 of the following year). Departmental certificates were not included in the counts as they are not recognized by the Chancellor’s Office as a formal award. The data includes performance in years 2008-2009, 2009-2010, 2010-2011, and 2011-2012. The award counts are duplicated by students (i.e., students were counted once for each degree they earned in the observed year) and do not take into account when students began their academic career.
Data and Analyses: Table 1.4: Certificates Awarded
2008-2009 2009-2010 2010-2011 2011-2012 Certificates 158 257 1,397 1,505
On average, SMC awarded approximately 829 certificates in the last four academic years. In the performance year, the college awarded 1,505 certificates, an increase of 108 certificates from the prior year. Between the 2009-2010 and 2010-2011 academic years, the numbers of certificates awarded increased by over 500%. The dramatic increase in certificates awarded is likely to due to the addition of new awards, the CSU GE and IGETC certificates of achievements, in 2010-2011. The new certificates are awarded to students who complete the general education coursework for transfer to the California State University (CSU) and University of California (UC) institutions, respectively.

20 | 2012 UPDATE INSTITUTIONAL EFFECTIVENESS DATA Santa Monica College Office of Institutional Research
1.5 Transfers to Public Four-Year Institutions
Data Source:
For academic years 2007-2008 to 2009-2010, the transfer to California public institutions data were obtained from the California Postsecondary Education Commission (CPEC) custom data reports. Funding for CPEC was discontinued in fall 2011, and while historical data was maintained, no new data was added to the custom reports function. Therefore, the 2010-2011 transfer to the California State University (CSU) system was obtained from the CSU Analytic Studies website and the transfer to the University of California (UC) system was obtained from the UC Office of the President website.
The transfer to California private and out-of-state institutions data were obtained from the California Community College Chancellor’s Office (CCCCO) Research Reports website. The CCCCO has a data matching agreement in place with the National Student Clearinghouse (a national consortium that hosts a database containing over 91% of postsecondary enrollments). In general, the transfer data reports are lagged by one or more years because the data collection process relies on other institutions to report student enrollment information.
Methodology:
Key Indicator 1.5 (Transfers to Public Four-Year Institutions) describes the total number of SMC students who transferred to a California State University (CSU) or a University of California (UC) institution in the academic years 2007-2008, 2008-2009, 2009-2010, and 2010-2011.
In addition to transfers to public four-year institutions, SMC transfers to California private and out-of-state institutions were tracked for 2007-2008, 2008-2009, and 2009-2010. As of October 2012, the 2010-2011 private and out-of-state transfer data were unavailable on the Chancellor’s Office Research Reports website.
This key indicator was modified to exclude information on SMC’s rank among all California community colleges in terms of total transfers based on the recommendation of DPAC. The change was made to report all key indicators consistently as the previous version of Key Indicator 1.5 reported two data points (transfer volume and rank) while other key indicators only reported one data point.

21 | 2012 UPDATE INSTITUTIONAL EFFECTIVENESS DATA Santa Monica College Office of Institutional Research
Data and Analyses: Table 1.5: Transfers to Public Four-Year Institutions (UC & CSU Combined)
2007-2008 2008-2009 2009-2010 2010-2011 UC 932 919 1,053 1,009 CSU 1,179 1,011 780 1,054 Total Public Transfers
2,111 1,930 1,833 2,063
On average, SMC transferred approximately 979 and 1,006 students to the UC and CSU system, respectively, over the last four academic years observed for a total of 1,984 to all California public institutions. SMC transferred more students to the UC system in the performance year (2010-2011) when compared to the 2007-2008 year. However, SMC transferred fewer students to the CSU system when comparing the same years.
A decreasing trend in total transfers to public four-year institutions was observed between the 2007-2008 and 2009-2010 academic years; however, in the performance year, the college recovered from the dip and climbed back to the transfer levels experienced in 2007-2008.
Transfer volume is influenced by numerous external factors such as impacted status and limited capacity, system budget cuts, and change in admission standards at the UC/CSU. For example, the CSU system did not accept spring transfers in 2009-2010, which may explain the drastic reduction in transfers to CSUs for that year. Recently, the CSU system established a Local Admissions Areas policy which gives priority admission to students attending community colleges in their local service area. For example, Fullerton College students are given priority for transfer admission to CSU-Fullerton, and a Fullerton College student applying to CSU-Fullerton will receive priority for admission over an SMC student with similar credentials (GPA, coursework, etc.). CSUs Northridge, Dominguez Hills, and Los Angeles are designated “local admissions” institutions for SMC, however, according to the leaders at the Transfer Center, these schools are not as desired by SMC students as institutions such as Fullerton, Long Beach, San Jose, or San Francisco. This policy impacts SMC students’ ability to transfer to non-local designated CSU campuses.
Table 1.5a: Transfers to California Privates and Out-of-States
2007-2008 2008-2009 2009-2010 2010-2011 California Privates 436 349 417 NA Out-of-States 297 289 333 NA Total 733 638 750 NA
The college transferred an average of 401 to in-state private and 306 students to out-of-state institutions over the last three academic years reported. The number of out-of-state transfers has steadily increased while the California private transfer count has fluctuated from year to year.
22 | 2012 UPDATE INSTITUTIONAL EFFECTIVENESS DATA Santa Monica College Office of Institutional Research
1.6 Progress & Achievement Rate
Data Source:
The data were obtained from the California Community College Chancellor’s Office (CCCCO) Data-on-Demand website and are the same source of data for the annual Accountability Reporting for Community Colleges (ARCC) report. Data-on-Demand relies on California State University Analytic Studies and University of California Office of the President database and the National Student Clearinghouse (a national consortium that hosts a database containing over 91% of postsecondary enrollments) in order to obtain transfer information. In general, the transfer data reports are lagged by one or more years because the data collection process depends on other institutions reporting student enrollment information. All other outcomes data (including definition of the cohort, attainment of certificates and degrees, and progress status) were obtained from the CCCCO Management Information Systems (MIS) database.
Methodology:
Key Indicator 1.6 (Progress and Achievement Rate) describes the percentage of first-time freshmen who showed intent to complete and achieved any of the progress and achievement outcomes within six years. The cohort included first-time freshmen in academic years 2002-2003, 2003-2004, 2004-2005, and 2005-2006 who showed intent to earn an award and/or transfer by earning a minimum of 12 credit units at SMC and/or anywhere in the California Community College (CCC) system and attempting a degree- applicable math or English or advanced occupational course within six years. First-time freshmen were defined as students enrolled in college for the first time after high school. The cohort included only students who began their postsecondary education at SMC.
The progress and achievement outcomes include:
• Transfer to a four-year institution (including public, private and out of state) • Earn a degree or Chancellor’s approved certificate at any CCC institution • Achieve “Transfer Directed” status (earn a C or better grade in transfer-level math
and English anywhere in the CCC system) • Achieve “Transfer Prepared” status (successfully complete 60 UC/CSU transferable
units with a GPA of 2.0 or higher)
The rate was calculated by dividing the number of students in the cohort who achieved at least one of the following progress and achievement outcomes within six years by the number of students in the cohort. The six-year threshold was applied because it is the standard for cohort tracking in the field.
This indicator is the same measure as ARCC Indicator 1.1. Data for cohort years 2002-2003, 2003-2004, and 2004-2005 were obtained from the 2011 ARCC Report. Data for cohort year 2005-2006 was obtained from the 2012 ARCC Report. Currently ARCC only reports three years, or cohorts, of data. Therefore, the college needed to rely on two editions of the ARCC report to compile a four-year trend of the progress and achievement rate. There are

23 | 2012 UPDATE INSTITUTIONAL EFFECTIVENESS DATA Santa Monica College Office of Institutional Research
minuscule differences in rates observed between the 2011 and 2012 ARCC reports for the 2003-2004 and 2004-2005 cohort years (which were reported in both versions of the report). The differences reflect the improvements in data quality.
Data and Analyses: Table 1.6: Progress & Achievement Rate
2002-03 by
2007-08 2003-04 by
2008-09 2004-05 by
2009-10 2005-06 by
2010-11 Cohort 4,418 3,371 4,448 4,837 Outcome 2,586 2,241 2,691 2,864 % Outcome 58.5% 66.5% 60.5% 59.2%
The average progress and achievement rate for the last four cohort years is 61.2%. The data reveal that, on average, approximately six in ten first-time freshmen who show intent to earn a certificate/degree or transfer (by enrolling in the defined courses) achieve an outcome or make progress towards an outcome within six years. The rate improved by 0.7% in the performance year (2005-2006) when compared to the 2002-2003 cohort. However, when examining the trend across all four years, a spike in performance from 58.5% in 2002-2003 to 66.5% in 2003-2004 is observed. The increase in rate for the 2003-2004 cohort may partly be attributed to the large reduction in course offerings during the 2003 and 2004 years at SMC, which, in turn, reduced the total number of students in the cohort and made the cohort less variable (from 4,418 in 2002-2003 to 3,371 in 2003-2004). In the most recent cohort years, the rates reverted back to the level observed in 2002-2003.
As with Key Indicator 1.5 (Transfers to Public Four-Year Institutions), the progress and achievement rates are influenced by factors such as the economic climate, budget cuts, and changes in admissions policies at four-year institutions. In addition, the inaccurate coding of some CTE courses may have affected the criteria determining the students to be included or excluded from the cohort (related to their enrollment in an advanced occupational course criteria). CTE courses at SMC are coded as being possibly occupational, clearly occupational, or advanced occupational. When a large proportion of CTE courses were found to be miscoded, the CTE faculty worked to clean and accurately recode the CTE courses. The changes in coding did not take effect in the CCCCO database until spring 2012.

24 | 2012 UPDATE INSTITUTIONAL EFFECTIVENESS DATA Santa Monica College Office of Institutional Research
1.7 Transfer Rate
Target: Remain stable
Target Range: 48.5 – 50.5% (within 1% of previous year performance of 49.5%)
Performance: 51.9% - Exceeds Target
Data Source:
The data were obtained from the California Community College Chancellor’s Office (CCCCO) Data-on-Demand website. Data-on-Demand relies on California State University Analytic Studies and University of California Office of the President database and the National Student Clearinghouse (a national consortium that hosts a database containing over 91% of postsecondary enrollments) in order to obtain transfer information.
Methodology:
Key Indicator 1.7 (Transfer Rate) describes the percentage of first-time freshmen who showed intent to transfer and transferred to a four-year institution within six years. The cohort included first-time freshmen in academic years 2002-2003, 2003-2004, 2004-2005, and 2005-2006 who completed 12 or more credit units and attempted transfer-level math or English. First-time freshmen were defined as students enrolled in college for the first time and include special admit students (high school students concurrently enrolled at a community college). Students were identified as being part of the SMC cohort if they completed the largest proportion of their credit units at SMC, regardless of whether they began their postsecondary education at SMC or another California community college. The rate was calculated by dividing the number of students in the cohort who transferred to a four-year institution (including public, private, and out-of-state institutions) within six years of entry in the California Community College (CCC) system by the number of students in the cohort.
Data and Analyses: Table 1.7: Transfer Rate
2002-03 by
2007-08 2003-04 by
2008-09 2004-05 by
2009-10 2005-06 by
2010-11 Cohort 2,673 2,218 2,956 2,474 Transferred 1,352 1,292 1,464 1,284 % Transferred 50.6% 58.3% 49.5% 51.9%
On average, just over half of first-time freshmen who show intent to transfer actually transfer to a four-year institution within six years. When compared to the 2002-2003 cohort year, the transfer rate increased by 1.3% in the performance year (2005-2006 cohort year).
25 | 2012 UPDATE INSTITUTIONAL EFFECTIVENESS DATA Santa Monica College Office of Institutional Research
There is a spike in performance for the cohort 2003-2004 (58.3%). The increase in rate for this year may partly be attributed to the large reduction in course offerings during the 2003 and 2004 years, which, in turn, reduced the total number of students in the cohort and made the cohort less variable. For the 2004-2005 and 2005-2006 cohorts, the rate and cohort size reverted back to the levels observed for the 2002-2003 cohort year.
The ability for students to transfer is influenced by numerous external factors such as impacted status and limited capacity, system budget cuts, and changes in admission standards at the UC/CSU. For example, the CSU system did not accept spring transfers in 2009-2010. In addition, the CSU system established a Local Admissions Areas policy which gives priority admission to students attending community colleges in their local service area. For example, Fullerton College students are given priority for transfer admission to CSU-Fullerton, and a Fullerton College student applying to CSU-Fullerton will receive priority for admission over an SMC student with similar credentials (GPA, coursework, etc.). CSUs Northridge, Dominguez Hills, and Los Angeles are designated “local admissions” institutions for SMC, however, according to the leaders at the Transfer Center, these schools are not as desired by SMC students as institutions such as Fullerton, Long Beach, San Jose, or San Francisco. This policy impacts SMC students’ ability to transfer to non-local designated CSU campuses.
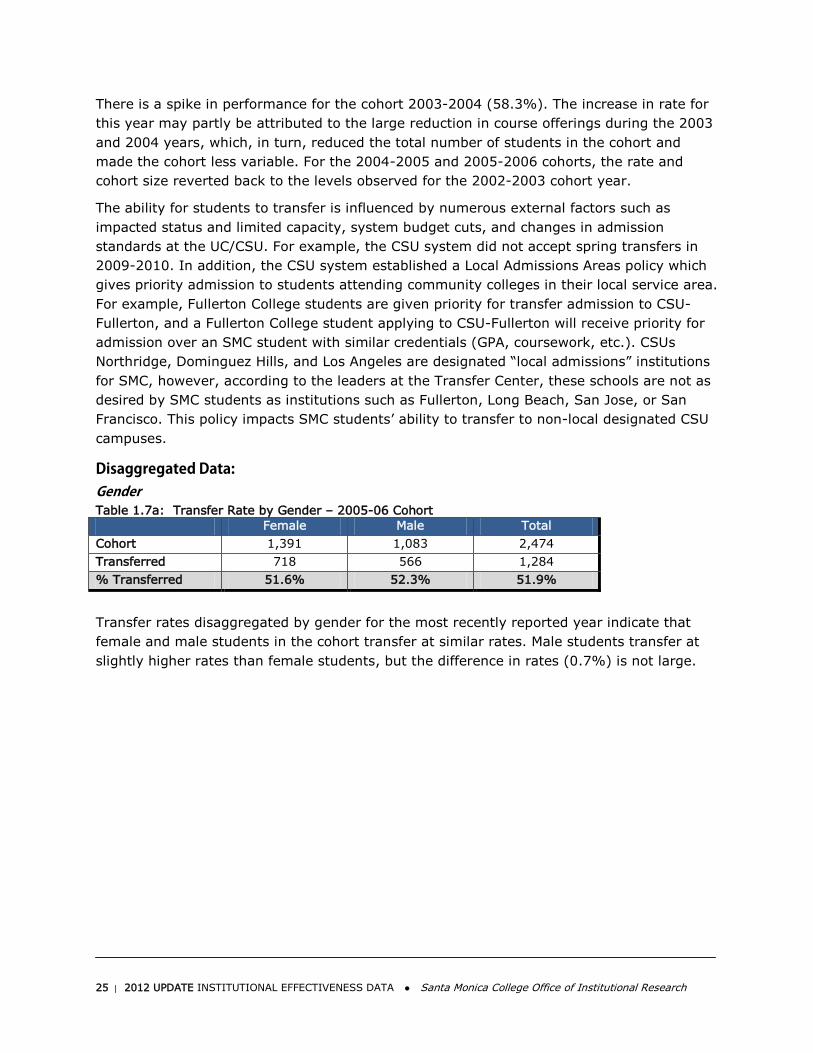
Disaggregated Data: Gender Table 1.7a: Transfer Rate by Gender – 2005-06 Cohort
Female Male Total Cohort 1,391 1,083 2,474 Transferred 718 566 1,284 % Transferred 51.6% 52.3% 51.9%
Transfer rates disaggregated by gender for the most recently reported year indicate that female and male students in the cohort transfer at similar rates. Male students transfer at slightly higher rates than female students, but the difference in rates (0.7%) is not large.

26 | 2012 UPDATE INSTITUTIONAL EFFECTIVENESS DATA Santa Monica College Office of Institutional Research
Ethnicity/Race Figure 1.7b: Transfer Rate by Ethnicity/Race – 2005-06 Cohort
The transfer rates for the four largest ethnicity/race groups (Asian/Pacific Islander, Black, Hispanic, and White) are reported in Figure 1.7b for the most recently reported cohort year (2005-2006). The total rate includes all ethnicity/race groups, including American Indian/Alaskan Native students and those with unreported ethnicity/race values.
The disaggregated data reveal that Black and Hispanic students in the cohort transfer at lower rates (34.2% and 35.7%, respectively) when compared to Asian/Pacific Islander and White students in the cohort (56.5% and 61.5%, respectively). The disparity of transfer rates among the different ethnicity/race groups is over 27% (highest, White: 61.5%; lowest, Black: 34.2%). The gap experienced in this key indicator between different student ethnicity/race groups is discussed further in Key Indicator 1.19 (Equity Gap – Transfer Rate).
Age Group Figure 1.7c: Transfer Rate by Age Group – 2005-06 Cohort
Students who are of traditional college age (24 years of age or younger) in their initial term transferred at higher rates when compared to older students (25 years or age or older) for the 2005-2006 cohort.
The difference between the lowest performing age group (25 to 29: 35.8%) and highest performing age groups (19 years of age or younger: 53.2%) is 17.4%. The data reveal that the 19 years of age or younger group accounts for over 83% of the cohort.
0.0%
20.0%
40.0%
60.0%
80.0%
White (n = 889) Asian/PI (n = 405) Total (N = 2,474) Hispanic (n = 672) Black (n = 199)
61.5% 56.5%
51.9%
35.7% 34.2%
0.0%
20.0%
40.0%
60.0%
<=19 (n = 2,065) Total (N = 2,474) 20 to 24 (n = 248) >=30 (n = 94) 25 to 29 (n = 67)
53.2% 51.9% 50.4%
38.3% 35.8%

27 | 2012 UPDATE INSTITUTIONAL EFFECTIVENESS DATA Santa Monica College Office of Institutional Research
Target: Given the current and anticipated challenges related to transfer, including statewide budget cuts in higher education and reduced capacity at the transferring (or receiving) institutions, the target for Key Indicator 1.7 (Transfer Rate) is to maintain the performance (within 1% of the previous year’s performance). The target was set by the primary sponsors of the key indicator, including the Dean of Counseling Programs, the Department Chair of Counseling, and the Faculty leaders in the Transfer Center.
In the 2010-2011 report, the transfer rate was 49.5%. Therefore, the target for the performance year was to maintain the 49.5% and achieve a rate between 48.5% and 50.5%, within 1% of the prior year performance. The data reveal that the college more than maintained the transfer rate and exceeded the target; for the performance year, the college had a transfer rate of 51.9%, an increase of 2.4% over the prior year performance.
This indicator is the focus of a follow-up study to be conducted in the current academic year (2012-2013) and is explained in more detail in the introduction of the report. A qualitative study examining the experiences of students who were ready to but did not transfer to a four-year institution will be conducted by the faculty lead of the Transfer Center and college researchers. In addition, a quantitative study investigating the factors that predict successful transfer will be employed. The ultimate purpose of the studies is to gather evidence that will inform transfer-related practices and programs and to improve the transfer rate.

28 | 2012 UPDATE INSTITUTIONAL EFFECTIVENESS DATA Santa Monica College Office of Institutional Research
1.8 Basic Skills Course Success Rate
Data Source:
The data were obtained from the college’s Management Information Systems (MIS) database.
Methodology:
Key Indicator 1.8 (Basic Skills Course Success Rate) describes the percentage of C or better grades earned in all credit basic skills courses in academic years 2008-2009, 2009-2010, 2010-2011, and 2011-2012. Only fall and spring terms were included in the annual performance data. The course success rates were calculated by dividing the total number of A, B, C, CR (credit), and P (pass) grades earned by the total number of course enrollments (A, B, C, CR, D, F, I, NC, NP, DR (drop), and W (withdrawal) grades earned). Grades of IP (in progress) and RD (report delayed) were excluded from the analyses.
Basic skills courses were identified as English, ESL, and math courses which are not transferable to UC/CSU and include Associate Degree-applicable courses. The following courses were included in the analyses:
• English: ENGL 23, ENGL 21A, ENGL 21B, ENGL 84W, ENGL 84R, ENGL 81A, ENGL 81B, ENGL 83A, ENGL 83B, ENGL 20*, and ENGL 85*
• ESL: ESL 11A, ESL 11B, ESL 10, ESL 10G, and ESL 10W • Math: MATH 18, MATH 20, MATH 31, MATH 32, MATH 84, and MATH 81
*ENGL 20 and ENGL 85 were offered for the first time in 2011-2012
This key metric is similar to the Annual Successful Course Completion Rate in Credit Basic Skills Courses in the Accountability Reporting for the California Community Colleges (ARCC) report (ARCC Indicator 1.4). The primary difference in methodology between the ARCC indicator and the institutional effectiveness measure is that the ARCC indicator includes enrollments in counseling courses coded as basic skills and skills support basic skills courses (such as lab courses). In addition, the 2012 ARCC reports 2010-2011 as the most recent year with data; the current indicator reports 2011-2012 as the most recent year with data.
Data and Analyses: Table 1.8: Basic Skills Course Success Rate
2008-2009 2009-2010 2010-2011 2011-2012 Enrollments 21,228 22,065 22,186 20,818 Success 11,373 12,230 12,667 11,842 % Success 53.6% 55.4% 57.1% 56.9%
The average success rate in basic skills courses over the last four academic years is 55.8%. In the performance year (2011-2012), the course success rate was 56.9%, an increase of 3.3% over the 2008-2009 year, but a decrease of 0.2% over the prior year (2010-2011).

29 | 2012 UPDATE INSTITUTIONAL EFFECTIVENESS DATA Santa Monica College Office of Institutional Research
When compared to the ARCC indicator measuring success rates in basic skills courses, the college performed worse on the key indicator. The ARCC reported a basic skills course success rate of 60.6% for the 2010-2011 year, a 3.5% rate higher than reported for the same year in the institutional effectiveness report (57.1%). The success rates in the ARCC report may be inflated as they include enrollments in counseling courses designated as basic skills, and counseling courses, on average, have higher course success rates than English, ESL, and math.
The following figure compares the basic skills course success rates by discipline.
Figure 1.8a: Basic Skills Course Success Rate by Discipline
Course success data by discipline reveal an upward trend in basic skills English and math courses. In the performance year (2011-2012), the success rate in basic skills English course increased a total of 4.6% over the 2008-2009 year, but experienced a decrease of 0.4% over the prior year. Success rates in basic skills math courses have steadily increased from 44.5% in 2008-2009 to 47.9% in the performance year. Course success rates in basic skills ESL decreased by 3.4% over the 2008-2009 year.
Overall, the highest performance in basic skills success is in ESL courses (an average of 73.3% in the last four years) and followed by English courses (an average of 65% in the last four years). Compared to the other disciplines, the success rates in basic skills math courses are disproportionately lower (an average of 46.4% in the last four years).
2008-2009 2009-2010 2010-2011 2011-2012
English 61.9% 64.6% 66.9% 66.5%
ESL 74.5% 74.7% 73.0% 71.1%
Math 44.5% 46.0% 47.1% 47.9%
30.0%
40.0%
50.0%
60.0%
70.0%
80.0%

30 | 2012 UPDATE INSTITUTIONAL EFFECTIVENESS DATA Santa Monica College Office of Institutional Research
1.9 Basic Skills Course Improvement Rate
Target: 69%
Target Range: 68 – 70% (within 1% of target)
Performance: 67.2% - Needs Improvement
Data Source:
The data were obtained from the California Community College Chancellor’s Office (CCCCO) Data-on-Demand website and are the same source of data for the annual Accountability Reporting for Community Colleges (ARCC) report.
Methodology:
Key Indicator 1.9 (Basic Skills Course Improvement Rate) describes the percentage of successful basic skills students who completed a higher-level course in the same discipline within three academic years of completing their initial basic skills course. The cohort included students whose initial enrollment in a basic skills discipline was in academic years 2005-2006, 2006-2007, 2007-2008, and 2008-2009, and began at least two levels below transfer level. Summer, fall, winter, and spring terms were included in the analyses (for example, summer 2008, fall 2008, winter 2009, and spring 2009 terms were included in the 2008-09 academic year). Only students who successfully completed (with a grade of C or better) the initial course were included in the analyses. Special admit students (high school students concurrently enrolled in community college) were excluded from the analyses.
The improvement rate was calculated by dividing the number of students in the cohort who completed a higher-level course in the same discipline within three years of the initial course at SMC or anywhere in the CCC system by the total number of students in the cohort. In English and ESL, course progress within a level (for example, ENGL 81A to ENGL 81B) were not counted as being “improved”. Only instances where students progressed to a higher level (for example, ENGL 81A to ENGL 21A) were counted as being “improved”. A student was counted once in each discipline regardless of the number of times they improved through the course sequence. Therefore, the overall figures are duplicated counts of students but are unduplicated within each discipline.
The cohort included students whose initial course was among the courses named below (at least two levels below transferable math, English writing, and ESL). Because English reading courses are not required for a degree or transfer, they were excluded from the analyses.
• English: ENGL 21A, ENGL 84W, ENGL 81B, ENGL 81A • ESL: ESL 11A, ESL 10W, ESL 10G • Math: MATH 31, MATH 84, and MATH 81

31 | 2012 UPDATE INSTITUTIONAL EFFECTIVENESS DATA Santa Monica College Office of Institutional Research
This institutional effectiveness metric is similar to the Improvement Rates for ESL and Credit Basic Skills Courses in the Accountability Reporting for the California Community Colleges (ARCC) report (ARCC Indicator 1.5). The primary difference in methodology between the ARCC indicator and the dashboard indicator is that ARCC includes reading and ESL elective or support courses.
This key indicator was modified from previous institutional effectiveness reports based on the feedback of the Student Success Committee (former Basic Skills Initiative Committee). In prior annual reviews of institutional effectiveness, the key indicator counted students who completed a higher level course within the same level as being “improved”. The current key indicator only counts completion of courses in higher levels as being “improved”. In addition, previous versions of this key indicator were unable to track students who take English, math, and ESL courses at other community colleges because it used the college’s MIS database. However, the key indicator was improved by the inclusion of student enrollments in English, math, and ESL courses at other community colleges to determine whether students “improved”.
Data and Analyses: Table 1.9: Basic Skills Course Improvement Rate
2005-06 to 2007-08
2006-07 to 2008-09
2007-08 to 2009-10
2008-09 to 2010-11
Cohort 6,483 5,463 5,792 6,173 Improved 4,335 3,766 3,945 4,151 % Improved 66.9% 68.9% 68.1% 67.2%
On average, the basic skills course improvement rate was 67.7% for the last four cohort years. The rate peaked at 68.9% for the 2006-2007 cohort. In the performance year (cohort 2008-2009), the improvement rate was 67.2%, slightly lower than the prior year improvement rate, but slightly higher than the cohort of 2005-2006.
Figure 1.9a: Basic Skills Course Improvement Rate by Discipline
05-06 to 07-08 06-07 to 08-09 07-08 to 09-10 08-09 to 10-11
English 70.4% 72.3% 72.7% 71.7%
ESL 82.5% 83.8% 82.4% 81.5%
Math 60.8% 62.6% 61.0% 59.6%
30.0%
40.0%
50.0%
60.0%
70.0%
80.0%
90.0%

32 | 2012 UPDATE INSTITUTIONAL EFFECTIVENESS DATA Santa Monica College Office of Institutional Research
Basic skills improvement rates by discipline reveal a somewhat steady downward trend in all disciplines. Data for ESL and math reveal that in the performance year, the improvement rates are 1% and 1.2% lower than the rates for the 2005-2006 cohorts. English, on the other hand, shows an improvement of 1.3% in the performance year over the rate observed for the 2005-2006 cohort.
Disaggregated Data: Gender Table 1.9b: Basic Skills Course Improvement Rate by Gender – 2008-09 Cohort
Female Male Total Cohort 3,025 3,148 6,173 Improved 2,353 1,798 4,151 % Improved 77.8% 57.1% 67.2%
Female students (77.8%) performed better on this key indicator when compared to male students (57.1%). Female students improve in basic skills courses at a rate higher than male students by more than 20%.
Ethnicity/Race Figure 1.9c: Basic Skills Course Improvement Rate by Ethnicity/Race – 2008-09 Cohort
The basic skills improvement rates for the four largest ethnicity/race groups (Asian/Pacific Islander, Black, Hispanic, and White) are reported in Figure 1.9c for the most recently reported cohort year (2008-2009). The total rate includes all ethnicity/race groups, including American Indian/Alaskan Native students and those with unreported ethnicity/race values.
The disaggregated data reveal that Black students (59.2%) in the cohort improve at lower rates when compared to Asian/Pacific Islander (75.9%), Hispanic (73.2%), and White (66.6%) students. Asian/PI students improve at the highest rates. Hispanic and White students improve in basic skills courses at similar rates. The disparity of improvement rates among the different ethnicity/race groups is nearly 17% (highest, Asian/PI: 75.8%; lowest, Black: 59.2%).
0.0%
20.0%
40.0%
60.0%
80.0%
Asian/PI (n = 878) Hispanic (n = 2,577) Total (N = 6,173) White (n = 1,346) Black (n = 855)
75.9% 67.3% 67.2% 66.6%
59.2%

33 | 2012 UPDATE INSTITUTIONAL EFFECTIVENESS DATA Santa Monica College Office of Institutional Research
Key Indicator 1.9 (Basic Skills Improvement Rate) was not disaggregated by student age as the data were not available.
Target: The target for this key indicator was set at 69%. The target was initially discussed at a meeting of the Student Success Committee (formerly the Basic Skills Initiative Committee). The members of the committee chose to set a target reflecting an improvement in the metric. The target of 69% was set by improving the rate of the two lowest performing ethnicity/race groups by 5% for the most recent year. Focusing on improving the rates for the two lowest performing groups is a manageable goal.
If the Black student rate improved by 5% the new rate would be 64.2%. If the White student rate improved by 5% the new rate would be 71.6%. Improving the rate by 5% for these groups translates into an additional 111 students in the cohort who improved through the basic skills sequence (43 additional students in the Black group and 68 additional students in the White group). Having an additional 111 students in the cohort improve in basic skills translates into a basic skills improvement rate of 69%. Therefore, the target for this key indicator is to improve the rate to 69% by the 2015-2016 institutional effectiveness report and year.
The data reveal that the college’s performance on this indicator (67.1%) falls below the target range (within 1% of the target of 69%).
Through the work of the Basic Skills Initiative, the Basic Skills Initiative/Career Technical Education Collaborative Project, and departments, several strategies and programs are being developed or have recently been developed to address the needs and success of basic skills students, including the development of accelerated English and math courses, contextualized basic skills courses and modules for CTE students, and a summer program (“Jams”) for incoming freshmen placed into basic skills courses.
This indicator is the focus of a follow-up study to be conducted in the current academic year (2012-2013) and is explained in more detail in the introduction of the report. A focus group study examining the experiences of successful basic skills students who do not progress through the basic skills students will be conducted by college researchers in consultation with basic skills faculty. The ultimate purpose of the study is to gather evidence that will inform basic skills practices and programs and to improve the basic skills improvement rate.
34 | 2012 UPDATE INSTITUTIONAL EFFECTIVENESS DATA Santa Monica College Office of Institutional Research
1.10 Basic Skills Transition to Degree Course Rate
Data Source:
The data were obtained from the college’s Management Information Systems (MIS) database.
Methodology:
Key Indicator 1.10 (Basic Skills Transition to Degree Course Rate) describes the percentage of basic skills students who enroll in the college-level course for the Associate Degree within three academic years. The cohort included students whose initial enrollment in a basic skills discipline was in academic year 2006-2007, 2007-2008, 2008-2009, and 2009-2010 (includes summer, fall, winter, and spring enrollments). The cohort excludes special admit students (high school students concurrently enrolled in community college). The transition to degree course rate was calculated by dividing the number of students in the cohort who enrolled in the course required for the Associate Degree (ENGL 1 for English and ESL and MATH 18/20/32 or any transferable course for math) within three years of the initial basic skills enrollment by the total number of students in the cohort. Each student was counted once in each discipline; therefore the overall figures are duplicated counts of students but are unduplicated within disciplines.
The cohort included only students whose initial course was one of the courses named below (i.e., any basic skills English and math course and any basic skills ESL course, with the addition of ESL 21A and 21B, which are transferable but do not fulfill the Associate Degree English requirement). Because English reading courses are not required for a degree or transfer, they were excluded from the analyses.
• English: ENGL 21B, ENGL 21A, ENGL 84W, ENGL 81B, ENGL 81A • ESL: ESL 21B, ESL 21A, ESL 11B, ESL 11A, ESL 10W, ESL 10G, ESL 10 • Math: MATH 31, MATH 84, and MATH 81
This key indicator was modified from “Basic Skills Transition to Transfer Rate” to “Basic Skills Transition to Degree Course Rate” in response to a recommendation made by DPAC. The Associate Degree and transfer requirements are different for math. Currently, the degree requirement for math is MATH 18 (Intermediate Algebra for Statistics and Finite Mathematics), MATH 20 (Intermediate Algebra), MATH 32 (Plane Geometry), or any transferable math course while the transfer requirement for math is any transferable math course (does not include MATH 18, 20, or 32). A student without a transfer goal would not be expected to transition to the transferable math courses. The Associate Degree and transfer requirements for English Composition are the same (ENGL 1). The revised indicator accounts for students whose intent is to earn an Associate Degree without transferring to a four-year institution.
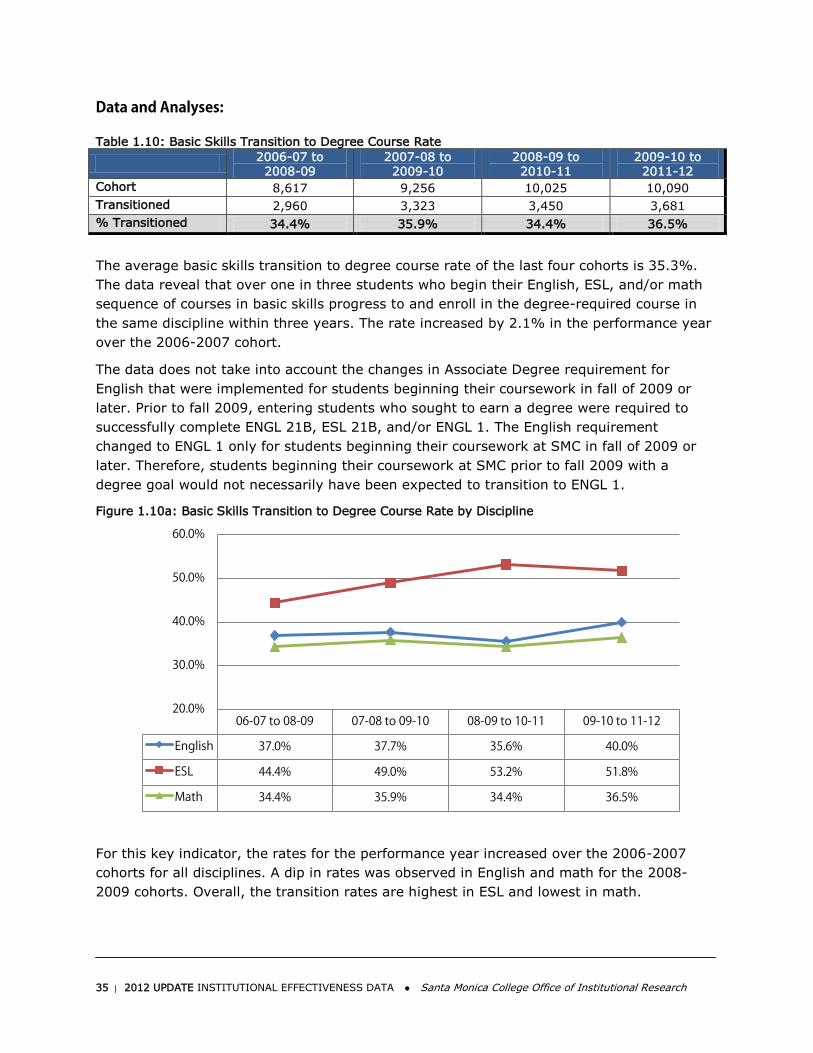
35 | 2012 UPDATE INSTITUTIONAL EFFECTIVENESS DATA Santa Monica College Office of Institutional Research
Data and Analyses: Table 1.10: Basic Skills Transition to Degree Course Rate
2006-07 to 2008-09
2007-08 to 2009-10
2008-09 to 2010-11
2009-10 to 2011-12
Cohort 8,617 9,256 10,025 10,090 Transitioned 2,960 3,323 3,450 3,681 % Transitioned 34.4% 35.9% 34.4% 36.5%
The average basic skills transition to degree course rate of the last four cohorts is 35.3%. The data reveal that over one in three students who begin their English, ESL, and/or math sequence of courses in basic skills progress to and enroll in the degree-required course in the same discipline within three years. The rate increased by 2.1% in the performance year over the 2006-2007 cohort.
The data does not take into account the changes in Associate Degree requirement for English that were implemented for students beginning their coursework in fall of 2009 or later. Prior to fall 2009, entering students who sought to earn a degree were required to successfully complete ENGL 21B, ESL 21B, and/or ENGL 1. The English requirement changed to ENGL 1 only for students beginning their coursework at SMC in fall of 2009 or later. Therefore, students beginning their coursework at SMC prior to fall 2009 with a degree goal would not necessarily have been expected to transition to ENGL 1.
Figure 1.10a: Basic Skills Transition to Degree Course Rate by Discipline
For this key indicator, the rates for the performance year increased over the 2006-2007 cohorts for all disciplines. A dip in rates was observed in English and math for the 2008-2009 cohorts. Overall, the transition rates are highest in ESL and lowest in math.
06-07 to 08-09 07-08 to 09-10 08-09 to 10-11 09-10 to 11-12
English 37.0% 37.7% 35.6% 40.0%
ESL 44.4% 49.0% 53.2% 51.8%
Math 34.4% 35.9% 34.4% 36.5%
20.0%
30.0%
40.0%
50.0%
60.0%

36 | 2012 UPDATE INSTITUTIONAL EFFECTIVENESS DATA Santa Monica College Office of Institutional Research
Disaggregated Data: Gender Table 1.9b: Basic Skills Transition to Degree Course Rate by Gender – 2009-10 Cohort
Female Male Total Cohort 5,368 4,722 10,090 Transitioned 2,003 1,678 3,681 % Transitioned 37.3% 35.5% 36.5%
Basic skills female (37.3%) and male (35.5%) students transition to the degree course at similar rates, however, female students perform at slightly higher rates.
Ethnicity/Race Figure 1.10c: Basic Skills Transition to Degree Course Rate by Ethnicity/Race – 2009-10 Cohort
The basic skills transition to degree course rates for the four largest ethnicity/race groups (Asian/Pacific Islander, Black, Hispanic, and White) are reported in Figure 1.10c for the most recently reported cohort year (2009-2010). The total rate includes all ethnicity/race groups, including American Indian/Alaskan Native students and those with unreported ethnicity/race values.
The disaggregated data reveal that Asian/Pacific Islanders students (56.9%) transition from basic skills to degree courses at higher rates than White (39.5%), Hispanic (32.5%), and Black (19.8%) students. White and Hispanic students transition at similar rates; Black students have the lowest basic skills transition to degree course rates. The disparity of basic skills to degree course transition rates among the different ethnicity/race groups is over 37% (highest, Asian/PI: 56.9%; lowest, Black: 19.8%).
0.0%
20.0%
40.0%
60.0%
Asian/PI (n = 1,530) White (n = 1,832) Total (N = 10,090) Hispanic (n = 4,398) Black (n = 1,386)
56.9%
39.5% 36.5% 32.5%
19.8%

37 | 2012 UPDATE INSTITUTIONAL EFFECTIVENESS DATA Santa Monica College Office of Institutional Research
Age Group Figure 1.10d: Basic Skills Transition to Degree Course Rate by Age Group – 2009-10 Cohort
A pattern is observed for transition rate by age group; the youngest basic skills student groups (19 and younger and 20 to 24 years of age) transition to the degree course at the highest rates (37.5% and 36.9%, respectively). The older students (25 to 29 and 30 and older) transition to degree courses at lower rates (34.0% and 29.1%, respectively). The difference between the highest performing age groups (19 and younger: 37.5%) and lowest performing age groups (30 and older; 29.1%) is 8.4%.
Target: A college-wide discussion to determine the target for Key Indicator 1.10 – Basic Skills Transition to Degree Course Rate is in progress.
Through the work of the Basic Skills Initiative, the Basic Skills Initiative/Career Technical Education Collaborative Project, and departments, several strategies and programs are being developed or have recently been developed to address the needs and success of basic skills students, including the development of accelerated English and math courses, contextualized basic skills courses and modules for CTE students, and a summer program (“Jams”) for incoming freshmen placed into basic skills courses.
This indicator is the focus of a follow-up study to be conducted in the current academic year (2012-2013) and is explained in more detail in the introduction of the report. A focus group study examining the experiences of successful basic skills students who do not progress through the basic skills students will be conducted by college researchers in consultation with basic skills faculty. The ultimate purpose of the study is to gather evidence that will inform basic skills practices and programs and to improve the basic skills transition to degree course rate.
0.0%
10.0%
20.0%
30.0%
40.0%
<=19 (n = 6,520) 20 to 24 (n = 2,096) Total (N = 10,090) 25 to 29 (n = 688) >=30 (n = 786)
37.5% 36.9% 36.5% 34.0% 29.1%

38 | 2012 UPDATE INSTITUTIONAL EFFECTIVENESS DATA Santa Monica College Office of Institutional Research
1.11 CTE Course Success Rate
Data Source:
The data were obtained from the college’s Management Information Systems (MIS) database.
Methodology:
Key Indicator 1.11 (CTE Course Success Rate) describes the percentage of C or better grades earned in all credit Career Technical Education (CTE) courses in academic years 2008-2009, 2009-2010, 2010-2011, and 2011-2012. Only fall and spring terms were included in the annual performance data. The course success rates were calculated by dividing the total number of A, B, C, CR (credit), and P (pass) grades earned by the total number of course enrollments (A, B, C, CR, D, F, I, NC, NP, DR (drop), and W (withdrawal) grades earned). Grades of IP (in progress) and RD (report delayed) were excluded from the analyses.
A CTE course was identified as any course coded with a SAM priority code of A (apprenticeship; SMC does not offer these courses), B (advanced occupational), C (clearly occupational), or D (possibly occupational). The SAM priority code is used to indicate the degree to which a course is occupational and assists in identifying course sequences in occupational programs. In 2009-2010, a large proportion of CTE courses were found to be miscoded. However, the courses were re-coded for accuracy in spring 2011. The data for academic years 2008-2009, 2009-2010, and 2010-2011 reflect the revised SAM codes and the formal changes in ISIS or the Chancellor’s Office Management Information Systems (MIS) took effect at the CCCCO in the 2011-2012 academic year.
This institutional effectiveness measure is similar to the Annual Successful Course Completion Rate in Credit Vocational Courses in the Accountability Reporting for the California Community Colleges (ARCC) report (ARCC Indicator 1.3). The primary difference in methodology between the ARCC indicator and the institutional effectiveness measure is that the ARCC uses the incorrect SAM codes to identify CTE courses for years prior to 2011-2012 and the current indicator uses the revised codes for all years. In addition, the 2012 ARCC reports 2010-2011 as the most recent year with data; the current indicator reports 2011-2012 as the most recent year with data.
Data and Analyses: Table 1.11: CTE Course Success Rate
2008-2009 2009-2010 2010-2011 2011-2012 Enrollments 39,307 40,659 40,481 38,992 Success 26,766 28,181 28,660 27,827 % Success 68.1% 69.3% 70.8% 71.4%
39 | 2012 UPDATE INSTITUTIONAL EFFECTIVENESS DATA Santa Monica College Office of Institutional Research
The average CTE course success rate for the last four academic years is approximately 70%. In the most recent academic year (2011-2012), the course success rate was 71.4%. The course success rate has steadily increased by 3.3% over the last four academic years.
When compared to the ARCC indicator, the college performed slightly better in the dashboard indicator; the ARCC reported a vocational course success rate of 70.4% for the 2010-2011 year, 0.4% lower than the rate reported for the 2010-2011 year in the current report (70.8%).

40 | 2012 UPDATE INSTITUTIONAL EFFECTIVENESS DATA Santa Monica College Office of Institutional Research
1.12 CTE Completion Rate
Target: 47%
Target Range: 46 – 48% (within 1% of target)
Performance: 45.8% - Needs Improvement
Data Source:
The data were obtained from the California Community College Chancellor’s Office (CCCCO) Data-on-Demand website and are the same source of data for the annual Accountability Reporting for Community Colleges (ARCC) report. Data-on-Demand relies on the California Postsecondary Education Commission (CPEC) database (transfers prior to 2010-2011), the California State University (CSU) Analytics website, the University of California (UC) President’s Office, and the National Student Clearinghouse (a national consortium that hosts a database containing over 91% of postsecondary enrollments) in order to obtain transfer information. In general, the transfer data reports are lagged by one or more years because the data collection process depends on other institutions reporting student enrollment information. All other outcomes data (including definition of the cohort, attainment of certificates and degrees, and progress status) were obtained from the CCCCO Management Information Systems (MIS) database.
Methodology:
Key Indicator 1.12 (CTE Completion Rate) describes the percentage of first-time freshmen who were Career Technical Education (CTE) students and achieved any of the achievement outcomes within six years. The cohort included first-time freshmen in academic years 2002-2003, 2003-2004, 2004-2005, and 2005-2006, and who earned a minimum of 12 credit units at SMC and/or anywhere in the California Community College (CCC) system and attempted an advanced occupational course within six years. First-time freshmen were defined as students enrolled in college for the first time after high school. The cohort included only students who began their postsecondary education at SMC.
The achievement outcomes include:
• Transfer to a four-year institution (including public, private and out-of-state) • Earn a degree or Chancellor’s approved certificate at any CCC institution
The rate was calculated by dividing the number of students in the cohort who achieved at least one of the achievement outcomes within six years by the number of students in the cohort. The six-year threshold was applied because it is the standard for cohort tracking in the field.

41 | 2012 UPDATE INSTITUTIONAL EFFECTIVENESS DATA Santa Monica College Office of Institutional Research
Data and Analyses: Table 1.12: CTE Completion Rate
2002-03 by
2007-08 2003-04 by
2008-09 2004-05 by
2009-10 2005-06 by
2010-11 Cohort 2,086 1,638 1,995 2,063 Outcome 912 829 927 944 % Outcome 43.7% 50.6% 46.5% 45.8%
The average CTE completion rate over the last four cohorts was 46.7%. The data reveal that, on average, approximately half of first-time CTE students earn a certificate of achievement, degree, or transfer to a four-year institution within six years. The rate improved by 2.1% in the performance year cohort (2005-2006) when compared to the 2002-2003 cohort year. However, when examining the trend across all three years, a spike in performance from 43.7% in 2002-2003 to 50.6% in 2003-2004 is observed. The increase in rate for the 2003-2004 year may be partly attributed to the sharp decrease in course offerings during the 2003 and 2004 years, which, in turn, reduced the total number of students in the cohort and made the cohort less variable (from 2,086 in 2002-2003 to 1,638 in 2003-2004). For the 2004-2005 cohort, the rate and cohort size reverted back to the levels observed in 2002-2003. The same pattern for the 2003-2004 cohort is observed in other key measures.
The CTE Completion Rate is influenced by factors such as the economy, and budgets and changes in admissions policies at the four-year institutions. In addition, the inaccurate coding of some CTE courses may affect the criteria determining who is included or excluded from the cohort. CTE courses at SMC are coded as being possibly occupational, clearly occupational, or advanced occupational. A large proportion of CTE courses were found to be miscoded; the CTE faculty cleaned and recoded the CTE courses in spring 2011 term. The changes in coding did not take effect at the CCCCO until spring 2012.
The key indicator has a noteworthy limitation; it does not take into account students who achieve a departmental certificate. Departmental certificates are short-term certificates of achievement that typically require fewer units for completion than Chancellor’s Office approved certificates of achievement. Departmental certificates are currently not reported to the CCCCO, and therefore, are not counted toward completion.
In the summer of 2011, the college surveyed 173 former CTE students who earned a career certificate or Associate Degree (completers) and those who took substantial coursework in a CTE program but did not receive an award (leavers). The purpose of the survey was to assess the impact of SMC CTE programs on student outcomes beyond certificates and degrees, such as satisfaction with SMC programs and gains in employment, wages, and benefits. The study found that a large majority of leavers (84.4%) reported that they were satisfied with the education received at SMC and that their SMC coursework helped them obtain their current job, advance in their current job, improvement their job performance, and/or improve their overall employability. Approximately 33% of leavers reported they were enrolled at SMC in order to update their job skills or professional development, and not

42 | 2012 UPDATE INSTITUTIONAL EFFECTIVENESS DATA Santa Monica College Office of Institutional Research
to earn a certificate, degree, or transfer to a four-year institution. The findings from this study reveal that some CTE students never intend to earn an award or transfer which impacts the CTE completion rate.
Disaggregated Data: Gender Table 1.11a: CTE Completion Rate by Gender – 2005-06 Cohort
Female Male Total Cohort 1,070 993 2,063 CTE Completion 514 430 944 % Completed 48.0% 43.3% 45.8%
CTE students who are female (48.0%) complete an award or transfer at higher rates when compared to male students (43.3%).
Ethnicity/Race Figure 1.11b: CTE Completion Rate by Ethnicity/Race – 2005-06 Cohort
CTE completion data disaggregated by student ethnicity/race groups reveal that White students complete at the highest rate (51.8%) followed by Asian/Pacific Islander students (47.5%). Hispanic (37.3%) and Black (36.6%) students complete at lower rates. White students perform slightly higher than Asian/Pacific Islander students on this key indicator, and Hispanic and Black students perform similarly to one another. The disparity of CTE completion rates among the four largest ethnicity/race groups is over 15% (highest, White: 51.8%; lowest, Black: 36.6%).
The “total” rate includes students who identified themselves as Native American/Alaskan Native and students who did not report their ethnicity/race group. These students were not reported separately because the group sizes were too small for analyses.
0.0%
20.0%
40.0%
60.0%
White (n = 633) Asian/PI (n = 596) Total (N = 2,063) Hispanic (n = 453) Black (n = 153)
51.8% 47.5% 45.8%
37.3% 36.6%

43 | 2012 UPDATE INSTITUTIONAL EFFECTIVENESS DATA Santa Monica College Office of Institutional Research
Age Group Figure 1.1c: Persistence Rate by Age Group – Fall 2009 Cohort
The student age group which performs the highest on the key indicator is that of students who are 19 years of age and younger in their initial term at SMC (48.2%). This group has a CTE completion higher rate that is slightly higher than students who are 25 to 29 years old when beginning college (46.0%). Students who are 30 years of age or older as a first-time college students perform at the lowest rates (32.0%). The difference between the highest and lowest performing groups is 16.2%.
Target: The target for Key Indicator 1.12 – CTE Completion Rate was set at 47%. The target was initially discussed at a meeting of the Career and Technical Education Committee. The members of the committee chose to set a target reflecting an improvement in the metric. The target of 47% was set by improving the rate of the two lowest performing ethnicity/race groups by 5% for the most recent year. Focusing on improving the rates for the two lowest performing groups is a manageable goal.
If the Black student rate improved by 5% the new rate would be 41.6%. If the Hispanic student rate improved by 5% the new rate would be 42.3%. Improving the rate by 5% for these groups translates into an additional 31 students in the cohort who complete a CTE outcome (8 additional students in the Black group and 23 additional students in the Hispanic group). Having an additional 31 students in the cohort complete a CTE outcome translates into a CTE completion rate of 47%. Therefore, the target for this key indicator is to improve the rate to 47% by the 2015-2016 institutional effectiveness report and year.
The data reveal that the college’s performance on this indicator (45.8%) falls below the target range (within 1% of the target of 47%).
Through the work of the Basic Skills Initiative/Career Technical Education Collaborative Project, CTE Committee, and CTE departments, several strategies and programs are being developed or have recently been developed to address the needs and success of CTE students, including the development of cohort programs such as “Promo Pathways” and contextualized basic skills courses and modules for CTE students.
0.0%
20.0%
40.0%
60.0%
<=19 (n = 1,460) 25 to 29 (n = 100) Total (N = 2,063) 20 to 24 (n = 381) >=30 (n = 122)
48.2% 46.0% 45.8% 40.9%
32.0%

44 | 2012 UPDATE INSTITUTIONAL EFFECTIVENESS DATA Santa Monica College Office of Institutional Research
Another survey of former CTE students, including completers and leavers, will be administered in spring of 2013. The purpose of the survey will be to document the impact of CTE programs on students after leaving the college and to assess the level of student satisfaction with the programs. Currently, there is no systematic method to collect student employment attainment after they leave the college. Therefore, the survey is an effort to document the success of CTE students who do not earn a certificate, degree, or transfer, including students who never intended to earn an award or transfer.

45 | 2012 UPDATE INSTITUTIONAL EFFECTIVENESS DATA Santa Monica College Office of Institutional Research
1.13 Distance Learning Course Success Rate Gap
Data Source:
The data were obtained from the college’s Management Information Systems (MIS) database.
Methodology:
Key Indicator 1.13 (Distance Learning Course Success Rate Gap) describes the gap in success rates between distance learning courses and non-distance learning courses in academic years 2008-2009, 2009-2010, 2010-2011, and 2011-2012. Only fall and spring terms were included in the annual performance data. The course success rates were calculated by dividing the total number of A, B, C, CR (credit), and P (pass) grades earned by the total number of course enrollments (A, B, C, CR, D, F, I, NC, NP, DR (drop), and W (withdrawal) grades earned). Grades of IP (in progress) and RD (report delayed) were excluded from the analyses.
Distance learning courses were identified as courses offered exclusively online or in a hybrid mode (blends face-to-face and online instruction). Non-distance learning courses were identified as courses taught exclusively on ground and face-to-face. The indicator was revised from previous versions of institutional effectiveness to include only courses offering both distance learning and non-distance learning class sections in the same term.
Data and Analyses: Table 1.13: Distance Learning Course Success Rate and Gap
2008-2009 2009-2010 2010-2011 2011-2012 DL Enrollments 14,822 15,587 14,781 14,884 DL Success 8,863 9,896 9,767 10,051 % DL Success 59.8% 63.5% 66.1% 67.5% Non-DL Enrollments 53,569 53,408 51,322 51,632 Non-DL Success 36,023 36,713 36,659 36,950 % Non-DL Success 67.2% 68.7% 71.4% 71.6% Gap (Non-DL – DL) 7.4% 5.2% 5.3% 4.1%
The four-year average success rate in distance learning classes is about 64%, approximately 6% lower than the success rates in non-distance learning classes (70%) in the same courses. The gap between success in non-distance learning courses and distance learning courses has decreased by 3.3% over the last four academic years which shows improvement in this key indicator. Overall, the data reveal that students enrolled in distance learning classes are performing at lower levels than students enrolled in non-distance learning classes, but the difference in performance is decreasing.

46 | 2012 UPDATE INSTITUTIONAL EFFECTIVENESS DATA Santa Monica College Office of Institutional Research
1.14 Distance Learning Course Retention Rate Gap
Data Source:
The data were obtained from the college’s Management Information Systems (MIS) database.
Methodology:
Key Indicator 1.14 (Distance Learning Course Retention Rate Gap) describes the gap in retention rates between distance learning courses and non-distance learning courses in academic years 2008-2009, 2009-2010, 2010-2011, and 2011-2012. Only fall and spring terms were included in the annual performance data. The course retention rates were calculated by dividing the total number of A, B, C, CR, P, D, F, I, NC, and NP grades earned by the total number of course enrollments (A, B, C, CR, P, D, F, I, NC, NP, DR (drop), and W (withdrawal) grades earned). Grades of IP (in progress) and RD (report delayed) were excluded from the analyses.
Distance learning courses were identified as courses offered exclusively online or in a hybrid mode (blends face-to-face and online instruction). Non-distance learning courses were identified as courses taught exclusively on ground and face-to-face. The indicator was revised from previous versions of institutional effectiveness to include only courses offering both distance learning and non-distance learning class sections in the same term.
Data and Analyses:
Table 1.14a: Distance Learning Course Retention Rate and Gap 2008-2009 2009-2010 2010-2011 2011-2012
DL Enrollments 14,822 15,587 14,781 14,884 DL Retained 11,153 12,426 11,928 12,333 % DL Retention 75.2% 79.7% 80.7% 82.9% Non-DL Enrollments 53,569 53,408 51,322 51,632 Non-DL Retained 45,150 46,026 44,764 45,419 % Non-DL Retention 84.3% 86.2% 87.2% 88.0% Gap (Non-DL – DL) 9.1% 6.5% 6.5% 5.1%
The four-year average retention rate in distance learning classes is 70%, approximately 6% lower than the retention rates in non-distance learning classes (86%) in the same courses. The gap between retention rates in non-distance learning courses and distance learning courses has decreased by 4% over the last four academic years which shows improvement in this key indicator. Overall, the data reveal that students enrolled in distance learning classes are performing at lower levels than students enrolled in non-distance learning classes, but the difference in performance is decreasing.

47 | 2012 UPDATE INSTITUTIONAL EFFECTIVENESS DATA Santa Monica College Office of Institutional Research
1.15 SMMUSD High School Graduates to SMC Rate
Data Source:
The data were obtained from the California Department of Education Data Quest.
Methodology:
Key Indicator 1.15 (SMMUSD High School Graduates to SMC Rate) describes the percentage of high school seniors graduating from the Santa Monica-Malibu Unified School District (SMMUSD) who subsequently enrolled at SMC within one year of high school graduation. The denominator in the rate includes high school students in the 2007-2008, 2008-2009, 2009-2010, and 2010-2011 graduating classes. The numerator in the rate includes students who subsequently enrolled in at least one credit course at SMC within one year of graduating from high school (for example, students in the graduating class of 2010-2011 who enrolled at SMC in summer 2011, fall 2011, winter 2012, and/or spring 2012 terms). High schools included in the analyses are Olympic Continuation High School, Malibu High School, and Santa Monica High School.
The rates may be deflated as students at SMC are not required to report their high school information; some students leave the last high school attended question blank on the college application.
This key indicator was revised from “District High School Graduates to SMC Rate” to “SMMUSD High School Graduates to SMC Rate”. Previous institutional effectiveness years relied on data produced by the California Postsecondary Education Commission (CPEC) data mart which included information for private schools in the district area. However, funding for CPEC was discontinued in fall 2011 and while historical data was maintained on the website, no new data was added to the database. The new data source, California Department of Education Data Quest, does not report data on private schools. Therefore, the indicator was revised to include only public schools in the district area which represent the high schools in the SMMUSD.
Data and Analyses: Table 1.15: SMMUSD High School Graduates to SMC Rate
Class of 2007-08 Class of 2008-09 Class of 2009-10 Class of 2010-11 High School Grads 913 895 927 916 Enrolled at SMC 294 284 279 277 % HS Grads at SMC 32.2% 31.7% 30.1% 30.2%
Over the last four graduating classes, SMC served an average of 31.1% of SMMUSD high school graduates in the year after graduation. The performance year reveals that over 30% of the high school graduating class of 2010-2011 from SMMUSD attended Santa Monica College after high school. Current performance reflects a slight decrease in rate (2%) when compared to the graduating class of 2007-2008.

48 | 2012 UPDATE INSTITUTIONAL EFFECTIVENESS DATA Santa Monica College Office of Institutional Research
1.16 Geographic Area High School Graduates to SMC Rate
Data Source:
The data were obtained from the California Department of Education Data Quest.
Methodology:
Key Indicator 1.16 (Geographic Area High School Graduates to SMC Rate) describes the percentage of high school seniors graduating from public and charter high schools located in a zip code within a 10-mile radius of the zip code of the main campus of SMC (zip code 90405) who subsequently enrolled at SMC within one year of high school graduation. The denominator of the rate includes high school students in the 2007-20808, 2008-2009, 2009-2010, and 2010-2011 graduating classes. The numerator in the rate includes students who subsequently enrolled in at least one credit course at SMC within one year of graduating from high school (for example, students in the graduating class of 2010-2011 who enrolled at SMC in summer 2011, fall 2011, winter 2012, and/or spring 2012 terms). Only high schools graduating at least one student in all four years were included in the analyses, including the following 32 public and charter schools:
• Alexander Hamilton Senior High • Animo Leadership High • Arena High (Continuation) • Beverly Hills High • Cheviot Hills Continuation • City Honors High • Crenshaw Senior High • Culver City High • Culver Park High • El Segundo High • Ellington (Duke) High (Continuation) • Fairfax Senior High • Foshay Learning Center • George Washington Preparatory High • Hawthorne High • Inglewood High • Los Angeles Center For Enriched Studies • Los Angeles Senior High • Marlton • Mira Costa High • Moreno High (Continuation) • Morningside High • Olympic High (Continuation) • Phoenix Continuation

49 | 2012 UPDATE INSTITUTIONAL EFFECTIVENESS DATA Santa Monica College Office of Institutional Research
• Santa Monica High • Susan Miller Dorsey Senior High • University Senior High • Venice Senior High • View Park Continuation • Westchester Senior High • Whitman Continuation • Whitney Young Continuation
The schools identified in the geographic area are not necessarily the schools that are visited by the Santa Monica College Office of Outreach and Recruitment.
The rate may be deflated as students at SMC are not required to report their high school information; some students leave the last high school attended question blank on the college application.
The data source for this key indicator was changed. Previous reports relied on data produced by the California Postsecondary Education Commission (CPEC) data mart. However, funding for CPEC was discontinued in fall 2011 and while historical data was maintained on the website, no new data was added to the database. Data from the California Department of Education Data Quest was used to calculate the rates for this key indicator. As a result, the current version of the indicator included a different list of high schools, including schools which were not represented in the CPEC dataset but were available in the California Department of Education Data Quest, than previous years of institutional effectiveness.
Data and Analyses: Table 1.16: Geographic Area High School Graduates Enrolled at SMC Rate
Class of 2007-08 Class of 2008-09 Class of 2009-10 Class of 2010-11 High School Grads 7,607 7,962 8,096 8,047 Enrolled at SMC 1,888 2,124 1,775 1,613 % HS Grads at SMC 24.8% 26.7% 21.9% 20.0%
Over the last four graduating classes, SMC served an average of 23.4% of high school graduates located within 10 miles of the SMC campus in the year after graduation. The performance year reveals that 20% of the high school graduating class of 2010-2011 from surrounding high schools attended Santa Monica College after high school. Current performance reflects a decrease in rate (4.8%) when compared to the graduating class of 2007-2008.

50 | 2012 UPDATE INSTITUTIONAL EFFECTIVENESS DATA Santa Monica College Office of Institutional Research
1.17 Equity Gap - Course Success Rate
Data Source:
The data were obtained from the college’s Management Information Systems (MIS) database.
Methodology:
Key Indicator 1.17 (Equity Gap - Course Success Rate) describes the gap in average course success rates between the highest and lowest performing groups in terms of ethnicity/race in academic years 2008-2009, 2009-2010, 2010-2011, and 2011-2012. Only fall and spring terms were included in the annual performance data. Lowest performing groups were identified as groups performing at least 10% lower than the highest performing group in the performance year. The course success rates were calculated by dividing the total number of A, B, C, CR, and P grades earned by the total number of course enrollments (A, B, C, CR, P, D, F, I, NC, NP, DR (drop), and W (withdrawal) grades earned). Grades of IP (in progress) and RD (report delayed) were excluded from the analyses.
Comparisons by gender and age yielded little-to-no difference in performance between groups; therefore, the indicator focuses on ethnicity/race.
Data and Analyses: The following table compares the course success rates of the four largest ethnicity/race groups. Because International (F-1 visa) students attend SMC under different circumstances than typical domestic students, they were excluded from the analyses.
Table 1.17: Equity Gap - Course Success Rate 2008-2009 2009-2010 2010-2011 2011-2012
Asian/Pacific Islander 67.8% 70.5% 72.6% 72.6% Black 48.3% 51.6% 55.5% 53.2% Hispanic 57.9% 60.1% 61.8% 63.1% White 69.8% 71.6% 73.0% 74.7% Higher-performing groups avg. 68.8% 71.1% 72.8% 73.7% Lower-performing groups avg. 53.1% 55.9% 58.7% 58.2% Difference 15.7% 15.2% 14.2% 15.5%
The highest performing student group in terms of course success was the White group in the performance year (74.7%). The groups who performed 10% or more below the performance of the highest performing group were the Black and Hispanic student groups (53.2% and 63.1%, respectively). In 2011-2012, Black students increased their performance by 4.9% when compared to 2008-2009, however experienced a decrease in rate of 2.3% when compared to the prior year. The course success rates of Hispanic students steadily increased by 5.2% from 57.9% in 2008-2009 to 63.1% in 2011-2012.

51 | 2012 UPDATE INSTITUTIONAL EFFECTIVENESS DATA Santa Monica College Office of Institutional Research
The gap in average course success rates between the highest (White and Asian/PI) and lowest (Black and Hispanic) performing groups has remained relatively stable, around 15%.

52 | 2012 UPDATE INSTITUTIONAL EFFECTIVENESS DATA Santa Monica College Office of Institutional Research
1.18 Equity Gap - Progress & Achievement Rate
Target: Decrease year-over-year
Prior Year: 23.2%
Current Year: 25.2%
Difference: +2% - Needs Improvement
Data Source:
The data were obtained from the California Community College Chancellor’s Office (CCCCO) Data-on-Demand website which is the same source of data for the annual Accountability Reporting for Community Colleges (ARCC) report. Data-on-Demand relies on the California Postsecondary Education Commission (CPEC) database and the National Student Clearinghouse (a national consortium that hosts a database containing over 91% of postsecondary enrollments) in order to obtain transfer information. In general, the transfer data reports are lagged by one or more years because the data collection process relies on other institutions to report student enrollment information. All other outcome data (including definition of the cohort, attainment of certificates and degrees, and progress status) were obtained from the CCCCO Management Information Systems (MIS) database.
Methodology:
Key Indicator 1.18 (Equity Gap - Progress and Achievement Rate) describes the difference in the progress and achievement rates between the highest and lowest performing groups in terms of student ethnicity/race. The rate describes the percentage of first-time freshmen who showed intent to complete and who achieved any of the progress and achievement outcomes within six years. The cohort included first-time freshmen in academic years 2002-2003, 2003-2004, 2004-2005, and 2005-2006 who showed intent to earn an award and/or transfer by earning a minimum of 12 credit units at SMC and/or anywhere in the California Community College (CCC) system and attempting a degree-applicable math, degree-applicable English, and/or an advanced occupational course within six years. First-time freshmen were defined as students enrolled in college for the first time after high school. The cohort included only students who began their postsecondary education at SMC.
The progress and achievement outcomes include:
• Transfer to a four-year institution (including public, private and out-of-state) • Earn a degree or Chancellor’s approved certificate at any CCC institution • Achieve “Transfer Directed” status (earn a C or better grade in transfer-level math
and English anywhere in the CCC system) • Achieve “Transfer Prepared” status (successfully complete 60 UC/CSU transferable
units with a GPA of 2.0 or higher)
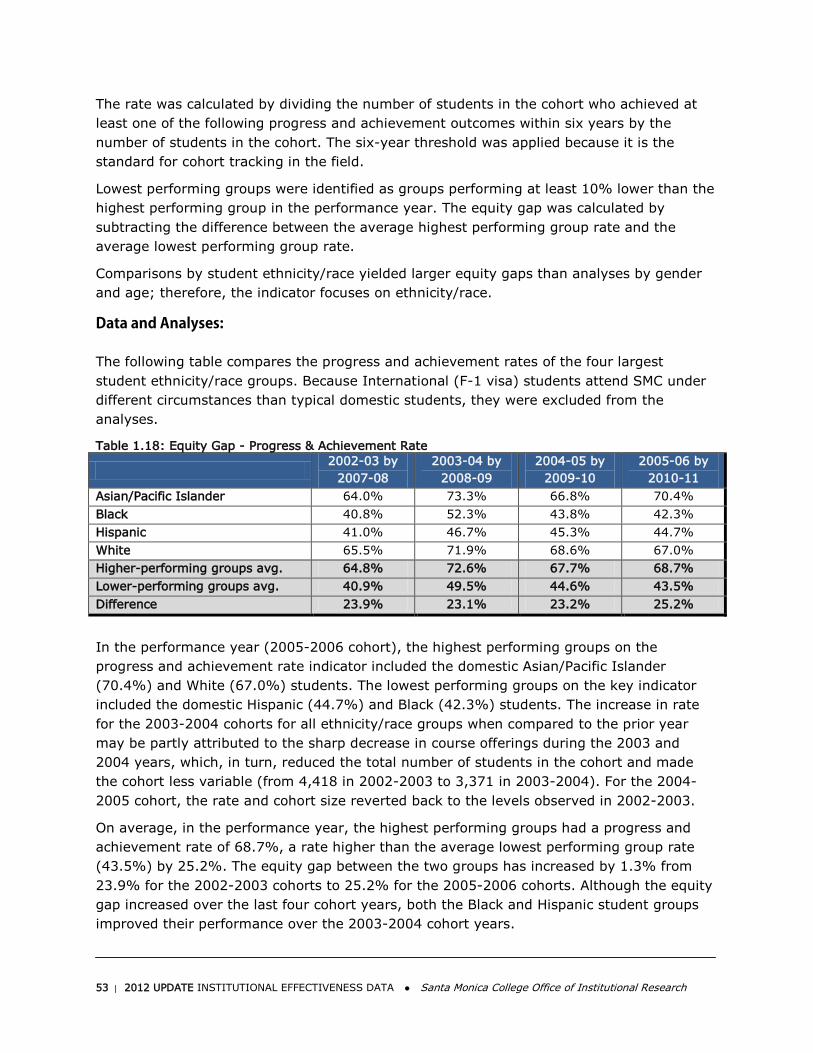
53 | 2012 UPDATE INSTITUTIONAL EFFECTIVENESS DATA Santa Monica College Office of Institutional Research
The rate was calculated by dividing the number of students in the cohort who achieved at least one of the following progress and achievement outcomes within six years by the number of students in the cohort. The six-year threshold was applied because it is the standard for cohort tracking in the field.
Lowest performing groups were identified as groups performing at least 10% lower than the highest performing group in the performance year. The equity gap was calculated by subtracting the difference between the average highest performing group rate and the average lowest performing group rate.
Comparisons by student ethnicity/race yielded larger equity gaps than analyses by gender and age; therefore, the indicator focuses on ethnicity/race.
Data and Analyses: The following table compares the progress and achievement rates of the four largest student ethnicity/race groups. Because International (F-1 visa) students attend SMC under different circumstances than typical domestic students, they were excluded from the analyses.
Table 1.18: Equity Gap - Progress & Achievement Rate
2002-03 by
2007-08 2003-04 by
2008-09 2004-05 by
2009-10 2005-06 by
2010-11 Asian/Pacific Islander 64.0% 73.3% 66.8% 70.4% Black 40.8% 52.3% 43.8% 42.3% Hispanic 41.0% 46.7% 45.3% 44.7% White 65.5% 71.9% 68.6% 67.0% Higher-performing groups avg. 64.8% 72.6% 67.7% 68.7% Lower-performing groups avg. 40.9% 49.5% 44.6% 43.5% Difference 23.9% 23.1% 23.2% 25.2%
In the performance year (2005-2006 cohort), the highest performing groups on the progress and achievement rate indicator included the domestic Asian/Pacific Islander (70.4%) and White (67.0%) students. The lowest performing groups on the key indicator included the domestic Hispanic (44.7%) and Black (42.3%) students. The increase in rate for the 2003-2004 cohorts for all ethnicity/race groups when compared to the prior year may be partly attributed to the sharp decrease in course offerings during the 2003 and 2004 years, which, in turn, reduced the total number of students in the cohort and made the cohort less variable (from 4,418 in 2002-2003 to 3,371 in 2003-2004). For the 2004-2005 cohort, the rate and cohort size reverted back to the levels observed in 2002-2003.
On average, in the performance year, the highest performing groups had a progress and achievement rate of 68.7%, a rate higher than the average lowest performing group rate (43.5%) by 25.2%. The equity gap between the two groups has increased by 1.3% from 23.9% for the 2002-2003 cohorts to 25.2% for the 2005-2006 cohorts. Although the equity gap increased over the last four cohort years, both the Black and Hispanic student groups improved their performance over the 2003-2004 cohort years.
54 | 2012 UPDATE INSTITUTIONAL EFFECTIVENESS DATA Santa Monica College Office of Institutional Research
Target: The target for Key Indicator 1.18 – Equity Gap Progress and Achievement Rate is to reduce the gap in performance between the highest and lowest performing groups each year. The target was established by DPAC and the Student Success Committee.
In the 2010-2010 institutional effectiveness year, the equity gap for this key indicator was 23.2%. In the current performance year, the equity gap for the progress and achievement rate increased to 25.2%. Therefore, the target for this key indicator was not met.
This indicator is the focus of a follow-up study to be conducted in the current academic year (2012-2013) and is explained in more detail in the introduction of the report. A qualitative study examining the educational experiences of students from different cultural and ethnic backgrounds will be conducted by a team of faculty and researchers. The ultimate purpose of the study is to gather evidence that will inform practice aimed to close the equity gap related to various student outcomes and to reduce the equity gap for this indicator.
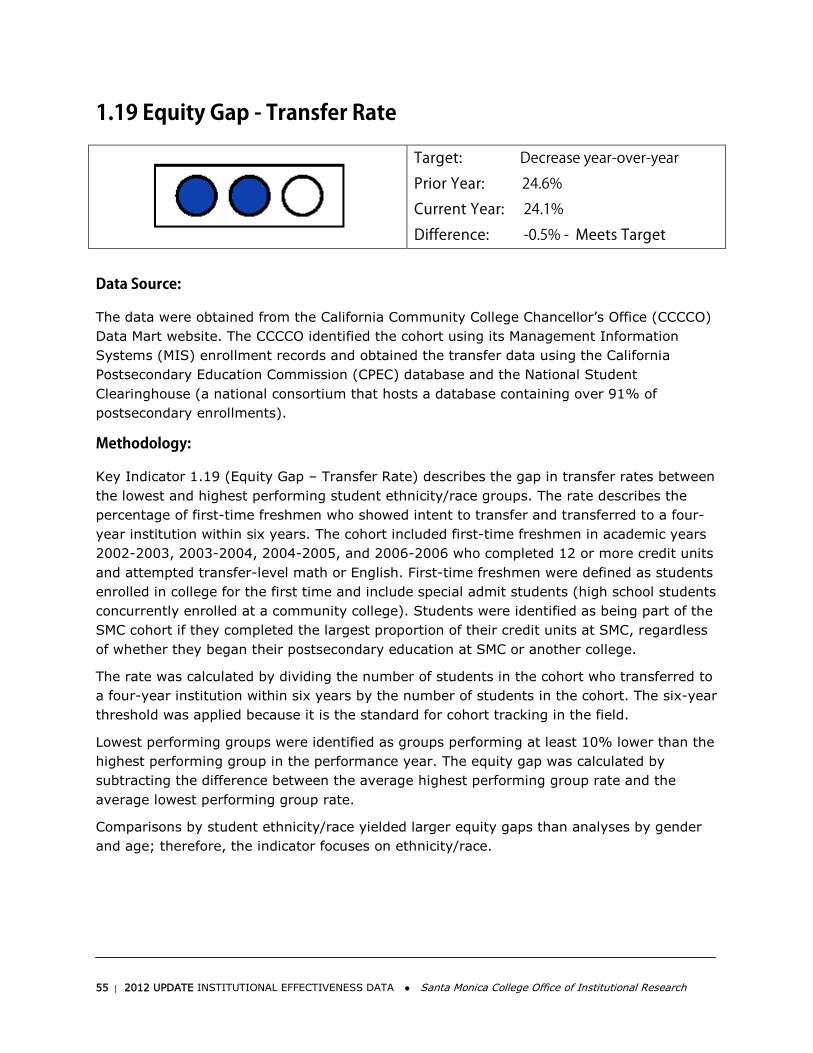
55 | 2012 UPDATE INSTITUTIONAL EFFECTIVENESS DATA Santa Monica College Office of Institutional Research
1.19 Equity Gap - Transfer Rate
Target: Decrease year-over-year
Prior Year: 24.6%
Current Year: 24.1%
Difference: -0.5% - Meets Target
Data Source:
The data were obtained from the California Community College Chancellor’s Office (CCCCO) Data Mart website. The CCCCO identified the cohort using its Management Information Systems (MIS) enrollment records and obtained the transfer data using the California Postsecondary Education Commission (CPEC) database and the National Student Clearinghouse (a national consortium that hosts a database containing over 91% of postsecondary enrollments).
Methodology:
Key Indicator 1.19 (Equity Gap – Transfer Rate) describes the gap in transfer rates between the lowest and highest performing student ethnicity/race groups. The rate describes the percentage of first-time freshmen who showed intent to transfer and transferred to a four-year institution within six years. The cohort included first-time freshmen in academic years 2002-2003, 2003-2004, 2004-2005, and 2006-2006 who completed 12 or more credit units and attempted transfer-level math or English. First-time freshmen were defined as students enrolled in college for the first time and include special admit students (high school students concurrently enrolled at a community college). Students were identified as being part of the SMC cohort if they completed the largest proportion of their credit units at SMC, regardless of whether they began their postsecondary education at SMC or another college.
The rate was calculated by dividing the number of students in the cohort who transferred to a four-year institution within six years by the number of students in the cohort. The six-year threshold was applied because it is the standard for cohort tracking in the field.
Lowest performing groups were identified as groups performing at least 10% lower than the highest performing group in the performance year. The equity gap was calculated by subtracting the difference between the average highest performing group rate and the average lowest performing group rate.
Comparisons by student ethnicity/race yielded larger equity gaps than analyses by gender and age; therefore, the indicator focuses on ethnicity/race.

56 | 2012 UPDATE INSTITUTIONAL EFFECTIVENESS DATA Santa Monica College Office of Institutional Research
Data and Analyses: The following table provides a comparison of performance on the transfer rate indicator between the four largest ethnicity/race groups. Unlike Key Indicators 1.17 and 1.18, international (F-1 visa) students were included in the analyses as the data source for transfer rates did not offer student-level data or data by residence status.
Table 1.19: Equity Gap - Transfer Rate
2002-03 by
2007-08 2003-04 by
2008-09 2004-05 by
2009-10 2005-06 by
2010-11 Asian/Pacific Islander 58.8% 61.4% 55.9% 56.5% Black 35.6% 47.0% 33.0% 34.2% Hispanic 32.1% 41.2% 35.2% 35.7% White 61.1% 64.8% 61.4% 61.5% Higher-performing groups avg. 60.0% 63.1% 58.7% 59.0% Lower-performing groups avg. 33.9% 44.1% 34.1% 35.0% Difference 26.1% 19.0% 24.6% 24.1%
In the performance year (2005-2006 cohort), the highest performing groups on the transfer rate indicator included the Asian/Pacific Islander (56.5%) and White (61.5%) students. The lowest performing groups on the key indicator included the Hispanic (35.7%) and Black (34.2%) students. The increase in rate for the 2003-2004 cohorts for all ethnicity/race groups compared to the prior year may be partly attributed to the sharp decrease in course offerings during the 2003 and 2004 years, which, in turn, reduced the total number of students in the cohort and made the cohort less variable (from 4,418 in 2002-2003 to 3,371 in 2003-2004). For the 2004-2005 cohort, the rate and cohort size reverted back to the levels observed in 2002-2003.
On average, in the performance year, the highest performing groups had a transfer rate of 59.0%; a rate higher than the average lowest performing group rate (35.0%) by 24.1%. The equity gap between the two groups has decreased by 2% from 26.1% for the 2002-2003 cohorts to 24.1% for the 2005-2006 cohorts which indicates improvement on this indicator.
Target: The target for Key Indicator 1.19 – Equity Gap Transfer Rate is to reduce the gap in performance between the highest and lowest performing groups each year. The target was established by DPAC and the Student Success Committee.
In the 2004-2005 cohort, the equity gap for this key indicator was 24.6%. The equity gap for transfer rate was reduced slightly to 24.1% in the current performance year. The target for this key indicator was met.
This indicator is the focus of a follow-up study to be conducted in the current academic year (2012-2013) and is explained in more detail in the introduction of the report. A qualitative study examining the educational experiences of students from different cultural and ethnic backgrounds will be conducted by a team of faculty and researchers. The ultimate purpose

57 | 2012 UPDATE INSTITUTIONAL EFFECTIVENESS DATA Santa Monica College Office of Institutional Research
of the study is to gather evidence that will inform practice aimed to close the equity gap related to various student outcomes and to reduce the equity gap for this indicator.
58 | 2012 UPDATE INSTITUTIONAL EFFECTIVENESS DATA Santa Monica College Office of Institutional Research
1.20 Percentage of Students Enrolled in Sustainability Related
or Focused Courses
Data Source:
The data were obtained from the college’s Management Information Systems (MIS) and Integrated School Information System (ISIS) databases.
Methodology:
Key Indicator 1.20 (Percentage of Students Enrolled in Sustainability Related or Focused Courses) describes the proportion of credit students enrolled in a course designated as either sustainability-related or sustainability-focused in fall term 2011. The data for this indicator was not collected prior to the fall 2011 term. Definitions for sustainability-focused and sustainability-related courses:
• Sustainability-focused course: a course that has been included as a requirement for the Environmental Science, Environmental Studies, Solar Photovoltaic Installation, Energy Efficiency, and Resource and Recycling Management Associate Degree and/or Certificates of Achievements AND has a student learning outcome (SLO) mapped to Institutional Learning Outcome (ILO) #4 (Applied knowledge and valuation of the physical world);
• Sustainability-related course: a course that has been included as a requirement for the Environmental Science, Environmental Studies, Solar Photovoltaic Installation, Energy Efficiency, and Resource and Recycling Management Associate Degree and/or Certificates of Achievements OR has a student learning outcome (SLO) mapped to Institutional Learning Outcome (ILO) #4 (Applied knowledge and valuation of the physical world).
The key indicator was calculated by dividing the number of credit students in a fall term enrolled in at least one sustainability-related or focused course by the number of credit students.
Data and Analyses: Table 1.20: Percentage of Students Enrolled in Sustainability Related or Focused Courses
Fall 2008 Fall 2009 Fall 2010 Fall 2011 Credit Students -- -- -- 29,977 Enrolled Sustainability -- -- -- 18,341 % Enrolled Sustainability -- -- -- 61.2%
The data reveal that over six in ten fall term students are enrolled in a course designated as sustainability-related or focused.

59 | 2012 UPDATE INSTITUTIONAL EFFECTIVENESS DATA Santa Monica College Office of Institutional Research
Chapter 2: Supportive Learning
Santa Monica College strives to create a supportive learning environment by providing access to comprehensive student learning resources such as library, tutoring, and technology and by providing access to comprehensive and innovative student support services such as admission and records, counseling, assessment, outreach, and financial aid. This area of institutional effectiveness measures how well the college is doing in terms of providing students access to support services. In addition to access, future reports will include data measuring effectiveness of support services. There are nine (9) key indicators in this chapter:
2.1 First-time Freshmen Orientation Rate
2.2 First-time Freshmen Assessment Rate
2.3 Percentage of Students Receiving Financial Aid
2.4 Counseling Contact Rate
2.5 CCSSE – Academic and Collaborative Learning
2.6 CCSSE – Student Effort
2.7 CCSSE – Academic Challenge
2.8 CCSSE – Student-Faculty Interaction
2.9 CCSSE – Support for Learners
Key Indicators 2.5 to 2.9 were added to the Institutional Effectiveness Dashboard this year and measure the extent to which students at SMC are engaged in effective educational practices, including active and collaborative learning, student effort, academic challenge, student-faculty interaction, and support for learners. The data was collected using the Community College Survey for Student Engagement (CCSSE), a national student engagement survey.
Future Key Indicators
Other measures were identified as potential key indicators for future editions of the report by campus groups affected by the “Supportive Learning Environment” goal. They were not included in the current document primarily because the data had not yet been collected. The future key indicators include:
• Percentage of Credit Students Who Completed an Educational Plan: This indicator measures the percentage of credit students with a credential goal (certificate, degree, or transfer) who completed an educational plan within a year of starting courses at SMC.

60 | 2012 UPDATE INSTITUTIONAL EFFECTIVENESS DATA Santa Monica College Office of Institutional Research
• Percentage of Students Utilizing Tutoring Services: This indicator measures the percentage of students enrolled in tutor-supported courses who participate in tutoring services. The tutor tracking system was implemented in fall of 2010; therefore, currently there are only two years of data. This indicator will be included in future dashboards when at least three years of data have been collected.
• Percentage of Students Participating in Supplemental Instruction (SI): This indicator measures the percentage of students enrolled in SI-supported courses who participate in at least one SI session. The SI program primarily served basic skills students in the past; however, the program was recently expanded to include science courses. This indicator will be included in future dashboards once data, including science courses, have been collected.
Key Indicators 2.1 (First-time Freshmen Orientation Rate), 2.2 (First-time Freshmen Assessment Rate), 2.4 (Counseling Contact Rate), and the future key indicators on educational plans and academic support are directly related to the recommendations made by the Student Success Taskforce, a group of community college practitioners established by the California Community Colleges Board of Governors, on providing students the tools necessary for student success. Based on research related to best practices and effective models within higher education, the taskforce produced a set of 22 recommendations designed to increase transfer, degree, and certificate attainment and help close the achievement gap for historically underrepresented students. For more information on the Student Success Taskforce and their recommendations, visit: http://www.californiacommunitycolleges.cccco.edu/PolicyInAction/StudentSuccessTaskForce.aspx
Each of the key indicators related to this goal are described and discussed.
61 | 2012 UPDATE INSTITUTIONAL EFFECTIVENESS DATA Santa Monica College Office of Institutional Research
2.1 First-time Freshmen Orientation Rate
Data Source:
The data were obtained from the college’s Management Information Systems (MIS).
Methodology:
Key Indicator 2.1 (First-time Freshmen Orientation Rate) describes the percentage of first-time freshmen in fall terms 2008, 2009, 2010, and 2011 with a credential goal (certificate, degree, or transfer) who complete the online orientation by the end of their initial term. First-time freshmen were defined as students enrolled in college for the first time after high school and only included credit students. Only students with a credential goal were included in the cohort in order to exclude students who are exempted from orientation services.
All first-time college students and some other groups of students (e.g., those who were disqualified and return to SMC) are required to complete the orientation in order to receive an enrollment priority appointment date and time. The online orientation introduces students to the various services and programs at SMC, describes the class enrollment process based on educational goals, and describes other matriculation-related processes (including assessment and financial aid). The rate was calculated by dividing the number of first-time freshmen in a fall term with a credential goal who completed by the end of their initial term by the total number of first-time freshmen in a fall term with a credential goal. Students who completed the orientation prior to enrolling at the college were counted as having oriented.
This data source for this key indicator was changed. Prior years of institutional effectiveness relied on data from the college’s student information system, Integrated School Information System (ISIS), a transactional system containing “live” data that can change from day-to-day. The revised indicator uses the college’s MIS Student Matriculation data, the official and final data reported to the Chancellor’s Office.
Data and Analyses: Table 2.1: First-Time Freshmen with Credential Goal Orientation Rate
Fall 2008 Fall 2009 Fall 2010 Fall 2011 Cohort 5,048 5,681 5,493 5,404 Oriented 4,963 5,615 5,417 5,334 % Oriented 98.3% 98.8% 98.6% 98.7%
Overall, a large majority of first-time freshmen completed the college orientation within the first term of enrollment; the rate has remained stable over the last four fall cohorts. The data reveal that nearly all of first-time students with a credential goal orient within their first term.

62 | 2012 UPDATE INSTITUTIONAL EFFECTIVENESS DATA Santa Monica College Office of Institutional Research
2.2 First-time Freshmen Assessment Rate
Data Source:
The data were obtained from the college’s Management Information Systems (MIS) database.
Methodology:
Key Indicator 2.2 (First-time Freshmen Assessment Rate) describes the percentage of first-time freshmen in fall terms 2008, 2009, 2010, and 2011 who completed the assessment (including SMC placement, challenge exam, prior completion of coursework, advanced placement exam, or other college’s placement) within one year of their initial term. First-time freshmen were defined as students enrolled in college for the first time after high school. The cohort includes only students enrolled in courses for credit in the initial fall term.
All first-time college students are required to complete the assessment process if they wish to enroll in seven or more units in their first semester, or plan to enroll in an English, ESL, or math course requiring a specific prerequisite in the subject.
The rate was calculated by dividing the number of students in the cohort who were assessed, by the end of the spring term immediately following the initial fall term, based on placement testing and/or some other measure (such as the challenge exam, prior completion of coursework, advanced placement exam, and another college’s placement exam) by the number of students in the cohort. Students who completed the assessment prior to enrolling at the college were counted as having been assessed.
Data and Analyses: Table 2.2: First-Time Freshmen Assessment Rate
Fall 2008 Fall 2009 Fall 2010 Fall 2011 Cohort 6,387 6,930 6,490 6,211 Assessed 6,296 6,834 6,386 6,112 % Assessed 98.6% 98.6% 98.4% 98.4%
Overall, nearly 99% of first-time freshmen complete the assessment requirements within the first year of enrollment.

63 | 2012 UPDATE INSTITUTIONAL EFFECTIVENESS DATA Santa Monica College Office of Institutional Research
2.3 Percentage of Students Receiving Financial Aid
Data Source:
The data were obtained from the college’s Management Information Systems (MIS) database.
Methodology:
Key Indicator 2.3 (Percentage of Students Receiving Financial Aid) describes the percentage of credit students in academic years 2008-2009, 2009-2010, 2010-2011, and 2011-2012 (fall and spring terms only) who received financial aid in at least one of the primary terms (fall or spring). Students who received Board of Governors (BOG) enrollment fee waivers, grants, loans, scholarships, and work-study were included in the count of financial aid recipients.
Data and Analyses: Table 2.3: Percentage of Students Receiving Financial Aid
2008-2009 2009-2010 2010-2011 2011-2012 Credit Students 42,433 42,037 40,078 38,410 Received Aid 13,065 15,035 16,196 17,723 % Received Aid 30.8% 35.8% 40.4% 46.1%
On average, 38.3% of credit students in the last four years received financial aid. The percentage of students receiving aid has increased by 15.3% over the last four years. In the performance year, more than four in ten credit students received some type of financial aid.
The data for this indicator should be interpreted with knowledge of the percentage of credit students who apply for financial aid. The following table describes the percentage of credit students in academic year 2008-2009, 2009-2010, 2010-2011, and 2011-2012 (fall and spring terms only) who completed a financial aid application at SMC during the years observed.
Table 2.3a: Percentage of Students Completing Financial Aid Application 2008-2009 2009-2010 2010-2011 2011-2012
Credit Students 42,433 42,037 40,078 38,410 Completed App 13,074 15,049 16,198 18,498 % Completed App 30.8% 35.8% 40.4% 48.2%
There is little difference in percentage of credit students who complete a financial aid application and percentage of credit students who receive aid; the data indicate that nearly all students who complete an application will receive some sort of aid. Students who complete the financial aid application and do not receive aid may have been determined ineligible with no need or disqualified for aid due to lack of satisfactory academic progress.

64 | 2012 UPDATE INSTITUTIONAL EFFECTIVENESS DATA Santa Monica College Office of Institutional Research
This key indicator is influenced by a variety of factors such as the economic state of the state and country, and the economic status of students enrolled at the college. However, the indicator is useful in documenting the percentage of students awarded aid given the numbers of applicants and the current resources of the college and has implications for the financial challenges students may or may not face in terms of success.
In May 2012, the college went live for the 2012-2013 processing year with Banner, an integrated software system designed to facilitate the applicant processing, need analysis, and packaging and distribution of student financial aid. The “state-of-the-art” financial aid processing system improves the processing of federal aid applicants, helps SMC with federal and state regulatory compliance standards, and increases the capacity for the financial aid office to respond to student needs.

65 | 2012 UPDATE INSTITUTIONAL EFFECTIVENESS DATA Santa Monica College Office of Institutional Research
2.4 Counseling Contact Rate
Data Source:
The data were obtained from the college’s Management Information Systems (MIS) and Integrated School Information Systems (ISIS) databases.
Methodology:
Key Indicator 2.4 (Counseling Count Rate) describes the percentage of credit students with a certificate, degree, or transfer goal in academic years 2008-2009, 2009-2010, 2010-2011, and 2011-2012 (fall and spring terms only) who made contact with a counselor during the year. Approximately 70% of credit students report a certificate, degree, or transfer goal. Students were identified as having contact with a counselor if the student either visited one of the multiple counseling centers and/or enrolled in COUNS 20 (Student Success Seminar). The following counseling centers were included in the analyses:
• Black Collegians • CalWorks • Career Services • Counseling and Transfer • Counseling center at AET (Academy of Entertainment & Technology) campus • Counseling center at Bundy campus • Counseling center at Performing Arts Center (PAC) campus • Disabled Student Program & Services (DSPS) • Equal Opportunity Program & Services (EOPS) • International Education • Latino – Adelante • Pico Partnership on the Move • Scholars • TRIO • Veteran’s Resource Center • Welcome Center
Centers that did not collect student contact information using ISIS for all of the years examined were not included in the analyses. In addition, cyber and online counseling data were not included in the analyses because the data were not available at the time of the report.

66 | 2012 UPDATE INSTITUTIONAL EFFECTIVENESS DATA Santa Monica College Office of Institutional Research
Data and Analyses: Table 2.4: Counseling Contact Rate
2008-2009 2009-2010 2010-2011 2011-2012 Cohort 26,744 28,392 28,832 28,689 Contact 15,460 16,922 17,709 17,573 % Contact 57.8% 59.6% 61.4% 61.3%
On average, approximately 60% of credit students with a credential goal (certificate, degree, transfer) make contact with a counselor each year. The contact rate increased by 3.5% in the performance year (2011-2012) when compared to the 2008-2009 year. The increase in the counseling contact rate in recent years may be attributed to a handful of factors. For example, the college opened a Veteran’s Resource Center in fall of 2009 to serve the growing veteran population which grew from 125 active veterans in 2004 to 580 in 2011. Veterans who receive G.I. benefits are required to attend counseling.
Another factor that may have contributed to the increase in counseling contacts may be the increase in the number of basic skills classes that were visited by a counselor as a part of the Counselor Visitation Program. The program, funded by the Basic Skills Initiative, focuses on the outreach of counselors in basic skills English and ESL classes and presenting students on topics such as the role of counselors at SMC and the various student support services and resources. The program started in spring of 2008 and involved counselors visiting 35 classes. By fall of 2010, the number of classes visited by counselors increased to 98. Previous research has documented that students exposed to the presentation were more likely to visit a counseling center than students enrolled in similar courses without counselor visitation.
In addition, the enrollment priority dates were moved from November to December in 2010. This change was significant because November is the busiest month for counseling as the UC/CSU application filing period is in November. When the enrollment priority dates occurred in the peak month of November, the student demand for services was too high to meet because counselors met both with students with transfer needs and those with enrollment needs. With the shift of the enrollment dates, counselors are better able to serve more students.
Other factors that may have impacted the increase in the counseling contact rate include the increased competitiveness in transferring over the last three years (students are more apt to seek counseling services to confirm transfer admissions criteria), the increased effectiveness of the department in promoting their services, and the implementation of the Early Alert system which allows faculty to recommend counseling services to students.
The data reveal that a staff of approximately 110 full-time and part-time counselors served over 60% of credit students with a credential goal. Given the diverse backgrounds and needs of our students, it is not expected for all students to meet with a counselor each year.
In the context of the statewide and college-wide budget climate, the counseling department has experienced some budget cuts to their programs, including a 50% cut in winter 2010,

67 | 2012 UPDATE INSTITUTIONAL EFFECTIVENESS DATA Santa Monica College Office of Institutional Research
and an expected 9% cut for the fall and spring terms and 50% cut for winter in the upcoming 2012-2013 year (based on the assumption that the Governor Jerry Brown’s tax initiative, Proposition 30, will pass in the November 6th election). The budget cuts in counseling services impact this key indicator.
68 | 2012 UPDATE INSTITUTIONAL EFFECTIVENESS DATA Santa Monica College Office of Institutional Research
2.5 to 2.9 CCSSE – Active & Collaborative Learning, Student
Effort, Academic Challenge, Student-Faculty Interaction, and
Support for Learners
Data Source:
The data were obtained from the spring 2012 administration of the Community College Survey of Student Engagement (CCSSE).
Background:
Key Indicators 2.5 to 2.9 (CCSSE – Active and Collaborative Learning, Student Effort, Academic Challenge, Student-Faculty Interaction, and Support for Learners) describe the extent to which SMC students are engaged in effective educational practices related to the five benchmarks (Active and Collaborative Learning, Student Effort, Academic Challenge, Student-Faculty Interaction, and Support for Learners).
There is mounting evidence suggesting that student engagement positively impacts multiple educational outcomes such as learning, persistence, and achievement (Pascarella & Terenzini, 2005)5. The research findings indicate that the more students are engaged with the academic and social environments of college, the more likely they are to persist and achieve academic outcomes (Pascarella & Terenzini, 2005; Tinto, 19936). A national survey instrument developed by the Center for Community College Student Engagement, the Community College Survey of Student Engagement (CCSSE), has been “specifically designed to assess the extent to which students are engaged in empirically derived good educational practices and what they gain from their college experience” (Kuh, 20017, p. 2). Therefore, the survey asks students to report their level of involvement in the programs and educational practices that have been found to positively impact student success in the research literature. The CCSSE has been administered in hundreds of different community colleges across the nation since its development in 2001. The purpose of the survey is to provide community practitioners a valuable yardstick for current levels of student engagement at their institution to inform institutional planning and decision making processes related to improvements in students’ educational experiences. Studies measuring the psychometric properties of the CCSSE reveal that the instrument is a valid and reliable measure for student engagement, and the “survey instrument is a valuable proxy for student success” (McClenney & Marti, 20068, p. 2).
5 Pascarella, E. T., & Terenzini, P. T. (2005). How college affects students: A third decade of research. San Francisco, CA: Jossey-Bass. 6 Tinto, V. (1993). Leaving college: Rethinking the causes and cures of student attrition. Chicago, IL: University of Chicago Press. 7 Kuh, G. D. (2001). The National Survey of Student Engagement conceptual framework and overview of psychometric properties. Bloomington, IN: Indiana University Center for Postsecondary Research and Planning. 8 McClenney, K. M., & Marti, C. N. (2006). Exploring relationships between student engagement and student outcomes in community colleges: Report on validation research. Austin, TX: University of Texas at Austin.

69 | 2012 UPDATE INSTITUTIONAL EFFECTIVENESS DATA Santa Monica College Office of Institutional Research
Along with 265 other community colleges across the nation, the CCSSE was administered at Santa Monica College (SMC) in the spring of 2012. It was the first administration of CCSSE in the college’s history. A total of 1,075 unique students enrolled in 46 randomly selected on-ground classes participated in the study. Twenty students reported taking the survey in another class and their non-primary survey responses were excluded from survey analyses. The study used a probability sampling procedure; therefore, the findings of the survey of the 1,075 students can be generalized to the overall college population. The CCSSE is designed to measure five benchmarks, groups of conceptually related survey items, of student engagement in community colleges, including active and collaborative learning, student effort, academic challenge, student-faculty interaction, and support for learners. The five benchmarks of student engagement have been supported by the research literature as educational practices that positively impact student learning and persistence. Active and Collaborative Learning Seven items on the CCSSE make up the Active and Collaborative Learning benchmark which measure the extent to which students are actively involved in their educational processes and collaborate with other learners. The following items are included in the Active and Collaborative Learning benchmark. In your experience at this college during the current school year, about how often have you done each of the following:
1. Asked questions in class or contributed to class discussions (item 4a); 2. Made a class presentation (item 4b); 3. Worked with other students on projects during class (item 4f); 4. Worked with classmates outside of class to prepare class assignments (item 4g); 5. Tutored or taught other students (paid or voluntary) (item 4h); 6. Participated in a community-based project as a part of a regular course (item 4i);
and, 7. Discussed ideas from your readings or classes with others outside of class (students,
family members, co-workers, etc.) (item 4r). Student Effort Eight items on the CCSSE make up the Student Effort benchmark which measure the extent to which students apply themselves to the learning processes. The following items are included in the Student Effort benchmark. In your experience at this college during the current school year, about how often have you done each of the following/used the following services:
1. Prepared two or more drafts of a paper or assignment before turning it in (item 4c); 2. Worked on a paper or project that required integrating ideas or information from
various sources (item 4d); 3. Come to class without completing readings or assignments (item 4e); 4. Used peer or other tutoring services (item 13d1); 5. Used skills labs (item 13e1); 6. Used a computer lab (item 13h1);

70 | 2012 UPDATE INSTITUTIONAL EFFECTIVENESS DATA Santa Monica College Office of Institutional Research
7. During the current school year, about how much reading and writing have you done at this college? Number of books read on your own (not assigned) for personal enjoyment or academic enrichment (item 6b); and,
8. About how many hours do you spend in a typical 7-day week doing each of the following? Preparing for class (studying, reading, writing, rehearsing, doing homework, or other activities related to your program) (item 10a).
Academic Challenge Ten survey items on the CCSSE make up the Academic Challenge benchmark which measure the nature and amount of assigned academic work is are challenging. The following items are included in the Academic Challenge benchmark. In your experience at this college during the current school year, about how often have you done each of the following:
1. Worked harder than you thought you could to meet an instructor’s standards or expectations(item 4p);
During the current school year, how much has your coursework at this college emphasized the following mental activities?
2. Analyzing the basic elements of an idea, experience, or theory (item 5b); 3. Synthesizing and/organizing ideas, information, or experiences in new ways (item
5c); 4. Making judgments about the value or soundness of information, arguments, or
methods (item 5d); 5. Applying theories or concepts to practical problems or in new situations (item 5e); 6. Using information you have read or heard to perform a new skill (item 5f);
During the current school year, about how much reading and writing have you done at this college?
7. Number of assigned textbooks, manuals, books, or book-length packs of course readings (item 6a);
8. Number of written papers or reports of any length (item 6c);
9. Mark the response that best represents the extent to which your examinations during the current school year have challenged you to do your best work at this college (item 7); and,
10. How much does this college emphasize: encouraging you to spend significant
amounts of time studying (item 9a).

71 | 2012 UPDATE INSTITUTIONAL EFFECTIVENESS DATA Santa Monica College Office of Institutional Research
Student-Faculty Interaction Six items on the CCSSE measure the extent to which students have personal contacts with their instructors, making up the Student-Faculty Interaction benchmark. The following items are included in the Student-Faculty Interaction benchmark. In your experience at this college during the current school year, about how often have you done each of the following:
1. Used email to communicate with an instructor (item 4k); 2. Discussed grades or assignments with an instructor (item 4l); 3. Talked about career plans with an instructor or advisor (item 4m); 4. Discussed ideas from your readings or classes with instructors outside of class (item
4n); 5. Received prompt feedback (written or oral) from instructors on your performance
(item 4o); and, 6. Worked with instructors on activities other than coursework (item 4q).
Support for Learners Seven items on the CCSSE form the Support for Learners benchmark. These items measure the extent to which students perceive the college provide services and support for their learning and academic success. The following items are included in the Support for Learners benchmark. How much does this college emphasize each of the following?
1. Providing the support you need to help you succeed at their college (item 9b); 2. Encouraging contact among students from different economic, social, and racial or
ethnic backgrounds (item 9c); 3. Helping you cope with your nonacademic responsibilities (work, family, etc.) (item
9d); 4. Providing the support you need to thrive socially (item 9e); 5. Providing the financial support you need to afford your education (item 9f);
In your experience at this college during the current school year, about how often have you used the following services?
6. Academic advising/planning services (item 13a1); and, 7. Career counseling services (item13b1).
Methodology:
Benchmark scores for Key Indicators 2.5 to 2.9 were computed by averaging the scores of the related survey items. High scores on survey items indicate positive engagement behavior. One item, item 4e “Frequency: Come to class without completing readings or assignments” in the Student Effort benchmark, was reverse coded so that lower scores indicated higher frequency of the behavior, and higher scores indicated lower frequency of the behavior.

72 | 2012 UPDATE INSTITUTIONAL EFFECTIVENESS DATA Santa Monica College Office of Institutional Research
The scales for the survey items are not equal. For example, some scales are scored on a four-point scale such as 1 = Never to 4 = Very often, while other scales are scored on a six-point scale such as 1 = None to 6 = More than 30. Therefore, all items were converted to a common scale with a range of 0 to 1. The following formula was used to covert items to a common scale: Converted Score = (Original Score – 1)/(Maximum Response Value – 1) For example, the question item, “In your experience at this college during the current school year, about how often have you asked questions in class or contributed to class discussion?” uses the scale 1 = Never, 2 = Sometimes, 3 = Often, 4 = Very often. The maximum response value for the scale is 4. A student who responded to the question with a 2 will have the converted score on the question item: 0.33 = (2 – 1) / (4 – 1) Raw individual student benchmark scores were calculated by averaging the converted scores for all items in the benchmark group. Raw college benchmark scores were calculated by averaging the raw individual student benchmark scores. For a more detailed description of how benchmarks were calculated, please refer to: http://www.ccsse.org/survey/docs/how_benchmakrs_are_calculated.pdf.
Data and Analyses: Figure 2.5 – 2.9: CCSSE – Comparison of Benchmark Scores
Benchmark scores range from 0 to 1, with higher scores indicating higher levels of engagement related to the effective educational practices that make up a benchmark. These measures are useful in monitoring the college’s progress on the benchmarks year after year. The highest score was for the Academic Challenge benchmark (M = 0.61); the lowest raw score was for the Active and Collaborative Learning benchmark (M = 0.38). The data reveal that SMC students, on average, reported being the least involved with active and
0.00
0.20
0.40
0.60
0.80
Active &
Collaborative
Learning
Student Effort Academic
Challenge
Student-Faculty
Interaction
Support for
Learners
0.38 0.48
0.61
0.40 0.42
0.16 0.16 0.17 0.19 0.22
Mean Std. Dev.

73 | 2012 UPDATE INSTITUTIONAL EFFECTIVENESS DATA Santa Monica College Office of Institutional Research
collaborative learning processes at the college when compared to other effective educational practices. A descriptive analysis of the sample demographics revealed that the percentage of students who participated in the CCSSE who were international students (25%) was higher than the percentage of international students in the entire credit student population (11%). As a result, international students were overrepresented in the CCSSE population. The oversampling of this student subgroup may be due to the sampling procedure. The survey was sampled at the classroom level; therefore, full-time students were more likely, by definition, to be selected for participation in the study than part-time students. In order to fulfill their student visa status, international students are required to enroll full-time at the college (12 or more units enrolled). As a result, international students were more likely to be selected for participation in CCSSE, a function of their full-time status. The overrepresentation of international students in the CCSSE sample likely impacts the college’s performance on the CCSSE benchmarks. The findings of the CCSSE were initially discussed at a meeting of the Research Advisory Committee in late October of 2012. Based on the recommendations from the committee, the CCSSE data will be disaggregated and reported by international student status. In addition, the findings of the CCSSE will be discussed and analyzed by campus groups in the 2012-2013 year. The CCSSE findings alone do not provide enough information to support decision-making processes and the development of intervention strategies. The CCSSE is designed to provide only a starting point for campus dialogue centered around student engagement and to further practitioner inquiry. The 2013 update to the institutional effectiveness process will discuss the outcome of the campus-wide dialogue on the CCSSE findings and any additional analyses.

74 | 2012 UPDATE INSTITUTIONAL EFFECTIVENESS DATA Santa Monica College Office of Institutional Research
Chapter 3: Stable Fiscal
Santa Monica College (SMC) strives to manage the fiscal environment by responding to dynamic fiscal conditions through ongoing evaluation and reallocation of existing resources and the development of new resources. This area of institutional effectiveness attempts to measure how well the college is doing in terms of generating revenue and spending monies on instruction and support services. There are four (4) key indicators measuring the stable fiscal goal: 3.1 Operating Surplus-Deficit
3.2 WSCH/FTEF
3.3 Fund Balance Ratio
3.4 Non-Resident Tuition Revenue
In addition to the performance indicators, the amount of unfunded FTES (total number of credit Full-Time Equivalent Student generated but unfunded by the state) is a measure that is included in the report for monitoring. The measure is not included as a dashboard indicator as the goal for the measure depends on the performance of Key Indicator 3.3 (Fund Balance Ratio).

75 | 2012 UPDATE INSTITUTIONAL EFFECTIVENESS DATA Santa Monica College Office of Institutional Research
3.1 Operating Surplus-Deficit Data Source:
The data were obtained from the Office of Business/Administration.
Methodology:
Key Indicator 3.1 (Operating Surplus-Deficit) measures the extent to which the college has a balanced budget or better for fiscal years 2008-2009, 2009-2010, 2010-2011, and 2011-2012. The budget represents the general unrestricted funds. The actual operating surplus-deficit is calculated by subtracting the actual expenditures with one-time items from the actual revenue and transfers. Positive dollar values represent an operating surplus and negative dollar values represent an operating deficit.
Data and Analyses: Table 3.1: Operating Surplus-Deficit
2008-2009 2009-2010 2010-2011 2011-2012 Operating Surplus/(Deficit)
$610,782 $1,061,345 $2,618,738 ($8,840,474)
The college ended the first three fiscal years reported with an operating surplus. The operating surplus increased from $610,782 in 2008-2009 to $2,618,738 in 2010-2011. However, the college ended the most recently completed fiscal year (2011-2012) with an operating deficit of more than $8.84 million as the college expended more ($139,096,992) than generated revenue ($130,256,518) (see Table 3.1a). The 2011-2012 expenditures exceeded revenues primarily because Santa Monica College intentionally served approximately 1,000 full-time equivalent resident students more than was funded by the State.
Table 3.1a: Revenues and Expenditures: General Unrestricted Funds 2008-2009 2009-2010 2010-2011 2011-2012
Revenue & Transfers $134,722,061 $133,350,058 $136,530,922 $130,256,518
Expenditures & Transfers $134,161,279 $132,288,713 $133,912,184 $139,096,992
The college has been severely impacted by the state funding reductions. According to the Chancellor’s Office, funding for California Community Colleges has been cut by $809 million, or 12 percent, since 2008-2009. The state implemented a reduction in funding to the college of approximately 9.4% or $10,087,522 in the 2011-2012 year, the largest reduction of state funding experienced in the college’s history. These reductions in state funding, the college’s primary source of revenue, were the main factor resulting in the college ending the 2011-2012 fiscal year with a $8,840,474 operating deficit, based on a comparison of all revenues and expenditures.

76 | 2012 UPDATE INSTITUTIONAL EFFECTIVENESS DATA Santa Monica College Office of Institutional Research
Based on the 2012-2013 state budget adopted in June, the college expects to receive approximately the same amount of state funding as last year. Based on the expected state funding, the college predicts that the operating deficit for 2012-2013 to be approximately $4,027,625. However, the optimistic state budget is built based upon the assumption that Governor Jerry Brown’s tax initiative, Proposition 30, will pass in the November 6th election. If the measure passes, the college could receive an additional $1.5 million in 2012-2013. If the measure fails, the college will face a mid-year cut of $7.4 million. Given these circumstance, it is expected that the college will continue to experience financial challenges which will impact performance in this key indicator.

77 | 2012 UPDATE INSTITUTIONAL EFFECTIVENESS DATA Santa Monica College Office of Institutional Research
3.2 WSCH/FTEF Data Source:
The data were obtained from a TIMS (The Instructional Management System) report.
Methodology:
Key Indicator 3.2 (WSCH/FTEF) describes the relationship between Full-Time Equivalent Faculty (FTEF) and Weekly Student Contact Hours (WSCH) for 2008, 2009, 2010, and 2011 fall terms. The indicator measures the productivity of instructional programs in terms of average class size. Considering SMC’s compressed calendar, a WSCH/FTEF of 560 represents an average class size of 35. California community colleges are largely funded by the state on the basis of the number of FTES; one FTES is equivalent to one student enrolled in 15 hours per week for two 17.5-week semesters and represents 525 class contact hours in a full academic year. The calculation of FTES depends on WSCH which is the sum of class contact hours per week per student in each class section. WSCH is calculated differently depending on the attendance accounting method (weekly census, positive attendance, daily census, or alternative attendance accounting) required for each individual course section.
One FTEF equals a full-time teaching load. The total FTEF includes both full-time and part-time instructors. WSCH/FTEF is the total WSCH divided by the weekly teaching load for a full-time faculty member.
Data and Analyses: Table 3.2: WSCH/FTEF
Fall 2008 Fall 2009 Fall 2010 Fall 2011 WSCH 399,989 412,478 410,223 401,287 FTEF 682.13 643.42 622.21 631.95 WSCH/FTEF 586.38 641.07 659.30 635.00
In the performance year (fall 2011), the WSCH/FTEF was 635, a decrease of approximately 24 WSCH/FTEF when compared to the previous term (fall 2010). However, when compared to the fall 2008, the WSCH/FTEF increased by 49, which indicates that the college has become more efficient or productive in terms of managing the cost of instruction and revenue from FTES over the last four fall terms.
The WSCH experienced an increase in fall 2009 and fall 2010 when compared to fall 2008; however, in fall 2011, the amount of WSCH reverted to the fall 2008 levels. The decrease in WSCH and FTEF in recent terms was the result of the state-imposed workload reductions.

78 | 2012 UPDATE INSTITUTIONAL EFFECTIVENESS DATA Santa Monica College Office of Institutional Research
3.3 Fund Balance Ratio Data Source:
The data were obtained from the Office of Business/Administration.
Methodology:
Key Indicator 3.3 (Fund Balance Ratio) describes the ratio of the general fund balance to the total expenditures, dollars spent for operating costs, for fiscal years 2008-2009, 2009-2010, 2010-2011, and 2011-2012. The ratio is calculated by dividing the fund balance (excluding designated revenue) by the total expenditures and transfers. A general fund balance is created when the college’s revenues exceeds the expenditures in the fund account within a fiscal year. A positive fund balance represents available financial resources for spending in the subsequent fiscal year. Having a large fund balance ratio is indicative of financial flexibility and stability because a large fund balance can help cover potential unforeseen costs or additional resources without borrowing (thus avoiding the cost of interest related to borrowing). The fund balance values do not include designated reserve funds.
Data and Analyses: Table 3.3: Fund Balance and Ratio
2008-2009 2009-2010 2010-2011 2011-2012 Total Expenditure $134,161,279 $132,288,713 $133,912,184 $139,096,992 General Fund Balance
$17,408,758 $18,470,103 $20,675,673 $11,662,215
Fund Balance Ratio 12.98% 13.96% 15.44% 8.38%
The size of the fund balance has decreased by $5.75 million over the last four fiscal years. In the performance year (2011-2012), the fund balance ratio was 8.38%, a reduction of over 7% over the prior year. The reduction in fund balance for 2011-2012 occurred, in part, because the fund balance was used to fund almost 1,000 FTES not funded by the State. The fund balance ratio is above the 5% minimum recommended by the Chancellor’s Office.

79 | 2012 UPDATE INSTITUTIONAL EFFECTIVENESS DATA Santa Monica College Office of Institutional Research
3.4 Non-Resident Tuition Revenue Data Source:
The data were obtained from the Office of Business/Administration.
Methodology:
Key Indicator 3.4 (Non-Resident Tuition Revenue) describes the revenue dollars generated from non-resident and Intensive English tuition in fiscal years 2008-2009, 2009-2010, 2010-2011, and 2011-2012. The non-resident tuition includes fee paid by international (F-1 visa) and out-of-state residents. The Intensive English Program (IEP) offers courses intended for F-1 visa international students who do not meet the minimum TOEFL requirements and/or do not have alternative proof of English proficiency to be admitted as fully matriculated students.
Data and Analyses: Table 3.4: Non-Resident Tuition Revenue
2008-2009 2009-2010 2010-2011 2011-2012 Non-Resident Revenue
$17,961,185 $20,199,343 $21,387,129 $24,544,282
The total dollars in revenue from non-resident and Intensive English tuition experienced an upward trend over the last four fiscal years which may be partly attributed to the increase in fees charged per unit for non-resident students. In 2008-2009, the non-resident tuition was $195 per unit (including enrollment fees); the cost increased to $221 and $222 per unit for the 2009-2010 and 2010-2011 years, respectively. In the performance year (2011-2012), the non-resident cost per tuition rose again to $239 per unit (including enrollment fees). Table 3.4a: Percentage Total Revenue from Non-Resident Tuition Revenue
2008-2009 2009-2010 2010-2011 2011-2012
Non-Resident Revenue $17,961,185 $20,199,343 $21,387,129 $24,544,282
Revenue and Transfers $134,722,061 $133,350,058 $136,530,922 $130,256,518
% Non-Resident Revenue/Total Revenue 13.3% 15.1% 15.7% 18.8%
Table 3.4a shows the proportion of the total revenue and transfers (unrestricted general funds) that is from non-resident tuition fees. The data reveal that the proportion of total revenues from non-resident tuition has increased from 13.3% in 2008-2009 to 18.8% in 2011-2012.
80 | 2012 UPDATE INSTITUTIONAL EFFECTIVENESS DATA Santa Monica College Office of Institutional Research
Chapter 4: Sustainable Physical
Santa Monica College (SMC) strives to create a sustainable physical environment by applying sustainable practices to maintain and enhance the colleges’ facilities and infrastructure including grounds, buildings, and technology. This area of institutional effectiveness attempts to measure how well the college is doing in employing sustainable practices and general efficiency in terms of the infrastructure. There are four (4) key indicators measuring the sustainable physical goal: 4.1 Electricity Usage by Sq. Foot
4.2 Gas Usage by Sq. Foot
4.3 Annual Employee per Capita Waste Disposal
4.4 Annual Student per Capita Waste Disposal
Future Key Indicators
Other measures were identified as potential key indicators for future editions of the report by campus groups affected by the “Sustainable Physical Environment” goal. They were not included in the current document primarily because the data had not yet been collected or were unreliable. The future key indicators include:
• Water Usage by FTES: This indicator measures the total HCF used in a fiscal year divided by the total FTES.
• Energy Generated from Solar Panels: This indicator measures the total kWh generated from the solar panels. The solar panels started generating energy in 2011.
• Average Vehicle Ridership: This indicator measures the average number of people in a car and describes use of alternative transportation. While employee data is regularly collected, student data is not. The college plans to systematically and regularly conduct a transportation survey of students each year.
• Technology-related indicators: A set of technology-related indicators will be developed to measure the technological infrastructure of the college.

81 | 2012 UPDATE INSTITUTIONAL EFFECTIVENESS DATA Santa Monica College Office of Institutional Research
4.1 Electricity Usage by Sq. Foot Data Source:
The data were obtained from the Office of Facilities, Maintenance, and Operations.
Methodology:
Key Indicator 4.1 (Electricity Usage by Sq. Foot) is calculated by dividing the annual electricity usage in kilowatt-hour (kWh) by the gross square footage from the space inventory (excluding space that does not use or meter electricity) for fiscal years 2008-2009, 2009-2010, 2010-2011, and 2011-2012. The data reflect 45 weeks of academic operation (classes in session) and 49 weeks of overall operation.
Data and Analyses: Table 4.1: Electricity Usage by Sq. Foot
2008-2009 2009-2010 2010-2011 2011-2012 Energy kWh Usage 14,778,084 14,655,136 13,510,336 14,520,011 Sq Ft 1,044,547 1,052,381 1,052,381 1,055,381 Usage by Sq Ft 14.15 13.93 12.84 13.76
The electricity consumption by square foot steadily decreased between the 2008-2009 and 2010-2011 years. The electricity consumption by square foot increased slightly in 2011-2012 to 13.76 kWh/sq. foot when compared to the 2010-2011 year. The total space of the college requiring electricity increased in 2011-2012 relative to the space in previous years.
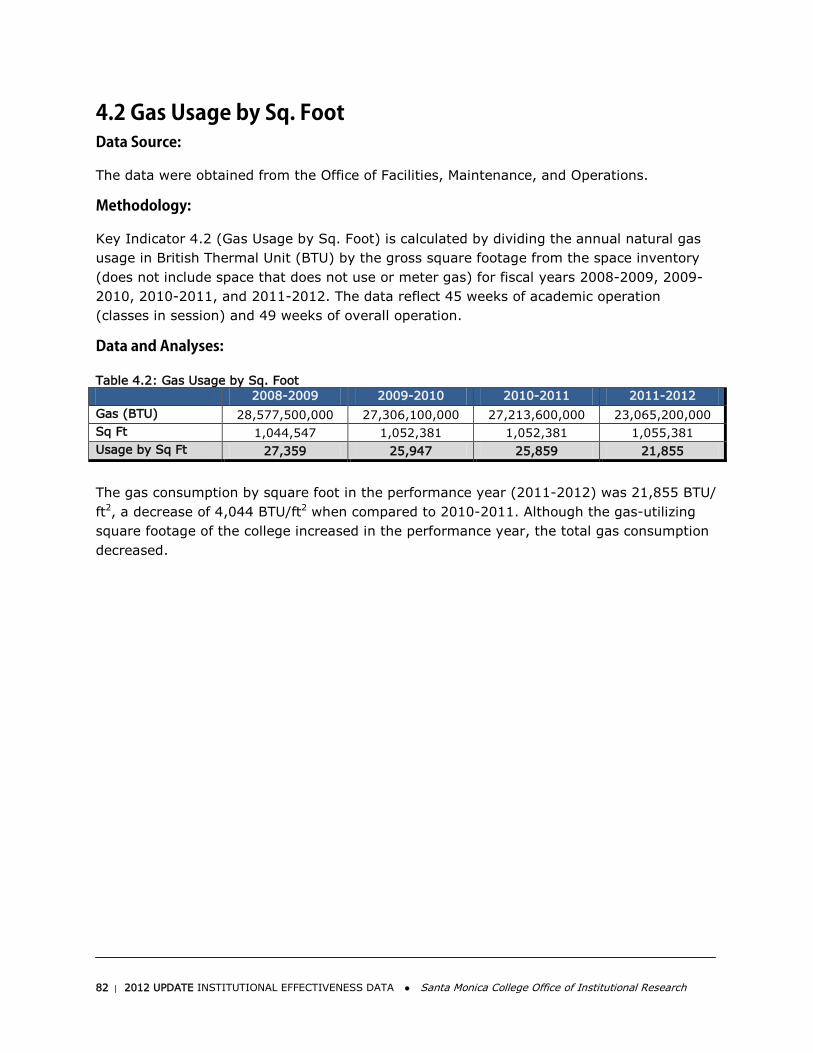
82 | 2012 UPDATE INSTITUTIONAL EFFECTIVENESS DATA Santa Monica College Office of Institutional Research
4.2 Gas Usage by Sq. Foot Data Source:
The data were obtained from the Office of Facilities, Maintenance, and Operations.
Methodology:
Key Indicator 4.2 (Gas Usage by Sq. Foot) is calculated by dividing the annual natural gas usage in British Thermal Unit (BTU) by the gross square footage from the space inventory (does not include space that does not use or meter gas) for fiscal years 2008-2009, 2009-2010, 2010-2011, and 2011-2012. The data reflect 45 weeks of academic operation (classes in session) and 49 weeks of overall operation.
Data and Analyses: Table 4.2: Gas Usage by Sq. Foot
2008-2009 2009-2010 2010-2011 2011-2012 Gas (BTU) 28,577,500,000 27,306,100,000 27,213,600,000 23,065,200,000 Sq Ft 1,044,547 1,052,381 1,052,381 1,055,381 Usage by Sq Ft 27,359 25,947 25,859 21,855
The gas consumption by square foot in the performance year (2011-2012) was 21,855 BTU/ ft2, a decrease of 4,044 BTU/ft2 when compared to 2010-2011. Although the gas-utilizing square footage of the college increased in the performance year, the total gas consumption decreased.

83 | 2012 UPDATE INSTITUTIONAL EFFECTIVENESS DATA Santa Monica College Office of Institutional Research
4.3 Annual Employee per Capita Waste Disposal Data Source:
The data were obtained from the State Agency Waste Management Annual Report.
Methodology:
Key Indicator 4.3 (Annual Employee per Capita Waste Disposal) describes the amount of waste disposed per employee per day for calendar years 2008, 2009, 2010, and 2011. It is calculated by dividing the total pounds of waste disposed by the number of employees working at SMC by the number of days in a year. Pounds of waste are converted from tonnage.
Data and Analyses: Table 4.3: Annual Employee per Capita Waste Disposal
2008 2009 2010 2011
Total Disposed Pounds 1,402,800 894,400 628,000 607,400
Employees 2,015 1,919 1,881 1,859
Annual per Capita Disposal (lbs/person/day)
1.9 1.3 0.9 0.9
In general, the amount of waste disposed has decreased over the last four years from 1,402,800 pounds (701.4 tons) in 2008 to 607,400 pounds (303.7 tons) in 2011. The data indicate that in the performance year (2011), the college disposed of approximately 0.9 pounds of waste per employee per day.
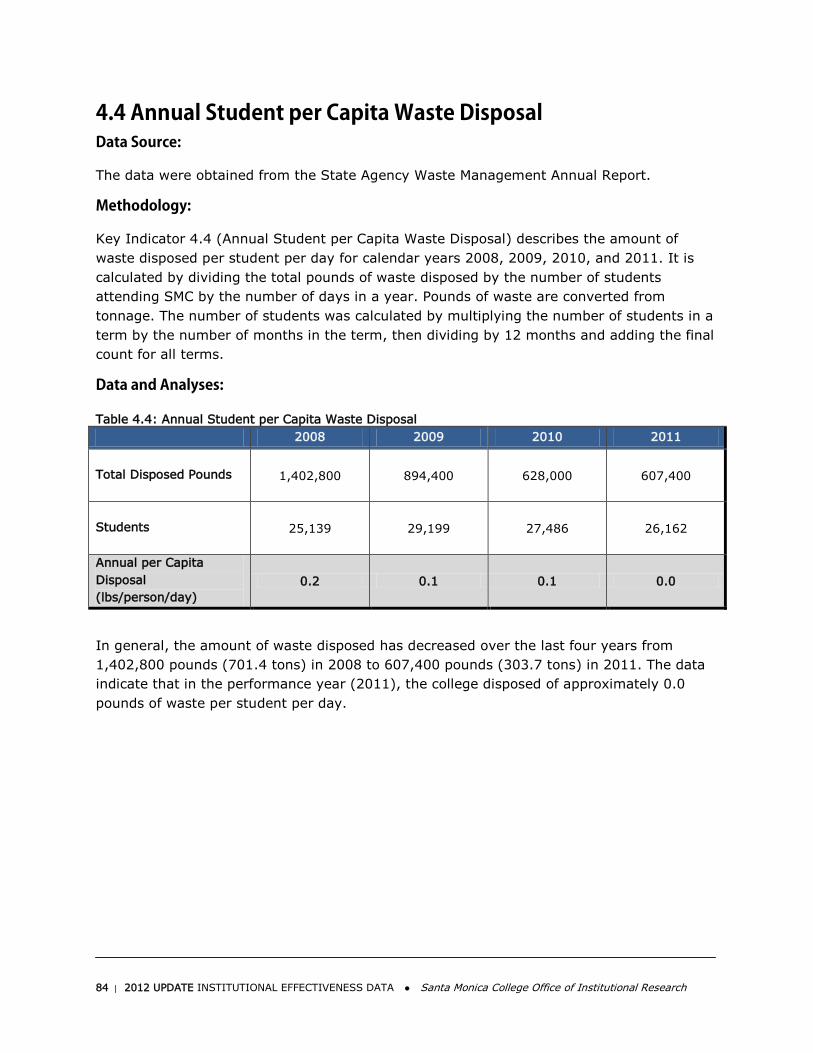
84 | 2012 UPDATE INSTITUTIONAL EFFECTIVENESS DATA Santa Monica College Office of Institutional Research
4.4 Annual Student per Capita Waste Disposal Data Source:
The data were obtained from the State Agency Waste Management Annual Report.
Methodology:
Key Indicator 4.4 (Annual Student per Capita Waste Disposal) describes the amount of waste disposed per student per day for calendar years 2008, 2009, 2010, and 2011. It is calculated by dividing the total pounds of waste disposed by the number of students attending SMC by the number of days in a year. Pounds of waste are converted from tonnage. The number of students was calculated by multiplying the number of students in a term by the number of months in the term, then dividing by 12 months and adding the final count for all terms.
Data and Analyses: Table 4.4: Annual Student per Capita Waste Disposal
2008 2009 2010 2011
Total Disposed Pounds 1,402,800 894,400 628,000 607,400
Students 25,139 29,199 27,486 26,162
Annual per Capita Disposal (lbs/person/day)
0.2 0.1 0.1 0.0
In general, the amount of waste disposed has decreased over the last four years from 1,402,800 pounds (701.4 tons) in 2008 to 607,400 pounds (303.7 tons) in 2011. The data indicate that in the performance year (2011), the college disposed of approximately 0.0 pounds of waste per student per day.

85 | 2012 UPDATE INSTITUTIONAL EFFECTIVENESS DATA Santa Monica College Office of Institutional Research
Chapter 5: Supportive Collegial
Santa Monica College (SMC) strives to create a supportive collegial environment by improving and enhancing decision making and communication processes in order to respect the diverse needs and goals of the entire college community. This area of institutional effectiveness attempts to measure how well the college is doing in supporting campus stakeholders and other constituents in program improvement, assessment of Student Learning Outcomes, and engaging in a culture of inquiry. There is one (1) key indicator measuring the supportive collegial goal: 5.1 Institutional Objectives Completion Rate
Future Key Indicator
Campus groups affected by the goal identified one measures as a potential performance indicator for the “Supportive Collegial Environment” goal. It was not included in the current document primarily because the data had not yet been collected.
• Professional Development Participation Rate: This indicator measures the percentage of employees who participate in at least one professional development activity, including flex activities and workshops organized by the Professional Development Council.

86 | 2012 UPDATE INSTITUTIONAL EFFECTIVENESS DATA Santa Monica College Office of Institutional Research
5.1 Institutional Objectives Completion Rate Data Source:
The data were obtained from the Office of the Executive Vice President.
Methodology:
Key Indicator 5.1 (Institutional Objectives Completion Rate) describes the percentage of the institutional objectives in the college’s Master Plan for Education which were at least substantially completed in the 2008-2009, 2009-2010, 2010-2011, and 2011-2012 academic years. Institutional objectives are action statements designed to meet the mission, goals, and strategic initiative of the college. Each year, the college develops new institutional objectives; any objectives that have not been completed carry over to the objectives for the following year. Completion of institutional objectives are reviewed annually and identified as being “completed”, “substantially completed”, “addressed”, or “not addressed” by the District Planning and Advisory Council (DPAC). The completion rate is calculated by dividing the number of institutional objectives that were completed or substantially completed by the total number of institutional objectives for the year.
Data and Analyses: Table 5.1 Institutional Objectives Completion Rate
2008-2009 2009-2010 2010-2011 2011-2012 Institutional Objectives 52 14 14 11 Completed/Substantially Completed 34 11 11 9 % Completed/Substantially Completed 65.4% 78.6% 78.6% 81.8%
In 2008-2009, the college had 52 different institutional objectives but completed or substantially completed 34 of them for a completion rate of 65.4%. The college had fewer institutional objectives in academic years 2009-2010 and 2010-2011; the completion rates for these years increased to 78.6%. The college had even fewer institutional objectives in the performance year (2011-2012). The numbers of institutional objectives may impact the completion rate. The data indicate that in the performance year (2011-2012), the college at least substantially completed more than 80% of institutional objectives.