Geochemical and sedimentologic variations in inter-annually laminated sediments from Santa Monica...
21
Marine Geology 125 (1995) 111-131 Geochemical and sedimentologic variations in inter-annually laminated sediments from Santa Monica Basin James W. Hagadorn, Lowell D. Stott, Ashish Sinha, Miguel Rincon Department of Earth Sciences, University of Southern CaliJornia, Los Angeles, CA 90089-0740, USA Received 20 January 1994; revision accepted 19 January 1995 Abstract Laminated sediments were recently discovered in the center of Santa Monica Basin, California Continental Borderland and extend from the present day to at least the Little Ice Age (ca. 1600 A.D.). Unlike the annual varves observed in Santa Barbara Basin, the light-dark lamination couplets observed in ‘l”Pb-dated cores from the center of Santa Monica Basin occur at 3 to 6 year intervals, very similar in length to the El Nifio Southern Oscillation (ENSO) phenomena. The mechanisms that control the temporal patterns of laminations in this basin are unknown. Potential causal mechanisms of lamination formation in Santa Monica Basin include: (1) changes in the flux of terrigenous vs. marine organic carbon and detritus; (2) surface water processes which affect marine productivity and organic carbon flux to the sediments; and (3) deep water processes which affect oxygen renewal and preservation of organic matter within the basin. A box core from the central portion of Santa Monica Basin was analyzed using a suite of geochemical, sedimentary, and micropaleontologic techniques in order to: (a) investigate which, if any, of these mechanisms has contributed to the occurrence of laminations; and (b) reconstruct proxy records of climate change. Samples were extracted from this core at 1 mm increments and provide a temporal resolution of l-3 years per sample, a resolution which is comparable in length to the thickness of individual laminae within the core. Geochemical and micropaleontologic analyses of core samples provide paleoclimatic and paleoceanographic records which are comparable to, and extend beyond, historical regional and global climate records. In addition to direct comparisons between these records, spectral analysis was used to investigate whether there were similar patterns of variability that would implicate dominant forcing functions in the historic and proxy records. Herein we present preliminary results of records from ca. 1860 to the present. Our results suggest that organic carbon fluxes are the dominant factors that affect lamination variability. Input of organic carbon is primarily a function of primary productivity, and, to a lesser extent, a function of percentage of terrestrial input. Thus, (1) and (2) are both mechanisms of lamination formation. Stability of (3) only allows preservation of the record of these variations. Variations in Southern California rainfall appear to be linked to decadal-scale variations in downcore density profiles, and thus cause variations in the thickness and character of the laminations in the deepest portions of this basin. Thus, filtered density records can be used to reconstruct general paleo-rainfall trends which compare well with historic rainfall records. Variations in the isotopic composition of total organic carbon (TOC) are compared to historic ENS0 and climate records and primarily reflect changes in the relative contribution of marine organic carbon to the basin. Variations in the carbon isotopic composition of N. pachyderma mirror changes in the sedimentary S’3C,oc record from Santa Monica Basin, and suggest that primary productivity is the primary control on the flux of organic carbon to the sediments and exerts a strong influence on the interannual variability in lamination composition. Variations in paleo-sea surface temperatures generated from the oxygen isotopic composition of N. pachyderma correlate well with historical SST records and suggest potential usage as a proxy for general paleoSST 0025-3227/95/$9.50 0 1995 Elsevier Science B.V. All rights reserved SSDZ 0025.3227(95)00012-7
-
Upload
independent -
Category
Documents
-
view
4 -
download
0
Transcript of Geochemical and sedimentologic variations in inter-annually laminated sediments from Santa Monica...

Marine Geology 125 (1995) 111-131
Geochemical and sedimentologic variations in inter-annually laminated sediments from Santa Monica Basin
James W. Hagadorn, Lowell D. Stott, Ashish Sinha, Miguel Rincon
Department of Earth Sciences, University of Southern CaliJornia, Los Angeles, CA 90089-0740, USA
Received 20 January 1994; revision accepted 19 January 1995
Abstract
Laminated sediments were recently discovered in the center of Santa Monica Basin, California Continental Borderland and extend from the present day to at least the Little Ice Age (ca. 1600 A.D.). Unlike the annual varves observed in Santa Barbara Basin, the light-dark lamination couplets observed in ‘l”Pb-dated cores from the center of Santa Monica Basin occur at 3 to 6 year intervals, very similar in length to the El Nifio Southern Oscillation (ENSO) phenomena. The mechanisms that control the temporal patterns of laminations in this basin are unknown. Potential causal mechanisms of lamination formation in Santa Monica Basin include: (1) changes in the flux of terrigenous vs. marine organic carbon and detritus; (2) surface water processes which affect marine productivity and organic carbon flux to the sediments; and (3) deep water processes which affect oxygen renewal and preservation of organic matter within the basin.
A box core from the central portion of Santa Monica Basin was analyzed using a suite of geochemical, sedimentary, and micropaleontologic techniques in order to: (a) investigate which, if any, of these mechanisms has contributed to the occurrence of laminations; and (b) reconstruct proxy records of climate change. Samples were extracted from this core at 1 mm increments and provide a temporal resolution of l-3 years per sample, a resolution which is comparable in length to the thickness of individual laminae within the core. Geochemical and micropaleontologic analyses of core samples provide paleoclimatic and paleoceanographic records which are comparable to, and extend beyond, historical regional and global climate records. In addition to direct comparisons between these records, spectral analysis was used to investigate whether there were similar patterns of variability that would implicate dominant forcing functions in the historic and proxy records.
Herein we present preliminary results of records from ca. 1860 to the present. Our results suggest that organic carbon fluxes are the dominant factors that affect lamination variability. Input of organic carbon is primarily a function of primary productivity, and, to a lesser extent, a function of percentage of terrestrial input. Thus, (1) and (2) are both mechanisms of lamination formation. Stability of (3) only allows preservation of the record of these variations.
Variations in Southern California rainfall appear to be linked to decadal-scale variations in downcore density profiles, and thus cause variations in the thickness and character of the laminations in the deepest portions of this basin. Thus, filtered density records can be used to reconstruct general paleo-rainfall trends which compare well with historic rainfall records. Variations in the isotopic composition of total organic carbon (TOC) are compared to historic ENS0 and climate records and primarily reflect changes in the relative contribution of marine organic carbon to the basin. Variations in the carbon isotopic composition of N. pachyderma mirror changes in the sedimentary S’3C,oc record from Santa Monica Basin, and suggest that primary productivity is the primary control on the flux
of organic carbon to the sediments and exerts a strong influence on the interannual variability in lamination composition. Variations in paleo-sea surface temperatures generated from the oxygen isotopic composition of N. pachyderma correlate well with historical SST records and suggest potential usage as a proxy for general paleoSST
0025-3227/95/$9.50 0 1995 Elsevier Science B.V. All rights reserved SSDZ 0025.3227(95)00012-7

112 J. W. Hagadorn et aL/Marine Geology 125 (1995) III-131
patterns. Oxygen-sensitive assemblages of benthic foraminifera (Bolivina argentea and B. spimz) have been used to identify potential large-scale flushing events and construct a historical record of variations in deep water oxygen levels.
Spectral analysis of regional historic records indicate dominance of short-term (ENSO-length) and long-term (decadal) patterns of climate variability. The short-term ENS0 signal is not dominant in the Santa Monica proxy records. However, strong decadal-length signals are identified in all of the proxy records and suggest that the dominant forcing mechanisms in Santa Monica Basin may be decadal in length.
1. Introduction
There is growing awareness that short-term climate variations which are centered in one particular region may be teleconnected to other regions of the world via the atmosphere and/or the ocean (Glantz, 1991). In particular, the El Nifio-Southern Oscillation, which is centered in the equatorial Pacific, has effects that are felt as far away as Africa. The southern coast of California can be strongly affected by ENS0 cycles. Heavy rainfall (in excess of 50 in/year) and increased sea surface temperatures during the 1983 and 1992 events provide striking examples of the impact that strong El Nifios have on this region. The northward incursion of warm water fauna and flora into the Southern California Bight is another excellent example of the effect El Nifios have on the biota of the California Borderland (Lange et al., 1987, 1990).
Previous attempts to reconstruct ancient El Nifio occurrence and magnitude from these marine deposits have focused on Santa Barbara Basin where varved sediments provide an opportunity to extract annual climate information (Soutar and Crill, 1977; Schimmelmann and Tegner, 1991). However, attempts to extract detailed information on the magnitude of El Nifios and to reconstruct accurate records of climatic and oceanographic variations from this basin have met with mixed results (Schimmelmann and Tegner, 1991; Kennedy and Brassel, 1992). This may be because Santa Barbara Basin is isolated from warm cur- rents to the south and is more strongly influenced by the colder south-flowing California Current (Eppley and Holm-Hansen, 1986; Jackson et al., 1989).
In 1981, laminations were documented in Santa Monica Basin sediments (Malouta et al., 1981). Whereas these laminations are not seen visually in
core sections stored in core lockers, they are visible in fresh core sections (Hollander, pers. commun.) and as density contrasts in X-radiographs. The presence of these laminations affords an opportu- nity to extract paleoclimate and paleoceanographic information from Santa Monica Basin and to examine potential links between laminations and climate forcing functions such as the El Nifio- Southern Oscillation.
Christensen (1991) and Christensen et al. (1994) developed an age model for Santa Monica lamin- ations and attempted to constrain the temporal frequency of down-core variations in thickness of laminations by digitizing the X-radiographs of several cores from the center of the basin (includ- ing core DOE 26; Fig. 1) and constructing relative density profiles downcore. Low density layers appear as dark bands (in X-radiographs) and higher density layers appear as light bands.
Unlike Santa Barbara Basin, which has annual lamination couplets, the Santa Monica Basin lami- nation couplets, (consisting of one light and one dark lamination), occur at intervals of approxi- mately 3-6 years (Christensen, 1991; Christensen et al., 1994). The 3 to 6 year recurrence of the laminae is similar in duration to the El Nifio phenomena (Quinn et al., 1978, 1987) and was inferred by Christensen ( 1991) and Christensen et al. (1994) to reflect strong ENS0 forcing. Christensen ( 199 1) observed decadal-scale similar- ities between the smoothed historical record of annual rainfall and the time series of density variations in Santa Monica Basin laminations (Fig. 2). Extended periods of higher rainfall appear to match intervals of higher density within the core, interpreted by Christensen (1991) to reflect increased flux of terrigenous siliciclastics and lower relative flux of marine biogenic material to the basin floor. Although the causal mechanisms of lamination variability have not yet been

J. W. Hagadorn et al.,Marine Geology 125 (1995) 1 II-131 113
0,
1,
2,
3,
4,
5
6,
7,
8
9,
z 10,
3 11,
5 12,
g 13. w
14,
15,
16,
17,
18.
19.
20.
21.
22.
23.
24.
1988
1975
1950
1925
1900 8
1875 :
1850 3
1825 2
1800 B
1775 b
1750 -
1725
1700
1675
1650
Fig. 1. Print of an X-radiograph of Santa Monica Basin core DOE 26. Light bands on the print reflect low density layers in the core, whereas dark bands represent higher density layers in the core.
resolved, these results suggest that the lamin- ated sediments record climate variability (e.g., Christensen, 1991; Christensen et al., 1994).
Soutar and Crill (1977) suggested that in Santa Barbara Basin, lamination thickness is related to
-100 ,. I-7 80
-80 / * -60 j .=
‘--Density --Rainfall 6.
F 40 5
iu”
20 E _. 3
,O
100 L I-, ~L.I I. L._.-.L.I.,.L , .,
1860 1880 1900 1920 1940 1960 ti_,
198b
Age
Fig. 2. Comparison of the relative density record (and hence proxy lamination record; Christensen, 1991) from core DOE 26 to the historic Los Angeles annual rainfall record (from PACLIM workshop #5, 1988).
rainfall patterns. Similarly, Christensen ( 199 1) sug- gested that lamination thicknesses in Santa Monica Basin may be related to rainfall patterns, suggest- ing that dark laminations were deposited under brief (- 1 year) periods of increased bottom water oxygenation following ENS0 events (Reimers et al., 1990; Berelson, 1991). Conversely, the light laminations may have formed during extended (3-10 year) periods of anoxia between larger flushing events. The idea is that during extended periods of anoxia, there is growth of bacterial mats that have higher porosity and lower density. The increased thickness of the less dense light laminations (by 25-30%) versus dark laminations supports this idea.
Although the decadal-length patterns are very similar in the density and rainfall records, it is difficult to resolve whether or not these records are similar at the scale of the laminations. We reasoned that if Christensen was correct and the laminations occur because of variations in the amount of organic carbon buried, then there are 3 potential factors that could contribute to this variability, including:
(1) Changes in the flux of terrigenous vs. marine organic carbon and detritus.
(2) Surface water processes which affect marine productivity and organic carbon flux to the sediments.
(3) Deep water processes which affect oxygen

114 J. W. Hagadorn et al./Marine Geology 125 (1995) Ill-I31
renewal and preservation or organic matter within the basin.
To determine if and how these factors affect lamination variability, we examined climate vari- ability recorded in six ‘tracers’ that respond to variations in either rainfall, surface or deep-water organic carbon fluxes, surface water conditions, or benthic oxygen levels within the basin. These trac- ers are sediment X-ray density, 613Croc, TOC content, 613C and #*O of planktonic foraminifera Neogloboquadrina pachyderma (dextral), and abundance ratios of benthic foraminifera Bolivina argentea and B. spissa. Although similarities in decadal patterns are apparent in direct compari- sons between these records, comparison of nonlin- ear and linear time series necessitates usage of additional techniques to analyze potential forcing functions. Spectral analysis was thus used to resolve these complex patterns of climate variabil- ity and to identify temporal patterns that would implicate large-scale climate-forcing functions (such as the ENS0 phenomena) in the basinal sediment records.
2. Geologic and oceanographic setting
The California Borderland has a complicated topography that influences surface and deep water circulation within each basin (Fig. 3; Sverdrup and Fleming, 1941; Emery, 1954; Hickey, 1991, 1992). The California Undercurrent, a northwesterly flowing water mass between about 200 and 800 m, brings cold, oxygen-deficient water into Borderland basins. The Undercurrent is saltier, lower in oxygen, and higher in nutrients than the shallower California Current. Whereas waters fill- ing deep basins in the California Bight are mixtures of the south-flowing California Current and the north-flowing California Undercurrent (Emery, 1954; Douglas, 1981; Eppley and Holm-Hansen, 1986; Jackson et al., 1989), the California Undercurrent is the primary source of deep water in coastal basins such as Santa Monica Basin (Reid et al., 1958; Reid, 1965; Knauss, 1962; Douglas, 1981; Hickey, 1992).
In the basins south of Santa Barbara Basin, Undercurrent water contributes between 70% and
Fig. 3. Path of deep water transport in California Continental Borderland Basins. The width of the line is proportional to the volume of transport (modiied from Emery, 1954).
80% of the deep basin waters (Sverdrup and Fleming, 1941) but aside from diffusive renewal, is only renewed intermittently within the deep basins (Hickey, 1991, 1992). Santa Barbara Basin bottom water, in contrast, is renewed annually in response to the seasonal migration of the North Pacific High Pressure system. Hickey ( 1991, 1992) has documented small annual hydrographic varia- tions which were considered to be flushing events in Santa Monica Basin. These occur abruptly during the spring, but result in only a minor elevation of oxygen concentrations. This oxygen is then gradually depleted by oxidation of organic matter over a period of several months (see Berelson, 1991, for similar phenomena described in San Pedro Basin). It is not yet clear how much interannual variation there is in oxygen renewal in Santa Monica Basin.
In Santa Barbara Basin, very strong El Nifio or southeasterly storms are hypothesized to force a shutdown of upwelling regimes, stimulate re-oxygenation of deep waters, and lead to the deposition of laminated sediments in Santa Barbara Basin (Schimmelmann et al., 1992). Because of the sheltered geographic position of Santa Monica Basin within the Borderland Province (Fig. 4), it seems unlikely that normal or weak El Nifio or storm conditions would initiate

J. W Hagadorn et al./Marine Geology 125 (1995) Ill-131 115
PREVAILING rosa NORTHERLY WINDS
c
OUTER BASIN
LOW 9ho SURFACE WATER ;!I; ; C
2
DEEP WATER HIGH %. LOW T” C LOW 02
Fig. 4. Modern environmental conditions in Borderland basins, including inner basins (such as Santa Monica Basin), are modeled in this schematic cross-sectional diagram taken from Douglas (1981).
such deep water overturn in Santa Monica Basin on 3-6 year time scales. However, when very strong ENS0 or climate forcing events manage to pass over the sills that surround Santa Monica Basin, they may reinforce the seasonal mixing processes and cause deep water renewal in the basin.
Residence times of deep water in the adjacent San Pedro Basin support turnover rates of Santa Monica deep water of probably at least intra- annual duration. San Pedro and San Nicolas Basins experienced a flushing event in 1982-1984, and a period of relative stagnation in 1984-1987 (Berelson, 1991; Hickey, 1992). The flushing epi- sodes of these coastal basins are coincident with the El Nifio phenomenon. The residence times of deep waters in these basins during the flushing periods are (respectively), 12 + 6 months and 9 + 2 months (Berelson, 1991; Hickey, 1991, 1992). Because Santa Monica Basin lies directly upstream of San Pedro Basin, advection of new water into Santa Monica Basin is effectively buffered (Hickey, 1991, 1992). Thus, deep water residence times in Santa Monica Basin will be as long as, if not longer than, those in San Pedro Basin. Because Santa Monica Basin is surrounded by topographic ridges, deep water flow is restricted to meandering flow patterns over and around basin sills (Hickey, 1992).
Today, Santa Monica Basin is characterized by high sedimentation rates (17.7 cm3 yr-‘) and dysaerobic (c.2 ml 1-l) bottom waters (e.g., Gorsline, 1980; Gorsline and Teng, 1989; Huh et al., 1990; Christensen et al., in press). The top meter of sediment, for which piston cores are available, indicates Holocene deposition has been predominantly hemipelagic rain of green clayey silts with low sand contents (2-4% by weight; Gorsline and Emery, 1959; Gorsline, 1980; Malouta et al., 1981). The sediment has an average carbonate content of 7-8%, (which is mostly of biogenic origin), and may contain as much as 6% organic carbon by weight (Flocks, 1993).
Bacterial mats (Beggiutoa sp.) in Santa Barbara Basin have been hypothesized to cause deposition of detritus-poor lower density layers at the sedi- ment-water interface during times of depleted bottom water oxygenation and availability of H,S in pore waters (Reimers et al., 1990; Grant, 1991). The thin, laterally extensive filaments of these mats trap falling particles, binding these particles to the low porosity sediment surface, and prevent erosion by weak traction currents (Reynolds, 1988; Lange et al., 1990). Seasonal variations in bottom water oxygenation (summer = 0.03 ml l- ‘, winter = 0.32 ml 1-l) may result from flushing events and are thought to kill off these bacterial mats, produc- ing ‘varve-like’ lamination structures. Although
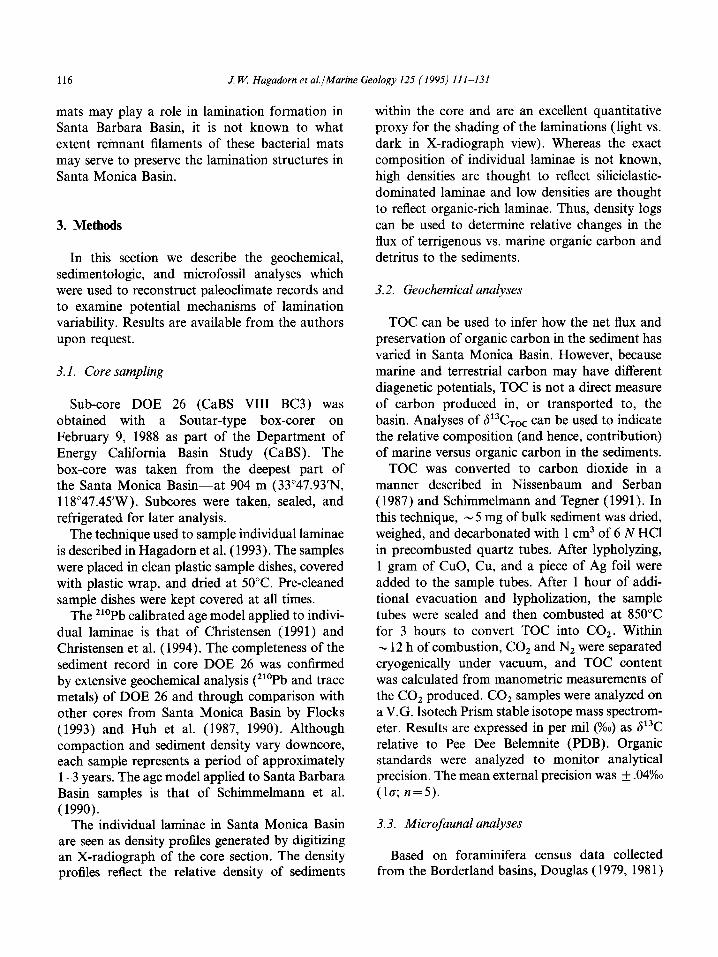
116 J. W. Hagadorn et al.JMarine Geology 125 (1995) 111-131
mats may play a role in lamination formation in Santa Barbara Basin, it is not known to what extent remnant filaments of these bacterial mats may serve to preserve the lamination structures in Santa Monica Basin.
3. Methods
In this section we describe the geochemical, sedimentologic, and microfossil analyses which were used to reconstruct paleoclimate records and to examine potential mechanisms of lamination variability. Results are available from the authors upon request.
3.1. Core sampling
Sub-core DOE 26 (CaBS VIII BC3) was obtained with a Soutar-type box-corer on February 9, 1988 as part of the Department of Energy California Basin Study (CaBS). The box-core was taken from the deepest part of the Santa Monica Basin-at 904 m (33”47.93’N, 118”47.45’W). Subcores were taken, sealed, and refrigerated for later analysis.
The technique used to sample individual laminae is described in Hagadorn et al. (1993). The samples were placed in clean plastic sample dishes, covered with plastic wrap, and dried at 50°C. Pre-cleaned sample dishes were kept covered at all times.
The ‘l”Pb calibrated age model applied to indivi- dual laminae is that of Christensen ( 1991) and Christensen et al. (1994). The completeness of the sediment record in core DOE 26 was confirmed by extensive geochemical analysis (‘l”Pb and trace metals) of DOE 26 and through comparison with other cores from Santa Monica Basin by Flocks (1993) and Huh et al. (1987, 1990). Although compaction and sediment density vary downcore, each sample represents a period of approximately l-3 years. The age model applied to Santa Barbara Basin samples is that of Schimmehnann et al. (1990).
The individual laminae in Santa Monica Basin are seen as density profiles generated by digitizing an X-radiograph of the core section. The density profiles reflect the relative density of sediments
within the core and are an excellent quantitative proxy for the shading of the laminations (light vs. dark in X-radiograph view). Whereas the exact composition of individual laminae is not known, high densities are thought to reflect siliciclastic- dominated laminae and low densities are thought to reflect organic-rich laminae. Thus, density logs can be used to determine relative changes in the flux of terrigenous vs. marine organic carbon and detritus to the sediments.
3.2. Geochemical analyses
TOC can be used to infer how the net flux and preservation of organic carbon in the sediment has varied in Santa Monica Basin. However, because marine and terrestrial carbon may have different diagenetic potentials, TOC is not a direct measure of carbon produced in, or transported to, the basin. Analyses of 613CToc can be used to indicate the relative composition (and hence, contribution) of marine versus organic carbon in the sediments.
TOC was converted to carbon dioxide in a manner described in Nissenbaum and Serban (1987) and Schimmelmann and Tegner (1991). In this technique, - 5 mg of bulk sediment was dried, weighed, and decarbonated with 1 cm3 of 6 N HCl in precombusted quartz tubes. After lypholyzing, 1 gram of CuO, Cu, and a piece of Ag foil were added to the sample tubes. After 1 hour of addi- tional evacuation and lypholization, the sample tubes were sealed and then combusted at 850°C for 3 hours to convert TOC into C02. Within - 12 h of combustion, CO2 and N2 were separated cryogenically under vacuum, and TOC content was calculated from manometric measurements of the CO2 produced. CO2 samples were analyzed on a V.G. Isotech Prism stable isotope mass spectrom- eter. Results are expressed in per mil (%o) as 613C relative to Pee Dee Belemnite (PDB). Organic standards were analyzed to monitor analytical precision. The mean external precision was + .04%0 (la; n=5).
3.3. Microfaunal analyses
Based on foraminifera census data collected from the Borderland basins, Douglas (1979, 1981)

J. W. Hagadorn et al./Marine Geology 125 (1995) 111-131 117
and Douglas et al. (1976, 1979, 1980) determined that foraminiferal abundance is dependent on sample size, uniformity, and quality, and must be normalized for variation in these properties. Because of the excellent sample preservation in these laminated sediments, the latter two factors are negligible. Samples taken in this study are thus only normalized to sample size (by dry weights).
Oxygen levels from benthic foraminifera Quantification of benthic oxygen levels allows
one to address the effects of oxygen renewal events in Santa Monica Basin. Although oxygen levels may be very low at the sediment surface, there is enough oxygen to allow colonization of the seafloor by benthic foraminifera which have relatively low metabolic rates and secrete thin, less ornamented tests (e.g., Douglas, 1979, 1981; Douglas et al., 1976, 1979, 1980).
The deep low-oxygen environments of Santa Monica Basin are dominated by an anaerobic- tolerant fauna, the Epistominella-Suggrunda com- munity. This community is only found in waters that range in temperature from 4” to 8°C and in salinity from 34.25 to 34.5%0 (e.g., Douglas, 1981; Douglas et al., 1976). Dominance of this assem- blage downcore suggests that general paleoceano- graphic salinity and temperature regimes have remained relatively constant for at least the last 200 years. In addition, species of the low oxygen assemblages (e.g., the Epistominella-Suggrunda community) in Santa Monica Basin are rarely found outside this low-oxygen zone (Douglas et al., 1976). Whereas benthic foraminifera can be displaced by storm-generated flows, currents, and waves from shallower to deeper parts of the basin, this seasonally-driven bias does not affect the very deepest portions of Santa Monica Basin (R. Douglas, pers. commun.).
Generalized oxygen variations are inferred from abundance changes in oxygen-sensitive species of the Epistominella-Suggrunda community (Douglas, 1979, 1981; Douglas et al., 1976, 1979, 1980). Relative abundance of Bolivina spissa and B. argentea are sensitive to variations in bottom- water oxygen concentrations (Fig. 5; Lutze, 1964; Douglas, 1979, 198 1). Peak abundances of B. spissa occur at oxygen concentrations of 1.2 ml 1-l
S- 8. argentea
I I
1 2 3 4 5 6
DISSOLVED OXYGEN (ml/I)
Fig. 5. Variation in the abundance of Bolivina species related to dissolved oxygen (from Douglas, 1981). Note the critical change in abundance of B. spissa and B. argentea which occurs at 0.9 ml 1-l.
and exceed abundances of B. argentea at oxygen levels greater than 0.9 ml 1-l. B. argentea exhibit peak abundances at 0.6 ml 1-r and exceed abun- dances of B. spissa at oxygen levels less than 0.9 ml 1-l (Douglas, 1979, 1981). Thus, measurement of the ratio between B. argentea and B. spissa is used to infer large-scale changes in oxygen levels in the deepest part of Santa Monica Basin. Because each lamination sample represents -2 years of depos- ition, the abundance of these two species provides a general interannual record of relative oxygen variations. However, this method does not allow us to infer shorter-term (i.e., seasonal) patterns of oxygen renewal or potential effects of carbon flux variations that may affect the production of benthic species.
813C, PO, andpaleoSSTfromplanktonic foraminifera
Temperature-sensitive assemblages of plank- tonic foraminifera flourish in the productive sur- face waters of Santa Monica Basin. Planktonic foraminifera which inhabit the upper water column include G. bulloides, which lives at the surface, and N. pachyderma (dextral), which inhabits the upper 50 m of the water column (Sautter and Thunell, 1991). IV. pachyderma are extremely abundant in core DOE 26 and are thus used (instead of G. bulloides) as an indicator of general surface water

118 J. W. Hagadorn et al./Marine Geology 125 (1995) 111-131
conditions. These foraminifera reflect spring sur- face water conditions because sediment trap studies have shown that 80% of their production and flux to the sediments occurs between April and June (Sautter and Thunell, 199 1).
Both oxygen and carbon isotopic compositions of N. pachyderma were analyzed in order to assess surface water conditions. Samples consisting of 15-20 individuals were sonified in methanol, dried at 50°C roasted under vacuum at 375°C and analyzed in an automated carbonate preparation device attached to the V.G. Isotech Prism mass spectrometer.
Paleo-sea surface temperature (paleoSST) records were constructed based on paleotempera- ture equations from Shackleton (1974) which assume a constant ambient water 6180 composi- tion based on modern ambient sea water #‘O values (e.g., Grossman, 1982). However, the oxygen isotopic composition of foraminiferal tests is also affected by salinity (Shackleton, 1974) as well as temperature (Epstein and Mayeda, 1953). Variations in salinity and ambient water composi- tion are primarily due to evaporation and vapor/rain transport (Craig and Gordon, 1965). We assume that variations in salinity attributable to ENS0 phenomena are no greater than 0.05%0 and that these will cause negligible changes in the 6i80 of surface waters (Hickey, 1991; Craig and Gordon, 1965). Rapid movement of water masses and ENS0 events affect the temperature and to a lesser extent, the isotopic composition of ambient water (e.g., Quinn et al., 1978, 1987; Bird, 1988; Cole and Fairbanks, 1991; Kennedy and Brassell, 1992). Because variations in isotopic gradients due to long-term changes, such as ice volume effects, exceed the length of inter-annual to decadal pat- terns examined in this study, these potentially biasing factors are considered negligible. Thus, in Santa Monica Basin, oxygen isotopic compositions are likely controlled by the temperature-dependent fractionation of oxygen isotopes in the calcite lattice of the foraminiferal tests.
3.4, Spectral analyses
Whereas our sampling resolution approximates the thickness of individual laminae, it is difficult
to correlate individual laminae with individual peaks in our relatively noisy proxy records. In addition, it is difficult to make point-by-point comparisons (and hence calculate significant corre- lation coefficients) when comparing nonlinear (i.e., sedimentary and proxy) and linear (i.e., historical) time series. Thus, it is not always clear from direct observation what forcing function causes varia- tions within these records. Several forcing func- tions may be present, albeit overprinted, within the Santa Monica Basin proxy records. Spectral analysis allowed us to break up the signals in these records into more readily identifiable components. High resolution multiple-taper spectral analysis was utilized to determine whether there are persis- tent recurring patterns in the proxy and historical records and to constrain possible forcing functions in Santa Monica Basin (e.g., Park and Herbert, 1987; Park et al., 1987). Identification of similar spectral patterns in these records provides a way to resolve potential forcing mechanisms for the laminations and to alleviate problems with noise and with correlation of linear and nonlinear time series (e.g., Park and Herbert, 1987).
Although downcore measurements of Santa Monica and Santa Barbara Basin sediments are evenly spaced, changes in porosity and compaction distribute data points in a nonlinear fashion with respect to time. For spectral analysis, data points were linearly interpolated in order to construct time series which still preserved the ‘peaks’ and ‘troughs’ in both data sets. In addition, all data sets in this study were demeaned and detrended prior to transformation. The long-term historic ENS0 and X-ray density records were truncated to match the length of the Santa Monica data set lengths and are 122 years in length. All proxy and historic data sets used in spectral analysis represent time periods comparable to the SM 613CToc record, and are approximately 120 years in length, with the exception of the 75 year paleo-oxygen record and the 32 year Spring SST record.
In order to increase the resolution of power spectral signals (with respect to frequency number), spectral analyses were conducted on “zero-padded” data sets. Zeros were added to the original data set (prior to transformation) until the number of data points equaled 512. Other

J. W. Hagadorn et al.jMarine Geology 125 (199s) Ill-131 119
values of 2” were also tried, but experimental plots indicated that 512 points produced the clearest spectral peaks.
These data sets were analyzed on a Sun worksta- tion using a multi-taper spectral analysis program [for more information, see Park et al. (1987) Park and Herbert ( 1987) and references therein). Results are expressed as frequency versus magni- tude. 95% confidence intervals are not plotted because of the shortness (i.e., m 120 yrs) of the historical and proxy records relative to the length of the observed signals. However, distinct peaks and bands of power are easily visible and are noted in Figs. 14-20.
4. Historical records
Los Angeles rainfall and runoff data for the last 110 years (from PACLIM workshop #5, 1988) represent mean annual fluxes measured by the Los Angeles Weather Bureau and are expressed in inches and million acre feet, respectively. Spring sea surface temperatures represent temperatures measured in Santa Monica Basin by research groups at Scripps Institution of Oceanography (i.e., CalCOFI). Rainfall and runoff records are recorded as mid-year values (e.g., 1985.5, 1986.5, etc.). These mid-year values were converted to annual values by subtracting 0.5 year from each time value. Whereas this added a 0.5 year time lag to all direct comparisons, this preserved the peaks and troughs of the data sets for spectral analysis.
ENS0 records were taken from historical data compiled by Quinn et al. ( 1978, 1987). ENS0 events were converted to a numerical format based on intensity of event: 0 = no event, 1 = weak event, 2 = moderate event, 3 = strong event, 4 = very strong event. Quinn et al.‘s (1987) record may exhibit bias as it does not include weak ENS0 events. This bias results from difficulties in inter- pretation or lack of historical records because moderate to weak ENS0 events are often not noted in historical records (Quinn et al., 1987). Omission of these events cannot be avoided; it is hoped that this will not significantly affect the amplitude, frequency, or periodicity of larger scale trends (which this study strives to observe) in the
historical ENS0 record, as only data which is comparable to the length of the proxy data sets is examined. Biases may arise with usage of this record as it reflects events which affect the Peruvian coastline. Whereas very strong ENS0 events may affect the California coastline in a similar fashion, this does not always occur (Schimmelmann and Tegner, 1991). Thus, comparison of this ENS0 record to measured parameters may alias ENS0 events which are restricted (in both magnitude and geographic occurrence) to only northern or south- ern eastern Pacific continental margins.
Durations of onset and offset of ENS0 events vary; the average time from non-ENS0 conditions to peak ENS0 conditions is 13 months (Quinn et al., 1978). Average time from peak ENS0 conditions to non-ENS0 conditions is 12 months. Quinn et al. (1987) list ENS0 events over a one or two year-long period-it is inferred that peak ENS0 conditions occur at the mid-point of listed ENS0 occurrences. Cane (1983) indicates, how- ever, that ENS0 events rarely last more than 18 months-thus one should be skeptical of Quinn et al’s (1987) description of historical 2 year ENS0 events. As ENS0 events build up and taper off, it might be necessary to account for the 6 month build up and breakdown of these conditions when constructing a global ENS0 record. However, because these assumptions are difficult to test in historical records, historical global ENS0 records have been constructed utilizing only origi- nal data.
5. Results
5.1. Geochemical, microfaunal, and sediment analyses
LP3C TOC and density profiles from core DOE 26 for the period 1866-1988 are plotted in Fig. 6. The absolute ranges of carbon isotopic ratios of TOC are from - 21.728 to -23.016%0. Relative density values range from -55.465 to 33.009 mg/cm’ (Christensen, 1991). Density values are lowest in the upper portions of the core, reflecting low sediment compaction. In order to facilitate com- parison to other historical and proxy records, the

120 J. W. Hagadorn et aLlMarine Geology 125 (1995) Ill-131
-401 Y, l-23.0 1990 1990 1900 1920 1940 1990 1990 2000
Age Fig. 6. Santa Monica PCToc compared to relative density variations in core DOE 26. Density records are from Christensen (1991).
density records have been detrended (as in Christensen, 1991 and Christensen et al., 1994). Longer-term (decadal) variations in the isotopic signature of TOC generally correlate with density patterns from 1988 to 1940 (R*=O.670; 5 yr filter), but the correlation diminishes further downcore.
The 110 year historical Los Angeles rainfall record is compared to the Santa Monica 613Croc record and exhibits a range in values from 6.33 to 27.06 in/year (Fig. 7). Comparison of 613Croc ratios to rainfall records for this area exhibits a general trend of decreased 613Croc values in
Fig. 7. Comparison of the Santa Monica 613CToc record to Fig. 9. The Santa Monica PCToc record is compared to the the historical record of Los Angeles Rainfall. Rainfall data is PC record from N. pachyderma (dextral). In general, these from the Los Angeles Weather Bureau and is expressed records exhibit similar patterns, especially from ca. 1900 to in inches. the present.
periods following years of high rainfall. However, the reverse is not true; not all troughs in the 613Croc record correspond to years of high rainfall.
The TOC content record extends from 1883 to 1986 and is compared to the density record in Fig. 8. TOC contents range from 47 to 298 mg C per gm of sediment. Longer-term patterns of varia- tion are observed in these two records and seem to covary from N 1940 to the present (R2=0.711; 5 yr filter).
The Santa Monica 613C TOC record is compared to a section of the N. pachyderma 613C record in Fig. 9. The N. pachyderma 613C record ranges from 1.280 to -0.138%0. Patterns of variation are observed between these records, and seem to
z E 60.0
5 50.0 :
0 40.0 1 G 0 -10
+ 30.0 1
20.0 i -30
10.0
1860 1880 1900 1920 1940 1960 1980 2000
Age
Fig. 8. Direct comparison of the downcore variations in TOC content (expressed as mg C per g of sediment) to the variations in density in core DOE 26. TOC contents were calculated by normalizing the amount of CO, released from each sample.
-21.6 p- ,I.4
’ ,I
0
0.8 2” iO.6 i
10.4 8
0.2 3
-23
1860 1999 1940 1980 be

J. W Hagadorn et al.JMarine Geology 125 (1995) Ill-131 121
exhibit some decadal-scale covariance from N 1900 to the recent (R’ = 0.424; 5 yr filter).
Whereas Santa Barbara 6r3C,,, signatures range from -21.82 to -22.39%0, Santa Monica signatures are more negative, ranging from -21.728 to -23.016%0 (Fig. 10). No systematic correlation is observed between the Santa Monica and Santa Barbara records (R’ = 0.058; 5 yr filter).
The Santa Monica 613C TOC record is compared to the same Quinn et al. (1987) ENS0 record used by Schimmelmann and Tegner ( 1991; Fig. 11). Out of the 19 significant decreases (or troughs) in the P3C TOC record, 10 of these correlate with ENS0 events-of these, six are very strong or strong events. Assuming a l-2 year lag, 16 of these decreases correlate with ENS0 events-of which 8 are very strong or strong events. We note no systematic relationship between the magnitude of the 613C TOC variability and the strength of particu- lar El Niiios.
The paleoSST record constructed from oxygen isotopic analyses of N. pachyderma is compared to the historical spring SST record and extends from 1981 to 1955 (Fig. 12a). Both records yield similar temperature ranges-paleoSST range from 13.37” to 15.49”C and historical spring SST range from
-23.21. _ -. I_L.,._.ILJ.
1880 1880 1900 1920 1940 1980 1980
Fig. 10. The 613CToc record from Santa Monica Basin is compared to the 6i3C,oc record from Santa Barbara Basin. The PC Tot measurements from Santa Barbara Basin were obtained from Arndt Schimmelmann at Scripps Institution of Oceanography (Schimmelmann and Tegner, 1991). Although no similar patterns of variation are observed, note that the Santa Monica 6°C values are more negative, suggesting that Santa Monica?jasin is more heavily influenced by terrestrial organic matter.
Age
Fig. 11. The 613C,oc record from Santa Monica Basin is compared to the Quinn et al. (1987) ENS0 record. Out of the 19 significant decreases (or troughs) in the 6i3Croc record, 10 of these correlate with ENS0 events-if one assumes a 1-2 year lag, 16 of these decreases correlate with ENS0 events.
Fig. 12. (A) Comparison of the short-term historical record of Spring SST to the paleoSST record generated from the 6’*0 of N. pachyderma. (B) Comparison of a segment of the long- term paleoSST record to the Global Temperature Anomaly (GTA).

122 J. W. Hagadorn et al.lMarine Geology 125 (1995) 111-131
14.1’ to 16.8”C. The paleoSST and the short term historical SST record also exhibit similar patterns of variation.
A longer section of the paleoSST record (extend- ing from 1981 to 1855) is compared to the longer- term Global Temperature Anomaly (GTA). PaleoSST range from 15.49” to 13.O”C, and GTA values range from 0.48” to -0.52”C (Fig. 12b). Although the scales are very different, major warm- ing trends from - 1900 to the recent are evident in both records.
The deep-water oxygen record is constructed from relative abundances of benthic foraminifera and extends from 1909 to 1983 (Fig. 13). In con- structing this record, we assume flushing of basinal deep waters by East Pacific Intermediate waters does not raise oxygen levels above those character- istic for this water mass (1.4 ml 1-l). This allows us to reconstruct a record of generalized changes in oxygen concentrations based on ratios of Bolivina sp. abundance. Whereas the ratios between Bolivina sp. abundances are plotted linearly, the oxygen concentrations change non-linearly with respect to relative abundance. Because similar relative abundances may be reached at points farther away from the intercept of the Bolivina argentea and B. spissa abundances (Fig. 5), we are hesitant to estimate actual paleo- oxygen levels below 0.9 ml 1-l. However, ratios
less than 0.6 probably reflect oxygen concen- trations significantly less than 0.2 ml 1-i.
Several excursions in deep water oxygen concen- trations are observed from 1957 to 1959, from 1914 to 1916, and in 1921. An extended period of higher O2 levels is observed from 1929 to 1939. There is a general trend of fewer flushing events or lower average oxygen levels since - 1940. There does not appear to be any correlation between the Quinn et al. (1987) El Nifio record an the pattern of O2 changes in Santa Monica Basin.
5.2. Spectral analysis
Historical records of Los Angeles rainfall, runoff, and the Quinn et al. (1987) ENS0 record are analyzed (using multi-taper spectral analysis) for time periods represented in the Borderland proxy data sets (Fig. 14). The historical rainfall and runoff records reveal two distinct frequency bands of high power at 10.4-27.3 years and one at 4.5-6.1 years. Two components may exist within the longer term band, one at - 10 years and one at - 19 years. Whereas the ENS0 record does not exhibit a similar decadal length signal, it does have a strong band in the 4-6 year frequency range.
Two dominant decadal-length spectral peaks are visible at 19.96 and 12.92 years in the Santa Monica density record (Fig. 15). Longer term
- :r.-- 1 -__._. -.
ENS0 Event (height - magnitude) from Quinn et al. (1987) I
d 3 _
0.9 ml/l dissolved oxygen i
Fig. 13. The paleoxygen record is compared to the Quinn et al. (1987) ENS0 record. Abundance ratios reflect the relative abundance of B. spissa versus B. argentea.

J. W. Hagadorn et al./Marine Geology 125 (1995) 111-131 123
0 0.1 0.2 0.3 0.4 a.5
Frequency (yr-‘)
Fig. 14. Spectral analysis of the historical Los Angeles rainfall, runoff, and Quinn et al. (1987) ENS0 record. Note the distinct frequency bands in the rainfall and runoff records at 10.4-27.3 years and one at 4.5-6.1 years. Note the strong frequency band in the ENS0 record at 4-6 years.
19.96 yrs
Yrs
1
i
0.34
Fig. 15. Spectral analysis of the Santa Monica density record. Two distinct spectral peaks are visible at -20 and N 13 years.
frequency bands at - 26 and - 15 years are visible in the Santa Monica Basin 613CToc record, and weaker bands at -20 and - 50 years are visible in Santa Barbara Basin record (Fig. 16). Spectral analysis of the TOC content record reveals deca- dal-length bands centered around -20 and - 10 years (Fig. 17). Spectral analysis of the deep water paleo-oxygen record is illustrated in Fig. 18 and exhibits a weak band of spectral power at -46 years. Analysis of the N. pachyderma 613C record reveals a strong frequency band at 6-10 years, as well as peaks at - 17 and - 46 years (Fig. 19). Decadal-length bands at -7.75 and - 15.5 years are observed in the historical spring SST record
120 ~_ .~.
1 Qb -~ il.1
Fre~~encyQ&m’) 0.4 0.5
Fig. 16. Spectral analysis of the Santa Monica and Santa Barbara 6%Z,,, records. Dominant frequency bands are visible at -26 and N 15 years in the Santa Monica record. Longer and weaker bands at -50 and -20 years are visible in the Santa Barbara record.
6000 - 7 ___-
I--TOC Content1
g 4000
a2 3000 &
g 2000
0 0.1 Fre&fency!&
0.4 0.5
Fig. 17. Spectral analysis of the Santa Monica TOC content record. A weak decadal-length band may exist at N 28 years.
(Fig. 20a). A very robust frequency band, centered near 15.5 years, dominates the paleoSST record (Fig. 20b).
6. Discussion
6.1. Geochemical, microfaunal, and sediment analyses
If rainfall and/or runoff causes variations in the downcore density profile from Santa Monica Basin (Christensen, 1991), then similar systematic varia- tions might be observed in the relative contribution

124 J. W. Hagadorn et aL/Marine Geology 125 (1995) Ill-131
of marine and terrestrial organic carbon to the basin. Because terrestrial and marine organic carbon differ in their 613C by as much as ten per mil, a systematic relationship should exist between the 613C ToC, the laminations, and rainfall records in Santa Monica Basin.
Comparisons of 613&o, record to lamination (density) and rainfall records do not reveal a persistent phase relationship prior to - 1940 (Figs. 6 and 7). However, after - 1940, the records exhibit similar general patterns of variation. Lack of correlation of these records prior to 1940 sug- gests that higher rates of sedimentation (noted by Christensen, 1991) may affect the (nonlinear) Santa Monica density record. Although slight fluctua- tions in this nonlinear time series (likely due to short-term variations in sedimentation rates) may not affect longer-term (decadal) patterns, they may hamper direct correlation of these records on shorter timescales (comparable in length to the ENS0 phenomena). Observation of systematic interannual variations between the amount of carbon preserved and the density record should indicate that the relative contribution of organic matter controls the patterns of lamination in Santa Monica Basin. The relative TOC content and density profile from Santa Monica both exhibit broadly similar patterns of variation, particularly since - 1940 (Fig. 8).
Similar general long-term patterns are also observed in the Santa Monica 613CToc record and the N. pachyderma 613C record (Fig. 9). We inter- pret this as a dominance of marine productivity as the primary control on the flux of organic carbon to the sediments, except, perhaps, under unusually strong and extended ENS0 conditions, like those that occurred in 1885, 1890, and 1901. Although point-by-point comparisons of these records is difficult because of the noisy nature of
the records, in general it appears that higher values of 6i3C in N pachyderma tend to correlate with high 613C values of organic carbon. There are two potential explanations of this correlation. If pri- mary productivity is increased, the 613C of HCO, should increase since photosynthesis preferentially removes “C from surface waters. Time series studies of 613C of particulate organic carbon during the North Atlantic Spring bloom experi-
ment have shown that 6i3C in the organic and inorganic carbon pools varies like a closed system (Rau et al., 1992). Inorganic and organic carbon both become progressively enriched in 13C as photosynthate is progressively exported from the surface water (Rau et al., 1992). We believe that 6r3C variability in Santa Monica Basin behaves in a similar way. In a time series study conducted in San Pedro Basin, the basin adjacent to Santa Monica Basin, Stott (in prep.) observed that 613C and 615N of various plankton groups is highest during spring months when productivity is highest. The isotopic values decrease during late Summer and Fall and are lowest during winter months when productivity is low. The pattern of 613C changes observed in San Pedro Basin can be extrapolated to the down-core variations observed between planktonic foraminifera (a monitor of HCO,) and photosynthate in the Santa Monica Basin box-core record. The down-core variations observed in the Santa Monica Basin record would suggest that interannual variations in photo- synthate export during spring production cycles is responsible for the 2%0 variation in organic carbon and the 1%0 variation in inorganic carbonates. An additional influence on the 6i3C of N. pachyderma and the 613C of TOC is the negative shift in atmospheric CO2 613C since the beginning of industrialization (Quay et al., 1992; see also Broecker and Peng, 1993). Approximately 0.5%0 change has occurred since 1860 (Quay et al., 1992). Consequently, the period of low 613C between 1910 and 1930 may reflect lower productivity and the period of relatively high 6i3C between 1940 and 1960 may reflect relatively higher levels of productivity in the basin. In summary, these obser- vations do not suggest that at the scale of the laminations, the flux of terrigenous organic carbon controls the patterns of lamination.
Considered together, N. pachyderma 613C values and 613CToc suggest that phytoplankton is the dominant organic carbon contributor to the sedi- ments. This agrees with findings by Eppley and Holm-Hansen (1986). Because the primary com- ponents of organic carbon ratios in these Santa Monica Basin sediments are phytoplankton and terrigenous sources of organic carbon, when one of these sources is diminished or shut off, one

J. W. Hagadarn et al. JMarine Geology 125 ( 1995) I I I-131 125
should see a shift in the overall isotopic composi- tion of the sediments. Weak patterns of decreased 613C TOC values following years of high rainfall are observed in our data sets and suggest that when large amounts of terrigenous sediments are flushed into the basin during ‘wet’ years, the mass balance of the carbon flux to the sediments may be shifted slightly toward the input of isotopically-light ter- rigenous organic carbon.
However, ENS0 events may be overprinting these records. During an ENS0 event, the produc- tivity of phytoplankton in surface waters is greatly diminished due to shut-down of upwelling (Chelton et al., 1982; McGowan, 1985; Lange et al., 1987, 1990). This could affect the overall mass balance of the different carbon sources; effec- tively decreasing marine organic carbon fluxes and/or possibly increasing terrestrial organic carbon fluxes. Schimmelmann and Tegner ( 1991) tested this in the annual laminations found in Santa Barbara Basin and found a correlation between the 613C rOC and the historical record of storm and ENS0 events.
However, we note no similar systematic correla- tion between the 613C TOC records from Santa Monica and Santa Barbara Basin (Fig. 10). This lack of correlation suggests that organic carbon deposits in Santa Monica Basin and Santa Barbara Basin may not be recording the same regional signal or may respond differently to climate forcing events. Additionally, the - 1%0 disparity between the Santa Monica and Santa Barbara records suggests that Santa Monica Basin is more heavily influenced by terrestrial organic matter.
The mixed correlation of the Santa Monica Basin 613C Tot record with the Quinn et al. (1987) ENS0 record (Fig. 11) suggests that not all ENS0 events affect Santa Monica Basin, nor do they affect the basinal TOC inventory in a similar manner. The correlation of the Quinn et al. (1987) ENS0 record with the Santa Monica Basin PC TOC record compares well with levels of corre- lation observed by Schimmelmann and Tegner (1991) and Kennedy and Brassel (1992). Our results suggest that: ( 1) the magnitude or duration of strong or very strong ENS0 events does not correlate with the magnitude (and hence relative effects) of negative shifts in the 613CToc record
within Santa Monica Basin; and (2) ENS0 events are not the dominant control on the temporal pattern of variations in TOC; this may occur because weak or ‘normal’ ENS0 events are over- printed or reinforced by other intra- or inter- basinal processes.
These laminated sediments also preserve a record of other climate changes which may be forcing hydrographic or biologic changes within the basin. For example, previous studies associate variations in plankton abundances, diversity, and species composition in Santa Barbara Basin with ENS0 cycles (Lange et al., 1990). Foraminiferal abundances from surficial sediments have also been found to be negatively correlated to bottom- water oxygen concentrations, with maximum numerical densities occurring within the oxygen minimum zone in perpendicular transects off the central California coast (Bernhard, 1992). In addi- tion, both planktonic and benthic foraminiferal assemblages are extremely well preserved in the core utilized in this study (core DOE 26) as a result of high pore water alkalinities generated by sulfate-reducing bacteria and lack of predation in the central basin (Douglas, 1981; Douglas et al., 1980).
To assess changes in surface water conditions, the oxygen isotopic composition of N. pachyderma
was also examined-primarily because it is a potential recorder of variations in surface water temperatures. The N. pachyderma paleoSST and the short-term historical spring SST record exhibit similar patterns of variation and suggest the poten- tial use of these foraminfera as SST proxies (Fig. 12a). To assess how well this record reflects long-term and larger-scale climate fluctuations (and hence forcing factors), the paleoSST record is compared to the GTA. Both records exhibit similar patterns of warming over the last 100 years (Fig. 12b). However, the extent to which larger- scale and longer SST records can be derived from isotopic analysis of these foraminifera is an area which needs further examination Although these results are preliminary, extension of paleothermo- metric SST records holds promise for estimating long-term general trends in regional and global climate variability, and may suggest whether these

126 J. W. Hagadorn et al.IMarine Geology 125 (1995) 111-131
trends changed at the onset of increased anthropo- genie forcing.
Although the lamination packages represent 3-6 year time periods, it is difficult to directly couple the historic or proxy records with this phenomena. Could these lamination couplets represent changes in deep water conditions, either as a result of basin flushing, or deep water oxygen renewal? It has been suggested that Santa Monica oxygen levels have fluctuated periodically in the past (Berelson, 1991; Hickey, 1991, 1992), yet a record of oxygen variations over decadal to century time scales has never been presented.
To address this problem, a deep water oxygen record was constructed based on previous work by Douglas (1979, 1981) and Douglas et al. (1976, 1979, 1980). Douglas (1979, 1981) illustrated that there is a critical difference in abundances of two species of benthic foraminifera, Bolivina argentea and Bolivina spissa, which occurs at oxygen levels below - 1 ml 1-i. Our initial research utilizes this relationship to reconstruct a semi-quantitative record of oxygen variations within the deepest part of Santa Monica Basin (Fig. 13). This record may provide some insight about how bottom water oxygen levels have changed in the past, how they have responded to potential ENSO-forced oxygen renewal events, and possible effects of anthropo- genie input to the basin. Although we are hesitant to quantitatively extrapolate these results for indi- vidual years, in general, this record indicates the presence of at least disoxic to suboxic (Tyson and Pearson, 1991) basin floor environments dating back to 1910. Although the oxygen record does not closely correlate with the historical ENS0 record, several large excursions of oxygen concen- trations are observed. These excursions may be real, or might suggest that Bolivina sp. are not sensitive paleo-oxygen proxies at extremely low (< 0.1 ml l- ‘) oxygen levels. If this record is accu- rate, then there is an overall pattern of depressed oxygen levels (or fewer flushing events) toward the recent. This decrease parallels post-World War II population growth in Los Angeles. This population increase was accompanied by increased sewage levels which may have placed an increased demand on oxygen concentrations in the basin (Flocks, 1993). At the very least, our preliminary results
suggest that the duration of renewal events may not have been sufficient to raise oxygen levels above the threshold necessary to allow recoloniza- tion by bioturbating organisms.
6.2. Climate forcing functions
Systematic variations are observed in the proxy records from Santa Monica and Santa Barbara Basins, some of which may be associated with regional or global historical climate variations. These short-term regional climate variations may be linked to other regions of the world. In particu- lar, the El Niiio-Southern Oscillation, which pri- marily occurs in the equatorial Pacific, has effects which are felt as far away as Africa and has been suggested to be a dominant forcing function along the margin of Southern California. Unfortunately, direct comparisons of our proxy records to the ENS0 record are hampered by high noise levels in the data sets. Additional uncertainties are intro- duced when comparing linear and nonlinear time series. Thus, it is not always clear from direct observation what forcing function causes varia- tions within these records. Several forcing func- tions may be present, albeit overprinted, within the Santa Monica Basin proxy records. Spectral analysis is one way to break up the signals in these records into more readily identifiable components in order to identify forcing functions.
The first step necessary to identify forcing func- tions is to find out what patterns exist in historical records. Historical records of Los Angeles rainfall, runoff, and the Quinn et al. (1987) ENS0 record are analyzed for time periods comparable to the Borderland proxy data sets. The historical rainfall and runoff records reveal two distinct frequency bands of high power at lo-28 years and one at 4-6 years (Fig. 14). Two components may exist within the longer term band, one at approximately 10 years and one at 20 years. Whereas the ENS0 record does not exhibit a similar decadal length signal, it does have a dominant band in the 4-6 year frequency range.
If ENS0 events control the lamination patterns, one should see a 3-6 year signal in the density record (Fig. 15). No ENS0 length signal appears to be dominant. The dominant frequency bands

J. W Hagadorn et aLlMarine Geology 125 (1995) 111-131 121
visible in the density data, however, are at 20 and 13 years, and are similar to the decadal band seen in the rainfall and runoff records. Lack of correla- tion of our results with Christensen (1991) and Christensen et al. (1994) may occur because they compile stacked frequency distributions of lamin- ations ‘picked’ from the density data by a computer algorithm, whereas our results are based on analy- sis of the actual density records.
If the variations in the 613C ToC record in Santa Monica and Santa Barbara Basin are related to ENS0 and strong storm events, then they would also be expected to show a close correlation. Analysis of the data suggests longer-term fre- quency bands of - 26 and - 15 years dominate variations in Santa Monica Basin, whereas weaker and longer bands of - 20 and - 50 years dominate Santa Barbara Basin (Fig. 16). This suggests that Santa Barbara Basin may be less sensitive to these larger-scale forcing functions or that these larger- scale forcing functions are obscured by a noisy signal. An important point to note is that an ENSO-length signal does not appear to be dominant in either the Santa Barbara or Santa Monica records.
Whereas comparative analysis of the TOC varia- tions did not reveal any direct correlations with interannual variability in the Santa Monica density record, this record does appear to vary on interan- nual time-scales. Spectral analysis of the TOC content record reveals decadal-length bands which are similar in length to those observed in the climate and the density records (Fig. 17).
Analysis of the paleo-oxygen and N. pachyderma 613C records reveals similar but weaker 46-year frequency bands (Figs. 18 and 19). The N. pachy- derma 613C record exhibits a dominant frequency band of 6 to 10 years, and a smaller frequency band at -4 years. The latter short-term patterns may represent a link to short-term forcing func- tions observed in the historical records and suggest that the isotopic composition of N. pachyderma is more sensitive to surface water variations than are some of the other proxy records.
To further examine forcing functions which may affect surface water conditions, the historic and proxy SST records were analyzed. Although analy- sis of the short historical SST record may not be
35 .~_ _._~~____. ._ r _._ ..~~, .~~ = 46.5 yrs
30 h
(-Paleo-Oxygen ( !
a25 -0 3 20 .E
$5 ;
!I
&O’ 11.1 yrs
5 i ,’ J
0~ _!k_ ..i__.___l - .~ -...
0 0.1 0.2 0.3 0.4 0.5 0.6
Frequency (yr-‘) 0.7
Fig. 18. Spectral analysis of the Santa Monica paleo-oxygen record. Weak decadal-length spectral peaks may exist at -46 and N 11 years.
- 8% of N. pachyderma
I J
Y 4.5 yrs s 4.1 yrs
K
Fig. 19. Spectral analysis of the 613C of N. pachyderma record from Santa Monica Basin. Strong decadal-length peaks are visible at -46 and -17 years. A dominant frequency band from - 10 to - 6 years is visible. A weak band is also visible from -3 to -4 years.
significant, both records exhibit almost identical 15 year frequency bands (Fig. 20). In addition, the robust paleoSST signal is similar to the decadal length band observed in the historical rainfall and runoff records.
Unfortunately, the ENS0 signal does not appear to be the dominant signal in the proxy data sets from Santa Monica or Santa Barbara Basin. The absence of this signal may be an artifact of sam- pling because it becomes increasingly difficult to resolve periodic signals (like the 3-6 yr ENS0 signal) as their length approaches the length of time represented by the sampling interval (e.g.,

128 J. W Hagadorn et aLlMarine Geology 125 (1995) Ill-131
01 1 0 0.1 Fre&nc;$/r-‘) 0.4 0.5
12,
B) I
0 0 0.1
Fre&n~;~r-~) 0.4 0.5
Fig. 20. (A) Spectral analysis of the short-term historical Spring SST record. (B) Spectral analysis of the long-term paleoSST record. Note the similar frequency bands at _ 15 yrs in both figures.
l-3 yrs). All time series span an interval which is several times longer than the longer-term band of variations observed in the proxy and historic data sets and should not significantly affect the magni- tude of frequency bands observed.
To summarize, a dominant decadal-length fre- quency band is observed in all of the Santa Monica and Santa Barbara proxy data sets (including density, Santa Monica and Santa Barbara d13CToc, TOC content, 613C and al80 of N. pachyderma, and paleoxygen records) and seems to correlate with similar decadal length frequency bands in historical rainfall, runoff, and SST records (Table 1). With the exception of the N. pachyderma 613C record, none of these proxy records exhibit dominant variability which is similar in length to the ENS0 phenomena. However, this does not mean that an ENSO-length signal does not exist, but rather may suggest that this signal is more difficult to resolve because the sampling interval may too closely approach the length of the ENS0 signals.
Table 1 Summary of spectral analysis results. Strong signals (and hence potential forcing functions) are listed as individual peaks (duration in number of years) or as bands of high power (range in number of years)
Record
Rainfall Runoff ENS0 Density SM 6% TOC SB 613C TOC CinQnt
Decadal signals Short-term signals
(years) (years)
21-17 6-4.5 27-18, 10 6-4.5 _ 7-4.5 20, 13 _
30-26, 15 53-42, 22-16 _
29-20, 10-7 - Paleoxygen 47?, ll? _
6% of N. pachyderma 47, 17, 10-7 4.5-4 Spring SST 15.5, 8 _
PaleoSST 18-13 _
These strong decadal-length frequency bands are hypothesized to represent an internal climate signal, yet at this point, it is difficult to determine what they represent or why they are so dominant. Because similar decadal-length bands are found in tree ring and other data sets and they are similar in length to solar or Bruckner length cycles (Guiot, 1987), these decadal patterns indicate a strong link between the Santa Monica Basin proxy records and larger-scale (possibly global) climate changes.
7. Conclusions
Whereas it is not clear that there is an individual forcing function which controls lamination pro- cesses within Santa Monica Basin, initiation and shut-off of these mechanisms centers around the presence of unbioturbated, low-oxygen conditions in the deepest portions of the basin. These condi- tions allow the preservation of an extractable sedimentary archive of valuable prehistoric cli- matic and oceanic records, including records of rainfall, organic carbon burial, primary produc- tivity, sea surface temperatures, and deep water oxygen conditions. Records of density, TOC content 613C TOC > and 613C of N. pachyderma suggest ‘that the interannual variability in the lam-

J. W. Hagadorn et al.,bVarine Geology 125 (1995) 111-131 129
inations may be strongly influenced by the relative contribution of organic carbon, particularly from marine pelagics (i.e. phytoplankton), to the sediment.
Variations in marine and terrestrial carbon fluxes combine to produce variations in the total organic carbon content of the laminated sediments. The relative contribution of terrestrial vs. marine sources is likely mediated by climatic effects (including rainfall and possibly ENS0 events). Comparison of X-ray density profiles to rainfall records suggests that the decadal-length variations in the X-ray density of Santa Monica Basin sedi- ments may be controlled by influx of terrigenous material into the basin during periods of increased rainfall or by variations in porosity (possibly related to bacterial mats).
Although the Santa Monica 613C.roc record can be correlated to the Quinn et al. (1987) ENS0 record and suggests that Santa Monica Basin may predominately experience strong or very strong ENS0 activity, we do not feel confident that the 613C TOC record is an independent and reliable proxy for ENS0 events. Whereas the variations in fY3C TOC do not appear to be directly linked with variations in rainfall and runoff, the sedimentary TOC record compares well with the N. pachyderma 613C record, and hence reflects changes in the surface water carbon pool. This correlation sug- gests that changes in organic carbon burial may be strongly influenced by changes in primary pro- ductivity, and secondarily influenced by changes in terrigenous carbon fluxes.
6180 records from N. pachyderma exhibit strik- ing similarities to historical SST records and sug- gest possible usage of this proxy to reconstruct climate variability on longer (and possibly larger) scales.
Benthic foraminiferal analyses suggest that either the sediments may not record all bottom water oxygenation events or that Bolivina sp. are not sensitive paleo-oxygen proxies at extremely low (~0.1 ml 1-l) oxygen levels. However, our semi-quantitative record suggests that these fora- minifera do record strong oxygenation or flushing events. At present we are uncertain whether peri- odic deep-water oxygenation events are driven by basin turnover, deep-water overflow, changes in
surface water productivity, or a combination of these factors. However, we do not observe varia- tions in benthic foraminiferal abundances which are similar in length to the ENS0 phenomena. In addition, our results suggest that basinal deep waters may be becoming more resistant to large- scale, rapid changes in oxygen concentrations.
Similarly, spectral analysis indicates that the ENS0 phenomenon may not be the dominant climate-forcing function in the proxy records obtained from these sediments. Instead, spectral analysis indicates dominance of a decadal-length signal in all of the proxy records. ENS0 length signals may indeed exist in Santa Monica Basin laminated sediments, but are either not as strong as these decadal signals or are obscured because of difficulties in extracting sediment samples at a higher sampling resolution. Although we are unsure exactly what this decadal signal represents, its similarity in length to solar and/or Bruckner cycles suggests that it represents a longer-term mechanism in the internal climate process.
Acknowledgements
We thank W. Berger and an anonymous reviewer for comments which greatly improved this manu- script. A. Schimmelmann provided helpful com- ments and data from Santa Barbara Basin. D.G. Foley, S.P. Lund, and J.D. Wiggert provided much aid with spectral and time series analysis. D.S. Gorsline, S.P. Lund, and D.G. Hammond facili- tated many improvements in this project through reviews of early versions of the manuscript. T.D. Dickey, R.G. Douglas, A.G. Fischer, T.-L. Ku, and S.P. Lund also provided helpful suggestions and comments on this project. This contribu- tion was supported by the National Science Foundation, Division of Ocean Sciences grant # OCE 9101662 and Petroleum Research Fund #25622-G2.
References
Berelson, W.M., 1991. The flushing of two deep sea basins, southern California Borderland. Limnol. Oceanogr., 36: 1150-1166.

130 J. W Hagadorn et al./Marine Geology 125 (1995) Ill-131
Bernhard, J.M., 1992. Benthic foraminiferal distribution and biomass related to pore-water oxygen content: Central California continental slope and rise. Deep-Sea Res., 39: 585-605.
Bird, M.I., 1988. Isotopically depleted rainfall and El Nino. Nature, 331: 489490.
Broecker, W.S. and Peng, T.-H., 1993. Evaluation of the 13C constraint on the uptake of fossil fuel CO2 by the ocean. Global Biogeochem. Cycles, 7: 619-626.
Cane, M.A., 1983. Oceanographic events during El Nifio. Science, 222: 1189-1195.
Chelton, D.B., Bernal, P.A. and McGowan, J.A., 1982. Large- scale interannual physical and biological interactions in the California Current. J. Mar. Res., 40: 1095-1125.
Christensen, C.J., 1991. An analysis of sedimentation rates and cyclicity in the laminated sediments of Santa Monica Basin, California Continental Borderland. MS. Thesis, Univ. Southern California, 144 pp. (Unpubl.)
Christensen, C.J., Gorsline, D.S., Hammond, D.E. and Lund, S.P., 1994. Non-annual laminations and expansion of anoxic basin-floor conditions in Santa Monica Basin, California Borderland, over the past four centuries. Mar. Geol., 116: 399-418.
Cole, J.E. and Fairbanks, R.G., 1991. The Southern Oscillation recorded in the 6i*O of corals from Tarawa Atoll. Paleoceanography, 5: 669-683.
Craig, H. and Gordon, L.I., 1965. Deuterium and oxygen-18 variations in the ocean and the marine atmosphere. Proc. Spoleto Conf. Stable Isotopes in Oceanographic Studies and Paleotemperatures, 2: l-87.
Douglas, R.H, 1979. Benthic foraminiferal ecology and paleoe- cology: A review of concepts and methods. In: J.H. Lipps, W.H. Berger, M.A. Buzas, R.G. Douglas and C.A. Ross (Editors), Foraminiferal Ecology and Paleoecology. (SEPM Short Course, 6.) SEPM, pp. 21-55.
Douglas, R.G., 1981. Paleoecology of continental margin basins: A modern case history from the Borderland of southern California. In: Depositional Systems of Active Continental Margin Basins. (SEPM Pac. Sect. Short Course Notes.) SEPM, San Francisco, CA, pp. 121-156.
Douglas, R.G., Walch, C. and Blake, G., 1976. Benthic foraminifera from the Borderland of southern California. BLM Tech. Rep., TR 76-2. Bureau of Land Management, Washington, D.C., 164 pp.
Douglas, R.H., Cotton, M.L. and Wall, L., 1979. Distributional variability analysis of benthic foraminifera in the southern California bight. Southern California Baseline Study, Bureau of Land Management Rep., 2(21). Bureau of Land Management, Washington, D.C., 219 pp.
Douglas, R.G., Liestman, J., Walch, C., Blake, G. and Cotton, M.L., 1980. The transition from live to sediment assemblage in benthic foraminifera from the southern California Borderland. In: M. Field, A. Bouma, I. Colbum, R.G. Douglas and J. Ingle (Editors), Quatemary Depositional Environment of the Pacific Coast. Pac. Coast Paleogeogr. Symp., 4. Pac. Sect. SEPM, pp. 257-280.
Emery, K.O., 1954. Source of waters in basins off southern California. J. Mar. Res., 13: l-21.
Eppley, R.W. and Holm-Hansen, O., 1986. Primary production in the southern California bight. In: R.W. Eppley (Editor), Plankton Dynamics of the Southern California Bight. (Lecture Notes on Coastal Estuarine Studies.) Springer, New York, pp. 176-215.
Epstein, S. and Mayeda, T., 1953. Variation of 0” content of waters from natural sources. Geochim. Cosmochim. Acta, 27: 213-224.
Flocks, J.G., 1993. Transport mechanisms and element distribu- tion in a semi-enclosed, anoxic marine basin and the influences of natural and anthropogenic input, California Continental Borderland. MS. Thesis, Univ. Southern California, 246 pp. (Unpubl.)
Glantz, M.H., 1991. Introduction. In: M.H. Glantz, R.W. Katz and N. Nicholls (Editors), Teleconnections Linking Worldwide Climate Anomalies. Univ. Press, Cambridge, 535 pp.
Gorsline, D.S., 1980. Depositional patterns of hemipelagic Holocene sediment in borderland basins on an active margin. In: M.E. Field, A.H. Bouma, I.P. Colbum, R.G. Douglas and J.C. Ingle (Editors), Quatemary Environments of the Pacific Coast. SEPM Pac. Sect. Symp., 4, pp. 185-200.
Gorsline, D.S. and Emery, K.O., 1959. Turbidity-current deposits in San Pedro and Santa Monica Basins off Southern California. Geol. Sot. Am. Bull., 70: 2799290.
Gorsline, D.S. and Teng, L.S., 1989. The California Continental Borderland. In: E.L. Winterer, D.M. Hussong and R.W. Decker (Editors), The Eastern Pacific Ocean and Hawaii. Geol. Sot. Am., Boulder, CO, N, pp. 471-487.
Grant, C.W., 1991. Distribution of bacterial mats (Beggiatoa sp.) in Santa Barbara Basin, California: a modem analog for organic-rich facies of the Monterey Formation. M.S. Thesis, California State Univ., Long Beach, 201 pp. (Unpubl.)
Grossman, E.L., 1982. Stable isotopes in live benthic foramini- fera from the Southern California Borderland. Ph.D. Thesis, Univ. Southern California, Los Angeles, 164 pp. (Unpubl.)
Guiot, J., 1987. Reconstruction of seasonal temperatures in central Canada since A.D. 1700 and detection of the 18.6- and 22 year signals. Clim. Change, 10: 249-268.
Hagadom, J.W., Flocks, J.G., Stott, L.D. and Gorsline, D.S., 1993. A simple method to obtain high-resolution (millimeter- thick) samples from laminated sediments. J. Sediment. Petrol., 63: 755-758.
Hickey, B.M., 1991. Variability in two deep coastal basins (Santa Monica and San Pedro) off southern California. J. Geophys. Res., 96: 16689-16708.
Hickey, B.M., 1992. Circulation over the Santa Monica-San Pedro Basin and Shelf. Prog. Oceanogr., 30: 37-l 15.
Huh, CA., Aahnle, D.L., Small, L.F. and Noshkin, V.E., 1987. Budgets and behaviors of uranium and thorium series isotopes in Santa Monica Basin sediments. Geochim. Cosmochim. Acta, 51: 1743-1754.
Huh, C.A., Small, L.F., Niemnil, S., Finney, B.P., Hickey, B.M., Kachel, N.B., Gorsline, D.S. and Williams, P.M.,

J. W. Hagadorn et al./Marine Geology 12.5 (199.5) 111-131 131
1990. Sedimentation dynamics in the Santa Monica-San Pedro Basin off Los Angeles: Radiochemical, sediment trap and transmissometer studies. Cont. Shelf Res., 10: 137-164.
Jackson, G.A., Azam, F., Carlucci, A.F., Eppley, R.W., Williams, P.M., Finney, B., Huh, C.A., Small, L.F., Gorsline, D.S., Hickey, B., Jahnke, R.A., Kaplan, I.R., Venkatesan, M-I., Landry, M.R. and Wong, K.M., 1989. Elemental cycling and fluxes off Southern California. EOS, Trans. Am. Geophys Union, 70: 1466149, 154-155.
Kennedy, J.A. and Brassell, S., 1992. Molecular records of twentieth-century El Nino events in laminated sediments from the Santa Barbara basin. Nature, 357: 62-64.
Knauss, J., 1962. On some aspects of the deep circulation of the Pacific. J. Geophys. Res., 67: 394333954.
Lange, C.B., Berger, W.H., Burke, SK., Casey, R.E., Schimmelmann, A., Soutar, A. and Weinheimer, A.L., 1987. El Nifio in Santa Barbara Basin: Diatom, Radiolarian, and Foraminiferan responses to the “1983 El Nifio” event. Mar. Geol., 78: 153-160.
Lange, C.B., Burke, S.K. and Berger, W.H., 1990. Biological production off southern California is linked to climatic change. Clim. Change, 16: 319-329.
Lutze, G., 1964. Statistical investigations on the variability of Bolivina argentea. Cushman Found. Foraminiferal Res., 15: 105-134.
Malouta, D.N., Gorsline, D.S. and Thornton, SE., 1981. Processes and rates of recent (Holocene) basin filling in an active transform margin. Santa Monica Basin, California Continental Borderland. J. Sediment. Petrol., 51: 1077-1095.
McGowan, J.A., 1985. El Niiio 1983 in the southern California bight. In: W.S. Wooster and D.L. Fluharty (Editors), El Nifio North. Washington Sea Grant Prog. Univ. Washington, Seattle, WA, pp. 166-184.
Nissenbaum, A. and Serban, A., 1987. Enzymatic activity associated with humic substances in deep sediments from the Cariaco Trench and Walvis Ridge. Geochim. Cosmochim. Acta, 51: 373-378.
Park. J. and Herbert, T.D., 1987. Hunting for paleoclimatic periodicities in a geologic time series with an uncertain time scale. J. Geophys. Res., 92: 14,027714,040.
Park. J., Lindberg, C.R. and Vernon, F.L., 1987. Multitaper spectral analysis of high-frequency seismograms. J. Geophys. Res., 92: 12,675-12,684.
PACLIM Workshop, 1988. Climate Variability of the Eastern North Pacific and Western North America. 5, 77 pp.
Quay, P.D., Tilbrook, B. and Wong, C.S., 1992. Oceanic uptake of fossil fuel COz. Carbon-13 evidence. Science, 256: 74-79.
Quinn, W.H., Zopf, D.O., Short, KS. and Kuo Yang, T.W., 1978. Historical trends and statistics of the southern
oscillation, El Nitio, and Indonesian droughts. Fish. Bull., 76: 663-678.
Quinn, W.H., Neal, V.T. and Antunez de Mayolo, S.E., 1987. El Niiio occurrences over the past four and a half centuries. J. Geophys. Res., 92: 14,449-14,461.
Rau, G.H., Takahashi, T., Des Marais, D.J., Repeta, D.J. and Martin, J.H., 1992. The relationship between 6% of organic matter and [C02(aq)] in ocean surface water: Data from a JGOFS site in the northeast Atlantic Ocean and a model. Geochim. Cosmochim. Acta, 56: 1413-1419.
Reid, J.L., 1965. Intermediate waters of the Pacific ocean. Johns Hopkins Univ. Oceanogr. Stud., 2, 85 pp.
Reid, J.L., Roder, G.I. and Wyllie, J.G., 1958. Studies of the California current system. Calif. Coop. Fisheries Invest. Prog. Rep., 1 July 1956 to 1 January 1958, pp 27-57.
Reimers, C.E., Lange, C.B., Tabak, M. and Bernhard, J.M., 1990. Seasonal spillover and varve formation in the Santa Barbara Basin, California. Limnol. Oceanogr., 35: 1577-1585.
Reynolds, S.R., 1988. The fabrics of deep-sea detrital muds and mudstones: A scanning electron microscope study. Ph.D. Thesis, Univ. Southern California, 169 pp. (Unpubl.)
Sautter, L.R. and Thunell, R.C., 1991. Seasonal variability in the #a0 and 6i3C of planktonic foraminifera from an upwelling environment; Sediment trap results from the San Pedro Basin, Southern California Bight. Paleoceanography, 6: 307-334.
Schimmelmann, A., Lange, C.B. and Berger, W.H., 1990. Climatically controlled marker layers in Santa Barbara Basin sediments, and fine-scale core-to-core correlation. Limnol. Oceanogr., 35: 1655173.
Schimmelmann, A., Lange, C.B., Berger, W.H., Simon, A., Burke, S.K. and Dunbar, R.B., 1992. Extreme climatic conditions recorded in Santa Barbara Basin laminated sediments. The 1835-1840 Macoma event. Mar. Geol., 106: 279-299.
Schimmelmann, W. and Tegner, M.J., 1991. Historical oceano- graphic events reflected in i3C/i3C ratios of total organic carbon in Santa Barbara Basin sediment. Global Biogeochem. Cycles, 5: 1733188.
Shackleton, N.J., 1974. Attainment of isotopic equilibrium between ocean water and benthonic foraminiferal genus Uvigerina; Isotopic changes in the oceans during the last glacial. Coll. Int. Cent. Natl. Rech. Sci., 219: 203-219.
Soutar, A. and Crill, P.A., 1977. Sedimentation and climatic patterns in the Santa Barbara Basin during the 19th and 20th centuries. Geol. Sot. Am. Bull., 88: 1161-1172.
Sverdrup, H.U. and Fleming, R.H., 1941. The waters off the coast of southern California, March to July 1937. Scripps Inst. Oceanogr., Univ. California Press, 4: 261-378.
Tyson, R.V. and Pearson, T.H., 1991. Modem and Ancient Continental Shelf Anoxia. Geol. Sot. London, 470 pp.