Annually Boiler A1-2 Stack Emissions Monitoring Report for ...
42
Company Name: Pfizer Ireland Pharmaceuticals Licence No: P0652-01 Year: 2018, Visit No: 1 Report No: 2018-131 Page 1 of 13 Glenside Environmental Services Doc No: GEN2-001rev11 Rev Date: 06/02/2018 Issued by: QM Glenside Environmental, Unit 18 Great Island Industrial Park, Ballincollig, Co. Cork T: 021 4810016 M: 086 3819387 [email protected] www.glenenv.ie _______________________________________________________________ Annually Boiler A1-2 Stack Emissions Monitoring Report for Pfizer Ireland Pharmaceuticals The Pfizer Biotech Campus at Grange Castle, Grange Castle International Business Park, Kilmahuddrick, Grange and Nangor Townlands, Nangor Road, Clondalkin, Dublin 22 EPA IPPC Licence REF: P0652-01 _______________________________________________________________ Report No: 2018-131 Monitoring Date: 2 nd August 2018 Test report shall not be reproduced except in full, without written approval of the laboratory. For inspection purposes only. Consent of copyright owner required for any other use. EPA Export 02-12-2018:03:53:43
-
Upload
khangminh22 -
Category
Documents
-
view
1 -
download
0
Transcript of Annually Boiler A1-2 Stack Emissions Monitoring Report for ...
Company Name: Pfizer Ireland Pharmaceuticals Licence No: P0652-01 Year: 2018, Visit No: 1 Report No: 2018-131
Page 1 of 13 Glenside Environmental Services Doc No: GEN2-001rev11
Rev Date: 06/02/2018 Issued by: QM
Glenside Environmental, Unit 18 Great Island Industrial Park,
Ballincollig, Co. Cork
T: 021 4810016 M: 086 3819387 [email protected] www.glenenv.ie
_______________________________________________________________
Annually Boiler A1-2
Stack Emissions Monitoring Report
for
Pfizer Ireland Pharmaceuticals The Pfizer Biotech Campus at Grange Castle, Grange Castle
International Business Park, Kilmahuddrick, Grange and Nangor Townlands, Nangor Road, Clondalkin, Dublin 22
EPA IPPC Licence REF: P0652-01
_______________________________________________________________
Report No: 2018-131
Monitoring Date: 2nd August 2018
Test report shall not be reproduced except in full, without written approval of the laboratory.
For
insp
ectio
n pur
pose
s only
.
Conse
nt of
copy
right
owne
r req
uired
for a
ny ot
her u
se.
EPA Export 02-12-2018:03:53:43
Company Name: Pfizer Ireland Pharmaceuticals Licence No: P0652-01 Year: 2018, Visit No: 1 Report No: 2018-131
Page 2 of 13 Glenside Environmental Services Doc No: GEN2-001rev11
Rev Date: 06/02/2018 Issued by: QM
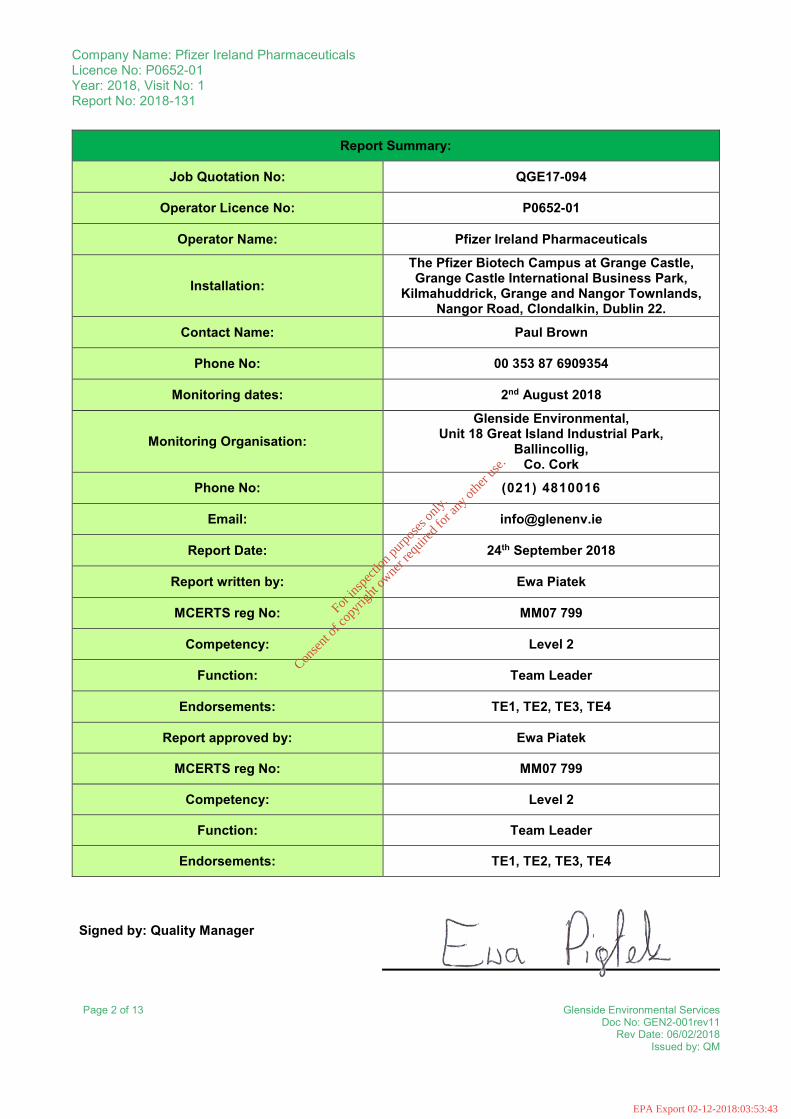
Report Summary:
Job Quotation No: QGE17-094
Operator Licence No: P0652-01
Operator Name: Pfizer Ireland Pharmaceuticals
Installation: The Pfizer Biotech Campus at Grange Castle, Grange Castle International Business Park,
Kilmahuddrick, Grange and Nangor Townlands, Nangor Road, Clondalkin, Dublin 22.
Contact Name: Paul Brown
Phone No: 00 353 87 6909354
Monitoring dates: 2nd August 2018
Monitoring Organisation: Glenside Environmental,
Unit 18 Great Island Industrial Park, Ballincollig,
Co. Cork Phone No: (021) 4810016
Email: [email protected]
Report Date: 24th September 2018
Report written by: Ewa Piatek
MCERTS reg No: MM07 799
Competency: Level 2
Function: Team Leader
Endorsements: TE1, TE2, TE3, TE4
Report approved by: Ewa Piatek
MCERTS reg No: MM07 799
Competency: Level 2
Function: Team Leader
Endorsements: TE1, TE2, TE3, TE4
Signed by: Quality Manager
For
insp
ectio
n pur
pose
s only
.
Conse
nt of
copy
right
owne
r req
uired
for a
ny ot
her u
se.
EPA Export 02-12-2018:03:53:43
Company Name: Pfizer Ireland Pharmaceuticals Licence No: P0652-01 Year: 2018, Visit No: 1 Report No: 2018-131
Page 3 of 13 Glenside Environmental Services Doc No: GEN2-001rev11
Rev Date: 06/02/2018 Issued by: QM
TABLE OF CONTENTS
PAGE
1. INTRODUCTION........................................................................................................................ 4
2. OBJECTIVES .............................................................................................................................. 4
2.1. SUBSTANCES TO BE MONITORED AT EACH EMISSION POINT ..................................................... 4 2.2. SPECIAL REQUIREMENTS ........................................................................................................ 4
4. MATERIALS AND METHODS ................................................................................................ 5
4.1. FLUE GAS ANALYSIS (CO – IS EN 15058:2017, CO2 – ISO12039:2001, NOX – IS EN 14792:2017, O2 – IS EN 14789:2017, SO2 – METHOD TGN M21) .................................................... 5 4.2. PARTICULATES - ISO9096:2003 (HIGH) OR IS EN 13284-1:2002 (LOW) ................................ 5 4.3. VOLUMETRIC FLOW RATE – ISO 16911-1:2013 ..................................................................... 5
5. MONITORING RESULTS ......................................................................................................... 6
5.1. MONITORING RESULTS ........................................................................................................... 6 5.3. REFERENCE CONDITIONS ........................................................................................................ 7 5.4. VOLUMETRIC FLOW RATE ...................................................................................................... 7 5.6. METHODS AND ACCREDITATION STATUS................................................................................ 8
6. OPERATING INFORMATION................................................................................................. 9
7. MONITORING DEVIATION .................................................................................................... 9
9. ANNEX 1 .................................................................................................................................... 11
9.1. PERSONNEL ........................................................................................................................... 11
11. ANNEX 2 ................................................................................................................................ 12
11.1. DIAGRAM OF THE STACK SAMPLING PLANE ........................................................................... 12 11.2. SAMPLING MEASUREMENTS .................................................................................................. 12
12. ANNEX 3 ................................................................................................................................ 13
12.1. RESULTS AND UNCERTAINTY CALCULATIONS FOR STACK A1-2 – TOTAL OF 27 PAGES ......... 13 12.2. LABORATORY CERTIFICATES – TOTAL OF 2 PAGES ............................................................... 13
For
insp
ectio
n pur
pose
s only
.
Conse
nt of
copy
right
owne
r req
uired
for a
ny ot
her u
se.
EPA Export 02-12-2018:03:53:43
Company Name: Pfizer Ireland Pharmaceuticals Licence No: P0652-01 Year: 2018, Visit No: 1 Report No: 2018-131
Page 4 of 13 Glenside Environmental Services Doc No: GEN2-001rev11
Rev Date: 06/02/2018 Issued by: QM
1. Introduction
Glenside Environmental was commissioned by Pfizer Ireland Pharmaceuticals Ltd to perform air emission monitoring at The Pfizer Biotech Campus at Grange Castle, Grange Castle International Business Park, Kilmahuddrick, Grange and Nangor Townlands, Nangor Road, Clondalkin, Dublin 22. The monitoring was carried out as required by Condition 11 and Schedule 1 i) of IPPC Licence P0652-01 for the facility. This report presents details of this monitoring programme.
2. Objectives
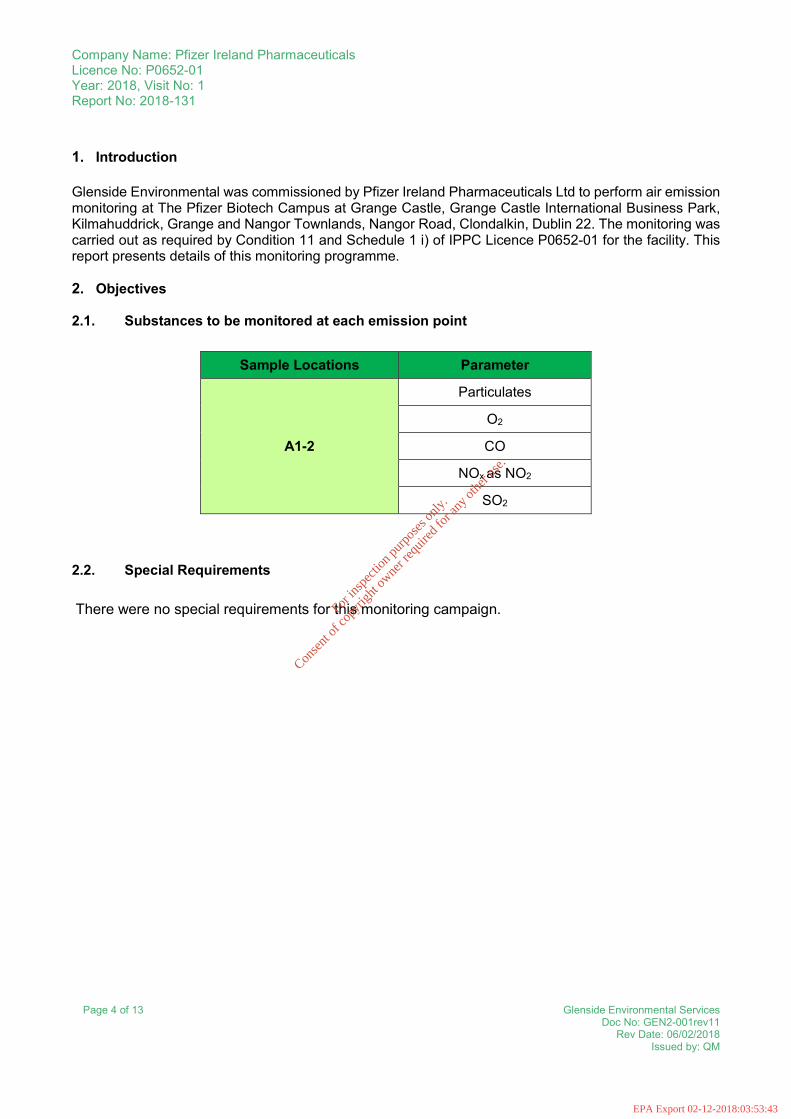
2.1. Substances to be monitored at each emission point
Sample Locations Parameter
A1-2
Particulates
O2
CO
NOx as NO2
SO2
2.2. Special Requirements There were no special requirements for this monitoring campaign.
For
insp
ectio
n pur
pose
s only
.
Conse
nt of
copy
right
owne
r req
uired
for a
ny ot
her u
se.
EPA Export 02-12-2018:03:53:43
Company Name: Pfizer Ireland Pharmaceuticals Licence No: P0652-01 Year: 2018, Visit No: 1 Report No: 2018-131
Page 5 of 13 Glenside Environmental Services Doc No: GEN2-001rev11
Rev Date: 06/02/2018 Issued by: QM
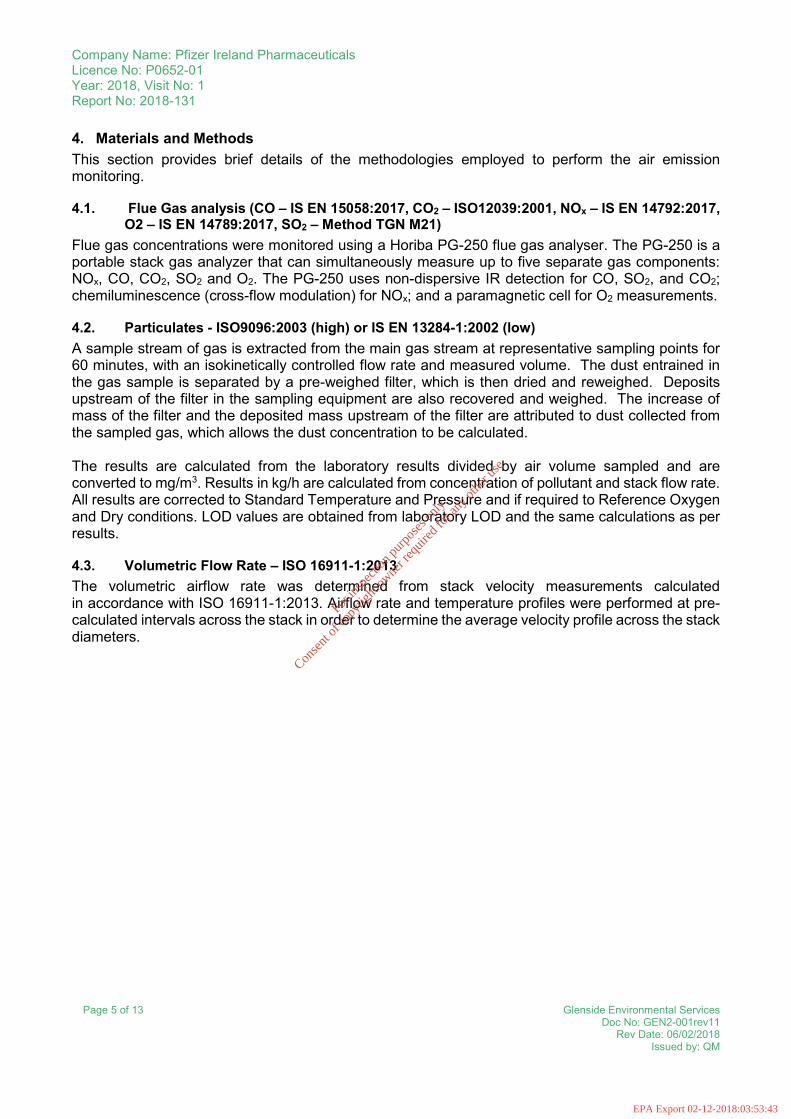
4. Materials and Methods This section provides brief details of the methodologies employed to perform the air emission monitoring.
4.1. Flue Gas analysis (CO – IS EN 15058:2017, CO2 – ISO12039:2001, NOx – IS EN 14792:2017, O2 – IS EN 14789:2017, SO2 – Method TGN M21)
Flue gas concentrations were monitored using a Horiba PG-250 flue gas analyser. The PG-250 is a portable stack gas analyzer that can simultaneously measure up to five separate gas components: NOx, CO, CO2, SO2 and O2. The PG-250 uses non-dispersive IR detection for CO, SO2, and CO2; chemiluminescence (cross-flow modulation) for NOx; and a paramagnetic cell for O2 measurements.
4.2. Particulates - ISO9096:2003 (high) or IS EN 13284-1:2002 (low) A sample stream of gas is extracted from the main gas stream at representative sampling points for 60 minutes, with an isokinetically controlled flow rate and measured volume. The dust entrained in the gas sample is separated by a pre-weighed filter, which is then dried and reweighed. Deposits upstream of the filter in the sampling equipment are also recovered and weighed. The increase of mass of the filter and the deposited mass upstream of the filter are attributed to dust collected from the sampled gas, which allows the dust concentration to be calculated. The results are calculated from the laboratory results divided by air volume sampled and are converted to mg/m3. Results in kg/h are calculated from concentration of pollutant and stack flow rate. All results are corrected to Standard Temperature and Pressure and if required to Reference Oxygen and Dry conditions. LOD values are obtained from laboratory LOD and the same calculations as per results.
4.3. Volumetric Flow Rate – ISO 16911-1:2013 The volumetric airflow rate was determined from stack velocity measurements calculated in accordance with ISO 16911-1:2013. Airflow rate and temperature profiles were performed at pre-calculated intervals across the stack in order to determine the average velocity profile across the stack diameters.
For in
spec
tion p
urpo
ses o
nly.
Conse
nt of
copy
right
owne
r req
uired
for a
ny ot
her u
se.
EPA Export 02-12-2018:03:53:43
Company Name: Pfizer Ireland Pharmaceuticals Licence No: P0652-01 Year: 2018, Visit No: 1 Report No: 2018-131
Page 6 of 13 Glenside Environmental Services Doc No: GEN2-001rev11
Rev Date: 06/02/2018 Issued by: QM
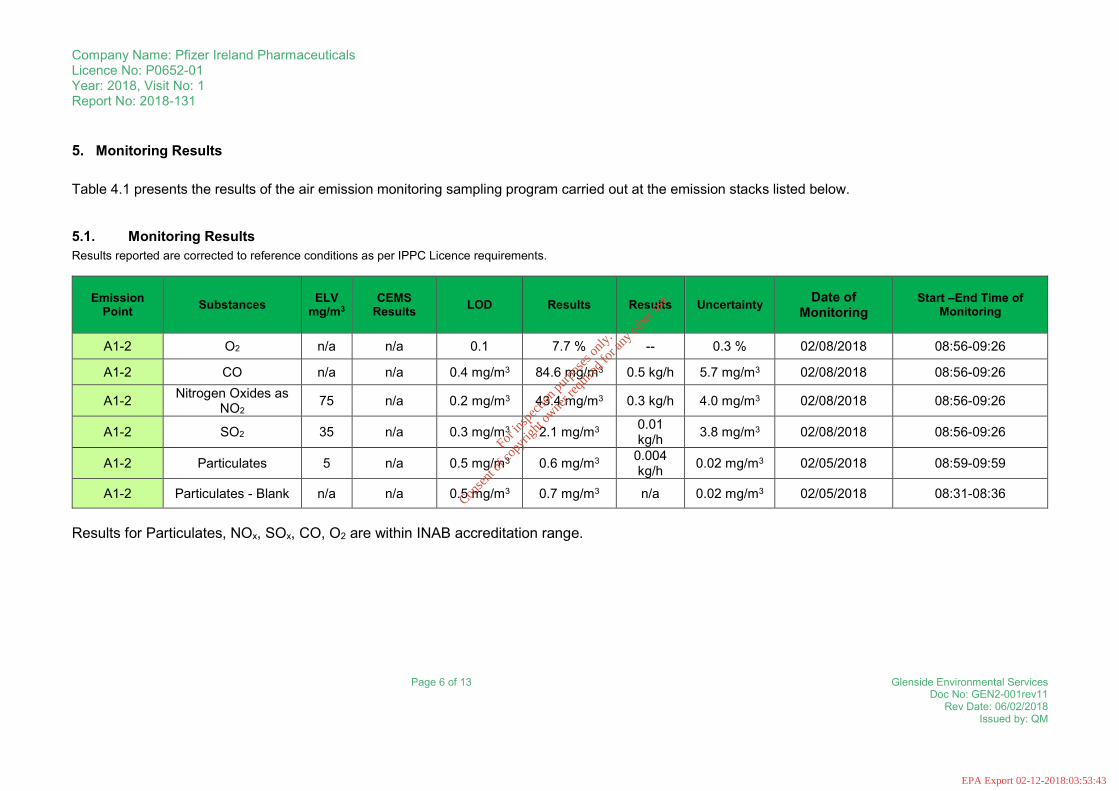
5. Monitoring Results Table 4.1 presents the results of the air emission monitoring sampling program carried out at the emission stacks listed below.
5.1. Monitoring Results Results reported are corrected to reference conditions as per IPPC Licence requirements.
Emission Point Substances ELV
mg/m3 CEMS
Results LOD Results Results Uncertainty Date of Monitoring
Start –End Time of Monitoring
A1-2 O2 n/a n/a 0.1 7.7 % -- 0.3 % 02/08/2018 08:56-09:26
A1-2 CO n/a n/a 0.4 mg/m3 84.6 mg/m3 0.5 kg/h 5.7 mg/m3 02/08/2018 08:56-09:26
A1-2 Nitrogen Oxides as NO2
75 n/a 0.2 mg/m3 43.4 mg/m3 0.3 kg/h 4.0 mg/m3 02/08/2018 08:56-09:26
A1-2 SO2 35 n/a 0.3 mg/m3 2.1 mg/m3 0.01 kg/h 3.8 mg/m3 02/08/2018 08:56-09:26
A1-2 Particulates 5 n/a 0.5 mg/m3 0.6 mg/m3 0.004 kg/h 0.02 mg/m3 02/05/2018 08:59-09:59
A1-2 Particulates - Blank n/a n/a 0.5 mg/m3 0.7 mg/m3 n/a 0.02 mg/m3 02/05/2018 08:31-08:36
Results for Particulates, NOx, SOx, CO, O2 are within INAB accreditation range.
For
insp
ectio
n pur
pose
s only
.
Conse
nt of
copy
right
owne
r req
uired
for a
ny ot
her u
se.
EPA Export 02-12-2018:03:53:43
Company Name: Pfizer Ireland Pharmaceuticals Licence No: P0652-01 Year: 2018, Visit No: 1 Report No: 2018-131
Page 7 of 13 Glenside Environmental Services Doc No: GEN2-001rev11
Rev Date: 06/02/2018 Issued by: QM
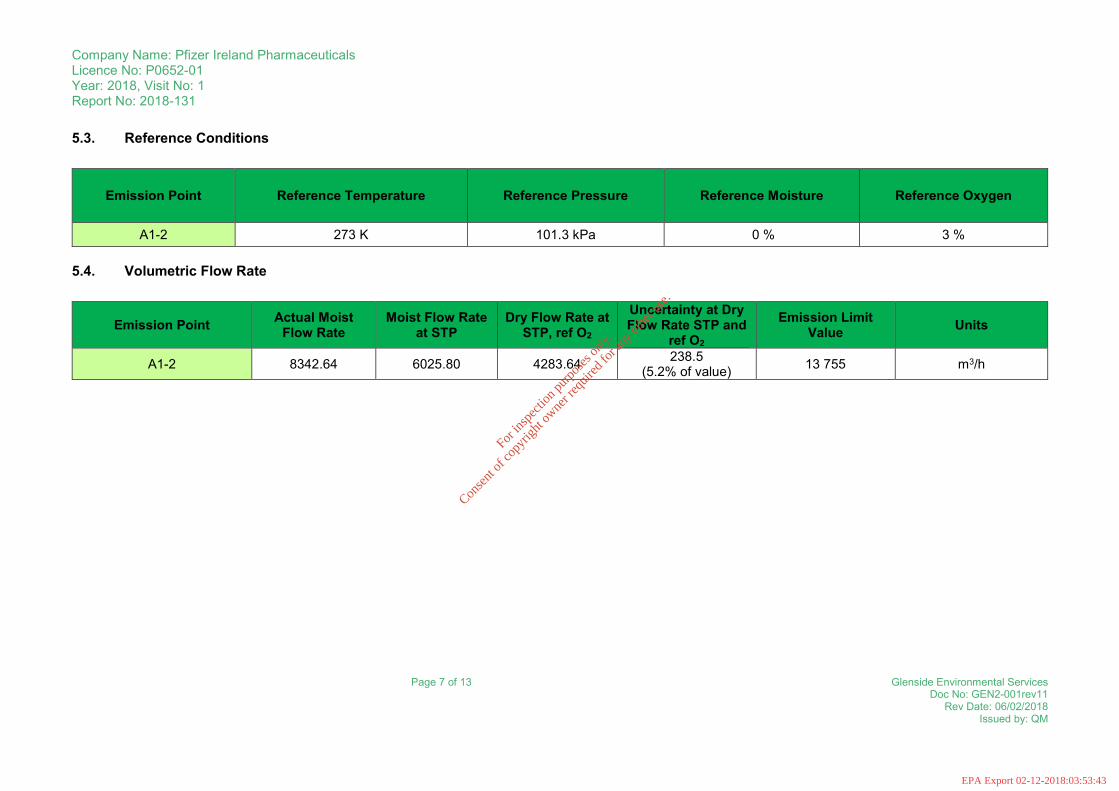
5.3. Reference Conditions
Emission Point Reference Temperature Reference Pressure Reference Moisture Reference Oxygen
A1-2 273 K 101.3 kPa 0 % 3 %
5.4. Volumetric Flow Rate
Emission Point Actual Moist Flow Rate
Moist Flow Rate at STP
Dry Flow Rate at STP, ref O2
Uncertainty at Dry Flow Rate STP and
ref O2
Emission Limit Value Units
A1-2 8342.64 6025.80 4283.64 238.5 (5.2% of value) 13 755 m3/h
For
insp
ectio
n pur
pose
s only
.
Conse
nt of
copy
right
owne
r req
uired
for a
ny ot
her u
se.
EPA Export 02-12-2018:03:53:43
Company Name: Pfizer Ireland Pharmaceuticals Licence No: P0652-01 Year: 2018, Visit No: 1 Report No: 2018-131
Page 8 of 13 Glenside Environmental Services Doc No: GEN2-001rev11
Rev Date: 06/02/2018 Issued by: QM
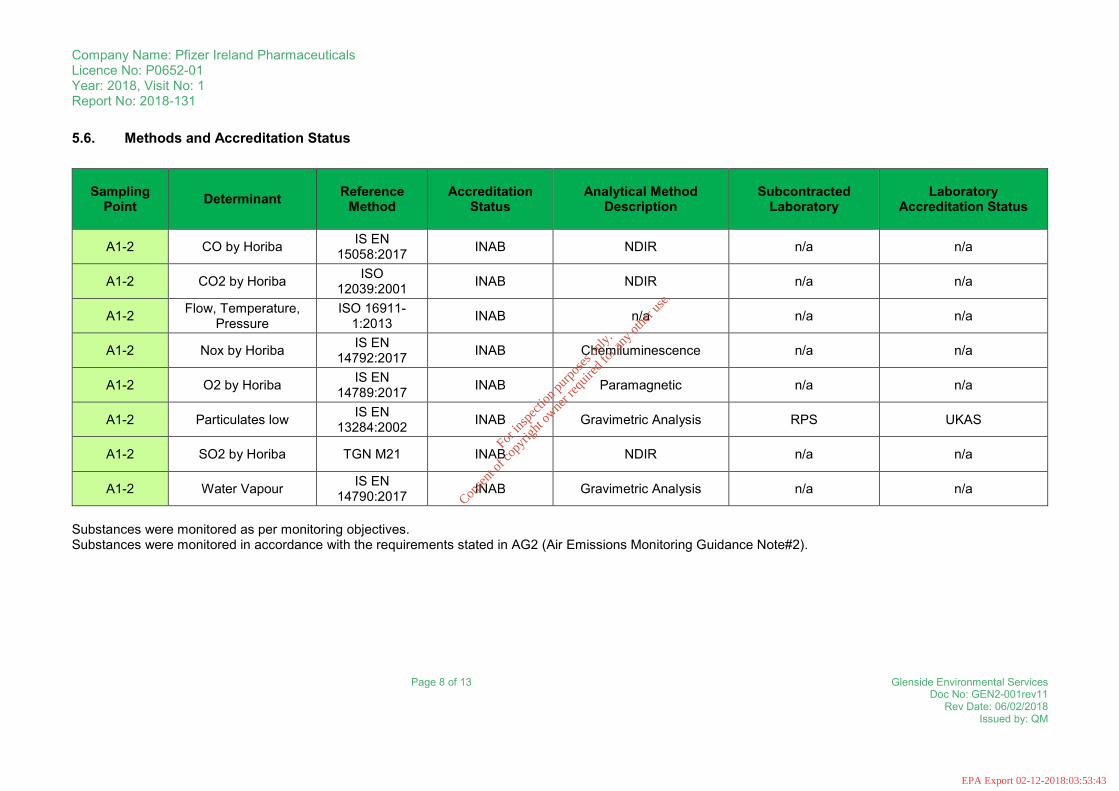
5.6. Methods and Accreditation Status
Sampling Point Determinant Reference
Method Accreditation
Status Analytical Method
Description Subcontracted
Laboratory Laboratory
Accreditation Status
A1-2 CO by Horiba IS EN 15058:2017 INAB NDIR n/a n/a
A1-2 CO2 by Horiba ISO 12039:2001 INAB NDIR n/a n/a
A1-2 Flow, Temperature, Pressure
ISO 16911-1:2013 INAB n/a n/a n/a
A1-2 Nox by Horiba IS EN 14792:2017 INAB Chemiluminescence n/a n/a
A1-2 O2 by Horiba IS EN 14789:2017 INAB Paramagnetic n/a n/a
A1-2 Particulates low IS EN 13284:2002 INAB Gravimetric Analysis RPS UKAS
A1-2 SO2 by Horiba TGN M21 INAB NDIR n/a n/a
A1-2 Water Vapour IS EN 14790:2017 INAB Gravimetric Analysis n/a n/a
Substances were monitored as per monitoring objectives. Substances were monitored in accordance with the requirements stated in AG2 (Air Emissions Monitoring Guidance Note#2).
For
insp
ectio
n pur
pose
s only
.
Conse
nt of
copy
right
owne
r req
uired
for a
ny ot
her u
se.
EPA Export 02-12-2018:03:53:43
Company Name: Pfizer Ireland Pharmaceuticals Licence No: P0652-01 Year: 2018, Visit No: 1 Report No: 2018-131
Page 9 of 13 Glenside Environmental Services Doc No: GEN2-001rev11
Rev Date: 06/02/2018 Issued by: QM
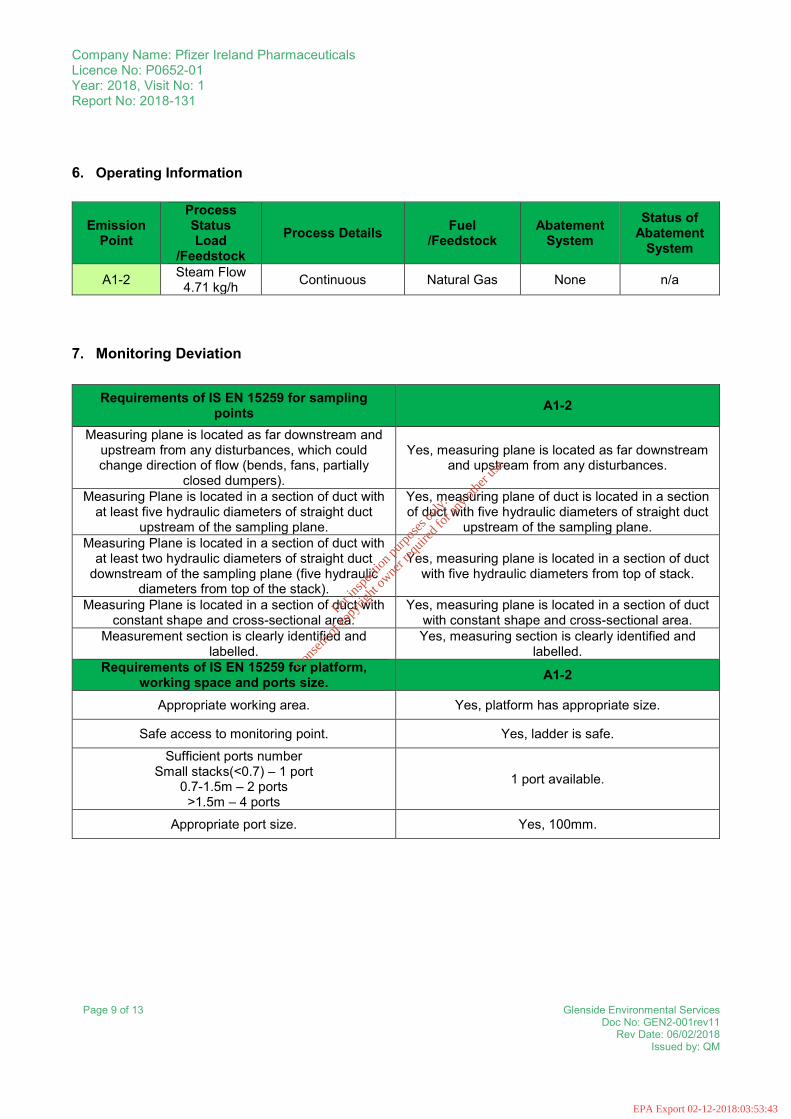
6. Operating Information
Emission Point
Process Status Load
/Feedstock Process Details Fuel
/Feedstock Abatement
System Status of
Abatement System
A1-2 Steam Flow 4.71 kg/h Continuous Natural Gas None n/a
7. Monitoring Deviation
Requirements of IS EN 15259 for sampling points A1-2
Measuring plane is located as far downstream and upstream from any disturbances, which could change direction of flow (bends, fans, partially
closed dumpers).
Yes, measuring plane is located as far downstream and upstream from any disturbances.
Measuring Plane is located in a section of duct with at least five hydraulic diameters of straight duct
upstream of the sampling plane.
Yes, measuring plane of duct is located in a section of duct with five hydraulic diameters of straight duct
upstream of the sampling plane. Measuring Plane is located in a section of duct with
at least two hydraulic diameters of straight duct downstream of the sampling plane (five hydraulic
diameters from top of the stack).
Yes, measuring plane is located in a section of duct with five hydraulic diameters from top of stack.
Measuring Plane is located in a section of duct with constant shape and cross-sectional area.
Yes, measuring plane is located in a section of duct with constant shape and cross-sectional area.
Measurement section is clearly identified and labelled.
Yes, measuring section is clearly identified and labelled.
Requirements of IS EN 15259 for platform, working space and ports size. A1-2
Appropriate working area. Yes, platform has appropriate size.
Safe access to monitoring point. Yes, ladder is safe. Sufficient ports number
Small stacks(<0.7) – 1 port 0.7-1.5m – 2 ports
>1.5m – 4 ports
1 port available.
Appropriate port size. Yes, 100mm.
For
insp
ectio
n pur
pose
s only
.
Conse
nt of
copy
right
owne
r req
uired
for a
ny ot
her u
se.
EPA Export 02-12-2018:03:53:43
Company Name: Pfizer Ireland Pharmaceuticals Licence No: P0652-01 Year: 2018, Visit No: 1 Report No: 2018-131
Page 10 of 13 Glenside Environmental Services Doc No: GEN2-001rev11
Rev Date: 06/02/2018 Issued by: QM
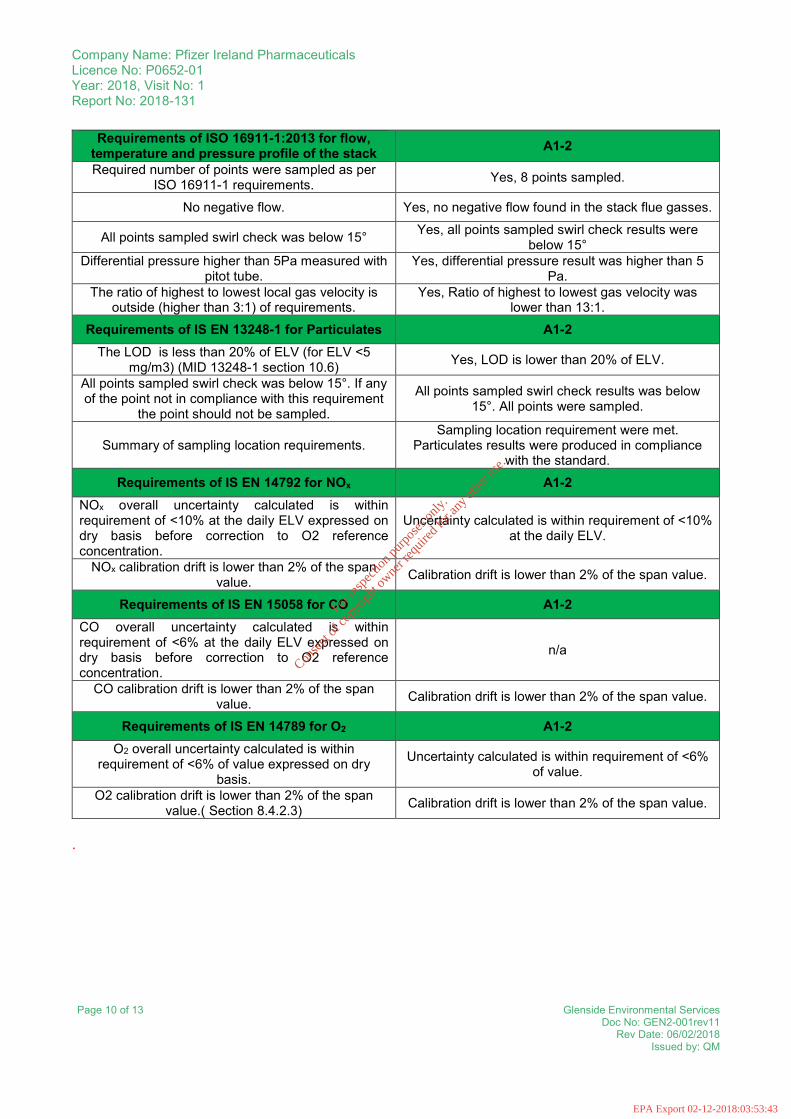
Requirements of ISO 16911-1:2013 for flow, temperature and pressure profile of the stack A1-2
Required number of points were sampled as per ISO 16911-1 requirements. Yes, 8 points sampled.
No negative flow. Yes, no negative flow found in the stack flue gasses.
All points sampled swirl check was below 15° Yes, all points sampled swirl check results were below 15°
Differential pressure higher than 5Pa measured with pitot tube.
Yes, differential pressure result was higher than 5 Pa.
The ratio of highest to lowest local gas velocity is outside (higher than 3:1) of requirements.
Yes, Ratio of highest to lowest gas velocity was lower than 13:1.
Requirements of IS EN 13248-1 for Particulates A1-2 The LOD is less than 20% of ELV (for ELV <5
mg/m3) (MID 13248-1 section 10.6) Yes, LOD is lower than 20% of ELV.
All points sampled swirl check was below 15°. If any of the point not in compliance with this requirement
the point should not be sampled. All points sampled swirl check results was below
15°. All points were sampled.
Summary of sampling location requirements. Sampling location requirement were met.
Particulates results were produced in compliance with the standard.
Requirements of IS EN 14792 for NOx A1-2 NOx overall uncertainty calculated is within requirement of <10% at the daily ELV expressed on dry basis before correction to O2 reference concentration.
Uncertainty calculated is within requirement of <10% at the daily ELV.
NOx calibration drift is lower than 2% of the span value. Calibration drift is lower than 2% of the span value.
Requirements of IS EN 15058 for CO A1-2 CO overall uncertainty calculated is within requirement of <6% at the daily ELV expressed on dry basis before correction to O2 reference concentration.
n/a
CO calibration drift is lower than 2% of the span value. Calibration drift is lower than 2% of the span value.
Requirements of IS EN 14789 for O2 A1-2 O2 overall uncertainty calculated is within
requirement of <6% of value expressed on dry basis.
Uncertainty calculated is within requirement of <6% of value.
O2 calibration drift is lower than 2% of the span value.( Section 8.4.2.3) Calibration drift is lower than 2% of the span value.
.
For
insp
ectio
n pur
pose
s only
.
Conse
nt of
copy
right
owne
r req
uired
for a
ny ot
her u
se.
EPA Export 02-12-2018:03:53:43
Company Name: Pfizer Ireland Pharmaceuticals Licence No: P0652-01 Year: 2018, Visit No: 1 Report No: 2018-131
Page 11 of 13 Glenside Environmental Services Doc No: GEN2-001rev11
Rev Date: 06/02/2018 Issued by: QM
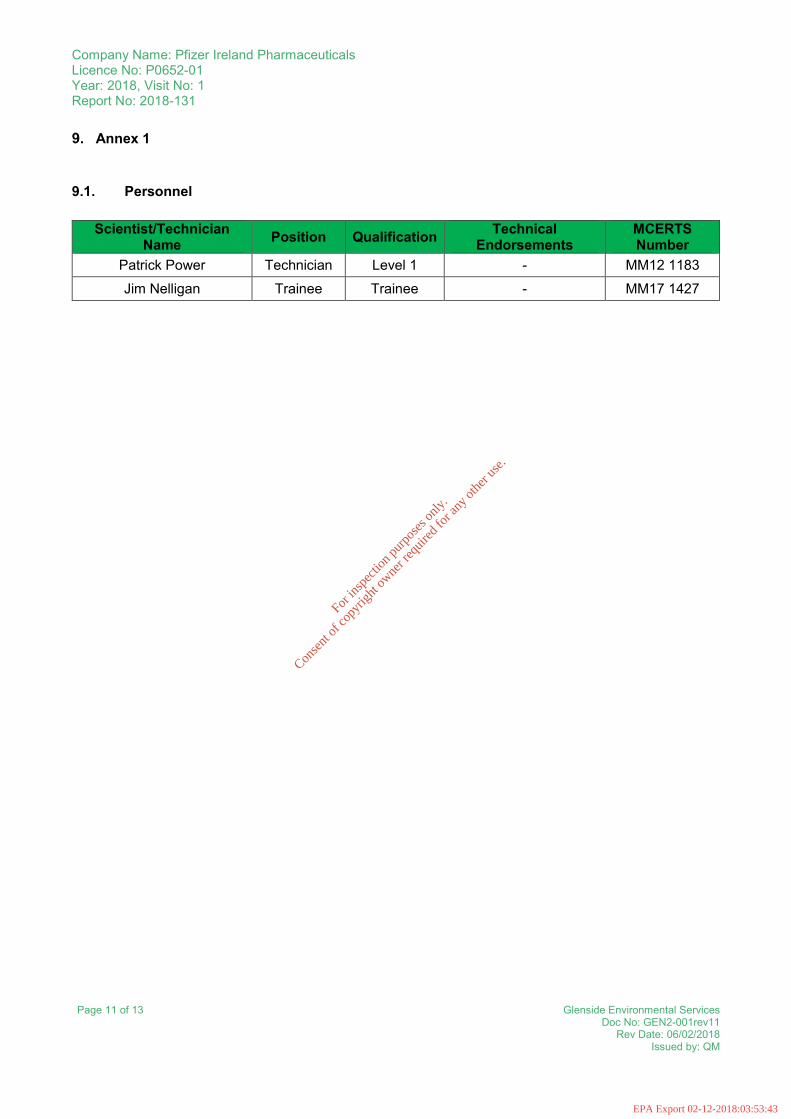
9. Annex 1
9.1. Personnel
Scientist/Technician Name Position Qualification Technical
Endorsements MCERTS Number
Patrick Power Technician Level 1 - MM12 1183 Jim Nelligan Trainee Trainee - MM17 1427
Ewa Piatek Team Leader Level 2 TE1, TE2, TE3, TE4 MM07 799
For
insp
ectio
n pur
pose
s only
.
Conse
nt of
copy
right
owne
r req
uired
for a
ny ot
her u
se.
EPA Export 02-12-2018:03:53:43
Company Name: Pfizer Ireland Pharmaceuticals Licence No: P0652-01 Year: 2018, Visit No: 1 Report No: 2018-131
Page 12 of 13 Glenside Environmental Services Doc No: GEN2-001rev11
Rev Date: 06/02/2018 Issued by: QM
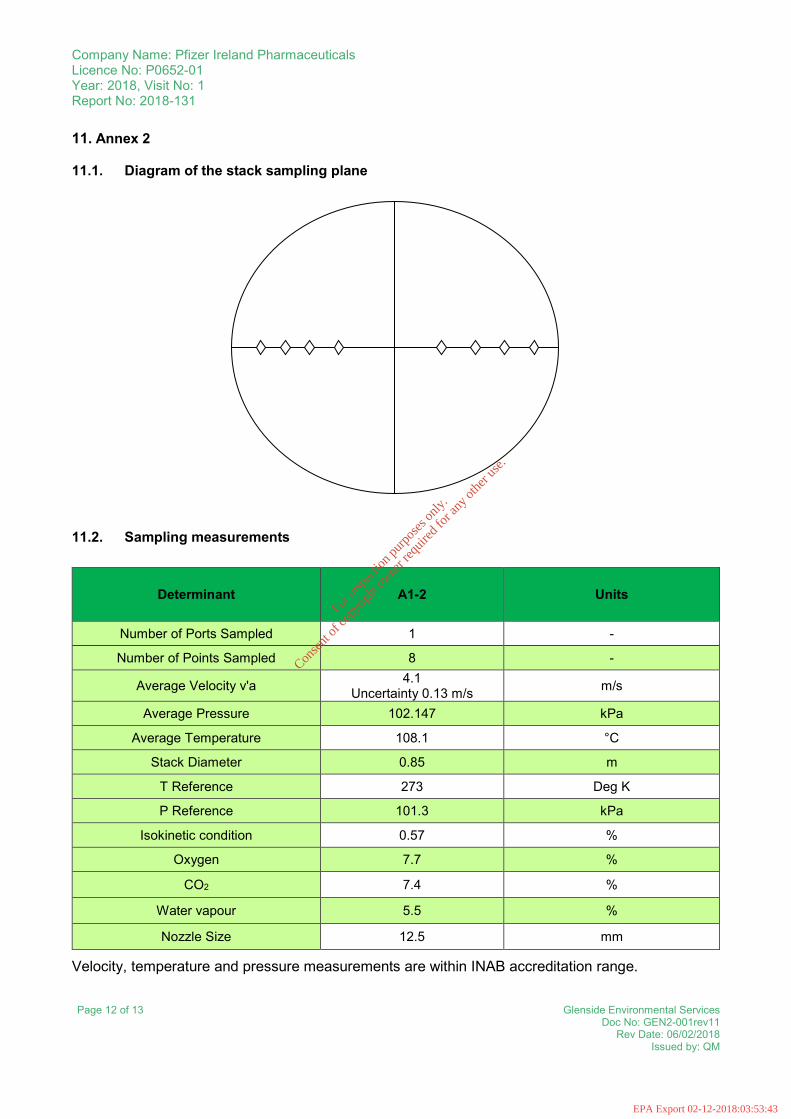
11. Annex 2
11.1. Diagram of the stack sampling plane
11.2. Sampling measurements
Determinant A1-2 Units
Number of Ports Sampled 1 -
Number of Points Sampled 8 -
Average Velocity v'a 4.1 Uncertainty 0.13 m/s m/s
Average Pressure 102.147 kPa
Average Temperature 108.1 °C
Stack Diameter 0.85 m
T Reference 273 Deg K
P Reference 101.3 kPa
Isokinetic condition 0.57 %
Oxygen 7.7 %
CO2 7.4 %
Water vapour 5.5 %
Nozzle Size 12.5 mm
Velocity, temperature and pressure measurements are within INAB accreditation range.
For
insp
ectio
n pur
pose
s only
.
Conse
nt of
copy
right
owne
r req
uired
for a
ny ot
her u
se.
EPA Export 02-12-2018:03:53:43

Company Name: Pfizer Ireland Pharmaceuticals Licence No: P0652-01 Year: 2018, Visit No: 1 Report No: 2018-131
Page 13 of 13 Glenside Environmental Services Doc No: GEN2-001rev11
Rev Date: 06/02/2018 Issued by: QM
12. Annex 3
12.1. Results and uncertainty calculations for Stack A1-2 – Total of 27 pages
12.2. Laboratory Certificates – Total of 2 pages
For
insp
ectio
n pur
pose
s only
.
Conse
nt of
copy
right
owne
r req
uired
for a
ny ot
her u
se.
EPA Export 02-12-2018:03:53:43
Page1of27
Company Name: Doc NoLicence No: Rev Date:Year: 2018 Issued by:Sampling Date:Report No: Flow Calculations for A1-2
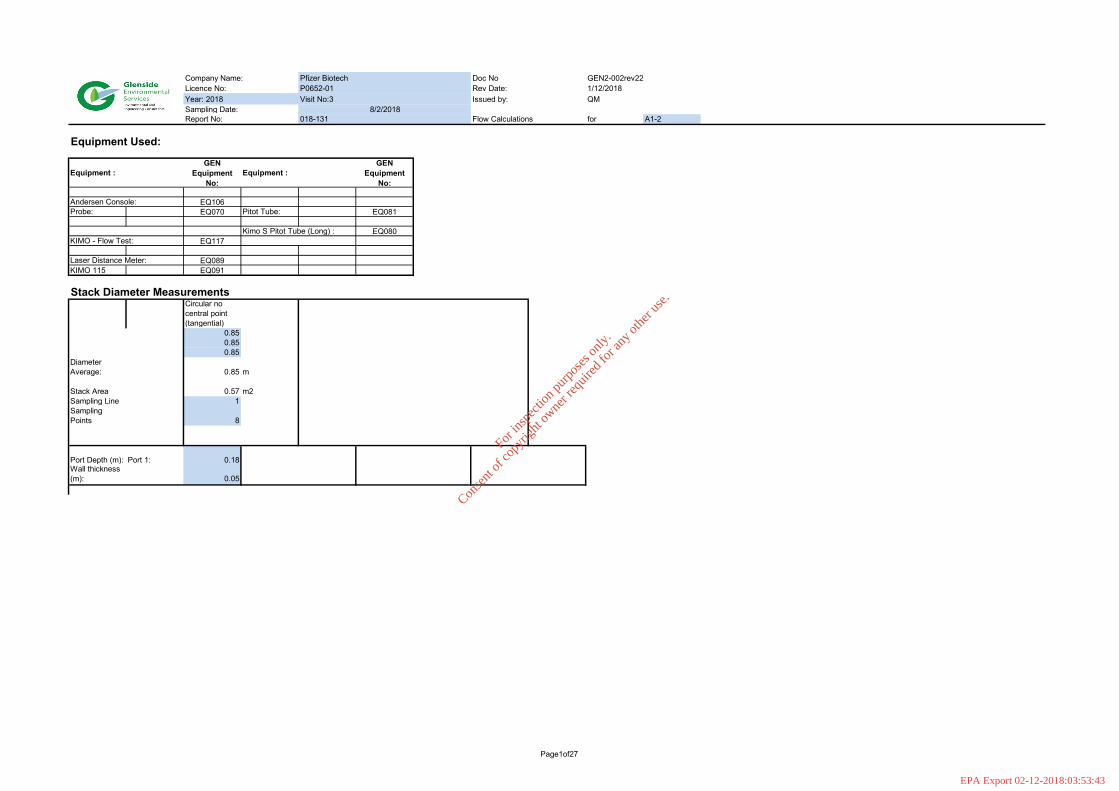
Equipment Used:
Equipment :GEN
Equipment No:
Equipment :GEN
Equipment No:
Millennium 5 console: EQ069Andersen Console: EQ106Probe: EQ070 Pitot Tube: EQ081Probe: EQ107 Pitot Tube: EQ113KIMO - Flow Test: EQ079 Kimo S Pitot Tube (Long) : EQ080KIMO - Flow Test: EQ117 Kimo L Pitot Tube : EQ116Rule: EQ083Laser Distance Meter: EQ089KIMO 115 EQ091
Stack Diameter MeasurementsCircular no central point (tangential)
0.850.850.85
Diameter Average: #DIV/0! 0.85 m
Stack Area #DIV/0! 0.57 m2Sampling Line 1Sampling Points 8
Port Depth (m): Port 1: 0.18 Port 2: Port 3: Port 4:Wall thickness (m): 0.05
GEN2-002rev221/12/2018QM
8/2/2018018-131
Pfizer BiotechP0652-01Visit No:3
For
insp
ectio
n pur
pose
s only
.
Conse
nt of
copy
right
owne
r req
uired
for a
ny ot
her u
se.
EPA Export 02-12-2018:03:53:43
Page2of27
Company Name: Doc NoLicence No: Rev Date:Year: 2018 Issued by:Sampling Date:Report No: Flow Calculations for A1-2
GEN2-002rev221/12/2018QM
8/2/2018018-131
Pfizer BiotechP0652-01Visit No:3
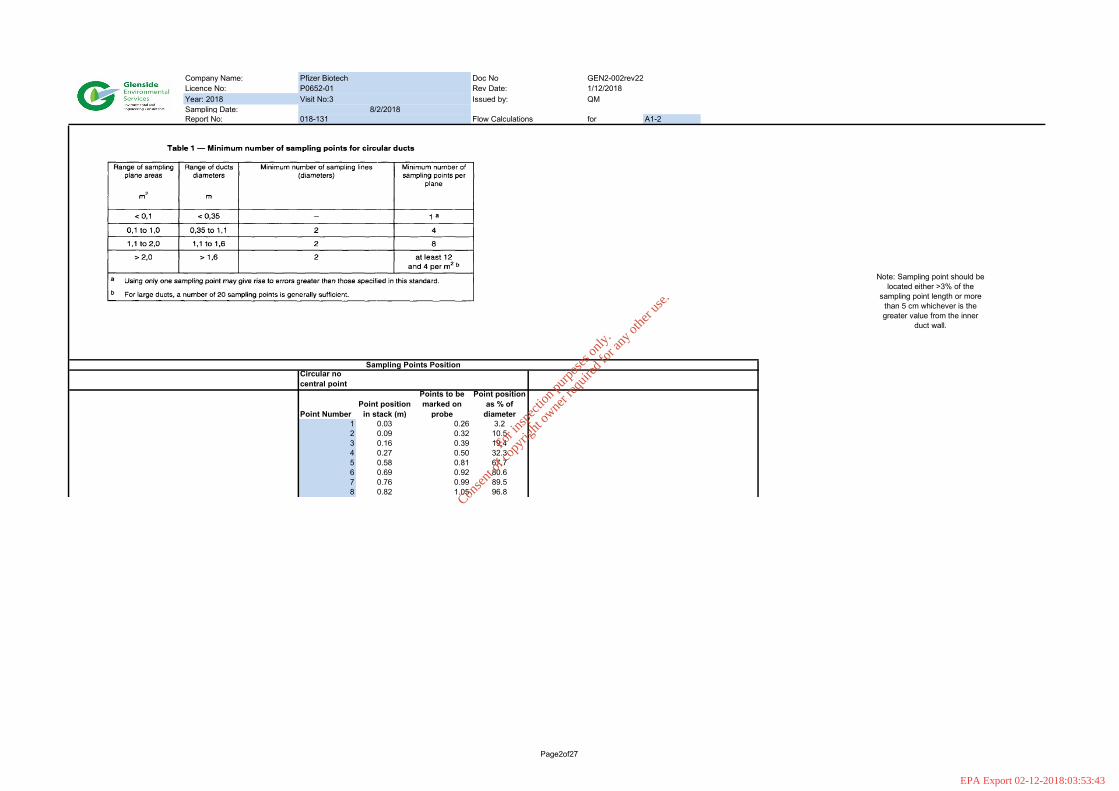
Circular no central point
Point NumberPoint position
in stack (m)
Points to be marked on
probe
Point position as % of
diameter1 0.03 0.26 3.22 0.09 0.32 10.53 0.16 0.39 19.44 0.27 0.50 32.35 0.58 0.81 67.76 0.69 0.92 80.67 0.76 0.99 89.58 0.82 1.05 96.8
Note: Sampling point should be located either >3% of the
sampling point length or more than 5 cm whichever is the greater value from the inner
duct wall.
Sampling Points Position
For
insp
ectio
n pur
pose
s only
.
Conse
nt of
copy
right
owne
r req
uired
for a
ny ot
her u
se.
EPA Export 02-12-2018:03:53:43
Page3of27
Company Name: Doc NoLicence No: Rev Date:Year: 2018 Issued by:Sampling Date:Report No: Flow Calculations for A1-2
GEN2-002rev221/12/2018QM
8/2/2018018-131
Pfizer BiotechP0652-01Visit No:3
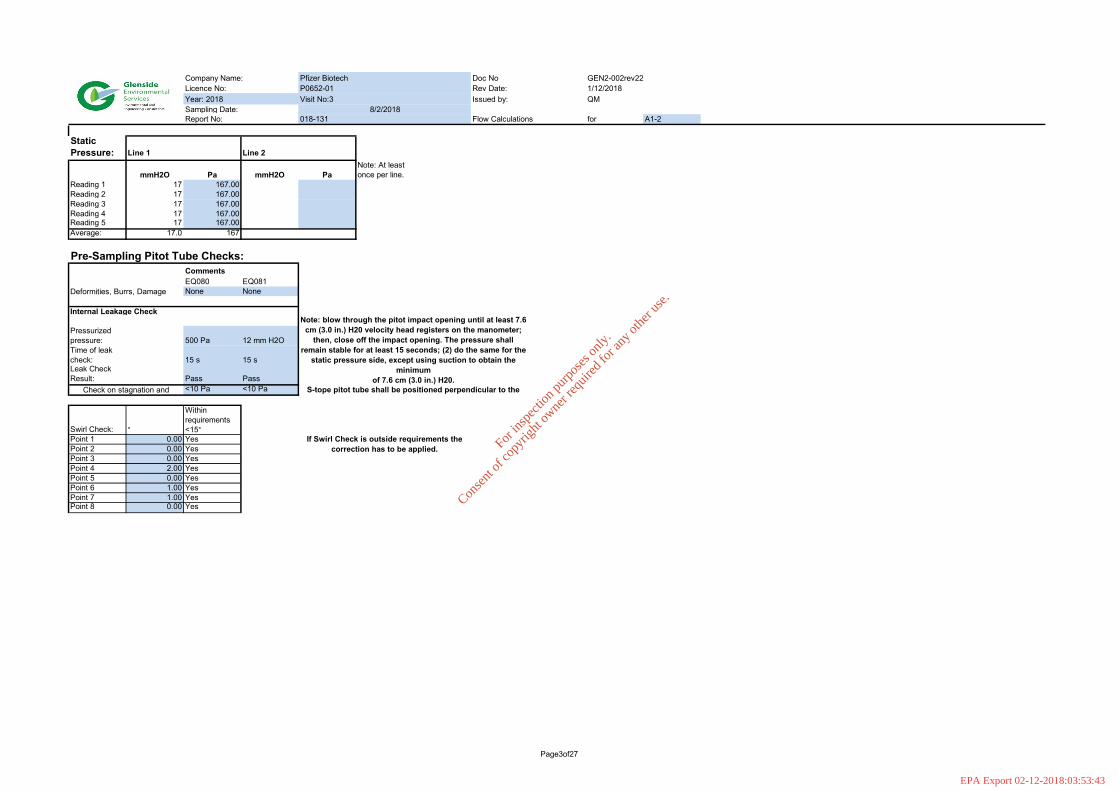
Static Pressure: Line 1 Line 2
mmH2O Pa mmH2O PaNote: At least once per line.
Reading 1 17 167.00 17 167.00Reading 2 17 167.00 17 167.00Reading 3 17 167.00 17 167.00Reading 4 17 167.00 17 167.00Reading 5 17 167.00 17 167.00Average: 17.0 167 17.0 167
Pre-Sampling Pitot Tube Checks:CommentsEQ080 EQ081None None
Internal Leakage Check
Pressurized pressure: 500 Pa 12 mm H2OTime of leak check: 15 s 15 sLeak Check Result: Pass Pass
<10 Pa <10 Pa
Swirl Check: °
Within requirements <15°
Point 1 0.00 YesPoint 2 0.00 YesPoint 3 0.00 YesPoint 4 2.00 YesPoint 5 0.00 YesPoint 6 1.00 YesPoint 7 1.00 YesPoint 8 0.00 Yes
S-tope pitot tube shall be positioned perpendicular to the
Note: blow through the pitot impact opening until at least 7.6 cm (3.0 in.) H20 velocity head registers on the manometer;
then, close off the impact opening. The pressure shall remain stable for at least 15 seconds; (2) do the same for the
static pressure side, except using suction to obtain the minimum
of 7.6 cm (3.0 in.) H20.
If Swirl Check is outside requirements the correction has to be applied.
Deformities, Burrs, Damage
Check on stagnation and
For
insp
ectio
n pur
pose
s only
.
Conse
nt of
copy
right
owne
r req
uired
for a
ny ot
her u
se.
EPA Export 02-12-2018:03:53:43
Page4of27
Company Name: Doc NoLicence No: Rev Date:Year: 2018 Issued by:Sampling Date:Report No: Flow Calculations for A1-2
GEN2-002rev221/12/2018QM
8/2/2018018-131
Pfizer BiotechP0652-01Visit No:3
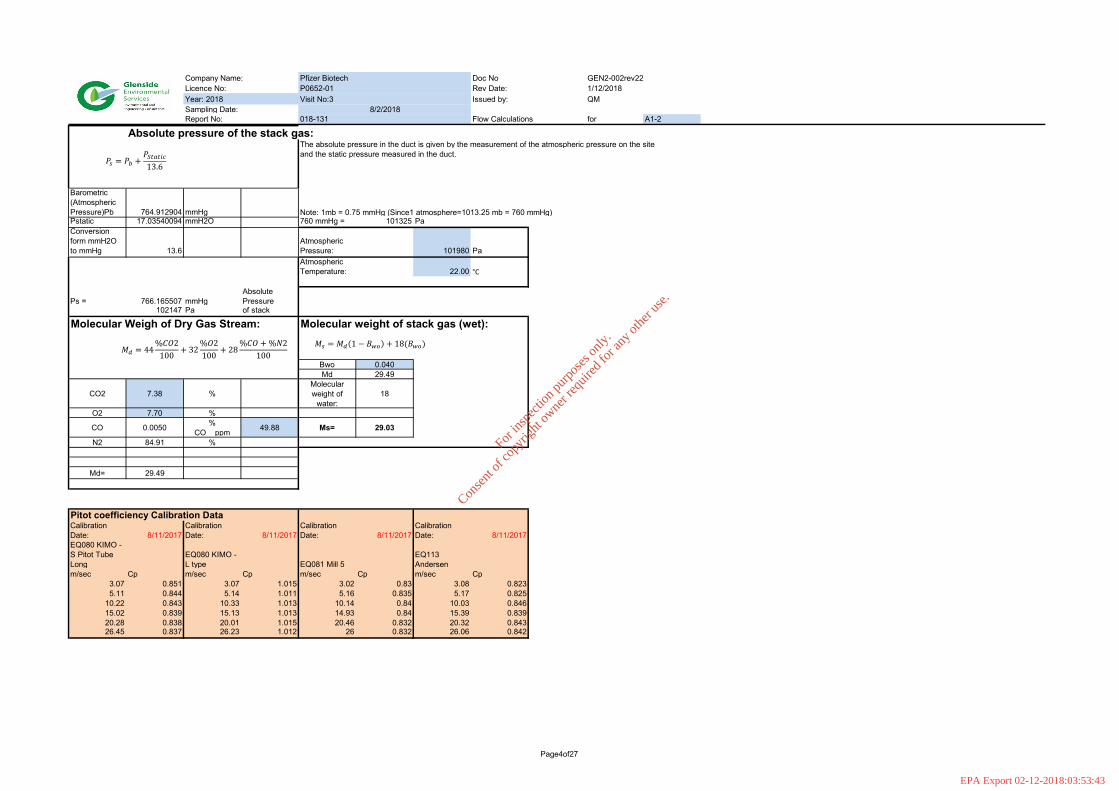
Absolute pressure of the stack gas:The absolute pressure in the duct is given by the measurement of the atmospheric pressure on the siteand the static pressure measured in the duct.
Barometric (Atmospheric Pressure)Pb 764.912904 mmHg Note: 1mb = 0.75 mmHg (Since1 atmosphere=1013.25 mb = 760 mmHg)Pstatic 17.03540094 mmH2O 760 mmHg = 101325 PaConversion form mmH2O to mmHg 13.6
Atmospheric Pressure: 101980 PaAtmospheric Temperature: 22.00 °C
Ps = 766.165507 mmHgAbsolute Pressure
102147 Pa of stack
Molecular Weigh of Dry Gas Stream: Molecular weight of stack gas (wet):
Bwo 0.040Md 29.49
CO2 7.38 %Molecular weight of
water:18
O2 7.70 %
CO 0.0050 % CO ppm 49.88 Ms= 29.03
N2 84.91 %
Md= 29.49
Pitot coefficiency Calibration DataCalibration Date: 8/11/2017
Calibration Date: 8/11/2017
Calibration Date: 8/11/2017
Calibration Date: 8/11/2017
EQ080 KIMO - S Pitot Tube Long
EQ080 KIMO - L type EQ081 Mill 5
EQ113 Andersen
m/sec Cp m/sec Cp m/sec Cp m/sec Cp3.07 0.851 3.07 1.015 3.02 0.83 3.08 0.8235.11 0.844 5.14 1.011 5.16 0.835 5.17 0.825
10.22 0.843 10.33 1.013 10.14 0.84 10.03 0.84615.02 0.839 15.13 1.013 14.93 0.84 15.39 0.83920.28 0.838 20.01 1.015 20.46 0.832 20.32 0.84326.45 0.837 26.23 1.012 26 0.832 26.06 0.842
𝑃𝑃𝑠𝑠 = 𝑃𝑃𝑏𝑏 +𝑃𝑃𝑆𝑆𝑆𝑆𝑆𝑆𝑆𝑆𝑆𝑆𝑆𝑆13.6
𝑀𝑀𝑑𝑑 = 44%𝐶𝐶𝐶𝐶𝐶
100+ 3𝐶
%𝐶𝐶𝐶100
+ 𝐶8%𝐶𝐶𝐶𝐶 + %𝑁𝑁𝐶
100𝑀𝑀𝑠𝑠 = 𝑀𝑀𝑑𝑑 1− 𝐵𝐵𝑤𝑤𝑤𝑤 + 18(𝐵𝐵𝑤𝑤𝑤𝑤)
For
insp
ectio
n pur
pose
s only
.
Conse
nt of
copy
right
owne
r req
uired
for a
ny ot
her u
se.
EPA Export 02-12-2018:03:53:43
Page5of27
Company Name: Doc NoLicence No: Rev Date:Year: 2018 Issued by:Sampling Date:Report No: Flow Calculations for A1-2
GEN2-002rev221/12/2018QM
8/2/2018018-131
Pfizer BiotechP0652-01Visit No:3
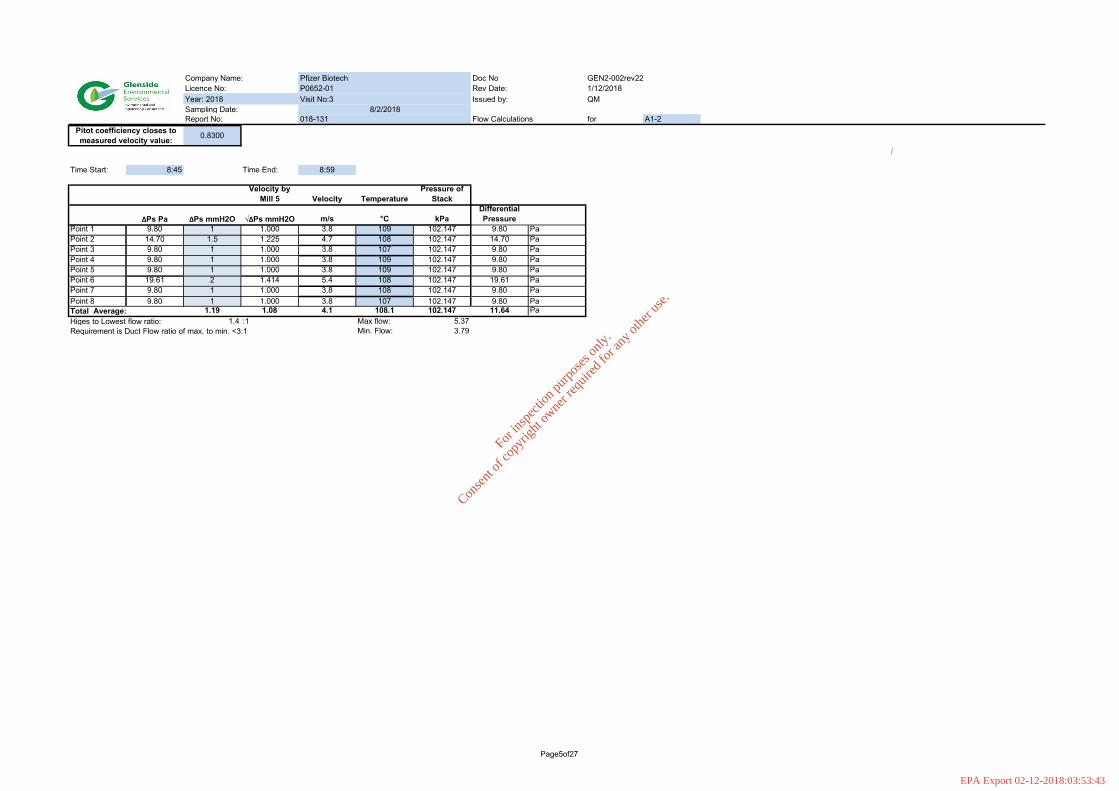
Time Start: 8:45 Time End: 8:59
Velocity by Mill 5 Velocity Temperature
Pressure of Stack
ΔPs Pa ΔPs mmH2O √ΔPs mmH2O m/s °C kPaDifferential Pressure
Point 1 9.80 1 1.000 3.8 109 102.147 9.80 PaPoint 2 14.70 1.5 1.225 4.7 108 102.147 14.70 PaPoint 3 9.80 1 1.000 3.8 107 102.147 9.80 PaPoint 4 9.80 1 1.000 3.8 109 102.147 9.80 PaPoint 5 9.80 1 1.000 3.8 109 102.147 9.80 PaPoint 6 19.61 2 1.414 5.4 108 102.147 19.61 PaPoint 7 9.80 1 1.000 3.8 108 102.147 9.80 PaPoint 8 9.80 1 1.000 3.8 107 102.147 9.80 PaTotal Average: 1.19 1.08 4.1 108.1 102.147 11.64 PaHiges to Lowest flow ratio: 1.4 :1 Max flow: 5.37Requirement is Duct Flow ratio of max. to min. <3:1 Min. Flow: 3.79
Pitot coefficiency closes to measured velocity value: 0.8300
For
insp
ectio
n pur
pose
s only
.
Conse
nt of
copy
right
owne
r req
uired
for a
ny ot
her u
se.
EPA Export 02-12-2018:03:53:43
Page6of27
Company Name: Doc NoLicence No: Rev Date:Year: 2018 Issued by:Sampling Date:Report No: Flow Calculations for A1-2
GEN2-002rev221/12/2018QM
8/2/2018018-131
Pfizer BiotechP0652-01Visit No:3
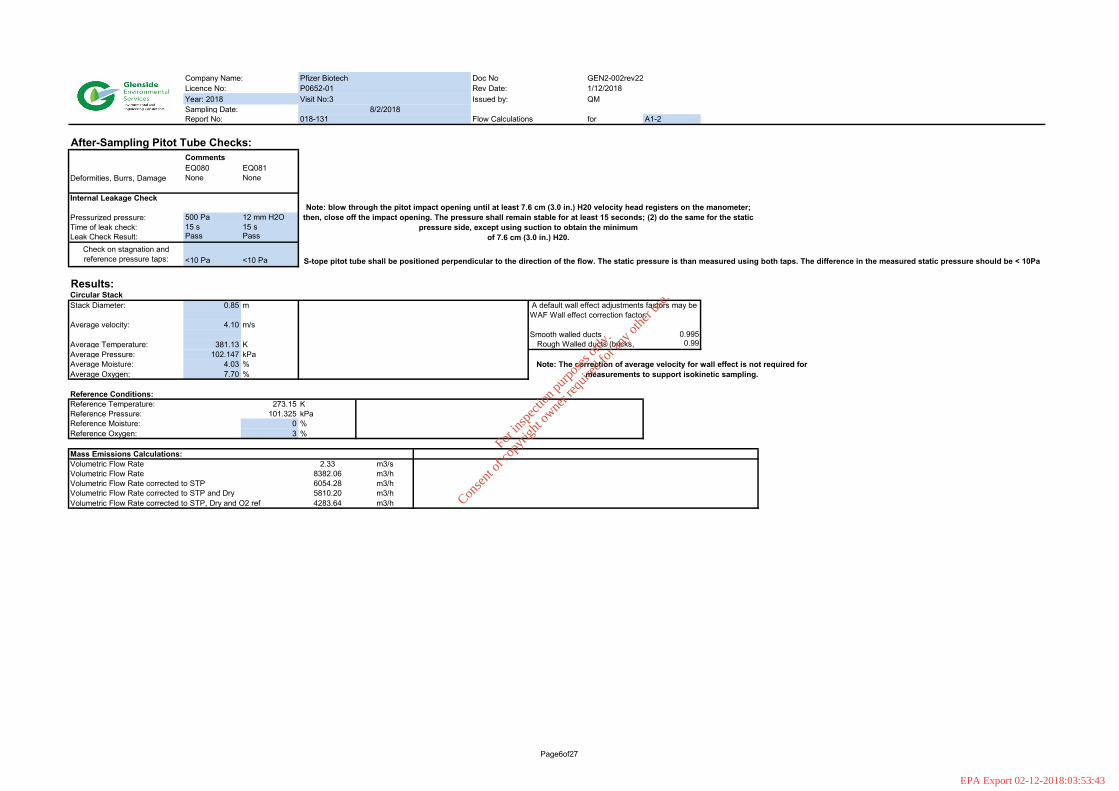
After-Sampling Pitot Tube Checks:CommentsEQ080 EQ081None None
Internal Leakage Check
Pressurized pressure: 500 Pa 12 mm H2OTime of leak check: 15 s 15 sLeak Check Result: Pass Pass
<10 Pa <10 Pa
Results:Circular Stack Rectangular stackStack Diameter: 0.85 m Port Size: 0 m
WAF Wall effect correction factor:Average velocity: 4.10 m/s Deep Size: 0 m
1 Average Velocity: 4.10 m/s Smooth walled ducts 0.995Average Temperature: 381.13 K Average Temperature: 381.13 K 0.99Average Pressure: 102.147 kPa Average Pressure: 102.147 kPaAverage Moisture: 4.03 % Average Moisture: 5 %Average Oxygen: 7.70 % Average Oxygen: 5 %
Reference Conditions:Reference Temperature: 273.15 KReference Pressure: 101.325 kPaReference Moisture: 0 %Reference Oxygen: 3 %
Mass Emissions Calculations:Volumetric Flow Rate 2.33 m3/sVolumetric Flow Rate 8382.06 m3/hVolumetric Flow Rate corrected to STP 6054.28 m3/hVolumetric Flow Rate corrected to STP and Dry 5810.20 m3/hVolumetric Flow Rate corrected to STP, Dry and O2 ref 4283.64 m3/h
Note: The correction of average velocity for wall effect is not required for measurements to support isokinetic sampling.
A default wall effect adjustments factors may be
Rough Walled ducts (bricks,
Deformities, Burrs, Damage
Check on stagnation and reference pressure taps: S-tope pitot tube shall be positioned perpendicular to the direction of the flow. The static pressure is than measured using both taps. The difference in the measured static pressure should be < 10Pa
Note: blow through the pitot impact opening until at least 7.6 cm (3.0 in.) H20 velocity head registers on the manometer; then, close off the impact opening. The pressure shall remain stable for at least 15 seconds; (2) do the same for the static
pressure side, except using suction to obtain the minimumof 7.6 cm (3.0 in.) H20.
For
insp
ectio
n pur
pose
s only
.
Conse
nt of
copy
right
owne
r req
uired
for a
ny ot
her u
se.
EPA Export 02-12-2018:03:53:43
Page7of27
Company Name: Doc NoLicence No: Rev Date:Year: 2018 Issued by:Sampling Date:Report No: Flow Calculations for A1-2
GEN2-002rev221/12/2018QM
8/2/2018018-131
Pfizer BiotechP0652-01Visit No:3
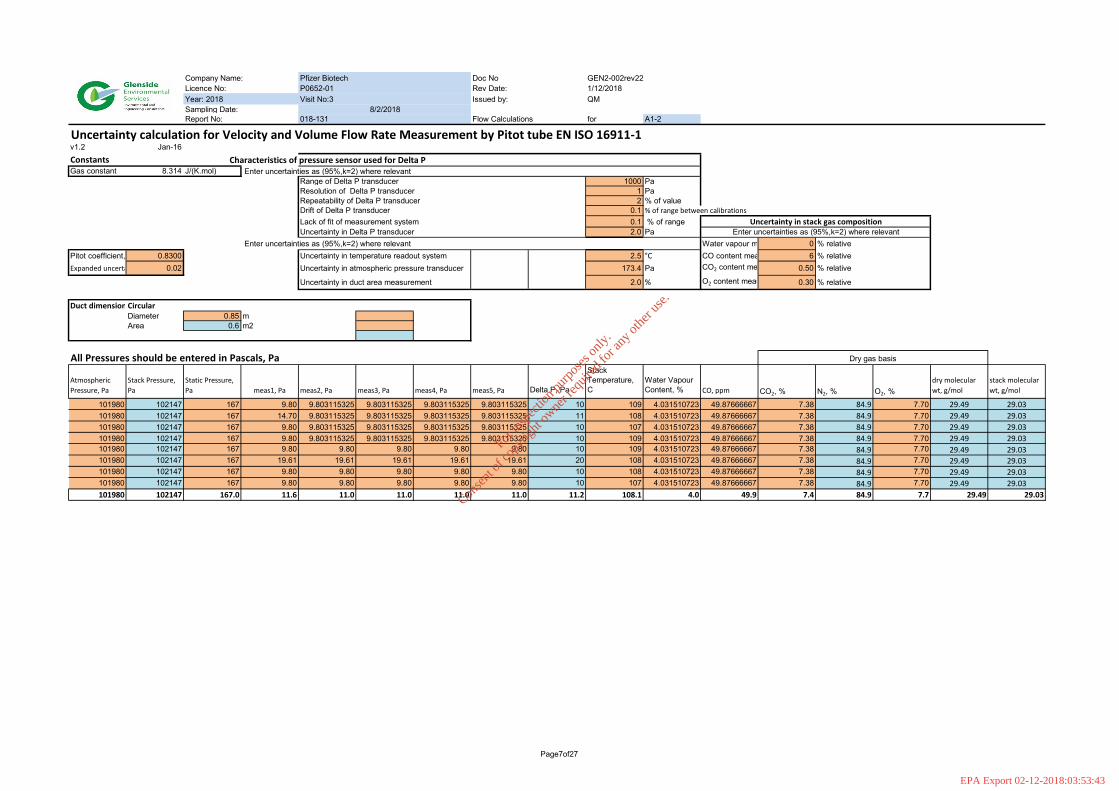
Uncertainty calculation for Velocity and Volume Flow Rate Measurement by Pitot tube EN ISO 16911-1v1.2 Jan-16Constants Characteristics of pressure sensor used for Delta PGas constant 8.314 J/(K.mol) Enter uncertainties as (95%,k=2) where relevant
Range of Delta P transducer 1000 PaResolution of Delta P transducer 1 PaRepeatability of Delta P transducer 2 % of valueDrift of Delta P transducer 0.1 % of range between calibrationsLack of fit of measurement system 0.1 % of rangeUncertainty in Delta P transducer 2.0 Pa
Enter uncertainties as (95%,k=2) where relevant Water vapour m 0 % relativePitot coefficient, 0.8300 Uncertainty in temperature readout system 2.5 °C CO content mea 6 % relativeExpanded uncerta 0.02 Uncertainty in atmospheric pressure transducer 173.4 Pa CO2 content me 0.50 % relative
Uncertainty in duct area measurement 2.0 % O2 content meas 0.30 % relative
Duct dimension CircularDiameter 0.85 mArea 0.6 m2
All Pressures should be entered in Pascals, Pa
Atmospheric Pressure, Pa
Stack Pressure, Pa
Static Pressure, Pa meas1, Pa meas2, Pa meas3, Pa meas4, Pa meas5, Pa Delta P, Pa
Stack Temperature, C
Water Vapour Content, % CO, ppm CO2, % N2, % O2, %
dry molecular wt, g/mol
stack molecular wt, g/mol
101980 102147 167 9.80 9.803115325 9.803115325 9.803115325 9.803115325 10 109 4.031510723 49.87666667 7.38 84.9 7.70 29.49 29.03101980 102147 167 14.70 9.803115325 9.803115325 9.803115325 9.803115325 11 108 4.031510723 49.87666667 7.38 84.9 7.70 29.49 29.03101980 102147 167 9.80 9.803115325 9.803115325 9.803115325 9.803115325 10 107 4.031510723 49.87666667 7.38 84.9 7.70 29.49 29.03101980 102147 167 9.80 9.803115325 9.803115325 9.803115325 9.803115325 10 109 4.031510723 49.87666667 7.38 84.9 7.70 29.49 29.03101980 102147 167 9.80 9.80 9.80 9.80 9.80 10 109 4.031510723 49.87666667 7.38 84.9 7.70 29.49 29.03101980 102147 167 19.61 19.61 19.61 19.61 19.61 20 108 4.031510723 49.87666667 7.38 84.9 7.70 29.49 29.03101980 102147 167 9.80 9.80 9.80 9.80 9.80 10 108 4.031510723 49.87666667 7.38 84.9 7.70 29.49 29.03101980 102147 167 9.80 9.80 9.80 9.80 9.80 10 107 4.031510723 49.87666667 7.38 84.9 7.70 29.49 29.03101980 102147 167.0 11.6 11.0 11.0 11.0 11.0 11.2 108.1 4.0 49.9 7.4 84.9 7.7 29.49 29.03
Uncertainty in stack gas compositionEnter uncertainties as (95%,k=2) where relevant
Dry gas basis
For
insp
ectio
n pur
pose
s only
.
Conse
nt of
copy
right
owne
r req
uired
for a
ny ot
her u
se.
EPA Export 02-12-2018:03:53:43
Page8of27
Company Name: Doc NoLicence No: Rev Date:Year: 2018 Issued by:Sampling Date:Report No: Flow Calculations for A1-2
GEN2-002rev221/12/2018QM
8/2/2018018-131
Pfizer BiotechP0652-01Visit No:3
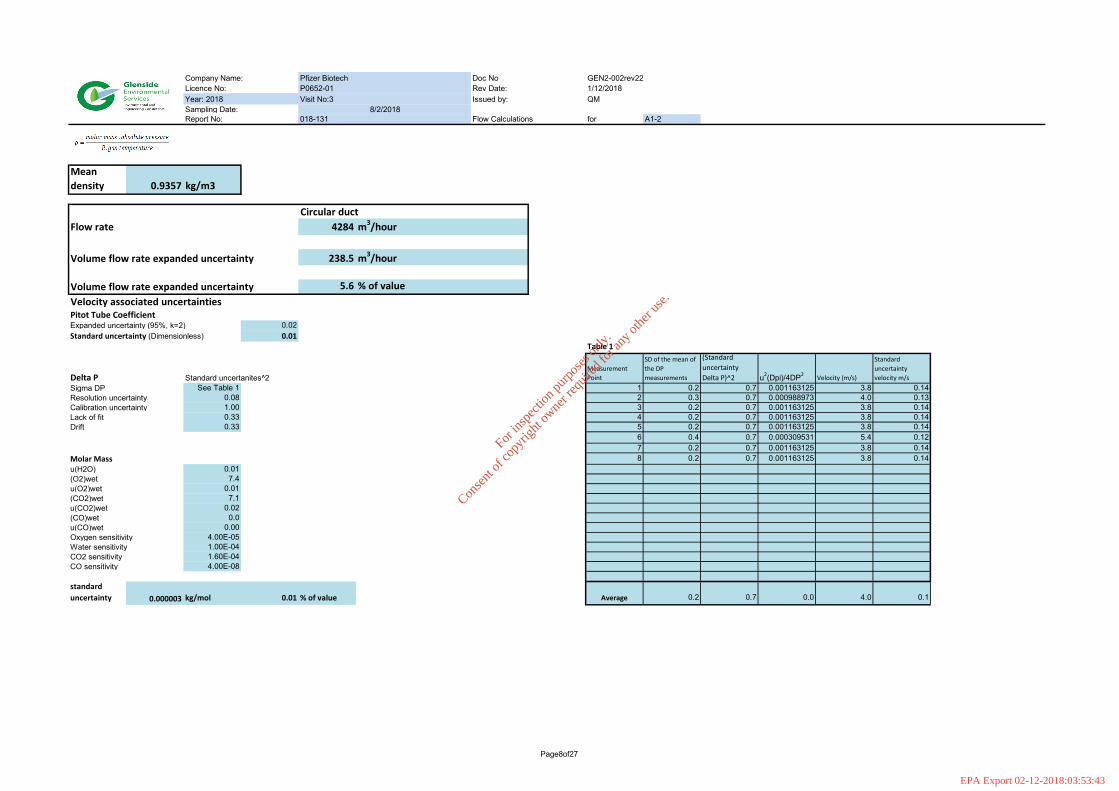
Mean density 0.9357 kg/m3
Circular ductFlow rate 4284 m3/hour
Volume flow rate expanded uncertainty 238.5 m3/hour
Volume flow rate expanded uncertainty 5.6 % of valueVelocity associated uncertaintiesPitot Tube CoefficientExpanded uncertainty (95%, k=2) 0.02Standard uncertainty (Dimensionless) 0.01
Table 1
Delta P Standard uncertanites^2Measurement Point
SD of the mean of the DP measurements
(Standard uncertainty Delta P)^2 u2(Dpi)/4DP2 Velocity (m/s)
Standard uncertainty velocity m/s
Sigma DP See Table 1 1 0.2 0.7 0.001163125 3.8 0.14Resolution uncertainty 0.08 2 0.3 0.7 0.000988973 4.0 0.13Calibration uncertainty 1.00 3 0.2 0.7 0.001163125 3.8 0.14Lack of fit 0.33 4 0.2 0.7 0.001163125 3.8 0.14Drift 0.33 5 0.2 0.7 0.001163125 3.8 0.14
6 0.4 0.7 0.000309531 5.4 0.127 0.2 0.7 0.001163125 3.8 0.14
Molar Mass 8 0.2 0.7 0.001163125 3.8 0.14u(H2O) 0.01(O2)wet 7.4u(O2)wet 0.01(CO2)wet 7.1u(CO2)wet 0.02(CO)wet 0.0u(CO)wet 0.00Oxygen sensitivity 4.00E-05Water sensitivity 1.00E-04CO2 sensitivity 1.60E-04CO sensitivity 4.00E-08
standard uncertainty 0.000003 kg/mol 0.01 % of value Average 0.2 0.7 0.0 4.0 0.1
For
insp
ectio
n pur
pose
s only
.
Conse
nt of
copy
right
owne
r req
uired
for a
ny ot
her u
se.
EPA Export 02-12-2018:03:53:43
Page9of27
Company Name: Doc NoLicence No: Rev Date:Year: 2018 Issued by:Sampling Date:Report No: Flow Calculations for A1-2
GEN2-002rev221/12/2018QM
8/2/2018018-131
Pfizer BiotechP0652-01Visit No:3
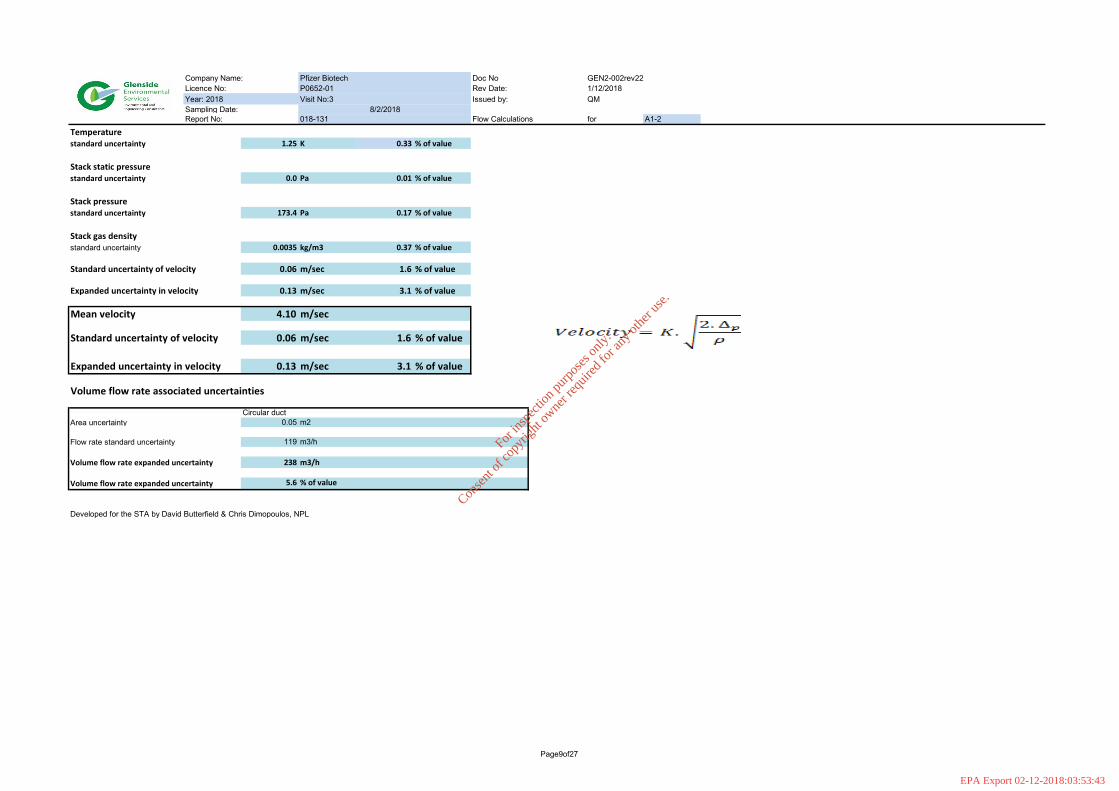
Temperaturestandard uncertainty 1.25 K 0.33 % of value
Stack static pressurestandard uncertainty 0.0 Pa 0.01 % of value
Stack pressurestandard uncertainty 173.4 Pa 0.17 % of value
Stack gas densitystandard uncertainty 0.0035 kg/m3 0.37 % of value
Standard uncertainty of velocity 0.06 m/sec 1.6 % of value
Expanded uncertainty in velocity 0.13 m/sec 3.1 % of value
Mean velocity 4.10 m/sec
Standard uncertainty of velocity 0.06 m/sec 1.6 % of value
Expanded uncertainty in velocity 0.13 m/sec 3.1 % of value
Volume flow rate associated uncertainties
Circular ductArea uncertainty 0.05 m2
Flow rate standard uncertainty 119 m3/h
Volume flow rate expanded uncertainty 238 m3/h
Volume flow rate expanded uncertainty 5.6 % of value
Developed for the STA by David Butterfield & Chris Dimopoulos, NPL
For
insp
ectio
n pur
pose
s only
.
Conse
nt of
copy
right
owne
r req
uired
for a
ny ot
her u
se.
EPA Export 02-12-2018:03:53:43
Page10of27
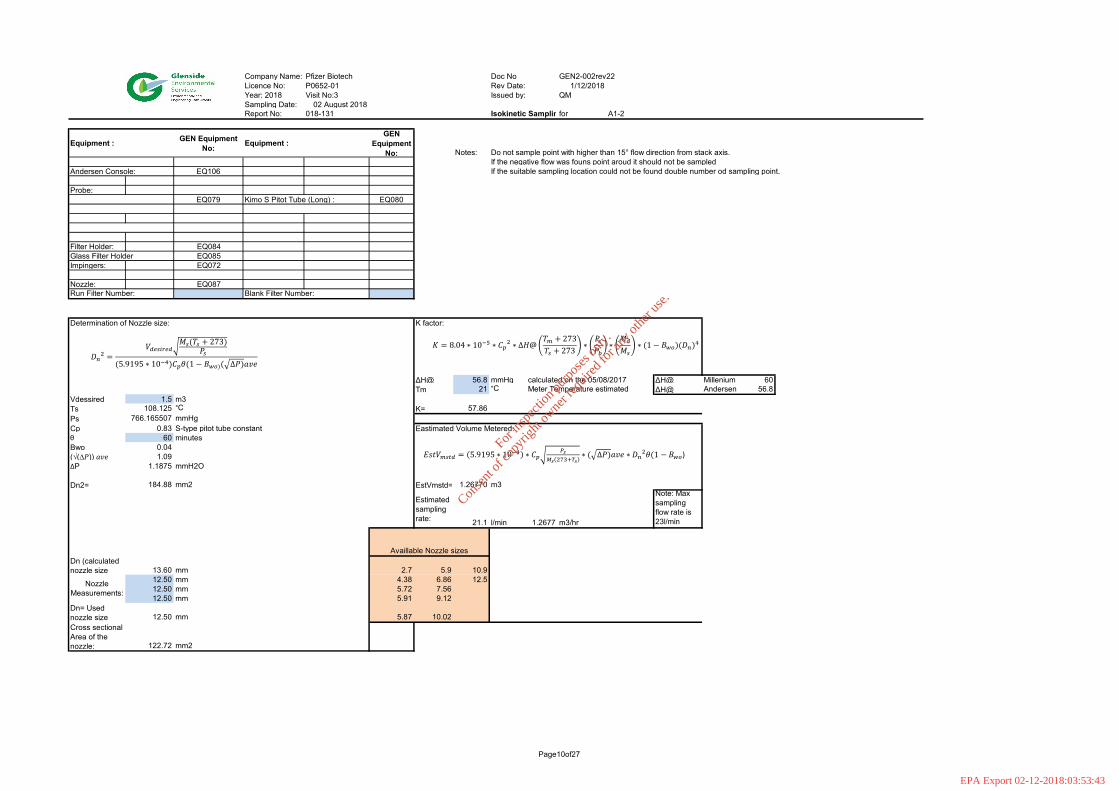
Company Name: Pfizer Biotech Doc No GEN2-002rev22Licence No: P0652-01 Rev Date: 1/12/2018Year: 2018 Visit No:3 Issued by: QMSampling Date: 02 August 2018Report No: 018-131 Isokinetic Samplin for A1-2
Equipment : GEN Equipment No: Equipment :
GEN Equipment
No: Notes: Do not sample point with higher than 15° flow direction from stack axis.Millennium 5 console: EQ069 If the negative flow was founs point aroud it should not be sampledAndersen Console: EQ106 If the suitable sampling location could not be found double number od sampling point.Probe: EQ070 Pitot Tube: EQ071Probe: EQ107 Pitot Tube: EQ113KIMO - Flow Test: EQ079 Kimo S Pitot Tube (Long) : EQ080KIMO - Flow Test: EQ117 Kimo L Pitot Tube : EQ116Rule: EQ083Laser Distance Meter: EQ089KIMO 115 EQ091Filter Holder: EQ084Glass Filter Holder EQ085Impingers: EQ072Impingers: EQ124Nozzle: EQ087Run Filter Number: Blank Filter Number:
Determination of Nozzle size: K factor:
ΔH@ 56.8 mmHg calculated on the 05/08/2017 ΔH@ Millenium 60Tm 21 °C Meter Temperature estimated ΔH@ Andersen 56.8
Vdessired 1.5 m3Ts 108.125 °C K= 57.86Ps 766.165507 mmHgCp 0.83 S-type pitot tube constant Eastimated Volume Metered:θ 60 minutesBwo 0.04(√(∆𝑃𝑃)) 𝑎𝑎𝑎𝑎𝑎𝑎 1.09ΔP 1.1875 mmH2O
Dn2= 184.88 mm2 EstVmstd= 1.26770 m3
Estimated sampling rate: 21.1 l/min 1.2677 m3/hr
Note: Max sampling flow rate is 23l/min
Dn (calculated nozzle size 13.60 mm 2.7 5.9 10.9
12.50 mm 4.38 6.86 12.512.50 mm 5.72 7.5612.50 mm 5.91 9.12
Dn= Used nozzle size 12.50 mm 5.87 10.02Cross sectional Area of the nozzle: 122.72 mm2 12.45
Availlable Nozzle sizes
Nozzle Measurements:
𝐷𝐷𝑛𝑛2 =𝑉𝑉𝑑𝑑𝑑𝑑𝑠𝑠𝑆𝑆𝑑𝑑𝑑𝑑𝑑𝑑
𝑀𝑀𝑠𝑠(𝑇𝑇𝑠𝑠 + 𝐶73)𝑃𝑃𝑠𝑠
(5.9195 ∗ 10−4)𝐶𝐶𝑝𝑝𝜃𝜃(1 − 𝐵𝐵𝑤𝑤𝑤𝑤)( ∆𝑃𝑃)𝑎𝑎𝑎𝑎𝑎𝑎
𝐾𝐾 = 8.04 ∗ 10−5 ∗ 𝐶𝐶𝑝𝑝2 ∗ ∆𝐻𝐻𝐻𝑇𝑇𝑚𝑚 + 𝐶73𝑇𝑇𝑠𝑠 + 𝐶73
∗𝑃𝑃𝑠𝑠𝑃𝑃𝑏𝑏
∗𝑀𝑀𝑑𝑑
𝑀𝑀𝑠𝑠∗ (1 − 𝐵𝐵𝑤𝑤𝑤𝑤)(𝐷𝐷𝑛𝑛)4
𝐸𝐸𝐸𝐸𝐸𝐸𝑉𝑉𝑚𝑚𝑠𝑠𝑆𝑆𝑑𝑑 = 5.9195 ∗ 10−4 ∗ 𝐶𝐶𝑝𝑝𝑃𝑃𝑠𝑠
𝑀𝑀𝑠𝑠 273+𝑇𝑇𝑠𝑠∗ ( ∆𝑃𝑃)𝑎𝑎𝑎𝑎𝑎𝑎 ∗ 𝐷𝐷𝑛𝑛2𝜃𝜃(1 −𝐵𝐵𝑤𝑤𝑤𝑤)
For
insp
ectio
n pur
pose
s only
.
Conse
nt of
copy
right
owne
r req
uired
for a
ny ot
her u
se.
EPA Export 02-12-2018:03:53:43
Page11of27
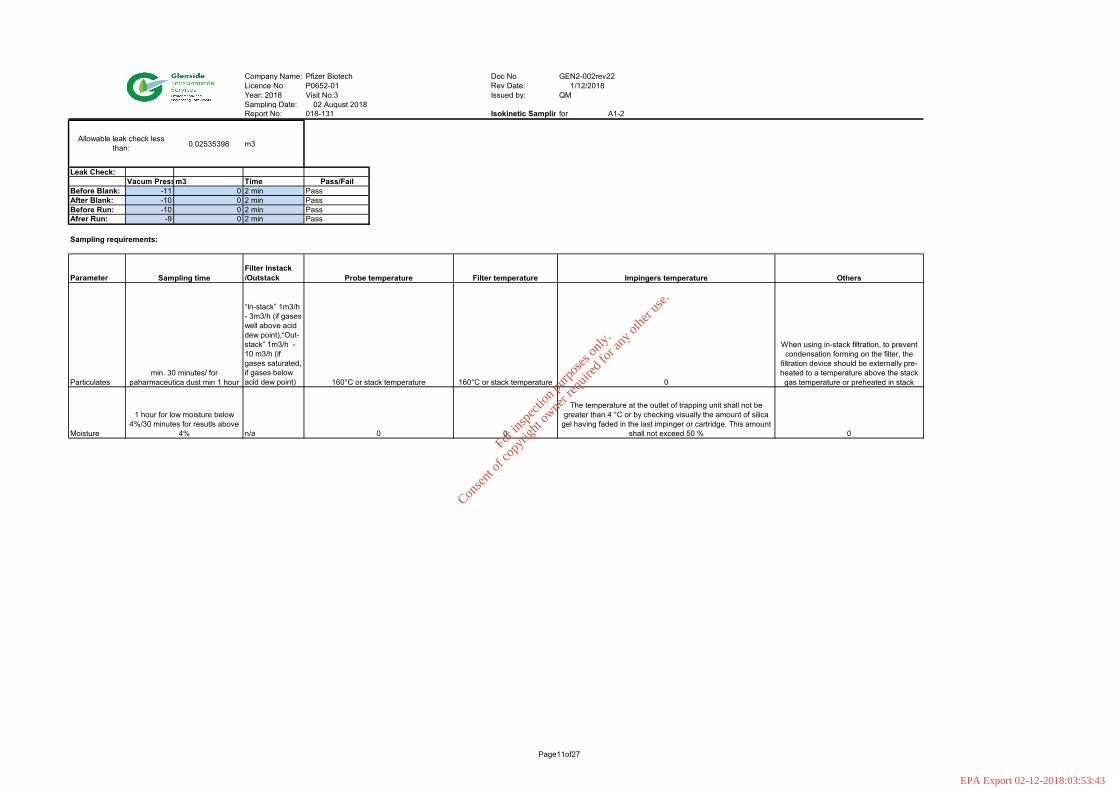
Company Name: Pfizer Biotech Doc No GEN2-002rev22Licence No: P0652-01 Rev Date: 1/12/2018Year: 2018 Visit No:3 Issued by: QMSampling Date: 02 August 2018Report No: 018-131 Isokinetic Samplin for A1-2
0.02535398 m3
Leak Check:Vacum Pressm3 Time Pass/Fail
Before Blank: -11 0 2 min PassAfter Blank: -10 0 2 min PassBefore Run: -10 0 2 min PassAfrer Run: -9 0 2 min Pass
Sampling requirements:
ParameterFilter Instack /Outstack
Particulates
“In-stack” 1m3/h - 3m3/h (if gases well above acid dew point),“Out-stack” 1m3/h - 10 m3/h (if gases saturated, if gases below acid dew point)
Moisture n/a
The temperature at the outlet of trapping unit shall not be greater than 4 °C or by checking visually the amount of silica
gel having faded in the last impinger or cartridge. This amount shall not exceed 50 %
Filter temperature
160°C or stack temperature
0
Probe temperature
160°C or stack temperature
0
Sampling time
min. 30 minutes/ for paharmaceutica dust min 1 hour
1 hour for low moisture below 4%/30 minutes for resutls above
4%
Allowable leak check less than:
Others
When using in-stack filtration, to prevent condensation forming on the filter, the
filtration device should be externally pre-heated to a temperature above the stack gas temperature or preheated in stack
0
Impingers temperature
0
For
insp
ectio
n pur
pose
s only
.
Conse
nt of
copy
right
owne
r req
uired
for a
ny ot
her u
se.
EPA Export 02-12-2018:03:53:43
Page12of27
Company Name: Pfizer Biotech Doc No GEN2-002rev22Licence No: P0652-01 Rev Date: 1/12/2018Year: 2018 Visit No:3 Issued by: QMSampling Date: 02 August 2018Report No: 018-131 Isokinetic Samplin for A1-2
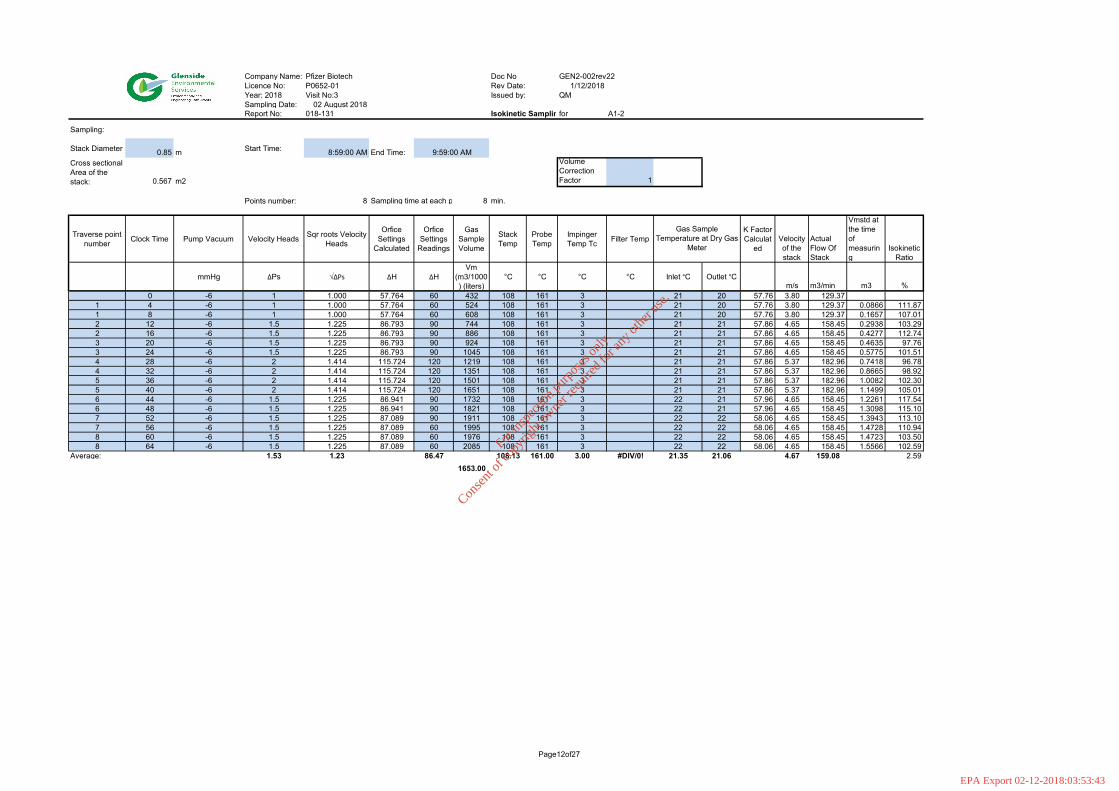
Sampling:
Stack Diameter 0.85 m Start Time: 8:59:00 AM End Time:Cross sectional Area of the stack: 0.567 m2
Volume Correction Factor 1
Points number: 8 Sampling time at each p 8 min.
Traverse point number Clock Time Pump Vacuum Velocity Heads Sqr roots Velocity
Heads
Orfice Settings
Calculated
Orfice Settings
Readings
Gas Sample Volume
Stack Temp
Probe Temp
Impinger Temp Tc Filter Temp
K Factor Calculat
edVelocity of the stack
Actual Flow Of Stack
Vmstd at the time of measuring
Isokinetic Ratio
mmHg ΔPs √ΔPs ΔH ΔHVm
(m3/1000) (liters)
°C °C °C °C Inlet °C Outlet °Cm/s m3/min m3 %
0 -6 1 1.000 57.764 60 432 108 161 3 21 20 57.76 3.80 129.371 4 -6 1 1.000 57.764 60 524 108 161 3 21 20 57.76 3.80 129.37 0.0866 111.871 8 -6 1 1.000 57.764 60 608 108 161 3 21 20 57.76 3.80 129.37 0.1657 107.012 12 -6 1.5 1.225 86.793 90 744 108 161 3 21 21 57.86 4.65 158.45 0.2938 103.292 16 -6 1.5 1.225 86.793 90 886 108 161 3 21 21 57.86 4.65 158.45 0.4277 112.743 20 -6 1.5 1.225 86.793 90 924 108 161 3 21 21 57.86 4.65 158.45 0.4635 97.763 24 -6 1.5 1.225 86.793 90 1045 108 161 3 21 21 57.86 4.65 158.45 0.5775 101.514 28 -6 2 1.414 115.724 120 1219 108 161 3 21 21 57.86 5.37 182.96 0.7418 96.784 32 -6 2 1.414 115.724 120 1351 108 161 3 21 21 57.86 5.37 182.96 0.8665 98.925 36 -6 2 1.414 115.724 120 1501 108 161 3 21 21 57.86 5.37 182.96 1.0082 102.305 40 -6 2 1.414 115.724 120 1651 108 161 3 21 21 57.86 5.37 182.96 1.1499 105.016 44 -6 1.5 1.225 86.941 90 1732 108 161 3 22 21 57.96 4.65 158.45 1.2261 117.546 48 -6 1.5 1.225 86.941 90 1821 108 161 3 22 21 57.96 4.65 158.45 1.3098 115.107 52 -6 1.5 1.225 87.089 90 1911 108 161 3 22 22 58.06 4.65 158.45 1.3943 113.107 56 -6 1.5 1.225 87.089 60 1995 108 161 3 22 22 58.06 4.65 158.45 1.4728 110.948 60 -6 1.5 1.225 87.089 60 1976 108 161 3 22 22 58.06 4.65 158.45 1.4723 103.508 64 -6 1.5 1.225 87.089 60 2085 108 161 3 22 22 58.06 4.65 158.45 1.5566 102.59
Average: 1.53 1.23 86.47 108.13 161.00 3.00 #DIV/0! 21.35 21.06 4.67 159.08 2.591653.00
Gas Sample Temperature at Dry Gas
Meter
9:59:00 AM
For
insp
ectio
n pur
pose
s only
.
Conse
nt of
copy
right
owne
r req
uired
for a
ny ot
her u
se.
EPA Export 02-12-2018:03:53:43
Page13of27
Company Name: Pfizer Biotech Doc No GEN2-002rev22Licence No: P0652-01 Rev Date: 1/12/2018Year: 2018 Visit No:3 Issued by: QMSampling Date: 02 August 2018Report No: 018-131 Isokinetic Samplin for A1-2
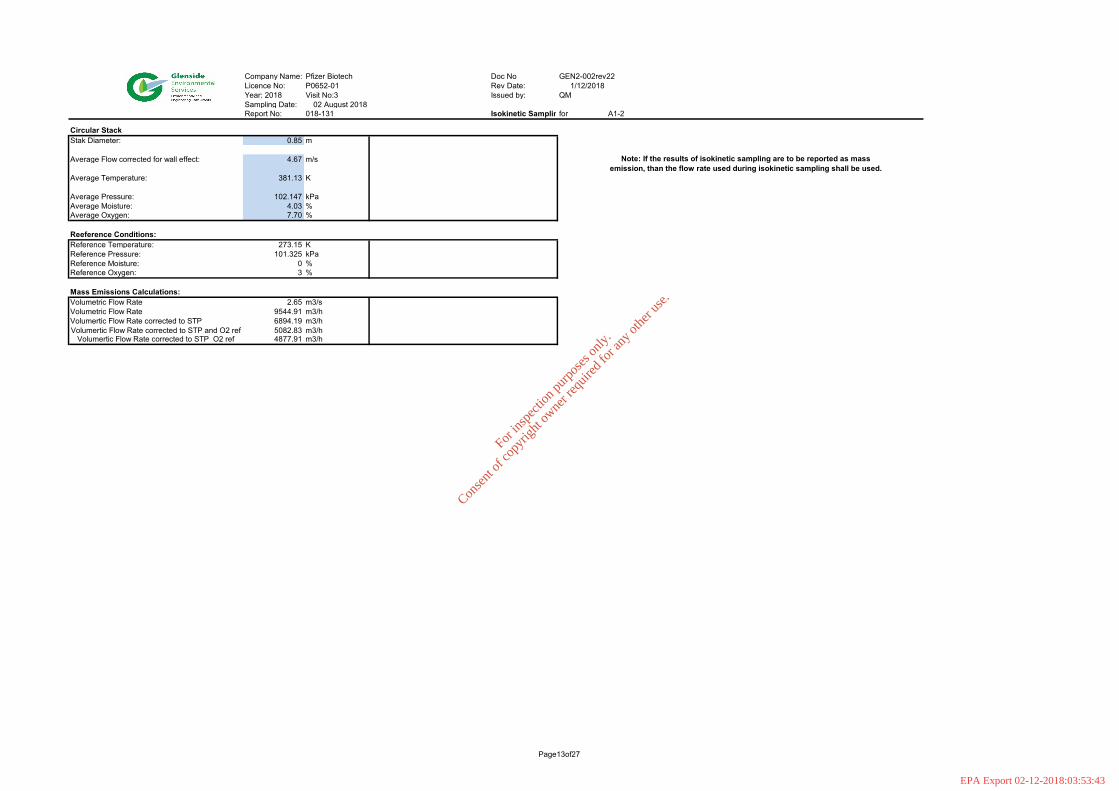
Circular StackStak Diameter: 0.85 m
Average Flow corrected for wall effect: 4.67 m/s
Average Temperature: 381.13 K
Average Pressure: 102.147 kPaAverage Moisture: 4.03 %Average Oxygen: 7.70 %
Reeference Conditions:Reference Temperature: 273.15 KReference Pressure: 101.325 kPaReference Moisture: 0 %Reference Oxygen: 3 %
Mass Emissions Calculations:Volumetric Flow Rate 2.65 m3/sVolumetric Flow Rate 9544.91 m3/hVolumertic Flow Rate corrected to STP 6894.19 m3/h
5082.83 m3/h4877.91 m3/h
Note: If the results of isokinetic sampling are to be reported as mass emission, than the flow rate used during isokinetic sampling shall be used.
Volumertic Flow Rate corrected to STP and O2 refVolumertic Flow Rate corrected to STP O2 ref
For
insp
ectio
n pur
pose
s only
.
Conse
nt of
copy
right
owne
r req
uired
for a
ny ot
her u
se.
EPA Export 02-12-2018:03:53:43
Page14of27
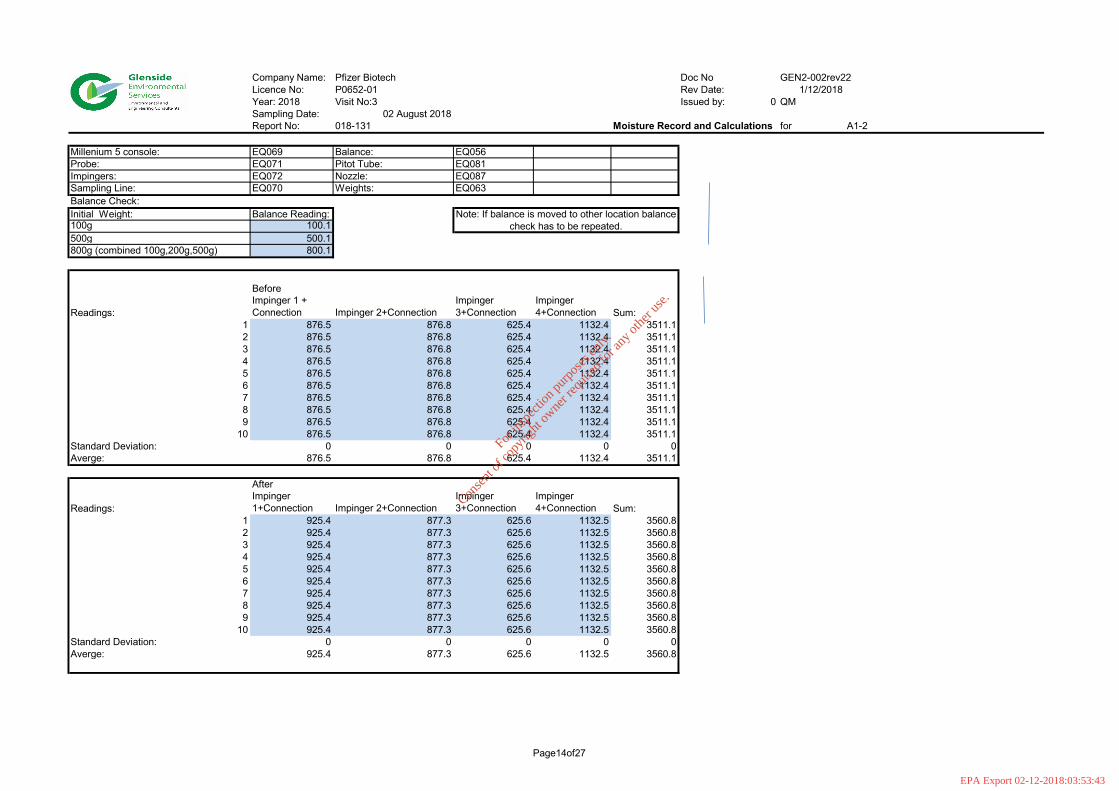
Company Name: Pfizer Biotech Doc No GEN2-002rev22Licence No: P0652-01 Rev Date: 1/12/2018Year: 2018 Visit No:3 Issued by: 0 QMSampling Date: 02 August 2018Report No: 018-131 Moisture Record and Calculations for A1-2
Millenium 5 console: EQ069 Balance: EQ056Probe: EQ071 Pitot Tube: EQ081Impingers: EQ072 Nozzle: EQ087Sampling Line: EQ070 Weights: EQ063Balance Check:Initial Weight: Balance Reading:100g 100.1500g 500.1800g (combined 100g,200g,500g) 800.1
Before
Readings:Impinger 1 + Connection Impinger 2+Connection
Impinger 3+Connection
Impinger 4+Connection Sum:
1 876.5 876.8 625.4 1132.4 3511.12 876.5 876.8 625.4 1132.4 3511.13 876.5 876.8 625.4 1132.4 3511.14 876.5 876.8 625.4 1132.4 3511.15 876.5 876.8 625.4 1132.4 3511.16 876.5 876.8 625.4 1132.4 3511.17 876.5 876.8 625.4 1132.4 3511.18 876.5 876.8 625.4 1132.4 3511.19 876.5 876.8 625.4 1132.4 3511.1
10 876.5 876.8 625.4 1132.4 3511.1Standard Deviation: 0 0 0 0 0Averge: 876.5 876.8 625.4 1132.4 3511.1
After
Readings:Impinger 1+Connection Impinger 2+Connection
Impinger 3+Connection
Impinger 4+Connection Sum:
1 925.4 877.3 625.6 1132.5 3560.82 925.4 877.3 625.6 1132.5 3560.83 925.4 877.3 625.6 1132.5 3560.84 925.4 877.3 625.6 1132.5 3560.85 925.4 877.3 625.6 1132.5 3560.86 925.4 877.3 625.6 1132.5 3560.87 925.4 877.3 625.6 1132.5 3560.88 925.4 877.3 625.6 1132.5 3560.89 925.4 877.3 625.6 1132.5 3560.8
10 925.4 877.3 625.6 1132.5 3560.8Standard Deviation: 0 0 0 0 0Averge: 925.4 877.3 625.6 1132.5 3560.8
Note: If balance is moved to other location balance check has to be repeated.
For
insp
ectio
n pur
pose
s only
.
Conse
nt of
copy
right
owne
r req
uired
for a
ny ot
her u
se.
EPA Export 02-12-2018:03:53:43
Page15of27
Company Name: Pfizer Biotech Doc No GEN2-002rev22Licence No: P0652-01 Rev Date: 1/12/2018Year: 2018 Visit No:3 Issued by: 0 QMSampling Date: 02 August 2018Report No: 018-131 Moisture Record and Calculations for A1-2
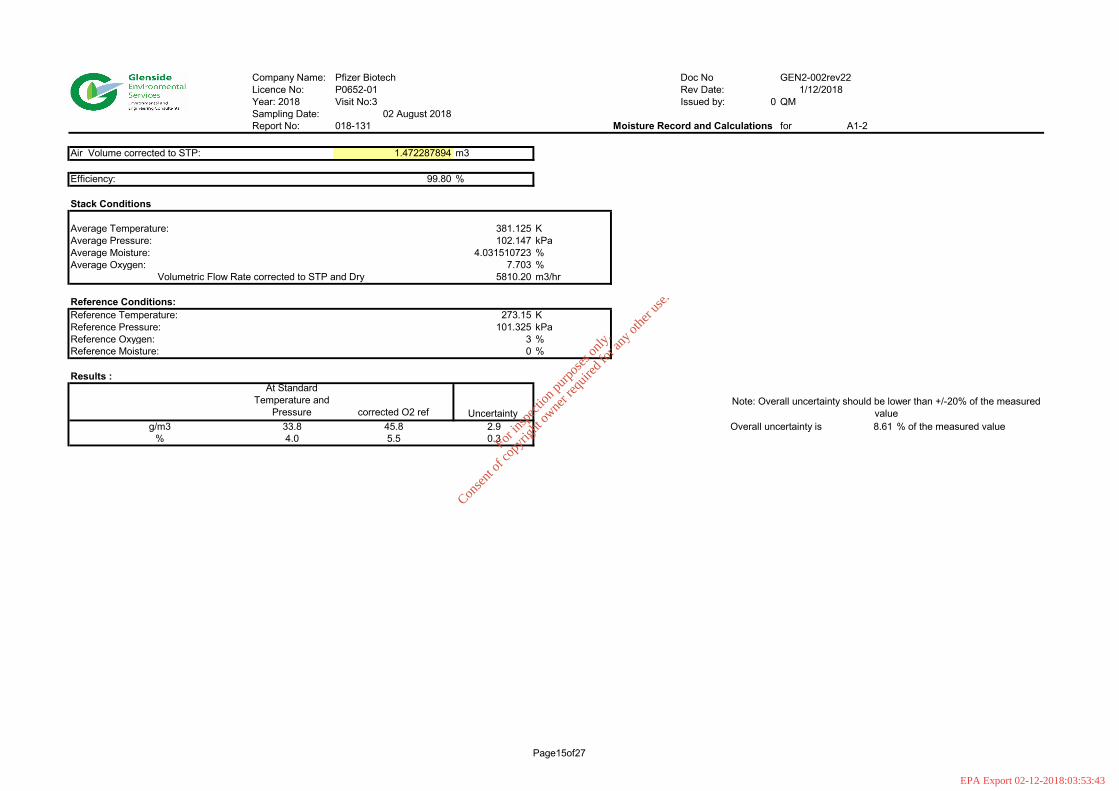
Air Volume corrected to STP: 1.472287894 m3
Efficiency: 99.80 %
Stack Conditions
Average Temperature: 381.125 KAverage Pressure: 102.147 kPaAverage Moisture: 4.031510723 %Average Oxygen: 7.703 %
5810.20 m3/hr
Reference Conditions:Reference Temperature: 273.15 KReference Pressure: 101.325 kPaReference Oxygen: 3 %Reference Moisture: 0 %
Results :At Standard
Temperature and Pressure corrected O2 ref Uncertainty
g/m3 33.8 45.8 2.9 Overall uncertainty is 8.61 % of the measured value% 4.0 5.5 0.3
Note: Overall uncertainty should be lower than +/-20% of the measured value
Volumetric Flow Rate corrected to STP and Dry
For
insp
ectio
n pur
pose
s only
.
Conse
nt of
copy
right
owne
r req
uired
for a
ny ot
her u
se.
EPA Export 02-12-2018:03:53:43
Page16of27
Company Name: Pfizer Biotech Doc No GEN2-002rev22Licence No: P0652-01 Rev Date: 1/12/2018Year: 2018 Visit No:3 Issued by: 0 QMSampling Date: 02 August 2018Report No: 018-131 Moisture Record and Calculations for A1-2
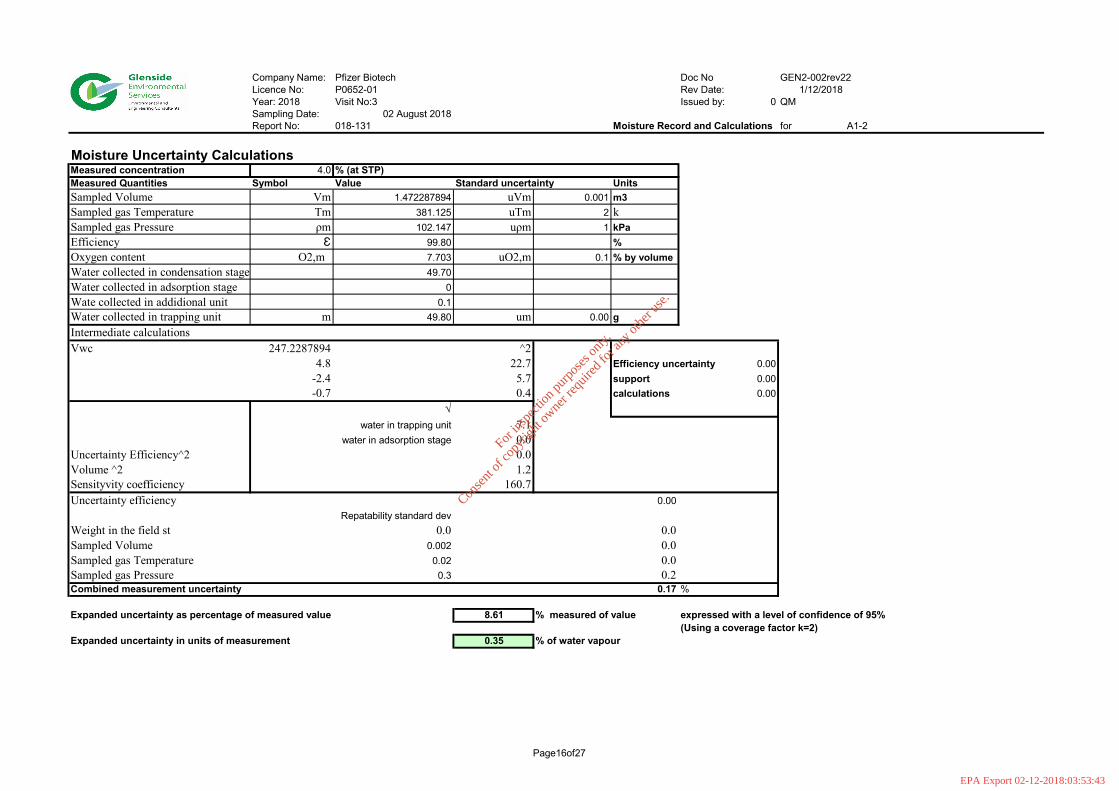
Moisture Uncertainty CalculationsMeasured concentration 4.0 % (at STP)Measured Quantities Symbol Value Standard uncertainty UnitsSampled Volume Vm 1.472287894 uVm 0.001 m3Sampled gas Temperature Tm 381.125 uTm 2 kSampled gas Pressure ρm 102.147 uρm 1 kPaEfficiency Ɛ 99.80 %Oxygen content O2,m 7.703 uO2,m 0.1 % by volumeWater collected in condensation stage 49.70Water collected in adsorption stage 0Wate collected in addidional unit 0.1Water collected in trapping unit m 49.80 um 0.00 gIntermediate calculationsVwc 247.2287894 ^2
4.8 22.7 Efficiency uncertainty 0.00-2.4 5.7 support 0.00-0.7 0.4 calculations 0.00
√water in trapping unit 7.1
water in adsorption stage 0.0Uncertainty Efficiency^2 0.0Volume ^2 1.2Sensityvity coefficiency 160.7Uncertainty efficiency 0.00
Repatability standard devWeight in the field st 0.0 0.0Sampled Volume 0.002 0.0Sampled gas Temperature 0.02 0.0Sampled gas Pressure 0.3 0.2Combined measurement uncertainty 0.17 %
Expanded uncertainty as percentage of measured value 8.61 % measured of value expressed with a level of confidence of 95%(Using a coverage factor k=2)
Expanded uncertainty in units of measurement 0.35 % of water vapour
For
insp
ectio
n pur
pose
s only
.
Conse
nt of
copy
right
owne
r req
uired
for a
ny ot
her u
se.
EPA Export 02-12-2018:03:53:43

Page17of27
Company Name: Pfizer Biotech Doc No GEN2-002rev22Licence No: P0652-01 Rev Date: 1/12/2018Year: 2018 Visit No:3 Issued by: QMSampling Date: 02 August 2018Report No: 018-131 Particulates Results Calculations for A1-2
Paticulates Data:
Certs Results: mg Date analysis completed:LOD Filter: 0.04 8/21/2018
LOD Nozzle Wash: 0.5 Sample reference number:
Blank Filter: 0.04 1006165Blank Nozzle Wash: 0.81 1006166Run Filter: 0.21 1006163Run Nozzle Wash: 0.5 1006164
0.54Blank 0.85Run 0.71
Dry Air Volume corrected to STP: 1.556556366 m3
Stack ConditionsAverage Temperature: 381.125 KAverage Pressure: 102.147 kPaAverage Moisture: 4.0 %Average Oxygen: 7.7 %
5810.20 m3/h
Reference ConditionsReference Temperature: 273.15 KReference Pressure: 101.325 kPaReference Oxygen: 3 %Reference Moisture: 0 %
Particulates Results :mg/m3 mg/m3 kg/hr Uncertainty
corrected to O2 mg/m3 Note: Blank result should be < 10% of ELVLOD 0.3 0.5 0.003 n/a <20% for ELV 5mg/m3 or lowerBlank 0.5 0.7 0.004 0.03 Blank result is: 14.8 % of ELVRun 0.5 0.6 0.004 0.02 If the blank result is higher than requirements of ELV result should be rejected
Volumetric Flow Rate corrected to STP and Dry
For
insp
ectio
n pur
pose
s only
.
Conse
nt of
copy
right
owne
r req
uired
for a
ny ot
her u
se.
EPA Export 02-12-2018:03:53:43
Page18of27
Company Name: Pfizer Biotech Doc No GEN2-002rev22Licence No: P0652-01 Rev Date: 1/12/2018Year: 2018 Visit No:3 Issued by: QMSampling Date: 02 August 2018Report No: 018-131 Particulates Results Calculations for A1-2
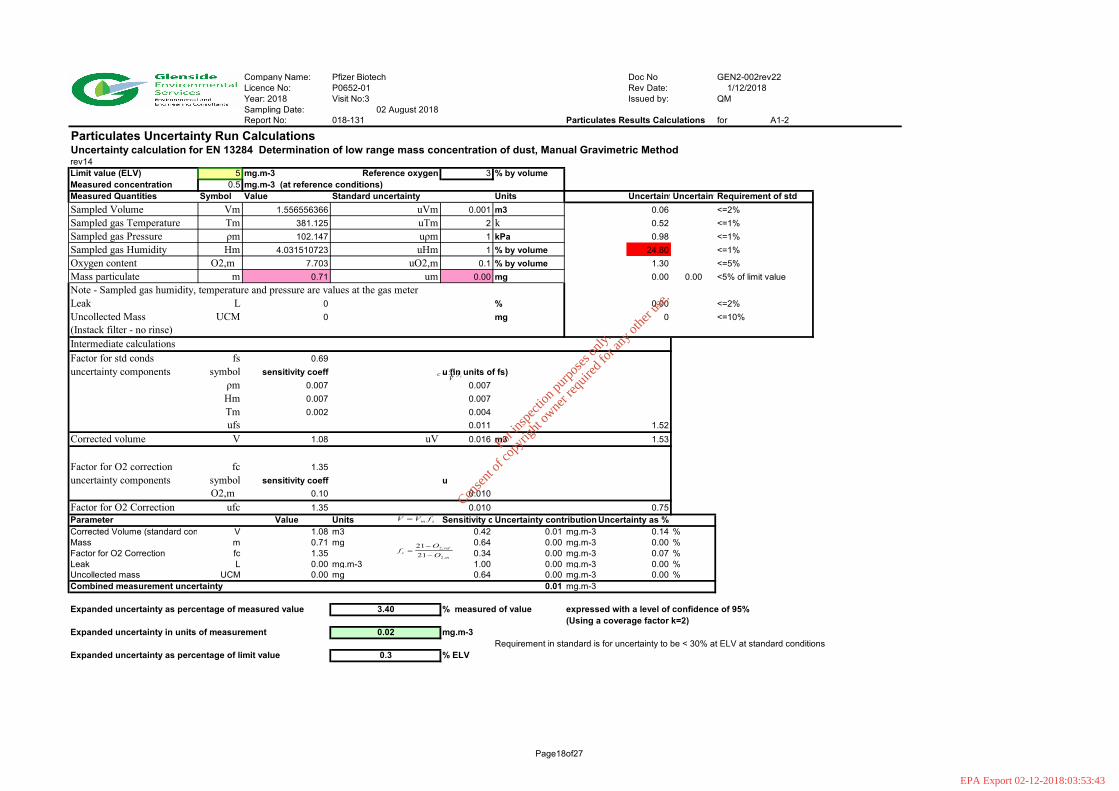
Particulates Uncertainty Run CalculationsUncertainty calculation for EN 13284 Determination of low range mass concentration of dust, Manual Gravimetric Methodrev14Limit value (ELV) 5 mg.m-3 Reference oxygen 3 % by volumeMeasured concentration 0.5 mg.m-3 (at reference conditions)Measured Quantities Symbol Value Standard uncertainty Units Uncertaint Uncertaint Requirement of stdSampled Volume Vm 1.556556366 uVm 0.001 m3 0.06 <=2%Sampled gas Temperature Tm 381.125 uTm 2 k 0.52 <=1%Sampled gas Pressure ρm 102.147 uρm 1 kPa 0.98 <=1%Sampled gas Humidity Hm 4.031510723 uHm 1 % by volume 24.80 <=1%Oxygen content O2,m 7.703 uO2,m 0.1 % by volume 1.30 <=5%Mass particulate m 0.71 um 0.00 mg 0.00 0.00 <5% of limit valueNote - Sampled gas humidity, temperature and pressure are values at the gas meterLeak L 0 % 0.00 <=2%Uncollected Mass UCM 0 mg 0 <=10%(Instack filter - no rinse)Intermediate calculationsFactor for std conds fs 0.69uncertainty components symbol sensitivity coeff u (in units of fs)
ρm 0.007 0.007Hm 0.007 0.007Tm 0.002 0.004ufs 0.011 1.52
Corrected volume V 1.08 uV 0.016 m3 1.53
Factor for O2 correction fc 1.35uncertainty components symbol sensitivity coeff u
O2,m 0.10 0.010Factor for O2 Correction ufc 1.35 0.010 0.75Parameter Value Units Sensitivity c Uncertainty contribution Uncertainty as %Corrected Volume (standard con V 1.08 m3 0.42 0.01 mg.m-3 0.14 %Mass m 0.71 mg 0.64 0.00 mg.m-3 0.00 %Factor for O2 Correction fc 1.35 0.34 0.00 mg.m-3 0.07 %Leak L 0.00 mg.m-3 1.00 0.00 mg.m-3 0.00 %Uncollected mass UCM 0.00 mg 0.64 0.00 mg.m-3 0.00 %Combined measurement uncertainty 0.01 mg.m-3
Expanded uncertainty as percentage of measured value 3.40 % measured of value expressed with a level of confidence of 95%(Using a coverage factor k=2)
Expanded uncertainty in units of measurement 0.02 mg.m-3Requirement in standard is for uncertainty to be < 30% at ELV at standard conditions
Expanded uncertainty as percentage of limit value 0.3 % ELV
sm fVV =
m
refc O
Of
,2
,2
2121
−
−=
cfVmc =
For
insp
ectio
n pur
pose
s only
.
Conse
nt of
copy
right
owne
r req
uired
for a
ny ot
her u
se.
EPA Export 02-12-2018:03:53:43
Page19of27
Company Name: Pfizer Biotech Doc No GEN2-002rev22Licence No: P0652-01 Rev Date: 1/12/2018Year: 2018 Visit No:3 Issued by: QMSampling Date: 02 August 2018Report No: 018-131 Particulates Results Calculations for A1-2
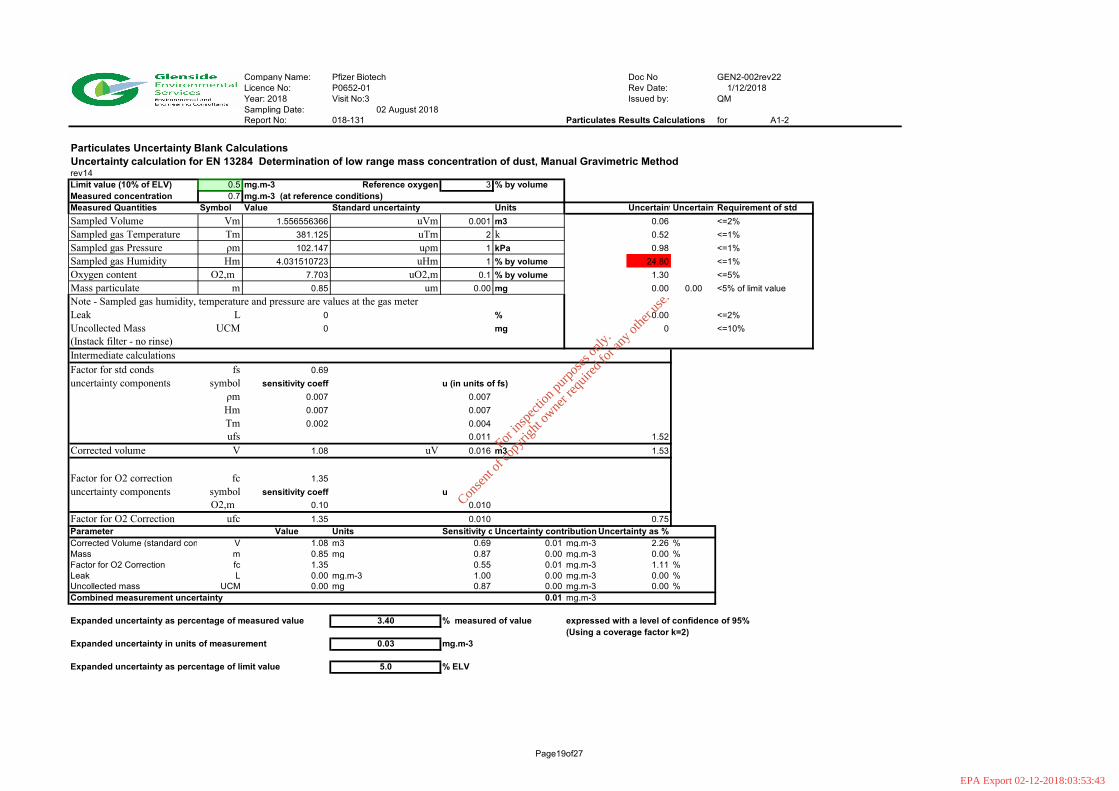
Particulates Uncertainty Blank CalculationsUncertainty calculation for EN 13284 Determination of low range mass concentration of dust, Manual Gravimetric Methodrev14Limit value (10% of ELV) 0.5 mg.m-3 Reference oxygen 3 % by volumeMeasured concentration 0.7 mg.m-3 (at reference conditions)Measured Quantities Symbol Value Standard uncertainty Units Uncertaint Uncertaint Requirement of stdSampled Volume Vm 1.556556366 uVm 0.001 m3 0.06 <=2%Sampled gas Temperature Tm 381.125 uTm 2 k 0.52 <=1%Sampled gas Pressure ρm 102.147 uρm 1 kPa 0.98 <=1%Sampled gas Humidity Hm 4.031510723 uHm 1 % by volume 24.80 <=1%Oxygen content O2,m 7.703 uO2,m 0.1 % by volume 1.30 <=5%Mass particulate m 0.85 um 0.00 mg 0.00 0.00 <5% of limit valueNote - Sampled gas humidity, temperature and pressure are values at the gas meterLeak L 0 % 0.00 <=2%Uncollected Mass UCM 0 mg 0 <=10%(Instack filter - no rinse)Intermediate calculationsFactor for std conds fs 0.69uncertainty components symbol sensitivity coeff u (in units of fs)
ρm 0.007 0.007Hm 0.007 0.007Tm 0.002 0.004ufs 0.011 1.52
Corrected volume V 1.08 uV 0.016 m3 1.53
Factor for O2 correction fc 1.35uncertainty components symbol sensitivity coeff u
O2,m 0.10 0.010Factor for O2 Correction ufc 1.35 0.010 0.75Parameter Value Units Sensitivity c Uncertainty contribution Uncertainty as %Corrected Volume (standard con V 1.08 m3 0.69 0.01 mg.m-3 2.26 %Mass m 0.85 mg 0.87 0.00 mg.m-3 0.00 %Factor for O2 Correction fc 1.35 0.55 0.01 mg.m-3 1.11 %Leak L 0.00 mg.m-3 1.00 0.00 mg.m-3 0.00 %Uncollected mass UCM 0.00 mg 0.87 0.00 mg.m-3 0.00 %Combined measurement uncertainty 0.01 mg.m-3
Expanded uncertainty as percentage of measured value 3.40 % measured of value expressed with a level of confidence of 95%(Using a coverage factor k=2)
Expanded uncertainty in units of measurement 0.03 mg.m-3
Expanded uncertainty as percentage of limit value 5.0 % ELV
For
insp
ectio
n pur
pose
s only
.
Conse
nt of
copy
right
owne
r req
uired
for a
ny ot
her u
se.
EPA Export 02-12-2018:03:53:43
Page20of27
Company Name: Pfizer Biotech Doc No GEN2-002rev22Licence No: P0652-01 Rev Date: 1/12/2018Year: 2018 Visit No:3 Issued by: QMSampling Date: 02 August 2018Report No: 018-131 Flue Gasses Records and Calculations for A1-2
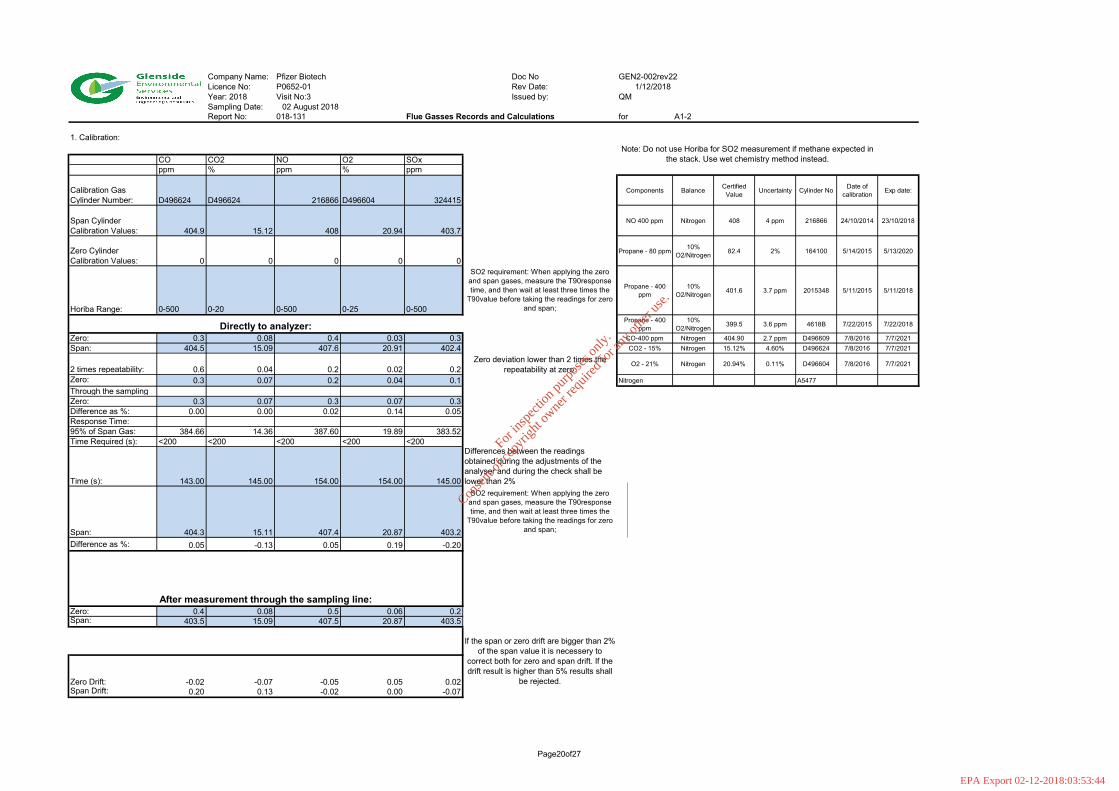
1. Calibration:
CO CO2 NO O2 SOxppm % ppm % ppm
Calibration Gas Cylinder Number: D496624 D496624 216866 D496604 324415
Components Balance Certified Value Uncertainty Cylinder No Date of
calibration Exp date:
Span Cylinder Calibration Values: 404.9 15.12 408 20.94 403.7
NO 400 ppm Nitrogen 408 4 ppm 216866 24/10/2014 23/10/2018
Zero Cylinder Calibration Values: 0 0 0 0 0
Propane - 80 ppm 10% O2/Nitrogen 82.4 2% 164100 5/14/2015 5/13/2020
Horiba Range: 0-500 0-20 0-500 0-25 0-500
Propane - 400 ppm
10% O2/Nitrogen 401.6 3.7 ppm 2015348 5/11/2015 5/11/2018
Propane - 400 ppm
10% O2/Nitrogen 399.5 3.6 ppm 4618B 7/22/2015 7/22/2018
Zero: 0.3 0.08 0.4 0.03 0.3 CO-400 ppm Nitrogen 404.90 2.7 ppm D496609 7/8/2016 7/7/2021Span: 404.5 15.09 407.6 20.91 402.4 CO2 - 15% Nitrogen 15.12% 4.60% D496624 7/8/2016 7/7/2021
2 times repeatability: 0.6 0.04 0.2 0.02 0.2O2 - 21% Nitrogen 20.94% 0.11% D496604 7/8/2016 7/7/2021
Zero: 0.3 0.07 0.2 0.04 0.1 Nitrogen A5477
Through the sampling Zero: 0.3 0.07 0.3 0.07 0.3Difference as %: 0.00 0.00 0.02 0.14 0.05Response Time:95% of Span Gas: 384.66 14.36 387.60 19.89 383.52Time Required (s): <200 <200 <200 <200 <200
Time (s): 143.00 145.00 154.00 154.00 145.00
Span: 404.3 15.11 407.4 20.87 403.2Difference as %: 0.05 -0.13 0.05 0.19 -0.20
Zero: 0.4 0.08 0.5 0.06 0.2Span: 403.5 15.09 407.5 20.87 403.5
Zero Drift: -0.02 -0.07 -0.05 0.05 0.02Span Drift: 0.20 0.13 -0.02 0.00 -0.07
SO2 requirement: When applying the zero and span gases, measure the T90response time, and then wait at least three times the
T90value before taking the readings for zero and span;
If the span or zero drift are bigger than 2% of the span value it is necessery to
correct both for zero and span drift. If the drift result is higher than 5% results shall
be rejected.
Note: Do not use Horiba for SO2 measurement if methane expected in the stack. Use wet chemistry method instead.
Zero deviation lower than 2 times the repeatability at zero.
Differences between the readings obtained during the adjustments of the analyser and during the check shall be lower than 2%
Directly to analyzer:
After measurement through the sampling line:
SO2 requirement: When applying the zero and span gases, measure the T90response time, and then wait at least three times the
T90value before taking the readings for zero and span;
For
insp
ectio
n pur
pose
s only
.
Conse
nt of
copy
right
owne
r req
uired
for a
ny ot
her u
se.
EPA Export 02-12-2018:03:53:44
Page21of27
Company Name: Pfizer Biotech Doc No GEN2-002rev22Licence No: P0652-01 Rev Date: 1/12/2018Year: 2018 Visit No:3 Issued by: QMSampling Date: 02 August 2018Report No: 018-131 Flue Gasses Records and Calculations for A1-2
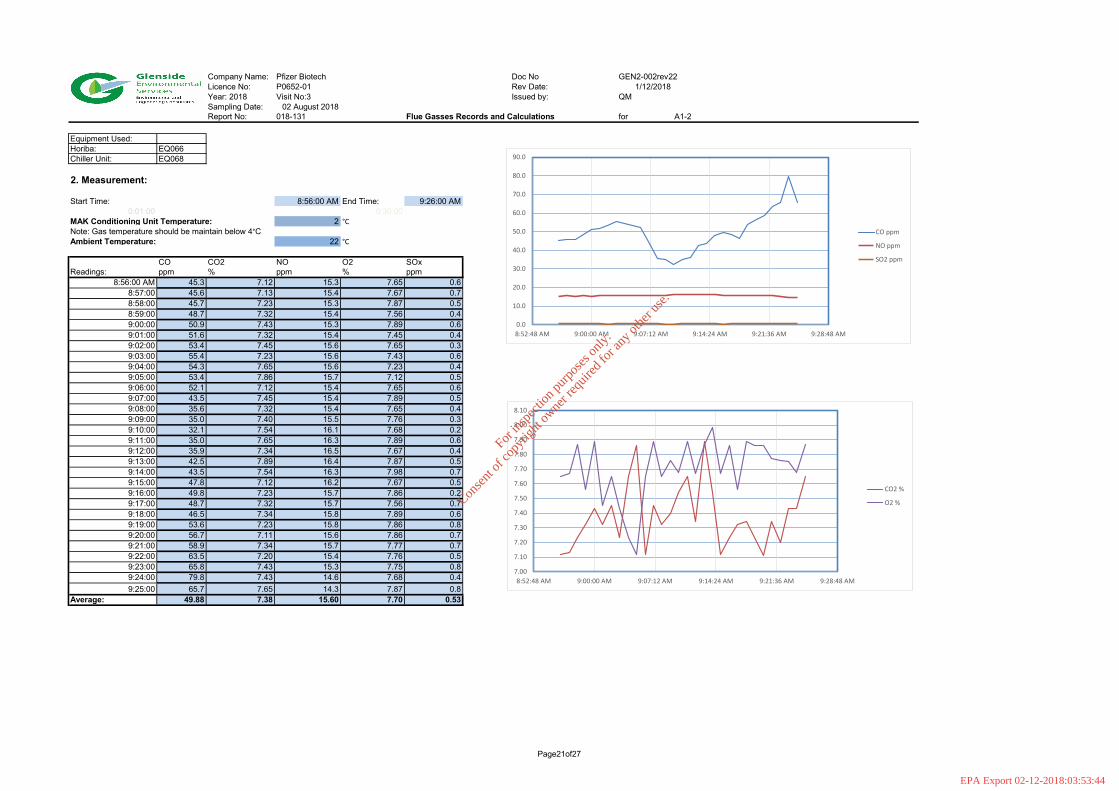
Equipment Used:Horiba: EQ066Chiller Unit: EQ068
2. Measurement:
Start Time: 8:56:00 AM End Time: 9:26:00 AM0:01:00 0:30:00
MAK Conditioning Unit Temperature: 2 °CNote: Gas temperature should be maintain below 4°CAmbient Temperature: 22 °C
CO CO2 NO O2 SOxReadings: ppm % ppm % ppm
8:56:00 AM 45.3 7.12 15.3 7.65 0.68:57:00 45.6 7.13 15.4 7.67 0.78:58:00 45.7 7.23 15.3 7.87 0.58:59:00 48.7 7.32 15.4 7.56 0.49:00:00 50.9 7.43 15.3 7.89 0.69:01:00 51.6 7.32 15.4 7.45 0.49:02:00 53.4 7.45 15.6 7.65 0.39:03:00 55.4 7.23 15.6 7.43 0.69:04:00 54.3 7.65 15.6 7.23 0.49:05:00 53.4 7.86 15.7 7.12 0.59:06:00 52.1 7.12 15.4 7.65 0.69:07:00 43.5 7.45 15.4 7.89 0.59:08:00 35.6 7.32 15.4 7.65 0.49:09:00 35.0 7.40 15.5 7.76 0.39:10:00 32.1 7.54 16.1 7.68 0.29:11:00 35.0 7.65 16.3 7.89 0.69:12:00 35.9 7.34 16.5 7.67 0.49:13:00 42.5 7.89 16.4 7.87 0.59:14:00 43.5 7.54 16.3 7.98 0.79:15:00 47.8 7.12 16.2 7.67 0.59:16:00 49.8 7.23 15.7 7.86 0.29:17:00 48.7 7.32 15.7 7.56 0.79:18:00 46.5 7.34 15.8 7.89 0.69:19:00 53.6 7.23 15.8 7.86 0.89:20:00 56.7 7.11 15.6 7.86 0.79:21:00 58.9 7.34 15.7 7.77 0.79:22:00 63.5 7.20 15.4 7.76 0.59:23:00 65.8 7.43 15.3 7.75 0.89:24:00 79.8 7.43 14.6 7.68 0.49:25:00 65.7 7.65 14.3 7.87 0.8
Average: 49.88 7.38 15.60 7.70 0.53
0.0
10.0
20.0
30.0
40.0
50.0
60.0
70.0
80.0
90.0
8:52:48 AM 9:00:00 AM 9:07:12 AM 9:14:24 AM 9:21:36 AM 9:28:48 AM
CO ppm
NO ppm
SO2 ppm
7.00
7.10
7.20
7.30
7.40
7.50
7.60
7.70
7.80
7.90
8.00
8.10
8:52:48 AM 9:00:00 AM 9:07:12 AM 9:14:24 AM 9:21:36 AM 9:28:48 AM
CO2 %
O2 %
For in
spec
tion p
urpo
ses o
nly.
Conse
nt of
copy
right
owne
r req
uired
for a
ny ot
her u
se.
EPA Export 02-12-2018:03:53:44
Page22of27
Company Name: Pfizer Biotech Doc No GEN2-002rev22Licence No: P0652-01 Rev Date: 1/12/2018Year: 2018 Visit No:3 Issued by: QMSampling Date: 02 August 2018Report No: 018-131 Flue Gasses Records and Calculations for A1-2
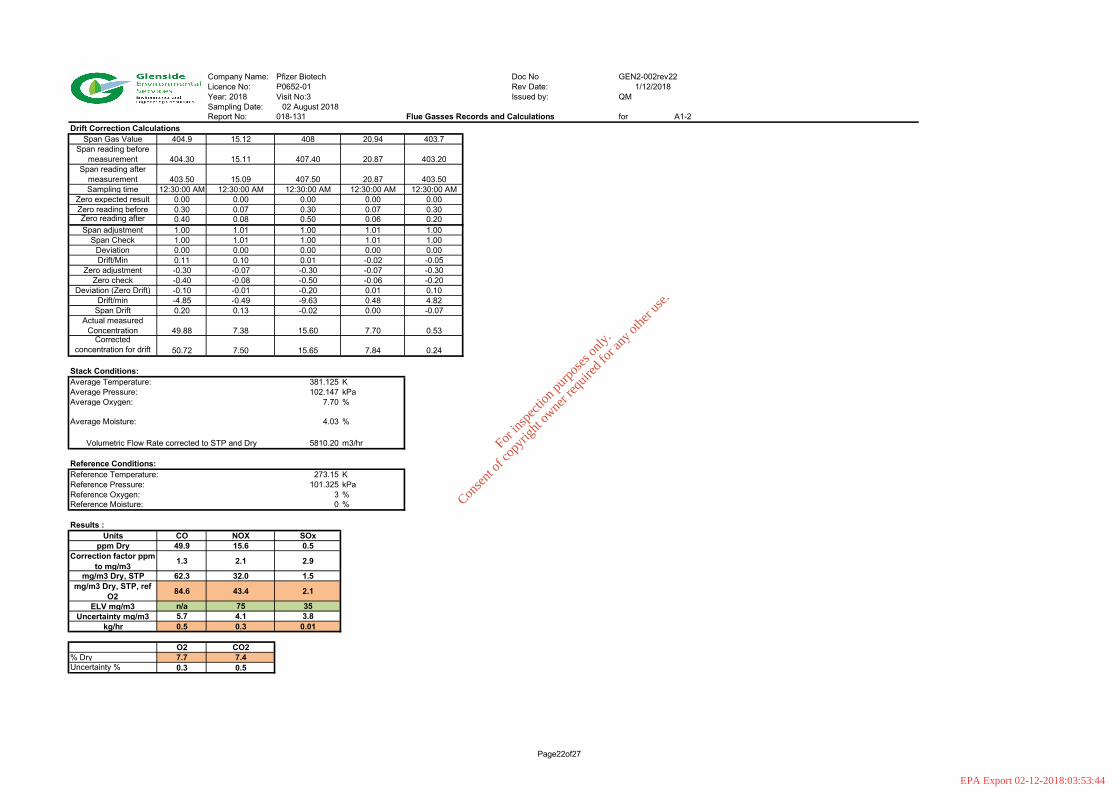
Drift Correction CalculationsSpan Gas Value 404.9 15.12 408 20.94 403.7
Span reading before measurement 404.30 15.11 407.40 20.87 403.20
Span reading after measurement 403.50 15.09 407.50 20.87 403.50Sampling time 12:30:00 AM 12:30:00 AM 12:30:00 AM 12:30:00 AM 12:30:00 AM
Zero expected result 0.00 0.00 0.00 0.00 0.00Zero reading before 0.30 0.07 0.30 0.07 0.30Zero reading after 0.40 0.08 0.50 0.06 0.20Span adjustment 1.00 1.01 1.00 1.01 1.00
Span Check 1.00 1.01 1.00 1.01 1.00Deviation 0.00 0.00 0.00 0.00 0.00Drift/Min 0.11 0.10 0.01 -0.02 -0.05
Zero adjustment -0.30 -0.07 -0.30 -0.07 -0.30Zero check -0.40 -0.08 -0.50 -0.06 -0.20
Deviation (Zero Drift) -0.10 -0.01 -0.20 0.01 0.10Drift/min -4.85 -0.49 -9.63 0.48 4.82
Span Drift 0.20 0.13 -0.02 0.00 -0.07Actual measured
Concentration 49.88 7.38 15.60 7.70 0.53Corrected
concentration for drift 50.72 7.50 15.65 7.84 0.24
Stack Conditions:Average Temperature: 381.125 KAverage Pressure: 102.147 kPaAverage Oxygen: 7.70 %
Average Moisture: 4.03 %
5810.20 m3/hr
Reference Conditions:Reference Temperature: 273.15 KReference Pressure: 101.325 kPaReference Oxygen: 3 %Reference Moisture: 0 %
Results :Units CO NOX SOx
ppm Dry 49.9 15.6 0.5Correction factor ppm
to mg/m3 1.3 2.1 2.9
mg/m3 Dry, STP 62.3 32.0 1.5mg/m3 Dry, STP, ref
O2 84.6 43.4 2.1
ELV mg/m3 n/a 75 35Uncertainty mg/m3 5.7 4.1 3.8
kg/hr 0.5 0.3 0.01
O2 CO2% Dry 7.7 7.4Uncertainty % 0.3 0.5
Volumetric Flow Rate corrected to STP and Dry
For
insp
ectio
n pur
pose
s only
.
Conse
nt of
copy
right
owne
r req
uired
for a
ny ot
her u
se.
EPA Export 02-12-2018:03:53:44
Page23of27
Company Name: Pfizer Biotech Doc No GEN2-002rev22Licence No: P0652-01 Rev Date: 1/12/2018Year: 2018 Visit No:3 Issued by: QMSampling Date: 02 August 2018Report No: 018-131 Flue Gasses Records and Calculations for A1-2
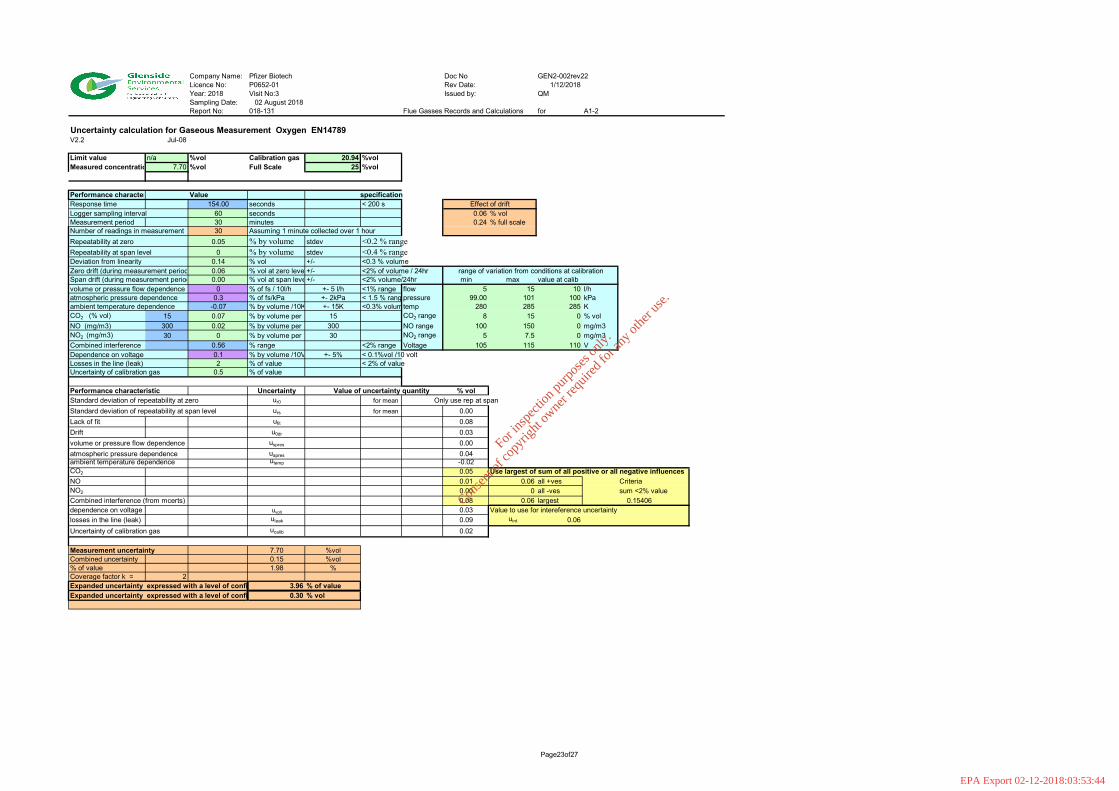
Uncertainty calculation for Gaseous Measurement Oxygen EN14789V2.2 Jul-08
Limit value n/a %vol Calibration gas 20.94 %volMeasured concentratio 7.70 %vol Full Scale 25 %vol
Performance character Value specificationResponse time 154.00 seconds < 200 sLogger sampling interval 60 seconds 0.06 % volMeasurement period 30 minutes 0.24 % full scaleNumber of readings in measurement 30 Assuming 1 minute collected over 1 hourRepeatability at zero 0.05 % by volume stdev <0.2 % rangeRepeatability at span level 0 % by volume stdev <0.4 % rangeDeviation from linearity 0.14 % vol +/- <0.3 % volumeZero drift (during measurement period 0.06 % vol at zero leve +/- <2% of volume / 24hrSpan drift (during measurement period 0.00 % vol at span leve+/- <2% volume/24hr min max value at calibvolume or pressure flow dependence 0 % of fs / 10l/h +- 5 l/h <1% range flow 5 15 10 l/hatmospheric pressure dependence 0.3 % of fs/kPa +- 2kPa < 1.5 % rang pressure 99.00 101 100 kPaambient temperature dependence -0.07 % by volume /10K +- 15K <0.3% volum temp 280 285 285 KCO2 (% vol) 15 0.07 % by volume per 15 CO2 range 8 15 0 % volNO (mg/m3) 300 0.02 % by volume per 300 NO range 100 150 0 mg/m3NO2 (mg/m3) 30 0 % by volume per 30 NO2 range 5 7.5 0 mg/m3Combined interference 0.56 % range <2% range Voltage 105 115 110 VDependence on voltage 0.1 % by volume /10V +- 5% < 0.1%vol /10 voltLosses in the line (leak) 2 % of value < 2% of valueUncertainty of calibration gas 0.5 % of value
Performance characteristic Uncertainty Value of uncertainty quantity % volStandard deviation of repeatability at zero ur0 for mean Only use rep at spanStandard deviation of repeatability at span level urs for mean 0.00Lack of fit ufit 0.08Drift u0dr 0.03volume or pressure flow dependence uspres 0.00atmospheric pressure dependence uapres 0.04ambient temperature dependence utemp -0.02CO2 0.05 Use largest of sum of all positive or all negative influencesNO 0.01 0.06 all +ves CriteriaNO2 0.00 0 all -ves sum <2% valueCombined interference (from mcerts) 0.08 0.06 largest 0.15406dependence on voltage uvolt 0.03 Value to use for intereference uncertaintylosses in the line (leak) uleak 0.09 uint 0.06Uncertainty of calibration gas ucalib 0.02
Measurement uncertainty 7.70 %volCombined uncertainty 0.15 %vol% of value 1.98 %Coverage factor k = 2Expanded uncertainty expressed with a level of confi 3.96 % of valueExpanded uncertainty expressed with a level of confi 0.30 % vol
Effect of drift
range of variation from conditions at calibration
For
insp
ectio
n pur
pose
s only
.
Conse
nt of
copy
right
owne
r req
uired
for a
ny ot
her u
se.
EPA Export 02-12-2018:03:53:44
Page24of27
Company Name: Pfizer Biotech Doc No GEN2-002rev22Licence No: P0652-01 Rev Date: 1/12/2018Year: 2018 Visit No:3 Issued by: QMSampling Date: 02 August 2018Report No: 018-131 Flue Gasses Records and Calculations for A1-2
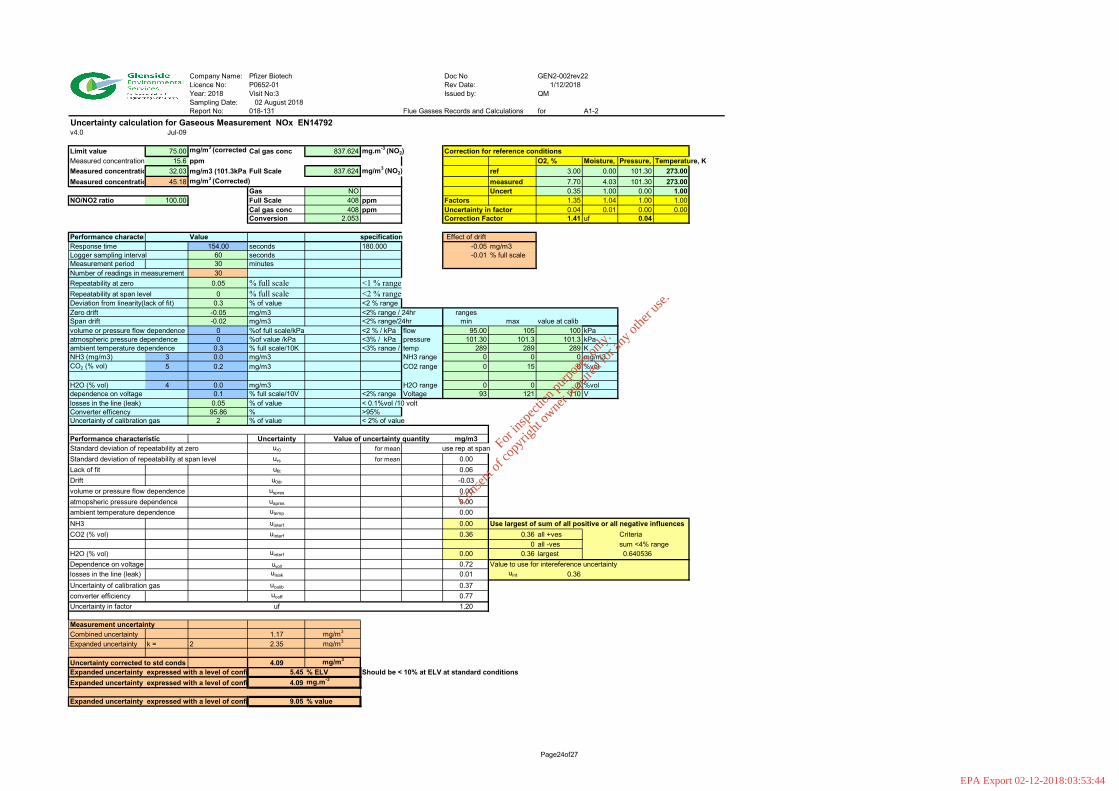
Uncertainty calculation for Gaseous Measurement NOx EN14792v4.0 Jul-09
Limit value 75.00 mg/m3 (corrected) Cal gas conc 837.624 mg.m-3 (NO2) Correction for reference conditionsMeasured concentration 15.6 ppm O2, % Moisture, %Pressure, Temperature, KMeasured concentratio 32.03 mg/m3 (101.3kPa, Full Scale 837.624 mg/m3 (NO2) ref 3.00 0.00 101.30 273.00Measured concentratio 45.18 mg/m3 (Corrected) measured 7.70 4.03 101.30 273.00
Gas NO Uncert 0.35 1.00 0.00 1.00NO/NO2 ratio 100.00 Full Scale 408 ppm Factors 1.35 1.04 1.00 1.00
Cal gas conc 408 ppm Uncertainty in factor 0.04 0.01 0.00 0.00Conversion 2.053 Correction Factor 1.41 uf 0.04
Performance character Value specification Effect of driftResponse time 154.00 seconds 180.000 -0.05 mg/m3Logger sampling interval 60 seconds -0.01 % full scaleMeasurement period 30 minutesNumber of readings in measurement 30Repeatability at zero 0.05 % full scale <1 % rangeRepeatability at span level 0 % full scale <2 % rangeDeviation from linearity(lack of fit) 0.3 % of value <2 % rangeZero drift -0.05 mg/m3 <2% range / 24hr rangesSpan drift -0.02 mg/m3 <2% range/24hr min max value at calibvolume or pressure flow dependence 0 %of full scale/kPa <2 % / kPa flow 95.00 105 100 kPaatmospheric pressure dependence 0 %of value /kPa <3% / kPa pressure 101.30 101.3 101.3 kPaambient temperature dependence 0.3 % full scale/10K <3% range / temp 289 289 289 K NH3 (mg/m3) 3 0.0 mg/m3 NH3 range 0 0 0 mg/m3CO2 (% vol) 5 0.2 mg/m3 CO2 range 0 15 0 %vol
H2O (% vol) 4 0.0 mg/m3 H2O range 0 0 0 %voldependence on voltage 0.1 % full scale/10V <2% range Voltage 93 121 110 Vlosses in the line (leak) 0.05 % of value < 0.1%vol /10 voltConverter efficency 95.86 % >95%Uncertainty of calibration gas 2 % of value < 2% of value
Performance characteristic Uncertainty Value of uncertainty quantity mg/m3Standard deviation of repeatability at zero ur0 for mean use rep at spanStandard deviation of repeatability at span level urs for mean 0.00Lack of fit ufit 0.06Drift u0dr -0.03volume or pressure flow dependence uspres 0.00atmopsheric pressure dependence uapres 0.00ambient temperature dependence utemp 0.00NH3 uinterf 0.00 Use largest of sum of all positive or all negative influencesCO2 (% vol) uinterf 0.36 0.36 all +ves Criteria
0 all -ves sum <4% rangeH2O (% vol) uinterf 0.00 0.36 largest 0.640536Dependence on voltage uvolt 0.72 Value to use for intereference uncertaintylosses in the line (leak) uleak 0.01 uint 0.36Uncertainty of calibration gas ucalib 0.37converter efficiency uceff 0.77Uncertainty in factor uf 1.20
Measurement uncertaintyCombined uncertainty 1.17 mg/m3
Expanded uncertainty k = 2 2.35 mg/m3
Uncertainty corrected to std conds 4.09 mg/m3
Expanded uncertainty expressed with a level of confi 5.45 % ELV Should be < 10% at ELV at standard conditionsExpanded uncertainty expressed with a level of confi 4.09 mg.m-3
Expanded uncertainty expressed with a level of confi 9.05 % value
For
insp
ectio
n pur
pose
s only
.
Conse
nt of
copy
right
owne
r req
uired
for a
ny ot
her u
se.
EPA Export 02-12-2018:03:53:44

Page25of27
Company Name: Pfizer Biotech Doc No GEN2-002rev22Licence No: P0652-01 Rev Date: 1/12/2018Year: 2018 Visit No:3 Issued by: QMSampling Date: 02 August 2018Report No: 018-131 Flue Gasses Records and Calculations for A1-2
Uncertainty calculation for Gaseous Measurement SO2 EA M21V2.2 Jul-08
Limit value 35.00 mg/m3 (corrected) Cal gas conc 1154.582 mg.m-3 Correction for reference conditionsO2, % Moisture, %Pressure, Temperature, K
Measured concentratio 1.52 mg/m3 Full Scale 1154.582 mg/m3 ref 3.00 0.00 101.30 273.00Measured concentratio 2.06 mg/m3 (Corrected) measured 7.70 0.00 101.30 273.00
Uncert 0.35 1.00 0.00 1.00Factors 1.35 1.00 1.00 1.00Uncertainty in factor 0.04 0.01 0.00 0.00Correction Factor 1.35 uf 0.04
Performance character Value specification Effect of driftResponse time 145.00 seconds 180.000 0.02 mg/m3Logger sampling interval 60 seconds 0.00 % full scaleMeasurement period 30 minutesNumber of readings in measurement 30Repeatability at zero 0 % full scale <1 % rangeRepeatability at span level 0 % full scale <2 % rangeDeviation from linearity(lack of fit) 0.13 % of value <2 % rangeZero drift 0.02 mg/m3 <2% range / 24hr rangesSpan drift -0.07 mg/m3 <2% range/24hr min max value at calibvolume or pressure flow dependence 0.02 % of full scale/3 kPa <2 % / 3 kPa flow 95.00 105 100 kPaatmospheric pressure dependence 0.8 % of full scale/2 kPa <3% / 2 kPa pressure 100.76 100.92 100.88 kPaambient temperature dependence 0.01 % full scale/10K <3% range / temp 287 288.5 287.5 K N2O (mg/m3) 20 0.2 mg/m3 N2O range 0 40 0 mg/m3CO2 (% vol) 15 0.2 mg/m3 CO2 range 0 15 0 %volCH4 (mg/m3) 40 0.7 mg/m3 CH4 range 0 57 0 mg/m3H2O (% vol) 20 0.2 mg/m3 H2O range 0 1 0 %voldependence on voltage 0.1 % full scale/10V <2% range Voltage 93 121 110 Vlosses in the line (leak) 1 % of value < 0.1%vol /10 voltUncertainty of calibration gas 1.07 % of value < 2% of value
Performance characteristic Uncertainty Value of uncertainty quantity mg/m3Standard deviation of repeatability at zero ur0 for mean use rep at spanStandard deviation of repeatability at span level urs for mean 0.00Lack of fit ufit 0.00Drift u0dr 0.01volume or pressure flow dependence uspres 0.22atmopsheric pressure dependence uapres 0.28ambient temperature dependence utemp 0.00N2O (mg/m3) uinterf 0.23 Use largest of sum of all positive or all negative influencesCO2 (% vol) uinterf 0.12 0.93 all +ves CriteriaCH4 (mg/m3) uinterf 0.58 0 all -ves sum <4% rangeH2O (% vol) uinterf 0.01 0.93 largest 0.030316Dependence on voltage uvolt 1.00 Value to use for intereference uncertaintylosses in the line (leak) uleak 0.01 uint 0.93Uncertainty of calibration gas ucalib 0.01Uncertianty in factor uf 0.06
Measurement uncertaintyCombined uncertainty 1.41 mg/m3
Expanded uncertainty k = 2 2.82 mg/m3
Uncertainty corrected to std conds 3.81 mg/m3
Expanded uncertainty expressed with a level of confi 10.89 % ELV Should be < 10% at ELV at standard conditionsExpanded uncertainty expressed with a level of confi 3.81 mg.m-3
Expanded uncertainty expressed with a level of confi 185.45 % value
For
insp
ectio
n pur
pose
s only
.
Conse
nt of
copy
right
owne
r req
uired
for a
ny ot
her u
se.
EPA Export 02-12-2018:03:53:44
Page26of27
Company Name: Pfizer Biotech Doc No GEN2-002rev22Licence No: P0652-01 Rev Date: 1/12/2018Year: 2018 Visit No:3 Issued by: QMSampling Date: 02 August 2018Report No: 018-131 Flue Gasses Records and Calculations for A1-2
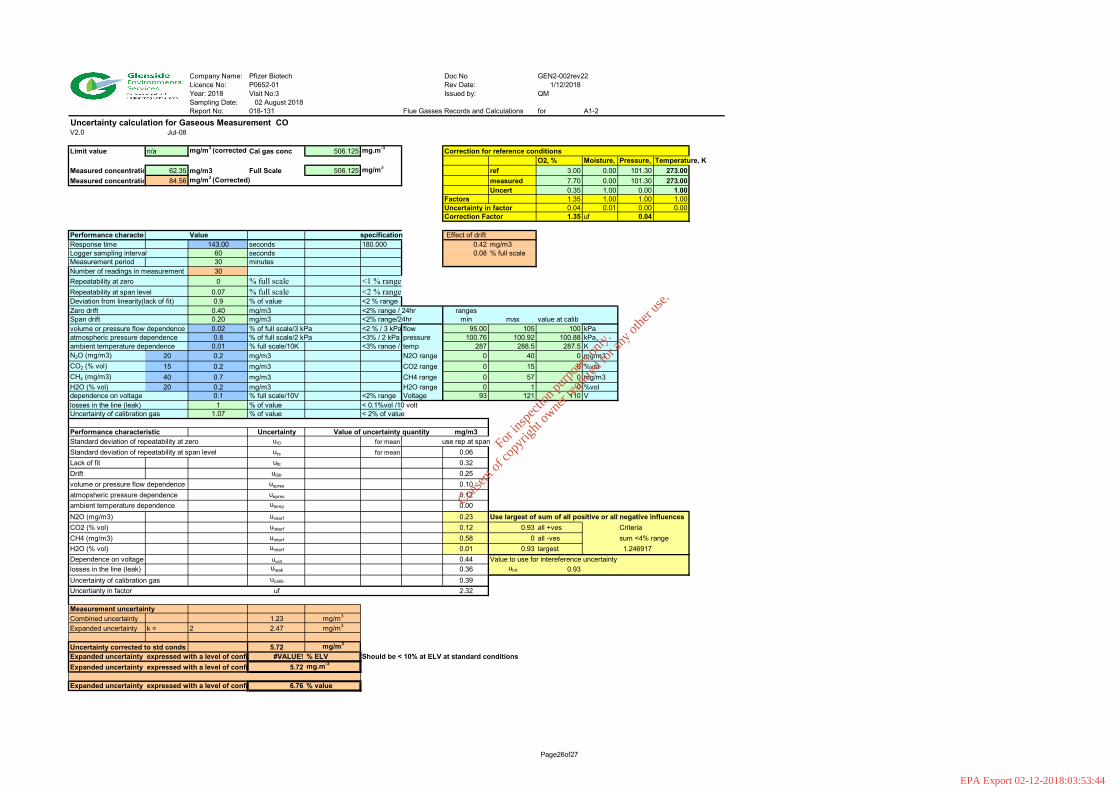
Uncertainty calculation for Gaseous Measurement COV2.0 Jul-08
Limit value n/a mg/m3 (corrected) Cal gas conc 506.125 mg.m-3 Correction for reference conditionsO2, % Moisture, %Pressure, Temperature, K
Measured concentratio 62.35 mg/m3 Full Scale 506.125 mg/m3 ref 3.00 0.00 101.30 273.00Measured concentratio 84.56 mg/m3 (Corrected) measured 7.70 0.00 101.30 273.00
Uncert 0.35 1.00 0.00 1.00Factors 1.35 1.00 1.00 1.00Uncertainty in factor 0.04 0.01 0.00 0.00Correction Factor 1.35 uf 0.04
Performance character Value specification Effect of driftResponse time 143.00 seconds 180.000 0.42 mg/m3Logger sampling interval 60 seconds 0.08 % full scaleMeasurement period 30 minutesNumber of readings in measurement 30Repeatability at zero 0 % full scale <1 % rangeRepeatability at span level 0.07 % full scale <2 % rangeDeviation from linearity(lack of fit) 0.9 % of value <2 % rangeZero drift 0.40 mg/m3 <2% range / 24hr rangesSpan drift 0.20 mg/m3 <2% range/24hr min max value at calibvolume or pressure flow dependence 0.02 % of full scale/3 kPa <2 % / 3 kPa flow 95.00 105 100 kPaatmospheric pressure dependence 0.8 % of full scale/2 kPa <3% / 2 kPa pressure 100.76 100.92 100.88 kPaambient temperature dependence 0.01 % full scale/10K <3% range / temp 287 288.5 287.5 K N2O (mg/m3) 20 0.2 mg/m3 N2O range 0 40 0 mg/m3CO2 (% vol) 15 0.2 mg/m3 CO2 range 0 15 0 %volCH4 (mg/m3) 40 0.7 mg/m3 CH4 range 0 57 0 mg/m3H2O (% vol) 20 0.2 mg/m3 H2O range 0 1 0 %voldependence on voltage 0.1 % full scale/10V <2% range Voltage 93 121 110 Vlosses in the line (leak) 1 % of value < 0.1%vol /10 voltUncertainty of calibration gas 1.07 % of value < 2% of value
Performance characteristic Uncertainty Value of uncertainty quantity mg/m3Standard deviation of repeatability at zero ur0 for mean use rep at spanStandard deviation of repeatability at span level urs for mean 0.06Lack of fit ufit 0.32Drift u0dr 0.25volume or pressure flow dependence uspres 0.10atmopsheric pressure dependence uapres 0.12ambient temperature dependence utemp 0.00N2O (mg/m3) uinterf 0.23 Use largest of sum of all positive or all negative influencesCO2 (% vol) uinterf 0.12 0.93 all +ves CriteriaCH4 (mg/m3) uinterf 0.58 0 all -ves sum <4% rangeH2O (% vol) uinterf 0.01 0.93 largest 1.246917Dependence on voltage uvolt 0.44 Value to use for intereference uncertaintylosses in the line (leak) uleak 0.36 uint 0.93Uncertainty of calibration gas ucalib 0.39Uncertianty in factor uf 2.32
Measurement uncertaintyCombined uncertainty 1.23 mg/m3
Expanded uncertainty k = 2 2.47 mg/m3
Uncertainty corrected to std conds 5.72 mg/m3
Expanded uncertainty expressed with a level of confi #VALUE! % ELV Should be < 10% at ELV at standard conditionsExpanded uncertainty expressed with a level of confi 5.72 mg.m-3
Expanded uncertainty expressed with a level of confi 6.76 % value
For
insp
ectio
n pur
pose
s only
.
Conse
nt of
copy
right
owne
r req
uired
for a
ny ot
her u
se.
EPA Export 02-12-2018:03:53:44
Page27of27
Company Name: Pfizer Biotech Doc No GEN2-002rev22Licence No: P0652-01 Rev Date: 1/12/2018Year: 2018 Visit No:3 Issued by: QMSampling Date: 02 August 2018Report No: 018-131 Flue Gasses Records and Calculations for A1-2
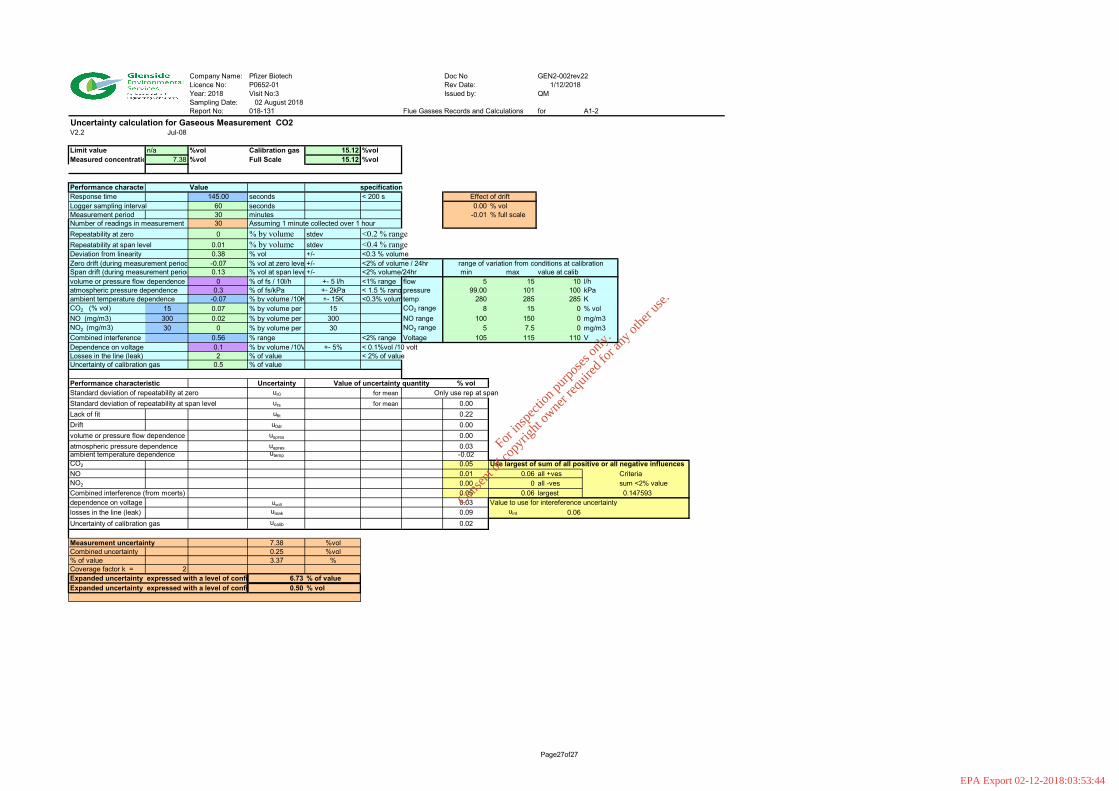
Uncertainty calculation for Gaseous Measurement CO2V2.2 Jul-08
Limit value n/a %vol Calibration gas 15.12 %volMeasured concentratio 7.38 %vol Full Scale 15.12 %vol
Performance character Value specificationResponse time 145.00 seconds < 200 sLogger sampling interval 60 seconds 0.00 % volMeasurement period 30 minutes -0.01 % full scaleNumber of readings in measurement 30 Assuming 1 minute collected over 1 hourRepeatability at zero 0 % by volume stdev <0.2 % rangeRepeatability at span level 0.01 % by volume stdev <0.4 % rangeDeviation from linearity 0.38 % vol +/- <0.3 % volumeZero drift (during measurement period -0.07 % vol at zero leve +/- <2% of volume / 24hrSpan drift (during measurement period 0.13 % vol at span leve+/- <2% volume/24hr min max value at calibvolume or pressure flow dependence 0 % of fs / 10l/h +- 5 l/h <1% range flow 5 15 10 l/hatmospheric pressure dependence 0.3 % of fs/kPa +- 2kPa < 1.5 % rang pressure 99.00 101 100 kPaambient temperature dependence -0.07 % by volume /10K +- 15K <0.3% volum temp 280 285 285 KCO2 (% vol) 15 0.07 % by volume per 15 CO2 range 8 15 0 % volNO (mg/m3) 300 0.02 % by volume per 300 NO range 100 150 0 mg/m3NO2 (mg/m3) 30 0 % by volume per 30 NO2 range 5 7.5 0 mg/m3Combined interference 0.56 % range <2% range Voltage 105 115 110 VDependence on voltage 0.1 % by volume /10V +- 5% < 0.1%vol /10 voltLosses in the line (leak) 2 % of value < 2% of valueUncertainty of calibration gas 0.5 % of value
Performance characteristic Uncertainty Value of uncertainty quantity % volStandard deviation of repeatability at zero ur0 for mean Only use rep at spanStandard deviation of repeatability at span level urs for mean 0.00Lack of fit ufit 0.22Drift u0dr 0.00volume or pressure flow dependence uspres 0.00atmospheric pressure dependence uapres 0.03ambient temperature dependence utemp -0.02CO2 0.05 Use largest of sum of all positive or all negative influencesNO 0.01 0.06 all +ves CriteriaNO2 0.00 0 all -ves sum <2% valueCombined interference (from mcerts) 0.05 0.06 largest 0.147593dependence on voltage uvolt 0.03 Value to use for intereference uncertaintylosses in the line (leak) uleak 0.09 uint 0.06Uncertainty of calibration gas ucalib 0.02
Measurement uncertainty 7.38 %volCombined uncertainty 0.25 %vol% of value 3.37 %Coverage factor k = 2Expanded uncertainty expressed with a level of confi 6.73 % of valueExpanded uncertainty expressed with a level of confi 0.50 % vol
Effect of drift
range of variation from conditions at calibration
For
insp
ectio
n pur
pose
s only
.
Conse
nt of
copy
right
owne
r req
uired
for a
ny ot
her u
se.
EPA Export 02-12-2018:03:53:44
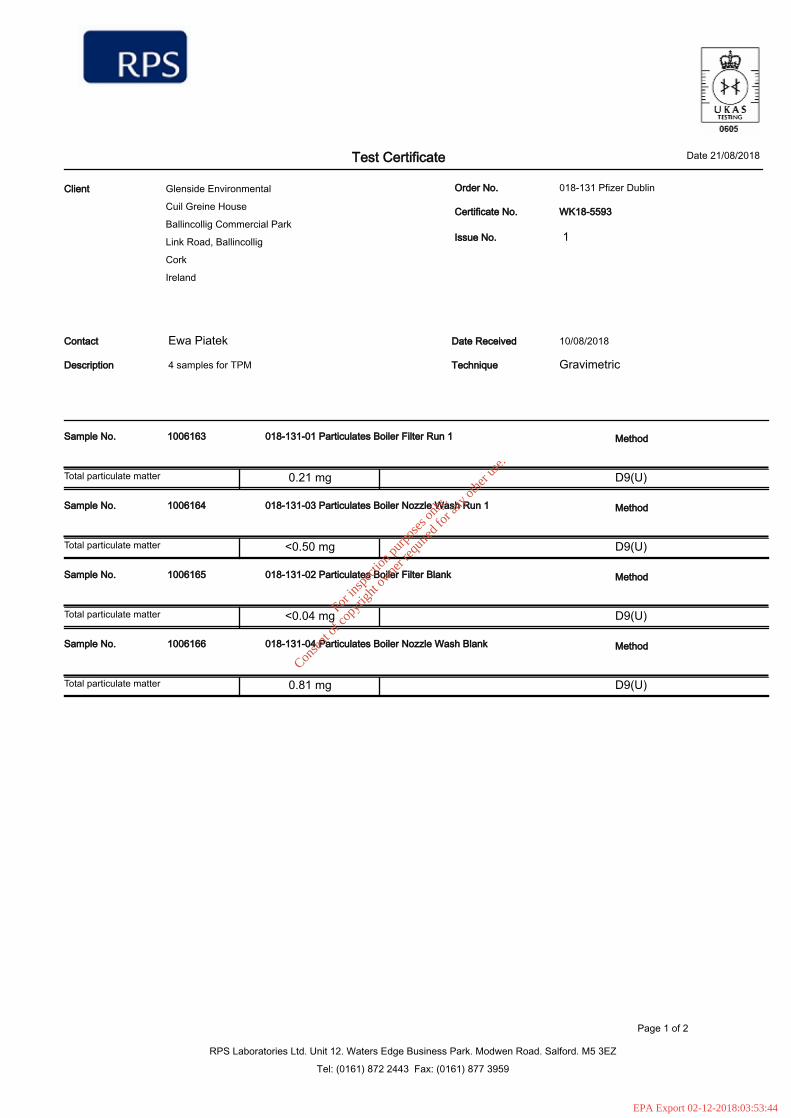
Test Certificate Date 21/08/2018
Glenside Environmental
Cuil Greine House
Ballincollig Commercial Park
Link Road, Ballincollig
Cork
Ireland
Client Order No. 018-131 Pfizer Dublin
WK18-5593Certificate No.
Issue No. 1
Contact 10/08/2018Date ReceivedEwa Piatek
Description 4 samples for TPM Technique Gravimetric
Sample No. 1006163 018-131-01 Particulates Boiler Filter Run 1 Method
D9(U)0.21 mgTotal particulate matter
Sample No. 1006164 018-131-03 Particulates Boiler Nozzle Wash Run 1 Method
D9(U)<0.50 mgTotal particulate matter
Sample No. 1006165 018-131-02 Particulates Boiler Filter Blank Method
D9(U)<0.04 mgTotal particulate matter
Sample No. 1006166 018-131-04 Particulates Boiler Nozzle Wash Blank Method
D9(U)0.81 mgTotal particulate matter
RPS Laboratories Ltd. Unit 12. Waters Edge Business Park. Modwen Road. Salford. M5 3EZ
Tel: (0161) 872 2443 Fax: (0161) 877 3959
Page 1 of 2
For
insp
ectio
n pur
pose
s only
.
Conse
nt of
copy
right
owne
r req
uired
for a
ny ot
her u
se.
EPA Export 02-12-2018:03:53:44
Date 21/08/2018Test Certificate
WK18-5593Certificate No.
1Issue No.
Client Glenside Environmental
Approved By Date
Tammy IllingworthTested By 17/08/2018Date
Joanne Dewhurst
Operational Manager
For and on authority of RPS Laboratories Ltd.
Method Symbols (U) Analysis is UKAS Accredited
(N) Analysis is not UKAS Accredited
Concentration values (mg/m3 and ppm) are calculated on the basis of information provided by the customer.
Results stated as ml are refering to the sample volume.
Analysis carried out on samples 'as received'
This document may not be reproduced other than in full, except with the written approval of the issuing laboratory.
RPS Laboratories terms and conditions apply - a copy is available on request.
Alex McKerracher 21/08/2018
21/08/2018
RPS Laboratories Ltd. Unit 12. Waters Edge Business Park. Modwen Road. Salford. M5 3EZ
Tel: (0161) 872 2443 Fax: (0161) 877 3959
Page 2 of 2
For
insp
ectio
n pur
pose
s only
.
Conse
nt of
copy
right
owne
r req
uired
for a
ny ot
her u
se.
EPA Export 02-12-2018:03:53:44