2010 How Healthy Are We - Cobb & Douglas Public Health
147
-
Upload
khangminh22 -
Category
Documents
-
view
2 -
download
0
Transcript of 2010 How Healthy Are We - Cobb & Douglas Public Health
A MA MESSAGEESSAGE FROMFROM THETHE
DDISTRICTISTRICT HHEALTHEALTH DDIRECTORIRECTOR
www.cobbanddouglaspublichealth.org
It is my pleasure to present Cobb County 2010: How Healthy Are We? This report conveys valuable information
regarding the health status of our county. I hope that you will find it informative on current health issues and trends. I also hope it will serve as a call to action for us — as individuals and as a community — to be deliberate in living healthier
and safer lives.
From a health and safety standpoint, we have much to be thankful for in Cobb County. Our infant mortality rates have
remained low. There have been decreases in the number of tuberculosis (TB) and acute hepatitis cases reported. Im-munization rates in children under the age of two have increased, and immunization rates in the elderly populations for
both seasonal flu and pneumonia have been high. Yet we also have areas that need significant improvement. In Cobb County, cardiovascular disease and cancer are the
leading causes of mortality. Preventable injuries including motor vehicle crashes, homicide, and suicide are among the leading causes of premature death. Significant disparities exist between different county populations when it comes to
infant mortality. Sexually transmitted diseases (STDs) are prevalent in Cobb County. Lastly, behavioral survey data in-dicate that too few of our residents are receiving preventable medical screenings while too many are practicing behav-
iors which put them at higher risk for chronic illnesses such as cardiovascular disease and cancer.
I believe that having ―healthy people in healthy communities‖ is not a goal that can be accomplished by one agency or
health district alone — or even by a few large organizations working together. Successfully improving our health status will depend on a long-term collaborative effort involving many stakeholders including public health, our hospital systems,
our physicians and other health care providers, our local governments, our schools, our Chamber of Commerce, busi-nesses, churches, civic organizations, non-profits, and other partners. But even the most meticulous planning and im-
plementation by these stakeholders will have limited impact unless each of us is willing to make our health a top priority.
This means changing our behaviors as needed so that we’re eating better, exercising more, driving more safely, and avoiding harmful substances.
Our Cobb Public Health staff, Board of Health members, and community partners are working hard to promote and pro-
tect the health, safety and well-being of the residents of Cobb County. In 2011, we will begin a very important initiative
called MAPP (Mobilizing for Action through Planning and Partnerships), which is a community-wide strategic planning process for improving our community’s health. In this context, ―health‖ refers to a dynamic state of complete physical,
mental, spiritual and social well-being - not merely the absence of disease or infirmity (World Health Organization, 1998). While CDPH leadership will facilitate the MAPP process, participation and ownership will be spread throughout
the community. Broad participation by a wide range of organizations and individuals is essential to maintaining and im-
proving our community’s health. If you’d like to learn more about MAPP please visit our website at www.CobbandDouglasPublicHealth.org.
Many thanks to the staff of Cobb Public Health, the Cobb County Community Services Board, and other partners for the
effort and expertise contributed to produce this report. Thanks also to everyone in our community who works hard to
make Cobb County a safer and healthier place. May we continue working together to help each other live healthier, longer and more rewarding lives.
Kind regards,
Jack Kennedy
John D. Kennedy, M.D.
District Health Director

II
TTABLEABLE OFOF CCONTENTSONTENTS
Highlights ........................................................................................................... 1
Profile of Our County .......................................................................................... 5
Geography of Cobb County 6
Health 7
Population 8
Age Distribution 10
Households 11
Economics 13
Unemployment 14
Poverty 15
Homelessness 16
Education 17
Access to Healthcare .......................................................................................... 20
Access to Primary Care 21
Access to Dental Care 22
Insurance Coverage 23
Leading Causes ................................................................................................... 26
Leading Causes of Mortality (Death) 27
Age Adjusted Mortality Rates 27
Leading Causes of Premature Deaths 29
Leading Causes of Hospitalization 29
Chronic Disease .................................................................................................. 30
Cardiovascular Disease 31
Cancer 36
Breast Cancer 39
Asthma 42
Diabetes 45
Chronic Obstructive Pulmonary Disease (COPD) 49
Alcohol Use 50
Smoking 52
Overweight/Obesity 53
Infectious Disease .............................................................................................. 56
Sexually Transmitted Diseases 57
Human Immunodeficiency Virus (HIV) 61
Tuberculosis 65
Hepatitis 67
Seasonal Influenza 68
H1N1 Influenza 69
Pneumonia 69
Vaccine Preventable Illness 70
Invasive Bacterial Disease 72
Gastrointestinal Illness 73
Foodborne Outbreaks 74

III
TTABLEABLE OFOF CCONTENTSONTENTS
Maternal & Child Health ..................................................................................... 77
Pregnancy 78
Prenatal Care 80
Abortions 81
Infant Mortality 82
Breastfeeding 86
Childhood Morbidity 86
Childhood Immunization 87
Youth Risk Behaviors 87
Youth Obesity 88
Alcohol Use 91
Youth Smoking 92
Behavioral Health .............................................................................................. 94
Mental Disorders 96
Mood Disorders 98
Psychotic Disorders 98
Mental Disorders Among Children & Adolescents 99
Addictive Disease 99
Community Safety ............................................................................................. 102
Crime 103
Family Violence 105
Injuries 106
Motor Vehicle Crashes 106
Suicide 111
Emergency Preparedness and Response 112
Environmental Health ........................................................................................ 113
Air Quality 115
Water Quality 116
Hazardous Waste Sites 117
Rabies 118
Improving Our Community ................................................................................ 121
About Us ............................................................................................................ 124
Mission 125
Vision 125
Programs and Services 127
Appendices ......................................................................................................... 132
I. Board Members 133
II. Healthy People 2010 Objectives 134
III. List of Tables & Figures 135
IV. Sources 138
V. Cobb & Douglas Public Health Locations 142

Back to TOC
2 Cobb County Health Status Report, 2010
HHIGHLIGHTSIGHLIGHTS
Highlights Cobb and Douglas Public Health (CDPH) staff designed How Healthy Are We? to provide a general assessment of Cobb County residents’ health. We partnered with the Cobb County Community Services Board to provide the information for the section on behavioral health. The contents of this report represent information we track, trend and use to assess our community’s current and future health needs. We hope this report pro-vides you with valuable information regarding the health of the community in which we live, work and play. Below are highlights from the report.
Population The population in Cobb County continues to grow and has a large percentage of youth and an increasing per-centage of minority populations.
Over one-fourth of the population is under the age of 19.
Minority populations grew 26% over the past 5 years.
There is a greater percentage of Hispanics in Cobb County than in Georgia.
Almost 5% of households are linguistically isolated and do not have a household member who
speaks English well. These language differences often make healthcare communications difficult.
Access to Care Residents must have access to healthcare (facilities and providers) in order to be healthy.
Primary care physicians (family practitioners, internists and pediatricians) make up 34% of Cobb
County physicians. These physicians provide the gateway to healthcare, including specialty care.
The current economy causes job and insurance loss, resulting in residents not receiving regular
dental care. Regular dental care is vital to good health.
The percentage of uninsured individuals in Cobb County is higher than in Georgia despite the fact
that Cobb County is ranked as the 4th highest county in the state for household income.
Leading Causes There are specific leading causes of illness, hospitalization and death in the county.
The top 5 leading causes of mortality (death) for Cobb County are consistent with the United
States’ top 5 leading causes of mortality.
Heart disease, cancer and stroke are the leading causes of illness (morbidity), death (mortality)
and premature death in Cobb County.
The age adjusted mortality rate for Cobb County is lower than it is for Georgia.
Pregnancy and normal delivery cause a high number of hospitalizations, indicating a growing
county.
Preventable deaths, including accidents, homicide and suicide, are the leading causes of premature
deaths (death prior to age 75).
Cobb County Health Status Report, 2010 3
HHIGHLIGHTSIGHLIGHTS
Chronic Diseases Chronic diseases (diseases lasting longer than 3 months) such as diabetes and asthma continue to cause a high number of illnesses and deaths in the county; they also cause high healthcare costs.
Cancer is the leading cause of premature death (<75 years of age) in Cobb County, followed
by heart disease.
Lung cancer is the leading cause of cancer mortality for both men and women in Cobb County.
The age adjusted mortality rate due to breast cancer in females is slightly higher in Cobb
County than in Georgia or the United States.
In 2007, the age adjusted mortality rate due to alcoholic liver disease was slightly higher in
Cobb County than in Georgia. Additionally, based on self-reported results, Cobb County adults report a higher incidence of heavy drinking and binge drinking than adults in Georgia (2006-
2008).
In 2008, a higher percentage of adult residents reported being ―overweight‖ in Cobb County
than in Georgia; however, a lower percentage of adults in Cobb County reported being ―obese‖ than did adults in Georgia.
Infectious Diseases Infectious diseases can spread quickly through populations, causing high numbers of illness, death and disability.
Sexually transmitted diseases (STDs) such as gonorrhea, syphilis, AIDS and hepatitis B are
prevalent in Cobb County and in Georgia.
In 2008, Georgia ranked 3rd highest in the U.S. for rates of primary and secondary syphilis;
from 2003-2007, Cobb County ranked 7th highest out of Georgia’s 159 counties for the rate of syphilis (cases per 100,000 population).
The number of tuberculosis (TB) cases in Cobb County decreased by 30.8% from 2008-2009;
a similar decrease was seen throughout the state of Georgia.
Vaccine-preventable diseases are still occurring in Cobb County; childhood immunization rates
are slightly lower in the County than in Georgia.
The CDC expects the H1N1 flu virus to return in the 2010-2011 flu season, along with seasonal
flu viruses. Unlike seasonal flu, H1N1 primarily affected persons 49 and under in 2009. This year’s seasonal flu vaccine will protect against H1N1 and 2 other flu viruses.
Maternal and Child Health One can assess the overall health status of the population by analyzing the health of mothers and their babies.
Overall pregnancy rates are higher in Cobb County than in Georgia.
Teen pregnancy rates increased overall in 2006 and 2007 in both Georgia and Cobb County.
The Hispanic population has the highest pregnancy rates both overall and for teens (15-19 years)
in the County.
Hispanics, compared to all populations, have the highest rate of inadequate prenatal care.
Cobb County ranks poorly in the percentage of infants who are born with low birth weight (LBW)
which can cause serious medical problems in the infants. Incidents of LBW occur most frequently in the black population.
4 Cobb County Health Status Report, 2010
HHIGHLIGHTSIGHLIGHTS
Maternal and Child Health (continued) Cobb County’s youth play a key role in determining the County’s future health status.
In the 2008 – 2009 school year, 9.6% of 12th grade students in Marietta City Schools and 15.6 %
in Cobb County Schools reported using tobacco in the last 30 days.
In the 2008 – 2009 school year, 5.2% of 12th grade students in Marietta City Schools and 8.4 %
in Cobb County Schools reported binge alcohol drinking in the last 30 days.
Obesity in children and adolescents continued to be a major public health concern in the United
States, Georgia and the County. In 2009, 12.4% of Georgia’s youth were reported as being
obese compared to 12.0% in the United States.
Community Safety Residents must feel safe in their community in order to enjoy a good quality of life.
The violent crime rate is lower in Cobb County than in Georgia.
From 2004-2008, larceny was the most frequently committed crime in Cobb County.
During the same period, injuries due to external causes (such as motor vehicle crashes, homicide,
falls and suicide) accounted for 25.7% of all Cobb County Emergency Department visits; falls were the number one cause of injury-related Emergency Department visits.
In 2008, Cobb County ranked 2nd highest out of the 159 counties in Georgia for the number of
motor vehicle crash fatalities.
Motor vehicle crashes remain a leading cause of hospitalization and death in the county.
Behavioral Health Behavioral health refers to how a person’s mental well-being affects his or her actions and ability to function.
It is estimated that 26.3% of adults suffer from a mental disorder in a given year in Cobb County.
Estimates suggest that approximately 6% of adults suffer from a serious mental illness such as
major depression, bipolar disorder, or schizophrenia in Cobb County.
Environmental Health The environment plays a key role in the health status of the community.
Cobb County has an award winning water system. In 2009, drinking water met or exceeded all
safety and quality standards set by the State of Georgia and the Environmental Protection Agency.
In 2009, Metropolitan Atlanta (including Cobb County) air quality measured in the unhealthy
range 16 out of the 340 days measured.
In 2009, 27 hazardous waste sites were identified in Cobb County.
In 2009, the greatest numbers of positive rabies tests were for raccoons.

Back to TOC

6 Cobb County Health Status Report, 2010
PPROFILEROFILE OFOF OUROUR CCOUNTYOUNTY
Cobb County is located north of Atlanta along the scenic Chattahoochee River. It is bordered on the north-
west by Lake Allatoona, and its southernmost boundary lies south of Interstate 20. Marietta, the seat of
Cobb County government, lies 20 miles northwest of downtown Atlanta.
Cobb County’s 340 square miles include the municipalities of Marietta, Austell, Powder Springs, Smyrna, Ac-
worth, Kennesaw, and suburban areas in unincorporated Cobb County.
GEOGRAPHY OF COBB COUNTY
Cobb County Health Status Report, 2010 7
PPROFILEROFILE OFOF OUROUR CCOUNTYOUNTY
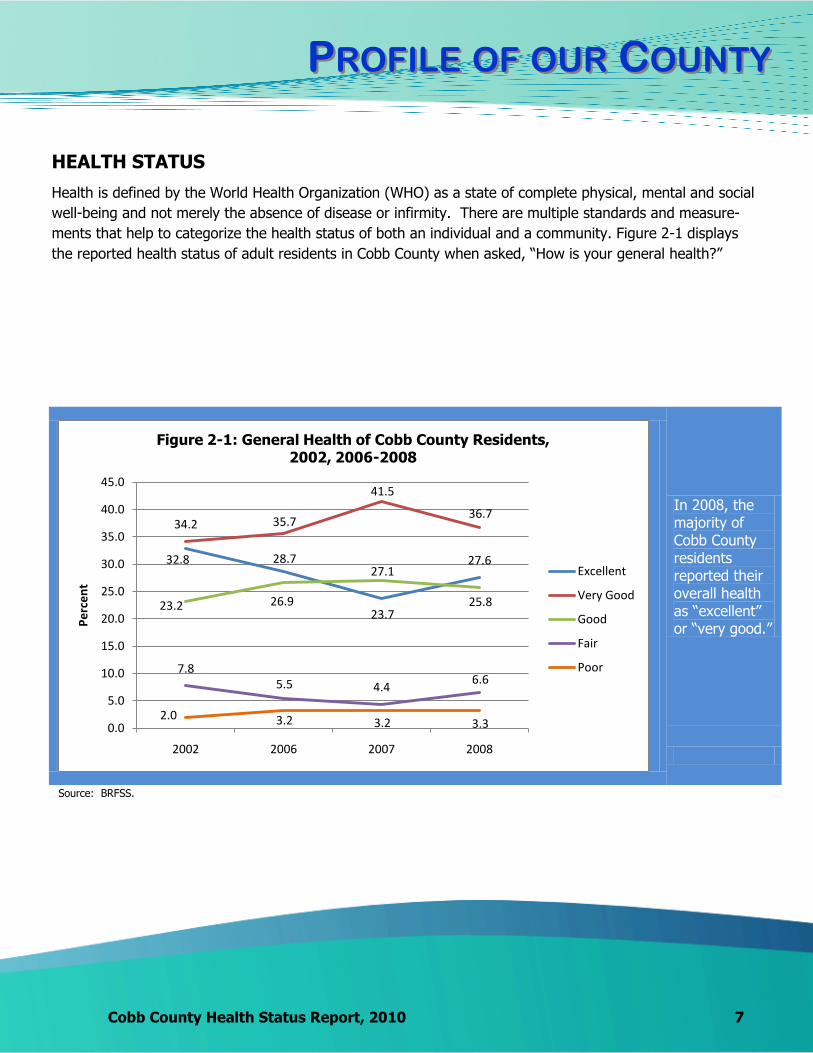
HEALTH STATUS
Health is defined by the World Health Organization (WHO) as a state of complete physical, mental and social
well-being and not merely the absence of disease or infirmity. There are multiple standards and measure-
ments that help to categorize the health status of both an individual and a community. Figure 2-1 displays
the reported health status of adult residents in Cobb County when asked, ―How is your general health?‖
In 2008, the majority of Cobb County residents reported their overall health as ―excellent‖ or ―very good.‖
32.8 28.7
23.7
27.6
34.2 35.7
41.5
36.7
23.2 26.9
27.1
25.8
7.85.5 4.4
6.6
2.0 3.2 3.2 3.30.0
5.0
10.0
15.0
20.0
25.0
30.0
35.0
40.0
45.0
2002 2006 2007 2008
Pe
rce
nt
Figure 2-1: General Health of Cobb County Residents, 2002, 2006-2008
Excellent
Very Good
Good
Fair
Poor
Source: BRFSS.

8 Cobb County Health Status Report, 2010
PPROFILEROFILE OFOF OUROUR CCOUNTYOUNTY
Demographic factors including age, race, ethnicity, sex, education and income are directly and indirectly re-
lated to health status and health outcomes.
POPULATION
Cobb County population increased by
14.9% between 2000-2008.
A 12.7% increase in Cobb’s population
is projected from 2008 to 2015.
Cobb ranks 4th highest in population
out of the 159 counties in Georgia.
The minority (non-white) population
in Cobb has grown by 26.0% over
the past 5 years.
Blacks made up 23.3% of the
Cobb population in 2008.
In 2008, Hispanics comprised 11.7% of Cobb’s population,
compared to 7.7% in Georgia and 15.1% in the U.S.
The Hispanic population in Cobb
grew 33.8% from 2003-2008.
Foreign born residents made
up approximately 14.7% of Cobb
County residents in 2008.
Of the foreign born population in Cobb
County, 53.3% were from Latin America; the second most populous
group was from Asia, which made up
23.5% of the foreign born population
in 2008.
Source: OASIS
Cobb County Health Status Report, 2010 9
PPROFILEROFILE OFOF OUROUR CCOUNTYOUNTY
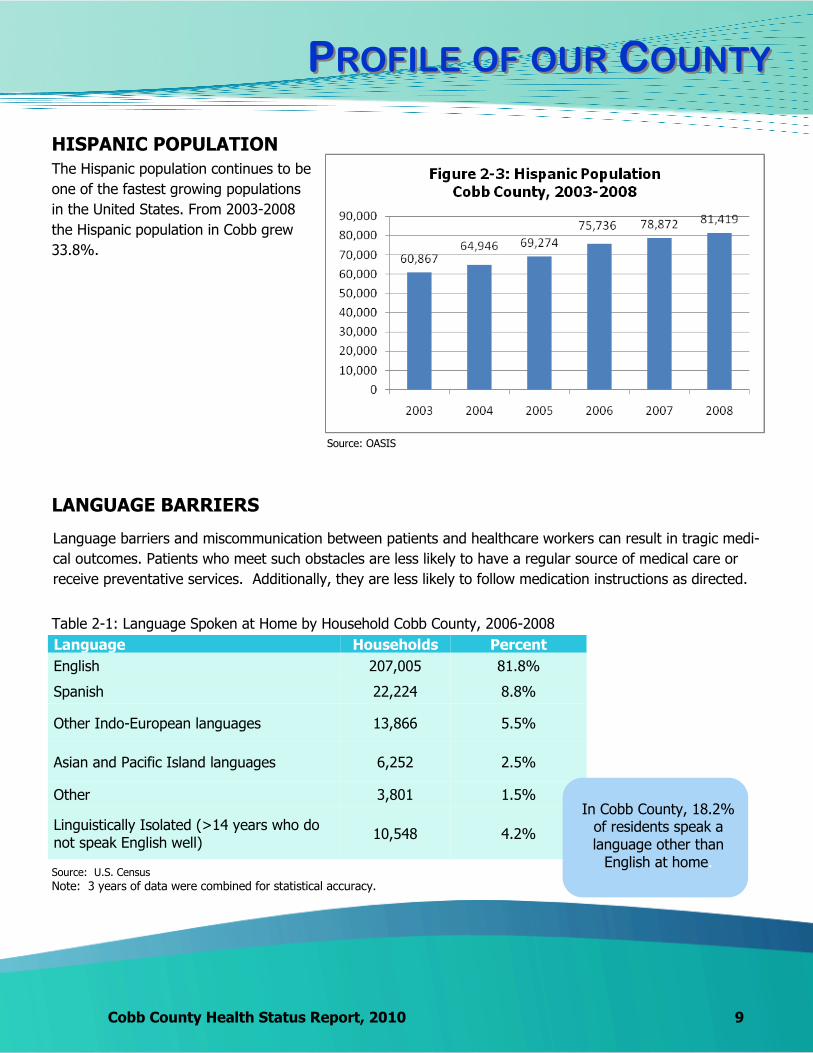
HISPANIC POPULATION
The Hispanic population continues to be
one of the fastest growing populations
in the United States. From 2003-2008
the Hispanic population in Cobb grew
33.8%.
LANGUAGE BARRIERS
Language barriers and miscommunication between patients and healthcare workers can result in tragic medi-
cal outcomes. Patients who meet such obstacles are less likely to have a regular source of medical care or
receive preventative services. Additionally, they are less likely to follow medication instructions as directed.
Table 2-1: Language Spoken at Home by Household Cobb County, 2006-2008
Language Households Percent
English 207,005 81.8%
Spanish 22,224 8.8%
Other Indo-European languages 13,866 5.5%
Asian and Pacific Island languages 6,252 2.5%
Other 3,801 1.5%
Linguistically Isolated (>14 years who do not speak English well)
10,548 4.2%
In Cobb County, 18.2% of residents speak a language other than
English at home.
Source: OASIS
Source: U.S. Census Note: 3 years of data were combined for statistical accuracy.
10 Cobb County Health Status Report, 2010
PPROFILEROFILE OFOF OUROUR CCOUNTYOUNTY
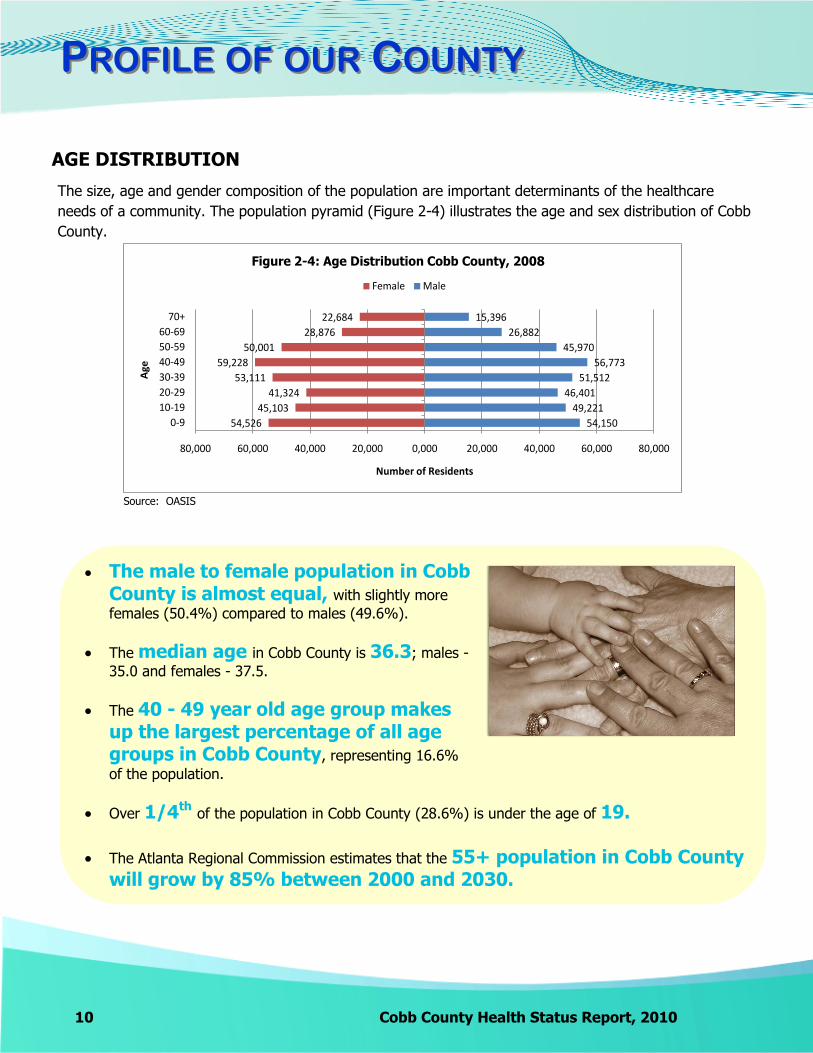
The size, age and gender composition of the population are important determinants of the healthcare
needs of a community. The population pyramid (Figure 2-4) illustrates the age and sex distribution of Cobb
County.
AGE DISTRIBUTION
The male to female population in Cobb County is almost equal, with slightly more
females (50.4%) compared to males (49.6%).
The median age in Cobb County is 36.3; males -
35.0 and females - 37.5.
The 40 - 49 year old age group makes up the largest percentage of all age groups in Cobb County, representing 16.6%
of the population.
Over 1/4th of the population in Cobb County (28.6%) is under the age of 19. The Atlanta Regional Commission estimates that the 55+ population in Cobb County
will grow by 85% between 2000 and 2030.
54,150
49,221
46,401
51,512
56,773
45,970
26,882
15,396
54,526
45,103
41,324
53,111
59,228
50,001
28,876
22,684
80,000 60,000 40,000 20,000 0,000 20,000 40,000 60,000 80,000
0-9
10-19
20-29
30-39
40-49
50-59
60-69
70+
Number of Residents
Age
Figure 2-4: Age Distribution Cobb County, 2008
Female Male
Source: OASIS

Cobb County Health Status Report, 2010 11
PPROFILEROFILE OFOF OUROUR CCOUNTYOUNTY
HOUSEHOLDS
Household characteristics directly impact health status. Single parent and grandparent raising grandchildren
families often experience poorer physical and mental health. Table 2-2 shows select household characteris-
tics for Cobb County (2006-2008).
Table 2-2: Household Profile Cobb County, 2006-2008
Total Households 253,148
Married Couple Family Households 51.3%
Nonfamily Households * 32.1%
Female Householder; no husband present 12.0%
Male Householder; no wife present 4.6%
Households with Children (< 18 years old) 71.3%
Married Couple with Children 72.7%
Female Householder with Children 20.4%
Male Householder with Children 6.2%
Nonfamily Household with Children 0.7%
Source: U.S. Census Note: 3 years of data were combined for statistical accuracy.
* Nonfamily households include individuals who are living alone
(66,270 households) and individuals who are not related (14,977
households).
12 Cobb County Health Status Report, 2010
PPROFILEROFILE OFOF OUROUR CCOUNTYOUNTY
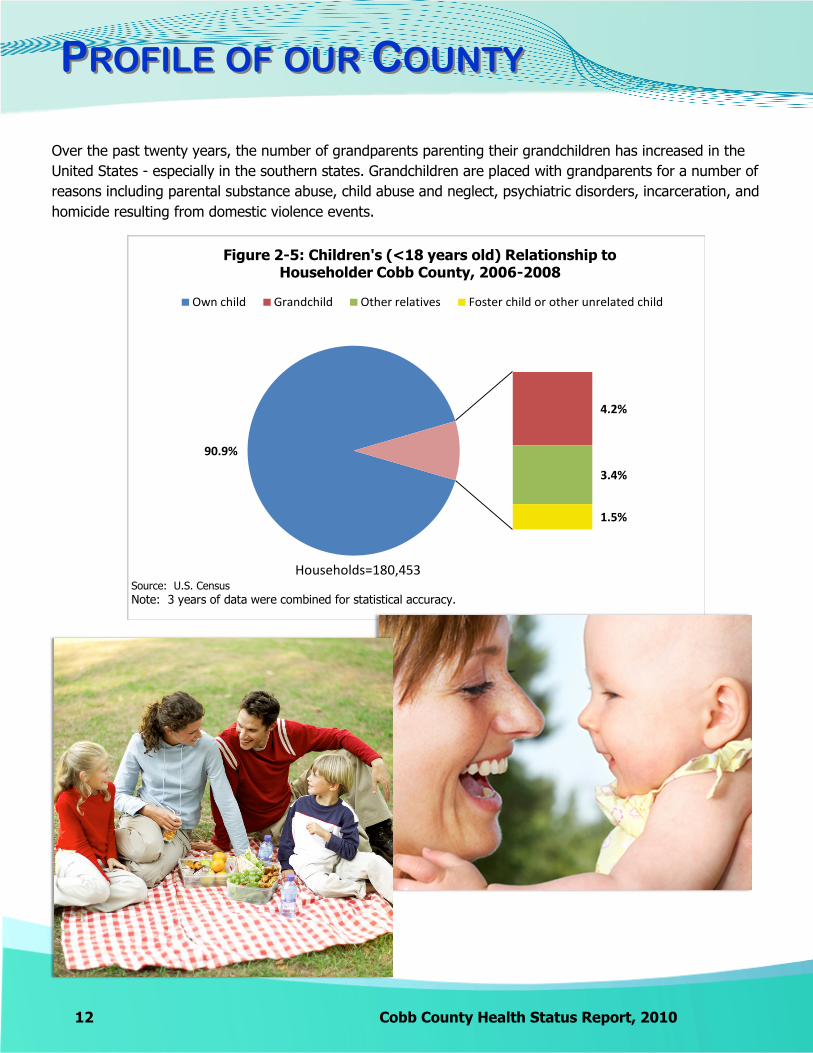
Over the past twenty years, the number of grandparents parenting their grandchildren has increased in the
United States - especially in the southern states. Grandchildren are placed with grandparents for a number of
reasons including parental substance abuse, child abuse and neglect, psychiatric disorders, incarceration, and
homicide resulting from domestic violence events.
90.9%
4.2%
3.4%
1.5%
Figure 2-5: Children's (<18 years old) Relationship to Householder Cobb County, 2006-2008
Own child Grandchild Other relatives Foster child or other unrelated child
Households=180,453Source: U.S. Census Note: 3 years of data were combined for statistical accuracy.
Cobb County Health Status Report, 2010 13
PPROFILEROFILE OFOF OUROUR CCOUNTYOUNTY
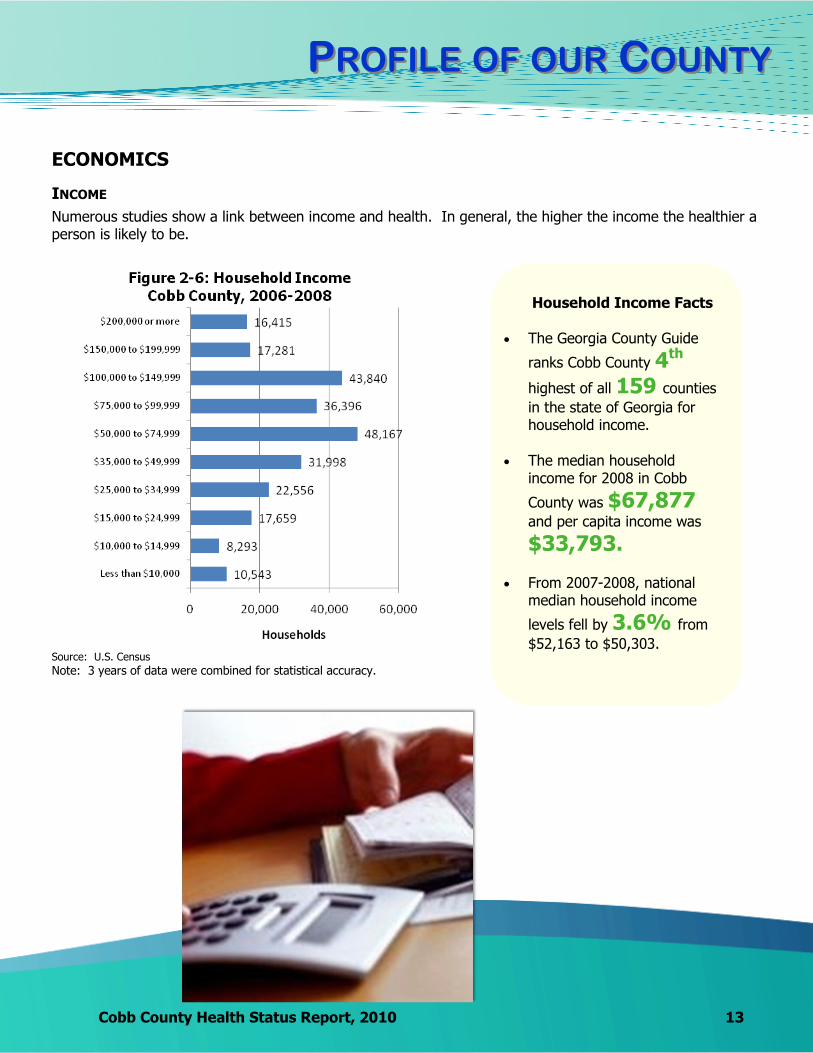
ECONOMICS
Numerous studies show a link between income and health. In general, the higher the income the healthier a person is likely to be.
INCOME
Household Income Facts
The Georgia County Guide
ranks Cobb County 4th highest of all 159 counties
in the state of Georgia for household income.
The median household income for 2008 in Cobb
County was $67,877 and per capita income was
$33,793.
From 2007-2008, national median household income
levels fell by 3.6% from
$52,163 to $50,303. Source: U.S. Census Note: 3 years of data were combined for statistical accuracy.

14 Cobb County Health Status Report, 2010
PPROFILEROFILE OFOF OUROUR CCOUNTYOUNTY
Unemployment rates have increased throughout the United States, Georgia and Cobb County since 2007. Unemployment negatively affects access to healthcare due to potential loss of health insurance coverage and the inability to pay for healthcare services.
UNEMPLOYMENT
Unemployment data in the United States is collected through a monthly sample survey called the Cur-
rent Population Survey (CPS). An employed person is defined as a person who did any work for pay
during the reference week or a person who worked over 15 hours not for pay in a family-owned busi-
ness, and all persons who are temporally absent from jobs regardless of pay.
Unemployment Facts
Unemployment rates
continued to increase throughout 2009; Cobb County remained under the Georgia rate at
9.6%.
In June 2010, it was
estimated that
36,393 persons
out of the labor force of 366,266 were unemployed in Cobb County
Source: U.S. Department of Labor Statistics

Cobb County Health Status Report, 2010 15
PPROFILEROFILE OFOF OUROUR CCOUNTYOUNTY
POVERTY
Individuals in poverty have poorer health outcomes. Children and adults with incomes at or below the poverty line often face issues including inadequate nutrition, substandard housing, environmental haz-ards, unhealthy lifestyles, and decreased access to and use of healthcare services. Poverty thresholds are set based on size and age of family members. (For more information on poverty thresholds go to http://www.census.gov/hhes/www/poverty/methods/measure.html).
Table 2-3: Poverty, 2006-2008
Location Individuals in
Poverty
Percent in Poverty
Cobb 62,408 9.2%
Georgia 1,339,822 14.5% United States 38,573,393 13.2%
The Georgia County
Guide ranks Cobb County
favorably, 9th lowest out of the
159 counties in the
state for poverty levels based on 2008 estimates.
Nonfamily households made up the largest percentage of households in poverty at
48.6%.
The largest percentage of family households in poverty were female households with no husband present at
28.0%.
Source: U.S. Census
Note: 3 years of data were combined for statistical accuracy.
16 Cobb County Health Status Report, 2010
PPROFILEROFILE OFOF OUROUR CCOUNTYOUNTY
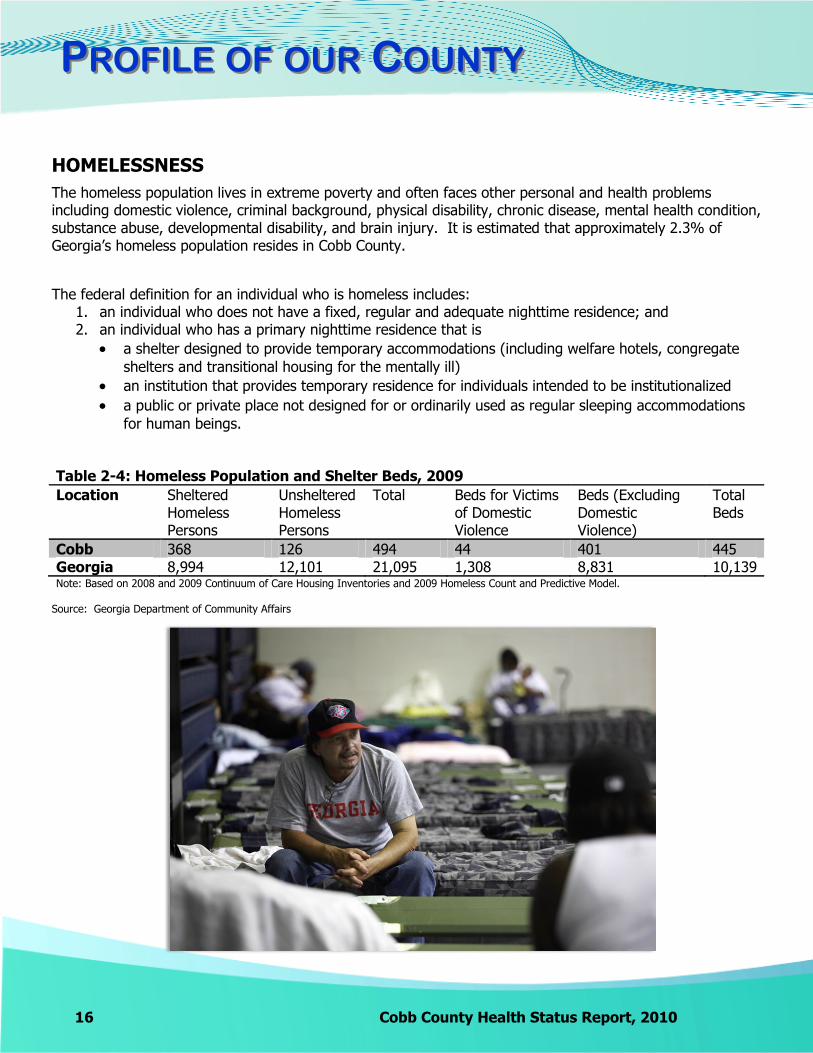
HOMELESSNESS
The homeless population lives in extreme poverty and often faces other personal and health problems including domestic violence, criminal background, physical disability, chronic disease, mental health condition, substance abuse, developmental disability, and brain injury. It is estimated that approximately 2.3% of Georgia’s homeless population resides in Cobb County.
The federal definition for an individual who is homeless includes: 1. an individual who does not have a fixed, regular and adequate nighttime residence; and 2. an individual who has a primary nighttime residence that is
a shelter designed to provide temporary accommodations (including welfare hotels, congregate
shelters and transitional housing for the mentally ill)
an institution that provides temporary residence for individuals intended to be institutionalized
a public or private place not designed for or ordinarily used as regular sleeping accommodations
for human beings.
Table 2-4: Homeless Population and Shelter Beds, 2009
Location Sheltered Homeless Persons
Unsheltered Homeless Persons
Total Beds for Victims of Domestic Violence
Beds (Excluding Domestic Violence)
Total Beds
Cobb 368 126 494 44 401 445 Georgia 8,994 12,101 21,095 1,308 8,831 10,139 Note: Based on 2008 and 2009 Continuum of Care Housing Inventories and 2009 Homeless Count and Predictive Model.
Source: Georgia Department of Community Affairs
Cobb County Health Status Report, 2010 17
PPROFILEROFILE OFOF OUROUR CCOUNTYOUNTY
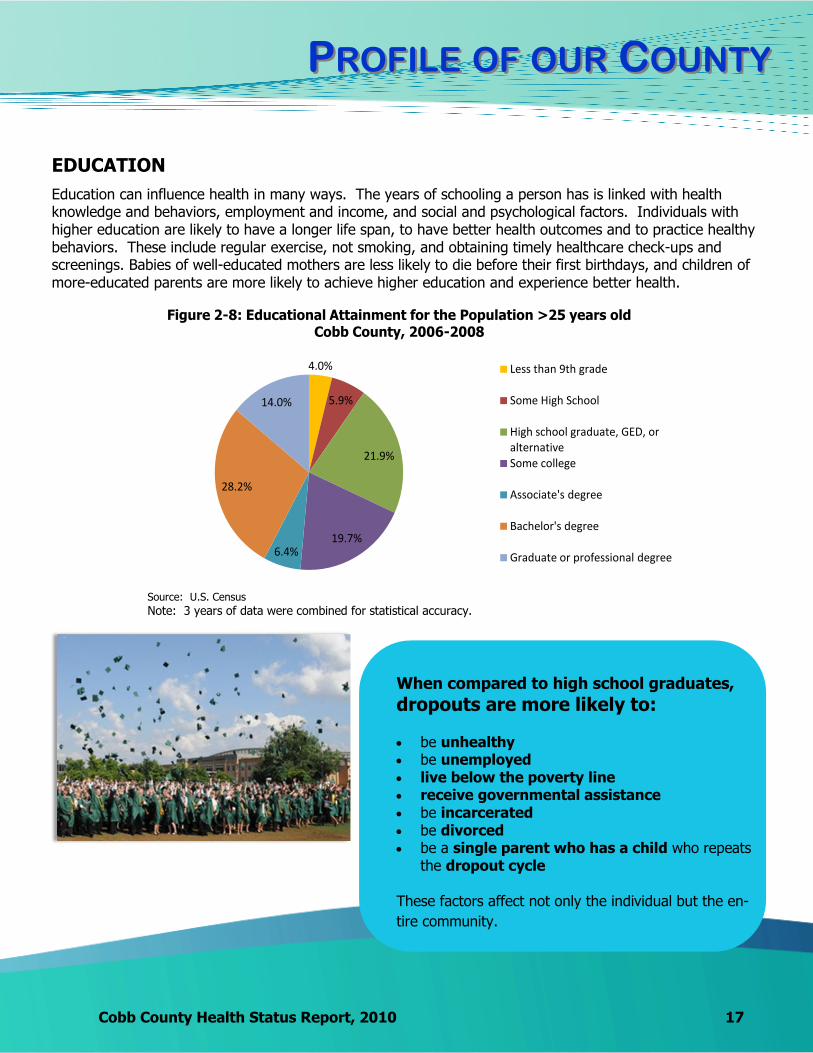
EDUCATION
Education can influence health in many ways. The years of schooling a person has is linked with health knowledge and behaviors, employment and income, and social and psychological factors. Individuals with higher education are likely to have a longer life span, to have better health outcomes and to practice healthy behaviors. These include regular exercise, not smoking, and obtaining timely healthcare check-ups and screenings. Babies of well-educated mothers are less likely to die before their first birthdays, and children of more-educated parents are more likely to achieve higher education and experience better health.
4.0%
5.9%
21.9%
19.7%6.4%
28.2%
14.0%
Figure 2-8: Educational Attainment for the Population >25 years old Cobb County, 2006-2008
Less than 9th grade
Some High School
High school graduate, GED, or alternativeSome college
Associate's degree
Bachelor's degree
Graduate or professional degree
Source: U.S. Census Note: 3 years of data were combined for statistical accuracy.
When compared to high school graduates,
dropouts are more likely to: be unhealthy be unemployed live below the poverty line receive governmental assistance be incarcerated be divorced be a single parent who has a child who repeats
the dropout cycle These factors affect not only the individual but the en-
tire community.
18 Cobb County Health Status Report, 2010
PPROFILEROFILE OFOF OUROUR CCOUNTYOUNTY
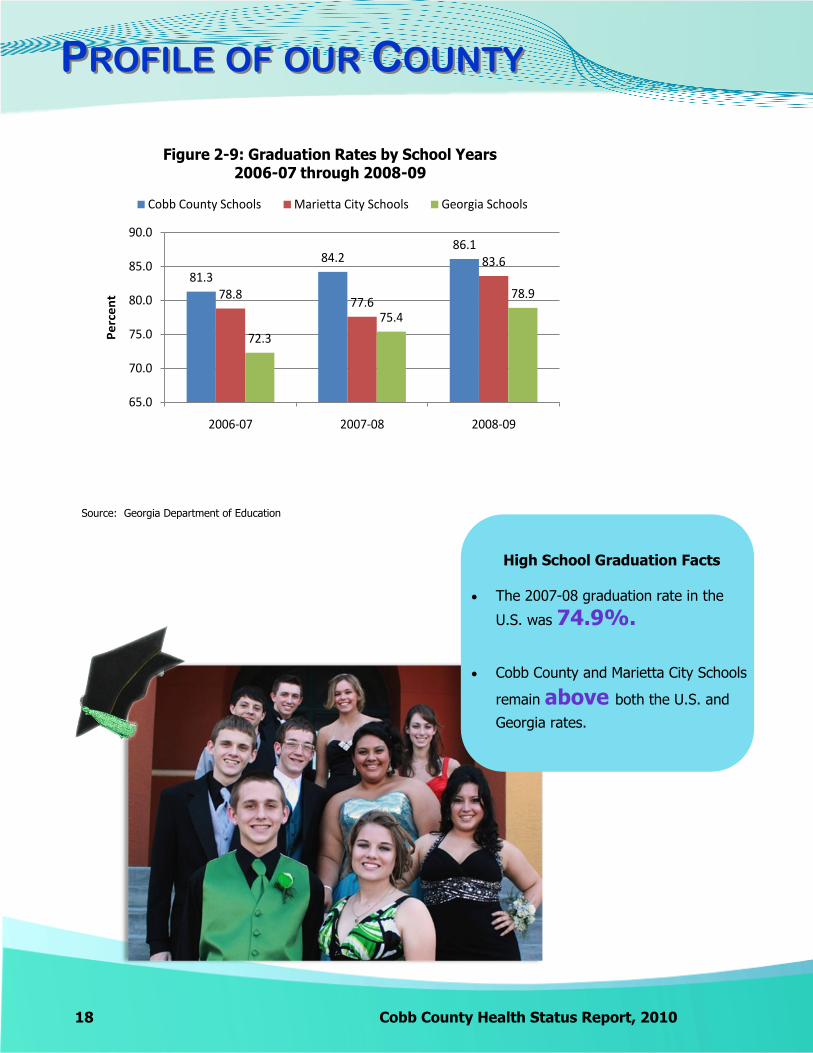
High School Graduation Facts The 2007-08 graduation rate in the
U.S. was 74.9%.
Cobb County and Marietta City Schools
remain above both the U.S. and
Georgia rates.
81.3
84.286.1
78.877.6
83.6
72.3
75.4
78.9
65.0
70.0
75.0
80.0
85.0
90.0
2006-07 2007-08 2008-09
Pe
rce
nt
Figure 2-9: Graduation Rates by School Years 2006-07 through 2008-09
Cobb County Schools Marietta City Schools Georgia Schools
Source: Georgia Department of Education
Cobb County Health Status Report, 2010 19
PPROFILEROFILE OFOF OUROUR CCOUNTYOUNTY
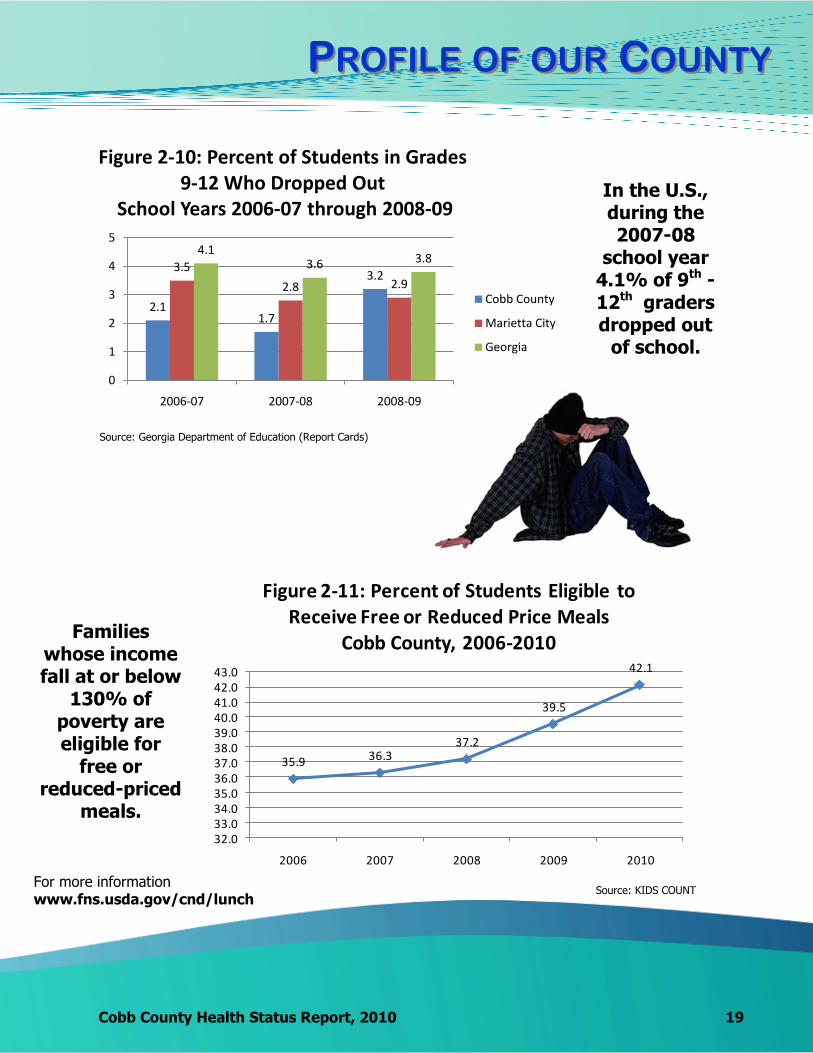
In the U.S., during the 2007-08
school year 4.1% of 9th -12th graders dropped out
of school.
2.11.7
3.23.5
2.8 2.9
4.13.6 3.8
0
1
2
3
4
5
2006-07 2007-08 2008-09
Figure 2-10: Percent of Students in Grades 9-12 Who Dropped Out
School Years 2006-07 through 2008-09
Cobb County
Marietta City
Georgia
Source: Georgia Department of Education (Report Cards)
Source: KIDS COUNT
35.9 36.337.2
39.5
42.1
32.033.034.035.036.037.038.039.040.041.042.043.0
2006 2007 2008 2009 2010
Figure 2-11: Percent of Students Eligible to Receive Free or Reduced Price Meals
Cobb County, 2006-2010Families
whose income fall at or below
130% of poverty are eligible for
free or reduced-priced
meals.
For more information www.fns.usda.gov/cnd/lunch
Back to TOC

AACCESSCCESS TOTO HHEALTHCAREEALTHCARE
Cobb County Health Status Report, 2010 21
Access to care is affected by a number of different factors including the number of healthcare facilities and providers in an area and the availability and affordability of healthcare.
Letter Grade
Access to Care Category Comments
B Access to Primary Care Providers
The Report designates Cobb as a ―partial-county health professional shortage area.‖ Eleven of the 32 counties received an A.
B Primary Care Safety Net
Cobb County residents have access to a federally qualified community health center, which provides primary care to residents.
C Health Professional Diversity
Measure of the black and Latino physicians per 100,000 black and Latino population. The Cobb rate is 74.0 minority physicians per 100,000 population. Even though Cobb’s rate is higher than many of the 32 counties studied, it is still much lower than the rate for white physicians. Often resi-dents from minority races prefer to see phy-sicians of their own race.
According to the County Guide, in 2006 there were 583 persons per physician in Cobb County compared to Georgia at 494 persons per physician.
ACCESS TO PRIMARY CARE
In 2008, more Georgia physicians provided specialty care than primary care. The Georgia County Guide 2010 reports that 34% of Cobb County physicians are considered primary care physicians (family practice, internal medicine and pediatrics), an adequate percentage for the county. The Georgia Health Disparities Report 2008 compares 32 counties in Georgia, including Cobb, on a number of important health issues including access to care. Letter grades were assigned to the counties based on various criteria. Cobb County received the following letter grades.
AACCESSCCESS TOTO HHEALTHCAREEALTHCARE
22 Cobb County Health Status Report, 2010
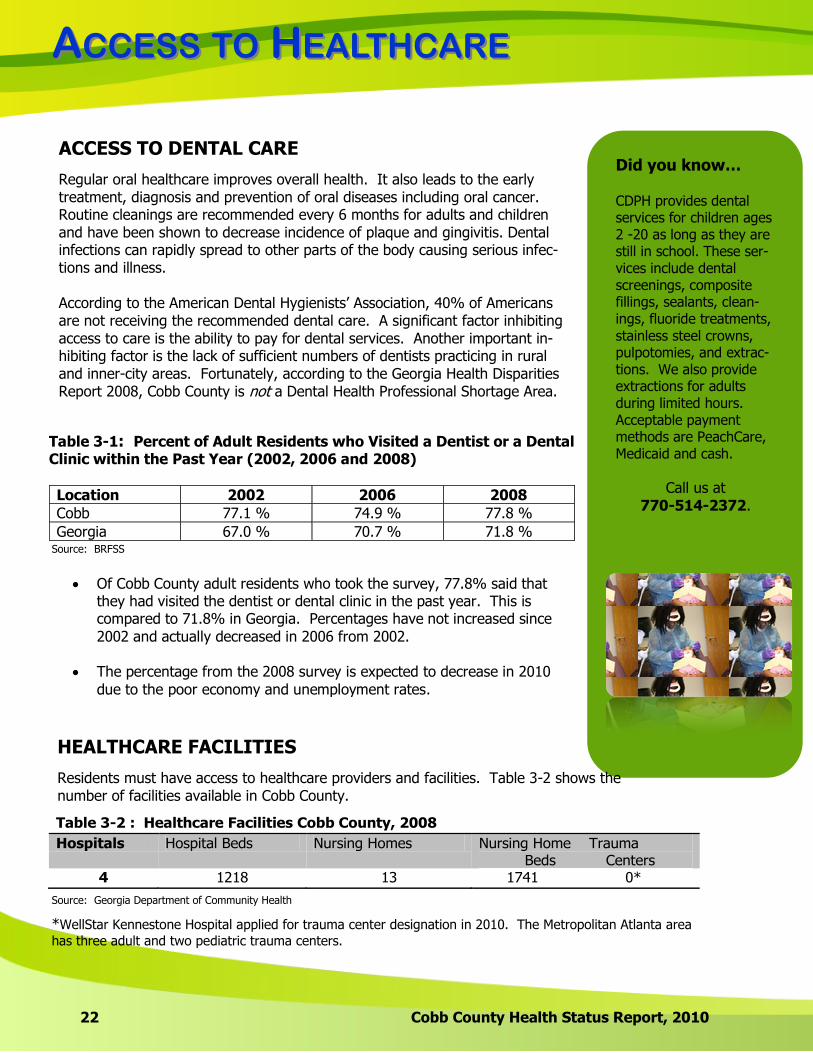
ACCESS TO DENTAL CARE
Regular oral healthcare improves overall health. It also leads to the early treatment, diagnosis and prevention of oral diseases including oral cancer. Routine cleanings are recommended every 6 months for adults and children and have been shown to decrease incidence of plaque and gingivitis. Dental infections can rapidly spread to other parts of the body causing serious infec-tions and illness. According to the American Dental Hygienists’ Association, 40% of Americans are not receiving the recommended dental care. A significant factor inhibiting access to care is the ability to pay for dental services. Another important in-hibiting factor is the lack of sufficient numbers of dentists practicing in rural and inner-city areas. Fortunately, according to the Georgia Health Disparities Report 2008, Cobb County is not a Dental Health Professional Shortage Area.
Table 3-1: Percent of Adult Residents who Visited a Dentist or a Dental Clinic within the Past Year (2002, 2006 and 2008)
Location 2002 2006 2008
Cobb 77.1 % 74.9 % 77.8 %
Georgia 67.0 % 70.7 % 71.8 %
Of Cobb County adult residents who took the survey, 77.8% said that they had visited the dentist or dental clinic in the past year. This is compared to 71.8% in Georgia. Percentages have not increased since 2002 and actually decreased in 2006 from 2002.
The percentage from the 2008 survey is expected to decrease in 2010
due to the poor economy and unemployment rates.
Did you know… CDPH provides dental services for children ages 2 -20 as long as they are still in High School. These services include dental screenings, composite fillings, sealants, cleanings, fluoride treatments, stainless steel crowns, pulpotomies, and extractions. We also provide extractions for adults during limited hours. Acceptable payment methods are Peachcare, Medicaid and cash.
Call us at 770-514-2372.
Did you know… CDPH provides dental services for children ages 2 -20 as long as they are still in school. These ser-vices include dental screenings, composite fillings, sealants, clean-ings, fluoride treatments, stainless steel crowns, pulpotomies, and extrac-tions. We also provide extractions for adults during limited hours. Acceptable payment methods are PeachCare, Medicaid and cash.
Call us at 770-514-2372.
HEALTHCARE FACILITIES
Residents must have access to healthcare providers and facilities. Table 3-2 shows the number of facilities available in Cobb County.
Table 3-2 : Healthcare Facilities Cobb County, 2008
Hospitals Hospital Beds Nursing Homes Nursing Home Trauma Beds Centers
4 1218 13 1741 0*
*WellStar Kennestone Hospital applied for trauma center designation in 2010. The Metropolitan Atlanta area
has three adult and two pediatric trauma centers.
Source: BRFSS
Source: Georgia Department of Community Health

AACCESSCCESS TOTO HHEALTHCAREEALTHCARE
Cobb County Health Status Report, 2010 23
INSURANCE COVERAGE
Health insurance coverage has a profound effect on access to care. Those without health insurance are less likely to have regular medical care and are more likely to go without care. In Georgia, Medicaid and PeachCare are available to provide health insurance coverage for chil-dren and adults who are low income or disabled. Medicare is available to seniors over age 65. Table 3-3 shows the percentage of uninsured population in Cobb County.
Table 3-3: Uninsured Residents Cobb County, 2008
Cobb County Number Percent of
Population
Uninsured Population
107,019 15.4%
Under 18 years 18,740 2.7%
18 to 64 years 87,308 12.6%
65 years or over 971 0.1%
Source: U.S. Census Bureau
Uninsured Facts
Cobb County has an uninsured population of 15.4% of the total county population.
The largest percentage of uninsured population falls in the 18 – 64 age group. Persons included in this group exceed the maximum income level allowed to qualify for Medicaid but often cannot afford to pay for healthcare.
The Georgia Health Disparities Report 2008 gave Cobb County a grade of C on the uninsured as percent of total population. The median percentage for the 32 Georgia counties in the report was 14.8%.
PAYOR SOURCES
MEDICAID
The Medicaid program in Georgia provides healthcare for children, pregnant women, and people who are low income, aged, blind and disabled. Table 3-4 shows the average number of members and payment for Georgia Medicaid in 2008. Averaging membership over the year is necessary because persons enroll in and are dropped from the plan throughout the year.
Table 3-4: Medicaid Member Average and Payment, 2008
Location Average Number of
Members Total Net Payment
Average Payment per Member
Cobb 48,645 $172,101,474 $5,209
Georgia 1,260,519 $4,515,345,997 $5,005
Cobb County residents made up 3.9% of the Georgia Medicaid members in 2008.
The annual Medicaid payment per Cobb County member was slightly higher than
payment per Georgia member.
There are approximately equal proportions of white and black populations who are
Medicaid members in Cobb County.
Source: Georgia Department of Community Health

AACCESSCCESS TOTO HHEALTHCAREEALTHCARE
24 Cobb County Health Status Report, 2010
45.7%
44.4%
5.1%2.1% 1.5% 1.2%
Figure 3-1: Medicaid Members by Race/Ethnicity Cobb County, 2008
Black White Unknown Asian Other Hispanic
PEACHCARE FOR KIDS™
In 1997, Congress created Title XXI of the Social Security Act to provide healthcare for the grow-ing number of uninsured children in the United States. This legislation provided states with the opportunity to create programs to increase children’s access to affordable health insurance. In Georgia, this program is PeachCare for Kids™.
Source: Georgia Department of Community Health
Source: Georgia Department of Community Health
Medicaid Facts
Most Medicaid
users in Cobb County are between 0-10 years
of age. A Medicaid
membership is established for eligible infants in
the hospital after birth.
0.0 10.0 20.0 30.0 40.0 50.0
0-10
11-19
20-29
30-45
46-59
60+
49.8
18.2
9.6
8.8
4.7
8.9
Figure 3-2: Percent Medicaid Members by Age Cobb County, 2008
The black and white populations used Medi-
caid almost equally, however whites comprise
70.1% of the total population in Cobb County and blacks make-up 23.3%.
AACCESSCCESS TOTO HHEALTHCAREEALTHCARE
Cobb County Health Status Report, 2010 25
35.6%
25.0%
24.9%
10.3%
3.9%0.3%
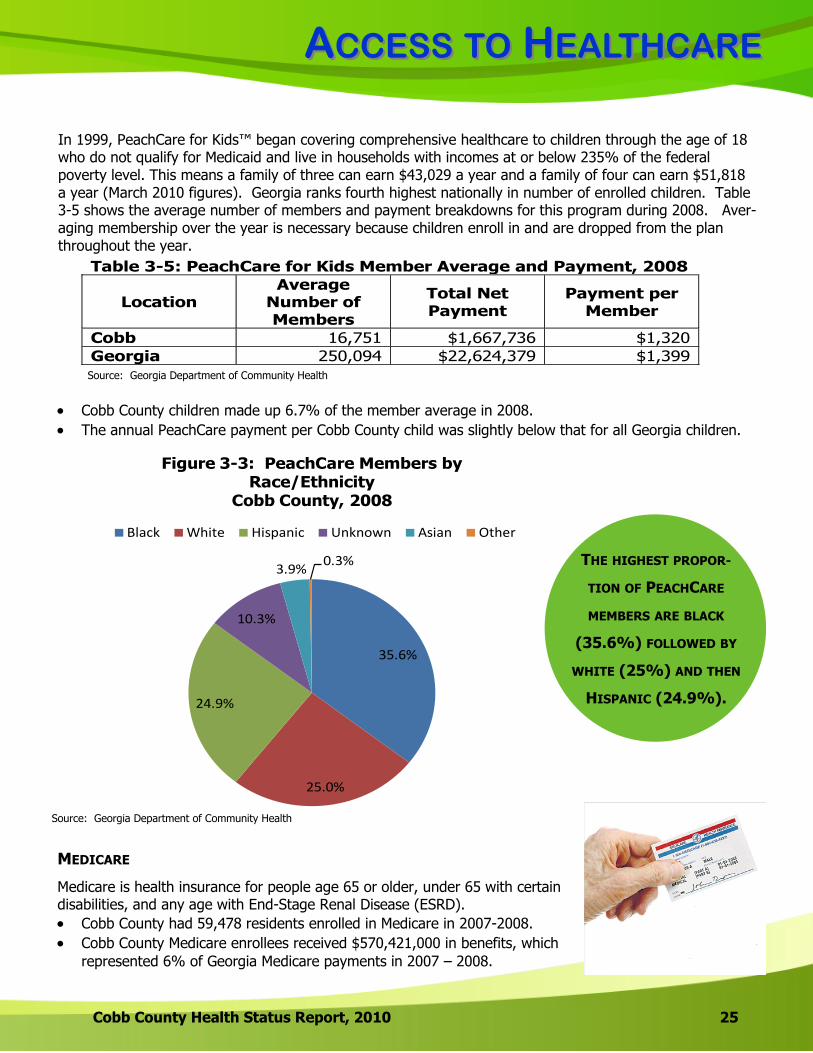
Figure 3-3: PeachCare Members by Race/Ethnicity
Cobb County, 2008
Black White Hispanic Unknown Asian Other
In 1999, PeachCare for Kids™ began covering comprehensive healthcare to children through the age of 18 who do not qualify for Medicaid and live in households with incomes at or below 235% of the federal poverty level. This means a family of three can earn $43,029 a year and a family of four can earn $51,818 a year (March 2010 figures). Georgia ranks fourth highest nationally in number of enrolled children. Table 3-5 shows the average number of members and payment breakdowns for this program during 2008. Aver-aging membership over the year is necessary because children enroll in and are dropped from the plan throughout the year.
Table 3-5: PeachCare for Kids Member Average and Payment, 2008
Location Average
Number of Members
Total Net Payment
Payment per Member
Cobb 16,751 $1,667,736 $1,320
Georgia 250,094 $22,624,379 $1,399
Cobb County children made up 6.7% of the member average in 2008.
The annual PeachCare payment per Cobb County child was slightly below that for all Georgia children.
THE HIGHEST PROPOR-
TION OF PEACHCARE
MEMBERS ARE BLACK
(35.6%) FOLLOWED BY
WHITE (25%) AND THEN
HISPANIC (24.9%).
MEDICARE
Medicare is health insurance for people age 65 or older, under 65 with certain disabilities, and any age with End-Stage Renal Disease (ESRD).
Cobb County had 59,478 residents enrolled in Medicare in 2007-2008.
Cobb County Medicare enrollees received $570,421,000 in benefits, which
represented 6% of Georgia Medicare payments in 2007 – 2008.
Source: Georgia Department of Community Health
Source: Georgia Department of Community Health

Back to TOC
LLEADINGEADING CCAUSESAUSES
27 Cobb County Health Status Report, 2010
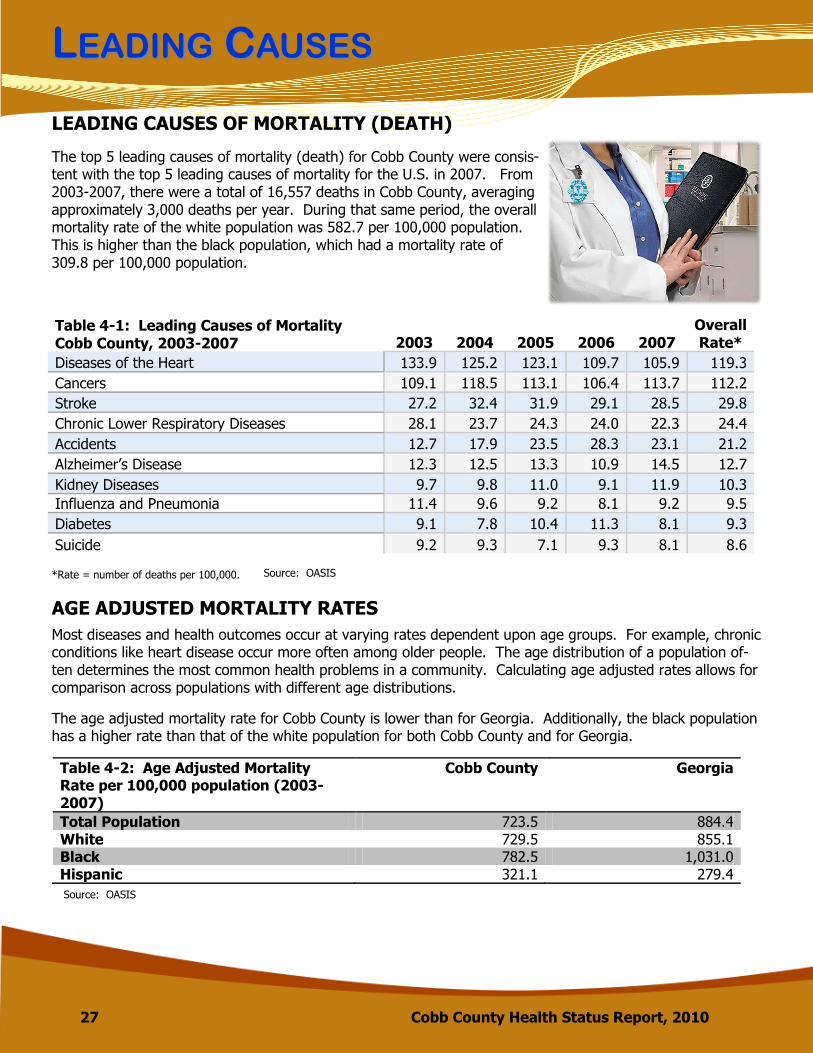
LEADING CAUSES OF MORTALITY (DEATH)
The top 5 leading causes of mortality (death) for Cobb County were consis-tent with the top 5 leading causes of mortality for the U.S. in 2007. From 2003-2007, there were a total of 16,557 deaths in Cobb County, averaging approximately 3,000 deaths per year. During that same period, the overall mortality rate of the white population was 582.7 per 100,000 population. This is higher than the black population, which had a mortality rate of 309.8 per 100,000 population.
Table 4-1: Leading Causes of Mortality Cobb County, 2003-2007 2003 2004 2005 2006 2007
Overall Rate*
Diseases of the Heart 133.9 125.2 123.1 109.7 105.9 119.3
Cancers 109.1 118.5 113.1 106.4 113.7 112.2
Stroke 27.2 32.4 31.9 29.1 28.5 29.8
Chronic Lower Respiratory Diseases 28.1 23.7 24.3 24.0 22.3 24.4
Accidents 12.7 17.9 23.5 28.3 23.1 21.2
Alzheimer’s Disease 12.3 12.5 13.3 10.9 14.5 12.7
Kidney Diseases 9.7 9.8 11.0 9.1 11.9 10.3
Influenza and Pneumonia 11.4 9.6 9.2 8.1 9.2 9.5
Diabetes 9.1 7.8 10.4 11.3 8.1 9.3
Suicide 9.2 9.3 7.1 9.3 8.1 8.6
*Rate = number of deaths per 100,000. Source: OASIS
AGE ADJUSTED MORTALITY RATES
Most diseases and health outcomes occur at varying rates dependent upon age groups. For example, chronic conditions like heart disease occur more often among older people. The age distribution of a population of-ten determines the most common health problems in a community. Calculating age adjusted rates allows for comparison across populations with different age distributions.
Source: OASIS
The age adjusted mortality rate for Cobb County is lower than for Georgia. Additionally, the black population has a higher rate than that of the white population for both Cobb County and for Georgia.
Table 4-2: Age Adjusted Mortality Rate per 100,000 population (2003-2007)
Cobb County Georgia
Total Population 723.5 884.4 White 729.5 855.1 Black 782.5 1,031.0 Hispanic 321.1 279.4
LLEADINGEADING CCAUSESAUSES
Cobb County Health Status Report, 2010 28
*
0.0
20.0
40.0
60.0
80.0
100.0
120.0
140.0
160.0
180.0
200.0
Diseases of the Heart
Cancers Stroke Chronic Lower
Respiratory Diseases
Accidents Alzheimer's Disease
Kidney Diseases
Influenza and
Pneumonia
Diabetes Blood Poisoning
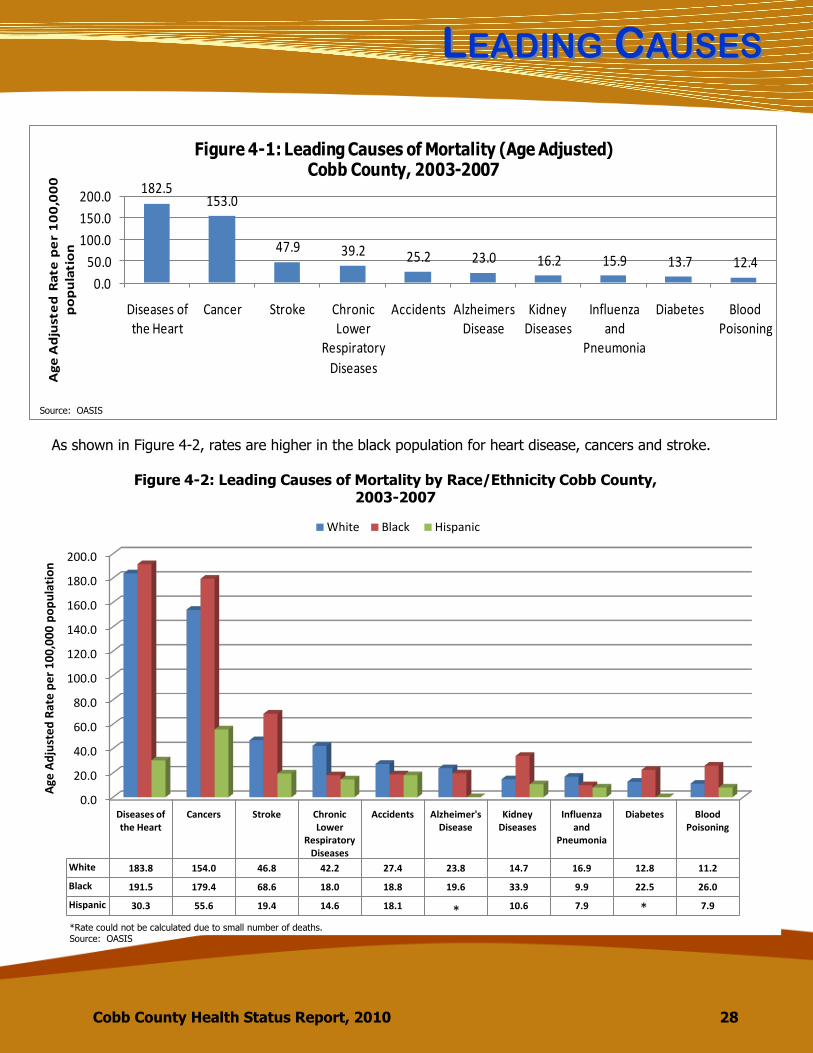
White 183.8 154.0 46.8 42.2 27.4 23.8 14.7 16.9 12.8 11.2
Black 191.5 179.4 68.6 18.0 18.8 19.6 33.9 9.9 22.5 26.0
Hispanic 30.3 55.6 19.4 14.6 18.1 10.6 7.9 7.9
Age
Ad
just
ed
Rat
e p
er
10
0,0
00
po
pu
lati
on
Figure 4-2: Leading Causes of Mortality by Race/Ethnicity Cobb County, 2003-2007
White Black Hispanic
* **Rate could not be calculated due to small number of deaths. Source: OASIS
182.5153.0
47.9 39.2 25.2 23.0 16.2 15.9 13.7 12.4
0.0
50.0
100.0
150.0
200.0
Diseases of the Heart
Cancer Stroke Chronic Lower
Respiratory
Diseases
Accidents Alzheimers Disease
Kidney Diseases
Influenza and
Pneumonia
Diabetes Blood Poisoning
Ag
e A
dju
ste
d R
ate
pe
r 1
00
,00
0
po
pu
lati
on
Figure 4-1: Leading Causes of Mortality (Age Adjusted)Cobb County, 2003-2007
Source: OASIS
As shown in Figure 4-2, rates are higher in the black population for heart disease, cancers and stroke.
LLEADINGEADING CCAUSESAUSES
29 Cobb County Health Status Report, 2010
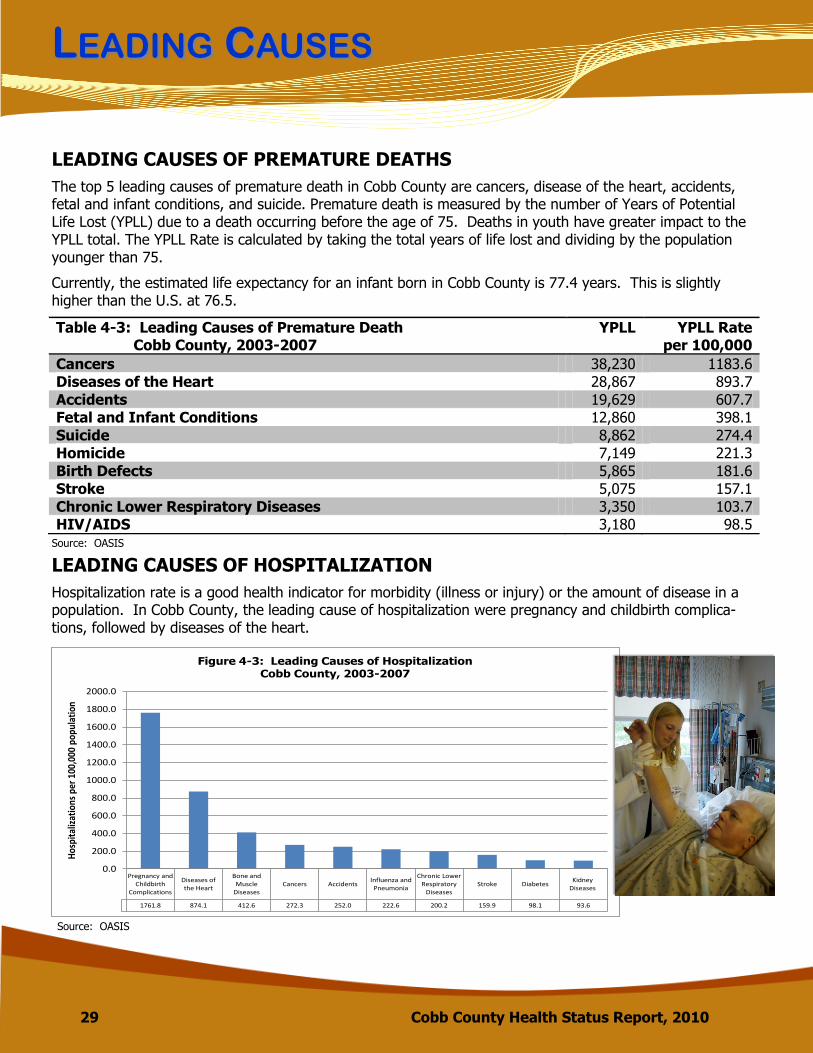
LEADING CAUSES OF PREMATURE DEATHS
Table 4-3: Leading Causes of Premature Death Cobb County, 2003-2007
YPLL YPLL Rate per 100,000
Cancers 38,230 1183.6
Diseases of the Heart 28,867 893.7
Accidents 19,629 607.7
Fetal and Infant Conditions 12,860 398.1
Suicide 8,862 274.4
Homicide 7,149 221.3
Birth Defects 5,865 181.6
Stroke 5,075 157.1
Chronic Lower Respiratory Diseases 3,350 103.7
HIV/AIDS 3,180 98.5
Source: OASIS
The top 5 leading causes of premature death in Cobb County are cancers, disease of the heart, accidents, fetal and infant conditions, and suicide. Premature death is measured by the number of Years of Potential Life Lost (YPLL) due to a death occurring before the age of 75. Deaths in youth have greater impact to the YPLL total. The YPLL Rate is calculated by taking the total years of life lost and dividing by the population younger than 75.
Currently, the estimated life expectancy for an infant born in Cobb County is 77.4 years. This is slightly higher than the U.S. at 76.5.
LEADING CAUSES OF HOSPITALIZATION
Hospitalization rate is a good health indicator for morbidity (illness or injury) or the amount of disease in a population. In Cobb County, the leading cause of hospitalization were pregnancy and childbirth complica-tions, followed by diseases of the heart.
Pregnancy and Childbirth
Complications
Diseases of the Heart
Bone and Muscle
DiseasesCancers Accidents
Influenza and Pneumonia
Chronic Lower Respiratory
DiseasesStroke Diabetes
Kidney Diseases
1761.8 874.1 412.6 272.3 252.0 222.6 200.2 159.9 98.1 93.6
0.0
200.0
400.0
600.0
800.0
1000.0
1200.0
1400.0
1600.0
1800.0
2000.0
Hos
pita
lizat
ions
per
100
,000
pop
ulat
ion
Figure 4-3: Leading Causes of Hospitalization Cobb County, 2003-2007
Source: OASIS

Back to TOC

CCHRONICHRONIC DDISEASEISEASE
31 Cobb County Health Status Report, 2010
Cardiovascular disease (CVD) includes all disease of the heart and blood vessels including ischemic heart dis-ease, stroke, congestive heart failure, high blood pressure and hardening of the arteries (atherosclerosis). Heart disease and stroke are both leading causes of mortality, premature death and illness in the U.S. and in Georgia. In 2007, CVD accounted for 32% of all deaths in Georgia. Conditions including high cholesterol, high blood pressure and diabetes put people at an increased risk of CVD. Additionally, behaviors and lifestyle choices such as tobacco use, diet, physical activity, obesity and al-cohol can lead to CVD. A family history of CVD can also make individuals more susceptible.
According to U.S. National Center for Health Statistics, a chronic disease is a disease lasting 3 or more months. Generally, a chronic disease cannot be prevented by vaccines or cured by medication. Behaviors that put you at risk for developing a chronic disease include tobacco use, lack of physical activity, and poor eating habits.
CARDIOVASCULAR DISEASE
The mortality rate for CVD in the
white population from 2003-2007 was 249.6 per
100,000 popula-tion, slightly lower
than the black mortality rate of
288.5.
295.4271.0 263.7
224.4 209.3
342.9 326.1 307.7282.6 269.0
0.0
100.0
200.0
300.0
400.0
2003 2004 2005 2006 2007Age
Ad
just
ed
Rat
e p
er
10
0,0
00
p
op
ula
tio
n
Figure 5-1: Mortality Rate due to Cardiovascular Diseases, 2003-2007
Cobb Georgia
Source: OASIS
CCHRONICHRONIC DDISEASEISEASE
Cobb County Health Status Report, 2010 32
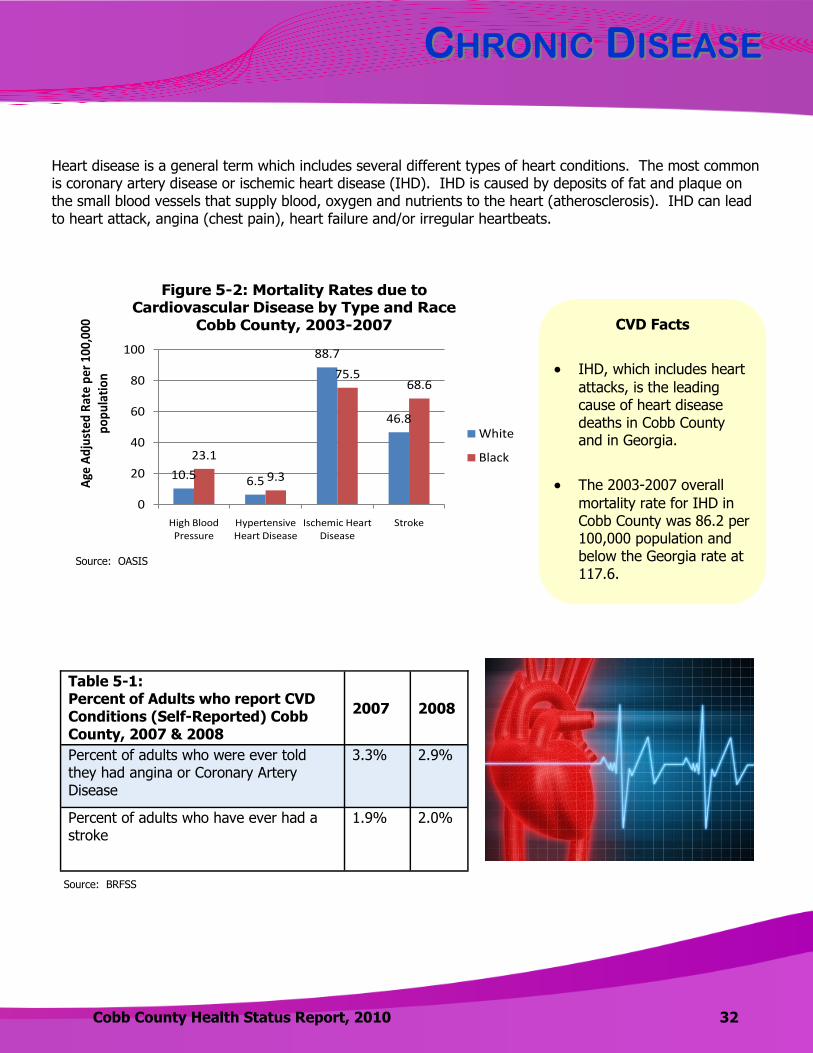
10.5 6.5
88.7
46.8
23.1
9.3
75.568.6
0
20
40
60
80
100
High Blood Pressure
Hypertensive Heart Disease
Ischemic Heart Disease
Stroke
Age
Ad
just
ed R
ate
per
100
,000
p
op
ula
tio
n
Figure 5-2: Mortality Rates due to Cardiovascular Disease by Type and Race
Cobb County, 2003-2007
White
Black
Source: OASIS
Table 5-1: Percent of Adults who report CVD Conditions (Self-Reported) Cobb County, 2007 & 2008
2007 2008
Percent of adults who were ever told they had angina or Coronary Artery Disease
3.3% 2.9%
Percent of adults who have ever had a stroke
1.9% 2.0%
Source: BRFSS
CVD Facts
IHD, which includes heart
attacks, is the leading cause of heart disease deaths in Cobb County and in Georgia.
The 2003-2007 overall
mortality rate for IHD in Cobb County was 86.2 per 100,000 population and below the Georgia rate at 117.6.
Heart disease is a general term which includes several different types of heart conditions. The most common is coronary artery disease or ischemic heart disease (IHD). IHD is caused by deposits of fat and plaque on the small blood vessels that supply blood, oxygen and nutrients to the heart (atherosclerosis). IHD can lead to heart attack, angina (chest pain), heart failure and/or irregular heartbeats.
CCHRONICHRONIC DDISEASEISEASE
33 Cobb County Health Status Report, 2010
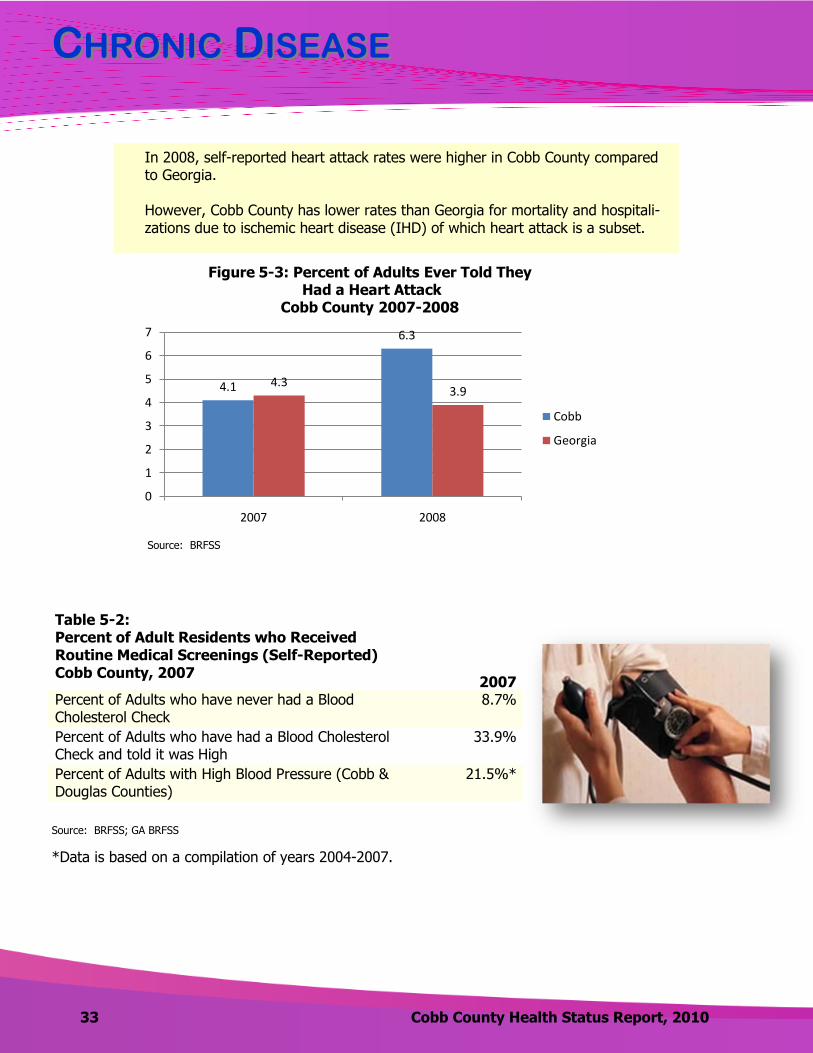
In 2008, self-reported heart attack rates were higher in Cobb County compared to Georgia. However, Cobb County has lower rates than Georgia for mortality and hospitali-zations due to ischemic heart disease (IHD) of which heart attack is a subset.
*Data is based on a compilation of years 2004-2007.
Table 5-2: Percent of Adult Residents who Received Routine Medical Screenings (Self-Reported) Cobb County, 2007
2007 Percent of Adults who have never had a Blood Cholesterol Check
8.7%
Percent of Adults who have had a Blood Cholesterol Check and told it was High
33.9%
Percent of Adults with High Blood Pressure (Cobb & Douglas Counties)
21.5%*
Source: BRFSS; GA BRFSS
4.1
6.3
4.33.9
0
1
2
3
4
5
6
7
2007 2008
Figure 5-3: Percent of Adults Ever Told TheyHad a Heart Attack
Cobb County 2007-2008
Cobb
Georgia
Source: BRFSS
WWHYHY IISS CCARDIOVASCULARARDIOVASCULAR DDISEASEISEASE IMPORTANTIMPORTANT??
34 Cobb County Health Status Report, 2010
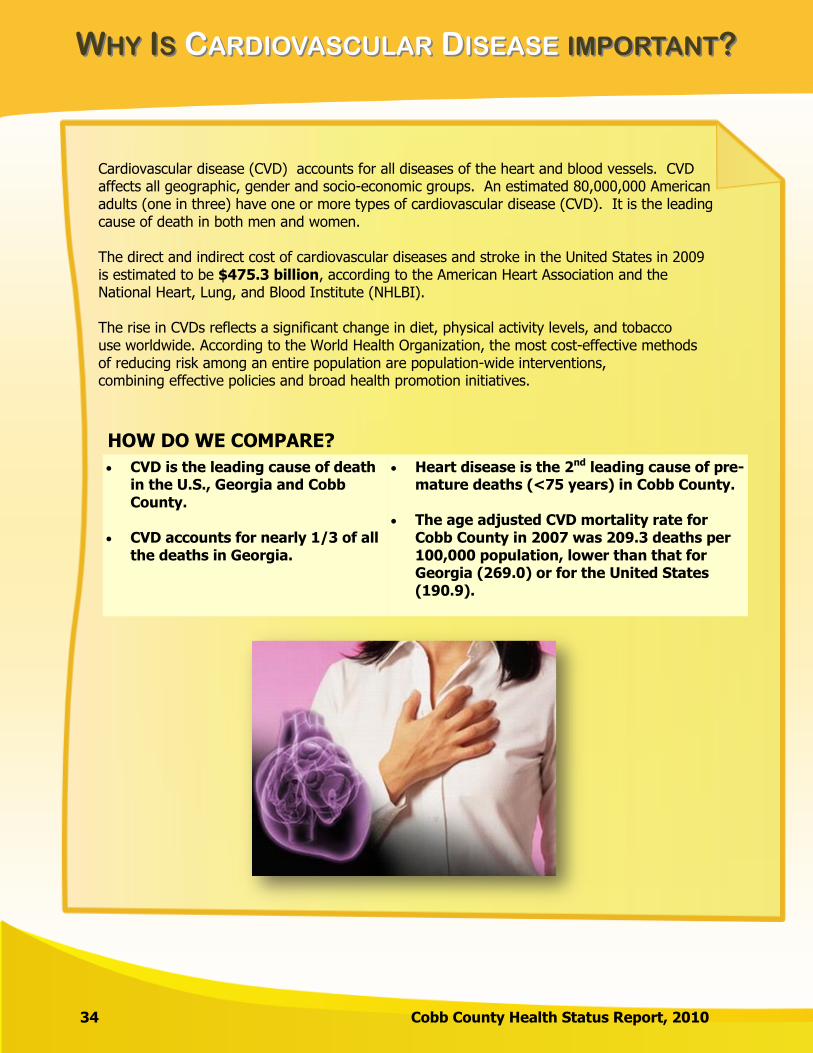
Cardiovascular disease (CVD) accounts for all diseases of the heart and blood vessels. CVD affects all geographic, gender and socio-economic groups. An estimated 80,000,000 American adults (one in three) have one or more types of cardiovascular disease (CVD). It is the leading cause of death in both men and women. The direct and indirect cost of cardiovascular diseases and stroke in the United States in 2009 is estimated to be $475.3 billion, according to the American Heart Association and the National Heart, Lung, and Blood Institute (NHLBI). The rise in CVDs reflects a significant change in diet, physical activity levels, and tobacco use worldwide. According to the World Health Organization, the most cost-effective methods of reducing risk among an entire population are population-wide interventions, combining effective policies and broad health promotion initiatives.
HOW DO WE COMPARE?
CVD is the leading cause of death in the U.S., Georgia and Cobb County.
CVD accounts for nearly 1/3 of all
the deaths in Georgia.
Heart disease is the 2nd leading cause of pre-mature deaths (<75 years) in Cobb County.
The age adjusted CVD mortality rate for
Cobb County in 2007 was 209.3 deaths per 100,000 population, lower than that for Georgia (269.0) or for the United States (190.9).
WWHYHY IISS CCARDIOVASCULARARDIOVASCULAR DDISEASEISEASE IMPORTANTIMPORTANT??
Cobb County Health Status Report, 2010 35
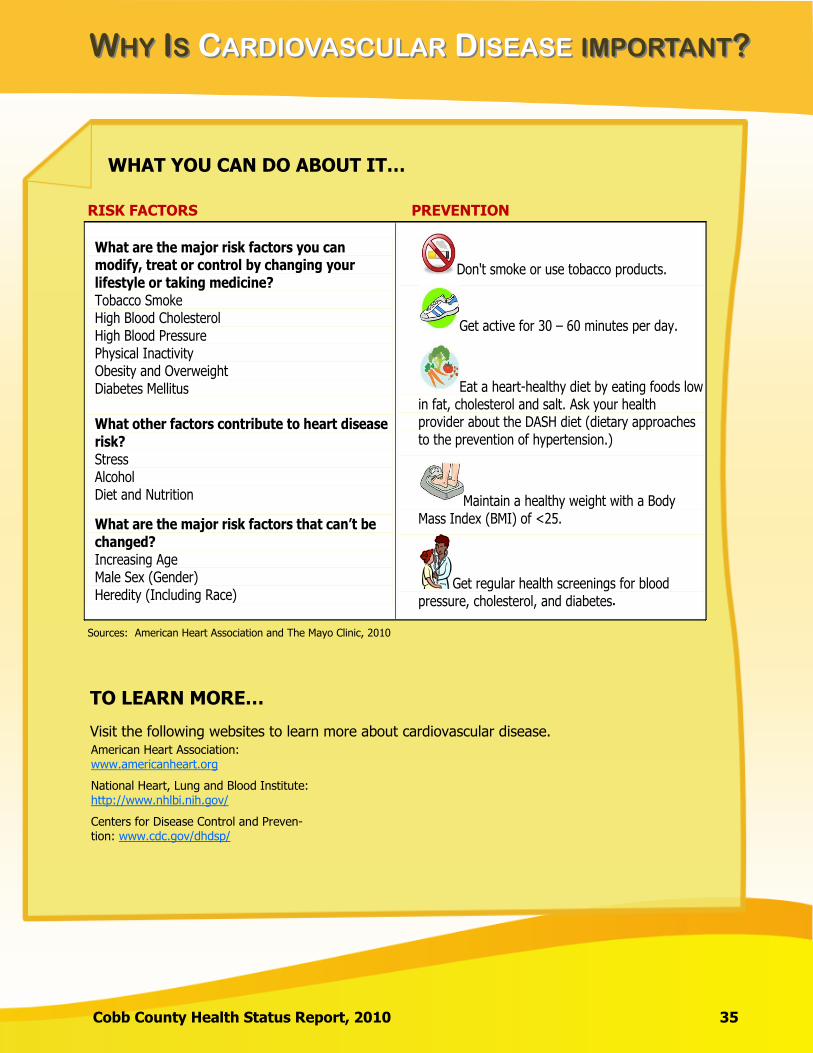
WHAT YOU CAN DO ABOUT IT…
RISK FACTORS PREVENTION
What are the major risk factors you can modify, treat or control by changing your lifestyle or taking medicine? Tobacco Smoke High Blood Cholesterol High Blood Pressure Physical Inactivity Obesity and Overweight Diabetes Mellitus What other factors contribute to heart disease risk? Stress Alcohol Diet and Nutrition
What are the major risk factors that can’t be changed? Increasing Age Male Sex (Gender) Heredity (Including Race)
Don't smoke or use tobacco products.
Get active for 30 – 60 minutes per day.
Eat a heart-healthy diet by eating foods low in fat, cholesterol and salt. Ask your health provider about the DASH diet (dietary approaches to the prevention of hypertension.)
Maintain a healthy weight with a Body Mass Index (BMI) of <25.
Get regular health screenings for blood pressure, cholesterol, and diabetes
Sources: American Heart Association and The Mayo Clinic, 2010
TO LEARN MORE…
Visit the following websites to learn more about cardiovascular disease. American Heart Association: www.americanheart.org
Centers for Disease Control and Preven-tion: www.cdc.gov/dhdsp/
National Heart, Lung and Blood Institute: http://www.nhlbi.nih.gov/
.
CCHRONICHRONIC DDISEASEISEASE
36 Cobb County Health Status Report, 2010
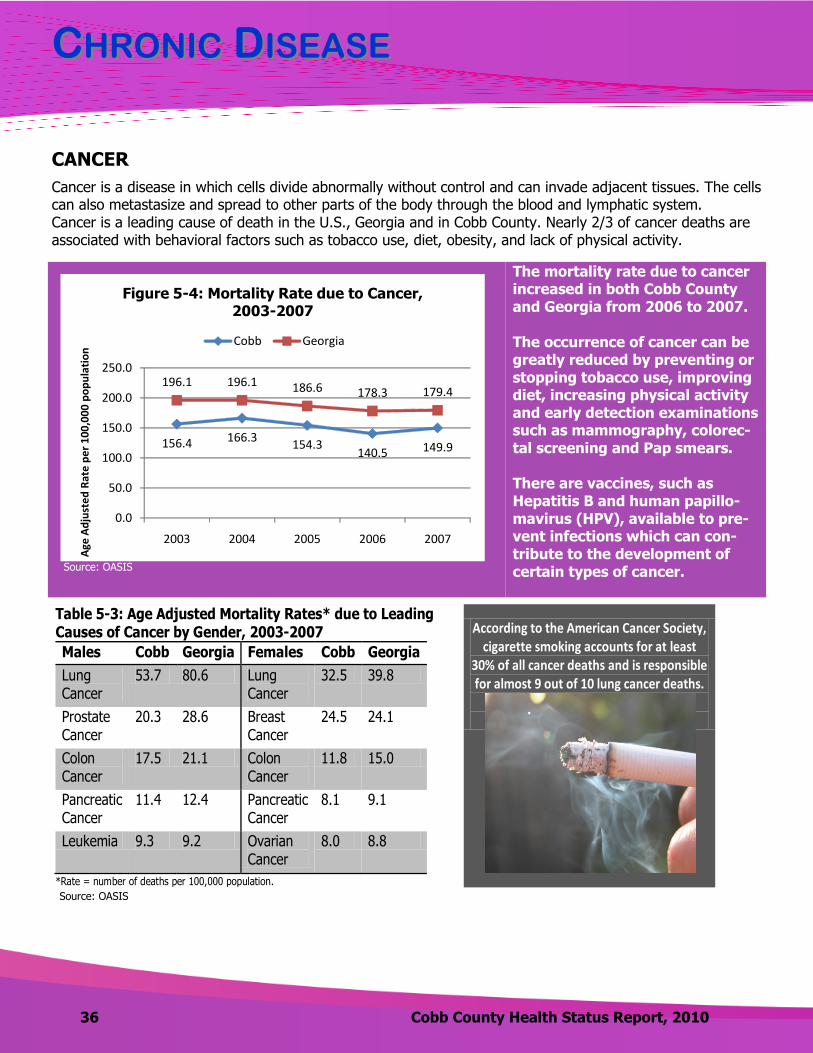
Cancer is a disease in which cells divide abnormally without control and can invade adjacent tissues. The cells can also metastasize and spread to other parts of the body through the blood and lymphatic system. Cancer is a leading cause of death in the U.S., Georgia and in Cobb County. Nearly 2/3 of cancer deaths are associated with behavioral factors such as tobacco use, diet, obesity, and lack of physical activity.
CANCER
The mortality rate due to cancer increased in both Cobb County and Georgia from 2006 to 2007. The occurrence of cancer can be greatly reduced by preventing or stopping tobacco use, improving diet, increasing physical activity and early detection examinations such as mammography, colorec-tal screening and Pap smears. There are vaccines, such as Hepatitis B and human papillo-mavirus (HPV), available to pre-vent infections which can con-tribute to the development of certain types of cancer.
Table 5-3: Age Adjusted Mortality Rates* due to Leading Causes of Cancer by Gender, 2003-2007
Males Cobb Georgia Females Cobb Georgia
Lung Cancer
53.7 80.6 Lung Cancer
32.5 39.8
Prostate Cancer
20.3 28.6 Breast Cancer
24.5 24.1
Colon Cancer
17.5 21.1 Colon Cancer
11.8 15.0
Pancreatic Cancer
11.4 12.4 Pancreatic Cancer
8.1 9.1
Leukemia 9.3 9.2 Ovarian Cancer
8.0 8.8
*Rate = number of deaths per 100,000 population.
According to the American Cancer Society, cigarette smoking accounts for at least
30% of all cancer deaths and is responsible for almost 9 out of 10 lung cancer deaths.
156.4 166.3154.3
140.5 149.9
196.1 196.1 186.6 178.3 179.4
0.0
50.0
100.0
150.0
200.0
250.0
2003 2004 2005 2006 2007
Age
Ad
just
ed
Rat
e p
er
10
0,0
00
po
pu
lati
on
Figure 5-4: Mortality Rate due to Cancer, 2003-2007
Cobb Georgia
Source: OASIS
Source: OASIS
CCHRONICHRONIC DDISEASEISEASE
Cobb County Health Status Report, 2010 37
Lung cancer is the leading cause of cancer mortality for both men and women in both Cobb County and in
Georgia.
The 2nd leading cause of cancer mortality is prostate cancer for men and breast cancer for women.
From 2003-2007, the age adjusted mortality rate due to breast cancer in Cobb County was slightly above
the rate in Georgia (24.5 vs. 24.1 per 100,000 women). Both are above the 2003-2007 mortality rate in
the U.S., which was 24.0 per 100,000 women.
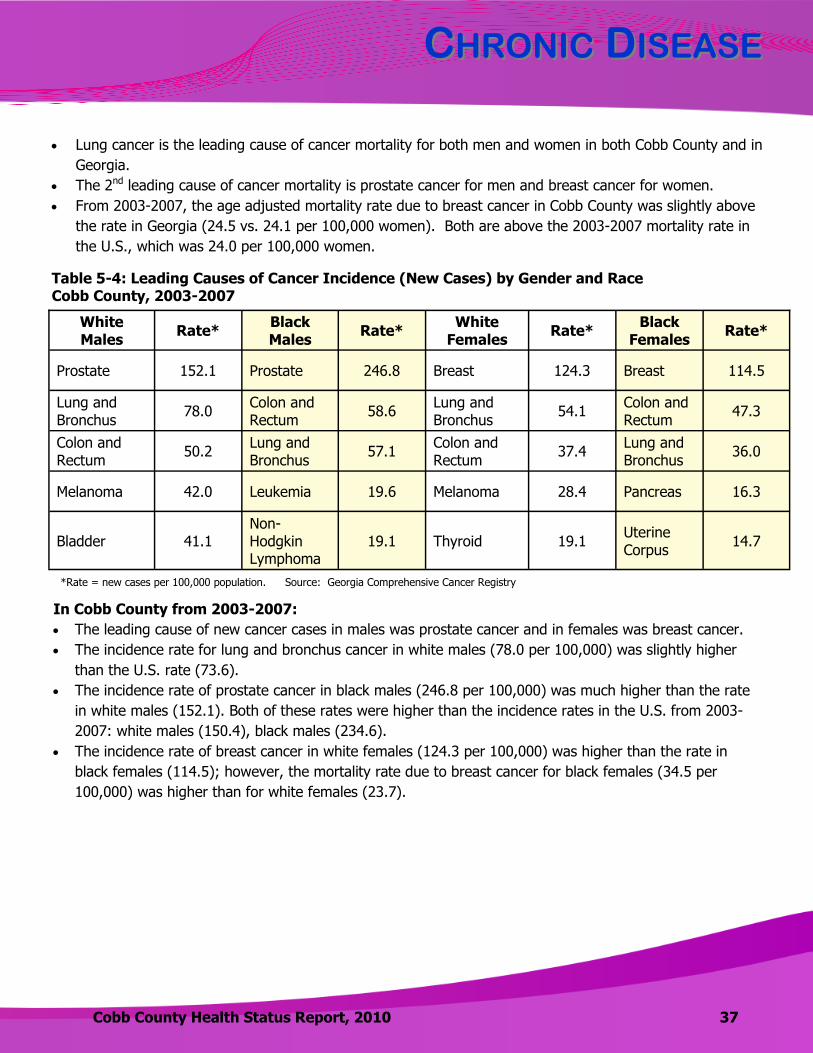
Table 5-4: Leading Causes of Cancer Incidence (New Cases) by Gender and Race Cobb County, 2003-2007
White Males
Rate* Black Males
Rate* White
Females Rate*
Black Females
Rate*
Prostate 152.1 Prostate 246.8 Breast 124.3 Breast 114.5
Lung and Bronchus
78.0 Colon and Rectum
58.6 Lung and Bronchus
54.1 Colon and Rectum
47.3
Colon and Rectum
50.2 Lung and Bronchus
57.1 Colon and Rectum
37.4 Lung and Bronchus
36.0
Melanoma 42.0 Leukemia 19.6 Melanoma 28.4 Pancreas 16.3
Bladder 41.1 Non-Hodgkin Lymphoma
19.1 Thyroid 19.1 Uterine Corpus
14.7
*Rate = new cases per 100,000 population.
In Cobb County from 2003-2007:
The leading cause of new cancer cases in males was prostate cancer and in females was breast cancer.
The incidence rate for lung and bronchus cancer in white males (78.0 per 100,000) was slightly higher
than the U.S. rate (73.6).
The incidence rate of prostate cancer in black males (246.8 per 100,000) was much higher than the rate
in white males (152.1). Both of these rates were higher than the incidence rates in the U.S. from 2003-
2007: white males (150.4), black males (234.6).
The incidence rate of breast cancer in white females (124.3 per 100,000) was higher than the rate in
black females (114.5); however, the mortality rate due to breast cancer for black females (34.5 per
100,000) was higher than for white females (23.7).
Source: Georgia Comprehensive Cancer Registry
CCHRONICHRONIC DDISEASEISEASE
38 Cobb County Health Status Report, 2010
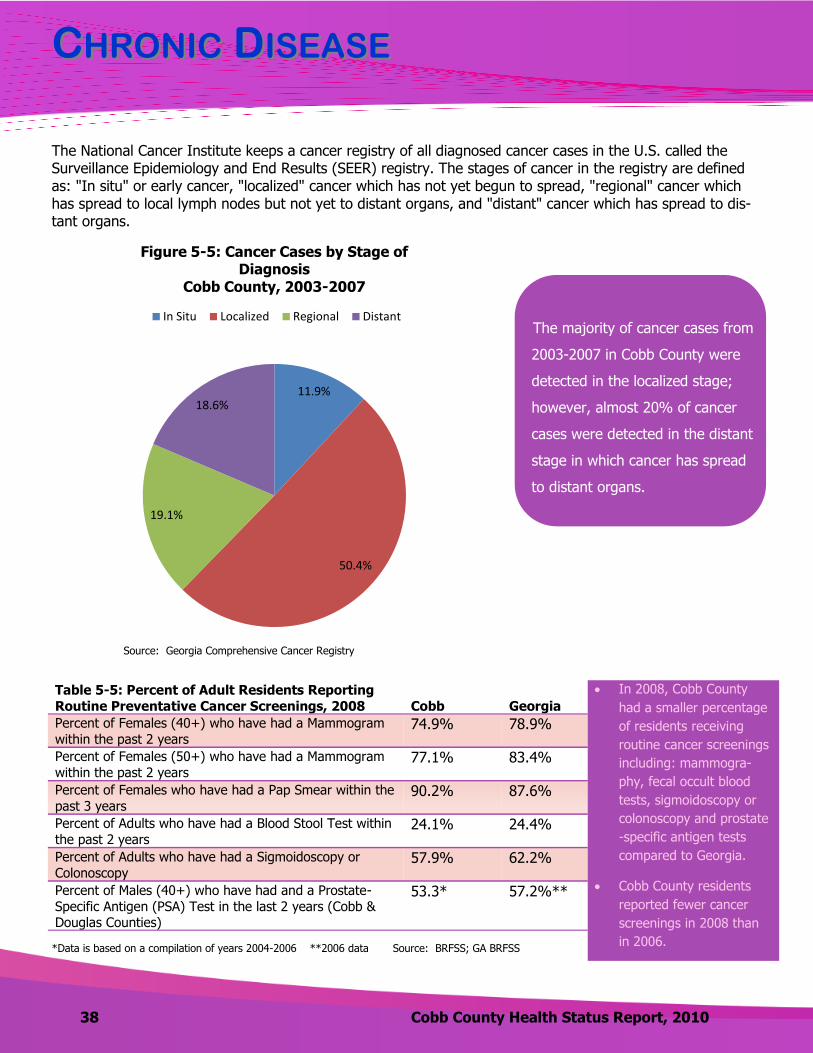
11.9%
50.4%
19.1%
18.6%
Figure 5-5: Cancer Cases by Stage of Diagnosis
Cobb County, 2003-2007
In Situ Localized Regional Distant
Source: Georgia Comprehensive Cancer Registry
*Data is based on a compilation of years 2004-2006 **2006 data
Table 5-5: Percent of Adult Residents Reporting
Routine Preventative Cancer Screenings, 2008
Cobb
Georgia
Percent of Females (40+) who have had a Mammogram
within the past 2 years 74.9% 78.9%
Percent of Females (50+) who have had a Mammogram
within the past 2 years 77.1% 83.4%
Percent of Females who have had a Pap Smear within the
past 3 years 90.2% 87.6%
Percent of Adults who have had a Blood Stool Test within
the past 2 years 24.1% 24.4%
Percent of Adults who have had a Sigmoidoscopy or
Colonoscopy 57.9% 62.2%
Percent of Males (40+) who have had and a Prostate-
Specific Antigen (PSA) Test in the last 2 years (Cobb & Douglas Counties)
53.3* 57.2%**
In 2008, Cobb County
had a smaller percentage
of residents receiving
routine cancer screenings
including: mammogra-
phy, fecal occult blood
tests, sigmoidoscopy or
colonoscopy and prostate
-specific antigen tests
compared to Georgia. Cobb County residents
reported fewer cancer
screenings in 2008 than
in 2006. Source: BRFSS; GA BRFSS
The majority of cancer cases from
2003-2007 in Cobb County were
detected in the localized stage;
however, almost 20% of cancer
cases were detected in the distant
stage in which cancer has spread
to distant organs.
The National Cancer Institute keeps a cancer registry of all diagnosed cancer cases in the U.S. called the Surveillance Epidemiology and End Results (SEER) registry. The stages of cancer in the registry are defined as: "In situ" or early cancer, "localized" cancer which has not yet begun to spread, "regional" cancer which has spread to local lymph nodes but not yet to distant organs, and "distant" cancer which has spread to dis-tant organs.
CCHRONICHRONIC DDISEASEISEASE
Cobb County Health Status Report, 2010 39
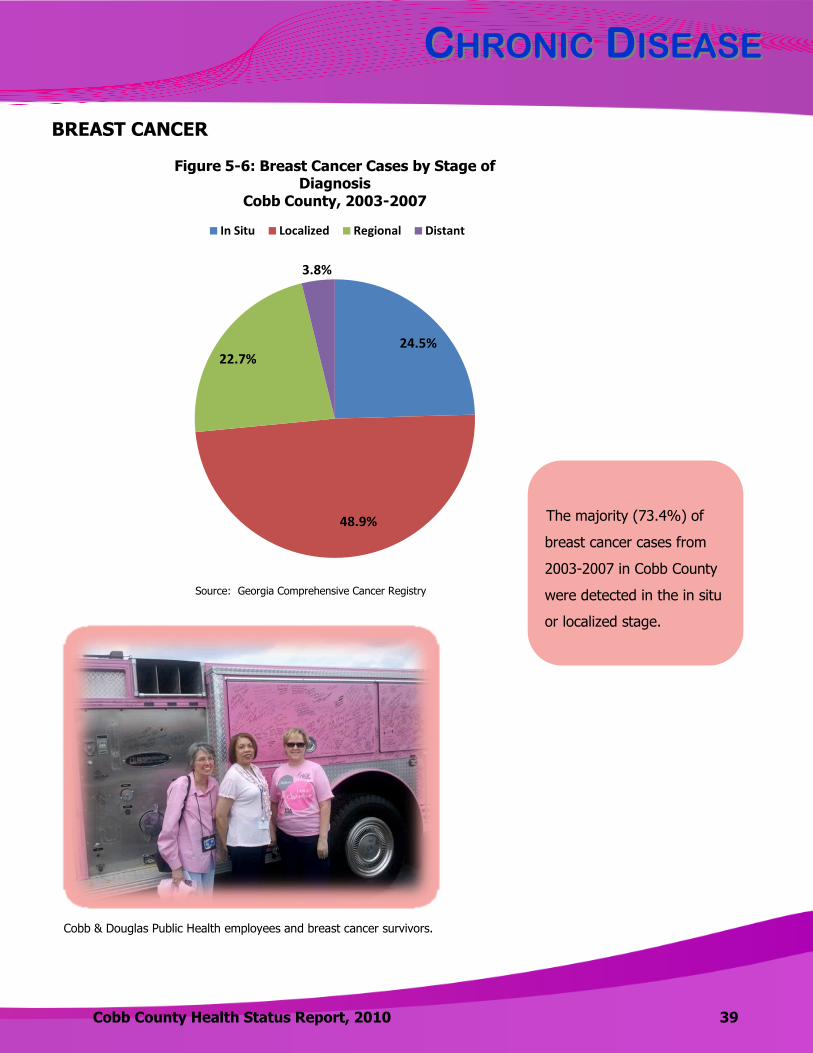
24.5%
48.9%
22.7%
3.8%
Figure 5-6: Breast Cancer Cases by Stage of Diagnosis
Cobb County, 2003-2007
In Situ Localized Regional Distant
Cobb & Douglas Public Health employees and breast cancer survivors.
The majority (73.4%) of
breast cancer cases from
2003-2007 in Cobb County
were detected in the in situ
or localized stage.
BREAST CANCER
Source: Georgia Comprehensive Cancer Registry
WWHYHY IISS BBREASTREAST CCANCERANCER IMPORTANTIMPORTANT??
40 Cobb County Health Status Report, 2010
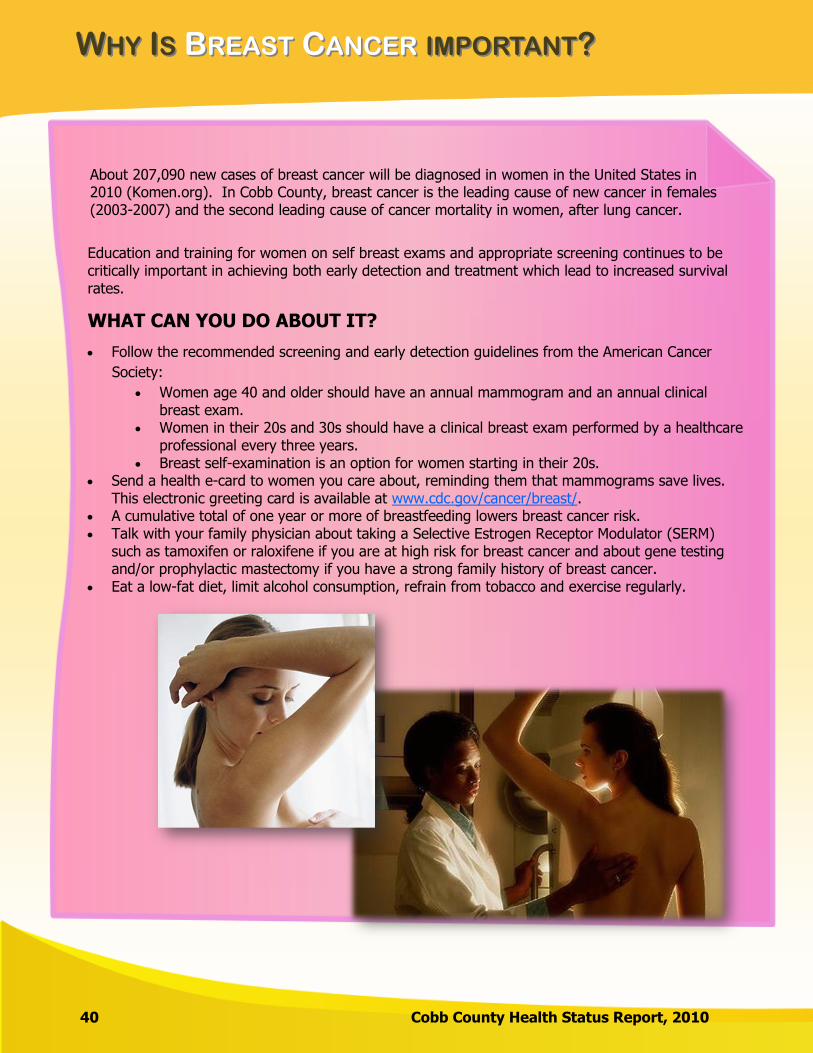
Education and training for women on self breast exams and appropriate screening continues to be critically important in achieving both early detection and treatment which lead to increased survival rates.
WHAT CAN YOU DO ABOUT IT?
Follow the recommended screening and early detection guidelines from the American Cancer
Society:
Women age 40 and older should have an annual mammogram and an annual clinical breast exam.
Women in their 20s and 30s should have a clinical breast exam performed by a healthcare professional every three years.
Breast self-examination is an option for women starting in their 20s. Send a health e-card to women you care about, reminding them that mammograms save lives.
This electronic greeting card is available at www.cdc.gov/cancer/breast/. A cumulative total of one year or more of breastfeeding lowers breast cancer risk. Talk with your family physician about taking a Selective Estrogen Receptor Modulator (SERM)
such as tamoxifen or raloxifene if you are at high risk for breast cancer and about gene testing and/or prophylactic mastectomy if you have a strong family history of breast cancer.
Eat a low-fat diet, limit alcohol consumption, refrain from tobacco and exercise regularly.
About 207,090 new cases of breast cancer will be diagnosed in women in the United States in 2010 (Komen.org). In Cobb County, breast cancer is the leading cause of new cancer in females (2003-2007) and the second leading cause of cancer mortality in women, after lung cancer.
WWHYHY IISS BBREASTREAST CCANCERANCER IMPORTANTIMPORTANT??
Cobb County Health Status Report, 2010 41
HOW DO WE COMPARE?
Breast cancer mortality rates (2003-2007): United States: 24.0 cases per 100,000 female
population Georgia: 24.1 cases per 100,000 female population Cobb County: 24.5 cases per 100,000 female
population Cobb County’s rate is slightly higher than the rate for Georgia and the U.S.
TO LEARN MORE….
The following two websites are recommended for more information: www.komenatlanta.org – Susan G. Komen Foundation; www.cancer.org – American Cancer Society
Did you know Cobb & Douglas Public Health
offers a Breast Test screening program?
Visit our website to learn more. www.cobbanddouglaspublichealth.org/
HealthAndWellness/WomensHealth/
CCHRONICHRONIC DDISEASEISEASE
42 Cobb County Health Status Report, 2010
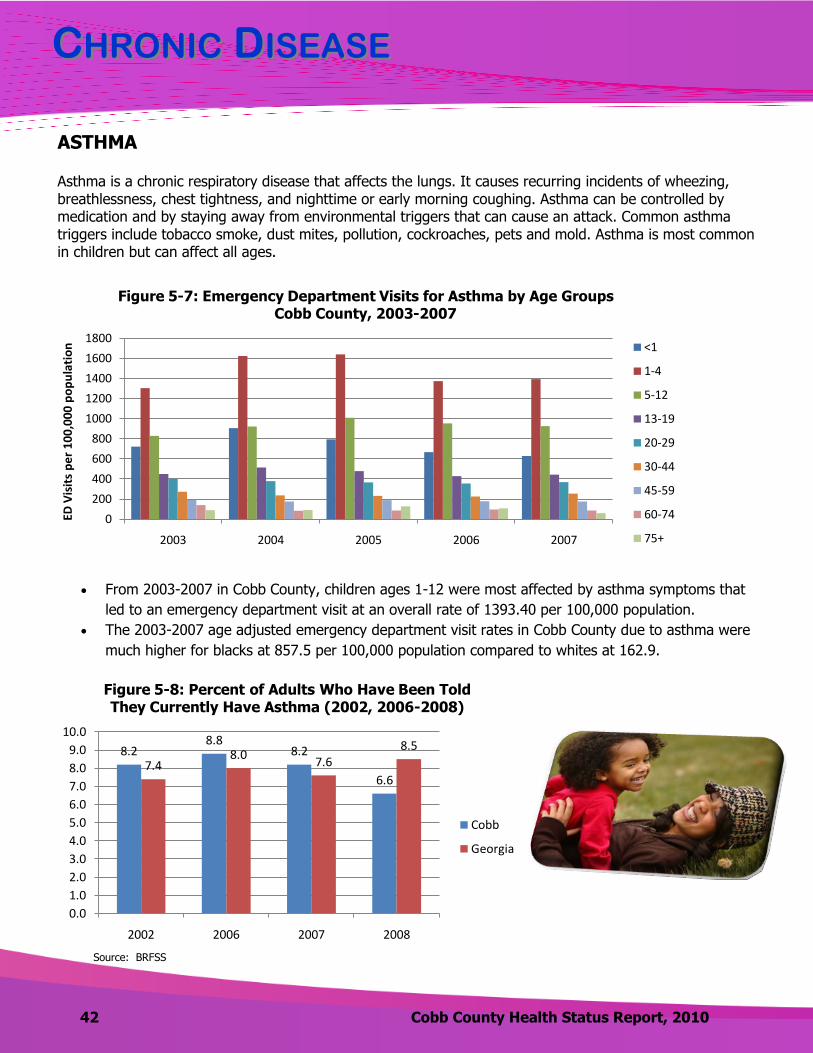
ASTHMA
Asthma is a chronic respiratory disease that affects the lungs. It causes recurring incidents of wheezing, breathlessness, chest tightness, and nighttime or early morning coughing. Asthma can be controlled by medication and by staying away from environmental triggers that can cause an attack. Common asthma triggers include tobacco smoke, dust mites, pollution, cockroaches, pets and mold. Asthma is most common in children but can affect all ages.
From 2003-2007 in Cobb County, children ages 1-12 were most affected by asthma symptoms that
led to an emergency department visit at an overall rate of 1393.40 per 100,000 population.
The 2003-2007 age adjusted emergency department visit rates in Cobb County due to asthma were
much higher for blacks at 857.5 per 100,000 population compared to whites at 162.9.
Source: Georgia Division of Public Health, OASIS
0
200
400
600
800
1000
1200
1400
1600
1800
2003 2004 2005 2006 2007
ED V
isit
s p
er
10
0,0
00
po
pu
lati
on
Figure 5-7: Emergency Department Visits for Asthma by Age Groups Cobb County, 2003-2007
<1
1-4
5-12
13-19
20-29
30-44
45-59
60-74
75+
8.28.8
8.2
6.67.4
8.07.6
8.5
0.0
1.0
2.0
3.0
4.0
5.0
6.0
7.0
8.0
9.0
10.0
2002 2006 2007 2008
Figure 5-8: Percent of Adults Who Have Been Told They Currently Have Asthma (2002, 2006-2008)
Cobb
Georgia
Source: BRFSS
WWHYHY IISS AASTHMASTHMA IMPORTANTIMPORTANT??
43 Cobb County Health Status Report, 2010
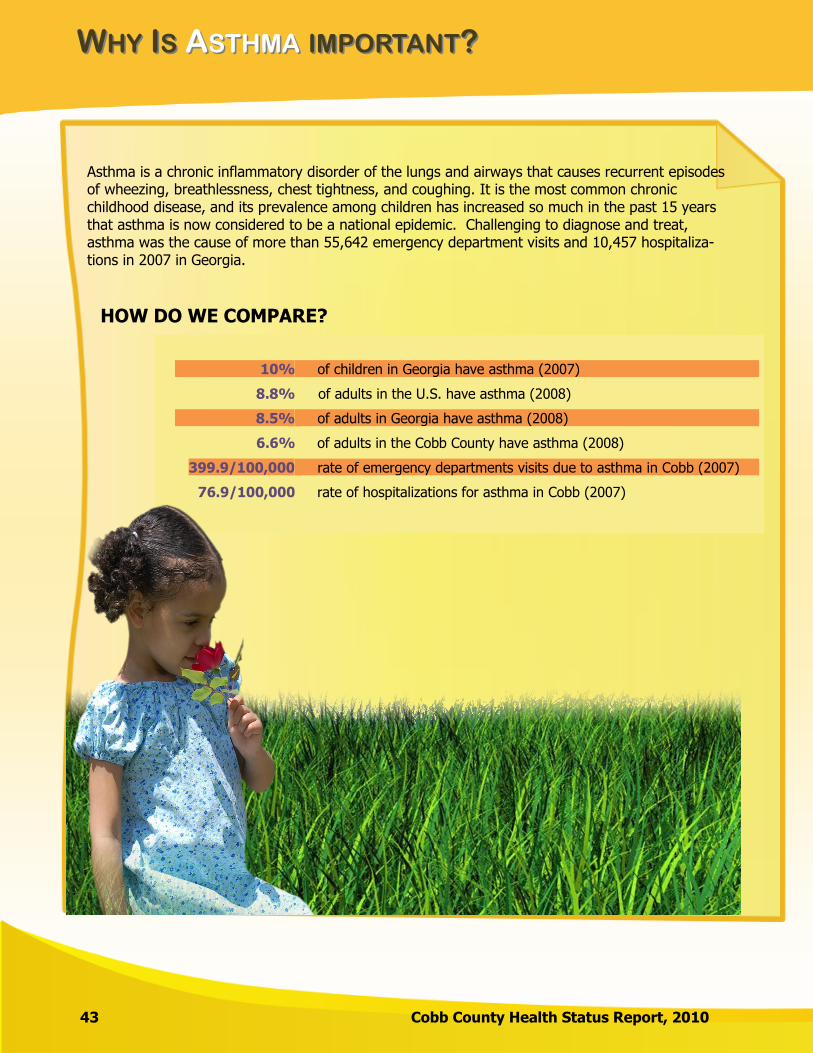
Asthma is a chronic inflammatory disorder of the lungs and airways that causes recurrent episodes of wheezing, breathlessness, chest tightness, and coughing. It is the most common chronic childhood disease, and its prevalence among children has increased so much in the past 15 years that asthma is now considered to be a national epidemic. Challenging to diagnose and treat, asthma was the cause of more than 55,642 emergency department visits and 10,457 hospitaliza-tions in 2007 in Georgia.
HOW DO WE COMPARE?
10%
8.8%
8.5%
6.6%
399.9/100,000
76.9/100,000
of children in Georgia have asthma (2007)
of adults in the U.S. have asthma (2008)
of adults in Georgia have asthma (2008)
of adults in the Cobb County have asthma (2008)
rate of emergency departments visits due to asthma in Cobb (2007)
rate of hospitalizations for asthma in Cobb (2007)
WWHYHY IISS AASTHMASTHMA IMPORTANTIMPORTANT??
Cobb County Health Status Report, 2010 44
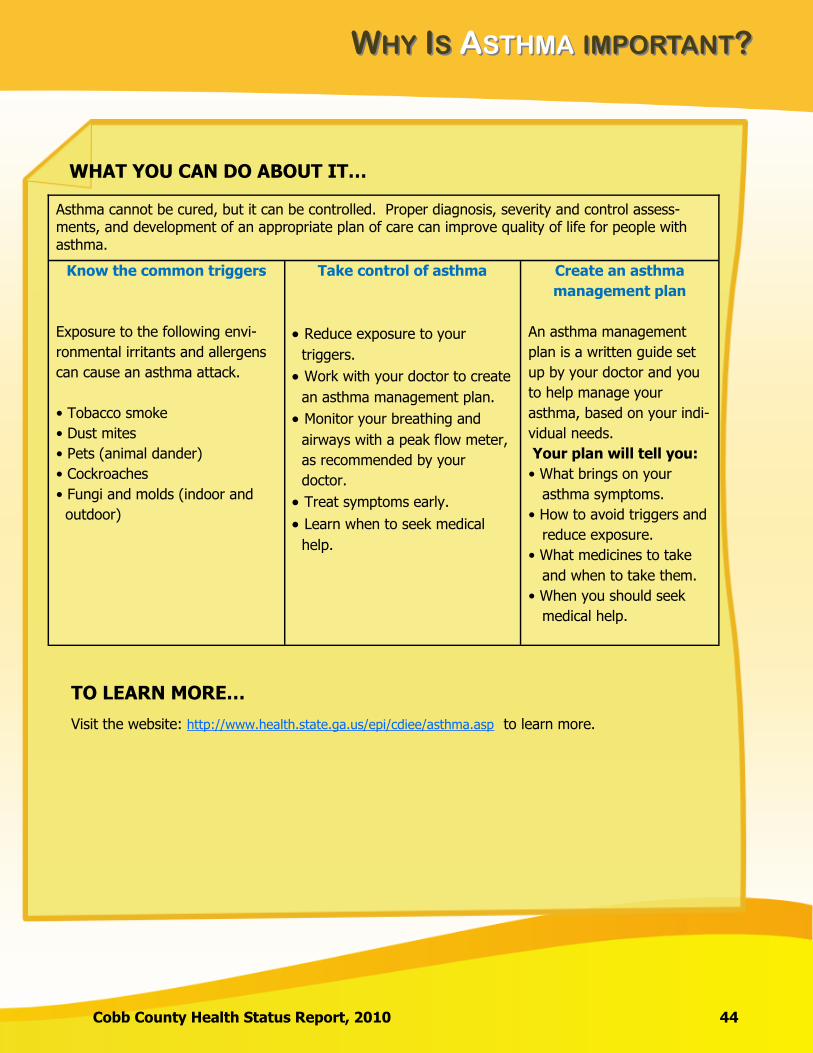
WHAT YOU CAN DO ABOUT IT…
Asthma cannot be cured, but it can be controlled. Proper diagnosis, severity and control assess-ments, and development of an appropriate plan of care can improve quality of life for people with asthma.
Know the common triggers
Exposure to the following envi-
ronmental irritants and allergens
can cause an asthma attack.
• Tobacco smoke
• Dust mites
• Pets (animal dander)
• Cockroaches
• Fungi and molds (indoor and
outdoor)
Take control of asthma
Reduce exposure to your
triggers.
Work with your doctor to create
an asthma management plan.
Monitor your breathing and
airways with a peak flow meter,
as recommended by your
doctor.
Treat symptoms early.
Learn when to seek medical
help.
Create an asthma
management plan
An asthma management
plan is a written guide set
up by your doctor and you
to help manage your
asthma, based on your indi-
vidual needs.
Your plan will tell you:
• What brings on your
asthma symptoms.
• How to avoid triggers and
reduce exposure.
• What medicines to take
and when to take them.
• When you should seek
medical help.
TO LEARN MORE…
Visit the website: http://www.health.state.ga.us/epi/cdiee/asthma.asp to learn more.
CCHRONICHRONIC DDISEASEISEASE
45 Cobb County Health Status Report, 2010
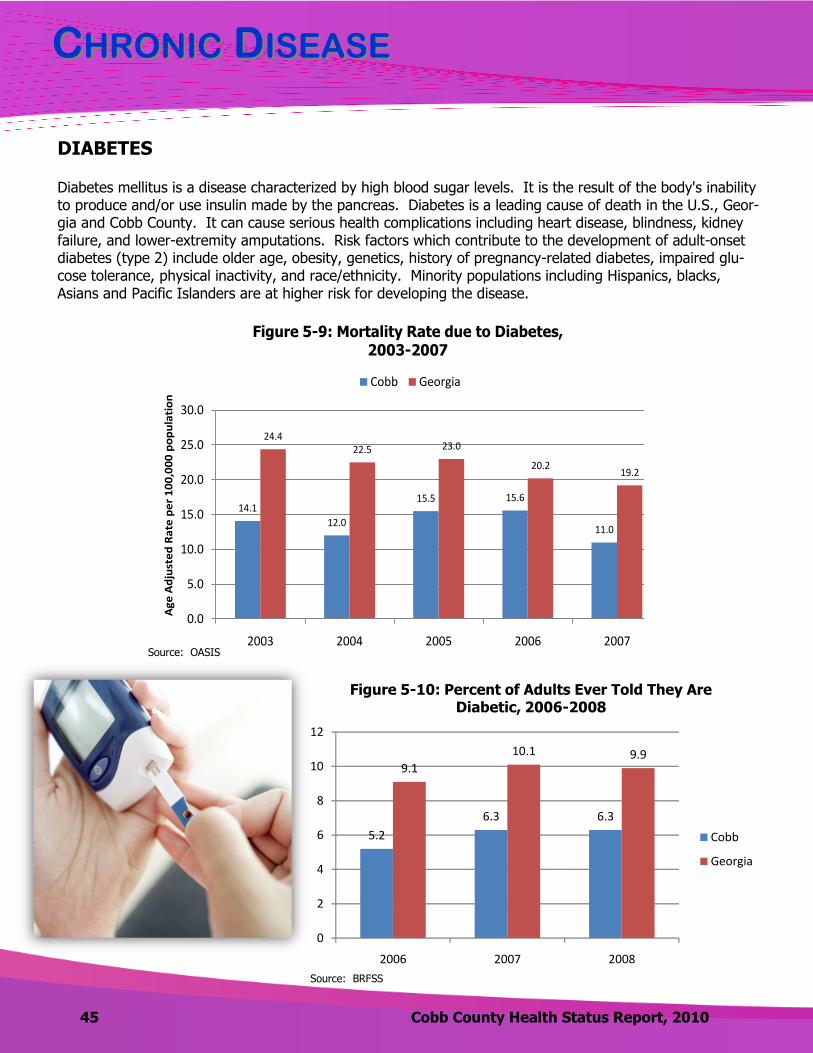
14.1
12.0
15.5 15.6
11.0
24.422.5 23.0
20.219.2
0.0
5.0
10.0
15.0
20.0
25.0
30.0
2003 2004 2005 2006 2007
Ag
e A
dju
ste
d R
ate
pe
r 1
00
,00
0 p
op
ula
tio
n
Figure 5-9: Mortality Rate due to Diabetes, 2003-2007
Cobb Georgia
DIABETES
Diabetes mellitus is a disease characterized by high blood sugar levels. It is the result of the body's inability to produce and/or use insulin made by the pancreas. Diabetes is a leading cause of death in the U.S., Geor-gia and Cobb County. It can cause serious health complications including heart disease, blindness, kidney failure, and lower-extremity amputations. Risk factors which contribute to the development of adult-onset diabetes (type 2) include older age, obesity, genetics, history of pregnancy-related diabetes, impaired glu-cose tolerance, physical inactivity, and race/ethnicity. Minority populations including Hispanics, blacks, Asians and Pacific Islanders are at higher risk for developing the disease.
5.2
6.3 6.3
9.1
10.1 9.9
0
2
4
6
8
10
12
2006 2007 2008
Figure 5-10: Percent of Adults Ever Told They Are Diabetic, 2006-2008
Cobb
Georgia
Source: BRFSS
Source: OASIS

CCHRONICHRONIC DDISEASEISEASE
Cobb County Health Status Report, 2010 46
0.9
3.1
0.3
1.11.3
0.8
0
0.5
1
1.5
2
2.5
3
3.5
2006 2007 2008
Figure 5-11: Percent of Adult Females Ever Told They Have Pregnancy Related Diabetes
2006-2008
Cobb
Georgia
Source: BRFSS
Diabetes Facts
In Cobb County, 2003-2007:
The black mortality rate due to diabetes (22.5
per 100,000 population) was almost 2 times
the white mortality rate (12.8)
The age adjusted emergency department visit
rate for diabetes was 122.9 per 100,000:
Black: 381.9
Other: 107.9 (Asian, American Indian or Alaska
Native, Native Hawaiian or Pacific Islander,
Multiracial)
White: 79.6

WWHYHY IISS DDIABETESIABETES IMPORTANTIMPORTANT??
47 Cobb County Health Status Report, 2010
Diabetes is consistently in the top 10 leading causes of death in Georgia. In addition, for every death with diabetes as a primary cause, there are two other deaths in which diabetes is a contrib-uting cause. It can lead to blindness, kidney failure, amputations, heart disease, stroke, hyperten-sion, nerve damage, repeated infections, slow wound healing, sexual dysfunctions, skin disorders, periodontal disease, pregnancy complications, disability, and premature death. In Georgia... DIABETES IS:
more common among black adults than among white adults
6 times more common among adults aged 65 years and older than among adults aged 18 to 34
years
3 times more common among adults whose annual household income was less than $15,000
than among adults in households that earned $75,000 or more a year
significantly more common in adults with less than a high school education than among college
graduates
WHAT YOU CAN DO ABOUT IT…
Many complications of diabetes can be prevented with early detection, proper intervention, and comprehensive management. If you are diabetic, get checked…. √ Blood sugar checked daily or as recommended
by your doctor √ Hemoglobin A1C checked at least twice a year
√ Eyes dilated and checked at least once a year √ Urine checked for the protein albumin as
needed √ Feet checked daily and at all doctor visits
WWHYHY IISS DDIABETESIABETES IMPORTANTIMPORTANT??
Cobb County Health Status Report, 2010 48
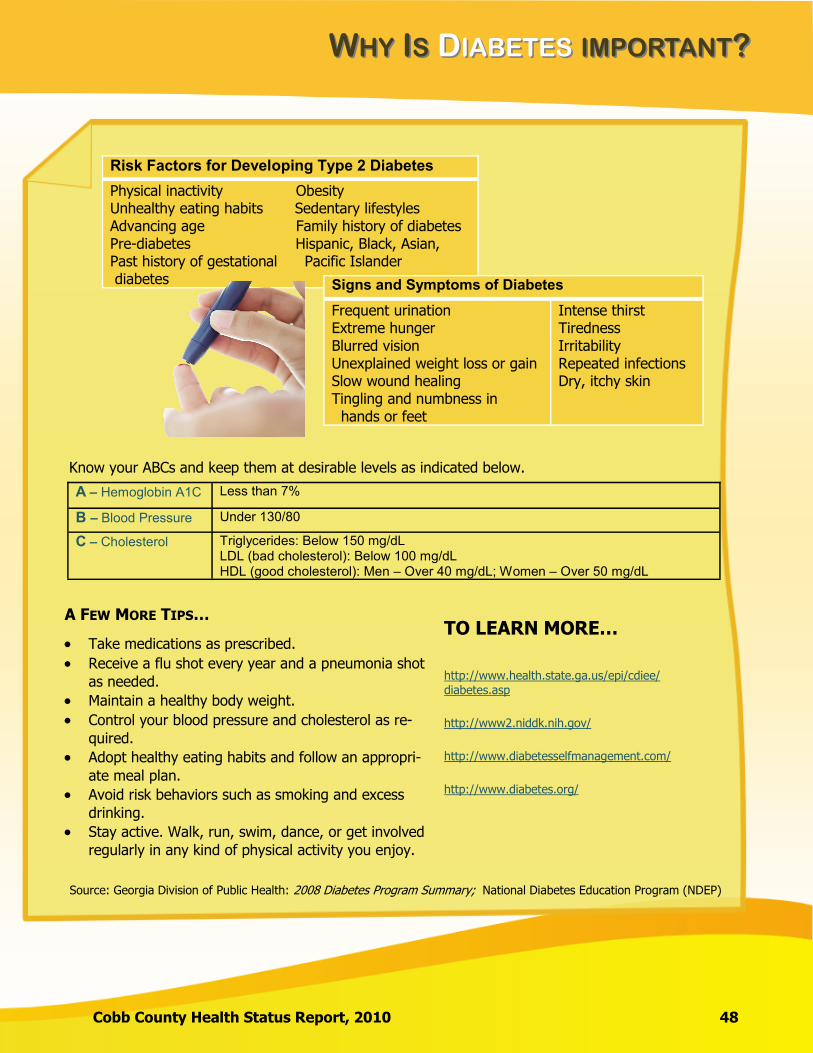
Know your ABCs and keep them at desirable levels as indicated below.
A – Hemoglobin A1C Less than 7%
B – Blood Pressure Under 130/80
C – Cholesterol Triglycerides: Below 150 mg/dL LDL (bad cholesterol): Below 100 mg/dL HDL (good cholesterol): Men – Over 40 mg/dL; Women – Over 50 mg/dL
A FEW MORE TIPS…
Take medications as prescribed.
Receive a flu shot every year and a pneumonia shot
as needed.
Maintain a healthy body weight.
Control your blood pressure and cholesterol as re-
quired.
Adopt healthy eating habits and follow an appropri-
ate meal plan.
Avoid risk behaviors such as smoking and excess
drinking.
Stay active. Walk, run, swim, dance, or get involved
regularly in any kind of physical activity you enjoy.
TO LEARN MORE…
http://www.health.state.ga.us/epi/cdiee/diabetes.asp
http://www2.niddk.nih.gov/
http://www.diabetesselfmanagement.com/
http://www.diabetes.org/
Risk Factors for Developing Type 2 Diabetes
Physical inactivity Obesity Unhealthy eating habits Sedentary lifestyles Advancing age Family history of diabetes Pre-diabetes Hispanic, Black, Asian, Past history of gestational Pacific Islander diabetes Signs and Symptoms of Diabetes
Frequent urination Extreme hunger Blurred vision Unexplained weight loss or gain Slow wound healing Tingling and numbness in hands or feet
Intense thirst Tiredness Irritability Repeated infections Dry, itchy skin
Source: Georgia Division of Public Health: 2008 Diabetes Program Summary; National Diabetes Education Program (NDEP)
CCHRONICHRONIC DDISEASEISEASE
49 Cobb County Health Status Report, 2010
CHRONIC OBSTRUCTIVE PULMONARY DISEASE (COPD)
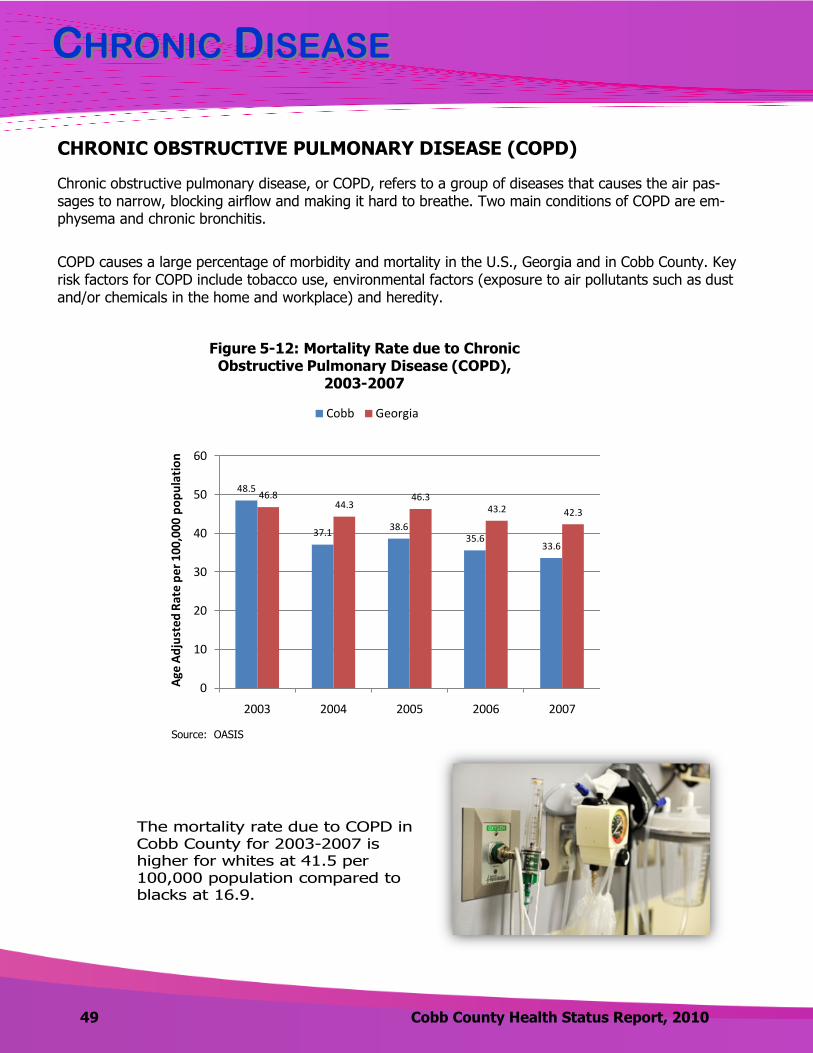
Chronic obstructive pulmonary disease, or COPD, refers to a group of diseases that causes the air pas-sages to narrow, blocking airflow and making it hard to breathe. Two main conditions of COPD are em-physema and chronic bronchitis.
COPD causes a large percentage of morbidity and mortality in the U.S., Georgia and in Cobb County. Key risk factors for COPD include tobacco use, environmental factors (exposure to air pollutants such as dust and/or chemicals in the home and workplace) and heredity.
The mortality rate due to COPD in Cobb County for 2003-2007 is higher for whites at 41.5 per 100,000 population compared to blacks at 16.9.
48.5
37.138.6
35.633.6
46.844.3
46.343.2 42.3
0
10
20
30
40
50
60
2003 2004 2005 2006 2007Age
Adju
sted
Rat
e pe
r 100
,000
pop
ulat
ion
Figure 5-12: Mortality Rate due to Chronic Obstructive Pulmonary Disease (COPD),
2003-2007
Cobb Georgia
48.5
37.138.6
35.633.6
46.844.3
46.343.2 42.3
0
10
20
30
40
50
60
2003 2004 2005 2006 2007
Age
Ad
just
ed R
ate
per
100
,000
po
pu
lati
on
Figure 5-12: Mortality Rate due to Chronic Obstructive Pulmonary Disease (COPD),
2003-2007
Cobb Georgia
Source: OASIS

CCHRONICHRONIC DDISEASEISEASE
Cobb County Health Status Report, 2010 50
ALCOHOL USE
Excessive drinking in the form of heavy drinking or binge drinking is associated with numerous health prob-lems, including:
Cirrhosis (damage to liver cells) of the liver
Pancreatitis (inflammation of the pancreas)
Cancers, including liver, mouth, throat, larynx and esophagus
High blood pressure
Psychological disorders
Unintentional injuries
Motor-vehicle crashes, falls, drowning, burns and firearm injuries
Violence
Child maltreatment, homicide and suicide
5.0
3.2
4.1
5.1
3.9 3.94.4 4.5
0.0
1.0
2.0
3.0
4.0
5.0
6.0
2002 2006 2007 2008
Figure 5-13: Percent of Adults Classified as Heavy Drinkers*
(2002, 2006-2008)
Cobb Georgia
56.6 58.2
65.860.1
49.345.5
48.4 46.8
0.0
10.0
20.0
30.0
40.0
50.0
60.0
70.0
2002 2006 2007 2008
Figure 5-14: Percent of Adults Who Have Had at Least One Alcoholic Drink within the Last Thirty Days
(2002, 2006-2008)
Cobb Georgia
*Heavy drinkers defined as 3+ drinks/day for men and 2+ drinks/day for women
Source: BRFSS Source: BRFSS

CCHRONICHRONIC DDISEASEISEASE
51 Cobb County Health Status Report, 2010
ALCOHOLIC LIVER DISEASE (CIRRHOSIS)
Alcoholic liver disease is defined as damage to the liver and its function due to alcohol abuse. Alcoholic liver disease can start in the liver as inflammation (hepatitis) and progress to fatty liver and cirrhosis. Cirrhosis is scarring of the liver which effects liver functioning; it has multiple causes. Cirrhosis can cause health compli-cations including bleeding disorders, ascites (fluid in the abdomen), portal hypertension, hepatic encephalo-pathy, kidney failure and liver cancer.
Excessive alcohol use is a leading lifestyle related cause of death in the United States. Alcoholic liver disease usually occurs after years of extreme drinking. Other factors that contribute to the development of alcoholic liver disease are genetics, personal susceptibility to alcohol-induced liver disease and toxicity of alcohol to the
liver.
Source: BRFSS
1.7
1.1
2.4
1.5
2.42.52.7
2.42.1
2.3
0
0.5
1
1.5
2
2.5
3
2003 2004 2005 2006 2007
Age
Ad
just
ed
Mo
rtal
ity
Rat
e p
er
10
0,0
00
p
op
ula
tio
n
Figure 5-16: Mortality Rates due to Alcoholic Liver Disease
2003-2007
Cobb Georgia
Source: OASIS
15.7 15.8
17.9
12.1 12.614.0
0.0
2.0
4.0
6.0
8.0
10.0
12.0
14.0
16.0
18.0
20.0
2006 2007 2008
Figure 5-15: Percent of Adults who Binge Drink*, 2006-2008
Cobb Georgia
*Binge drinkers defined as 5+ drinks/day for men and 4+ drinks/day for women
The mortality rate due to alcoholic liver disease remains low and has been sporadic from 2003-2007 in both Cobb County and in Georgia.
The mortality rate in Cobb County during 2007 was slightly higher than in Georgia. This should be monitored based on the high self-reported rates of both binge drinking and heavy drinking in Cobb County.
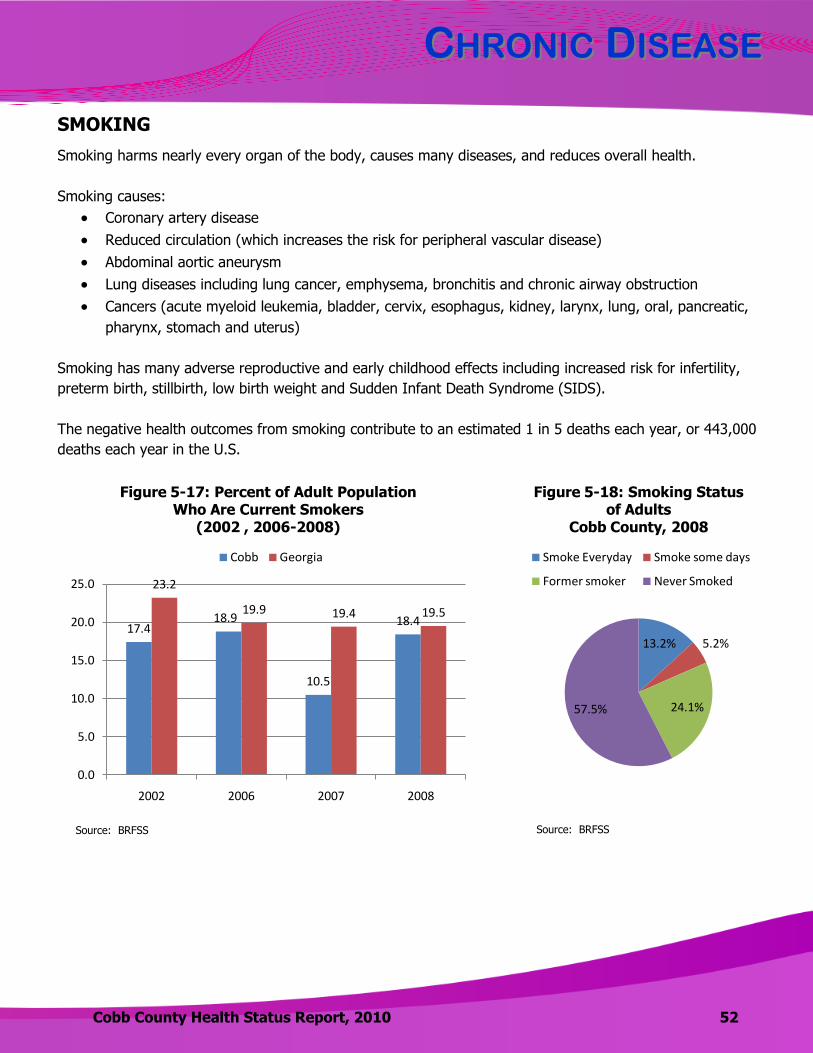
CCHRONICHRONIC DDISEASEISEASE
Cobb County Health Status Report, 2010 52
SMOKING
Smoking harms nearly every organ of the body, causes many diseases, and reduces overall health.
Smoking causes:
Coronary artery disease
Reduced circulation (which increases the risk for peripheral vascular disease)
Abdominal aortic aneurysm
Lung diseases including lung cancer, emphysema, bronchitis and chronic airway obstruction
Cancers (acute myeloid leukemia, bladder, cervix, esophagus, kidney, larynx, lung, oral, pancreatic,
pharynx, stomach and uterus)
Smoking has many adverse reproductive and early childhood effects including increased risk for infertility,
preterm birth, stillbirth, low birth weight and Sudden Infant Death Syndrome (SIDS).
The negative health outcomes from smoking contribute to an estimated 1 in 5 deaths each year, or 443,000
deaths each year in the U.S.
17.418.9
10.5
18.4
23.2
19.9 19.4 19.5
0.0
5.0
10.0
15.0
20.0
25.0
2002 2006 2007 2008
Figure 5-17: Percent of Adult Population Who Are Current Smokers
(2002 , 2006-2008)
Cobb Georgia
13.2% 5.2%
24.1%57.5%
Figure 5-18: Smoking Status of Adults
Cobb County, 2008
Smoke Everyday Smoke some days
Former smoker Never Smoked
Source: BRFSS Source: BRFSS
CCHRONICHRONIC DDISEASEISEASE
53 Cobb County Health Status Report, 2010
Deaths from tobacco use
surpass the total deaths
from human immunodeficiency virus (HIV), illegal drug use, alcohol use, motor vehicle injuries, suicides, and
murders combined.
OVERWEIGHT/OBESITY
Overweight and obesity are terms to describe weight that is above what is considered healthy. For adults, the terms are dependent on an individual’s body mass index. Overweight is defined as a BMI of 25 to 29.9. Obesity is defined as a BMI of 30 or higher.
CALCULATION OF BMI (SOURCE: CDC)
BMI is calculated the same way for both adults and children. The calculation is based on the following for-
mulas:
Measurement Units Formula and Calculation
Kilograms and meters (or centimeters)
Formula: weight (kg) / [height (m)]2
With the metric system, the formula for BMI is weight in kilograms divided by
height in meters squared. Since height is commonly measured in centimeters,
divide height in centimeters by 100 to obtain height in meters.
Example: Weight = 68 kg, Height = 165 cm (1.65 m)
Calculation: 68 ÷ (1.65)2 = 24.98
Pounds and inches Formula: weight (lb) / [height (in)]2 x 703
Calculate BMI by dividing weight in pounds (lbs) by height in inches (in) squared
and multiplying by a conversion factor of 703.
Example: Weight = 150 lbs, Height = 5'5" (65")
Calculation: [150 ÷ (65)2] x 703 = 24.96
VISIT THIS WEBSITE FOR A BMI CALCULATOR FOR ADULTS
www.cdc.gov/healthyweight/assessing/bmi/adult_bmi/english_bmi_calculator/bmi_calculator.html

CCHRONICHRONIC DDISEASEISEASE
Cobb County Health Status Report, 2010 54
Obesity and being overweight have been associated with increased risk of certain diseases and other health problems including:
According to the CDC, in 2007-2008, the age adjusted prevalence of obesity in the United States was 33.8% overall, 32.2% among men, and 35.5% among women. There are a variety of factors which con-tribute to being overweight or obese. These include caloric intake, environment, activity levels, genetics and medications.
Coronary heart disease
Type 2 diabetes
Cancers (endometrial, breast, and colon)
High blood pressure
High total cholesterol or high levels of
triglycerides
Stroke
Liver and gallbladder disease
Sleep apnea and respiratory problems
Osteoarthritis (a degeneration of cartilage and
its underlying bone within a joint)
Gynecological problems (abnormal menses,
infertility)
A higher percentage of residents reported being
overweight in Cobb County than in Georgia.
A lower percentage of residents reported being
obese in Cobb County than in Georgia.
29.9
36.333.4
38.335.4 34.6
36.3 36.9
0.0
5.0
10.0
15.0
20.0
25.0
30.0
35.0
40.0
45.0
2002 2006 2007 2008
Figure 5-19: Percent of Adults who are Overweight by BMI(2002, 2006-2008)
Cobb Georgia
20.318.6
23.221.0
23.5
27.128.7 27.8
0.0
5.0
10.0
15.0
20.0
25.0
30.0
35.0
2002 2006 2007 2008
Figure 5-20: Percent of Adults who are Obese by BMI
(2002, 2006-2008)
Cobb Georgia
EXERCISE
Inactive children and adults are more likely to become obese, leading to increased healthcare costs and decreased quality of life. Regular physical activity improves overall health and fitness and reduces risk for many chronic diseases.
Source: BRFSS Source: BRFSS
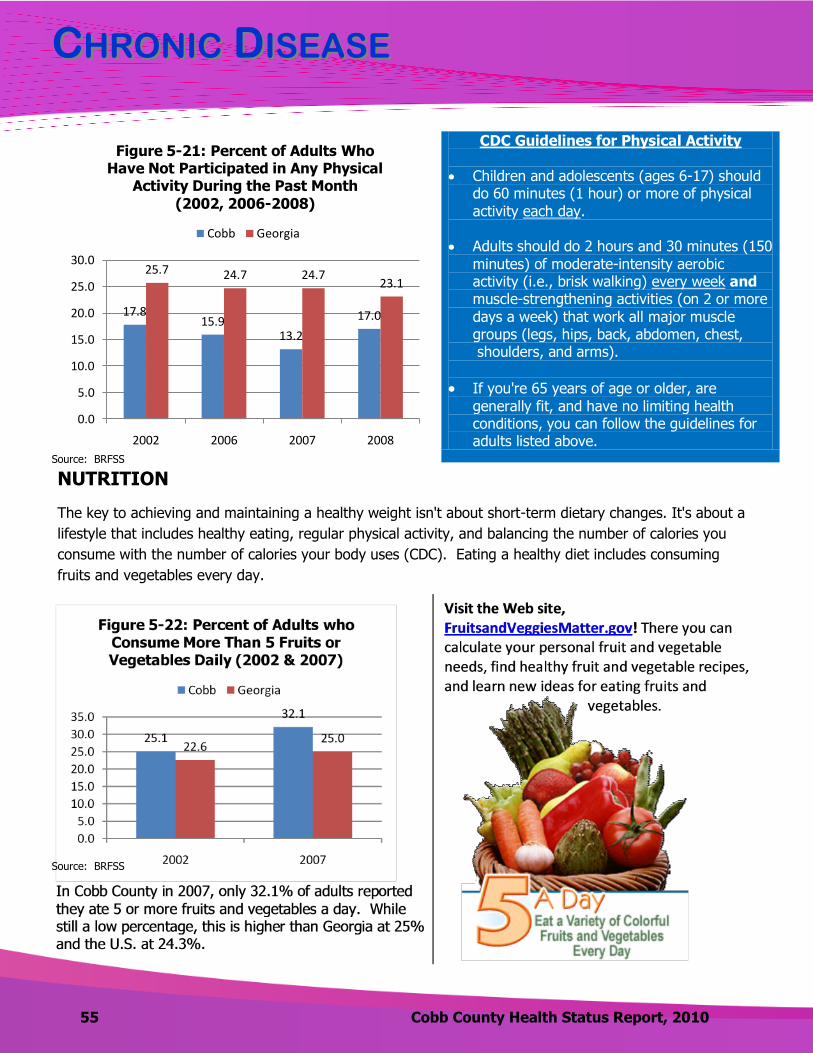
CCHRONICHRONIC DDISEASEISEASE
55 Cobb County Health Status Report, 2010
CDC Guidelines for Physical Activity
Children and adolescents (ages 6-17) should do 60 minutes (1 hour) or more of physical activity each day.
Adults should do 2 hours and 30 minutes (150
minutes) of moderate-intensity aerobic activity (i.e., brisk walking) every week and muscle-strengthening activities (on 2 or more
days a week) that work all major muscle groups (legs, hips, back, abdomen, chest, shoulders, and arms).
If you're 65 years of age or older, are generally fit, and have no limiting health conditions, you can follow the guidelines for adults listed above.
17.815.9
13.2
17.0
25.7 24.7 24.723.1
0.0
5.0
10.0
15.0
20.0
25.0
30.0
2002 2006 2007 2008
Figure 5-21: Percent of Adults Who Have Not Participated in Any Physical
Activity During the Past Month
(2002, 2006-2008)
Cobb Georgia
NUTRITION
The key to achieving and maintaining a healthy weight isn't about short-term dietary changes. It's about a
lifestyle that includes healthy eating, regular physical activity, and balancing the number of calories you
consume with the number of calories your body uses (CDC). Eating a healthy diet includes consuming
fruits and vegetables every day.
Source: BRFSS
Source: BRFSS

Back to TOC
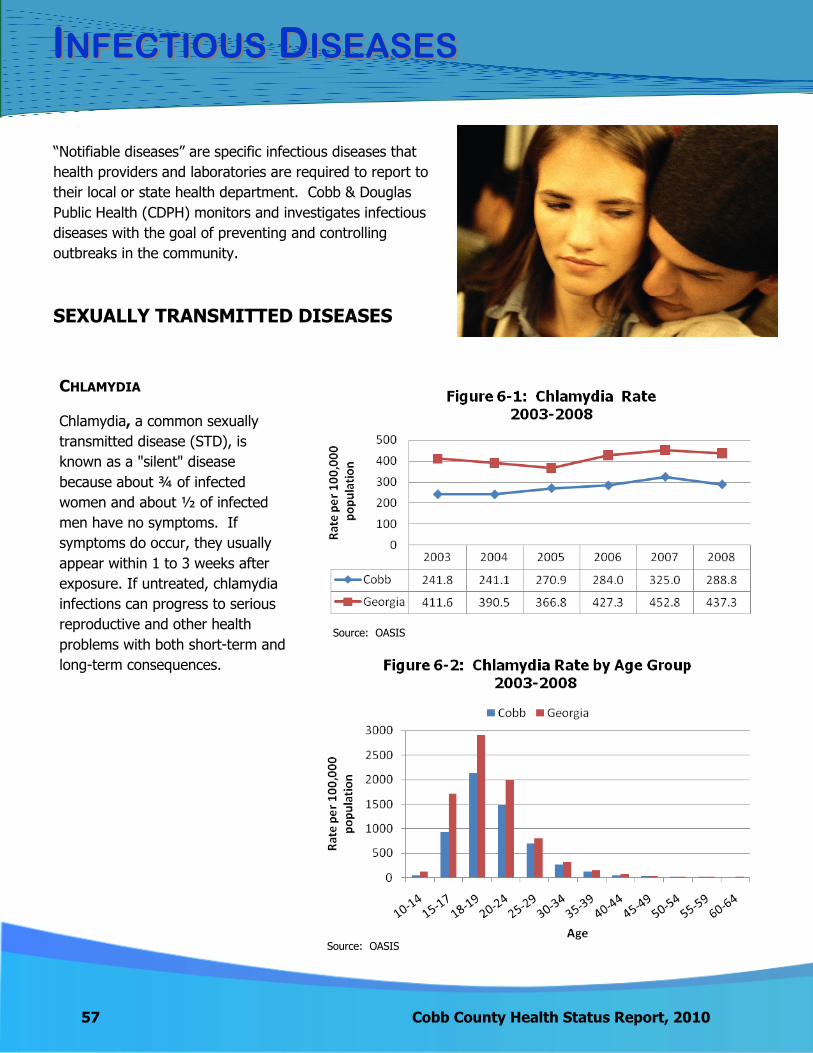
57 Cobb County Health Status Report, 2010
IINFECTIOUSNFECTIOUS DDISEASESISEASES
―Notifiable diseases‖ are specific infectious diseases that
health providers and laboratories are required to report to
their local or state health department. Cobb & Douglas
Public Health (CDPH) monitors and investigates infectious
diseases with the goal of preventing and controlling
outbreaks in the community.
SEXUALLY TRANSMITTED DISEASES
CHLAMYDIA
Chlamydia, a common sexually
transmitted disease (STD), is
known as a "silent" disease
because about ¾ of infected
women and about ½ of infected
men have no symptoms. If
symptoms do occur, they usually
appear within 1 to 3 weeks after
exposure. If untreated, chlamydia
infections can progress to serious
reproductive and other health
problems with both short-term and
long-term consequences.
Source: OASIS
Source: OASIS
IINFECTIOUSNFECTIOUS DDISEASESISEASES
Cobb County Health Status Report, 2010 58
Chlamydia Facts
According to 2008 data, Georgia ranks 13th highest in the U.S. for rates of
chlamydia.
From 2003-2008, Cobb ranked 3rd highest out of 159 counties for the number of
chlamydia cases and 104th highest for the rate (cases per 100,000 population.)
In Cobb County, there is a much larger percentage of females diagnosed with chlamydia than males (78.2% versus 22.8%). However, the CDC estimates that the actual
occurrence of chlamydia is similar among men and women.
The highest rates of chlamydia cases in Cobb County and in Georgia occurred among
persons 18-19 years of age.
In the U.S. (2008), the chlamydia rate among blacks was more than eight times higher than that of whites (1,519.3 vs. 173.6 cases per 100,000 population.)
In Cobb County (2003-2008), of the known chlamydia cases where race was identified, the rate
among the black population was 300.4 per 100,000 and 40.1 among whites.
In 64.7% of the cases reported in Cobb County for 2008, race was unknown.

59 Cobb County Health Status Report, 2010
IINFECTIOUSNFECTIOUS DDISEASESISEASES
GONORRHEA
Gonorrhea is a sexually transmitted disease that if left untreated can cause serious and permanent health problems in both men and women. In women, gonorrhea is a common cause of pelvic inflammatory disease. In men, gonorrhea can cause epididymitis, a painful condition of the ducts attached to the testicles that may lead to infertility if left untreated. Increases in drug resistant gonorrhea in 2007 led to changes in the national treatment guidelines.
GONORRHEA FACTS
The south has higher rates of gonorrhea than other U.S. regions.
Georgia ranked 6th highest in the United
States for its rate of gonorrhea (2008).
From 2003-2008, Cobb County ranked 101st highest out of the 159
counties in Georgia for the rate of gonorrhea (cases per 100,000 population).
Gonorrhea rates for 2003-
2008 were highest in the 18-19 year old age group at a rate of
606.9 per 100,000
population for Cobb County
and 1057.7 for Georgia.
In 2008, gonorrhea rates in the United States
were highest among females 15 to 19 and women 20 to 24.
According to the Centers for Disease Control and Prevention, in 2008
blacks made up more than 70% of gonorrhea cases but
represented only 12 percent of the total U.S. population. The same pattern was consistent in Cobb County.
Source: OASIS
Source: OASIS
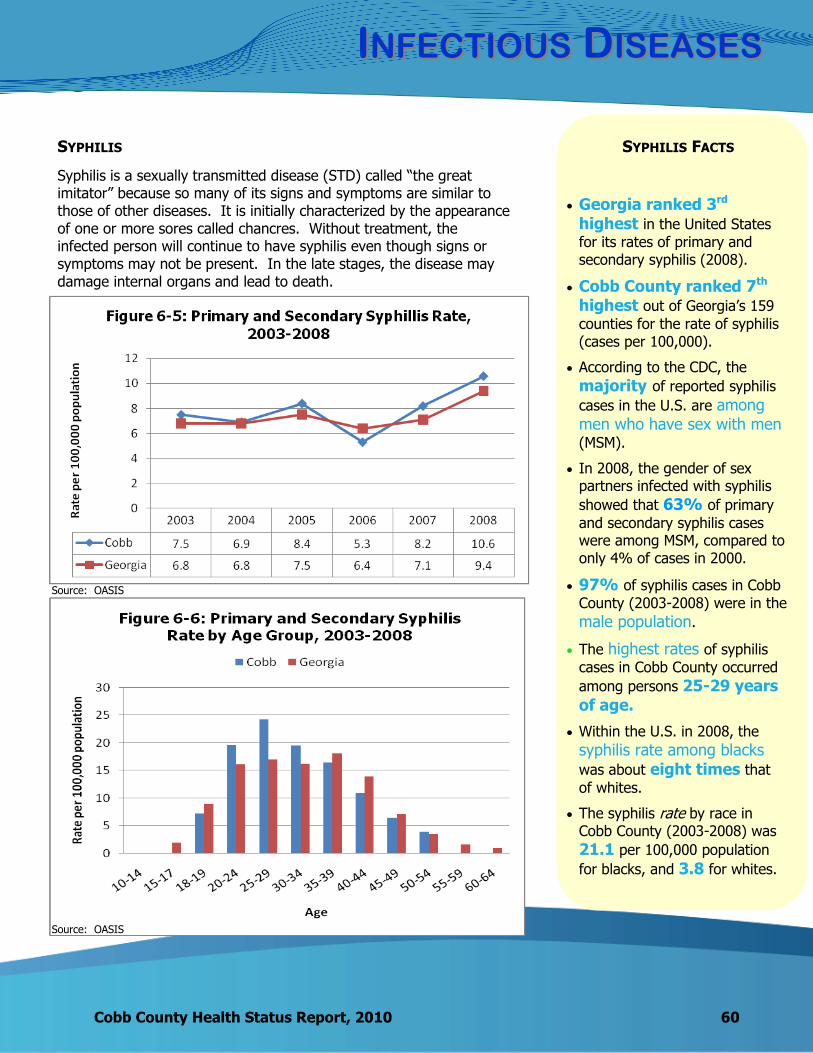
IINFECTIOUSNFECTIOUS DDISEASESISEASES
Cobb County Health Status Report, 2010 60
SYPHILIS
Syphilis is a sexually transmitted disease (STD) called ―the great imitator‖ because so many of its signs and symptoms are similar to those of other diseases. It is initially characterized by the appearance of one or more sores called chancres. Without treatment, the infected person will continue to have syphilis even though signs or symptoms may not be present. In the late stages, the disease may damage internal organs and lead to death.
SYPHILIS FACTS
Georgia ranked 3rd highest in the United States
for its rates of primary and secondary syphilis (2008).
Cobb County ranked 7th highest out of Georgia’s 159
counties for the rate of syphilis (cases per 100,000).
According to the CDC, the
majority of reported syphilis
cases in the U.S. are among men who have sex with men (MSM).
In 2008, the gender of sex partners infected with syphilis
showed that 63% of primary
and secondary syphilis cases were among MSM, compared to only 4% of cases in 2000.
97% of syphilis cases in Cobb
County (2003-2008) were in the
male population.
The highest rates of syphilis
cases in Cobb County occurred
among persons 25-29 years of age.
Within the U.S. in 2008, the
syphilis rate among blacks was about eight times that
of whites.
The syphilis rate by race in Cobb County (2003-2008) was
21.1 per 100,000 population
for blacks, and 3.8 for whites.
Source: OASIS
Source: OASIS

61 Cobb County Health Status Report, 2010
IINFECTIOUSNFECTIOUS DDISEASESISEASES
HUMAN IMMUNODEFICIENCY VIRUS (HIV)
Human immunodeficiency virus (HIV) causes acquired immunodeficiency syndrome (AIDS) and is transmitted by contact with infected body fluids: blood, semen, vaginal fluids and breast milk. The most common methods of transmission are sexual intercourse or sharing needles. Currently, there is no cure for HIV or AIDS.
Source: Georgia Division of Public Health, HIV/AIDS Epidemiology Unit (1992-2009).
Source: Georgia Division of Public Health, HIV/AIDS Epidemiology Unit (1992-2009).
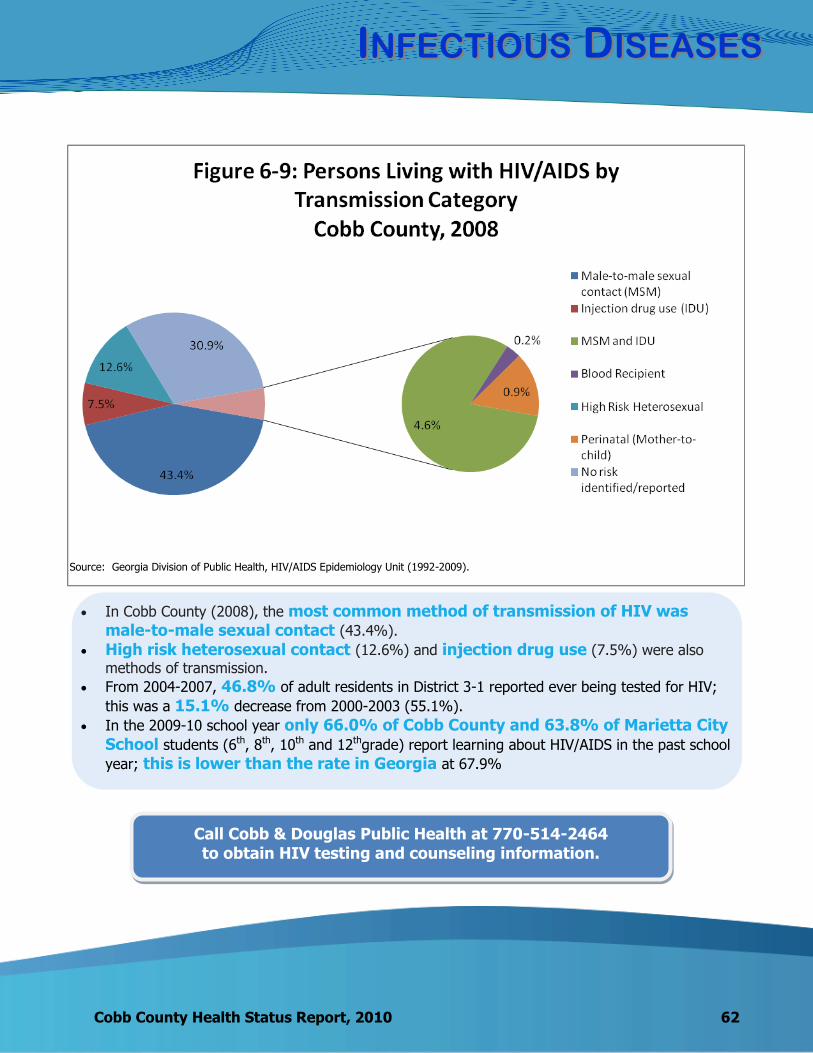
IINFECTIOUSNFECTIOUS DDISEASESISEASES
Cobb County Health Status Report, 2010 62
In Cobb County (2008), the most common method of transmission of HIV was male-to-male sexual contact (43.4%).
High risk heterosexual contact (12.6%) and injection drug use (7.5%) were also
methods of transmission.
From 2004-2007, 46.8% of adult residents in District 3-1 reported ever being tested for HIV;
this was a 15.1% decrease from 2000-2003 (55.1%).
In the 2009-10 school year only 66.0% of Cobb County and 63.8% of Marietta City School students (6th, 8th, 10th and 12thgrade) report learning about HIV/AIDS in the past school
year; this is lower than the rate in Georgia at 67.9%
Call Cobb & Douglas Public Health at 770-514-2464 to obtain HIV testing and counseling information.
Source: Georgia Division of Public Health, HIV/AIDS Epidemiology Unit (1992-2009).

WWHYHY AARERE SSEXUALLYEXUALLY TTRANSMITTEDRANSMITTED DDISEASESISEASES
IMPORTANTIMPORTANT??
63 Cobb County Health Status Report, 2010
Sexually transmitted diseases (also called sexually transmitted infections or STIs) are a major public health problem, affecting men and women of all backgrounds and economic levels. They are commonly transferred from one person to another through sexual contact and fall into two categories: bacterial or viral. Some of the most common STDs are chlamydia, gonorrhea, syphilis and HIV.
According to the CDC there are over 19 million new cases of STDs each year, almost half of them among young people ages 15-24. Those at increased risk are adolescents and young adults (15-24), persons who engage in unprotected sexual intercourse and injection drug users. Many STDs are easily treated with antibiotics; however, it is not uncommon for an STD to develop a resistance to some medications. Some STDs such as herpes, HIV, and genital warts are caused by viruses and have no cure.
WHAT CAN YOU DO ABOUT THEM?
STDs are most commonly transmitted through sexual contact including anal, vaginal and oral sex, and/or needle sharing.
Abstinence is the only sure way to avoid STDs.
Reduce the number of your sex partners to minimize exposure.
Consistently use latex or polyurethane condoms during vaginal, anal and oral sex.
Condoms are made for males and females.
Make STD screening part of your routine healthcare.
Know the signs and symptoms of STDs and get checked by a health provider.
Note: Signs and symptoms are not guaranteed; testing is the only way to know if you have an STD.
Consider vaccines that help protect you against certain STDs such as Hepatitis B virus
(HBV) and Human Papillomavirus (HPV) infection.
If you are treated for an STD, take all the medication as prescribed and abstain from sex until your health provider says it is safe.
Know your HIV status by getting tested at your local health department or by your
healthcare provider.
If injecting drugs, do not share needles and use a clean needle each time.
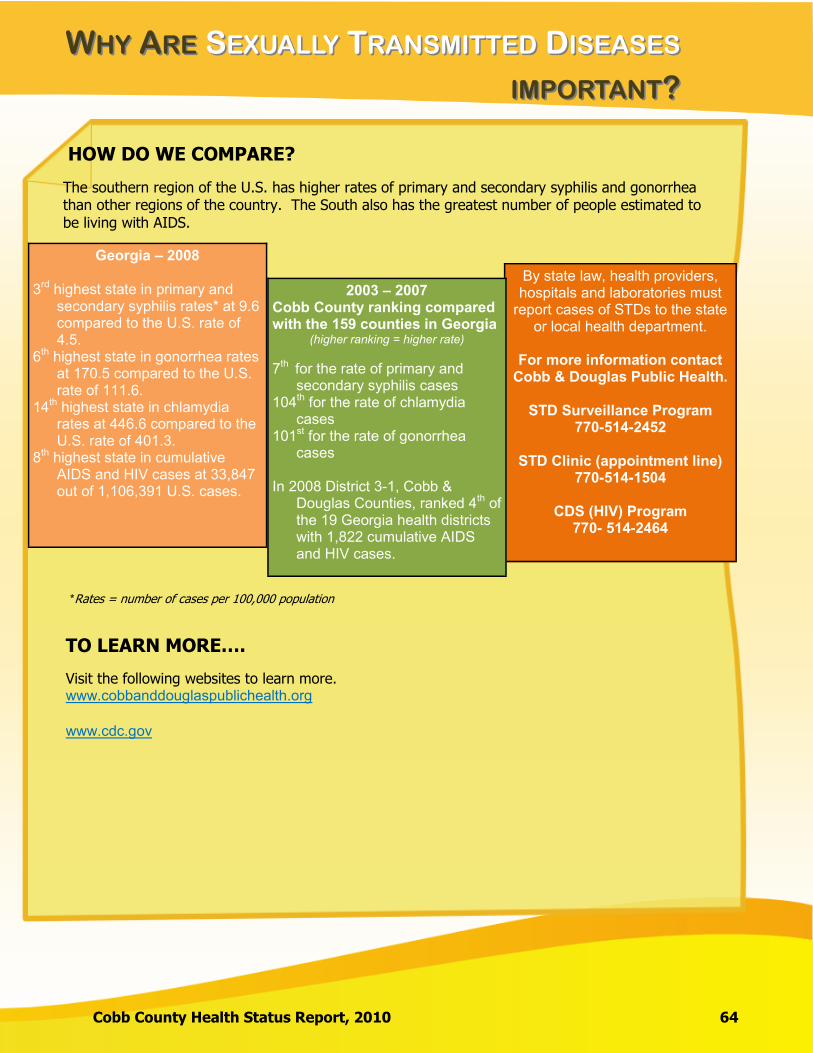
Cobb County Health Status Report, 2010 64
WWHYHY AARERE SSEXUALLYEXUALLY TTRANSMITTEDRANSMITTED DDISEASESISEASES
IMPORTANTIMPORTANT??
HOW DO WE COMPARE?
The southern region of the U.S. has higher rates of primary and secondary syphilis and gonorrhea than other regions of the country. The South also has the greatest number of people estimated to be living with AIDS.
*Rates = number of cases per 100,000 population
TO LEARN MORE….
Visit the following websites to learn more. www.cobbanddouglaspublichealth.org
www.cdc.gov
Georgia – 2008
3rd highest state in primary and secondary syphilis rates* at 9.6 compared to the U.S. rate of 4.5.
6th highest state in gonorrhea rates at 170.5 compared to the U.S. rate of 111.6.
14th highest state in chlamydia rates at 446.6 compared to the U.S. rate of 401.3.
8th highest state in cumulative AIDS and HIV cases at 33,847 out of 1,106,391 U.S. cases.
By state law, health providers, hospitals and laboratories must
report cases of STDs to the state or local health department.
For more information contact
Cobb & Douglas Public Health.
STD Surveillance Program 770-514-2452
STD Clinic (appointment line)
770-514-1504
CDS (HIV) Program 770- 514-2464
2003 – 2007 Cobb County ranking compared with the 159 counties in Georgia
(higher ranking = higher rate)
7th for the rate of primary and secondary syphilis cases
104th for the rate of chlamydia cases
101st for the rate of gonorrhea cases
In 2008 District 3-1, Cobb &
Douglas Counties, ranked 4th of the 19 Georgia health districts with 1,822 cumulative AIDS and HIV cases.

65 Cobb County Health Status Report, 2010
IINFECTIOUSNFECTIOUS DDISEASESISEASES
TUBERCULOSIS
Tuberculosis (TB) is a bacterial disease caused by Mycobacterium tuberculosis. The most common site of disease is the lung, but other organs may be involved. TB disease in the lungs (or pulmonary TB) usually causes the following symptoms: coughing that lasts longer than 2 weeks, pain in the chest when breathing or coughing, and coughing up sputum or blood. A person can either have latent TB infection or active TB infection. Latent TB infection (LTBI) is an infection with tubercle bacilli that are alive but inactive in the body. Persons with LTBI have no symptoms, do not feel sick, cannot spread TB to others; but, they may develop TB disease later in life if they do not receive treatment for LTBI.
In 2009, Cobb County had a
total of 18 active cases
of tuberculosis. The number of cases in
Cobb County decreased by 30.8% from 2008 to 2009. This decrease was also consistently seen throughout the state of Georgia.
From 2003-2009, TB occurred predominantly among men (63.2%) compared to
women (36.8%).
The highest number and proportion of TB cases by age group for
both sexes occurred among
persons 30 to 39,
followed by the 20 to 29 age group.
From 2003 to 2009, there
were 25 cases of TB in children (0-19 years) in
Cobb County.
TUBERCULOSIS FACTS
Source: Georgia Division of Public Health. (2010). Notifiable Disease Query

IINFECTIOUSNFECTIOUS DDISEASESISEASES
Cobb County Health Status Report, 2010 66
In 2008, 59% of TB cases in the U.S. occurred in foreign-born persons. Foreign-born persons have accounted for the majority of TB cases in the U.S.
every year since 2001.
Persons at higher risk for TB are:
Foreign born HIV infected Refugee or immigrant People living in close quarters (congregate setting)
The most frequent country of origin for foreign born TB cases in Cobb County
(2009) are:
Mexico 21.1%
India 10.5%
Kenya 10.5%
Brazil 10.5%

67 Cobb County Health Status Report, 2010
IINFECTIOUSNFECTIOUS DDISEASESISEASES
HEPATITIS
Hepatitis is a viral disease that causes inflammation of the liver. Viral hepatitis is the leading cause of liver cancer and the most common reason for liver transplantation. There are five different types of hepatitis: A, B, C, D and E viruses. In the state of Georgia, hepatitis A, B, and C are reportable and the most common type. Vaccination is available for hepatitis A and B but not for hepatitis C. Symptoms that are common to these three forms of acute hepatitis are nausea, vomiting, fatigue, jaundice (yellow eyes and skin), abdominal pain, clay-colored stools, joint pain and loss of appetite.
Hepatitis A Hepatitis B Hepatitis C
Route or Transmission
Fecal Matter Close contact or sexual
contact with an infected person
Ingestion of contaminated food or water
Blood, semen, and other bodily fluids Birth through an infected
mother Sexual contact with an
infected person Sharing needles or other drug
equipment Needle stick or other sharp
instrument injuries
Primarily through blood: Sharing needles or other drug
equipment Less commonly through: Sexual contact with an
infected person Birth to an infected mother Needle stick or other sharp
instrument injuries
Potential for Chronic Infection
None Among unimmunized persons: >90% of infants (less than 1
year) 25%-50% of children (1 to 5
years old) 6%-10% of older children and
adults
75-85% of newly infected develop chronic infection
Vaccination Yes 2 doses 6 months apart
Yes Infants and children: 3 or 4 doses depending on vaccine type and schedule Adults: 3 doses over 6 month period
No vaccine available
Table 6-1: The ABCs of Hepatitis
Hepatitis A has decreased 92.6% from 2003 (54 cases) to 2009(4 cases) in
Cobb County.
There was an increase in hepatitis A cases in 2007 due to multiple
small outbreaks that were within the same residence or family.
Hepatitis B has decreased 76.5% from 2003 (34 cases) to 2009 (8 cases) in
Cobb County.
These decreases are most likely due to higher levels of immunizations.
Source: CDC
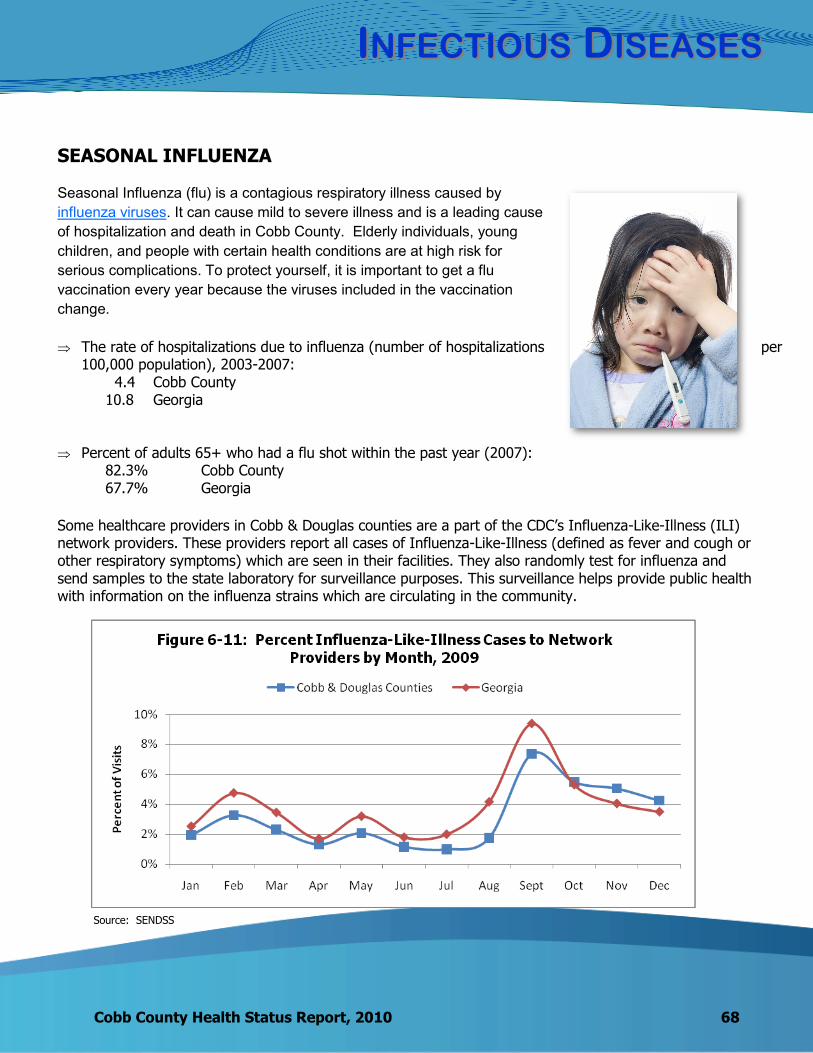
IINFECTIOUSNFECTIOUS DDISEASESISEASES
Cobb County Health Status Report, 2010 68
SEASONAL INFLUENZA
Seasonal Influenza (flu) is a contagious respiratory illness caused by
influenza viruses. It can cause mild to severe illness and is a leading cause
of hospitalization and death in Cobb County. Elderly individuals, young
children, and people with certain health conditions are at high risk for
serious complications. To protect yourself, it is important to get a flu
vaccination every year because the viruses included in the vaccination
change.
The rate of hospitalizations due to influenza (number of hospitalizations per 100,000 population), 2003-2007:
4.4 Cobb County 10.8 Georgia
Percent of adults 65+ who had a flu shot within the past year (2007):
82.3% Cobb County 67.7% Georgia
Some healthcare providers in Cobb & Douglas counties are a part of the CDC’s Influenza-Like-Illness (ILI) network providers. These providers report all cases of Influenza-Like-Illness (defined as fever and cough or other respiratory symptoms) which are seen in their facilities. They also randomly test for influenza and send samples to the state laboratory for surveillance purposes. This surveillance helps provide public health with information on the influenza strains which are circulating in the community.
Source: SENDSS

69 Cobb County Health Status Report, 2010
IINFECTIOUSNFECTIOUS DDISEASESISEASES
H1N1 INFLUENZA
In April 2009 a new and very different flu virus (called 2009 H1N1) spread worldwide causing the first flu
pandemic in more than 40 years. The Centers for Disease Control and
Prevention (CDC) expects the 2009 H1N1 virus to return in the 2010-2011 flu
season along with other seasonal flu viruses. The 2010-2011 flu vaccine will
protect against 2009 H1N1 and two other influenza viruses.
Unlike seasonal
influenza, 2009
H1N1 primarily
affected persons 49
and under.
PNEUMONIA
Pneumonia is an infection of the lungs and can be caused by bacteria or viruses. Globally, pneumonia causes more deaths than any other infectious disease. The elderly (65 and older) and children younger than 5 years of age are at higher risk for pneumonia. There are vaccines available that prevent pneumonia.
Source: SENDSS

IINFECTIOUSNFECTIOUS DDISEASESISEASES
Cobb County Health Status Report, 2010 70
Percent of adults age 65+ who had a pneumonia
vaccine (2007)
Cobb 79.0%
Georgia 63.6%
Did you know that influenza and pneumonia vaccines are
available at Cobb & Douglas Public Health?
Call 770-514-2417
VACCINE PREVENTABLE ILLNESS
Prevention of disease is the foundation of public health. Vaccines help to prevent illnesses caused by either viruses or bacteria and can save lives. Vaccine-preventable diseases are costly to individuals and families, resulting in missed time from work, doctor's visits, hospitalizations, and possibly death.
From 2003-2009, there were no cases of measles,
mumps, rubella, polio, diptheria or tetanus reported in Cobb County.
Vaccinations to prevent serious diseases are available at
Cobb & Douglas Public Health (770-514-2417).
Table 6-2: Vaccine-Preventable Diseases (Cases) Cobb County 2003-2009
2003 2004 2005 2006 2007 2008 2009
Pertussis 1 6 7 4 3 3 17
Neisseria Meningitis 1 0 1 3 1 1 4
(Invasive) Haemophilus influenza* 1 5 5 5 5 9 17
Streptococcal pneumoniae* 12 15 29 22 25 15 23
Source: OASIS
Source: Georgia Division of Public Health. (2010). Notifiable Disease Query * All subtypes
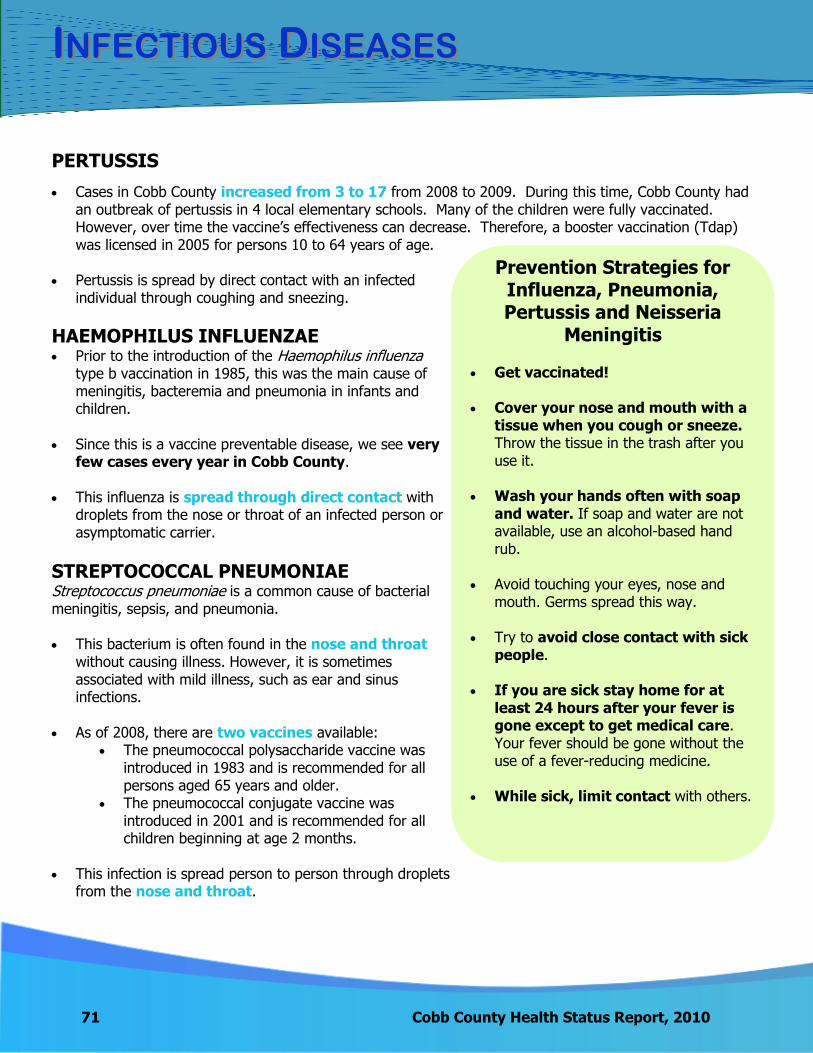
71 Cobb County Health Status Report, 2010
IINFECTIOUSNFECTIOUS DDISEASESISEASES
PERTUSSIS
Cases in Cobb County increased from 3 to 17 from 2008 to 2009. During this time, Cobb County had an outbreak of pertussis in 4 local elementary schools. Many of the children were fully vaccinated. However, over time the vaccine’s effectiveness can decrease. Therefore, a booster vaccination (Tdap) was licensed in 2005 for persons 10 to 64 years of age.
Pertussis is spread by direct contact with an infected
individual through coughing and sneezing.
STREPTOCOCCAL PNEUMONIAE Streptococcus pneumoniae is a common cause of bacterial meningitis, sepsis, and pneumonia. This bacterium is often found in the nose and throat
without causing illness. However, it is sometimes associated with mild illness, such as ear and sinus infections.
As of 2008, there are two vaccines available:
The pneumococcal polysaccharide vaccine was introduced in 1983 and is recommended for all persons aged 65 years and older.
The pneumococcal conjugate vaccine was introduced in 2001 and is recommended for all children beginning at age 2 months.
This infection is spread person to person through droplets
from the nose and throat.
HAEMOPHILUS INFLUENZAE Prior to the introduction of the Haemophilus influenza
type b vaccination in 1985, this was the main cause of meningitis, bacteremia and pneumonia in infants and children.
Since this is a vaccine preventable disease, we see very
few cases every year in Cobb County. This influenza is spread through direct contact with
droplets from the nose or throat of an infected person or asymptomatic carrier.
Prevention Strategies for Influenza, Pneumonia, Pertussis and Neisseria
Meningitis Get vaccinated! Cover your nose and mouth with a
tissue when you cough or sneeze. Throw the tissue in the trash after you use it.
Wash your hands often with soap
and water. If soap and water are not available, use an alcohol-based hand rub.
Avoid touching your eyes, nose and
mouth. Germs spread this way. Try to avoid close contact with sick
people. If you are sick stay home for at
least 24 hours after your fever is gone except to get medical care. Your fever should be gone without the use of a fever-reducing medicine.
While sick, limit contact with others.
IINFECTIOUSNFECTIOUS DDISEASESISEASES
Cobb County Health Status Report, 2010 72
INVASIVE BACTERIAL DISEASES (NON-VACCINE PREVENTABLE)
Invasive bacterial diseases can occur when a bacteria enters the body and causes an infection in a particular area. The following diseases (Table 6-3) can cause serious illness and possibly death.
Streptococcal Disease Group A Group A Streptococcus (Streptococcus pyogenes) is a bacterium commonly carried in the throat and on
the skin, often without symptoms. It usually causes mild illness such as strep throat and impetigo. Occasionally life-threatening illness can
occur, such as blood infections, toxic shock syndrome and necrotizing fasciitis. Antibiotics are commonly used to treat this infection.
This infection is spread through contact with large respiratory droplets or direct contact with patients or carriers. It is rarely spread through contaminated objects.
Streptococcal Disease Group B Group B Streptococcus (Streptococcus agalactiae) is a
bacterium that colonizes in the colon and genital tract of women. It may cause infections in mothers and be passed to their infants at the time of delivery. It is the most common cause of sepsis and meningitis among newborns.
It is common for an adult to carry this disease and have no symptoms.
The mode of transmission in non-pregnant adults is unknown.
Methicillin-resistant Staphylococcus Aureus (MRSA)
Methicillin-resistant Staphylococcus aureus (MRSA) has recently been recognized as a serious threat in the community. Initially, MRSA was a disease acquired only by patients who were hospitalized. However, now it can be acquired virtually anywhere.
Athletes, children in childcare settings and congregate settings such as prisons and jails are at higher risk for MRSA.
It is a resistant form of staph bacteria that is primarily spread through direct skin to skin contact.
Source: Georgia Division of Public Health. (2010). Notifiable Disease Query
Table 6-3: Cases of Invasive Bacterial Diseases, 2003-2009
2003 2004 2005 2006 2007 2008 2009
Streptococcal Disease - Group A
13 15 14 11 12 16 14
Streptococcal Disease - Group B
24 35 41 34 37 46 49
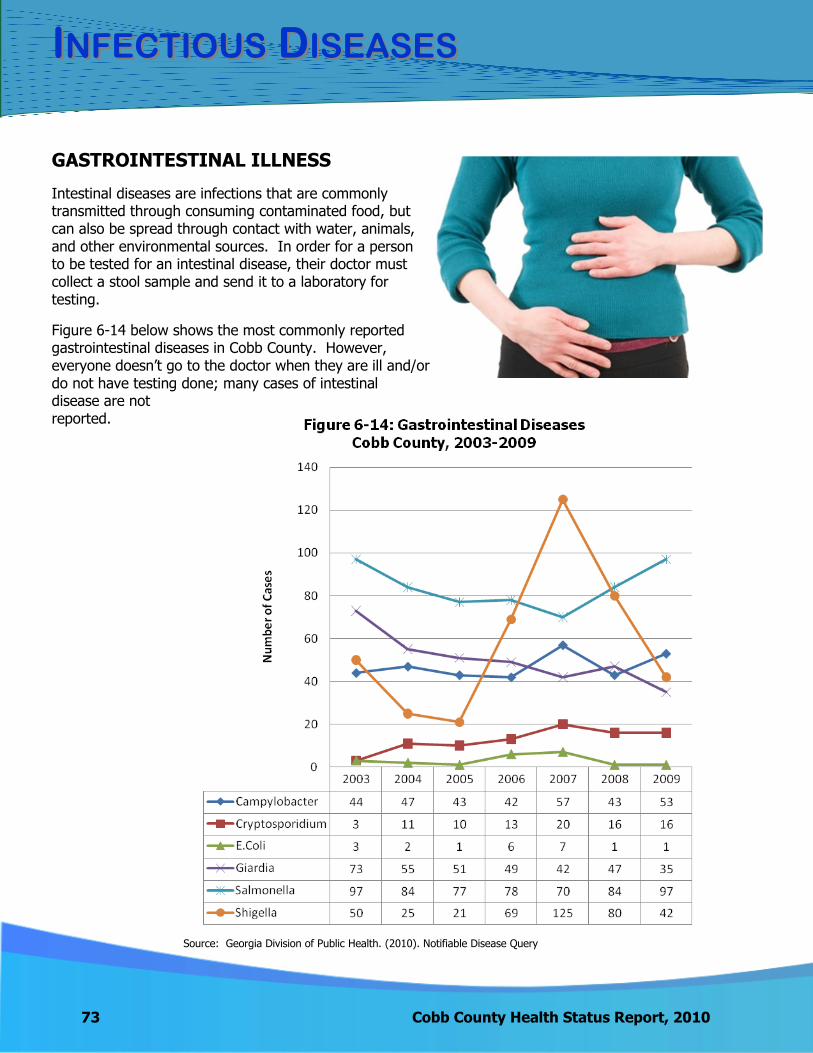
73 Cobb County Health Status Report, 2010
IINFECTIOUSNFECTIOUS DDISEASESISEASES
GASTROINTESTINAL ILLNESS
Intestinal diseases are infections that are commonly transmitted through consuming contaminated food, but can also be spread through contact with water, animals, and other environmental sources. In order for a person to be tested for an intestinal disease, their doctor must collect a stool sample and send it to a laboratory for testing.
Figure 6-14 below shows the most commonly reported gastrointestinal diseases in Cobb County. However, everyone doesn’t go to the doctor when they are ill and/or do not have testing done; many cases of intestinal disease are not reported.
Source: Georgia Division of Public Health. (2010). Notifiable Disease Query

IINFECTIOUSNFECTIOUS DDISEASESISEASES
Cobb County Health Status Report, 2010 74
From 2005 to 2007 shigella cases increased from 21 to 125. This is
attributed to the cyclical pattern of shigella.
Salmonella has consistently had the largest number of cases through 2003 to 2009.
Cobb County’s leading causes of gastrointestinal illness mirror the national leading
causes.
FOODBORNE OUTBREAKS
The CDC considers a foodborne disease outbreak a cluster of two or more infections caused by the same agent (pathogen or toxin) linked to the same food. CDPH Environmental Health staff regularly inspect restaurants and investigate potential outbreaks.
Between 2005-2009 there were 7 confirmed foodborne outbreaks in District 3-1 (Cobb & Douglas counties). However, some outbreaks go unreported.

WWHYHY IISS FFOODBORNEOODBORNE IILLNESSLLNESS IMPORTANTIMPORTANT??
75 Cobb County Health Status Report, 2010
HOW DO WE COMPARE?
According to the CDC, the number of outbreaks reported in 2009 by states ranged from 0 to almost 200. These numbers probably reflect the varying capacity in local health departments to detect outbreaks rather than an actual difference in the number of outbreaks per state. From 2005-2009 District 3-1 (Cobb and Douglas counties) had a total of 7 confirmed foodborne illness outbreaks.
In Cobb County the top three foodborne illnesses are campylobacter, salmonella and shigella, which is consistent with the top three foodborne illnesses in Georgia and nationally.
The CDPH Epidemiology and Environmental Health Programs investigate foodborne illness complaints and outbreaks. Call the Environmental Health Program at 770-435-7815 to report a foodborne illness after eating at a restaurant. For more information on foodborne illnesses please call the CDPH Epidemiology Office at 770-514-2432.
While the food supply in the United States is one of the safest in the world, each year about 76 million illnesses occur, more than 300,000 persons are hospitalized, and 5,000 die from foodborne illness. Tracking single cases of foodborne illness and investigating outbreaks are critical public health functions in which the CDC and state and local health departments are involved.
WHAT YOU CAN DO ABOUT IT…
You can help prevent food poisoning from bacteria and viruses by following four simple steps when you prepare food.
The Basics: Clean, Separate, Cook and Chill
CLEAN Wash hands and surfaces often
SEPARATE Don't cross-contaminate!
COOK Cook to proper temperature
CHILL Refrigerate promptly
WWHYHY IISS FFOODBORNEOODBORNE IILLNESSLLNESS IMPORTANTIMPORTANT??
Cobb County Health Status Report, 2010 76
TO LEARN MORE…
The following websites provide food safety tips and health information on foodborne
illnesses:
www.FoodSafety.gov
www.cdc.gov/foodnet
www.fsis.usda.gov
For Cobb County restaurant inspection scores, visit the website:
http://www.cobbanddouglaspublichealth.org/Programs/EnvHealth/Restaurants/cobbscores
Source: www.cdc.gov/foodnet
Back to TOC

MMATERNALATERNAL & C& CHILDHILD HHEALTHEALTH
78 Cobb County Health Status Report, 2010
At the beginning of the 20th century, for every 1000 live births, six to nine women in the United States died of pregnancy-related complications. In 1900 in some U.S. cities, up to 30% of infants died before reaching their first birthday. From 1915 through 1997, the infant mortality rate declined greater than 90%. This re-markable decline is a result of: environmental interventions, improvements in nutrition, advances in clinical medicine and access to healthcare, improvements in surveillance and monitoring of disease, increases in education levels, and improvements in standards of living. Despite this dramatic decline, however, chal-lenges remain. Perhaps the greatest is the persistent difference in maternal and infant health among vari-ous racial/ethnic groups, particularly between black and white women and infants (CDC). This chapter pre-sents data on maternal and child health issues in Cobb County.
PREGNANCY
Pregnancy rates in the U.S. rose steadily from 1970 until reaching a peak in 1990. From 1990-2004, pregnancy rates were on the decline. In the young teens (15-19 years old) population, pregnancy rates declined 48% and rates for older teens (18-19 years old) fell by 30%. From 2005-2006, slight increases in teen pregnancy, births and abortions were seen across the U.S. Additionally, preliminary 2007 data suggests an increase in birth rate in both the teen and young adult populations. This data will be monitored to determine if the increases will continue. It is thought that increases in pregnancy rates are affected by changes in the minority popula-tions, increases in poverty, abstinence-only sex education programs, and changes in attitude toward teenage and unintended pregnancy.
50.7 54.8 48.8 51.5 53.1
155.2 152.9 156.1 163.0 166.0
71.4 72.7 72.2 73.9 75.4
0.0
50.0
100.0
150.0
200.0
2003 2004 2005 2006 2007
Rat
e p
er
1,0
00
fe
mal
e p
op
ula
tio
n
Figure 7-1: Pregnancy Rates by Age Group Cobb County, 2003-2007
15-19 20-29 30-44
Pregnancy Facts
The overall pregnancy
rate for Cobb County from 2003-2007 was 61.4 per 1,000 female popula-tion, which was greater than the pregnancy rate in Georgia of 58.8.
Compared with the 144
counties reporting in Georgia, Cobb ranked favorably (23rd lowest) for the teen (15-17 year old) pregnancy rate in 2007.
Source: OASIS
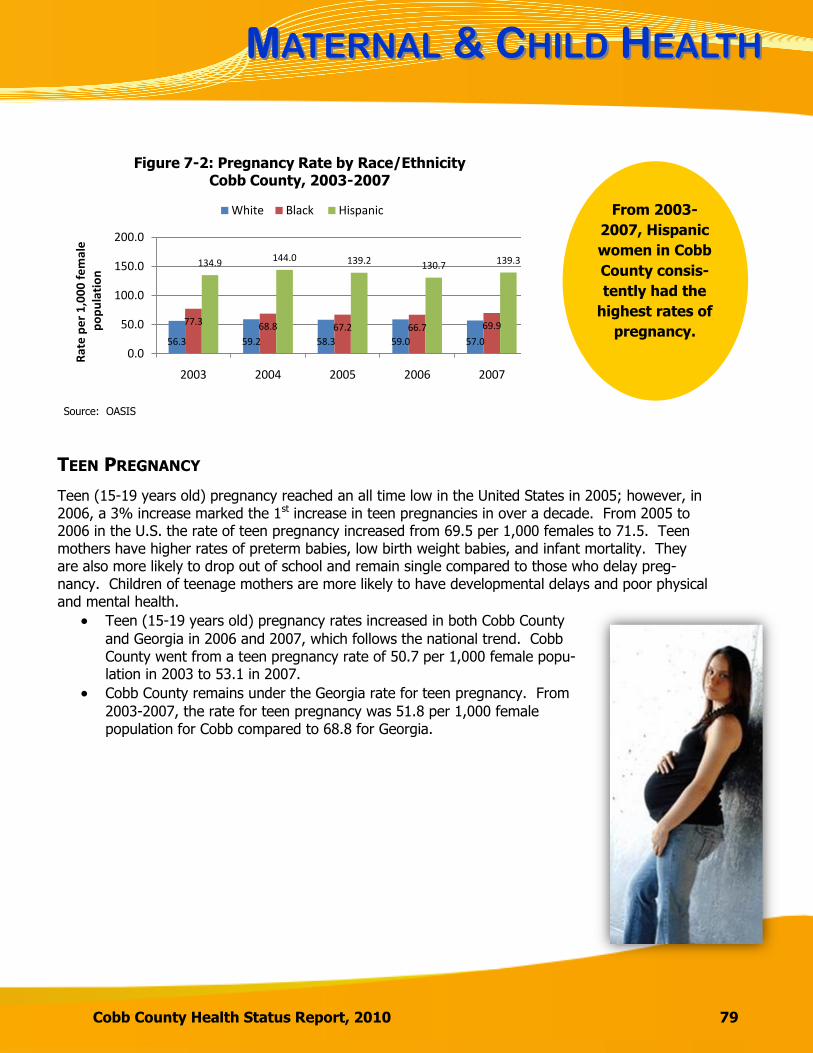
MMATERNALATERNAL & C& CHILDHILD HHEALTHEALTH
Cobb County Health Status Report, 2010 79
56.3 59.2 58.3 59.0 57.0
77.3 68.8 67.2 66.7 69.9
134.9 144.0 139.2 130.7 139.3
0.0
50.0
100.0
150.0
200.0
2003 2004 2005 2006 2007
Ra
te p
er
1,0
00
fe
ma
lep
op
ula
tio
n
Figure 7-2: Pregnancy Rate by Race/Ethnicity Cobb County, 2003-2007
White Black Hispanic
TEEN PREGNANCY
Teen (15-19 years old) pregnancy reached an all time low in the United States in 2005; however, in 2006, a 3% increase marked the 1st increase in teen pregnancies in over a decade. From 2005 to 2006 in the U.S. the rate of teen pregnancy increased from 69.5 per 1,000 females to 71.5. Teen mothers have higher rates of preterm babies, low birth weight babies, and infant mortality. They are also more likely to drop out of school and remain single compared to those who delay preg-nancy. Children of teenage mothers are more likely to have developmental delays and poor physical and mental health.
Teen (15-19 years old) pregnancy rates increased in both Cobb County
and Georgia in 2006 and 2007, which follows the national trend. Cobb County went from a teen pregnancy rate of 50.7 per 1,000 female popu-lation in 2003 to 53.1 in 2007.
Cobb County remains under the Georgia rate for teen pregnancy. From
2003-2007, the rate for teen pregnancy was 51.8 per 1,000 female population for Cobb compared to 68.8 for Georgia.
From 2003-
2007, Hispanic
women in Cobb
County consis-
tently had the
highest rates of
pregnancy.
Source: OASIS
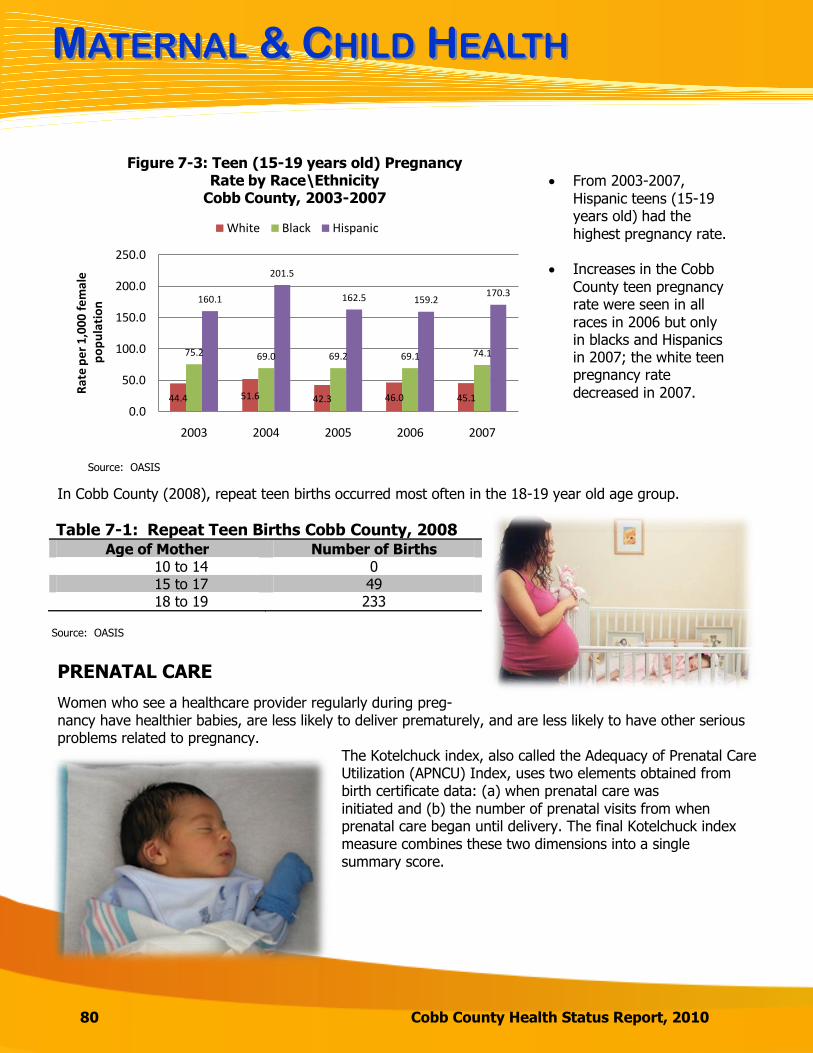
MMATERNALATERNAL & C& CHILDHILD HHEALTHEALTH
80 Cobb County Health Status Report, 2010
From 2003-2007, Hispanic teens (15-19 years old) had the
highest pregnancy rate. Increases in the Cobb
County teen pregnancy rate were seen in all races in 2006 but only in blacks and Hispanics in 2007; the white teen pregnancy rate
decreased in 2007.
44.4 51.6 42.3 46.0 45.1
75.2 69.0 69.2 69.1 74.1
160.1
201.5
162.5 159.2170.3
0.0
50.0
100.0
150.0
200.0
250.0
2003 2004 2005 2006 2007
Rat
e p
er
1,00
0 fe
mal
ep
op
ula
tio
n
Figure 7-3: Teen (15-19 years old) Pregnancy Rate by Race\Ethnicity
Cobb County, 2003-2007
White Black Hispanic
In Cobb County (2008), repeat teen births occurred most often in the 18-19 year old age group.
Table 7-1: Repeat Teen Births Cobb County, 2008 Age of Mother Number of Births
10 to 14 0 15 to 17 49 18 to 19 233
PRENATAL CARE
Women who see a healthcare provider regularly during preg-nancy have healthier babies, are less likely to deliver prematurely, and are less likely to have other serious problems related to pregnancy.
The Kotelchuck index, also called the Adequacy of Prenatal Care Utilization (APNCU) Index, uses two elements obtained from birth certificate data: (a) when prenatal care was initiated and (b) the number of prenatal visits from when prenatal care began until delivery. The final Kotelchuck index measure combines these two dimensions into a single summary score.
Source: OASIS
Source: OASIS
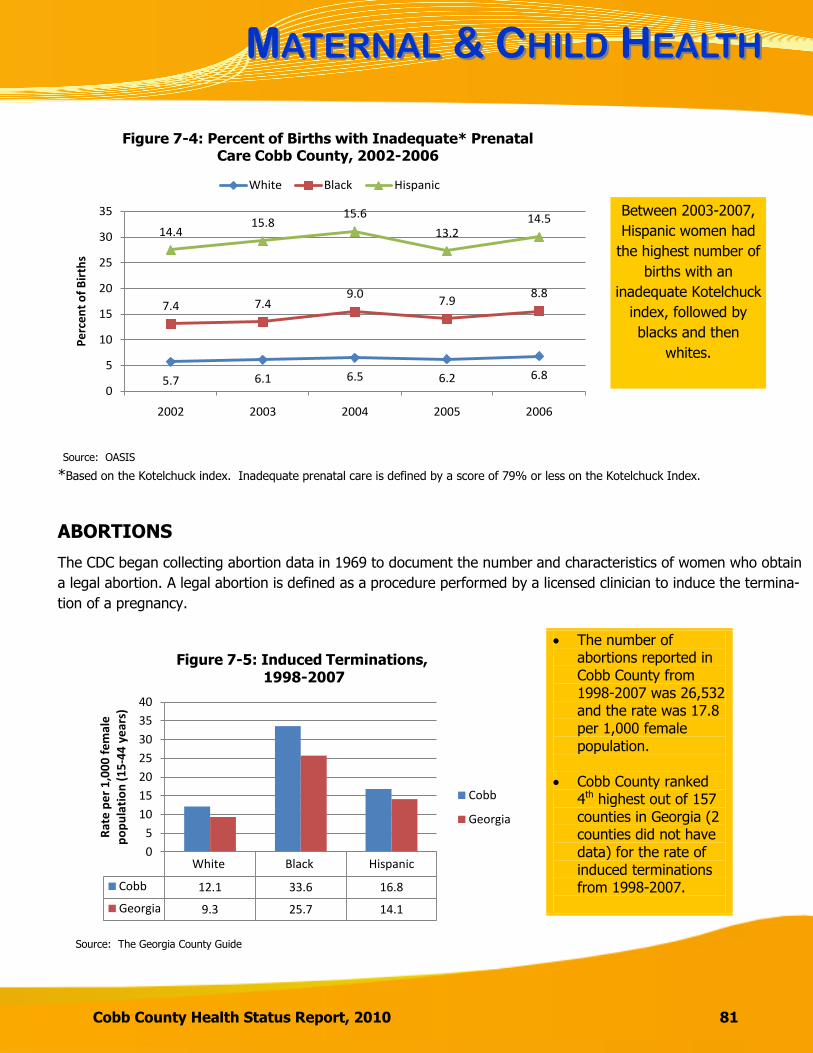
MMATERNALATERNAL & C& CHILDHILD HHEALTHEALTH
Cobb County Health Status Report, 2010 81
*Based on the Kotelchuck index. Inadequate prenatal care is defined by a score of 79% or less on the Kotelchuck Index.
ABORTIONS
The CDC began collecting abortion data in 1969 to document the number and characteristics of women who obtain
a legal abortion. A legal abortion is defined as a procedure performed by a licensed clinician to induce the termina-
tion of a pregnancy.
The number of abortions reported in Cobb County from 1998-2007 was 26,532 and the rate was 17.8 per 1,000 female population.
Cobb County ranked 4th highest out of 157 counties in Georgia (2 counties did not have data) for the rate of induced terminations from 1998-2007.
White Black Hispanic
Cobb 12.1 33.6 16.8
Georgia 9.3 25.7 14.1
0
5
10
15
20
25
30
35
40
Rat
e p
er
1,0
00
fe
mal
e
po
pu
lati
on
(1
5-4
4 y
ear
s)
Figure 7-5: Induced Terminations,1998-2007
Cobb
Georgia
5.7 6.1 6.5 6.2 6.8
7.4 7.49.0
7.98.8
14.415.8
15.6
13.214.5
0
5
10
15
20
25
30
35
2002 2003 2004 2005 2006
Per
cen
t o
f B
irth
s
Figure 7-4: Percent of Births with Inadequate* Prenatal Care Cobb County, 2002-2006
White Black Hispanic
Source: OASIS
White Black Hispanic
Cobb 12.1 33.6 16.8
Georgia 9.3 25.7 14.1
0
5
10
15
20
25
30
35
40
Rat
e p
er
1,0
00
fe
mal
e
po
pu
lati
on
(1
5-4
4 y
ear
s)
Figure 7-5: Induced Terminations,1998-2007
Cobb
Georgia
Source: The Georgia County Guide
Between 2003-2007,
Hispanic women had
the highest number of
births with an
inadequate Kotelchuck
index, followed by
blacks and then
whites.

MMATERNALATERNAL & C& CHILDHILD HHEALTHEALTH
82 Cobb County Health Status Report, 2010
INFANT MORTALITY
The infant mortality rate is the number of deaths among infants less than one year of age per 1,000 live births. Infant mortality is often used as an overall indicator of health in an area. It can reflect the health of the mother, the quality and access to care, socio-economic conditions and public health practices. The most common causes of infant mortality in Georgia include prematurity, birth defects and sudden in-
fant death syndrome (SIDS). Risk factors which contribute to infant mortality and low birth weight (<2500
grams) babies include pregnancy in adolescents, births with multiples, poor maternal health and nutrition,
inadequate or late prenatal care, infections, drug use, alcohol and tobacco use, closely spaced pregnancies,
poor prenatal care and positioning of sleeping babies.
Cobb County ranked 10th lowest out of the
50 more populated counties in Georgia for infant mortality
in 2007.
Infant mortality rates have been
consistently higher in the black
population from 2003 through 2007
in Cobb County. This may be
attributed to a higher percentage of low birth weight babies in the black
population.
2003 2004 2005 2006 2007
Cobb 4.8 6.0 5.3 8.0 6.1
Georgia 8.5 8.5 8.0 8.1 7.9
0.0
1.0
2.0
3.0
4.0
5.0
6.0
7.0
8.0
9.0
Rat
e pe
r 1,
000
live
birt
hs
Figure 7-6: Infant Mortality, 2003-2007
4.63.9 3.6
5.74.1
6.8
11.610.1
15.4
12.4
3.3 3.3 3.1
5.6
2.2
0
2
4
6
8
10
12
14
16
18
2003 2004 2005 2006 2007
Rat
e Pe
r 1,
000
Live
Bir
ths
Figure 7-7: Infant Mortality by Race/Ethnicity Cobb County, 2003-2007
White Black Hispanic
Source: OASIS
Source: OASIS

MMATERNALATERNAL & C& CHILDHILD HHEALTHEALTH
Cobb County Health Status Report, 2010 83
Table 7-2: Top Causes of Infant Deaths Cobb County, 1998-2007 Cause of Death Number of Deaths
Birth Defects 144
Prematurity 115
SIDS 60
Major Cardiovascular Diseases 34
Birth Related Infections 24
Total 666
Source: OASIS
7.06.2 6.1
6.9 6.7 6.9
11.511.0
12.8 12.713.2
12.0
5.6 5.8 6.2 6.0 5.6
6.9
0.0
2.0
4.0
6.0
8.0
10.0
12.0
14.0
2003 2004 2005 2006 2007 2008
Figure 7-8: Percent of Low Birth Weight by Race/Ethnicity Cobb County, 2003-2008
White Black Hispanic
Black females continue to give birth to low birth
weight babies at a higher percentage than do whites and
Hispanics.
Source: Online Analytical Statistical Information System (OASIS).
LOW BIRTH WEIGHT BIRTHS
Babies born weighing less than 5 pounds, 8 ounces (2,500 grams) are considered low birth weight. Low birth weight babies are at increased risk for serious health problems, lasting disabilities, and even death.
In Cobb County, from 2003-2008, 8.1% of births were babies with low birth weights, compared to
9.4% for Georgia.
In 2008, Cobb County ranked 42nd lowest out of 151 counties reporting in Georgia for the percent-
age of babies with a low birth weight (―1‖ being the most favorable and ―151‖ being the least favor-able).
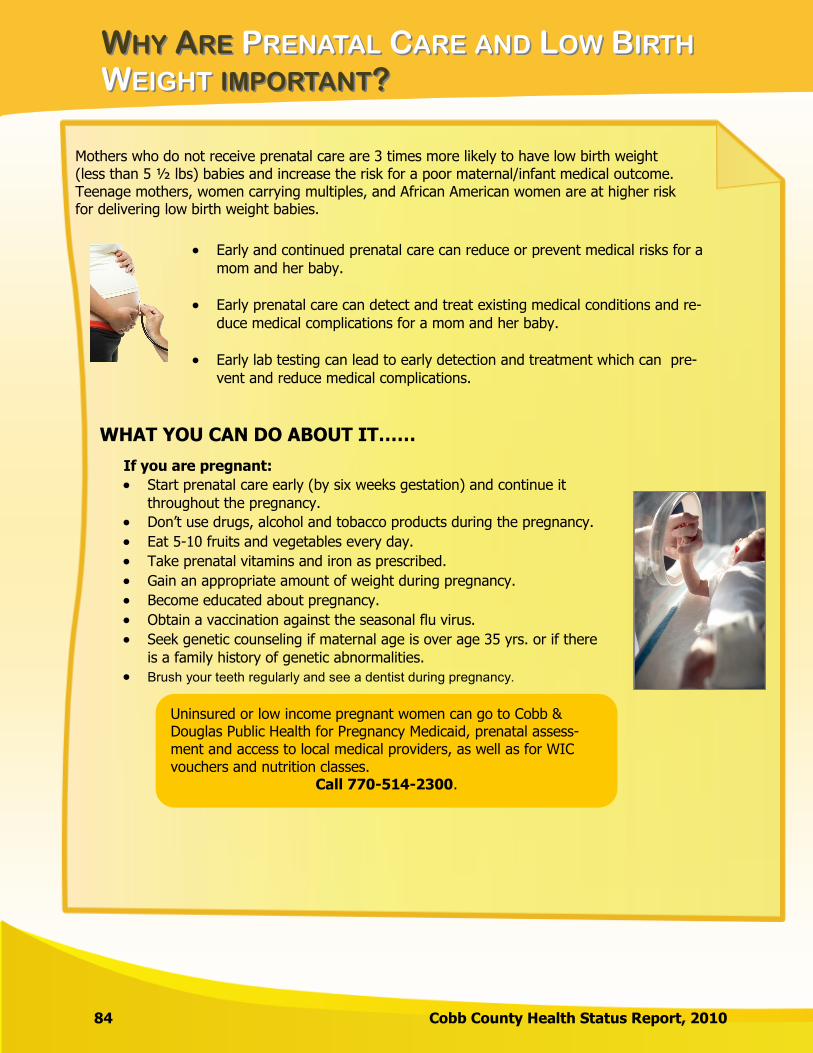
WWHYHY AARERE PPRENATALRENATAL CCAREARE ANDAND LLOWOW BBIRTHIRTH
WWEIGHTEIGHT IMPORTANTIMPORTANT??
84 Cobb County Health Status Report, 2010
Mothers who do not receive prenatal care are 3 times more likely to have low birth weight (less than 5 ½ lbs) babies and increase the risk for a poor maternal/infant medical outcome. Teenage mothers, women carrying multiples, and African American women are at higher risk for delivering low birth weight babies.
Early and continued prenatal care can reduce or prevent medical risks for a
mom and her baby.
Early prenatal care can detect and treat existing medical conditions and re-
duce medical complications for a mom and her baby.
Early lab testing can lead to early detection and treatment which can pre-
vent and reduce medical complications.
WHAT YOU CAN DO ABOUT IT……
If you are pregnant:
Start prenatal care early (by six weeks gestation) and continue it
throughout the pregnancy.
Don’t use drugs, alcohol and tobacco products during the pregnancy.
Eat 5-10 fruits and vegetables every day.
Take prenatal vitamins and iron as prescribed.
Gain an appropriate amount of weight during pregnancy.
Become educated about pregnancy.
Obtain a vaccination against the seasonal flu virus.
Seek genetic counseling if maternal age is over age 35 yrs. or if there
is a family history of genetic abnormalities.
Brush your teeth regularly and see a dentist during pregnancy.
Uninsured or low income pregnant women can go to Cobb & Douglas Public Health for Pregnancy Medicaid, prenatal assess-ment and access to local medical providers, as well as for WIC vouchers and nutrition classes.
Call 770-514-2300.
WWHYHY AARERE PPRENATALRENATAL CCAREARE ANDAND LLOWOW BBIRTHIRTH
WWEIGHTEIGHT IMPORTANTIMPORTANT??
Cobb County Health Status Report, 2010 85
HOW DO WE COMPARE?
952 (8.4%) of Cobb infants were born with low birth weights (less than 2500 grams) compared
to Georgia at 9.5% (2007).
1,231 (10.9%) of Cobb infants were born prematurely (before 37 weeks gestation) compared to
the Georgia at 14.1% (2007).
352 (3.8%) of Cobb women had less than 5 prenatal care visits compared to Georgia at 6.0%
(2007).
298 (2.8%) of Cobb women had late or no prenatal care compared to Georgia at 4.1% (2006).
TO LEARN MORE…
The following websites provide additional information.
1. http://www.cdc.gov
2. http://www.whattoexpect.com/what-to-expect/landing-page.aspx
3. http://www.marchofdimes.com/georgia/
4. http://www.pregnancy.com/

MMATERNALATERNAL & C& CHILDHILD HHEALTHEALTH
86 Cobb County Health Status Report, 2010
Table 7-3: Leading Causes of Emergency Department (ED) Visits in Children 1-19 Years of Age in
Cobb County, 2003-2007
Major Disease Category Number of ED
Visits
ED Visit Rate per
100,000 population All External Causes 73,667 8,149.4
Falls 21,537 2,382.5
Motor Vehicle Accidents 6,614 731.7
All Respiratory Diseases 49,092 5,430.8
Asthma 8,045 890.0
Pneumonia 5,196 574.8
Infectious and Parasitic Diseases 16,813 1,859.9
Digestive System Diseases 15,090 1,669.3
Reproductive and Urinary System Diseases 7,860 869.5
BREASTFEEDING
The Pregnancy Risk Assessment Monitoring System (PRAMS) reports that from 2004-2006, 69.1% of mothers who delivered a live birth in Georgia breastfed their baby (for any length of time). The Healthy People 2010 goal is to increase the percentage of mothers who ever breastfeed their babies to 75%.
70.4 67.0 69.9
0
20
40
60
80
100
2004 2005 2006
Figure 7-9: Percent of Mothers who Reported Ever Breastfeeding their
Infant in Georgia, 2004-2006
BREASTFEEDING FACTS
From 2004-2006, Georgia
consistently fell below the Healthy People 2010 goal for the percentage of mothers that breast-feed their infants.
In 2006, the highest per-
centage of mothers who breastfeed their infants were Hispanics at 78.3% followed by whites at 75.1% and blacks at 58.2%.
CHILDHOOD MORBIDITY (INJURY AND ILLNESS)
Injury is the leading cause of Emergency Department visits in children 1-19 years of age in Cobb County
(2003-2009).
Source: 2004-2006 PRAMS Survey Report
Source: OASIS
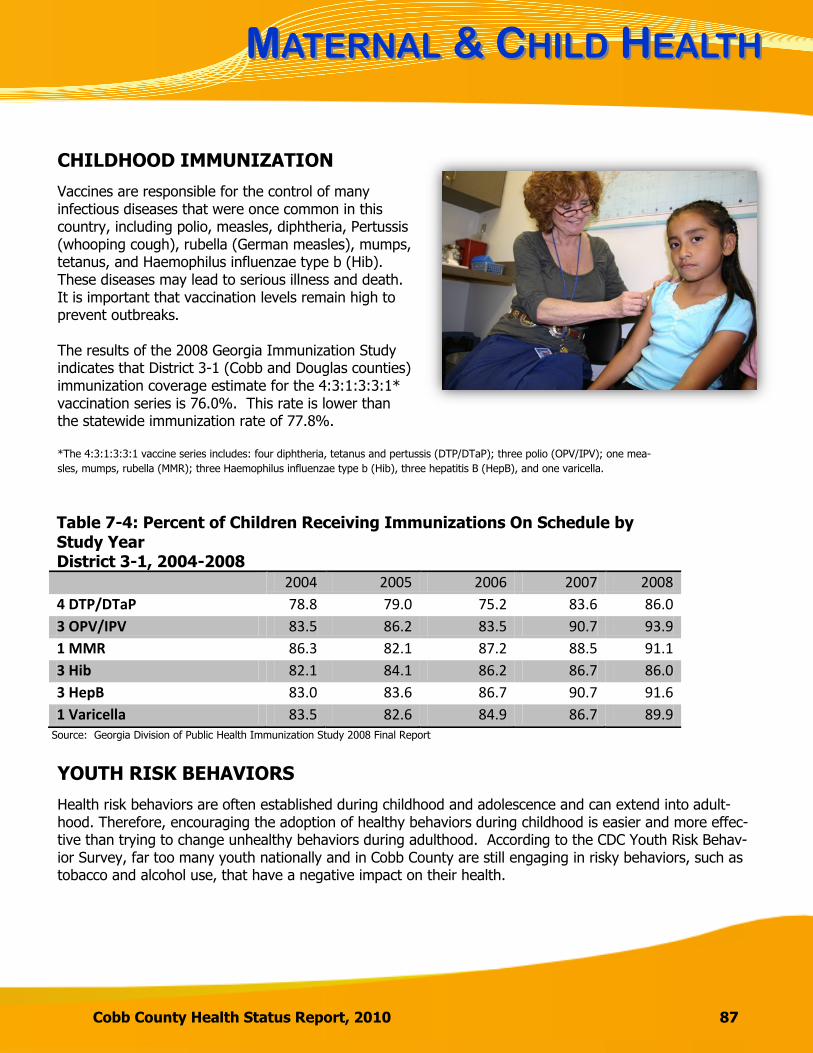
MMATERNALATERNAL & C& CHILDHILD HHEALTHEALTH
Cobb County Health Status Report, 2010 87
CHILDHOOD IMMUNIZATION
Vaccines are responsible for the control of many infectious diseases that were once common in this country, including polio, measles, diphtheria, Pertussis (whooping cough), rubella (German measles), mumps, tetanus, and Haemophilus influenzae type b (Hib). These diseases may lead to serious illness and death. It is important that vaccination levels remain high to prevent outbreaks. The results of the 2008 Georgia Immunization Study indicates that District 3-1 (Cobb and Douglas counties) immunization coverage estimate for the 4:3:1:3:3:1* vaccination series is 76.0%. This rate is lower than the statewide immunization rate of 77.8%. *The 4:3:1:3:3:1 vaccine series includes: four diphtheria, tetanus and pertussis (DTP/DTaP); three polio (OPV/IPV); one mea-
sles, mumps, rubella (MMR); three Haemophilus influenzae type b (Hib), three hepatitis B (HepB), and one varicella.
YOUTH RISK BEHAVIORS
Health risk behaviors are often established during childhood and adolescence and can extend into adult-hood. Therefore, encouraging the adoption of healthy behaviors during childhood is easier and more effec-tive than trying to change unhealthy behaviors during adulthood. According to the CDC Youth Risk Behav-ior Survey, far too many youth nationally and in Cobb County are still engaging in risky behaviors, such as tobacco and alcohol use, that have a negative impact on their health.
Table 7-4: Percent of Children Receiving Immunizations On Schedule by Study Year District 3-1, 2004-2008
2004 2005 2006 2007 2008
4 DTP/DTaP 78.8 79.0 75.2 83.6 86.0
3 OPV/IPV 83.5 86.2 83.5 90.7 93.9
1 MMR 86.3 82.1 87.2 88.5 91.1
3 Hib 82.1 84.1 86.2 86.7 86.0
3 HepB 83.0 83.6 86.7 90.7 91.6
1 Varicella 83.5 82.6 84.9 86.7 89.9
Source: Georgia Division of Public Health Immunization Study 2008 Final Report

MMATERNALATERNAL & C& CHILDHILD HHEALTHEALTH
88 Cobb County Health Status Report, 2010
YOUTH OBESITY
Obesity in children and adolescents continues to be a major public health concern in the U.S. Obesity in
children is based on the 2000 CDC Growth Charts. These growth charts reflect age, sex and body mass
index (BMI). BMI for children is calculated in the same manner as for adults (weight/(height)2) but
obesity in children is defined differently. Children are considered obese if they are ≥ 95th percentile
(based on CDC Growth Charts) for BMI. Visit the following website for a BMI Calculator for children and
teens: http://apps.nccd.cdc.gov/dnpabmi/
Children who are obese may experience immediate health issues. Obesity can lead to high blood pressure, cholesterol, type 2 diabetes, asthma, and sleep apnea. Children also may face emotional issues due to their weight.
In 2009, 12.4% of Georgia youth were estimated to be obese com-pared to the U.S. rate of 12.0%.
Black youth had the highest
percentage of obesity at 13.2%, compared to whites at 12.5% and Hispanics at 11.0%.
Georgia had significantly higher rates than the U.S. on a number of risk factors related to being overweight or obese. Of high school students in Georgia in 2009:
82.9% reported eating fruits and vegetables less than five times per
week compared to 77.7% in the U.S.
56.4% reported not attending physical education classes in an average
week (when in school) compared to 43.6% in the U.S.
39.2% reported watching television for 3 or more hours per day
compared to 32.8% in the U.S.
WWHYHY ISIS CCHILDHOODHILDHOOD OOBESITYBESITY IMPORTANTIMPORTANT??
89 Cobb County Health Status Report, 2010
Obesity is a serious health concern for children and adolescents. Results from the 2007-2008 National Health and Nutrition Examination Survey (NHANES) indicate that an estimated 17% of children and adolescents ages 2-19 are obese. In Georgia, approximately 15% of children in the WIC (Women, Infants & Children) program, 24% of third graders, 15% of middle school students and 14% of high school students are obese (2009 Georgia Data Summary: Obesity in Children and Youth).
Obese children and adolescents are at risk for health problems during their youth and as adults. They are more likely to have risk factors associated with cardiovascular disease such as high blood pressure, high cholesterol, and type 2 diabetes. They are also prone to become inactive and obese as adults, leading to increased healthcare costs and decreased quality of life.
Source: Georgia Division of Public Health, 2009 Georgia Data Summary: Obesity in Children and Youth, Physical Activity in Youth, Healthy Eating
55% middle school students that met requirements for physical activity 44% high school students that met requirements for physical activity 52% 5th and 7th grade students who did not pass a cardiovascular health assessment 22% 5th and 7th grade students who did not meet standards of muscular strength and
flexibility
Recommended physical activity in Georgia
39% middle school students who attend daily physical education classes 34% high school students who attend daily physical education classes 66% middle schools that offer intramural activities to students 54% high schools that offer intramural activities to students 19% middle school students who live one mile or less from school and walk to school 22% high school students who live one mile or less from school and walk to school
Policies and envi-ronments in schools and com-munities influence physical activity behaviors
44% middle school students who watch TV for 3 or more hours on a school day 43% high school students who watch TV for 3 or more hours on a school day 19% high school students who consume 5 or more servings of fruits and vegetables
daily The percentage of high school students and adults who consume the minimum recom-mended servings of fruits and vegetables is consistently low across all sex, race, ethnic, and age groups.
Poor diet and physical inactivity are reasons for the rise in childhood obesity
12% middle schools that have a policy to offer fruits and vegetables in school settings 10% high schools that have a policy to offer fruits and vegetables in school settings Less nutritious snack foods and beverages are readily available in many middle school (39%-63%) and high school (75%-89%) vending machines.
School policies and environments influence healthy eating behaviors
In Georgia in 2009…
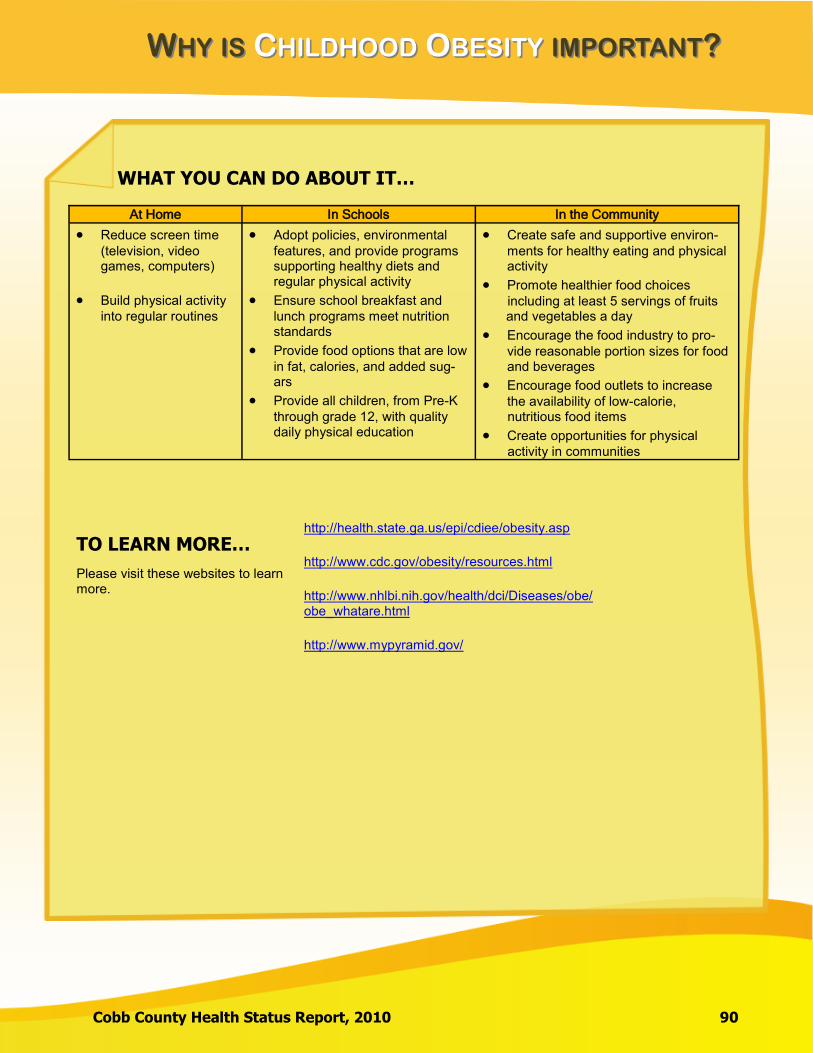
WWHYHY ISIS CCHILDHOODHILDHOOD OOBESITYBESITY IMPORTANTIMPORTANT??
Cobb County Health Status Report, 2010 90
WHAT YOU CAN DO ABOUT IT…
TO LEARN MORE…
Please visit these websites to learn more.
http://health.state.ga.us/epi/cdiee/obesity.asp
http://www.cdc.gov/obesity/resources.html
http://www.nhlbi.nih.gov/health/dci/Diseases/obe/obe_whatare.html
http://www.mypyramid.gov/
At Home In Schools In the Community
Reduce screen time
(television, video games, computers)
Build physical activity
into regular routines
Adopt policies, environmental
features, and provide programs supporting healthy diets and regular physical activity
Ensure school breakfast and
lunch programs meet nutrition standards
Provide food options that are low
in fat, calories, and added sug-ars
Provide all children, from Pre-K
through grade 12, with quality daily physical education
Create safe and supportive environ-
ments for healthy eating and physical activity
Promote healthier food choices including at least 5 servings of fruits and vegetables a day
Encourage the food industry to pro-
vide reasonable portion sizes for food and beverages
Encourage food outlets to increase
the availability of low-calorie, nutritious food items
Create opportunities for physical activity in communities

MMATERNALATERNAL & C& CHILDHILD HHEALTHEALTH
91 Cobb County Health Status Report, 2010
ALCOHOL USE
Across the U.S, it is illegal for youth under the age of 21 to purchase alcohol. Underage drinking (defined
as having a drink in the past 30 days) in U.S. high school students decreased from 50% in 1999 to 42% in
2009. In 2009, 24% of students reported binge drinking (5 or more drinks within a couple of hours on one
day) in the U.S. Cobb County data is not fully comparable to U.S. data due to the inclusion of middle
school students in the county data.
In school years 2008-09 and
2009-10, Cobb County had a
higher percentage of
students reporting
alcohol use compared to the state of
Georgia.
16.415.4
14.0
10.5
15.714.4
0.0
2.0
4.0
6.0
8.0
10.0
12.0
14.0
16.0
18.0
2008-09 2009-10
Figure 7-10: Percent of Students who Reported Alcohol Use in the Past 30 days by School Year 2008-09 through 2009-10
Cobb County
Marietta City
Georgia
Note: The Georgia Student Health Survey Report data from grades 6, 8, 10 and 12.
According to the Georgia Student Health Survey,
the average age of onset use of alcohol in Marietta
City Schools is 12.4 for males and 12.6 for
females.
Table: 7-5 Average Age of Onset Use of Alcohol School Year 2009-10
School System
Males Females
Cobb County 13.0 13.2
Marietta City 12.4 12.6
Georgia 12.7 13.1 Source: Georgia Department of Education, Georgia Student Health Survey
Source: The Georgia Student Health Survey
Table: 7-5 Average Age of Onset Use of Alcohol School Year 2009-10
School System Males Females
Cobb County 13.0 13.2
Marietta City 12.4 12.6
Georgia 12.7 13.1
Source: The Georgia Student Health Survey
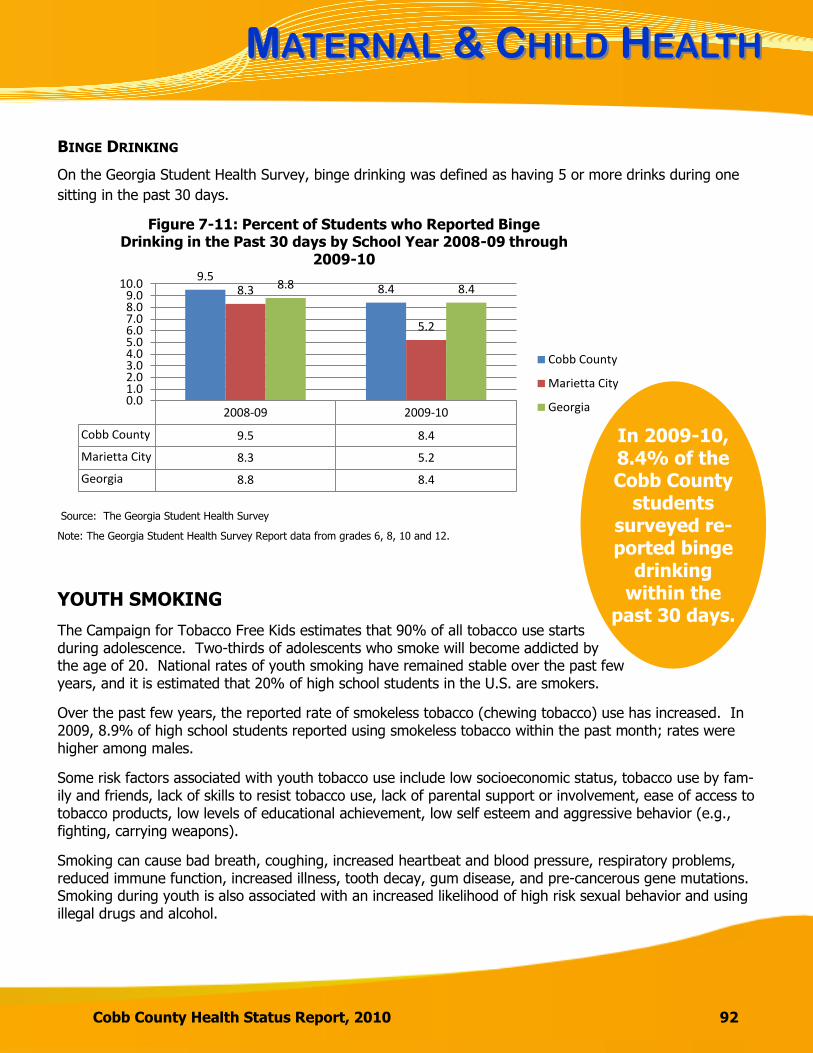
MMATERNALATERNAL & C& CHILDHILD HHEALTHEALTH
Cobb County Health Status Report, 2010 92
2008-09 2009-10
Cobb County 9.5 8.4
Marietta City 8.3 5.2
Georgia 8.8 8.4
9.58.48.3
5.2
8.8 8.4
0.01.02.03.04.05.06.07.08.09.0
10.0
Figure 7-11: Percent of Students who Reported Binge Drinking in the Past 30 days by School Year 2008-09 through
2009-10
Cobb County
Marietta City
Georgia
BINGE DRINKING
On the Georgia Student Health Survey, binge drinking was defined as having 5 or more drinks during one
sitting in the past 30 days.
YOUTH SMOKING
The Campaign for Tobacco Free Kids estimates that 90% of all tobacco use starts during adolescence. Two-thirds of adolescents who smoke will become addicted by the age of 20. National rates of youth smoking have remained stable over the past few years, and it is estimated that 20% of high school students in the U.S. are smokers.
Over the past few years, the reported rate of smokeless tobacco (chewing tobacco) use has increased. In 2009, 8.9% of high school students reported using smokeless tobacco within the past month; rates were higher among males.
Some risk factors associated with youth tobacco use include low socioeconomic status, tobacco use by fam-ily and friends, lack of skills to resist tobacco use, lack of parental support or involvement, ease of access to tobacco products, low levels of educational achievement, low self esteem and aggressive behavior (e.g., fighting, carrying weapons).
Smoking can cause bad breath, coughing, increased heartbeat and blood pressure, respiratory problems, reduced immune function, increased illness, tooth decay, gum disease, and pre-cancerous gene mutations. Smoking during youth is also associated with an increased likelihood of high risk sexual behavior and using illegal drugs and alcohol.
In 2009-10, 8.4% of the Cobb County
students surveyed re-ported binge
drinking within the
past 30 days.
Note: The Georgia Student Health Survey Report data from grades 6, 8, 10 and 12.
Source: The Georgia Student Health Survey
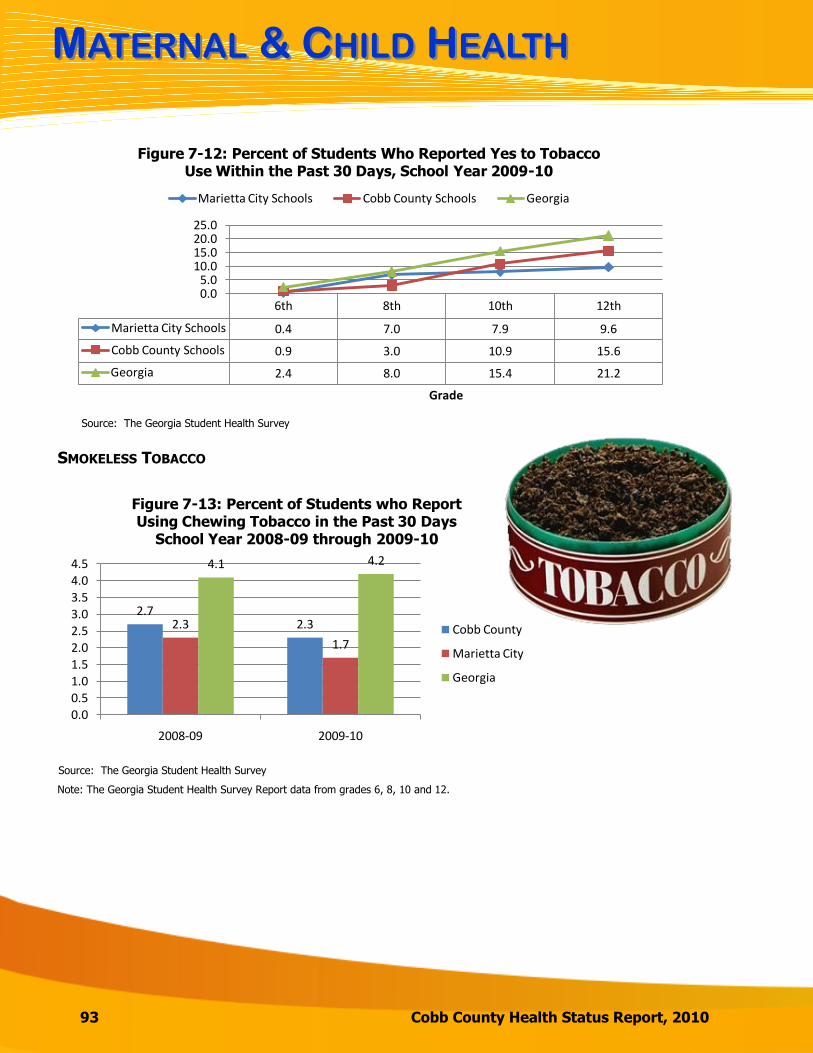
MMATERNALATERNAL & C& CHILDHILD HHEALTHEALTH
93 Cobb County Health Status Report, 2010
6th 8th 10th 12th
Marietta City Schools 0.4 7.0 7.9 9.6
Cobb County Schools 0.9 3.0 10.9 15.6
Georgia 2.4 8.0 15.4 21.2
0.05.0
10.015.020.025.0
Grade
Figure 7-12: Percent of Students Who Reported Yes to Tobacco Use Within the Past 30 Days, School Year 2009-10
Marietta City Schools Cobb County Schools Georgia
SMOKELESS TOBACCO
2.72.32.3
1.7
4.1 4.2
0.0
0.5
1.0
1.5
2.0
2.5
3.0
3.5
4.0
4.5
2008-09 2009-10
Figure 7-13: Percent of Students who Report Using Chewing Tobacco in the Past 30 Days
School Year 2008-09 through 2009-10
Cobb County
Marietta City
Georgia
Source: The Georgia Student Health Survey
Note: The Georgia Student Health Survey Report data from grades 6, 8, 10 and 12.
Source: The Georgia Student Health Survey

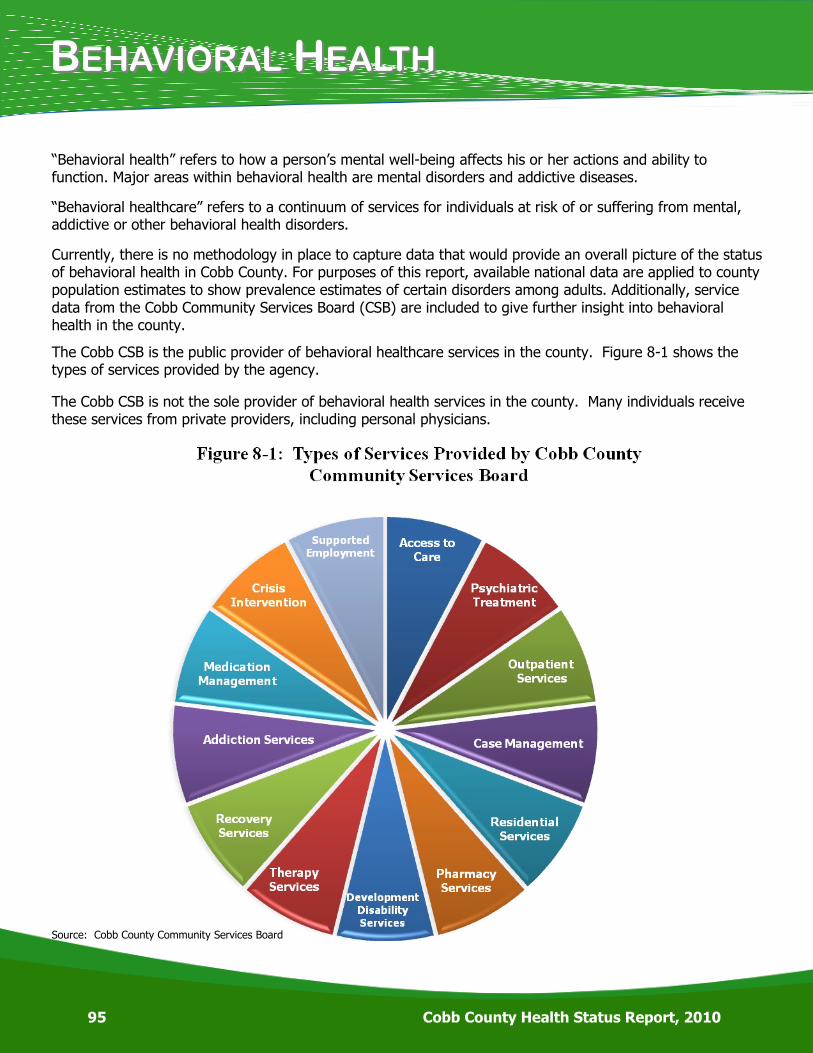
BBEHAVIORALEHAVIORAL HHEALTHEALTH
95 Cobb County Health Status Report, 2010
―Behavioral health‖ refers to how a person’s mental well-being affects his or her actions and ability to function. Major areas within behavioral health are mental disorders and addictive diseases.
―Behavioral healthcare‖ refers to a continuum of services for individuals at risk of or suffering from mental, addictive or other behavioral health disorders.
Currently, there is no methodology in place to capture data that would provide an overall picture of the status of behavioral health in Cobb County. For purposes of this report, available national data are applied to county population estimates to show prevalence estimates of certain disorders among adults. Additionally, service data from the Cobb Community Services Board (CSB) are included to give further insight into behavioral health in the county.
The Cobb CSB is the public provider of behavioral healthcare services in the county. Figure 8-1 shows the types of services provided by the agency.
The Cobb CSB is not the sole provider of behavioral health services in the county. Many individuals receive these services from private providers, including personal physicians.
Source: Cobb County Community Services Board

BBEHAVIORALEHAVIORAL HHEALTHEALTH
Cobb County Health Status Report, 2010 96
MENTAL DISORDERS
Mental disorders are common in the U.S. and can begin at any age without respect to gender or sex. While there is no specific identifiable cause of mental disorders, they are thought to be caused by a variety of biochemical, genetic, and environmental risk factors. Many people suffer from more than one mental disorder at any given time. In the U.S., mental disorders are diagnosed based on the Diagnostic and Statistical Manual of Mental Disorders (DSM-IV).
According to the National Institute of Mental Health:
26.2% of the U.S. population ages 18 and older,
or about one in four adults, suffer from a diagnosable mental disorder in a given year. This translates to an estimated 57.7 million persons in the U.S.
1 in 17 Americans over age 18 suffers from a
serious mental illness.
Mental Disorders in Cobb County (Estimates based on U.S. Census Bureau’s 2009 population estimates and NIMH prevalence data translated to Cobb County)
138, 377 (26.3%) persons age 18 and older suffer from a mental disorder in a given year.
31,068 (5.9%) persons ages 18 and older suffer from a serious mental illness, such as major
depression, bipolar disorder, or schizophrenia.
Sources: National Institute of Mental Health, The Numbers Count; U.S. Census Bureau, State and County Quick Facts
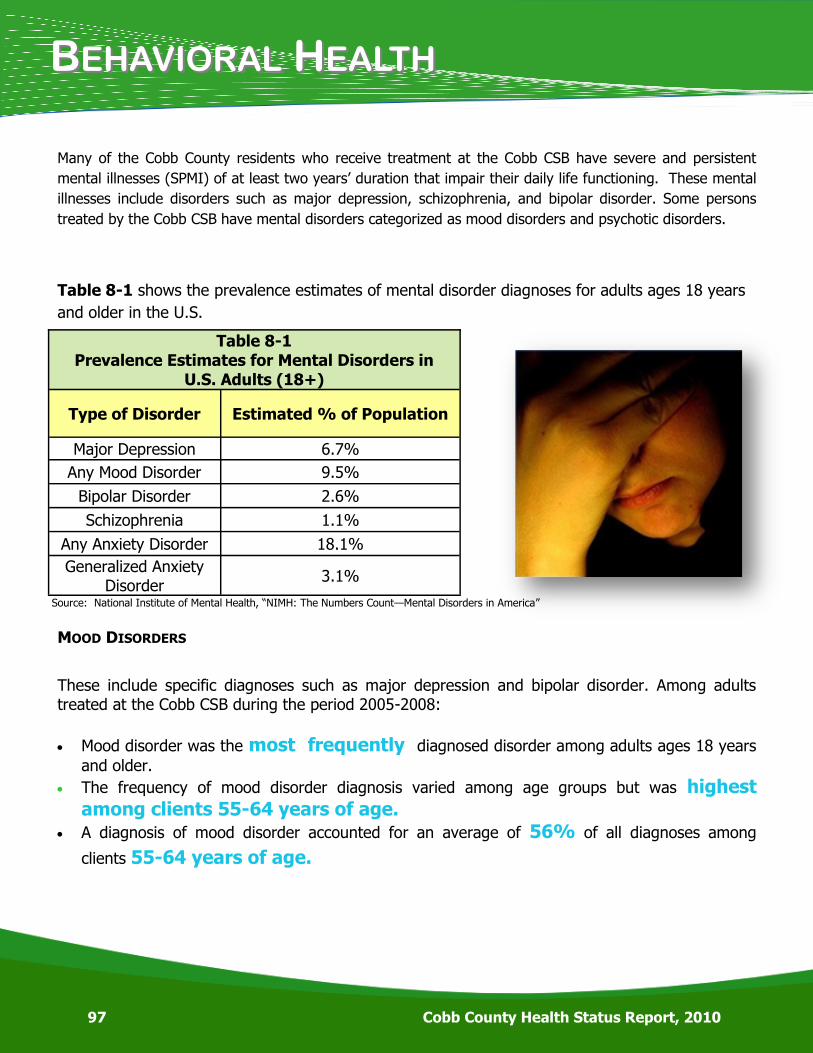
BBEHAVIORALEHAVIORAL HHEALTHEALTH
97 Cobb County Health Status Report, 2010
Table 8-1 shows the prevalence estimates of mental disorder diagnoses for adults ages 18 years
and older in the U.S.
Table 8-1
Prevalence Estimates for Mental Disorders in U.S. Adults (18+)
Type of Disorder Estimated % of Population
Major Depression 6.7%
Any Mood Disorder 9.5%
Bipolar Disorder 2.6%
Schizophrenia 1.1%
Any Anxiety Disorder 18.1%
Generalized Anxiety Disorder
3.1%
Many of the Cobb County residents who receive treatment at the Cobb CSB have severe and persistent
mental illnesses (SPMI) of at least two years’ duration that impair their daily life functioning. These mental
illnesses include disorders such as major depression, schizophrenia, and bipolar disorder. Some persons
treated by the Cobb CSB have mental disorders categorized as mood disorders and psychotic disorders.
MOOD DISORDERS
These include specific diagnoses such as major depression and bipolar disorder. Among adults treated at the Cobb CSB during the period 2005-2008:
Mood disorder was the most frequently diagnosed disorder among adults ages 18 years
and older.
The frequency of mood disorder diagnosis varied among age groups but was highest among clients 55-64 years of age.
A diagnosis of mood disorder accounted for an average of 56% of all diagnoses among
clients 55-64 years of age.
Source: National Institute of Mental Health, ―NIMH: The Numbers Count—Mental Disorders in America‖
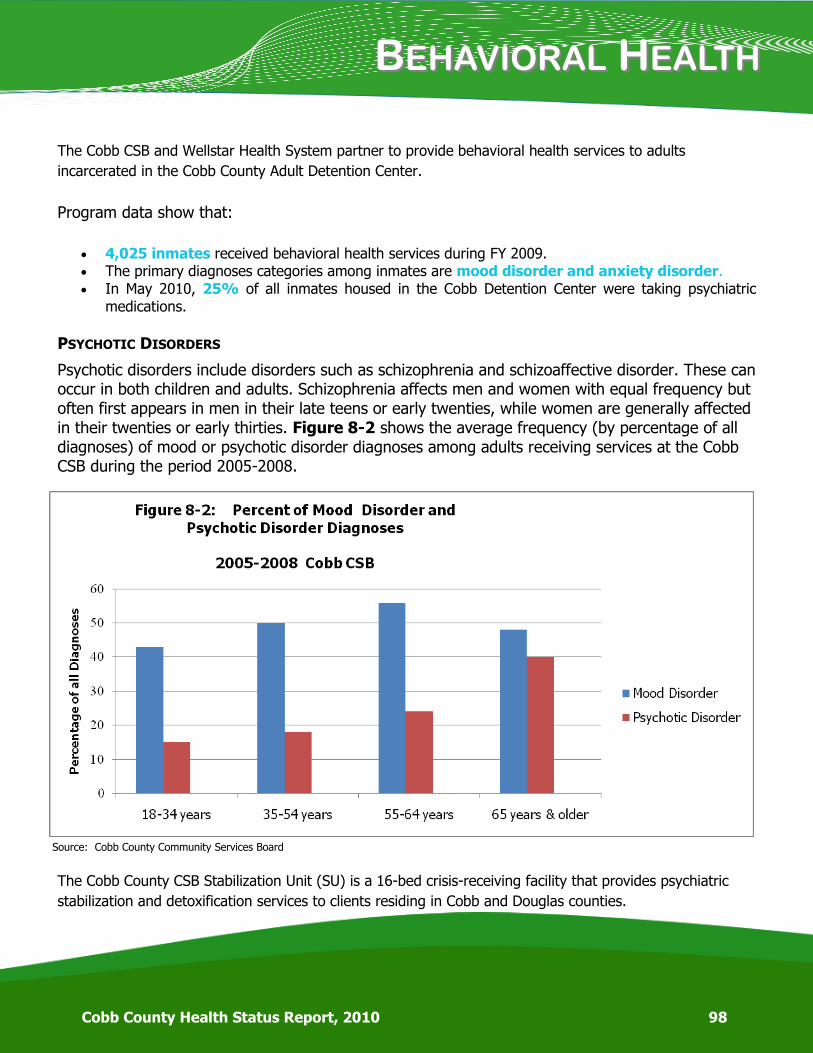
BBEHAVIORALEHAVIORAL HHEALTHEALTH
Cobb County Health Status Report, 2010 98
The Cobb CSB and Wellstar Health System partner to provide behavioral health services to adults
incarcerated in the Cobb County Adult Detention Center.
Program data show that:
4,025 inmates received behavioral health services during FY 2009. The primary diagnoses categories among inmates are mood disorder and anxiety disorder. In May 2010, 25% of all inmates housed in the Cobb Detention Center were taking psychiatric
medications.
PSYCHOTIC DISORDERS
Psychotic disorders include disorders such as schizophrenia and schizoaffective disorder. These can occur in both children and adults. Schizophrenia affects men and women with equal frequency but often first appears in men in their late teens or early twenties, while women are generally affected in their twenties or early thirties. Figure 8-2 shows the average frequency (by percentage of all diagnoses) of mood or psychotic disorder diagnoses among adults receiving services at the Cobb CSB during the period 2005-2008.
The Cobb County CSB Stabilization Unit (SU) is a 16-bed crisis-receiving facility that provides psychiatric
stabilization and detoxification services to clients residing in Cobb and Douglas counties.
Source: Cobb County Community Services Board

BBEHAVIORALEHAVIORAL HHEALTHEALTH
99 Cobb County Health Status Report, 2010
Data for the Stabilization Unit show that:
A total of 834 persons were admitted for treatment during FY 2009. Of these persons, 53% were treated for addictive diseases, and 47% were treated for mental disorders.
Alcohol dependence is the most frequent disorder treated at the facility. Other drugs of abuse include prescription drugs and illicit drugs such as cocaine. Mood disorders accounted for 23% of all admissions to the SU during the period 2005-2008. Some individuals are admitted to the unit with suicidal ideation (thoughts of suicide) which may
result from other problems such as depression or drug use.
ADDICTIVE DISEASES
The Cobb CSB provides addictive disease services for youth and adults through its outpatient services and
residential programs. Additionally, the agency provides addiction services at the Stabilization Unit and
within the criminal justice system.
Mental disorders commonly seen in children and adolescents are depression, attention-deficit/hyperactivity disorder (ADHD), adjustment disorder, and conduct disorder. Among children ages 5-17 receiving services from the Cobb CSB (2005-2008), approximately:
MENTAL DISORDERS AMONG CHILDREN AND ADOLESCENTS
30% had attention deficit disorder 27% had a mood disorder

BBEHAVIORALEHAVIORAL HHEALTHEALTH
Cobb County Health Status Report, 2010 100
Data from Cobb CSB show that:
For the period 2005-2008, substance abuse diagnoses accounted for about 17% of all diagnoses among all age groups served by the Cobb CSB.
Addictive diseases appear more often among clients ages 18-34 than among other
age groups served by the Cobb CSB. The majority of clients who receive addictive disease services are seen for alcohol dependence. Other drugs of abuse include opiates, cocaine, amphetamines, barbiturates, and marijuana. During the period 2005-2008, approximately 13% of all persons treated for substance abuse at the
Cobb CSB were poly substance abusers. Some persons with addictions also have a co-occurring mental illness which complicates treatment
outcomes.
Among children and adolescents ages 5-17 receiving services from the Cobb CSB during the period 2005-2008:
Addictive disease disorders (alcohol and other drugs) accounted for an average of 11.5% of all diagnoses.
Alcohol dependence/abuse accounted for an average of 6% of all substance abuse diagnoses. Cannabis (marijuana) abuse/dependence accounted for an average of 69% of all substance abuse diagnoses.
Some Risk Factors for Substance Abuse Among Youth
Early aggressive behavior Poor classroom behavior or social
skills Academic failure A caregiver who abuses drugs Association with drug-abusing peers Lack of parental supervision Drug availability Major social transitions (i.e.,
beginning middle school or college)
Source: National Institute on Drug Abuse (NIDA): Preventing Drug Abuse Among Children and Adolescents

WWHYHY IISS BBEHAVIORALEHAVIORAL HHEALTHEALTH IMPORTANTIMPORTANT??
101 Cobb County Health Status Report, 2010
Behavioral health is an integral part of overall health and well-being, not just for individuals, but for families and the community. Insight into the prevalence and impact of behavioral health issues within the county provides vital information to facilitate service planning and delivery. With proper treatment and support, those persons and families affected by mental or addictive disorders can be more fully integrated into the community and have opportunities to enjoy meaningful, fulfilling lives.
WHAT CAN YOU DO ABOUT IT?
Seek professional behavioral health services if you feel you need help. Develop a support network that includes family, friends, and community resources. Take care of your whole self. If you know someone who is suffering from a behavioral health issue, inform the
individual that treatment services are available and recovery is possible. Treat persons who have behavioral health issues with respect and dignity.
TO LEARN MORE….
Georgia Department of Behavioral Health and Developmental Disabilities:
www.dbhdd.georgia.gov
24 Hour Crisis Line 1-800-715-4225
Cobb County Community Services Board www.cobbcsb.com
Access Line 770-422-0202
Substance Abuse and Mental Health Services Administration (SAMHSA): 1-877-726-4727, www.samhsa.gov
National Alliance on Mental Illness Georgia (NAMI): 770-234-0855,
www.namiga.org
National Institute on Drug Abuse (NIDA): www.nida.nih.gov
Back to TOC
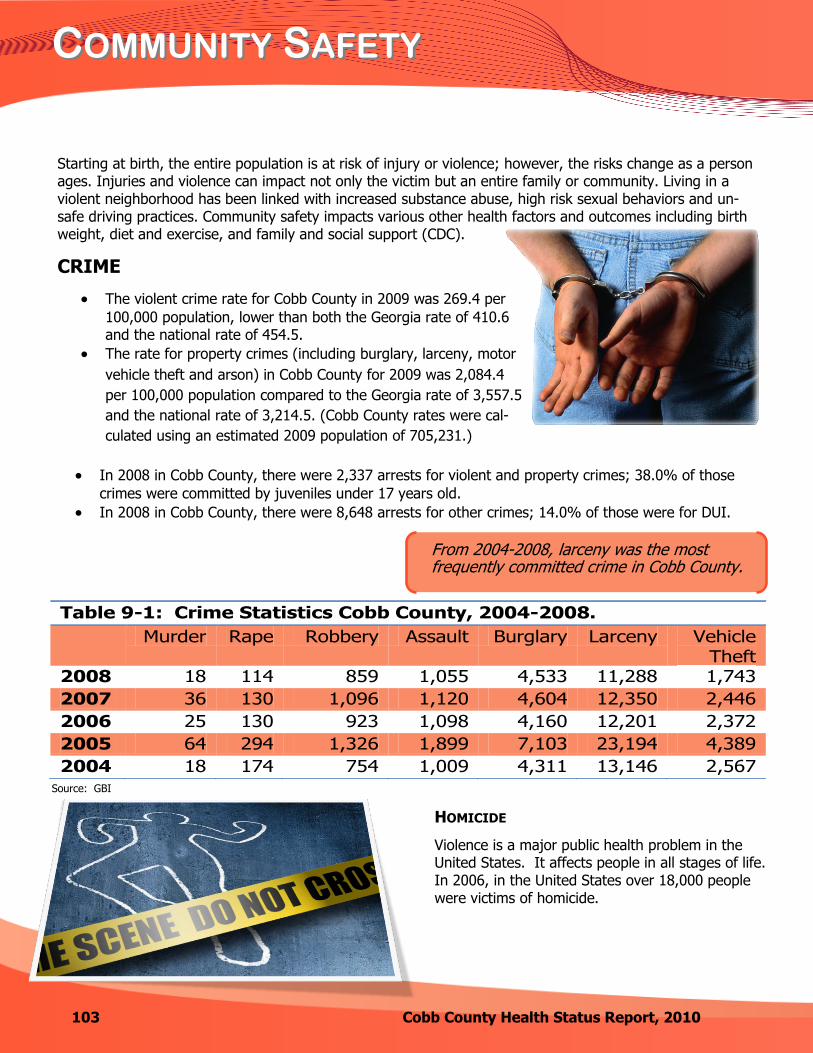
CCOMMUNITYOMMUNITY SSAFETYAFETY
103 Cobb County Health Status Report, 2010
Starting at birth, the entire population is at risk of injury or violence; however, the risks change as a person ages. Injuries and violence can impact not only the victim but an entire family or community. Living in a violent neighborhood has been linked with increased substance abuse, high risk sexual behaviors and un-safe driving practices. Community safety impacts various other health factors and outcomes including birth weight, diet and exercise, and family and social support (CDC).
CRIME
The violent crime rate for Cobb County in 2009 was 269.4 per
100,000 population, lower than both the Georgia rate of 410.6 and the national rate of 454.5.
The rate for property crimes (including burglary, larceny, motor
vehicle theft and arson) in Cobb County for 2009 was 2,084.4
per 100,000 population compared to the Georgia rate of 3,557.5
and the national rate of 3,214.5. (Cobb County rates were cal-
culated using an estimated 2009 population of 705,231.)
Table 9-1: Crime Statistics Cobb County, 2004-2008.
Murder Rape Robbery Assault Burglary Larceny Vehicle Theft
2008 18 114 859 1,055 4,533 11,288 1,743
2007 36 130 1,096 1,120 4,604 12,350 2,446
2006 25 130 923 1,098 4,160 12,201 2,372
2005 64 294 1,326 1,899 7,103 23,194 4,389
2004 18 174 754 1,009 4,311 13,146 2,567
From 2004-2008, larceny was the most frequently committed crime in Cobb County.
HOMICIDE
Violence is a major public health problem in the United States. It affects people in all stages of life. In 2006, in the United States over 18,000 people were victims of homicide.
Source: GBI
In 2008 in Cobb County, there were 2,337 arrests for violent and property crimes; 38.0% of those
crimes were committed by juveniles under 17 years old.
In 2008 in Cobb County, there were 8,648 arrests for other crimes; 14.0% of those were for DUI.
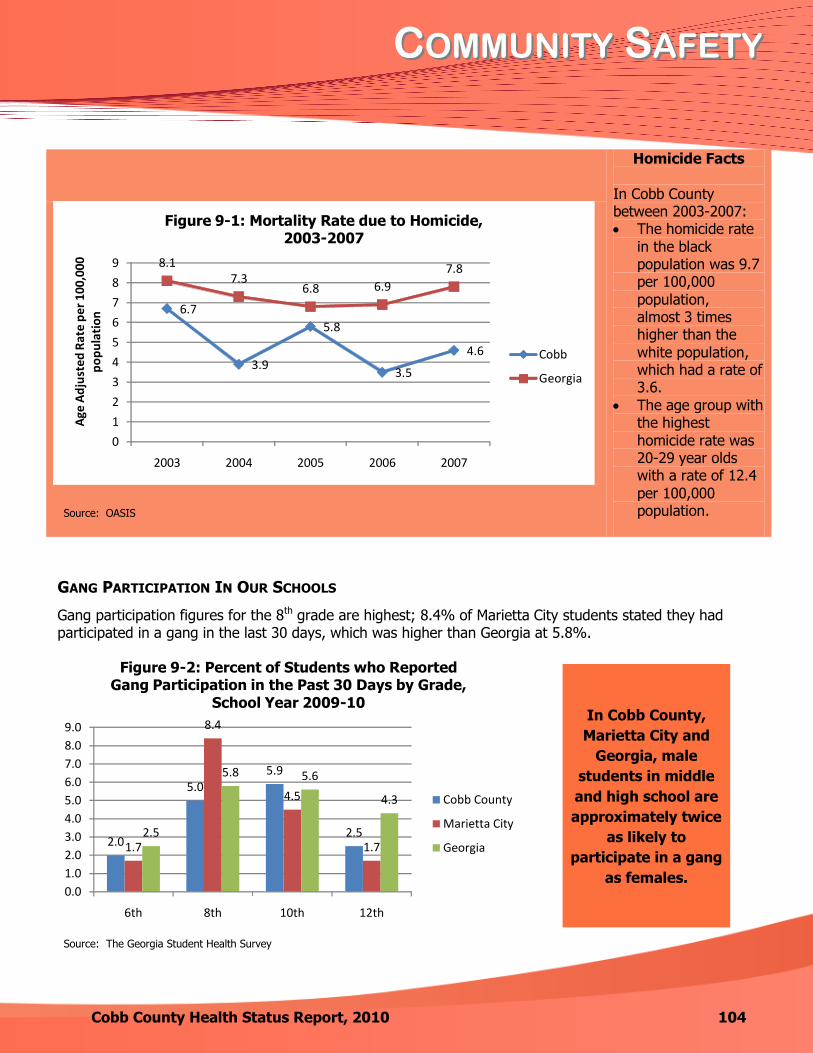
CCOMMUNITYOMMUNITY SSAFETYAFETY
Cobb County Health Status Report, 2010 104
Homicide Facts
In Cobb County between 2003-2007: The homicide rate
in the black population was 9.7 per 100,000
population, almost 3 times higher than the
white population, which had a rate of 3.6.
The age group with the highest homicide rate was 20-29 year olds with a rate of 12.4
per 100,000 population.
6.7
3.9
5.8
3.5
4.6
8.17.3
6.8 6.9
7.8
0
1
2
3
4
5
6
7
8
9
2003 2004 2005 2006 2007
Age
Ad
just
ed R
ate
per
100
,000
p
op
ula
tio
n
Figure 9-1: Mortality Rate due to Homicide, 2003-2007
Cobb
Georgia
GANG PARTICIPATION IN OUR SCHOOLS
Gang participation figures for the 8th grade are highest; 8.4% of Marietta City students stated they had participated in a gang in the last 30 days, which was higher than Georgia at 5.8%.
In Cobb County, Marietta City and
Georgia, male students in Middle and
High School are approximately twice as likely to participate in a gang as females.
2.0
5.05.9
2.51.7
8.4
4.5
1.72.5
5.8 5.6
4.3
0.0
1.0
2.0
3.0
4.0
5.0
6.0
7.0
8.0
9.0
6th 8th 10th 12th
Figure 9-2: Percent of Students who Reported Gang Participation in the Past 30 Days by Grade,
School Year 2009-10
Cobb County
Marietta City
Georgia
Source: OASIS
Source: The Georgia Student Health Survey
In Cobb County,
Marietta City and
Georgia, male
students in middle
and high school are
approximately twice
as likely to
participate in a gang
as females.
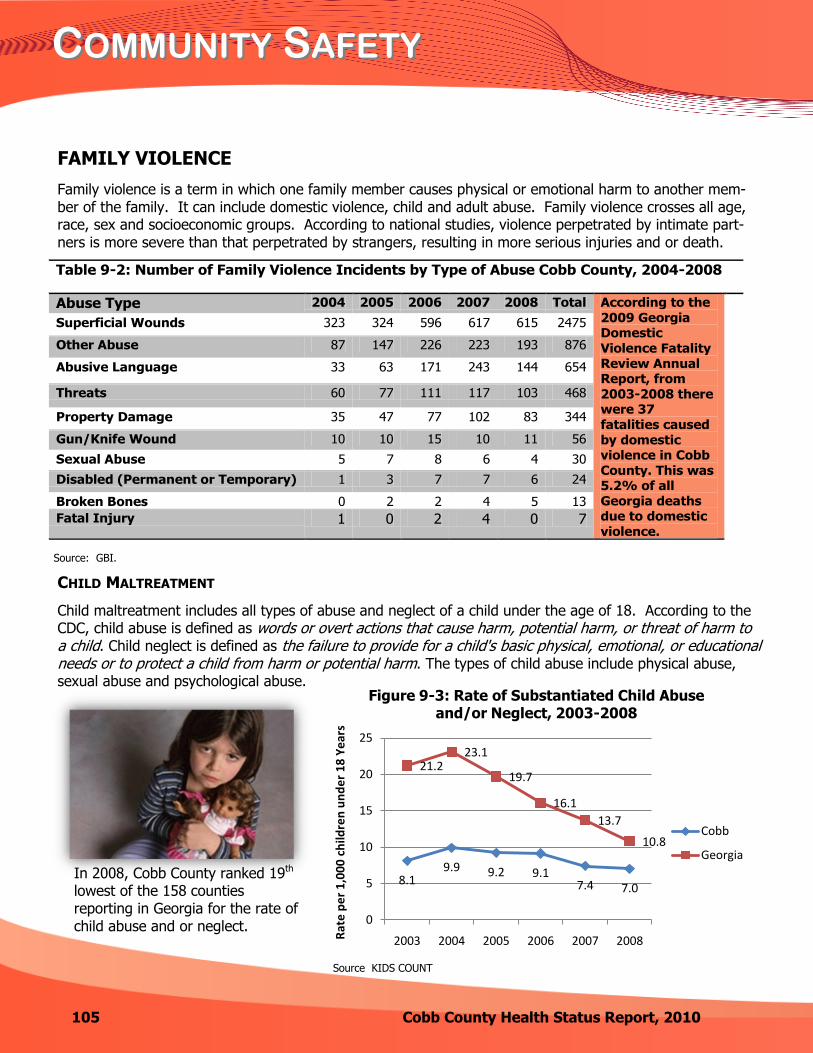
CCOMMUNITYOMMUNITY SSAFETYAFETY
105 Cobb County Health Status Report, 2010
FAMILY VIOLENCE
Family violence is a term in which one family member causes physical or emotional harm to another mem-ber of the family. It can include domestic violence, child and adult abuse. Family violence crosses all age, race, sex and socioeconomic groups. According to national studies, violence perpetrated by intimate part-ners is more severe than that perpetrated by strangers, resulting in more serious injuries and or death.
Table 9-2: Number of Family Violence Incidents by Type of Abuse Cobb County, 2004-2008
Abuse Type 2004 2005 2006 2007 2008 Total According to the
2009 Georgia Domestic
Violence Fatality
Review Annual Report, from
2003-2008 there were 37
fatalities caused
by domestic violence in Cobb
County. This was 5.2% of all
Georgia deaths due to domestic
violence.
Superficial Wounds 323 324 596 617 615 2475
Other Abuse 87 147 226 223 193 876
Abusive Language 33 63 171 243 144 654
Threats 60 77 111 117 103 468
Property Damage 35 47 77 102 83 344
Gun/Knife Wound 10 10 15 10 11 56
Sexual Abuse 5 7 8 6 4 30
Disabled (Permanent or Temporary) 1 3 7 7 6 24
Broken Bones 0 2 2 4 5 13
Fatal Injury 1 0 2 4 0 7
In 2008, Cobb County ranked 19th lowest of the 158 counties reporting in Georgia for the rate of child abuse and or neglect.
8.19.9 9.2 9.1
7.4 7.0
21.223.1
19.7
16.1
13.7
10.8
0
5
10
15
20
25
2003 2004 2005 2006 2007 2008Rat
e p
er
1,0
00
ch
ildre
n u
nd
er
18
Ye
ars
Figure 9-3: Rate of Substantiated Child Abuse and/or Neglect, 2003-2008
Cobb
Georgia
CHILD MALTREATMENT
Child maltreatment includes all types of abuse and neglect of a child under the age of 18. According to the CDC, child abuse is defined as words or overt actions that cause harm, potential harm, or threat of harm to a child. Child neglect is defined as the failure to provide for a child's basic physical, emotional, or educational needs or to protect a child from harm or potential harm. The types of child abuse include physical abuse, sexual abuse and psychological abuse.
Source: GBI.
Source KIDS COUNT

CCOMMUNITYOMMUNITY SSAFETYAFETY
Cobb County Health Status Report, 2010 106
INJURIES
In Cobb County, injuries due to external causes account for 25.7% of all emergency depart-ment visits, and falls are the number one cause of emergency department visits due to injury.
Table 9-3: Number of Emergency Department Visits due to External Causes, 2003-2007
External Causes 2003 2004 2005 2006 2007 Total
Falls 10,620 10,674 10,791 10,740 10,276 53,101
Motor Vehicle Crashes 6,862 7,070 7,132 6,766 6,116 33,946
Homicide 1,237 1,304 1,332 1,284 1,297 6,454
Poisoning 470 490 467 542 479 2,448
Suicide 392 370 406 361 351 1,880
Fire and Smoke Exposure 132 113 106 101 84 536
Accidental Shooting 39 37 59 82 45 262
Legal Intervention 45 38 27 31 46 187
Drowning 11 15 16 12 16 70
Total 42,673 42,708 41,710 40,476 37,842 205,409
From 2003-2007 the rate of emergency department visits for falls was highest in the elderly, over age 75, with a rate of 5,157.1 per 100,000 visits compared to an overall rate of 1,589.8 for all age groups.
MOTOR VEHICLE CRASHES (MVC)
The mortality rate for motor vehicle crashes (MVCs) in Cobb County is lower than Georgia’s rate. However, MVCs still account for a large number of deaths in the county.
Source: OASIS
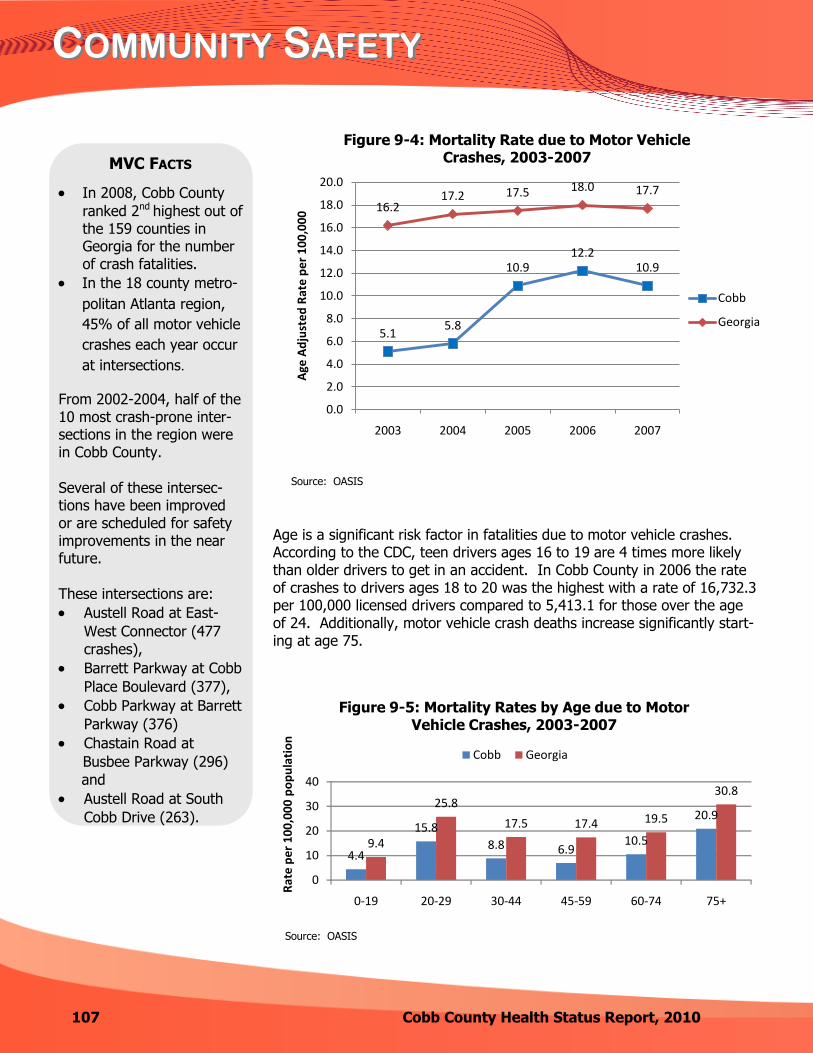
CCOMMUNITYOMMUNITY SSAFETYAFETY
107 Cobb County Health Status Report, 2010
4.4
15.8
8.8 6.910.5
20.9
9.4
25.8
17.5 17.4 19.5
30.8
0
10
20
30
40
0-19 20-29 30-44 45-59 60-74 75+
Rat
e p
er
10
0,0
00
po
pu
lati
on
Figure 9-5: Mortality Rates by Age due to Motor Vehicle Crashes, 2003-2007
Cobb Georgia
MVC FACTS
In 2008, Cobb County
ranked 2nd highest out of the 159 counties in Georgia for the number of crash fatalities.
In the 18 county metro-
politan Atlanta region,
45% of all motor vehicle
crashes each year occur
at intersections.
From 2002-2004, half of the 10 most crash-prone inter-sections in the region were in Cobb County.
Several of these intersec-tions have been improved or are scheduled for safety improvements in the near future.
These intersections are:
Austell Road at East-
West Connector (477
crashes),
Barrett Parkway at Cobb
Place Boulevard (377),
Cobb Parkway at Barrett
Parkway (376)
Chastain Road at
Busbee Parkway (296)
and
Austell Road at South
Cobb Drive (263).
5.15.8
10.912.2
10.9
16.217.2 17.5 18.0 17.7
0.0
2.0
4.0
6.0
8.0
10.0
12.0
14.0
16.0
18.0
20.0
2003 2004 2005 2006 2007
Age
Ad
just
ed
Rat
e p
er
10
0,0
00
Figure 9-4: Mortality Rate due to Motor Vehicle Crashes, 2003-2007
Cobb
Georgia
Age is a significant risk factor in fatalities due to motor vehicle crashes. According to the CDC, teen drivers ages 16 to 19 are 4 times more likely than older drivers to get in an accident. In Cobb County in 2006 the rate of crashes to drivers ages 18 to 20 was the highest with a rate of 16,732.3 per 100,000 licensed drivers compared to 5,413.1 for those over the age of 24. Additionally, motor vehicle crash deaths increase significantly start-ing at age 75.
Source: OASIS
Source: OASIS
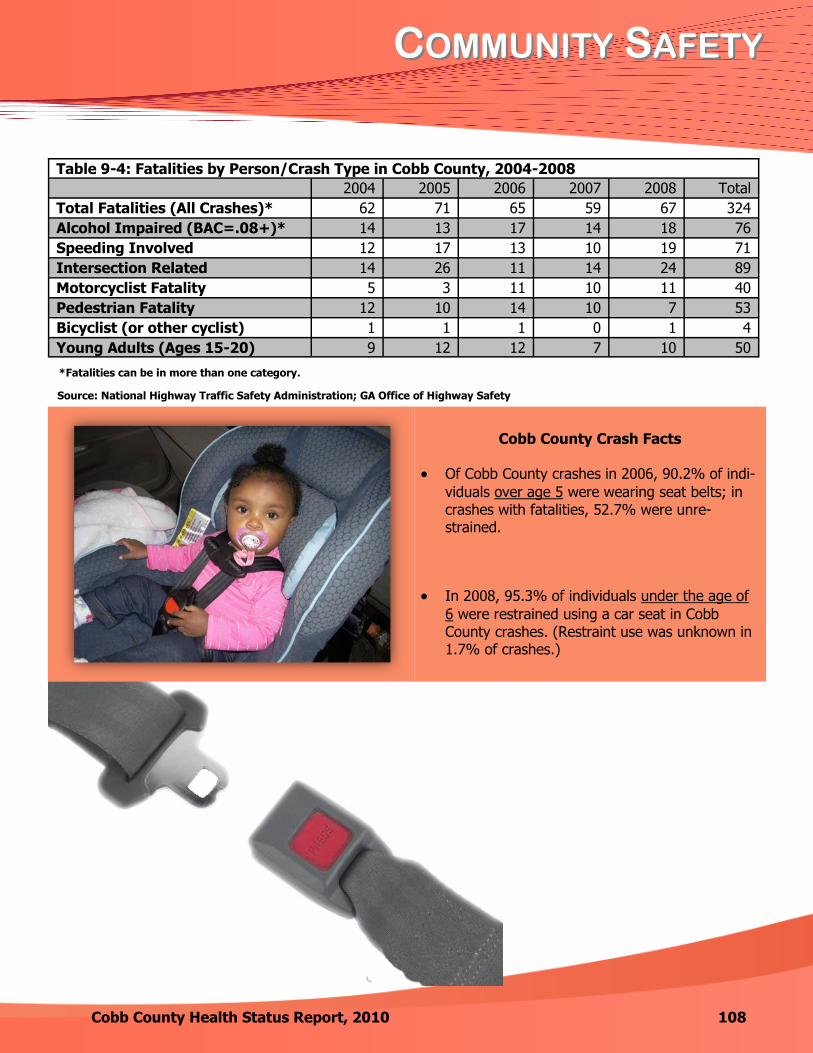
CCOMMUNITYOMMUNITY SSAFETYAFETY
Cobb County Health Status Report, 2010 108
Cobb County Crash Facts
Of Cobb County crashes in 2006, 90.2% of indi-
viduals over age 5 were wearing seat belts; in crashes with fatalities, 52.7% were unre-strained.
In 2008, 95.3% of individuals under the age of
6 were restrained using a car seat in Cobb County crashes. (Restraint use was unknown in 1.7% of crashes.)
*Fatalities can be in more than one category.
Source: National Highway Traffic Safety Administration; GA Office of Highway Safety
Table 9-4: Fatalities by Person/Crash Type in Cobb County, 2004-2008
2004 2005 2006 2007 2008 Total
Total Fatalities (All Crashes)* 62 71 65 59 67 324
Alcohol Impaired (BAC=.08+)* 14 13 17 14 18 76
Speeding Involved 12 17 13 10 19 71
Intersection Related 14 26 11 14 24 89
Motorcyclist Fatality 5 3 11 10 11 40
Pedestrian Fatality 12 10 14 10 7 53
Bicyclist (or other cyclist) 1 1 1 0 1 4
Young Adults (Ages 15-20) 9 12 12 7 10 50

WWHYHY AARERE MMOTOROTOR VVEHICLEEHICLE CCRASHESRASHES IMPORTANTIMPORTANT??
109 Cobb County Health Status Report, 2010
Motor vehicle crashes are a leading cause of death for people ages 1-34 in the U.S., and it is esti-mated that approximately 5 million people sustain crash-related injuries that require an emergency department visit.
WHAT CAN YOU DO ABOUT IT?
Common Driving Distractions
Don’t be a distracted driver.
cell phone use & texting
adjusting your radio, CD
player or GPS
reading
eating or drinking
taking off your coat or
jacket
putting on makeup,
combing hair
listening to music too
loudly
smoking
Always wear your seatbelt.
Properly restrain children while in a
vehicle.
An infant or child should be in a car
safety seat until at least 4 year/40 lbs. After they reach 4 years/40 lbs, they
should use a booster seat until they are 4’9’’/80-100 lbs (normally 9-10
years of age).
Do not consume alcohol and drive.
Turn on headlights when it’s raining.
Obey all traffic laws.
Don’t go above the speed limit.
Car seat inspections and edu-cation is available through
Safe Kids Cobb County, a
program offered through a partnership between Cobb & Douglas Public Health and the Wellstar Health System.
Contact
Safe Kids Cobb County (770) 514-2369
to set up a car seat inspection appointment.
Did you know…
Crash forces double on impact with every 10 mph
increase in speed above 50 mph.
Children not restrained in a child safety seat during a crash are 3 times more likely to be injured.
The misuse rate for child safety seats is 80 – 85%.
Learn to properly install and use your car seat.
WWHYHY AARERE MMOTOROTOR VVEHICLEEHICLE CCRASHESRASHES IMPORTANTIMPORTANT??
Cobb County Health Status Report, 2010 110
HOW DO WE COMPARE?
In 2008, Cobb County ranked 2nd highest out of the 159 counties in Georgia for the number of crash fatalities. In the 18 county metropolitan Atlanta region, 45% of all motor vehicle crashes each year occur at intersections. From 2002-2004, half of the 10 most crash-prone intersections in the region were in Cobb County.
TO LEARN MORE…..
Websites Phone Numbers
www.safekidscobbcounty.org
www.NHTSA.gov
www.gahighwaysafety.org
www.carseat.org
Safe Kids Cobb County (770) 852-3258
Governor’s Office of Highway Safety (404) 656-6996
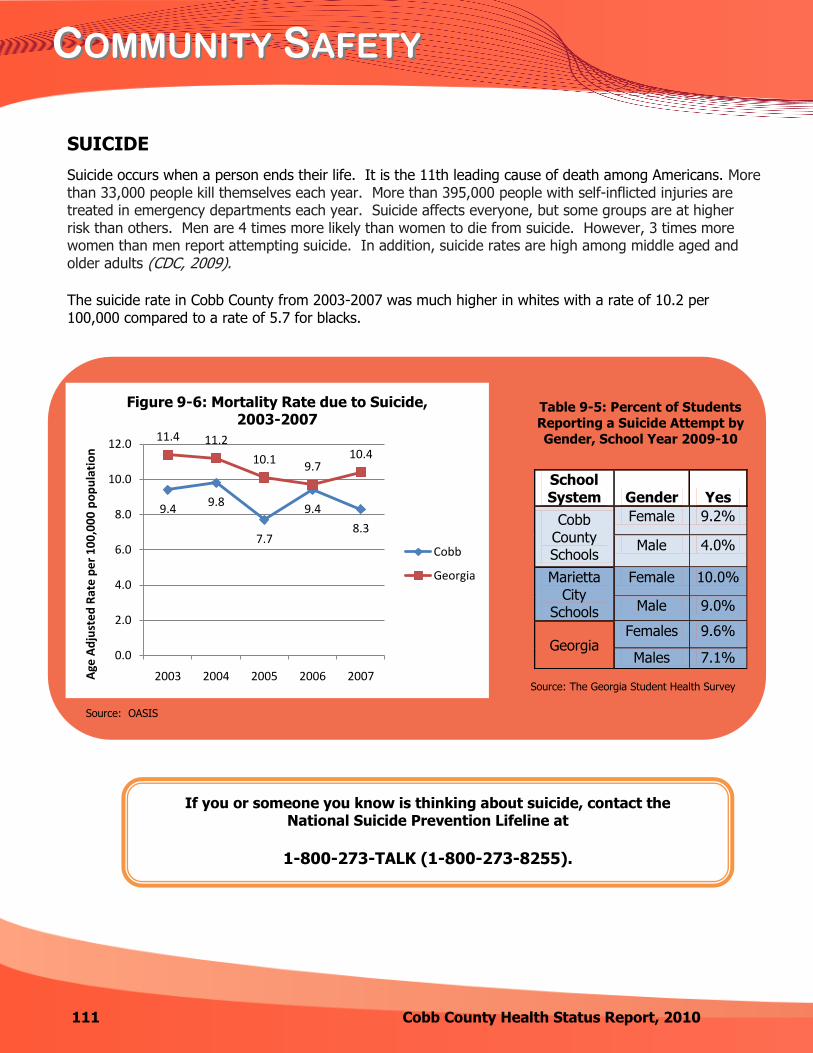
CCOMMUNITYOMMUNITY SSAFETYAFETY
111 Cobb County Health Status Report, 2010
If you or someone you know is thinking about suicide, contact the National Suicide Prevention Lifeline at
1-800-273-TALK (1-800-273-8255).
SUICIDE
Suicide occurs when a person ends their life. It is the 11th leading cause of death among Americans. More than 33,000 people kill themselves each year. More than 395,000 people with self-inflicted injuries are treated in emergency departments each year. Suicide affects everyone, but some groups are at higher risk than others. Men are 4 times more likely than women to die from suicide. However, 3 times more women than men report attempting suicide. In addition, suicide rates are high among middle aged and older adults (CDC, 2009).
The suicide rate in Cobb County from 2003-2007 was much higher in whites with a rate of 10.2 per 100,000 compared to a rate of 5.7 for blacks.
Table 9-5: Percent of Students
Reporting a Suicide Attempt by
Gender, School Year 2009-10
School System Gender Yes
Cobb County Schools
Female 9.2%
Male 4.0%
Marietta City
Schools
Female 10.0%
Male 9.0%
Georgia Females 9.6%
Males 7.1%
9.49.8
7.7
9.4
8.3
11.4 11.2
10.19.7
10.4
0.0
2.0
4.0
6.0
8.0
10.0
12.0
2003 2004 2005 2006 2007Age
Ad
just
ed
Rat
e p
er
10
0,0
00
po
pu
lati
on
Figure 9-6: Mortality Rate due to Suicide, 2003-2007
Cobb
Georgia
Source: OASIS
Source: The Georgia Student Health Survey

CCOMMUNITYOMMUNITY SSAFETYAFETY
Cobb County Health Status Report, 2010 112
EMERGENCY PREPAREDNESS AND RESPONSE
Cobb & Douglas Public Health (CDPH) conducts emergency preparedness planning, training, exercising and response to all hazard emergency events which have the potential to affect the entire population. Recent events that required public health emergency response in Cobb County include the 2009 Flood, the H1N1 pandemic, and the receiving of Haitian earthquake victims through activation of
the National Disaster Medical System (NDMS).
CDPH’s Center for Emergency
Preparedness and Response may be contacted at (770) 514-2333.

Back to TOC

114 Cobb County Health Status Report, 2010
EENVIRONMENTALNVIRONMENTAL HHEALTHEALTH
The environment plays an important role in human development and health. People born today have a life
expectancy about twice that of people born a century ago. The National Institute of Environmental Health
Sciences attributes most of these additional years to healthful environmental changes such as improved
sanitation, purified water, cleaner air and the safer use of chemicals.
Hippocrates, the Father of Medicine said:
“If you want to learn about the health of the population, look at the air they breathe, the water they drink, and the places where they live.”
CDPH’s Center for Environmental Health administers the following environmental health
services in the county:
Plan review, permitting, inspection and complaint investigation of: Food service establishments Public swimming pools Tourist accommodations Mobile home parks On-site sewage management systems and pumper operations
Investigation of foodborne, waterborne and vectorborne diseases Food safety training and certification Investigation of general nuisance complaints concerning sewage, insects, rodents, solid wastes, and other
environmental issues On-site sewage contractor testing and certification Inspection and testing of individual water wells West Nile virus surveillance, technical assistance and complaint investigation Radon education and testing Childhood Lead Poisoning Prevention Program

Cobb County Health Status Report, 2010 115
EENVIRONMENTALNVIRONMENTAL HHEALTHEALTH
AIR QUALITY
Federal and state standards are set for air quality. These standards define levels of quality that are necessary, with an adequate margin of safety, to protect the public from known or anticipated harmful effects of pollutants. The Georgia Environmental Protection Division (EPD) monitors air quality year-round on pollutants with the exception of ozone, which is measured March through November. The Air Quality Index (AQI) converts the measured pollutant concentration in a community’s air to a number on a scale of 0 to 500. A pollutant reading is in the unsatisfactory range if it exceeds 100. Cobb County AQI is part of the Metropolitan Atlanta AQI. You may access air quality on any given day at www.georgiaepd.org.
OZONE The air quality standard for ozone, which is designed to protect public health with an adequate margin of safety, is established by the United States Environmental Protection Agency (EPA). In 2008, EPA revised the 8-hour average ozone standard to lower the thresholds for ozone levels reported as 'unhealthy'. The air quality standard for ozone is 0.075 parts per million (ppm) averaged over eight hours. According to the EPA, ground-level ozone, a primary component of smog, is one of the major air pollution problems in the United States. Ozone is measured March through November at 24 sites across Georgia, one of which is in Kennesaw. In 2009, there were 14 days in metropolitan Atlanta where the ozone level exceeded standards set by the EPA. You may access ozone levels on any given day by going to www.georgiaepd.org.
In 2009, Metropolitan Atlanta (which includes
Cobb County) overall air
quality measured in the
unhealthy range 16 out of
340 days measured.

116 Cobb County Health Status Report, 2010
EENVIRONMENTALNVIRONMENTAL HHEALTHEALTH
WATER QUALITY
Cobb County receives its drinking water from the Cobb County-
Marietta Water Authority, a regional wholesale provider. Cobb’s
drinking water originates entirely in Georgia and is delivered to
residents by the Cobb County Water System. The System is an
award winning provider that has been nationally and locally
recognized for excellence in water systems.
Drinking water, including bottled water, may reasonably be expected
to contain at least small amounts of some contaminants. The
presence of contaminants does not necessarily indicate that water
poses a health risk. Contaminants that may be present include
microbial, inorganic, pesticides, herbicides, organic and radioactive.
More information about contaminants and potential health effects can be obtained
by calling the EPA’s Safe Drinking Water Hotline at 1-800-426-4791.
People more vulnerable to contaminants in drinking include:
Immuno-compromised persons, such as persons with cancer undergoing chemotherapy, persons who have undergone organ transplants, people with HIV/AIDS or other immune system disorders
Some elderly people Infants
Each year the Cobb County Water System publishes an annual water quality report. You may access the current
and past reports by going to www.cobbwater.org.
The Cobb County Water System reported that in 2009
drinking water met or exceeded all safety and quality standards set by the State of Georgia and
the EPA.
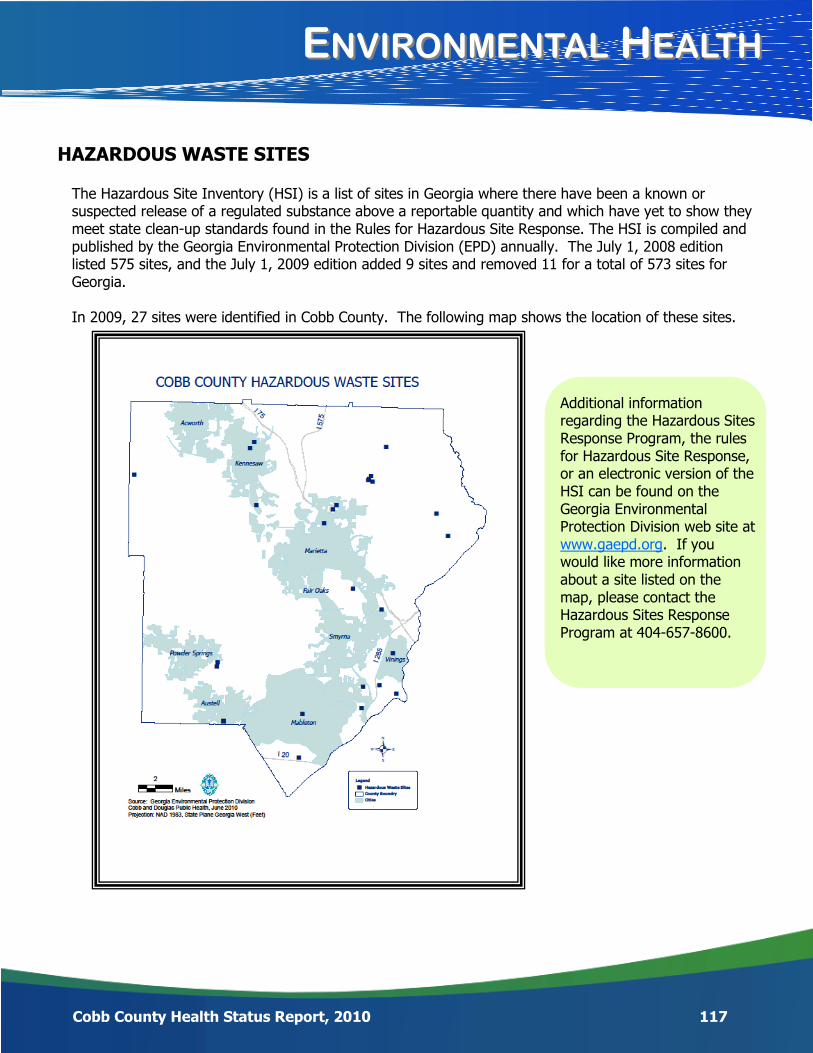
Cobb County Health Status Report, 2010 117
EENVIRONMENTALNVIRONMENTAL HHEALTHEALTH
HAZARDOUS WASTE SITES
The Hazardous Site Inventory (HSI) is a list of sites in Georgia where there have been a known or suspected release of a regulated substance above a reportable quantity and which have yet to show they meet state clean-up standards found in the Rules for Hazardous Site Response. The HSI is compiled and published by the Georgia Environmental Protection Division (EPD) annually. The July 1, 2008 edition listed 575 sites, and the July 1, 2009 edition added 9 sites and removed 11 for a total of 573 sites for Georgia. In 2009, 27 sites were identified in Cobb County. The following map shows the location of these sites.
Additional information regarding the Hazardous Sites Response Program, the rules for Hazardous Site Response, or an electronic version of the HSI can be found on the Georgia Environmental Protection Division web site at www.gaepd.org. If you would like more information about a site listed on the map, please contact the Hazardous Sites Response Program at 404-657-8600.
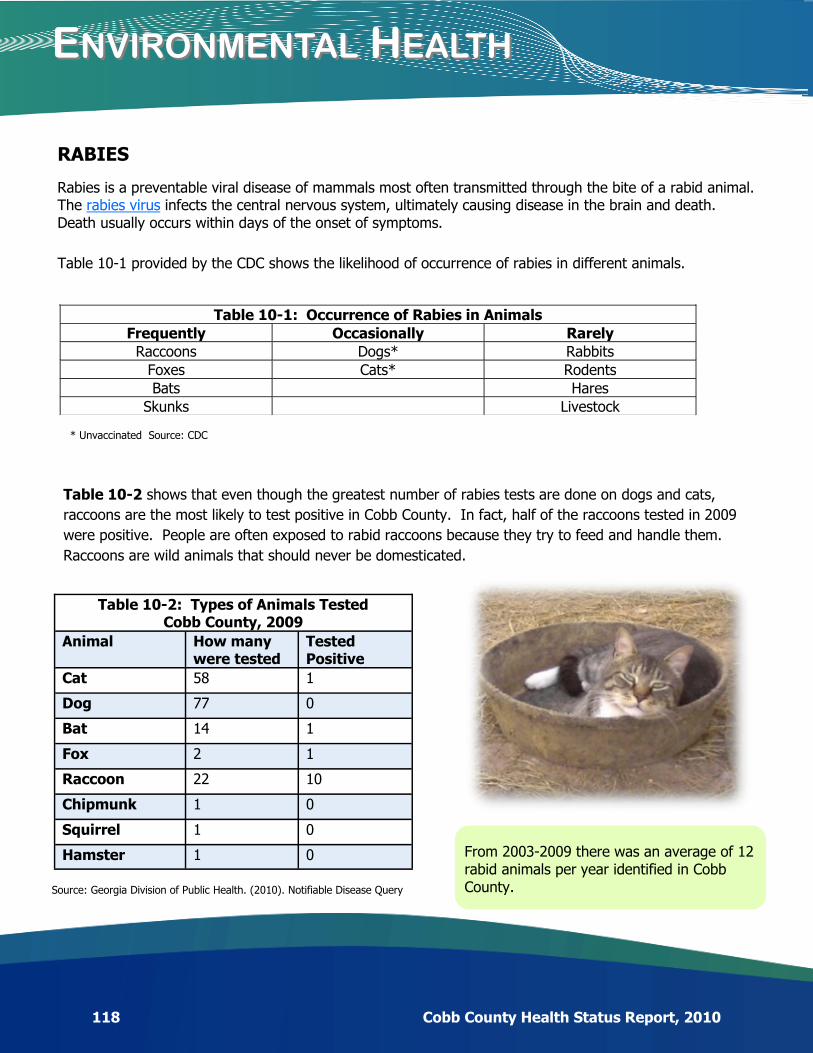
118 Cobb County Health Status Report, 2010
EENVIRONMENTALNVIRONMENTAL HHEALTHEALTH
RABIES
Rabies is a preventable viral disease of mammals most often transmitted through the bite of a rabid animal. The rabies virus infects the central nervous system, ultimately causing disease in the brain and death. Death usually occurs within days of the onset of symptoms.
Table 10-1 provided by the CDC shows the likelihood of occurrence of rabies in different animals.
Table 10-1: Occurrence of Rabies in Animals
Frequently Occasionally Rarely
Raccoons Dogs* Rabbits
Foxes Cats* Rodents
Bats Hares
Skunks Livestock
* Unvaccinated Source: CDC
Table 10-2 shows that even though the greatest number of rabies tests are done on dogs and cats,
raccoons are the most likely to test positive in Cobb County. In fact, half of the raccoons tested in 2009
were positive. People are often exposed to rabid raccoons because they try to feed and handle them.
Raccoons are wild animals that should never be domesticated.
Table 10-2: Types of Animals Tested Cobb County, 2009
Animal How many were tested
Tested Positive
Cat 58 1
Dog 77 0
Bat 14 1
Fox 2 1
Raccoon 22 10
Chipmunk 1 0
Squirrel 1 0
Hamster 1 0 From 2003-2009 there was an average of 12 rabid animals per year identified in Cobb County. Source: Georgia Division of Public Health. (2010). Notifiable Disease Query
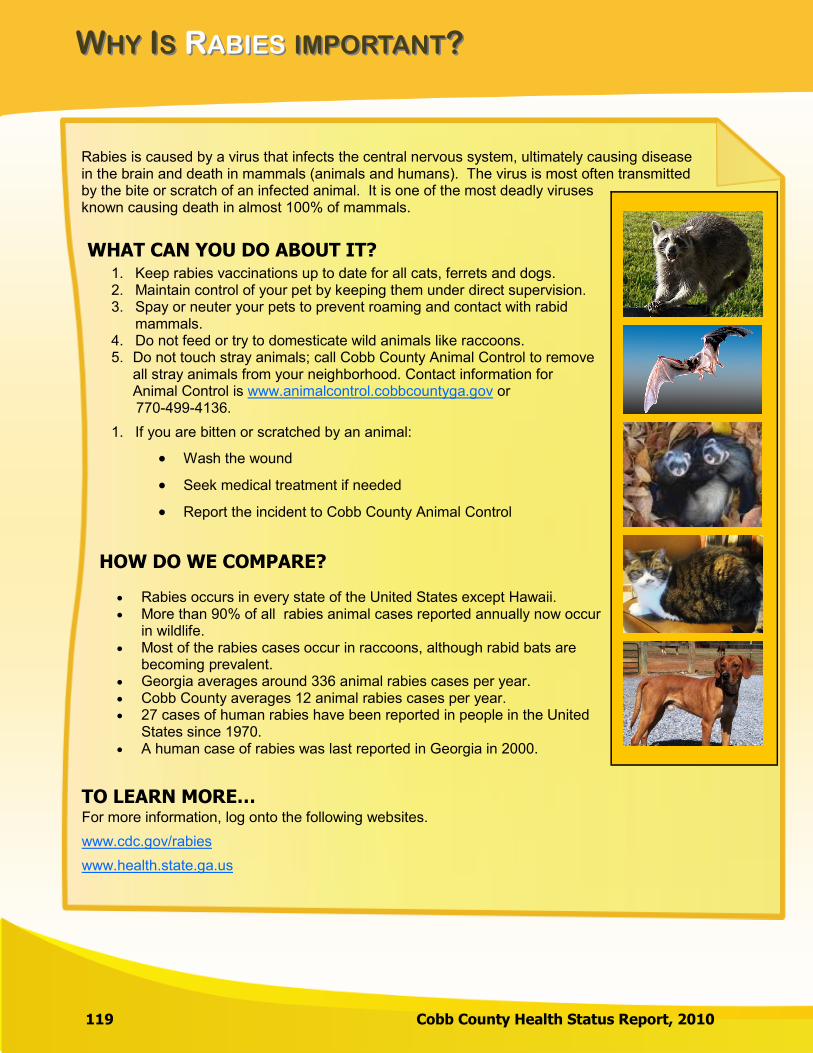
WWHYHY IISS RRABIESABIES IMPORTANTIMPORTANT??
119 Cobb County Health Status Report, 2010
Rabies is caused by a virus that infects the central nervous system, ultimately causing disease in the brain and death in mammals (animals and humans). The virus is most often transmitted by the bite or scratch of an infected animal. It is one of the most deadly viruses known causing death in almost 100% of mammals.
WHAT CAN YOU DO ABOUT IT? 1. Keep rabies vaccinations up to date for all cats, ferrets and dogs. 2. Maintain control of your pet by keeping them under direct supervision. 3. Spay or neuter your pets to prevent roaming and contact with rabid
mammals. 4. Do not feed or try to domesticate wild animals like raccoons. 5. Do not touch stray animals; call Cobb County Animal Control to remove
all stray animals from your neighborhood. Contact information for Animal Control is www.animalcontrol.cobbcountyga.gov or 770-499-4136.
1. If you are bitten or scratched by an animal:
Wash the wound
Seek medical treatment if needed
Report the incident to Cobb County Animal Control
HOW DO WE COMPARE?
Rabies occurs in every state of the United States except Hawaii. More than 90% of all rabies animal cases reported annually now occur
in wildlife. Most of the rabies cases occur in raccoons, although rabid bats are
becoming prevalent. Georgia averages around 336 animal rabies cases per year. Cobb County averages 12 animal rabies cases per year. 27 cases of human rabies have been reported in people in the United
States since 1970. A human case of rabies was last reported in Georgia in 2000.
TO LEARN MORE… For more information, log onto the following websites.
www.cdc.gov/rabies
www.health.state.ga.us

120 Cobb County Health Status Report, 2010
EENVIRONMENTALNVIRONMENTAL HHEALTHEALTH
VECTOR-BORNE DISEASES
Diseases that are carried by arthropods such as mosquitoes and ticks are called vector-borne diseases.
West Nile virus (WNV) is a potentially serious vector-borne illness that appeared in the eastern United States in 1999. Most often, WNV is spread by the bite of an infected mosquito. Mosquitoes become infected when they feed on infected birds. Infected mosquitoes can then spread WNV to humans and other animals when they bite.
Important facts about WNV include:
1 in 150 people infected with the virus develop severe illness, which can include paralysis.
4 out of 5 people who are infected with the virus never show any symptoms and do not seek medical care.
10 human WNV cases were confirmed in Cobb County from 2005-2009.
Did you know…
The Cobb & Douglas Public Health (CDPH) Epidemiology Team interviews reported human cases of WNV. These interviews provide valuable epidemiological data as well as education to infected residents. The CDPH Environmental Health staff work in conjunction with the Cobb County Water Authority to place larvicide in standing water throughout the county and investigate mosquito complaints. Larvicide kills mosquito larvae before they become biting adults. Residents may call the CDPH Environmental Health Program to report mosquito complaints at 770-435-7815.
WHAT CAN YOU DO TO PREVENT WNV?
The best way to avoid WNV is to prevent mosquito bites.
Use insect repellent containing DEET, Picaridin, Oil of Lemon Eucalyptus (or PMD), or IR3535. Pregnant
women should contact their healthcare provider before using repellent.
Avoid outdoor activities at dawn and dusk when mosquitoes are most active.
Make sure you have good screens on your windows and doors to keep mosquitoes out.
Get rid of mosquito breeding sites by emptying standing water from flower pots, buckets and barrels.
Change the water in pet dishes and replace the water in bird baths weekly.
Drill holes in tire swings so water drains out.
Keep children's wading pools empty and on their sides when not in use.

Back to TOC

IIMPROVINGMPROVING OOURUR CCOMMUNITYOMMUNITY
122 Cobb County Health Status Report, 2010
MAPP
We hope the information in this report provided you with valuable knowledge regarding the health of Cobb County – the community in which we live, work and play. We all have a responsibility and must work together to make ourselves, our families, our neighborhoods, and our county healthy.
In 2011, Cobb County will begin a very important initiative called MAPP (Mobilizing for Action through Planning and Partnerships). MAPP is a community-wide strategic planning process
for improving our community’s health. In this context, we broadly think of “health” as a dynamic state of complete physical, mental, spiritual and social well-being and not merely the absence of disease or infirmity (World Health Organization, 1998). Although Cobb & Douglas Public Health leadership will facilitate the MAPP process, participation and ownership
will be spread throughout the community. It is a community-driven process that will engage
and seek active participation from schools, faith-based organizations, local business, local government, hospi-tals, physicians, behavioral health services, philanthropists, foundations, parks & recreation services, mass transit, police, fire, EMS, employers, and civic groups…just to name a few! Broad community participation is essential because a wide range of organizations and individuals contribute to our community’s health.
Through MAPP, a broad collection of system partners and community residents will come together to:
Prioritize public health issues Identify resources for addressing them, and
Take action!
The model below shows how the MAPP process works – the phases of MAPP are shown along a road that leads to “A Healthier Cobb.”
Model provided by NACCHO (National Association of County and City Health Officials)
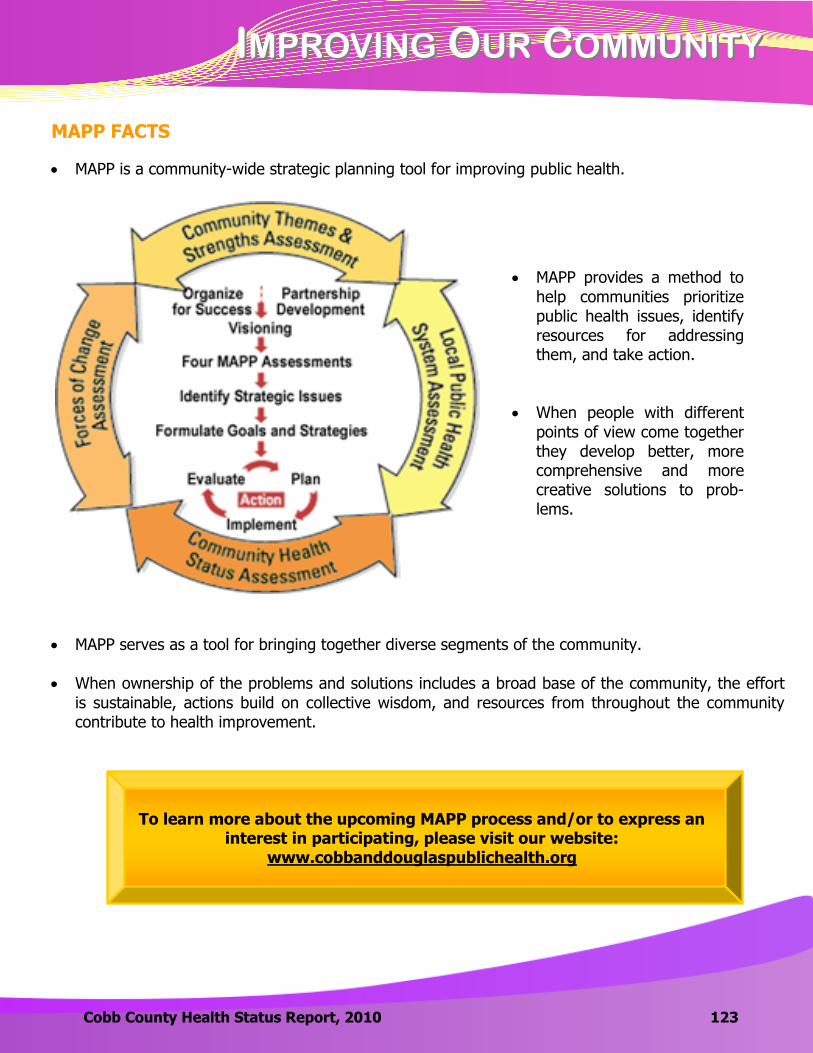
IIMPROVINGMPROVING OOURUR CCOMMUNITYOMMUNITY
Cobb County Health Status Report, 2010 123
MAPP FACTS
MAPP is a community-wide strategic planning tool for improving public health.
MAPP serves as a tool for bringing together diverse segments of the community.
When ownership of the problems and solutions includes a broad base of the community, the effort
is sustainable, actions build on collective wisdom, and resources from throughout the community contribute to health improvement.
MAPP provides a method to
help communities prioritize public health issues, identify resources for addressing them, and take action.
When people with different
points of view come together they develop better, more comprehensive and more creative solutions to prob-lems.
To learn more about the upcoming MAPP process and/or to express an interest in participating, please visit our website:
www.cobbanddouglaspublichealth.org
Back to TOC

125 Cobb County Health Status Report, 2010
AABOUTBOUT UUSS

AABOUTBOUT UUSS
Cobb County Health Status Report, 2010 126
CCOBBOBB HHEALTHEALTH FFUTURESUTURES FFOUNDATIONOUNDATION, I, INCNC..
WHY SUPPORT COBB PUBLIC HEALTH?
Today, Cobb Public Health operates over 35 different programs, many of them receiving little or no public funding. Our clients—especially the children—are the ones who suffer most as we continue to face cuts to some of our most important services. Below are just a few of our programs in need of private support: Babies Born Healthy: Saves the lives of women and infants by providing under- and uninsured pregnant
women with early prenatal care to help reduce infant mortality. Children 1st: Improves children’s well-being and chances for success in school by identifying their medical
and developmental issues and linking them to the necessary services. Adolescent Health & Youth Development: Helps keep teens out of trouble by providing health and
youth development opportunities designed to reduce risky behaviors. Injury Prevention/Safe Kids: Reduces children’s accidents by providing car seat inspections along with
education on poison prevention, pedestrian and bicycle safety, and home and water safety. Breast & Cervical Cancer Prevention: Saves women’s lives by providing access to breast and cervical
cancer screenings and diagnostics for low-income, uninsured, and underserved women.
HOW TO SUPPORT THE PROGRAMS OF COBB PUBLIC HEALTH
Contributions can be accepted directly by Cobb Public Health or through the Cobb Health Futures Foundation, our 501(c)3 development affiliate that allows individuals, corporations, and foundations to contribute tax de-ductible gifts to support our public health programming. For more information, contact Jan Heidrich-Rice in our Development Department at (770) 514-2325 or [email protected].
ABOUT OUR FOUNDATION
The Cobb Health Futures Foundation, Inc. is a 501(c)3 philanthropic arm of public health in the Cobb
County. Incorporated in 1994, the foundation’s purpose is to support the mission it shares with Cobb Public
Health, which is, with our partners, to promote and protect the health and safety of the residents of our
county—the mission to which our county board of health has been committed since 1920.
127 Cobb County Health Status Report, 2010
AABOUTBOUT UUSS
Programs & Services Description Contact Information
Adolescent Health &
Youth Development
(AHYD)
Provides health & sexuality education and
positive youth development opportunities
designed to reduce risky behaviors among
adolescents 10-19 years of age through
education, health services and community
partnerships.
Agnes F. Brown
Director, AHYD
(678) 385-1371
(678) 385-1376 (fax)
Babies Born Healthy
Offers prenatal services at a discount through
participating obstetric offices to help reduce
infant mortality; also may offer some financial
assistance towards this care.
Rose Bishop, RN, PHN
Supervisor, Family Support Pregnancy
Services
(770) 514-2376
(678) 354-0751 (fax)
Body Arts
Develops and enforces safety standards for
tattoo parlors.
Pat Koffman
County Manager, Environmental Health
(770) 438-5101
(770) 431-7410 (fax)
Breast & Cervical Cancer
Prevention
Provides access to timely breast and cervical
cancer screening and diagnostic services for
low-income, uninsured, and underserved
women.
Cheri Holden, RN
Coordinator, BreasTest & More
(770) 514-2314
Child Health
Provides health care services to low-income or
uninsured children through health checks,
mental assessments, and developmental
evaluations. Provides pediatric primary care at
key locations.
Deborah S. Heaton, RN
District Director, Child Health, School Health,
& Dental Health
(770) 514-2339
(770) 514-2414 (fax)
Children 1st
Increases access to health care for children,
identifies medical/ developmental issues in
children, and links them to necessary services
as soon as identified.
Kathy Woods, RN
Supervisor, Cobb County Family Support
(770) 514-2404
(678) 354-0751 (fax)
Children's Medical
Services (CMS)
Helps coordinate a comprehensive system of
healthcare for children and youth from birth to
twenty-one years of age who have eligible
chronic medical conditions which may include
special needs caused by medical, behavioral,
developmental, learning or mental health
factors.
Carol VanderPlate, RN,C.
Supervisor, CMS
(770) 432-0112 x2121
(770) 432-1774 (fax)
COBB & DOUGLAS PUBLIC HEALTH PROGRAMS AND SERVICES

AABOUTBOUT UUSS
Cobb County Health Status Report, 2010 128
Programs & Services Description Contact Information
Chronic Disease
Prevention
Implements programs and services aimed at
reducing disease risks by targeting unhealthy
behaviors, providing access to early detection
and treatment, and improving management to
reduce the burden of diabetes, obesity,
asthma, cardiovascular disease, and tobacco
abuse.
Cathy Wendholt-McDade
District Health Behaviors Director
(770) 432-1980
(770) 432-1774 (fax)
Early Intervention
Babies Can't Wait
Serves as an early intercession system for the
families of special-needs infants and toddlers,
ages birth to 3 years old.
Beth Mathison, MEd
Children and Youth with Special Needs
District Director
(770) 514-2462
(770) 514-2803 (fax)
Emergency
Preparedness &
Response
Conducts preparedness planning, training,
exercising and response to all hazard
emergency events which have the potential to
affect the entire population.
Pam Blackwell, RN
Director, Center for Emergency Preparedness
and Response
(770) 514-2333
(678) 784-1075 (fax)
Epidemiology & Disease
Surveillance
Follows up on reports of notifiable illnesses in
the district; conducts contact investigation and,
when appropriate, provides medication to
those contacts at risk.
Joy Wells, MPH
Director, Epidemiology and Infectious
Diseases
(770) 514-2747
(770) 514-2313 (fax)
Family Planning
Provides education and services to help reduce
unintended pregnancies, to improve birth
outcomes through preconceptual health
promotion, and to promote the health of
mothers by providing basic reproductive health
care to women in need.
Patti Duckworth, RN, DNP, APRN, BC
Director, Clinical Nursing Services
(770) 514-2496
(770) 514-2414 (fax)
Food Service
Enforces local and state food service
regulations for over 2,100 establishments in
order to prevent the occurrence of foodborne
illnesses and to ensure a standard level of food
safety in retail and institutional food facilities.
Karen Gulley
County Manager, Environmental Health
(678) 385-5066
High Risk Infant
Follow-Up
Provides services to infants, birth to age one,
who are at increased risk for health and
developmental problems due to their medical
conditions at birth.
Kathy Woods, RN
Supervisor, Cobb County Family Support
(770) 514-2404
(678) 354-0751 (fax)
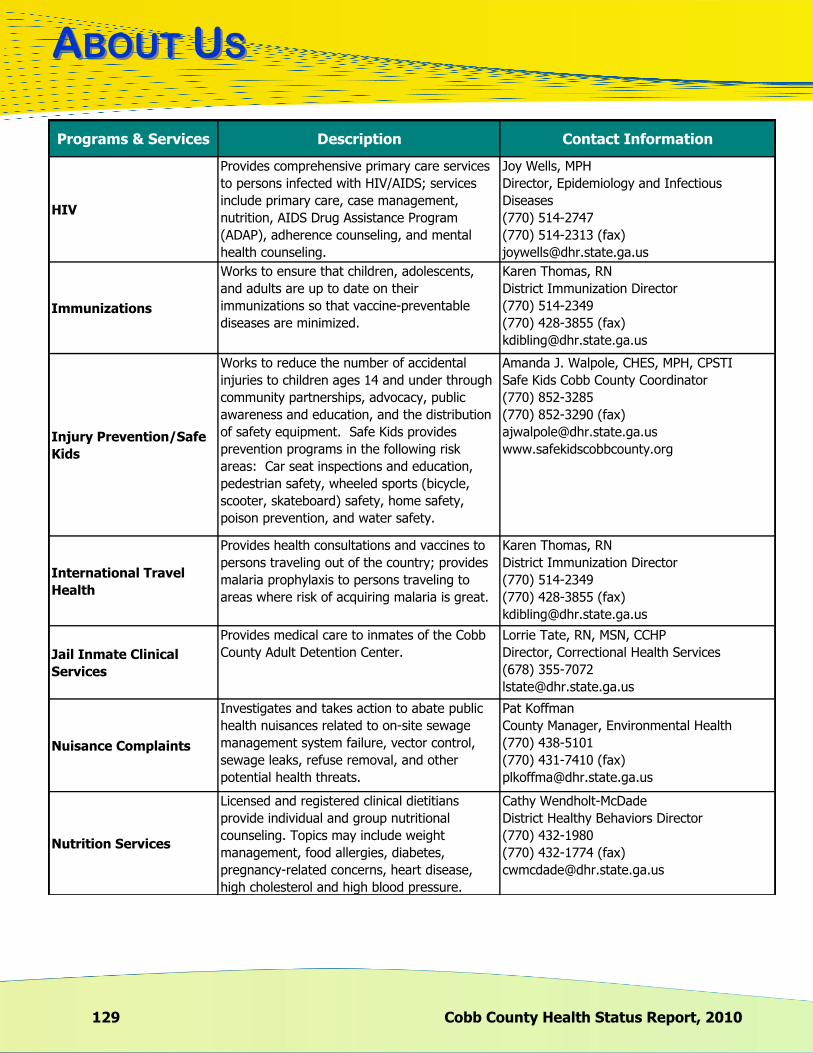
129 Cobb County Health Status Report, 2010
AABOUTBOUT UUSS
Programs & Services Description Contact Information
HIV
Provides comprehensive primary care services
to persons infected with HIV/AIDS; services
include primary care, case management,
nutrition, AIDS Drug Assistance Program
(ADAP), adherence counseling, and mental
health counseling.
Joy Wells, MPH
Director, Epidemiology and Infectious
Diseases
(770) 514-2747
(770) 514-2313 (fax)
Immunizations
Works to ensure that children, adolescents,
and adults are up to date on their
immunizations so that vaccine-preventable
diseases are minimized.
Karen Thomas, RN
District Immunization Director
(770) 514-2349
(770) 428-3855 (fax)
Injury Prevention/Safe
Kids
Works to reduce the number of accidental
injuries to children ages 14 and under through
community partnerships, advocacy, public
awareness and education, and the distribution
of safety equipment. Safe Kids provides
prevention programs in the following risk
areas: Car seat inspections and education,
pedestrian safety, wheeled sports (bicycle,
scooter, skateboard) safety, home safety,
poison prevention, and water safety.
Amanda J. Walpole, CHES, MPH, CPSTI
Safe Kids Cobb County Coordinator
(770) 852-3285
(770) 852-3290 (fax)
www.safekidscobbcounty.org
International Travel
Health
Provides health consultations and vaccines to
persons traveling out of the country; provides
malaria prophylaxis to persons traveling to
areas where risk of acquiring malaria is great.
Karen Thomas, RN
District Immunization Director
(770) 514-2349
(770) 428-3855 (fax)
Jail Inmate Clinical
Services
Provides medical care to inmates of the Cobb
County Adult Detention Center.
Lorrie Tate, RN, MSN, CCHP
Director, Correctional Health Services
(678) 355-7072
Nuisance Complaints
Investigates and takes action to abate public
health nuisances related to on-site sewage
management system failure, vector control,
sewage leaks, refuse removal, and other
potential health threats.
Pat Koffman
County Manager, Environmental Health
(770) 438-5101
(770) 431-7410 (fax)
Nutrition Services
Licensed and registered clinical dietitians
provide individual and group nutritional
counseling. Topics may include weight
management, food allergies, diabetes,
pregnancy-related concerns, heart disease,
high cholesterol and high blood pressure.
Cathy Wendholt-McDade
District Healthy Behaviors Director
(770) 432-1980
(770) 432-1774 (fax)

AABOUTBOUT UUSS
Cobb County Health Status Report, 2010 130
Programs & Services Description Contact Information
Onsite Sewage
Management Systems
Provides ongoing surveillance to ensure proper
installation and functioning of onsite sewage
management systems, helping more than
50,000 households and businesses effectively
treat and dispose of liquid waste.
Pat Koffman
County Manager, Environmental Health
(770) 438-5101
(770) 431-7410 (fax)
Oral Health/Dental
Conducts dental screenings and provides
dental services for children ages 2 to 20,
including composite fillings, sealants,
cleanings, fluoride treatments, stainless steel
crowns, pulpotomies, and extractions; provides
dental health education in the community.
Penny H. Madderra, RDH
District Dental Manager
(770) 514-2373
Perinatal Case
Management
Encourages early prenatal care by reducing the
barriers to getting medical care, assisting with
the Medicaid process, and providing healthy
pregnancy education and community referrals.
Rose Bishop, RN, PHN
Supervisor, Family Support Pregnancy
Services
(770) 514-2376
(678) 354-0751 (fax)
Pharmacy Services
Provides a large formulary of low cost
medications related to clinical programs such
as Pediatric Primary Care, Family Planning,
Sexually Transmitted Infections, HIV and other
programs; also provides pharmacy services to
low income clients of several area medical
clinics.
Jeff McGhee, RPh
Pharmacy Director
(770) 514-2350
Private Water Systems
Assures the proper location of wells and
encourages the routine testing of well water to
prevent the transmission of waterborne
diseases to individuals that consume well
water.
Pat Koffman
County Manager, Environmental Health
(770) 438-5101
(770) 431-7410 (fax)
Public Swimming Pools
Enforces a local, comprehensive swimming
pool regulation to address the 1,300 public
swimming pools that are operated within the
health district.
Karen Gulley
County Manager, Environmental Health
(678) 385-5066
Radon Follow-Up
Educates the public concerning health risks
associated with radon; provides radon testing
and mitigation resources.
Pat Koffman
County Manager, Environmental Health
(770) 438-5101
(770) 431-7410 (fax)
School Health
Provides support and guidance to district
School Health nurses; coordinates and
conducts scoliosis, hearing, vision & dental
screenings and referrals; provides the first line
access of health care available to non-Medicaid
or low-income, uninsured children in the
Marietta City Schools; connects children to
health care resources.
Deborah S. Heaton, RN
District Director, Child Health, School Health,
& Dental Health
(770) 514-2339
(770) 514-2414 (fax)

131 Cobb County Health Status Report, 2010
AABOUTBOUT UUSS
Programs & Services Description Contact Information
Sexually Transmitted
Disease
Works to reduce morbidity associated with
sexually transmitted infections, thereby
preventing STIs and their complications.
Patti Duckworth, RN, DNP, APRN, BC
Director, Clinical Nursing Services
(770) 514-2496
(770) 514-2414 (fax)
TB (Tuberculosis)
Identifies and treats persons who have active
TB disease; finds, screens, and treats contacts;
and screens high-risk populations in an effort
to control transmission, prevent illness and
ensure treatment of disease due to
tuberculosis.
Phyllistine Gardner
District Coordinator
Tuberculosis Clinic
(770) 514-2343
(770) 514-2801 (fax)
Tourist
Accommodations
Conducts design and routine inspections for
over 130 tourist accommodations operated
throughout the district, ensuring that minimum
standards regarding construction,
maintenance, and operations are met.
Karen Gulley
County Manager, Environmental Health
(678) 385-5066
Trailer Parks
Assures a standard level of park safety and
sanitation through routine inspections and
enforcement actions related to garbage
disposal, rodent harborage, sewage leaks,
drinking water safety, and general sanitation
issues.
Pat Koffman
County Manager, Environmental Health
(770) 438-5101
(770) 431-7410 (fax)
Universal Newborn
Hearing Screening
Educates medical providers and parents as to
the importance of infant hearing screening and
tracks children in need of follow-up hearing
evaluations.
Laurie A. Ross, RN
District Director, Birth to Five Division
(770) 514-2460
(770) 514-2414 (fax)
Vital Records Services
Provides access to birth certificates for
individuals born in most counties in
Georgia. Also provides access to death
certificates for individuals who died in Cobb
County or individuals who were a resident of
Cobb County at the time of death and died in
another county in the State of Georgia.
Balvina Garcia
Supervisor, Vital Records Office
(770) 514-2337
West Nile Virus-
Mosquito Control
Fights to prevent mosquito-borne illnesses;
strives to eliminate mosquito breeding sites
through education, larviciding, and complaint
investigation.
Peter Imhoff
Assistant Director, Environmental Health
(770) 438-5110
Women, Infants and
Children (WIC)
(Special Supplemental Nutrition Program for
Women, Infants and Children) provides
nutrition assessment, health screening,
medical history, body measurement (weight
and height), hemoglobin check, nutrition
education, breast-feeding support and
education, and vouchers for healthy foods.
Barbara Stahnke, MEd, RD, LD
WIC/Nutrition Services
Nutrition Services Director
(770) 514-2453
(770) 514-2414 (fax)

Back to TOC
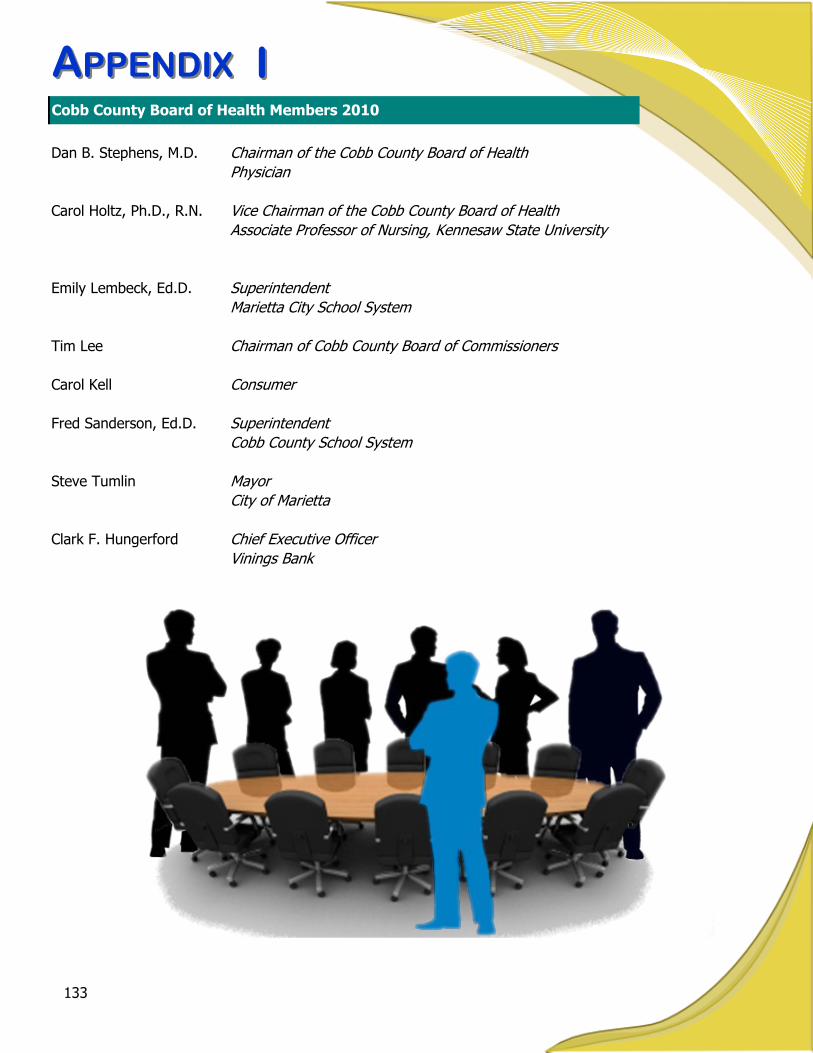
AAPPENDIXPPENDIX
133
II
Dan B. Stephens, M.D. Chairman of the Cobb County Board of Health
Physician
Carol Holtz, Ph.D., R.N. Vice Chairman of the Cobb County Board of Health
Associate Professor of Nursing, Kennesaw State University
Emily Lembeck, Ed.D. Superintendent
Marietta City School System
Tim Lee Chairman of Cobb County Board of Commissioners
Carol Kell Consumer
Fred Sanderson, Ed.D. Superintendent
Cobb County School System
Steve Tumlin Mayor
City of Marietta
Clark F. Hungerford Chief Executive Officer
Vinings Bank
Cobb County Board of Health Members 2010
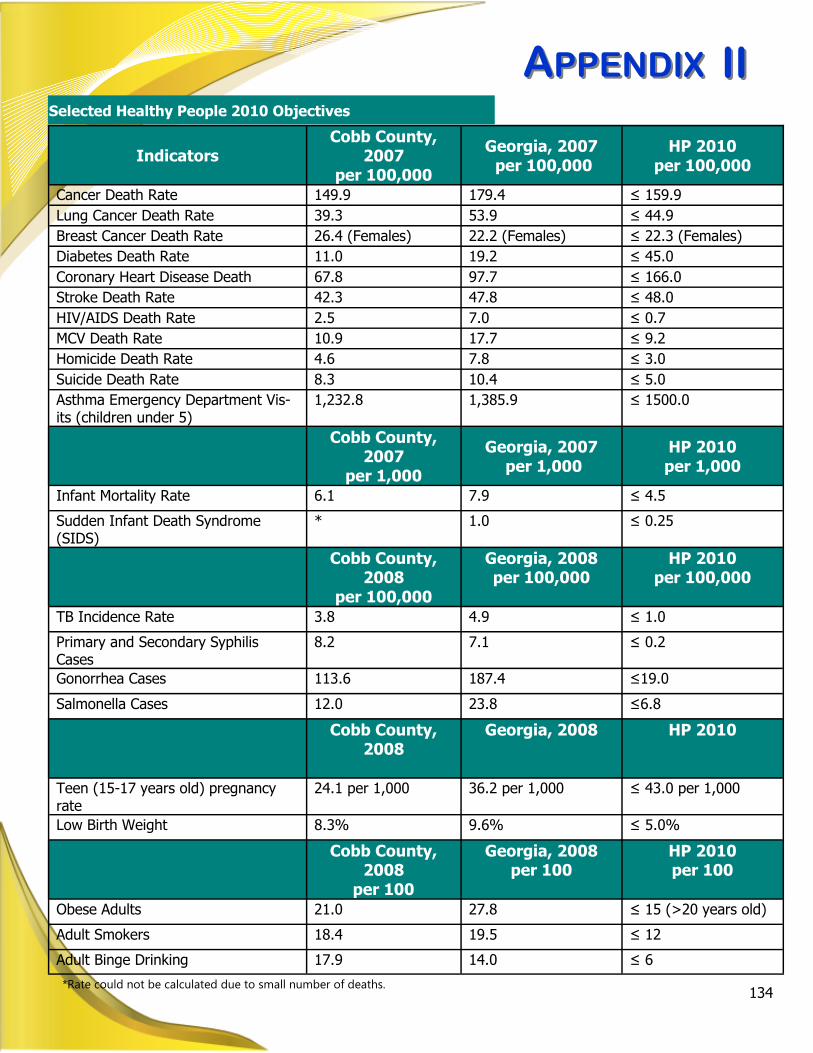
AAPPENDIXPPENDIX
134
IIII
*Rate could not be calculated due to small number of deaths.
Selected Healthy People 2010 Objectives
Indicators
Cobb County, 2007
per 100,000
Georgia, 2007
per 100,000
HP 2010
per 100,000
Cancer Death Rate 149.9 179.4 ≤ 159.9
Lung Cancer Death Rate 39.3 53.9 ≤ 44.9
Breast Cancer Death Rate 26.4 (Females) 22.2 (Females) ≤ 22.3 (Females)
Diabetes Death Rate 11.0 19.2 ≤ 45.0
Coronary Heart Disease Death 67.8 97.7 ≤ 166.0
Stroke Death Rate 42.3 47.8 ≤ 48.0
HIV/AIDS Death Rate 2.5 7.0 ≤ 0.7
MCV Death Rate 10.9 17.7 ≤ 9.2
Homicide Death Rate 4.6 7.8 ≤ 3.0
Suicide Death Rate 8.3 10.4 ≤ 5.0
Asthma Emergency Department Vis-its (children under 5)
1,232.8 1,385.9 ≤ 1500.0
Cobb County, 2007
per 1,000
Georgia, 2007
per 1,000
HP 2010
per 1,000
Infant Mortality Rate 6.1 7.9 ≤ 4.5
Sudden Infant Death Syndrome (SIDS)
* 1.0 ≤ 0.25
Cobb County, 2008
per 100,000
Georgia, 2008
per 100,000
HP 2010
per 100,000
TB Incidence Rate 3.8 4.9 ≤ 1.0
Primary and Secondary Syphilis Cases
8.2 7.1 ≤ 0.2
Gonorrhea Cases 113.6 187.4 ≤19.0
Salmonella Cases 12.0 23.8 ≤6.8
Cobb County, 2008
Georgia, 2008
HP 2010
Teen (15-17 years old) pregnancy rate
24.1 per 1,000 36.2 per 1,000 ≤ 43.0 per 1,000
Low Birth Weight 8.3% 9.6% ≤ 5.0%
Cobb County, 2008
per 100
Georgia, 2008
per 100
HP 2010
per 100
Obese Adults 21.0 27.8 ≤ 15 (>20 years old)
Adult Smokers 18.4 19.5 ≤ 12
Adult Binge Drinking 17.9 14.0 ≤ 6
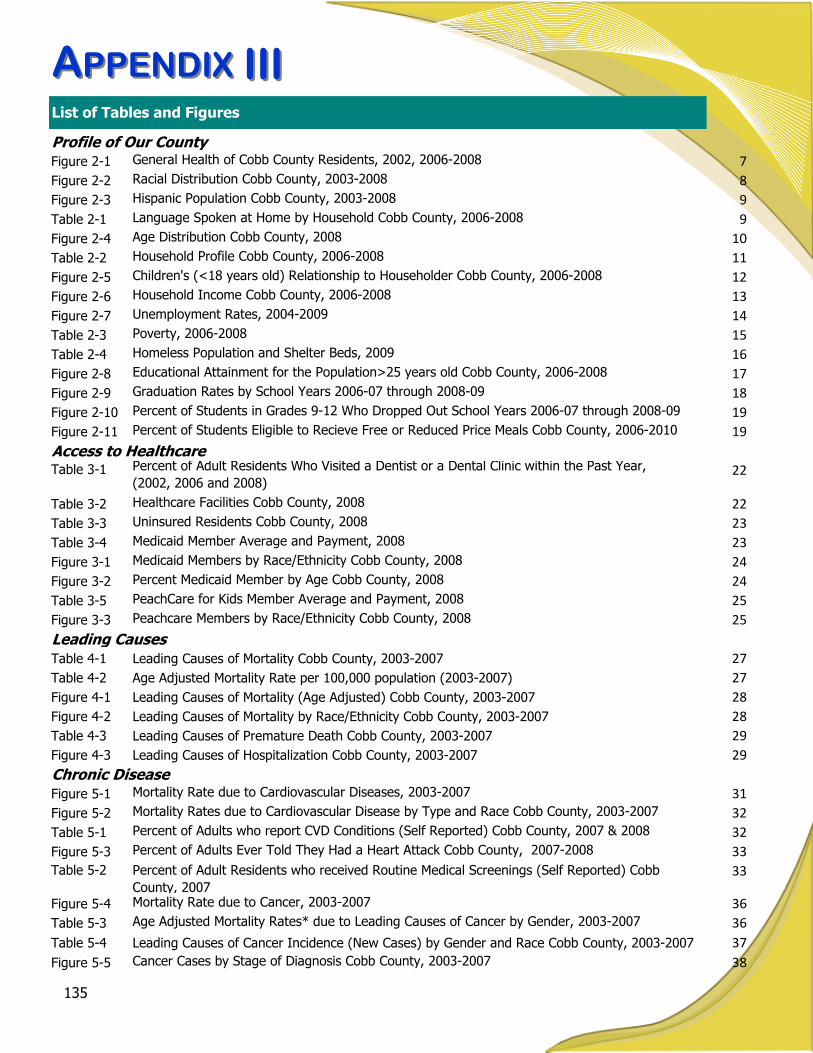
AAPPENDIXPPENDIX
135
List of Tables and Figures
IIIIII
Profile of Our CountyFigure 2-1 General Health of Cobb County Residents, 2002, 2006-2008 7
Figure 2-2 Racial Distribution Cobb County, 2003-2008 8
Figure 2-3 Hispanic Population Cobb County, 2003-2008 9
Table 2-1 Language Spoken at Home by Household Cobb County, 2006-2008 9
Figure 2-4 Age Distribution Cobb County, 2008 10
Table 2-2 Household Profile Cobb County, 2006-2008 11
Figure 2-5 Children's (<18 years old) Relationship to Householder Cobb County, 2006-2008 12
Figure 2-6 Household Income Cobb County, 2006-2008 13
Figure 2-7 Unemployment Rates, 2004-2009 14
Table 2-3 Poverty, 2006-2008 15
Table 2-4 Homeless Population and Shelter Beds, 2009 16
Figure 2-8 Educational Attainment for the Population>25 years old Cobb County, 2006-2008 17
Figure 2-9 Graduation Rates by School Years 2006-07 through 2008-09 18
Figure 2-10 Percent of Students in Grades 9-12 Who Dropped Out School Years 2006-07 through 2008-09 19
Figure 2-11 Percent of Students Eligible to Recieve Free or Reduced Price Meals Cobb County, 2006-2010 19
Access to HealthcareTable 3-1 Percent of Adult Residents Who Visited a Dentist or a Dental Clinic within the Past Year,
(2002, 2006 and 2008)22
Table 3-2 Healthcare Facilities Cobb County, 2008 22
Table 3-3 Uninsured Residents Cobb County, 2008 23
Table 3-4 Medicaid Member Average and Payment, 2008 23
Figure 3-1 Medicaid Members by Race/Ethnicity Cobb County, 2008 24
Figure 3-2 Percent Medicaid Member by Age Cobb County, 2008 24
Table 3-5 PeachCare for Kids Member Average and Payment, 2008 25
Figure 3-3 Peachcare Members by Race/Ethnicity Cobb County, 2008 25
Leading CausesTable 4-1 Leading Causes of Mortality Cobb County, 2003-2007 27
Table 4-2 Age Adjusted Mortality Rate per 100,000 population (2003-2007) 27
Figure 4-1 Leading Causes of Mortality (Age Adjusted) Cobb County, 2003-2007 28
Figure 4-2 Leading Causes of Mortality by Race/Ethnicity Cobb County, 2003-2007 28
Table 4-3 Leading Causes of Premature Death Cobb County, 2003-2007 29
Figure 4-3 Leading Causes of Hospitalization Cobb County, 2003-2007 29
Chronic DiseaseFigure 5-1 Mortality Rate due to Cardiovascular Diseases, 2003-2007 31
Figure 5-2 Mortality Rates due to Cardiovascular Disease by Type and Race Cobb County, 2003-2007 32
Table 5-1 Percent of Adults who report CVD Conditions (Self Reported) Cobb County, 2007 & 2008 32
Figure 5-3 Percent of Adults Ever Told They Had a Heart Attack Cobb County, 2007-2008 33
Table 5-2 Percent of Adult Residents who received Routine Medical Screenings (Self Reported) Cobb
County, 2007
33
Figure 5-4 Mortality Rate due to Cancer, 2003-2007 36
Table 5-3 Age Adjusted Mortality Rates* due to Leading Causes of Cancer by Gender, 2003-2007 36
Table 5-4 Leading Causes of Cancer Incidence (New Cases) by Gender and Race Cobb County, 2003-2007 37
Figure 5-5 Cancer Cases by Stage of Diagnosis Cobb County, 2003-2007 38

AAPPENDIXPPENDIX
136
Chronic Disease (continued)Table 5-5 Percent of Adult Residents Reporting Routine Preventative Cancer Screenings, 2008 38
Figure 5-6 Breast Cancer Cases by Stage of Diagnosis Cobb County, 2003-2007 39
Figure 5-7 Emergency Department Visits for Asthma by Age Groups Cobb County, 2003-2007 42
Figure 5-8 Percent of Adult Who Have Been Told They Currently Have Asthma (2002, 2006-2008) 42
Figure 5-9 Mortality Rate due to Diabetes, 2003-2007 45
Figure 5-10 Percent of Adults Ever Told They Are Diabetic, 2006-2008 45
Figure 5-11 Percent of Adult Females Ever Told They Have Pregnancy Related Diabetes 2006-2008 46
Figure 5-12 Mortality Rate due to Chronic Obstructive Pulmonary Disease (COPD), 2003-2007 49
Figure 5-13 Percent of Adults Classified as Heavy Drinkers* (2002, 2006-2008) 50
Figure 5-14 Percent of Adults Who Have Had at Least One Alcoholic Drink within the Last Thirty Days (2002,
2006-2008)50
Figure 5-15 Percent of Adults who Binge Drink*, 2006-2008 51
Figure 5-16 Mortality Rates due to Alcoholic Liver Disease 2003-2007 51
Figure 5-17 Percent of Adult Population Who Are Current Smokers (2002, 2006-2008) 52
Figure 5-18 Smoking Status of Adults Cobb County, 2008 52
Figure 5-19 Percent of Adults who are Overweight by BMI (2002, 2006-2008) 54
Figure 5-20 Percent of Adults who are Obese by BMI (2002, 2006-2008) 54
Figure 5-21 Percent of Adults Who Have Not Participated in Any Physical Activity During the Past Month
(2002, 2006-2008)55
Figure 5-22 Percent of Adults who Consume More Than 5 Fruit or Vegetables Daily (2002 & 2007) 55
Infectious DiseaseFigure 6-1 Chlamydia Rate, 2003-2008 57
Figure 6-2 Chlamydia Rate by Age Group 2003-2008 57
Figure 6-3 Gonorrhea Rate 2003-2008 59
Figure 6-4 Gonorrhea Rate by Age Group 2003-2008 59
Figure 6-5 Primary and Secondary Syphillis Rate, 2003-2008 60
Figure 6-6 Primary and Secondary Syphilis Rate by Age Group, 2003-2008 60
Figure 6-7 Newly Diagnosed HIV/AIDS Cases by Year Cobb County, 1992-2008 61
Figure 6-8 Persons Living with HIV/AIDS by Age Group Cobb County, 2008 61
Figure 6-9 Persons Living with HIV/AIDS by Transmission Category Cobb County, 2008 62
Figure 6-10 Tuberculosis Cases Cobb County, 2003-2009 65
Table 6-1 The ABCs of Hepatitis 67
Figure 6-11 Percent Influenza-Like-Illness Cases to Network Providers by Month, 2009 68
Figure 6-12 Hospitalizations for Confirmed H1N1 by Age Group Cobb County, 2009 69
Figure 6-13 Hospitalizations due to Pneumonia, 2003-2007 70
Table 6-2 Vaccine-Preventable Diseases (Cases) Cobb County, 2003-2009 70
Table 6-3 Cases of Invasive Bacterial Diseases, 2003-2009 72
Figure 6-14 Gastrointestinal Diseases Cobb County, 2003-2009 73
Maternal & Child Health
Figure 7-1 Pregnancy Rates by Age Group Cobb County, 2003-2007 78
Figure 7-2 Pregnancy Rate by Race/Ethnicity Cobb County, 2003-2007 79
Figure 7-3 Teen (15-19 years old) Pregnancy Rate by Race\Ethnicity Cobb County, 2003-2007 80
Table 7-1 Repeat Teen Births Cobb County, 2008 80
List of Tables and Figures
IIIIII

AAPPENDIXPPENDIX
137
Maternal & Child Health (continued)
Figure 7-4 Percent of Births with Inadequate* Prenatal Care Cobb County, 2002-2006 81
Figure 7-5 Induced Terminations, 1998-2007 81
Figure 7-6 Infant Mortality, 2003-2007 82
Figure 7-7 Infant Mortality by Race/Ethnicity Cobb County, 2003-2007 82
Table 7-2 Top Causes of Infant Deaths Cobb County, 1998-2007 83
Figure 7-8 Percent of Low Birth Weight Babies by Race/Ethnicity Cobb County, 2003-2008 83
Figure 7-9 Percent of Mothers who Reported Ever Breastfeeding their Infant in Georgia, 2004-2006 86
Table 7-3 Leading Causes of Emergency Department (ED) Visits in Children 1-19 Years of Age in Cobb
County, 2003-200786
Table 7-4 Percent of Children Receiving Immunizations On Schedule by Study Year District 3-1,
2004-200887
Figure 7-10 Percent of Students who Reported Alcohol Use in the Past 30 days by School Year 2008-09
through 2009-1092
Table 7-5 Average Age of Onset Use of Alcohol School Year 2009-10 92
Figure 7-11 Percent of Students who Reported Binge Drinking in the Past 30 days by School Year 2008-09
through 2009-10 93
Figure 7-12 Percent of Students Who Reported Yes to Tobacco Use Within the Past 30 Days, 2009-10 94
Figure 7-13 Percent of Students who Report Using Chewing Tobacco in the Past 30 Days School Year 2008-09
through 2009-1094
Behavioral HealthFigure 8-1 Types of Services Provided by Cobb Community Services Board 95
Table 8-1 Prevalence Estimates for Mental Disorders in U.S. Adults (18+) 97
Figure 8-2 Percent of Mood and Psychotic Disorder Diagnoses, 2005-08 98
Community HealthTable 9-1 Crime Statistics Cobb County, 2004-2008 103
Figure 9-1 Mortality Rates due to Homicide, 2003-2007 104
Figure 9-2 Percent of Students Who Reported Gang Participation in the Past 30 Days by Grade, School Year
2009-10104
Table 9-2 Number of Family Violence Incidents by Type of Abuse Cobb County, 2004-2008 105
Figure 9-3 Rate of Substantiated Child Abuse and/or Neglect, 2003-2008 105
Table 9-3 Number of Emergency Department Visits due to External Causes, 2003-2007 106
Figure 9-4 Mortality Rate due to Motor Vehicle Crashes, 2003-2007 107
Figure 9-5 Mortality Rates by Age due to Motor Vehicle Crashes, 2003-2007 107
Table 9-4 Fatalities by Person/Crash Type in Cobb County, 2004-2008 108
Figure 9-6 Mortality Rate due to Suicide, 2003-2007 111
Table 9-5 Percent of Students Reporting a Suicide Attempt by Gender, School Year 2009-10 111
Environmental HealthTable 10-1 Occurrence of Rabies in Animals 118
Table 10-2 Types of Animals Tested Cobb County, 2009 118
List of Tables and Figures
IIIIII
AAPPENDIXPPENDIX
138
Chapter 2 Profile Administration for Children and Families, Region IV. (n. d). Grandparents Raising
Grandchildren: A Call to Action. Retrieved from http://www.pochs.org/Brochures/GrandparentsRaisingGrandchildren.pdf
(CDC) Centers for Disease Control and Prevention. (2010). Behavioral Risk Factor Surveillance System (BRFSS). Retrieved from http://
apps.nccd.cdc.gov/BRFSS-SMART/ Georgia Department of Community Health, Division of Public Health, Office of Information and Policy. (2003-2009). Online Analytical
Statistical Information System (OASIS). Retrieved from http://oasis.state.ga.us/index.asp Georgia Department of Education. (2009). Report Cards. Retrieved from http://www.doe.k12.ga.us/ (HUD) U.S. Department of Housing and Urban Development. United States Department of Labor. (2008). Bureau of Labor Statis-
tics. Retrieved from http://www.bls.gov/home.htm Perry, Sherice. (2010). Improving Language Access Children's Health Insurance Program Reauthorization Act (CHIPRA)
Provides Increased Funding For Language Services. Retrieved from http://www.familiesusa.org/issues/medicaid/
Robert Wood Johnson Foundation (2009). Education Matters for Health. Retrieved from http://www.rwjf.org/pr/ U.S. Census Bureau. (2010). American Community Survey 2006-2008. Retrieved from http://www.census.gov/acs/www/ U.S. Department of Education Institute of Education Sciences. National Center for Education Statistics. Student Education
and Educational Progress.
U.S. Department of Health and Human Services Centers for Disease Control and Prevention National Center for Health Statistics (2009). Health, United States, 2008 With a Special Feature on Health of Young Adults. Retrieved from http://www.cdc.gov/nchs/hus.htm
U.S. Department of Labor. (2008). Bureau of Labor Statistics. Retrieved from http://www.bls.gov/home.htm Chapter 3-Access to Care Boatwrite, S.R. (Eds.) (2010). The Georgia County Guide (28th ed.). Athens, GA: The University of Georgia Center for Agribusiness and
Economic Development. Retrieved from http://www.countyguide.uga.edu/ (CDC) Centers for Disease Control and Prevention. (2010). Behavioral Risk Factor Surveillance System (BRFSS). Retrieved from http://
apps.nccd.cdc.gov/BRFSS-SMART/ Georgia Department of Community Health (2007). 2007 Annual Report. Retrieved from
http://dch.georgia.gov/00/channel_title/0,2094,31446711_67165950,00.html Georgia Department of Community Health (2008). 2008 Annual Report. Retrieved from
http://dch.georgia.gov/00/channel_title/0,2094,31446711_67165950,00.html Georgia Department of Community Health (2008), Office of Regulatory Services. Retrieved from http://www.ors.dhr.state.ga.us U.S. Census Bureau. (2010). American Community Survey 2006-2008. Retrieved from http://www.census.gov/acs/www/ Chapter 4-Leading Causes of Death
(CHSI) Community Health Status Indicators. Retrieved from http://communityhealth.hhs.gov/homepage.aspx?j=1
Georgia Department of Community Health, Division of Public Health, Office of Information and Policy. (2003-2009). Online Analytical
Statistical Information System (OASIS). Retrieved from http://oasis.state.ga.us/index.asp
Sources
IVIV
AAPPENDIXPPENDIX
139
Chapter 5-Chronic Diseases (CDC) Centers for Disease Control and Prevention. Asthma (2010). Retrieved from
http://www.cdc.gov/asthma/
(CDC) Centers for Disease Control and Prevention. (2010). Behavioral Risk Factor Surveillance System (BRFSS). Retrieved from http://apps.nccd.cdc.gov/BRFSS-SMART/
(CDC) Centers for Disease Control and Prevention. Chronic Obstructive Pulmonary Disease (2009). Retrieved from
http://www.cdc.gov/copd/copdfaq.htm (CDC) Center for Disease Control and Prevention. Diabetes (2010). Retrieved from http://www.cdc.gov/diabetes/ (CDC) Center for Disease Control and Prevention. Nutrition (2010). Retrieved from http://www.cdc.gov/nutrition/ (CDC) Centers for Disease Control and Prevention. Smoking and Tobacco Use (2010). Retrieved from
http://www.cdc.gov/tobacco/index.htm (CDC) Center for Disease Control and Prevention. Overweight and Obesity (2010). Retrieved from
http://www.cdc.gov/obesity/
Georgia Department of Community Health, Division of Public Health, 2008 Georgia Program and Data Summary Cancer (2008). Retrieved from http://health.state.ga.us/programs/gccr/data.asp
Georgia Department of Community Health, Division of Public Health, 2008 Georgia Program and Data Summary Cardiovascular Disease (2008). Retrieved from http://health.state.ga.us/epi/cdiee/cardio.asp
Georgia Department of Community Health, Division of Public Health. Behavioral Risk Factor Surveillance System (BRFSS) (2007) Re-
port. Retrieved from http://health.state.ga.us/epi/brfss/publications.asp
Georgia Department of Community Health, Division of Public Health, Georgia Comprehensive Cancer Registry. (2003-2007). Retrieved from http://health.state.ga.us/programs/gccr/
Georgia Department of Community Health, Division of Public Health, Office of Information and Policy. (2003-2009). Online Analytical
Statistical Information System (OASIS). Retrieved from http://oasis.state.ga.us/index.asp National Institute of Health Medline Plus (2010). Alcoholic Liver Disease. Retrieved from
http://www.nlm.nih.gov/medlineplus/ency/article/000281.htm
U.S. National Institutes of Health. National Cancer Institute What is Cancer? (2008). Retrieved from http://www.cancer.gov/cancertopics/what-is-cancer.
U.S. National Institutes of Health. National Cancer Institute (2004). Staging Questions and Answers. Retrieved From
http://www.cancer.gov/cancertopics/factsheet/Detection/staging Chapter 6-Infectious Diseases (CDC) Center for Disease Control and Prevention. (2009). How Vaccines Prevent Disease. Retrieved from
http://www.cdc.gov/vaccines/vac-gen/howvpd.htm
(CDC) Center for Disease Control and Prevention. (2009). Sexually Transmitted Diseases in the United States, 2008. Retrieved from http://www.cdc.gov/std/stats08/trends.htm
(CDC) Center for Disease Control and Prevention. (2009). Vaccines and Preventable Diseases: Combined Tetanus,
Diphtheria and Pertussis (Tdap) Vaccines. Retrieved from
http://www.cdc.gov/vaccines/vpd-vac/combo-vaccines/DTaP-Td-DT/tdap.htm
Sources
IVIV

AAPPENDIXPPENDIX
140
(CDC) Center for Disease Control and Prevention. Seasonal Influenza. (2010). Retrieved from http://www.cdc.gov/flu/
(CDC) Center for Disease Control and Prevention. Viral Hepatitis (2010). http://www.cdc.gov/hepatitis/ Georgia Department of Community Health, Division of Public Health (2009). 2008 Georgia Tuberculosis Report. Retrieved
from http://health.state.ga.us/pdfs/epi/tb/2008%20Georgia%20TB%20Report.pdf Georgia Department of Community Health, Division of Public Health. (2009). State Electronic Notifiable Disease Surveillance System
(SENDSS). Retrieved from https://sendss.state.ga.us/sendss/login.validateUser Georgia Department of Community Health, Division of Public Health. (2010). Invasive Bacterial Diseases Unit. Retrieved
from http://health.state.ga.us/epi/bacterial/
Georgia Department of Community Health, Division of Public Health. (2010). Notifiable Disease Query. Retrieved from http://
health.state.ga.us/epi/disease/report.asp Georgia Department of Community Health, Division of Public Health, Epidemiology Branch, HIV/AIDS Epidemiology Unit. (1992-
2009). Retrieved from http://health.state.ga.us/epi/hivaids/
Georgia Department of Community Health, Division of Public Health, Office of Information and Policy. (2003-2009). Online Analytical Statistical Information System (OASIS). Retrieved from http://oasis.state.ga.us/index.asp
Chapter 7-Maternal and Child Health Boatwrite, S.R. (Eds.) (2010). The Georgia County Guide (28th ed.). Athens, GA: The University of Georgia Center for Agribusiness and
Economic Development. Retrieved from http://www.countyguide.uga.edu/ (CDC) Center for Disease Control and Prevention. (2010). Preventing Teen Pregnancy: An Update in 2009. Retrieved from
http://www.cdc.gov/reproductivehealth/adolescentreprohealth/AboutTP.htm (CDC) Center for Disease Control and Prevention. Health Youth! YRBSS: Youth Risk Behavior Surveillance System (2010).
(CDC) Centers for Disease Control and Prevention. Smoking and Tobacco Use (2010). Retrieved from
http://www.cdc.gov/tobacco/index.htm
Georgia Department of Community Health, Division of Public Health. (2006). Fact Sheet Infant Mortality. Retrieved from Georgia Department of Community Health, Division of Public Health. (2007). 2004-2006 (PRAMS) Surveillance Report. Retrieved from
http://health.state.ga.us/epi/prams/index.asp Georgia Department of Community Health, Division of Public Health. (2008). 2008 Georgia Data Summary: Infant Georgia Department of Community Health, Division of Public Health. (2009). Georgia Immunization Study, 2008 Final Report. Retrieved
from http://health.state.ga.us/pdfs/publications/reports/gaimmunizationstudy.03.pdf Georgia Department of Community Health, Division of Public Health, Office of Information and Policy. (2003-2009). Online Analytical
Statistical Information System (OASIS). Retrieved from http://oasis.state.ga.us/index.asp Georgia Department of Education. (2010). Georgia Results of the Georgia Student
Health Survey II 2008-2009. Retrieved from http://www.doe.k12.ga.us/sia_titleiv.aspxfolderID=35333&m=links&ft=Resources
Guttmacher Institute (2010). U.S. Teenage Pregnancies, Births and Abortions: National and State Trends and Trends by Race and Ethnicity. Retrieved from www.guttmacher.org
The Annie E. Casey Foundation. (2008 ). Kids Count. Retrieved from
http://www.aecf.org/MajorInitiatives/KIDSCOUNT.aspx
Ventura SJ, Abma JC, Mosher WD, Henshaw SK. (2009). Estimated pregnancy rates for the United States, 1990–2005: An update. National vital statistics reports, 58 (4)1-15. Retrieved from http://www.cdc.gov/nchs/
Sources
IVIV

AAPPENDIXPPENDIX
141
Chapter 8-Behavioral Health (CCSB) Cobb County Community Service Board. http://www.cobbcsb.com/ (NIDA) National Institute of Drug Abuse. Retrieved from http://www.nida.nih.gov/nidahome.html
(NIMH) National Institute of Mental Health. Retrieved from http://www.nimh.nih.gov/health/topics/index.shtml
U.S. Census Bureau. State and County Quick Facts. Retrieved from http://quickfacts.census.gov/qfd/index.html Chapter 9-Community Safety (ARC) Atlanta Regional Commission. Traffic Crash Profiles. Retrieved from
http://www.atlantaregional.com/transportation/roads-highways/traffic-crash-profiles.
(CDC) Center for Disease Control and Prevention. (2009). Child Maltreatment-Definitions. Retrieved from http://www.cdc.gov/ViolencePrevention/childmaltreatment/definitions.html.
(CDC) Centers for Disease Control and Prevention. (2010). Injury Prevention and Control: Violence Prevention. Retrieve from http://www.cdc.gov/ViolencePrevention/
(CDC) Centers for Disease Control and Prevention. Injury Prevention & Control: Motor Vehicle Safety (2010). Retrieved
from http://www.cdc.gov/Motorvehiclesafety/index.html (GBI) Georgia Bureau of Investigation. (2010). Crime Statistics. Retrieved from http://gbi.georgia.gov/00/
channel_modifieddate/0,2096,67862954_88103906,00.html Georgia Department of Community Health, Division of Public Health, Office of Information and Policy. (2003-2009). Online
Analytical Statistical Information System (OASIS). Retrieved from http://oasis.state.ga.us/index.asp Georgia Department of Education. (2010). Georgia Results of the Georgia Student
Health Survey II 2008-2009. Retrieved from http://www.doe.k12.ga.us/sia_titleiv.aspx?folderID=35333&m=links&ft=Resources
Governor’s Office of Highway Safety. County by County Fact Sheets (n.d). Retrieved from http://www.gahighwaysafety.org/gacountycrashes.html
National Highway Traffic Safety Administration, Fatality Analysis Reporting System (2010). Retrieved from http://www-
nrd.nhtsa.dot.gov/departments/nrd-30/ncsa/STSI/13_GA/2008/Counties/Georgia_Cobb%20County_2008.HTM The Annie E. Casey Foundation. (2008). Kids Count. Retrieved from http://www.aecf.org/MajorInitiatives/
KIDSCOUNT.aspx Robert Wood Johnson Foundation (2010). County Health Rankings Mobilizing Action Toward Community Health.
http://www.countyhealthrankings.org/health-factors/community-safety U.S. Department of Justice Federal Bureau of Investigation (2009). 2008 Crime in the United States. Retrieved from
http://www.fbi.gov/ucr/cius2008/index.html Chapter 10-Environmental Health (CDC) Center for Disease Control. Retrieved from http://www.cdc.gov/nczved/ Georgia Department of Community Health, Division of Public Health. (2009). State Electronic Notifiable Disease Surveil-
lance System (SENDSS). Retrieved from https://sendss.state.ga.us/sendss/login.validateUser Georgia Department of Natural Resources, Environmental Protection Division. Retrieved from http://www.georgiaepd.org/ The Cobb County Water System. Retrieved from http://www.water.cobbwater.org
Sources
IVIV

AAPPENDIXPPENDIX
142
Acworth Public Health Center
4489 Acworth Industrial Drive Acworth, Georgia 30101 (770) 974-3330
The Center for Environmental Health 3830 South Cobb Drive, Suite 102 Smyrna, Georgia 30080 (770) 435-7815
Marietta Public Health Center 1650 County Services Parkway Marietta, Georgia 30008 (770) 514-2300
Smyrna Public Health Center 3830 South Cobb Drive, Suite 200 Smyrna, Georgia 30080 (770) 438-5105
East Cobb Public Health Center 4938 Lower Roswell Road Marietta, Georgia 30068 (678) 784-2180
South Cobb Public Health Center 875 Six Flags Drive Austell, Georgia 30168 (678) 385-1360
Lake Park 1955 Lake Park Drive, Suite 300 Smyrna, Ga. 30080 (770) 432-0112
VV
Douglas Teen Health and Resource Center 6457 East Strickland Street Douglasville, Georgia 30134 (770) 489-9686
Douglasville Community Health Center
6770 Selman Drive Douglasville, Georgia 30134 (770) 949-1970
Douglas Environmental Health
8700 Hospital Drive, 1st Floor Douglasville, Georgia 30134 (770) 920-7311
Cobb County
Douglas County