2009 DirectionFinder® Survey - City of Auburn
206
2 2 0 0 0 0 9 9 D D i i r r e e c c t t i i o o n n F F i i n n d d e e r r ® ® S S u u r r v v e e y y F F I I N N A A L L R R E E P P O O R R T T By 7 7 2 2 5 5 W W. . F F r r o o n n t t i i e e r r O O l l a a t t h h e e , , K K S S 6 6 6 6 0 0 6 6 1 1 ( ( 9 9 1 1 3 3 ) ) 8 8 2 2 9 9 - - 1 1 2 2 1 1 5 5 April 2009 Submitted to:
-
Upload
khangminh22 -
Category
Documents
-
view
2 -
download
0
Transcript of 2009 DirectionFinder® Survey - City of Auburn

222000000999 DDDiiirrreeeccctttiiiooonnnFFFiiinnndddeeerrr®®® SSSuuurrrvvveeeyyy FFFIIINNNAAALLL RRREEEPPPOOORRRTTT
By
777222555 WWW... FFFrrrooonnntttiiieeerrr
OOOlllaaattthhheee,,, KKKSSS 666666000666111
(((999111333))) 888222999--- 111222111555 April 2009
Submitted to:

Contents
Executive Summary ...................................................................... i Section 1: Charts and Graphs...................................................... 1 Section 2: Benchmarking Data ................................................. 32 Section 3: Importance-Satisfaction Analysis ............................ 43 Importance-Satisfaction Matrix Analysis ................. 52 Section 4: GIS Maps ................................................................. 59 Section 5: Tabular Data and Survey Instrument .................... 148

2009 City of Auburn DirectionFinder Survey: Final Report
ETC Institute (April 2009) i
DirectionFinder® Survey Executive Summary
Purpose and Methodology
ETC Institute administered the DirectionFinder® survey for the City of Auburn during the spring of 2009. The survey was administered as part of the City’s on-going effort to assess citizen satisfaction with the quality of city services. The City of Auburn has been administering an annual citizen survey for over 20 years.
Resident Survey. A six-page survey was mailed to a random sample of 1,500 households in the City of Auburn. Approximately seven days after the surveys were mailed; residents who received the survey were contacted by phone. Those who indicated that they had not returned the survey were given the option of completing it by phone. Of the households that received a survey, 397 completed the survey by phone and 339 returned it by mail for a total of 736 completed surveys (49% response rate). The results for the random sample of 736 households have a 95% level of confidence with a precision of at least +/- 3.7%. There were no statistically significant differences in the results of the survey based on the method of administration (phone vs. mail). In order to better understand how well services are being delivered by the City, ETC Institute geocoded the home address of respondents to the survey. The map to the right shows the physical distribution of survey respondents based on the location of their home.

2009 City of Auburn DirectionFinder Survey: Final Report
ETC Institute (April 2009) ii
The percentage of “don’t know” responses has been excluded from many of the graphs shown in this report to facilitate valid comparisons of the results from Auburn with the results from other communities in the DirectionFinder® database. Since the number of “don’t know” responses often reflects the utilization and awareness of city services, the percentage of “don’t know” responses has been provided in the tabular data section of this report. When the “don’t know” responses have been excluded, the text of this report will indicate that the responses have been excluded with the phrase “who had an opinion”.
This report contains:
� a summary of the methodology for administering the survey and major findings
� charts showing the overall results for most questions on the survey
� GIS maps that show the results of selected questions as maps of the City
� benchmarking data that shows how the results for Auburn compare to other cities
� importance-satisfaction analysis
� tables that show the results for each question on the survey
� a copy of the survey instrument.
*note: tables showing the results of the leader survey will be provided in appendix A.
Major Findings
� Most of the residents surveyed were satisfied with City services. Ninety-two percent
(92%) of the residents surveyed who had an opinion were satisfied (rating of 4 or 5 on a 5-
point scale) with the quality of the City’s public school system, 90% were satisfied with
quality of city libraries, 88% were satisfied with the quality of police, fire and ambulance
services, and 81% were satisfied with the quality of city parks programs and facilities.
Satisfaction with the flow of traffic and congestion management increased by 7% over the
past year. There were also significant increases in satisfaction with the quality of the city’s
stormwater runoff/stormwater management system (+4%) and enforcement of city
codes/ordinances (+4%). There were no significant decreases.
*Note: changes of 4% or more were statistically significant
� Services that residents thought should receive the most increase in emphasis over the
next two years. The areas that residents thought should receive the most increase in emphasis
from the City of Auburn over the next two years were: (1) management of traffic flow and
congestion and (2) the maintenance of city streets and facilities. These were also the top
priorities in the 2004, 2005, 2006, 2007 and 2008 surveys.
2009 City of Auburn DirectionFinder Survey: Final Report
ETC Institute (April 2009) iii
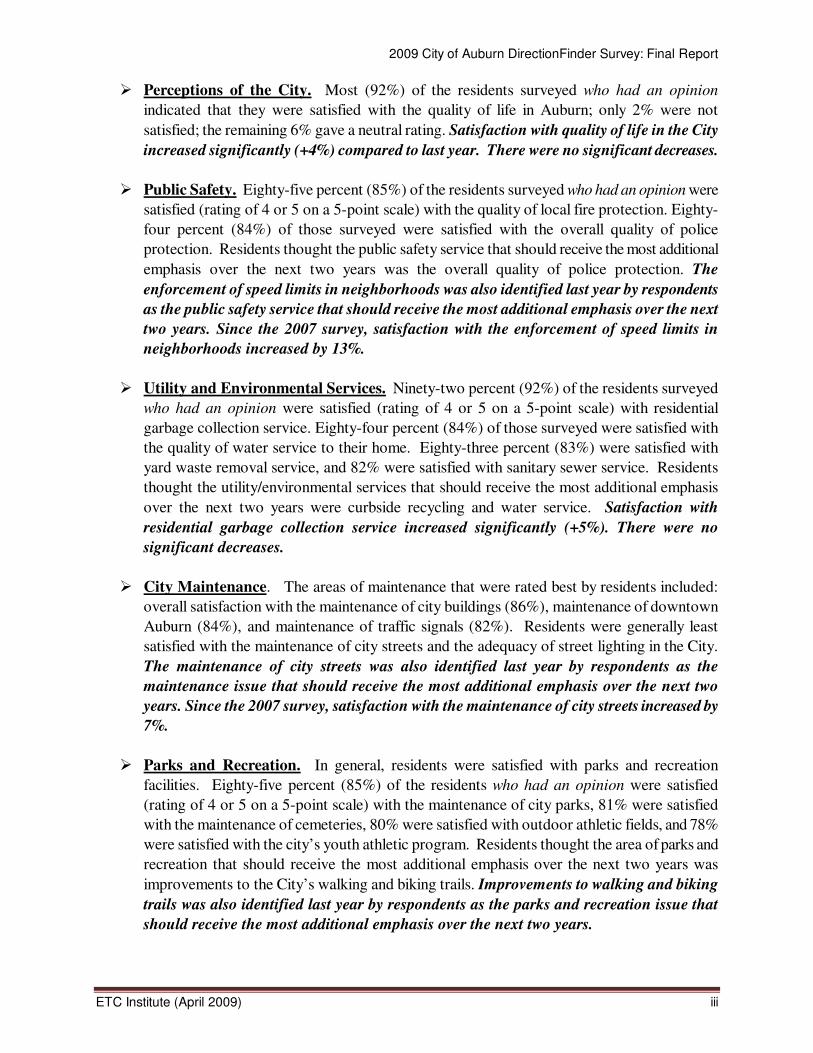
� Perceptions of the City. Most (92%) of the residents surveyed who had an opinion
indicated that they were satisfied with the quality of life in Auburn; only 2% were not
satisfied; the remaining 6% gave a neutral rating. Satisfaction with quality of life in the City
increased significantly (+4%) compared to last year. There were no significant decreases.
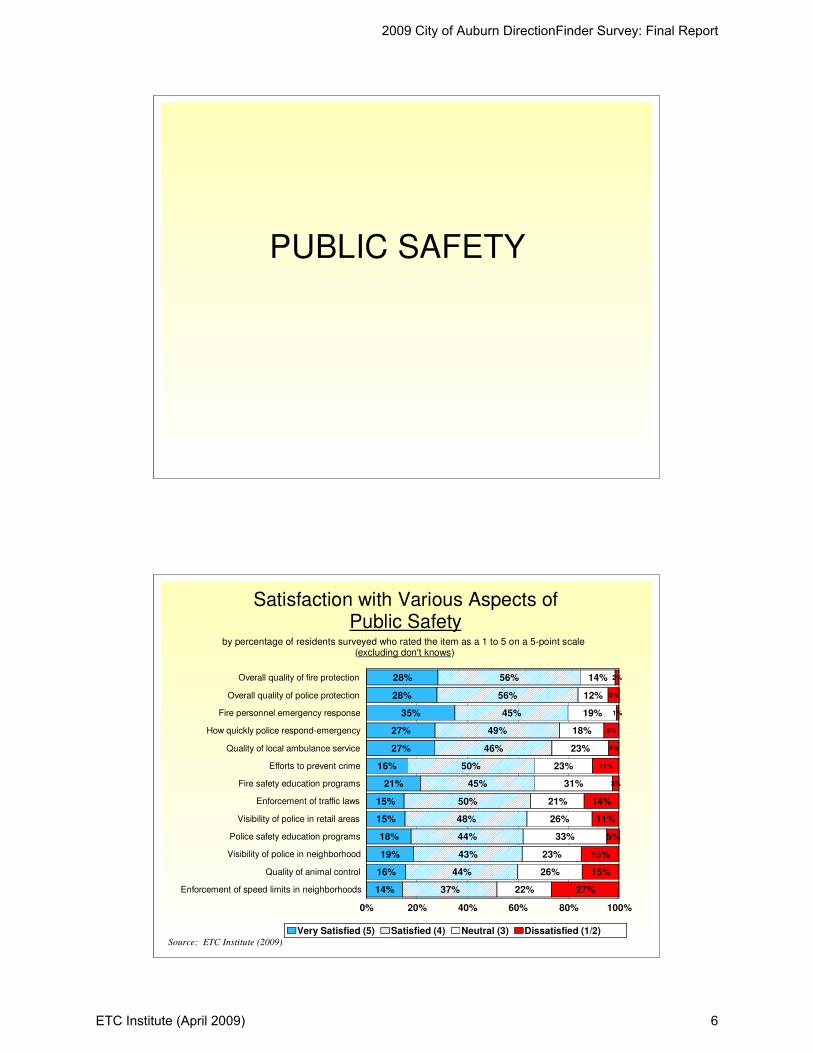
� Public Safety. Eighty-five percent (85%) of the residents surveyed who had an opinion were
satisfied (rating of 4 or 5 on a 5-point scale) with the quality of local fire protection. Eighty-
four percent (84%) of those surveyed were satisfied with the overall quality of police
protection. Residents thought the public safety service that should receive the most additional
emphasis over the next two years was the overall quality of police protection. The
enforcement of speed limits in neighborhoods was also identified last year by respondents
as the public safety service that should receive the most additional emphasis over the next
two years. Since the 2007 survey, satisfaction with the enforcement of speed limits in
neighborhoods increased by 13%.
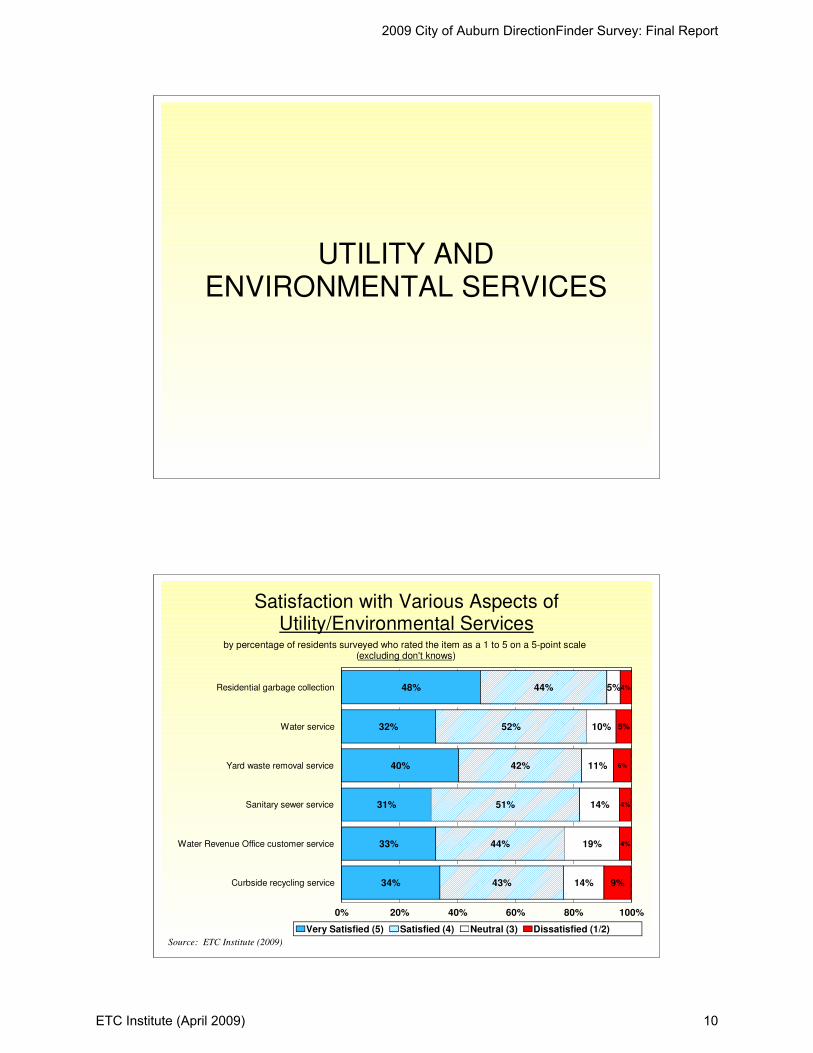
� Utility and Environmental Services. Ninety-two percent (92%) of the residents surveyed
who had an opinion were satisfied (rating of 4 or 5 on a 5-point scale) with residential
garbage collection service. Eighty-four percent (84%) of those surveyed were satisfied with
the quality of water service to their home. Eighty-three percent (83%) were satisfied with
yard waste removal service, and 82% were satisfied with sanitary sewer service. Residents
thought the utility/environmental services that should receive the most additional emphasis
over the next two years were curbside recycling and water service. Satisfaction with
residential garbage collection service increased significantly (+5%). There were no
significant decreases.
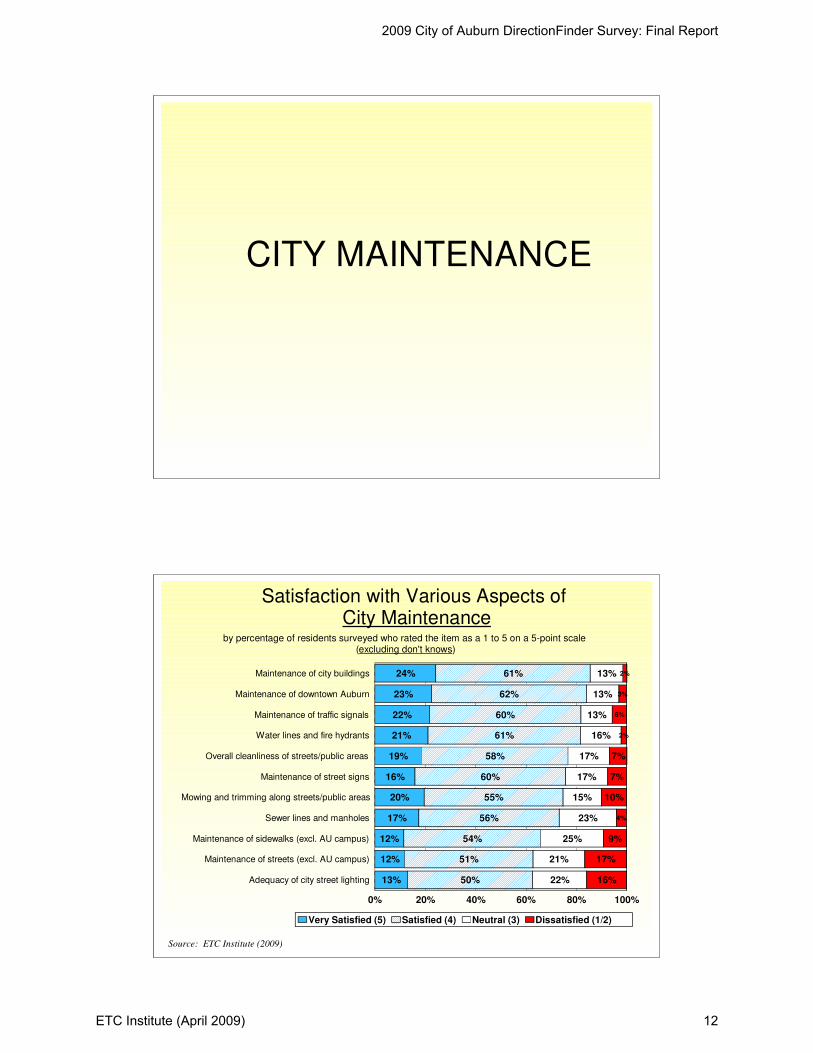
� City Maintenance. The areas of maintenance that were rated best by residents included:
overall satisfaction with the maintenance of city buildings (86%), maintenance of downtown
Auburn (84%), and maintenance of traffic signals (82%). Residents were generally least
satisfied with the maintenance of city streets and the adequacy of street lighting in the City.
The maintenance of city streets was also identified last year by respondents as the
maintenance issue that should receive the most additional emphasis over the next two
years. Since the 2007 survey, satisfaction with the maintenance of city streets increased by
7%.
� Parks and Recreation. In general, residents were satisfied with parks and recreation
facilities. Eighty-five percent (85%) of the residents who had an opinion were satisfied
(rating of 4 or 5 on a 5-point scale) with the maintenance of city parks, 81% were satisfied
with the maintenance of cemeteries, 80% were satisfied with outdoor athletic fields, and 78%
were satisfied with the city’s youth athletic program. Residents thought the area of parks and
recreation that should receive the most additional emphasis over the next two years was
improvements to the City’s walking and biking trails. Improvements to walking and biking
trails was also identified last year by respondents as the parks and recreation issue that
should receive the most additional emphasis over the next two years.

2009 City of Auburn DirectionFinder Survey: Final Report
ETC Institute (April 2009) iv
� City Communications. More than three-fourths (79%) of the residents surveyed who had
an opinion were satisfied (rating of 4 or 5 on a 5-point scale) with the quality of the City
newsletter, Open Line and 71% were satisfied with the availability of information about city
parks and recreation services.
Other Findings.
� 89% of the residents surveyed in 2009 had access to the Internet at home. Ninety percent
(90%) of those with Internet access at home had high-speed access. In 2006, 80% of those
surveyed had Internet access at home, but only 75% had high-speed access.
� 96% of the residents surveyed were satisfied with Auburn as a place to raise children; 94%
were satisfied with Auburn as a place to live and 82% were satisfied with Auburn as a place
to work.
� 46% of the residents surveyed had called or visited the City with a question or complaint over
the past year. Of those who had called or visited the City, 85% found it very or somewhat
easy to reach the person they needed to reach; 13% found it difficult. More than three-
fourths (81%) of those who had contacted the City thought the department they contacted
was responsive to their needs.
� 35% of the residents surveyed thought that Auburn University students had a positive impact
on their neighborhood (this is an increase of 6% from 2008), 14% thought that students had a
negative impact, 46% thought they had no impact, and 6% did not have an opinion. (total
does not sum 100% due to rounding).
Significant Increases with Traffic Flow
� Satisfaction with ease of East-West travel increased from 47% in 2008 to 53% in 2009.
� Satisfaction with ease of North-South travel increased from 44% in 2008 to 48% in 2009.

Section 1: Charts and Graphs
2009 City of Auburn DirectionFinder Survey: Final Report
ETC Institute (April 2009) 1
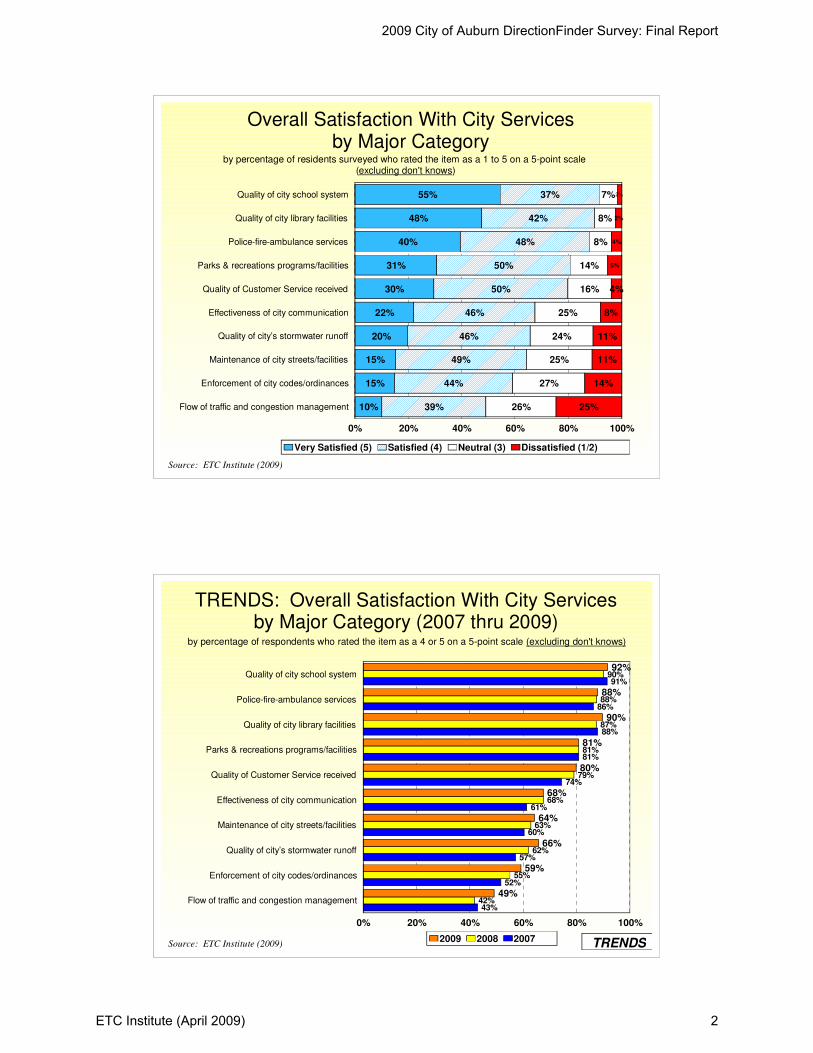
55%
48%
40%
31%
30%
22%
20%
15%
15%
10%
37%
42%
48%
50%
50%
46%
46%
49%
44%
39%
7%
8%
8%
14%
16%
25%
24%
25%
27%
26%
2%
2%
4%
5%
4%
8%
11%
11%
14%
25%
Quality of city school system
Quality of city library facilities
Police-fire-ambulance services
Parks & recreations programs/facilities
Quality of Customer Service received
Effectiveness of city communication
Quality of city’s stormwater runoff
Maintenance of city streets/facilities
Enforcement of city codes/ordinances
Flow of traffic and congestion management
0% 20% 40% 60% 80% 100%
Very Satisfied (5) Satisfied (4) Neutral (3) Dissatisfied (1/2)
Overall Satisfaction With City Servicesby Major Category
by percentage of residents surveyed who rated the item as a 1 to 5 on a 5-point scale (excluding don't knows)
Source: ETC Institute (2009)
92%
88%
90%
81%
80%
68%
64%
66%
59%
49%
90%
88%
87%
81%
79%
68%
63%
62%
55%
42%
91%
86%
88%
81%
74%
61%
60%
57%
52%
43%
Quality of city school system
Police-fire-ambulance services
Quality of city library facilities
Parks & recreations programs/facilities
Quality of Customer Service received
Effectiveness of city communication
Maintenance of city streets/facilities
Quality of city’s stormwater runoff
Enforcement of city codes/ordinances
Flow of traffic and congestion management
0% 20% 40% 60% 80% 100%
2009 2008 2007
TRENDS: Overall Satisfaction With City Servicesby Major Category (2007 thru 2009)
by percentage of respondents who rated the item as a 4 or 5 on a 5-point scale (excluding don't knows)
Source: ETC Institute (2009) TRENDS
2009 City of Auburn DirectionFinder Survey: Final Report
ETC Institute (April 2009) 2

61%
47%
43%
37%
22%
19%
17%
16%
6%
6%
Flow of traffic and congestion management
Maintenance of city streets/facilities
Quality of city school system
Police-fire-ambulance services
Enforcement of city codes/ordinances
Parks & recreations programs/facilities
Quality of city’s stormwater runoff
Effectiveness of city communication
Quality of Customer Service received
Quality of city library facilities
0% 20% 40% 60%
1st choice 2nd choice 3rd choice
City Services That Should Receive the Most Emphasis Over the Next Two Years
by percentage of residents surveyed who selected the item as one of their top three choices
Source: ETC Institute (2009)
41%
34%
27%
22%
23%
51%
51%
57%
53%
52%
6%
12%
14%
18%
16%
2%
3%
3%
7%
9%
Overall quality of life in the city
Overall image of the city
Overall quality of city services
Overall value received for City tax dollars/fees
Overall appearance of the city
0% 20% 40% 60% 80% 100%
Very Satisfied (5) Satisfied (4) Neutral (3) Dissatisfied (1/2)
Satisfaction With Items That Influence the Perception Residents Have of the City
Source: ETC Institute (2009)
by percentage of residents surveyed who rated the item as a 1 to 5 on a 5-point scale (excluding don't knows)
2009 City of Auburn DirectionFinder Survey: Final Report
ETC Institute (April 2009) 3
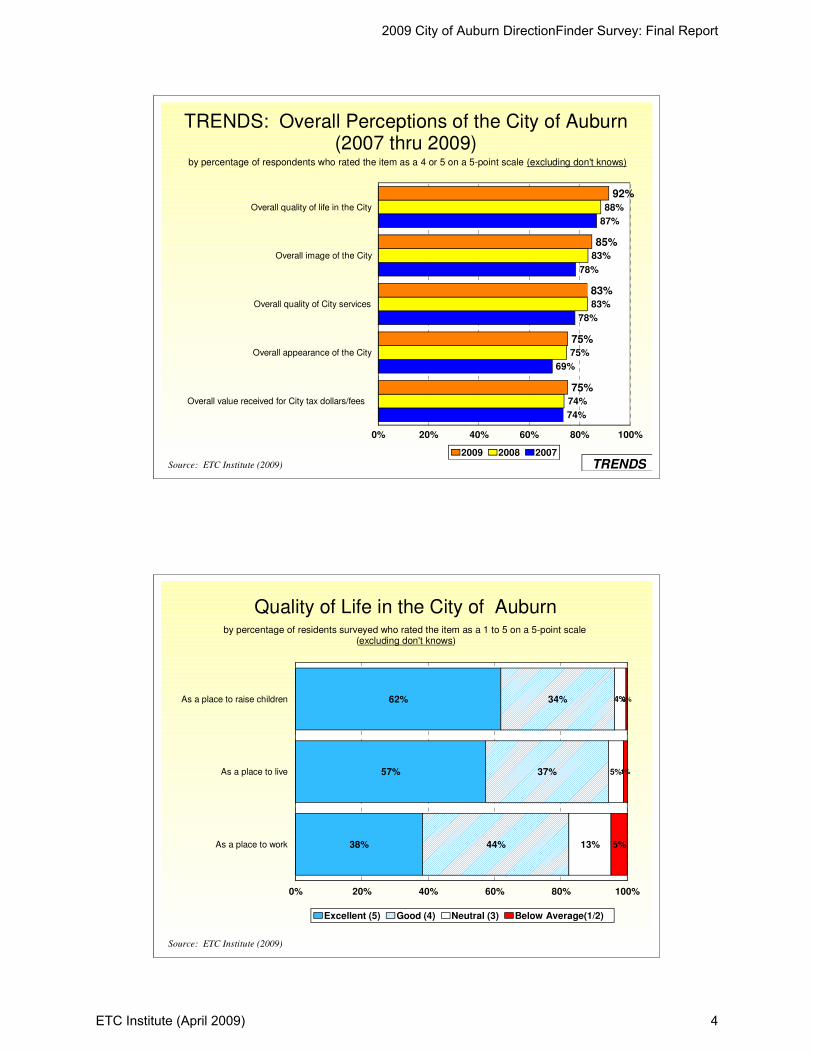
92%
85%
83%
75%
75%
88%
83%
83%
75%
74%
87%
78%
78%
69%
74%
Overall quality of life in the City
Overall image of the City
Overall quality of City services
Overall appearance of the City
Overall value received for City tax dollars/fees
0% 20% 40% 60% 80% 100%
2009 2008 2007
TRENDS: Overall Perceptions of the City of Auburn(2007 thru 2009)
by percentage of respondents who rated the item as a 4 or 5 on a 5-point scale (excluding don't knows)
Source: ETC Institute (2009) TRENDS
62%
57%
38%
34%
37%
44%
4%
5%
13%
0%
1%
5%
As a place to raise children
As a place to live
As a place to work
0% 20% 40% 60% 80% 100%
Excellent (5) Good (4) Neutral (3) Below Average(1/2)
Quality of Life in the City of Auburn
Source: ETC Institute (2009)
by percentage of residents surveyed who rated the item as a 1 to 5 on a 5-point scale (excluding don't knows)
2009 City of Auburn DirectionFinder Survey: Final Report
ETC Institute (April 2009) 4
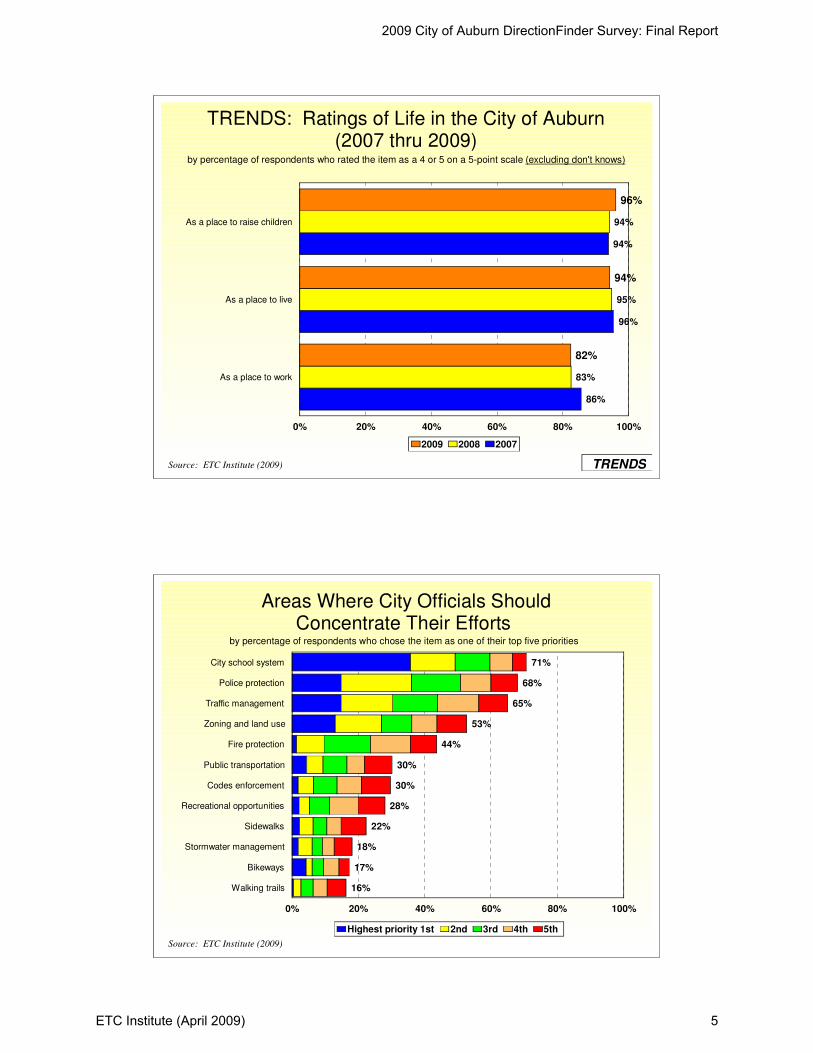
96%
94%
82%
94%
95%
83%
94%
96%
86%
As a place to raise children
As a place to live
As a place to work
0% 20% 40% 60% 80% 100%
2009 2008 2007
TRENDS: Ratings of Life in the City of Auburn (2007 thru 2009)
by percentage of respondents who rated the item as a 4 or 5 on a 5-point scale (excluding don't knows)
Source: ETC Institute (2009) TRENDS
71%
68%
65%
53%
44%
30%
30%
28%
22%
18%
17%
16%
City school system
Police protection
Traffic management
Zoning and land use
Fire protection
Public transportation
Codes enforcement
Recreational opportunities
Sidewalks
Stormwater management
Bikeways
Walking trails
0% 20% 40% 60% 80% 100%
Highest priority 1st 2nd 3rd 4th 5th
Source: ETC Institute (2009)
Areas Where City Officials Should Concentrate Their Efforts
by percentage of respondents who chose the item as one of their top five priorities
2009 City of Auburn DirectionFinder Survey: Final Report
ETC Institute (April 2009) 5
PUBLIC SAFETY
28%
28%
35%
27%
27%
16%
21%
15%
15%
18%
19%
16%
14%
56%
56%
45%
49%
46%
50%
45%
50%
48%
44%
43%
44%
37%
14%
12%
19%
18%
23%
23%
31%
21%
26%
33%
23%
26%
22%
2%
5%
1%
6%
4%
11%
3%
14%
11%
5%
15%
15%
27%
Overall quality of fire protection
Overall quality of police protection
Fire personnel emergency response
How quickly police respond-emergency
Quality of local ambulance service
Efforts to prevent crime
Fire safety education programs
Enforcement of traffic laws
Visibility of police in retail areas
Police safety education programs
Visibility of police in neighborhood
Quality of animal control
Enforcement of speed limits in neighborhoods
0% 20% 40% 60% 80% 100%
Very Satisfied (5) Satisfied (4) Neutral (3) Dissatisfied (1/2)
Satisfaction with Various Aspects of Public Safety
Source: ETC Institute (2009)
by percentage of residents surveyed who rated the item as a 1 to 5 on a 5-point scale (excluding don't knows)
2009 City of Auburn DirectionFinder Survey: Final Report
ETC Institute (April 2009) 6

85%
84%
80%
76%
73%
66%
65%
66%
64%
62%
62%
60%
52%
86%
85%
83%
77%
75%
69%
66%
65%
65%
63%
62%
60%
46%
88%
84%
82%
75%
75%
70%
61%
67%
63%
66%
61%
59%
39%
Overall quality of fire protection
Overall quality of police protection
Fire personnel emergency response
How quickly police respond-emergency
Quality of local ambulance service
Fire safety education programs
Enforcement of traffic laws
Efforts to prevent crime
Visibility of police in retail areas
Visibility of police in neighborhood
Police safety education programs
Quality of animal control
Enforcement of speed limits in neighborhoods
0% 20% 40% 60% 80% 100%
2009 2008 2007
TRENDS: Overall Satisfaction with Public Safety Services (2007 thru 2009)
by percentage of respondents who rated the item as a 4 or 5 on a 5-point scale (excluding don't knows)
Source: ETC Institute (2009) TRENDS
32%
30%
28%
26%
16%
14%
10%
8%
6%
5%
4%
3%
2%
Overall quality of police protection
Efforts to prevent crime
Visibility of police in neighborhood
Enforcement of speed limits in neighborhoods
Enforcement of traffic laws
Overall quality of fire protection
Visibility of police in retail areas
How quickly police respond-emergency
Quality of animal control
Quality of local ambulance service
Police safety education programs
Fire safety education programs
Fire personnel emergency response
0% 10% 20% 30% 40%
1st choice 2nd choiceSource: ETC Institute (2009)
Public Safety Services That Should Be Emphasized Most Over the Next Two Years
by percentage of residents surveyed who selected the item as one of their top two choices
2009 City of Auburn DirectionFinder Survey: Final Report
ETC Institute (April 2009) 7

CITY CODES AND ORDINANCES
25%
17%
16%
13%
10%
11%
10%
46%
52%
48%
38%
36%
33%
31%
16%
28%
27%
38%
32%
38%
35%
13%
3%
10%
11%
22%
19%
24%
Clean up of debris/litter in neighborhoods
Fire codes and regulations
Sign regulations
Building codes
Zoning regulations
Erosion and sediment control regulations
Unrelated occupancy regulations
0% 20% 40% 60% 80% 100%
Very Satisfied (5) Satisfied (4) Neutral (3) Dissatisfied (1/2)
Satisfaction with Enforcement of City Codes and Ordinances
Source: ETC Institute (2009)
by percentage of residents surveyed who rated the item as a 1 to 5 on a 5-point scale (excluding don't knows)
2009 City of Auburn DirectionFinder Survey: Final Report
ETC Institute (April 2009) 8

72%
69%
64%
52%
46%
44%
41%
72%
70%
61%
52%
44%
42%
39%
67%
67%
57%
42%
34%
33%
32%
Clean up of debris/litter in neighborhoods
Fire codes and regulations
Sign regulations
Building codes
Zoning regulations
Erosion and sediment control regulations
Unrelated occupancy regulations
0% 20% 40% 60% 80%
2009 2008 2007
TRENDS: Overall Satisfaction with Enforcement of Codes and Ordinances (2007 thru 2009)
by percentage of respondents who rated the item as a 4 or 5 on a 5-point scale (excluding don't knows)
Source: ETC Institute (2009) TRENDS
45%
42%
22%
20%
20%
14%
12%
Zoning regulations
Clean up debris/litter in neighborhoods
Erosion & sediment control regulations
Unrelated occupations regulations
Building codes
Sign regulation
Fire codes and regulations
0% 10% 20% 30% 40% 50% 60%
1st choice 2nd choiceSource: ETC Institute (2009)
Codes and Ordinances That Should Be Emphasized Most Over the Next Two Years
by percentage of residents surveyed who selected the item as one of their top two choices
2009 City of Auburn DirectionFinder Survey: Final Report
ETC Institute (April 2009) 9
UTILITY AND ENVIRONMENTAL SERVICES
48%
32%
40%
31%
33%
34%
44%
52%
42%
51%
44%
43%
5%
10%
11%
14%
19%
14%
4%
5%
6%
4%
4%
9%
Residential garbage collection
Water service
Yard waste removal service
Sanitary sewer service
Water Revenue Office customer service
Curbside recycling service
0% 20% 40% 60% 80% 100%
Very Satisfied (5) Satisfied (4) Neutral (3) Dissatisfied (1/2)
Satisfaction with Various Aspects of Utility/Environmental Services
Source: ETC Institute (2009)
by percentage of residents surveyed who rated the item as a 1 to 5 on a 5-point scale (excluding don't knows)
2009 City of Auburn DirectionFinder Survey: Final Report
ETC Institute (April 2009) 10

92%
84%
82%
83%
77%
77%
87%
86%
83%
81%
79%
76%
87%
82%
82%
82%
77%
75%
Residential garbage collection
Water service
Sanitary sewer service
Yard waste removal service
Water Revenue Office customer service
Curbside recycling service
0% 20% 40% 60% 80% 100%
2009 2008 2007
TRENDS: Overall Satisfaction with Utility/Environmental Services (2007 thru 2009)
by percentage of respondents who rated the item as a 4 or 5 on a 5-point scale (excluding don't knows)
Source: ETC Institute (2009) TRENDS
42%
33%
30%
30%
24%
7%
Curbside recycling service
Residential garbage collection
Water service
Yard waste removal service
Sanitary sewer service
Water Revenue Office customer service
0% 10% 20% 30% 40% 50%
1st choice 2nd choiceSource: ETC Institute (2009)
Utility/Environmental Services That Should Be Emphasized Most Over the Next Two Years
by percentage of residents surveyed who selected the item as one of their top two choices
2009 City of Auburn DirectionFinder Survey: Final Report
ETC Institute (April 2009) 11
CITY MAINTENANCE
24%
23%
22%
21%
19%
16%
20%
17%
12%
12%
13%
61%
62%
60%
61%
58%
60%
55%
56%
54%
51%
50%
13%
13%
13%
16%
17%
17%
15%
23%
25%
21%
22%
2%
3%
6%
2%
7%
7%
10%
4%
9%
17%
16%
Maintenance of city buildings
Maintenance of downtown Auburn
Maintenance of traffic signals
Water lines and fire hydrants
Overall cleanliness of streets/public areas
Maintenance of street signs
Mowing and trimming along streets/public areas
Sewer lines and manholes
Maintenance of sidewalks (excl. AU campus)
Maintenance of streets (excl. AU campus)
Adequacy of city street lighting
0% 20% 40% 60% 80% 100%
Very Satisfied (5) Satisfied (4) Neutral (3) Dissatisfied (1/2)
Satisfaction with Various Aspects of City Maintenance
by percentage of residents surveyed who rated the item as a 1 to 5 on a 5-point scale (excluding don't knows)
Source: ETC Institute (2009)
2009 City of Auburn DirectionFinder Survey: Final Report
ETC Institute (April 2009) 12

63%
86%
84%
66%
76%
63%
82%
75%
77%
73%
82%
64%
85%
80%
67%
75%
62%
82%
73%
77%
75%
80%
64%
83%
77%
65%
70%
56%
79%
72%
74%
71%
79%
Adequacy of city street lighting
Maintenance of city buildings
Maintenance of downtown Auburn
Maintenance of sidewalks (excl. AU campus)
Maintenance of street signs
Maintenance of streets (excl. AU campus)
Maintenance of traffic signals
Mowing and trimming along streets/public areas
Overall cleanliness of streets/public areas
Sewer lines and manholes
Water lines and fire hydrants
0% 20% 40% 60% 80% 100%
2009 2008 2007
TRENDS: Overall Satisfaction with City Maintenance(2007 thru 2009)
by percentage of respondents who rated the item as a 4 or 5 on a 5-point scale (excluding don't knows)
Source: ETC Institute (2009) TRENDS
51%
26%
18%
17%
16%
12%
10%
9%
8%
7%
2%
Maintenance of streets (excl. AU campus)
Adequacy of city street lighting
Overall cleanliness of streets/public areas
Maintenance of sidewalks (excl. AU campus)
Mowing and trimming along streets/public areas
Maintenance of downtown Auburn
Maintenance of traffic signals
Maintenance of street signs
Sewer lines and manholes
Water lines and fire hydrants
Maintenance of city buildings
0% 20% 40% 60%
1st choice 2nd choice
Source: ETC Institute (2009)
City Maintenance Services That Should Be Emphasized Most Over the Next Two Years
by percentage of residents surveyed who selected the item as one of their top two choices
2009 City of Auburn DirectionFinder Survey: Final Report
ETC Institute (April 2009) 13

FEELING OF SAFETY
57%
28%
32%
33%
21%
15%
37%
60%
55%
49%
58%
56%
5%
11%
12%
12%
16%
24%
2%
2%
2%
6%
5%
6%
In your neighborhood during the day
Overall feeling of safety in Auburn
In downtown Auburn
In your neighborhood at night
In commercial and retail areas
In the City parks
0% 20% 40% 60% 80% 100%
Very Safe (5) Safe (4) Neutral (3) Unsafe (2/1)
Feelings of Safety in Auburn
Source: ETC Institute (2009)
by percentage of residents surveyed who rated the item as a 1 to 5 on a 5-point scale (excluding don't knows)
2009 City of Auburn DirectionFinder Survey: Final Report
ETC Institute (April 2009) 14
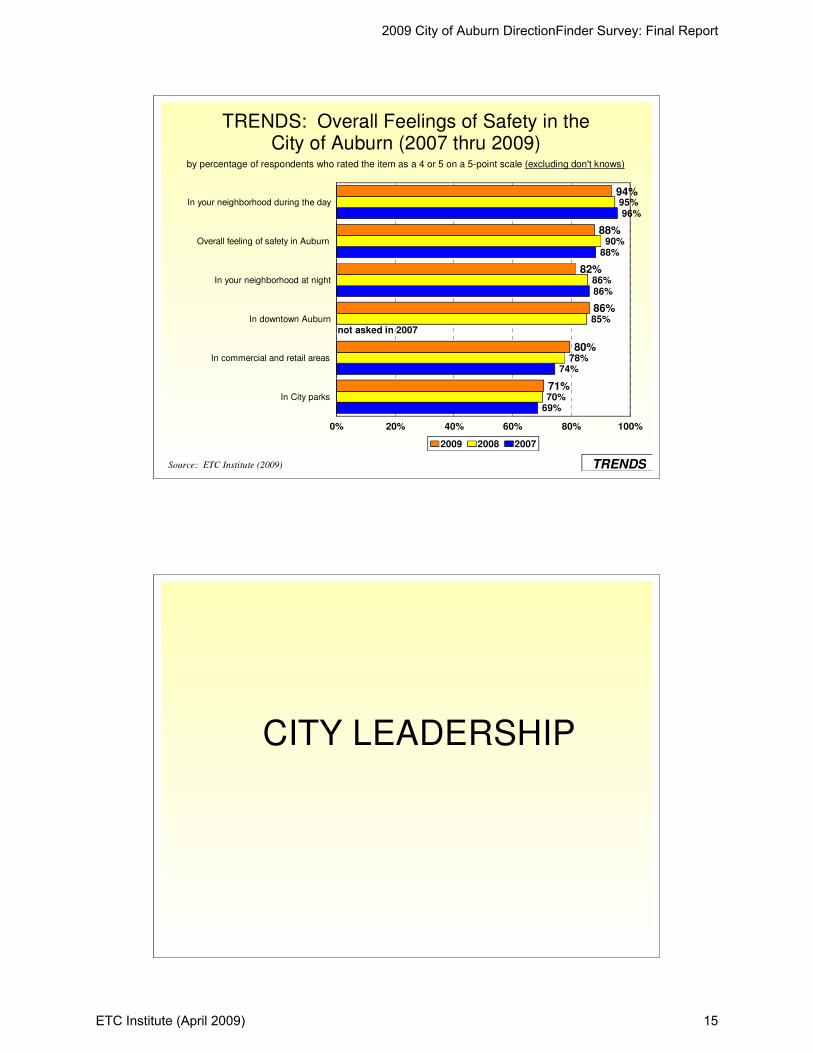
94%
88%
82%
86%
80%
71%
95%
90%
86%
85%
78%
70%
96%
88%
86%
74%
69%
In your neighborhood during the day
Overall feeling of safety in Auburn
In your neighborhood at night
In downtown Auburn
In commercial and retail areas
In City parks
0% 20% 40% 60% 80% 100%
2009 2008 2007
TRENDS: Overall Feelings of Safety in the City of Auburn (2007 thru 2009)
by percentage of respondents who rated the item as a 4 or 5 on a 5-point scale (excluding don't knows)
Source: ETC Institute (2009)
not asked in 2007
TRENDS
CITY LEADERSHIP
2009 City of Auburn DirectionFinder Survey: Final Report
ETC Institute (April 2009) 15

22%
20%
15%
47%
47%
44%
24%
23%
28%
7%
10%
13%
Effectiveness of the City Manager
Leadership provided by City's elected officials
Effectiveness of appointed boards
0% 20% 40% 60% 80% 100%
Very Satisfied (5) Satisfied (4) Neutral (3) Dissatisfied (1/2)
Satisfaction with City Leadership
Source: ETC Institute (2009)
by percentage of residents surveyed who rated the item as a 1 to 5 on a 5-point scale (excluding don't knows)
67%
69%
59%
64%
64%
57%
58%
63%
55%
Leadership provided by City's elected officials
Effectiveness of the City Manager
Effectiveness of appointed boards
0% 20% 40% 60% 80%
2009 2008 2007
TRENDS: Overall Satisfaction with City Leadership(2007 thru 2009)
by percentage of respondents who rated the item as a 4 or 5 on a 5-point scale (excluding don't knows)
Source: ETC Institute (2009) TRENDS
2009 City of Auburn DirectionFinder Survey: Final Report
ETC Institute (April 2009) 16

PARKS & RECREATION
25%
24%
27%
26%
23%
18%
19%
18%
19%
17%
13%
13%
60%
57%
53%
52%
50%
48%
45%
43%
40%
41%
43%
37%
12%
15%
15%
17%
22%
26%
21%
31%
23%
32%
30%
33%
4%
3%
4%
5%
5%
8%
15%
8%
18%
9%
15%
18%
Maintenance of parks
Maintenance of cemeteries
Outdoor athletic fields
Youth athletic programs
Ease of registering for programs
Fees charged for recreation program
Number of parks
Other city recreation programs
Walking and biking trails
Adult athletic programs
Community recreation centers
Swimming pools
0% 20% 40% 60% 80% 100%
Very Satisfied (5) Satisfied (4) Neutral (3) Dissatisfied (1/2)
Satisfaction with Various Aspects of Parks and Recreation
Source: ETC Institute (2009)
by percentage of residents surveyed who rated the item as a 1 to 5 on a 5-point scale (excluding don't knows)
2009 City of Auburn DirectionFinder Survey: Final Report
ETC Institute (April 2009) 17

59%
55%
73%
66%
81%
85%
64%
61%
80%
50%
59%
78%
64%
56%
71%
67%
80%
84%
66%
65%
79%
54%
62%
78%
61%
53%
72%
64%
78%
84%
64%
65%
81%
50%
61%
79%
Adult athletic programs
Community recreation centers
Ease of registering for programs
Fees charged for recreation programs
Maintenance of cemeteries
Maintenance of parks
Number of parks
Other city recreation programs
Outdoor athletic fields
Swimming pools
Walking and biking trails
Youth athletic programs
0% 20% 40% 60% 80% 100%
2009 2008 2007
TRENDS: Overall Satisfaction with Parks and Recreation (2007 thru 2009)
by percentage of respondents who rated the item as a 4 or 5 on a 5-point scale (excluding don't knows)
Source: ETC Institute (2009) TRENDS
27%
25%
21%
19%
16%
13%
9%
9%
8%
8%
8%
5%
Walking and biking trails
Maintenance of parks
Community recreation centers
Number of parks
Youth athletic programs
Swimming pools
Other city recreation programs
Maintenance of cemeteries
Adult athletic programs
Outdoor athletic fields
Fees charged for recreation programs
Ease of registering for programs
0% 5% 10% 15% 20% 25% 30%
1st choice 2nd choiceSource: ETC Institute (2009)
Parks and Recreation Services That Should Be Emphasized Most Over the Next Two Years
by percentage of residents surveyed who selected the item as one of their top two choices
2009 City of Auburn DirectionFinder Survey: Final Report
ETC Institute (April 2009) 18

Traffic Flow
6%
9%
6%
7%
47%
44%
42%
25%
26%
28%
24%
35%
21%
20%
29%
32%
Ease of east-west travel
Ease of pedestrian travel in Auburn
Ease of north-south travel
Ease of travel by bicycle in Auburn
0% 20% 40% 60% 80% 100%
Very Satisfied (5) Satisfied (4) Neutral (3) Dissatisfied (1/2)
Satisfaction with Various Aspects ofTraffic Flow
Source: ETC Institute (2009)
by percentage of residents surveyed who rated the item as a 1 to 5 on a 5-point scale (excluding don't knows)
2009 City of Auburn DirectionFinder Survey: Final Report
ETC Institute (April 2009) 19
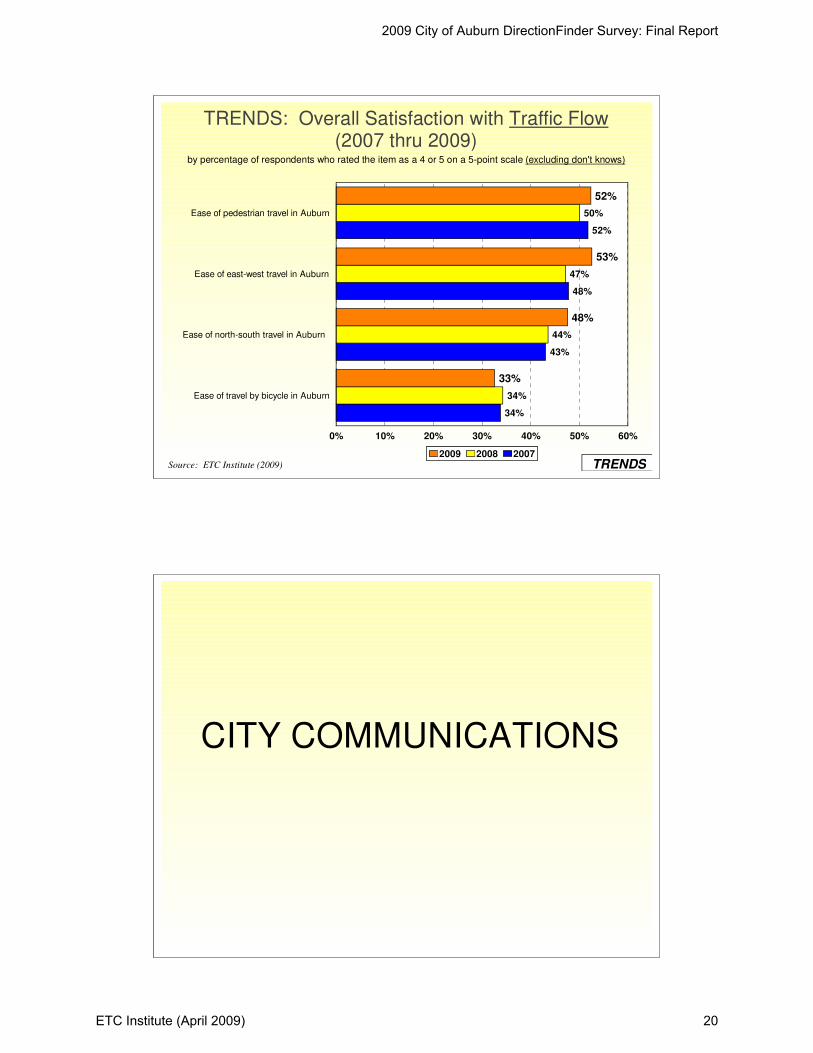
52%
53%
48%
33%
50%
47%
44%
34%
52%
48%
43%
34%
Ease of pedestrian travel in Auburn
Ease of east-west travel in Auburn
Ease of north-south travel in Auburn
Ease of travel by bicycle in Auburn
0% 10% 20% 30% 40% 50% 60%
2009 2008 2007
TRENDS: Overall Satisfaction with Traffic Flow(2007 thru 2009)
by percentage of respondents who rated the item as a 4 or 5 on a 5-point scale (excluding don't knows)
Source: ETC Institute (2009) TRENDS
CITY COMMUNICATIONS
2009 City of Auburn DirectionFinder Survey: Final Report
ETC Institute (April 2009) 20
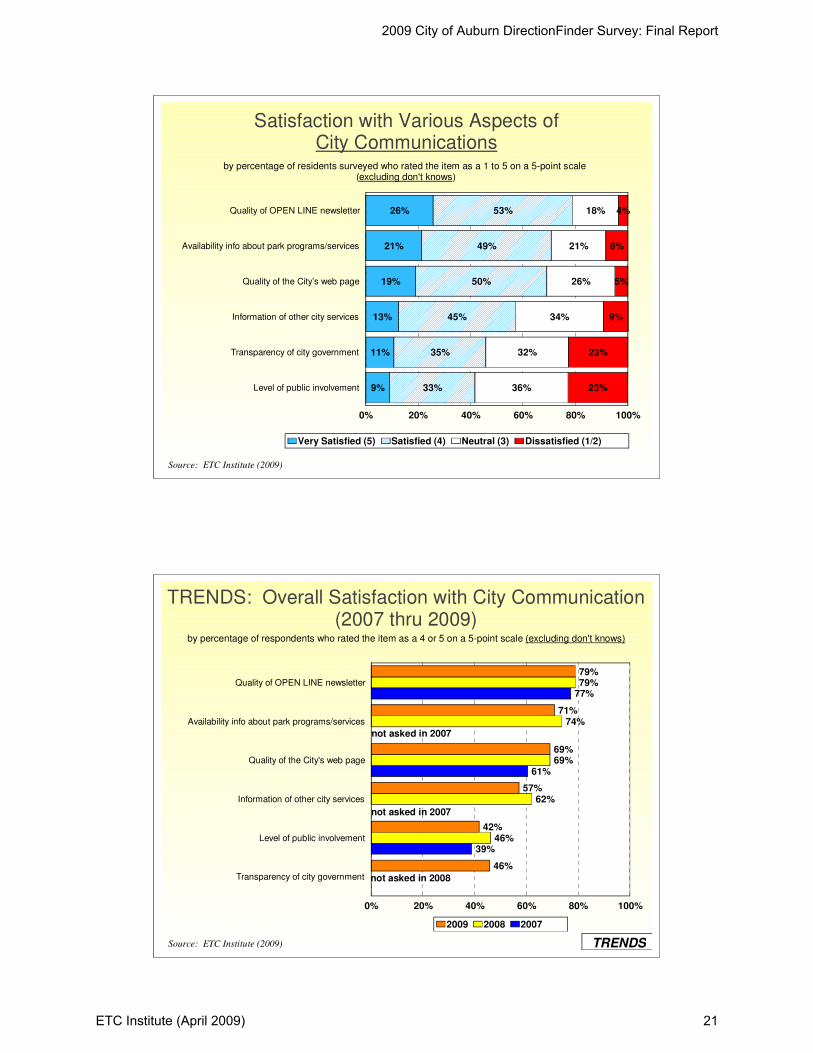
26%
21%
19%
13%
11%
9%
53%
49%
50%
45%
35%
33%
18%
21%
26%
34%
32%
36%
4%
8%
5%
9%
23%
23%
Quality of OPEN LINE newsletter
Availability info about park programs/services
Quality of the City’s web page
Information of other city services
Transparency of city government
Level of public involvement
0% 20% 40% 60% 80% 100%
Very Satisfied (5) Satisfied (4) Neutral (3) Dissatisfied (1/2)
Satisfaction with Various Aspects ofCity Communications
Source: ETC Institute (2009)
by percentage of residents surveyed who rated the item as a 1 to 5 on a 5-point scale (excluding don't knows)
79%
71%
69%
57%
42%
46%
79%
74%
69%
62%
46%
77%
61%
39%
Quality of OPEN LINE newsletter
Availability info about park programs/services
Quality of the City's web page
Information of other city services
Level of public involvement
Transparency of city government
0% 20% 40% 60% 80% 100%
2009 2008 2007
TRENDS: Overall Satisfaction with City Communication(2007 thru 2009)
by percentage of respondents who rated the item as a 4 or 5 on a 5-point scale (excluding don't knows)
Source: ETC Institute (2009) TRENDS
not asked in 2007
not asked in 2008
not asked in 2007
2009 City of Auburn DirectionFinder Survey: Final Report
ETC Institute (April 2009) 21

OTHER ISSUES
Do You Have Access to the Internet at Your Home?
by percentage of residents surveyed
Yes89%
No9%
Don't know2%
High speed90%
Dial-up6% Satellite
2%
Don't know2%
Source: ETC Institute (2009)
Do You Have High Speed or Dial-up Access?
2009 City of Auburn DirectionFinder Survey: Final Report
ETC Institute (April 2009) 22

Have You Called or Visited the City with a Question, Problem, or Complaint During the Past Year?
Yes46%
No52%
Don't know2%
Very easy44%
Somewhat easy41%
Difficult12%
Very difficult1%
Don't know2%
Source: ETC Institute (2009)
How easy was it to contact the person you needed to reach?
by percentage of residents surveyed
40%
28%
21%
17%
17%
14%
14%
12%
12%
7%
7%
4%
Environmental
Police
Parks & recreation
Water Revenue
Water resource
Planning
Codes enforce
Public works
City Manager
Finance
Other
Fire
0% 10% 20% 30% 40% 50%
Source: ETC Institute (2009)
What City department did you contact?by percentage of residents who had contacted the City during the past year
2009 City of Auburn DirectionFinder Survey: Final Report
ETC Institute (April 2009) 23

Was the Department You Contacted Responsive to Your Issue?
Yes 81%
No 16%
No response 3%
Source: ETC Institute (2009)
by percentage of residents who had called or visited the City during the past year
Do You Think Auburn University Students Have Had a Positive, Negative, or No Impact on Your Neighborhood?
Positive 35%
Negative 14%
No impact 46%
Don't know 6%
Source: ETC Institute (2009)
by percentage of residents surveyed
2009
Positive 29%
Negative 17%
No impact 46%
Don't know 8%
2008
TRENDS
2009 City of Auburn DirectionFinder Survey: Final Report
ETC Institute (April 2009) 24

How Much Residents Would be Willing to Pay Per Month on Their Utility Bill to Fund Stormwater
Improvements in Auburn?
Nothing26%
Up to $118%
Up to $213%
Up to $38%
Up to $43%
Up to $514%
More than $54%
Don't know15%
Source: ETC Institute (2009)
by percentage of residents surveyed
Nothing23%
Up to $115%
Up to $216%
Up to $39%
Up to $43%
Up to $513%More than $5
5%
Don't know15%
20082009
TRENDS
by percentage of residents surveyed
Do you think the current rate of growth in the City of Auburn is too fast, too slow, or about right?
Source: ETC Institute (2009)
Too fast 47%
About right 44%
Too slow 4%
Don't know 5%
2009 City of Auburn DirectionFinder Survey: Final Report
ETC Institute (April 2009) 25

by percentage of residents surveyed
Do you believe that the City of Auburn is building sufficient streets, intersections, sidewalks, and
water/sewer systems to keep up with the City's growth?
Yes 35%
No 38%
Don't know 27%
Source: ETC Institute (2009)
Yes 38%
No 39% Don't know 23%
20082009
TRENDS
Do you think the City's efforts to pursue commercial and industrial projects in Auburn, in order to create
jobs and revenue, should be increased, stay the same, or be reduced?
Be increased48%
Stay the same35%
Be reduced12%
Don't know5%
Source: ETC Institute (2009)
by percentage of residents surveyed
2009 City of Auburn DirectionFinder Survey: Final Report
ETC Institute (April 2009) 26
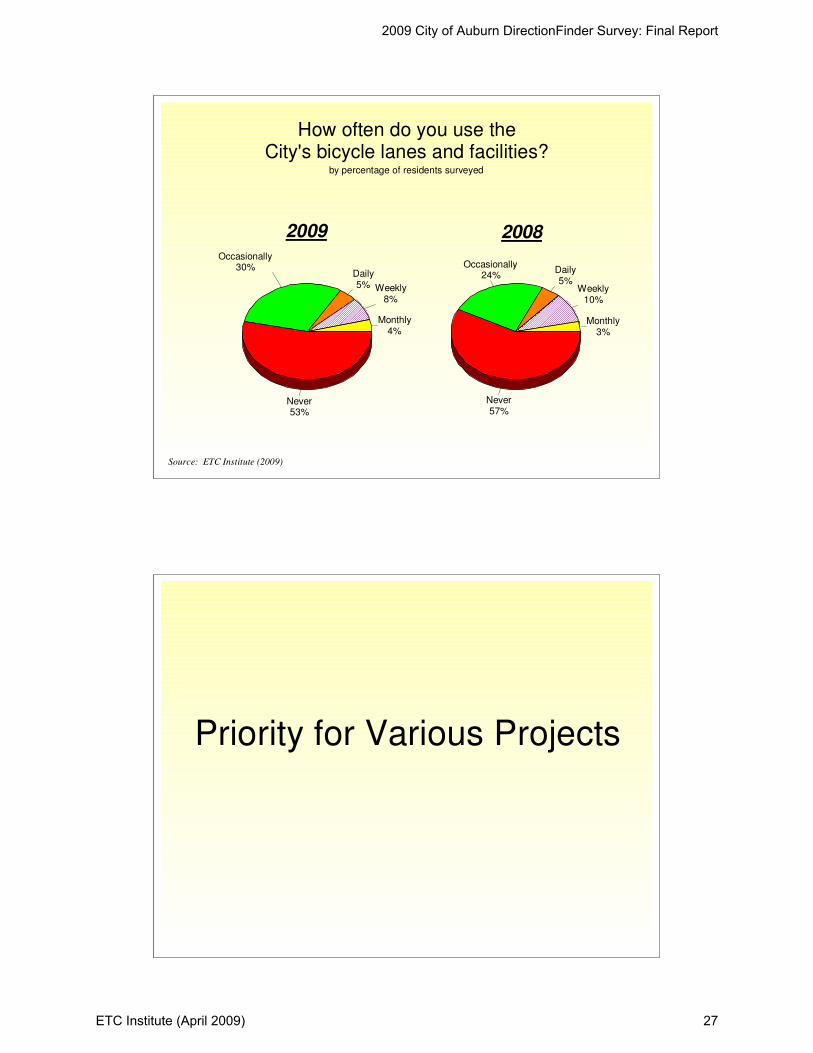
How often do you use the City's bicycle lanes and facilities?
Monthly4%
Weekly8%
Daily5%
Occasionally30%
Never53%
Monthly3%
Weekly10%
Daily5%
Occasionally24%
Never57%
Source: ETC Institute (2009)
by percentage of residents surveyed
20082009
Priority for Various Projects
2009 City of Auburn DirectionFinder Survey: Final Report
ETC Institute (April 2009) 27
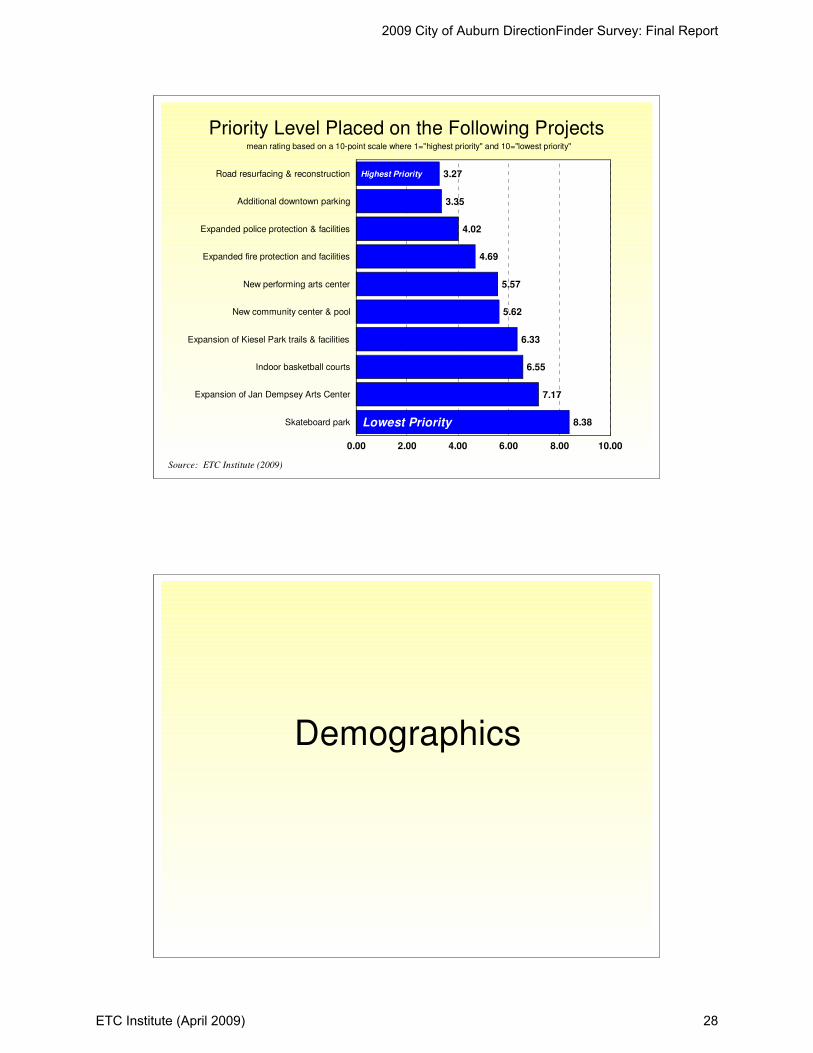
3.27
3.35
4.02
4.69
5.57
5.62
6.33
6.55
7.17
8.38
Road resurfacing & reconstruction
Additional downtown parking
Expanded police protection & facilities
Expanded fire protection and facilities
New performing arts center
New community center & pool
Expansion of Kiesel Park trails & facilities
Indoor basketball courts
Expansion of Jan Dempsey Arts Center
Skateboard park
0.00 2.00 4.00 6.00 8.00 10.00
Source: ETC Institute (2009)
Priority Level Placed on the Following Projectsmean rating based on a 10-point scale where 1="highest priority" and 10="lowest priority"
Highest Priority
Lowest Priority
Demographics
2009 City of Auburn DirectionFinder Survey: Final Report
ETC Institute (April 2009) 28

Demographics: Ages of people in respondents' households
Under age 59%
Ages 5-99%
Ages 10-147%
Ages 15-196%Ages 20-24
5%
Ages 25-3411%
Ages 35-4415%
Ages 45-5416%
Ages 55-6412%
Ages 65-747%
Ages 75+5%
Source: ETC Institute (2009)
by percentage of residents surveyed
Demographics: How Many Years Have You Lived in the City of Auburn?
5 years or less21%
6-10 years16%
11-20 years24%
21-30 years16%
31 or more years23%
Source: ETC Institute (2009)
by percentage of residents surveyed
2009 City of Auburn DirectionFinder Survey: Final Report
ETC Institute (April 2009) 29

78%
15%
2%
3%
1%
1%
78%
17%
2%
3%
0%
1%
White
Black/African American
Hispanic
Asian/Pacific Islander
Am Indian/Eskimo
Other
0% 10% 20% 30% 40% 50% 60% 70% 80% 90% 100%
Sample Census
Source: ETC Institute (2009)
Demographics: Which best describes your race/ethnicity?
by percentage of residents surveyed
Under $30k10%
$30K-$59,99920%
$60K-$99,99930%
$100K+35%
Not provided5%
Demographics: Total Annual Household Income
Source: ETC Institute (2009)
by percentage of residents surveyed
2009 City of Auburn DirectionFinder Survey: Final Report
ETC Institute (April 2009) 30
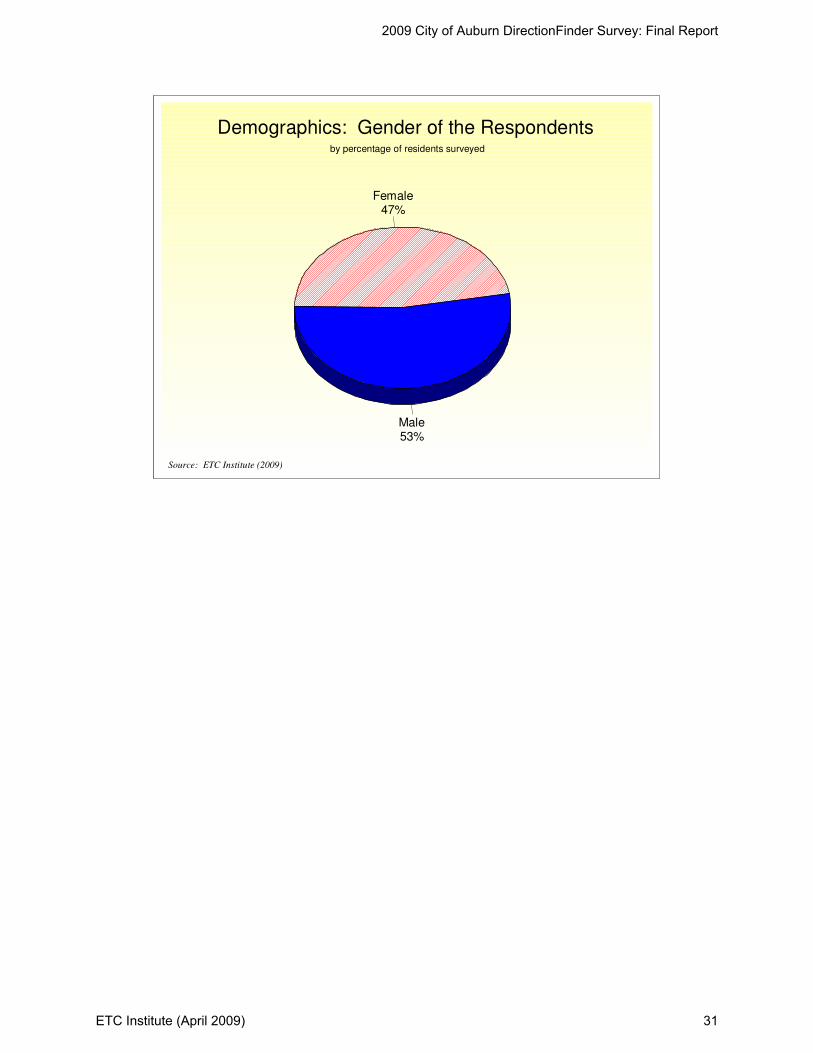
Male53%
Female47%
Demographics: Gender of the Respondents
Source: ETC Institute (2009)
by percentage of residents surveyed
2009 City of Auburn DirectionFinder Survey: Final Report
ETC Institute (April 2009) 31

Section 2: Benchmarking Data
2009 City of Auburn DirectionFinder Survey: Final Report
ETC Institute (April 2009) 32

DirectionFinder® Survey
Year 2009 Benchmarking Summary Report
Overview
ETC Institute's DirectionFinder program was originally developed in 1999 to help community leaders across the United States use statistically valid community survey data as a tool for making better decisions. Since November of 1999, the survey has been administered in more than 100 cities in 21 states. Most participating cities conduct the survey on an annual or biennial basis. This report contains benchmarking data from two sources: (1) a national survey that was administered by ETC Institute during March 2007 to a random sample of 2,000 residents in the continental United States and (2) survey results from 20 medium sized cities (population of 20,000 to 199,999) where the DirectionFinder® survey was administered between March 2005 and March 2007. The national survey results were used as the basis for the mean performance ratings that are shown in this report. The results from individual cities were used as the basis for developing the range of performance that is shown in this report for specific types of services. The 20 cities included in the performance comparisons that are shown in this report are listed below (cities that are home to a major university are identified with an “*”)
• Blue Springs, Missouri • Bridgeport, Connecticut • Burbank, California • Casper, Wyoming • Columbia, Missouri* • Independence, Missouri • Kansas City, Kansas • Lawrence, Kansas* • Lee's Summit, Missouri • Lenexa, Kansas
• Manhattan, Kansas* • Naperville, Illinois • Olathe, Kansas • Overland Park, Kansas • Peoria, Arizona • Palm Desert, California • Shoreline, Washington • San Bernardino, California • Tamarac, Florida • West Des Moines, Iowa
The charts on the following pages show the range of satisfaction among residents in the communities listed above. The charts show the highest, lowest, and average (mean) levels of satisfaction for nearly 50 areas of municipal service delivery. The mean rating is shown as a vertical line and indicates the mean ratings from ETC Institute’s national survey for residents who live in cities with a population of 20,000 to 199,999. The actual ratings for Auburn are listed to the right of each chart. The dot on each bar shows how the results for Auburn compare to the other communities where the DirectionFinder® survey has been administered.
2009 City of Auburn DirectionFinder Survey: Final Report
ETC Institute (April 2009) 33
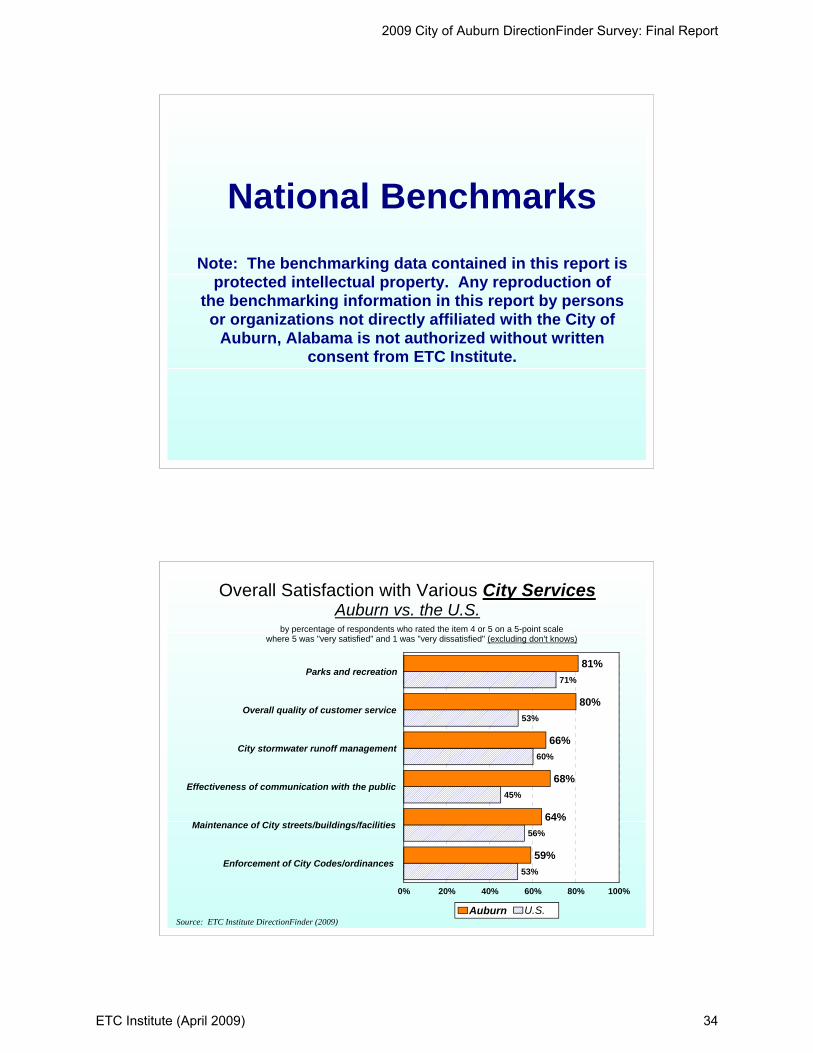
National BenchmarksNote: The benchmarking data contained in this report is
protected intellectual property. Any reproduction ofthe benchmarking information in this report by persons or organizations not directly affiliated with the City of
Auburn, Alabama is not authorized without written consent from ETC Institute.
81%
80%
66%
68%
64%
59%
71%
53%
60%
45%
56%
53%
Parks and recreation
Overall quality of customer service
City stormwater runoff management
Effectiveness of communication with the public
Maintenance of City streets/buildings/facilities
Enforcement of City Codes/ordinances
0% 20% 40% 60% 80% 100%
Auburn U.S.
Overall Satisfaction with Various City ServicesAuburn vs. the U.S.
by percentage of respondents who rated the item 4 or 5 on a 5-point scalewhere 5 was "very satisfied" and 1 was "very dissatisfied" (excluding don't knows)
Source: ETC Institute DirectionFinder (2009)
2009 City of Auburn DirectionFinder Survey: Final Report
ETC Institute (April 2009) 34
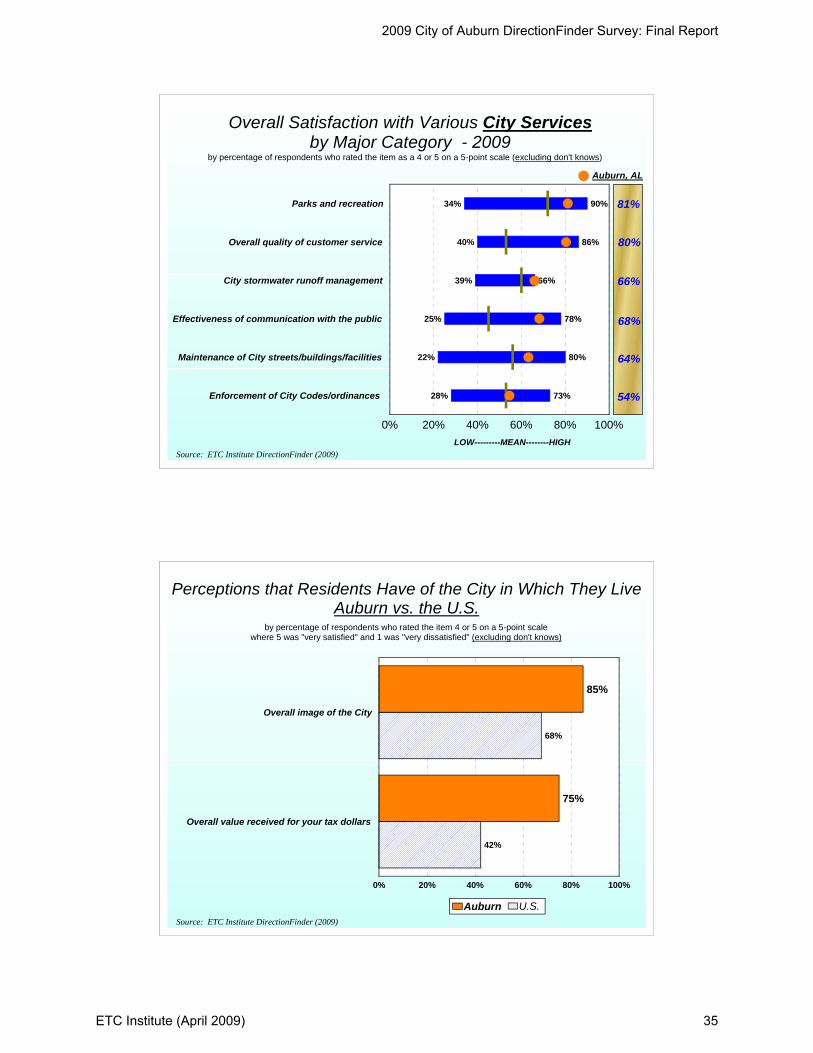
90%
86%
66%
78%
80%
73%
34%
40%
39%
25%
22%
28%
Parks and recreation
Overall quality of customer service
City stormwater runoff management
Effectiveness of communication with the public
Maintenance of City streets/buildings/facilities
Enforcement of City Codes/ordinances
0% 20% 40% 60% 80% 100%
Overall Satisfaction with Various City Services by Major Category - 2009
by percentage of respondents who rated the item as a 4 or 5 on a 5-point scale (excluding don't knows)
LOW---------MEAN--------HIGH
Auburn, AL
81%
68%
66%
54%
80%
64%
Source: ETC Institute DirectionFinder (2009)
85%
75%
68%
42%
Overall image of the City
Overall value received for your tax dollars
0% 20% 40% 60% 80% 100%
Auburn U.S.
Perceptions that Residents Have of the City in Which They LiveAuburn vs. the U.S.
by percentage of respondents who rated the item 4 or 5 on a 5-point scalewhere 5 was "very satisfied" and 1 was "very dissatisfied" (excluding don't knows)
Source: ETC Institute DirectionFinder (2009)
2009 City of Auburn DirectionFinder Survey: Final Report
ETC Institute (April 2009) 35

94%
82%
22%
25%
Overall image of the City
Overall value received for your tax dollars
0% 20% 40% 60% 80% 100%LOW---------MEAN--------HIGH
Perceptions that Residents Haveof the City in Which They Live - 2009
by percentage of respondents who rated the item as a 4 or 5 on a 5-point scale (excluding don't knows)
85%
75%
Auburn, AL
Source: ETC Institute DirectionFinder (2009)
66%
62%
65%
60%
64%
58%
59%
63%
61%
59%
The City's overall efforts to prevent crime
Visibility of police in neighborhoods
Enforcement of local traffic laws
Quality of animal control
Visibility of police in retail areas
0% 20% 40% 60% 80% 100%
Auburn U.S.
Overall Satisfaction with Public Safety ServicesAuburn vs. the U.S.
by percentage of respondents who rated the item 4 or 5 on a 5-point scalewhere 5 was "very satisfied" and 1 was "very dissatisfied" (excluding don't knows)
Source: ETC Institute DirectionFinder (2009)
2009 City of Auburn DirectionFinder Survey: Final Report
ETC Institute (April 2009) 36

85%
80%
79%
80%
72%
39%
47%
40%
26%
38%
The City's overall efforts to prevent crime
Visibility of police in neighborhoods
Enforcement of local traffic laws
Quality of animal control
Visibility of police in retail areas
0% 20% 40% 60% 80% 100%LOW---------MEAN--------HIGH
by percentage of respondents who rated the item as a 4 or 5 on a 5-point scale (excluding don't knows)
Satisfaction with Various Public Safety Services Provided by Cities - 2009
66%
65%
62%
64%
60%
Auburn, AL
Source: ETC Institute DirectionFinder (2009)
67%
59%
69%
59%
54%
58%
Leadership of Elected Officials
Effectiveness of appointed boards/commissions
Effectiveness of City Manager
0% 20% 40% 60% 80% 100%
Auburn U.S.
Overall Satisfaction with City LeadershipAuburn vs. the U.S.
by percentage of respondents who rated the item 4 or 5 on a 5-point scalewhere 5 was "very satisfied" and 1 was "very dissatisfied" (excluding don't knows)
Source: ETC Institute DirectionFinder (2009)
2009 City of Auburn DirectionFinder Survey: Final Report
ETC Institute (April 2009) 37

82%
74%
82%
37%
30%
39%
Leadership of Elected Officials
Effectiveness of appointed boards/commissions
Effectiveness of City Manager
0% 20% 40% 60% 80% 100%LOW---------MEAN--------HIGH
by percentage of respondents who rated the item as a 4 or 5 on a 5-point scale (excluding don't knows)
Satisfaction with City Leadership Compared to Satisfaction with City Leadership
in Other Communities - 2009
67%
59%
69%
Auburn, AL
Source: ETC Institute DirectionFinder (2009)
86%
77%
75%
63%
84%
63%
66%
78%
66%
61%
62%
57%
57%
49%
Maintenance of City buildings such as City Hall
Overall cleanliness of City streets/public areas
Mowing/trimming of public areas
Adequacy of City street lighting
Maintenance/preservation of downtown Auburn, AL
Maintenance of City Streets
Maintenance of City sidewalks
0% 20% 40% 60% 80% 100%
Auburn U.S.
Overall Satisfaction with MaintenanceAuburn vs. the U.S.
by percentage of respondents who rated the item 4 or 5 on a 5-point scalewhere 5 was "very satisfied" and 1 was "very dissatisfied" (excluding don't knows)
Source: ETC Institute DirectionFinder (2009)
2009 City of Auburn DirectionFinder Survey: Final Report
ETC Institute (April 2009) 38
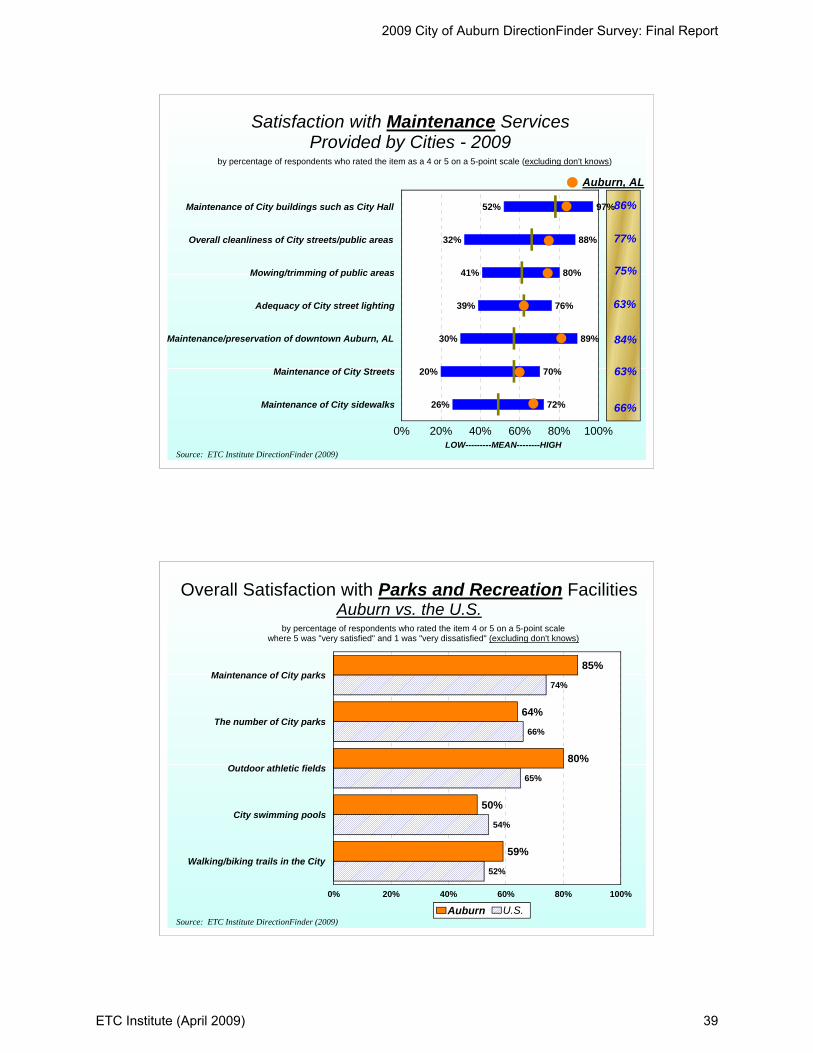
97%
88%
80%
76%
89%
70%
72%
52%
32%
41%
39%
30%
20%
26%
Maintenance of City buildings such as City Hall
Overall cleanliness of City streets/public areas
Mowing/trimming of public areas
Adequacy of City street lighting
Maintenance/preservation of downtown Auburn, AL
Maintenance of City Streets
Maintenance of City sidewalks
0% 20% 40% 60% 80% 100%LOW---------MEAN--------HIGH
by percentage of respondents who rated the item as a 4 or 5 on a 5-point scale (excluding don't knows)
Satisfaction with Maintenance Services Provided by Cities - 2009
86%
77%
84%
63%
66%
63%
75%
Auburn, AL
Source: ETC Institute DirectionFinder (2009)
85%
64%
80%
50%
59%
74%
66%
65%
54%
52%
Maintenance of City parks
The number of City parks
Outdoor athletic fields
City swimming pools
Walking/biking trails in the City
0% 20% 40% 60% 80% 100%
Auburn U.S.
Overall Satisfaction with Parks and Recreation FacilitiesAuburn vs. the U.S.
by percentage of respondents who rated the item 4 or 5 on a 5-point scalewhere 5 was "very satisfied" and 1 was "very dissatisfied" (excluding don't knows)
Source: ETC Institute DirectionFinder (2009)
2009 City of Auburn DirectionFinder Survey: Final Report
ETC Institute (April 2009) 39

91%
84%
83%
80%
78%
56%
31%
39%
20%
17%
Maintenance of City parks
The number of City parks
Outdoor athletic fields
City swimming pools
Walking/biking trails in the City
0% 20% 40% 60% 80% 100%LOW---------MEAN--------HIGH
by percentage of respondents who rated the item as a 4 or 5 on a 5-point scale (excluding don't knows)
Satisfaction with Parks and Recreation Facilities and Services Provided by Cities - 2009
85%
64%
80%
59%
50%
Auburn, AL
Source: ETC Institute DirectionFinder (2009)
64%
72%
60%
52%
Enforcing sign regulations
Enforcing clean up of debris on private property
0% 20% 40% 60% 80% 100%
Auburn U.S.
Overall Satisfaction with the Enforcement of Codes and Ordinances
Auburn vs. the U.S.by percentage of respondents who rated the item 4 or 5 on a 5-point scale
where 5 was "very satisfied" and 1 was "very dissatisfied" (excluding don't knows)
Source: ETC Institute DirectionFinder (2009)
2009 City of Auburn DirectionFinder Survey: Final Report
ETC Institute (April 2009) 40
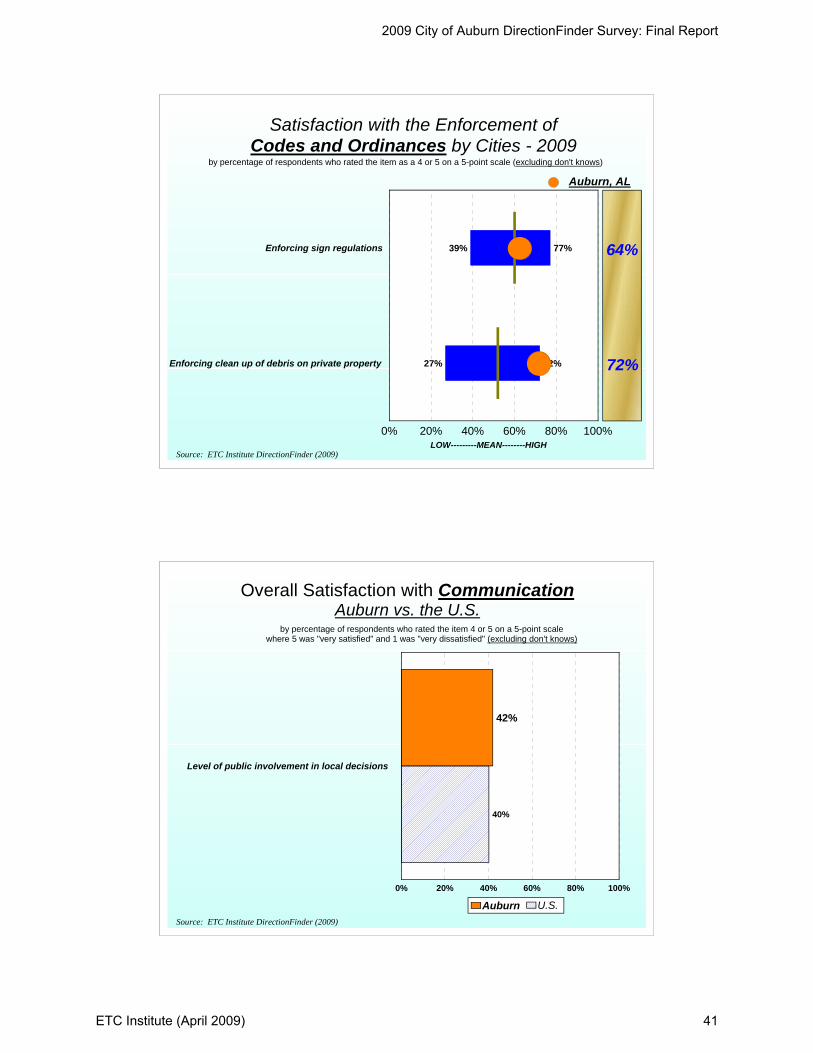
77%
72%
39%
27%
Enforcing sign regulations
Enforcing clean up of debris on private property
0% 20% 40% 60% 80% 100%LOW---------MEAN--------HIGH
by percentage of respondents who rated the item as a 4 or 5 on a 5-point scale (excluding don't knows)
Satisfaction with the Enforcement of Codes and Ordinances by Cities - 2009
64%
72%
Auburn, AL
Source: ETC Institute DirectionFinder (2009)
42%
40%
Level of public involvement in local decisions
0% 20% 40% 60% 80% 100%
Auburn U.S.
Overall Satisfaction with CommunicationAuburn vs. the U.S.
by percentage of respondents who rated the item 4 or 5 on a 5-point scalewhere 5 was "very satisfied" and 1 was "very dissatisfied" (excluding don't knows)
Source: ETC Institute DirectionFinder (2009)
2009 City of Auburn DirectionFinder Survey: Final Report
ETC Institute (April 2009) 41

63%19%Level of public involvement in local decisions
0% 20% 40% 60% 80% 100%LOW---------MEAN--------HIGH
by percentage of respondents who rated the item as a 4 or 5 on a 5-point scale (excluding don't knows)
Satisfaction with Various Aspects ofCity Communications - 2009
42%
Auburn, AL
Source: ETC Institute DirectionFinder (2009)
2009 City of Auburn DirectionFinder Survey: Final Report
ETC Institute (April 2009) 42

Section 3: Importance-Satisfaction
Analysis
2009 City of Auburn DirectionFinder Survey: Final Report
ETC Institute (April 2009) 43

Importance-Satisfaction Analysis Auburn, Alabama
Overview Today, city officials have limited resources which need to be targeted to activities that are of the most benefit to their citizens. Two of the most important criteria for decision making are (1) to target resources toward services of the highest importance to citizens; and (2) to target resources toward those services where citizens are the least satisfied. The Importance-Satisfaction (IS) rating is a unique tool that allows public officials to better understand both of these highly important decision making criteria for each of the services they are providing. The Importance-Satisfaction rating is based on the concept that cities will maximize overall citizen satisfaction by emphasizing improvements in those service categories where the level of satisfaction is relatively low and the perceived importance of the service is relatively high. Methodology
The rating is calculated by summing the percentage of responses for items selected as the first, second, and third most important services for the City to emphasize over the next two years. This sum is then multiplied by 1 minus the percentage of respondents that indicated they were positively satisfied with the City's performance in the related area (the sum of the ratings of 4 and 5 on a 5-point scale “excluding don't knows”). “Don't know” responses are excluded from the calculation to ensure that the satisfaction ratings among service categories are comparable. [IS=Importance x (1-Satisfaction)].
Example of the Calculation. Respondents were asked to identify the Overall City services they thought should receive the most emphasis over the next two years. Twenty-two percent (22%) selected the “Enforcement of city codes and ordinances” as one of the most important Overall City service issues to emphasize over the next two years. With regard to satisfaction, 59% of the residents surveyed rated their overall satisfaction with the “Enforcement of city codes and ordinances” as a “4” or a “5” on a 5-point scale (where “5” means “very satisfied) excluding “Don't know” responses. The I-S rating for the “Enforcement of city codes and ordinances” was calculated by multiplying the sum of the most important
2009 City of Auburn DirectionFinder Survey: Final Report
ETC Institute (April 2009) 44

percentages by 1 minus the sum of the satisfaction percentages. In this example, 22% was multiplied by 41%. (1-0.59). This calculation yielded an I-S rating of 0.0904, which ranked third out of ten Overall City Services. The maximum rating is 1.00 and would be achieved when 100% of the respondents select an item as one of their top three choices to emphasize over the next two years and 0% indicate that they are positively satisfied with the delivery of the service. The lowest rating is 0.00 and could be achieved under either one of the following two situations:
• if 100% of the respondents were positively satisfied with the delivery of the service
• if none (0%) of the respondents selected the service as one of the three most
important areas for the City to emphasize over the next two years. Interpreting the Ratings Ratings that are greater than or equal to 0.20 identify areas that should receive significantly more emphasis over the next two years. Ratings from .10 to .20 identify service areas that should receive increased emphasis. Ratings less than .10 should continue to receive the current level of emphasis.
• Definitely Increase Emphasis (IS>=0.20)
• Increase Current Emphasis (0.10<=IS<0.20)
• Maintain Current Emphasis (IS<0.10) The results for Auburn are provided on the following page.
2009 City of Auburn DirectionFinder Survey: Final Report
ETC Institute (April 2009) 45
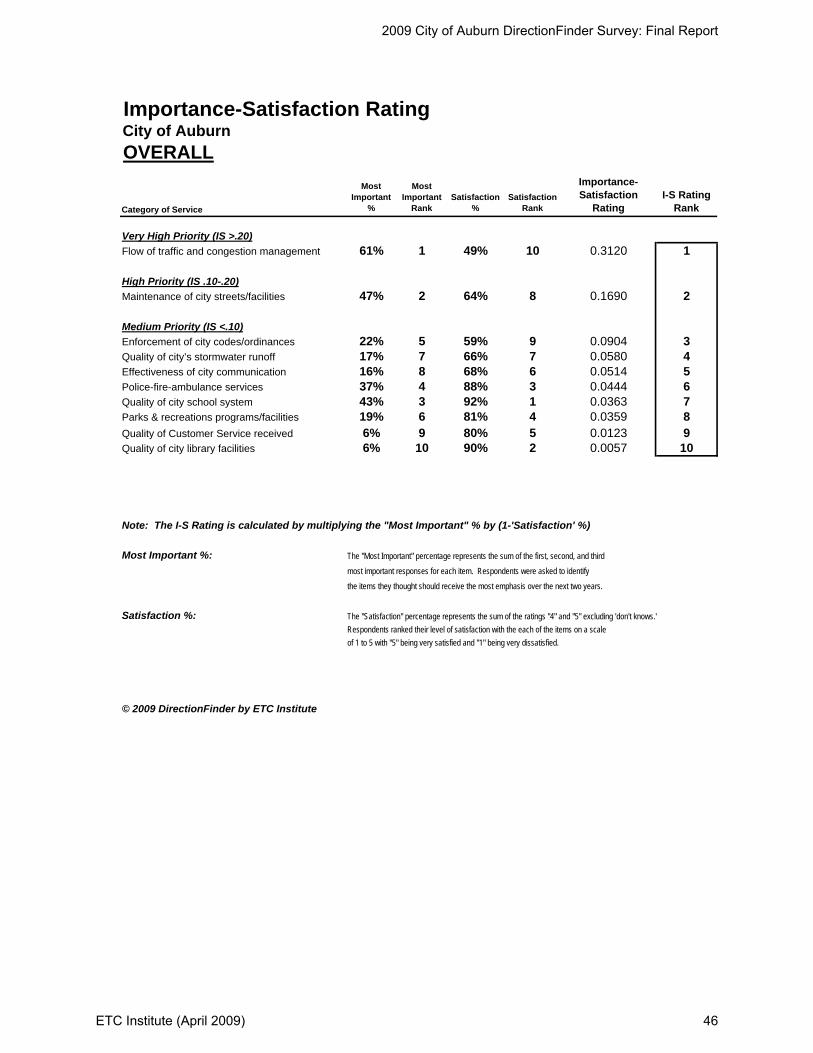
Importance-Satisfaction RatingCity of AuburnOVERALL
Category of Service
Most Important
%
Most Important
RankSatisfaction
%Satisfaction
Rank
Importance-Satisfaction
RatingI-S Rating
Rank
Very High Priority (IS >.20)Flow of traffic and congestion management 61% 1 49% 10 0.3120 1
High Priority (IS .10-.20)Maintenance of city streets/facilities 47% 2 64% 8 0.1690 2
Medium Priority (IS <.10)Enforcement of city codes/ordinances 22% 5 59% 9 0.0904 3Quality of city’s stormwater runoff 17% 7 66% 7 0.0580 4Effectiveness of city communication 16% 8 68% 6 0.0514 5Police-fire-ambulance services 37% 4 88% 3 0.0444 6Quality of city school system 43% 3 92% 1 0.0363 7Parks & recreations programs/facilities 19% 6 81% 4 0.0359 8Quality of Customer Service received 6% 9 80% 5 0.0123 9Quality of city library facilities 6% 10 90% 2 0.0057 10
Note: The I-S Rating is calculated by multiplying the "Most Important" % by (1-'Satisfaction' %)
Most Important %: The "Most Important" percentage represents the sum of the first, second, and third
most important responses for each item. Respondents were asked to identify
the items they thought should receive the most emphasis over the next two years.
Satisfaction %: The "Satisfaction" percentage represents the sum of the ratings "4" and "5" excluding 'don't knows.'Respondents ranked their level of satisfaction with the each of the items on a scaleof 1 to 5 with "5" being very satisfied and "1" being very dissatisfied.
© 2009 DirectionFinder by ETC Institute
2009 City of Auburn DirectionFinder Survey: Final Report
ETC Institute (April 2009) 46

Importance-Satisfaction RatingCity of AuburnPUBLIC SAFETY
Category of ServiceMost
Important %
Most Important
Rank Satisfaction %Satisfaction
Rank
Importance-Satisfaction
RatingI-S Rating
Rank
High Priority (IS .10-.20)Enforcement of speed limits in neighborhoods 26% 4 52% 13 0.1275 1Visibility of police in neighborhoods 28% 3 62% 11 0.1088 2Efforts to prevent crime 30% 2 66% 6 0.1018 3
Medium Priority (IS < .10)Enforcement of traffic laws 16% 5 65% 8 0.0546 4Overall quality of police protection 32% 1 84% 2 0.0514 5Visibility of police in retail areas 10% 7 64% 9 0.0368 6Quality of animal control 6% 9 60% 12 0.0253 7Overall quality of fire protection 14% 6 85% 1 0.0217 8How quickly police respond-emergency 8% 8 76% 4 0.0177 9Police safety education programs 4% 11 62% 10 0.0133 10Quality of local ambulance service 5% 10 73% 5 0.0130 11Fire safety education programs 3% 12 66% 7 0.0091 12Fire personnel emergency response 2% 13 80% 3 0.0046 13
Note: The I-S Rating is calculated by multiplying the "Most Important" % by (1-'Satisfaction' %)
Most Important %: The "Most Important" percentage represents the sum of the first and secondmost important responses for each item. Respondents were asked to identifythe items they thought should receive the most emphasis over the next two years.
Satisfaction %: The "Satisfaction" percentage represents the sum of the ratings "4" and "5" excluding 'don't knows.'Respondents ranked their level of satisfaction with the each of the items on a scaleof 1 to 5 with "5" being very satisfied and "1" being very dissatisfied.
© 2009 DirectionFinder by ETC Institute
2009 City of Auburn DirectionFinder Survey: Final Report
ETC Institute (April 2009) 47

Importance-Satisfaction RatingCity of AuburnCode and Ordinance Enforcement
Category of ServiceMost
Important %
Most Important
Rank Satisfaction %Satisfaction
Rank
Importance-Satisfaction
Rating
I-S Rating Rank
Very High Priority (IS >.20)Zoning regulations 45% 1 46% 5 0.2431 1
High Priority (IS .10-.20)Erosion & sediment control regulations 22% 3 44% 6 0.1255 2Unrelated occupancy regulations 20% 4 41% 7 0.1202 3Clean up debris/litter in neighborhoods 42% 2 72% 1 0.1183 4
Medium Priority (IS < .10)Building codes 20% 5 52% 4 0.0966 5Sign regulation 14% 6 64% 3 0.0518 6Fire codes and regulation 12% 7 69% 2 0.0374 7
Note: The I-S Rating is calculated by multiplying the "Most Important" % by (1-'Satisfaction' %)
Most Important %: The "Most Important" percentage represents the sum of the first and two
most important responses for each item. Respondents were asked to identify
the items they thought should receive the most emphasis over the next two years.
Satisfaction %: The "Satisfaction" percentage represents the sum of the ratings "4" and "5" excluding 'don't knows.'Respondents ranked their level of satisfaction with the each of the items on a scaleof 1 to 5 with "5" being very satisfied and "1" being very dissatisfied.
© 2009 DirectionFinder by ETC Institute
2009 City of Auburn DirectionFinder Survey: Final Report
ETC Institute (April 2009) 48

Importance-Satisfaction RatingCity of AuburnUtility and Environmental Services
Category of Service Most Important %
Most Important
RankSatisfaction
%Satisfaction
Rank
Importance-Satisfaction
Rating
I-S Rating Rank
Medium Priority (IS < .10)Curbside recycling service 42% 1 77% 6 0.0992 1Yard waste removal service 30% 4 83% 3 0.0507 2Water service 30% 3 84% 2 0.0470 3Sanitary sewer service 24% 5 82% 4 0.0421 4Residential garbage collection 33% 2 92% 1 0.0277 5Water Revenue Office customer service 7% 6 77% 5 0.0169 6
Note: The I-S Rating is calculated by multiplying the "Most Important" % by (1-'Satisfaction' %)
Most Important %: The "Most Important" percentage represents the sum of the first and secondmost important responses for each item. Respondents were asked to identifythe items they thought should receive the most emphasis over the next two years.
Satisfaction %: The "Satisfaction" percentage represents the sum of the ratings "4" and "5" excluding 'don't knows.'Respondents ranked their level of satisfaction with the each of the items on a scaleof 1 to 5 with "5" being very satisfied and "1" being very dissatisfied.
© 2009 DirectionFinder by ETC Institute
2009 City of Auburn DirectionFinder Survey: Final Report
ETC Institute (April 2009) 49

Importance-Satisfaction RatingCity of AuburnCITY MAINTENANCE
Category of ServiceMost
Important %
Most Important
Rank Satisfaction %Satisfaction
Rank
Importance-Satisfaction
RatingI-S Rating
Rank
High Priority (IS .10-.20)Maintenance of streets (excl. AU campus) 51% 1 63% 10 0.1897 1
Medium Priority (IS < .10)Adequacy of city street lighting 26% 2 63% 11 0.0965 2Maintenance of sidewalks (excl. AU campus) 17% 4 66% 9 0.0571 3Overall cleanliness of streets/public areas 18% 3 77% 5 0.0424 4Mowing and trimming along streets/public areas 16% 5 75% 7 0.0402 5Maintenance of street signs 9% 8 76% 6 0.0226 6Sewer lines and manholes 8% 9 73% 8 0.0217 7Maintenance of downtown Auburn 12% 6 84% 2 0.0198 8Maintenance of traffic signals 10% 7 82% 3 0.0184 9Water lines and fire hydrants 7% 10 82% 4 0.0125 10Maintenance of city buildings 2% 11 86% 1 0.0028 11
Note: The I-S Rating is calculated by multiplying the "Most Important" % by (1-'Satisfaction' %)
Most Important %: The "Most Important" percentage represents the sum of the first and second
most important responses for each item. Respondents were asked to identify
the items they thought should receive the most emphasis over the next two years.
Satisfaction %: The "Satisfaction" percentage represents the sum of the ratings "4" and "5" excluding 'don't knows.'Respondents ranked their level of satisfaction with the each of the items on a scaleof 1 to 5 with "5" being very satisfied and "1" being very dissatisfied.
© 2009 DirectionFinder by ETC Institute
2009 City of Auburn DirectionFinder Survey: Final Report
ETC Institute (April 2009) 50

Importance-Satisfaction RatingCity of AuburnPARKS and RECREATION
Category of Service
Most Important
%
Most Important
Rank Satisfaction %Satisfaction
Rank
Importance-Satisfaction
RatingI-S Rating
Rank
High Priority (IS .10-.20)Walking and biking trails 27% 1 59% 9 0.1092 1
Medium Priority (IS <.10)Community recreation centers 21% 3 55% 11 0.0928 2Number of parks 19% 4 64% 7 0.0697 3Swimming pools 13% 6 50% 12 0.0667 4Maintenance of parks 25% 2 85% 1 0.0387 5Other city recreation programs 9% 7 61% 8 0.0365 6Youth athletic programs 16% 5 78% 4 0.0362 7Adult athletic programs 8% 9 59% 10 0.0328 8Fees charged for recreation programs 8% 11 66% 6 0.0260 9Maintenance of cemeteries 9% 8 81% 2 0.0176 10Outdoor athletic fields 8% 10 80% 3 0.0150 11Ease of registering for programs 5% 12 73% 5 0.0141 12
Note: The I-S Rating is calculated by multiplying the "Most Important" % by (1-'Satisfaction' %)
Most Important %: The "Most Important" percentage represents the sum of the first and second
most important responses for each item. Respondents were asked to identify
the items they thought should receive the most emphasis over the next two years.
Satisfaction %: The "Satisfaction" percentage represents the sum of the ratings "4" and "5" excluding 'don't knows.'Respondents ranked their level of satisfaction with the each of the items on a scaleof 1 to 5 with "5" being very satisfied and "1" being very dissatisfied.
© 2009 DirectionFinder by ETC Institute
2009 City of Auburn DirectionFinder Survey: Final Report
ETC Institute (April 2009) 51

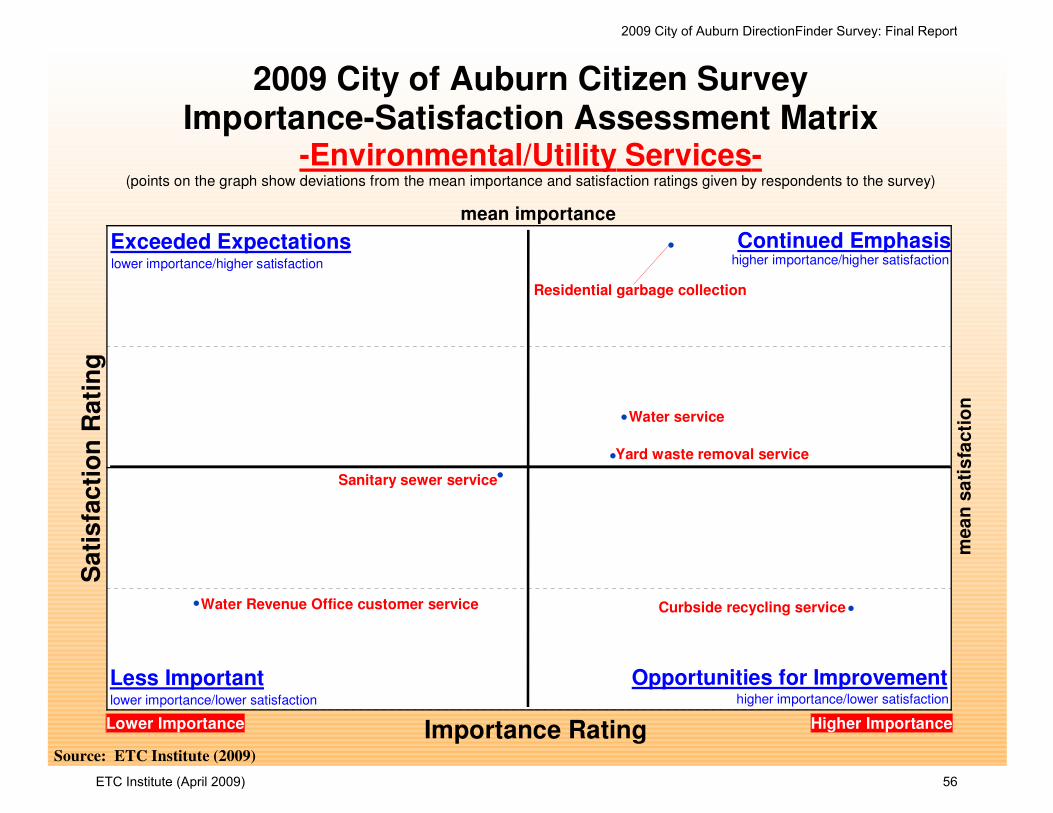
Importance-Satisfaction Matrix Analysis. The Importance-Satisfaction rating is based on the concept that public agencies will maximize overall customer satisfaction by emphasizing improvements in those areas where the level of satisfaction is relatively low and the perceived importance of the service is relatively high. ETC Institute developed an Importance-Satisfaction Matrix to display the perceived importance of major services that were assessed on the survey against the perceived quality of service delivery. The two axes on the matrix represent Satisfaction (vertical) and relative Importance (horizontal). The I-S (Importance-Satisfaction) matrix should be interpreted as follows.
Continued Emphasis (above average importance and above average satisfaction). This area shows where the City is meeting customer expectations. Items in this area have a significant impact on the customer’s overall level of satisfaction. The City should maintain (or slightly increase) emphasis on items in this area.
Exceeding Expectations (below average importance and above average
satisfaction). This area shows where the City is performing significantly better than customers expect the City to perform. Items in this area do not significantly affect the overall level of satisfaction that residents have with City services. The City should maintain (or slightly decrease) emphasis on items in this area.
Opportunities for Improvement (above average importance and below
average satisfaction). This area shows where the City is not performing as well as residents expect the City to perform. This area has a significant impact on customer satisfaction, and the City should DEFINITELY increase emphasis on items in this area.
Less Important (below average importance and below average satisfaction).
This area shows where the City is not performing well relative to the City’s performance in other areas; however, this area is generally considered to be less important to residents. This area does not significantly affect overall satisfaction with City services because the items are less important to residents. The agency should maintain current levels of emphasis on items in this area.
Matrices showing the results for the Auburn are provided on the following pages.
2009 City of Auburn DirectionFinder Survey: Final Report
ETC Institute (April 2009) 52

Sa
tis
fac
tio
n R
ati
ng
!
!
!
!
!
!
!
!!
!
me
an
sati
sfa
cti
on
Opportunities for Improvement
2009 City of Auburn Citizen SurveyImportance-Satisfaction Assessment Matrix
-Overall-(points on the graph show deviations from the mean importance and satisfaction ratings given by respondents to the survey)
mean importance
Importance RatingLower Importance Higher Importance
lower importance/higher satisfaction higher importance/higher satisfaction
lower importance/lower satisfaction higher importance/lower satisfaction
Exceeded Expectations
Less Important
Continued Emphasis
Source: ETC Institute (2009)
Flow of traffic and congestion
Maintenance of city streets
Quality of city school system
Police-fire-ambulance services
Enforcement of city codes
Parks & recreations programs
Quality of city’s stormwater runoff
Effectiveness of city communication
Quality of Customer Service received
Quality of city library facilities
2009 City of Auburn DirectionFinder Survey: Final Report
ETC Institute (April 2009) 53

Sa
tis
fac
tio
n R
ati
ng
!
!
!
!
!
!
!
!
!
!
!
!
!
me
an
sa
tisfa
cti
on
Opportunities for Improvement
mean importance
Importance RatingLower Importance Higher Importance
lower importance/higher satisfaction higher importance/higher satisfaction
lower importance/lower satisfaction higher importance/lower satisfaction
Exceeded Expectations
Less Important
Continued Emphasis
Source: ETC Institute (2009)
2009 City of Auburn Citizen SurveyImportance-Satisfaction Assessment Matrix
-Public Safety-(points on the graph show deviations from the mean importance and satisfaction ratings given by respondents to the survey)
Efforts to prevent crime
Visibility of police in neighborhood
Overall quality of police protection
Enforcement of speed limits in neighborhoods
Enforcement of traffic laws
Overall quality of fire protection
Visibility of police in retail areas
How quickly police respond-emergency
Quality of animal control
Quality of local ambulance service
Police safety education programs
Fire safety education programs
Fire personnel emergency response
2009 City of Auburn DirectionFinder Survey: Final Report
ETC Institute (April 2009) 54

Sa
tis
fac
tio
n R
ati
ng
!
!
!
!
!
!
!
me
an
sati
sfa
cti
on
Opportunities for Improvement
2009 City of Auburn Citizen SurveyImportance-Satisfaction Assessment Matrix
-Code/Ordinances Enforcement-(points on the graph show deviations from the mean importance and satisfaction ratings given by respondents to the survey)
mean importance
Importance RatingLower Importance Higher Importance
lower importance/higher satisfaction higher importance/higher satisfaction
lower importance/lower satisfaction higher importance/lower satisfaction
Exceeded Expectations
Less Important
Continued Emphasis
Source: ETC Institute (2009)
Zoning regulations
Clean up of debris/litter
Erosion & sediment control
Unrelated occupancy regulations
Building codes
Sign regulation
Fire codes and regulations
2009 City of Auburn DirectionFinder Survey: Final Report
ETC Institute (April 2009) 55
Sa
tis
fac
tio
n R
ati
ng
!!
!
!
!!
mea
n s
ati
sfa
cti
on
Opportunities for Improvement
mean importance
Importance RatingLower Importance Higher Importance
lower importance/higher satisfaction higher importance/higher satisfaction
lower importance/lower satisfaction higher importance/lower satisfaction
Exceeded Expectations
Less Important
Continued Emphasis
Source: ETC Institute (2009)
2009 City of Auburn Citizen SurveyImportance-Satisfaction Assessment Matrix
-Environmental/Utility Services-(points on the graph show deviations from the mean importance and satisfaction ratings given by respondents to the survey)
Curbside recycling service
Residential garbage collection
Water service
Yard waste removal service
Sanitary sewer service
Water Revenue Office customer service
2009 City of Auburn DirectionFinder Survey: Final Report
ETC Institute (April 2009) 56
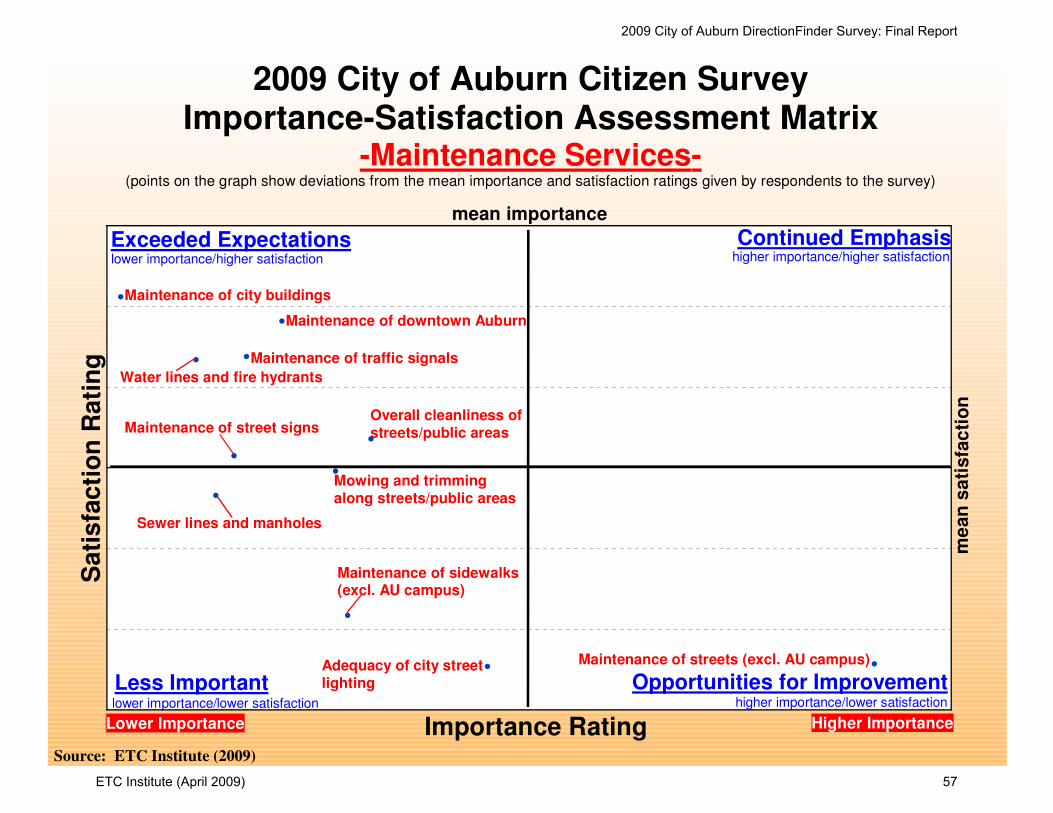
Sa
tis
fac
tio
n R
ati
ng
!
!
!
!
!
!
!
!
!
!
!
me
an
sa
tisfa
cti
on
Opportunities for Improvement
mean importance
Importance RatingLower Importance Higher Importance
lower importance/higher satisfaction higher importance/higher satisfaction
lower importance/lower satisfaction higher importance/lower satisfaction
Exceeded Expectations
Less Important
Continued Emphasis
Source: ETC Institute (2009)
2009 City of Auburn Citizen SurveyImportance-Satisfaction Assessment Matrix
-Maintenance Services-(points on the graph show deviations from the mean importance and satisfaction ratings given by respondents to the survey)
Maintenance of traffic signals
Maintenance of streets (excl. AU campus)
Maintenance of downtown Auburn
Adequacy of city street lighting
Overall cleanliness of streets/public areas
Maintenance of sidewalks (excl. AU campus)
Mowing and trimming along streets/public areas
Maintenance of street signs
Sewer lines and manholes
Water lines and fire hydrants
Maintenance of city buildings
2009 City of Auburn DirectionFinder Survey: Final Report
ETC Institute (April 2009) 57

Sa
tis
fac
tio
n R
ati
ng
!
!
!
!
!
!
!
!
!
!
!
!
me
an
sati
sfa
cti
on
Opportunities for Improvement
2009 City of Auburn Citizen SurveyImportance-Satisfaction Assessment Matrix
-Parks and Recreation Services-(points on the graph show deviations from the mean importance and satisfaction ratings given by respondents to the survey)
mean importance
Importance RatingLower Importance Higher Importance
lower importance/higher satisfaction higher importance/higher satisfaction
lower importance/lower satisfaction higher importance/lower satisfaction
Exceeded Expectations
Less Important
Continued Emphasis
Source: ETC Institute (2009)
Maintenance of parks
Walking and biking trails
Community recreation centers
Number of parks
Youth athletic programs
Swimming pools
Other city recreation programs
Maintenance of cemeteries
Adult athletic programs
Outdoor athletic fields
Fees charged for recreation program
Ease of registering for programs
2009 City of Auburn DirectionFinder Survey: Final Report
ETC Institute (April 2009) 58
Section 4: GIS Maps
2009 City of Auburn DirectionFinder Survey: Final Report
ETC Institute (April 2009) 59

Interpreting the Maps The maps on the following pages show the mean ratings for several questions on the survey by Census Block Group. A Census Block Group is an area defined by the U.S. Census Bureau, which is generally smaller than a zip code but larger than a neighborhood. If all areas on a map are the same color, then residents generally feel the same about that issue regardless of the location of their home. When reading the maps, please use the following color scheme as a guide: • DARK/LIGHT BLUE shades indicate POSITIVE ratings. Shades of
blue generally indicate satisfaction with a service. • OFF-WHITE shades indicate NEUTRAL ratings. Shades of neutral
generally indicate that residents thought the quality of service delivery is adequate.
• ORANGE/RED shades indicate NEGATIVE ratings. Shades of
orange/red generally indicate dissatisfaction with a service.
2009 City of Auburn DirectionFinder Survey: Final Report
ETC Institute (April 2009) 60

Location of Survey Respondents
City of Auburn Citizen Survey for 2009
2009 City of Auburn DirectionFinder Survey: Final Report
ETC Institute (April 2009) 61

Q1a Quality of city school system
LEGENDMean ratingMean rating on a 5-point scale, where:
1.0-1.8 Very Dissatisfied1.8-2.6 Dissatisfied2.6-3.4 Neutral
3.4-4.2 Satisfied
4.2-5.0 Very SatisfiedOther
Note: “Other” areas did not contain any responses
City of Auburn Citizen Survey for 2009Shading reflects the mean rating for all respondents by Census Block Group
* Selected CBGs were merged as needed based on respondent distribution
2009 City of Auburn DirectionFinder Survey: Final Report
ETC Institute (April 2009) 62

Q1b Quality of police, fire, & ambulance services
LEGENDMean ratingMean rating on a 5-point scale, where:
1.0-1.8 Very Dissatisfied1.8-2.6 Dissatisfied2.6-3.4 Neutral
3.4-4.2 Satisfied
4.2-5.0 Very SatisfiedOther
Note: “Other” areas did not contain any responses
City of Auburn Citizen Survey for 2009Shading reflects the mean rating for all respondents by Census Block Group
* Selected CBGs were merged as needed based on respondent distribution
2009 City of Auburn DirectionFinder Survey: Final Report
ETC Institute (April 2009) 63

Q1c Quality of parks & recreation programs and facilities
LEGENDMean ratingMean rating on a 5-point scale, where:
1.0-1.8 Very Dissatisfied1.8-2.6 Dissatisfied2.6-3.4 Neutral
3.4-4.2 Satisfied
4.2-5.0 Very SatisfiedOther
Note: “Other” areas did not contain any responses
City of Auburn Citizen Survey for 2009Shading reflects the mean rating for all respondents by Census Block Group
* Selected CBGs were merged as needed based on respondent distribution
2009 City of Auburn DirectionFinder Survey: Final Report
ETC Institute (April 2009) 64

Q1d Maintenance of city streets and facilities
LEGENDMean ratingMean rating on a 5-point scale, where:
1.0-1.8 Very Dissatisfied1.8-2.6 Dissatisfied2.6-3.4 Neutral
3.4-4.2 Satisfied
4.2-5.0 Very SatisfiedOther
Note: “Other” areas did not contain any responses
City of Auburn Citizen Survey for 2009Shading reflects the mean rating for all respondents by Census Block Group
* Selected CBGs were merged as needed based on respondent distribution
2009 City of Auburn DirectionFinder Survey: Final Report
ETC Institute (April 2009) 65

Q1e Enforcement of city codes and ordinances
LEGENDMean ratingMean rating on a 5-point scale, where:
1.0-1.8 Very Dissatisfied1.8-2.6 Dissatisfied2.6-3.4 Neutral
3.4-4.2 Satisfied
4.2-5.0 Very SatisfiedOther
Note: “Other” areas did not contain any responses
City of Auburn Citizen Survey for 2009Shading reflects the mean rating for all respondents by Census Block Group
* Selected CBGs were merged as needed based on respondent distribution
2009 City of Auburn DirectionFinder Survey: Final Report
ETC Institute (April 2009) 66

Q1f Quality of Customer Service you receive from city employees
LEGENDMean ratingMean rating on a 5-point scale, where:
1.0-1.8 Very Dissatisfied1.8-2.6 Dissatisfied2.6-3.4 Neutral
3.4-4.2 Satisfied
4.2-5.0 Very SatisfiedOther
Note: “Other” areas did not contain any responses
City of Auburn Citizen Survey for 2009Shading reflects the mean rating for all respondents by Census Block Group
* Selected CBGs were merged as needed based on respondent distribution
2009 City of Auburn DirectionFinder Survey: Final Report
ETC Institute (April 2009) 67

Q1g Effectiveness of city communication with the public
LEGENDMean ratingMean rating on a 5-point scale, where:
1.0-1.8 Very Dissatisfied1.8-2.6 Dissatisfied2.6-3.4 Neutral
3.4-4.2 Satisfied
4.2-5.0 Very SatisfiedOther
Note: “Other” areas did not contain any responses
City of Auburn Citizen Survey for 2009Shading reflects the mean rating for all respondents by Census Block Group
* Selected CBGs were merged as needed based on respondent distribution
2009 City of Auburn DirectionFinder Survey: Final Report
ETC Institute (April 2009) 68

Q1h Quality of city’s stormwater runoff/stormwatermanagement system
LEGENDMean ratingMean rating on a 5-point scale, where:
1.0-1.8 Very Dissatisfied1.8-2.6 Dissatisfied2.6-3.4 Neutral
3.4-4.2 Satisfied
4.2-5.0 Very SatisfiedOther
Note: “Other” areas did not contain any responses
City of Auburn Citizen Survey for 2009Shading reflects the mean rating for all respondents by Census Block Group
* Selected CBGs were merged as needed based on respondent distribution
2009 City of Auburn DirectionFinder Survey: Final Report
ETC Institute (April 2009) 69

Q1i Quality of city library facilities and services
LEGENDMean ratingMean rating on a 5-point scale, where:
1.0-1.8 Very Dissatisfied1.8-2.6 Dissatisfied2.6-3.4 Neutral
3.4-4.2 Satisfied
4.2-5.0 Very SatisfiedOther
Note: “Other” areas did not contain any responses
City of Auburn Citizen Survey for 2009Shading reflects the mean rating for all respondents by Census Block Group
* Selected CBGs were merged as needed based on respondent distribution
2009 City of Auburn DirectionFinder Survey: Final Report
ETC Institute (April 2009) 70

Q1j Flow of traffic and congestion management
LEGENDMean ratingMean rating on a 5-point scale, where:
1.0-1.8 Very Dissatisfied1.8-2.6 Dissatisfied2.6-3.4 Neutral
3.4-4.2 Satisfied
4.2-5.0 Very SatisfiedOther
Note: “Other” areas did not contain any responses
City of Auburn Citizen Survey for 2009Shading reflects the mean rating for all respondents by Census Block Group
* Selected CBGs were merged as needed based on respondent distribution
2009 City of Auburn DirectionFinder Survey: Final Report
ETC Institute (April 2009) 71

Q3a Overall value that you receive for your city tax dollars and fees
LEGENDMean ratingMean rating on a 5-point scale, where:
1.0-1.8 Very Dissatisfied1.8-2.6 Dissatisfied2.6-3.4 Neutral
3.4-4.2 Satisfied
4.2-5.0 Very SatisfiedOther
Note: “Other” areas did not contain any responses
City of Auburn Citizen Survey for 2009Shading reflects the mean rating for all respondents by Census Block Group
* Selected CBGs were merged as needed based on respondent distribution
2009 City of Auburn DirectionFinder Survey: Final Report
ETC Institute (April 2009) 72
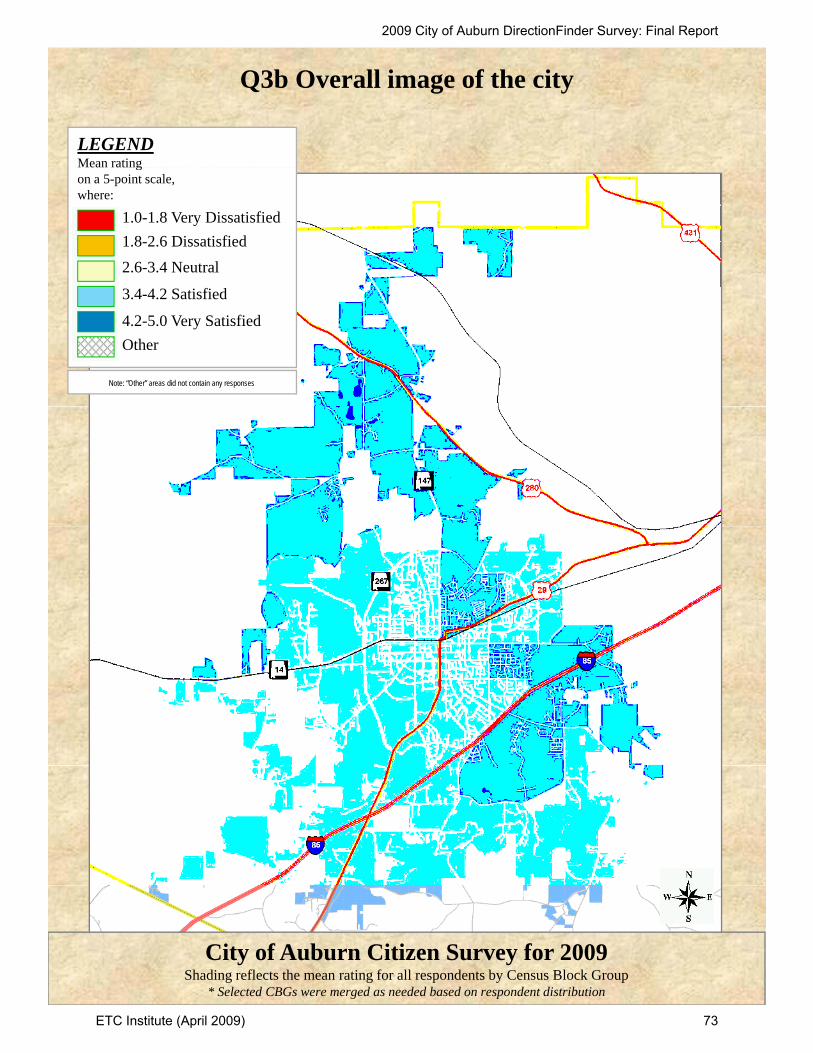
Q3b Overall image of the city
LEGENDMean ratingMean rating on a 5-point scale, where:
1.0-1.8 Very Dissatisfied1.8-2.6 Dissatisfied2.6-3.4 Neutral
3.4-4.2 Satisfied
4.2-5.0 Very SatisfiedOther
Note: “Other” areas did not contain any responses
City of Auburn Citizen Survey for 2009Shading reflects the mean rating for all respondents by Census Block Group
* Selected CBGs were merged as needed based on respondent distribution
2009 City of Auburn DirectionFinder Survey: Final Report
ETC Institute (April 2009) 73

Q3c Overall quality of life in the city
LEGENDMean ratingMean rating on a 5-point scale, where:
1.0-1.8 Very Dissatisfied1.8-2.6 Dissatisfied2.6-3.4 Neutral
3.4-4.2 Satisfied
4.2-5.0 Very SatisfiedOther
Note: “Other” areas did not contain any responses
City of Auburn Citizen Survey for 2009Shading reflects the mean rating for all respondents by Census Block Group
* Selected CBGs were merged as needed based on respondent distribution
2009 City of Auburn DirectionFinder Survey: Final Report
ETC Institute (April 2009) 74

Q3d Overall appearance of the city
LEGENDMean ratingMean rating on a 5-point scale, where:
1.0-1.8 Very Dissatisfied1.8-2.6 Dissatisfied2.6-3.4 Neutral
3.4-4.2 Satisfied
4.2-5.0 Very SatisfiedOther
Note: “Other” areas did not contain any responses
City of Auburn Citizen Survey for 2009Shading reflects the mean rating for all respondents by Census Block Group
* Selected CBGs were merged as needed based on respondent distribution
2009 City of Auburn DirectionFinder Survey: Final Report
ETC Institute (April 2009) 75
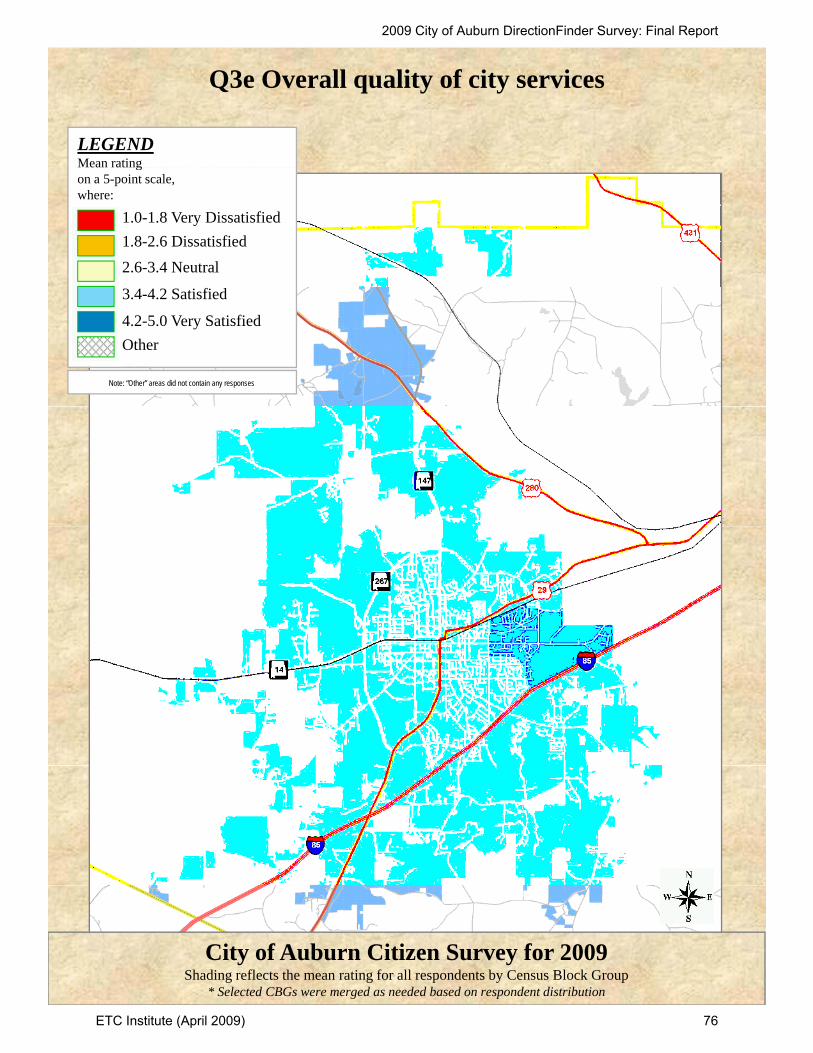
Q3e Overall quality of city services
LEGENDMean ratingMean rating on a 5-point scale, where:
1.0-1.8 Very Dissatisfied1.8-2.6 Dissatisfied2.6-3.4 Neutral
3.4-4.2 Satisfied
4.2-5.0 Very SatisfiedOther
Note: “Other” areas did not contain any responses
City of Auburn Citizen Survey for 2009Shading reflects the mean rating for all respondents by Census Block Group
* Selected CBGs were merged as needed based on respondent distribution
2009 City of Auburn DirectionFinder Survey: Final Report
ETC Institute (April 2009) 76
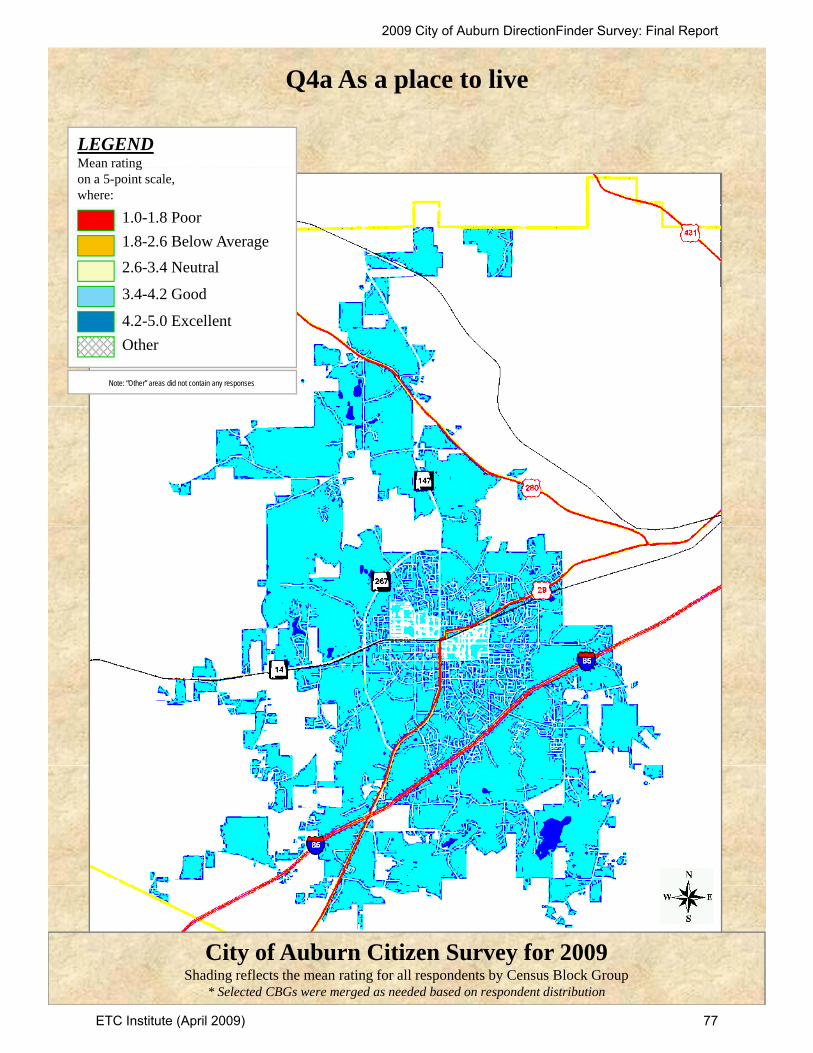
Q4a As a place to live
LEGENDMean ratingMean rating on a 5-point scale, where:
1.0-1.8 Poor 1.8-2.6 Below Average2.6-3.4 Neutral
3.4-4.2 Good
4.2-5.0 ExcellentOther
Note: “Other” areas did not contain any responses
City of Auburn Citizen Survey for 2009Shading reflects the mean rating for all respondents by Census Block Group
* Selected CBGs were merged as needed based on respondent distribution
2009 City of Auburn DirectionFinder Survey: Final Report
ETC Institute (April 2009) 77

Q4b As a place to raise children
LEGENDMean ratingMean rating on a 5-point scale, where:
1.0-1.8 Poor 1.8-2.6 Below Average2.6-3.4 Neutral
3.4-4.2 Good
4.2-5.0 ExcellentOther
Note: “Other” areas did not contain any responses
City of Auburn Citizen Survey for 2009Shading reflects the mean rating for all respondents by Census Block Group
* Selected CBGs were merged as needed based on respondent distribution
2009 City of Auburn DirectionFinder Survey: Final Report
ETC Institute (April 2009) 78

Q4c As a place to work
LEGENDMean ratingMean rating on a 5-point scale, where:
1.0-1.8 Poor 1.8-2.6 Below Average2.6-3.4 Neutral
3.4-4.2 Good
4.2-5.0 ExcellentOther
Note: “Other” areas did not contain any responses
City of Auburn Citizen Survey for 2009Shading reflects the mean rating for all respondents by Census Block Group
* Selected CBGs were merged as needed based on respondent distribution
2009 City of Auburn DirectionFinder Survey: Final Report
ETC Institute (April 2009) 79
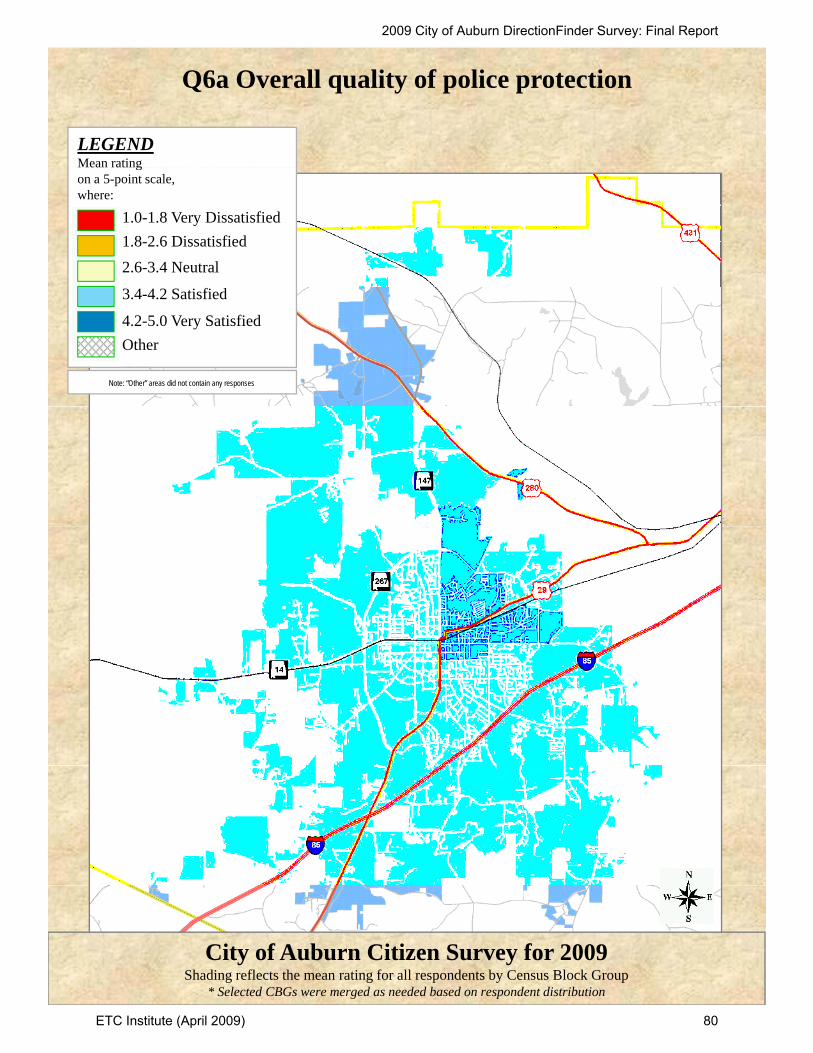
Q6a Overall quality of police protection
LEGENDMean ratingMean rating on a 5-point scale, where:
1.0-1.8 Very Dissatisfied1.8-2.6 Dissatisfied2.6-3.4 Neutral
3.4-4.2 Satisfied
4.2-5.0 Very SatisfiedOther
Note: “Other” areas did not contain any responses
City of Auburn Citizen Survey for 2009Shading reflects the mean rating for all respondents by Census Block Group
* Selected CBGs were merged as needed based on respondent distribution
2009 City of Auburn DirectionFinder Survey: Final Report
ETC Institute (April 2009) 80

Q6b Visibility of police in neighborhoods
LEGENDMean ratingMean rating on a 5-point scale, where:
1.0-1.8 Very Dissatisfied1.8-2.6 Dissatisfied2.6-3.4 Neutral
3.4-4.2 Satisfied
4.2-5.0 Very SatisfiedOther
Note: “Other” areas did not contain any responses
City of Auburn Citizen Survey for 2009Shading reflects the mean rating for all respondents by Census Block Group
* Selected CBGs were merged as needed based on respondent distribution
2009 City of Auburn DirectionFinder Survey: Final Report
ETC Institute (April 2009) 81

Q6c Visibility of police in retail areas
LEGENDMean ratingMean rating on a 5-point scale, where:
1.0-1.8 Very Dissatisfied1.8-2.6 Dissatisfied2.6-3.4 Neutral
3.4-4.2 Satisfied
4.2-5.0 Very SatisfiedOther
Note: “Other” areas did not contain any responses
City of Auburn Citizen Survey for 2009Shading reflects the mean rating for all respondents by Census Block Group
* Selected CBGs were merged as needed based on respondent distribution
2009 City of Auburn DirectionFinder Survey: Final Report
ETC Institute (April 2009) 82

Q6d How quickly police respond to emergencies
LEGENDMean ratingMean rating on a 5-point scale, where:
1.0-1.8 Very Dissatisfied1.8-2.6 Dissatisfied2.6-3.4 Neutral
3.4-4.2 Satisfied
4.2-5.0 Very SatisfiedOther
Note: “Other” areas did not contain any responses
City of Auburn Citizen Survey for 2009Shading reflects the mean rating for all respondents by Census Block Group
* Selected CBGs were merged as needed based on respondent distribution
2009 City of Auburn DirectionFinder Survey: Final Report
ETC Institute (April 2009) 83

Q6e Efforts to prevent crime
LEGENDMean ratingMean rating on a 5-point scale, where:
1.0-1.8 Very Dissatisfied1.8-2.6 Dissatisfied2.6-3.4 Neutral
3.4-4.2 Satisfied
4.2-5.0 Very SatisfiedOther
Note: “Other” areas did not contain any responses
City of Auburn Citizen Survey for 2009Shading reflects the mean rating for all respondents by Census Block Group
* Selected CBGs were merged as needed based on respondent distribution
2009 City of Auburn DirectionFinder Survey: Final Report
ETC Institute (April 2009) 84

Q6f Police safety education programs
LEGENDMean ratingMean rating on a 5-point scale, where:
1.0-1.8 Very Dissatisfied1.8-2.6 Dissatisfied2.6-3.4 Neutral
3.4-4.2 Satisfied
4.2-5.0 Very SatisfiedOther
Note: “Other” areas did not contain any responses
City of Auburn Citizen Survey for 2009Shading reflects the mean rating for all respondents by Census Block Group
* Selected CBGs were merged as needed based on respondent distribution
2009 City of Auburn DirectionFinder Survey: Final Report
ETC Institute (April 2009) 85

Q6g Enforcement of traffic laws
LEGENDMean ratingMean rating on a 5-point scale, where:
1.0-1.8 Very Dissatisfied1.8-2.6 Dissatisfied2.6-3.4 Neutral
3.4-4.2 Satisfied
4.2-5.0 Very SatisfiedOther
Note: “Other” areas did not contain any responses
City of Auburn Citizen Survey for 2009Shading reflects the mean rating for all respondents by Census Block Group
* Selected CBGs were merged as needed based on respondent distribution
2009 City of Auburn DirectionFinder Survey: Final Report
ETC Institute (April 2009) 86

Q6h Overall quality of fire protection
LEGENDMean ratingMean rating on a 5-point scale, where:
1.0-1.8 Very Dissatisfied1.8-2.6 Dissatisfied2.6-3.4 Neutral
3.4-4.2 Satisfied
4.2-5.0 Very SatisfiedOther
Note: “Other” areas did not contain any responses
City of Auburn Citizen Survey for 2009Shading reflects the mean rating for all respondents by Census Block Group
* Selected CBGs were merged as needed based on respondent distribution
2009 City of Auburn DirectionFinder Survey: Final Report
ETC Institute (April 2009) 87

Q6i Fire personnel emergency response time
LEGENDMean ratingMean rating on a 5-point scale, where:
1.0-1.8 Very Dissatisfied1.8-2.6 Dissatisfied2.6-3.4 Neutral
3.4-4.2 Satisfied
4.2-5.0 Very SatisfiedOther
Note: “Other” areas did not contain any responses
City of Auburn Citizen Survey for 2009Shading reflects the mean rating for all respondents by Census Block Group
* Selected CBGs were merged as needed based on respondent distribution
2009 City of Auburn DirectionFinder Survey: Final Report
ETC Institute (April 2009) 88

Q6j Fire safety education programs
LEGENDMean ratingMean rating on a 5-point scale, where:
1.0-1.8 Very Dissatisfied1.8-2.6 Dissatisfied2.6-3.4 Neutral
3.4-4.2 Satisfied
4.2-5.0 Very SatisfiedOther
Note: “Other” areas did not contain any responses
City of Auburn Citizen Survey for 2009Shading reflects the mean rating for all respondents by Census Block Group
* Selected CBGs were merged as needed based on respondent distribution
2009 City of Auburn DirectionFinder Survey: Final Report
ETC Institute (April 2009) 89

Q6k Quality of local ambulance service
LEGENDMean ratingMean rating on a 5-point scale, where:
1.0-1.8 Very Dissatisfied1.8-2.6 Dissatisfied2.6-3.4 Neutral
3.4-4.2 Satisfied
4.2-5.0 Very SatisfiedOther
Note: “Other” areas did not contain any responses
City of Auburn Citizen Survey for 2009Shading reflects the mean rating for all respondents by Census Block Group
* Selected CBGs were merged as needed based on respondent distribution
2009 City of Auburn DirectionFinder Survey: Final Report
ETC Institute (April 2009) 90
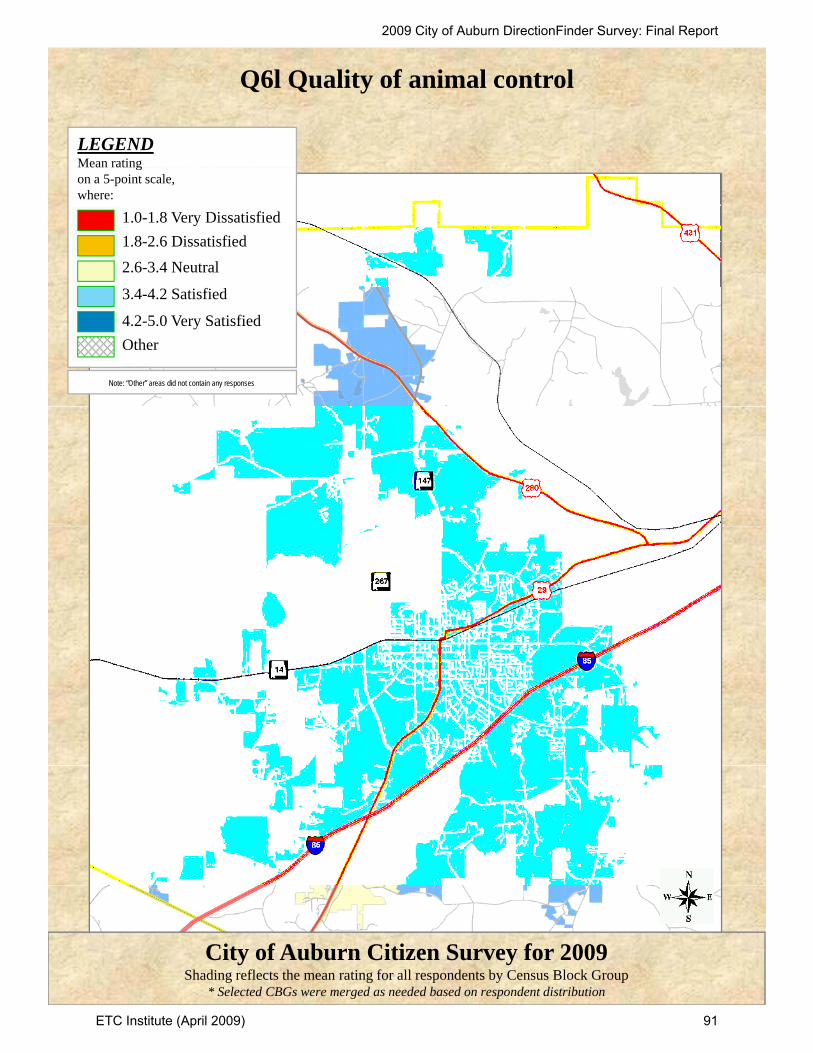
Q6l Quality of animal control
LEGENDMean ratingMean rating on a 5-point scale, where:
1.0-1.8 Very Dissatisfied1.8-2.6 Dissatisfied2.6-3.4 Neutral
3.4-4.2 Satisfied
4.2-5.0 Very SatisfiedOther
Note: “Other” areas did not contain any responses
City of Auburn Citizen Survey for 2009Shading reflects the mean rating for all respondents by Census Block Group
* Selected CBGs were merged as needed based on respondent distribution
2009 City of Auburn DirectionFinder Survey: Final Report
ETC Institute (April 2009) 91
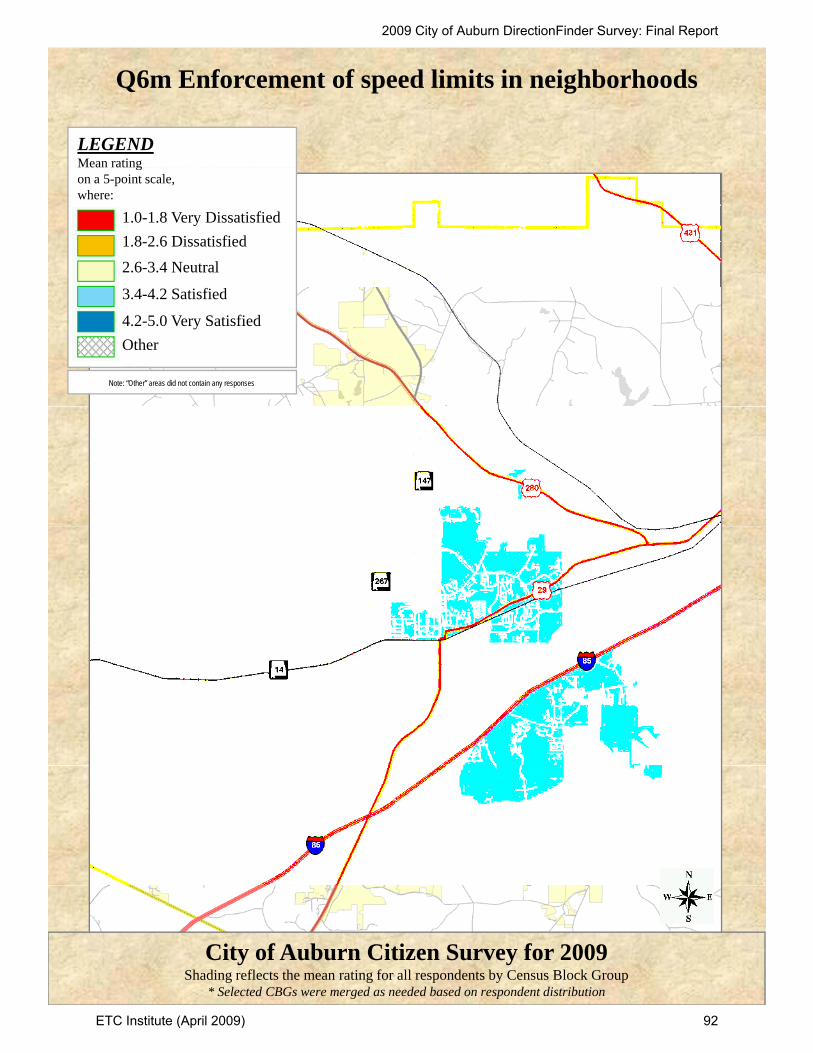
Q6m Enforcement of speed limits in neighborhoods
LEGENDMean ratingMean rating on a 5-point scale, where:
1.0-1.8 Very Dissatisfied1.8-2.6 Dissatisfied2.6-3.4 Neutral
3.4-4.2 Satisfied
4.2-5.0 Very SatisfiedOther
Note: “Other” areas did not contain any responses
City of Auburn Citizen Survey for 2009Shading reflects the mean rating for all respondents by Census Block Group
* Selected CBGs were merged as needed based on respondent distribution
2009 City of Auburn DirectionFinder Survey: Final Report
ETC Institute (April 2009) 92
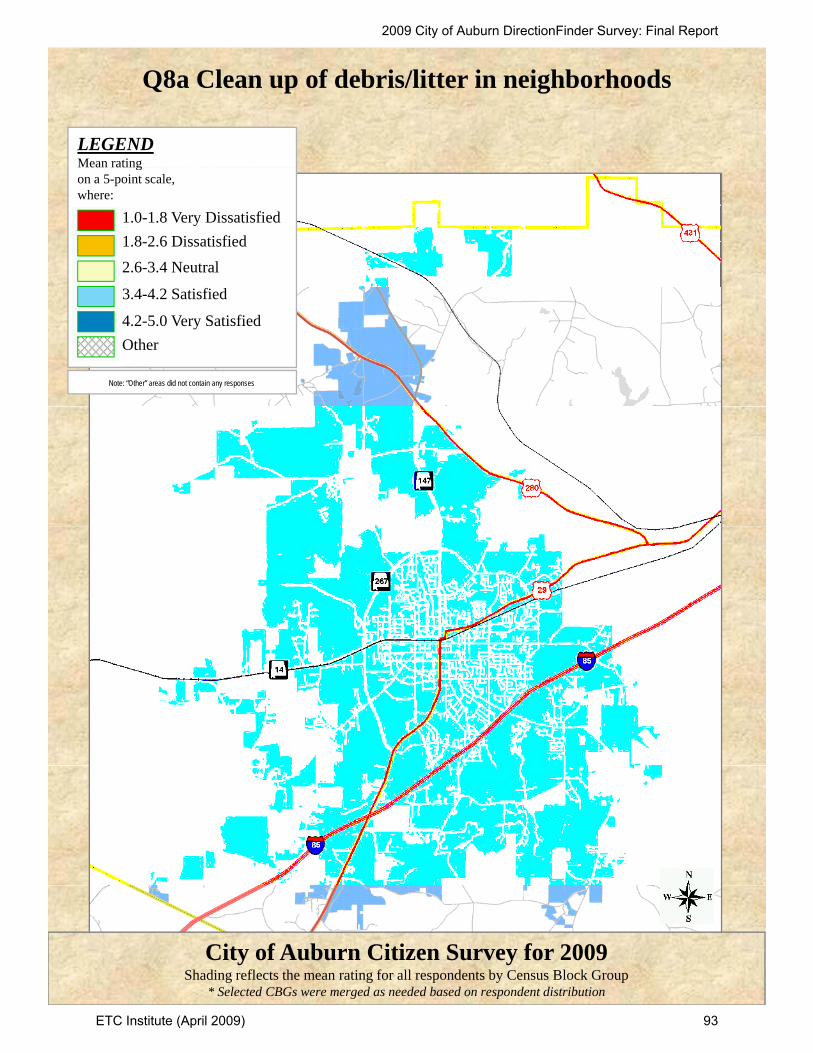
Q8a Clean up of debris/litter in neighborhoods
LEGENDMean ratingMean rating on a 5-point scale, where:
1.0-1.8 Very Dissatisfied1.8-2.6 Dissatisfied2.6-3.4 Neutral
3.4-4.2 Satisfied
4.2-5.0 Very SatisfiedOther
Note: “Other” areas did not contain any responses
City of Auburn Citizen Survey for 2009Shading reflects the mean rating for all respondents by Census Block Group
* Selected CBGs were merged as needed based on respondent distribution
2009 City of Auburn DirectionFinder Survey: Final Report
ETC Institute (April 2009) 93

Q8b Sign regulations
LEGENDMean ratingMean rating on a 5-point scale, where:
1.0-1.8 Very Dissatisfied1.8-2.6 Dissatisfied2.6-3.4 Neutral
3.4-4.2 Satisfied
4.2-5.0 Very SatisfiedOther
Note: “Other” areas did not contain any responses
City of Auburn Citizen Survey for 2009Shading reflects the mean rating for all respondents by Census Block Group
* Selected CBGs were merged as needed based on respondent distribution
2009 City of Auburn DirectionFinder Survey: Final Report
ETC Institute (April 2009) 94

Q8c Zoning regulations
LEGENDMean ratingMean rating on a 5-point scale, where:
1.0-1.8 Very Dissatisfied1.8-2.6 Dissatisfied2.6-3.4 Neutral
3.4-4.2 Satisfied
4.2-5.0 Very SatisfiedOther
Note: “Other” areas did not contain any responses
City of Auburn Citizen Survey for 2009Shading reflects the mean rating for all respondents by Census Block Group
* Selected CBGs were merged as needed based on respondent distribution
2009 City of Auburn DirectionFinder Survey: Final Report
ETC Institute (April 2009) 95

Q8d Unrelated occupancy regulations
LEGENDMean ratingMean rating on a 5-point scale, where:
1.0-1.8 Very Dissatisfied1.8-2.6 Dissatisfied2.6-3.4 Neutral
3.4-4.2 Satisfied
4.2-5.0 Very SatisfiedOther
Note: “Other” areas did not contain any responses
City of Auburn Citizen Survey for 2009Shading reflects the mean rating for all respondents by Census Block Group
* Selected CBGs were merged as needed based on respondent distribution
2009 City of Auburn DirectionFinder Survey: Final Report
ETC Institute (April 2009) 96

Q8e Building codes
LEGENDMean ratingMean rating on a 5-point scale, where:
1.0-1.8 Very Dissatisfied1.8-2.6 Dissatisfied2.6-3.4 Neutral
3.4-4.2 Satisfied
4.2-5.0 Very SatisfiedOther
Note: “Other” areas did not contain any responses
City of Auburn Citizen Survey for 2009Shading reflects the mean rating for all respondents by Census Block Group
* Selected CBGs were merged as needed based on respondent distribution
2009 City of Auburn DirectionFinder Survey: Final Report
ETC Institute (April 2009) 97

Q8f Erosion and sediment control regulations
LEGENDMean ratingMean rating on a 5-point scale, where:
1.0-1.8 Very Dissatisfied1.8-2.6 Dissatisfied2.6-3.4 Neutral
3.4-4.2 Satisfied
4.2-5.0 Very SatisfiedOther
Note: “Other” areas did not contain any responses
City of Auburn Citizen Survey for 2009Shading reflects the mean rating for all respondents by Census Block Group
* Selected CBGs were merged as needed based on respondent distribution
2009 City of Auburn DirectionFinder Survey: Final Report
ETC Institute (April 2009) 98
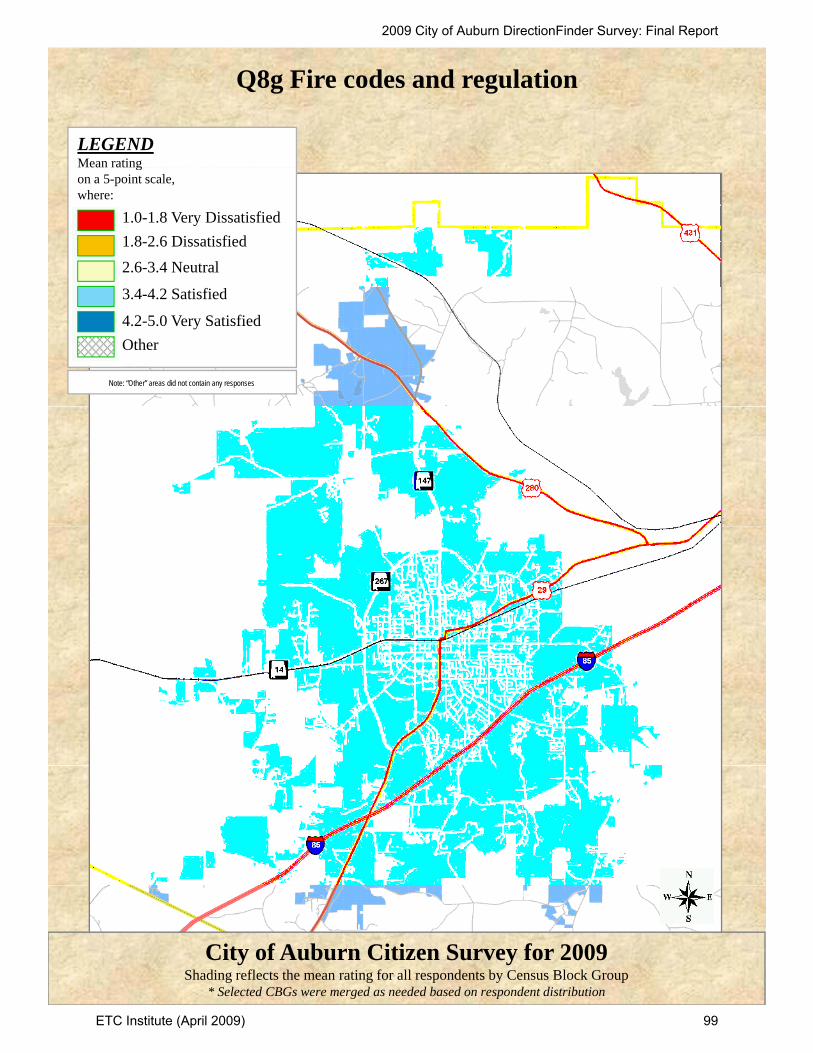
Q8g Fire codes and regulation
LEGENDMean ratingMean rating on a 5-point scale, where:
1.0-1.8 Very Dissatisfied1.8-2.6 Dissatisfied2.6-3.4 Neutral
3.4-4.2 Satisfied
4.2-5.0 Very SatisfiedOther
Note: “Other” areas did not contain any responses
City of Auburn Citizen Survey for 2009Shading reflects the mean rating for all respondents by Census Block Group
* Selected CBGs were merged as needed based on respondent distribution
2009 City of Auburn DirectionFinder Survey: Final Report
ETC Institute (April 2009) 99

Q10a Residential garbage collection
LEGENDMean rating gon a 5-point scale, where:
1.0-1.8 Very Dissatisfied1.8-2.6 Dissatisfied2.6-3.4 Neutral
3.4-4.2 Satisfied
4.2-5.0 Very SatisfiedOther
Note: “Other” areas did not contain any responses
City of Auburn Citizen Survey for 2009Shading reflects the mean rating for all respondents by Census Block Group
* Selected CBGs were merged as needed based on respondent distribution
2009 City of Auburn DirectionFinder Survey: Final Report
ETC Institute (April 2009) 100

Q10b Curbside recycling service
LEGENDMean rating gon a 5-point scale, where:
1.0-1.8 Very Dissatisfied1.8-2.6 Dissatisfied2.6-3.4 Neutral
3.4-4.2 Satisfied
4.2-5.0 Very SatisfiedOther
Note: “Other” areas did not contain any responses
City of Auburn Citizen Survey for 2009Shading reflects the mean rating for all respondents by Census Block Group
* Selected CBGs were merged as needed based on respondent distribution
2009 City of Auburn DirectionFinder Survey: Final Report
ETC Institute (April 2009) 101

Q10c Yard waste removal serice
LEGENDMean rating gon a 5-point scale, where:
1.0-1.8 Very Dissatisfied1.8-2.6 Dissatisfied2.6-3.4 Neutral
3.4-4.2 Satisfied
4.2-5.0 Very SatisfiedOther
Note: “Other” areas did not contain any responses
City of Auburn Citizen Survey for 2009Shading reflects the mean rating for all respondents by Census Block Group
* Selected CBGs were merged as needed based on respondent distribution
2009 City of Auburn DirectionFinder Survey: Final Report
ETC Institute (April 2009) 102

Q10d Sanitary sewer service
LEGENDMean rating gon a 5-point scale, where:
1.0-1.8 Very Dissatisfied1.8-2.6 Dissatisfied2.6-3.4 Neutral
3.4-4.2 Satisfied
4.2-5.0 Very SatisfiedOther
Note: “Other” areas did not contain any responses
City of Auburn Citizen Survey for 2009Shading reflects the mean rating for all respondents by Census Block Group
* Selected CBGs were merged as needed based on respondent distribution
2009 City of Auburn DirectionFinder Survey: Final Report
ETC Institute (April 2009) 103
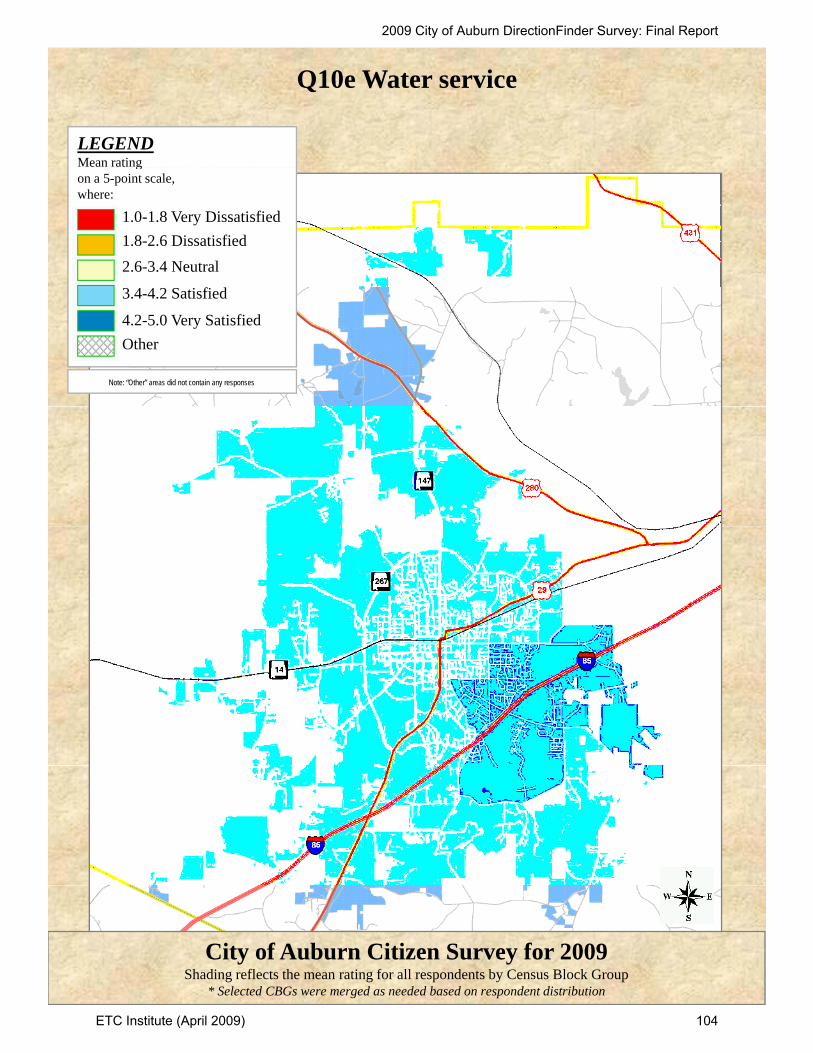
Q10e Water service
LEGENDMean rating gon a 5-point scale, where:
1.0-1.8 Very Dissatisfied1.8-2.6 Dissatisfied2.6-3.4 Neutral
3.4-4.2 Satisfied
4.2-5.0 Very SatisfiedOther
Note: “Other” areas did not contain any responses
City of Auburn Citizen Survey for 2009Shading reflects the mean rating for all respondents by Census Block Group
* Selected CBGs were merged as needed based on respondent distribution
2009 City of Auburn DirectionFinder Survey: Final Report
ETC Institute (April 2009) 104
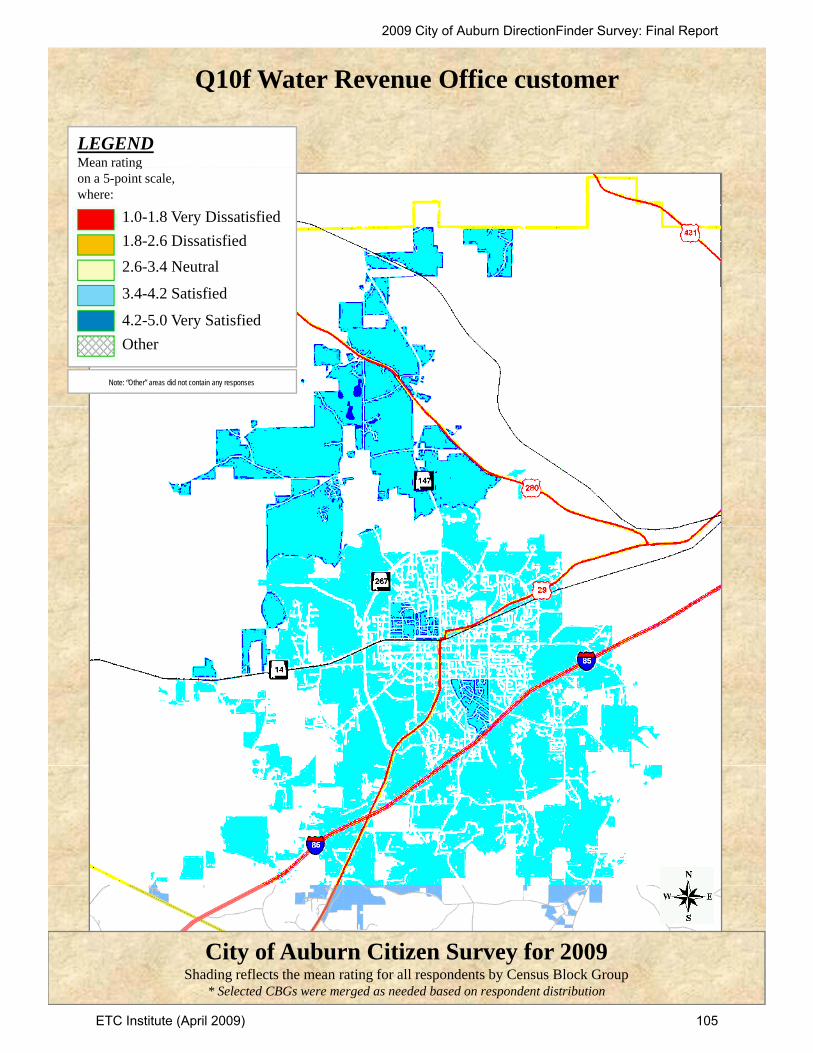
Q10f Water Revenue Office customer
LEGENDMean rating gon a 5-point scale, where:
1.0-1.8 Very Dissatisfied1.8-2.6 Dissatisfied2.6-3.4 Neutral
3.4-4.2 Satisfied
4.2-5.0 Very SatisfiedOther
Note: “Other” areas did not contain any responses
City of Auburn Citizen Survey for 2009Shading reflects the mean rating for all respondents by Census Block Group
* Selected CBGs were merged as needed based on respondent distribution
2009 City of Auburn DirectionFinder Survey: Final Report
ETC Institute (April 2009) 105
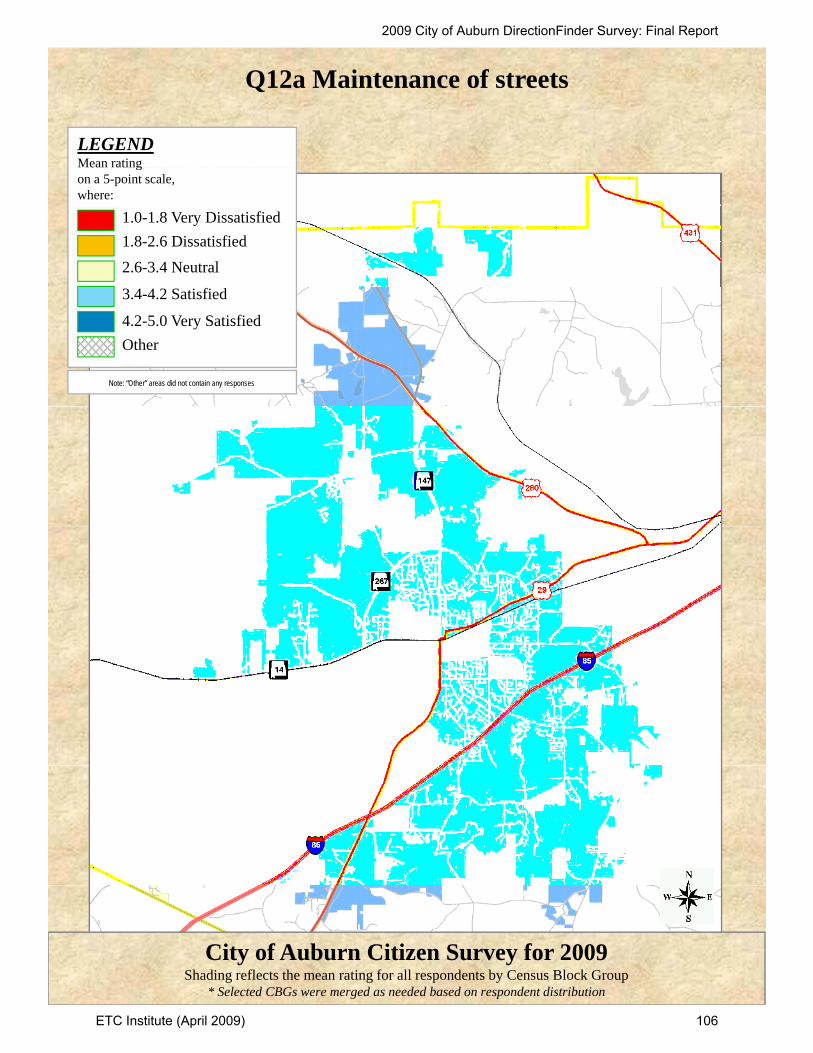
Q12a Maintenance of streets
LEGENDMean ratingMean rating on a 5-point scale, where:
1.0-1.8 Very Dissatisfied1.8-2.6 Dissatisfied2.6-3.4 Neutral
3.4-4.2 Satisfied
4.2-5.0 Very SatisfiedOther
Note: “Other” areas did not contain any responses
City of Auburn Citizen Survey for 2009Shading reflects the mean rating for all respondents by Census Block Group
* Selected CBGs were merged as needed based on respondent distribution
2009 City of Auburn DirectionFinder Survey: Final Report
ETC Institute (April 2009) 106

Q12b Maintenance of sidewalks
LEGENDMean ratingMean rating on a 5-point scale, where:
1.0-1.8 Very Dissatisfied1.8-2.6 Dissatisfied2.6-3.4 Neutral
3.4-4.2 Satisfied
4.2-5.0 Very SatisfiedOther
Note: “Other” areas did not contain any responses
City of Auburn Citizen Survey for 2009Shading reflects the mean rating for all respondents by Census Block Group
* Selected CBGs were merged as needed based on respondent distribution
2009 City of Auburn DirectionFinder Survey: Final Report
ETC Institute (April 2009) 107

Q12c Maintenance of street signs
LEGENDMean ratingMean rating on a 5-point scale, where:
1.0-1.8 Very Dissatisfied1.8-2.6 Dissatisfied2.6-3.4 Neutral
3.4-4.2 Satisfied
4.2-5.0 Very SatisfiedOther
Note: “Other” areas did not contain any responses
City of Auburn Citizen Survey for 2009Shading reflects the mean rating for all respondents by Census Block Group
* Selected CBGs were merged as needed based on respondent distribution
2009 City of Auburn DirectionFinder Survey: Final Report
ETC Institute (April 2009) 108

Q12d Maintenance of traffic signals
LEGENDMean ratingMean rating on a 5-point scale, where:
1.0-1.8 Very Dissatisfied1.8-2.6 Dissatisfied2.6-3.4 Neutral
3.4-4.2 Satisfied
4.2-5.0 Very SatisfiedOther
Note: “Other” areas did not contain any responses
City of Auburn Citizen Survey for 2009Shading reflects the mean rating for all respondents by Census Block Group
* Selected CBGs were merged as needed based on respondent distribution
2009 City of Auburn DirectionFinder Survey: Final Report
ETC Institute (April 2009) 109

Q12e Maintenance of downtown Auburn
LEGENDMean ratingMean rating on a 5-point scale, where:
1.0-1.8 Very Dissatisfied1.8-2.6 Dissatisfied2.6-3.4 Neutral
3.4-4.2 Satisfied
4.2-5.0 Very SatisfiedOther
Note: “Other” areas did not contain any responses
City of Auburn Citizen Survey for 2009Shading reflects the mean rating for all respondents by Census Block Group
* Selected CBGs were merged as needed based on respondent distribution
2009 City of Auburn DirectionFinder Survey: Final Report
ETC Institute (April 2009) 110

Q12f Maintenance of city buildings
LEGENDMean ratingMean rating on a 5-point scale, where:
1.0-1.8 Very Dissatisfied1.8-2.6 Dissatisfied2.6-3.4 Neutral
3.4-4.2 Satisfied
4.2-5.0 Very SatisfiedOther
Note: “Other” areas did not contain any responses
City of Auburn Citizen Survey for 2009Shading reflects the mean rating for all respondents by Census Block Group
* Selected CBGs were merged as needed based on respondent distribution
2009 City of Auburn DirectionFinder Survey: Final Report
ETC Institute (April 2009) 111

Q12g Mowing and trimming along streets and other public areas
LEGENDMean ratingMean rating on a 5-point scale, where:
1.0-1.8 Very Dissatisfied1.8-2.6 Dissatisfied2.6-3.4 Neutral
3.4-4.2 Satisfied
4.2-5.0 Very SatisfiedOther
Note: “Other” areas did not contain any responses
City of Auburn Citizen Survey for 2009Shading reflects the mean rating for all respondents by Census Block Group
* Selected CBGs were merged as needed based on respondent distribution
2009 City of Auburn DirectionFinder Survey: Final Report
ETC Institute (April 2009) 112

Q12h Overall cleanliness of streets and other public areas
LEGENDMean ratingMean rating on a 5-point scale, where:
1.0-1.8 Very Dissatisfied1.8-2.6 Dissatisfied2.6-3.4 Neutral
3.4-4.2 Satisfied
4.2-5.0 Very SatisfiedOther
Note: “Other” areas did not contain any responses
City of Auburn Citizen Survey for 2009Shading reflects the mean rating for all respondents by Census Block Group
* Selected CBGs were merged as needed based on respondent distribution
2009 City of Auburn DirectionFinder Survey: Final Report
ETC Institute (April 2009) 113

Q12i Adequacy of city street lighting
LEGENDMean ratingMean rating on a 5-point scale, where:
1.0-1.8 Very Dissatisfied1.8-2.6 Dissatisfied2.6-3.4 Neutral
3.4-4.2 Satisfied
4.2-5.0 Very SatisfiedOther
Note: “Other” areas did not contain any responses
City of Auburn Citizen Survey for 2009Shading reflects the mean rating for all respondents by Census Block Group
* Selected CBGs were merged as needed based on respondent distribution
2009 City of Auburn DirectionFinder Survey: Final Report
ETC Institute (April 2009) 114
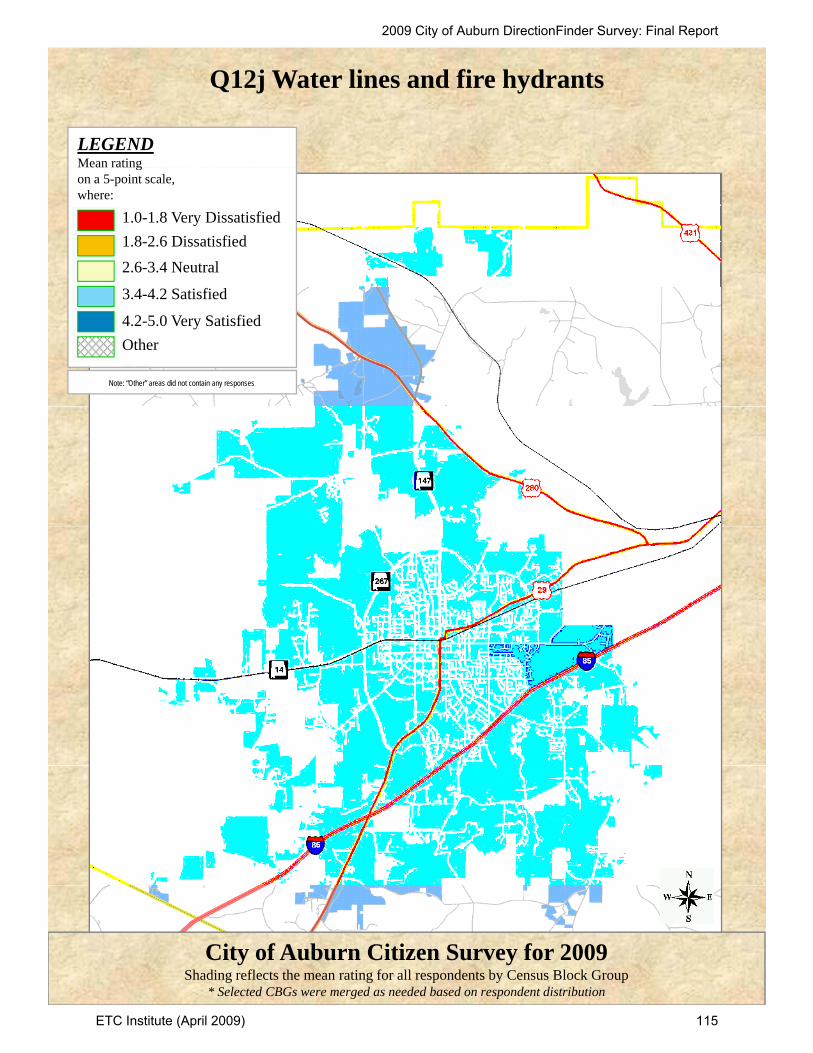
Q12j Water lines and fire hydrants
LEGENDMean ratingMean rating on a 5-point scale, where:
1.0-1.8 Very Dissatisfied1.8-2.6 Dissatisfied2.6-3.4 Neutral
3.4-4.2 Satisfied
4.2-5.0 Very SatisfiedOther
Note: “Other” areas did not contain any responses
City of Auburn Citizen Survey for 2009Shading reflects the mean rating for all respondents by Census Block Group
* Selected CBGs were merged as needed based on respondent distribution
2009 City of Auburn DirectionFinder Survey: Final Report
ETC Institute (April 2009) 115

Q12k Sewer lines and manholes
LEGENDMean ratingMean rating on a 5-point scale, where:
1.0-1.8 Very Dissatisfied1.8-2.6 Dissatisfied2.6-3.4 Neutral
3.4-4.2 Satisfied
4.2-5.0 Very SatisfiedOther
Note: “Other” areas did not contain any responses
City of Auburn Citizen Survey for 2009Shading reflects the mean rating for all respondents by Census Block Group
* Selected CBGs were merged as needed based on respondent distribution
2009 City of Auburn DirectionFinder Survey: Final Report
ETC Institute (April 2009) 116

Q14a In your neighborhood during the day
LEGENDMean ratingMean rating on a 5-point scale, where:
1.0-1.8 Very Unsafe1.8-2.6 Unsafe2.6-3.4 Neutral
3.4-4.2 Safe
4.2-5.0 Very SafeOther
Note: “Other” areas did not contain any responses
City of Auburn Citizen Survey for 2009Shading reflects the mean rating for all respondents by Census Block Group
* Selected CBGs were merged as needed based on respondent distribution
2009 City of Auburn DirectionFinder Survey: Final Report
ETC Institute (April 2009) 117
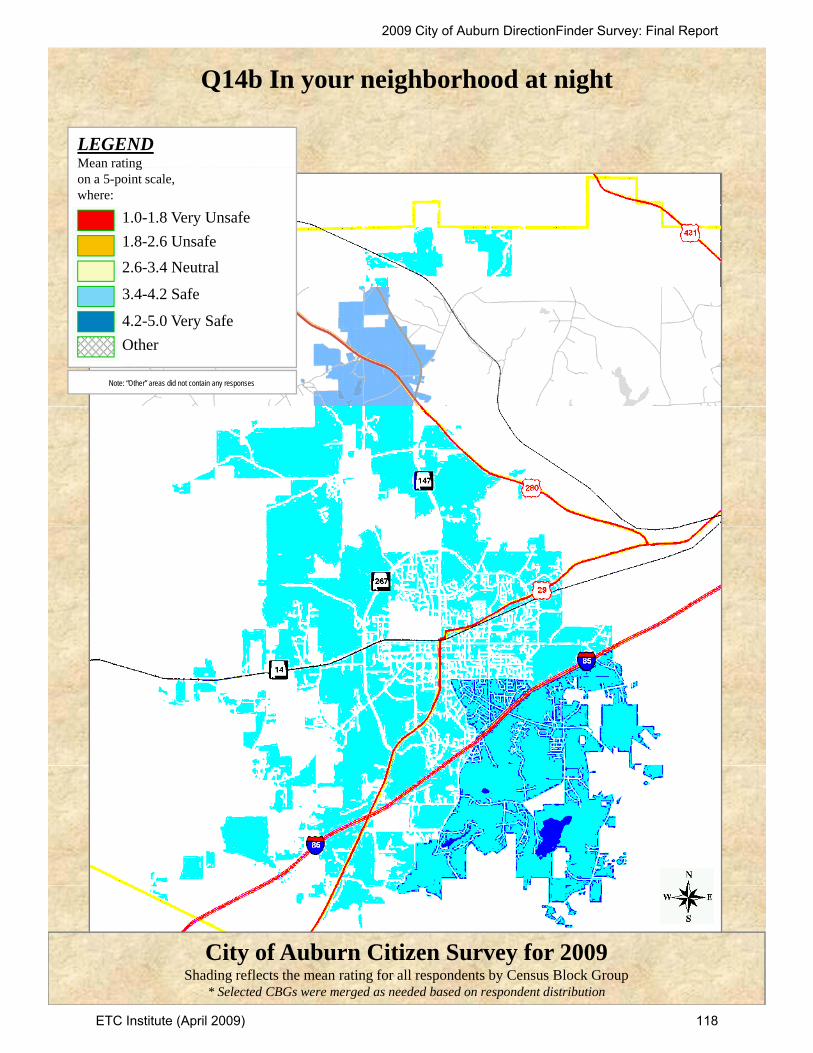
Q14b In your neighborhood at night
LEGENDMean ratingMean rating on a 5-point scale, where:
1.0-1.8 Very Unsafe1.8-2.6 Unsafe2.6-3.4 Neutral
3.4-4.2 Safe
4.2-5.0 Very SafeOther
Note: “Other” areas did not contain any responses
City of Auburn Citizen Survey for 2009Shading reflects the mean rating for all respondents by Census Block Group
* Selected CBGs were merged as needed based on respondent distribution
2009 City of Auburn DirectionFinder Survey: Final Report
ETC Institute (April 2009) 118

Q14c In the City’s parks
LEGENDMean ratingMean rating on a 5-point scale, where:
1.0-1.8 Very Unsafe1.8-2.6 Unsafe2.6-3.4 Neutral
3.4-4.2 Safe
4.2-5.0 Very SafeOther
Note: “Other” areas did not contain any responses
City of Auburn Citizen Survey for 2009Shading reflects the mean rating for all respondents by Census Block Group
* Selected CBGs were merged as needed based on respondent distribution
2009 City of Auburn DirectionFinder Survey: Final Report
ETC Institute (April 2009) 119
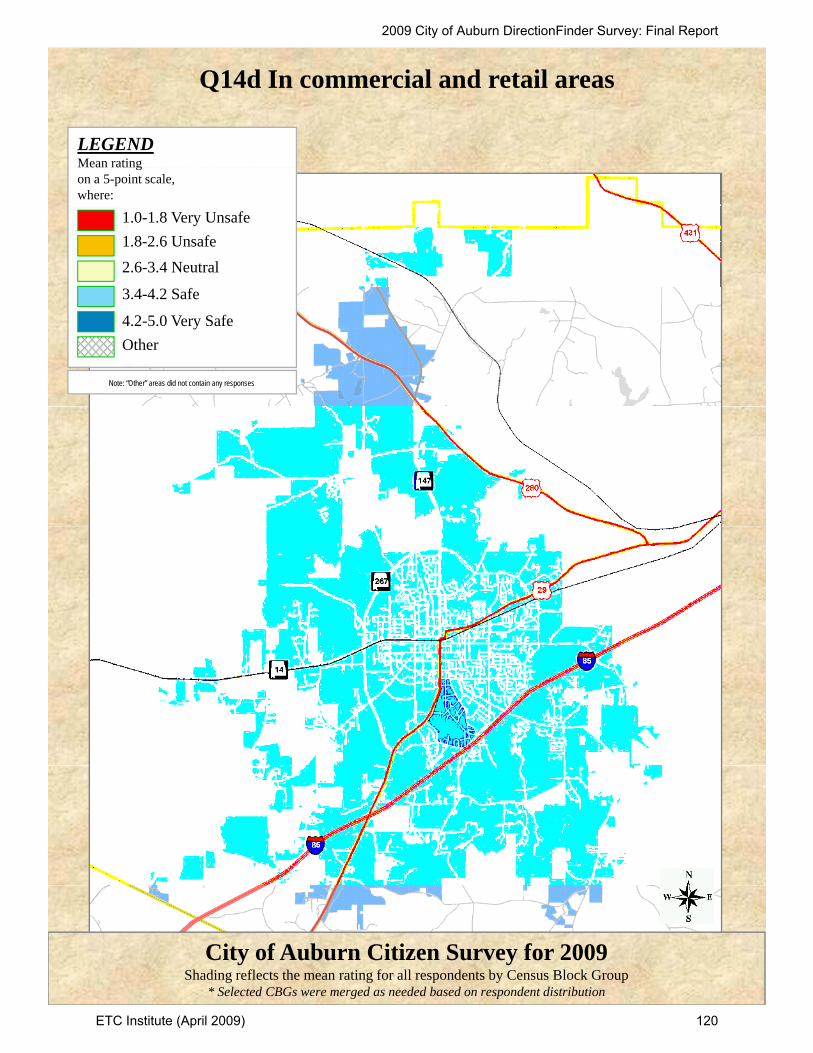
Q14d In commercial and retail areas
LEGENDMean ratingMean rating on a 5-point scale, where:
1.0-1.8 Very Unsafe1.8-2.6 Unsafe2.6-3.4 Neutral
3.4-4.2 Safe
4.2-5.0 Very SafeOther
Note: “Other” areas did not contain any responses
City of Auburn Citizen Survey for 2009Shading reflects the mean rating for all respondents by Census Block Group
* Selected CBGs were merged as needed based on respondent distribution
2009 City of Auburn DirectionFinder Survey: Final Report
ETC Institute (April 2009) 120

Q14e In downtown Auburn
LEGENDMean ratingMean rating on a 5-point scale, where:
1.0-1.8 Very Unsafe1.8-2.6 Unsafe2.6-3.4 Neutral
3.4-4.2 Safe
4.2-5.0 Very SafeOther
Note: “Other” areas did not contain any responses
City of Auburn Citizen Survey for 2009Shading reflects the mean rating for all respondents by Census Block Group
* Selected CBGs were merged as needed based on respondent distribution
2009 City of Auburn DirectionFinder Survey: Final Report
ETC Institute (April 2009) 121

Q14f Overall feeling of safety in Auburn
LEGENDMean ratingMean rating on a 5-point scale, where:
1.0-1.8 Very Unsafe1.8-2.6 Unsafe2.6-3.4 Neutral
3.4-4.2 Safe
4.2-5.0 Very SafeOther
Note: “Other” areas did not contain any responses
City of Auburn Citizen Survey for 2009Shading reflects the mean rating for all respondents by Census Block Group
* Selected CBGs were merged as needed based on respondent distribution
2009 City of Auburn DirectionFinder Survey: Final Report
ETC Institute (April 2009) 122

Q15a Quality of leadership provided by the City’s elected officials
LEGENDMean ratingMean rating on a 5-point scale, where:
1.0-1.8 Very Dissatisfied1.8-2.6 Dissatisfied2.6-3.4 Neutral
3.4-4.2 Satisfied
4.2-5.0 Very SatisfiedOther
Note: “Other” areas did not contain any responses
City of Auburn Citizen Survey for 2009Shading reflects the mean rating for all respondents by Census Block Group
* Selected CBGs were merged as needed based on respondent distribution
2009 City of Auburn DirectionFinder Survey: Final Report
ETC Institute (April 2009) 123

Q15b Effectiveness of appointed boards and commissions
LEGENDMean ratingMean rating on a 5-point scale, where:
1.0-1.8 Very Dissatisfied1.8-2.6 Dissatisfied2.6-3.4 Neutral
3.4-4.2 Satisfied
4.2-5.0 Very SatisfiedOther
Note: “Other” areas did not contain any responses
City of Auburn Citizen Survey for 2009Shading reflects the mean rating for all respondents by Census Block Group
* Selected CBGs were merged as needed based on respondent distribution
2009 City of Auburn DirectionFinder Survey: Final Report
ETC Institute (April 2009) 124

Q15c Overall effectiveness of the City Manager
LEGENDMean ratingMean rating on a 5-point scale, where:
1.0-1.8 Very Dissatisfied1.8-2.6 Dissatisfied2.6-3.4 Neutral
3.4-4.2 Satisfied
4.2-5.0 Very SatisfiedOther
Note: “Other” areas did not contain any responses
City of Auburn Citizen Survey for 2009Shading reflects the mean rating for all respondents by Census Block Group
* Selected CBGs were merged as needed based on respondent distribution
2009 City of Auburn DirectionFinder Survey: Final Report
ETC Institute (April 2009) 125

Q16a Maintenance of parks
LEGENDMean ratingMean rating on a 5-point scale, where:
1.0-1.8 Very Dissatisfied1.8-2.6 Dissatisfied2.6-3.4 Neutral
3.4-4.2 Satisfied
4.2-5.0 Very SatisfiedOther
Note: “Other” areas did not contain any responses
City of Auburn Citizen Survey for 2009Shading reflects the mean rating for all respondents by Census Block Group
* Selected CBGs were merged as needed based on respondent distribution
2009 City of Auburn DirectionFinder Survey: Final Report
ETC Institute (April 2009) 126

Q16b Maintenance of cemeteries
LEGENDMean ratingMean rating on a 5-point scale, where:
1.0-1.8 Very Dissatisfied1.8-2.6 Dissatisfied2.6-3.4 Neutral
3.4-4.2 Satisfied
4.2-5.0 Very SatisfiedOther
Note: “Other” areas did not contain any responses
City of Auburn Citizen Survey for 2009Shading reflects the mean rating for all respondents by Census Block Group
* Selected CBGs were merged as needed based on respondent distribution
2009 City of Auburn DirectionFinder Survey: Final Report
ETC Institute (April 2009) 127

Q16c Number of parks
LEGENDMean ratingMean rating on a 5-point scale, where:
1.0-1.8 Very Dissatisfied1.8-2.6 Dissatisfied2.6-3.4 Neutral
3.4-4.2 Satisfied
4.2-5.0 Very SatisfiedOther
Note: “Other” areas did not contain any responses
City of Auburn Citizen Survey for 2009Shading reflects the mean rating for all respondents by Census Block Group
* Selected CBGs were merged as needed based on respondent distribution
2009 City of Auburn DirectionFinder Survey: Final Report
ETC Institute (April 2009) 128

Q16d Walking and biking trails
LEGENDMean ratingMean rating on a 5-point scale, where:
1.0-1.8 Very Dissatisfied1.8-2.6 Dissatisfied2.6-3.4 Neutral
3.4-4.2 Satisfied
4.2-5.0 Very SatisfiedOther
Note: “Other” areas did not contain any responses
City of Auburn Citizen Survey for 2009Shading reflects the mean rating for all respondents by Census Block Group
* Selected CBGs were merged as needed based on respondent distribution
2009 City of Auburn DirectionFinder Survey: Final Report
ETC Institute (April 2009) 129

Q16e Swimming pools
LEGENDMean ratingMean rating on a 5-point scale, where:
1.0-1.8 Very Dissatisfied1.8-2.6 Dissatisfied2.6-3.4 Neutral
3.4-4.2 Satisfied
4.2-5.0 Very SatisfiedOther
Note: “Other” areas did not contain any responses
City of Auburn Citizen Survey for 2009Shading reflects the mean rating for all respondents by Census Block Group
* Selected CBGs were merged as needed based on respondent distribution
2009 City of Auburn DirectionFinder Survey: Final Report
ETC Institute (April 2009) 130

Q16f Community recreation centers
LEGENDMean ratingMean rating on a 5-point scale, where:
1.0-1.8 Very Dissatisfied1.8-2.6 Dissatisfied2.6-3.4 Neutral
3.4-4.2 Satisfied
4.2-5.0 Very SatisfiedOther
Note: “Other” areas did not contain any responses
City of Auburn Citizen Survey for 2009Shading reflects the mean rating for all respondents by Census Block Group
* Selected CBGs were merged as needed based on respondent distribution
2009 City of Auburn DirectionFinder Survey: Final Report
ETC Institute (April 2009) 131

Q16g Outdoor athletic fields
LEGENDMean ratingMean rating on a 5-point scale, where:
1.0-1.8 Very Dissatisfied1.8-2.6 Dissatisfied2.6-3.4 Neutral
3.4-4.2 Satisfied
4.2-5.0 Very SatisfiedOther
Note: “Other” areas did not contain any responses
City of Auburn Citizen Survey for 2009Shading reflects the mean rating for all respondents by Census Block Group
* Selected CBGs were merged as needed based on respondent distribution
2009 City of Auburn DirectionFinder Survey: Final Report
ETC Institute (April 2009) 132

Q16h Youth athletic programs
LEGENDMean ratingMean rating on a 5-point scale, where:
1.0-1.8 Very Dissatisfied1.8-2.6 Dissatisfied2.6-3.4 Neutral
3.4-4.2 Satisfied
4.2-5.0 Very SatisfiedOther
Note: “Other” areas did not contain any responses
City of Auburn Citizen Survey for 2009Shading reflects the mean rating for all respondents by Census Block Group
* Selected CBGs were merged as needed based on respondent distribution
2009 City of Auburn DirectionFinder Survey: Final Report
ETC Institute (April 2009) 133
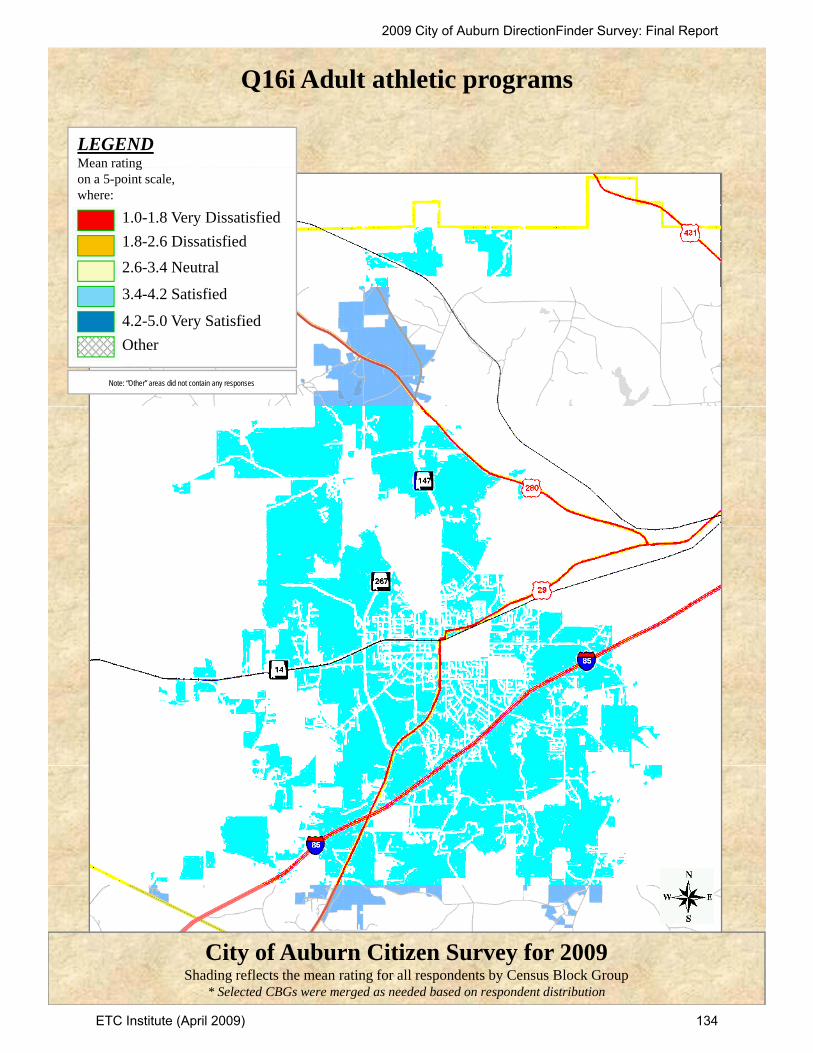
Q16i Adult athletic programs
LEGENDMean ratingMean rating on a 5-point scale, where:
1.0-1.8 Very Dissatisfied1.8-2.6 Dissatisfied2.6-3.4 Neutral
3.4-4.2 Satisfied
4.2-5.0 Very SatisfiedOther
Note: “Other” areas did not contain any responses
City of Auburn Citizen Survey for 2009Shading reflects the mean rating for all respondents by Census Block Group
* Selected CBGs were merged as needed based on respondent distribution
2009 City of Auburn DirectionFinder Survey: Final Report
ETC Institute (April 2009) 134

Q16j Other city recreation programs
LEGENDMean ratingMean rating on a 5-point scale, where:
1.0-1.8 Very Dissatisfied1.8-2.6 Dissatisfied2.6-3.4 Neutral
3.4-4.2 Satisfied
4.2-5.0 Very SatisfiedOther
Note: “Other” areas did not contain any responses
City of Auburn Citizen Survey for 2009Shading reflects the mean rating for all respondents by Census Block Group
* Selected CBGs were merged as needed based on respondent distribution
2009 City of Auburn DirectionFinder Survey: Final Report
ETC Institute (April 2009) 135

Q16k Ease of registering for programs
LEGENDMean ratingMean rating on a 5-point scale, where:
1.0-1.8 Very Dissatisfied1.8-2.6 Dissatisfied2.6-3.4 Neutral
3.4-4.2 Satisfied
4.2-5.0 Very SatisfiedOther
Note: “Other” areas did not contain any responses
City of Auburn Citizen Survey for 2009Shading reflects the mean rating for all respondents by Census Block Group
* Selected CBGs were merged as needed based on respondent distribution
2009 City of Auburn DirectionFinder Survey: Final Report
ETC Institute (April 2009) 136
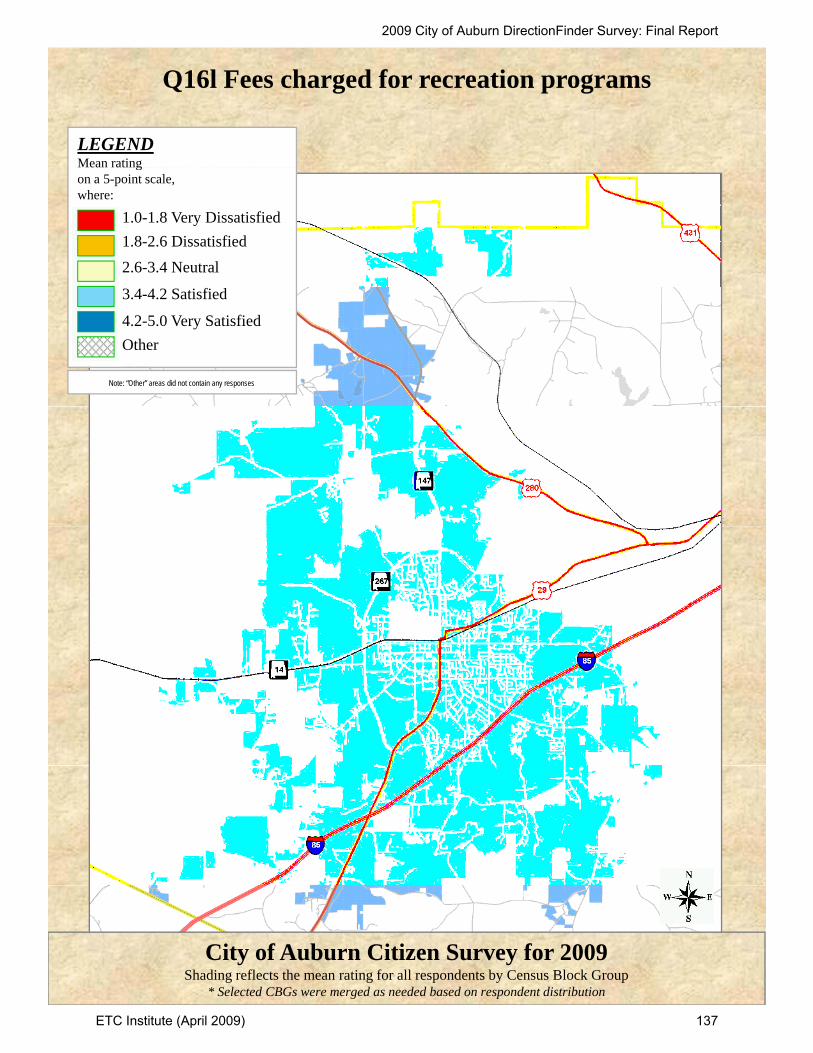
Q16l Fees charged for recreation programs
LEGENDMean ratingMean rating on a 5-point scale, where:
1.0-1.8 Very Dissatisfied1.8-2.6 Dissatisfied2.6-3.4 Neutral
3.4-4.2 Satisfied
4.2-5.0 Very SatisfiedOther
Note: “Other” areas did not contain any responses
City of Auburn Citizen Survey for 2009Shading reflects the mean rating for all respondents by Census Block Group
* Selected CBGs were merged as needed based on respondent distribution
2009 City of Auburn DirectionFinder Survey: Final Report
ETC Institute (April 2009) 137
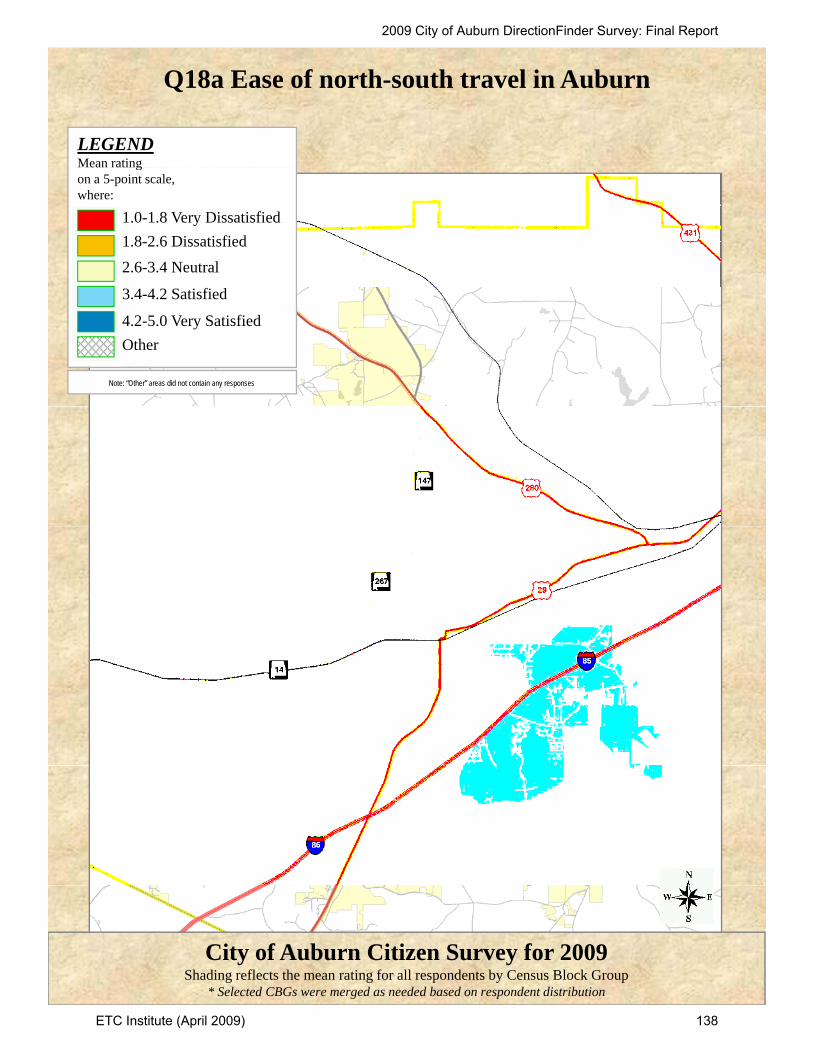
Q18a Ease of north-south travel in Auburn
LEGENDMean ratingMean rating on a 5-point scale, where:
1.0-1.8 Very Dissatisfied1.8-2.6 Dissatisfied2.6-3.4 Neutral
3.4-4.2 Satisfied
4.2-5.0 Very SatisfiedOther
Note: “Other” areas did not contain any responses
City of Auburn Citizen Survey for 2009Shading reflects the mean rating for all respondents by Census Block Group
* Selected CBGs were merged as needed based on respondent distribution
2009 City of Auburn DirectionFinder Survey: Final Report
ETC Institute (April 2009) 138

Q18b Ease of east-west travel in Auburn
LEGENDMean ratingMean rating on a 5-point scale, where:
1.0-1.8 Very Dissatisfied1.8-2.6 Dissatisfied2.6-3.4 Neutral
3.4-4.2 Satisfied
4.2-5.0 Very SatisfiedOther
Note: “Other” areas did not contain any responses
City of Auburn Citizen Survey for 2009Shading reflects the mean rating for all respondents by Census Block Group
* Selected CBGs were merged as needed based on respondent distribution
2009 City of Auburn DirectionFinder Survey: Final Report
ETC Institute (April 2009) 139
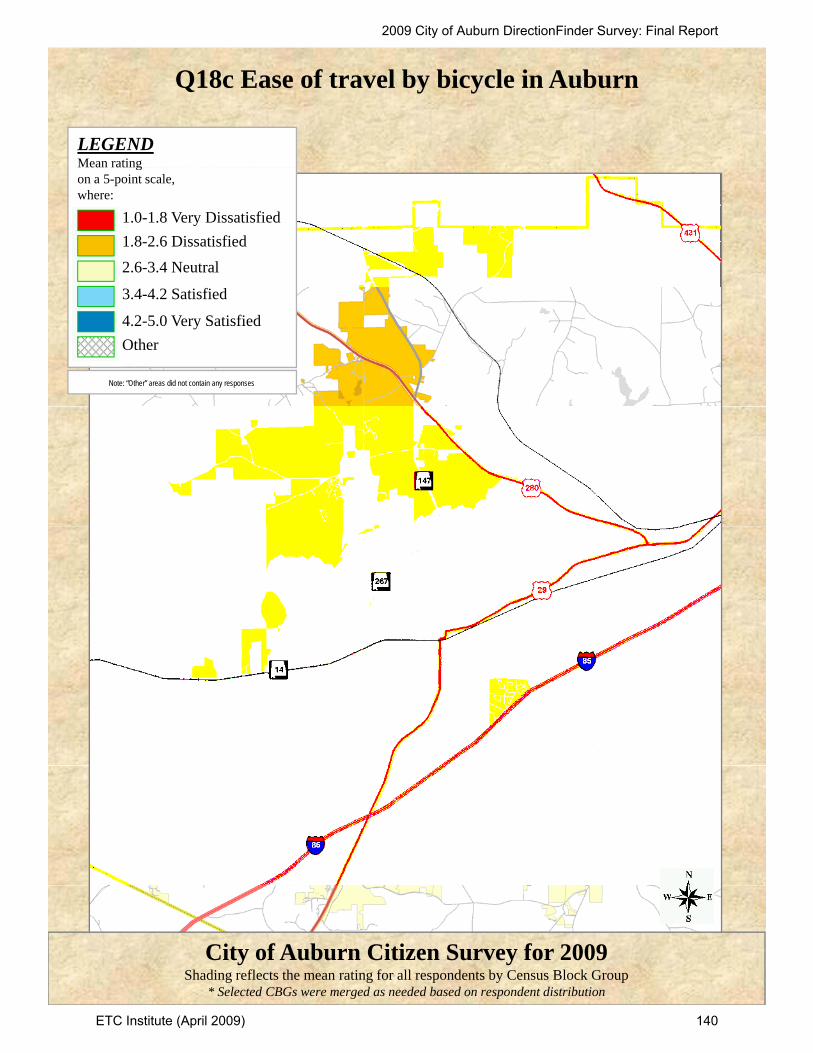
Q18c Ease of travel by bicycle in Auburn
LEGENDMean ratingMean rating on a 5-point scale, where:
1.0-1.8 Very Dissatisfied1.8-2.6 Dissatisfied2.6-3.4 Neutral
3.4-4.2 Satisfied
4.2-5.0 Very SatisfiedOther
Note: “Other” areas did not contain any responses
City of Auburn Citizen Survey for 2009Shading reflects the mean rating for all respondents by Census Block Group
* Selected CBGs were merged as needed based on respondent distribution
2009 City of Auburn DirectionFinder Survey: Final Report
ETC Institute (April 2009) 140

Q18d Ease of pedestrian travel in Auburn
LEGENDMean ratingMean rating on a 5-point scale, where:
1.0-1.8 Very Dissatisfied1.8-2.6 Dissatisfied2.6-3.4 Neutral
3.4-4.2 Satisfied
4.2-5.0 Very SatisfiedOther
Note: “Other” areas did not contain any responses
City of Auburn Citizen Survey for 2009Shading reflects the mean rating for all respondents by Census Block Group
* Selected CBGs were merged as needed based on respondent distribution
2009 City of Auburn DirectionFinder Survey: Final Report
ETC Institute (April 2009) 141
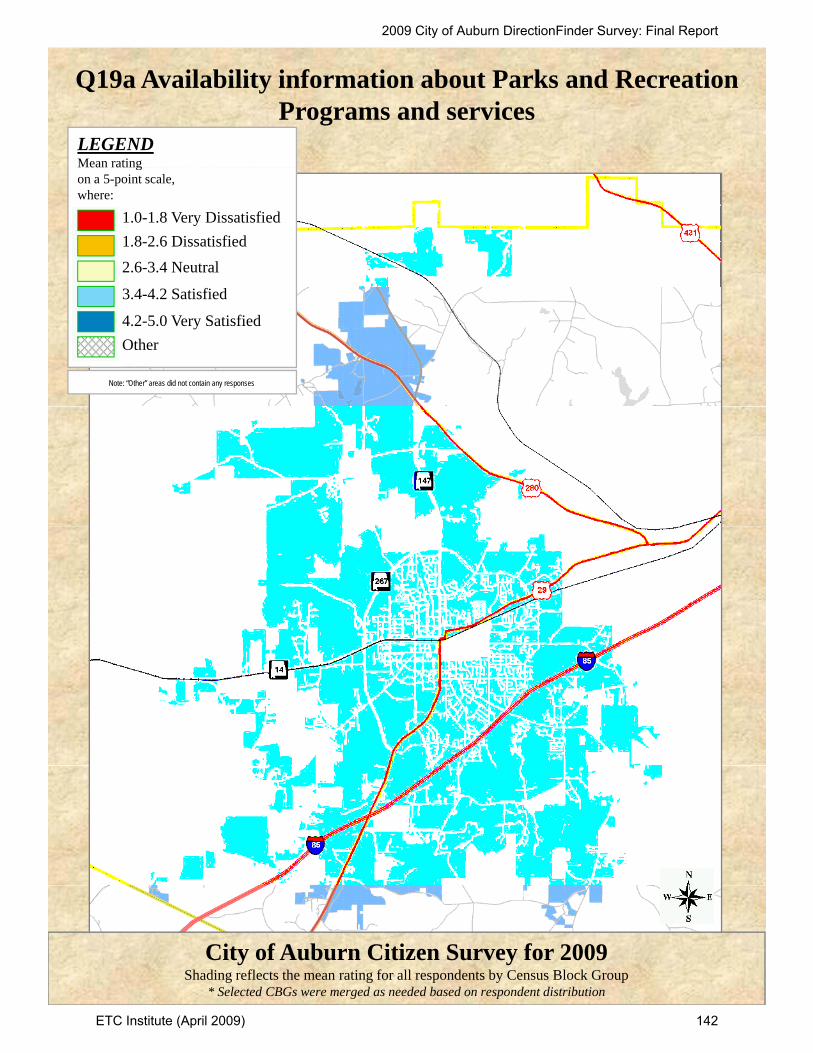
Q19a Availability information about Parks and RecreationPrograms and services
LEGENDMean ratingMean rating on a 5-point scale, where:
1.0-1.8 Very Dissatisfied1.8-2.6 Dissatisfied2.6-3.4 Neutral
3.4-4.2 Satisfied
4.2-5.0 Very SatisfiedOther
Note: “Other” areas did not contain any responses
City of Auburn Citizen Survey for 2009Shading reflects the mean rating for all respondents by Census Block Group
* Selected CBGs were merged as needed based on respondent distribution
2009 City of Auburn DirectionFinder Survey: Final Report
ETC Institute (April 2009) 142
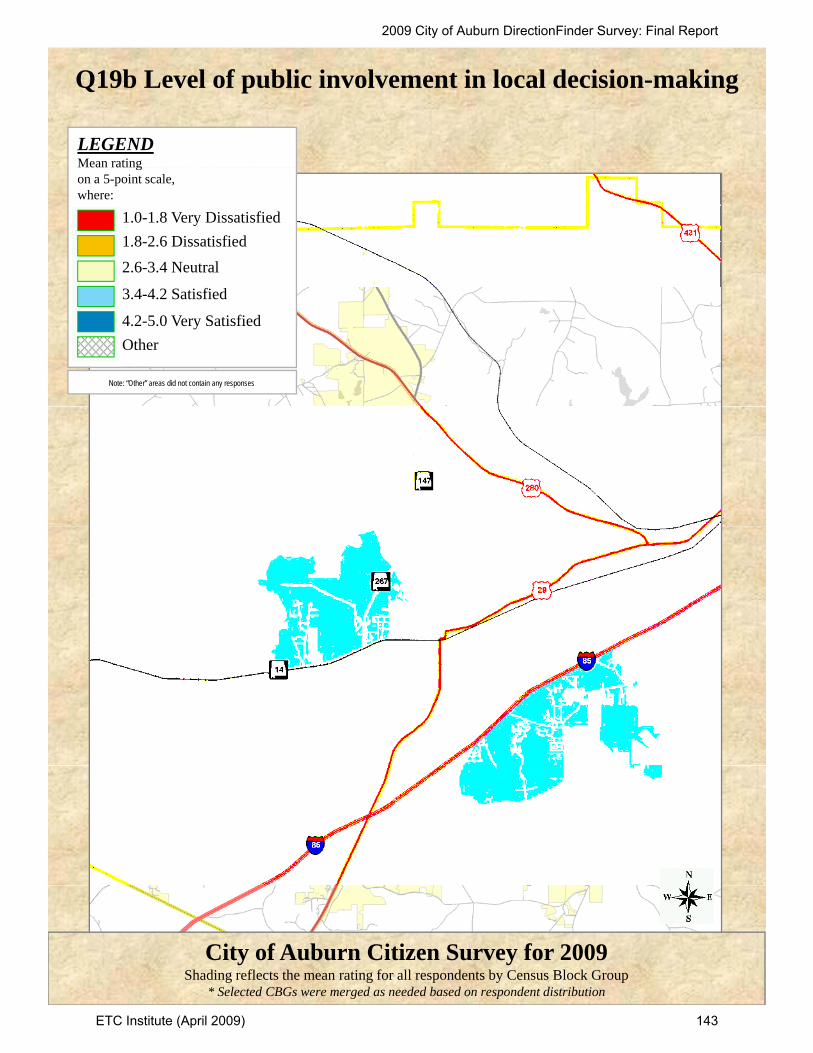
Q19b Level of public involvement in local decision-making
LEGENDMean ratingMean rating on a 5-point scale, where:
1.0-1.8 Very Dissatisfied1.8-2.6 Dissatisfied2.6-3.4 Neutral
3.4-4.2 Satisfied
4.2-5.0 Very SatisfiedOther
Note: “Other” areas did not contain any responses
City of Auburn Citizen Survey for 2009Shading reflects the mean rating for all respondents by Census Block Group
* Selected CBGs were merged as needed based on respondent distribution
2009 City of Auburn DirectionFinder Survey: Final Report
ETC Institute (April 2009) 143

Q19c Quality of OPEN LINE newsletter
LEGENDMean ratingMean rating on a 5-point scale, where:
1.0-1.8 Very Dissatisfied1.8-2.6 Dissatisfied2.6-3.4 Neutral
3.4-4.2 Satisfied
4.2-5.0 Very SatisfiedOther
Note: “Other” areas did not contain any responses
City of Auburn Citizen Survey for 2009Shading reflects the mean rating for all respondents by Census Block Group
* Selected CBGs were merged as needed based on respondent distribution
2009 City of Auburn DirectionFinder Survey: Final Report
ETC Institute (April 2009) 144

Q19d Quality of the City’s web page
LEGENDMean ratingMean rating on a 5-point scale, where:
1.0-1.8 Very Dissatisfied1.8-2.6 Dissatisfied2.6-3.4 Neutral
3.4-4.2 Satisfied
4.2-5.0 Very SatisfiedOther
Note: “Other” areas did not contain any responses
City of Auburn Citizen Survey for 2009Shading reflects the mean rating for all respondents by Census Block Group
* Selected CBGs were merged as needed based on respondent distribution
2009 City of Auburn DirectionFinder Survey: Final Report
ETC Institute (April 2009) 145

Q19e Availability of information on other city services and programs
LEGENDMean ratingMean rating on a 5-point scale, where:
1.0-1.8 Very Dissatisfied1.8-2.6 Dissatisfied2.6-3.4 Neutral
3.4-4.2 Satisfied
4.2-5.0 Very SatisfiedOther
Note: “Other” areas did not contain any responses
City of Auburn Citizen Survey for 2009Shading reflects the mean rating for all respondents by Census Block Group
* Selected CBGs were merged as needed based on respondent distribution
2009 City of Auburn DirectionFinder Survey: Final Report
ETC Institute (April 2009) 146

Q19f Transparency of city government
LEGENDMean ratingMean rating on a 5-point scale, where:
1.0-1.8 Very Dissatisfied1.8-2.6 Dissatisfied2.6-3.4 Neutral
3.4-4.2 Satisfied
4.2-5.0 Very SatisfiedOther
Note: “Other” areas did not contain any responses
City of Auburn Citizen Survey for 2009Shading reflects the mean rating for all respondents by Census Block Group
* Selected CBGs were merged as needed based on respondent distribution
2009 City of Auburn DirectionFinder Survey: Final Report
ETC Institute (April 2009) 147

Section 5:
Tabular Data and Survey Instrument
2009 City of Auburn DirectionFinder Survey: Final Report
ETC Institute (April 2009) 148

Q1. Please rate your overall satisfaction with the following major categories of services provided by the
City of Auburn.
(N=736) Very Very Satisfied Satisfied Neutral Dissatisfied Dissatisfied Don’t know 5 4 3 2 1 9 Q1a Quality of city school system 47.3% 32.2% 5.8% 1.4% 0.1% 13.2% Q1b Police-fire-ambulance services 37.8% 46.2% 7.9% 3.0% 0.7% 4.5% Q1c Parks & recreations programs/facilities 28.5% 46.7% 13.2% 4.2% 0.7% 6.7% Q1d Maintenance of city streets/facilities 14.9% 48.2% 24.3% 8.4% 2.4% 1.6% Q1e Enforcement of city codes/ordinances 13.5% 40.2% 24.6% 9.2% 3.3% 9.2% Q1f Quality of Customer Service received 27.9% 47.4% 15.4% 3.1% 0.5% 5.7% Q1g Effectiveness of city communication 21.3% 44.2% 23.8% 6.5% 1.2% 3.0% Q1h Quality of city’s stormwater runoff 17.3% 40.5% 20.8% 7.1% 2.3% 12.1% Q1i Quality of city library facilities/services 43.6% 38.7% 7.5% 1.6% 0.4% 8.2% Q1j Flow of traffic & congestion management 9.9% 38.9% 26.1% 18.9% 5.6% 0.7%
2009 City of Auburn DirectionFinder Survey: Final Report
ETC Institute (April 2009) 149

EXCLUDING DON’T KNOWS Q1. Please rate your overall satisfaction with the following major categories of services provided by the
City of Auburn. (excluding don't know)
Very Very Satisfied Satisfied Neutral Dissatisfied Dissatisfied 5 4 3 2 1 Q1a Quality of city school system 54.5% 37.1% 6.7% 1.6% 0.2% Q1b Police-fire-ambulance services 39.5% 48.4% 8.3% 3.1% 0.7% Q1c Parks & recreations programs/facilities 30.6% 50.1% 14.1% 4.5% 0.7% Q1d Maintenance of city streets/facilities 15.2% 49.0% 24.7% 8.6% 2.5% Q1e Enforcement of city codes/ordinances 14.8% 44.3% 27.1% 10.2% 3.6% Q1f Quality of Customer Service received 29.5% 50.3% 16.3% 3.3% 0.6% Q1g Effectiveness of city communication 22.0% 45.5% 24.5% 6.7% 1.3% Q1h Quality of city’s stormwater runoff 19.6% 46.1% 23.6% 8.0% 2.6% Q1i Quality of city library facilities/services 47.5% 42.2% 8.1% 1.8% 0.4% Q1j Flow of traffic & congestion management 10.0% 39.1% 26.3% 19.0% 5.6%
2009 City of Auburn DirectionFinder Survey: Final Report
ETC Institute (April 2009) 150

Q2. Which THREE of these items do you think should receive the MOST emphasis from City leaders
over the next TWO years?
Q2 1st choice Number Percent A=City school system 179 24.3 % B=Police, fire, ambulance services 81 11.0 % C=Parks & Recreation programs/facilities 27 3.7 % D=Maintenance of streets/facilities 108 14.7 % E=Code enforcement 32 4.3 % F=Customer Service 13 1.8 % G=City communication 16 2.2 % H=City’s stormwater runoff 26 3.5 % I=City library facilities 7 1.0 % J=Flow of traffic and congestion management 201 27.3 % Z=None chosen 46 6.3 % Total 736 100.0 %
Q2 2nd choice Number Percent A=City school system 79 10.7 % B=Police, fire, ambulance services 123 16.7 % C=Parks & Recreation programs/facilities 40 5.4 % D=Maintenance of streets/facilities 137 18.6 % E=Code enforcement 58 7.9 % F=Customer Service 14 1.9 % G=City communication 40 5.4 % H=City’s stormwater runoff 48 6.5 % I=City library facilities 19 2.6 % J=Flow of traffic and congestion management 111 15.1 % Z=None chosen 67 9.1 % Total 736 100.0 %
Q2 3rd choice Number Percent A=City school system 60 8.2 % B=Police, fire, ambulance services 66 9.0 % C=Parks & Recreation programs/facilities 70 9.5 % D=Maintenance of streets/facilities 102 13.9 % E=Code enforcement 73 9.9 % F=Customer Service 18 2.4 % G=City communication 60 8.2 % H=City’s stormwater runoff 51 6.9 % I=City library facilities 14 1.9 % J=Flow of traffic and congestion management 139 18.9 % Z=None chosen 83 11.3 % Total 736 100.0 %
2009 City of Auburn DirectionFinder Survey: Final Report
ETC Institute (April 2009) 151
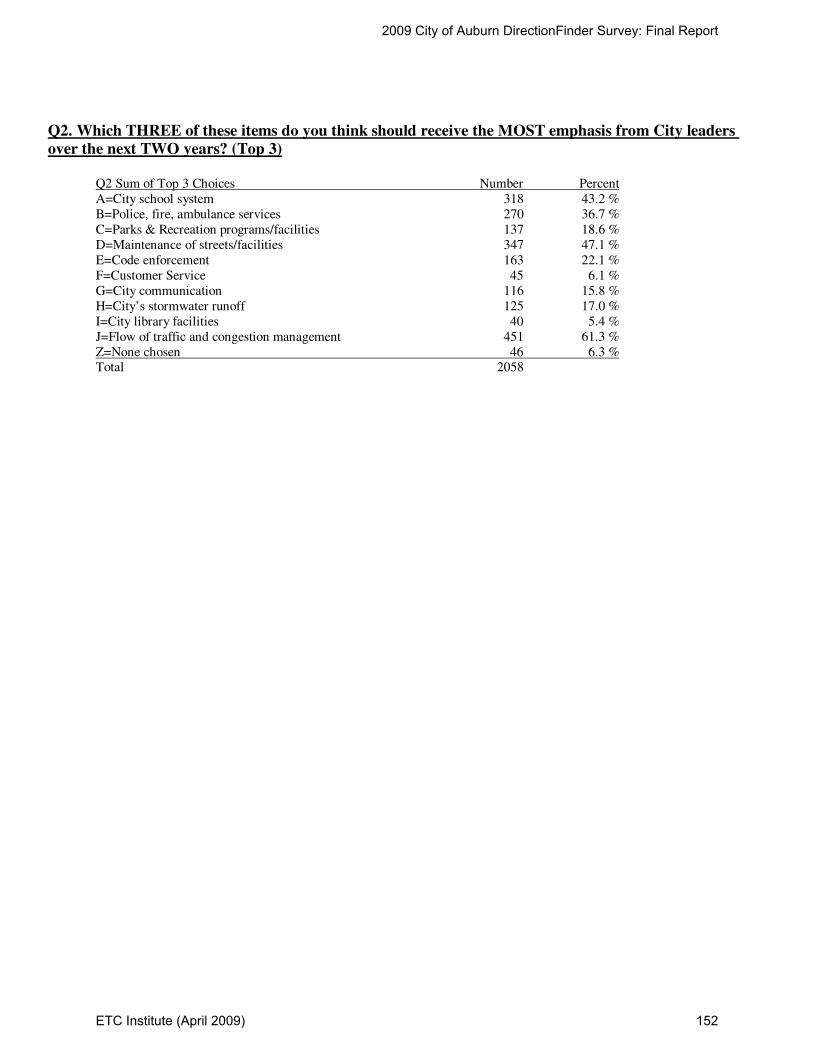
Q2. Which THREE of these items do you think should receive the MOST emphasis from City leaders
over the next TWO years? (Top 3)
Q2 Sum of Top 3 Choices Number Percent A=City school system 318 43.2 % B=Police, fire, ambulance services 270 36.7 % C=Parks & Recreation programs/facilities 137 18.6 % D=Maintenance of streets/facilities 347 47.1 % E=Code enforcement 163 22.1 % F=Customer Service 45 6.1 % G=City communication 116 15.8 % H=City’s stormwater runoff 125 17.0 % I=City library facilities 40 5.4 % J=Flow of traffic and congestion management 451 61.3 % Z=None chosen 46 6.3 % Total 2058
2009 City of Auburn DirectionFinder Survey: Final Report
ETC Institute (April 2009) 152

Q3. Please rate your satisfaction with the following items.
(N=736) Very Very Satisfied Satisfied Neutral Dissatisfied Dissatisfied Don’t know 5 4 3 2 1 9 Q3a Value received for tax dollars/fees 21.3% 52.3% 17.9% 5.3% 1.1% 2.0% Q3b Overall image of the city 33.4% 50.7% 11.5% 3.3% 0.1% 1.0% Q3c Overall quality of life in the city 40.4% 50.4% 6.0% 1.9% 0.4% 1.0% Q3d Overall appearance of the city 23.1% 51.5% 16.2% 7.5% 1.0% 0.8% Q3e Overall quality of city services 26.4% 56.1% 14.3% 2.4% 0.1% 0.7%
EXCLUDING DON’T KNOWS Q3. Please rate your satisfaction with the following items. (excluding don't know) Very Very Satisfied Satisfied Neutral Dissatisfied Dissatisfied 5 4 3 2 1 Q3a Value received for tax dollars/fees 21.8% 53.4% 18.3% 5.4% 1.1% Q3b Overall image of the city 33.7% 51.2% 11.7% 3.3% 0.1% Q3c Overall quality of life in the city 40.7% 50.9% 6.0% 1.9% 0.4% Q3d Overall appearance of the city 23.3% 51.9% 16.3% 7.5% 1.0% Q3e Overall quality of city services 26.5% 56.5% 14.4% 2.5% 0.1%
2009 City of Auburn DirectionFinder Survey: Final Report
ETC Institute (April 2009) 153
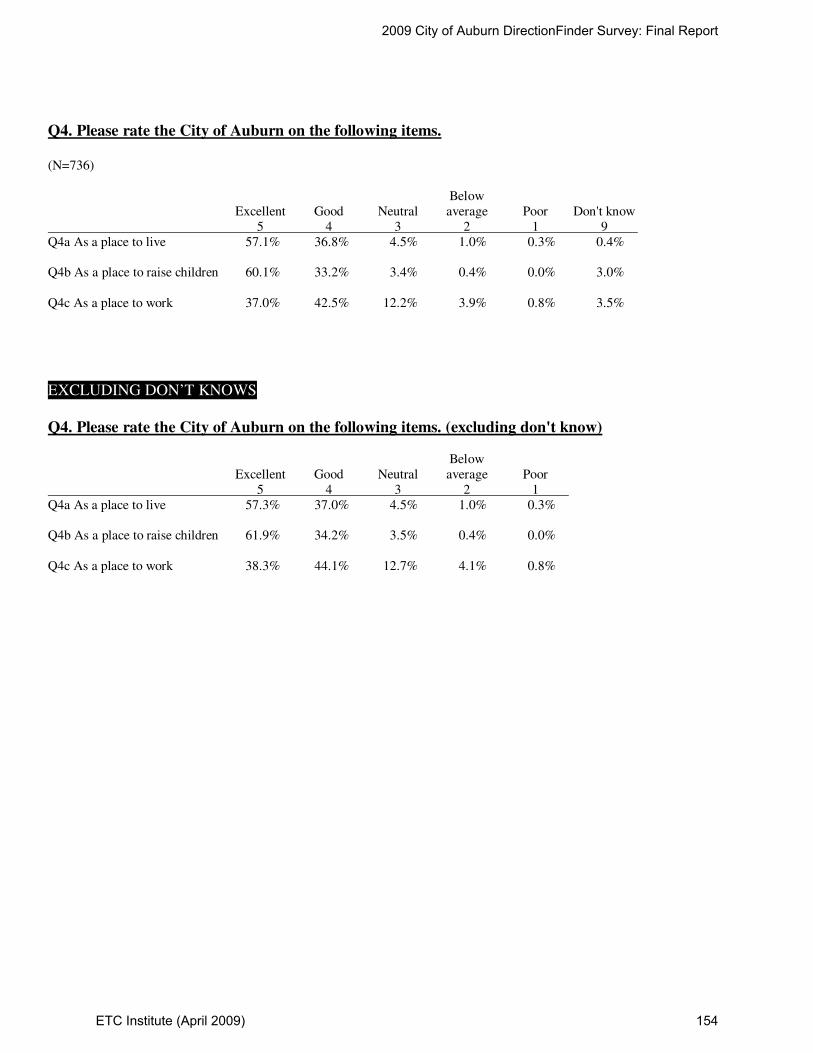
Q4. Please rate the City of Auburn on the following items.
(N=736) Below Excellent Good Neutral average Poor Don't know 5 4 3 2 1 9 Q4a As a place to live 57.1% 36.8% 4.5% 1.0% 0.3% 0.4% Q4b As a place to raise children 60.1% 33.2% 3.4% 0.4% 0.0% 3.0% Q4c As a place to work 37.0% 42.5% 12.2% 3.9% 0.8% 3.5%
EXCLUDING DON’T KNOWS Q4. Please rate the City of Auburn on the following items. (excluding don't know) Below Excellent Good Neutral average Poor 5 4 3 2 1 Q4a As a place to live 57.3% 37.0% 4.5% 1.0% 0.3% Q4b As a place to raise children 61.9% 34.2% 3.5% 0.4% 0.0% Q4c As a place to work 38.3% 44.1% 12.7% 4.1% 0.8%
2009 City of Auburn DirectionFinder Survey: Final Report
ETC Institute (April 2009) 154

Q5. In addressing the growth of the City of Auburn in the past two decades, please indicate which of the
following should be the highest priorities for city officials.
Q5 1st issue Number Percent A=Bikeways 32 4.3 % B=City school system 263 35.7 % C=Codes enforcement 14 1.9 % D=Fire protection 10 1.4 % E=Police protection 110 14.9 % F=Public transportation 33 4.5 % G=Recreational opportunities 16 2.2 % H=Sidewalks 17 2.3 % I=Stormwater management 15 2.0 % J=Traffic management 110 14.9 % K=Walking trails 3 0.4 % L=Zoning and land use 96 13.0 % Z=None chosen 17 2.3 % Total 736 100.0 %
Q5 2nd issue Number Percent A=Bikeways 13 1.8 % B=City school system 99 13.5 % C=Codes enforcement 34 4.6 % D=Fire protection 61 8.3 % E=Police protection 155 21.1 % F=Public transportation 36 4.9 % G=Recreational opportunities 23 3.1 % H=Sidewalks 30 4.1 % I=Stormwater management 30 4.1 % J=Traffic management 114 15.5 % K=Walking trails 17 2.3 % L=Zoning and land use 103 14.0 % Z=None selected 21 2.9 % Total 736 100.0 %
Q5 3rd issue Number Percent A=Bikeways 26 3.5 % B=City school system 77 10.5 % C=Codes enforcement 52 7.1 % D=Fire protection 103 14.0 % E=Police protection 109 14.8 % F=Public transportation 53 7.2 % G=Recreational opportunities 44 6.0 % H=Sidewalks 30 4.1 % I=Stormwater management 23 3.1 % J=Traffic management 99 13.5 % K=Walking trails 27 3.7 % L=Zoning and land use 67 9.1 % Z=None selected 26 3.5 % Total 736 100.0 %
2009 City of Auburn DirectionFinder Survey: Final Report
ETC Institute (April 2009) 155
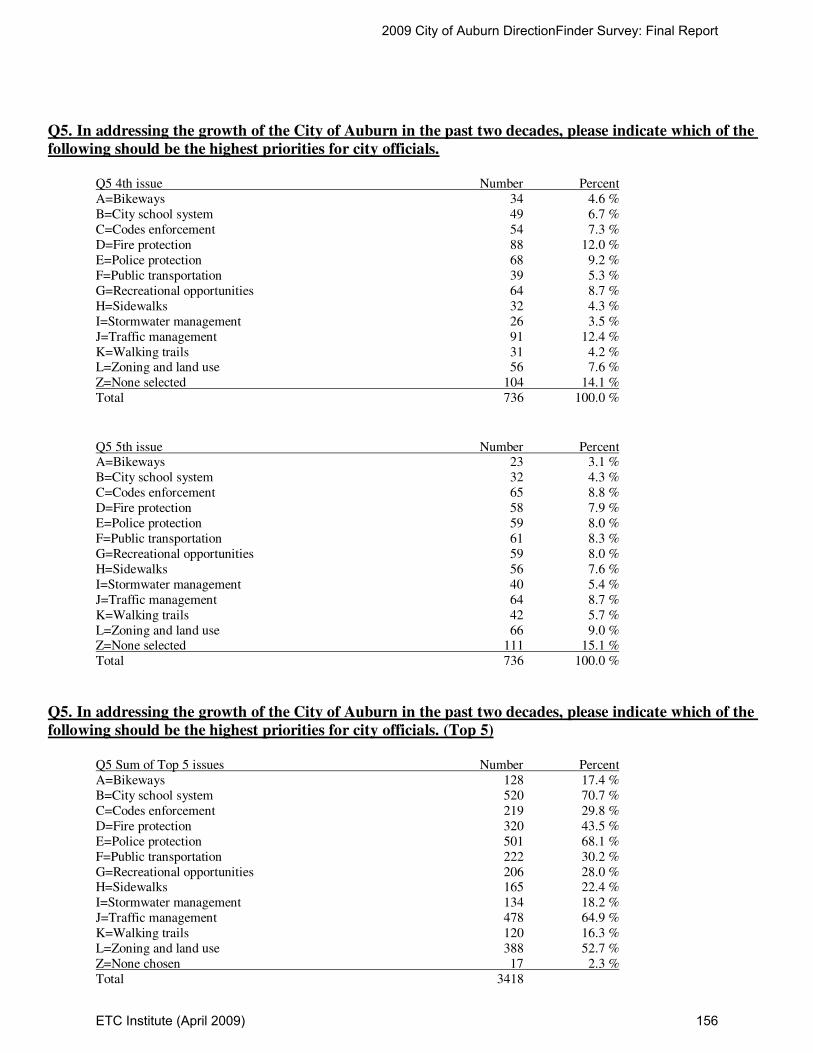
Q5. In addressing the growth of the City of Auburn in the past two decades, please indicate which of the
following should be the highest priorities for city officials.
Q5 4th issue Number Percent A=Bikeways 34 4.6 % B=City school system 49 6.7 % C=Codes enforcement 54 7.3 % D=Fire protection 88 12.0 % E=Police protection 68 9.2 % F=Public transportation 39 5.3 % G=Recreational opportunities 64 8.7 % H=Sidewalks 32 4.3 % I=Stormwater management 26 3.5 % J=Traffic management 91 12.4 % K=Walking trails 31 4.2 % L=Zoning and land use 56 7.6 % Z=None selected 104 14.1 % Total 736 100.0 %
Q5 5th issue Number Percent A=Bikeways 23 3.1 % B=City school system 32 4.3 % C=Codes enforcement 65 8.8 % D=Fire protection 58 7.9 % E=Police protection 59 8.0 % F=Public transportation 61 8.3 % G=Recreational opportunities 59 8.0 % H=Sidewalks 56 7.6 % I=Stormwater management 40 5.4 % J=Traffic management 64 8.7 % K=Walking trails 42 5.7 % L=Zoning and land use 66 9.0 % Z=None selected 111 15.1 % Total 736 100.0 %
Q5. In addressing the growth of the City of Auburn in the past two decades, please indicate which of the
following should be the highest priorities for city officials. (Top 5)
Q5 Sum of Top 5 issues Number Percent A=Bikeways 128 17.4 % B=City school system 520 70.7 % C=Codes enforcement 219 29.8 % D=Fire protection 320 43.5 % E=Police protection 501 68.1 % F=Public transportation 222 30.2 % G=Recreational opportunities 206 28.0 % H=Sidewalks 165 22.4 % I=Stormwater management 134 18.2 % J=Traffic management 478 64.9 % K=Walking trails 120 16.3 % L=Zoning and land use 388 52.7 % Z=None chosen 17 2.3 % Total 3418
2009 City of Auburn DirectionFinder Survey: Final Report
ETC Institute (April 2009) 156

Q6. Please rate your satisfaction on with the following public safety services. (N=736) Very Very Satisfied Satisfied Neutral Dissatisfied Dissatisfied Don’t know 5 4 3 2 1 9 Q6a Overall quality of police protection 27.0% 54.2% 11.4% 3.1% 1.2% 3.0% Q6b Visibility of police in neighborhood 18.3% 42.4% 23.0% 12.5% 2.2% 1.6% Q6c Visibility of police in retail areas 14.7% 46.2% 24.6% 8.6% 1.6% 4.3% Q6d How quickly police respond-emergency 20.4% 36.8% 13.2% 3.3% 1.2% 25.1% Q6e Efforts to prevent crime 14.0% 43.8% 20.1% 7.5% 1.6% 13.0% Q6f Police safety education program 12.4% 31.0% 23.2% 2.3% 1.1% 30.0% Q6g Enforcement of traffic laws 14.1% 47.6% 20.1% 9.5% 3.5% 5.2% Q6h Overall quality of fire protection 24.2% 48.2% 11.8% 1.1% 0.3% 14.4% Q6i Fire personnel emergency response 23.4% 29.9% 12.8% 0.5% 0.1% 33.3% Q6j Fire safety education programs 14.4% 30.4% 20.9% 1.4% 0.4% 32.5% Q6k Quality of local ambulance service 19.0% 32.5% 15.8% 1.8% 1.1% 29.9% Q6l Quality of animal control 12.9% 36.8% 21.2% 8.3% 3.8% 17.0% Q6m Enforcement of speed limits-neighborhoods 13.9% 36.3% 20.9% 17.0% 8.8% 3.1%
2009 City of Auburn DirectionFinder Survey: Final Report
ETC Institute (April 2009) 157

EXCLUDING DON’T KNOWS Q6. Please rate your satisfaction on with the following public safety services. (excluding don't know) Very Very Satisfied Satisfied Neutral Dissatisfied Dissatisfied 5 4 3 2 1 Q6a Overall quality of police protection 27.9% 55.9% 11.8% 3.2% 1.3% Q6b Visibility of police in neighborhood 18.6% 43.1% 23.3% 12.7% 2.2% Q6c Visibility of police in retail areas 15.3% 48.3% 25.7% 8.9% 1.7% Q6d How quickly police respond-emergency 27.2% 49.2% 17.6% 4.4% 1.6% Q6e Efforts to prevent crime 16.1% 50.3% 23.1% 8.6% 1.9% Q6f Police safety education program 17.7% 44.3% 33.2% 3.3% 1.6% Q6g Enforcement of traffic laws 14.9% 50.1% 21.2% 10.0% 3.7% Q6h Overall quality of fire protection 28.3% 56.3% 13.8% 1.3% 0.3% Q6i Fire personnel emergency response 35.0% 44.8% 19.1% 0.8% 0.2% Q6j Fire safety education programs 21.3% 45.1% 31.0% 2.0% 0.6% Q6k Quality of local ambulance service 27.1% 46.3% 22.5% 2.5% 1.6% Q6l Quality of animal control 15.5% 44.4% 25.5% 10.0% 4.6% Q6m Enforcement of speed limits-neighborhoods 14.3% 37.4% 21.6% 17.5% 9.1%
2009 City of Auburn DirectionFinder Survey: Final Report
ETC Institute (April 2009) 158

Q7. Which TWO areas of public safety do you think should be emphasized most by city leaders over the
next two years?
Q7 1st Choice Number Percent A=Police protection 189 25.7 % B= Visibility of police in neighborhood 112 15.2 % C= Visibility of police in retail areas 24 3.3 % D=Police response time 20 2.7 % E=Efforts to prevent crime 119 16.2 % F=Police safety education 18 2.4 % G=Traffic laws enforcement 37 5.0 % H=Fire protection 14 1.9 % I=Fire response time 6 0.8 % J=Fire safety education programs 2 0.3 % K=Ambulance service 19 2.6 % L=Animal control 16 2.2 % M=Speed limits enforcement in neighborhoods 111 15.1 % Z=None chosen 49 6.7 % Total 736 100.0 %
Q7 2nd choice Number Percent A=Police protection 44 6.0 % B= Visibility of police in neighborhood 97 13.2 % C= Visibility of police in retail areas 50 6.8 % D=Police response time 35 4.8 % E=Efforts to prevent crime 104 14.1 % F=Police safety education 8 1.1 % G=Traffic laws enforcement 78 10.6 % H=Fire protection 90 12.2 % I=Fire response time 11 1.5 % J=Fire safety education programs 18 2.4 % K=Ambulance service 17 2.3 % L=Animal control 30 4.1 % M=Speed limits enforcement in neighborhoods 83 11.3 % Z=None selected 71 9.6 % Total 736 100.0 %
2009 City of Auburn DirectionFinder Survey: Final Report
ETC Institute (April 2009) 159
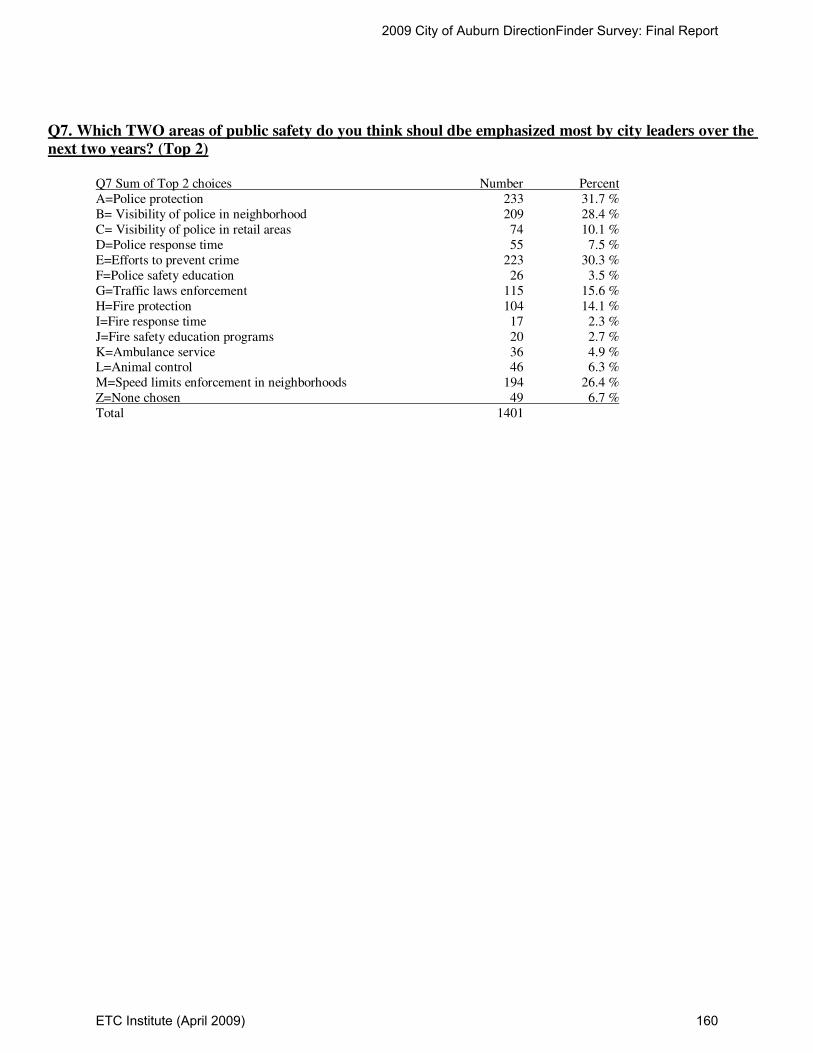
Q7. Which TWO areas of public safety do you think shoul dbe emphasized most by city leaders over the
next two years? (Top 2)
Q7 Sum of Top 2 choices Number Percent A=Police protection 233 31.7 % B= Visibility of police in neighborhood 209 28.4 % C= Visibility of police in retail areas 74 10.1 % D=Police response time 55 7.5 % E=Efforts to prevent crime 223 30.3 % F=Police safety education 26 3.5 % G=Traffic laws enforcement 115 15.6 % H=Fire protection 104 14.1 % I=Fire response time 17 2.3 % J=Fire safety education programs 20 2.7 % K=Ambulance service 36 4.9 % L=Animal control 46 6.3 % M=Speed limits enforcement in neighborhoods 194 26.4 % Z=None chosen 49 6.7 % Total 1401
2009 City of Auburn DirectionFinder Survey: Final Report
ETC Institute (April 2009) 160

Q8. Please rate your satisfaction with the enforcement of the following.
(N=736) Very Very Satisfied Satisfied Neutral Dissatisfied Dissatisfied Don’t know 5 4 3 2 1 9 Q8a Clean up of debris/litter in neighborhoods 24.6% 44.7% 15.4% 9.1% 3.3% 3.0% Q8b Sign regulations 14.7% 43.6% 24.7% 6.3% 2.6% 8.2% Q8c Zoning regulations 8.8% 31.0% 27.9% 14.3% 4.3% 13.7% Q8d Unrelated occupancy regulations 7.5% 23.0% 26.0% 12.1% 5.6% 26.0% Q8e Building codes 10.1% 28.9% 28.4% 6.0% 2.0% 24.6% Q8f Erosion and sediment control regulations 8.3% 24.6% 28.3% 9.6% 4.5% 24.7% Q8g Fire codes and regulation 12.9% 39.0% 20.9% 1.8% 0.5% 24.9%
EXCLUDING DON’T KNOWS Q8. Please rate your satisfaction with the enforcement of the following. (excluding don't know) Very Very Satisfied Satisfied Neutral Dissatisfied Dissatisfied 5 4 3 2 1 Q8a Clean up of debris/litter in neighborhoods 25.4% 46.1% 15.8% 9.4% 3.4% Q8b Sign regulations 16.0% 47.5% 26.9% 6.8% 2.8% Q8c Zoning regulations 10.2% 35.9% 32.3% 16.5% 5.0% Q8d Unrelated occupancy regulations 10.1% 31.0% 35.0% 16.3% 7.5% Q8e Building codes 13.3% 38.4% 37.7% 7.9% 2.7% Q8f Erosion and sediment control regulations 11.0% 32.7% 37.5% 12.8% 6.0% Q8g Fire codes and regulation 17.2% 51.9% 27.8% 2.4% 0.7%
2009 City of Auburn DirectionFinder Survey: Final Report
ETC Institute (April 2009) 161
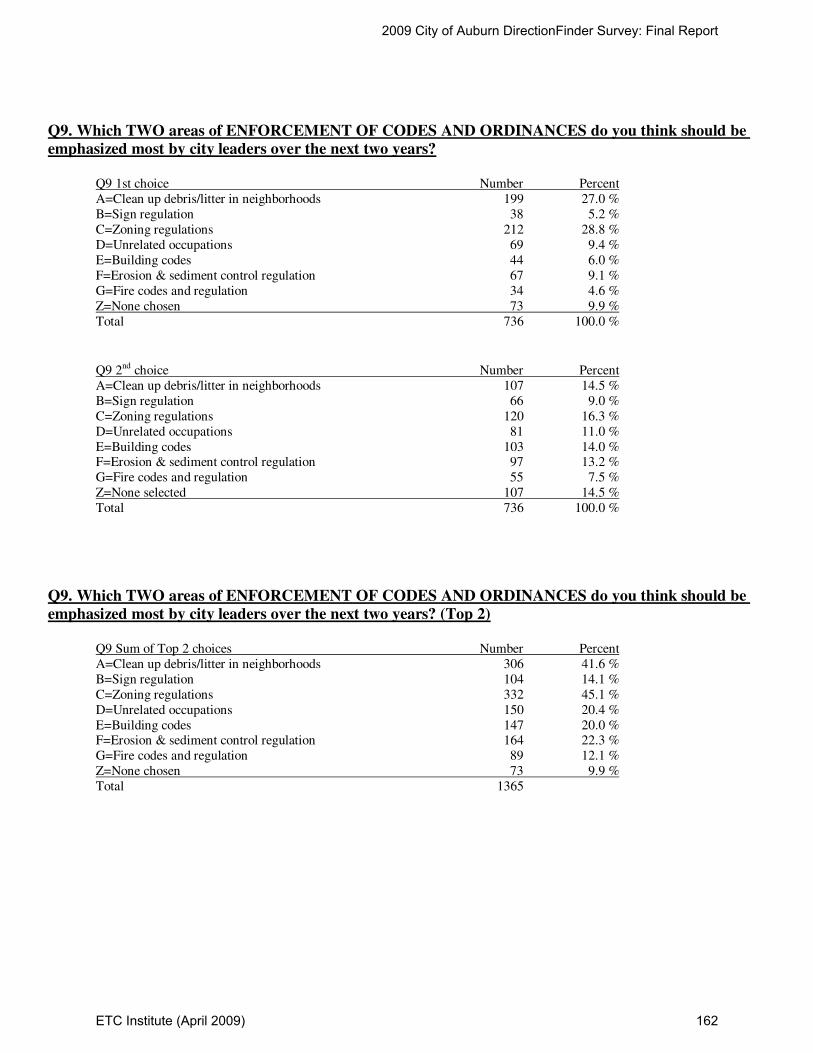
Q9. Which TWO areas of ENFORCEMENT OF CODES AND ORDINANCES do you think should be
emphasized most by city leaders over the next two years?
Q9 1st choice Number Percent A=Clean up debris/litter in neighborhoods 199 27.0 % B=Sign regulation 38 5.2 % C=Zoning regulations 212 28.8 % D=Unrelated occupations 69 9.4 % E=Building codes 44 6.0 % F=Erosion & sediment control regulation 67 9.1 % G=Fire codes and regulation 34 4.6 % Z=None chosen 73 9.9 % Total 736 100.0 %
Q9 2nd choice Number Percent A=Clean up debris/litter in neighborhoods 107 14.5 % B=Sign regulation 66 9.0 % C=Zoning regulations 120 16.3 % D=Unrelated occupations 81 11.0 % E=Building codes 103 14.0 % F=Erosion & sediment control regulation 97 13.2 % G=Fire codes and regulation 55 7.5 % Z=None selected 107 14.5 % Total 736 100.0 %
Q9. Which TWO areas of ENFORCEMENT OF CODES AND ORDINANCES do you think should be
emphasized most by city leaders over the next two years? (Top 2)
Q9 Sum of Top 2 choices Number Percent A=Clean up debris/litter in neighborhoods 306 41.6 % B=Sign regulation 104 14.1 % C=Zoning regulations 332 45.1 % D=Unrelated occupations 150 20.4 % E=Building codes 147 20.0 % F=Erosion & sediment control regulation 164 22.3 % G=Fire codes and regulation 89 12.1 % Z=None chosen 73 9.9 % Total 1365
2009 City of Auburn DirectionFinder Survey: Final Report
ETC Institute (April 2009) 162

Q10. Please rate your satisfaction with each of the following utility and environmental services.
(N=736) Very Very Satisfied Satisfied Neutral Dissatisfied Dissatisfied Don’t know 5 4 3 2 1 9 Q10a Residential garbage collection 47.1% 42.9% 4.5% 2.9% 1.0% 1.6% Q10b Curbside recycling service 31.3% 39.3% 12.9% 5.4% 3.3% 7.9% Q10c Yard waste removal service 38.3% 40.2% 10.5% 4.2% 1.6% 5.2% Q10d Sanitary sewer service 27.0% 44.7% 12.1% 2.3% 1.2% 12.6% Q10e Water service 31.4% 50.3% 9.9% 3.8% 1.4% 3.3% Q10f Water Revenue Office customer service 26.1% 35.6% 15.4% 2.2% 1.1% 19.7%
EXCLUDING DON’T KNOWS Q10. Please rate your satisfaction with each of the following utility and environmental services.
(excluding don't know) Very Very Satisfied Satisfied Neutral Dissatisfied Dissatisfied 5 4 3 2 1 Q10a Residential garbage collection 47.9% 43.6% 4.6% 2.9% 1.0% Q10b Curbside recycling service 33.9% 42.6% 14.0% 5.9% 3.5% Q10c Yard waste removal service 40.4% 42.4% 11.0% 4.4% 1.7% Q10d Sanitary sewer service 30.9% 51.2% 13.8% 2.6% 1.4% Q10e Water service 32.4% 52.0% 10.3% 3.9% 1.4% Q10f Water Revenue Office customer service 32.5% 44.3% 19.1% 2.7% 1.4%
2009 City of Auburn DirectionFinder Survey: Final Report
ETC Institute (April 2009) 163

Q11. Which TWO areas of UTILITY AND ENVIRONMENTAL SERVICES do you think should be
emphasized most by city leaders over the next two years?
Q11 1st choice Number Percent A=Garbage collection 146 19.8 % B=Curbside recycling 202 27.4 % C=Yard waste 67 9.1 % D=Sanitary sewer 81 11.0 % E=Water service 113 15.4 % F=Water revenue 31 4.2 % Z=None chosen 96 13.0 % Total 736 100.0 %
Q11 2nd choice Number Percent A=Garbage collection 94 12.8 % B=Curbside recycling 109 14.8 % C=Yard waste 150 20.4 % D=Sanitary sewer 92 12.5 % E=Water service 108 14.7 % F=Water revenue 23 3.1 % Z=None selected 160 21.7 % Total 736 100.0 %
Q11. Which TWO areas of UTILITY AND ENVIRONMENTAL SERVICES do you think should be
emphasized most by city leaders over the next two years? (Top 2)
Q11 Sum of Top 2 Choices Number Percent A=Garbage collection 240 32.6 % B=Curbside recycling 311 42.3 % C=Yard waste 217 29.5 % D=Sanitary sewer 173 23.5 % E=Water service 221 30.0 % F=Water revenue 54 7.3 % Z=None chosen 96 13.0 % Total 1312
2009 City of Auburn DirectionFinder Survey: Final Report
ETC Institute (April 2009) 164

Q12. Please rate your satisfaction with the following city maintenance items.
(N=736) Very Very Satisfied Satisfied Neutral Dissatisfied Dissatisfied Don’t know 5 4 3 2 1 9 Q12a Maintenance of streets (excludes AU campus) 11.5% 50.1% 20.1% 14.0% 2.4% 1.8% Q12b Maintenance of sidewalks (excludes AU campus) 11.0% 52.2% 24.0% 7.1% 1.8% 3.9% Q12c Maintenance of street signs 15.6% 58.7% 16.4% 6.5% 0.8% 1.9% Q12d Maintenance of traffic signals 21.2% 59.0% 12.2% 4.9% 0.7% 2.0% Q12e Maintenance of downtown Auburn 22.0% 60.2% 12.6% 2.9% 0.1% 2.2% Q12f Maintenance of city buildings 22.6% 57.2% 12.1% 1.1% 0.4% 6.7% Q12g Mowing and trimming along streets 19.3% 54.2% 14.9% 7.7% 2.2% 1.6% Q12h Overall cleanliness of streets/other public areas 18.3% 57.6% 16.3% 5.7% 1.1% 1.0% Q12i Adequacy of city street lighting 12.8% 49.0% 21.2% 12.5% 3.1% 1.4% Q12j Water lines and fire hydrants 19.6% 56.3% 15.1% 1.5% 0.5% 7.1% Q12k Sewer lines and manholes 15.2% 48.8% 19.8% 3.0% 0.5% 12.6%
2009 City of Auburn DirectionFinder Survey: Final Report
ETC Institute (April 2009) 165
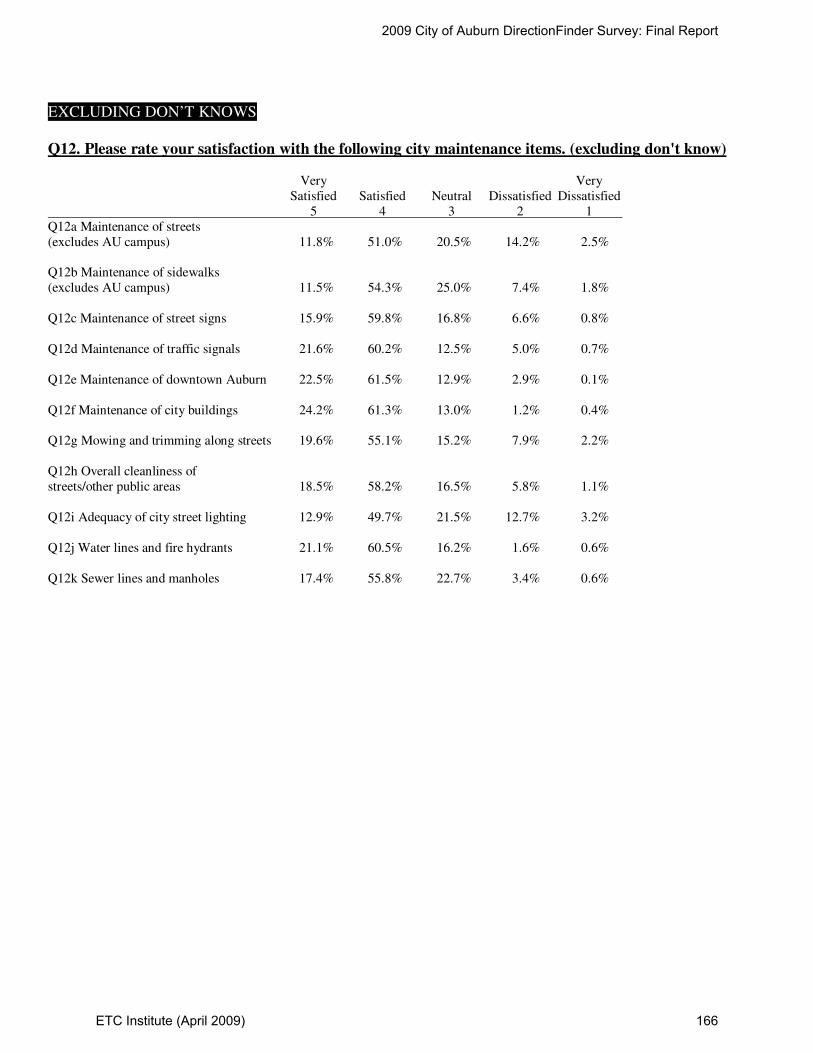
EXCLUDING DON’T KNOWS Q12. Please rate your satisfaction with the following city maintenance items. (excluding don't know) Very Very Satisfied Satisfied Neutral Dissatisfied Dissatisfied 5 4 3 2 1 Q12a Maintenance of streets (excludes AU campus) 11.8% 51.0% 20.5% 14.2% 2.5% Q12b Maintenance of sidewalks (excludes AU campus) 11.5% 54.3% 25.0% 7.4% 1.8% Q12c Maintenance of street signs 15.9% 59.8% 16.8% 6.6% 0.8% Q12d Maintenance of traffic signals 21.6% 60.2% 12.5% 5.0% 0.7% Q12e Maintenance of downtown Auburn 22.5% 61.5% 12.9% 2.9% 0.1% Q12f Maintenance of city buildings 24.2% 61.3% 13.0% 1.2% 0.4% Q12g Mowing and trimming along streets 19.6% 55.1% 15.2% 7.9% 2.2% Q12h Overall cleanliness of streets/other public areas 18.5% 58.2% 16.5% 5.8% 1.1% Q12i Adequacy of city street lighting 12.9% 49.7% 21.5% 12.7% 3.2% Q12j Water lines and fire hydrants 21.1% 60.5% 16.2% 1.6% 0.6% Q12k Sewer lines and manholes 17.4% 55.8% 22.7% 3.4% 0.6%
2009 City of Auburn DirectionFinder Survey: Final Report
ETC Institute (April 2009) 166
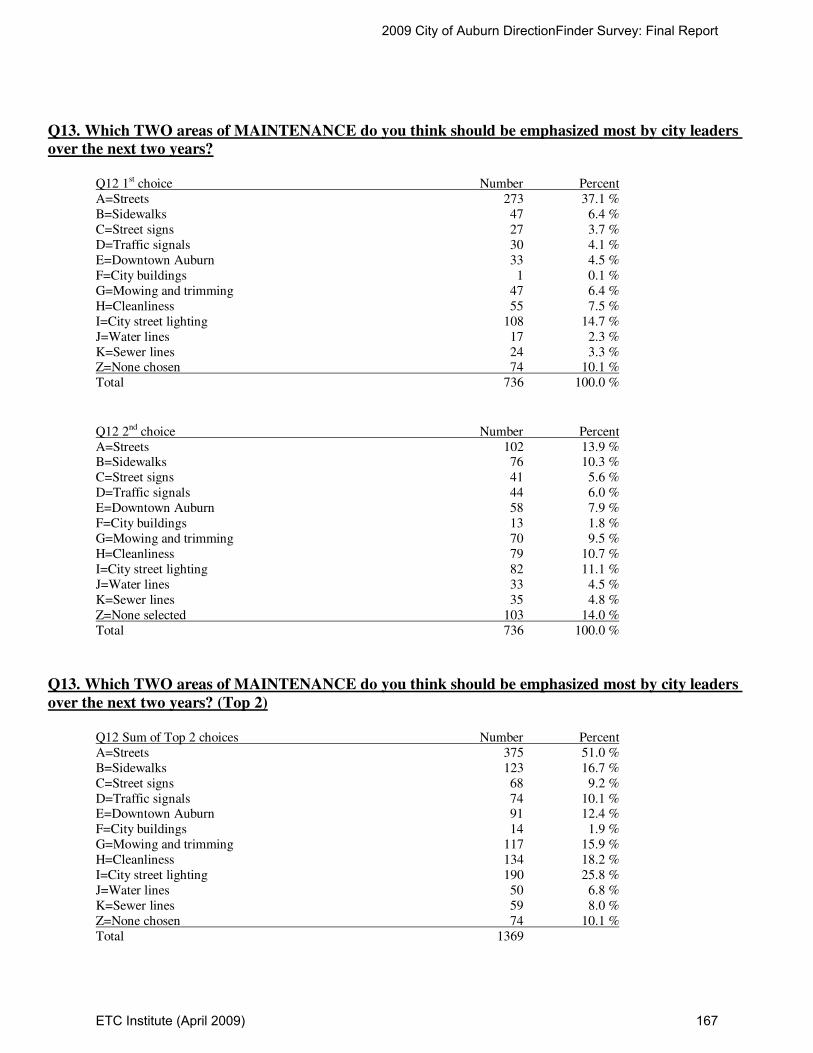
Q13. Which TWO areas of MAINTENANCE do you think should be emphasized most by city leaders
over the next two years?
Q12 1st choice Number Percent A=Streets 273 37.1 % B=Sidewalks 47 6.4 % C=Street signs 27 3.7 % D=Traffic signals 30 4.1 % E=Downtown Auburn 33 4.5 % F=City buildings 1 0.1 % G=Mowing and trimming 47 6.4 % H=Cleanliness 55 7.5 % I=City street lighting 108 14.7 % J=Water lines 17 2.3 % K=Sewer lines 24 3.3 % Z=None chosen 74 10.1 % Total 736 100.0 %
Q12 2nd choice Number Percent A=Streets 102 13.9 % B=Sidewalks 76 10.3 % C=Street signs 41 5.6 % D=Traffic signals 44 6.0 % E=Downtown Auburn 58 7.9 % F=City buildings 13 1.8 % G=Mowing and trimming 70 9.5 % H=Cleanliness 79 10.7 % I=City street lighting 82 11.1 % J=Water lines 33 4.5 % K=Sewer lines 35 4.8 % Z=None selected 103 14.0 % Total 736 100.0 %
Q13. Which TWO areas of MAINTENANCE do you think should be emphasized most by city leaders
over the next two years? (Top 2)
Q12 Sum of Top 2 choices Number Percent A=Streets 375 51.0 % B=Sidewalks 123 16.7 % C=Street signs 68 9.2 % D=Traffic signals 74 10.1 % E=Downtown Auburn 91 12.4 % F=City buildings 14 1.9 % G=Mowing and trimming 117 15.9 % H=Cleanliness 134 18.2 % I=City street lighting 190 25.8 % J=Water lines 50 6.8 % K=Sewer lines 59 8.0 % Z=None chosen 74 10.1 % Total 1369
2009 City of Auburn DirectionFinder Survey: Final Report
ETC Institute (April 2009) 167
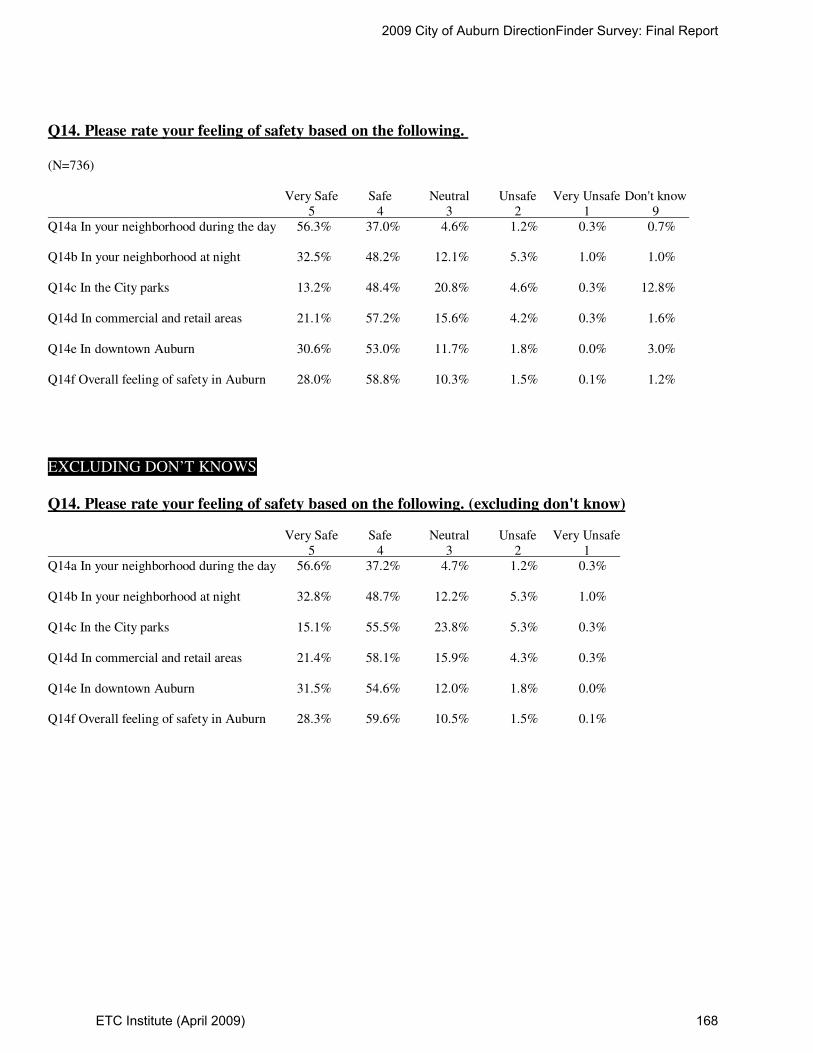
Q14. Please rate your feeling of safety based on the following.
(N=736) Very Safe Safe Neutral Unsafe Very Unsafe Don't know 5 4 3 2 1 9 Q14a In your neighborhood during the day 56.3% 37.0% 4.6% 1.2% 0.3% 0.7% Q14b In your neighborhood at night 32.5% 48.2% 12.1% 5.3% 1.0% 1.0% Q14c In the City parks 13.2% 48.4% 20.8% 4.6% 0.3% 12.8% Q14d In commercial and retail areas 21.1% 57.2% 15.6% 4.2% 0.3% 1.6% Q14e In downtown Auburn 30.6% 53.0% 11.7% 1.8% 0.0% 3.0% Q14f Overall feeling of safety in Auburn 28.0% 58.8% 10.3% 1.5% 0.1% 1.2%
EXCLUDING DON’T KNOWS Q14. Please rate your feeling of safety based on the following. (excluding don't know) Very Safe Safe Neutral Unsafe Very Unsafe 5 4 3 2 1 Q14a In your neighborhood during the day 56.6% 37.2% 4.7% 1.2% 0.3% Q14b In your neighborhood at night 32.8% 48.7% 12.2% 5.3% 1.0% Q14c In the City parks 15.1% 55.5% 23.8% 5.3% 0.3% Q14d In commercial and retail areas 21.4% 58.1% 15.9% 4.3% 0.3% Q14e In downtown Auburn 31.5% 54.6% 12.0% 1.8% 0.0% Q14f Overall feeling of safety in Auburn 28.3% 59.6% 10.5% 1.5% 0.1%
2009 City of Auburn DirectionFinder Survey: Final Report
ETC Institute (April 2009) 168

Q15. Please rate your satisfaction with the following city leadership items.
(N=736) Very Very Satisfied Satisfied Neutral Dissatisfied Dissatisfied Don’t know 5 4 3 2 1 9 Q15a Quality of leadership provided by City’s elected officials 18.5% 43.2% 21.2% 7.3% 2.2% 7.6% Q15b Effectiveness of appointed boards/commissions 13.5% 39.0% 25.3% 9.4% 1.9% 11.0% Q15c Effectiveness of the City Manager 19.6% 42.0% 21.6% 4.3% 1.9% 10.6%
EXCLUDING DON’T KNOWS Q15. Please rate your satisfaction with the following city leadership items. (excluding don't know) Very Very Satisfied Satisfied Neutral Dissatisfied Dissatisfied 5 4 3 2 1 Q15a Quality of leadership provided by City’s elected officials 20.0% 46.8% 22.9% 7.9% 2.4% Q15b Effectiveness of appointed boards/commissions 15.1% 43.8% 28.4% 10.5% 2.1% Q15c Effectiveness of the City Manager 21.9% 47.0% 24.2% 4.9% 2.1%
2009 City of Auburn DirectionFinder Survey: Final Report
ETC Institute (April 2009) 169
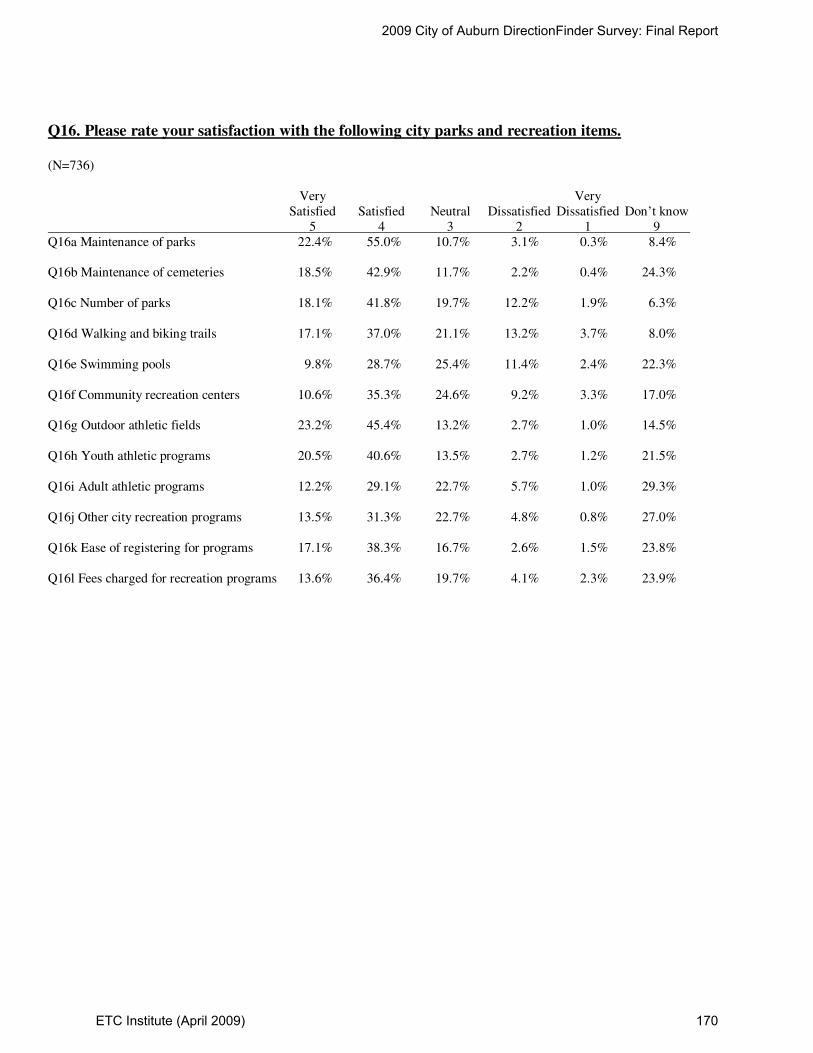
Q16. Please rate your satisfaction with the following city parks and recreation items.
(N=736) Very Very Satisfied Satisfied Neutral Dissatisfied Dissatisfied Don’t know 5 4 3 2 1 9 Q16a Maintenance of parks 22.4% 55.0% 10.7% 3.1% 0.3% 8.4% Q16b Maintenance of cemeteries 18.5% 42.9% 11.7% 2.2% 0.4% 24.3% Q16c Number of parks 18.1% 41.8% 19.7% 12.2% 1.9% 6.3% Q16d Walking and biking trails 17.1% 37.0% 21.1% 13.2% 3.7% 8.0% Q16e Swimming pools 9.8% 28.7% 25.4% 11.4% 2.4% 22.3% Q16f Community recreation centers 10.6% 35.3% 24.6% 9.2% 3.3% 17.0% Q16g Outdoor athletic fields 23.2% 45.4% 13.2% 2.7% 1.0% 14.5% Q16h Youth athletic programs 20.5% 40.6% 13.5% 2.7% 1.2% 21.5% Q16i Adult athletic programs 12.2% 29.1% 22.7% 5.7% 1.0% 29.3% Q16j Other city recreation programs 13.5% 31.3% 22.7% 4.8% 0.8% 27.0% Q16k Ease of registering for programs 17.1% 38.3% 16.7% 2.6% 1.5% 23.8% Q16l Fees charged for recreation programs 13.6% 36.4% 19.7% 4.1% 2.3% 23.9%
2009 City of Auburn DirectionFinder Survey: Final Report
ETC Institute (April 2009) 170

EXCLUDING DON’T KNOWS
Q16. Please rate your satisfaction with the following city parks and recreation items. (excluding don't
know) Very Very Satisfied Satisfied Neutral Dissatisfied Dissatisfied 5 4 3 2 1 Q16a Maintenance of parks 24.5% 60.1% 11.7% 3.4% 0.3% Q16b Maintenance of cemeteries 24.4% 56.7% 15.4% 2.9% 0.5% Q16c Number of parks 19.3% 44.6% 21.0% 13.0% 2.0% Q16d Walking and biking trails 18.6% 40.2% 22.9% 14.3% 4.0% Q16e Swimming pools 12.6% 36.9% 32.7% 14.7% 3.1% Q16f Community recreation centers 12.8% 42.6% 29.6% 11.1% 3.9% Q16g Outdoor athletic fields 27.2% 53.1% 15.4% 3.2% 1.1% Q16h Youth athletic programs 26.1% 51.7% 17.1% 3.5% 1.6% Q16i Adult athletic programs 17.3% 41.2% 32.1% 8.1% 1.3% Q16j Other city recreation programs 18.4% 42.8% 31.1% 6.5% 1.1% Q16k Ease of registering for programs 22.5% 50.3% 21.9% 3.4% 2.0% Q16l Fees charged for recreation programs 17.9% 47.9% 25.9% 5.4% 3.0%
2009 City of Auburn DirectionFinder Survey: Final Report
ETC Institute (April 2009) 171
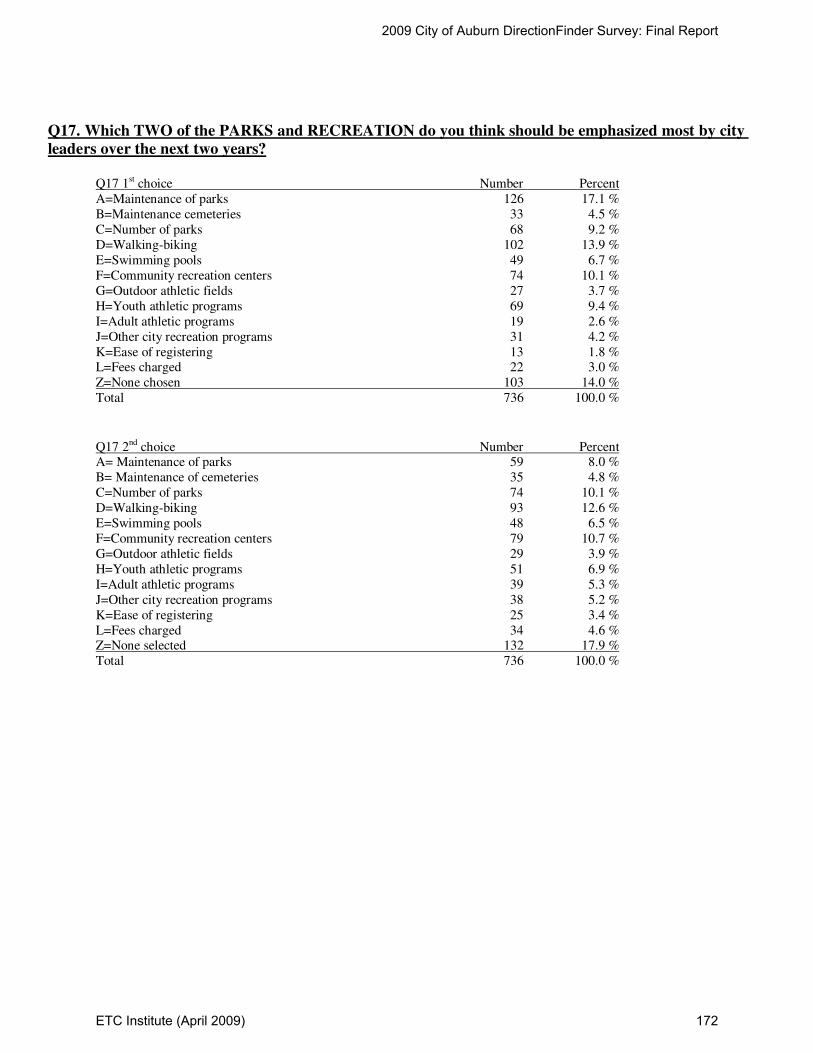
Q17. Which TWO of the PARKS and RECREATION do you think should be emphasized most by city
leaders over the next two years?
Q17 1st choice Number Percent A=Maintenance of parks 126 17.1 % B=Maintenance cemeteries 33 4.5 % C=Number of parks 68 9.2 % D=Walking-biking 102 13.9 % E=Swimming pools 49 6.7 % F=Community recreation centers 74 10.1 % G=Outdoor athletic fields 27 3.7 % H=Youth athletic programs 69 9.4 % I=Adult athletic programs 19 2.6 % J=Other city recreation programs 31 4.2 % K=Ease of registering 13 1.8 % L=Fees charged 22 3.0 % Z=None chosen 103 14.0 % Total 736 100.0 %
Q17 2nd choice Number Percent A= Maintenance of parks 59 8.0 % B= Maintenance of cemeteries 35 4.8 % C=Number of parks 74 10.1 % D=Walking-biking 93 12.6 % E=Swimming pools 48 6.5 % F=Community recreation centers 79 10.7 % G=Outdoor athletic fields 29 3.9 % H=Youth athletic programs 51 6.9 % I=Adult athletic programs 39 5.3 % J=Other city recreation programs 38 5.2 % K=Ease of registering 25 3.4 % L=Fees charged 34 4.6 % Z=None selected 132 17.9 % Total 736 100.0 %
2009 City of Auburn DirectionFinder Survey: Final Report
ETC Institute (April 2009) 172

Q17. Which TWO of the PARKS and RECREATION do you think should be emphasized most by city
leaders over the next two years? (Top 2)
Q17 Sum of Top 2 Choices Number Percent A= Maintenance of parks 185 25.1 % B= Maintenance of cemeteries 68 9.2 % C=Number of parks 142 19.3 % D=Walking-biking 195 26.5 % E=Swimming pools 97 13.2 % F=Community recreation centers 153 20.8 % G=Outdoor athletic fields 56 7.6 % H=Youth athletic programs 120 16.3 % I=Adult athletic programs 58 7.9 % J=Other city recreation programs 69 9.4 % K=Ease of registering 38 5.2 % L=Fees charged 56 7.6 % Z=None chosen 103 14.0 % Total 1340
2009 City of Auburn DirectionFinder Survey: Final Report
ETC Institute (April 2009) 173

Q18. Please rate your satisfaction with the following traffic flow items.
(N=736) Very Very Satisfied Satisfied Neutral Dissatisfied Dissatisfied Don’t know 5 4 3 2 1 9 Q18a Ease of north-south travel 5.6% 41.4% 23.4% 22.7% 5.6% 1.4% Q18b Ease of east-west travel 5.4% 46.3% 25.8% 17.0% 3.8% 1.6% Q18c Ease of travel by bicycle in Auburn 4.6% 16.0% 22.1% 12.8% 7.7% 36.7% Q18d Ease of pedestrian travel in Auburn 7.6% 37.6% 24.2% 10.5% 6.4% 13.7%
EXCLUDING DON’T KNOWS Q18. Please rate your satisfaction with the following traffic flow items. (excluding don't know) Very Very Satisfied Satisfied Neutral Dissatisfied Dissatisfied 5 4 3 2 1 Q18a Ease of north-south travel 5.6% 42.0% 23.7% 23.0% 5.6% Q18b Ease of east-west travel 5.5% 47.1% 26.2% 17.3% 3.9% Q18c Ease of travel by bicycle in Auburn 7.3% 25.3% 35.0% 20.2% 12.2% Q18d Ease of pedestrian travel in Auburn 8.8% 43.6% 28.0% 12.1% 7.4%
2009 City of Auburn DirectionFinder Survey: Final Report
ETC Institute (April 2009) 174

Q19. Please rate your satisfaction on the following city communication items.
(N=736) Very Very Satisfied Satisfied Neutral Dissatisfied Dissatisfied Don’t know 5 4 3 2 1 9 Q19a Availability information about parks and recreation programs/services 19.8% 45.8% 19.3% 6.0% 1.8% 7.3% Q19b Level of public involvement in local decision-making 8.2% 29.1% 31.7% 16.0% 4.2% 10.9% Q19c Quality of OPEN LINE newsletter 22.8% 47.3% 15.6% 2.3% 0.8% 11.1% Q19d Quality of the City’s web page 15.2% 40.1% 20.8% 3.0% 1.0% 20.0% Q19e Information on other city services/programs 10.7% 38.0% 28.8% 6.1% 1.8% 14.5% Q19f Transparency of city government 9.6% 31.3% 28.3% 13.6% 6.7% 10.6%
EXCLUDING DON’T KNOWS Q19. Please rate your satisfaction on the following city communication items. (excluding don't know)
Very Very Satisfied Satisfied Neutral Dissatisfied Dissatisfied 5 4 3 2 1 Q19a Availability information about parks and recreation programs/services 21.4% 49.4% 20.8% 6.5% 1.9% Q19b Level of public involvement in local decision-making 9.1% 32.6% 35.5% 18.0% 4.7% Q19c Quality of OPEN LINE newsletter 25.7% 53.2% 17.6% 2.6% 0.9% Q19d Quality of the City’s web page 19.0% 50.1% 26.0% 3.7% 1.2% Q19e Information on other city services/programs 12.6% 44.5% 33.7% 7.2% 2.1% Q19f Transparency of city government 10.8% 35.0% 31.6% 15.2% 7.4%
2009 City of Auburn DirectionFinder Survey: Final Report
ETC Institute (April 2009) 175

Q20. Do you have access to the Internet at your home?
Q20 Do you have access to internet Number Percent 1=Yes 656 89.1 % 2=No 68 9.2 % 9=don't know 12 1.6 % Total 736 100.0 %
Q20a. [If YES to #20] Do you have high speed, broadband, or dial-up Internet access at your home?
Q20a If yes Have high speed-broadband Number Percent 1=Broadband DSL 593 90.4 % 2=Dial-up 37 5.6 % 3=Satellite 15 2.3 % 9=Don't know 11 1.7 % Total 656 100.0 %
2009 City of Auburn DirectionFinder Survey: Final Report
ETC Institute (April 2009) 176

Q21. Have you called or visited the city with a question, problem, or complaint during the past year?
Q21 Have you called/visited City Number Percent 1=Yes 338 45.9 % 2=No 386 52.4 % 9=Don't know 12 1.6 % Total 736 100.0 %
Q21a. [If YES to #21] How easy was it to contact the person you needed to reach?
Q21a How easy was it to contact person Number Percent 1=Very easy 150 44.4 % 2=Somewhat easy 139 41.1 % 3=Difficult 40 11.8 % 4=Very difficult 4 1.2 % 9=Don't know 5 1.5 % Total 338 100.0 %
Q21b. [If YES to #21] What department did you contact?
Q21b What department did you contact Number Percent 01=Police 95 28.1 % 02=Fire 15 4.4 % 03=Planning 48 14.2 % 04=Parks & recreation 72 21.3 % 05=Finance 25 7.4 % 06=Water Revenue 58 17.2 % 07=City Manager 40 11.8 % 08=Environmental 136 40.2 % 09=Codes enforce 46 13.6 % 10=Public works 42 12.4 % 11=Water resource 57 16.9 % 12=Other 25 7.4 % Total 659
Q21c. [If YES to #21] Was the department you contacted responsive to your issue?
Q21c Was department responsive to issue Number Percent 1=Yes 272 80.5 % 2=No 55 16.3 % 9=Don't know 11 3.3 % Total 338 100.0 %
2009 City of Auburn DirectionFinder Survey: Final Report
ETC Institute (April 2009) 177
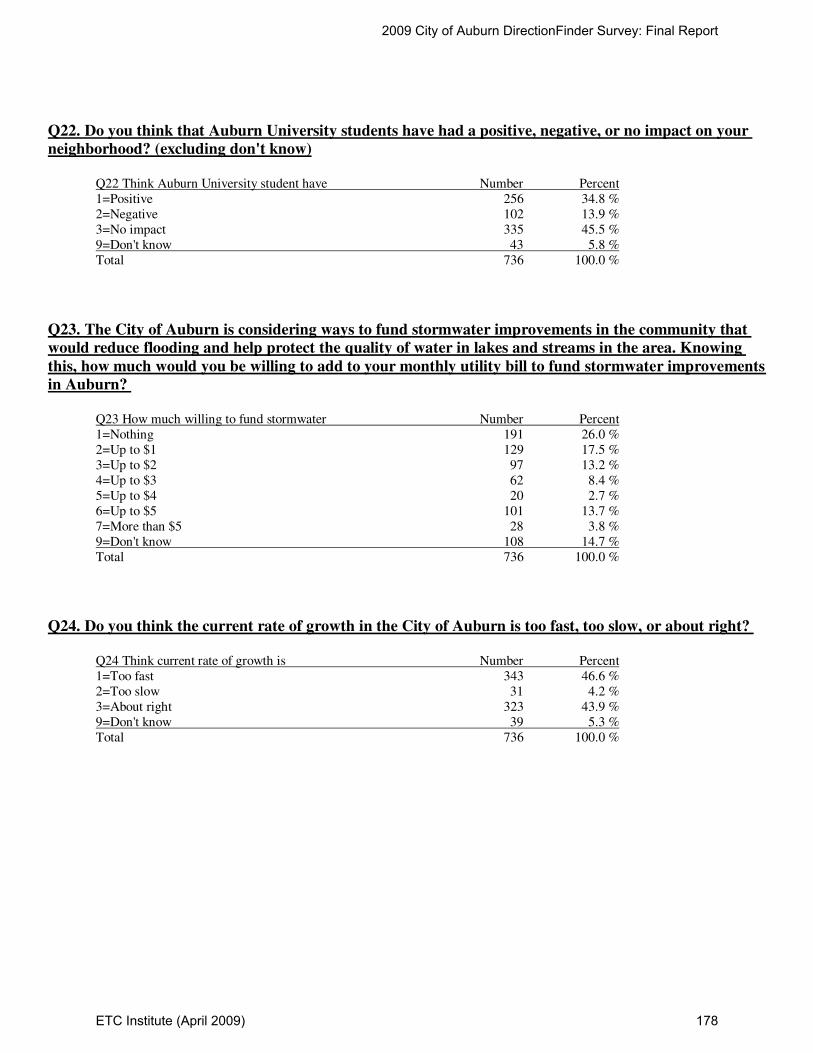
Q22. Do you think that Auburn University students have had a positive, negative, or no impact on your
neighborhood? (excluding don't know)
Q22 Think Auburn University student have Number Percent 1=Positive 256 34.8 % 2=Negative 102 13.9 % 3=No impact 335 45.5 % 9=Don't know 43 5.8 % Total 736 100.0 %
Q23. The City of Auburn is considering ways to fund stormwater improvements in the community that
would reduce flooding and help protect the quality of water in lakes and streams in the area. Knowing
this, how much would you be willing to add to your monthly utility bill to fund stormwater improvements
in Auburn?
Q23 How much willing to fund stormwater Number Percent 1=Nothing 191 26.0 % 2=Up to $1 129 17.5 % 3=Up to $2 97 13.2 % 4=Up to $3 62 8.4 % 5=Up to $4 20 2.7 % 6=Up to $5 101 13.7 % 7=More than $5 28 3.8 % 9=Don't know 108 14.7 % Total 736 100.0 %
Q24. Do you think the current rate of growth in the City of Auburn is too fast, too slow, or about right?
Q24 Think current rate of growth is Number Percent 1=Too fast 343 46.6 % 2=Too slow 31 4.2 % 3=About right 323 43.9 % 9=Don't know 39 5.3 % Total 736 100.0 %
2009 City of Auburn DirectionFinder Survey: Final Report
ETC Institute (April 2009) 178

Q25. Do you believe that the City of Auburn is building sufficient streets, intersections, sidewalks, and
water/sewer systems to keep up with the City's growth?
Q25 Believe city keeping up with growth Number Percent 1=Yes 277 37.6 % 2=No 286 38.9 % 9=Don't know 173 23.5 % Total 736 100.0 %
Q26. Do you think the City's efforts to pursue commercial and industrial projects in Auburn, in order to
create jobs and revenue, should be increased, stay the same, or be reduced?
Q26 Think city efforts to create jobs Number Percent 1=Be increase 351 47.7 % 2=Stay the same 256 34.8 % 3=Be reduced 90 12.2 % 9=Don't know 39 5.3 % Total 736 100.0 %
Q27. How often do you use the City's bicycle lanes and facilities?
Q27 How often do you use city bike lanes Number Percent 1=Monthly 28 3.8 % 2=Weekly 55 7.5 % 3=Daily 33 4.5 % 4=Occasionally 218 29.6 % 5=Never 394 53.5 % 9=Don't know 8 1.1 % Total 736 100.0 %
2009 City of Auburn DirectionFinder Survey: Final Report
ETC Institute (April 2009) 179

Q28. What priority would you place on the following projects? (excluding no response)
Mean Q28a Additional downtown parking 3.35 Q28b Expanded fire protection and facilities 4.69 Q28c Expanded police protection & facilities 4.02 Q28d Road resurfacing & reconstruction 3.27 Q28e Skateboard park 8.38 Q28f Indoor basketball courts 6.55 Q28g New community center & pool 5.62 Q28h New performing arts center 5.57 Q28i Expansion of Kiesel Park trails & facilities 6.33 Q28j Expansion of Jan Dempsey Arts Center 7.17
2009 City of Auburn DirectionFinder Survey: Final Report
ETC Institute (April 2009) 180

Q29. If you could change one thing about the City of Auburn, what would you change?
• 4-WAY STOPS THAT ARE 5-6-7-8 WAY STOPS
• BETTER TRAFFIC FLOW DOWNTOWN & MORE JOBS
• A FEW PROMINENT DEVELOPERS ALWAYS GET WHAT THEY WANT FROM THE CITY
• A PLACE TO PARK AT AUBURN FOOTBALL GAMES!
• A UNIQUE & NATURAL BUILDING CODE-ALSO CLEAN THE PLACE UP
• ABILITY TO FIND A JOB WITHOUT HAVING TO KNOW SOMEONE!
• ADD A SIDEWALK ON OGLETREE RD-IT IS DANGEROUS
• ADD HIGH SCHOOL (TECHNICAL-MANY STUDENTS DON’T PLAN TO GO TO COLLEGE)
• ADD HOUSING,PROGRAMS,FACILITIES & CARE FOR HANDICAPPED YOUTH
• ADD MORE BIKE LANES
• ADD RECREATION CENTER THAT INCLUDES INDOOR/OUTDOOR POOL, FITNESS CENTER, BASKETBALL
• ADD TRAFFIC LIGHT @ SHELL TOOMER & S COLLEGE (29)
• ADD WATER/SEWAGE/GAS TO EXISTING SUBDIVISIONS BEFORE INFRASTRUCTURE
• ALL A 4-WAY STOP AT SANFORD AVE & GREEN ST
• ALL TRAFFIC LIGHTS WOULD SWITCH TO FLASH YELLOW/RED AT 11 PM
• ALLEYS BEHIND HOMES
• ALLOW EXPANDED GROWTH & COMMERCIAL TAX BASE GROWTH
• ALLOWING GATED COMMUNITIES
• AN OFF-ROAD BICYCLE TRAIL FROM N DONAHUE TO S DONAHUE
• ANNEXATION OF COUNTY PROPERTY-IT TAKES AWAY CITY SERVICES
• APPARENT CONTROL THAT PRIVATE DEVELOPERS HAVE ON THE CITY
• APPEARANCE S COLLEGE & CURRENT DOWNTOWN ZONING RESTRICTIONS
• AUBURN EARLY EDUCATION CENTER
• AUBURN IS GROWING TOO FAST-THE "LOVLIEST VILLAGE" IS GONE
• AUBURN IS SUCH AN EXPENSIVE CITY. IT'S ALL ABOUT THE MONEY
• AUBURN NEEDS A YMCA FACILITY
• AUBURN NEEDS BETTER ZONING ENFORCEMENT/LESS APARTMENTS
• AUBURN SHOULD HAVE AUBURN LIGHT & POWER INSTEAD OF ALABAMA POWER
• AUTOMATIC WATER/SEWER FEE TO CREDIT CARD
• AVAILABILITY LOCAL CHANNELS-OR AT LEAST WAIVERS FOR DISHNET
• AVAILABILITY OF COMMUNITY PROGRAMS
• AVAILABILTY OF DIFFERENT CABLE COMPANIES
• BE FIRM WITH DEVELOPERS & CONSENTRATE ON PROPERTY OWNERS
• BE MORE SELECTIVE IN TEAR DOWNS/NEW CONSTRUCTION
• BE PROACTIVE IN PURSUING COMMERCIAL PROJECTS
• BESIDE THE TRAFFIC BETWEEN 4-6, IT'S A GREAT PLACE TO LIVE
• BETTER ATTENTION TO CITY STREETS AND INTERSECTIONS
• BETTER BIKING TRAILS
• BETTER CABLE/INTERNET SERVICE
• BETTER CONTROL OF COMMERCIAL DEVELOPMENT
• BETTER CONTROL OF GROWTH-CONTRACTORS ALWAYS WINNERS
2009 City of Auburn DirectionFinder Survey: Final Report
ETC Institute (April 2009) 181

Q29. If you could change one thing about the City of Auburn, what would you change? (continued)
• BETTER EMS SERVICE
• BETTER FUNDING ON MINORITY SECTIONS OF THE CITY
• BETTER GARBAGE/RECYCLING; MORE BOOKS IN LIBRARY
• BETTER MANAGEMENT OF TRAFFIC FLOW
• BETTER PAYING JOBS
• BETTER PLANNING FOR COMMERCIAL DEVELOPMENT
• BETTER PRESERVATION OF HISTORIC CHARACTER OF AUBURN
• BETTER PUBLIC POOL-INDOOR POOL
• BETTER ROADS
• BETTER ROADS & TRAVEL AROUND CITY
• BETTER SERVICES FOR FAMILIES LIVING IN POVERTY OR HOMELESS
• BETTER TRAFFIC FLOW IN DOWTOWN
• BETTER TRAFFIC FLOW INTO & OUT OF AUBURN DURING WORK HOURS
• BETTER TRAFFIC FLOW-TRAFFIC LIGHTS
• BETTER WIDE STREETS
• BETWEEN DEON AND SANFORD, ITS VERY ROUGH
• BIKE LANES
• BUDGET CUTS AT AV
• BUILD A CHILDRENS MUSEUM THAT IS HANDS-ON AND INTERACTIVE
• BUILD AN ADULT RECREATION CENTER
• BUILD MORE FURNITURE STORES
• BUILD MORE PARKS IE LAKE WILMORE WITH NATURE TRAILS
• BUILDING OF NEW NEIGHBORHOODS/HOMES IS OUT OF CONTROL
• CABLE-PROVIDER-CHARTER IS AND HAS BEEN A POORLY RUN COMPANY
• CAMPUS POLICE & CITY POLICE SHOUD BE SEPARATE AGAIN
• CHANGE CITY GOV'T SO IT'S NOT INFLUENCED BY SPECIFIC INTEREST GROUPS
• CHANGE CITY MANAGER & ASSISTANTS
• CHANGE SOUTH COLLEGE FROM LOOKING LIKE VICTORY DRIVE IN COLUBUS, GA
• CHANGE THE CITY COUNCIL TO BE LESS PRO-BUSINESS
• CHANGE THE COST OF LIVING & PRESERVE HISTORIC HOUSES & AREAS
• CHARGE DEVELOPER MORE FOR CITY EXPANSION
• CHANGE APPEARANCE OF CITY BUILDINGS, STOP GROWTH OF UNSIGHTLY SIGNS
• CHOOSE OFFICIALS MORE CONCERNED ABOUT NEIGHBORHOODS
• CONTINUE TO IMPROVE SCHOOL SYSTEM
• CITY COUNCIL & DEVELOPERS
• CITY COUNCIL/MAYOR TOO HEAVILY INFLUENCED BY DEVELOPERS
• CITY OPERATED EMS
• CITY TAX SHOULD BE BASED ON PROPERTY TAX
• CLEAR-CUTTING OF TREES WHEN NEW HOUSING IS CONSTRUCTED
2009 City of Auburn DirectionFinder Survey: Final Report
ETC Institute (April 2009) 182

Q29. If you could change one thing about the City of Auburn, what would you change? (continued)
• CLOSE THE STREET DOWNTOWN ON COLLEGE-MAKE IT PEDESTRIAN ONLY
• CLOSE TOOMERS CORNER TO TRAFFIC & MAKE AREA PEDESTRIAN ONLY
• COLLEGE STREET ENTRANCE
• COLLEGE STUDENTS RUN RED LIGHTS, WHERE ARE THE POLICE?
• COMMUNICATIONS
• COMPETITION FOR CABLE PROVIDERS
• CONGESTION IN CERTAIN AREAS SUCH AS OUT MOORE'S MILL ROAD
• CONGESTION OF DOWNTOWN AUBURN
• CONGESTION-TRAFFIC AT FOOTBALL GAMES-ORGANIZED PARKING
• CONSTRUCTION OF MORE BUILDINGS WHEN STANDING BUILDINGS COULD BE USED
• CONTROL SPRAWL THAT CAUSE CONGESTION OF STREETS
• CONTROL GROWTH WITH REMOVAL OF TOO MANY TREES
• CONTROLLED, PLANNED GROWTH
• CONTROLLING THE UNDERAGE PROBLEM OF STUDENTS GOING INTO BARS
• CORRECT FLOW OF TRAFFIC & LIGHT SIGNALS
• COST OF GARBAGE PICK-UP SEWER SERVICES
• CYCLISTS RIDE ON ROAD-GET TOO CLOSE TO CARS/DON’T STAY IN LANE
• DECREASE PROPERTY THEFT & DAMAGE, ESPECIALLY WHEN SCHOOLS NOT IN SESSION
• DEMOLISH MOTON APARTMENTS AND BUILD APARTMENTS FOR SENIOR CITIZENS
• DEVELOPERS HAVE TOO MUCH INFLUENCE ON THE BOARDS
• DEVELOPMENT BETWEEN EXIT 51 & DONAHUE DRIVE
• DIRECT MORE ATTENTION TO OLDER NEIGHBORHOODS BY UPGRADING
• DO NOT SACRIFICE THE BEAUTY, TREES AND SMALL TOWN APPEAL
• DON’T WASTE ANY MORE MONEY ON TRAFFIC CIRCLES!
• DOWNTOWN AREA
• DOWNTOWN AUBURN
• DOWNTOWN IS NOT PRETTY
• DOWNTOWN PARKING
• DOWNTOWN TRAFFIC FLOW-NEED MORE LANES, MORE TURN SIGNALS
• DRIVING SAFETY AWARENESS OF HIGH SCHOOL & COLLEGE INDIVIDUAL
• DUNKIN DONUT, STARBUCKS COFFEE
• EASE OF TRAVEL BY BICYCLE
• ELECTED OFFICIALS
• ELIMINATE THE CONSTRUCTION OF CONDOS
• ELIMINATE TOWING CARS-IT IS A DISGRACE
• ELIMINATION OF PUBLIC HOUSING
• ENCOURAGE TREE GROWTH ALONG ROADS-USE UNDERGROUND UTILITIES
• END THEFT & CRIME ISSUES, THEN FOCUS ON IMPROVING DOWNTOWN
• ENFORCE CODES EQUALLY IN ALL PARTS OF CITY
• ENFORCE NOISE ORDINANCE
• ENFORCE OCCUPANCY CODES TO STUDENTS THAT RENT
• ENFORCE THE RULES YOU CURRENTLY HAVE-NO EXCEPTIONS
• ENFORCEMENT OF CODES & ORDINANCES & CONTROL DEVELOPERS
• ENFORCEMENT OF PROMPT GARBAGE CONTAINERS FROM CURB
2009 City of Auburn DirectionFinder Survey: Final Report
ETC Institute (April 2009) 183
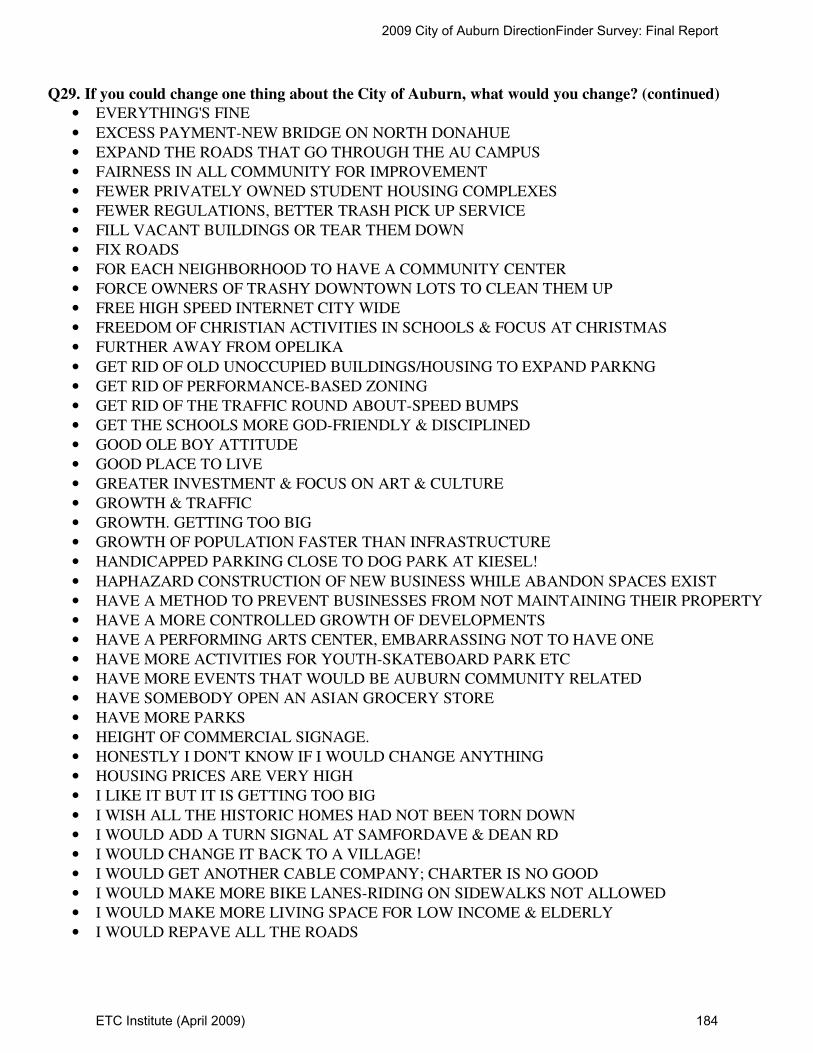
Q29. If you could change one thing about the City of Auburn, what would you change? (continued)
• EVERYTHING'S FINE
• EXCESS PAYMENT-NEW BRIDGE ON NORTH DONAHUE
• EXPAND THE ROADS THAT GO THROUGH THE AU CAMPUS
• FAIRNESS IN ALL COMMUNITY FOR IMPROVEMENT
• FEWER PRIVATELY OWNED STUDENT HOUSING COMPLEXES
• FEWER REGULATIONS, BETTER TRASH PICK UP SERVICE
• FILL VACANT BUILDINGS OR TEAR THEM DOWN
• FIX ROADS
• FOR EACH NEIGHBORHOOD TO HAVE A COMMUNITY CENTER
• FORCE OWNERS OF TRASHY DOWNTOWN LOTS TO CLEAN THEM UP
• FREE HIGH SPEED INTERNET CITY WIDE
• FREEDOM OF CHRISTIAN ACTIVITIES IN SCHOOLS & FOCUS AT CHRISTMAS
• FURTHER AWAY FROM OPELIKA
• GET RID OF OLD UNOCCUPIED BUILDINGS/HOUSING TO EXPAND PARKNG
• GET RID OF PERFORMANCE-BASED ZONING
• GET RID OF THE TRAFFIC ROUND ABOUT-SPEED BUMPS
• GET THE SCHOOLS MORE GOD-FRIENDLY & DISCIPLINED
• GOOD OLE BOY ATTITUDE
• GOOD PLACE TO LIVE
• GREATER INVESTMENT & FOCUS ON ART & CULTURE
• GROWTH & TRAFFIC
• GROWTH. GETTING TOO BIG
• GROWTH OF POPULATION FASTER THAN INFRASTRUCTURE
• HANDICAPPED PARKING CLOSE TO DOG PARK AT KIESEL!
• HAPHAZARD CONSTRUCTION OF NEW BUSINESS WHILE ABANDON SPACES EXIST
• HAVE A METHOD TO PREVENT BUSINESSES FROM NOT MAINTAINING THEIR PROPERTY
• HAVE A MORE CONTROLLED GROWTH OF DEVELOPMENTS
• HAVE A PERFORMING ARTS CENTER, EMBARRASSING NOT TO HAVE ONE
• HAVE MORE ACTIVITIES FOR YOUTH-SKATEBOARD PARK ETC
• HAVE MORE EVENTS THAT WOULD BE AUBURN COMMUNITY RELATED
• HAVE SOMEBODY OPEN AN ASIAN GROCERY STORE
• HAVE MORE PARKS
• HEIGHT OF COMMERCIAL SIGNAGE.
• HONESTLY I DON'T KNOW IF I WOULD CHANGE ANYTHING
• HOUSING PRICES ARE VERY HIGH
• I LIKE IT BUT IT IS GETTING TOO BIG
• I WISH ALL THE HISTORIC HOMES HAD NOT BEEN TORN DOWN
• I WOULD ADD A TURN SIGNAL AT SAMFORDAVE & DEAN RD
• I WOULD CHANGE IT BACK TO A VILLAGE!
• I WOULD GET ANOTHER CABLE COMPANY; CHARTER IS NO GOOD
• I WOULD MAKE MORE BIKE LANES-RIDING ON SIDEWALKS NOT ALLOWED
• I WOULD MAKE MORE LIVING SPACE FOR LOW INCOME & ELDERLY
• I WOULD REPAVE ALL THE ROADS
2009 City of Auburn DirectionFinder Survey: Final Report
ETC Institute (April 2009) 184
Q29. If you could change one thing about the City of Auburn, what would you change? (continued)
• I WOULD STOP LETTING DEVELOPERS RUN AUBURN
• IMPLEMENT STRICT BUILDING CODES FOR COMMERCIAL CONSTRUCTION
• IMPROVE BASKETBALL FACILITY
• IMPROVE EAST OF NORTH-SOUTH & EAST-WEST TRAVEL
• IMPROVE OVERALL, A LITTLE EVERYWHERE
• IMPROVE TRAFFIC FLOW
• IMPROVED PARK & REC FACILITIES-OPTIONS POOLS ESP AJHS
• IMPROVED RETAIL SHOPPING & RESTAURANTS
• INCREASE PUBLIC SAFETY BUDGET (PROTECTION-MANPOWER-FACILITIES)
• INCREASE THE LOT SIZE ON NEW HOMES
• INCREASED ABILITY FOR BICYCLES & PEDESTRIANS TO TRAVEL
• INCREASED POLICE PATROLS/PROTECTION IN NORTHWEST AUBURN
• INCREASING RATE OF THEFTS/BURGLARIES
• INFLUENCE OF DEVELOPERS & DISREGARD FOR HISTORICAL PRESERVATION
• INCOME TAX REDUCED
• INSTALL SOME KIND OF RIVER WALK, DAY & NIGHT HOURS AVAILABLE
• KEEP COMMERCIAL BUSINESS AWAY FROM RESIDENTAL AREAS
• KEEP STREETS MAINTAINED-OUR STREETS HAVE NEVER BEEN PAVED
• KEEP THE STUDENTS OUT OF RESIDENTIAL RENTAL PROPERTY!
• KEEPING THE "SMALL TOWN" FEELING, ESPECIALLY DOWNTOWN
• LACK OF LONG RANGE VISION CONCERNING COMMERCIAL DEVELOPMENT
• LACK OF TRANSPARENCY IN CITY GOVERNMENT
• LANDSCAPING ON NEW PROJECTS-SAVE LARGER TREES
• LARGE DEVELOPMENT WITHOUT REGARD TO SURROUNDING HOUSING
• LARGER MALL
• LESS CONDOS-MORE GREENSPACE
• LESS INDUSTRIAL PROJECTS-WHICH RUIN THE APPEARANCE
• LESS LITTER
• LESS STUDENT DRIVING CARS RUNNING RED LIGHTS!!
• LESS TRAILERS
• LIMIT STUDENT HOUSING DEVELOPMENT OFF CAMPUS (APTS & CONDOS)
• LITTER ON THE ROADWAYS. THIS IS A HUGE PROBLEM!
• LOCATION OF AUBURN UNIVERSITY
• LOWER THE EVER-INCREASING CRIME RATE
• MAGNOLIA AVE-SPEED BUMPS & TURNING LIGHTS AT DONAHUE
• MAKE A STRATEGIC PLAN TO CONTROL GROWTH SO IT'S GOOD GROWTH
• MAKE DOWNTOWN COLLEGE ST BETWEEN GLENN & THACH PEDESTRN ONLY
• MAKE ENFORCEMENT MUCH STONGER TOO MANY RULES BROKEN
• MAKE HOMESTEAD EXCEPTION, EFFECTIVE FROM DAY PERSON BUYS HOME
• MAKE IT A PEDESTRIAN FRIENDLY OFF CAMPUS
• MAKE IT BIKE & PEDESTRIAN FRIENDLY-YOU CANT FUNCTION W/O CAR
• MAKE IT LARGER
2009 City of Auburn DirectionFinder Survey: Final Report
ETC Institute (April 2009) 185
Q29. If you could change one thing about the City of Auburn, what would you change? (continued)
• MAKE IT MORE FAMILY ORIENTED-ACTIVITES, EVENTS, ETC
• MAKE IT MORE FRIENDLY FOR PEDESTRIANS & BICYCLISTS
• MAKE PERMITTING/PLANNING EASIER FOR DEVELOPERS
• MAKE SURE DOWNTOWN KEEPS THE OLD TOWN FEEL
• MAYOR/CITY COUNCIL
• MORE & BETTER SIDEWALKS
• MORE & BETTER SIDEWALKS SO JOGGERS AREN'T JOGGING ON STREETS
• MORE ATTENTION TO GREEN SPACE-WOODS
• MORE BIKE LANES
• MORE BIKEWAYS
• MORE COMMUNITY EVENTS. WE LOVE THE DOWNTOWN EVENT NIGHTS
• MORE CONSIDERATION/INPUT BEFORE ALLOWING DEVELOPERS TO BUILD
• MORE DIVERSE AMD MULTICULTURAL COMMUNITY
• MORE GREEN SPACE AND FEWER DEVELOPERS RUNNING OVER CITY
• MORE HIGH END SHOPPING
• MORE HOUSING FOR MIDDLE-INCOME AND SENIOR CITIZENS WITH LOW INCOME.
• MORE INTERNATIONAL FOOD CHOICES
• MORE INTERNATIONAL SHOPPING PLACES
• MORE JOB OPPORTUNITIES; MORE COMMUNITY ACTIVITIES
• MORE JOBS AND HIGH END RETAIL
• MORE JOBS THAT PAY REAL LIVING WAGES
• MORE KID FRIENDLY ATTACTIONS/ENTERTAINMENT
• MORE MONEY & EMPHASIS ON THE ARTS, SUCH AS A PERFORMANCE ARTS CENTR
• MORE NOTICE OF WHEN SCHOOL WILL BE STARTING
• MORE OPENNESS BY ELECTED OFFICIALS. LESS PLANNED GROWTH
• MORE ORGANIZED PLANNING TO REDUCE CONGESTION & CLUTTER
• MORE OUTDOOR DINING DOWNTOWN
• MORE PARKING
• MORE PARKING DOWNTOWN
• MORE PARKING SPACE FOR STUDENTS AT AUBURN UNIVERSITY!
• MORE PARKS & BENCHES. SMALL PARKS
• MORE PARKS, TREES & GREEN SPACE
• MORE PARKS-BIKE TRAILS
• MORE PARKS-WALKING PATH & BIKE TRAILS
• MORE PLACES FOR KIDS TO DO THINGS & PLAY & WALK
• MORE POLICE OFFICERS
• MORE POLICE ON FRIDAY & SATURDAY TO COMBAT DRUNK DRIVING ON CAMPUS
• MORE PRESERVATION OF GREEN SPACE, ESPECIALLY ALONG DRAINAGE SYSTEMS
• MORE PROGRAMS FOR YOUTH 7TH GRADE & ABOVE
• MORE REASONABLE ENFORCEMENT OF ZONING ORDINANCES
• MORE REASONABLE RENTAL RATES
• MORE RESTAURANT CHOICES
2009 City of Auburn DirectionFinder Survey: Final Report
ETC Institute (April 2009) 186

Q29. If you could change one thing about the City of Auburn, what would you change? (continued)
• MORE SAFETY (LESS BREAK-INS) & CONTROL OF STUDENT INFLUENCE
• MORE SHOPPING & BETTER PLACES TO EAT
• MORE SHOPPING CENTERS LIKE TIGERTOWN
• MORE SIDEWALKS
• MORE SIDEWALKS IN OLDER NEIGHBORHOODS
• MORE SIDEWALKS, MORE GREEN SPACE
• MORE SIDEWALKS,BETTER TRAFFIC FLOW,MORE KID-FRIENDLY PLAY AREAS
• MORE SIDEWALKS/WALKING PATHS
• MORE STREET LIGHTS
• MORE STREETS & TRAFFIC LIGHTS
• MORE STRINGENT REGULATIONS ON DEVELOPERS TO PROTECT GREENSPACE/TREES
• MORE THEATRE, MUSIC, DANCE ACTIVITIES-CONCERT FACILITY
• MORE THINGS TO DO FOR SINGLE ADULTS
• MORE VIBRANT DOWNTOWN & BETTER SHOPS & RESTAURANTS
• MORE VIBRANT DOWNTOWN, MORE & BETTER SHOPS & RESTAURANTS
• MORE INFO REGARDING CURRENT ISSUES/MEETINGS/ORDINANCES
• MOVE AIRPORT OUT OF CITY LIMITS! PROPERTY IS TOO VALUABLE!
• MOVE THE AIRPORT OUT OF TOWN & EXPAND THE PUBLIC GOLF COURSE
• NEED MORE COMMERCIAL, RETAIL
• NEED TO SLOW DOWN ON DEVELOPING-GROWING TOO FAST
• NEEDS TO HAVE FREE CITY WIDE HIGH SPEED INTERNET
• NEGATE THE APPEARANCE OF DEVELOPERS RUINING THE CITY
• NO CARS ON COLLEGE BETWEEN GLENN & MAGNOLIA
• NO CITY INCOME TAX. I AM NOT GETTING MY MONEY'S WORTH!
• NO LEFT TURN FROM SAMFORD ONTO MOORES MILL RD
• NO MORE APARTMENTS & NO SECTION 8 HOUSING
• NO MORE CONDO CONSTRUCTION DOWNTOWN
• NO MORE SHOPPING CENTERS, HOUSING, ETC. ENOUGH GROWTH
• NO TALL BUILDINGS-THE UGLY WHITE ONE ON COLLEGE
• NOT BUILDING NEW HOUSES UNTIL THERE IS A NEED
• NOT MUCH-WE LOVE IT!
• OBJECTIVITY & OPENNESS IN CITY & SCHOOL YOUTH SPORT ACTIVITIES
• OCCUPATIONAL LICENSE FEE
• OFF ROAD BIKE LANES-SIDE OF ROAD LANES ARE SIMPLY UNSAFE
• ONE THING I WOULD CHANGE ABOUT AUBURN WOULD BE INCOME LEVELS
• ORDINANCES TO MAKE S COLLEGE & HWY 14 MORE ATTRACTIVE
• OVER BUILDING DORMS, CONDOS, APARTMENTS & LOSING OLD AUBURN
• PARKING DOWNTOWN
• PARKING DOWNTOWN-BUSINESS LOCATED DOWNTOWN IS NOT ACCESSIBLE
• PARKS & REC FACILITIES FOR FOOTBALL & BASKETBALL TOO SMALL
• PARKS & REC MORE OPEN FOR SUGGESTIONS FROM PEOPLE
• PARTNER WITH ALL & GO TO SINGLE STREAM RECYCLING FOR AUBURN
• PERMIT FISHING IN LAKE AT INDIAN PINES
• PLAN & IMPLEMENT MORE INFRASTRUCTURE! PUSH RETAIL BASE
2009 City of Auburn DirectionFinder Survey: Final Report
ETC Institute (April 2009) 187

Q29. If you could change one thing about the City of Auburn, what would you change? (continued)
• PLANNED GROWTH-MAYBE DEVELOP COMMUNITIES
• POLICE BETTER AT SOLVING MAJOR CRIMES
• POLICE DEPT DOES A TERRIBLE JOB IN PROTECTING & SERVING
• POLICE DEPT DOES NOT SPEND ENOUGH TIME ON IMPORTANT CRIME
• POLICE NEED TO QUIT INTERVENING WITH VICTIM-LESS CRIMES
• POLICE PROTECTION
• POLICE REACH OUT TO YOUTH IN LOW-INCOME AREAS FOR MENTORING
• POLITICAL MADNESS
• POLITICS
• POOR COMMERCIAL DEVELOPMENT
• PRESERVE MORE TREES FROM CONSTRUCTION
• PRESERVE MORE WOODED, UNDEVELOPED AREAS. RESTRICT TREE REMOVAL
• PROATIVE APPROACH TO FUTURE DEVELOPMENT
• PROBLEM WITH POLICE HOLD ON CARS THAT SPEED AWAY
• PROTECT NEIGHBORS BY LIMITING DEVELOPMENT WITHIN NEIGHBORHOODS
• PUBLIC TRANSPORTATION
• PUBLIC TRANSPORTATION
• PUBLIC TRANSPORTATION FOR CHILDREN TO LIBRARY, SOCCER ETC
• PUT A TIGER TOWN AT EXIT 51 (GROWTH AREA) NOT CAR DEALERSHIP
• RACISM
• RAILROAD
• RAISE SPEED LIMIT ON EAST UNIVERSITY
• READJUST TIMING OF TRAFFIC SIGNALS AT GROVE HILL RD
• REAL ESTATE PRICES
• REBUILD HISTORIC HOMES WHICH WERE DESTROYED FOR CONDOS, APTS
• RECRUIT NON-MANUFACTURING BUSINESSES
• RECYCLING
• REDUCE BICYCLE TRAFFIC - NO MORE BIKE LANES
• REDUCE DEVELOPER INVOLVEMENT IN CITY GOVERNMENT
• REDUCE GROWTH RATE-GIVE UP ON OUR DOWNTOWN-IT'S TOO LATE
• REDUCE ROBBERY & BREAK IN CRIMES
• REDUCE SALES TAX, PROMOTE COMMERCIAL & INDUSTRIAL ACTIVITIES
• REDUCE SEWER COST
• REDUCE TAXES/FEES ON SMALL BUSINESSES IN AUBURN
• REDUCE THE AMOUNT OF CONDO BUILDING-CONSTRUCTION
• REDUCE THE TRAFFIC
• REDUCE WATER ACCESS FEE ($1000) FOR IRREGATION METER
• RELEASE LOCAL STATIONS FROM UNDER CHARTER MONOPOLY
• REMOVE INFLUENCE OF BUILDERS & REALTORS
• REPAIR OUTDOOR BASKETBALL GOALS AT FRANK BROWN
2009 City of Auburn DirectionFinder Survey: Final Report
ETC Institute (April 2009) 188

Q29. If you could change one thing about the City of Auburn, what would you change? (continued)
• REPLACE VACANT MALLS WITH PARKS
• REQUIREMENT TO MAKE NEW GROWTH LESS UGLY
• RETAIL SHOPPING SO TAX DOLLARS COME TO AUBURN NOT OPELIKA
• REVAMP ZONING PROCESS TO PROTECT NEIGHBORHOODS & HOMEOWNERS
• REVERSE THE LOSS OF CHARACTER DUE TO POOR REGULATED GROWTH
• ROAD MAINTENANCE
• ROADS & RUNOFF IN MY NEIGHBORHOOD
• ROADS NEED TO BE PEDESTRIAN/BIKE FRIENDLY
• RUNNING RED LIGHTS
• S COLLEGE TRAFFIC BY ADDING ALTER RD TO SHUG JORDAN
• SAFE ROUTES TO SCHOOL FOR BIKING FOR ALL AGES
• SAFER EASIER ACCESS TO BIKE TO TOWN-DONAHUE IS TOO BUSY
• SANITATION & RECYCLING PICK-UP CREW TOO PICKY OR LAZY
• SCHOOL SYSTEM SHOULD BE HIGHER PRIORITY
• SHOPPING AREA
• SKIP MALL DEVELOPMENT
• SLOW DEVELOPMENT & FAVORITISM TO DEVELOPERS
• SLOW DOWN DEVELOPMENT
• SLOW DOWN GROWTH
• SLOW DOWN GROWTH OF NEW HOUSING-SUBDIVISIONS
• SLOW DOWN RAMPANT NEW CONSTRUCTION
• SLOW DOWN THE GROWTH OF HOUSES/APARTMENTS IN AUBURN
• SLOW DOWN-STOP THE GROWTH IT INCREASES TAXES
• SLOW THE GROWTH RATE
• SLOW TRAFFIC ON MY STREET (300 BLOCK OF GREEN ST)
• SLOWER & SAFER DRIVING HABITS (ESP THROUGH NEIGHBORHOODS)
• SOUTH COLLEGE ST-TRAFFIC FLOW, TERRIBLE LAYOUT OF BUSINESSES
• SPEED BUMPS ON SANDERS ST BETWEEN NORTH & SOUTH CARY DRIVES
• SPEED LIMITS ON SOME STREETS
• STOP APPROVING RESIDENTAL DEVELOPMENTS THAT SIT EMPTY
• STOP CUTTING TREES FOR DEVELOPMENT. LEAVE SOME!
• STOP DESTROYING THE LOVELIEST VILLAGE ON THE PLAINS
• STOP DESTROYING YOUR HERITAGE HOUSES IN FAVOR OF CONDOS
• STOP OVERBUILDING STUDENT HOUSING! CREEPERS MOVE INTO HOUSING
• STOP PEOPLE FROM RUNNING RED LIGHTS
• STOP THE GROWTH
• STOP THE OVERBUILDING OF LUXURY STUDENT HOUSING
• STOP THE SAMFORD EXTENSION PROJECT
• STOP TOWING AND WHEEL LOCKING CARS
• STREET SIGNS
2009 City of Auburn DirectionFinder Survey: Final Report
ETC Institute (April 2009) 189
Q29. If you could change one thing about the City of Auburn, what would you change? (continued)
• STREETSCAPES ARE UGLY
• STRENGTHEN BUILDING CODES TO INCLUDE DESIGN REGULATIONS & GREEN SPACE
• STRICTER LAW ENFORCEMENT AS FAR AS DOGS & HOW MANY IN HOUSEHOLD
• STUDENTS PARTY TOO MUCH. SOME DON’T WANT TO HEAR NOISE ALL NIGHT LONG
• TAKE AWAY THE POWER REAL ESTATE BUSINESSES HERE
• TAKE CONTROL OF CITY OUT OF DEVELOPERS' HANDS
• TAKE PROPERTY CRIME MORE SERIOUSLY
• TAKING CARE OF WHAT WE HAVE NOT BUILDING NEW
• TAKING DOWN VACANT BUILDING ON GLENN AVE-DAYLIGHT DONUTS
• THAT ALL CITIZENS HAVE A VOICE NOT A SELECT FEW
• THAT ALL ROADS WITHIN CITY LIMITS WERE PAVED
• THE $1248 CHARGE FOR WATER METERS
• THE APPEARANCE OF S COLLEGE & OTHER COMMERCIAL AREAS
• THE APPEARANCE OF STRIP MALLS AT THE ENTRANCE TO THE CITY
• THE AREA ON OPELIKA RD FROM GUTHRIES TO DEAN RD LOOKS JUNKY
• THE CITY IS RUN EXCEPTIONALLY WELL
• THE COMMUNICATION W/RESIDENTS
• THE DESTRUCTION OF OLDER HOUSING
• THE EMS
• THE LACK OF A REPRESENTATIVE NUMBER OF MINORITIES
• THE NUMBER OF LIBERALS WHO LIVE HERE
• THE OVERALL AMOUNT OF BUILDING
• THE OVERBUILDING OF CONDOS & APT COMPLEXES THROUGHOUT CITY
• THE OVERLY PERMISSIVE ATTITUDE TOWARD BUILDING & PLANNING
• THE PUSH FOR GROWTH-ONLY A FEW PEOPLE BENEFIT
• THE QUALITY OF TRAFFIC SIGNALS (FUNCTION) & TRAFFIC CONTROL
• THE RACE/ETNICITY HIRING OF CITY OF AUBURN EMPLOYEES
• THE RELATIONSHIPS BETWEEN MEMBERS OF CITY GOVERNMENT & DEVELOPERS
• THE SCHOOLS' LACK OF PROTECTION FOR THE CHILDREN
• THE SPRAWL & LACK OF A LIVING ZONE CONCEPT
• THE STUDENTS
• THE UNRELENTING UGLY GROWTH OF APARTMENTS,KEEP GREEN SPACE
• THE WAY THE RIVER PEOPLE IN THE CITY TREAT YOU!
• THERE ARE A LOT OF ABANDONED HOMES THAT NEED TO BE TORN DOWN
• THERE ARE NO CHILDREN FACILITIES FOR ENTERTAINMENT!
• THERE ARE TOO MANY TRAFFIC LIGHTS AT INTERSECTIONS
• TIGERTOWN WOULD BE IN AUBURN NOT OPELIKA
• TO INCREASE NUMBER OF LANES ON COLLEGE ST
• TOO MANY ACCESS ROADS TOO CLOSE TOGETHER
• TOO MANY APARTMENTS ARE BECOMING SUBSIDIZED HOUSING
• TOO MANY CRIMES-NEED MORE POLICE PRESENCE
• TOO MANY NEW HOUSING DEVELOPMENTS WHILE CUTTING GREEN SPACES
• TOO MANY POLICE
2009 City of Auburn DirectionFinder Survey: Final Report
ETC Institute (April 2009) 190

Q29. If you could change one thing about the City of Auburn, what would you change? (continued)
• TOO MUCH COMMERCIAL DEVELOPMENT
• TOO MUCH CUTTING & CLEARING FOR BUILDINGS NOT OCCUPIED
• TOWING OF VEHICLES FOR AUBURN UNIVERSITY FOOTBALL GAMES
• TRAFFIC
• TRAFFIC
• TRAFFIC CONGESTION
• TRAFFIC CONGESTION AT PEAK TIMES
• TRAFFIC CONGESTION; FURTHER IMPROVEMENT ON RAILROAD CROSSNGS
• TRAFFIC DURING GAMES BLOCKS MY STREET HARD TO EXIT TO NEIGHBORHOOD
• TRAFFIC FLOW
• TRAFFIC FLOW DURING RUSH HOURS
• TRAFFIC FLOW FROM BOWLING ALLEY TO DOWNTOWN
• TRAFFIC FLOW IN AND AROUND DOWNTOWN & UNIVERSITY & MALL
• TRAFFIC FLOW ON DONAHUE-MAGNOLIA-NEW KROGER
• TRAFFIC FLOW ON N COLLEGE ST
• TRAFFIC FLOW, MORE 1 WAY STREETS
• TRAFFIC FLOW-PARKING
• TRAFFIC FLOW-SYNCHRONIZE THE LIGHTS; MORE TURN LIGHTS
• TRAFFIC FLOW/PARKING
• TRAFFIC LIGHTS NEEDS IMPROVEMENTS
• TRAFFIC PATTERNS
• TRAFFIC SIGNAL ENFORCEMENT
• TRANSPARENCY IN GOVERNMENT, ESPECIALLY IN REGARD TO ZONING
• TURN THE CITY INTO A RESIDENTIAL VS COMMERCIAL DISTRICT
• TUTORING FOR PUBLIC SCHOOL CHILDREN IN MATH, LANGUAGE, READ
• UNCONTROLLED GROWTH/UNATTRACTIVE COMMERCIAL AREAS
• UP-GRADE THE CURB APPEAL & SHIPPING
• URBAN SPRAWL
• VISIBILITY OF POLICE IN MY NEIGHBORHOOD
• WE NEED TO RECYLCE MORE PLASTICS
• WE'RE VERY HAPPY LIVING HERE-LEADERS ARE DOING WELL
• WHERE MONEY IS SPENT/ZONING
• WIDEN SAMFORD AVE TO 4 LANES(& AUBURN LN FROM COLLEGE GLENN)
• WIDEN STREETS IE MORES MILL ROAD
• WOULD NOT BUILD CONDOS IN DOWNTOWN AUBURN
• ZONING
• ZONING & BUILDING CODES ARE A JOKE
• ZONING ON COLLEGE STUDENTS IN RESIDENTAL AREAS
• ZONING REGULATIONS
2009 City of Auburn DirectionFinder Survey: Final Report
ETC Institute (April 2009) 191

Q30. How many persons in your home are:
Mean Total number 2.81 Under age 5 0.25 Ages 5-9 0.25 Ages 10-14 0.19 Ages 15-19 0.16 Ages 20-24 0.13 Ages 25-34 0.31 Ages 35-44 0.43 Ages 45-54 0.44 Ages 55-64 0.34 Ages 65-74 0.20 Ages 75+ 0.13
Q31. How many years have you lived in the City of Auburn?
Q31 How many years live in Auburn Number Percent 5 years or less 156 21.3 % 6-10 years 113 15.4 % 11-20 years 174 23.7 % 21-30 years 120 16.3 % 31 or more years 171 23.3 % Total 734 100.0 %
Q32. How many people in your household work in the Auburn city limits?
Q32 How many people in household work Number Percent None 225 30.8 % 1 person 278 38.0 % 2 people 195 26.7 % 3 or more people 33 4.5 % Total 731 100.0 %
Q33. Are you a full time Auburn University student?
Q33 Are you full time Auburn student Number Percent 1=Yes 39 5.3 % 2=No 693 94.2 % 9=Not provided 4 0.5 % Total 736 100.0 %
2009 City of Auburn DirectionFinder Survey: Final Report
ETC Institute (April 2009) 192

144 Tichenor Avenue Auburn, Alabama 36830 (334) 501-7260 FAX (334) 501-7299 www.auburnalabama.org
January 2009 Dear Auburn Resident,
I would like to ask for your assistance in completing the 2009 Citizen Survey. This survey, administered annually for over 20 years, is very important to our community. The feedback we receive from the results of the survey helps us gauge how successful we have been in providing quality services to the residents of Auburn. The Citizen Survey is one of the main tools we use in establishing budget priorities and forming policy decisions. Auburn is known for encouraging active citizen involvement in city government; your participation in this survey is another important way to get involved in guiding your community.
This year, we have partnered with ETC Institute to administer the survey.
Please take a few minutes to complete and return this survey in the next few days. If you are not a resident of the City of Auburn, please disregard this survey. A postage-paid return envelope addressed to ETC Institute has been provided for your convenience. ETC Institute will compile the results and present a report to the City in a few weeks. Your responses to the questions in the survey are completely anonymous. The sticker on the survey serves only to identify broad geographic areas and helps us to know in which areas of the City we might improve our service delivery.
The results of the survey will be presented to the City Council and to the public in early April. Additionally, a comprehensive report analyzing the survey results will be available at City Hall and posted on the City’s website, with a summary included in a future issue of Auburn’s monthly citizen newsletter, Open Line. If you have any questions about the survey, please call me at (334) 501-7261. Thank you for helping guide the direction of our community by completing the enclosed survey. Your participation will help to ensure that “the Loveliest Village on the Plains” remains a very special place in which to live. Sincerely,
Charles M. Duggan, Jr. City Manager Enclosure
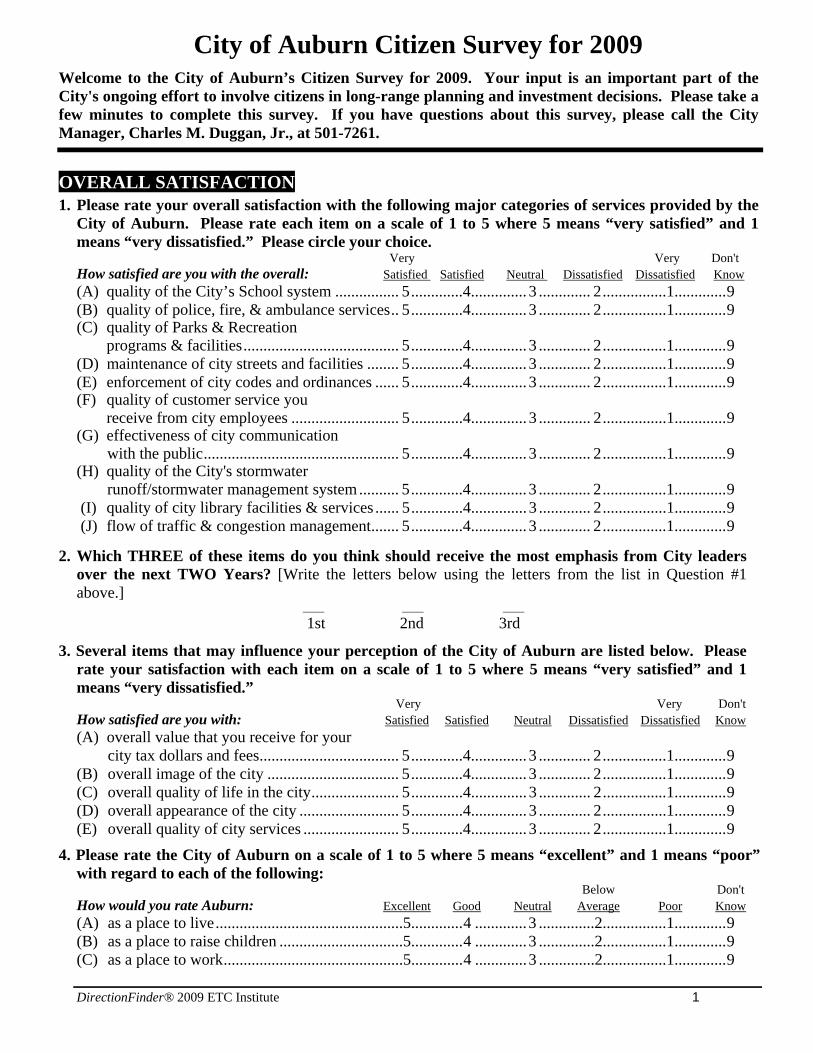
DirectionFinder® 2009 ETC Institute 1
City of Auburn Citizen Survey for 2009
Welcome to the City of Auburn’s Citizen Survey for 2009. Your input is an important part of the City's ongoing effort to involve citizens in long-range planning and investment decisions. Please take a few minutes to complete this survey. If you have questions about this survey, please call the City Manager, Charles M. Duggan, Jr., at 501-7261.
OVERALL SATISFACTION
1. Please rate your overall satisfaction with the following major categories of services provided by the City of Auburn. Please rate each item on a scale of 1 to 5 where 5 means “very satisfied” and 1 means “very dissatisfied.” Please circle your choice.
Very Very Don't How satisfied are you with the overall: Satisfied Satisfied Neutral Dissatisfied Dissatisfied Know (A) quality of the City’s School system ................ 5 .............4.............. 3 ............. 2 ................1............. 9 (B) quality of police, fire, & ambulance services .. 5 .............4.............. 3 ............. 2 ................1............. 9 (C) quality of Parks & Recreation programs & facilities ....................................... 5 .............4.............. 3 ............. 2 ................1............. 9 (D) maintenance of city streets and facilities ........ 5 .............4.............. 3 ............. 2 ................1............. 9 (E) enforcement of city codes and ordinances ...... 5 .............4.............. 3 ............. 2 ................1............. 9 (F) quality of customer service you receive from city employees ........................... 5 .............4.............. 3 ............. 2 ................1............. 9 (G) effectiveness of city communication with the public ................................................. 5 .............4.............. 3 ............. 2 ................1............. 9 (H) quality of the City's stormwater runoff/stormwater management system .......... 5 .............4.............. 3 ............. 2 ................1............. 9 (I) quality of city library facilities & services ...... 5 .............4.............. 3 ............. 2 ................1............. 9 (J) flow of traffic & congestion management....... 5 .............4.............. 3 ............. 2 ................1............. 9
2. Which THREE of these items do you think should receive the most emphasis from City leaders over the next TWO Years? [Write the letters below using the letters from the list in Question #1 above.]
____ ____ ____ 1st 2nd 3rd
3. Several items that may influence your perception of the City of Auburn are listed below. Please rate your satisfaction with each item on a scale of 1 to 5 where 5 means “very satisfied” and 1 means “very dissatisfied.”
Very Very Don't How satisfied are you with: Satisfied Satisfied Neutral Dissatisfied Dissatisfied Know (A) overall value that you receive for your city tax dollars and fees ................................... 5 .............4.............. 3 ............. 2 ................1............. 9 (B) overall image of the city ................................. 5 .............4.............. 3 ............. 2 ................1............. 9 (C) overall quality of life in the city ...................... 5 .............4.............. 3 ............. 2 ................1............. 9 (D) overall appearance of the city ......................... 5 .............4.............. 3 ............. 2 ................1............. 9 (E) overall quality of city services ........................ 5 .............4.............. 3 ............. 2 ................1............. 9
4. Please rate the City of Auburn on a scale of 1 to 5 where 5 means “excellent” and 1 means “poor” with regard to each of the following:
Below Don't How would you rate Auburn: Excellent Good Neutral Average Poor Know (A) as a place to live ...............................................5............. 4 ............. 3 ..............2................1............. 9 (B) as a place to raise children ...............................5............. 4 ............. 3 ..............2................1............. 9 (C) as a place to work .............................................5............. 4 ............. 3 ..............2................1............. 9

DirectionFinder® 2009 ETC Institute 2
5. Lee County and the City of Auburn have experienced steady employment, population, and economic growth over the past two decades. In addressing this growth, please indicate where city officials should concentrate their efforts by ranking the top FIVE issues from the list below. Write “1” for the item you think should be the HIGHEST priority, “2” for the second highest priority, “3” for the third highest priority, and so on. ___(A) bikeways ___(B) city school system ___(C) codes enforcement ___(D) fire protection
___(E) police protection ___(F) public transportation ___(G) recreational opportunities ___(H) sidewalks
___(I) stormwater management ___(J ) traffic management ___(K) walking trails ___(L) zoning and land use
6. Public Safety Services. For each of the following, please rate your satisfaction on a scale of 1 to 5
where 5 means “very satisfied” and 1 means “very dissatisfied.” Very Very Don't
How satisfied are you with: Satisfied Satisfied Neutral Dissatisfied Dissatisfied Know (A) overall quality of police protection ...................... 5 ............. 4 ........... 3 ............. 2 .............. 1 ............. 9 (B) visibility of police in neighborhoods .................... 5 ............. 4 ........... 3 ............. 2 .............. 1 ............. 9 (C) visibility of police in retail areas .......................... 5 ............. 4 ........... 3 ............. 2 .............. 1 ............. 9 (D) how quickly police respond to emergencies ........ 5 ............. 4 ........... 3 ............. 2 .............. 1 ............. 9 (E) efforts to prevent crime ........................................ 5 ............. 4 ........... 3 ............. 2 .............. 1 ............. 9 (F) police safety education programs ......................... 5 ............. 4 ........... 3 ............. 2 .............. 1 ............. 9 (G) enforcement of traffic laws .................................. 5 ............. 4 ........... 3 ............. 2 .............. 1 ............. 9 (H) overall quality of fire protection .......................... 5 ............. 4 ........... 3 ............. 2 .............. 1 ............. 9 (I) fire personnel emergency response time .............. 5 ............. 4 ........... 3 ............. 2 .............. 1 ............. 9 (J) fire safety education programs ............................. 5 ............. 4 ........... 3 ............. 2 .............. 1 ............. 9 (K) quality of local ambulance service ....................... 5 ............. 4 ........... 3 ............. 2 .............. 1 ............. 9 (L) quality of animal control ...................................... 5 ............. 4 ........... 3 ............. 2 .............. 1 ............. 9 (M) enforcement of speed limits in neighborhoods .... 5 ............. 4 ........... 3 ............. 2 .............. 1 ............. 9
7. Which TWO areas of PUBLIC SAFETY do you think should be emphasized most by city leaders over the next two years? [Write the letters below for your top two choices from Question #6 above.]
1st Choice: ________ 2nd Choice: ________
8. Enforcement of City Codes and Ordinances. For each of the following, please rate your satisfaction on a scale of 1 to 5 where 5 means “very satisfied” and 1 means “very dissatisfied.”
How satisfied are you with the Very Very Don't enforcement of the following: Satisfied Satisfied Neutral Dissatisfied Dissatisfied Know (A) clean up of debris/litter in neighborhoods ........... 5 ............ 4 ............ 3 ..............2.............. 1 ..............9 (B) sign regulations .................................................... 5 ............ 4 ............ 3 ..............2.............. 1 ..............9 (C) zoning regulations ................................................ 5 ............ 4 ............ 3 ..............2.............. 1 ..............9 (D) unrelated occupancy regulations .......................... 5 ............ 4 ............ 3 ..............2.............. 1 ..............9 (E) building codes…….. ............................................ 5 ............ 4 ............ 3 ..............2.............. 1 ..............9 (F) erosion & sediment control regulations ............... 5 ............ 4 ............ 3 ..............2.............. 1 ..............9 (G) fire codes and regulation ...................................... 5 ............ 4 ............ 3 ..............2.............. 1 ..............9
9. Which TWO areas of ENFORCEMENT OF CODES AND ORDINANCES do you think should be emphasized most by city leaders over the next two years? [Write the letters below for your top two choices from Question #8 above.]
1st Choice: _________ 2nd Choice: _________
DirectionFinder® 2009 ETC Institute 3
10. Utility and Environmental Services. For each of the following, please rate your satisfaction on a scale of 1 to 5 where 5 means “very satisfied” and 1 means “very dissatisfied.”
Very Very Don't How satisfied are you with: Satisfied Satisfied Neutral Dissatisfied Dissatisfied Know (A) residential garbage collection service ..............5................4.............. 3 ..............2................1.............9 (B) curbside recycling service ............................... 5 ................4.............. 3 ..............2................1.............9 (C) yard waste removal service ............................. 5 ................4.............. 3 ..............2................1.............9 (D) sanitary sewer service ......................................5................4.............. 3 ..............2................1.............9 (E) water service ....................................................5................4.............. 3 ..............2................1.............9 (F) Water Revenue Office customer service ..........5................4.............. 3 ..............2................1.............9
11. Which TWO areas of UTILITY AND ENVIRONMENTAL SERVICES do you think should be emphasized most by city leaders over the next two years? [Write the letters below for your top two choices from Question #10 above]
1st Choice: ________ 2nd Choice: ________
12. City Maintenance. For each of the following, please rate your satisfaction on a scale of 1 to 5 where 5 means “very satisfied” and 1 means “very dissatisfied.”
Very Very Don't How satisfied are you with: Satisfied Satisfied Neutral Dissatisfied Dissatisfied Know (A) maintenance of streets (not including
those on the AU campus) .......................................... 5 .............4.............. 3 ..............2................1.............9 (B) maintenance of sidewalks (not including those on the AU campus) .......................................... 5 .............4.............. 3 ..............2................1.............9 (C) maintenance of street signs ................................ 5 .............4.............. 3 ..............2................1.............9 (D) maintenance of traffic signals ............................ 5 .............4.............. 3 ..............2................1.............9 (E) maintenance of downtown Auburn .................... 5 .............4.............. 3 ..............2................1.............9 (F) maintenance of city buildings ............................ 5 .............4.............. 3 ..............2................1.............9 (G) mowing and trimming along streets and other public areas ........................................ 5 .............4.............. 3 ..............2................1.............9 (H) overall cleanliness of streets and other public areas ............................................... 5 .............4.............. 3 ..............2................1.............9 (I) adequacy of city street lighting .......................... 5 .............4.............. 3 ..............2................1.............9 (J) water lines and fire hydrants .............................. 5 .............4.............. 3 ..............2................1.............9 (K) sewer lines and manholes................................... 5 .............4.............. 3 ..............2................1.............9
13. Which TWO areas of MAINTENANCE do you think should be emphasized most by city leaders over the next two years? [Write the letters below for your top two choices from Question #12 above.]
1st Choice: ________ 2nd Choice: ________
14. Feeling of Safety. Please rate your feeling of safety on a scale of 1 to 5 where 5 means “very safe” and 1 means “very unsafe.”
Don't How safe do you feel: Very Safe Safe Neutral Unsafe Very Unsafe Know (A) in your neighborhood during the day .............. 5 .............4.............. 3 ............... 2 ..............1............. 9 (B) in your neighborhood at night ......................... 5 .............4.............. 3 ............... 2 ..............1............. 9 (C) in the City’s parks ........................................... 5 .............4.............. 3 ............... 2 ..............1............. 9 (D) in commercial and retail areas ........................ 5 .............4.............. 3 ............... 2 ..............1............. 9 (E) in downtown Auburn ...................................... 5 .............4.............. 3 ............... 2 ..............1............. 9 (F) overall feeling of safety in Auburn ................. 5 .............4.............. 3 ............... 2 ..............1............. 9

DirectionFinder® 2009 ETC Institute 4
15. City Leadership. For each of the following, please rate your satisfaction on a scale of 1 to 5 where 5 means “very satisfied” and 1 means “very dissatisfied.”
Very Very Don't How satisfied are you with: Satisfied Satisfied Neutral Dissatisfied Dissatisfied Know (A) overall quality of leadership provided by the City's elected officials ............................ 5 ..............4.............. 3 ............... 2 ..............1.............9 (B) overall effectiveness of appointed boards and commissions ............................................... 5 ..............4.............. 3 ............... 2 ..............1.............9 (C) overall effectiveness of the City Manager ........ 5 ..............4.............. 3 ............... 2 ..............1.............9
16. City Parks and Recreation. For each of the following, please rate your satisfaction on a scale of 1 to 5 where 5 means “very satisfied” and 1 means “very dissatisfied.”
Very Very Don't Satisfied Satisfied Neutral Dissatisfied Dissatisfied Know
How satisfied are you with the: (A) maintenance of parks .......................................5................4.............. 3 ..............2................1.............9 (B) maintenance of cemeteries ...............................5................4.............. 3 ..............2................1.............9 (C) number of parks ...............................................5................4.............. 3 ..............2................1.............9 (D) walking and biking trails ..................................5................4.............. 3 ..............2................1.............9 (E) swimming pools ...............................................5................4.............. 3 ..............2................1.............9 (F) community recreation centers ..........................5................4.............. 3 ..............2................1.............9 (G) outdoor athletic fields (i.e. baseball, soccer, and softball) .........................................5................4.............. 3 ..............2................1.............9 (H) youth athletic programs ....................................5................4.............. 3 ..............2................1.............9 (I) adult athletic programs .....................................5................4.............. 3 ..............2................1.............9 (J) other city recreation programs, (classes, trips, special events and arts programming) ...............5................4.............. 3 ..............2................1.............9 (K) ease of registering for programs ......................5................4.............. 3 ..............2................1.............9 (L) fees charged for recreation programs ...............5................4.............. 3 ..............2................1.............9
17. Which TWO areas of PARKS and RECREATION do you think should be emphasized most by city leaders over the next two years? [Write the letters below for your top two choices from Question #16 above]
1st Choice: ________ 2nd Choice: ________
18. Traffic Flow. For each of the following, please rate your satisfaction on a scale of 1 to 5 where 5 means “very satisfied” and 1 means “very dissatisfied.”
Very Very Don't Satisfied Satisfied Neutral Dissatisfied Dissatisfied Know
How satisfied are you with the: (A) ease of north-south travel in Auburn by car on roads such as Donahue Dr., College St., Gay St. and Dean Rd. .................... 5 ..............4.............. 3 ............... 2 ..............1.............9 (B) ease of east-west travel in Auburn by car on roads such as Glenn Ave., Thach Ave., and Samford Ave .......................... 5 ..............4.............. 3 ............... 2 ..............1.............9 (C) ease of travel by bicycle in Auburn .................. 5 ..............4.............. 3 ............... 2 ..............1.............9 (D) ease of pedestrian travel in Auburn ................... 5 ..............4.............. 3 ............... 2 ..............1.............9
DirectionFinder® 2009 ETC Institute 5
19. City Communication. For each of the following, please rate your satisfaction on a scale of 1 to 5 where 5 means “very satisfied” and 1 means “very dissatisfied.”
Very Very Don't Satisfied Satisfied Neutral Dissatisfied Dissatisfied Know
How satisfied are you with: (A) availability of information about Parks and Recreation programs and services .............. 5 ..............4.............. 3 ............... 2 ..............1........... 9 (B) level of public involvement in local decision-making ................................................ 5 ..............4.............. 3 ............... 2 ..............1........... 9 (C) quality of Open Line newsletter ........................ 5 ..............4.............. 3 ............... 2 ..............1........... 9 (D) quality of the City’s web page .......................... 5 ..............4.............. 3 ............... 2 ..............1........... 9 (E) availability of information on other
city services and programs ................................ 5 ..............4.............. 3 ............... 2 ..............1........... 9 (F) transparency of city government/the city’s
willingness to openly share information with the community .................................................. 5 ..............4.............. 3 ............... 2 ..............1........... 9
20. Do you have access to the Internet at your home? ___(1) Yes ___(2) No
20a. [Only if YES to #20] Do you have high speed, broadband or dial-up Internet access at your home?
___(1) broadband (DSL/cable) ___(3) broadband (satellite) ___(2) dial-up ___(9) don’t know
21. Have you called or visited the city with a question, problem, or complaint during the past year? ___(1) Yes [answer Q#21a-c] ___(2) No [go to Q#22] 21a. [Only if YES to Q#21] How easy was it to contact the person you needed to reach? ____(1) very easy ____(2) somewhat easy
____(3) difficult ____(4) very difficult
21b. [Only if YES to Q#21] What department did you contact? (Check all that apply) ___(01) Police ___(02) Fire ___(03) Planning ___(04) Parks and Recreation ___(05) Finance (city licenses) ___(06) Water Revenue Office ___(07) City Manager's Office
___(08) Environmental Services (garbage, trash, recycling, animal control) ___ (09) Codes Enforcement ___(10) Public Works ___(11) Water Resource Management (Water, sewer and watershed/stormwater management) ___(12) other ____________________
21c. [Only if YES to Q#21] Was the department you contacted responsive to your issue?
___(1) Yes ___(2) No
22. Do you think that Auburn University students have had a positive, negative or no impact on your neighborhood? ___(1) positive ___(3) no impact ___(2) negative ___(9) don’t know
23. The City of Auburn is considering ways to fund stormwater improvements in the community. The improvements would reduce flooding and help protect the quality of water in lakes and streams in the area. Knowing this, how much would you be willing to add to your monthly utility bill to fund stormwater improvements in Auburn?
___(1) nothing ___(2) up to $1
___(3) up to $2 ___(4) up to $3
___(5) up to $4 ___(6) up to $5 ___(7) more than $5 ___(9) don't know
6
24. Do you think the current rate of growth in the City of Auburn is too fast, too slow, or about right? (1) too Fast ___(2) too Slow ___(3) about right ____(9) don’t know
25. Do you believe that the City of Auburn is building sufficient streets, intersections, sidewalks, and
water/sewer systems to keep up with the City’s growth? (1) yes ___(2) no ___(9) don’t know
26. Do you think the City’s efforts to pursue commercial and industrial projects in Auburn, in order to create jobs and revenue, should be increased, stay the same, or be reduced?
(1) be increased ___(2) stay the same ____(3) be reduced ___(9) don’t know
27. How often do you use the City’s bicycle lanes and facilities? ___(1) monthly ___(2) weekly ___(3) daily ___(4) occasionally ____(5) never
28. What priority would you place on the following projects? [please indicate priority, with 1 being the HIGHEST priority and 10 being the LOWEST priority]
___(A) additional downtown parking ___(F) indoor basketball courts ___(B) expanded fire protection & facilities ___(G) new community center and pool (Lake Wilmore) ___(C) expanded police protection & facilities ___(H) new performing arts center ___(D) road resurfacing & reconstruction ___(I) expansion of Kiesel Park trails and facilities ___(E) skateboard park ___(J) expansion of Jan Dempsey Community Arts Center
29. If you could change ONE thing about the City of Auburn, what would you change? _____________________________________________________________________________________________
30. How many persons in your household (counting yourself), are? Under age 5____ Ages 20-24 ____ Ages 55-64 ____ Ages 5-9 ____ Ages 25-34 ____ Ages 65-74 ____ Ages 10-14 ____ Ages 35-44 ____ Ages 75+ ____ Ages 15-19 ____ Ages 45-54 ____
31. How many years have you lived in the City of Auburn? ______ years
32. How many people in your household work within the Auburn city limits? _____ people
33. Are you a full time Auburn University student? ____(1) Yes ____(2) No
34. Do you own or rent your current residence? ____(1) own ____(2) rent
35. What is your age?
____(1) under 25 years ____(2) 25 to 34 years ____(3) 35 to 44 years
____(4) 45 to 54 year ____(5) 55 to 64 years ____(6) 65+ years
36. Which of the following best describes your race/ethnicity (check all that apply)?
____(1) Asian/Pacific Islander ____(2) Black/African American ____(3) Hispanic
____(4) White ____(5) American Indian/Eskimo ____(6) other: _______________
37. Your total household income is: ____(1) under $30,000 ____(2) $30,000 to $59,999
____(3) $60,000 to $99,999 ____(4) more than $100,000
38. Your gender: ____(1) male ____(2) female
This concludes the survey. Thank you for your time! Please return your completed survey in the enclosed postage paid envelope addressed to:
ETC Institute, 725 W. Frontier Circle, Olathe, KS 66061

7
Your responses will remain completely confidential. The information printed on the sticker to the right will ONLY be used to geographically code the responses and to help identify specific areas for improvement. Thank you!