2008 The Piled Raft Foundation for The Burj Dubai
23
so., gat ; . mvirair v i a. IGS-Ferroco Terzaghi Oration - 2008 The Piled Raft Foundation for The Burj Dubai - Design & Performance Oration by Prof. Harry Poulos
-
Upload
khangminh22 -
Category
Documents
-
view
0 -
download
0
Transcript of 2008 The Piled Raft Foundation for The Burj Dubai

so., gat ; . mvirair via.
IGS-Ferroco Terzaghi Oration - 2008
The Piled Raft Foundation for The Burj Dubai -
Design & Performance
Oration by
Prof. Harry Poulos

IGS — Ferroco Terzaghi Oration 2008
THE PILED RAFT FOUNDATION FOR THE BURJ DUBAI - DESIGN AND PERFORMANCE
Harry G. Poulos Coffey Geoteclhnics Sydney, and University of Sydney, Australia
ABSTRACT
This paper sets out the principles of piled raft foundation design and outlines the circumstances in which they can provide an economical alternative to conventional piled foundations. The foundation design process adopted for the Burj Dubai, the world's tallest building, is then described. The foundation system is a piled raft, founded on deep deposits of carbonate soils and rocks. The paper discusses the geotechnical investigations undertaken, the field and laboratory testing programs, and the design process, and how various design issues, including cyclic degradation of skin friction due to wind loading, were addressed. The numerical computer analysis that was adopted for the original design, together with the check/calibration analyses will be outlined, and then the alternative analysis employed for the peer review process will be described. The paper sets out how the various design issues were addressed, including ultimate capacity, overall stability under wind and seismic loadings, and the settlement and differential settlements.
The comprehensive program of pile load testing that was undertaken, which included grouted and non-grouted piles to a maximum load of 64MN, is presented and "Class A" predictions of the axial load-settlement behaviour are compared with the measured behavior. The settlements of the towers observed during construction are also compared with those predicted.
INTRODUCTION settlements with those measured during construction.
Over the past two decades, piled raft foundations have become increasingly recognized and employed as an effective foundation system under appropriate circumstances. Considerable stimulus has been given to piled raft use by their adoption in cities such as Frankfurt, London and Dubai (Sommer et al, 1985, Katzenbach et al, 1998, Hemsley, 2000, Mandolini et al, 2005, Poulos and Davids, 2005)
This paper will outline briefly a design process for piled raft foundations and will consider the advantages of using this type of foundation system as compared to a conventional piled foundation. It will then describe the design and independent verification analyses carried out for the piled raft foundation system of the world's tallest building, the Bun Dubai. The pile testing program to verify the predicted pile performance will be outlined, and finally, some limited information will be presented on the measured settlements of the building during construction.
This paper describes the foundation design and verification processes, and the results of the pile load testing programs. It also compares the predicted
PILED RAFT FOUNDATIONS
Foundation Concept
Piled raft foundations utili7e piled support for control of settlements with piles providing most of the stiffness at serviceability loads, and the raft element providing additional capacity at ultimate loading. A geotechnical assessment for design of such a foundation system therefore needs to consider not only the capacity of the pile elements and the raft elements, but their combined capacity and interaction under serviceability loading. This section sets out some of the basic design issues to be considered in piled raft design, and some of the characteristics of behaviour that are found from numerical analyses.
Design Issues
As with any foundation system, a design of a piled raft foundation requires the consideration of a number of issues, including:
H.G. Poulos
IGS — Ferroco Terzaghi Oration 2008
1. Ultimate load capacity for vertical, lateral and moment loadings
2. Maximum settlement 3. Differential settlement 4. Raft shears and moments, for the structural
design of the raft 5. Pile loads and moments, for the structural
design of the piles.
In much of the available literature, emphasis has been placed on the bearing capacity and settlement under vertical loads. While this is a critical aspect, and is considered in detail herein, the other issues must also be addressed. In some cases, the pile requirements may be governed by the overturning moments applied by wind loading, rather than the vertical dead and live loads.
Alternative Design Philosophies
Randolph (1994) has defined clearly three different design philosophies with respect to piled rafts:
• The "conventional approach", in which the piles are designed as a group to carry the major part of the load, while making some allowance for the contribution of the raft, primarily to ultimate load capacity.
• "Creep Piling", in which the piles are designed to operate at a working load at which significant creep starts to occur, typically 70-80% of the ultimate load capacity. Sufficient piles are included to reduce the net contact pressure between the raft and the soil to below the preconsolidation pressure of the soil.
• Differential settlement control, in which the piles are located strategically in order to reduce the differential settlements, rather than to substantially reduce the overall average settlement.
In addition, there is a more extreme version of creep piling, in which the full load capacity of the piles is utilized, i.e. some or all of the piles operate at 100% of their ultimate load capacity. This gives rise to the concept of using piles primarily as settlement reducers, while recognizing that they also contribute to increasing the ultimate load capacity of the entire foundation system.
Clearly, the latter approaches are most conducive to economical foundation design. However, it should be emphasized that the design methods to be
discussed allow any of the above design philosophies to be implemented.
Figure 1 illustrates, conceptually, the load-settlement behaviour of piled rafts designed according to the various strategies. Curve 0 shows the behaviour of the raft alone, which in this case settles excessively at the design load. Curve 1 represents the conventional design philosophy, for which the behaviour of the pile-raft system is governed by the pile group behaviour, and which may be largely linear at the design load. In this case, the piles take the great majority of the load. Curve 2 represents the case of creep piling where the piles operate at a lower factor of safety, but because there are fewer piles, the raft carries more load than for Curve 1. Curve 3 illustrates the strategy of using the piles as settlement reducers, and utilizing the full capacity of the piles at the design load. Consequently, the load-settlement may be nonlinear at the design load, but nevertheless, the overall foundation system has an adequate margin of safety, and the settlement criterion is satisfied. Therefore, the design depicted by Curve 3 is acceptable and is likely to be considerably more economical than the designs depicted by Curves 1 and 2.
Curve 0: raft only (settlement excessive)
Curve 1: raft with pile designed for conventional safety factor
Curve 2: raft with piles designed for lower safety factor
Curve 3: raft with piles designed for full utilization of capacity
Fig. 1 Load — Settlement curves for various piled raft design philosophies
Favourable and Unfavourable Circumstances for Piled Rafts
The most effective application of piled rafts occurs when the raft can provide adequate load capacity, but the settlement and/or differential settlements of the raft alone exceed the allowable values. Poulos (2001) has examined a number of idealized soil profiles, and found that the following situations may
Load
Design load
Piles & raft
Piles yielding
yielding
3 No
yield
Allowable settlement
Settlement
H.G. Poulos 2

IGS — Ferroco Terzaghi Oration 2008
be favourable:
• Soil profiles consisting of relatively stiff clays • Soil profiles consisting of relatively dense
sands.
In both circumstances, the raft can provide a significant proportion of the required load capacity and stiffness, with the piles acting to "boost" the performance of the foundation, rather than providing the major means of support.
Conversely, there are some situations which are unfavourable, including:
• Soil profiles containing soft clays near the surface
• Soil profiles containing loose sands near the surface
• Soil profiles which contain soft compressible layers at relatively shallow depths
• Soil profiles which are likely to undergo consolidation settlements
• Soil profiles which are likely to undergo swelling movements due to external causes.
In the first two cases, the raft may not be able to provide significant load capacity and stiffness, while in the third case, long-term settlement of the compressible underlying layers may reduce the contribution of the raft to the long-term stiffness of the foundation. The latter two cases should be treated with considerable caution. Consolidation settlements (such as those due to dewatering or shrinking of an active clay soil) may result in a loss of contact between the raft and the soil, thus increasing the load on the piles, and leading to increased settlement of the foundation system. In the case of swelling soils, substantial additional tensile forces may be induced in the piles because of the action of the swelling soil on the raft. Theoretical studies of these latter situations have been described by Poulos (1993) and Sinha and Poulos (1999).
The Design Process
It is suggested that a rational design process for piled rafts involves three main stages:
• A preliminary stage to assess the feasibility of using a piled raft, and the required number of piles to satisfy design requirements.
• A second stage to assess where piles are required and the general characteristics of the piles.
• A final detailed design stage to obtain the optimum number, location and configuration of the piles, and to compute the detailed distributions of settlement, bending moment and shear in the raft, and the pile loads and moments.
The first and second stages may involve relatively simple calculations which can usually be performed without a complex computer program. Poulos (2001) gives details of some methods that may be employed for each of the above design stages.
Once the preliminary stage has indicated that a piled raft foundation is feasible, and an indication has been obtained of the likely piling requirements, it is necessary to carry out a more detailed design in order to assess the detailed distribution of settlement and decide upon the optimum locations and arrangement of the piles. The raft bending moments and shears, and the pile loads, should also be obtained for the structural design of the foundation.
The detailed stage will generally demand the use of a suitable computer program which accounts in a rational manner for the interaction among the soil, raft and piles. The effect of the superstructure may also need to be considered. Several methods of analyzing piled rafts have been developed, and some of these have been summarized by Poulos et al (1997). The less simplified methods of numerical analysis tend to fall into the following categories:
• Methods employing a "strip on springs" approach, in which the raft is represented by a series of strip footings, and the piles are represented by springs of appropriate stiffness (e.g. Poulos, 1991)
• Methods employing a "plate on springs" approach, in which the raft is represented by a plate and the piles as springs (e.g. Clancy and Randolph, 1996; Poulos, 1994; Russo and Viggiani, 1998; Viggiani, 1998; Anagnastopoulos and Georgiadis, 1998)
• Boundary element methods, in which both the raft and the piles within the system are discretized, and use is made of elastic theory (e.g. Butterfield and Banerjee, 1971; Kuwabara, 1989; Sinha, 1997)
• Methods combining boundary element analysis for the piles and finite element analysis for the
H.G. Poulos 3
IGS — Ferroco Terzaghi Oration 2008
raft (e.g. Hain and Lee, 1978; Ta and Small, 1996; Franke et al, 1994)
• Simplified finite element analyses, usually involving the representation of the foundation system as a plane strain problem (Desai,1974) or an axi-symmetric problem (Hooper, 1974)
• Three-dimensional finite element analyses (e.g. Zhuang et al, 1991: Lee, 1993; Wang, 1995; Katzenbach et al, 1998).
It was found that, despite some differences among the various methods, most of those which incorporate nonlinear behaviour give somewhat similar results, although there are significant differences among the computed raft bending moments. However, it would appear that, provided the analysis method is soundly based and takes into account the limited load capacity of the piles, similar results may be expected for similar parameter inputs.
Some Characteristics of Piled Raft Behaviour
Poulos (2001) has examined some of the characteristics of behaviour of piled rafts and the effect of the following factors on this behaviour:
1. The number of piles 2. The nature of the loading (concentrated versus
uniformly distributed) 3. Raft thickness 4. Applied load level.
The following important points have been noted for practical design:
• Increasing the number of piles, while generally of benefit, does not always produce the best foundation performance, and there is an upper limit to the number of piles, beyond which very little additional benefit is obtained.
• The raft thickness affects differential settlement and bending moments, but has little effect on load sharing or maximum settlement.
• For control of differential settlement, optimum performance is likely to be achieved by strategic location of a relatively small number of piles, rather than using a large number of piles evenly distributed over the raft area, or increasing the raft thickness.
• The nature of the applied loading is important for differential settlement and bending moment, but is generally not very important for maximum settlement or load-sharing between the raft and the piles.
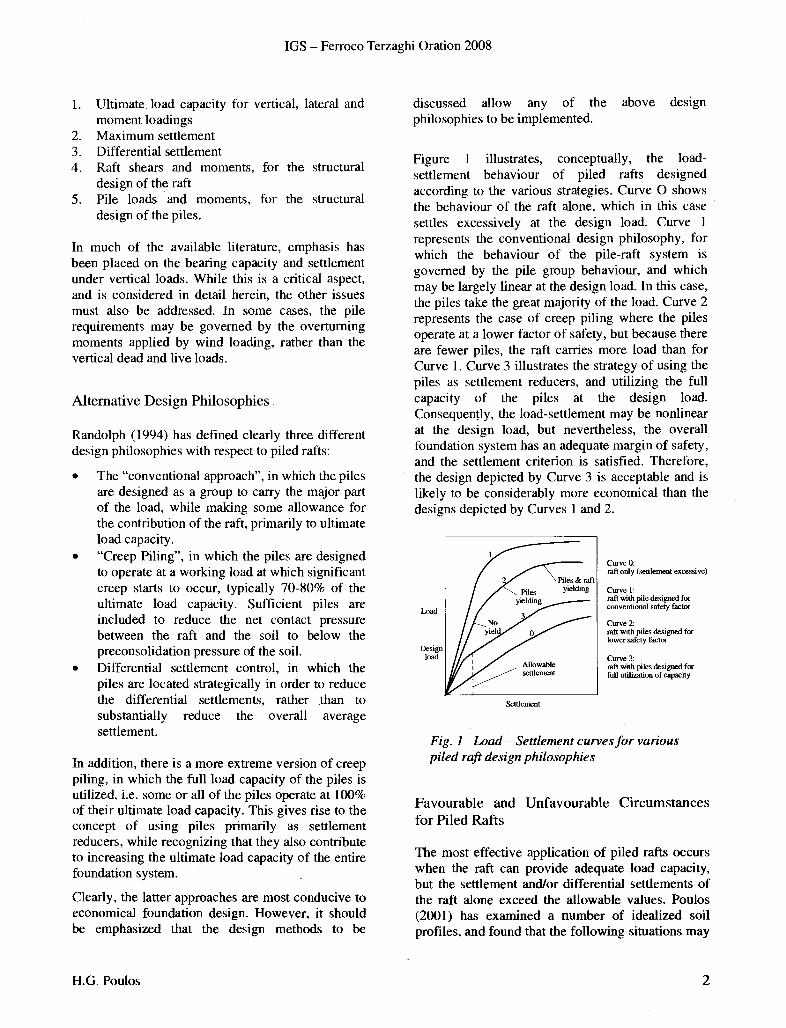
It has also been found that the performance of a piled raft foundation can be optimized by selecting suitable locations for the piles below the raft. In general, the piles should be concentrated in the most heavily loaded areas, while the number of piles can be reduced, or even eliminated, in less heavily loaded areas (Horikoshi and Randolph, 1998). An interesting example of pile location optimization is presented by Fadaee and Rowhani (2006), who considered a square raft with a square line load as shown in Figure 2. The authors compared the computed distribution of settlement for two pile arrangements: 25 piles uniformly distributed across the raft, and the arrangement concentrated in the vicinity of the line load, as shown in Figure 2. Figure 3 compares the computed settlement distributions, and clearly demonstrates a dramatic reduction in differential settlement with the latter pile arrangement.
Line Load • Optimal Piles Arrangement
• • • • • •
• •
•• •
• • • • • • •
• • •
• • II • •
Fig. 2 Piled raft example and optimal pile arrangement (Fadaee and Rowhani, 2006).
H.G. Poulos 4

15
E E
20
A
25
0
5
10
15
20
X (m)
IGS — Ferroco Terzaghi Oration 2008
results obtained by Katzenbach et al (1998) indicate that the piles within the piled raft foundation develop more than twice the shaft resistance of a single isolated pile or a pile within a normal pile group, with the centre piles showing the largest values. Thus, the usual design procedures for a piled raft, which assume that the ultimate pile capacity is the same as that for an isolated pile, will tend to be conservative, and the ultimate capacity of the piled raft foundation system will be greater than that assumed in design.
Fig. 3 Computed settlement profiles across piled raft (Fadaee and Rowhani, 2006)
Some useful further insights into piled raft behaviour have been obtained by Katzenbach et al (1998) who carried out three-dimensional finite element analyses of various piled raft configurations. They used a realistic elasto-plastic soil model with dual yield surfaces and a non-associated flow rule. They analyzed a square raft containing from 1 to 49 piles, as well as a raft alone, and examined the effects of the number and relative length of the piles on the load-sharing between the piles and the raft, and the settlement reduction provided by the piles. An interaction diagram was developed, relating the relative settlement (ratio of the settlement of the piled raft to the raft alone) to the number of piles and their length-to-diameter ratio, L/d. This diagram clearly shows that, for a given number of piles, the relative settlement is reduced as L/d increases. It was also found that there is generally very little benefit to be obtained in using more than about 20 piles or so, a conclusion which is consistent with the results obtained by Poulos (2001).
An interesting aspect of piled raft behaviour, which cannot be captured by simplified analyses such as GARP, is that the ultimate shaft friction developed by piles within a piled raft can be significantly greater than that for a single pile or a pile in a conventional pile group. This is because of the increased normal stresses generated between the soil and the pile shaft by the loading on the raft. The
THE BURJ DUBAI TOWER
The Burj Dubai project in Dubai comprises the construction of an approximately 160 storey high rise tower, with a podium development around the base of the tower, including a 4-6 storey garage. The Burj Dubai Tower is now the world's tallest building, and is founded on a 3.7m thick raft supported on bored piles, 1.5 m in diameter, extending approximately 50m below the base of the raft. Figure 4 shows an artist's impression of the completed tower. The site is generally level and site levels are related to Dubai Municipality Datum (DMD).
The client for the project is Emaar, a leading developer based in Dubai. The Architects and Structural Engineers for the project were Skidmore Owings and Merrill LLP (SOM) in Chicago. Hyder Consulting (UK) Ltd (HCL) were appointed geotechnical consultant for the works by Emaar and carried out the design of the foundation system and an independent peer review has been undertaken by Coffey Geosciences (Coffey). The following sections describe the foundation design and verification processes, and the results of the pile load testing programs. It also compares the predicted settlements with those measured during construction.
Although its final height remains a closely guarded secret, the Burj Dubai has reached a height of well over 600m as at the beginning of 2008. The 280,000 m2 reinforced concrete tower will be utilized for
H.G. Poulos 5

IGS — Ferroco Terzaghi Oration 2008
multiple purposes, including retail hotel, residential and office spaces. The building is 'Y' shaped in plan, to reduce the wind forces on the tower and to keep the structure relatively simple and aid constructability. Baker et al (2007) describe the structural system as a "buttressed core". Each wing has its own high-performance concrete corridor walls and perimeter columns, and buttresses the others via a six-sided central core or hexagonal hub. As a consequence, the tower is very stiff laterally and torsionally. The structural aspects are described by Baker et al (2007), while Smith (2008) provides an architectural perspective of the building. The structural design has involved a three dimensional model consisting of the reinforced concrete walls, link beams, slabs, raft and piles, together with the steel structural steel system. Gravity, wind and seismic loadings have been considered. According to Baker et al (2007), under lateral wind loading, the building deflections are assessed to be well below commonly used criteria. Dynamic analyses have indicated a period of 11.3 s for the first lateral mode of vibration, a period of 10.2s for the second mode, with the fifth mode (torsional motion) having a period of 4.3s.
The construction of the Burj Dubai has utilized the latest advancements in construction techniques and material technology. 80 MPa and 60 MPa concrete, with flyash, the higher strength being used for the lower portion of the structure. The walls have been formed using an automatic self-climbing formwork system, and the circular nose columns have been formed with steel forms, while the floor slabs have been poured on to special formwork. The wall reinforcement has been fabricated on the ground in 8m sections to allow for rapid placement. The central core and slabs have been cast first, in three sections: the wing walls and slabs then have followed, and after them, the wing nose and slabs have followed. Concrete has been pumped by specially designed pumps, capable of pumping to heights of 600m in a single stage. A special GPS system was developed to monitor the verticality of the structure during construction.
Fig 4: Impression of Burj Dubai when Complete
GEOTECHNICAL INVESTIGATION & TESTING PROGRAM
Geology of Dubai
The geology of the Arabian Gulf area has been substantially influenced by the deposition of marine sediments resulting from a number of changes in sea level during relatively recent geological time. The country is generally relatively low-lying (with the exception of the mountainous regions in the north-east of the country), with near-surface geology dominated by deposits of Quaternary to late Pleistocene age, including mobile Aeolian dune sands, evaporite deposits and marine sands.
H.G. Poulos 6
IGS — Ferroco Terzaghi Oration 2008
Dubai is situated towards the eastern edge of the geologically stable Arabian Plate and is separated from the unstable Iranian Fold Belt to the north by the Arabian Gulf. The site is therefore considered to be located within a seismically active area.
Geotechnical Investigation Program
The geotechnical investigation was carried out in four phases as follows:
Phase 1 (main investigation): 23 boreholes, in situ SPT's, 40 pressuremeter tests in 3 boreholes, installation of 4 standpipe piezometers, laboratory testing, specialist laboratory testing and contamination testing — 1st June to 23rd July 2003;
Phase 2 (main investigation): 3 geophysical boreholes with cross-hole and tomography geophysical surveys carried out between 3 new boreholes and 1 existing borehole — 7th to 25th August, 2003;
Phase 3: 6 boreholes, in situ SPT's, 20 pressuremeter tests in 2 boreholes, installation of 2 standpipe piezometers and laboratory testing — 16th September to 10th October 2003;
Phase 4: 1 borehole, in situ SPT's, cross-hole geophysical testing in 3 boreholes and down-hole geophysical testing in 1 borehole and laboratory testing.
The drilling was carried out using cable percussion techniques with follow-on rotary drilling methods to depths between 30m and 140m below ground level. The quality of core recovered in some of the earlier boreholes was somewhat poorer than that recovered in later boreholes, and therefore the defects noted in the earlier rock cores may not have been representative of the actual defects present in the rock mass. Phase 4 of the investigation was targeted to assess the difference in core quality and this indicated that the differences were probably related to the drilling fluid used and the overall quality of drilling.
Disturbed and undisturbed samples and split spoon samples were obtained from the boreholes. Undisturbed samples were obtained using double tube core barrels (with Coreliner) and wire line core barrels producing core varying in diameter between 57mm and 108.6mm.
Standard Penetration Tests (SPTs) were carried out at various depths in the boreholes and were generally carried out in the overburden soils, in weak rock or soil bands encountered in the rock strata.
Pressuremeter testing, using an OYO Elastmeter, was carried out in 5 boreholes between depths of about 4m to 60m below ground level typically below the Tower footprint.
The geophysical survey comprised cross-hole seismic survey, cross-hole tomography and down-hole geophysical survey. The main purpose of the geophysical survey was to complement the borehole data and provide a check on the results obtained from borehole drilling, in situ testing and laboratory testing.
The cross-hole seismic survey was used to assess compression (P) and shear (S) wave velocities through the ground profile. Cross-hole tomography was used to develop a detailed distribution of P-wave velocity in the form of a vertical seismic profile of P-wave with depth, and highlight any variations in the nature of the strata between boreholes. Down-hole seismic testing was used to determine shear (S) wave velocities through the ground profile.
Laboratory Testing
The geotechnical laboratory testing program consisted of two broad classes of test:
1. Conventional tests, including moisture content, Atterberg limits, particle size distribution, specific gravity, unconfined compressive strength, point load index, direct shear tests, and carbonate content tests.
2. Sophisticated tests, including stress path triaxial, resonant column, cyclic undrained triaxial, cyclic simple shear and constant normal stiffness (CNS) direct shear tests. These tests were undertaken by a variety of commercial, research and university laboratories in the UK, Denmark and Australia.
H.G. Poulos 7

Strata 1 (Sand)
• Borehole 2 - Pressmen.. Reload 1
01 Borehole 2 - Pressuremeter Reload 2
• Borehole 3 • Preasuremeter Rebel 1
O Borehole 3 - Preasuremeter Rented 2
Borehraer • - Press•emeter Reload 1
Borehole • - Pr...remoter Reload 2
• Borehole 25 - Pressuromel. Reload 1
O Borehole 25 - Prossurenteter • 2
• Borehole 28 • Presaistemater Reload 1
O Borehole 28 - Presair.mrner Reload 2
• Stress Path Tel et 0.01% strain
• Stress Pe. 141 at 0.1% strain
Cl Resonant Column at 0 0001% Orem
A Resonant Co.mn al 0 001% Wain
O R
esonant Column 0 01% strain
— Geoollysios E Valuea (owe./
—adopted Small Strain Design Values
Fig 5: Modulus Values vs Elevation
Proposed Ncolinear Gard Strata Characteristics
0.02 Dim 0.06
0.06
0.1 0.12 0.14
Strain
—Stoats 2 — Strata 3a — Strata 3b """' Strata 3c & 4 —Seas 5a, 5b, 6,7
IGS — Ferroco Terzaghi Oration 2008
GEOTECHNICAL CONDITIONS
30 00
-40.
-6000 -60.00
0.0
0.00 The ground conditions comprise a horizontally stratified subsurface profile which is complex and highly variable, due to the nature of deposition and the prevalent hot and climatic conditions. Medium dense to very loose granular silty sands (Marine Deposits) are underlain by successions of very weak to weak sandstone interbedded with very weakly cemented sand, gypsiferous fine grained sandstone/siltstone and weak to moderately weak conglomerate/calcisiltite.
Groundwater levels were generally high across the site and excavations were likely to encounter groundwater at approximately +0.0m DMD (approximately 2.5m below ground level). Overall, the ground conditions encountered in the investigation were consistent with the available geological information.
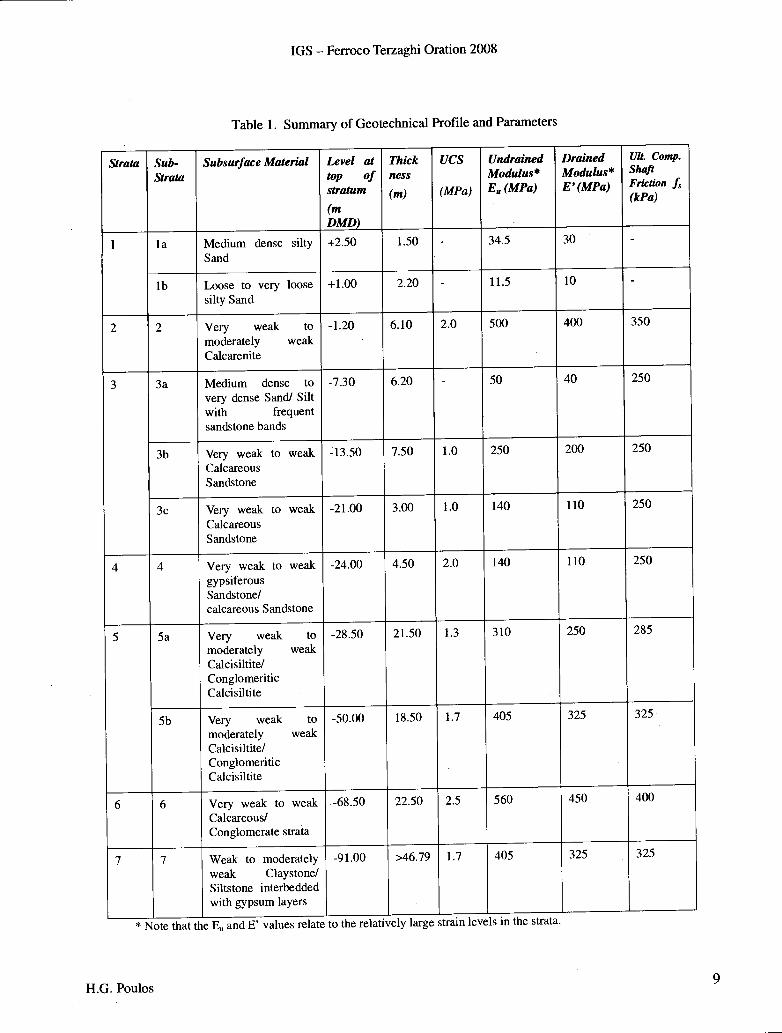
The ground profile and derived geotechnical design parameters assessed from the investigation data are summarized in Table 1.
E Valuitpilloa)
50000
10000.0 15000 0
20000 0
25000 0
• e,
15 • Strata 2 (Cake...
0• • 0
0 ----1
-6- e
1 '1
Strata 3a (Sand)
Strata 30 (5arMstetel
O
tra 3c ISand1
Strata 4 (Synisiferous Sandstone)
0 •
• • Strata Sa (Cal..., cong.mentic Calusatite)
. I
1 I
•
•
11
Slate 50 (Caki5iIltlei congionieritic Calcientite)
../3
Strata 6 • (Calcareous/ Congiorned. St's.)
Stiffness values from the pressuremeter reload cycle, the specialist tests and the geophysics are presented in Figure 5. There is a fair correlation between the estimated stiffness profiles from the pressuremeter and the specialist testing results at small strain levels. Non-linear stress-strain responses were derived for each strata type using the results from the SPT's, the pressuremeter, the geophysics and the standard and specialist laboratory testing. Best estimate and maximum design curves were generated and the best estimate curves are presented in Figure 6.
An assessment of the potential for degradation of the stiffness of the strata under cyclic loading was carried out through a review of the CNS and cyclic triaxial specialist test results, and also using the computer program SHAKE91 (Idriss and Sun, 1992) for potential degradation under earthquake loading. The results indicated that there was a potential for degradation of the mass stiffness of the materials but limited potential for degradation of the pile-soil interface. An allowance for degradation of the mass stiffness of the materials has been incorporated in the derivation of the non-linear curves in Figure 6.
Fig 6: Non-linear Stress-strain Curves
H.G. Poulos 8
IGS - Ferroco Terzaghi Oration 2008
Table 1. Summary of Geotechnical Profile and Parameters
Strata Sub- Strata
Subsurface Material Level at top of stratum
(m DMD)
Thick ness (m)
UCS
(MPa)
Undrained Modulus* E. (MPa)
Drained Modulus* E' (MPa)
Ult. Comp. Shaft Friction f, (kPa)
1 la Medium dense silty Sand
+2.50 1.50 34.5 30 -
lb Loose to very loose silty Sand
+1.00 2.20 - 11.5 10 -
2 2 Very weak to moderately weak Calcarenite
-1.20 6.10 2.0 500 400 350
3 3a Medium dense to very dense Sand/ Silt with frequent sandstone bands
-7.30 6.20 - 50 40 250
3b Very weak to weak Calcareous Sandstone
-13.50 7.50 1.0 250 200 250
3c Very weak to weak Calcareous Sandstone
-21.00 3.00 1.0 140 110 250
4 4 Very weak to weak gypsiferous Sandstone/ calcareous Sandstone
-24.00 4.50 2.0 140 110 250
5 5a Very weak to moderately weak Calcisiltite/ Conglomeritic Calcisiltite
-28.50 21.50 1.3 310 250 285
5b Very weak to moderately weak Calcisiltite/ Conglomeritic Calcisiltite
-50.00 18.50 1.7 405 325 325
6 6 Very weak to weak Calcareous/ Conglomerate strata
-68.50 22.50 2.5 560 450 400
7 7 Weak to moderately weak Claystone/ Siltstone interbedded with gypsum layers
-91.00
.
>46.79 1.7
.
405 325 325
H.G. Poulos 9

IGS — Ferroco Terzaghi Oration 2008
GEOTECHNICAL MODELS AND ANALYSES
The foundation system selected for the tower was a piled raft, designed according to the conventional approach for piled raft foundation design (see Section 2 above), i.e. with most of the load being carried by the piles, but with some contribution coming from the raft. A number of analyses were used to assess the response of the foundation for the Burj Dubai Tower and Podium. The main design model by Hyder UK was developed using a Finite Element (FE) program ABAQUS run by a specialist company KW Ltd, based in the UK. Other models were developed to validate and correlate the results from the ABAQUS model using software programs comprising REPUTE (Geocentrix, 2002), PIGLET (Randolph, 1996) and VDISP (OASYS Geo, 2001).
The ABAQUS model comprised a detailed foundation mesh of 500m by 500m by 90m deep. The complete model incorporated a 'far field' coarse mesh of 1500m by 1500m by 300m deep. A summary of the model set up is as follows:
Soil Strata: Modeled as Von Mises material (pressure independent), based on non-linear stress-strain curvesTower Piles: Modeled as beam elements connected to the soil strata by pile-soil interaction elements. Class A load-settlement predictions were used to calibrate the elements; Podium Piles: Beam elements fully bonded to the soil strata; Tower and Podium Loadings: Applied as concentrated loadings at the column locations; Tower raft submerged weight: Applied as a uniformly distributed load; Tower Shearing Action: Applied as a body load to the tower raft elements, in a direction to coincide with the appropriate wind action assumed; Building Stiffness Effect: Superstructure shear walls (not interrupted at door openings) were modeled as a series of beam elements overlaid on the tower raft elements. The moment of inertia was modified to simulate the stiffening effect of the tower, as specified by SOM.
FOUNDATION DESIGN
An assessment of the foundations for the structure was carried out and it was clear that piled foundations would be appropriate for both the
Tower and Podium construction. An initial assessment of the pile capacity was carried out using the following design recommendations given by Horvath and Kenney (1979), as presented by Burland and Mitchell (1989):
Ultimate unit shaft resistance f, = 0.25 (qu) 0.5
where f, is in kPa, and qu = uniaxial compressive strength in MN/m2 .
The adopted ultimate compressive unit shaft friction values for the various site rock strata are tabulated in Table 1. The ultimate unit pile skin friction of a pile loaded in tension was taken as half the ultimate unit shaft resistance of a pile loaded in compression.
The assessed pile capacities were provided to SOM and they then supplied details on the layout, number and diameter of the piles. Tower piles were 1.5m diameter and 47.45m long with the tower raft founded at -7.55mDMD. The podium piles were 0.9m diameter and 30m long with the podium raft being founded at -4.85mDMD. The thickness of the raft was 3.7m. Loading was provided by SOM and comprised 8 load cases including four load cases for wind and three for seismic conditions.
The initial ABAQUS runs indicated that the strains in the strata were within the initial small strain region of the non-linear stress strain curves developed for the materials. The secant elastic modulus values at small strain levels were therefore adopted for the validation and sensitivity analyses carried out using PIGLET and REPUTE. A non-linear analysis was carried out in VDISP using the non-linear stress strain curves developed for the materials.
Linear and non-linear analyses were carried out to obtain predictions for the load distribution in. the piles and for the settlement of the raft and podium.
The settlements from the FE analysis model and from VDISP have been converted from those for a flexible pile cap to those for a rigid pile cap for comparison with the REPUTE and PIGLET models using the following general equation and are shown in Table 2:
Brigid = 1/2 (6 centre + 8 edge)flexible
H.G. Poulos 10

IGS — Ferroco Terzaghi Oration 2008
Gratifyingly, the settlements from the FEA model correlated acceptably well with the results obtained from REPUTE, PIGLET and VDISP.
A sensitivity analysis was carried out using the FE analysis model and applying the maximum design soil strata non-linear stress-strain relationships. The results from the stiffer soil strata response gave a 28% reduction in Tower settlement for the combined dead load, live load and wind load case analyzed, from 85mm to 61mm
The maximum and minimum pile loadings were obtained from the FE analysis for all loading combinations. The maximum loads were at the corners of the three "wings" and were of the order of 35 MN, while the minimum loads were within the center of the group and were of the order of 12-13 MN. Figure 7 shows contours of the computed maximum axial load. The impact of cyclic loading on the pile was an important consideration and in order to address this, the load variation above or below the dead load plus live load cases was determined. The maximum load variation was found to be less than 10 MN.
SOM carried out an analysis of the pile loads and a comparison on the results indicates that although the maximum pile loads are similar, the distribution is different. The SOM calculations indicated that the largest pile loads are in the central region of the Tower piled raft and decreasing towards the edges. However, the FE analyses indicated the opposite where the largest pile loads are concentrated towards the edges of the pile group reducing towards the centre of the group. Similarly, the PIGLET and REPUTE standard pile group analyses carried out indicated that the largest pile loads are concentrated towards the edge of the pile cap.
The difference between the pile load distributions could be attributed to a number of reasons including:
The FE, REPUTE and PIGLET models take account of the pile-soil-pile interaction whereas SOM modelled the soil as springs connected to the raft and piles using an S-Frame analysis.
•
The HCL FE analysis modelled the soil/rock using non-linear responses compared to the linear spring stiffnesses assumed in the SOM analysis.
The specified/assumed superstructure stiffening effects on the foundation response were modelled more accurately in the SOM analysis.
In reality the actual pile load distribution is expected to be somewhere between the two models depending on the impact of the different modeling approaches.
Table 2. Computed Settlements from Analyses
Analysis Method
Locidease Settlement mm
Flexible Rigid
FEA Tower Only
(DL+LL)
56 66
REPUT
E
Tower Only
(DL+LL)
45 -
PIGLET Tower Only
(DL+LL)
62 -
VDISP Tower Only
(DL+LL)
46 72
Fig 7: Contours of Maximum Axial Load (kN)
H.G. Poulos 11
IGS — Ferroco Terzaghi Oration 2008
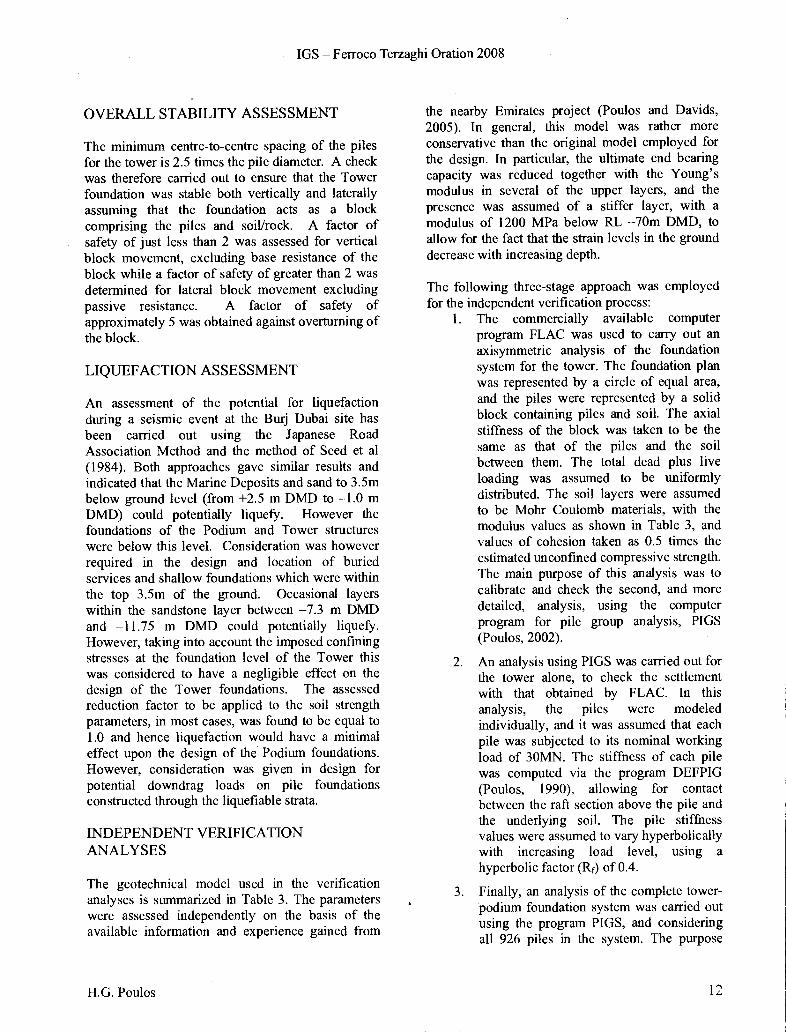
OVERALL STABILITY ASSESSMENT
The minimum centre-to-centre spacing of the piles for the tower is 2.5 times the pile diameter. A check was therefore carried out to ensure that the Tower foundation was stable both vertically and laterally assuming that the foundation acts as a block comprising the piles and soil/rock. A factor of safety of just less than 2 was assessed for vertical block movement, excluding base resistance of the block while a factor of safety of greater than 2 was determined for lateral block movement excluding passive resistance. A factor of safety of approximately 5 was obtained against overturning of the block.
LIQUEFACTION ASSESSMENT
An assessment of the potential for liquefaction during a seismic event at the Burj Dubai site has been carried out using the Japanese Road Association Method and the method of Seed et al (1984). Both approaches gave similar results and indicated that the Marine Deposits and sand to 3.5m below ground level (from +2.5 m DMD to —1.0 m DMD) could potentially liquefy. However the foundations of the Podium and Tower structures were below this level. Consideration was however required in the design and location of buried services and shallow foundations which were within the top 3.5m of the ground. Occasional layers within the sandstone layer between —7.3 m DMD and —11.75 m DMD could potentially liquefy. However, taking into account the imposed confining stresses at the foundation level of the Tower this was considered to have a negligible effect on the design of the Tower foundations. The assessed reduction factor to be applied to the soil strength parameters, in most cases, was found to be equal to 1.0 and hence liquefaction would have a minimal effect upon the design of the Podium foundations. However, consideration was given in design for potential downdrag loads on pile foundations constructed through the liquefiable strata.
INDEPENDENT VERIFICATION ANALYSES
The geotechnical model used in the verification analyses is summarized in Table 3. The parameters were assessed independently on the basis of the available information and experience gained from
the nearby Emirates project (Poulos and Davids, 2005). In general, this model was rather more conservative than the original model employed for the design. In particular, the ultimate end bearing capacity was reduced together with the Young's modulus in several of the upper layers, and the presence was assumed of a stiffer layer, with a modulus of 1200 MPa below RL —70m DMD, to allow for the fact that the strain levels in the ground decrease with increasing depth.
The following three-stage approach was employed for the independent verification process:
1. The commercially available computer program FLAC was used to carry out an axisymmetric analysis of the foundation system for the tower. The foundation plan was represented by a circle of equal area, and the piles were represented by a solid block containing piles and soil. The axial stiffness of the block was taken to be the same as that of the piles and the soil between them. The total dead plus live loading was assumed to be uniformly distributed. The soil layers were assumed to be Mohr Coulomb materials, with the modulus values as shown in Table 3, and values of cohesion taken as 0.5 times the estimated unconfined compressive strength. The main purpose of this analysis was to calibrate and check the second, and more detailed, analysis, using the computer program for pile group analysis, PIGS (Poulos, 2002).
2. An analysis using PIGS was carried out for the tower alone, to check the settlement with that obtained by FLAC. In this analysis, the piles were modeled individually, and it was assumed that each pile was subjected to its nominal working load of 30MN. The stiffness of each pile was computed via the program DEFPIG (Poulos, 1990), allowing for contact between the raft section above the pile and the underlying soil. The pile stiffness values were assumed to vary hyperbolically with increasing load level, using a hyperbolic factor (Rf) of 0.4.
3. Finally, an analysis of the complete tower-podium foundation system was carried out using the program PIGS, and considering all 926 piles in the system. The purpose
H.G. Poulos 12

IGS — Ferroco Terzaghi Oration 2008
was to obtain pile axial stiffness values for the structural designers. In this analysis, each of the piles was subjected to its nominal working load.
Table 3. Summary of Geotechnical Model for Independent Verification Analyses
Stratum Number
Description RL Range DMD
Undrained Modulus Eu MPa
Drained Modulus E' MPa
Ultimate Skin Friction kPa
Ultimate End Bearing MPa
1 a Med. Dense silty sand +2.5 to 30 25 - +1.0
1b Loose-v.loose silty to _1.0 12.5 10 - - sand —1.2
2 Weak-mod. Weak -1.2 to 400 325 400 4.0 calcarenite —7.3
3 V. weak calc. -7.3 to 190 150 300 3.0 Sandstone -24
4 V. weak-weak -24 to 220 175 360 3.6 sandstone/calc. —28.5 Sandstone
5A V. weak-weak-mod. -28.5 to 250 200 250 2.5 Weak calcisiltite/conglom.
—50
5B V. weak-weak-mod. -50 to — 275 225 275 2.75 Weak calcisiltite/conglom
70
6 Calcareous siltstone -70 & 500 400 375 3.75 below
FLAC & PIGS Results for the Tower Alone
Because of the difference in shape between the actual foundation and the equivalent circular foundation, only the central (maximum) settlement was considered for comparison purposes. The following results were obtained for the central settlement:
FLAC analysis, using an equivalent block to represent the piles: 72.9mm
PIGS analysis, modeling all 196 piles: 74.3mm
Thus, despite the quite different approaches adopted, the computed settlements were in remarkably good
agreement. It should be noted that the computed settlement is influenced by the assumptions made regarding the ground properties below the pile tips. For example, if in the PIGS analysis the modulus of the ground below RL-70m DMD was taken as 400
MPa (rather than 1200 MPa), the computed settlement at the centre of the tower would increase to about 96 mm.
PIGS Results for Tower & Podium
Figure 8 shows the contours of computed settlement for the entire area. It can be seen that the maximum settlements are concentrated in the central area of the tower.
H.G. Poulos
13

70
30
20
10
I 40
IGS — Ferroco Terzaghi Oration 2008
70
60
50
40
30
20
10
Figure 9 shows the settlement profile across a section through the centre of the tower. The notable feature of this figure is that the settlements reduce rapidly outside the tower area, and become of the order of 10-12 mm for much of the podium area.
The settlements of the tower computed from the independent verification process agreed reasonably well with those obtained for the original design, as reported above.
!SO
•14.*1
Fig 8: Computed Settlement Contours for Tower and Podium
P313 Px7 121151•193 POI PM PSI PE NUM
POP flt,
30 . -80 . -03 -40 , -20 1 I
D 23 aKJ 60 SD 11 0 . 120 , 140
:
.8 . ,S...
10 -80 -03 -40 -20 0 2n 43
*Imo au
60 13E) 100 120 140
Fig 9: Computed Settlement Across Section Through Centre of Tower
CYCLIC LOADING EFFECTS
The possible effects of cyclic loading were investigated via the following means:
• Cyclic triaxial laboratory tests;
• Cyclic direct shear tests; • Cyclic Constant Normal Stiffness (CNS)
laboratory tests; • Via an independent theoretical analysis
carried out by the independent verifier.
The cyclic triaxial tests indicated that there was some potential for degradation of stiffness and accumulation of excess pore pressure, while the direct shear tests indicated a reduction in residual shear strength, although these were carried out using large strain levels which are not representative of the likely field conditions.
The CNS tests indicated that there was not a significant potential for cyclic degradation of skin friction, provided that the cyclic shear stress remained within the anticipated range.
The independent analysis of cyclic loading effects was undertaken using the approach described by Poulos (1988), and implemented via the computer program SCARP (Static and Cyclic Axial Response of Piles). This analysis involved a number of simplifying assumptions, together with parameters that were not easily measured or estimated from available data. As a consequence, the analysis was indicative only. Since the analysis of the entire foundation system was not feasible with SCARP, only a typical pile (assumed to be a single isolated pile) with a diameter of 1.5m and a length of 48m was considered. The results were used to explore the relative effects of the cyclic loading, with respect to the case of. static loading.
It was found that a loss of capacity would be experienced when the cyclic load exceeded about ± 10MN. The maximum loss of capacity (due to degradation of the skin friction) was of the order of 15-20%. The capacity loss was relatively insensitive to the mean load level, except when the mean load exceeded about 30 MN. It was predicted that, at a mean load equal to the working load and under a cyclic load of about 25% of the working load, the relative increase in settlement for 10 cycles of load would be about 27%.
The indicative pile forces calculated from the ABAQUS finite element analysis of the structure suggested that cyclic loading of the Burj Tower foundation would not exceed ± 10MN. Thus, it seemed reasonable to assume that the effects of
H.G. Poulos
14

IGS — Ferroco Terzaghi Oration 2008
cyclic loading would not significantly degrade the axial capacity of the piles, and that the effects of cyclic loading on both capacity and settlement were unlikely to be significant.
PILE LOAD TESTING
Two programs of static load testing were undertaken for the Bud Dubai project:
• Static load tests on seven trial piles prior to foundation construction.
• Static load tests on eight works piles, carried out during the foundation construction phase (i.e. on about 1% of the total number of piles constructed).
In addition, dynamic pile testing was carried out on 10 of the works piles for the tower and 31 piles for the podium, i.e. on about 5% of the total works piles. Sonic integrity testing was also carried out on a number of the works piles. Attention here is focused on the static load tests.
Preliminary Pile Testing Program
The details of the piles tested within this program are summarized in Table 4. The main purpose of the tests was to assess the general load-settlement behaviour of piles of the anticipated length below the tower, and to verify the design assumptions. Each of the test piles was different, allowing various factors to be investigated, as follows:
• The effects of increasing the pile shaft length;
• The effects of shaft grouting; • The effects of reducing the shaft
diameter; • The effects of uplift (tension) loading; • The effects of lateral loading; • The effect of cyclic loading.
The piles were constructed using polymer drilling fluid, rather than the more conventional bentonite drilling fluid. As will be shown below, the use of the polymer appears to have led to piles whose performance exceeded expectations.
Strain gauges were installed along each of the piles, enabling detailed evaluation of the load transfer along the pile shaft, and the assessment of the distribution of mobilized skin friction with depth along the shaft. The reaction system provided for the axial load tests consisted of four or six adjacent
reaction piles (depending on the pile tested), and these reaction piles had the potential to influence the results of the pile load tests via interaction with the test pile through the soil. The possible consequences of this are discussed subsequently.
Table 4. Summary of Pile Load Tests — Preliminary Pile Testing
Pile No.
Pile Main. in
Pile Length ril
Side Grouted )
Test Type
TP1 1.5 45.15 No Compression
TP2 1.5 55.15 No Compression
TP3 1.5 35.15 Yes Compression
TP4 0.9 47.10 No Compression (cyclic)
TP5 0.9 47.05 Yes Compression
TP6 0.9 36.51 No Tension
TP7A 0.9 37.51 No Lateral
Ultimate Axial Load Capacity
None of the 6 axial pile load tests appears to have reached its ultimate axial capacity, at least with respect to geotechnical resistance. The 1.5m diameter piles (TP1, TP2 and TP3) were loaded to twice the working load, while the 0.9m diameter test piles TP4 and TP6 were loaded to 3.5 times the working load, and TP5 was loaded to 4 times working load. With the exception of TP5, none of the other piles showed any strong indication of imminent geotechnical failure. Pile TP5 showed a rapid increase in settlement at the maximum load, but this was attributed to structural failure of the pile itself. From a design viewpoint, the significant finding was that, at the working load, the factor of safety against geotechnical failure appeared to be in excess of 3, thus giving a comfortable margin of safety against failure, especially as the raft would also provide additional resistance to supplement that of the piles.
Ultimate Shaft Friction
From the strain gauge readings along the test piles, the mobilized skin friction distribution along each pile was evaluated. Figure 10 summarizes the ranges
H.G. Poulos 15

100
loins SW MDT. Tim (IST
200 300 400 SOD
-7111 TP2 TP4 —11140107. —Fran PPT Prcgram - - Sepia LBWS
IGS — Ferroco Terzaghi Oration 2008
of skin friction deduced from the measurements, together with the original design assumptions and the modified design recommendations made after the preliminary test results were evaluated. The following comments can be made:
• The skin friction values down to about RL-30m DMD appear to be ultimate values, i.e. the available skin friction has been fully mobilized.
• The skin friction values below about RL-30m DMD do not appear to have been fully mobilized, and thus were assessed to be below the ultimate values.
• The original assumptions appear to be comfortably conservative within the upper part of the ground profile.
• Shaft grouting appeared to enhance the skin friction developed along the pile.
Because the skin friction in the lower part of the ground profile does not appear to have been fully mobilized, it was recommended that the original values (termed the "theoretical ultimate unit skin friction") be used in the lower strata. It was also recommended that the "theoretical" values in the top layers (Strata 2 and 3a) be used because of the presence of the casing in the tests would probably have given skin friction values that may have been too low. For Strata 3b, 3c and 4, the minimum measured skin friction values were used for the final design.
Ultimate End Bearing Capacity
None of the load tests was able to mobilize any significant end bearing resistance, because the skin friction appeared to be more than adequate to resist loads well in excess of the working load. Therefore, no conclusions could be reached about the accuracy of the estimated end bearing component of pile capacity. For the final design, the length of the piles was increased where the proposed pile toe levels were close to or within the gypsiferous sandstone layer (Stratum 4). It was considered prudent to have the pile toes founded below this stratum, to allow for any potential long-term degradation of engineering properties of this layer (e.g. via solution of the gypsum) that could reduce the capacity of the piles.
Fig 10: Measured and Design Values of Shaft Friction
Table 5. Summary of Pile Load Test Results — Axial Loading
Pile Number Working Load MN
Max.. Load MN
Settlement at .
W Load .mm Settlemen at Mat Lid mm
Stiffne at .
WMN/rn
Stiffnes at Max: Load
MN/m —TP1 30.13 60.26 7.89 21.26 3819 2834
TP2 30.13 60.26 5.55 16.85 5429 3576
TP3 30.13 60.26 5.78 20.24 5213 2977
TP4 10.1 35.07 4.47 26.62 2260 1317
TP5 10.1 40.16 3.64 27.45 2775 1463
TP6 -1.0 -3.5 -0.65 -4.88 1536 717
H.G. Poulos 16

IGS — Ferroco Terzaghi Oration 2008
Load-Settlement Behaviour
Table 5 summarises the measured pile settlements at the working load and at the maximum test load, and the corresponding values of pile head stiffness (load/settlement). The following observations are made:
• The measured stiffness values are relatively large, and are considerably in excess of those anticipated.
• As expected, the stiffness is greater for the larger diameter piles.
• The stiffness of the shaft grouted piles (TP3 and TP5) is greater than that of the corresponding ungrouted piles.
Effect of Reaction Piles
On the basis of the experience gained in the nearby Emirates Project (Poulos and Davids, 2005) site), it had been expected that the pile head stiffness values for the Burj Dubai piles would be somewhat less than those for the Emirates Towers, in view of the apparently inferior quality of rock at the Burj Dubai site. This expectation was certainly not realized, and it is possible that the improved performance of the piles in the present project may be attributable, at least in part, to the use of polymer drilling fluid, rather than bentonite, in the construction process. However, it was also possible that at least part of the reason for the high stiffness values is related to the interaction effects of the reaction piles. When applying a compressive load to the test pile, the reaction piles will experience a tension and a consequent uplift, which will tend to reduce the settlement of the test pile. Thus, the apparent high stiffness of the pile may not reflect the true stiffness of the pile beneath the structure. The mechanisms of such interaction are discussed by Poulos (2000).
Pile Axial Stiffness Predictions
"Class A" predictions of the anticipated load-settlement behaviour were made prior to the construction of the preliminary test piles. The designer used the finite element program ABAQUS, while the independent verifier used the computer program PIES (Poulos, 1989). No allowance was made for the effects of interaction from the reaction piles. There was close agreement between the predicted curves for the 1.5m diameter piles extending to RL-50m, but for the 0.9m diameter piles
extending to RL-40m, the agreement was less close, with the designer predicting a somewhat softer behaviour than the independent verifier.
The measured load-settlement behaviour was considerably stiffer than either of the predictions. This is shown in Figure 11, which compares the measured stiffness values with the predicted values, at the working load. As mentioned above, the high measured stiffness may be, at least partly, a consequence of the effects of the adjacent reaction piles. An analysis of the effects of these reaction piles on the settlement of pile TP1 revealed that the presence of the reaction piles could reduce the settlement at the working load of 30MN by 30%. In other words, the real stiffness of the piles might be only about 70% of the values measured from the load test. This would then reduce the stiffness to a value which is more in line with the stiffness values experienced in the Emirates project, where the reaction was provided by a series of inclined anchors that would have had a very small degree of interaction with the test piles.
U
▪
t.
Fig 11: Measured and Predicted Pile Head Stiffness Values
Uplift versus Compression Loading
On the basis of the tension test on pile TP6, the ultimate skin friction in tension was taken as 0.5 times that for compression. It is customary to allow for a reduction in skin friction for piles in granular soils or rocks subjected to uplift. De Nicola and Randolph (1993) have developed a theoretical relationship between the tensile and compressive skin friction values, and have shown that this relationship depends on the Poisson's ratio of the pile, the relative
H.G. Poulos 17

IGS — Ferroco Terzaghi Oration 2008
stiffness of the pile to the soil, the interface friction characteristics and the pile length to diameter ratio. This theoretical relationship was applied to the Burj Dubai case, and the calculated ratio of tension to compression skin friction was about 0.6, which was reasonably consistent with the assumption of 0.5 made in the design.
Cyclic Loading Effects
In all of the axial load tests, a relatively small number of cycles of loading was applied to the pile after the working load was reached. Table 6 summarizes the test results inferred from the load-settlement data. The settlement after cycling was related to the settlement for the first cycle, both settlements being at the maximum load of the cycling process. It can be seen that there is an accumulation of settlements under the action of the cyclic loading, but that this accumulation is relatively modest, given the relatively high levels of mean and cyclic stress that have been applied to the pile (in all cases, the maximum load reached is 1.5 times the working load).
These results are consistent with the assessments made during design that cyclic loading effects would be unlikely to be significant for this building.
Table 6. Summary of Displacement Accumulation for Cyclic Loading
Pile Number
Mean Load/P„
Cyclic Loorl/P,,
No. of Cycles (N)
SO I
TP1 1.0 ±0.5 6 1.12
TP2 1.0 ±0.5 6 1.25
TP3 1.0 ±0.5 6 1.25
TP4 1.25 ±0.25 9 1.25
TP5 1.25 ±0.25 6 1.3
TP6 1.0 ±0.5 6 1.1
Note: Pw = working load; SN = settlement after N cycles; 51=settlement after 1 cycle
Lateral Loading
One lateral load test was carried out, on pile TP7A, with the pile being loaded to twice the working load (50t). At the working lateral load of 25t, the lateral deflection was about 0.47mm, giving a lateral stiffness of about 530 MN/m, a value which was consistent with the designer's predictions using the program ALP (Oasys, 2001). An analysis of lateral deflection was also carried out by the independent verifier using the program DEFPIG. In this latter analysis, the Young's modulus values for lateral loading were assumed to be 30% less than the values for axial loading, while the ultimate lateral pile-soil pressure was assumed to be similar to the end bearing capacity of the pile, with allowances being made for near-surface effects. These calculations indicated a lateral movement of about 0.7mm at 25t load, which is larger than the measured deflection, but of a similar order.
Thus, pile TP7A appeared to perform better than anticipated under the action of lateral loading, mirroring the better-than-expected performance of the test piles under axial load. However, there may again have been some effect of the reaction system used for the test, as the reaction block will develop a surface shear which will tend to oppose the lateral deflection of the test pile.
Works Pile Testing Program
A total of eight works pile tests were carried, including two 1.5m diameter piles and six 0.9m diameter piles. All pile tests were carried out in compression, and each pile was tested approximately 4 weeks after construction. The piles were tested to a maximum load of 1.5 times the working load.
The following observations were made from the test results:
• The pile head stiffness of the works piles was generally larger than for the trial piles.
• None of the works piles reached failure, and indeed, the load-settlement behaviour up to 1.5 times the working load was essentially linear, as evident from the relatively small difference in stiffness between the stiffness values at the working load and 1.5 times the working load. In contrast, the relative difference between the two stiffnesses was
H.G. Poulos 18

IGS — Ferroco Terzaghi Oration 2008
considerably greater for the preliminary trial piles.
At least three possible explanations could be offered for the greater stiffness and improved load-settlement performance of the trial piles:
1. The level of the bottom of the casing was higher for the works piles than for the trial piles (about 3.5-3.6 m higher), thus leading to a higher skin friction along the upper portion of the shaft;
2. A longer period between the end of construction and testing of the works piles (about 4 weeks, versus about 3 weeks for the trial piles);
3. Natural variability of the strata.
Cyclic loading was undertaken on two of the works piles, and it was observed that there was a relatively small amount of settlement accumulation due to the cyclic loading, and certainly less than that observed on TP1 or the other trial piles (see Table 6). The smaller amount of settlement accumulation could be attributed to the lower levels of mean and cyclic loading applied to the works piles (which were considered to be more representative of the design condition) and also to the greater capacity that the works piles seem to possess. Thus, the results of these tests reinforced the previous indications that the cyclic degradation of capacity and stiffness at the pile — soil interface appeared to be negligible.
In summary, both the preliminary test piling program and the tests on the works piles provided very positive and encouraging information on the capacity and stiffness of the piles. The measured pile head stiffness values were well in excess of those predicted. The interaction effects between the test piles and the reaction piles may have contributed to the higher apparent pile head stiffnesses, but the piles nevertheless exceeded expectations. The capacity of the piles also appeared to be in excess of the predicted values, although none of the tests fully mobilized the available geotechnical resistance. The works piles performed even better than the preliminary trial piles, and demonstrated almost linear load-settlement behaviour up to the maximum test load of 1.5 times working load.
Shaft grouting appeared to have enhanced the load-settlement response of the piles, but it was assessed that shaft grouting would not need to be carried out
for this project, given the very good performance of the ungrouted piles.
The inferences from the pile load test data are that the design estimates of capacity and settlement may be conservative, although it must be borne in mind that the overall settlement behaviour (and perhaps the overall load capacity) are dependent not only on the individual pile characteristics, but also on the characteristics of the ground within the zone of influence of the structure.
SETTLEMENT PERFORMANCE DURING CONSTRUCTION
The settlement of the Tower raft has been monitored since completion of concreting. The stress conditions within the raft have been determined with the placement of strain rosettes at the top and base of the raft. In addition three pressure cells have been placed at the base of the raft and five piles have been strain gauged to determine the load distribution between and down the pile. This paper presents only the current situation on the settlement. It is hoped to present the results from the strain gauges at a later date.
A summary of the settlements to February 2008 in Wing C is shown on Figure 12 which also shows the final predicted settlement profile from the design. At this time, the majority of the dead loading would have been applied to the foundation, and the maximum settlement measured was about 43mm. It will be seen that the measured settlements are less than those predicted during the design process However, there remains some dead and live load to be applied to the foundation system, and it should also be noted that the monitored figures do not include the impact of the raft, cladding and live loading which will total in excess of 20% of the overall mass. Extrapolating for the full dead plus live load, it might be anticipated that the final settlement will be of the order of 55-60mm, which is comfortably less than the predicted final settlement of about 70-75mm
Figure 13 shows contours of measured settlement. The general distribution is similar to that predicted by the various analyses.
H.G. Poulos 19

Settlement in Wing C
Distance aiong wing moss-section (m)
0 20 40 60
--•- 77-Jun-06
16-Jul06
16-Aug-06 80 1BSep-06
16-0c1-06
-•- 141bv-06
19-Dee-06
—16-Jan-07
- 19-Feb-07
18-Mat-07
12-Jul-07
• 14Aug07
17-Sep-07
— 17-0d-07
—14-Nov-07
17-Dee-07 — 18Feb-06
— design
0
-10
-20 E E
O -4° • _50 • .60
-70
-80
-90
Fig 12: Measured and Computed Settlements for Wing C.
is substantially greater than the foundation settlements.
waver 800001. 0. irq r Xli twos
Inbmpse amit0 —r04 aw Serseave ett Cseire Itlietteu lifloaq2441044, •••• -fa* 6411041110 CM% 1011f1 6411111W14.4jare
U 910 US NA SU vanoomp...te.0
Fig. 14Predicted Vertical Shortening of Tower at 30 Years After Casting (Baker et al, 2007)
278793
278792
278791
277
2787
2707
27078
273784, 493990 494000 494010 494020 494030 494040 494030 494060 4940 70 494080 494090
IGS — Ferroco Terzaghi Oration 2008
Fig. 13 Contours of Measured Settlement as at February 2008
To put the foundation settlements into perspective, reference can be made to Figure 14, which shows the computed shortening of the structure after 30 years (Baker et al, 2007). It can be seen that the shortening
CONCLUSIONS
This paper has outlined the processes for design of piled raft foundations, and has then set out how these processes have been followed in the design of the piled raft foundations for the Burj Dubai, and also in the independent verification of the design. The ground conditions at the site comprise a horizontally stratified subsurface profile which is complex whose properties are highly variable with depth. A piled raft foundation system, with the piles socketed into weak rock, has been employed and the design of the foundation is found to be governed primarily by the tolerable settlement of the foundation rather than the overall allowable bearing capacity of the foundation. The capacity of the piles is derived mainly from the skin friction developed between the pile concrete and rock, although limited end bearing capacity is likely to be provided by the very weak to weak rock at depth.
The estimated maximum settlement of the tower foundation, calculated using the various analysis tools are in reasonable agreement, with predicted settlements of the tower ranging from 45mm to 75mm. These results are considered to be within an acceptable range.
H.G. Poulos 20

IGS — Ferroco Terzaghi Oration 2008
The maximum settlement predicted by ABAQUS for the tower and podium foundation compares reasonably well with the maximum settlement estimated by the revised PIGS analysis carried out during the independent verification process.
There is a potential for a reduction in axial load capacity and stiffness of the foundation strata under cyclic loading; but based on the pile load test data, laboratory tests and on theoretical analyses, it would appear that the cyclic degradation effects at the pile-soil interface are relatively small.
Both the preliminary test piling program and the tests on the works piles have provided very positive and encouraging information on the capacity and stiffness of the piles.
The measured pile head stiffness values have been well in excess of those predicted, and those expected on the basis of the experience with the nearby Emirates Towers. However, the interaction effects between the test piles and the reaction piles may have contributed to the higher apparent pile head stiffnesses. The capacity of the piles also appears to be in excess of that predicted, and none of the tests appears to have fully mobilized the available geotechnical resistance.
The works piles have performed even better than the preliminary trial piles, and have demonstrated almost linear load-settlement behaviour up to the maximum test load of 1.5 times working load.
The settlements measured during construction are consistent with, but slightly smaller than, those predicted, and overall, the performance of the piled raft foundation system has exceeded expectations to date.
ACKNOWLEDGEMENTS
The Author would like to thank Mr Grahame Bunce, Mr Kamiran Ibrahim, Ms Catherine Murrells and Ms Louise Baker from Hyder, and Frances Badelow and Muliadi Merry from Coffey, for their invaluable contributions to the design and review of the foundation for the Burj Tower. The author would also like to thank Mr Bill Baker, Mr Stan Korista and Mr Larry Novak of SOM for their inputs and useful discussions through the design period.
REFERENCES
Anagnostopoulos, C. and Georgiadis, M. (1998). A simple analysis of Piles in Raft Foundations". Geot. Eng., Vol. 29 (1), 71-83.
Baker, W.F., Korista, D.S. and Novak, L.C. (2007). "Btuj Dubai: Engineering the World's Tallest Building". Struct. Design Tall Spec. Buildings, Wiley Interscience, 16: 361-375.
Burland, J. B., & Mitchell, J. M. (1989). Piling and Deep Foundations. Proc. Int. Conf. on Piling and Deep Foundations, London, May 1989.
Clancy, P. and Randolph, M.F. (1996). "Simple Design Tools for Piled Raft Foundations". Geotechnique, 46(2): 313-328.
De Nicola, A. and Randolph, M.F. (1993). "Tensile and compressive shaft capacity of piles in sand". kit. Geot. Eng., ASCE, Vol.119 (12): 1952-1973.
Fleming, W. G. K., Weltman, A. J., Randolph, M.F. , Elson, W. K. (1994). Piling Engineering.
Geocentrix Ltd. (2002). "Repute Version 1 Reference Manual".
Fadaee, M.J. and Rowhani, M. (2006). "Optimization of Piled Raft Foundations Using Generic Algorithm and Neural Networks". 10th East Asia Pacific Conf. on Struct. Eng. and Constrn., Bangkok.
Hemsley, J.A. (2000)."Design Applications of Raft Foundations". Thomas Telford, London.
Horikoshi, K. and Randolph, M.F. (1998). "Optimum Design of Piled Rafts". Geotechnique 48(3): 301-317.
Horvath, R. and Kenney, T.C. (1979). "Shaft resistance of rock-socketed drilled piers". Presented at ASCE Annual Convention, Atlanta, GA, preprint No. 3698.
Idriss, I.M, Sun, J.I. (1992). "User's Manual for SHAKE91", Structures Division, Building and Fire Research Laboratory, National Institute of Standards and Technology, Gaithersburg, Maryland and Center for Geotechnical Modeling, Department of Civil &
H.G. Poulos 21
IGS - Ferroco Terzaghi Oration 2008
Environmental Engineering, University of California, Davis, California. Horikoshi, K. amd Randolph, M.F. (1998). "A Contribution to the Optimum Design of Piled Rafts". Geotechnique, 48(2): 301-317.
Katzenbach, R., ArsIan, U., Moorman, C. and Reul, 0. (1998). "Piled Raft Foundations: Interaction Between Piles and Raft". Darmstadt Geotechnics, Darmstadt University of Technology, 4: 279-296.
Mandolini, A., Russo, G. and Viggiani, C. (2005). "Pile Foundations: Experimental investigations, analysis and design". Proc. 16th Int. Conf. Soil Mechs. Geot. Eng., Osaka, Millpress, Rotterdam, 1: 177-213.
OASYS Geo (2001), "ALP 17 GEO Suite for Windows".
OASYS Geo (2001), "VDISP 17 GEO Suite for Windows".
Poulos, H.G. (1988). "Cyclic Stability Diagram for Axially Loaded Piles". Jnl. Geot. Eng., ASCE, Vol. 114 (8): 877-895.
Poulos, H.G. (1989). "PIES User's Manual". Centre for Geotechnical Research, University of Sydney, Australia.
Poulos, H.G. (1990). "DEFPIG Users Manual". Centre for Geotechnical Research, University of Sydney, Australia.
Poulos, H.G. (1991). "Analysis of Piled Strip Foundations". Computer Methods and Advances in Geomechanics, Ed. G. Beer, J.R. Booker and J.P. Carter, Balkema, Rotterdam, 1: 183-191.
Poulos, H.G. (1993). "Piled Rafts in Swelling or Consolidating Soils". Jnl. Geot. Eng., ASCE, 119 (2): 374-380.
Poulos, H.G. (2000). "Pile testing - from the designer's viewpoint". STATNAMIC Loading Test '98, Kusakabe, Kuwabara & Matsumoto (eds), Balkema, Rotterdam, 3-21.
Poulos, H.G. (2001). "Piled Rafts - Design and Applications". Geotechnique,
Poulos, H.G. (2002). "Prediction of Behaviour of Building Foundations due to Tunnelling Operations". Proc. 3rd Int. Symp. On Geot. Aspects of Tunnelling in Soft Ground, Toulouse, Preprint Volume, 4.55-4.61.
Poulos, H.G. and Davids, A.J. (2005). "Foundation Design for the Emirates Twin Towers, Dubai". Can. Geot. Jnl., 42: 716-730.
Randolph, M.F. (1996), "PIGLET Analysis and Design of Pile Groups". The University of Western Australia Seed, H.B., Tokimatsu, K., Harder, L.F. and Chung, R.M. (1984). "The influence of SPT procedure in soil liquefaction resistance evaluation". EERC-84/15, Univ. of California, Berkeley.
Russo, G. and Viggiani, C. (1998). "Factors Controlling Soil-Structure Interaction for Piled Rafts". Darmstadt Geotechnics, Darmstadt Univ. of Technology, No. 4, 297-322.
Sinha, J. and Poulos, H.G. (1999). "Piled Raft Systems and Free Standing Pile Groups in Expansive Soils". Proc. 8th Australia-New Zealand Conf. Geomechanics, Hobart, Aust. Geomechs. Society, 1: 207-212.
Smith, A. (2008). "Burj Dubai: Designing the World's Tallest". CTBUH 8th World Congress, Dubai.
Sommer, H., Wittmann, P. and Ripper, P. (1985). Piled Raft Foundation of a Tall Building in Frankfurt Clay. Proc. 11 ICSMFE, San Francisco, 4: 2253-2257.
Viggiani, C. (1998). "Pile Groups and Piled Rafts Behaviour". Deep Founds. on Bored and Auger Piles, BAP III, van Impe and Haegman (eds), Balkema, Rotterdam, 77-90.
Zhang, L. and Einstein, H. (1998). End bearing capacity of drilled shafts in rock. Jnl. Geot. Eng., ASCE, 124(7): 574-584.
H.G. Poulos 22