Approaches to Mauerpark fleamarket spatial dynamics (Berlin, 2005-2006)
Upload
independentCategory
view
0download
0

CPSC Hotline: 1-800-638-CPSC(2772) CPSC's Web Site: http://www.cpsc.gov
2005-2006 ELECTROCUTIONS ASSOCIATED WITH CONSUMER PRODUCTS∗
Matthew V. Hnatov Hazard Analysis Division
Directorate for Epidemiology June 2010
∗ This analysis was prepared by the CPSC staff. It has not been reviewed or approved by, and may not necessarily reflect the views of, the Commission.
1
Executive Summary This report provides information about the estimated number of unintentional electrocutions associated with the use of consumer products in 2005 and 2006 and companion statistics since 2002. This report was prepared by U.S. Consumer Product Safety Commission (CPSC) staff. It is important to note that the electrocution incidents covered in this report were associated with a consumer product but not necessarily caused by the product1
.
Some of the key findings in this report are:
• There was an estimated average of 70 electrocution fatalities2
associated with consumer products per year over the three-year period from 2004 through 2006 with an estimated 90 consumer product-related electrocutions in 2005 and 50 in 2006.
• The age-adjusted death rate for electrocutions due to consumer product use was 0.31 and 0.15 per million population for 2005 and 2006, respectively, with the three-year average from 2004 through 2006 being 0.22. Tests indicate that there is no statistical evidence of a trend in the electrocution death rate from 2002 to 2006.
• Victim age appears to be a factor in electrocution incidents. There were nearly twice as
many electrocutions to victims 40 through 59 years old than there were to victims 19 years of age and younger even though the U.S. population in these age groups is roughly equal.
• There were greater than five times more estimated consumer product-related
electrocutions to males than to females over the years 2002 through 2006.
• The three most common product categories associated with electrocutions over the three-year period 2004 – 2006 were “Large Appliances”, “Small Appliances”, and “Power Tools”.
1 Not all of these fatalities are addressable by an action the CPSC could take; however, it was not the purpose of this report to evaluate the addressability of the incidents but rather to update the estimates of the number of consumer productassociated electrocutions. 2 Estimated electrocutions are rounded to the nearest 10.
2
Introduction This report was prepared by U.S. Consumer Product Safety Commission (CPSC) staff and contains estimates of the number of non-work-related electrocutions involving consumer products and the corresponding age-adjusted death rates from 2002 through 2006. National estimates of consumer product-related electrocutions are derived from in-scope death certificate records contained in CPSC databases. An in-scope case is any accidental electrocution in which a consumer product was involved (e.g., power drill or microwave oven) and that was not work-related. CPSC records contain the majority of death certificates identified as electrocutions. The National Center for Health Statistics (NCHS) has records of every electrocution which occurred in the United States. NCHS records, however, lack product information. National estimates are generated by scaling or projecting CPSC records using NCHS record totals. This report contains annual estimates for consumer product-related electrocutions for 2002 through 2006. The three-year average of the latter three years is also presented. In addition, this report presents a breakdown of consumer product-related electrocutions by age group and gender as well as age-adjusted mortality rates for direct comparison of year to year data. Finally, there is a breakdown by product category (e.g., Large Appliance or Power Tool).
3
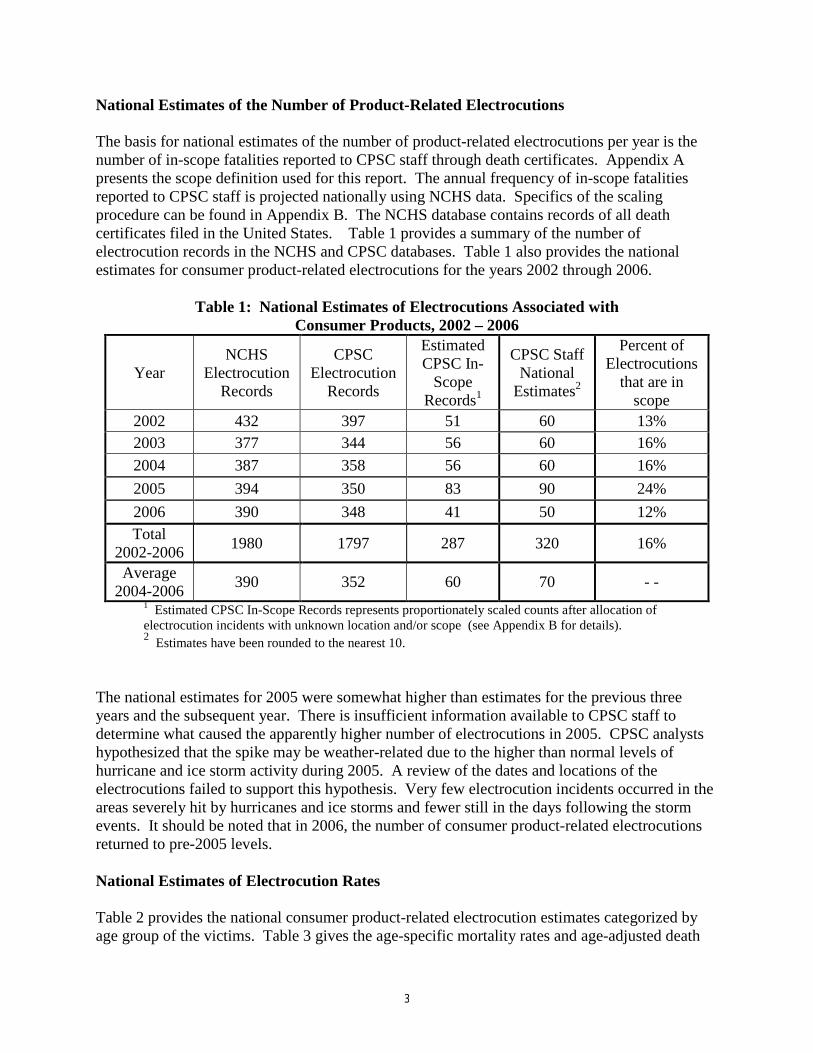
National Estimates of the Number of Product-Related Electrocutions The basis for national estimates of the number of product-related electrocutions per year is the number of in-scope fatalities reported to CPSC staff through death certificates. Appendix A presents the scope definition used for this report. The annual frequency of in-scope fatalities reported to CPSC staff is projected nationally using NCHS data. Specifics of the scaling procedure can be found in Appendix B. The NCHS database contains records of all death certificates filed in the United States. Table 1 provides a summary of the number of electrocution records in the NCHS and CPSC databases. Table 1 also provides the national estimates for consumer product-related electrocutions for the years 2002 through 2006.
Table 1: National Estimates of Electrocutions Associated with Consumer Products, 2002 – 2006
Year NCHS
Electrocution Records
CPSC Electrocution
Records
Estimated CPSC In-
Scope Records1
CPSC Staff National
Estimates2
Percent of Electrocutions
that are in scope
2002 432 397 51 60 13% 2003 377 344 56 60 16% 2004 387 358 56 60 16% 2005 394 350 83 90 24% 2006 390 348 41 50 12% Total
2002-2006 1980 1797 287 320 16%
Average 2004-2006 390 352 60 70 - -
1 Estimated CPSC In-Scope Records represents proportionately scaled counts after allocation of electrocution incidents with unknown location and/or scope (see Appendix B for details). 2 Estimates have been rounded to the nearest 10.
The national estimates for 2005 were somewhat higher than estimates for the previous three years and the subsequent year. There is insufficient information available to CPSC staff to determine what caused the apparently higher number of electrocutions in 2005. CPSC analysts hypothesized that the spike may be weather-related due to the higher than normal levels of hurricane and ice storm activity during 2005. A review of the dates and locations of the electrocutions failed to support this hypothesis. Very few electrocution incidents occurred in the areas severely hit by hurricanes and ice storms and fewer still in the days following the storm events. It should be noted that in 2006, the number of consumer product-related electrocutions returned to pre-2005 levels. National Estimates of Electrocution Rates Table 2 provides the national consumer product-related electrocution estimates categorized by age group of the victims. Table 3 gives the age-specific mortality rates and age-adjusted death
4
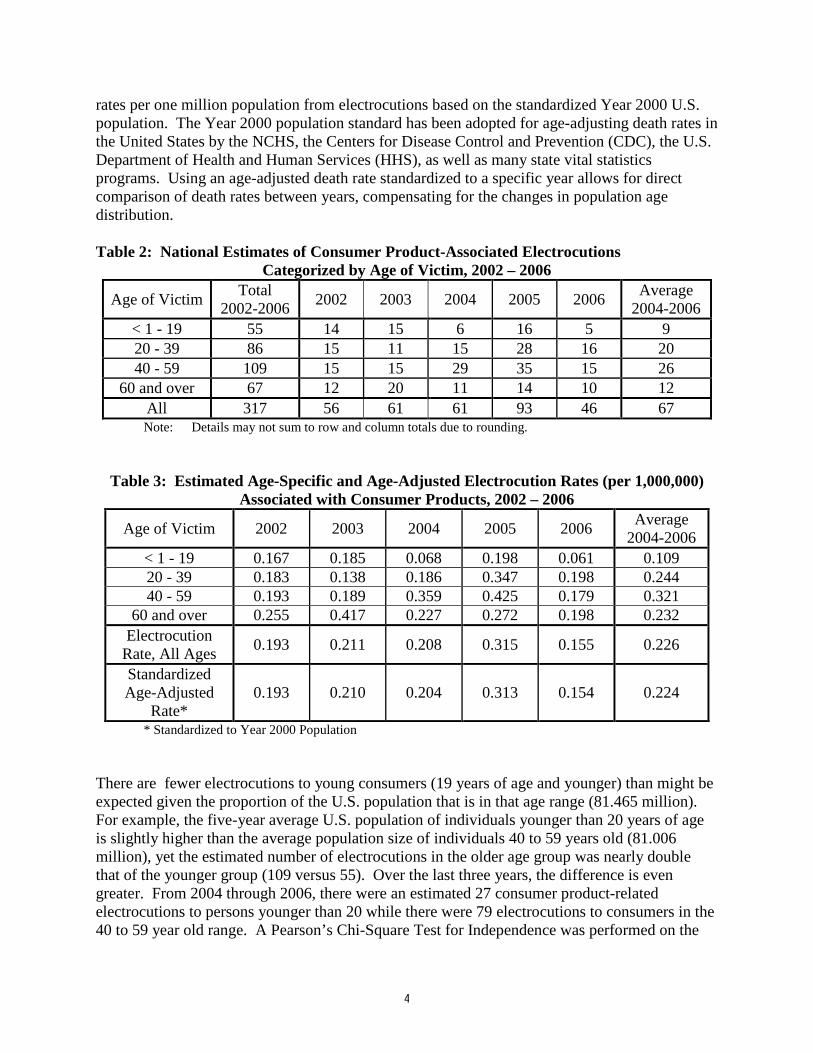
rates per one million population from electrocutions based on the standardized Year 2000 U.S. population. The Year 2000 population standard has been adopted for age-adjusting death rates in the United States by the NCHS, the Centers for Disease Control and Prevention (CDC), the U.S. Department of Health and Human Services (HHS), as well as many state vital statistics programs. Using an age-adjusted death rate standardized to a specific year allows for direct comparison of death rates between years, compensating for the changes in population age distribution. Table 2: National Estimates of Consumer Product-Associated Electrocutions
Categorized by Age of Victim, 2002 – 2006
Age of Victim Total 2002-2006 2002 2003 2004 2005 2006 Average
2004-2006 < 1 - 19 55 14 15 6 16 5 9 20 - 39 86 15 11 15 28 16 20 40 - 59 109 15 15 29 35 15 26
60 and over 67 12 20 11 14 10 12 All 317 56 61 61 93 46 67 Note: Details may not sum to row and column totals due to rounding.
Table 3: Estimated Age-Specific and Age-Adjusted Electrocution Rates (per 1,000,000) Associated with Consumer Products, 2002 – 2006
Age of Victim 2002 2003 2004 2005 2006 Average 2004-2006
< 1 - 19 0.167 0.185 0.068 0.198 0.061 0.109 20 - 39 0.183 0.138 0.186 0.347 0.198 0.244 40 - 59 0.193 0.189 0.359 0.425 0.179 0.321
60 and over 0.255 0.417 0.227 0.272 0.198 0.232 Electrocution
Rate, All Ages 0.193 0.211 0.208 0.315 0.155 0.226
Standardized Age-Adjusted
Rate* 0.193 0.210 0.204 0.313 0.154 0.224
* Standardized to Year 2000 Population
There are fewer electrocutions to young consumers (19 years of age and younger) than might be expected given the proportion of the U.S. population that is in that age range (81.465 million). For example, the five-year average U.S. population of individuals younger than 20 years of age is slightly higher than the average population size of individuals 40 to 59 years old (81.006 million), yet the estimated number of electrocutions in the older age group was nearly double that of the younger group (109 versus 55). Over the last three years, the difference is even greater. From 2004 through 2006, there were an estimated 27 consumer product-related electrocutions to persons younger than 20 while there were 79 electrocutions to consumers in the 40 to 59 year old range. A Pearson’s Chi-Square Test for Independence was performed on the
5
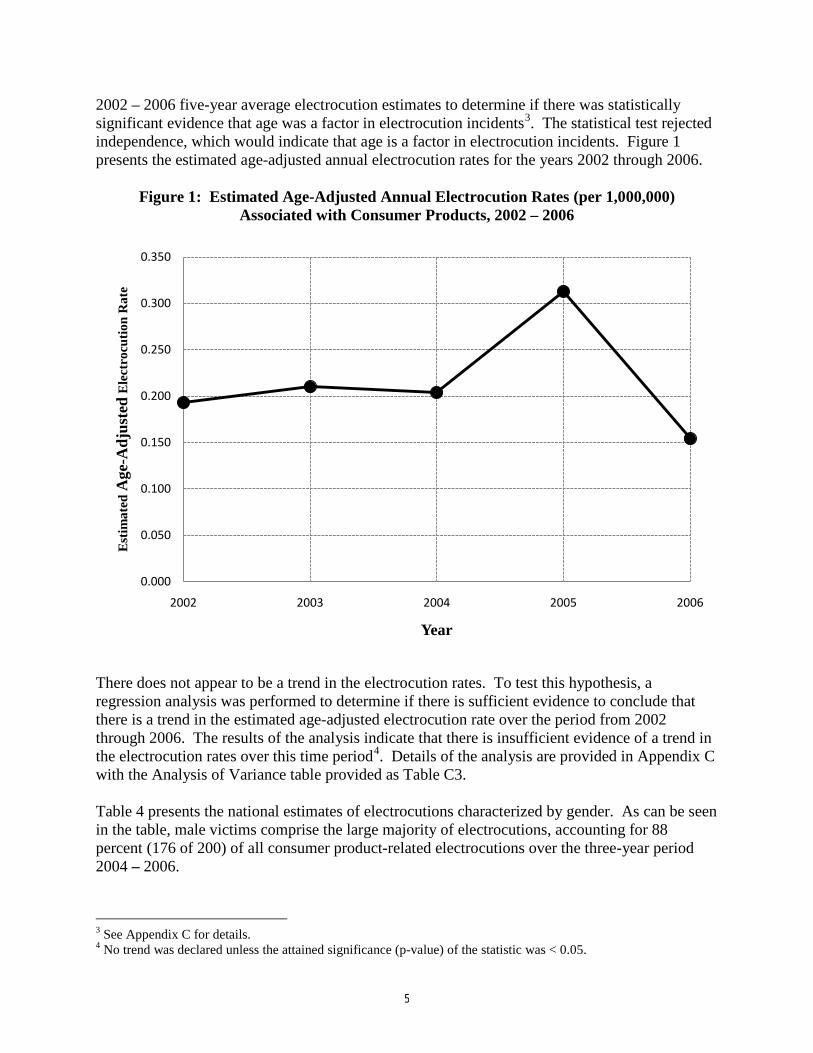
2002 – 2006 five-year average electrocution estimates to determine if there was statistically significant evidence that age was a factor in electrocution incidents3
. The statistical test rejected independence, which would indicate that age is a factor in electrocution incidents. Figure 1 presents the estimated age-adjusted annual electrocution rates for the years 2002 through 2006.
Figure 1: Estimated Age-Adjusted Annual Electrocution Rates (per 1,000,000) Associated with Consumer Products, 2002 – 2006
There does not appear to be a trend in the electrocution rates. To test this hypothesis, a regression analysis was performed to determine if there is sufficient evidence to conclude that there is a trend in the estimated age-adjusted electrocution rate over the period from 2002 through 2006. The results of the analysis indicate that there is insufficient evidence of a trend in the electrocution rates over this time period4
. Details of the analysis are provided in Appendix C with the Analysis of Variance table provided as Table C3.
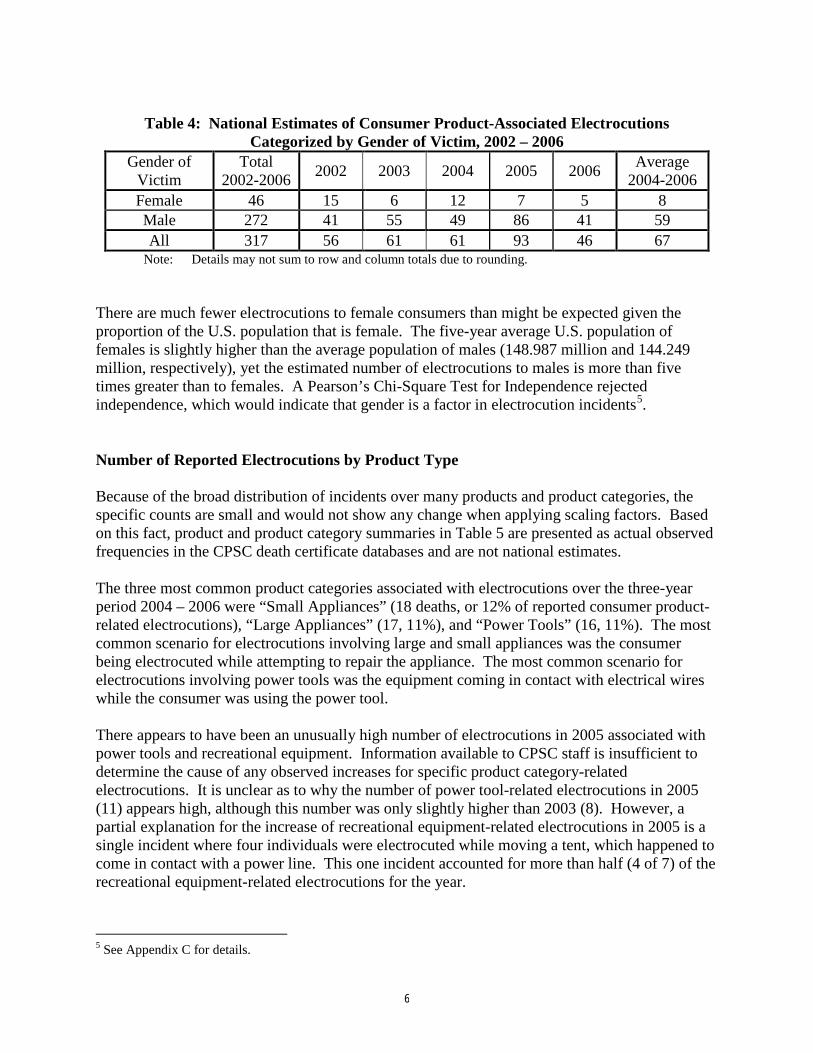
Table 4 presents the national estimates of electrocutions characterized by gender. As can be seen in the table, male victims comprise the large majority of electrocutions, accounting for 88 percent (176 of 200) of all consumer product-related electrocutions over the three-year period 2004 – 2006.
3 See Appendix C for details. 4 No trend was declared unless the attained significance (p-value) of the statistic was < 0.05.
0.000
0.050
0.100
0.150
0.200
0.250
0.300
0.350
2002 2003 2004 2005 2006
Estim
ated
Age
-Adj
uste
dEl
ectr
ocut
ion
Rat
e
Year
6
Table 4: National Estimates of Consumer Product-Associated Electrocutions
Categorized by Gender of Victim, 2002 – 2006 Gender of
Victim Total
2002-2006 2002 2003 2004 2005 2006 Average 2004-2006
Female 46 15 6 12 7 5 8 Male 272 41 55 49 86 41 59 All 317 56 61 61 93 46 67
Note: Details may not sum to row and column totals due to rounding. There are much fewer electrocutions to female consumers than might be expected given the proportion of the U.S. population that is female. The five-year average U.S. population of females is slightly higher than the average population of males (148.987 million and 144.249 million, respectively), yet the estimated number of electrocutions to males is more than five times greater than to females. A Pearson’s Chi-Square Test for Independence rejected independence, which would indicate that gender is a factor in electrocution incidents5
.
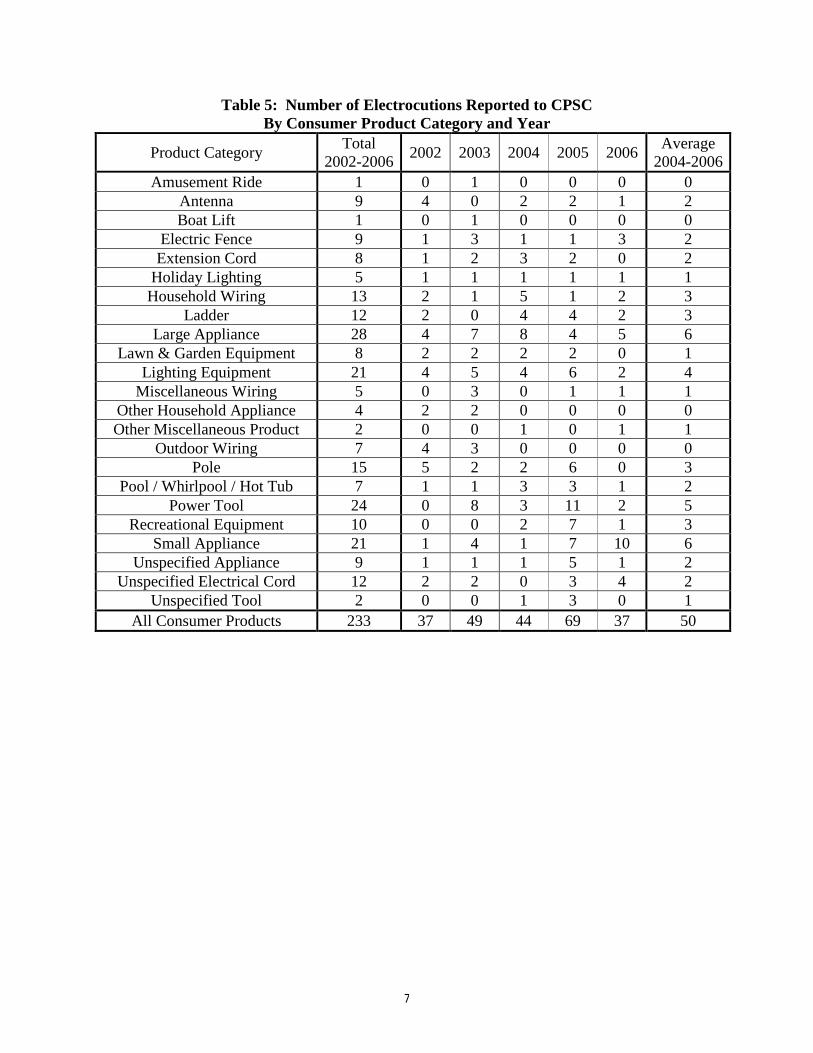
Number of Reported Electrocutions by Product Type Because of the broad distribution of incidents over many products and product categories, the specific counts are small and would not show any change when applying scaling factors. Based on this fact, product and product category summaries in Table 5 are presented as actual observed frequencies in the CPSC death certificate databases and are not national estimates. The three most common product categories associated with electrocutions over the three-year period 2004 – 2006 were “Small Appliances” (18 deaths, or 12% of reported consumer product-related electrocutions), “Large Appliances” (17, 11%), and “Power Tools” (16, 11%). The most common scenario for electrocutions involving large and small appliances was the consumer being electrocuted while attempting to repair the appliance. The most common scenario for electrocutions involving power tools was the equipment coming in contact with electrical wires while the consumer was using the power tool.
There appears to have been an unusually high number of electrocutions in 2005 associated with power tools and recreational equipment. Information available to CPSC staff is insufficient to determine the cause of any observed increases for specific product category-related electrocutions. It is unclear as to why the number of power tool-related electrocutions in 2005 (11) appears high, although this number was only slightly higher than 2003 (8). However, a partial explanation for the increase of recreational equipment-related electrocutions in 2005 is a single incident where four individuals were electrocuted while moving a tent, which happened to come in contact with a power line. This one incident accounted for more than half (4 of 7) of the recreational equipment-related electrocutions for the year.
5 See Appendix C for details.
7
Table 5: Number of Electrocutions Reported to CPSC By Consumer Product Category and Year
Product Category Total 2002-2006 2002 2003 2004 2005 2006 Average
2004-2006 Amusement Ride 1 0 1 0 0 0 0
Antenna 9 4 0 2 2 1 2 Boat Lift 1 0 1 0 0 0 0
Electric Fence 9 1 3 1 1 3 2 Extension Cord 8 1 2 3 2 0 2
Holiday Lighting 5 1 1 1 1 1 1 Household Wiring 13 2 1 5 1 2 3
Ladder 12 2 0 4 4 2 3 Large Appliance 28 4 7 8 4 5 6
Lawn & Garden Equipment 8 2 2 2 2 0 1 Lighting Equipment 21 4 5 4 6 2 4
Miscellaneous Wiring 5 0 3 0 1 1 1 Other Household Appliance 4 2 2 0 0 0 0 Other Miscellaneous Product 2 0 0 1 0 1 1
Outdoor Wiring 7 4 3 0 0 0 0 Pole 15 5 2 2 6 0 3
Pool / Whirlpool / Hot Tub 7 1 1 3 3 1 2 Power Tool 24 0 8 3 11 2 5
Recreational Equipment 10 0 0 2 7 1 3 Small Appliance 21 1 4 1 7 10 6
Unspecified Appliance 9 1 1 1 5 1 2 Unspecified Electrical Cord 12 2 2 0 3 4 2
Unspecified Tool 2 0 0 1 3 0 1 All Consumer Products 233 37 49 44 69 37 50
8
APPENDIX A: CPSC Scope Assessments CPSC has jurisdiction over thousands of consumer products used in and around the home, in sports and recreation, and in schools. In the cases of electrocution, the following determinate factors were used to assess if the case was in scope or not:
• All work-related incidents were determined to be out of scope. • All incidents involving products outside CPSC jurisdiction were determined to be out of
scope. Examples of these include, but are not limited to, incidents involving autos, boats, direct contact with power lines, direct contact with household wiring with no other consumer product involvement, and industrial equipment.
• Incidents involving a product under CPSC jurisdiction which comes in contact with an electrical source such as power lines or household current (e.g., a drill or power saw cutting into an electrical wire) were considered in-scope.
When there was insufficient information to make a definitive determination of whether a case was in scope or out of scope, or where apparent contradictions existed, the following assumption was used:
• Incidents involving an individual apparently functioning in his/her regular occupation in which the death certificate indicates that the fatality was not work-related are assumed to be in error. In these cases, the incident was assumed to be work-related. For example, a tree-trimmer by profession was electrocuted while trimming trees at a residence, other than his own, yet was classified as not work-related on the death certificate. There are many reasons that could explain this discrepancy. First, the death certificate may simply have been miscoded, or the coder may have a different interpretation of the “work-related” question on the death certificate. On many death certificates, the work-related question field states something to the effect of, “Did the death occur at work?” Perhaps the coders interpreted “at work” as referring to an office or factory, and working in a yard of a residence does not fit this interpretation. Finally, it may be possible that the individual may actually not be “working” and may have been helping out a friend or family member. Without evidence of this, however, it was assumed to be miscoded.
There are also many cases where one or more key piece(s) of information are missing and a determination cannot be made from the known information. An imputation method (simple proportional adjustment) was applied to adjust the overall and categorical counts if possible. The key factors to determining scope are:
1. Work-related status, 2. Location of injury, 3. Profession of victim, 4. Age of victim (to assist in work-related status determination when this
information is not provided), 5. Product involved, and 6. Activity engaged in when the incident occurred.

9
Even though there may be some missing key data, a determination can often be made with limited information. For example, all work-related incidents can be eliminated regardless of what other information is missing. As another example, if a child is injured, it would be assumed not to be a work-related injury even if work status were missing. In this latter case, the incident would be considered in scope unless some other factor would eliminate it, such as the product involved.
10
APPENDIX B: Derivation of National Estimates and Age Standardized Electrocution Rate Calculations This appendix describes the data sources and methodology used to compute the national estimates of electrocutions associated with the use of consumer products. All death certificates filed in the United States are compiled by the National Center for Health Statistics (NCHS) into a multiple cause of mortality data file. The NCHS Mortality File contains demographic and geographic information, as well as the International Statistical Classification of Diseases and Related Health Problems codes for the underlying cause of death. Data are compiled in accordance with the World Health Organization instructions, which request that member nations classify causes of death by the current Manual of the International Statistical Classification of Diseases and Related Health Problems. The International Classification of Diseases, Tenth Revision (ICD-10) was implemented in 1999. Although the NCHS data contain cause of death codes that are helpful in identifying deaths due to electrocution, the data do not contain any narrative information that might indicate the involvement of a consumer product. To complement the NCHS mortality data, the CPSC staff purchases death certificates from the 50 states, the District of Columbia, and New York City. Specifically, the CPSC staff purchases death certificates with certain cause of death codes for which there is a high probability that consumer products are involved. In addition to the cause of death codes and demographic and geographic information, the death certificate contains information about the incident location and a brief narrative describing the incident. Any references to consumer products are usually found in these narratives. The CPSC staff conducts follow-up in-depth investigations on selected deaths to confirm and expand upon the involvement of consumer products, as resources allow. The in-depth investigation reports, or IDIs, are contained within the CPSC In-depth Investigation (INDP) File. Additionally, information which may help the analyst in the determination of product involvement can sometimes be ascertained from the Injury or Potential Injury Incident (IPII) File which contains news articles and medical examiner reports associated with the incident. Searches were conducted on both of the CPSC death certificate databases, Death Certificate (DTHS) File and Abbreviated Death Certificate (ABDT) File, and the NCHS database to retrieve all electrocution cases available within the timeframe of concern. The search criteria limited the death certificate records to those classified by ICD-10 codes as electrocution. These death certificates have one of the following ICD-10 cause of death codes:
• W85 - Accident caused by electric current: Electric transmission lines • W86 - Accident caused by electric current: Other specified electric current • W87 - Accident caused by electric current: Unspecified electric current
The search criteria also constrained the records to those fatalities which occurred between January 1, 2002 and December 31, 2006.
11
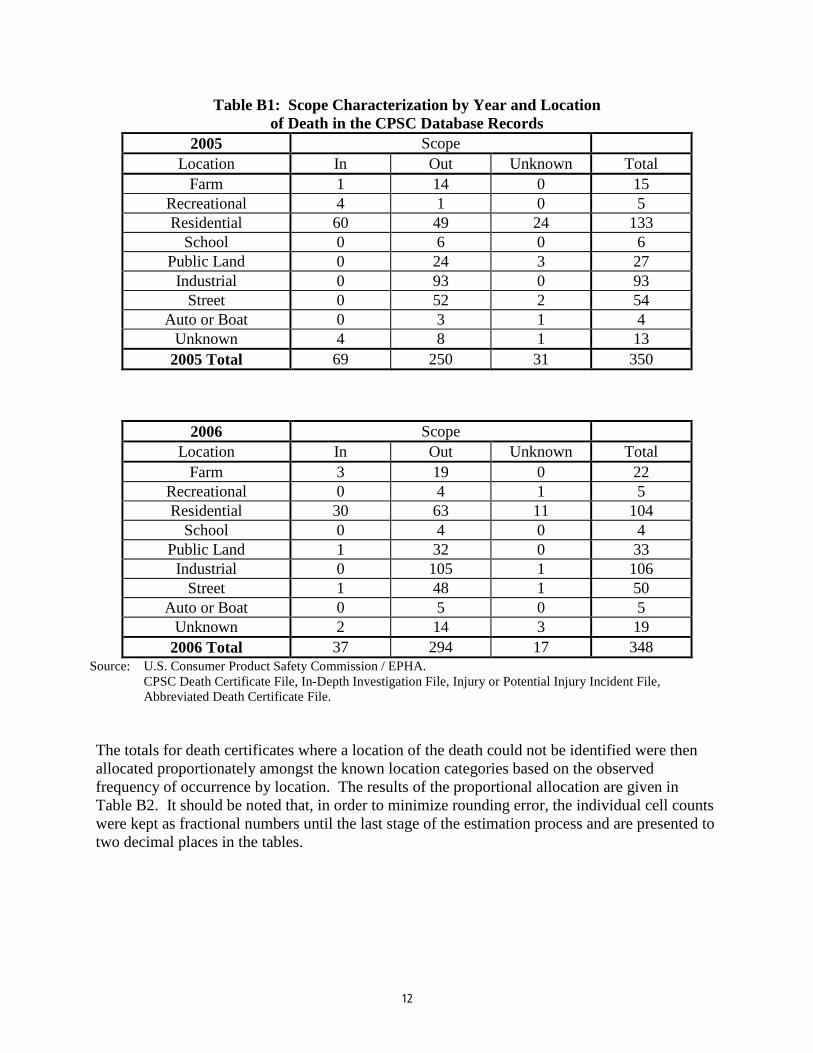
Step 1: Review of CPSC records for scope determination The first step in computing the annual estimates of electrocutions associated with consumer products is to compile an electrocution dataset of all electrocution death certificates available to CPSC staff. The CPSC’s DTHS File and the CPSC’s ABDT File were both searched for cases associated with ICD-10 codes W85 through W87. Each death found in the DTHS database coded as an electrocution was reviewed by an analyst and categorized as in scope, out of scope, or of unknown scope. In-scope cases are unintentional electrocutions associated with a consumer product under the jurisdiction of the CPSC. Out-of-scope cases are cases that involve products that are not under the jurisdiction of the CPSC, work-related incidents, or intentional electrocutions. The scope of a case was classified as unknown in incidents where a consumer product was possibly associated with the incident but could not be explicitly identified. An example of this scenario might be a consumer who was electrocuted in his home that was determined to not be work-related, but a product was not identified. Most deaths found in the ABDT database were categorized as out-of-scope cases. Most of the ABDT File contains death certificates for electrocutions that involve non-consumer situations, such as a lineman being electrocuted while working on power lines, or involve non-consumer products such as motor vehicles and industrial equipment. Occasionally, an analyst review of an ABDT case resulted in a case being reassessed as being either in CPSC jurisdiction or possibly in CPSC jurisdiction. The former cases were included as in-scope deaths and the latter cases were identified as “unknown scope” and used in the allocation of unknown scope phase (Step 3) of the staff’s analysis. Step 2: Allocation of unknown location cases to known location categories After review of the death certificate records in the two databases (DTHS and ABDT) for scope determination, the two databases were combined. Location of the incident is an important factor in the likelihood that an incident would be in scope or not. For example, based on CPSC records, a significant proportion of residential electrocutions were determined to be in scope (consumer product- and non-work-related), while virtually no industrial incidents were within CPSC scope. Table B1 provides a summary of the CPSC electrocution death certificates categorized by location and scope for each of the years 2005 and 2006.
12
Table B1: Scope Characterization by Year and Location of Death in the CPSC Database Records
2005 Scope Location In Out Unknown Total
Farm 1 14 0 15 Recreational 4 1 0 5 Residential 60 49 24 133
School 0 6 0 6 Public Land 0 24 3 27
Industrial 0 93 0 93 Street 0 52 2 54
Auto or Boat 0 3 1 4 Unknown 4 8 1 13
2005 Total 69 250 31 350
2006 Scope Location In Out Unknown Total
Farm 3 19 0 22 Recreational 0 4 1 5 Residential 30 63 11 104
School 0 4 0 4 Public Land 1 32 0 33
Industrial 0 105 1 106 Street 1 48 1 50
Auto or Boat 0 5 0 5 Unknown 2 14 3 19
2006 Total 37 294 17 348 Source: U.S. Consumer Product Safety Commission / EPHA.
CPSC Death Certificate File, In-Depth Investigation File, Injury or Potential Injury Incident File, Abbreviated Death Certificate File.
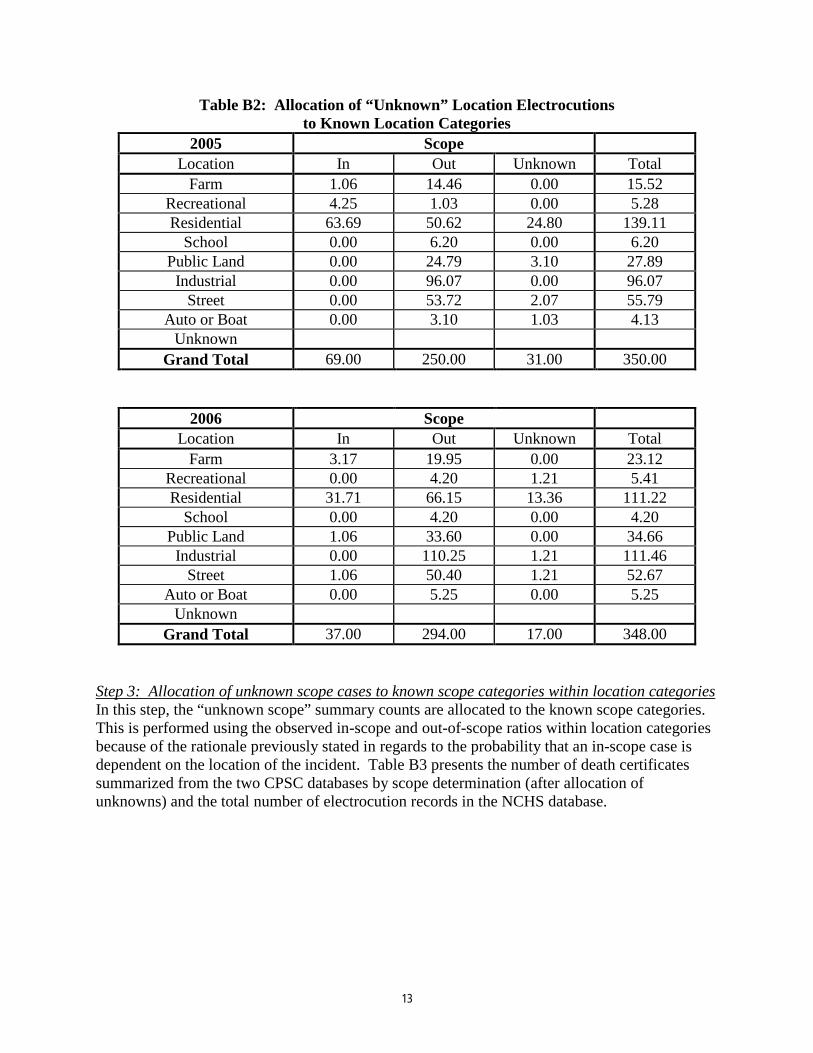
The totals for death certificates where a location of the death could not be identified were then allocated proportionately amongst the known location categories based on the observed frequency of occurrence by location. The results of the proportional allocation are given in Table B2. It should be noted that, in order to minimize rounding error, the individual cell counts were kept as fractional numbers until the last stage of the estimation process and are presented to two decimal places in the tables.
13
Table B2: Allocation of “Unknown” Location Electrocutions to Known Location Categories
2005 Scope Location In Out Unknown Total
Farm 1.06 14.46 0.00 15.52 Recreational 4.25 1.03 0.00 5.28 Residential 63.69 50.62 24.80 139.11
School 0.00 6.20 0.00 6.20 Public Land 0.00 24.79 3.10 27.89
Industrial 0.00 96.07 0.00 96.07 Street 0.00 53.72 2.07 55.79
Auto or Boat 0.00 3.10 1.03 4.13 Unknown
Grand Total 69.00 250.00 31.00 350.00
2006 Scope Location In Out Unknown Total
Farm 3.17 19.95 0.00 23.12 Recreational 0.00 4.20 1.21 5.41 Residential 31.71 66.15 13.36 111.22
School 0.00 4.20 0.00 4.20 Public Land 1.06 33.60 0.00 34.66
Industrial 0.00 110.25 1.21 111.46 Street 1.06 50.40 1.21 52.67
Auto or Boat 0.00 5.25 0.00 5.25 Unknown
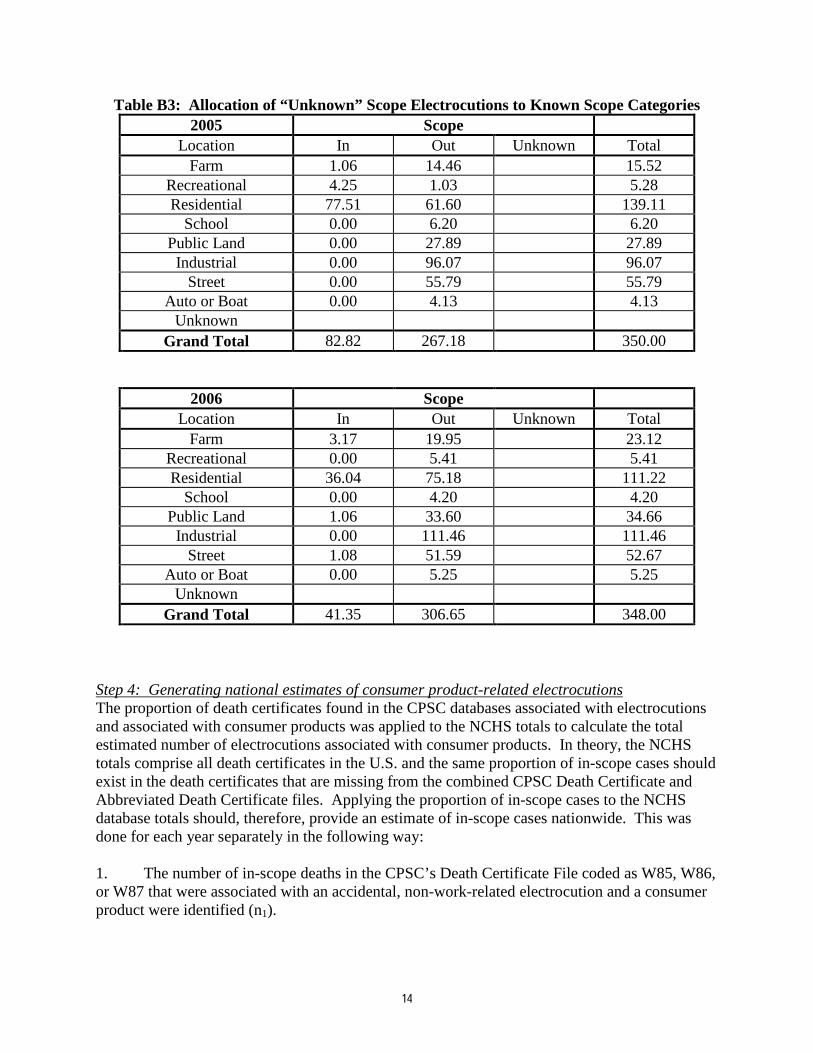
Grand Total 37.00 294.00 17.00 348.00 Step 3: Allocation of unknown scope cases to known scope categories within location categories In this step, the “unknown scope” summary counts are allocated to the known scope categories. This is performed using the observed in-scope and out-of-scope ratios within location categories because of the rationale previously stated in regards to the probability that an in-scope case is dependent on the location of the incident. Table B3 presents the number of death certificates summarized from the two CPSC databases by scope determination (after allocation of unknowns) and the total number of electrocution records in the NCHS database.
14
Table B3: Allocation of “Unknown” Scope Electrocutions to Known Scope Categories 2005 Scope
Location In Out Unknown Total Farm 1.06 14.46 15.52
Recreational 4.25 1.03 5.28 Residential 77.51 61.60 139.11
School 0.00 6.20 6.20 Public Land 0.00 27.89 27.89
Industrial 0.00 96.07 96.07 Street 0.00 55.79 55.79
Auto or Boat 0.00 4.13 4.13 Unknown
Grand Total 82.82 267.18 350.00
2006 Scope Location In Out Unknown Total
Farm 3.17 19.95 23.12 Recreational 0.00 5.41 5.41 Residential 36.04 75.18 111.22
School 0.00 4.20 4.20 Public Land 1.06 33.60 34.66
Industrial 0.00 111.46 111.46 Street 1.08 51.59 52.67
Auto or Boat 0.00 5.25 5.25 Unknown
Grand Total 41.35 306.65 348.00
Step 4: Generating national estimates of consumer product-related electrocutions The proportion of death certificates found in the CPSC databases associated with electrocutions and associated with consumer products was applied to the NCHS totals to calculate the total estimated number of electrocutions associated with consumer products. In theory, the NCHS totals comprise all death certificates in the U.S. and the same proportion of in-scope cases should exist in the death certificates that are missing from the combined CPSC Death Certificate and Abbreviated Death Certificate files. Applying the proportion of in-scope cases to the NCHS database totals should, therefore, provide an estimate of in-scope cases nationwide. This was done for each year separately in the following way: 1. The number of in-scope deaths in the CPSC’s Death Certificate File coded as W85, W86, or W87 that were associated with an accidental, non-work-related electrocution and a consumer product were identified (n1).
15
2. The total number of deaths in the CPSC’s Death Certificate File and the Abbreviated Death Certificate File coded as W85 through W87 was summed separately for each year (n2). 3. The total number of deaths in the NCHS data coded as W85 through W87 was counted (n3). 4. The estimate of the number of accidental, non-work-related electrocutions associated with consumer products in codes W85 through W87 was calculated separately for each year using the formula:
N= (n1 / n2) * n3
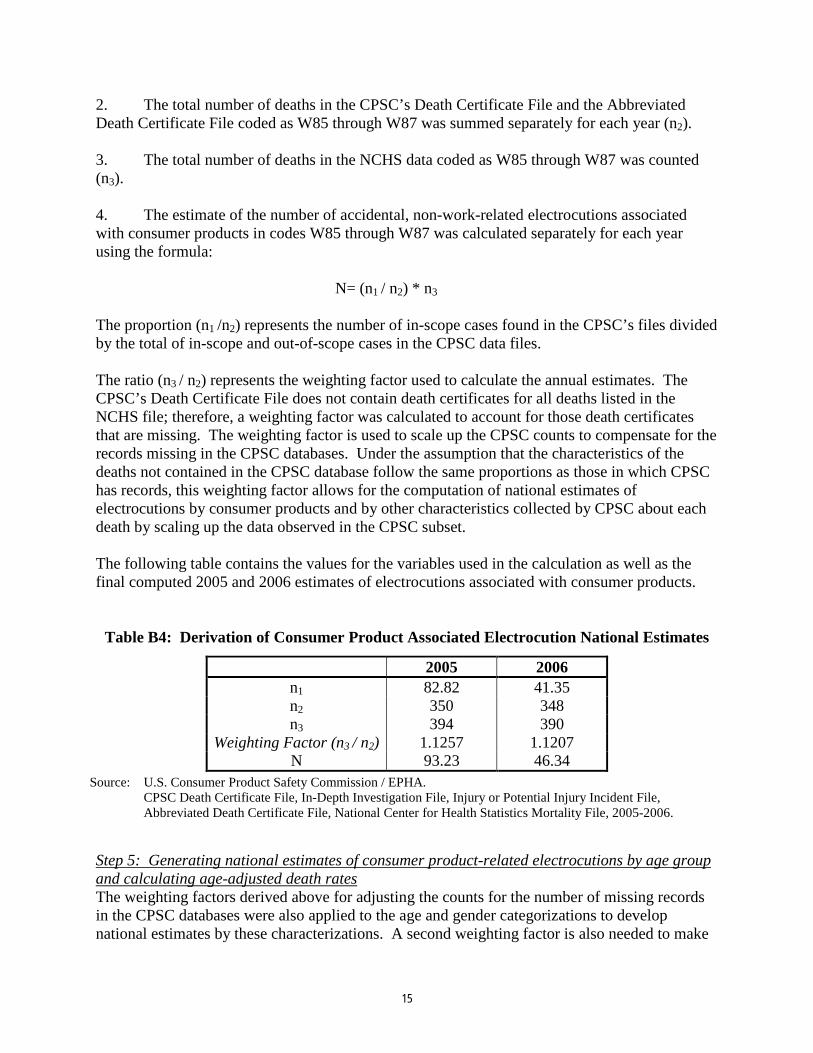
The proportion (n1 /n2) represents the number of in-scope cases found in the CPSC’s files divided by the total of in-scope and out-of-scope cases in the CPSC data files. The ratio (n3 / n2) represents the weighting factor used to calculate the annual estimates. The CPSC’s Death Certificate File does not contain death certificates for all deaths listed in the NCHS file; therefore, a weighting factor was calculated to account for those death certificates that are missing. The weighting factor is used to scale up the CPSC counts to compensate for the records missing in the CPSC databases. Under the assumption that the characteristics of the deaths not contained in the CPSC database follow the same proportions as those in which CPSC has records, this weighting factor allows for the computation of national estimates of electrocutions by consumer products and by other characteristics collected by CPSC about each death by scaling up the data observed in the CPSC subset. The following table contains the values for the variables used in the calculation as well as the final computed 2005 and 2006 estimates of electrocutions associated with consumer products.
Table B4: Derivation of Consumer Product Associated Electrocution National Estimates
Source: U.S. Consumer Product Safety Commission / EPHA.
CPSC Death Certificate File, In-Depth Investigation File, Injury or Potential Injury Incident File, Abbreviated Death Certificate File, National Center for Health Statistics Mortality File, 2005-2006.
Step 5: Generating national estimates of consumer product-related electrocutions by age group and calculating age-adjusted death rates The weighting factors derived above for adjusting the counts for the number of missing records in the CPSC databases were also applied to the age and gender categorizations to develop national estimates by these characterizations. A second weighting factor is also needed to make
2005 2006 n1 82.82 41.35 n2 350 348 n3 394 390
Weighting Factor (n3 / n2) 1.1257 1.1207 N 93.23 46.34
16
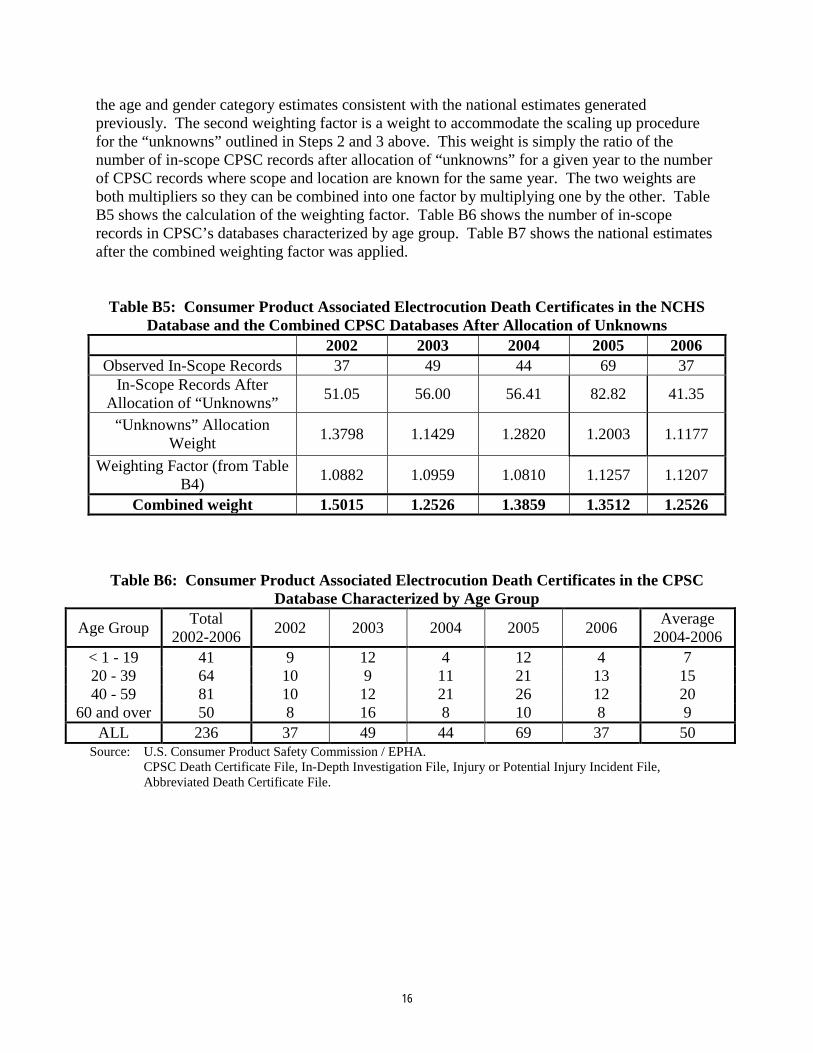
the age and gender category estimates consistent with the national estimates generated previously. The second weighting factor is a weight to accommodate the scaling up procedure for the “unknowns” outlined in Steps 2 and 3 above. This weight is simply the ratio of the number of in-scope CPSC records after allocation of “unknowns” for a given year to the number of CPSC records where scope and location are known for the same year. The two weights are both multipliers so they can be combined into one factor by multiplying one by the other. Table B5 shows the calculation of the weighting factor. Table B6 shows the number of in-scope records in CPSC’s databases characterized by age group. Table B7 shows the national estimates after the combined weighting factor was applied.
Table B5: Consumer Product Associated Electrocution Death Certificates in the NCHS Database and the Combined CPSC Databases After Allocation of Unknowns
2002 2003 2004 2005 2006 Observed In-Scope Records 37 49 44 69 37
In-Scope Records After Allocation of “Unknowns” 51.05 56.00 56.41 82.82 41.35
“Unknowns” Allocation Weight 1.3798 1.1429 1.2820 1.2003 1.1177
Weighting Factor (from Table B4) 1.0882 1.0959 1.0810 1.1257 1.1207
Combined weight 1.5015 1.2526 1.3859 1.3512 1.2526
Table B6: Consumer Product Associated Electrocution Death Certificates in the CPSC Database Characterized by Age Group
Age Group Total 2002-2006 2002 2003 2004 2005 2006 Average
2004-2006 < 1 - 19 41 9 12 4 12 4 7 20 - 39 64 10 9 11 21 13 15 40 - 59 81 10 12 21 26 12 20
60 and over 50 8 16 8 10 8 9 ALL 236 37 49 44 69 37 50
Source: U.S. Consumer Product Safety Commission / EPHA. CPSC Death Certificate File, In-Depth Investigation File, Injury or Potential Injury Incident File, Abbreviated Death Certificate File.

17
Table B7: National Estimates of Consumer Product Associated Electrocutions Characterized by Age Group After Weights were Applied
Prior to Rounding to Nearest Whole Number
Age Group Total 2002-2006 2002 2003 2004 2005 2006 Average
2004-2006 < 1 - 19 55.31 13.51 15.03 5.54 16.21 5.01 8.92 20 - 39 86.19 15.01 11.27 15.24 28.37 16.28 19.97 40 - 59 109.31 15.01 15.03 29.10 35.13 15.03 26.42
60 and over 66.67 12.01 20.04 11.09 13.51 10.02 11.54 ALL 317.48 55.55 61.38 60.98 93.23 46.34 66.85
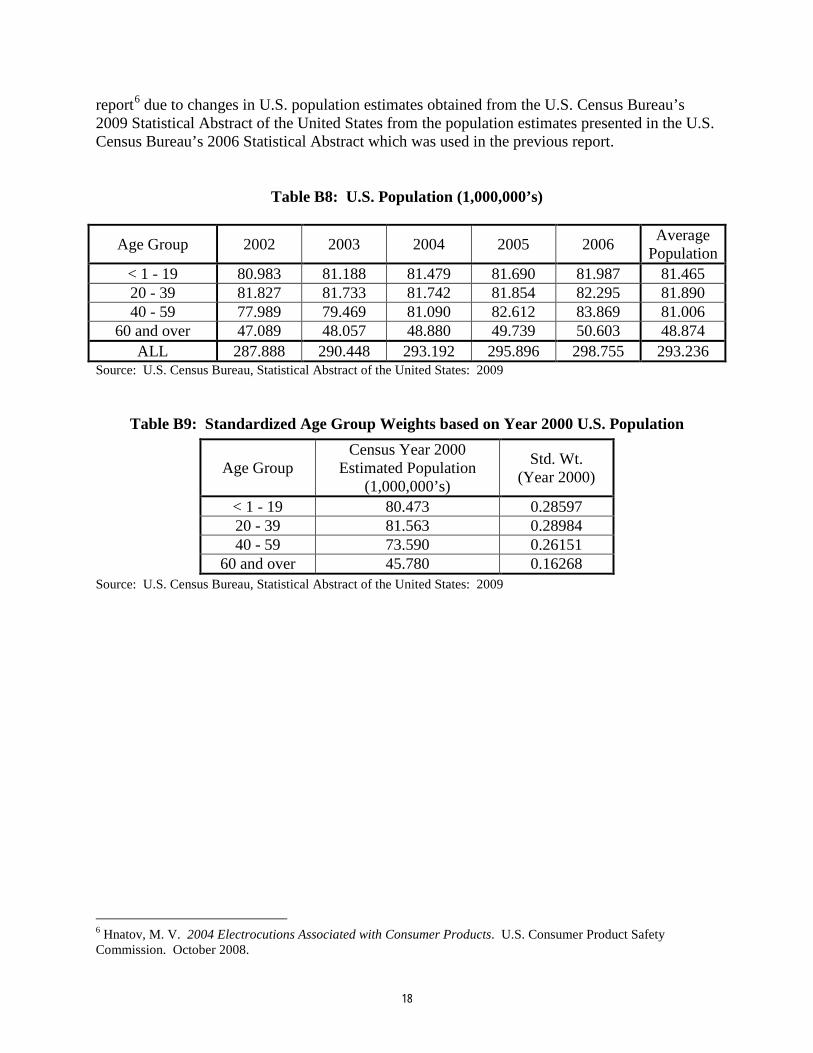
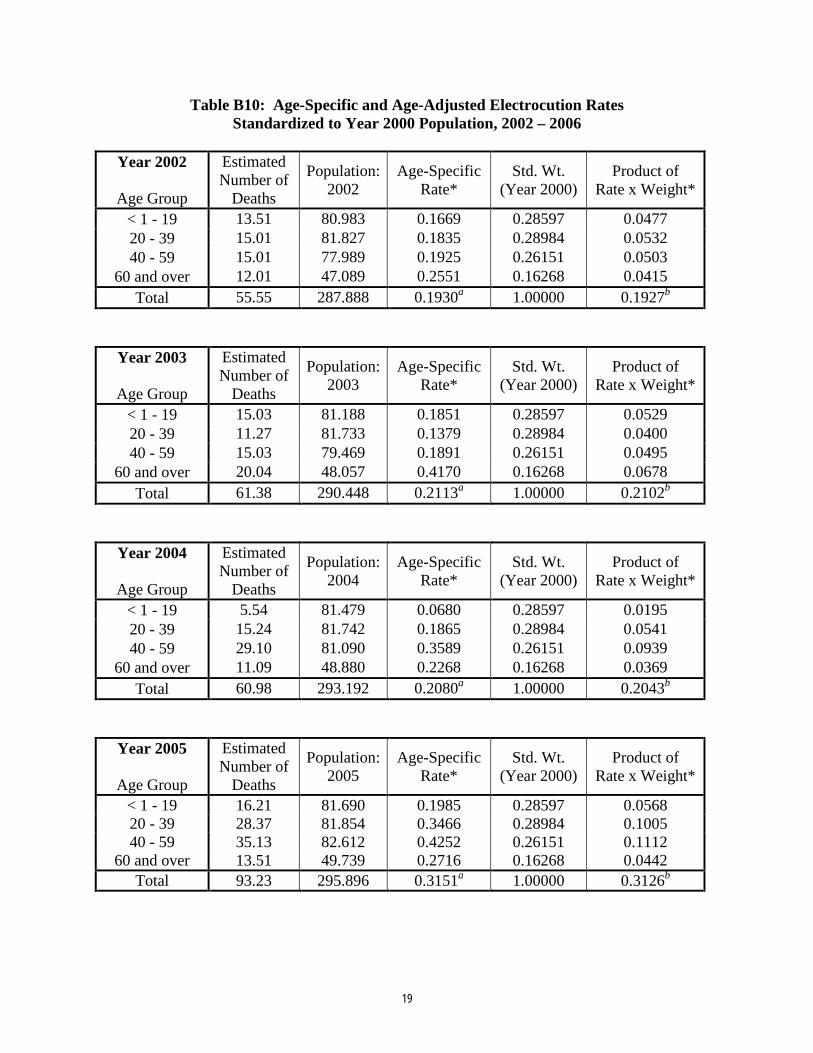
The crude death rate is typically defined as the number of deaths in a given population during a given time period divided by the total population and multiplied by one thousand (or some other population scaler). Crude death rates are a widely used measure of mortality which can be used to compare subpopulations within the greater population of incidents. However, crude death rates are not the best measure when comparing year to year death rates. In a National Vital Statistics Report titled “Age Standardization of Death Rates: Implementation of the Year 2000 Standard” a rationale for age-adjusting death rate is stated: “…crude death rates are influenced by age composition of the population. As such, comparisons of crude death rates over time or between groups may be misleading if the populations being compared differ in age composition. This is relevant, for example, in trend comparisons of U.S. mortality given the aging of the U.S. population.” For this report, the electrocution incidents were characterized into subpopulations by year of death and age group and by year of death and gender. The death rates by year/age are presented as standardized death rates using the 2000 U.S. population as the standard. In August 1998 the use of the Year 2000 standard population was established in a policy statement from the Secretary of the Department of Health and Human Services (DHHS) which directed all DHHS agencies, including NCHS and the Centers for Disease Control and Prevention (CDC), to use this standard. The crude death rate is determined by dividing the total number of deaths for a specific characterization by the mid-year population for the same characterization. The standardized age-adjusted death rate is calculated by multiplying each age-specific category rate by a standardized weight which represents the proportion of the population in the specific subpopulation for the given standard year (Year 2000). The products of the age-specific rates and the weights are then summed over age group to produce the age-adjusted rate. Table B8 presents the U.S. population subdivided by age group for the years 2002 through 2006. Table B9 provides the standardized age group weights based on the Year 2000 U.S. Population. Table B10 provides a summary of the calculations to determine age-adjusted death rates for the years 2002 and 2006 standardized to Year 2000 population. It should be noted that the age-adjusted death rates for the years 2002 through 2004 presented in Table 3 of the main body of this report have changed slightly from the previous electrocutions
18
report6
due to changes in U.S. population estimates obtained from the U.S. Census Bureau’s 2009 Statistical Abstract of the United States from the population estimates presented in the U.S. Census Bureau’s 2006 Statistical Abstract which was used in the previous report.
Table B8: U.S. Population (1,000,000’s)
Age Group 2002 2003 2004 2005 2006 Average Population
< 1 - 19 80.983 81.188 81.479 81.690 81.987 81.465 20 - 39 81.827 81.733 81.742 81.854 82.295 81.890 40 - 59 77.989 79.469 81.090 82.612 83.869 81.006
60 and over 47.089 48.057 48.880 49.739 50.603 48.874 ALL 287.888 290.448 293.192 295.896 298.755 293.236
Source: U.S. Census Bureau, Statistical Abstract of the United States: 2009
Table B9: Standardized Age Group Weights based on Year 2000 U.S. Population Source: U.S. Census Bureau, Statistical Abstract of the United States: 2009
6 Hnatov, M. V. 2004 Electrocutions Associated with Consumer Products. U.S. Consumer Product Safety Commission. October 2008.
Age Group Census Year 2000
Estimated Population (1,000,000’s)
Std. Wt. (Year 2000)
< 1 - 19 80.473 0.28597 20 - 39 81.563 0.28984 40 - 59 73.590 0.26151
60 and over 45.780 0.16268
19
Table B10: Age-Specific and Age-Adjusted Electrocution Rates Standardized to Year 2000 Population, 2002 – 2006
Year 2002
Age Group
Estimated Number of
Deaths
Population: 2002
Age-Specific Rate*
Std. Wt. (Year 2000)
Product of Rate x Weight*
< 1 - 19 13.51 80.983 0.1669 0.28597 0.0477 20 - 39 15.01 81.827 0.1835 0.28984 0.0532 40 - 59 15.01 77.989 0.1925 0.26151 0.0503
60 and over 12.01 47.089 0.2551 0.16268 0.0415 Total 55.55 287.888 0.1930a 1.00000 0.1927b
Year 2003
Age Group
Estimated Number of
Deaths
Population: 2003
Age-Specific Rate*
Std. Wt. (Year 2000)
Product of Rate x Weight*
< 1 - 19 15.03 81.188 0.1851 0.28597 0.0529 20 - 39 11.27 81.733 0.1379 0.28984 0.0400 40 - 59 15.03 79.469 0.1891 0.26151 0.0495
60 and over 20.04 48.057 0.4170 0.16268 0.0678 Total 61.38 290.448 0.2113a 1.00000 0.2102b
Year 2004
Age Group
Estimated Number of
Deaths
Population: 2004
Age-Specific Rate*
Std. Wt. (Year 2000)
Product of Rate x Weight*
< 1 - 19 5.54 81.479 0.0680 0.28597 0.0195 20 - 39 15.24 81.742 0.1865 0.28984 0.0541 40 - 59 29.10 81.090 0.3589 0.26151 0.0939
60 and over 11.09 48.880 0.2268 0.16268 0.0369 Total 60.98 293.192 0.2080a 1.00000 0.2043b
Year 2005
Age Group
Estimated Number of
Deaths
Population: 2005
Age-Specific Rate*
Std. Wt. (Year 2000)
Product of Rate x Weight*
< 1 - 19 16.21 81.690 0.1985 0.28597 0.0568 20 - 39 28.37 81.854 0.3466 0.28984 0.1005 40 - 59 35.13 82.612 0.4252 0.26151 0.1112
60 and over 13.51 49.739 0.2716 0.16268 0.0442 Total 93.23 295.896 0.3151a 1.00000 0.3126b
20
Year 2006
Age Group
Estimated Number of
Deaths
Population: 2006
Age-Specific Rate*
Std. Wt. (Year 2000)
Product of Rate x Weight*
< 1 - 19 5.01 81.987 0.0611 0.28597 0.0175 20 - 39 16.28 82.295 0.1979 0.28984 0.0573 40 - 59 15.03 83.869 0.1792 0.26151 0.0469
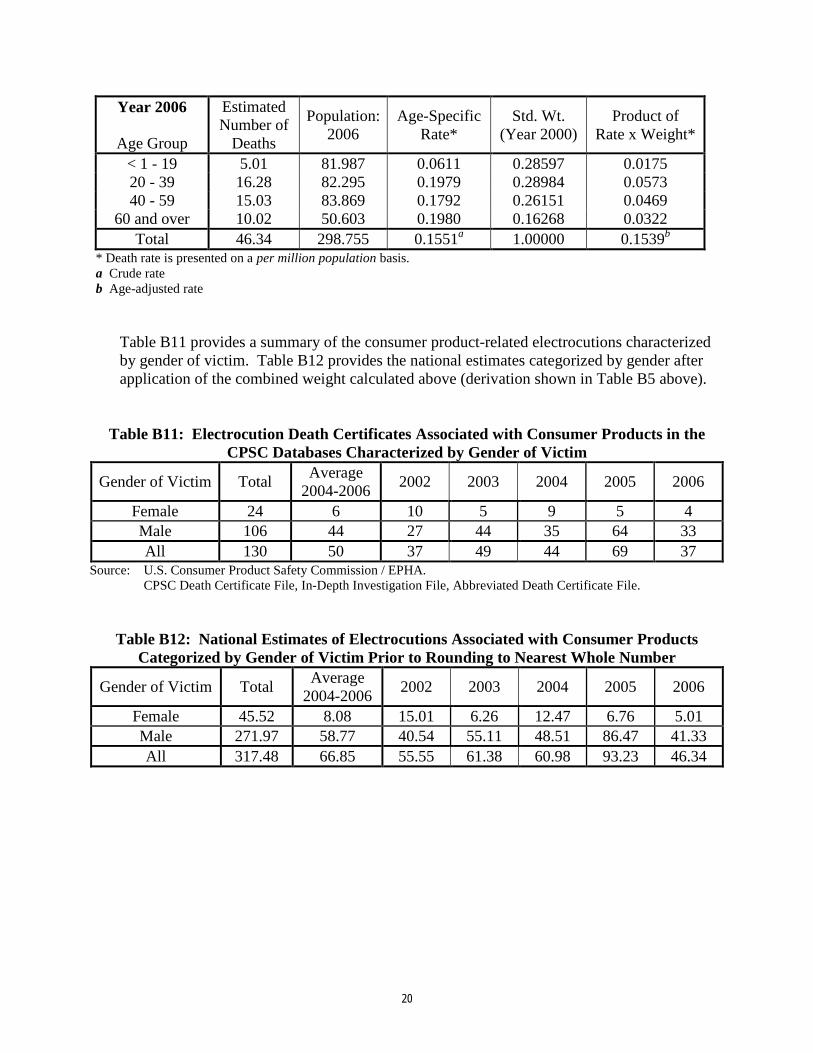
60 and over 10.02 50.603 0.1980 0.16268 0.0322 Total 46.34 298.755 0.1551a 1.00000 0.1539b
* Death rate is presented on a per million population basis. a Crude rate b Age-adjusted rate
Table B11 provides a summary of the consumer product-related electrocutions characterized by gender of victim. Table B12 provides the national estimates categorized by gender after application of the combined weight calculated above (derivation shown in Table B5 above).
Table B11: Electrocution Death Certificates Associated with Consumer Products in the
CPSC Databases Characterized by Gender of Victim
Gender of Victim Total Average 2004-2006 2002 2003 2004 2005 2006
Female 24 6 10 5 9 5 4 Male 106 44 27 44 35 64 33 All 130 50 37 49 44 69 37
Source: U.S. Consumer Product Safety Commission / EPHA. CPSC Death Certificate File, In-Depth Investigation File, Abbreviated Death Certificate File.
Table B12: National Estimates of Electrocutions Associated with Consumer Products Categorized by Gender of Victim Prior to Rounding to Nearest Whole Number
Gender of Victim Total Average 2004-2006 2002 2003 2004 2005 2006
Female 45.52 8.08 15.01 6.26 12.47 6.76 5.01 Male 271.97 58.77 40.54 55.11 48.51 86.47 41.33 All 317.48 66.85 55.55 61.38 60.98 93.23 46.34
21
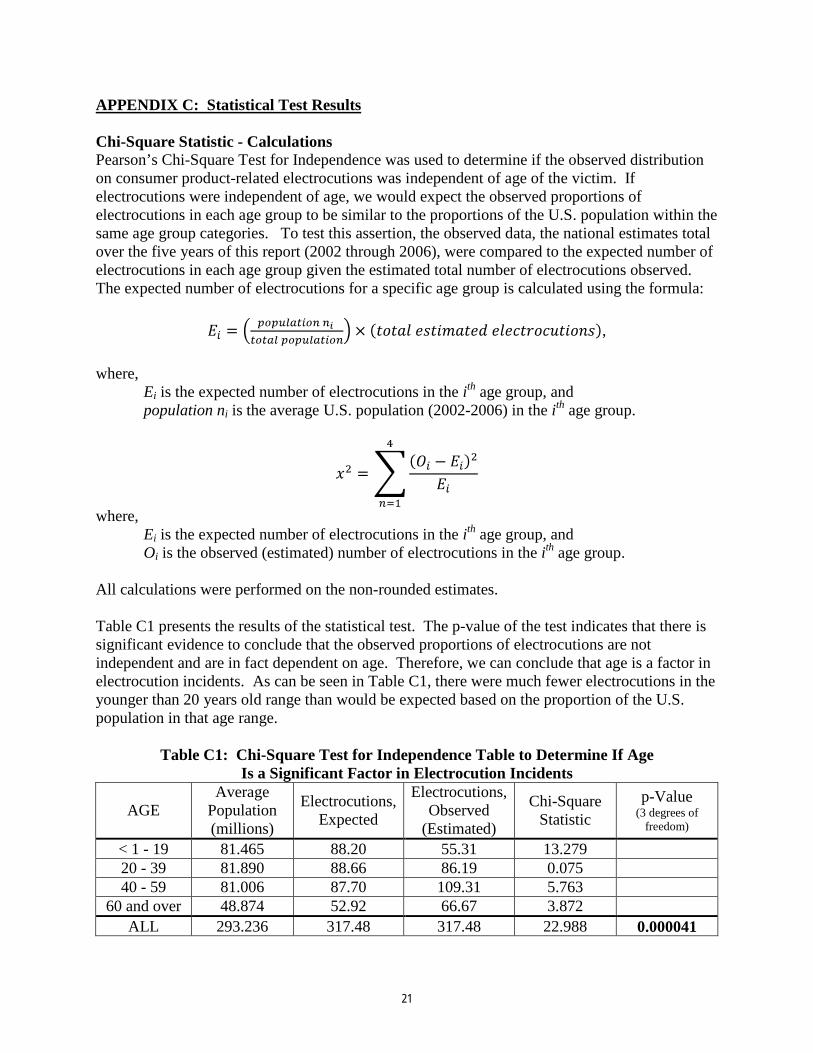
APPENDIX C: Statistical Test Results Chi-Square Statistic - Calculations Pearson’s Chi-Square Test for Independence was used to determine if the observed distribution on consumer product-related electrocutions was independent of age of the victim. If electrocutions were independent of age, we would expect the observed proportions of electrocutions in each age group to be similar to the proportions of the U.S. population within the same age group categories. To test this assertion, the observed data, the national estimates total over the five years of this report (2002 through 2006), were compared to the expected number of electrocutions in each age group given the estimated total number of electrocutions observed. The expected number of electrocutions for a specific age group is calculated using the formula:
,
where, Ei is the expected number of electrocutions in the ith age group, and
population ni is the average U.S. population (2002-2006) in the ith age group.
where, Ei is the expected number of electrocutions in the ith age group, and
Oi is the observed (estimated) number of electrocutions in the ith age group.
All calculations were performed on the non-rounded estimates. Table C1 presents the results of the statistical test. The p-value of the test indicates that there is significant evidence to conclude that the observed proportions of electrocutions are not independent and are in fact dependent on age. Therefore, we can conclude that age is a factor in electrocution incidents. As can be seen in Table C1, there were much fewer electrocutions in the younger than 20 years old range than would be expected based on the proportion of the U.S. population in that age range.
Table C1: Chi-Square Test for Independence Table to Determine If Age Is a Significant Factor in Electrocution Incidents
AGE Average
Population (millions)
Electrocutions, Expected
Electrocutions, Observed
(Estimated)
Chi-Square Statistic
p-Value (3 degrees of
freedom) < 1 - 19 81.465 88.20 55.31 13.279 20 - 39 81.890 88.66 86.19 0.075 40 - 59 81.006 87.70 109.31 5.763
60 and over 48.874 52.92 66.67 3.872 ALL 293.236 317.48 317.48 22.988 0.000041
22
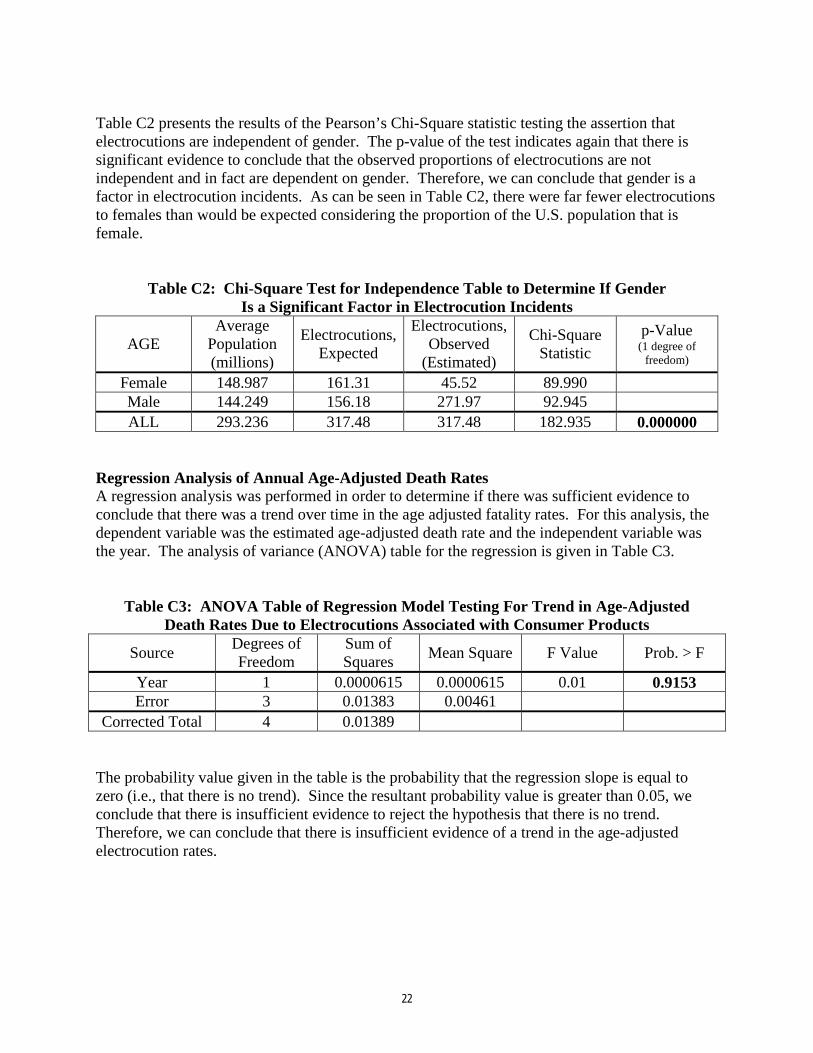
Table C2 presents the results of the Pearson’s Chi-Square statistic testing the assertion that electrocutions are independent of gender. The p-value of the test indicates again that there is significant evidence to conclude that the observed proportions of electrocutions are not independent and in fact are dependent on gender. Therefore, we can conclude that gender is a factor in electrocution incidents. As can be seen in Table C2, there were far fewer electrocutions to females than would be expected considering the proportion of the U.S. population that is female.
Table C2: Chi-Square Test for Independence Table to Determine If Gender Is a Significant Factor in Electrocution Incidents
AGE Average
Population (millions)
Electrocutions, Expected
Electrocutions, Observed
(Estimated)
Chi-Square Statistic
p-Value (1 degree of
freedom) Female 148.987 161.31 45.52 89.990 Male 144.249 156.18 271.97 92.945 ALL 293.236 317.48 317.48 182.935 0.000000
Regression Analysis of Annual Age-Adjusted Death Rates A regression analysis was performed in order to determine if there was sufficient evidence to conclude that there was a trend over time in the age adjusted fatality rates. For this analysis, the dependent variable was the estimated age-adjusted death rate and the independent variable was the year. The analysis of variance (ANOVA) table for the regression is given in Table C3.
Table C3: ANOVA Table of Regression Model Testing For Trend in Age-Adjusted Death Rates Due to Electrocutions Associated with Consumer Products
Source Degrees of Freedom
Sum of Squares Mean Square F Value Prob. > F
Year 1 0.0000615 0.0000615 0.01 0.9153 Error 3 0.01383 0.00461
Corrected Total 4 0.01389 The probability value given in the table is the probability that the regression slope is equal to zero (i.e., that there is no trend). Since the resultant probability value is greater than 0.05, we conclude that there is insufficient evidence to reject the hypothesis that there is no trend. Therefore, we can conclude that there is insufficient evidence of a trend in the age-adjusted electrocution rates.
23
References 1. Anderson, R.N., Ph.D. and Rosenberg, H.M., Ph.D.: Age Standardization of Death Rates:
Implementation of the Year 2000 Standard, Centers for Disease Control and Prevention and the National Center for Health Statistics, Volume 47, Number 3, October 1998.
2. Hnatov, Matthew V.: 2004 Electrocutions Associated With Consumer Products, October
2005, Directorate for Epidemiology, Division of Hazard Analysis, U.S. Consumer Product Safety Commission.
3. Klein, Richard J., M.P.H. and Schoenborn, Charlotte A., M.P.H.: Age Adjusting Using the
2000 Projected U.S. Population, Centers for Disease Control and Prevention and the National Center for Health Statistics, Statistical Notes, Volume 20, January 2001.
4. U.S. Census Bureau, Statistical Abstract of the United States: 2009.
http://www.census.gov/compendia/statab/ 5. Year 2000 Population Standard for Age-Adjusting Death Rates in the United States,
Department of Health and Human Services, Centers for Disease Control and Prevention, National Center for Health Statistics.
http://www.cdc.gov/nchs/data/dvs/IW134Pfct.pdf
Copyright © 2022 FDOKUMEN