
The state of the California Current, 2005-2006: warm in the north, cool in the south
45
STATE OF THE CALIFORNIA CURRENT CalCOFI Rep., Vol. 47, 2006 THE ST ATE OF THE CALIFORNIA CURRENT, 2005–2006: WARM IN THE NORTH, COOL IN THE SOUTH ABSTRACT This report summarizes the recent state of the California Current System (CCS), primarily during the period April 2005 through early 2006, and includes ob- servations of ocean conditions made from Washington State south to Baja California. During 2005, the CCS experienced very unusual “ocean weather.” For exam- ple, off Washington, Oregon and northern California, the start of upwelling was delayed, resulting in anom- alously warm sea surface temperatures through the spring and the early summer months. The warming observed in the northern California Current (NCC) in the spring and early summer appeared to be a regional phenome- non, since waters south of approximately 35 ˚ N to the California–Mexico border were near the long-term av- erage, and cooler-than-normal temperatures prevailed off Baja California. The extent of the warming and sub- sequent ecosystem response was similar to that of a major tropical El Niño event. However, we know from ob- servations made at the equator that equatorial waters were in an El Niño-neutral state. The impacts on the NCC pelagic ecosystem were profound with very low biomass of zooplankton observed in Monterey Bay, the Gulf of the Farallones, and off Oregon, accompanied by unprecedented reproductive failure and mortality in sev- eral locally-breeding seabird species. Recruitment fail- ure was seen in a variety of fishes as well. The proxi- mate cause was a delay in the initiation of the upwelling season in the NCC (which usually begins in April) to a nearly unprecedented start time of late July. Thus, ani- mals that reproduce in spring and in other years would find bountiful food resources, found themselves faced with famine rather than feast. Similarly, marine mam- mals and birds which migrate to the NCC upwelling region in spring and summer, which would otherwise find a high biomass of energetically-rich zooplankton and small pelagic fish upon which to feed, were equally disappointed. Moreover, 2005 marked the third year of chronically warm conditions in the NCC, a situation which could have led to a general reduction in physio- logical condition of fish and birds, rendering them less tolerant of adverse ocean conditions in 2005. INTRODUCTION This is the thir teenth in a series of annual reports prepared since 1993 that summarize the climatology, oceanography, and biology of the California Current System (CCS). It is the third to include data from the entire length of the California Current System. Programs or institutions contributing to this report include U.S. 30 BILL PETERSON, ROBERT EMMETT NOAA Fisheries Northwest Fisheries Science Center Fish Ecology Division Hatfield Marine Science Center Newport, Oregon 97365-5275 RALF GOERICKE, ELIZABETH VENRICK, ARNOLD MANTYLA Integrative Oceanography Division Scripps Institution of Oceanography La Jolla, California 92093-0218 STEVEN J. BOGRAD, FRANKLIN B. SCHWING NOAA Fisheries Southwest Fisheries Science Center Environmental Research Division 1352 Lighthouse Ave Pacific Grove, California 93950-2097 ROGER HEWITT, NANCY LO, WILLIAM WATSON, JAY BARLOW, MARK LOWRY NOAA Fisheries Southwest Fisheries Science Center 8604 La Jolla Shores Drive La Jolla, California 92038 STEVE RALSTON, KARIN A. FORNEY NOAA Fisheries Southwest Fisheries Science Center 110 Shaffer Road Santa Cruz, California 95060 BERTHA E. LAVANIEGOS Departmento de Oceanografía Biológica Centro de Investigación Cientifica y Educación Superior de Ensenada Apartado Postal 2732 22860 Ensenada, Baja California, México WILLIAM J. SYDEMAN, DAVID HYRENBACH, RUSSEL W. BRADLEY, PETE WARZYBOK Marine Ecology Division Point Reyes Bird Observatory 4990 Shoreline Highway Stinson Beach, California 94970 FRANCISCO CHAVEZ Monterey Bay Aquarium Research Institute 7700 Sandholdt Road Moss Landing, California 95039-9044 KAREN HUNTER Cooperative Institute for Marine Resource Studies, Oregon State University Hatfield Marine Science Center 2030 SE Marine Science Drive Newport, Oregon 97365 SCOTT BENSON NOAA Fisheries Southwest Fisheries Science Center Moss Landing Marine Laboratories 7544 Sandholdt Road Moss Landing, California 95039 MICHAEL WEISE Department of Ecology and Evolutionary Biology University of California, Santa Cruz 100 Shaffer Road Santa Cruz, California 95060 JAMES HARVEY Moss Landing Marine Laboratories 8272 Moss Landing Road Moss Landing, California 95039 GILBERTO GAXIOLA-CASTRO Departamento de Oceanografía Biológica Centro de Investigación Cientifica y Educación Superior de Ensenada Km 107 Carretera Tijuana-Ensenada, Apartado Postal 2732 22860 Ensenada, Baja California, Mexico REGINALDO DURAZO Facultad de Ciencias Marinas, Universidad Autónoma de Baja California km 107 Carretera Tijuana-Ensenada, Apartado Postal 453 Ensenada, Baja California, Mexico 30-74 State of the Current bl 2 2/5/07 8:26 PM Page 30
-
Upload
independent -
Category
Documents
-
view
7 -
download
0
Transcript of The state of the California Current, 2005-2006: warm in the north, cool in the south

STATE OF THE CALIFORNIA CURRENTCalCOFI Rep., Vol. 47, 2006
THE STATE OF THE CALIFORNIA CURRENT, 2005–2006:WARM IN THE NORTH, COOL IN THE SOUTH
ABSTRACTThis report summarizes the recent state of the
California Current System (CCS), primarily during theperiod April 2005 through early 2006, and includes ob-servations of ocean conditions made from WashingtonState south to Baja California. During 2005, the CCSexperienced very unusual “ocean weather.” For exam-ple, off Washington, Oregon and northern California,the start of upwelling was delayed, resulting in anom-alously warm sea surface temperatures through the springand the early summer months. The warming observedin the northern California Current (NCC) in the springand early summer appeared to be a regional phenome-non, since waters south of approximately 35˚N to theCalifornia–Mexico border were near the long-term av-erage, and cooler-than-normal temperatures prevailedoff Baja California. The extent of the warming and sub-sequent ecosystem response was similar to that of a majortropical El Niño event. However, we know from ob-servations made at the equator that equatorial waterswere in an El Niño-neutral state. The impacts on theNCC pelagic ecosystem were profound with very lowbiomass of zooplankton observed in Monterey Bay, theGulf of the Farallones, and off Oregon, accompanied byunprecedented reproductive failure and mortality in sev-
eral locally-breeding seabird species. Recruitment fail-ure was seen in a variety of fishes as well. The proxi-mate cause was a delay in the initiation of the upwellingseason in the NCC (which usually begins in April) to anearly unprecedented start time of late July. Thus, ani-mals that reproduce in spring and in other years wouldfind bountiful food resources, found themselves facedwith famine rather than feast. Similarly, marine mam-mals and birds which migrate to the NCC upwellingregion in spring and summer, which would otherwisefind a high biomass of energetically-rich zooplanktonand small pelagic fish upon which to feed, were equallydisappointed. Moreover, 2005 marked the third year of chronically warm conditions in the NCC, a situationwhich could have led to a general reduction in physio-logical condition of fish and birds, rendering them lesstolerant of adverse ocean conditions in 2005.
INTRODUCTIONThis is the thirteenth in a series of annual reports
prepared since 1993 that summarize the climatology,oceanography, and biology of the California CurrentSystem (CCS). It is the third to include data from theentire length of the California Current System. Programsor institutions contributing to this report include U.S.
30
BILL PETERSON, ROBERT EMMETT
NOAA FisheriesNorthwest Fisheries Science Center
Fish Ecology DivisionHatfield Marine Science CenterNewport, Oregon 97365-5275
RALF GOERICKE, ELIZABETH VENRICK, ARNOLD MANTYLA
Integrative Oceanography DivisionScripps Institution of Oceanography
La Jolla, California 92093-0218
STEVEN J. BOGRAD, FRANKLIN B. SCHWING
NOAA FisheriesSouthwest Fisheries Science CenterEnvironmental Research Division
1352 Lighthouse AvePacific Grove, California 93950-2097
ROGER HEWITT, NANCY LO, WILLIAM WATSON, JAY BARLOW,
MARK LOWRYNOAA Fisheries
Southwest Fisheries Science Center8604 La Jolla Shores DriveLa Jolla, California 92038
STEVE RALSTON, KARIN A. FORNEYNOAA Fisheries
Southwest Fisheries Science Center110 Shaffer Road
Santa Cruz, California 95060
BERTHA E. LAVANIEGOSDepartmento de Oceanografía Biológica
Centro de Investigación Cientifica y Educación Superior de EnsenadaApartado Postal 2732
22860 Ensenada, Baja California, México
WILLIAM J. SYDEMAN, DAVID HYRENBACH,
RUSSEL W. BRADLEY, PETE WARZYBOKMarine Ecology Division
Point Reyes Bird Observatory4990 Shoreline Highway
Stinson Beach, California 94970
FRANCISCO CHAVEZMonterey Bay Aquarium Research Institute
7700 Sandholdt RoadMoss Landing, California 95039-9044
KAREN HUNTERCooperative Institute for Marine Resource Studies,
Oregon State UniversityHatfield Marine Science Center2030 SE Marine Science Drive
Newport, Oregon 97365
SCOTT BENSONNOAA Fisheries
Southwest Fisheries Science CenterMoss Landing Marine Laboratories
7544 Sandholdt RoadMoss Landing, California 95039
MICHAEL WEISE Department of Ecology and Evolutionary Biology
University of California, Santa Cruz100 Shaffer Road
Santa Cruz, California 95060
JAMES HARVEYMoss Landing Marine Laboratories
8272 Moss Landing RoadMoss Landing, California 95039
GILBERTO GAXIOLA-CASTRODepartamento de Oceanografía Biológica
Centro de Investigación Cientifica y EducaciónSuperior de Ensenada
Km 107 Carretera Tijuana-Ensenada, Apartado Postal 2732
22860 Ensenada, Baja California, Mexico
REGINALDO DURAZOFacultad de Ciencias Marinas, Universidad
Autónoma de Baja Californiakm 107 Carretera Tijuana-Ensenada,
Apartado Postal 453Ensenada, Baja California, Mexico
30-74 State of the Current bl 2 2/5/07 8:26 PM Page 30

STATE OF THE CALIFORNIA CURRENTCalCOFI Rep., Vol. 47, 2006
GLOBEC, NOAA/Stock Assessment ImprovementProgram, Pacific Coast Ocean Observing System(PaCOOS), NOAA/NWFSC/Fish Ecology Division,Point Reyes Bird Observatory, Monterey Bay AquariumResearch Institute, NOAA/SWFSC/EnvironmentalResearch Division (formerly known as the Pacific Fish-eries Environmental Laboratory), Monterey Ocean Timeseries and Observatory (MOTO), California CooperativeOceanic Fisheries Investigations (CalCOFI), and Investi-gaciones Mexicanas de la Corriente de California pro-gram (IMECOCAL).
Three significant climate events have had a profoundeffect on the California Current System during the pastdecade: the first was the 1997–98 El Niño event; the sec-ond was the dramatic shift to cold ocean conditions thatlasted for a period of four years (1999–2002), and thethird was the more subtle but persistent return to warmocean conditions initiated in October 2002. Many pub-lications have described these recent changes in oceanconditions, including a special journal issue focused onthe impacts of the 1997–98 El Niño event (Progress inOceanography, Volume 54, 2002), several papers discussingimplications of the four-year cool phase (e.g., Schwing etal. 2000; Peterson and Schwing 2003; Bond et al. 2003),papers discussing general changes in the California CurrentSystem (DiLorenzo et al. 2005; Perez-Brunius et al. 2006),and a Special Section of Geophysical Research Letters tobe published in November 2006 that discusses the warmocean conditions during summer of 2005.
The present warm phase has now continued for morethan three years in the NCC. Warming which began inlate 2002 was probably due to a weak equatorial El Niñoevent, but continuation of warming through 2005 seemsto be related to weaker than normal upwelling (in 2004)and unusual weather conditions that led to a delay in thestart of the upwelling season (in 2005). The impacts ofthese chronic warm conditions in the NCC were clearlymanifested in an increase in copepod species diversity offOregon (Hooff and Peterson 2006) from late 2002 untilthe present, declines in zooplankton biomass in the north-ern and central California Current, and a failure of Cassin’sauklets to nest successfully in the Gulf of the Farallonesin 2005 (Sydeman et al. 2006). The breeding failure ap-pears to be related to the fixed timing of nesting occur-ring when sufficient krill resources for the seabirds wereunavailable, i.e., egg-laying, in May and June. A recruit-ment failure in several rockfish species off central Californiawas also noted in the summers of 2005 and 2006 (S.Ralston, personal communication; see also Brodeur etal. 2006). In addition, Pacific hake (Merluccius productus)migrated farther north in 2005 than in recent years, pre-sumably due to poor feeding conditions in offshore wa-ters (Thomas et al. 2006). Much of the poor survival andrecruitment of fishes and birds may be attributed to the
failure of the food chain to produce sufficient prey bio-mass. Zooplankton volumes in the southern CaliforniaCurrent have been declining since 1999, and copepodbiomass off Oregon was the lowest measured in the past10 years—20% lower than during the 1998 El Niño event.Also, euphausiid spawning off Oregon (which usually ex-tends from March through October) was restricted toAugust and September, suggesting recruitment failure ofkrill in spring and early summer. Very low abundancesof adult euphausiids were observed off both the Farallonesand Monterey Bay (Sydeman et al. In press).
DATA SETS AND METHODS
Basin- and Coast-Wide AnalysesLarge-scale patterns of SST are summarized from the
National Center for Environmental Prediction Reanalysisfields (Kister et al. 2001) and from the NOAA-CIRESClimate Diagnostics Center (http://www.cdc.noaa.gov).The reanalysis fields are monthly gridded (approximately2˚ × 2˚) anomalies of sea surface temperature (SST) andsurface winds. The base period is 1968–96. Monthlyupwelling indices and their anomalies for the NorthAmerican west coast (21˚–52˚N) are calculated relativeto 1948–67. The daily alongshore wind component andSST are from the NOAA National Data Buoy Center(NDBC). Values from six representative buoys are plot-ted against the harmonic mean of each buoy.
Regional Analyses—Oregon and Washington Regular sampling of the Newport Hydrographic (NH)
line along 44.65˚N continued on a biweekly basis alongthe inner portions of the line, at seven stations rangingfrom 1 to 25 nautical miles from shore. Stations are des-ignated according to distance from shore; e.g., NH05 isthe station five miles off Newport. At each station, aconductivity-temperature-depth (CTD) profile is madewith a Seabird 19 + that is fitted with a Seabird 43Oxygen sensor and Wetlabs fluorometer. Seawater sam-ples are collected with a bucket for later analysis of chloro-phyll a and nutrients. Nutrient data for 1997–2003 areprovided by P. Wheeler (Oregon State University,GLOBEC, LTOP Program). Zooplankton is sampledwith a 0.5 m diameter ring net fitted with a 200 µmmesh net (and TSK flowmeter) that is towed verticallyfrom near the sea floor (or from a depth of 100 m atdeeper water stations) to the sea surface. The cruises de-part in late afternoon so as to arrive at the offshore sta-tion by nightfall. Zooplankton is sampled during daytimeon the outbound leg of the cruise; each station is revis-ited on the inbound leg, at night, so that euphausiidscan be sampled using 60 cm bongo nets fitted with 333µm mesh nets and a GO flowmeter, which is towed overthe upper 20–25 m of the water column. In the labo-
31
30-74 State of the Current bl 2 2/5/07 8:26 PM Page 31
STATE OF THE CALIFORNIA CURRENTCalCOFI Rep., Vol. 47, 2006
ratory, zooplankton are enumerated by species and de-velopmental stage, and biomass is calculated by multiply-ing counts (units of number per cubic meter) by weightsof individuals (mostly from literature values). Waters outto 85 miles offshore of Newport were sampled in May2005. Temperature anomalies along the Newport lineare based on the Smith et al. (2001) climatology.
Cruises to sample pelagic fish typically sample everyten days from mid-April through mid-July. Since 1998,pelagic forage and predatory fish have been sampled at night with a pelagic rope trawl (NET Systems 244, 20× 30 m mouth, 100 m in length; mesh size ranges from163 cm near the throat of the trawl to 8.9 cm in the codend; a 6 m long section of 0.8 cm mesh lines the codend). Trawls are typically 30 minutes in duration, sam-pling from the surface down to a depth of 20 m. Fourstations are sampled along each of two transect lines inshelf waters off Columbia River and Willapa Bay, Wash-ington (for station locations see Emmett et al. 2005).
Regional Analyses—Central California The Monterey Bay region time series consists of two
moored telemetering buoys located in the Bay, hydro-graphic surveys of the Bay every three weeks, and quar-terly surveys along CalCOFI Lines 60 and 67 from thecoast out to station 90. Stations are sampled to near bot-tom or 1012 m where water depth permits. Parametersmeasured are similar to those for the CalCOFI program(described below), and methods are described more fullyin Chavez et al. (2002). Properties are mapped for each
section and can be viewed at http://www.mbari.org/bog/projects/secret/default.htm.
The Fishery Ecology Division of the Southwest Fish-ery Science Center has conducted a standardized mid-water trawl survey during May–June aboard the NOAAR/V David Starr Jordan every year since 1983. Histori-cally, the survey was conducted between 36˚30'–38˚20'Nlatitude (Carmel to Bodega Bay, California), but start-ing in 2003, coverage has expanded to effectively sam-ple the entire coast of California. The primary purposeof the survey is to estimate the abundance of pelagicjuvenile rockfishes (Sebastes spp.) and to develop indicesof year-class strength for use in groundfish stock assess-ments on the U.S. West Coast.
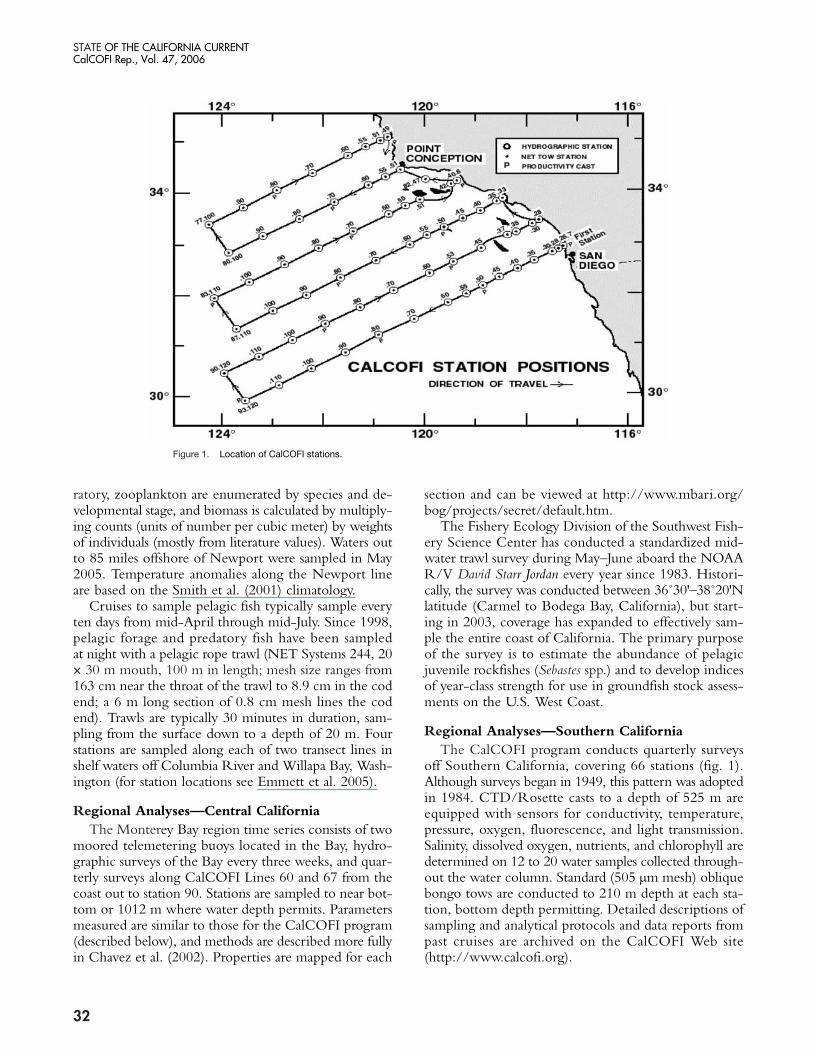
Regional Analyses—Southern California The CalCOFI program conducts quarterly surveys
off Southern California, covering 66 stations (fig. 1).Although surveys began in 1949, this pattern was adoptedin 1984. CTD/Rosette casts to a depth of 525 m areequipped with sensors for conductivity, temperature,pressure, oxygen, fluorescence, and light transmission.Salinity, dissolved oxygen, nutrients, and chlorophyll aredetermined on 12 to 20 water samples collected through-out the water column. Standard (505 µm mesh) obliquebongo tows are conducted to 210 m depth at each sta-tion, bottom depth permitting. Detailed descriptions ofsampling and analytical protocols and data reports frompast cruises are archived on the CalCOFI Web site(http://www.calcofi.org).
32
Figure 1. Location of CalCOFI stations.
30-74 State of the Current 11/12/06 5:20 PM Page 32

STATE OF THE CALIFORNIA CURRENTCalCOFI Rep., Vol. 47, 2006
The mixed layer is defined as the layer within whichthe sigma-theta differential is less than 0.002 kg/m3. Thenitracline depth is defined as the depth where concen-trations of nitrate reach values of 1 µM. Climatologiesare based on data collected during 1984–2005. Cruiseaverages and anomalies presented below are based onmeasurements made at these 66 stations. Unless other-wise stated, anomalies are calculated as the cruise meanvalue minus harmonic mean. Individual cruise data from200 m (interpolated standard level) were averaged foroffshore stations (station numbers xx.60 and higher) onall lines for cruises since 1984. Annual averages andanomalies, relative to the years 1984–2005, were calcu-lated as described above.
Since 2003, the winter cruise has extended mea-surements into Central California, primarily to exam-ine distribution of hake larvae. The daily hake larvalproduction at hatching and the instantaneous mortalityrate (IMR) were estimated using a Pareto survival curve,because it was evident that the IMR decreases as age oflarvae increases (Lo1 in prep). This was done for years
when surveys covered the whole area. For years whenhake larval data were collected only from San Diego toMorro Bay (southern area), the larval production for thewhole area was computed from mean larvae density fromthe south.
Regional Analyses—IMECOCAL Data off northern and central Baja California are col-
lected quarterly with a grid of about 93 stations (fig. 2).At each station a CTD/Rosette cast is made to 1000 mdepth, and is equipped with sensors for pressure, tem-perature, salinity, dissolved oxygen, and fluorescence.Water samples from the upper 200 m are collected with5 liter Niskin bottles at 0, 10, 20, 50, 100, 150, and200 m depths to determine dissolved oxygen, chloro-phyll a and phaeopigments, nutrients (NO3, NO2, PO4,SiO3), and primary production. Macrozooplankton issampled with bongo net tows from 200 m to the sur-face. IMECOCAL cruise schedules, data collection,methods, and analyses are fully described in data reportsat the Web site: http://www.imecocal.cicese.mx.
Avifauna Since 1987, CalCOFI cruises have included system-
atic surveys of the distribution and abundance of ma-rine birds in relation to oceanographic conditions (Veitet al. 1996; Hyrenbach and Veit 2003). Since the early1970s the Point Reyes Bird Observatory (PRBO) MarineEcology Division has monitored the reproductive per-formance and the diet of seabird populations breedingat the Farallon Islands (central California) (Sydeman etal. 2001; Abraham and Sydeman 2004).
Marine Mammals Marine mammal populations along the U.S. West
Coast are assessed every 2–5 years by means of compre-hensive shipboard line-transect surveys. Previous marinemammal assessment surveys were conducted during 1991and 1993 (California only), and during 1996 and 2001(entire U.S. West Coast) by the Southwest FisheriesScience Center. The most recent survey, extending alongthe entire U.S. West Coast and about 550 km offshore,was completed during June–December 2005. For thefirst time, additional fine-scale surveys were conductedwithin the National Marine Sanctuaries in centralCalifornia and Washington. The project, CollaborativeSurvey of Cetacean Abundance and the Pelagic Eco-system (CSCAPE), also incorporated extensive ecosys-tem studies, including underway and station-basedoceanographic sampling, net tows, and seabird surveys.All survey data are currently being processed and ana-lyzed by SWFSC staff, but some preliminary marinemammal observations for 2005 are described below andrelated to previous survey years.
33
Figure 2. The standard IMECOCAL sampling grid. Black points representthe 93-station pattern (CalCOFI lines 100 to 137) occupied by theIMECOCAL program since 1997 (including line 97 for April surveys since2003). Depth contours are in meters.
1Lo in prep. Time series of daily Pacific hake larval production off California in1951–2005.
30-74 State of the Current 11/12/06 5:20 PM Page 33

STATE OF THE CALIFORNIA CURRENTCalCOFI Rep., Vol. 47, 2006
BASINWIDE PATTERNSSea surface temperature (SST) anomalies in 2005 and
2006 continued to display a heterogeneous pattern thatdoes not resemble the characteristic spatial patterns de-fined in previous analyses (e.g., Pacific Decadal Oscillation[PDO]), Mantua and Hare 2002; Victoria mode, Bondet al. 2003). For most of the past 12 months, positiveSST anomalies have been maintained northwest ofHawaii, but negative anomalies have prevailed in theKuroshio/Oyashio region (fig. 3). Northeast PacificSSTs have been controlled by local wind processes. TheNorth Pacific High (NPH) failed to strengthen as usualin spring 2005, leading to anomalously strong down-welling in the Gulf of Alaska and weaker than normalupwelling along the North American west coast (fig. 3a).However, the NPH remained strong into the fall of2005, leading to sustained coastal upwelling and coolSSTs in the California Current System (fig. 3b). Warmanomalies again prevailed during much of the winter2005–06 (fig. 3c).
The most recent assessment (May 2006) shows gen-erally negative SST anomalies in the northeast Pacific,and warm SSTs northwest of Hawaii and off SouthernCalifornia and Mexico (fig. 3d). California CurrentSystem SST anomalies have become more positive sinceApril, indicating that the seasonal development of coastalupwelling in 2006 has been delayed like in 2005. In con-
trast, SSTs off Peru continue a cool tendency that beganin early 2005 (Climate Prediction Center 2005). In con-trast to the North Pacific, the Atlantic remains extremelywarm, which suggests another active hurricane season.
The tropical Pacific was in a weak La Niña state inspring–summer 2005, but has returned to an ENSO-neutral state during the past several months (ClimatePrediction Center 2005). The Multivariate ENSO Index(Wolter and Timlin 1998) has been slightly negative sinceOctober 2005, suggesting weak to moderate La Niñaconditions. Recent equatorial Pacific SSTs have beennear normal, except for cool anomalies (fig. 3) and anassociated shallow thermocline near the South Americancoast. The lack of a clear ENSO signal in the tropicsduring the past year suggests that equatorial processeshave not played a significant role in creating ENSO-likeanomalies in the California Current System. ENSO-neutral conditions are forecast for the next three to sixmonths (Climate Prediction Center 2005).
The atmospheric variability has been dominated bythe 60–90 day signal of the Madden-Julian Oscillation(MJO). The MJO is reflected in the large-scale windsover the Northeast Pacific and upper ocean anomaliesas well, making it difficult to characterize any persistentlong-term anomaly pattern. The predominant MJO forc-ing has also excited atmospheric variability at relativelyshort wavelengths (sub-ocean basin), which may have
34
Figure 3. SST anomalies in the North Pacific Ocean for (A) May 2005, (B) September 2005, (C) January 2006, and (D) May 2006. Contour interval is 1.0˚C.Positive (warm) anomalies are shaded light grey, and negative (cool) anomalies are shaded dark grey. SST climatology is 1968–96. Monthly data obtained fromthe NOAA-CIRES Climate Diagnostics Center.
30-74 State of the Current 11/12/06 5:20 PM Page 34

STATE OF THE CALIFORNIA CURRENTCalCOFI Rep., Vol. 47, 2006
contributed to the continuing spatially complex and het-erogeneous anomaly patterns in SST. The MJO patternis strengthening again in spring 2006.
COASTWIDE CONDITIONSFor 1999–2003, the California Current System had
very strong summer upwelling and very cool SSTs (sum-marized in past CalCOFI Reports). In 2004, this pat-tern switched, with weaker summer upwelling, butanomalously strong upwelling in the fall and early win-ter of 2004 north of Monterey Bay (fig. 4). Since theweak El Niño of 2002–04 and through the first half of2005, upwelling anomalies South of Monterey have beennegative with anomalously weak upwelling extendingalong the entire coast in spring and early summer 2005.These are consistent with winds at the National Data
Buoy Center (NDBC) coastal buoys (fig. 5) and anom-alously warm coastal SSTs (fig. 6).
Most of the California Current System experiencedunusually warm upper ocean conditions in spring–summer 2005. In the Southern California Bight, SSTswere up to 4˚C above normal (http://www.pfeg.noaa.gov).However, this warm surface layer may have been quitethin, reflecting low winds and weak mixing, rather thandeep warming due to an anomalously deep thermoclineand a large change in heat content. Strong upwellingcommenced in July–August and continued into earlyspring 2006, leading to rapid surface cooling and an ad-justment of SSTs back to near-normal values. However,with the exception of positive upwelling anomalies offnorthern California and southern Oregon, upwellingagain has been anomalously weak in 2006, strikingly
35
Figure 4. Monthly upwelling index and upwelling index anomaly for January 2004–May. 2006.Shaded areas denote positive (upwelling-favorable) values in upper panel, and positive anomalies(generally greater than normal upwelling) in lower panel. Anomalies are relative to 1948–67 monthlymeans. Units are in m3/s per 100 km of coastline.
30-74 State of the Current 11/12/06 5:20 PM Page 35
STATE OF THE CALIFORNIA CURRENTCalCOFI Rep., Vol. 47, 2006
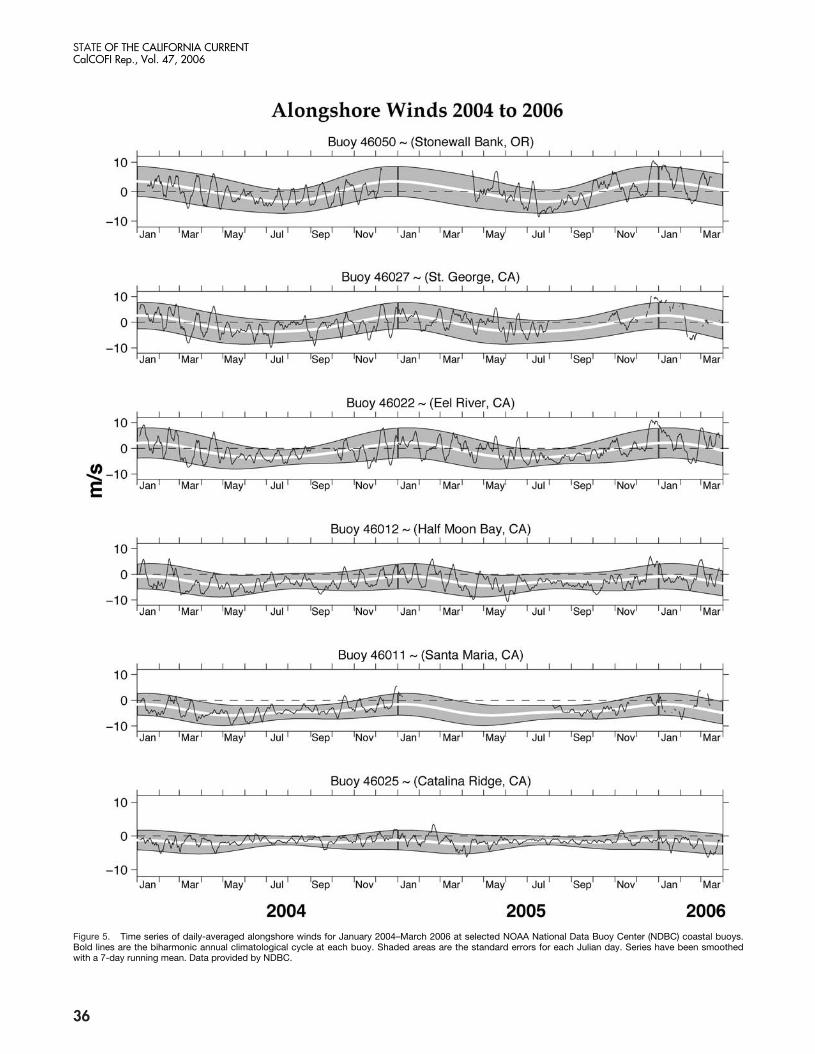
Figure 5. Time series of daily-averaged alongshore winds for January 2004–March 2006 at selected NOAA National Data Buoy Center (NDBC) coastal buoys.Bold lines are the biharmonic annual climatological cycle at each buoy. Shaded areas are the standard errors for each Julian day. Series have been smoothedwith a 7-day running mean. Data provided by NDBC.
36
30-74 State of the Current 11/12/06 5:20 PM Page 36

STATE OF THE CALIFORNIA CURRENTCalCOFI Rep., Vol. 47, 2006
Figure 6. Time series of daily-averaged SST for January 2004–March 2006 at selected NDBC coastal buoys. Bold lines are the biharmonic annual climatologicalcycle at each buoy. Shaded areas are the standard errors for each Julian day. Data provided by NOAA NDBC.
37
30-74 State of the Current 11/12/06 5:20 PM Page 37

STATE OF THE CALIFORNIA CURRENTCalCOFI Rep., Vol. 47, 2006
similar to the pattern in 2005 (fig. 4). There is no ap-parent surface ocean teleconnection with the tropicalPacific contributing to these warm anomalies.
The predominance of strong intra-seasonal variabil-ity in the California Current System is illustrated by aseries of ca. 30-day alongshore fluctuations in NDBCwinds (fig. 5). These strong fluctuations or reversals inthe alongshore winds were observed throughout the2004–05 period, particularly in the northern CaliforniaCurrent System. This anomalous wind forcing is re-flected in the SST time series from the NDBC buoys(fig. 6). The intra-seasonal oscillations in alongshorewinds in summer and fall 2005 resulted in strong fluc-tuations in SST, with changes sometimes exceeding 5˚Cover the course of a few days.
REGIONAL STUDIES
Oregon The time series of sea surface temperature 22 miles
off Newport, Oregon (NOAA Buoy 46050), shows hightemperatures during the summer of the 1997–98 trop-ical El Niño event, and cold temperatures during thenegative (cool) phase of the PDO during 1999–2002.Between spring-early summer 2003 and the end of 2005,anomalously warm water was common. Sea surface tem-peratures at NOAA buoy 46050 (22 miles off Newportin 140 m water depth) were 1˚ to 2˚C above normal formost months after autumn 2002 (fig. 7). Some monthsin 2004 and 2005 had positive SST anomalies thatexceeded those seen during the 1998 El Niño event.
There is correspondence between the PDO and localtemperature anomalies (fig. 7). The four-year period ofnegative PDO values from late-1998 until late-2002 ismatched closely by negative SST anomalies off Oregon.The positive PDO values from late-2002 until present
38
Figure 7. Time series of the Pacific Decadal Oscillation (PDO, upper) andsea surface temperature (lower) at NOAA Buoy 46050, 22 miles off Newport,Oregon. Note that anomalously warm water persisted off the Oregon coastfrom late-2002 through late-2005; The two time series appear to be correlat-ed, with SST lagging the two major changes in the PDO by about six months.
Figure 8. Temperature (left) and temperature anomalies (right) off Newport,Oregon, measured on 10 May 2005. Note that warming was observedchiefly in the upper 100 m of the water column, with +2˚C anomaliesobserved at least as far offshore as 150 km.
Figure 9. Time series of temperature (upper) and salinity (lower) measuredat a depth of 150 m at station NH 25 (25 miles off Newport, Oregon; waterdepth, 300 m), from July 1997 to present.
30-74 State of the Current 11/12/06 5:20 PM Page 38

STATE OF THE CALIFORNIA CURRENTCalCOFI Rep., Vol. 47, 2006
also match positive SST anomalies. This suggests thatchanges in the basin-scale forcing result in changes lo-cally (off Oregon), and that local changes may be dueto differences in transport of water out of the NorthPacific into the northern California Current, as sug-gested by DiLorenzo et al. (2005). The temperature sec-tion along the Newport Line, May 2005 (fig. 8), showsa +3˚C anomaly in the upper 20–25 m and a +1˚Canomaly in the upper 100 m. Deeper waters only hadan anomaly of about +0.5˚C. Another temperature sec-tion along the Newport Line was completed in mid-July (Pierce et al. 2006) with the same result; Pierce et al.(2006) note that the July 2005 section resembled sec-tions made in July of 1983 and 1997, both El Niño years.
A time series of temperature measured at a depth of150 m at a shelf break station off Newport shows a strongseasonal cycle (fig. 9). Summertime temperatures showthe same pattern as the SST at NOAA Buoy 46050.Temperatures were cool during summers of 1999–2002,with the average ranging from 7.39˚C (1999) to 7.24˚C(2002). Following this four-year period of cool tem-peratures, the deep waters began to warm, and averagetemperatures increased to 7.56˚C (2003), 7.71˚C (2004),and 7.65˚C (2005). Salinity at 150 m at the same sta-tion had the opposite pattern, with relatively high val-ues during summers 1999–2002 when the averagesranged from 33.92 to 33.96, decreasing in 2003 to 33.90,then 33.89 (2004) and 33.93 (2005). As of July 2006 thetrend is towards colder and saltier water similar to thatobserved from 1999 to 2002. From this (albeit limited)data set, it appears that relatively warm and fresh wateroff Oregon occurs during the positive phase of the PDOand colder and saltier water during the negative phase,supporting a hypothesis that different water types occuroff Oregon as a function of the PDO phase.
Central California In Monterey Bay, sea surface salinity anomalies were
about 0.2 units fresher from late 2002 until the present,with the strongest anomalies in the winter (fig. 10). Seasurface temperatures were cooler than average from 1999to late-2002, but were near the long-term average fromearly 2003 through late-2005, with the exception ofabout +1˚C anomalies during spring 2005.
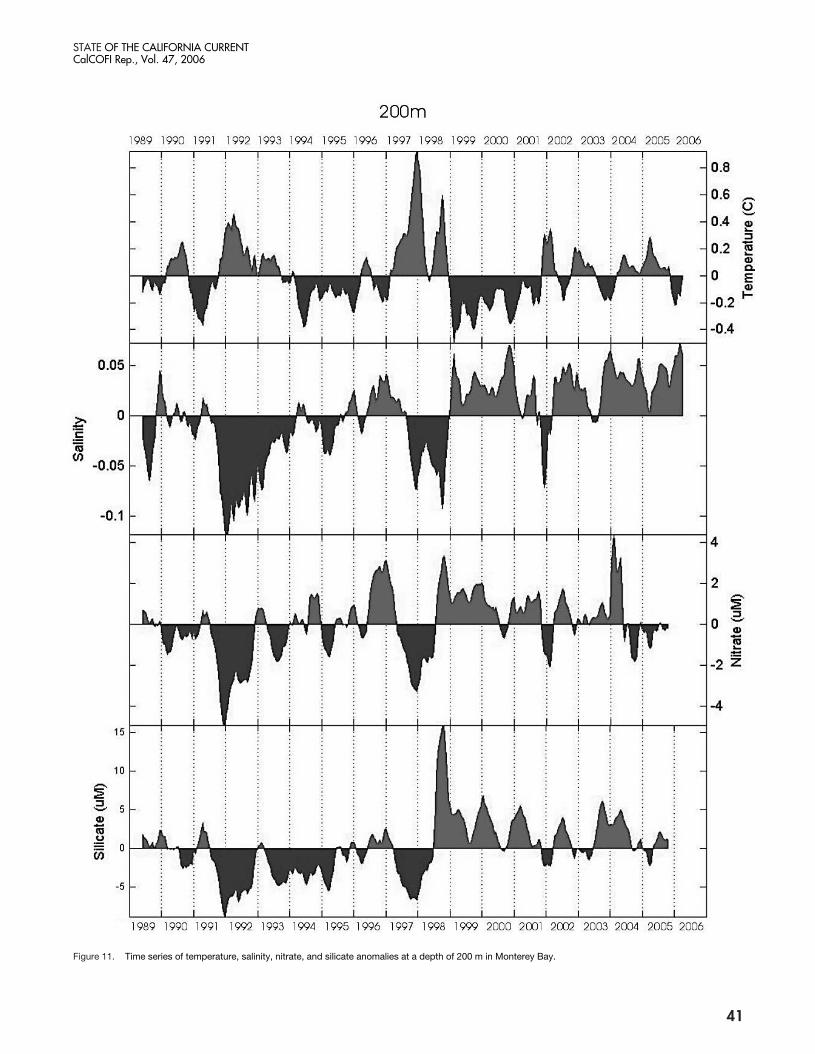
Temperatures at 200 m were cooler than average from1999 to late-2001 (fig. 11), but were warmer in wintersof 2001–02 and 2002–03. However from early-2004through late-2005, temperatures were warmer by about0.2˚C, similar to that observed off Oregon. The salin-ity record was different from that off Oregon in thatabove average salinities have been observed in MontereyBay in all years since 1999.
Another significant trend in Monterey Bay (notshown) is a long-term warming of 0.2˚C since 1989, or
a change of 0.012˚C per year. A similar change has beennoted for the Newport Line. When historical data fromNH 25 at 150 m (from 1961–71) are compared to re-cent temperatures, the overall temperature increase is0.006˚C per year. Given the lack of measurements be-tween 1972 and 1997, the temperature increase offMonterey and Newport may well be the same.
Southern and Baja California: CalCOFI Overview
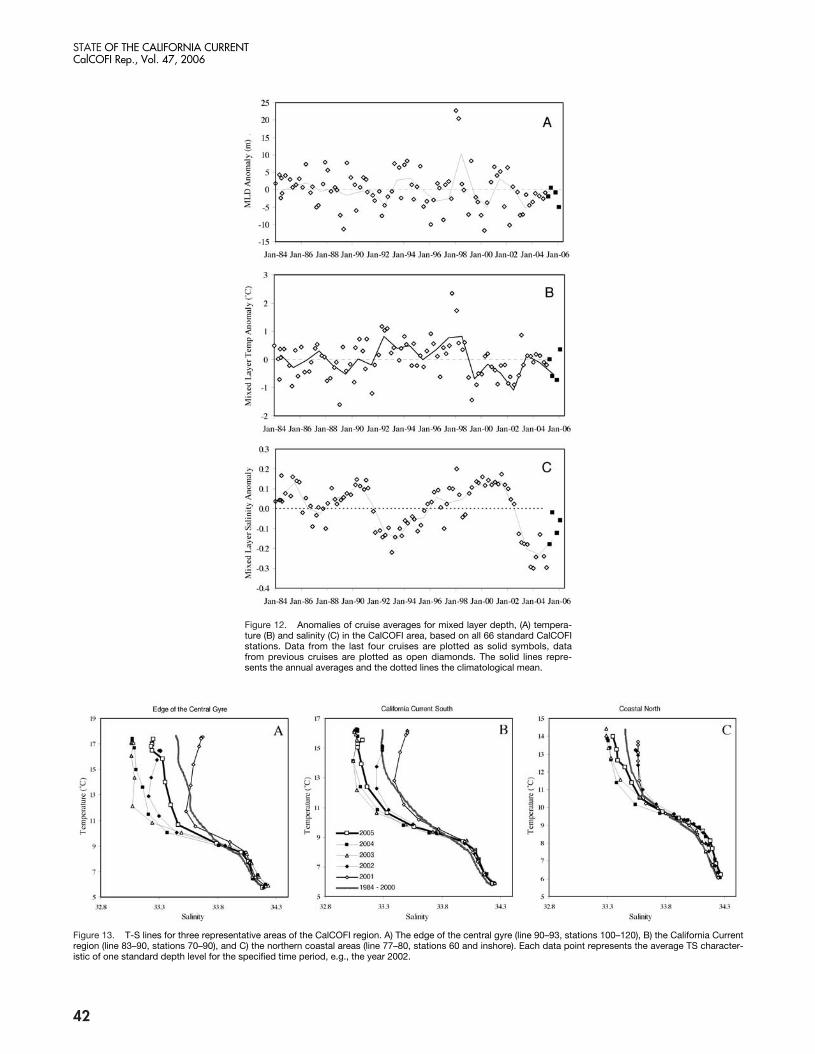
This report is based on cruises in April, July, andNovember of 2005, and February of 2006. In theCalCOFI region, mixed-layer depths (MLD) during thelast year were slightly below the long-term average(fig. 12a) with values similar to those observed since2002. Mixed-layer temperatures during 2005 were 0.5˚Cbelow the long-term average, similar to values measuredsince 1999. The value for February 2006 was slightlyabove the long-term average (fig. 12b).
Mixed-layer salinity anomalies over the last year werebelow zero but were higher than those observed duringthe previous two years (fig. 12c), reversing a trend ofdecreasing salinities that began in 2003. This increase ofsalinities was seen throughout the CalCOFI region, butwas particularly pronounced at the edge of the CentralGyre of the North Pacific (fig. 13a) and less so in otherregions (e.g., figs. 13b, c). Temperatures at a depth of200 m were close to the long-term average over the lastyear, continuing conditions observed since 1998 (fig.14a). Salinities at a depth of 200 m had values similar tothose observed since 1999 (fig. 14b), and were similarto salinities observed in Monterey Bay. The large neg-ative salinity anomaly observed over the last few years isnot apparent at 200 m and must have been confined tothe upper 100 to 150 m.
IMECOCAL Overview IMECOCAL surveys were completed in April, July,
and October 2005, and February 2006. Data shown hereare relative to a climatology of 1997–2004. The recentsurveys found that 0–500 m temperature-salinity char-acteristics contrasted to climatological means (Lynn et al.1982; Ramirez-Manguilar 2005), showing lower-than-normal salinities in the upper layer (�t < 25.5) similarto previous years (Goericke et al. 2004, 2005; Durazoet al. 2005). The near-surface salinities were, however,slightly closer to the climatological mean than they werein 2002–04 (fig. 15). Although average TS (Temperature-Salinity) diagrams for each cruise (except July 2005) sug-gest near normal sea surface temperatures, a closerscrutiny of T and S anomalies (not shown) for each ofthe hydrographic sections, indicate that California Currentflows were generally displaced offshore (see surface flowpatterns and property distributions below), and were
39
30-74 State of the Current 11/12/06 5:20 PM Page 39

STATE OF THE CALIFORNIA CURRENTCalCOFI Rep., Vol. 47, 2006
Figure 10. Time series of sea surface temperature, salinity, nitrate, chlorophyll and primary production anomalies in Monterey Bay.
40
30-74 State of the Current 11/12/06 5:20 PM Page 40
STATE OF THE CALIFORNIA CURRENTCalCOFI Rep., Vol. 47, 2006
Figure 11. Time series of temperature, salinity, nitrate, and silicate anomalies at a depth of 200 m in Monterey Bay.
41
30-74 State of the Current 11/12/06 5:20 PM Page 41
STATE OF THE CALIFORNIA CURRENTCalCOFI Rep., Vol. 47, 2006
Figure 13. T-S lines for three representative areas of the CalCOFI region. A) The edge of the central gyre (line 90–93, stations 100–120), B) the California Currentregion (line 83–90, stations 70–90), and C) the northern coastal areas (line 77–80, stations 60 and inshore). Each data point represents the average TS character-istic of one standard depth level for the specified time period, e.g., the year 2002.
42
Figure 12. Anomalies of cruise averages for mixed layer depth, (A) tempera-ture (B) and salinity (C) in the CalCOFI area, based on all 66 standard CalCOFIstations. Data from the last four cruises are plotted as solid symbols, datafrom previous cruises are plotted as open diamonds. The solid lines repre-sents the annual averages and the dotted lines the climatological mean.
30-74 State of the Current 11/12/06 5:20 PM Page 42
STATE OF THE CALIFORNIA CURRENTCalCOFI Rep., Vol. 47, 2006
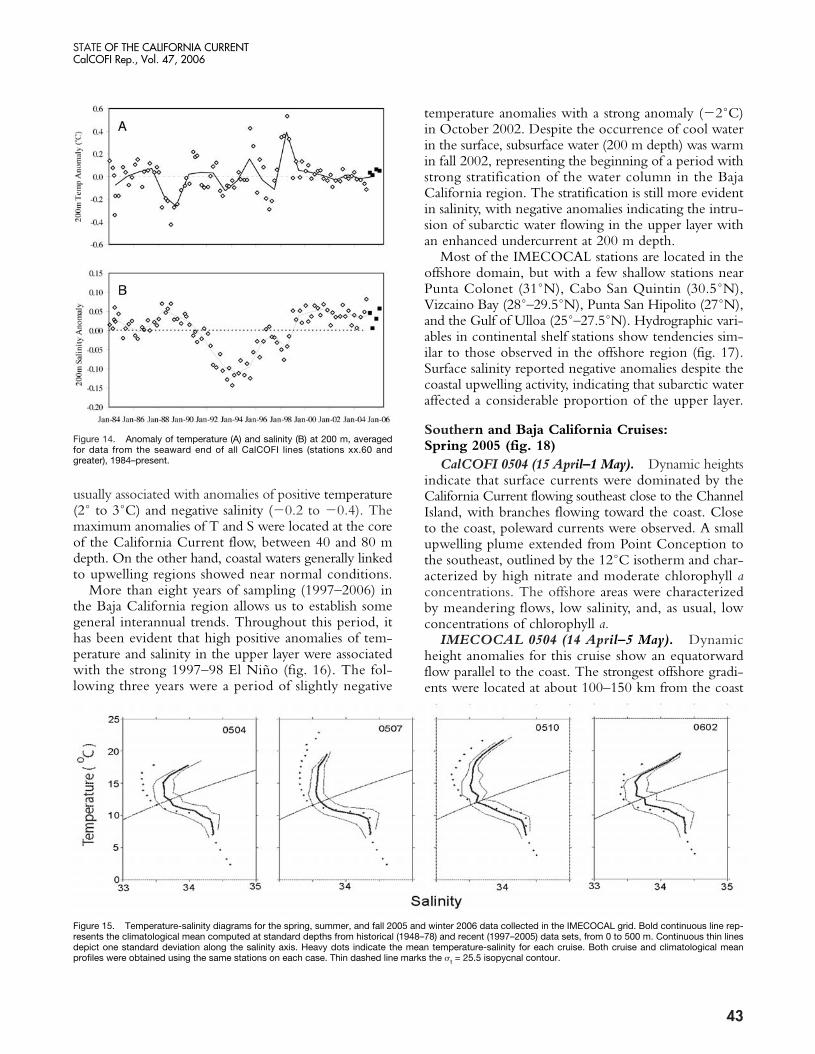
usually associated with anomalies of positive temperature(2˚ to 3˚C) and negative salinity (�0.2 to �0.4). Themaximum anomalies of T and S were located at the coreof the California Current flow, between 40 and 80 mdepth. On the other hand, coastal waters generally linkedto upwelling regions showed near normal conditions.
More than eight years of sampling (1997–2006) inthe Baja California region allows us to establish somegeneral interannual trends. Throughout this period, ithas been evident that high positive anomalies of tem-perature and salinity in the upper layer were associatedwith the strong 1997–98 El Niño (fig. 16). The fol-lowing three years were a period of slightly negative
temperature anomalies with a strong anomaly (�2˚C)in October 2002. Despite the occurrence of cool waterin the surface, subsurface water (200 m depth) was warmin fall 2002, representing the beginning of a period withstrong stratification of the water column in the BajaCalifornia region. The stratification is still more evidentin salinity, with negative anomalies indicating the intru-sion of subarctic water flowing in the upper layer withan enhanced undercurrent at 200 m depth.
Most of the IMECOCAL stations are located in theoffshore domain, but with a few shallow stations nearPunta Colonet (31˚N), Cabo San Quintin (30.5˚N),Vizcaino Bay (28˚–29.5˚N), Punta San Hipolito (27˚N),and the Gulf of Ulloa (25˚–27.5˚N). Hydrographic vari-ables in continental shelf stations show tendencies sim-ilar to those observed in the offshore region (fig. 17).Surface salinity reported negative anomalies despite thecoastal upwelling activity, indicating that subarctic wateraffected a considerable proportion of the upper layer.
Southern and Baja California Cruises: Spring 2005 (fig. 18)
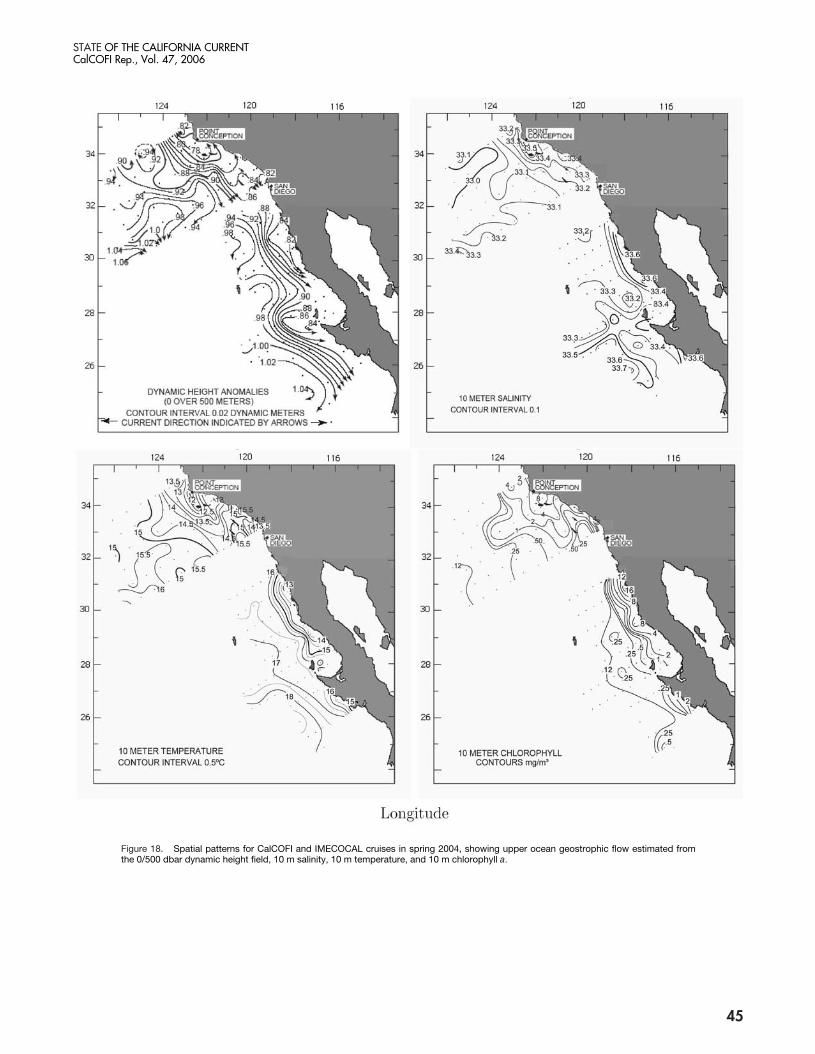
CalCOFI 0504 (15 April–1 May). Dynamic heightsindicate that surface currents were dominated by theCalifornia Current flowing southeast close to the ChannelIsland, with branches flowing toward the coast. Closeto the coast, poleward currents were observed. A smallupwelling plume extended from Point Conception tothe southeast, outlined by the 12˚C isotherm and char-acterized by high nitrate and moderate chlorophyll aconcentrations. The offshore areas were characterizedby meandering flows, low salinity, and, as usual, lowconcentrations of chlorophyll a.
IMECOCAL 0504 (14 April–5 May). Dynamicheight anomalies for this cruise show an equatorwardflow parallel to the coast. The strongest offshore gradi-ents were located at about 100–150 km from the coast
43
Figure 14. Anomaly of temperature (A) and salinity (B) at 200 m, averagedfor data from the seaward end of all CalCOFI lines (stations xx.60 andgreater), 1984–present.
Figure 15. Temperature-salinity diagrams for the spring, summer, and fall 2005 and winter 2006 data collected in the IMECOCAL grid. Bold continuous line rep-resents the climatological mean computed at standard depths from historical (1948–78) and recent (1997–2005) data sets, from 0 to 500 m. Continuous thin linesdepict one standard deviation along the salinity axis. Heavy dots indicate the mean temperature-salinity for each cruise. Both cruise and climatological meanprofiles were obtained using the same stations on each case. Thin dashed line marks the �t = 25.5 isopycnal contour.
30-74 State of the Current 11/12/06 5:20 PM Page 43
STATE OF THE CALIFORNIA CURRENTCalCOFI Rep., Vol. 47, 2006
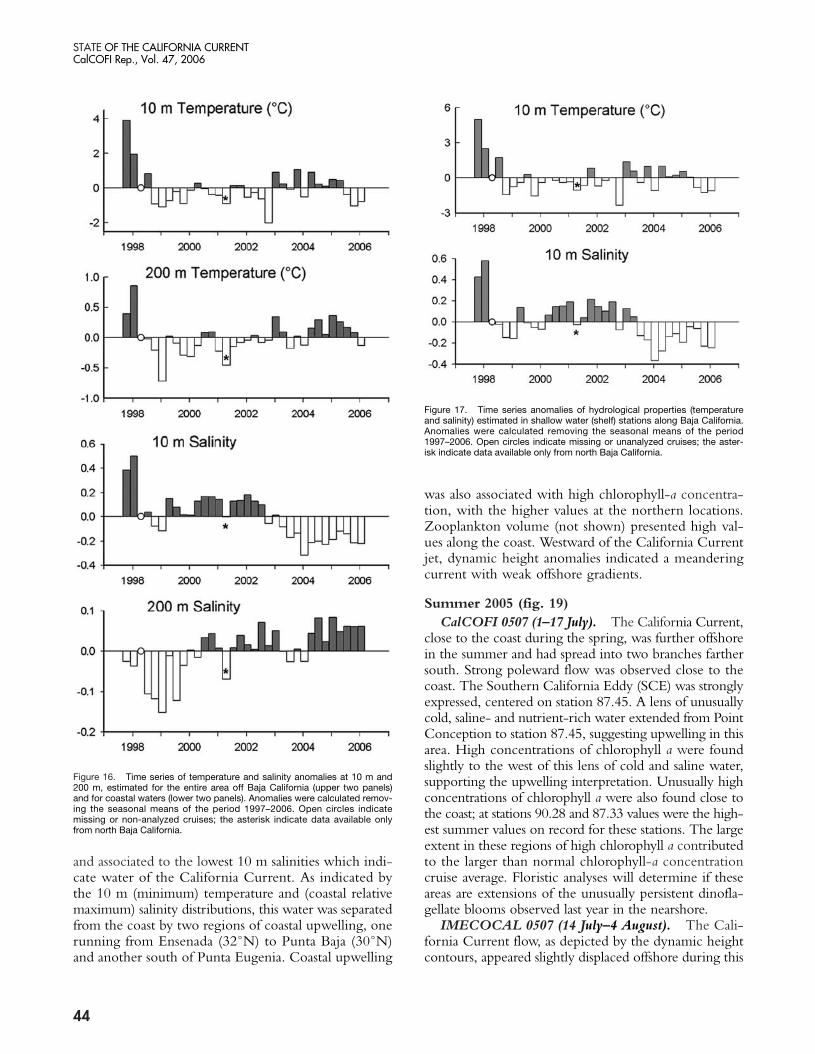
and associated to the lowest 10 m salinities which indi-cate water of the California Current. As indicated bythe 10 m (minimum) temperature and (coastal relativemaximum) salinity distributions, this water was separatedfrom the coast by two regions of coastal upwelling, onerunning from Ensenada (32˚N) to Punta Baja (30˚N)and another south of Punta Eugenia. Coastal upwelling
was also associated with high chlorophyll-a concentra-tion, with the higher values at the northern locations.Zooplankton volume (not shown) presented high val-ues along the coast. Westward of the California Currentjet, dynamic height anomalies indicated a meanderingcurrent with weak offshore gradients.
Summer 2005 (fig. 19)CalCOFI 0507 (1–17 July). The California Current,
close to the coast during the spring, was further offshorein the summer and had spread into two branches farthersouth. Strong poleward flow was observed close to thecoast. The Southern California Eddy (SCE) was stronglyexpressed, centered on station 87.45. A lens of unusuallycold, saline- and nutrient-rich water extended from PointConception to station 87.45, suggesting upwelling in thisarea. High concentrations of chlorophyll a were foundslightly to the west of this lens of cold and saline water,supporting the upwelling interpretation. Unusually highconcentrations of chlorophyll a were also found close tothe coast; at stations 90.28 and 87.33 values were the high-est summer values on record for these stations. The largeextent in these regions of high chlorophyll a contributedto the larger than normal chlorophyll-a concentrationcruise average. Floristic analyses will determine if theseareas are extensions of the unusually persistent dinofla-gellate blooms observed last year in the nearshore.
IMECOCAL 0507 (14 July–4 August). The Cali-fornia Current flow, as depicted by the dynamic heightcontours, appeared slightly displaced offshore during this
44
Figure 16. Time series of temperature and salinity anomalies at 10 m and200 m, estimated for the entire area off Baja California (upper two panels)and for coastal waters (lower two panels). Anomalies were calculated remov-ing the seasonal means of the period 1997–2006. Open circles indicatemissing or non-analyzed cruises; the asterisk indicate data available onlyfrom north Baja California.
Figure 17. Time series anomalies of hydrological properties (temperatureand salinity) estimated in shallow water (shelf) stations along Baja California.Anomalies were calculated removing the seasonal means of the period1997–2006. Open circles indicate missing or unanalyzed cruises; the aster-isk indicate data available only from north Baja California.
30-74 State of the Current 11/12/06 5:20 PM Page 44
STATE OF THE CALIFORNIA CURRENTCalCOFI Rep., Vol. 47, 2006
Figure 18. Spatial patterns for CalCOFI and IMECOCAL cruises in spring 2004, showing upper ocean geostrophic flow estimated fromthe 0/500 dbar dynamic height field, 10 m salinity, 10 m temperature, and 10 m chlorophyll a.
45
30-74 State of the Current 11/12/06 5:21 PM Page 45

STATE OF THE CALIFORNIA CURRENTCalCOFI Rep., Vol. 47, 2006
46
Figure 19. Spatial patterns for CalCOFI and IMECOCAL cruises in summer 2005, showing upper-ocean geostrophic flow estimated fromthe 0/500 dbar dynamic height field, 10 m salinity, 10 m temperature, and 10 m chlorophyll a.
30-74 State of the Current 11/12/06 5:21 PM Page 46

STATE OF THE CALIFORNIA CURRENTCalCOFI Rep., Vol. 47, 2006
47
Figure 20. Spatial patterns for CalCOFI and IMECOCAL cruises in fall 2005, showing upper-ocean geostrophic flow estimated from the0/500 dbar dynamic height field, 10 m salinity, 10 m temperature, and 10 m chlorophyll a. Data used for these plots are still preliminary.
30-74 State of the Current 11/12/06 5:21 PM Page 47

STATE OF THE CALIFORNIA CURRENTCalCOFI Rep., Vol. 47, 2006
48
Figure 21. Spatial patterns for CalCOFI and IMECOCAL winter in February 2006 showing upper-ocean geostrophic flow estimated fromthe 0/500 dbar dynamic height field, 10 m salinity, 10 m temperature, and 10 m chlorophyll a. Data used for these plots are still preliminary.
30-74 State of the Current 11/12/06 5:21 PM Page 48

STATE OF THE CALIFORNIA CURRENTCalCOFI Rep., Vol. 47, 2006
season, and ran southward west of stations xxx.45. Thejet was narrow and meandered around coastal cycloniceddies that might have shed from recently upwelled wateron the coast. Minimum temperatures (~12˚C) occurredat the coast south of Ensenada (32˚N), associated withpigments higher than 8 mg chlorophyll a m�3. Zoo-plankton volume (not shown) follows the same patternas that of chlorophyll, with the highest volume on recordfound at the Gulf of Ulloa (26.5˚N). The eddy struc-tures were linked to relatively high chlorophyll-a con-centration and to slightly higher near-surface salinities.Temperature and salinity anomalies along the CaliforniaCurrent jet indicated warmer and fresher waters, whilethose eastward, associated with eddies, indicated colderand saltier waters.
Fall 2005 (fig. 20)CalCOFI 0511 (4–21 November). Compared with
its location in April and July 2005, the California Currentwas found even farther offshore, still split in two brancheswith a cyclonic eddy between these branches centeredon station 90.90. The Southern California Eddy, cen-tered on stations 87.45 and 87.50, was as strong as it wasduring the summer. Water was flowing poleward alongthe coast, as is typical of this time of the year (Bogradet al. 2000). Somewhat elevated concentrations of chloro-phyll a were found along the coast and off PointConception.
IMECOCAL 0510 (13–27 October). Dynamic heightcontours portrayed a more diffuse, weaker, and mean-dering California Current. The 10 m salinity distribu-tion suggested that the California Current core (S ~33.3)had been displaced off the limits of the survey region inmost of the area. Coastal upwelling, as suggested by the10 m temperature coastal minimum (T ~15˚–17˚C) anda chlorophyll a coastal maximum (chlorophyll a ~2 mgm�3), was restricted to the northern portion, betweenEnsenada and Punta Baja.
Winter 2006 (fig. 21)CalCOFI 0602 (3–22 February). Data for this cruise
are preliminary. The flow patterns are similar to thoseobserved during July and November 2005, with a strongCalifornia Current entering the area along the center ofline 77 and splitting into two branches with an extendedmeander in the southern part of the study area. TheSouthern California Eddy was strong, still centered onstations 87.45 to 87.50. Low temperatures and high salin-ities were observed off Point Conception and farthernorth, suggesting localized upwelling. However, con-centrations of chlorophyll a were still low, typical of win-ter conditions.
IMECOCAL 0602 (4–25 February). Property dis-tributions for winter 2006 are mostly uniform through-
out the survey region, typical of this season (e.g., Lynnand Simpson 1987). Temperatures ranged from 15˚ to18˚C, while salinities varied from 33.4 to 33.8.Chlorophyll-a values were low, also typical of the season,with highest (~1 mg m�3) values inside Vizcaino Bayand south of Punta Eugenia.
BIOLOGICAL PATTERNS AND PROCESSES
Macronutrients, Chlorophyll a, and Primary Production
Oregon: The year 2005 was characterized by verylow nutrient concentrations during spring months. Atstation NH 05, the average surface nitrate concentra-tions (March–June) were the lowest measured for our10-year time series at 0.67 µM. This compares to 1.91µM in spring 1998 (during the El Niño), and 5.03 ±1.55 (95% CI) for March–June, averaged for the years1997 and 1999–2004. After upwelling was initiated inJuly 2005, nitrate concentrations increased to 14.5 µM,the highest average concentration observed in our timeseries for July–August. This compares to the July–Augustaverage for 1997 and 1999–2004 of 10.53 ± 1.77 µM.The average for 1998 was only 2.3 µM. Table 1 sum-marizes these results.
Chlorophyll-a concentrations for April–June in 2005were 2.9 µg per liter, the median value for the 10-yeartime series. The lowest chlorophyll values for theApril–June period were from 1997–2000, averaging 1.7µg per liter over this four-year period. Thus, althoughvery low concentrations of nitrate may have limited phy-toplankton growth in spring 2005, chlorophyll-a con-centrations were not strongly affected.
The chlorophyll a values averaged over the upwellingseason (May–September) ranged from 3.7 (1997) to 8.5(2002) µg per liter; the 2005 value was near the medianat 6.3 µg per liter. Thus, there is no evidence for anydramatic effect of warm ocean conditions on either
49
TABLE 1Average nitrate (µM) and chlorophyll (µg chl-a L�1)concentrations measured at the sea surface at station NH 05, five miles off Newport, in spring (April–June) and summer (July–August) for the years 1997–2005.
Nitrate (µM) Chlorophyll-a (µg chl-a L-1)
YEAR April–June July–August April–June July–August
1997 5.21 7.95 1.14 6.11998 1.91 2.25 2.23 10.51999 4.95 10.20 1.79 5.52000 8.65 12.00 1.93 8.42001 4.16 9.43 6.59 9.02002 4.28 11.49 6.09 10.92003 4.37 10.30 2.99 9.72004 3.62 8.41 4.92 8.12005 0.67 14.49 2.94 8.7
30-74 State of the Current 11/12/06 5:21 PM Page 49

STATE OF THE CALIFORNIA CURRENTCalCOFI Rep., Vol. 47, 2006
spring-averaged or seasonally-averaged chlorophyll con-centrations in shelf waters off Newport in 2005.
Nitrate and silicate measured at a depth of 150 m atNH 25 are shown in Figure 22. One clear pattern is theincrease in nitrate and silicate concentration from the1997–98 El Niño period until 2002; since then, therehas been a tendency toward lesser concentrations of eachnutrient. These trends match the trend observed at 200m both in the Monterey region and Southern CaliforniaBight (see below). Since late-2003, nitrate and silicateconcentrations seem to have declined sharply. Howeverthere are too few data points to draw any firm conclu-sions. In 2006, we added water-bottle sampling from adepth of 150 m at our NH 25 station during our bi-weekly cruise, to allow us to measure the deep-waternutrients with greater certainty.
Central California: In Monterey Bay, sea surfacenitrate concentrations were lower than average by 1 to4 µM from early-2003 through late-2005 (fig. 10). Thelowest values measured in spring 2005 (�4 µM anom-
aly) were similar to those measured during the 1998 ElNiño event. By spring 2006, nitrate concentration wereabout 2 µM above average.
Sea surface chlorophyll a concentrations have beenhigher than average since 1999, and that trend contin-ues (fig. 10). Slightly reduced concentrations were seenin summer 2002 and 2003; however, values in 2005 wereamong the highest measured. Thus, the warm ocean of2005 did not have a dramatic negative effect on phyto-plankton biomass, as indexed by chlorophyll-a concen-trations, the same result as seen off Newport, Oregon.A similar pattern is seen with the primary productionmeasurements with maximum above-average rates seenin the summers of 2002, 2003, and 2005.
Nitrate and silicate measured at a depth of 200 m inMonterey Bay (fig. 11) showed that concentrations ofboth nutrients were above average from 1999–present,except early in 2005 when silicate concentrations wereslightly below normal, and from summer 2004 until thepresent when nitrate concentrations were below normalby 1–2 µM.
CalCOFI: Nitracline depth anomalies for the wholeCalCOFI region were slightly below the long-termaverage over the last year (shallower nitricline; fig. 23),continuing patterns observed since 2000. Concentrationsof mixed-layer nitrate varied over the past year; the an-nual average was close to the long-term average (fig. 24).It appears that concentrations of phosphate have beendeclining since 2003, a trend that requires further ob-servations for confirmation. Over the last three cruises,concentrations of silica have been close to the long-termaverage, in contrast to observations during the previoustwo years which had the lowest silicate anomalies ob-served over the 23-year observation period. It is prob-able that silicate and salinity anomalies are linked sincethese have co-varied over the last six years. Last year’sreport suggested that these are linked to the possibly in-creased transport of subarctic waters into the CalCOFIarea (Goericke et al. 2005).
Concentrations of all macronutrients at a depth of200 m (e.g., nitrate, fig. 25a) co-vary strongly with salin-ity at depth (fig. 14), i.e., these have been relatively con-stant and above their long-term average since 1998.Nitrate-silicate ratios at 200 m were relatively constantover the last year (fig. 25b).
Temporal changes in nitrate concentration at the bottom of the Santa Barbara Basin (not illustrated) show that the basin flushed during the winter/springof 2004 and the winter of 2005–06. Subsequent ratesof denitrification, however, were sufficiently high todraw nitrate at the bottom of the basin down to valuesof 6.8 µM in November 2005. Concentrations of ni-trite reached levels of 3.5 µM. These values for nitrateand nitrite during the fall of 2005 are similar to the
50
Figure 22. Time series of silicate and nitrate concentration from stationNH 25 (25 miles off Newport, Oregon). Station depth is 300 m; samplingdepth is 150 m. Note that in any given year, concentrations are lower inwinter than summer.
Figure 23. Cruise mean nitracline depth anomalies in the CalCOFI area.The nitracline depth is defines as the depth where nitrate reaches values of 1µM. Data from the last four cruises are plotted as solid symbols. The solidline is the annual mean.
30-74 State of the Current 11/12/06 5:21 PM Page 50

STATE OF THE CALIFORNIA CURRENTCalCOFI Rep., Vol. 47, 2006
record levels, lowest and highest, respectively, observedduring late-2004 and early-2005 (Goericke et al.2005). Corresponding rates of denitrification during2005, approximately 0.09 µM day�1, were similar tothose observed during 2004, 0.06 µM day�1 (Goerickeet al. 2005).
Standing stocks of chlorophyll a over the last year weresimilar to values observed over the last five to 10 years(fig. 26a). The values are consistent with the trend ofincreasing chlorophyll a observed since measurements
began (for annual means, the r2 = 0.42). Standing stocksduring the summer and fall were among the highestmeasured during these time periods (fig. 26b). Depth-integrated rates of primary production over the last yearwere well within the range of rates measured over thelast two decades (fig. 26c) and follow the previous sea-sonal pattern (fig. 26d). In contrast to annually averagedstanding stocks of chlorophyll a, annually averaged ratesof primary production have not increased over the lasttwo decades (r2 = 0.01).
51
Figure 24. Anomalies of concentrations of (A) nitrate, (B) phosphate, and (C) silicate in the mixed layer of the CalCOFI area. Data from the last four cruises areplotted as solid symbols. The solid lines are the annual means.
30-74 State of the Current 11/12/06 5:21 PM Page 51

STATE OF THE CALIFORNIA CURRENTCalCOFI Rep., Vol. 47, 2006
Figure 25. Nitrate (A) and nitrate/silicate ratios (B) at a depth of 200 m in the CalCOFI area. Data from the last four cruises are plotted as solid symbols. Thesolid lines are the annual means.
Figure 26. Averages for standing stocks of chlorophyll a in the CalCOFI area, plotted against time (A) and the day of the year (B), rates of primary productionintegrated to the bottom of the euphotic zone plotted against time (C) and day of the year (D). Data from the last four cruises are plotted as solid symbols. Thesolid lines represents the annual averages. Days within months are defined as fraction of the full month, i.e., January takes on values ranging from 0.0 to 1.0.
52
30-74 State of the Current 11/12/06 5:21 PM Page 52
STATE OF THE CALIFORNIA CURRENTCalCOFI Rep., Vol. 47, 2006
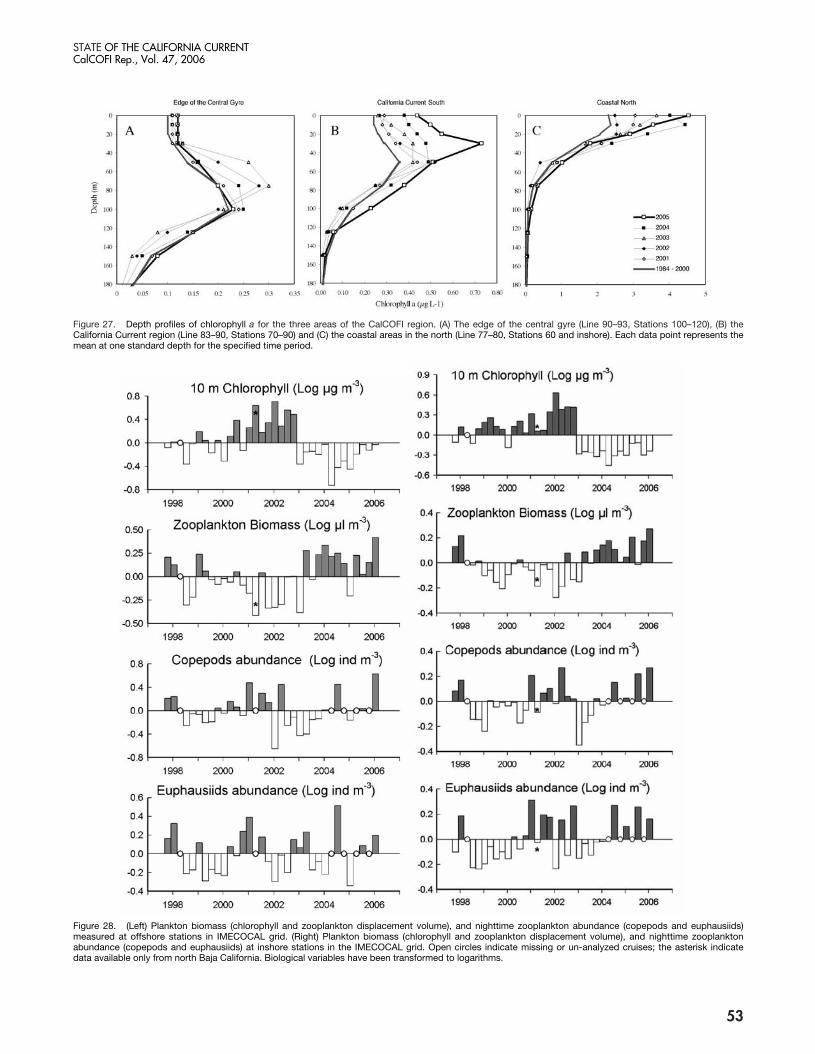
Figure 27. Depth profiles of chlorophyll a for the three areas of the CalCOFI region. (A) The edge of the central gyre (Line 90–93, Stations 100–120), (B) theCalifornia Current region (Line 83–90, Stations 70–90) and (C) the coastal areas in the north (Line 77–80, Stations 60 and inshore). Each data point represents themean at one standard depth for the specified time period.
Figure 28. (Left) Plankton biomass (chlorophyll and zooplankton displacement volume), and nighttime zooplankton abundance (copepods and euphausiids)measured at offshore stations in IMECOCAL grid. (Right) Plankton biomass (chlorophyll and zooplankton displacement volume), and nighttime zooplanktonabundance (copepods and euphausiids) at inshore stations in the IMECOCAL grid. Open circles indicate missing or un-analyzed cruises; the asterisk indicatedata available only from north Baja California. Biological variables have been transformed to logarithms.
53
30-74 State of the Current 11/12/06 5:21 PM Page 53

STATE OF THE CALIFORNIA CURRENTCalCOFI Rep., Vol. 47, 2006
In most regions, the vertical distribution of chloro-phyll a was close to the long-term average profile (fig. 27).At the edge of the central gyre (fig. 27a), where the deepchlorophyll-a maximum had been about 20 m above theclimatological average during 2002 and 2003, the pro-file had returned to normal. The exception was seen inthe southern portion of the California Current whereconcentrations of chlorophyll a in the upper 40 m wereelevated relative to the long-term average (fig. 27b).
IMECOCAL: At the offshore stations, surfacechlorophyll-a concentrations have dropped since January2003, as is shown by a shift from positive to negativeanomalies (fig. 28), changes associated with increasedstratification. At the inshore stations, chlorophyll ashowed a similar decrease, although the anomalies weremore variable in time. The most negative anomalies oc-curred through 2004, and there was a progressive ten-dency toward zero anomalies between April 2005 andJanuary 2006.
ZooplanktonOregon: The 10-year time series of copepod bio-
mass measured at Newport shows that a strong seasonalcycle with peaks in July–August prevailed during thesummers of 2000–04. However, there was only a veryweak seasonal signal in 1997–99, and in 2005 (fig. 29).Seasonally-averaged (May–September) copepod biomassmeasured in 2005 had the lowest value of the recent10-year time series (fig. 29)—about 9 mg carbon m�3—and the lowest value compared to data from 1969–73and 1983. We attribute this decline in biomass to a lackof significant levels of copepod production in spring2005 due to the delayed spring transition.
Figure 30 shows that copepod species richness wasanomalously high from autumn 2002 through spring2006, during the period of warmer-than-average sea sur-face temperatures. Copepod species richness was veryhigh in 2005, and remained anomalously high through-out spring and summer months. Thus, despite strongupwelling from late-July through September 2005, thecopepod community did not immediately change fromone dominated by a highly-diverse warm-water com-munity to one dominated by a low-diversity cold-watercommunity. Instead there was a time lag of severalmonths, with high species richness prevailing untilNovember–December of 2005. We suggest that anom-alously low numbers of copepod species are associatedwith the transport of coastal subarctic water into thecoastal waters of the NCC (as in 1999–2002), whereasanomalously high numbers of species are associated witheither a greater amount of onshore transport of warm,offshore, subtropical water, or northward transport ofsubtropical coastal neritic water along a coastal corridor(as in late-2002 to early-2006).
The two persistent changes in copepod species rich-ness in late-1998 and late-2002 lag the PDO by aboutsix months (fig. 30). The two transition points were:(1) the change to a negative anomaly of species richnessin December 1998, which was preceded by a change insign of the PDO in July–August 1998, and (2) a changeto a positive anomaly of species richness in November2002, which followed changes in the PDO in Augustand April 2002. The same lag was seen when PDO andSST were compared (fig. 7). Thus, comparing the PDO,SST, and copepod species richness indicates that thecoastal ecosystem in the northern California Current offOregon was warmer than usual two years prior to thewarm summer of 2005, with a dominance of subtropi-cal neritic zooplankton species (see Hooff and Peterson2006 for details). The warm summer of 2005 was thethird such year in a row, suggesting the possibility that
54
Figure 29. Time series of monthly-averaged values of copepod biomassmeasured at a mid-shelf station (NH-05), off Newport, Oregon, 1996–present(UPPER). Summer-averaged values of copepod biomass measured at NH-05 (LOWER). Note that the summer of 2005 had the lowest average biomassfor any summer in our 10-year time series.
Figure 30. Time series of copepod species richness at station NH-05 offNewport, Oregon, and the Pacific Decadal Oscillation, from 1996 throughMay 2006.
30-74 State of the Current 11/12/06 5:21 PM Page 54

STATE OF THE CALIFORNIA CURRENTCalCOFI Rep., Vol. 47, 2006
deleterious effects on the ecosystem observed duringsummer 2005 may have been due to three years ofchronic warming.
The seasonal cycle of euphausiid egg abundances atstations NH 15 and NH 25 along the Newport Line isshown in Figure 31. A minor peak in abundance canoccur in winter (in either February or March), but themajor spawning time is clearly during summer (July–August). This pattern corresponds to the tendency ofThysanoessa spinifera to spawn in winter-spring and forboth species (T. spinifera and Euphausia pacifica) to spawnin summer. Interannual variability is very high, with sea-sonal averages of egg abundances ranging over an orderof magnitude (tab. 2). The year 2005 was exceptional inthat few eggs were found at any station in spring, but
an average number of eggs were found in July–August.The appearance of large numbers of eggs in summer of2005 did not occur until after the onset of strong up-welling in mid-July.
Monterey Bay: Sampling of zooplankton alongCalCOFI Line 67 has been sporadic since 1985, but hasbeen carried out on a regular basis for the past threeyears. Zooplankton displacement volumes measured in2005 were very low, similar to values measured duringthe tropical El Niño events of 1983 and 1998 (not shown;see Mackas et al. In review). Strong negative biomassanomalies were seen for both transition zone copepodsand central/equatorial copepods. The two most com-mon euphausiids, Euphausia pacifica and Thysanoessaspinifera, also had negative biomass anomalies (not shown:see Sydeman et al. 2006).
CalCOFI: Data for macrozooplankton displace-ment volumes are available up to November 2005. Theannual average for 2005 (86 ml/1000 m3) was close tothe long-term average (horizontal line in fig. 32). Thedecline in zooplankton biomass from the early sixtiesuntil the late nineties has been extensively described(McGowan et al. 1998 and previous reports in this se-ries). Zooplankton displacement volumes recovered withthe advent of the 1999 La Niña conditions and havesince been at levels similar to those observed during the1980s. However, the annual averages since 1999 show adeclining trend with a regression coefficient that is sim-ilar to that characteristic of the 1984–98 time series(fig. 32). Considering the high cruise-to-cruise vari-ability of these data it is prudent to wait for more databefore attempting detailed interpretations of these trends.
Like copepods in Monterey Bay, both transition-zoneand central/equatorial copepod species had negative bio-mass anomalies (not shown; see Mackas et al. In review).On the other hand, for the more common euphausiidspecies, E. pacifica biomass was equal to the long-termmean, whereas T. spinifera had a positive biomass anom-aly (Sydeman et al. 2006).
IMECOCAL: Zooplankton biomass in 2005 washigher than average during the IMECOCAL surveys,in contrast to measurements made in the rest of theCalifornia Current. This was due to higher-than-averagebiomass of both copepods and euphausiids (fig. 28).Zooplankton biomass has increased since April 2003.However, a closer inspection of the abundance for themain suspension feeding crustaceans indicated a dramaticdecrease from October 2002 to January 2003 (notshown), with a progressive recovery for copepods, buta step-response for euphausiids, since July 2004.
The zooplankton biomass in shallow-water stationsshowed positive anomalies that were relatively high in2003–06, with negative anomalies observed only in thewinters of 2003 and 2005 (fig. 28). Negative abundance
55
Figure 31. Monthly averages of euphausiid eggs for all samples at two sta-tions along the Newport Line from 1996–present (bars), compared to abun-dances observed during the warm summer of 2005 (spline). Note the onemonth delay in the peak in egg production in 2005 (from July–August toAugust–September).
TABLE 2Abundance of euphausiid eggs (number m�3) along
the Newport Line at stations 5, 15, and 25 miles fromshore, averaged for spring (March–June) and summer
(July–August). Water depths at these stations are 62 m, 92 m, and 300 m respectively. The dashes (—) indicate
that samples were not collected during that year.
March–June July–August
NH 05 NH 15 NH 25 NH 05 NH 15 NH 25
1996 0.4 — — 45.2 — —1997 0.6 5.1 — 50.0 97.2 —1998 0.2 8.5 — 0.5 84.1 —1999 99.3 15.3 — 27.3 75.4 —2000 22.9 8.0 — 437.7 332.2 —2001 11.4 11.2 1.7 52.1 366.8 102.92002 3.8 13.0 23.4 112.5 107.4 215.62003 0.2 84.1 14.4 18.2 101.1 515.32004 6.9 39.9 28.5 154.1 212.8 251.42005 0.2 3.4 4.4 38.8 231.5 143.2
30-74 State of the Current 11/12/06 5:21 PM Page 55

STATE OF THE CALIFORNIA CURRENTCalCOFI Rep., Vol. 47, 2006
anomalies of copepods and euphausiids were seen dur-ing January 2005 near the coast, while offshore theanomalies were positive (fig. 28). By July 2005, stronglypositive anomalies occurred offshore, but anomalies wereclose to zero on the shelf. However, we found hugeabundances of copepods and euphausiids in Vizcainoand the Gulf of Ulloa, but low abundance along thenorthern coast.
Another interesting feature of the offshore and in-shore plankton time series is that zooplankton biomassseems to be inversely related to both salinity (fig. 16)and chlorophyll (fig. 28). This relationship could reflecteither the transport of different plankton communities
into Mexican waters as reflected by higher or lower salin-ity, or a strong coupling between phytoplankton andzooplankton through grazing.
FishOregon and Washington: Forage Fish (whitebait smelt,
herring, anchovies, sardines). Pelagic rope-trawl sur-veys off the Columbia River and southern Washingtonstate captured very low numbers of forage fishes duringthe 1998 tropical El Niño event and during 1999 (fig. 33).By 2000, stocks had increased greatly by factors rangingfrom 5.6 (sardines) to 240 (whitebait smelt), and contin-ued to grow through 2001. Forage fish densities peaked
56
Figure 32. CalCOFI cruise mean macrozooplankton displacement volumes plotted against the year (A, log axis)and the month of the year (B, linear axis). The climatological average is shown by the horizontal striped line in A.Annual averages are connected by the solid line. Linear regressions of values vs. time for the time periods 1984 to1998 and 1999 to 2005 have identical regression coefficients (�0.035).
30-74 State of the Current bl 11/18/06 10:02 PM Page 56
STATE OF THE CALIFORNIA CURRENTCalCOFI Rep., Vol. 47, 2006
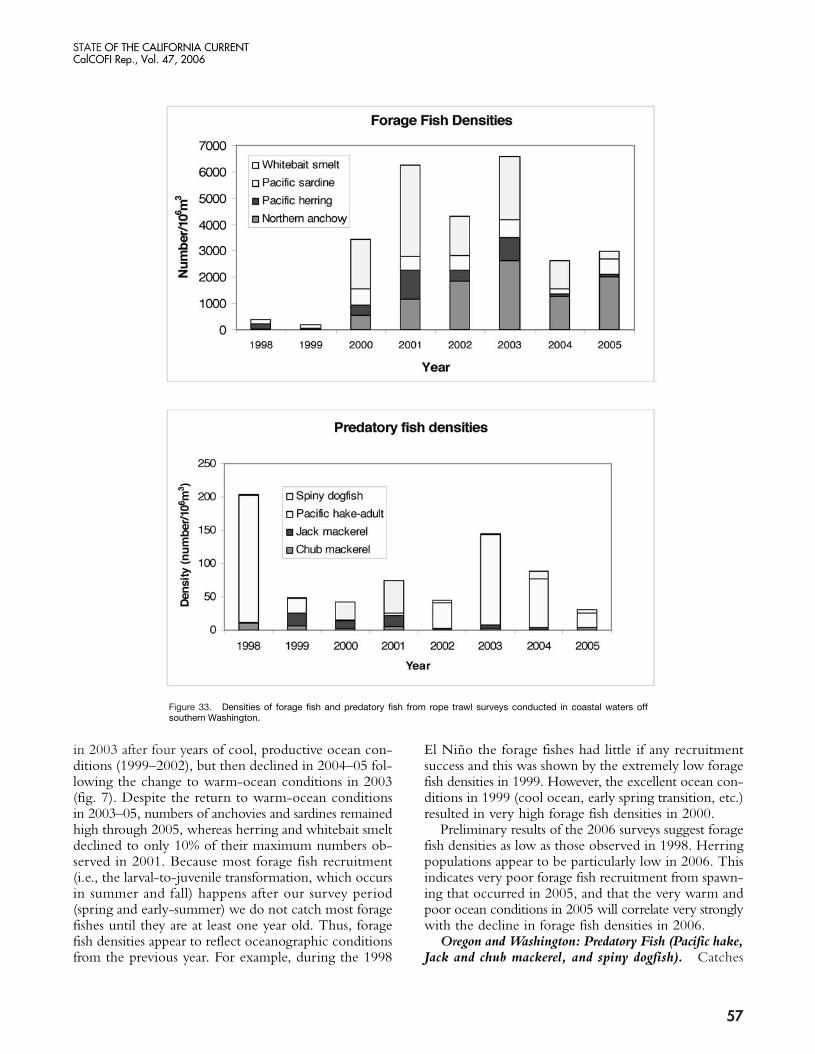
in 2003 after four years of cool, productive ocean con-ditions (1999–2002), but then declined in 2004–05 fol-lowing the change to warm-ocean conditions in 2003(fig. 7). Despite the return to warm-ocean conditionsin 2003–05, numbers of anchovies and sardines remainedhigh through 2005, whereas herring and whitebait smeltdeclined to only 10% of their maximum numbers ob-served in 2001. Because most forage fish recruitment(i.e., the larval-to-juvenile transformation, which occursin summer and fall) happens after our survey period(spring and early-summer) we do not catch most foragefishes until they are at least one year old. Thus, foragefish densities appear to reflect oceanographic conditionsfrom the previous year. For example, during the 1998
El Niño the forage fishes had little if any recruitmentsuccess and this was shown by the extremely low foragefish densities in 1999. However, the excellent ocean con-ditions in 1999 (cool ocean, early spring transition, etc.)resulted in very high forage fish densities in 2000.
Preliminary results of the 2006 surveys suggest foragefish densities as low as those observed in 1998. Herringpopulations appear to be particularly low in 2006. Thisindicates very poor forage fish recruitment from spawn-ing that occurred in 2005, and that the very warm andpoor ocean conditions in 2005 will correlate very stronglywith the decline in forage fish densities in 2006.
Oregon and Washington: Predatory Fish (Pacific hake,Jack and chub mackerel, and spiny dogfish). Catches
57
Figure 33. Densities of forage fish and predatory fish from rope trawl surveys conducted in coastal waters offsouthern Washington.
30-74 State of the Current bl 11/18/06 10:02 PM Page 57

STATE OF THE CALIFORNIA CURRENTCalCOFI Rep., Vol. 47, 2006
of adult Pacific hake with the rope trawl were somewhatrelated to ocean conditions, with highest catches dur-ing the warm 1998 tropical El Niño event, low catchesduring the four cool years (1999–2002), but with in-creasing abundances during the warm years of 2003–04(fig. 33). We had expected to see increased numbers ofadult Pacific hake in 2005 both because numbers werebuilding in 2003 and 2004, and because hydrographyand zooplankton in the Pacific Northwest in 2005 re-sembled the 1998 El Niño event. However, this expec-tation was not met; it is not known why numbers werelow although it is possible that the bulk of the adult hakepopulation is living more to the north, in Canadian wa-ters (Thomas et al. 2006; see also the discussion of lar-val hake, central and southern California, below). BothJack mackerel (Trachurus symmetricus) and spiny dogfish(Squalus acanthias) had highest abundances during thecool years, 1999–2002. Abundances of chub mackerel(Scomber japonicus) did not seem to be related to eithercool- or warm-ocean conditions since they were mostabundant during the warm 1998 El Niño and the coolyears of 1999 and 2001.
Central California: Pelagic Juvenile Young-of-the-Year Rockfish (Sebastes spp.). During 2005, the stan-dardized midwater trawl surveys conducted by SWFSCindicated that pelagic juvenile rockfish catches in thecore area (Carmel to Bodega Bay, California) were at anall time low when considered in relation to the 23 yearsthe survey has been conducted (fig. 34). However, it isimportant to note that with the new data available fromthe expanded survey coverage in 2005 (spanning SanDiego, California to Westport, Washington), two typesof shifts in distribution were revealed. Specifically, speciescharacterized by a more southerly geographic range (e.g.,
bocaccio, shortbelly, and squarespot rockfish) were caughtin relatively large numbers south of Point Conception.Conversely, species with more northerly distributions(widow, canary, and yellowtail rockfish) were caught inmoderate numbers north of Cape Mendocino. The nearabsence of fish in the core survey area was associatedwith a redistribution of fish, both to the north and thesouth, as well as overall lower abundances.
There has been tremendous interannual variability inthe abundance of the 10 species that are routinely in-dexed in the survey. The overall pattern in the survey(fig. 34) is one of very high concordance in abundanceamong the 10 species. A number of striking patterns areevident including: (1) substantial high-frequency inter-annual variation (e.g., 1991–92), and (2) obvious low-frequency variability, as evidenced by the protractedperiod of low abundance from 1994–2000. The first ofthese conclusions is consistent with very poor repro-ductive success for these winter-spawning species dur-ing El Niño years, including the 1983, 1992, and 1998events. The second observation is likely related to“regime”-scale variability, as evidenced by the PDO,wherein rockfish reproductive success is poor during the“warm” phase.
Figure 35 shows the first two principal componentscores for the collective rockfish assemblage within thecore survey area. Note the divergence in the relationshipbetween the first and second principal components, whichare positively correlated early in the time series (through~1993) but are negatively correlated thereafter. Thischange in relationship may be due to a shift in the speciescomposition of survey catches towards a more northernassemblage, particularly during the last four years, as evi-denced by relatively higher catches of blue, black, widow,
58
Figure 34. Time series of juvenile rockfish within the core area off central California. Long term trends in reproductive success of 10species of rockfish (genus Sebastes) are shown on log-scale (individual species patterns are shown as thin black lines). The bold linesrepresent the first and second principal components scores, respectively, which together account for 75% of the total variance.
30-74 State of the Current 11/12/06 5:21 PM Page 58

STATE OF THE CALIFORNIA CURRENTCalCOFI Rep., Vol. 47, 2006
and canary rockfish in relation to catches of shortbelly,bocaccio, chilipepper, and squarespot rockfish.
The extremely low abundances of juvenile rockfishin 2005 are consistent with an anomalously warm oceanstate. The production of many populations was extremelylow in 2005, perhaps a result of a delayed onset of sea-sonal coastal upwelling in spring and low primary pro-duction. Populations were also redistributed to the north.Given the lower production of rockfish, managementmust consider the long-term impacts of future warmconditions on annual recruitment. It is also noteworthythat preliminary indications are that the spring 2006 wasequally anomalous.
Central and Southern California: Pacific Hake(Merluccius productus). Since 2003, five samplinglines north of Morro Bay have been reinstated into theCalCOFI sampling pattern in the January survey, pri-marily to collect hake larvae for comparison with sam-ples collected before the range restriction post-1984.Pacific hake is a migratory species occurring off the westcoast of the American continent between Baja Californiaand British Columbia. Pacific hake larvae live below themixed layer in colder water and have been obtained asfar offshore as 200–250 miles. Conventional wisdom isthat adult hake migrate south in autumn from the PacificNorthwest to the waters off California and Baja Californiain order to spawn, then return north in spring where
they feed during summer months (Hollowed 1992). Itis believed that during warm years, the spawning cen-ter moves northward where they may spawn as far northas Oregon (R. Emmett, personal communication,NMFS/Newport, Oregon), whereas during cool yearsthe spawning center is located between mid-BajaCalifornia and San Francisco. The expansion of winterCalCOFI sampling for hake larvae is designed to test theidea of a northward-shifting spawning center.
The time series of daily larval production at hatch-ing (Ph) from 1951–2005 (earlier years from Moser et al.1993) is shown in fig. 36 for the area between San Diegoand San Francisco in January–April, the peak spawn-ing period.
The daily larval production fluctuated with a grandpeak in 1987 and minor peaks at 1952, 1958, 1966, and1972. The larval production has been declining since 1987in this survey area. The comparison between the larvalproduction and the temperature at 57 m depth whereyolk-sac larvae concentrate (fig. 36), shows that the tem-perature has been increasing from mid-1970 to mid-1990and decreasing since 1997. Peaks of larval production tendto coincide with the low points of temperatures. Thehigh production off California may be partially relatedto migration of a large biomass of hake that migrated tothe California waters from the north when the watertemperature decreased dramatically. Hake larval produc-
59
Figure 35. Principal components analysis (PCA) of the eight most important rockfish taxa within the core area; 2006 was similar to 2005 in terms of overallabundance patterns and species composition. Note similarity to the 1998 El Niño event as well.
30-74 State of the Current bl 11/18/06 10:02 PM Page 59

STATE OF THE CALIFORNIA CURRENTCalCOFI Rep., Vol. 47, 2006
tion has been declining since 1987. (See also the discus-sion of adult hake, Oregon and Washington, above.)
Southern California: Spawning by Sardines, Anchovyand Jack Mackerel. In spring 2005, eggs of sardine andJack mackerel were not abundant compared to other re-cent spring values, while anchovy eggs seemed to bequite abundant (fig. 37). Sardine eggs were most abun-dant between San Diego and Avila Beach in a narrowstrip and fewer were observed in the north than in 2004(Goericke et al. 2005). Anchovy eggs were relativelyabundant and were confined to the Southern CaliforniaBight; Jack mackerel eggs were offshore of the sardineeggs, with relatively little overlap, a pattern seen in otheryears. Like sardine eggs, both anchovy and Jack mack-erel eggs were centered in the area south of Avila Beach.Overall, sardine and anchovy eggs were more abundantthan Jack mackerel eggs. In 2005, sardine eggs werefound in temperatures ranging between 12˚C and 18˚C;the majority of eggs were found between 13˚C and16˚C. The mean sea surface temperature weighted byabundance of sardine eggs was 14.2˚C. In 2003 and 2004,sardine eggs were found in the area between 12˚–14˚Csea surface temperature, and the mean weighted tem-peratures were 13.7˚C and 13.4˚C, respectively. (Formore information, see http://swfsc.nmfs.noaa.gov/FRD/CalCOFI/CurrentCruise/sardmaps.htm.)
The spawning biomass of Pacific sardine is a fishery-independent population index, useful for examining thepast relationship between spawning and sea surface tem-perature (Lo and Macewicz 2006). The spawning bio-mass of Pacific sardine is positively related to the dailyegg production, in particular if the number of oocytesper biomass weight remains constant (Lo et al. 2005).The relationship between the daily egg production per0.05m2 and the average sea surface temperature (˚C)
during 1994–2005, indicated that in most years, exceptin 1997 and 2002, the increase of daily egg productioncoincides with the increase of sea surface temperature(fig. 38). This relationship is consistent with high tem-perature being favorable for the Pacific sardine (Jacobsonand MacCall 1995).
Southern California: Lanternfish and Lightfish Larvae.Stenobrachius leucopsarus, the Northern Lampfish, is a sub-arctic-transitional, midwater species that inhabits CaliforniaCurrent waters south to the central Baja CaliforniaPeninsula and ranges westward in the transitional zone.Larvae are present year-round, but with a strong win-ter-spring maximum and very low incidence and abun-dance during summer and fall. During the 1977–98warm regime its larval distribution off southern Californiacontracted shoreward and northward compared with thepreceding cool period, although no consistent long-termchange in larval abundance was apparent. With the ad-vent of cool-ocean conditions following the strong ElNiño of 1997–98, both frequency of larval occurrenceand larval abundance off southern California began toincrease and the distribution began to expand seawardand southward, much like the pre-1977 pattern.However, these trends were short-lived, with both abun-dance and incidence declining in 2003 and 2004, andthe larger catches once again being made at more north-ern and shoreward stations. In 2005, larval abundancewas lower again, about half of 2004 abundance, with thelargest decline off central California (~40% of the 2004abundance). Most of the largest catches in 2005 were atmore shoreward and northern stations. Similar patternswere seen for the blue lanternfish, Tarletonbeania crenu-laris, another subarctic-transition-zone species.
The Panama lightfish, Vinciguerria lucetia, is a tropical-subtropical, midwater species that ranges from Chile to
60
Figure 36. Time series of daily hake larval production /10m2 (Ph) between San Diego and San Francisco, California, andmean the temperature at the 57 m depth experienced by yolk-sac larvae in 1951–2005.
30-74 State of the Current 11/12/06 5:21 PM Page 60

STATE OF THE CALIFORNIA CURRENTCalCOFI Rep., Vol. 47, 2006
Figure 37. Rate of occurrence of eggs of Pacific sardine (Sardinops sagax), northern anchovy (Engraulis mordax), and Jack mackerel (Trachurus symmetricus)sampled with the continuous underway fish egg sampler (CUFES) and sea surface temperatures in 28 March–1 May 2005. One egg per minute corresponds toapproximately five eggs per cubic meter.
61
30-74 State of the Current 11/12/06 5:21 PM Page 61

STATE OF THE CALIFORNIA CURRENTCalCOFI Rep., Vol. 47, 2006
central California. Larvae are present year-round offsouthern California, with a maximum in summer–falland low incidence and abundance during winter–spring.Larval incidence and abundance often increase duringEl Niño events and decrease during La Niña events.Following the 1976–77 regime shift from cool- to warm-ocean conditions, both abundance and incidence in-creased substantially, peaking during the 1997–98 ElNiño, then declining dramatically in 1999. During thewarm regime, the larval distribution expanded shore-ward and northward as abundance increased. Concurrentwith declining abundance beginning in 1999, the larvaldistribution returned to its pre-1977 pattern of highercatches largely restricted to offshore, southern CalCOFIstations. Larval Panama lightfish abundance reboundedbriefly in 2001, declined again in 2002, then increasedfrom 2003–05. Incidence also increased a little each yearfrom 2003–05.
The 2005 larval abundances of these mesopelagic fishesare consistent with those seen during previous warm-water events, including El Niño. The declines in larvalabundance of the subarctic species and the higher inci-dence of the subtropical species in 2005 may indicate anincreasing percentage of subtropical water entering theCalifornia Current. This is probably a result of a weakersouthward transport of the California Current, and anenhanced poleward undercurrent transport. The mid-water adjustments may be part of the region’s interan-
nual variability, or they could signal the demise of thecool regime that began following the 1997–98 El Niño.
TurtlesCentral California: Leatherback Turtles. The crit-
ically endangered leatherback turtle (Dermochelys coriacea)occurs seasonally along the U.S. Pacific Coast. The hugemarine reptiles migrate from nesting beaches in Papua,Indonesia, to forage on jellyfish (Scyphomedusae) that areusually present during late-summer and fall months. TheSouthwest Fisheries Science Center monitors the abun-dance and distribution of leatherback turtles at foraginggrounds off the coast of California. Results of aerial sur-veys conducted during 1990–2003 revealed that the coastof central California is a key destination for leatherbacks,because great densities of jellyfish develop in areas wherealternating upwelling and relaxation events create suit-able habitat in nearshore retention areas.
Fine-scale aerial surveys of leatherbacks and jellyfishhave been conducted annually during August–Octoberwithin Monterey Bay and the Gulf of the Farallonessince 2002. Leatherbacks were generally most abundantoff the San Mateo coast, but during 2002–04 they werealso encountered throughout the study area. The com-position of Scyphomedusae was diverse, including seanettles (Chrysaora fuscescens), purple stripe jelly (Chrysaoracolorata), egg-yolk jelly (Phacellophora camtschatica), andmoon jelly (Aurelia labiata). In contrast, during 2005
62
Figure 38. Daily egg production/0.05m2 of Pacific sardine (circle) and average sea surface temperature (˚C) (diamond)during March–April CalCOFI cruises from 1994–2005.
30-74 State of the Current 11/12/06 6:44 PM Page 62

STATE OF THE CALIFORNIA CURRENTCalCOFI Rep., Vol. 47, 2006
(fig. 39) leatherbacks were found only in a small area offSan Francisco, although sea surface temperature andchlorophyll-a concentrations were similar throughoutthe study area. Results of shipboard net sampling re-vealed that there was a difference in jellyfish species com-position compared to previous years. Egg-yolk jellies andmoon jellies dominated the assemblage in Monterey Bay,whereas sea nettles were densely aggregated only in alimited area off San Francisco where the leatherbackswere seen (fig. 39). Thus, leatherbacks appear to favorsea nettles over other available jellyfish species. The pat-tern of jellyfish distribution may have been affected bythe later onset of upwelling during late-spring and fewerprolonged wind relaxation events during late-summer2005. Studies are currently underway to examine poten-tial benefits of sea nettle consumption, and to under-stand the oceanographic and trophic processes that leadto foraging habitat for leatherbacks.
AvifaunaCentral California: Cassin’s Auklet (Ptychoramphus
aleuticus). Cassin’s auklets are among the best harbin-gers and sentinels of ecological change in the CaliforniaCurrent (fig. 40). Breeding failures of auklets in the
Farallones have been associated with ENSO conditions,which affect the pelagic food web structure of northernCalifornia (Ainley et al. 1995). Significant positive anom-alies in breeding success occurred during the cold-wateryears of 1994, 2001, and 2002. Significant negative anom-alies in breeding success occurred in 1983, 1990, 1992,and 2005. The decrease was much greater during the1982–83 El Niño than during the 1997–98 event.Breeding success rates during a somewhat weaker El Niño event in 1992 were similar to those observedin 1983 (~0.25). The abandonment rate during 1983and 1992 El Niño mirrored the low breeding success,and peaked at roughly 65% of the breeding pairs. Thelong-term mean breeding success for the period1971–2004 for this population is 0.70 offspring per breed-ing pair, and the correlation between breeding successand abandonment rate is negative (Spearman r = �0.306,p = 0.076, n = 34).
The complete breeding failure of the Cassin’s aukletobserved in 2005 was the first indication of major changesin the ecosystem (fig. 40). The population initiated egg-laying within the “normal” nesting period (April), butby mid-May, all adults had essentially abandoned thecolony. A small second pulse of egg-laying was observed
63
Figure 39. Distribution of leatherback turtles in 2005 in relation to distribution of jellyfish. Turtles were only found in asso-ciation with Chrysaora fuscecens.
30-74 State of the Current 11/12/06 5:21 PM Page 63
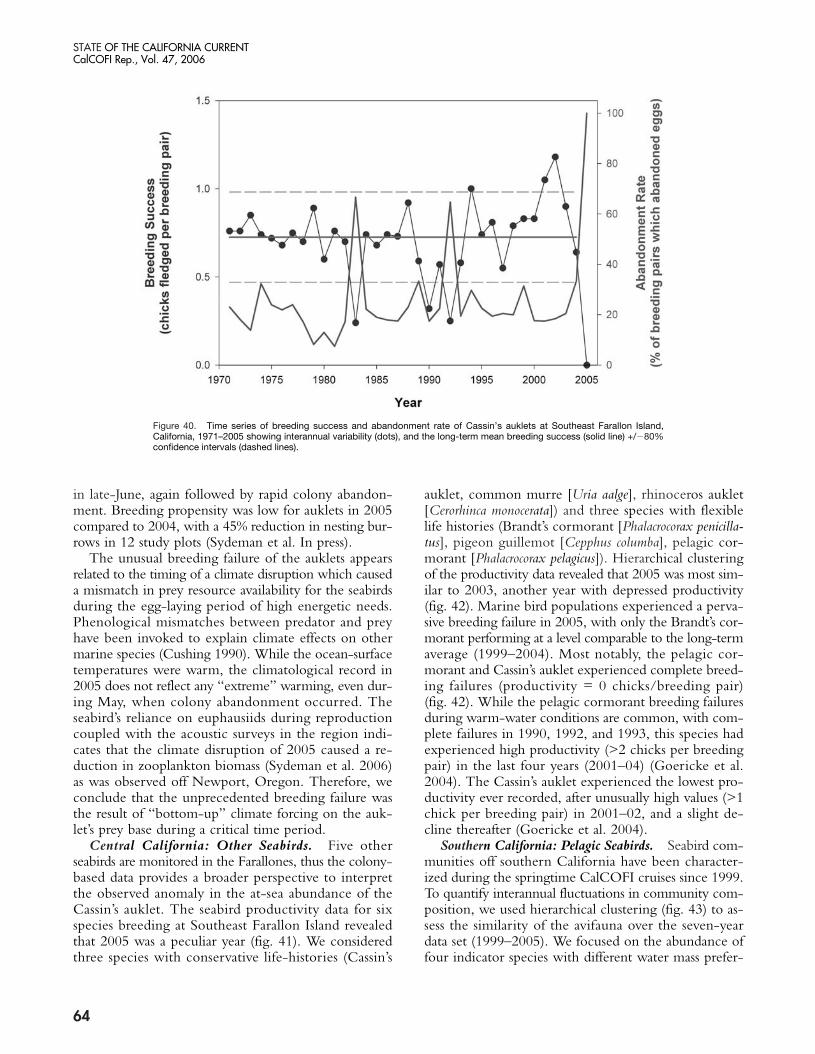
STATE OF THE CALIFORNIA CURRENTCalCOFI Rep., Vol. 47, 2006
in late-June, again followed by rapid colony abandon-ment. Breeding propensity was low for auklets in 2005compared to 2004, with a 45% reduction in nesting bur-rows in 12 study plots (Sydeman et al. In press).
The unusual breeding failure of the auklets appearsrelated to the timing of a climate disruption which causeda mismatch in prey resource availability for the seabirdsduring the egg-laying period of high energetic needs.Phenological mismatches between predator and preyhave been invoked to explain climate effects on othermarine species (Cushing 1990). While the ocean-surfacetemperatures were warm, the climatological record in2005 does not reflect any “extreme” warming, even dur-ing May, when colony abandonment occurred. Theseabird’s reliance on euphausiids during reproductioncoupled with the acoustic surveys in the region indi-cates that the climate disruption of 2005 caused a re-duction in zooplankton biomass (Sydeman et al. 2006)as was observed off Newport, Oregon. Therefore, weconclude that the unprecedented breeding failure wasthe result of “bottom-up” climate forcing on the auk-let’s prey base during a critical time period.
Central California: Other Seabirds. Five otherseabirds are monitored in the Farallones, thus the colony-based data provides a broader perspective to interpretthe observed anomaly in the at-sea abundance of theCassin’s auklet. The seabird productivity data for sixspecies breeding at Southeast Farallon Island revealedthat 2005 was a peculiar year (fig. 41). We consideredthree species with conservative life-histories (Cassin’s
auklet, common murre [Uria aalge], rhinoceros auklet[Cerorhinca monocerata]) and three species with flexiblelife histories (Brandt’s cormorant [Phalacrocorax penicilla-tus], pigeon guillemot [Cepphus columba], pelagic cor-morant [Phalacrocorax pelagicus]). Hierarchical clusteringof the productivity data revealed that 2005 was most sim-ilar to 2003, another year with depressed productivity(fig. 42). Marine bird populations experienced a perva-sive breeding failure in 2005, with only the Brandt’s cor-morant performing at a level comparable to the long-termaverage (1999–2004). Most notably, the pelagic cor-morant and Cassin’s auklet experienced complete breed-ing failures (productivity = 0 chicks/breeding pair)(fig. 42). While the pelagic cormorant breeding failuresduring warm-water conditions are common, with com-plete failures in 1990, 1992, and 1993, this species hadexperienced high productivity (>2 chicks per breedingpair) in the last four years (2001–04) (Goericke et al.2004). The Cassin’s auklet experienced the lowest pro-ductivity ever recorded, after unusually high values (>1chick per breeding pair) in 2001–02, and a slight de-cline thereafter (Goericke et al. 2004).
Southern California: Pelagic Seabirds. Seabird com-munities off southern California have been character-ized during the springtime CalCOFI cruises since 1999.To quantify interannual fluctuations in community com-position, we used hierarchical clustering (fig. 43) to as-sess the similarity of the avifauna over the seven-yeardata set (1999–2005). We focused on the abundance offour indicator species with different water mass prefer-
64
Figure 40. Time series of breeding success and abandonment rate of Cassin’s auklets at Southeast Farallon Island,California, 1971–2005 showing interannual variability (dots), and the long-term mean breeding success (solid line) +/�80%confidence intervals (dashed lines).
30-74 State of the Current 11/12/06 5:21 PM Page 64
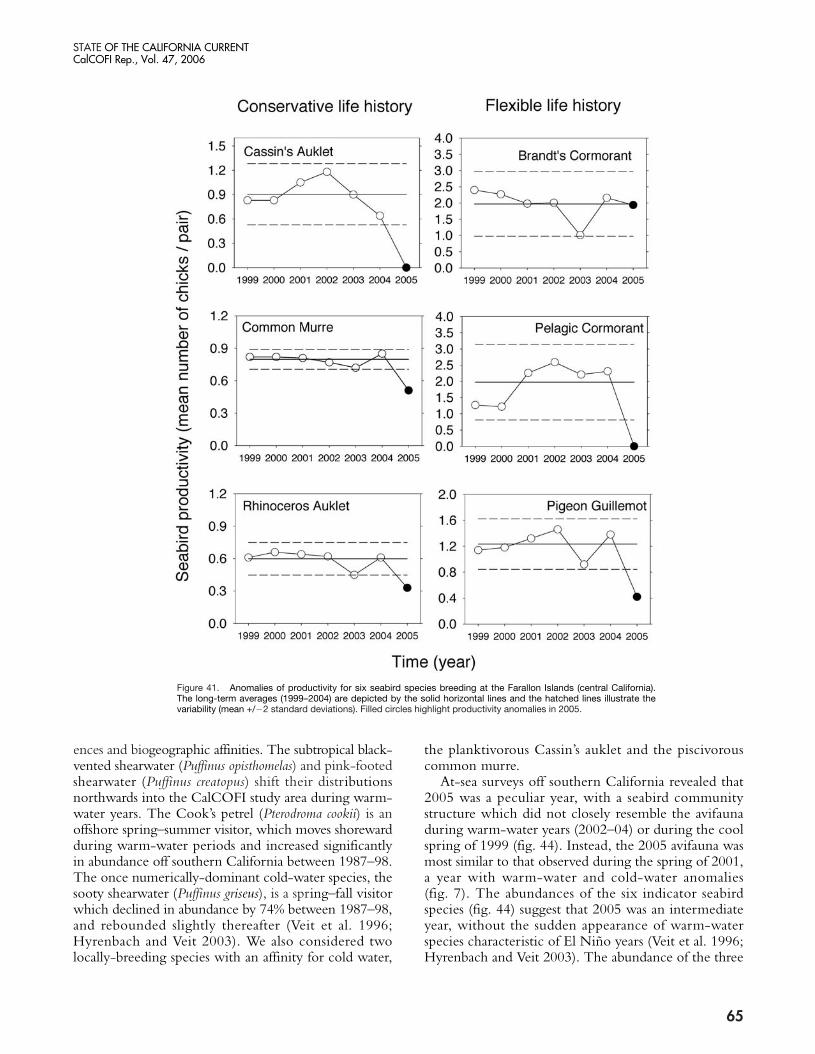
STATE OF THE CALIFORNIA CURRENTCalCOFI Rep., Vol. 47, 2006
ences and biogeographic affinities. The subtropical black-vented shearwater (Puffinus opisthomelas) and pink-footedshearwater (Puffinus creatopus) shift their distributionsnorthwards into the CalCOFI study area during warm-water years. The Cook’s petrel (Pterodroma cookii) is anoffshore spring–summer visitor, which moves shorewardduring warm-water periods and increased significantlyin abundance off southern California between 1987–98.The once numerically-dominant cold-water species, thesooty shearwater (Puffinus griseus), is a spring–fall visitorwhich declined in abundance by 74% between 1987–98,and rebounded slightly thereafter (Veit et al. 1996;Hyrenbach and Veit 2003). We also considered twolocally-breeding species with an affinity for cold water,
the planktivorous Cassin’s auklet and the piscivorouscommon murre.
At-sea surveys off southern California revealed that2005 was a peculiar year, with a seabird communitystructure which did not closely resemble the avifaunaduring warm-water years (2002–04) or during the coolspring of 1999 (fig. 44). Instead, the 2005 avifauna wasmost similar to that observed during the spring of 2001,a year with warm-water and cold-water anomalies(fig. 7). The abundances of the six indicator seabirdspecies (fig. 44) suggest that 2005 was an intermediateyear, without the sudden appearance of warm-waterspecies characteristic of El Niño years (Veit et al. 1996;Hyrenbach and Veit 2003). The abundance of the three
65
Figure 41. Anomalies of productivity for six seabird species breeding at the Farallon Islands (central California).The long-term averages (1999–2004) are depicted by the solid horizontal lines and the hatched lines illustrate thevariability (mean +/�2 standard deviations). Filled circles highlight productivity anomalies in 2005.
30-74 State of the Current 11/12/06 5:21 PM Page 65
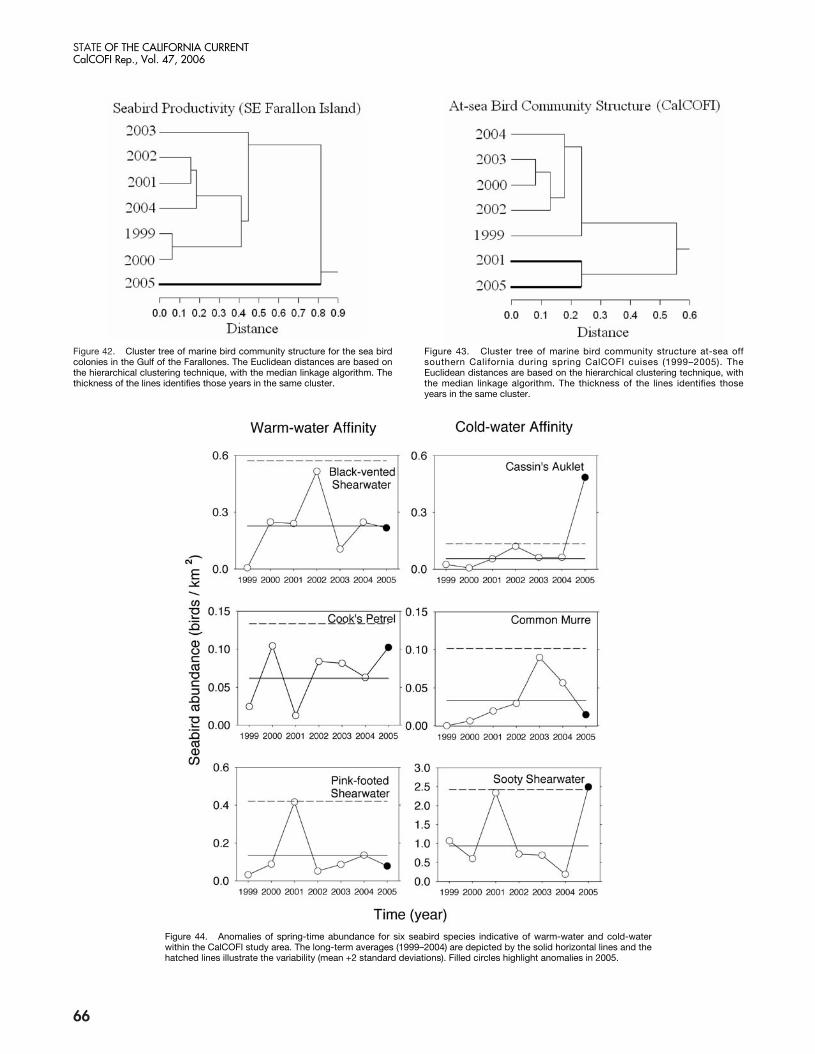
STATE OF THE CALIFORNIA CURRENTCalCOFI Rep., Vol. 47, 2006
66
Figure 42. Cluster tree of marine bird community structure for the sea birdcolonies in the Gulf of the Farallones. The Euclidean distances are based onthe hierarchical clustering technique, with the median linkage algorithm. Thethickness of the lines identifies those years in the same cluster.
Figure 43. Cluster tree of marine bird community structure at-sea offsouthern California during spring CalCOFI cuises (1999–2005). TheEuclidean distances are based on the hierarchical clustering technique, withthe median linkage algorithm. The thickness of the lines identifies thoseyears in the same cluster.
Figure 44. Anomalies of spring-time abundance for six seabird species indicative of warm-water and cold-waterwithin the CalCOFI study area. The long-term averages (1999–2004) are depicted by the solid horizontal lines and thehatched lines illustrate the variability (mean +2 standard deviations). Filled circles highlight anomalies in 2005.
30-74 State of the Current 11/12/06 5:21 PM Page 66
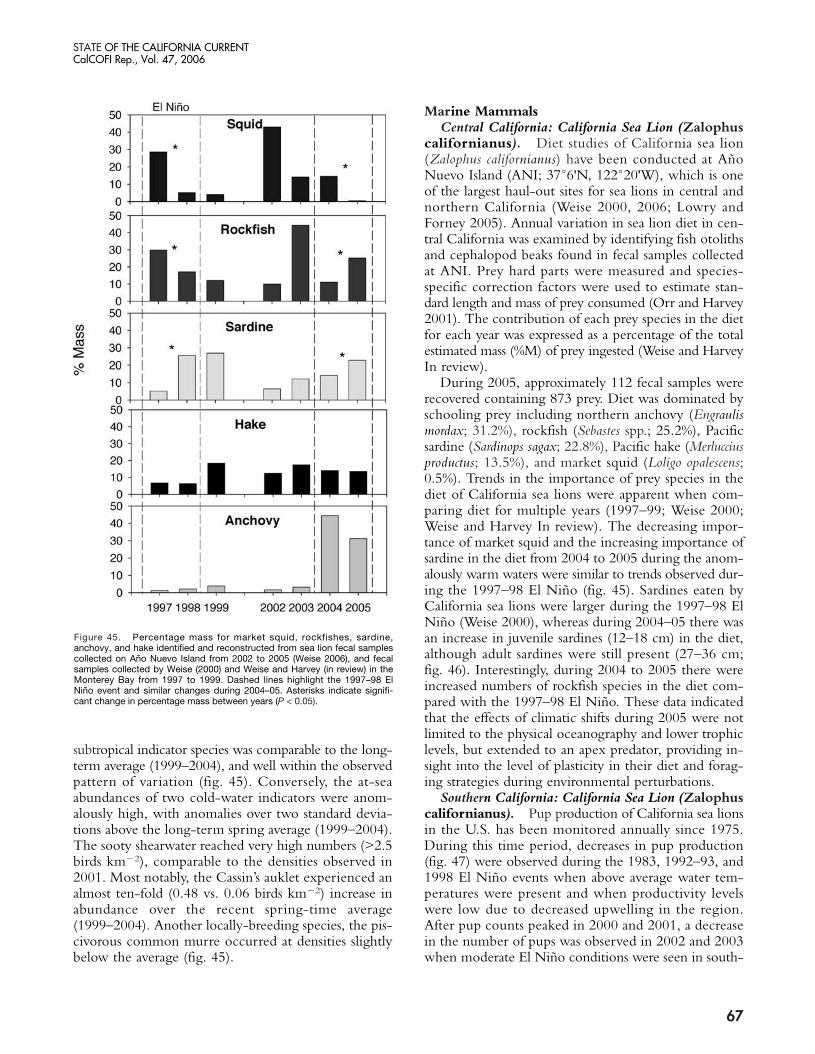
STATE OF THE CALIFORNIA CURRENTCalCOFI Rep., Vol. 47, 2006
subtropical indicator species was comparable to the long-term average (1999–2004), and well within the observedpattern of variation (fig. 45). Conversely, the at-seaabundances of two cold-water indicators were anom-alously high, with anomalies over two standard devia-tions above the long-term spring average (1999–2004).The sooty shearwater reached very high numbers (>2.5birds km�2), comparable to the densities observed in2001. Most notably, the Cassin’s auklet experienced analmost ten-fold (0.48 vs. 0.06 birds km�2) increase inabundance over the recent spring-time average(1999–2004). Another locally-breeding species, the pis-civorous common murre occurred at densities slightlybelow the average (fig. 45).
Marine MammalsCentral California: California Sea Lion (Zalophus
californianus). Diet studies of California sea lion(Zalophus californianus) have been conducted at AñoNuevo Island (ANI; 37˚6'N, 122˚20'W), which is oneof the largest haul-out sites for sea lions in central andnorthern California (Weise 2000, 2006; Lowry andForney 2005). Annual variation in sea lion diet in cen-tral California was examined by identifying fish otolithsand cephalopod beaks found in fecal samples collectedat ANI. Prey hard parts were measured and species-specific correction factors were used to estimate stan-dard length and mass of prey consumed (Orr and Harvey2001). The contribution of each prey species in the dietfor each year was expressed as a percentage of the totalestimated mass (%M) of prey ingested (Weise and HarveyIn review).
During 2005, approximately 112 fecal samples wererecovered containing 873 prey. Diet was dominated byschooling prey including northern anchovy (Engraulismordax; 31.2%), rockfish (Sebastes spp.; 25.2%), Pacificsardine (Sardinops sagax; 22.8%), Pacific hake (Merlucciusproductus; 13.5%), and market squid (Loligo opalescens;0.5%). Trends in the importance of prey species in thediet of California sea lions were apparent when com-paring diet for multiple years (1997–99; Weise 2000;Weise and Harvey In review). The decreasing impor-tance of market squid and the increasing importance ofsardine in the diet from 2004 to 2005 during the anom-alously warm waters were similar to trends observed dur-ing the 1997–98 El Niño (fig. 45). Sardines eaten byCalifornia sea lions were larger during the 1997–98 ElNiño (Weise 2000), whereas during 2004–05 there wasan increase in juvenile sardines (12–18 cm) in the diet,although adult sardines were still present (27–36 cm;fig. 46). Interestingly, during 2004 to 2005 there wereincreased numbers of rockfish species in the diet com-pared with the 1997–98 El Niño. These data indicatedthat the effects of climatic shifts during 2005 were notlimited to the physical oceanography and lower trophiclevels, but extended to an apex predator, providing in-sight into the level of plasticity in their diet and forag-ing strategies during environmental perturbations.
Southern California: California Sea Lion (Zalophuscalifornianus). Pup production of California sea lionsin the U.S. has been monitored annually since 1975.During this time period, decreases in pup production(fig. 47) were observed during the 1983, 1992–93, and1998 El Niño events when above average water tem-peratures were present and when productivity levelswere low due to decreased upwelling in the region.After pup counts peaked in 2000 and 2001, a decreasein the number of pups was observed in 2002 and 2003when moderate El Niño conditions were seen in south-
67
Figure 45. Percentage mass for market squid, rockfishes, sardine,anchovy, and hake identified and reconstructed from sea lion fecal samplescollected on Año Nuevo Island from 2002 to 2005 (Weise 2006), and fecalsamples collected by Weise (2000) and Weise and Harvey (in review) in theMonterey Bay from 1997 to 1999. Dashed lines highlight the 1997–98 ElNiño event and similar changes during 2004–05. Asterisks indicate signifi-cant change in percentage mass between years (P < 0.05).
30-74 State of the Current 11/12/06 5:21 PM Page 67

STATE OF THE CALIFORNIA CURRENTCalCOFI Rep., Vol. 47, 2006
68
Figure 46. Reconstructed body length of sardines identified in fecal samples of California sea lions collected onAño Nuevo Island during 2002 to 2005, and sea lion fecal samples collected in Monterey Bay from 1997 to 1999.
Figure 47. Counts of California sea lion (Zalophus californianus) pups in Channel Islands.
30-74 State of the Current 11/12/06 5:21 PM Page 68
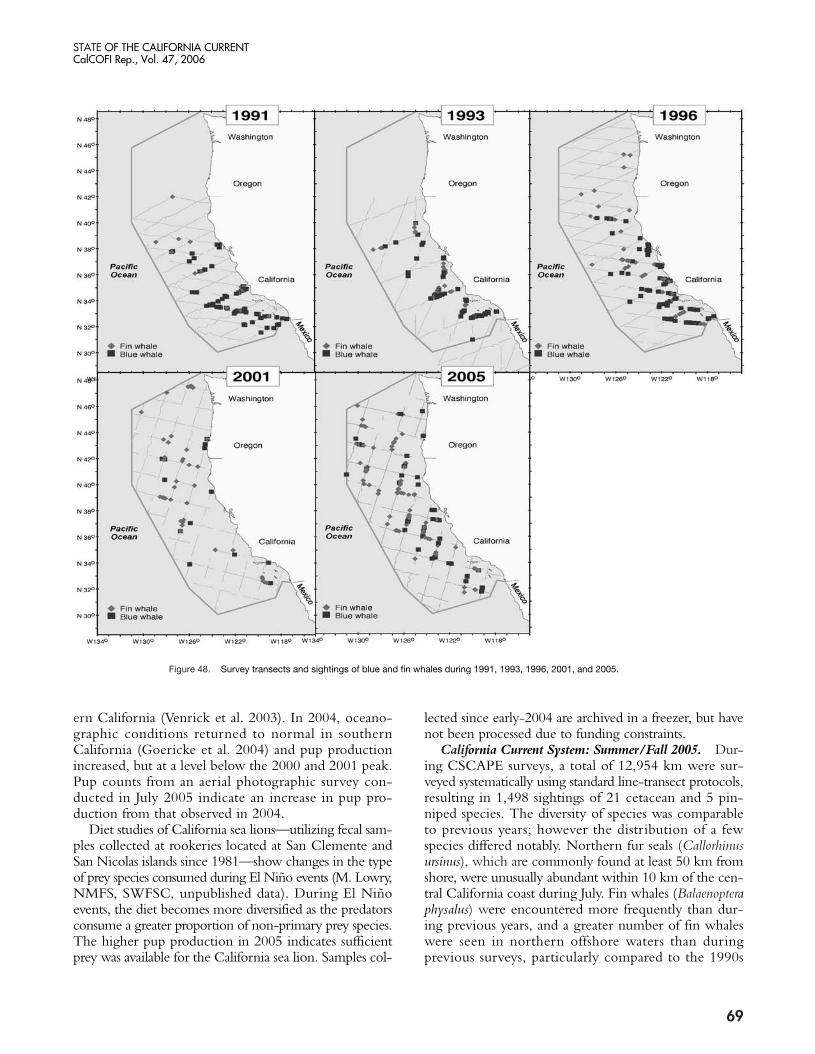
STATE OF THE CALIFORNIA CURRENTCalCOFI Rep., Vol. 47, 2006
ern California (Venrick et al. 2003). In 2004, oceano-graphic conditions returned to normal in southernCalifornia (Goericke et al. 2004) and pup productionincreased, but at a level below the 2000 and 2001 peak.Pup counts from an aerial photographic survey con-ducted in July 2005 indicate an increase in pup pro-duction from that observed in 2004.
Diet studies of California sea lions—utilizing fecal sam-ples collected at rookeries located at San Clemente andSan Nicolas islands since 1981—show changes in the typeof prey species consumed during El Niño events (M. Lowry,NMFS, SWFSC, unpublished data). During El Niñoevents, the diet becomes more diversified as the predatorsconsume a greater proportion of non-primary prey species.The higher pup production in 2005 indicates sufficientprey was available for the California sea lion. Samples col-
lected since early-2004 are archived in a freezer, but havenot been processed due to funding constraints.
California Current System: Summer/Fall 2005. Dur-ing CSCAPE surveys, a total of 12,954 km were sur-veyed systematically using standard line-transect protocols,resulting in 1,498 sightings of 21 cetacean and 5 pin-niped species. The diversity of species was comparableto previous years; however the distribution of a fewspecies differed notably. Northern fur seals (Callorhinusursinus), which are commonly found at least 50 km fromshore, were unusually abundant within 10 km of the cen-tral California coast during July. Fin whales (Balaenopteraphysalus) were encountered more frequently than dur-ing previous years, and a greater number of fin whaleswere seen in northern offshore waters than during previous surveys, particularly compared to the 1990s
69
Figure 48. Survey transects and sightings of blue and fin whales during 1991, 1993, 1996, 2001, and 2005.
30-74 State of the Current bl 11/18/06 10:02 PM Page 69

STATE OF THE CALIFORNIA CURRENTCalCOFI Rep., Vol. 47, 2006
(fig. 48). Blue whales (B. musculus) were also distributedmore widely throughout the study area than in previ-ous years (fig. 48). This may have been related to thepoor recruitment of their euphausiid prey in nearshoreforaging areas during 2005. As in previous years, hump-back whales (Megaptera novaeangliae) were concentratedin nearshore waters off central California and Oregon-Washington. They were observed foraging primarily ondense aggregations of small pelagic schooling fish, par-ticularly in nearshore regions where small cetaceans thatfeed on fish and cephalopods were also abundant, in-cluding Pacific white-sided dolphin (Lagenorhynchus obliq-uidens), northern right whale dolphin (Lissodelphis borealis),Risso’s dolphin (Grampus griseus), and Dall’s porpoise(Phocoenoides dalli) (fig. 49).
Although the distributions of cetacean species havevaried between surveys, species-environment relation-ships for some species have been remarkably consistent.For example, the offshore extent of Dall’s porpoise offCalifornia appears directly linked to the offshore extentof upwelling-modified waters (fig. 50). During all sur-vey years, this species was primarily found in cool, up-welling-modified waters less than about 17˚C, whileavoiding the coldest, most recently upwelled waters nearshore. Further analyses of the CSCAPE results in thecontext of oceanographic processes are planned in thefuture, and, combined with the results of other studiesin this report, will enhance our understanding of thedynamic nature of the California Current and the ma-rine predators that inhabit this region.
70
Figure 49. Sightings of marine mammals within the central California National Marine Sanctuaries.
30-74 State of the Current 11/12/06 5:21 PM Page 70
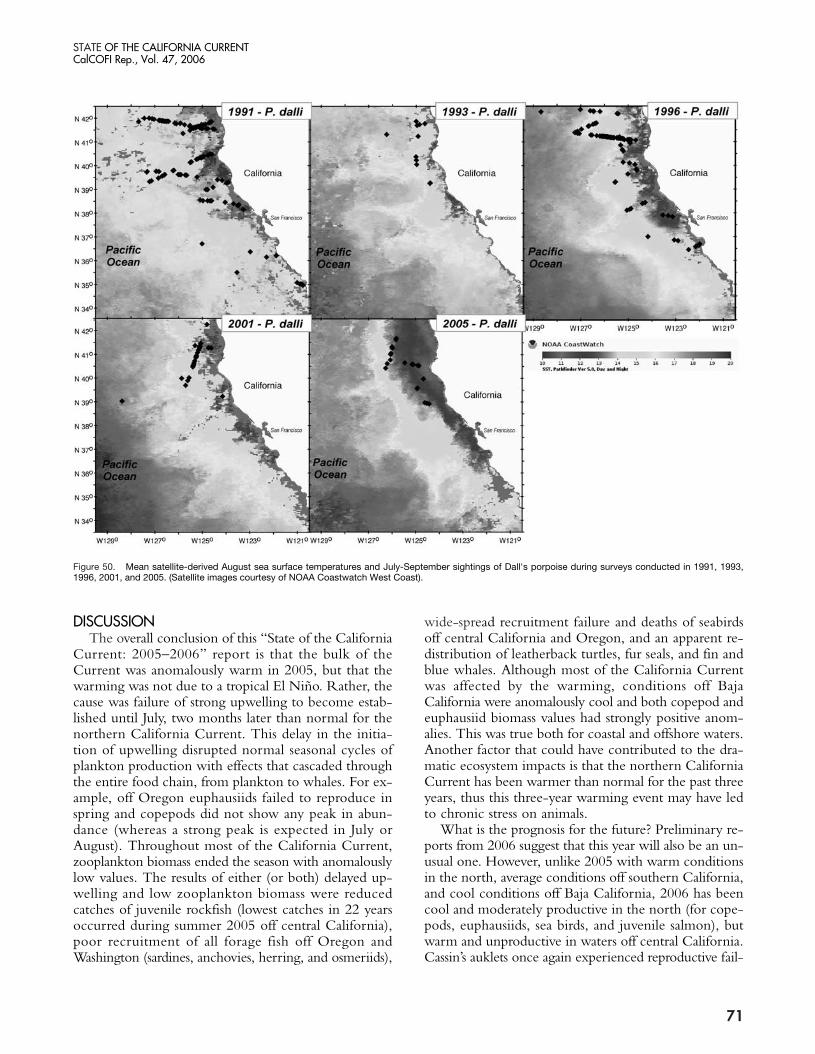
STATE OF THE CALIFORNIA CURRENTCalCOFI Rep., Vol. 47, 2006
DISCUSSIONThe overall conclusion of this “State of the California
Current: 2005–2006” report is that the bulk of theCurrent was anomalously warm in 2005, but that thewarming was not due to a tropical El Niño. Rather, thecause was failure of strong upwelling to become estab-lished until July, two months later than normal for thenorthern California Current. This delay in the initia-tion of upwelling disrupted normal seasonal cycles ofplankton production with effects that cascaded throughthe entire food chain, from plankton to whales. For ex-ample, off Oregon euphausiids failed to reproduce inspring and copepods did not show any peak in abun-dance (whereas a strong peak is expected in July orAugust). Throughout most of the California Current,zooplankton biomass ended the season with anomalouslylow values. The results of either (or both) delayed up-welling and low zooplankton biomass were reducedcatches of juvenile rockfish (lowest catches in 22 yearsoccurred during summer 2005 off central California),poor recruitment of all forage fish off Oregon andWashington (sardines, anchovies, herring, and osmeriids),
71
wide-spread recruitment failure and deaths of seabirdsoff central California and Oregon, and an apparent re-distribution of leatherback turtles, fur seals, and fin andblue whales. Although most of the California Currentwas affected by the warming, conditions off BajaCalifornia were anomalously cool and both copepod andeuphausiid biomass values had strongly positive anom-alies. This was true both for coastal and offshore waters.Another factor that could have contributed to the dra-matic ecosystem impacts is that the northern CaliforniaCurrent has been warmer than normal for the past threeyears, thus this three-year warming event may have ledto chronic stress on animals.
What is the prognosis for the future? Preliminary re-ports from 2006 suggest that this year will also be an un-usual one. However, unlike 2005 with warm conditionsin the north, average conditions off southern California,and cool conditions off Baja California, 2006 has beencool and moderately productive in the north (for cope-pods, euphausiids, sea birds, and juvenile salmon), butwarm and unproductive in waters off central California.Cassin’s auklets once again experienced reproductive fail-
Figure 50. Mean satellite-derived August sea surface temperatures and July-September sightings of Dall's porpoise during surveys conducted in 1991, 1993,1996, 2001, and 2005. (Satellite images courtesy of NOAA Coastwatch West Coast).
30-74 State of the Current 11/12/06 5:21 PM Page 71

STATE OF THE CALIFORNIA CURRENTCalCOFI Rep., Vol. 47, 2006
ure (W. Sydeman, personal communication) and juve-nile rockfish abundances were again at near-record lowlevels (S. Ralston, personal communication).
SUMMARY• Sea surface temperatures (SST) throughout the cen-
tral and northern California Current System in 2005were typically 1˚–2˚C above normal (and up to 4˚Cabove normal) and have been warmer than normalsince the 2002–03 El Niño. Conditions were partic-ularly warm in May and June 2005, months whenupwelling is ordinarily expected to have its strongestimpact. Upwelling became relatively strong com-mencing in June–July, resulting in a cooling of SSTby August and a delayed pulse in seasonal productiv-ity. Coastal upwelling continued later than expectedinto 2005, resulting in near-normal net upwelling forthe year. Thus, the year 2005 will be a good exam-ple of a year in which the “seasonally averaged up-welling” will be a deceiving statistic.
• Average temperatures in southern and Baja Californiawere nearly normal or slightly cooler than usual.
• The impact of the warm anomaly on the pelagicecosystem in Washington, Oregon, and northernCalifornia were perhaps best described as devastating.
• Preliminary indications are that this pattern of de-layed upwelling may repeat in 2006 in the centralCalifornia region.
• Nutrient concentrations were lower than average offNewport and Monterey but slightly above average inthe CalCOFI region, yet chlorophyll concentrationswere average off Newport, above average off Montereyand CalCOFI, but below average off Mexico. Thus,nitrate and chlorophyll did not appear to be closelyrelated.
• Zooplankton biomass was below normal off Newport,Monterey, and in the CalCOFI region, but above nor-mal off Mexico. The normal pattern of an increase inzooplankton biomass in spring-summer also did notoccur off British Columbia (Mackas et al. In review),Oregon, northern California, or central California
• The most noticeable signal off Newport was thepresence of a “warm-water copepod community”throughout most of 2005, which resembled the com-munity type seen during strong El Niño conditions.Warm-water copepod species also appeared to be moreabundant off Monterey.
• Euphausiids off Oregon failed to spawn during spring;spawning was delayed in summer and did not com-mence until upwelling was initiated. The highestnumbers of eggs occurred in September, rather thanthe usual July. Adult euphausiid biomass was belownormal in central California but average in theCalCOFI region.
• The numbers of herring and white-bait smelt offOregon fell to values that were 10% of the maximaobserved during the cool-ocean conditions of1999–2002, whereas sardine and anchovy numberswere little different from previous years. However, re-cruitment of all forage fish species appeared to be verylow in 2005 since the surveys in 2006 are finding verylow numbers, similar to numbers observed during the1998 El Niño event. Thus, there will be a one-yearlag between perturbation caused by “the warm oceanof 2005” and a measurable impact on biomass of for-age fish in 2006.
• The abundances of juvenile rockfish off centralCalifornia were the lowest ever measured from the22-year time series. The near-absence of fish in thesurvey area was associated with a re-distribution ofadult fishes, both to the north (for northern species)and to the south (for southern species), leaving a gapin the central portions of the current. Catches in 2006were low as well.
• Sardine and Jack mackerel eggs in the CalCOFI sur-veys were not as abundant as in previous years butthere was no evidence of anomalously low numbers,nor was there any evidence for warmer-than-usualconditions. Anchovy egg numbers were quite abun-dant, but again, nothing out of the ordinary.
• The abundances of the larvae of the mesopelagic lamp-fish and lanternfish suggest an ecosystem response tothe warm conditions of 2005 that penetrated downseveral hundred meters in the water column. Northernlampfish (with a subarctic-transitional affinity) werefound shoreward and northward during 2005, simi-lar to observations made during years of warm phasePDO; during a cool phase these species are foundseaward and southward. The tropical-subtropicalmesopelagic species move in the opposite pattern ofshoreward and northward during a warm phase ofthe PDO but seaward and southward during a neg-ative phase.
• Cassin’s auklets may be the most sensitive sentinelspecies in the California Current as a collapse in theirbreeding success was the first harbinger of the impactsof the 2005 warm event on any component of theecosystem. Other seabirds in the Gulf of the Farallonesshowed a similar, but not as dramatic, response.
• For pelagic seabirds in the CalCOFI survey region,2005 was unusual, but unlike other components ofthe ecosystem, they did not strongly resemble an “ElNiño” assemblage. Interestingly, the Cassin’s auklet,which is not usually very abundant in the CalCOFIregion, became abundant there, suggesting a south-ward migration of the birds away from centralCalifornia, perhaps similar to the southward migra-tion suggested for rockfish.
72
30-74 State of the Current 11/12/06 5:21 PM Page 72

STATE OF THE CALIFORNIA CURRENTCalCOFI Rep., Vol. 47, 2006
• Studies of diets of California sea lions in the MontereyBay region found a decreasing importance of marketsquid and increasing importance of sardines in 2005,similar to observations made during the 1998 El Niñoevent, and consistent with the reported decline ofmarket squid in Monterey Bay.
• On the other hand, California sea lions in southernCalifornia showed no sign of being affected by warm-ocean conditions, indicated by a continued increasein production of pups in 2005. Pup production de-clined during past El Niño events (1983, 1992–93,1998), but not during the 2005 warm event.
• Northern fur seals were found unusually close to shorein 2005; fin whales were more frequently encoun-tered on coast-wide surveys and blue whales were dis-persed and widely distributed, possibly in response toa scarcity of their primary prey, euphausiids.
ACKNOWLEDGEMENTS CalCOFI cruises off Southern California were jointly
conducted by Scripps Institution of Oceanography andSouthwest Fisheries Science Center and supported byNOAA JIMO Grant NA17RJ1231. A large number ofconscientious people from both institutions collectedsamples at sea, processed them in laboratories, main-tained the databases, and generated tables, graphics, andreports. Without their dedication the legacy of CalCOFIcould not have been sustained. Cruises off Monterey areconducted primarily by personnel from the MontereyBay Aquarium Research Institute and University ofCalifornia at Santa Cruz under the direction of J. TimPennington with data support from Reiko Michisaki.Support for these efforts comes from NOAA and the David and Lucile Packard Foundation. Cruises offNewport were carried out under the leadership of TracyShaw, Jen Menkel, and Leah Feinberg, and supportedby the U.S. GLOBEC Program and the NOAA/NMFSStock Assessment Improvement Program. Xuemei Qiuassisted with the drafting of figures. The studies onCalifornia Current seabirds were funded by the U.S. Fishand Wildlife Service, the David and Lucile PackardFoundation, Resources Legacy Fund Foundation, Friendsof the Farallones, and Point Reyes Bird Observatory(PRBO). Christine Abraham and Chris Rintoul man-aged the seabird databases used in this report. This isPRBO contribution no. 1214. The sea lion work ofWeise and Harvey was supported by Joe Scordino atNational Marine Fisheries Service through the WestCoast Expanding Pinniped Program, and additional sup-port through the Center for Integrative Marine Tech-nologies, the Tagging of Pacific Pelagics, and CaliforniaSea Grant Program. Thanks to P. Morris for her assis-tance in the field, H. Vuorisalo and other interns fortheir assistance in processing and analyzing samples.
This work was conducted under NMFS permit num-ber 87-1593-05.
IMECOCAL cruises were supported by CONACYT(Grants 42569 and 47044). Special thanks are given toJose Luis Cadena-Ramírez, Julio Cesar Hernández-Leónand Patricia García-García for helping in the analysis ofthe zooplankton samples, and to Martín de la Cruz-Orozco for chlorophyll analysis.
LITERATURE CITEDAbraham, C. L. and W. J. Sydeman. 2004. Ocean climate, euphausiids, and
auklet nesting: interannual trends and variation in phenology, diet, andgrowth of a planktivorous seabird, Ptychoramphus aleuticus. Mar. Ecol. Prog.Ser. 274:235–250.
Ainley, D. G., W. J. Sydeman, and J. Norton. 1995. Upper trophic levelpredators indicate interannual negative and positive anomalies in theCalifornia Current food web. Mar. Ecol. Prog. Ser. 118:79–89.
Bograd, S. J., P. M. DiGiacomo, R. Durazo, T. L. Hayward, K. D.Hyrenback, R. J. Lynn, A. W. Mantyla, F. B. Schwing, W. J. Sydeman,T. Baumgartner, B. Lavaniegos, and C. S. Moore. 2000. The state of theCalifornia Current, 1990–2000: forward to a new regime? Calif. Coop.Oceanic Fish. Invest. Rep. 41:26–52.
Bond, N. A., J. E. Overland, M. Spillane, and P. Stabeno. 2003. Recentshifts in the state of the North Pacific. Geophys. Res. Letters 30(23), 2183,doi:10.1029/2003GL)18597, 2003.
Brodeur, R. D., S. Ralston, R. L. Emmett, M. Trudel, T. D. Auth, and A.J. Phillips. 2006. Anomlous pelagic nekton abundance, distribution, andapparent recruitment in the northern California Current in 2004 and 2005.Geophys. Res. Letters. 33, L22SO8, doi:10.1029/2006GLO26614.
Chavez, F. P., J. T. Pennington, C. G. Castro, J. P. Ryan, R. P. Michisaki,B. Schlining, P. Walz, K. R. Buck, A. McFadyen, and C. A. Collins.2002. Biological and chemical consequences of the 1997–98 El Niño incentral California waters. Prog. Oceanogr. 54:205–232.
Climate Prediction Center. 2005. Climate Diagnostics Bulletin. 2005. on-line at: www.cpc.ncep.noaa.gov/products/analysis_monitoring/CDB_archive.html
Cushing, D. H. 1990. Plankton production and year-class strength in fishpopulations: an update of the match/mismatch hypothesis. Adv. Mar. Biol.26:249–293.
DiLorenzo, E., A. J. Miller, N. Schneider, and J. C. McWillliams. 2005. Thewarming of the California Current System: Dynamics and EcosystemImplications. J. Phys. Oceanogr. 35:336–362.
Durazo, R., G. Gaxiola-Castro, B. Lavaniegos, R. Castro-Valdez, J. Gomez-Valdes, A. S. Mascarenhas Jr. 2005. Oceanographic conditions west of theBaja California coast, 2002-2003: A weak El Niño and subartic water en-hancement. Cienc. Mar. 31:537–552.
Emmett, R. L., R. D. Brodeur, T. W. Miller, S. S. Pool, P. J. Bentley, G. K.Krutzikowsky, and J. McCrae. 2005. Pacific sardine (Sardinops sagax) abun-dance, distribution, and ecological relationships in the Pacific Northwest.Calif. Coop. Oceanic Fish. Invest. 46:122–143.
Goericke, R., S. J. Bograd, G. Gaxiola-Castro, J. Gomex-Valdes, R. Hooff,A. Huyer, K. D. Hyrenbach, B. E. Laveniegos, A. Mantyla, W. T. Peterson,F. B. Schwing, R. L. Smith, W. J. Sideman, E. Venrick, and P. A. Wheeler.2004. The State of the California Current, 2003–2004: A rare “normal”year. Calif. Coop. Oceanic Fish. Invest. Rep. 45:27–60.
Goericke, R., E. Venrick, A. Mantyla, R. Hooff, C. Collins, G. Gaxiola-Castro, S. J. Bograd, F. B. Schwing, W. T. Peterson, B. Marinovic,A. Huyer, P. Wheeler, R. L. Smith, F. Chavez, N. Lo., K. D. Hyrenbach,and W. J. Sydeman. 2005. The state of the California Current, 2004–2005:still cool? Calif. Coop. Oceanic Fish. Invest. Rep. 46:32–71.
Hollowed, A. B. 1992. Spatial and temporal distribution of Pacific hake,Merluccius productus, larvae and estimates of survival during early life stages.Calif. Coop. Oceanic Fish. Invest. Rep. 33:100–123.
Hooff, R. C. and W. T. Peterson. 2006. Copepod biodiversity as an indi-cator of changes in ocean and climate conditions of the northern Californiacurrent ecosystem. Limnol. Oceanogr. 51(6): 2042–2051.
73
30-74 State of the Curre#2E503F 1/29/07 10:16 PM Page 73

STATE OF THE CALIFORNIA CURRENTCalCOFI Rep., Vol. 47, 2006
Hyrenbach, K. D. and R. R. Veit. 2003. Ocean warming and seabird as-semblages of the California Current System (1987–1998): response at mul-tiple temporal scales. Deep-Sea Res. II. 50(14-16):2537–2565.
Jacobson, L. D. and A. D. MacCall. 1995. Stock-recruitment models forPacific sardine (Sardinops sagax). Can. J. Fish. Aquat. Sci. 52:566–577.
Kister, R., and co-authors. 2001. The NCEP-NCAR 50-year reanalysis:Monthly means CD-ROM and documentation, Bull. Am. Meteorol. Soc.82: 247–268.
Lo, N. C. H. and B. Macewicz. 2006. Spawning biomass of Pacific sardine(Sardinops sagax) off California in 2005. National Oceanic and Atmosphericadministration, U.S. Dep. Commer. NOAA-TM-NMFS-SWFSC-387.29pp.
Lo, N. C. H., B. Macewicz, and D. Griffith. 2005. The spawning biomassof Pacific sardine during 1994–2004 off California. Calif. Coop. OceanicFish. Invest. Rep. 46:93–112.
Lowry, M. S. and K. A. Forney. 2005. Abundance and distribution ofCalifornia sea lions (Zalophus californianus) in central and northern Californiaduring 1998 and summer 1999. U.S. Fish. Bull. 103:331–343.
Lynn, R. J., K. A. Bliss, and L. E. Eber. 1982. Vertical and horizontal dis-tributions of seasonal mean temperature, salinity, sigma-t, stability, dy-namic height, oxygen, and oxygen saturation in the California Current,1950–1978. Calif. Coop. Oceanic Fish. Invest. Atlas No. 30.
Lynn, R. J. and J. J. Simpson. 1987. The California Current System: the sea-sonal variability of its physical characteristics. J. Geophys. Res.92:12947–12966.
Mackas, D. L., W. T. Peterson, M. D. Ohman, and B. E. Lavaniegos. In re-view. Zooplankton anomalies in the California Current system before andduring the warm ocean conditions of 2005. Geophys. Res. Letters.
Mantua, N. J. and S. R. Hare. 2002. The Pacific Decadal Oscillation. J.Oceanogr. 58:35–44.
McGowan, J. A., D. R. Cayan, and L. C. Dorman. 1998. Climate-oceanvariability and ecosystem response in the Northeast Pacific. Science281:210–217.
Moser, H. G., R. L. Charter, P. E. Smith, D. A. Ambrose, S. R. Charter,C. A. Meyer, E. M. Sandknop, and W. Watson. 1993. Distributional Atlasof fish larvae and eggs in the California current region: Taxa with 1000or more: total larvae, 1951 through 1984. Calif. Coop. Oceanic Fish.Invest. Atlas No. 31. 233 pp.
Orr, A. J. and J. T. Harvey. 2001. Quantifying errors associated with usingfecal samples to determine the diet of the California sea lion (Zalophus cal-ifornianus). Can. J. Zool. 79:1080–1087.
Pérez-Brunius, P., M. López, and J. Pineda. 2006. Hydrographic conditionsnear the coast of northwestern Baja California. Cont. Shelf Res. 26:885–901.
Peterson, W. T. and F. B. Schwing. 2003. A new climate regime in north-east Pacific ecosystems. Geophys. Res. Letters 30(17), 1896, doi:10.1029/2003GL)17528, 2003.
Pierce, S. D., J. A. Barth, R. E. Thomas, and G. W. Fleischer. In press.Anomalously warm July 2005 in the northern California Current: his-torical context and the significance of cumulative wind stress. Geophys.Res. Letters.
Ramírez-Manguilar, A. M. 2005. Variabilidad estacional e interanual en elSistema de la Corriente de California frente a la costa de Baja California,México. M. S. Thesis, Facultad de Ciencias Marinas, Univ. Autón. BajaCalif., Mexico, 107 pp.
Schwing, F. B., C. S. Moore, S. Ralston, and K. M. Sakuma. 2000. Recordcoastal upwelling in the California Current in 1999. Coop. Oceanic Fish.Invest. Rep. 41:148–160.
Smith, R. L., A. Huyer, and J. Fleischbein. 2001. The coastal ocean offOregon from 1961 to 2000: is there evidence of climate change or onlyLos Niños? Prog. Oceanogr. 49:63–93.
Sydeman, W. J., R. W. Bradley, P. Warzybok, J. Jahncke, K. D. Hyrenbach,V. Kousky, M. A. Hipfner, and M. D. Ohman. 2006. Krill and KrillPredators: Responses of Planktivorous Auklets (Ptychoramphus aleuticus) tothe Anomaly of 2005. Geophys. Res. Lett.
Sydeman, W. J., M. M. Hester, J. A. Thayer, F. Gress, P. Martin, and J.Buffa. 2001. Climate change, reproductive performance, and diet com-position of marine birds in the southern California Current system,1969–1997. Prog. Oeanogr. 49:309–329.
Thomas, R. E., G. W. Fleischer, K. D. Cooke, I. A. Holmes, P. H. Ressler,and S. D. Pierce. 2006. Distribution of Pacific hake in relation to oceanconditions: implications for documenting climate change. Published Abstract,p. 120, American Society of Limnology and Oceanography, SummerMeeting, Victoria, BC, Canada.
Veit, R. R., P. Pyle, and J. A. McGowan. 1996. Ocean warming and long-term change of pelagic bird abundance within the California CurrentSystem. Mar. Ecol. Prog. Ser. 139:11–18.
Venrick, E., S. J. Bograd, D. Checkley, R. Durazo, G. Gaxiola-Castro, J. Hunter, A. Huyer, K. D. Hyrenbach, B. E. Laveniegos, A. Mantyla, F. B. Schwing, R. L. Smith, W. J. Sideman, and P. A. Wheeler. 2003.The state of the California Current, 2002–2003. Calif. Coop. OceanicFish. Invest. Rep. 44:28–60.
Weise, M. J. 2000. Abundance, food habits, and annual fish consumption ofCalifornia sea lion (Zalophus californianus) and its impact on salmonid fish-eries in Monterey Bay, California. M.S. Thesis, San Jose State University.
Weise, M. J. 2006. Foraging ecology of male California sea lion (Zalophuscalifornianus): movement, diving and foraging behavior, and diving capac-ity. Ph.D. Dissertation, University of California, Santa Cruz.
Weise, M. J. and J. T. Harvey. In review. Effects of El Niño and La Niñaon Seasonal and Annual Variability in Abundance, Diet, and Consumptionof California Sea Lion (Zalophus californianus). Mar. Ecol. Progr.
Wolter, K. and M. S. Timlin. 1998. Measuring the strength of ENSO—howdoes 1997–1998 rank? Weather 53:315–324.
74
30-74 State of the Curre#2E503F 1/29/07 10:16 PM Page 74


![[Cool] Gas Chromatography and Lipids](https://static.fdokumen.com/doc/165x107/6325a4b1852a7313b70e98e9/cool-gas-chromatography-and-lipids.jpg)


