1st Croatian Direct Marketing Association ... - Crodma
223
ISSN 2459-7953
-
Upload
khangminh22 -
Category
Documents
-
view
3 -
download
0
Transcript of 1st Croatian Direct Marketing Association ... - Crodma

ISSN 2459-7953


1st Croatian Direct Marketing Association Conference
(1st CRODMA Conference 2016)
BOOK OF PAPERS
THEME:
INTEGRATED MARKETING
Challenges of big data technology
Varaždin, Croatia
20th – 21st October 2016
1st CRODMA Conference 2016
1st Croatian Direct Marketing Association Conference, Book of Papers. Copyright 2016.
Croatian Direct Marketing Association. All rights reserved. No part of this publication may be
reproduced, stored in a retrieval system, or transmitted in any form, or by any means –
electronic, mechanical, photocopying, recording, or otherwise, without the prior permission of
the publishers.
Publisher
CRODMA
Croatian Direct Marketing Association
10 000 Zagreb, Trg biskupa Josipa Langa 4
Croatia
For the publisher
Associate Professor Damir Dobrinić, PhD - President of Croatian Direct Marketing
Association
Editor
Associate Professor Damir Dobrinić, PhD
Technical Editor
Petra Grd, PhD
ISSN 2459-7953
Editors disclaim responsibility for language errors.

Book of Papers
CRODMA is a free trade association, which brings together, includes and connects individuals
and legal entities engaged in direct and interactive marketing, with the aim of promoting more
efficient and more effective management in all areas of Republic of Croatia using the principles,
ethics, concepts, knowledge, skills, tools and techniques of direct and interactive marketing.
The Association is active in professional and organizational sense independently and in line
with the Statute.
MISSION
CRODMA’s mission is to support the development and status of direct and interactive
marketing as a business strategy.
The mission will be achieved by supporting: development of a legislative framework that will
enable prosperity of activities of direct and interactive marketing and market equality of
CRODMA members, promotion of activities of direct and interactive marketing to the public
(political, economic and general) as a successful business strategy in the prevailing market
conditions and education of members and communication of achievements so that the direct
and interactive marketing would be properly considered in the domestic and international,
primarily European market.
VISION
To become a factor in the development and acceptance of the marketing philosophy as the
dominant philosophy of business in Croatia.
CRODMA is focused on the popularization and development of direct and interactive
marketing with its members’ influence, contacts and activities related to the presentation of
ideas and success of direct and interactive marketing for the business, political and general
public.

1st CRODMA Conference 2016
COMMITTEE MEMBERS
PROGRAM COMMITTEE
Mr. Sébastien Houzé, Program committee president
Secretary General, Federation of European Direct and Interactive Marketing
Professor Sanja Bijakšić (University of Mostar, Bosnia and Hercegovina), Professor Marijan
Cingula (University of Zagreb, Croatia), Mihaela Constantinescu (Christian University, Faculty
of Marketing, „Dimitrie Cantemir”, Romania), Professor Barbara Čater (University of
Ljubljana, Ljubljana), Professor Damir Dobrinić (University of Zagreb, Croatia), Professor
Stjepan Dvorski (University of Zagreb, Croatia), Professor Branimir Dukić (University of
Osijek, Croatia), Professor Ivan Frančišković (University of Rijeka, Croatia), Professor Dóra
Horváth (Corvinus University of Budapest, Hungary), Professor Zsófia Kenesei (Corvinus
University Budapest, Hungary), Professor Lara Jelenc (University of Rijeka, Croatia),
Professor Mirela Mihić (University of Split, Croatia), Professor Wilson Ozuem Regents
(University, London, UK), Professor Jurica Pavičić (University of Zagreb, Croatia), Profesor
Almir Peštek (University of Sarajevo, Bosnia and Herzegovina), Professor Drago Ružić
(University of Osijek, Croatia), Professor Anita Ciunova Shuleska (Saints Cyril and Methodius
University of Skopje, Macedonia (FYROM)), Professor Marija Tomašević Lišanin (University
of Zagreb, Croatia), Professor Tihomir Vranešević (University of Zagreb, Croatia), Professor
Neven Vrček (University of Zagreb, Croatia), Professor Kovač P. Žnideršić (University of Novi
Sad, Serbia).
ORGANIZING COMMITTEE
Associate Professor Damir Dobrinić, Organizing committee president
Iva Gregurec, PhD
Miroslav Mandić, PhD
Petra Grd, PhD
Rikard Lumezi
CORRESPONDENCE
Associate Professor Damir Dobrinić
damir.dobrinic@crodma.

Book of Papers
i
CONTENTS
Elizabeta Vachkova, Krasimira Staneva
EVALUATION OF THE POTENTIAL OF THE CROSS-BORDER REGION
BULGARIA-SERBIA FOR THE DEVELOPMENT OF WELLNESS, MEDICAL
SPA AND SPA TOURISM – POSSIBILITIES AND PERSPECTIVES-PART II 1
Suzana Keglević Kozjak, Tanja Šestanj-Perić
BONITEST ANALYSIS OF COMPANIES IN PRE-BANKRUPTCY
PROCEEDINGS 11
Matea Matić, Barbara Puh, Barbara Miloglav
CONSUMER PURCHASE FEATURES TOWARD NATURAL COSMETICS IN
ONLINE ENVIRONMENT 21
Iva Sorić, Dražen Oreščanin, Marko Štajcer
HADOOPING THE MARKETING GAME 33
Aleksandra Krajnović, Dominik Sikirić, Jurica Bosna
DIGITAL MARKETING AND BEHAVIORAL ECONOMICS 43
Daniela Jurčić, Igor Jurčić
GENDER DIFFERENCES IN ADVERTISING - MISUSE OF WOMEN 57
Antun Biloš, Davorin Turkalj, Ivan Kelić
MICRO-MOMENTS OF USER EXPERIENCE: AN APPROACH TO
UNDERSTANDING ONLINE USER INTENTIONS AND BEHAVIOR 67
Anton Manfreda
NEW BUSINESS MODELS - FROM BUSINESS PROCESS REDESIGN TO THE
DIGITAL TRANSFORMATION 79
Ines Marinčić, Mateja Zbodulja
PERCEPTION OF THE SOCIAL NETWORKS' IMPACT ON THE
REPUTATION OF ICT COMPANIES 91
Krasimira Staneva
PREREQUISITES FOR BALANCED DEVELOPMENT OF WELLBEING AND
MEDICAL SPA IN BULGARIA 103
Marija Tomašević Lišanin, Albert Galfi, Mirko Palić
ROLE OF THE NEW MEDIA AS A DISTRIBUTION CHANNEL FOR
ACCOMMODATION SERVICES IN TOURISM 111
Sanja Bijakšić, Brano Markić, Arnela Bevanda
SOCIAL NETWORKS AS CHALLENGE FOR MARKETING INTELLIGENCE 121

1st CRODMA Conference 2016
ii
Igor Jurčić, Daniela Jurčić
SPECIAL FEATURES OF ADVERTISING ON SOCIAL NETWORKS:
LINKEDIN 135
Elizabeta Bolarić
THE CORRELATION BETWEEN SOCIAL MEDIA APPLICATIONS USE AND
THE NUMBER OF REQUESTS FOR PROPOSALS IN TOURISM 149
Miroslav Mandić, Vladislav Valiček, Zrinka Skelin
CRM IN A CROATIAN HOTEL CHAIN 157
Ivana Dvorski Lacković, Vladimir Kovšca, Zrinka Lacković Vincek
THE POTENTIAL FOR BIG DATA APPLICATION IN THE MARKETING OF
BANKING INSTITUTIONS 169
Filip Šinko Morandini, Damir Dobrinić
THE ROLE OF SEGMENTATION IN E-MAIL MARKETING 177
Mladen Rajko, Aleksandra Krajnović, Ivica Zdrilić
WEB SITE - ONE OF THE KEY TOOLS OF CRM SYSTEM IN LOCAL
GOVERNMENT UNITS 189
Danijel Ferić
DIGITAL MARKETING CROATIAN LOTTERY 203

Book of Papers
1
EVALUATION OF THE POTENTIAL OF THE CROSS-BORDER
REGION BULGARIA-SERBIA FOR THE DEVELOPMENT OF
WELLNESS, MEDICAL SPA AND SPA TOURISM – POSSIBILITIES
AND PERSPECTIVES-PART II
Assoc.prof. KRASIMIRA STANEVA, PhD
Business Management Faculty, University of Forestry , 10 bld Kl. Ohridski, Sofia 1797
e-mail : [email protected]
MPH, Prof. ELIZABETA VACHKOVA, DSc,
Business Management Faculty, University of Forestry , 10 bld Kl. Ohridski, Sofia 1797
e-mail : [email protected]
ABSTRACT
The aim of this study is to analyze the potential of the Bulgaria- Serbia cross-border region for
the development of balanced Wellness and SPA tourism concerning the medico-biological and
medico-social assessment of tourism resources and professional competencies of the
employees.
More than 30 mineral springs and 21 tourist sites have been studied. There are good medico-
biological conditions for the development of intensive medical SPA, Wellness and SPA Tourism.
The combination of free spring flow and specific climate conditions is a big advantage for the
development of highly specialized tourism as the medical SPA. On the other hand, the lack of a
working model to control health risk, environmental and safe working conditions in SPAs is
one of the obstacles for the development of this kind of tourism. The obtained results show the
need to develop specific skills and professional competencies of the personnel.
A new model for management of Wellness and SPA Tourism, based on competency modeling
is presented.
The core idea of this model is to find a good balance between indoor and outdoor environment,
highly qualified personnel and quality services. The necessity of establishing a competency
framework and certifying the medical SPA and SPA services, implementing the quality
management system (QMS) and health risk assessment system (HSE) is outlined with the view
of promoting the specialized tourism product on the international market.
KEYWORDS: Wellness, Medical SPA Tourism, competency model, cross-border region
Bulgaria- Serbia, HSE standards

1st CRODMA Conference 2016
2
1 INTRODUCTION
The analysis of the international tourism market proves convincingly that for the last three years
medical and recreational tourism exhibits high rates of development. The marketability of the
offered specialized packages, including balneological destinations, shows that they are desired
by more and more EU citizens. This may be explained with the possibilities afforded by the EU
member-states to their citizens – free choice of medical and health services in all countries,
members of the European family. The dynamics of this process reflects both on the quality of
the offered tourism services in the individual states and on the creativity of managers in tourism.
The quality of the proposed health and balneo- therapeutic services in the different countries is
also positively affected.
The fast-growing expectations of the clients (Bulgaria has been declared “European SPA
capital” in 2015) call for more concentrated and strategically oriented efforts to perfect
constantly the staff qualification through modern methods and approaches. They include a
permanent study of the market needs and adaptation of the offered knowledge, skills and
competencies of the staff to the clients’ topical needs. Competence-based management and
training of the personnel is widely used nowadays as one of the adequate approaches for staff
qualification in the tourist industry. As an adequate answer to this challenge Bulgarian Chamber
of Commerce has launched an Internet based information system for professional evaluation
of the employees in 20 industries, among which the tourist one. This system can be used for
elaboration of a model for professional competence, particular for the SPA tourism through
modification of the already existing system.
2 DESIGN OF INVESTIGATION
Purpose and tasks of the research
The objective of the study is to evaluate the potential of the cross border region (CBR) Bulgaria-
Serbia for development of Medical SPA, SPA and Wellness Tourism.
The main tasks of the investigation were:
Evaluation of medico-biological and medico-social prerequisites for developing of
medical SPA and SPA Tourism in the CBR Bulgaria –Serbia ;
Evaluation of professional competencies of the employees, working in these industries
and the current needs of the tourism market for knowledge, skills and competences of
the staff ;
Creation of a new model for management of Wellness and SPA Tourism in CBR , based
on competency modeling.

Book of Papers
3
2.1. METHODS OF INVESTIGATION
A specifically developed methodology has been applied for implementing the set tasks and
achieving the project objective, which has the following sequence:
Analysis and assessment of the medico-biological effect of the studied mineral water on
the basis of chemical composition and physical properties;
Evaluation of the medico-social aspects and existing conditions for development of the
medical SPA, SPA and Wellness sector in CBR using assessment of the current status
of the deposits and their impact on the socio-economic outlook of the region;
”Face to face” surveys, including one pilot study of the qualification of the personnel
occupied in SPA hotels and another one of the market needs for knowledge, abilities
and competencies of the employees in this industry (100 respondents /hotel staff);
Blitz questionnaire survey for medico-social evaluation of mineral bath in Knjajevo,
Sofia (30 tourists with different profile);
Assessment of the prospective areas for investment purposes;
Evaluation of the potential of the areas for development of Wellness , Medical SPA and
SPA Tourism in CBR ;
2.2. THE INVESTIGATION AREA
The investigation plan includes following districts from Bulgaria: Montana, Sofia districts and
Nish , Pirot from Serbia.
Figure 1. Map of the investigation area
Limiting factors in conducting the survey:
All experts’ and prediction assessments are based solely on the chemical analyses
submitted during the investigation work. The available archive materials are used to evaluate
the sustainability of the hydro chemical characteristics of mineral waters, using for treatment.

1st CRODMA Conference 2016
4
3 OBTAINED RESULTS OF THE INVESTIGATION
The main research data, characterizing the objects of the study are presented in Table 1.
Table 1. Obtained results
Obtained results Cross-border region sites
An evaluation of the hydrogeological potential More than 30 mineral springs
Medico-biological assessment of mineral waters More than 30 mineral springs
Medico-social assessment of tourism development in
CBR
More than 30 mineral springs
Touristic infrastructure audit 21 SPA and medical SPA centers
Environmental assessment (indoor and outdoor audit) 6 plots
Assessment of SPA centers 21 SPA and medical SPA centers
Assessment of Certification status of SPA centers 21 SPA and medical SPA centers
Assessment of professional competency of employees 10 SPA and medical SPA centers
Assessment of HSE competency 10 SPA and medical SPA centers
Model for sustainability development of tourism in
CBR
Applicable for all area
According to our investigation plan, we choose some of the achieved results and discuss them.
The main preconditions for sustainability development of Wellness and Medical SPA tourism
are the presence of mineral waters, good technical equipment of the wells, free flow rate of
springs, staff experience in medical rehabilitation.
3.1. HYDROGEOLOGICAL CHARACTERIZATION AND EVALUATION OF THE
HYDROGEOLOGICAL POTENTIAL FOR THE DEVELOPMENT OF MEDICAL
SPA AND SPA IN THE REGION
More than 30 mineral springs have been studied in the cross-border region, which are in several
hydrogeological basins, belonging in geographical respect to the following administrative
districts (Fig.1). All of them have their own chemical and physical characteristics, but the
common origin of some of them gave us the possibility to combine the springs in some
hydrogeological groups/basins.
List of examined mineral springs
Republic of Bulgaria (17 thermal springs)
o Montana district: Varshets basin: Varshets, Spanchevtsi, Barzia,
Slatina, Opletnya, Gabrovnitsa-Elov Dol
o Sofia district : (10 thermal springs with 18 wells)-Pancharevo, Ovcha
Kupel, Bankya, Gorna Banya, Knyazhevo, Sofia Bani, Batalova
Vodenitsa, Svoboda quarter, Nadezhda quarter, Lozenets .
Republic of Serbia (6 thermal springs, 25 wells )

Book of Papers
5
o Vranska Banya - 11 working wells with high geothermal potential
o Topilo- 18 wells
o Nishka Banya- Glavni izvor, Suva banja and Školska česma;
o Zushanitsa-1;
o Gvozdena- 1;
o Soko Banya – Soko area and Joshinska area.
All the investigated sites are well-known tourist centers, where there are good hydrogeological
conditions for the development of intensive Medical SPA, Wellness and SPA Tourism in the
three areas of investigation. The existing abundance of mineral waters affiliated to different
genetic classes provides the possibility of using them for domestic purposes (drinking, hygiene
needs), irrigation, bottling, heating and cure [1].
More of the wells are in a good hydrotechnical condition. The main standard hygienic
requirements are satisfied. Especially valuable are the mineral water wells with a free flow
rate. The last one is a big advantage for the development of highly specialized tourism as
Medical SPA [2].
3.2. MEDICO-BIOLOGICAL AND MEDICO-SOCIAL ASSESSMENT OF MINERAL
RESOURCE
In order to estimate the medico-biological importance of mineral water, it is necessary to
understand the conditions for water formation, the way of water recharge, which are directly
related to the flow rate of water sources and the longevity of their use, the hydrotechnical state
of the water sources with the aim of ensuring the necessary sanitary-hygiene and the
environmental standards for their exploitation. In this context, the collected information about
the locations of the hydrothermal deposits in CBR with data characterizing the resources,
temperature and content of biologically important macro components in the water, as well as
the description of the individual water sources was the base for medico-biological assessment
of mineral resource for tourism.
The ecological state of the deposits and the utilization of the hydrothermal resources are
evaluated at present on the basis of data from the respective basin directorates. Some
recommendations are given for their more rational management, control and protection.
With regards to our results, we can outline the high potential areas for Medical SPA and SPA
Tourism development: Sofia Mineral Bath, Knjajevo Mineral Bath and Nishava region in
Serbia. There are prerequisites for development of complex tourist services as Eco-tourism,
Medical SPA , City SPA, Geo Wellness, Geo-medical and Forestry tourism particularly in
Sofia and Nish districts [3].

1st CRODMA Conference 2016
6
Site Knjajevo Mineral Bath, Sofia
A special blitz questionnaire survey for medico-social evaluation was carried out in Sofia,
district Knjajevo (July, 2015). 30 participants with different socio-demographic profile took
part in the survey. All of them are tourists and visitors.
The age and education profiles are presented on fig.1-2.
Some results about the level of Wellness and SPA culture of the participants are shown
on fig. 3-4.
The core of our pool is associated with the participants’ opinion about the need for Daily
SPA with Mineral Bath in the city (Fig.5).
The results turned our attention to a very specific part of the public health culture-health
prevention. All participants realized the power of the mineral waters as a factor of Wellbeing .
The benefits of SPA and Wellness can improve their health and quality of life [4].
Figure 1-5. Tourists ‘ Questionnaire Results Knjajevo Mineral Bath, Sofia

Book of Papers
7
Some comments on the outcome
Study of staff qualification
The pilot survey aiming at characterizing the qualification of the staff in the observed SPA
hotels is presented in Table 2. The main contents of the questions were to describe the staff’s
area of professional competency and their HSE and QMS certification culture [5] .
Table 2. Some characteristics of the personnel occupied in SPA hotels in Cross border region
Questions/
Answers
Q1 Q2 Q3 Q4 Q5 Q6
Profession
al
competenc
y of staff
Education
needed for
SPA
therapist
Education
needed for
SPA
managers
Managers’
opinion
about HSE
and QMS
implementa
tion
Respondent’s
qualification
Planning
professional
training in the
area of Health
Safety
Environment
System HSE and
QMS
A.Public
Health
100
B.Medical
Rehabilitati
on
0
C..Economi
cs
0
D. Other 0
A. SPA and
aqua trainers
(BSc)
0
B. Sport
Trainer
18
C. Medical
rehabilitatio
n /or
Kynesithera
py
23
D. Others 49
A.
Managemen
t of tourism
21
B.
Managemen
t of social
services
0
C.
Managemen
t of healt
9
D. Others 70

1st CRODMA Conference 2016
8
A. Master in
ABM
78 0
B. Medical
specialist
2 12
C.
Economics
11 8
D. Others 9 80
A. No, we
are not
10
B. It is not
required by
the
Regulations
85
C. Yes, we
are planning
2
D. Other 3
The results of this pilot survey of 100 individuals show the great variety of the respondents
understandings about the needed qualification of SPA therapists (49 % - “others”) and SPA
managers (70% - “others”)as well as the big differences in the qualification of the employed
managers (80% - “others”). These outcomes are strong arguments in favor of the need to create
common criteria and standards for the knowledge, skills and competencies of all professions in
the industry, which can be used for both designing training programs and formulating adequate
selection criteria.
Along with this survey another one was carried out to study the necessary knowledge, skills
and competency of the staff occupied in the tourist industry (in all types of alternative tourism,
including Wellness, Medical Spa and SPA). The respondents are 43 employers from the tourist
industry (31 – from alternative tourism and 12 - from mass tourism). They have been asked to
rank the importance of knowledge, skills and competencies necessary to satisfy the
contemporary needs of the clients and to meet the standards of these industries.
The questions have been formulated using the competence model [5] elaborated in Bulgaria for
the evaluation of the tourist staff industry.
The survey shows the following results [6]:
among the most important skills are : analyzing the market needs and the wishes of the
client (1,31)1, elaborating and offering new tourist products (1,31), acquiring new
knowledge quickly (1,42), following criteria and standards (1,65) ;
1 values of the overall scores

Book of Papers
9
among the most topical general competences are: effective time management (1,37),
recognition of new opportunities (1,30), social engagement and ethical behavior (1,59)
and control of the observation of the standards (1.67) ;
the most important competencies needed to learn turned out to be : constant perfection
of language culture (1,37), acquisition of new knowledge on the basis of new
information and new technologies (1,37), upgrading the knowledge about the global
processes, self-actualization of the competences according to the topical requirements
(1,37);
the fourth ranked two communicative and social competencies are communication with
the clients (1,07) and team working (1,23).
The respondents have been asked to rank the most important deficits in their requirements listed
above, shown by newly appointed graduates of Bulgarian universities. They pointed out team
working (5,3) and customer care (5,3) as greatest deficits, respectively these should be the areas
of most active training and education.
Existing competency models, elaborated for the tourist industry can be periodically modified
in compliance with the results of the topical market needs. The organizations that have adopted
competence-based management (CBM) apply it more often in the area of training and
development, because of the following reasons, showing that it:
Enables a common understanding and standard criteria to be applied across a wide range
of employee functions
Assists both managers and employees in identifying training and development needs
Enables the organization to promote its values, goals and objectives
Assists in the management of change
Enables employees to know what exactly is expected of them
Helps to clarify the career development milestones
The use of competence-based training for the tourist staff will enable the employers to manage
the qualification of the personnel in compliance with the topical market requirements and thus
to increase constantly the competitiveness of their hotels.
4 CONCLUSION
1. The cross–border region is characterized by different types of mineral waters, applicable to
medical treatment and cure. The combination of mineral water and specific climate conditions
is a favorable prerequisite for the development of Medical SPA therapy and Tourism.

1st CRODMA Conference 2016
10
2. There is no distinct boundary between Medical SPA and SPA Tourism in CBR. This creates
preconditions for incomplete utilization of the available natural resources, as well as for
unprofessionally developed advertising products.
3. Finding a good balance between interior, unique environment, highly qualified personnel,
quality of services and innovation products as Wellment and Geo-medical tourism will
contribute to developing Wellness and SPA Tourism making it a successful business today.
4. The key role for the progress in the branch belongs to the reconsideration of the possibilities
offered by the existing natural environment and the material facilities, the awareness that
changes in the overall organization of the sector are necessary by introducing innovative
tourism products and using good practices for development of the cross-border region
implementation of QMS and HSE systems.
5. The hotels and SPA centers need an efficient competence-based management (CBM).
REFERENCES
[1] Станева, К., Е. Маринов, 2014. Концептуален модел за устойчиво развитие на
Wellbeing и medical SPA в България, използвайки геомедицински индикатори,
Тракийски университет, Мед. Колеж, 301-306.
[2] Illing, K.-T, 2006. Mental Issues of Health Tourism Industry- Macro Economic Approach
to Relaxation, Personal Growth and Consciousness Exploration. 165 p.
[3] Цветкова, Е., Станева, К., 2014. Медикобиологични и медико-социални
предпоставки за развитие на SPA и балнеотуризма в Софийска област. Тракийски
университет, Мед. колеж , 281-286.
[4] Станева, К. 2013. Мениджмънт на уелнес туризма и качество на живот. Науч. конф.
с международно участие Знанието-традиции, иновации, перспективи, Бургас, т. ІІІ,
369-374. ISBN 978-954-9370-97-3,369-374.
[5] Staneva, K. 2016. The Implementation of HSE Management System Model in Wellness,
Medical SPA and SPA Tourism in Bulgaria-requirement and
[6] Advantages. Yale Journal of Science and Education. N1 (18), vol. X, 622-629.Yale Univ.
Press
[7] Vatchkova E. et all. Actualization of the Syllabuses of the Specialties in the Faculty of
Business Administration in Accordance with the Market Needs. Intell Entrance, Sofia,
2015
[8] www. mycompetence.bg

Book of Papers
11
BONITEST ANALYSIS OF COMPANIES IN PRE-BANKRUPTCY
PROCEEDINGS
SUZANA KEGLEVIĆ KOZJAK
Faculty of Organization and Informatics
University of Zagreb
Pavlinska 2, 42000 Varaždin, Croatia
TANJA ŠESTANJ-PERIĆ
Faculty of Organization and Informatics
University of Zagreb
Pavlinska 2, 42000 Varaždin, Croatia
ABSTRACT
For illiquid and insolvent companies operating in the Republic of Croatia a possibility for
financial and operative restructuring has been introduced in order to enable the continuity of
operations for such companies. The aim of the paper is to research the financial rating the
companies have or had before, during and after pre-bankruptcy proceeding in order to
establish the risks of business cooperation with these companies.
Financial ratings of companies were measured by BONITEST model. The model was developed
so as to enable a quick and efficient solvency control for business partners operating in the
Republic of Croatia and is accessible on the web pages of Računovodstvo, revizija i financije
magazine. Since companies operating in the Republic of Croatia face significant credit risks
reflecting in uncollectible receivables, it is necessary to pay special attention to the control of
business partner’s solvency.
The results of the research have shown that the majority of companies has a low or the lowest
rating in the period before, during or after pre-bankruptcy proceeding. Such rating implies that
there is a very high bankruptcy threat in these companies even after the conducted pre-
bankruptcy proceeding. Owing to that, business cooperation with such companies faces
significant credit risks and calls for strong payment insurance instruments. Although the results
of the research suggest that the pre-bankruptcy proceedings have not significantly improved
the solvency of the observed companies, it is necessary to consider the usefulness of future pre-
bankruptcy proceedings in the Republic of Croatia from the social perspective as well, which
has not been taken into account in this paper.

1st CRODMA Conference 2016
12
KEYWORDS: BONITEST, financial statements analysis, companies in pre-bankruptcy
proceeding
1 INTRODUCTION
Companies that operate in any country are exposed to significant risks originating from bad
debts. This is why checking the creditworthiness of business partners is extremely important
process which should be given special attention. In situations of poor financial stability, it is
likely that a company will stop paying regularly its liabilities and some of such companies soon
face bankruptcy. When operating with such companies one needs strong collateral such as a
mortgage on the property or personal guarantees of owners. In Croatia, Bankruptcy Act
(Official Gazette 71/15) allows for financial restructuring in a process called pre-bankruptcy
proceeding for debtors who have become illiquid and/or insolvent and who meet certain
conditions. Bankruptcy Act encompasses now both bankruptcy and pre-bankruptcy proceeding,
the latter previously been regulated by Financial Operations and Pre-Bankruptcy Settlement
Act from 2012. The main aim of our paper is to investigate if pre-bankruptcy proceeding
introduced in 2012 proved useful i.e. if the process led to improvement in operations of
businesses that were eligible for this proceeding.
Researching financial (in) stability of companies has a long tradition in the economics literature,
not so much in the domestic as in foreign. The expansion of economic activity after the World
War II, especially during 1960s, resulted in a large number of companies whose financial (in)
stability should have been assessed. In the beginning financial stability of companies was
evaluated by simple methods mainly qualitative in nature. The first serious steps to predict
financial (in) stability of enterprises were created using quantitative methods. Quantitative
methods include a series of mathematical and statistical methods which comprise the following:
firstly, defining the variables significant for predicting bankruptcy and then combining them
with the aim of forecasting the ability of companies to operate as a going concern as precise as
possible.
The beginnings of quantitative methods usage dates back to the second half of 1960’s when
Beaver (1966) and Altman (1968) developed accounting-based prognostic models for
predicting bankruptcy on a sample of US companies using univariate and multiple discriminant
analysis. Following this seminal research numerous researchers developed bankruptcy
prediction models based on different statistical methods such as Ohlson (1980) whose model is
based on logit analysis. It is very likely that accounting-based models will be sample specific
since in the process of their development it is required that accounting ratios of large sample of
failed and non-failed firms is studied to estimate ratio weightings used in the model (Agarwal
& Taffler, 2008, p. 1542). The samples usually include companies from one country and

Book of Papers
13
consequently models are country specific. In Croatia, the prognostic models for predicting the
financial (in) stability were developed by the authors listed in Table 1.
Table 1. Models for predicting financial (in) stability developed in Croatia
Authors Model Statistical method
Škeljo (2001) Bankruptcy prediction model - ZAV
model
Multidiscriminat analysis
Zenzerović (2008) Model for going concern assessment
- GCE
Discriminant analysis and
logistic regression
Belak i Aljinović
Barać (2008, 2014)
(BEX) model for assessment of
business excellence
Multidiscriminat analysis
Pervan (2010) FP Rating - model to predict (in)
solvency of business partners
Discriminant analysis and
logistic regression
Source: Authors
There are also simpler accounting-based scoring models whose aim is prompt solvency check
of one’s business partners. Kralicek’s Quicktest (Kralicek, 2007) is developed using Austrian,
German and Swiss data. One of the quality models developed on Croatian data for quick and
efficient assessment of a company’s creditworthiness is BONITEST (Bešvir, 2010).
BONITEST model requires three steps to test the creditworthiness. The first step requires the
user to enter data from the financial statements, in the second step the model calculates financial
ratios pertaining to the safety and efficiency of operations and ranks them and in the third step
on the basis of the calculated average ranking, the model assigns rating to the company. In a
study conducted in the Republic of Croatia (Keglević Kozjak, et. al., 2014) BONITEST has
proved accurate in predicting bankruptcy and therefore is used in our paper to assess operations
of businesses in pre-bankruptcy proceedings.
The rest of the paper is organized as follows: in section 2 we present the results of our research
and analyse it, and section 3 concludes.
2 RESEARCH AND ANALYSIS
In this paper we investigate if the introduction of pre-bankruptcy proceeding has proved useful
in saving companies which face difficulties in their operations i.e. if business cooperation with
such companies after proceeding does not carry significant credit risks for business partners. It
is assumed that after the pre-bankruptcy proceeding creditworthiness of the debtor will be
considerably more favourable. To test this assumption in the paper we explore the
creditworthiness of enterprises in the period before, during and after the pre-bankruptcy
proceeding. Creditworthiness of companies is determined by BONITEST. The model consists
of three parts (Table 2).

1st CRODMA Conference 2016
14
Table 2. BONITEST model
1st part 2nd part 3rd part
Requires the user to enter the
following items:
Balance sheet: fixed
assets, current assets,
inventories, total assets,
equity, long term
liabilities, short term
liabilities
Profit and loss account:
revenues, expenses (cost
of goods sold + operating
expenses), amortization,
profit/loss
Calculation of financial
ratios (see table 3)
Grading each ratio
Final grade
Rating is assigned:
the worst
weak
marginal
middle
very good
excellent
Source: Authors according to Bešvir (2010)
After entering the required data (part 1) the model calculates (part 2) financial ratios explained
in table 3 and each ratio gets individual grade that can take values between 1 and 5, 1 being the
worst grade. The final grade is calculated as a simple arithmetic mean of individual grades.
Finally, the assessed company is assigned a rating (part 3) and if it is lower than 2,31 (which is
the worst or weak rating) the company is considered to be bankruptcy threatened.
Table 3: BONITEST – financial ratios being considered (Bešvir, 2010, p. 98)
Ratio
Liquidity Net working capital = current assets – current liabilities
Short-term financial position = (current assets – inventories) – current liabilities
Current ratio = current assets/current liabilities
Quick ratio = (current assets – inventories) /current liabilities
Financial stability ratio = fixed assets/(equity + long-term liabilities)
Leverage Debt ratio = total liabilities/total assets in %
Cash flow leverage ratio = total liabilities/(earnings after tax + amortization)
Financial strength ratio = 5 ∙ (earnings after tax + amortization + depreciation)/total liabilities
Profitability Net ROA = EAT/total assets in %
ROE = EAT/equity in %
EBIT in %
Activity Asset turnover ratio = Total revenues/total assets
Source: Authors according to Bešvir (2010)
Companies in our sample belong to the manufacturing industry since in the total number of
companies in pre-bankruptcy proceedings the largest share make companies from this industry.
To enable mutual comparison our sample focused on medium-sized companies for which the

Book of Papers
15
pre-bankruptcy proceeding was opened in year 2013. The total number consists of 33
companies. The period reviewed in this study includes three years, and these are the year before
(2012), during (2013) and after (2014) the pre-bankruptcy proceeding. The companies that have
not published financial statements for all the observed years are excluded from the sample. Our
sample consists of 20 companies whose financial statements for the period from 2012 to 2014
were publicly available on FINA website.
Financial statements data for years 2012-2014 were analysed in a statistic package R and Table
4 shows descriptive statistics.
Table 4. Financial statements data – descriptive statistics
N Mean
(000 kn)
Standard
deviation
(000 kn)
Minimum (000
kn)
Maximum (000
kn)
Total assets 2012 20 107.177 83.569 29.573 367.078
Total assets 2013 20 100.879 101.854 25.877 417.449
Total assets 2014 20 96.878 89.373 16.427 352.649
Equity 2012 20 16.332 76.260 -174.410 142.216
Equity 2013 20 -2.630 75.722 -202.596 140.120
Equity 2014 20 13.497 70.780 -160.299 138.964
Long-term liabilities 2012 20 26.939 39.394 0 134.594
Long-term liabilities 2013 20 31.014 52.841 0 208.194
Long-term liabilities 2014 20 33.040 55.989 0 210.702
Short-term liabilities 2012 20 63.083 50.414 6.761 181.855
Short-term liabilities 2013 20 64.955 62.965 7.352 250.780
Short-term liabilities 2014 20 42.400 49.861 4.422 204.259
Profit/loss2012 20 -13.383 41.486 -149.830 82.626
Profit/loss2013 20 -12.322 17.055 -54.357 8.375
Profit/loss2014 20 -747 14.151 -27.104 50.674
Source: Authors
The mean represents the average value of the data from the balance sheet of all companies in
the sample, which relate to the period from 2012 to 2014. This is shown in Table 4:
Total assets continuously decrease – year before pre-bankruptcy proceeding the
average total assets were 107 million kn, the year following pre-bankruptcy proceeding
this value fell to 97 million kn.
Average value of equity in 2013 is negative (-2,6 million kn), which indicates that most
companies are insolvent. In the following year the equity has positive average value
(13,497 million kn), which can be expected given that one of the options of
restructuring of debts is that debts can be turned into equity i.e. creditors become partial
owners of these companies.
One can notice a change in the structure of long-term and short-term liabilities. For
long-term liabilities there is a trend of growth in average value, while the average value

1st CRODMA Conference 2016
16
of short-term liabilities decreased, which was realistic to expect considering that in the
process of restructuring a part of current liabilities becomes a long-term source of
funding.
The average financial results: it can be seen that losses are continuously decreasing in
the period.
Table 5 shows BONITEST final grades and ratings.
Table 5. BONITEST – final grades and ratings
OIB 2012 2013 2014
Final
grade
BONITEST
rating
Final
grade
BONITEST
rating
Final
grade
BONITEST
rating 351 1,0 The worst 1,56 Weak 2,67 Marginal
549 1,11 The worst 1,0 The worst 1,11 The worst
056 2,78 Middle 3,0 Middle 3,33 Middle
597 1,67 Weak 1,56 Weak 1,44 Weak
340 1,56 Weak 1,0 The worst 1,0 The worst
665 1,33 The worst 1,33 The worst 1,78 Weak
721 1,33 The worst 1,0 The worst 1,33 The worst
481 1,89 Weak 1,56 Weak 2,00 Weak
494 1,0 The worst 1,0 The worst 2,33 Marginal
412 1,67 Weak 1,67 Weak 2,56 Marginal
602 1,56 Weak 1,11 The worst 1,22 The worst
436 1,33 The worst 3,33 Middle 2,44 Marginal
874 1,11 The worst 1,0 The worst 3,67 Very good
598 1,22 The worst 1,11 The worst 3,56 Very good
483 1,33 The worst 1,11 The worst 1,0 The worst
243 1,89 Weak 1,89 Weak 1,11 Weak
337 2,0 Weak 1,56 Weak 3,11 Middle
910 2,0 Weak 1,44 The worst 1,44 The worst
292 1,0 The worst 1,0 The worst 1,0 The worst
230 1,0 The worst 1,0 The worst 1,0 The worst
Average 1,489 1,462 1,955
Source: Authors
Table 5 indicates the following:
in year 2012 (the year before pre-bankruptcy proceeding) the average final grade was
1,489 which indicates very low average rating
in year 2013 (year of pre-bankruptcy proceeding) the average final grade 1,462 was
even lower than in previous year

Book of Papers
17
in year 2014 (the year after pre-bankruptcy proceeding) the average final grade is
increased to 1,955 but the rating is still low and the companies considered as facing
high risk of bankruptcy.
BONITEST analysis conducted for the period from 2012 to 2014 i.e. for the period before and
after the pre-bankruptcy proceeding indicates that the ratings of the companies did not
considerably change after the pre-bankruptcy proceeding. If looking at absolute numbers, 12
out of 20 companies in year 2014 still have very low final grades and consequently the worst
or a weak rating. The frequency of each rating is presented in table 6.
Table 6. BONITEST – Frequency of ratings
No. of companies
Rating 2012 2013 2014
The worst 11 12 8
Weak 8 6 4
Marginal 0 0 4
Middle 1 2 2
Very good 0 0 2
Source: Authors
The pre-bankruptcy proceedings proved useful in 8 cases where companies reached marginal,
middle or very good rating in a year after the proceeding which means they restructured their
operations and continued their business so they are not considered being at bankruptcy risk any
more. However, 12 companies have the worst or weak ratings so in 12 cases the companies are
still very close to bankruptcy. This raises a question if pre-bankruptcy proceeding was
conducted too late when the continuity of operations could no longer be retained or if the
intention was to make a fraud on creditors.
3 CONCLUSION
A comparative financial analysis of companies in the sample for the period before and after the
pre-bankruptcy proceedings has found that the value of assets and equity declined in the period
and the structure of short-term and long-term liabilities changed meaning short-term liabilities
decreased while long-term liabilities increased. This is the result of Financial Operations and
Pre-Bankruptcy Settlement Act from 2012 in which it was clearly stated that some of short-
term liabilities in the process become long-term sources of funding.
BONITEST analysis proved that 60% of the observed companies retained a weak or the lowest
rating meaning they were very close to bankruptcy even after pre-bankruptcy proceeding. For
40% of observed companies the rating improved to marginal, middle or very good. Owing to

1st CRODMA Conference 2016
18
that it can be concluded that for the majority of the observed companies the pre-bankruptcy
proceeding was conducted too late and the continuity of their operations is doubtful.
Since the aim of pre-bankruptcy proceeding in the Republic of Croatia is to enable illiquid and
insolvent companies to continue their operations and preserve jobs, it is necessary to observe
the usefulness of pre-bankruptcy proceeding not only from the financial perspective but also
from the social one, which hasn’t been done in this paper.
REFERENCES
[1] Agarwal, V., Taffler, R. (2008). Comparing the performance of market-based and
accounting-based bankruptcy prediction models. Journal of Banking & Finance 32, pp.
1541-1551
[2] Altman E.I. (1968). Financial ratios, discriminant analysis and the prediction of
corporate bankruptcy. Journal of Finance 23(4), pp. 589-609
[3] Beaver, W. H. (1966). Financial Ratios as Predictors of Failure. Empirical Research in
Accounting: Selected Studies, 4(3), pp. 71-111
[4] Belak V., Aljinović Barać Ž. (2008). Tajne tržišta kapitala, Zagreb, Belak Excellens
d.o.o.
[5] Belak V. (2014). Analiza poslovne uspješnosti 130 ključnih pokazatelja performanse i
mjerila za kontroling, Zagreb, RRIF plus
[6] Bešvir B. (2008). Kako čitati i analizirati financijske izvještaje, Zagreb, RRIF plus
[7] Bešvir, B. (2010). Bonitest – brza provjera boniteta poduzetnika. Računovodstvo, revizija
i financije 11/2010, pp. 96-100
[8] Keglević-Kozjak S., Šestanj-Perić Tanja, Bešvir B. (2014) Assessment of bankruptcy
prediction models' applicability in Croatia, 7th International Conference „An Enterprise
Odyssey: Leadership, Innovation and Development for Responsible Economy“
[9] Kralicek, P. (2007). Eine Probe-Excel Auswertung im pdf-Format, Ertrags- und
vermögensanalyse (Quicktest), http://www.kralicek.at/index.php?gr=-302, access: June
5th, 2016
[10] Ohlson, J. A., (1980). Financial Ratios and the Probabilistic Prediction of Bankruptcy.
Journal of Accounting Research, 18(1), pp. 109-131.
[11] Pervan, I., Filipović, D. (2010). FP Rating – model za predviđanje (in)solventnosti
poslovnih partnera. Računovodstvo, revizija i financije 10/2010, pp. 92-96
[12] Škeljo K. (2001). Statistički modeli ranog upozorenja na poslovnu krizu, Računovodstvo,
revizija i financije 4/2001., pp. 75-80
Book of Papers
19
[13] Zenzerović R., Peruško T. (2009). Ocjenjivanje pretpostavke vremenske neograničenosti
poslovanja u tranzicijskom okruženju – empirijski nalazi u Republici Hrvatskoj,
Ekonomski pregled, 60 (7-8) pp. 348-368
[14] Zenzerović R. (2008). Model ocjene vremenske neograničenosti poslovanja poslovnih
subjekta u Republici Hrvatskoj. Doktorska disertacija, Pula: Sveučilište Jurja Dobrile

1st CRODMA Conference 2016
20

Book of Papers
21
CONSUMER PURCHASE FEATURES TOWARD NATURAL
COSMETICS IN ONLINE ENVIRONMENT
Assistant Professor MATEA MATIĆ, PhD
University of Dubrovnik, Department of Economics and Business Economics
Lapadska obala 7, 20000 Dubrovnik, Croatia
Phone: ++385 20 445 939
Email: [email protected]
Senior Assistant BARBARA PUH, PhD
University of Dubrovnik, Department of Economics and Business Economics
Lapadska obala 7, 20000 Dubrovnik, Croatia
Phone: ++385 20 445 939
Email: [email protected]
BARBARA MILOGLAV, student
University of Dubrovnik, Department of Economics and Business Economics
Lapadska obala 7, 20000 Dubrovnik, Croatia
ABSTRACT
The trend of natural cosmetics is increasing round the world as consumers are becoming more
aware of the benefits of natural products. The aim of this study is to identify the consumer
attitudes towards natural cosmetic products. Also, the paper determines the consumer purchase
intention towards product of natural cosmetics and the features of pre purchase consumer
behaviour in online environment. The data was collected online survey research conducted in
March and April 2015 on a sample of 204 respondents in the Dubrovnik-Neretva County. The
descriptive and inferential statistics were used. The results suggest that most consumers have
positive attitude towards products of natural cosmetics. However, the survey also found that
consumers are not inclined to purchasing products of natural cosmetics in online environment.
Furthermore, the results of correlation analysis indicate statistically significant, moderately
strong relation between attitude toward natural cosmetics and consumers’ pre purchasing
behaviour toward natural cosmetic products.
KEYWORDS: consumer purchase intentions, consumer attitudes, pre purchase behavior,
natural cosmetics, online environment

1st CRODMA Conference 2016
22
1 INTRODUCTION
The trend of natural cosmetic products is increasing year by year worldwide, as consumer
awareness is growing at the same time. Global climate change on one side and the need for
healthier way of living, youth appearance and following trends on the other side affect natural
cosmetic market as its sales are growing rapidly and will reach 16 billion US dollars in 2020
[www.vivaness.de]. Studies have documented that consumers are getting more and more
educated and aware of the harmful effects of synthetic cosmetics which influences growing
demand for natural cosmetic products [Rajagopal, 2007, Davis-Bundrage and Kim, 2012].
Also, consumers are getting more sensible to the state of the environment which reflects in their
preferences, attitudes and the need for buying natural products [Laroche et al., 2001, Sarigollu,
2009, Kaufmann et al., 2012].
Regardless of the growth of natural cosmetics industry, the natural cosmetic market is still
neglected in academic research and little has been published regarding consumer behaviour
towards natural cosmetics. Studies about natural and organic personal care products are fewer
in number and inconclusive as the factors that influence purchase intention [Davis-Bundrage
and Kim, 2012, 196].
On the other side, the revolutionary change brought by computers and information technology
has an important impact on consumers’ daily lives [Lim et al., 2010, 155]. The Internet has
provided consumers with more control in accessing information on products and services and
has reduced the time and effort that they spend on shopping [Ko et al, 2004], although web
shopping behaviour does not necessarily follow traditional consumer behaviour [Ling et al.,
2010].
The aim of this study is to identify consumer attitudes towards natural cosmetics products. Also,
the paper determines the consumer purchase intention towards product of natural cosmetic and
the features of pre purchase consumer behaviour in online environment.
Following the introduction, the second section provides a selected literature review on attitudes
and purchasing behaviour towards natural cosmetics, with a special emphasis on consumers’
online buying behaviour. Data and research methodology are discussed in the third section,
while the fourth presents research results and the discussion of findings. The final section of
the paper draws certain conclusions and directions for future research.

Book of Papers
23
2 LITERATURE REVIEW
The market of natural products is growing around the world in variety of industries, from food
industry, fashion, cosmetics and beyond [Cervellon, Rinaldi and Wernerfeld, 2011]. Most of
researches dealing with natural products are made in food industry [Gil et al., 2000, Yiridoe et
al., 2005, Hughner et al, 2007, Tsakiridou, E. et al, 2008, Martić, Kuran and Mihić, 2014, Wee
et al, 2014.] Above mentioned studies refer to perception, attitudes, purchase intentions and
purchase of organic food and have indicated that consumers’ attitudes towards organic food are
the best predictor on purchase intention. Although the research from Mintel [2013] has shown
many similarities in purchase behaviour regarding purchase of organic food and natural
cosmetics, the determination of the same purchase patterns in these two industries is not
possible [Kim and Chung, 2011] which results in necessity of investigating behaviour patterns
regarding natural cosmetics.
In a cosmetic market many researches have been conducted regarding conventional cosmetics
[Weber and Capitant de Villebonne, 2002, Kumar, 2005, Souiden and Diagne, 2009, Kim et al.,
2013, Lopaciuk and Łoboda 2013, Deshmukh, 2015, Kumari and Natarajan, 2015] but little has
been written about attitudes and purchase behaviour towards natural cosmetics. Rising
awareness about environmental degradation resulted in more ecological consciousness and
desire to purchase natural products [Laroche et al, 2001, Kaufmann, 2012] which led to
increasing number of researches regarding natural cosmetics [Johri and Sahasakmontri ,1998,
Rajagopal ,2007, Kim and Seock ,2009, Dimitrova et al, 2009, Kim and Chung , 2011, Davis-
Bundrage and Kim, 2012, Hansen et al., 2012, Rybowska, 2014, Jansri and Marimuthu, 2015].
Johri and Sahasakmontri [1998] found out that the main attributes of products in process of
buying natural cosmetics are colour, packaging, image of brand, skin safety, fragrance and
product composition as well as value for money. Rajagopal [2007] high lightened the
importance of promotional activities on natural cosmetic market in order to change preferences
on behalf of green brands. Kim and Seock [2009] emphasised that consumers with high health
consciousness more often purchase natural cosmetics and that high health consciousness is
related to the possibility of discernment of conventional and natural cosmetics. A cross cultural
study made by Dimitrova et al. [2009] showed that the level of education is very important
factor that influences purchase behaviour. This research also found out that natural flavours,
together with high quality, skin protection, good promotion, hypoallergenic ingredients and
hydration are the most important motivational factors regarding selection of natural cosmetics.
The research of Kim and Chung [2011] resulted in demonstrating that attitudes are the most
important determinant of natural cosmetics’ purchase intentions. Hansen et al. [2012] in their
research indicated that consumers’ willingness to purchase free-of cosmetics is influences by
attitude and subjective norm, with attitude having the largest predicting power. Davis –
Bundrage and Kim [2012] using qualitative meta-analysis emphasised multidimensionality in
perceiving natural cosmetics while the research of Rybowska [2014] showed that natural

1st CRODMA Conference 2016
24
cosmetic products are recognized as expensive and unreachable and high lightened the need for
its popularisation and promotion. Jansri and Marimuthru [2015] results show that
environmental and health consciousness have positive and significant impacts on consumers'
repurchase intention of luxury natural products.
Electronic commerce has become one of the essential characteristics in the Internet era since
online shopping has become the third most popular internet activity [Osman et al, 2010, 134].
Internet has changed the way in which consumers purchase goods and services [Forsythe and
Shi, 2003] while marketers have identified many factors that influence consumers’ purchase
decisions and their online buying behaviour [Osman et al. 2010]. Lim et al. [2010] high
lightened top ten e- commerce categories, with apparel and personal care products being one of
them.
Consumer online purchase intention is one of the intensive research areas in the literature [Ling
et al, 2010]. Most studies examining the relationship between intention to buy online and online
purchase are based on the theory of planned behaviour by Ajzen [1991] which states that
behaviour can be predicted by intention, and that intention is determinated by three factors,
namely attitudes toward the behaviour, subjective norm [social pressure to perform or not to
perform the behaviour] and perceived behavioural control [perceived as ease or difficult of
performing the behaviour].
Online purchase intention is a situation when a consumer is willing and intends to become
involved in online transaction while online transactions can be described as an activity in which
the process of information retrieval, information transfer and product purchase have taken place
[Pavlou, 2003]. Some authors have proposed that searching for product/service information is
the most important predictor of online buying behaviour so when consumers spend more time
on Internet and have more online experience they tend to research and buy more [Bellman et
al. 1999, Lim et al., 2010, 158]. This can also be supported by Lohse et al. [2000] “Not
surprisingly, the degree of Internet usage to search for product information explained the most
variation in whether someone would make an online purchase” [p.23]. The Internet users
perceive Internet’s role in consumer information search as one of the most important features
Internet provides [Shim et al., 2001] which indicates that information search on internet will
continue as a major vehicle for shopping comparison as technologies advance [Dickson, 2000].
3 METHODOLOGY
The data was collected online survey research conducted in March and April 2015 on a sample
of 204 respondents in the Dubrovnik-Neretva County. The survey instrument was a
questionnaire and the questions were structured in accordance with the objectives of the
research. The first part of the questionnaire consisted of the demographic characteristics of
Book of Papers
25
respondents such as gender and age. The second part of the questionnaire included statements
regarding consumer purchase behaviour in offline and online environment. The scale of
measurement was ordinal with degrees from 1 to 5, where respondents expressed their degree
of agreement or disagreement with the statement (1=completely disagree, 5=strongly agree).
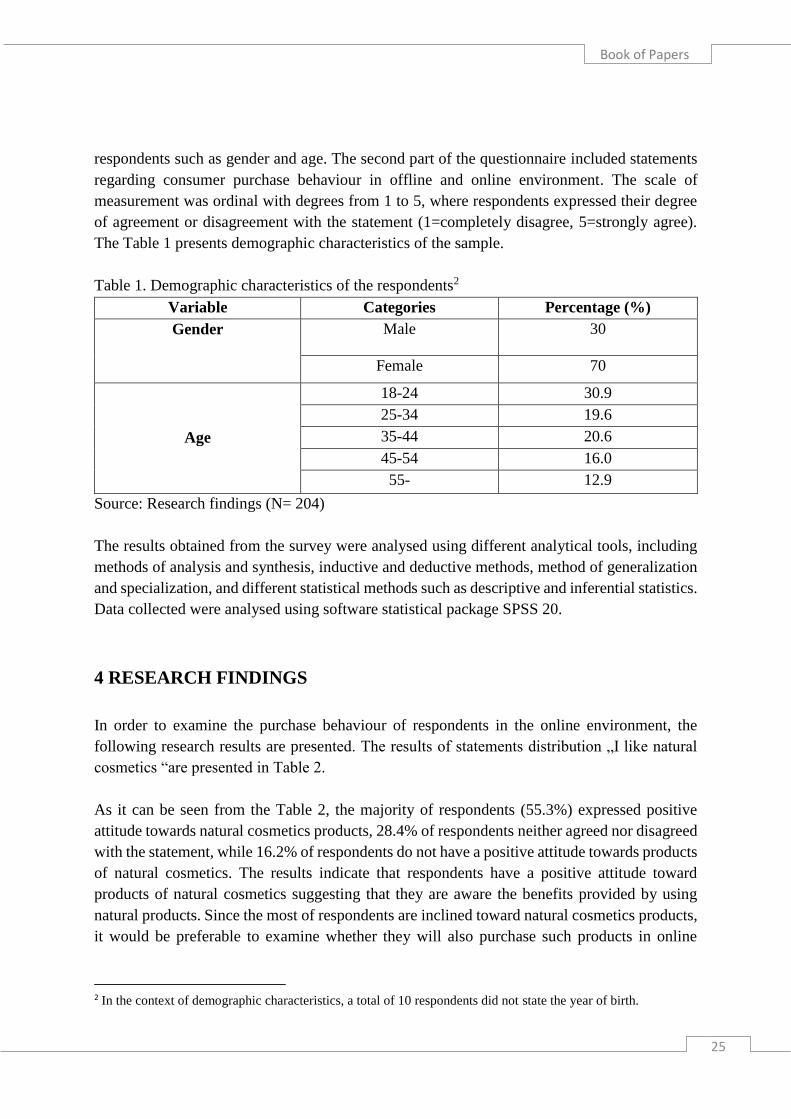
The Table 1 presents demographic characteristics of the sample.
Table 1. Demographic characteristics of the respondents2
Variable Categories Percentage (%)
Gender
Male 30
Female 70
Age
18-24 30.9
25-34 19.6
35-44 20.6
45-54 16.0
55- 12.9
Source: Research findings (N= 204)
The results obtained from the survey were analysed using different analytical tools, including
methods of analysis and synthesis, inductive and deductive methods, method of generalization
and specialization, and different statistical methods such as descriptive and inferential statistics.
Data collected were analysed using software statistical package SPSS 20.
4 RESEARCH FINDINGS
In order to examine the purchase behaviour of respondents in the online environment, the
following research results are presented. The results of statements distribution „I like natural
cosmetics “are presented in Table 2.
As it can be seen from the Table 2, the majority of respondents (55.3%) expressed positive
attitude towards natural cosmetics products, 28.4% of respondents neither agreed nor disagreed
with the statement, while 16.2% of respondents do not have a positive attitude towards products
of natural cosmetics. The results indicate that respondents have a positive attitude toward
products of natural cosmetics suggesting that they are aware the benefits provided by using
natural products. Since the most of respondents are inclined toward natural cosmetics products,
it would be preferable to examine whether they will also purchase such products in online
2 In the context of demographic characteristics, a total of 10 respondents did not state the year of birth.

1st CRODMA Conference 2016
26
environment. Therefore, the next table shows the distribution of the statement "I purchase
natural cosmetics through Internet“.
Table 2. Distribution of the statement “I like products of natural cosmetics”
Source: Research findings (N= 204)
Table 3. Distribution of the statement “I purchase products of natural cosmetics through
Internet“
Source: Research findings (N= 204)
Results presented in Table 3. show that most of the respondents (68.8%) do not purchase natural
cosmetics through the Internet. 9.8% are purchasing natural cosmetics though Internet while
21.6% are indifferent to this form of purchase, ie. either agree or disagree with the statement.
The majority of respondents in the survey sample do not buy natural cosmetics on the Internet
which can be result of numerous negative elements online environment provides such as lack
of trust or unsecure payments etc. The most of respondents do not buy natural cosmetics through
the Internet although they have a positive attitude towards products of natural cosmetics.
Although, when it comes to consumer online purchasing behaviour, most of the respondents
expressed a certain level of distrust and uncertainty in the purchase of such specific products.
9,8%6,4%
28,4%
22,5%
32,8%
I strongly disagree I disegree Not disagree nor agree I agree I strongly agree
50,0%
18,6%21,6%
7,8%
2,0%
0%
10%
20%
30%
40%
50%
60%
I strongly disagree I disagree Not disagree nor agree I agree I strongly agree

Book of Papers
27
The further processing of data is approached by using the Spearman's correlation coefficient.
Relation between attitude toward natural cosmetics and consumers’ pre purchasing behaviour
toward natural cosmetic products was examined. The results of correlation analysis between
the attitude towards products of natural cosmetics and consumers’ pre purchasing behaviour
toward natural cosmetic products are presented in Table 4.
Table 4. Correlation matrix between attitude toward natural cosmetics and consumers’ pre
purchasing behaviour toward natural cosmetic products
I like natural cosmetics
Before purchasing natural
cosmetics I compare products
on the Internet
Before purchasing natural
cosmetics I collect information
via the Internet
.305** .366**
.000 .000
Source: Research findings (N= 204)
Correlation analysis indicates statistically significant and moderately strong relation between
attitude toward natural cosmetics and consumers’ pre purchasing behaviour toward natural
cosmetic products at a significance level of 1%. The correlation coefficients indicate the
existing positive relation between observed variables i.e. growth of one variable will be
accompanied by the growth of other variables. Also, regarding the relation strength,
respondents who have stronger attitude toward natural cosmetics will use internet as a place to
get necessary information and to compare different types of natural cosmetic products. Thus,
the positive attitude towards products of natural cosmetics will influence on consumer pre
purchasing behaviour in the context of searching and evaluating information on the Internet
before making a purchasing decision in offline environment.
These respondents are not inclined to purchasing natural cosmetics products through Internet
and they are not aware of the benefits such environment could provide. Although consumers
do not buy products natural cosmetics through the Internet they use the Internet to collect and
evaluate information about desire products. Also, for these respondents Internet provides a
useful place for comparing different products and offers in order to get necessary information
to make quality purchasing decisions in offline environment. Therefore, they will definitely use
Internet for getting more information before they make a final decision to buy products of
natural cosmetics.
Finally, it can be concluded that there is a statistically significant relationship between observed
variables which indicates that consumers who have positive attitude toward products of natural
cosmetics will use the Internet as a useful place to collect information in order to make the
enhanced purchasing decisions in offline environment.

1st CRODMA Conference 2016
28
5 CONCLUSION
While most of previous researches have been focused on exploring purchase attitudes regarding
organic food, little has been done in a field of natural cosmetics. From the results of this research
it can be concluded that most consumers do not purchase natural cosmetics online. Consumers
still feel that traditional surroundings is a safer place for purchasing especially for products of
natural origin. So, lack of trust has resulted in non-purchasing behaviour which means that
consumers unwillingly purchase online, especially when it comes to natural cosmetic products
they are not familiar with or purchase them for the first time. The reasons for non-purchasing
can be numerous. For example it is well known that natural cosmetic products have much
shorter expiration date and that such products require special delivery conditions. So, lack of
trust regarding conditions and way of delivery as well as impossibility of product testing are
some of the possible reasons that result in online non purchasing behaviour of natural cosmetic
products.
Research analysis shows that most of the respondents (55.3%) expressed a positive attitude
towards the purchase of natural cosmetics. However, when it comes to the Internet as a potential
place for purchasing their preference for buying tends to fall. Analysing the consumer purchase
intentions towards products of natural cosmetics in online environment, it is evident that
although consumers do not purchase natural cosmetics products through Internet they still use
it as an information resource where they evaluate different products. The complexity of the
process of purchasing decisions in the offline environment makes the purchase challenging for
modern consumers, especially in information and evaluation stage. Today, modern consumers
do not have time for searching and comparing the desirable products in order to make the best
purchase decision. The product selection and comparison is much easier in the Internet
environment and therefore consumers are more inclined toward this form of pre purchase
behaviour.
This research contributes to the literature by identifying consumer attitudes toward natural
cosmetic and their pre purchase behaviour toward these products. However, the findings should
be considered in the light of their limitations. First of all, it refers to a sample selection. This
limited sampling frame may affect the generalization of findings. Future research sample should
be extended by including other region or counties. It would also be interesting to include
demographic data, i.e. the socio-economic characteristics of consumers. For example, gender
differences could be identified in terms of online purchase behaviour. Moreover, other factors
should also be included in the future research, primarily age, education, and household income.
However, factors such as product type, prior purchase or negative characteristics of online
environment could be taken into consideration. The research findings may be useful to web-
retailers, marketing managers and internet marketers to recognize and understand the motives
affecting their online purchasing behaviour in order to target better their consumers.

Book of Papers
29
REFERENCES
[1] Ajzen, I. (1991) The Theory of Planned Behaviour, Organizational Behaviour and
Human Decision Processes, 50 (2) pp.179-211
[2] Bellman, S. et al. (1999). Predictors of Online Buying Behaviour. Communications of
the ACM, 42(12), pp. 32-38.
[3] Cervellon, M. C. et al., (2011). How Green is Green? Consumers’ Understanding of
Green Cosmetics and their Certifications in Proceedings of 10th International
Marketing Trends Conference, pp. 20-21.
[4] Davis-Bundrage, M. R., Kim, S. (2012). Predicting Purchases of Eco-Beauty Products:
a Qualitative Meta-Analysis, in Proceedings of the Atlantic Marketing Association, pp.
195-209,
[5] Deshmukh, P. (2015). A Study of Male Consumption Pattern of Cosmetic Products in
Aurangabad City, Maharashtra. International Journal of Management (IJM), 6(5), pp.
37-45.
[6] Dickson, P. R. (2000). Understanding the Trade Winds: The Global Evolution of
Production, Consumption, and the Internet. Journal of Consumer Research, 27(1), pp.
115-122.
[7] Dimitrova V., et al., (2009). Customer Knowledge Management in the Natural
Cosmetics Industry, Industrial Management & Data Systems, 109(9), pp. 1155 – 1165.
[8] Forsythe, S.M. and Shi, B. (2003). Consumer Patronage and Risk Perceptions in Internet
Shopping, Journal of Business research, 56, pp. 867-875
[9] Gil, J.M. et al., (2000). Market Segmentation and Willingness to Pay for Organic
Products in Spain, International Food and Agribusiness Management Review, 3,
pp.207-226.
[10] Hansen, T., et al. (2012). Understanding Consumer Purchase of Free‐of Cosmetics: A
Value‐Driven TRA Approach. Journal of Consumer Behaviour, 11(6), pp. 477-486.
[11] Hughner, R. S., et al., (2007). Who are Organic Food Consumers? A Compilation and
Review of Why People Purchase Organic Food, Journal of Consumer Behaviour, 6,
pp. 94–110.
[12] Jansri, W., and Marimuthu, M. (2015). Are consumers of luxury natural products
concerned about environmental issues? Advances in Environmental Biology, pp. 82-86.
[13] Johri; L.M. and Sahasakmontri, K., (1998). Green Marketing of Cosmetics and
Toiletries in Thailand, Journal of Consumer Marketing, 15(3), pp. 265 – 281.

1st CRODMA Conference 2016
30
[14] Kaufmann, H.R. et al., (2012). Factors Affecting Consumers’ Green Purchase
Behaviour: An Integrated Conceptual Behaviour, Amfiteatru Economic, 14(31), pp. 50-
69
[15] Kim, J., et al., (2013). Is beauty in the eye of the beholder? Gender and beauty in the
Cosmetics Sector: A comparative study of Indonesia and Korea. Marketing Intelligence
and Planning, 31(2), pp.127-140.
[16] Kim, S., K., and Seock; Y., (2009). Impacts of Health and Environmental Consciousness
on Young Female Consumers' Attitude towards and Purchase of Natural Beauty
Products, International Journal of Consumer Studies. 33 (6), pp. 627–638.
[17] Kim; H.Y., Cung; J., (2011). Consumer Purchase Intention for Organic Personal Care
Products, Journal of Consumer Marketing, 28(1), str. 40-47.
[18] Ko, H. et al. (2004). Cross- Cultural Differences in Perceived Risk of Online Shopping,
Journal of Interactive Advertising, 4(2), pp.20-29
[19] Kumar, S. (2005). Exploratory Analysis of Global Cosmetic Industry: Major Players,
Technology and Market Trends. Technovation, 25(11), pp. 1263-1272.
[20] Kumari, S. K., and Natarajan, M. L. (2015). A Study on Brand Loyalty and Purchase
Behaviour of Women towards Cosmetic Products in Namakkal. International Journal
of Physical and Social Sciences, 5(9), pp. 418-427.
[21] Laroche, M. et al., (2001). Targeting Consumers who are willing to Pay More for
Environmentally Friendly Products, Journal of Consumer Marketing, 18(6), pp.503-
520.
[22] Lim, Y. M., at al. (2010). Online Search and Buying Behaviour: Malaysian
Experience/Recherche en ligne et Habitudes d'achat: Experience Malaisienne.
Canadian Social Science, 6(4), pp. 154-166.
[23] Ling, K. C. et al. (2010). The Effects of Shopping Orientations, Online Trust and Prior
Online Purchase Experience toward Customers' Online Purchase Intention.
International Business Research, 3(3), pp.63-76
[24] Lohse, G., et al. (2000). Consumer Buying Behavior on the Internet: Findings from
Panel Data, Journal of Interactive Marketing, 14(1), pp.15-29.
[25] Łopaciuk, A., and Łoboda, M. (2013). Global beauty industry trends in the 21st century.
In: Management, Knowledge and Learning International Conference, pp. 1079-1087,
Zadar, Croatia
[26] Martić Kuran, L. and Mihić, M., (2014). Primjena teorije planiranog ponašanja u
kupovini ekološke hrane, Tržište, 26(2), pp.179-197.
[27] Mintel (2013). Natural and Organic Toiletries – UK,
http://academic.mintel.com/display/640063/, accessed [June, 4th 2015]

Book of Papers
31
[28] Osman, S. et al. (2010). Undergraduates and Online Purchase Behaviour, Asian Social
Science, 6(19), pp.133-146
[29] Pavlou, P. A. (2003). Consumer Acceptance of Electronic Commerce: Integrating Trust
and Risk with the Technology Acceptance Model. International Journal of Electronic
Commerce, 7(3), pp.101-134.
[30] Rajagopal, V. (2007). Buying Decisions towards Organic Products: An Analysis of
Customer Value and Brand Drivers, International Journal of Emerging Markets, 2 (3),
pp.236-251
[31] Rybowska, A., (2014), Consumers Attitudes with Respect to Ecological Cosmetic
Products, Zeszyty naukowe Akademii Morskiej w Gdyni, 84, pp. 158-164.
[32] Sarigollu, E., (2009). A Cross-Country Exploration of Environmental Attitudes,
Environment and Behaviour, 41(3), pp.365-386.
[33] Shim, S.,et al. (2001). An Online Prepurchase Intentions Model: The Role of Intention
to Search, Journal of retailing, 77(3), pp.397-416.
[34] Souiden, N., and Diagne, M. (2009). Canadian and French Men's Consumption of
Cosmetics: A Comparison of their Attitudes and Motivations. Journal of Consumer
Marketing, 26(2), pp. 97-109.
[35] Tsakiridou, E. et al., (2008). Attitudes and Behaviour towards Organic Products: An
Exploratory Study, International Journal of Retail and Distribution Management,
36(2), pp.158-175.
[36] Vivaness (2015) The place to be for a global natural cosmetics industry,
www.vivaness.de, accessed [July, 20th 2015]
[37] Weber, J. M., and Capitant de Villebonne, J. (2002). Differences in Purchase Behaviour
between France and the USA: The Cosmetic Industry. Journal of Fashion Marketing
and Management: An International Journal, 6(4), pp. 396-407.
[38] Wee, C. S., et al. (2014). Consumers’ Perception, Purchase Intention and Actual
Purchase Behaviour of Organic Food Products. Review of Integrative Business and
Economics Research, 3(2), pp.378-397.
[39] Yiridoe, E.K. et al., (2005). Comparison of Consumers Perceptions and Preference
towards Organic versus Conventionally Produced Foods: A Review and update of the
literature, Renewable Agriculture and Food Systems, 20(4), pp.193-205.

1st CRODMA Conference 2016
32

Book of Papers
33
HADOOPING THE MARKETING GAME
IVA SORIĆ
Poslovna Inteligencija d.o.o.
Stubička 50b, 10000 Zagreb, Croatia
DRAŽEN OREŠČANIN
Poslovna Inteligencija d.o.o.
Stubička 50b, 10000 Zagreb, Croatia
MARKO ŠTAJCER
Poslovna Inteligencija d.o.o.
Stubička 50b, 10000 Zagreb, Croatia
ABSTRACT
Big data allows marketers to define and describe their customers at a more detailed and precise
level than it was even considered possible just a couple of years ago. With the speed this field
is evolving, big data is becoming increasingly important in the marketing domain.
While it is not a problem to collect the data, the problem remains to leverage these vast amounts
of data, coming from different sources, in an efficient manner. Most marketing departments use
many marketing applications, causing data fragmentation problems. This paper describes a
different, data-driven approach that refers to this problem by using the Data Lake concept
allowing the marketers to leverage data as their biggest and most valuable resource in a more
agile and flexible manner. The goal is to collect the data, across all applications and channels,
consolidate it and analyze all at once, regardless of source and type, which will enable a more
complete picture of customer behavior than ever before, answer questions that were previously
unanswerable, give rise to many other possibilities, and by extension – lead to more profit.
We describe in detail the strategy and its benefits, give an overview of technologies in terms of
functionalities inside the Data Lake architecture, and finally, we elaborate the advantages of
this concept, in comparison to traditional marketing techniques, through some of the many use
cases that show how this approach can respond to the challenges of marketing today and in the
future.
KEYWORDS: Data Lake, big data, data-driven marketing, customer interactions, big data
analytics

1st CRODMA Conference 2016
34
1 INTRODUCTION
The digital age has brought extensive changes to consumers' buying process. In this
hyperconnected world we live in, customers have easier access to offers, and more options to
interact with brands and each other, than ever before. Depending on the industry, their journeys
with a brand or a company include physically visiting a shop, visiting their website, blogs and
social media, email communication, credit card payments, etc. Massive Internet expansion and
digitalization also brings many more features, like mobile apps, sensor data, GPS, cameras, call
recordings, etc. All these channels of interactions generate data about customers, and that data
contains information about their requirements, preferences, taste, and their lifestyle. Customers
are, empowered by technological advances, becoming more demanding than ever, and the data
they generate on the way to purchase, is marketers' best asset in trying to respond to their needs.
All that is driving marketing's aspiration to become more data-driven. It is all about
understanding their customers better, and the way to do that is by using all the information
about them they can get. Data is the greatest resource marketers have, but leveraging
information hidden in it, i.e. turning vast amounts of data into valuable insights remains a
challenge. Marketing now has to deal with data of various types – structured and unstructured,
transactions and social media. This is where big data methods and tools come in. Traditional
marketing technologies cannot provide the agility and flexibility they badly need.
Most marketing departments have multiple marketing applications like CRM, CMS, email,
mobile apps, campaign management, etc. There is an overabundance of tools and platforms,
and every time a new demand arises, marketers will first look for a solution in the form of a
new tool. However, dramatical changes in customer behavior are driving changes in this
composition. When asked about their priorities, 78% of marketers said that the 'ability to
integrate' was their most important goal (Source: Forrester’s Q2 2014 Global Enterprise
Marketing Software Suite Customer Reference Online Survey). Therefore, traditional
marketing systems are being replaced with comprehensive platforms based on a centralized
repository, which will solve data fragmentation problems and address the critical need for fast
insights. Basic marketing objectives are keeping their place, but more sophisticated big data
methods will gain companies real competitive advantage.
2 DATA-DRIVEN MARKETING
All the changes prompted mostly by Internet expansion, caused dramatical changes in the
marketing domain too, pushing customers and their wishes to the first place. Marketing is
falling behind, and cannot keep pace with their customers' individual activities. Big data tools
and technologies have the power to transform marketing, and the right ingredients to build a
better marketing machine, one that is able to address inbound demands. Therefore, marketers

Book of Papers
35
should take advantage of that, and embrace the innovations. This chapter describes some of the
biggest problems marketers are facing and how big data technologies can address them. [2] [4]
Problems:
Dealing with customer interactions across channels. On their decision journeys,
customers use websites, email, blogs and social platforms, mobile applications, etc.
They produce large amounts of data while searching, exploring, buying and discussing
products. All these touchpoints are capturing relevant data about an individual, but
collecting and managing data coming from various sources is not a simple task. Having
many different data sources also means various data types and formats – structured and
unstructured. There is social networks data, emails, web logs, mobile data, M2M
(machine-to-machine) data, etc. The ability to efficiently use external sources, along
with traditional enterprise data such as product and historical customer data, is one of
the requests the digital world imposes on marketing experts.
Data fragmentation. The data fragmentation problem is often labelled as the biggest
obstacle in conducting modern marketing. Marketing departments mostly use
specialized systems and applications for different purposes. Each of those applications,
and its data, lives in its own silo, unaware of other processes the same customer
participates in. When it comes to the ability to integrate, marketers are falling short.
After acquiring several technologies, they now need a way to seamlessly connect data
across systems, to create a complete view of who the customer is. For example,
integrating CRM, email marketing campaigns and clickstream analysis can provide
extremely valuable insights. In addition, they often have redundant or conflicting data
sitting in separate silos, which makes linking and integrating that data expensive, time
consuming and bothersome.
Speed and relevance. Marketers know how important timely and relevant reaction is in
their field. As the speed and volume of customer interactions grows, as well as their
desires and expectations, companies are struggling to respond adequately and in a timely
manner. Businesses are failing to keep the pace, and realizing that traditional databases
do not scale. The need to deliver faster decision making based on customer insights is
becoming critically important.
How big data approach can address those problems:
Centralized data repository inside a platform. Considering the problems of data
fragmentation, and the rising number of various channels and touchpoints that
participate in customers purchase journeys, a centralized data repository makes sense.
Instead of using multiple applications, marketers are turning to more comprehensive
solutions, hubs or platforms, which will give them the agility and performances they
need. Big data technologies allow them to store all kinds of data, both structured and
unstructured, and join them to get a better, exhaustive view of customer behavior across

1st CRODMA Conference 2016
36
all channels and applications. That simplifies data integration, reduces time, and
provides possibilities that were before hard or impossible to accomplish.
Improved analytics and real-time technologies. Big data technologies provide more than
a distributed storage system. There are a lot of processing tools, including sophisticated
analytics and visualization tools. The ability to develop more accurate predictions,
powerful analytics and data mining are some of the keys to effective data-driven
marketing. Moreover, big data technologies can respond to ever-growing demands for
faster insights, which are proving to be so important in marketing. Managing real-time
interactions at scale is something that really brings a shift to the process.
3 THE DATA LAKE CONCEPT
3.1. BIG DATA AND HADOOP
There is no unique and precise definition of big data. Everybody is talking about the volume,
velocity and variety, some add more 'V-s', but what it is really about is finding a way to use that
data efficiently. Although there is a lot of talk around this topic, in most cases really mastering
your data remains unfulfilled, at least partially.
In the marketing data domain, the first and most obvious 'V' - volume is definitely a factor,
especially in larger companies. But more importantly, it is about the variety of data types and
formats. That part is especially prominent in marketing, because it has the most diverse data
sources, and new ones will most probably appear in the future. There is also the speed at which
data comes in and has to be dealt with, e.g. sensor data. Big data technologies make it possible
to gain real-time insights, which is especially important in marketing where timely and relevant
response is essential.
Since marketers always want to know more about their customers, all the data they can gather,
from all the sources they have, and can acquire, is a valuable resource to them. It is where
customers offer information about themselves. But it takes certain knowledge and skills to get
them. The holy grail of customer experience – the '360 degree customer view' is an illusion
without mastering the data game. And big data technologies are a step in the right direction.
The next chapter explains some basic big data terms and gives an overview of the Data Lake
concept.
A word that most commonly goes hand in hand with the term 'big data' is Hadoop. Hadoop is
not a synonym for big data software, but it has established itself as a great prospect in the field.
It is not one tool; it is a platform of tools, which makes it suitable for a variety of use cases. The
main purpose of Hadoop is storage and fast distributed processing of large amounts of data

Book of Papers
37
across clusters of computers, but there are also a lot of functionalities and tools built on top of
it.
Some of the advantages of Hadoop over traditional data warehouses (although it can be used
with DWH, it is not necessarily a replacement) are:
Agility. It is suitable for all kinds of data – structured and unstructured.
It is built out of commodity hardware, so it is far more affordable.
As the need arises, the system can be expanded through the addition of nodes in the
cluster, i.e. scale-out.
It enables advanced real-time data processing and analytics.
The reason Hadoop is convenient for storing most disparate data types, is the 'schema on read'
concept. Basically, it means you do not have to pre-process data or structure it before saving.
You can save anything and decide what to do with it later – when needed. That flexibility is the
essential difference; it makes adding data from various sources easy, which is especially
suitable for unpredictable marketing demands.
3.2. DATA LAKE
In short, Data Lake is a platform for managing data in a more flexible manner. It allows
marketers to bring all their data together in one place (Hadoop), covering all marketing
channels. It brings the agility and accessibility marketing needs, and the main benefit is – no
more data silos. That is where this concept scores big points.
The technology stack does not have explicitly defined components; they can vary depending on
the environment and preferences [3]. Here is a schema:
Marketing applications (CRM, web analytics, marketing automation)
DWH
Hadoop
Data management tools
Third party applications as additional data sources
Predictive analytics tools
Visualization tools
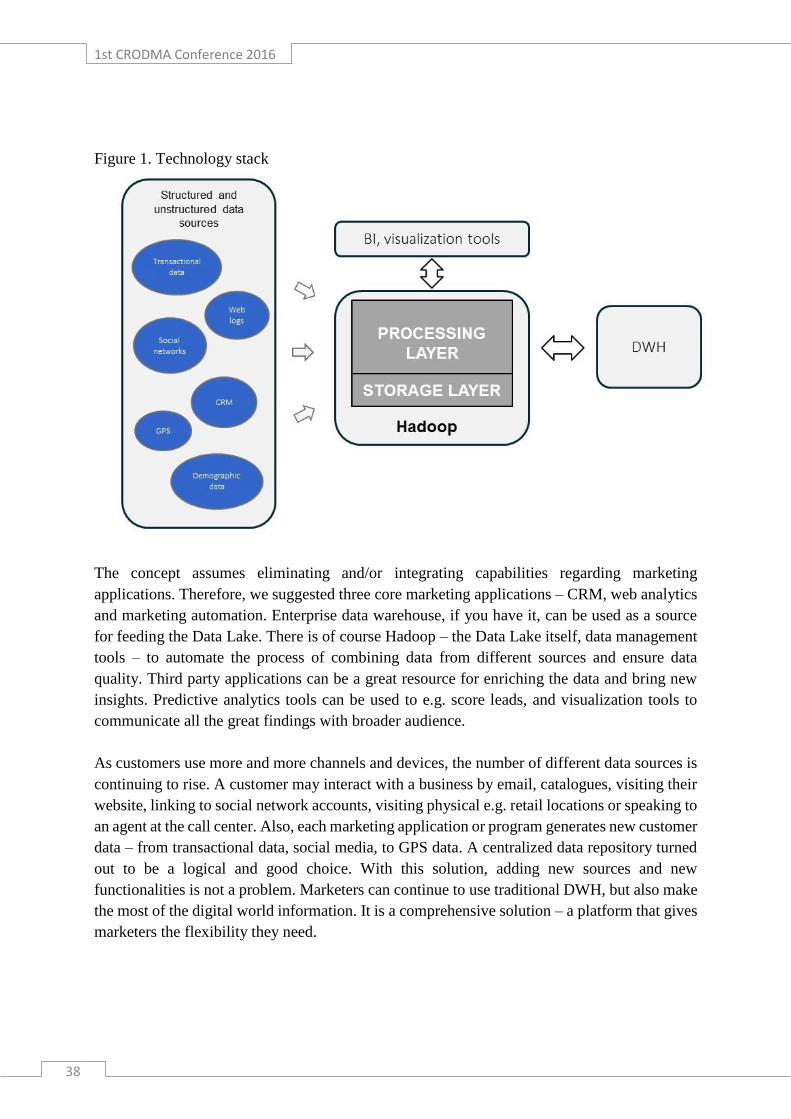
1st CRODMA Conference 2016
38
Figure 1. Technology stack
The concept assumes eliminating and/or integrating capabilities regarding marketing
applications. Therefore, we suggested three core marketing applications – CRM, web analytics
and marketing automation. Enterprise data warehouse, if you have it, can be used as a source
for feeding the Data Lake. There is of course Hadoop – the Data Lake itself, data management
tools – to automate the process of combining data from different sources and ensure data
quality. Third party applications can be a great resource for enriching the data and bring new
insights. Predictive analytics tools can be used to e.g. score leads, and visualization tools to
communicate all the great findings with broader audience.
As customers use more and more channels and devices, the number of different data sources is
continuing to rise. A customer may interact with a business by email, catalogues, visiting their
website, linking to social network accounts, visiting physical e.g. retail locations or speaking to
an agent at the call center. Also, each marketing application or program generates new customer
data – from transactional data, social media, to GPS data. A centralized data repository turned
out to be a logical and good choice. With this solution, adding new sources and new
functionalities is not a problem. Marketers can continue to use traditional DWH, but also make
the most of the digital world information. It is a comprehensive solution – a platform that gives
marketers the flexibility they need.

Book of Papers
39
Key benefits of the concept are:
Ability to seamlessly transmit content between systems
Reduce complexity in data management
Agility
Speed and relevance
The Data Lake concept can address exactly the problems identified by marketers as their most
common challenges. The biggest gain this approach brings is the view across channels, silos
and platforms. It enables marketers to run through their data to match specific marketing
activities to specific customers. They can drill down to individual transaction-level data. This
complete visibility is what makes a difference. The biggest challenge of the concept is how to
properly link data from all systems, clean it and validate, but there are APIs that make it work,
and the final result is worth the initial trouble.
4 USE CASES
The Data Lake concept can have a positive impact on marketing strategies in different industries
and it is suitable for many different use cases, particularly where data fragmentation is a
common problem. For the purpose of this article, we describe two use cases for two big
industries – telco and retail.
4.1. CASE 1 – TELCO
In comparison with other industries telecoms generate larger amounts of data. They are also
more prone to accepting new technologies and innovations. That is why they are a logical
beneficiary for the presented concept.
We are assuming a telecom operator wishes to improve customer experience, make more
personalized offers to their clients, which will lead to higher revenue per customer, and better
customer retention rates. The main problem in creating personalized offers is, as analyzed
before, that all the data relevant for a single customer is split across systems. That complicates
the process of collecting all necessary data, linking it by a common ID and analyzing it, let
alone doing it fast enough to make relevant real-time offers.
For example, customer data in telecommunications can include his past purchases and used
tariffs, usage patterns and billing data, customer support requests, clickstream analysis, social
networks activity, location and demographic data, etc. Using the Data Lake concept we
described, all data regardless of the source or type, is in one place – Hadoop storage, ready to
be analyzed. Marketers can use visualization tools to create dashboards that contain detailed
customer data arranged in a way that neatly comprehends his preferences. There are some great

1st CRODMA Conference 2016
40
visualization tools that support connections to Hadoop in the market. The dashboard captures
customer's taste and preferences, and allows marketers or sales agent to drill down by specific
attributes for different perspectives and insights. They are also pretty and easy to use, suitable
for nontechnical staff members.
To demonstrate one of the use cases, consider a customer who contacts the call center. The
agent who takes the call can automatically get detailed information about the customer on the
line at the moment of interaction. Assume the agent gets a recommendation dashboard, which
will generate the best offers considering the data he has, in real-time. There is a wide range of
data that needs to be utilized to create this view, for example behavioral data, calls to customer
support, contract details, previous campaigns responses, sentiment analysis applied to social
media data, customer interest rating derived from his website and other activities, scores
expressing how valuable or how prone to converting the customer in question is. The key is to
bring different sources together, so that predictive models under the hood can create
recommendations based on all relevant data. The dashboard can be updated in real-time, and
the agent is presented with all potential products and tariffs to offer to the customer on the line.
That approach is expected to bring many benefits such as upsell opportunities, higher retention
rates, improved customer satisfaction and ultimately, turning consumers in loyal customers.
4.2. CASE 2 – RETAIL
Retailers can use Data Lake to combine historical purchase data with real-time streams, in order
to personalize their promotions and boost sales. Previous buying habits and patterns can be used
in predictive analytics to create recommendations. Together with real-time data such as
geolocation, marketers can achieve the ultimate goal – target the right customer with the right
offer, at the right time and in the right place. Again the Data Lake serves as a central repository
for data from different sources, and big data technologies enable real-time processing and
powerful analytics capabilities.
Retailers are turning to mobile apps for new possibilities to improve customer experience, and
that is a great resource for data-driven marketing. By using GPS data from their mobile
subscribers, detailed profile and product data, marketers have the ability to develop customized
offers, suited to the customer but also to the company's demands. For example, a retail company
can notify their customers about special offers and sales that match their preferences and are
happening in their vicinity at that exact moment.
5 CONCLUSION
Technological advances brought by the digital age, especially massive Internet expansion,
brought changes to the marketing domain too. Customers today have more options than ever,

Book of Papers
41
they use more and more devices and channels, have easier access to information, and that makes
them more demanding. As their expectations grow, their interactions with companies and each
other multiply, as a side effect they generate a lot of data. It is a challenge for marketers to use
that data efficiently and respond to their growing demands. Since traditional marketing
technologies and methods have proven to be inadequate for the task, they are being replaced
with big data technologies.
In a field that is so unpredictable and ever-changing, as marketing is, the main goal is to provide
flexibility and speed. The Data Lake solution is suited for marketing problems because it allows
all data from various sources to be collected together and analyzed at once, thus providing the
agility. It also brings advanced analytics and real-time technologies, thus providing
performances. Therefore, big data technologies bring the tools and methods marketers need to
develop an effective data-driven marketing strategy.
REFERENCES
[1] Forbes Insights, 2015, Data Driven and Digitally savvy: The Rise of the New Marketing
Organization.
[2] Forrester Research, Inc., January 2014, Marketing’s Big Leap Forward.
[3] Franz Aman, Anish Jariwala (2016), The Marketing Data Lake, USA, ISBN 978-0-
9976012-0-6.
[4] Rusty Warner, Forrester Research, Inc., October 19, 2015, Combine Systems Of Insight
And Engagement For Contextual Marketing.
[5] Stephan Kudyba (2014), Big Data, Mining, and Analytics: Components of Strategic
Decision Making, CRC Press.

1st CRODMA Conference 2016
42

Book of Papers
43
DIGITAL MARKETING AND BEHAVIORAL ECONOMICS
ALEKSANDRA KRAJNOVIĆ
University of Zadar, Department of Economics
Splitska 1, 23000 Zadar, Croatia
DOMINIK SIKIRIĆ
University of Zadar, Department of Economics
Splitska 1, 23000 Zadar, Croatia
JURICA BOSNA
University of Zadar, Department of Economics
Splitska 1, 23000 Zadar, Croatia
ABSTRACT
The use of modern technologies affects all spheres of modern life. Social and economic life
becomes impossible without fast, relevant, high-quality and timely information. More recent
scientific discovers, as well, talk about new insights in the behavior of homo economicus, as
individual who, it is revealed, in his decisions in economic behavior actually is not primarily
motivated by utility, but the decision-making process including other mechanisms, except
cognitive. However, even these cognitive processes occur in a specific way, such as using
heuristics (shortcuts) in decision-making.
Furthermore, "familiarity" of the product, emotions, risk assessment, etc., are relevant factors
of the decision-making process in consumer behavior when deciding on a purchase.
What new processes, new aspects and new challenges, these facts set on marketing? Is
marketing, in these new circumstances, increasingly important in modern life? In which way
marketing processes must innovate to keep up with new marketing age? And, finally, are we
now days facing the era of the „new marketing esthetics” and the new marketing paradigm or
is a modern digital marketing just a tool used on the platform of the classical marketing
paradigm? These are issues that the authors, using a multidisciplinary approach, examine in
their paper, with the aim of better understanding of (not only digital) marketing, but also of the
new post-industrial era where marketing place a significant role in the lives of individuals,
business organizations and other organized entities.
KEYWORDS: behavioral economics, consumer behavior, "aesthetics of marketing",
marketing paradigm, post-industrial era.

1st CRODMA Conference 2016
44
1 INTRODUCTION
The paper has been based on the thesis how digital marketing and contemporary technology in
its application in the marketing management, necessarily change the concept of modern
marketing and even its paradigm. In the period of information over load it is crucial to choose
carefully information which are going to been transmitted to potential customers for which
digital marketing presents key platform. It is about information economy which strives to reduce
number of information and enhance their effectiveness. Contemporary literature also leads to
the conclusion how homo economicus has been primarily driven by emotions and less with
rationality during his purchasing process what has circumstances not only on the theoretical
understanding of the marketing but also on contemporary marketing practice and managing the
marketing process. Actually, that is the subject of this paper.
It has been generally accepted trend of focusing on marketing efforts and intensification of the
communication process with the emphasize on online marketing and contemporary technology
in the last few decades. As a result, it is the necessary to introduce systematic and planned CRM
processes in all organizations which needs to be more focused on the customer in a manner to
transmit even sharper information to the potential consumer. In the recent past, marketing and
marketing experts have made conclusions about consumer preferences from their ordinary
behavior and characteristics (age, sex, place of residence, etc.). Today, new technology provides
us further step. Conclusions about consumer behavior and their decisions about purchase
provides us digital consumer behavior, actually digital consumer activities which contemporary
technology and digital marketing have ability to constantly track. Digital marketing affects the
formation of a customer needs on a more efficient way but also implies certain ethical
implications.
Storytelling as a relevant part of the successful purchasing process has been enabled through
digital marketing as far as possible. The aim is to tell the story first, and after the potential
customer embrace the story, the desire for the product has been generated as well as purchasing
decision.
2 ERA OF BEHAVIORAL ECONOMICS AND THE DIGITAL
ECONOMY - PLATFORM OF DIGITAL MARKETING
Marketing is an applied science that tries to explain and influence how firms and consumers
behave in markets. Marketing models are usually applications of standard economic theories,
which rely on strong assumptions of rationality of consumers and firms. Behavioral economics
explores the implications of the limits of rationality, with the goal of making economic theories
more plausible by explaining and predicting behavior more accurately while maintaining formal
power [Teck et al., 2006].

Book of Papers
45
Behavioral economics is a relatively new scientific discipline and is increasingly attracting the
attention of many authors. We can find its primary source in psychology, but is mostly applied
for better understanding of the consumers particularly in the area of decision-making, while its
basic feature connects these two sciences by explaining how different terms and knowledge of
scientific disciplines influence the behavior of consumers and their decision on the choice.
Behavioral economics connects theoretical frameworks of rationality of classical and
neoclassical economics and the way on which consumers make decisions, including personal
feelings and limitations in a realistic way. At the same time, its contribution to the modern
understanding presents departure from rationality and recognition of the existence of '' mistakes
'' of human behavior in the decision making process.
In fact, these errors are not random, but are generated by applying heuristics or intuitive
psychological mechanisms that produce bias. Understanding the model of homo economicus
provides insight about contradiction in previous interpretation how decisions are made
rationally, not emotionally [Jovanović, 2016].
The neoclassical theory in its simple terms describes the behavior of consumers, given that the
model has been perceived in such a way that man behaves like a robot, which will be in decision
making process followed by self-interest and rely only on the costs and benefits [Henrich et al.,
2001]. Introduction of behavioral economics in the study of human behavior, emphasizes the
importance of emotions and their interaction with society [Bakucs et al., 2010].
The digital economy is based on electronic transactions via the Internet or another electronic
channel. Its main characteristics are flexibility, cooperation and high speed interaction between
individual subject chain value (eg. the interaction of certain corporate with suppliers and
consumers). Digital Economy leads to the ability to quickly re-organization of resources
companies and creating new value and business models, which meet the needs of more
demanding consumers. According to many predictions of the end of the last century The
Internet is viewed as a means to introduce a "revolution" in modern business, so that then for
the first time appeared the terms "new economy", "digital economy "and" Internet economy ".
This pointed to the fact that a large part of business operations switched to electronic platform,
that is that more companies switch to electronic communication with its partners and customers.
With the advent of the first virtual companies (dot.com) and their rapid collapse, many analysts
have gone to the extreme and watched it only as a promotional channel. The Internet represents
the largest promotional channel, but it can be much more than that - very important for
companies whose business is based on knowledge and information. Many well-known
companies in the world today perform more than 80% its business activities through the Internet
and thus deliver two key advantages: first, reduce costs, and secondly, your customers offer
benefits that without this channel would not be possible (eg. Dell allows its customers configure
their own computer). Perhaps the most important feature of business in the 21st century will be

1st CRODMA Conference 2016
46
moving negotiation power in the value chain from producers to consumers, whose needs and
requirements dictate the success or failure of individual companies and their products and
services. According to some opinions, the 21st century is more properly called age of the
consumer, before century of technology. Modern companies have to understand that their
consumers power generating most of the current and future operating revenues and that they
create value for the company, not the contemporary technological solutions. The new
technology in business is just a tool for the connection of the technological possibilities with
what consumers want. Best business technology solutions adjusted technological capabilities
with the wishes and needs of the people as consumers, instead of changing consumer behavior
in line with new technological solutions (possible but very hard work). Realizing that
consumers are a major resource companies, consumers are located in the center of all business
activities of the company in order to create superior value for consumers [Đorđević, 2007: 139].
Most empirical models of choice in economics and consumer research assume that the decision
maker assesses all alternatives and information in a perfect information-processing sense. The
complexity of the choice environment, the ability of the individual to make complex decisions,
and the effect of choice context on the decision strategy are generally not considered in
statistical model development. One of the reasons for this omission is that theoretical literature
on choice complexity and imperfect ability to choose that has developed in psychology and
behavioral decision theory (BDT) literatures has not been translated into empirical econometric
analysis. Second, the data used in economics and consumer research studies tend to be
somewhat different from the data structures used in psychology and BDT literatures [Joffre and
Adamowicz, 2001].
3 FROM CONTENT MARKETING TO CONTENT DIGITAL
MARKETING
Rolf Jensen stated “In the information society in the last century the best product was winning,
this century the best story is winning.” It is well known how previously mentioned paradigm
find its sense in designing marketing mix (4P). All of these elements should be communicated
to the market through the message in a manner to adopt features of the story. This concept
developed content marketing, which is the product / service turned into value for customers and
value for customers should have been communicated to the customer in the form of stories
about the product / service, or something that has value to the customers and is associated with
the product / service. Only with the appearance of digital marketing that process has been fully
enabled, especially by the emergence of the Internet, but also the possibility of interactions with
customers. This provides dynamic and more flexible process of creating web content in an
optimal way.

Book of Papers
47
The web provides an ever-changing, morphing platform for content, which is an ongoing
conversation between the company and her customers. We need to keep up, not only with the
technology but also the audience — who are they, what do they want, and how can we get their
attention and keep it? The answers to all of those questions start with one thing — content
strategy. We need to learn about our audience, figure out how to reach them, and enter into a
conversation with them so that there is trust and comfort. To do that, we need a solid system
that keeps us on track throughout this process. Content marketing is the tactic that will help the
companies establish a brand audience who engages consistently with their marketing content
and recommends the company brand to others via social networks [Leibtag, 2014].
The importance of digital content to business and society grows it is important seek a holistic
perspective on the definition and nature of digital content marketing (DCM). Along the journey
it becomes evident that a recurrent theme in DCM is customer value, while is important an
exploration of customer value in digital content marketplaces. Digital content is defined as: 'bit-
based objects distributed through electronic channels'. The conclusion sums up the unique
characteristics of digital content, and associated consequences for digital content marketing
[Rowley, 2008].
4 INBOUND MARKETING VS. OUTBOUND MARKETING
Classic but also contemporary marketing continued "tradition" of "pushing" a certain
aggressiveness to the customer, which is reflected through their own names of strategies and
tactics that have dominated in the marketing by the end of the 20th century: „push“ marketing,
„offensive marketing tactics“ etc. For that reason, effectiveness of promotional activities
systematically began to decline. This is supported also by contribution of the new technology
which provided through modern software tools blocking displays of advertising messages on
cell phones and computers. Therefore, marketing needed to find out new solutions due to the
fact that the old approach to the customer does not work anymore. New marketing stopped to
push product/service to the customer and created new tactics which aim is to deserve customer
attention.
That kind of new marketing has been often called inbound marketing and tradition marketing
as outbound marketing. The most obvious differences between inbound and outbound
marketing brings us figure 1.
The main tool of the new marketing is content. "Content Marketing" or marketing where
"Content is king" shows explosive growth in the last five years. It is just enough to look for the
term in "Google Trends" Web application to see how until 2011-12 years the term "content
marketing" was relatively uninteresting, until after that happens ascent in recent years. It is also
indicative to see the top five countries from which users have searched this concept (Figure 2).
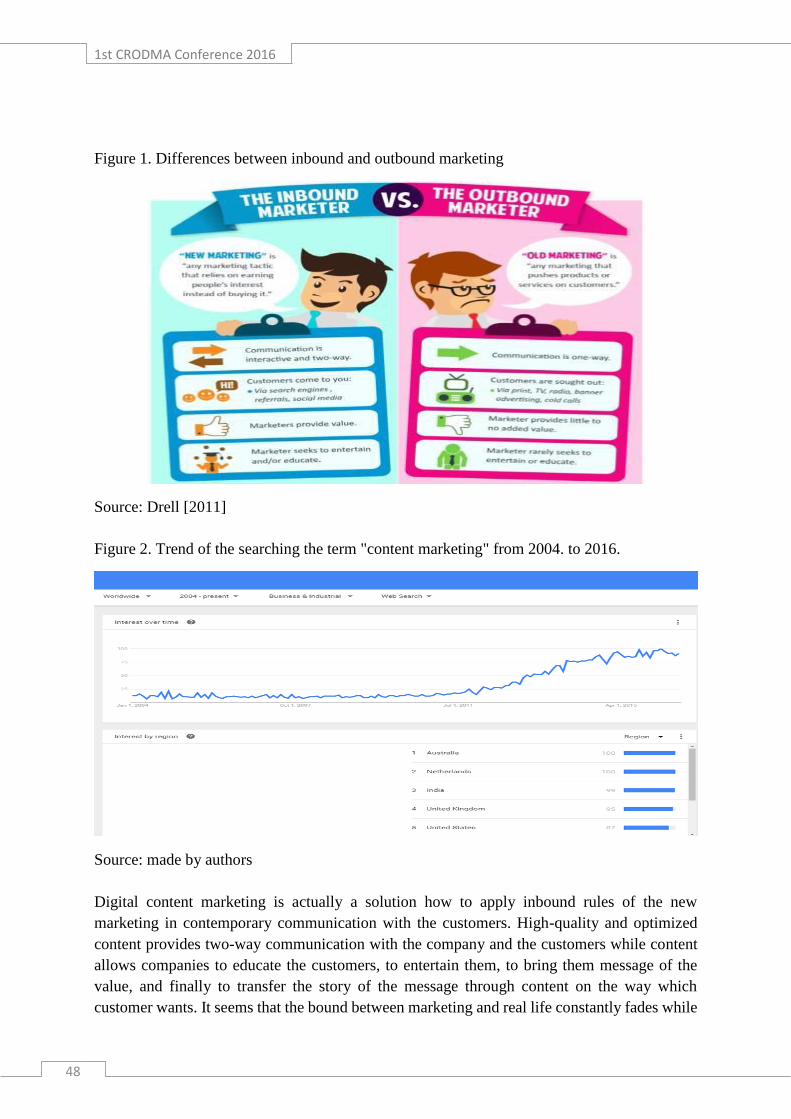
1st CRODMA Conference 2016
48
Figure 1. Differences between inbound and outbound marketing
Source: Drell [2011]
Figure 2. Trend of the searching the term "content marketing" from 2004. to 2016.
Source: made by authors
Digital content marketing is actually a solution how to apply inbound rules of the new
marketing in contemporary communication with the customers. High-quality and optimized
content provides two-way communication with the company and the customers while content
allows companies to educate the customers, to entertain them, to bring them message of the
value, and finally to transfer the story of the message through content on the way which
customer wants. It seems that the bound between marketing and real life constantly fades while

Book of Papers
49
digital marketing becomes integrative part of customers digital lives. That certainly evokes
ethical implications and further multidisciplinary research on this subject, which exceeds the
bounds of this paper. Digital marketing goes in line with contemporary trends which are reality
of the contemporary society.
5 ZERO MOMENT OF TRUTH – ZMOT
Due to the shift from outbound to inbound marketing, marketing experts started to generate
more content which spread like a virus across the Internet and social networks. The goal became
to earn attention and credibility that results in a large number of followers, better positioning
on the search engines and ultimately capitalizing relations with followers in the form of profits.
Key question is: When is the precise moment when buyer makes his choice about purchase?
That moment actually represents key outcome – goal of the content marketing.
Marketing expert Gary Vaynerhuk depicts content marketing by catchword "Jab Jab Jab, Right
hook" in which jabs represent content which prepare customers for the "right hook" – actually,
decision and the final purchase. This preparation consists in the aforementioned education,
entertainment and value provision to the consumers. Marketing experts should be also aware
how the impact on purchase decision depends even on the content generated from the other
“stakeholders” – especially medias and previous customers.
Google Company in 2011. presented “Zero Moment of truth” concept which describes a
revolution in the way how consumers search for information online and make decisions about
brands. Classical concept “moment of truth” has been applied for decades in marketing, but
now has been transmitted from the moment of purchase to the moment of making a decision to
purchase.
Moments of Truth (MOT) in marketing, is the moment when a customer/user interacts with a
brand, product or service to form or change an impression about that particular brand, product
or service. In 2005 A.G. Lafley - President and CEO of Procter & Gamble, coined two Moments
of Truth i.e. first and second [Lafley, 200]. Third was gradually introduced later [Cohen, 2013].
Types of MOT are following: First moment of truth (FMOT): When a customer is confronted
with the product in-store or in real life [Nelson and Allison, 2005]. When a customer purchases
a product and experiences its quality as per the promise of the brand refers to the second moment
of truth (SMOT). Third moment of truth (TMOT): Consumers feedback or reaction towards a
brand, product or service i.e. consumer becomes brand advocate and gives back via word of
mouth or social media publishing [Ashby and Miles, 2002].

1st CRODMA Conference 2016
50
Zero Moment of truth (ZMOT) is a term coined by Google in 2011 which actually refers to the
research which is conducted by a user online about a product or service before taking any action
i.e. searching for mobile reviews before making a purchase. The internet has changed altogether
the way consumers are interacting with brands, products or services this online decision-making
moment is termed as ZMOT. According to research conducted by Google in 2011, 88% of US
customers are researching online before actually buying the product.
The less than Zero Moment of truth (<ZMOT) is a term started by Eventricity Ltd in 2014
referring to the time between an Event in a Customer's life happening and the point at which
they decide to research a purchase (ZMOT).
In the context of digital marketing, the most interesting and crucial is to comprehensively
describe Zero Moment of Truth.
"We saw that people are increasingly making these decisions at the Zero Moment - the precise
moment when they have a need, intent or question they want answered online. These questions
can be anything from "Which brand of diapers will help my baby sleep through the night?" to
"What toothpaste is going to make my smile brighter?" or "What will remove crayon marks
from my wood dining table?" A brand that answers these questions at just the right time scores
a double win: It helps improve a consumer's life and stands to gain a competitive advantage
over brands that do not” [Google Research, 2011].
Figure 3. Zero Moment of Truth model
Source: Google Research (2011)

Book of Papers
51
Traditional 3 step Mental Model of Marketing did not involve ZMOT but only Stimulus, First
moment of truth (at shelf in store) and Second moment of truth (experience).
In the phase of Zero Moment of truth, consumers are informed about the product, its
alternatives, read the reviews, the experience of other users, look for coupons and discounts,
and this is all before the first moment of truth or departure in the real or virtual stores.
Research on 5000 customers in 12 different product categories showed that consumers use more
than 10.4 different sources before buying in 2011 while the number of sources in 2010. was
5.3. It is also important to note that the second moment of truth, and the experience of our users
become ZMOT - zero moment of truth for another user.
Figure 4. Number of information sources before the purchase
Source: Google Research, 2011.
The same research showed how ZMOT is the most important phase during the process of
making decision to purchase product/service.
Due to the fact how the decision to purchase is a key moment in marketing, it is extremely
important to master the skills necessary for success in this new - "zero moment of truth". For
success in this moment of truth, it is necessary to adapt the training and skills of the personnel
that will equally include understanding of technology and marketing.

1st CRODMA Conference 2016
52
Figure 5. The impact of individual phases on the decision to purchase product/service
Source: Google Research, 2011.
6 INTIMATE AUTOMATION FOR THE ONGOING RELATIONSHIP
WITH (POTENTIAL) CUSTOMERS
Second moment of the truth for one user in ZMOT model (Figure 3) becomes ZMOT for the
other user. That goes in favor for the need of establishing ongoing relationship with customers,
not only before buying (in stages to stimulate the purchase and MOT stage) but also later.
Today, it has been provided by process of marketing automation which literally connects
multiple touch points and marketing channels including social media, email marketing, content
marketing, and they automate and measure in order to achieve long-term relationships with
customers. Due to the fact how technology is increasingly becoming a part of man, the process
is easier to achieve. Also, it is crucial to synchronize all data from the current communication
channels in a manner to provide each user personalized multi-channel experience without delay.
Today is no longer a problem to have information about the customer, but is to synchronize this
information from his cell phone and computer. The ultimate goal is to achieve "an intimate
automation" with individual follower (one to one) which is similar to the original concept
focused on attempts to adapt the marketing mix (then the only possible) to the small focus
groups.
Figure 6 shows us the example of automation in which first step is to provoke potential customer
by various previously mentioned channels and tools of marketing content (blog, youtube videos,
facebook posts, forum, chat, podcast, etc.) in a manner to turn this interest into the purchase.

Book of Papers
53
Figure 6. The example of marketing automation
Source: AWD, 2014.
7 DIGITAL MARKETING, NEW “MARKETING AESTHETICS” AND
“UNBEARABLE LIGHTNESS OF PURCHASE”
CRM and digital marketing as its main tool can be put in the context of quality and understood
as "something good, something beautiful". That kind of hedonistic view of quality [Avelini,
2007] gets its meaning in the age of digital marketing, so the authors of this paper argue for
questioning the concept of aesthetics in marketing, trying to figure out how marketing as a link
between company and customer, facilitates and enhances the life of the customers, and thus
improves quality of life. Marketing encourages the purchase and consumption that becomes not
only an individual but also a social act, which needs to be shared in real and virtual world.
Generally, authors are off opinion that the issue of aesthetics has been moved forward due to
transition from the aesthetics of product design to the aesthetics and design of marketing.
Therefore, aesthetics become crucial in the brand – customer relationship while purchase in the
era of digital marketing is no longer the most important act. Drucker catchword “make sales
superfluous" in digital marketing takes on its full meaning. Moreover, an essential is long-term
relationship with customers, which in essence means repeated purchase.
Many companies have been sold for huge amounts of money due to the established customer
relationships, power of brand and potentially usable database of customers. One of the newest
example is Facebook’s acquisition of the Whatsapp - free messaging app which does not have
any revenues, for incredible 19 billion dollars. Facebook actually paid more than 1 billion
currently active Whatsapp users.

1st CRODMA Conference 2016
54
Although the sale is no longer necessary, it is also incredibly simplified, leading to a reflection
on the concept of “The Unbearable Lightness of purchase”. The emphasize is therefore on
continuous relationship, the moment of truth is no longer moment - it becomes a long-lasting
experience while the purchase itself is simply the end of a thought process which represents a
multi-channel experience. Therefore, the final goal of the CRM system is not purchase but
customer, which was the unfulfilled dream of every classical marketing expert. This dream has
been realized due to the new technology.
8 CONCLUDING REMARKS
The purpose of this paper was to examine on which way digital marketing, through interactive
communication with the customers on the global level, brings new insights and opens new
questions, not only for the science and marketing practice, but also the issues of the economy
in general, including the role and way of functioning individuals (homo economicus) in
contemporary information and technological oversaturated society.
Authors find key starting point in the thesis of behavioral economics, which is that the modern
customer actually purchases guided by emotions and less according to its utility what reveals
numerous options and challenges to digital marketing. There is a possibility of two-way
communication, storytelling, creating and optimizing marketing content which has been spread
through the channels of the digital world. In that sense, paper deals with the issue of digital
marketing content, especially considering the concept “zero moment of truth” (ZMOT).
That fact is certainly a challenge for experts from the field of digital marketing. Information,
technique and technology should be carefully screened and focus - do not overdo with content,
information channels, but the same dose. Content should be intelligent, informative, funny,
useful, in accordance with ethical values and based on ethical principles.
Ethical considerations that have been generally extended through the issue of the use of modern
technology have been emphasized also in the sphere of digital marketing. Research in that field
may be connected with the empirical researches of luck perception, which is known to be
partially related to the level of an individual income, and has been achieved at a certain point
of household income.
People literally enjoy new technology which has enabled marketing to become specific life
video game while line between marketing and the "rest of life" becomes thinner. Marketing is
more than ever become a multidisciplinary and transdisciplinary phenomenon, which raises
questions not only for informatics, but also for psychology, sociology, anthropology,
communication, philosophy, and especially ethics.

Book of Papers
55
An interesting area for further research could be, according to Stephen (2016) consumer digital
culture, responses to digital advertising, effects of digital environments on consumer behavior,
mobile environments, and online word of mouth (WOM). Much is still to be understood, and
existing knowledge tends to be disproportionately focused on WOM, which is only part of the
digital consumer experience [Stephen, 2016].
From the point of digital marketing application and looking at marketing as a management
process, it has been examined digital marketing content optimization, as well as associated
consequences for digital marketing content. Central issue is the impact of developing a notion
of 'value' in the context of digital content, and its consequences for value chain structures,
pricing strategies, marketing communications and branding, and licensing and digital rights
management. In addition, the customer's experience of digital content is influenced by all
stakeholders in the value chain as well as requiring the customer to participate in learning and
co-creation of the experience. The potential of the 'value-in-use' notion of customer value as a
basis for ensuring that consumers are fully engaged as stakeholders in the content economy has
to be discussed [Rowley, 2008].
Marketing, at least one of his key part definitely moved into the virtual space. It seems that we
should all get used to spend an increasing part of life in virtual world, where the companies,
products, brands and we our self are different. Definitely, difference between real person and
its virtual identity constantly decreases. Marketing becomes successful if one of its key
segments include digital marketing what does not change classical view on marketing.
Marketing mix and value chain under the pressure of new technology have been expanded and
complemented.
REFERENCES
[1] Affordable Web Design (AWD) (2014). https://www.affordablewebdesign.com/wp-
content/uploads/2014/11/marketing-automation-cycle.gif downloaded: [August, 12th
2016]
[2] Ashby, M.; S., Miles (2002). Leaders Talk Leadership: Top Executives Speak Their
Minds 1st Edition, Oxford University Press.
[3] Bakucs, Z., L; Ferto, I.; Szabo, G. (2010). Institutions in Transition – Challenges for New
Modes of Governance, IAMO Forum, Germany, pp 3-5.
[4] Cohen, H. (2013) Marketing: The 4 Moments of Truth, http://heidicohen.com/marketing-
the-4-moments-of-truth-chart/ downloaded: [July, 27th 2016]
[5] Đorđević, B. (2007). Odnosi s potrošačima u digitalnoj ekonomiji, Communications, pp
133-157.

1st CRODMA Conference 2016
56
[6] Drell, L. (2011). Outbound and Outbound Marketing,
http://mashable.com/2011/10/30/inbound-outbound-marketing/#iDTazO20lPqw
downloaded: [August, 22th 2016]
[7] Eventricity Ltd (2014). 10 Feb the Less than Zero Moment of Truth,
http://www.eventricity.biz/the-less-than-zero-moment-of-truth/ downloaded: [August,
21th 2016]
[8] Google research (2011). The Zero Moment of
Truth,https://www.thinkwithgoogle.com/research-studies/the-zero-moment-of-truth-
macro-study.html downloaded: [August, 21th 2016]
[9] Henrich, J.; Boyd, R.; Bowles, S.; Camerer, C.; Fehr, E.; Gintis, H.; McElreath, R. (2001).
In Search of Homo Economicus: Behavioral Experiments in 15 Small-Scale Societies,
The American Economic Review, 91(2), pp 73-78.
[10] Joffre S.; Adamowicz, W. (2001). Choice Environment, Market Complexity, and
Consumer Behavior: A Theoretical and Empirical Approach for Incorporating Decision
Complexity into Models of Consumer Choice, Organizational Behavior and Human
Decision Processes, 86(2), pp 141-167.
[11] Jovanović, N. (2016). Bihevioralna ekonomija i ponašanje potrošča, Diplomski rad,
Sveučilište u Zadru, Odjel za ekonomiju.
[12] Lafley, A., G. (2008) The Game-Changer: How You Can Drive Revenue and Profit
Growth with Innovation Hardcover. Crown business.
[13] Leibtag, A. (2014). The Digital Crown - Winning at Content on the Web. Elsevier,
Waltham, USA.
[14] Libert, K. (2015). The Inbound Marketing Economy, https://moz.com/blog/the-inbound-
marketing-economy downloaded: [August, 11th 2016]
[15] Nelson, E.; Ellison, S. (2005). In a Shift, Marketers Beef Up Ad Spending Inside Stores,
Funky Displays and Lighting, TV Spots in Wal-Mart; Unsettling Madison Avenue.
http://www.wsj.com/articles/SB112725891535046751 downloaded: [August, 21th 2016]
[16] Rowley, J. (2008). Understanding digital content marketing, Journal of Marketing
Management. 24(5-6), pp 517-540.
[17] Rowley, J. (2008). Understanding digital content marketing. Journal of Marketing
Management, 24 (5-6) pp 517-540.
[18] Stephen, T., A. (2016). The role of digital and social media marketing in consumer
behavior. Current Opinion in Psychology, 10, pp 17-21.
[19] Teck H.; Lim, N; Camerer, F. (2006). Modeling the Psychology of Consumer and Firm
Behavior with Behavioral Economics. Journal of Marketing Research, 43(3), pp 307-
331.

Book of Papers
57
GENDER DIFFERENCES IN ADVERTISING - MISUSE OF WOMEN
DANIELA JURČIĆ
Filozofski fakultet, Sveučilište u Mostaru,
Matice hrvatske bb, Mostar, Bosna i Hercegovina
IGOR JURČIĆ
JP Hrvatske telekomunikacije d.d. Mostar,
Kneza Branimira bb, 88000 Mostar, Bosna i Hercegovina
[email protected]; [email protected]
ABSTRACT
Advertisements are absolutely everywhere. They do exist in a huge quantity everywhere around
us and many people do not notice them at all. Mut, It is very imortant to research them because
they are very indicative and they represent, in a way, system in which we live.They have and
influence on the construction of our identities but also on the notion of social roles and on the
difference between women and men. In this context, it is interesting to watch advertisements in
terms of gender stereotypes as well as the use of women's bodies in the advertising industry.
The aim of the analysis of advertising content to determine the extent to which a woman's body
used in advertising but also the violation of a law on gender equality in advertising content.
KEYWORDS: advertising, advertisment, stereotype, sexism, women.
1 INTRODUCTION
We live in a time of advertising. It is now a very powerful industry that not only sells products,
but also the value, status, and at the end – ideals. Marketing ad is the simplest way to reach the
customer, and the ad certainly has to leave a striking impression. So, there are many videos
those are packed into a joke, pun, caricature but unfortunately the provocation, stereotypes and
sexist messages. Advertising, posing as questionable and timeless, sale notions of how the
world should look like and how it should behave people and often played the wrong ideas about
society, its values, but also on its individual segments and members. The difference in the
presentation of women and men in advertising is undeniable. It is well known that the
advertising industry through advertisements wants to attract attention and sell a product and
because of these reasons, the physicality of a woman and the woman's body is only function of
images very often. The fact is that many brands in the region significantly playing with the
woman and her place in society, whether it is present as a sex object or housekeeper. Such
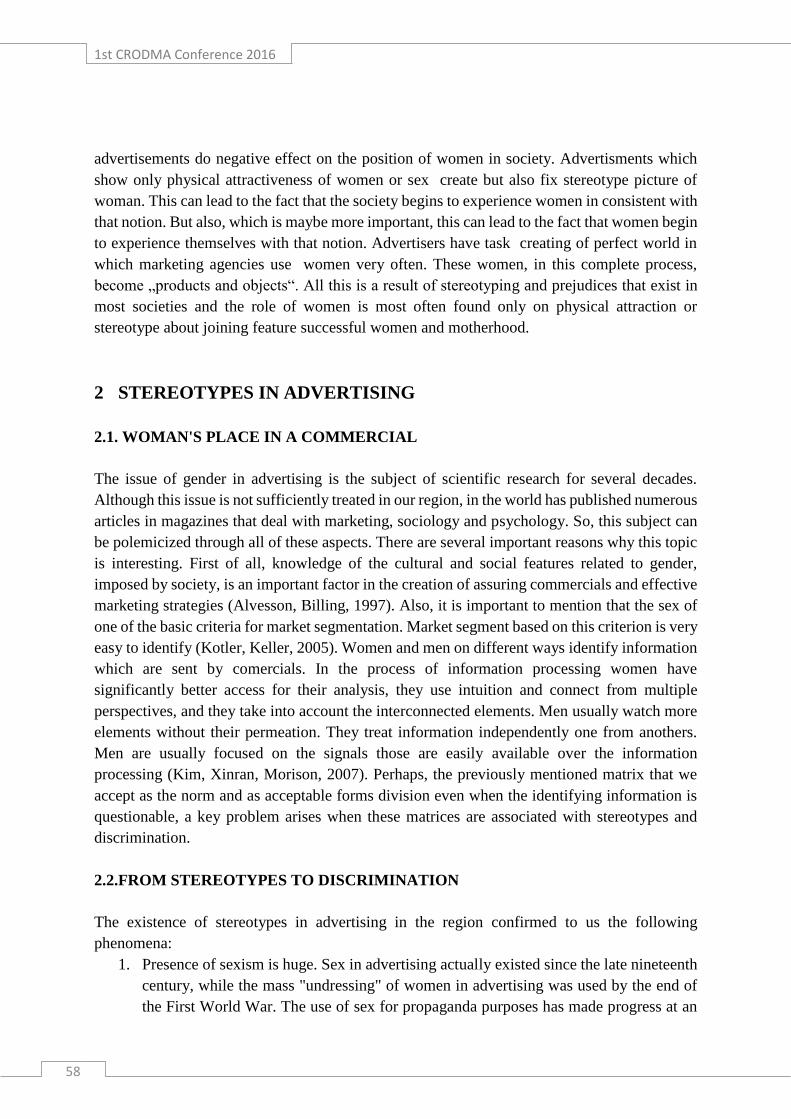
1st CRODMA Conference 2016
58
advertisements do negative effect on the position of women in society. Advertisments which
show only physical attractiveness of women or sex create but also fix stereotype picture of
woman. This can lead to the fact that the society begins to experience women in consistent with
that notion. But also, which is maybe more important, this can lead to the fact that women begin
to experience themselves with that notion. Advertisers have task creating of perfect world in
which marketing agencies use women very often. These women, in this complete process,
become „products and objects“. All this is a result of stereotyping and prejudices that exist in
most societies and the role of women is most often found only on physical attraction or
stereotype about joining feature successful women and motherhood.
2 STEREOTYPES IN ADVERTISING
2.1. WOMAN'S PLACE IN A COMMERCIAL
The issue of gender in advertising is the subject of scientific research for several decades.
Although this issue is not sufficiently treated in our region, in the world has published numerous
articles in magazines that deal with marketing, sociology and psychology. So, this subject can
be polemicized through all of these aspects. There are several important reasons why this topic
is interesting. First of all, knowledge of the cultural and social features related to gender,
imposed by society, is an important factor in the creation of assuring commercials and effective
marketing strategies (Alvesson, Billing, 1997). Also, it is important to mention that the sex of
one of the basic criteria for market segmentation. Market segment based on this criterion is very
easy to identify (Kotler, Keller, 2005). Women and men on different ways identify information
which are sent by comercials. In the process of information processing women have
significantly better access for their analysis, they use intuition and connect from multiple
perspectives, and they take into account the interconnected elements. Men usually watch more
elements without their permeation. They treat information independently one from anothers.
Men are usually focused on the signals those are easily available over the information
processing (Kim, Xinran, Morison, 2007). Perhaps, the previously mentioned matrix that we
accept as the norm and as acceptable forms division even when the identifying information is
questionable, a key problem arises when these matrices are associated with stereotypes and
discrimination.
2.2.FROM STEREOTYPES TO DISCRIMINATION
The existence of stereotypes in advertising in the region confirmed to us the following
phenomena:
1. Presence of sexism is huge. Sex in advertising actually existed since the late nineteenth
century, while the mass "undressing" of women in advertising was used by the end of
the First World War. The use of sex for propaganda purposes has made progress at an

Book of Papers
59
incredible speed at the end of the last century, so in these days the woman is „one step
to plastic dolls whose sole physical characteristics excessively exploited for marketing
of different products“ (Pavlović, 2004;221). The fact is that the amount of sexism varies
from country to country and this can be explained by cultural context and political
culture of authoritarianism (Ibroscheva, 2007). The higher level of authoritarianism,
lower the level of sexism, or vice versa.
2. In the advertising industry in the region, women are mostly naked, and such a
phenomenon usually causes erotic allusions. Women, throughout this process, gets only
a decorative function. This phenomenon will be linked with globalization and the
phenomenon of copying the concept of US print and TV advertising (Wolin, 2003).
3. One of the big problems is the prejudice that there are so-called primary customers. In
the case of most products (mainly those much financially cost) men are the primary
buyers. The starting point for this view is the belief that men have a higher authority,
expertise and competence, particularly in the field of cars and techniques. There are
several reasons that can cause these attitudes:
Imbedded traditional view that women are dependent on men,
General progress for women starts to grow only in the last few years (it is a
very complex and slow process),
Advertisements are indicators of the dominant social values and represent a
kind of reflection of the distribution of of power in society.
Today, the advertisements in the modern media generally can be characterized according to
their content and focus on those that address to the female population and on those which are
turn to the male population.
2.3. CLASSIFICATION OF ADVERTISING IN RESPECT OF SEX
There are two types of advertising in which women appear: the first type of advertising is
intended for women and it has many subtypes. In this category are advertisements with the
woman who is shown in a socially imposed role: she is worth a housewife and caring wife and
mother who chooses the best for her children and her family. Analyzing ads that promoting
food products (in countries in the region), it is obvious allusion according to which is the
fundamental task of women caring for family. Mothers are the ones who care for food,
protecting their families, while men are portrayed in advertising but only as passive observers.
In the "domestic" commercials, experts say that there are three kinds of women: "woman-child",
"woman-woman" and "woman-mother". The first type of commercials are those where a little
girl immensely enjoys the smell of fabric softener, or daughter who competes in the purchase
of better laundry detergent, and mothers support their choice. In this group there are
commercials for women concerning cosmetic products which will help her to seduce and
conquer any man (Shauma, Garnier). The local media are full of commercials of cosmetic
products. In these commercials are usually displayed world-famous singers, models, actresses,
1st CRODMA Conference 2016
60
which with their appearance confirm the effectiveness of a particular product. The messages
that are sent by celebrities is that women can and deserve to look nice, groomed and desirable,
just like them. Advertisements almost always show some innovation (all products operate from
the first day). The industry of cosmetic products in its advertising emphasis put on beauty,
stereotypes or the imperatives. The products through commercials, get symbolic, "the
exchange" value on a human scale, if it is possible to create (and enforce) the connection
between the product and the customer.
Another type of commercials is addressed to men, and in them women usually have a decorative
function, they are shown through erotic allusions or as part of promotional goods. These are the
various commercials for cars (an example of fashion model with her legs spread, advertises car
Golf V, with the message "indecent proposal"). In those kind of commercials could be seen
women with perfect proportions which send messages to men, "between the lines", that they
will be more desirable after buying these products.
3 PRESENTATION OF WOMEN IN CROATIAN WAY
This article was created from a desire to show how female gender represented in advertisements
in women's magazines in Croatia. Perhaps even more importantly, we wanted to show the ways
in which women are presented. Because of these reasons, it was made one, albeit brief survey,
but sufficient to notice potential problems when considering showing the woman's role in
society. The research which was done, actually presents an analysis of the advertising content
of two women's magazines in Croatia (Glorija and Story). These newspapers are considered as
representative for this type of research and analysis. We analyzed samples of these newspapers
in the period from July 27th to August 19th, 2016. A total of eight publications (publications
are weekly newspapers) and the sample included the entire newspaper content. The
methodology of this study included the techniques that can be classified into two categories:
1. The representation of female characters (how many women are represented in
commercials in comparation with men);
2. The status of women (their identity, what they show, do the comercials confirm the
stereotypes).
3.1. ANALYSIS OF STORY
Analysis of the Croatian women's magazine shows that women have an absolute advantage
over men in the advertising presentation. Graph 1 shows a representation of female and male
characters in the analyzed sample of newspapers, and points to the fact that women mainly
participate in the advertising industry (there is a significant number of commercials in the
category "Others" what indicates commercials in which neither women nor men have leading

Book of Papers
61
roles). The presence of women and men in advertisements can be illustrated as follows (Graph
1.).
Graph 1. Advertisements in the magazine Story
Table 1. The total representation of female and male characters in advertisements in the
magazine Story
STORY The total number of
advertisements (1)
The number of
impressions of women in
advertisements (2)
The number of
impressions of men in
advertisements (3)
Percentage
(Index 2/1)
27.07.2016. 31 15 1 48,38%
03.08.2016. 32 11 2 34,37%
10.08.2016. 27 10 1 37,03%
17.08.2016. 16 5 1 31,25%
TOTAL 106 41 5 38,67%
Table 1 provides data on the overall representation of female and male characters in the
advertising space of Croatian women's publications. It is interesting that women appear more
than 8 times than men. Male characters in the commercials are indeed a rarity (in some editions
appear even one time). Analyzing the the entire media content, it is evident that there are more
recognizable identity-male characters are for serious, authoritative and credible role. On the
other hand, women mainly creates a good visual scene, and in this context, commercials are
ideal place for female characters.
3.2. ANALYSIS OF GLORIJA
The above-mentioned views are similar in the second magazine which is analyzed. Female
characters are absolutely dominant in relation to the male characters.
Women
Men
Total
0
50
100
150
1
Women
Men
Total

1st CRODMA Conference 2016
62
Graph 2. Advertisments in the magazine Glorija
Table 2. The representation of female and male characters in Gloria
GLORIJA The total number of
advertisements (1)
The number of
impressions of women in
advertisements (2)
The number of
impressions of men in
advertisements (3)
Percentage
(Index 2/1)
28.07.2016. 26 8 3 30,76%
04.08.2016. 31 8 - 25,80%
11.08.2016. 24 6 - 25%
18.08.2016. 16 6 - 37,5%
TOTAL 97 28 3 28,86%
Very interesting data were appeared in this analysis. For example, women were appeared 28
times in a total of four time editions, and it is 28.86% of entire advertising content. The men
in the commercials were present only 3% (there were no men in commercials in three editions
in August). These data show that women in relation to men, in quantitative terms, scored
significantly better role. However, in the distribution of social power and prestige, they are
absolutely subordinate. In this context, it was very interesting to observe the categorization of
the main protagonist in commercials by occupation and / or the position they occupy in society.
The status of women and men in the advertising can be an indicator for the assessment of status
of these characters, their identities and roles, as well as an indicator for the assessment of their
importance and also of positioning in society. To realize what the professional status of women
is in advertising, it will be displayed graph that shows what actually are the main occupations
of women that advertise certain products.
Women
Men
Total
0
50
100 Women
Men
Total

Book of Papers
63
Graph 3. The professional status of women that appear in the weekly magazines*
* Graphic indicates the professional status of women in a single edition of the weekly magazine
Story, number 30, July 27th 2016.
Graph 4. The professional status of women in magazine Gloria**
** The graph indicates the professional status of women in the edition of magazine Gloria
(August, 11th, 2016).
Analyzing data from the graph 3, it is evident that women, generally, have a role whose
references are reduced to beauty, physicality and entertainment. Thus, 46% of women were in
the role of the model, 6% of them were were in the role of the singer, and the other 46% of
women had anonymous status (women with no known professional status). Women in Gloria
are sportswomen (16%), models (50%) and women of unknown status (33%).
3.3. INEVITABLY MOTHERHOOD
Advertisements in Croatia (in women's newspapers) are very interesting. At first sight, it seems
that the commercials that show and link women with beauty, cosmetics and fashion are very
interesting. However, more detailed analysis reveals that of "inevitable" nature of motherhood
as part of the life of a woman which is not only essential, but also a natural expectation of the
role of women in society. In this sense, in advertisements, motherhood is inevitable, and very
Models
SingersUnknown status
0
2
4
6
8
Models
Singers
Unknown status
Sportswomen
ModelUnknown status
0
1
2
3
Sportswomen
Model
Unknown status

1st CRODMA Conference 2016
64
often implies that a woman is not and can not be happy unless she is part of the traditional
family and if she does not take care of her family.
Figure 1. An example of advertisements published in Gloria
Figure 2. Precedent advertising that alludes that motherhood is the most important for woman
(a commercial of Podravka)
Author Rebranović (Kultura komuniciranja, 2013.) states that the first role of women in
advertising is motherhood, and then, the deceitfulness, perfection, manipulation and
dependence on men. Unfortunately, all these facts are present in the Croatian advertising
industry.
3.4. BRIEF ANALYSIS OF RESEARCH
In Croatia, there is the Law on Advertising in the framework of the Media Act in which, in
Article 20, it is clearly stated that it is not permissible advertising in which women and men in
an insulting manner. Indeed, there were not found advertisements which woman shows in an
insulting and degrading manner (in terms of sexuality), and also in women's newspapers was
not found sexist advertising (it does not mean they do not exist: it mustn't be forgotten
advertisements such as those of the Croatian Tourist Board which is prohibited in order to sexist
message, advertisements for beer's industry and many others that have occurred and which are
broadcasted on Croatian territory), but of course there are those commercials that promote
Book of Papers
65
stereotypes and promote wrongly acquired the role of women in which she is reduced mainly
to physical attraction and visual sensation. This study found that ads in Croatian women's
magazines still more promote stereotypical roles of men and women, but they are also harmful
and they are not at all, harmless social problem. Sexism, prejudices and gender discrimination
in the media and in the advertising industry, are mostly related to negative objectification and
presentation of women, and as such they have very harmful effects. Presentation of women in
advertising and the media in general, shows clearly the position of women in contemporary
society: it is still strongly patriarchal and it is under the influence of stereotypes.
4 CONCLUSION
It is necessary to make extensive research and analysis of media content to more accurately
could analyze the manner of representation of women in the advertising industry. This work
suggests that media companies in the region (mainly commercial) prefer male gender, assigning
them all the roles that determine the fate of a large number of people, and even the whole
society. A woman comes to the fore when it should be showed attributes of physicality and
attractiveness - she becomes a natural attraction and visual sensations. In general, the systematic
exploration of advertisements throughout the region are missing, and the study of these issues
could lead to the identification of key relationships in the society and serve as an indicator for
the assessment of elements of the overall cultural matrix.
The media have great influence in promoting social values so it is important that media is
showing both sex. It must be changed attitudes and awareness of the roles and functions of
women and men. It must be stoped showing woman through stereotypes, and thus, equality,
which is guaranteed by the law, will not be just a phrase. The correct presentation of women
and their roles in the society is one of the key factors in strengthening the social awareness
about equality between men and women and eliminating discrimination based on sex.
REFERENCES
[1] Alvesson M., Billing Y.(1997): Understanding Gender and Organizations, Sage,
London.
[2] Bal Frensis (1996):Moć medija, Clio, Beograd.
[3] Bamburać, Jusić, Isanović (2007): Sereotipizacija: Predstavljanje žena u štampanim
medijima u jugoistočnoj Evropi, Mediacentar, Sarajevo.
[4] Beetles A., Harris L. C. (2005): Consumer attitudes towards female nudity in advertising:
An empirical study, Marketing Theory, Vol. 5.
[5] Ibroscheva E. (2007): Caught Between East and West? Portrayals of Gender in
Bulgarian Television Advertisements, Sex Roles, Vol.57.

1st CRODMA Conference 2016
66
[6] Jurčić, D.(2014): Predstavljanje žena u tiskanim medijima u BiH, od stereotipa do
diskriminacije, doktorska disertacija, Mostar.
[7] Kotler P, Keller K. L. (2005): Marketing Management, 12. edition, PrenticeHall, New
Jersey.
[8] Kim D. Y, Xinran Y. L, Morrison A. M. (2007): Genderdifferences in
onlinetravelinformationsearch: Implications for marketing communications on the
internet, TourismManagement, Vol 28.
[9] Kultura komuniciranja, znanstveno stručni godišnjak, Fram Ziral, Mostar, 2013.
[10] Pavlović, M. (2004): Odnosi s javnošću, Megatrend univerzitet primenjenih nauka,
Beograd.
[11] Vidmar, K., H.(2002): Nasa zena and the image of the mother: contradictions and
oppositions, 1991-2000, Boznar&Partner, Ljubljana.
[12] Wolin D. (2003): Gender Issues in Advertising – An Oversight Synthesis of Research:
1970-2002, Journal of Advertising Research.

Book of Papers
67
MICRO-MOMENTS OF USER EXPERIENCE: AN APPROACH TO
UNDERSTANDING ONLINE USER INTENTIONS AND BEHAVIOR
ANTUN BILOŠ
Faculty of Economics in Osijek
Josip Juraj Strossmayer University of Osijek
Gajev trg 7, 31000 Osijek, Croatia
DAVORIN TURKALJ
Faculty of Economics in Osijek
Josip Juraj Strossmayer University of Osijek
Gajev trg 7, 31000 Osijek, Croatia
IVAN KELIĆ
Faculty of Economics in Osijek
Josip Juraj Strossmayer University of Osijek
Gajev trg 7, 31000 Osijek, Croatia
ABSTRACT
In recent years, in the advent of global internet availability and almost equally omnipresent
mobile device usage, online user behavior together with the resulting experience has been
changing and evolving at a significant pace. Users do not only spend more time online, they
consult online resources and seek information for various goals and are motivated by a variety
of needs: those intent-driven actions are dispersed throughout the day (or night) and integrated
within their daily activities. The user behavior is determined by specific micro-moments which
are truly the moments of consumer needs and therefore the moments the marketers need to be
a part of. Furthermore, mobile devices and smartphones in particular, possess the ability to
promptly meet the immediate needs of their users thus shaping new opportunities for marketers
to capture and utilize. In order to have a better understanding of online user intention and
behavioral patterns, the paper provides an insight of recent studies of user micro-moments
within the digital environment. The main goal of this paper is to provide an overview of recent
academic and professional papers on the changes in online user experience and behavior and
suggest the theoretical background for further research. Mobile devices can directly influence
user behavior and emotional states by addressing a wide variety of information needs. The

1st CRODMA Conference 2016
68
implications of these findings are important as they empower the possibilities of direct
marketing in the digital era.
KEYWORDS: micro-moments, mobile devices, online user experience, user behavior
1 INTRODUCTION
In recent years, there have been significant changes in patterns of information search and
information consumption paired with highly accelerated information flows through different
mediums and associated channels [Nicholas et al., 2013]. Information access and transmission
has been heavily influenced by the use of mobile devices such as portable computers (laptops),
mobile phones, tablets, wearables and similar devices. Mobile devices are highly individualized
communication tools [Bacile et al., 2014] that have enabled consumers’ global access to digital
information while empowering them to initiate engagement with desired content at the time and
place of their preference [Fulgoni, 2016].
An overwhelming majority of consumers in developed and emerging economies alike are
mobile phone users [Nielsen Research, 2013]. For 2016, the number of mobile phone users
worldwide is forecast to reach 4.61 billion while the same source project over 5 billion mobile
phone users in 2019 [Statista, 2016a]. Within that majority, the percentage of smartphone
ownership is on the rise. Smartphones are usually described as advanced mobile phones with
data access capabilities and a multitude of software applications [Mang et al., 2016]. In 2016,
the number of smartphone users is expected to reach 2.08 billion worldwide and by 2019, the
number of smartphone users should surpass 2.66 billion [Statista, 2016b].
Mobile devices have been rapidly altering user behavior: the change is evident in the way users
search, interact, socialize and make purchases [Ghose et al., 2013]. This type of change is
affecting the entire user experience across various screens, devices and channels [Adams et al.,
2015]. Mobile devices represent “the most important dislocation in the historical
communication flow from brands to consumers” [Fulgoni, 2016]. Furthermore, in many
countries more searches take place on mobile devices than on (desktop) computers. Adams et
al. [2015] suggest that mobile search behavior is a good reflection of growing user reliance on
mobile devices worldwide. Avci [2013] proposes that a simultaneous usage of several media
formats and devices is a behavior leading to a ‘glance culture’ where users split their attention
between varieties of condensed media forms. Within this behavioral change, consumer
attitudes, expectations and values are transformed and shaped towards new conventions.
The global internet and mobile device presence equally enabled the potential reach of their
respective users: it allowed marketers to reach their target audience constantly and more directly
[Grewal et al., 2016]. Considering the decreasing user attention span and lower patience levels,

Book of Papers
69
it is relatively easier to provide all the relevant information through mobile device [Sarvepalli
et al., 2016], acknowledging the user-specific needs and preferences. The ability to support
location-based applications is an extremely important feature that is very specific to mobile
devices [Grewal et al., 2016]. Those interconnected devices allow access to a range of context-
based and location-based services that were previously unavailable.
2 MICRO-MOMENTS OF USER EXPERIENCE
The availability of mobile devices resulted in changing the user experience in the digital
environment. The traditional user journey is fractured into hundreds of real-time intent-driven
moments which occur billions of times per day (Solis, 2015). In 2011, Google specialists
introduced the term Zero Moment Of Truth (ZMOT) as an online “decision-making moment of
user experience” (Lecinski, 2014). However, the term ‘micro-moment’ started to appear more
frequently in digital information environment around 2012 but was made extremely popular by
Google, among others, during 2015 (Google Trends, 2016). Llewellyn (2015) suggests that the
micro-moment concept is a successor to ZMOT concept and is influenced by the increasingly
evolving state of mobile device usage among users. Besides many available professional
articles, the usage of the term micro-moments is still rather limited in the scientific domain.
Ramaswamy (2015) refers to micro-moments as "intent-driven moments of decision-making
and preference-shaping” that occur during the entire user journey and ultimately determine how
that journey ends (Adams et al., 2015). These micro-moments happen when individuals almost
reflexively reach for a device (usually smartphone) to promptly act on any sort of immediate
need. In these moments, user expectations are very high because they expect businesses to
proactively anticipate their needs powered by contextual data (Husson, Ask, 2014). In addition,
digitally-savvy users expect companies to immediately deliver useful content to help them
shape preferences and ultimately make decisions (Milhinhos, 2015).
Micro-moments unfold through a variety of user-oriented scenarios (Solis, 2015). Adams et
al. (2015) propose 4 categories of micro-moments: I-want-to-know, I-want-to-go, I-want-to-
buy, and I-want-to-do moments. In several articles additional categories or sub-categories of
micro-moments are also mentioned. Solis (2015) suggests an additional micro-moment type:
I-want-to-learn (even though it might be considered within the I-want-to-know category).
Regardless of the micro-moment category, every micro-moment is determined by user intent,
context and immediacy.
Wan et al. (2010) mention micro-moments in the context of information services of smartphone
applications, yet the detailed elaboration of the term is missing. However, the same authors
continue to conclude that personalized information services of smartphones support many
micro-moments within the travel process (Wang et al., 2013; Karanasios et al., 2015) in addition

1st CRODMA Conference 2016
70
to supporting main travel activities such as planning, reservation and navigation. The similar
influence on user searching and purchasing activities is apparent across multiple mobile devices
(Ghose et al., 2013; Google, 2012).
Several researches (Luo et al., 2014; Bernoff et al., 2014) use the term mobile-moments along
with micro-moments. Luo et al. (2014) suggest that mobile-moments are specific situations
when users reach for a mobile device “for instantaneous response to a moment in context”.
Furthermore, Bernoff (2014) differentiates the two terms suggesting that micro-moment is a
mobile moment that requires only “a glance to identify and delivers quick information that you
can either consume, or act on immediately”. Some marketing professionals even propose the
term moment marketing (Friedman, 2014; Ferreira, 2015; Pollock, 2016; eMarketer, 2015a) or
micro-moment marketing (Lacoste, 2016) suggesting that micro-moments create a significant
starting point of understanding the target audience behavior. In the following subsections, the
influence of micro-moments in specific market-related situations and fields will be addressed.
2.1 MICRO-MOMENTS IN MOBILE COMMERCE
One of the most important marketers’ goals over time is reaching target audience at the
moments they are open to be influenced and motivated towards preferred action, namely
purchase decision (Samarhan, 2016; Court et al., 2009). For many years these moments were
understood through a funnel where users evaluate a number of potential actions and reduce the
number of alternatives, ultimately choosing one desired action (Court et al., 2009). The funnel
approach proposes that users “systematically narrow the initial consideration set” as they
evaluate alternatives in order to reach a final decision about the purchase (Samarhan, 2016).
However, the funnel concept doesn't capture the complexity of the decision process (Baik et al.,
2014; Marvin, 2015). The path of user experience is less linear and far more complicated as it
is comprised of various micro-moments of user experience.
Solis (2016) suggests that understanding user intentions, context and expectations for
immediacy and relevance helps marketers in reaching their target audience more effectively.
Digitally versed companies capture their target audience earlier in the decision-making process
by creating useful content and utilizing those micro-moments (Think with Google, 2016). Users
are attracted to the brands that best address specific micro-moment needs namely because
mobile and digitally connected users are far more oriented on their personal needs than they are
loyal to a particular brand or product (Fulgoni, 2016).
The rapid adoption of mobile devices as well as the widespread use of mobile applications has
fueled the growth of mobile commerce (or m-commerce) worldwide (Xu et al.,, 2016). A recent
study (Meeker, 2016) showed that the average global mobile phone user has 33 applications
(apps) installed on the device, out of which 12 apps are used on a daily level. eMarketer (2016)
estimates that US retail m-commerce sales will reach $123.13 billion in 2016, which is slightly

Book of Papers
71
under a 40% increase in comparison with 2015 and more than double the amount compared to
2014. In addition, m-commerce will account for just under one-third of retail e-commerce sales
in 2016.
Based on a recent Google/Ipsos study (Ramaswamy, 2015), 91% of US based smartphone users,
look up information on their smartphones while in the middle of a task. Furthermore, 82% use
their phones while they're standing in a physical store deciding which product to purchase. One
in 10 of those buy a different product than they had initially planned. A similar study (Google,
2016) revealed that 88% of online users accessed a device for immediate information or ideas
while 78% of smartphone users regularly turn to their smartphone for ideas while doing a given
task. In addition, more than half of smartphone users agree that the last time they used their
smartphone while shopping at the physical store, the information found impacted their purchase
decision. Furthermore, 50% of consumers conducting research on their smartphone have
purchased a product they would not normally purchase because of relevant information
available on their smartphone in the specific moment (micro-moment).
Xu et al. (2016) confirmed that users rely on micro-moments across devices to browse for
products and make purchases and in fact positively influence the consumer purchase process.
In addition, Milhinhos (2015) investigated how the intersection of content marketing and e-
commerce affects attitudes and behavioral intent, thus leveraging the micro-moments of user
experience. The results indicate that content marketing in commercial product pages is relevant
in driving consumer attitudes and purchase intentions. Interestingly enough, recent changes in
user online behavior also influenced the frequency of physical store visits. Adams, Burkholder
and Hamilton (2015) propose that even though the physical store visits have declined,
consumers are spending more when they visit as a result of prior research and decisions made
ahead of coming to the physical store.
A recent study of the US market (Forrester, 2015) indicated that many businesses recognize the
sense of urgency that mobile-oriented user behavior has on user experience. In fact, 70% of
companies stated they have begun to transform their businesses on account of mobile device
usage among their target audiences. Furthermore, the same study found that businesses that act
on implementing the micro-moment approach in their strategies reap tangible benefits in overall
marketing investment.
2.2 MICRO-MOMENTS IN ONLINE ADVERTISING
Bearing in mind the popularity and global connectivity of mobile devices, it is apparent that
mobile advertising presents major opportunities for various businesses. The global mobile
advertising market is growing, with estimation to reach over $100 billion and account for more
than half of total digital advertising spending in 2016 (eMarketer, 2015b).

1st CRODMA Conference 2016
72
Professional research has shown that the consumer engagement and the impact of advertising
is higher on mobile devices than on desktop computers (comScore et al., 2015). Fulgoni (2016)
suggest that the reason behind this is less advertising clutter on mobile devices in comparison
to traditional desktop computers and that advertisements can be delivered closer to the actual
point of purchase or, in more general terms, closely aligned to the consumer mindset utilizing
the micro-moments of user experience.
The message oversaturation of advertising communication channels has traditionally driven
advertisers towards the need of being unique and different at almost any cost thus alienating
them from the initial communication goals. Although target audience might respond to the
novelty of advertising message, Gevelber (2015) argues that the consumers value utility over
novelty which ultimately leads to achieving desired business goals. However, leveraging the
potential of mobile advertising has proven to be a significant challenge with somewhat
questionable effectiveness (Del Rey, 2012). In addition, a large percentage of consumers
perceive mobile ads as irrelevant, thus considering them as irritating and often ignoring those
ads entirely. This perception can lead to absence of any positive effect or even create negative
influence on consumer attitudes and purchase intentions (Bart et al., 2014; Patel et al., 2013).
On the other hand, prior research has shown that valid geo-targeting or consumer micro-location
context is crucial to mobile ad effectiveness (Ghose et al., 2014; Luo et al., 2014).
2.3 MICRO-MOMENTS IN ONLINE TRAVEL INDUSTRY
Smartphones appear to have substantial influence on travelers enabling them to access online
information virtually anytime and anywhere (Brown, Chalmers, 2003) and construct their
personal travel experience (Wang et al., 2010; Rasinger et al., 2007). Mobile devices “can
change tourists’ behavior and emotional states by addressing a wide variety of information
needs” while empowering them to solve problems more effectively, share their experiences and
even preserve memories (Wang et al., 2013).
Common travel usages for smartphones usually include taking photos, social networking,
viewing maps, finding transportation and searching for shops and restaurants (Mang et al.,
2016). However, smartphone apps support tourists’ information processing activities in the
consumption stage, but also the activities in the pre-consumption and post-consumption stages
of tourism services (Wang et al., 2010). A number of activities that had been traditionally
conducted by tourists in the pre-travel and the post-travel stage (searching for information,
booking, feedback, reviews) are now being carried out in the during-travel stage. Karanasios et
al. (2015) refer to this as a ‘concertina effect’ on tourism-related activities.
Location-based capabilities of mobile devices can foster “a scale of response and immediacy
by tourists” which can’t be matched by any traditional means of tourist attention seeking
(Brown et al., 2013). The omnipresence and strong computational capability of smartphones

Book of Papers
73
motivate tourists’ impulsive action (Wang et al., 2013) which accentuates the significance of
micro-moments and the necessity of examining their influence.
3 CONCLUSION
In recent years, there have been significant changes in patterns of information search and
information consumption. With the increasing number of mobile phone users worldwide, user
behavior has been changing and evolving at a significant pace. Mobile devices have been
rapidly altering user behavior: the change is evident in the way users search, interact, socialize
and make purchases. This type of change is affecting the entire user experience across various
screens, devices and channels. Furthermore, mobile devices enabled consumers’ global access
to digital information while empowering them to initiate engagement with desired content at
the time and place of their preference. The user behavior is influenced by specific micro-
moments which are truly the moments of consumer needs and therefore provide a significant
platform of research. Micro-moments are intent-driven moments of decision-making and
preference-shaping that occur during the entire user journey. These micro-moments happen
when individuals reflexively reach for a mobile device to promptly act on any sort of immediate
need. In those specific moments, user expectations are very high because they expect businesses
to proactively anticipate their needs powered by contextual data. Therefore, every micro-
moment is determined by the user intent, context and immediacy. In addition, mobile devices
and smartphones in particular, possess the ability to promptly meet the immediate needs of their
users thus shaping new opportunities for marketers to capture and utilize. In order to have a
better understanding of online user intention and behavioral patterns, the paper provides an
insight of recent studies of user micro-moments within the digital environment. The main goal
of this paper is to provide an overview of recent academic and professional papers on the
changes in online user experience and behavior and suggest the theoretical background for
further research. The implications of these findings are important as they empower the
possibilities of direct marketing in the digital era. Therefore, in order to obtain a more
comprehensive understanding of this issue, further research is encouraged to test, observe and
measure the influence of micro-moments of user experience and behavior.
REFERENCES
[1] Adams, L., Burkholder, E., Hamilton, K. (2015), Micro-Moments: Your Guide to Winning the
Shift to Mobile, Think with Google, https://www.thinkwithgoogle.com/research-
studies/micromoments-guide-pdfdownload.html, [August, 25th 2016]
[2] Avci, B. (2013). Multitasking with mobile devices in contemporary cultural industry.
[3] Bacile, T. J., Ye, C., & Swilley, E. (2014), From Firm-Controlled to Consumer-Contributed:
Consumer Co-Production of Personal Media Marketing Communication, Journal of Interactive
Marketing, 28(2) 117–133.

1st CRODMA Conference 2016
74
[4] Baik, A., Venkatesan, R. & Farris, P. (2014). Mobile shopper marketing: assessing the impact
of mobile technology on consumer path to purchase. Shopper marketing and the role of in-store
marketing, Review of Marketing Research, 11, 1-25.
[5] Bart, Y., Stephen, A. T. & Sarvary, M. (2014). Which Products Are Best Suited to Mobile
Advertising? A Field Study of Mobile Display Advertising Effects on Consumer Attitudes and
Intentions. Journal of Marketing Research (JMR), 51(3), 270–285.
[6] Bernoff, J. (2014). Your Mobile Moments Are Shrinking. Marketing Management,
https://www.ama.org/publications/MarketingNews/Pages/your-mobile-moments-are-
shrinking.aspx, downloaded: [August, 22nd 2016]
[7] Bernoff, J., Ask, J., Schadler, T., & Rogowski, R. (2014). Mobile Moments Transform
Customer Experience. FORRESTER Research White Paper, January Issue, 1–19.
[8] Brown, A., Kappes, J., & Marks, J. (2013). Mitigating theme park crowding with incentives and
information on mobile devices. Journal of Travel Research, 0047287512475216.
[9] Brown, B., & Chalmers, M. (2003). Tourism and mobile technology. In Proceedings of the
eighth conference on European Conference on Computer Supported Cooperative Work (pp.
335-354). Helsinki, Finland: Kluwer Academic Publishers.
[10] Court, D., Elzinga, D., Mulder, S. & Vetvik, O.J. (2009) The consumer decision journey,
McKinsey Quarterly, http://www.mckinsey.com/business-functions/marketing-and-sales/our-
insights/the-consumer-decision-journey, [August, 25th 2016]
[11] Del Rey, J. (2012). Will Mobile’s Massive Growth Ever Equal Real Revenue? Advertising Age,
http://adage.com/article/digital/mobile-s-massive-growth-equal-real-revenue/237511/,
downloaded: [August, 22nd 2016]
[12] eMarketer (2015a). In the UK, Real-Time Marketing Moves to Moment Marketing,
http://www.emarketer.com/Article/UK-Real-Time-Marketing-Moves-Moment-
Marketing/1013369, [August, 25th 2016]
[13] eMarketer (2015b). Mobile Ad Spend to Top $100 Billion Worldwide in 2016, 51% of Digital
Market, http://www.emarketer.com/Article/Mobile-Ad-Spend-Top-100-Billion-Worldwide-
2016-51-of-Digital-Market/1012299, downloaded: [August, 22nd 2016]
[14] eMarketer (2016). Shoppers Are Downloading More Mobile Retail Apps,
https://www.emarketer.com/Article/Shoppers-Downloading-More-Mobile-Retail-
Apps/1014041?ecid=MX1086, [August, 26th 2016]
[15] Ferreira, J. (2015). Why Brands Need to be Living in the Micro-Moment, State Of Digital,
http://www.stateofdigital.com/brands-need-living-micro-moment/, [August, 25th 2016]
[16] Forrester Consulting (2015) Moments That Matter Intent-Rich Moments Are Critical To
Winning Today’s Consumer Journey, https://storage.googleapis.com/think/docs/forrester-
moments-that-matter-research-study.pdf, [August, 27th 2016]
[17] Friedman, L. (2014). 3 Ways To Capitalize On Moment Marketing, iMedia Connection,
http://www.imediaconnection.com/articles/ported-articles/red-dot-articles/2014/feb/3-ways-to-
capitalize-on-moment-marketing/, [August, 25th 2016]
[18] Fulgoni, G. M. (2016). In the Digital World, Not Everything That Can Be Measured Matters.
Journal of Advertising Research, 56(3), 9-13.
[19] Gevelber, L. (2015). A Micro-Moments Report Card: Are We Making the Grade?, Think with
Google, https://www.thinkwithgoogle.com/articles/micro-moment-report-card.html, [August,
27th 2016]

Book of Papers
75
[20] Ghose, A. & Han, S. P. (2014). Estimating demand for mobile applications in the new economy.
Management Science, 60(6), 1470-1488.
[21] Ghose, A., Han, S. P., & Xu, K. (2013). Mobile commerce in the new tablet economy. In
Proceedings of the 34th International Conference on Information Systems (ICIS) (pp. 1-18).
Chicago
[22] Google (2012). The New Multi-Screen World: Understanding Cross-platform Consumer
Behavior, http://services.google.com/fh/files/misc/multiscreenworld_final.pdf, downloaded:
[August, 22nd 2016]
[23] Google (2016) Moments that Matter Research, April 2016
[24] Google Trends (2016) micro-moments (Explore),
https://www.google.com/trends/explore?date=all&q=micro-moments, downloaded: [August,
24th 2016]
[25] Grewal, D., Bart, Y., Spann, M., & Zubcsek, P. P. (2016). Mobile advertising: a framework and
research agenda. Journal of Interactive Marketing, 34, 3-14.
[26] Husson, T & Ask, J. A. (2014). Predictions 2015: Most Brands Will Underinvest In Mobile
Brands Embracing The Mobile Mind Shift Will Pull Ahead Of Those Treating Mobile As Just
Another Channel, Forrester Research,
https://www.forrester.com/report/Predictions+2015+Most+Brands+Will+Underinvest+In+Mobi
le/-/E-RES118065, [August, 26th 2016]
[27] Karanasios, S., Burgess, S., & Sellitto, C. (2015). Mobile devices and information patterns
amongst tourists. Information Research, 20(1).
[28] Lacoste, J. (2016). WTF is Micro-Moment Marketing? Inc.com, http://www.inc.com/jonathan-
lacoste/wtf-is-micro-moment-marketing.html, [August, 25th 2016]
[29] Lecinski, J. (2014). ZMOT: Why It Matters Now More Than Ever, Think with Google,
https://www.thinkwithgoogle.com/articles/zmot-why-it-matters-now-more-than-ever.html,
[August, 25th 2016]
[30] Llewellyn, G. (2015). Micro-moments: What are they and how do marketers need to respond?,
Smart Insights, http://www.smartinsights.com/digital-marketing-platforms/google-
marketing/google-micro-moments/, [August, 25th 2016]
[31] Luo, X., Andrews, M., Fang, Z., & Phang, C. W. (2014). Mobile Targeting. Management
Science, 60(7), 1738–1756.
[32] Luo, X., Reinaker, A., Phang, C. W. & Fang, Z. (2014). Mobile moments. Available at SSRN.
[33] Mang, C. F., Piper, L. A. & Brown, N. R. (2016). The Incidence of Smartphone Usage among
Tourists. International Journal of Tourism Research.
[34] Marvin, G. (2015). Google Says Micro-Moments Are The New Path To Purchase, Marketing
Land, http://marketingland.com/google-says-micro-moments-are-the-new-path-to-purchase-
131009, [August, 26th 2016]
[35] Meeker, M. (2016). Internet Trends 2016 – Code Conference, Kleiner Perkins Caufield &
Byers, http://www.kpcb.com/internet-trends, [August, 26th 2016]
[36] Milhinhos, P. R. V. (2015). The impact of content marketing on attitudes and purchase
intentions of online shoppers: the case videos & tutorials and user-generated content. Escola
Brasileira de Administração Pública e de Empresas, Centro de Formação Acadêmica e Pesquisa.
(Doctoral dissertation)

1st CRODMA Conference 2016
76
[37] Nicholas, D., Clark, D., Rowlands, I., & Jamali, H. R. (2013). Information on the go: A case
study of Europeana mobile users. Journal of the American Society for Information Science and
Technology, 64(7), 1311-1322.
[38] Nielsen Research (2013). The Mobile Consumer: A Global Snapshot,
http://www.nielsen.com/us/en/reports/2013/mobile-consumer-report-february-2013.html,
[August, 24th 2016]
[39] Patel, D., Schneider, J. & Surana, K. (2013). Cracking the Mobile Advertising Code. Harvard
Business Review, http://blogs.hbr.org/2013/09/cracking-the-mobile-advertisin/, downloaded:
[August, 22nd 2016]
[40] Pollock, C. (2016). Making "Moment Marketing" Work for Your Brand, iProspect,
https://www.iprospect.com/en/us/our-blog/making-moment-marketing-work-for-your-brand/,
[August, 25th 2016]
[41] Ramaswamy, S. (2015) How Micro-Moments Are Changing the Rules, Think with Google,
https://www.thinkwithgoogle.com/articles/how-micromoments-are-changing-rules.html,
[August, 24th 2016]
[42] Rasinger, J., Fuchs, M., & Hopken, W. (2007). Information search with mobile tourist guides: A
survey of usage intention. Information Technology & Tourism, 9, 3(4),177–194.
[43] Samarhan, A. (2016). In-store Consumer Shopping Behaviour Through Mobile Phones.
(Doctoral dissertation)
[44] Sarvepalli, M. S. K. K., & Prakash, N. M. (2016). Conceptual Study on Online Shopper
Behavior Towards E-Tailers Shift From Portal To APP Strategy. PARIPEX-Indian Journal of
Research, 5(5).
[45] Solis, B. (2015) Best Practices: 10 Ways Marketers Can Compete for Micro-Moments: The
New Moment of Truth: Google's Micro-Moments Reshape the Marketing Funnel,
http://adage.com/article/digitalnext/practices-cmos-advantage-micro-moments/298855/,
[August, 24th 2016]
[46] Solis, B. (2016) Intents Vs. Demographics: How Micro-Moments Reshape The Future Of
Digital Advertising, Forbes, http://www.forbes.com/sites/briansolis/2016/01/28/intents-vs-
demographics-how-micro-moments-reshape-the-future-of-digital-advertising, [August, 26th
2016]
[47] Statista (2016a). Mobile phone users worldwide 2013-2019,
http://www.statista.com/statistics/274774/forecast-of-mobile-phone-users-worldwide/, [August,
28th 2016]
[48] Statista (2016b). Smartphone phone users worldwide 2013-2019,
http://www.statista.com/statistics/330695/number-of-smartphone-users-worldwide/, [August,
28th 2016]
[49] Think with Google (2016). How to Create and Measure Effective Mobile Content for Micro-
Moments, https://www.thinkwithgoogle.com/articles/create-and-measure-effective-mobile-
content-for-micro-moments.html, [August, 26th 2016]
[50] Wang, D, S. Park, & Fesenmaier, D (2010). “An examination of information services and
smartphone applications.” Proceedings of 16th Annual Graduate Student Research Conference
in Hospitality and Tourism, Houston, TX, USA.
[51] Wang, D., Park, S., & Fesenmaier, D. R. (2012). The role of smartphones in mediating the
touristic experience. Journal of Travel Research, 51(4), 371-387.
Book of Papers
77
[52] Xu, K., Chan, J., Ghose, A., & Han, S. P. (2016). Battle of the Channels: The Impact of Tablets
on Digital Commerce. Management Science, 1-24.

1st CRODMA Conference 2016
78

Book of Papers
79
NEW BUSINESS MODELS – FROM BUSINESS PROCESS REDESIGN
TO THE DIGITAL TRANSFORMATION
ANTON MANFREDA
University of Ljubljana, Faculty of Economics
Kardeljeva ploščad 17, 1000 Ljubljana, Slovenia
ABSTRACT
Companies are today faced with challenges that are driven by the new technologies,
innovations or the advent of new companies that are completely adapted to the digital era.
Modern technological trends, such as social networks, mobile devices, cloud computing and
data analytics together with the complexity of coordinating all these aspects are bringing
several new issues and unanswered questions. One of the main challenges of the existing
companies is transforming their business models into the digital ones. Easily said; however
hardly done. Existing companies are heavily relying on the tradition and their past success
making that transformation even harder. However, digital transformation cannot be done
without rethinking existing business processes. Companies that want to remain competitive
should have well-regulated and optimized business processes that are enabling them to
efficiently perform their business. Moreover, changing business models is highly related with
business process redesign, which requires additional endeavour particular in companies with
a long tradition. The paper will thus focus on the challenges based on the new digital models
and examine some practical examples of innovative digital products. Furthermore, the paper
will also focus on the business process management as an important prerequisite for successful
digital transformation. The paper thus analyses the possibilities to implement business process
redesign and key challenges during business process redesign. Lastly, the paper will focus on
the trends that should be researched in the future.
KEYWORDS: digitalization, business processes, business models, transformation, CRODMA
1 INTRODUCTION
The digital transformation era is currently going on and will probably even hasten in the next
years, since it is one of the core topics of several academic and practitioner conferences. Some
even denote it as a next revolution. Although the digitization drive began in the 1980s it has
become more important over the last 10 and is set to accelerate even more in the decades ahead
[Gerth and Peppard, 2016]. However, many organisations will have problems adapting to this
revolution. Not merely due to lack of finances or skills but rather due to not having a proper

1st CRODMA Conference 2016
80
vision of the future and being unsure of how to align organisational strategy with the so many
options and possibilities that are challenging the them in their digital transformation.
In contemporary organisations, digital skills are greatly valued and enquired and it is anticipated
that in the future they will become critical. Digitalization has spread to all areas of business and
is creating new job possibilities with particular skills. It has been claimed more than a decade
ago that by adjusting the business to the new technologies, the need for skilled IT personnel
will appear in order to maintain a competitive advantage with value adding activities
[Kakabadse and Korac-Kakabadse, 2000]. Highly required skills are today related to cloud
computing, big data, analytics, HTML, Android, iOS and the future seems to even increase the
need for these skills.
Digital transformation has an important impact on the corporate world. Contemporary
technological trends have considerable influence on business processes, services, products and
business models. All these trend and issues are forcing companies to rethink their strategies and
their value proposition. Existing companies are relying on the tradition and their past success,
and therefore making the transformation even harder. However, these traditional companies are
under pressure of new emerging companies that have larger potential for rapid innovation and
growth. Therefore, digital transformation of existing companies cannot be done without
rethinking existing business processes. The purpose of the paper is thus to focus on the business
process management as an important prerequisite for successful digital transformation.
Over the past two decades, both academics and practitioners have frequently misused the term
business model. It has been suggested that business models are particularly important; however,
consensus on its meaning has not been established [da Silva, 2013]. The term business model
often denotes various things from strategy, marketing, products to revenue model. Therefore,
the paper will also focus on the concept of business models together with its changes over the
years. The paper will also present new challenges that are based on the digital transformation
and discuss the possibilities for future research.
2 DIGITAL TRANSFORMATION ERA
The digital transformation era is sometimes called as a new revolution [I-SCOOP, 2016]. It is
claimed that digital transformation will transform business processes, the customer experience
and the entire business model and consequently improve competitive success. However, the
question is to what extent the digital transformation differs from the business process
management. Since transformation cannot be done without rethinking business processes,
business process management is crucial the era of digital transformation.
Book of Papers
81
2.1. BUSINESS PROCESS MANAGEMENT
BPM is generally defined as a top-down set of organizational principles and methods designed
to organize, manage and measure the organization based on the organization's core processes
[Harmon, 2014]. Awareness for BPM is increasing both in practice and research [Houy et al.,
2010] and is becoming even more important in the last few years. Nevertheless, it has been
claimed that business processes are a method for achieving a value for internal and external
clients [Melão and Pidd, 2000] while proper BPM can bring a long-term competitive advantage
[Gartner, 2006]. Therefore, it seems that BPM has been claimed to have the same advantages
as it is claimed today for digital transformation.
Some considered BPM a management innovation [Rich, 2008], while others regard BPM a
management fad [Steininger et al., 2009]. Generally, the implementation part of BPM is
claimed to be the most problematic and is often leading to several failed projects [Sarker et al.,
2006]. The success of BPM namely rest on careful implementation and is depended on a several
organizational factors [Sidorova and Isik, 2010] which is true for most organizational
transformations including the digital transformation.
One of the most important key success factors for a successful BPM is the proper approach of
the employees and management. People are the key issue in this process [Wahid and Corner,
2009]; therefore, developing a proper mind-set is the critical part [Smart et al., 2009]. For BPM
a proper mid-set refers to process thinking and process orientation. Therefore, BPM presents a
holistic management discipline that needs to consider several aspects for its successful adoption
[Rosemann and vom Brocke, 2010].
2.2. BUSINESS MODELS
The concept of business model was presented in an academic paper more than fifty years ago
[Bellman et al., 1957] and after that the concept experienced a constant evolution and
consolidation. One of the first contemporary attempts [Slywotzky, 1996] defined a business
model as a holistic approach, namely (1) how the organizations select their clients; (2) how to
differentiate their offerings; (3) how to plan tasks to be performed out within the organization
and also outside the organization for which external experts will be needed; (3) how to organize
organizational own resources; (4) behaviour on the market; (5) creating products designed for
customers; and (6) making profit. Later several additional definitions were proposed
[Osterwalder et al., 2005; Zott and Amit, 2008]. However, it has been claimed [Nenonen and
Storbacka, 2010] that research on business models is still at the beginning, mainly due to no
commonly agreed definition.
Business model was presented as [Amit and Zott, 2001] governance of transactions designed in
order to create value through the utilization of different business opportunities. Later
1st CRODMA Conference 2016
82
[Chesbrough and Rosenbloom, 2002], additional importance was given to the value creation
process and how the organisation fits in the value chain. Further definitions focused on
emphasizing the strategic view, competition and resources needed for a success [Chesbrough,
2007; Shafer et al., 2005]. Moreover, the importance of partnership and value network has later
been claimed as well as an important part of a business model [Zott and Amit, 2008]. In the
recent years the focus of research moved to the relations between business models and
sustainability [Schaltegger et al., 2015; Stubbs and Cocklin, 2008]. In order to assess the
possibilities for business model growth it is important to interact between infrastructure,
institutions and other actors that build the whole systems [Bolton and Hannon, 2016]. However,
the problem with definitions dealing with the business models exist in the components of a
model; and therefore, there is confusion in terminology, since business model, revenue model,
economic model or strategy are often interchangeably used [Morris et al., 2005].
Even though several academic and practitioner papers propose different definitions for business
models without a matching base, it is possible to identify similarities among their viewpoints
[Nenonen and Storbacka, 2010]. Namely, one common point is that definitions consist of how
business models explain customer value creation. Additional common point is focusing on
strategic orientation and value network, particularly on organizational relations with
stakeholders. Lastly, the majority of definitions focus on explaining how organizations create
profit in their business activities.
The popularity of the topic is evident from the scientific articles dealing with the business
models. In the last five years there has been more than 700 papers published in SCI or SSCI
journal based on the data derived from the Web of Science. In 2015 alone, there were 113
scientific articles with the term “Business Model” or “Business Models” in the title of the paper.
Including also the indexed conferences and books, the number rises to more than 300 in just
one year. In 2016, the number of SCI or SSCI articles dealing with the same topic has already
exceeded 100.
2.3. DIGITAL TRANSFORMATION AND NEW CHALLENGES
All disruptive changes that were driven by new technology like the information and
communication technologies in general have resulted into new forms of business models.
Technological advancement required and enabled a faster adaptation to innovations. Therefore,
business models from the industrial age were not appropriate to deal with the coming challenges
of the information age [Venkatraman and Henderson, 1998]. Moreover, it has been claimed that
new business models were even more important as the talent of individual entrepreneurs
[Hamel, 2002] and were the key reason behind the success of several corporations like Wal-
Mart, eBay, Microsoft, Amazon or Southwest Airlines [Afuah, 2004].

Book of Papers
83
One of the main challenges in the last decade is related to the cloud computing and how to
utilize its power. Cloud computing delivers on-demand computing resources via the Internet on
a pay-for-use basis or any other predefined method. Allowing access from anywhere anytime,
it presents a new way how individuals and organisations work and communicate over the
internet [da Silva, 2013]. The cloud offers a scalable IT system infrastructure enabling
organizations to promptly build scalable businesses at a lower starting costs [Hugos and
Hulitzky, 2010]. Lastly, it offers additional business models like infrastructure as a Service,
Platform as a Service, and Software as a Service.
Cloud computing, social networks and other contemporary challenges are presenting new
possibilities for organizations. Several ideas were live for a decade; however, the technological
advance makes them possible. Beside already known examples of digital transformation for the
products that are easily transformed into digital (like banking, insurance, marketing etc.), the
main challenge is to digitalize non-digital products. The table below presents a few examples
of innovative ideas or products that were digitalized.
Table 1. Digitalizing non-digital products
Product / service Provider Characteristics
A tennis racquet Babolat Play application & sensor
Sport T-shirt Athos application & sensor
Book experience Lost my name offer flexibility
A fax machine aFax application
A locomotive production GE transportation sensor
The whole physical store Tesco application
Motivation SAP application & motivation
Flavour uFlavor application
These examples were more or less successfully transformed into digital, and therefore present
a motivation for many other companies for not being afraid of innovative thinking and starting
rethinking of their existing business models and their products. Some examples required
completely new business models; however at times there is a merely a need for new digital
products. Nevertheless, all these organizations are presenting a driving force for other
companies and are forcing them into changes together with the general trend that are impacting
business models. These general trends are presented in the Figure below.
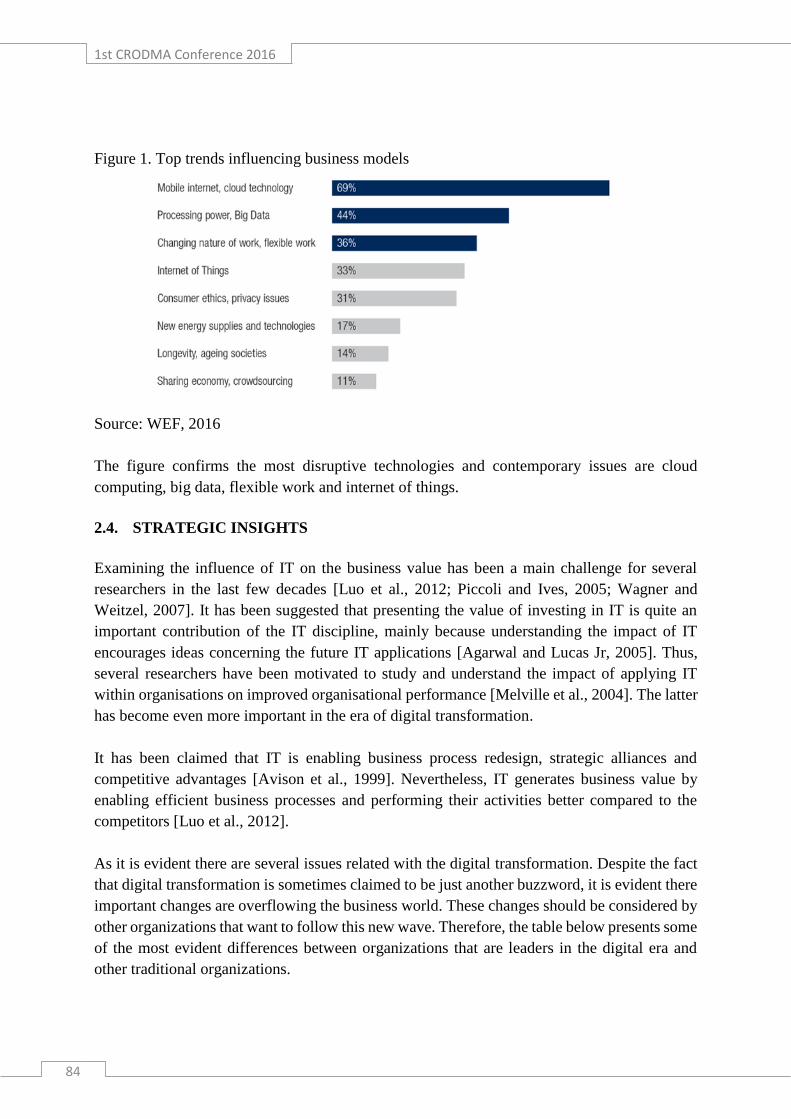
1st CRODMA Conference 2016
84
Figure 1. Top trends influencing business models
Source: WEF, 2016
The figure confirms the most disruptive technologies and contemporary issues are cloud
computing, big data, flexible work and internet of things.
2.4. STRATEGIC INSIGHTS
Examining the influence of IT on the business value has been a main challenge for several
researchers in the last few decades [Luo et al., 2012; Piccoli and Ives, 2005; Wagner and
Weitzel, 2007]. It has been suggested that presenting the value of investing in IT is quite an
important contribution of the IT discipline, mainly because understanding the impact of IT
encourages ideas concerning the future IT applications [Agarwal and Lucas Jr, 2005]. Thus,
several researchers have been motivated to study and understand the impact of applying IT
within organisations on improved organisational performance [Melville et al., 2004]. The latter
has become even more important in the era of digital transformation.
It has been claimed that IT is enabling business process redesign, strategic alliances and
competitive advantages [Avison et al., 1999]. Nevertheless, IT generates business value by
enabling efficient business processes and performing their activities better compared to the
competitors [Luo et al., 2012].
As it is evident there are several issues related with the digital transformation. Despite the fact
that digital transformation is sometimes claimed to be just another buzzword, it is evident there
important changes are overflowing the business world. These changes should be considered by
other organizations that want to follow this new wave. Therefore, the table below presents some
of the most evident differences between organizations that are leaders in the digital era and
other traditional organizations.

Book of Papers
85
Table 2. The comparison between traditional and digitally transformed organizations
Item Traditional organizations Digital transformation era
Hierarchy &
organisation
The importance of hierarchy Unclear hierarchy
Expert groups Interdisciplinary groups
Workday Routine work Improvisational work
Relying on formal rules Formal rules are digitalized
Formal procedures Formal procedures are digitalized
Repeatable work Flexible teams
Planning Predicting the future Agile responsiveness
Products Relying on trademark Relying on services
BPM Different BPM maturity Agile processes
Education Formal training Agile flexibility
IT Supporting role Partnering role
It is important to add that these items are based merely on some examples of organizations
offering digital products, which presents a limitation of this paper and therefore a future
research should be done to justify these items and to provide a more sophisticated list of
differences between traditional and digitally transformed organizations.
However, digitalization should be an essential component of the organisational strategy since
the technology only does not contribute to organisational performance by itself. Therefore it is
important that IT as an enabler of digitalization is part of an overall system that improves the
creation of economic value [Piccoli and Ives, 2005].
3 FUTURE RESEARCH
Future research is needed to discover main differences between business process redesign or
business process management and digital transformation. Further, since digital transformations
is becoming more and more accepted concept there is a strong need to identify the key factors
that are driving a company towards digital transformation. A lot has been written in the last
months regarding the personnel responsible for starting and leading the process of digital
transformation in the company.
However, all these guidance rules were based more on the individual consultants’ impressions,
and therefore a detail research on who should participate in the digital transformation together
with knowledge and skills needed for successful transformation is more than welcome.
Nevertheless, the debate regarding the importance of different knowledge and skills is as old as
IT field itself, although up until the 1980s the importance of technical versus business and
management skills was mainly emphasised [Byrd and Turner, 2001; Vitalari, 1985]. That view
gradually changed in the 1990s when it became obvious that IT personnel need a combination

1st CRODMA Conference 2016
86
of technical, business and interpersonal skills [Mata et al., 1995]. It has been shown that
technical and managerial skills are some of the determining factors of successful IT
implementation [Caldeira and Ward, 2003] and the importance of the different skills and
capabilities of IT personnel was confirmed in various studies [Lerouge et al., 2005; Parolia et
al., 2007; Wade and Parent, 2001].
Nevertheless, the new era of digitalization also requests a new detailed research on knowledge
and skills items, since proper cooperation between business and IT is becoming more important
as ever before. Moreover, the future research should also focus on the trends in the digitalization
and to the extent to which new business models may continue to affect the future business.
Some of the common items for the digitally transformed organizations were already presented;
however, additional research should be carried out to offer a more detailed list of differences
between traditional and digitally transformed organizations together with the impact of these
items on the overall successful digital transformation.
4 CONCLUSION
The paper focused on one of the main contemporary business challenges, namely transforming
the existing business models into the digital ones. The problem became even more complex
since several existing companies are depending on the tradition and their previous success,
which is making that transformation even harder. Therefore, it is particularly important that
organizations rethink their existing business processes and existing business models. The paper
thus focused on the business process management as an important prerequisite for successful
digital transformation. Further, the paper shed light on the concept of business models that is
significantly changing over the years. The paper also presents new challenges that are based on
the digital transformation together with some main differences between traditional and digitally
transformed organizations. Lastly, the possibilities for future research were discussed.
REFERENCES
[1] Afuah, A. (2004). Business models: A strategic management approach.
[2] Agarwal, R. and Lucas Jr, H.C. (2005). The information systems identity crisis: Focusing
on high-visibility and high-impact research, MIS Quarterly, 29, 381-398.
[3] Amit, R. and Zott, C. (2001). Value creation in e‐business, Strategic management journal,
22, 493-520.
[4] Avison, D.E., Cuthbertson, C.H. and Powell, P. (1999). The paradox of information
systems: strategic value and low status, The Journal of Strategic Information Systems, 8,
419-445.

Book of Papers
87
[5] Bellman, R., Clark, C.E., Malcolm, D.G., Craft, C.J. and Ricciardi, F.M. (1957). On the
construction of a multi-stage, multi-person business game, Operations Research, 5, 469-
503.
[6] Bolton, R. and Hannon, M. (2016). Governing sustainability transitions through business
model innovation: Towards a systems understanding, Research Policy, 45, 1731-1742.
[7] Byrd, T.A. and Turner, D.B. (2001). An Exploratory Analysis of the Value of the Skills
of IT Personnel: Their Relationship to IS Infrastructure and Competitive Advantage,
Decision Sciences, 32, 21-54.
[8] Caldeira, M.M. and Ward, J.M. (2003). Using resource-based theory to interpret the
successful adoption and use of information systems and technology in manufacturing
small and medium-sized enterprises, European Journal of Information Systems, 12, 127-
141.
[9] Chesbrough, H. (2007). Business model innovation: it's not just about technology
anymore, Strategy & leadership, 35, 12-17.
[10] Chesbrough, H. and Rosenbloom, R.S. (2002). The role of the business model in
capturing value from innovation: evidence from Xerox Corporation's technology spin‐off
companies, Industrial and corporate change, 11, 529-555.
[11] da Silva, C.M. (2013). Business Models: Theoretical Foundation and Application in E-
business Companies: Doctoral Dissertation.
[12] Gartner (2006). Gartner's Position on Business Process Management,, 26.
[13] Gerth, A.B. and Peppard, J. (2016). The dynamics of CIO derailment: How CIOs come
undone and how to avoid it, Business Horizons, 59, 61-70.
[14] Hamel, G. (2002). Leading the revolution: How to thrive in turbulent times by making
innovation a way of life. Harvard Business School Press Boston, MA.
[15] Harmon, P. (2014). Business Process Change: A Business Process Management Guide
for Managers and Process Professionals, (Third ed.). Morgan Kaufmann.
[16] Houy, C., Fettke, P. and Loos, P. (2010). Empirical research in business process
management – analysis of an emerging field of research, Business Process Management
Journal, 16, 619 - 661.
[17] Hugos, M.H. and Hulitzky, D. (2010). Business in the cloud: what every business needs
to know about cloud computing. John Wiley & Sons.
[18] I-SCOOP. (2016). Digital transformation: online guide to digital business transformation,
from http://www.i-scoop.eu/
[19] Kakabadse, A. and Korac-Kakabadse, N. (2000). Leading the pack: future role of IS/IT
professionals, Journal of Management Development, 19, 97-155.
[20] Lerouge, C., Newton, S. and Blanton, J.E. (2005). Exploring the systems analyst skill set:
perceptions, preferences, age, and gender, Journal of Computer Information Systems, 45,
12-23.
[21] Luo, J., Fan, M. and Zhang, H. (2012). Information technology and organizational
capabilities: A longitudinal study of the apparel industry, Decision Support Systems, 53,
186-194.
1st CRODMA Conference 2016
88
[22] Mata, F.J., Fuerst, W.L. and Barney, J.B. (1995). Information technology and sustained
competitive advantage: A resource-based analysis, MIS Quarterly, 19, 487-505.
[23] Melão, N. and Pidd, M. (2000). A conceptual framework for understanding business
processes and business process modelling, Information Systems Journal, 10, 105-129.
[24] Melville, N., Kraemer, K. and Gurbaxani, V. (2004). Information technology and
organizational performance: An integrative model of it business value, MIS Quarterly,
28, 283-322.
[25] Morris, M., Schindehutte, M. and Allen, J. (2005). The entrepreneur's business model:
toward a unified perspective, Journal of Business Research, 58, 726-735.
[26] Nenonen, S. and Storbacka, K. (2010). Business model design: conceptualizing
networked value co‐creation, International Journal of Quality and Service Sciences, 2,
43-59.
[27] Osterwalder, A., Pigneur, Y. and Tucci, C.L. (2005). Clarifying business models: Origins,
present, and future of the concept, Communications of the Association for Information
Systems, 16, 1.
[28] Parolia, N., Goodman, S., Li, Y. and Jiang, J.J. (2007). Mediators between coordination
and IS project performance, Information & Management, 44, 635-645.
[29] Piccoli, G. and Ives, B. (2005). Review: IT-dependent strategic initiatives and sustained
competitive advantage: A review and synthesis of the literature, MIS Quarterly, 29, 747-
776.
[30] Rich, E. (2008). Management fads and information delays: An exploratory simulation
study, Journal of Business Research, 61, 1143-1151.
[31] Rosemann, M. and vom Brocke, J. (2010). The six core elements of business process
management Handbook on Business Process Management 1, Introduction, Methods and
Information Systems, Springer, Berlin, pp. 105-122.
[32] Sarker, S., Sarker, S. and Sidorova, A. (2006). Understanding Business Process Change
Failure: An Actor-Network Perspective, Journal of Management Information Systems,
23, 51-86.
[33] Schaltegger, S., Hansen, E.G. and Lüdeke-Freund, F. (2015). Business Models for
Sustainability Origins, Present Research, and Future Avenues, Organization &
Environment, 1086026615599806.
[34] Shafer, S.M., Smith, H.J. and Linder, J.C. (2005). The power of business models,
Business Horizons, 48, 199-207.
[35] Sidorova, A. and Isik, O. (2010). Business process research: a cross-disciplinary review,
Business Process Management Journal, 16, 566-597.
[36] Slywotzky, A.J. (1996). Value migration: how to think several moves ahead of the
competition. Harvard Business Press.
[37] Smart, P.A., Maddern, H. and Maull, R.S. (2009). Understanding Business Process
Management: Implications for Theory and Practice, British Journal of Management, 20,
491-507.

Book of Papers
89
[38] Steininger, K., Riedl, R., Roithmayr, F. and Mertens, P. (2009). Fads and Trends in
Business and Information Systems Engineering and Information Systems Research – A
Comparative Literature Analysis, Business & Information Systems Engineering, 1, 411-
428.
[39] Stubbs, W. and Cocklin, C. (2008). Conceptualizing a “sustainability business model”,
Organization & Environment, 21, 103-127.
[40] Venkatraman, N. and Henderson, J.C. (1998). Real strategies for virtual organizing, MIT
Sloan Management Review, 40, 33.
[41] Vitalari, N.P. (1985). Knowledge as a Basis for Expertise in Systems Analysis: An
Empirical Study, MIS Quarterly, 9, 221-241.
[42] Wade, M., R. and Parent, M. (2001). Relationships between job skills and performance:
A study of webmasters, Journal of Management Information Systems, 18, 71-96.
[43] Wagner, H.T. and Weitzel, T. (2007). Towards an IT production function: Understanding
routines as fundamental for IT value creation, Journal of Enterprise Information
Management, 20, 380-395.
[44] Wahid, R.A. and Corner, J.L. (2009). Critical success factors and problems in ISO 9000
maintenance, International Journal of Quality & Reliability Management, 26, 881-893.
[45] WEF. (2016). World Economic Forum: The Future of Jobs, 2016, from
http://reports.weforum.org/future-of-jobs-2016/
[46] Zott, C. and Amit, R. (2008). The fit between product market strategy and business model:
implications for firm performance, Strategic management journal, 29, 1-26.

1st CRODMA Conference 2016
90

Book of Papers
91
PERCEPTION OF THE SOCIAL NETWORKS' IMPACT ON THE
REPUTATION OF ICT COMPANIES
INES MARINČIĆ
Croatian Studies
University of Zagreb
Borongajska cesta 4d, 10000 Zagreb, Croatia
MATEJA ZBODULJA
Lemax d.o.o. – iTravel software
Remetinečka cesta 139, 10000 Zagreb, Croatia
ABSTRACT
Globalization trends presupposes social cohesion in one network in order to exchange
information without any boundaries. Hence, communication technology has a leading role in
planning and organization of private lives and, especially, businesses. This paper explains the
theoretical concept of social networks' usage as an informational tool for providing content
with stakeholders with the purpose of improving reputation and business management.
After integrating social networks into the business structure, it is necessary for the company to
plan and evaluate actions as well as to be prepared for the upcoming changes and possible
difficulties that may stand in the way. Because of the importance of social networks that
nowdays directly impact business results and reputation, this paper focuses on building
relationships with customers and public, planning and evaluating communication strategies
and following trends about social networks marketing.
Including social networks in its business is challenging for every industry because it is public,
fast and it demands flexibility. This paper demonstrates how social networks affect Croatian
ICT companies' reputation. Futhermore, this paper examines, via the survey method, managers'
attitudes and opinions about the subject in order to show how companies, whose primary
activity is ICT development, use social networks and which behaviours have a good or bad
impact in building a reputation.
KEYWORDS: social networks, communication, communication technology, reputation, ICT,
Croatian ICT companies, customer relationship management

1st CRODMA Conference 2016
92
1 INTRODUCTION
Over the past two decades constant development of IT-based economy have resulted with
surrounding characterized by information flow and redesigned business processes towards ICT
integration. Therefore, it is not surprising that ICT has the highest rate of growth in the world
economy and is an integral part of all economic and non-economic activities. In such
surrounding, management faces with: changes in organizational structure, management mode,
using human and other resources, usage of new knowledge and training of personnel for the
implementation of technologically new knowledge and skills [Živadinović and Zelić, 2014].
The aim of this paper is to show the correlation between social networks activities and their
impact on building ICT companies online reputation which is reflected through stakeholders
trust and operating results. In order to reach more precise results, 13 managers of the largest
Croatian ICT companies have described their perception about planning such communication
strategies and incorporate them using social networks.
1.1. LITERATURE REVIEW
According to Quadrans konzalting research from September 2015, in which social networks
activities of hundred biggest Croatian companies have been analyzed, the most successful
companies by followers, fans or reputation were ICT companies. ICT's importance to aspects
of social relations and business development, arising out of their use, have created information
society. Furthermore, technologies have changed the global market and related industries,
customer relationship, market research, pricing formation and business transactions [Brakuš,
2015].
On the one hand, by properly combining the use of these services, especially social networks,
and applying proper strategy, it is possible to achieve a good company reputation in challenging
and changing online environment [Brakuš, 2015]. Researchers from the VU University
Amsterdam conducted a study that revealed that corporate reputation can be enhanced through
social networks activities [Dijkmans et al., 2014]. On the other hand, social networks expand
the spectrum of reputation risks and boost risk dynamics [Aula, 2010]. Although corporate
reputation is a valuable asset, it seems that its constitution is rather fragile and exposed to many
reputation risks. Social networks users can publish true and false facts about companies, or
distribute information about them that differs from what the companies are willing to share
[Grützmacher, 2011].
Despite risks, in 2001 Michel Porter said it was not the key issue of competitiveness of
companies to apply or not to apply Internet technology, but how to do it [Gujić et al., 2016]. In
terms of strategic reputation management, it is important that social networks content cannot
be controlled. Namely, social networks users spread opinions about what organizations should

Book of Papers
93
focus on in the future. In other words, on social networks, „an organization cannot just look
good; it has to be good“. Once they have built a picture, they share it with others and the
subjective truth turns into a collective truth about what an organization is and what it should be
[Aula, 2010]. However, the followers and fans of ICT companies leave traces of themselves on
social networks, so that data can be used as a basis for building reputation and dealing with
reputation risks. Therefore, in managing online reputation other companies are learning from
ICT companies [Brakus, 2015].
Leading to the notion that the reputation of companies is no longer defined only by their actions
and accomplishments, but by how stakeholders perceive, share and comment on company’s
social networks [Grützmacher, 2011]. The three principles of social networks are information,
persuasion and networking, in order to build company’s image and strengthen reputation
[Lančić, 161]. According to Gotsi and Wilson [2001] “corporate reputation is a stakeholder’s
overall evaluation of a company over time. This evaluation is based on the stakeholder’s direct
experiences with the company, any other form of communication and symbolism that provides
information about the firm’s actions and/or a comparison with the actions of other leading
rivals”. Reputation can even be formed through indirect experiences with the firm triggered,
through word-of-mouth, the media, or other publics [Grützmacher, 2011].
Word-of-Mouth, online named World-of-Mouse, is used on social networks for increasing
awareness of the company and creates the potential for prolonged duration of the desired
message [Brakus, 2015]. Furthermore, it is necessary to differentiate corporate reputation from
the related concepts of corporate image and corporate identity, which, as key components of
corporate communication, form the internal and external perception of companies
[Grützmacher, 2011].
In order to build good corporate reputation, communication model of ICT companies has to be
two-way, interactive and directed on „one to one“ and „many to many“, while the desires and
requirements of the stakeholders are trying to be accepted as partners [Lančić, 2009]. Corporate
communication affects corporate reputation because ICT companies, through its chosen
messages, enable stakeholders to appreciate the company’s operations on social networks, and
it positively loads the perception of the company’s activities, which can lead to an overall
positive evaluation of the company [Floreddu and Cabiddu, 2013].
In order to build and maintain their reputation, ICT companies have to understand who their
stakeholders on social networks are and how they perceive them. Hence, ICT companies need
to measure, monitor and coordinate different stakeholder reputations that they possess, in order
to manage their corporate reputation. The more these stakeholder reputations are identical, the
stronger the reputation of ICT companies is [Grützmacher, 2011].

1st CRODMA Conference 2016
94
Further, there is also a direct relationship between the company's reputation and investing in
newest IT developments which affect on the number of mass-customers, revenue growth and
market share. Practice shows that business culture, along with the implementation of multi-
media materials, is successfully stabilizing an already built reputation of ICT companies on
social networks [Živadinović and Zelić, 2014].
According to Grayling Pulse research, the two most common goals of ICT companies when
developing digital strategies are improving reputation and increasing awareness. In this sector,
83 % of companies have developed digital strategy and use social networks for the fulfillment
of mentioned goals. [Ličina Borja, 2012].
2 EXPLANATION OF METHODS
A research has been conducted for the purposes of this article. A anonymous sample of 13
managers from different Croatian ICT companies was taken (all of them use social media
profiles).
Online survey took place in August 2016 and had 35 questions. After survey was done and the
data was gathered, a thorough content analysis was performed.
Possible limitations of the study are: giving socially desirable answers, misunderstanding of
questions due to errors in setting, lack of knowledge about the subject of study and the
inability of generalization because of non-representative sample.
3 RESULTS AND DISCUSSION
From the 13 companies that participated in the survey, 12 of them use Facebook, 10 Linkedin,
9 Twitter, 6 Instagram, 2 Google+, 2 Quora, 2 Slideshare and 2 of them use other social
networks. Companies were able to choose more than one answer.
61.5% of the companies stated that they have a preplanned communication strategy on their
social networks accounts, 30.8% mentioned they do not have any stategy and 7.7% does not
know whether the company has a strategy or not. Thereunto, 53.8% of the companies do not
have a predefined budget for social activities, while 46.2% of them have.
11 of 13 managers participate in the communication on their companies social networks
accounts. What is interesting is that 7 companies do not have a dedicated person for the position
of community manager which executes only online marketing activities, while 6 of them have
a person dedicated only for digital marketing. It is obvious that new roles dedicated for doing

Book of Papers
95
only online marketing are developing. That is why companies spend so much time on social
networks profiles engaging with the community. Namely, 15.4% of companies stated that they
are active on social networks less than 1 hour per week, 30.8% are active from 1 to 5 hours per
week, 15.4% from 5 to 10 hours per week and the most of them (38.5%) are active more than
10 hours a week.
46.2% of the companies share internal photos, 23.1% share blog posts, 15.4% industry news,
7.6% articles and 7.7% share other materials. 46.2% stated that the main goal of communication
on social networks is to improve the reputation of the company, 23.1% choose attracting
employees, 15.4% increase sales, 7.6% information and 7.7% other. Reputation and emyployee
loyalty is connected. Nowadays, ICT is the most wanted and highest paid profession. If
companies want to attract and keep employees, they have to invest in the brand image. The
more respectable the company is, the more quality staff will they attract and retain. ICT is
constantly changing and the biggest capital consists of human resources. By sharing internal
photos and showing their culture they are attracting employees and target audience. This is also
why 69.2% of them pointed out that they have opened social networks in order to promote the
company itself and offered services and/or products, 23.1% in order to attract quality pool of
candidates and 7.7% because of customer relationship management.
According to the international survey, 84% of the interviewed companies (n=600) said that they
are able to reach more customers by using social media and 68% of them used social media for
promoting their products/services [Bhanot, 2011].
3.1. SOCIAL NETWORKS' IMPACT ON THE REPUTATION
As mentioned before, brand image and reputation are crucial in any indrustry for attracting
employees and customers. In ICT industry customers are mostly “online” and it is not strange
that 8 of 13 companies mentioned that using one or more social networks accounts has direct
positive impact on reputation, while 5 of them does not know. Nobody answered that using
social networks is not affecting reputation, which proves the impact of social media on
reputation.
Furthermore, 69.2% of the companies believe that the amount of posts published on social
networks has an affect on improving or disproving reputation of the company, 23.1% do not
know, 7.7% say that the amount of posts are not affecting reputation. It can be connected with
the next answers that show how 53.8% of the companies believe that all the activities on social
networks are crucial for their reputation, 38.5% believe that they are not crucial, and 7.7% do
not know. As we can see, more than half of the companies told that using social networks is
crucial for their reputation, but more of them (69.2%) said that in the next two years activities
on social networks will impact even more on the reputation of the company, 23.1% of them do
not know and 7.7% think it will not affect more than today.

1st CRODMA Conference 2016
96
Figure 1. Impact of the number of social network accounts on the reputation
No company disagrees with the statement that one of the benefits of using social networks for
reputation is preventive PR, 7.7% of the companies mainly disagree, 30.8% have no opinion
about it, 38.5% agree with the statement and 23.1% strongly agree.
Further, no company disagrees with the statement that one of the benefits of using social
networks for reputation is understanding the needs of consumers by analyzing their
communication habits, 7.7% of the companies mainly disagree, 38.5% have no opinion about
it, 30.8% agree with the statement and 23.1% strongly agree.
It's known that articles in media are very important for buidling the reputation of any company.
Therefore, since ICT companies cooperate with a lot of foreign customers and are managing
contracts world wide exporting their services or/and products, it is crucial to be visible to
foreign media. Local media are more important for employee branding atracting good potential
employees. That is why 30.8% of them agree and 30.8% strongly agree with the statement that
one of the benefits of using social networks for reputation is presentation of services or/and
products.
From all social activities the biggest impact on the company’s reputation is good
communication with network users (61.5%), suitability of content to the group of users that
reads it (46.2%), publicly communicated and transparent information (38.5%), continuous
updating (38.5%), diversity of content shared (30.8%), visual presentation of content (30.8%),
number of followers (15.4%) and other (7.7%). Companies were able to choose more than one
answer.
61,5%
38,5%
0
Yes I don't know No

Book of Papers
97
Figure 2. Impact of social network activities on the company reputation
Companies mentioned that what harms the reputation the most is bad communication with
customers and users (46.2%), no suitability of content to the group that follows it (23.1%), no
diversity of content shared (15.4%), no transparent information (7.7%) and rare updating
(7.6%).
46.2% of companies said that they should be better in updating information on social networks,
15.4% said they should be better in communicating with network users, 15.4% think that they
should work more on diversity of content shared, 7.7% said they should work more in getting
more followers, 7.7% in visual presentation of content and 7.7% on suitability of content to the
group that follows it.
3.2. SOCIAL NETWORKS' IMPACT ON THE EMPLOYEE BRANDING
According to the international survey, which asked over 600 human resources and recruiting
professionals as to how they use social networking in their recruiting process, 73.3% said they
currently use social media to recruit candidates [Bhanot, 2011].
76.9% of companies said that there were candidates who had come to the interview already
heard something about company on social networks, while 23.1% of them do not know.
61,5%
38,5% 38,5%30,8%
46,2%
30,8%
15,4% 7,7%0,0%
10,0%
20,0%
30,0%
40,0%
50,0%
60,0%
70,0%

1st CRODMA Conference 2016
98
Figure 3. Potential employees perception of the company based on company's activities on
social networks
77% of the companies believe that candidates who came to the job interview already had a
certain perception of the company based on company's activities on social networks, while
23.1% of them do not know and nobody answered no. This is a proof that potential employees
are studying companies carefully and that the online presence is crucial for presenting the
company in an attractive way. Companies that are not “famous” and do not have a good online
pressence will have a harder time finding (and keeping) good employees. Before the acctual
job interviews, it is important to get as much applications as possible. The reputation, then,
directly affects how many applications will the company receive. 69.2% of companies said that
they believe that the response to the interviews and open positions (applications) would be less
popular if there was no communication on social networks, while 30.8% of them do not know.
It is not only how popular their social network accounts are, but also the power of word of
mouth, apropos how will existing employees present the company online, tell their friends about
it or share open positions. 61.6% of the companies believe that social activities affect directly
on employee satisfaction and the perception of the company, 30.8% of them do not know while
7.7% of them disagree. Further, 12 companies declared that their employees are involved in
sharing and commenting content on social networks, while only 1 said that the employees are
not sharing or commenting the content published by the company.
The power of social networks is allowing people to write and publish their thoughts, opinions
and critics. It is also easy to find all information online or to leave a review with just a few
mouse clicks that will be visible to all people around the globe. That is why 53.9% of the
companies encourage employees to take education in the field of online marketing, while 46.2%
of them do not.
77%
0
23%
Yes No I don't know

Book of Papers
99
3.3. SOCIAL NETWORK USERS AND POTENTIAL BUYERS
Only 1 company stated that negative comments on their networks do not affect the company's
business, 2 of them do not know, 4 companies claimed that negative comments are affecting
the company's business while 6 of them claimed that they never had a negative comment.
Figure 4. Impact of negative feedback/review on the company's business
15.4% of the companies said that they do not lose potential customers because of the negative
feedback or review, 15.4% do not know, 15.4% claim to have lost potential customers based
on negative feedback, while 53.8% of them stated that there was no negative feedback. It is
possible that there was no negative feedback because of the knowledge how to manage social
network accounts, how to communicate and what to share. As mentioned before, over 50% of
companies are investing in educating their stuff for online marketing management. Even if the
company is not paying professional courses, people are teaching themselves by reading free
online courses, articles and ebooks.
No company disagrees with the statement that because of the social activities their brand has a
strong subliminal effect on customer preferences, 15.4% of the companies mainly disagree,
38.5% have no opinion about it, 38.5 % agree with the statement that because of the activities
on their networks the brand has a strong subliminal effect on customer preferences and 7.7% of
them strongly agree with that statement.
No company disagrees with the statement that because of the social activities they seem more
reliable than companies that do not use social networks, no company mainly disagrees, 30.8%
have no opinion about it, 30.8% agree with the statement that because of the activities on their
15,40%
15,40%
53,80%
15,40%
Lost potential buyers
Didn't loose potential buyers
Had no negative feedback/review
Don't know

1st CRODMA Conference 2016
100
networks they seem more reliable than companies that do not use social networks and 38.5%
strongly agree with that statement.
No company disagrees with the statement that because of the social activities they seem more
serious than companies that do not use social networks, no company mainly disagrees, 38.5%
have no opinion about it, 30.8% agree with the statement that because of the activities on their
networks they seem more serious than companies that do not use social networks and 30.8%
strongly agree with that statement.
No company disagrees with the statement that because of the social activity they seem to have
better quality than companies that do not use social networks, no company mainly disagrees,
46.2% have no opinion about it, 23.1% agree with the statement that because of the activities
on their networks they seem to have better quality than companies that do not use social
networks, while 30.8% strongly agree with that statement.
No company disagrees with the statement that because of the social activities they seem to be
more professional than companies that do not use social networks, 7.7% of the companies
mainly disagree, 23.1% have no opinion about it, 38.5% agree with the statement that because
of the activities on their networks they seem to be more professional than companies that do
not use social networks and 30.8% strongly agree with that statement.
No company disagrees with the statement that because of the social activities they seem to be
more popular than companies that do not use social networks, no company mainly disagrees,
15.4% have no opinion about it, 53.8% agree with the statement that because of the activities
on their networks they seem to be more popular than companies that do not use social networks
and 30.8% strongly agree with that statement.
These results show that the biggest difference in numbers is visible when companies were asked
if they consider themselves more popular than companies that do not use social profiles. By
using social networks, companies are engaging with a cool and young community which makes
the brand more popular and follow techological trends. That is specially important in ICT
industry. Their goal is to have active fans that spread the word about the company to their
friends, which, in the end, can be profitable.
4 CONCLUSIONS
It is assumed that ICT companies are most focused and invest the most of all industries in social
networks activities because such focus on technologies is their primary work. With this
assumption survey was conducted and confirmed in most answers. Most companies believe that

Book of Papers
101
they are more professional, more popular, more credible and more serious than companies in
the same sector that do not have social network accounts.
However, there were few surprising facts. Even 4 out of 13 companies doesn't have a developed
strategy for communicating on social networks, and 7 of them doesn't have a community
manager or a preplanned budget for social networks activities, although they agree that those
activities are crucial for building reputation. Hence, it is important to notice that there is a need
for educating managers and employees in ICT sector and showing them the importance of
online reputation management in order to be competitive globally. Regardless of that,
companies recognize that primarly communication goals on social networks are to improve
reputation, increase sale and attract potential employees. Also, they believe that postponement
of communication with users can ruin company's reputation and that there is a space for
improving that within their own company, especially because users have created an image about
them through content on their social networks accounts.
To conclude, this paper has proved positive relationship between social networks usage and the
reputation of the Croatian ICT companies. Namely, managers in ICT sector are mostly aware
of the importance of online communication strategies and activities for building and
maintaining online reuputation. Also, they equate terms online reputation and reputation in
general. But, there is more space for exploring. This findings can be used as a starting point for
future research. For instance, relations between social networks activities, reputation demolition
and its affect on the business can be examine in more details.
5 REFERENCES
[1] Aula, P. (2010). Social media, reputation risk and ambient publicity management.
Strategy and Leadership, 38(6), pp 43-49.
[2] Bhanot, S. (2011). A study on impact of social media on company performance. College
of Management Studies, pp 1-14, Nerul, Navi Mumbai.
[3] Brakus, A. (2015). Mediji i marketing. In Medias Res: časopis filozofije medija, 4(7), pp
1096-1103, 2008.
[4] Caruana, A., Chircop, S. (2000). Measuring Corporate Reputation: A Case Example.
Corporate Reputation, 3(1), pp 43-57.
[5] Demeterffy Lančić, R. (2010). Novi mediji i odnosi s javnošću. Medijske studije, 1(2),
pp 157-169.
[6] Dijkmans, C., Kerkhof, P., Beukeboom, C. J. (2014). A stage to engage: social media use
and corporate reputation. Tourism Management, 7(1), pp 58-67.
[7] Floreddu, P. B., Cabiddu, F. (2013). Managing online reputation: the role of social media.
73th Annual Meeting of the Academy of Management, pp, 1-24, Anaheim, California.

1st CRODMA Conference 2016
102
[8] Gotsi M., Wilson, A. M. (2001). Corporate reputation: Seeking a definition. Corporate
Communications: An International Journal, 6(1), pp 24-30.
[9] Grützmacher, A. (2011). Reputation 2.0: The role of social media in corporate reputation
– Case Nokia. International Business Communication, Aalto University, pp 1-160.
[10] Gujić, M., Kraljević, R., Milun, T. (2016.) Poduzetnici i nova komunikacijska
tehnologija: zapreke ili izazovi. Acta Economica Et Turistica, 1(2), pp 113-212.
[11] Ličina Borja, B. (2012). 22% tvrtki ne posjeduje strategiju za komunikaciju na društvenim
mrežama, http://www.planb.hr/22-tvrtki-ne-posjeduje-strategiju-za-komunikaciju-na-
drustvenim-mrezama/, downloaded: [August, 11th 2016]
[12] Quadrans konzalting (2015). Like, Tweet i Share u službi Top 100 tvrtki,
http://www.quadrans.hr/images/PDF/LikeTweetShareuTop100.pdf, downloaded:
[August, 11th 2016]
[13] Živadinović, V., Zelić, M (2014). Uticaj online-tržišta i digitalnih tehnologija na
reputaciju preduzeća. Infotech-Jahorina, 13(1), pp 723-726.

Book of Papers
103
PREREQUISITES FOR BALANCED DEVELOPMENT OF
WELLBEING AND MEDICAL SPA IN BULGARIA
Assoc. prof. KRASIIRA STANEVA, MPH, PhD
Business Management Faculty, University of Forestry
10 bld Kl. Ohridski , Sofia 1797 e-mail: [email protected]
ABSTRACT
The aim of investigation is to evaluate prerequisites for balanced development of medical SPA
and Wellbeing tourism in Bulgaria. An electromagnetic pollution screening, geopathic stress
investigation and an ergonomic comfort evaluation were the core of the study.
Methods of investigation Different Wellbeing destinations were modeled in area of Bansko,
Velingrad and Sunny Beach. Nine high stars SPA hotels, which are situated in different
environmental areas were evaluated. In the survey attended 48 clients, 24 medical
SPA/Wellness managers and 12 SPA professional Associations members. The quality
assessment indicators were: indoor and outdoor environment audit including quality of air,
water, soil and mineral resources; implementation of environmental technology – green energy,
blue waste management, HSE (Healthy Safety Environment) assessment for clients/patients;
implementation of Quality Management System (QMS); electromagnetic pollution screening
and ergonomic facilities comfort.
Results The obtained results from “Face to face” research are in line with Framework of
Bulgarian legislation in the area of SPA tourism. The quality of environmental characteristics
of research areas is suitable for development of green/blue tourism. The ergonomic audit
obtained deficiency of main ergonomic standards for healthy and safety workplace.
Electromagnetic pollution and geopathic stress were not revealed. The managers opinion about
impact of environmental conditions on quality of Wellbeing including medical SPA services
were too varying and depends on professional expertise of staff and client’s profile.
All clients need of specific geomedical data of healthy risk assessment and ergonomic audit of
hotels and Wellness equipment also.
Conclusion The innovation conceptual model for sustainability development of Wellbeing and
Medical SPA in Bulgaria based on some geomedical indicators were obtained. All of them are
applicable for planning actions, risk analysis and balance development of Wellbeing industry.
KEYWORDS: Wellbeing, medical SPA, tourism, geomedical indicators, HSE, EMP

1st CRODMA Conference 2016
104
1 INTRODUCTION
The impact of Wellbeing and medical SPA tourism on economic development grows in recent
days. The main question is how to optimize and organize the sector in line with a balanced use
of tourism resources.
The aim of investigation was to test several indicators that are successfully applied by the
World Tourism Organization for measurement of Sustainable Tourism Development and to
find applicable ones for Bulgarian Medical SPA and Wellbeing tourism.
2 METHODOLOGY
Some established Medical SPA and Wellbeing destinations were situated in Devin, Velingrad,
Sunny Beach, Bansko and were researched (2007-2016). 12 SPA hotels located in regions
with different environmental characteristics were examined. The objects were divided into four
examined group: EG1- hotels in urban area, EG2: clean mountain environment area, EG3:
Black Sea area, EG4 (Control group): mountain area in Austria (Bregenz -pension and family
wellness hotel) and city SPA hotel in Nurnberg, Germany (table 1). The main indicators are:
indoor and outdoor environment audit including quality of air, water, soil and mineral
resources; implementation of environmental technology – green energy, innovation waste
management, HSSR Healthy Safety Security Risk Assessment for clients/patients;
implementation of Quality Management System (QMS); electromagnetic screening.
The chemical investigation of underground water and soils included analysis of contents of Cu,
Zn, Pb, Cd, Mn, SO4, BTEX and TPH. The analysis was done at Certificated Laboratory
INTERGEO Umwelttechnologie und Abfallwirtschaft GmbH, Salzburg.
The case study type “Face to face” joined 24 managers /owners, managers of SPA centers, 18
members of SPA Associations and 48 clients. The questionnaire’s block is aimed to evaluation
of environmental and ergonomic culture of managers.
Questionnaire’s block
Q 1: What is your opinion about Electromagnetic pollution’s impact on human health?
A- No impact; B- I have not information; C- EMP impact on health
Q 2: Do you have enough information about ergonomic comfort of SPA equipment?
A- No, I have not; B- Yes, I’ have enough information; C- There is not connection with
Regulations
Q 3: What is your position about Indoor and Outdoor audit of SPA centers?
A- It is very important; B- There is not relation with Regulations; C- I’m not familiar
with the problem

Book of Papers
105
Q 4: Have you implemented HSSR and QMS in the SPA hotel?
A. No, we have not; B- We are considering; C- We have to implement the systems
Limit of investigation
This investigation on the object in question provided a current insight to the existing
situation of the soils and underground water. All statements and assessments derived are based
on the investigation procedures and chemical results described in the report.
Table 1 Investigation profile of hotels
Research group profile Managers/owners SPA
managers
Members of
professional
bodies
Clients
EG1: hotels in urban area 3 3 3 12
EG2: clean mountain
environment area
3 3 3 12
EG3: Black Sea area 3 3 3 12
EG4: control group - Austria
and Germany
3 3 3 12
3. RESULTS AND DISCUSSION
3.1. QUALITY OF SOILS, UNDERGROUND WATER AND MINERAL WATER
The main chemical laboratory results showed good quality of underground water, soils and
mineral water in mountain SPA objects in generally. We detected some environmental
problems in urban objects with quality of underground water near to the SPA hotels. The
presence of hydrocarbons in the underground water impact on human health and quality of
medical SPA and SPA services also (tables 2, 3).
The results of mineral water’s quality screening (2007-2013) illustrated a sustainability of
quantity and quality characteristics of wells in Devin, Pomorie and Velingrad [1-4 ].
The value of examined components Cu, Zn, Pb, Cd, Mn, SO4 and soils rеaction- pH is in line
with Bulgarian standard for the ecological limit values (according to Regulation N 3/2002).
The quality of underground water is quite well in the mountain areas. But the ecological quality
of groundwater in urban plots demonstrated uncommonly high quantities of total hydrocarbons
(tables 2 and 3).
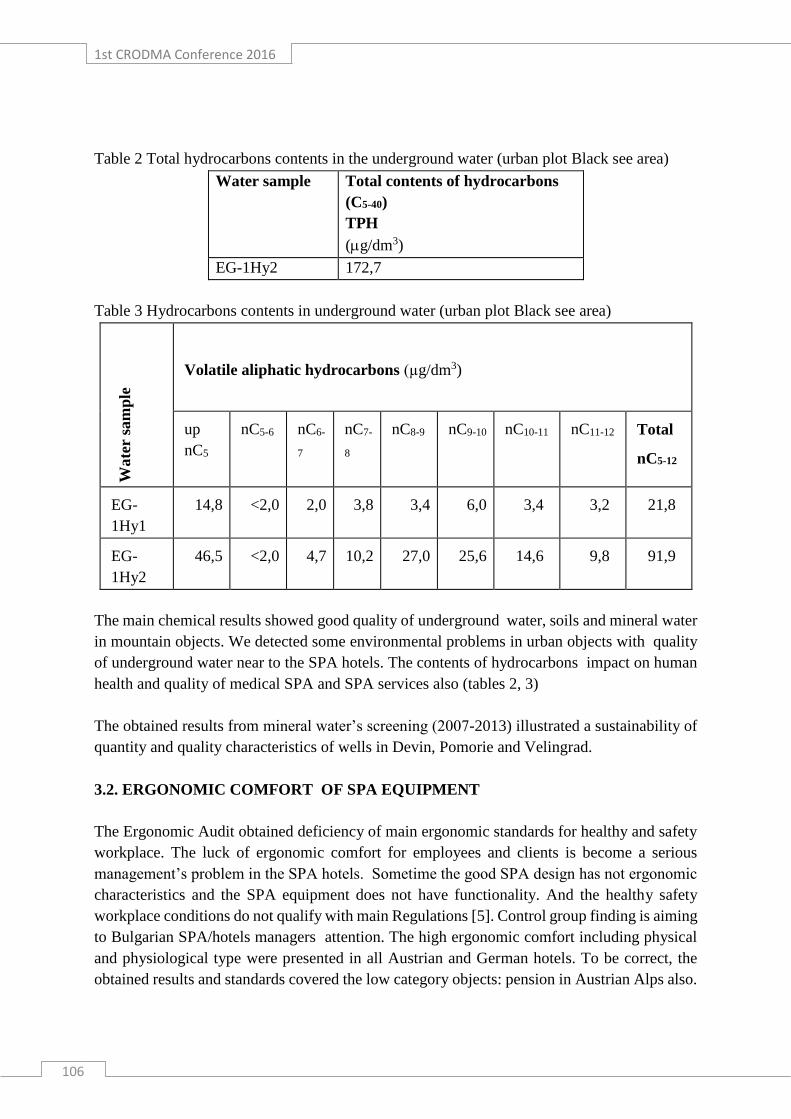
1st CRODMA Conference 2016
106
Table 2 Total hydrocarbons contents in the underground water (urban plot Black see area)
Water sample Total contents of hydrocarbons
(C5-40)
TPH
(g/dm3)
EG-1Hy2 172,7
Table 3 Hydrocarbons contents in underground water (urban plot Black see area)
Wate
r sa
mp
le
Volatile aliphatic hydrocarbons (µg/dm3)
up
nC5
nC5-6 nC6-
7
nC7-
8
nC8-9 nC9-10 nC10-11 nC11-12 Total
nC5-12
EG-
1Hy1
14,8 <2,0 2,0 3,8 3,4 6,0 3,4 3,2 21,8
EG-
1Hy2
46,5 <2,0 4,7 10,2 27,0 25,6 14,6 9,8 91,9
The main chemical results showed good quality of underground water, soils and mineral water
in mountain objects. We detected some environmental problems in urban objects with quality
of underground water near to the SPA hotels. The contents of hydrocarbons impact on human
health and quality of medical SPA and SPA services also (tables 2, 3)
The obtained results from mineral water’s screening (2007-2013) illustrated a sustainability of
quantity and quality characteristics of wells in Devin, Pomorie and Velingrad.
3.2. ERGONOMIC COMFORT OF SPA EQUIPMENT
The Ergonomic Audit obtained deficiency of main ergonomic standards for healthy and safety
workplace. The luck of ergonomic comfort for employees and clients is become a serious
management’s problem in the SPA hotels. Sometime the good SPA design has not ergonomic
characteristics and the SPA equipment does not have functionality. And the healthy safety
workplace conditions do not qualify with main Regulations [5]. Control group finding is aiming
to Bulgarian SPA/hotels managers attention. The high ergonomic comfort including physical
and physiological type were presented in all Austrian and German hotels. To be correct, the
obtained results and standards covered the low category objects: pension in Austrian Alps also.

Book of Papers
107
3.3. GEOPATHIC STRESS AND ELECTROMAGNETIC POLLUTION SCREENING
The obtained results from three different areas are moderate and depended on geographical
position, geological history of the plot and anthropogenic impact of place. In general,
electromagnetic pollution we detected in every hotels. But in the other hand, the Geopathic
stress we found in the mountain plots. The range of values of electromagnetic pollution EMP
is 0.22 to 3326 mW/m2. The fixed values are higher than values for healthy life according to
EU Regulations. We outlined the main source of electro smog- WiFi, antennas for amplification
of cell phones, high voltage cables network etc.
The results of electromagnetic pollution screening in control group are very clear: EMP no
detected. Geopathic stress is not detected also. All of objects under study were remediated and
special shield for protection were observed.
3.4. CASE STUDY RESULTS
Table 4. Results from case study
Answer/Question Q 1 Q 2 Q 3 Q 4
A 18 25 29 28
B 43 21 27 (managers and professional
members)
18
C 23 38 28 (clients mainly) 0 (Remark: The
Bulgarian clients’
opinion did not
estimate)
The Managers opinion about impact of environmental status on quality of Wellbeing (including
medical SPA services) were too different and depended on geographical situation of examined
object and professional expertise of employees. Our results indicate that employees’
professionalism, motivation and tangibility impact on quality of SPA services. The similar
results obtained in Portugal [6].
Summarized the obtained results from Bulgarian plots, we have to declare that managers culture
depends on economics results. There is not any interest to implement HSE and QMS, to accept
the environmental benefits for improving quality of Wellbeing services. Every innovations has
to correlate with obligatory Regulations. The clients’ culture about benefits of geomedical
information, ergonomic comfort and geopathic stress free zones is too insufficient. And all
managers take advantage of the situation. But increasing relocation of tourists and exchange
the information will change the existing situation. The quality in tourism will be the main
differentiation factor in the sector’s competitiveness.

1st CRODMA Conference 2016
108
Conclusion
According obtained results and an economical estimate of situation in Bulgaria we can describe
the framework of very new concept for implementation of some environmental characteristics
as sustainability development indicators [4, 5]. Special attention we paid to indoor assessment
as a main health prevention of employees and clients also [7]. The lack of a working model for
control of health risk, environmental and safe working conditions in SPAs, is a real
disadvantage of tourism development. We need of developed HSE model and implementation
of standards. Bulgarian country is orientated towards a modern system of quality control and
screening of standards. The first Regulations for medical SPA centers are published in 2016
[8]. Obviously we have to create the main standards for balance development of medical SPA
in Bulgaria, using previous experience, obtained investigation results and EU recommendation.
The idea of balanced development of Wellbeing and medical SPA tourism in line with
improving the quality of life of clients and personnel based on environmental standards,
ergonomic comfort, electromagnetic pollution standards and adequate professional
qualification of staff [9]. The innovation model has to associate with sustainability using and
development of tourism resources and achieving a better quality of life of clients and personnel
(fig. 1).
Figure 1. Conceptual approach chart
Conceptual model chart:
An identification of Wellbeing and medical SPA destinations and description of clients’
benefits;
An identification of special national indicators and their documentation for
sustainability development of medical SPA in Bulgaria – geocological and geomedical
;
Monitoring and evaluation of geoenvironmental /geomedical indicators: data collection
and analysis;
The indoor and outdoor assessment with focus on: quality control of mineral healing
resources and electromagnetic pollution screening;
A newer tourism policy towards to
Environmental quality control of medical SPA
products and resources
Health risk control
Safety work place
Ergonomic comfort
Standardization and certification for
SPA areas

Book of Papers
109
Hotel/ SPA centers ergonomic comfort control [10, 11,12].;
Customer’s satisfaction assessment for balance between expected and perceived quality
of SPA services [13, 14].
4 CONCLUSION
Some of national indicators has occurred in response to development of risk process in medical
SPA/Balneology today, electromagnetic pollution especially [9, 10]. We noticed some
advances of application of geoecological indicators in Bulgaria. The innovative management
policy with respect to geoecological indicators coresponded to European Environmental
Agency rules and Bulgarian Ministry of Environment and Water also. The special
geoecological/geomedical information can be used for various purposes such as socio-
economic reality, prevention of public health and improving of quality of medical SPA services
. “Service quality and customer satisfaction have increasingly been identified as key factors in
the battle for competitive differentiation and customer retention” [13]. The clear connection
between HSE, geomedical indicators and professional competency of staff have a special place
in balanced approach of Wellbeing and medical SPA tourism in Bulgaria.
REFERENCES
[1] Станева, 2008. Устойчивост на показателите на минералните води от находище
Девин, използвани за геотерапевтични цели. : ГМР, 5, 29-31.
[2] Staneva K. 2013. Medical Geology Аssessment of urban areas. GMR, 2, 23-34.
[3] Станева, К., 2013. Устойчиво управление на находищата с минерални води в
условията на динамичен СПА туризъм. ГМР, 6, 29-33.
[4] Станева, К., С. Балтова, 2013. Индикаторни методи за устойчиво развитие на SPA
туризма в България. Научни трудове на Русенския университет 2013, т.52, серия
5.1, 90-96./
[5] Staneva, K. 2016. The Implementation of HSE Management System model in Wellness,
medical SPA and SPA tourism in Bulgaria-requirement and advantages. Yale Journal of
Science and Education, N1(18), vol.10 ,p. 622-629., Yale Univ. Press
[6] Joukes, V. et all, 2013. Sustainable Medical and Wellness Destinations. Client-Result-
and Innovation-Focussed Case Studies . Publ. Universidade de Trás-os-Montes e Alto
Douro. http://www.cetrad.info/static/docs/documentos/371.pdf
[7] Tappler, P. 2000. The Healthy Indoor-Air Guide. 2000. Published by the Austrian Federal
Ministry of Environment, Youth and Family in co-operation with IBO - Austrian Institute
for Healthy and Ecological Building
[8] Наредба № 2 за условията и реда за сертифициране на балнеолечебен (медикъл
СПА) център, СПА център, уелнес център и таласотерапевтичен център. ДВ бр. 11/

1st CRODMA Conference 2016
110
2016.
http://www.tourism.government.bg/sites/tourism.government.bg/files/documents/2016-
02/naredba-08-02-2016.pdf
[9] Станева, К., 2013. Устойчиво развитие и управление на СПА туризма в екологични
райони. Науч. конф. с международно участие Знанието-традиции, иновации,
перспективи, Бургас, т. ІІІ, 358-364. ISBN 978-954-9370-97-3., 358-364.
[10] http://ergo.human.cornell.edu/hotelezra/hecwebpage/hotelergo.html
[11] “World Health Organization International Agency for Research on Cancer Classifies RF-
EMF Fields as Possibly Carcinogenic to Humans, May 31, 2011.
[12] http://www.spineuniverse.com/wellness/ergonomics/ergonomics-human-body-injury-
prevention
[13] Holjevac, I., S. Marković, S. Raspor, 2009. Customer satisfaction measurement in hotel
industry: Content analysis study, https://bib.irb.hr/datoteka/397335.PAP039.pdf
[14] Kandampully, J. & Suhartanto, D. , 2000. Customer loyalty in the hotel industry: the role
of customer satisfaction and image. International Journal of Contemporary Hospitality
Management, 12(6): 346-351.

Book of Papers
111
ROLE OF THE NEW MEDIA AS A DISTRIBUTION CHANNEL FOR
ACCOMMODATION SERVICES IN TOURISM
MARIJA TOMAŠEVIĆ LIŠANIN, Ph.D.
Faculty of Economics and Business, University of Zagreb
Trg J.F. Kennedya 6, Zagreb, Croatia
ALBERT GALFI, M.Sc.
Faculty of Economics and Business, University of Zagreb
Trg J.F. Kennedya 6, Zagreb, Croatia
MIRKO PALIĆ, Ph.D.
Faculty of Economics and Business, University of Zagreb
Trg J.F. Kennedya 6, Zagreb, Croatia
ABSTRACT
The new media has changed the tourism and hospitality industry on many levels bringing an
unprecedented change in the way consumers purchase the accommodation services. More and
more consumers in a tourism industry use the new media in order to seek information and
purchase. At the same time companies that sell accommodation services, or are intermediaries
in their sales, are adapting and rapidly increasing an implementation of the new media in their
business as a new and innovative channel of distribution. Use of the new media is therefore
widely accepted by accommodation providers in a tourism today. This paper gives a brief
review of main forms of the new media, which are used in purchasing and selling of the
accommodation services, including web sites (and blogs), e-mail, social medias and mobile
commerce. An empirical research have been conducted in order to investigate the role of the
new media as a channel for distribution of accommodation services in tourism. Exploratory
research used for survey a highly structured questionnaire answered by a sample of 102
respondents. The objective was to explore their experience and perspective of their use of the
new media in seeking information and purchasing. According to the research, it can be
concluded that the new media is the core and the key to a successful business, not only in the
sale of accommodation services, but in the whole tourism and accommodation industry. As a
result large share of the sales have moved to the new media as a dominant channel for
distribution of such services.
KEYWORDS: new media, accommodation service, distribution channels, internet, tourism

1st CRODMA Conference 2016
112
1 INTRODUCTION
“New media of 21st century” have several definitions. Most of them revolve around internet
and user interactions through different technologies carrying video, text, pictures and sound.
The definition changes as new media change during to the advances in technology (Peruško,
2011). Beal (2016) defines new media as content available on demand through the internet
which is available to be used on any digital device and that usually contains user feedback and
creative and interactive response. Therefore examples of the new media would include web
pages such as newspaper portals, blogs, videogames and social networks. Key characteristic of
such media is a dialogue. They enable sharing and interacting with the content. Unlike
traditional media those new media are based on user involvement and interaction. Television,
movies, journals, books and other printed materials are not new media. In defining new media
Manovich (2001) goes further and proposes that new media does not means only interactivity
and hypermedia but should also have the following characteristics:
Numeric in nature – they are composed of data, digital codes
Modularity – they are made from different elements such as sounds, pictures, forms,
that can exist separately
Automatization – many operations in process of generating content, distribution and
manipulation are automatized
Changeability – new media are changing over time
Transcoding – computer logic influences how we understand and perceive ourselves.
For the purpose of this paper we define new media according to some of their main
characteristics: availability through the internet, interactivity, availability on digital devices in
real time without time and spatial boundaries. Those include web pages, blogs, live streaming
of sounds and video, chat rooms, social networks, certain mobile applications, virtual reality
and similar. Importance of communication through new media with potential customers are
rapidly gaining importance. Companies have tangible benefits when using different channels
such as social media for communication and promotion of its products and services. Social
media are important for building and managing relationships with customers and employees,
for making new contact points for extending service to the customers, for identification and
motivation of customers in promoting a brand, for creating events, audience and followers, and
similar (Marta and Thomas, 2013). As customers spend more time online and on social
networks, those media became more and more important for business strategies of a companies
(Panian, 2013). New media promote not just user interaction but also become an important
channel for distribution of different goods and services, especially today through different
applications optimized for smartphones (Urbančić, 2016).
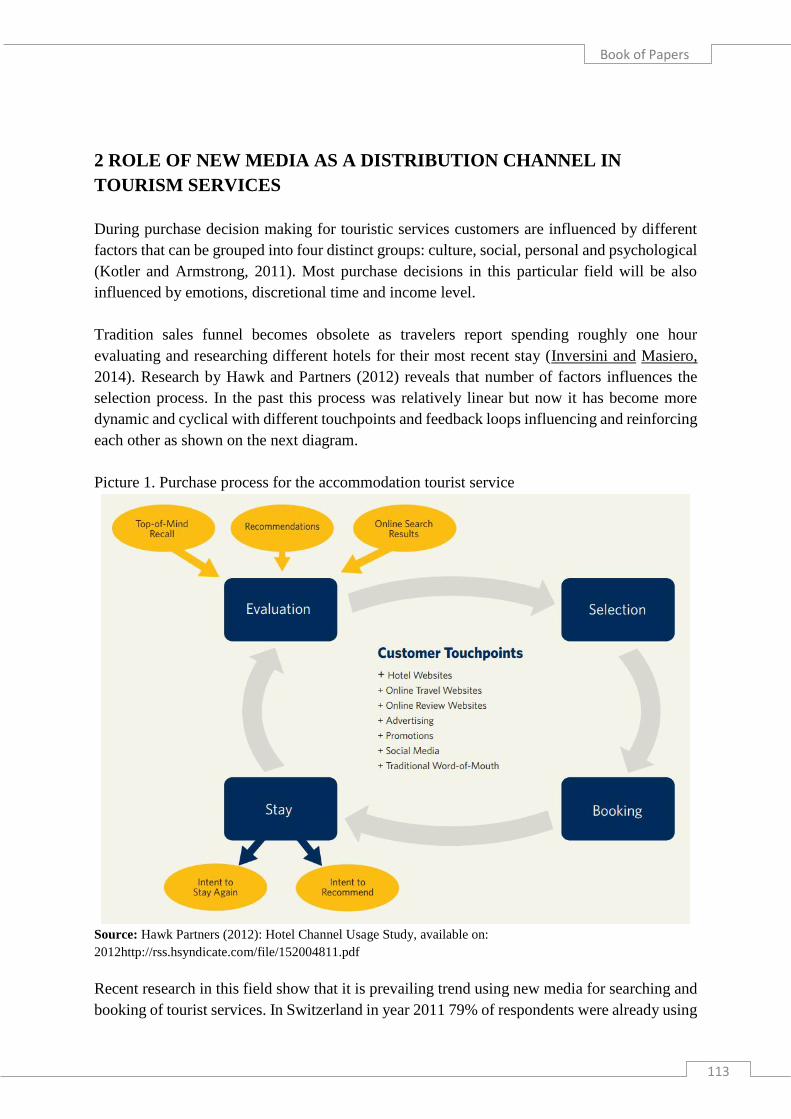
Book of Papers
113
2 ROLE OF NEW MEDIA AS A DISTRIBUTION CHANNEL IN
TOURISM SERVICES
During purchase decision making for touristic services customers are influenced by different
factors that can be grouped into four distinct groups: culture, social, personal and psychological
(Kotler and Armstrong, 2011). Most purchase decisions in this particular field will be also
influenced by emotions, discretional time and income level.
Tradition sales funnel becomes obsolete as travelers report spending roughly one hour
evaluating and researching different hotels for their most recent stay (Inversini and Masiero,
2014). Research by Hawk and Partners (2012) reveals that number of factors influences the
selection process. In the past this process was relatively linear but now it has become more
dynamic and cyclical with different touchpoints and feedback loops influencing and reinforcing
each other as shown on the next diagram.
Picture 1. Purchase process for the accommodation tourist service
Source: Hawk Partners (2012): Hotel Channel Usage Study, available on:
2012http://rss.hsyndicate.com/file/152004811.pdf
Recent research in this field show that it is prevailing trend using new media for searching and
booking of tourist services. In Switzerland in year 2011 79% of respondents were already using

1st CRODMA Conference 2016
114
new media for booking stays (Law et al., 2015). Booking.com was the main site used and
providers of service such as small hotels, house owners and similar rated it as very important
sales channel. Some of the most important factors contributing to the success of the new media
as a distribution channel are their extensive reach, nonstop availability, user ratings, user
friendliness and automatization of the whole search and booking process which results in a low
transaction costs (Laškarin, 2010).
It is no wonder that hotels and other providers of room and board services recognized the
importance of IT, internet and new media as a new channels for distributing or selling of their
touristic services. New media enable more reach at lower costs while at the same time ensure
more information and easier purchasing for the consumers seeking those services (Baldigara et
al., 2013). Such technologically supported channels make it much easier to manage free
resources, automatically adjust pricing and in some instances to exclude unnecessary
intermediaries from the process (Galičić et al., 2008).
3 RESEARCH GOALS AND METHODOLOGY
Main goal of the research was to explore application of new media as a distribution channel for
tourist services, more accurately for selecting and booking touristic stays. Also levels of
communication and level of adoption have been investigated. Research methodology included
quantitative exploratory research that was carried out on a sample of 102 respondents via highly
structured questionnaire. Data was gathered by snowballing. Questionnaire contained 17
questions mostly in a form of Likert and Thurstons scales. Questions have been modified
according to existing research tools used on this topics by Kwon et al. (2013) and Wongkalng
(2013). Data was gathered during August 2016.
4 RESEARCH RESULTS
Demographic characteristics of sample as presented in the table 1 shows that majority of
respondents were female (64%) and that most of respondents were young people currently
enrolled in higher education institution mainly Faculty of Business and Economics at University
of Zagreb.
Graph 1 shows the frequency of usage of a new media when looking for information about
booking and selecting hotel stays and touristic services. 78% of respondents stated that they are
always using new media, while 12% uses them often, 6% rarely and 3% never as shown below.

Book of Papers
115
Table 1. Demographic structure of sample
Frequency Percent
Gender
(n = 102)
Female
Male
65
37
64%
36%
Age
(n = 102)
18-25
26-34
35-44
45-54
55+
49
28
16
7
2
48%
27%
16%
7%
2%
Graph 1. Frequency of usage of new media for information about accommodation services
Next graph displays the use of new media for reservation or booking of a stay. Out of 99
respondents that reported using new media 53% always uses new media for making booking,
21% does it often and 16% rarely and 10% never. It is interesting to mention that respondents
for this purposes mostly used computer (90%) and only occasionally (10%) smartphone or
tablet.
Graph 2: Use of new media for booking/purchase of accommodation (%)
Always Often Rarely Never
1016
21
53
0
10
20
30
40
50
60
Never Rarely Often Always
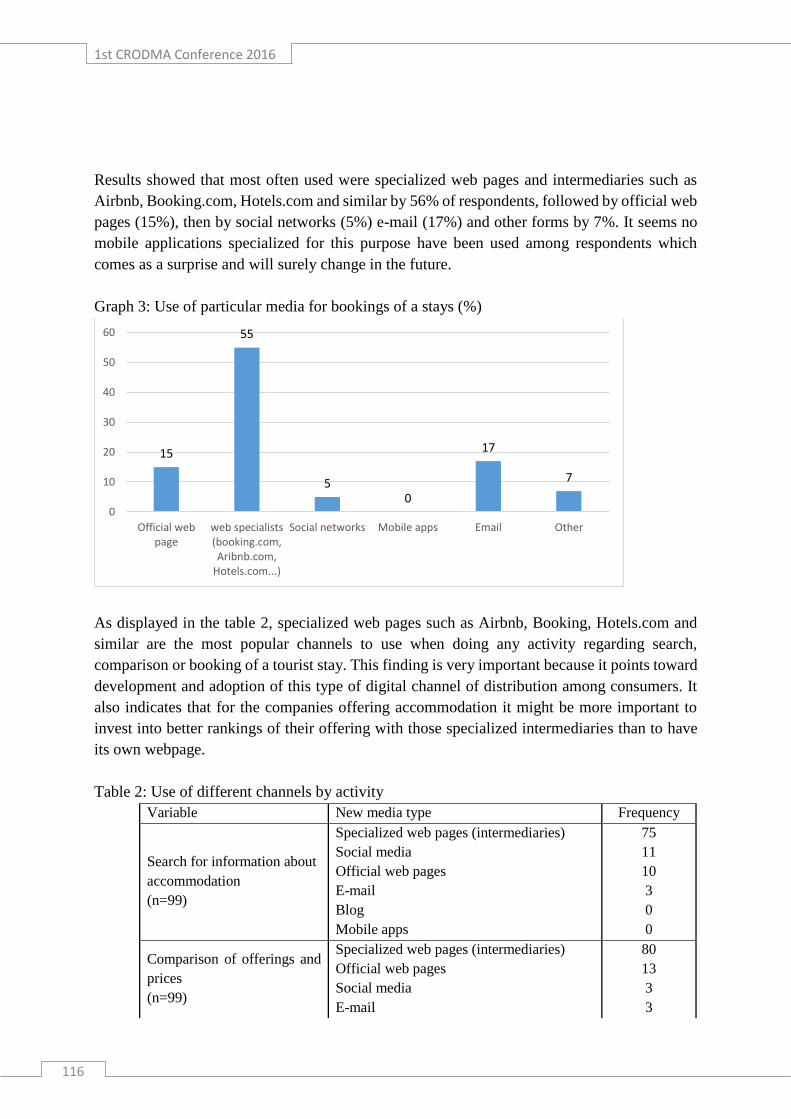
1st CRODMA Conference 2016
116
Results showed that most often used were specialized web pages and intermediaries such as
Airbnb, Booking.com, Hotels.com and similar by 56% of respondents, followed by official web
pages (15%), then by social networks (5%) e-mail (17%) and other forms by 7%. It seems no
mobile applications specialized for this purpose have been used among respondents which
comes as a surprise and will surely change in the future.
Graph 3: Use of particular media for bookings of a stays (%)
As displayed in the table 2, specialized web pages such as Airbnb, Booking, Hotels.com and
similar are the most popular channels to use when doing any activity regarding search,
comparison or booking of a tourist stay. This finding is very important because it points toward
development and adoption of this type of digital channel of distribution among consumers. It
also indicates that for the companies offering accommodation it might be more important to
invest into better rankings of their offering with those specialized intermediaries than to have
its own webpage.
Table 2: Use of different channels by activity
Variable New media type Frequency
Search for information about
accommodation
(n=99)
Specialized web pages (intermediaries)
Social media
Official web pages
Blog
Mobile apps
75
11
10
3
0
0
Comparison of offerings and
prices
(n=99)
Specialized web pages (intermediaries)
Official web pages
Social media
80
13
3
3
15
55
50
17
7
0
10
20
30
40
50
60
Official webpage
web specialists(booking.com,Aribnb.com,
Hotels.com...)
Social networks Mobile apps Email Other

Book of Papers
117
Mobile apps
Blog
0
0
Getting discounts
(n=41)
Specialized web pages (intermediaries)
Official web pages
Social media
Forums
Mobile apps
Blog
18
12
8
3
0
0
0
Searching for information
about events in the vicinity of
accommodation
(n=75)
Specialized web pages (intermediaries)
Social media
Official web pages
Forums
Mobile apps
Blog
52
14
5
4
0
0
0
Finally, on the graph 4 there is a result of 5 point Likert scale regarding agreement with
statements about benefits of using new media. Respondents most agree with the statements that
new media offer them cheaper and secure payment (M=4.29) and offer wealth of information
(M=4.27) and they tend to agree the least with the idea of downloading mobile application of a
hotel or similar accommodation provider (M=2.49).
Graph 4: Perception of benefits of using new media for booking of stays (arithmetic mean, M)
4,27
4,00
3,29
3,93
4,29
2,49
3,25
1,00 2,00 3,00 4,00 5,00
Offer wealth of information
Enable actions in the real time
Offer more privacy if needed
Easy booking
Enable cheaper and secure payment
would download mobile app of a hotel or asimilar accomodation
Trust more to the referrals than advertising

1st CRODMA Conference 2016
118
5 CONCLUSION AND RESEARCH LIMITATIONS
The results might not be generalized to the whole population because the sample was small and
sampling method was not adequate for such purpose. However, there are some interesting and
indicative results. Almost all of the respondents (97%) used new media at past at least once
when booking or searching for the information about their stays. This shows high market
penetration of new media and their importance during the purchase of touristic services process.
New media has also become an important channel of distribution for such services as 90% of
respondents reported using them at least once for actual booking/purchasing of their stay. Out
of that number 74% reported using them always or often which points toward high adoption
rate and their maturity. Most of the customers used specialized digital intermediaries such as
Airbnb, Booking.com and similar. Implications for the hotels are numerous as this shows that
they should pay more attention and channel their marketing efforts also through those
specialized digital intermediaries. Classical channels such as tourist agencies are loosing market
share fast and can not compete with digital channels in availability 24/7, quality and quantity
of information and price. Therefore agencies have to add additional value for the consumers
and offer more complex touristic products. In the future it is expected that such trend toward
adoption of digital channels of distribution for touristic services will increase even further as
all of the specialized intermediaries already offer their applications for the mobile devices. The
only unexpected result of the survey was actual negligence of mobile devices among
respondents. Industry reports show that mobile devices in the next few years will be the main
source for using different internet services and that already significant number of customers is
using them for doing business transactions today. It is important for managers in this sector to
understand importance of new media for business success and to invest into meaningful
presence of their companies on all those channels in order to be closer to the customers who
changed their behavior and spend more and more time online posting, sharing, liking and living.
REFERENCES
[1] Baldigara,T., Štambuk, A., Mamula,M. (2013): „Contribution to e-tourism demand
modelling“, Informatol, 46 (4), pp. 343.-352.
[2] Beal, V. (2013): New media, available at:
http://www.webopedia.com/TERM/N/new_media.html, (25.07.2016.)
[3] Galičić, V., Ivanović, S., Lupić, M. (2008): Hotelska prodaja i recepcijsko poslovanje,
Fakultet za turistički i hotelski menadžment Opatija, Opatija
[4] Hawk Partners (2012): Hotel Channel Usage Study, available at:
2012http://rss.hsyndicate.com/file/152004811.pdf (20.07.2016.)
[5] Inversini, A., Masiero, L. (2014): „Selling rooms online: the use of social media and
online travel agents“, International Journal of Contemporary Hospitality Management,
26 (2), pp. 272. – 292.

Book of Papers
119
[6] Kotler, P, Armstrong, G.M., Adam, S., Denize, S. (2011): Principles of Marketing, 5th
edition, Pearson: New Yersey
[7] Kwon, J.M., Bae, J., Blum, S.C. (2013): “Mobile applications in the hospitality industry”,
Journal of Hospitality and Tourism Technology, 4 (1), pp. 81. – 92.
[8] Laškarin, M. (2010): „Upravljanje web komunikacijom u hotelskom marketingu“,
Informatologija, 45 (4), pp. 314.-322.
[9] Law, R., Leung, R. ,Lo, A. ,Leung, D. , Nang Fong, L.H. (2015): „Distribution channel
in hospitality and tourism: Revisiting disintermediation from the perspectives of hotels
and travel agencies“, International Journal of Contemporary Hospitality Management,
27 (3), pp. 431. – 452.
[10] Manovich L. (2001): The Language of New Media, Massachusetts Institute of
Technology
[11] Martha, A.C., Thomas, J.T. (2013): „The new customer-facing technology: mobile and
the constantly-connected consumer“, Journal of Hospitality and Tourism Technology, 4
(2), pp.177. – 187.
[12] Panian, Ž. (2013): Elektroničko poslovanje druge generacije, Ekonomski fakultet, Zagreb
[13] Peruško, Z. (2011): Uvod u medije, Naklada Jesenski i Turk, Zagreb
[14] Urbančić, M. (2016): Internet marketing u turizmu : vodič za bolju popunjenost
smještajnih kapaciteta, Paradox, Rijeka
[15] Wongklang, K. (2013): „Mobile Applications in the Hotel Industry: A Case Study of
Hotels in Phuket”, available at:
http://kb.psu.ac.th/psukb/bitstream/2010/9776/1/391123.pdf (24.04.2016.)

1st CRODMA Conference 2016
120

Book of Papers
121
SOCIAL NETWORKS AS CHALLENGE FOR MARKETING
INTELLIGENCE
Professor SANJA BIJAKŠIĆ, Ph.D.
Faculty of Economics University of Mostaru,
e-mail: [email protected]
Professor BRANO MARKIĆ, Ph.D.
Faculty of Economics University of Mostaru,
e-mail: [email protected]
Professor ARNELA BEVANDA, Ph.D.
Faculty of Economics University of Mostaru,
e-mail: [email protected]
ABSTRACT
Social networks are changing the way of connection and communication between people by
increasing the amount of publicly available information and knowledge. People of similar
professional backgrounds and occupations link to online communities to share information.
This has a direct impact on what is one of the most difficult aspects of marketing intelligence
"efficient and rapid collection and sharing of data and information". The aim of marketing
intelligence is not only access data but manage them, analyze them and based on the analysis
to make the right decisions related to customers, products, price, promotion, sale. Therefore, a
large number of companies today are looking for solutions by marketing intelligence that will
enable access to text data, analyze them and improve the quality of marketing decisions.
The paper raises the hypothesis that it is possible to build a system for marketing intelligence
that collects and analyzes data from social networks and uses the analysis results (information)
to make precise, concise and accurate marketing decisions. In the paper is used the R
programming language for marketing intelligence system and the R language demonstrated
satisfactory simplicity and application power.
KEYWORDS: marketing intelligence, text mining, social network, sentiment analysis,
marketing decision making.
1 INTRODUCTION
Marketing intelligence is a systematic approach to gathering data from internal and external
sources of companies with the ultimate goal of generating reliable, usable and timely

1st CRODMA Conference 2016
122
information for making marketing decisions. Crowley, Ed., [1] analysis marketing intelligence
by three interconnected pyramids: information, communication and people / processes.
Information pyramid as component of marketing intelligence has three levels: data, analysis
and insight, communication pyramid has again three levels: gathering, dissemination and
dialoque and people& processes have research, reporting and capability. Marketing intelligence
for Crowley is decomposing in competitive insight (competitor intelligence and product
intelligence) and market insight (market understanding and customer insight). Marketing
intelligence on social networks is focusing on customers, their preferences, satisfaction rates,
customer opinion and attitudes. Social networks are today a big data sources available to
marketing intelligence. The real power of the social networks for marketing intelligence are
feedbacks of customers about products, promotion, prices, employees, brand awareness, brand
preferences, loyality.
Market intelligence is closely related to marketing research. But there are some differences
because marketing research involves solving a specific marketing problem at a specific point
in time, market intelligence involves gathering information on a regular, ongoing basis to stay
in touch with what’s happening in the marketplace [8].According to Kotler [4] marketing
intelligence provides current information about marketing environment to help managers to
organize and prepare marketing plans. Marketing intelligence increasing attention from internal
data such as transaction histories, databases, data warehouses, data marts, loyalty cards and so
to social networks. Social media monitoring is a type of marketing intelligence that overlaps
with market research. But the social networks analysis is not specific marketing problem
because today it involves gathering and analysis on a regule basis.
Social networks are becoming a safe source of quality data about the products, the mood of the
market to the products but also the image of the company as a whole, as a system on the market.
Without proper software tools and information technology support is not possible to collect and
analyze huge amounts of data in the form of messages and comments on social networks.
However, it is necessary to be cautious in the use of data from social networks. The reliability
of conclusions and information obtained by analysis is particularly important. The
representativeness of data on social networks depends on the wide of their use. If social network
has more users then the data representativeness for marketing intelligence is higher (properly
represent the views of the whole market and exclude dominant influence of opinion leaders).
2 MARKETING INTELLIGENCE AND THE SOURCE OF DATA
Marketing intelligence follows the logic of any scientific research. The research is based on a
preset reasonable assumption about the relationship of two or more research variables. Such
logical and meaningful assumptions in terms of analysis are called hypotheses.

Book of Papers
123
Figure 1. Marketing intelligence dynamics
Research dynamics within the marketing intelligence presupposes the existence of data and
appropriate algorithms (methods) of data analysis in order to refute or accept the proposed
hypotheses. Data from social networks contributes to shape a complete view of the market, the
market intelligence view. Today, research is based in principle on the huge amounts of data and
uncovering hidden regularities that are established among them. Such regularities are not trivial
nor simple. Information technology is almost at all stages of marketing intelligence from
collecting, storing data to their analysis and visualization of the analysis results.
The corporate database relational or object oriented is first and indispensable data source for
marketing intelligence. In transactional database are stored data about all daily business
transaction. This database records data about customers, suppliers, order details, products,
orders, inventories etc. Semantically rich data model implemented in the form of a database
enables marketing experts analysis and this analysis ends with information for better decision
making [7]. However, transactional database hiding most information about customers, their
behavior, correctness ways of pricing, the results of promotional campaigns.
Subproblem 3
Implementig text
mining algorithms
Discussion on
literature (modern
and
classical)
Marketing intelligence problem - research problem description
(attitudes of customers to Medjugorje tourist destinatination)
Constrains
Assumptions
Subproblem 1
Accessing data
on social network
(Facebbok, Tweeter...)
Subproblem 2
Creating the data set
(data frame in R)
Data sources
Databases about customers, products, bills, bills details, suppliers.
Data warehoouse for entire company
Data marts for business function (eg. marketing)
Social networks: Facebook, Tweeter, Instagram, You tube..... Web pages, Blogs...
Research
dy
nam
ics of
data co
llection
Fee
dbac
k d
ynam
ics
of
pro
cess
ed d
ata
Hyphotesis 1 Hyphotesis 2 Hyphotesis 3
The facts that
support the
hypothesis
The facts that
support the
hypothesis
Dynamics of marketing intelligence
H0: marketing intelligence of social networks enables concise and
accurate marketing decisions

1st CRODMA Conference 2016
124
The growth of transactional databases is very fast and they are not adequit for analytical
purposes. Therefore, medium and large enterprises develop specific databases for analytical
purposes. These are called data warehouses. Foundation of the data warehouse concept is a
separation of day-to-day transactions from analyzing and reporting that make marketing
analysts or entrepreneurs.
According to Inmon [2] the key objective of data warehouse is to place end users directly in
touch with the data they need to make better decisions. Kimball [3] states data staging process
called ETT (Extraction, Transformation, and Transportation) as the key part of the data
warehouse project.
However, databases and data warehouses are not the only sources of data for marketing
intelligence. Thus, the views and opinions of the customers can be analyzed by using a
questionnaire as an instrument of data collection or data stored in social networks.
Corporate website may contain valuable data about who is looking for its products or
services. Finding hidden patterns and correlations within the data from a large dataset is a
challenging data mining or text mining.
3 SOCIAL NETWORKS AS DATA SOURCE FOR MARKETING
INTELLIGENCE
Social networks such as Twitter, Facebook, LinkedIn, blog, online forums have important roles
for people, business, political parties, science because enable communication and sharing
information with others. Internet marketing implements various social networks in order to
achieve integrated marketing communication by supporting activities of social sharing of
content, images, and video. Social networks are important element in marketing plans. Namely,
internet marketing using social networks may offer valuable information that customers will
find interesting, may create a variety of content by implementing videos,images, graphics in
addition to classic text-based content. Using social networks improves business sharing of
original content in order to gain followers and fans. Sharing content and linking to outside
sources stimulates customers to improve trust and reliability in products and corporate.
The Facebook social network is accessible online communication service used for business
purposes. Allows you to connect with users. They save money, they cost almost nothing and
are made very quickly. Simply, invitations sent via social networks save you money and time.
Marketing and promotion are particularly valuable for social networks and vice versa.
Measuring the success of promotional activities and marketing decisions is carried out by
analyzing the content on social networks.
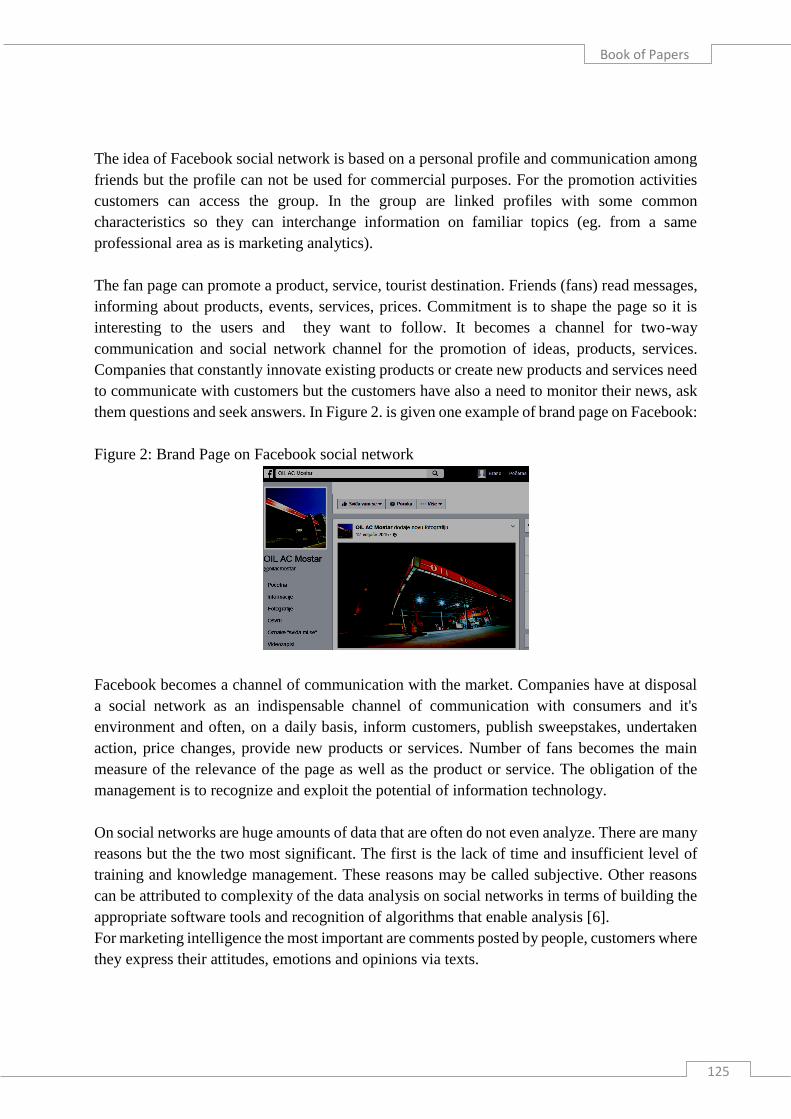
Book of Papers
125
The idea of Facebook social network is based on a personal profile and communication among
friends but the profile can not be used for commercial purposes. For the promotion activities
customers can access the group. In the group are linked profiles with some common
characteristics so they can interchange information on familiar topics (eg. from a same
professional area as is marketing analytics).
The fan page can promote a product, service, tourist destination. Friends (fans) read messages,
informing about products, events, services, prices. Commitment is to shape the page so it is
interesting to the users and they want to follow. It becomes a channel for two-way
communication and social network channel for the promotion of ideas, products, services.
Companies that constantly innovate existing products or create new products and services need
to communicate with customers but the customers have also a need to monitor their news, ask
them questions and seek answers. In Figure 2. is given one example of brand page on Facebook:
Figure 2: Brand Page on Facebook social network
Facebook becomes a channel of communication with the market. Companies have at disposal
a social network as an indispensable channel of communication with consumers and it's
environment and often, on a daily basis, inform customers, publish sweepstakes, undertaken
action, price changes, provide new products or services. Number of fans becomes the main
measure of the relevance of the page as well as the product or service. The obligation of the
management is to recognize and exploit the potential of information technology.
On social networks are huge amounts of data that are often do not even analyze. There are many
reasons but the the two most significant. The first is the lack of time and insufficient level of
training and knowledge management. These reasons may be called subjective. Other reasons
can be attributed to complexity of the data analysis on social networks in terms of building the
appropriate software tools and recognition of algorithms that enable analysis [6].
For marketing intelligence the most important are comments posted by people, customers where
they express their attitudes, emotions and opinions via texts.

1st CRODMA Conference 2016
126
4 RESEARCH METHODOLOGY
The research framework in this paper consists of four main phases which are definition of
research problem, data gathering and building the data set for analysis, text mining and result
analysis.
4.1.DATA COLLECTION
The first step will be to take data from from Medjugorje Facebook pages. For access any data
from facebook pages, user required to login to Facebook (the assumption isthat there is a profile
on Facebook). A precondition for data collection from Facebook's is to access URL address:
https://developers.facebook.com, register and fill required information on Facebook developer
page (form).
After register and login to Facebook the next step for the user (marketing intelligence) is getting
the basic application settings: (the name of application is BrAnSa) application ID and secret
code.
Data from Facebook will be collected as well as analysied using R programming language3.
The packages devtools and Rfacebook have to be install using the statements4:
>install.packages("devtools")
>library(devtools)
>install_github("Rfacebook", "pablobarbera", subdir="Rfacebook")
The package „Rfacebook“ provides a few functions that allow R users to get information about
Facebook users, pages, comments and posts.
After installing these packages need to connect R session with test application and
authenticate it to Facebook Profile for Data Mining. The package Rfacebook offers a very
simple function for that. All you need is to copy app id and app secret from app settings on
the Facebook developer page:
>require("Rfacebook")
> library(httr)
> fb_oauth <- fbOAuth(app_id=" app id from our app settings ", app_secret =" app secret
oour app settings ", extended_permissions = TRUE).
3 R is an interpreted computer programming language where most user-visible functions are written in R itself. R
is made up of: operators (+ - <- * %*% …) for calculations, collection of functions for making quality graphics
and sets of functions (packages). R is simple and also suitable for data analysis. 4 These packages are installed from github as this is currently the most recent version.

Book of Papers
127
The function fbOAuth creates an access token that enables R to make authenticated calls to the
Facebook API5.
The package httr is organised around four most popular verbs of http (hypertext transfer
protocol): GET (fetch an existing resource), POST (create a new resource), PUT (update an
existing resource) and DELETE (delete an existing resource).
After dialog with R language using the fbOauth() function:
> fb_oauth <- fbOAuth(app_id=" app id from our app settings ", app_secret =" app
secret oour app settings ", extended_permissions = TRUE)
Copy and paste into Site URL on Facebook App Settings: http://localhost:1410/
When done, press any key to continue...
The main hypotheses of this paper is that it is possible to build a system for marketing
intelligence that collects and analyzes data from social networks in order to make accurate
marketing decisions.
Therefore will be collected data in the form of comments for the pages with keyword
Medjugorje on social network Facebook. The packet Rfacebook includes the function
searchPages() whichs retrieves public pages that mention a given keyword.6
>pages<-searchPages(string="Medjugorje", token= fb_oauth, n = 20)
The keyword is Medjugorje, token is assigned fb_oauth and the number of pages is 20.
The application goal is to extract list of posts from a public Facebook page Medjugorje. The
function getPage() with three parameters is applied:
>pageMedjugorje <- getPage("Medjugorje", token= fb_oauth, n = 2000)
where the first parameter „Medjugorje" is page name, the second parameter token= fb_oauth
is the OAuth token created with fbOAuth and the third parameter n=2000 is number of posts
of page to return. We were requested 2000 posts and API returns all of them:
>pageMedjugorje <- getPage("Medjugorje", token= fb_oauth, n = 2000)
>25 posts 50 posts 75 posts 100 posts..... 1796 posts 1821 posts 1823 posts
The total number of messages that contain the name of Medjugorje destination is 2000 so we
in the R session did not get any warning message (we defined in the previous statement 2000
posts). The first three amomg 1823 posts are:
>pageMedjugorje[1:2,]
5 OAuth is a protocol that provides to clients a "secure delegated access" to server resources on behalf of a
resource owner. 6 This function has three parameters searchPages(string, token, n = 100), where parameters have the next
meaning: string: containing keywords to search, token: either a temporary access token created at
https://developers.facebook. com/tools/explorer or the OAuth token created with fbOAuth, n: mximum number
of pages to return. Authors of this function are Pablo Barbera and Joel Gombin.

1st CRODMA Conference 2016
128
The returned data frame basically contains the fields from_name, from_id for every single like of the
post, message, created_time, type, likes_count, comments_count and shares_count. For the first
row in data frame pageMedjugorje result is displayed in the next table:
Table 1. Data frame of posts for pages Medjugorje on Facebook
from_id from_name message created_time type
1 169173713621 Medjugorje nella tempesta,
fidiamoci di Gesu...
2016-08-
18T14:02:54+0000
link
id likes_count comments_count shares_count
1 http://www.amicidilazzaro.it/index.
php/la-fiducia-in-dio-forza-nelle-
tempeste-raniero-cantalamessa 166 5 15
The last three columns in data frame pageMedjugorje contain information about the number
of likes, comments and shares. This information can be used to get the popularity of a post in
a page. The most messages are written in italien language7.
Marketing intelligence is concetrated only on text data stored in column message of data
frame pageMedjugorje. This is the third column in data frame and extraction of all messages
(comments) enables the function:
>fb_wcloud=pageMedjugorje[, 3]
The first eight messages will display the next statemenf od R languages:
> comMed=pageMedjugorje[1:3,3]
> comMed
[1] "nella tempesta, fidiamoci di Gesù..."
[2] "Affidarsi a Dio....\n\n(in English : Act fo trust ---> http://goo.gl/NKWocM)"
[3] "\"Aiutaci a portare il fardello delle tribolazioni quotidiane, non con l’anima dei disperati,
ma con la serenità di chi sa di essere custodito nel cavo della mano di Dio... If you followed
all the previous steps of the algorithm for extracting data from Facebook pages and R
language commands data in the form of text will be stored in variable fb_wcloud. This data
can be analyzed using text mining algorithms and in theb paper will be implemented a word
cloud. It is an acceptable form of textual data analysis because in graphical form shows the
keywords most frequently-occurring in the text.
7 Now we could analyse the gender od users by implementation the R functions which are based on the column
from_id. The user insights can get with the getUsers() function. This function extracts the user_id which is the
field from_id. From the returning user data is possible extract the gender and save it to a temporary
gender_frame. The complete code and solution is at the URL https://www.r-bloggers.com/gender-analysis-of-
facebook-post-likes/.

Book of Papers
129
4.2. TERM DOCUMENT MATRIX
Initial data sets fb_wcloud consisted of textual messages and comments. Term document matrix
reprensets the frequency of each term in document. If the Di denotes i-th document (message)
and Tj denotes j-th term then fij is frequency of j-th term i j-th document. Often used in
information retrieval and text mining is tf-idf parameter. This parameter stands for term
frequency - inverse document frequency and evaluates how important a word is to a document
in a corpus (collection). The package tm is a framerk for text mining in R language and need to
be load first.
The main structure for handling documents in the package tm makes the so-called Corpus and
it represents a set of documents [9]. You must enter the following sequence of commands:8
> library(tm)
>fb_Corpus<-Corpus(VectorSource(fb_wcloud))
The package tm provides a set of predefined sources (DirSource, VectorSource,
DataframeSource). VectorSource interpreting each component as document and only accepts
(character) vectors. After being "caught" a collection of documents (fb_Corpus) we need to
modify this collection so that will eliminate the blank spaces in the documents (messages), signs
of punctuation and the like. The logic is to eliminate all signs and words that do not carry
information relevant to the semantics of the text. The aim is to translate the documents into a
simpler form so that they are suitable for parsing. It is sufficient in the loop for(i in
seq(fb_Corpus)) add commands that from the collection of documents extract characters or
words that will be replaced by spaces. It displays the following loop9
for(i in seq(fb_Corpus))
{
fb_Corpus [[i]] <- gsub("del", " ", fb_Corpus [[i]])
fb_Corpus [[i]] <- gsub("#", " ", fb_Corpus [[i]])
fb_Corpus [[i]] <- gsub("\\|", " ",fb_Corpus [[i]])
fb_Corpus [[i]] <- gsub("con", " ",fb_Corpus [[i]])
.................................................................................
fb_Corpus [[i]] <- gsub("que", " ",fb_Corpus [[i]])
It is very useful implement the transformation of corpus to be sure all of data is in
PlainTextDocument:
8 To understand thecommands, packages and functions in the R language is helpful to visit websites that give
detailed explanations of the use of the. For package tm useful site is:
http://cran.r-project.org/web/packages/tm/vignettes/tm.pdf. 9 Most of the text in the collection of documents fb_Corpus is written in Italian. Therefore, from the text are
eliminated the Italian words that not have a special semantic value.
1st CRODMA Conference 2016
130
>fbCorpus<- tm_map(fb_Corpus, PlainTextDocument)10
The next step is to create a matrix for learning which includes frequency of terms. A document
term matrix or term-document matrix is a mathematical matrix that describes the frequency of
terms that occur in a collection of messages from Facebook pages Medjugorje as tourist
destination. In a document term matrix, rows correspond to documents in the collection
fb_wcloud and columns correspond to terms. DocumentTermMatrix is a central part of text
mining and in the tm package the functions DocumentTermMatrix or TermDocumentMatrix
(depending on whether you want documents as rows and terms as columns, or vice versa)
transforms corpora into matrix. This is very important step because the analysis and text mining
is based on the quality of document term matrix. The function DocumentTermMatrix()in R
language has the following syntax:
TermDocumentMatrix(x, control = list())
where is: x - a corpus for the constructors; control - a named list of control options
In our example control includes in term document matrix only the words with minimum length
of five characters:
> fb_tdm<- TermDocumentMatrix(fbCorpus, control = list(minWordLength = 5))
> fb_tdm
<<TermDocumentMatrix (terms: 9910, documents: 1823)>>
The number of terms in given example is 9910 and documents 1823. The terms (terms) are
chosen based on the frequency of the document (Document Frequency-DF). Words that
exceed a certain threshold (minimum length of three characters) will form a list of index
terms.
4.3.RESULT ANALYSIS
The next step is to create a term matrix that contains frequencies of terms for learning. In our
example, the number of terms is 9910 and the number of documents 1802. On term document
matrix can be applied a huge amount of R functions for data mining like classifications,
prediction, clustering etc.
First will fb_tdm transform in matrix y function as.matrix(). It is generic function and for data
frames will return a character matrix:
>m_dtm<- as.matrix(fb_tdm)
Ne next very useful step is to sum the frequency each one term (row of term document
matrix) and sort the frequency in decreasing order.
>m_s<- sort(rowSums(m_dtm),decreasing=TRUE)
10Plain text is file contents that represent only characters but not its graphical representation nor other object. That
is done by fbCorpus<- tm_map(fb_Corpus, PlainTextDocument) and now should made DocumentTermMatrix.

Book of Papers
131
Than will be created the data frame m_df with two columns: word and freq (frequency):
>m_df<- data.frame(word = names(m_s),freq=m_s)
Ten words with the highest frequency shows the function head():
> head(m_df,3)
Table 2. The most frequency terms in term document matrix of colelction fb_corpus
word freq
medjugorje 805
185
reina 173
Now we can start asking questions like: what are the most association with word „dio“ where
corellation is greater than 0.28? Answer is very simple by implementation the function
findAssocs():
Table 3. Associations in fb_corpus with word „dio“
> findAssocs(m_dtm, "dio", corlimit=0.28)
$dio
dio: liberaci, suppli, disprezzare, protezione, prova, rifugio, santa, benedetta,
0.31 0.31 0.31 0.30 0.30 0.30 0.30 0.30 0.29
icolo, ogni, tua, cerchiamo
0.29 0.29 0.29 0.28
The primary goal of the paper is to present the analysis result in visual form which is especially
acceptable in business environment. There are a few reasons why is word cloud used to
represent the research information, First, word cloud discovers the essential and an overall sense
of comments and messages about Medjugorje as destination. It may stimulate more questions
and answers, but that it is a good entry point to take marketing and promotional actions. The
marketing intelligence using word cloud may give a fast insights in products, services, customer
satisfactions, perception etc. Marketing expert does not need to understood all technological
and sofware aspects of research results but can share back results from reserach very quickly.
To display the results of research it is necessary to load the wordcloud package in the R session:
>library(wordcloud)
The function wordcloud plot a word cloud11:
11 The first argument m_df$word takes the terms from data frame m_df, the second argument m_df$freq is the
words frequency, the third argument scale=c(4,.5) scale a vector of length 2 indicating the range of the size of the
words, min.freq denotes that words with frequency below min.freq will not be plotted, the argument max.words is
maximum number of words to be plotted,, the argument random.order plot words in random order (false means
they will be plotted in decreasing frequency and the last argument colors choose colors of the word cloud.

1st CRODMA Conference 2016
132
>wordcloud(m_df$word, m_df$freq, scale=c(4,.5), min.freq=40, max.words=Inf,
random.order=FALSE, rot.per=.15, colors= brewer.pal(8,”Dark2”))
The result of reserach is visible at the next Figure:
Figure 3. Word cloud for page Medjugorje on social network Facebook
The most frequent words are Medjugorje, message, reina, dio, preghiera, madre, regina, papa,
vaticano and so on. The most messages and key words in word cloud are in Italian. The
marketing intelligence expert could conclude that Medjugorje is a place of prayer (preghiera)
in which respects the Queen of Peace (regina) and about Medjugorje care the pope and Vatican.
The same algorithm and analysis could be implemented to other destinations, brands, events,
people and so on. The marketing intelligence get a very fast, accurate and reliable insight into
these objects of analysis.
5 CONCLUSION
Systematic view decomposing marketing intelligence in competitive insight (competitor
intelligence and product intelligence) and market insight (market understanding and customer
insight). Social networks are today a big data sources available to marketing intelligence and
the real power of the social networks for marketing intelligence are feedbacks of customers
about products, promotion, prices, employees, brand awareness, brand preferences, loyality.
This paper shows in details how is possible build the application for marketing intelligence
which gathers data from Facebook as one of the most important social networks, analyze this
data and get the complete insight about customers opinion about tourist destination. Except the
marketing knowledge it was necessary to know the way of functioning of social networks but
also knowledge of software tools, packages and their features that allow the construction of
such a system for marketing intelligence. The programming language R showed a strong

Book of Papers
133
application and development power. The research results are visualized in the form of a word
cloud and are simple to use in marketing.
This system is open to new extensions in terms of collecting data from social networks
Facebook and analyze them by other complex algorithms such as are algorithms of clustering
(k-means or fuzzy c-means), classification (naive Bayes classifier, logistic regression, Support
Vector Machines) and prediction.
REFERENCES
[1] Crowley, Ed., (2004), Market intelligence versus marketing research, Quirk’s
Marketing Research Review.
[2] Inmon W.H.,Welch J.D., Glassey K.L.,(1997), Managing the Data Warehouse, New
York: John Wiley & Sons.
[3] Kimball R.,Reeves L.,Ross M.,Thornthwaite W.,(1998), The data warehouse Lifecycle
Toolkit, New York: John Wiley & Sons.
[4] Kotler, P., (1996), Principles of Marketing. The European Edition, USA: Prentice Hall.
[5] Markić, B., Bijakšić, S., Bevanda, (2016), Sentiment analysis of social networks as a
challenge to the digital marketing, Ekonomski vjesnik/ECONVIEWS, God.XXIX, BR.
1/2016, str. 95-107.
[6] Markić, B., Bijakšić, S., Bevanda(2016), Customer Intelligence Analytics on Social
Networks, Expert Journal of Marketing, 4 (1), pp. 24-30.
[7] Markić, B., Bijakšić, S., Bevanda, A., (2016), Data driven marketing as a challenge for
entreprenurship, REDETE 2016 Conference; Economic development and
entrepreneurship in transition economies: Assessment of the last 25 years, going beyond
the „transition“; Belgrade, Serbia, October, 2016.
[8] Tanner, John F. , Raymond, M., A., (2010), Principles of Marketing 2.0, University of
Minnesota Libraries Publishing.
[9] Wu, H., Luk, R., Wong, K., Kwok, K., (2008), Interpreting TF-IDF term weights as
making relevance decisions", ACM Transactions on Information Systems, 26 (3).

1st CRODMA Conference 2016
134

Book of Papers
135
SPECIAL FEATURES OF ADVERTISING ON
SOCIAL NETWORKS: LINKEDIN
IGOR JURČIĆ
JP Hrvatske telekomunikacije d.d. Mostar,
Kneza Branimira bb, 88000 Mostar, Bosna i Hercegovina
[email protected]; [email protected]
DANIELA JURČIĆ
Filozofski fakultet, Sveučilište u Mostaru,
Matice hrvatske bb, Mostar, Bosna i Hercegovina
ABSTRACT
Advertising in recent years experienced great changes. The development of ICT technology,
mobile networks and Internet access "anytime and anywhere" and the mass use of social
networks (Facebook, Twitter, Instagram, Linkedin ...) have dramatically changed advertising
industry. Experts from advertising industry are becoming more aware of these facts and
advertising are increasingly moving to the Internet and to the social networks. Special features
and ways of advertising on social networks are significantly different from conventional
advertising in traditional media (TV, radio, print, outdoor, ...). In the paper will be presented
specifics and ways of advertising on social networks. It will be specially analyzed advertising
on the social network Linkedin. It will be analyzed access to advertising on LinkedIn social
network in the region and in the world and it will be pointed out the basic mistakes that
companies from the region makinkg in advertising process - emphasis will be placed on the
market of telecommunications.
KEYWORDS: new technologies, mobile Internet, advertising, social networks, Linkedin
1 INTRODUCTION
Social network marketing is a term that has significantly used in marketing area during last
several years. And more important – it will be more nad more often used in following years.
This fact can be confirmed if it will be analyzed the number of customers who use one or more
social networks – Facebook, Twitter, Google+, Linkedin,… The number of people who use
social networks is higher and higher from day to day. On the other hand, it is very important to
analyze activities of private or business customers on social networks. Some customers are very

1st CRODMA Conference 2016
136
active but some of them are not and use one or more social networks periodically. For marketers
is crucial to analyze these two facts: how many customers they can attract to their posts and
how many of these customers are active every day or at least once or twice a week. It is very
important to have more followers or connections but if they are not active every day or at least
several times per week, the number of connections or number of followers lose their
importance. The authors have analyzed important facts about social network marketing and
advertising, the most often mistakes and create suggestions for better usability of social
networks. Specially, it will be analyzed opportunities of LinkedIn social network and
possibilities for business customers.
2 DIGITAL MARKETING PLAN
Before starting with social media marketing or better say advertising, it is necessary to build a
„digital marketing plan“. And of course it is necessary to define digital marketing strategy and
change organization in a company which must/should include a „digital marketing department“
or „on-line marketing department“. Through these changes, comapnies should prepare
themselves for new age that is coming in following years.
2.1. DIGITAL MARKETING PLAN – HOW TO START
In marketing, creating and defining strategy begins with understanding what
companies/organizations want to achieve in their businesses and what problems they have to
solve. After that, it is necessary to consider the environment in which companies/organizations
and their competitors operate. And, of course, marketing plan and strategy have to find key
ways how companies/organizations and their brands can gain advantages and add values.
Marketing has to create and satisfy demands and digital marketing, as a part of the marketing,
should drive creation of these demands by using the power of Internet. This means that digital
marketing must satisfy previously mentioned demands on completely new and inovative ways.
Digital marketing is using Internet (as interactive medium) as a main base and this is main
advantage of digital marketing and its approach to customers.
So, how to start? As the first it is necessary to create digital marketing plan as very important
part (very soon it will be the most important part) of general marketing plan, and of course it is
important to create digital marketing strategy as part of general marketing strategy. It will be
more and more important to develop digital margeting strategy – it can be expected that digital
marketing will be main part of general marketing plan very soon. And companies will spend
more than half of money (of whole amount of money that is planned for marketing) for digital
marketing very soon. Digital marketing becomes more and more important and companies,
which want to have and play an important role in their businesses, will create very strong digital
marketing plans and very inovative digital marketing strategies.

Book of Papers
137
The Internet has changed the world and whole environment in which companies work, create
products and services and advertise their products and services. It is not new tool for creating
products and servicer or new marketing channel or new working place. The Internet is new way
for connecting brands and customers, brands and brands and of course, customers and
customers. The whole scope of marketing on the Internet can be presented on following way:
products and services are positioned, promoted, purchased, distributed and serviced. All
companies which want to stay and play important roles in following years mustn't forget these
facts.
2.2. DIGITAL MARKETING STRATEGY – HOW TO START
When experts from a company start to create digital marketing strategy it is important to know
what the main targets of digital marketing plan are and what they want to achieve with digital
marketing as a component of general marketing plan. Building an effective digital marketing
strategy is not a simple process. A the beginning it is mandatory to create plans and strategies
for all elements of digital marketing activities and put them together in one complete digital
marketing plan. That plan has to have target(s) and it/they must be defined through detailed
digital marketing strategy – i.e. how marketing plan put into an action.
Digital marketing allows several very important facts [Building an effective digital marketing
strategy; Failte Ireland, Dublin, Ireland]: build a brand, sell products and services, reach
international prospect, talk directly to current/previous customers, connect with personal and
business contacts, respond to customers querries/complaints, manage PR stories, recruit staff
and get referrals from people who have used produsts or services of company which implement
digital marketing approach. According to some authors [Dr. Dave Chaffey and Danyl
Bosomworth:„Digital Marketing Strategy, seven steps to success guide“] there are seven steps
for creating quality digital marketing strategy:
1. Define your approach to digital strategy
2. Understand your ecosystem,
3. Define your future
4. Strategy: Targeting
5. Strategy: Proposition
6. Strategy: Getting new customers
7. Strategy: Keeping customers engaged and loyal.
According to same authors, after research they have carried out, appx. 69% of entire researched
base, apply digital marketing in their marketing activities but they don't have digital marketing
strategy. And this is the real problem – companies spend money for digital marketing but
without any digital marketing strategy. When companies create digital marketing strategy it is
important to use before mentioned steps but also to hear opinions all relevant employees in
company: ICT department, sales department, customer service department,… and marketing

1st CRODMA Conference 2016
138
department has very important role – people from marketing must put all inputs in one high
quality digital marketing plan and strategy And only on that way, digital marketing strategy can
be successfully defined and can be enforceable into practice.
2.3. SOCIAL NETWORKS IN DIGITAL MARKETING STRATEGY
A simple and one of the oldest definition of marketing is that „marketing is the creation of
demand for products and services“. If it is definition of classical marketing, than digital
marketing drives creation of demand using the power of the Internet. Internet, as interactive
medium, allows the exhange of values and getting feedbacks of products and services values.
There are a lot of different tools and tacticts those are available when digital marketing plan
and digital marketing strategy have been defined. The strength of specific tools or tactics is
dependent of target(s) that company wants to achieve – for example e-mail marketing shows
the best results for selling more products to existing customets. E-mail marketing is one of the
best effective tools (in digital marketing strategy) for selling products to existing customers and
for customer retention. On the other hand, social media (social network) in digitral marketing
strategy is one of the most effective tools for branding and participation [Rob stokes and the
Minds of Quirk: „eMarketing – The essential guide to digital marketing“, 4th edition]. In digital
marketing strategy, social media is useful for branding, raising awareness of the brand story
and it allows customers to be part of the brand story through collaboration. Using of social
networks in digital marketing strategy also can play significant role in building brand awareness
because of their shereable, viral nature.
Social networks play very significant role in digital marketing strategy. No matter there will be
several social networks used together in digital marketing strategy or one or more social
networks will be combined with e-mail marketing or any other digital marketing strategy tools,
social networks are inevitable tools when some company create its digital marketing strategy.
It is very important question how to combine social networks in digital marketing plan and
digital marketing strategy and it is crucial to determine which social networks should be used
in digital marketing strategy and in digital marketing mix. Of course, it is impossible to answer
on these questions unambiguously and answer depends on what will be advertised, what are
targeted groups, what kind of company create its digital marketing plan/strategy, etc. But it is
very importantt to know and to remember that social networks are inevitable tools when
companies create their digital marketing plan and strategy.
3 SOCIAL NETWORK: LINKEDIN
Linkedin is the world's largest professional social network. And certainly the most influential
world's professional social network. According to the avalilable data, Linkedin had more than

Book of Papers
139
430 million active users at the end of first quarter 2016. year (Q12016). Today, this number is
certainly much higher. Except these facts, it is important to know that on LinkedIn exist:
more than 61 million senior level influencers,
more than 40 million decision makers,
more than 10 million opinion leaders,
approximately 7 million C-level executives,
approximately 3 million MBA graduates.
Also, there are more than 2 million publishers who post fresh content on LinkedIn and there are
more than 7 million brand-managed company pages. Linkedin is definitive professional
publishing platform, where users come to learn, share and get inspired. It is very important to
know and to remember: the world's professionals come to LonkedIn for knowledge [„The
Sophisticated Marketer's Guide to LinkedIn“- published by LinkedIn]. This fact is very
important to remember. If this fact would be analyzed deeper, it could be seen that professionals
com to LinkedIn for: industry news, expert advices, career training, peer insights and
recommendations and content published by LinkedIn's 500+ influencers.
Figure 1. LinkedIn by the numbers [„The Sophisticated Marketer's Guide to LinkedIn“-
published by LinkedIn]
There is a phrase „a picture says more than 1000 words“: main facts about LinkedIn is shovn
on Figure 2. Anylizing all these bacis facts, it is obvious that potential of LinkedIn for B2B
marketing is a huge and that LinkedIn must be one of the main components in digital marketing
plan of modern companies.

1st CRODMA Conference 2016
140
3.1. KEY TOOLS AND TACTICS FOR LINKEDIN B2B APPROACH
It is definetly clear that social network LinkedIn is inevitable part of every successful digital
marketing plan and strategy. But eeach marketing expert should ask himself/herself what are
the best tools and tactics for using LinkedIn in B2B approach for his/her company. Because
LinkedIn is social network which is suitable for each types/kinds and for each sizes of
companies but approach for each of them are not the same. It would take a lot of space and a
lot of time for analyzing all types and sizes of companies and specifities for B2B marketing for
all of them. In this article will be taken into consideration companies in ICT sector and for
companies which have more than 50 employees.
It is crucial to create and regularly update company page on LinkedIn (this fact worths for all
types (and sizes) of companies). Term „regularly update“ means that company has to update
(refresh) company page with news and usefull information but also company mustn't to put on
company page useless information (it mustn't spam their users and followers with useless
information). Each ICT company has (or it should have) ICT experts but also such company
has experts from another areas. All of them must be involved in creating content for LinkedIn.
„Proffesionals come to LinkedIn for knowledge“ and ICT companies have to offer them high
quality knowledge – not only for professionals from ICT area, but for professionals (experts)
from another field of interests. Today, ICT penetrates in all industries and people want to know
about opportunities those ICT industry can offer them. Except on company page those
knowledge and usefull content can be published on [„The Sophisticated Marketer's Guide to
LinkedIn“- published by LinkedIn]:
Showcase pages
Long-form posts
Content uploaded on Slideshare
LinkedIn sponsored content
Sponsored inmail
LinkedIn display ads
LinkedIn dinamic ads.
How to use maximuum of these tools? It is explained on Figure 3. Of course, this tactical plan
worths for each type and size of company. But this is very important for analyzing for ICT
companies – for brand awareness and for image rising. This picture gives answers on many
questions regarding using LinkedIn for any company which wants to use LinkedIn on optimal
way. And it is very important to emphasize: ICT companies have to find way to use knowledge
of their employees. Either to pay them for usefull whitepapers, eBooks, etc. or send them to
symposiums and seminars from ICT field. Or on any other way - but managers of ICT
companeis have to find and see opportunities those LinkedIn offers to them and also their
employees have to know that their values in ICT area will be higher if they work on their own
„brand awereness“ and „image rising“ and of course if they actively work on building of „brand

Book of Papers
141
awereness“ and of „image raising“ of their companies. And of course any company has to find
way how to encourage their own employees „to be brand ambasadors“.
Figure 2.Tactical plan for LinkedIn [„LINKEDIN CONTENT MARKETING – TACTICAL
PLAN“]
3.2. USING LINKEDIN AS MARKETING AND SALES CHANNEL
LinkedIn social network, as the fisrt, can and should be used targeting on image raising and
brand awareness raising. But, LinkedIn also can be used as hihg quality marketing and sales
channel. But, companies those want use LinkedIn as marketing and sales channel sould be very
carefully with approach to potential and actual users. LinkedIn is not social network suitable
for aggressive campaigns.
LinkedIn is very suitable for „smart and indirect campaigns“. One excellent example is post of
Huawei regarding new smartphone. In short announcement there is a link for another text where
briefly was written good characteristic of mobile phone, it is stated how that smartphone wins
the competition, etc. But title (the title is also a link to smartphone's prospect) of that post was:
„The Huawei Honor 8 Is Proof You’re Paying Too Much for Phones“ and short text after
this title was: „A great smartphone costs $400. Everything else is marketing“. Many
companies can learn from this example. This is an example how companies should make
marketing and sales campaigns on social network LinkedIn.
What was the emphasis? As the first, Huawei has built their brand and image on LinkedIn and
Huawei has huge number of followers. The company publishes almost every day news about
their achievements, whitepapers, analysis, articles, etc. Followers and users know that Huawei
is well established, very known and one of the best and strongest companies in ICT area in the
world. Those steps were made very successfully by Huawei. After that, Huawei, overy simple
way, introduced new mobile phone to their followers and users. And noted quality/price ratio
as the best on the smartphone market. Very short text with the most significant technical details

1st CRODMA Conference 2016
142
and price and very short comparation with the bessmartphones on the market. And of course –
quality/price ratio is the best for new Huawei smartphone. And that's it! What can be learned
from this example? LinkedIn could be used as marketing and sales channel but as the first
company has to build brand and image and of course has to build its own network of followers.
3.3. MAIN RECOMMENDATIONS FOR MARKETING EXPERTS
There are a lot of recommendations those marketing experts should follow if they want to get
the maximum of opportunities those social network LinkedIn can offer to companies. Of course,
it is impossible to list all of them but there are some of the most important ones (listed from the
most relevant literature and from experience of the authors):
Optimize personal and/or company page,
Building your own and company networks,
Expand your network of Influencers (an exclusive group of C-level executives,
entrepreneurs, futurists, world leaders… to philantropists) – it is possible to follow
Influencers without being connected to them
Use LinkedIn to maintain professional relationships,
Use Showcase pages,
Use Slideshare for sharing knowledge,
Be active in specialized groups and wncourage company emloyees to be active in
specialized groups,
Encourage company employees to be a brand and a company ambasadors
Optimize company page for keywords,
Publish whitepapers, articles, analysis,… show employess knowledge and skills –
employees are the most significant value of the company,
Share knowledge and important information – show to another professionals your
personal and company knowledge,
and many other tips and tricks (and recommendations) – but is is impossible to list them
all in this aarticle.
And it is worth to remember [„Mark Amtower: “Mark Amtower’s LinkedIn Power Tips”]: „All
growth on LinkedIn – connections, attention, credibility – take time. Don’t be in hurry. It
is not a race“. There are a lot of literature of LinkedIn and marketinga and sales on LinkedIn.
Of course there are a lot of „tips and tricks“ for better marketinga and sales. Here will be pointed
out one of 140 tips from “Mark Amtower’s LinkedIn Power Tips”: “A good LinkedIn profile
can generate leads. A great LinkedIn profile can close sales”. This is very important to
remember when create a LinkedIn profile. It is crucial to improve LinkedIn profile, make it the
best and update it regularly with relevant information and knowledge.
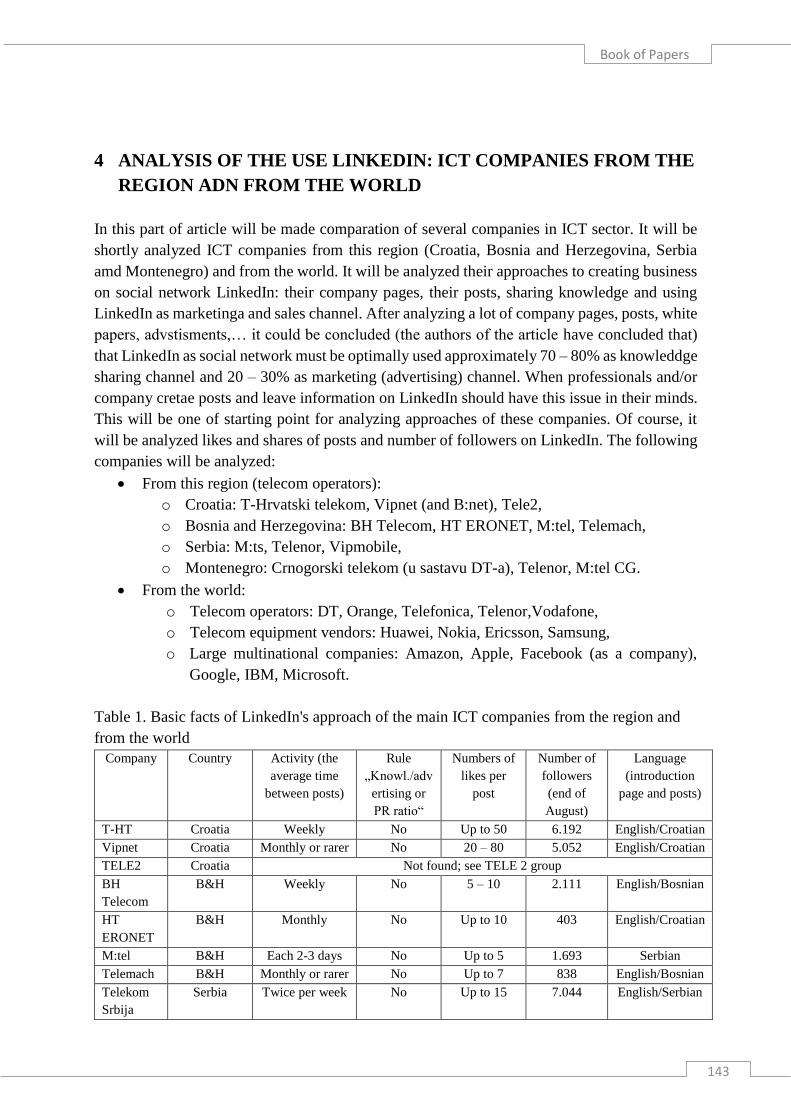
Book of Papers
143
4 ANALYSIS OF THE USE LINKEDIN: ICT COMPANIES FROM THE
REGION ADN FROM THE WORLD
In this part of article will be made comparation of several companies in ICT sector. It will be
shortly analyzed ICT companies from this region (Croatia, Bosnia and Herzegovina, Serbia
amd Montenegro) and from the world. It will be analyzed their approaches to creating business
on social network LinkedIn: their company pages, their posts, sharing knowledge and using
LinkedIn as marketinga and sales channel. After analyzing a lot of company pages, posts, white
papers, advstisments,… it could be concluded (the authors of the article have concluded that)
that LinkedIn as social network must be optimally used approximately 70 – 80% as knowleddge
sharing channel and 20 – 30% as marketing (advertising) channel. When professionals and/or
company cretae posts and leave information on LinkedIn should have this issue in their minds.
This will be one of starting point for analyzing approaches of these companies. Of course, it
will be analyzed likes and shares of posts and number of followers on LinkedIn. The following
companies will be analyzed:
From this region (telecom operators):
o Croatia: T-Hrvatski telekom, Vipnet (and B:net), Tele2,
o Bosnia and Herzegovina: BH Telecom, HT ERONET, M:tel, Telemach,
o Serbia: M:ts, Telenor, Vipmobile,
o Montenegro: Crnogorski telekom (u sastavu DT-a), Telenor, M:tel CG.
From the world:
o Telecom operators: DT, Orange, Telefonica, Telenor,Vodafone,
o Telecom equipment vendors: Huawei, Nokia, Ericsson, Samsung,
o Large multinational companies: Amazon, Apple, Facebook (as a company),
Google, IBM, Microsoft.
Table 1. Basic facts of LinkedIn's approach of the main ICT companies from the region and
from the world
Company Country Activity (the
average time
between posts)
Rule
„Knowl./adv
ertising or
PR ratio“
Numbers of
likes per
post
Number of
followers
(end of
August)
Language
(introduction
page and posts)
T-HT Croatia Weekly No Up to 50 6.192 English/Croatian
Vipnet Croatia Monthly or rarer No 20 – 80 5.052 English/Croatian
TELE2 Croatia Not found; see TELE 2 group
BH
Telecom
B&H Weekly No 5 – 10 2.111 English/Bosnian
HT
ERONET
B&H Monthly No Up to 10 403 English/Croatian
M:tel B&H Each 2-3 days No Up to 5 1.693 Serbian
Telemach B&H Monthly or rarer No Up to 7 838 English/Bosnian
Telekom
Srbija
Serbia Twice per week No Up to 15 7.044 English/Serbian
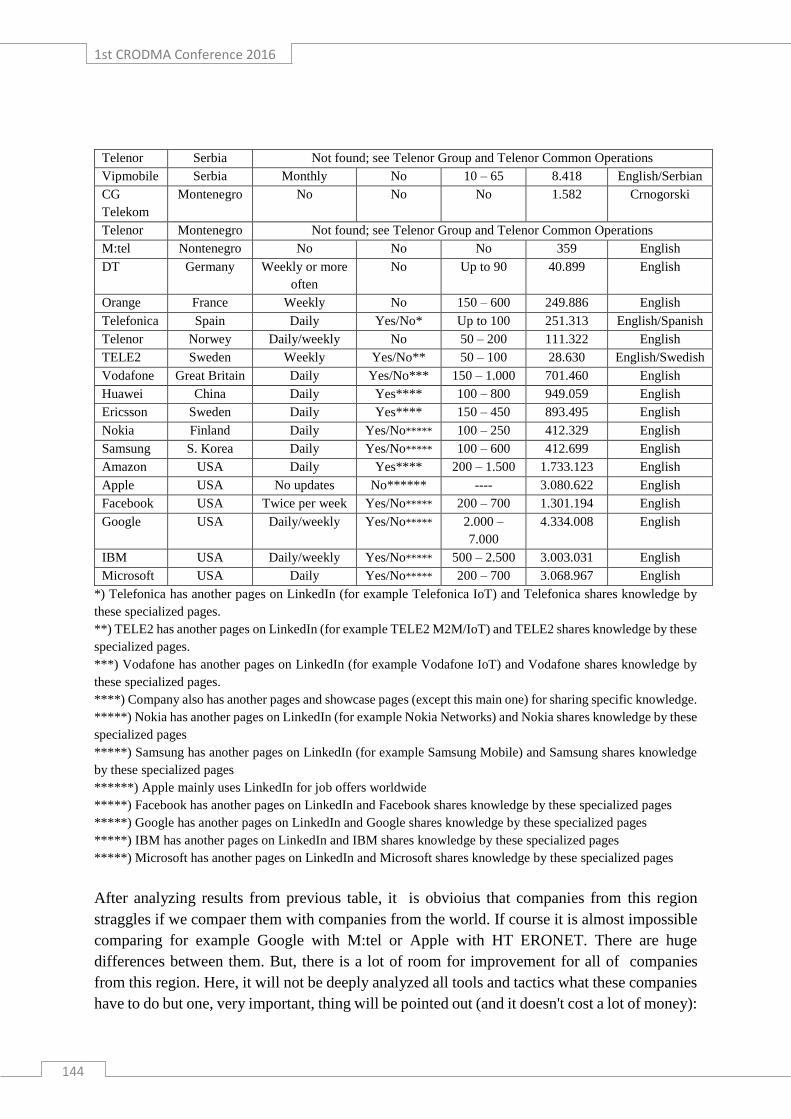
1st CRODMA Conference 2016
144
Telenor Serbia Not found; see Telenor Group and Telenor Common Operations
Vipmobile Serbia Monthly No 10 – 65 8.418 English/Serbian
CG
Telekom
Montenegro No No No 1.582 Crnogorski
Telenor Montenegro Not found; see Telenor Group and Telenor Common Operations
M:tel Nontenegro No No No 359 English
DT Germany Weekly or more
often
No Up to 90 40.899 English
Orange France Weekly No 150 – 600 249.886 English
Telefonica Spain Daily Yes/No* Up to 100 251.313 English/Spanish
Telenor Norwey Daily/weekly No 50 – 200 111.322 English
TELE2 Sweden Weekly Yes/No** 50 – 100 28.630 English/Swedish
Vodafone Great Britain Daily Yes/No*** 150 – 1.000 701.460 English
Huawei China Daily Yes**** 100 – 800 949.059 English
Ericsson Sweden Daily Yes**** 150 – 450 893.495 English
Nokia Finland Daily Yes/No***** 100 – 250 412.329 English
Samsung S. Korea Daily Yes/No***** 100 – 600 412.699 English
Amazon USA Daily Yes**** 200 – 1.500 1.733.123 English
Apple USA No updates No****** ---- 3.080.622 English
Facebook USA Twice per week Yes/No***** 200 – 700 1.301.194 English
Google USA Daily/weekly Yes/No***** 2.000 –
7.000
4.334.008 English
IBM USA Daily/weekly Yes/No***** 500 – 2.500 3.003.031 English
Microsoft USA Daily Yes/No***** 200 – 700 3.068.967 English
*) Telefonica has another pages on LinkedIn (for example Telefonica IoT) and Telefonica shares knowledge by
these specialized pages.
**) TELE2 has another pages on LinkedIn (for example TELE2 M2M/IoT) and TELE2 shares knowledge by these
specialized pages.
***) Vodafone has another pages on LinkedIn (for example Vodafone IoT) and Vodafone shares knowledge by
these specialized pages.
****) Company also has another pages and showcase pages (except this main one) for sharing specific knowledge.
*****) Nokia has another pages on LinkedIn (for example Nokia Networks) and Nokia shares knowledge by these
specialized pages
*****) Samsung has another pages on LinkedIn (for example Samsung Mobile) and Samsung shares knowledge
by these specialized pages
******) Apple mainly uses LinkedIn for job offers worldwide
*****) Facebook has another pages on LinkedIn and Facebook shares knowledge by these specialized pages
*****) Google has another pages on LinkedIn and Google shares knowledge by these specialized pages
*****) IBM has another pages on LinkedIn and IBM shares knowledge by these specialized pages
*****) Microsoft has another pages on LinkedIn and Microsoft shares knowledge by these specialized pages
After analyzing results from previous table, it is obvioius that companies from this region
straggles if we compaer them with companies from the world. If course it is almost impossible
comparing for example Google with M:tel or Apple with HT ERONET. There are huge
differences between them. But, there is a lot of room for improvement for all of companies
from this region. Here, it will not be deeply analyzed all tools and tactics what these companies
have to do but one, very important, thing will be pointed out (and it doesn't cost a lot of money):

Book of Papers
145
all of these companies have to motivate (there are many ways to do this) their employees to be
active in researches and in adoption of new knowledge and of course they have to be active and
publish proffesional and scientific articles and whitepapers on different symposiums and
seminars. Of course, these articles and white papers will be latter published on LinkedIn and
they will be available for all LinkedIn users who „come to LinkedIn for knowledge“. These
companies also should motivate their employees to be active as residential users on Linkedin
(for example almost 60% of Orange's employees have pages on Linkedin) because all these,
very active employees on LinkedIn, are an excellent „company abasadors“.
In this article will not be explained all (other) practical moves which these companies sholud
do because there is no room for that. It will be probably discussed and analyzed in some further
articles and analysis of the authors.
5 CONCLUSION
The time that comes, it will bring a lot of changes in our lives. The world becomes digital and
that is the fact. Acoording to some researches, more than 25% of eceonomy in the world by
2020 will be digitaly economy. In ICT sector Vision 2020 gives all important details and facts
about direction for the world and for global economy direction. As the economy will be digital,
at the same time marketing also becomes more and more digital. Digital marketing and adigital
marketing strategy become more and more important and digital marketing and digital maketing
strategy become infallible part of any marketing plan and marketing strategy. It may be even
cocluded that digital marketing plan and digital marketing strategy become crusial and the most
important parts of any marketing plan and marketing strategy.
Social networks are and in the future will be more and more very important part of any digital
marketing plan and strategy. There are a lot of social networks, but also there are up to 10 of
them which are the most popular in the world.
LinkedIn is definitely the most popular and the most influential business social networks. As
business social networks, it is set for business people and all type of professionals and like that,
LinkedIn has many tools and tactics those are different of tools and tactisc for other social
networks. In the article is given review of the most popular and usefull tools and tactics. It is
also briefly anlyzed how ICT and telecom companies from the region and from wthe world
approach to LinkedIn and how are trying to use what LinkedIn offers to them.
Definitely, telecom comapnies from the region do not use LinedIn on the right way and they do
not use all tools and tactics those LinkedIn offer to them. There are a lot of room for
improvement but there is not a lot of time for these changes. Telecom operators should, as soon
as possible, adopt new approaches for creating digital marketing plans and strategies and start

1st CRODMA Conference 2016
146
using social networks in attratcting new customers, churn reduction, brand awareness and imaga
raising. Social networks provide a lot of opportunities for them and they have to kearn how to
use them on the best way. And they all have to understand that digital marketing and strategy
will be very soon the most important parts of any marketing plan and strategy. And one
important thing for the end of this article (although this was not specially mentioned in the
article): social networks marketing and e-mail marketing together represent very
powerful combination. This mustn't be forgotten because many telecom operators have
already started with using e-mail marketing and sales as important part of marketing and sales
plan.
REFERENCES
[1] „5 „must have“ tactics for your 2016 Digital marketing plan“,
http://www.whosbloggingwhat.com/?src=16tb, downloaded on July, 1st, 2016.
[2] „10 things B2B companies should be doing on LinkedIn“, downloaded from
https://www.act-on.com/ebook/10-things-b2b-companies-should-be-doing-on-linkedin/,
on July, 1st, 2016,
[3] „Better lead yield in the content marketing field“, Whitepaper, June 2013, downloaded
from http://www.marketwired.com on June, 27th, 2016.
[4] „Building an effective digital marketing strategy“; Failte Ireland, Dublin, Ireland, Dr.
Dave Chaffey and Danyl Bosomworth: „Digital Marketing Strategy, seven steps to
success guide“
[5] Joshua Sherman: „Learn LinkedIn – how to build your living resume“, downloaded from
http://makeuseof.com on June, 30th, 2016.
[6] Kotler P, Keller K. L.: Marketing Management, 12. edition, PrenticeHall, NewJersey,
2005.
[7] Mark Amtower: „Mark Amtower's LinkedIn Power Tips“, A social media-enabled eBook
comprised of 140 Ahas, An Aha Amplifier Book; http://olsensystems.com/wp-
content/uploads/2016/04/Mark-Amtowers-LinkedIn-Power-Tips.pdf, dowloaded on July, 4th, 2016.
[8] Matt Heinz: „Successful Social Selling“ downloaded from
http://results.heinzmarketing.com/newsletter-thank-you.html?aliId=1350222 on July, 5th, 2016.
[9] Mike Nichols:„Your guide to your social marketing“, http://makeuseof.com, downloaded
on June, 30th, 2016.
[10] „Mobile first“, published by Sofrecom (Part of the Orange group),
http://www.sofrecom.com, downloaded on July, 1st, 2016.
[11] Neal Schaffer: „Maximizing LinkedIn for Business“, Social media, Center of Exellence,
[12] „The definitive guide to digital advertising“ http://www.marketo.com, dowloaded on
June, 28th, 2016.
[13] „The definitive guoide to social marketing“, A Marketo workbook, downloaded on June,
28th, 2016

Book of Papers
147
[14] „Transformational inbound marketing: your secret weapon for aquisition and retention“,
http://www.marketo.com, downloaded on June, 28th, 2016.
[15] The sophisticated marketer's guide to thought leadership“,
https://business.linkedin.com/marketing-solutions, published by LinkedIn team,
downloaded on July, 5th, 2016.

1st CRODMA Conference 2016
148

Book of Papers
149
THE CORRELATION BETWEEN SOCIAL MEDIA APPLICATIONS
USE AND THE NUMBER OF REQUESTS FOR PROPOSALS IN
TOURISM
ELIZABETA BOLARIĆ
Account Assistant, Degordian d.o.o.
Srebrnjak 36, 10000 Zagreb, Croatia
ABSTRACT
Nowadays, social media provides customers and businesses of modern times new ways of
communication and interaction on both B2C and B2B markets. Companies in tourism have
recognized the limitless opportunities for creating long-term relationships with their customers.
Therefore, a large number of companies have involved the social media into their marketing
strategies. In order to improve the engagement with the fans at the most influential social media
- Facebook, some companies use Facebook application. Those software solutions help
companies organize the contests and simultaneously collect the users' data. With the long-term
tracking of users' online behaviour and the interpretation of the gathered data, the companies
can boost brand awareness and improve sales.
KEYWORDS: social media, Facebook applications, contest, tourism, advertising, data
collection
1 INTRODUCTION
The Internet and new technologies have changed the way people communicate, share their
knowledge, experiences and spend their working and free time. Today, social media has a
global influence on customer behaviour due to its characteristics: two-way communication in
real time and transparency [Kesić, 2003]. Consequently, it boosts the power of customers and
other market participants.
Facebook is the most influencing social media both in Croatia [Alexa, 2015] and globally. In
the end of the 2015, it counts 1.44 billion users worldwide [The Statistic Portal, 2015].Facebook
applications are one of the most important communicational tools. Those software solutions are
used for boosting communication with the Facebook users, increasing the reach of current and
potential customers, improving the Facebook Pages’ content and collecting the data about

1st CRODMA Conference 2016
150
users’ behaviour. This data is afterwards used for other marketing activities such as email
marketing, remarketing campaigns and custom advertising [Facebook guide, 2015].
The research aimed to determinate is there an increase in the number of users’ interactions on
the Facebook page in a period when social media contest is implemented on a page in form of
application, in comparison with the period in which the application is not available. The
research is conducted on three cases in the tourism industry for a period of six months in 2013,
2014 and 2015. which is a very long period for the digital industry. The applications observed
refer to ones used for the promotion of services through the contest in tourism. Concurrently,
brands benefit from the data gathered during the contests, such as users' travel habits and
interests. By participating in the contest users permit usage of data available on their public
Facebook profile and email address in exchange for the opportunity to be awarded at the end of
the contest [Račić, 2015]. All the data is automatically stored in a database which enables easy
segmentation of users according to predefined factors. For example, the users can be filtered
according to their interests and demographic data. The information and contacts collected could
be used for ongoing marketing activities, e.g. for special offers through email marketing
campaigns in pre/post season in tourism. Online contests are also used to grab users' attention,
increase the time they spend on brand’s Facebook page and gain new fans e.i. potential
customers in a long run [Kirman, B., et al, 2010]. The process of transforming the fans into
loyal user demands careful interpretation of the data collected, usage of the email contact for
custom newsletter campaigns and finally increases the users' motivation for sending the request
for proposal.
2 RESEARCH METHODOLOGY
The paper bases its conclusion on cases involved in tourism business environment -Camping
Šimuni, Municipality tourist board Orebić and the anonymous company doing business in
tourism. All date is provided by Croatian Advertising agency Degordian Ltd. and its social
media applications named Socialpuzzle. Socialpuzzle presents the group of generic application
software which automatically create a database when user approaches the application and fill
in a contact form [Račić, 2015]. The data analyzed in the research was collected via statistic
tools such as Facebook Insights and Socialnumbers. The common Facebook metrics observed
for each case are the number of fans on the page and talking about. In addition, the number of
application visits, unique users and the number of newsletter subscriptions was reviewed
because they imply the users' interest for the brands' content in general. Financial metrics are
not available for the public use so that they are excluded from the research.

Book of Papers
151
3 RESULTS AND DISCUSSIONS
3.1. CASES OVERVIEW
The Facebook page Visit Orebić has used the Socialpuzzle application Runner game in 2014
and early 2015. The application is created with the aim of entertaining the users with an
animated character who run through the Orebić town, avoiding obstacles, trying to reach the
finish line as soon as possible. The entrance number for the users was not limited so that they
could play the game as many times as they wanted. The users were motivated by awards such
as free dinner in an expensive restaurant. All the results were gained organically.
The Camping Village Šimuni and anonymous page have used the Socialpuzzle application quiz.
The second application was live in 2014 while the third was introduced in 2013. The goal of
setting up those applications was to examine the users' familiarity with the brand and the
destination promoted via social media. Additionally, the purposes of the contests were
collecting the information about users' vacation planning and booking habits which would be
taken into consideration for the strategic planning of next touristic season. The users' were
inspired to run the quiz at most three times by free accommodation for a week and booking gift
coupons. The results of the campaigns are shown in Table 1. Application review.
Table 1. Applications review
page
Type of
application
/ contest
used
Duration
(in days)
The
number of
visits
The
number of
unique
users
The number
of
newsletter
subscription
Visit
Orebić
Runner
game 75* 347 45 13 (opt-in)
Camping
Village
Šimuni
Quiz 23** 3885 3082 3082 (opt-
out)
Anonymous Quiz 30*** 8431 6506 8431 (opt-
out)
Source: Degordian Ltd. *From 11th November to 24th December 2015
**From 19th November to 11th December 2014
***From 8th of August to 8th September 2013
As seen in Table no. 1. the huge difference is shown in the performances between Runner
game and Quizzes. This is a result of the organic communication in comparison with the
results gained through using advertising campaigns of Quizzes. Further, the first application

1st CRODMA Conference 2016
152
has direct newsletter subscription form available whereas the other two used opt-out system.
Opt-out was allowed according to the contest rules.
This study also confirms that the applications have increased overall communication on the
Facebook page and consequently impact the increase in a number of fans. The results are
illustrated for the six months in the following charts.
Chart 1. The growth in a number of fans on Visit Orebić page
Source: Author's production according to data gathered through Socialnumbers statistic tool
In the month when the application was implemented on the Facebook page, the page has
reached the highest rate of fan growth (18,84%) in a six months. That month the page gained
3028 new fans. The major rise happened in the first month which was followed by stagnation
and slightly increase in February 2015.
In a period of introducing the quiz contest, December 2014, the fan page Camping Village
Šimuni has also gained the largest amount of fans (620) in analyzed period. The calculated
growth rate was 3,79%. In comparison with Visit Orebić application, the page has gained fewer
users which are a result of regular advertising and different conditions in terms of reach,
engagement and Facebook algorithms in general.
15.52617.034
16.068
19.096 19.084 19.26120.355
0
5.000
10.000
15.000
20.000
25.000
18,84%

Book of Papers
153
Chart 2. The growth in a number of fans on Camping Village Šimuni page
Source: Author's production according to data gathered through Socialnumbers statistic tool
Chart 3. The growth in a number of fans on anonymous page
Source: Author's production according to data gathered through Socialnumbers statistic tool
The third application has equally gained the majority of new fans in the first month of
organizing the contest. 812 fans were gathered in 30 days and the rising trend was kept in the
following months.
The first case study presents that activity on the Facebook site can be increased organically. In
75 days during the contest, 45 unique users have visited the application. One user has
approached the application 7,1 times on average. The number of page visits had boosted page
12.45812.677
12.885 12.949
13.353
13.86013.973
11.500
12.000
12.500
13.000
13.500
14.000
14.500
3,79%
2.934
3.721
7.6417.972 7.989
8.5788.965
0
1.000
2.000
3.000
4.000
5.000
6.000
7.000
8.000
9.000
10.000
105%

1st CRODMA Conference 2016
154
interactions which are in positive correlation with higher placement on Facebook according to
its Edge rank alghorithm [Newman, 2012]. In a first month, the page has gathered 3028 new
fans. In the period of 75 days, the application has gained more than 500 interactions and 13
newsletter subscriptions.
Second and third case studies have used advertising in order to attract more fans to enter the
application. Camping Village Šimuni page has grabbed the attention of 3082 unique users and
their email addresses in 23 days. Each user has entered the application 1,26 times on average.
With the social media contest and all other factors such as regular communication with fans,
the page has got 620 new fans and 550 fans' interactions. In 6 months the number of impressions
and the average interaction per page post have significantly increased.
The third case study shows that the anonymous page has gained 6506 unique users and their
contacts (emails addresses and phone numbers). To specify, out of all unique users each user
have start quiz on average 1,29 times. In the first month of the contest, the page has gathered
812 new fans. All the users reached through Facebook posts related to the contest have made
more than 1300 interactions on th page during 30 days. The number of total impressions and
the interaction per post have increased accordingly.
The number of visits per application significantly differs due to different types of contests. In
the Runner game contest, the number of entrance per user was not limited whereas it was limited
to three in quizzes which examine users familiarity with brand e.i. destination.
3.2. DISCUSSION
Generally it can be remarked that today a great number of people willing to travel towards
specific touristic locations choose online communicating and planning alternatives, being
influenced by social media applications [Dina & Sabou, 2012]. Social media applications
enhance the voice of consumers [Munar & Jacobsen, 2014] allowing those who share a common
interest to join ideas and points of view and concurrently influence global market. On the other
hand, brands who have recognized this trend benefit from gathered data which is afterward used
for newsletter campaigns e.i. custom made emails for a specific segments of users [Kumar,
Zhang & Luo, 2014]. Applications are available on the Facebook from the early beginning,
since 2007 [Facebook, 2015]. Hence Hargittai and Thelwall have conducted the research related
to Facebook users' gender. The study results suggest that women spend more time using
Facebook application than men [Giannakos et al., 2012]. Much research relates to the impact
of social media on the tourism industry. Kaplan and Haenlein [2010] claim that web 2.0
technology has enabled connecting people in general, which has reflected on transparency and
real-time communication. Xiang and Gretzel [2010] have established that consumers have the
high rate of confidence in people who use the same social media as they do. This statement
could be compared with the research in 1979. made by Coher and Golden which explains that

Book of Papers
155
consumers whose attitude toward a product in not defined will prefer the product which is
imposed by the community they belong.
While a large number of studies discuss the factors mentioned in this research, none of the
research found analyzes the impact of the applications on Facebook page fans, engagement with
fans and the use of the information gained. Furthermore, some research elaborates the contest
influence on users' decision making and the use of database but no research have combined
those two approaches.
3.3.LIMITATIONS OF THE REVIEW
The presented review is not free from limitations, which should be enumerated. First, the
applications covered in this research have not been embedded on pages in the same period,
which means that the data could not be compared. Moreover, regarding the same metrics
observed, the presented data was taken from 2013, 2014 and 2015. This is a very long period
when taking into account frequently changes in Facebook algorithm regarding reach, available
buying ads space, the cost of advertising and the number of growing number of features
available for the marketers. Second, all contests have different duration while they were
organized by separate brands and under different conditions. Third, the runner game results
were gained organically whereas quizzes were promoted through the Facebook ads and the
newsletter campaigns.
4 CONCLUSION
Regardless of the aforementioned limitations, the findings presented in this paper indicate that
there is a positive correlation between social media application and the increase in the Facebook
page interactions which present the amount of brand awareness to the Facebook audience. The
awareness can not only boost interaction on a page in the short run but can also encourage users'
future actions while the page is already known to greater group of people. Facebook application
have enabled the marketers to implement an additional content to the page and to collect the
information about consumers' interests and their online behaviour. Those data are highly valued
for future offline and digital activities such as email marketing or remarketing campaigns. To
conclude, the Facebook application can gather new leads, increase brand awareness, but can
not directly impact consumers' behaviour such as sending the request for proposal to a certain
company in tourism.

1st CRODMA Conference 2016
156
REFERENCES
[1] Alexa Internet, (2015), Top sites in Croatia,
http://www.alexa.com/topsites/countries/HR, downloaded [June, 27th 2015]
[2] Camping Šimuni official Facebook page, (2015),
https://www.facebook.com/orebic.croatia?fref=ts, [December, 17th 2015]
[3] Cohen, J.; Golden, E. (1972). Informational social influence and product evaluation.
Journal of Applied Psychology, 56 (1), pp 54–59.
[4] Dina, R.; Sabou, G. (2012), Influence of social media in choice of touristic destination.
Cactus Tourism Journal, 3(2), pp 24-30.
[5] Email statistics report, (2013.), http://www.radicati.com/wp/wp-
content/uploads/2013/04/Email-Statistics-Report-2013-2017-Executive-Summary.pdf,
pristupljeno: 07.09.2015.
[6] Facebook Platform Policy, Facebook developers,
https://developers.facebook.com/policy/, [June, 27th 2015]
[7] Facebook, (2015.), Business Guide, https://www.facebook.com/business/ads-
guide/video-views/, [September, 4th 2015]
[8] Giannakos, N.M.; Chorianopoulos, K.; Giotopoulos, K.; Vlamos, P. (2013), Using
Facebook out of habit. Behaviour & Information Technology, 32 (6), pp 594-602.
[9] Hargittai, E. (2007), Whose space? Differences among users and non-users of social
network sites. Journal of Computer-Mediated Communication, 13 (1), pp 29-34.
[10] Kaplan, A. M; Haenlein, M. (2010.), Users of the world, unite! The challenges and
opportunities of Social Media, Business horizonts, 53 (1), pp 59-68.
[11] Kesić, T., (2003.), Interactive marketing commmunication, Opion, Zagreb, pp 418-420.
[12] Kirman, B., et al., (2010.), Improving social game engagement on Facebook through
enhanced socio-contextual information, Proceedings of the 28th international conference
on Human factors in computing systems (CHI ’10), New York, pp1753–1756.
[13] Kumar, V.; Zhanh, Xi.; Luo, A. (2014), Modeling Customer Opt-In and Opt-Out in a
Permission-Based Marketing Context, Journal of Marketing Research, pp 403-419.
[14] Munar, A.M.; Jacobsen, J.K.S., (2014) Motivations for sharing tourism experiences
through social media. Tourism management, 43 (1), pp 46-54.
[15] Newman, K. (2012.), Facebook Edgerank: What marketers need to know,
https://econsultancy.com/blog/9770-facebook-edgerank-what-marketers-need-to-know,
downloaded [October, 15th 2015]
[16] Račić, J. (2015) About Socialpuzzle, http://www.socialpuzzle.com/app/, downloaded
[January, 26th 2016]
[17] Socialnumbers, (2015), http://hr.socialnumbers.com/, [Janury, 22th 2016]
[18] The Statistic Portal, (2015), Facebook: Number of monthly active users worldwide 2008-
2015, http://www.statista.com/statistics/264810/number-of-monthly-active-facebook-
users-worldwide/, downloaded [June, 20th 2015]

Book of Papers
157
CRM IN A CROATIAN HOTEL CHAIN
MIROSLAV MANDIĆ
Faculty of Economics and Business, University of Zagreb
Trg J.F. Kennedya 6, 10000 Zagreb, Croatia
VLADISLAV VALIČEK
Nove Mogućnosti d.o.o.
Kalinovica 7, 10000 Zagreb, Croatia
ZRINKA SKELIN
Nove Mogućnosti d.o.o.
Kalinovica 7, 10000 Zagreb, Croatia
ABSTRACT
The paper aims to research the application of CRM's quality business practice in the Croatian
hospitality industry. The reason why this topic is being researched is a continued growth of the
hospitality industry in Croatia and worldwide. In Croatia tourism represents the key economic
sector. The factors such as addition on personal income, more free time and the customers'
desire to experience as much as possible while travelling are significantly influencing and
changing the hospitality industry. This means that the application of CRM in hospitality is
becoming ever more demanding and challenging. This paper used qualitative analysis so as to
research the application of CRM in one of Croatia's leading hospitality companies. The applied
case analysis used a specific example in order to analyse the application of CRM's quality
business practice. The paper focuses on analytical and operative challenges in CRM, for
example how to collect useful information out of all the numerous contact points which appear
between customers and companies, how to make sense of them and use them in the best possible
way. In accordance with the above mentioned, the focus is on the possibility of a successful and
efficient customer segmentation, determining the offer which satisfies the customers' needs the
most, as well as on determining the customers' value and applying the collected knowledge
about the customers in order to increase their value. The results of this research exhibit a
successful application of CRM in hospitality, and as such they might be interesting and useful
to researchers whose area of interest is CRM in general and especially CRM in the hospitality
industry. Furthermore, the paper might be interesting to managers and practitioners who
through a proper implementation of CRM want to segment their customers according to their
value and, finally, increase the value of their customers. The limitation of this paper is the

1st CRODMA Conference 2016
158
limited experience in the implementation of CRM within one company and a display of the
business practice within one market.
KEYWORDS: customer relationship management, hospitality industry, customer service,
customer value, Croatia.
1 INTRODUCTION
Customer relationship management (CRM) is one of the basic and most crucial elements of the
marketing philosophy. CRM puts in focus the customer and their satisfaction in such a way that
all the company’s activities are pointed towards the customer (Mandić, M., Vranešević, T.
2012). The main aim of CRM is to get to know the customer as well as possible, which can help
a company deliver better, more appropriate and higher added value to the customer. CRM is all
about collaborating with each customer – being able to create the classic win-win situation: you
add value to each customer’s daily life, and they give you loyalty in return (Temporal, Trott,
2001).
The primary goals of CRM are to: build long-term and profitable relationships with chosen
customers; get closer to those customers at every point of contact; and maximize the company’s
share of the customer’s wallet. Simply stated, CRM is about finding, getting, and retaining
customers. So, it is possible to conclude that CRM is business strategy and therefore more than
a functional strategy alone. It affects the organisations as a whole: marketing, IT, service,
logistics, finance, production and development, HR, management, etc (Peelen, 2005).
Also, Kumar and Werner (2005) look at CRM from a business strategy perspective. The aim is
to gain long-term competitive advantage by optimally delivering value and satisfaction to the
customer and extracting business value form the exchange. From this standpoint, CRM is the
strategic process of selecting the customers a firm can most profitably serve and of shaping the
interactions between a company and these customers. The goal is to optimize the current and
future value of the customers for the company.
CRM is a strategic process that includes all business units and departments. It is a process that
must be integral to the whole organisation (Mandić, Zbodulja, 2014). In other words, CRM is
not merely a technical solution; It is a continuous process of learning that entails business
strategy, business philosophy as well as a database (Osarenkhoe i Bennani, 2007).
The Interest in customer relationship management (CRM) began to grow in the 1990s.
Regardless of the size of an organization, businesses are still motivated to adopt CRM to create
and manage the relationships with their customers more effectively. An enhanced relationship
with one’s customers can ultimately lead to greater customer loyalty and retention and, also,

Book of Papers
159
profitability. In addition, the rapid growth of the Internet and its associated technologies has
greatly increased the opportunities for marketing and has transformed the way relationships
between companies and their customers are managed (Ngai, 2005).
CRM is a field encountered in marketing, management, but also in information technology as
well as science. A CRM application (software) strategy requires the usage of information,
processes, technology and people who work on maintaining a relationship between the
company and its clients (such as marketing, sales and support department etc.) An effective
CRM increases client loyalty, reduces costs and increases the overall value to the company as
well as to the interest groups that the company does business with (Kangal, 2012).
CRM appeared as a new concept at the peak of the Internet boom. In 1998 JPMorgan’s analysts
forecasted that the demand for CRM technology would grow with double-digit annual rate
because the Internet was causing a quiet revolution in the way were customers would demand
to interact with companies. All the mentioned points to the same conclusion - companies need
CRM because they have to improve their performance.
In today’s globally competitive world, customers expect more, have more choices, and are less
brand loyal. The only thing that is constant is change. Customers will continue to change with
regard to needs, demographics, lifestyle, and consumption behaviour. The companies that
survive and grow will be the ones which understand change and are in the lead, often creating
change.
Many businesses work hard to acquire new customers, but this is where the customer
relationship often stops. However, in implementing the CRM strategy, managers must
recognize the cultural orientation required to energize inter-firm communication and
knowledge sharing routines and build innovation and joint action. Infrastructure alone will not
build relationship bridges with strategic partners not leverage the resources that lie within those
partners. Thus, managers will need to ensure that processes are in place to stimulate new ideas
about relationship management and to capture current knowledge about relationship practice
and productivity (Jarratt, 2008). The development and implementation of the customer
relationship management strategy is influenced by a large number of factors. The three most
commonly present are as follows (Chen and Popovich, 2003, Liew, 2008):
The technology,
Business processes.
People.
The importance and influence of technology has already been mentioned several times since it
has offered support which has resulted in the current level of possibilities and application of
customer relationship management.
1st CRODMA Conference 2016
160
Furthermore, an emphasis has been put on efforts and aims of all companies which want to
implement the customer relationship management strategy in order to make all business
processes directed towards the customers, meaning satisfying the wishes and needs of their
customers. This includes activities inside all the companies’ departments.
Satisfying the previously mentioned factors without the support of the employee as the most
important factor is futile and does not make any sense. The given elements are basic according
to the latest theoretical findings but the question is whether they are sufficient for achieving
success.
A successful customer relationship management strategy implementation should in one
company cover all steps which are in contact with the customer. For the given approach to be
successful, companies should above all apply a systematic strategic approach. Crosby (2002)
says one of the biggest misapprehensions (or myths) concerning CRM is that it all evolves
around information technology. He claims the complete opposite (Crosby, 2002) by saying that
it is about the business strategy and that the loss or lack of strategy leads to undesired results
and a waste of big financial means, pouring money down the drain, if invested in CRM software
or hardware.
Kotorov (2003) thinks the same and in his opinion the success of customer relationship
management most importantly depends on understanding and approach according to which
customer relationship management is a strategy and not a software solution or a software
package. The commonly accepted belief is that the implementation of customer relationship
management strategy (CRM) strives to improve relationships with customers and their loyalty
but also it tends to reduce costs through business enhancements, boosting sales per customer
and attracting new customers.
Moreover, the aim of customer relationship management can be the total customer experience.
Improving customer relationships is definitely based on good communication skills, which are
ensured by a quality approach to customer relationship management strategy. No matter how
deeply rooted the customer and his satisfaction in the essence of marketing philosophy is, it is
still questionable how many companies truly know their customers. It is to understand that the
process is long-term and prone to changes which require continuous monitoring. Today’s
business environment is such that companies need customer relationship management (CRM)
in order to improve their businesses.
Implementing CRM requires an increase in knowledge and capability of the employees,
ensuring additional training, motivation and authority. One of the key requirements for this to
work is to create a new business culture and a new set of values, based on the client that will
result in a reorganization of the business process.

Book of Papers
161
Company related obstacles are in fact the reason why employee related obstacles can be
encountered before and during CRM implementation. The company's actions will directly
influence the employees' behaviour. As it has already been stated, implementing CRM requires
all departments in the company to work together (Yurong, et al. 2002) so many companies took
different actions in order to better develop their employees and achieving a satisfactory level of
internal and external relations as well as client satisfaction (Proctor, 2003.; 268). CRM is often
linked with high expectations and, consequently, dissatisfaction with its implementation.
Unfortunately, a high percentage of customer relationship management strategy
implementations fail because of the existence of elementary non-understanding of the strategic
approach here in question. Hoots (2004) stresses the importance of a more active role of ‘’top
management’’ and defines customer relationship management as a development of a universal
image of customers’ needs, of their expectations, behaviour and of managing the mentioned
elements (factors) which influence a company’s business. A more active role is especially
expected with regard to research into customers’ expectations and determining whether the
expected value has been delivered.
Kotorov (2003) supports the same approach and emphasises the importance of involvement of
top management. Otherwise, it is obvious that just implementation or acceptance of customer
relationship management will not be successful. Furthermore, Hoots (2004) introduced a
model, the so called ‘’3R’’, which represents resources, response and respect. The given model
shows there is a gap between customers’ expectations and value delivery.
On account of all this, customer relationship management is currently one of the most
interesting (‘’burning’’) issues in the business world. The crisis has done its part and proved
the importance of customer loyalty, so customer relationship management is experiencing
growth in practically all sectors and companies, regardless of the fact whether those companies
are focused on the market of final or business consumption expenditure.
2 METHODOLOGY
Qualitative research was carried out in order to collect primary information, while the secondary
sources were taken from books and scientific articles from the CRM area of study. The analysis
of previous works was an attempt of reaching general conclusions which can be used as
references for further implementations. Qualitative method is suitable for this type of research
because it is to be expected that such approach would contribute to a better understanding of
customer relationship management (Plakoyiannaki and Saren, 2006). An in-depth approach can
be achieved via detailed description of happenings, situations and communications which
occurred between the participants in customer relationship management. The data received

1st CRODMA Conference 2016
162
from this part of the research (qualitative) are linked with things and events which really took
place inside the company.
Methodologically, it is a combination of a case study analysis and an in-depth-interview with
an expert who took part in the CRM implementation. Case studies have been a commonly used
and legitimate method of research inquiry for studying related fields (McLeod, MacDonell,
2011). Case studies also typically involve multiple data sources, including observation,
interviews, documents and archival records, in order to develop a triangulated and in-depth
analysis and a contextual understanding of the research setting (McLeod, MacDonell, 2011).
Case study research offers a degree of flexibility in that key parameters of the research design
can be altered during the study in order to react or adapt to “the complex and dynamic
characteristics of real world phenomena” (McLeod, MacDonell, 2011).
Case theory can offer higher validity and relevance by focusing on outcome instead of on details
of the research process and techniques to augment reliability and rigor (Gummesson, 2014).
The choice of in-depth interview as a method seemed the appropriate with regard to the set
goals of the research. According to Finnegan and Willcocks (2007), the in-depth interview is a
good research method because it functions as a personal interview in which each interviewee
answers questions of the interviewer so as to reveal motives, beliefs, attitudes, feelings
connected with the topic, in this case feelings related to customer relationship management
strategy. An in-depth interview per se does not possess a high level of structure so in this case,
likewise, it was based on open questions which enable an ‘’informal’’ conversation about the
interviewee knowledge concerning customer relationship management.
The interview guide covered topics such as introduction to the field, the roles of the interviewee
and the interviewer, including the key elements from literary sources and previous research on
CRM. The interview had been previously arranged over the telephone and email and
conversations took place when and where it was most convenient for the interviewee, provided
that the conversations would not be interrupted.
The limitation of this paper is that the analysis of the CRM application was carried out in only
one hotel chain in Croatia. However, the results of this research could be useful to the scientific
and business community because they have shown a real case of CRM implementation, together
with many useful findings which reveal the steps in the application of CRM in the hospitality
industry.

Book of Papers
163
3 RESULTS
This paper describes the quality business practice of applying customer relationship
management (CRM) in the hospitality industry. If CRM is to be used in a correct and efficient
way, it is of key importance that it is approached in a strategic manner. This means the first step
is by no means technological. In order to be able to approach CRM in this way, it is necessary
to have the support of the management and a clear understanding of what the objectives are, as
well as to ensure the required resources. Besides the financial resources, just like everywhere
else, it is the people who are the factor of utmost importance. Besides the needed support from
the top management, it is required that one person in the company is employed especially for
the purpose of implementing CRM, and that this person has an assistant to deal with the
administrative work connected to it. Ideally, the person employed in the given company should
be very well acquainted with their business, its processes and its organisation.
A strategic application of CRM requires cooperation and inclusion of all departments of a
company, where the closest collaboration is expected with the marketing department. Besides
achieving the required level of cooperation, a precondition for successful implementation is
surely the level of a company’s maturity with regard to accepting CRM.
The simplest steps in applying the CRM strategy include customer identification, customer
differentiation, interaction with customers and customize treatment (Peppers, Rogers, 2004).
The given steps are carried out continually, which means this is a constant process of
identification, differentiation interaction and adjustment to clients.
Customer identification in a hotel involves managing all of the recorded information about the
guests, no matter where the information came from (for instance Wi-Fi, reservations, check-in,
manual reception entries, call centre, web, social media, newsletter, loyalty programme points,
questionnaire, or any other way in which guest information can be recorded). This is followed
by data cleansing in order to get a data base which is as accurate as possible. Here the key
challenge is to identify the customer in the sense that if in a period of one year a customer stayed
at the hotel several times, then it was not several different people but the same person. In this
manner CRM can provide data about how many guests actually stayed at the hotel, which
surpasses the information about the number of nights per stay.
This is a precondition for the ability to start differentiating clients. Besides the name and
surname and their basic contact details (address, email, date of birth), it is also required to gather
data about the stay (the room, stayed alone or with family), how much the customer spent, how
many times he or she stayed in that particular hotel, which services he or she used (for instance
only accommodation or also the restaurant, room service, wellness centre or services outside
the hotel).

1st CRODMA Conference 2016
164
In order to gain all the above mentioned information, it is necessary to motivate the employees
to enter all the data, but also to have the system collect the information from various other
sources (such as what was searched on the Internet, how active a person is, etc.), and that all
information is regularly updated. In this stage it is very important that the receptionists enter all
the required information about the guests.
The emphasis is placed on the guests’ interests, so as to later create customised offers in
accordance with those interests. Besides monitoring how much data they are entering in the
system on a weekly basis, in order to achieve a quality level of the employees’ engagement, it
is important the employees understand why this is being done.
The given data constitutes a guest’s profile, based on which customers can be differentiated
according to how much they spend and segmented into various value groups (for instance,
average spender, above average spender or below average spender). Since this paper describes
the application of CRM in a hotel chain, it is important to say that the value of each customer,
that is their differentiation, is done on the level of the hotel where they are staying. This means
the value segmentation on the hotel level takes into account all transactions a guest made in the
hotel. It is especially challenging to update a guest’s profile so as to ensure a continued flow
between the four mentioned steps, since the final goal is the conversion of a customer/guest
from one value category into another.
Differentiating between customers involves preparing various offers and creating different
activities for different customer groups. Premium customers, of course, receive different offers
than the customers who spend below average, and the communication with the two is not the
same either. Companies most commonly focus on the four different customer groups. Upon
creating campaigns, the content which is created for each group is of key importance. It is
evident that communication and the adaptation of the offer to the customers is taking place at
the same time.
What is important here are the interests the receptionists gathered and whether the employees
are providing the guests with the offers which suit their interests. For written communication
the staff are required to ask permission from the guest and allow the guest to choose the
language in which he or she wishes to receive information and offers. Information protection is
a fundamental precondition, and the only data which can be used is that which was approved
by the customer. When activating the guest data it is necessary to pay attention to whether the
channel through which the data is gained allows for their use. This usually happens with the
Online Travel Agency (OTA) channel (Booking.com and similar). Although the activation
collects data, the contract does not allow their use in communication with the guest. Since a
considerable number of reservations arrive through such channels, introducing a loyalty
programme would enable receiving contact permission by the guest, after which a hotel would
have the right to include the guest in their communication.

Book of Papers
165
No matter how adaptable to customers a business is, and how much they attempt to send them
offers in their native language, the content of an offer is of key importance in whether it will be
successful or not. Therefore, it is recommended to use less language options but to work on the
quality and variety of offers. A newsletter is one of the possible communication channels
towards customers, and its options are many, with the only limiting factor being the amount of
sensible activities an organisation is able to create. CRM enables hotels to know precisely the
channel a customer used to get to them. The additional tool which can also be of great use in
collecting and updating the necessary data for the application of CRM is a loyalty programme.
Considering all the above mentioned, it is evident that there are many sources of customer data.
All the information has to be updated. Companies have to make sure the data is not duplicated,
that the base undergoes regular cleansing, so it could provide the information based on which
further decisions can be made.
In practice, a considerable amount of data cannot be used in a systematic and organised way by
marketing and sales departments. In many cases, a company’s marketing department and sales
department operate in an old-fashioned way, and CRM is not used as a strategy but only as a
tool which provides support in creating campaigns. There is room for progress in revealing the
amount of potential coming from the customers. The question is how many guests can a certain
offer cover? Connecting CRM-created offers and price lists suited for each guest group, as well
as establishing a connection with feedback, is of great importance to CRM application on a
higher level.
Finally, it can be said that technology is not a problem, and in technological sense nothing is
impossible. The key issue in quality CRM application is in how mature a company so as to be
able to apply all the possibilities CRM can offer.
4 CONCLUSION
It is necessary for hotels to implement CRM if they want to know how many guests they really
had, as opposed to only looking at nights per stay. A possible approach to the implementation
can occur in four steps: customer identification, customer differentiation, interaction with a
customer and customize treatment. As the first and crucial step for data quality, identification
enables recognising a customer in a way that the information which used to be stored “in the
receptionist’s mind”, or at best in an Excel document, is now systematically organised and
available to everyone who needs to communicate with the guest.
CRM application can yield key information for the business, for instance when a guest stayed
in the hotel for the first time, the last time, how he or she arrived, how long he or she stayed,
the people he or she stayed with, the number of adults, the number of children, how much he
or she spent and on which activities and services.

1st CRODMA Conference 2016
166
CRM includes the performance analysis which shows the total number of guests who repeated
their stay. That data enables to determine the sales efficiency, such as: what was being sold, in
which way, at what price, and, finally, what was actually achieved. CRM enables simple and
fast reporting to the management, according to whichever success criteria they choose. The
only limitation in CRM application is whether a company is mature enough to accept and apply
all its possibilities.
A particular challenge and a recommendation for further research is how to successfully
manage all the above mentioned data. A lack of adequate methodology is evident, so further
research has to be directed towards preparing a methodological frame which could respond to
that challenge. The key limiting factor, once again, is whether a company is mature enough to
accept and apply all CRM possibilities.
REFERENCES
[1] Chen I.J., Popovich, K. (2003). Understanding customer relationship management
(CRM), Business Process Management Journal, Volume 9, Number 5, pp 672-688, ISSN
1463-7154
[2] Crosby, L.A. (2002). Exploding some myths about customer relationship management,
Managing Service Quality Journal, Volume 12, Number 5, pp 271-272, ISSN 0960-4529
[3] Finnegan, D. J., Willcocks, L. P. (2007). Implementing CRM; From Technology to
Knowledge, John Wiley & Sons, Ltd, England
[4] Gummesson, E. (2014). Service Research Methodology: From Case Study Research to
Case Theory, Revista Ibero - Americana de Estratégia, vol. 13, no. 4, pp. 8-17.
[5] Hoots, M. (2004). Customer relationship management for facility managers, Emerald
group publishing limited, 1741-0983, Journal of Facilities Management, Vol. 3., No. 4,
pp 346-361 Intelligence & Planning Journal, Volume 23, Number 6, pp 582-605, ISSN
0263-4503
[6] Jarratt, D. (2008). Testing a theoretically constructed relationship management capability,
European Journal of Marketing, Volume 42, Number 9/10, pp 1106-1132, ISSN 0309-
0566
[7] Kangal, A. (2012). Identifying the Dominant Perspective on Customer Relationship
Management in the Last Decade 2000 – 2010, Journal of Business Research / Isletme
Arastirmalari Dergisi, 4 (4), pp. 45-61.
[8] Kotorov, R. (2003). Customer relationship management: strategic lessons and future
directions, Business Process Management Journal, Volume 9, Number 5, pp 566-571,
ISSN: 1463-7154
[9] Kumar, V., Werner, J.R. (2005). Customer Relationship Management a Databased
Approach, John Wiley & Sons, Inc., USA

Book of Papers
167
[10] Liew, C-B, A. (2008), Strategic integration of knowledge management and customer
relationship management, Journal of Knowledge Management, Vol. 12, No. 4, pp 131-
146, ISSN: 1367-3270
[11] McLeod, L., MacDonell, S.G. & Doolin, B. Empir Software Eng (2011) 16: 430.
doi:10.1007/s10664-010-9153-5
[12] Mandić, M., Zbodulja, M. (2014). Importance of employees in CRM implementation,
2014 M-Sphere Book of Papers, Accent, Zagreb, pp. 286-291., ISBN 978-953-7930-06-
6
[13] Mandić, M., Vranešević, T. (2012). Successful Customer Relationship Management
implementation // 6th International Conference „An Enterprise Odyssey: Corporate
goverence and public policy – path to sustainable future“, Ekonomski fakultet Zagreb,
pp. 179-180.
[14] Ngai, E.W.T. (2005). Customer relationship management research (1992-2002),
Marketing
[15] Osarenkhoe, A., Bennani, A. E. (2007). An exploratory study of implementation of
customer relationship management strategy, Business Process Management Journal, 13
(1), pp. 139-164.
[16] Peelen, E. (2005). Customer Relationship Management, Pearson Education Limited,
Essex
[17] Plakoyiannaki, E., Saren, M. (2006). Time and the customer relationship management
process: conceptual and methodological insights, Journal of Business & Industrial
Marketing, Volume 21, Number 4, pp 218-230, ISSN 0885-8624
[18] Proctor, T. (2003). Change management: the role of internal communication and
employee development, Corporate communications: An International Journal, 8 (4), pp.
268-274.
[19] Peppers, D., Rogers, M. (2004). Managing Customer Relationships, John Wiley &
Sons, Inc., New Jersey
[20] Temporal, P., Trott, M. (2001). Romancing the Customer: Maximizing Brand Value
Through
[21] Yurong Xu (et al.) (2002). Adopting customer relationship technology, Industrial
Management & Data Systems, 102 (8), pp. 443.

1st CRODMA Conference 2016
168

Book of Papers
169
THE POTENTIAL FOR BIG DATA APPLICATION IN THE
MARKETING OF BANKING INSTITUTIONS
IVANA DVORSKI LACKOVIĆ
Faculty of Organization and Informatics, University of Zagreb
Pavlinska 2, 42 000 Varaždin, Croatia
VLADIMIR KOVŠCA
Faculty of Organization and Informatics, University of Zagreb
Pavlinska 2, 42 000 Varaždin, Croatia
ZRINKA LACKOVIĆ VINCEK
Faculty of Organization and Informatics, University of Zagreb
Pavlinska 2, 42 000 Varaždin, Croatia
ABSTRACT
The application of big data technology in various industries and sectors has been a significant
area of research interest lately. The aim of this paper is to contribute to the field by summarizing
existing knowledge on the topic of big data and explore its application in the domain of
marketing with special emphasis on banking institutions. The reason for this is the fact that
banks, with their turbulent environment characterised by high competition, strict regulatory
requirements and consumer centricity, are especially eligible for absorbing benefits of big data
technology adoption. The paper is structured in a way that general big data characteristics are
presented after the introductory notes. Following is the section related to big data application
in marketing. In the fourth section authors discuss banking environment and potential for big
data application in the marketing of banks.
KEYWORDS. Big data, marketing, banks
1 INTRODUCTION
Big data technology has been an important topic of research among scientific public in recent
years and there is a great interest for its usage in different industrial sectors. The purpose of this
paper is to examine potentials of usage of big data technology for marketing purposes in

1st CRODMA Conference 2016
170
banking industry. Motivation of authors is to present possible applications of big data in
marketing in banks with the aim of enhancing the business processes.
Provost and Fawcett [11, 2013] state that “with vast amounts of data now available, companies
in almost every industry are focused on exploiting data for competitive advantage”. Bakshi [1,
2012] argues that “the challenge is not only to collect and manage vast volume and different
type of data, but also to extract meaningful value from it”. According to Ruediger et al. [13,
1997] better understanding of customer needs can help banks acquire new customers, sell more
products to those customers and prevent other customers from taking their business elsewhere.
This statement is as topical nowadays due to the fact that banks are exposed to multiple
challenges: coping with the pressure of competition, satisfying customer needs and being
complied with regulatory requirements related to risk management but also on legal provisions
regarding consumer protection.
This paper is divided in five sections. Following the introductory notes, authors in second
section discuss general terms related to big data. Third section is related to overview of existing
research on the topic of big data in marketing. The focus of the fourth section is on discussion
of the application of big data in marketing in banks. Finally, conclusions are presented.
2 GENERAL OVERVIEW OF THE BIG DATA CONCEPT
Syed, Gillela and Venugopal [14, 2013] define big data as “data that exceeds the processing
capacity of conventional database systems. The data is too big, moves too fast, or does not fit
the strictures of your database architectures. To gain value from this data, you must choose an
alternative way to process it.”
Desouza and Smith [5, 2014] define big data through its characteristics, the so called “7 V’s”,
namely:
Volume: considers the amount of data generated and collected,
Velocity: refers to the speed at which data are analysed,
Variety: indicates the diversity of the types of data that are collected,
Viscosity: measures the resistance to flow of data,
Variability: measures the unpredictable rate of flow and types,
Veracity: measures the biases, noise, abnormality, and reliability in datasets,
Volatility: indicates how long data are valid and should be stored.
Desouza and Smith [5, 2014] also argue that “the most challenging V for organizations is
variety” due to the fact that integration of heterogeneous datasets and integration of new sources
of data (in terms of origin and type) requires economisation of process.

Book of Papers
171
As for potential benefits of big data usage for organizations some authors discuss that in the
past departments across organization have had each their own datasets which they managed
separately, but big data analytics is based on the premise that this data can be linked together in
order to receive synergic effects for both the organization, clients and business partners [12,
2012]. The others argue that the value of big data to an organization falls in one of following
two categories: analytical use or enabling new products [14, 2013]. Watson [16, 2014] points
out that “collecting and storing big data creates little value; it is only data infrastructure at this
point. It must be analysed and the results used by decision makers and organizational processes
in order to generate value”. Davenport and Dyche [3, 2013] argue that managers are impressed
with one of three other aspects of big data: the lack of structure, the opportunities presented and
low cost of the technologies involved. The same authors also point out following opportunities
arising from big data usage in organisations:
Cost reduction,
Substantial improvements in the time required to perform a computing task, or new
product and service offerings,
Support for internal business decisions [3, 2013].
According to a survey conducted by TDWI [15, 2011] 70% of respondents consider big data
technology as an opportunity and not a problem for their organisation because it yields detailed
analytics for business advantage.
In order to use big data as a tool for business decisions support organizations are expected to
incorporate big data analytics process. Gandomi and Haider [7, 2015] define following possible
types of big data analytics for structured and unstructured data:
1. Text analytics
a. Information extraction
b. Text summarization
c. Question answering
d. Sentiment analysis
2. Audio analytics
a. Large-vocabulary continuous speech recognition systems
b. Phonetic based systems
3. Video analytics
a. Server-based architecture
b. Edge-based architecture
4. Social media analytics
a. Content based analytics
b. Structure based analytics
c. Community detection
d. Social influence analysis
e. Link prediction
1st CRODMA Conference 2016
172
5. Predictive analytics (statistical methods)
Power [10, 2013] defines three major types of analyses that can be prepared with new data
sources and data manipulation technologies:
1. Retrospective data analyses – using historical data and quantitative tools to understand
patterns and results to make inferences about the future. This is the area of business
intelligence.
2. Predictive data analyses – using simulation models to generate scenarios based
on historical data to understand the future. Predictive means ‘looking forward’ and
making known in advance.
3. Prescriptive data analyses – using planned, quantitative analyses of real-time data that
may trigger events. Prescriptive analyses recommend actions.
3 BIG DATA IN THE MARKETING CONTEXT
The application of big data in marketing has been a topic of interest among scientific public but
also among marketing specialists. In this section the authors will present an overview of existing
available research related to big data usage in the domain of marketing.
According to TDWI Best practices report [15, 2011] implementation of big data technology
ensues benefit for following areas: better targeted social influencer marketing, more numerous
and accurate business insights, segmentation of customer base, recognition of sales and market
opportunities, automated decisions for real time processes, definition of churns and other
customer behaviour, detection of fraud, greater leverage and ROI for big data, quantification of
risks, trending for market sentiments, understanding of business change, better planning and
forecasting, identification of root causes of cost, understanding consumer behaviour from
clickstreams, manufacturing yield improvements. McKinsey Global Institute [8, 2011]
specifies, amongst others, following potential of big data in retail segment: in store behaviour
analysis, variety and price optimization, product placement design, improved performance,
labour inputs optimization, distribution and logistics optimization, web based markets. As can
be seen from the cited sources, the researchers find big potential for big data usage and its
implementation in the marketing field.
The influence of new, digital data on marketing is noticeable also when discussing types of data
used for analysis. In continuation to this, Rogers and Sexton [12, 2012] divide possible types
of data collected by marketers as:
traditional (demographic, customer transaction data, customer usage data) and
digital (social media content created by customers and targets, social network ties and
influence between customers and targets, customer mobile phone/device data).
Book of Papers
173
Having in mind the fact that the dynamics of retrieving data is dependable on the type of data
and “the 7 V’s” as main characteristics of big data, it is evident that there are many sources that
can be used in process of data extraction. Watson [16, 2014] gives following examples of
potential sources of big data:
Web log files used to improve understanding of clients’ buying behaviours and to
influence their consumption by dynamically recommending products,
Social media data analysis that can be used for understanding what people think about
new product introductions,
Data generated from machines can be used together with pricing plans in order to
motivate certain customer behaviour,
Geospatial (e.g., GPS) data that can be used in order to receive offers from nearby
services,
Image, voice, and audio analysis for applications in domain of security systems.
Although big data offer variety of opportunities for application in the marketing domain, big
data itself is not enough. Rogers and Sexton [12, 2012] point out that in order to leverage the
opportunities of big data, marketers need to improve their ability to:
Collect meaningful customer data from a variety of sources, including real-time data,
Link that data to metrics developed for measuring marketing ROI,
Share data across the organization, linking datasets together at the customer level,
Utilize this shared data to effectively target and personalize marketing efforts to
customers.
4 THE APPLICATION OF BIG DATA IN MARKETING IN BANKS
According to Oracle research [9, 2015] “banks and financial services companies seek to
differentiate themselves by developing and delivering unique products and services for their
customers. However, in this very competitive industry, successful products are often copied
and the customer’s barrier to exit is very low.” Oracle research [9, 2015] also suggests that
financial institutions are nowadays transient nodes for the customer who is the centre of
attention, in sense that he chooses his business relationships with a number of institutions that
offer financial services depending on what he assess as the most profitable combination in terms
of what he gets from that relationship. Consumers also expect to have full transparency about
the products and services being offered and thus for banks and financial services companies to
keep customers for the long term, they must get closer to them
and anticipate customer needs and be able to proactively position their products [9, 2015].
According to Deutsche Bank research [6, 2015] “gaining a more complete understanding of a
consumer’s interests and preferences is necessary to ensure that banks can continue to address

1st CRODMA Conference 2016
174
customer satisfaction and for building more extensive and richer predictive models. Big Data
technologies provide the ability to collect and integrate and augment
transactional and unstructured data from within and outside of the firm and
hence play a pivotal role in enabling customer centricity in this new reality”.
Deutsche Bank research [6, 2015] findings suggest that the drivers of big data technology
adoption in financial industry are:
Explosive data growth,
Regulation,
Fraud detection and security,
Customer insight and marketing analytics.
According to Capgemini Consulting [2, 2014] big data analytics can help banks maximize value
from customer data in three segments, namely:
Acquiring customers (improving credit risk estimation and maximizing lead generation
potential),
Growing share of wallet (driving efficiency of marketing programs and increasing sales
through predictive analysis),
Retaining customers (limiting customer attrition and improving customer satisfaction).
Oracle research [9, 2015] amongst others points out following solutions expected to arise from
big data project in financial institutions:
Increased customer wallet share (gaining insight into the life cycle of a customer),
Customer intimacy (better understanding of the customer enables positioning the right
product at the right time for the right price),
Reputational risk management (protecting the brand by understanding customer
sentiment towards the bank, its board members or employees).
In continuation to the big data sources previously defined by Watson [16, 2014], there are some
other specific data sources that banks may use, such as call centres, tellers or branch personnel
in order to understand the paths that customers follow through the bank, and how those paths
affect attrition or the purchase of particular financial services [3, 2013]. The Deutsche Bank
research [6, 2015] states that external sources of data are social networks, customer call records,
customer emails, claims data (albeit in an unstructured format) and that they provide them with
psychographic information about the consumer, aside
from utilising internal systems information. The same research also gives an example of use of
geotargeted advertising in financial industry as an excellent application of data arising from
various sources [6, 2015].
De Fortuny, Martens and Provost [4, 2013] observe that “big data thinking opens our view to
non-traditional data for predictive analytics—datasets in which each data point may incorporate

Book of Papers
175
less information, but when taken in aggregate may provide much more”. In that context it is
acceptable to assume that some prerequisites need to be satisfied in order to gain the most value
from big data. Rogers and Sexton [12, 2012] state that in order to effectively harness the
capabilities of new digital tools, marketers need to:
Set clear business objectives for any digital marketing effort,
Develop a variety of metrics for new digital tools (audience metrics, engagement
metrics, financial metrics),
Develop models that link channel-specific digital metrics (like retweets or Facebook
interactions) to universal metrics, including key performance indicators (KPIs),
Continuously innovate new measurement models as new digital tools and marketing
rapidly evolve.
5 CONCLUSION
In this paper authors have presented an overview of available research on the usage of big data
in the domain of marketing. An attempt has been made to point out the value of big data
application in banking due to the fact that banks nowadays operate in highly competitive,
strictly regulatory proscribed and client centric market and big data may contribute to banks’
position by adding extra value, especially in sense of gaining more insight into client’s habits,
creating more intimate relationship with client, managing reputational risk and reducing costs.
Having on mind continuous developments in the field of big data research there is a variety of
topics to be covered in future research with special emphasis on developing metrics and
measurement models that contribute to the field of marketing by measuring ratio of value of
investment made in application of big data technologies and benefits received.
REFERENCES
[1] Bakshi, K. (2012). Considerations for Big Data: Architecture and Approach. Aerospace
Conference IEEE, Big Sky Montana
[2] Capgemini Consulting. Big Data Alchemy: How can Banks Masimize the Value of their
Customer Data? (2014)
[3] Davenport, T.H., Dyche, J. (2013). Big Data in Big Companies. International Institute for
Analytics.
[4] De Fortuny, E.J., Martens, D., Provost, F. (2013). Predictive modelling with big data: Is
bigger really better? Big Data. pp. 215-226
[5] Desouza, K., Smith, K.L. (2014). Big Data for Social Innovation. [Stanford Social
Innovation Review, Summer 2014, pp. 39-43
[6] Deutsche Bank: Big Data: How it can become a differentiator (2015)

1st CRODMA Conference 2016
176
[7] Gandomi, A., Haider, M. (2015). Beyond the hype: Big data concepts, methods and
analytics. International Journal of Information Management, 35, pp. 137-144
[8] McKinsey Global Institute: Big data: The next frontier for innovation, competition,
and productivity (2011)
[9] Oracle Enterprise: Big Data in Financial Services and Banking (2015)
[10] Power, D. (2013). Decision Support, Analytics, and Business Intelligence. New York,
NY: Business Expert Press.
[11] Provost, F., Fawcett, T. (2013). Data science and its relationship to big data and data-
driven decision making. Big Data, 1 (1), pp. 51-59
[12] Rogers, D., Sexton, D. (2012). Marketing ROI in the Era of Big Data. The 2012 BRITE-
NYAMA Marketing in Transition Study.
[13] Ruediger, A., Grant-Thompson, S., Harrington, W., Singer, M. (1997). What leading
banks are learning about big databases and marketing. The McKinsey Quarterly, 3, pp.
187-192
[14] Syed, A. R., Gillela, K., Venugopal, C. (2013). The Future Revolution on Big Data.
International Journal of Advanced Research in Computer and Communication
Engineering, 2 (6), pp. 2446-2451
[15] TDWI Best practices report: Big data analytics (2011)
[16] Watson (2014). Tutorial: Big Data Analytics: Concepts, Technologies and Applications.
Communications of the Association for Information Systems, Vol. 34, Article 65.
Available at: http://aisel.aisnet.org/cais/vol34/iss1/65

Book of Papers
177
THE ROLE OF SEGMENTATION IN E-MAIL MARKETING
FILIP ŠINKO MORANDINI, mag. oec.
Faculty of organization and informatics Varaždin, University of Zagreb
Associate professor DAMIR DOBRINIĆ, Ph. D.
Faculty of organization and informatics Varaždin, University of Zagreb
ABSTRACT
E-mail marketing is considered the fastest growing form of communication technology in
history, while the globalization and the accelerated development of technology have managed
to bring Internet and e-mail services to a broad range of the world population. The latest trends
show that the importance of e-mail marketing will grow even further with a significant usage
of personalization in promotional campaigns. Thus, a quality segmentation of existing and
potential customers is highlighted as a necessary element of today's marketing activities.
Segmentation represents a process of dividing the market on different groups (segments) of
customers considering some of their common characteristics. Many studies have shown that
well segmented campaigns generate greater return on investment and achieve better open rates,
click through rates and conversion rates. As two popular analytical segmentation techniques,
RFM method and customer lifetime value (CLV) are presented in this paper. RFM method is a
three-dimensional way of ranking customers according to the time since their last purchase,
frequency and total value of their last purchases. Customer lifetime value (CLV) is the net
present value of all future profits generated by the existing or potential customers of the
company. The goal of this paper is to present the theoretical assumptions of the role of
segmentation in e-mail marketing and to show the results of the research about the use of
customer segmentation in e-mail marketing at Croatian companies.
KEYWORDS: personalization, segmentation, marketing, e-mail, direct marketing
1 INTRODUCTION
According to Vasudevan (2010) e-mail marketing is considered as "the promotion of products
and services via e-mail." It is pointed out that e-mail marketing is a form of direct marketing
that uses e-mail as means of communication with an audience for commercial purposes. Every
e-mail message sent to a potential or existing customer can be considered as e-mail marketing.
According to Chaffey (2009) some of the forms of e-mail marketing are:

1st CRODMA Conference 2016
178
Conversion e-mail - the user visits a web-site, expresses interest in a product or service
by registering and providing their e-mail address without buying anything. Then it is
possible to send an e-mail message to that address to convince the user to try the product
or service for which they showed an interest.
Regular e-newsletter - sent periodically (on a monthly or a quarterly basis, etc.) and with
different content for different publics and segments.
House-list campaign - periodic e-mail messages sent with different objectives, e. g.
encouraging trial of a service, repeated purchases or reactivation of customers who no
longer use a service.
Event-triggered - they are not regular and are sent out perhaps every 3 or 6 months
containing news about a new product or service.
E-mail sequence - various software can send out series of e-mail messages in intervals
determined by a marketing expert.
Considering the nature and the availability of today’s Internet communication, relatively low
costs are considered the primary advantage of e-mail marketing (especially compared to other
forms of direct marketing). Several authors, including Chaffey (2009), Ružić et al. (2014),
Dobrinić et al. (2005), Vasudevan (2010), Bawm and Nath (2014) state low costs as the primary
advantage of e-mail marketing. Including the speed and the above mentioned low costs, the
advantages and the disadvantages of e-mail marketing according to Chaffey (2009) are shown
in the Table 1.
Table 1. Advantages and disadvantages of e-mail marketing
ADVANTAGES OF E-MAIL
MARKETING
DISADVANTAGES OF E-MAIL
MARKETING
1. Direct response encourages immediate
customer action.
1. Problems with sending e-mail messages because
of different Internet providers, corporate firewalls
and different web-mail systems.
2. Rapid development of the marketing
campaign.
2. Difficulties with showing creativity within
different e-mail readers.
3. Simpler personalization. 3. Decline of answers.
4. Ability of testing. 4. The difference between the communication
preferences of recipients.
5. Ability of integration and combination with
other marketing forms.
5. The need for additional work resources.
Source: adapted from Chaffey D. et al. (2009), Internet Marketing: Strategy, Implementation
and Practice, 4th edition, Pearson Educated Limited

Book of Papers
179
Just like any other marketing or business activity, e-mail campaigns should be monitored and
evaluated and acted upon to improve their future results. Every organization defines itself which
metrics it will focus on, but there is one common guideline for every organization - metrics
used to monitor e-mail campaigns must match the business goals of the campaigns they are part
of. Therefore, enterprises should define their key performance indicators (KPIs). In order to
increase the relevance of those indicators, it is necessary to combine them in a systematic model
for monitoring e-mail campaigns performance. The key performance indicators are divided into
generic and specific ones. According to Charlesworth (2009), Chaffey et al. (2009), Ružić et
al. (2014) and Kolowich (2016), the generic key performance indicators of an e-mail campaign
are:
Delivery rate
Open rate
Click through rate (CTR)
Conversion rate
Viral rate
Comparison of e-mail campaigns
Charlesworth (2009) also mentions the specific key performance indicators of e-mail
campaigns: the number of units sold, the number of orders placed, the average order amount,
total profits, the number of downloads, response rate of opened messages and clicks on the ad
inside the message, and the mailing list growth rate.
2 SEGMENTING CUSTOMERS IN E-MAIL CAMPAIGNS
"Marketing segmentation is the process of aggregating individuals and businesses along similar
characteristics that pertain to the use, consumption, or benefits of a product or service." (Strauss,
El-Ansary, Frost, 2003) The procedure of segmentation is present in all marketing activities,
mostly with a goal to increase the effectiveness of marketing campaign, that is, to reduce the
cost of actions conducted towards customers who are not interested in particular offers, products
or services. Segmentation has its application also in the e-mail marketing by determining and
decomposing market segments and sending and acting towards them with more personalized
messages. Although current technology allows e-mail marketers to send bulk e-mail messages,
this so called generic segmentation can lead to irrelevant e-mail campaign and in the worst case
to marking the sent message as spam (Bawm, Nath, 2014). Analyzing different authors it can
be concluded that segmentation represents the procedure of dividing the market on different
homogenous groups of users (segments) according to their common preferences, patterns of
behavior and other characteristics which are the foundation of further process of targeting and
choosing the right strategy for each segment. In that context, the most notable methods of
segmentation are the RFM analysis and determining the customer lifetime value. Kotler, Keller
and Martinović (2012) define four main variables of segmentation: geographical,

1st CRODMA Conference 2016
180
demographical, psychographical and behavioral, while Ružić, Biloš and Turkalj (2014) mention
also the segmentation according to user status, segmentation according to usefulness and
segmentation of industrial markets (B2C).
Both academic researches and practices pointed out the importance of applying the
segmentation strategy, so Hiziroglu (2013) states that segmentation strategy is “an important
method to achieve more targeted communication with customers“. According to Green and
Krieger (1991) marketing segmentation is based on several basic presumptions:
Market segmentation presupposes customer heterogeneity.
Heterogeneity of preferences for products or services is linked with 1) personal variables
(e. g. demographic and psychographic characteristics, loyalty towards a certain brand
etc.) and 2) situational variables (e. g. gift purchasing vs. buying for yourself) and their
interactions.
Companies can react to the heterogeneity of preferences by modifying the
characteristics of existing products or services, distribution and promotion.
Companies are undertaking actions mentioned above if they estimate that it will bring
them greater net benefit.
According to Hughes (2006) segments are groups of customers with similar interest in products
or services that are based on their demographic characteristics and lifestyle; while Kotler, Keller
and Martinović (2012) state that the market segment consists of a group of consumers that share
a common set of needs and desires. According to Hughes (2006) an ideal segment is the one
which:
has definable characteristics in terms of behavior and demographics (e.g. students,
families with small children etc.),
is large enough in terms of potential sales to justify a marketing strategy,
encompasses customers who can be motivated to modify their behavior in ways that are
profitable for the company,
makes efficient analysis of available data,
can be measured and monitored in performance.
The question is how many segments a company should have. According to Hughes (2006), a
company should have as many segments as it can successfully manage and that for most of
them ten segments are sufficient.
After reviewing and defining various potential segments, marketing experts should decide on
the best approach towards each segment. This requires an optimal balance between market
environment and company’s expertise and resources. Then they decide about the strategy while
Strauss, El-Ansary and Frost (2003) mention four different approaches:
1) Mass marketing - one marketing mix for the entire market.
Book of Papers
181
2) Multisegment marketing - two or more segments and designed marketing mix strategies
tailored to each segment.
3) Marketing niche - one segment and one or more marketing mixes developed to meet the
needs of that segment.
4) Micromarketing – a part of or entire marketing mix adapted to a very small number of
people (in an extreme case, marketed to a single person).
After selecting the segmentation strategy, the company must ensure an adequate infrastructure
for the implementation of the segmentation plan. After selecting the right strategy and ensuring
sufficient infrastructure, the next step is the development of the action plan which represents a
guide for the development and implementation of the segmentation strategy and shows how to
get from one point to another. According to Hughes (2006), the action plan includes:
a roadmap showing what will happen and when it will happen,
a budget for the infrastructure and for the marketing segment plans,
standard application of segmentation - how to maintain consistency and control while
providing flexibility and localized power,
an organigram showing responsibilities for each segment,
specific goals to be achieved with milestones for measurement of success.
As the e-mail marketing function is correlated with the goals of the company, such as increasing
the revenues, cost reduction or market positioning, companies are looking for different ways to
increase their own effectiveness and the effectiveness of their e-mail marketing campaigns. In
this context, the segmentation is a powerful mechanism. In the context of e-mail marketing, we
talk about the mailing list segmentation, or the segmentation of the lists of subscribers who
gave permission to be included on that lists. The goal of segmentation in e-mail marketing is to
identify groups of customers with biggest tendency of forming online relationship (Chaffey,
2003). Then each segment is accessed with the chosen marketing strategy. According to
Chaffey (2003), some simple analytical tools like category analysis and determination of the
customer lifetime value with the RFM method are used to identify segment.
Bawm and Nath (2014) present a model for effective e-mail marketing consisting of two main
components: 1) Collecting subscribers' activities data, and 2) Subscriber segmentation. Before
the start of the segmentation process, every subscriber is marked as a general subscriber, and
their basic data is stored in the database. These raw data will be used for further segmentation.
During the segmentation, subscriber’s activities are tracked according to two key variables: the
open rate and the click rate of the e-mail messages. After finishing the first component, the
grouping and segmenting the data starts. Segmentation is executed according to the similarities
of subscribers’ activities throughout the marketing campaigns rather than according to their
gender, location or response rate. To segment subscribers based on their interests and activities,
Modified K-Means Clustering Algorithm is used (Nath et al., 2010). Subscribers' open rate,
click through rate, purchase rating and impression on products are used for clustering
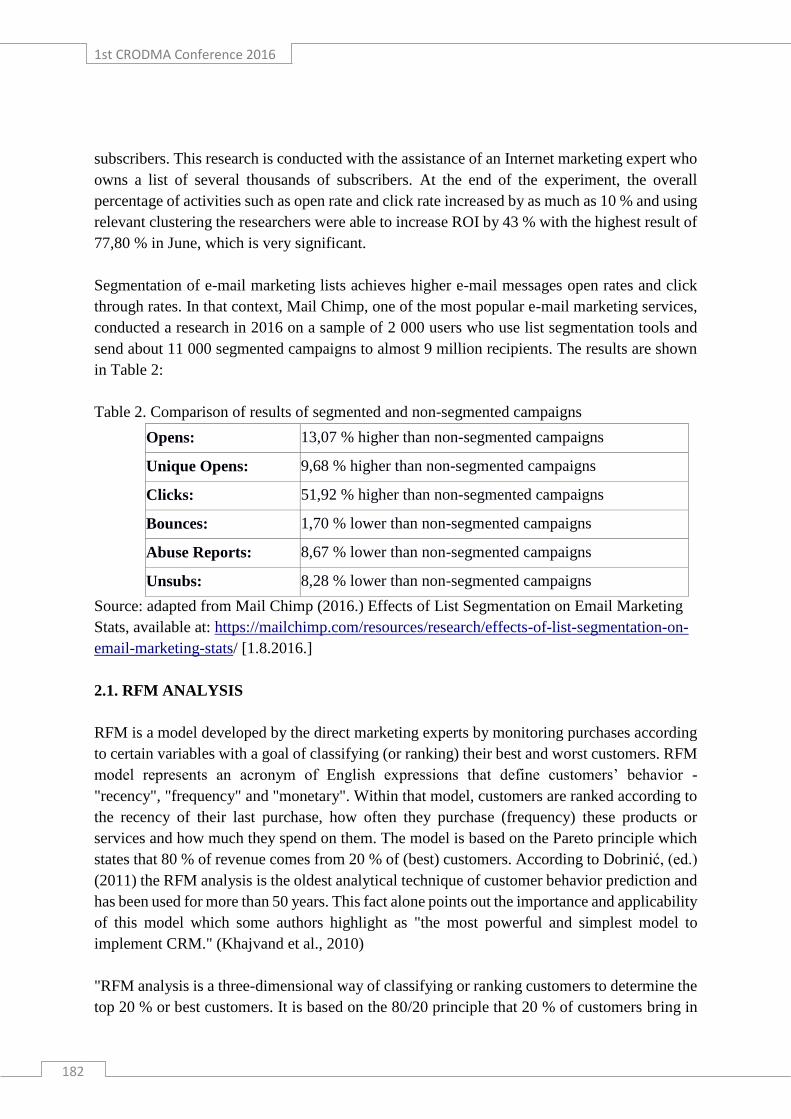
1st CRODMA Conference 2016
182
subscribers. This research is conducted with the assistance of an Internet marketing expert who
owns a list of several thousands of subscribers. At the end of the experiment, the overall
percentage of activities such as open rate and click rate increased by as much as 10 % and using
relevant clustering the researchers were able to increase ROI by 43 % with the highest result of
77,80 % in June, which is very significant.
Segmentation of e-mail marketing lists achieves higher e-mail messages open rates and click
through rates. In that context, Mail Chimp, one of the most popular e-mail marketing services,
conducted a research in 2016 on a sample of 2 000 users who use list segmentation tools and
send about 11 000 segmented campaigns to almost 9 million recipients. The results are shown
in Table 2:
Table 2. Comparison of results of segmented and non-segmented campaigns
Opens: 13,07 % higher than non-segmented campaigns
Unique Opens: 9,68 % higher than non-segmented campaigns
Clicks: 51,92 % higher than non-segmented campaigns
Bounces: 1,70 % lower than non-segmented campaigns
Abuse Reports: 8,67 % lower than non-segmented campaigns
Unsubs: 8,28 % lower than non-segmented campaigns
Source: adapted from Mail Chimp (2016.) Effects of List Segmentation on Email Marketing
Stats, available at: https://mailchimp.com/resources/research/effects-of-list-segmentation-on-
email-marketing-stats/ [1.8.2016.]
2.1. RFM ANALYSIS
RFM is a model developed by the direct marketing experts by monitoring purchases according
to certain variables with a goal of classifying (or ranking) their best and worst customers. RFM
model represents an acronym of English expressions that define customers’ behavior -
"recency", "frequency" and "monetary". Within that model, customers are ranked according to
the recency of their last purchase, how often they purchase (frequency) these products or
services and how much they spend on them. The model is based on the Pareto principle which
states that 80 % of revenue comes from 20 % of (best) customers. According to Dobrinić, (ed.)
(2011) the RFM analysis is the oldest analytical technique of customer behavior prediction and
has been used for more than 50 years. This fact alone points out the importance and applicability
of this model which some authors highlight as "the most powerful and simplest model to
implement CRM." (Khajvand et al., 2010)
"RFM analysis is a three-dimensional way of classifying or ranking customers to determine the
top 20 % or best customers. It is based on the 80/20 principle that 20 % of customers bring in

Book of Papers
183
80 % of revenue" (Aggelis, Christodoulakis, 2005). The three-dimensionality marks ranking
customers according to three attributes: recency - time since their last purchase; frequency -
how often they purchase; and monetary - total value of their purchases. RFM analysis is also
applicable in e-mail marketing and is used as a model of customers’ behavior prediction and as
a segmentation technique as well. This is especially important for selecting the right target
groups and sending them the right content. The following Table 3 shows how RFM attributes
can be adapted in e-marketing and e-mail marketing:
Table 3. Examples of RFM attributes e-marketing and e-mail marketing
Recency Frequency Monetary
- date of the last purchase
- date of the last visit to the web
site
- date of the last open e-mail
message
- number of purchases in an
interval
- number of visits to the web
site in an interval
- number of messages opened
- number of web sites logins
- total amount spent in an
interval
- total number of points awarded
based on web site activity
(commenting, reviewing,
recommending, etc.)
Source: adapted from Dobrinić D. (2011.) Marketing and databases, Faculty of Organization
and Informatics Varaždin
Some authors, like Stone, Jacobs (2001), and Chuang, Shen (2008) recommend in their
researches the WRFM - weighted RFM analysis. They suggest that, depending on the industry
the company operates in, higher weight is assigned to the R, F or M attribute. Using the AHP
method, relative weightiness of RFM attributes is determined. On the other hand, Cheng and
Chen (2009) suggest the model that connects RFM attributes and k-means clustering algorithm
(one of the popular clustering algorithms known as Forgy method) into RS theory not only to
increase the classification precision but improve company’s CRM as well. Additionally, the
theory effectively corrects the deficiencies in data mining. Other researchers expand and
develop the RFM model, and add additional attributes. Yeh et al. (2008) introduce an expanded
RFM model called RFMTC model (Recency, Frequency, Monetary, Time since first purchase,
Churn probability) which can estimate the probability that the customer will repeat the purchase
and the expected value of the total number of purchases in the future. The findings have shown
that the proposed model provides more predictive accuracy than RFM model. Also, because of
the increased importance of e-mail communication, Coussement and Poel (2008) presented an
extended RFM model by adding socio-demographic and other transactional variables (eRFM)
and a model adding emotional variables to eRFM (eRFM-EMO model). The findings have
shown that eRFM-EMO model has better results in predicting customers’ behavior.

1st CRODMA Conference 2016
184
2.2. CUSTOMER LIFETIME VALUE (CLV)
Alongside the already mentioned RFM analysis, customer lifetime value (CLV) represents one
of the most popular and most widely used segmentation techniques. Using this technique,
customer's future purchases can be predicted, which is one of the most important reasons CLV
is used so often. Many authors define this technique and they all agree in several defining points.
Hughes (2016) points out that CLV is the net present value of all future profits generated by a
specific number of new or existing customers throughout a specific number of years. Customer
lifetime value is the current value of all future profits generated by company’s customers and
clients (Khajvand et al., 2010). According to the same author, the calculation of CLV is widely
applicable, and several authors developed models for its application, such as performance
measurement, customer targeting, allocation of marketing resources, product offer, and
customer segmentation. The CLV determination can help marketers to determine the effects of
adopting a marketing strategy and in making a more informed pricing policy. (Berger and Nasr,
1998)
3 RESEARCHING THE SEGMENTATION IN E-MAIL MARKETING
3.1. INTRODUCTION AND METHODOLOGY
The goal of the research was to complete the findings of the way the sales/promotional activities
via direct marketing, especially e-mail, are done in Republic of Croatia, whereby the validity
and purposefulness of using segmentation from the aspect of enhancing response (action) rates
was considered.
The methodology of the research is based on a survey and the analysis of its results. The sample
used in this research consists of 74 companies with CEOs or heads of marketing departments
responding. E-mail addresses of the surveyed entities were collected using the Kompass
platform database. E-mail messages that contained the URL leading to the survey were designed
with Google Forms and were sent to 1,876 e-mail addresses on a weekly basis. The survey was
sent in six campaigns via Mail Chimp, an e-mail marketing system for sending bulk e-messages.
3.2. RESEARCH RESULTS
Analyzing the obtained results from 74 respondents, we can conclude that the most usual
respondent is a small enterprise (45,90 %) operating in the ICT sector (22,97 %) on both B2C
and B2B markets. E-message is the primary form of sale/communication with their customers
for 58,10 % respondents.

Book of Papers
185
Furthermore, the most common reason for using e-mail is the sale of products and services and
informing customers (83,90 %), followed by customer relationship development (79,00 %) with
use of e-mail, as a form of sales communication, for more than 5 years (77,40 %). While using
e-mail, respondents mostly use their own mailing lists (79,90 %) and they generate them mostly
directly from their customers (28,25 %) and through their own contacts (15,22 %). Respondents'
opinion of the support to forming a legal customers' information database market in Republic
of Croatia is divided, with 37,10 % of respondents supporting and 30,60 % not supporting the
formation of the database market, and 32,30% abstained from responding.
74,20 % of respondents have formed databases of their customers inside their company, with
most databases up to 1,000 names (39,10 %), followed by the database size 1,000 to 3,000
names (28,30 %). The information included in the databases is most frequently name and
surname, or the name of the business subjects, followed by the type of the purchased product
or service (69,60 %), type of the customer (60,90 %), number of all purchases (43,50 %), and
the amount of all previous purchases (41,30 %).
Most respondents (73,90 %) use that information for market segmentation, while the primary
purpose of the market segmentation is targeted selection (76,50 %) and different treatments of
customers (64,70 %). The most commonly used variable/criterion for segmentation is the
customers' interest (79,40 %), followed by geographical criteria, the amount of purchases in a
specific time period and the value of purchases in a specific time period with 26,50 %. The
success of the segmentation process is best evidenced by the fact that 32,40 % of the
respondents increased their response/reaction rate of their customers in e-mail marketing
activities by up to 2 %; 29,40 % by 2-5% and by more than 5%, by some other percentage rate
5,90% of respondents, while 2,90% of respondents did not have an increase in the rate.
From all the respondents that use segmentation in their operations, only 11,80 % of them use it
to track their customers' lifetime value, while 23,50 % of them use it sometimes for some
customers. From the respondents who don't use segmentation to track customers' lifetime value,
only 13,00 % of them plan to use it in the future, while 43,50 % of them abstain from
responding. 8,80 % of the respondents completely agree with the statement "E-mail marketing
campaigns based on tracking of customers' lifetime value contribute to a greater
response/reaction rate of customers.“, while 2,90 % of the respondents completely disagree. It
should be pointed out that �̄�= 3,12; σ = 0,96, and V = 30,89 %. According to these results we
can conclude that, regarding the deviation in the results, the differences between respondents
are obvious because the absolute and relative measures of variation are somewhat more
significant. The most frequent response is Mo = 3.
47,50 % of the respondents do not create profiles of their good/bad customers based on the
segmentation, while only 9,10 % of them plan to create them in the future. 20,60 % of the
respondents completely agree with the statement "Customer profiling enhances the success of

1st CRODMA Conference 2016
186
e-mail marketing campaigns", while no one completely disagrees. �̄�= 3,88; σ = 0,72, and V =
18,49 %. Relative deviation (V) indicates a noticeable homogeneity of the respondents. The
most frequent answer is Mo = 4.
27,00 % of the respondents completely agree with the statement "Customer segmentation can
increase the response rate (reaction/action) of customers in an e-mail marketing campaign.",
while 1,40 % of the respondents completely disagree. With this statement �̄�= 3,91; σ = 0,87,
and V = 22,34 % which also indicates that the respondents are approximately equal in their
responses and that they do not significantly differ. The most frequent response is Mo = 4.
As the reasons why they do not conduct segmentation, 41,50 % respondents marked a relatively
small market they operate on, 39,00 % of them marked incomplete databases, and 31,70 % of
them marked insufficient logistical support.
Only 9,50 % of the respondents are familiar with the RFM technique which is used to identify
profitable customers; it is not used by any of the respondents and only 4,10 % of the respondents
plan to use it in the future. From the respondents that use the RFM technique, 70,00 % find it a
very useful analytical technique. From all the respondents, 14,90 % have formed opt-out lists
(spam or Robinson's lists) with the addresses of the customers that do not accept the direct sales
communication form.
3.3. RESEARCH CONCLUSION
Analyzing the results we can conclude that using e-mail as a form of sale communication is in
line with the business trends worldwide and that the e-mail is extremely present in the
respondents' business processes. Most of the respondents have formed customers' databases
which they use for market segmentation and customer targeting so that they can treat their
customers differently. The respondents have stated that the use of such segmentation has
increased their customers' response rate in e-mail marketing activities. However, according to
analyzed results, it can be concluded that the respondents are not sufficiently familiar with the
analytical techniques like customer lifetime value (CLV) and RFM method. Although the
respondents are quite homogenous and agree that those analytical techniques are useful and that
they contribute to a better efficiency of the marketing campaigns, they do not plan to use them
in the future.
3.4. LIMITATIONS AND FUTURE RESEARCHES
The basic problem which the researchers have encountered is a relatively small response rate
of the companies, although the e-mail message with the survey link was sent to more than 1,800
addresses only 74 completed surveys were received. Using the Kompass database enabled
allowed the selection of the companies and the responsible persons which have received a

Book of Papers
187
personalized e-mail with the survey. In that sense, this research can be considered relevant
although the number of received answers does not suggest it. The author's intension was to
perceive the perception of the application of the concept of the marketing management of the
information and the level of the application, both the generic and personalized segmentation in
e-mail campaigns. Future researches, relying on the results of this research, should be directed
to the conclusions of the validity of using generic in relation to using personalized
segmentation.
REFERENCE
[1] Aggelis V., Christodoulakis D. (2005.) Customer Clustering Using RFM Analysis,
Proceedings of the 9th WSEAS International Conference on Computers, Article No. 2
[2] Bawm Z. L., Nath R. P. D. (2014.) A Conceptual Model for Effective Email
Marketing, 17th International Conference on Computer and Information Technology
(ICCIT), pg. 250-256
[3] Berger P. D., Nasr N. J. (1998) Customer lifetime value: Marketing models and
application, Journal of Interactive Marketing, vol. 12., Number 1., pg. 17-30
[4] Chaffey D. (2003.) Total Email Marketing, 1st edition, Butterworth-Heinemann
[5] Chaffey D. et al. (2009.) Internet Marketing: Strategy, Implementation and Practice,
4th edition, Pearson Education Limited
[6] Charlesworth A. (2009.) Internet Markteting: A Practical Approach, 1st
edition,Butterworth-Heinemann
[7] Cheng C.H., Chen Y.S. (2009.) Classifying the Segmentation of Customer Value Via
RFM Model and RS Theory, Expert Systems with Applications, pg. 4176-4184
[8] Chuang H.M., Shen C.C. (2009.) A Study on the Application of Data Mining
Techniques to Enhance Customer Lifetime Value Based on the Department Store
Industry, The 7th International Conference on Machine Learning and Cybernetics, pg.
168-173
[9] Coussement K., Poel D. V. (2008). Improving customer attrition prediction by
integrating emotions from client/company interaction emails and evaluating
multiple classifiers, Expert System with Applications, 36(3): pg. 6127-6134
[10] Dobrinić D. et al. (2005.) Izravni marketing, TIVA Varaždin
[11] Dobrinić, D., ed. (2011.) Marketing and databases, Faculty of organization and
informatics Varaždin
[12] Green P. E., Krieger A. M, (1991.) Segmenting Markets with Conjoint Analysis,
Journal of Marketing, Vol. 55, pg. 20-13
[13] Hiziroglu A. (2013.) A Neuro-fuzzy Two-stage Clustering Approach to Customer
Segmentation, Journal of Marketing Analytics 1, pg. 202-221
[14] Hughes A. M. (2006.) Strategic Database Marketing, 3rd edition, McGraw-Hill

1st CRODMA Conference 2016
188
[15] Hughes A. M. (2016.) How Lifetime Value is Used to Evaluate Email Customer
Marketing Strategy, Database Marketing Institute, available at:
http://www.dbmarketing.com/2010/03/how-lifetime-value-is-used-to-evaluate-email-
customer-marketing-strategy/ [02.08.2016.]
[16] Khajvand M. et al. (2010.) Estimating Customer Lifetime Value Based on RFM
Analysis of Customer Purchase Behaviour: Case Study, Procedia Computer Science,
Vol. 3, 57-63
[17] Kolowich L. (2016) Email Analytics: The 6 Email Marketing Metrics & KPIs You
Should Be Tracking, HubSpot.com, available at:
http://blog.hubspot.com/marketing/metrics-email-marketers-should-be-tracking
[12.07.2016.]
[18] Kotler P., Keller K. L., Martinović M. (2012.) Marketing Management, 14th edition,
MATE Zagreb
[19] Mail Chimp (2016.) Effects of List Segmentation on Email Marketing Stats, Mail
Chimp, availabe at: https://mailchimp.com/resources/research/effects-of-list-
segmentation-on-email-marketing-stats/ [1.8.2016.]
[20] Nath R. P. D., Lee H., Chowdhury N. K., Chang J. (2010) Modified K-means clustering
for travel time prediction based on historical traffic data, Knowledge-Based and
Intelligent Information and Engineering Systems, Springer Berlin Heidelberg, pg. 511-
521
[21] Ružić D., Biloš A., Turkalj D. (2014.) E-marketing, 3rd edition, University of Josipa
Juraja Strossmayera in Osijek, Faculty of economics in Osijek
[22] Stone B., Jacobs R. (2001.) Successful Direct Marketing Methods, 7th edition,
McGraw-Hill
[23] Strauss J., El-Ansary A., Frost R. (2003.) E-marketing, 3rd edition, Prentice Hall
[24] Vasudevan R. (2010.) E-mail Marketing, Journal of Contemporary Research in
Management, Vol. 5, No. 3, October-December, 2010, pg. 37-42
[25] Yeh I. C., Yang K. J., Ting T. M. (2008.) Knowledge discovery on RFM model using
Bernoulli sequence, Expert System with Applications, 36: pg. 5866-5871

Book of Papers
189
WEB SITE – ONE OF THE KEY TOOLS OF CRM SYSTEM
IN LOCAL GOVERNMENT UNITS
MLADEN RAJKO
University of Zadar, Department of Economics
Splitska 1, 23000 Zadar, Croatia
ALEKSANDRA KRAJNOVIĆ
University of Zadar, Department of Economics
Splitska 1, 23000 Zadar, Croatia
IVICA ZDRILIĆ
University of Zadar, Department of Economics
Splitska 1, 23000 Zadar, Croatia
ABSTRACT
In this paper, on the basis of primary research and the example of Istria County in Republic of
Croatia, the authors propose a conceptual model of optimizing the content of webpages in local
government units - cities and municipalities. The authors emphasize the thesis that the web site
is one of the key "points of contact", and therefore much more than just a marketing tool,
between public sector institutions and their customers - citizens. Therefore, the principles of
creating their contents are specific. Web sites should primarily provide its customers with an
overview of relevant information on the principles of transparency, clarity and ease of use.
They should be attractive designed and offer the possibility of interactive communication. Web
pages should be more than the tools for providing "user friendly" principle – they should
encourage users to visits web site more frequently and provide relevant and usefull content
which is easy to access. Therefore, the authors propose a model that should serve as a basis
for creating a CRM system in local governments, in which the user (in this case a citizen) is in
focus. Certainly it will help to include more actively the entities of local self-government in the
construction of inclusive, sustainable and smart economy and society, as a primary priorities
of the European Strategy 2020. In this process, the interactive digital marketing should play
one of the key roll.
KEYWORDS: public sector, cities and municipalities, CRM system in public sector, digital
marketing in the public sector, Europe 2020th, Istria County.
1st CRODMA Conference 2016
190
1 INTRODUCTION
In recent years, the World Wide Web (WWW) has become incredibly popular in homes and
offices alike. Consumers need to search for relevant information to help solve purchasing
problems on various Web sites. Although there is no question that great numbers of WWW
users will continue using search engines for information retrieval, consumers still hesitate
before making a final decision, often because only rough and limited information about the
products is made available. Consequently, consumers need the help of data mining in order to
help them make informed decisions [France et al., 2002].
Web page has become one of the key factors for attracting attention of potential customers and
for building up their loyalty. Therefore, it must be informative, visually attractive, should
provide relevant information and have regularly updated entertaining content. During the
process of building it up, there should be payed attention on each of these previously mentioned
factors. It is extremely important that by web site potential customer can get all necessary
information about products that has been interested, because limited information can have
negative impact on perception of product quality and thus the quality of the website. The content
must be regularly updated so the customers can have access to the newest information about
new discounts, products and other relevant information at any time of the day. In today's world
characterized by high competition, it has become very hard to get noticed. Due to that reason,
web page must have quality visual identity which will be in line with the company's visual
identity. It should be transparent, simple to use and must have interesting content tailored
according to visitor preferences. Also, technically important items such as clear and simple
links, fast loading, navigation, clearly designated categories and subcategories must not be
forgotten [Ljevaja, 2015].
After the web page has been created, decorated and filled in with all necessary information, it
must be optimized for search engines that has actually become the hardest part in process of
building it up. The result of inappropriately optimized web page has been reflected through
very low number of visitors and weak position on the search engines. Generally, high position
on the search engines guarantees high number of visitors what is one of the key reasons why
highly ranked web pages on the search engines became so successful. In a manner to provide
long-term positioning of the company in the minds of the customers, continuous investment in
the web site has been required. Efficient web site facilitates access to the basic information
about company and its products to the existing and potential customers while represents
powerful tool of contemporary marketing system [Ljevaja, 2015].
The aim of this paper is to determine the purpose of building-up the web site and how does it
serves as e-CRM key tool in the system of public administration. Authors are of opinion how
e-CRM is a key tool for establishment customer-oriented system in the public management in
which client-citizen has been settled in the center of interest according to the principles of the

Book of Papers
191
“new public management”- one of the key principals of contemporary public management. In
doing so, the citizen – user of information and services – has been no longer seen as a user, but
as a partner of public administration by which set up of CRM system becomes of the significant
importance.
The existing scientific literature deals much more with CRM models of companies, unlike CRM
in the system of public management, at least in Croatia, about which has not been written a lot.
This paper goes in these direction, moreover due to strategic document – Strategy of Public
Administration Development for the period from 2015.-2010., introduced by Croatian
Parliament in 2015. which clearly emphasizes how principles of the public management should
be guided by smart, inclusive and sustainable development of society and economy according
to Europe 2020 strategy.
On the example of local governments (cities and municipalities) in the Istria County, the authors
present the results of research - testing the quality of websites of local governments according
to the models 2QCV3Q and WebQual. Also, authors formed unique model for building up and
evaluation of web page quality in the local governments based on two models by taking into
account specifics of the public sector and citizens as users of information/service in public
sector which are equal partners in communication process in relation „citizen-public sector“.
2 WEB PAGE AS A PRECONDITION OF CONTEMPORARY
MARKETING SYSTEM
The Internet has proven to be extremely useful for business purposes and is almost impossible
to imagine of doing business without using Internet services. The web page has become an
important marketing tool and is the main carrier of marketing activities on the Internet. Most of
the companies, but also local governments and other economic and non-economic entities have
their own Web pages. Khavaja and Bokhari [2010] point out how company's web page is a key
tool for communication and customer attraction. It represents an interface which allows Internet
users to search for information or purchase products and services.
Došen et al. [2003] have been dealing with local state authorities web-pages while they pointed
out how web pages are usual communication channel whose function is based on interaction
with local authorities and the use of complex data sources such as databases. Communication
and image building through official websites of state bodies leads to reduction of the costs,
enables communication with remote destinations regardless of the time zone and provides
ability to communicate by multimedia content (text, image, audio and video recording). Web
page plays a key role in creating the link between users and companies. Clients become more
1st CRODMA Conference 2016
192
educated and informed than previous years, which means that companies today must deal with
consumer preferences that have become more complexed.
2.1. „WEB PAGE QUALITY“ CONCEPT
Prerequisite of each company which wants to be competitive is to possess quality web page.
Definitely, it is a task which requires a lot of effort, time, and investment. Huge number of
people, before purchasing on the Internet or making a decision will first checkup company's
web page whose service they need. Also, from the company's aspects, it is very important to
analyze web pages of the competing firms during the process of building it up in a manner to
find out their omissions. Also, local governments should be aware of these and specific other
principles. In over bureaucratized system of public management, web page largely provides and
facilitates users fast access to the relevant information, simplicity of research, transparency in
managing public budget and realization of public policies. Therefore, long-term communication
between citizens and the holders of public authorities has been encouraged.
Poddar et al. [2009] define quality of the web page as total perceived quality from the customer
point of view while it acts like an intermediary between companies and customer intent of
purchase. Translated to the public management system, it can be concluded that web-pages of
the local governments, besides meeting the standard - official and legal obligations and
transparency of information systems, need to be truly adapted to its customers - the broadest
range of different types of citizens.
In the wider context, this research and its results are focused on additional development of
competences of local and regional officials and employees in politics and the economy in
general. Besides scientific contribution, authors want to contribute for the wider involvement
of citizens in decision-making process about important public affairs. The dominant goals in
the development of society can brought some critical changes – on the level of individual person
to the change of whole society, which gets extra meaning in the context of the knowledge and
inclusive society in which access to the relevant information plays a key role.
3 CUSTOMER RELATIONSHIP MANAGEMENT (CRM)
CRM is a specific form of customer relationship manaement through more efficient and detailed
analysis of customer information by using information technology. The importance of CRM
has been recognized since 1990s while it does not exist unique definition of this system. For
example, Mihajlinović [2015] defines CRM like:
Strategic system of managing and understanding of the customer needs in a manner to
aquire and retain customers.
Book of Papers
193
Strategic use of information, processes, technology and people for managing with the
customer relationships.
Companie's strategy for effective management of customized goods and services to
customers and to the extension of the duration of customer loyalty.
There are 48 different definitions of CRM, but all of them have 5 simmilar categories: strategy,
processes, philosofie, ability and technology [Basar et al., 2011]. CRM is not activity which has
been limited only on the marketing department. Moreover, CRM includes sustainable and
integrated development in the culture and process of organization.
3.1. e-CRM
According to the literature, there is a growing importance of the electronic system for the
customer relationship while differences between CRM and e-CRM are extremely significant.
e-CRM represents setting up a culture that is oriented towards customer, whose strategy has
been created for enhancing profitability and retaining of the customers, and leads to the
achievement of mutual benefit provided by information technology [Rababah et al., 2011].
Milović [2011] defines e-CRM first of all as methodology and business strategy which is
customer-oriented, and only after that as a software and Internet support for organizations
whose aim is to effectively manage with the sales. Author emphasizes how e-CRM covers
interaction with potential and existing customers, in which customers are in the „hurt” of
business more than the products. For that reason, e-CRM should not be considered as a
technology but as a new business approach which is oriented towards customer and provides
competitive advantage.
Therefore, putting customer in the center of business is the basis for e-CRM system. In today's
world, products are created and adapted according to customer requirements while each
company which want to survive on the market must establish e-CRM system.
In the context of the relationship between local governments and citizens as users and even
more partners, e-CRM becomes key tool but also a basic philosophy for achieving customer-
oriented principle in public management systems.
4 NEW PUBLIC MANAGEMENT
Public management and public administration concepts have been defined by place and time of
appearance. New Public Management (NPM) is common name for a series of public sector
reforms carried out during the last twenty years in the most OECD (Organization for Economic
Co-operation and Development), developing and transition countries [Perko-Šeparović, 2006].
1st CRODMA Conference 2016
194
Ružić et al. [2014] state how new public management represents endeavor for introducing most
of the values and technics of the private sector in the public sector in a manner to become more
efficient, competitive and finally results oriented.
Efficiency, effectiveness and cost-effective approach are the initial basic orientations of public
administration while new public management appears as a new paradigm of public management
which imposes economic values and techniques of private sector.
4.1. NEW PUBLIC MANAGEMENT IN CROATIA
The most obvious evidence of political will in conducting the concept of the new public
management in Republic of Croatia represents document „Public Administration Development
Strategy from 2015. to 2020.“ which has been adopted by the Croatian Parliament on June 12th
2015.
Public Administration Development Strategy from 2015. to 2020 (NN 70/15) is a
comprehensive document which provides the framework for the development of public
administration and is focused on improving the administrative capacity and better organization
of public administration. The Strategy states that public administration is one of the key
strategic areas, while the modernization of public administration and the provision of fast and
reliable public services are essential components of stimulating entrepreneurial environment
and a prerequisite for ensuring higher standards of living for all citizens. Contemporary public
administration must reflect the harmonization of the Croatian legal system with the European,
as well as the acceptance of European administrative standards.
Public administration reform in the Republic of Croatia should provide effective law
enforcement and create a transparent, customer-oriented, efficient, professional, effective and
efficient public administration. Such public administration is an integral part of an effective
business environment, the lever of social and economic development and stronghold of the
democratic process. Since the scope of public bodies covers almost all segments of society,
without proper public administration that would be able to implement the decisions of the
authorities, society stagnates or regresses and generates dissatisfaction of users, economic
activity slows down and the consequences are reflected in all areas of society. Also, it should
be emphasized how time frame making, and to some extent the content of this strategy, has
been linked with the fulfillment of the preconditions for the use of EU funds for the period
2014th-2020th, thematic objective, 11 - Strengthening the institutional capacity of public
authorities, stakeholders and efficient public administration.
The strategy aims to harmonize the development of public administration with the objectives
of Europe 2020, the strategy of the European Union which aims to support the development of
smart, sustainable and inclusive economy by 2020. Obviously, this strategy has an
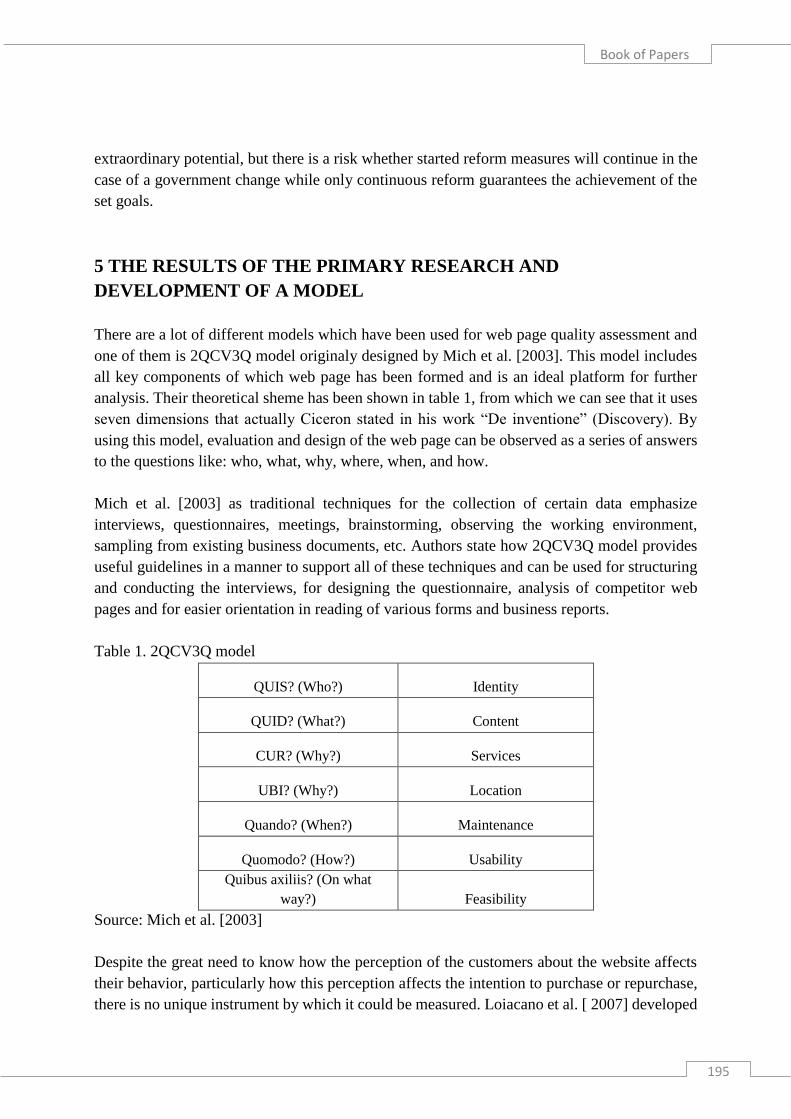
Book of Papers
195
extraordinary potential, but there is a risk whether started reform measures will continue in the
case of a government change while only continuous reform guarantees the achievement of the
set goals.
5 THE RESULTS OF THE PRIMARY RESEARCH AND
DEVELOPMENT OF A MODEL
There are a lot of different models which have been used for web page quality assessment and
one of them is 2QCV3Q model originaly designed by Mich et al. [2003]. This model includes
all key components of which web page has been formed and is an ideal platform for further
analysis. Their theoretical sheme has been shown in table 1, from which we can see that it uses
seven dimensions that actually Ciceron stated in his work “De inventione” (Discovery). By
using this model, evaluation and design of the web page can be observed as a series of answers
to the questions like: who, what, why, where, when, and how.
Mich et al. [2003] as traditional techniques for the collection of certain data emphasize
interviews, questionnaires, meetings, brainstorming, observing the working environment,
sampling from existing business documents, etc. Authors state how 2QCV3Q model provides
useful guidelines in a manner to support all of these techniques and can be used for structuring
and conducting the interviews, for designing the questionnaire, analysis of competitor web
pages and for easier orientation in reading of various forms and business reports.
Table 1. 2QCV3Q model
QUIS? (Who?) Identity
QUID? (What?) Content
CUR? (Why?) Services
UBI? (Why?) Location
Quando? (When?) Maintenance
Quomodo? (How?) Usability
Quibus axiliis? (On what
way?) Feasibility
Source: Mich et al. [2003]
Despite the great need to know how the perception of the customers about the website affects
their behavior, particularly how this perception affects the intention to purchase or repurchase,
there is no unique instrument by which it could be measured. Loiacano et al. [ 2007] developed
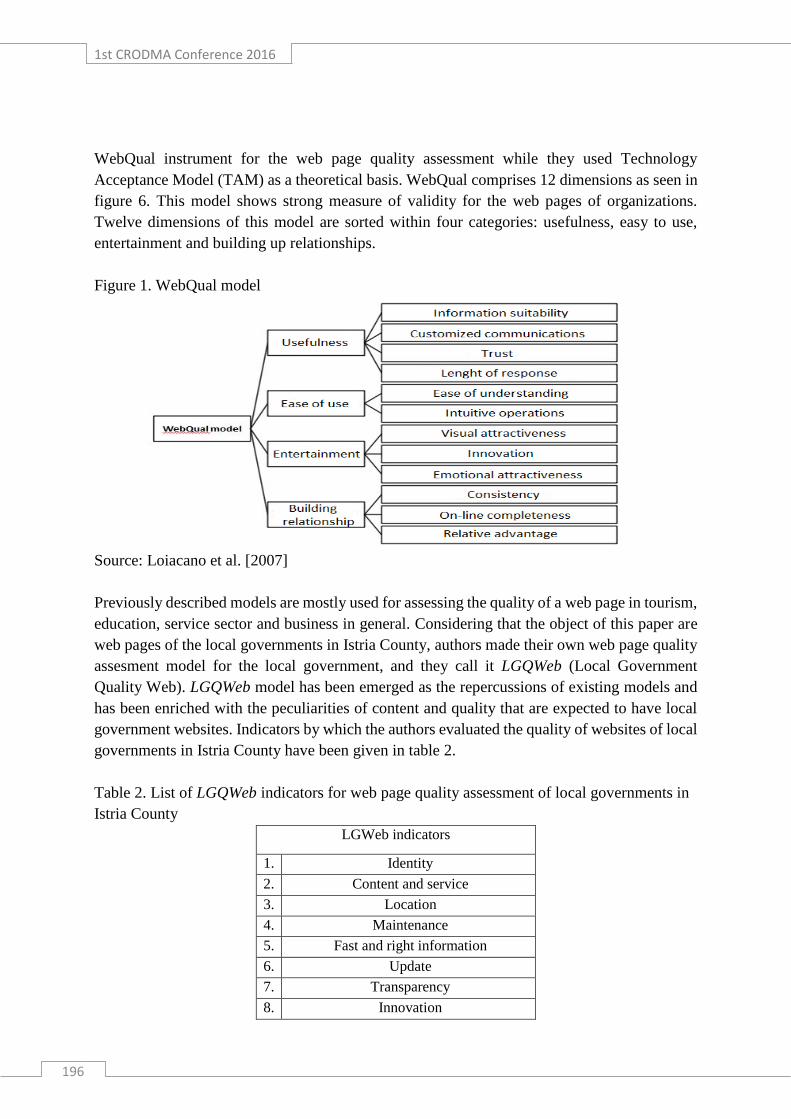
1st CRODMA Conference 2016
196
WebQual instrument for the web page quality assessment while they used Technology
Acceptance Model (TAM) as a theoretical basis. WebQual comprises 12 dimensions as seen in
figure 6. This model shows strong measure of validity for the web pages of organizations.
Twelve dimensions of this model are sorted within four categories: usefulness, easy to use,
entertainment and building up relationships.
Figure 1. WebQual model
Source: Loiacano et al. [2007]
Previously described models are mostly used for assessing the quality of a web page in tourism,
education, service sector and business in general. Considering that the object of this paper are
web pages of the local governments in Istria County, authors made their own web page quality
assesment model for the local government, and they call it LGQWeb (Local Government
Quality Web). LGQWeb model has been emerged as the repercussions of existing models and
has been enriched with the peculiarities of content and quality that are expected to have local
government websites. Indicators by which the authors evaluated the quality of websites of local
governments in Istria County have been given in table 2.
Table 2. List of LGQWeb indicators for web page quality assessment of local governments in
Istria County
LGWeb indicators
1. Identity
2. Content and service
3. Location
4. Maintenance
5. Fast and right information
6. Update
7. Transparency
8. Innovation

Book of Papers
197
9. Building customer relationships
Source: Made by authors according to 2QCV3Q, WebQual model and own observations.
LGQWeb model consists of defined indicators for assessment of each web sites that have been
compared by the grades from 1 to 5:
1- Insuficient quality
2- Satisfying quality
3- Good quality
4- Very good quality
5- Excellent quality
After assessment of all indicators, grades are added together and we get final indicator of the
web page quality – LGQWeb indicator. Therefore, web page has been classified in four
categories:
1. till 15 points – BAD
2. from 16 to 24 – GOOD
3. from 25 to 30 – VERY GOOD
4. from 31 to 45 – EXCELLENT
On the basis of conducted research and analizis of LGQWeb indicators for all local government
web pages (10 cities and 31 municipality) in Istria County, authors made graph which shows
average LGQWeb indicators which have been separated on cities and municipalities.
Graph 1. Average LGQWeb indicator in local goverment for Istria County
Source: made by authors
0
0,5
1
1,5
2
2,5
3
3,5
4
4,5
5
Cities
Municipalities

1st CRODMA Conference 2016
198
By the analysis of the research results and assessed LGQWeb indicators for the local
municipality web pages, authors find out following:
cities have on average more quality web pages with regard to municipalities;
welthier local governments do not have more quality web pages but more active local
government do have as compared to less active;
the largest differences occur in „maintain“ indicator which points out how cities (due to
better financial posibilities) and welthier municipalities regularly maintain and update
their web sites;
web pages of cities have been the worst assessed for indicators like building
relationships, innovation and usefulness, and the best for location and accessibility,
maintenance and update;
municipality web sites have been the worst assessed for indicators like building
relationships, innovation, content and services, and the best for location, accessibility,
transparency and identity.
6 CONCLUDING REMARKS
Customer Relationship Management has been well discussed in the literature as a holistic
concept which maintains and optimizes relationships between companies and consumers.
Recent studies show rising interest about the application of CRM in the public sector domain.
Paper deals with correlation between CRM system and web page quality for the public sector
institutions, on the example of local government – cities and municipalities in Istria County,
starting from the thesis that the website is one of the most important "contact point " between
public sector institutions and their users - citizens, and therefore one of the most important
segments of the CRM system.
To deliver superior quality of service, managers should first understand how customers perceive
and evaluate online customer service. Due to specifics of the public sector, we can conclude
how quality web site criterias are also specific. Therefore, authors generated its own model of
quality criteria web sites for the public sector institutions, so called LGQWeb.
This kind of issue has become more relevant due to the New Public Management (NPM) whose
one of the main charachteristics is interaction with the user, easy acces to information, services
and transparency via web pages.
Further research should be focused on further development of web page quality assessment
models and optimizing CRM system, both in public management and beyond. In the context of
local government, it is about application of marketing principles and setting up users in the
center of public institution interest, what contributes to the development of their innovation.
Therefore, scientific contribution of this paper is to encourage further discussion and research
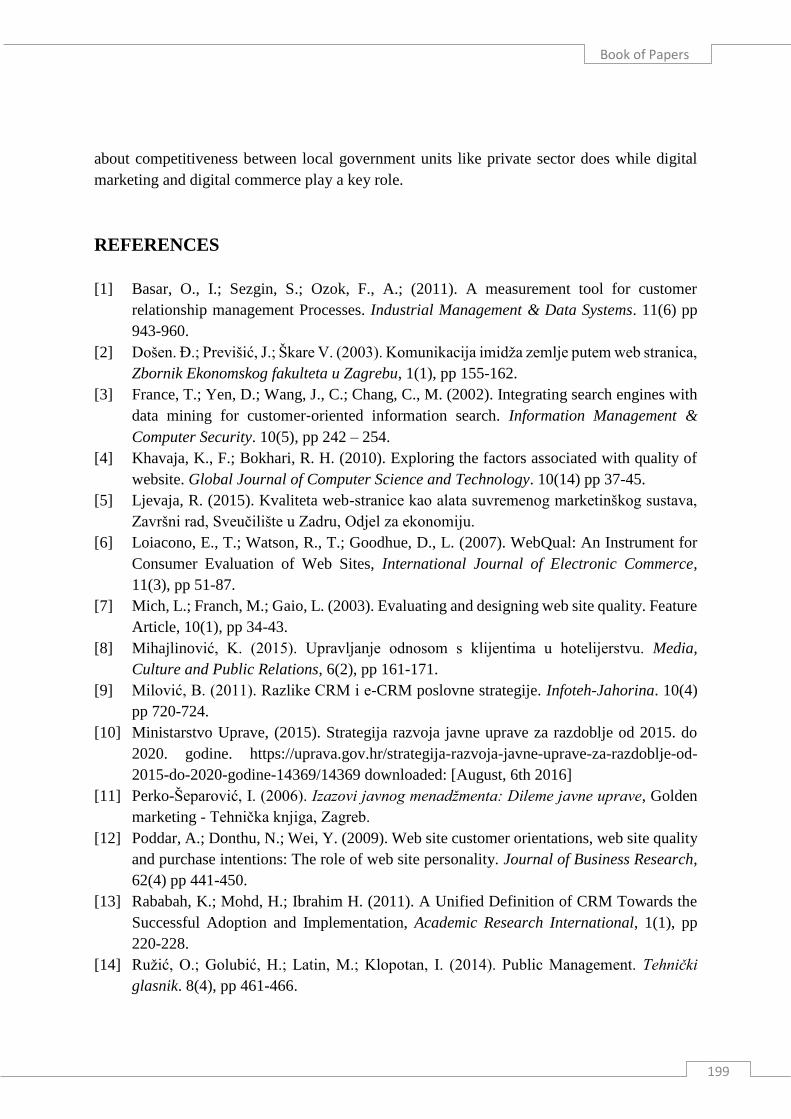
Book of Papers
199
about competitiveness between local government units like private sector does while digital
marketing and digital commerce play a key role.
REFERENCES
[1] Basar, O., I.; Sezgin, S.; Ozok, F., A.; (2011). A measurement tool for customer
relationship management Processes. Industrial Management & Data Systems. 11(6) pp
943-960.
[2] Došen. Đ.; Previšić, J.; Škare V. (2003). Komunikacija imidža zemlje putem web stranica,
Zbornik Ekonomskog fakulteta u Zagrebu, 1(1), pp 155-162.
[3] France, T.; Yen, D.; Wang, J., C.; Chang, C., M. (2002). Integrating search engines with
data mining for customer‐oriented information search. Information Management &
Computer Security. 10(5), pp 242 – 254.
[4] Khavaja, K., F.; Bokhari, R. H. (2010). Exploring the factors associated with quality of
website. Global Journal of Computer Science and Technology. 10(14) pp 37-45.
[5] Ljevaja, R. (2015). Kvaliteta web-stranice kao alata suvremenog marketinškog sustava,
Završni rad, Sveučilište u Zadru, Odjel za ekonomiju.
[6] Loiacono, E., T.; Watson, R., T.; Goodhue, D., L. (2007). WebQual: An Instrument for
Consumer Evaluation of Web Sites, International Journal of Electronic Commerce,
11(3), pp 51-87.
[7] Mich, L.; Franch, M.; Gaio, L. (2003). Evaluating and designing web site quality. Feature
Article, 10(1), pp 34-43.
[8] Mihajlinović, K. (2015). Upravljanje odnosom s klijentima u hotelijerstvu. Media,
Culture and Public Relations, 6(2), pp 161-171.
[9] Milović, B. (2011). Razlike CRM i e-CRM poslovne strategije. Infoteh-Jahorina. 10(4)
pp 720-724.
[10] Ministarstvo Uprave, (2015). Strategija razvoja javne uprave za razdoblje od 2015. do
2020. godine. https://uprava.gov.hr/strategija-razvoja-javne-uprave-za-razdoblje-od-
2015-do-2020-godine-14369/14369 downloaded: [August, 6th 2016]
[11] Perko-Šeparović, I. (2006). Izazovi javnog menadžmenta: Dileme javne uprave, Golden
marketing - Tehnička knjiga, Zagreb.
[12] Poddar, A.; Donthu, N.; Wei, Y. (2009). Web site customer orientations, web site quality
and purchase intentions: The role of web site personality. Journal of Business Research,
62(4) pp 441-450.
[13] Rababah, K.; Mohd, H.; Ibrahim H. (2011). A Unified Definition of CRM Towards the
Successful Adoption and Implementation, Academic Research International, 1(1), pp
220-228.
[14] Ružić, O.; Golubić, H.; Latin, M.; Klopotan, I. (2014). Public Management. Tehnički
glasnik. 8(4), pp 461-466.

1st CRODMA Conference 2016
200
[15] Schellong, A. (2005). CRM in the public sector: towards a conceptual research
framework. Proceedings of the 2005 national conference on Digital government research,
pp 326-332.

Book of Papers
201
CASE STUDIES

1st CRODMA Conference 2016
202

Book of Papers
203
DIGITAL MARKETING
CROATIAN LOTTERY
DANIJEL FERIĆ, CEO
Croatian Lottery
Ulica grada Vukovara 72, 10.000 Zagreb, Croatia
ABSTRACT
Digital marketing in Croatian Lottery will be presented through campaigns for 3 popular
games of chance: Eurojackpot, sports betting, and the online casino. Eurojackpot is the first
international game of chance in which the Croatian Lottery has participated together with other
European operators since 2013. Eurojackpot is available in 17 countries with approx. 270
million inhabitants. The aim of the Eurojackpot campaign is to keep the existing player base
and attract new players as well as achieve success without spill over from our traditional
games. It is therefore very important to target the promotion of new games to young,
unconventional players. Eurojackpot and sports betting can be played online and offline. The
Croatian sports betting market is very competitive (legal and unfair competition) and therefore
requires careful selection of advertising media. The online casino, called icasino, includes
games on slot machines and tables for games of chance, bingo, and poker exclusively online.
The icasino campaign started in spring 2015 and was primarily focused on the introduction of
new products to the Croatian market. A particular challenge in designing the campaign was
the positioning of Croatian Lottery on the unfair competitive market emphasising the distinction
from other operators that offer games without a concession for organising games of chance in
Croatia. Therefore, the campaign used the slogan ‘first in Croatia legally’ which, apart from
saying that icasino is legal, highlights the fact that it is also the first (legal) such online resource
in Croatia.
KEYWORDS: Croatian Lottery, digital marketing, game of chance, Eurojackpot, sports
betting, icasino
1 INTRODUCTION
Hrvatska Lutrija is a state-run lottery organization and its principal activity is organizing games
of chance. A significant portion of the revenues realised through the games is invested in the
promotion of various activities beneficial for the society. It began its operations in 1973 with
the passage of the Games of Chance Law. In the area of the former SR of Croatia, it was the

1st CRODMA Conference 2016
204
foundation for the establishment of an organization specializing in the organization of games
of chance under the name of Lutrija Hrvatske.
The topic of this document is digital marketing of Hrvatska Lutrija. Its advertising methods and
the implementation of campaigns are shown through actual examples, including Eurojackpot,
Kladionica Hrvatske Lutrije (sports betting) and icasino, the first legal online casino in Croatia.
The first part of the document deals with the definition of Hrvatska Lutrija as an organization,
followed by the role of the Marketing and Corporate Communications Sector, as well as the
methods used to advertise Hrvatska Lutrija. The second part of the document presents the
projects, that is, the campaigns that were implemented for Kladionica (sports betting),
Eurojackpot and icasino. The final chapter, or the conclusion, summarizes all the information
from the previous chapters.
2 HRVATSKA LUTRIJA AND THE OLE OF THE MARKETING AND
CORPORATE COMMUNICATIONS SECTOR
The story of Hrvatska Lutrija as an independent organization began in 1973 when the Games
of Chance Law was passed in the area of the former SR of Croatia thereby establishing an
organization that specialized in organizing games of chance. Since then, Hrvatska Lutrija has
been listening to the wishes of its players and continually improving and introducing new games
as well as sales channels. However, from the very start, socially responsible operations have
been established as its priority representing a true example of a positive impact on the society
and for the society. By striving to maintain our strong position on the games of chance market,
the company monitors the development of new technologies and trends, and with our vast
experience with organizing games of chance and the dedication of our employees to their jobs,
it is safe to say that our high goals will always be reached.
Marketing, as an economic and business discipline, integrates the responsibility of managing
all aspects of the marketing mix: the product, the price, the promotion and the place (4Ps of
marketing). The marketing mix, within the framework of Hrvatska Lutrija, in practice entails
the fundamental business processes that, in the sense of primary responsibility, are distributed
across three sectors – the Lottery and Sports Betting Game Sector, the Marketing and Corporate
Communications Sector and the Sales Sector. The Marketing and Corporate Communications
Sector of Hrvatska Lutrija is the carrier of the fundamental responsibility for managing
promotions and it is also partially responsible for the other three areas. The price and the place,
or the distribution, are the primary responsibility of the sales, while product development and
sales of games via the internet are the primary responsibility of the Lottery and Sports Betting
Game Sector.

Book of Papers
205
The fundamental task of the Marketing and Corporate Communications Sector is to create an
all-encompassing communication platform on the strategic level that enables effective product
promotions. On the operational level, the task of marketing is to implement effective
promotional campaigns with the goal of creating a demand for products as well as brand
positioning.
Furthermore, the fundamental task of marketing is to create a positive image of the company in
the eyes of the society. That part of the marketing activities is not directly associated with the
promotion of individual products even though it often indirectly impacts the creation of the
demand. The activities of institutional marketing, in this sense, will be focused on promoting
the social benefits of the business operations of Hrvatska Lutrija and on promoting socially
responsible activities.
Hrvatska Lutrija uses leased and own advertising spaces divided into: advertising and
advertising within own channels.
Advertising – Direct media buying is done through agencies HL has engaged to perform this
service. Advertising is divided into offline and online advertising. Offline includes advertising
on the national TV stations, radio stations with national concessions, print advertising and
outdoor advertising (billboards, city lights, public transportation). Online includes advertising
on the strongest and most visited portals. Unfortunately, Google and Facebook advertising is
currently not possible for games of chance in Croatia. There is media buying and cooperation
with TV stations in regards to advertising on television (HTV) and on teletext (HTV, RTL,
Nova TV). Contracts also include marketing packages that relate to broadcasting commercials.
Advertising on HTV is also used for broadcasting icasino commercials during the permitted
time slots (after 11 PM in accordance with the Guidelines for Responsible Advertising and
Marketing because icasino is considered a high risk product) and through the interventions of
the TV hosts during the lottery draw shows.
Own advertising - Hrvatska Lutrija has its own advertising space it uses to advertise its own
products. Since icasino is accessible only on the internet, advertising on the lutrija.hr website
that has more than 600,000 unique users per month was increased. Communication with the
players is also done via the newsletter broken down into categories: lottery, sports betting,
icasino and institutional. Social networks also play an important role, therefore, icasino has a
special Facebook profile and a Youtube page unlike the lottery games. Hrvatska Lutrija issues
its own weekly magazine entitled 'Glasnik HL', that, despite the fact it is primarily geared
towards sports betting players, has advertising space used for other games of Hrvatska Lutrija.
The most important sales channel of Hrvatska Lutrija is still its offline channel – the sales
network with the option of using billboards, broadcasting advertisements via the DMS system
and using advertising space on the back sides of the game payment slips.

1st CRODMA Conference 2016
206
3 DIGITAL CAMPAIGNS FOR THE EUROJACKPOT GAME
Eurojackpot is the first international game of chance Hrvatska Lutrija has been participating in
along with other European game of chance organizers since February 1st, 2013. 17 countries
and around 270 million residents participate in the game. Hrvatska Lutrija conducts research of
the games of chance market every year. Based on the research, a target player group has been
established and the campaign for introducing new games was geared towards it, as well as the
potential for growth and acquisition of new players:
Natural growth possibility – young people reaching the age of majority;
Players who stopped playing games of chance and who belong to the higher and
high economic class;
Persons who never played games of chance.
The goal of the campaign used to present the new international game to the players was to
maintain the existing player base and to attract new players and to be successful without the
payment spill-over to the traditional games of Hrvatska Lutrija. This is why it was very
important to properly aim the promotion of the new game at younger non-conventional players
(between the ages of 20 to 49), of medium and higher purchasing power in comparison to other
game players who are more conservative and of lower purchasing power.
The first digital campaign included the following:
Web banners on the Lottery and external internet webpages;
Facebook advertising;
Facebook application entitled “When I Win Eurojackpot“
o The content was created by the users in an interactive manner (players had to
make a video explaining what they would do if they won and then post it on the
Facebook page of Hrvatska Lutrija);
Youtube video content
o Funny characters from the campaign (a Swedish woman, a German man and an
Italian man) in unusual and interesting situations after winning Eurojackpot;
Newsletters for registered HL players inviting them to play;
Corporate e-mail signatures;
HL mobile application providing players with the results of the draws and reminders
to play.
After we introduced the new campaign and completed the first campaign, we had to prepare a
new, second campaign and use it to maintain the success of the game but also to increase the
number of players, participation consistency and to increase sales. The Eurojackpot game
became a popular and successful game among the players as proven by the data regarding the
winnings. In 2014 players in Croatia won almost 190 million HRK, that is, there were 662,188

Book of Papers
207
winnings amounting to 4.13% of the total winnings. This is why the message of the new
campaign that started in January 2015 was that the winners were not only the Swedes, Italians
or Germans, but also a woman from Lika, and men from Dalmatia and Zagorje. The TV
commercials and other materials depicted new Europjackpot 'winners' – Croatians showing how
they enjoy their newly won riches in their own specific ways.
The second digital campaign included everything mentioned for the first campaign plus a
different Facebook application entitled “Eurojackpot Alarm Clock“. The characters from the
campaign invited the users to play by sending reminders on the day of the draw, that is,
messages to all who have installed the Facebook application.
The implementation of the new game, the first international game open to the participation of
the Hrvatska Lutrija players was a true challenge because it was not possible to foresee how the
players would accept it. Furthermore, we had to be careful not the 'cannibalise' the most popular
game - Lotto 7/39. This is why the communication of the promotional campaign was more
challenging and more provocative in order to reach a different targeted audience. Results were
achieved, the new game became popular and well received, and sales are constantly growing
and maintaining their upward trend.
4 THE CAMPAIGN FOR THE SCORE ALARM APPLICATION OF
THE HRVATSKA LUTRIJA SPORTS BETTING
Sports betting is a part of the Hrvatska Lutrija portfolio that, unlike the lottery games, is not
protected by a monopoly and, as such, is on a very competitive market. Sports betting amounts
to 15-20% of the Hrvatska Lutrija revenues, while its market share is a little above 10%, and
the toughest competitor on the market is SuperSport that has almost 50% of the market.
Sports betting of Hrvatska Lutrija is specific within the portfolio because over 40% of the
revenues from that segment are realized through online channels on the web pages of Hrvatska
Lutrija, while the rest is realized at around 300 retail outlets of Hrvatska Lutrija that incorporate
the offer of lottery games and sports betting.
At the beginning of 2013, Hrvatska Lutrija implemented and branded a mobile application for
monitoring sports results entitled Score Alarm HL, and as of June 2016, the application enabled
purchasing of sports betting slips. The application for monitoring sports results entitled Score
Alarm HL was also upgraded with new functionalities. One that is worth mentioning is live and
pre-match (that is, sports) betting and live broadcasting of events. The main goal of the
campaign is downloading of the application and increasing turnovers, while the secondary goal
is branding. Just like with all the other promotions, this one also has its share of challenges, and
1st CRODMA Conference 2016
208
they are associated with: branding of sports betting (it is still closely associated with lottery
games), presenting the service the competition already has (with an emphasis on the advantages
of Hrvatska Lutrija), saturation of the market in terms of the application and the Google policy.
Campaign for the Mobile Application and the Results
The Score Alarm application for Androids that make up 80 percent of the visits to the pages of
Hrvatska Lutrija was not accessible on the Google Play Service due to the Google rules because
Google did not permit applications featuring financial transactions. This presented a problem
because applications outside of the Google Play Store are shown in the smart phone settings as
'from unsafe source'. Furthermore, it was not possible to redirect the existing Android
application users to the new version. In light of the mentioned problems, a new microsite for
downloading the application was created and the focus was on the mobile campaign with a clear
'call to action' visual and the 'download' message.
The mobile campaign consisted of two parts. The first part encompassed the most visited media
in the area of the target group and the mobile advertising network. Following the first part that
lasted around 10 days, we counted the visits to the destination link for downloading the
application and measured how much time the visitors spent on the site. The campaign continued
for the digital media and the networks with the best results in terms of the visits/time spent on
site ratio, and new media entered the media plan based on the reach to the given target group.
The media are permitted to use static or animated banners of various formats or they even
impact the preparation of the advertisements if it is believed that they give a better result. The
campaign optimisation resulted in a 20% increase of visits to the microsite, and the
responsibility for the result and the consequent budget spending intended for the campaign was
switched to the media itself, that is, the advertising network. In addition to the conventional
promotional activities, PR activities were also initiated through the presentation of the new face
of the campaign and through our partner in the preparation of the application – a young start-
up company. During the time of the European Football Championship, scratch tickets with
coupons for playing on the internet and a link and a QR code for downloading the Score Alarm
application were distributed at Karlovačko Beer corners.
The results of the campaign within the first 20 days:
31,765 visits to the microsite application from the mobile campaign
81,362 unique visits (and more than 100 thousand visits all together)
Application downloads: 5,917 (5,073 Android)
The integrated application broadened the reach among the targeted audience. Use of various
advertising platforms and other activities in accordance with the habits of the targeted audience
give more compared to the use of a single platform regardless of how dominant and important
it is for the product. In order for the campaign to be successfully implemented, it is important

Book of Papers
209
to set a clear goal, stand out from the competition, both with the product and the presentation,
measure everything that can be measured and react.
5 CAMPAIGN FOR THE INTRODUCTION OF THE FIRST LEGAL
ONLINE CASINO IN CROATIA
Hrvatska Lutrija became the first legal organizer of online casino games on the Croatian market
at the end of April 2015. Icasino games (slot machines and table games) were initially available
only on personal computers, and two months later, they also became available on mobile
phones. Bingo games became available on personal computers in March 2016, and on mobile
phones in August 2016. The project represents a continuation of the creation of the online game
system that, along with the existing lottery and sports betting games, expands the offer to the
casino games – table games, slot machines, poker and bingo.
The marketing plan of the icasino was prepared according to the previously defined revenue
plan and the associated budget. The plan briefly analyses the existing situation, defines the
targeted group and sets the budget for production and advertising. The goal is to market a new
product in the region of the Republic of Croatia and realise the planned revenues.
An Example of a Successful Digital Campaign
At the beginning of 2016 a campaign was conceptualised and implemented using the principle
of Cross-Selling technique. The goal was to offer the existing player base an online bonus for
playing in the icasino so that they could become familiar with the new product, but also to
attract new players not registered on the internet pages of Hrvatska Lutrija.
The campaign consisted of three parts and the most popular games of Hrvatska Lutrija also
accessible on the internet were selected:
Play Eurojackpot for 45 HRK and get an icasino bonus in the amount of 10 HRK (Jan.
27th – Feb. 3rd)
Make a 100 HRK bet and get an icasino bonus in the amount of 20 HRK (Feb. 16th -
26th)
Play Lotto 7/39 for 45 HRK and get an icasino bonus in the amount of 10 HRK (Mar.
2nd -18th)
Advertising was almost entirely digital. There were some exceptions in terms of interventions
by the TV show hosts during the draws since the entire group watches draws. The digital
campaign included advertising on the strongest and most visited portals in Croatia, our own
internet websites lutrija.hr and icasino.hr, as well as social networks: Facebook profiles of
Hrvatska Lutrija and HL casino.

1st CRODMA Conference 2016
210
The first results of the campaign were excellent and the best indicator was the 45.5% increase
in the number of unique players in the icasino (February compared to January). Currently, the
average monthly number of unique players in the icasino is 24% higher compared to 2015. This
shows that a part of the players drawn by this campaign continued to play icasino games. Icasino
is now in the second year of its life cycle. Turnovers, revenues and the number of unique players
grow at a stable rate and each month marks new records. We can conclude that the new product
was successfully marketed in the Republic of Croatia.
6 CONCLUSION
Hrvatska Lutrija has been organizing games of chance on the territory of the Republic of Croatia
for more than 40 years. We have been continually working to advance and introduce new games
and sales channels while listening to the wishes of our players. From the very beginning, our
priority has been socially responsible business operations that represent a true example of
positive activities in the society and for the society.
The fundamental task of the Marketing and Corporate Communications Sector on the strategic
level was the creation of an encompassing communication platform that would enable an
effective promotion of the product and a positive company image. On the operational level, the
task of the marketing is to implement effective promotion campaigns with the goal of creating
a demand for the products and brand positioning. The Eurojackpot game was introduced in
2013 and two digital campaigns have been implemented since then. The campaigns were
successful because the achieved results were good and we managed to avoid cannibalisation of
the Lotto 7/39 game. The new game was well received and its popularity is unquestionable even
today. This has been confirmed by the Eurojackpot ticket sales that continue to grow.
The sports betting of Hrvatska Lutrija, unlike the lottery games, is not protected by a monopoly,
and the strongest sales channel is the online channel on our own web pages. The campaign we
used to launch the new Score Alarm application faced a lot of challenges – competition,
branding, application market saturation and Google policies. Despite all the challenges, it
produced good results (we realised the planned number of application downloads) that was our
primary goal.
Introduction of the first legal online casino in Croatia was a project of exceptional significance.
Since these games are exclusively internet games, digital marketing was of key importance and
the associated campaign also included the other standard media (TV, radio, OOH.). The results
of the campaign were excellent; the number of the registered players as well as the unique
players in the icasino increased by as much as 45.5%.

Book of Papers
INDEX OF AUTHORS
B
Bevanda, Arnela
Bijakšić, Sanja
Biloš, Antun
Bolarić, Elizabeta
Bosna, Jurica
D
Dobrinić, Damir
Dvorski Lacković, Ivana
F
Ferić, Danijel
G
Galfi, Albert
J
Jurčić, Daniela
Jurčić, Igor
K
Keglević Kozjak, Suzana
Kovšca, Vladimir
Krajnović, Aleksandra
L
Lacković Vincek, Zrinka
M
Mandić, Miroslav
Manfreda, Anton
Marinčić, Ines
Markić, Brano
Matić, Matea
Miloglav, Barbara
O
Oreščanin, Dražen
P
Palić, Mirko
Puh, Barbara
R
Rajko, Mladen
S
Sikirić, Dominik
Skelin, Zrinka
Sorić, Iva
Staneva, Krasimira
Š
Šestanj-Perić, Tanja
Šinko Morandini, Filip
Štajcer, Marko
T
Tomašević Lišanin, Marija
Turkalj, Davorin
V
Vachkova, Elizabeta
Valiček, Vladislav
Z
Zdrilić, Ivica
Zbodulja, Mateja

1st CRODMA Conference 2016
NOTES

Book of Papers
NOTES

1st CRODMA Conference 2016

Book of Papers