
1st and 2nd International Workshops on Methodologies for ...
162
2010 edition Methodologies and Working papers ISSN 1977-0 375 1st and 2nd International Workshops on Methodologies for Job Vacancy Statistics Proceedings
-
Upload
khangminh22 -
Category
Documents
-
view
1 -
download
0
Transcript of 1st and 2nd International Workshops on Methodologies for ...

2010 edition
KS-RA-09-001-EN
-C
M e t h o d o l o g i e s a n d W o r k i n g p a p e r s
ISSN 1977-0375
1st and 2nd International Workshops onMethodologies for Job Vacancy Statistics Proceedings


2010 edition
M e t h o d o l o g i e s a n d W o r k i n g p a p e r s
1st and 2nd International Workshops onMethodologies for Job Vacancy Statistics Proceedings

More information on the European Union is available on the Internet (http://europa.eu). Cataloguing data can be found at the end of this publication Luxembourg: Publications Office of the European Union, 2010 ISBN 978-92-79-17006-5ISSN 1977-0375 Doi:10.2785/57804 Cat. No. KS-RA-10-027-EN-N Theme: Population and social conditions Collection: Methodologies and working papers © European Union, 2010
Europe Direct is a service to help you find answers to your questions about the European Union
Freephone number (*):
00 800 6 7 8 9 10 11(*) Certain mobile telephone operators do not allow access
to 00 800 numbers or these calls may be billed.

1
FOREWORD
In recent decades, labour market statistics have been developed in the Member States and then progressively harmonised at EU level in order to provide data that are fully comparable across the European Union. While a wealth of information is available on the supply side of the labour market, in particular through the EU-Labour Force Survey, there has so far been no EU-level information at all on the demand side. Eurostat and Member States have been working together in recent years to fill this information gap. A first step was the voluntary collection of job vacancy statistics by Member States under ‘Gentlemen’s Agreements’, initiated in March 2002. Subsequently, the need for a regulatory framework to collect harmonised job vacancy statistics was recognised. Consequently, a number of legal acts were adopted in 2008 and 2009, setting the first quarter of 2010 as the first reference period for the transmission of job vacancy statistics.
In order to prepare for this implementation, by sharing experiences and best practices, harmonising concepts and discussing practical issues with data collection, two workshops were held in 2008 and 2009. The first workshop took place on 11-12 December 2008 in Nuremberg, hosted by the German Institute for Employment Research (IAB). The second took place in Neuchâtel on 18-19 November 2009, hosted by the Federal Statistical Office of Switzerland. This publication gathers together most of the documents presented during the two workshops, and serves as a useful starting point for anybody interested in the field of job vacancy statistics.
For any further information on job vacancy statistics methodology, please send an email to [email protected] .
Inna Steinbuka
Director Social and information society statistics, Eurostat

2 1st and 2nd International Workshops on Methodologies for Job Vacancy Statistics - Proceedings
ACKNOWLEDGEMENTS
Eurostat would like to thank all workshop participants for their valuable contributions. A special acknowledgement goes to those who prepared the papers included in this publication. Special thanks also to Anja Kettner (IAB) and Francis Saucy (Federal Statistical Office of Switzerland) for kindly hosting, organising and co-chairing the events.
The proceedings have been put together by Beate Czech, Didier Dupré and Luis Biedma of Eurostat’s Unit for Labour Market Statistics.

Table of contents
3 1st and 2nd International Workshops on Methodologies for Job Vacancy Statistics - Proceedings
TABLE OF CONTENTS
1st International Workshop, Nuremberg, Germany, 11 – 12 December 2008 5
The German job vacancy survey: An overview 7
Job vacancy statistics in Switzerland: example of a coupled survey 18
Use of administrative sources in Belgium for the collection of job vacancy statistics 20
Weighting and estimation methods of the Romanian JVS 28
Weighting and estimation methods: JVS Estimation in Finland by Horvitz-Thompson-Type estimator 32
The UK job vacancy survey 39
Non sampling errors in the Italian job vacancy survey 47
The German job vacancy survey: Estimation of sampling errors 62
2nd International Workshop, Neuchâtel, Switzerland, 18 – 19 November 2009 71
Using administrative sources in Slovenia 73
Job vacancy survey – Israel’s experience 79
A comparison of estimators of the number of job openings in Sweden 83
Job vacancies in France: data collection difficulties and feasibility studies on small firms and the public sector 93
Temporary work agencies and vacancies: The Italian experience 104
The Romanian experience on the transition to NACE Rev.2 115
Job vacancies, employment and the economic cycle: Experiences from the German job vacancy survey 124
Job vacancies and the economic cycle: Comments from Switzerland 139
Recruitment processes: Experiences from the German job vacancy survey 143
Occupied posts 152


I 1st International Workshop
Nurem berg, Germany
11 – 12 December 2008


The German job vacancy survey: An overview
7 1st and 2nd International Workshops on Methodologies for Job Vacancy Statistics - Proceedings
The German job vacancy survey: An overview
Anja Kettner, IAB (Institute for Employment Research), Nuremberg, Germany & Kurt Vogler-Ludwig, Economix Research & Consulting, Munich, Germany 1st International Workshop, Nuremberg, 11 - 12 December 2008
1. History of the survey
The German job vacancy survey has been conducted since 1989 by the Institute for Employment Research (IAB), the research institute of the Federal Employment Agency. It was started as a yearly written survey in Western Germany and was extended to Eastern Germany in 1992. From the outset the object was to obtain information on the number and the structure of job vacancies (registered and not registered) and on staff searching processes. In each fourth quarter a multiple page questionnaire is sent out to a representative number of private firms and public administrations in all economic sectors (except Private households and Extra-territorial organizations and bodies). The statistical units are local units with at minimum one employee covered by the social insurance system.
Since 2006 the written surveys in the fourth quarter have been supplemented by short telephone interviews in the first, second and third quarter to get short-term information on the development of the labour demand during a year.
The results are published regularly by a press release. It informs the public and the scientific community on recent changes in the number and the structure of vacancies in the context of the overall development of the labour market and the business cycle. The results are highly important for policy consulting, for instance for state and federal ministries and agencies, for the German Council of Economic Advisors, the European Union and the OECD. Researchers at universities and research institutes use the data for the analysis of the labour demand and its determinants.
On behalf of the IAB the survey is conducted at present by Economix Research & Consulting, a research institute in Munich.
2. Overview of the written survey in the fourth quarter
The random sample for the survey is taken from the business register of the Federal Employment Agency. It contains all private and public firms and administrations with at least one employee covered by the social insurance system1.
1 In the following the term “firm” refers to all private and public firms and administrations with at least one employee covered by the social insurance system.

The German job vacancy survey: An overview
8 1st and 2nd International Workshops on Methodologies for Job Vacancy Statistics - Proceedings
The firms in this database employ around 80 % of the total workforce. The data are very precise as the register is continuously updated according to registration and deregistration of employees. However, the register information is available with a time lag of six months only. Therefore newly created firms are not captured completely and are underrepresented in the sample.
The sample is stratified by 26 economic sectors and 7 firm size classes in Eastern and Western Germany. Because the labour markets still differ widely between East and West, the sampling as well as most of the analyses is done separately for both regions. The response rate is approximately 20 percent; the net sample contains altogether 14,000 to 15,000 firms.
Beginning of October the first mailing is sent out. Up to two reminder letters follow in November and December. At present the written survey has a length of eight pages. It has three main parts. Part I captures the number and the structure of all job vacancies at the day of participation. The definition equates to the European definition and does not exclude very short-term or very long-term vacancies. Vacancies are divided into immediately to be filled and later to be filled. They are split by qualification level. The questions cover all vacancies that are registered at the Federal Employment Agencies and all other (not registered) vacancies. Regarding the ones immediately to be filled, firms are asked for information on the occupation, on the number of part-time-vacancies and on the number of vacancies that are difficult to fill.
To be able to interpret changes in the number and the structure of vacancies, information on the overall development of the firm are collected too: for instance on the current number of employees and their number 12 months ago, on factors hindering the increase of the number of employees during the recent 12 months and on the occurrence of labour shortages from the firms’ perspective. Firms are also asked to give their expectations on employment changes in the upcoming 12 months.
Part II of the questionnaire is related to the influence of the recent labour market reform (Hartz IV) on the labour demand. This part was introduced in 2005 when the reform was implemented. Especially the firm-level and the macroeconomic effects of the so called One-Euro-Jobs, a special kind of publicly financed jobs, are analysed. In the focus of our research is also the behaviour of firms with regard to the hiring of long term unemployed as well as the reasons, why long term unemployed fail in application processes.
Part III of the survey is related to the very last case of a successful hiring. The participants are asked to give very detailed information on the job they were searching a candidate for (for instance on occupation, qualification level, additional skills required, working time, working conditions, etc.), on the hired person (age, gender, previous status at the labour market etc.) and they are asked for information on the search process, like on search channels, search time, experiences with difficulties to find a candidate and on differences between the desired profile and the profile of the hired person.

The German job vacancy survey: An overview
9 1st and 2nd International Workshops on Methodologies for Job Vacancy Statistics - Proceedings
Since recently questions on unsuccessful recruitment activities have been integrated as part IV into the survey. This part covers information on cancelled search processes, like the search duration until cancelling, the reasons for the cancelling and the reaction of the firm, for instance with regard to changes in the working time of the employees or the external processing of orders.
3. Overview of the telephone surveys in the first, second and third quarter
After a pre-test in 2005 short quarterly telephone interviews have been added to the written survey since the first quarter 2006. They take place between the second week of the first month and the third week of the last month of the quarter. The sample consists of a sub-sample of the participants from the previous fourth quarter. Altogether about 8,000 firms are interviewed. Thereby a yearly panel is created: It starts in the fourth quarter of a year with the written survey and ends in the third quarter of the following year with a telephone interview. Afterwards a new gross sample is drawn from the business register.
The interviewers are trained specifically to fit them with the necessary knowledge to contact the firms, to interview them successfully and to answer occurring questions. The course of the interviews follows specific formulations. On average an interview takes 3-4 minutes. Roughly 30 percent of all telephone numbers are known from the written survey, the others are identified from public lists and registers.
The questions strongly focus on refreshing the data on the labour demand. Firms are asked for the number of job vacancies, divided into immediately and later to be filled and into registered and not registered vacancies. They shall give information on the three most important occupations among the vacancies immediately to be filled and on the number of vacancies for candidates with a college or a university degree. Firms are also asked for the number of employees at the day of participation and the expected trend for the number of employees in the upcoming 12 months.
4. Net sample structure in the survey 2007/2008
Altogether 14,381 firms have answered the written questionnaire in the fourth quarter 2007, about 7,500 in Western Germany and 7.000 in the Eastern Germany (see table 1). The sample is relatively larger in the East. Here the labour demand is quite weak and the probability for a job vacancy per firm is low. To get a sufficient number of respondents with at least one vacancy the sample needs to be larger then in the West. In the following three quarters 2008 the share of East German firms in the whole sample stays the same, but the sample is reduced to altogether 8,000 respondents.

The German job vacancy survey: An overview
10 1st and 2nd International Workshops on Methodologies for Job Vacancy Statistics - Proceedings
About one third of all participating firms belongs to the sectors L, M, N and O, as table 2 shows. These sectors are concerned specifically by the recent labour market reform; most of all publicly financed ‘One-Euro-Jobs’ are supplied here. To analyse their labour market effects in detail the sample was enlarged for these sectors. Table 3 shows the share of staff searching firms in all participating firms for the third quarter 2008 by sector. This share varies between 6 percent in A,B and 22 percent in K and M, N. Some sectors show higher fluctuations than others and sectors are influenced differently by business cycle and seasonal effects.
Firms with less than 10 employees have the highest share (30 percent) in the sample (see table 4). Firms with less than 50 employees cover altogether ¾ of the whole sample. This structure reflects the importance of smaller firms in the German economy. They count for about 40 percent of the total employment and for about 70 percent of the total number of vacancies. The probability for a single firm to have at least one vacancy at the date of the interview is very low in small firms, because they hire new staff less often than the larger ones. Therefore their share in the whole sample is relatively larger.
Table 1: Net sample structure in the survey 2007/2008 by region
Q4 2007 Q1 2008 Q2 2008 Q3 2008 Region
absolute shares absolute shares absolute shares absolute shares West Germany
7.485 52% 4.134 52% 4.140 52% 4.092 51%
East Germany
6.896 48% 3.865 48% 3.858 48% 3.909 49%
TOTAL 14.381 100% 7.999 100% 7.998 100% 8.001 100%
Source: IAB Job Vacancy Survey 2007-2008
Table 2: Net sample structure in the survey 2007/2008 by NACE
Q4 2007 Q1 2008 Q2 2008 Q3 2008 NACE
absolute shares absolute shares absolute shares absolute shares A, B 665 5% 355 4% 353 4% 355 4%
C, D, E 3.634 25% 2.210 28% 2.104 26% 2.067 26%
F 785 5% 420 5% 414 5% 397 5%
G, H, I 2.442 17% 1.310 16% 1.251 16% 1.187 15%
J, K 1.626 11% 929 12% 847 11% 812 10%
L, M, N, O
5.229 36% 2.775 35% 3.029 38% 3.183 40%
TOTAL 14.381 100% 7.999 100% 7.998 100% 8.001 100%
Source: IAB Job Vacancy Survey 2007-2008

The German job vacancy survey: An overview
11 1st and 2nd International Workshops on Methodologies for Job Vacancy Statistics - Proceedings
Table 3: Staff searching firms in the survey of the third quarter 2008 by NACE
NACE participants staff
searching participants
share of staff searching
participants
A, B 355 23 6%
DA, DB, DC, DN
400 48 12%
DD, DE 287 26 9%
DF, DG, DH 300 77 26%
DI 358 111 31%
DK, DL, DM 414 144 35%
CA, CB, E 308 26 8%
F 397 52 13%
G 458 61 13%
H 350 56 16%
I 379 71 19%
J, K 323 66 20%
K 489 107 22%
O, P 1.177 133 11%
M, N 1.006 225 22%
L 1.000 149 15%
TOTAL 8.001 1.375 17%
Source: IAB Job Vacancy Survey 2007-2008
Table 4: Net sample structure in the survey 2007/2008 by size classes
Q4 2007 Q1 2008 Q2 2008 Q3 2008 size
absolute shares absolute shares absolute shares absolute shares <10 4.261 30% 2.139 27% 2.118 26% 2.199 27%
10 - 19 3.153 22% 1.752 22% 1.713 21% 1.760 22%
20 - 49 3.449 24% 1.930 24% 1.966 25% 1.970 25%
50 - 199 1.911 13% 1.174 15% 1.178 15% 1.092 14%
200 - 499 840 6% 548 7% 553 7% 572 7%
500+ 767 5% 456 6% 470 6% 408 5%
TOTAL 14.381 100% 7.999 100% 7.998 100% 8.001 100%
Source: IAB Job Vacancy Survey 2007-2008
5. Data validation and imputation
The answers from the written survey as well as the answers from the telephone interviews are checked for outliers and implausible or wrong answers. In case of a given number of vacancies higher than 250 or in case of a vacancy/employment relation of more than 250 the number of vacancies is cut by 50 percent. In case of obviously wrong data the firm is contacted again, if possible. If no information on vacancies is available, the number is treated as missing.

The German job vacancy survey: An overview
12 1st and 2nd International Workshops on Methodologies for Job Vacancy Statistics - Proceedings
In cases of missing information on the number of employees these are estimated by single imputation and by the usage of other available information from the survey. For the number of vacancies several multiple imputation methods for missing answers have been tested but failed so far. The research hereon is continued at the IAB.
6. Grossing up
The projection method of the IAB job vacancy survey applies an iterative estimation procedure. This is used in order to achieve full compliance with five vectors:
• number of local units by sector • number of local units by size • number of registered vacancies by sector • number of registered employees2 by sector • number of registered employees by size
The adjustment to public data is essential as it allows direct comparisons of aggregated and projected data from different sources, labour market statistics and national accounts data in particular.
Projection unit
The basic unit of the projection is the local business unit rather than the company. This allows separating job vacancies precisely by regions and sectors. Estimates on a company base would create the problem that classifications are blurred as far as companies have subsidiaries in multiple regions or sectors.
Compared to the Eurostat classifications for job vacancy surveys some peculiarities appear in the German case:
• The manufacturing sector is separated into five groups as this sector appears to be essential for the German economy. In sum manufacturing would include ¼ of total employment. Non-separation would result in a loss of important information.
• Similarly trade and the hotel and catering sector are separated as they also appear to be important employers.
• Energy and mining however have to be aggregated as the number of firms is too small to provide valid estimates.
• Other private and public services as well as social services are aggregated as the present sample structure does not allow the separation.
• Separate estimates are undertaken for Western and Eastern Germany.
2 Registered employees are all employees employed by firms in the business register of the Federal Employment Agency.

The German job vacancy survey: An overview
13 1st and 2nd International Workshops on Methodologies for Job Vacancy Statistics - Proceedings
The application of NACE Rev. 2 is presently tested. In most of the sectors the adaptation to the new classification does not create substantial difficulties. Some sectors however (information and communication e.g.) require the restructuring of samples. This will be done in the course of the next revision of the survey.
The size structure differentiates between seven rather than two groups. This is necessary in order to reflect the significant differences in recruitment behaviour between small, medium and large size companies. It is related to the number of registered employees in the local unit. This is due to the sample selection from the business register of the Federal Employment Agency and guarantees the consistence of sampling and projection. However, it creates some problems in sectors with high shares of non-registered employees (self-employed persons, marginal jobs, civil servants).
Estimation principles
The estimation combines the standard Horvitz-Thompson estimator with the RAS method in order to achieve the simultaneous adjustment to both, the structure of local units by sectors and size groups, and the structure of registered vacancies by sectors. This is done in several steps (see figure 1):
1. The Horvitz-Thompson estimator provides a first estimate of the population of local units by 16 sectors and seven size groups.
2. These local units are split into two groups: local units with vacancies and without vacancies
3. Registered vacancies are estimated for local units with vacancies and compared with public statistics.
4. Weights for local units with vacancies are adjusted according to the differences in step 3.
5. Weights for local units without vacancies are adjusted according to the new weights from step 4.
6. A new RAS estimate of the population of local units is undertaken providing the new weights for step 1 and the following steps.
The procedure is continued until the pre-set minimal deviation from public reference statistics is achieved. This minimal deviation is usually set for individual elements of the reference vectors rather than the total sums.

The German job vacancy survey: An overview
14 1st and 2nd International Workshops on Methodologies for Job Vacancy Statistics - Proceedings
Figure 1: Three-dimensional projection
Practical problems
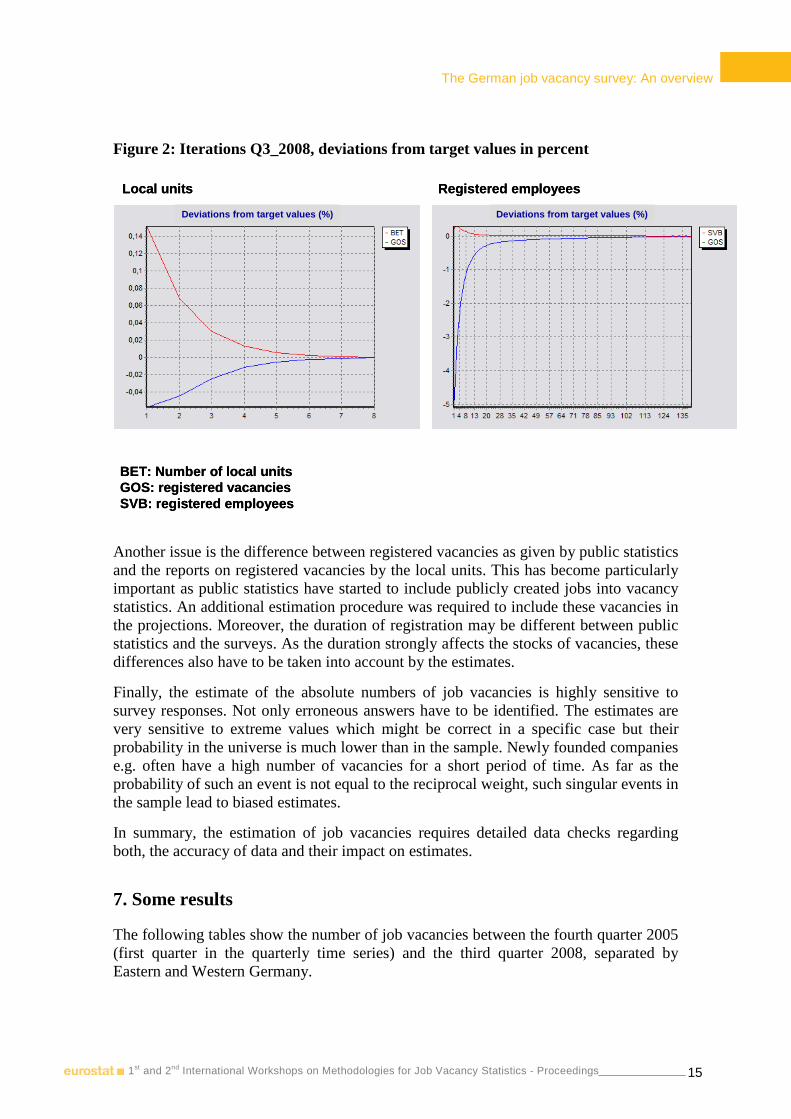
The estimation normally converges quickly towards the target values. This is shown in Figure 2 for the survey of the 3rd quarter 2008. For this survey the estimate of local units required 8 iterations, and the estimate of registered employees around 130 iterations. The deviations usually decline rapidly during the first steps but need a greater number of iterations to converge to the target vectors precisely. This can be observed in most of the surveys.
One of the problems arises with the appearance of zero values in the matrix of registered vacancies. This cannot be excluded as the number of registered vacancies can be zero in practice. However, this is much less probable in the universe than in the sample. In cases where such zero values appear in more than two cells of a sectoral vector, cells are aggregated with the next cell with positive values. If the majority of cells or all of them contain zero values, the sector needs to be aggregated with other sectors.
Sector
Sample:registeredvacancies
Real sample I:Cases with vacancies
Size
Real sample II:Cases without vacancies
Registered vacancies
Population of local units
+
Population:registe redvacancies
RAS
Sector
Sample:registeredvacancies
Real sample I:Cases with vacancies
Size
Real sample II:Cases without vacancies
Registered vacancies
Population of local units
+
Population:registe redvacancies
RAS
The German job vacancy survey: An overview
15 1st and 2nd International Workshops on Methodologies for Job Vacancy Statistics - Proceedings
Figure 2: Iterations Q3_2008, deviations from target values in percent
Another issue is the difference between registered vacancies as given by public statistics and the reports on registered vacancies by the local units. This has become particularly important as public statistics have started to include publicly created jobs into vacancy statistics. An additional estimation procedure was required to include these vacancies in the projections. Moreover, the duration of registration may be different between public statistics and the surveys. As the duration strongly affects the stocks of vacancies, these differences also have to be taken into account by the estimates.
Finally, the estimate of the absolute numbers of job vacancies is highly sensitive to survey responses. Not only erroneous answers have to be identified. The estimates are very sensitive to extreme values which might be correct in a specific case but their probability in the universe is much lower than in the sample. Newly founded companies e.g. often have a high number of vacancies for a short period of time. As far as the probability of such an event is not equal to the reciprocal weight, such singular events in the sample lead to biased estimates.
In summary, the estimation of job vacancies requires detailed data checks regarding both, the accuracy of data and their impact on estimates.
7. Some results
The following tables show the number of job vacancies between the fourth quarter 2005 (first quarter in the quarterly time series) and the third quarter 2008, separated by Eastern and Western Germany.
BET: Number of local unitsGOS: registered vacanciesSVB: registered employees
Registered employeesLocal units
Deviations from target values (%) Deviations from target values (%)
BET: Number of local unitsGOS: registered vacanciesSVB: registered employees
Registered employeesLocal units
Deviations from target values (%) Deviations from target values (%)

The German job vacancy survey: An overview
16 1st and 2nd International Workshops on Methodologies for Job Vacancy Statistics - Proceedings
Figure 3: Registered and not registered vacancies in Western and Eastern Germany
0000
200200200200
400400400400
600600600600
800800800800
1.0001.0001.0001.000
1.2001.2001.2001.200
Q4 2005 Q1 2006 Q2 2006 Q3 2006 Q4 2006 Q1 2007 Q2 2007 Q3 2007 Q4 2007 Q1 2008 Q2 2008
1,00
0 va
canc
ies
1,00
0 va
canc
ies
1,00
0 va
canc
ies
1,00
0 va
canc
ies
registeredregisteredregisteredregistered not registerednot registerednot registerednot registered
Figure 4: Vacancies for regular jobs and for publicly subsidized jobs in Western and Eastern Germany
0000
200200200200
400400400400
600600600600
800800800800
1.0001.0001.0001.000
1.2001.2001.2001.200
Q4 2005 Q1 2006 Q2 2006 Q3 2006 Q4 2006 Q1 2007 Q2 2007 Q3 2007 Q4 2007 Q1 2008 Q2 2008
1,00
0 va
canc
ies
1,00
0 va
canc
ies
1,00
0 va
canc
ies
1,00
0 va
canc
ies
"first" labour market"first" labour market"first" labour market"first" labour market vacancies for subsidized jobsvacancies for subsidized jobsvacancies for subsidized jobsvacancies for subsidized jobs
Figure 5: Vacancies immediately and later to be filled in Western and Eastern Germany
0000
200200200200
400400400400
600600600600
800800800800
1.0001.0001.0001.000
1.2001.2001.2001.200
Q4 2005 Q1 2006 Q2 2006 Q3 2006 Q4 2006 Q1 2007 Q2 2007 Q3 2007 Q4 2007 Q1 2008 Q2 2008
1,00
0 va
canc
ies
1,00
0 va
canc
ies
1,00
0 va
canc
ies
1,00
0 va
canc
ies
to be filled immediatelyto be filled immediatelyto be filled immediatelyto be filled immediately to be filled laterto be filled laterto be filled laterto be filled later

The German job vacancy survey: An overview
17 1st and 2nd International Workshops on Methodologies for Job Vacancy Statistics - Proceedings
Figure 3 contains both registered and not registered vacancies. As can be seen the registering behaviour of firms differs between the regions: More than half of all vacancies are registered in the East, whereas the share is much lower in the West. Also the relative number of vacancies for publicly subsidized jobs is higher in the East (figure 4). Because of the high unemployment rates several labour market instruments are used more intensively here. In general vacancies for subsidized jobs are part of the total labour demand and therefore need to be counted in a job vacancy survey. However, their development is more dependent from public policy than from the economic cycle.
Around two thirds of all vacancies are to be filled immediately (figure 5). The probability that these vacancies will be transferred into a hiring is higher than in cases of vacancies that shall be filled later. Long searching processes are mainly related to vacancies that require higher qualifications and skills. For these it takes longer to find suitable candidates, because unemployment is low and firms have to take into account the necessary time that employed job seekers need to change from one employer to another. The period of notice in some high skilled jobs is 6 months or longer. In periods of week labour demand the share of immediately to be filled vacancies is lower than in times of stronger demand. In times of uncertainty employers tend to take more time for recruitment and to observe the market carefully before they decide for a hiring.
More information on the German job vacancy survey and related publications can be found at the website: http://www.iab.de/stellenerhebung.
Contact Persons Anja Kettner Kurt Vogler-Ludwig
IAB (Institute for Employment Research), Economix Research & Consulting,
Nürnberg München
Email: Email:

Job vacancy statistics in Switzerland: example of a coupled survey
18 1st and 2nd International Workshops on Methodologies for Job Vacancy Statistics - Proceedings
Job vacancy statistics in Switzerland: example of a coupled survey
Francis Saucy Federal Statistical Office (FSO), Neuchâtel, Switzerland 1st International Workshop, Nuremberg, 11 – 12 December 2008
In Switzerland, the job vacancy statistics (JVS) is imbedded into the Swiss quarterly business survey. The sample is stratified by divisions of the NACE, regions and 4 size classes. All companies with at least 1 occupied post are included in the sampling frame. In addition to the question on occupied posts, a question on job vacancies is included in a one-page questionnaire since 1992, as well as two qualitative questions (difficulties in personal recruitment and previsions of evolution of employment). A questionnaire is validated when the question on occupied posts is filled, irrespective of answers to the other questions. The sample encompasses ca 63’000 of ca 390’000 local units (16%) and covers ca 2/3 of the total number of occupied posts. The response rate reaches ca 90% for the survey and ca 75% for the question on job vacancies (range 60-90% depending on the strata). The lowest response rates are observed among the smallest companies.
The survey is conducted using 3 approaches, postal mail, internet and files for large companies with many local units. Difficulties are often encountered in the data collection among the largest companies which are unable to report vacancies at the level of the local unit. In such cases, we collect the data at the enterprise level and we distribute the vacancies among the local units. Data are also collected on the internet pages of some large companies, partly to fill missing data and partly to help distributing the data among regions and local units. The data are validated against the number of occupied posts. When necessary, firms are contacted per phone for additional information.
Data on job vacancies are peculiar, because most firms do not have any vacancies. For instance, in the 2nd quarter 2008, 85% of the ca 48’000 respondents to the question on JVS reported 0 vacancy, 6% 1 vacancy and only 9% > 5 vacancies. Grossing up follows the rules applied for the questions on the numbers of occupied posts, using the same weighting scheme, treatment of outliers and adjustment to the sampling frame for non-response. In a second step, vacancies are roughly adjusted to the total numbers of occupied posts to account for non-response to the question on JVS. A method is currently under development to improve this second adjustment. For this reason, data are still published in an index form and not as absolute figures.
As compared to other approaches, coupling JVS with a business survey presents many advantages. From a practical view, it is a very cheap solution, since there is no need of developing a specific survey. From a methodological point of view, this is also an excellent approach, since there is a direct link (same sample and sampling frame) between the respondents to questions on number of vacancies and occupied posts.

Job vacancy statistics in Switzerland: example of a coupled survey
19 1st and 2nd International Workshops on Methodologies for Job Vacancy Statistics - Proceedings
A short questionnaire and a high response rate are additional strengths of the Swiss approach. However, this solution has also its limitations. For instance, a more elaborated questionnaire would offer additional information on reported vacancies and better opportunities to analyze the labour market. Contact Person Francis Saucy
Federal Statistical Office FSO, Division Business Surveys, Neuchâtel, Switzerland Email: [email protected]
Use of administrative sources in Belgium for the collection of job vacancy statistics
20 1st and 2nd International Workshops on Methodologies for Job Vacancy Statistics - Proceedings
Use of administrative sources in Belgium for the collection of job vacancy statistics
Astrid Depickere SPF Economie, PME, Classes moyennes et Energie, Bruxelles, Belgique 1st International Workshop, Nuremberg, 11 - 12 December 2008
1. Introduction
In March 2002 Eurostat and Member States signed a Gentlemen's agreement on the collection of job vacancy statistics, both for annual and quarterly data. As a first step Belgium conducted a feasibility report during the years 2005 and 2006, which allowed the first delivery to Eurostat of the quarterly job vacancy rate on the basis of administrative data in 2007.
In 2008, the Regulation (EC) No 453/2008 of the European Parliament (EP) and of the Council on quarterly statistics on Community job vacancies was approved and in 2010 the first official transmission will take place.
It should be noted that the collection of job vacancy statistics in Belgium started mainly under the impulse of the European regulation and only quarterly figures are collected. The first period available is the first quarter of 2004. The current methodology is based in the estimation of a job vacancy rate on the basis of administrative sources. This is partly due to a strong pressure on administrative simplification and reduction on the response burden on enterprises.
2. Use of administrative sources versus a survey
Administrative sources and surveys constitute two very different options for the collection of statistics. They have very different strengths and weaknesses.
- Limitations of Administrative sources:
• Lack of control of definitions, variables and their measurement. The main objective of administrative data is not the production of statistics and they are not collected by statistical agencies. This usually implies certain misalignment between the available data and the concept that is being trying to be measured.
• Problems of representative. Certain variables might suffer from an under coverage bias if for any reason the reporting varies across enterprises and/or individuals.
• Timeliness. When using multiple administrative sources the timeliness is set by the last available source. The decentralised organisation of Public Employment Services in Belgium adds another layer of complexity.

Use of administrative sources in Belgium for the collection of job vacancy statistics
21 1st and 2nd International Workshops on Methodologies for Job Vacancy Statistics - Proceedings
- Advantages of Administrative sources:
• No response burden for enterprises • Low cost and data easily available
- Limitations of surveys
• High cost • Response burden • Not necessarily free from bias
- Advantages:
• More control of quality • Low cost
3. Conceptual issues
There are two variables that should be estimated: the number of vacancies and the number of occupied posts. These two variables are used to calculate the job vacancy rate.
Occupied post means a post within an organisation to which an employee has been assigned.
A vacancy means a post (newly created, unoccupied or about to become vacant):
- For which the employer is taking active steps to find a suitable candidate from outside the enterprise concerned and is prepared to take more steps.
- Which the employer intends to fill either immediately or in the near future
We could differentiate between formal and informal channels for recruitment. While recruitments done through formal channels are preceded by a job vacancy, in most cases, recruitments through informal channels do not involve the existence of a vacancy.
Examples of formal recruitment channels involve the use of:
• Advertisements • Interim agencies • Public employment services • Recruitments and selection agencies • Public placements • Internet: company website or jobsites
It should be noted that the existence of vacancy does not automatically lead to recruitment. The vacancy may be dropped later or the search might stop if no suitable candidate is found.

Use of administrative sources in Belgium for the collection of job vacancy statistics
22 1st and 2nd International Workshops on Methodologies for Job Vacancy Statistics - Proceedings
Examples of informal recruitment channels are:
• Recalls of previous employees • Internal job offers • Spontaneous job applications • Agreements with schools and training institutes
In none of these cases active steps to find candidates outside the enterprise are taken.
The job vacancy rate is calculated with the following formula:
Job vacancy rate (JVR) = Vacancies / (Vacancies + Occupied posts)
In principle, the vacancies might be measured using the flow or stock concept.
• Flow: measures all the new job offers within a certain reference period, for example, a quarter.
• Stock: measures all unfilled job offers that exist on a certain reference date. The stock concept is used also to measure unemployment and occupied posts and is the primary concept chosen in Europe to measure vacancies.
In both cases it is very relevant the choice of the reference date. It could be the end of the quarter, a day in the middle of the quarter, the average of the monthly data, etc.
In the case of Belgium, the stock concept is calculated, as demanded in the European context, and the reference period is the last day of the quarter.
4. Available administrative sources
In Belgium, the databases of job vacancies available from the Public Employment Services (PES) are the administrative source used for estimating job vacancies. In principle, all enterprises are obliged by law to register job vacancies on the PES, but in practice the law is not fully respected. In Belgium there are four different PES. A study performed in 2005 obtained estimates of the market representativeness of the different PES. In Flanders, the PES registered 71% of all the available job vacancies available while the other PES (Wallonia, Brussels and the German-speaking Community) collected less than 50% of all available vacancies. The figures become available one month after the end of the quarter. The administrative data is combined with other sources. The use of other sources is necessary for correcting the different representativeness of PES.
For estimating occupied posts, the administrative source used is the National Office for Social Security (RSZ). The level of detail obtained is the NACE classification at one digit level. The main drawback of this source is that it does not include the entire Public Sector. The National Office of Social Security for the Provincial and Local Public Services (RSZPPO) information has to be estimated on the basis of older figures. The plan is to integrate both databases in the near future. The figures are available with a substantial delay, four months after the end of the quarter.

Use of administrative sources in Belgium for the collection of job vacancy statistics
23 1st and 2nd International Workshops on Methodologies for Job Vacancy Statistics - Proceedings
5. Calculation of the job vacancy rate
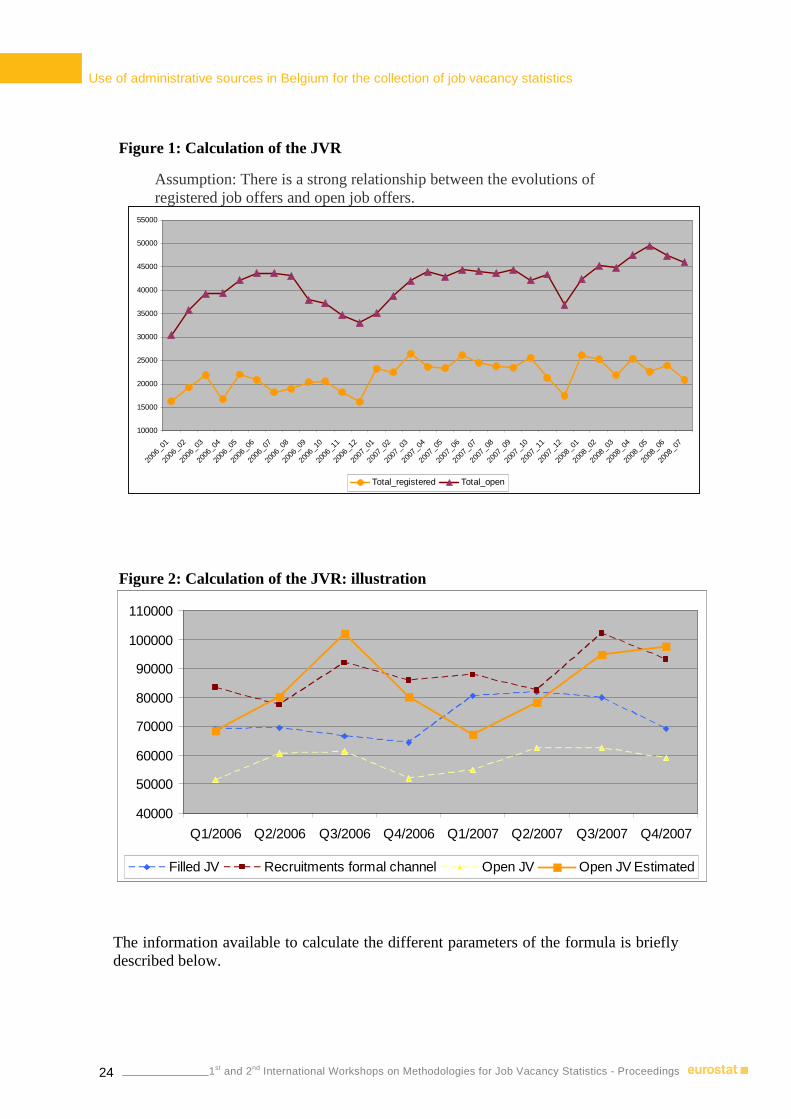
Once the main sources available have been described, this section focuses on the practical steps and the assumptions used to estimate the job vacancy rate in Belgium. The basic components are the number of open job offers stored in the databases of the various PES and the number of occupied posts stored in the National Office of Social Security. To overcome the problem of representativeness of the job offers available at the PES, information on the number of recruitments available from the Social Security registers is used. In principle, it could be expected that both series are correlated. This is the very first step of the estimation procedure. A second step introduces a number of necessary adjustments using the following parameters:
• Share of the number of recruitments that is preceded by a job vacancy • Share of the vacancies registered at PES in the total number of vacancies • Share of registered vacancies at PES that were filled in during the period • Not all recruitments are preceded by a job offer. It is necessary to use an
assumption of the share of formal recruitment channels.
All this assumptions can be summarised with the following formula:
Estimated number of open job vacancies =
(Number of recruitments (formal channels)/fulfilment rate x number of registered JV) *Number of open job vacancies
This formula implies the following assumptions:
• There is a strong relationship between the evolution of registered job offers and open job offers.
• The fulfilment rate of PES is representative for all job vacancies, not just the ones registered at PES.
• All job offers by PES that are considered as filled, lead to a subsequent recruitment.
Use of administrative sources in Belgium for the collection of job vacancy statistics
24 1st and 2nd International Workshops on Methodologies for Job Vacancy Statistics - Proceedings
40000
50000
60000
70000
80000
90000
100000
110000
Q1/2006 Q2/2006 Q3/2006 Q4/2006 Q1/2007 Q2/2007 Q3/2007 Q4/2007
Filled JV Recruitments formal channel Open JV Open JV Estimated
The information available to calculate the different parameters of the formula is briefly described below.
Figure 1: Calculation of the JVR
Assumption: There is a strong relationship between the evolutions of registered job offers and open job offers.
10000
15000
20000
25000
30000
35000
40000
45000
50000
55000
2006
_01
2006
_02
2006
_03
2006
_04
2006
_05
2006
_06
2006
_07
2006
_08
2006
_09
2006
_10
2006
_11
2006
_12
2007
_01
2007
_02
2007
_03
2007
_04
2007
_05
2007
_06
2007
_07
2007
_08
2007
_09
2007
_10
2007
_11
2007
_12
2008
_01
2008
_02
2008
_03
2008
_04
2008
_05
2008
_06
2008
_07
Total_registered Total_open
Figure 2: Calculation of the JVR: illustration

Use of administrative sources in Belgium for the collection of job vacancy statistics
25 1st and 2nd International Workshops on Methodologies for Job Vacancy Statistics - Proceedings
- Number of recruitments (formal channels):
• Recruitments (Social Security office):
• per quarter, per 5digit NACE • distinction between fixed, temporary and interim (NACE 74502) • correction applied to the share of temporary work, on the basis of the
Quarterly results of the Labour Force Survey (proportion of temporary work in total employment).
• correction for ‘false recruitments’ due to mergers, acquisitions and takeovers
• figures do not cover the entire public sector (extrapolation applied per activity sector). Integration of database missing sectors planned for the near future
• timeliness is a problem (‘in theory’ T+4 months, in practice often more)
• Idea Consult Survey 2005
• share of recruitments preceded by formal recruitment channel: estimated on the basis of a survey on Recruitment behaviour (Idea Consult)
• estimates by NACE section. On average: 45%. • parameter is kept constant
- Number of registered JV (VDAB, FOREM, ORBEM):
• available per month (sum of three months taken), by NACE section • interim work:
• reliable figures only available for VDAB = 65% of the interim activity in Belgium
• Problem of double counts
- Fulfilment rate:
• available per month (weighted average of three months taken), per Nace-section
• only available for VDAB (Flanders), extrapolated for Wallonia and Brussels
• figures highly influenced by administrative actions.
- Number of open job vacancies:
• available per month (average of three months taken), by NACE section. • only available for VDAB (Flanders) and Actiris (Brussels), estimated for
Wallonia, on the basis of fulfilment rates of VDAB

Use of administrative sources in Belgium for the collection of job vacancy statistics
26 1st and 2nd International Workshops on Methodologies for Job Vacancy Statistics - Proceedings
6. Some results
Table 1: JVR Belgium, 2007, per NACE
Figure 3: Job vacancy rate Belgium & EU
1
1.5
2
2.5
3
3.5
4
4.5
2006
q01
2006
q02
2006
q03
2006
q04
2007
q01
2007
q02
2007
q03
2007
q04
2008
q01
2008
q02
European Union (27 countries)
European Union (15 countries)
Belgium
Germany (including ex-GDR from 1991)
Netherlands
United Kingdom
2.62.52.11.8All NACE branches - Total
3.43.72.93.2Other community, social, personal service activities O
1.81.91.31Health and social work N
1.11.30.50.7Education M
0.90.80.40.6Public administration and defence; compulsory social
security L
4.333.12.3Real estate, renting and business activities K
1.31.71.21.3Financial intermediation J
1.82.32.11.9Transport, storage and communication I
7.17.37.15.3Hotels and restaurants H
2.72.52.32.1Wholesale and retail trade; repair of motor vehicles,
motorcycles and personal and household goods G
4.23.83.23.1Construction F
2.42.41.71.7Electricity, gas and water supply E
2.32.31.91.5Manufacturing D
0.711.41.2Mining and quarrying C
77.414.213.3Fishing B
6.411.710.48.8Agriculture, hunting and forestry A
Q4Q3Q2Q1
2007
1
1.5
2
2.5
3
3.5
4
4.5
2006q01 2006q02 2006q03 2006q04 2007q01 2007q02 2007q03 2007q04 2008q01 2008q02
European Union (27 countries) European Union (15 countries)Belgium Germany (including ex-GDR from 1991)Netherlands United Kingdom
Use of administrative sources in Belgium for the collection of job vacancy statistics
27 1st and 2nd International Workshops on Methodologies for Job Vacancy Statistics - Proceedings
7. Conclusion
Strengths:
- Administrative simplification: no extra burden for enterprises - Results are fairly consistent with other European countries
Limitations:
- Representativity of databases from public employment services. - Large number of assumptions, some of which are questionable. - Limitations due to administrative databases and to differences between the different
public employment services. - Timeliness, especially data from National Office for Social Security
Contact: SPF Economie, PME, Classes moyennes et Energie, Bruxelles, Belgique

Weighting and estimation methods of the Romanian JVS
28 1st and 2nd International Workshops on Methodologies for Job Vacancy Statistics - Proceedings
Weighting and estimation methods of the Romanian JVS
Mihaela ANGHEL National Institute of Statistics, Romania 1st International Workshop, Nuremberg, 11 - 12 December 2008
Job vacancy statistics – short description
Romania started the data collection of the job vacancy statistics under the guidelines of Phare Multi-country Programmes (PHARE STAT-2002 and PHARE STAT-2003). The first step was the pilot survey carried out for the middle month of the 3rd quarter of 2004. A full-scale job vacancy survey (JVS) has been produced starting with the first quarter of 2005.
The coverage concerns, the enterprises and local units with legal status, irrespective of their economic activity or ownership type, the economic activities, which comprise all NACE Rev.1.1 sections, the geographical areas, which are composed of 42 counties, the categories of employed persons, defined as employees who have a formal employment contract, irrespective of duration, the type of work, the number of hours worked. All occupations, meaning the major groups according to ISCO 88-COM, except major group 0 (armed forces) are covered.
The last day of the middle month of the quarter is considered as reference period. In terms of periodicity, the survey is carried out on quarterly basis.
The unit of selection is the enterprise and according to the communitarian rules is defined as the smallest combination of legal units that is an organisational unit producing goods or services, which benefits from a certain degree of autonomy in decision-making, especially for the allocation of its current resources. An enterprise carries out one or more activities at one or more locations. An enterprise may be a sole legal unit. The local unit is defined as the unit of observation.
There are two ways in which an enterprise should report the number of job vacancies. The first case is when the enterprise has local units, which are situated in other counties than the headquarters and/or carry out a different economic activity than the headquarters. Based on this the enterprise is obliged to report for each local unit the number of occupied posts and the number of job vacancies, broken down by major groups of occupations. The second case concerns the enterprises with no local units, the local unit being the same as the enterprise. In this situation, the information on the number of occupied posts and number of job vacancies is filled in only for the total enterprise and major groups of occupations (ISCO-88 COM - 1 digit level, except major group 0 (armed forces)).
Weighting and estimation methods of the Romanian JVS
29 1st and 2nd International Workshops on Methodologies for Job Vacancy Statistics - Proceedings
The questionnaire is designed to contain information on the enterprise (unit name), the location (NUTS3 level), the economic activity (NACE Rev.1.1, to 2 digit level), the number of occupied posts and number of job vacancies, for total unit and broken down by major groups of occupations. For the enterprises with local units that carries out other activities than the headquarters or are situated in other counties an annex was incorporated which contains the same requests as for the main questionnaire.
Both variables are collected through the same survey. The job vacancies survey is a separate survey, independent of all other surveys carried out by the National Institute of Statistics.
Self-registration is the method used. In case the enterprise has difficulties filling in the questionnaire, methodological assistance is provided by the territorial statistical experts. The variables are collected, exclusively on paper questionnaires and transmitted by post. Beginning with 2009 onwards, an electronic questionnaire is scheduled for release.
The data collection period is the month following the reference period.
Job vacancy statistics – sampling and weighting procedures
The sampling frame used for the sample selection is drawn from the Romanian Business Register (REGIS), which contains all enterprises, authorities and organisations as well as their local units that carries out any economic activity irrespective of their size or if they belong to the private or public sector. The Business Register is updated, yearly, on the balance sheets and contains the latest information on each enterprise in the statistical population such as the identification items (unique identification code, address etc.), economic activity codes (by NACE Rev.1.1), number of employees (giving the enterprise size class).
A stratified sampling technique is used as sampling method. The stratification variables are given by the economic activity (division level) and starting with second quarter of 2008 according to NACE Rev. 2 as well, the size classes of the enterprise (less than 10 employees, 10-49 employees, 50 employees and over).
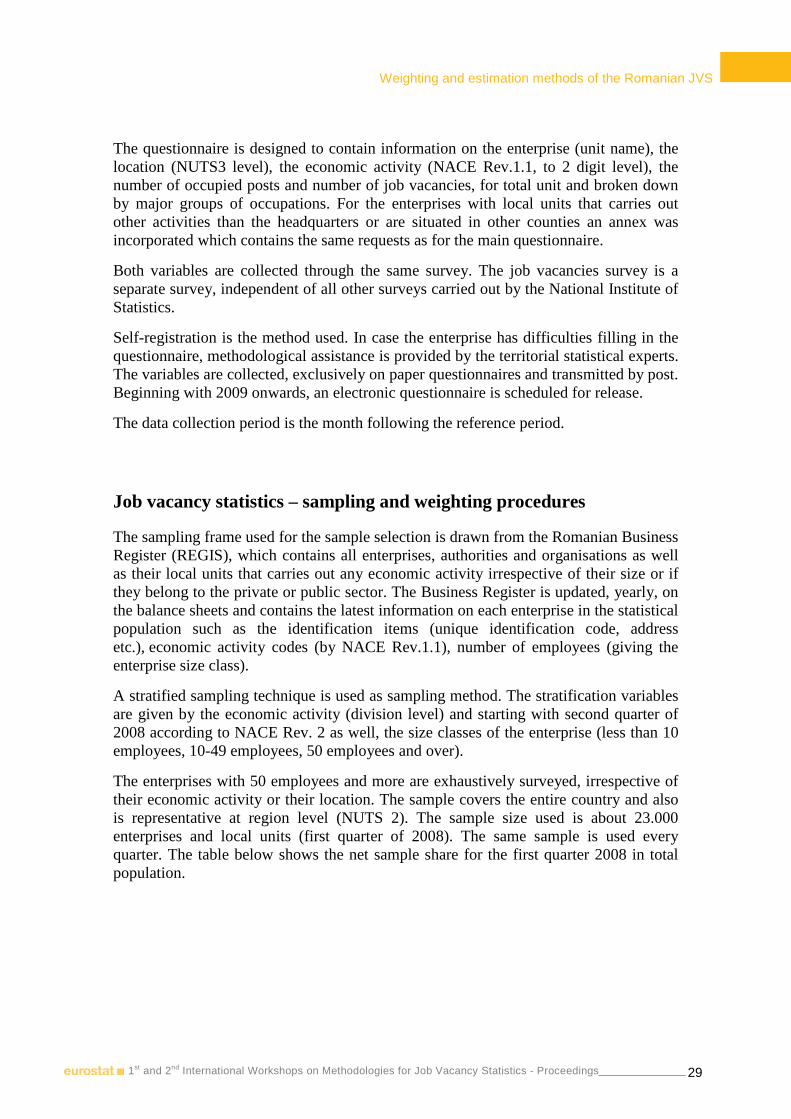
The enterprises with 50 employees and more are exhaustively surveyed, irrespective of their economic activity or their location. The sample covers the entire country and also is representative at region level (NUTS 2). The sample size used is about 23.000 enterprises and local units (first quarter of 2008). The same sample is used every quarter. The table below shows the net sample share for the first quarter 2008 in total population.
Weighting and estimation methods of the Romanian JVS
30 1st and 2nd International Workshops on Methodologies for Job Vacancy Statistics - Proceedings
Table 1: Net sample share (Q1 2008) in total population1
- % -
NACE Rev.1.1 Size Classes
Section level Total <10 employees ≥10 employees A 4.22 0.81 27.08 B 5.58 2.64 23.53 C 22.71 9.45 50.56 D 11.66 3.18 33.72 E 72.17 22.93 106.04 F 5.22 1.28 25.25 G 2.60 0.93 21.89 H 1.91 0.41 13.28 I 3.67 0.94 29.07 J 9.77 2.23 74.05 K 2.31 0.60 31.64 L 99.39 88.89 99.54 M 9.06 2.09 74.05 N 3.72 0.28 71.20 O 6.16 1.76 60.39
Total 4.51 1.14 30.88
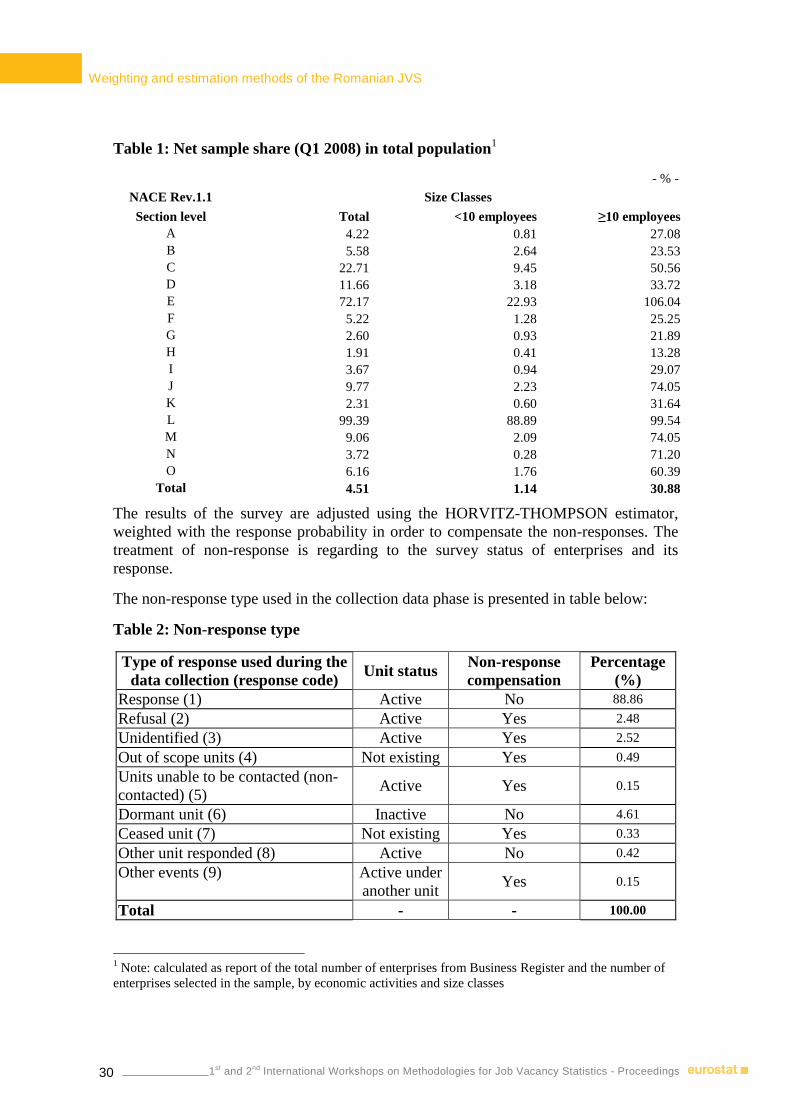
The results of the survey are adjusted using the HORVITZ-THOMPSON estimator, weighted with the response probability in order to compensate the non-responses. The treatment of non-response is regarding to the survey status of enterprises and its response.
The non-response type used in the collection data phase is presented in table below:
Table 2: Non-response type
Type of response used during the data collection (response code)
Unit status Non-response compensation
Percentage (%)
Response (1) Active No 88.86
Refusal (2) Active Yes 2.48
Unidentified (3) Active Yes 2.52
Out of scope units (4) Not existing Yes 0.49
Units unable to be contacted (non-contacted) (5)
Active Yes 0.15
Dormant unit (6) Inactive No 4.61
Ceased unit (7) Not existing Yes 0.33
Other unit responded (8) Active No 0.42
Other events (9) Active under another unit
Yes 0.15
Total - - 100.00
1 Note: calculated as report of the total number of enterprises from Business Register and the number of enterprises selected in the sample, by economic activities and size classes

Weighting and estimation methods of the Romanian JVS
31 1st and 2nd International Workshops on Methodologies for Job Vacancy Statistics - Proceedings
The estimation method involves multiplying the value for each sampled business by a combination of weights, one being outlier weight, one resulting from the sample design. An outlier weight (calculated for the indicator number of occupied posts) is computed as a Windsor weight.
The units having the normal score out of interval [-3, 3] are outlier units. The normal score, which determines the outlier units, is computed taking into account the stratification used in sample design. In order to perform the adjustment of non-response is computed a weight resulting from the sample design, as the sample weight adjusted by the inverse of response probability. The same final weight is applied either for grossing-up number of occupied posts and number of job vacancies.
The above procedures refer only to the indicator of the job vacancy and are done after the weighting procedures are applied to the raw data.
The initial checking for all outliers is part of the data validation routine. Further studies showed the need for outliers examination of the weighted data. The procedures applied for outliers examination are mainly based on graph representations of the data by NACE Rev.1.1 sections, size classes and geographical regions. When outliers are detected and the reason for it is the unit weight applied, the grossing-up factor for the number of job vacancies is made equal with 1. The weight of other observations is increased in a way that the sum of the weights still corresponds with the number of observations in sampling frame.
Only on units with 250 employees and over imputations are done (applied to maximum 1% of the surveyed enterprises). Imputations are needed when a significant difference between the number of occupied posts registered in monthly survey on wages and salaries and the same indicator register through the job vacancies survey, for the same period and NACE Rev.1.1 sections.
When data are not provided for the job vacancies survey but provided through the monthly survey on wages and salaries for the middle month of the previous quarter.
The number of occupied posts by total enterprise (the data are updated with the information from the monthly survey on wages and salaries) are distributed by major groups of occupation for total enterprise and corresponding local units. The distribution is kept from the previous quarter of the job vacancies survey.
Concerning the job vacancies by total enterprise (the data are updated with information belonging to similar enterprises from the same size class, economic activity and geographical region) and is distributed by major groups of occupation for total enterprise and corresponding local units. The distribution is retained from the previous quarter of the survey.
Contact Person Mihaela Anghel
National Institute of Statistics, Romania
Email: [email protected]

Weighting and estimation methods: JVS Estimation in Finland by Horvitz-Thompson-Type estimator
32 1st and 2nd International Workshops on Methodologies for Job Vacancy Statistics - Proceedings
Weighting and estimation methods: JVS Estimation in Finland by Horvitz-Thompson-Type estimator
Juha Martikainen Statistics Finland 1st International Workshop, Nuremberg, 11 - 12 December 2008
The job vacancy survey in Finland
• The survey is based on sample • The target population consists of establishments (local kind of units) with at
least one employee • As a sampling frame we use Statistics Finland’s Business Register (BR) • Contains some 150,000 active establishments with at least one employee • Data collection at the beginning of year 2002 by CATI and beginning of
2006 by CATI and WEB
Sample
• The sample size is 10,000 establishments per year divided equally between the different quarters; 2,500/quarter
• The sampling method is stratified sampling • stratification variables are size (4) of establishment and region (15) • The sample size for each stratum is defined using the Bankier's allocation
method (turnover and number of employees are utilised)
Data processing before the estimation
• The collected data are checked and corrected • The logic and compatibility of single observations are checked • Some missing job vacancy values are also imputed (hot deck imputation
method) • The outlier observations are detected and their effect in the estimation is
eliminated by decreasing their weights

Weighting and estimation methods JVS estimation in Finland by Horvitz-Thompson-Type estimator
33 1st and 2nd International Workshops on Methodologies for Job Vacancy Statistics - Proceedings
Estimation
• The weights are calculated using Horvitz-Thompson method • Both numbers of job vacancies and occupied posts are estimated • These figures are estimated also by size and ownership sector of
establishment, area and branch of industry
HT-type estimator for stratified simple random sample
Nh= size of the population in the stratum h
nh= size of the respondents in the stratum h
wh= the stratum weight
= summing over the respondent units of the stratum (h)
yk = the value of the observed variable
Stratification variables are size and region (60 stratums)
STRATUM (h) POPULATION (Nh)
RESPONDENT (nh)
WEIGHT (wh)
11 25078 69 411.08 12 9343 69 135.41 13 9237 163 56.67 15 975 131 7.44 21 8141 37 220.03 22 3141 44 71.39 23 2795 78 35.83 25 219 38 5.76 31 3414 19 179.68 32 1459 27 54.04 33 1242 52 23.88 35 85 6 14.17 41 5707 28 203.82 42 2238 34 65.82 43 1985 69 28.77 45 142 30 4.73 51 6973 33 211.30 52 2770 38 72.89 53 2541 78 32.58 55 236 28 8.43 … … … … 151 3138 21 149.43 152 1275 19 67.11 153 974 30 32.47 155 48 7 6.86
∑∑=
k k
H
h h
h yn
N
1∑∑
=
=k k
H
hh
yw1
=HTt̂

Weighting and estimation methods: JVS Estimation in Finland by Horvitz-Thompson-Type estimator
34 1st and 2nd International Workshops on Methodologies for Job Vacancy Statistics - Proceedings
2176 responding units, Q1 2008
Obs#STRATUM
ID (h )WEIGHT
(wh )OCCUPIED
POSTSVACANCIES
( yk )SUM
(wh*yk )
1 11 411.08 2 0 0
2 11 411.08 4 0 0
3 11 411.08 3 0 0
4 11 411.08 4 0 0
5 11 411.08 1 0 0
6 11 411.08 1 0 0
7 11 411.08 2 0 0
8 11 411.08 3 0 0
9 11 411.08 4 0 0
10 11 411.08 3 0 0
11 11 411.08 3 1 411.081967
12 11 411.08 3 0 0
… … … … … …
350 15 7.15 100 1 7.15441176
351 15 7.15 119 4 28.6176471
352 15 7.15 261 5 35.7720588
353 15 7.15 863 20 143.088235
354 15 7.15 124 4 28.6176471
355 15 7.15 174 5 35.7720588
356 15 7.15 160 0 0
… … … … … …
2174 155 6.00 124 0 0
2175 155 6.00 330 26 156
2176 155 6.00 150 2 12
Advantages and disadvantages Advantages
• simple estimators • improves accuracy of estimation • efficient • stratification improves representation of infrequently observed units • easy to use
Disadvantages
• sensitive to outlier observations • the sample needs careful design and testing • stratums might be unoptimal for the observed variable in some cases

Weighting and estimation methods JVS estimation in Finland by Horvitz-Thompson-Type estimator
35 1st and 2nd International Workshops on Methodologies for Job Vacancy Statistics - Proceedings
General applicability for the other countries
• Simple sampling method (as used in Finland) requires decent sampling frame
• Good auxiliary information (as register sources) can be used to improve the efficiency of estimation
The main estimation results
1. quarter 2008 Year 2007 Estimate standard
error Coefficients of
variation Estimate standard
error Coefficients of
variation Total 80 400 4 400 5.5 54 100 1 500 2.8
EMPLOYER Private enterprise 58 500 3 800 6.5 37 900 1 400 3.7 Local government 15 800 2 200 13.9 11 000 700 6.4 Central government 1 100 300 27.3 1 600 200 12.5 Non-profit organisation 2 900 800 27.6 2 100 300 14.3
NUMBER OF EMPLOYEES
1-4 14 800 2 600 17.6 9 800 900 9.2 5 - 10 14 300 1 700 11.9 10 000 600 6.0 11 - 99 32 300 2 300 7.1 23 200 900 3.9 100 or more 18 900 2 100 11.1 11 000 500 4.5
REGION Uusimaa 32 900 3 200 9.7 20 200 1 000 5.0 Etelä-Suomi (excl. Uusimaa) 9 100 1 700 18.7 6 400 500 7.8 Länsi-Suomi 25 000 2 100 8.4 18 000 900 5.0 Itä-Suomi 7 500 1 000 13.3 4 300 300 7.0 Oulu+Lappi 5 800 900 15.5 5 100 400 7.8
INDUSTRY 1) Nace A - B 500 200 40.0 800 200 25.0 Nace C - E 17 400 2 400 13.8 9 500 600 6.3 Nace F 5 200 1 200 23.1 4 000 400 10.0 Nace G - I 19 600 2 200 11.2 13 500 800 5.9 Nace J - K 15 300 1 800 11.8 10 500 800 7.6 Nace L - O, Q 22 400 2 500 11.2 15 800 800 5.1 (1) A = Agriculture, hunting and forestry, B = Fishing, C = Mining and quarrying, D = Manufacturing, E = Electricity, gas and water supply, F = Construction, G = Wholesale and retail trade, H = Hotels and restaurants, I = Transport, storage and communications, J = Financial intermediation, K = Real estate, renting and business activities, L = Public administration and defence; compulsory social security, M = Education, N = Health and social work, O = Other community, social and personal services activities, P = Activities of private households as employers and undifferentiated production activities of private households, Q = Extraterritorial organizations and bodies

Weighting and estimation methods: JVS Estimation in Finland by Horvitz-Thompson-Type estimator
36 1st and 2nd International Workshops on Methodologies for Job Vacancy Statistics - Proceedings
Job vacancies in Finland, 2003 - 2008
Job vacancies in Finland, Statistics Finland
2002 2003 2004 2005 2006 2007 2008
1.Quarter 63400 47600 55900 58100 63100 68700 80400
2.Quarter 62000 38400 35300 44000 52700 55300 60100
3.Quarter 34900 32900 32000 34800 40800 48900 42100
4 Quarter 27800 29800 25800 27200 37200 38400 27800
The discussion
The seasonal variation
The seasonal variation between the quarters is remarkable high in Finland. Round 16 percent of all employees had fixed-term work contract in the year 2008. The summer time workers (students) are recruited in the first half of the year, which increases vacancies especially in the first quarter.
0
10000
20000
30000
40000
50000
60000
70000
80000
90000
1/20
03
3/20
03
1/20
04
3/20
04
1/20
05
3/20
05
1/20
06
3/20
06
1/20
07
3/20
07
1/20
08
3/20
08
JVS (Statistics Finland) Ministry of Labour
Weighting and estimation methods JVS estimation in Finland by Horvitz-Thompson-Type estimator
37 1st and 2nd International Workshops on Methodologies for Job Vacancy Statistics - Proceedings
The low coefficients of variation in the first quarter of 2008
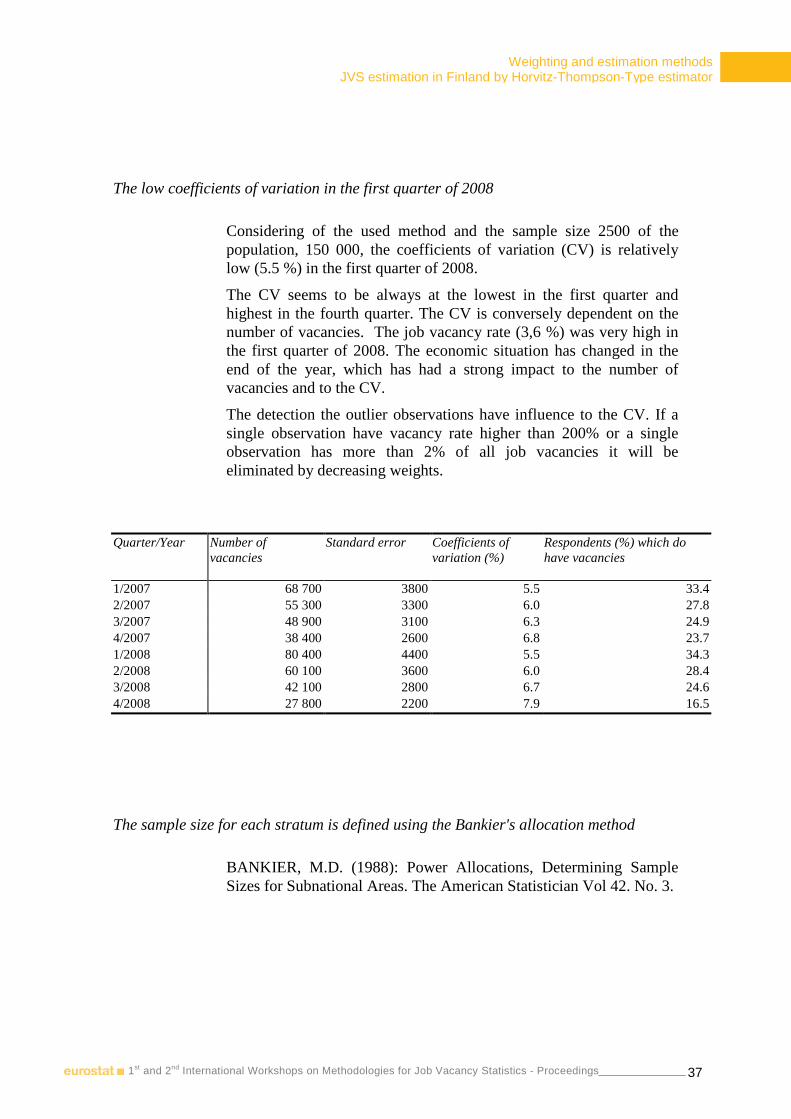
Considering of the used method and the sample size 2500 of the population, 150 000, the coefficients of variation (CV) is relatively low (5.5 %) in the first quarter of 2008.
The CV seems to be always at the lowest in the first quarter and highest in the fourth quarter. The CV is conversely dependent on the number of vacancies. The job vacancy rate (3,6 %) was very high in the first quarter of 2008. The economic situation has changed in the end of the year, which has had a strong impact to the number of vacancies and to the CV.
The detection the outlier observations have influence to the CV. If a single observation have vacancy rate higher than 200% or a single observation has more than 2% of all job vacancies it will be eliminated by decreasing weights.
Quarter/Year Number of
vacancies Standard error Coefficients of
variation (%) Respondents (%) which do have vacancies
1/2007 68 700 3800 5.5 33.4 2/2007 55 300 3300 6.0 27.8 3/2007 48 900 3100 6.3 24.9 4/2007 38 400 2600 6.8 23.7 1/2008 80 400 4400 5.5 34.3 2/2008 60 100 3600 6.0 28.4 3/2008 42 100 2800 6.7 24.6 4/2008 27 800 2200 7.9 16.5
The sample size for each stratum is defined using the Bankier's allocation method
BANKIER, M.D. (1988): Power Allocations, Determining Sample Sizes for Subnational Areas. The American Statistician Vol 42. No. 3.
Weighting and estimation methods: JVS Estimation in Finland by Horvitz-Thompson-Type estimator
38 1st and 2nd International Workshops on Methodologies for Job Vacancy Statistics - Proceedings
The Industrial classification as a stratification variable
The Industrial classification is not used as a stratification variable. Size of the establishment and area combine 60 stratums and all major NACE classes are well represented.
Exploitation of auxiliary information
Any additional information is not used in the estimation. The register of the Ministry of Employment and the Economy covers all job vacancies that are notified to the public employment services. Total numbers of job vacancies have a significant correlation, but among industrial classes differences can be large. A little bit more than half of the estimated vacancies are announced to the public employment services, but because of double-counting the difference is not so wide.
Contact person Juha Martikainen
Statistics Finland
Email: [email protected]

The UK job vacancy survey
39 1st and 2nd International Workshops on Methodologies for Job Vacancy Statistics - Proceedings
The UK job vacancy survey
Gareth Clancy Office for National Statistics, United Kingdom 1st International Workshop, Nuremberg, 11 - 12 December 2008
Work to establish a job vacancy survey in the UK began with a pre-pilot survey, which then led to a full pilot with cognitive testing. This work established the feasibility of collecting information on job vacancies from businesses. The new survey started with selected industrial sectors in November 2000 on a trial basis, before being extended to all sectors except agriculture, forestry and fishing in April 2001. In September 2002, the vacancy survey estimates were published on an experimental basis, with National Statistics status being granted in 2003.
The UK job vacancy survey is only one question, which asks how many vacancies the business or organisation is actively seeking to fill. However, the questionnaire length can be up to three pages, the majority of which explains the obligation to participate and the definition of a vacancy.
Responses from businesses are mainly submitted using a telephone data entry system. This helps reduce the burden on both the Office for National Statistics (ONS) and the respondent as the survey is conducted on a monthly basis.
Publication of Vacancy Estimates
Results from the vacancy survey are published in the UK’s monthly Labour Market Integrated First Release in two tables. In the March 2009 First Release, Table 21 provided vacancy levels and ratios based on three month rolling averages as well as single month estimates. In both cases (levels and ratios) the headline figures are based on the three month rolling average because of the volatility of the monthly series. This volatility can be seen in Figure 1. In the same release Table 22 provides the vacancies by industry on a levels and ratio basis. The latest integrated first release can be found at: www.statistics.gov.uk/STATBASE/Product.asp?vlnk=1944
Figure 2 shows the vacancy ratio time series from February 2002. It is calculated using employee jobs as the denominator, which gives the number of vacancies per 100 employee jobs. The number of employee jobs is calculated from a number of surveys, including the short term employer surveys (STES) and public administrative jobs series.

The UK job vacancy survey
40 1st and 2nd International Workshops on Methodologies for Job Vacancy Statistics - Proceedings
Figure 1: Monthly and quarterly job vacancy levels, 000s seasonally adjusted
400
450
500
550
600
650
700
750
2002Feb
2002Jun
2002Oct
2003Feb
2003Jun
2003Oct
2004Feb
2004Jun
2004Oct
2005Feb
2005Jun
2005Oct
2006Feb
2006Jun
2006Oct
2007Feb
2007Jun
2007Oct
2008Feb
2008Jun
2008Oct
2009Feb
3 month Average Vacancy Levels AP2Y
Monthly estimates Monthly Estimate Vacancy Level AP2X
Figure 2: Vacancy ratio for three months ending
0.0
0.5
1.0
1.5
2.0
2.5
3.0
2002Feb
2002Aug
2003Feb
2003Aug
2004Feb
2004Aug
2005Feb
2005Aug
2006Feb
2006Aug
2007Feb
2007Aug
2008Feb
2008Aug
2009Feb

The UK job vacancy survey
41 1st and 2nd International Workshops on Methodologies for Job Vacancy Statistics - Proceedings
Definition of a vacancy
Providing businesses with a clear definition of a vacancy is critical to ensuring consistent responses from the sampling frame. To do this the short questionnaire is supplemented with an Annex defining a vacancy (see Machin and Christian 2002). In summary, position is defined as a vacancy if:
• it is newly created and/or unoccupied, or identified as becoming vacant in the near future;
• the employer has taken active steps to fill the position, and is prepared to take more steps; and
• it is available for a suitable candidate, and open to people from outside the business or organisation concerned, either immediately or in the near future after the necessary recruitment procedure.
‘Active steps to fill the position’ include advertising the vacancy in the media, on a public notice board or registering with a Jobcentre or private employment agency and approaching, interviewing or selecting potential recruits.
Survey Coverage
The survey is run monthly in Great Britain (not Northern Ireland), but weighted up to provide United Kingdom estimates (N.I included). Returns are received from nearly 6,000 businesses each month, with each business providing the total number of vacancies they hold. Data are collected on the Friday between the second and eighth of each month and published 40 days later. As indicated earlier, responses are mainly submitted to ONS by head offices using a telephone keypad.
Enterprises are sampled from the interdepartmental business register (IDBR), and stratified according to type of industry and number of people employed. The survey covers the whole economy, apart from agriculture, forestry and fishing. Using the IDBR as the sampling frame allows analysis of vacancies to be produced by industry and by size of enterprise on a rolling quarterly basis, in addition to the total monthly estimates.
At present the survey stratifies the sampling frame by 10 employer size bands and 29 industry classifications. However, one of the recommendations of the last Triennial Review was that the size bands be reduced to 5.
The IDBR produces the sampling frame of businesses by primarily taking information from the Inland Revenue’s Pay-as-you-earn (PAYE) system and Her Majesty’s Custom and Excise Value-added-Tax (VAT) register. The IDBR stores details of about 2 million businesses registered in the UK.
Although every effort is made to keep the IDBR as up to date as possible there are inevitably lags between the establishment of a business for trading purposes, the completion of that businesses tax returns and its use in the vacancy register. This type of lag is sometimes called a ‘birth lag’.
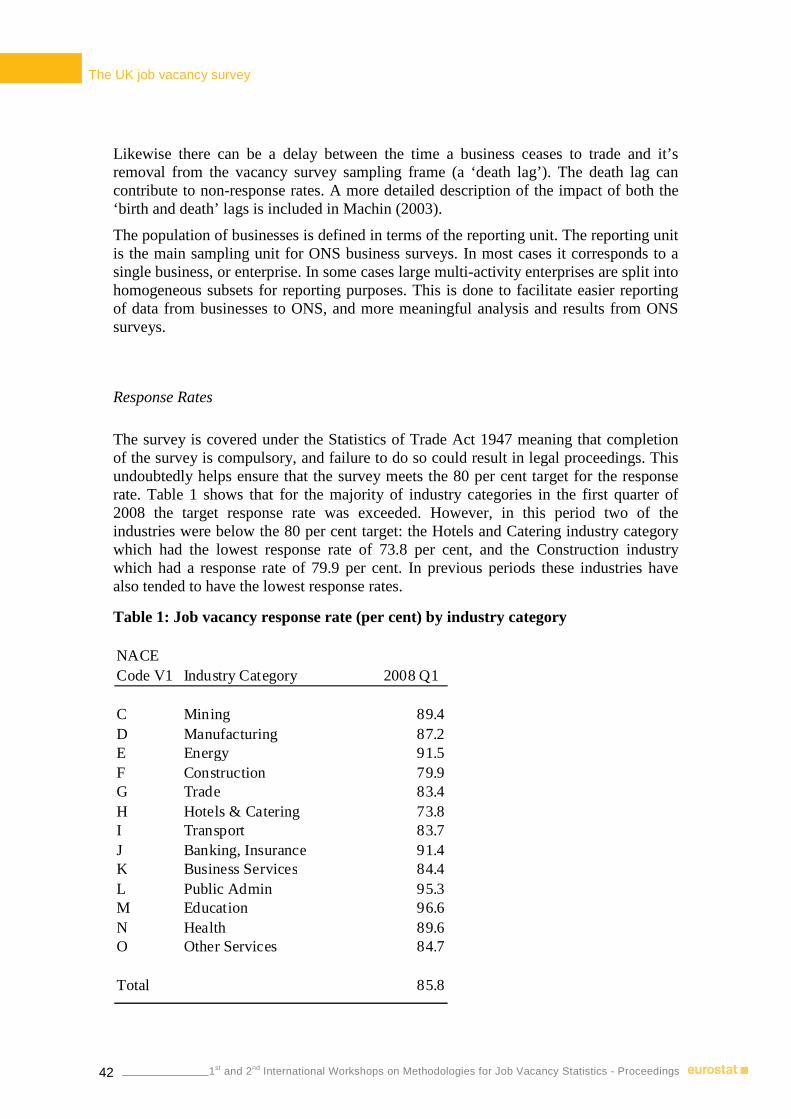
The UK job vacancy survey
42 1st and 2nd International Workshops on Methodologies for Job Vacancy Statistics - Proceedings
Likewise there can be a delay between the time a business ceases to trade and it’s removal from the vacancy survey sampling frame (a ‘death lag’). The death lag can contribute to non-response rates. A more detailed description of the impact of both the ‘birth and death’ lags is included in Machin (2003).
The population of businesses is defined in terms of the reporting unit. The reporting unit is the main sampling unit for ONS business surveys. In most cases it corresponds to a single business, or enterprise. In some cases large multi-activity enterprises are split into homogeneous subsets for reporting purposes. This is done to facilitate easier reporting of data from businesses to ONS, and more meaningful analysis and results from ONS surveys.
Response Rates
The survey is covered under the Statistics of Trade Act 1947 meaning that completion of the survey is compulsory, and failure to do so could result in legal proceedings. This undoubtedly helps ensure that the survey meets the 80 per cent target for the response rate. Table 1 shows that for the majority of industry categories in the first quarter of 2008 the target response rate was exceeded. However, in this period two of the industries were below the 80 per cent target: the Hotels and Catering industry category which had the lowest response rate of 73.8 per cent, and the Construction industry which had a response rate of 79.9 per cent. In previous periods these industries have also tended to have the lowest response rates.
Table 1: Job vacancy response rate (per cent) by industry category
NACE Code V1 2008 Q1
C Mining 89.4D Manufacturing 87.2E Energy 91.5F Construction 79.9G Trade 83.4H Hotels & Catering 73.8I Transport 83.7J Banking, Insurance 91.4K Business Services 84.4L Public Admin 95.3M Education 96.6N Health 89.6O Other Services 84.7
Total 85.8
Industry Category

The UK job vacancy survey
43 1st and 2nd International Workshops on Methodologies for Job Vacancy Statistics - Proceedings
Standard errors for the three-month estimates are currently around 10,000 (nearly 20,000 for the monthly estimates), or 1.5 per cent expressed as a coefficient of variation (that is, the standard deviation of the estimate as a proportion of the mean). For a typical individual industrial sector, the coefficient of variation for the three-month average estimate is around 10 per cent. The 95 per cent confidence interval for the overall three-monthly estimate of vacancies is +/- 20,000 (around +/- 3 per cent).
Sample Design
The population is stratified by 29 industry bands and 10 employee size bands. The industries are divided by Standard Industrial Classification (2003) groupings, and the size bands are derived from the employment values shown on the IDBR for each reporting unit.
A minimum sample of five businesses is sampled for each cell. This minimum sample size is represented in Figure 3. It also shows that not all industries have the same employer size bands or same number of categories. The Figure 3 provides a diagrammatic representation of this stratification and is not the actual stratification or employer size bands used in each industry.
Figure 3: UK Vacancy Survey: Diagrammatic Representation of Stratification
Employer Size Bands
Industry: C, E Mining and Extraction
Industry:D Manufacturing
Industry: F Construction
Industry: G, H Wholesale and Retail
Industry: I Transport and Comms
Industry: J-K Financial And Real Estate
Industry: L-N Public Admin, Education and Health
Industry: 0 Other Services
1-4
5-9
10-19
20-49
50-99
100-249
250-499
500-999
1,000-2,499
2,500+
Standard Industry Classifications
Notes The diagram represents the stratification of the sampling frame, but is not accurate in terms of numbers of businesses or the actual size bands that exist in a industry classification. The largest employer size band in each industry is exhaustively sampled and is always in the sample frame. Smaller cells have a minimum of 5 businesses and businesses the sample for these cells are rotated.
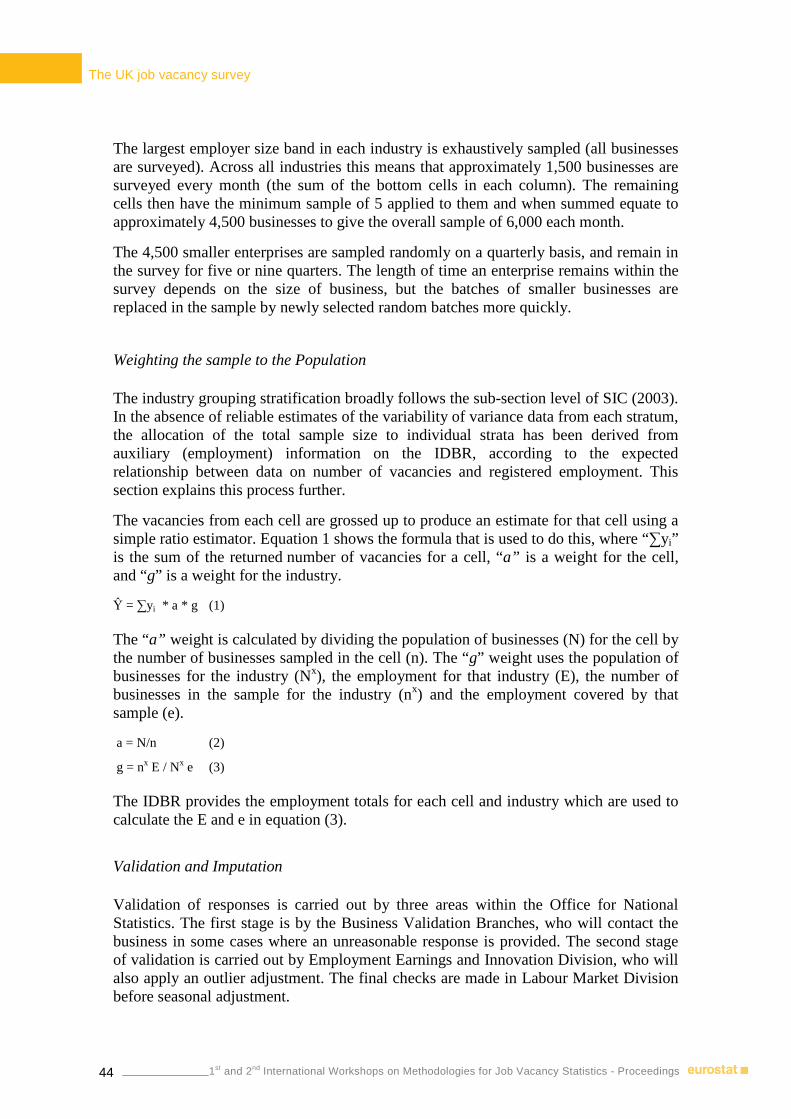
The UK job vacancy survey
44 1st and 2nd International Workshops on Methodologies for Job Vacancy Statistics - Proceedings
The largest employer size band in each industry is exhaustively sampled (all businesses are surveyed). Across all industries this means that approximately 1,500 businesses are surveyed every month (the sum of the bottom cells in each column). The remaining cells then have the minimum sample of 5 applied to them and when summed equate to approximately 4,500 businesses to give the overall sample of 6,000 each month.
The 4,500 smaller enterprises are sampled randomly on a quarterly basis, and remain in the survey for five or nine quarters. The length of time an enterprise remains within the survey depends on the size of business, but the batches of smaller businesses are replaced in the sample by newly selected random batches more quickly.
Weighting the sample to the Population
The industry grouping stratification broadly follows the sub-section level of SIC (2003). In the absence of reliable estimates of the variability of variance data from each stratum, the allocation of the total sample size to individual strata has been derived from auxiliary (employment) information on the IDBR, according to the expected relationship between data on number of vacancies and registered employment. This section explains this process further.
The vacancies from each cell are grossed up to produce an estimate for that cell using a simple ratio estimator. Equation 1 shows the formula that is used to do this, where “∑yi”
is the sum of the returned number of vacancies for a cell, “a” is a weight for the cell, and “g” is a weight for the industry.
Ŷ = ∑yi * a * g (1)
The “a” weight is calculated by dividing the population of businesses (N) for the cell by the number of businesses sampled in the cell (n). The “g” weight uses the population of businesses for the industry (Nx), the employment for that industry (E), the number of businesses in the sample for the industry (nx) and the employment covered by that sample (e).
a = N/n (2)
g = nx E / Nx e (3)
The IDBR provides the employment totals for each cell and industry which are used to calculate the E and e in equation (3).
Validation and Imputation
Validation of responses is carried out by three areas within the Office for National Statistics. The first stage is by the Business Validation Branches, who will contact the business in some cases where an unreasonable response is provided. The second stage of validation is carried out by Employment Earnings and Innovation Division, who will also apply an outlier adjustment. The final checks are made in Labour Market Division before seasonal adjustment.

The UK job vacancy survey
45 1st and 2nd International Workshops on Methodologies for Job Vacancy Statistics - Proceedings
Outliers are detected manually and are treated by setting their weight in estimation to one. Thereby, they only represent themselves. In the Vacancy Survey, outliers have traditionally been treated in this manner and so not given their full sampling weight. Work was conducted where all returns were treated as representative, and given their full sampling weight. Comparisons showed a difference of 2.4 per cent between the higher and lower estimates, suggesting that the first method of treating these uncharacteristically high values have only affected headline vacancy levels to a very small extent. In light of these findings, outliers continue to have their weight in estimation set to one.
Imputation only takes for the top size band in each industry sector (normally > 250 employees). Imputation is based on the pattern of responses for similar businesses. A link factor is derived and applied to previous returned data for each non-responding business. The link factor is essentially the average growth in vacancies for firms in the same cell (same size of firm and industry). Imputation is compounded rather than recalculated from the last actual return. For example, if on the first non-response a growth factor of 5 per cent was applied on the last valid return, for the second missing value a new growth factor will be calculated of based on the average growth in vacancies for that cell, e.g 7 per cent. The 7 per cent growth factor for that month is applied to the previous months’ imputed value.
The original construction for a never-responding firm is calculated from a ratio (calculated from other contributor values in the same estimation group) being applied to selection employment. For subsequent periods, imputed values will go up if the other respondents in the same class / cell (depending on which level results are being run at) are reporting increased values.
Future Work and Challenges
• The job vacancy survey is still conducted at a reporting unit level, although a pilot study has been carried out by the ONS to ascertain whether a local unit survey is feasible. A report will be available in 2009.
• No regional breakdown is possible from the current survey. • The job vacancy survey does not include Agriculture and Fishing industries
because of problems covering such large numbers of local units. • The NACE Rev 2. (SIC 2007) will first be published in June 2010. The first
selection on SIC 2007 will be carried out earlier in the year. The UK has an agreement with Eurostat in place to work with them on providing the data at the earliest opportunity.

The UK job vacancy survey
46 1st and 2nd International Workshops on Methodologies for Job Vacancy Statistics - Proceedings
References
Machin A, (2003), ‘The Vacancy Survey: a new series of National Statistics’, Labour Market Trends, Volume 111, no 7, pp349 -362, and at
www.statistics.gov.uk/cci/article.asp?id=406
Machin A, Christian V, ‘ A new survey of job vacancies: the first experimental results’, Labour Market Trends, October 2002, pp535-548, and at
www.statistics.gov.uk/downloads/theme_labour/article.pdf Contact person Gareth Clancy
Office for National Statistics, United Kingdom
Email: [email protected]

Non sampling errors in the Italian job vacancy survey
47 1st and 2nd International Workshops on Methodologies for Job Vacancy Statistics - Proceedings
Non sampling errors in the Italian job vacancy survey
Ciro Baldi, Diego Bellisai, Stefania Fivizzani, Marina Sorrentino ISTAT, Italy 1st International Workshop, Nuremberg, 11 - 12 December 2008
1. Introduction: the Italian job vacancy survey
The Italian data on quarterly job vacancies are produced by the national statistical office (ISTAT) on the basis of a quarterly survey on job vacancies and hours worked (in the following, VELA), which has been carried out since the third quarter of 2003.
The main variables collected by VELA are: occupied posts on the last day of the previous and reference quarter; hirings and separations in the reference quarter; job vacancies on the last day of the reference quarter; hours worked as normal time and overtime and hours not worked but paid by the employer in the quarter. All variables are measured separately for manual and non manual workers (managers excluded).
The target population comprises all enterprises with at least 10 employees classified, until the end of 2007, in NACE Rev. 1.1 sections C-K and, since the beginning of 2008, in NACE Rev. 2 sections B-N.
The sample includes around 13,000 enterprises and is drawn on the basis of a stratified random scheme with economic activity, size and geographical area as stratification variables. All population enterprises with at least 500 employees belong to take-all strata. Around one third of the sample enterprises with 10-499 employees are rotated once a year.
Data are collected mainly via CATI and Web (while a small share of responses is transmitted via fax or mail). The first time an enterprise is included in the sample, it is requested to respond via CATI, while afterwards it can opt for the Web mode. Hence, the share of enterprises responding via Web is smallest in the wave after a sample rotation and largest in the wave preceding a rotation.
A comprehensive set of error prevention methods are implemented both in preparation of and during the data collection.
The editing and imputation methods are based on an integration of the VELA microdata with those of other two ISTAT surveys: the Monthly Survey on Employment, Hours Worked, Wages and Labour Cost in the largest enterprises (from now on LE survey) and OROS (a quarterly administrative based survey on Employment, Wages and Social Contributions).
Non sampling errors in the Italian job vacancy survey
48 1st and 2nd International Workshops on Methodologies for Job Vacancy Statistics - Proceedings
The LE survey collects monthly from a panel of about 1,100 enterprises (which had at least an average of 500 employees in the base year and which are classified, until 2008, in NACE Rev. 1.1 sections C-K, and, from 2009, in NACE Rev. 2 sections B-N) the number of occupied posts at the end of the month, hirings and separations, hours worked (with the same definitions as VELA1), as well as variables related to wages and labour cost.
On the other hand, the OROS survey relies on the whole population of the DM10 forms which enterprises are due to monthly fill and send to the social security institute (INPS), in order to declare the compulsory social contributions. By integrating the information included in these forms with that collected by the LE survey for the panel enterprises, OROS produces quarterly indicators on wages, labour cost and occupied posts for, until 2008, NACE Rev. 1.1 sections C-K, and, from 2009, NACE Rev. 2 sections B-N classification. The occupied posts variable measured by OROS is the quarterly average of the monthly number of employees. In turn this amounts to the employees to whom at least an hour worked in the month has been paid.
The aggregate data on job vacancy rates are transmitted to Eurostat. Furthermore, since January 2009, they are also published in Italy, in particular in the ISTAT short term statistics online data base, http://con.istat.it.
In this paper, a set of indicators of non sampling error measurement, calculated as averages over the four VELA waves of 2008, are presented, together with more qualitative evidence acquired while running the survey. In Section 2 a comparison of the frame from which the survey sample is drawn and the OROS list of active enterprises allows to gain some insight on coverage and classification errors. Our experience on the main difficulties and problems encountered by the respondents in measuring job vacancies is described in Section 3. Indicators on unit response rates, with a focus on the response mode and the enterprise’s characteristics, are presented in Section 4. Item non response rates, imputation rates on job vacancies and occupied posts, and evidence on the imputation effects on aggregate data are illustrated in Section 5. Some final remarks are then included in Section 6.
2. Coverage and classification errors
The job vacancy survey sample is split into two components: enterprises with at least 500 employees, which belong to take-all strata, and enterprises with 10-499 employees, which are selected with inclusion probability strictly lower than one. The sample is drawn with a constrained optimisation method (where the sample size is minimised under constraints on the maximum values of the coefficients of variation for the interest variables in the study domains) from the most recent release of the Italian statistical business register (ASIA). In particular, in this paper, the sample for 2008 is considered, which was drawn from the 2005 ASIA release. 1 In order to reduce the statistical burden on the sampling units as well as the costs and resources necessary to the data collection and treatment, the enterprises taking part both in VELA and in the LE survey are allowed not to provide VELA with data on hours worked.

Non sampling errors in the Italian job vacancy survey
49 1st and 2nd International Workshops on Methodologies for Job Vacancy Statistics - Proceedings
Sampling fractions calculated at the study domain level, that is for NACE 1.1 sections, show that almost all enterprises in ASIA with at least 500 employees were included in the 2008 sample (see Table 1). The few exceptions were enterprises on which robust information on the closing down or structural enterprise events (concentration or deconcentration) of all activities between 2005 and the survey reference quarter had been acquired. Furthermore, the different sampling fractions on smaller enterprises are due to either small population sizes (for sections C and E) or to large variability of the job vacancy sample data for previous quarters (in particular, for sections J and H).
Table 1: Sample size and sampling fractions (average for 2008)
10-499 employees
500+ employees
10+ employees10-499
employees500+ employees 10+ employees
C 502 2 504 65.0 100.0 65.1D 3,156 519 3,675 4.5 96.1 5.2E 394 32 427 78.4 97.7 79.6F 1,354 30 1,384 6.3 96.8 6.4G 1,034 158 1,192 4.0 96.9 4.5H 1,891 45 1,936 20.2 97.3 20.5I 1,037 126 1,163 10.7 97.9 11.9J 650 116 766 37.1 91.3 40.8K 1,588 245 1,833 9.6 91.2 10.9C-K total 11,605 1,273 12,878 7.4 95.0 8.2
Sample size Sampling fractionsNACE Rev. 1.1 section
An assessment of coverage errors for the ASIA register can be obtained by comparing the sampling frame (the list of enterprises with at least 10 employees in the ASIA release used to draw the sample) with the target population here represented by the OROS list of all enterprises satisfying the same size threshold for the reference quarter. In fact, the OROS list contains records for all enterprises which in at least one month of the reference quarter paid social contributions for their employees and hence is a reliable list of the units which were actually active in that period. Thus, the main discrepancies among the OROS and ASIA lists of enterprises should be ascribed to the different reference periods. Hence, the share of enterprises in ASIA which are not in OROS2 can be interpreted as a measure of overcoverage due to the distance between the reference quarter of the survey and the reference year of the ASIA release from which the sample was drawn. In the following, the average results of this comparison for the four quarters of 2008 are presented.
On the entire range of considered economic activities, 13% of ASIA enterprises are not in the OROS list (see Table 2), presumably because they closed down all activities before the reference quarters, or moved below the 10 employees threshold. Among the sections which are most affected by this overcoverage, there are I, K and F, while in C, but also in G and J there is higher similarity between the two sources. In the job vacancy survey sample the overlapping is larger than in the entire ASIA register, possibly because the sampling fractions for larger enterprises are greater than those for the smaller ones, which could experience larger birth and death rates. However, the pattern of the overlapping across economic activities is very similar in the sample and in the entire ASIA register. 2 Both ASIA and OROS lists are built considering the 10 employee threshold. The explicit reference to this threshold will be in places avoided in the following, for simplicity’s sake.

Non sampling errors in the Italian job vacancy survey
50 1st and 2nd International Workshops on Methodologies for Job Vacancy Statistics - Proceedings
Table 2: Enterprises in the 2005 ASIA register and in the sample drawn from it which are not in the average for 2008 OROS enterprise list
total in OROSnot in OROS
(%)in ASIA
both in ASIA and OROS
not in OROS (%)
C 504 484 4.0 774 730 5.7D 3,675 3,414 7.1 70,585 62,197 11.9E 427 403 5.6 536 464 13.4F 1,384 1,225 11.5 21,483 17,993 16.2G 1,192 1,143 4.1 26,304 23,846 9.3H 1,936 1,762 9.0 9,423 8,146 13.6I 1,163 1,039 10.7 9,779 8,035 17.8J 766 728 4.9 1,877 1,697 9.6K 1,833 1,592 13.1 16,805 13,971 16.9C-K total 12,878 11,789 8.5 157,567 137,078 13.0
NACE Rev. 1.1 section
Sample enterprises Enterprises in the population lists
Furthermore, the share of OROS enterprises which cannot be found in the ASIA register can be interpreted as a measure of undercoverage, that can be attributed mainly to the enterprises which became active, or whose size reached or exceeded the 10 employees threshold, after the ASIA reference year. This measure can be quite relevant for a job vacancy survey, if we think that new enterprises are likely to have specific job vacancy patterns. For example, they could experience growth phases which could imply relatively large job vacancy rates.
Table 3: Enterprises in the average for 2008 OROS list which are not in the 2005 ASIA register
NACE Rev. 1.1 section Enterprises in OROSEnterprises both in ASIA and
OROSEnterprises not in ASIA
(%)C 784 635 18.9D 73,553 55,417 24.7E 599 433 27.7F 26,086 14,109 45.9G 30,405 20,728 31.8H 14,346 6,585 54.1I 11,158 6,866 38.5J 2,099 1,537 26.8K 20,530 11,724 42.9C-K total 179,556 118,034 34.3
It seems that this measure of undercoverage could be quite relevant. In fact, on the entire range of considered economic activities, 34.3% of all units in the OROS lists of enterprises with at least 10 employees in the four quarters of 2008 are not included in the 10+ employee part of the 2005 release of the ASIA register (see Table 3). The non overlapping share is even higher in sections H (where it reaches 54.1%), F and K, while it is substantially lower in C, D, E and J.
It seems plausible to argue that the very high undercoverage measures in H and F could be at least partly attributed to the more frequent and larger changes in size affecting many enterprises in these activities. In fact, hotels can experience large size changes across quarters due to the seasonality of tourist flows, while construction enterprises are affected by large size changes when they open or close their yards.
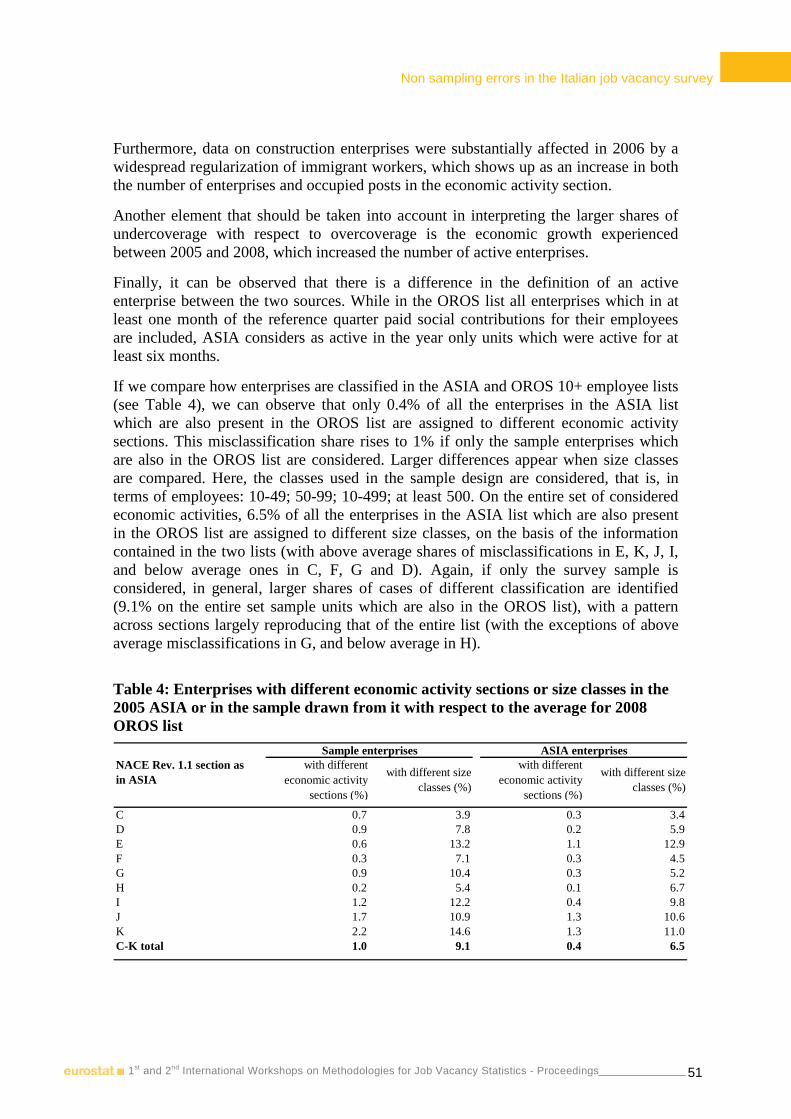
Non sampling errors in the Italian job vacancy survey
51 1st and 2nd International Workshops on Methodologies for Job Vacancy Statistics - Proceedings
Furthermore, data on construction enterprises were substantially affected in 2006 by a widespread regularization of immigrant workers, which shows up as an increase in both the number of enterprises and occupied posts in the economic activity section.
Another element that should be taken into account in interpreting the larger shares of undercoverage with respect to overcoverage is the economic growth experienced between 2005 and 2008, which increased the number of active enterprises.
Finally, it can be observed that there is a difference in the definition of an active enterprise between the two sources. While in the OROS list all enterprises which in at least one month of the reference quarter paid social contributions for their employees are included, ASIA considers as active in the year only units which were active for at least six months.
If we compare how enterprises are classified in the ASIA and OROS 10+ employee lists (see Table 4), we can observe that only 0.4% of all the enterprises in the ASIA list which are also present in the OROS list are assigned to different economic activity sections. This misclassification share rises to 1% if only the sample enterprises which are also in the OROS list are considered. Larger differences appear when size classes are compared. Here, the classes used in the sample design are considered, that is, in terms of employees: 10-49; 50-99; 10-499; at least 500. On the entire set of considered economic activities, 6.5% of all the enterprises in the ASIA list which are also present in the OROS list are assigned to different size classes, on the basis of the information contained in the two lists (with above average shares of misclassifications in E, K, J, I, and below average ones in C, F, G and D). Again, if only the survey sample is considered, in general, larger shares of cases of different classification are identified (9.1% on the entire set sample units which are also in the OROS list), with a pattern across sections largely reproducing that of the entire list (with the exceptions of above average misclassifications in G, and below average in H).
Table 4: Enterprises with different economic activity sections or size classes in the 2005 ASIA or in the sample drawn from it with respect to the average for 2008 OROS list
with different economic activity
sections (%)
with different size classes (%)
with different economic activity
sections (%)
with different size classes (%)
C 0.7 3.9 0.3 3.4D 0.9 7.8 0.2 5.9E 0.6 13.2 1.1 12.9F 0.3 7.1 0.3 4.5G 0.9 10.4 0.3 5.2H 0.2 5.4 0.1 6.7I 1.2 12.2 0.4 9.8J 1.7 10.9 1.3 10.6K 2.2 14.6 1.3 11.0C-K total 1.0 9.1 0.4 6.5
Sample enterprises ASIA enterprisesNACE Rev. 1.1 section as in ASIA

Non sampling errors in the Italian job vacancy survey
52 1st and 2nd International Workshops on Methodologies for Job Vacancy Statistics - Proceedings
We tackle these coverage and classification problems by calibrating to the number of employees of the OROS list of enterprises above the size threshold for the reference quarter, in cells defined both by activity and size.
3. Measurement errors
Measurement errors are difficult to identify and evaluate, especially on job vacancies, since there is no auxiliary information such as a survey or an administrative source that provide information on variables similar to job vacancies nor a subsidiary survey that repeat the measurement process.
Although a comprehensive evaluation of response errors is not possible at present, the survey operations bring about a lot of information about the difficulties that the enterprises meet when they answer questions on job vacancies. The following discussion is based on two information sources: on the one hand the meetings with the CATI interviewers aimed at debriefing the data collection phase and, on the other hand, the direct communication that the survey experts have with the enterprises to help them solve their problems with the questionnaire or the survey and the reminders performed at the end of each survey wave. A useful starting point consists in keeping in mind that the number of job vacancies is normally not recorded in the enterprise information system unlike the number of occupied posts or other labour input variables, such as the number of work hours paid. A second point is that some enterprises may miss to identify actions they perform as active search of candidates. For instance, some enterprises report that a large part of the search activities is carried out by word of mouth by asking their employees if they know somebody who could be a suitable candidate for a given post. Other enterprises, with marked seasonal workloads, mainly from the Hotels and Restaurants section, report that part of the people hired during the seasonal peaks come from a pool of persons that have worked for the enterprise in the past, and that have been re-contacted. In this case it may happen that they fail to consider those positions as vacancies. These two points characterize small and very small enterprises whose procedures of search, recruiting and hiring are mainly informal. Medium and large enterprises instead perform these operations in a more formal way, frequently sustaining specific costs both to search for candidates and to select among them. These costs, either explicit, as in commissioning specialized “head hunter” agencies or advertising vacancies in the media, or implicit in devoting part of the staff of the human resources division to select among curricula and interview candidates, are normally associated with better information available on the number of job vacancies. Nonetheless large enterprises may deal with specific obstacles in interpreting the questions and collecting information to fill the section of the questionnaire concerning job vacancies. Some of them constantly receive job inquiries and curricula from people in search of a job and they may not be able to tell the actions devoted to examining those curricula just with the purpose of cataloguing and filing them for future reference from those aimed at reviewing them with the intention of hiring candidates for specific positions. The first type of action does not identify any job vacancies as the enterprise has not opened (or is not opening) any specific position. The second, on the contrary, belongs to the kind of actions that are classifiable as “active steps to find a suitable candidate”. The question can get more complicated because some enterprises, especially

Non sampling errors in the Italian job vacancy survey
53 1st and 2nd International Workshops on Methodologies for Job Vacancy Statistics - Proceedings
banks, report that, even when they have no plans to hire a candidate, can engage in recruiting activities whenever they come across a curriculum of particular interest. Another source of problems for the measurement of job vacancies in large enterprises is represented by enterprises organized in a (potentially large) number of local units (for instance large national banks or retail trade enterprises of the large scale distribution). The problems arise in association with the distribution of the decision power between the centre and the periphery and the availability of information at the head office (that is normally the survey unit). The decision centre, which has the power to decide how many people to hire and for which positions to activate search steps, is usually the head office, but in some cases this power can be delegated to the local units (for instance in order to minimize the time required to replace workers exiting the enterprise). In this case the head office may not be able to collect timely the information from all the local units. The small number of the occurrences of the above mentioned circumstances, combined with the indications that the interviewer is instructed to give to the contact person of the enterprise suggest that these difficulties should not imply a systematic error in the estimates of job vacancies. However, the issue of response errors will be constantly monitored. Furthermore, we are considering the possibility of an auxiliary survey aimed at shedding light on this problem, to be run in case a deeper understanding of the figures provided be necessary.
A totally different set of problems has been observed for the temporary employment agencies. The first issue with this kind of enterprises is that they have to transmit figures on job vacancies and occupied posts that include both the staff workers – those engaged in the functioning of the enterprise - and the temporary workers –that is the human resources provided to other businesses. The latter are workers employed and paid by the temporary agency, usually under a temporary work contract, but contracted out to a client enterprise which has requested them. The analysis on the data collected during the first years of the survey has showed a variety of measurement problems in this industry: unit non response by some leading enterprises, partial responses regarding only the staff workers, and units that during the time have alternated responses related only to staff workers and responses related both to staff workers and temporary workers. Due to the growing importance of this kind of activities, reflected in the steady increase in the number of persons employed by these enterprises during the last years, and to a potentially large number of job vacancies regarding the temporary workers, a decision has been taken to suspend estimates of the aggregates including this industry and redefine the target population of the survey as the population of enterprises belonging to the sectors B-N (NACE Rev 2) excluding the temporary employment agency activities (code 7820 of the NACE Rev 2). At the same time a set of actions has been implemented to improve the data collection with the aim of re-extending the target population as soon as the measurement is accurate enough. A first step has consisted in formulating a more operational definition of job vacancies for the temporary workers. In fact, since the search of this kind of workers is the core business of the employment agencies, they usually record information on the orders received by the client enterprises, but they do not associate this information with the one requested by the questionnaire. Hence, in order to help these enterprises in answering the questions on job vacancies, we have suggested them to answer with “the number of orders received by the client enterprises which have not yet been fulfilled nor cancelled”. This is probably a good approximation of the number of people for which active search steps

Non sampling errors in the Italian job vacancy survey
54 1st and 2nd International Workshops on Methodologies for Job Vacancy Statistics - Proceedings
have been taken (the number of job vacancies). In fact these enterprises, as a part of their normal activity, record information of candidate workers, and activate search actions as soon as an order by a client enterprise is received.
A second step has been the training of a CATI interviewer who is dedicated to this group of enterprises. This interviewer is instructed not only to repeat the contact a greater number of times with respect to other enterprises but also to convince the reference persons of the enterprises of the importance of this collection of information and reassure them about the confidentiality of the figures provided. In fact, some enterprises have expressed concern about the disclosure on the data of job vacancies on temporary workers since they represent a direct measure of the economic activity of the enterprise. The interviewer is also provided with extra benchmark information that alerts her when the enterprise is responding with data only referred to the staff employment. The experience gained in this field of activity allows her also to recognize signs of measurement error in the number of job vacancies.
Finally, a subsequent follow-up of the largest enterprises of the sector by the survey experts at ISTAT is performed in the concluding phases of the collection operations.
4. Unit Non Response Errors
Non response typically increases the variance of the estimates and may introduce a bias if it is correlated with the target variables. For these reasons response rates play an important role among the indicators for error measurement and in quality reports of a survey.
In this section unit non response rates are presented highlighting the differences among economic activities and size of the enterprises. Since VELA is a mixed mode survey the output of different data collection modes is analysed. Furthermore, for the enterprises which respond CATI the main causes of non response will be presented.
Overall, in 2008 the annual average response rate is around 72% (Table 5). At the economic activity level, this rate ranges between 60% in K and 81% in J.
Table 5: Unit response rate (average for 2008)
NACE Rev. 1.1 section Sample units Respondent units Unit response rate
C 504 397 78.9D 3,675 2,839 77.3E 427 334 78.3F 1,384 938 67.8G 1,192 931 78.1H 1,936 1,414 73.1I 1,163 760 65.4J 766 619 80.8K 1,833 1,106 60.3C-K Total 12,878 9,338 72.5

Non sampling errors in the Italian job vacancy survey
55 1st and 2nd International Workshops on Methodologies for Job Vacancy Statistics - Proceedings
Regarding the response mode, data are collected mainly via CATI and Web while a small residual share of questionnaires is sent by fax. It is important to note that the first time an enterprise is included in the sample it is asked to respond via CATI, while in the subsequent quarters it can opt to respond via Web. Thus, the composition of respondents by collection mode varies among quarters: the share of enterprises responding via Web is typically smaller in the wave after a sample rotation and larger in the subsequent waves. On average, in 2008 about 79% of the respondents have been interviewed through CATI and the remaining 21% used the Web mode (see Table 6)3. The table shows that large enterprises have a higher propensity to respond via Web. In the C-K total the share of enterprises that use this mode is 19.1% for the smaller enterprises and 38.1% for the larger ones. The result is partly due to the fact that the sample rotation mechanism only involves small and medium enterprises and the newly included units are contacted via CATI at least for the first quarter after the rotation. A second reason has probably to do with the fact that large enterprises, contacted by several surveys, and generally more computerized, are more used to this form of data transmission and more willing to adopt it. Albeit it has a prominent role, the enterprise size is not the only factor characterizing the preferences of enterprises over response modes. In fact the table shows that within the same size class the Financial Intermediation (J) has a share of Web respondents twice as large as the sector of Trade and Repair (G) 57.0% versus 27.9% in the group of enterprises with more than 500 employees and 36,7% versus 19,9% in the group of enterprises with less than 500 employees).
Table 6: Respondent enterprises by actual data collection mode (average for 2008)
cati web/email cati web/email cati web/email
C 81.3 18.7 81.2 18.8 100.0 0.0D 80.1 19.9 83.7 16.3 60.5 39.5E 61.7 38.3 62.9 37.1 48.1 51.9F 85.5 14.5 86.2 13.8 63.2 36.8G 79.0 21.0 80.1 19.9 72.1 27.9H 82.5 17.5 82.9 17.1 67.7 32.3I 80.3 19.7 83.6 16.4 58.5 41.5J 60.0 40.0 63.3 36.7 43.0 57.0K 78.9 21.1 80.3 19.7 71.1 28.9C-K Total 78.8 21.2 80.9 19.1 61.9 38.1
NACE Rev. 1.1 section
Percentage shares
10+employees 10-499 employees 500+ employees
The response rates are rather different for the two data collection modes. Table 7 shows that while over 100 units expected to respond by CATI only 70 actually respond, the percentage for the Web rises to over 81%4. This difference however is not informative about the comparative effectiveness of the two collection modes, since enterprises are not randomly assigned to a collection mode. 3 In the table, the fax responses are added to the CATI mode. 4 The indicator has been calculated as the ratio between the enterprises responding in a given mode and the enterprises assigned to a given response mode when sending them the questionnaire. It is possible that an enterprise is expected to respond by CATI and decides to fill the questionnaire via Web, so that the actual data collection mode is different from the expected one.

Non sampling errors in the Italian job vacancy survey
56 1st and 2nd International Workshops on Methodologies for Job Vacancy Statistics - Proceedings
First, as mentioned above, the enterprises just entered in the sample, and for which the number of list errors (wrong postal address, wrong or missing telephone number, units out of scope…) is larger, are contacted via CATI. Second, enterprises that declared the willingness to respond via Web and are not respondent for two consecutive quarters are contacted to respond CATI in the following quarter. So the list of enterprises assigned to the CATI mode includes those which have a smaller predisposition to respond or are more difficult to contact.
Table 7: Response rate by expected data collection mode (average for 2008)
Expected data collection mode Response rate
Cati 69.1
Web/email 81.4
Total 71.3
Finally, the reasons for non responses are analysed. This is possible only for enterprises contacted via CATI since all CATI contacts and attempts of contact are recorded in a database along with their outcome.
Table 8 shows that the vast majority of non respondents (about 72%) are represented by units impossible to contact (wrong number, reference person not found etc.). This result can be probably related to the overcoverage of the sampling frame analysed in Section 2: indeed, a share of these enterprises are likely to be already dead. About 23% of non respondents, here classified as “other non respondents”, are units that promised to transmit the data via Web or via fax as soon as possible. Finally, 5% of contacted enterprises are identified as not eligible (inactive enterprises, enterprises experiencing an economic slump or which are “out of scope” because they moved below the 10 employees threshold or they are not in C-K Nace sections).
Table 8: Causes of non response for enterprises contacted via CATI
Non contact Other non respondents Unit not eligible
71.9 23.1 5.0
5. Item Non Responses
Other indicators for error measurement are item non response rate and item imputation rate, which lead to investigate the Editing and Imputation Strategy adopted in the survey. As already mentioned above, one of the main points of such strategy consists in integrating the survey data with those of the LE Survey and OROS.
The strategy of integration is based on a different treatment for the enterprises which belong to the LE survey and those which do not. The VELA sample is split between these two sets. In the first set all units, either respondents or non respondents, are imputed, that is a unit non response imputation is performed. In the second set only the enterprises responding to VELA go through the process of E&I and are then passed to a calibration procedure.
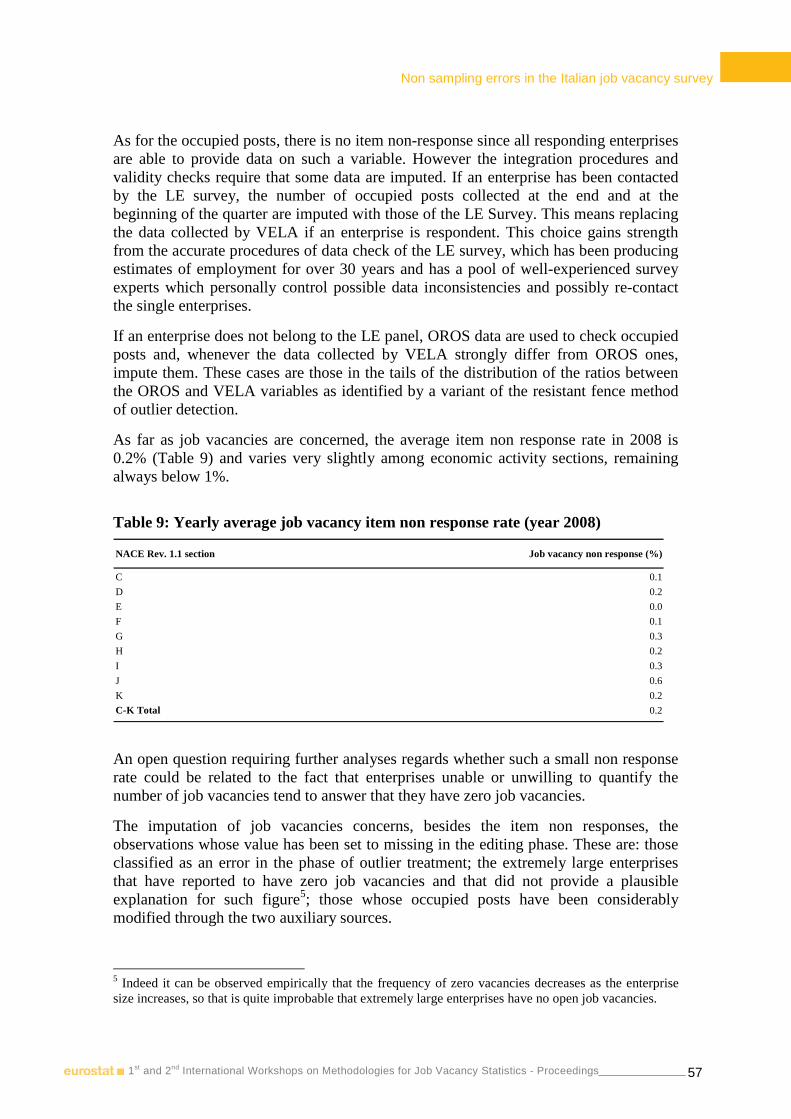
Non sampling errors in the Italian job vacancy survey
57 1st and 2nd International Workshops on Methodologies for Job Vacancy Statistics - Proceedings
As for the occupied posts, there is no item non-response since all responding enterprises are able to provide data on such a variable. However the integration procedures and validity checks require that some data are imputed. If an enterprise has been contacted by the LE survey, the number of occupied posts collected at the end and at the beginning of the quarter are imputed with those of the LE Survey. This means replacing the data collected by VELA if an enterprise is respondent. This choice gains strength from the accurate procedures of data check of the LE survey, which has been producing estimates of employment for over 30 years and has a pool of well-experienced survey experts which personally control possible data inconsistencies and possibly re-contact the single enterprises.
If an enterprise does not belong to the LE panel, OROS data are used to check occupied posts and, whenever the data collected by VELA strongly differ from OROS ones, impute them. These cases are those in the tails of the distribution of the ratios between the OROS and VELA variables as identified by a variant of the resistant fence method of outlier detection.
As far as job vacancies are concerned, the average item non response rate in 2008 is 0.2% (Table 9) and varies very slightly among economic activity sections, remaining always below 1%.
Table 9: Yearly average job vacancy item non response rate (year 2008)
C 0.1
D 0.2
E 0.0
F 0.1
G 0.3
H 0.2
I 0.3
J 0.6
K 0.2
C-K Total 0.2
NACE Rev. 1.1 section Job vacancy non response (%)
An open question requiring further analyses regards whether such a small non response rate could be related to the fact that enterprises unable or unwilling to quantify the number of job vacancies tend to answer that they have zero job vacancies.
The imputation of job vacancies concerns, besides the item non responses, the observations whose value has been set to missing in the editing phase. These are: those classified as an error in the phase of outlier treatment; the extremely large enterprises that have reported to have zero job vacancies and that did not provide a plausible explanation for such figure5; those whose occupied posts have been considerably modified through the two auxiliary sources.
5 Indeed it can be observed empirically that the frequency of zero vacancies decreases as the enterprise size increases, so that is quite improbable that extremely large enterprises have no open job vacancies.

Non sampling errors in the Italian job vacancy survey
58 1st and 2nd International Workshops on Methodologies for Job Vacancy Statistics - Proceedings
In all cases the imputed variable is the job vacancy rate (JVR from now on), defined as the ratio between the number of job vacancies and the number of occupied posts at the end of the quarter6.
The main imputation method is the nearest neighbour donation, performed within classes defined by enterprise size and economic activity. The matching variables differ between the enterprises of the LE survey and the others enterprises (hereafter respectively LEs and SMEs), reflecting the different sources of auxiliary information used for the two groups of enterprises, the OROS survey for the SMEs and the LE Survey for the LEs. This method is not considered appropriate for the extremely large enterprises since their characteristics are too peculiar for their data to be simply donated by a similar enterprise. For those where enough information is available, the imputation is based on the longitudinal information of the enterprise using a time series model. In a small number of cases where the previous methods cannot be applied a mean imputation is used.
In Table 10 the item imputation rates for occupied posts and job vacancy rates are shown for the year 2008.
Table 10: Occupied posts and job vacancies imputation rates for LEs and SMEs (average for 2008)
occupied posts imputation rate
Job vacancies imputation rate
Occupied posts imputation rate
Job vacancies imputation rate
C 100.0 0.0 0.3 0.3
D 100.0 27.9 0.5 0.3
E 100.0 30.2 0.4 0.1
F 100.0 35.4 0.8 0.6
G 100.0 21.0 0.7 0.5
H 100.0 35.0 0.7 0.4
I 100.0 22.0 0.8 0.6
J 100.0 19.0 0.7 0.7
K 100.0 33.5 0.7 0.6
C-K total 100.0 26.8 0.6 0.4
NACE Rev. 1.1 sectionLE SME
As it can be seen the occupied posts imputation rate for LEs is always 100% as a consequence of the replacement of the figures collected by the VELA survey with those of the LE Survey7.
In this framework the occupied posts collected by VELA can be seen as a control variable for the job vacancy rate, since job vacancies are considered reliable if VELA occupied posts are compatible with those collected by the LE Survey.
6 The job vacancy rate defined in this way at the single enterprise level is different from the job vacancy rate used for the final estimates at the economic activity section level, which has at the numerator the number of job vacancies and at the denominator the number of occupied posts augmented by the number of job vacancies. 7 This high rate of imputation is not to be misinterpreted as resulting from a low quality of the figures collected by VELA on occupied posts for large enterprises. In fact, the replacement occurs always even if, as in the vast majority of cases, the difference between the data collected by the two sources is negligible.

Non sampling errors in the Italian job vacancy survey
59 1st and 2nd International Workshops on Methodologies for Job Vacancy Statistics - Proceedings
The job vacancies imputation rate for LEs is clearly much smaller than the occupied posts imputation rate and varies between 19.0% for the J section and 35.4% for the F section. In this case these percentages correspond to the share, with respect to the LE set, of non responding units or responding units whose value of occupied posts differs too much from that of the LE survey.
As far as SMEs are concerned the occupied posts imputation rate is very small and below 1% for all economic activity sections, which shows that discrepancies between VELA and OROS occupied posts are always very limited.
Also the job vacancies imputation rate for SMEs is very small, below 1%, and of the same order of magnitude of the occupied posts imputation rate since, on the one hand, for these enterprises whenever VELA employment is considered incompatible with OROS data and erroneous, both occupied posts and job vacancies are imputed and, on the other hand, imputation due to job vacancies non response is very limited.
It is possible to roughly quantify the effect of the job vacancy rate imputation methods by calculating the annual sample average job vacancy rate using pre- and post-imputation job vacancy rates. The estimates are calculated prior to the calibration phase, so that all units, both LEs and SMEs, have been given unit weight.
In Table 11 we show such estimates separately for LEs and for SMEs, since the imputation rates strongly differ between the two groups and also the imputation methods are of different kind.
Table 11: Effects of imputation on LEs, SMEs and for all the enterprises (average for 2008)
JVR pre-imputation
JVR post-imputation
JVR pre-imputation
JVR post-imputation
JVR pre-imputation
JVR post-imputation
C 0.0 0.0 0.4 0.4 0.2 0.2
D 0.6 0.6 1.0 0.8 0.7 0.7
E 0.6 0.6 0.7 0.7 0.6 0.6
F 0.6 0.5 1.2 0.9 1.0 0.7
G 1.1 1.1 0.9 0.8 1.1 1.0
H 1.7 1.2 1.1 1.1 1.4 1.2
I 0.5 0.6 0.9 1.0 0.5 0.6
J 1.1 1.1 1.4 1.4 1.1 1.1
K 1.3 1.3 1.1 1.1 1.2 1.2
C-K total 0.8 0.8 1.0 1.0 0.8 0.8
NACE Rev. 1.1 section
LE SME TOTAL
The differences in the pre- and post-imputation JVRs for the SMEs are almost always negligible. This is due to the very small item non response rate combined with the fact that unit non response imputation is not performed for SMEs. The differences in the D and F sections are mainly due to the imputation of occupied posts for few units with large differences with OROS, which has led to a strong modification of the employment variable (and thus of the job vacancy rate).
Non sampling errors in the Italian job vacancy survey
60 1st and 2nd International Workshops on Methodologies for Job Vacancy Statistics - Proceedings
Regarding the LEs, the differences are also very small, with the exception of the H section where in the original data an erroneous outlier is present, which has been subsequently imputed thus lowering the job vacancy rate. An analysis of the differences in the pre- and post-imputation JVR for all enterprises in Table 11 could be misleading due to the fact that SMEs have been assigned unit weight.
6. Concluding remarks
In this paper, the issue of non sampling error measurement in the Italian job vacancy survey has been tackled via both a set of quantitative indicators and more qualitative evidence acquired while running the survey itself.
This overview on the quality of the survey has shown both strength points and problematic issues. Clear strength points are the response rates. The average unit response rate is above 72% which is a quite high figure, when compared with those for other (both structural and short term) business surveys run in Italy. It can be observed that once also overcoverage is considered (8.5% on the entire sample), response rates on the enterprises which were actually active in the reference quarter is about 80%.
An important factor which points towards this result is the mix of response modes available to the sample units. In particular, the CATI seems very useful to contain non response, which appears to be due mainly to the difficulties of finding enterprises’ telephone numbers. Web data collection, on the other hand, is important as a complementary response mode, which can be perceived by some sample units as less burdensome. However, it is not suitable for all enterprises, and it allows less control on data quality than the CATI.
The possibility to invest substantially in error prevention both in the organisation and while running the CATI seems a very important feature of this technique, in the light of the job vacancy characteristics and the measurement difficulties highlighted in the paper.
The survey performs very well also with regard to explicit item non responses: the item non response rate for occupied posts is zero and that for job vacancies is just the 0.2%. Imputation rates are, as a consequence, very low on Small and Medium Enterprises, while, in the larger enterprises, they reflect the integration with the LE survey and the imputation also of unit non responses. However, on the whole, the impact of imputation on non weighted aggregate job vacancy rates is negligible.
On the other side, the main source of concern is the undercoverage of the sampling frame which depends on the time lag between the reference period of the target population (current quarter) and the reference year of the business register. We try to cope with it using a calibration procedure to totals referred to the current quarter.
Non sampling errors in the Italian job vacancy survey
61 1st and 2nd International Workshops on Methodologies for Job Vacancy Statistics - Proceedings
The presented error measurement indicators can be considered a core set of information, that can be used also to respond to institutional requests for quality measurements. In particular, VELA has to comply with two such requests with respect to job vacancies and occupied posts: the ISTAT system of quality documentation (called SIDI); and the annual quality report required by Reg. EC n. 453/2008 and whose contents are defined by Reg. EC n. 1062/2008.
For what concerns the quality report that will have to be sent yearly to Eurostat starting from 2011, the information presented here covers what is requested for coverage errors and non response errors (for the latter, in the paper more information is supplied than it is asked for). Furthermore, the discussion on measurement errors seems consistent with what is requested for this dimension. Three quality dimensions have not been considered. The first regards model assumption errors whose assessment requires further analysis. The second is revisions: so far there has been only one revision, concerning the entire series previously transmitted to Eurostat, due to major changes in the editing and imputation and calibration methods. However, no regular policy of revisions is either implemented or planned. The third is the estimation of the bias, which we are not currently performing and which we need to study carefully. Contact person Marina Sorrentino
ISTAT, Italy
Email: [email protected]

The German job vacancy survey: Estimation of sampling errors
62 1st and 2nd International Workshops on Methodologies for Job Vacancy Statistics - Proceedings
The German job vacancy survey: Estimation of sampling errors
Hans Kiesl IAB (In stitute for Employment Research), Nuremberg, Germany 1st International Workshop, Nuremberg, 11 - 12 December 2008
Overview
Notation
Coefficient of variation

The German job vacancy survey: Estimation of sampling errors
63 1st and 2nd International Workshops on Methodologies for Job Vacancy Statistics - Proceedings
Variance estimation
Variance estimation: SRSWOR
Variance estimation: stratified SRSWOR

The German job vacancy survey: Estimation of sampling errors
64 1st and 2nd International Workshops on Methodologies for Job Vacancy Statistics - Proceedings
Variance estimation: GREG

The German job vacancy survey: Estimation of sampling errors
65 1st and 2nd International Workshops on Methodologies for Job Vacancy Statistics - Proceedings
Variance estimation: calibration estimators different than (linear) GREG
Variance estimation of ratios

The German job vacancy survey: Estimation of sampling errors
66 1st and 2nd International Workshops on Methodologies for Job Vacancy Statistics - Proceedings
Variance estimation: Taylor series approx.

The German job vacancy survey: Estimation of sampling errors
67 1st and 2nd International Workshops on Methodologies for Job Vacancy Statistics - Proceedings
Variance estimation: Rescaling bootstrap (Rao, Wu, Yue 1992)
Results for IV/2007, using GREG and CLAN

The German job vacancy survey: Estimation of sampling errors
68 1st and 2nd International Workshops on Methodologies for Job Vacancy Statistics - Proceedings
Comparison Taylor approx./Bootstrap
Conclusions
The German job vacancy survey: Estimation of sampling errors
69 1st and 2nd International Workshops on Methodologies for Job Vacancy Statistics - Proceedings
References
Contact Person Anja Kettner
IAB (Institute for Employment Research), Nürnberg, Germany
Email: [email protected]


II 2nd International Workshop
Neuchâ tel, Switzerland
18 – 19 November 2009

Using administrative sources in Slovenia
73 1st and 2nd International Workshops on Methodologies for Job Vacancy Statistics - Proceedings
Using administrative sources in Slovenia
Nuška Brnot Statistical Office of the Republic of the Slovenia (SORS) 2nd International Workshop, Neuchâtel, 18 – 19 November 2009
Countries which are using an administrative sources
Besides Slovenia, there are three other countries which are using administrative sources to provide data on job vacancies and/or occupied posts. Those countries are Luxembourg, Belgium and the Czech Republic. In Slovenian case we are using an administrative source on job vacancies and on occupied posts as well.
Legal basis
The main objective of SORS is to be a trustworthy and user-oriented organization that leads us not to burden reporting units if data are already collected by other organizations or institutions.
The legal basis is the National Statistics Act (OJ RS No. 5/91) which stipulates that data collected by other organizations or institutions must be sent to SORS free of charge.
Observation units
Observation units are all business entities and their local units registered on the territory of the Republic of Slovenia which registered job vacancies in a certain month and which have at least one occupied post.
Source of data on job vacancies
The source for the data on the number of job vacancies is the PD-1 form of the Employment Service of Slovenia (ESS).
On the basis of the Employment and Insurance against Unemployment Act (OJ RS No. 5/91, 12/92, 71/93, 2/94, 38/94, 80/97 – Constitutional Court decisions 69/98, 67/02, 79/06 and 107/06) employers are obliged to report every job vacancy except for:
• self-employed natural persons (sole proprietors), • own account workers such as lawyers,
o journalists, o doctors, o notaries,

Using administrative sources in Slovenia
74 1st and 2nd International Workshops on Methodologies for Job Vacancy Statistics - Proceedings
o cultural workers, o independent researchers, o priests, o foster mothers,
• farmers.
The Employment Service collects data on all job vacancies in the country and displays them on the message board. In this way jobseekers are informed regarding job offers at the same time and in the same way. Every employer can also advertise job vacancies in a newspaper, website or in some other way.
The Employment Relationships Act (OJ RS No. 42/2002, 103/2007) states additional exceptions from the obligation to report job vacancies:
• a new employment contract between an employer and an employee due to changed circumstances;
• obligations of an employer according to a scholarship contract; • employment of a disabled person according to the law regulating the
employment of disabled persons; • fixed-time employment that lasts at the most three months in a calendar year
or fixed-time employment for replacing a temporarily absent worker; • fixed-time employment due to work during the adjustment period on the
basis of the decision and certificate issued by a competent authority in the process of acknowledging qualifications according to a special law;
• indefinite employment of a person who was a trainee at the same employer or who was employed by the same employer for fixed time;
• full-time employment of a person who used to work for the same employer part time;
• employment of partners by a legal person; • employment of elected and appointed officials or other workers who have a
mandate or of an official in a local community, political party, trade union, chamber, society, etc.;
• managers and confidential clerks; • employment of the employer’s (natural person) family members.
Method of collecting data on job vacancies
The reference day for job vacancies is the last day of the month. Employers have to define in the PD-1 form the time for applying for a job vacancy. The minimum time limit is 5 days; some employers expand it to 90 days or more. The survey includes only those job vacancies for which the time limit hasn’t run out yet (5 days + 2 days because of the weekend). About 45% of all jobs in each month are included in the JVS and in the additional process linked to occupied posts.

Using administrative sources in Slovenia
75 1st and 2nd International Workshops on Methodologies for Job Vacancy Statistics - Proceedings
At national level job vacancies are published by two institutions: by the Employment Service and also by the Statistical Office. Because of the changes in the methodology, there are some differences in data published by those two institutions.
SORS methodology:
According to the European methodology, job vacancies statistics include only those demands for workers to whom - on the last day of the reference month - the time limit hasn’t run out yet. It is very important because in the additional process those job vacancies are linked to occupied posts on the same reference day.
ESS methodology:
The ESS publishes monthly data as a cumulative sum of the data from the first day of the month to the last day of the month.
Some differences in data publication:
Employment Service Statistical Office
all JV in the month only those JV for which the time limit hasn’t run out
monthly quarterly, annually
according to national methodology according to the European methodology
Chart 1: Comparison of the JV rate between Slovenia and the EU-27, quarterly
Job Vacancy Rate
0,0
0,5
1,0
1,5
2,0
2,5
3,0
3,5
4,0
2007Q1 2007Q2 2007Q3 2007Q4 2008Q1 2008Q2 2008Q3 2008Q4 2009Q1 2009Q2 2009Q3 2009Q4
%
SI EU (27)
Chart 1 shows that data for Slovenia and the EU (27) are pretty much the same by quarter, except the Slovenian JV rate is lower by about 1 percentage point.

Using administrative sources in Slovenia
76 1st and 2nd International Workshops on Methodologies for Job Vacancy Statistics - Proceedings
Source of data on occupied posts
The source for the data on the number of occupied posts is the Statistical Register of Employment, which is kept by the Statistical Office. It was set up in 1986; since then are includes persons in paid employment and since 1995 also self-employed persons. The Statistical Register of Employment contains data about persons in employment such us: level of school education, school education (finished school), level of professional attainment, level of professional skills, occupation, place of living, workplace, citizenship, working/insurance hours per week, shift work, etc.
Table 1: Number of registered enterprises, enterprises with persons in employment and number of enterprises with reported job vacancies, Slovenia, 2008, annually
Activity Number of registered enterprises
Number of enterprises
with persons in
employment (at least one employed person)
Number of enterprises
with reported
JV
Share of enterprises
with persons in
employment
Share of enterprises
with reported JV
Total 152.541 98.299 3.090 64,4 2,0 A AGRICULTURE, FORESTRY AND FISHING 2.055 830 26 40,4 1,3
B MINING AND QUARRYING 114 101 5 88,6 4,4
C MANUFACTURING 17.644 13.511 525 76,6 3,0 D ELECTRICITY, GAS, STEAM AND AIR CONDITIONING SUPPLY
406 132 7 32,5 1,7
E WATER SUPPLY, SEWERAGE, WASTE MANAGEMENT AND REMEDIATION ACTIVITIES
346 258 20 74,6 5,8
F CONSTRUCTION 21.056 16.978 753 80,6 3,6 G WHOLESALE AND RETAIL TRADE, REPAIR OF MOTOR VEHICLES AND MOTORCYCLES
23.662 17.583 433 74,3 1,8
H TRANSPORTATION AND STORAGE 9.194 7.574 253 82,4 2,8 I ACCOMMODATION AND FOOD SERVICE ACTIVITIES 7.965 6.367 237 79,9 3,0
J INFORMATION AND COMMUNICATION 4.927 3.022 69 61,3 1,4
K FINANCIAL AND INSURANCE ACTIVITIES 1.859 1.114 43 59,9 2,3
L REAL ESTATE ACTIVITIES 2.049 1.044 23 51,0 1,1 M PROFESSIONAL, SCIENTIFIC AND TECHNICAL ACTIVITIES 20.533 13.141 191 64,0 0,9
N ADMINISTRATIVE AND SUPPORT SERVICE ACTIVITIES 3.823 2.417 115 63,2 3,0
O PUBLIC ADMINISTRATION AND DEFENCE, COMPULSORY SOCIAL SECURITY
2.197 562 58 25,6 2,6
P EDUCATION 2.975 1.865 143 62,7 4,8 Q HUMAN HEALTH AND SOCIAL WORK ACTIVITIES 3.700 2.722 98 73,6 2,6
R ARTS, ENTERTAINMENT AND RECREATION 10.580 4.126 34 39,0 0,3
S OTHER SERVICE ACTIVITIES 17.456 4.953 62 28,4 0,4
Using administrative sources in Slovenia
77 1st and 2nd International Workshops on Methodologies for Job Vacancy Statistics - Proceedings
Data are collected on combined “M forms” for four institutions at the same time:
• Health Insurance Institute of Slovenia, • Employment Services of Slovenia, • Pension and Disability Insurance Institute of Slovenia, • Statistical Office of Slovenia.
The system of a single methodology by all institutions was set up in 1986. The Health Insurance Institute collects “M forms” and sends data to the other three institutions every month. Data regarding persons in employment are published monthly - the reference day is the last day of the month.
In the job vacancies survey occupied posts include all persons in employment except:
• farmers (holders of agricultural holdings) and their family members performing agricultural activity as the only or main occupation and having pension and health insurance,
• persons employed in activity P – Private households with employed persons (until 31 December 2007 classified by NACE Rev. 1.1),
• persons employed in activity T – Activities of households as employers, undifferentiated goods – and services-producing activities of householders for own use (since 1 January 2008 classified by NACE Rev. 2),
• persons performing military occupations.
Reasons for provisional data
All data published so far are marked as “provisional” data. The reason is a slight difference regarding the definition of occupied posts:
Slovenian definition: an occupied post is a post filled by a person in employment (a person in paid employment or a self-employed person) who has compulsory pension and health insurance on the basis of an employment contract or who is in an employment relationship in Slovenia. The employment relationship may be established for a fixed or indefinite period on the basis of full-time or part-time work.
Definition in the Regulation: an occupied post shall mean a paid post within the organization to which an employee has been assigned.
Using administrative sources in Slovenia
78 1st and 2nd International Workshops on Methodologies for Job Vacancy Statistics - Proceedings
Plans for the future
To come closer to the definition in the Regulation regarding an occupied post, we are planning the following steps:
• to recalculate back series data from 2001 and eliminate self-employed persons (administrative data are already available),
• to eliminate persons who are on maternity leave (SORS is in the process to acquire data from other records),
• in the future also to eliminate persons who are absent for a longer time because of illness (more than 30 days).
When the recalculation is done we expect that the job vacancy rate will be higher.
Conclusion
An administrative source for the job vacancies survey can be used but just in case that the whole population is covered. The data collected once are available for more purposes - in the Slovenian case for the JVS and for the Active Employment Policy. The reporting units are less burdened.
Contact Person Nuška BRNOT
Statistical Office of the Republic of the Slovenia (SORS
Email: [email protected]

Job vacancy survey - Israel's experience
79 1st and 2nd International Workshops on Methodologies for Job Vacancy Statistics - Proceedings
Job vacancy survey – Israel’s experience
Elana Dror Central Bureau of Statistics, Israel 2nd International Workshop, Neuchâtel, 18 - 19 November 2009
While Israel is preparing to join the OECD, the Central Bureau of Statistics (CBS) received a special funding in order to develop a new statistic series regarding the job vacancies in the country and the purpose is to expend the knowledge on labour demand.
The estimate of job vacancies has extreme significance in defining changes in the leading indicator system and to recognize turnabouts in the business cycle.
The survey has two main parts:
Initial phase – identification of contact person, clarification of economic activity and introduction of survey.
Collecting data – is a monthly or quarterly matter depending on the size of the enterprise.
Population
The Survey population includes all of the enterprises that report to the National Insurance Institute (NII) and that employ at least five employees (Israeli or foreign). Based on the employers report regarding their enterprises main activity an economic industry is determined according to the "Industrial Classification of all Economic Activities" (1993).
The population does not include enterprises that belong to the following economic industries:
• Agriculture (ISIC-Code A ) • Public Administration (ISIC-Code J) • Public sector, incl. central government and local authorities • Manufacture of Diamonds and Extra-Territorial Organizations and
Bodies (Divisions 37 and 99 respectively). • Primary and Secondary Education Institutions (Divisions 801-802). • Pre-primary Education Institutions - kindergartens and child day-care
activities (Divisions 8000 and 8611) • Israel Broadcasting Authority, Israeli Employment Service, the Israel
Institute for Biological Research.

Job vacancy survey - Israel's experience
80 1st and 2nd International Workshops on Methodologies for Job Vacancy Statistics - Proceedings
Purposes
• To estimate the number of job vacancies in the private sector that express the demand for employees.
• To compare the demand for labor as measured by the job vacancy survey, to the estimate of labor supply produced by the labor force survey. This will allow a diagnosis of the extent of balance in the labor market in the macro level and planning vocational training in the micro level.
• To make a contribution to the leading indicators in order to define the country's economic situation and to follow turnabouts in the business cycle.
• To recognize job opportunities by economic industry and occupation. • To measuring the labor demand by:
o Economic industries o Size of the business o Occupation
The Interview
The data is collected by three main methods:
• Mail • Telephone • Fax
Sampling
The sampling frame for the job vacancy survey includes all the employers fitting the definition of the survey population reporting at least five Israeli or foreign employees in the period between July 2007 and June 2008 fitting.
The sample unit in the job vacancy survey is the NII file, except when there are a number of files from the same business involved in the same economic activity (defined by 2 digits). In such cases the files are integrated into one sample unit.
The sample of the survey is a one-stage stratified sample. The strata are defined by two nested variables: branch of economic activity and number of employees (usually grouped into four size-groups). Units that belong to the top size-group in a given branch are sampled with certainty (thus known as "certainty" units) and are contacted on a monthly basis. In all other size-groups a random sample is drawn, the sampling probability increasing with the group size. The units thus chosen are sampled together and then allocated evenly between the three months (known as "probabilistic" units) of the quarter and are contacted once every quarter in a given month.

Job vacancy survey - Israel's experience
81 1st and 2nd International Workshops on Methodologies for Job Vacancy Statistics - Proceedings
The following table demonstrates the sample design for the economic activity F - Accommodation Services and Restaurants.
Sample size
Unit size Probability for monthly sample
Number of units in sample frame
Number of sampled units per month
1 5-20 1:131 2,752 21
2 20-70 1:35 1,490 43
3 70-250 1:6.5 320 49
4 250+ 1 43 43
The Estimation Method
Each unit that is sampled, answered the questionnaire and is found to belong to the survey population is assigned a “weight” that reflects the number of units in the population that it represents.
For the chosen probabilistic units, the weight is calculated by multiplying the inverse of the sampling probability by an adjustment factor that equals the ratio between the number of units that belong to the strata and the number of respondents in the strata, to compensate for non-response.
For the certainty units, the weight equals the ratio between the total of employees in a strata according to the NII data and the number of employees in the units that replied.
Table A. Employees, job vacancies, May 2009 - January 2010 (thousands)
Total number of employees
Total number of job vacancies
Job vacancy ratio (percent)
Change from previous month
(percent) May (1) 2,022.4 38.7 1.9
June 2,014.9 43.9 2.1 13.6
July 2,007.4 44.0 2.1 0.1
August 2,038.7 42.2 2.0 4.2 -
September 2,025.1 50.0 2.4 18.7
October 2,006.0 44.7 2.2 10.7-
November 2,025.9 40.7 2.0 9.0 -
December 2,048.5 36.2 1.7 11.0 -
January (2) 2,051.1 40.3 1.9 9.6
February (2) 2,044.6 43.6 2.1 8.2
(1) In May, the first month of the job vacancy survey, the response rate was relatively low in comparison to the following months. Therefore it a bias in the estimate of job vacancies in this month is possible. (2) Early estimate is subject to change in the following months.
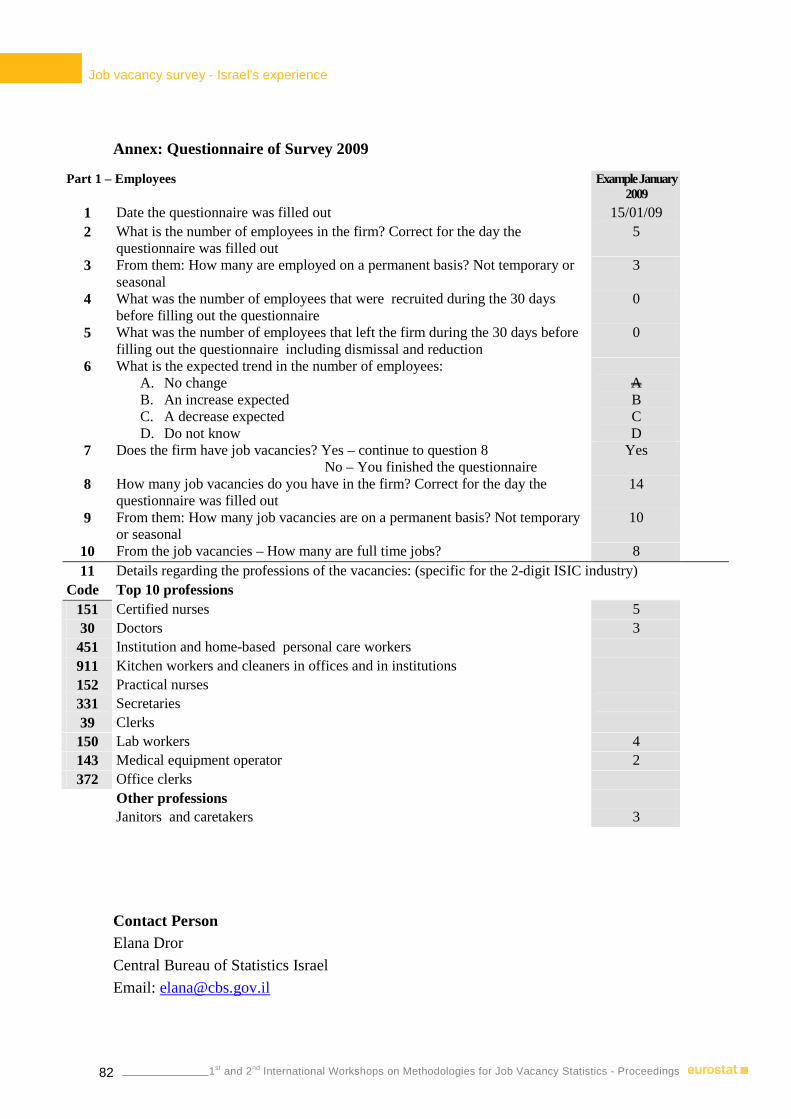
Job vacancy survey - Israel's experience
82 1st and 2nd International Workshops on Methodologies for Job Vacancy Statistics - Proceedings
Annex: Questionnaire of Survey 2009
Part 1 – Employees Example January 2009
1 Date the questionnaire was filled out 15/01/09 2 What is the number of employees in the firm? Correct for the day the
questionnaire was filled out 5
3 From them: How many are employed on a permanent basis? Not temporary or seasonal
3
4 What was the number of employees that were recruited during the 30 days before filling out the questionnaire
0
5 What was the number of employees that left the firm during the 30 days before filling out the questionnaire including dismissal and reduction
0
6 What is the expected trend in the number of employees: A. No change B. An increase expected C. A decrease expected D. Do not know
A B C D
7 Does the firm have job vacancies? Yes – continue to question 8 No – You finished the questionnaire
Yes
8 How many job vacancies do you have in the firm? Correct for the day the questionnaire was filled out
14
9 From them: How many job vacancies are on a permanent basis? Not temporary or seasonal
10
10 From the job vacancies – How many are full time jobs? 8 11 Details regarding the professions of the vacancies: (specific for the 2-digit ISIC industry)
Code Top 10 professions 151 Certified nurses 5 30 Doctors 3 451 Institution and home-based personal care workers 911 Kitchen workers and cleaners in offices and in institutions 152 Practical nurses 331 Secretaries 39 Clerks 150 Lab workers 4 143 Medical equipment operator 2 372 Office clerks
Other professions Janitors and caretakers 3
Contact Person Elana Dror
Central Bureau of Statistics Israel
Email: [email protected]

A comparison of estimators of the number of job openings in Sweden
83 1st and 2nd International Workshops on Methodologies for Job Vacancy Statistics - Proceedings
A comparison of estimators of the number of job openings in Sweden
Natalie Jansson and Thomas Laitila Statistics Sweden, SE-701 89 Örebro 2nd International Workshop, Neuchâtel, 18 - 19 November 2009
1. Background
Important information on changes in the Swedish labor market is provided by the survey ”Job Openings and Unmet Labour Demand” (the JO-Survey) at Statistics Sweden. The survey is conducted each quarter and one set of estimates presented are estimates of job openings in domains and for the total labour market. In addition to point and interval estimates of the quarter average level, estimates of percentage change from corresponding quarter last year are given.
A major problem with the JO-survey is the low precision of estimates presented. For the 1st quarter of 2007, the total number of job openings, for the private sector, was estimated to 43809 with a 95% CI of ± 2596 (Statistics Sweden, 2007). For the transportation and communication sector, as another example, the corresponding estimate is 2862 with a 95% CI of ± 574. The estimated percentage change between 1st quarter of 2006 and 1st quarter of 2007 is 34,9% with a 95% CI of ± 50,8%. Thus, both level and change estimates are associated with high standard errors.
Several approaches have been tried to improve the precision of the estimates but without success. The search for a better estimation approach is complicated by the characteristics of the variables and the survey design. Some of the problems are: i) the survey design where up to 40 % of the sample can be renewed between two corresponding quarters, ii) the survey variable ”Number of Job Openings” is a discrete variable, where zero values constitute over 80% of the observations and, iii) there are no informative auxiliary variables available.
Another complicating factor is the coordination of the JO- Survey with a Short-term Employment Survey. A change of the sampling design is therefore not an option. Earlier efforts have therefore been placed on trying to find an improved estimation method. Examples are an improvement of the Ratio Regression estimates by enlarging the model with an intercept and, use of the Horvitz-Thompson estimator. These approaches have not improved the estimates.
The properties of a model-assisted regression estimator with a non-liner underlying model, addressing problem ii) above, are studied in this paper by means of simulation. Estimator bias and MSE are considered. The study variable is limited to the natural numbers whereby it is possible that a regression function adapted to this restriction will contribute with an improved precision of estimates.

A comparison of estimators of the number of job openings in Sweden
84 1st and 2nd International Workshops on Methodologies for Job Vacancy Statistics - Proceedings
An example of a non-linear regression estimator is found in Lehtonen and Veijanen (1998) who propose a logistic generalized regression estimator (LGREG) for estimation of class frequencies. Here a non-linear GREG estimator based on a Poisson regression model (e.g. McCullagh and Nelder, 1989), is studied for estimation of the number of job openings in the JO-Survey. In addition, a synthetic and two composite estimators are included in the simulation study.
The estimators included in the simulation and the design of the simulation study is explained in the next section. In Section 3 the results of a simulation study involving two experiments are presented. A discussion of the results and suggestions for future research are contained in the final section.
2. Estimators and set up of the simulation study
The variable “Number of employees at the enterprise” is presently used as auxiliary information for regression estimation of total number of job openings. The Pearson correlation coefficient between these two variables is low (r≈0,25), implying that the occurrence of job openings is nearly independent of the size of the enterprise measured in number of employees and/or there is a non-linear relation between them.
2.1. Data generation
The population for the simulation study presented below was constructed by expanding the sample data from the JO-survey conducted in the first quarter of 2007 (Statistics Sweden, 2007). The data set contained information from 14 844 enterprises and was replicated by stratified simple random sampling with replacement such that the sizes of the resulting population and strata corresponded to the sizes of the original sampling frame. The final data set, hereafter called “the sampling frame”, contained 275 772 enterprises and the variables:
• Identification Number • NACE1 group • Stratum • Total number of enterprises per stratum (Nh) • Number of employers at the enterprise (xk) • The number of job openings at the enterprise (yk)
Enterprises in the sampling frame were divided into 44 NACE groups and 14 size groups. The strata were constructed by combining a sector and a size group, which resulted in 325 strata (66 totally enumerated (A-strata) and 259 sampled strata (B-strata)).
1 European Classification of Economic Activities

A comparison of estimators of the number of job openings in Sweden
85 1st and 2nd International Workshops on Methodologies for Job Vacancy Statistics - Proceedings
This division into strata is in accordance with the principles applied in the original survey. The survey design is constructed in such a way that the primary sample is divided into three secondary samples, that reference to the one of the quarter’s months respectively. Enterprises in the totally enumerated strata answer the questionnaire every month while the rest parts of the samples do it just concerning one allotted month. We have however released the approach with monthly values that weights up to the quarter values, that is valid for the survey today, and for simplicity considered every answer as a quarter value. The number of job openings at an enterprise has in this artificial population a zero-value at 92 % of the cases and within stratum variation is similar to the corresponding variation in a real population for all of the strata. Estimates are given for nine industry domains defined by aggregation of NACE groups (see Table 1).
Table 1: Domains of study
Domain NACE Group
A+B Agriculture, forestry, hunting and fishing
C+D+E Mining, quarrying and manufacturing. Electricity, gas and water works
F Construction industry
G Wholesale & retail trade; repair shops for motor vehicles, motorcycles, personal & household goods
I Transport, storage and communication companies
J+K Financing, insurance, real estate and business services
M+N Educational establishments. Health and social work establishments
H Hotels and restaurants
O Other community and personal service establishments
2.2 Estimators
The properties of three estimators are studied in the simulation. The first estimator considered is the GREG estimator with a non-liner underlying model:
∑ ∑ −+=d dU ks kknkdyG bxywbxt ))(()(ˆ µγµ
(1)
where kw is the kth units sampling weight, )( bxkµ is a model estimate for yk, kx is a
vector of auxiliary variables, b is a vector of parameters and nγ is a constant in the
interval [0,1] decided by the researcher. The natural logarithm of the register variable “Number of employees at the enterprise” (x) was used as a regressor and b was determined using a maximum likelihood estimator based on data from all domains and incorporating the sampling weights. The use of sampling weights can be motivated by the results of Godambe and Thompson (1986). One characteristic of this ML estimator

A comparison of estimators of the number of job openings in Sweden
86 1st and 2nd International Workshops on Methodologies for Job Vacancy Statistics - Proceedings
is that, with domain specific constants included in the model and a Poisson model with a log-linear link function (e.g. McCullagh and Nelder, 1989), the second term in (1) equals zero, whereby the synthetic estimator, defined as the first term in (1), is equivalent to the non-linear GREG estimator ( 1=nγ ). The estimator (1) was tested with
different combinations of three exponential models ( )exp()( bxbx kk =µ ), two variants
of the data set used for determining the value of b (either including or excluding the data from the totally enumerating strata) and four different values on the nγ parameter
(see Table 2).
The second estimator studied is a model-assisted ratio estimator with a liner underlying model
∑ ∑ −+=d dU ks kkkdyGREG xywxt )(ˆ ββ
where kw is the kth units sampling weight, βkx is a model estimate for yk , and β is a
model parameter. The register variable “Number of employees at the enterprise” was used as auxiliary information and β was derived as a weighted least squares estimate. This linear GREG estimator is used at present to produce the total estimates of job openings in Sweden and should be considered as a benchmark in the evaluation of alternative estimators.
For comparison the Horwitz-Thompson (HT) estimator
∑=ds kkdyHT ywt̂
is the third estimator included in the study. This estimator has been considered as a conceivable alternative to the GREG estimator because of its simplicity and the absence of appropriate auxiliary information. However, it has not before been studied in terms of Bias and MSE for the JO-survey and is therefore included in this study.
The estimators included in the simulation study are summarized in Table 2. The SYN, GREG_E, COMP_E06 and COMP_E08 are all used in combination with both Model A and Model B. For Model C, all these estimators are equivalent as the second term on the rhs of (1) is zero. This is due to the ML estimation of the parameters and the domain specific constants.
2.3 Experiments design and parameters estimation
The artificial population generated by the principles described in 2.1 was used to draw a stratified simple random sample of 12 413 enterprises from the B strata and 2 431 enterprises from A strata. The sample size was adjusted to follow the allocation used in the survey at the first quarter 2007 and full response was assumed. Two experiments corresponding to the two different sets of data used for estimation was conducted (cf. Table 2.).
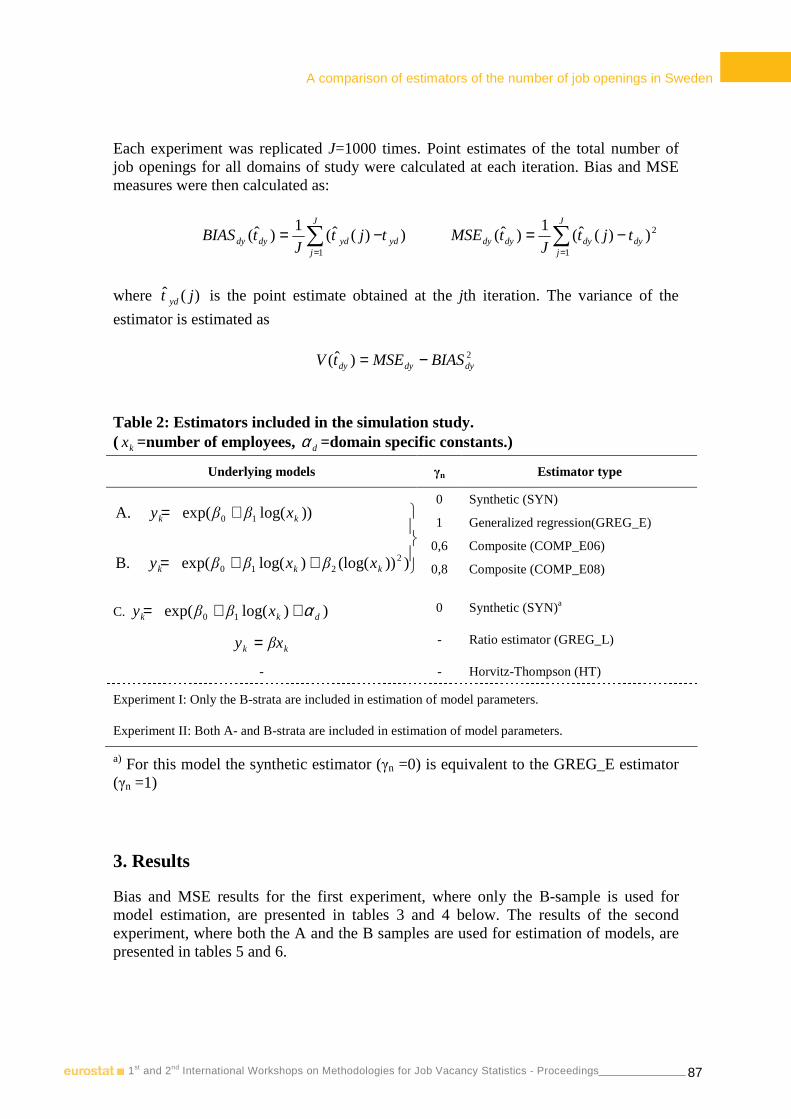
A comparison of estimators of the number of job openings in Sweden
87 1st and 2nd International Workshops on Methodologies for Job Vacancy Statistics - Proceedings
Each experiment was replicated J=1000 times. Point estimates of the total number of job openings for all domains of study were calculated at each iteration. Bias and MSE measures were then calculated as:
∑=
−=J
jydyddydy tjt
JtBIAS
1
))(ˆ(1
)ˆ( ∑=
−=J
jdydydydy tjt
JtMSE
1
2))(ˆ(1
)ˆ(
where )(ˆ jt yd is the point estimate obtained at the jth iteration. The variance of the
estimator is estimated as
2)ˆ( dydydy BIASMSEtV −=
Table 2: Estimators included in the simulation study. ( kx =number of employees, dα =domain specific constants.)
Underlying models γn Estimator type
++=
+=
)))(log()log(exp( B.
))log(exp( A.
2210
10
kkk
kk
xβxββy
xββy
0
1
0,6
0,8
Synthetic (SYN)
Generalized regression(GREG_E)
Composite (COMP_E06)
Composite (COMP_E08)
C. ))log(exp( 10 dkk xββy α++= 0 Synthetic (SYN)a
kk βxy = - Ratio estimator (GREG_L)
- - Horvitz-Thompson (HT)
Experiment I: Only the B-strata are included in estimation of model parameters.
Experiment II: Both A- and B-strata are included in estimation of model parameters.
a) For this model the synthetic estimator (γn =0) is equivalent to the GREG_E estimator (γn =1)
3. Results
Bias and MSE results for the first experiment, where only the B-sample is used for model estimation, are presented in tables 3 and 4 below. The results of the second experiment, where both the A and the B samples are used for estimation of models, are presented in tables 5 and 6.

A comparison of estimators of the number of job openings in Sweden
88 1st and 2nd International Workshops on Methodologies for Job Vacancy Statistics - Proceedings
Bias and MSE results are almost the same for the HT, GREG_L, GREG_E (model A and model B) and the synthetic (model C) estimators. Bias estimates are small for all domains and insignificant when compared with variance estimates. MSE estimates correlates with the size of the domains. For the largest domain (J+K), the MSE estimates for the HT estimator in experiment I gives a standard error equal to 932 and a 95% CI band for the population total equal to ±1826. The half width of the CI corresponds to 14% of the population total. For the smallest domain (A+B) the standard error of the HT estimator in experiment I equal 220 giving a 95% CI band equal to ±431. Here the half width corresponds to 45% of the population total.
The synthetic estimator under both model A and model B is in general associated with large bias estimates. Comparison of MSE estimates shows that the synthetic estimator do well for the domains A+B, F and M+N. For the two last of these domains the gain of using the synthetic estimator is large. On the other hand, there is a large loss in terms of increased MSE of using the synthetic estimator instead of e.g. the HT estimator for several other domains, e.g. C+D+E, G, and J+K. The large MSE estimates of the synthetic estimator for these domains are due to large bias estimates.
The composite estimators GREG_E06 and GREG_E08 have the smallest MSE estimates for some domains. Compared with the HT estimator, smaller MSE estimates for one or both of the composite estimates are observed for the domains A+B, C+D+E, F, I, and M+N. The GREG_E06 estimator has very low MSE estimates for some domains but also very large MSE estimates for other domains. The GREG_E08 estimator shows a more stable result.
The MSE results from experiment II shows on generally higher MSE estimates, a result due to different starting points for the random number generator. Adjusting for the difference in level, using the results for the HT estimator, shows on small differences between the two experiments. There is, however, a general pattern indicating smaller MSEs for the first experiment, where only the B sample is used for estimation of the model parameters.
Concentrating on experiment I and comparing the GREG_L estimator with the estimators GREG_E (Model A), GREG_E (Model B) and SYNT (Model C), the results show that the last three of these estimators have smaller MSE estimates than the GREG_L estimator in six of the domains and for the total. Also, in the first experiment, the composite estimators GREG_E08 have smaller MSE estimates than the SYNT (Model C) estimator for five of the nine domains. These patterns are not observed for experiment II. However, the GREG_E (Model A), GREG_E (Model B) and SYNT (Model C) are also in this experiment associated with smaller MSE estimates for the estimates of the total.

89
Table 3: Bias of the studied estimators in experiment I (B-sample used for estimation of model coefficients). Model A Model B Model C
DOMAIN HT GREG_L SYNT GREG_E GREG_E06 GREG_E08 SYNT GREG_E GREG_E06 GREG_E08 SYNT
A+B 11 11 -215 10 -80 -35 -189 10 -70 -30 10
C+D+E -9 -15 626 -9 245 118 634 -9 248 120 -9
F 1 2 -291 2 -115 -57 -331 2 -131 -65 2
G -21 -22 2 469 -20 975 477 2 296 -21 906 443 -20
I -1 -1 813 0 325 163 843 0 337 169 0
J+K -11 -14 -5 073 -14 -2 037 -1 025 -4 821 -13 -1 937 -975 -15
M+N 11 11 158 11 70 40 146 11 65 38 11
H -3 -2 755 -1 301 150 691 -2 275 137 -2
O -5 -3 733 -3 291 144 707 -3 281 139 -3
TOTAL -28 -32 -25 -25 -25 -25 -25 -25 -25 -25 -28
Table 4: MSE of the studied estimators in experiment I (B-sample used for estimation of model coefficients). Model A Model B Model C
DOMAIN HT GREG_L SYNT GREG_E GREG_E06 GREG_E08 SYNT GREG_E GREG_E06 GREG_E08 SYNT
A+B 48 250 49 156 48 023 48 058 24 441 32 316 37 869 48 108 22 934 32 008 48 274
C+D+E 169 719 171 036 429 229 168 622 139 995 132 164 440 573 168 876 141 909 132 785 168 648
F 246 525 244 703 101 730 244 496 116 170 168 463 126 880 244 506 120 346 169 574 244 844
G 250 429 248 087 6 198 495 251 547 1 085 926 411 336 5 373 624 250 493 954 484 378 278 250 087
I 88 402 87 932 672 849 87 831 142 445 85 239 722 801 87 691 150 341 87 118 87 713
J+K 867 997 857 797 25 824 511 851 103 4 556 064 1 656 183 23 343 882 854 268 4 162 923 1 560 730 846 906
M+N 106 463 106 068 33 550 105 967 48 070 72 197 29 812 106 066 47 402 72 040 105 849
H 40 234 40 352 576 008 40 678 107 708 49 676 482 870 40 487 92 557 45 708 40 339
O 42 482 42 122 549 628 42 354 104 181 49 754 511 212 42 236 97 898 48 079 42 175
TOTAL 1 802 442 1 790 574 1 784 854 1 784 854 1 784 854 1 784 854 1 786 095 1 786 098 1 786 097 1 786 097 1 782 376
89

90 1st and 2nd International Workshops on Methodologies for Job Vacancy Statistics - Proceedings
Table 5: Bias of the studied estimators in experiment II (Both A- and B-samples used for estimation of model coefficients). Model A Model B Model C
DOMAIN HT GREG_L SYNT GREG_E GREG_E06 GREG_E08 SYNT GREG_E GREG_E06 GREG_E08 SYNT
A+B 4 3 -199 3 -78 -37 -180 3 -70 -34 3
C+D+E -45 -49 1 483 -44 567 261 1 574 -44 603 279 -44
F -14 -13 -223 -14 -98 -56 -213 -14 -94 -54 -14
G 7 6 2 000 6 804 405 1 930 6 776 391 7
I -4 -3 1 102 -2 439 218 1 069 -2 426 212 -3
J+K 28 26 -6 023 26 -2 393 -1 184 -6 007 26 -2 387 -1 180 25
M+N -11 -11 132 -12 46 17 107 -12 36 12 -12
H -5 -4 795 -5 315 155 779 -5 309 152 -4
O -2 -3 889 -3 354 176 897 -3 357 177 -2
TOTAL -42 -48 -44 -44 -44 -44 -44 -44 -44 -44 -45
Table 6: MSE of the studied estimators in experiment II (Both A- and B-samples used for estimation of model coefficients). Model A Model B Model C
DOMAIN HT GREG_L SYNT GREG_E GREG_E06 GREG_E08 SYNT GREG_E GREG_E06 GREG_E08 SYNT
A+B 49 817 49 674 41 009 49 601 24 768 33 618 34 530 49 587 23 844 33 429 49 450
C+D+E 154 032 156 605 2 249 512 152 828 398 801 177 031 2 524 154 152 848 440 406 186 466 152 850
F 247 737 245 738 67 295 245 914 112 423 168 828 63 475 245 933 111 752 168 643 246 137
G 262 651 264 113 4 114 761 266 521 796 395 363 221 3 830 160 266 127 749 054 350 476 264 746
I 91 911 91 509 1 225 585 91 297 231 278 108 999 1 155 153 91 246 219 858 106 060 91 271
J+K 849 348 837 681 36 374 461 836 594 6 137 930 2 001 627 36 186 530 837 005 6 109 318 1 995 245 835 461
M+N 108 394 107 136 26 465 107 174 45 279 71 291 19 917 107 182 44 112 70 953 107 203
H 44 624 44 652 638 574 45 241 118 184 54 314 612 060 45 192 113 889 53 199 44 912
O 43 054 43 151 801 910 43 628 144 035 60 014 817 995 43 574 146 610 60 636 43 169
TOTAL 1 911 790 1 912 150 1 910 860 1 910 860 1 910 860 1 910 860 1 910 260 1 910 261 1 910 261 1 910 261 1 907 913
90

A comparison of estimators of the number of job openings in Sweden
91 1st and 2nd International Workshops on Methodologies for Job Vacancy Statistics - Proceedings
4. Discussion
From earlier studies it is known that the auxiliary variable “number of employees” contributes only little information to the estimation of the number of job openings. This result is replicated here as the HT estimator works almost as well as the GREG_L estimator. The linear specification of the relationship between the response variable and the auxiliary variable, the specification used in the GREG_L estimator, is not reasonable in the present application. The response variable has a lower limit of zero, a value reported by a large majority of respondents, and is otherwise a positive integer. The alternative specification considered here, the Poisson regression model, gives a non-linear GREG estimator. Three different models are considered in the first two experiments where two models focus on the functional form and the third includes domain specific constants. As the ML estimator is used for parameter estimation the GREG estimator for this third model coincides with a synthetic estimator (SYNT, model C).
The data set consists of one A-sample, units included with probability 1, and one B-sample, units included with a probability less than 1. The A-sample contains the largest companies and exclusion of these observations in the estimation of the model parameters may improve the model fit; the model has to approximate the relationship in a smaller interval. Results presented here give some indication on that only the B sample should be used for estimation. The problem should be explored in further studies.
Overall, the non-linear GREG estimators considered here works as well as the linear GREG and the HT estimator. Only small differences are observed among them in terms of bias and MSE. With the results of experiment I and the comparison of the results in experiments I and II, a non-linear GREG estimator is indicated to be a better alternative than the present linear GREG estimator. The difference between the estimators is not large, but the results and the character of the variable under study suggest that a non-linear GREG estimator does a better job in capturing the information in the auxiliary variables used.
The composite estimators have large biases for several domains in the two experiments. It can be noted though, that the MSE of e.g. the GREG_E08 estimator (both models) is smaller or in par with the MSE of the linear GREG for several domains and for the overall total. The reduction in MSE by using the GREG_E08 estimator is substantial in several of these cases. It is likely that the development of a less biased synthetic estimator would improve the performance of the composite estimator making it an interesting alternative for estimation.
In summary the results are somewhat disappointing. The usage of an estimator accounting for the character of the study variable does not give a major improvement in precision of estimates. Other means are needed for improved estimation. One path to follow is to use new auxiliary information. One such variable is job openings reported to the Labor Market Board. Results presented here suggest that evaluation of new auxiliary variables should be done within a non-linear GREG estimation framework.

A comparison of estimators of the number of job openings in Sweden
92 1st and 2nd International Workshops on Methodologies for Job Vacancy Statistics - Proceedings
The Poisson regression model tried here is one alternative, but it could also be used as a starting point for development of other models, e.g. an estimator based on a model including a specific component for the high rate of zeros.
References
Godambe, V.P. and M.E. Thompson (1986). Parameters of Superpopulation and Survey Population: Their Relationships and Estimation, International Statistical Review, 54, 127-138.
Lehtonen, R. and A. Veijanen (1998). Logistic Generalized Regression Estimators, Survey Methodology, 24, 51-55.
McCullagh, P. and J.A. Nelder (1989). Generalized Linear Models 2nd ed, Chapman and Hall, London.
Statistics Sweden (2007). Statistiska Meddelanden – AM 46 SM 0702, Statistics Sweden, Stockholm.
Contact Persons Natalie Jansson Thomas Laitila
Statistics Sweden, Örebro Statistics Sweden, Örebro
Email: [email protected] Email: [email protected]

Job vacancies in France: Data collection difficulties and feasibility studies on small firms and the public sector
93 1st and 2nd International Workshops on Methodologies for Job Vacancy Statistics - Proceedings
Job vacancies in France: data collection difficulties and feasibilit y studies on small firms and the public sector
Claire Goarant, Valérie Ulrich DARES, France 2nd International Workshop, Neuchâtel, 18 - 19 November 2009
This article provides an overview of the current situation and forthcoming improvements regarding the collection of job vacancies data in France. Currently, quarterly job vacancies statistics transmitted to Eurostat are measured through a general business survey and cover only firms with 10 employees or more in the private profit sector (1). During the first semester of 2009, a working group has been settled: its objective was to improve job vacancies data collection and to consider different options to extend the scope to small companies and the public sector. Through a qualitative survey, special attention has been attached to the wording of questions in the survey on businesses with 10 employees or more (2). Possibilities to measure job vacancies in units from 1 to 9 employees (3) and in the public sector (4) have also been analysed.
1 A brief description of French job vacancies statistics (in firms with 10 employees or more in the private profit sector)
In France, questions on job vacancies were first introduced in 2003 in a quarterly general business survey, called “enquête ACEMO” (enquête sur l’Activité et les Conditions d’Emploi de la Main d’Oeuvre).
1.1 The quarterly ACEMO survey
The quarterly ACEMO survey is postal and covers companies with 10 employees or more from the private profit sector, except agriculture and personal service activities, representing one half of all occupied persons (around 12 millions employees). Firms with less than 10 employees, the non profit sector and the public sector are excluded. Its sample is of 34 000 units and stratified by sectors and firm size classes (10-19, 20-49, 50-99, 100-249, 250-499, 500 employees or more).
The survey contains questions on number of employees, wages and collective working time duration. According to a gentlemen agreement, from the 2nd quarter of 2003 on, two questions on job vacancies and difficulties to fill in jobs were added in this survey. Until 2008Q3, these questions were :
- Do you have difficulties to fill in jobs? Yes No - Do you have any job vacancies? Yes No
- If yes, how many?
(Underneath, a translation of the Eurostat job vacancies definition was given).

Job vacancies in France: Data collection difficulties and feasibility studies on small firms and the public sector
94 1st and 2nd International Workshops on Methodologies for Job Vacancy Statistics - Proceedings
1.2 The non response rate
The global non response rate to the ACEMO questionnaire is stable over the period 2008 Q1 to 2009 Q3 (table 1). The partial non response rate to job vacancies and difficulties to fill in jobs questions, obtained after re-contacting non respondents, has decreased over this period. The monitoring of the non respondents to these two questions has indeed been improved: in the past, these two questions were not considered of high priority, whereas in the last two years they have become more and more compulsory to meet the European obligation. Now, in case of missing data, contacts are made, as often as possible, in order to explain and to try to obtain response.
Table 2 shows that the partial non response concerns often the two questions simultaneously; very few firms answer to only one of the two questions. This reveals that “job vacancies” and “difficulties to fill in jobs” concepts are in this survey very much linked one to the other. Moreover, the “yes, no” or “no, yes” answers are very rare. Most firms answer “yes, yes” or “no, no”. On the one hand, firms seem to consider as job vacancies only jobs they are having difficulties to fill. On the other hand, firms without difficulties to fill feel certainly not concerned by this set of questions.
To get round this problem, the order of these two questions has been reversed from the 2008 Q4 on: the question on job vacancies is now asked first, followed by the one on difficulties to fill. At the same time, the wording of the question on job vacancies has slightly been improved to be closer to the European definition1. Results for 2009 Q3 in table 2 display that the systematic link established between both questions has apparently not been reduced. It is however difficult to conclude whether this change in the questionnaire had an impact, since it was coincident with the beginning of the economic downturn. From 2008 Q3 on, the percentage of firms declaring job vacancies has indeed decreased (-27% between 2008 Q3 and 2009 Q3), the percentage of firms having difficulties to fill in jobs has followed the same trend, even more sharply (-36%).
1.2 The job vacancy rate
The question on job vacancies enables to measure a job vacancy rate by economic activity, upon which a total number of job vacancies in firms in the scope of the quarterly ACEMO survey is estimated and provided to Eurostat.
1 In particular, the first definition contained the term “very active steps”, which has now been replaced by “active steps”.

95
08Q1 08Q2 08Q3 08Q4 09Q1 09Q2 09Q333350 32984 32753 33603 33315 33011 3280724598 23935 24482 24352 24454 24218 2442426.2 27.4 25.3 27.5 26.6 26.6 25.6
979 335 484 274 266 186 1764.0 1.4 2.0 1.1 1.1 0.8 0.7
3795 3716 3282 2598 2394 2379 239215.4 15.5 13.4 10.7 9.8 9.8 9.8
YES to difficulties to fill, among YES to job vacancies 2858 2811 2362 1784 1442 1467 1404YES to difficulties to fill rate, among YES to job vacancies (%)75.3 75.6 72.0 68.7 60.2 61.7 58.7
NO to difficulties to fill in 934 903 915 803 946 904 983Non response to difficulties to fill in 3 2 5 11 6 8 5
19824 19883 20716 21480 21793 21653 218551022 321 455 371 437 271 2374.2 1.3 1.9 1.5 1.8 1.1 1.0
YES to difficulties to fill 3722 3654 3113 2560 2082 2097 198015.1 15.3 12.7 10.5 8.5 8.7 8.1
YES to job vacancies, among YES to difficulties to fill 2858 2811 2362 1784 1442 1467 1404YES to job vacancies rate, among YES to difficulties to fill (%)76.8 76.9 75.9 69.7 69.3 70.0 70.9NO to job vacancies 859 833 726 767 632 627 575Non response to job vacancies 5 10 25 9 8 3 1
19854 19959 20914 21421 21935 21850 22207Source : quarterly Acemo survey, 08Q1 to 09Q3Note : definitive results established after re-contacting non respondantsFrom 08Q4 on, job vacancies and difficulties to fill questions were reversed.
YES to difficulties to fill rate, non response included (%)
NO to difficulties to fill in
YES to job vacancies rate, non response included (%)
NO to job vacancies
non respondants to difficulties to fill non response rate to difficulties to fill, among respondants (%)
total non response rate (%)
non respondants to job vacancies non response rate to job vacancies, among respondants (%)YES to job vacancies
Table 1 : total non response rate, non response rate to job vacancies and difficulties to fill questions
total sampled units total respondants
95

96 1st and 2nd International Workshops on Methodologies for Job Vacancy Statistics - Proceedings
Job vacancies - difficulties to fill 10-19 20-49 50-99 100-249 250-499 500-more totalNon response to both questions 2 2 2 2 2 2 2No - No 89 85 81 76 76 73 82No - Yes 3 3 4 3 2 2 2Yes - No 1 2 4 5 6 9 4Yes - Yes 5 8 10 13 14 14 10total 100 100 100 100 100 100 100
Job vacancies - difficulties to fill 10-19 20-49 50-99 100-249 250-499 500-more totalNon response to both questions 1 1 1 1 1 1 1No - No 92 90 87 84 83 78 87No - Yes 2 3 3 2 2 2 2Yes - No 2 2 4 6 6 10 4Yes - Yes 3 4 5 7 8 9 6total 100 100 100 100 100 100 100Source : quarterly Acemo survey
Table 2 : Cross responses to job vacancies and difficulties to fill, by firm size
2008Q3
2009Q3
Lecture : in 2008Q3, 89% of firms with 10 to 19 employees declare having no job vacancies and no difficulties to fill in jobs, 3% declare having no job vacancies but diffi culties to fill in jobs.
96

Job vacancies in France: Data collection difficulties and feasibility studies on small firms and the public sector
97 1st and 2nd International Workshops on Methodologies for Job Vacancy Statistics - Proceedings
Figure 1 presents the job vacancies rate in firms with 10 employees or more, by economic activity, from 2003 Q2 to 2009 Q3. In average, the job vacancies rate ranks between 0.4 and 0.7. It seems to be a coincident indicator with economic activity (see the sharp decrease starting in 2008) but does not display any seasonal variations. Moreover, the level of total number of job vacancies is very low in this survey (ranking for all activities between 30 000 and 80 000) in comparison with other sources (job offers collected by the national employment office, surveys on intentions to recruit, etc.). These observations suggested that there are many data collection difficulties concerning job vacancies in the ACEMO survey. A qualitative survey to detect these difficulties was therefore initiated by the working group.
Figure 1: Job vacancies rates by economic activity in firms with 10 employees or more
0
0.2
0.4
0.6
0.8
1
1.2
1.4
1.6
1.8
03
Q2
03
Q3
03
Q4
04
Q1
04
Q2
04
Q3
04
Q4
05
Q1
05
Q2
05
Q3
05
Q4
06
Q1
06
Q2
06
Q3
06
Q4
07
Q1
07
Q2
07
Q3
07
Q4
08
Q1
08
Q2
08
Q3
08
Q4
09
Q1
09
Q2
09
Q3
ALL ACTIVITIES G-H-I Trade, hotel, and catering, transport
C-D-E : Mining, manufacturing, energy F : Construction
J-K : Banking, insurance, business services L-M-N-O : other services
Source : Quarterly ACEMO survey, 2002 Q3 to 2009 Q3
2 A qualitative survey on questionnaire results
A qualitative survey of the ACEMO questionnaire results was carried out in March 2009 to find out why the non-response rate is so high and which difficulties firms encounter in reporting their job vacancies. Special attention was paid to the wording of the questions in order to check whether the words used correspond to the correct concepts for respondents. 92 phone interviews of units who answered to the ACEMO questionnaire in 2009 Q1 were conducted along the four weeks of March.
The main results of this qualitative survey are the following:

Job vacancies in France: Data collection difficulties and feasibility studies on small firms and the public sector
98 1st and 2nd International Workshops on Methodologies for Job Vacancy Statistics - Proceedings 1st and 2nd International Workshops on Methodologies for Job Vacancy Statistics - Proceedings
2.1 Reasons of non response
In many firms, the ACEMO questionnaire is not addressed to the adequate person for collecting job vacancies. Indeed, information on job vacancies is often not available to the person who usually answers to the questionnaire, either because the person is in charge of pay and not of human resources or because he/she is outside of the unit (accountancy firm). Another common reason is that recruitment is done by an external consulting office: the contact person therefore is aware that some recruitments are underway but the number of vacancies is unknown to him/her. Sometimes also, job vacancies are said confidential, even inside the firm, or are not registered nor counted: it is not a “business indicator”.
Moreover, the job vacancies question is not compulsory, is located at the end of the questionnaire and therefore appears less important to respondents.
2.2 Understanding of job vacancies questions
The qualitative survey reveals that special attention needs to be taken to the wording of the question. The exact translation of the term “job vacancy” in French is « emploi vacant » which means an empty or unoccupied « chair ». For this reason, only currently unoccupied jobs are considered as vacancies; jobs newly created or about to become vacant are often missing.
« Active steps » are generally well understood and multiple (internet, newspapers, national employment office, etc.). Similarly, « candidate from outside » is well understood, though some firms report not being able to distinguish between jobs offered to insiders only from the others.
Many interviewed firms mentioned that vacancies on short term contracts, seasonal or temporary jobs are often not reported. This occurs in all economic activities, but in particular in those with high turnover. For example, cashier jobs are often vacant but are filled in rapidly by former workers, for this reason they are often not reported as job vacancies.
2.3 Propositions of wording improvements
These results lead to propose to drop the term « emploi vacant » in the wording of the question and to precise in the question itself (and not in a definition underneath) what is meant by job vacancies: jobs for which the employer is taking active steps to find a suitable candidate from outside the enterprise and which the employer intends to fill either immediately or within a specific period.
It should also be better underscored that short term/seasonal/temporary job vacancies but also vacancies on newly created jobs and jobs to become vacant are to be included. Therefore, it is suggested to split the question on job vacancies in two. The first question will measure the total number of job vacancies, the second distinguishing the number of such jobs being 1) newly created, 2) currently unoccupied or 3) currently occupied and about to become vacant.
Job vacancies in France: Data collection difficulties and feasibility studies on small firms and the public sector
99 1st and 2nd International Workshops on Methodologies for Job Vacancy Statistics - Proceedings
Finally, the question on difficulties to fill in jobs should be dropped to loose the connection often established by respondents between jobs for which candidates are actively researched and jobs for which candidates are difficult to find.
These propositions of changes, if adopted by the working group, will be implemented from 2010 Q4 on. However, remains the problem of the inadequate contact person which is difficult to resolve since the ACEMO questionnaire is a general business survey and not a stand alone survey on job vacancies.
3 Collecting job vacancies data in small firms
In order to provide Eurostat with a feasibility study, a pilot study was conducted on firms with less than 10 employees by introducing questions on job vacancies in a yearly ACEMO survey concerning these small firms.
3.1 The yearly ACEMO survey on small firms
The yearly ACEMO survey enables to complete once a year the quarterly ACEMO survey, by questioning businesses with 1 to 9 employees. Until the 2009 survey, the situation of firms on the 30th June was considered. The questionnaire contains 2 parts. The first part collects general information on companies; the second individual information on each employee. The question on job vacancy has been introduced, in 2008, in the first part of the questionnaire (in a similar way than in the quarterly survey but without the question on difficulties to fill in job):
Do you have any job vacancies? Yes No
If yes, how many?
The yearly ACEMO survey is postal and covers small firms from the private profit sector. Its sample is of 60 000 units, which represents around 6% of French small firms. It is stratified by sectors, 2 firm size classes (1-4, 5-9 employees) and implantation’s region of seat firms.
3.2 The non response rate in the yearly ACEMO survey on small firms
Concerning the 2008 survey, questionnaires were sent in the beginning of July 2008. Some of them were not returned because of business discontinuation, some others because firms were out of scope or non respondents. About 28 000 questionnaires were returned, totally or partially completed. The response rate is about 46,8%.
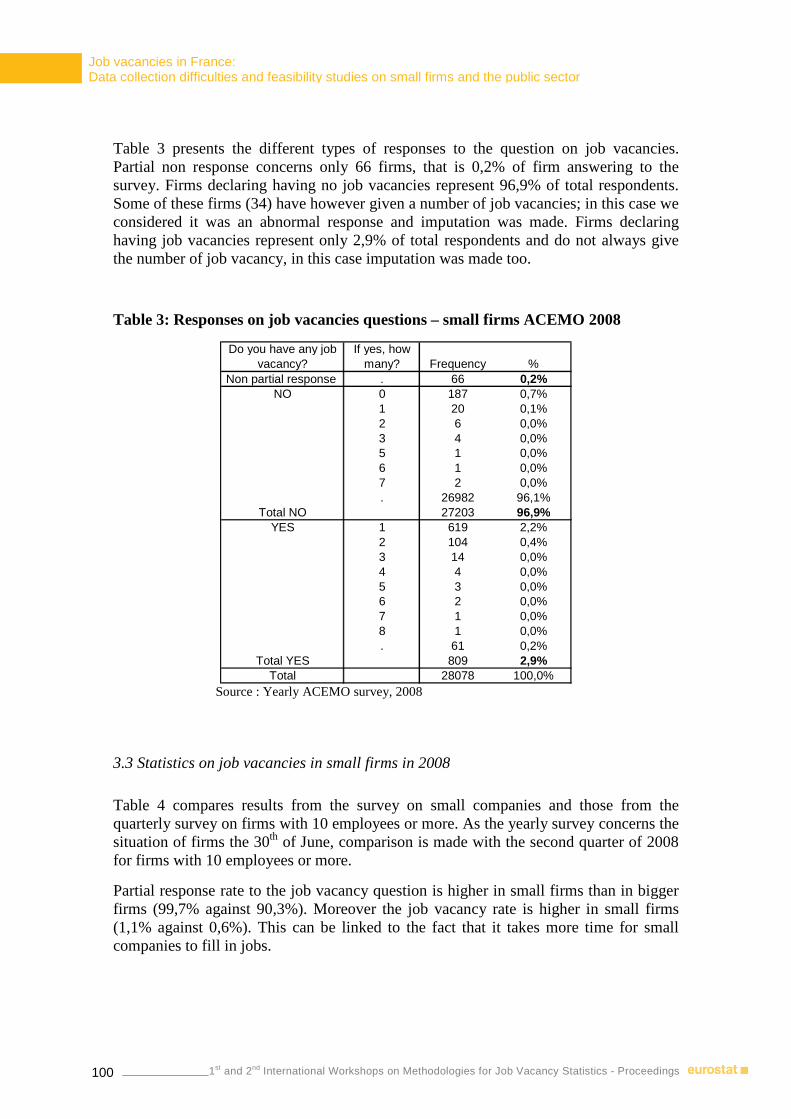
Job vacancies in France: Data collection difficulties and feasibility studies on small firms and the public sector
100 1st and 2nd International Workshops on Methodologies for Job Vacancy Statistics - Proceedings 1st and 2nd International Workshops on Methodologies for Job Vacancy Statistics - Proceedings
Table 3 presents the different types of responses to the question on job vacancies. Partial non response concerns only 66 firms, that is 0,2% of firm answering to the survey. Firms declaring having no job vacancies represent 96,9% of total respondents. Some of these firms (34) have however given a number of job vacancies; in this case we considered it was an abnormal response and imputation was made. Firms declaring having job vacancies represent only 2,9% of total respondents and do not always give the number of job vacancy, in this case imputation was made too.
Table 3: Responses on job vacancies questions – small firms ACEMO 2008
Do you have any job vacancy?
If yes, how many? Frequency %
Non partial response . 66 0,2%NO 0 187 0,7%
1 20 0,1%2 6 0,0%3 4 0,0%5 1 0,0%6 1 0,0%7 2 0,0%. 26982 96,1%
Total NO 27203 96,9%YES 1 619 2,2%
2 104 0,4%3 14 0,0%4 4 0,0%5 3 0,0%6 2 0,0%7 1 0,0%8 1 0,0%. 61 0,2%
Total YES 809 2,9%Total 28078 100,0%
Source : Yearly ACEMO survey, 2008
3.3 Statistics on job vacancies in small firms in 2008
Table 4 compares results from the survey on small companies and those from the quarterly survey on firms with 10 employees or more. As the yearly survey concerns the situation of firms the 30th of June, comparison is made with the second quarter of 2008 for firms with 10 employees or more.
Partial response rate to the job vacancy question is higher in small firms than in bigger firms (99,7% against 90,3%). Moreover the job vacancy rate is higher in small firms (1,1% against 0,6%). This can be linked to the fact that it takes more time for small companies to fill in jobs.

Job vacancies in France: Data collection difficulties and feasibility studies on small firms and the public sector
101 1st and 2nd International Workshops on Methodologies for Job Vacancy Statistics - Proceedings
Table 4: Comparison quarterly survey – yearly survey
Quarterly Acemo survey
(2008 Q2)
Yearly Acemo survey (June 2008)
Response rate (%) 78,8 46,8Job vacancies response rate, among respondants (%) 90,3 99,7Job vacancies rate (%) 0,6 1,1Number of job vacancies 76222 58275Source : Quarterly (firms with 10 employees or more) and yearly ACEMO (firms with 1 to 9 employees) surveys Note : results are here weighted by number of employees
Results show that despite the complexity of the notion of job vacancies, small firms answer massively to the job vacancies question (99,7%), one explanation could be that it is easier to find the right contact person in small firms than in the bigger ones. Nevertheless, few firms declare having job vacancies (less than 3%). It may be because of a misunderstanding problem, it may also be a seasonality problem : just before summer time, firms take on less people.
This pilot study appeared however promising and leads to maintain the question on job vacancies in the annual ACEMO survey on small firms for the coming years. Results for the 2009 survey will be available soon.
From 2010 on, the implementation of this survey will be modified so that to take account of a new regulation on minimum wages: the question on job vacancies will remain unchanged but firms will be questioned on the 31st of December of each year.
Data on job vacancies has therefore been collected in June 2008 (2008 survey), in June 2009 (2009 survey) and in December 2009 (2010 survey). This calendar change will certainly impact the number of job vacancies collected.
In the 2011 survey (on the 31st December of 2010), the question on job vacancies will certainly be modified to harmonize its wording with the one in the quarterly ACEMO survey on firms with 10 employees or more. This change will again impact the evolution of the job vacancy rate between December 2009 (2010 survey) and December 2010 (2011 survey).
Beside these changes, the survey on small firms will remain annual and, thus, the measure of job vacancies rate in small firms will be provided to Eurostat only annually during the first years. A methodological work will be implemented in 2011- 2012 to estimate a quarterly figure, if possible.
4 Collecting job vacancies data in the public sector
The public sector in France represents one fifth of all occupied persons. Different options to count job vacancies in the public sector have been considered by the working group. One source of difficulties raised from its division in three parts: state government, local government and public hospitals.
Job vacancies in France: Data collection difficulties and feasibility studies on small firms and the public sector
102 1st and 2nd International Workshops on Methodologies for Job Vacancy Statistics - Proceedings 1st and 2nd International Workshops on Methodologies for Job Vacancy Statistics - Proceedings
State government is composed of ministries and national government agencies. Currently, most recruitments concern civil servants, which are measured annually in a ministries human resources department survey, called “enquête annuelle sur les bilans des recrutements”. The number of civil servants recruited per year is a good proxy for the number of job vacancies, since civil servants are recruited through an examination and the number of examination openings corresponds to the number of vacant jobs. Results of this survey are currently available with a delay of 2 years. In the coming years, this delay will be reduced and the survey will be extended to all national government agencies but results will remain annual.
The state government also recruits many non civil servants on short term contracts. Likewise, civil servants often change positions, creating temporarily many job vacancies. These vacant jobs are published on a internet website, called “Bourse interministérielle pour l’emploi public” (BIEP2),13 but so far not exhaustively. However, posting all job vacancies on the BIEP website will become compulsory in 2012. The BIEP will enable to edit the number of job vacancies by ministry, region, profession, etc.
Contrary to state government, local government has many small employers, about 58 000 units and 72% of them have less than 10 agents. Currently, no information on job vacancies is available for local government. As for state government, evaluation of job vacancies could be done through the number of examination openings314 and through the BIEP website for non civil servants recruitments and civil servants mobility. Another option would be to introduce a question on job vacancies in a yearly local government survey.
In public hospitals, a website called Hospimob4,15 similar to the BIEP, has been settled very recently (beginning of 2010). Combined with administrative sources on civil servants, this Hospimob website is the most promising way for measuring job vacancies in public hospitals.
For the public sector, as for small firms, job vacancies statistics will be transmitted once a year.
Conclusion
In France, questions on job vacancies were first introduced in 2003 in a quarterly general business survey. This survey, called “enquête ACEMO”, concerns businesses with 10 employees or more in the private profit sector. It enables to measure a job vacancy rate by economic activity, upon which a total number of job vacancies in firms in the scope of the survey is estimated and provided to Eurostat.
13 2 http://www.biep.gouv.fr/ 14 3 A major difference comes from the fact that examination openings does not necessarily lead to a civil
servant recruitment, examination success provides the right to candidate to civil servants vacancies during two years.
15 4 http://www.hospimob.fr/

Job vacancies in France: Data collection difficulties and feasibility studies on small firms and the public sector
103 1st and 2nd International Workshops on Methodologies for Job Vacancy Statistics - Proceedings
In this quarterly survey, different problems of data collection are obvious. First, the partial non response rate to job vacancies questions is high (about 30%). Second, the estimated number of job vacancies displays no seasonal variations and is low in comparison with other survey or administrative sources. Therefore, a qualitative phone survey was conducted in march 2009 to find out why the non-response rate is so high and which difficulties firms encounter in reporting their job vacancies. Conclusions of this qualitative survey lead to a proposition to review the wording of job vacancies questions in the ACEMO questionnaire.
Since the quarterly ACEMO survey covers only private firms with 10 employees or more, feasibility studies were conducted to try to measure the number of job vacancies in all sectors and firm sizes according to the European regulation.
Therefore, in 2008, a pilot study was conducted on firms with less than 10 employees from the private sector. Questions on job vacancies were introduced in a yearly ACEMO survey concerning these small firms. Results from this pilot study are promising and questions on job vacancies will be maintained in this annual survey for the coming years.
In the public sector, there is so far no exhaustive source for estimating job vacancies. However, by 2012, administrative sources on job offers could be mobilised : publication of job vacancies on dedicated internet websites will become compulsory in the whole public sector and civil servants recruitments could be used as a good approximation of civil servants job vacancies.
Contact Persons Claire Goarant Valérie Ulrich
DARES, France DARES, France
Email: [email protected] Email: [email protected]

Temporary work agencies and vacancies: The Italian experience
104 1st and 2nd International Workshops on Methodologies for Job Vacancy Statistics - Proceedings 1st and 2nd International Workshops on Methodologies for Job Vacancy Statistics - Proceedings
Temporary work agencies and vacancies: The Italian experience
Stefania Fivizzani and Marina Sorrentino Istat, Italy 2nd International Workshop, Neuchâtel, 18 - 19 November 2009
1 Introduction
In this paper, a specific subset of the target population of the Italian job vacancy survey, temporary work agencies, is considered. The main economic activity of these enterprises is the search for (and hiring of) candidates for temporary jobs. These jobs have been found to be useful as a leading economic cycle indicator1. Hence these agencies’ job vacancies would seem a potentially useful indicator of the short term dynamics of occupied posts in the economy or GDP. However, the measurement of temporary work agencies’ job vacancies incurs in specific problems, related to the very nature of the economic activity carried out by these firms. In fact, job vacancies, rather than being opened in order to better carry out the main economic activity as it is the case for all the other enterprises in the target population of the survey, are at the very core of their business.
Here, after a brief summary of the main features of the Italian job vacancy survey (Section 2), the principal characteristics of temporary work agencies and their role in the Italian economy are assessed (Section 3). In Section 4, the main problems faced when measuring job vacancies of these agencies, the strategies implemented to deal with them, and the obtained results are described. Some concluding remarks are presented in Section 5.
2 A brief description of the Italian job vacancy survey
Italy has been collecting data on job vacancies within a quarterly business survey since 2003. Besides job vacancies and occupied posts on the last day of the reference quarter, the survey collects data also on hirings and separations and hours (worked, and paid by the employer but not worked). All the variables are measured separately for manual and non manual workers.
The target population of the survey includes all the enterprises with at least 10 employees classified in the Nace Rev.2 sections B to N (until the third quarter of 2007, Nace Rev.1.1 sections C to K). The sample comprises around 14,000 enterprises and it is based on a random scheme with economic activity, size and geographical area as stratification variables. All the enterprises with at least 500 employees in the population are included in take all strata, while one third of the sample units with 10-499 employees are rotated once a year. 1 See, for example, Canoy, Donker van Heel and Hazebroek (2009), and the references mentioned there.

Temporary work agencies and vacancies: The Italian experience
105 1st and 2nd International Workshops on Methodologies for Job Vacancy Statistics - Proceedings
Data are collected mainly via CATI (computer assisted telephone interviews) and web. About 80% of respondent enterprises provides data by telephone interviews. Only a small share of responses are transmitted via fax or mail. The first time an enterprise is included in the sample, it is requested to respond via CATI, while afterwards it can respond via web. Thus, the share of enterprises responding via web is smallest in the wave after a sample rotation and increasing in the successive waves reaching at most around 20% of the total response.
3 Temporary work agencies: main characteristics, and relevance in the Italian economy
The Ilo defines temporary work agencies as “any natural or legal person who, under national legislation, is qualified to recruit workers who then become its legal employees, with a view to making these workers available to a third-party user who supervises this work and with whom the agency has signed an assignment contract”2.
Temporary work agencies are very different from other private employment agencies because they supply a service for the enterprises which are looking for workers, and, at the same time, they become the employers of temporary workers. However, they can provide also the services supplied by all other employment agencies: recruitment, personnel selection, outplacement.
At European level there is not a unique legal paradigm regulating temporary work, but in all countries there is a relation between three subjects, where an agency is the intermediary between workers and enterprises requiring their services. Furthermore, in most countries a written contract between worker and agency is needed. However, the level of regulation is very different between countries, from very low to very detailed. In the literature, four different models are identified: continental (used in France, Germany, Spain, Italy), British, Scandinavian and Dutch “polder”3. The first one is characterized by detailed regulations requiring authorisations and licences for the agencies. On the other end of the spectrum, in the British case, there is no specific legislation and a temporary worker can be an employee of the agency, of the user or self-employed. Temporary work does not have a separate regulation in the Scandinavian countries either, but these workers are protected both by national legislation and collective contracts. No authorisation is needed by agencies either in the UK or in the Scandinavian countries. An intermediate situation characterizes the Dutch “polder” model, where the contract between the agency and the worker is subject to a detailed regulation, but there are no entry barriers for new agencies or restrictions to the use of temporary work.
In Italy, since 2003, temporary work agencies can supply also the services typical of the other employment agencies. There are both legal and contractual constraints to the use of temporary workers. In particular, there are legal restrictions to their use, with the exception of particular situations like: replacement, seasonal work or an extraordinary event. Moreover, the collective bargaining can determine the maximum number of temporary workers who can be assigned to any enterprise.
2 See Ilo (1996). 3 See, for example, Consiglio and Moschera (2005).

Temporary work agencies and vacancies: The Italian experience
106 1st and 2nd International Workshops on Methodologies for Job Vacancy Statistics - Proceedings 1st and 2nd International Workshops on Methodologies for Job Vacancy Statistics - Proceedings
The recruitment of temporary workers is generally based on the information stored in the agencies databases. In general, most agencies have two different databases. In the first one they register all the received curricula, while the second one contains only the profiles of interviewed prospective workers. It is from this last one that the agency selects the workers to be actually hired for job assignments.
In the following, some evidence on the relevance of temporary work in the Italian economy is presented.
According to the figures published by Ebitemp (an agency to which both temporary workers unions and the association of temporary work agencies participate), and based on administrative data held by two social security institutions4, in 2008, temporary workers, measured as full time equivalent, were 240 thousands (see Table 1 and Ebitemp, 2009). Most of temporary workers in 2008 were employed in manufacturing (55.9 percent of the total), while half of those employed in services worked either in business services or trade (respectively, 11.8 and 10.7 percent of the total).
The same source, Ebitemp (2009), supplies also information additional to that in Figure 1, on the changes with respect to the previous year and the geographical distribution of temporary work. In particular, the number of full time equivalent temporary workers was unchanged from 2007 to 2008, while there was a 2 percent reduction in job assignments. Moreover, temporary work was very unequally distributed across geographical areas: in 2008, 70.9 of temporary workers and 65.6 percent of job assignments were in the North of the country.
Table 1: Full time equivalent temporary workers by economic activity – Year 2008 (number and percentage share of the total)
number % share of total
A 394 0.2B 26 0.0C 210 0.1D 134,374 55.9E 1,572 0.7F 5,638 2.3G 25,775 10.7H 6,467 2.7I 9,993 4.2J 6,369 2.6K 28,312 11.8L 5,729 2.4M 910 0.4N 6,010 2.5O 7,496 3.1P 7 0.0unclassified 1,297 0.5
total 240,579 100.0
2008
NACE Rev. 1.1 section full time equivalent temporary workers
Source: Ebitemp (2009).
4 INAIL, the national institute for the industrial injuries insurance, and INPS, the national institute for compulsory social contributions.
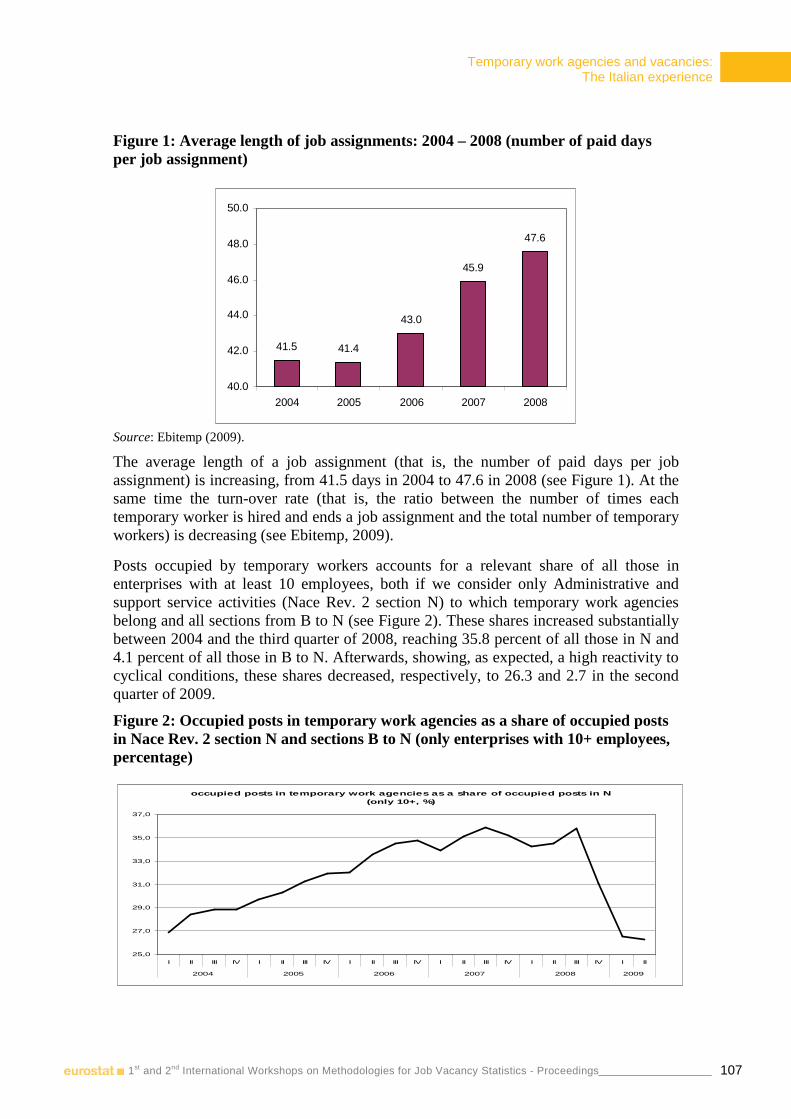
Temporary work agencies and vacancies: The Italian experience
107 1st and 2nd International Workshops on Methodologies for Job Vacancy Statistics - Proceedings
Figure 1: Average length of job assignments: 2004 – 2008 (number of paid days per job assignment)
41.5 41.4
43.0
45.9
47.6
40.0
42.0
44.0
46.0
48.0
50.0
2004 2005 2006 2007 2008
Source: Ebitemp (2009).
The average length of a job assignment (that is, the number of paid days per job assignment) is increasing, from 41.5 days in 2004 to 47.6 in 2008 (see Figure 1). At the same time the turn-over rate (that is, the ratio between the number of times each temporary worker is hired and ends a job assignment and the total number of temporary workers) is decreasing (see Ebitemp, 2009).
Posts occupied by temporary workers accounts for a relevant share of all those in enterprises with at least 10 employees, both if we consider only Administrative and support service activities (Nace Rev. 2 section N) to which temporary work agencies belong and all sections from B to N (see Figure 2). These shares increased substantially between 2004 and the third quarter of 2008, reaching 35.8 percent of all those in N and 4.1 percent of all those in B to N. Afterwards, showing, as expected, a high reactivity to cyclical conditions, these shares decreased, respectively, to 26.3 and 2.7 in the second quarter of 2009.
Figure 2: Occupied posts in temporary work agencies as a share of occupied posts in Nace Rev. 2 section N and sections B to N (only enterprises with 10+ employees, percentage)
occupied posts in temporary work agencies as a share of occupied posts in N (only 10+, %)
25,0
27,0
29,0
31,0
33,0
35,0
37,0
I II III IV I II III IV I II III IV I II III IV I II III IV I II
2004 2005 2006 2007 2008 2009
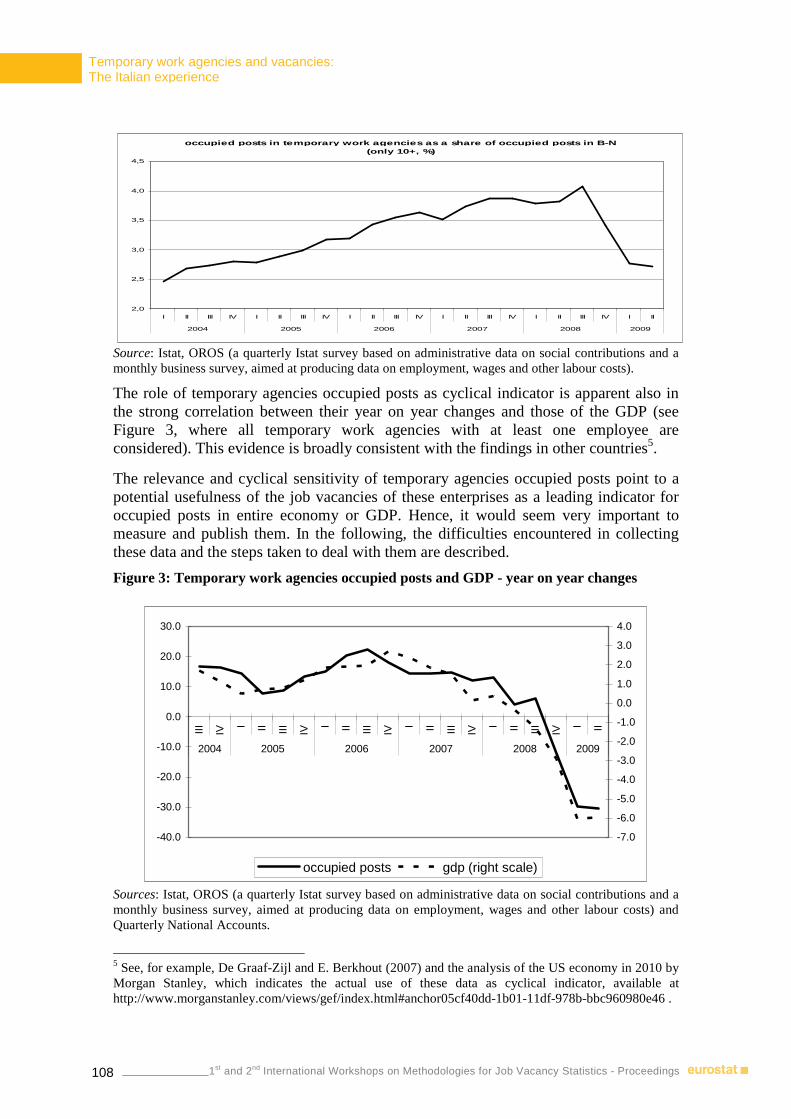
Temporary work agencies and vacancies: The Italian experience
108 1st and 2nd International Workshops on Methodologies for Job Vacancy Statistics - Proceedings 1st and 2nd International Workshops on Methodologies for Job Vacancy Statistics - Proceedings
occupied posts in temporary work agencies as a share of occupied posts in B-N (only 10+, %)
2,0
2,5
3,0
3,5
4,0
4,5
I II III IV I II III IV I II III IV I II III IV I II III IV I II
2004 2005 2006 2007 2008 2009
Source: Istat, OROS (a quarterly Istat survey based on administrative data on social contributions and a monthly business survey, aimed at producing data on employment, wages and other labour costs).
The role of temporary agencies occupied posts as cyclical indicator is apparent also in the strong correlation between their year on year changes and those of the GDP (see Figure 3, where all temporary work agencies with at least one employee are considered). This evidence is broadly consistent with the findings in other countries5.
The relevance and cyclical sensitivity of temporary agencies occupied posts point to a potential usefulness of the job vacancies of these enterprises as a leading indicator for occupied posts in entire economy or GDP. Hence, it would seem very important to measure and publish them. In the following, the difficulties encountered in collecting these data and the steps taken to deal with them are described.
Figure 3: Temporary work agencies occupied posts and GDP - year on year changes
-40.0
-30.0
-20.0
-10.0
0.0
10.0
20.0
30.0
III IV
I II III IV
I II III IV
I II III IV
I II III IV
I II
2004 2005 2006 2007 2008 2009
-7.0
-6.0
-5.0
-4.0
-3.0
-2.0
-1.0
0.0
1.0
2.0
3.0
4.0
occupied posts gdp (right scale)
Sources: Istat, OROS (a quarterly Istat survey based on administrative data on social contributions and a monthly business survey, aimed at producing data on employment, wages and other labour costs) and Quarterly National Accounts.
5 See, for example, De Graaf-Zijl and E. Berkhout (2007) and the analysis of the US economy in 2010 by Morgan Stanley, which indicates the actual use of these data as cyclical indicator, available at http://www.morganstanley.com/views/gef/index.html#anchor05cf40dd-1b01-11df-978b-bbc960980e46 .

Temporary work agencies and vacancies: The Italian experience
109 1st and 2nd International Workshops on Methodologies for Job Vacancy Statistics - Proceedings
4 Problems in measuring job vacancies of the temporary work agencies: how are we dealing with them
The measurement of temporary work agencies’ job vacancies incurs in a specific set of problems, related to the nature of the economic activity carried out by these firms. Looking for suitable candidates for specific jobs, rather than being an activity performed in order to better carry out the main one, is the very core of their business.
Therefore, temporary work agencies typically have very large numbers of vacancies (also as a ratio on their occupied posts). Furthermore, since the length of each vacancy is an indicator of their effectiveness in performing the core business, these durations are generally very short (even a single day, at most few days). These characteristics make it likely that the set of vacancies of an agency varies from day to day. Hence it can be potentially difficult for one of these enterprises to measure its job vacancies on a given date. Moreover, depending on each agency organisation, it can be complex to collect data from all the offices it has all over the country, if there is no frequently updated central database of the requests by prospective users of temporary workers and their subsequent hiring. A further problem can arise because data on vacancies for a given agency need to include not only those for temporary workers but also those for the agency staff. In fact, the information on these two sets of vacancies could be available to different offices. On a different level of difficulty, some temporary work agencies are uncertain as to how to identify vacancies in their activities, that is as to how to apply the job vacancy definition to their situation. Finally, we have observed that agencies can have problems in supplying not only data on the vacancies for temporary workers, but also on the posts occupied by them.
A separate set of problems is related to the possibility of double counting, that is that in the aggregate data some job vacancies are counted more than once. We believe that there could be three possible cases of double counting. The first one would happen if the users of temporary workers were to count their searches for them as vacancies. In this case, the same vacancy would be counted in the economic activity both of the user and the temporary work agency, rather than only in the latter. The questionnaire wording should avoid this case, as it specifies that vacancies are associated with searches for candidates for hirings. The same result would occur also if a temporary work agency were to count as vacancies also its searches for workers to be hired by other firms (i.e. its work as a recruitment agency). However, in this second case, the inappropriate counting would be by the temporary work agency rather than by the user/client. A third case of double counting could happen if a same prospective user of temporary workers were to address its request for a specific job to be filled to more than one agency at the same time. In this case, the aggregate number of temporary work agencies’ vacancies would be spuriously inflated. The survey data does not allow to check for double counting of any of the three types. However, the information received by survey experts, through contacts with these enterprises, suggests that double counting of the first two types should not be happening, while the possibility that a user addresses more than one agency at the same time for the same job is a real one. However, we do not have estimates of how much this could affect the aggregate figures on vacancies for temporary work agencies. The following analysis does not concern double counting, due to the lack of strong evidence on it so far.

Temporary work agencies and vacancies: The Italian experience
110 1st and 2nd International Workshops on Methodologies for Job Vacancy Statistics - Proceedings 1st and 2nd International Workshops on Methodologies for Job Vacancy Statistics - Proceedings
Evidence of the measurement problems faced when collecting data from temporary work agencies is presented in Table 2. Here, the situation in 2006 is synthesized via sample data6. Around two thirds of responding enterprises supplied only data on the agencies’ staff and no information on temporary workers. Less than 20 percent of responding units supplied data on both occupied posts and job vacancies for both types of workers. Around 60 percent of all sampled agencies responded, but those supplying information on both variables and all their workers were only 11 percent of the sample units, and 5 percent of all the temporary work agencies with at least 10 employees active in Italy at the time. Their occupied posts were a similarly small share (6 percent) of all those in the population of these agencies with at least 10 employees.
Table 2: Temporary work agencies by data supplied within the job vacancy survey – Year 2006 (annual average)
responding enterprises
(level)
responding enterprises
(%share of total number of
responding enterprises)
responding enterprises
(%share of total number of
sampled enterprises)
responding enterprises
(%share of total number of population
enterprises)
occupied posts of respondent
enterprises (%share of total
number of occupied posts
in the population)
only staff data 15 64.2 38.1 18.3 54.7- only on occupied posts 7 30.5 18.1 8.7 27.4- also on job vacancies 8 33.7 20.0 9.6 27.3
data on staff and temporary workers 9 35.8 21.3 10.2 8.4- only on occupied posts 4 16.8 10.0 4.8 2.3- also on job vacancies 5 18.9 11.3 5.4 6.1
all respondents 24 100.0 59.4 28.5 63.1
2006
Sources: Istat, quarterly survey of job vacancy and hours worked and OROS (a quarterly Istat survey based on administrative data on social contributions and a monthly business survey, aimed at producing data on employment, wages and other labour costs).
The small number of units responding fully to the survey was a strong obstacle towards the inclusion of temporary work agencies data in the aggregate figures for the job vacancy rate. Furthermore, the peculiarities of these enterprises with respect to all the other units in the population do not allow to reduce the non response or partial response problems by extending to them the check and editing methods implemented on all the other sample units. Finally, relevant heterogeneities among temporary work agencies make it very difficult to use the data collected on some of them to impute or edit those of the non or partially responding ones. Therefore, so far, the disseminated aggregate data on the Italian job vacancy rate do not cover temporary work agencies.
6 All the data on temporary work agencies presented in the paper and based on the job vacancy survey are non grossed up sample data.

Temporary work agencies and vacancies: The Italian experience
111 1st and 2nd International Workshops on Methodologies for Job Vacancy Statistics - Proceedings
The evidence presented in Table 2 prompted a series of countering actions which were implemented starting from the data collection for the first quarter of 2007. First of all, a specification of the job vacancy definition that helps agencies in identifying among their activities those which can be considered as opening and closing a vacancy was drawn up. This was done on the basis of the regulation and a series of telephone conversations between Istat experts and these enterprises, in which detailed information on the procedures followed in their searches for temporary workers was gathered. To all agencies enquiring about the definition of this variable, it is said that they have to count the orders (or requests) received by prospective users, which have not yet been satisfied or cancelled at the reference date. Moreover, these enterprises started to be contacted by a small subset of dedicated CATI interviewers. They received a specific training on the difficulties that these enterprises have in responding and on how to deal with them (for example, using the just described specification of the job vacancy definition). Furthermore, these interviewers received information that could be useful to carry out a first assessment, while still on the phone, of whether also data on temporary workers is supplied (occupied posts for both staff and temporary workers from an administrative source, OROS, as a proxy for those that should be measured by the job vacancy survey). Finally, a series of measures were taken which directly involved Istat experts and researchers, including: a much stricter monitoring of the data collected via CATI or Web; phone reminders to non respondent units; and follow-ups for the agencies whose data are thought to require further checks.
Table 3: Temporary work agencies by data supplied within the job vacancy survey – Year 2008 (annual average)
responding enterprises
(level)
responding enterprises
(%share of total number of
responding enterprises)
responding enterprises
(%share of total number of
sampled enterprises)
responding enterprises
(%share of total number of population
enterprises)
occupied posts of respondent
enterprises (%share of total
number of occupied posts
in the population)
only staff data 4 12.2 9.1 4.4 8.3- only on occupied posts 3 8.9 6.7 3.2 4.3- also on job vacancies 1 3.3 2.4 1.2 4.0
data on staff and temporary workers 27 87.8 65.9 31.5 64.9- only on occupied posts 10 31.7 23.8 11.4 11.6- also on job vacancies 17 56.1 42.1 20.1 53.3
all respondents 31 100.0 75.0 35.9 73.2
2008
Sources: Istat, quarterly survey of job vacancy and hours worked and OROS (a quarterly Istat survey based on administrative data on social contributions and a monthly business survey, aimed at producing data on employment, wages and other labour costs).

Temporary work agencies and vacancies: The Italian experience
112 1st and 2nd International Workshops on Methodologies for Job Vacancy Statistics - Proceedings 1st and 2nd International Workshops on Methodologies for Job Vacancy Statistics - Proceedings
The improvements in data quality are apparent in Table 3, which presents the indicators discussed above for 2008. In the second year of the implementation of the just described measures, the share of responding agencies which were supplying all the requested information had risen from 19 to 56 percent, while that of units supplying only data on the staff had decreased from 64 to 12 percent. Also the overall response rate had increased, from 59 to 75 percent. Units supplying information on both variables and both types of workers had reached the 42 percent of all sample units. They were the 20 percent of all the population units, but accounted for 53 percent of all occupied posts in the population of temporary work agencies with at least 10 employees. The indicators for 2009 were similar and slightly better than those for 2008.
The coverage of the job vacancy data has risen substantially. However, there is still room for improvement. In 2008 there were still 44 percent of responding temporary work agencies which supplied incomplete data. A much lower figure than that for 2006, when they were 81 percent. However, in particular, slightly less than one third of respondent units still transmitted data on posts occupied by, but not on vacancies for temporary workers.
Figure 4: Average sample temporary work agencies job vacancy rate by week day of the reference date – Years 2004-2009 (percentage)
6.0
7.0
8.0
9.0
10.0
11.0
12.0
13.0
14.0
15.0
16.0
Sun Mon Tue Wed Thu Fri Sat
Source: Istat, quarterly survey of job vacancy and hours.
A further cause for concern is related to the implications of the job vacancy reference date, the last day of the quarter, on the data quality for temporary work agencies. In Figure 4, the average sample job vacancy rate on the respondent agencies is plotted against the day of the week of the reference date. It is apparent that this variable depends on the day of the week on which it is measured, at least for the subpopulation considered here. Telephone conversations between Istat experts and some large agencies have confirmed that they aim at satisfying all requests received by prospective
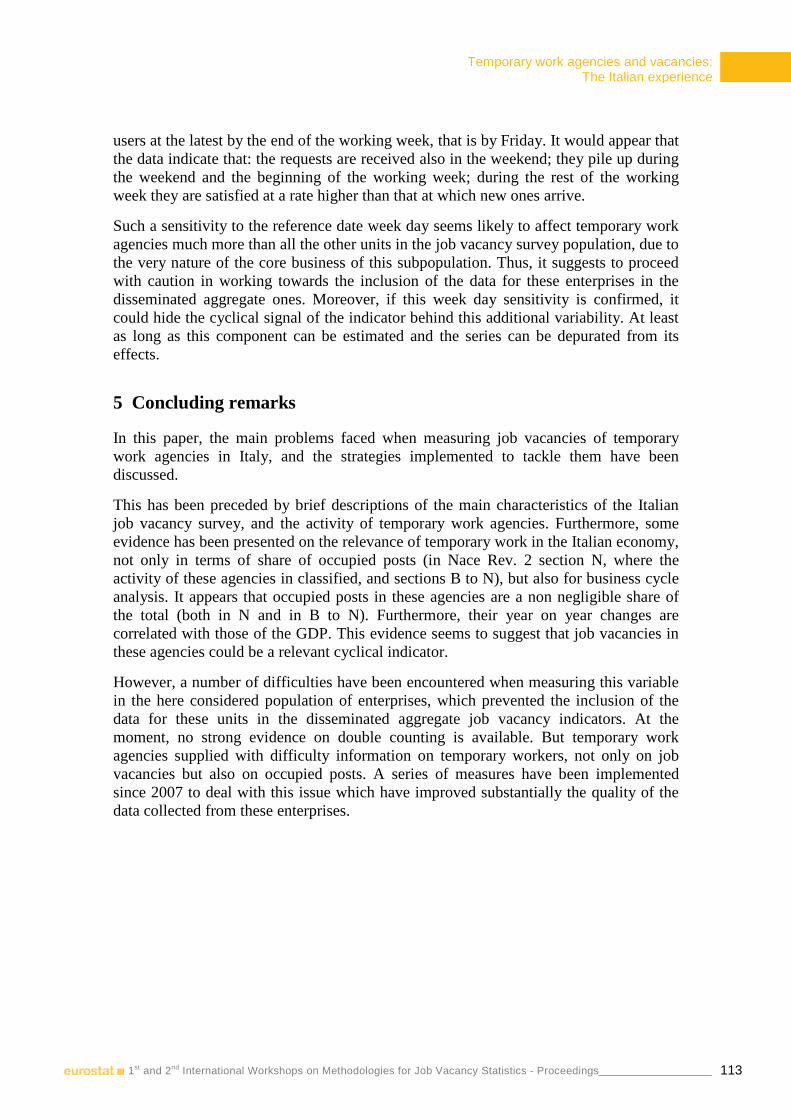
Temporary work agencies and vacancies: The Italian experience
113 1st and 2nd International Workshops on Methodologies for Job Vacancy Statistics - Proceedings
users at the latest by the end of the working week, that is by Friday. It would appear that the data indicate that: the requests are received also in the weekend; they pile up during the weekend and the beginning of the working week; during the rest of the working week they are satisfied at a rate higher than that at which new ones arrive.
Such a sensitivity to the reference date week day seems likely to affect temporary work agencies much more than all the other units in the job vacancy survey population, due to the very nature of the core business of this subpopulation. Thus, it suggests to proceed with caution in working towards the inclusion of the data for these enterprises in the disseminated aggregate ones. Moreover, if this week day sensitivity is confirmed, it could hide the cyclical signal of the indicator behind this additional variability. At least as long as this component can be estimated and the series can be depurated from its effects.
5 Concluding remarks
In this paper, the main problems faced when measuring job vacancies of temporary work agencies in Italy, and the strategies implemented to tackle them have been discussed.
This has been preceded by brief descriptions of the main characteristics of the Italian job vacancy survey, and the activity of temporary work agencies. Furthermore, some evidence has been presented on the relevance of temporary work in the Italian economy, not only in terms of share of occupied posts (in Nace Rev. 2 section N, where the activity of these agencies in classified, and sections B to N), but also for business cycle analysis. It appears that occupied posts in these agencies are a non negligible share of the total (both in N and in B to N). Furthermore, their year on year changes are correlated with those of the GDP. This evidence seems to suggest that job vacancies in these agencies could be a relevant cyclical indicator.
However, a number of difficulties have been encountered when measuring this variable in the here considered population of enterprises, which prevented the inclusion of the data for these units in the disseminated aggregate job vacancy indicators. At the moment, no strong evidence on double counting is available. But temporary work agencies supplied with difficulty information on temporary workers, not only on job vacancies but also on occupied posts. A series of measures have been implemented since 2007 to deal with this issue which have improved substantially the quality of the data collected from these enterprises.

Temporary work agencies and vacancies: The Italian experience
114 1st and 2nd International Workshops on Methodologies for Job Vacancy Statistics - Proceedings 1st and 2nd International Workshops on Methodologies for Job Vacancy Statistics - Proceedings
An assessment of whether data on job vacancy for temporary work agencies can be now included in the disseminated aggregate ones will have to comprise further analysis on response quality. In particular, the issue of the relevance of the week day of the reference date, on which some evidence has been presented here, should be investigated further. Moreover, specific edit and imputation procedures, different from those used for all the other sample units in the Nace Rev. 2 B to N population will have to be designed and implemented. To this end, because of the non negligible heterogeneities among these enterprises, which discourage the use of hot deck donation methods in case of non response or when microdata need to be edited, it is relevant to assess the incidence of wave non responses, especially among the largest agencies. If this is a frequent phenomenon, and unit non response imputation is difficult, grossing up methods based on cross sectional data risk producing undesirable patterns in the time series.
Once the aggregate data on job vacancies of temporary work agencies will have been produced, if the outcome of the validation is positive, aggregate data would be disseminated both including and excluding this subpopulation, so as to avoid a break in the time series available until now.
References
Canoy, M., Donker van Heel, P. and E. Hazebroek (2009), “Temporary Agency Work as a Leading Economic Indicator”, February 2009, available at
http://www.ciett.org/fileadmin/templates/eurociett/docs/Temporary_Agency_Work_as_leading_indicator_-_February_2009.pdf
Consiglio, S. and L. Moschera (2005), Le agenzie per il lavoro: organizzazione, regolazione e competitività, Milano, Il Sole 24 Ore
De Graaf-Zijl, M., and E. Berkhout (2007), “Temporary agency work and the business cycle”, International Journal of Manpower, 28(7), pp. 539 – 556
Ebitemp (2009), Osservatorio nazionale: Il lavoro interinale nel 2008 e nel primo trimestre 2009 attraverso i dati INAIL e INPS, Rome, July
Ilo (1996), Convention of private employment agencies, n. 181
Contact Person Marina Sorrentino
ISTAT, Italy
Email: [email protected]

The Romanian experience on the transition to NACE Rev. 2
115 1st and 2nd International Workshops on Methodologies for Job Vacancy Statistics - Proceedings
The Romanian experience on the transition to NACE Rev.2
Doru-Alin CotîrŃă National Institute of Statistics, Romania 2nd International Workshop, Neuchâtel, 18 - 19 November 2009
1 Job vacancy survey
Romania started the data collection of the job vacancy statistics under the guidelines of Phare Multi-country Programmes (PHARE STAT-2002 and PHARE STAT-2003). The first step was a pilot survey carried out for the middle month of the 3rd quarter of 2004. A full -scale job vacancy survey has been produced starting with the first quarter of 2005. Until 2009 the survey was based on NACE Rev .1.1 classification.
Starting with the second quarter of 2008 the survey was carried out in accordance with the new economic classification (NACE Rev.2), also.
Concerning the legal basis, the survey was conducted based on the Gentlemen’s Agreement. In 2008, the Regulation (EC) no. 453/2008 of the European Parliament and of the Council on quarterly statistics on Community job vacancies was published to be entering in force in 2010. Two other regulations concerning the implementation of the base regulation namely the Commission Regulation (EC) no. 1062/2008 implementing Regulation (EC) no 453/2008 of the European Parliament and of the Council on quarterly statistics on community job vacancies, as regards seasonal adjustment procedures and quality reports and the Commission Regulation (EC) no. 19/2009 implementing Regulation (EC) no 453/2008 of the European Parliament and of the Council on quarterly statistics on community job vacancies, as regards the definition of a job vacancy, the reference dates for data collection, data transmission specifications and feasibility studies were adopted. For the annual statistics on job vacancies the Gentlemen’s Agreement are still applied.
As regards the coverage, it comprise the following elements: the enterprises and local units with legal status, irrespective of their economic activity or ownership type; the economic activities, which comprise all NACE Rev.1.1 sections, respectively, NACE Rev.2; the geographical areas composed of 42 counties; the categories of employed persons defined as employees who have a formal employment contract, irrespective of duration, the type of work or number of hours worked. Are covered, also, all major groups at one digit level according to ISCO 88-COM, except major group 0 (armed forces).
The reference period is considered to be the last day of the middle month of the quarter. In terms of periodicity, the survey is carried out on quarterly basis.

The Romanian experience on the transition to NACE Rev. 2
116 1st and 2nd International Workshops on Methodologies for Job Vacancy Statistics - Proceedings 1st and 2nd International Workshops on Methodologies for Job Vacancy Statistics - Proceedings
The unit of selection is the enterprise and according to the communitarian rules is defined as the smallest combination of legal units that is an organisational unit producing goods or services, which benefits from a certain degree of autonomy in decision-making, especially for the allocation of its current resources. An enterprise carries out one or more activities at one or more locations. An enterprise may be a sole legal unit. The local unit is defined as the unit of observation.
There are two ways in which an enterprise may report the job vacancies and the number of occupied posts. In the first case, when the enterprise has local units, which are situated in other counties than the headquarters and/or carries out a different economic activity than the headquarters. Based on this, the enterprise is obliged to report for each local unit the number of occupied posts and the job vacancies, broken down by major groups of occupations. The second case when the enterprise is equivalent with the local unit or has local units in the same county and carries out the same activity as the headquarters. In this situation, the information for the two variables are filled in only for the total enterprise and major groups of occupations.
The questionnaire is designed to contain information on the enterprise (unit name), the geographical location (NUTS3 level), the economic activity (NACE Rev.1.1/NACE Rev.2) at four digit level, the number of occupied posts and number of job vacancies for total unit and broken down by major groups of occupation. For the enterprises with local units that carries out other activities than the headquarters or are situated in other counties an annex was incorporated which contain the same requests as for the main questionnaire.
Self-registration is the method used. In case that the enterprise encounters difficulties in filling in the questionnaire, methodological assistance is provided by the territorial statistical experts. The variables are collected on paper questionnaires and transmitted by post or on an electronic questionnaire (introduced in 2009) which is posted on the INS website. The data are collected in the month following the reference period.
The sampling frame used for the sample selection is drawn from the Romanian Business Register (REGIS), which contains all enterprises, authorities and organisations as well as their local units that carries out any economic activity irrespective of their size or if they belong to the private or public sector. The Business Register is updated, yearly, on the balance sheets and contains the latest information on each enterprise in the statistical population such as the identification items (unique identification code, address etc.), economic activity codes (NACE Rev.1.1/NACE Rev.2), number of employees (giving the enterprise size class).
A stratified sampling technique is used as sampling method. The stratification variables are given by the economic activity (division level), the size classes of the enterprise (less than 10 employees, 10-49 employees, 50 employees and over). The enterprises with 50 employees and more are exhaustively surveyed, irrespective of their economic activity or their location. The sample covers the entire country and also is representative at region level (NUTS 2). The same sample is used every quarter.
The results of the survey are adjusted using the HORVITZ-THOMPSON estimator, weighted with the response probability in order to compensate the non-responses. The treatment of non-response is regarding to the survey status of enterprises and its response.

The Romanian experience on the transition to NACE Rev. 2
117 1st and 2nd International Workshops on Methodologies for Job Vacancy Statistics - Proceedings
Concerning the data dissemination process, the results are published quarterly and annually at national level (job vacancies only) as well as on European level. Quarterly, at communitarian level, the number of occupied posts and job vacancies are broken down by size classes (+1,+10 employees) and economic activities (section level). Annually, the results are broken down by size classes (+1,+10 employees), economic activities (section level), macro regions (NUTS 1) and regions (NUTS 2) and major groups of occupation.
At national level, the job vacancies rates are quarterly published in the Monthly Statistical Bulletin broken down by size classes (+1 employees), economic activities (section level) and by total economy (NUTS 0). Also, quarterly, the rates are published in the TEMPO data base broken down by size classes (+1 employees), economic activities (section level), total economy, macro regions, regions and major groups of occupation. In the Romanian Year Book the annual vacancies rates are published broken down by size classes (+1 employees), economic activities (section level), total economy, region and major groups of occupation.
2 Transition to NACE Rev. 2
Starting with the second quarter of 2008 the variables were collected in double coding (NACE Rev.1.1 and NACE Rev.2). In organising the job vacancies survey the EU and national legislation was studied for the new classification of the economic activities and the available documentation for the correspondence between the two classifications. Also, the survey sample was designed in such a way thus to assure the data representativeness at national level and by economic activity (division level), for both NACE Rev.1.1 and NACE Rev.2. The stratification variables were the main economic activity and the size class of the enterprise (less than 10 employees, 10-49 employees, 50 employees and over).
The survey tools were updated (questionnaire, explanatory notes and classifications). For the double coding the same questionnaire was used. At central level the updating of the questionnaire was made by introducing a new column for NACE Rev.2 activities for total enterprise and the corresponding local units. Also, the updating the IT application for data entry and validation for both NACE REV 1.1 and NACE Rev.2 was performed. At local level, the data collection from the respondent units, the data entry, checking and first validation were undertaken.
Concerning the processing of the job vacancies statistics the data checking, validation and correlation with other data sources (the Monthly Survey on Wages and Salaries) and between the two NACE classifications were performed. After finalising the above mentioned aspects the grossing-up procedures were applied. The final step was the data aggregation and the analysis of the results.
Due to the fact that the first quarter of 2008 was not collected in double coding, the data was estimated using conversion matrices based on the results of the other quarters.
The algorithm applied to build the conversion matrices consisted in computing the grossing-up factors for each respondent unit, based on the two classifications, the size class of the enterprise and the response rate of the corresponding cells. In accordance with both classifications, the collected data for the number of occupied posts and job vacancies were grossed-up and two data sets of final results were obtained.

The Romanian experience on the transition to NACE Rev. 2
118 1st and 2nd International Workshops on Methodologies for Job Vacancy Statistics - Proceedings 1st and 2nd International Workshops on Methodologies for Job Vacancy Statistics - Proceedings
The information on the respective variables were aggregated at two digit level for each activity and conversion coefficients were computed at NACE Rev.2 division level for each variable.
Matrices were created for both the number of occupied posts and job vacancies. Based on the one concerning the number of occupied posts, the conversion coefficients were applied to the data collected on NACE Rev.1.1. resulting the “missing” first quarter. The same process was applied to obtain the data regarding the job vacancies.
Annual data were calculated as averages based on the quarterly data estimated (1st quarter 2008) and the quarterly data collected and processed (quarters 2nd to 4th 2008) by NACE Rev.2.
Due to the estimated character of the annual data for NACE Rev.2, an estimated flag was attached to the data transmitted to Eurostat and disseminated at national level. where:
OP – occupied posts JV – job vacancies JVR - job vacancy rate a – annually q - quarterly
For sections with complete or relative comparability, graphs were made in order to analyse their behaviour. The graphs analysed both variables (see Annexes).
The tables below emphasise the correlation degree for the two variables: Job vacancies/Number of occupied posts Section Correlation degree (NACE rev.1.1/NACE Rev.2) Mining and quarrying Perfect correlation in terms of trends and coverage;
Manufacturing Good correlation in terms of trends; it can be noticed that in terms of coverage, NACE Rev.2 data are slightly lower by comparison with NACE Rev.1.1;
Construction Perfect correlation in terms of trends and coverage;
Wholesale and retail trade; repair of motor vehicles and motorcycles
Good correlation in terms of trends; in terms of coverage NACE Rev.2 data are slightly different by comparison with NACE Rev.1.1;
Accommodation and Food Services Activities
Perfect correlation in terms of trends and coverage;
Public Administration and Defence; Compulsory Social Security
Perfect correlation in terms of trends; coverage wise NACE Rev.2 data are slightly lower by comparison with NACE Rev.1.1;
Education Perfect correlation in terms of trends and coverage; Human Health and Social Work Activities
Good correlation in terms of trends; coverage wise NACE Rev.2 data are lower by comparison with NACE Rev.1.1
100*aa
aa
JVOP
JVJVR
+=
4
)(4
1∑
== iiq
a
OP
OP4
)(4
1∑
== iiq
a
JV
JV

119
Annex
Total (NACE Rev 1.1/NACE Rev 2) - vacancies -
70000
79000
88000
97000
106000
115000
Q1 Q2 Q3 Q4
A-O (NACE Rev 1.1) A-S (NACE Rev 2)Year A-O (NACE Rev 1.1) Year A-S (NACE Rev 2)
Total (NACE Rev 1.1/NACE Rev 2) - occupied posts -
3000000
4000000
5000000
6000000
7000000
8000000
9000000
10000000
Q1 Q2 Q3 Q4
A-O (NACE Rev 1.1) A-S (NACE Rev 2) Year A-O (NACE Rev 1.1) Year A-S (NACE Rev 2)
Mining and Quarrying (NACE Rev 1.1/NACE Rev 2) - vacancies -
0
100
200
300
400
500
600
Q1 Q2 Q3 Q4C (NACE Rev 1.1) B (NACE Rev 2) Year C (NACE Rev 1.1) Year B (NACE Rev 2)
Mining and Quarrying (NACE Rev 1.1/NACE Rev 2) - occupied posts -
60000
70000
80000
90000
100000
110000
120000
Q1 Q2 Q3 Q4
C (NACE Rev 1.1) B (NACE Rev 2) Year C (NACE Rev 1.1) Year B (NACE Rev 2)
119

120 1st and 2nd International Workshops on Methodologies for Job Vacancy Statistics - Proceedings 1st and 2nd International Workshops on Methodologies for Job Vacancy Statistics - Proceedings
Manufacturing (NACE Rev 1.1/NACE Rev 2) - vacancies -
7000
12000
17000
22000
27000
32000
37000
Q1 Q2 Q3 Q4
D (NACE Rev 1.1) C (NACE Rev 2) Year D (NACE Rev 1.1) Year C (NACE Rev 2)
Manufacturing (NACE Rev 1.1/NACE Rev 2) - occupied posts -
1000000
1080000
1160000
1240000
1320000
1400000
1480000
Q1 Q2 Q3 Q4
D (NACE Rev 1.1) C (NACE Rev 2) Year D (NACE Rev 1.1) Year C (NACE Rev 2)
Construction (NACE Rev 1.1/NACE Rev 2) - vacancies -
2000
3000
4000
5000
6000
7000
8000
9000
10000
Q1 Q2 Q3 Q4
F (NACE Rev 1.1) F (NACE Rev 2) Year F (NACE Rev 1.1) Year F (NACE Rev 2)
Construction (NACE Rev 1.1/NACE Rev 2) - occupied posts -
100000
200000
300000
400000
500000
600000
700000
Q1 Q2 Q3 Q4
F (NACE Rev 1.1) F (NACE Rev 2) Year F (NACE Rev 1.1) Year F (NACE Rev 2)
120

121
Wholesale and retail trade; repair of motor vehicles and motorcycles (NACE Rev 1.1/NACE Rev 2) - vacancies -
2000
3000
4000
5000
6000
7000
8000
9000
Q1 Q2 Q3 Q4
G (NACE Rev 1.1) G (NACE Rev 2) Year G (NACE Rev 1.1) Year G (NACE Rev 2)
Wholesale and retail trade; repair of motor vehicles and motorcycles (NACE Rev 1.1/NACE Rev 2) - occupied posts -
700000
720000
740000
760000
780000
800000
Q1 Q2 Q3 Q4
G (NACE Rev 1.1) G (NACE Rev 2) Year G (NACE Rev 1.1) Year G (NACE Rev 2)
Accommodation and Food Services Activities (NACE Rev 1.1/NACE Rev 2) - vacancies -
300
600
900
1200
1500
1800
Q1 Q2 Q3 Q4
H (NACE Rev 1.1) I (NACE Rev 2) Year H (NACE Rev 1.1) Year I (NACE Rev 2)
Accommodation and Food Services Activities (NACE Rev 1.1/NACE Rev 2) - occupied posts -
500000
600000
700000
800000
900000
Q1 Q2 Q3 Q4
G (NACE Rev 1.1) G (NACE Rev 2) Year G (NACE Rev 1.1) Year G (NACE Rev 2)
121

122 1st and 2nd International Workshops on Methodologies for Job Vacancy Statistics - Proceedings 1st and 2nd International Workshops on Methodologies for Job Vacancy Statistics - Proceedings
Public Administration and Defence; Compulsory Social Security (NACE Rev 1.1/NACE Rev 2) - vacancies -
5000
10000
15000
20000
25000
30000
35000
40000
Q1 Q2 Q3 Q4
L (NACE Rev 1.1) O (NACE Rev 2) Year L (NACE Rev 1.1) Year O (NACE Rev 2)
Public Administration and Defence; Compulsory Social Security (NACE Rev 1.1/NACE Rev 2) - occupied posts -
90000
180000
270000
360000
450000
Q1 Q2 Q3 Q4
L (NACE Rev 1.1) O (NACE Rev 2) Year L (NACE Rev 1.1) Year O (NACE Rev 2)
Education (NACE Rev 1.1/NACE Rev 2) - vacancies -
1500
3000
4500
6000
7500
9000
Q1 Q2 Q3 Q4
M (NACE Rev 1.1) P (NACE Rev 2) Year M (NACE Rev 1.1) Year P (NACE Rev 2)
Education (NACE Rev 1.1/NACE Rev 2) - occupied posts -
80000
160000
240000
320000
400000
480000
560000
Q1 Q2 Q3 Q4
M (NACE Rev 1.1) P (NACE Rev 2) Year M (NACE Rev 1.1) Year P (NACE Rev 2)
122

123
Human Health and Social Work Activities (NACE Rev 1.1/NACE Rev 2) - vacancies -
5000
10000
15000
20000
25000
30000
Q1 Q2 Q3 Q4
N (NACE Rev 1.1) Q (NACE Rev 2) Year N (NACE Rev 1.1) Year Q (NACE Rev 2)
Human Health and Social Work Activities (NACE Rev 1.1/NACE Rev 2) - occupied posts -
90000
180000
270000
360000
450000
Q1 Q2 Q3 Q4
N (NACE Rev 1.1) Q (NACE Rev 2) Year N (NACE Rev 1.1) Year Q (NACE Rev 2)
123
Contact Person CotîrŃă Doru-Alin
National Institute of Statistics, Romania Email: [email protected]

Job vacancies, employment and the economic cycle: Experiences from the German job vacancy survey
124 1st and 2nd International Workshops on Methodologies for Job Vacancy Statistics - Proceedings 1st and 2nd International Workshops on Methodologies for Job Vacancy Statistics - Proceedings
Job vacancies, employment and the economic cycle: Experiences from the German job vacancy survey
Anja Kettner IAB (In stitute for Employment Research), Nuremberg, Germany 2nd International Workshop, Neuchâtel, 18 - 19 November 2009
Background
The German job vacancy survey was started in 1989 as a yearly written survey in Western Germany. In 1992 it was extended to Eastern Germany. Since 2006 the written survey, conducted in the fourth quarter of the year, has been supplemented by short telephone interviews in the first, second and third quarter. The statistical units are local units with at least one employee covered by the social security system. All economic sectors and all sizes of employers are covered for Eastern and Western Germany.
About 13,500 firms and administrations participated in the written survey in the fourth quarter 2008. The questions focused on the number and structure of job vacancies, the procedures to fill open positions and the amount and the causes of labour and skill mismatch. About 8,000 firms and administrations were asked for information on the number of job vacancies in the first, second and third quarter 2009. Usually these telephone interviews only take 3 to 4 minutes.
Results are published regularly 4 to 6 weeks after the end of the quarter. In a press release and in several publications of the IAB they are discussed in the context of the overall labour market development and with regard to the labour demand in the near future.
More detailed information on the survey can be found in the article “The German job vacancy survey: An overview” by Anja Kettner and Kurt Vogler-Ludwig and at the website http://www.iab.de/stellenerhebung.
Whereas there is detailed information available on the number and the structure of employees and unemployed (labour supply) there is a lack of detailed information on the labour demand. Labour demand consists of the number of employees and the number of job vacancies. Until recently in most European countries only data on the registered job vacancies were available. As we know from the German survey, the share of registered vacancies in all vacancies strongly varies over time and differs by sectors, size classes and occupations. An employer’s decision to announce a vacancy to the public employment agency also depends from his/her former experience with the agency and the regional activity of the employment agencies. Up to the present a stable relation between the number of registered vacancies and the total number of vacancies could not be estimated for Germany. Even at the aggregate level the registering quotas range from 34 to 58 percent in Western Germany and from 49 to 71 percent in Eastern Germany between 2005 and 2009.

Job vacancies, employment and the economic cycle: Experiences from the German job vacancy survey
125 1st and 2nd International Workshops on Methodologies for Job Vacancy Statistics - Proceedings
To get information on the total number of vacancies, including the not registered ones, the German job vacancy survey was started in 1989. The survey results not only complete the picture of the labour demand side, but are discussed with regard to the future employment growth. For instance, politicians and the media often assume, that ‘job vacancies today are employment tomorrow’. Sometimes a positive job vacancy growth is interpreted as a sign for positive employment growth in the following periods. In a research project at the IAB we analyse if this simple assumption on the relation between job vacancies and employment really can be made. This research bases on the available data from the German job vacancy survey. The results will have implications for the interpretation of changes in the number and the structure of job vacancies in different sectors, firm size classes and by occupational groups, not least for decisions on education and migration policy that affect the supply side of the labour market.
First considerations on the research project and first results of simple correlation analyses are presented in the following.
Job vacancies from the macroeconomic perspective
The announcement of job vacancies by firms can have several reasons. According to the economic theory an overall increase in the demand for products and services in the course of an economic boom generates an increasing number of job vacancies, because firms want to increase their number of employees. In practice time lags are observed between positive GDP growth rates and an increase of new engagements, because at first firms can adjust internally to the demand, by increasing the working hours of the employees. The lower the degree of utilization was before the upturn, the less new staff is needed. A positive economic growth and higher profits in the firms might also be used to reduce the employment of labour and to increase the employment of capital, thereby labour costs are reduced. The number of job vacancies decreases whereas GDP growth rates rise up in these cases.
Job vacancies can also reflect a change in the demand for product and services, for instance with regard to the degree of technologies that need to be applied or with regard to new forms of handling contacts to customers or clients. The more flexible the employees of a firm are and the more a firm and its employees invest regularly into vocational and advanced training, the less new staff is needed from the external labour market. In cases of strong changes in the demand structure an increase in the number of vacancies does not necessarily imply an increase in the future employment, because employees not adaptable to the changing conditions will be displaced.
Firms’ employment structure
Apart from changes in the demand that require firms to adjust the employees by quantity or quality, the age structure of employees, the share of fixed term contracts and the fluctuation of employees affect the recruitment activities. The higher the share of leaving employees the more vacancies need to be announced to fill the positions with new staff. Therefore an increasing number of vacancies does not necessarily imply a growth in the future employment. It might be stable if all leaving employees are replaced or it might even decline, if not all positions are filled again.

Job vacancies, employment and the economic cycle: Experiences from the German job vacancy survey
126 1st and 2nd International Workshops on Methodologies for Job Vacancy Statistics - Proceedings 1st and 2nd International Workshops on Methodologies for Job Vacancy Statistics - Proceedings
Firms’ experiences with labour and skill shortages
If a firm experiences a lack of suitable candidates for job vacancies in period t, the share of vacancies that cannot be filled successfully, increases. On the other hand the share of engagements in relation to the number of vacancies decreases. In the following period t+1 the number of vacancies consists of these unfilled vacancies from period t plus the number of newly created vacancies in t+1. The higher the share of unfilled vacancies in the previous periods the higher the number of vacancies in the actual period is, assuming a constant inflow of new vacancies. Positive growth rates in the number of vacancies might therefore reflect labour and skill shortages and not necessarily an increase in the overall labour demand.
The present recession shows the importance of this aspect at the German labour market: Despite high negative GDP growth rates caused by the international crisis the labour market developed quite stable in 2009 and 2010, the unemployment rates grew only slightly. This is not just an effect of short term working programmes financed by the Federal Employment Agencies, but also an outcome of the strong experiences of many firms with labour and skill shortages in the boom years 2006-2008. At first mainly engineers, IT specialists and technical staff were concerned, since 2008 there has also been a lack of staff in the social service sector. In the actual crisis in 2009 firms attempt to avoid dismissals because they anticipate the recurrence of shortages in the course of the next upturn. Probably the next upturn will, different from other European countries, generate less new vacancies in Germany than expected in a boom, because firms can make use of the hoarded labour before they need to announce vacancies for additional staff.
Institutional regulations and the structure of labour supply
Changes in institutional regulations, like in Germany the recent labour market reform Hartz IV, or a change in dismissal rules influence the behaviour of job seekers and unemployed. Changing searching and recruitment behaviour does not only affect the number of vacancies (e.g. more vacancies if fluctuation increases) but also the duration and the share of vacancies that are difficult to fill. An increasing demand of job seekers for part time jobs or for jobs with flexible working time arrangements to balance work and family might increase the number of firms’ vacancies that can’t be filled, as long as firms need to adjust to these changes by offering suitable jobs. This could for instance be observed with regard to female engineers in the boom 2006/2007.
First summary
Many factors including the individual recruitment behaviour of single firms influence the number and structure of vacancies that are measured by job vacancy surveys. The distinction between these underlying factors in the empirical research is difficult but essential to answer the question, if changes in the number and the structure of vacancies do reflect changes in the employment growth or if only the structure of employment, for instance with regard to qualification, is affected.

Job vacancies, employment and the economic cycle: Experiences from the German job vacancy survey
127 1st and 2nd International Workshops on Methodologies for Job Vacancy Statistics - Proceedings
On the other hand it is well known that not every new engagement presupposes a vacancy. An engagement without a vacancy can take place in form of recalls of former employees, by the use of informal search channels that are not covered by the official job vacancy definition or if firms decide for the hiring just because an outstanding job seeker is available. The relation between changes in job vacancies and changes in new engagements or changes in the total employment is unclear so far.
Results from first correlation analyses and graphs
To start with the analysis of possible relations between job vacancies and employment the time series of job vacancies have been correlated with several measures of employment and new engagements. Table 1 shows the results by sector.
The correlation coefficients according to Pearson show positive significant results between the number of vacancies and the employment in the same quarter, the following quarter and the second following quarter for the sector Education, Health and Social Work. This sector is mainly publicly organized and financed. Usually quite a lot bureaucratic procedures are necessary to decide on the announcement of a vacancy. The recruitment processes are highly standardized. If a vacancy is announced, the probability for hiring is high. This sector still offers relatively stable working contracts, dismissals are the exception. The fluctuations out of this sector are comparably low.
In the Social Services, also a mainly publicly organized sector, the correlation between vacancies and employees in the same and in the following quarter is also positive, for the sum of vacancies as well as for the ones immediately to be filled. In the other sectors the correlation coefficients are not significant or only weak.
Surprisingly the correlation coefficients between the number of vacancies and the number of new engagements (newly hired persons) are lower and less often significant. Also the correlation between the job vacancy rate and the number of employees does not give convincing results on stable relations between both economic variables. In one case the coefficient is even negative.
With figures that show time series of job vacancies and employees for some selected sectors the different course of the time series becomes visible. Figure 1 shows the number of all vacancies, the number of vacancies immediately to be filled and the number of employees for the total economy. Whereas in 2006 the time series behave like one would expect from the economic theory, the relation changes in 2007: Despite a constant or even decreasing number of vacancies the number of employees is rising until the third quarter 2008.
Figure 2 shows the number of new engagements instead of the number of employees. There is no stable relation visible at all. The development of new engagements is very much affected by seasonal effects. For job vacancies seasonal adjusted time series are not available at the present.
Figures 3 and 4 show time series for the manufacturing sector, figures 5 and 6 for Construction, figures 7 and 8 for Real Estate, Renting, Business Activities and Consulting and figures 9 and 10 for the Social Services.
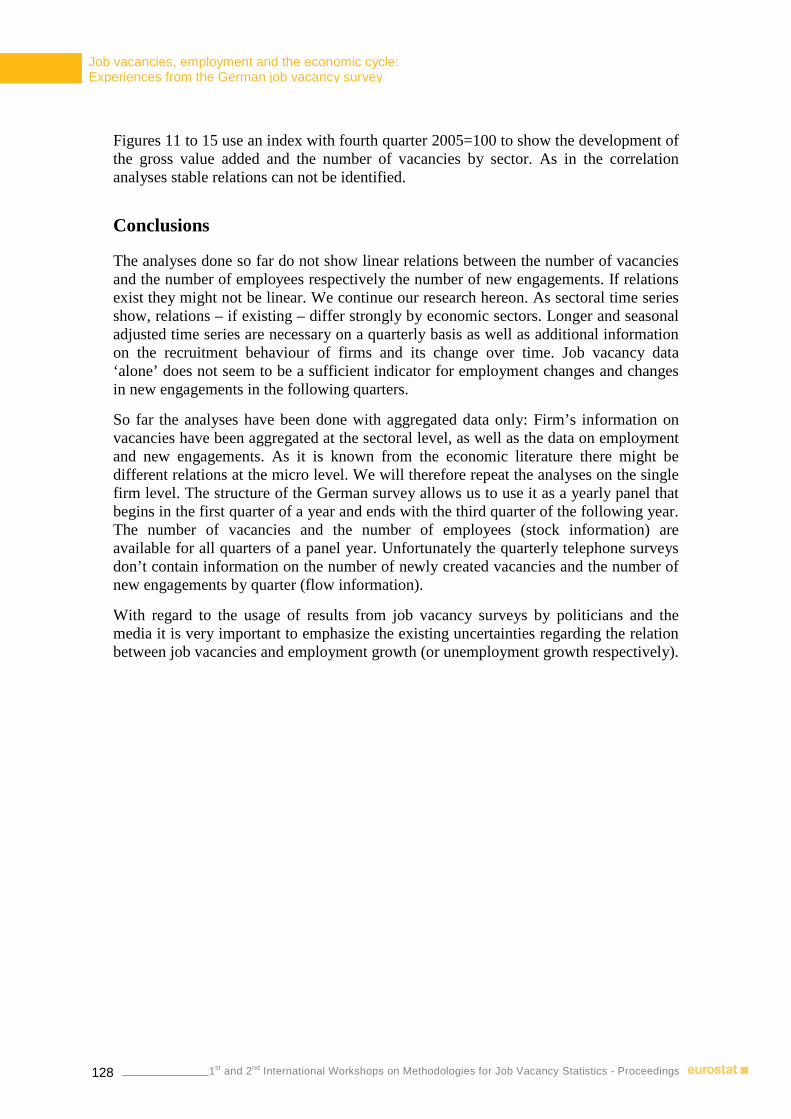
Job vacancies, employment and the economic cycle: Experiences from the German job vacancy survey
128 1st and 2nd International Workshops on Methodologies for Job Vacancy Statistics - Proceedings 1st and 2nd International Workshops on Methodologies for Job Vacancy Statistics - Proceedings
Figures 11 to 15 use an index with fourth quarter 2005=100 to show the development of the gross value added and the number of vacancies by sector. As in the correlation analyses stable relations can not be identified.
Conclusions
The analyses done so far do not show linear relations between the number of vacancies and the number of employees respectively the number of new engagements. If relations exist they might not be linear. We continue our research hereon. As sectoral time series show, relations – if existing – differ strongly by economic sectors. Longer and seasonal adjusted time series are necessary on a quarterly basis as well as additional information on the recruitment behaviour of firms and its change over time. Job vacancy data ‘alone’ does not seem to be a sufficient indicator for employment changes and changes in new engagements in the following quarters.
So far the analyses have been done with aggregated data only: Firm’s information on vacancies have been aggregated at the sectoral level, as well as the data on employment and new engagements. As it is known from the economic literature there might be different relations at the micro level. We will therefore repeat the analyses on the single firm level. The structure of the German survey allows us to use it as a yearly panel that begins in the first quarter of a year and ends with the third quarter of the following year. The number of vacancies and the number of employees (stock information) are available for all quarters of a panel year. Unfortunately the quarterly telephone surveys don’t contain information on the number of newly created vacancies and the number of new engagements by quarter (flow information).
With regard to the usage of results from job vacancy surveys by politicians and the media it is very important to emphasize the existing uncertainties regarding the relation between job vacancies and employment growth (or unemployment growth respectively).

129
Table 1: Pearson Correlation coefficients, time series Q4_2005 – Q1_2009
Vts
Et
Vts
Et+1
Vts
Et+2
Vti
Et
Vti
Et+1
Vti
Et+2
Vts
Enewt
Vts
Enew t+1
Vts
Enewt+2
Vti
Enewt
Vti
Enew t+1
Vti
Enewt+2
VRts
Et
VRts
Et+1
VRts
Et+2
VRti
Et
VRti
Et+1
VRti
Et+2
Agriculture, forestry and fishing
.038 .323 .266 ,535* .448 .242 .249 .432 -.002 .293 .106 -.110 -.002 .329 .323 .096 .308 .170
Manufacturing industry .432 .206 .314 .450 .287 .321 .037 .233 ,523* -.018 ,499* .350 .233 .038 .240 .249 .122 .260
Manufacturing of foods, textiles, leather, furniture
.228 .038 -.007 .201 .135 -.076 .132 -.195 .237 .031 .101 .126
Manufacturing of wood, paper; Publishing
.333 .196 .314 .325 .166 .379 -.153 ,526* -.061 -.038 ,583* -.059
Manufacturing of chemicals, plastic, glass and building materials
.362 -.229 .456 .272 -.349 .100 -.286 .345 .070 -,638** .359 .364
Manufacturing and processing of metals
.166 .347 .463 .229 .384 .489 .238 .470 .253 .208 .442 .218
Manufacturing of machinery, electronics
.395 .396 .465 .372 .351 .374 .256 .430 .474 .147 .347 .392
Mining, Quarrying; Electricity .097 .156 .048 .140 .118 .115 -.113 .416 .183 -.231 ,536* .006
Construction .424 .239 .087 ,487* .250 -.064 -.169 -.289 -.001 -.122 -.435 -.011 .393 .310 .073 ,455* .280 -.090
Wholesale, Hotels and Restaurants; Transport and communication
-.413 .029 -.174 -.218 .161 -.137 -.373 .446 .236 -,473* .440 .094 -,468* -.095 -.205 -.255 .062 -.142
Real estate, renting and business activities, consulting
.295 .365 ,572* ,602* ,535* .473 .431 .341 ,595* .431 .076 .406 .058 .134 .441 .296 .261 .392
Social Services ,665** ,570* .404 ,712** ,631* .426 .226 ,491* .172 .268 .401 .196 ,465* .298 .211 ,504* .414 .237
Other service activities .429 .371 .230 .415 .415 .297 .162 .284 .070 .156 .201 .236
Education, health and social work
,880** ,813** ,734** ,924** ,826** ,655* .452 ,636** .418 ,488* ,550* .312
Public administration, defence .231 .146 -.157 .190 .061 -.224 -.425 -.079 -.366 -.416 -.096 -.367
129

Job vacancies, employment and the economic cycle: Experiences from the German job vacancy survey
130 1st and 2nd International Workshops on Methodologies for Job Vacancy Statistics - Proceedings 1st and 2nd International Workshops on Methodologies for Job Vacancy Statistics - Proceedings
The following connotations are used:
V number of job vacancies
VR job vacancy rate
index s sum of all vacancies / vacancy rate on base of all vacancies
index i only vacancies immediately to be filled / vacancy rate on base of vacancies immediately
to be filled
E number of employees
Enew number of new engagements (new employees)
index t quarter

Job Vacancies, employment and the economic cycle: Experiences from the German job vacancy survey
131 1st and 2nd International Workshops on Methodologies for Job Vacancy Statistics - Proceedings
Figure 1: Sum of vacancies, vacancies to be filled immediately and employment for the total economy
0
500,000
1,000,000
1,500,000
2,000,000
Q4_20
05
Q1_20
06
Q2_20
06
Q3_20
06
Q4_20
06
Q1_20
07
Q2_20
07
Q3_20
07
Q4_20
07
Q1_20
08
Q2_20
08
Q3_20
08
Q4_20
08
Q1_20
09
Vacancies
25,000,000
25,500,000
26,000,000
26,500,000
27,000,000
27,500,000
28,000,000
Employees
Vacancies (sum) Vacancies (imm.) Employees
Source: IAB-Job Vacancy Survey 2005-2009
Figure 2: Sum of vacancies, vacancies to be filled immediately and employment for manufacturing
0
50,000
100,000
150,000
200,000
250,000
300,000
Q4_20
05
Q1_20
06
Q2_20
06
Q3_20
06
Q4_20
06
Q1_20
07
Q2_20
07
Q3_20
07
Q4_20
07
Q1_20
08
Q2_20
08
Q3_20
08
Q4_20
08
Q1_20
09
Vacancies
6,200,000
6,400,000
6,600,000
6,800,000
7,000,000
7,200,000
7,400,000
Employees
Vacancies (sum) Vacancies (imm.) Employees
Source: IAB-Job Vacancy Survey 2005-2009

Job vacancies, employment and the economic cycle: Experiences from the German job vacancy survey
132 1st and 2nd International Workshops on Methodologies for Job Vacancy Statistics - Proceedings 1st and 2nd International Workshops on Methodologies for Job Vacancy Statistics - Proceedings
Figure 3: Sum of vacancies, vacancies to be filled immediately and employment for construction
0
50,000
100,000
150,000
200,000
250,000
Q4_20
05
Q1_20
06
Q2_20
06
Q3_20
06
Q4_20
06
Q1_20
07
Q2_20
07
Q3_20
07
Q4_20
07
Q1_20
08
Q2_20
08
Q3_20
08
Q4_20
08
Q1_20
09
Vacancies
1,300,000
1,350,000
1,400,000
1,450,000
1,500,000
1,550,000
1,600,000
1,650,000
Employees
Vacancies (sum) Vacancies (imm.) Employees
Source: IAB-Job Vacancy Survey 2005-2009
Figure 4: Sum of vacancies, vacancies to be filled immediately and employment for real estate, renting, business services and consulting
0
100,000
200,000
300,000
400,000
500,000
600,000
700,000
Q4_20
05
Q1_20
06
Q2_20
06
Q3_20
06
Q4_20
06
Q1_20
07
Q2_20
07
Q3_20
07
Q4_20
07
Q1_20
08
Q2_20
08
Q3_20
08
Q4_20
08
Q1_20
09
Vacancies
3,800,000
4,000,000
4,200,000
4,400,000
4,600,000
4,800,000
5,000,000
Employees
Vacancies (sum) Vacancies (imm.) Employees
Source: IAB-Job Vacancy Survey 2005-2009

Job Vacancies, employment and the economic cycle: Experiences from the German job vacancy survey
133 1st and 2nd International Workshops on Methodologies for Job Vacancy Statistics - Proceedings
Figure 5: Sum of vacancies, vacancies to be filled immediately and employment for social services
0
100,000
200,000
300,000
400,000
500,000
Q4_20
05
Q1_20
06
Q2_20
06
Q3_20
06
Q4_20
06
Q1_20
07
Q2_20
07
Q3_20
07
Q4_20
07
Q1_20
08
Q2_20
08
Q3_20
08
Q4_20
08
Q1_20
09
Vacancies
6,800,000
6,900,000
7,000,000
7,100,000
7,200,000
7,300,000
7,400,000
Employees
Vacancies (sum) Vacancies (imm.) Employees
Source: IAB-Job Vacancy Survey 2005-2009
Figure 6: Sum of vacancies, vacancies to be filled immediately and new employment for the total economy
0
500,000
1,000,000
1,500,000
2,000,000
Q4_20
05
Q1_20
06
Q2_20
06
Q3_20
06
Q4_20
06
Q1_20
07
Q2_20
07
Q3_20
07
Q4_20
07
Q1_20
08
Q2_20
08
Q3_20
08
Q4_20
08
Q1_20
09
Vacancies (sum) Vacancies (imm.) New Employees
Source: IAB-Job Vacancy Survey 2005-2009

Job vacancies, employment and the economic cycle: Experiences from the German job vacancy survey
134 1st and 2nd International Workshops on Methodologies for Job Vacancy Statistics - Proceedings 1st and 2nd International Workshops on Methodologies for Job Vacancy Statistics - Proceedings
Figure 7: Sum of vacancies, vacancies to be filled immediately and new employment for manufacturing
0
50,000
100,000
150,000
200,000
250,000
300,000
Q4_20
05
Q1_20
06
Q2_20
06
Q3_20
06
Q4_20
06
Q1_20
07
Q2_20
07
Q3_20
07
Q4_20
07
Q1_20
08
Q2_20
08
Q3_20
08
Q4_20
08
Q1_20
09
Vacancies (sum) Vacancies (imm.) New Employees
Source: IAB-Job Vacancy Survey 2005-2009
Figure 8: Sum of vacancies, vacancies to be filled immediately and new employment for construction
0
50,000
100,000
150,000
200,000
250,000
Q4_20
05
Q1_20
06
Q2_20
06
Q3_20
06
Q4_20
06
Q1_20
07
Q2_20
07
Q3_20
07
Q4_20
07
Q1_20
08
Q2_20
08
Q3_20
08
Q4_20
08
Q1_20
09
Vacancies (sum) Vacancies (imm.) New Employees
Source: IAB-Job Vacancy Survey 2005-2009

Job Vacancies, employment and the economic cycle: Experiences from the German job vacancy survey
135 1st and 2nd International Workshops on Methodologies for Job Vacancy Statistics - Proceedings
Figure 9: Sum of vacancies, vacancies to be filled immediately and new employment for real estate, renting, business services and consulting
0
100,000
200,000
300,000
400,000
500,000
600,000
700,000
Q4_20
05
Q1_20
06
Q2_20
06
Q3_20
06
Q4_20
06
Q1_20
07
Q2_20
07
Q3_20
07
Q4_20
07
Q1_20
08
Q2_20
08
Q3_20
08
Q4_20
08
Q1_20
09
Vacancies (sum) Vacancies (imm.) New Employees
Source: IAB-Job Vacancy Survey 2005-2009
Figure 10: Sum of vacancies, vacancies to be filled immediately and new employment for social services
0
100,000
200,000
300,000
400,000
500,000
Q4_20
05
Q1_20
06
Q2_20
06
Q3_20
06
Q4_20
06
Q1_20
07
Q2_20
07
Q3_20
07
Q4_20
07
Q1_20
08
Q2_20
08
Q3_20
08
Q4_20
08
Q1_20
09
Vacancies (sum) Vacancies (imm.) New Employees
Source: IAB-Job Vacancy Survey 2005-2009

Job vacancies, employment and the economic cycle: Experiences from the German job vacancy survey
136 1st and 2nd International Workshops on Methodologies for Job Vacancy Statistics - Proceedings 1st and 2nd International Workshops on Methodologies for Job Vacancy Statistics - Proceedings
Figure 11: Sum of vacancies, vacancies to be filled immediately and gross value added for the total economy, index Q4_2005=100
60
70
80
90
100
110
120
130
140
Q4_20
05
Q1_20
06
Q2_20
06
Q3_20
06
Q4_20
06
Q1_20
07
Q2_20
07
Q3_20
07
Q4_20
07
Q1_20
08
Q2_20
08
Q3_20
08
Q4_20
08
Q1_20
09
Q2_20
09
Gross Value Added Vacancies (sum) Vacancies (imm.)
Source: IAB-Job Vacancy Survey 2005-2009
Figure 12: Sum of vacancies, vacancies to be filled immediately and gross value added for manufacturing, index Q4_2005=100
20
40
60
80
100
120
140
160
180
200
Q4_20
05
Q1_20
06
Q2_20
06
Q3_20
06
Q4_20
06
Q1_20
07
Q2_20
07
Q3_20
07
Q4_20
07
Q1_20
08
Q2_20
08
Q3_20
08
Q4_20
08
Q1_20
09
Q2_20
09
Gross Value Added Vacancies (sum) Vacancies (imm.)
Source: IAB-Job Vacancy Survey 2005-2009

Job Vacancies, employment and the economic cycle: Experiences from the German job vacancy survey
137 1st and 2nd International Workshops on Methodologies for Job Vacancy Statistics - Proceedings
Figure 13: Sum of vacancies, vacancies to be filled immediately and gross value added for construction, index Q4_2005=100
0
50
100
150
200
250
300
350
400
Q4_20
05
Q1_20
06
Q2_20
06
Q3_20
06
Q4_20
06
Q1_20
07
Q2_20
07
Q3_20
07
Q4_20
07
Q1_20
08
Q2_20
08
Q3_20
08
Q4_20
08
Q1_20
09
Q2_20
09
Gross Value Added Vacancies (sum) Vacancies (imm.)
Source: IAB-Job Vacancy Survey 2005-2009
Figure 14: Sum of vacancies, vacancies to be filled immediately and gross value added for real estate, renting, business services and consulting, index Q4_2005=100
50
70
90
110
130
150
170
Q4_20
05
Q1_20
06
Q2_20
06
Q3_20
06
Q4_20
06
Q1_20
07
Q2_20
07
Q3_20
07
Q4_20
07
Q1_20
08
Q2_20
08
Q3_20
08
Q4_20
08
Q1_20
09
Q2_20
09
Gross Value Added Vacancies (sum) Vacancies (imm.)
Source: IAB-Job Vacancy Survey 2005-2009

Job vacancies, employment and the economic cycle: Experiences from the German job vacancy survey
138 1st and 2nd International Workshops on Methodologies for Job Vacancy Statistics - Proceedings 1st and 2nd International Workshops on Methodologies for Job Vacancy Statistics - Proceedings
Figure 15: Sum of vacancies, vacancies to be filled immediately and gross value added for social services, index Q4_2005=100
80
90
100
110
120
130
140
150
Q4_20
05
Q1_20
06
Q2_20
06
Q3_20
06
Q4_20
06
Q1_20
07
Q2_20
07
Q3_20
07
Q4_20
07
Q1_20
08
Q2_20
08
Q3_20
08
Q4_20
08
Q1_20
09
Q2_20
09
Gross Value Added Vacancies (sum) Vacancies (imm.)
Source: IAB-Job Vacancy Survey 2005-2009
Contact Person Anja Kettner
IAB (Institute for Employment Research), Nürnberg, Germany
Email: [email protected]
Job vacancies and the economic cycle: Comments from Switzerland
139 1st and 2nd International Workshops on Methodologies for Job Vacancy Statistics - Proceedings
Job vacancies and the economic cycle: Comments from Switzerland
Francis Saucy & Raphael Neuenschwander Federal Statistical Office (FSO), Neuchâtel, Switzerland 2nd International Workshop, Neuchâtel, 18 – 19 December 2009
Using correlation analysis, A. Kettner and M. Sorrentino did not found unequivocal relationships between job vacancies (JV) and the “economic cycle” during the period 2004-2009 in the data from Germany and Italy. These results contrast with those from Switzerland where job vacancies have been collected over two “economic cycles” and where major changes in job vacancies are interpreted as early indicators of significant trend changes on the labour market.
Using the same approach (correlation analysis), we compared the number of vacancies with employment and unemployment. We avoid using the job vacancy rate (JVR) which is a function of employment itself. Despite the fact that correlation analysis may be a useful and heuristic tool, there are also several pitfalls associated with this approach. Firstly, a strong correlation does not mean that a causal relationship exists between two sets of data. A second difficulty arises from the need to correct for multiple comparisons when looking for “statistically significant” correlations. We use the Bonferroni correction to handle this issue. Finally, strong relationships may be delayed in time or hidden in non-linear and complex combinations of the considered variables. We addressed the first issue by cross-correlation analysis (cross-correlograms) and the second by detrending the data. We expected a positive correlation with employment, respectively negative with unemployment. We also expected time-lags with both employment and unemployment lagging behind vacancies.
We summarize here the results gathered after a series of trials and errors based on intuition and involving a large number of comparisons. We firstly investigated the relationship between job vacancies (JV) and the total number of occupied posts using the data collected in the quarterly business survey in Switzerland for the period 1.Q.1997-1.Q.2009 (49 quarters). Variables have been converted in an index form with the reference date (index = 100) set to the 2nd quarter 2003.
The cross-correlogram indicates a strong relationship with a time-lag of 3 quarters (Fig. 3). On this basis, we decided to consider the correlations between JV at time t and total number of occupied posts at times t, t+1, t+2 and t+3. Correlation analyses were applied at different levels of aggregation of the data including most divisions of the NACE. Including a subset of analyses restricted to the last “economical cycle”, a total number of 464 comparisons were performed (Table 1). The correlation coefficients are very high for most aggregates for the period 2002-2009. They are much higher than those for the whole series. Removing a linear trend (Fig. 2) allowed to unravel a high correlation for the whole period for lags >0 (Table 1).

Job vacancies and the economic cycle: Comments from Switzerland
140 1st and 2nd International Workshops on Methodologies for Job Vacancy Statistics - Proceedings 1st and 2nd International Workshops on Methodologies for Job Vacancy Statistics - Proceedings
Table 1
Correlations between total employment and job vacancies
Correlation: TE - JVS
NACE Rev. 1 / LAG in aquarters 0 1 2 3 0 1 2 3
10-93 TOTAL 0.21 0.28 0.31 0.29 0.82 0.91 0.96 0.9510-93 TOTAL : LINEAR TREND REMOVED 0.63 0.79 0.85 0.86 N/A N/A N/A N/A10-45 SECTEUR II 0.43 0.57 0.60 0.55 0.77 0.93 0.97 0.9050-93 SECTEUR III 0.14 0.18 0.21 0.20 0.83 0.89 0.94 0.9550-93 SECTEUR III : LINEAR TREND REMOVED 0.58 0.70 0.79 0.84 N/A N/A N/A N/A10-14 Mining and quarrying -0.05 0.03 -0.10 -0.17 0.11 0.29 0.09 0.0815-37 Manufacturing 0.58 0.75 0.83 0.83 0.73 0.90 0.98 0.9615 Man. of food products and beverages 0.34 0.38 0.44 0.49 -0.16 -0.21 -0.11 0.1416 Man. of tobacco products 0.05 0.02 0.06 0.07 0.51 0.52 0.65 0.5417 Man. of textiles 0.29 0.29 0.29 0.30 -0.57 -0.58 -0.54 -0.4918 Man. of wearing apparel; ...of fur 0.07 0.58 0.61 0.66 0.22 0.03 0.20 0.3719 Tanning and dressing of leather; ... footwear 0.37 0.38 0.42 0.44 -0.43 -0.63 -0.62 -0.2620 Man. of wood and of products of wood and… 0.11 0.24 0.25 0.17 0.49 0.69 0.77 0.7421 Man. of pulp, paper and paper products 0.27 0.28 0.30 0.31 -0.51 -0.54 -0.54 -0.5222 Publishing, printing and reproduction of .. media 0.33 0.38 0.43 0.46 -0.77 -0.80 -0.75 -0.7323 Man. of coke, refined petroleum … 0.16 0.29 0.46 0.32 0.26 0.43 0.76 0.4324 Man. of chemicals and chemical products 0.74 0.78 0.80 0.80 0.73 0.82 0.86 0.8325 Man. of rubber and plastic products 0.79 0.84 0.78 0.63 0.83 0.87 0.85 0.7526 Man. of other non-metallic mineral products 0.01 0.04 0.02 -0.04 0.62 0.74 0.76 0.6227 Man. of basic metals 0.58 0.58 0.51 0.45 0.72 0.82 0.78 0.7228 Man. of fabricated metal products, except … 0.28 0.46 0.56 0.55 0.65 0.86 0.95 0.9329 Man. of machinery and equipment n.e.c 0.44 0.50 0.54 0.54 0.58 0.73 0.81 0.7930 Man. of office machinery and computers 0.39 0.43 0.47 0.50 -0.45 -0.28 -0.24 -0.2031 Man. of electrical machinery and apparatus n.e.c. 0.26 0.46 0.62 0.72 0.31 0.54 0.68 0.7232 Man. of radio, television and communication equip. … 0.57 0.59 0.55 0.42 0.81 0.88 0.89 0.8533 Man. of medical,..., watches and clocks 0.59 0.69 0.73 0.71 0.80 0.92 0.99 0.9834 Man. of motor vehicles, trailers and semi-trailers 0.37 0.59 0.69 0.70 0.55 0.75 0.82 0.8035 Man. of other transport equipment 0.53 0.49 0.38 0.28 0.73 0.81 0.91 0.9136-37 Manufacturing n.e.c. 0.59 0.69 0.74 0.77 0.23 0.49 0.61 0.7240-41 Electricity, gas and water supply 0.40 0.39 0.37 0.30 0.69 0.72 0.70 0.6245 Construction -0.20 -0.11 -0.14 -0.17 0.49 0.76 0.65 0.3450-52 Wholesale and retail trade; … 0.21 0.29 0.27 0.22 0.67 0.81 0.83 0.8550 Sale, maintenance and repair of motor vehicles … 0.09 0.13 0.13 0.12 0.41 0.43 0.31 0.2651 Wholesale trade and commission trade, except … 0.20 0.25 0.26 0.21 0.78 0.90 0.94 0.9452 Retail trade, except of motor vehicles … 0.36 0.44 0.41 0.44 0.13 0.32 0.27 0.4355 Hotels and restaurants 0.71 0.78 0.75 0.71 0.59 0.68 0.74 0.7360-64 Transport, storage and communication 0.60 0.66 0.73 0.74 0.41 0.60 0.79 0.8660 Land transport; transport via pipelines 0.09 0.10 0.17 0.16 0.67 0.69 0.80 0.8461 Water transport 0.03 0.20 0.39 0.23 -0.29 0.00 0.34 0.0362 Air transport -0.04 0.02 0.04 0.04 -0.42 -0.35 -0.27 -0.1363 Supporting ...; activities of travel agencies 0.39 0.45 0.47 0.44 0.53 0.71 0.80 0.7964 Post and telecommunications 0.50 0.42 0.33 0.24 -0.25 -0.39 -0.39 -0.3565-67 Financial intermediation 0.06 0.19 0.33 0.43 0.27 0.47 0.68 0.7665 Financial intermediation, except… 0.08 0.23 0.40 0.50 -0.04 0.21 0.45 0.6066 Insurance and pension funding, except … 0.45 0.42 0.41 0.40 -0.69 -0.73 -0.65 -0.6667 Activities auxiliary to financial intermediation 0.56 0.57 0.57 0.56 0.77 0.76 0.79 0.7970-74 Real estate, renting and business activities 0.20 0.25 0.28 0.29 0.84 0.91 0.95 0.9570 Real estate activities 0.71 0.76 0.77 0.76 0.72 0.84 0.87 0.8971 Renting of machinery and equipment without … 0.16 0.21 0.29 0.31 0.55 0.55 0.68 0.6572 Computer and related activities 0.02 0.09 0.16 0.19 0.78 0.88 0.96 0.9673 Research and development 0.60 0.60 0.59 0.58 0.82 0.85 0.82 0.7274 Other business activities 0.29 0.33 0.37 0.38 0.80 0.87 0.91 0.9375 Public administration; defence; social security 0.84 0.82 0.79 0.77 0.86 0.86 0.81 0.8180 Education 0.23 0.18 0.19 0.25 0.71 0.54 0.56 0.7585 Health and social work 0.46 0.43 0.41 0.35 0.70 0.69 0.69 0.6490-93 Other community, ...service activities 0.12 0.09 0.06 0.03 0.67 0.66 0.65 0.6590 Sewage and refuse disposal, sanitation … -0.43 -0.43 -0.48 -0.51 0.18 0.21 0.19 0.2091 Activities of membership organizations n.e.c 0.61 0.59 0.57 0.56 0.70 0.71 0.68 0.6992 Recreational, cultural and sporting activities 0.22 0.18 0.17 0.10 0.42 0.38 0.42 0.3793 Other service activities 0.36 0.29 0.26 0.18 0.17 0.14 0.15 0.07
Significant correlation coefficients (p<0.05; one tailed)
Significant correlation coefficients (p<0.05; one tailed; corrected for multiple comparisons)
Period 1.Q.1997-1.Q.2009 (49 quarters) Perio d 2.Q.2002-1.Q.2009 (32 quarters)
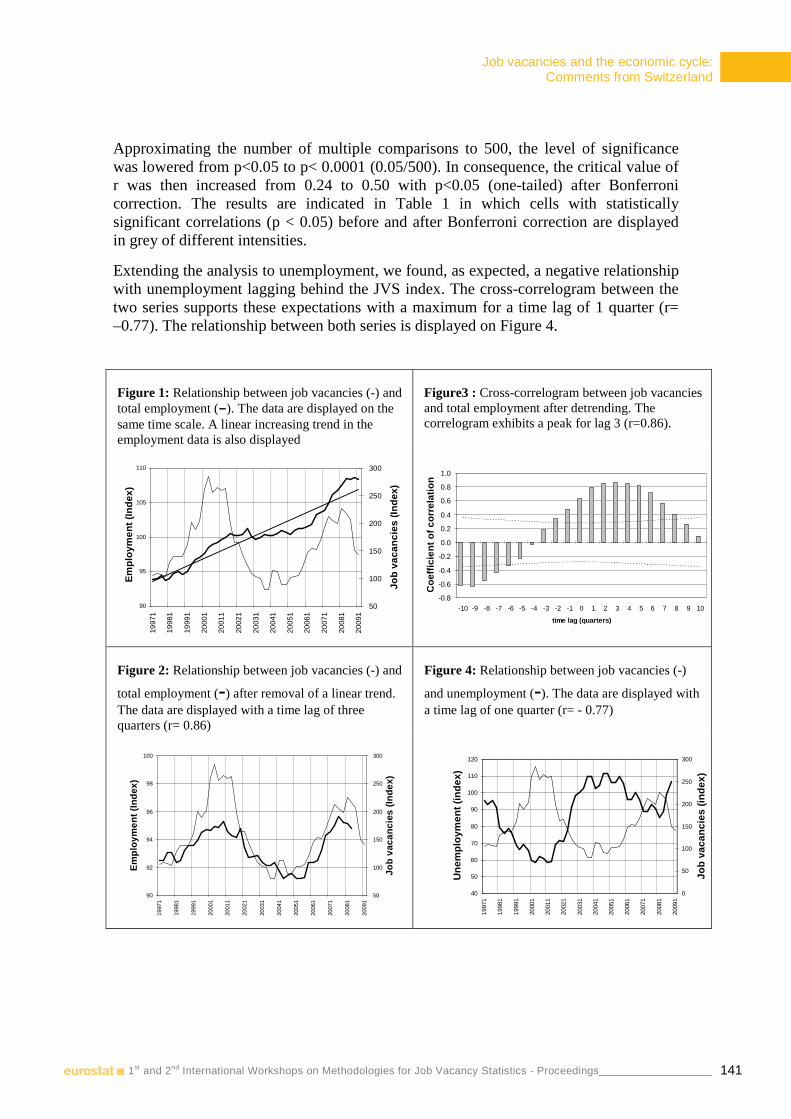
Job vacancies and the economic cycle: Comments from Switzerland
141 1st and 2nd International Workshops on Methodologies for Job Vacancy Statistics - Proceedings
Approximating the number of multiple comparisons to 500, the level of significance was lowered from p<0.05 to p< 0.0001 (0.05/500). In consequence, the critical value of r was then increased from 0.24 to 0.50 with p<0.05 (one-tailed) after Bonferroni correction. The results are indicated in Table 1 in which cells with statistically significant correlations (p < 0.05) before and after Bonferroni correction are displayed in grey of different intensities.
Extending the analysis to unemployment, we found, as expected, a negative relationship with unemployment lagging behind the JVS index. The cross-correlogram between the two series supports these expectations with a maximum for a time lag of 1 quarter (r= –0.77). The relationship between both series is displayed on Figure 4.
Figure 1: Relationship between job vacancies (-) and total employment (-). The data are displayed on the same time scale. A linear increasing trend in the employment data is also displayed
Figure3 : Cross-correlogram between job vacancies and total employment after detrending. The correlogram exhibits a peak for lag 3 (r=0.86).
90
95
100
105
110
1997
1
1998
1
1999
1
2000
1
2001
1
2002
1
2003
1
2004
1
2005
1
2006
1
2007
1
2008
1
2009
1
Em
ploy
men
t (In
dex)
50
100
150
200
250
300
Job
vaca
ncie
s (I
ndex
)
-0.8
-0.6
-0.4
-0.2
0.0
0.2
0.4
0.6
0.8
1.0
-10 -9 -8 -7 -6 -5 -4 -3 -2 -1 0 1 2 3 4 5 6 7 8 9 10
time lag (quarters)
Coe
ffici
ent o
f cor
rela
tion
Figure 2: Relationship between job vacancies (-) and
total employment (-) after removal of a linear trend. The data are displayed with a time lag of three quarters (r= 0.86)
Figure 4: Relationship between job vacancies (-)
and unemployment (-). The data are displayed with a time lag of one quarter (r= - 0.77)
90
92
94
96
98
100
1997
1
1998
1
1999
1
2000
1
2001
1
2002
1
2003
1
2004
1
2005
1
2006
1
2007
1
2008
1
2009
1
Em
ploy
men
t (In
dex)
50
100
150
200
250
300
Job
vaca
ncie
s (I
ndex
)
x
40
50
60
70
80
90
100
110
120
1997
1
1998
1
1999
1
2000
1
2001
1
2002
1
2003
1
2004
1
2005
1
2006
1
2007
1
2008
1
2009
1
Une
mpl
oym
ent (
inde
x)
0
50
100
150
200
250
300
Job
vaca
ncie
s (in
dex)
Job vacancies and the economic cycle: Comments from Switzerland
142 1st and 2nd International Workshops on Methodologies for Job Vacancy Statistics - Proceedings 1st and 2nd International Workshops on Methodologies for Job Vacancy Statistics - Proceedings
In conclusion, the correlation analysis supports the hypothesis of a strong relationship between job vacancies and major changes on the Swiss labour market. However, the present study shows that the relationship may be difficult to unravel. The findings support our expectations with a positive correlation with employment (respectively negative with unemployment) and total employment lagging behind the number of vacancies. The time lag of 3 quarters is surprisingly high and suggests an important inertia between the announcement of vacancies and the actual hiring of recruits.
Contact Person Francis Saucy
Federal Statistical Office FSO, Division Business Surveys, Neuchâtel, Switzerland
Email: [email protected]

Recruitment processes: Experiences from the German job vacancy survey
143 1st and 2nd International Workshops on Methodologies for Job Vacancy Statistics - Proceedings
Recruitment processes: Experiences from the German job vacancy survey
Markus Heckmann IAB (In stitute for Employment Research), Nuremberg, Germany 2nd International Workshop, Neuchâtel, 18 - 19 November 2009
1. Introduction
It is obvious to conclude from the development of vacancies to the economic situation of a country or economic sector. But one has to be careful in doing so. To get a better picture of the situation, additional information is helpful. First, it is necessary to understand why such additional information is important for the right conclusions: For example, when a vacancy is filled the employment might increase. But this has not to be the case: If an employee retires and the open position is filled again, the number of employees remains the same. Keeping this in mind, it is wise to take conclusions from the number of vacancies in respect to the reoccupation rate. The higher the reoccupation rate, the smaller is a possible increase in employment due to a higher number of vacancies. And the smaller is a decline in unemployment (see Kettner/Stops (2009, 368p.).
Furthermore one has to consider the macro economic environment. National labour market policies can have high influence on the labour demand side. In Germany the so called Hartz-reforms lead to an increase of the positions which are assisted by the state. This in turn led to a significant increase in vacancies. Again, if one looks only at the development of vacancies, the misinterpretation of a growing economy is obvious. The risk of such a misinterpretation will be lesser if one has information about the development of positions in the so-called “first labour market” and in the subsidies market.
In the following an overview of crucial results from the German job vacancy survey will be presented. The written questionnaire is directed to enterprises and administrations in the fourth quarter of each year. The results of this representative survey will be extrapolated to the economy.
2. Results from the German job vacancy survey fourth quarter 2008
The population in 2008 contains about 2.1 million local units. For the annual survey 2008 (fourth quarter) a gross sample of about 75.000 firms was chosen, stratified by sectors (NACE), firm size and by regions (NUTS 1). About 10.000 cases were included, financed by the Federal Ministry of Labour and Social Affairs for research on labour market reforms in specific economic sectors. As every year the representative random sample for the survey was drawn from the official business statistics of the Federal Employment Services, which contains all public and private establishments with at least one employee covered by the social security system.

Recruitment processes: Experiences from the German job vacancy survey
144 1st and 2nd International Workshops on Methodologies for Job Vacancy Statistics - Proceedings 1st and 2nd International Workshops on Methodologies for Job Vacancy Statistics - Proceedings
As in the past the main part of the questionnaire firstly asked questions on employment in the current and the previous year, staff turnover, expectations concerning future employment, appraisal of the economic environment etc. Secondly firms should state the number of vacancies, differentiated into vacancies to be filled immediately and vacancies to be filled later, each by level of qualification. Vacancies to be filled immediately should also be defined by occupation and by type of contract (fixed-term or permanent). The number of vacancies to be filled immediately that are difficult to fill was also asked for.
The second part of the questionnaire is traditionally related to the very last case of a recruitment in this firm. Questions concern the job requirements, the characteristics of the hired person, information on recruitment channels, reasons why positions were difficult to fill etc.
Number of vacancies
The number of open positions has declined from 1.22 million in fourth quarter 2007 to 1.09 million in fourth quarter 2008. In this quarter especially the later to be filled vacancies grew back to two thirds of the supply in fourth quarter 2007. The immediately to be filled positions kept relatively constant; the decline was only about two percent. This means that the fraction of the later to be filled positions at the whole vacancies declined from 29 to 22 percent in fourth quarter 2008.
Number of Vacancies by firm size classes
The size structure of the enterprises shows that the possibility of having open positions strongly depends on the size of the enterprises: Only every twelfth of the very small businesses (with fewer than ten employees covered by the social security system) had open positions (Table 1). In contrast, six of ten enterprises with more than 499 employees reported vacancies. The total number of vacancies reveals that more than 20 percent of vacancies belong to very small businesses, but only every ninth to the major size class. Despite the low possibility for open positions in very small and small enterprises their high number in Germany induces that the total number of vacancies in these enterprises is a significant parameter for the economy.
Table 1: Number of vacancies by size class 2008
absoluteshare in size
class
less than 10 1,389,500 108,200 8% 245,000 22%
10 to 19 431,000 88,000 20% 198,000 18%
20 to 49 185,800 52,300 28% 181,000 17%
50 to 199 91,700 37,300 41% 258,000 24%
200 to 499 16,400 9,000 55% 93,000 9%
500 and more 6,700 4,100 61% 115,000 11%
total 2,121,100 299,000 14% 1,090,000 100%
vacancies
totalshare in all vacancies
size of establishment
(number of employees)
companies/administrations
totalcompanies with vacancies
German Job Vacancy Survey 2008

Recruitment processes: Experiences from the German job vacancy survey
145 1st and 2nd International Workshops on Methodologies for Job Vacancy Statistics - Proceedings
Hard-to-fill vacancies
The information of the fraction of hard-to-fill vacancies also helps to draw reasonable conclusions from the development of the open positions. Assuming that the number of incoming vacancies in period t and t-1 are constant, the number of vacancies in t will increase by the number of not filled but still open positions in t-1. Drawing the conclusion that this increase might be a precursor of growing employment is a fallacy. If there is additional information available about the rate of hard-to-fill positions, one can take more precise deductions.
Hard-to-fill vacancies in the German job vacancy survey are defined as positions, the search of which takes longer as usual or lasts longer as originally planned. In the fourth quarter of 2008 this applied to 20 percent of all immediately to be filled vacancies. This means a decline of two percentage points compared to the fraction in the fourth quarter of 2007. The proportion of these vacancies differs significantly over sectors and can be interpreted carefully as a possible indicator for skill shortages. Especially in the sectors manufacturing and processing of metals and manufacturing of machinery high fractions of hard-to-fill jobs are reported (48 respectively 43 percent).
Vacancy rates by qualification
The German job vacancy survey defines the vacancy rate as the relation between immediately to be filled positions and the number of employees. This relation can be taken as one indicator for labour market tightness. Table 2 shows the vacancy rates for the years 2004, 2006 and 2008. In 2006 and 2008 the rates for unskilled or semiskilled workers lied considerable above average. This is true for the regular labour market as well as for the labour market including subsidied jobs. There seems to be an interdependence with the business cycle: In the fourth quarter of 2004, during a bad economic situation in Germany, the vacancy rate was very low. The opposite of high vacancy rates occurs in 2006 and 2008 when the German economy boomed respectively the crisis did not reach the economy so far.
Table 2: Vacancy rates by qualification
2004 2006 2008 2004 2006 2008un-/ semi-skilled worker 1.5 5.7 3.7 1.2 4.5 2.9skilled worker 0.9 2.8 2.0 0.9 2.2 1.6employee for low-grade jobs 1.4 2.8 3.2 1.3 2.2 2.5employees for skilled occupations 1.5 1.9 1.9 1.4 1.6 1.5 - without university degree 1.1 1.2 1.3 1.1 1.0 1.1 - with university degree 2.1 3.5 3.2 2.1 2.8 2.5Total 1.3 2.9 2.4 1.2 2.3 1.9
vacancy rate without 2nd labour market
total vacancy rates
German Job Vacancy Survey 2004, 2006 and 2008

Recruitment processes: Experiences from the German job vacancy survey
146 1st and 2nd International Workshops on Methodologies for Job Vacancy Statistics - Proceedings 1st and 2nd International Workshops on Methodologies for Job Vacancy Statistics - Proceedings
For occupations that required an university degree the vacancy rates are high too, but there is no sign for an interdependency with the business cycle: Throughout all years there are similar vacancy rates on the first labour market. This also seems to confirm the picture before the crisis, as the demand of skilled labour was very high in some regions and some sectors.
Most wanted Occupations
The enterprises were also asked about their five most frequently searched for occupations applying to their open positions. This information makes it possible to create a ranking (Table 3). This table shows for the fourth quarter of 2008 that the most asked for professions are engineers (69.000) which is a decline of 10.000 positions related to the fourth quarter of 2007, but still at a high level. For the first time social service related occupations were highlighted in this ranking. Those occupations include positions for social workers and pedagogues, teachers and educators, hospital and geriatric nurses.
Table 3: Top 5 of immediately to be filled vacancies (1000)
engineers 69
social occupations 57
occupations of ground transport 47
occupations in management, consulting and company audit 41
occupations in information/ computer science 40
engineers 79
occupations in information/ computer science 54
electronic engineers, electricians etc. 45
occupations of ground transport 43
technicians 39
2008
2007
German Job Vacancy Survey 2007 and 2008
This picture will be confirmed through the development in the sector “Education, health and social work”: Compared to fourth quarter of 2007 the open positions increased about 37 percent. This increase is also documented in the registered vacancies of the Federal Employment Agency. Chart 1 shows the development of the above ranked professions from January 2007 to April 2009. The Index is set 100 in January 2007 and is growing for all listed occupations until April 2009, whereas the total sum of vacancies is decreasing in this period.

Recruitment processes: Experiences from the German job vacancy survey
147 1st and 2nd International Workshops on Methodologies for Job Vacancy Statistics - Proceedings
Chart 1: Vacancies in social occupations
60
80
100
120
140
160
180
200
220
Jan Apr Jul Oct Jan Apr Jul Oct Jan Apr
2007 2008 2009
total number of registered vacancies
hospital nurses, midwives
geriatric nurses
social workers, social pedagogues
nursery-school teachers, educators
teachers
8.800
14.000
800
7.100
4.200
495.000
Federal Employment Agency 2007 to 2009
Looking at the available information from the enterprises, this development seems sustainable: Asked for their expectations in the next three years extrapolated 63.000 enterprises assume a growing demand in these social occupations. Moreover every second of these enterprises fears shortages.
Recruitment strategies
In 2008, for 41 percent of all hires the enterprises used advertisements to search for candidates for the open position (Table 4). In East Germany the most frequented searching option has been the jobcentres (47 percent). As well in the eastern as in the western part, enterprises often searched through network contacts, what means enterprises used personal contacts and asked their employees for applicable staff.
The most effective search way has been the network contacts: 29 percent of all hires were completed through this recruiting channel. Considering that in 34 percent of all new hires enterprises used this way of searching the success rate will be 85 percent.1 No other recruiting channel was this effective. Aside this, advertisements and employment agencies were the most effective ways to recruit staff. These findings are quite stable for the last few years.
1 Effectiveness=fraction of recruiting through this channel/fraction of searching through this channel*100.
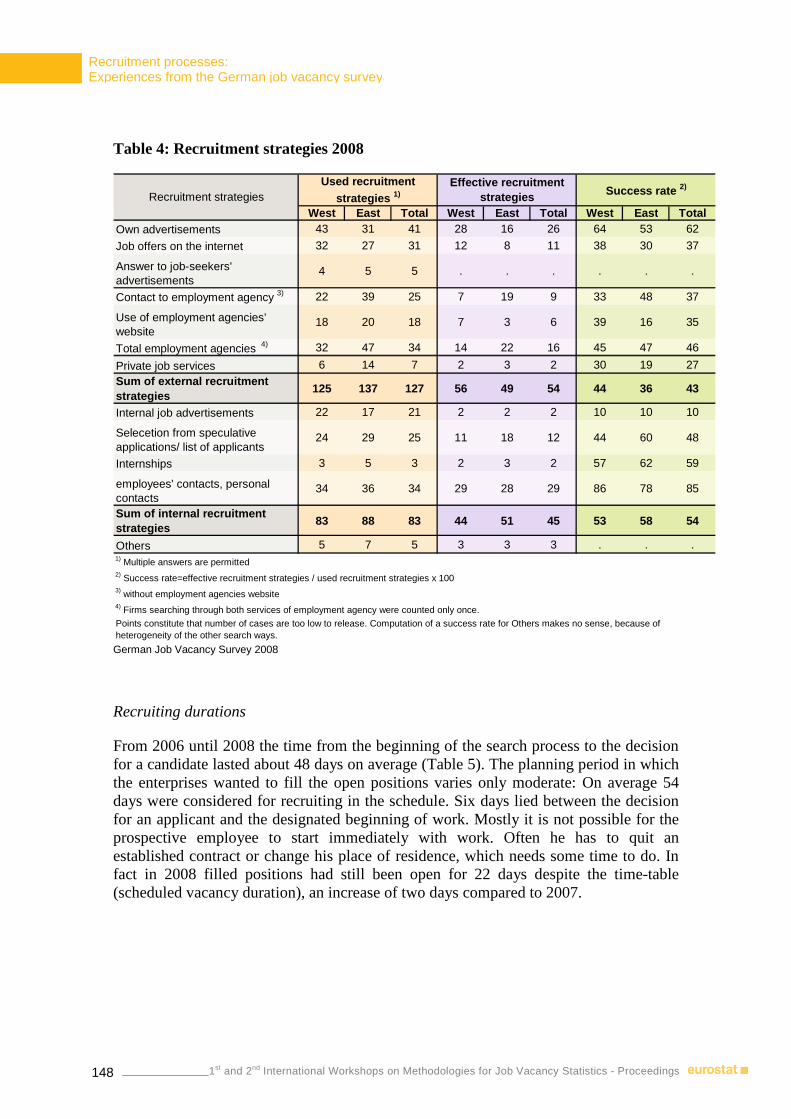
Recruitment processes: Experiences from the German job vacancy survey
148 1st and 2nd International Workshops on Methodologies for Job Vacancy Statistics - Proceedings 1st and 2nd International Workshops on Methodologies for Job Vacancy Statistics - Proceedings
Table 4: Recruitment strategies 2008
West East Total West East Total West East TotalOwn advertisements 43 31 41 28 16 26 64 53 62
Job offers on the internet 32 27 31 12 8 11 38 30 37
Answer to job-seekers' advertisements
4 5 5 . . . . . .
Contact to employment agency 3) 22 39 25 7 19 9 33 48 37
Use of employment agencies' website
18 20 18 7 3 6 39 16 35
Total employment agencies 4) 32 47 34 14 22 16 45 47 46
Private job services 6 14 7 2 3 2 30 19 27Sum of external recruitment strategies
125 137 127 56 49 54 44 36 43
Internal job advertisements 22 17 21 2 2 2 10 10 10
Selecetion from speculative applications/ list of applicants
24 29 25 11 18 12 44 60 48
Internships 3 5 3 2 3 2 57 62 59
employees' contacts, personal contacts
34 36 34 29 28 29 86 78 85
Sum of internal recruitment strategies
83 88 83 44 51 45 53 58 54
Others 5 7 5 3 3 3 . . .1) Multiple answers are permitted2) Success rate=effective recruitment strategies / used recruitment strategies x 1003) without employment agencies website4) Firms searching through both services of employment agency were counted only once.
Points constitute that number of cases are too low to release. Computation of a success rate for Others makes no sense, because of heterogeneity of the other search ways.
Used recruitment strategies 1)
Effective recruitment strategies Success rate 2)
Recruitment strategies
German Job Vacancy Survey 2008
Recruiting durations
From 2006 until 2008 the time from the beginning of the search process to the decision for a candidate lasted about 48 days on average (Table 5). The planning period in which the enterprises wanted to fill the open positions varies only moderate: On average 54 days were considered for recruiting in the schedule. Six days lied between the decision for an applicant and the designated beginning of work. Mostly it is not possible for the prospective employee to start immediately with work. Often he has to quit an established contract or change his place of residence, which needs some time to do. In fact in 2008 filled positions had still been open for 22 days despite the time-table (scheduled vacancy duration), an increase of two days compared to 2007.

Recruitment processes: Experiences from the German job vacancy survey
149 1st and 2nd International Workshops on Methodologies for Job Vacancy Statistics - Proceedings
Table 5: Durations of recruitment processes
all occupations
engineersall
occupationsengineers
all occupations
engineersall
occupationsengineers
Duration of personnel recruitment (start of search to decision)
43 57 49 80 48 80 48 81
Scheduled duration of vacancy filling (start of search to designated start of work)
54 103 56 58 53 80 54 74
Actual duration of vacancy filli ng (start of search to actual start of work)
71 127 75 122 74 116 76 128
Scheduled vacancy durati on (date of decision to designated start of work)
11 46 7 -22 5 0 6 -7
Actual vacancy duration (date of decision to actual start of work)
28 70 26 42 26 36 28 47
Scheduled vacancy durati on (designated to actual start of work)
17 24 20 64 20 36 22 55
20082005 2006 2007
German Job Vacancy Survey 2005-2008
The average duration values in 2008 showed no tightening of the labour market. This changes looking at the most wanted profession of the engineers: With an average search duration of 128 days the recruitment lasted longer as in the years before. The scheduled duration of recruiting was shorter than before (74 days). The scheduled vacancy duration approached the value of 2006; compared with the time-table it lasted 55 days since the open position was filled.
Cancelled recruitment activities
To elaborate the perspective on the labour market it is useful to consider the cancelled recruitment activities. In total 14 percent of all enterprises report of such cancelled recruitments in the last twelve months. To get a better picture these results were compared to the hires in the last twelve month. The comparison shows that the very small enterprises with fewer than ten employees covered by the social security system are overrepresented: One third of all these cancelled activities had been registered in very small enterprises, compared to only every ninth hire (Table 6). Enterprises with 200 and more employees show the opposite: Every third hire was reported there, but only every 14th cancelled recruitment activity.

Recruitment processes: Experiences from the German job vacancy survey
150 1st and 2nd International Workshops on Methodologies for Job Vacancy Statistics - Proceedings 1st and 2nd International Workshops on Methodologies for Job Vacancy Statistics - Proceedings
Table 6: Cancelled staff recruitment activities 2008 – shares in size classes
Shares in size classesCancelled
recruitment activities
New hires
less than 10 employees 31 11
10 to 49 employees 44 28
50 to 199 employees 18 27
200 and more employees 7 34
Total 100 100 German Job Vacancy Survey 2008
Nearly every second cancelled recruiting activity was reported in the sector “Financial intermediation; Insurance; Real estate” (Table 7). Another every fourth belonged to the “Wholesale; Hotels and Restaurants; Transport and communication”-sector. This means, that seven out of ten cancelled activities were reported in these two sectors. The comparison with the structure of the hires in business sectors shows that the sector of the financial intermediation etc. was overrepresented: The enterprises report every fourth hire but every second cancelled recruitment activity.
Table 7: Cancelled staff recruitment activities 2008 – shares in business sectors
Cancelled recruitment
activitiesNew hires
Agriculture, forestry and fishing 1 1
Manufacturing industry 10 15
Construction 9 6
Wholesale; Hotels and Restaurants; Transport and communication
24 29
Financial intermediation; Insurance; Real estate 46 28
Other service activities 11 21
Total 100 100 German Job Vacancy Survey 2008

Recruitment processes: Experiences from the German job vacancy survey
151 1st and 2nd International Workshops on Methodologies for Job Vacancy Statistics - Proceedings
3. Conclusion
One important objective for the German job vacancy survey is to advise the Federal Employment Agency, the Federal Ministry of Labour and Social Affairs as well as the interested public. As showed rudimental the survey has very rich and detailed information beyond the development of the open positions. The view on the labour market will be completed through questions which focus on cancelled recruitment activities. This gives insight into the not realized labour market demand and enables us to broaden our view how the recruitment processes works on the enterprise-level and why enterprises cancel recruitment activities. As said before: This information might be quite helpful in drawing conclusions from the development of the number of open positions and to avoid misinterpretation.
Contact Person Markus Heckmann
IAB (Institute for Employment Research), Nürnberg, Germany
Email: [email protected]

Occupied posts
152 1st and 2nd International Workshops on Methodologies for Job Vacancy Statistics - Proceedings 1st and 2nd International Workshops on Methodologies for Job Vacancy Statistics - Proceedings
Occupied posts
Luis Biedma Eurostat, Luxembourg 2nd International Workshop, Neuchâtel, 18 - 19 November 2009
Although the main focus of Regulation (EC) No 453/2008 is the collection of statistics on job vacancy statistics (JVS), it also requires the delivery of statistics on occupied posts. This document provides a short overview of definition and compilation issues.
Definition of occupied posts
Paragraph 2 of Article 2 of Regulation (EC) No 453/2008 states: ‘occupied post’ shall mean a paid post within the organisation to which an employee has been assigned. The subsidiary role of occupied post in the framework of the Regulation is clearly depicted by Paragraph 2 of Article 3: Member States shall provide data on occupied posts in order to standardise job vacancy data for comparative purposes. There is no additional guidance anywhere on the Regulation about the exact interpretation of occupied posts. Furthermore, it seems that the term occupied posts is not explicitly included as such in other legal documents and/or manuals dealing with employment statistics.
The interpretation by Eurostat is that occupied posts correspond to the concept of employee jobs as defined in the European System of Accounts (ESA 95). ESA 11.22 provides the definition of jobs and employee job: "A job is defined as an explicit or implicit contract between a person and a resident institutional unit to perform work in return for compensation for a defined period or until further notice. In that definition, both employee and self-employment jobs are covered: that is, an employee job if the person belongs to another institutional unit than the employer and a self-employment job if the person belongs to the same institutional unit as the employer".
Interpretation of borderline cases
ESA 95 clarifies the problem of persons temporarily not at work but who have a formal attachment to their job. They are considered employees (ESA 11.14) but not counted as jobs (ESA 11.23a). Eurostat proposes not to consider persons temporarily not at work as occupied posts, as it could potentially lead to double-counting occupied posts if, for example, a temporarily replacement is hired.
The treatment of apprentices in occupied posts (and job vacancies) is particularly difficult. First, national practices are very different (paid versus not paid, by whom, etc) and secondly, their treatment seems to be different across statistical domains (Labour Force Survey versus National Accounts). For the purposes of Regulation (EC) No 453/2008 apprentices should be included as occupied posts only if they receive some remuneration. As the definition of vacancies states that it shall mean a paid post it seems natural to exclude unpaid posts from the denominator.

Occupied posts
153 1st and 2nd International Workshops on Methodologies for Job Vacancy Statistics - Proceedings
Compilation issues
From a practical point of view the best option to compile statistics on occupied posts is to use the same source from where data on job vacancies is obtained. This should ensure that a common reference period is used for both statistics, units or enterprises are classified uniformly, common imputation methods are applied, etc.
In those countries where occupied posts figures are derived from the Labour Force Survey the following elements should be taken into consideration:
• Adjustment from national to domestic concept. • Sizeable differences on NACE results between business and household
surveys. • Timeliness of the LFS data, which are usually available 90 days after the
reference period.
Dissemination issues
As said before, data on occupied posts only play a minor, but important, role: they are used to standardise job vacancy data for comparative purposes. Other statistics are better suited for analysing employment developments: National Accounts, the Labour Force Survey and Short-Term Business Statistics. Nevertheless, for countries that must produce flash estimates 45 days after the end of the reference period, occupied posts may become the first employment indicator which becomes available and therefore could raise certain attention from analysts.
Also, from Eurostat's perspective, it is very important to receive occupied posts for all breakdowns to calculate job vacancy rates. The NACE and enterprise size coverage is rather heterogeneous and might continue being heterogeneous after 2010, depending on the results of the feasibility studies. The use of vacancy rates, as opposed to the number of vacancies, provides the best option to offer comparable figures across countries.
Contact Person Luis Biedma
Eurostat, Luxembourg
Email: [email protected]


European Commission 1st and 2nd International Workshops onMethodologies for Job Vacancy Statistics - Proceedings Luxembourg: Publications Office of the European Union 2010 — 153 pp. — 21 x 29.7 cm ISBN 978-92-79-17006-5ISSN 1977-0375 Doi:10.2785/57804 Cat. No KS-RA-10-027-EN-N Theme: Population and social conditions Collection: Methodologies and working papers


terza_copertina.indd 3 24-05-2007 17:58:14
How to obtain EU publicationsFree publications:
• viaEUBookshop(http://bookshop.europa.eu);
• attheEuropeanUnion’srepresentationsordelegations.YoucanobtaintheircontactdetailsontheInternet(http://ec.europa.eu)orbysendingafax to +352 2929-42758.
Priced publications:
• viaEUBookshop(http://bookshop.europa.eu).
Priced subscriptions (e.g. annual series of the Official Journal of the European Union and reports of cases before the Court of Justice of the European Union):
• viaoneofthesalesagentsofthePublicationsOfficeoftheEuropeanUnion (http://publications.europa.eu/others/agents/index_en.htm).

2008 edition
KS-RA-10-027-EN
-N
M e t h o d o l o g i e s a n d W o r k i n g p a p e r s
Domestic tourism manual
ISSN 1977-0375